Mapping and analysis of types of migration from CEE countries: Comparative report
49
IMAGINATION COMPARATIVE PROJECT REPORT 1 2014 Mapping and analysis of types of migrants from CEE countries Comparative Report By Deniz Sert This report draws on research undertaken within the IMAGINATION project, which focuses on migration from Central and EasternEuropean (CEE) countries. IMAGINATION is funded by JPI Urban Europe. See www.projectimagination.eu
Transcript of Mapping and analysis of types of migration from CEE countries: Comparative report
IMAGINATION COMPARATIVE PROJECT REPORT 1 2014
Mapping and analysis of types of migrants from CEE countries
Comparative Report By Deniz Sert
This report draws on research undertaken within the IMAGINATION project, which focuses on migration from Central and Eastern-‐European (CEE) countries. IMAGINATION is funded by JPI-‐ Urban Europe. See www.project-‐imagination.eu
1
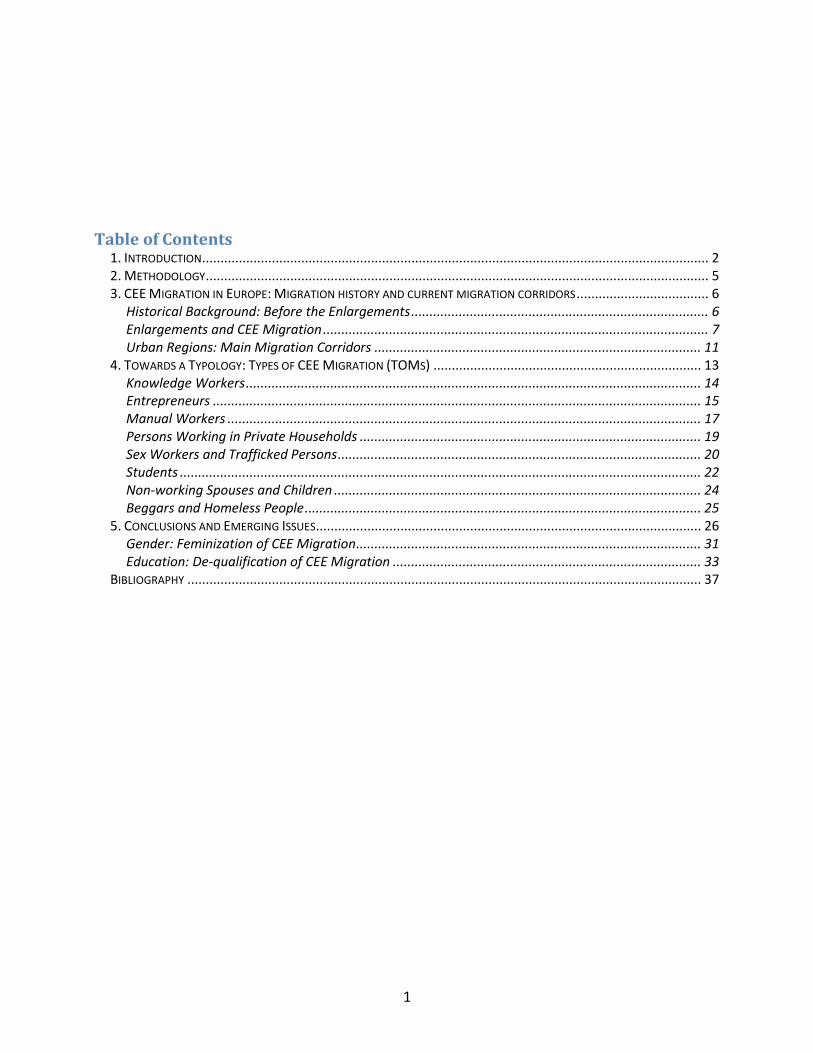
Table of Contents 1. INTRODUCTION .......................................................................................................................................... 2 2. METHODOLOGY ......................................................................................................................................... 5 3. CEE MIGRATION IN EUROPE: MIGRATION HISTORY AND CURRENT MIGRATION CORRIDORS .................................... 6
Historical Background: Before the Enlargements ................................................................................. 6 Enlargements and CEE Migration ......................................................................................................... 7 Urban Regions: Main Migration Corridors ......................................................................................... 11
4. TOWARDS A TYPOLOGY: TYPES OF CEE MIGRATION (TOMS) ......................................................................... 13 Knowledge Workers ............................................................................................................................ 14 Entrepreneurs ..................................................................................................................................... 15 Manual Workers ................................................................................................................................. 17 Persons Working in Private Households ............................................................................................. 19 Sex Workers and Trafficked Persons ................................................................................................... 20 Students .............................................................................................................................................. 22 Non-‐working Spouses and Children .................................................................................................... 24 Beggars and Homeless People ............................................................................................................ 25
5. CONCLUSIONS AND EMERGING ISSUES......................................................................................................... 26 Gender: Feminization of CEE Migration .............................................................................................. 31 Education: De-‐qualification of CEE Migration .................................................................................... 33
BIBLIOGRAPHY ............................................................................................................................................ 37
2
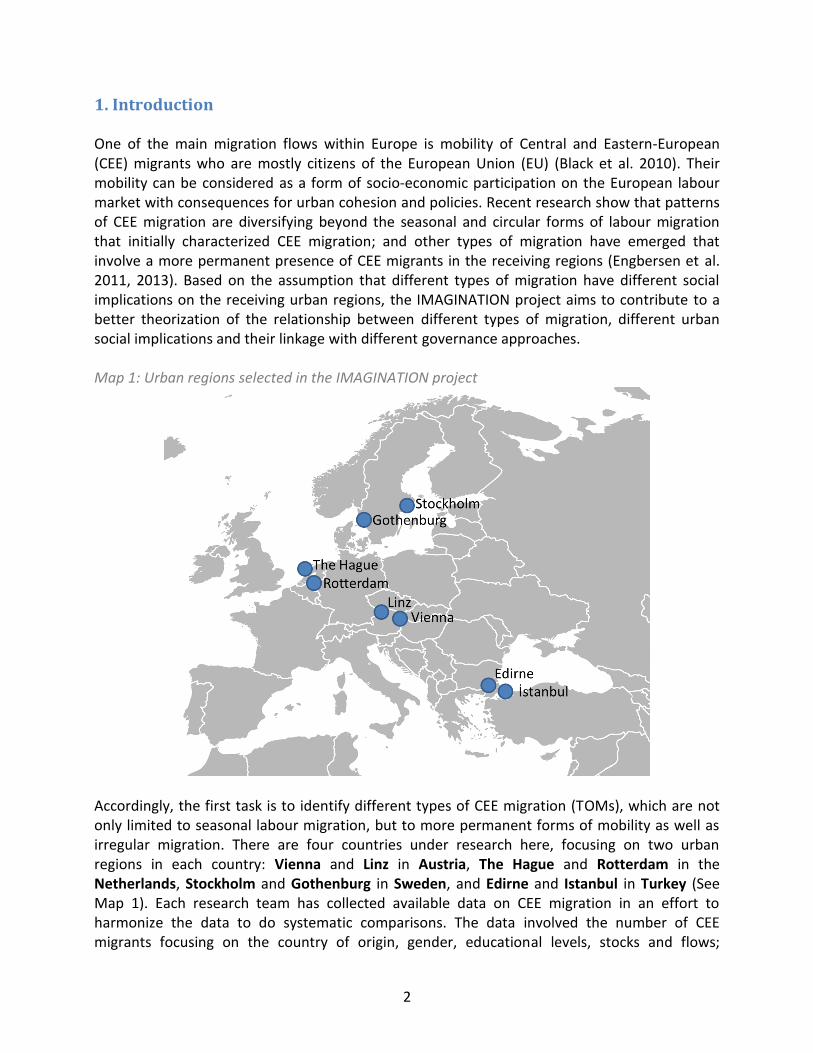
1. Introduction One of the main migration flows within Europe is mobility of Central and Eastern-‐European (CEE) migrants who are mostly citizens of the European Union (EU) (Black et al. 2010). Their mobility can be considered as a form of socio-‐economic participation on the European labour market with consequences for urban cohesion and policies. Recent research show that patterns of CEE migration are diversifying beyond the seasonal and circular forms of labour migration that initially characterized CEE migration; and other types of migration have emerged that involve a more permanent presence of CEE migrants in the receiving regions (Engbersen et al. 2011, 2013). Based on the assumption that different types of migration have different social implications on the receiving urban regions, the IMAGINATION project aims to contribute to a better theorization of the relationship between different types of migration, different urban social implications and their linkage with different governance approaches. Map 1: Urban regions selected in the IMAGINATION project
Accordingly, the first task is to identify different types of CEE migration (TOMs), which are not only limited to seasonal labour migration, but to more permanent forms of mobility as well as irregular migration. There are four countries under research here, focusing on two urban regions in each country: Vienna and Linz in Austria, The Hague and Rotterdam in the Netherlands, Stockholm and Gothenburg in Sweden, and Edirne and Istanbul in Turkey (See Map 1). Each research team has collected available data on CEE migration in an effort to harmonize the data to do systematic comparisons. The data involved the number of CEE migrants focusing on the country of origin, gender, educational levels, stocks and flows;
3
migration motives such as labour, family, and/or study; duration of migration in terms of temporality and permanency; and labour market participation based on formal or informal employment. The findings were presented in four country reports, which comprised the first four Working Papers of the project, and published on the project website (See http://www.project-‐imagination.eu/). Based on the findings presented in these country reports, the research teams created a typology of CEE migration, presenting eight different categories: knowledge workers, entrepreneurs, manual workers, persons working in private households, sex workers and trafficked persons, students, non-‐working spouses and children, beggars and homeless people.
but rather as a highly differentiated category. It involves high as well as low-‐skilled migrants, as well as migrants that reside only temporarily as well as those who settle more permanently (Engbersen et al. 2013). Subsequently, this report is an effort to present these categories within a comparative analysis and with a focus on the existing migration corridors between CEE countries and Austria, the Netherlands, Sweden and Turkey. This comparative report involves a synthesis of the main findings based on the four country reports as well as an analysis of differences and similarities between the selected cases. There are some main findings regarding the typology. Looking at the category of knowledge workers, while there is a small presence of knowledge workers in all countries, there are more differences than similarities. While high skilled positions in the labour market in Austria were usually reserved for Austrian citizens, there is a certain level of improvement in this situation; in the Netherlands, despite the conventional belief that CEE migrants hold low-‐skilled jobs, there is an observed heterogeneity in the labour market positions of the migrants from the CEE, where migrants also have high skilled employment. In contrast to Austria and the Netherlands, the highest shares within the skill-‐level-‐ Sweden are observed in high and medium skilled jobs the latter being larger than the former in both regions. In contrast to other countries under research, the conventional wisdom in Turkey is that migrants from the CEE have higher skills than the local population, where the Istanbul region specifically seems to attract high skilled professionals from the CEE. The category of entrepreneurs is observed as an important path for formal employment in all four countries, where there is a noticeable relationship between the legal conditions of the labour market in the host country and the use of self-‐employment by the migrants. For example, on the one hand, as the transitional rules are revoked in Austria and the Netherlands, there is an expected decrease in the trend of self-‐employment. On the other hand, in Sweden, as more regulations are applied in the berry picking market, the number of self-‐employed migrants in this sector rise. Self-‐employment is also detected in Turkey as a means of formal status in the labour market. The classification of manual workers is a widely observed type of CEE migration in the cases under research with the exception of Turkey. The agriculture, industry, construction, and in big cities such as Vienna, service sectors employ large segments of CEE migrants, both in the formal
4
and informal employment schemes. In Turkey, internal migration of the local Kurdish population is largely supplying the demand in these sectors. Persons working in private households is a category are identified in all four countries. A prevalent issue regarding the migrants working in private households as care workers, nannies, cleaning persons, and gardeners are observed phenomena is the problem of registration, where the distinction between regular versus irregular migrants becomes difficult to distinguish. Another category where the distinction between formal and informal arrangements is hard to differentiate is the sex workers and trafficked persons. On the one hand, some sex workers are not registered and working informally. On the other hand, there are a number of registered sex workers that may represent a voluntary choice of profession in a formal setting. However, within this latter group there are also many that are forced into prostitution. Thus, sex workers and trafficked persons are usually mixed in this category. Students as a category of CEE migration are increasing in volume in all four countries. Student mobility is an expanding phenomenon not only among the Member States of the EU, but also in Turkey (Findlay et al. 2014; Van Mol &Timmerman 2013). Sometimes students see education as a stepping-‐stone to permanent residency within a country (Gribble 2008), but further research is needed to understand the motivations and future plans of CEE students in the four countries. While less is known about the qualitative features of the type of non-‐working spouses and children migration, quantitatively, this category is extending in numbers in all four countries. Still, this category receives less attention both in policy and academic circles. In contrast, the category of beggars and homeless people emerges as a sensitive issue that attracts public debate, although the numbers of this type of migration are rather low compared to the other categories. In this comparative report, the typology is further elaborated. Accordingly, the report is composed of several chapters. The following chapter introduces the methodology that was followed in the initial phase of the project, while also addressing the issue of availability of comparable data. Chapter three discusses the background of CEE migration in Europe. It first presents a historical overview of CEE migration to the four countries, focusing on the period before the enlargements of 2004 and 2007. Subsequently, it gives an overview of the effects of the enlargements on the volume of CEE migration to the four countries with a focus also on the transitional arrangements. Furthermore, it introduces the chosen urban regions in each country, identifying the main migration routes in each. The fourth chapter depicts the typology of CEE migration more in-‐depth. The final chapter is the conclusion. The focus here is on two major issues that emerge from the country reports, addressing whether CEE migration is becoming largely feminized for all four countries under research, and whether the educational level or qualifications of migrants correspond with their employment status.
5
2. Methodology The methodology followed for the initial part of the research project was twofold. First, each research team has outlined and analysed the available data on CEE migration based on secondary sources, which comprised a literature review of earlier research as well as study of available official statistics. Despite the importance of CEE migration in Europe, there were some difficulties in terms of availability of data. To illustrate, in Austria, the Central Population Register (CPR) draws on a system of continuous reporting on the changes of main residences at the municipal level covering all persons who have registered a main residence in Austria for more than 90 consecutive days. While this provides a valuable source for an overview on stocks and flows of migrants including basic demographic features such as age and gender, the population register lacks important information on education, professional background or legal status. In the Netherlands, population statistics give reliable information about the registered migrants in the country. However, only those migrants who intend to stay in the Netherlands more than four months need to register thus migration statistics are incomplete and socially selective. There are analyses on CEE migration derived from representative samples from these population registers, but the problem remains that many CEE migrants are not registered. There are also survey studies based on non-‐representative sampling of CEE migration, which provide better insight into the more volatile category of temporary and often less integrated CEE migrants in the Netherlands, but the unemployed and other non-‐working migrants tend to be absent in these. In Sweden, data on CEE migration were derived from the official statistics from Statistics Sweden, the Swedish Work Environment Authority, the National Board of Health and Welfare, and the Swedish Higher Education Authority. However, like the Netherlands, there is a time dimension in the population registers where only those migrants who declare their intention to stay for at least one year in Sweden are included in the population statistics. Moreover, like in Austria, the official data hardly provide any information on the educational levels of the CEE migrants. In Turkey, the problem of availability of data is more critical than other cases. International migration in Turkey has become a policy concern only in late 90s, and collection and distribution of data have not been considered as statistically important. Moreover, a large portion of international migration in Turkey is on irregular basis, adding to the problem of not having a centralized system of registers. The official statistics that are available are only on national level. Regardless, where no official data were available, the country reports also utilized qualitative interviews that were conducted to get estimates of the scale of migration and to uncover experiences with different types of migration. Within this second approach, teams have conducted semi-‐structured interviews with different stakeholders. These included representatives of the CEE migrants mostly from different migrant organizations, officials from
6
local governments, relevant private agencies such as labour recruitment agencies, and NGOs involved in the related areas of migration like housing corporations and educational institutions. The first part of the IMAGINATION project showed that unavailability of comparable data on CEE migration is a deficiency for conducting research on the subject. Thus, the data to be collected in the following stages of the IMAGINATION project becomes an important contribution to the field, partially filling in this gap in the literature, and increasing the importance of the project both for the academic and the policy circles.
3. CEE Migration in Europe: Migration history and current migration corridors This section outlines the (historical) background of CEE migration within Europe, and maps the current migration corridors at which the IMAGINATION project focuses. In terms of the historical background, the enlargement of the EU with a number of CEE countries was evidently a defining moment for migration (to and) from CEE countries. Therefore, we will briefly sketch the historical background of CEE migration before and after the EU enlargements. Subsequently, we zoom in on a number of more specific migration corridors between urban regions, which will be the focus of this project.
Historical Background: Before the Enlargements In all four countries under research here, international migration flows from CEE countries have a historical track record. In Austria, two groups of CEE migrants have been of particular importance: refugees from the communist countries whose migration continued until late 1980s, and labour migrants and their families. Due to its neutrality during Cold War, Austria received three major waves of refugees, namely from Hungary in 1956, from Czechoslovakia in 1968 and from Poland in 1981; for many, Austria was only a transit country on their way to other destinations. At the beginning of the 1960s, Austria was confronted with a growing need for additional labour and started to recruit workers from countries such as Turkey (1964) and the Socialist Federal Republic of Yugoslavia (1966). Despite original plan of rotation model of
stayed and brought their families to Austria, still comprising the most important and growing foreign-‐born group in the country. Like Austria, the Netherlands also received refugees from the same three countries (Hungary, Czechoslovakia, and Poland) during the same periods (1956, 1968, and 1981 respectively) (Bonjour 1980: 48). Unlike other countries, the Netherlands was also home to a unique type of movement: those Polish soldiers who fought with the Allied forces to liberate the Netherlands from the German occupation during World War II stayed and married here. Furthermore, there was some marital migration of females from CEE countries (particularly from Poland) that married Dutch males the so the so-‐called Polish brides (Dagevos 2011). However, the Netherlands has also been an important destination for labour migration. Even before and shortly after World War II several thousands of CEE nationals (mainly from Poland and Slovenia) arrived to work in the Dutch mines (Brassé and Van Schelven 1980). In the late 1980s, 50,000 Poles were estimated to work as seasonal workers in the Dutch horticulture (Dagevos 2011: 31).
7
Like Austria and the Netherlands, Sweden is also a destination for humanitarian immigration, and in increasing numbers (Boguslaw 2012). However, unlike the two other cases, Sweden followed a more cautious immigration policy in terms of labour migration. In the wake of the economic downturn in the beginning of the 1970s, Sweden made labour migration only to be allowed if the labour demand could not be met by the existing domestic labour Prop. 1968: 142 ). With the Swedish accession into the EU in 1995, most existing obstacles for free movement 1992). Turkey was a rather different case. In the Early Republican Period, CEE immigration, usually categorized as Balkan migrations, was the widest one and formed of three origin countries of the time: Bulgaria, Romania and Yugoslavia. After its independence war, the country was in need of human capital for a homogenous nation state and welcomed migrants of Sunni-‐Islam origin from countries such as Bulgaria, Romania and Yugoslavia. In the period of 1940 and 1945, more than 20,000 people migrated to Turkey with Bulgarians, Romanians and Yugoslavians representing 73 per cent, 19 per cent and eight per cent of this migrant community respectively. During the Cold War, when approximately 830,000 migrants entered Turkey, a similar trend was observed. In this period, Bulgarians, with 72 per cent, formed the largest group followed by Yugoslavian migrants who constituted 22 per cent of the migrant community. The large scale
minorities including those of Turkish ethnicity. Overall, the history of CEE migration to Turkey demonstrates the weight of Bulgarians, Yugoslavians and Romanians of Muslim origin, usually looking for a safe haven thus, somehow resembling the humanitarian migration in other countries under research. Recently, with the neo-‐liberal economic policies of governments after 1990, more diverse migration flows are observed.
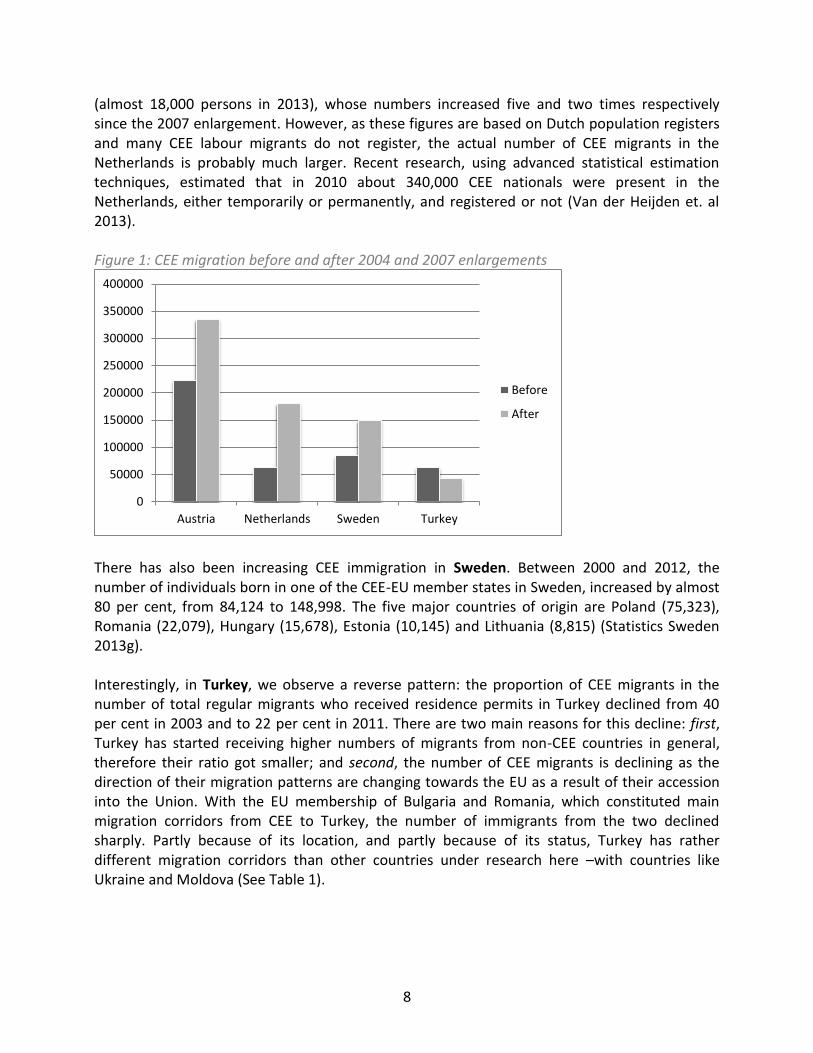
Enlargements and CEE Migration For all four countries under research, the EU enlargements of EU-‐10 (mostly Eastern European countries) of 2004 and EU-‐2 (Bulgaria and Romania) of 2007 were turning points in CEE migration. As of 2013, in Austria, where EU migration is not only pertained to the CEE, but also to Germany for example, a total of 334,499 persons (source: Population Register, Statistics Austria) who have been born in CEE EU-‐member states were officially registered. Their number grew by one third since 2002 (See Figure 1). The main migration corridors, which can be defined as routes that are created under certain conditions that facilitate movement of people, are with Romania, Poland, and Hungary (See Table 1). In the Netherlands the number of CEE migrants has also increased: While there were about 50,000 CEE residents in the Netherlands in the 1990s, and 62,000 in 2003 (just before the EU enlargement of 2004), in 2013, their numbers had increased to almost 180,000 thousands almost three times more than in 2003. Like in Austria, Poland and Hungary constitute important migration corridors to the Netherlands (See Table 1). The number of immigrants from Poland nearly tripled between 2004 and 2013 from almost 36,000 to 111,000, and the number of Hungarians increased one-‐third to almost 19,500 persons. The other two main CEE migrant categories in the Netherlands are Bulgarians (almost 21,000 persons in 2013), and Romanians
8
(almost 18,000 persons in 2013), whose numbers increased five and two times respectively since the 2007 enlargement. However, as these figures are based on Dutch population registers and many CEE labour migrants do not register, the actual number of CEE migrants in the Netherlands is probably much larger. Recent research, using advanced statistical estimation techniques, estimated that in 2010 about 340,000 CEE nationals were present in the Netherlands, either temporarily or permanently, and registered or not (Van der Heijden et. al 2013). Figure 1: CEE migration before and after 2004 and 2007 enlargements
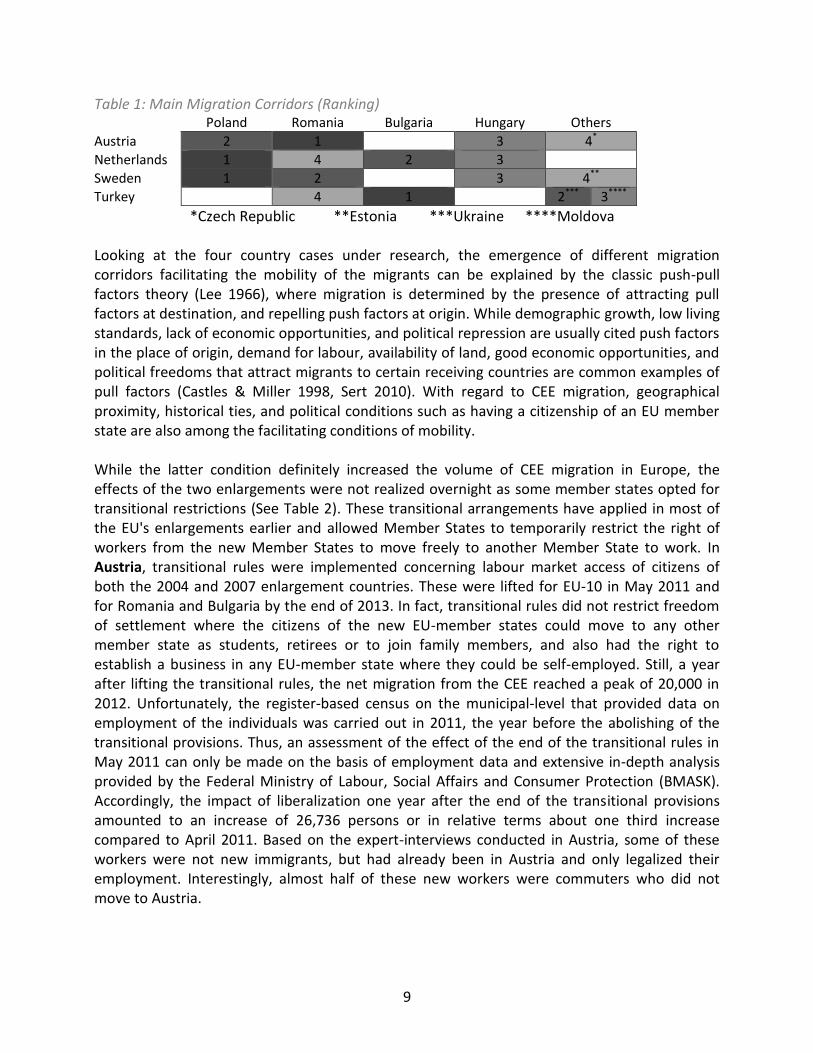
There has also been increasing CEE immigration in Sweden. Between 2000 and 2012, the number of individuals born in one of the CEE-‐EU member states in Sweden, increased by almost 80 per cent, from 84,124 to 148,998. The five major countries of origin are Poland (75,323), Romania (22,079), Hungary (15,678), Estonia (10,145) and Lithuania (8,815) (Statistics Sweden 2013g). Interestingly, in Turkey, we observe a reverse pattern: the proportion of CEE migrants in the number of total regular migrants who received residence permits in Turkey declined from 40 per cent in 2003 and to 22 per cent in 2011. There are two main reasons for this decline: first, Turkey has started receiving higher numbers of migrants from non-‐CEE countries in general, therefore their ratio got smaller; and second, the number of CEE migrants is declining as the direction of their migration patterns are changing towards the EU as a result of their accession into the Union. With the EU membership of Bulgaria and Romania, which constituted main migration corridors from CEE to Turkey, the number of immigrants from the two declined sharply. Partly because of its location, and partly because of its status, Turkey has rather different migration corridors than other countries under research here with countries like Ukraine and Moldova (See Table 1).
0
50000
100000
150000
200000
250000
300000
350000
400000
Austria Netherlands Sweden Turkey
Before
After
9
Table 1: Main Migration Corridors (Ranking) Poland Romania Bulgaria Hungary Others
Austria 2 1 3 4* Netherlands 1 4 2 3 Sweden 1 2 3 4** Turkey 4 1 2*** 3****
*Czech Republic **Estonia ***Ukraine ****Moldova
Looking at the four country cases under research, the emergence of different migration corridors facilitating the mobility of the migrants can be explained by the classic push-‐pull factors theory (Lee 1966), where migration is determined by the presence of attracting pull factors at destination, and repelling push factors at origin. While demographic growth, low living standards, lack of economic opportunities, and political repression are usually cited push factors in the place of origin, demand for labour, availability of land, good economic opportunities, and political freedoms that attract migrants to certain receiving countries are common examples of pull factors (Castles & Miller 1998, Sert 2010). With regard to CEE migration, geographical proximity, historical ties, and political conditions such as having a citizenship of an EU member state are also among the facilitating conditions of mobility. While the latter condition definitely increased the volume of CEE migration in Europe, the effects of the two enlargements were not realized overnight as some member states opted for transitional restrictions (See Table 2). These transitional arrangements have applied in most of the EU's enlargements earlier and allowed Member States to temporarily restrict the right of workers from the new Member States to move freely to another Member State to work. In Austria, transitional rules were implemented concerning labour market access of citizens of both the 2004 and 2007 enlargement countries. These were lifted for EU-‐10 in May 2011 and for Romania and Bulgaria by the end of 2013. In fact, transitional rules did not restrict freedom of settlement where the citizens of the new EU-‐member states could move to any other member state as students, retirees or to join family members, and also had the right to establish a business in any EU-‐member state where they could be self-‐employed. Still, a year after lifting the transitional rules, the net migration from the CEE reached a peak of 20,000 in 2012. Unfortunately, the register-‐based census on the municipal-‐level that provided data on employment of the individuals was carried out in 2011, the year before the abolishing of the transitional provisions. Thus, an assessment of the effect of the end of the transitional rules in May 2011 can only be made on the basis of employment data and extensive in-‐depth analysis provided by the Federal Ministry of Labour, Social Affairs and Consumer Protection (BMASK). Accordingly, the impact of liberalization one year after the end of the transitional provisions amounted to an increase of 26,736 persons or in relative terms about one third increase compared to April 2011. Based on the expert-‐interviews conducted in Austria, some of these workers were not new immigrants, but had already been in Austria and only legalized their employment. Interestingly, almost half of these new workers were commuters who did not move to Austria.
10
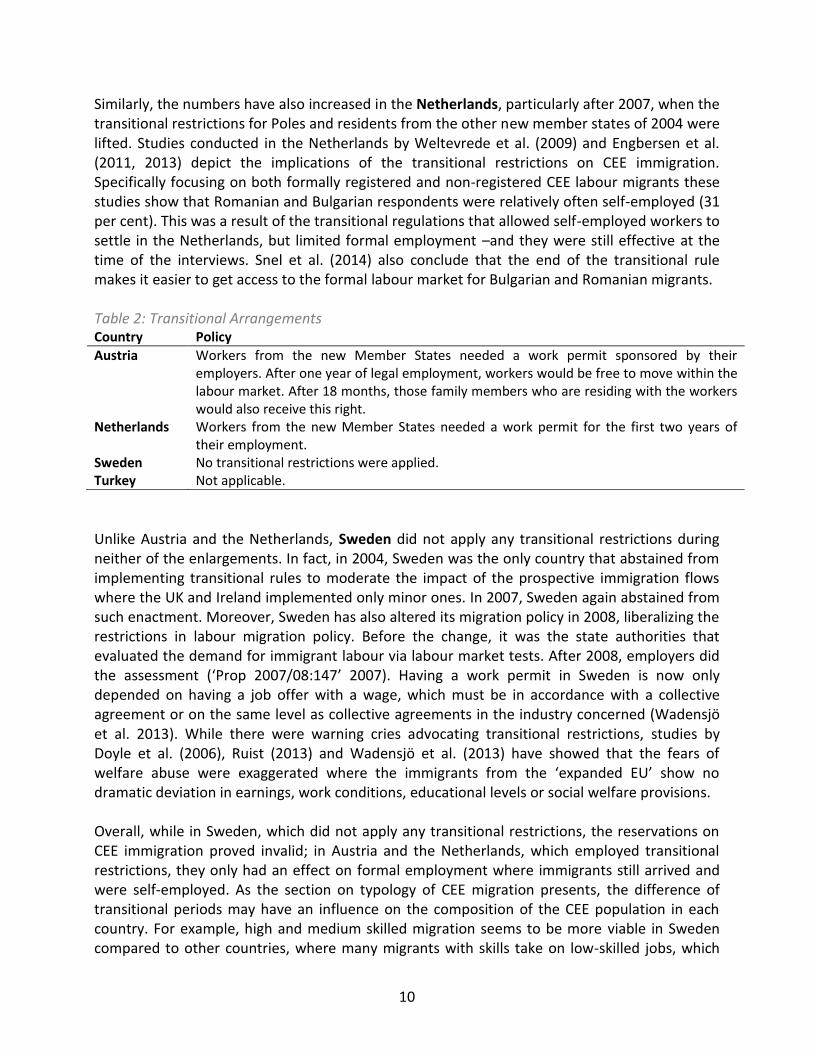
Similarly, the numbers have also increased in the Netherlands, particularly after 2007, when the transitional restrictions for Poles and residents from the other new member states of 2004 were lifted. Studies conducted in the Netherlands by Weltevrede et al. (2009) and Engbersen et al. (2011, 2013) depict the implications of the transitional restrictions on CEE immigration. Specifically focusing on both formally registered and non-‐registered CEE labour migrants these studies show that Romanian and Bulgarian respondents were relatively often self-‐employed (31 per cent). This was a result of the transitional regulations that allowed self-‐employed workers to settle in the Netherlands, but limited formal employment and they were still effective at the time of the interviews. Snel et al. (2014) also conclude that the end of the transitional rule makes it easier to get access to the formal labour market for Bulgarian and Romanian migrants. Table 2: Transitional Arrangements Country Policy Austria Workers from the new Member States needed a work permit sponsored by their
employers. After one year of legal employment, workers would be free to move within the labour market. After 18 months, those family members who are residing with the workers would also receive this right.
Netherlands Workers from the new Member States needed a work permit for the first two years of their employment.
Sweden No transitional restrictions were applied. Turkey Not applicable. Unlike Austria and the Netherlands, Sweden did not apply any transitional restrictions during neither of the enlargements. In fact, in 2004, Sweden was the only country that abstained from implementing transitional rules to moderate the impact of the prospective immigration flows where the UK and Ireland implemented only minor ones. In 2007, Sweden again abstained from such enactment. Moreover, Sweden has also altered its migration policy in 2008, liberalizing the restrictions in labour migration policy. Before the change, it was the state authorities that evaluated the demand for immigrant labour via labour market tests. After 2008, employers did the assessment ( Prop 2007/08:147 2007). Having a work permit in Sweden is now only depended on having a job offer with a wage, which must be in accordance with a collective agreement or on the same level as collective agreements in the industry concerned (Wadensjö et al. 2013). While there were warning cries advocating transitional restrictions, studies by Doyle et al. (2006), Ruist (2013) and Wadensjö et al. (2013) have showed that the fears of
dramatic deviation in earnings, work conditions, educational levels or social welfare provisions. Overall, while in Sweden, which did not apply any transitional restrictions, the reservations on CEE immigration proved invalid; in Austria and the Netherlands, which employed transitional restrictions, they only had an effect on formal employment where immigrants still arrived and were self-‐employed. As the section on typology of CEE migration presents, the difference of transitional periods may have an influence on the composition of the CEE population in each country. For example, high and medium skilled migration seems to be more viable in Sweden compared to other countries, where many migrants with skills take on low-‐skilled jobs, which
11
leads to the problem of de-‐qualification. In Turkey, which is not a EU member state, the issue of effects of transitional period was non-‐existing.
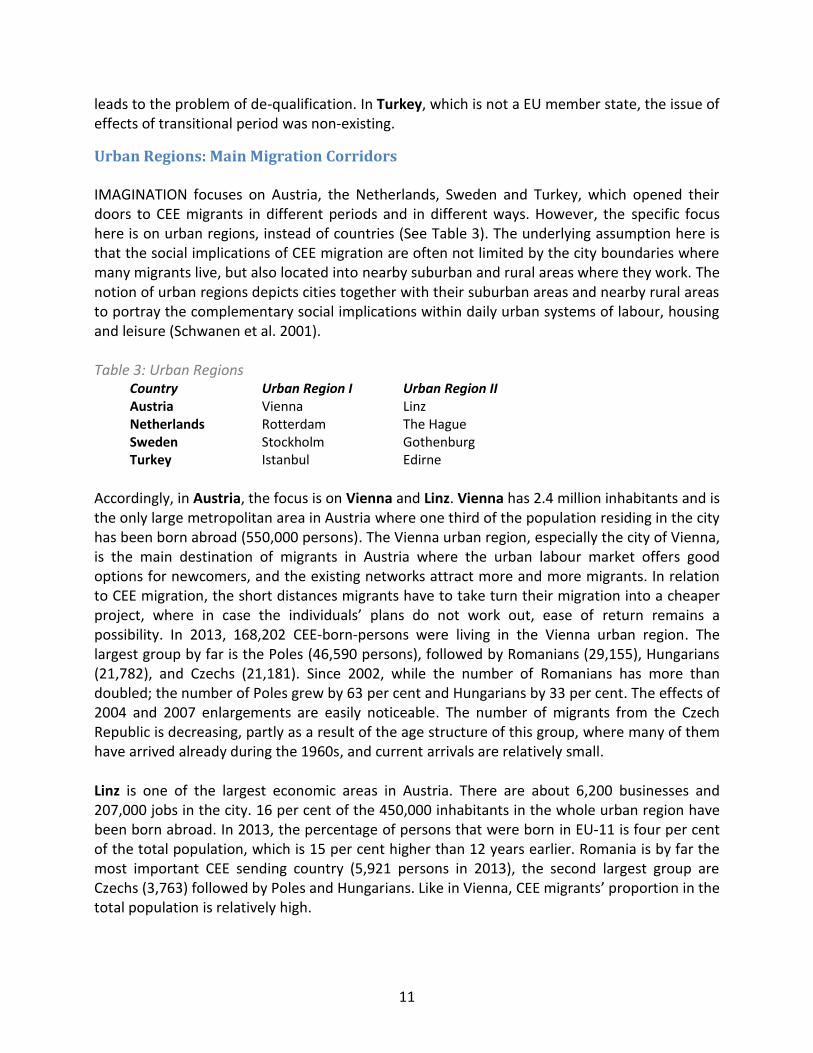
Urban Regions: Main Migration Corridors IMAGINATION focuses on Austria, the Netherlands, Sweden and Turkey, which opened their doors to CEE migrants in different periods and in different ways. However, the specific focus here is on urban regions, instead of countries (See Table 3). The underlying assumption here is that the social implications of CEE migration are often not limited by the city boundaries where many migrants live, but also located into nearby suburban and rural areas where they work. The notion of urban regions depicts cities together with their suburban areas and nearby rural areas to portray the complementary social implications within daily urban systems of labour, housing and leisure (Schwanen et al. 2001). Table 3: Urban Regions
Country Urban Region I Urban Region II Austria Vienna Linz Netherlands Rotterdam The Hague Sweden Stockholm Gothenburg Turkey Istanbul Edirne
Accordingly, in Austria, the focus is on Vienna and Linz. Vienna has 2.4 million inhabitants and is the only large metropolitan area in Austria where one third of the population residing in the city has been born abroad (550,000 persons). The Vienna urban region, especially the city of Vienna, is the main destination of migrants in Austria where the urban labour market offers good options for newcomers, and the existing networks attract more and more migrants. In relation to CEE migration, the short distances migrants have to take turn their migration into a cheaper project return remains a possibility. In 2013, 168,202 CEE-‐born-‐persons were living in the Vienna urban region. The largest group by far is the Poles (46,590 persons), followed by Romanians (29,155), Hungarians (21,782), and Czechs (21,181). Since 2002, while the number of Romanians has more than doubled; the number of Poles grew by 63 per cent and Hungarians by 33 per cent. The effects of 2004 and 2007 enlargements are easily noticeable. The number of migrants from the Czech Republic is decreasing, partly as a result of the age structure of this group, where many of them have arrived already during the 1960s, and current arrivals are relatively small. Linz is one of the largest economic areas in Austria. There are about 6,200 businesses and 207,000 jobs in the city. 16 per cent of the 450,000 inhabitants in the whole urban region have been born abroad. In 2013, the percentage of persons that were born in EU-‐11 is four per cent of the total population, which is 15 per cent higher than 12 years earlier. Romania is by far the most important CEE sending country (5,921 persons in 2013), the second largest group are Czechs (3,763) followed by Poles and Hungarians. Like in Vienna, CEE migrants proportion in the total population is relatively high.
12
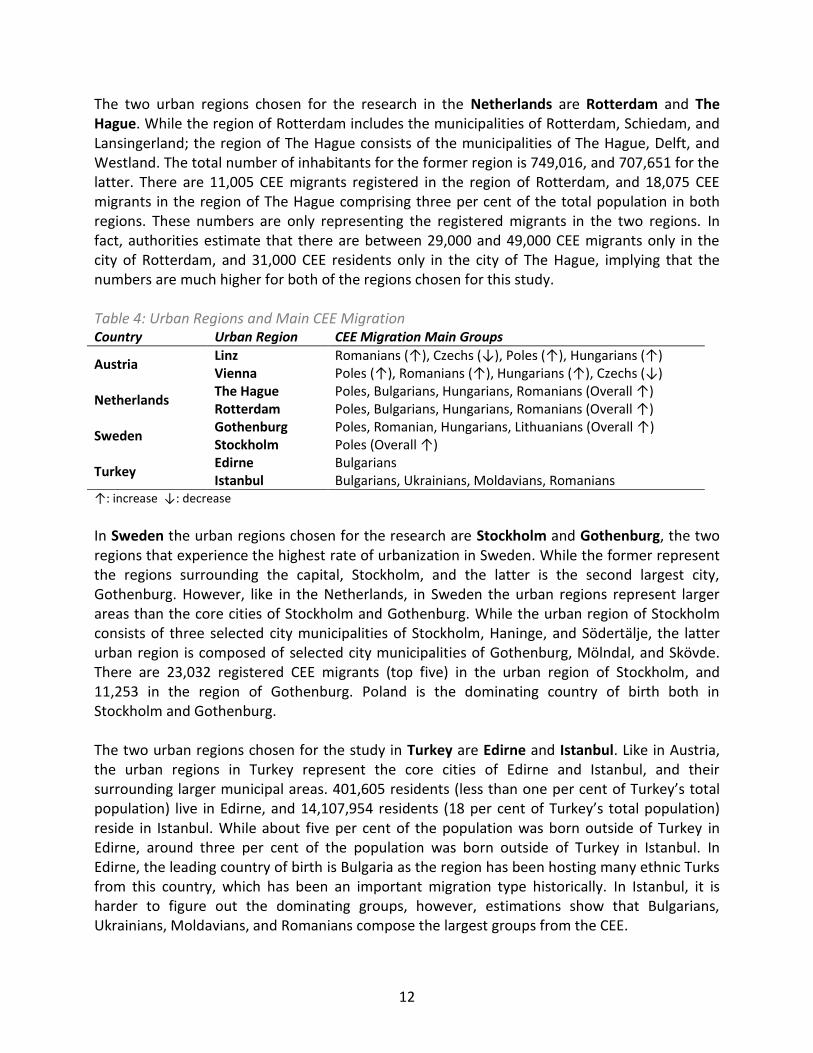
The two urban regions chosen for the research in the Netherlands are Rotterdam and The Hague. While the region of Rotterdam includes the municipalities of Rotterdam, Schiedam, and Lansingerland; the region of The Hague consists of the municipalities of The Hague, Delft, and Westland. The total number of inhabitants for the former region is 749,016, and 707,651 for the latter. There are 11,005 CEE migrants registered in the region of Rotterdam, and 18,075 CEE migrants in the region of The Hague comprising three per cent of the total population in both regions. These numbers are only representing the registered migrants in the two regions. In fact, authorities estimate that there are between 29,000 and 49,000 CEE migrants only in the city of Rotterdam, and 31,000 CEE residents only in the city of The Hague, implying that the numbers are much higher for both of the regions chosen for this study. Table 4: Urban Regions and Main CEE Migration Country Urban Region CEE Migration Main Groups
Austria Linz Romanians ( ), Czechs ( , Poles ( ), Hungarians ( ) Vienna Poles ( ), Romanians ( ), Hungarians ( ), Czechs (
Netherlands The Hague Poles, Bulgarians, Hungarians, Romanians (Overall ) Rotterdam Poles, Bulgarians, Hungarians, Romanians (Overall )
Sweden Gothenburg Poles, Romanian, Hungarians, Lithuanians (Overall ) Stockholm Poles (Overall )
Turkey Edirne Bulgarians Istanbul Bulgarians, Ukrainians, Moldavians, Romanians
: increase : decrease In Sweden the urban regions chosen for the research are Stockholm and Gothenburg, the two regions that experience the highest rate of urbanization in Sweden. While the former represent the regions surrounding the capital, Stockholm, and the latter is the second largest city, Gothenburg. However, like in the Netherlands, in Sweden the urban regions represent larger areas than the core cities of Stockholm and Gothenburg. While the urban region of Stockholm consists of three selected city municipalities of Stockholm, Haninge, and , the latter urban region is composed of selected city municipalities of Gothenburg, , and . There are 23,032 registered CEE migrants (top five) in the urban region of Stockholm, and 11,253 in the region of Gothenburg. Poland is the dominating country of birth both in Stockholm and Gothenburg. The two urban regions chosen for the study in Turkey are Edirne and Istanbul. Like in Austria, the urban regions in Turkey represent the core cities of Edirne and Istanbul, and their surrounding larger municipal areas. 401,605 residents (less than one per cent total population) live in Edirne, and 14,107,954 residents (18 per cent reside in Istanbul. While about five per cent of the population was born outside of Turkey in Edirne, around three per cent of the population was born outside of Turkey in Istanbul. In Edirne, the leading country of birth is Bulgaria as the region has been hosting many ethnic Turks from this country, which has been an important migration type historically. In Istanbul, it is harder to figure out the dominating groups, however, estimations show that Bulgarians, Ukrainians, Moldavians, and Romanians compose the largest groups from the CEE.
13
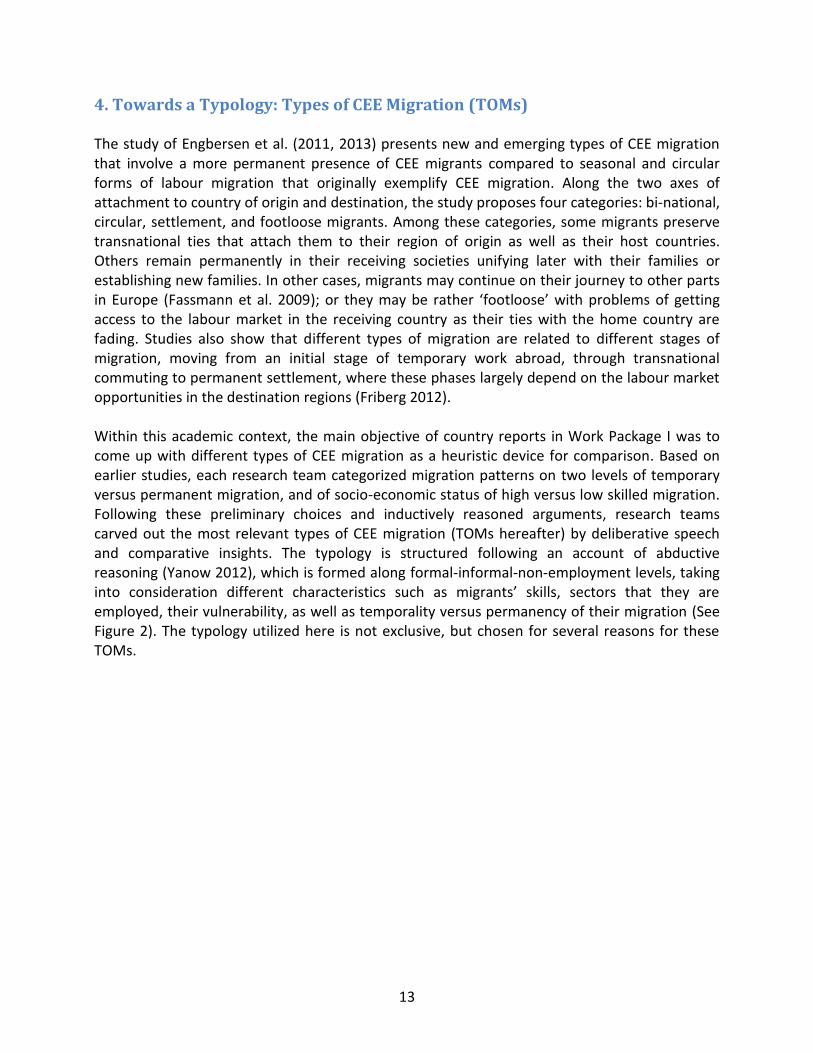
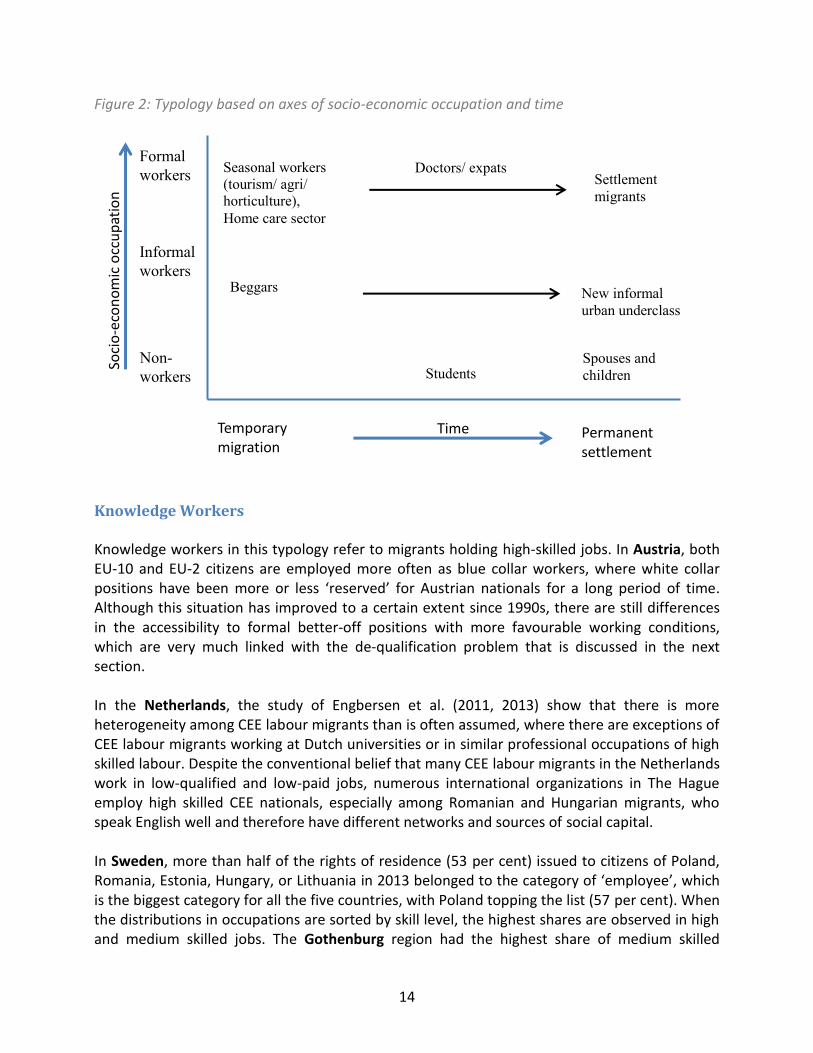
4. Towards a Typology: Types of CEE Migration (TOMs) The study of Engbersen et al. (2011, 2013) presents new and emerging types of CEE migration that involve a more permanent presence of CEE migrants compared to seasonal and circular forms of labour migration that originally exemplify CEE migration. Along the two axes of attachment to country of origin and destination, the study proposes four categories: bi-‐national, circular, settlement, and footloose migrants. Among these categories, some migrants preserve transnational ties that attach them to their region of origin as well as their host countries. Others remain permanently in their receiving societies unifying later with their families or establishing new families. In other cases, migrants may continue on their journey to other parts in Europe (Fassmann et al. 2009 problems of getting access to the labour market in the receiving country as their ties with the home country are fading. Studies also show that different types of migration are related to different stages of migration, moving from an initial stage of temporary work abroad, through transnational commuting to permanent settlement, where these phases largely depend on the labour market opportunities in the destination regions (Friberg 2012). Within this academic context, the main objective of country reports in Work Package I was to come up with different types of CEE migration as a heuristic device for comparison. Based on earlier studies, each research team categorized migration patterns on two levels of temporary versus permanent migration, and of socio-‐economic status of high versus low skilled migration. Following these preliminary choices and inductively reasoned arguments, research teams carved out the most relevant types of CEE migration (TOMs hereafter) by deliberative speech and comparative insights. The typology is structured following an account of abductive reasoning (Yanow 2012), which is formed along formal-‐informal-‐non-‐employment levels, taking
employed, their vulnerability, as well as temporality versus permanency of their migration (See Figure 2). The typology utilized here is not exclusive, but chosen for several reasons for these TOMs.
14
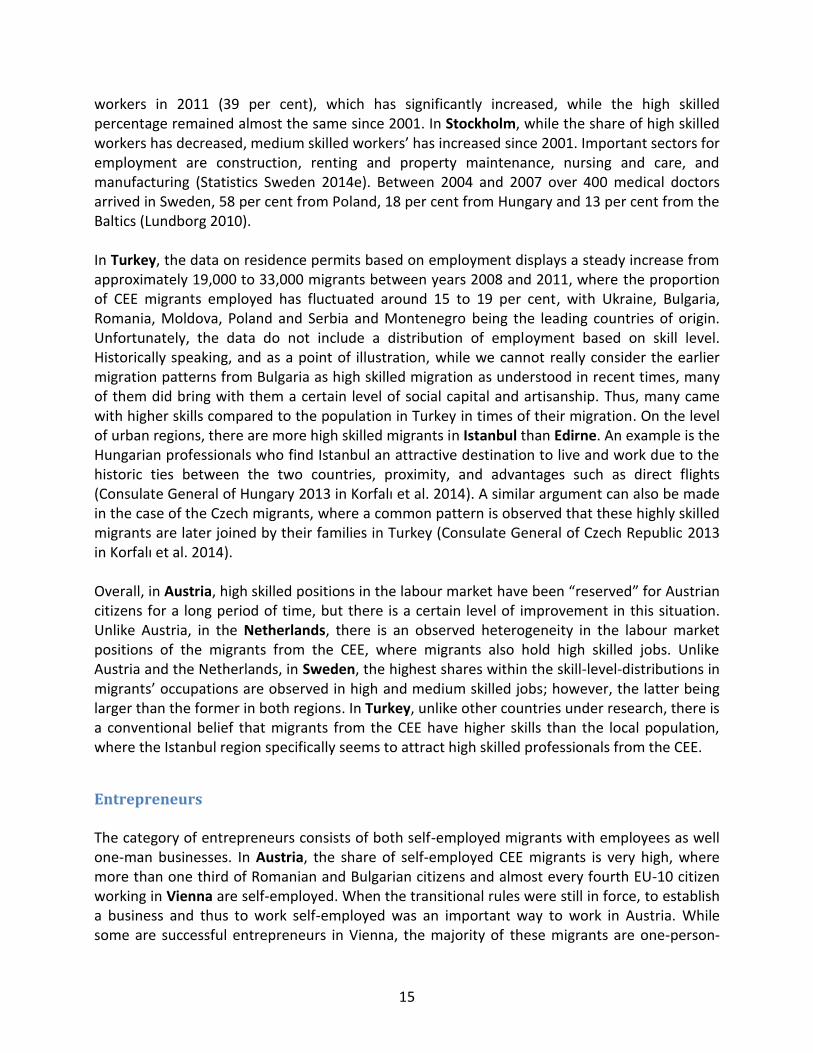
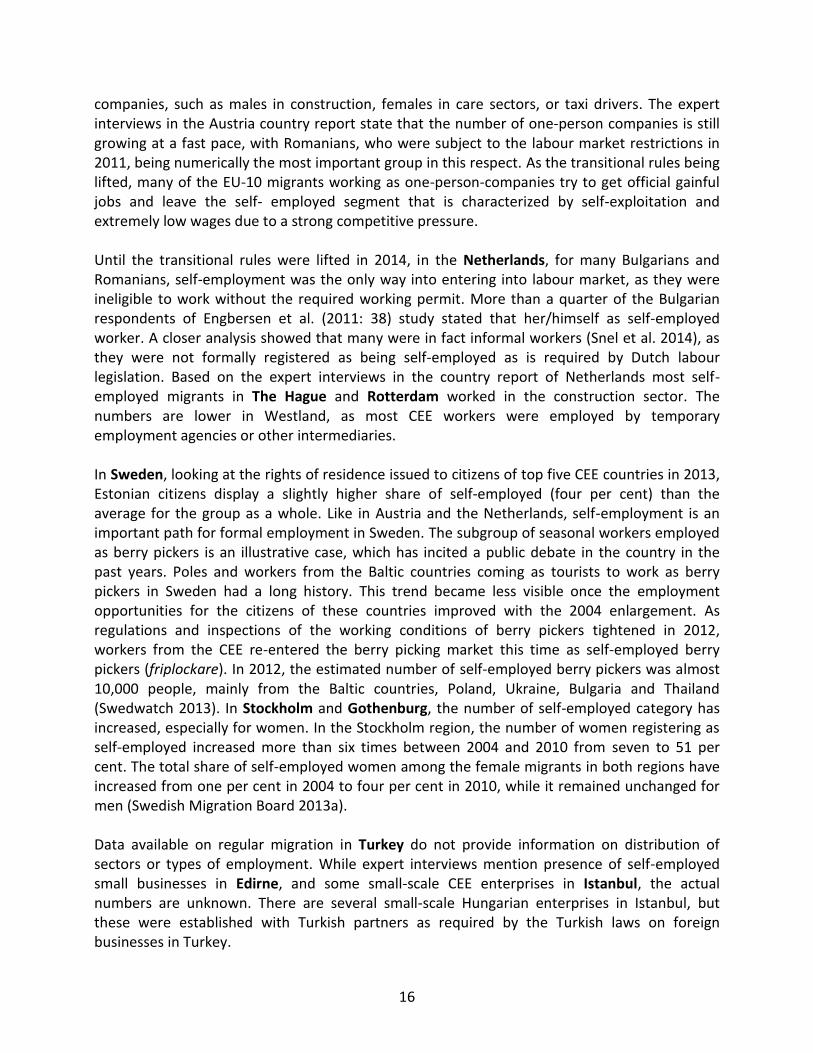
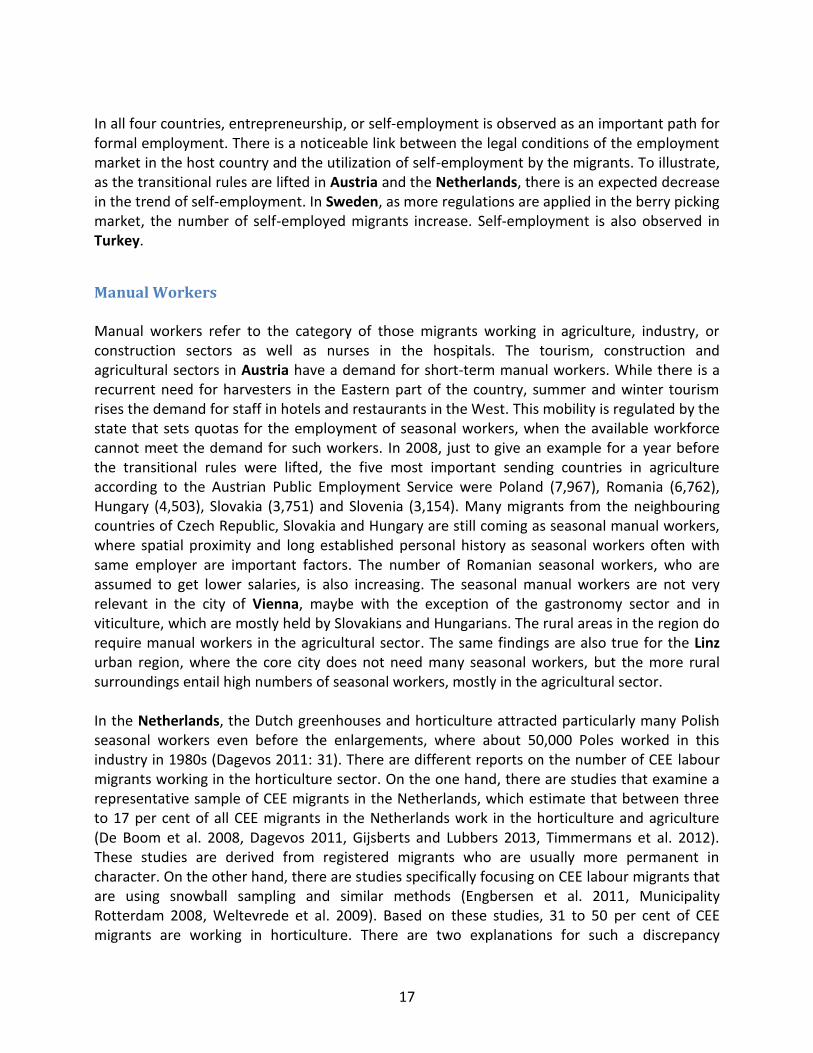
Figure 2: Typology based on axes of socio-‐economic occupation and time
Knowledge Workers Knowledge workers in this typology refer to migrants holding high-‐skilled jobs. In Austria, both EU-‐10 and EU-‐2 citizens are employed more often as blue collar workers, where white collar positions have been for a long period of time. Although this situation has improved to a certain extent since 1990s, there are still differences in the accessibility to formal better-‐off positions with more favourable working conditions, which are very much linked with the de-‐qualification problem that is discussed in the next section. In the Netherlands, the study of Engbersen et al. (2011, 2013) show that there is more heterogeneity among CEE labour migrants than is often assumed, where there are exceptions of CEE labour migrants working at Dutch universities or in similar professional occupations of high skilled labour. Despite the conventional belief that many CEE labour migrants in the Netherlands work in low-‐qualified and low-‐paid jobs, numerous international organizations in The Hague employ high skilled CEE nationals, especially among Romanian and Hungarian migrants, who speak English well and therefore have different networks and sources of social capital. In Sweden, more than half of the rights of residence (53 per cent) issued to citizens of Poland, Romania, Estonia, Hungary, or Lithuania in 2013 which is the biggest category for all the five countries, with Poland topping the list (57 per cent). When the distributions in occupations are sorted by skill level, the highest shares are observed in high and medium skilled jobs. The Gothenburg region had the highest share of medium skilled
Temporary migration
Time Permanent settlement
Socio-‐econ
omic occup
ation
Formal workers
Informal workers
Non-workers
Beggars
Seasonal workers (tourism/ agri/ horticulture), Home care sector
Doctors/ expats Settlement migrants
New informal urban underclass
Students Spouses and children
15
workers in 2011 (39 per cent), which has significantly increased, while the high skilled percentage remained almost the same since 2001. In Stockholm, while the share of high skilled workers has decreased, medium skilled worker since 2001. Important sectors for employment are construction, renting and property maintenance, nursing and care, and manufacturing (Statistics Sweden 2014e). Between 2004 and 2007 over 400 medical doctors arrived in Sweden, 58 per cent from Poland, 18 per cent from Hungary and 13 per cent from the Baltics (Lundborg 2010). In Turkey, the data on residence permits based on employment displays a steady increase from approximately 19,000 to 33,000 migrants between years 2008 and 2011, where the proportion of CEE migrants employed has fluctuated around 15 to 19 per cent, with Ukraine, Bulgaria, Romania, Moldova, Poland and Serbia and Montenegro being the leading countries of origin. Unfortunately, the data do not include a distribution of employment based on skill level. Historically speaking, and as a point of illustration, while we cannot really consider the earlier migration patterns from Bulgaria as high skilled migration as understood in recent times, many of them did bring with them a certain level of social capital and artisanship. Thus, many came with higher skills compared to the population in Turkey in times of their migration. On the level of urban regions, there are more high skilled migrants in Istanbul than Edirne. An example is the Hungarian professionals who find Istanbul an attractive destination to live and work due to the historic ties between the two countries, proximity, and advantages such as direct flights (Consulate General of Hungary 2013 ). A similar argument can also be made in the case of the Czech migrants, where a common pattern is observed that these highly skilled migrants are later joined by their families in Turkey (Consulate General of Czech Republic 2013
). Overall, in Austria, high skilled positions in the labour market reserved for Austrian citizens for a long period of time, but there is a certain level of improvement in this situation. Unlike Austria, in the Netherlands, there is an observed heterogeneity in the labour market positions of the migrants from the CEE, where migrants also hold high skilled jobs. Unlike Austria and the Netherlands, in Sweden, the highest shares within the skill-‐level-‐distributions in
occupations are observed in high and medium skilled jobs; however, the latter being larger than the former in both regions. In Turkey, unlike other countries under research, there is a conventional belief that migrants from the CEE have higher skills than the local population, where the Istanbul region specifically seems to attract high skilled professionals from the CEE.
Entrepreneurs The category of entrepreneurs consists of both self-‐employed migrants with employees as well one-‐man businesses. In Austria, the share of self-‐employed CEE migrants is very high, where more than one third of Romanian and Bulgarian citizens and almost every fourth EU-‐10 citizen working in Vienna are self-‐employed. When the transitional rules were still in force, to establish a business and thus to work self-‐employed was an important way to work in Austria. While some are successful entrepreneurs in Vienna, the majority of these migrants are one-‐person-‐
16
companies, such as males in construction, females in care sectors, or taxi drivers. The expert interviews in the Austria country report state that the number of one-‐person companies is still growing at a fast pace, with Romanians, who were subject to the labour market restrictions in 2011, being numerically the most important group in this respect. As the transitional rules being lifted, many of the EU-‐10 migrants working as one-‐person-‐companies try to get official gainful jobs and leave the self-‐ employed segment that is characterized by self-‐exploitation and extremely low wages due to a strong competitive pressure. Until the transitional rules were lifted in 2014, in the Netherlands, for many Bulgarians and Romanians, self-‐employment was the only way into entering into labour market, as they were ineligible to work without the required working permit. More than a quarter of the Bulgarian respondents of Engbersen et al. (2011: 38) study stated that her/himself as self-‐employed worker. A closer analysis showed that many were in fact informal workers (Snel et al. 2014), as they were not formally registered as being self-‐employed as is required by Dutch labour legislation. Based on the expert interviews in the country report of Netherlands most self-‐employed migrants in The Hague and Rotterdam worked in the construction sector. The numbers are lower in Westland, as most CEE workers were employed by temporary employment agencies or other intermediaries. In Sweden, looking at the rights of residence issued to citizens of top five CEE countries in 2013, Estonian citizens display a slightly higher share of self-‐employed (four per cent) than the average for the group as a whole. Like in Austria and the Netherlands, self-‐employment is an important path for formal employment in Sweden. The subgroup of seasonal workers employed as berry pickers is an illustrative case, which has incited a public debate in the country in the past years. Poles and workers from the Baltic countries coming as tourists to work as berry pickers in Sweden had a long history. This trend became less visible once the employment opportunities for the citizens of these countries improved with the 2004 enlargement. As regulations and inspections of the working conditions of berry pickers tightened in 2012, workers from the CEE re-‐entered the berry picking market this time pickers (friplockare). In 2012, the estimated number of self-‐employed berry pickers was almost 10,000 people, mainly from the Baltic countries, Poland, Ukraine, Bulgaria and Thailand (Swedwatch 2013). In Stockholm and Gothenburg, the number of self-‐employed category has increased, especially for women. In the Stockholm region, the number of women registering as self-‐employed increased more than six times between 2004 and 2010 from seven to 51 per cent. The total share of self-‐employed women among the female migrants in both regions have increased from one per cent in 2004 to four per cent in 2010, while it remained unchanged for men (Swedish Migration Board 2013a). Data available on regular migration in Turkey do not provide information on distribution of sectors or types of employment. While expert interviews mention presence of self-‐employed small businesses in Edirne, and some small-‐scale CEE enterprises in Istanbul, the actual numbers are unknown. There are several small-‐scale Hungarian enterprises in Istanbul, but these were established with Turkish partners as required by the Turkish laws on foreign businesses in Turkey.
17
In all four countries, entrepreneurship, or self-‐employment is observed as an important path for formal employment. There is a noticeable link between the legal conditions of the employment market in the host country and the utilization of self-‐employment by the migrants. To illustrate, as the transitional rules are lifted in Austria and the Netherlands, there is an expected decrease in the trend of self-‐employment. In Sweden, as more regulations are applied in the berry picking market, the number of self-‐employed migrants increase. Self-‐employment is also observed in Turkey.
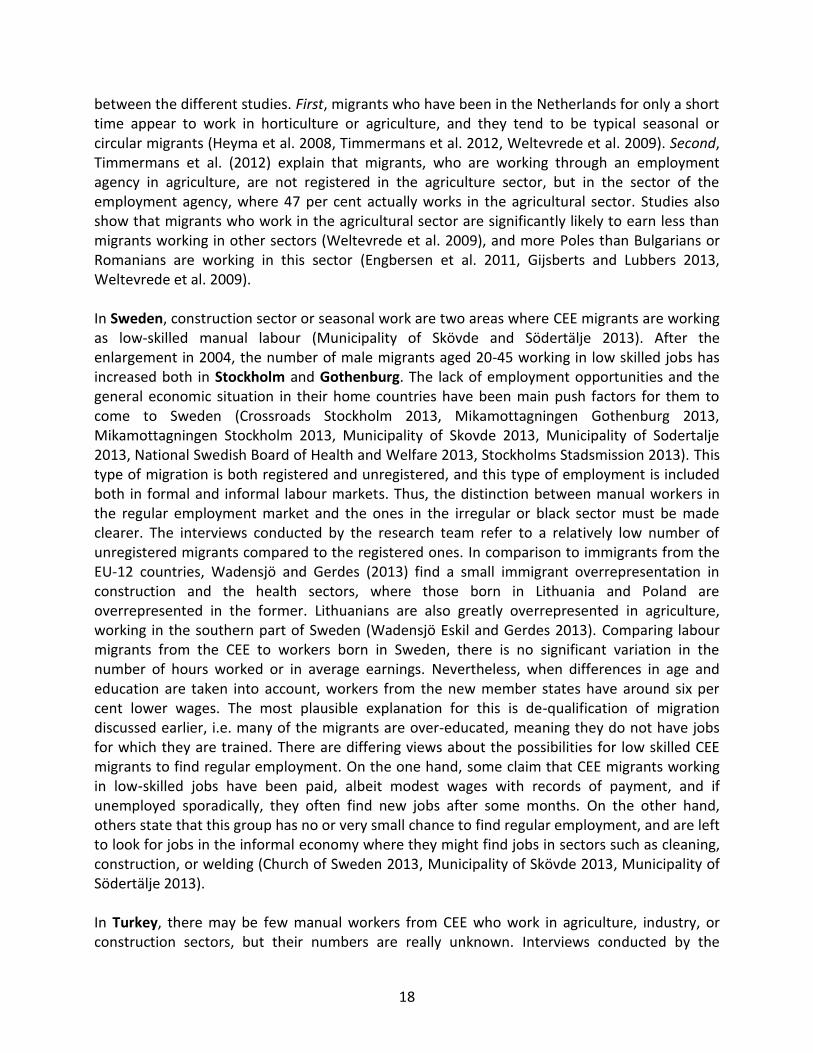
Manual Workers Manual workers refer to the category of those migrants working in agriculture, industry, or construction sectors as well as nurses in the hospitals. The tourism, construction and agricultural sectors in Austria have a demand for short-‐term manual workers. While there is a recurrent need for harvesters in the Eastern part of the country, summer and winter tourism rises the demand for staff in hotels and restaurants in the West. This mobility is regulated by the state that sets quotas for the employment of seasonal workers, when the available workforce cannot meet the demand for such workers. In 2008, just to give an example for a year before the transitional rules were lifted, the five most important sending countries in agriculture according to the Austrian Public Employment Service were Poland (7,967), Romania (6,762), Hungary (4,503), Slovakia (3,751) and Slovenia (3,154). Many migrants from the neighbouring countries of Czech Republic, Slovakia and Hungary are still coming as seasonal manual workers, where spatial proximity and long established personal history as seasonal workers often with same employer are important factors. The number of Romanian seasonal workers, who are assumed to get lower salaries, is also increasing. The seasonal manual workers are not very relevant in the city of Vienna, maybe with the exception of the gastronomy sector and in viticulture, which are mostly held by Slovakians and Hungarians. The rural areas in the region do require manual workers in the agricultural sector. The same findings are also true for the Linz urban region, where the core city does not need many seasonal workers, but the more rural surroundings entail high numbers of seasonal workers, mostly in the agricultural sector. In the Netherlands, the Dutch greenhouses and horticulture attracted particularly many Polish seasonal workers even before the enlargements, where about 50,000 Poles worked in this industry in 1980s (Dagevos 2011: 31). There are different reports on the number of CEE labour migrants working in the horticulture sector. On the one hand, there are studies that examine a representative sample of CEE migrants in the Netherlands, which estimate that between three to 17 per cent of all CEE migrants in the Netherlands work in the horticulture and agriculture (De Boom et al. 2008, Dagevos 2011, Gijsberts and Lubbers 2013, Timmermans et al. 2012). These studies are derived from registered migrants who are usually more permanent in character. On the other hand, there are studies specifically focusing on CEE labour migrants that are using snowball sampling and similar methods (Engbersen et al. 2011, Municipality Rotterdam 2008, Weltevrede et al. 2009). Based on these studies, 31 to 50 per cent of CEE migrants are working in horticulture. There are two explanations for such a discrepancy
18
between the different studies. First, migrants who have been in the Netherlands for only a short time appear to work in horticulture or agriculture, and they tend to be typical seasonal or circular migrants (Heyma et al. 2008, Timmermans et al. 2012, Weltevrede et al. 2009). Second, Timmermans et al. (2012) explain that migrants, who are working through an employment agency in agriculture, are not registered in the agriculture sector, but in the sector of the employment agency, where 47 per cent actually works in the agricultural sector. Studies also show that migrants who work in the agricultural sector are significantly likely to earn less than migrants working in other sectors (Weltevrede et al. 2009), and more Poles than Bulgarians or Romanians are working in this sector (Engbersen et al. 2011, Gijsberts and Lubbers 2013, Weltevrede et al. 2009). In Sweden, construction sector or seasonal work are two areas where CEE migrants are working as low-‐skilled manual labour (Municipality of Skövde and Södertälje 2013). After the enlargement in 2004, the number of male migrants aged 20-‐45 working in low skilled jobs has increased both in Stockholm and Gothenburg. The lack of employment opportunities and the general economic situation in their home countries have been main push factors for them to come to Sweden (Crossroads Stockholm 2013, Mikamottagningen Gothenburg 2013, Mikamottagningen Stockholm 2013, Municipality of Skovde 2013, Municipality of Sodertalje 2013, National Swedish Board of Health and Welfare 2013, Stockholms Stadsmission 2013). This type of migration is both registered and unregistered, and this type of employment is included both in formal and informal labour markets. Thus, the distinction between manual workers in the regular employment market and the ones in the irregular or black sector must be made clearer. The interviews conducted by the research team refer to a relatively low number of unregistered migrants compared to the registered ones. In comparison to immigrants from the EU-‐12 countries, Wadensjö and Gerdes (2013) find a small immigrant overrepresentation in construction and the health sectors, where those born in Lithuania and Poland are overrepresented in the former. Lithuanians are also greatly overrepresented in agriculture, working in the southern part of Sweden (Wadensjö Eskil and Gerdes 2013). Comparing labour migrants from the CEE to workers born in Sweden, there is no significant variation in the number of hours worked or in average earnings. Nevertheless, when differences in age and education are taken into account, workers from the new member states have around six per cent lower wages. The most plausible explanation for this is de-‐qualification of migration discussed earlier, i.e. many of the migrants are over-‐educated, meaning they do not have jobs for which they are trained. There are differing views about the possibilities for low skilled CEE migrants to find regular employment. On the one hand, some claim that CEE migrants working in low skilled jobs have been paid, albeit modest wages with records of payment, and if unemployed sporadically, they often find new jobs after some months. On the other hand, others state that this group has no or very small chance to find regular employment, and are left to look for jobs in the informal economy where they might find jobs in sectors such as cleaning, construction, or welding (Church of Sweden 2013, Municipality of Skövde 2013, Municipality of Södertälje 2013). In Turkey, there may be few manual workers from CEE who work in agriculture, industry, or construction sectors, but their numbers are really unknown. Interviews conducted by the
19
research team imply a small sample of Moldovan men working in the construction sector. One reason for the difference of the Turkish case than the other countries under research is that internal migration of the Kurdish minority, especially from the less developed regions of the Eastern part of Turkey to the richer coastal and agricultural areas, is really supplying the demand in these sectors in the country. On the whole, with the exception of Turkey, manual workers compose a widely observed type of CEE migration in other cases under research here. The agriculture, industry, construction, and in big cities such as Vienna, service sectors employ large segments of CEE migrants, both in formal and informal employment schemes.
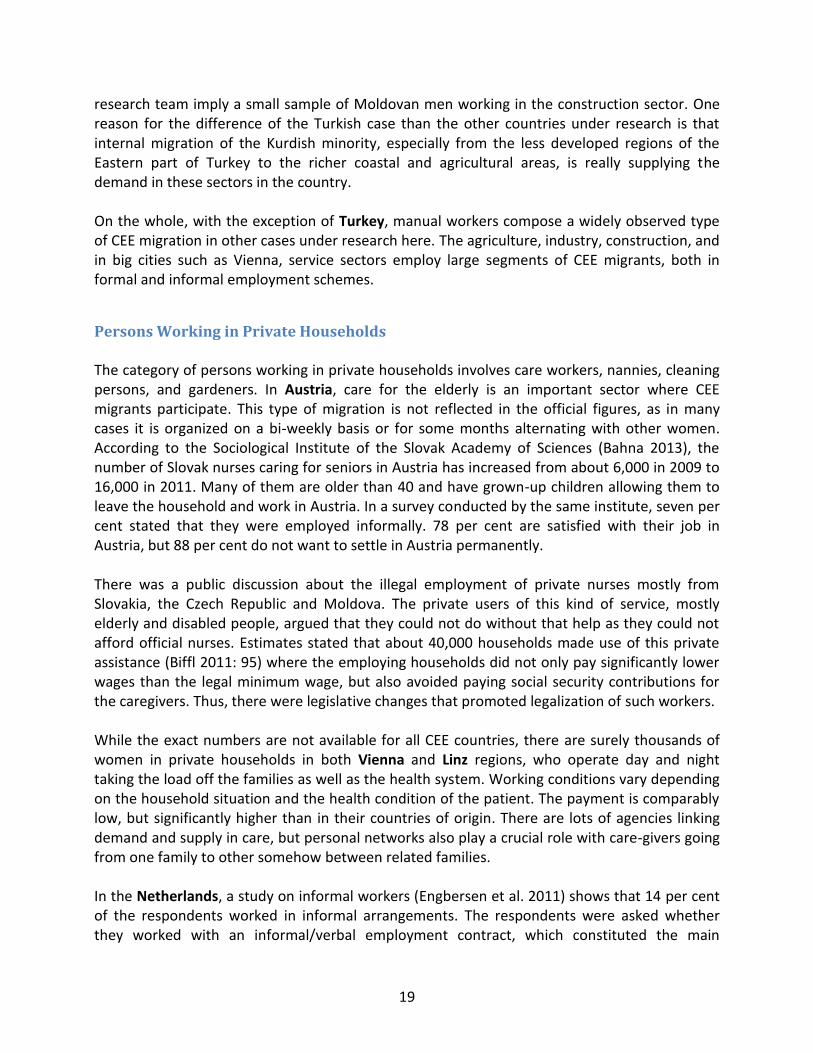
Persons Working in Private Households The category of persons working in private households involves care workers, nannies, cleaning persons, and gardeners. In Austria, care for the elderly is an important sector where CEE migrants participate. This type of migration is not reflected in the official figures, as in many cases it is organized on a bi-‐weekly basis or for some months alternating with other women. According to the Sociological Institute of the Slovak Academy of Sciences (Bahna 2013), the number of Slovak nurses caring for seniors in Austria has increased from about 6,000 in 2009 to 16,000 in 2011. Many of them are older than 40 and have grown-‐up children allowing them to leave the household and work in Austria. In a survey conducted by the same institute, seven per cent stated that they were employed informally. 78 per cent are satisfied with their job in Austria, but 88 per cent do not want to settle in Austria permanently. There was a public discussion about the illegal employment of private nurses mostly from Slovakia, the Czech Republic and Moldova. The private users of this kind of service, mostly elderly and disabled people, argued that they could not do without that help as they could not afford official nurses. Estimates stated that about 40,000 households made use of this private assistance (Biffl 2011: 95) where the employing households did not only pay significantly lower wages than the legal minimum wage, but also avoided paying social security contributions for the caregivers. Thus, there were legislative changes that promoted legalization of such workers. While the exact numbers are not available for all CEE countries, there are surely thousands of women in private households in both Vienna and Linz regions, who operate day and night taking the load off the families as well as the health system. Working conditions vary depending on the household situation and the health condition of the patient. The payment is comparably low, but significantly higher than in their countries of origin. There are lots of agencies linking demand and supply in care, but personal networks also play a crucial role with care-‐givers going from one family to other somehow between related families. In the Netherlands, a study on informal workers (Engbersen et al. 2011) shows that 14 per cent of the respondents worked in informal arrangements. The respondents were asked whether they worked with an informal/verbal employment contract, which constituted the main
20
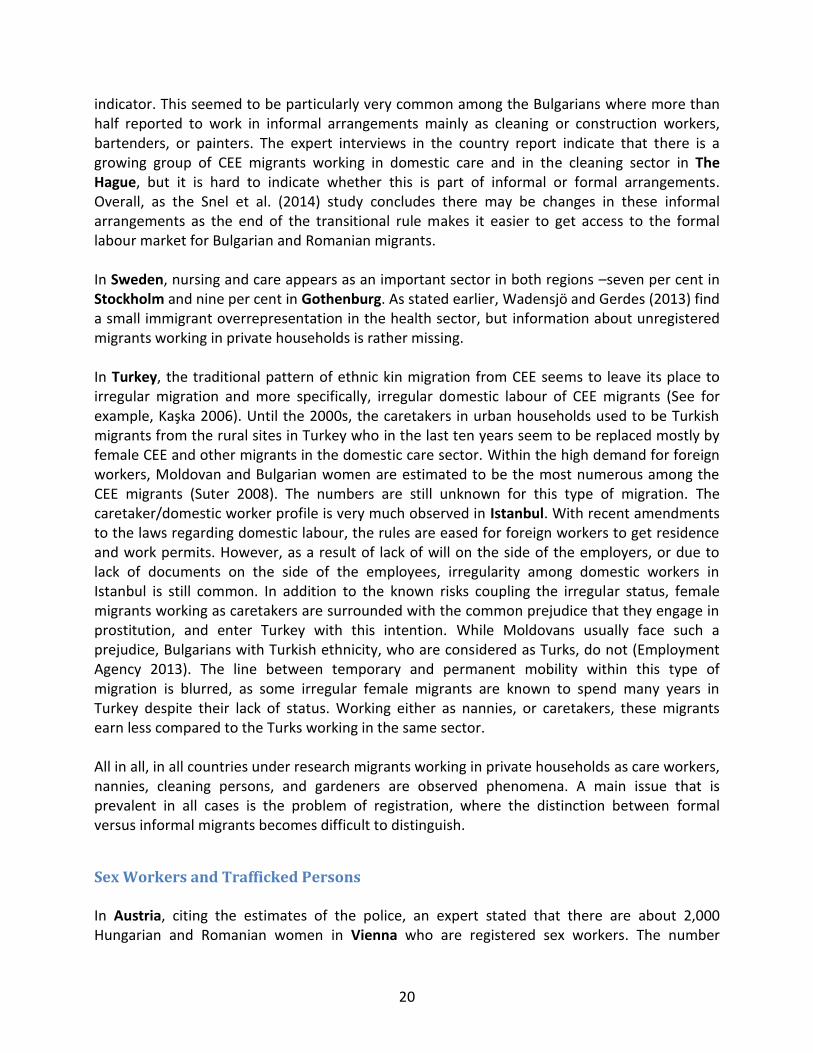
indicator. This seemed to be particularly very common among the Bulgarians where more than half reported to work in informal arrangements mainly as cleaning or construction workers, bartenders, or painters. The expert interviews in the country report indicate that there is a growing group of CEE migrants working in domestic care and in the cleaning sector in The Hague, but it is hard to indicate whether this is part of informal or formal arrangements. Overall, as the Snel et al. (2014) study concludes there may be changes in these informal arrangements as the end of the transitional rule makes it easier to get access to the formal labour market for Bulgarian and Romanian migrants. In Sweden, nursing and care appears as an important sector in both regions seven per cent in Stockholm and nine per cent in Gothenburg. As stated earlier, Wadensjö and Gerdes (2013) find a small immigrant overrepresentation in the health sector, but information about unregistered migrants working in private households is rather missing. In Turkey, the traditional pattern of ethnic kin migration from CEE seems to leave its place to irregular migration and more specifically, irregular domestic labour of CEE migrants (See for
Until the 2000s, the caretakers in urban households used to be Turkish migrants from the rural sites in Turkey who in the last ten years seem to be replaced mostly by female CEE and other migrants in the domestic care sector. Within the high demand for foreign workers, Moldovan and Bulgarian women are estimated to be the most numerous among the CEE migrants (Suter 2008). The numbers are still unknown for this type of migration. The caretaker/domestic worker profile is very much observed in Istanbul. With recent amendments to the laws regarding domestic labour, the rules are eased for foreign workers to get residence and work permits. However, as a result of lack of will on the side of the employers, or due to lack of documents on the side of the employees, irregularity among domestic workers in Istanbul is still common. In addition to the known risks coupling the irregular status, female migrants working as caretakers are surrounded with the common prejudice that they engage in prostitution, and enter Turkey with this intention. While Moldovans usually face such a prejudice, Bulgarians with Turkish ethnicity, who are considered as Turks, do not (Employment Agency 2013). The line between temporary and permanent mobility within this type of migration is blurred, as some irregular female migrants are known to spend many years in Turkey despite their lack of status. Working either as nannies, or caretakers, these migrants earn less compared to the Turks working in the same sector. All in all, in all countries under research migrants working in private households as care workers, nannies, cleaning persons, and gardeners are observed phenomena. A main issue that is prevalent in all cases is the problem of registration, where the distinction between formal versus informal migrants becomes difficult to distinguish.
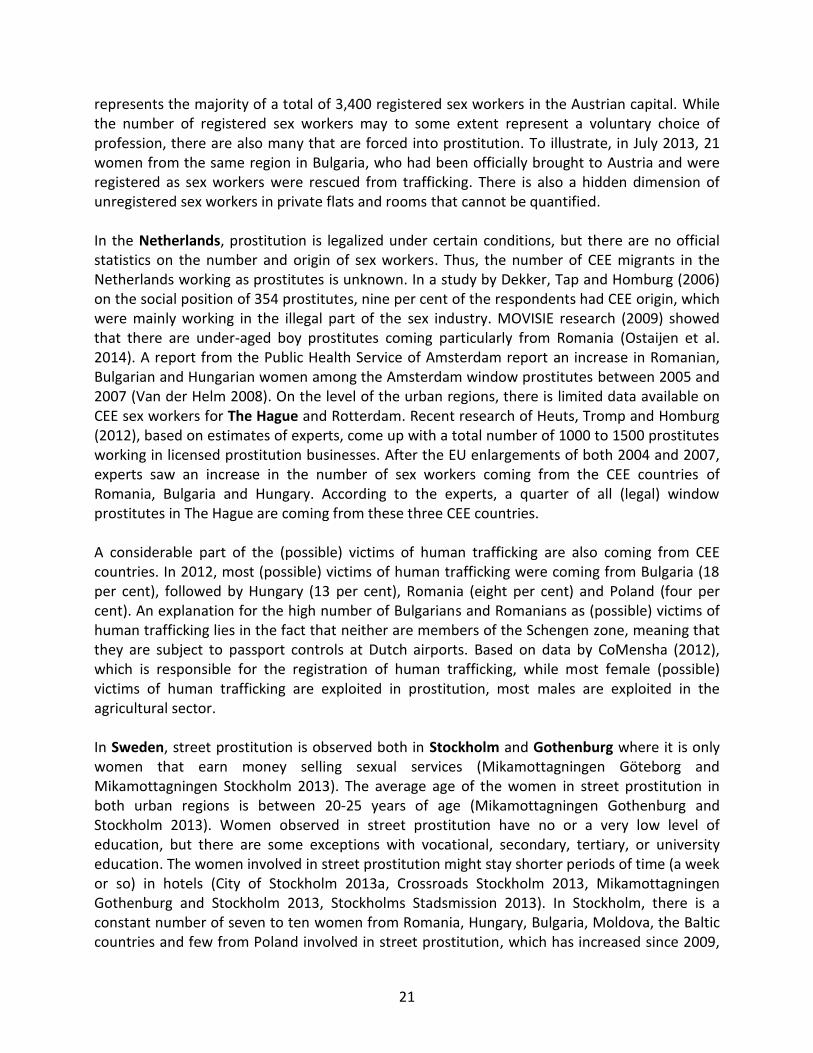
Sex Workers and Trafficked Persons In Austria, citing the estimates of the police, an expert stated that there are about 2,000 Hungarian and Romanian women in Vienna who are registered sex workers. The number
21
represents the majority of a total of 3,400 registered sex workers in the Austrian capital. While the number of registered sex workers may to some extent represent a voluntary choice of profession, there are also many that are forced into prostitution. To illustrate, in July 2013, 21 women from the same region in Bulgaria, who had been officially brought to Austria and were registered as sex workers were rescued from trafficking. There is also a hidden dimension of unregistered sex workers in private flats and rooms that cannot be quantified. In the Netherlands, prostitution is legalized under certain conditions, but there are no official statistics on the number and origin of sex workers. Thus, the number of CEE migrants in the Netherlands working as prostitutes is unknown. In a study by Dekker, Tap and Homburg (2006) on the social position of 354 prostitutes, nine per cent of the respondents had CEE origin, which were mainly working in the illegal part of the sex industry. MOVISIE research (2009) showed that there are under-‐aged boy prostitutes coming particularly from Romania (Ostaijen et al. 2014). A report from the Public Health Service of Amsterdam report an increase in Romanian, Bulgarian and Hungarian women among the Amsterdam window prostitutes between 2005 and 2007 (Van der Helm 2008). On the level of the urban regions, there is limited data available on CEE sex workers for The Hague and Rotterdam. Recent research of Heuts, Tromp and Homburg (2012), based on estimates of experts, come up with a total number of 1000 to 1500 prostitutes working in licensed prostitution businesses. After the EU enlargements of both 2004 and 2007, experts saw an increase in the number of sex workers coming from the CEE countries of Romania, Bulgaria and Hungary. According to the experts, a quarter of all (legal) window prostitutes in The Hague are coming from these three CEE countries. A considerable part of the (possible) victims of human trafficking are also coming from CEE countries. In 2012, most (possible) victims of human trafficking were coming from Bulgaria (18 per cent), followed by Hungary (13 per cent), Romania (eight per cent) and Poland (four per cent). An explanation for the high number of Bulgarians and Romanians as (possible) victims of human trafficking lies in the fact that neither are members of the Schengen zone, meaning that they are subject to passport controls at Dutch airports. Based on data by CoMensha (2012), which is responsible for the registration of human trafficking, while most female (possible) victims of human trafficking are exploited in prostitution, most males are exploited in the agricultural sector. In Sweden, street prostitution is observed both in Stockholm and Gothenburg where it is only women that earn money selling sexual services (Mikamottagningen Göteborg and Mikamottagningen Stockholm 2013). The average age of the women in street prostitution in both urban regions is between 20-‐25 years of age (Mikamottagningen Gothenburg and Stockholm 2013). Women observed in street prostitution have no or a very low level of education, but there are some exceptions with vocational, secondary, tertiary, or university education. The women involved in street prostitution might stay shorter periods of time (a week or so) in hotels (City of Stockholm 2013a, Crossroads Stockholm 2013, Mikamottagningen Gothenburg and Stockholm 2013, Stockholms Stadsmission 2013). In Stockholm, there is a constant number of seven to ten women from Romania, Hungary, Bulgaria, Moldova, the Baltic countries and few from Poland involved in street prostitution, which has increased since 2009,
22
but now remains constant (Mikamottagningen Stockholm 2013). In Gothenburg, more or less a constant number of almost 28 CEE citizens are participating in street prostitution, all of them of the Roma minority (Mikamottagningen Gothenburg 2013). In Turkey, statistics on human trafficking based on the data of Ministry of Internal Affairs demonstrate that there were a total of 1,145 (known) victims of human trafficking between the years 2004 and 2010. With a steady decrease, the numbers of trafficked people fell from more than 200 in 2004 to below 50 persons in 2010. The proportion of CEE migrants in this category was 43 per cent in 2004, 63 per cent in 2005, 46 per cent in 2006, 47 per cent in 2007, 29 per cent in 2008, 13 per cent in 2009 and 20 per cent in 2010. The highest numbers of trafficking victims from the CEE countries were from Moldova, Ukraine, Romania, Belarus and Bulgaria. Human trafficking victims from Moldova constituted more than half of all trafficking cases from CEE countries. Overall, the distinction between formal and informal arrangements is hard to differentiate regarding the sex workers and trafficked persons. The problem is twofold: while some sex workers are not registered and working informally, among registered sex workers that may represent a voluntary choice of profession in a formal setting there are also many that are forced into prostitution.
Students In Austria, the experts agreed that besides economic motivations, education and better future perspectives constitute major migration motives. In 2012, there were 12,799 students from the eleven CEE countries in Austria, and 75 per cent were registered in universities in the region of Vienna. Only three per cent of students from CEE were registered in Linz. In general, between 2002 and 2012, the number of students increased by 44 per cent (+42 per cent for CEE-‐11) in Vienna and by 63 per cent (+48 per cent for CEE-‐11) in Linz. One expert stated that Bulgarians constitute the third largest group of foreign students after German and Italian citizens in Austria. In the Netherlands, like high skilled knowledge workers, CEE students also employ a category that does not fit in the popular image of CEE nationals working at the bottom of the Dutch labour market. In 2012, 166 students from CEE countries were registered at Delft University (29 Bulgarian, 21 Hungarian, 37 Polish, and 79 Romanian students) (TU Delft 2012). Rotterdam also has students from CEE, where many Polish, Romanian and Bulgarian students are enrolled at the Erasmus University Rotterdam (Ostaijen et al. 2014). In Sweden, 313 individuals, five per cent, are registered as students in 2013. The number of university students from the five largest CEE countries increased from 38 in 2001 to 165 in 2011 in Gothenburg. There is also an increase in the numbers in the Stockholm urban region for the same academic years. Since the 2004 and 2007 enlargements, the number of Lithuanian students has increased the most in both regions, followed by Romanians in Stockholm (Swedish
23
Higher Education Authority 2013). Some gender differences are observed within this type of migration: While 13 per cent of women in Gothenburg and 11 per cent of women in Stockholm are registered as students, the corresponding figure for the men is an average of four per cent in both regions. However, while the share of students among male migrants remained more or less the same, the share of women registering as student had decreased to four per cent in Gothenburg and six per cent in Stockholm in 2010. In Turkey, encouraged by the state authorities of higher education in Turkey, student migration in general, and from CEE in particular, is visibly increasing. Between 2003 and 2012 the percentage of CEE migrants with residence permits based on education constituted an average of 22 per cent of all foreign students in Turkey, fluctuating between five and seven thousand in a total number of 21 to 37 thousand residence permits based on education. In 2009, the proportion of CEE students dropped to 21 per cent in a total of 27,000 students followed by a further decrease to 17 per cent in a total of 37,000 students in 2011. The decrease in the proportion of CEE is essentially caused by the increase in the total number of residence permits based on education, which jumped from close to 22,000 to more than 37,000 in a period of eight years in Turkey. Among the CEE students in Turkey, the largest communities are Bulgarian, Albanian, Serbian, Macedonian, and Ukrainian students. More specifically, Bulgarians make up nine per cent, Albanians approximately three per cent, students from Serbia and Montenegro and Macedonia constitute approximately two per cent each, and Ukrainian students make up one per cent in the pool of all foreign students in Turkey. In another light, EU-‐2 countries led by Bulgaria constitute the largest migration corridor, followed by the Potential Candidates led by Albania and Kosovo and finally Eastern Partnership States driven by Ukraine and Moldova. University of Thrace in Edirne receives a large scale of student migration from Kosovo, Serbia, Montenegro, Croatia and Macedonia, especially to the Balkan Research Centre and Balkan Languages Translation Department. The university has the target of becoming a centre for foreign students in the region, which reflects on the migration patterns in the province (University of Thrace 2013 ). For example, CEE students in the university in 2013 are approximately 47 per cent of the total foreign student population. The largest student communities are from Kosovo with 287 students, Bulgaria with 215 students, Macedonia with 103 students and Albania with 33 students. In other words, the proportion of Kosovars is 19 per cent, Bulgarians 14 per cent, Macedonians seven per cent, and Albanians two per cent among all foreign students. The gender distribution in each group is very similar with female CEE students in this university being 318 in comparison to 384 male CEE students. Students from these regions have established student solidarity organizations based on nationality and are well integrated with the student community in Edirne. While this movement is a more temporary form of migration, students seem mostly to have the intention of staying after their graduation. However, there is no specific data on the number and backgrounds of the students who continue their residence in Turkey after their graduation. Like Edirne, student migration in Istanbul is also noticeable. However, this has a more temporary character as many students are coming as exchange students. Erasmus and other EU scheme exchange programs are definitely facilitating this type of mobility. Moreover, in some cases, like Hungary, there exists a bilateral agreement of student exchange with Turkey outside of Erasmus and other EU schemes. All in all, international student mobility from CEE countries is increasing in all four countries.
24
Non-‐working Spouses and Children Most CEE migrants come to Austria in order to improve their economic situation and living standard, fleeing from poverty and/or unemployment. Others accompany their partner or spouse. Another migration motive involves future chances for children including better schooling and improving their language proficiency in the German language. In Austria children (those aged under 15) form a small portion of migration from CEE. This is also true for Vienna and Linz. In the Vienna urban region, 7,931 children were registered, and their share in all registered CEE migrants varies from two per cent (the Czech Republic) up to six per cent (Romania). In Linz, there are only 756 children of CEE descent who were registered in 2013, the majority of them coming from Romania. temporary and volatile migration projects may be a reason contributing to the low presence of children in numbers where migration does not allow a whole family to participate, so children have to remain in the country of origin staying with either one parent, their grandparents or other relatives. Recently, there is also a rather new phenomenon of children entering Austria as daily commuters or attending boarding schools, which is part of a new migration type of volatile transnational lives that needs more exploration. In the Netherlands, experts in the country report indicate that 80 per cent of CEE migration in Rotterdam was related to families, where women were becoming more independent and leading migration. This is a rather new and different phenomenon than the single male migration that has been historically observed. In the cities of Rotterdam and The Hague, the numbers of registered pupils are increasing. In Rotterdam, there are 2,228 registered children of CEE migrants (age 4-‐22), of which 65 per cent (1,437) are getting education (in the academic year 2011-‐2012). Most children (955) are in the age of 4-‐11 years or in the age of 0-‐3 years (864) (Municipality Rotterdam 2013a: 27). In The Hague, the total amount of CEE children going to school has nearly doubled from 1,077 in 2010 to 2,083 in 2013. Not only in early schooling, but also in primary education, the numbers of CEE children have increased from 532 in 2008 to 1,224 in 2013 (Starrenburg and Van der Velden 2013). In Sweden, after employment, the second largest reason for registering for residence permit is the intention of family members to accompany their spouses and parents. Thus, among the registered migrants, an average of 20 per cent of residence permits is issued to children and 15 per cent to relatives (Swedish Migration Board 2013b). Migrant children seem to get access to the Swedish primary education system without problems, independently of the labour market status or socioeconomic situation of the parents. Children are rarely seen in the street, partly explained by the fact that the social services get involved if a child is spotted in a risk environment such as begging. In relation to unregistered migration, there is a domination of men migrating alone, leaving their spouses or children back in their home countries. In Turkey, the data on residence permits do not include those children who are residing in
, but the highest proportion of residence permits granted upon education is in primary education, which may point out that in different cases migration also involves accompanying children and probably other family members.
25
Beggars and Homeless People In Austria, begging is a sensitive public issue that is relevant for both Vienna and Linz, but there are no reliable figures and/or estimates of the number of beggars and their countries of origin. Thuswald (2012) shows that many beggars in Vienna are female, young and commuting from the neighbouring countries, especially from Slovakia and Hungary, who see begging in Austria as a kind of informal survival strategy. The push factors for this type of migrants are poverty, unemployment and a lack of perspectives in their home country, while a major pull factor is the informal information that begging in Austria would offer a chance of earning money. Romania and Bulgaria have also become important sending countries for this type of informal migrants, who often live in vacant accommodations or rent rooms. In Vienna, a lobby that came into existence after a conference of the Austrian Network against Poverty and Social Exclusion (a large network of NGOs) in the year 2008 is seeking to raise awareness about the situation of beggars and offers a comprehensive internet presence where beggars can receive information on medical help, warm food, clothes or shelter, or legal advice in case they are arrested or fined in Hungarian, Slovakian, Bulgarian, and Romanian languages. In the Netherlands, there is a formal criterion homeless people present in a city for at least two years may be accepted into a homeless shelter, which cannot be met by most homeless CEE migrants (Snel et al. 2011b). This requirement is not applied, when temperatures are expected to be too cold to sleep out during winter. Accordingly, and to illustrate, in the cold winter of 2012, homeless shelters in the four largest cities in the Netherlands provided shelter to 16 to 131 CEE migrants. Some studies consider these as marginal residents rather than typifying them homeless (Van Gestel, Van Straalen, Verhoeven and Kouwenberg 2013: 84). Like in Austria, there was a public debate about homeless CEE nationals, mainly Poles, particularly in The Hague. The estimations about number of homeless CEE nationals differed from 600, which is probably exaggerated as CEE nationals who are not necessarily really homeless, but make use of day care facilities for the homeless are also included in this (Engbersen et al. 2011, Snel et al. 2011b) to 135 (Bertram and Van Aartsen 2012: 5). In fact, the numbers are low and decreasing, which can be a result of collaboration with Barka, a Polish organization that organizes voluntary return for Polish nationals without any means of existence, and the fact that sleeping rough is officially forbidden in Rotterdam for example. There is an interesting new phenomenon of non-‐registered Bulgarians selling homeless journals in the streets, which they consider as real work, or street musicians with more informal survival strategies becoming more visible in Rotterdam and The Hague. In order to be eligible to sell homeless journals, one needs a pass; the maximum of 500 passes is already reached in Rotterdam. In Sweden, in an attempt to find out information about the number of marginalised irregular migrants, in 2012, the National Swedish Board of Health and Welfare asked municipal authorities to report their observations from a 24-‐hour period. Based on these reports, the board estimated the number of homeless EU citizens as 370, majority being men with an
26
average age of 38 years old (the age span really ranging from 18 to 76 years), coming from Romania as well as Poland, Bulgaria, Slovakia and Spain (National Swedish Board of Health and Welfare 2013). However, the total number of such people is likely to be higher. For example, the NGO Crossroads Stockholm alone receives on average 120 visits every day (Crossroads Stockholm 2013). From Nov 2012 to April 2013 the outreach team of the municipality of Stockholm working exclusively with people in risk environments, observed 205 individuals in open homelessness or other situation and a total of 13 under aged children (City of Stockholm 2013b). As another point of illustration, only in the municipality of Haninge, the Church of Sweden meets 78 to 80 individuals from Poland, the Baltic countries and Russia daily, a routine that has been more or less permanent since 2011 (Church of Sweden 2013). The first sign of irregular migration flows from the CEE came in 2006, when the outreach unit of the municipal social services observed a group of 10 to 12 individuals begging in the streets of Gothenburg. A year later, the number had increased to 19 people, mainly from Slovakia, Romania and Hungary (City of Gothenburg 2013a). As of 2012, begging has been observed in almost all municipalities, where social services stated that the majority of the EU migrants begging in the streets of Gothenburg were women. In Turkey, the local Roma population is observed begging in the streets, but beggars or homeless people from the CEE countries are rare.
5. Conclusions and Emerging Issues Despite the differences in availability, form and nature of data in four countries, the exercise of a comparative mapping and analysis of types of migration from CEE countries to Austria, the Netherlands, Sweden, and Turkey develops interesting conclusions. The reasons that make international comparisons challenging are not unique to these four countries, where disparities in data collection practices between countries, the changing nature of political unions (in our case for example, being a member of the EU, or applying transitional rules), and informal paths of migration all contribute to the problem. Still, creating a typology of CEE migration is possible as a heuristic device for comparison and as a tool with an exploratory value (See Table 5 for an overview). To begin with, the small presence of knowledge workers of high-‐skilled jobs in all four countries is informative not only for understanding the de-‐qualification of migrants with CEE origin in the labour market, but also to recognise the glass ceiling created by the established structures in all four countries. In EU member states, self-‐employment seems to be an important instrument for migrants from different CEE countries to overcome the limitations created by the recognized structures such as transitional rules in the case of Austria and the Netherlands, or strict labour market regulations in the case of Sweden. Manual workers in Austria, the Netherlands, and Sweden seem to be taking more seasonal jobs mostly in agricultural sector, suggesting prospects for new regimes of circular migration, where the difference between registered/unregistered migrants is blurred.
27
In all four countries, persons working in private households seem to be part of unregistered or irregular migration patterns, and there is still much to learn about both the scale and nature of this type of migration. A similar observation can also be made about sex workers and trafficked persons, non-‐working spouses and children, and beggars and homeless people. All three groups comprise vulnerable persons, and more research needs to be done to understand the level and character of their vulnerabilities. The number of foreign students is increasing in all four countries, also opening a rather new venue for research. Within this larger context, it may be interesting to analyse two further issues in relation to CEE migration in more detail: (1) Feminization of migration, where the analysis should not only focus on the increasing number of female migrants in CEE migration, but also explore the changes in the profiles of female migrants with a gender approach. The country reports show that CEE migration is becoming largely feminized for all four countries under research. (2) Degradation of qualifications or de-‐qualification of migrants, where reports also underline that the educational level or qualifications of migrants do not always correspond with their employment status.
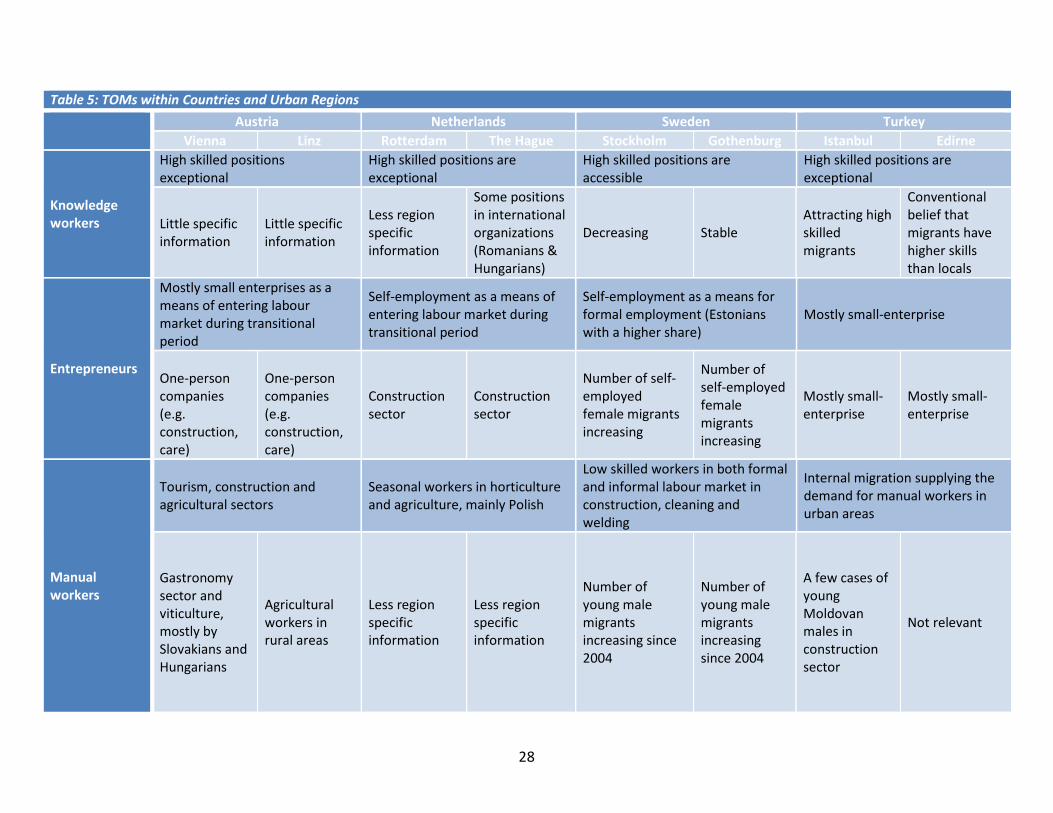
28
Table 5: TOMs within Countries and Urban Regions Austria Netherlands Sweden Turkey
Vienna Linz Rotterdam The Hague Stockholm Gothenburg Istanbul Edirne
Knowledge workers
High skilled positions exceptional
High skilled positions are exceptional
High skilled positions are accessible
High skilled positions are exceptional
Little specific information
Little specific information
Less region specific information
Some positions in international organizations (Romanians & Hungarians)
Decreasing Stable Attracting high skilled migrants
Conventional belief that migrants have higher skills than locals
Entrepreneurs
Mostly small enterprises as a means of entering labour market during transitional period
Self-‐employment as a means of entering labour market during transitional period
Self-‐employment as a means for formal employment (Estonians with a higher share)
Mostly small-‐enterprise
One-‐person companies (e.g. construction, care)
One-‐person companies (e.g. construction, care)
Construction sector
Construction sector
Number of self-‐employed female migrants increasing
Number of self-‐employed female migrants increasing
Mostly small-‐enterprise
Mostly small-‐enterprise
Manual workers
Tourism, construction and agricultural sectors
Seasonal workers in horticulture and agriculture, mainly Polish
Low skilled workers in both formal and informal labour market in construction, cleaning and welding
Internal migration supplying the demand for manual workers in urban areas
Gastronomy sector and viticulture, mostly by Slovakians and Hungarians
Agricultural workers in rural areas
Less region specific information
Less region specific information
Number of young male migrants increasing since 2004
Number of young male migrants increasing since 2004
A few cases of young Moldovan males in construction sector
Not relevant
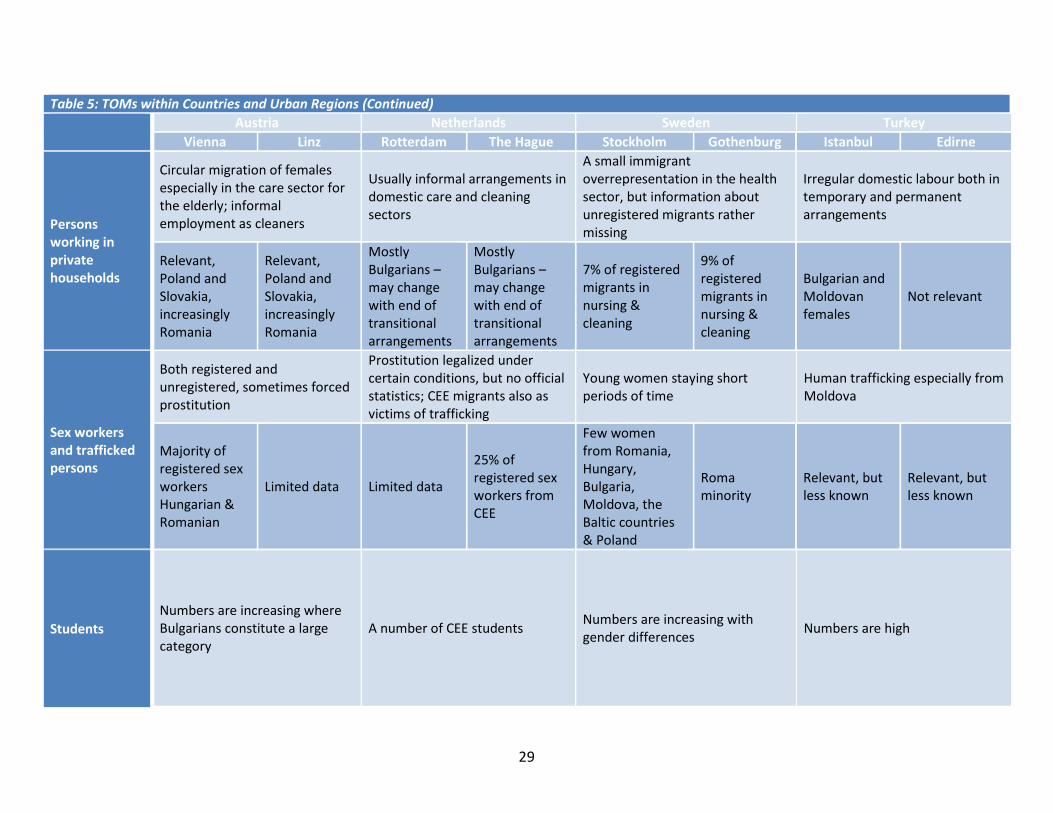
29
Table 5: TOMs within Countries and Urban Regions (Continued) Austria Netherlands Sweden Turkey
Vienna Linz Rotterdam The Hague Stockholm Gothenburg Istanbul Edirne
Persons working in private households
Circular migration of females especially in the care sector for the elderly; informal employment as cleaners
Usually informal arrangements in domestic care and cleaning sectors
A small immigrant overrepresentation in the health sector, but information about unregistered migrants rather missing
Irregular domestic labour both in temporary and permanent arrangements
Relevant, Poland and Slovakia, increasingly Romania
Relevant, Poland and Slovakia, increasingly Romania
Mostly Bulgarians may change with end of transitional arrangements
Mostly Bulgarians may change with end of transitional arrangements
7% of registered migrants in nursing & cleaning
9% of registered migrants in nursing & cleaning
Bulgarian and Moldovan females
Not relevant
Sex workers and trafficked persons
Both registered and unregistered, sometimes forced prostitution
Prostitution legalized under certain conditions, but no official statistics; CEE migrants also as victims of trafficking
Young women staying short periods of time
Human trafficking especially from Moldova
Majority of registered sex workers Hungarian & Romanian
Limited data Limited data
25% of registered sex workers from CEE
Few women from Romania, Hungary, Bulgaria, Moldova, the Baltic countries & Poland
Roma minority
Relevant, but less known
Relevant, but less known
Students Numbers are increasing where Bulgarians constitute a large category
A number of CEE students Numbers are increasing with gender differences Numbers are high
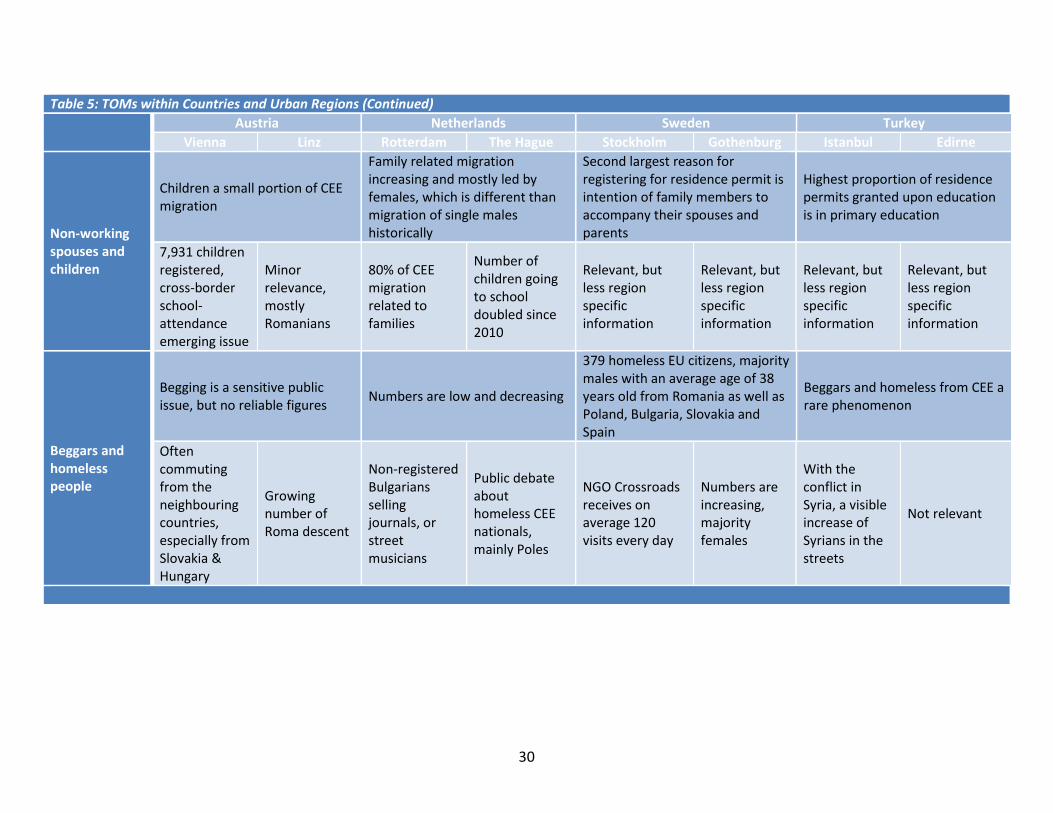
30
Table 5: TOMs within Countries and Urban Regions (Continued) Austria Netherlands Sweden Turkey
Vienna Linz Rotterdam The Hague Stockholm Gothenburg Istanbul Edirne
Non-‐working spouses and children
Children a small portion of CEE migration
Family related migration increasing and mostly led by females, which is different than migration of single males historically
Second largest reason for registering for residence permit is intention of family members to accompany their spouses and parents
Highest proportion of residence permits granted upon education is in primary education
7,931 children registered, cross-‐border school-‐attendance emerging issue
Minor relevance, mostly Romanians
80% of CEE migration related to families
Number of children going to school doubled since 2010
Relevant, but less region specific information
Relevant, but less region specific information
Relevant, but less region specific information
Relevant, but less region specific information
Beggars and homeless people
Begging is a sensitive public issue, but no reliable figures Numbers are low and decreasing
379 homeless EU citizens, majority males with an average age of 38 years old from Romania as well as Poland, Bulgaria, Slovakia and Spain
Beggars and homeless from CEE a rare phenomenon
Often commuting from the neighbouring countries, especially from Slovakia & Hungary
Growing number of Roma descent
Non-‐registered Bulgarians selling journals, or street musicians
Public debate about homeless CEE nationals, mainly Poles
NGO Crossroads receives on average 120 visits every day
Numbers are increasing, majority females
With the conflict in Syria, a visible increase of Syrians in the streets
Not relevant
31
Gender: Feminization of CEE Migration Feminization of migration is described here as increasing number of female migrants in CEE migration. Feminization of migration can also be taken as a change on the analytical criteria of the migratory phenomenon by including the approach of gender and/or as a change in the female mig The latter two approaches are also important to analyse, and it is exactly why the issue is presented here as emerging, thus implying a venue for further research. In Austria, the gender composition of CEE migration has changed a lot since the end of the Cold War. Female migrants from CEE (being 15 years and older) have an increasing presence and importance, clearly outnumbering males. While the proportion of male migrants among all CEE-‐migrants ranged at around 70 per cent with only little variation between the sending countries and with around one third not having reached the age of 30 years in 1991, today, young and middle-‐aged female migrants gained importance and visibly exceeding the number of males. Women from CEE are more visible in the service sector, in child caring as well as caring for old-‐aged people in private households, which are those fields of occupation with a strong demand in Austria, thus providing considerable numbers of jobs, but generally displaying modest incomes and often organized on an informal basis. The urban regions of Vienna and Linz do not show a variance from this trend on the national level. While the figures of residents that were born in EU-‐11 do not show big differences in gender patterns in the whole of Vienna urban region, the study of Lechner et al. (2010) referring primarily to the (daily) commuters in the Austro-‐Hungarian border region (South-‐Eastern parts of the region of Vienna) show clear gender and age specific patterns. Accordingly, about 75 per cent of the Hungarian workers are male. Many of these migrants choose to commute to Austria daily, as they can stay and live in western Hungary (with still lower living and residential costs) and work in the border regions of Austria with higher wage levels. Thus, geographical proximity is a determining factor of their type of migration, where males show a stronger presence than females. In the Netherlands, there is also a tendency towards feminization of migration, where majority (albeit a small portion in some cases) of the officially registered CEE migrants in the Netherlands are females (51 per cent of Polish and Bulgarian, 54 per cent of Hungarian, and 60 per cent of Romanians). While the portion of females among the labour migrants is low (Nicolaas 2011a, Jennissen 2011), females are overrepresented in migration for family motives (Gijsberts and Lubbers 2013). Looking at the ratios on the level of urban regions, in Rotterdam, the total percentage of females is more than the males in all three municipalities. The difference is profound among the Romanian migrants, where females are overrepresented in all municipalities (37 per cent males, 63 per cent females in Rotterdam; 38 per cent males, 62 females in Schiedam; and 28 per cent males, 72 per cent females in Lansingerland). Similarly, the male-‐female-‐ratio in The Hague region is also in favour of the female migrants, where the total percentage of females is more than the males in all three municipalities. In the municipalities of The Hague and Westland, women are overrepresented among both Romanians
32
(59-‐60 per cent female) and Hungarians (63-‐64 per cent females). In the municipality of Delft, a similar overrepresentation is true for the Polish (62 per cent females). In Sweden, gender distribution shows a variance between registered and unregistered migrants. While the flows of regular and registered CEE migrants are characterized by a rather even gender distribution, the group of CEE immigrants overlooked by the official records is dominantly male. In 2012, of the 148,998 individuals born in one of the EU-‐10 countries living in Sweden, the gender distribution was 45 per cent male and 55 per cent female. For the CEE as a whole, the gender distribution has been more or less the same throughout the period between 2000 and 2012, with a somewhat larger share of women than men (average of 42 per cent men, 58 per cent women). The same is true for the five largest immigrant populations, with the exception for the Polish and Lithuanian ones, where the share of males have increased slightly during the ten years period between 2000-‐2012 (Statistics Sweden 2013g). Of the 2732 citizens from the CEE region who obtained Swedish citizenship in 2012, 1627 were women and 1105 were men (Statistics Sweden 2013a). Polish women consist the largest category representing 36 per cent (975) of all CEE naturalizations in Sweden in 2012. In the urban region of Stockholm, women had a larger share than men in both the municipality of Haninge and Stockholm (51 and 56 per cent respectively). In Södertälje, the ratio was 48 per cent women, 52 per cent men. In the region of Gothenburg, women were the larger category in all three municipalities ranging from 53 to 60 per cent. In Turkey, the number of female CEE migrants with residence permits in 2011 was approximately 59 per cent of the total regular CEE migrants. In the previous years, the residence permits given to women constituted 55 per cent in 2008, 54 per cent in 2009, and 55 per cent in 2010. These high percentages of female migrants among the CEE migrants were also higher than the averages of female migrants among total migrants in Turkey. For same years, female migrants constituted 50 per cent (2008), 51 per cent (2009), 52 per cent (2010) and 54 per cent (2011) of total migrants in Turkey, which are below the proportion of women among CEE migrants. In a more detailed analysis, it is demonstrated that there is a gender balance of CEE migration between 2003 and 2005, male domination in 2006 and 2007, and female domination after the year 2008. A similar trend of increasing female domination is also observed, when we look at the work permits. An analysis of gender distribution of CEE migrants with work permits in the year 2008 shows that female migrants constitute only 37 per cent of the CEE community holding employment permits. However, the difference between women and men with employment permits starts closing in 2009 when women constitute almost half of the CEE migrants with work permits. More, in an increasing trenmigrants with employment permits in 2010, 2011 and 2012 becomes 52, 65 and 67 per cent respectively. However, like in Sweden, the gender distribution may show a variance between registered and unregistered migrants. While the flows of regular and registered CEE migrants are characterized by a recent female domination, looking at the apprehension data (a basic variable for estimation of unofficial migration) especially in Edirne, we see that it is dominantly male. However, there is also a variance among unregistered migration between irregular labour migrants and irregular transit migrants. While female CEE migrants may largely dominate the former (like in Austria, there is a strong demand for domestic female workers), the latter is
33
largely a male dominated phenomenon. In Istanbul, the variance is also visible between different types of migration. As stated earlier, analysis of feminization of migration should not only focus on the increasing number of female migrants in CEE migration, which was already largely reflected in the country reports, but also explore the changes in the profiles of female migrants with a gender approach; thus, paving the way for further research on the subject.
Education: De-‐qualification of CEE Migration Like feminization of CEE migration, de-‐qualification appears as a noticeable area for further research. Literature suggest several factors that lead migrants to take on jobs that do not match with their skills, which are non-‐recognition of credentials, educational level or experience abroad (Green and Worswick 2002, Ferrer and Riddell 2003); poorer quality of education in some countries (Sweetman 2003); language disadvantage; weak social networks; and lack of information regarding the job market in the host country (Galarneau and Morissette 2004). The issue is particularly visible and discussed among academic and policy circles in the case of Austria, where a significant feature of CEE migration, which is largely different from the guest worker migration from the former Yugoslavia and Turkey of the 1960s and 1970s, was the above average level of education of many immigrants (Fassmann et al. 1993, 1999). Thus, brain drain is an integral part of CEE migration since 1989 (Iredale 2001). There are higher shares of migrants from EU-‐10 as well as EU-‐2 countries with a tertiary education compared to the Austrian born population. There are also differences between EU-‐10 and EU-‐2: while 17 per cent of EU-‐10 immigrants have tertiary education, almost every third immigrant born in Romania and Bulgaria only displays primary education. There are also notable differences between Vienna and Linz in relation to educational levels of CEE migrants: The share of persons with a tertiary education is higher in Vienna than in Linz for all groups under consideration. On the one hand, every fifth CEE migrant in the capital belongs to the best-‐educated group, a fact once again proving the high qualifications East-‐West migrants have brought to Austria since 1989. On the other hand, around one third of CEE migrants in Linz display primary education only. Thus, it is obvious that access to a more qualified labour market in the capital of Austria demands higher qualifications. Within this context, de-‐qualification remains to be a problem that has often been detected and analysed (for example, Fassmann et al. (1995, 2004) on Polish migration; and Morocvasic (1994) and Morocvasic and De Tinguy (1993) on East-‐West migration in general). Even in the early phase of East-‐West migration, the anticipation and acceptance of de-‐qualification by the migrants themselves was a widespread phenomenon among potential migrants from CEE (Fassmann et al. 1993), which is still a compromise some CEE migrants have to make to enter the labour market during the initial phase of their stay in Austria. Despite the fact that the educational structure of CEE migrants was and is still comparably high and markedly higher than the Austrian average (Hryniewicz et al. 1993), particularly women from CEE are often locked in de-‐qualifying jobs and sectors, with low wages, lacking the opportunity of upward mobility in the labour market, often accepting downward mobility in terms of status and qualifications
34
(Lendvai 2010: 8). Favell (2008) emphasbecoming a new Victorian servant class for a West European aristocracy of creative-‐class
PhD are working in Austria in child or geriatric care. Almost all experts interviewed for the Austrian country report agree that de-‐qualification is still an issue for many CEE migrants in Austria. University graduates are more disposed to work below their skill levels, which is specifically the case for new and middle aged migrants (Biffl 2011: 86 f.). While there is a growing awareness of this problem among policymakers and the labour market, there seems to be no clear solution. Existing wage differentials, the fact that
proficiency, and poor knowledge about the system are the main causes of the problem. The duration of stay and a formal employment may lead towards an adequate employment. On the one hand, the longer migrants are present, the higher is the likelihood to work in an adequate job. On the other hand, the longer they work in de-‐qualified positions the harder it gets to connect to jobs complying with their skills, given the fast changing working world realities. Like in Austria, in the Netherlands, unlike the former guest workers of the 1960s and 1970s, CEE labour migrants are generally well educated. In the Netherlands, the data available on educational level and labour market participation of CEE migrants rely on survey data. For example, Weltevrede et al. (2009: 61, 153) found relatively high educational levels among CEE migrants. Based on their study, only 28 per cent of their CEE respondents had a low level of education, which was significantly less than the traditional migrant categories in the Netherlands (such as the former guest workers and their families from countries like Turkey and Morocco); but also less than among the native Dutch population. The same study showed that 20 per cent of their respondents had completed higher education. However, educational levels also differed among different migrant groups. The survey conducted by Gijsberts and Lubbers (2013) among Polish and Bulgarians in the Netherlands, found large differences in the educational levels of the two CEE migrant groups they studied. While 30 per cent of the Polish residents had a low education, the number was 64 per cent for the Bulgarians in their sample. On a similar line, compared to the 19 per cent of their Polish respondents who had an academic educational level, only six per cent of the Bulgarian respondents stated such a level of education. Engbersen et al. (2011: 28), in their study about Polish, Romanian and Bulgarian labour migrants in the Netherlands, found even more variation in the educational levels of CEE migrants. Only a small minority of their respondents (13 per cent) were classified as low skilled in the sense that they have finished primary or lower secondary (up to the age of 15 years) education. However, among the Bulgarian respondents there were more low skilled individuals (30 per cent). In all migrant groups, the (large) majority of all respondents have finished at least high school; and 15 per cent of the Polish and more than 38 per cent of the Romanian have completed higher education. The findings are also similar on the level of urban regions of Rotterdam and The Hague, where Bulgarians seem to have a lower level of education compared to their counterparts from other
35
CEE countries. Two main conclusions can be drawn from these findings: first, there are significant differences in the educational levels of different groups of CEE migrants, and second, like in Austria, the relatively high educational level of many migrants from CEE indicates that there is a serious issue. In Sweden, there are data problems concerning the educational level of CEE migrants, as the information is missing for a larger share of immigrants, particularly for those who have been in Sweden for a short time (Statistics Sweden 2013c; Wadensjö Eskil and Gerdes 2013). Still, like in Austria and the Netherlands, CEE migrants in Sweden are comparatively well educated than those born in Sweden, usually having at least secondary education; partly reflecting the fact that immigrants from these countries are primarily young people; younger cohorts are on average better educated, and many have a university education (Wadensjö Eskil and Gerdes 2013). Within this context, migrants from the Baltic States show a higher level of education than most groups in the Swedish labour market (Wadensjö Eskil and Gerdes 2013), also showing a similarity to the Netherlands where there are variances of educational level among different migrant groups. While half or more than half of the migrants born in one of the top five CEE countries have a tertiary education or higher, the number for the Swedish born population is 40 per cent. Lithuanians display the highest share of highly educated (tertiary education of more than three years); as much as 47 per cent of Lithuanian women have tertiary education, compared to 30 per cent of the Sweden born women or 29 per cent of female Poles (Statistics Sweden 2013c). In urban regions of Sweden, the share of CEE inhabitants with tertiary education have increased in all groups except for CEE men in the Stockholm region, where the share have remained around 30 per cent since 1998. Observing the educational level for men and women in 2012, Lithuanian women stand out by being highly educated. Among Romanian and Lithuanian women 51 per cent have tertiary education, followed by Hungarian (49 per cent), Estonian (40 per cent), and Polish (38 per cent). In the Gothenburg region, 49 per cent of the Lithuanian women have tertiary education, compared to 30 per cent of all CEE female inhabitants. The Lithuanian men dispose a much smaller share with tertiary education with figures of 27 per cent in Gothenburg (more or less to the same extent with other male CEE inhabitants) and 24 per cent in Stockholm (the lowest among the top five CEE countries). The country report on Sweden does not provide much information on de-‐qualification of CEE migrants in the employment market, and information about the sector of employment is missing for quite a large share of migrants. However, looking at the distribution in occupations sorted by skill level, it is seen that the highest shares are found in high and medium skilled occupations. The Gothenburg region had the highest share of medium skilled workers in 2011 (39 per cent). The share of high skilled workers remained almost unchanged, and the share of low skilled workers increased just a little. In Stockholm, the share of high skilled workers has decreased since 2001, while the share of CEE migrants working in low skilled professions has increased from four per cent to nine per cent between 2001 and 2011. Thus, given the higher level of education of migrants, these increases in low skilled jobs may hint at a de-‐qualification.
36
In Turkey, the only data available on the education of the migrants is the residence permits granted based on education. However, this data mostly holds information on student migration, rather than presenting estimates on educational level of migrants and their labour market participation. Based on the interviews conducted by the research team, we can assert that many of the CEE migrants coming to Turkey are better qualified than the average in Turkey. Historically, many Bulgarian migrants that have arrived in Edirne are known to be better educated, who had at least a certain type of vocational training. In Istanbul, like in Austria, many educated female migrants are known to be holding informal jobs in private households regardless of their qualifications. Overall, migration from CEE to Austria, the Netherlands, Sweden, and Turkey serves as an interesting empirical case study to understand the changes and continuities of migratory systems that involve this large region. On the one hand, historical trends of circular and seasonal migration seem to be continuing both in formal and informal settings. On the other hand, CEE migration is becoming more of an urban phenomenon as new types of migrations; such as student migration is becoming more and more visible. Also, new forms of transnationalism are emerging, where the possible effects of geographical proximities, such as in the cases of Austria and Turkey, are discovered in creation of more transnational lifestyles. Next phases of the IMAGINATION Project will elaborate further on these continuities and changes along a comparative analysis of different urban spaces.
37
Bibliography Adam, G. (2007) 'New law sanctions private care services by foreign nationals', available: http://www.eurofound.europa.eu/eiro/2007/09/articles/AT0709019I.htm [accessed 01.08.2013].
Bahna, M. (2013) 'Slovak Elder Care Workers in Austria: Do their Families Suffer?', in ESA 11th Conference -‐ Crisis, Critique and Change: Abstract Book, Torino, European Sociological Association, 28-‐31 August 2013, 624.
Bender, S. and Seifert, W. (1996) 'Zuwanderer auf dem Arbeitsmarkt: Nationaliäten-‐ und geschlechtsspezifische Unterschiede', Zeitschrift für Soziologie, 25(6), 473-‐495.
Bertram, A.W.H., & Van Aartsen, J.J. (2012). Voortgangsrapportage EU arbeidsmigratie. Letter to municipality of The Hague. 12 april 2012.
Biffl, G. (2002) Arbeitsmarktrelevante Effekte der Ausländerintegration in Österreich. Studie des Österreichischen Instituts für Wirtschaftsforschung, Wien.
Biffl, G. (2011) Migration and Labour Integration in Austria, SOPEMI Report on Labour Migration, Austria 2010-‐ 11, [online], available: http://www.donau-‐ uni.ac.at/imperia/md/content/department/migrationglobalisierung/forschung/sopemi/biffl-‐sopemi-‐ 2011.pdf [accessed 01.08.2013].
Black, R. Engbersen, G. Okolski M. & C. Pantiru (2010) A Continent Moving West? EU Enlargement and Labour Migration from Central and Eastern Europe, Amsterdam: AUP.
BMI (2011) Niederlassungs-‐ und Aufenthaltsstatistik 2011, [online], available: http://www.bmi.gv.at/cms/BMI_Niederlassung/statistiken/files/2011/Niederlassungs_und_Aufenthalt sstatistik_2011.pdf [accessed 02.12.2013].
BMI (2012) Niederlassungs-‐ und Aufenthaltsstatistik 2012, [online], available: http://www.bmi.gv.at/cms/BMI_Niederlassung/statistiken/files/2013/Niederlassungs_und_Aufenthalt sstatistik_Jahr_2012.pdf [accessed 02.12.2013].
Boguslaw, J. (2012). Svensk invandringspolitik under 500 år: 1512-‐ (1:1 ed.). Lund: Studentlitteratur.
Bonjour, S.A. (2009). Grens en gezin. Beleidsvorming inzake gezinsmigratie in Nederland, 1955-‐ Amsterdam: Aksant.
Brassé, P., & Van Schelven, W. (1980). Assimilatie van vooroorlogse immigranten. Drie generaties Polen, Slovenen, Italianen in Heerlen. Den Haag: Ministerie van Cultuur, Recreatie en Maatschappelijk Werk.
Middle Eastern Studies. 40:3, 86-‐101.
Castles, S. & Miller. M. J. (1998). The age of migration. New York: Guilford Press.
Church of Sweden. (2013). Church of Sweden, Congregation of Haninge. In K. Zelano (Ed.).
City of Gothenburg. (2013a). City of Gothenburg, the unit for social resources. In K. Zelano (Ed.).
City of Gothenburg. (2013b). Återkoppling (3): Uppdrag migrerande EU-‐
City of Stockholm. (2013a). City of Stockholm, the unit for social assistance (outreach unit). In K. Zelano (Ed.).
38
City of Stockholm. (2013b). Lägesrapport 20121101 -‐ Stockholms Stad, Socialförvaltningen, uppsökarenheten.
City of Stockholm. (2013c). Tjänsteutlåtande Insatser för fattiga EU-‐ -‐0466/2012.
CoMensha (2012). Jaaroverzicht 2012 CoMensha. Amersfoort: CoMensha. Accessed at 10 February 2014 via http://mensenhandel.nl/jaaroverzicht2012/#/4/.
Convention for the Protection of Human Rights and FundamentalFreedoms As Amended by Protocol No. 11 with Protocol Nos. 1, 4, 6, 7, 12 and 13 (2003).
Crossroads Gothenburg. (2013). Crossroads Gothenburg. In K. Zelano (Ed.).
Crossroads Stockholm. (2013). Crossroads Stockholm. In K. Zelano (Ed.).
Cyrus, N. (1997) 'Grenzkultur und Stigmamanagement. Mobile Ethnographie und Situationsanalyse eines irregulär beschäftigten polnischen Wanderarbeiters in Berlin', kea Zeitschrift für Kulturwissenschaften, 10, 83-‐104.
Cyrus, N. (2008) 'Being Illegal in Europe: Strategies and Policies for Fairer Treatment of Migrant Domestic Workers' in Lutz, H., ed. Migration and Domestic Work. A European Perspective in a Global Theme, Aldershot, Hants [et al.]: Ashgate, 177-‐194.
Daalder, A. L., (2007). Prostitutie in Nederland na opheffing van het bordeelverbod. Meppel: Boom Juridische uitgevers.
Dagevos, J. (red.) (2011). Poolse migranten. The Hague: Sociaal en Cultureel Planbureau.De Bondt, H., and Grijpstra, D. 2008. Nieuwe grenzen, oude praktijken. Onderzoek naar malafide bemiddelaars op de arbeidsmarkt. Zoetermeer: Research voor Beleid.
Journal of Ethnic and Migration Studies, 33:4.
De Boom, J., Weltevrede, A., Rezai, S., & Engbersen, G. (2008). Oost-‐ verkenning van de maatschappelijke positie van migranten uit Oost-‐ Rotterdam: Risbo.
Dekker, H., Tap, R. & Homburg, G. (2006). Evaluatie opheffing bordeelverbod. De sociale posities van prostituees 2006. Amsterdam: Regioplan Beleidsonderzoek.
Doyle Nicola and Hughes, G. a. W., Eskil. (2006). Freedom of Movement for Workers from Central and Eastern Europe-‐ SIEPS. Stockholm.
Dündar, F. (1999) Eade, J. (2007). Class and Ethnicity: Polish Migrant Workers in London: Full Research Report. ESRC End of Award Report. Swindon: ESRC
-‐ Toplum ve Bilim, 108. Enengel, M. L., Fassmann, H., Kohlbacher, J., and Reeger, U. (2014) Mapping and analysis of types of migration from CEE countries: Country report Austria, IMAGINATION Working Paper No. 1.
39
Engbersen, G. (2012) 'Migration Transitions in an Era of Liquid Migration' in Okolski, M., ed. European Immigrations. Trends, Structures and Policy Implications. IMISCOE Research, Amsterdam: Amsterdam University Press, 91-‐105.
Engbersen, G., Ilies, M., Leerkes, A., Snel, E., & Van der Meij, R. (2011). Arbeidsmigratie in vieren. Bulgaren en Roemenen vergeleken met Polen. EUR: Rotterdam.
Engbersen, G., Van de Pol, S., Burgers, J., Snel, E., Ilies, M., Van der Meij, R., & Rusinovic, K. (2012). Poolse arbeidsmigranten in het Westland. NICIS/ EUR: Rotterdam.
Engbersen, G., Leerkes, A., Grabowska-‐ J. (2013). On the differential attachments of migrants from Central and Eastern Europe: A typology of labour migration, Journal of Ethnic and Migration Studies, 39 (6), 959-‐
Enste, D. and Schneider, F. (2006) 'Schattenwirtschaft und Irreguläre Beschäftigung: Irrtümer, Zusammenhänge und Lösungen', available: http://www.economics.jku.at/members/Schneider/files/publications/Schattenwirtschaft%20und%20I rregulaere%20Beschaeftigung%20160605.pdf [accessed 14.08.2013].
Erikson, R., Goldthorpe, J. H. & Portocarero, L. (1979). Intergenerational class mobility in three Western European societies: England, France and Sweden. British Journal of Sociology, 30 (4), 415-‐441.
EurActive (2012) 'Central and Eastern Europe's emigration challenge', available: http://www.euractiv.com/europes-‐east/central-‐eastern-‐europes-‐emigrati-‐analysis-‐512346 [accessed 14.08.2013].
EURES. (2013). EURES. In K. Zelano (Ed.). Fassmann, H., Hintermann, C., Kohlbacher, J. and Reeger, U. (1999) "Arbeitsmarkt Mitteleuropa". Die Rückkehr historischer Migrationsmuster, ISR-‐Forschungsbericht, Vienna: Verlag der Österreichischen Akademie der Wissenschaften.
Fassmann, H., Kohlbacher, J. and Reeger, U. (1993) "Suche Arbeit" -‐ Eine empirische Analyse über Stellensuchende aus dem Ausland, ISR-‐Forschungsberichte, Vienna: Verlag der Österreichischen Akademie der Wissenschaften.
Fassmann, H., Kohlbacher, J. and Reeger, U. (1995) Die "neue" Zuwanderung aus Ostmitteleuropa -‐ Eine empirische Analyse am Beispiel der Polen in Österreich, ISR-‐Forschungsberichte, Vienna: Verlag der Österreichischen Akademie der Wissenschaften.
Fassmann, H., Kohlbacher, J. and Reeger, U. (2004) Polen in Wien. Entwicklung, Strukturmerkmale und Interaktionsmuster, ISR-‐Forschungsberichte, Vienna: Verlag der Österreichischen Akademie der Wissenschaften.
Fassmann, H. and Kollar, D. (1996) 'Les migrations frontalières entre la Slovaquie et l'Autriche', Migrations Societé, 8(43), 91-‐102.
Fassmann, H. and Reeger, U. (2012) '"Old" immigration countries in Europe' in Okolski, M., ed. European Immigrations. Trends, Structures and Policy Implications, Amsterdam: Amsterdam University Press, 65-‐ 90.
Favell, A. (2008) 'The new face of East-‐West migration in Europe', Journal for Ethnic and Migration Studies, 34(5), 701-‐716.
Federation of Swedish Forestry and Agricultural Employers. (2013). Arbetskraften i företaget Okt 2013
Ferrer, A. & Riddell, C. (2003) Education, credentials and immigrant earnings, University of British Columbia working
40
paper www.econ. ubc.ca/ferrer/ferrer&riddell(2).pdf.
Findlay, Allan M, King, Russell, Smith, Fiona M, Geddes, Alistair and Skeldon, Ronald (2012) World class? An investigation of globalisation, difference and international student mobility. Transactions of the Institute of British Geographers, 37 (1). pp. 118-‐131. ISSN 0020-‐2754
Galarneau, D. & Morissette, R. (2004) Immigrants settling for less? Perspectives June 2004, Statistics Canada Catalogue No. 75-‐001-‐XIE.
Gendera, S. & Haidinger, B. (2007) ''Ich kann in Österreich als Putzfrau arbeiten. Vielen Dank, ja.' Bedingungen der bezahlten Haushalts-‐ und Pflegearbeit von Migrantinnen', Grundrisse, 23, 28-‐40.
Gijsberts, M. & Lubbers., G. (2013). Nieuw in Nederland. The Hague: Sociaal en Cultureel Planbureau.
Göteborgs Kyrkliga Stadsmission. (2013a). Fattiga EU-‐
Göteborgs Kyrkliga Stadsmission. (2013b). Stadsmissionen Gothenburg. In K. Zelano (Ed.).
Göteborgs Räddningsmission. (2012). Sammanfattande rapport om hemlösa romers situation i Göteborg.
-‐disequilibrium in the Polish labour market' in Black, R., Engbersen, G., Okolski, M. and Pantiru, C., eds., A Contintent moving West? EU enlargement and Labour Migration from Central and Eastern Europe, IMISCOE Research Amsterdam, 187-‐207.
Green, D. A. & Worswick, C. (2002) Earnings of immigrant men in Canada: The roles of labour market entry effects and returns to foreign experience. Paper prepared for Citizenship and Immigration Canada. www.cic.gc.ca/english/research/papers/earnings/ earnings-‐toc.html.
Journal of Higher Education Policy and Management, Vol. 30, No. 1, pp. 25-‐39
Grzegorzewska-‐Mischka, E. (1995) 'Die polnische Emigration in den 80er Jahren und ihre demographische Struktur' Ostmitteleuropa Eine
empirische Analyse am Beispiel der Polen in Österreich, Vienna: Verlag der Österreichischen Akademie der Wissenschaften, 63-‐68.
Haidinger, B. (2007) Migration and Irregular Work in Europe, Literature Review, Work Package 3, EU Sixth Framework Programme, Contract Number: 044272, Vienna.
Heuts, L., Tromp, E. & Homburg, G. (2012). Doubletstraat sluiten? Een marktonderzoek naar de seksuele dienstverleningsbranche in Den Haag. Amsterdam: Regioplan Beleidsonderzoek.
Heyma, A., Berkhout, E., Van der Werff, S., & Hof, B. (2008). De economische impact van arbeidsmigratie uit de MOE-‐Amsterdam: Stichting Economisch Onderzoek.
Hoppesteyn, M. (2012). Bevolkingsprognose Rotterdam 2013-‐ Rotterdam: Centrum voor Onderzoek en Statistiek.
Hryniewicz, J., Jalowiecki, B., Mync, A. and Szul, R. (1993) 'Brain Drain in Poland in the Period of Transition. Proceedings of the International Seminar on UNESCO, 25 27th April 1993,
41
Venice, Italy,
Huber, P., Mayerhofer, P., Nowotny, K. and Palme, G. (2007) Labour Market Monitoring II -‐ Veränderungen auf dem Arbeitsmarkt im Zuge der EU-‐Erweiterung. Handlungsorientierter Bericht., [online], available: http://www.arbeitsmarktmonitoring.at/pdf/WIFO-‐_lamo_2_2007_12_03.pdf [accessed 04.12.2013].
Huddleston, T., et.al. (2011). Migrant Integration Policy Index.
Land of Diverse Migrations, Istanbul, Bilgi University Press.
International Economics. (http://www.focus-‐migration.de)
Migration in the Southern Balkans, Amsterdam, University of Amsterdam Press. Iredale, R. (2001) 'The Migration of Professionals: Theories and Typologies', International Migration Review, 5(7), 7-‐24.
Jandl, M. (2004) 'The Estimation of Illegal Migration in Europe', Migration Studies, 41(153), 141-‐155. Jandl, M., Hollomey, C. and Stepien, A. (2007) Migration and Irregular Work in Austria: Results of a Delphi-‐Study, International Migration Papers, Geneva: ILO.
Jennissen, R. (2011). Ethnic migration in Central and Eastern Europe: Its historical background and contemporary flows. Studies in Ethnicity and Nationalism, 11: 252270.
The New International Migration and Migrant Women in Turkey: The Case of The Moldovan Domestic Workers, -‐2006.
Middle Eastern Studies, 36:3, 1-‐22. Kraler, A., Reichel, D. and Hollomey, C. (2009) Undocumented Migration in Austria, Clandestino Research Brief, [online], available: http://clandestino.eliamep.gr/wp-‐content/uploads/2009/11/austria-‐policy-‐ brief_july-‐20091.pdf [accessed 01.08.2013].
report Turkey, IMAGINATION Working Paper No. 4. König, T., Van der Linden, F., Sluiter, N., & Verschuren, S. (2013). Migrantenmonitor fase 2, 2007-‐2012. CBS, Centrum voor Beleidsstatistiek. Accessed at 12 February 2014 via http://www.cbs.nl/nl-‐NL/menu/informatie/beleid/publicaties/maatwerk/archief/2013/130212-‐ -‐ -‐ -‐ -‐2012-‐
Kratzmann, K., Marik-‐Lebeck, S., Petzl, E. and Mária, T. (2011) Temporary and Circular Migration in Austria, Vienna: International Organisation of Migration.
Kratzmann, K. and Reyhani, A.-‐N. (2012) Practical Measures for Reducing Irregular Migration in Austria. Study of the National Contact Point Austria in the European Migration Network, [online], available: http://ec.europa.eu/dgs/home-‐affairs/what-‐we-‐ do/networks/european_migration_network/reports/docs/emn-‐studies/irregular-‐ migration/at_20120823_irregular_migration_en_version_final_en.pdf [accessed 15.09.2013].
Lechner, F., Major, A., Matt, I. and Willsberger, B. (2010) Ungarische GrenzgängerInnen in Wien. Studie im Auftrag
42
von EURES-‐T Pannonia, [online], available: http://media.arbeiterkammer.at/noe/pdfs/broschueren/ungar_grenzgaenger.pdf [accessed 05.12.2013].
Lee, S. E. (1966) A Theory of Migration. Demography 3(1), 47-‐57.
Lendvai, N. (2010) Ties and Ruptures: Welfare States and Migration in Central and Eastern Europe, [online], available: http://cadmus.eui.eu/bitstream/handle/1814/14214/MWP_2010_09.pdf?sequence=1 [accessed 21.08.2013].
LO. (2013a). Gäst i verkligheten om utstationerad arbetskraft i praktiken. In C.-‐ r. L. Jonsson (Ed.).
LO. (2013b, 2013-‐ -‐ Online article. LO.
Lundborg, P. (2010). Second draft: Do Medical Doctors Lose fromthe Immigration of Doctors? CEIFO and SULCIS. Stockholm University.
Marinucci, R. (2007). Feminization of migration? Revista Interdisciplinar da Mobilidade Humana, Vol.15:29. Available at: http://www.csem.org.br/remhu/index.php/remhu/article/viewFile/55/47 Accessed June 2014.
Metropoolregio Rotterdam en Den Haag (MRDH), 2014. Kaart. Accessed via http://mrdh.nl/kaart.
Mikamottagningen Gothenburg. (2013). Mikamottagningen Gothenburg. In K. Zelano (Ed.).
Mikamottagningen Stockholm. (2013). MIkamottagningen, City of Stockholm. In K. Zelano (Ed.).
Morocvasic, M. (1994) 'Pendeln statt Auswandern. Das Beispiel der Polen' in Morocvasic, M. and Rudolph, H., eds., Wanderungsraum Europa. Menschen und Grenzen in Bewegung, Berlin: Ed. Sigma, 166-‐187.
Morocvasic, M. (2007) 'Migration, gender, empowerment' in Lenz, I., Ullrich, C. and Fersch, B., eds., Gender orders unbound: globalisation, restructuring and reciprocity, Opladen [et al.]: Budrich, 69-‐98.
Morocvasic, M. and De Tinguy, A. (1993) 'Between East and West: A new migratory space' in Rudolph, H. and Morocvasic, M., eds., Bridging states and markets: international migration in the early 1990s, Berlin: Ed. Sigma, 245-‐263.
MOVISIE (2009). Factsheet jongensprostitutie: feiten en cijfers. Accessed at 10 February 2014, via http://www.jeugdprostitutie.nu/doc/Factsheet_Jongensprostitutie.pdf.
Municipality of Haninge. (2014). Municipality of Haninge, the unit for economic support. In K. Zelano (Ed.).
Municipality of Mölndal. (2013). Municipality of Mölndal. In K. Zelano (Ed.).
Municipality Rotterdam (2008). Polen in Rotterdam. Een verkennend onderzoek naar de leef-‐(toekomst)plannen van Polen in Nederland. Rotterdam: Gemeente Rotterdam/Directie veiligheid kenniscentrum.
Municipality Rotterdam (2012). Rotterdam Wereldwijd. Jaarverslag 2011. Accessed at 17 February 2014, via http://www.rotterdam.nl/BSD/Document/BJI/Rotterdam%20Wereldwijd%20nr%208.pdf.
Municipality Rotterdam (2013a). Monitor Programma EU-‐ Rotterdam: Gemeente Rotterdam.
Municipality Rotterdam (2013b). De Uitvoeringsagenda 2013-‐ Accessed at 17 February 2014 via http://cpr.rotterdam.nl/Clusters/Stadsontwikkeling/Document%202013/wonen/Uitvoeringsagenda
43
%202013%203014%20EU%20arbeidsmigratie.pdf
Municipality Schiedam. (2012). (Tijdelijk) Thuis in Schiedam. Uitvoeringsplan arbeidsmigranten uit Midden-‐Oost-‐ -‐ Schiedam.
Municipality Schiedam. (2013). Monitor (Tijdelijk) Thuis in Schiedam, Uitvoeringsplan arbeidsmigranten uit Midden-‐-‐ Schiedam.
Municipality of Skövde. (2013). Municipality of Skövde, the unit for economic support In K. Zelano (Ed.).
Municipality of Södertälje. (2013). Municipality of Södertälje, the unit for economic support. In K. Zelano (Ed.).
Municipality The Hague. (2012). Kerncijfers van Den Haag 2012. The Hague: Concern Overleg Onderzoek.
National Employment Agency. Arbetsmarknadsläget i Västra Götaland. Retrieved 20140117, 2014.
National Swedish Board of Health and Welfare. (2013). Hemlöshet bland utrikesfödda personer utan permanent uppehållstillstånd i Sverige. Stockholm.
Nicolaas, H. (2011a). Poolse migratie. Voorbode voor gezingshereniging? Demos 27 (10), 5-‐7.
Nicolaas, H. (2011b). Ruim helft Poolse immigranten vertrekt weer. Bevolkingstrends 59, 32-‐36.
OECD. (2009-‐ 112, from OECD Persson, G. (2003). Ekot. In S. Radio (Ed.). Okólski, M. (2012) 'Transition from Emigration to Immigration. Is it the destiny of modern European countries?' in Okólski, M., ed. European Immigrations. Trends, Structures and Policy Implications, Amsterdam: Amsterdam University Press 23-‐44.
Ostaijen, M., Snel, E., Hart, M., Faber, M., Engbersen, G. and Scholten, P. (2014), Mapping and analysis of types of migration from CEE countries: Country report the Netherlands, IMAGINATION Working Paper No. 2.
-‐International Migration, 45, 157 181.
Southeast European and Black Sea Studies 6:4, 543-‐557.
-‐ Ethnography 4, 561-‐5. Prop 2007/08:147 Nya regler för arbetskraftsinvandring (2007).
Prop. 1968:142 Kungl. Maj:ts proposition till riksdagen angående riktlinjer för utlänningspolitiken (1968).
Prop. 2009/10:60 Nyanlända invandrares arbetsmarknadsreglering-‐ (2009).
Reeger, U. (2009) 'Austria' in Fassmann, H., Reeger, U. and Sievers, W., eds., Statistics and Reality. Concepts and Measurements of Migration in Europe, Amsterdam: Amsterdam University Press, 111-‐130.
Ruist, J. (2013). Immigration, Work and Welfare. (PhD), University of Gothenburg, Gothenburg.
Rusinovic, K. Burgers, J., Van der Meij, R., Engbersen, G., Ilies, M., S. & Snel, E. (2011). Oost-‐
44
arbeidsmigranten in het Oostland. Rotterdam: NICIS/ EUR.
SALAR. (2013). Maktfördelning 2013-‐ -‐ -‐ http://www.skl.se: Sveriges Kommuner och Landsting (SKL).
Sassen, S. (1996) 'New employment regimes in cities: the impact on immigrant workers', New Community, 22(4), 579-‐594.
Sauberer, M. (1991) 'Zusätzliche Arbeitskräfte für die Ostregion Migration und Pendelwanderung' in ÖROK, ed. Offene Grenzen neue Aufgaben für die Regionalpolitik. ÖROK-‐Enquete, 29th April 1991, Vienna: 33-‐38.
SCB (2013a, 20131025).
SCB. (2013b). Statistik med inriktning mot demografi efter region, kön, variabel, tabellinnehåll och år. Retrieved 20140111
Schneider, F. (2006) Nur noch leicht sinkende Schattenwirtschaft in Deutschland im Gegensatz zu anderen OECD-‐Ländern im Jahr 2006: Fluch oder Segen?, Linz: Universität Linz.
Sert, D. (2010) Explaining Why People Move: Intra and Interdisciplinary Debates about the Causes of International Migration, in Robert A. Denemark, Ed., The International Studies Encyclopedia, Wiley.
SFS 1992:1163 Lag om arbetskraftens fria rörlighet inom Europeiska Ekonomiska Samarbetet (1992).
SFS 1994:1500 Lag med anledning av Sveriges anslutning till Europeiska Unionen (1994).
SFS 2010:407 Förordning om ersättning till vissa nyanlända invandrare (2010).
SFS 2010:408 Förordning om mottagande för bosättning av vissa nyanlända invandrare (2010).
SFS 2013:352 Förordning om anmälningsskyldighet vid utstationering av arbetstagare (2013).
SLA. (2013). Andel medlemsföretag per län.
SLL. (2012). Befolkning, sysselsättning och inkomster i Östra Mellansverige reviderad framskrivningar till år 2050 Rapport 2012:1. http://www.tmr.sll.se.
SLL. (2013). Rapport 2013:1 Befolkningsutvecklingen 2012 i Stockholms län.
Statistics Austria (2002/2012) Higher Education Statistics, Vienna.Statistics Austria (2002/2013) Population Register, Vienna.Statistics Austria (2011a) Census of Enterprises and their Local Units, Vienna. Statistics Austria (2011b) Register-‐based Census 2011, Vienna.
Statistics Netherlands (2012). Immigratie van niet-‐ Accessed via http://statline.cbs.nl/StatWeb/publication/?VW=T&DM=SLNL&PA=70693NED&D1=1-‐6&D2=0&D3=13,29,37,43,45,49,56&D4=0&D5=3-‐ -‐
Statistics Netherlands (2013a). Bevolking op 1 januari; leeftijd, geboorteland en regio. Accessed via http://statline.cbs.nl/StatWeb/publication/?DM=SLNL&PA=70648NED&D1=0&D2=0&D3=24,32,38, 41&D4=0&D5=2-‐
Statistics Netherlands (2013b). Immi-‐ cht. Accessed via http://statline.cbs.nl/StatWeb/publication/?DM=SLNL&PA=03742&D1=0,3&D2=0&D3=0&D4=36,87
45
,101,106,111,177,181,199,202,206-‐ -‐
Statistics Netherlands (2013c). Bevolking; geslacht, leeftijd en nationaliteit op 1 januari. Accessed via http://statline.cbs.nl/StatWeb/publication/?DM=SLNL&PA=03743&D1=a&D2=0,117-‐126&D3=33,75,146,148&D4=l&HDR=G3&STB=G1,G2,T&VW=T
Statistics Netherlands (2013d). Aantal personen met geboorteland Bulgarije en Roemenië naar geslacht, leeftijd en woongemeente in de Metropoolregio Rotterdam Den Haag, 1 januari 1998/2001/2004/2007/2010/2013. (H. Nicolaas, personal communication; 20 December, 2013).
Statistics Netherlands (2013e). Bevolking; generatie, geslacht, leeftijd en herkomstgroepering, 1 januari. Accessed via http://statline.cbs.nl/StatWeb/publication/?DM=SLNL&PA=37325&D1=1&D2=0& D3=0&D4=a&D5=38,89,178,182&D6=l&VW=T
Statistics Netherlands (2013f). Allochtonen; 1e generatie naar verblijfsduur in Nederland, 1 januari. Accessed via http://statline.cbs.nl/StatWeb/publication/?DM=SLNL&PA=70747NED&D1=0&D2=0& D3=36,87,176,180&D4=1-‐18&D5=l&HDR=G4,T&STB=G1,G2,G3&VW=T.
Snel, E., Burgers, J., Engbersen, G., Ilies, M., Van der Meij, R., & Rusinovic, K. (2010). Arbeidsmigranten in Rotterdam. Rotterdam: NICIS/ EUR.
Snel, E., Engbersen, G.B.M., Ilies, M., Van der Meij, R., & Hamberg, J. (2011b). De schaduwzijden van de nieuwe arbeidsmigratie. Dakloosheid en overlast van Midden-‐ -‐ Haag. Rotterdam: EUR.
Snel, E., Faber, M. & Engbersen, G. (2014). Civic Stratification and Social Positioning: CEE Labour Migrants without a Work Permit. Population, Space and Place,
Snel, E., Van de Pol, S., Burgers, J., Engbersen, G., Ilies, M., Van der Meij, R., Rusinovic, K. (2011a). Arbeidsmigranten in Den Haag. NICIS/ EUR: Rotterdam.
Starrenburg, J., & Van der Velden, A. (reds.) (2013). Monitor EU-‐ tatieve beschrijving van de instroom en de situatie van arbeidsmigranten in Den Haag. The Hague: Gemeente Den Haag, Dienst Onderwijs, Cultuur en Welzijn.
Statistics Sweden. (2011). Fortsatt stor ökning av befolkning i tätorter [Press release]
Statistics Sweden. (2013a). Antal personer som fått svenskt medborgarskap efter medborgarskapsland, kön och år (2000, 2002, 2004, 2006, 2008, 2010, 2012). Retrieved 20140110, from Statistiska Centralbbyrn (SCB)
Statistics Sweden. (2013b). Befolkningen 15-‐ andel i procent efter arbetskraftstillhörighet, inrikes/utrikes född, kön, ålder och år. Retrieved 20140112, from Statistiska Centralbyrån (SCB)
Statistics Sweden. (2013c). Befolkningen 2012 fördelad efter utbildningsnivå, födelseland och kön. 25-‐ Retrieved 20131208, from Statistiska Centralbyrån (SCB)
Statistics Sweden. (2013d) Integration en beskrivning av läget i Sverige. Rapport 6.
Stockholm: SCB.Statistics Sweden. (2013e). Invandringar och utvandringar efter födelseland, kön, tabellinnehåll och tid. Retrieved 20131208, from Statistiska Centralbyrån (SCB)
Statistics Sweden. (2013f). Utrikes födda efter födelseland, kön och tid. Retrieved 20131207, from SCBStatistics Sweden. (2013g). Utrikes födda efter födelseland, ålder, kön och tid. Retrieved 20131025, from SCB
46
Statistics Sweden. (2013h). Utrikes födda efter födelseland, ålder, kön och år. Retrieved 20140111, from Statistiska Centralbyrån (SCB)
Statistics Sweden. (2013i). Utrikes födda samt födda i Sverige med en eller två utrikes födda föräldrar efter födelseland/ursprungsland, 31 december 2012, totalt. SCB Retrieved 20131025, from SCB
Statistics Sweden. (2014a). Antal personer per kommun efter födelseland, kön och sysselsättning.
Statistics Sweden. (2014b). Antal personer efter utbildningsgrupp, födelseland, kön och utbildningsnivå (SUN2000Niva_old)
Statistics Sweden. (2014c). Antal personer per kommun kön och födelseland.
Statistics Sweden. (2014d). Antal personer per region och födelseland efter civilstånd.
Statistics Sweden. (2014e). Antal personer per region* efter födelseland, kön och Arbetsställets näringsgren
Statistics Sweden. (2014f). Antal personer per region* efter födelseland, kön och inkomster (Dispinklevn).
Stockholm County Administrative Board. (2012). Läget i länet: Arbetsmarknad och ekonomi oktober 2012. In S. Länsstyrelsen (Ed.). Länsstyrelsen, Stockholm.
Stockholms Stadsmission. (2013). Stockholms Stadsmission. In K. Zelano (Ed.).
Suter, B. (2008)
SVT. (2008). Barn bor bland missbrukare på camping.
Swedish Higher Education Authority. (2013). Antal inresande utbytestudenter och freemover-‐lärosäte.: Källa: Universitets-‐ SCB.
Swedish Migration Board. (2013a). Beviljade tillstånd och uppehållsrätter enligt ees-‐Stockholms län.
Swedish Migration Board. (2013b). Registrerade upphållsrätter 2013. Retrieved 20131128
Swedish Migration Board (2013c, 20131128). [Written communication with the statistics unit].
Swedish Migration Board. (2013d). Översikt av beviljade arbets och uppehållstillstånd åren 2005-‐ -‐ -‐Retrieved 20140110, from Migrationsverket
Swedish Migration Board. (2014a). Applications for asylum received, 2013.
Swedish Migration Board. (2014b). Asylum decisions, Swedish Migration Board, 2013.
Swedish Union of Forestry Wood and Graphical workers (2014, 20140113). [the Swedish Union of Forestry, Wood and Graphical workers (GS), ].
Swedish Work Environment Authority. (2013). Retrieved 20131212, from Swedish Work Environment Authority
Swedwatch.(2013).Arbetsvillkoriblåbärsskogen:Enrapportserieomsnårigaregler, utnyttjade plockare och solskenshistorier.
47
Sweetman, A. (2003) Immigrant source country education quality and Canadian labour market outcomes. Kingston,
Temporary Parliamentary Commission. (2011). Lessen uit recente arbeidsmigratie. Eindrapport Arbeidsmigratie in goede banen. Tweede Kamer, vergaderjaar 20112012, 32 680, 4.
Thörnqvist, C. (1999). The Decentralization of Industrial Relations: The Swedish Case in Comparative Perspective. European Journal of Industrial Relations, 5(1), 71 87.
Thuswald, M. (2012) 'Betteln als Frauenarbeit? Zur Situation von Pendelbettlerinnen in Wien' in Koller, F., ed. Betteln in Wien. Fakten und Analysen aus unterschiedlichen Wissenschaftsdisziplinen, Vienna [et al.]: Lit-‐Verlag.
Tieleman, M. (2013). Abeidsmigranten in Westland. Wonen, werken en leven. Accessed at 10 February 2014 via http://www.gemeentewestland.nl/fileadmin/files/Typo/Bestuur/Beleid/Arbeidsmigranten_in_Wes tland__12-‐0042430__def_2013.pdf
Timmermans, N., & Verhoeven, W. (2008): Meerwaarde van de seizoenmigrant: Onderzoek naar de omvang en de economische effecten van seizoensmigratie voor Nederland. Zoetermeer: EIM.
Timmermans, N.G.L., Snoei, J., Verhoeven, W.H.J. (2012). Arbeidsmigratie in het Stadsgewest Haaglanden. Zoetermeer: Panteia/EIM.
TU Delft (2012). Studentenindeling naar nationaliteit. Accessed at 17 February 2014 via: http://www.tudelft.nl/over-‐ -‐ -‐ -‐ herkomst-‐
Van den Berg, N., Brukman, M., Van Rij, C., (2008). De Europese grenzen verlegd. Evaluatie flankerend beleid vrij verkeer van werknemers MOE-‐ Amsterdam: Regioplan.
Van Gestel, B., Van Straalen, E.K., Verhoeven, M.A., & Kouwenberg, R.F.D. (2013). Overlast, lokaal beleid en arbeidsmigranten uit Midden-‐ -‐
Van der Heijden, P. G. M., Cruijff, M., & Van Gils, G. (2011). Aantallen geregistreerde en niet-‐ geregistreerde burgers uit MOE-‐ Utrecht: Universiteit Utrecht.
Van der Heijden, P. G. M., Cruijff, M., & Van Gils, G. (2013). Aantallen geregistreerde en niet-‐burgers uit MOE-‐ Utrecht: Universiteit Utrecht.
Van der Helm, T. (2008). Verslag project vertrouwensvrouw voor prostituees. 2005 t/m 2007. Amsterdam: GGD Amsterdam.
Van Mol, C. & Timmerman, C. (2013) Should I stay or should I go? An analysis of the determinants of intra-‐European student mobility. Population, Space, and Place. Article first published online: 6 NOV 2013 DOI: 10.1002/psp.1833
VGR. (2011). Fakta om Västra Götalandsregionen. Göteborg.
VGR. (2013). Befolkningsprognos i Västra Götaland 2013-‐ Rapport 2013:2. http://www.vgregion.se/upload/Regionutveckling/Publikationer/2013/1306kortrapport_befolkningsprognos_2013.pdf.
48
VGR and SCB. (2013). Konjunkturbaromenter för Västra Götaland 2013.
Wadensjö, E. (2012). Framtidens migration: Underlagsrapport nr 5 till Framtidskommissionen. In Regeringskansliet (Ed.). Stockholm.
Wadensjö, E. (2013). Övertäckning och bortfall SULCIS (Vol. 2013:3). University of Stockholm: The Stockholm University Linnaeus Center for Integration Studies (SULCIS).
Wadensjö Eskil and Gerdes, C. (2013). Immigration to Sweden from the New EU Member States SIEPS. University of Stockholm: Swedish Institute for European Policy Studies.
Weltevrede, A., De Boom, J., Rezai, S., Zuiderwijk, L., & Engbersen, G. (2009). Arbeidsmigranten uit Midden-‐Oost-‐ -‐ Rotterdam: Risbo.
Walterskirchen, E. and Dietz, R. (1998) Auswirkungen der EU-‐Osterweiterung auf den österreichischen Arbeitsmarkt: Studie des Österreichischen Instituts für Wirtschaftsforschung im Auftrag der Bundesarbeiterkammer, Vienna: WIFO, Österreichisches Institut für Wirtschaftsforschung.
Yanow, D. (2012) Organizational ethnography between toolbox and world-‐making, Journal of Organizational Ethnography, Vol. 1 Iss: 1, pp.31 42. Zelano, K., Bucken-‐Knapp, G., Hinnfors, J., Spehar, A. (2014) Mapping and analysis of types of migration from CEE countries: Country report Sweden, IMAGINATION Working Paper No. 3.