Manual de prueba de funciones basica y protocolo (1)
14
This content has been downloaded from IOPscience. Please scroll down to see the full text. Download details: IP Address: 169.236.1.253 This content was downloaded on 23/08/2014 at 22:41 Please note that terms and conditions apply. Magnetic properties of ultra-small goethite nanoparticles View the table of contents for this issue, or go to the journal homepage for more 2014 J. Phys. D: Appl. Phys. 47 365003 (http://iopscience.iop.org/0022-3727/47/36/365003) Home Search Collections JournalsAbout Contact usMy IOPscience
-
Upload
independent -
Category
Documents
-
view
0 -
download
0
Transcript of Manual de prueba de funciones basica y protocolo (1)
This content has been downloaded from IOPscience. Please scroll down to see the full text.
Download details:
IP Address: 169.236.1.253This content was downloaded on 23/08/2014 at 22:41
Please note that terms and conditions apply.
Magnetic properties of ultra-small goethite nanoparticles
View the table of contents for this issue, or go to the journal homepage for more
2014 J. Phys. D: Appl. Phys. 47 365003(http://iopscience.iop.org/0022-3727/47/36/365003)
Home Search CollectionsJournalsAbout Contact usMy IOPscience
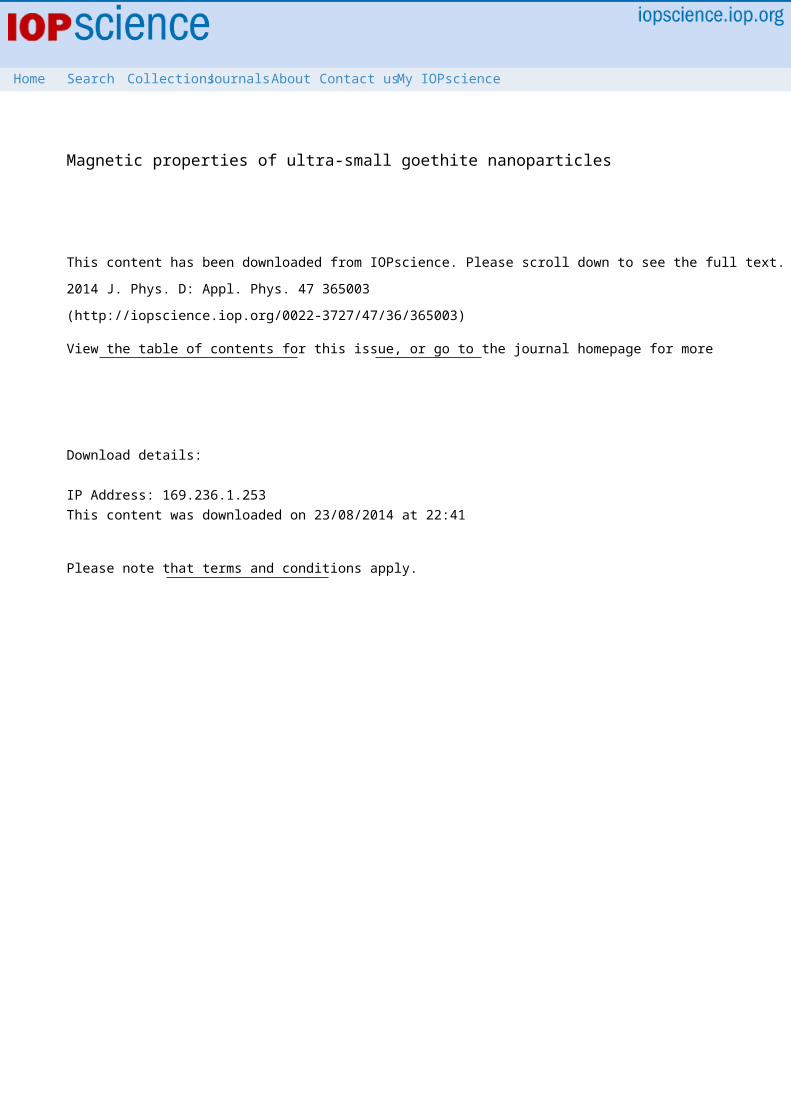
Journal of Physics D: Applied PhysicsJ. Phys. D: Appl. Phys. 47 (2014) 365003 (13pp) doi:10.1088/0022-3727/47/36/365003
Magnetic properties of ultra-small goethitenanoparticlesE Brok1,2, C Frandsen1,8, D E Madsen1, H Jacobsen3, J O Birk3,K Lefmann3, J Bendix4, K S Pedersen4, C B Boothroyd5, A A Berhe6,G G Simeoni7 and S Mørup11 Department of Physics, Technical University of Denmark, DK-2800 Kgs. Lyngby, Denmark2 Center for Electron Nanoscopy, Technical University of Denmark, DK-2800 Kgs. Lyngby, Denmark3 Nano-Science Center, Niels Bohr Institute, University of Copenhagen, DK-2100 Copenhagen Ø,Denmark4 Department of Chemistry, University of Copenhagen, DK-2100 Copenhagen Ø, Denmark5 Ernst Ruska-Centrum und Peter Grunberg Institut, Forschungszentrum Julich, D-52425 Julich, Germany6 Life and Environmental Sciences Group, University of California, Merced, CA 95343, USA7 Heinz Maier-Leibnitz Zentrum (MLZ) and Physics Department, Technische Universitat Munchen,D-85748 Garching, GermanyE-mail: [email protected]
Received 11 April 2014, revised 20 June 2014Accepted for publication 1 July 2014Published 21 August 2014
AbstractGoethite (α-FeOOH) is a common nanocrystalline antiferromagnetic mineral.However, it istypically difficult to study the properties of isolated single-crystalline goethite nanoparticles,because goethite has a strong tendency to form particles of aggregated nanograins often withlow-angle grain boundaries.This nanocrystallinity leads to complex magnetic properties thatare dominated by magnetic fluctuations in interacting grains.Here we present a study of themagnetic properties of 5.7 nm particles of goethite by use of magnetization measurements,inelastic neutron scattering and Mossbauer spectroscopy.The ‘ultra-small’ size of theseparticles (i.e. that the particles consist of one or only a few grains) allows for more directelucidation of the particles’ intrinsic magnetic properties.We find from ac and dc magnetizationmeasurements a significant upturn of the magnetization at very low temperatures most likelydue to freezing of spins in canted spin structures.From hysteresis curves we estimate thesaturation magnetization from uncompensated magnetic moments to be σs = 0.044 A m2kg−1at room temperature.Inelastic neutron scattering measurements show a strong signal fromexcitations of the uniform mode (q = 0 spin waves) at temperatures of 100–250 K andM ossbauer spectroscopy studies show that the magnetic fluctuations are dominated by‘classical’ superparamagnetic relaxation at temperatures above ∼170 K. From the temperaturedependence of the hyperfine fields and the excitation energy of the uniform mode we estimate amagnetic anisotropy constant of around 1.0 × 10⁵J m−3.
Keywords: magnetic dynamics, nanoparticles of antiferromagnetic materials, nano-crystallinity(Some figures may appear in colour only in the online journal)
1.Introduction
Goethite (α-FeOOH) is a common mineral on Earth [1] and ithas also recently been found on Mars [2].The crystal structureof goethite is orthorhombic with space group Pnma.Itis8 Author to whom any correspondence should be addressed.
antiferromagnetic with antiferromagnetic modulation alongthe orthorhombic a-axis and a Neel temperature around 400 K[3, 4].Goethite usually forms rod-shaped nanoparticles, whichoften lack long-range crystalline order,because the particlesconsist of many grains, typically around 3–7 nm in size, withlow-angle grain boundaries [5–7], both when found in natureand when laboratory synthesized.The complex influence of
0022-3727/14/365003+13$33.00 1 © 2014 IOP Publishing LtdPrinted in the UK

J. Phys. D: Appl. Phys. 47 (2014) 365003 E Brok et al
the nanocrystallinity on the magnetic properties of goethiteis apparentin Mossbauerspectroscopy studies [5]and themagnetic properties have been the subject of many such studies[4, 5, 8–13].
The magneticpropertiesof nanoparticleshavebeenstudied extensively by use of several experimental techniques,and the understandingof the magneticpropertiesofnanoparticlesis of greatimportancefor theirmanyapplications in, for example, magnetic data storage, ferrofluids,bioseparation and medicine[14, 15].In many studies,collectivemagneticpropertiesof interactinggrainsandinteracting particles seem to play an important role [16–18].Incase of antiferromagnetic goethite, dipolar interactions may benegligible, and inter-grain and inter-particle interactions maybe predominantly due to exchange interactions.
Usually,M ossbauer spectra of non-interacting magneticnanoparticlesshow asuperposition ofa doubletdue toparticles with fast superparamagnetic relaxation and a sextetdue to particles with slow relaxation.The relative areasof thetwo componentsdepend on temperaturebecauseof the temperature dependence ofthe superparamagneticrelaxation time.However,inter-particle interactionscanhavea significantinfluenceon themagneticdynamicsand resultin magnetically splitM ossbauerspectrawithasymmetrically broadened lines attemperatures where non-interacting particles show a quadrupole doublet because of fastsuperparamagnetic relaxation [14, 15].
Using amean field modelforexchangeinteractingparticles,the magnetic energy,E p,of a nanoparticle p maybe written as a sum of a uniaxial anisotropy term Ea
p and anexchange interaction term, Eint
p [14–17]
E p = E ap + E int
p = KV psin2θp − J peffMp · Mp (1)
where Vp is the particle volume, K is the magnetic anisotropyconstant, θp is the angle between the sublattice magnetizationvectorand theeasy magnetization direction,Mp isthesublattice magnetization,Mp is the average value ofthesublattice magnetizations of neighbouring particles and Jp
effisthe effective inter-particle exchange coupling constant (withdimensions J m2A −2 ). J p
effMp can be considered as aneffective interaction field acting onMp.
Almost all Mossbauer studies of goethite particles haveshown spectra,which consist of sextets with asymmetricallybroadened lines, typical for interacting nanoparticles that areinfluenced by relaxation effects.This is the case even forquite large goethite particles (e.g.,rods which are around100 nm wide and 1000 nm long) [10].The magnetic anisotropyconstantis relatively large (K ≈ 5 × 10⁴J m−3 ) [5]andtherefore one mightexpectthatrelaxation effectsshouldbe negligible atroom temperature for particles of this size.However, within the rod-shaped nanoparticles there are usuallymany defects such as low-angle grain boundaries, dislocationsand interstitial water and/or OH− [5–8, 19, 20] that may lead toa reduced magnetic coupling between the grains [5].Becauseof the many defects, the magnetic dynamics is dominated byfluctuations of the sublattice magnetization directions in smallinteracting grains within the particles.In a mean field model,
the magnetic energy,E g of such a grain g may be writtenas a sum of a uniaxial anisotropy term, Ea
g, and an exchangeinteraction term, Eint
g ,
E g = E ag + E int
g = KV gsin2θg − J geff−→Mg · −→Mg, (2)
where Vg is the grain volume,θg is the angle between thesublattice magnetization vector and the easy magnetizationdirection,−→M g represents the sublattice magnetization vectorofthe grain,−→Mg is the average sublattice magnetizationof neighbouring grainsand J geffisan effective exchangecoupling constant representing the exchange interactions withneighbouring grains such that Jg
effMg can be considered asan effective interaction field acting onMg.This grain modelcan explain the asymmetric line broadening in the Mossbauerspectra of larger goethite particles [5].
There is usually a large tendency for oriented attachmentor nearly oriented attachment of particles and grains in goethitesamples [5–7, 19, 20].Therefore,the interaction field canbe considered approximately parallel to the easy direction ofmagnetization.Equations (1) and (2) may therefore be writtenin the form [5]
E (θ) ≈ KV sin2θ − JeffM 20(T )b(T ) cos θ , (3)
where M0(T ) is the sublattice magnetization and
b(T ) = |M(T )|M0(T ) (4)
istheorderparameterat temperatureT . In thermalequilibrium, the order parameter can be calculated by the useof Boltzmann statistics:
b(T ) =
π
0exp − E(θ )
kBT sin θ cos θ dθπ
0exp − E(θ )
kBT sin θ dθ. (5)
Equations (3) and (5) are a set of coupled equations,whichcan be numerically solved self-consistently to find the orderparameter b(T ) [5, 17].
For interacting nanoparticles or grains the relative sizeofthe two terms in equations (1)or(2)is important.Ifthe interaction energy is predominant, there will only be oneenergy minimum,and the relaxation willthen take placebetween states in this energy well and is expected to be fast [5].The magnetic hyperfine splitting can therefore be considered tobe proportional to |M(T )| = M 0(T )b(T ). If the anisotropyenergy is predominant or comparable to the interaction energy,there will be two (non-equivalent) energy minima, which areseparated by an energy barrier.In the absence of interactions,there are two equivalent minima and the magnetic dynamics isdominated by ‘classical’ superparamagnetic relaxation with arelaxation time given by [21, 22]
τ = τ0expKVkBT , (6)
where τ0 is on the order of 10−9−10−13 s.
2
J. Phys. D: Appl. Phys. 47 (2014) 365003 E Brok et al
Classicalsuperparamagneticbehaviour,i.e.reversalsof thesublatticemagnetizationdirectionsof a particleas a whole,israrelyobservedin studiesof goethite,because magnetic fluctuations within the exchange-coupledgrainsarepredominant[5]. However,iftheparticlesare sufficiently smalland separated such thatinter-particleinteractionsare negligible (Eint
p E ap), the magnetic
dynamics may be dominated by superparamagnetic relaxationof individualparticles,and itmay then bepossibletoestimate,forexample,the magnetic anisotropy energy byuse ofM ossbauerspectroscopy and neutron scattering asithas been done in earlierstudies ofhematite (α-Fe2O 3)nanoparticles [16, 23–25].No previously published studiesof goethite particles have included inelastic neutron scatteringbutrecently,Pankhurstet al suggested investigationsbythis technique to help understand the magnetic properties ofgoethite [26].
In this paper we present studies of a commercial sampleof ultra-small goethite particles before and after low-energyball-milling togetherwith rock salt(NaCl)nanoparticles.The goethitenanoparticleshavean averagediameterofaround 5.7 nm,buteach particle is made ofup to a fewsmaller interacting grains (or clusters).We therefore havetwo types of magnetic interactions in the samples,namelyinteractions between particles and interactions between grains.The interactionsbetween mostofthe particlesare weak,especially in the ball-milled sample, and because the particlesare very smallthe Mossbauerspectra are dominated byclassical superparamagnetic relaxation at temperatures above∼170 K in contrastto largergoethite particlesin whichthe magnetic dynamicswas dominated by fluctuationsininteracting grains.Due to thesmallparticlesizeandweak inter-particle interaction,we have been able to studymore directly the intrinsic magnetic properties ofgoethiteparticles by use of Mossbauer spectroscopy,magnetizationmeasurements and inelastic neutron scattering.
2.Experimental details
A goethite powder sample was obtained from the companyNanoChemonics Inc.The sample was sold as F-2506 (Blend07PSL-204).In the following this sample is named G1.Partof G1 was ball-milled with NaCl nanoparticles (weight ratio1 : 3) atlow intensity (40 rpm) for 48 h in an agate millinorder to reduce inter-particle interactions.NaCl nanoparticles,here termed ‘nano’-salt,were prepared by high-intensity(200 rpm) ball-milling in a tungsten carbide (WC) ball-millfor 24 h.This sample of goethite ball-milled with ‘nano’-saltis named GBM and used as prepared for the neutron scattering,M ossbauerspectroscopy and magnetization measurements,but with the salt washed out for the x-ray diffraction (XRD)and transmission electron microscopy (TEM) measurements.
XRD over an angular range of 15◦–90◦ was performedatroom temperature,using a BrukerD8 Advance powderdiffractometerwith a Co anode (λ= 1.79 Å).Rietveldrefinementof the orthorhombic Pnma structure of goethitewas performed using the WINPOW program,a modifiedversion of the LHMP1 program [27].The G1 sample was
measured for 8 h on a plexiglas sample holder whereas thewashed GBM sample was dried on a single crystalSidiscand measured for 18 h.The leastsquares refinements wereperformed with Voigtian peak profiles and the background wasmodelled with Chebyshew polynomials.Initial structural andatomic parameters were taken from [28].
TEM brightand dark-field images of the samples weretakenusingan FEI TechnaiT20 G2 microscopewitha thermionicLaB6 filamentand an accelerating voltageof 200 kV.
57Fe M ossbauerspectroscopy wascarried outusingconventional constant acceleration spectrometers with sourcesof57Co in rhodium and calibration was carried outusing a12.5 µm foil of α-Fe at room temperature.Spectra obtainedattemperaturesdown to 20 K were recorded in a closedcycle helium refrigerator from APD Cryogenics.A spectrumobtained with an applied magnetic field of 6 T was recorded ina liquid helium cryostat with a superconducting coil.
Inelasticneutron scattering measurementswere per-formed at the time-of-flight spectrometer TOFTOF at FRMII,Munich [29].A neutron wavelength of 7.0 Å was used, witha chopper speed of 12 000 rpm,giving an energy resolutionof the elastic line of 10 µeV.Data were taken in a tempera-ture range of 10–300 K using the two samples G1 and GBM.Both samples had a mass of about 2 g and were filled in hollowcylinder Al cans.The typical exposure time was 5 h (8 h) forthe G1 (GBM) sample.
AC and DC magnetization measurements were performedwith a quantum design MPMS-XL magnetometerusing aSQUID detector.The sample forthe dc magnetizationmeasurements was comprised of33.06 mg ofGBM mixedwith 28.65 mg ofeicosane.The mixture washeated toapproximately 40◦C where eicosane is a liquid.When thesample is cooled the eicosane becomes a solid wax, ensuringthat the particles in the sample maintain the original (random)orientation.The sample was loaded in a capsule of gelatine.A sample with a larger amount of goethite (139.4 mg GBM)was prepared in a similarway forthe ac measurements.Zero field cooled (ZFC) magnetization measurements wereperformed in a temperature range from 4.2 to 300 K inapplied fields µ0H = 2.0 mT and 4.8 T.Aftereach ZFCmeasurementthe sample was cooled to 4.2 K and a fieldcooled (FC) magnetization measurementwas performed inthe same way as the ZFC.To isolate the contribution to themagnetization coming from the goethite particles we havesubtracted the diamagnetic contributions from NaCl, eicosane(wax) and gelatine (capsule) in the ZFC/FC and hysteresismeasurements,using the corresponding mass susceptibilities(in 10−9 m 3kg−1 ) of −6.4, −10.8 and −6.3, respectively.ACmagnetization measurements were performed over the sametemperature range with a driving field amplitude of 0.38 mT,at frequencies ranging from 1.0 to 1000 Hz.The magnetizationas a function of applied field (hysteresis loops) was measuredin fields over the range between −5 and + 5 T at temperaturesof 4.2 and 300 K.
3
J. Phys. D: Appl. Phys. 47 (2014) 365003 E Brok et al
(200)
(101)
(201
)
(301
)(2
10)
(111)
(211) (10
2)(401
)
(311
)(410)
(112
)(212
)(402
)(6
00)
Inte
nsity
(arb
.uni
ts)
G1ObservedCalculatedDifferenceBackground
1 2 3 4 5
Inte
nsity
(arb
.uni
ts)
Scattering vector(Å−1)
GBM ObservedCalculatedDifferenceBackground
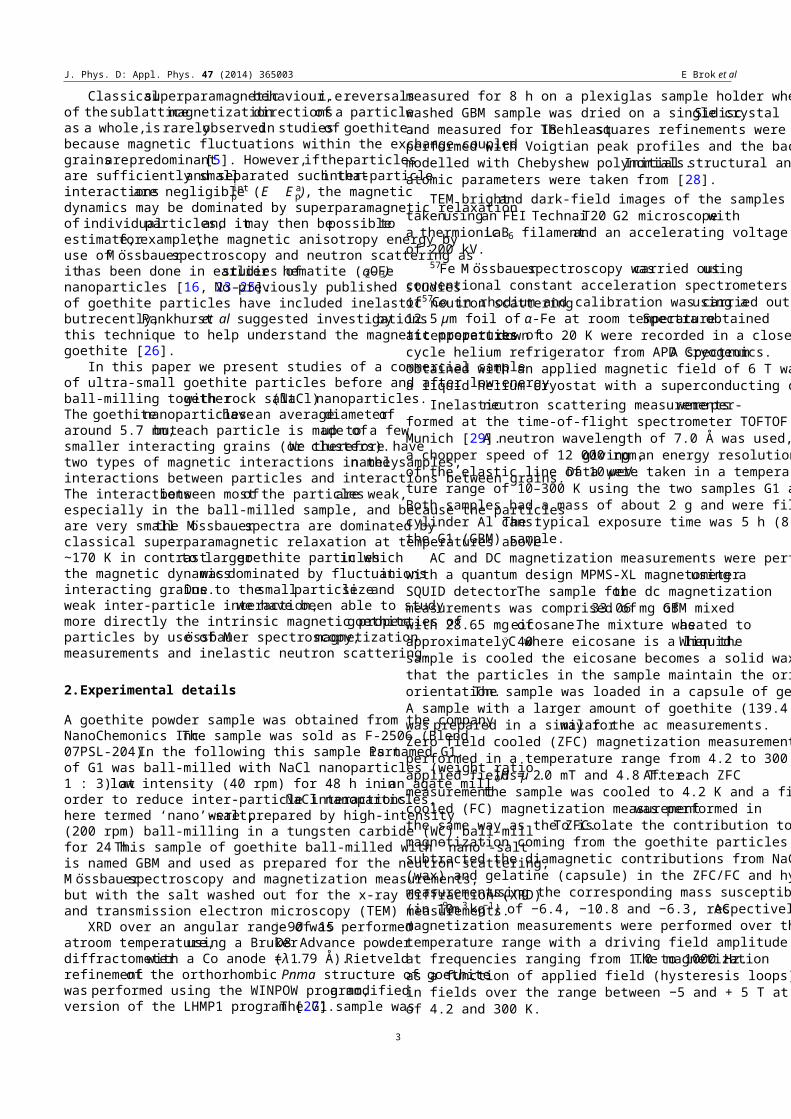
Figure 1.XRD patterns of samples G1 and GBM. The refinedmodel, the background and the difference between model andexperiment are displayed.The most prominent reflections up to thescattering vector length q = 4 Å−1 have been indexed.
3.Results
3.1. Structural characterization
The XRD patterns of sample G1 and sample GBM (after the‘nano’-salthas been washed away)are shown in figure 1,together with the refined models.For the G1 sample there areno signs of other phases in the sample than the Pnma goethiterepresented by the model.For GBM, there is,in addition toPnma goethite, minor impurity peaks at the scattering vectorlength q= 2.2 and 3.3 Å−1. The peak at2.2 Å−1 canbe ascribed to the (2 0 0) reflection of NaCl(Fm3m) (fromresidual salt after washing).The peak at 3.3 Å−1 is from anunidentified impurity.The unit cell parameters, a Lorentzianprofile broadening parameter,an overalltemperature factor,and background parameters were refined.The instrumentalbroadening was assumed to be Gaussian and was knownfrom measurement of a corundum (Al2O 3) standard, while thesample broadening was assumed to be Lorentzian.The refinedlattice parameters are a= 9.986(3) Å,b = 3.0273(8) Å,and c = 4.630(2) Å, and the weighted-profile-residual (RWP )and Bragg-R-value (RB ) are 0.95 and 0.30 respectively forsample G1.The refined lattice parameters for GBM are similar
(a = 9.987(6) Å, b = 3.022(2) Å, and c = 4.627(4) Å), andthe R-values are RWP = 1.61 and RB = 0.31. Assumingthe line broadening is only due to the finite particle size therefinements result in average particle diameters of 6 .7 ± 1 nmfor sample G1 and 4.9 ± 1 nm for GBM. While the positionsof the diffraction peaks confirm that both samples consist ofgoethite with limited impurities the agreementbetween thedata and the refined model is not ideal.This is likely due toan anisotropic peak broadening from non-spherical particles,and for the GBM data a large non-uniform background.Theparticle sizes determined from the diffraction patterns aretherefore only estimates of the true average particle size.
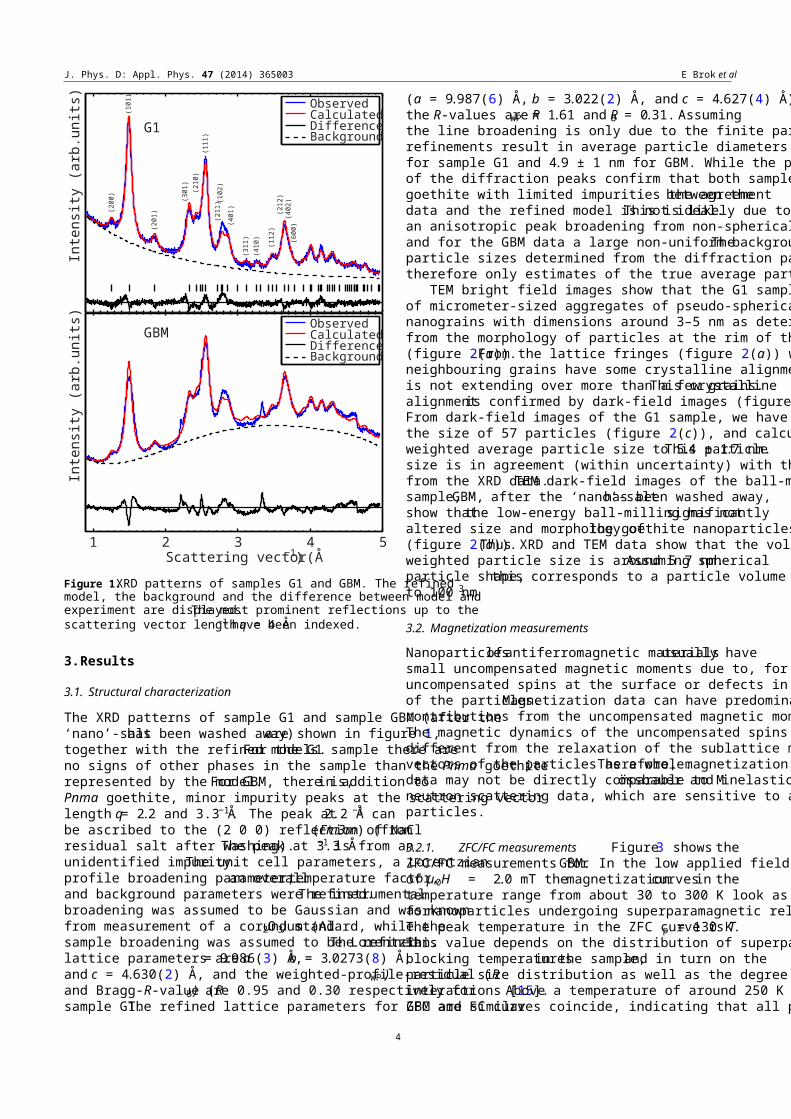
TEM bright field images show that the G1 sample consistsof micrometer-sized aggregates of pseudo-spherical goethitenanograins with dimensions around 3–5 nm as determinedfrom the morphology of particles at the rim of the aggregates(figure 2(a)).From the lattice fringes (figure 2(a)) we infer thatneighbouring grains have some crystalline alignment, but thisis not extending over more than a few grains.This crystallinealignmentis confirmed by dark-field images (figure 2(b)).From dark-field images of the G1 sample, we have measuredthe size of 57 particles (figure 2(c)), and calculated a volume-weighted average particle size to 5.4 ± 1.7 nm.This particlesize is in agreement (within uncertainty) with that determinedfrom the XRD data.TEM dark-field images of the ball-milledsample,GBM, after the ‘nano’-salthas been washed away,show thatthe low-energy ball-milling has notsignificantlyaltered size and morphology ofthe goethite nanoparticles(figure 2(d)).Thus XRD and TEM data show that the volumeweighted particle size is around 5.7 nm.Assuming sphericalparticle shape,this corresponds to a particle volume closeto 100 nm3.
3.2. Magnetization measurements
Nanoparticlesofantiferromagnetic materialsusually havesmall uncompensated magnetic moments due to, for example,uncompensated spins at the surface or defects in the interiorof the particles.Magnetization data can have predominantcontributions from the uncompensated magnetic moments.The magnetic dynamics of the uncompensated spins may bedifferent from the relaxation of the sublattice magnetizationvectors of the particles as a whole.Therefore, magnetizationdata may not be directly comparable to Mossbauer and inelasticneutron scattering data, which are sensitive to all parts of theparticles.
3.2.1. ZFC/FC measurements Figure3 shows theZFC/FC measurements forGBM. In the low applied fieldof µ0H = 2.0 mT themagnetizationcurvesin thetemperature range from about 30 to 300 K look as expectedfornanoparticles undergoing superparamagnetic relaxation.The peak temperature in the ZFC curve is Tp = 130 K.This value depends on the distribution of superparamagneticblocking temperaturesin the sample,and in turn on theparticle size distribution as well as the degree of inter-particleinteractions [15].Above a temperature of around 250 K theZFC and FC curves coincide, indicating that all particles have
4
J. Phys. D: Appl. Phys. 47 (2014) 365003 E Brok et al
Figure 2.TEM images.(a) High-resolution image from the rim of a G1 aggregate.(b) Dark-field image from a G1 aggregate.(c) Particlesizes measured from a dark-field image of the G1 sample.(d) Dark-field image of sample GBM, after the ‘nano’-salt has been washed away.
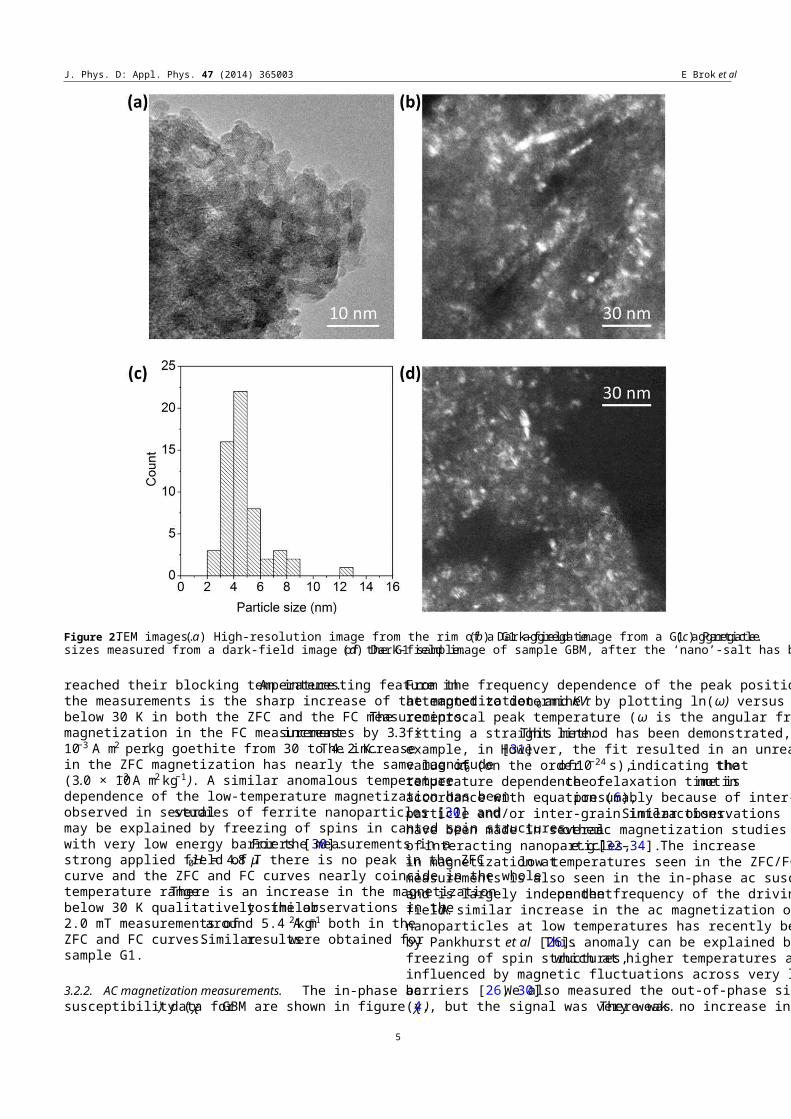
reached their blocking temperature.An interesting feature inthe measurements is the sharp increase of the magnetizationbelow 30 K in both the ZFC and the FC measurements.Themagnetization in the FC measurementincreases by 3.3 ×10⁻³ A m2 perkg goethite from 30 to 4.2 K.The increasein the ZFC magnetization has nearly the same magnitude(3.0 × 10⁻³ A m2kg−1 ). A similar anomalous temperaturedependence of the low-temperature magnetization has beenobserved in severalstudies of ferrite nanoparticles [30] andmay be explained by freezing of spins in canted spin structureswith very low energy barriers [30].For the measurements in astrong applied field of µ0H = 4.8 T there is no peak in the ZFCcurve and the ZFC and FC curves nearly coincide in the wholetemperature range.There is an increase in the magnetizationbelow 30 K qualitatively similarto the observations in the2.0 mT measurements ofaround 5.4 A m2kg−1 both in theZFC and FC curves.Similarresultswere obtained forsample G1.
3.2.2. AC magnetization measurements. The in-phase acsusceptibility (χ) data forGBM are shown in figure 4.
From the frequency dependence of the peak positions it wasattempted to determine τ0 and KV by plotting ln(ω) versus thereciprocal peak temperature (ω is the angular frequency) andfitting a straight line.This method has been demonstrated, forexample, in [31].However, the fit resulted in an unreasonablevalue ofτ0 (on the orderof10−24 s),indicating thatthetemperature dependence ofthe relaxation time isnotinaccordance with equation (6),presumably because of inter-particle and/or inter-grain interactions.Similar observationshave been made in severalotherac magnetization studiesof interacting nanoparticles,e.g.[32–34].The increasein magnetization atlow temperatures seen in the ZFC/FCmeasurements is also seen in the in-phase ac susceptibilityand is largely independenton the frequency of the drivingfield.A similar increase in the ac magnetization of goethitenanoparticles at low temperatures has recently been observedby Pankhurst et al [26].This anomaly can be explained byfreezing of spin structures,which at higher temperatures areinfluenced by magnetic fluctuations across very low energybarriers [26, 30].We also measured the out-of-phase signal(χ ), but the signal was very weak.There was no increase in
5
J. Phys. D: Appl. Phys. 47 (2014) 365003 E Brok et al
100 200 3000
2
4
6
8
10
Temperature (K)
µ0H = 2.0 mT
(10−3
Am2 /k g)Mass
magne
tiza
tion
ZFCFCFC- Z FC
0
2
4
6
8
10(A
m2/k
g) µ0H = 4.8 T
ZFCFCFC- Z FC
Figure 3.ZFC/FC magnetization curves for the sample GBMobtained in an applied field of (top) 4.8 T and (bottom) 2.0 mT. Themagnetization is given per kg of goethite in the sample.
0 50 100 150 200 250 3001
2
3
4
Temperature (K)
In-p
hase s
uscept
ibil
ity (1
0−6 m
3 /kg)
µ0H = 0.38 mT1 Hz10 Hz100 Hz500 Hz1000 Hz
Figure 4.In-phase ac susceptibility (χ) as a function oftemperature for the GBM sample.The amplitude of the driving fieldwas µ0H = 0.38 mT.
χ at low temperatures.AC magnetization measurements onsample G1 gave results similar to those for GBM.Thus thereduction of inter-particle interactions after ball-milling hasonly little influence on the ac and dc magnetization data.Thismay be explained by a large contribution to the magnetizationfrom the uncompensated magnetic moment,which is onlyslightly influenced by inter-particle interactions.
−5 −4 −3 −2 −10 1 2 3 4 5
−2.5−2.0−1.5−1.0−0.5
00.51.01.52.02.5
Mass
mag
neti
zati
on (
Am2 /kg
)
µ0H (T)
T = 300 K
−5 0 5−0.10
−0.05
0
0.05
0.10
−5 0 5−10−50510 T = 4.2 K
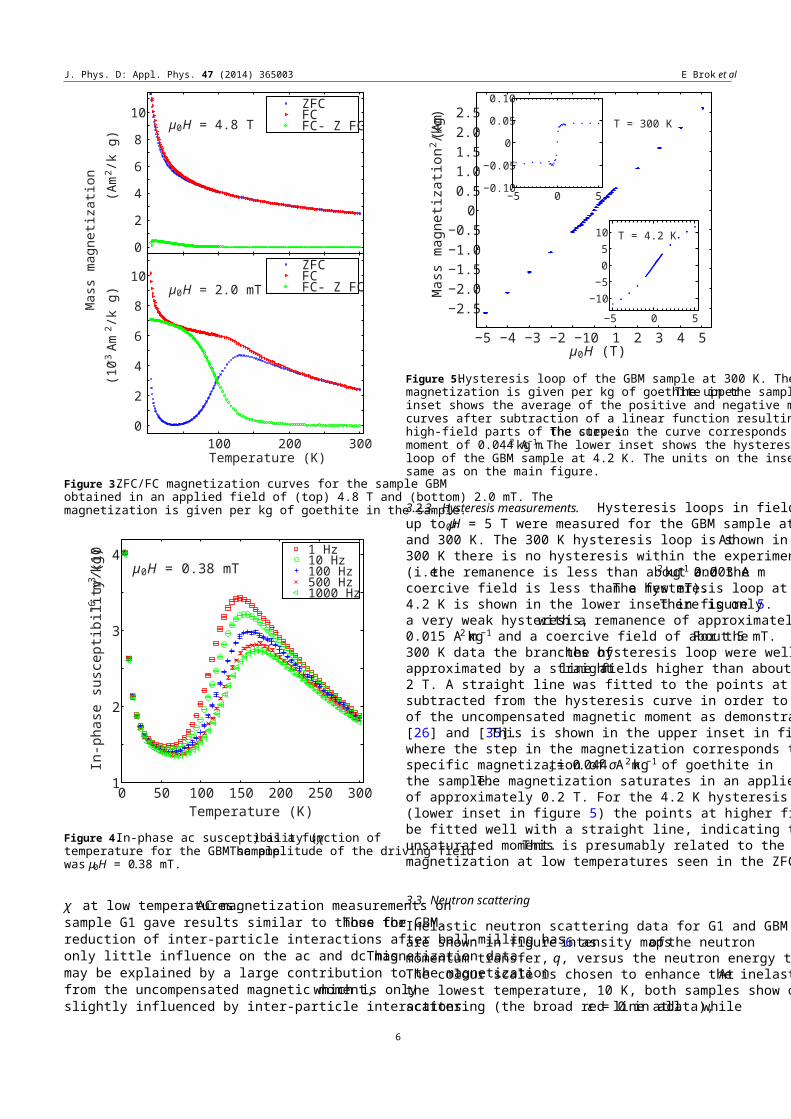
Figure 5.Hysteresis loop of the GBM sample at 300 K. Themagnetization is given per kg of goethite in the sample.The upperinset shows the average of the positive and negative magnetizationcurves after subtraction of a linear function resulting from a fit to thehigh-field parts of the curves.The step in the curve corresponds to amoment of 0.044 A m2kg−1.The lower inset shows the hysteresisloop of the GBM sample at 4.2 K. The units on the insets are thesame as on the main figure.
3.2.3. Hysteresis measurements. Hysteresis loops in fieldsup to µ0H = 5 T were measured for the GBM sample at 4.2and 300 K. The 300 K hysteresis loop is shown in figure 5.At300 K there is no hysteresis within the experimental uncertainty(i.e.the remanence is less than about 0.003 A m2kg−1 and thecoercive field is less than a few mT).The hysteresis loop at4.2 K is shown in the lower inset in figure 5.There is onlya very weak hysteresis,with a remanence of approximately0.015 A m2kg−1 and a coercive field of about 5 mT.For the300 K data the branches ofthe hysteresis loop were wellapproximated by a straightline atfields higher than about2 T. A straight line was fitted to the points at higher fields andsubtracted from the hysteresis curve in order to see the responseof the uncompensated magnetic moment as demonstrated in[26] and [35].This is shown in the upper inset in figure 5,where the step in the magnetization corresponds to a saturationspecific magnetization of σs = 0.044 A m2kg−1 of goethite inthe sample.The magnetization saturates in an applied fieldof approximately 0.2 T. For the 4.2 K hysteresis measurement(lower inset in figure 5) the points at higher fields could notbe fitted well with a straight line, indicating that there is someunsaturated moment.This is presumably related to the rise inmagnetization at low temperatures seen in the ZFC/FC curves.
3.3. Neutron scattering
Inelastic neutron scattering data for G1 and GBM at 10–300 Kare shown in figure 6 asintensity mapsof the neutronmomentum transfer, q, versus the neutron energy transfer, ε.The colour scale is chosen to enhance the inelastic features.Atthe lowest temperature, 10 K, both samples show only elasticscattering (the broad red line atε = 0 in alldata),while
6

J. Phys. D: Appl. Phys. 47 (2014) 365003 E Brok et al
Figure 6.Inelastic neutron scattering data for samples G1 and GBM shown as intensity maps of neutron momentum transfer q and neutronenergy transfer ε at the indicated temperatures.
inelastic features show up atelevated temperatures of 100–300 K. In the G1 sample at 100 K, a singular inelastic signalappears at q = 1.258 Å−1 and ε ∼ 1.5 meV,with a weakercounterpartatq = 1.502 Å−1. These two inelastic signalsgradually broaden and decrease in energy with increasingtemperature, to almost merge with the (quasi-)elastic scatteringat 300 K. The GBM sample shows many of the same featuresas G1, only with a much weaker signal due to the lower amountof goethite in the GBM sample.Again,the most prominentfeature is the singular peak atq = 1.258 Å−1 and ε ∼ 1–
1.5 meV, showing most clearly at 150 K, but hints of a similarsignal at q = 1.502 Å−1 is also visible in this sample.Thehigh-energy background seen at250 and 300 K in the G1sample is also present in the GBM sample, but is more difficultto see in the latter due to the generally smaller signal.
q-values of 1.258 and 1.502 Å−1 correspond to the (2 0 0)and (1 0 1) diffraction peaks.There are both structuralandmagnetic contributions to the (2 0 0)and (1 0 1)diffractionpeaks [3].The inelastic signalis,however,mostlikely ofmagnetic origin because there is an energy gap between the
7

J. Phys. D: Appl. Phys. 47 (2014) 365003 E Brok et al
elastic line and the excitation at temperatures up to about 200 Kwhere after it collapses into the elastic line at a temperatureofabout300 K.Ifthe signalwas originating from latticedynamics,i.e.phonons,itmightalso be gapped because ofthe finite particle size,butthe gap would then be expectedto remain attemperatures up to the melting pointofthesample.The broadening around ε= 0 is expected to bedue to superparamagnetic relaxation and the strong satellitepeak around an energy transfer of 1.0–1.5 meV a signatureof excitations of the uniform mode (q = 0 spin waves) asseen in previous studies of antiferromagnetic (e.g., hematite)nanoparticles [16, 24].Although the signals from the twomagnetic reflections partially overlap, we performed a separatetreatment of the intense q = 1.258 Å−1 signal assuming thatall inelastic signal has a magnetic origin.
Figure 7 shows the energy transfer at q = 1.258 Å−1 at100–300 K for samples G1 and GBM. The data for GBM havea low signalto noise ratio because the sample was dilutedwith NaCl.If allparticles were identical,non-interacting,and withouta grain structure,the energy dependence ofthe magnetic signalwould consistof one quasi-elastic peakcentered at ε = 0 and two side peaks at energy ±ε0.The quasi-elastic peak would have a width and shape determined by theinstrumental resolution and the superparamagnetic relaxationtime, while the side peaks have an intrinsic broadening due toits damped harmonic oscillator (dho) nature [24].However,in practice there willbe additionalbroadening due to adistribution ofuncompensated spins [36]and inter-particleand inter-grain interactions [16] leading to a distribution ofexcitation energies.In the data for samples G1 and GBM theside peaks are asymmetrically broadened and can be describedas relatively sharp peaks at ±ε0and broader peaks extending tohigher energies.We suggest that a large fraction of the particleshave limited interactions, giving rise to the satellite peak at ε0.The broader peaks at higher energies can be attributed to morestrongly interacting grains and/or interacting particles, becausemagnetic interactions resultin an increase of the excitationenergies [16].The data are therefore fitted with one Voigtianprofile to take account of the (quasi-)-elastic line at ε = 0 plustwo dho modes to fit the main peak at ε0 and the scatteringat higher energies,respectively.The fits are shown togetherwith the data in figure 7.Even though the assumption of onlytwo dho modes to fit the inelastic signal is quite simple,thefit reproduces the observed features reasonably well, includingthe clear asymmetry with tails extending towards higher energyvalues.We have used this method consistently in our dataanalysis for all data from the G1 and GBM samples taken attemperatures between 100 and 300 K. The inelastic signal istoo small in the 10 K data to extract any reliable information.Figure 8 shows the temperature dependence of ε0,i.e.theenergy positions of the sharp peaks,which we attribute touniform magnetic excitations of non-interacting particles.Wefound that for sample G1 ε0 decreases from around 1.38 meVat 100 K to 1.06 meV at 250 K. Correspondingly, for the GBMsample ε0 decreases from about 1.48 meV at 100 K to 1.03 (3)meV at 250 K. The solid lines in figure 8 are fits of the data attemperatures below 300 K to the theoretical model developedby Wurger [37] in which the temperature dependence of the
0 1 2 3 4 50
1
2
3
G1
0 1 2 3 4 50
1
2
3
4 100 K
Inte
nsit
y (
arb.
uni
ts)
dataVoigtdho 1dho 2sum
0 1 2 3 4 50
2
4
6 200 K
Inte
nsit
y (
arb.
uni
ts)
0 1 2 3 4 50
2
4
6
8 250 K
Inte
nsit
y (
arb.
uni
ts)
0 2 40
1
2
3
Inte
nsit
y (
arb.
uni
ts)
300 K
GBM
0 1 2 3 4 50
1
2
Inte
nsit
y (
arb.
uni
ts)
100 KdataVoigtdho 1dho 2sum
0 1 2 3 4 50
1
2
3150 K
Inte
nsit
y (
arb.
uni
ts)
0 1 2 3 4 50
1
2
3
4
5200 K
Inte
nsit
y (
arb.
uni
ts)
Energy transfer (meV)Energy transfer (meV)
Energy transfer (meV)Energy transfer (meV)
Energy transfer (meV)Energy transfer (meV)
Energy transfer (meV)Energy transfer (meV)
Inte
nsit
y (
arb.
uni
ts)
250 K
dataVoigtdho 1dho 2sum
dataVoigtdho 1dho 2sum
dataVoigtdho 1dho 2sum
dataVoigtdho 1dho 2sum
dataVoigtdho 1dho 2sum
dataVoigtdho 1dho 2sum
Figure 7.Neutron energy transfer data integrated over a narrowq-range at q = 1.258 Å−1 of samples G1 and GBM at the indicatedtemperatures.Each data set is fitted with one Voigtian profile(Voigt) and two damped harmonic oscillator modes (dho1 and dho2)as described in the text.
excitation energy is given by
ε0 = ε 0 (T = 0) 1 −kBTKV (kBT < KV ) . (7)
The model represents the data well and yields the parametersε0 (T = 0) ≈ 1.55 meV and KV /kB ≈ 467 K forG1,and ε0 (T = 0) ≈ 1.68 meV and KV /kB ≈ 417 K forGBM. With a particle volume of 100 nm3 this correspondsto a magnetic anisotropy constant ofK ≈ 0.6 × 10⁵J m−3forboth samples.(In the calculations we have neglected
8
J. Phys. D: Appl. Phys. 47 (2014) 365003 E Brok et al
0 50 100 150 200 250 3000
0.5
1
1.5
Temperature (K)
0(meV
)
G1GBM
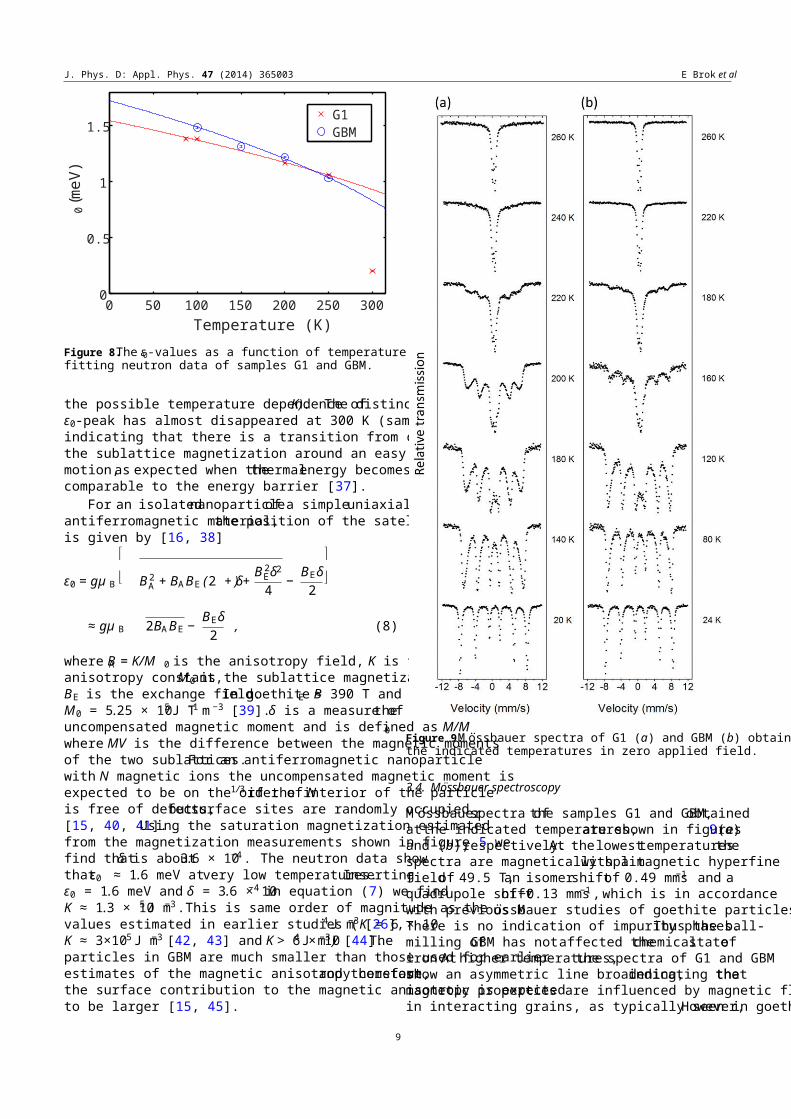
Figure 8.The ε0-values as a function of temperature obtained fromfitting neutron data of samples G1 and GBM.
the possible temperature dependence ofK). The distinctε0-peak has almost disappeared at 300 K (sample G1, figure 7),indicating that there is a transition from coherent precession ofthe sublattice magnetization around an easy axis to incoherentmotion,as expected when thethermalenergy becomescomparable to the energy barrier [37].
For an isolatednanoparticleof a simpleuniaxialantiferromagnetic material,the position of the satellite peakis given by [16, 38]
ε0 = gµ B
B 2A + BABE (2 + δ) + B 2
Eδ24 − BEδ
2
≈ gµ B 2BABE −BEδ2 , (8)
where BA = K/M 0 is the anisotropy field, K is the magneticanisotropy constant,M0 is the sublattice magnetization andBE is the exchange field.In goethite BE ≈ 390 T andM0 = 5.25 × 10⁵J T−1 m −3 [39].δ is a measure oftheuncompensated magnetic moment and is defined as M/M0where MV is the difference between the magnetic momentsof the two sublattices.For an antiferromagnetic nanoparticlewith N magnetic ions the uncompensated magnetic moment isexpected to be on the order of N1/3if the interior of the particleis free of defects,butsurface sites are randomly occupied[15, 40, 41].Using the saturation magnetization estimatedfrom the magnetization measurements shown in figure 5 wefind thatδ is about3.6 × 10−4. The neutron data showthatε0 ≈ 1.6 meV atvery low temperatures.Insertingε0 = 1.6 meV and δ = 3.6 × 10⁻⁴ in equation (7) we findK ≈ 1.3 × 10⁵J m−3.This is same order of magnitude as thevalues estimated in earlier studies (K = 6 × 10⁴J m−3 [26],K ≈ 3×10⁵J m−3 [42, 43] and K > 6 × 10⁴J m−3 ) [44].Theparticles in GBM are much smaller than those used for earlierestimates of the magnetic anisotropy constant,and thereforethe surface contribution to the magnetic anisotropy is expectedto be larger [15, 45].
Figure 9.M ossbauer spectra of G1 (a) and GBM (b) obtained atthe indicated temperatures in zero applied field.
3.4. Mossbauer spectroscopy
M ossbauerspectra ofthe samples G1 and GBM,obtainedatthe indicated temperatures,are shown in figures9(a)and (b),respectively.At thelowesttemperaturesthespectra are magnetically splitwith a magnetic hyperfinefieldof 49.5 T,an isomershiftof 0.49 mms−1 and aquadrupole shiftof−0.13 mms−1,which is in accordancewith previous Mossbauer studies of goethite particles [4, 42].There is no indication of impurity phases.Thus the ball-milling ofGBM has notaffected thechemicalstateofiron.At higher temperatures,the spectra of G1 and GBMshow an asymmetric line broadening,indicating thatthemagnetic properties are influenced by magnetic fluctuationsin interacting grains, as typically seen in goethite.However,
9
J. Phys. D: Appl. Phys. 47 (2014) 365003 E Brok et al
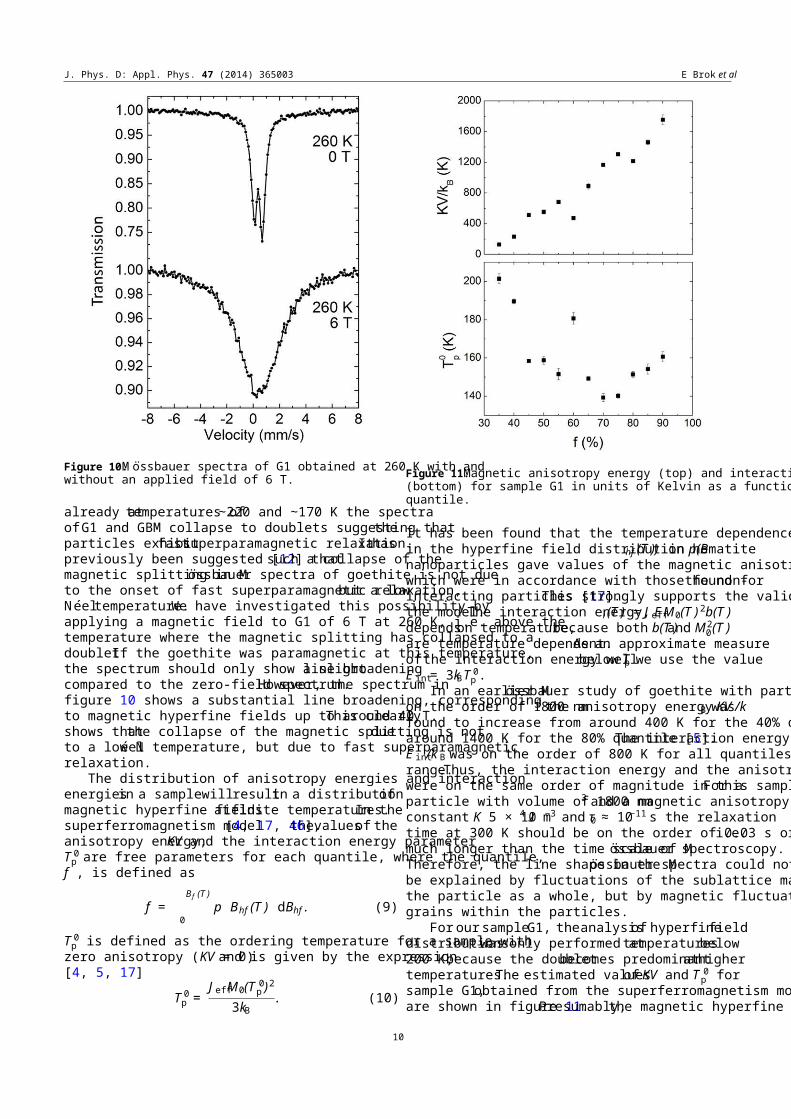
Figure 10.M ossbauer spectra of G1 obtained at 260 K with andwithout an applied field of 6 T.
already attemperatures of∼220 and ∼170 K the spectraofG1 and GBM collapse to doublets suggesting thattheparticles exhibitfastsuperparamagnetic relaxation.Ithaspreviously been suggested [12] thatsuch a collapse of themagnetic splitting in Mossbauer spectra of goethite is not dueto the onset of fast superparamagnetic relaxation,but a lowNeeltemperature.We have investigated this possibility byapplying a magnetic field to G1 of 6 T at 260 K, i.e. above thetemperature where the magnetic splitting has collapsed to adoublet.If the goethite was paramagnetic at this temperature,the spectrum should only show a slightline broadeningcompared to the zero-field spectrum.However, the spectrum infigure 10 shows a substantial line broadening, correspondingto magnetic hyperfine fields up to around 40 T.This clearlyshows thatthe collapse of the magnetic splitting is notdueto a low Neel temperature, but due to fast superparamagneticrelaxation.
The distribution of anisotropy energies and interactionenergiesin a samplewillresultin a distributionofmagnetic hyperfine fieldsatfinite temperatures.In thesuperferromagnetism model[4, 17, 46],thevaluesof theanisotropy energy,KV and the interaction energy parameterT 0p are free parameters for each quantile, where the quantile,
f , is defined as
f =B f (T )
0p Bhf (T ) dBhf . (9)
T 0p is defined as the ordering temperature for a sample withzero anisotropy (KV = 0)and is given by the expression[4, 5, 17]
T 0p =
J effM0(T 0p )2
3kB. (10)
Figure 11.Magnetic anisotropy energy (top) and interaction energy(bottom) for sample G1 in units of Kelvin as a function of thequantile.
It has been found that the temperature dependence of quantilesin the hyperfine field distribution p(Bhf (T )) in hematitenanoparticles gave values of the magnetic anisotropy energies,which were in accordance with those found forthe non-interacting particles [17].This strongly supports the validity ofthe model.The interaction energy, Ei (T ) = J effM0(T ) 2b(T )dependson temperature,because both b(T )and M2
0(T )are temperature dependent.As an approximate measureofthe interaction energy wellbelow Tp we use the valueE int= 3kBT 0
p.In an earlier Mossbauer study of goethite with particle size
on the order of 1800 nm3 the anisotropy energy KV /kB wasfound to increase from around 400 K for the 40% quantile toaround 1400 K for the 80% quantile [5].The interaction energyE int/k B was on the order of 800 K for all quantiles in the samerange.Thus, the interaction energy and the anisotropy energywere on the same order of magnitude in this sample.For aparticle with volume of 1800 nm3 and a magnetic anisotropyconstant K 5 × 10⁴J m−3 and τ0 ≈ 10−11 s the relaxationtime at 300 K should be on the order of 0.03 s or longer,i.e.much longer than the time scale of Mossbauer spectroscopy.Therefore, the line shape in the Mossbauer spectra could notbe explained by fluctuations of the sublattice magnetization inthe particle as a whole, but by magnetic fluctuations in smallgrains within the particles.
For oursampleG1, theanalysisof hyperfinefielddistributionswas only performed attemperaturesbelow200 K,because the doubletbecomes predominantathighertemperatures.The estimated valuesof KV and T 0
p forsample G1,obtained from the superferromagnetism model,are shown in figure 11.Presumably,the magnetic hyperfine
10
J. Phys. D: Appl. Phys. 47 (2014) 365003 E Brok et al
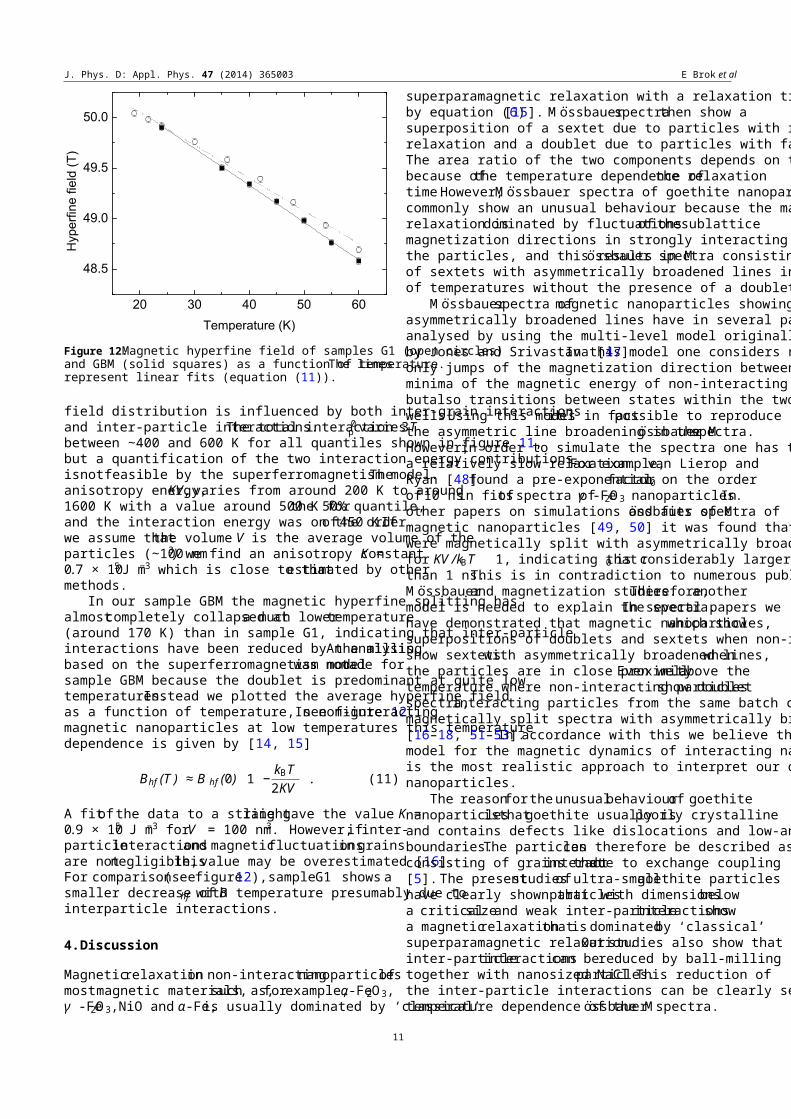
Figure 12.Magnetic hyperfine field of samples G1 (open circles)and GBM (solid squares) as a function of temperature.The linesrepresent linear fits (equation (11)).
field distribution is influenced by both inter-grain interactionsand inter-particle interactions.The total interaction 3T0
p variesbetween ∼400 and 600 K for all quantiles shown in figure 11,but a quantification of the two interaction energy contributionsisnotfeasible by the superferromagnetism model.Theanisotropy energy,KV,varies from around 200 K to around1600 K with a value around 500 K forthe 50% quantile,and the interaction energy was on the orderof450 K.Ifwe assume thatthe volume V is the average volume of theparticles (∼100 nm3) we find an anisotropy constantK ≈0.7 × 10⁵J m−3 which is close to thatestimated by othermethods.
In our sample GBM the magnetic hyperfine splitting hasalmostcompletely collapsed ata much lowertemperature(around 170 K) than in sample G1, indicating that inter-particleinteractions have been reduced by the milling.An analysisbased on the superferromagnetism modelwas notmade forsample GBM because the doublet is predominant at quite lowtemperatures.Instead we plotted the average hyperfine fieldas a function of temperature, see figure 12.In non-interactingmagnetic nanoparticles at low temperatures this temperaturedependence is given by [14, 15]
Bhf (T ) ≈ B hf (0) 1 − kBT2KV . (11)
A fitofthe data to a straightline gave the value K =0.9 × 10⁵ J m−3 forV = 100 nm3. However,ifinter-particleinteractionsand magneticfluctuationsin grainsare notnegligible,thisvalue may be overestimated [16].For comparison(seefigure12),sampleG1 shows asmaller decrease of Bhf with temperature presumably due tointerparticle interactions.
4.Discussion
Magneticrelaxationin non-interactingnanoparticlesofmostmagnetic materials,such as,forexample,α-Fe2O 3,γ -Fe2O 3,NiO and α-Fe,is usually dominated by ‘classical’
superparamagnetic relaxation with a relaxation time givenby equation (6)[15]. M ossbauerspectrathen show asuperposition of a sextet due to particles with relatively slowrelaxation and a doublet due to particles with fast relaxation.The area ratio of the two components depends on temperaturebecause ofthe temperature dependence ofthe relaxationtime.However,M ossbauer spectra of goethite nanoparticlescommonly show an unusual behaviour because the magneticrelaxation isdominated by fluctuationsof thesublatticemagnetization directions in strongly interacting grains withinthe particles, and this results in Mossbauer spectra consistingof sextets with asymmetrically broadened lines in a broad rangeof temperatures without the presence of a doublet [5].
M ossbauerspectra ofmagnetic nanoparticles showingasymmetrically broadened lines have in several papers beenanalysed by using the multi-level model originally proposedby Jones and Srivastava [47].In this model one considers notonly jumps of the magnetization direction between the twominima of the magnetic energy of non-interacting particles,butalso transitions between states within the two energywells.Using this modelitis in factpossible to reproducethe asymmetric line broadening in the Mossbauerspectra.However,in order to simulate the spectra one has to assumea relatively slow relaxation.For example,van Lierop andRyan [48]found a pre-exponentialfactorτ0 on the orderof10 nsin fitsofspectra ofγ -Fe2O 3 nanoparticles.Inother papers on simulations and fits of Mossbauer spectra ofmagnetic nanoparticles [49, 50] it was found that the spectrawere magnetically split with asymmetrically broadened linesfor KV /kBT 1, indicating that τ0 is considerably largerthan 1 ns.This is in contradiction to numerous publishedM ossbauerand magnetization studies.Therefore,anothermodel is needed to explain the spectra.In several papers wehave demonstrated that magnetic nanoparticles,which showsuperpositions of doublets and sextets when non-interacting,show sextetswith asymmetrically broadened lines,whenthe particles are in close proximity.Even wellabove thetemperature where non-interacting particlesshow doubletspectra,interacting particles from the same batch can showmagnetically split spectra with asymmetrically broadened lines[16–18, 51–53].In accordance with this we believe that ourmodel for the magnetic dynamics of interacting nanoparticlesis the most realistic approach to interpret our data for goethitenanoparticles.
The reasonfortheunusualbehaviourof goethitenanoparticlesisthatgoethite usually ispoorly crystallineand contains defects like dislocations and low-angle grainboundaries.The particlescan therefore be described asconsisting of grains thatinteractdue to exchange coupling[5].The presentstudiesofultra-smallgoethite particleshave clearly shown thatparticleswith dimensionsbelowa criticalsizeand weak inter-particleinteractionsshowa magneticrelaxationthatis dominatedby ‘classical’superparamagnetic relaxation.Our studies also show thatinter-particleinteractionscan bereduced by ball-millingtogether with nanosized NaClparticles.This reduction ofthe inter-particle interactions can be clearly seen from thetemperature dependence of the Mossbauer spectra.
11
J. Phys. D: Appl. Phys. 47 (2014) 365003 E Brok et al
Inelasticneutron scattering hasearlierrevealed thatuniform excitations are the predominant spin-wave excitationsin α-Fe2O 3[16, 24] and NiO [54] below the superparamagneticblocking temperature.The present neutron study shows thatthis is also the case forgoethite.In the inelastic neutrondata for both G1 and GBM, a relatively sharp peak at around1.0–1.5 meV was attributed to particles with negligible inter-particle interactions, whereas a broader component with higherenergy was attributed to magnetic fluctuations in interactingparticles and interacting grains.This can explain why theposition of the sharp peak is notmuch affected by the ballmilling.This interpretation is in accordance with earlierstudies ofα-Fe2O 3 [16]and NiO [54]with varying inter-particle interactions.We have previously performed inelasticneutron scattering studies of larger goethite particles in whichthe magnetic fluctuations are dominated by fluctuations of thesublattice magnetization of interacting grains (unpublished).In these studies no sharp satellite peaks were observed.Insteadthe data showed very broad features,similarto the broadsatellite peaks in figure 7.In inelastic neutron studies of8 nm hematite particles [16] and disc shaped NiO nanoparticles[54] itwas also found thatinter-particle interactions resultin broadening ofthe satellite peaksand a shifttowardshigher energies.This supports the interpretation of the broadcomponents in the inelastic neutron scattering data for G1 andGBM.
The magnetic anisotropy of goethite has been the subjectof much controversy.In early Mossbauer studies it was noticedthatthe magnetically splitspectra had strongly asymmetriclines and the magnetic hyperfine splitting in relatively largegoethite particles collapsed well below the Neel temperature[55, 56].Itwas thereforeconcluded thatthemagneticanisotropy constant was much smaller than that of α-Fe2O 3and was on the order of only 103J m−3 [56].Later, Mossbauerstudies of a single crystal of goethite in large applied magneticfields indicated a much largervalue,K > 6 × 10 4J m−3[44],whereasM ossbauerstudiesof the line shape ofapolycrystalline sample in large applied fields indicated a valueof 3 × 10⁵J m−3 [42].Magnetization measurements at 4.2 Krevealed a spin flop transition atan applied field of20 T,corresponding to a magnetic anisotropy constantof around6 × 104J m−3 [39].The presentestimates of the magneticanisotropy constant from inelastic neutron scattering data andM ossbauer data are on the order of 105J m−3. In a recentstudy of hysteresis loops of natural goethite samples a muchsmaller value of only 210 J m−3 at 5 K was estimated from thevalues of the coercivity [35].The samples are substituted byAl and Mn, and it is likely that this results in uncompensatedmagnetic moments.Indeed,the saturation magnetization isrelatively large (∼0.3 A m2kg−1 ). Irrespective of the originof the uncompensated moment,the field dependence of themagnetization of the uncompensated spins may not be directlyrelated to the reversal of the sublattice magnetization vectorsof the particlesas a whole.Therefore,the analysisofmagnetization data may give incorrect values for the anisotropyconstant.
In antiferromagnetic nanoparticles, it has been predictedthatthe initialsusceptibility atlow temperature and the
magnetization should increase with temperature because ofthermoinduced magnetization [57].This has been observedin a study of akaganeite (β-FeOOH) nanoparticles [58].Ingoethite nanoparticles, the magnetization at low temperaturesisdominated by alargeupturn ofboth theac and dcmagnetization with decreasing temperature,as one can seein figures 3 and 4.This was also observed in an earlierac magnetization study ofgoethiteparticles[26]. Weinterpret this as a result of freezing of the magnetization ofuncompensated spins and canted spin structures around defectsand at the surface of the particles [30].
The ZFC magnetization curve of GBM (figure 3) shows amaximum ataround 130 K.Such a peak may be explainedas a resultof blockingof superparamagneticparticles.However, the blocking temperature estimated from Mossbauerspectroscopy with a time scale on the order of 5 × 10⁻⁹ s isaround 160 K, and for the ZFC measurement with a time scaleof around 100 s one should therefore expecta much lowerblocking temperature (around 30 K).Therefore,the peak at130 K cannotbe explained by superparamagnetic blocking.Pankhurst et al [26] found a similar peak in ZFC magnetizationstudies of goethite particles.They suggested that it is relatedto ‘cluster ordering’ of magnetically interacting clusters orparticles.Our estimates of the interaction energy from theM ossbauer data indicate values on the order of 150 K, i.e. closeto the peak temperature in the ZFC measurement of GBM. Thissupports the interpretation in terms of ‘cluster ordering’.
5.Conclusions
The presentM ossbauerstudieshave shown thatin ultra-small goethite particles the magnetic relaxation is dominatedby ‘classical’ superparamagnetic relaxation attemperaturesabove ∼170 K,in contrastto largergoethite particlesinwhich the relaxation commonly is dominated by magneticfluctuationsin interactinggrains. We haveestimatedthevalueof theuncompensated magneticmoment frommagnetization measurements.The temperature dependenceof the magnetization shows a large anomalous upturn at verylow temperatures.This can be explained by freezing of cantedspin structures atthe surface and around defects.Inelasticneutron scattering and Mossbauerspectroscopy both showthat the value of the magnetic anisotropy constant is close to105J m−3. Previously,the value of the magnetic anisotropyconstant for goethite has been much debated.The difficultyin determining K relies partly on difficulties in separatingthe magnetic anisotropy energy from the interaction energyin samples of interacting grains.In the present study of smallparticles with limited inter-grain and inter-particle interactionsthis problem has been reduced.The inelastic neutron scatteringdata show that for small particles not dominated by interactioneffects, this technique can be very useful in determining K asthe measurements single out (with a sharp inelastic signal) theexcitation energy of the q = 0 modes at low temperatures.
Acknowledgments
We acknowledgefunding from theDanish CouncilsforIndependent Research (DanScatt, and CF Steno grant).AAB
12
J. Phys. D: Appl. Phys. 47 (2014) 365003 E Brok et al
acknowledges financialsupportfrom the NationalResearchInitiative of the US Departmentof Agriculture CooperativeState Research,Education,and Extension Service throughCompetitive Grant No. 2007-35107-17893.
References
[1]Cornell R M and Schwertmann U 2003 The Iron Oxides:Structure, Properties, Reactions, Occurrences and Uses 2ndedn (Weinheim: Wiley-VCH)
[2]Morris R V et al 2006 J. Geophys. Res. 111 E02S13[3]Forsyth J B, Hadley I G and Johnson C E 1968 J. Phys. C 1 179[4]Mørup S, Madsen M B, Franck J, Villadsen J and Koch C J W
1983 J. Magn. Magn. Mater 40 163[5]Madsen D E, Cervera-Gontard L, Kasama T,
Dunin-Borkowski R E, Koch C B, Hansen M F, Frandsen Cand Mørup S 2009 J. Phys.: Condens. Matter 21 016007
[6]Burleson D J and Penn R L 2006 Langmuir 22 402[7]Penn R L, Erbs J J and Gulliver D M 2006 J. Cryst. Growth
293 1[8]Barrero C A, Betancur J D, Greneche J M, Goya G F and
Berquo T S 2006 Geophys. J. Int 164 331[9]Madsen D E, Hansen M F, Bender Koch C and Mørup S 2008
J. Phys.: Condens. Matter 20 135215[10]Koch C J W, Madsen M B and Mørup S 1985 Surf. Sci. 156 249[11]Murad E 1982 Am. Miner. 67 1007[12]Bocquet S, Pollard R J and Cashion J D 1992 Phys. Rev. B
46 11657[13]Berquo T S, Imbernon R L, Blot A, Franco D R, Toledo M C M
and Partiti C S M 2007 Phys. Chem. Miner. 34 287[14]Mørup S, Madsen D E, Frandsen C, Bahl C R H and Hansen
M F 2007 J. Phys.: Condens. Matter 19 213202[15]Mørup S, Hansen M F and Frandsen C 2011 Comprehensive
Nanoscience and Technology vol 1, ed D Andrews et al(Amsterdam: Elsevier) pp 437–91
[16]Theil Kuhn L, Lefmann K, Bahl C R H, Klausen S N,Lindgård P-A, Frandsen C, Madsen D E and Mørup S 2006Phys. Rev. B 74 184406
[17]Hansen M F, Bender Koch C and Mørup S 2000 Phys. Rev. B62 1124
[18]Lartigue L, Hugounenq P, Alloyeau D, Clarke S P, Levy M,Bacri J-C, Bazzi R, Brougham D F, Wilhelm C andGazeau F 2012 ACS Nano 6 10935
[19]Banfield J F, Welch S A, Zhang H, Ebert T T and Penn R L2000 Science 289 751
[20]Nesterova M, Moreau J and Banfield J F 2003 Geochim.Cosmochim. Acta 67 1177
[21]Neel L 1949 Ann. Geophys. 5 99[22]Brown W F 1963 Phys. Rev. 130 1677[23]Bødker F, Hansen M F, Bender Koch C, Lefmann K and
Mørup S 2000 Phys. Rev. B 61 6826[24]Hansen M F, Bødker F, Mørup S, Lefmann K, Clausen K N
and Lindgård P-A 1997 Phys. Rev. Lett. 79 4910[25]Klausen S N, Lefmann K, Lindgård P-A, Kuhn L T,
Frandsen C, Mørup S, Roessli B and Cavadini N 2004 Phys.Rev. B 70 214411
[26]Pankhurst Q A, Barquın L F, Lord J S, Amato A andZimmermann U 2012 Phys. Rev. B 85 174437
[27]Howard C J and Hill R J 1986 AAEC (now ANSTO) ReportM112 (Lucas Heights Research Laboratory)
[28]Szytula A, Burewickz A, Dimitrij Z, Krasnick S, Rzany H,Todorovi J, Wanic A and Wolski W 1968 Phys. Status Solidi26 429
[29]Unruh T, Neuhaus J and Petry W 2007 Nucl. Instrum. MethodsA 580 1414
[30]Jacobsen H, Lefmann K, Brok E, Frandsen C and Mørup S2012 J. Magn. Magn. Mater. 324 3218
[31]Madsen D E, Hansen M F, Bendix J and Mørup S 2008Nanotechnology 19 315712
[32]Majetich S A and Sachan M 2006 J. Phys. D: Appl. Phys.39 R407
[33]Parker D, Dupuis V, Ladieu L, Bouchaud J-P, Dubois E,Perzynski R and Vincent E 2008 Phys. Rev. B 77 104428
[34]Sharma S K, Kumar R, Kumar S, Knobel M, Meneses C T,Kumar V V S, Reddy V R, Singh M and Lee C G 2008J. Phys.: Condens. Matter 20 235214
[35]Martin-Hernandez F and Garcia-Hernandez M M 2010Geophys. J. Int. 181 756
[36]Bahl C R H, Garde J, Lefmann K, Jensen T B S, Lindgård P-A,Madsen D E and Mørup S 2008 Eur. Phys. J. B 62 53
[37]W urger A 1998 Europhys. Lett. 44 103[38]Kittel C 1951 Phys. Rev. 82 565[39]Coey J M D, Barry A, Brotto J-M, Rakoto H, Brennan S,
Mussel W N, Collomb A and Fruchard D 1995 J. Phys.:Condens. Matter 7 759
[40]Neel L 1961 Comptes Rendus Hebdomadaires des Seances deL’academie des Sciences 252 4075
[41]Richardson J T, Yiagas D I, Turk B, Forster K and Twigg M W1991 J. Appl. Phys. 70 6977
[42]Pankhurst Q A and Pollard R J 1990 J. Phys.: Condens.Matter 2 7329
[43]Pankhurst Q A 1994 Hyperfine Interact. 90 201[44]Meagher A, Pankhurst Q A and Dickson D P E 1986 Hyperfine
Interact. 28 533[45]Bødker F and Mørup S 2000 Europhys. Lett. 52 217[46]Mørup S, Frandsen C and Hansen M F 2010 Beilstein J.
Nanotechnol. 1 48[47]Jones D H and Srivastava K K P 1986 Phys. Rev. B 34 7542[48]van Lierop J and Ryan D H 2001 Phys. Rev. B 63 064406[49]Chuev M A, Cherepanov V M and Polikarpov M A 2010 JETP
Lett. 92 21[50]Chuev M A 2011 J. Phys.: Condens. Matter 23 426003[51]Xu M, Bahl C R H, Frandsen C and Mørup S 2004 J. Colloid
Interface Sci. 279 132[52]Frandsen C et al 2005 Phys. Rev. B 72 214406[53]Frandsen C and Mørup S 2003 J. Magn. Magn. Mater. 266 36[54]Bahl C R H, Lefmann K, Kuhn L T, Christensen N B,
Varquez H and Mørup S 2006 J. Phys.: Condens. Matter18 11203
[55]van der Kraan A M and van Loef J J 1966 Phys. Lett. 20 614[56]Shinjo T 1966 J. Phys. Soc. Japan 21 917[57]Mørup S and Frandsen C 2004 Phys. Rev. Lett. 92 217201[58]Urtiberea A, Luis F, Millan A, Natividad E, Palacio F,
Kampart E and Zeitler U 2011 Phys. Rev. B 83 214426
13