Man's place in hominoidea revealed by mitochondrial DNA genealogy
12
J Mol Evol (1992) 35:32-43 Journal of Molecular Evolution (~ Springer-Verlag New York Inc. 1992 Man's Place in Hominoidea Revealed by Mitochondrial DNA Genealogy Satoshi Horai, ~ Yoko Satta, 1 Kenji Hayasaka, 1 Rumi Kondo, ~ Tadashi Inoue, 2 Takafumi Ishida, 3 Seiji Hayashi, 4 and Naoyuki Takahata I 1 National Institute of Genetics, Mishima411, Japan 2Collegeof Agricultureand VeterinaryMedicine,Nihon University,Kanagawa252, Japan 3Facultyof Science,the Universityof Tokyo, Tokyo 113, Japan 4Facultyof Science, NagoyaUniversity,Nagoya464, Japan Summary. Molecular biology has resurrected C. Darwin and T.H. Huxley's question about the origin of humans, but the precise branching pattern and dating remain controversial. To settle this issue, a large amount of sequence information is required. We determined mitochondrial (mr) DNA sequences for five hominoids; pygmy and common chimpan- zees, gorilla, orangutan, and siamang. The common region compared with the known human sequence is 4759 bp long, encompassing genes for 11 transfer RNAs and 6 proteins. Because of the high substi- tution rates in mammalian mtDNA and an unprec- edentedly large region compared, the sequence dif- ferences clearly indicate that the closest relatives to human are chimpanzees rather than gorilla. For dat- ing the divergences of human, chimpanzee, and go- rilla, we used only unsaturated parts of sequence differences in which the mtDNA genealogy is not obscured by multiple substitutions. The result sug- gests that gorilla branched off7.7 + 0.7 million years (Myr) ago and human 4.7 + 0.5 Myr ago; the time difference between these divergences being as long as 3 Myr. Key words: Hominoid phylogeny -- Mitochon- drial DNA -- Nucleotide substitutions -- Molecular clock -- Phylogenetic trees -- Divergence times Introduction Ever since Darwin, man's place in nature, from either a zoocentric or anthropocentric perspective, Offprint requests to: S. Horai has been a cardinal question in building compre- hensive systems in biology (Darwin 1859; Huxley 1894; Gould 1980). The discovery of a molecular clock (constancy of molecular evolutionary rate) has revolutionized the field (Zuckerkandl and Pauling 1965; Sarich and Wilson 1967), and it has become widely accepted that human and the African apes share a Pliocene ancestor, much more recent than previously thought (Pilbeam 1984; Mellars and Stringer 1989; Stringer 1990). The precise branching pattern (cladogram) and dating in hominoid diver- sification are nevertheless highly controversial (Goodman et al. 1983; Foran et al. 1988; Djian and Green 1989; Gibbons 1990). This controversy re- flects the stochastic nature of the molecular clock and the fact that human, chimpanzee, and gorilla might have diverged within a short period of evo- lutionary time (trichotomy). To resolve the trichot- omy problem, it is essential to find a number of nucleotide substitutions that can be assigned to in- ternodal branches in the cladogram of hominoids. Although the longest DNA sequences now available (the ffn-globin gene and its flanking region; 11,483 bp) assign about 8-14 substitutions that can support the human-chimpanzee clade, the likelihood is not significantly higher than that of the human-gorilla or chimpanzee-gorilla clade (Goodman et al. 1989). This is due to relatively slow rates of nuclear DNA evolution, and the trichotomy remains an open question. As for ourselves, the significance in this molecular systematic pursuit is to provide a basis for better understanding of the evolution of mor- phological and behavioral traits of our own species, Homo sapiens sapiens. To this end, and because of a large number of
Transcript of Man's place in hominoidea revealed by mitochondrial DNA genealogy
J Mol Evol (1992) 35:32-43 Journal of Molecular Evolution (~ Springer-Verlag New York Inc. 1992
Man's Place in Hominoidea Revealed by Mitochondrial DNA Genealogy
Satoshi Horai, ~ Yoko Satta, 1 Kenji Hayasaka, 1 Rumi Kondo, ~ Tadashi Inoue, 2 Takafumi Ishida, 3 Seiji Hayashi, 4 and Naoyuki Takahata I
1 National Institute of Genetics, Mishima 411, Japan 2 College of Agriculture and Veterinary Medicine, Nihon University, Kanagawa 252, Japan 3 Faculty of Science, the University of Tokyo, Tokyo 113, Japan 4 Faculty of Science, Nagoya University, Nagoya 464, Japan
Summary. Molecular biology has resurrected C. Darwin and T.H. Huxley's question about the origin of humans, but the precise branching pattern and dating remain controversial. To settle this issue, a large amount of sequence information is required. We determined mitochondrial (mr) DNA sequences for five hominoids; pygmy and common chimpan- zees, gorilla, orangutan, and siamang. The common region compared with the known human sequence is 4759 bp long, encompassing genes for 11 transfer RNAs and 6 proteins. Because of the high substi- tution rates in mammalian mtDNA and an unprec- edentedly large region compared, the sequence dif- ferences clearly indicate that the closest relatives to human are chimpanzees rather than gorilla. For dat- ing the divergences of human, chimpanzee, and go- rilla, we used only unsaturated parts of sequence differences in which the mtDNA genealogy is not obscured by multiple substitutions. The result sug- gests that gorilla branched off7.7 + 0.7 million years (Myr) ago and human 4.7 + 0.5 Myr ago; the time difference between these divergences being as long as 3 Myr.
Key words: Hominoid phylogeny -- Mitochon- drial DNA -- Nucleotide substitutions -- Molecular clock -- Phylogenetic trees -- Divergence times
Introduction
Ever since Darwin, man's place in nature, from either a zoocentric or anthropocentric perspective,
Offprint requests to: S. Horai
has been a cardinal question in building compre- hensive systems in biology (Darwin 1859; Huxley 1894; Gould 1980). The discovery of a molecular clock (constancy of molecular evolutionary rate) has revolutionized the field (Zuckerkandl and Pauling 1965; Sarich and Wilson 1967), and it has become widely accepted that human and the African apes share a Pliocene ancestor, much more recent than previously thought (Pilbeam 1984; Mellars and Stringer 1989; Stringer 1990). The precise branching pattern (cladogram) and dating in hominoid diver- sification are nevertheless highly controversial (Goodman et al. 1983; Foran et al. 1988; Djian and Green 1989; Gibbons 1990). This controversy re- flects the stochastic nature of the molecular clock and the fact that human, chimpanzee, and gorilla might have diverged within a short period of evo- lutionary time (trichotomy). To resolve the trichot- omy problem, it is essential to find a number of nucleotide substitutions that can be assigned to in- ternodal branches in the cladogram of hominoids. Although the longest DNA sequences now available (the ffn-globin gene and its flanking region; 11,483 bp) assign about 8-14 substitutions that can support the human-chimpanzee clade, the likelihood is not significantly higher than that of the human-gorilla or chimpanzee-gorilla clade (Goodman et al. 1989). This is due to relatively slow rates of nuclear DNA evolution, and the trichotomy remains an open question. As for ourselves, the significance in this molecular systematic pursuit is to provide a basis for better understanding of the evolution of mor- phological and behavioral traits of our own species, H o m o sapiens sapiens.
To this end, and because of a large number of
33
sequence differences required, we used mi tochon- drial (mr) D N A that is known to evolve m u c h more rapidly (Brown et al. 1982; H ixon and Brown 1986). We sequenced a c o m m o n region o f 4938 bp length for p y g m y (Pan paniscus) and c o m m o n (Pan trog- lodytes) c h i m p a n z e e s , gor i l l a (Gorilla gorilla), orangutan (Pongo pygmaeus), and s iamang (Hylob- ates syndactylus). This region contains the comple te genes for N A D H dehydrogenase subunit 2 (ND2), cytochrome oxidase subunit I and I I (COIand COIl), A TPase 8, por t ions o f two genes for ND1 and A TP- ase 6, and 11 interspersed tRNAs . Here we focus on the phylogenet ic impl ica t ion o f these sequences together with the known sequence of h u m a n (An- derson et al. 1981) and present o ther molecular as- pects elsewhere.
Materials and Methods
Extraction and Cloning of mtDNA. We purified mtDNA from cultured cells of a common chimpanzee and an orangutan, where- as relevant segments of mtDNA were amplified from a pygmy chimpanzee, a gorilla, and a siamang by means of the polymerase chain reaction (PCR) (Saiki et al. 1988). The total DNAs were used as templates in the PCR. A preliminary study by Southern hybridization analysis showed that a human EcoRI site [bp 4121 by Anderson et al.'s (1981) numbering] and a PstI site Cop 9020) are conserved in the hominoid species except for siamang. We then prepared a clone library from each species by digesting mtDNA with EcoRI alone, EcoRI plus HindIII, and HindIII plus PstI, and cloned the resultant fragments in plasmid vectors. We cleaved these fragments from the recombinant plasmids un- der the above enzyme combinations and purified them by agarose gel electrophoresis. For siamang, PCR-amplified fragments, rang- ing from bp 3694 to bp 9912, were used for subsequent enzyme digestions. The fragments recovered from the gels were further digested with HaeIII and/or AIuI and subcloned in the Sinai- cleaved vector, M 13mp 10, in order to prepare a single-stranded template DNA.
DNA Sequencing. Sequencing reactions were performed by the dideoxynucleotide chain-termination method (Sanger et al. 1977) using 32p-dCTP (Amersham) and Sequenase version 2.0 (USB Co.). We sequenced both double-stranded DNA from the original plasmid clones and the single-stranded DNA. Because the sizes of most subcloned fragments that were cleaved with HaeIII or AluI were less than 300 bp, we could read a full length of any insert in one sequence reaction. These fragmental se- quences were connected and assembled by GENETYX (Software Development Co., Ltd., Japan). The sequences of 4.9 kb in length were aligned together with the human homologue to compute the pairwise sequence differences.
Results and Discussion
Mode o f Substitution
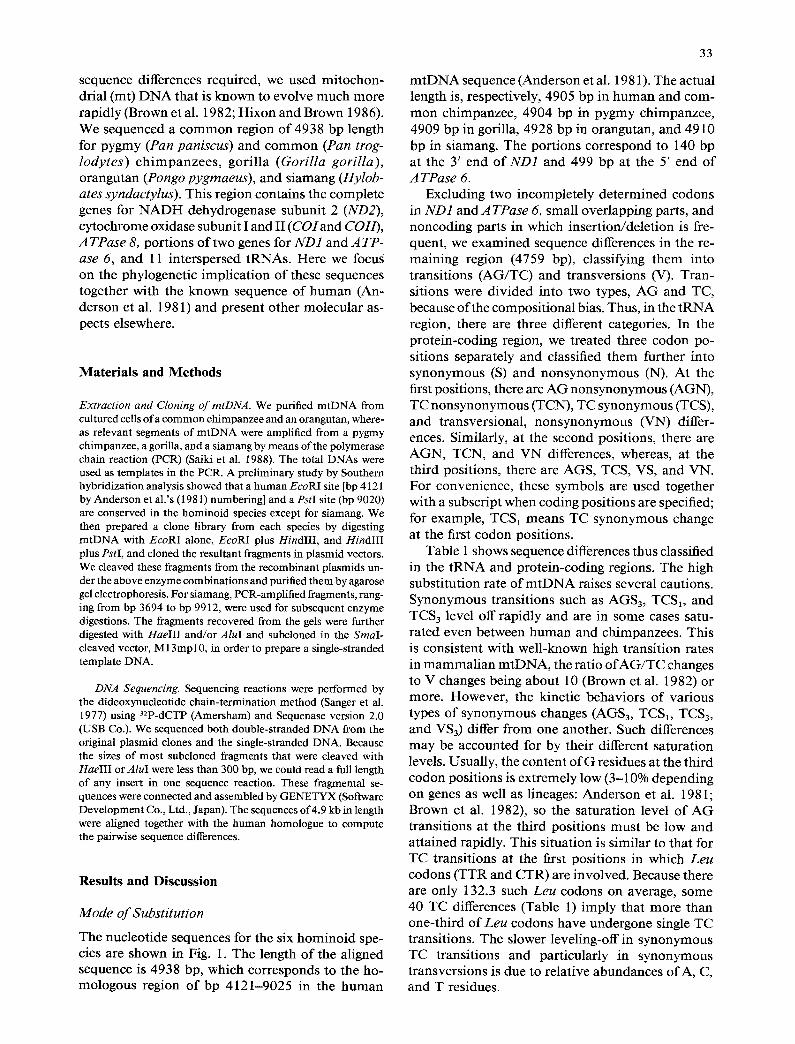
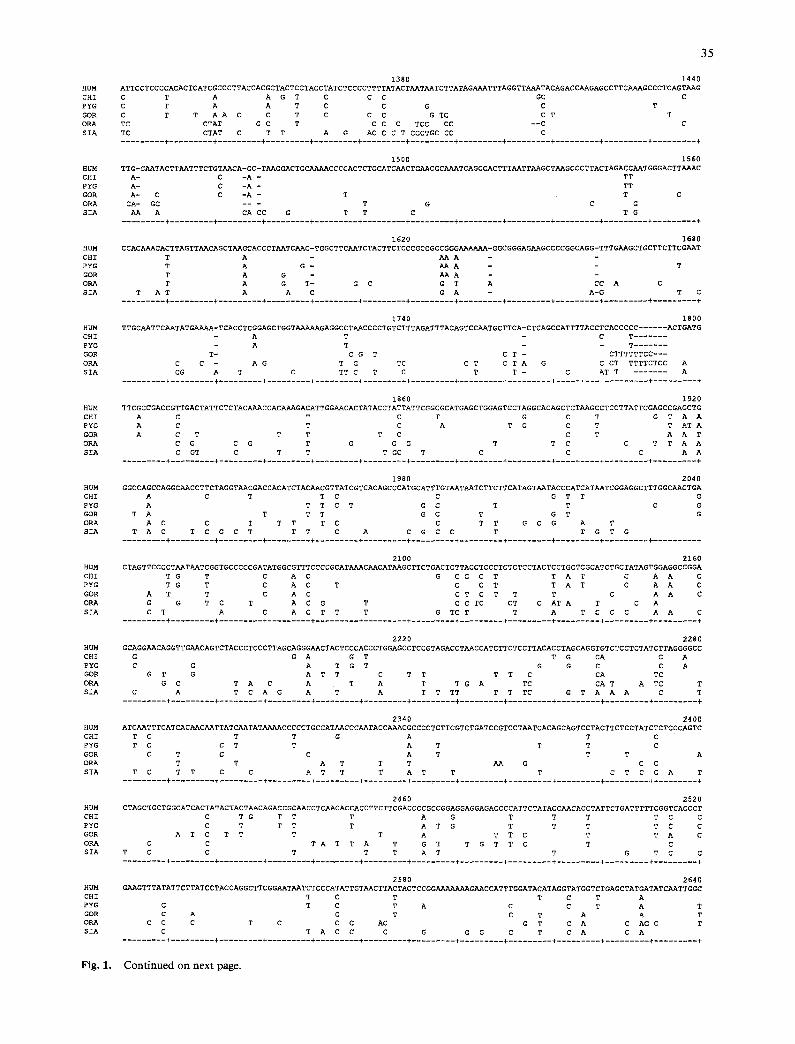
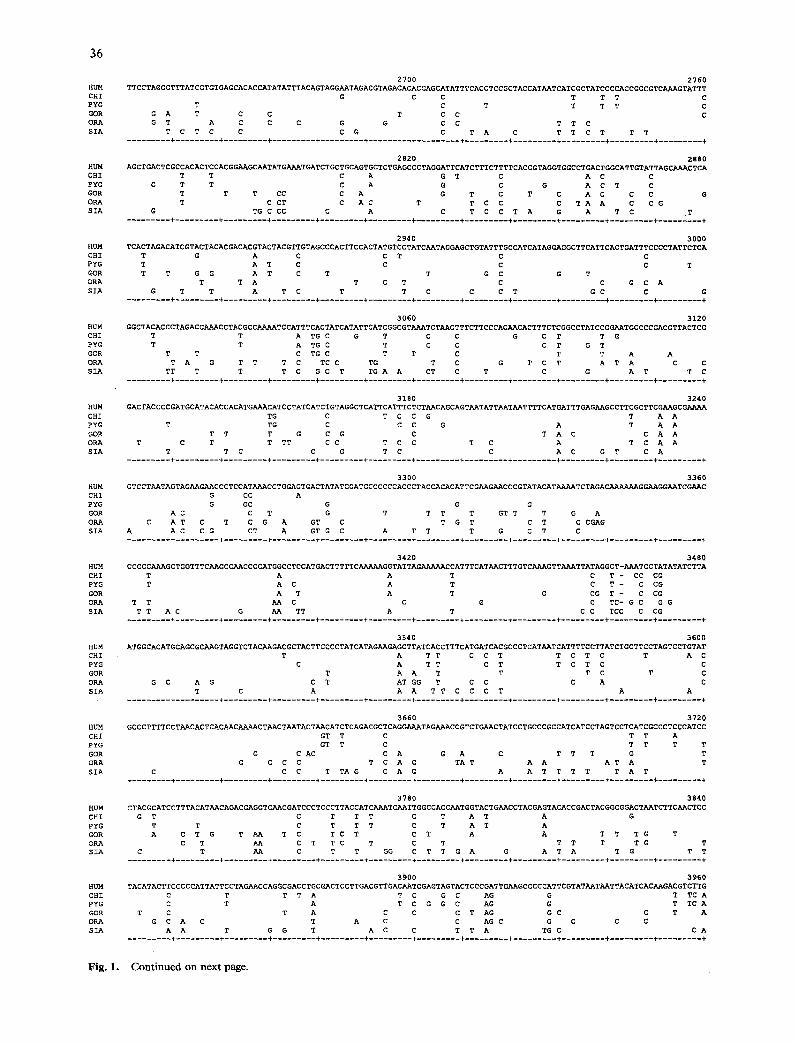
The nucleot ide sequences for the six h o m i n o i d spe- cies are shown in Fig. 1. The length o f the aligned sequence is 4938 bp, which corresponds to the ho- mologous region o f bp 4121-9025 in the h u m a n
m t D N A sequence (Anderson et al. 1981). The actual length is, respectively, 4905 bp in h u m a n and com- m o n chimpanzee , 4904 bp in p y g m y chimpanzee , 4909 bp in gorilla, 4928 bp in orangutan, and 4910 bp in s iamang. The por t ions cor respond to 140 bp at the 3' end of ND1 and 499 bp at the 5' end o f A TPase 6.
Excluding two incomple te ly de te rmined codons in ND1 and A TPase 6, small over lapping parts, and noncoding parts in which inser t ion/delet ion is fre- quent, we examined sequence differences in the re- main ing region (4759 bp), classifying t hem into t ransi t ions (AG/TC) and t ransvers ions (V). Tran- sit ions were d iv ided into two types, A G and TC, because o f the composi t ional bias. Thus, in the t R N A region, there are three different categories. In the prote in-coding region, we t reated three codon po- sit ions separately and classified t hem further into s y n o n y m o u s (S) and n o n s y n o n y m o u s (N). At the first positions, there are A G nonsynonymous (AGN), T C n o n s y n o n y m o u s (TCN), TC s y n o n y m o u s (TCS), and transversional , n o n s y n o n y m o u s (VN) differ- ences. Similarly, at the second posit ions, there are A G N , TCN, and V N differences, whereas, at the third posit ions, there are AGS, TCS, VS, and VN. For convenience, these symbols are used together with a subscript when coding posi t ions are specified; for example , TCS1 means T C synonymous change at the first codon posit ions.
Table 1 shows sequence differences thus classified in the t R N A and prote in-coding regions. The high subst i tut ion rate o f m t D N A raises several cautions. Synonymous transi t ions such as AGS3, TCS1, and TCS3 level off rapidly and are in some cases satu- ra ted even between h u m a n and chimpanzees . This is consistent with wel l -known high t ransi t ion rates in m a m m a l i a n m t D N A , the ratio o f A G / T C changes to V changes being abou t 10 (Brown et al. 1982) or more . However , the kinetic behav iors of var ious types o f synonymous changes (AGS3, TCS~, TCS3, and VS3) differ f rom one another . Such differences m a y be accounted for by their different saturat ion levels. Usually, the content o f G residues at the third codon posi t ions is ex t remely low (3-10% depending on genes as well as lineages: Anderson et al. 198 i; Brown et al. 1982), so the sa turat ion level o f A G transi t ions at the third posi t ions mus t be low and a t ta ined rapidly. This s i tuat ion is s imilar to that for TC transi t ions at the first posi t ions in which Leu codons ( T T R and CTR) are involved. Because there are only 132.3 such Leu codons on average, some 40 TC differences (Table 1) imply that more than one- th i rd o f Leu codons have undergone single TC transit ions. The slower leveling-off in synonymous T C transi t ions and part icularly in synonymous t ransvers ions is due to relative abundances o f A, C, and T residues.

34
60 120 HUM GAATTCGAACAGCATACCCCCGATTCCGCTACGACCAACTCATACACCTCCTATGAAA•AACTTCC•ACCACTCACCCTAGCATTACTTATATGATATGTCTCCATACCCATTACAATCT
CHI T T G C C G A C
PYG A T C TT C C G A T C
GOR T T T T G G T G G C C A T T CC
ORA CA A G T G C A C CA C
T G SIA C A T T G G CC C CA T TC T TG ......... + ......... + ......... + ......... + ......... + ......... + ......... + ......... + ......... + ......... + ......... + ......... +
180 240
HUM CCAGCATTCCCCCTCAAACCTAAGAAATATGTCTGATAAAAGAGTTACTTTGATAGAGTAAATAATAGGAGCTTAAACCCCCTTATTTCTAGGACTATGAGAATCGAACCCATCCCTGAG
CHI C A T C T A T
PYG C A T T G
GOR AG T T
ORA TG A C A AG TC T G T C
SIA T C T C C CG C G T T A C AG G T ......... + ......... + ......... + ......... + ......... + ......... + ......... + ......... + ......... + ......... + ......... + ......... +
300 360
HUM AATCCAAAATTCTCCGTGCCACCTATCACACCCCATCCTAAAGTAAGGTCAGCTAAATAAGCTATCGGGCCCATACCCCGAAAATGTTGGTTATACCCTTCCCGTACTAATTAATCCCCT
CHI C
PYG
GOR G C C T C
ORA C C C
SIA C CG G TG T - A C ......... + ......... + ......... + ......... + ......... + ......... + ......... + ......... + ......... + ......... + ......... + ......... +
420 480
HUM GGCCCAAcc•GTCATCTACTCTACCATCTTTGCAGGCACACTCATCAcAGCGCTAAGcTcG•ACTGATTTTTTACcTGAGTAGGC•TAGAAATAAACATGCTAGCTTTTATTCCAGTTCT CH~ A A C A G T A C T A C A C
PYG A A C T T T A A C T A C C GOR A C T T T C G A C C
ORA A T A CTC G CA T T A G C C G C G A C C C C
SIA A T A A T T T C ATCT A CC CG T C C CT ......... + ......... + ......... + ......... + ......... + ......... + ......... + ......... + ......... + ......... + ......... + ......... +
540 600
HUM AACcAAAAAAATAAACCCTCGTTCCACAGAAGCTGCCATCAAGTATTTcCTCACG•AAGCAACCG•ATCCATAATCCTTCTAATAGCTATCCTCTTCAACAATATACTCTCCGGA•AATG CHI G C C C A C T A T G T C G C GC
PYG G C C A C T A G G T C C C
GOR T C C C A A T C C C C
ORA C G C C C T A A TT C C CA C T T G
SIA A C C T T GTA A C CT T CC T ......... + ......... + ......... + ......... + ......... + ......... + ......... + ......... + ......... + ......... + ......... + ......... +
660 720
HUM AACCATAACCAATAcTACCAATCAATACTCATCATTAATAATCATAATAGCTATAGCAATAAAACTAGGAATAGCCC•CTTTCA•TTCTGAGTCcCAGAGGTTA••CAAGGcACcccTCT CHI T A G T T A C
PYG C T C G T T A C
GOR C G C T G G G T G A C C
ORA C G C C C T TC TG CC CC C A C AGT C
SIA C C T C C T C CT C C A C T A TA C ......... + ......... + ......... + ......... + ......... + ......... + ......... + ......... + ......... + ......... + ......... + ......... +
780 840
HUM GACATCCGGCCTGCTTCTTCTCACATGACAAAAACTAGCCCCCATCTCAATCATATACCAAATCTCTCCCTCACTAAACGTAAGCCTTCTCCTCACTCTCTCAATCTTATCCATCATAGC
CHI A T A C C T T T T CT A G A C T G T
PYG A T A C C T A CT A G A C T G T
GOR A TG T A C C T G T CT G AC TAC T C C ORA A A C C T T T T A AC A G G A A C C TC T C G T
SIA C A A C T T TC AGT A A A C AT T T T T ......... + ......... + ......... + ......... + ......... + ......... + ......... + ......... + ......... + ......... + ......... + ......... +
900 960
HUM AGGCAGTTGAGGTGGATTAAACCAGACCCAGCTACGCAAAATCTTAGCATAcTCCTCAATTACCCACATAGGATGAATAATAGCAGTTCTACCGTACAACCCTAACATAACCATTCTTAA
CHI C C C A A C C C C A T
PYG C C C A A C C C A
GOR C C C A T A G TC C TG A T T T
ORA C C C A A A C G C T G A C A C T C C
SIA C C C A CAAC TCGC AT CT G C TG C C C A T A A C T C ......... + ......... + ......... + ......... + ......... + ......... + ......... + ......... + ......... + ......... + ......... + ......... +
1020 1080
HUM TTTAACTATTTATATTATCCTAACTACTACCGCATTCcTACTACTCAACTTAAACTCCAGCACCAcGACCCTACTA•TAT•TCGCACCTGAAACAAG•TAACATGACTAA•ACCCTTAAT CHI C C C T G A T T C
PYG C A G A T TC
GOR C G C C A T C G A T T T T A G T TC
ORA CC TC C C G A A A T G T A T GT C A G T C
SIA CC C C CG A A C T GC C T A T C T AT C CT C . . . . . . . . . + . . . . . . . . . + . . . . . . . . . + . . . . . . . . . + . . . . . . . . . + . . . . . . . . . + . . . . . . . . . + . . . . . . . . . + . . . . . . . . . + . . . . . . . . . + . . . . . . . . . + . . . . . . . . . +
1140 1200
HUM TCCATCCACCCTCCTCTCCCTAGGAGGCCTGCCCCCGCTAACCGGCTTTTTGCCCAAATGGGCCATTATCGAAGAATTCACAAAAAACAATAGCCTCATCATCCCCACCATCATAGCCAC
CHI A A T C A A TT C T T
PYG C A A C A TT C T T C T
GOR C C T A A CC A CTT T CGA T C T G T
ORA CT A T A A T G A CC A A T C T G G G C AT T TGCT A T
SIA C AT A A G A T A CC A CTTG C T GC GG CT T A T T T ......... + ......... + ......... + ......... + ......... + ......... + ......... + ......... + ......... + ......... + ......... + ......... +
1260 1320
HUM CATCACCCTCCTTAACCTCTACTTCTACCTACGCCTAATCTACTCCACCTCAATCACACTACTCCCCATATCTAACAACGTAAAAATAAAATGACAGTTTGAACATACAAAACCCACCCC
CHI T T T T T A C
PYG T T C G T T C T T A T
GOR C T T T T A C G C C T T T
ORA T T T C GC T AT G A C A G
SIA G TA C A A T T C C T A A C T A T ......... + ......... + ......... + ......... + ......... + ......... + ......... + ......... + ......... + ......... + ......... + ......... +
Fig. 1. Cont inued on pages 35 -37 ,
35
1380 1440
HUM ATTCCTCCCCAcACTCATCG~CTTACCACG~TACTCCTACCTAT~TC~CCTTTTATAcT~ATAATCTTATAGAAATTTAGGTTAAATACAGACCAAGAGCcTTCAAAG~CcTCAGT~G CHI C T A A G T C C C GC C
PYG C T A A T C C G C T
GOR C T T A A C C T C C C G TC C T T
O~ TC CTAT G C T C C C TCC CC --C C
SIA TC CTAT C T T A G AC C C T CCCTGC CC C ......... + ......... + ......... + ......... + ......... + ......... + ......... + ......... + ......... + ......... + ......... + ......... +
15D0 1560
HUM TTG-C~TACTTAATTTCTGT~CA-GC-TAAGGACTGCAAAACCCCACTCTGCATC~CTG~CGCAAATCAGCCACTTTAATT~GCTAAGCCCTTACTAGACCAATGGGACTTAAAC
CHI A- C -A - TT
PYG A- C -A - TT
GOR A- C C -A - T T C
OH CA- GC --- T G C G
SIA AA A CA CC G T T C T G ......... + ......... + ......... + ......... + ......... + ......... + ......... + ......... + ......... + ......... + ......... + ......... +
1620 1680
HUM CCACAAACACTTAGTTAACAGCT~GCACCCTAATCAAC-TGGCTTCAATCTACTTCTCCCGCCGCCGGGAAAAAA-GGCGGGAG~GCCCCGGCAGG-TTTGAAGCTGCTTCTTCG~T
CHI T A AA A -
PYG T A G - AA A - T
GOR T A G - AA A
O~ T A G T- G C G T A CC A C
SIA T A T A A C G A - A-G T C ......... + ......... + ......... + ......... + ......... + ......... + ......... + ......... + ......... + ......... + ......... + ......... +
1740 1800
HUM TTGCAATTCAATATGAAAA-TCAC~TCGGAGCTGGTAAAAAGAGGCCT~CC~CTGTCTTTAGATTTACAGTCCAATGCTTCA-CTCAGCCATTTTACCT~A~CCCC ...... ACTGATG
CHI - A T C T .......
PYG - A T - T .......
GOR T- C G T C T - CTTTTTTCC---
OH C C - A G T G TC C T C T A G C CT TTTTCTCC A
SIA CG A T C TT C T C T T - C AT T ....... A ......... + ......... + ......... + ......... + ......... + ......... + ......... + ......... + ......... + ......... + ......... + ......... +
1860 1920
HUM TTCGCCGACcGTTGACTATTCTCTACAAACCA•AAAGACATTGGAACACTATAcCTATTATTCGGCGCATGAGCTGGAGTCCTAGGCACAGCTCTAAGCCTCCTTATTCGAGCCGAGCTG CHI A C T C T G C T G T A A
PYG A C T C A T G C T T AT A
GOR A C T T T T C C T A A T
OH C G C G T G G G T T C C T T A A
SIA C GT C T T T GC T C C C A A ......... + ......... + ......... + ......... + ......... + ......... + ......... + ......... + ......... + ......... + ......... + ......... +
1980 2040
HUM GGc~AGCCAGGC~CcTTCTAGGTAACGACCACATCTACAACGTTATCGTCACAG~CCATGCATTTGT~TAATCTTCTTCATAGT~TACCCATCATAATCGGAGG~TTTGGCAACTGA CHI A C T T C C G T T G
PYG A T T C T G C T T C G
~R T A T T T G C T G T G
O~ A C C T T T T C C T T G C G A T
SIA T A C T C G C T T T C A C G C C T T G T G ......... + ......... + ......... + ......... + ......... + ......... + ......... + ......... + ......... + ......... + ......... ÷ ......... +
2100 2160
HUM CTAGTTCCc•TAATAATCGGTGCCCCCGATATGGcGTTTCCcCGCATAAA•AA•ATAAGCTTCTGACTCTTACCTCCCTCTcTCCTACTCCTGCT•GCATCTGCTATAGTGGAGGCCGGA CHI T G T C A C G C G C T T A T C A A C
PYG T G T C A C T C C T T A T C A A C
GOR A T T C A C C T C T T T C A A C
O~ G G T C T A C G T C C TC CT C AT A T C A
SIA C T A C A C T T T G T C T T A T C C C A A C ......... + ......... + ......... + ......... + ......... + ......... + ......... + ......... + ......... + ......... + ......... + ......... +
2 2 2 0 2280
HUM GCAGG~CAGGTTGAACAGTCTACCCTCCCTTAGCAGGGAACTACTCCCACCCTG~GCCTCCGTAGACCTAACCATCTTCTCCTTACACCTAGCAGGTGTCTCCTCTATCTTAGGGGCC
CHI G G A G T T G CA C A
PYG C G A T G T G G C C A
GOR G T G A T T C T T T T C CA TC
O~ G C T A C A T A T T G A TC CA T A TC T
SIA C A T C A G A T A T T T T T T T C G T A A A C T . . . . . . . . . + . . . . . . . . . + . . . . . . . . . + . . . . . . . . . + . . . . . . . . . + . . . . . . . . . + . . . . . . . . . + . . . . . . . . . + . . . . . . . . . + . . . . . . . . . + . . . . . . . . . + . . . . . . . . . +
2340 2400
HUM ATCAATTTCATCACAAC~TTATCAATATAAAACCCCCTGCCATAACCC~TACCAAACG~CCTCTTCGTCTGATCCGTccTAATCACAGCAGT~CTACTTCTCCTATCTCTCCCAGTC CHI T C T T G A T C
PYG T C C T T A T T T C
GOR C T C C A T T T A
O~ T T A T T T AA G C C
SIA T C T T C C A T T T A T T T C T C C A T ......... + ......... + ......... + ......... + ......... + ......... + ......... + ......... + ......... + ......... + ......... + ......... +
2460 2520
HUM CTAG~TGCTGGCATCACTATACTACT~CAGACCGC~CCT~AACAC~ACCTTCTTCGACCCCGC~GGAGGAGGAGACCCCATTCTATACCAACACCTATTCTGATTTTTCGGTCAC~CT CHI C T G T T T A G T T T T C C
PYG C T T T T A T G T T T T C C
GOR A T C T T T T A T T C T T A C
OH C C T A T T A T G T T G T T C T C SIA C T C T T T A T T G T C C
......... + ......... + ......... + ......... +---~ ..... + ......... + ......... + ......... + ......... + ......... + ......... + ......... +
2580 2640
HUM G~GTTTATATTCTTAT~CTACCAGGCTTCGGAATAATCTCCCATATTGT~CTTACTAcTCCGGAAAAAAAG~CcATTTGGATACATAGGTATGGTCTGAGcTATGATATCAATTGGC CHI T C T T C T A
PYG C T C T A C C T A T
GOR C A C T C T A A T
O~ C C C T C C C AC G T C A C AG C T
SIA C G G C T C A C A T A C C C G ......... + ......... + ......... + ......... + ......... + ......... + ......... + ......... + ......... + ......... + ......... + ......... +
Fig. 1. Cont inued on next page.
36
2700 2760
HUM TTCCTAGGGTTTATCGTGTGAGCACACCATATATTTACAGTAGGAATAGACGTAGACACACGAGCATATTTCACCTCCGCTACCATAATCATCGCTATCCCCACCGGCGTCAAAGTATTT
CHI G C C T T T C
PYG T C T T T T C
GOR G A T C C T C C C
ORA G T A C C C G G C C T T C
SIA T C T C C C G C T A C T T C T T T . . . . . . . . . + . . . . . . . . . + . . . . . . . . . + . . . . . . . . . + . . . . . . . . . + . . . . . . . . . + . . . . . . . . . + . . . . . . . . . + . . . . . . . . . + . . . . . . . . . + . . . . . . . . . + . . . . . . . . . +
2820 2880
HUM AGCTGACTCGCCACACTCCACGGAAGCAATATGAAATGATCTGCTGCAGTGCTCTGAGCCCTAGGATTCATCTTTCTTTTCACCGTAGGTGGCCTGACTGGCATTGTATTAGCA•ACTCA
CHI T T C A G T C A C C
PYG G T T C A G C G A C T C
GOR T T T CC C A G T C T C A C C C G
ORA T C CT C A C T T C C C T A A C C G
SIA G TG C CC C A C T C C T A G A T C T ......... + ......... + ......... + ......... + ......... + ......... + ......... + ......... + ......... + ......... + ......... + ......... +
2 9 4 0 3 0 0 0
HUM TCACTAGACATCGTACTACACGACACGTACTACGTTGTAGCCCACTTCCACTATGTCCTATCAATAGGAGCTGTATTTGCCATCATAGGAGGCTTCATTCACTGATTTCCCCTATTCTCA
CHI T G A C C T C C
PYG T A T C C C C T
GOR T T G G A T C T T G C G T
ORA T T A T C T C C G C A
SIA G T T A T C T T C C C T G C C G . . . . . . . . . + . . . . . . . . . + . . . . . . . . . + . . . . . . . . . + . . . . . . . . . + . . . . . . . . . + . . . . . . . . . + . . . . . . . . . + . . . . . . . . . + . . . . . . . . . + . . . . . . . . . + . . . . . . . . . +
3 0 6 0 3120
HUM GGCTACACCCTAGACCAAACCTACGCCAAAATCCATTTCACTATCATATTCATCGGCGTAAATCTAACTTTCTTCCCACAACACTTTCTCGGCCTATCCGGAATGCCCCGACGTTACTCG
CHI T T A TG C G T C C G C T T G
PYG T T A TG C T C C C T G T
GOR T T T C TG C T T C T T A A
ORA A G T T T C TC C TG T C G T C T A T A C C
SIA TT T T T C G C T TG A A CT C T C G A T T C . . . . . . . . . + . . . . . . . . . + . . . . . . . . . + . . . . . . . . . + . . . . . . . . . + . . . . . . . . . + . . . . . . . . . + . . . . . . . . . + . . . . . . . . . + . . . . . . . . . + . . . . . . . . . + . . . . . . . . . +
3 1 8 0 3 2 4 0 HUM GACTACCCCGATGCATACACCACATGAAACATCCTATCATCTGTAGGCTCATTCATTTCTCTAACAGCAGTAATATTAATAATTTTCATGATTTGAGAAGCCTTCGCTTCGAAGCGAAAA
CHI TG C T C C G T A A
PYG T TG C C C G A T A A
GOR T T T G C G C T A C C A A
ORA T C T T TT C C T C C T C A T C A A
SIA T T C C G T C C A C G T C A . . . . . . . . . + . . . . . . . . . + . . . . . . . . . + . . . . . . . . . + . . . . . . . . . + . . . . . . . . . + . . . . . . . . . + . . . . . . . . . + . . . . . . . . . + . . . . . . . . . + . . . . . . . . . + . . . . . . . . . +
3 3 0 0 3 3 6 0
HUM GTCCTAATAGTAGAAGAACCCTCCATAAACCTGGAGTGACTATATGGATGCCCCCCACCCTACCACACATTCGAAGAACCCGTATACATAAAATCTAGACAAAAAAGGAAGGAATCGAAC
CHI G GC A
PYG G GC G G G
GOR A C C T G T T T T GT T T G A
ORA C A T C T C G A GT C T G T C T C CGAG
SIA A A C C G CT A GT G C A T T T G C T C . . . . . . . . . + . . . . . . . . . + . . . . . . . . . + . . . . . . . . . + . . . . . . . . . + . . . . . . . . . + . . . . . . . . . + . . . . . . . . . + . . . . . . . . . + . . . . . . . . . + . . . . . . . . . + . . . . . . . . . +
3420 3480
HUM CCCCCAAAGCTGGTTTCAAGCCAACCCCATGGCCTCCATGACTTTTTCAAAAAGGTATTAG~CCATTTCATAACTTTGTCAAAGTTAAATTATAGGCT-AAATCCTATATATCTTA
CHI T A A T C T - CC CG
PYG T A C A T C T - C CG
GOR A T A T G CG T - C CG
ORA T T AA C C G C TC- G C G G
A C C TCC C CG SIA T T A C G AA TT T ......... + ......... + ......... + ......... + ......... + ......... + ......... + ......... + ......... + ......... + ......... + ......... +
3540 3 6 0 0
HUM ATGG•ACATG•AG•G•AAGTAGGTCTACAAGACGCTACTTCCC•TATCATAGAAGAGCTTATCACCTTT•ATGATCA•GCCCTCATAAT•ATTTTCCTTATCTGCTTCCTAGTCCTGTAT CHI T A T T C C T T C T C T A C
PYG C A T T C T T C T C C
GOR T A A T T T C T C
ORA G C A G C T AT GG T C C C A C
SIA T C A A A T T C C C T A A ......... + ......... + ......... + ......... + ......... + ......... + ......... + ......... + ......... + ......... + ......... + ......... +
366Q 3720
HUM GCCCTTTTCcTA•CACTCACAACAAAACTA•CTAATACTAACATCTCAGACGCTCAGGAAATAGAAACCGTCTGAACTATCCTGCCCGCCATCATCCTAGTCCTCATCGCCCTCCCATCC
CHI GT T C T T A
PYG GT T C T T T T
GOR G C AC C A G A C T T T G T
ORA G C C C T C A G TAT A A A T A T
SIA C CC T T A G C A G A A T T T T T A T . . . . . . . . . + . . . . . . . . . + . . . . . . . . . + . . . . . . . . . + . . . . . . . . . + . . . . . . . . . + . . . . . . . . . + . . . . . . . . . + . . . . . . . . . + . . . . . . . . . + . . . . . . . . . + . . . . . . . . . +
3780 3840
HUM CTACGCATCCTTTACATAACAGACGAGGTCAACGATCCCTCCCTTACCATCAAATCAATTGGCCACCAATGGTACTGAACCTACGAGTACACCGACTACGGCGGACTAATCTTCAACTCC
CHI G T C T T T C T A T A G
PYG T T C T T T C T A T A
GOR A C T G T AA T C T C T C T A A T T T G T
ORA C T AA C T T C T C T T T T T G T SIA C T AA C T T GG C T T G A G A T A T G T T
. . . . . . . . . + . . . . . . . . . + . . . . . . . . . + . . . . . . . . . + . . . . . . . . . + . . . . . . . . . + . . . . . . . . . + . . . . . . . . . + . . . . . . . . . + . . . . . . . . . + . . . . . . . . . + . . . . . . . . . +
3 9 0 0 3 9 6 0
HUM TACATACTTCCCCcATTATTCCTAGAACCAGGCGACCTGCGACTCCTTGACGTTGACAATCGAGTAGTACTCCCGATTGAAGCCCCCATTCGTATAATAATTACATCACAAGACGTCTTG
CHI C T T T A T C G C AG G T TC A
PYG C T A T C G G C AG G T TC A
GOR T C T A C C C T AG G C C T A
ORA G C A C T A C C AG C G C C C
SIA A A T G G T A C C T T A TG C C A ......... + ......... + ......... + ......... + ......... + ......... + ......... + ......... + ......... + ......... + ......... + ......... +
Fig. 1. Cont inued on next page.
37
4020 4080
HUM CA CT C ATGAGC T GTCCCCACAT TAG GCT TAAAAACAGATGCAAT T C C C GGACG TCTAAACCAAACCACT TTCACCGC T ACACGACCGGGGG T ATACTACGG T C AATGCTCTGAAATCTGT
CHI T C C C C A A C A
PYG C C C C A A T C A
GOR T C C C G C G A C A A C G A
ORA A C T C C G C C C A T C A A T T C A
SIA A T C TC T G T C C A C C A A C A ......... + ......... + ......... + ......... + ......... + ......... + ......... + ......... + ......... + ......... + ......... + ......... +
4140 4200
HUM GGAGCAAACCACAGTT T CATGCCCAT CGTCC TAGAATTAAT T C CCC TAAAAAT C T T TGAAATAGGGCCC GTATTTAC C C TATAGCACC C C C TC TA- CCCCCTC TA ...............
CHI T A C T A C T TT C T C ...............
PYG T A G C A C T A TT C T C ...............
GOR C T T T GC C A CG AT TCTC T T C ...............
ORA T C T T C C C A CG TT A T TT A CCC C C TCCTACCTCCTTTCC
SIA G C T C T A G T T C T C G T A C G CTCTG- T C GT ............... ......... + ......... + ......... + ......... + ......... + ......... + ......... + ......... + ......... + ......... + ......... + ......... +
4260 4320
HUM -GAGCC-CACT GTAAAGC T AACTTAGCATTAAC C T T T T AAGTTAAAGAT T AAGAGAAC CAACACCTCTT T ACAGTGAAATGCCCCAACTAAATAC T ACCGTATGGC CCAC CA TAAT T AC C
CHI T- C G G CG A
PYG -A T- C G CG A C
GOR T- C G T T GG G G C G ORA T G - T C C C G CT G A C AC T G C C T
SIA -A T T G GACC C T C G T C C G A T A C C A ......... + ......... + ......... + ......... + ......... + ......... + ......... + ......... + ......... + ......... + ......... + ......... +
4380 4440
HUM C C CATACTC C TTACACTATTCCTCATCACC CAACTAAAAATATTAAACACAAACTACCACCTACC TC C CTCACCAAAGCCCATAAAAATAAAAAATTATAACAAACCCTGAGAAC C AAA
CHI G T G TT T T C A C C T
PYG T T T T T T C A C C T GOR A C T T G T T C T AA T C TCTGT
ORA A C T G GT C T T C CT C CA C ATTT CC C CCCC CGC
SIA T A T C C TA C C TGT T C CG C A T C T CCCC C C AC ......... + ......... + ......... + ......... + ......... + ......... + ......... + ......... + ......... + ......... ÷ ......... + ......... +
4500 4560
HUM TGAACGAAAAT CTG T TCGCTTCAT TCATTGCCCCCACAATCC T AGGC CTACCCGCCGCAGTACTGATCAT T C T ATT TCC C C CTC T ATTGAT C C CCAC C TCCAAATAT CTCATCAACAAC C
CHI A GC T A C C G T T C
PYG GC C C G T T C
GOR T A T T A T C C C
ORA G A A CC C A G C T A T AG CT CT C AG T C T
SIA A GC T CA T T C A T T T C T ......... + ......... + ......... + ......... + ......... + ......... + ......... + ......... + ......... + ......... + ......... + ......... +
4620 4680
HUM GAC TAAT C AC CA C C C AACAAT GACTAAT C AAAC T AAC CT C AAAACAAAT GATAAC C ATACACAACACTAAAGGACGAAC C T GATCTC TTATAC T AGTATCCT TAAT C ATTT TTATT G C CA
CHI T TC G A T G C A
PYG T TC G A T C T
GOR G TG G C A T T G C G C GT A GA T
ORA T T G CG C CT A T CC T T C A AC C C T
SIA T TC T G T A AC C C T A T TC T C T ......... + ......... + ......... + ......... + ......... + ......... + ......... + ......... + ......... + ......... + ......... + ......... +
4740 4800
HUM CAAC TAAC C TCC T C GGACTCC TGCCTCAC T CAT TTACAC C AAC C AC C C AAC TAT C T ATAAACC TAGCCAT GGC C ATCCCC T T ATGAGC G GGCACAGTGATTATAGGC T T TCGC T CTAAGA
CHI C T T T G T A C C T C A G AG C T
PYG T T T A C T C A AG C T
GOR C T C C T G G A C G A G A C C C
ORA C T C CT T G C T T A A C AA G AGCC G C A TC G
SIA T C T A C C G C A A T C A T GCC C T A TCTC A ......... + ......... + ......... + ......... + ......... + ......... + ......... + ......... + ......... + ......... + ......... + ......... +
4860 4920
HUM T TAAAAA T G C C C TAG C C CAC T T C T TAC CACAA G G CACAC C TACA C C C C T TAT C C C CA TAC TAGT TAT TAT C GAAA C CAT CAG C C TACTCAT T CAAC CAATAGC CC T G G C C G TAC GCC TAA CHI C G C T T T A T
PYG C G A C T T T A T
GOR C C AC C T C C T T C A T
ORA CC T AG T C G T C C C A T T T TT T GC T A
SIA CC CA T T T C T C G C T A C T T T T C C G A AT ......... + ......... + ......... + ......... + ......... + ......... + ......... + ......... + ......... + ......... + ......... + ......... +
4936
CCGCTAACATTACTGCAG HUM
CHI
PYG
GOR C ORA C C
s~A __L__~___L+____~ . . . . . .
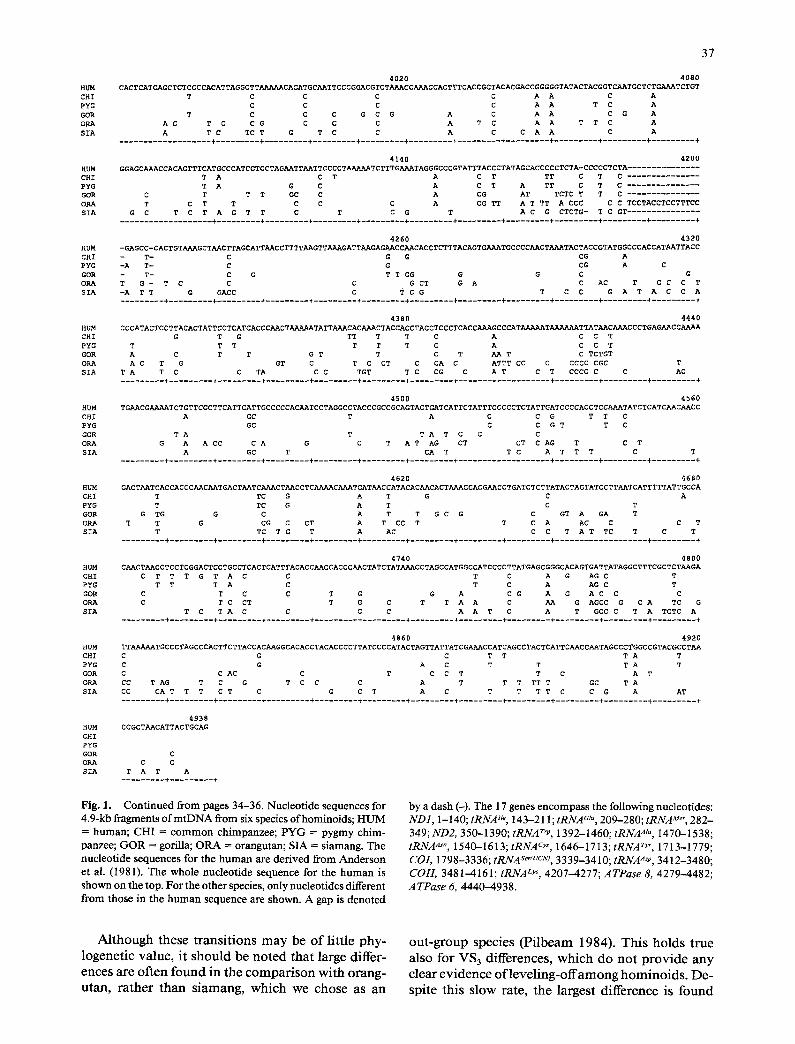
Fig, 1. Continued from pages 34-36. Nucleotide sequences for 4.9-kb fragments ofmtDNA from six species of hominoids; HUM = human; CHI = common chimpanzee; PYG = pygmy chim- panzee; GOR = gorilla; ORA = orangutan; SIA = siamang. The nucleotide sequences for the human are derived from Anderson et al. (1981). The whole nucleotide sequence for the human is shown on the top. For the other species, only nucleotides different from those in the human sequence are shown. A gap is denoted
by a dash (-). The 17 genes encompass the following nucleotides: ND1, 1-140; tRNA ll~, 143-211; tRNA Gtu, 209-280; tRNA Me', 282- 349; ND2, 350-1390; tRNA TM, 1392-1460; tRNA Ate, 1470-1538; tRNA As', 1540-1613; tRNA cys, 1646-1713; tRNA r~r, 1713-1779; COL 1798-3336; tRNA ser(ucN;, 3339-3410; tRNA Asp, 3412-3480; C011, 3481-4161; tRNA z~s, 4207-4277; ATPase 8, 4279-4482; ATPase 6, 4440-4938.
A l t h o u g h these trans i t ions m a y be o f l i tt le phy- l ogene t i c va lue , it s h o u l d be n o t e d that large differ- ences are of ten f o u n d in the c o m p a r i s o n w i t h orang- utan, rather than s iamang , w h i c h we c ho s e as an
out -group spec ies ( P i l b e a m 1984) . T h i s h o l d s true also for VS3 differences, w h i c h do n o t p r o v i d e any clear e v i d e n c e o f l e v e l i n g - o f f a m o n g h o m i n o i d s . D e - spite this s l ow rate, the largest difference is f o u n d
38
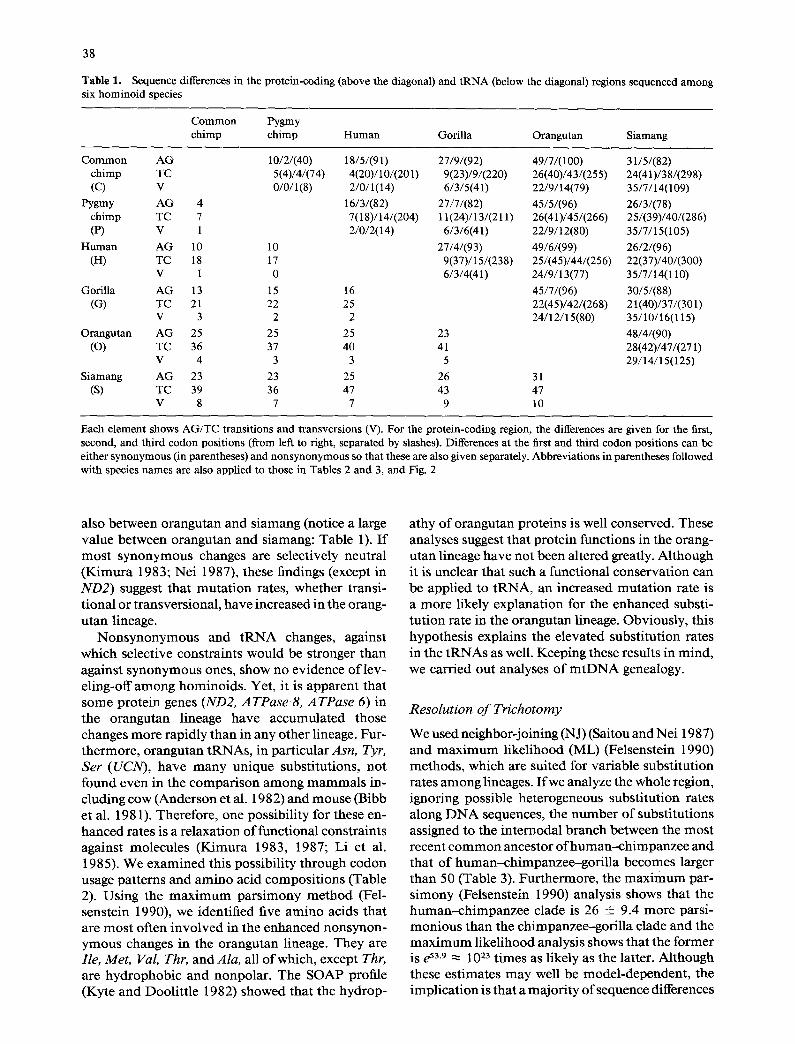
Table 1. Sequence differences in the protein-coding (above the diagonal) and tRNA (below the diagonal) regions sequenced among six hominoid species
Common Pygmy chimp chimp Human Gorilla Orangutan Siamang
Common AG 10/2/(40) 18/5/(91) 27/9/(92) 49/7/(100) 31/5/(82) chimp TC 5(4)/4/(74) 4(20)/10/(201) 9(23)/9/(220) 26(40)/43/(255) 24(41)/38/(298) (C) V 0/0/1(8) 2/0/1(14) 6/3/5(41) 22/9/14(79) 35/7/14(109)
Pygmy AG 4 16/3/(82) 27/7/(82) 45/5/(96) 26/3/(78) chimp TC 7 7(18)/14/(204) 11(24)/13/(211) 26(41)/45/(266) 25/(39)/40/(286) (P) V 1 2/0/2(14) 6/3/6(41) 22/9/12(80) 35/7/15(105)
Human AG 10 10 27/4/(93) 49/6/(99) 26/2/(96) (H) TC 18 17 9(37)/15/(238) 25/(45)/44/(256) 22(37)/40/(300)
V 1 0 6/3/4(41) 24/9/13(77) 35/7/14(110) Gorilla AG 13 15 16 45/7/(96) 30/5/(88)
(G) TC 21 22 25 22(45)/42/(268) 21(40)/37/(301) V 3 2 2 24/12/15(80) 35/10/16(115)
Orangutan AG 25 25 25 23 48/4/(90) (O) TC 36 37 40 41 28(42)/47/(271)
V 4 3 3 5 29/14/15(125) Siamang AG 23 23 25 26 31
(S) TC 39 36 47 43 47 V 8 7 7 9 10
Each element shows AG/TC transitions and transversions (V). For the protein-coding region, the differences are given for the first, second, and third codon positions (from left to right, separated by slashes). Differences at the first and third codon positions can be either synonymous (in parentheses) and nonsynonymous so that these are also given separately. Abbreviations in parentheses followed with species names are also applied to those in Tables 2 and 3, and Fig. 2
also be tween orangutan and s iamang (notice a large value between orangutan and siamang: Table 1). I f m o s t s y n o n y m o u s changes are selectively neutral ( K i m u r a 1983; Nei 1987), these findings (except in ND2) suggest tha t m u t a t i on rates, whether transi- t ional or t ransversional , have increased in the orang- u tan lineage.
N o n s y n o n y m o u s and tRNA changes, against which selective constraints would be stronger than against s y n o n y m o u s ones, show no evidence o f lev- eling-off a m o n g hominoids . Yet, it is apparen t that some prote in genes (ND2, ATPase 8, ATPase 6) in the orangutan lineage have accumula ted those changes m o r e rapidly than in any other lineage. Fur- the rmore , o rangutan tRNAs , in part icular Ash, Tyr, Ser (UCN), have m a n y unique substi tutions, not found even in the compar i son a m o n g m a m m a l s in- cluding cow (Anderson et al. 1982) and mouse (Bibb et al. 1981). Therefore , one possibil i ty for these en- hanced rates is a re laxat ion o f funct ional constraints against molecules (K_imura 1983, 1987; Li et al. 1985). We examined this possibil i ty through codon usage pat terns and a m i n o acid compos i t ions (Table 2). Using the m a x i m u m p a r s i m o n y m e t h o d (Fel- senstein 1990), we identified five a m i n o acids that are m o s t often invo lved in the enhanced nonsynon- y m o u s changes in the orangutan lineage. They are Ile, Met, Val, Thr, and Ala, all o f which, except Thr, are hydrophob ic and nonpolar . The SOAP profile (Kyte and Dooli t t le 1982) showed that the hydrop-
a thy o f orangutan proteins is well conserved. These analyses suggest that prote in functions in the orang- u tan lineage have not been al tered greatly. Al though it is unclear that such a functional conservat ion can be appl ied to t R N A , an increased muta t ion rate is a more likely explanat ion for the enhanced substi- tu t ion rate in the orangutan lineage. Obvious ly , this hypothesis explains the e levated subst i tut ion rates in the t R N A s as well. Keeping these results in mind , we carr ied out analyses o f m t D N A genealogy.
Resolution of Trichotomy
We used neighbor-joining (NJ) (Saitou and Nei 1987) and m a x i m u m likel ihood (ML) (Felsenstein 1990) methods , which are suited for var iable subst i tut ion rates a m o n g lineages. I f we analyze the whole region, ignoring possible heterogeneous subst i tut ion rates along D N A sequences, the n u m b e r o f subst i tut ions assigned to the in ternodal b ranch between the m o s t recent c o m m o n ancestor o f human--ch impanzee and that o f h u m a n - c h i m p a n z e e - g o r i l l a becomes larger than 50 (Table 3). Fur thermore , the m a x i m u m par- s imony (Felsenstein 1990) analysis shows that the h u m a n - c h i m p a n z e e clade is 26 + 9.4 more parsi- mon ious than the ch impanzee-gor i l l a clade and the m a x i m u m likel ihood analysis shows that the fo rmer is e 53.9 ~ 1023 t imes as likely as the latter. Although these es t imates m a y well be model -dependent , the impl ica t ion is tha t a major i ty o f sequence differences

Siamang
(4,S) 4
(3,4l
I
13 Myr
(4,0)
(3,G)
3 (2,H)
(2,3) 1211 , P)
(1,C)
I I I
T T T g h c
Gorilla
Human
Pygmy chimpanzee
Common chimpanzee
Orangutan
39
Fig. 2. Genealogy of six hominoid mtDNAs. As a cladogram, all tree-making methods best support this mtDNA genealogy, irrespective of genes or data sets as in Table 3. A node is numbered through 1-4, and a branch length between X and Y (either nodes or tips) is in- dicated by (X, Y). The gorilla splitting time (Tg in text) was estimated from the divergence time between orangutan and the African apes (13 Myr ago) multiplied by the proportion of
(H,G) branch length, (3, 4) + (H, G)' where (H, G)
= 1/2[(2, 3) + (2, H) + (3, G)], and then the human divergence time (Th in text) was ob-
tained by (2, H)Tg Here, a constant (2, H) + (2, 3)"
rate is assumed in both lineages leading to go- rilla and human. In the chimpanzee lineage, the rate appears to be constant but somewhat
(C, P)Th retarded, so (1, 2) + (C, P)' where (C, P) =
1/2[(I, C) + (1, P)]. The maximum sampling errors of estimated divergence times were computed by modifying the method in Taka- hata and Tajima (1991).
undoubtedly support the human-chimpanzee clade, provided that the mtDNA genealogy is topologically identical to the hominoid ancestry (see below). Thus, we conclude that chimpanzees are the closest extant relatives to human. With relatively small numbers of nucleotide differences, the same conclusion was drawn by data on the COHgene (Ruvolo et al. 1991), the ~b~- (Koop et al. 1986; Miyamoto et al. 1987) and ~-globin genes (Koop et al. 1989), the rRNA gene (Gonzalez et al. 1990), and the immunoglob- ulin-~ pseudogene (Ueda et al. 1989). This is also supported by DNA-DNA hybridization (Sibley and Ahlquist 1984; Caccone and Powell 1989; Sibley et al. 1990).
Divergence Times
The dating of species divergences is a subtler prob- lem. It depends more strongly on the inference of multiple-hit substitutions. Although there are a number of statistical studies on such inferences (KJ- mura 1983; Nei 1987), we think that information is still too meager to construct accurate methods for correcting extensive multiple-hits. For long se- quences that include many different genes, another complication might occur due to gene-specific evo- lutionary rates and/or to extensive multiple-hit sub- stitutions in some regions. To avoid these problems and obtain reliable dating, it seems necessary to restrict an analysis to relatively conserved regions that we are, to a certain extent, confident of what might happen in the evolutionary process. In fact, if we consider all types of differences, the estimates of branch lengths in the mtDNA genealogy by MP, ML, and NJ would differ from each other not to a small extent (the first three rows in Table 3). For
this reason, AG-TCS3 and T C S 1 differences were excluded in N J, whereas all information at the third codon positions was discarded in MP and ML (but not TCS~ differences for technical reasons).
However, it is statistically undesirable to divide data into too many categories. The first data set we collectively used for dating hominoid diversifica- tions consists of the tRNAs, first and second codon posit ions (DATA1). Even for these conserved regions, MP tends to underestimate long branch length and overestimate recent divergence times. For this reason, we did not use it for dating. It turned out that synonymous changes at the first positions of Leu codons have substantial effects on the esti- mation. Because such changes are nearly saturated among hominoids (Table 1), we became skeptical of including them. We therefore examined another data set DATA2, which consists of the tRNA and nonsynonymous differences. As mentioned, VS3 dif- ferences do not show any leveling-off. However, be- cause VS3 differences alone are subjected to large sampling errors due to a small number of relevant sites (481), we included them into DATA2 (DATA3). DATA2 and DATA3 could be analyzed only by NJ.
Under the assumption that the divergence time between orangutan and the African apes is 13 Myr ago (Pilbeam 1984), we estimated the divergence times of gorilla (T~), human (Th), and between com- mon and pygmy chimpanzees (To) to be
T~ T~ T~ DATAI(ML) 7.0 4.3 2.1 DATA 1 (NJ) 8.1 5.6 2.8 DATA2(NJ) 7.6 5.2 2.7 DATA3(NJ) 7.7 4.7 2.5
4O
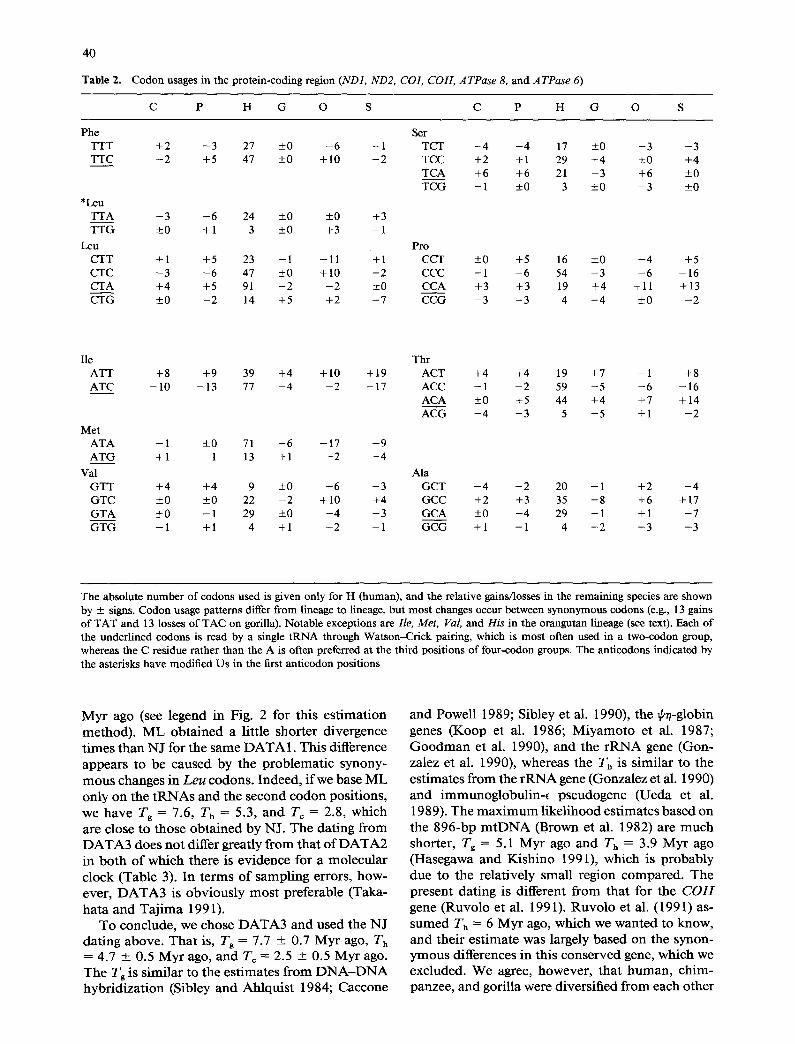
Table 2. Codon usages in the protein-coding region (NDI, ND2, CO1, COIl, ATPase 8, and ATPase 6)
C P H G O S C P H G O S
Phe Ser TTT +2 - 3 27 ±0 - 6 - 1 TCT - 4 - 4 17 ±0 - 3 - 3 TTC - 2 +5 47 ±0 +10 +2 TCC +2 +1 29 +4 ±0 +4
TCA +6 +6 21 - 3 +6 ±0 TCG - 1 ±0 3 ±0 - 3 ±0
*Leu TTA - 3 - 6 24 ±0 ±0 +3 TTG ±0 +1 3 ±0 +3 +1
Leu Pro CTT +1 +5 23 - 1 -11 +1 CCT CTC - 3 - 6 47 ±0 +10 +2 CCC CTA +4 +5 91 - 2 - 2 ±0 CCA CTG ±0 - 2 14 +5 +2 - 7 CCG
±0 +5 16 ±0 - 4 +5 - 1 - 6 54 - 3 - 6 -16 +3 +3 19 +4 +11 +13 - 3 - 3 4 - 4 ±0 - 2
lie Thr ATT +8 +9 39 +4 + 10 + 19 ACT ATC - 1 0 -13 77 - 4 - 2 -17 ACC
ACA ACG
Met ATA - 1 ±0 71 - 6 -17 - 9 ATG +1 - 1 13 +1 - 2 - 4
Val Ala GTT +4 +4 9 ±0 - 6 - 3 GCT GTC ±0 ±0 22 - 2 +10 +4 GCC GTA ±0 - 1 29 ±0 - 4 +3 GCA GTG - 1 +1 4 +1 - 2 - 1 GCG
+4 +4 19 +7 - 1 +8 - 1 - 2 59 - 5 - 6 -16 ±0 +5 44 +4 +7 +14 - 4 - 3 5 - 5 +1 - 2
- 4 - 2 20 - 1 +2 - 4 +2 +3 35 +8 +6 +17 + 0 - 4 29 - 1 + 1 - 7
+1 - 1 4 - 2 - 3 - 3
The absolute number of codons used is given only for H (human), and the relative gains/losses in the remaining species are shown by + signs. Codon usage patterns differ from lineage to lineage, but most changes occur between synonymous codons (e.g., 13 gains of TAT and 13 losses of TAC on gorilla). Notable exceptions are lie, Met, Val, and His in the orangutan lineage (see text). Each of the underlined codons is read by a single tRNA through Watson-Crick pairing, which is most often used in a two-codon group, whereas the C residue rather than the A is often preferred at the third positions of four-codon groups. The anticodons indicated by the asterisks have modified Us in the first anticodon positions
M y r ago (see l egend in Fig . 2 for t h i s e s t i m a t i o n m e t h o d ) . M L o b t a i n e d a l i t t le s h o r t e r d i v e r g e n c e t i m e s t h a n N J for t he s a m e D A T A 1. T h i s d i f fe rence a p p e a r s to b e c a u s e d b y the p r o b l e m a t i c s y n o n y -
m o u s changes in L e u c o d o n s . I n d e e d , i f we b a s e M L o n l y o n the t R N A s a n d the s e c o n d c o d o n p o s i t i o n s , we h a v e Tg = 7.6, Th = 5.3, a n d Tc = 2.8, w h i c h a r e c lose to t h o s e o b t a i n e d b y N J . T h e d a t i n g f r o m D A T A 3 d o e s n o t d i f fer g rea t ly f r o m t h a t o f D A T A 2 in b o t h o f w h i c h t h e r e is e v i d e n c e for a m o l e c u l a r c l o c k ( T a b l e 3). I n t e r m s o f s a m p l i n g e r ro rs , h o w - ever , D A T A 3 is o b v i o u s l y m o s t p r e f e r a b l e ( T a k a -
h a t a a n d T a j i m a 1991). T o c o n c l u d e , we c h o s e D A T A 3 a n d u s e d the N J
d a t i n g a b o v e . T h a t is, Tg = 7.7 +__ 0.7 M y r ago, Th = 4.7 +__ 0.5 M y r ago, a n d Tc = 2.5 + 0.5 M y r ago. T h e Tg is s i m i l a r to t he e s t i m a t e s f r o m D N A - D N A h y b r i d i z a t i o n (S ib ley a n d A h l q u i s t 1984; C a c c o n e
a n d Powe l l 1989; S ib ley et al. 1990), the ~n -g lob in genes ( K o o p et al. 1986; M i y a m o t o et al. 1987; G o o d m a n et al. 1990), a n d the r R N A gene ( G o n - za lez et al. 1990), w h e r e a s the Th is s i m i l a r to t he e s t i m a t e s f r o m the r R N A gene ( G o n z a l e z et al. 1990) a n d i m m u n o g l o b u l i n - ~ p s e u d o g e n e ( U e d a et al. 1989). T h e m a x i m u m l i k e l i h o o d e s t i m a t e s b a s e d o n the 8 9 6 - b p m t D N A (Brown et al. 1982) a re m u c h shor te r , Tg = 5.1 M y r ago a n d Th = 3.9 M y r ago
( H a s e g a w a a n d K i s h i n o 1991), w h i c h is p r o b a b l y d u e to t he r e l a t i v e l y s m a l l r eg ion c o m p a r e d . T h e p r e s e n t d a t i n g is d i f fe ren t f r o m tha t for t he C O H gene ( R u v o l o et al . 1991). R u v o l o et al. (1991) as- s u m e d Th = 6 M y r ago, w h i c h we w a n t e d to k n o w , a n d t h e i r e s t i m a t e was la rge ly b a s e d on the s y n o n - y m o u s d i f fe rences in th i s c o n s e r v e d gene, w h i c h we e x c l u d e d . W e agree, h o w e v e r , t h a t h u m a n , c h i m - panzee , a n d gor i l l a were d i v e r s i f i e d f r o m each o t h e r
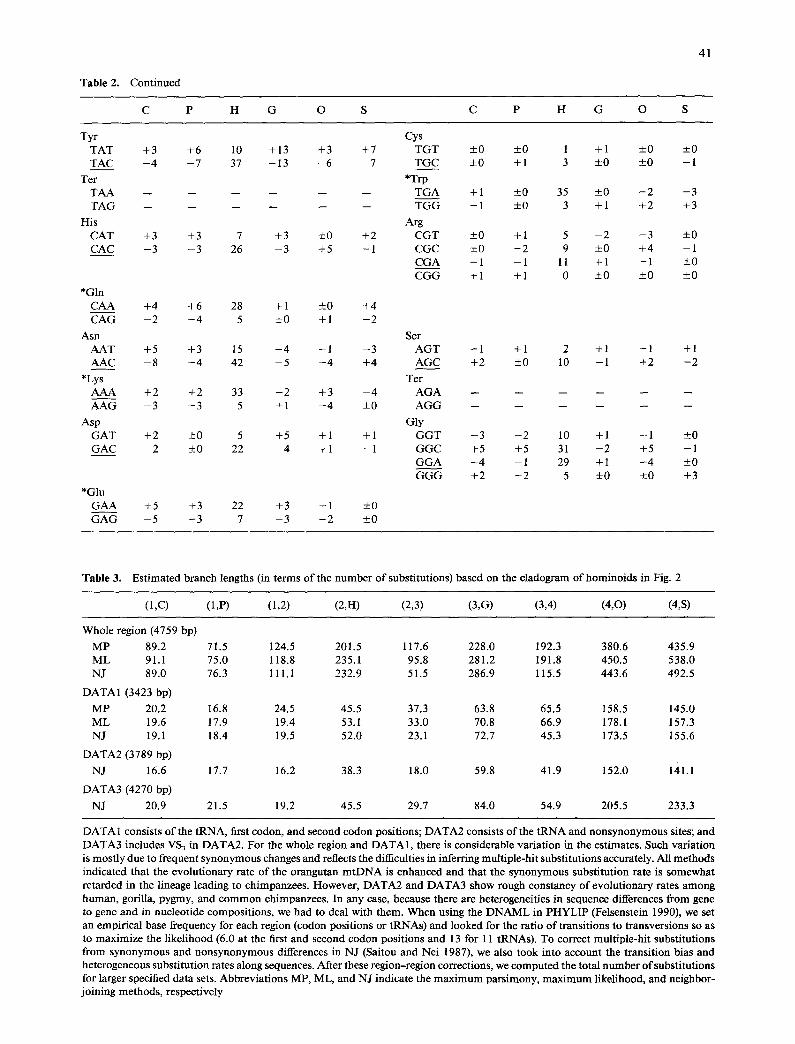
Table 2. Continued
C P H G O S C P H G O S
41
Tyr Cys TAT +3 +6 10 +13 +3 +7 TGT +0 +0 1 +1 -+0 - 0 TAC - 4 - 7 37 - 1 3 - 6 - 7 TGC +0 +1 3 +0 +0 - 1
Ter *Trp TAA . . . . . . TGA +1 +0 35 _+0 - 2 - 3 TAG . . . . . . TGG - 1 _+ 0 3 + 1 + 2 + 3
His Arg CAT +3 +3 7 +3 __+0 +2 CGT _+0 + 1 5 - 2 - 3 - 0 CAC - 3 - 3 26 - 3 +5 - 1 CGC +0 - 2 9 _+0 +4 - 1
CGA - 1 - 1 11 +1 - 1 +0 CGG + 1 + 1 0 +0 _+0 +0
*Gin CAA +4 +6 28 +1 - 0 +4 CAG - 2 - 4 5 _+0 + 1 - 2
Ash Ser AAT +5 +3 15 +4 - 1 - 3 AGT +1 +1 2 +1 - 1 +1 AAC - 8 - 4 42 - 5 - 4 +4 AGC +2 +0 10 - 1 +2 - 2
*Lys Ter AAA +2 +2 33 - 2 +3 - 4 AGA . . . . . . AAG - 3 - 3 5 + 1 - 4 _+0 AGG . . . . . .
Asp Gly GAT +2 ___0 5 +5 +1 +1 GGT - 3 - 2 10 +1 - 1 _+0 GAC - 2 _0 22 - 4 +1 - 1 GGC +5 +5 31 - 2 +5 - 1
GGA - 4 - 1 29 + 1 - 4 _+0 GGG +2 - 2 5 +0 _+0 +3
*Glu GAA +5 +3 22 +3 +1 +0 GAG - 5 - 3 7 - 3 - 2 - 0
Table 3. Estimated branch lengths (in terms of the number of substitutions) based on the cladogram of hominoids in Fig. 2
(1 ,C) (1,P) (1,2) (2,H) (2,3) (3,G) (3,4) (4,0) (4,S)
Whole region (4759 bp)
MP 89.2 71.5 124.5 201.5 117.6 228.0 192.3 380.6 435.9 ML 91.1 75.0 118.8 235.1 95.8 281.2 191.8 450.5 538.0 NJ 89.0 76.3 111.1 232.9 51.5 286.9 115.5 443.6 492.5
DATA1 (3423 bp)
MP 20.2 16.8 24.5 45.5 37.3 63.8 65.5 158.5 145.0 ML 19.6 17.9 19.4 53.1 33.0 70.8 66.9 178.1 157.3 NJ 19.1 18.4 19.5 52.0 23.1 72.7 45.3 173.5 155.6
DATA2 (3789 bp)
NJ 16.6 17.7 16.2 38.3 18.0 59.8 41.9 152.0 141.1
DATA3 (4270 bp)
NJ 20.9 21.5 19.2 45.5 29.7 84.0 54.9 205.5 233.3
DATA 1 consists of the tRNA, first codon, and second codon positions; DATA2 consists of the tRNA and nonsynonymous sites; and DATA3 includes VS3 in DATA2. For the whole region and DATA 1, there is considerable variation in the estimates. Such variation is mostly due to frequent synonymous changes and reflects the difficulties in inferring multiple-hit substitutions accurately. All methods indicated that the evolutionary rate of the orangutan mtDNA is enhanced and that the synonymous substitution rate is somewhat retarded in the lineage leading to chimpanzees. However, DATA2 and DATA3 show rough constancy of evolutionary rates among human, gorilla, pygmy, and common chimpanzees. In any case, because there are heterogeneities in sequence differences from gene to gene and in nucleotide compositions, we had to deal with them. When using the DNAML in PHYLIP (Felsenstein 1990), we set an empirical base frequency for each region (codon positions or tRNAs) and looked for the ratio of transitions to transversions so as to maximize the likelihood (6.0 at the first and second codon positions and 13 for 11 tRNAs). To correct multiple-hit substitutions from synonymous and nonsynonymous differences in NJ (Saitou and Nei 1987), we also took into account the transition bias and heterogeneous substitution rates along sequences. After these region-region corrections, we computed the total number of substitutions for larger specified data sets. Abbreviations MP, ML, and NJ indicate the maximum parsimony, maximum likelihood, and neighbor- joining methods, respectively
42
wi th subs t an t i a l s epa ra t ion t imes (Sibley a n d Ahl - qu is t 1984; Gonza l ez et al. 1990; R u v o l o et al. 1991).
T h e t i m e difference b e t w e e n gori l la a n d h u m a n
thus appears 3 M y r a n d a m o u n t s to 200 ,000 gen- e ra t ions i f the gene ra t i on t i m e o f the ances t ra l spe-
cies was 15 years. W h e t h e r different e s t ima tes o f this t i m e pe r iod are a t t r i b u t e d to ances t ra l poly-
m o r p h i s m ( R u v o l o et al. 1991), a po t en t i a l cause o f
d i s co rdance b e t w e e n sequence genealogy a n d spe-
cies re la tedness , d e p e n d s o n the ances t ra l p opu l a - size ( P a m i l o a n d Ne i 1988; T a k a h a t a 1989). Be it
the s ame order o f m a g n i t u d e (104 ) as the e s t i m a t e d
c u r r e n t h u m a n p o p u l a t i o n size (Nei 1987), the effect
m u s t be smal l , a n d it is l ikely tha t m t D N A genealogy
is i den t i ca l to species re la tedness ( T a k a h a t a 1989). No te , however , tha t i f the ances t ra l p o p u l a t i o n size t u r n s ou t to be o n the o rder o f 105 ( T a k a h a t a et al.
1992), m o l e c u l a r phy logeny o f h o m i n o i d s m a y dif-
fer f r o m gene to gene. O n the o the r hand , the t i m e p e r i o d s ince h u m a n first b r a n c h e d off a m o u n t s to
s o m e 300 ,000 genera t ions . D u r i n g these gene ra t ions
the h o m i n i d l ine u n d e r w e n t a d d i t i o n a l l y a t least four or five m a j o r changes in m o r p h o l o g i c a l t ra i ts
( P i l b e a m 1984; Lewin 1988; St r inger 1990). O u r
resul ts do n o t clarify the causes a n d m e c h a n i s m s o f
h u m a n e v o l u t i o n , b u t e s tab l i sh ing the phy logeny a n d t i m e s p r o v i d e s the necessary b a c k g r o u n d for
such research.
Acknowledgments. This paper is dedicated to the late Allan C. Wilson who pioneered and had made outstanding contributions to molecular systematics. We thank J.F. Crow and J. Klein for comments on an early version of this paper and S. Ueda and O. Takenaka for providing the gorilla and pygmy chimpanzee ge- nomic DNA.
References
Anderson S, Bankier AT, Barrell BG, de Brnijn MHL, Coulson AR, Drouin J, Eperon IC, Nierlich DP, Roe BA, Sanger F, Schreier PH, Smith AJH, Staden R, Young IG (1981) Se- quence and organization of the human mitochondrial ge- nome. Nature 290:457-465
Anderson S, de Bruijn MHL, Coulson AR, Eperon IC, Sanger F, Young IG (1982) Complete sequence of bovine mitochon- drial DNA: conserved features of the mammalian mitochon- drial genome. J Mol Biol. 156:683-717
Bibb M J, Van Etten RA, Wright CT, Walberg MW, Clayton DA (1981) Sequence and gene organization of mouse mitochon- drial DNA. Cell 26:167-180
Brown WM, Prager EM, Wang A, Wilson AC (1982) Mito- chondrial DNA sequences of primates: tempo and mode of evolution. J Mol Evol 18:225-239
Caccone A, Powell JR (1989) DNA divergence among homi- noids. Evolution 43:925-942
Darwin C (1859) The origin of species by means of natural selection. John Murray, London
Djian P, Green H (1989) Vectorial expansion of the involucrin gene and the relatedness of the hominoids. Proc Natl Acad Sci USA 86:8447-8451
Felsenstein J (1990) PHYLIP manual version 3.3. University Herbarium, University of California, Berkeley
Foran DR, Hixson JE, Brown WM (1988) Comparison of ape and human sequences that regulate mitochondrial DNA tran- scription and D-loop DNA synthesis. Nucleic Acids Res 16: 5841-5861
Gibbons A (1990) Our chimp cousins get that much closer. Science 250:376
Gonzalez IL, Sylvester JE, Smith TF, Stambolian D, Schmickel RD (1990) Ribosomal RNA gene sequences and hominoid phylogeny. Mol Biol Evol 7:203-219
Goodman M, Braunitzer G, Stangl A, Schrank B (1983) Evi- dence on human origin from haemoglobins of African apes. Nature 303:546-548
Goodman M, Koop BF, Czelusniak J, Fitch DHA, Tagle DA, Slightom JL (1989) Molecular phylogeny of the family of apes and humans. Genome 31:316-335
Gould SJ (1980) Our natural place. In: Hen's teeth and horse's toes. W.W. Norton, New York, p 241
Hasegawa M, Kishino H (1991) DNA sequence analysis and evolution of Hominoidea. In: Kimura M, Takahata N (eds) New aspects of the genetics of molecular evolution. Springer/ Verlag, Tokyo, p 303
Hixson JE, Brown WM (1986) A comparison of the small ri- bosomal RNA genes from the mitochondrial DNA of great apes and humans: sequence, structure, evolution, and phy- logenetic implications. Mol Biol Evol 3:1-18
Huxley TH (1894) Evolution and ethics and other essays. D. Appleton, New York
Kimura M (1983) The neutral theory of molecular evolution. Cambridge University Press, Cambridge
Kimura M (1987) Molecular evolutionary clock and the neutral theory. J Mol Evol 26:24-33
Koop BF, Goodman M, Xu P, Chan K, Slightom JL (1986) Primate n-globin DNA sequences and man's place among the great apes. Nature 319:234-238
Koop BF, Tagle DA, Goodman M, Slightom JL (1989) A mo- lecular view of primate phylogeny and important systematic and evolutionary questions. Mol Biol Evol 6:580-612
Kyte J, Doolittle RF (1982) A simple method for displaying the hydropathic character of a protein. J Mol Biol 157:105- 132
Lewin R (1988) In the age of mankind. Smithsonian Book, Washington DC
Li W-H, Luo C-C, Wu C-I (1985) Evolution of DNA sequences. In: Maclntyre RJ (ed) Molecular evolutionary genetics. Ple- num, New York, pp 1-94
Mellars P, Stringer C (1989) The human revolution: behavioral and biological perspectives on the origin of modern humans. Princeton University Press, Princeton NJ
Miyamoto MM, Slightom JL, Goodman M (1987) Phylogenetic relations of humans and African apes from DNA sequences in the ¢/~-globin region. Science 238:369-373
NeiM (1987) Molecular evolutionary genetics. ColumbiaUni- versity Press, New York
Pamilo P, Nei M (1988) Relationships between gene trees and species trees. Mol Biol Evol 5:568-583
Pilbeam DR (1984) The descent of hominoids and hominids. Sci Am 250:60-69
Ruvolo M, Disotell TR, Allard MW, Brown WM, Honeycutt RL (1991) Resolution of the African hominoid trichotomy by use of a mitochondrial gene sequence. Proc Natl Acad Sei USA 88:1570-1574
Saiki RK, Gelfand DH, Stoffen S, Scharf SH, Higuchi R, Horn GT, Mullis KB, Erlich HA (1988) Primer-directed enzy- matic amplifications of DNA with a thermostable DNA poly- merase. Science 239:487-491
Saitou N, Nei M (1987) The neighbour-joining method: a new
method for reconstructing phylogenetic trees. Mol Biol Evol 4:406-425
Sanger F, Nicklen S, Coulson AR (1977) DNA sequence with chain terminating inhibitors. Proc Natl Acad Sci USA 74: 5463-5467
Sarich VM, Wilson AC (1967) Immunological time scale for hominoid evolution. Science 158:1200-1203
SibleyCG, AhlquistJE (1984) The phylogeny of the hominoid primates, as indicated by DNA hybridization. J Mol Evol 20: 2-15
Sibley CG, Comstock JA, Ahlquist JE (1990) DNA hybridiza- tion evidence of hominoid phylogeny: a reanalysis of the data. J Mol Evol 30:202-236
Stringer CB (1990) The emergence of modern humans. Sci Am 263:68-74
TakahataN (1989) Gene genealogy in three related populations: consistency probability between gene and population trees. Genetics 122:957-966
43
Takahata N, Tajima F (1991) Sampling errors in phylogeny. Mol Biol Evol 8:494-502
Takahata N, Satta Y, Klein J (1992) Polymorphism and bal- ancing selection at the major histocompatibility complex loci. Genetics 130:925-938
Ueda S, Watanabe Y, Saitou N, Omoto K, Hayashida H, Miyata T, Hisajima H, Honjo T (1989) Nucleotide sequences of immunoglobulin-epsilon pseudogenes in man and apes and their phylogenetic relationships. J Mol Biol 205:85-90
ZuckerkandlE, PaulingL (1965) Evolutionary divergence and convergence in proteins. In: Bryson Y, Vogel HJ (eds) Evolv- ing genes and proteins. Academic Press, New York, pp 97- 166
Received September 8, 1991/Revised and accepted February 22, 1992