Managing Performance Level of Tram Services in Kolkata : A Factor Analysis Based Approach
10
INDIAN JOURNAL OF MANAGEMENT SCIENCE (IJMS) EISSN 2231-279X – ISSN 2249-0280 www.scholarshub.net Vol.– IV, Issue – 2, June 2014 66 MANAGING PERFORMANCE LEVEL OF TRAM SERVICES IN KOLKATA: A FACTOR ANALYSIS BASED APPROACH Teesta Dey, Senior Research Fellow Department of Geography, University of Calcutta, Kolkata, India. Dr. Sukla Bhaduri, Professor Department of Geography, University of Calcutta, Kolkata, India. ABSTRACT For managing any transport sector, performance level measurement is an effective method. The extant revival strategy of the tram services in Kolkata has not been implemented properly and hence the problems of the CTC tram service sector are continuously converging towards the final extinction of this Asia’s oldest public transport sector. Hence, an attempt has been made to assess the overall performance level of the tram services considering four major criteria viz. infrastructural effectiveness, service quality, economic status and workers’ efficiency. Finally the tram depots are ranked based on their entire performance level. An attempt is also made to identify the prime factors that have direct influence on revenue generation of this State Transport Undertaking (STU). The cumulative result of this research work can be proved beneficial for the future execution of upgradation policies of the CTC tram service in Kolkata city. Keywords: The Calcutta Tramways Company, Infrastructural Effectiveness, Service Quality, Economic Status, Workers’’ Efficiency, Revenue Generation.
-
Upload
kidderporecollege -
Category
Documents
-
view
0 -
download
0
Transcript of Managing Performance Level of Tram Services in Kolkata : A Factor Analysis Based Approach

INDIAN JOURNAL OF MANAGEMENT SCIENCE (IJMS) EISSN 2231-279X – ISSN 2249-0280
www.scholarshub.net Vol.– IV, Issue – 2, June 2014
66
MANAGING PERFORMANCE LEVEL OF TRAM SERVICES IN
KOLKATA: A FACTOR ANALYSIS BASED APPROACH
Teesta Dey,
Senior Research Fellow Department of Geography,
University of Calcutta, Kolkata, India.
Dr. Sukla Bhaduri,
Professor
Department of Geography,
University of Calcutta, Kolkata, India.
ABSTRACT
For managing any transport sector, performance level measurement is an effective method. The extant
revival strategy of the tram services in Kolkata has not been implemented properly and hence the
problems of the CTC tram service sector are continuously converging towards the final extinction of
this Asia’s oldest public transport sector. Hence, an attempt has been made to assess the overall
performance level of the tram services considering four major criteria viz. infrastructural
effectiveness, service quality, economic status and workers’ efficiency. Finally the tram depots are
ranked based on their entire performance level. An attempt is also made to identify the prime factors
that have direct influence on revenue generation of this State Transport Undertaking (STU). The
cumulative result of this research work can be proved beneficial for the future execution of
upgradation policies of the CTC tram service in Kolkata city.
Keywords: The Calcutta Tramways Company, Infrastructural Effectiveness, Service Quality,
Economic Status, Workers’’ Efficiency, Revenue Generation.

INDIAN JOURNAL OF MANAGEMENT SCIENCE (IJMS) EISSN 2231-279X – ISSN 2249-0280
www.scholarshub.net Vol.– IV, Issue – 2, June 2014
67
Introduction:
The Calcutta Tramways Company is the oldest transport organization of India. It is one among a very few in the
world which survived over 140 years through heavy odds. The glory of tram services lasted up to the mid-sixties of
the last century. Thereafter, a modification wave started in the world transport scenario. Most of the pioneered
European cities of tram services decided to terminate tramcars due to astronomical increase of passenger and
vehicular pressure. The inherent limitations like slowness and non-flexibility of tram services was considered as
hindrance towards future speedy urban travel life. Considering various constraints posed by tram services, the
thought of tram service termination was raised in Kolkata during 1960s and 1970s. During that period, most of the
other Indian cities already abandoned tram services. Kolkata was also influenced by that neighbouring effect. The
congested and unplanned city like Kolkata has been facing severe transport problems associated with tram services.
On the contrary, the fragile and senile tram service has also been affected by severe downs and reflecting a steady
falling trend. Tram service was initially started with so much expectation to speed up the urban life, but that was
more than 150 years ago. With the technological advancement in relation to ever increasing population demand, the
viability of running trams has been fallen down. There is a host of problems associated with Kolkata tram services
that make it a non-profitable; subsidy guzzled State Transport Undertaking (STU) with overburdened loss. The
problems of tram services can be categorized into four broad types viz. Infrastructural problems like inadequate
fleet strength, lack of maintenance and no renewal of tramcars, potentiality to cause congestion, concretization of
tram tracks causing vibrations, high breakdown rates, frequent derailment, power supply problems etc.; Traffic and
service related problems like no route flexibility, fixed route on fixed line, low route variety, poor frequency,
restricted services in certain places, hindrances to smooth flow, lack of passengers’ reliability etc.; Economic
problems like low earning from ticket sale but high expenditure that causing severe losses, poor sale per route and
sale per vehicle and lastly problems associated with excess labour pressure and low staff productivity. The
cumulative effect of all these problems try to terminate tram services which is also associated with poor
performance pattern and lack in management sector with improper policy implementation.
Bases for Revival of Tram Services:
In spite of enormous problems, the extant sustainable approach is attracted towards the viability of tram services
due to emerging trend of green transport aspects. The tram has gained tremendous importance worldwide since the
oil crisis of the seventies. The western countries which had abolished tramways in the 1940s and 1950s, to boost
their automobile sector, have brought back tram in an upgraded version. Today as many as 343 tramways and light
rail transits system are operating worldwide. Seven cities of India lost tramcars, but it is hopeful about the resilience
of Kolkata tram services which has withstood the threat of extinction. The pollution free, eco-friendly, disciplined,
convenient for children and age old, almost accident free, low fare based high carrying capacity tramcars have all
the possible potentiality to exist in the global sustainable transport forum. But to sustain this transport mode in the
highly competitive private and mass trafficscape of Kolkata city, emphasis should be given on the improvement and
maintenance of performance level with proper managing viewpoint. Government has failed to do this job earlier,
but recently some evidence of tram up gradation schemes can be observed with policy managements and
performance analysis for future survival aspect. The performance level can be assessed by evaluating quality of
managing tram depots in various aspects. The CTC has six depots within the boundary of core city of Kolkata i.e.
the Kolkata Municipal Corporation (KMC). The depots are named by their location viz. Belgatchhia depot,
Rajabazar Depot, Park Circus Depot, Khidderpore depot, Gariahat depot and Tollygunge depot. The depots are self
contained units which carry out day to day work of repair and maintenance of vehicles and put the vehicles on the
specified routes as per pre-fixed schedules. The generation of revenue and balance of earning and expenditure
largely depends on the management efficiency of the depots. Hence an attempt should be made to identify the
major loopholes of falling trend of tram services and to develop an effective performance up gradation scheme that
can be efficiently managed and implemented by the depot managers to sustain this mode on the roads of Kolkata.
Performance Measurement: Concept and significance:
Performance measurement is a process by which an organization establishes the parameters within which
programmes, investments and acquisitions reaching the intended targets. It often requires the use of statistical
evidences to determine the progress towards specific defined organizational objectives. There are eight reasons for
adapting performance measurement, they are to evaluate, control, budget, motivate, celebrate, promote, learn and

INDIAN JOURNAL OF MANAGEMENT SCIENCE (IJMS) EISSN 2231-279X – ISSN 2249-0280
www.scholarshub.net Vol.– IV, Issue – 2, June 2014
68
improve. Effective performance evaluation is an important method for promoting operational efficiency and service
quality of urban public transport system. It is of utmost requirement for an establishment, if they are to be linked to
decision making.
Decision makers in various transport sectors are frequently faced with the problems of assessing a wide range of
alternatives and selecting one, based on a set of conflicting criteria. The main objective of any selection procedures
is to identify apt selection criteria and obtain the most appropriate combination of criteria with the real requirement.
There is always a need for simple, systematic and logical methods with some mathematical tools to guide decision
makers. There are two main issues that need to be answered; firstly, selection of the factors from a grouped and well
structured criteria, secondly, hierarchical arrangement of the organizations considering their performance pattern
using the selected criteria.
It is always very important to generate an integrated performance measurement system for an organization which is
in the business of providing public transportation to a large population. The objective is to provide the organization
with a transport, easy to understand and flexible methodology for measurement. Also it helps in gauging the overall
performance by incorporating productivity aspects as well as service quality dimensions. This would enable the
management to identify the strengths and weakness, detects any trends prevailing and benchmark against the best in
the business. This simple and practical methodology could be very interesting to policy makers involving in
decision making process under complex condition.
Necessity for Performance Measurement of the Tram Services in Kolkata:
The stagnant and declining conditions of the CTC tram service in Kolkata is the main concern of the transport
department of West Bengal where since 2011 continuous attempts have been making for its revival but till now no
proper results come out in this context. There is a group of relevant reasons for applying the performance
measurement study of this STU as mentioned below –
i. Unlike the STUs of the other Indian cities, Kolkata based STU have been running under severe loss for
several times.
ii. Each of the developmental strategies of this STU is now mal functioning due to lack of implementation of
relevant and effective plans and policies and lack of modifications.
iii. The requirement of subsidy for sustaining this STU is enormous and difficult to supply for the state
government.
iv. In spite of certain resource availability (like land, man power, und etc.) poor maintenance and inefficient
management cause the deterioration of this STU in a regular manner.
v. Performance measurement of this STU considering its depot character can be an effective method for the
identification of dominant factors of its future potential development and management of severe factors for
continuation of the best performance.
vi. Performance measurement leads to the ranking of the depots from which the officials and managerial sectors
can compare and co-operate each other for their holistic development.
vii. In performance measurement, emphasis is given on each factor that has prospective importance for the
rejuvenation of this STU in different aspects.
viii. Performance measurement can point out those factors that cause past deformities and acted for deteriorations
of this organization.
ix. Through performance measurement, best possible way out can be identified for future up gradation of the
tram depots under the CTC.
x. STU based performance measurement can be carried out to place depots hierarchically on the future
development potentiality level and simultaneously up gradation plans can be implemented for the worst
performing depot.
Objectives:
The basic objectives of this study are –
i. To develop a simple, systematic and logical method to guide the depot managers and decision makers by
considering a number of selected criteria.

INDIAN JOURNAL OF MANAGEMENT SCIENCE (IJMS) EISSN 2231-279X – ISSN 2249-0280
www.scholarshub.net Vol.– IV, Issue – 2, June 2014
69
ii. To get an effective performance evaluation of the depots based on four selected criteria viz. Infrastructural
effectiveness, service Quality, Economic Status and Workers’ Efficiency.
iii. To rank the depots of this public transport sector by considering various performance character.
Criteria for Performance Measurement of the CTC Tram Depots:
The performance analysis is purely based on the secondary data of 14 selected indicators under four appropriate
criteria collected from the Tram Depot Managers of the CTC in the financial year of 2011-12 (table 1). The chosen
criteria for performance analysis are infrastructural effectiveness, service quality, economic status and workers’
efficiency. The indicators or the factors are assessed to identify the dimensions along which the performance varies
and for ranking of the depots according to the calculated performance level.
Table 1: Selection of Factors under Different Criteria
Criteria Number of
Indicators/factors Name of the indicators / factors with symbol
C1. Infrastructural Effectiveness Two C1a. Percentage of Outshedded vehicle
C1b. Vehicle Utilization
C2. Service Quality Three
C2a. Effective km run
C2b. Effective Vehicle per route
C2c. Percentage of actual trip per day
C3. Economic Status Six
C3a. Total Earning per day
C3b. Earning per km
C3c. Cost per km
C3d. Loss per km
C3e. Sale per route per day
C3f. Sale per vehicle per day
C4. Workers’ Efficiency Three
C4a. Staff Productivity
C4b. Staff Vehicle Ratio
C4c. Loss per staff
Source: Selected by the author
Indicators of Infrastructural Effectiveness:
The superior tramcar infrastructure refers to the mechanical specification of the vehicle that provides comfortable,
convenient, reliable, consistent, safe, effective and eco-friendly service that is accessible to all (Fielding et. al.,
1985). To assess the present condition and quality of the vehicular infrastructure of the CTC, two different
indicators are considered for analysis (table 2).
Table 2: Description of the Indicators of Infrastructural Effectiveness
Symbol Indicator Basis of Selection Description Quantitative
Unit
C1a Percentage of
Outshedded trams
Determination of regularity
of service
Percentage of Outshedded vehicles to
the total number of working buses Percentage
C1b Vehicle utilization Determination of degree of
vehicle utilization
Kilometre actually operated per day per
vehicle
Km / day /
vehicle
Source: Selected by the author
Indicators of Service Quality:
The quality of tram service largely depends on the degree of availability of tramcars for the general public on a
fixed time at a regular interval. It should provide various route options to offer more or less door to door service.
Such proficient tram service mostly covers effective km with maximum earning from ticket sale and utilize the

INDIAN JOURNAL OF MANAGEMENT SCIENCE (IJMS) EISSN 2231-279X – ISSN 2249-0280
www.scholarshub.net Vol.– IV, Issue – 2, June 2014
70
vehicle for its fullest. The economic gain of the CTC mostly depends on the good quality of tram services. For the
assessment of road based mass transport tram service level four indicators have been chosen for ranking and further
analysis of depot performance (table 3).
Table 3: Description of the Indicators of Service Quality
Symbol Indicator Basis of Selection Description Quantitative
Unit
C2a Effective km
run
Determination of route length
coverage efficiency
Kilometre actually operated by
tram for purposes of earning
revenue through ticket sale and
from other sources per day
Kilometre per
day
C2b
Effective
vehicle per
Route
Determination of vehicular
strength and service pattern on
each route
Number of vehicles capable of
earning revenue in each route
(city or long distance)
Number of
vehicles per
route
C2c
Percentage of
Actual Trip
per day
Determination of punctuality
and consistency of vehicular
services
Percentage of actual trip to the
scheduled trip Percentage
Source: Selected by the author
Indicators of Economic Status:
The transport economics of the CTC deals with movement of passengers over space and time in relation to demand
and supply pattern of the tram services and associated level of earning and expenditure. It deals with the allocation
of resources within the public transport sector (in this case depot wise) that establish the economic ground either
with profit or with loss. Based on the available data six indicators are selected and described (table 4) for the
assessment of economic performance of the STUs.
Table 4: Description of the Indicators of Economic Status
Symbol Indicator Basis of Selection Description Quantitative
Unit
C3a
Total
Earning
per day
Determination of standard level of
revenue generation mainly from ticket
sale on an average week day
Summation of earnings
from each route per day Rs. Per day
C3b EPKM
Determination of profitability of the
operation and the earning potential of
the routes.
Total Earning / Total
Effective km Rs. per km
C3c CPKM
Determination of amount of
expenditure required for each km of
the routes
Total Expenditure / Total
Effective km Rs. per km
C3d LPKM
Determination of the magnitude of
loss from running the vehicles on
routes
Difference between CPKM
and EPKM Rs. per km
C3e
Sale per
route per
day
Determination of nature of route
selection that can provide high
revenue through ticket sale
Earning by ticket sale of
public vehicles per route Rs. per km per day
C3f
Sale per
vehicle
per day
Determination of revenue per
vehicular operation which depends on
average vehicle utilization, fare
structure and earning potential of the
route.
Total earning during an
entire working day / total
number of vehicles on road
during that day.
Rs. per km per day
Source: Selected by the author

INDIAN JOURNAL OF MANAGEMENT SCIENCE (IJMS) EISSN 2231-279X – ISSN 2249-0280
www.scholarshub.net Vol.– IV, Issue – 2, June 2014
71
Indicators of Workers’ Efficiency:
Man power is the most important aspect for the determination of depot performance as it has direct influence on the
previous three criteria. The recent issue regarding the implementation of Voluntary Retirement Scheme (VRS) for
the selected inefficient and excess labour, (either physical ability wise or due to discrepancies in earlier labour
appointments system) acts as the prime factor behind the selection of this criterion. Four major indicators are taken
for consideration for the assessment of the workers’ role in the functioning of the depots and overall improvement.
The indicators clearly reveal the amount of actual requirement of the workers in this sector for maintaining the
services. The description of the selected indicators is clearly explained in table 5.
Table 5: Description of the Indicators of Workers’ Efficiency
Symbol Indicator Basis of Selection Description Quantitative
Unit
C4a Staff
Productivity
Determination of working
capacity of each staff for
each effective km
performed per day.
It is the ratio of total
effective km performed
by total staff in each day
km / employee /
day
C4b Staff -
Vehicle Ratio
Determination of pressure
of staffs and actual
requirement for running
the business.
It is the ratio of the total
staff employed for a
specific period to the total
number of vehicles on
road for the same period.
Unit free
C4c Loss per
Worker
Determination of the
pressure of excess worker
on the economic condition
of this organization.
Difference between
expenditure and earning
in a year / total number of
workers during that year.
Rs. per worker
Source: Selected by the author
Determination of Dominant Factors for the Assessment of Performance Level of the CTC Tram Services:
For performance measurement, single criterion or a small group of criteria may not truly represent the actual scenario and
variations. Combination of various performance parameters including infrastructural, service related, economic and
workforce condition may influence the level of performance up gradation. In this context, an attempt has been made to
bring out the variations in performance pattern of the STUs by combining all the selected parameters. Factor analysis has
been used to combine several performance related parameters to explain the variations in performance pattern,
identification of dominant parameters and hierarchical arrangement of the depots. Since many variables are responsible
for proper tram service development, it is interesting to search out the factors by grouping the variables using the
technique of factor analysis. Here Principal Component Analysis (PCA) method of Factor Analysis has been applied to
study the performance level and pattern by constructing composite indices using IBM SPSS 19 software. The factor
analysis has been widely used for the identification of development indices and finding out the disparities among the
CTC Tram depots and for the determination of their level of performance.
Performance Measurement of the Calcutta Tramways Company (CTC) Tram Services at Depot Level:
For determining the dominant factors that mostly influence the overall performance of the tram depots, total 14
factors are selected to run Principal Component Analysis method. The scenario represents the performance pattern
in 2012. Here factor analysis is carried out with PCA method and four components were extracted. For the
determination of the dominant factors a standard value of ±0.800 is selected, as component scores above this value
is considered to be important. In component matrix (table 1), total six factors are identified dominant based on
the mentioned criteria. In first component, the sequential arrangement of the dominant factors is effective km
performed, earning per month, percentage of Outshedded vehicles, staff productivity and effective vehicle per
route. In second component, only sale per vehicle per day becomes significant. No dominant factors are identified
in component 3 and 4. For the verification of the selected dominant factors, the component matrix is again rotated
using Varimax methods with Kaiser Normalization and is converged in 7 iterations. Here 11 factors are identified as

INDIAN JOURNAL OF MANAGEMENT SCIENCE (IJMS) EISSN 2231-279X – ISSN 2249-0280
www.scholarshub.net Vol.– IV, Issue – 2, June 2014
72
dominant where component 1 comprises of five factors viz. loss per staff per month, effective km run, earning per
month, staff productivity and percentage of Outshedded vehicles; component 2 consists of three factors viz. CPKM,
LPKM and effective vehicle per route; two factors are identified as dominant in component 3 viz. percentage of
actual trip and staff vehicle ratio and finally in component 4 only one factors is identified i.e. EPKM.
Comparing the component and rotated component matrices, those factors are selected as most dominant which have
dual presence. Hence total of six factors are identified covering all the four pre-selected criteria. These are
percentage of Outshedded vehicles as an indicator of infrastructural effectiveness; effective km run and effective
vehicle per route as indicators of service efficiency; total earning as economic indicator and staff productivity and
loss per staff per month as indicators of workers’ efficiency. Hence for future developmental purpose, emphasis
should be given of the improvement of these six factors primarily.
Both the component and rotated component matrices explain 98.79 percentage of the total variance up to four
components. In component matrix, component 1 explains 46.79 percentages, component 2 explains 29.01
percentages, component 3 explains 14.54 percentages and component 4 explains 8.44 percentages. Up to second
component it is far more explained with 75.80 percentages. In case of rotated component matrix 36.83 percentages
is explained in component 1, 29.93 percentages in component 2, 20.56 percentages in component 3 and 11.45
percentages in component 4.
Table 6: Component Matrix
Factors Components
1 2 3 4
Effective km run per day 0.911 0.281 0.261 0.090
Total Earning per day 0.910 0.315 0.262 -0.048
Percentage of outshedded vehicle 0.893 0.252 0.148 0.343
Staff Productivity 0.891 0.420 0.164 -0.041
Effective Vehicle per route per day 0.805 -0.310 -0.463 0.201
Loss per km -0.767 0.422 0.467 0.122
Cost per km -0.743 0.470 0.472 0.070
Loss per staff per month 0.714 0.634 0.287 0.027
Sale per vehicle per day -0.441 0.871 -0.092 -0.191
Vehicle Utilization -0.592 0.798 -0.105 -0.015
Staff Vehicle Ratio 0.011 0.734 -0.183 0.622
Sale per route per day 0.323 0.468 -0.795 -0.204
Percentage of actual trip per day 0.425 -0.510 0.655 -0.198
Earning per km 0.418 0.577 -0.003 -0.698
Table 7: Rotated Component Matrix
Factors Components
1 2 3 4
Loss per staff per month 0.965 0.067 0.114 0.217
Effective km run per day 0.953 -0.248 -0.104 0.070
Total Earning per day 0.942 -0.226 -0.131 0.208
Staff Productivity 0.941 -0.223 0.007 0.252
Percentage of outshedded vehicle 0.931 -0.327 0.042 -0.152
Cost per km -0.162 0.975 0.129 -0.085
Loss per km -0.195 0.961 0.123 -0.151
Effective Vehicle per route per day 0.342 -0.931 0.052 -0.104
Vehicle Utilization -0.123 0.694 0.670 0.228
Sale per vehicle per day -0.002 0.653 0.623 0.429
Percentage of actual trip per day 0.296 -0.105 -0.899 -0.059
Staff Vehicle Ratio 0.407 0.237 0.808 -0.292
Sale per route per day 0.133 -0.445 0.708 0.529
Earning per km 0.459 0.052 0.065 0.881
INDIAN JOURNAL OF MANAGEMENT SCIENCE (IJMS) EISSN 2231-279X – ISSN 2249-0280
www.scholarshub.net Vol.– IV, Issue – 2, June 2014
73
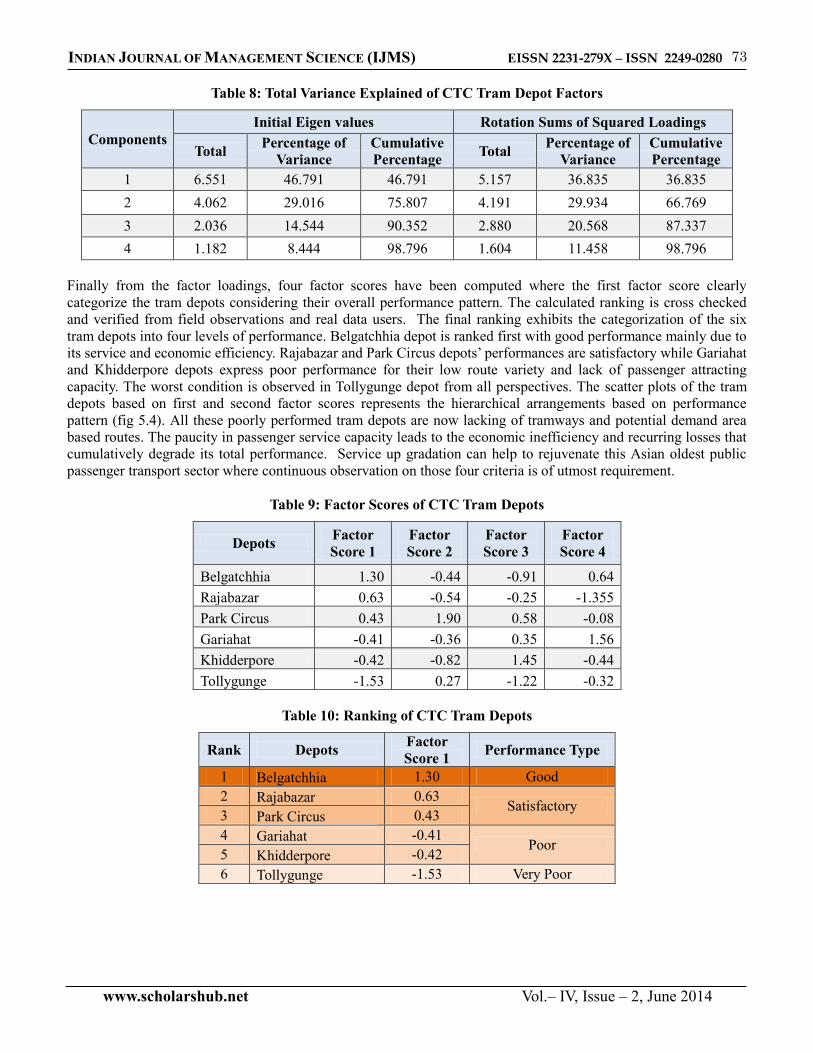
Table 8: Total Variance Explained of CTC Tram Depot Factors
Components
Initial Eigen values Rotation Sums of Squared Loadings
Total Percentage of
Variance
Cumulative
Percentage Total
Percentage of
Variance
Cumulative
Percentage
1 6.551 46.791 46.791 5.157 36.835 36.835
2 4.062 29.016 75.807 4.191 29.934 66.769
3 2.036 14.544 90.352 2.880 20.568 87.337
4 1.182 8.444 98.796 1.604 11.458 98.796
Finally from the factor loadings, four factor scores have been computed where the first factor score clearly
categorize the tram depots considering their overall performance pattern. The calculated ranking is cross checked
and verified from field observations and real data users. The final ranking exhibits the categorization of the six
tram depots into four levels of performance. Belgatchhia depot is ranked first with good performance mainly due to
its service and economic efficiency. Rajabazar and Park Circus depots’ performances are satisfactory while Gariahat
and Khidderpore depots express poor performance for their low route variety and lack of passenger attracting
capacity. The worst condition is observed in Tollygunge depot from all perspectives. The scatter plots of the tram
depots based on first and second factor scores represents the hierarchical arrangements based on performance
pattern (fig 5.4). All these poorly performed tram depots are now lacking of tramways and potential demand area
based routes. The paucity in passenger service capacity leads to the economic inefficiency and recurring losses that
cumulatively degrade its total performance. Service up gradation can help to rejuvenate this Asian oldest public
passenger transport sector where continuous observation on those four criteria is of utmost requirement.
Table 9: Factor Scores of CTC Tram Depots
Depots Factor
Score 1
Factor
Score 2
Factor
Score 3
Factor
Score 4
Belgatchhia 1.30 -0.44 -0.91 0.64
Rajabazar 0.63 -0.54 -0.25 -1.355
Park Circus 0.43 1.90 0.58 -0.08
Gariahat -0.41 -0.36 0.35 1.56
Khidderpore -0.42 -0.82 1.45 -0.44
Tollygunge -1.53 0.27 -1.22 -0.32
Table 10: Ranking of CTC Tram Depots
Rank Depots Factor
Score 1 Performance Type
1 Belgatchhia 1.30 Good
2 Rajabazar 0.63 Satisfactory
3 Park Circus 0.43
4 Gariahat -0.41 Poor
5 Khidderpore -0.42
6 Tollygunge -1.53 Very Poor

INDIAN JOURNAL OF MANAGEMENT SCIENCE (IJMS) EISSN 2231-279X – ISSN 2249-0280
www.scholarshub.net Vol.– IV, Issue – 2, June 2014
74
Earning Generation for the STU:
Based on the impact assessment of dominant factors on the overall performance level of this STU, the prime
objective of the central committee of the state government was to find out the options and factors to escalate the
revenue generation level. The main source of earning is from ticket sale from city services. Apart from that, some
occasional collection of money from special tram services (like during Durga puja) or from private sources, hired
for various purposes like occurrence of marriage ceremony or from movie also supply some revenue. But such
generation of revenue from all the various sources does not incorporate any substantial capitals for enhancing
economic potentiality. The exorbitant expenditure exceeds the level of earning and causes severe loss to this STU.
Such economic unstable condition is identified as the prime factor influencing declining performance level and thus
it is of utmost requirement to identify the sources or factors that can generate more earning. Future up gradation
planning policy should emphasize on the required modification of the factors to minimize the economic
malfunctioning. Hence it is necessary to identify the dominant independent variables upon which the earning level
is mostly dependent. The execute the objective, some variable are reselected as the independent variable among all
the preselected variables which are significant at 0.01 significance level, derived from the correlation matrix (table
11). All of these variables directly and significantly influence the earning level of the CTC Tram sector. But their
degree of influence is determined by multiple regression method.
Table 11: Correlation Matrix of Factors Determining Revenue Generation
C1a C1b C2a C2b C2c C3a C3b C3c C3d C3e C3f C4a C4b C4c
C1a 1.000
C1b -.346 1.000
C2a .951 -.350 1.000
C2b .642 -.675 .539 1.000
C2c .288 -.709 .362 .171 1.000
C3a .912 -.316 .987 .501 .394 1.000
C3b .281 .228 .471 .023 .042 .592 1.000
C3c -.451 .763 -.413 -.948 -.266 -.406 -.091 1.000
C3d -.468 .738 -.445 -.941 -.266 -.447 -.166 .997 1.000
C3e -.253 .970 -.202 -.620 -.647 -.143 .454 .680 .639 1.000
C3f .220 .272 .193 .444 -.563 .240 .554 -.410 -.448 .379 1.000
C4a .911 -.210 .973 .502 .272 .989 .641 -.389 -.434 -.035 .361 1.000
C4b .386 .599 .201 .000 -.553 .154 .010 .291 .288 .538 .377 .257 1.000
C4c .847 .049 .915 .248 .141 .927 .639 -.094 -.141 .204 .289 .951 .423 1.000
Factors Influencing Revenue Generation of the CTC Bus Services:
Tram service analysis is determined by comparatively fewer variables than bus services. Although 14 variables
have been identified but considering the significance level of the correlation matrix among those 14 variables only

INDIAN JOURNAL OF MANAGEMENT SCIENCE (IJMS) EISSN 2231-279X – ISSN 2249-0280
www.scholarshub.net Vol.– IV, Issue – 2, June 2014
75
nine factors have been identified as most significant at 0.01 significance level. These factors have direct impact on
the generation of earning of the CTC tram services. These are as follows – Percentage of Outshedded vehicle (C1a),
vehicle productivity (C1b), effective km run per day (C2a), effective vehicle per route (C2b), cpkm (C3c), lpkm (C3d),
sale per vehicle per day (C3f), staff productivity (C4b) and loss per staff per month (C4c ). Thus the estimated linear
multiple regression equation is –
Yc = 1346.513+3.159x-0.866x-96.707x-1.850x+0.00325x
The estimated value of Yc increases by 3.159 for each unit change of x () and 0.00325 for x () whereas it decreases
by 96.707 for each unit change of x (), 1.850 for x () and 0.866 for x (). The other variables remain insignificant in
this matter. The multiple regressions are explained by 100 percent with the value of R2 of 1.00.
The above equation exhibits effective vehicle per route per day () explains the maximum proportion of variations in
revenue generation followed by percentage of Outshedded vehicle, cpkm / lpkm, vehicle productivity and loss per
staff per month.
Conclusion:
Since inception, in spite of several highs and hiccups, survival of tram service is a great effort but the sustenance of
tram services is now on the verge of extinction. A significant section of the daily passengers in Kolkata depend on
the tam services for various reasons. Apart from that, most of the passengers’ perception regarding continuation of
the tramcars is affirmative in nature. Government of West Bengal has actively started to launch tram revival
programmes. But such initiative should incorporate proper management in accordance with changing spatio-
temporal framework of passengers’ demand. Here the selected indicators encompass all the possible aspects that
directly influence tram service quality. The result exhibits that effective km run per day, share of outshedded
vehicles per day and staff productivity should be increased to get desired performance level for all the depots.
Increasing route variety and frequency can upgrade the present status of Khidderpore, Gariahat and Tollygunge
depots whereas, maintenance of service and vehicle improvement should be implemented in Belgatchhia, Rajabazar
and Park Circus depots. The entire method would enable the management to identify the strengths and weakness of
this organization as a whole, detect any trends prevailing and benchmark against the best in the business (Zanakis
et. al. 1998).This simple and practical methodology could be very interesting to policy makers involved in decision
making process under complex conditions.
References:
[1] Energy Sector Management Assistance Programme (ESMAP) (2011): Guidance Note: Best Operational and
Maintenance Practices for City Bus Fleets to Maximize Fuel Economy, The International Bank for
Reconstruction and Development, The World Bank Group, Washington D.C., U.S.A.
[2] Fielding, G. J, Timlynn, T. Babilsky, Mary, E. Brenner (1985): Performance Evaluation for Bus Transit,
Transportation Research, 19(1),
[3] Halder, D (2006): Urban Transport in India: Crisis and Cure, Book Well, New Delhi,
[4] Kannan, V. R and Tan, K. C (2002): Supplier Selection and Assessment, Their Impacts on Business
Performance, Journal of Supply Chain Management, volume - 38,
[5] Nakanishi Yuko J. (1997): Bus Performance Indicators: On-Time Performance and Service Regularity,
Transportation Research Record.
[6] Ramanathan, R (2004): Indian Transport towards the New Millennium: Performance, Analysis and Policy,
Concept Publishing Company, New Delhi, India.
[7] Sezhian, M. Vetrivel (2011): Performance Measurement in a Public Sector Passenger Bus Transport
Company Using FUZZY TOPSIS, FUZZY AHP and ANOVA – A Case Study, International Journal of
Engineering Science and Technology, Vol. 3 No. 2.
[8] Turton B., Black W. R. (2001): Inter Urban Transport, in Hoyle B. and Knowles R. (ed.), Modern Transport
Geography, John Wiley and Sons.
[9] World Bank (2002): “Cities on the move- A Urban Transport Strategy Review”, Washington D.C.
[10] Zanakis, S, Solomon, A, Wishart, N and Dublish, S (1998): Multi-attribute decision making: A comparison
of select methods, European Journal of Operational Research, volume – 107.
****