
Management practices and M&A success - University of ...
17
Journal of Banking and Finance 134 (2022) 106355 Contents lists available at ScienceDirect Journal of Banking and Finance journal homepage: www.elsevier.com/locate/jbf Management practices and M&A success Manthos D. Delis a,# , Maria Iosifidi a,# , Pantelis Kazakis b,# , Steven Ongena c,#,∗ , Mike G. Tsionas a,d,# a Montpellier Business School, 2300 Avenue des Moulins, Montpellier 34080, France b Adam Smith Business School, University of Glasgow, Gilbert Scott Building, West Quadrangle, Glasgow G12 8QQ, United Kingdom c KU Leuven and CEPR, University of Zurich, Swiss Finance Institute, Plattenstrasse 14, Zurich CH-8032, Switzerland d Montpellier Business School & Lancaster University Management School, Lancaster University Management School, Lancaster LA1 4YX, United Kingdom a r t i c l e i n f o Article history: Received 14 May 2021 Accepted 29 October 2021 Available online 8 November 2021 JEL classification: G14 G34 J24 Keywords: Mergers and acquisitions Management practices Acquirer returns a b s t r a c t We study whether management practices determine merger and acquisition (M&A) success. We model management as an unobserved (latent) variable in a standard microeconomic model of the firm and derive firm-year management estimates. We validate these estimates against benchmark survey data on management practices and by using Monte Carlo simulation. We show that our measure is among the most important determinants of value creation in M&A deals, substantially increasing the predictive power of models that explain cumulative abnormal returns. Thus, we offer a measure of management practices that identifies the best-performing M&As. Our results are robust to the inclusion of acquirer fixed effects and many control variables, and to several other sensitivity tests. We identify the Q-theory as the key mechanism driving our results. © 2021 The Authors. Published by Elsevier B.V. This is an open access article under the CC BY-NC-ND license (http://creativecommons.org/licenses/by-nc-nd/4.0/) 1. Introduction Despite a voluminous literature on merger and acquisition (M&A) success, the main source of that success remains an issue of debate. Most of the variables that researchers propose as deter- minants of acquirers’ performance add little explanatory power to models of value creation. A main reason is that M&A success re- lies on firm characteristics that, by their own nature, relate to the acquirer’s qualitative management practices (Golubov et al., 2015). This is an element difficult to observe or measure. In this study, we first broadly measure management practices following its theoret- ical modeling as an input of production (Lucas, 1978; Bloom et al., 2017). Subsequently, we examine their effect of management prac- tices on M&A value creation. We show that our measure is among the most important determinants (the sine qua non) of cumulated abnormal returns (CARs). We show that our key finding is con- sistent with the Q-theory of M&As, which predicts that acquirers ∗ Corresponding author. E-mail addresses: [email protected] (M.D. Delis), m.iosifi[email protected] (M. Iosifidi), [email protected] (P. Kazakis), [email protected] (S. Ongena), [email protected] (M.G. Tsionas). # These authors contributed equally to this work. with superior management create value in M&As by transferring this management to target firms. The broad definition of “management practices” includes all business decisions and leadership elements. According to main- stream management theory (Katz, 1974), there are three compo- nents of management: human resource management (the ability to interact, communicate, motivate, and negotiate), technical abilities (human capital, knowledge, and proficiency), and conceptual skills (understanding concepts, develop ideas, and implement strategies). We use the term “management practices,” as it is the most general term encompassing the three components. To measure management practices, we use the implications of recent literature. Specifically, Bloom et al. (2017) build on early models of management by Lucas (1978) and Melitz (2003) and show that in addition to capital (physical capital, financial capital, R&D expenses, and land) and labor, firms use management prac- tices to achieve their objectives. This assumption perfectly aligns with the idea that there are three (instead of two) inputs of pro- duction and that management complements capital and labor (e.g., Samuelson and Nordhaus, 2009). Following this set of theoretical models, we measure manage- ment practices as a latent (unobserved) input of firms’ production function (Delis and Tsionas, 2018; Delis et al., 2020). The merit of this approach is threefold. First, it incorporates all firms (acquirers) to yield a firm-year index. Second, it is consistent with both the https://doi.org/10.1016/j.jbankfin.2021.106355 0378-4266/© 2021 The Authors. Published by Elsevier B.V. This is an open access article under the CC BY-NC-ND license (http://creativecommons.org/licenses/by-nc-nd/4.0/)
-
Upload
khangminh22 -
Category
Documents
-
view
3 -
download
0
Transcript of Management practices and M&A success - University of ...
Journal of Banking and Finance 134 (2022) 106355
Contents lists available at ScienceDirect
Journal of Banking and Finance
journal homepage: www.elsevier.com/locate/jbf
Management practices and M&A success
Manthos D. Delis a , # , Maria Iosifidi a , # , Pantelis Kazakis b , # , Steven Ongena
c , # , ∗, Mike G. Tsionas a , d , #
a Montpellier Business School, 2300 Avenue des Moulins, Montpellier 34080, France b Adam Smith Business School, University of Glasgow, Gilbert Scott Building, West Quadrangle, Glasgow G12 8QQ, United Kingdom
c KU Leuven and CEPR, University of Zurich, Swiss Finance Institute, Plattenstrasse 14, Zurich CH-8032, Switzerland d Montpellier Business School & Lancaster University Management School, Lancaster University Management School, Lancaster LA1 4YX, United Kingdom
a r t i c l e i n f o
Article history:
Received 14 May 2021
Accepted 29 October 2021
Available online 8 November 2021
JEL classification:
G14
G34
J24
Keywords:
Mergers and acquisitions
Management practices
Acquirer returns
a b s t r a c t
We study whether management practices determine merger and acquisition (M&A) success. We model
management as an unobserved (latent) variable in a standard microeconomic model of the firm and
derive firm-year management estimates. We validate these estimates against benchmark survey data
on management practices and by using Monte Carlo simulation. We show that our measure is among
the most important determinants of value creation in M&A deals, substantially increasing the predictive
power of models that explain cumulative abnormal returns. Thus, we offer a measure of management
practices that identifies the best-performing M&As. Our results are robust to the inclusion of acquirer
fixed effects and many control variables, and to several other sensitivity tests. We identify the Q-theory
as the key mechanism driving our results.
© 2021 The Authors. Published by Elsevier B.V.
This is an open access article under the CC BY-NC-ND license
( http://creativecommons.org/licenses/by-nc-nd/4.0/ )
1
(
o
m
m
l
a
T
fi
i
2
t
t
a
s
m
K
T
w
t
b
s
n
i
(
(
W
t
r
m
s
R
t
h
0
. Introduction
Despite a voluminous literature on merger and acquisition
M&A) success, the main source of that success remains an issue
f debate. Most of the variables that researchers propose as deter-
inants of acquirers’ performance add little explanatory power to
odels of value creation. A main reason is that M&A success re-
ies on firm characteristics that, by their own nature, relate to the
cquirer’s qualitative management practices ( Golubov et al., 2015 ).
his is an element difficult to observe or measure. In this study, we
rst broadly measure management practices following its theoret-
cal modeling as an input of production ( Lucas, 1978 ; Bloom et al.,
017 ). Subsequently, we examine their effect of management prac-
ices on M&A value creation. We show that our measure is among
he most important determinants (the sine qua non ) of cumulated
bnormal returns (CARs). We show that our key finding is con-
istent with the Q-theory of M&As, which predicts that acquirers
∗ Corresponding author.
E-mail addresses: [email protected] (M.D. Delis),
[email protected] (M. Iosifidi), [email protected] (P.
azakis), [email protected] (S. Ongena), [email protected] (M.G.
sionas). # These authors contributed equally to this work.
w
d
S
m
f
t
t
ttps://doi.org/10.1016/j.jbankfin.2021.106355
378-4266/© 2021 The Authors. Published by Elsevier B.V. This is an open access article u
ith superior management create value in M&As by transferring
his management to target firms.
The broad definition of “management practices” includes all
usiness decisions and leadership elements. According to main-
tream management theory ( Katz, 1974 ), there are three compo-
ents of management: human resource management (the ability to
nteract, communicate, motivate, and negotiate), technical abilities
human capital, knowledge, and proficiency), and conceptual skills
understanding concepts, develop ideas, and implement strategies).
e use the term “management practices,” as it is the most general
erm encompassing the three components.
To measure management practices, we use the implications of
ecent literature. Specifically, Bloom et al. (2017) build on early
odels of management by Lucas (1978) and Melitz (2003) and
how that in addition to capital (physical capital, financial capital,
&D expenses, and land) and labor, firms use management prac-
ices to achieve their objectives. This assumption perfectly aligns
ith the idea that there are three (instead of two) inputs of pro-
uction and that management complements capital and labor (e.g.,
amuelson and Nordhaus, 2009 ).
Following this set of theoretical models, we measure manage-
ent practices as a latent (unobserved) input of firms’ production
unction ( Delis and Tsionas, 2018 ; Delis et al., 2020 ). The merit of
his approach is threefold. First, it incorporates all firms (acquirers)
o yield a firm-year index. Second, it is consistent with both the
nder the CC BY-NC-ND license ( http://creativecommons.org/licenses/by-nc-nd/4.0/ )
M.D. Delis, M. Iosifidi, P. Kazakis et al. Journal of Banking and Finance 134 (2022) 106355
t
n
t
o
t
f
p
t
M
T
t
G
m
e
C
s
i
p
i
e
p
t
c
S
t
t
f
y
s
d
i
g
m
i
i
m
T
f
t
s
t
a
fi
a
a
fi
a
w
m
f
a
t
c
M
i
i
i
t
e
M
m
t
a
p
b
p
d
fi
n
m
2
T
f
a
2
H
a
n
m
s
e
t
m
p
c
t
t
r
2
2
a
a
H
H
b
M
m
h
t
e
p
s
c
B
t
l
t
d
a
o
t
b
o
i
e
s
t
c
heoretical economic models of management and the broad defi-
ition in the management literature. Third, it includes a stochastic
erm to avoid attributing the estimates to other unobserved inputs
r to operations efficiency (which in the stochastic frontier litera-
ure is part of the error term).
Subsequently, our key contribution is to examine the ef-
ect of management practices on the M&A deals’ CARs. We
osit that management is among the most important CAR de-
erminants, given good management’s ability to identify lucrative
&A deals and realize them in the most efficient way possible.
hus, our baseline specification follows from the extant litera-
ure on CAR modeling around M&As (e.g., Bao and Edmans, 2011 ;
olubov et al., 2015 ), with the exception that we add our manage-
ent index.
The results of our study indicate that management practices are
conomically one of the most significant explanatory variables of
ARs. Specifically, a one-standard-deviation increase in our mea-
ure increases the CAR of the average M&A deal by more than 50%
n all our baseline specifications. Importantly, our results are still
otent when including acquirer fixed effects. Therefore, our find-
ngs suggest that management practices are not merely a firm fixed
ffect. They are time-variant, implying that the dynamics of em-
loyment (entry and exit of employees), the learning process, and
he evolution of human capital are important in defining M&A suc-
ess.
Our baseline results survive a large battery of sensitivity tests.
pecifically, we first use a long list of explanatory variables that
he accounting and finance literatures identify as significant de-
erminants of CARs. Second, we control for industry characteristics
or the acquirer, the target, or both, and also conduct our anal-
sis by industry. Third, we use alternative time windows to con-
truct CARs, remove outliers by winsorizing our data, include with-
rawn deals, and examine standard errors from different cluster-
ng. Fourth, we look at the role of managerial practices in syner-
istic gains (measured through synergy CARs). Fifth, we examine
anagement’s longer-term effects on M&A success using account-
ng measures of firm performance. In most cases, we identify pos-
tive correlations between management practices and firm perfor-
ance post-acquisition, especially concerning return on equity and
obin’s q.
We contend that the key mechanism explaining the strong ef-
ect of management practices on M&A value creation is the Q-
heory of M&As ( Jovanovic and Rousseau, 2002 ). Specifically, we
how that firms with better management practices are more likely
o pursue M&As, more firm value is created with a larger man-
gement practices gap between the acquirer and the target, and
rms with good management tend to acquire firms with bad man-
gement. Moreover, the cross-sectional dispersion in firm man-
gement practices positively affects the likelihood of M&As. These
ndings are economically significant, especially considering the
bility of acquirers with good management practices to target firms
ith weaker ones and create value from advancing the target’s
anagement practices.
Our paper makes three interrelated contributions. First and
oremost, we show that management, when broadly measured, is
mong the most important determinants of M&A success, essen-
ially doubling the power of CAR models. Recent literature, espe-
ially Golubov et al. (2015) , alludes to the idea (as in standard
&A event studies) that including acquirer fixed effects markedly
ncreases CAR models’ explanatory power. With our management
ndex we explain part of this fixed effect, but we also show the
mportance of within-firm variations in management practices, as
he effect on M&A success comes over and above acquirer fixed
ffects.
Second, we introduce to the relevant literature (e.g.,
cDonald et al., 2008 ; Custódio et al., 2013 , 2018 ) a thorough
2
anagement measure that originates in standard microeconomic
heory. We eclectically view this measure as a complement of (not
substitute for) governance characteristics such as executive com-
ensation and CEO and director experience (especially investment
anking experience as in Huang et al., 2014 ), which are more
recise in what they aim to measure.
Third, and related, we bring together three well-established but
istinct strands of literature in production economics, corporate
nance, and management science. The relevant production eco-
omics literature highlights important aspects of empirically esti-
ating production functions (e.g., Greene, 2008 ; Ackerberg et al.,
006 ) and management (e.g., Bloom and Van Reenen, 2007 ; 2010 ).
he relevant corporate finance literature examines the driving
orces behind M&A success and explains a limited part of the vari-
bility in abnormal returns (e.g., Moeller et al., 2004 ; Masulis et al.,
0 07 ; Aktas et al., 20 07 ; Harford et al., 2012 ; Born et al., 2014 ;
uang et al., 2014 ; Golubov et al., 2015 ). Finally, the relevant man-
gement science literature introduces the theoretical ideas of dy-
amic manager capabilities and overall effects on performance. The
erger of these three strands of literature allows us to explain a
ignificant part of M&A success and opens up new pathways for
xploring important aspects of financial management, both within
he borders of a country, but also in the international arena.
The rest of the paper proceeds as follows. Section 2 defines
anagement practices, briefly discusses existing measures, and
rovides the model and estimation for our measure. Section 3 dis-
usses the sample of M&As and CAR estimation. Section 4 provides
he main results of the empirical analysis. Section 5 discusses po-
ential economic mechanisms. Section 6 concludes and provides di-
ections for future research.
. Management practices: definition, theory, and measurement
.1. A broad definition of management practices
Management’s role as a determinant of firm performance is
vivid avenue for academic research in economics, finance,
nd management sciences (e.g., Harris and Holmstrom, 1982 ;
ermalin and Weisbach, 1998 ; Huang et al., 2014 ; Silva, 2010 ).
ere we define management practices in the broadest way possi-
le, closely following micro-founded economic models. Specifically,
anne (1965) , Lucas (1978) , and Bloom et al. (2017) suggest that
anagement should be viewed as a separate production factor that
as important implications for firm productivity and performance.
Manne (1965) notes that the allocation of production factors
o managers with different ability explains productivity differ-
nces especially in acquisitions. Lucas (1978) is the first to ex-
licitly model the management technology as a function of a
kill endowment and diminishing returns due to their span of
ontrol (the manager does not control everything in the firm).
loom et al. (2017) consider management as a technology that en-
ers the production function along with other forms of technology,
abor, and capital, to contribute to total factor productivity. A dis-
inguishing element of the latter model is that management is en-
ogenously determined to improve firm performance by, for ex-
mple, hiring management consultants, spending time developing
r reinforcing improved organizational processes, investing in con-
inuing education, learning-by-doing (experience), or paying for a
etter CEO. Thus, management practices are not fixed and evolve
ver time.
This general definition of management also relates to the def-
nition in the management science literature ( Katz, 1974 ), which
ncompasses three key dimensions. The first relates to human re-
ource management, which encapsulates the abilities to lead, in-
eract, communicate, motivate, and negotiate. Second are techni-
al abilities, which relate to human capital, depth of knowledge,
M.D. Delis, M. Iosifidi, P. Kazakis et al. Journal of Banking and Finance 134 (2022) 106355
a
n
v
a
u
i
p
a
f
2
o
p
w
t
e
a
l
m
t
e
fi
b
a
M
c
c
s
t
u
t
M
h
t
m
p
a
f
t
o
p
t
H
r
m
t
t
a
n
d
fi
m
s
a
v
a
e
o
s
W
m
o
a
t
B
f
p
f
a
a
e
i
a
2
m
b
m
T
m
t
p
m
m
f
v
t
c
(
B
t
t
d
s
q
2 There might be two problems with this approach. The first is that, especially
when using DEA, regressing efficiency scores on covariates results in econometric
bias and inconsistency ( Simar and Wilson, 2007 ). The second problem is that the
variables in the second stage never completely capture all firm elements that are
beyond managerial control (much like performance indicators). This naturally cre-
ates omitted-variable bias in the residuals, which then include other elements of
efficiency besides those that managers control. 3 Bloom and Van Reenen (2007) use an evaluation tool designed by a consultancy
firm (McKinsey) that is composed of 18 management practices (e.g., performance
tracking, or managing human capital, inter alia ). In addition, using an economet-
ric model of productivity, they validate their managerial practices data following a
two-step approach, where they estimate the production function in the first stage
and calculate total factor productivity (TFP) in the second stage. The free version
of WMS is available from the following link: http://worldmanagementsurvey.org/
survey- data/download- data/
nd proficiency among CEOs, top executives, and managers. Tech-
ical skill implies, inter alia, proficiency in all aspects of firm
alue creation, including M&A deals or choices regarding those
iding in completing these deals. Third, conceptual skills include
nderstanding concepts, developing new ideas, and implement-
ng strategies. This involves seeing the enterprise as a whole, im-
roving efficiency (the optimal use of inputs), and understanding
firm’s relationship with industry, political, social, and economic
orces.
.2. Previous measures of management and recent theory
A number of past studies measure managerial quality based
n a firm’s economic outcomes after a CEO departs. For exam-
le, Hayes and Schaefer (1999) argue that good managers are those
hose former firms experience negative shocks after their depar-
ures. The way a CEO manages a company might have long-lasting
ffects, even after her departure, but one can argue that there are
lso managerial skill differentials and styles among individuals be-
ow the CEO level, such as among CFOs.
Another important aspect of studying managerial skill is its
ultidimensional profile. For example, Kaplan et al. (2012) iden-
ify two components of managerial practices—general ability and
xecution skills (e.g., communication and interpersonal skills)—and
nd that CEOs with higher general ability and execution skills are
etter at increasing firm value.
In M&As, where the allocation of resources is considerable
nd the risk of heavy losses is high ( Harford and Li, 2007 ;
oeller et al., 2005 ), we expect management practices to play a
rucial role in creating value for acquirers. However, the literature
onsiders only how distinct elements of management affect M&A
uccess.
Most closely related to our research objectives, for example, is
he work on CEO experience in M&A deals. Jaffe et al. (2013) doc-
ment that CEOs who were successful in their last deals tend
o have higher-performing subsequent acquisitions. Custódio and
etzger (2013) and McDonald et al. (2008) find that CEOs who
ave experience in M&As for specific industries are more likely
o increase corporate value. Custódio et al. (2018) document the
eans through which management skill spurs innovation. This ex-
ertise could provide management teams with better information
nd superior bargaining power, all of which have positive effects
or acquiring firms. Hayward (2002) provides similar results from
he whole firm (as opposed to CEO). However, CEO experience and
ther corporate governance characteristics do not capture all as-
ects of management practices. 1
Additional literature attempts to proxy for management prac-
ices via firm size, performance indicators, and firm fixed effects.
owever, performance indicators tend to assume everything is the
esult of managerial skill; clearly this is not the case, because nu-
erous firm characteristics and operational processes are outside
he managers’ reach. Similarly, fixed effects tend to assume all
ime-invariant firm characteristics are management-related, which
gain is not the case because, inter alia , management practices are
ot stable over time ( Bloom et al., 2017 ).
Recent techniques also include frontier-efficiency methods (e.g.,
ata envelopment analysis, or DEA) and assume that skill is de-
ned as efficiency if one subtracts variables outside the reach of
1 Advisors could also affect M&A outcomes. For example, Bao and Ed-
ans (2011) find a positive relationship between M&A outcomes and using advi-
ors from U.S. banks. However, this is not the case for cross-border acquisitions,
s Rajamani et al. (2016) document. They find that employing internationally di-
ersified advisors decreases M&A returns. One reason could be that international
dvisors have less to lose compared to domestic ones.
o
b
b
(
a
m
t
i
3
xecutives and managers, such as firm size and age, market share,
wnership status, etc. (e.g., Demerjian et al., 2012 ). 2
Bloom and Van Reenen (2007 , 2010 ) and later studies by the
ame team use survey data (the World Management Survey, or
MS) for a limited number of firms worldwide to quantify best
anagement practices. These practices focus mostly on plant-level
perations and the authors create firm-year management scores
cross a few thousand firms located in several countries. 3
Delis and Tsionas (2018) estimate management prac-
ices using the theoretical implications of Lucas (1978) and
loom et al. (2017) . Specifically, their model assumes a cost
unction in which management is an unobserved (latent) input of
roduction. Subsequently, they approximate latent management
rom its latent dynamics and observed firm characteristics, such
s firm size and input prices (as proxies of investment in man-
gement). 4 Importantly, they validate their model using formal
conometric techniques and show that what they measure is
ndeed management (and not general production efficiency or
nother unobserved component of production).
.3. Estimating management practices
We estimate management using the theoretical economic
odels of management ( Lucas, 1978 ; Bloom et al., 2017 ), the
road definition in the management literature ( Katz, 1974 ;
any others henceforth), and the empirical model of Delis and
sionas (2018) and Delis et al. (2020) . We assume that manage-
ent practices constitute an unobserved (latent) input of produc-
ion, along with observed labor and capital. The latter includes
hysical capital, financial capital, R&D expenses, and land. Our
odel is stochastic, which allows distinguishing between manage-
ent as a latent input and operations efficiency. In the stochastic
rontier models, operations efficiency is estimated in relative terms
ia separating the error term into the inefficiency component and
he remainder disturbance (e.g., Greene, 2008 ).
From a theoretical viewpoint, all modern textbooks list human
apital, entrepreneurship, or a similar concept as that third factor
e.g., Samuelson and Nordhaus, 2009 ), and this completes the list.
loom et al. (2017) explicitly model management as that third fac-
or of production (again, this completes the list) and show that
heir model consistently explains productivity and performance
ifferences among firms. Corporate governance and management
cience largely revolve around the idea that coordinating inputs re-
uires human resource management, technical skills, and concep-
4 The broad definition of management practices that we adopt here is not with-
ut shortcomings. Good managers produce optimal firm outcomes by managing
oth tangible and intangible inputs, and our broad definition naturally encompasses
oth. However, if the research objective is to measure the role of intangible inputs
such as corporate culture, brand reputation and recognition, strong relationships
nd business ties, etc.) on firm outcomes, then our broad definition and associated
easure needs more detailed data. Specifically, any empirical model needs to fur-
her distinguish between these components of management practices, and this is
mpossible without detailed survey data on specific firms.
M.D. Delis, M. Iosifidi, P. Kazakis et al. Journal of Banking and Finance 134 (2022) 106355
t
s
H
m
l
a
o
i
u
t
p
s
w
l
t
p
t
a
(
t
t
a
c
p
B
l
i
t
t
a
(
1
p
r
m
a
c
w
e
l
L
G
i
t
a
t
fl
t
I
p
t
r
m
w
p
i
m
t
m
a
m
o
i
o
p
c
a
p
(
i
(
t
t
l
p
S
6 To construct this variable, we follow Demerjian et al. (2012) and use firms’ foot-
notes in Compustat to calculate the discounted present value of future (five years)
operating lease payments. The Compustat items for the five lease obligations are
MRC1-MRC5, and we use a discount rate of 10% in accordance with previous stud-
ies. 7 We follow the literature to calculate net R&D (e.g., Lev and Sougiannis, 1996 ;
Demerjian et al., 2012 ). Specifically, based on the Compustat item XRD, which mea-
sures research and development expense, net R&D is: R D cap =
0 ∑
t= −4
( 1 + 0 . 2 t ) × R D exp .
8 To construct the price of labor, we optimally need information on staff expenses
in order to determine the ratio of staff expenses to total employees. Unfortunately,
the data for staff expenses are missing for many firms in our sample. We remedy
this problem in two ways. The first is to regress the existing staff-expense obser-
vations on total operating expenses and predict the missing staff expenses from
the fitted values of that regression. For precision, we use a model with firm and
year fixed effects. The adjusted R-squared is as high as 91%. A simple alternative is
to construct the price of labor from the ratio of total operating expenses to total
number of employees. Irrespective of the method, the production function yields
highly correlated estimates of management practices (about 96% and with perfect
rank correlation). In addition, the change in the effect of management practices on
M&A value creation is minimal. To use the actual data and avoid criticism related
to estimation bias, we use the ratio of total operating expenses to total number of
employees. 9 For the price of labor to be a valid instrument in Eq. (2) , the identification con-
dition is that it is uncorrelated with the production function residuals u . For this
ual skills in order to gather, allocate, and distribute economic re-
ources or consumer products to individuals and other businesses.
owever, and in stark contrast, “best management practices” are
issing from the list of inputs needed to estimate production re-
ations.
From an empirical viewpoint, this assumption is in fact testable
s in Delis and Tsionas (2018) , who validate their approach based
n a Monte Carlo method. Note that by its very nature our model
s stochastic, allowing for an unobserved error term (besides the
nobserved latent variable). This is not just semantics: it shows
hat a stochastic model is preferable to deterministic approaches
recisely because the stochastic component also reflects unob-
erved elements other than management.
Instead of using a cost function as in Delis and Tsionas (2018) ,
e prefer to model a production function for three reasons re-
ated to simplicity and replicability. First, management directly en-
ers the production function as a latent input. In contrast, cost and
rofit equations are functions of input prices (and not input quan-
ities). This implies that an estimation of management (as a vari-
ble) needs involved transformations with the cost share equations
the cost share of inputs). Second, estimating the production func-
ion implies that we do not need data on management compensa-
ion (i.e., the price of management quality), which in principle is
nother latent variable in the model. This increases the estimation
omplexity, potentially introducing bias in our estimates. Third, the
roduction model perfectly aligns with the theoretical model of
loom et al. (2017) .
The production function takes the form:
n q it = β0 + βk ln k it + βl ln l it + βm
ln m it
+
1
2
βkk ( ln k it ) 2 +
1
2
βll ( ln l it ) 2
+
1
2
βmm
( ln m it ) 2 + βkl ln k it ln l it + βkm
ln k it ln m it
+ βlm
ln l it ln m it + u it . (1)
In Eq. (1) , q is the output of firm i in year t; k, l , and m are cap-
tal, labor, and management (inputs); and u is the stochastic dis-
urbance. This is a translog specification including all the squared
erms and interaction terms, which is preferred because of the
ppealing properties of flexibility and linearity in the parameters
e.g., Greene, 2008 ).
To estimate Eq. (1) we use firm-year data from Compustat for
980–2016. We proxy firm output using the log of sales (Com-
ustat item SALE), which reflects how well managers maximize
evenue. We estimate management twice, differentiating between
odels with four inputs ( Capital, Cost of inventory, Employees ,
nd Net operating leases ) and seven inputs (adding Net R&D, Pur-
hased goodwill , and Other intangible assets ). 5 To measure capital,
e use the log of the sum of the dollar amount of net prop-
rty, plant, and equipment (Compustat item PPENT); net operating
eases ( Demerjian et al., 2012 ); net R&D ( Demerjian et al., 2012 ;
ev and Sougiannis, 1996 ); purchased goodwill (Compustat item
DWL); other intangible assets (the difference in the Compustat
tems INTAN-GDWL); and the cost of inventory (Compustat item
5 The reason is that the additional three inputs might bias management estima-
ion in favor of CAR performance. Specifically, R&D depreciation rates might differ
cross firms in ways that might be correlated with future M&A value creation. Fur-
her, the inclusion of purchased goodwill and other intangible assets as inputs re-
ecting intangible capital might yield measurement error in intangible capital, and
his error might be correlated with a firm’s past acquisition activity.
t
l
l
k
d
f
b
T
s
f
c
4
NVT). 6 , 7 To measure labor, we use the log of the number of em-
loyees (Compustat item EMP). The choice of these inputs is jus-
ified based on their contributions to sales revenue and managers’
ole in determining their level.
For latent management practices, we assume:
it =
G ∑
g=1
γg ϕ
(αg + x ′ it βg
)+ v it, 2 , i = 1 , ..., n, t = 1 , ..., T . (2)
here ϕ(z) =
1 1+ e −z , z ∈ R , is a sigmoid activation function and the
rocess is an artificial neural network (ANN) with G nodes. For
dentification, we order the intercepts as: α1 < ... < αG . Using the
arginal likelihood criterion, the best choice is G = 5 .
Economics and management theory guide the assumption on
he determinants of m in Eq. (2) . We assume that latent manage-
ent practices in Eq. (2) are a function of lagged values of inputs,
nd current and lagged values of the price of labor p in logs (esti-
ated from the ratio of total operating expenses to total number
f employees). 8 In other words, we assume that the use of inputs
n optimal quantities and their allocation determines the quality
f management. Also, including the price of labor follows the cor-
orate governance literature identifying compensation as a positive
orrelate of ability and human capital (e.g., Custódio et al., 2013 ); it
lso serves as an external instrument. Identification through input
rices has a long tradition in the production economics literature
e.g., Nevo, 2001 ). In our case, where we assume the labor market
s fairly competitive, the price of labor can be a valid instrument
Ackerberg et al., 2006 ). 9
The system of Eqs. (1) and (2) essentially constitutes a struc-
ural equation model (SEM) with a latent variable. We estimate
his model using Bayesian techniques. Contemporary econometrics
iterature prefers Bayesian methods to standard techniques in the
resence of latent variables (e.g., Kaplan and Depaoli, 2012 ; van de
choot et al., 2014 ). The key theoretical reason for this is that the
o hold, we must exclude a number of possibilities. First and foremost, the price of
abor needs to have a strong effect on m . Theoretically, this must hold, as higher
abor prices should reflect better management practices in a competitive labor mar-
et. Empirically, we find that this is indeed the case. Second, these prices should not
irectly affect (enter) the production of firm output. By construction, the production
unction has this property. Third, and related to the first, the labor market needs to
e perfectly competitive so that each firm separately has no effect on market prices.
he size and depth of the markets considered should mean that, at least in our data
et, this property is satisfied. Fourth, input prices should vary sufficiently to allow
or good econometric identification. Our labor prices vary by firm-year so that this
ondition is also met.
M.D. Delis, M. Iosifidi, P. Kazakis et al. Journal of Banking and Finance 134 (2022) 106355
B
c
t
d
o
i
p
p
m
a
q
o
t
c
s
i
t
(
f
W
5
c
M
d
m
d
0
a
o
a
p
a
C
c
i
3
a
h
p
a
M
i
c
f
p
M
t
t
s
t
t
p
(
e
s
m
i
W
s
G
p
a
t
w
c
a
q
a
o
w
a
B
1
w
h
g
(
a
a
e
i
i
q
c
(
e
n
f
h
p
a
t
0
t
(
r
a
p
t
a
+2
b
a
t
10 When we study synergistic gains, the number of observations drops to around
1,011. We expect this because we deal with unlisted targets that therefore do not
have information in CRSP. 11 Past studies also find positive combined returns (e.g., Andrade et al., 2001 ;
Moeller et al., 2004 ; Bhagat et al., 2005 ; Wang and Xie, 2008 ). 12 This comes at the cost of being unable to conduct any meaningful analysis of
target firms and their management practices. We limit our sample to firms with
repeated acquisitions and, thus, a reduced sample of M&As. The sample of targets
then becomes quite small because target firm information in Compustat and CRSP
is quite limited (e.g., if the firm is not public, there is no information in CRSP).
Subsequently, when the number of targets decreases, the same happens for synergy
calculations, as target information from CRSP is needed to measure synergy CARs.
ayesian analysis incorporates uncertainty in measurements be-
ause of the infusion of prior knowledge (if priors are informa-
ive) or lack thereof (if priors are uninformative) into the prior
istributions (e.g., van de Schoot et al., 2014 ). Given that we need
ne or more variables to approximate management practices, the
nformative priors help us towards a better approximation com-
ared to a standard approach to SEM estimation. From a purely
ractical perspective, estimating our model with standard maxi-
um likelihood encounters convergence problems in some of our
pplications.
We use a prior αg , βg , γg ∼ iidN( 0 , 1 ) , q̄
σ 2 2
∼ χ2 n̄
. where n̄ = 50 ,
¯ = 10 which means that in a fictitious sample of size 50, σ 2 2
is,
n average, 1/5. Our results on the effect of management prac-
ices on M&A value creation are not particularly sensitive to these
hoices. This prior ensures that our management estimates take
imilar values and have similar distributions with the correspond-
ng estimates in the WMS database.
As is standard practice in the Bayesian literature, we resort
o Markov chain Monte Carlo (MCMC) methods for inference
StataCorp, 2017 ). We implement MCMC using a Gibbs sampling
or increased efficiency ( Gelfand et al., 1990 ; Andrieu et al., 2010 ).
e run the Gibbs sampler for 150,0 0 0 iterations and burn the first
0,0 0 0 to mitigate possible start-up effects. We successfully test
onvergence using Geweke’s (1992) diagnostic; autocorrelation in
CMC never exceeds approximately 0.40 for any parameter. We
iscuss the technical details in the Appendix.
Using the model described by Eqs. (1) and (2) , we obtain a
ean value of management practices equal to 0.539 and standard
eviation equal to 0.126. Also, our measure takes values between
and 0.968. In table A1 of the online appendix, we report aver-
ge estimates of management practices by industry and year. We
bserve a similar level of skill across industries, which is intuitive
s there is a priori no reason that more skillful individuals are em-
loyed in specific industries.
Importantly, we conduct many robustness tests on our man-
gement estimates when examining the effect of management on
ARs in the next section. Further, in addition to the validation pro-
edures in Delis and Tsionas (2018) and Delis et al. (2020) , we val-
date our measure within our M&A sample.
. M&A sample, CAR estimation, and summary statistics
Having estimated management practices, we subsequently ex-
mine whether and how they affect M&A value creation. Our key
ypothesis is that management practices are one of the most im-
ortant determinants of M&A value creation, due to the superior
bility of firms with good management to identify value-enhancing
&A deals and execute them effectively. Thus, we expect that the
nclusion of management practices in CAR models substantially in-
reases their power (in terms of the adjusted R-squared).
We draw M&A data from the Thomson One Banker database
rom January 1, 1980, to December 31, 2016. The data-selection
rocess follows the five restrictions imposed by Fuller et al. (2002) ,
asulis et al. (2007) , and Golubov et al. (2015) . Specifically, (i)
he bidder is a U.S. publicly listed company, and the target is ei-
her a public, private, or subsidiary U.S. company; (ii) the acqui-
ition is complete; (iii) the acquirer owns less than 50% of the
arget prior to the acquisition and 100% after; (iv) the transac-
ion is at least 1% of the bidder’s market capitalization 11 days
rior to the announcement and it exceeds $1 million in value; and
v) multiple deals within the same day for the same acquirer are
xcluded.
We end up with 15,261 events. From this sample, we drop ob-
ervations lacking information on the variables needed to estimate
anagement practices and on some of our important controls used
5
n the baseline specifications. Our final sample has 7721 events. 10
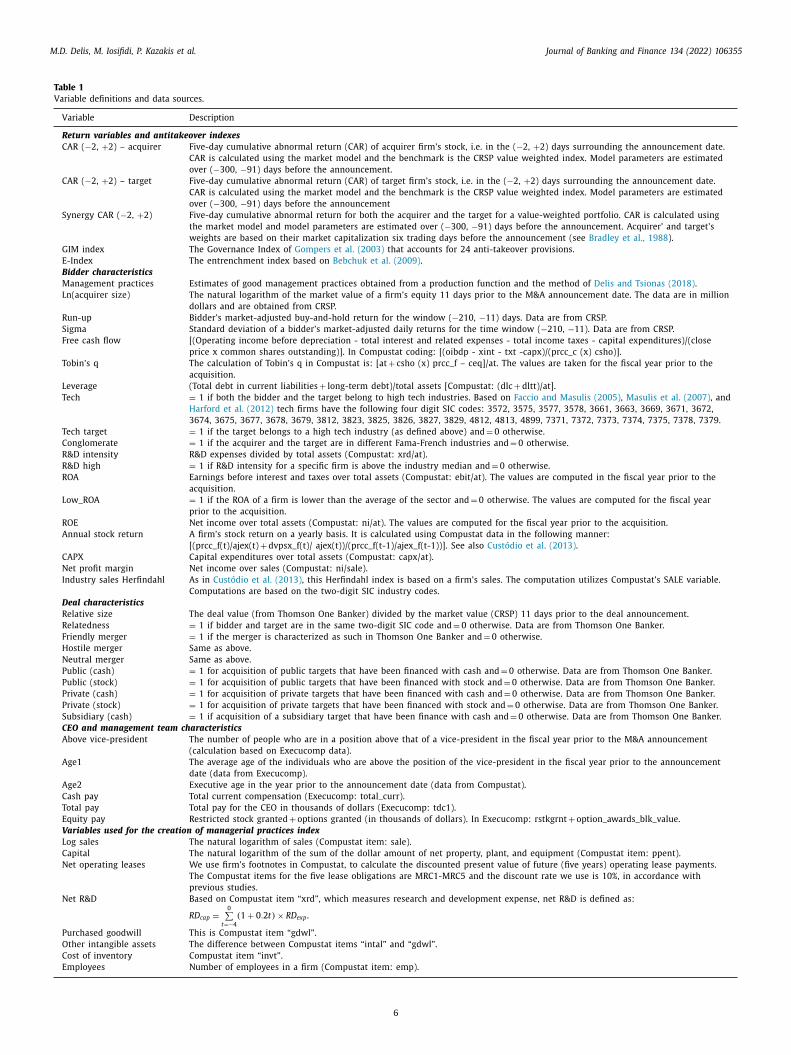
e provide variable definitions and data sources in Table 1 and
ummary statistics in Table 2 . Following Fuller et al. (2002) and
olubov et al. (2015) , we carry out our analysis using three sam-
les. The first includes all deals (full sample), the second includes
cquirers that completed at least five deals within a three-year
ime window (frequent acquirers), and the third includes acquirers
ho completed at least two deals within a three-year window (oc-
asional acquirers). This practice allows us to study persistence in
cquirers’ returns and use acquirer fixed effects. The sample of fre-
uent acquirers includes 1294 deals, and the sample of occasional
cquirers includes 5136 deals. Nonetheless, because the number of
bservations drops considerably when we study synergistic gains,
e use the whole sample without distinguishing between frequent
nd occasional acquirers.
As in previous studies, we find anemic gains for acquirers.
ased on the summary statistics of Table 2 , the mean CAR is about
.4% and the median is 0.8%. This is not the case for target firms,
here the mean (median) CARs are 26.5% (23%). For synergies, we
ave a mean of 2.4% and a median of 1.5%. 11
Using firm fixed effects is very important because it disentan-
les the time-invariant firm characteristics from our time-variant
firm-year) measure of management practices. In our view, man-
gement practices, as defined in our context, are dynamic through
learning-by-doing process and the addition of new managers and
xecutives. In that sense, and unlike previous studies, we exam-
ne the role of time-varying, firm-specific management practices
n M&A success. 12 Although our focus is on acquirers, in a subse-
uent section we study how acquirer management practices affect
ombined firm CARs.
Table A2 in the online appendix reports average acquirer CAR
−2, + 2) values for 1980–2016 for 12 different industries. The high-
st values are in the telephone/TV and consumer (durables and
ondurables) industries . However, some of these industries per-
orm either superbly or very poorly around the events, indicating
igh volatility.
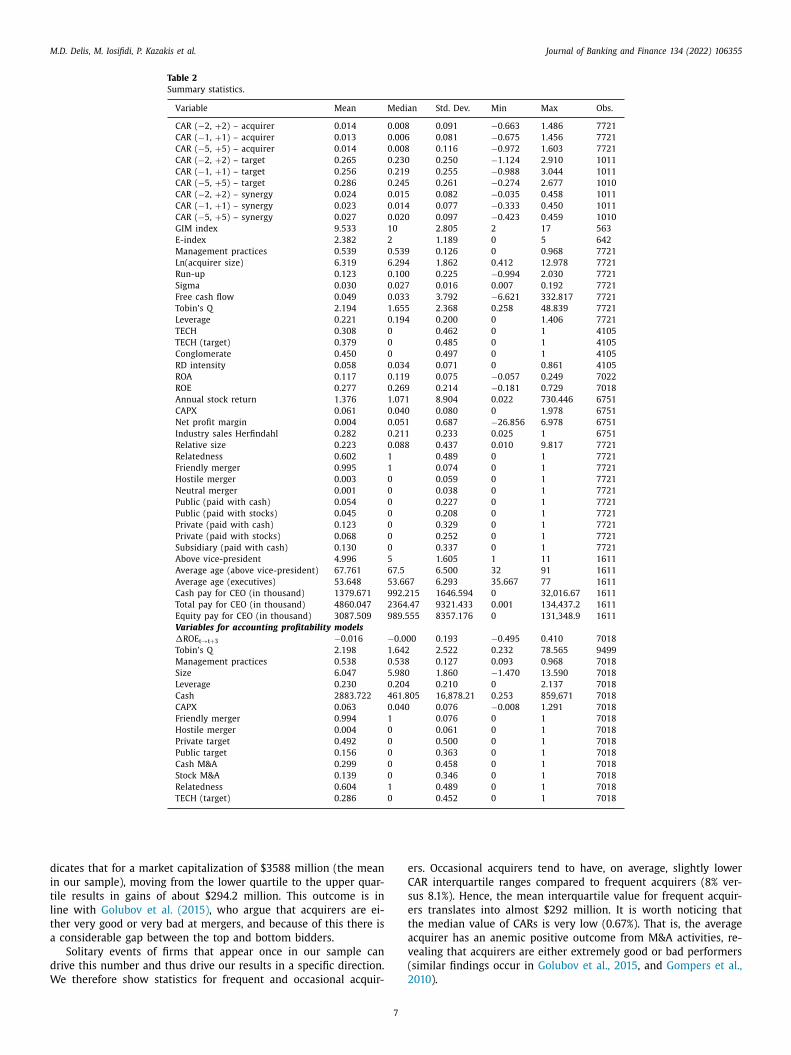
Table 3 reports distributional information on the management
ractices index and three different acquirer CARs (three-, five-,
nd 11-day windows around an M&A). The statistics show that
he management quality of the lowest 1% is slightly less than
.245, but for the top 1% this value surpasses 0.8. This indicates
hat management practices among top performers are about 3.42
0.838/0.245) times better than those among low performers. The
ange between the 75 and 25th quartile is about 0.17 points, which
ccounts for about one-third of the mean value of the management
ractices index.
As expected, there are considerable differences in abnormal re-
urns. For the bottom 1% of performers, the returns are negative
nd span from −29% for CAR ( −5, + 5) to −18.7% for CAR ( −1,
1). In contrast, the top 1% performers have returns spanning from
6.2% to 35.6%. Hence, the average difference in cumulative returns
etween the top and bottom performers is about 54.7%. With an
verage of 8.2%, the interquartile difference ranges from 6.3% (for
he three-day window) to 10.5% (for the 11-day window). This in-
M.D. Delis, M. Iosifidi, P. Kazakis et al. Journal of Banking and Finance 134 (2022) 106355
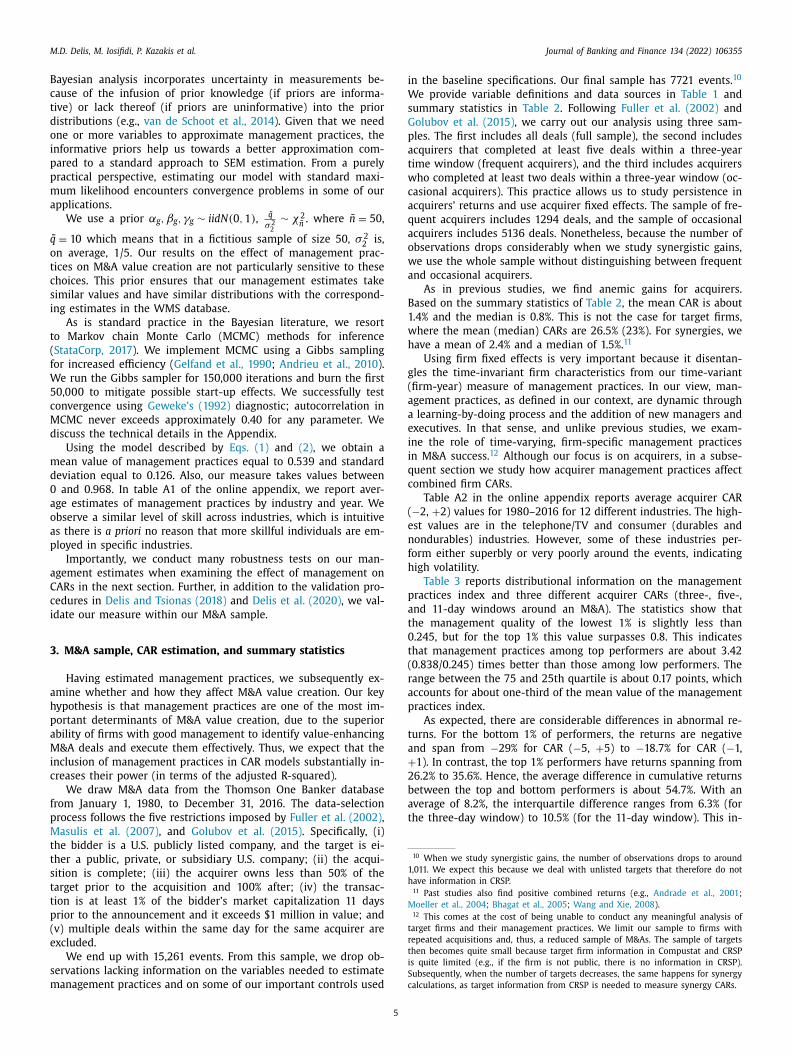
Table 1
Variable definitions and data sources.
Variable Description
Return variables and antitakeover indexes
CAR ( −2, + 2) – acquirer Five-day cumulative abnormal return (CAR) of acquirer firm’s stock, i.e. in the ( −2, + 2) days surrounding the announcement date.
CAR is calculated using the market model and the benchmark is the CRSP value weighted index. Model parameters are estimated
over ( −300, −91) days before the announcement.
CAR ( −2, + 2) – target Five-day cumulative abnormal return (CAR) of target firm’s stock, i.e. in the ( −2, + 2) days surrounding the announcement date.
CAR is calculated using the market model and the benchmark is the CRSP value weighted index. Model parameters are estimated
over ( −300, −91) days before the announcement
Synergy CAR ( −2, + 2) Five-day cumulative abnormal return for both the acquirer and the target for a value-weighted portfolio. CAR is calculated using
the market model and model parameters are estimated over ( −300, −91) days before the announcement. Acquirer’ and target’s
weights are based on their market capitalization six trading days before the announcement (see Bradley et al., 1988 ).
GIM index The Governance Index of Gompers et al. (2003) that accounts for 24 anti-takeover provisions.
E-Index The entrenchment index based on Bebchuk et al. (2009) .
Bidder characteristics
Management practices Estimates of good management practices obtained from a production function and the method of Delis and Tsionas (2018) .
Ln(acquirer size) The natural logarithm of the market value of a firm’s equity 11 days prior to the M&A announcement date. The data are in million
dollars and are obtained from CRSP.
Run-up Bidder’s market-adjusted buy-and-hold return for the window ( −210, −11) days. Data are from CRSP.
Sigma Standard deviation of a bidder’s market-adjusted daily returns for the time window ( −210, −11). Data are from CRSP.
Free cash flow [(Operating income before depreciation - total interest and related expenses - total income taxes - capital expenditures)/(close
price x common shares outstanding)]. In Compustat coding: [(oibdp - xint - txt -capx)/(prcc_c (x) csho)].
Tobin’s q The calculation of Tobin’s q in Compustat is: [at + csho (x) prcc_f – ceq]/at. The values are taken for the fiscal year prior to the
acquisition.
Leverage (Total debt in current liabilities + long-term debt)/total assets [Compustat: (dlc + dltt)/at].
Tech = 1 if both the bidder and the target belong to high tech industries. Based on Faccio and Masulis (2005) , Masulis et al. (2007) , and
Harford et al. (2012) tech firms have the following four digit SIC codes: 3572, 3575, 3577, 3578, 3661, 3663, 3669, 3671, 3672,
3674, 3675, 3677, 3678, 3679, 3812, 3823, 3825, 3826, 3827, 3829, 4812, 4813, 4899, 7371, 7372, 7373, 7374, 7375, 7378, 7379.
Tech target = 1 if the target belongs to a high tech industry (as defined above) and = 0 otherwise.
Conglomerate = 1 if the acquirer and the target are in different Fama-French industries and = 0 otherwise.
R&D intensity R&D expenses divided by total assets (Compustat: xrd/at).
R&D high = 1 if R&D intensity for a specific firm is above the industry median and = 0 otherwise.
ROA Earnings before interest and taxes over total assets (Compustat: ebit/at). The values are computed in the fiscal year prior to the
acquisition.
Low_ROA = 1 if the ROA of a firm is lower than the average of the sector and = 0 otherwise. The values are computed for the fiscal year
prior to the acquisition.
ROE Net income over total assets (Compustat: ni/at). The values are computed for the fiscal year prior to the acquisition.
Annual stock return A firm’s stock return on a yearly basis. It is calculated using Compustat data in the following manner:
[(prcc_f(t)/ajex(t) + dvpsx_f(t)/ ajex(t))/(prcc_f(t-1)/ajex_f(t-1))]. See also Custódio et al. (2013) .
CAPX Capital expenditures over total assets (Compustat: capx/at).
Net profit margin Net income over sales (Compustat: ni/sale).
Industry sales Herfindahl As in Custódio et al. (2013) , this Herfindahl index is based on a firm’s sales. The computation utilizes Compustat’s SALE variable.
Computations are based on the two-digit SIC industry codes.
Deal characteristics
Relative size The deal value (from Thomson One Banker) divided by the market value (CRSP) 11 days prior to the deal announcement.
Relatedness = 1 if bidder and target are in the same two-digit SIC code and = 0 otherwise. Data are from Thomson One Banker.
Friendly merger = 1 if the merger is characterized as such in Thomson One Banker and = 0 otherwise.
Hostile merger Same as above.
Neutral merger Same as above.
Public (cash) = 1 for acquisition of public targets that have been financed with cash and = 0 otherwise. Data are from Thomson One Banker.
Public (stock) = 1 for acquisition of public targets that have been financed with stock and = 0 otherwise. Data are from Thomson One Banker.
Private (cash) = 1 for acquisition of private targets that have been financed with cash and = 0 otherwise. Data are from Thomson One Banker.
Private (stock) = 1 for acquisition of private targets that have been financed with stock and = 0 otherwise. Data are from Thomson One Banker.
Subsidiary (cash) = 1 if acquisition of a subsidiary target that have been finance with cash and = 0 otherwise. Data are from Thomson One Banker.
CEO and management team characteristics
Above vice-president The number of people who are in a position above that of a vice-president in the fiscal year prior to the M&A announcement
(calculation based on Execucomp data).
Age1 The average age of the individuals who are above the position of the vice-president in the fiscal year prior to the announcement
date (data from Execucomp).
Age2 Executive age in the year prior to the announcement date (data from Compustat).
Cash pay Total current compensation (Execucomp: total_curr).
Total pay Total pay for the CEO in thousands of dollars (Execucomp: tdc1).
Equity pay Restricted stock granted + options granted (in thousands of dollars). In Execucomp: rstkgrnt + option_awards_blk_value.
Variables used for the creation of managerial practices index
Log sales The natural logarithm of sales (Compustat item: sale).
Capital The natural logarithm of the sum of the dollar amount of net property, plant, and equipment (Compustat item: ppent).
Net operating leases We use firm’s footnotes in Compustat, to calculate the discounted present value of future (five years) operating lease payments.
The Compustat items for the five lease obligations are MRC1-MRC5 and the discount rate we use is 10%, in accordance with
previous studies.
Net R&D Based on Compustat item “xrd”, which measures research and development expense, net R&D is defined as:
R D cap =
0 ∑
t= −4
( 1 + 0 . 2 t ) × R D exp .
Purchased goodwill This is Compustat item “gdwl”.
Other intangible assets The difference between Compustat items “intal” and “gdwl”.
Cost of inventory Compustat item “invt”.
Employees Number of employees in a firm (Compustat item: emp).
6
M.D. Delis, M. Iosifidi, P. Kazakis et al. Journal of Banking and Finance 134 (2022) 106355
Table 2
Summary statistics.
Variable Mean Median Std. Dev. Min Max Obs.
CAR ( −2, + 2) – acquirer 0.014 0.008 0.091 −0.663 1.486 7721
CAR ( −1, + 1) – acquirer 0.013 0.006 0.081 −0.675 1.456 7721
CAR ( −5, + 5) – acquirer 0.014 0.008 0.116 −0.972 1.603 7721
CAR ( −2, + 2) – target 0.265 0.230 0.250 −1.124 2.910 1011
CAR ( −1, + 1) – target 0.256 0.219 0.255 −0.988 3.044 1011
CAR ( −5, + 5) – target 0.286 0.245 0.261 −0.274 2.677 1010
CAR ( −2, + 2) – synergy 0.024 0.015 0.082 −0.035 0.458 1011
CAR ( −1, + 1) – synergy 0.023 0.014 0.077 −0.333 0.450 1011
CAR ( −5, + 5) – synergy 0.027 0.020 0.097 −0.423 0.459 1010
GIM index 9.533 10 2.805 2 17 563
E-index 2.382 2 1.189 0 5 642
Management practices 0.539 0.539 0.126 0 0.968 7721
Ln(acquirer size) 6.319 6.294 1.862 0.412 12.978 7721
Run-up 0.123 0.100 0.225 −0.994 2.030 7721
Sigma 0.030 0.027 0.016 0.007 0.192 7721
Free cash flow 0.049 0.033 3.792 −6.621 332.817 7721
Tobin’s Q 2.194 1.655 2.368 0.258 48.839 7721
Leverage 0.221 0.194 0.200 0 1.406 7721
TECH 0.308 0 0.462 0 1 4105
TECH (target) 0.379 0 0.485 0 1 4105
Conglomerate 0.450 0 0.497 0 1 4105
RD intensity 0.058 0.034 0.071 0 0.861 4105
ROA 0.117 0.119 0.075 −0.057 0.249 7022
ROE 0.277 0.269 0.214 −0.181 0.729 7018
Annual stock return 1.376 1.071 8.904 0.022 730.446 6751
CAPX 0.061 0.040 0.080 0 1.978 6751
Net profit margin 0.004 0.051 0.687 −26.856 6.978 6751
Industry sales Herfindahl 0.282 0.211 0.233 0.025 1 6751
Relative size 0.223 0.088 0.437 0.010 9.817 7721
Relatedness 0.602 1 0.489 0 1 7721
Friendly merger 0.995 1 0.074 0 1 7721
Hostile merger 0.003 0 0.059 0 1 7721
Neutral merger 0.001 0 0.038 0 1 7721
Public (paid with cash) 0.054 0 0.227 0 1 7721
Public (paid with stocks) 0.045 0 0.208 0 1 7721
Private (paid with cash) 0.123 0 0.329 0 1 7721
Private (paid with stocks) 0.068 0 0.252 0 1 7721
Subsidiary (paid with cash) 0.130 0 0.337 0 1 7721
Above vice-president 4.996 5 1.605 1 11 1611
Average age (above vice-president) 67.761 67.5 6.500 32 91 1611
Average age (executives) 53.648 53.667 6.293 35.667 77 1611
Cash pay for CEO (in thousand) 1379.671 992.215 1646.594 0 32,016.67 1611
Total pay for CEO (in thousand) 4860.047 2364.47 9321.433 0.001 134,437.2 1611
Equity pay for CEO (in thousand) 3087.509 989.555 8357.176 0 131,348.9 1611
Variables for accounting profitability models
�RO E t → t+3 −0.016 −0.000 0.193 −0.495 0.410 7018
Tobin’s Q 2.198 1.642 2.522 0.232 78.565 9499
Management practices 0.538 0.538 0.127 0.093 0.968 7018
Size 6.047 5.980 1.860 −1.470 13.590 7018
Leverage 0.230 0.204 0.210 0 2.137 7018
Cash 2883.722 461.805 16,878.21 0.253 859,671 7018
CAPX 0.063 0.040 0.076 −0.008 1.291 7018
Friendly merger 0.994 1 0.076 0 1 7018
Hostile merger 0.004 0 0.061 0 1 7018
Private target 0.492 0 0.500 0 1 7018
Public target 0.156 0 0.363 0 1 7018
Cash M&A 0.299 0 0.458 0 1 7018
Stock M&A 0.139 0 0.346 0 1 7018
Relatedness 0.604 1 0.489 0 1 7018
TECH (target) 0.286 0 0.452 0 1 7018
d
i
t
l
t
a
d
W
e
C
s
e
t
a
v
(
2010 ).
icates that for a market capitalization of $3588 million (the mean
n our sample), moving from the lower quartile to the upper quar-
ile results in gains of about $294.2 million. This outcome is in
ine with Golubov et al. (2015) , who argue that acquirers are ei-
her very good or very bad at mergers, and because of this there is
considerable gap between the top and bottom bidders.
Solitary events of firms that appear once in our sample can
rive this number and thus drive our results in a specific direction.
e therefore show statistics for frequent and occasional acquir-
7
rs. Occasional acquirers tend to have, on average, slightly lower
AR interquartile ranges compared to frequent acquirers (8% ver-
us 8.1%). Hence, the mean interquartile value for frequent acquir-
rs translates into almost $292 million. It is worth noticing that
he median value of CARs is very low (0.67%). That is, the average
cquirer has an anemic positive outcome from M&A activities, re-
ealing that acquirers are either extremely good or bad performers
similar findings occur in Golubov et al., 2015 , and Gompers et al.,
M.D. Delis, M. Iosifidi, P. Kazakis et al. Journal of Banking and Finance 134 (2022) 106355
Table 3
Percentile statistics . This table reports distribution characteristics for management
practices and acquirer CAR measured over different time windows (2 days, 5 days,
and 11 days). CAR is calculated based on the market model. We report characteris-
tics for the whole sample, for frequent acquirers and for occasional acquirers. Defi-
nitions of all variables along with their sources are in Table 1 .
Statistics
Management
practices
CAR
( −1, + 1)
CAR
( −2, + 2)
CAR
( −5, + 5)
Panel A: Whole sample
1st percentile 0.245 −0.187 −0.206 −0.290
5th percentile 0.334 −0.092 −0.114 −0.158
10th percentile 0.378 −0.060 −0.075 −0.107
25th percentile 0.453 −0.022 −0.029 −0.043
50th percentile
(median)
0.539 0.006 0.007 0.007
75th percentile 0.625 0.041 0.049 0.062
90th percentile 0.701 0.093 0.109 0.138
95th percentile 0.746 0.137 0.160 0.198
99th percentile 0.838 0.262 0.290 0.356
p75-p25
(interquartile
range)
0.172 0.063 0.078 0.105
Panel B: Frequent acquirers
1st percentile 0.250 −0.156 −0.193 −0.285
5th percentile 0.343 −0.087 −0.113 −0.158
10th percentile 0.386 −0.061 −0.076 −0.105
25th percentile 0.454 −0.022 −0.030 −0.043
50th percentile
(median)
0.548 0.007 0.007 0.006
75th percentile 0.634 0.040 0.049 0.059
90th percentile 0.698 0.086 0.100 0.126
95th percentile 0.746 0.118 0.147 0.194
99th percentile 0.843 0.226 0.266 0.323
p75-p25
(interquartile
range)
0.179 0.063 0.079 0.102
Panel C: Occasional acquirers
1st percentile 0.245 −0.171 −0.200 −0.275
5th percentile 0.333 −0.088 −0.109 −0.154
10th percentile 0.378 −0.058 −0.074 −0.104
25th percentile 0.452 −0.021 −0.028 −0.041
50th percentile
(median)
0.539 0.006 0.007 0.008
75th percentile 0.627 0.039 0.048 0.060
90th percentile 0.702 0.090 0.105 0.133
95th percentile 0.745 0.131 0.154 0.192
99th percentile 0.840 0.246 0.279 0.324
p75-p25
(interquartile
range)
0.175 0.060 0.076 0.102
4
4
o
m
C
w
t
a
a
w
m
G
o
c
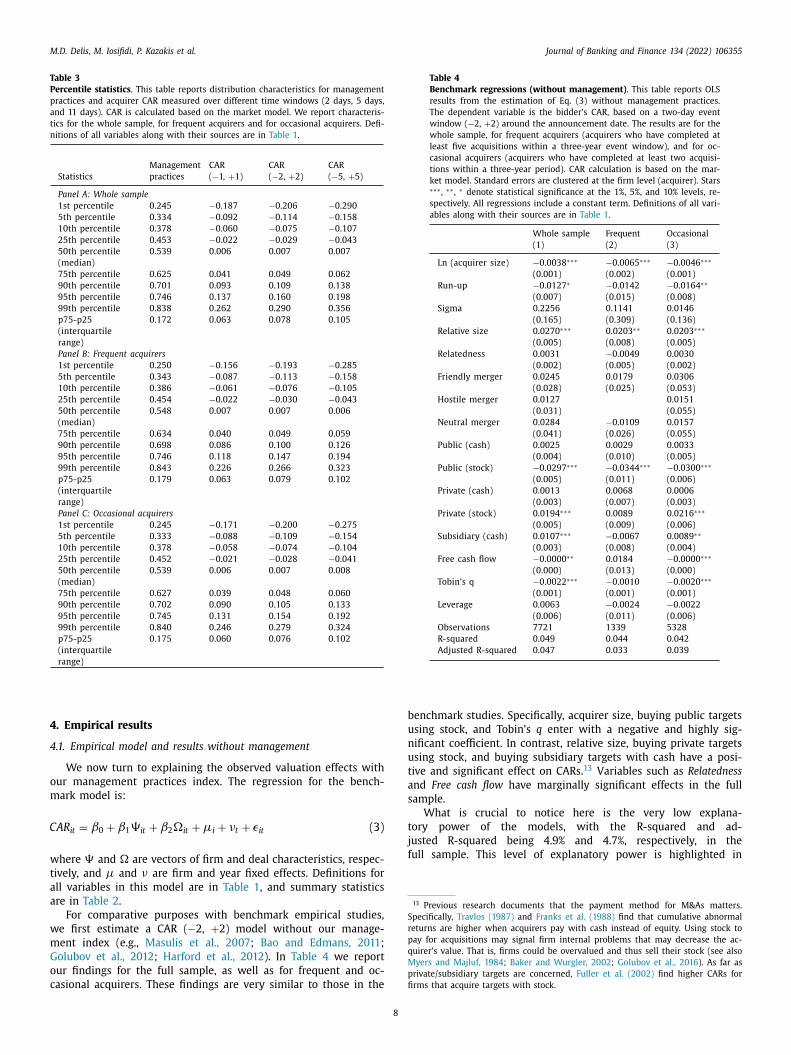
Table 4
Benchmark regressions (without management) . This table reports OLS
results from the estimation of Eq. (3) without management practices.
The dependent variable is the bidder’s CAR, based on a two-day event
window ( −2, + 2) around the announcement date. The results are for the
whole sample, for frequent acquirers (acquirers who have completed at
least five acquisitions within a three-year event window), and for oc-
casional acquirers (acquirers who have completed at least two acquisi-
tions within a three-year period). CAR calculation is based on the mar-
ket model. Standard errors are clustered at the firm level (acquirer). Stars ∗∗∗ , ∗∗ , ∗ denote statistical significance at the 1%, 5%, and 10% levels, re-
spectively. All regressions include a constant term. Definitions of all vari-
ables along with their sources are in Table 1 .
Whole sample Frequent Occasional
(1) (2) (3)
Ln (acquirer size) −0.0038 ∗∗∗ −0.0065 ∗∗∗ −0.0046 ∗∗∗
(0.001) (0.002) (0.001)
Run-up −0.0127 ∗ −0.0142 −0.0164 ∗∗
(0.007) (0.015) (0.008)
Sigma 0.2256 0.1141 0.0146
(0.165) (0.309) (0.136)
Relative size 0.0270 ∗∗∗ 0.0203 ∗∗ 0.0203 ∗∗∗
(0.005) (0.008) (0.005)
Relatedness 0.0031 −0.0049 0.0030
(0.002) (0.005) (0.002)
Friendly merger 0.0245 0.0179 0.0306
(0.028) (0.025) (0.053)
Hostile merger 0.0127 0.0151
(0.031) (0.055)
Neutral merger 0.0284 −0.0109 0.0157
(0.041) (0.026) (0.055)
Public (cash) 0.0025 0.0029 0.0033
(0.004) (0.010) (0.005)
Public (stock) −0.0297 ∗∗∗ −0.0344 ∗∗∗ −0.0300 ∗∗∗
(0.005) (0.011) (0.006)
Private (cash) 0.0013 0.0068 0.0006
(0.003) (0.007) (0.003)
Private (stock) 0.0194 ∗∗∗ 0.0089 0.0216 ∗∗∗
(0.005) (0.009) (0.006)
Subsidiary (cash) 0.0107 ∗∗∗ −0.0067 0.0089 ∗∗
(0.003) (0.008) (0.004)
Free cash flow −0.0000 ∗∗ 0.0184 −0.0000 ∗∗∗
(0.000) (0.013) (0.000)
Tobin’s q −0.0022 ∗∗∗ −0.0010 −0.0020 ∗∗∗
(0.001) (0.001) (0.001)
Leverage 0.0063 −0.0024 −0.0022
(0.006) (0.011) (0.006)
Observations 7721 1339 5328
R-squared 0.049 0.044 0.042
Adjusted R-squared 0.047 0.033 0.039
b
u
n
u
t
a
s
t
j
f
13 Previous research documents that the payment method for M&As matters.
Specifically, Travlos (1987) and Franks et al. (1988) find that cumulative abnormal
returns are higher when acquirers pay with cash instead of equity. Using stock to
pay for acquisitions may signal firm internal problems that may decrease the ac-
quirer’s value. That is, firms could be overvalued and thus sell their stock (see also
Myers and Majluf, 1984 ; Baker and Wurgler, 2002 ; Golubov et al., 2016 ). As far as
private/subsidiary targets are concerned, Fuller et al. (2002) find higher CARs for
firms that acquire targets with stock.
. Empirical results
.1. Empirical model and results without management
We now turn to explaining the observed valuation effects with
ur management practices index. The regression for the bench-
ark model is:
A R it = β0 + β1 it + β2 it + μi + νt + εit (3)
here and are vectors of firm and deal characteristics, respec-
ively, and μ and ν are firm and year fixed effects. Definitions for
ll variables in this model are in Table 1 , and summary statistics
re in Table 2 .
For comparative purposes with benchmark empirical studies,
e first estimate a CAR ( −2, + 2) model without our manage-
ent index (e.g., Masulis et al., 2007 ; Bao and Edmans, 2011 ;
olubov et al., 2012 ; Harford et al., 2012 ). In Table 4 we report
ur findings for the full sample, as well as for frequent and oc-
asional acquirers. These findings are very similar to those in the
8
enchmark studies. Specifically, acquirer size, buying public targets
sing stock, and Tobin’s q enter with a negative and highly sig-
ificant coefficient. In contrast, relative size, buying private targets
sing stock, and buying subsidiary targets with cash have a posi-
ive and significant effect on CARs. 13 Variables such as Relatedness
nd Free cash flow have marginally significant effects in the full
ample.
What is crucial to notice here is the very low explana-
ory power of the models, with the R-squared and ad-
usted R-squared being 4.9% and 4.7%, respectively, in the
ull sample. This level of explanatory power is highlighted in
M.D. Delis, M. Iosifidi, P. Kazakis et al. Journal of Banking and Finance 134 (2022) 106355
Table 5
Benchmark model with management . This table reports OLS results from the estimation of Eq. (3) with management practices. The dependent variable is the bidder’s CAR,
based on a two-day event window ( −2, + 2) around the announcement date. The results are for the whole sample, for frequent acquirers (acquirers who have completed at
least five acquisitions within a three-year event window), and for occasional acquirers (acquirers who have completed at least two acquisitions within a three-year period).
CAR calculation is based on the market model. Standard errors (in parentheses) are clustered at the firm level (acquirer). Stars ∗∗∗ , ∗∗ , ∗ denote statistical significance at
the 1%, 5%, and 10% levels, respectively. The last three specifications include firm and year fixed effects. All regressions include a constant term. Definitions of all variables
along with their sources are in Table 1 .
Whole sample Frequent Occasional Whole sample Frequent Occasional
(1) (2) (3) (4) (5) (6)
Management practices 0.0876 ∗∗∗ 0.0366 ∗∗ 0.0650 ∗∗∗ 0.0592 ∗∗∗ 0.0178 0.0544 ∗∗∗
(0.009) (0.017) (0.010) (0.010) (0.021) (0.011)
Ln (acquirer size) −0.0039 ∗∗∗ −0.0064 ∗∗∗ −0.0046 ∗∗∗ −0.0108 ∗∗∗ −0.0233 ∗∗∗ −0.0156 ∗∗∗
(0.001) (0.002) (0.001) (0.003) (0.006) (0.003)
Run-up −0.0130 ∗ −0.0138 −0.0163 ∗∗ −0.0103 −0.0123 −0.0065
(0.007) (0.015) (0.008) (0.009) (0.020) (0.010)
Sigma 0.2076 0.0995 −0.0002 0.0003 −0.1876 −0.0388
(0.163) (0.308) (0.135) (0.199) (0.493) (0.258)
Relative size 0.0257 ∗∗∗ 0.0207 ∗∗ 0.0194 ∗∗∗ 0.0194 ∗∗∗ 0.0243 ∗∗∗ 0.0176 ∗∗∗
(0.005) (0.008) (0.005) (0.005) (0.009) (0.006)
Relatedness 0.0034 −0.0044 0.0032 0.0031 −0.0120 ∗ 0.0016
(0.002) (0.005) (0.002) (0.003) (0.007) (0.003)
Friendly merger 0.0151 0.0180 0.0296 0.0329 0.0425 ∗∗ 0.0461
(0.032) (0.026) (0.057) (0.042) (0.019) (0.051)
Hostile merger 0.0021 0.0129 0.0226 0.0279 0.0385
(0.034) (0.059) (0.045) (0.031) (0.054)
Neutral merger 0.0197 −0.0072 0.0149 0.0316 0.0457
(0.043) (0.027) (0.060) (0.045) (0.056)
Public (cash) 0.0017 0.0027 0.0024 −0.0015 0.0028 0.0032
(0.004) (0.010) (0.005) (0.005) (0.014) (0.005)
Public (stock) −0.0293 ∗∗∗ −0.0354 ∗∗∗ −0.0296 ∗∗∗ −0.0248 ∗∗∗ −0.0410 ∗∗∗ −0.0255 ∗∗∗
(0.005) (0.011) (0.006) (0.007) (0.013) (0.008)
Private (cash) 0.0015 0.0070 0.0007 0.0003 0.0032 0.0024
(0.003) (0.007) (0.003) (0.004) (0.008) (0.004)
Private (stock) 0.0196 ∗∗∗ 0.0084 0.0215 ∗∗∗ 0.0195 ∗∗∗ 0.0022 0.0267 ∗∗∗
(0.005) (0.009) (0.006) (0.006) (0.014) (0.008)
Subsidiary (cash) 0.0102 ∗∗∗ −0.0071 0.0085 ∗∗ 0.0039 −0.0159 0.0020
(0.003) (0.008) (0.004) (0.003) (0.010) (0.004)
Free cash flow −0.0000 0.0195 −0.0000 −0.0001 ∗∗ 0.0049 −0.0001 ∗∗
(0.000) (0.013) (0.000) (0.000) (0.034) (0.000)
Tobin’s q −0.0022 ∗∗∗ −0.0010 −0.0020 ∗∗∗ −0.0016 ∗ −0.0007 −0.0018 ∗
(0.001) (0.001) (0.001) (0.001) (0.002) (0.001)
Leverage 0.0040 −0.0044 −0.0041 −0.0121 −0.0501 −0.0243
(0.006) (0.011) (0.006) (0.012) (0.030) (0.015)
Firm FE No No No Yes Yes Yes
Year FE No No No Yes Yes Yes
Observations 7721 1339 5328 6570 1294 5136
R-squared 0.064 0.047 0.051 0.330 0.263 0.327
Adjusted R-squared 0.062 0.035 0.048 0.100 0.055 0.086
M
a
4
p
w
w
w
n
p
i
i
(
s
c
s
b
s
i
s
a
f
14 Prior research by Delis and Tsionas (2018) has validated the management prac-
tices score via a Monte Carlo analysis. They show that this index captures man-
agement quality and not something else. Here, we perform another validation exer-
cise. We compare the effect of our management practices measure on CARs against
the equivalent effect of fitted values of management practices computed from the
World Management Survey (WMS). This exercise also yields a positive relation be-
tween the fitted values of management practices and CARs. The results are in the
online appendix in the detailed discussion of the Bayesian method and in the online
appendix table A3. 15 To be sure that our results are not driven by extreme values, we rerun our mod-
els by winsorizing the continues variables. The results are in the online appendix
A5 and remain qualitatively and quantitatively unchanged. Further, instead of split-
ting the sample into frequent and infrequent acquirers, in the online table A6 we
include the number of deals in the past five years and the ratio of dollar value of
past deals to acquirer market capitalization. Our inferences are very similar to those
of the benchmark model.
oeller et al. (2004) , Masulis et al. (2007) , Harford et al. (2012) ,
nd Golubov et al. (2015) , among others.
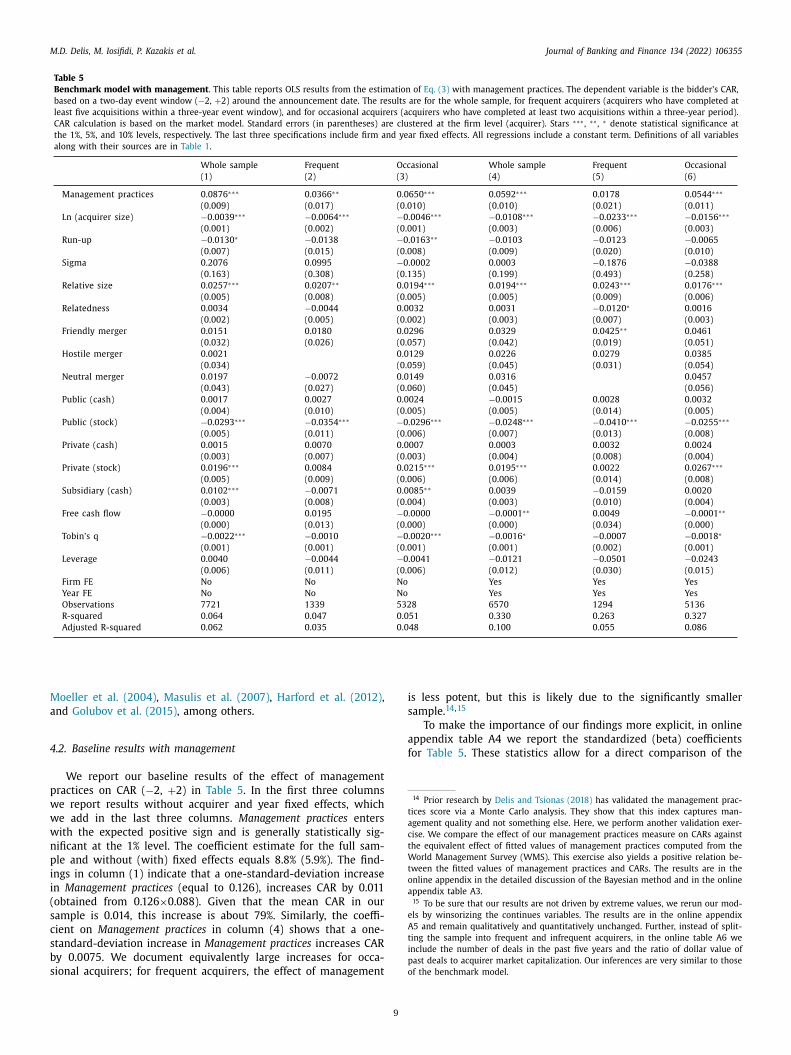
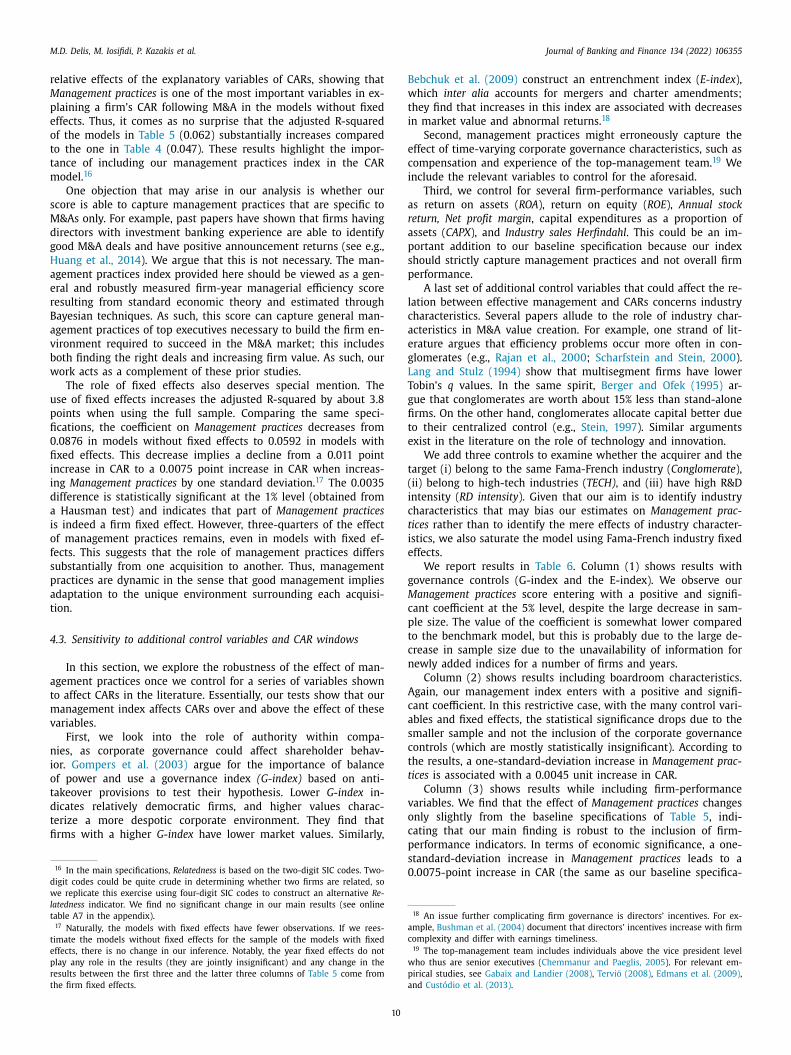
.2. Baseline results with management
We report our baseline results of the effect of management
ractices on CAR ( −2, + 2) in Table 5 . In the first three columns
e report results without acquirer and year fixed effects, which
e add in the last three columns. Management practices enters
ith the expected positive sign and is generally statistically sig-
ificant at the 1% level. The coefficient estimate for the full sam-
le and without (with) fixed effects equals 8.8% (5.9%). The find-
ngs in column (1) indicate that a one-standard-deviation increase
n Management practices (equal to 0.126), increases CAR by 0.011
obtained from 0.126 ×0.088). Given that the mean CAR in our
ample is 0.014, this increase is about 79%. Similarly, the coeffi-
ient on Management practices in column (4) shows that a one-
tandard-deviation increase in Management practices increases CAR
y 0.0075. We document equivalently large increases for occa-
ional acquirers; for frequent acquirers, the effect of management
9
s less potent, but this is likely due to the significantly smaller
ample. 14 , 15
To make the importance of our findings more explicit, in online
ppendix table A4 we report the standardized (beta) coefficients
or Table 5 . These statistics allow for a direct comparison of the
M.D. Delis, M. Iosifidi, P. Kazakis et al. Journal of Banking and Finance 134 (2022) 106355
r
M
p
e
o
t
t
m
s
M
d
g
H
a
e
r
B
a
v
b
w
u
p
fi
0
fi
i
i
d
a
i
o
f
s
p
a
t
4
a
t
m
v
n
i
o
t
d
t
fi
d
w
l
t
t
e
p
r
t
B
w
t
i
e
c
i
a
r
a
p
s
p
l
c
a
e
g
L
T
g
fi
t
e
t
(
i
c
t
i
e
g
M
c
p
t
c
n
A
c
a
s
c
t
t
v
o
c
elative effects of the explanatory variables of CARs, showing that
anagement practices is one of the most important variables in ex-
laining a firm’s CAR following M&A in the models without fixed
ffects. Thus, it comes as no surprise that the adjusted R-squared
f the models in Table 5 (0.062) substantially increases compared
o the one in Table 4 (0.047). These results highlight the impor-
ance of including our management practices index in the CAR
odel. 16
One objection that may arise in our analysis is whether our
core is able to capture management practices that are specific to
&As only. For example, past papers have shown that firms having
irectors with investment banking experience are able to identify
ood M&A deals and have positive announcement returns (see e.g.,
uang et al., 2014 ). We argue that this is not necessary. The man-
gement practices index provided here should be viewed as a gen-
ral and robustly measured firm-year managerial efficiency score
esulting from standard economic theory and estimated through
ayesian techniques. As such, this score can capture general man-
gement practices of top executives necessary to build the firm en-
ironment required to succeed in the M&A market; this includes
oth finding the right deals and increasing firm value. As such, our
ork acts as a complement of these prior studies.
The role of fixed effects also deserves special mention. The
se of fixed effects increases the adjusted R-squared by about 3.8
oints when using the full sample. Comparing the same speci-
cations, the coefficient on Management practices decreases from
.0876 in models without fixed effects to 0.0592 in models with
xed effects. This decrease implies a decline from a 0.011 point
ncrease in CAR to a 0.0075 point increase in CAR when increas-
ng Management practices by one standard deviation. 17 The 0.0035
ifference is statistically significant at the 1% level (obtained from
Hausman test) and indicates that part of Management practices
s indeed a firm fixed effect. However, three-quarters of the effect
f management practices remains, even in models with fixed ef-
ects. This suggests that the role of management practices differs
ubstantially from one acquisition to another. Thus, management
ractices are dynamic in the sense that good management implies
daptation to the unique environment surrounding each acquisi-
ion.
.3. Sensitivity to additional control variables and CAR windows
In this section, we explore the robustness of the effect of man-
gement practices once we control for a series of variables shown
o affect CARs in the literature. Essentially, our tests show that our
anagement index affects CARs over and above the effect of these
ariables.
First, we look into the role of authority within compa-
ies, as corporate governance could affect shareholder behav-
or. Gompers et al. (2003) argue for the importance of balance
f power and use a governance index (G-index) based on anti-
akeover provisions to test their hypothesis. Lower G-index in-
icates relatively democratic firms, and higher values charac-
erize a more despotic corporate environment. They find that
rms with a higher G-index have lower market values. Similarly,
16 In the main specifications, Relatedness is based on the two-digit SIC codes. Two-
igit codes could be quite crude in determining whether two firms are related, so
e replicate this exercise using four-digit SIC codes to construct an alternative Re-
atedness indicator. We find no significant change in our main results (see online
able A7 in the appendix). 17 Naturally, the models with fixed effects have fewer observations. If we rees-
imate the models without fixed effects for the sample of the models with fixed
ffects, there is no change in our inference. Notably, the year fixed effects do not
lay any role in the results (they are jointly insignificant) and any change in the
esults between the first three and the latter three columns of Table 5 come from
he firm fixed effects.
p
s
0
a
c
w
p
a
10
ebchuk et al. (2009) construct an entrenchment index ( E-index ),
hich inter alia accounts for mergers and charter amendments;
hey find that increases in this index are associated with decreases
n market value and abnormal returns. 18
Second, management practices might erroneously capture the
ffect of time-varying corporate governance characteristics, such as
ompensation and experience of the top-management team. 19 We
nclude the relevant variables to control for the aforesaid.
Third, we control for several firm-performance variables, such
s return on assets ( ROA ), return on equity ( ROE ), Annual stock
eturn, Net profit margin , capital expenditures as a proportion of
ssets ( CAPX ), and Industry sales Herfindahl . This could be an im-
ortant addition to our baseline specification because our index
hould strictly capture management practices and not overall firm
erformance.
A last set of additional control variables that could affect the re-
ation between effective management and CARs concerns industry
haracteristics. Several papers allude to the role of industry char-
cteristics in M&A value creation. For example, one strand of lit-
rature argues that efficiency problems occur more often in con-
lomerates (e.g., Rajan et al., 20 0 0 ; Scharfstein and Stein, 20 0 0 ).
ang and Stulz (1994) show that multisegment firms have lower
obin’s q values. In the same spirit, Berger and Ofek (1995) ar-
ue that conglomerates are worth about 15% less than stand-alone
rms. On the other hand, conglomerates allocate capital better due
o their centralized control (e.g., Stein, 1997 ). Similar arguments
xist in the literature on the role of technology and innovation.
We add three controls to examine whether the acquirer and the
arget (i) belong to the same Fama-French industry ( Conglomerate ),
ii) belong to high-tech industries ( TECH) , and (iii) have high R&D
ntensity ( RD intensity ). Given that our aim is to identify industry
haracteristics that may bias our estimates on Management prac-
ices rather than to identify the mere effects of industry character-
stics, we also saturate the model using Fama-French industry fixed
ffects.
We report results in Table 6 . Column (1) shows results with
overnance controls (G-index and the E-index). We observe our
anagement practices score entering with a positive and signifi-
ant coefficient at the 5% level, despite the large decrease in sam-
le size. The value of the coefficient is somewhat lower compared
o the benchmark model, but this is probably due to the large de-
rease in sample size due to the unavailability of information for
ewly added indices for a number of firms and years.
Column (2) shows results including boardroom characteristics.
gain, our management index enters with a positive and signifi-
ant coefficient. In this restrictive case, with the many control vari-
bles and fixed effects, the statistical significance drops due to the
maller sample and not the inclusion of the corporate governance
ontrols (which are mostly statistically insignificant). According to
he results, a one-standard-deviation increase in Management prac-
ices is associated with a 0.0045 unit increase in CAR.
Column (3) shows results while including firm-performance
ariables. We find that the effect of Management practices changes
nly slightly from the baseline specifications of Table 5 , indi-
ating that our main finding is robust to the inclusion of firm-
erformance indicators. In terms of economic significance, a one-
tandard-deviation increase in Management practices leads to a
.0075-point increase in CAR (the same as our baseline specifica-
18 An issue further complicating firm governance is directors’ incentives. For ex-
mple, Bushman et al. (2004) document that directors’ incentives increase with firm
omplexity and differ with earnings timeliness. 19 The top-management team includes individuals above the vice president level
ho thus are senior executives ( Chemmanur and Paeglis, 2005 ). For relevant em-
irical studies, see Gabaix and Landier (2008) , Terviö (2008) , Edmans et al. (2009) ,
nd Custódio et al. (2013) .
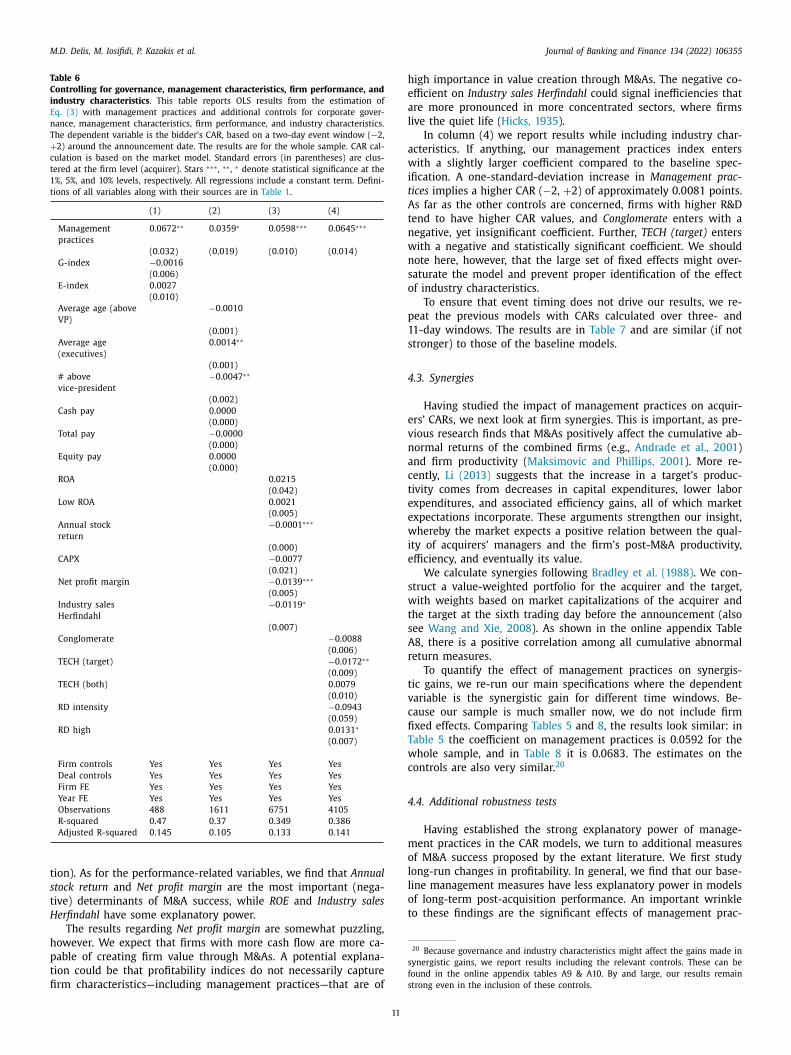
M.D. Delis, M. Iosifidi, P. Kazakis et al. Journal of Banking and Finance 134 (2022) 106355
Table 6
Controlling for governance, management characteristics, firm performance, and
industry characteristics . This table reports OLS results from the estimation of
Eq. (3) with management practices and additional controls for corporate gover-
nance, management characteristics, firm performance, and industry characteristics.
The dependent variable is the bidder’s CAR, based on a two-day event window ( −2,
+ 2) around the announcement date. The results are for the whole sample. CAR cal-
culation is based on the market model. Standard errors (in parentheses) are clus-
tered at the firm level (acquirer). Stars ∗∗∗ , ∗∗ , ∗ denote statistical significance at the
1%, 5%, and 10% levels, respectively. All regressions include a constant term. Defini-
tions of all variables along with their sources are in Table 1 .
(1) (2) (3) (4)
Management
practices
0.0672 ∗∗ 0.0359 ∗ 0.0598 ∗∗∗ 0.0645 ∗∗∗
(0.032) (0.019) (0.010) (0.014)
G-index −0.0016
(0.006)
E-index 0.0027
(0.010)
Average age (above
VP)
−0.0010
(0.001)
Average age
(executives)
0.0014 ∗∗
(0.001)
# above
vice-president
−0.0047 ∗∗
(0.002)
Cash pay 0.0000
(0.000)
Total pay −0.0000
(0.000)
Equity pay 0.0000
(0.000)
ROA 0.0215
(0.042)
Low ROA 0.0021
(0.005)
Annual stock
return
−0.0001 ∗∗∗
(0.000)
CAPX −0.0077
(0.021)
Net profit margin −0.0139 ∗∗∗
(0.005)
Industry sales
Herfindahl
−0.0119 ∗
(0.007)
Conglomerate −0.0088
(0.006)
TECH (target) −0.0172 ∗∗
(0.009)
TECH (both) 0.0079
(0.010)
RD intensity −0.0943
(0.059)
RD high 0.0131 ∗
(0.007)
Firm controls Yes Yes Yes Yes
Deal controls Yes Yes Yes Yes
Firm FE Yes Yes Yes Yes
Year FE Yes Yes Yes Yes
Observations 488 1611 6751 4105
R-squared 0.47 0.37 0.349 0.386
Adjusted R-squared 0.145 0.105 0.133 0.141
t
s
t
H
h
p
t
fi
h
e
a
l
a
w
i
t
A
t
n
w
n
s
o
p
1
s
4
e
v
n
a
c
t
e
e
w
i
e
s
w
t
s
A
r
t
v
c
fi
T
w
c
4
m
o
l
l
o
t
20 Because governance and industry characteristics might affect the gains made in
synergistic gains, we report results including the relevant controls. These can be
found in the online appendix tables A9 & A10. By and large, our results remain
strong even in the inclusion of these controls.
ion). As for the performance-related variables, we find that Annual
tock return and Net profit margin are the most important (nega-
ive) determinants of M&A success, while ROE and Industry sales
erfindahl have some explanatory power.
The results regarding Net profit margin are somewhat puzzling,
owever. We expect that firms with more cash flow are more ca-
able of creating firm value through M&As. A potential explana-
ion could be that profitability indices do not necessarily capture
rm characteristics—including management practices—that are of
11
igh importance in value creation through M&As. The negative co-
fficient on Industry sales Herfindahl could signal inefficiencies that
re more pronounced in more concentrated sectors, where firms
ive the quiet life ( Hicks, 1935 ).
In column (4) we report results while including industry char-
cteristics. If anything, our management practices index enters
ith a slightly larger coefficient compared to the baseline spec-
fication. A one-standard-deviation increase in Management prac-
ices implies a higher CAR ( −2, + 2) of approximately 0.0081 points.
s far as the other controls are concerned, firms with higher R&D
end to have higher CAR values, and Conglomerate enters with a
egative, yet insignificant coefficient. Further, TECH (target) enters
ith a negative and statistically significant coefficient. We should
ote here, however, that the large set of fixed effects might over-
aturate the model and prevent proper identification of the effect
f industry characteristics.
To ensure that event timing does not drive our results, we re-
eat the previous models with CARs calculated over three- and
1-day windows. The results are in Table 7 and are similar (if not
tronger) to those of the baseline models.
.3. Synergies
Having studied the impact of management practices on acquir-
rs’ CARs, we next look at firm synergies. This is important, as pre-
ious research finds that M&As positively affect the cumulative ab-
ormal returns of the combined firms (e.g., Andrade et al., 2001 )
nd firm productivity ( Maksimovic and Phillips, 2001 ). More re-
ently, Li (2013) suggests that the increase in a target’s produc-
ivity comes from decreases in capital expenditures, lower labor
xpenditures, and associated efficiency gains, all of which market
xpectations incorporate. These arguments strengthen our insight,
hereby the market expects a positive relation between the qual-
ty of acquirers’ managers and the firm’s post-M&A productivity,
fficiency, and eventually its value.
We calculate synergies following Bradley et al. (1988) . We con-
truct a value-weighted portfolio for the acquirer and the target,
ith weights based on market capitalizations of the acquirer and
he target at the sixth trading day before the announcement (also
ee Wang and Xie, 2008 ). As shown in the online appendix Table
8, there is a positive correlation among all cumulative abnormal
eturn measures.
To quantify the effect of management practices on synergis-
ic gains, we re-run our main specifications where the dependent
ariable is the synergistic gain for different time windows. Be-
ause our sample is much smaller now, we do not include firm
xed effects. Com paring Tables 5 and 8 , the results look similar: in
able 5 the coefficient on management practices is 0.0592 for the
hole sample, and in Table 8 it is 0.0683. The estimates on the
ontrols are also very similar. 20
.4. Additional robustness tests
Having established the strong explanatory power of manage-
ent practices in the CAR models, we turn to additional measures
f M&A success proposed by the extant literature. We first study
ong-run changes in profitability. In general, we find that our base-
ine management measures have less explanatory power in models
f long-term post-acquisition performance. An important wrinkle
o these findings are the significant effects of management prac-
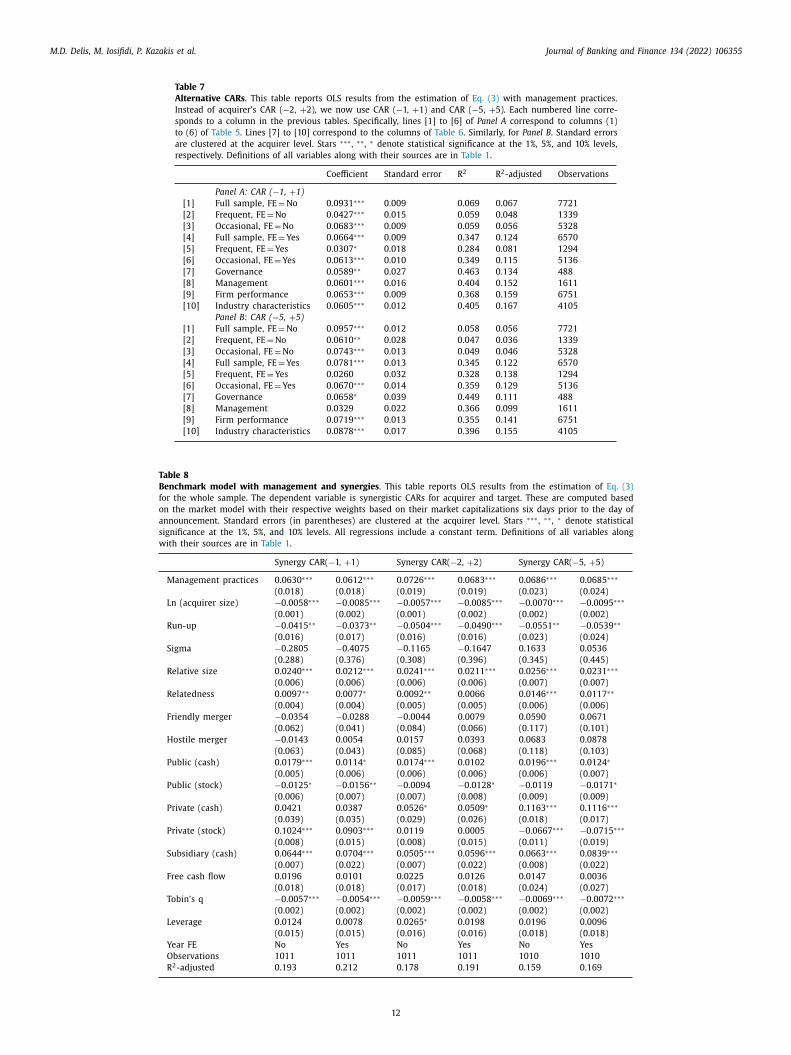
M.D. Delis, M. Iosifidi, P. Kazakis et al. Journal of Banking and Finance 134 (2022) 106355
Table 7
Alternative CARs . This table reports OLS results from the estimation of Eq. (3) with management practices.
Instead of acquirer’s CAR ( −2, + 2), we now use CAR ( −1, + 1) and CAR ( −5, + 5). Each numbered line corre-
sponds to a column in the previous tables. Specifically, lines [1] to [6] of Panel A correspond to columns (1)
to (6) of Table 5 . Lines [7] to [10] correspond to the columns of Table 6 . Similarly, for Panel B . Standard errors
are clustered at the acquirer level. Stars ∗∗∗ , ∗∗ , ∗ denote statistical significance at the 1%, 5%, and 10% levels,
respectively. Definitions of all variables along with their sources are in Table 1 .
Coefficient Standard error R 2 R 2 -adjusted Observations
Panel A: CAR ( −1, + 1)
[1] Full sample, FE = No 0.0931 ∗∗∗ 0.009 0.069 0.067 7721
[2] Frequent, FE = No 0.0427 ∗∗∗ 0.015 0.059 0.048 1339
[3] Occasional, FE = No 0.0683 ∗∗∗ 0.009 0.059 0.056 5328
[4] Full sample, FE = Yes 0.0664 ∗∗∗ 0.009 0.347 0.124 6570
[5] Frequent, FE = Yes 0.0307 ∗ 0.018 0.284 0.081 1294
[6] Occasional, FE = Yes 0.0613 ∗∗∗ 0.010 0.349 0.115 5136
[7] Governance 0.0589 ∗∗ 0.027 0.463 0.134 488
[8] Management 0.0601 ∗∗∗ 0.016 0.404 0.152 1611
[9] Firm performance 0.0653 ∗∗∗ 0.009 0.368 0.159 6751
[10] Industry characteristics 0.0605 ∗∗∗ 0.012 0.405 0.167 4105
Panel B: CAR ( −5, + 5)
[1] Full sample, FE = No 0.0957 ∗∗∗ 0.012 0.058 0.056 7721
[2] Frequent, FE = No 0.0610 ∗∗ 0.028 0.047 0.036 1339
[3] Occasional, FE = No 0.0743 ∗∗∗ 0.013 0.049 0.046 5328
[4] Full sample, FE = Yes 0.0781 ∗∗∗ 0.013 0.345 0.122 6570
[5] Frequent, FE = Yes 0.0260 0.032 0.328 0.138 1294
[6] Occasional, FE = Yes 0.0670 ∗∗∗ 0.014 0.359 0.129 5136
[7] Governance 0.0658 ∗ 0.039 0.449 0.111 488
[8] Management 0.0329 0.022 0.366 0.099 1611
[9] Firm performance 0.0719 ∗∗∗ 0.013 0.355 0.141 6751
[10] Industry characteristics 0.0878 ∗∗∗ 0.017 0.396 0.155 4105
Table 8
Benchmark model with management and synergies . This table reports OLS results from the estimation of Eq. (3)
for the whole sample. The dependent variable is synergistic CARs for acquirer and target. These are computed based
on the market model with their respective weights based on their market capitalizations six days prior to the day of
announcement. Standard errors (in parentheses) are clustered at the acquirer level. Stars ∗∗∗ , ∗∗ , ∗ denote statistical
significance at the 1%, 5%, and 10% levels. All regressions include a constant term. Definitions of all variables along
with their sources are in Table 1 .
Synergy CAR( −1, + 1) Synergy CAR( −2, + 2) Synergy CAR( −5, + 5)
Management practices 0.0630 ∗∗∗ 0.0612 ∗∗∗ 0.0726 ∗∗∗ 0.0683 ∗∗∗ 0.0686 ∗∗∗ 0.0685 ∗∗∗
(0.018) (0.018) (0.019) (0.019) (0.023) (0.024)
Ln (acquirer size) −0.0058 ∗∗∗ −0.0085 ∗∗∗ −0.0057 ∗∗∗ −0.0085 ∗∗∗ −0.0070 ∗∗∗ −0.0095 ∗∗∗
(0.001) (0.002) (0.001) (0.002) (0.002) (0.002)
Run-up −0.0415 ∗∗ −0.0373 ∗∗ −0.0504 ∗∗∗ −0.0490 ∗∗∗ −0.0551 ∗∗ −0.0539 ∗∗
(0.016) (0.017) (0.016) (0.016) (0.023) (0.024)
Sigma −0.2805 −0.4075 −0.1165 −0.1647 0.1633 0.0536
(0.288) (0.376) (0.308) (0.396) (0.345) (0.445)
Relative size 0.0240 ∗∗∗ 0.0212 ∗∗∗ 0.0241 ∗∗∗ 0.0211 ∗∗∗ 0.0256 ∗∗∗ 0.0231 ∗∗∗
(0.006) (0.006) (0.006) (0.006) (0.007) (0.007)
Relatedness 0.0097 ∗∗ 0.0077 ∗ 0.0092 ∗∗ 0.0066 0.0146 ∗∗∗ 0.0117 ∗∗
(0.004) (0.004) (0.005) (0.005) (0.006) (0.006)
Friendly merger −0.0354 −0.0288 −0.0044 0.0079 0.0590 0.0671
(0.062) (0.041) (0.084) (0.066) (0.117) (0.101)
Hostile merger −0.0143 0.0054 0.0157 0.0393 0.0683 0.0878
(0.063) (0.043) (0.085) (0.068) (0.118) (0.103)
Public (cash) 0.0179 ∗∗∗ 0.0114 ∗ 0.0174 ∗∗∗ 0.0102 0.0196 ∗∗∗ 0.0124 ∗
(0.005) (0.006) (0.006) (0.006) (0.006) (0.007)
Public (stock) −0.0125 ∗ −0.0156 ∗∗ −0.0094 −0.0128 ∗ −0.0119 −0.0171 ∗
(0.006) (0.007) (0.007) (0.008) (0.009) (0.009)
Private (cash) 0.0421 0.0387 0.0526 ∗ 0.0509 ∗ 0.1163 ∗∗∗ 0.1116 ∗∗∗
(0.039) (0.035) (0.029) (0.026) (0.018) (0.017)
Private (stock) 0.1024 ∗∗∗ 0.0903 ∗∗∗ 0.0119 0.0005 −0.0667 ∗∗∗ −0.0715 ∗∗∗
(0.008) (0.015) (0.008) (0.015) (0.011) (0.019)
Subsidiary (cash) 0.0644 ∗∗∗ 0.0704 ∗∗∗ 0.0505 ∗∗∗ 0.0596 ∗∗∗ 0.0663 ∗∗∗ 0.0839 ∗∗∗
(0.007) (0.022) (0.007) (0.022) (0.008) (0.022)
Free cash flow 0.0196 0.0101 0.0225 0.0126 0.0147 0.0036
(0.018) (0.018) (0.017) (0.018) (0.024) (0.027)
Tobin’s q −0.0057 ∗∗∗ −0.0054 ∗∗∗ −0.0059 ∗∗∗ −0.0058 ∗∗∗ −0.0069 ∗∗∗ −0.0072 ∗∗∗
(0.002) (0.002) (0.002) (0.002) (0.002) (0.002)
Leverage 0.0124 0.0078 0.0265 ∗ 0.0198 0.0196 0.0096
(0.015) (0.015) (0.016) (0.016) (0.018) (0.018)
Year FE No Yes No Yes No Yes
Observations 1011 1011 1011 1011 1010 1010
R 2 -adjusted 0.193 0.212 0.178 0.191 0.159 0.169
12
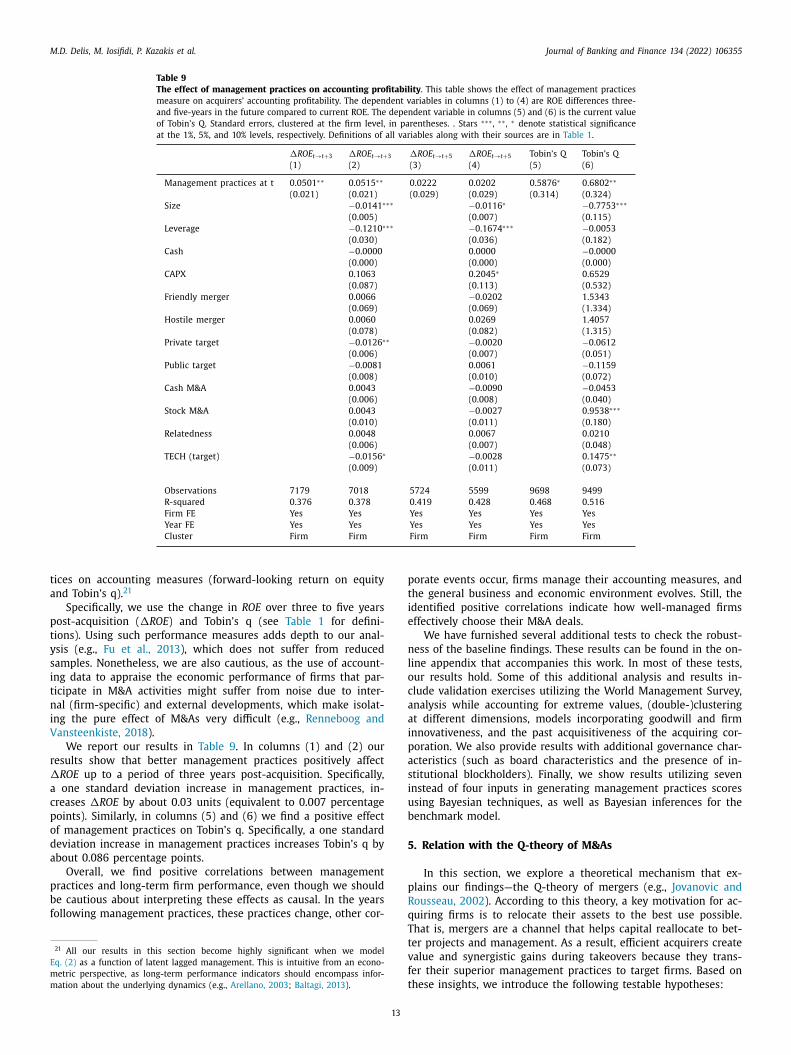
M.D. Delis, M. Iosifidi, P. Kazakis et al. Journal of Banking and Finance 134 (2022) 106355
Table 9
The effect of management practices on accounting profitability . This table shows the effect of management practices
measure on acquirers’ accounting profitability. The dependent variables in columns (1) to (4) are ROE differences three-
and five-years in the future compared to current ROE. The dependent variable in columns (5) and (6) is the current value
of Tobin’s Q. Standard errors, clustered at the firm level, in parentheses. . Stars ∗∗∗ , ∗∗ , ∗ denote statistical significance
at the 1%, 5%, and 10% levels, respectively. Definitions of all variables along with their sources are in Table 1 .
�RO E t → t +3 �RO E t → t +3 �RO E t → t +5 �RO E t → t +5 Tobin’s Q Tobin’s Q
(1) (2) (3) (4) (5) (6)
Management practices at t 0.0501 ∗∗ 0.0515 ∗∗ 0.0222 0.0202 0.5876 ∗ 0.6802 ∗∗
(0.021) (0.021) (0.029) (0.029) (0.314) (0.324)
Size −0.0141 ∗∗∗ −0.0116 ∗ −0.7753 ∗∗∗
(0.005) (0.007) (0.115)
Leverage −0.1210 ∗∗∗ −0.1674 ∗∗∗ −0.0053
(0.030) (0.036) (0.182)
Cash −0.0000 0.0000 −0.0000
(0.000) (0.000) (0.000)
CAPX 0.1063 0.2045 ∗ 0.6529
(0.087) (0.113) (0.532)
Friendly merger 0.0066 −0.0202 1.5343
(0.069) (0.069) (1.334)
Hostile merger 0.0060 0.0269 1.4057
(0.078) (0.082) (1.315)
Private target −0.0126 ∗∗ −0.0020 −0.0612
(0.006) (0.007) (0.051)
Public target −0.0081 0.0061 −0.1159
(0.008) (0.010) (0.072)
Cash M&A 0.0043 −0.0090 −0.0453
(0.006) (0.008) (0.040)
Stock M&A 0.0043 −0.0027 0.9538 ∗∗∗
(0.010) (0.011) (0.180)
Relatedness 0.0048 0.0067 0.0210
(0.006) (0.007) (0.048)
TECH (target) −0.0156 ∗ −0.0028 0.1475 ∗∗
(0.009) (0.011) (0.073)
Observations 7179 7018 5724 5599 9698 9499
R-squared 0.376 0.378 0.419 0.428 0.468 0.516
Firm FE Yes Yes Yes Yes Yes Yes
Year FE Yes Yes Yes Yes Yes Yes
Cluster Firm Firm Firm Firm Firm Firm
t
a
p
t
y
s
i
t
n
i
V
r
�
a
c
p
o
d
a
p
b
f
E
m
m
p
t
i
e
n
l
o
c
a
a
i
p
a
s
i
u
b
5
p
R
q
ices on accounting measures (forward-looking return on equity
nd Tobin’s q). 21
Specifically, we use the change in ROE over three to five years
ost-acquisition ( �ROE ) and Tobin’s q (see Table 1 for defini-
ions). Using such performance measures adds depth to our anal-
sis (e.g., Fu et al., 2013 ), which does not suffer from reduced
amples. Nonetheless, we are also cautious, as the use of account-
ng data to appraise the economic performance of firms that par-
icipate in M&A activities might suffer from noise due to inter-
al (firm-specific) and external developments, which make isolat-
ng the pure effect of M&As very difficult (e.g., Renneboog and
ansteenkiste, 2018 ).
We report our results in Table 9 . In columns (1) and (2) our
esults show that better management practices positively affect
ROE up to a period of three years post-acquisition. Specifically,
one standard deviation increase in management practices, in-
reases �ROE by about 0.03 units (equivalent to 0.007 percentage
oints). Similarly, in columns (5) and (6) we find a positive effect
f management practices on Tobin’s q. Specifically, a one standard
eviation increase in management practices increases Tobin’s q by
bout 0.086 percentage points.
Overall, we find positive correlations between management
ractices and long-term firm performance, even though we should
e cautious about interpreting these effects as causal. In the years
ollowing management practices, these practices change, other cor-
21 All our results in this section become highly significant when we model
q. (2) as a function of latent lagged management. This is intuitive from an econo-
etric perspective, as long-term performance indicators should encompass infor-
ation about the underlying dynamics (e.g., Arellano, 2003 ; Baltagi, 2013 ).
T
t
v
f
t
13
orate events occur, firms manage their accounting measures, and
he general business and economic environment evolves. Still, the
dentified positive correlations indicate how well-managed firms
ffectively choose their M&A deals.
We have furnished several additional tests to check the robust-
ess of the baseline findings. These results can be found in the on-
ine appendix that accompanies this work. In most of these tests,
ur results hold. Some of this additional analysis and results in-
lude validation exercises utilizing the World Management Survey,
nalysis while accounting for extreme values, (double-)clustering
t different dimensions, models incorporating goodwill and firm
nnovativeness, and the past acquisitiveness of the acquiring cor-
oration. We also provide results with additional governance char-
cteristics (such as board characteristics and the presence of in-
titutional blockholders). Finally, we show results utilizing seven
nstead of four inputs in generating management practices scores
sing Bayesian techniques, as well as Bayesian inferences for the
enchmark model.
. Relation with the Q-theory of M&As
In this section, we explore a theoretical mechanism that ex-
lains our findings—the Q-theory of mergers (e.g., Jovanovic and
ousseau, 2002 ). According to this theory, a key motivation for ac-
uiring firms is to relocate their assets to the best use possible.
hat is, mergers are a channel that helps capital reallocate to bet-
er projects and management. As a result, efficient acquirers create
alue and synergistic gains during takeovers because they trans-
er their superior management practices to target firms. Based on
hese insights, we introduce the following testable hypotheses:
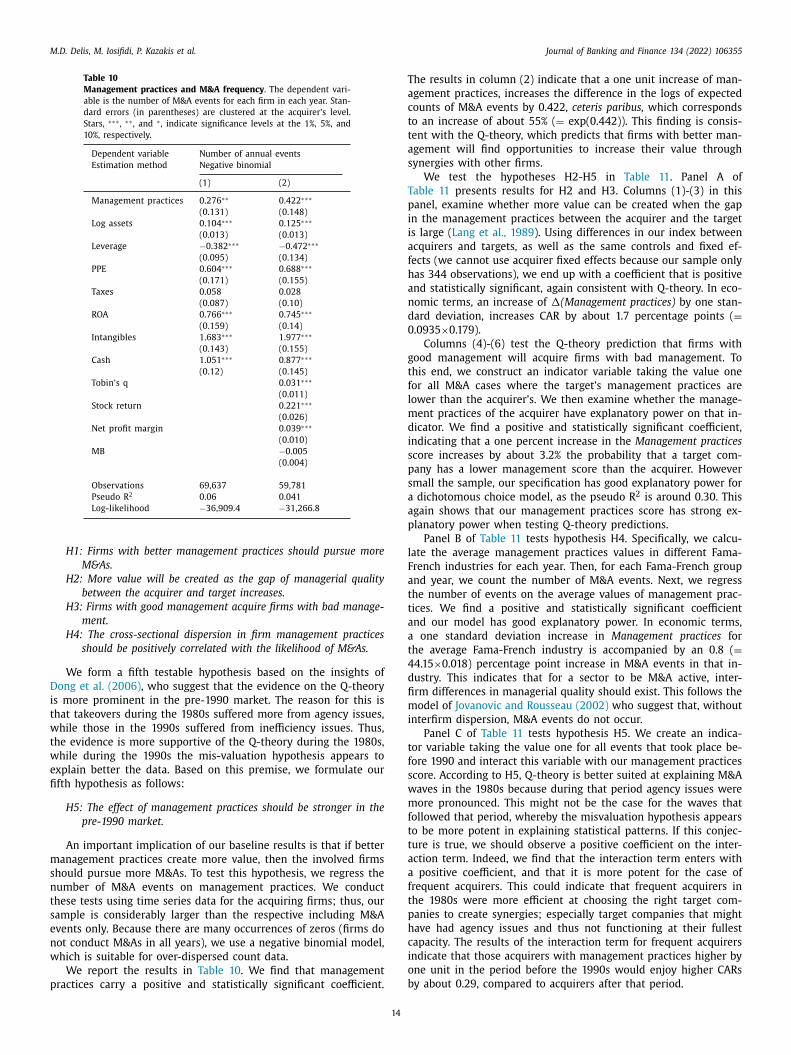
M.D. Delis, M. Iosifidi, P. Kazakis et al. Journal of Banking and Finance 134 (2022) 106355
Table 10
Management practices and M&A frequency . The dependent vari-
able is the number of M&A events for each firm in each year. Stan-
dard errors (in parentheses) are clustered at the acquirer’s level.
Stars, ∗∗∗ , ∗∗ , and ∗ , indicate significance levels at the 1%, 5%, and
10%, respectively.
Dependent variable Number of annual events
Estimation method Negative binomial
(1) (2)
Management practices 0.276 ∗∗ 0.422 ∗∗∗
(0.131) (0.148)
Log assets 0.104 ∗∗∗ 0.125 ∗∗∗
(0.013) (0.013)
Leverage −0.382 ∗∗∗ −0.472 ∗∗∗
(0.095) (0.134)
PPE 0.604 ∗∗∗ 0.688 ∗∗∗
(0.171) (0.155)
Taxes 0.058 0.028
(0.087) (0.10)
ROA 0.766 ∗∗∗ 0.745 ∗∗∗
(0.159) (0.14)
Intangibles 1.683 ∗∗∗ 1.977 ∗∗∗
(0.143) (0.155)
Cash 1.051 ∗∗∗ 0.877 ∗∗∗
(0.12) (0.145)
Tobin’s q 0.031 ∗∗∗
(0.011)
Stock return 0.221 ∗∗∗
(0.026)
Net profit margin 0.039 ∗∗∗
(0.010)
MB −0.005
(0.004)
Observations 69,637 59,781
Pseudo R 2 0.06 0.041
Log-likelihood −36,909.4 −31,266.8
D
i
t
w
t
w
e
fi
m
s
n
t
s
e
n
w
p
T
a
c
t
t
a
s
T
p
i
i
a
f
h
a
n
d
0
g
t
f
l
m
d
i
s
p
s
a
a
p
l
F
a
t
t
a
a
t
4
d
fi
m
i
t
f
s
w
m
f
t
t
a
a
f
t
p
h
c
i
o
b
H1: Firms with better management practices should pursue more
M&As.
H2: More value will be created as the gap of managerial quality
between the acquirer and target increases.
H3: Firms with good management acquire firms with bad manage-
ment.
H4: The cross-sectional dispersion in firm management practices
should be positively correlated with the likelihood of M&As.
We form a fifth testable hypothesis based on the insights of
ong et al. (2006) , who suggest that the evidence on the Q-theory
s more prominent in the pre-1990 market. The reason for this is
hat takeovers during the 1980s suffered more from agency issues,
hile those in the 1990s suffered from inefficiency issues. Thus,
he evidence is more supportive of the Q-theory during the 1980s,
hile during the 1990s the mis-valuation hypothesis appears to
xplain better the data. Based on this premise, we formulate our
fth hypothesis as follows:
H5: The effect of management practices should be stronger in the
pre-1990 market.
An important implication of our baseline results is that if better
anagement practices create more value, then the involved firms
hould pursue more M&As. To test this hypothesis, we regress the
umber of M&A events on management practices. We conduct
hese tests using time series data for the acquiring firms; thus, our
ample is considerably larger than the respective including M&A
vents only. Because there are many occurrences of zeros (firms do
ot conduct M&As in all years), we use a negative binomial model,
hich is suitable for over-dispersed count data.
We report the results in Table 10 . We find that management
ractices carry a positive and statistically significant coefficient.
14
he results in column (2) indicate that a one unit increase of man-
gement practices, increases the difference in the logs of expected
ounts of M&A events by 0.422, ceteris paribus, which corresponds
o an increase of about 55% ( = exp(0.442)). This finding is consis-
ent with the Q-theory, which predicts that firms with better man-
gement will find opportunities to increase their value through
ynergies with other firms.
We test the hypotheses H2-H5 in Table 11 . Panel A of
able 11 presents results for H2 and H3. Columns (1)-(3) in this
anel, examine whether more value can be created when the gap
n the management practices between the acquirer and the target
s large ( Lang et al., 1989 ). Using differences in our index between
cquirers and targets, as well as the same controls and fixed ef-
ects (we cannot use acquirer fixed effects because our sample only
as 344 observations), we end up with a coefficient that is positive
nd statistically significant, again consistent with Q-theory. In eco-
omic terms, an increase of �(Management practices) by one stan-
ard deviation, increases CAR by about 1.7 percentage points ( =
.0935 ×0.179).
Columns (4)-(6) test the Q-theory prediction that firms with
ood management will acquire firms with bad management. To
his end, we construct an indicator variable taking the value one
or all M&A cases where the target’s management practices are
ower than the acquirer’s. We then examine whether the manage-
ent practices of the acquirer have explanatory power on that in-
icator. We find a positive and statistically significant coefficient,
ndicating that a one percent increase in the Management practices
core increases by about 3.2% the probability that a target com-
any has a lower management score than the acquirer. However
mall the sample, our specification has good explanatory power for
dichotomous choice model, as the pseudo R
2 is around 0.30. This
gain shows that our management practices score has strong ex-
lanatory power when testing Q-theory predictions.
Panel B of Table 11 tests hypothesis H4. Specifically, we calcu-
ate the average management practices values in different Fama-
rench industries for each year. Then, for each Fama-French group
nd year, we count the number of M&A events. Next, we regress
he number of events on the average values of management prac-
ices. We find a positive and statistically significant coefficient
nd our model has good explanatory power. In economic terms,
one standard deviation increase in Management practices for
he average Fama-French industry is accompanied by an 0.8 ( =
4.15 ×0.018) percentage point increase in M&A events in that in-
ustry. This indicates that for a sector to be M&A active, inter-
rm differences in managerial quality should exist. This follows the
odel of Jovanovic and Rousseau (2002) who suggest that, without
nterfirm dispersion, M&A events do not occur.
Panel C of Table 11 tests hypothesis H5. We create an indica-
or variable taking the value one for all events that took place be-
ore 1990 and interact this variable with our management practices
core. According to H5, Q-theory is better suited at explaining M&A
aves in the 1980s because during that period agency issues were
ore pronounced. This might not be the case for the waves that
ollowed that period, whereby the misvaluation hypothesis appears
o be more potent in explaining statistical patterns. If this conjec-
ure is true, we should observe a positive coefficient on the inter-
ction term. Indeed, we find that the interaction term enters with
positive coefficient, and that it is more potent for the case of
requent acquirers. This could indicate that frequent acquirers in
he 1980s were more efficient at choosing the right target com-
anies to create synergies; especially target companies that might
ave had agency issues and thus not functioning at their fullest
apacity. The results of the interaction term for frequent acquirers
ndicate that those acquirers with management practices higher by
ne unit in the period before the 1990s would enjoy higher CARs
y about 0.29, compared to acquirers after that period.
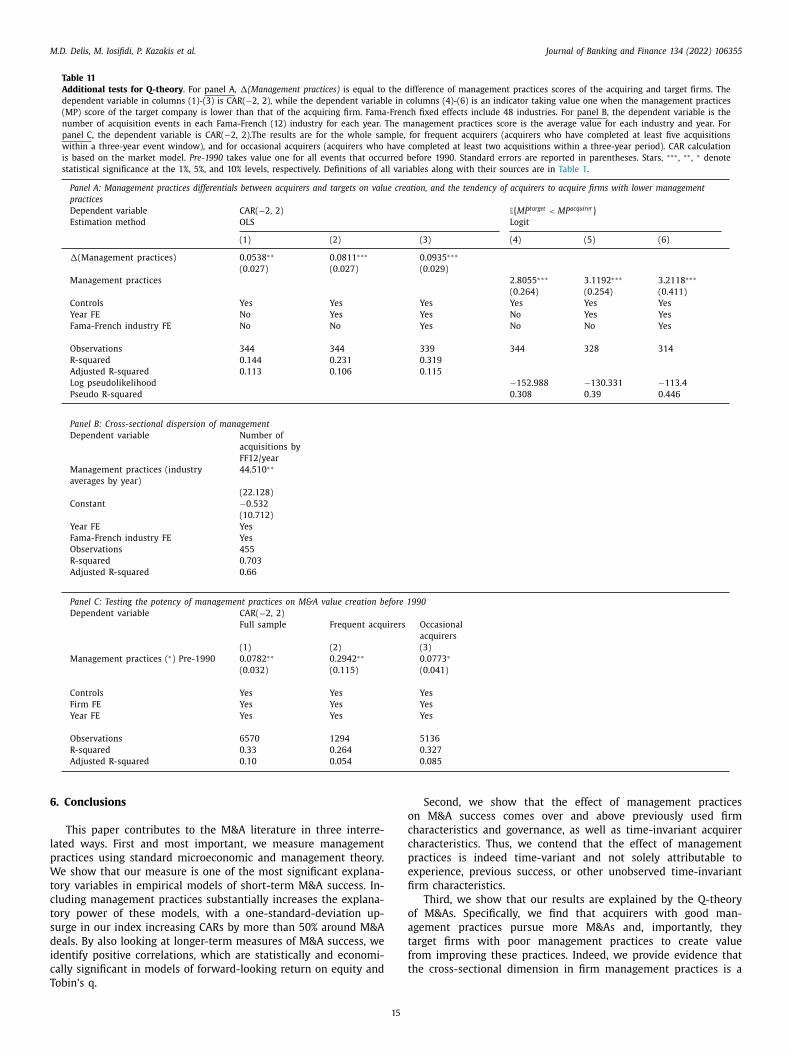
M.D. Delis, M. Iosifidi, P. Kazakis et al. Journal of Banking and Finance 134 (2022) 106355
Table 11
Additional tests for Q-theory . For panel A , �(Management practices) is equal to the difference of management practices scores of the acquiring and target firms. The
dependent variable in columns (1)-(3) is CAR( −2, 2), while the dependent variable in columns (4)-(6) is an indicator taking value one when the management practices
(MP) score of the target company is lower than that of the acquiring firm. Fama-French fixed effects include 48 industries. For panel B , the dependent variable is the
number of acquisition events in each Fama-French (12) industry for each year. The management practices score is the average value for each industry and year. For
panel C , the dependent variable is CAR( −2, 2).The results are for the whole sample, for frequent acquirers (acquirers who have completed at least five acquisitions
within a three-year event window), and for occasional acquirers (acquirers who have completed at least two acquisitions within a three-year period). CAR calculation
is based on the market model. Pre-1990 takes value one for all events that occurred before 1990. Standard errors are reported in parentheses. Stars, ∗∗∗ , ∗∗ , ∗ denote
statistical significance at the 1%, 5%, and 10% levels, respectively. Definitions of all variables along with their sources are in Table 1 .
Panel A: Management practices differentials between acquirers and targets on value creation, and the tendency of acquirers to acquire firms with lower management
practices
Dependent variable CAR( −2, 2) I { M P target < M P acquirer } Estimation method OLS Logit
(1) (2) (3) (4) (5) (6)
�(Management practices) 0.0538 ∗∗ 0.0811 ∗∗∗ 0.0935 ∗∗∗
(0.027) (0.027) (0.029)
Management practices 2.8055 ∗∗∗ 3.1192 ∗∗∗ 3.2118 ∗∗∗
(0.264) (0.254) (0.411)
Controls Yes Yes Yes Yes Yes Yes
Year FE No Yes Yes No Yes Yes
Fama-French industry FE No No Yes No No Yes
Observations 344 344 339 344 328 314
R-squared 0.144 0.231 0.319
Adjusted R-squared 0.113 0.106 0.115
Log pseudolikelihood −152.988 −130.331 −113.4
Pseudo R-squared 0.308 0.39 0.446
Panel B: Cross-sectional dispersion of management
Dependent variable Number of
acquisitions by
FF12/year
Management practices (industry
averages by year)
44.510 ∗∗
(22.128)
Constant −0.532
(10.712)
Year FE Yes
Fama-French industry FE Yes
Observations 455
R-squared 0.703
Adjusted R-squared 0.66
Panel C: Testing the potency of management practices on M&A value creation before 1990
Dependent variable CAR( −2, 2)
Full sample Frequent acquirers Occasional
acquirers
(1) (2) (3)
Management practices ( ∗) Pre-1990 0.0782 ∗∗ 0.2942 ∗∗ 0.0773 ∗
(0.032) (0.115) (0.041)
Controls Yes Yes Yes
Firm FE Yes Yes Yes
Year FE Yes Yes Yes
Observations 6570 1294 5136
R-squared 0.33 0.264 0.327
Adjusted R-squared 0.10 0.054 0.085
6
l
p
W
t
c
t
s
d
i
c
T
o
c
c
p
e
fi
o
a
t
f
t
. Conclusions
This paper contributes to the M&A literature in three interre-
ated ways. First and most important, we measure management
ractices using standard microeconomic and management theory.
e show that our measure is one of the most significant explana-
ory variables in empirical models of short-term M&A success. In-
luding management practices substantially increases the explana-
ory power of these models, with a one-standard-deviation up-
urge in our index increasing CARs by more than 50% around M&A
eals. By also looking at longer-term measures of M&A success, we
dentify positive correlations, which are statistically and economi-
ally significant in models of forward-looking return on equity and
obin’s q.
15
Second, we show that the effect of management practices
n M&A success comes over and above previously used firm
haracteristics and governance, as well as time-invariant acquirer
haracteristics. Thus, we contend that the effect of management
ractices is indeed time-variant and not solely attributable to
xperience, previous success, or other unobserved time-invariant
rm characteristics.
Third, we show that our results are explained by the Q-theory
f M&As. Specifically, we find that acquirers with good man-
gement practices pursue more M&As and, importantly, they
arget firms with poor management practices to create value
rom improving these practices. Indeed, we provide evidence that
he cross-sectional dimension in firm management practices is a
M.D. Delis, M. Iosifidi, P. Kazakis et al. Journal of Banking and Finance 134 (2022) 106355
p
o
o
p
m
t
a
b
e
a
e
p
a
t
b
m
a
a
e
r
A
a
p
t
r
S
s
a
b
d
u
L
S
B
2
S
f
R
A
A
A
A
AB
B
B
B
B
B
B
B
B
B
B
B
C
C
C
C
D
D
D
D
E
F
F
F
F
G
G
G
G
G
G
G
G
G
H
H
H
H
H
H
H
H
J
J
K
ositive and economically significant determinant of the likelihood
f M&As.
Overall, we view management as an important component
f short-term M&A performance that significantly increases the
ower of relevant empirical models. Future research can use this
easure as a control in predicting M&As, but also in reexamining
he relation between management practices and corporate char-
cteristics such as CEO turnover, board independence, and female
oard participation. Further, our analysis provides incentives to re-
xamine the relation between the quality of managerial practices
nd executive or employee compensation. Finally, our approach to
stimating management practices via a latent variable model might
rovide new ideas for modeling notions that, by their own nature,
re unobserved or related to the management of intangible capi-
al. These include but are not limited to corporate social responsi-
ility, corporate culture, and accounting practices such as earnings
anagement and profit-shifting. In doing so, future studies will be
ble to also define and estimate management practices less broadly
nd mitigate part of the relevant limitations that our measure in-
vitably faces. We leave these ideas as a desideratum for future
esearch.
cknowledgments
We are grateful to the project partners of the World Man-
gement Survey (WMS) for providing the relevant data. The pa-
er was presented at the 2018 Royal Economic Society conference,
he Conference on Research on Economic Theory and Economet-
ics (CRETE) 2018 in Tinos, and in seminars at Montpellier Business
chool, University of Bristol, University of Cagliari, University of Es-
ex, University of Glasgow, and University of Surrey. For comments
nd suggestions, we are grateful to Renée Adams, Leonidas Bar-
opoulos, Sonny Biswas, Nicholas Bloom, Claudia Custódio, Theo-
osios Dimopoulos, Alex Edmans, Christos Genakos, Andrey Gol-
bov, Iftekhar Hasan, Constance Helfat, Balint Horvath, Woon Sau
eung, George Panos, Dimitrios Petmezas, Rafaella Sadun, Antonios
iganos, Nick Travlos, John Van Reenen, Patrick Verwijmeren, and
etty Wu. Ongena acknowledges financial support from ERC ADG
016 - GA 740272 lending.
upplementary materials
Supplementary material associated with this article can be
ound, in the online version, at doi: 10.1016/j.jbankfin.2021.106355 .
eferences
ckerberg, D.A. , Caves, K. , Frazer, G. , 2006. Structural Identification of Production
Functions. Mimeo, UCLA Department of Economics . ktas, N. , Bodt, E.D. , Roll, R. , 2007. Is European M&A regulation protectionist? Econ.
J. 117 (522), 1096–1121 .
ndrade, G. , Mitchell, M. , Stafford, E. , 2001. New evidence and perspectives onmergers. J. Econ. Perspect. 15 (2), 103–120 .
ndrieu, C. , Doucet, A. , Holenstein, R. , 2010. Particle Markov chain Monte Carlomethods (with discussion). J. R. Stat. Soc. Ser. B 72 (2), 1–33 .
rellano, M. , 2003. Panel Data Econometrics. Oxford University Press, Oxford . aker, M. , Wurgler, J. , 2002. Market timing and capital structure. J. Financ. 57 (1),
1–32 .
altagi, B.H. , 2013. Econometric Analysis of Panel Data. John Wiley and Sons, Chich- ester .
ao, J. , Edmans, A. , 2011. Do investment banks matter for M&A returns? Rev. Financ.Stud. 24, 2286–2315 .
ebchuk, L. , Cohen, A. , Ferrell, A. , 2009. What Matters in Corporate Governance?Rev. Financ. Stud. 22 (2), 783–827 .
erger, P.G. , Ofek, E. , 1995. Diversification’s Effect on Firm Value. J financ econ 37(1), 39–65 .
hagat, S. , Dong, M. , Hirshleifer, D. , Noah, R. , 2005. Do tender offers create value?
New methods and evidence. J. Financ. Econ. 76 (1), 3–60 . loom, N., Sadun, R., Van Reenen, J. (2017). Management as a technology? National
Bureau of Economic Research Working Paper No. 22327. loom, N. , Van Reenen, J. , 2007. Measuring and explaining management practices
across firms and countries. Q. J. Econ. 122 (4), 1351–1408 .
16
loom, N. , Van Reenen, J. , 2010. Why do management practices differ across firmsand countries? J. Econ. Perspect. 24, 203–224 .
orn, B. , Ehrmann, M. , Fratzscher, M. , 2014. Central bank communication on finan-cial stability. J. Econ. Perspect. 124 (577), 701–734 .
radley, M. , Desai, A. , Kim, E.H. , 1988. Synergistic gains from corporate acquisitionsand their division between the stockholders of target and acquiring firms. J.
Financ. Econ. 21 (1), 3–40 . ushman, R. , Chen, Q. , Engel, E. , Smith, A. , 2004. Financial accounting information,
organizational complexity and corporate governance systems. J. Acc. Econ. 37
(2), 167–201 . hemmanur, T.J. , Paeglis, I. , 2005. Management quality, certification, and initial pub-
lic offerings. J. Financ. Econ. 76 (2), 331–368 . ustódio, C. , Ferreira, M.A. , Matos, P. , 2013. Generalists versus specialists: life-
time work experience and chief executive officer pay. J. Financ. Econ. 108 (2), 471–492 .
ustódio, C. , Metzger, D. , 2013. How do CEOs matter? The effect of industry exper-
tise on acquisition returns. Rev. Financ. Stud. 26 (8), 2008–2047 . ustódio, C. , Ferreira, M.A. , Matos, P. , 2018. Do general managerial skills spur inno-
vation? Manag. Sci. 65 (2), 459–476 . elis, M.D., Tsionas, E.G., 2018. Measuring management practices. Int. J. Product.
Econ. doi: 10.1016/j.ijpe.2018.02.006 , forthcoming . elis, M.D. , Iosifidi, M. , Tsionas, M. , 2020. Management estimation in banking. Eur.
J. Oper. Res. 284 (1), 355–372 .
emerjian, P. , Lev, B. , McVay, S. , 2012. Quantifying managerial ability: a new mea-sure and validity tests. Manag. Sci. 58 (7), 1229–1248 .
ong, M. , Hirshleifer, D. , Richardson, S. , Teoh, S.H. , 2006. Does investor misvaluationdrive the takeover market? J. Financ. 61 (2), 725–762 .
dmans, A. , Gabaix, X. , Landier, A. , 2009. A multiplicative model of optimal CEOincentives in market equilibrium. Rev. Financ. Stud. 22 (12), 4 881–4 917 .
accio, M. , Masulis, R.W. , 2005. The Choice of payment method in European mergers
and acquisitions. J. Financ. 60 (3), 1345–1388 . ranks, J.R. , Harris, R.S. , Mayer, C. , 1988. Means of Payment in Takeovers: results for
the United Kingdom and the United States. In: Corporate Takeovers: Causes and Consequences. University of Chicago Press, pp. 221–264 .
u, F. , Lin, L. , Officer, M.S. , 2013. Acquisitions driven by stock overvaluation: are theygood deals? J. Financ. Econ. 109 (1), 24–39 .
uller, K. , Netter, J. , Stegemoller, M. , 2002. What do returns to acquiring firms
tell us? Evidence from firms that make many acquisitions. J. Financ. 57 (4), 1763–1793 .
abaix, X. , Landier, A. , 2008. Why has CEO pay increased so much? Q. J. Econ. 123(1), 49–100 .
elfand, A.E. , Hills, S.E. , Racine-Poon, A. , Smith, A.F. , 1990. Illustration of Bayesianinference in normal data models using Gibbs sampling. J. Am. Stat. Assoc. 85
(412), 972–985 .
eweke, J. Bernardo, J.M., Berger, J.O., Dawid, A.P., Smith, A.F.M. (Eds.), 1992. Evalu- ating the accuracy of sampling-based approaches to the calculation of posterior
moments. Bayesian Statistics 4 169–193 . olubov, A. , Petmezas, D. , Travlos, N.G. , 2012. When it pays to pay your investment
banker: new evidence on the role of financial advisors in M&As. J. Financ. 67 (1), 271–311 .
olubov, A. , Petmezas, D. , Travlos, N.G. , 2016. Do stock-financed acquisitions destroy value? New methods and evidence. Rev. Financ. 20 (1), 161–200 .
olubov, A. , Yawson, A. , Zhang, H. , 2015. Extraordinary acquirers. J. Financ. Econ. 116
(2), 314–330 . ompers, P. , Ishii, J. , Metrick, A. , 2003. Corporate governance and equity prices. Q.
J. Econ. 118 (1), 107–156 . ompers, P. , Kovner, A. , Lerner, J. , Scharfstein, D. , 2010. Performance persistence in
entrepreneurship. J. Financ. Econ. 96 (1), 18–32 . reene, W.H. , 2008. The econometric approach to efficiency analysis. In: The Mea-
surement of Productive Efficiency and Productivity Growth. Oxford University
Press, UK, pp. 92–250 . arford, J. , Li, K. , 2007. Decoupling CEO Wealth and firm performance: the case of
acquiring CEOs. J. Financ. 62 (2), 917–949 . arford, J. , Humphery-Jenner, M. , Powell, R. , 2012. The sources of value
destruction in acquisitions by entrenched managers. J. Financ. Econ. 106 (2), 247–261 .
arris, M. , Holmstrom, B. , 1982. A theory of wage dynamics. Rev. Econ. Stud. 49 (3),
315–333 . ayward, M.L.A. , 2002. When do firms learn from their acquisition experience? Ev-
idence from 1990 to 1995. Strateg. Manag. J. 23 (1), 21–39 . ayes, R.M. , Schaefer, S. , 1999. How much are differences in managerial ability
worth? J. Acc. Econ. 27 (2), 125–148 . ermalin, B.E. , Weisbach, M.S. , 1998. Endogenously chosen boards of directors and
their monitoring of the CEO. Am. Econ. Rev. 96–118 .
icks, J.R. , 1935. Annual survey of economic theory: the theory of monopoly. Econo- metrica 3, 1–20 .
uang, Q. , Jiang, F. , Lie, E. , Yang, K. , 2014. The role of investment banker directorsin M&A. J. Financ. Econ. 112 (2), 269–286 .
affe, J. , Pedersen, D. , Voetmann, T. , 2013. Skill differences in corporate acquisitions.J. Corp. Financ. 23, 166–181 .
ovanovic, B. , Rousseau, P.L. , 2002. The Q-theory of mergers. Am. Econ. Rev. 92 (2),
198–204 . aplan, D. , Depaoli, S. , 2012. Bayesian structural equation modeling. In: Hoyle, R.
(Ed.), Handbook of Structural Equation Modeling. Guilford Press, New York, NY, pp. 650–673 .
M.D. Delis, M. Iosifidi, P. Kazakis et al. Journal of Banking and Finance 134 (2022) 106355
K
KL
L
L
L
L
M
M
M
M
M
M
M
M
N
R
R
R
S
S
S
S
S
S
T
T
V
W
aplan, S.N. , Klebanov, M.M. , Sorensen, M. , 2012. Which CEO characteristics andabilities matter? J. Financ. 67 (3), 973–1007 .
atz, R. , 1974. Skills of an effective administrator. Harv. Bus. Rev. September . ang, L.H. , Stulz, R.M. , Walkling, R.A. , 1989. Managerial performance, Tobin’s q, and
the gains from successful tender offers. J. Financ. Econ. 24, 137–154 . ang, L.H. , Stulz, R.M. , 1994. Tobin’s q, corporate diversification, and firm perfor-
mance. J. Polit. Econ. 102 (6), 1248–1280 . ev, B. , Sougiannis, T. , 1996. The Capitalization, amortization, and value-relevance of
R&D. J. Acc. Econ. 21 (1), 107–138 .
i, X. , 2013. Productivity, restructuring, and the gains from takeovers. J. Financ. Econ.109 (1), 250–271 .
ucas, R. , 1978. On the size distribution of business firms. Bell J. Econ. 9 (2),508–523 .
aksimovic, V. , Phillips, G. , 2001. The market for corporate assets: who engagesin mergers and asset sales and are there efficiency gains? J. Financ. 56 (6),
2019–2065 .
anne, H.G. , 1965. Mergers and the market for corporate control. J. Polit. Econ. 73(2), 110–120 .
asulis, R.W. , Wang, C. , Xie, F. , 2007. Corporate governance and acquirer returns. J.Financ. 62 (4), 1851–1889 .
cDonald, M.L. , Westphal, J.D. , Graebner, M.E. , 2008. What do they know? The ef-fects of outside director acquisition experience on firm acquisition performance.
Strateg. Manag. J. 29 (11), 1155–1177 .
elitz, M. , 2003. The impact of trade on intra-industry reallocations and aggregate productivity growth. Econometrica 71 (6), 1695–1725 .
yers, S.C. , Majluf, N.S. , 1984. Corporate financing and investment decisions when firms have information that investors do not have. J. Financ. Econ. 13 (2),
187–221 . oeller, S.B. , Schlingemann, F.P. , Stulz, R.M. , 2004. Firm size and the gains from ac-
quisitions. J. Financ. Econ. 73 (2), 201–228 .
oeller, S.B. , Schlingemann, F.P. , Stulz, R.M. , 2005. Wealth destruction on a massivescale? A study of acquiring-firm returns in the recent merger wave. J. Financ.
60 (2), 757–782 .
17
evo, A. , 2001. Measuring market power in the ready-to-eat cereal industry. Econo- metrica 69 (2), 307–342 .
ajan, R. , Servaes, H. , Zingales, L. , 20 0 0. The cost of diversity: the diversificationdiscount and inefficient investment. J. Financ. 55 (1), 35–80 .
ajamani, A. , van der Poel, M. , de Jong, A. , Ongena, S. , 2016. The international diver-sification of banks and the value of their cross-border M&A advice. Manag. Sci.
63 (7), 2211–2232 . enneboog, L. , Vansteenkiste, C. , 2018. What goes wrong in M&As? On the long-run
success factors in M&As. On long run success factors in M&As . (December 20,
2018). Eur. Corp. Gov. Inst. (ECGI) Financ. Work. Pap. (589) . amuelson, P.A. , Nordhaus, W.D. , 2009. Economics, 19th ed. McGraw-Hill, New York,
U.S. . charfstein, D.S. , Stein, J.C. , 20 0 0. The Dark side of internal capital markets: divi-
sional rent-seeking and inefficient investment. J. Financ. 55 (6), 2537–2564 . ilva, A.C. , 2010. Managerial ability and capital flows. J. Dev. Econ. 93 (1), 126–136 .
imar, L. , Wilson, P.W. , 2007. Estimation and inference in two-stage, semi-paramet-
ric models of production processes. J. Econ. 136, 31–64 . tataCorp, L.P. , 2017. Bayesian Analysis Reference Manual. StataCorp LP, College Sta-
tion, TX . tein, J.C. , 1997. Internal capital markets and the competition for corporate re-
sources. J. Financ. 52 (1), 111–133 . erviö, M. , 2008. The difference that CEOs make: an assignment model approach.
Am. Econ. Rev. 98 (3), 642–668 .
ravlos, N.G. , 1987. Corporate takeover bids, methods of payment, and bidding firms’ stock returns. J. Financ. 42 (4), 943–963 .
an de Schoot, R. , Kaplan, D. , Denissen, J. , Asendorpf, J.B. , Neyer, F.J. , Van Aken, M.A. ,2014. A gentle introduction to Bayesian analysis: applications to developmental
research. Child Devlop. 85 (3), 842–860 . ang, C. , Xie, F. , 2008. Corporate governance transfer and synergistic gains from
mergers and acquisitions. Rev. Financ. Stud. 22 (2), 829–858 .