management, enterprise and benchmarking in the 21st century
510
-
Upload
khangminh22 -
Category
Documents
-
view
1 -
download
0
Transcript of management, enterprise and benchmarking in the 21st century


Óbuda University
MMAANNAAGGEEMMEENNTT,, EENNTTEERRPPRRIISSEE AANNDD BBEENNCCHHMMAARRKKIINNGG IINN TTHHEE 2211SSTT CCEENNTTUURRYY
“Global challenges, local answers”
Budapest, 2017.
http://kgk.uni-obuda.hu/meb
2
Published by: Óbuda University
Edited by: István Takács Ph.D.
Professor
Keleti Faculty of Business and Management
ISBN 978-963-449-027-2
3
TABLE OF CONTENTS
Introduction and Acknowledgement ......................................................................... 6
Preface ...................................................................................................................... 8
Opportunities and Limitations of Bussiness Planning of SME ................................. 9 Agnes Bogath
Attitudes and Motivations of Consumers in Sharing Economy ................................ 22 Gabriella Buda, Jozsef Lehota
Hungarian Retirement Plan of the Future ................................................................. 31 Laszlo Bujdoso, Marko Andrasics
The Interplay of Socioeconomic Development, Enterpreneurship, National Culture and Innovation Performance ..................................................................................... 42
Merima Cinjarevic, Ljiljan Veselinovic
Analysis of the Situation and Competitiveness of Hungarian Pasta Industry (based on Porter’s model) .................................................................................................... 55
Ilona Feher, Nikolett Nemeth
Constraints in Implementing Quality Assurance Programs in Food Manufacturing Firms in Shanghai, China .......................................................................................... 66
Wojciech J. Florkowski, Qijun Jiang
On what Factors the Wheat Production and Price Depends ..................................... 78 Gabor Gyarmati
The Effect of the Economic Crisis on the Bank Profitability in the V4 Countries ... 97 Laszlo Gyulai, Gabor Szucs
The Economic Recovery, including SMEs Sector, is Secured.................................. 110 Miroljub Hadzic, Petar Pavlovic
Digital Presence Index for the Examination of Small and Medium-sized Businesses ................................................................................................................. 121
Miklos Hornyak
Password Based Cryptography ................................................................................. 133 Nertila Hoxha

4
Smartphone Security Threats .................................................................................... 141 Esmeralda Kadena
Sale Opportunities of the Small-scale Producers at the Concentrated Food Commerce ................................................................................................................. 161
Kiss Konrad
Customer Based Brand Equity Analysis: An Empirical Analysis to Geographical Origin ....................................................................................................................... 171
Elena Kokthi, Drita Kruja
The Knowledge and Students’ Readiness to Join the Business Services Sector in Albania ..................................................................................................................... 183
Elena Kokthi, Drita Kruja
How would You Decide on behalf of Your Friend? ................................................. 195 Anita Kolnhofer-Derecskei
Drivers of Trust - Some Experiences of an Empirical Survey at ’Paprikakertész’ Producer Organisation .............................................................................................. 205
Zoltan Kovacs, Zsolt Baranyai, Miklos Vasary
Small Economy but Big Lessons: What India and Hungary can Learn from Outward Looking Model of Singapore? ................................................................... 216
Mamta Kumari, Nalin Bharti
Website Evaluation of the National Libraries (EU28) .............................................. 233 Gyorgy Losonczi
Environmental Protection Expenditures and Effects of Environmental Governance of Sustainable Development in Manufacture Enterprise ........................................... 244
Agata Mesjasz-Lech
Banking Competitiveness ......................................................................................... 258 Eva Mester, Robert Toth, Timea Kozma
Water – the Essence of Growth ................................................................................ 277 Zsuzsanna Nagy-Kovacs, Katalin Prof. Dr. Takacs-Gyorgy
Revitalization as an Instrument of Local Development in Poland ............................ 287 Aleksander Noworol

5
Agricultural Land Protection – the Case of Slovakia ................................................ 297 Lucia Palsova, Anna Bandlerova, Ina Meliskova, Pavol Schwarcz
The Role and Impact of Fairness on Cooperation in Hungarian Metal and Machinery Supply Chains ......................................................................................... 312
Noemi Piricz
Management Consultancy in Hungary and in Croatia in Light of Empirical Research – Market and Human Factors .................................................................... 323
Jozsef Poor, Ferenc Zsigri, Ildiko Csapo, Anton Barasic
Inter-sectoral cooperation as a factor of the regional development .......................... 334 Renata Przygodzka
Strengthening the Resilience of Small and Medium-Sized Enterprises .................... 345 Mirjana Radovic Markovic, Muhammad Shoaib Farooq, Dusan Markovic
Mobile Application Security ..................................................................................... 357 Kata Rebeka Szucs, Regina Zsuzsanna Reicher
Controlling in Germany from Practitioners’ and Students’ Point of View – An Empirical Time Series Analysis ................................................................................ 365
Walter Ruda, Pierre G. Keller
Are we destined to produce and consume GMO plants ............................................ 378 Adam Sadowski, Jarosław Mioduszewski
New Orientation on Entrepreneurship and Business Education at Petru Maior University of Tirgu Mures ........................................................................................ 392
Daniela Stefanescu
Older Employees in Sustainable Human Resources Management ........................... 402 Sukalova Viera, Ceniga Pavel
Green SMEs in the European Union ......................................................................... 413 Antal Szabo
Fight between the Giant and the Dwarf - The Retirement Security Basics ............... 432 Zsolt Szabo
George, Yoomurjak and the Tax - The Influence of Migration on Taxes ................. 442 Gabor Toth, Katalin Toth
6
The Moral Hazard issues of the State-Aid Programs for SME’s .............................. 453 Gyorgy Vas
The Importance of Regular Assessment at the Óbuda University ............................ 461 Andras Vass, Peter Szikora
Stakeholder Approach in Business Education and Management Practice – The case of Hungary ........................................................................................................ 474
Agnes Wimmer, Reka Matolay
Globalization and India – CEN’s Trade with special reference to Men's Shirts ....... 487 Toni Sharma, Nalin Bharti

7
INTRODUCTION AND ACKNOWLEDGEMENT
„Globalizing a bad thing makes it worse. But globalizing a good thing is usually good.” Richard Stallman The 47 studies of this new volume of „Management, Enterprise and Benchmarking in the 21st Century” – „Global challenges, local answers” may disprove the well-known motto of Richard Stallman. The pesented topics are related to the profile and research areas of Óbuda University. (Small & Medium Enterprises, Security & Safety, Human Resources, Applied Marketing, Management). I would like to render special thanks to:
the Authors, who accepted our invitation and sent high-standard manuscripts to our annual volume,
the Referees, who strictly reviewed the articles within the deadlines,
Dr. András Medve dean, who supported the organization of the 15th
Conference on Management Enterprise and Benchmarking – Global challenges, local answers, which is the foundation of this issue
Kata Báló, Éva Beke, Tímea Edőcs and Alexandra Vécsey, who worked hardly for the success of the conference as well as for this volume
Dr. Antal Szabó scientific director, who promotes our issue among the members of ERENET (Enterpreneurship Research and Education Network of Central European Universities)
Dr. György Kadocsa, whom thoughts gives the basis of the preface of this volume
furthermore to all collegues, who’s sacrificing work contributed to the publication of this volume.
Good reading!
István Takács editor

8
PREFACE The Organising Committee of MEB 2017 welcomes the participants to the 15th International Conference on Management, Enterprise and Benchmarking that is our traditional university event in Budapest.
15 years ago the Keleti Faculty of Business and Management of Óbuda University created a tradition with publishing the volume of “Management, Enterprise & Benchmarking in 21st Century”.
Principally, we would like to provide a high-level publication opportunity for our colleagues, and a good material for MA Students learning Business Economics, Management and Enterprise Development every year.
The growing international competition in the economical arena has created a demand to establish a forum several years ago in order to improve quality and education efficiency on the field of management, enterprise and benchmarking. The aim of the conference is to provide researchers and practitioners from higher education, academia and industry with a platform to report on recent developments in the area of economy.
The key topic recent of „Management, Enterprise & Benchmarking in the 21st Century” conference was “Global challenges, local answers”. Tutors and researchers of 13 international and 8 domestic higher educational institutions from 11 countries try to answer the questions with 47 new studies. The volume contains the edited and reviewed materials of the best presentations of Management, Enterprise & Benchmarking Conference.
We hope that all attendee of the conference found this event intellectually stimulating and professionally rewarding. We also hope that the studies are establishing further co-operations between the authors and subsequent readers.
We hope that our researcher colleagues, the business professionals and also university students can also benefit from our volume focusing on business development.
We want to acknowledge the effort of the committee chairs and committee members, and all those persons responsible for the background activities from local arrangements to conference secretariat.
Especially we thank Dr. András Medve, dean of our Faculty who supported the organisation of the MEB 2017 Conference.
We would like to thank Professor Dr. Mihály Réger Rector, who supported our MEB Programs from the beginning.
Finally, we are looking forward to meeting you on the next Management, Enterprise & Benchmarking Conference at Óbuda University in Budapest in 2018.
Budapest, May 2017

Management, Enterprise and Benchmarking in the 21st Century Budapest, 2017
9
Opportunities and Limitations of Bussiness Planning of SME
Ágnes Bogáth Óbuda University, Keleti Faculty of Business and Management, Hungary
Abstract: In the following, the potential of the SME business planning capabilities and
limitations reveal the use of the available literature. SMEs are dominant economic power,
both in the domestic and international level. Their development interests of all nations,
because of their untapped potential activation of the whole economic recovery can be
achieved. Productivity and efficiency increase of one means the conscious, systematic and
consistent planning. The introduction of the optimal form of business planning practices for
the SMEs.
The following is an analysis of the importance of business planning and the role of the
Business Plan in SMEs. Next, a description of the characteristics of SMEs and the role
follows, setting out how the characteristic features of SMEs to business planning. In the
next chapter of micro and small enterprises and medium sized enterprises will be presented
in two selected parts of SME current design practice. Thereafter, the business plan and the
main chapters deal with exploring business development opportunities inherent in these.
Keywords: bussiness planning, SME
1 The role of SMEs in the Hungarian economy
Small and medium-sized enterprises, and most important micro-enterprises are very pronounced in Hungary. Vecsenyi (2012) more appropriate to evaluate their corporate categories are summarized in abbreviated as MSMEs, indicating that micro-enterprises are also covered, but the literature has spread to SMEs. The SMEs size classification are shown in Table 2. The entire corporate sector, SMEs share of 99.95%, including micro enterprises registered 97.6% of the company, while 75.6% of the companies operating them. The SME sector gives 45% in the GDP, and 60% of employment in Hungary. (Szabó, 2010) The challenge is for SMEs to achieve competitiveness and retaining world-wide megtartása (Lazányi, 2014) however, the main weaknesses that make it difficult. In the SMEs the labor
Management, Enterprise and Benchmarking in the 21st Century Budapest, 2017
10
is often unskilled, the lack of venture capital and the risk is very low. (Keenan et al, 2009)
2 The importance of business planning
The design "means and measures to harmonize corporate goals, to achieve them". (Francsovics, 2005., pp. 18.) When developing the plans, emphasis should be placed not only the purpose to be achieved, but also the feasibility. “The design is the definition of tasks necessary to achieve the stated goals and the provision of conditions needed to carry out the tasks” .” (Körmendi - Tóth, 2006., pp. 29.)
“The plan worked out a program or framework that is used to describe how it intends to achieve the objectives of the organization, in short: means “future design”. It does all this in order to help in the short term operational efficiency of the organization in the long term survival and success ensure.” (Szóka, 2007., pp. 29)
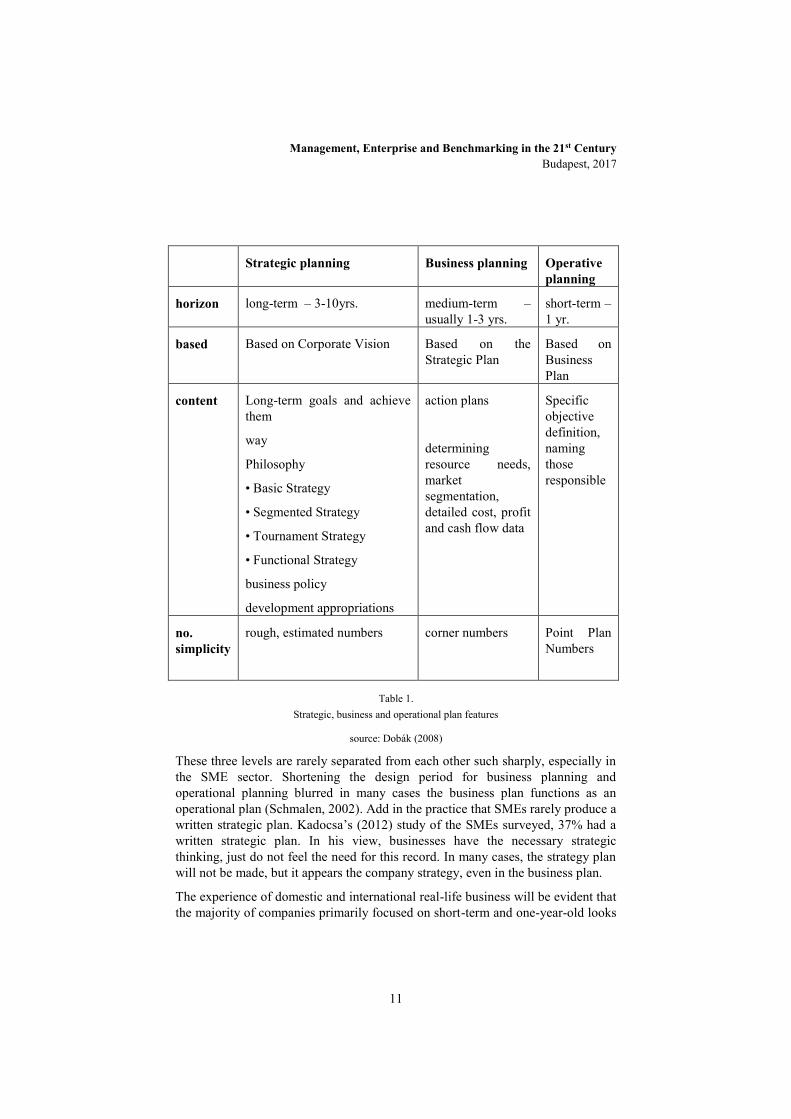
“The literature generally triple time divisions be allocated for discussing the planning time horizon. Long, medium and short term plans will be allocated to the authors. The three levels at Francsovics (2005) as follows: corporate strategy, strategic operational planning professional and objective system. Further Dobák (2008) kind of division follow, in which discrimination is strategic, business and operational annual plan, these characteristics are shown in Table 1.
Management, Enterprise and Benchmarking in the 21st Century Budapest, 2017
11
Strategic planning Business planning Operative planning
horizon long-term – 3-10yrs. medium-term –usually 1-3 yrs.
short-term – 1 yr.
based Based on Corporate Vision Based on the Strategic Plan
Based on Business Plan
content Long-term goals and achieve them
way
Philosophy
• Basic Strategy
• Segmented Strategy
• Tournament Strategy
• Functional Strategy
business policy
development appropriations
action plans
determining resource needs, market segmentation, detailed cost, profit and cash flow data
Specific objective definition, naming those responsible
no. simplicity
rough, estimated numbers corner numbers Point Plan Numbers
Table 1. Strategic, business and operational plan features
source: Dobák (2008)
These three levels are rarely separated from each other such sharply, especially in the SME sector. Shortening the design period for business planning and operational planning blurred in many cases the business plan functions as an operational plan (Schmalen, 2002). Add in the practice that SMEs rarely produce a written strategic plan. Kadocsa’s (2012) study of the SMEs surveyed, 37% had a written strategic plan. In his view, businesses have the necessary strategic thinking, just do not feel the need for this record. In many cases, the strategy plan will not be made, but it appears the company strategy, even in the business plan.
The experience of domestic and international real-life business will be evident that the majority of companies primarily focused on short-term and one-year-old looks
Management, Enterprise and Benchmarking in the 21st Century Budapest, 2017
12
ahead up to 3-4 years. Period exceeding 5 years, due to the constantly changing environment, it should not prepare a business plan, but long-term borrowing, the financial institution will require the submission made to the duration of the entire business plan. (Herczeg, Juhász 2010)
Hernádi (2007, 59.p) was summarized as follows strategic, business and operational plan intertwining of SME at "strategic variances shorter timeframe and more detailed action plan, usually informal, entrepreneurial business plan "in mind existing" strategy with small companies in the business plan usually includes the main strategic goals and the need for implementing the strategy, the business plan is valid for the timeframe of the action Programme. "
The business plan of the company starting from the basic position, foreshadowed a target state, outlining the steps for implementation, building on the available resources and capabilities of the firm and its environment. This can be achieved through a more efficient and effective operation.
One, conducted SMEs among nearly 300 sample questionnaire survey reveals (Kadocsa, 2012b) that most of the respondents, 18.75% did not produce a business plan, 25% only verbal planning is done, you can not consult with other participants in the business . CIB Baton Research companies of the SME sector is examined through a representative sample of 800 companies were interviewed. The entrepreneurs surveyed, 42% of preparing plans for the current year, a further 21% in 1-2 years. more than 3 years time only 19% planning. (Rado, 2014)
3 Corporate design size-dependent characteristics
The characteristics of the different sizes of companies planning is reviewed below, separated in the micro and small enterprises and medium-sized enterprises according to different design requirements.
3.1 Micro and small business planning practices
The micro and small enterprises in most cases they can not invest the time and effort to develop a strategy too. This is emphatically true of business start-up and scaling up period. Here, most of the operational-level planning is what is feasible and necessary.
Creating a complex business plan is time-consuming, which means the already busy entrepreneurs is almost an impossible time-consuming. Thus, the design itself is often exhausted informal preparation of plans, of which there is no written documentation. "Governance is essentially an oral and a written record less. Contributors working on the basis of oral statements, strategic and business plans

Management, Enterprise and Benchmarking in the 21st Century Budapest, 2017
13
are made either in writing to the important decisions and associated information are mostly in the minds of entrepreneurs. .” (Kadocsa, 2015, 122.p.). The creation of the strategy is unformal. The owner-entrepreneur of intuition, vision of being built.Since the planning is done at no knitted structure accordingly, the content is often inconsistent. accepted on the basis of micro and small enterprises in the informal, this design method, due to the company sizes, the level of complexity of the business processes. (Hermádi,2007) Solution to this enterprise size when the accountant has to prepare and together with applications, credit applications submission of appropriate skills business plan. (Sinkovics, 2006)
IT background supporting the design needs a modest size for this category. Stored data can provide adequate information basis for business planning. If a system is used, this so-called .: "island system“ is operated, that is, a system, a corporate issue provides solutions, such as order management, inventory records, but the management of the data is not uniform. (Pollákné, 2004) Primarily customers, handling orders require IT background, which is often enough to solve the opportunities offered by Microsoft Excel, but more comprehensive solution for the "cloud Computering" that cloud-based computing services, which are becoming increasingly widespread in Hungary.
3.2 Middle Enterprises planning practice
Medium-sized enterprise is becoming a serious need arises for the first time a complex, comprehensive plans to prepare. At the company's size has been the manager is not able to perform daily management of company processes alone. Many times you experience just that in parallel with the increase in turnover, seemingly unjustified decline in profit, the defaults are delayed, reduced revenues, surging costs. The reasons for organizing, planning errors can be traced.
Change is needed, namely as follows: gathering information, conducting analysis and categorization, so a comprehensive information system and planning and controlling system design. "The controlling regarded as a sub-system of management that coordinates the planning, control and information supply. Due to the evaluation of information and facilitate coordination function, and allows management to purpose oriented in line with the company to manage environmental changes "(Francsovics, Kadocsa, 2005, p. 217). The increase in size, from small enterprises to become medium-sized enterprise is very important in planning attitude. While small business is highly recommended as an option for planning and controlling approach to design, medium-sized companies as it is a basic condition for survival.
Management, Enterprise and Benchmarking in the 21st Century Budapest, 2017
14
Making this business category has been inescapable formal plans. These plans are recorded in writing and content are consistent, well-structured. (Hermádi, 2007)
4 Motivation to make business planning
There are two basic types can be distinguished by a business plan according to the demands made on the basis of everyone. Accordingly, we can talk about internal and external all claims according to the environment or the enterprise is an actor.
4.1 External demand was motivated by a business plan
In case of external demand for the firm's external financing of fund prepares the business plan. External demand may be (Vecsenyi, 2012):
loan application
competition
attracting investors
Csiszárik-Kocsír (2014) from 201 patterned research reveals that 52% of small businesses, medium-sized enterprises while 23.5% do not have a funding strategy. It states that "small and medium-sized businesses do not deal with the conscious management of funding, either because this capacity, nor the vocation" (Csiszárik-Kocsír, 2014, p 53) Pollákné (2004) is a similar view of the SME sector. In her view, the most micro and small enterprises it is true that on the one hand do not recognize the importance of funding needed for forecasting, often neglecting the investments, on the other hand do not have the proper apparatus, the handling of this issue
This deficiency makes the sector vulnerable against potential funders who have a home practice, the vast majority of banks (Csiszárik-Kocsír, 2014). Difficult finding the necessary funds because of the high risk in these companies, banks often do not establish creditworthiness. It is therefore important sector of the project funds flowing, government grants, preferential loans. (Pollákné, 2004)
The possibility of exploiting favorable credit programs largely depends on whether the company is able to provide adequate quality business plan attached to the loan applications. The Hungarian SME lending activity is lower than the EU average. (Kazainé, 2014) The business planning practices among micro and small companies lacking experience in this area, so we need them bad preparation of the business plan, which will be their access to credit. As a result of the completed

Management, Enterprise and Benchmarking in the 21st Century Budapest, 2017
15
business plans provided for this purpose reality, the realization of the intention and the majority of professional accuracy is questionable. (Apatini, 1999)
Despite the favorable loan and grant opportunities if the SMEs are not even asking for it. The development of SMEs is often found a lack of resources, it is also playing a role that does not fit and are not ready to receive the funds. Most of them, especially the micro-enterprises in the operation and development of predominantly equity financing implemented. It is also the largest share of external financing from catching. The tender offer, as opposed to prefer more loans. Micro-enterprises are proportionately less involved in competitions and even these comparatively less successful in winning than larger SMEs. (Némethné, 2009)
4.2 A business plan motivated by an internal demand
For internal demand to support its business plan prepared by the contractor operating the course of order. This design work supports different levels, different functions of the operation of businesses. These support functions, I present on the model (Figure 2). Hernádi (2007).

Management, Enterprise and Benchmarking in the 21st Century Budapest, 2017
16
Figure 2.
Functions of bussiness planning
source: Hernádi, 2007, 66.pp
The following are examined on the basis Hernádi’s model that offers companies the opportunities for SMEs preparing a business plan
1. It helps in systematic thinking.
The conscious reflection, planning for long-term survival. Business planning process helps the entrepreneur through the operation of the company's vision, which is also important for micro and small enterprises as the "owner-operator" company management, where the owner manages and leads the company from operative to strategic level (Kadocsa, 2015). These entrepreneurs have characteristics that are held throughout the run of the company's operation, which is needed to complete the understanding of business, comprehensive thinking about the future, which can reveal new opportunities and perspectives.

Management, Enterprise and Benchmarking in the 21st Century Budapest, 2017
17
2. It helps the business environment and private endowments in the understanding of.
The most common manifestation of environmental analysis of SWOT analysis outlines a systematic analysis, the entrepreneur business opportunity and profits is available to the difficulties encountered. To complete the analysis of the information entrepreneurs need, such as business planning promotes and encourages the contractor to collect and organize information. (Hernádi, 2007)
The changes in the market situation for the past period since accession to the EU, SMEs touch, Kadocsa’s (2012, 36.p) research summed up as follows:
"The market entry costs have not decreased
a little expanded market opportunities
no more and better supplier
mostly were stronger competitors faced a growing market
The role of the co-operation of enterprises increased somewhat "
3. It helps clear definition of goals
During the preparation of the business plan objectives forced the contractor wild cards given time horizon. Based on an international survey of SMEs, 80% not reach its objectives. In order to realize objectives laid down in the concrete short-term goals should be detailed and measurable. (Kohl, 2012).
In addition to other corporate objectives to maximize profits also come to the fore, such as persistence, market expansion, business growth, ensure the livelihood of families (Herczeg, Juhász 2010).
4. It promotes good decision
According to Tayeb (2000) the most important elements in the decision-making objectives and decision-makers from the environment to the pressure. The organization's target system to the development ambitions of the participants and objectives, available resources and capacity to contribute to corporate strategy. Factors influencing the decision from the environment to the domestic / international market conditions, such as tax, legal / financial environment, the type of industry, possible profit expectations. These sums up the business plan, helping the driver make the right decision.
5. It facilitates the provision of funding
The implementation can provide the financial resources necessary to support the creation of the business plan this before, external motivation than I wrote in detail.
6. It helps the realization of the objectives

Management, Enterprise and Benchmarking in the 21st Century Budapest, 2017
18
The business plan contains an action program, which sets out to achieve the targets should be carried out what activities the contractor. A well-prepared business plan should include the tasks that can be executed realized the plan set goals. (Hernádi, 2007)
7. It helps to stimulate staff
The business plan is not only for investors, managers and owners made it clear view of the staff is that the company where it is going, what are the main objectives. (Herczeg, Juhasz, 2010) The business plan encourages employees to work effectively. (Hernádi, 2007)
8. It helps in monitoring progress.
The facts and data within the prescribed plan by comparing numbers to track the progress. Continuous monitoring using the differences can interfere with the operation of the company immediately. (Hernádi, 2007) With this function, the business plan has one kind of task, controlling, analyzing which of the planned and actual data comparing the resulting differences, and the possibility of responding to. (Francsovics, 2008)
9. Helps to amend its plan, prepare new plans
In the CIB Baton Research (Radó, 2014), the SME entrepreneurs, 67% responded that they plan adjusted if appropriate, co-ordinate. This is most often take place because of changes in customer needs, the behavior of competitors and needed to respond to changing external control.
Conclusions
The economic significance of SMEs is undeniable. The corporate sector, SMEs share of 99.95%, the majority of them are micro enterprises, 45% of the GDP and 60% of the workforce in Hungary. Increasing efficiency throughout the domestic economy continue to strengthen. This may include the operation thoughtful, future-oriented and conscious planning.
For SMEs in the short, medium and long-term planning most often blurred. The business plan, which is basically a medium-term planning over time spans, often includes a long-term strategy of the company and short-term operational action program, so it can be said that the business plan is the most comprehensive planning tool for SMEs.
A distinction is made in the micro and small enterprises and medium-sized companies in business planning practices.

Management, Enterprise and Benchmarking in the 21st Century Budapest, 2017
19
• The micro and small enterprises is more prevalent in the informal, often verbal design, leading to what makes a person. The size of the corporate business planning and everyday tasks limits the immersion in this most company size.
• If the business is growing at about the mid-market size is reached, it will be necessary for a comprehensive business planning, which includes the preparation of a complete, written, formal business plan, creating opportunities to the corporate long-term, successful operation.
Based on the results of the various national studies that about 30-40% of SMEs produce a business plan, this rate is very low.
The SME features mostly limited to planning, but perhaps that's why they win a lot of consistent business planning. With the help of their operational transparency, more effective and efficient business operations could realize, increasing their productivity and thus employment. The higher profits and rising employment at macro level is also showing beneficial effects on the Hungarian economy.
References
[1] Apatini K.(1999): Kis- és középvállalkozások finanszírozása, Közgazdasági és Jogi Könyvkiadó, Budapest
[2] Csiszárik-Kocsir Á. (2014) A hazai vállalkozások által alkalmazott finanszírozási stratégiák egy kérdőíves kutatás eredményeinek tükrében, Vállalkozásfejlesztés a XXI. században Budapest, 2015 (letöltve 2016.05.15: http://kgk.uni-obuda.hu/sites/default/files/03_CsiszarikKocsirAgnes_fin.pdf)
[3] Dobák M. (2008): Szervezeti formák és vezetés. Akadémia Kiadó, Budapest.
[4] Francsovics A.:(2005) A CONTROLLING FEJLŐDÉSÉNEK SAJÁTOSSÁGAI Ph.D. értekezés, Budapest (letöltve 2016.05.29 http://phd.lib.uni-corvinus.hu/170/1/francsovics_anna.pdf )
[5] Kadocsa Gy.: (2012) A Kis és közepes vállalkozások versenyképessége a XXI. sz. első évtizedeiben, Amicus Kiadó, Budapest
[6] Francsovics A., Kadocsa Gy.(2005): Vállalati gazdaságtan, Amicus Kiadó, Budapest
[7] Hernádi L.: (2007) Üzleti tervezés és a kontrolling a kisvállalatoknál a vállalkozások méretének hatása az üzleti tervezés és kontrolling rendszerekre, Ph.D. értekezés, Miskolci Egyetem (letöltve 2016.05.15 http://193.6.1.94:9080/JaDoX_Portlets/documents/document_5787_section_1203.pdf)

Management, Enterprise and Benchmarking in the 21st Century Budapest, 2017
20
[8] Herczeg J. – Juhász L. (2010): Az üzleti tervezés gyakorlata. Aula Kiadó, Budapest, 216. p.
[9] Kadocsa Gy.: (2012) A Kis és közepes vállalkozások versenyképessége a XXI. sz. első évtizedeiben, Amicus Kiadó, Budapest
[10] Kadocsa Gy.: (2015) Vállalkozásszervezés, Óbudai Egyetem elektronikus jegyzet, ÓE-KGK 4050
[11] Kazainé Ónodi, A. (2014) A magyarországi kis és középvállalkozások pénzügyi stabilitása és forráshoz jutása. Gazdaság és Pénzügy, 1 (1). pp. 33-51. ISSN 2415-8909 (letöltve 2016.05.15: http://unipub.lib.uni-corvinus.hu/2071/1/EF2015v1n1p33.pdf )
[11] Keenan, M.- Hutschenreiter, G.- Polt, W: [2009]: OECD Innovációpolitikai országtanulmány – Magyarország, NKTH Budapest, pp. 11-80.
[12] Kohl, Zs.:(2012) A jó célmeghatározás fél siker, Piac&Profit (letöltve 2016.06.02: http://www.piacesprofit.hu/kkv_cegblog/a-jo-celmeghatarozas-fel-siker/)
[13] Körmendi L. -– Tóth A. (2006): A kontrolling elmélete és gyakorlata. Budapest, Perfekt könyvkiadó
[14] Lazányi, K. (2014): Entrepreneurs of the future. Serbian Journal of Management 9:(2) pp. 149-158.
[15] Némethné Gál Andrea (2009): A kis- és középvállalatok versenyképessége, Doktori értekezés tézisei, Széchenyi István Egyetem Regionális- és Gazdaságtudományi Doktori Iskola letöltve 2016.06.10: http://rgdi.sze.hu/files/Ertekezesek,%20tezisek/Magyar%20Tezis%20NGA.pdf)
[16] Pollákné Császár, E.: (2004) A vállalati pénzfolyamok menedzselésének változásai és sajátosságai a kis- és középvállalati szférában – IT összefüggések és az EU-csatlakozás hatásai, EU working papers 3/2004 (letöltve 2016.06.06: http://epa.niif.hu/00000/00026/00024/pdf/05_pollakne.pdf)
[17] Radó T.(2014): SAJTÓKÖZLEMÉNY CIB Stafétabot Kutatás (letöltve 2016.05.17: http://www.cib.hu/system/fileserver?file=/Sajtoszoba/cib_sajtokozlemeny_stafetabot_kutatas_141029.pdf&type=related )
[18] Sinkovics A. (2006): Kisvállalkozások controlling megoldásai, Controller II évf. július-augusztus, 24p 1-2p Ecovit Kft ISSN 1787-3983
[19] Schmalen, H. (2002): Általános üzleti gazdaságtan. Axel-Springer Budapest Kiadó.

Management, Enterprise and Benchmarking in the 21st Century Budapest, 2017
21
[20] Szabó Dániel Róbert [2014]: Policentricity in Europe and Hungary. 2nd International Scientific Correspondence Conference 2014, Nitra, Slovak University of Agriculture in Nitra.
[21] Szóka, K.:(2007) A pénzügyi-számviteli tervezés és a controlling összefüggései és gyakorlata (Különös tekintettel a kis- és középvállalkozásokra) Doktori (Ph.D.) értekezés, Sopron, (letöltve 2016.05.30 http://doktori.nyme.hu/222/1/disszertacio.pdf)
[21] Tayeb, M. (2000): International Business. Pearson Education Limited. Harlow. The micro, small and medium enterprises development act, 2006, India
[22] Vecsényi, J.: (2012): Kisvállalkozások indítása és működtetése, Perfekt Kiadó, Budapest
Management, Enterprise and Benchmarking in the 21st Century Budapest, 2017
22
Attitudes and Motivations of Consumers in Sharing Economy
Gabriella Buda PhD student, Szent István University
Dr. József Lehota DSc. Professor, Szent István University, Faculty of Economics and Social Sciences, Institute of Business Sciences
Abstract: This study first provides a brief overview of the theoretical background of sharing economy, then it discloses the main results of our research related to consumer behaviour and consumer attitudes. By using our qualitative results, we have identified the main consumer motivation factors that we later used in our country-wide quantitative research for the classification of sharing economy users into 4 groups. The first group includes those enthusiastic frequent users who are less motivated by the economic benefits, they rather pursuit the good experience in using these services. The second group consists of users who are definitely motivated by better prices. The third group is made up of environmentally conscious consumers who support sustainability not just on the level of attitude, but also on the level of actions. The fourth group embraces occasional users, not necessarily enjoying the personal touch, they rather use sharing-based services only in the case of attractive offers.
Keywords: sharing economy, community management, digital technology, consumer behaviour
1 Introduction With the development and worldwide spreading of digital technologies and devices, the number of transactions between digitally connected private individuals is on the rise. People unknown to each other get in contact in this environment, they close deals primarily based on mutual trust, typically without entering a contractual relationship known as a basic requirement in the traditional business environment.
Management, Enterprise and Benchmarking in the 21st Century Budapest, 2017
23
Business transactions between private individuals can occur in multiple ways, either by buying/selling second-hand products or by sharing a product, i.e. when the owner of a product shares the particular product with someone else. In both cases, the first point of contact is facilitated by a digital platform. This was first defined by R. Botsman and R. Rogers in their best-seller book as ‘collaborative consumption’, which is an umbrella term that incorporates sharing-based community services or sharing economy as a key element.
2 Theoretical background, review of the related international literature
In this study, we essentially focus on sharing economy. This relatively new business model is definitely expanding. Several definitions have emerged for the sharing economy over time but there has been no consensus about a commonly accepted definition, supposedly due to the dynamic development of the new model. Other terms often used are ‘gig economy’ and ‘peer to peer economy’. Based on a thorough review of the international (scientific) literature and on our research, we believe that out of the interpretations we have seen, the definition we found in a PwC study is an appropriate starting point that fairly captures the substance of sharing economy: ‘Users share their unused capacities or untapped resources (e.g. tangible assets, services, money) with each other on an on-demand basis, i.e. immediately when the need arises. They usually do this through an IT platform, on the basis of mutual trust, with special consideration given to personal interaction and communal experience, while striving for sustainability.”
In our opinion, knowledge and information could be mentioned next to the unused capacities and resources in the above definition. The sharing of information and knowledge is getting more and more widespread, so this can well become part of the sharing economy model, though there is no or relatively restricted monetisation in this case. The IT platform, where supply and demand first meet, is typically operated by an independent legal entity for profits.
Another approach, often called access (platform) technology, has also gained ground lately (first mentioned by Eckhard-Bardhi in 2015). This model is aimed at the successful running of the platform, so that its value increases in time for the benefit of the platform’s owner, while facilitating transactions between individuals is simply less of a priority.
For all these models it is commonly true and it becomes a matter of fact that when a new activity is being launched, private individuals first share their unused capacities with each other on an occasional basis, but later, as the model turns successful, new participants will also join the model and they will start sharing their assets for profit, on a commercial basis, not just occasionally like people did at the
Management, Enterprise and Benchmarking in the 21st Century Budapest, 2017
24
beginning. This can raise fiscal and regulatory issues; most of the countries are trying hard to properly address them, but this subject is out of the scope of this study. The success of sharing economy lies most of all in the fact that an extraordinarily large number of people can get in contact with each other through a digital platform, where supply and demand can meet quickly and efficiently, allowing a genuinely dynamic pricing. All these success factors, along with the relatively easy entry to and exit from this market segment, make it clear that sharing economy – within its own limits – is fairly close to meet the criteria of perfect competition (Buda-Lehota, 2016).
Having said that, there is one other important prerequisite for the transactions to be successful – (mutual) trust between participants. This is largely guaranteed by the evaluation systems operated by the digital platforms. These systems ensure that both sellers and buyers keep having a good conduct, otherwise they will be disqualified for future transactions according to the logic of the system. The creditworthiness built up this way will allow for lower transaction costs. The existence of transaction costs was first mentioned by R. Coase in his article titled “The Nature of the Firm” in 1937, and his concept has by now become one of the key principles of institutional economics. Obviously in agreement with Coase, we believe that a part of the transaction costs disappears in the case of sharing economy, and transactions get regulated again by the market.
Categories of sharing economy The sharing economy model basically originated from the “consumer to consumer” (C2C) business model. Private individuals got in contact with each other through a digital platform and shared their spare devices, knowledge or tangible assets. Such services are provided for instance by Uber, AirBnB or BlaBlaCar, but information and knowledge is being shared by people on Skillshare, Wikipedia or even Facebook. In all cases, platform operators are independent businesses maintaining their platforms for profit. Monetization occurs in certain cases that have become typical, well-known examples of sharing economy, but we are of the opinion that Wikipedia and Facebook belong to the same category, the slight difference being that people share knowledge and information here, typically free of charge. It is important to note that the sharing of knowledge and information is often detrimental to the business of traditional suppliers of these values.
Building on the success of the initial operating logic, a new direction has also emerged in the economy: the so-called “business to consumer” (B2C) model, in which the company not only operates the platform, but it also provides the products and services as supplier, replacing the individual owners. However, this is not any more just about sharing the already existing spare assets or the unused capacity of properties, but it’s more about ensuring the best utilization - typically through short-term renting as long as demand effectively exists - of a product portfolio specifically set up for this purpose (Mol Bubi, ZipCar, Car2Go, ReachNow owned by BMW car
Management, Enterprise and Benchmarking in the 21st Century Budapest, 2017
25
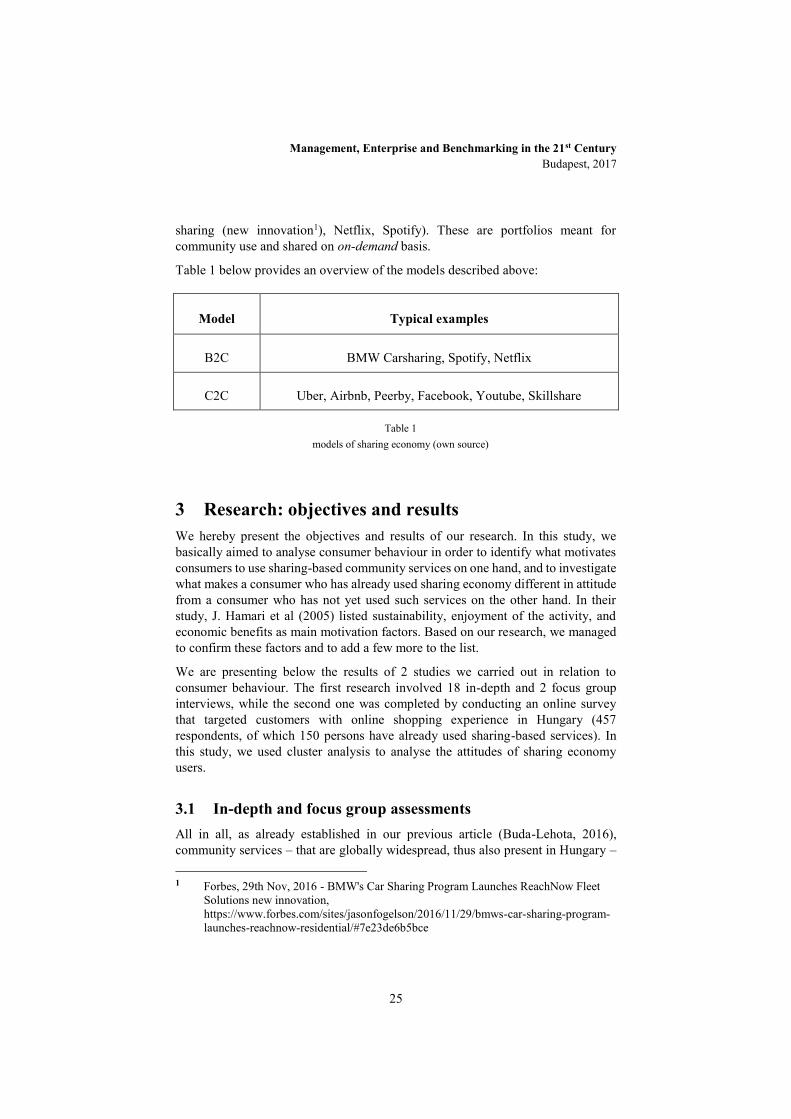
sharing (new innovation1), Netflix, Spotify). These are portfolios meant for community use and shared on on-demand basis.
Table 1 below provides an overview of the models described above:
Model Typical examples
B2C BMW Carsharing, Spotify, Netflix
C2C Uber, Airbnb, Peerby, Facebook, Youtube, Skillshare
Table 1 models of sharing economy (own source)
3 Research: objectives and results We hereby present the objectives and results of our research. In this study, we basically aimed to analyse consumer behaviour in order to identify what motivates consumers to use sharing-based community services on one hand, and to investigate what makes a consumer who has already used sharing economy different in attitude from a consumer who has not yet used such services on the other hand. In their study, J. Hamari et al (2005) listed sustainability, enjoyment of the activity, and economic benefits as main motivation factors. Based on our research, we managed to confirm these factors and to add a few more to the list.
We are presenting below the results of 2 studies we carried out in relation to consumer behaviour. The first research involved 18 in-depth and 2 focus group interviews, while the second one was completed by conducting an online survey that targeted customers with online shopping experience in Hungary (457 respondents, of which 150 persons have already used sharing-based services). In this study, we used cluster analysis to analyse the attitudes of sharing economy users.
3.1 In-depth and focus group assessments All in all, as already established in our previous article (Buda-Lehota, 2016), community services – that are globally widespread, thus also present in Hungary – 1 Forbes, 29th Nov, 2016 - BMW's Car Sharing Program Launches ReachNow Fleet
Solutions new innovation, https://www.forbes.com/sites/jasonfogelson/2016/11/29/bmws-car-sharing-program-launches-reachnow-residential/#7e23de6b5bce

Management, Enterprise and Benchmarking in the 21st Century Budapest, 2017
26
are well known and generally accepted among certain consumer groups since they are true alternatives to services provided in the traditional business model.
While conducting the interviews, we first focused on the identification of consumer drivers that we later used in our next study, the country-wide research. Based on this work, we have identified the following motivation factors: better price, flexible system, immediate or very quick reaction/response, easy and transparent use, fairness, reliability, credibility, trendiness, personal experience, cashless settlement, traceability.
Sustainability, as a motivation factor, has not been separately mentioned by participants, but when asked as a general matter whether they find it important and if they do, what they would be willing to do for sustainability, it turned out that most of the respondents not only find it important, but are also actively supporting it (e.g. through selective waste collection, use of public transport, etc.).
Another important finding of our research is that people using sharing economy typically belong to those internet users who are open to novelties, frequently use applications, and regularly use their bank card for purchases. Furthermore, they are flexible, extroverted, cost-sensitive and environmentally conscious people.
Based on the above, we have set the following categories for the country-wide online survey:
General attitudes: cost-sensitivity, trust towards private individuals, activeness on social media, attitude towards sustainability
Special attitudes specific to sharing economy users: consideration of economic benefits, use of services for joy and fun, use and appreciation of the available systems of evaluation
We prepared the questionnaire for the country-wide online survey along these elements. The relevant part of the results is summarized below.
3.2 Country-wide online survey The data collection was carried out between 20 and 28 February 2017, with the questionnaire completed by 452 respondents, of whom 150 have already used sharing-based community services. We focused our analysis on those 150 responses, who have already used sharing economy services. We used the SPSS software to analyse the collected data.
The structure of the sample was the following: the average age of the respondents was 37.23 years, with a deviation of 8.6 years. Women were highly overrepresented in this sample: 95 women filled in the questionnaire, compared to just 55 men. The vast majority (70%) of the participants live in Budapest. University graduates accounted for 81% of the sample, being largely overrepresented, but we assume that this is exactly the segment that typically uses sharing-based services; in fact, this is

Management, Enterprise and Benchmarking in the 21st Century Budapest, 2017
27
the primary target segment in the sharing economy so the results can fairly reflect the consumer behaviour patterns.
Review of responses from sharing economy users only We dealt exclusively with the attitudes of sharing economy users (150), searching for specific clusters within this group. We isolated the clusters in consideration of both general consumer attitudes and special attitudes specific to sharing economy users as you can find in chart no 1. Further, we investigated the association of the clusters with sociodemographic variables on one hand, and with other variables closely related to sharing on the other hand. Based on our questionnaire, we elaborated the model illustrated below. We searched for the clusters on the basis of the main factors (such as economic benefits, sustainability, use of services for joy and fun, credibility) that influence participation in the sharing economy; these factors had already been identified from our previous in-depth interviews and focus group assessments.
Chart 1.
model about investigation of consumers’ motivation and attititudes among sharing economy users
Then we ran a cluster analysis for the sharing economy users, and identified 4 clusters. As part of the cluster analysis, we worked with the general consumer

Management, Enterprise and Benchmarking in the 21st Century Budapest, 2017
28
attitudes that we have introduced earlier, and we extended these by adding consumer attitudes that are explicitly specific to consumers who have already used sharing-based services. The results are included in Table no. 2. below. The table does not contain sociodemographic variables, these have been included in the narrative analysis. (The rows in the table do not point to factors, but to aggregate categories that are based on the similar trend of averages)2
Table 2
clusters by user groups (own source) +++ very characteristic, ++ fairly characteristic, + more characteristic than not
’- - - very uncharacteristic, - - fairly uncharacteristic, - rather uncharacteristic by rows, by categories
The categories listed above proved to be significant during the cluster analysis (we only dropped 2 factors from the sharing economy attributes as they were not significant).
We recognized 4 clusters based on the above-mentioned variables.
The first cluster includes 21 participants: those enthusiastic and open private individuals who have used sharing-based services not only for financial reasons but also because they literally enjoy both using and offering sharing economy services. These people are typically extroverted, active on social media, and consider sharing as a trendy activity.
2 In cluster analysis ANOVA-test was performed to determine the significance of cluster
forming variables. Differences were considered significant if p<0.05.
Enthusiastic, not
price sensitive
consumers (21
people)
Price sensitive
consumers (29
people)
Environmental
conscious users
(54 people)
Casual users (46
people)
Cost awareness+ +++ ++ +
Trust toward
other individuals++ - + -
Activity on
community sides+++ + ++ +
Doing for
sustainability+ - +++ +
Economic benefit+ +++ ++ - -
Enjoyment +++ - - ++ - - -
Frequency+++ + ++ - -
Rating of
evaluation
system++ ++ + - -
General and sharing related
attitudes / Clusters (4)
Gen
eral
co
nsu
mer
atti
tud
esSh
arin
g re
late
d a
ttit
ud
es

Management, Enterprise and Benchmarking in the 21st Century Budapest, 2017
29
The second cluster is made up of those 29 price-sensitive consumers, to whom it is of utmost importance in general that they purchase at the best possible price, they usually go for products and services on sale. This group uses social media to a certain extent, without being very active on these websites though. They do not unconditionally trust private individuals, thus they strongly rely on the evaluation systems in place, which they find very important as these systems provide them with trust and safety (they do not risk their money or property).
The third cluster consists of those 54 environmentally conscious people who find sustainability very important, so much so that they are ready to take actions for it. These people feel good when using sharing-based services, they truly value being part of this community. They visit social media websites but they do not often share on these websites.
The fourth cluster includes those 46 occasional users of sharing economy services who are the least price-sensitive within sharing economy users and less open to novelties (again within sharing economy users) but have already used some sharing-based services when they really needed. They do not think that sharing is trendy, they rather find it more important to satisfactorily address their own needs.
We also reviewed the sociodemographic variables and sharing-related issues that are not directly related to behaviour/attitude in the above-mentioned clusters. Although we noted some differences, none of them was significant, which we presume is partially due to the low number of elements in the sample.
4 Conclusions This study was meant to deliver a fair view on the substance of sharing economy, which allows for sharing not only unused capacities or assets, but also other resources in a broader sense, such as knowledge and information. The main goal of our research was to identify and describe consumer behaviours, attitudes and motivation factors. The results of our country-wide online survey have led us to the conclusion that we can form 4 clusters of sharing economy users based on their consumer motivations. The first group includes those enthusiastic frequent users who are less motivated by the economic benefits, they rather pursuit the good experience in using these services. The second group consists of users who are definitely motivated by better prices. The third group is made up of environmentally conscious consumers who support sustainability not just on the level of attitude, but also on the level of actions. The fourth group embraces occasional users, not necessarily enjoying the personal touch; they rather use sharing-based services only in the case of attractive offers. Our online survey in Hungary has demonstrated that it is not just the price that motivates users to be part of the sharing economy market, but also the personal touch and interaction, as well as the reliability and credibility of the supporting systems.

Management, Enterprise and Benchmarking in the 21st Century Budapest, 2017
30
References
[1] Botsman, R. - Rogers, R. (2011): What’s mine is yours – The rise of collaborative consumption, Harper Business, https://www.harpercollins.com/9780061963544/whats-mine-is-yours
[2] Buda, G – Lehota, J: The Spreading Of Sharing Economy And Its Impact On Customers’ Behavior, ACTA CAROLUS ROBERTUS, 44 – 59., ISSN 2498-9312, http://uzletitudomanyok.uni-eszterhazy.hu/public/uploads/acta-carolus-robertus-6-2-jav2_588b56c5d51e7.pdf, letöltés: 2017-03-07
[3] Coase, Ronald H. (1937): The Nature of the Firm, Economica 4 (November), 388-392.p.
[4] Hamari, J –Sjöklint, M. – Ukkonen, A (2015): The Sharing Economy: Why People Participate in Collaborative Consumption. Journal of the Association for Information Science and Technology, Version of Record online: 2 JUN 2015, DOI: 10.1002/asi.23552
[5] Harvard Business Review, Eckhard, G.M. – Bradhi, F. (2015): The sharing economy isn’t about sharing at all, https://hbr.org/2015/01/the-sharing-economy-isnt-about-sharing-at-all, download: 2017-03-07
[6] PWC tanulmány, Osztogatnak vagy fosztogatnak – A sharing economy térnyerése, http://www.pwc.com/hu/hu/kiadvanyok/assets/pdf/sharing_economy.pdf, download: 2016-07-08
Management, Enterprise and Benchmarking in the 21st Century Budapest, 2017
31
Hungarian Retirement Plan of the Future
Dr. László Bujdosó, Márkó Andrasics Óbudai University, Keleti Faculty of Business and Management
Abstract: Many happenings take place in the today's world day by day and we do not notice what happens around us many times. The humanity's development quickened, all on a technical and economic level, and beside these the consumption claims and the population of Earth has increased equally. All peapole has bigger needs like everything would be need less time than we could fulfil our growing desires. The world's states continually will be more extreme opposite each other in social, economic, or demographic situation thet pull the nation of people’s living conditions apart than stay together How can the good existence be reached? First of all, every member of society should creates value, something new constructing, like technical one, engineering one, economic one, or educational one, that made to fit his profit for even the individual and the surrounding of that make the future better. Secondly creating an optimal living standard, when everything given to the basis living need, as Abraham Maslow defined it, also a big step for the good existence. Not in a last row, I think the state's task to maintain and to ensure the circumstances for the citizens, that makes the final calmness and carefree position of their opportunity of succesful path of life. The people has the right of being free and reach the goal of happiness on its’ own way. In Hungary the state's duty to support his citizens in financial way too. The pension system is connected to this case also. Hungary has a Pay as you Go system, also kown as PAYG system, where from tax contribution of the active employees are distributed monthy to the not capable persons, pensioners, and not in a last row the unemployed workers. The state also supports self-catering solutions, that everything natural or legal member of the society could use from innate right, in that case of barely visible and unsteady sustainability of pension sytem in the future. The topic of our future is coming into the foreground rather continually since the pension situation puts on critical perspectives currently in Hungary. The society's ageing in a totally usual process, and at the same time, the economic and social problem equally. The younger generations has more time to be prepared, opposite the elderly who stading before pension. Above all the question arises rather at it the carefree pensioner regarding the financing of years, that how a sum up an optimal amount of money in a caring form, whereby easier to do against the continuously postponing the quality of calm years after retirement age. In the this publication, the Hungarian retirement plans are presented and single researches will show, that the society is not ready for avoiding the pension catastrophe, showing my research from the last years..In the first step the history snd development of the hungarian pension system will be presented.

Management, Enterprise and Benchmarking in the 21st Century Budapest, 2017
32
1 History of the Hungarian Pension System
1.1 Defition of pension
The pension a continuous or partial money support, that based on the conditions of the measures in a given age, and the suffered bigger health impairment attained concerning an employment with particular time assured, and their decease their grantees included. The rights achieved with the payment of contribution, with the conditions developed in the measure providing to a pension of the right of truth. Because of the earnings serving as the basis of the pension contribution, incomes and sums going after the fulfilment of prescribed length of service received with suitable payment of contribution, where the social security pension scheme on an own right after their relatives received retirement allowances. According to the older stories before the pension schemes the pension the socially from the poor, person in needs, reported taking care of wartime widows, but defined it likewise the laws of the poor, concerning the mutual aid social groupings.1
1.2 Eras of the Hungarian pension system
The social security in Hungary, which is part of the formation of the pension scheme started the beginning of the 20th century. Our homeland introduced the social security as the third, while the pension scheme much later. Due to the townish risings, the Bethlen government made that decision because of the consequence of the lost war, that made the state ropemaker onto the taking a role of the nation social assistance, while of this the superannuation act was started in 1929. The lifetime which can be defined at the time of the birth between 1900 and 1970 from 37 years grew to 69 years in Hungary. Unfortunately the mortality is deteriorating minimally since then. A person at the middle-aged men; and the women lifetime increased hardly. So the average life expectancy it latest in three decades under 70 years been fixed, and the male, and the difference between the female lifetime increased. The number of the births conformed to the decreasing decease rather continually in the first half of the 20th century, but to say tall was left over. Until the 1945 years, our homeland, the converted capital, so-called life annuity system was introduced by way of which pensions were covered and the flowed money into the pension insurer, that handled it on sums and invested it in real estates, which have leased to the people. It may have received the supply, the prescribed 15 year waiting times expired being due who attained the 65. year. The fact, that at most people would have ensued after the end of a world war II:, which brought the pension system into a catastrophic state otherwise. Three capital tribes formed the retirement pension:
1 Andrasics-Fézer, Vedd kezedbe a jövőd, avagy a magyar nyugdíjrendszer alakulása,
2015
Management, Enterprise and Benchmarking in the 21st Century Budapest, 2017
33
the tribe allowance, tribe surrogate, cumulative allowance. Final part the mentioned system leaning in can be attributed for the II: world war and due the Sztójay government’s (1944) actions made the sustainability of the system more difficult. The retirement age was reduced to 60. year, multiplied by four the basic amount of the pensions, and they made use of the soldiery arming the reserves.
All Hungarian pension funds went bankrupt following the World War II., the hyperinflation and the real estates given out understands as a result of harms. 40 of the percentage of a national property were destroyed in the then one according to estimates was lost. It was introduced around 1950 for the ones living on the wages and payments as the PAYG. “Pay as you go” system, that differently right collector system, which flowed in from the taxes' monthly pension allowances, the compiling of sums, meant uniform distribution to the pensioners then. The new system fell on more tuning, refinement until 1952 from 1945 accross, the population affected his half initially on the dawn of the system so, but next the entitlement, they extended it concerning, rather the circle of the pension allowances continually. This number onto 1975 accomplished the 100 percentage, because of the effects of the decrees emitted under the years. It was extended over the circle of the allowance ones likewise. Onto 1975 the system worked close to 100 percentage of propotion. It concerned the complex old-age one, and relatives and disability one managed pension allowance. The pension system begat more tenseness gradually in the course of the 1970 years the growing earnings, concerned as a result of prices. The pensions increased it irregularly and drastically, the smallest pensions kept pace with the change of the wages and prices because of this, while the medium one and the bigger pensions fell behind rather continually under this.2
The capitalism received a role instead of the socialism after the political transformation. The social refuge, which can be identified as the relatively luxurious one, built up in the earlier socialism thet was not maintainable already, after the strengthening inflation on the beginning of the 1990 years turned into number of two digits, due to the money deteriorated as the pension equally. It more necessary changes happened in the pension scheme on the front of 90 years..3
2 Andrasics-Fézer, Vedd kezedbe a jövőd! 2015
3 Augusztinovics -Gál–Matits–Máté–Simonovits–Stahl, 2002
Management, Enterprise and Benchmarking in the 21st Century Budapest, 2017
34
2 Pension System in nowdays
2.1 About the Hungarian pension system
Presently the Hungarian Pension system contains two pillars. One is the main State Pension and the other one is the Voluntary Self-provision pillar. There is existinga a third pillar, which has no longer use for the system, what was devoted to the instalment of public debt in the year of 2011. It was an obligatory system containig statement rights and after all it’s largest part was taken away.
Every citizen who has reached the 40th own age of retirement, and has worked for the required years by the law that subject to state pension. When calculating the pension, the sum of formerly paid commissions is taken into account, yet the formula based on which the calculation is made and defined by the law and connected to alteration based on the national budget, as seen before. That is why we do not really know about the amount of our pension received from the state. The retirement age changes were announced in 2008 therefore for those who were born in 1951 or earlier the retirement age is 62 years, and since 2010 for those who were born in 1952 or later the retirement age increased to 65 by 2022 for males and femaley. In order to qualify for a minimum pension from the first pillar, beneficiaries must have a contribution history of at least 20 years; and for a partial pension without a minimum is paid after 15 contribution years.
The earnings-related public pension system is a mandatory defined benefit system where theearnings-related pension is calculated as 33% of average earnings for the first ten years of coverage from the year of 1988. After each additional year of coverage adds 2% from year 11 to 25, then 1% from year 26 to 36, and in last row 1.5% from year 37 to year 40 and 2%. The earnings based on net salary. From 2012 pension benefits are modified for the consumer prices index, so nowdays there is a minimum amount of pension, which is worth HUF 28 500 per month. The government has started negosiations of the increasing, but it has remained unchanged since 2009. After all the extra income beyond the state pension can be managed from private savings, that includes the voluntary pension system and their future value can be predicted much more accurately than that of the state pensions, plus the state supports the private savings.
2.2 Problems of the system
There are many problem that comes from each other, which will cause the sustainability of the PAY ang GO system in Hungary. In the first hand there is the aging society Onto 2050 the 65th years people will filled it may be amounted to the population one third
Management, Enterprise and Benchmarking in the 21st Century Budapest, 2017
35
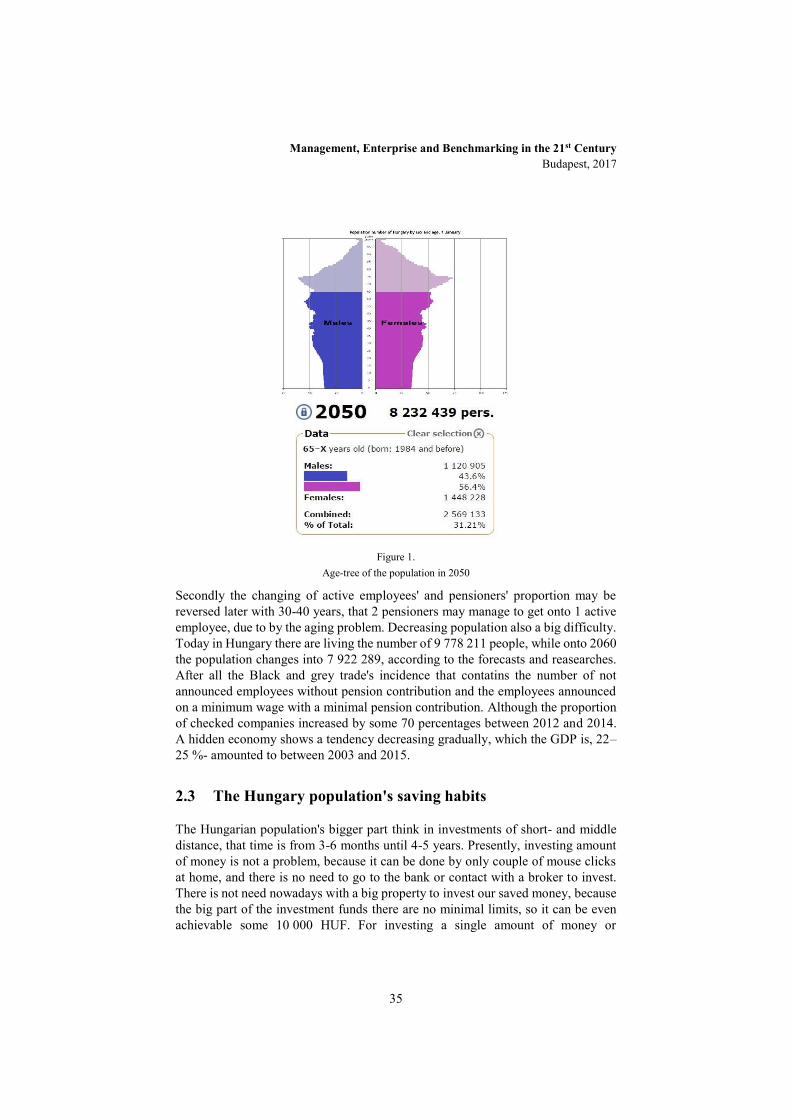
Figure 1.
Age-tree of the population in 2050
Secondly the changing of active employees' and pensioners' proportion may be reversed later with 30-40 years, that 2 pensioners may manage to get onto 1 active employee, due to by the aging problem. Decreasing population also a big difficulty. Today in Hungary there are living the number of 9 778 211 people, while onto 2060 the population changes into 7 922 289, according to the forecasts and reasearches. After all the Black and grey trade's incidence that contatins the number of not announced employees without pension contribution and the employees announced on a minimum wage with a minimal pension contribution. Although the proportion of checked companies increased by some 70 percentages between 2012 and 2014. A hidden economy shows a tendency decreasing gradually, which the GDP is, 22–25 %- amounted to between 2003 and 2015.
2.3 The Hungary population's saving habits
The Hungarian population's bigger part think in investments of short- and middle distance, that time is from 3-6 months until 4-5 years. Presently, investing amount of money is not a problem, because it can be done by only couple of mouse clicks at home, and there is no need to go to the bank or contact with a broker to invest. There is not need nowadays with a big property to invest our saved money, because the big part of the investment funds there are no minimal limits, so it can be even achievable some 10 000 HUF. For investing a single amount of money or

Management, Enterprise and Benchmarking in the 21st Century Budapest, 2017
36
continuous saving, the necessary and rudimentary knowledges easily can be acquired, but it is worthy to choose from the products cautiously. It is not absolutely right, that an investment is risky. The measure of the hazard and the profit of investment form is also variable. The invested money is heavy to lose, because in generality can be related, that a taller yield is accompanied by a bigger risk, but at the same time the capital guaranteed, or a capital saved in case of the choice of a product. The liquidity characteristic many times is accompanied at this time, why number form of saving are exists, which we may get any time.With exterior financial adviser the operation can be developed by consisting of more saving products adjusting to personal aims though. It emerges from OTP Bank's 2014/15 saving research, that 65 percentage of the hungarian people comes to terms with the lower yield according to his own acknowledgement, although let that investment enjoy capital protection on the other hand. At the same time the 33 percentage would be willing to risk the minimal part of his capital in the hope of the taller yield already, while simply 2 percentage declared that he would risk the full capital. It is possible to experience gradual restructuring in the past years considering the households' liquid reserve based on deposit type investments and devices into the direction of the investment funds and the state papers. The proportion of the deposits decreased while that of the investment funds and that of the state papers grew. Although smaller part of the savers, but increasingly more people are enquiring already and they invest the absolute yield type, the mixed one, concerned into the bases of bases, or primarily into immovable investment type. The interest environment decreasing continuously furthered the restructuring process in the past periods.
Research between OECD countries represents it as one of his results, that the Hungarians averagely onto 180 billion HUF Christmas and New Year, onto 150 billion HUF of gamble, and only the country altogether 220 billion HUF are spent on self-catering, which it exemplifies, in proportion one, that more than 87 percentage any kind of longer-term provision at their disposal for respondents currently.

Management, Enterprise and Benchmarking in the 21st Century Budapest, 2017
37
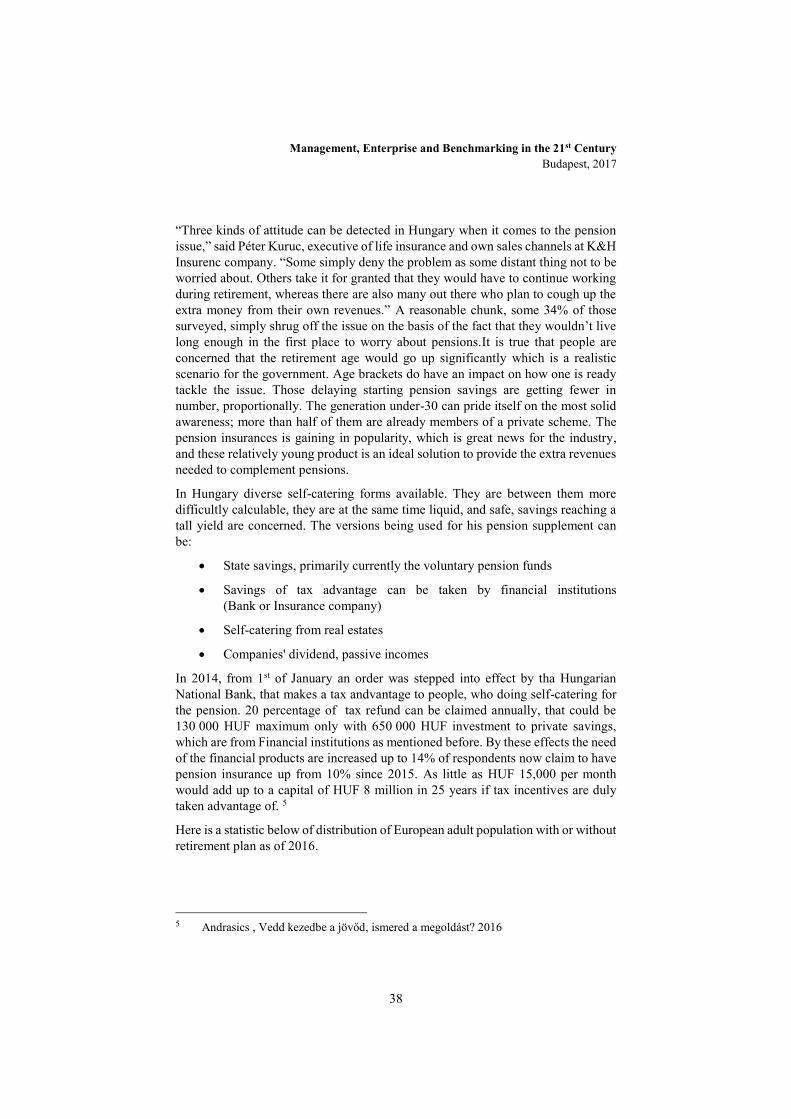
Figure 2.
Approaches to retirement saving in Hungary as of 2016
This statistic shows the approaches to retirement saving in Hungary as of 2016. A total of 35 percent of the respondents said that they were not saving for their retirement, but they intend to do this in the future. A further 25 percent claimed that they were always making sure to be generating retirement income.
2.4 Retirement plan in Hungary4
Most Hungarians plan to work on after retirement age. Nearly four-fifths of the Hungarian population do not have any savings for pension purposes, whilst as many of them anticipate a worse or a lot worse standard of living than during their active career. Still, there are some signs of awareness of the need for improvement. Although Hungarian society is becoming more aware of the fact that the state pension would not provide them with enough resources after retirement, still only 22% of people have savings specifically intended to beef up their pension pot. Pessimism is clearly widespread, as 69% of respondents in 2016 said they would expect to work during their grey years. That ratio was just 61% in 2015. The overall picture of the post-retirement financial situation looks just as gloomy, with 34% projecting a positive scenario and some two-thirds expecting the entire state pension scheme to collapse.
4 By Levente Hörömpöli-Tóth http://bbj.hu/analysis/most-hungarians-plan-to-work-on-
after-retirement-age_127614
Management, Enterprise and Benchmarking in the 21st Century Budapest, 2017
38
“Three kinds of attitude can be detected in Hungary when it comes to the pension issue,” said Péter Kuruc, executive of life insurance and own sales channels at K&H Insurenc company. “Some simply deny the problem as some distant thing not to be worried about. Others take it for granted that they would have to continue working during retirement, whereas there are also many out there who plan to cough up the extra money from their own revenues.” A reasonable chunk, some 34% of those surveyed, simply shrug off the issue on the basis of the fact that they wouldn’t live long enough in the first place to worry about pensions.It is true that people are concerned that the retirement age would go up significantly which is a realistic scenario for the government. Age brackets do have an impact on how one is ready tackle the issue. Those delaying starting pension savings are getting fewer in number, proportionally. The generation under-30 can pride itself on the most solid awareness; more than half of them are already members of a private scheme. The pension insurances is gaining in popularity, which is great news for the industry, and these relatively young product is an ideal solution to provide the extra revenues needed to complement pensions.
In Hungary diverse self-catering forms available. They are between them more difficultly calculable, they are at the same time liquid, and safe, savings reaching a tall yield are concerned. The versions being used for his pension supplement can be:
State savings, primarily currently the voluntary pension funds
Savings of tax advantage can be taken by financial institutions (Bank or Insurance company)
Self-catering from real estates
Companies' dividend, passive incomes
In 2014, from 1st of January an order was stepped into effect by tha Hungarian National Bank, that makes a tax andvantage to people, who doing self-catering for the pension. 20 percentage of tax refund can be claimed annually, that could be 130 000 HUF maximum only with 650 000 HUF investment to private savings, which are from Financial institutions as mentioned before. By these effects the need of the financial products are increased up to 14% of respondents now claim to have pension insurance up from 10% since 2015. As little as HUF 15,000 per month would add up to a capital of HUF 8 million in 25 years if tax incentives are duly taken advantage of. 5
Here is a statistic below of distribution of European adult population with or without retirement plan as of 2016.
5 Andrasics , Vedd kezedbe a jövőd, ismered a megoldást? 2016
Management, Enterprise and Benchmarking in the 21st Century Budapest, 2017
39
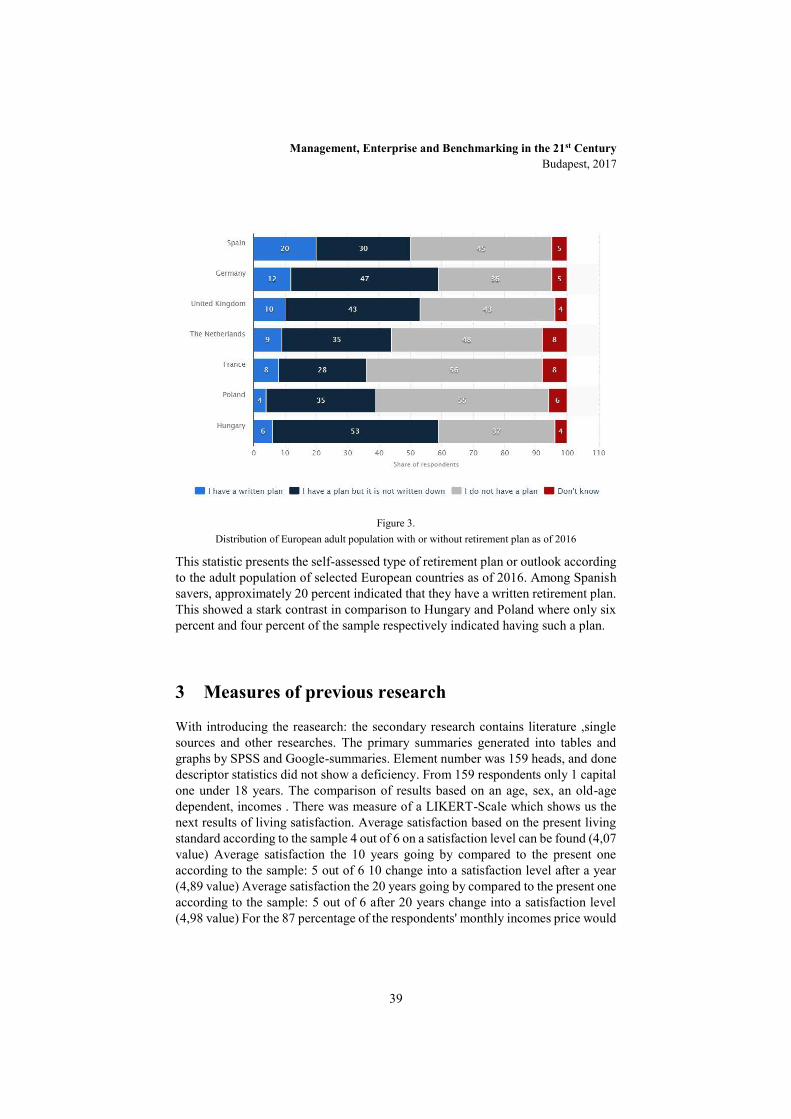
Figure 3.
Distribution of European adult population with or without retirement plan as of 2016
This statistic presents the self-assessed type of retirement plan or outlook according to the adult population of selected European countries as of 2016. Among Spanish savers, approximately 20 percent indicated that they have a written retirement plan. This showed a stark contrast in comparison to Hungary and Poland where only six percent and four percent of the sample respectively indicated having such a plan.
3 Measures of previous research
With introducing the reasearch: the secondary research contains literature ,single sources and other researches. The primary summaries generated into tables and graphs by SPSS and Google-summaries. Element number was 159 heads, and done descriptor statistics did not show a deficiency. From 159 respondents only 1 capital one under 18 years. The comparison of results based on an age, sex, an old-age dependent, incomes . There was measure of a LIKERT-Scale which shows us the next results of living satisfaction. Average satisfaction based on the present living standard according to the sample 4 out of 6 on a satisfaction level can be found (4,07 value) Average satisfaction the 10 years going by compared to the present one according to the sample: 5 out of 6 10 change into a satisfaction level after a year (4,89 value) Average satisfaction the 20 years going by compared to the present one according to the sample: 5 out of 6 after 20 years change into a satisfaction level (4,98 value) For the 87 percentage of the respondents' monthly incomes price would
Management, Enterprise and Benchmarking in the 21st Century Budapest, 2017
40
be their need under a pensioner's years. According to the 36 percentage of the respondents, the present monthly own real-income would be the own state pension in the future. 52 percentage would love to provide in a some kind of form onto the supplement of own pension, from among these most votes his immovable investments, and the second place of the supplement took place through of a financial institution.
The measurement of the distrust in connection with the pension scheme and the financial services showed that, 40 out of 159 heads distrustful with the system and uninformed financially, is not confident about the financial services concerned altogether. 8 out of 159 heads confident about the system, informed, is confident about financial services concerned. Into the intermediary groups can be enumerated his number 111 heads what are divided mixed, concerned between the two extreme values fivefold the difference because of this in the system rather distrustful, than rather hopeful based on the questions.
We got an answer to the knowledge of the pension product ones in the successors. Altogether 25 heads elected that “I do not know an opportunity” at the first question, but the interviewees 29,4 percentage takes action some kind of pension saving product, although 26,2 percentage just plans it. The most popular form of saving was Volunter Saving System, that was elected by 22 heads. The inference sound, that more people know a some kind of form, but few people take action private saving product.
The respondents 61,6 percentage would make use of a financial adviser in order to ask for his council in connection with private savings forms and at the time of the strain of the service the most would ask for competent were the family and familiar opinion friend or realative.
Conclusions
The fact is the Hungarian population is decreasing by the ages and the number of elders ages people are increasing. According to these the active employees are getting into background, that cause big financial problems of the Hungarian pension system, which based on the “Pay as you go” system. People should be more prepared in self-catering in worldwide, because the nations are lack of the stable pension background. Everybody has to concern the sustainability of their own pension future, and make sure of a main retirement plan by the years. Anyway the government should be take some serious instructions in the future to avoid the pension chatastrophy and the bankruptcy.

Management, Enterprise and Benchmarking in the 21st Century Budapest, 2017
41
Acknowledgement
Summing up the full research as a personal opinion, established that the sustainability of the Hungarian pension scheme, which it is necessary to remedy in the future, is with a critical situation. Today looks yet, but the Hungarian population, which the state can take over difficultly in a present situation, may suffer from his later disadvantages. To the achievement of the aim and the maintenance of the living standard it is necessary to do it and to enquire for all opportunities that the state may provide or ourselves inventiveness discover. The facts speak for themselves and supported, that not to put off, but to accept necessary. As everything is important for a man the himself and szerettei his future, some just as important the solution of the crisis of the system state, and they were eligible for the later pension his financing.My opinion is that, the population has to recognise the problems of the system before according to and to think over, to talk with an expert even, who opens the eyes and gives financial advises of a retirement plan. After a free material margin accumulates after everyday incomes and expenses, then must to provide for everybody own, his children, and from his relatives' future. The formula plain, it is necessary to do something for the problem. I suggest it in order for us to be up-to-date, let us orient ourselves, we should grasp the opportunities and plan regarding the future, that let us create it safely the later one of own living circumstances. We should request the vocational helps and let us not hesitate to act in exchange of the self-catering.
After all I would like to gratitude to authors, who represented in the below references and my consul, dr. László Bujdosó who proposed the publishing to MEB conference.
References
[1] Márkó Andrasics – Zsolt Fézer, Take your future in your hand, aka. the hungarian plans of the future - 2015
[2] Márkó Andrasics, Take your future in your hand, do you know the solution? 2016
[3] Augusztinovics -Gál–Matits–Máté–Simonovits–Stahl, Issues in pension system design, 2002
[4] https://www.statista.com/
[5] Levente Hörömpöli-Tóth http://bbj.hu/analysis/most-hungarians-plan-to-work-on-after-retirement-age_127614
Management, Enterprise and Benchmarking in the 21st Century Budapest, 2017
42
The Interplay of Socioeconomic Development, Enterpreneurship, National Culture and innovation Performance
Merima Činjarević School of Economics and Business, University of Sarajevo
Ljiljan Veselinović School of Economics and Business, University of Sarajevo
Abstract: The main purpose of this study is to investigate the relations between national cultural dimensions, socioeconomic development, entrepreneurship, and national innovation performance. Data set for this study was obtained from secondary sources and it included the following measures: (1) the scores of Hofstede's national culture dimensions; (2) UNDP Human Development Index, (3) Total Early-Stage Entrepreneurial Activity rates provided by The Global Entrepreneurship Monitor (GEM); and (4) Global Innovation Index (GII). These measures were gathered for 77 countries across seven regions of the world. Support was found for the positive effect of socioeconomic development on national innovation performance indicating that a long and healthy life (health), the access to knowledge (education), and a decent standard of living (income) are significant predictors of innovation performance. In terms of cultural dimensions findings of the regression analysis indicate that innovation performance are higher in countries that have lower power distance between citizens and those in power and have lower level of uncertainty avoidance. The link between entrepreneurial activity and national innovation performance was found to be negative. This study emphasizes the importance socioeconomic and cultural impacts on national innovation performance and, thus, provides implications for policy-making regarding innovation policies.
Keywords: socioeconomic development, national culture, innovation performance, enttrepreneurship
Management, Enterprise and Benchmarking in the 21st Century Budapest, 2017
43
1 Introduction Innovation, understood as the production, diffusion and translation of technological knowledge into new products or new processes, is considered to be the main driver of growth in modern capitalistic economies (Watkins, Papaioannou, Mugwagwa and Kale, 2015). Moreover, it has been argued that “successful economic development is linked to a country’s capacity to acquire, absorb, disseminate, and apply modern technologies, a capacity embodied in its National Innovation System (NIS)” (Metcalfe and Ramolgan, 2008, p. 436). In other words, innovation does not occur in the vacuum; innovation is the result of the NIS, that combines the efforts of individual firms with the actions of other innovating actors such as universities and government agencies (Crespo and Crespo, 2016; Metcalfe & Ramlogan, 2008; Watkins et al., 2015). Based on the literature review in the area of NIS, three basic research streams can be identified: (1) NIS studies in general; (2) NIS studies with a focus on particular aspects of the NIS; and (3) theoretical perspectives on NIS (Marxt and Brunner, 2013). The present study strives to enhance the body of knowledge within the first research NIS stream (NIS studies in general) by exploring the impact of the socioeconomic development, national cultural and entrepreneurship on the national innovation performance. In order to accomplish this aim, we made three basic assumptions. The first assumption is that a large share of variance in the national innovation performance can be explained by the key aspects of socioeconomic development (income, education, health). The second assumption is that the culture, as the set of shared attitudes, values, goals and practices that characterizes institutions, organizations or groups, influences overall national innovation performance. The third assumption is that entrepreneurship activity enhances the national innovation performance.
This paper is organised as follows. Section two provides the theoretical background, while section three describes the methodology and data sources. Section four presents the model used in the analysis followed by the discussion. Final section provides main concluding remarks of the paper.
2 Theoretical background
2.1 National innovation system The term national innovation system (NIS) emerged in the mid-1980s with the context of debates over innovation policy in Europe (Sharif, 2006). Since them, the concept of NIS has been rapidly embraced by policymakers and academic scholars across the world. According to Lundvall, Joseph, Chaminade and Vang (2009), NSI refers to the „open, complex, and evolving system that encompasses
Management, Enterprise and Benchmarking in the 21st Century Budapest, 2017
44
relationships within and between organizations, institutions and socio-economic structures which determine the rate and direction of innovation and competence-building emanating from processes of science-based and experience-based learning“ (p.6). Similarly, Patel and Pavitt (1994) defined NSI as „the national institutions, their incentive structures and their competencies, that determine the rate and direction of technological learning (or the volume and composition of change-generating activities) in a country“ (p. 79). Thus, NSI can be perceived as the sub-system of the national economy in which various organizations and institutions interact and influence each other in the carrying out of innovative activity. Although the NIS approach is not the theory, it can be used as the research framework intended to capture the processes of innovation, their antecedents and some of the outcomes. (Edquist, 1997). Furthermore, the NSI approach is in the line with the Nelson and Winter's (1982) evolutionary theory of economic growth which postulates that governments and collective activities can and do play a central orchestrating role in the generation and diffusion of innovation in a national economy (Watkins et al., 2015). Recently, a number of scholars placed emphasis on the role of functions or building blocks of the NIS. These scholars argue that additional academic efforts are needed to better understand the ways in which institutions (innovating actors) interact and how the structure of the innovation system and its functions can foster innovation (e.g. Liu and White, 2001). Furthermore, some scholar examined the effectiveness of government intervention regarding the innovation policies and tried to compare the position of countries regarding innovation policies and performance (Crespo and Crespo, 2016; Mahroum and Al-Saleh, 2013). Preliminary work in this research stream placed focus mainly on the analysis of different countries' innovation systems and/or on their comparative results (Lin, Shen and Chou, 2010). However, since late 1990s several international institutions developed a range of innovation indices (European Innovation Scoreboard, the National Innovative Capacity Index from the World Economic Forum, the UNCTAD's indices, the Innovation Index of the World Bank, the Nordic Innovation Monitor, the OECD Science, Technology and Industry scoreboard, the Bloomberg Innovation Index, and the Global Innovation Index). Since then, the most common way to evaluate the performances of different innovation systems is the use of indices (Crespo and Crespo, 2016). Therefore, the present study uses the Global Innovation Index (GII) as a proxy measure of national innovation performance.
2.2 Entrepreneurship The concepts of innovation and entrepreneurship were linked for the first time by Schumpeter (1934), who argued that entrepreneurship leads to innovation, which in turn induces economic growth. Although the literature suggests that entrepreneurship and national innovation system (i.e. national innovation performance) are enablers of economic growth, there is a lack of research on the role of entrepreneurship in reinforcing the national innovation performance
Management, Enterprise and Benchmarking in the 21st Century Budapest, 2017
45
(Albulescu and Draghici, 2016). Moreover, the findings of empirical studies exploring the effect of entrepreneurship on economic growth are ambiguous. Therefore, researchers have embraced two-way causality in modelling the link between entrepreneurship and economic growth. These studies posit that there is both a ‘‘Schumpeter’’ effect (i.e. new firms enhance economic growth by stimulating economic activity and creating new hobs) and a ‘‘refugee’’ effect (i.e. unemployment stimulated entrepreneurial activity). It is suggested that the ‘‘Schumpeter’’ effect would be most likely observed in advanced countries while the ‘‘refugee’’ effect is likely to be found in lower-income nations with less-developed social security systems. Furthermore, it has been found that entrepreneurship activity does not affect the national innovation performance (Albulescu and Draghici, 2016) or economic growth (Wong, Ho and Autio, 2005). These findings indicate that national innovation performance and economic growth are driven by large and fast growing new firms, not new firms in general. Based on the above discussion, we expect that entrepreneurship will not be significantly related to the national innovation performance.
2.3 National culture In order to capture national culture in the present study, we applied Hofstede’s (1980) cultural dimensions. We chose to integrate the particular Hofstede scores for the primary dimensions of national culture - power distance, individualism, masculinity, and uncertainty avoidance. Power distance refers to “the extent to which the members of a society accept that power in institutions and organizations is distributed unequally” (Hofstede, 1985, p. 347). The ability to monitor innovation activities and to implement innovation policies can be hindered by a high level of power distance. In high power distance countries, power-less people are less likely to defend their rights of equal access to opportunities, and they are more likely to accept the behaviour of those in power. Individualism, as opposed to collectivism, captures whether individuals primarily cater to their own needs instead of acting in the interest of their group (Hofstede and Bond, 1984). People in individualistic national culture tend to express their opinions freely, even in situations when their opinions do not match with the opinions of others (members of family, friends, colleagues, etc.) However, in collective culture people are more prone to hold their opinions for the sake of creating and maintaining good relations with others. Thus, we can expect that individualism enhances national innovation performance, while collectiveness hampers the national innovation performance. Masculinity is defined as “a situation in which the dominant values of society are success, money, and things” (Hofstede, 1980) In a masculine culture, values like achievement, advancement, gathering of money and power are more important than the values like building relationships, empathy, modesty, whch are considered to be more important in a feminine culture. In a culture where people value more quantity of life (i.e. high masculinity) than the quality of life (i.e. high femininity, we expect the higher level of national innovation performance. The fourth cultural dimension, uncertainty avoidance, assesses “the
Management, Enterprise and Benchmarking in the 21st Century Budapest, 2017
46
extent to which the members of a society feel uncomfortable with uncertainty and ambiguity and leads them to support beliefs promising certainty and to maintain institutions protecting conformity“ (Hofstede, 1985, p. 347). In cultures characterized by a high level of uncertainty avoidance, people are not optimistic about their ability to influence decisions made by those in power. As high uncertainty avoidance indicates low willingness to introduce the change, people are less willing to engage in activities that might lead to the innovation.
2.3 Human development One potential explanatory factor related to national innovation performance may be found in a country’s level of socioeconomic development. Socioeconomic development is measured by the United Nations and refers to the ability of a nation’s people to be able to lead full and productive lives. This includes not only education and their ability to earn a living wage, but more importantly the personal choices they have available as citizens that impact their lives (Sims, Gong and Ruppel, 2012). Since higher level of education and better conditions of living are pillars of innovation activity, we expect that a country with high level of socioeconomic development is likely to have better national innovation performance.
3 Methodology
3.1 Measures and sample In our analysis, national innovation performance (dependent variable) is measured using Global Innovation Index (GII) released by Cornell University, INSEAD and the World Intellectual Property Organization (WIPO). The GII depends on two sub-indices, the innovation input sub index and the innovation output sub index, each one built on several enablers (or pillars). Over the years, this index has improved and, in 2016 included 82 indicators divided into five input enablers (institutions, human capital and research, infrastructure, market sophistication, and business sophistication) and two output enablers (knowledge and technology outputs and creative outputs). Based on the GII framework, four measures can be calculated, namely innovation input sub-index (i.e. average of the five input scores), output sub-index (i.e. average of the two output scores), the overall global innovation index (i.e. average of the innovation input sub-index and innovation output sub-index), and the innovation efficiency ratio (i.e. ratio of the output sub-index and input sub-index). For the purpose of this study, we applied all four measures.

Management, Enterprise and Benchmarking in the 21st Century Budapest, 2017
47
Socioeconomic development, as independent variable in our analysis, is measured by Human Development Index (HDI) Human development scores for the year 2013 were gathered for each of the countries included in the sample from the United Nations Development Programme. This index is a composite measure of health, education, and income designed to assess well-being.
Entrepreneurship, as independent variable, is assessed through the TEA which represents the percentage of individuals in the nation, aged between 18 and 64, that are actively engaged in starting or managing a new business.
National culture is measured in terms of Hofstede's five dimensions of national culture: power distance, individualism, masculinity, uncertainty avoidance, and long-term orientation. Values for each of the scores of the five dimensions of national culture were obtained from Hofstede (2011).
The sample for this study included data gathered for 77 countries, located in seven regions of the world. The inclusion of countries was limited by the secondary data available for GII, HDI, TEA, and national culture dimension scores. Most countries (40.3%) belong to Europe & Central Asia region, while 20.8% are from Latin America & Caribbean. Approximate equal number of countries comes from “East Asia and the Pacific “and Sub-Saharan Africa (11.7% and 13.0% respectively). Most countries belong to high income group (46.8%), while the rest are either in upper middle income (29.9%) or lower middle income group (23.4%). As the data were collected from different sources, this procedure limited the total number of countries in each category. No data for country in low income category were collected. Table 1 show number of countries included in the analysis classified according to income group and region.
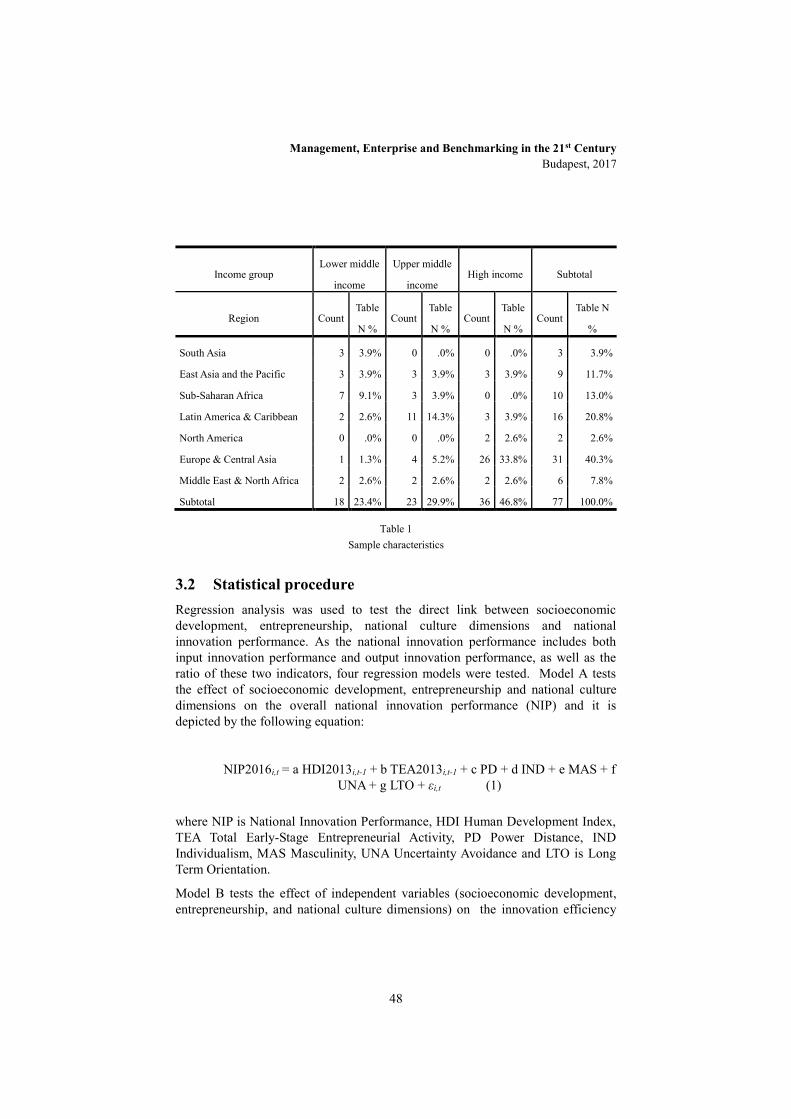
Management, Enterprise and Benchmarking in the 21st Century Budapest, 2017
48
Income group Lower middle
income
Upper middle
income High income Subtotal
Region Count Table
N % Count
Table
N % Count
Table
N % Count
Table N
%
South Asia 3 3.9% 0 .0% 0 .0% 3 3.9%
East Asia and the Pacific 3 3.9% 3 3.9% 3 3.9% 9 11.7%
Sub-Saharan Africa 7 9.1% 3 3.9% 0 .0% 10 13.0%
Latin America & Caribbean 2 2.6% 11 14.3% 3 3.9% 16 20.8%
North America 0 .0% 0 .0% 2 2.6% 2 2.6%
Europe & Central Asia 1 1.3% 4 5.2% 26 33.8% 31 40.3%
Middle East & North Africa 2 2.6% 2 2.6% 2 2.6% 6 7.8%
Subtotal 18 23.4% 23 29.9% 36 46.8% 77 100.0%
Table 1 Sample characteristics
3.2 Statistical procedure Regression analysis was used to test the direct link between socioeconomic development, entrepreneurship, national culture dimensions and national innovation performance. As the national innovation performance includes both input innovation performance and output innovation performance, as well as the ratio of these two indicators, four regression models were tested. Model A tests the effect of socioeconomic development, entrepreneurship and national culture dimensions on the overall national innovation performance (NIP) and it is depicted by the following equation:
NIP2016i,t = a HDI2013i,t-1 + b TEA2013i,t-1 + c PD + d IND + e MAS + f UNA + g LTO + εi,t (1)
where NIP is National Innovation Performance, HDI Human Development Index, TEA Total Early-Stage Entrepreneurial Activity, PD Power Distance, IND Individualism, MAS Masculinity, UNA Uncertainty Avoidance and LTO is Long Term Orientation.
Model B tests the effect of independent variables (socioeconomic development, entrepreneurship, and national culture dimensions) on the innovation efficiency
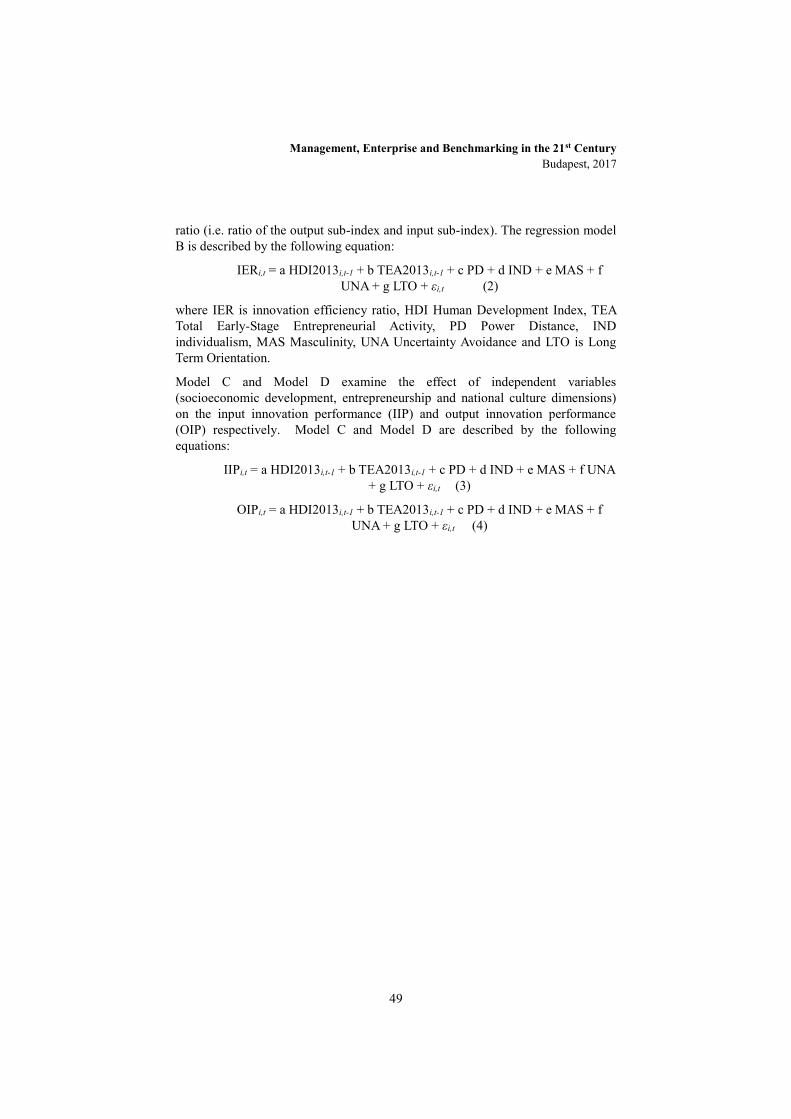
Management, Enterprise and Benchmarking in the 21st Century Budapest, 2017
49
ratio (i.e. ratio of the output sub-index and input sub-index). The regression model B is described by the following equation:
IERi,t = a HDI2013i,t-1 + b TEA2013i,t-1 + c PD + d IND + e MAS + f UNA + g LTO + εi,t (2)
where IER is innovation efficiency ratio, HDI Human Development Index, TEA Total Early-Stage Entrepreneurial Activity, PD Power Distance, IND individualism, MAS Masculinity, UNA Uncertainty Avoidance and LTO is Long Term Orientation.
Model C and Model D examine the effect of independent variables (socioeconomic development, entrepreneurship and national culture dimensions) on the input innovation performance (IIP) and output innovation performance (OIP) respectively. Model C and Model D are described by the following equations:
IIPi,t = a HDI2013i,t-1 + b TEA2013i,t-1 + c PD + d IND + e MAS + f UNA + g LTO + εi,t (3)
OIPi,t = a HDI2013i,t-1 + b TEA2013i,t-1 + c PD + d IND + e MAS + f UNA + g LTO + εi,t (4)
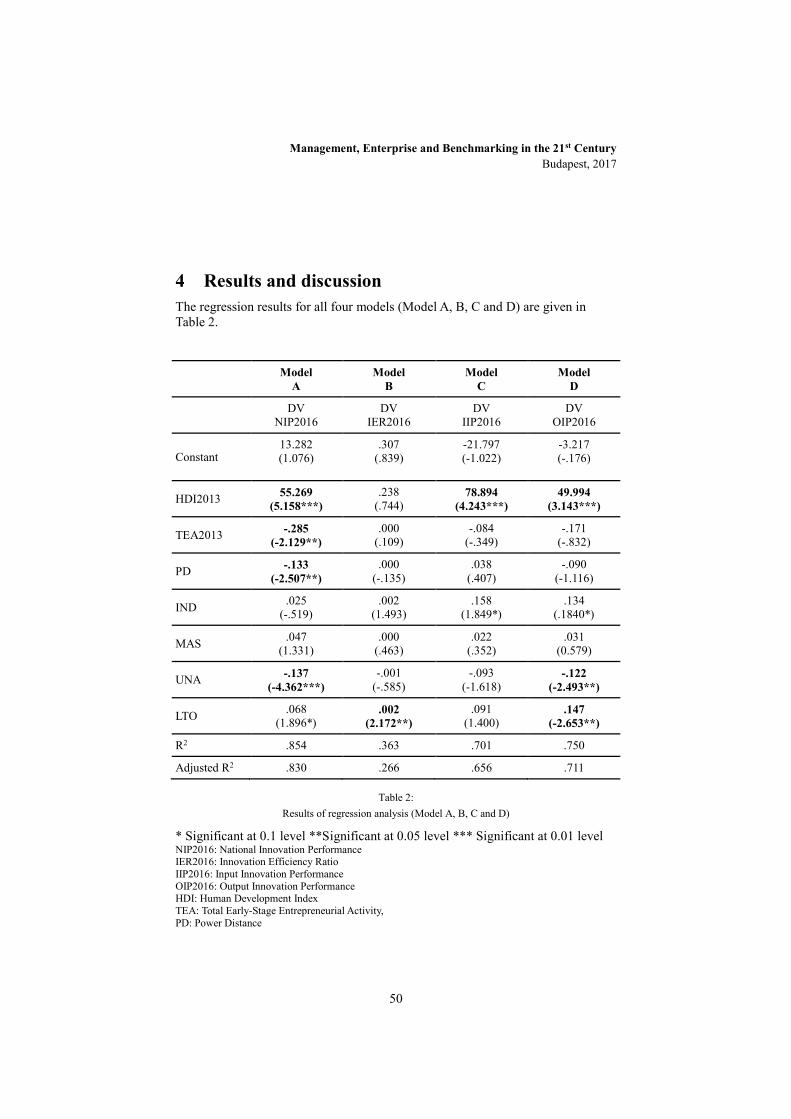
Management, Enterprise and Benchmarking in the 21st Century Budapest, 2017
50
4 Results and discussion The regression results for all four models (Model A, B, C and D) are given in Table 2. Model
A Model
B Model
C Model
D
DV NIP2016
DV IER2016
DV IIP2016
DV OIP2016
Constant 13.282 (1.076)
.307 (.839)
-21.797 (-1.022)
-3.217 (-.176)
HDI2013 55.269 (5.158***)
.238 (.744)
78.894 (4.243***)
49.994 (3.143***)
TEA2013 -.285 (-2.129**)
.000 (.109)
-.084 (-.349)
-.171 (-.832)
PD -.133 (-2.507**)
.000 (-.135)
.038 (.407)
-.090 (-1.116)
IND .025 (-.519)
.002 (1.493)
.158 (1.849*)
.134 (.1840*)
MAS .047 (1.331)
.000 (.463)
.022 (.352)
.031 (0.579)
UNA -.137 (-4.362***)
-.001 (-.585)
-.093 (-1.618)
-.122 (-2.493**)
LTO .068 (1.896*)
.002 (2.172**)
.091 (1.400)
.147 (-2.653**)
R2 .854 .363 .701 .750
Adjusted R2 .830 .266 .656 .711
Table 2: Results of regression analysis (Model A, B, C and D)
* Significant at 0.1 level **Significant at 0.05 level *** Significant at 0.01 level NIP2016: National Innovation Performance IER2016: Innovation Efficiency Ratio IIP2016: Input Innovation Performance OIP2016: Output Innovation Performance HDI: Human Development Index TEA: Total Early-Stage Entrepreneurial Activity, PD: Power Distance
Management, Enterprise and Benchmarking in the 21st Century Budapest, 2017
51
IND: Individualism MAS: Masculinity UNA: Uncertainty Avoidance LTO: Long Term Orientation.
In line with our expectations, the results of regression analysis (Model A) confirm that socioeconomic development is positively related to the national innovation performance. Moreover, the results of model C and D indicate that socioeconomic development positively contributes to the input innovation performance and output innovation performance, indicating that income, health and decent standard of living are triggers of the national innovation capacity and national innovation performance. The link between entrepreneurship and national innovation performance was found to significant only for Model A (B= - 0.285; p<0.05). More precisely, findings suggest that entrepreneurship measured as percentage of individuals in the nation aged between 18 and 64 that are actively engaged in starting or managing a new business, hampers the national innovation performance. This finding is in the line with the view that the new, small entrepreneurial companies do not have the capacity to innovate and that national innovation performance is driven by large firms (Moche and Morse, 1977; Albulescu and Draghici, 2016). Moreover, the negative relation between entrepreneurship and national innovation performance can be explained by “refugee effect” indicating that entrepreneurial efforts, motivated only by the current unemployment status, can reduce the national innovation performance if these efforts are not accompanied with adequate level of education of people who are engaging in entrepreneurial activities.
Only two cultural dimensions have negative and statistically significant effect on the national innovation performance: power distance (p<0.05) and uncertainty avoidance (p<0.01). These findings suggest that countries with higher distance between citizens and those in power (hierarchy, required privileges for superiors, inaccessible superiors, and formal attitudes towards managers) will have lower level of national innovation performance. Regarding the uncertainty avoidance, our findings suggest that higher degree of uncertainty avoidance leads to the lower level of national innovation performance. Thus, countries characterized by people who are motivated by rules, norm and who are intolerant to different behaviour and ideas, are like to have lower level of national innovation performance. In addition, our findings suggest that uncertainty avoidance is negatively related to the output innovation performance, indicating that countries with high level of uncertainty avoidance are likely to have lower level of output innovation performance (knowledge and technology outputs and creative outputs). Analysing the effect of national cultural dimensions on the innovation efficiency ratio (Model B), input innovation performance (Model C), and output innovation performance (Model D), it was found that long-term orientation has significant and positive effect on innovation efficiency ratio and output innovation performance. As this cultural dimension explains whether the country can be described as country with normative societies (low score on this dimension) or

Management, Enterprise and Benchmarking in the 21st Century Budapest, 2017
52
pragmatic (high score on this dimension), our findings suggest that pragmatic countries (i.e. people show ability to adapt traditions easily to change conditions) are more likely to have higher levels of output innovation performance, including (1) knowledge and technology outputs, and (2) creative outputs.
5 Conclusion The results of this study indicate that as socioeconomic development increases national innovation performance increases accordingly. Thus, countries with the capacity to meet the human needs of their citizens, to sustain and enhance the quality of their lives, and to create the conditions for all citizens to reach their full potential, are more likely to experience increased levels of innovation. However, socioeconomic development does not not fully explain the variation in nation's level of innovation performance. As indicated by the findings of this study, two national culture dimensions (power distance and uncertainty avoidance) are related to the national innovation performance. More precisely, the results of the present study show that countries with lower level of power distance and lower level of uncertainty avoidance are likely to exhibit higher levels of national innovation performance. Furthermore, findings of the present study suggest that entrepreneurship reduces the level of national innovation performance. This finding is not in the line with so-called “Schumpeter’’ effect according to which entrepreneurship motives innovation and economic growth. The findings of the present study have important implications for policy makers. Since socioecnomic development is significant predictor of national innovation performance, we suggest that innovation policies should be formulated with the understanding that national innovation performance can be increased by the improvement of the capacity of society to meet human needs of their citizens, to sustain and enhance the quality of their lives, and to create the conditions for citizens to reach their full potential. When citizens are poorly educated, when they do not have opportunity to satisfy their basic needs and/or reach their full potential, they are less likely to engage in innovation activities. Thus, by placing focus on the development issues, like education, health, employment, and poverty, governments might be effective in their efforts to increase national innovation performance.
References
[1] Albulescu, C.T. and Draghici, A. (2016). Entrepreneurial activity and national innovative capacity in selected European countries, The International Journal of Entrepreneurship and Innovation, 17(3), 155-172.
Management, Enterprise and Benchmarking in the 21st Century Budapest, 2017
53
[2] Crespo, N. F, and Crespo, C. F. (2016). Global Innovation Index: Moving beyond the absolute ranking with a fuzzy-set analysis. Journal of Business Research, 69, 5265-5271.
[3] Edquist, C (ed.) (1997) Systems of Innovation: Technology Institutions and Organisations , London: Pinter.
[4] Hofstede, G. (1980). Culture’s consequences: International differences in work- related values. Beverly Hills, CA: Sage.
[5] Hofstede, G. (1985). The interaction between national and organizational value systems. Journal of Management Studies, 22 (4), 347-357.
[6] Hofstede, G. And Bond, M. H. (1984). Hofstede’s culture dimensions : An independent validation using Rokeach’s value survey. Journal of Cross-cultural Psychology, 15 (4), 417-433.
[7] Lin, G. T. R., Shen, Y.-C., and Chou, J. (2010). National innovation policy and performance: Comparing the small island countries of Taiwan and Ireland. Technology in Society, 32 (2), 161–172.
[8] Liu, X. and White, S. (2001). Comparing innovation systems: a framework and application to China’s transitional context, Research Policy, 30, 1091–1114
[9] Lundvall, B. A. (2007). National innovation systems — analytical concept and development tool. Industry and Innovation, 14(1), 95–119.
[10] Lundvall,B. A, Joseph, K. J., Chaminade, C. and Vang, J. (Eds.). (2009). Handbook of in- novation systems and developing countries. Learning Cheltenham: Edward Elgar, Cheltenham, UK. Northhamton, MA, USA.
[11] Mahroum, S., Al-Saleh, Y.M. (2013). Towards a functional framework for measuring national innovation efficacy. Technovation, 33(10), 320-332.
[12] Marxt, C. and Brunner, A. (2013). Analyzing and improving the national innovation system of highly developed countries — The case of Switzerland. Technological Forecasting & Social Change, 80, 1035-1049.
[13] Metcalfe, S. and Ramlogan, R. (2008). Innovation systems and the competitive process in developing economies. Quarterly Review of Economics and Finance, 48 (2), 433-446.
[14] Moche, M. and Morse, E. (1977). Size, centralization, and organizational adoption of innovat ions. American Sociological Review, 42, 716-725.
[15] Patel, P. and Pavitt, K. (1994). National innovation systems: Why they are Important, and how they might be Measured and Compared. Economics of Innovation and New Technology, 3, 77-95.
Management, Enterprise and Benchmarking in the 21st Century Budapest, 2017
54
[16] Schumpeter, J A . (1934) The Theory of Economic Development. An Inquiry into Profits, Capital, Credit, Interest, and the Business Cycle. Cambridge: Harvard University Press
[17] Sims, R. L., Gong, B., & Ruppel, C. P. (2012). A contingency theory of corruption: The effect of human development and national culture. The Social Science Journal, 49, 90-97.
[18] Watkins, a., Papaioannou, T., Mugwagwa, J. and Kale, M. (2015). National innovation systems and the intermediary role of industry associations in building institutional capacities for innovation in developing countries: A critical review of the literature. Research Policy, 44(8), 1407-1418.
[19] Wong, P.K., Ho, Y.P and Autio, E. (2005) Entrepreneurship, innovation and economic growth: evidence from GEM data. Small Business Economics, 24(3), 335–350.

Management, Enterprise and Benchmarking in the 21st Century Budapest, 2017
55
Analysis of the Situation and Competitiveness of Hungarian Pasta Industry (based on Porter’s model)
Ilona Fehér [email protected]
Nikolett Németh [email protected]
Abstract: Our present study wishes to introduce the market situation of pasta manufacturing industry based on secondary sources. Pasta industry subsector, belonging to bakery and pastry sector, is considered to be one of the basic food products in food industry. The analysis takes a lookout on the world, on Europe and Hungary, besides we search for the resource of long-term competitiveness. It is a major problem that the actors of the concentrated pasta industry can get into an asymmetrical bargaining position in the strong competition according to their power. Another problem is that the private label products of domestic retail companies have an adverse impact on domestic pasta manufacturing. We explore the present situation as well as domestic and international judgement of pasta industry by means of Porter’s Five Forces model. We map the structure of pasta manufacturing industry sector; beside the supply and demand conditions, our study also covers the characteristics of rivalry within the industry and inter-company relations. It can be clearly seen from the analysis that those sustainably competitive companies who are able to renew themselves continuously in the pasta market or try to establish another type of need and consumer culture with a range of special products.
Keywords: pasta industry, market situation, competitiveness, Porter’s model
1 Introduction Our study wishes to draw a picture about the competitiveness and market situation of food industry based on secondary sources. The definition of pasta industry subsector belonging to bakery and pasta sector is definied by KSH (TEAOR
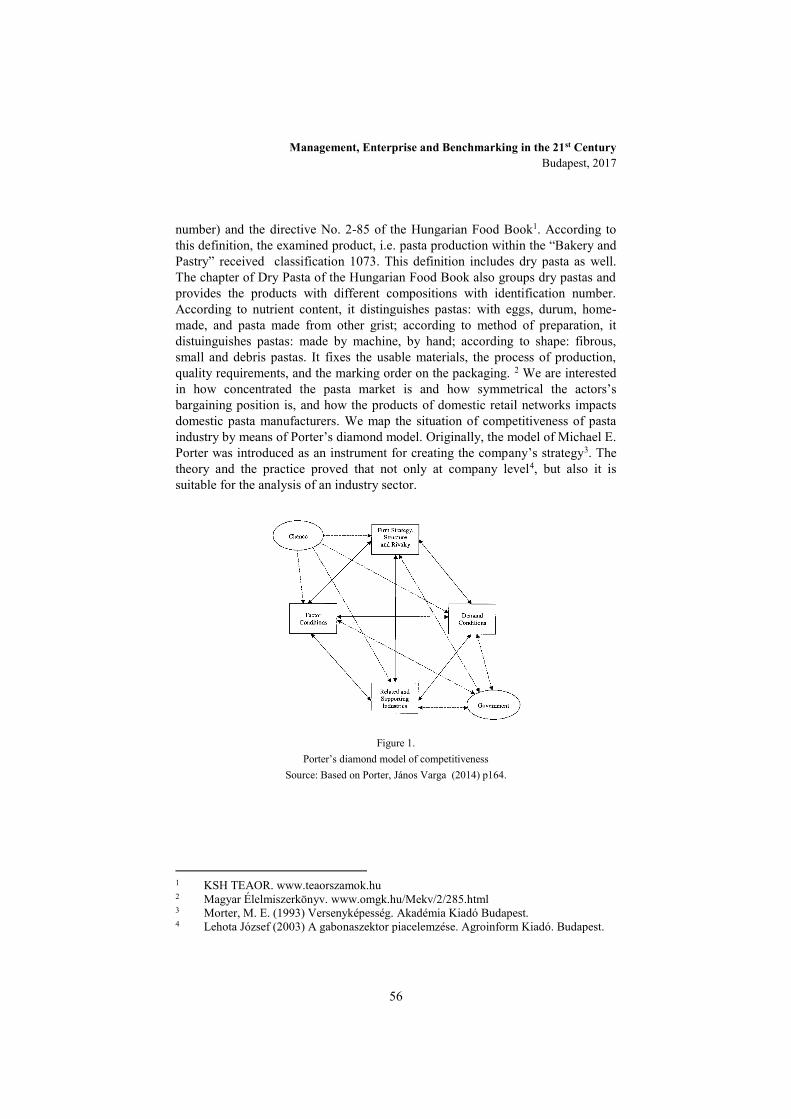
Management, Enterprise and Benchmarking in the 21st Century Budapest, 2017
56
number) and the directive No. 2-85 of the Hungarian Food Book1. According to this definition, the examined product, i.e. pasta production within the “Bakery and Pastry” received classification 1073. This definition includes dry pasta as well. The chapter of Dry Pasta of the Hungarian Food Book also groups dry pastas and provides the products with different compositions with identification number. According to nutrient content, it distinguishes pastas: with eggs, durum, home-made, and pasta made from other grist; according to method of preparation, it distuinguishes pastas: made by machine, by hand; according to shape: fibrous, small and debris pastas. It fixes the usable materials, the process of production, quality requirements, and the marking order on the packaging. 2 We are interested in how concentrated the pasta market is and how symmetrical the actors’s bargaining position is, and how the products of domestic retail networks impacts domestic pasta manufacturers. We map the situation of competitiveness of pasta industry by means of Porter’s diamond model. Originally, the model of Michael E. Porter was introduced as an instrument for creating the company’s strategy3. The theory and the practice proved that not only at company level4, but also it is suitable for the analysis of an industry sector.
Figure 1. Porter’s diamond model of competitiveness
Source: Based on Porter, János Varga (2014) p164.
1 KSH TEAOR. www.teaorszamok.hu 2 Magyar Élelmiszerkönyv. www.omgk.hu/Mekv/2/285.html 3 Morter, M. E. (1993) Versenyképesség. Akadémia Kiadó Budapest. 4 Lehota József (2003) A gabonaszektor piacelemzése. Agroinform Kiadó. Budapest.

Management, Enterprise and Benchmarking in the 21st Century Budapest, 2017
57
2 The structure and financial competition of pasta industry sector The produced quantitiy on the worlds’ pasta market was 13,5 million tons in 2012, of which the great majority was produced by the determinative actors. The EU was ranked first, the second is North America and the third is South America. This data changed, according to the estimation in 2016, Middle and South America took over the lead, shortly before the European Union.
Figure 2 The world’s pasta production (2006-2015)
Source: http://www.pasta-unafpa.org/ingstatistics2.htm
Between the countries, 25 percent of the world’s pasta emission was given by Italy. This quantity makes up 6 percent of the Italian food industry. Besides, the USA with 14-15 percent, Brasil with 9-10 percent, Russia with 7-8 percent contributes to the world’s pasta production. Hungary is in the 25th on list of 47 countries.5 Considering pasta consumption per capita, Italy is in the first place in the world with 26/kg/per capita per year in 2012, the inhabitants of Venezuela are in the second place with the quantity of 13,2 kg /persons/year. In the third and fourth place are Tunisia (11,9/kg /person/year) and Greece (10,6 kg /person/year). Hungary is in the 15th place with the consumption of 7,5 kg pastas. (International Pasta Organisation, 2013. cites Katalin Székelyhídi, 2016. p148.)
5 Katalin Székelyhídi, 2016. p147

Management, Enterprise and Benchmarking in the 21st Century Budapest, 2017
58
Table 1. Manufacturing of the world’s pasta products (Tons)
Source: http://www.pasta-unafpa.org/ingstatistics2.htm
Figure 3. The manufacturing of the quantity of pasta in the European (2006-2015)
Source: http://www.pasta-unafpa.org/ingstatistics2.htm

Management, Enterprise and Benchmarking in the 21st Century Budapest, 2017
59
Examining dry pasta manufacturers, it can be said that in the rankings Barilla Holding is the first, which is the market leader in the United States and in Europe equally. The second actor is the Spanish Ebro Foods, who is present in 25 countries with its 5,5 percent share. The third in the rankings is the De Cecco firm, who is in the market with its 2,2 percent share with its traditional and health conscious products. Barilla reached the highest turnover in pasta production in 2016 (393,7 million euro), followed by Ronzoni brand, its turnover was 73,6 million euro in 2013. (Statista, 2013. cites Katalin Székelyhídi, 2016. 150. p.)
Figure 4. The composition of pasta market in the European Union Source: http://www.pasta-unafpa.org/ingstatistics2.htm
Another important trend in the pasta market is the rise of commercial brands. Till the 1970 years industrial brands of manufacturers have dominated the consumer market. With the concentration of retailers network, retailers’ brands entered the market, which was of a lower quality at the beginning. The third and fourth generation however, due to higher quality assurance system are similar to manufacturer’s brands since responsinility for food safety has increased. Commercial brands moved around 70 percent in the UK, in Spain and Germany around 40 percent in 2011. (Frozen Food Europe, 2012.) This trend can be observed in the US, since the turnover of retail brands exceeded Barilla’s turnover as well. The brand sale of the first ten companies was around 40 percent in 2013 in the European Union, commercial brands are not far behind it (33%). Looking at the same in 2013 in Eastern Europe we can see that the share of the first ten companies was around 40 percent as well. This was 33 percent in 2010. The ratio of pastas the with commercial brands is around 10 percent in the whole pasta market. Hungary is different. In other countries, market is characterized by small pasta manufacturers concentraring on the local market. (Euromonitor, 2014. idézi Székelyhidi Katalin, 2016. 151. p.)

Management, Enterprise and Benchmarking in the 21st Century Budapest, 2017
60
In Hungary’s pasta market Gyermelyi is the market leader with its sales of nearly 20 billion HUF in 2014. Its share is 33 percent in the market. (Trade Magazin). All part of the product line are carried out by the company itself, from wheat seed production, throughout mills, to pasta manufacturing. Another important actor is Mary Ker Pasta Kft, in 2014 its net sales were 3,1 billion HUF. The ratio of micro-entrepreneurs in pasta manufacturing was 72,2 percent. The ratio of small businesses is 23, 8 percent. The large and medium-sized companies’s ratio is 6 percent. However, large companies gave 63,5 percent of the sector’s turnover.
Figure 5. Development of revenue and outcome of pasta industry between 2003 and 2013, on the price of 2013
Source: AKI calculation, based on corporate database of NAV
3 The elements of Porter’s model
3.1 The demand conditions of industry players “The safety of food supply in developed and moderatetly developed countries has increased significantly, the selection of food has expanded, the technology of industrial food processing has spread and the impact of fashion and lifestyle of consumer behavior has changed. Compared to the two previous decades, the emotional viewpoint of consumer decisions became significant.” 6 About the development of the standards and structure of consumer expenditures, it can be seen that, in 2010 the average of the total consumption of the poulation per capita on comparative price was 3,2 percent less than in the previous year. Further decline of household consumption – though 1,1 percent less than the previous year’s – happened despite of the fact that the real wages – despite higher inflation
6 József Lehota (2001) Marketingkutatás az agrárgazdaságban. Mezőgazdasági Kiadó.
29. p.

Management, Enterprise and Benchmarking in the 21st Century Budapest, 2017
61
– increased due to the personal income tax changes introduced in 2010. However, private consumption was held back by the reduction in the number of employees, by the increase in loan repayment burden on the population, and by the increase of living expenses. The growth of domestic retail sales has slowed down in 2016 compared to the same period of the previous year, but still remaines dynamic (4,3%), this has been explained by the rapid expansion of purchasing power. Real earnings in the first quarter rose by 7.4% percent. This can boost the consumption compared to previous year, with a rate of around 3,5 percent next year. Consumer prices barely rose in the first quarter of 2016, (0,3%), but it is the tenth highest in the European Union, compared to the same period of the previous year.7
3.2 Factor conditions Raw material production is determined by the situation and availability of natural resources in the country. The availability of water resources throughout the whole country allows for an increased yield and efficiency in agricultural production. Natural conditions in Hungary are favourable for geothermal energy production and utilization. Hungary has a quite diverse territory considering precipitation and temperature, because it lies on the borderline of three different climatic zones (oceanic, continental and Mediterranean). Annual precipitation in Hungary ranges between 500 and 750 mm8. Hungarian soils have favourable conditions for agricultural production which is suitable for wheat production. There is also a massive and skilled labour force employed in the agricultural sector with qualifications acquired from a wide range of universities, training schools and vocational training institutions. Scientific know-how is also available locally, offered by internationally recognized university experts and research institutes. The agricultural sector employs more than 200,000 full-time workers. The average wage level for agricultural workers has not changed (risen) significantly during the past decade.9 (Tradehouse)
3.3 Company strategy and structers Pasta production belongs to concentrated classes. In 2013, 151 companies were reported in the class, the turnover of the first five companies was 70 percent. In this same year, the turnover of the first ten companies was 80,9 percent in 2013. As for the structure according to size, the ratio of large and medium-sized 7 Lassuló növekedés - gyorsuló fogyasztás. GKI Gazdaságkutató Zrt. 30.05.2016.
Downloaded: 20.02.2017 8 http://www.iib.org.tr/files/downloads/PageFiles/%7B2efae485-9a7f-417f-a7cc-
5a68a8ad19d5%7D/Files/EK3_TheHungarianAgriculturalAndFoodIndustryLandscape.pdf
9 Tradehouse: Hungarian agriculture: The potential of tradition and innovation http://www.tradehouse.hu/uploads/document-storage/files/Hungarian%20Agriculture_digital.pdf
Management, Enterprise and Benchmarking in the 21st Century Budapest, 2017
62
enterprises was just 4 percent in 2013, but the revenue of these companies made up 70 percent of the sectors’s revenue. In contrast with this, micro-enterprises gave 4,5 percent of the sector’s revenue and employed 11,9 percent of employees. Medium-sized companies are in the most difficult situation. Products of small companies - concentrating on the local market – are especially bought by local shops. They would not even be able to serve bigger markets. While large enterprises are able to get into the shelves of large chain stores by their production capacity. Pasta can be bought in all types of shops, but according to different surveys, nearly half of Hungarian customers buy pasta in shops greater than 400 square meters, which most of them are hiper and supermarkets. Small and medium-sized companies thus can specialize in niche markets targeting a specific group of population with pasta specialities (biomarket, ricepasta, pearl pasta, crouton). As for customer needs, two trends can be separated: namely, there is a growing trend for cheap imported products, on the other hand, premium pasta gains ground – high quality and high-priced pastas. Furthermore, it is a global trend that healthy lifestyle is getting more and more popular – as well as – healthy eating, and biopasta has occurred in the market (Szabó, 2006).
3.4 Relating and supporting industries Crop production – as the first stage of product line – can play an important role in the activities of pasta manufacturers. Crop production in Hungary is very diverse: cereal grains (wheat, rye, barley, oats, maize) are in the leading positions with average production yields higher than the European mid-range— even without irrigation. The amount of excellent quality wheat traditionally produced in Hungary exceeded 4.5 million tons in the past years. Crop production safety is supported by the highest technical standards and plant breeding technologies, while quality is ensured by controlled seeds and plant protection authorities. The next stage is milling. In 2013, 57 companies produced grain products, among them 25 produced wheat flour. In 2013, mills produced a total of 910 thousand tons of wheat. Egg, another main component of pasta, comes from poultry farms: Animal farming accounts for approximately 40% of all agricultural activities of Hungary.
3.5 Government regulations Hungary’s agri-supported position is especially favourable within the European Union, therefore, basic interest is that within the resources of Common Agricultural Policy (CAP) Hungary’s share should not reduce after 2020. Hungary’s share in the total CAP budget is 3,2 percent, which is proportionally higher than the weight of the Hungarian agriculture in the European Union, thus for Hungary it would be a better situation if the present subsidy rates, constructions would not change. In 2017, nearly 400 billion euros and around 100 billion HUF national subsidy arrives at the Hungarian agriculture, thereby contributing to the stabilization of farmers' income, which is similarly helped by

Management, Enterprise and Benchmarking in the 21st Century Budapest, 2017
63
the availability of affordable credit facilities. The government pays great attention to the support of the high-quality raw materials, moreover, the ministry identified as an important endeavor the way of the product from producer to customer. A remuneration system for quality products has been rolled out by the government. The goal is the accession to the quality system of the European Union.The domestic quality system that wishes to support the product manufacturer, was built on this. Policy makers expect from the system of trademarks and indicators that it is a guarantee for quality, it gives legal protection to manufacterers and increases consumers trust. Thereby the added value of the product is increasing which increses the opportunity of market sale. The last government will in food industry is the sustainable rural development.10 Industry regulation also discusses crafts pasta products. By the strengthening of consumer awareness there is a growing social demand towards high quality foods such as pasta products. To keep this in mind - subject to the Hungarian consumer habits and expectations – the government renewed Bakery and Confectionery products pages of Hungarian Food Codex. The continuously updated rules guarantee that, by abiding the standard and appropriate expertise, high-quality products can be made.
3.6 Chance There can be several type of risks in food industry that manufacturers have to face: Natural risk: Factors such as drought, floods and rainy harvest periods can influence raw material production. Supply chain risk: Compared to other industries, the food sector is particularly reliant on its suppliers. Food health safety risks: One of the biggest risks associated with the food industry is health. Products need to be stored at certain temperatures, expiration dates need to be monitored, cross-contamination needs to addressed and the list goes on. In food processing, a hazard is a biological, chemical, allergenic or physical substance that has the potential to harm. It may also be a condition (e.g. high humidity) that could cause harm. Risk management is very important in food industry – as well as in pasta industry. Errors can result in more than just productivity problems, consumer health can be put at jeopardy.
Conclusions In our study we examined the situation and competitiveness of pasta manufacturing industry by means of Porter’s model. It could be seen from the analysis that pasta market is concentrated. Entering the pasta market is not easy as there are several barriers that can make it difficult for new competitors to set up a business, such as the existing price level, significant capital investment is required 10 Pallóné Dr. Kisérdi Imola (2010) Európai Unió és a hazai programok a hagyományos és
tájjellegű élelmiszerek piacán. In.: Marketing a hagyományos és tájjellegű élelmiszerek piacán. 51. p.
Management, Enterprise and Benchmarking in the 21st Century Budapest, 2017
64
to start a business, well-known brand names and the access to distribution channels. Small companies face intense rivalry in the industry especially from large competitors. Product differentation allows business to compete in areas other than price, such as taste, colour, consistency, etc. Offering innovating products may help establish a business. Manufacturers which sell pasta with added attributes are differentiating their products and can earn profit. An important trend in the pasta market is the rise of commercial brands. In some cases the turnover of retail brands may exceed the market leader’s brand turnover in pasta market. We can conclude from the analysis that those sustainably competitive companies who are able to renew themselves continuously in the pasta market or try to establish another type of needs and consumer culture with a range of special products.
References
[1] Fehér Ilona: Opportunities for Small Enterprises in Our Pasta Culture. In.: Agri-Business for Rual Development, Environment and Quality of Life. 49 th Georgikon Scientific Conference, Keszthely, 2007. pp158-159.
[2] Food Drink Europe: UNAFPA - Union of Organisations of Manufacturers of Pasta Products of the EU. http://www.pasta-unafpa.org/ingstatistics2.htm Downloaded: 2017. 02. 23.
[3] KSH: Az egyéni fogyasztás rendeltetés szerinti osztályozása (COICOP) Nemzetközi Statisztikai dokumentumok. KSH, Budapest, 2000.
[4] Lehota József: Marketingkutatás az agrárgazdaságban. Mezőgazdasági Kiadó, Budapest, 2001
[5] Magyar Élelmiszekönyv. (Codex Alimentarius Hungaricus) 2-85 számú irányelv, Száraztészták (Dried pasta) Jóváhagyta a Magyar Élelmiszerkönyv Bizottság, 1997. http://www.omgk.hu/Mekv/2/285.html Downloaded: 23.02. 2017.
[6] Pallóné Dr. Kisérdi Imola: Európai Unió és a hazai programok a hagyományos és tájjellegű élelmiszerek piacán. In.: Marketing a hagyományos és tájjellegű élelmiszerek piacán, 2010, 51 - 68. p.
[7] Porter, E. Michael: Versenystratégia. Akadémia Kiadó. Budapest, 1993
[8] Szabó Tünde: A márkateremtés gyakorlati lehetőségei az erősen telített hazai tésztapiacon. Budapesti Gazdasági Főiskola, Budapest, 2006
[9] Székelyhidi Katalin: Pékáru, tésztafélék gyártása. In.: A magyarországi élelmiszeripar helyzete. Agrárgazdasági tanulmányok sorozat. Agrárgazdasági Kutató Intézet. Budapest, 2016.

Management, Enterprise and Benchmarking in the 21st Century Budapest, 2017
65
[10] UNAFPA - Union of Organisations of Manufacturers of Pasta Products of the EU. Downloaded: 23.02.2017. http://www.fooddrinkeurope.eu/member/unafpa/
[11] Varga János: A versenyképesség többszintű értelmezése. PhD értekezés, Gödöllő, 2014
Management, Enterprise and Benchmarking in the 21st Century Budapest, 2017
66
Constraints in Implementing Quality Assurance Programs in Food Manufacturing Firms in Shanghai, China
Wojciech J. Florkowski University of Georgia
Qijun Jiang Shanghai Ocean University
Note: Copyright 2017 by Wojciech J. Florkowski and Qijun Jiang. All rights reserved. Readers may make verbatim copies of this document for non-commercial purposes by any means, provided that this copyright notice appears on all such copies.
Abstract: This paper investigates the relationship between firm and respondent characteristics and opinions about the perception of 12 statements describing potential constraints of implementing quality assurance program by food manufacturing companies in Shanghai, China. The data were collected from 199 firms between September and December 2016. The descriptive statistical analysis includes reporting summary frequencies and the calculated Spearman’s correlation coefficients. Firm size appears to be an important factor and results suggest that larger firms do not view the listed factors as constraining their implementation of quality assurance programs as compared to smaller firms. Also, younger and better educated respondents (mostly quality managers) did not view the listed factors as constraints. Small and medium size firms are most likely to benefit from assistance in designing a quality assurance program and staff training.
Key words: Survey, quality manager, training
Management, Enterprise and Benchmarking in the 21st Century Budapest, 2017
67
1 Introduction China’s consumers represent the largest food market in the world. Food demand increases in response to growing household incomes, illustrated by the rising GDP per capita which between 2011 and 2015 has increased by 40% [3]. Growing incomes enable consumers to purchase food of higher quality than in the past. Annual per capita consumption expenditures increased from 15,160.89 yuan in 2011 to 19,968.10 yuan in 2014, a 31.7% increase Food expenditures account for 35.8% of urban residents’ income in China in 2006 [2, 9]. The share of food expenditure is relatively large, but the average in a country of that size does not accurately reflect the changing food demand. In particular, consumers in fast growing areas such as Shanghai have larger than average incomes and expenditures. Moreover, their preferences regarding food quality and safety resemble those of areas with a comparable level of development and, while offering new opportunities for the food manufacturing sector, their expectations pose a challenge.
Should preferred foods not meet quality and safety expectations, rising incomes allow consumers to shift their purchase patterns away from inferior quality and unsafe foods. The risk of demand shift is real but the recognition of such risk varies among food manufacturing companies in China. This paper investigates the constraints that incentivize or prevent food manufacturing companies from establishing and implementing quality assurance programs. Geographically, the study is limited to a sample of companies located in Shanghai Province in China. Shanghai is a leading commercial area in China and a trendsetting region in terms of consumer demand, including food consumption. This study provides insights from the company manager perspective regarding obstacles they face in implementing quality assurance programs, including their own perceptions of limitations. Given the size of the food manufacturing sector in Shanghai and Shanghai’s commercial importance, understanding gained from this study has potential application in countries and regions with similar levels of economic development. It appears that the dynamic growth of the food manufacturing companies and keen competition among Shanghai’s SMEs focused on immediate economic gains prevents the full recognition of quality assurance program importance. Because of limited resources, many SMEs may be unable to initiate the design and implementation of a program leaving an opening for the government agencies to provide the necessary assistance. Additionally, potential entrants into food manufacturing in China or food exporters and marketers may adjust their decisions and exploit quality assurance programs to strengthen their competitive position. Important policy implications stem from the presented results indicating areas of possible regulatory adjustment and need for public programs alleviating some of the constraints that concern food manufacturers with regard to adoption of quality assurance procedures.

Management, Enterprise and Benchmarking in the 21st Century Budapest, 2017
68
2 Changes in Consumer Preferences and Food Quality
Chinese consumer preferences regarding food are shaped by similar forces as the overall consumption in that country. Preferences change in response to changing incomes and the regional disparity in incomes as well as the income differences between rural and urban areas. Another force is changing demographics and very different attitudes towards spending between older and younger generations. Higher income, better education, and getting older are factors reflected in concerns about food safety and quality.
Regional income disparities in China are particularly pronounced between coastal urban areas and rural interior areas [4]. Shanghai is an example of a fast growing urban area, where residents enjoyed the highest per household consumer expenditure, an equivalent of $16,605, in 2013 [4], more than three times higher than expenditures in the poorest region of the country. The share of well-off Shanghai households is expected to rapidly increase by 2020 [6] and the number of well-off households is to reach 30 million in three cities alone, namely, Shanghai, Beijing, and Guangzhou. Additionally, changing demographics are a major driving force behind the 14% annual consumption expenditure growth rate of those 35 years old or younger, who are also often college-educated.
A major characteristic of the growing consumption, including of food, is the consumer’s ability to choose what products to purchase given the origin of the company. In terms of product brand, international brands are well-trusted among first-time buyers as compared to domestic brands [6]. The forecasted annual growth of basic food consumption is expected to increase at a 7.2% rate through 2020 [1], while the discretionary spending, including dining out, is expected to grow 10.2% annually. The share of annual food consumption in urban households is expected to decline from 28% in 2010 to 20% in 2020.
Under the circumstances, urban consumers in the largest, fastest-growing agglomerations, including Shanghai, already consume a sufficient volume of food products and are becoming increasingly concerned about quality and safety. Health is fast becoming the primary concern for the well-educated young generation, but also for the other fast growing segment, older consumers. The emergence of this segment is relatively new and reflects the improving living conditions extending life expectancy, but also the past (only recently changed) demographic policy of the government. Among residents 55 to 65 years old in the largest commercial cities, including Shanghai, the share of food expenditure amounts to about one half [1], while those between ages of 34 and 45 years allocate 34% of expenditures to food. As time passes, the older urban consumers are expected to spend relatively less on food, but likely increase attention to its quality due to health concerns.
Despite existing regulations, food safety incidents occur although they have become less frequent in recent years. However, despite the progress, quality assurance

Management, Enterprise and Benchmarking in the 21st Century Budapest, 2017
69
remains an area needing improvement. In part, food safety incidents have been related to changing consumption patterns and an increasing share of animal product consumption. Animal products are highly susceptible to microbiological contamination although this is not the only type of food contamination responsible for safety incidents and cause of concern about food quality. Zheng and Rastegari Henneberry [11] noted that grain consumption has decreased by 40%, while animal product consumption increased by 78% between 1990 and 2004. Such a shift in consumption stretched the supply chain, opening opportunities for possible contamination at various supply stages.
Food fraud and adulteration incidents in China along with imported Chinese food products in other countries have periodically brought consumer attention to the problem. Melamine addition to dairy products is one of the examples of adulterating a product [8] largely perceived as wholesome that undermined public confidence. Formaldehyde found in crawfish in Shanghai several years ago is another example of incidents causing consumer mistrust. Chinese consumers tend to purchase imported products because they have higher confidence in their safety and quality than in domestic products, aided by their increased purchasing power. China’s food trade balance is negative suggesting that the imported food products are becoming more accessible to consumers. Among imported foods, an increasing share is represented by the processed, high quality products, which compete with domestic and traditional foods.
Chinese consumers have expressed willingness to pay for safe and quality foods. Earlier research suggests that food safety problems reflect under-enforcement of regulations [5, 6]. Enforcement requires resources, while responsibilities for food safety are shared by multiple agencies at the national and provincial level. The effectiveness of enforcement of existing regulations would be helped greatly by not only examining if consumers are willing to pay for a product, but by investigating what constraints food manufacturers from undertaking actions assuring quality and safety of their products. Such an approach has been hampered primarily by the lack of data and more difficulty in collecting data from firms than from consumers. Food manufacturers are difficult to reach and pose a huge challenge in obtaining their participation in a survey. Therefore this study is unique in that it examines responses from a large sample of food manufacturing companies.
3 Survey Preparation and Implementation The geographic scope of the survey is limited to Shanghai Province, a top tier city in China that has been experiencing fast population and income growth. The area contains highly concentrated purchasing power represented by relatively young, well-educated, and increasingly sophisticated consumers. Education, income, and lifestyles that include foreign travel influence consumption patterns, which involve

Management, Enterprise and Benchmarking in the 21st Century Budapest, 2017
70
preferences for a variety of foods, the ability to pay for quality, and a strong desire for safety. The demand is met by a variety of small, medium, and large firms. The small and medium firms focus on the regional market, but the size of Shanghai (in terms of population and purchasing power) also attracts foreign entrants into the food manufacturing sector. The already mentioned differences in regional income levels, urbanization, and demographics dictated the focus of the survey on firms in the area of Shanghai. However, the findings are likely to be applicable to firms in other regions as they undergo fast-paced changes.
The preparation of the survey consisted of several stages. The process was initiated by meeting a small group of company managers to identify the issues related to quality assurance and motives behind adopting quality assuring procedures. Insights gained from the discussions were used to prepare the specific questions contained in the survey instrument. The prepared questionnaire was subject to a pretest involving two companies before the full-scale survey was implemented. The questionnaire was distributed with the help of the Shanghai Minhang Quality Supervision Bureau and the Shanghai Fengxian Quality Supervision Bureau. The survey was conducted between early September and early December 2016. From a total of 244 distributed questionnaires, 199 were completed and returned, yielding an 81.6% rate of return. This impressive return rate was possible because the company representatives participated in workshops organized by the quality supervision bureaus and completed the questionnaire at the workshop, prior to leaving the premises.
The questionnaire included a number of questions, some focusing on quality assurance program, while some probed for opinions or indication of the company behavior with regard to quality related issues. Specifically, a set of questions asked companies to share information about measures describing the company, e.g., annual revenues, indication of main source of revenues accounting for various types of food manufacturing sectors, employment and various employment categories such as full- and part-time employment. Another set of questions probed respondents to indicate the agreement with 12 constraints regarding the implementation of quality assurance program. The constraints encompassed the costs of a program; market benefits from having a program; limitations on the part of management including the costs associated with the permanent operation of a program; and, the effort required to train personnel, while lacking knowledge of consultants able to provide the necessary expertise to implement a program. Still another group of questions asked respondents to share information about their position, education, age, and experience in working for the company. It is plausible that such measures of respondent characteristics may influence the provided responses.
Management, Enterprise and Benchmarking in the 21st Century Budapest, 2017
71
3.1 Firm Characteristics Among firm characteristics, a measure of size such as annual revenue is an insightful descriptor. Respondents provided figures for revenues for 2015, the calendar year proceeding the year of the survey. The average revenues were nearly 87 million yuan-renimbi (or about $12.528 million at the exchange rate of $1=6.9447 recorded on January 1, 2017; [10]). The reported range of revenues was substantial suggesting that the majority of firms were small or medium in size.
An average firm employed about 141 individuals. Similar to the results regarding the total 2015 revenues, some firms appear to be quite small, while the largest firm reported nearly 4800 workers. Among various forms of employment, 53 firms indicated having part-time year-round employees. An average firm had a total of about 17 year-round part-time employees with the largest number of this type of job amounting to 261 persons. Food manufacturing is affected by seasonality of available raw material for processing and some plants may adjust their employment according to the season. An average firm, among 60 firms reporting seasonal workers, employed about 63 full-time persons. Another 21 firms stated they employed part-time workers on a seasonal basis, with the average firm employing about 21 workers.
Ownership type is important because it influences a firm’s objectives and motives. The survey instrument distinguished among five types of ownership ranging from privately-owned company, to foreign-owned, to a firm being a part of a larger company, a firm owned by a large international firm, or a franchise. The most common form was a privately-owned firm, 58%, followed by foreign-owned companies that accounted for 27%. Firms representing a part of a larger company accounted for nearly 14%, while the remaining one percent of firms was part of a large international firm. Franchise as a form of company ownership was absent in the sample.
3.2 Respondent Characteristics In the current survey, 45% of respondents were males. A respondent was nearly 37 years old on average. The average education score is 2.45 suggesting that the education level fell somewhere between junior college and college undergraduate degree. The most common position occupied by a respondent in the company was classified as “middle management”. Although the period of working for the company ranges from less than a year to 35 years, the average respondent has been with a given company only about 6.5 years. The length of employment with the company corresponds to the average age of a respondent suggesting that many respondents were at the beginning of their professional careers. Not surprisingly, the age and education level of respondents corresponds well to the dominant group of consumers in Shanghai, who are generally not older than 35 years and college-educated.
Management, Enterprise and Benchmarking in the 21st Century Budapest, 2017
72
4 Results Survey data have been analyzed using descriptive statistical methods. The primary focus of the study was to investigate respondents’ opinions about the limitations preventing or hampering the adoption of a quality assurance program by their company. Although the position of many respondents was classified as middle management, the respondents were most often in charge of quality control in the company, so they were familiar with company management, while having intimate insights into the various aspects of quality control and assurance.
4.1 Summary of Quality Assurance Constraints The discussion with company managers helped to identify 12 possible constraints that prevent or obstruct the implementation of a quality assurance program. The constraints addressed various cost aspects of a quality assurance program, lack or knowledge of expertise, and other possible limitations. Among those related to costs, the short-term and long-term costs were distinguished because short-term costs involve the disruption of routine manufacturing, while long-term costs most likely need to be passed on to buyers in the form of higher prices. Consumer studies indicated that consumers in China are willing to pay for quality and safety. Moreover, results of consumer studies have been published in research journals but are seldom known to company managers, who would face immediate rising costs of a quality program implementation.
The lack of knowledge on the part of managers of consumer preferences was captured by the ignorance of “clear rewards in the market for having a quality assurance system”, unclear benefits, and lack of knowledge about advantages and disadvantages of alternative quality assurance systems. Other constraints involve the need to train personnel and requirement of keeping records. The potential resistance of companies to introduce a quality assurance program was reflected in the statement that the current program was adequate. Finally, a company may have difficulties in finding competent consultants capable of advising, especially small companies, about the quality assurance program adoption.
The cost of a quality assurance program and the uncertainty of consumer reactions cannot be underestimated as impeding the decisions regarding quality assurance programs. For small companies or companies with limited resources, the expense of such a program can be relatively large. It has been suggested that there is a role for the government to possibly offset the costs of a program in part, if not in full.
Respondents indicated the degree of agreement with a statement regarding the constraint of implementing a quality assurance program along a five-step scale. The two extreme steps were “strongly disagree” and ”strongly agree” with the middle step indicating a respondent’s neutral opinion (neither agree nor disagree). The highest score, 3.27, was associated with a statement that the implementation of a quality assurance program required additional staff training. Training typically has
Management, Enterprise and Benchmarking in the 21st Century Budapest, 2017
73
to be conducted on company time and implies that staff is not performing its assigned tasks. Consequently, training disrupts the flow of operations and training employees of one department may unsettle the smooth operation in another unit. Additionally, it is quite likely that the respondent, who often represented quality control, would have to be responsible for training. The high score regarding the statement may reflect possible concerns about the responsibility for training on the part of young, relatively inexperienced respondents as suggested by the average age and time working for the company.
The second highest score was associated with the cost of managing the quality assurance system permanently (3.16). Whereas the training can be viewed as a onetime cost, maintaining the permanent system creates a continuous obligation to monitor and update the system in response to the changes in production technology, product-mix, or customer requirements. As such, the system requires managers in charge of the quality assurance program to continually learn about all novel aspects that may affect product quality.
The third highest score among the 12 listed constraints was associated with the lack of competent consultants to advise about the implementation of quality assurance programs (3.03). This is an important result and one suggesting a need for possible assistance from public institutions. Namely, those likely expressing this opinion represent relatively small companies, which tend to be most resource-constrained, both in terms of human and financial assets. The sheer costs of searching for a suitable consultant can be substantial, while tailoring a quality assurance system to the needs of a small company can generate additional costs. A publicly funded program aimed at enhancing the adoption of a quality assurance program by a company may be an essential factor reducing the importance of that constraint.
Among the constraints assigned the lowest scores on average were: lack of time on the part of management (2.75), requirement of additional record keeping (2.79), and the long term cost of quality assurance program implementation (2.81). However, the overall range of 12 scores was somewhat narrow, from 2.75 to 3.28 and the average scores had a tendency to indicate a slight disagreement with most of the statements. Factors that could affect this pattern of responses is the desire to present the company in a good light and, possibly, attitudinal issues in adopting quality assurance programs such as simply not recognizing the need for such programs.
4.2 Correlations between Quality Assurance Constraints and Firm Characteristics
This section examines the three largest calculated Spearman’s correlation coefficients between the company size as measured by the total number of employees and the constraints in implementing the quality assurance program. The three constraints are the long-term cost of a program, lack of clear benefits from
Management, Enterprise and Benchmarking in the 21st Century Budapest, 2017
74
having a program, and the requirement of having to keep additional records associated with operating a program.
To calculate correlation coefficients companies were grouped into seven categories. The categories were: no more than 15 employees; 16-25; 26-40; 41-60; 61-100; 101-200; 201 or more employees. The largest share, 27% of firms, was in the first group, but 18% each were included in the third and fifth size groups.
All but two calculated (Spearman’s) correlation coefficients were negatively associated with the agreement that they represented a constraint, while the remaining two were of very small size. The correlation between the firm’s size and the agreement that a quality assurance program was a constraint, -0.1501, indicates that respondents from larger firms were less likely to agree that the long-term costs were a limiting factor as compared to small firms. Even more importantly, the correlation between size and the statement that “benefits of having a quality assurance program are unclear” is also negative, -0.1518. This result is further strengthened by the negative association between size and the notion that requirements of additional record keeping represent a constraint. Finally, larger firms were less likely to agree that there is a lack of competent consultants, who could advise about quality assurance program implementation; the value of correlation coefficient is -0.1083.
4.3 Correlations between Quality Assurance Constraints and Respondent Characteristics
Personal characteristics of a respondent can influence the answer about the importance of a constraint regarding the implementation of quality program and determine the choice of an option on a five-step scale. Education is a major factor because it determines formally acquired knowledge, but also shapes perception of issues. The calculation of Spearman’s correlation coefficient with 12 scores reflecting the agreement with the constraints shows that the majority of associations with the level of respondent’s education are negative and generally small.
However, four correlation coefficients are worth a discussion. The correlation coefficients refer to the following constraints of implementing the quality assurance programs: the short- and long-term cost of the quality assurance program, the requirement of maintaining records of the program (presumably the timing and outcomes of measuring quality of products and processes), and the lack of competent consultants to help in implementing the program.
Education of a respondent is negatively correlated with the scale of agreement regarding the short- and long-term costs of implementing the quality assurance program. Their values are -0.1741 and -0.1407, respectively. Also, the requirement of keeping records is negatively correlated with education of the respondent, -0.1225. Lastly, although the average score about the statement that there is “a lack of competent consultants to advise about the implementation of a quality assurance
Management, Enterprise and Benchmarking in the 21st Century Budapest, 2017
75
program”, the latter is negatively correlated with education (-0.1538). The result suggests that the perception of difficulty in finding competent consultants is tempered by education of persons responsible for quality control in a company.
The calculated correlation coefficients between age and any of the 12 constraints are negligible in size suggesting the absence of any associations. But the correlation coefficients were of much larger size between the number of years working for the company and 12 constraints. The values of two were particularly large. The value of the correlation coefficient between the number of years a respondent worked for a particular company and the requirement of additional record keeping associated with the quality assurance program is negative 0.1244. Another negative correlation was established between the years working for the company and the lack of finding a consultant capable of advising about quality assurance program (-0.1517). Interestingly, it was the number of years working for the company and not the age of a respondent that was more relevant with regard to the importance of constraints.
Concluding Remarks Quality assurance has been viewed from the perspective of a consumer and supported by earlier studies. However, the view from the company perspective is different because of different objectives. Company management is focused on the economic viability of a company and areas where a company can exercise some control. That approach implies eliminating any unnecessary costs. Quality assurance programs can be perceived as an expense that lacks justification. But as incomes of Chinese consumers increase, they will become increasingly aware of quality differences and able to make purchases consistent with a preference for quality, safe food products.
The implementation of a quality assurance program may be imposed on the company by a regulator or voluntarily adopted to enhance the competitive position in the market place. Some companies may be reluctant to adopt a program because of their limited resources. This paper presented a summary of results from a survey of 199 food manufacturing companies in Shanghai Province, China with regard to 12 potential constraints preventing or delaying a company’s implementation of a quality assurance program.
Among company characteristics, it appears that size, measured by 2015 revenues, is a major factor that influences opinions about the constraints. Specifically, the calculated correlation coefficients suggest that large companies did not consider the listed constraints as obstacles in implementing a quality assurance program. It appears that small to medium size companies could benefit from assistance in this area and small companies dominate the food manufacturing sector in Shanghai. Finding knowledgeable consultants and training of staff are among the limitations.
Management, Enterprise and Benchmarking in the 21st Century Budapest, 2017
76
Characteristics of managers responsible for quality control in the surveyed firms suggest that those with more education are less likely to view any of the listed causes as constraining quality assurance program adoption. Also, those with a relatively short period of working for a company were less likely to consider the listed reasons as limiting quality assurance program adoption. It seems that as the generation of quality managers changes, some of the constraints are less likely to be perceived as truly restraining. The question remains, however, if such change will keep pace with fast-evolving changes in consumer preferences. Any mismatch between the two may eliminate a company from the market if it is unable to deliver safe and high quality products.
Acknowledgements
The authors express their appreciation to Laura Alfonso and Amanda Hollar for their assistance in preparing this manuscript, Harvey Witt for assistance in statistical analysis, and the staff of Shanghai Minhang Quality Supervision Bureau and the Shanghai Fengxian Quality Supervision Bureau for the assistance in data collection.
References
[1] Y. Atsmon, M. Magni. 2012. Meet the Chinese consumer 2020. McKinsey & Company. Available online at http://www.mckinsey.com/global-themes/asia-pacific/meet-the-chinese-cosnumer-of-2020. Accessed April 7, 2017.
[2] FAO. 2017. Food consumption expenditure. Available online at www.fao.org/fileadmin/templates/ess/documents/food.../ShareOfFood_en.xls. Accessed April 8, 2017.
[3] FocusEconomics. 2017. Available online at https://www.focus-economics.com/country-indicator/china/gdp-per-capita-USD. Accessed April 7, 2017.
[4] A. Hodgson 2014. Income and expenditure in China: understanding regional disparities to unleash market potential. Available online at http://blog.euromonitor.com/author/anhodgson, February 24. Accesses April 7, 2017.
[5] N. Holtkamp, P. Liu, W. Mcguire. 2014. Regional patterns of food safety in China: What can we learn from media data? China Economic Review, 30, pp. 459-468.
[6] Y. Kuo. 2017. 3 great forces changing China’s consumer market. Worl Economic Forum on Latin America 2017. Available online at https://www.weforum.org/agenda/2-16/01/3-great-forces-changing-chinas-consumer-market/. Accessed April 7, 2017.
Management, Enterprise and Benchmarking in the 21st Century Budapest, 2017
77
[7] H-G. Ni, H. Zeng. 2009. Law enforcement is key to China’s food safety. Environmental Pollution, 157, pp. 1990-1992.
[8] X. Pei, A. Tandon, A. Alldrick, L. Giorgi, W. Huang, R. Yang. 2011. The China melamine milk scandal and its implications for food safety regulation. Food Policy, 36, pp. 412-420.
[9] www.statista.com, 2017. Annual per capit consumption expenditure in China. Available on line at www.statista.com/statistics/278699/annual-per-capita-consumption-expenditure-in-china/. Accessed April 7, 2017.
[10] XE Currency Converter. 2017. Available online at http://www.xe.com/currencyconverter/convert/?Amount=1&From=USD&To=CNY. Accessed April 1, 2017.
[11] Z. Zheng, S. Rastegari Henneberry. 2009. An analysis of food demand in China: a case study of urban household in Jiangsu Province. Review of Agricultural Economics, 31(4):873-893.
Management, Enterprise and Benchmarking in the 21st Century Budapest, 2017
78
On what Factors the Wheat Production and Price Depends
Gyarmati, Gábor Ph.D. Óbuda University, Keleti Faculty of Business and Management, Budapest, Hungary
Abstract: Wheat is a basic cereal in the catering in Europe. There are a lot of
factors which can affect the price and quantity of this crop. The experts need to
understand the main factors of price and quantity changes. The aim of this article
is to find what factors can affect the price and production of wheat. Why is it so
important and useful? With the knowledge of these factors, we can predict the
volume and price of wheat based on explanatory variables. If these explanatory
variables change, the characteristics of wheat would change expectedly. Using
international and Hungarian bank, statistical, price data to find these factors, and
some basic statistical methods (mainly correlation analysis) this paper examines
the main factors influenced. The hypothesis of the article is that oil price,
exchange rates, transportation, population increase, climate change are some of
the main factors which can affect the question of this grain. The cost of
transportation influences the price of wheat and there are some links between the
characteristics of wheat and factors examined. The most significant factors are oil
price, increase of population, and ruin of soils. The world commercial has to take
into account these changes in the wheat markets. Preventing the ruin of soils is
standard protocol for wheat production, but how to deal with an increasing
population is a much more complex question.
Keywords: wheat production, effects, prices.
Introduction People in different parts of the world use various sources of energy for subsistence. In many developing countries, up to 75% of energy demands by the body is provided by carbohydrates.
The world's 30 most important food plants include cereals, root crops, fruits, vegetables and legumes. Some, for example corn and wheat, are widespread and in different amounts across North America, South America, Europe, Africa, Asia
Management, Enterprise and Benchmarking in the 21st Century Budapest, 2017
79
and Australia. The three most important cereal crops are wheat, rice and maize, followed by sorghum, barley and oats. The corn, oats, barley and grain sorghum in the US as fodder plants is also used in large quantities. In 2000, the amount of grain produced in the world was 1871 million tons, of which 332.2 million tons were the US share of volume. Corn and wheat are widely grown in North America, Central America and South America, with large quantities concentrated in certain areas. Rice production is greatest in Asia.
Grain crops are relatively cheap and easy, and contribute to the reduction of hunger and population explosion. Crops and potatoes cover over of 75% of the caloric needs of the world's population. This ratio is even higher in certain parts of Asia, approaching 90% (Sárvári, 2011).
One of the major food crops is wheat, which plays a very important role in the nutrition of the world and Hungary. There were times when some prisoners survived on only bread and water for months or even years. Food is also a matter of wheat, mainly in the temperate climate zone countries. Biological parameters in addition to the main purpose of the article is to briefly examine what are the main factors that affect world trade in wheat markets, and the impact on the domestic wheat trade. As with any product market, there are special features specific to wheat, and this article examines the possible influencing factors one by one. If a relationship(s) exists between these factors, it is necessary to determine the strength of this (or multiple) relationship(s). I hope by reading this article the reader understands the most important factors in the world trade of wheat, because knowing these factors can predict future trends.
Wheat is a basic food mainly in the temperate climate zone countries. The main purpose of the article is to briefly examine the main factors that affect world trade wheat markets, and the impact on the domestic wheat trade. As with any product market of wheat, there are specialties, with features that can only occur with him. The article looks through one by one and examine the possible influencing factors, and to consider if there is a relationship between the factors, then how is strength. So I hope by reading this article the reader understands what are the most important factors in world trade of wheat and knowing this, what are the likely future trends.
In general, agriculture is a sector with the highest risk in the production process. It is very sensitive to different factors like changing temperature, rain/lack of rain and other precipitation patterns as well as frequencies of extreme weather events. Effects on agriculture trickle down to producers, yield, and eventually production prices. The qualiy of the soil can dictate if one country reaches a high yield and another country simultaneously produces almost zero because of drought or other extreme weather. Some studies have dealt with these types of factors (for example Mendelsohn et al., 1994, Nelson et al., 2014, Mitterl et al., 2015 in Fogarai et al., 2016 )

Management, Enterprise and Benchmarking in the 21st Century Budapest, 2017
80
Prices of agricultural commodities are naturally unstable. The variability of prices is caused by the fluctuation of weather and pest events that influence harvest and that are aggravated by the varaible nature of demand and supply. Besides these, agricultural commodities are connected to financial and energy markets, with destabilizing impacts on prices (von Braun and Tadesse, 2012).
This study would examine factors influencing the world market price of wheat. Since Hungarian food markets are the part of the global market, it is necessary to take into account international trends. The question arises: what are these factors? Based on practice we have to examine the price changes of petroleum, the fluctuation of exchange rates, competitivness, the changing eating habits, climate change, the effects of competitors, logistics and other important effects.
Sixty percent of world cereal production consists of wheat and corn. Therefore, they are vital to the evolution of mankind in terms of nutrition. According to the UN Food and Agriculture Organization, the FAO final data for 2012 was a harvest of 872.8 million of the world's corn, and wheat amounted to 671.5 million tonnes. The yield of corn was the second while wheat was the fourth largest after sugar cane, - animal goods origin - involving agricultural products ranking. In terms of the cereals harvested in 2012, the global quantity of corn was 34%, 29% for paddy rice, and wheat was 26%. Compared to 2005, the increase in yield for maize and wheat in recent years was 22% and 7%, respectively. The increase in yield occurring over seven years in the case of maize growing area is caused by the predominantly growth (21%), while in the case of wheat in respect of expansion experienced solely due to the rise in yields (8%).
66% of the wheat grown in the world serves to feed people. In addition, only 20% is used as animal feed, while the remainder are seeds, starch, and ethanol production material. Human nutrition in developing countries, twice as many cereals (mainly flour) were consumed on average than in developed countries. (Statisztikai Tükör, 2014.)
My main aim is to identify the factors which concern the wheat production and price in general. According to practical experiences there some explanatory variables which are likely influencers, for example the price of wheat. In this article, I will examine if this is true or false. As aforementioned, one aim is to discover the connection between price changes of oil products and wheat. I assume that the price change in oil prices can affect the wheat production. Furthermore, I can search the affect of the exchange rate, transportation, biodiesel, speculation in finance markets, population change, climate change, rain and irrigation, water and soil effects.
Management, Enterprise and Benchmarking in the 21st Century Budapest, 2017
81
1 Methodology This article examines the scope for Króner Csilla’s (2016 Szent István University) thesis as it presents the scientific literature and experts views. However, where data is available, I would like to support or criticize the factors listed and to question the existence of a relationship using statistical and mathematical methods. This articles examines the issue in greater depth and I intend to present the results in the context of the relevant research. Therefore, I will examine the relation of the characteristics of wheat (for example price changes of petroleum, the fluctuation of exchange rates etc.) with the method of correlation analysis.
If both of the cause and the effect is mediated by quantitative criteria we speak about a correlational relationship. Hereinafter primarily shown in the relationship between a factor or explanatory variables (X) and a dependent variable (Y) is measured, however, it should be understood that in reality it is not usually one, but several factors formed jointly in a complex result from a phenomenon. However, in the measurement of correlation analysis, the combined effect of several factors can be easily resolved. The nature of correlation allows for the interpretation of the following relationships between variables: monotonic correlation, which encompasses linear relationship. Both connections can be positive or negative, which helps with perceiving the graphical display. Two existing relationships between the quantitative criteria can be represented well in the Cartesian coordinate system, a so-called points chart. The correlation between the measurement of the most widely used indicator of the linear correlation coefficient (labeled r), assuming a linear relationship between the variables in which the application or if the linearity assumption is not far from the studied problem. The correlation coefficient calculates how characteristic variables move together and includes a measure of standard deviation in covariance variables (Ács, 2014.).
1.1 The effects of the price of petroleum The markets of today are based on the industry of fossil energy, transportation, and logistics; agriculture has to use petroleum products to work. Petroleum, natural gas and coal are a large part of energy needs. The basic production sectors are exposed to the energy sector including petroleum sector. Energy resources desposing of humanity will be exhausted, therefore the energy sources of our societies have a level of uncertainty. There is concern about the over-consumption of energy. An average American citizen consumes 95-100 times more energy than a Tuareg one. In 1860, 15% of the world's entire energy usage was still human origin, 73% was animal origin, and 12% had "other" origins. Today, territories with the poorest animal and human energy resources produce 99% of their total energy by "other" resources. The average energy consumption equals the power of 60 slaves or the energy of 6 draft horses. Hungary’s average equals 2 times the average of the world, and the average of the US is 6 times. The African average is one sixths of it. (Tóth József, 2010.)

Management, Enterprise and Benchmarking in the 21st Century Budapest, 2017
82
In addition, the question of food issues also appears. On Earth, about 925 million people are chronically underfed. This is 8% of humanity. Every year millions of people die from starvation or chronic malnutrition. These deaths are almost certainly avoidable if given access to basic needs, such as good medical care and adequate nutrition. Overproduction is a crisis in some regions, and some states pay the farmers not to produce. The solution is to increase food production commensurate to population growth in poor countries. In particular, appropriate agricultural production technologies are exported widely to resolve issues of irrigation, proper seeds to use, reducing crop losses, pest management and fertilizer solution and mechanization spreading. (Tóth József, 2010.; A világ helyzete 2013.)
Let us examine under several sets of data, and observe if there is a close correlation is between oil and oil products market price and the wheat and the market prices of wheat-based products. Króner’s studies covered prices of unspecified petroleum-based or corn-based product groups between 2006 and 2015. The author has found a correlation between the two sets of data values. Furthermore this article examined the issue using correlation analysis. The correlation coefficient is 0.69 which points to a moderate connection. But, there is a strong relationship over 0.7, so actually the price of petroleum products can influence the prices of wheat products from moderate to heavy. The determination value is 48%. We can tell that the cost of petroleum-based products defined the price of wheat-based products with 48% in this period. We definitely assume the fuel prices’ influence.
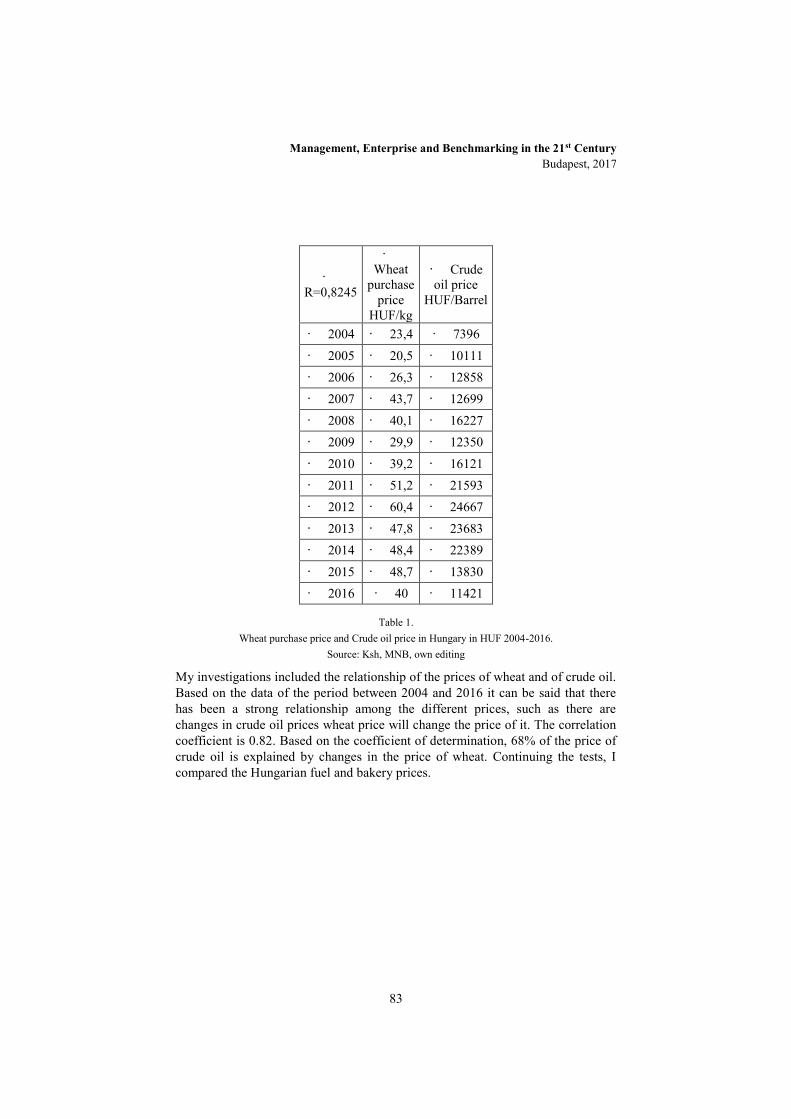
Management, Enterprise and Benchmarking in the 21st Century Budapest, 2017
83
· R=0,8245
· Wheat
purchase price
HUF/kg
· Crude oil price
HUF/Barrel
· 2004 · 23,4 · 7396 · 2005 · 20,5 · 10111 · 2006 · 26,3 · 12858 · 2007 · 43,7 · 12699 · 2008 · 40,1 · 16227 · 2009 · 29,9 · 12350 · 2010 · 39,2 · 16121 · 2011 · 51,2 · 21593 · 2012 · 60,4 · 24667 · 2013 · 47,8 · 23683 · 2014 · 48,4 · 22389 · 2015 · 48,7 · 13830 · 2016 · 40 · 11421
Table 1. Wheat purchase price and Crude oil price in Hungary in HUF 2004-2016.
Source: Ksh, MNB, own editing
My investigations included the relationship of the prices of wheat and of crude oil. Based on the data of the period between 2004 and 2016 it can be said that there has been a strong relationship among the different prices, such as there are changes in crude oil prices wheat price will change the price of it. The correlation coefficient is 0.82. Based on the coefficient of determination, 68% of the price of crude oil is explained by changes in the price of wheat. Continuing the tests, I compared the Hungarian fuel and bakery prices.
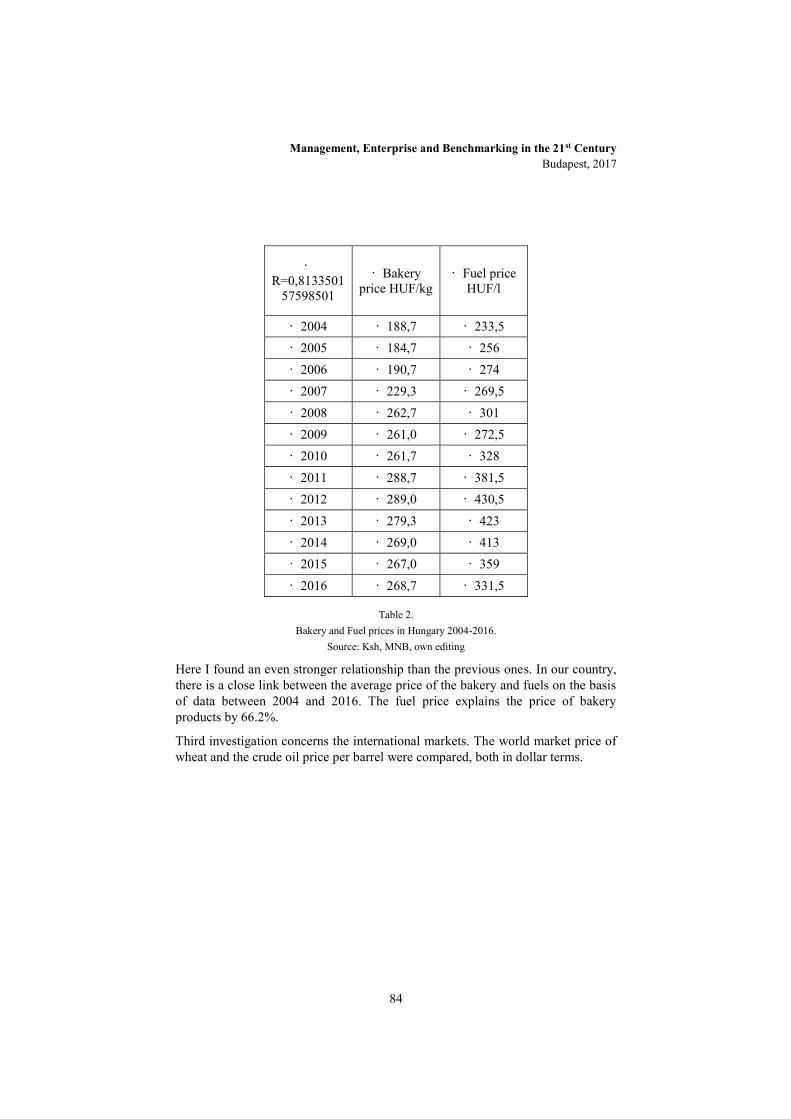
Management, Enterprise and Benchmarking in the 21st Century Budapest, 2017
84
· R=0,8133501
57598501
· Bakery price HUF/kg
· Fuel price HUF/l
· 2004 · 188,7 · 233,5 · 2005 · 184,7 · 256 · 2006 · 190,7 · 274 · 2007 · 229,3 · 269,5 · 2008 · 262,7 · 301 · 2009 · 261,0 · 272,5 · 2010 · 261,7 · 328 · 2011 · 288,7 · 381,5 · 2012 · 289,0 · 430,5 · 2013 · 279,3 · 423 · 2014 · 269,0 · 413 · 2015 · 267,0 · 359 · 2016 · 268,7 · 331,5
Table 2. Bakery and Fuel prices in Hungary 2004-2016.
Source: Ksh, MNB, own editing
Here I found an even stronger relationship than the previous ones. In our country, there is a close link between the average price of the bakery and fuels on the basis of data between 2004 and 2016. The fuel price explains the price of bakery products by 66.2%.
Third investigation concerns the international markets. The world market price of wheat and the crude oil price per barrel were compared, both in dollar terms.
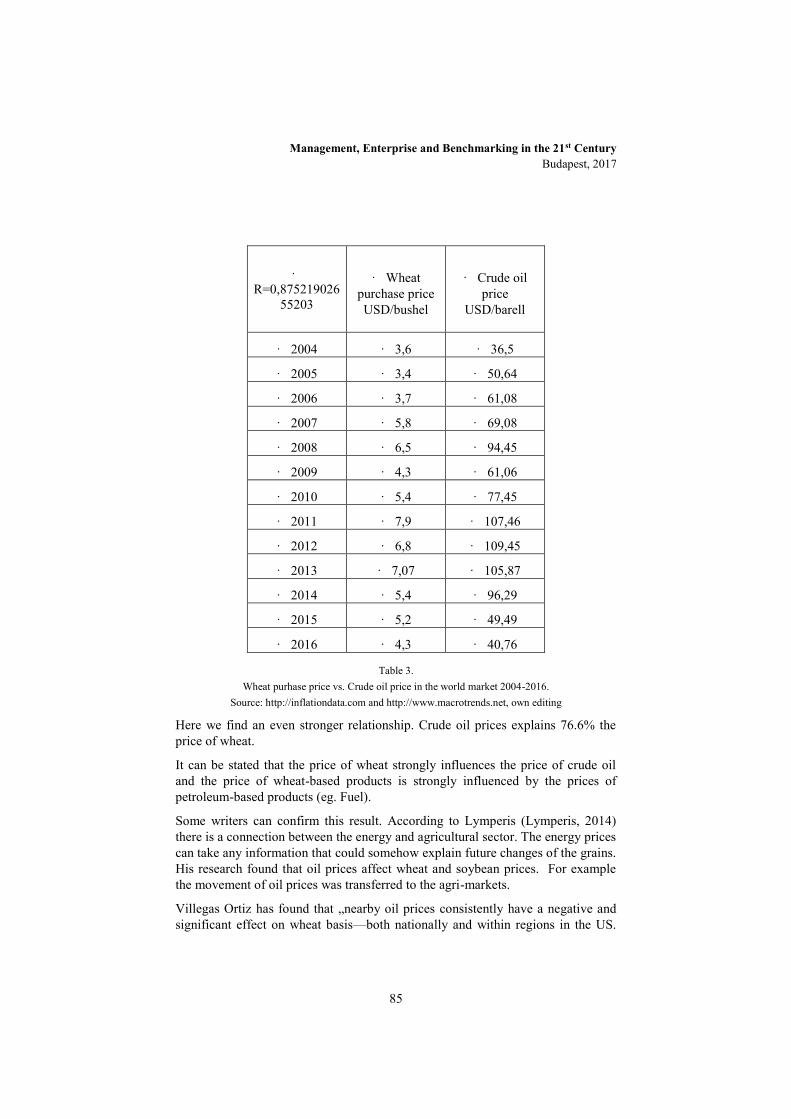
Management, Enterprise and Benchmarking in the 21st Century Budapest, 2017
85
· R=0,875219026
55203
· Wheat purchase price USD/bushel
· Crude oil price
USD/barell
· 2004 · 3,6 · 36,5
· 2005 · 3,4 · 50,64
· 2006 · 3,7 · 61,08
· 2007 · 5,8 · 69,08
· 2008 · 6,5 · 94,45
· 2009 · 4,3 · 61,06
· 2010 · 5,4 · 77,45
· 2011 · 7,9 · 107,46
· 2012 · 6,8 · 109,45
· 2013 · 7,07 · 105,87
· 2014 · 5,4 · 96,29
· 2015 · 5,2 · 49,49
· 2016 · 4,3 · 40,76
Table 3. Wheat purhase price vs. Crude oil price in the world market 2004-2016.
Source: http://inflationdata.com and http://www.macrotrends.net, own editing
Here we find an even stronger relationship. Crude oil prices explains 76.6% the price of wheat.
It can be stated that the price of wheat strongly influences the price of crude oil and the price of wheat-based products is strongly influenced by the prices of petroleum-based products (eg. Fuel).
Some writers can confirm this result. According to Lymperis (Lymperis, 2014) there is a connection between the energy and agricultural sector. The energy prices can take any information that could somehow explain future changes of the grains. His research found that oil prices affect wheat and soybean prices. For example the movement of oil prices was transferred to the agri-markets.
Villegas Ortiz has found that „nearby oil prices consistently have a negative and significant effect on wheat basis—both nationally and within regions in the US.
Management, Enterprise and Benchmarking in the 21st Century Budapest, 2017
86
The effect of a USD $1 increase per barrel of oil ranges from 1 to 8 cents per bushel at the national level, from 0.1 to 0.5 cents within the Midwest region, and it is fairly stable at a 0.1 cent decrease in the Gulf Coast region.” This research was based on wheat prices, not on grain prices. In the general literature, grain ranges from 11 to 18 cents per bushel. (Villegas Ortiz, 2016.)
Mutuc et. al. researched and found that the monthly changes of cotton, soybeans, corn, wheat prices were affected by changes in oil prices The global real economic activity can affect the oil prices, as well. (Mutuc et. al, 2010.)
There is a strong correlation among oil and commodity prices. According to initial statistical research there is no causal link between the energy and agricultural sector. But other research shows that the change of oil price can affect the prices of corn, soy and wheat prices. (Saghaian, 2010.)
Grain prices are converned by levels of oil prices. High oil prices have a direct impact on grain production and prices because thes cause higher production cost. (Kong et al. 2012)
These facts are verified by another research in 2009. „Recent oil price shocks appear to have triggered sharp price changes in agricultural commodity markets, especially the corn and wheat market, potentially because of the tighter interconnection between these food/feed and energy markets” (Xiadong et al., 2009)
1.2 The effects of exchange rates fluctuation The economics is well known that weakening national currency favors exporters, while strenghtening the national currency helps the importers. Hungary’s most important grain trade partners are: Italy, Germany, Austria, and Romania. The typical settlement currency with these countries is the euro. This is why I examined the relationship between the euro and the selling price of wheat using a correlation. Typically, most of the acquisitions are in the summer from June to September, and therefore I compared the data of these months to the foreign exchange rate with the euro. And I examined the annual average prices and exchange rate changes.
In the summer months there is a not loose correlation coefficient in the change of the euro, as the exchange rate only explained 16.5% of the prices of wheat.
What do we find in the case of annual average selling price of wheat?
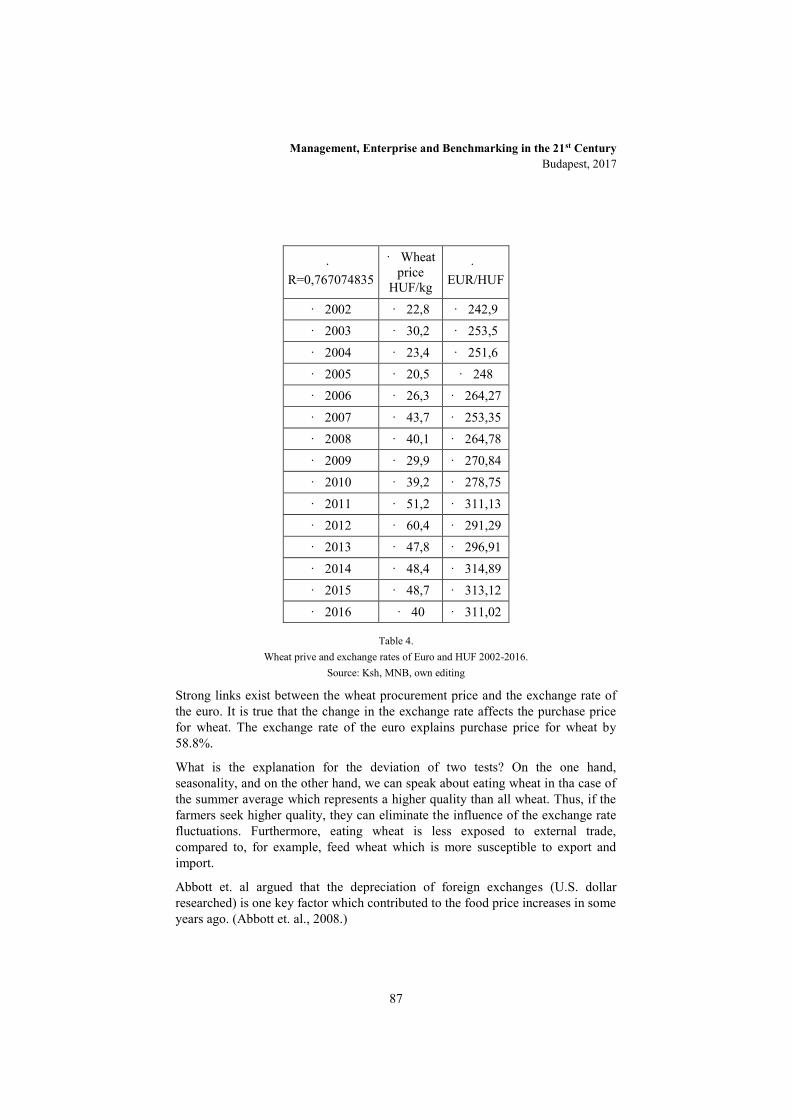
Management, Enterprise and Benchmarking in the 21st Century Budapest, 2017
87
· R=0,767074835
· Wheat price
HUF/kg
· EUR/HUF
· 2002 · 22,8 · 242,9 · 2003 · 30,2 · 253,5 · 2004 · 23,4 · 251,6 · 2005 · 20,5 · 248 · 2006 · 26,3 · 264,27 · 2007 · 43,7 · 253,35 · 2008 · 40,1 · 264,78 · 2009 · 29,9 · 270,84 · 2010 · 39,2 · 278,75 · 2011 · 51,2 · 311,13 · 2012 · 60,4 · 291,29 · 2013 · 47,8 · 296,91 · 2014 · 48,4 · 314,89 · 2015 · 48,7 · 313,12 · 2016 · 40 · 311,02
Table 4. Wheat prive and exchange rates of Euro and HUF 2002-2016.
Source: Ksh, MNB, own editing
Strong links exist between the wheat procurement price and the exchange rate of the euro. It is true that the change in the exchange rate affects the purchase price for wheat. The exchange rate of the euro explains purchase price for wheat by 58.8%.
What is the explanation for the deviation of two tests? On the one hand, seasonality, and on the other hand, we can speak about eating wheat in tha case of the summer average which represents a higher quality than all wheat. Thus, if the farmers seek higher quality, they can eliminate the influence of the exchange rate fluctuations. Furthermore, eating wheat is less exposed to external trade, compared to, for example, feed wheat which is more susceptible to export and import.
Abbott et. al argued that the depreciation of foreign exchanges (U.S. dollar researched) is one key factor which contributed to the food price increases in some years ago. (Abbott et. al., 2008.)
Management, Enterprise and Benchmarking in the 21st Century Budapest, 2017
88
Correlations among energy, agriculture, and exchange rate markets are relevant. „A good reason for these correlations could be the fact that grains are directly linked with ethanol and oil markets through the oil–ethanol–corn linkages. Also, a large percentage of grain output is exported and because crude oil prices are denominated in U.S. dollars, oil price hikes increase the supply of the dollar worldwide that lead to dollar depreciation and, in turn, increase demand for U.S. grain exports.” (Saghaian, 2010.)
1.3 The effects of transportation There are different characteristics for different transport modes. Each one has its advantages and disadvantages. They have in common that an energy source (eg. Fuel, electricity) price depending on the shipping charge. For a diesel engine or a barge, there is a clear correlation of these factors, but this includes electric locomotive. Road transport is the most flexible mode of transport. The liability insurance, road tolls, weight tax, fuel price, the driver wages affect the cost. The advantage of road transport is that it is possible to deliver door to door, it is fast, has flexible pricing, it is not necessary to be transhipped, and the risk is not excessive. The disadvantages are pollution, high demand of labor and energy needs specifically, there is high waiting times at borders, restrictions on the road, unpredictable journey times, the limited dimensions and weight, and the bad quality of Hungarian roads.
The rail freight is a transport rail subjectes. Its advantages include: moving in a protected field, well calculated travel time, less expensive mode of transport, the ability to move large crowds, and Combined Transport. The disadvantage are that there is no door to door transportation, it’s slower than the road, and uneconomical in short distances.
River or ocean shipping is the cheapest mode of transport. The advantages are: delivery of a large crowd, and Combined Transport. The disadvantages are the slowness, longer transport times, higher insurance premiums, and ports are a large distance from the destination (Sebestyén, 2013).
Air transport is not an option when we have to transport grain, specifically because it is the most expensive mode of transport, and as the grain is not perishable there is no need for fast transportation.
The main item of wheat costs are transport costs. As I mentioned, the wheat target countries are Central and Eastern European countries. Since delivery comes at a significant cost, the logistical issues have significant costs.
According to the Ksh data, we see that the most common mode of transport in the respect of mileage is the navigation on the Danube, and in recent years road transport has become the leading mode. River transport can be the most cost-effective, but is subject to changes in weather. Some sections of the river are
Management, Enterprise and Benchmarking in the 21st Century Budapest, 2017
89
subsided in the summer drought period so the barges become stuck. They must then switch to road freight. With rising costs and decrease in profits, the deliveries slip. (Króner, 2016)
This is the impact of transportation cost on grain prices. There is a positive significant effect of oil price on transportation and oil prices can therefore affect the price of wheat. (Villegas Ortiz, 2016.)
1.4 The effects of biodiesel and bioetanol Analysis on rising food prices usually assess the role of the biofuel industry (Popp - Potori, 2008 in Popp et al., 2010). Some researchers attributed surging biofuel demands in 75 percent of food price increases (The Guardian, 2008 in Popp et al., 2010), some in 10-30 per cent (eg. IFPRI, 2008 in Popp et al., 2010) alongside other factors mentioned above (eg. Drought, changes in consumer habits, speculation, etc. ). According to Collins (2008), the use of corn for ethanol production has contributed in 25-50 percent increase of the price of the crop (in this case the growth of producer prices of maize) (Popp et al., 2010).
The role of wheat is small with regard to bioethanol production compared to corn, but there is a strong link between the evolution of the price of corn and wheat. There is close relationship in Hungarian purchase price of wheat and corn. We can observed the same in the world market prices. Our country stands at the 24th volume with 1500 barrel per days in the whole world bio-ethanol fuel manufacturing. The total amount is 1.45 million barrels per day worldwide.

Management, Enterprise and Benchmarking in the 21st Century Budapest, 2017
90
· R=0,903303779
· Wheat purchase
price USD/kg
· Corn purchase
price USD/kg
· 2004 · 3,6 · 2,1 · 2005 · 3,4 · 1,89 · 2006 · 3,7 · 2,3 · 2007 · 5,8 · 4,09 · 2008 · 6,5 · 3,5 · 2009 · 4,3 · 3,4 · 2010 · 5,4 · 4,2 · 2011 · 7,9 · 6,8 · 2012 · 6,8 · 6,6 · 2013 · 7,07 · 5,8 · 2014 · 5,4 · 3,4 · 2015 · 5,2 · 3,7 · 2016 · 4,3 · 3,7
Table 5. The average price of wheat and corn in the world market 2004-2016. Source
http://www.macrotrends.net own editing.
Carriquiry et al. found that with ethanol consumption increasing, wheat prices trickle down to other crop prices. Higher ethanol demand pushes up the ethanol price and leads to higher production. There is another connection. As increasing demand of wheat as a feedstock in ethanol production, both wheat production and the wheat price increase. The world price of wheat increases. „The United States and other wheat exporters increase the supply of wheat to the world market to compensate for the short supply from the EU. U.S. wheat exports increase 0.03% and wheat area increases 0.008%. …As wheat accounts for a substantial share of the feed ration in the EU, livestock and dairy production are adversely impacted by the increasing use of wheat for ethanol production.” (Carriquiry et. al, 2010)
Increased biodiesel consumption results in a higher biodiesel price, and a higher price of rapeseed causes expansion of its planting area while a sufficient rapeseed meal supply dampens the meal price. (Carriquiry et. al, 2010)
The Renewable Fuel Standard (RFS) makes compulsory a certain level of alternative fuels to be blended into gasoline annually. The level increases each year. Hanon found that RFS had a positive impact on corn and food prices. After
Management, Enterprise and Benchmarking in the 21st Century Budapest, 2017
91
Hanon researched the question and the result was that corn prices were increased by the RFS but in the case of food prices the impact is more ambiguous. Wheat and barley prices also were impacted by the RFS. (Hanon, 2014)
1.5 The effects of speculation and monopolistic companies Due to the 2008 crisis and brokering scandals in recent years, investors are looking for forms that are not sensitive to these effects. One option is to invest long-term values in which demand is stable or increasing. Eg. Gold, real estate, or even basic foods. Wheat is a possibility.
We can find representatives in brokerage firms specializing in trade in commodities and we may also find representatives who specialize in the cereal sector. Spot, futures and options are realizable in the Commodities Section. Customers and brokers can obtain physical goods with IGS on the cash market. The appropriate level of prices can be ensured in advance up to 17 months. The contracts relate to a quantity of 100 tonnes, and costs are valid with shipped to Budapest Csepel Freeport.
Central European grain contracts can be traded in euros are unique among the futures because they have multiple delivery points along the Danube. These contracts have become attractive to traders from the neighboring countries.
The three most active instruments - corn, wheat and sunflower – can be associated with buying and selling American-style options in the option market. The product range of the most popular cereal product is corn having been a turnover of more than 50% share. (Fodor et al, 2008).
Large multinational companies with the highest turnover are able to influence the grain markets and prices developed. These companies are in the largest markets, and in many of the countries where wheat cultivation is importance. Its subsidiaries are in the major stock markets to be able to efficiently informed or traded.
1.6 The effects of population changes Does the yield of wheat and the number of population trends have any effect on each other? To determine whether the wheat harvest and the amount of the purchase price can affect each other can be used again in statistics methodology.

Management, Enterprise and Benchmarking in the 21st Century Budapest, 2017
92
· · Wheat harvested
volume tons
· Wheat retail price
HUF/kg
· Population of Hungary
· 2004 · 6 007 · 23,4 · 10 108 000 · 2005 · 5 088 · 20,5 · 10 097 549 · 2006 · 4 376 · 26,3 · 10 076 581 · 2007 · 3 987 · 43,7 · 10 066 158 · 2008 · 5 631 · 40,1 · 10 045 401 · 2009 · 4 419 · 29,9 · 10 030 975 · 2010 · 3 745 · 39,2 · 10 014 324 · 2011 · 4 107 · 51,2 · 9 985 722 · 2012 · 4 011 · 60,4 · 9 931 925 · 2013 · 5 058 · 47,8 · 9 908 798 · 2014 · 5 262 · 48,4 · 9 877 365 · 2015 · 5 331 · 48,7 · 9 855 571
Table 6. The average price of wheat and harvested volume and population in Hungary 2004-2015.
Source Ksh. Own editing.
There is an inverse loose relationship between the price of wheat and the harvest, rather than the quantity is primary expositor of prices (R = -0.311). However, there is reverse strong link between the population and the price so that the development of the population has a strong impact on the price of wheat (R = -0.783). As the population decreases, the price of wheat increases. There is an additional explanation is needed. As the population decreases in normal way the demand can decreased. This study does not stay. Some of the wheat produced go for export, so the local market conditions can make the prices it looks like it would influence the population.
The strange situation occurs that the population of the wheat production leader countries is reduced and where can be observed growth in the population, those countries do not have wheat substantial volumes in wheat production, that started a hunger spiral, more and more people are suffering from hunger on Earth.
1.7 The effects of climate change Many experts studied the relationship between climate change and agriculture. Because of extreme weather anomalies of last years, decades, ages we have to
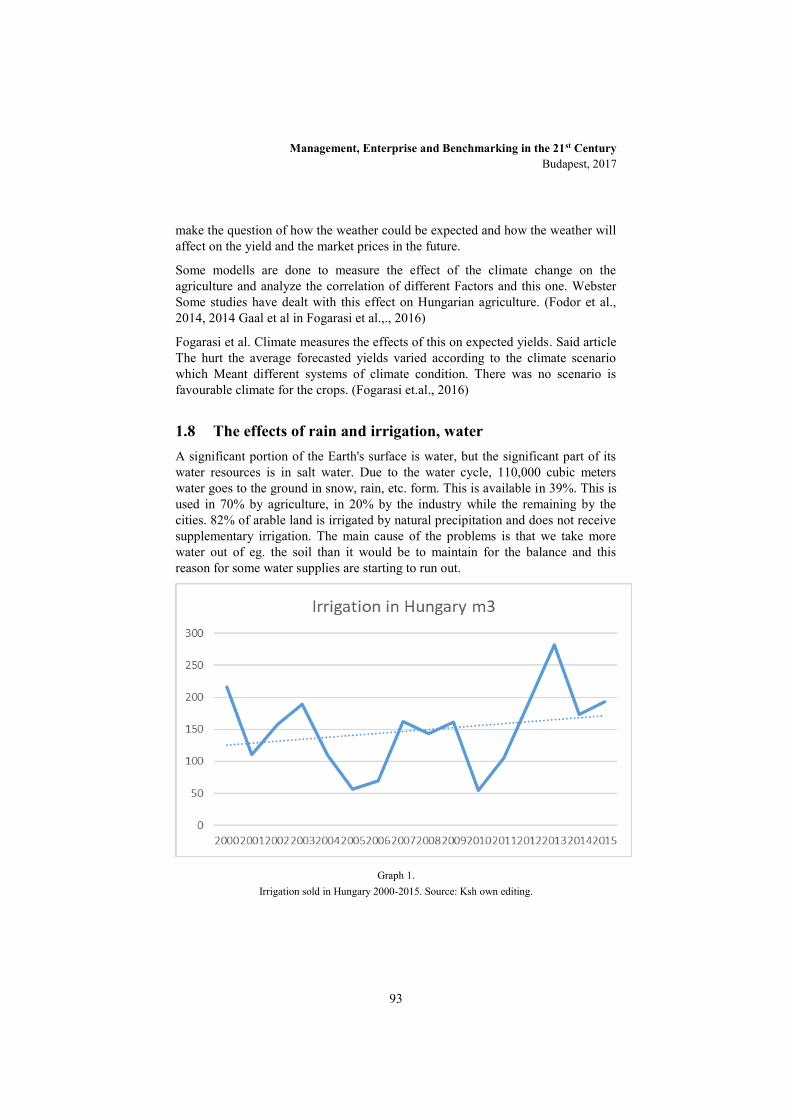
Management, Enterprise and Benchmarking in the 21st Century Budapest, 2017
93
make the question of how the weather could be expected and how the weather will affect on the yield and the market prices in the future.
Some modells are done to measure the effect of the climate change on the agriculture and analyze the correlation of different Factors and this one. Webster Some studies have dealt with this effect on Hungarian agriculture. (Fodor et al., 2014, 2014 Gaal et al in Fogarasi et al.,., 2016)
Fogarasi et al. Climate measures the effects of this on expected yields. Said article The hurt the average forecasted yields varied according to the climate scenario which Meant different systems of climate condition. There was no scenario is favourable climate for the crops. (Fogarasi et.al., 2016)
1.8 The effects of rain and irrigation, water A significant portion of the Earth's surface is water, but the significant part of its water resources is in salt water. Due to the water cycle, 110,000 cubic meters water goes to the ground in snow, rain, etc. form. This is available in 39%. This is used in 70% by agriculture, in 20% by the industry while the remaining by the cities. 82% of arable land is irrigated by natural precipitation and does not receive supplementary irrigation. The main cause of the problems is that we take more water out of eg. the soil than it would be to maintain for the balance and this reason for some water supplies are starting to run out.
Graph 1.
Irrigation sold in Hungary 2000-2015. Source: Ksh own editing.

Management, Enterprise and Benchmarking in the 21st Century Budapest, 2017
94
Similarly, the amount of water used increase in the Hungarian Agriculture. Mainly irrigation water should be used in order to protect the crop during drought period. In any case, the lack of water may result in lower quantities produced, which will cause an increase in consumer prices. (Világ helyzete 2013.))
1.9 The effects of soil (quality and quantity) The land can decrease in both of in quantity and in quality. In the first case it may have positive effects because we are witnesses as withdrawn from cultivation of bad quality lands. It does not happens in every cases. Desertification does not affect our country, but in other parts of the world, yes. As a result of it, there can be reduced the amount of arable land. In our country there is decrease due to the non-cultivated virtue and the amount of withdrawal from cultivation of the land. If this occurs, then we can count price increasing impact of lower yield.
The other major problem is the deterioration of the quality of soils. The soils are exploited less and less organic matter and minerals, so it will reduce the nutritional value of crops as well. By contrast, soil fertilization is very serious problems, leading to soil nitration. The price of agricultural land has continues grown since 2008, and has an average of it is about 1 million HUF per hectare. It is increasingly difficult to get land and its improper use or even over long periods of set-aside will reduce the supply of crops. (Ksh)
Conclusions Many factors affect the cultivation of wheat, the selling price of it in the world and in our country. The effect of oil is clear, but the effects of other transport fuels in the future will be demonstrated on the basis of the investigations. The exchange rate fluctuations of currencies and the impact of commodity speculation, we can not rule out, but they can affect regardless of the wheat. There could be an issue even changes in eating habits. As a developing country is developing a growing proportion of the population wouldeat foods of animal origin, which are needed to produce a unit of larger areas such as the cultivation of a vegetable grain. In the relationship to bioethanol production and consumption of wheat is likely to increase the increase of use, but this factor depends on law as well. The growth of population has a significant impact on the development of prices and the climatic changes and decrease of land and dwindling water resources is likely to cause trouble in the future, thereby influence the production or prices.
Management, Enterprise and Benchmarking in the 21st Century Budapest, 2017
95
References:
[1] A világ helyzete Van még esély a fenntarthatóságra? Föld Napja Alapítvány, Budapest, 2013. World watch Institute: State of the World
[2] Abbott, Phillip.C., Hurt, Christopher, Tyner, Wallace,E.: ‘‘What’s Driving Food Prices?’’ Issue Report, Farm Foundation
[3] Ács Pongrác szerk.: Gyakorlati adatelemzés, p. 228-231. PTE ÉTK, Pécs, 2014. http://www.etk.pte.hu/protected/OktatasiAnyagok/%21Palyazati/GyakorlatiAdatelemzes.pdf download 18th of March 2017.
[4] Carriquiry, Miguel, Dong, Fengxia, Xiaodong Du, Amani Elobeid, Jacinto F. Fabiosa, Ed Chavez, Suwen Pan: World Market Impacts of High Biofuel Use in the European Union Working Paper 10-WP 508 July 2010. http://ageconsearch.tind.io/record/91923/files/10-WP_508.pdf download 22th of April 2017.
[5] Du, Xiaodong ; Yu, Cindy L. ; Hayes, Dermot J.: Speculation and Volatility Spillover in the Crude Oil and Agricultural Commodity Markets: A Bayesian Analysis. Selected Paper prepared for presentation at the Agricultural & Applied Economics Association 2009 AAEA & ACCI Joint Annual Meeting, Milwaukee, WI, July 26-28, 2009.
[6] Fodor Lóránt, Szabó Imre László: Kereskedés az integrált budapesti értéktőzsdén Gazdálkodás 2008 1.sz.
[7] Fogarasi József, Kemény Gábor, Molnár András, Keményné Horváth Zsuzsanna, Zubor-Nemes Anna, Kiss Andrea: Modellin climate effects on Hungarian wheat and maize yields, Studies in Agricultural Economics 118, p. 85-90. 2016.
[8] http://inflationdata.com download 18th of March 2017.
[9] http://www.indexmundi.com/energy/?product=ethanol&graph=production&display=rank download 18th of March 2017.
[10] http://www.macrotrends.net download 18th of March 2017.
[11] Kong, Minji ; Han, Doo Bong ; Nayga, Rodolfo M., Jr. Interrelationship and Volatility Transmission between
[12] Króner Csilla: Magyarországi búzatermesztés lehetőségei és kihívásai a kereskedelemi értékesítésben, szakdolgozat SZIE KTK, 2016.
[13] Ksh: Külkereskedelem 2014. (https://www.ksh.hu/docs/hun/xftp/idoszaki/kulker/kulker14.pdf) typically download

Management, Enterprise and Benchmarking in the 21st Century Budapest, 2017
96
[14] Lymperis, Georgios:The Relationship of U.S. Agricultural Commodities with Oil and Ethanol Prices, London
[15] Mutuc, Maria M., Pan, Suwen, Hudson, Darren: What Drives Commodity Prices More: Oil Demand or Supply
[16] Popp József, Somogyi Andrea, Bíró Tamás: Újabb feszültség a láthatáron az élelmiszer- és bioüzemanyag-ipar között. Gazdálkodás, 2010., 6.sz.
[17] Saghaian, Sayed H.: The Impact of the Oil Sector on Commodity Prices: Correlation or Causation? Journal of Agricultural and Applied Economics, 42,3 (August 2010):477–485 2010 Southern Agricultural Economics Association
[18] Sárvári Mihály: Egyéb gabonanövények termesztése, DE, NYME, PE, 2011. http://www.tankonyvtar.hu/en/tartalom/tamop425/0010_1A_Book_adaptalt_02_egyeb_gabonanovenyek_termesztese/ch02.html download 18th of March 2017.
[19] Sebestyén László: Szállítás, Fuvarozás, Szállítmányozás, Budapest, Kit kiadó, 2013.
[20] Statisztikai Tükör: A búza és a kukorica termesztése, kereskedelme és felhasználása a világon, 2014.
[21] Tóth József főszerk.: Világföldrajz, p.698-699. Akadémiai Kiadó, Budapest, 2010.
[22] Tristan Hanon: The new normal: A policy analysis of the US renewable fuel standard, SS-AAEA Journal of Agricultural Economics, 2014. https://ageconsearch.tind.io/record/232730/files/TristanHanonFinal.pdf download 2nd of May 2017.
[23] Villegas Ortiz, Laura: No train no grain: the impact of increased demand for rail services by the energy sector on wheat prices – a preliminary analysis. International Journal of Food and Agricultural Economics Vol. 4 No. 3, 2016, pp. 103-125
[24] von Braun, Joachim., & Tadesse, Ghirmai:. Food Security, Commodity Price Volatility and the Poor. In Masahiko Aoki, Timur Kuran & G. Roland (Eds.), Institutions and Comparative Economic Development: Palgrave Macmillan Publ. IAE Conference Volume 2012.
[25] www.ksh.hu download 18th of March 2017.
[26] www.mnb.hu download 18th of March 2017.
[27] www.mnb.hu download 18th of March 2017.

Management, Enterprise and Benchmarking in the 21st Century Budapest, 2017
97
The Effect of the Economic Crisis on the Bank Profitability in the V4 Countries
Dr. Laszlo Gyulai [email protected]
Gabor Szucs [email protected]
Abstract: In our study we are focusing on the average profitability of the Hungarian commercial banking sector from 2005 to 2014 with special attention on the effects of the financial crisis. In our globalized world the unavoidable question is how the profitability of our banks fits the same values of the North-American and European, especially the V4 commercial banks. In order to find a well-established answer we carried on a financial ratio analysis with the help of the Bankscope database, which was extended with a panel analysis. On the basis of the time series it can be concluded that the performance of the Hungarian commercial banks – at least in case of the profitability- was in a steady decline and far away from the V3 numbers. It cannot be stated that the higher profitability delivers only advantages for the affected national economies. However it is presumed that the interests of the shareholders have an effect on the quantity and quality of the debts, indirectly on the development of the total economy.
Keywords: crisis, commercial banks, lending
Introduction
There were several studies about the financial crisis. The authors are dealing with a very important aspect of the crisis from a Hungarian point of view, namely with the role of the decline on the profitability of the domestic commercial banks, more accurately whether the evaluation of the average profitability of our commercial banks fits the tendencies of the V4 countries or the developed countries.
The commercial banking system is an inevitable part of the modern economy which plays an important role in the creation, flow, reallocation and effective handling of the money. The development of the commercial banking system, the
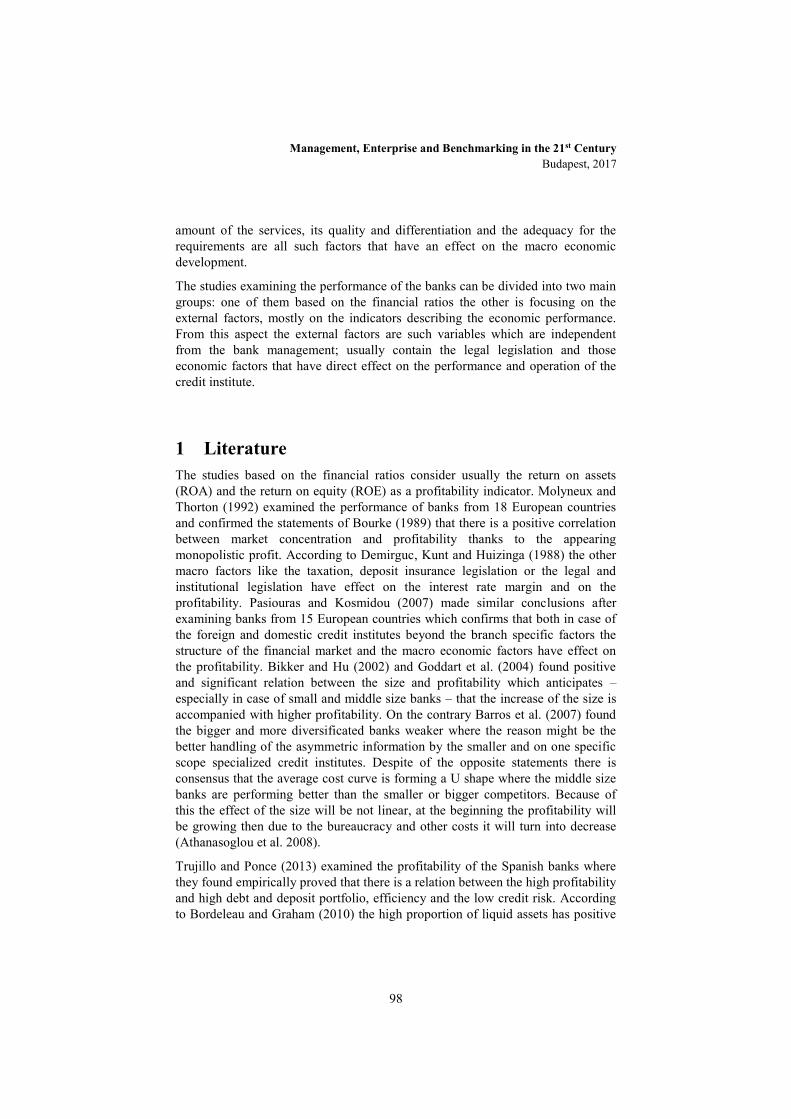
Management, Enterprise and Benchmarking in the 21st Century Budapest, 2017
98
amount of the services, its quality and differentiation and the adequacy for the requirements are all such factors that have an effect on the macro economic development.
The studies examining the performance of the banks can be divided into two main groups: one of them based on the financial ratios the other is focusing on the external factors, mostly on the indicators describing the economic performance. From this aspect the external factors are such variables which are independent from the bank management; usually contain the legal legislation and those economic factors that have direct effect on the performance and operation of the credit institute.
1 Literature The studies based on the financial ratios consider usually the return on assets (ROA) and the return on equity (ROE) as a profitability indicator. Molyneux and Thorton (1992) examined the performance of banks from 18 European countries and confirmed the statements of Bourke (1989) that there is a positive correlation between market concentration and profitability thanks to the appearing monopolistic profit. According to Demirguc, Kunt and Huizinga (1988) the other macro factors like the taxation, deposit insurance legislation or the legal and institutional legislation have effect on the interest rate margin and on the profitability. Pasiouras and Kosmidou (2007) made similar conclusions after examining banks from 15 European countries which confirms that both in case of the foreign and domestic credit institutes beyond the branch specific factors the structure of the financial market and the macro economic factors have effect on the profitability. Bikker and Hu (2002) and Goddart et al. (2004) found positive and significant relation between the size and profitability which anticipates – especially in case of small and middle size banks – that the increase of the size is accompanied with higher profitability. On the contrary Barros et al. (2007) found the bigger and more diversificated banks weaker where the reason might be the better handling of the asymmetric information by the smaller and on one specific scope specialized credit institutes. Despite of the opposite statements there is consensus that the average cost curve is forming a U shape where the middle size banks are performing better than the smaller or bigger competitors. Because of this the effect of the size will be not linear, at the beginning the profitability will be growing then due to the bureaucracy and other costs it will turn into decrease (Athanasoglou et al. 2008).
Trujillo and Ponce (2013) examined the profitability of the Spanish banks where they found empirically proved that there is a relation between the high profitability and high debt and deposit portfolio, efficiency and the low credit risk. According to Bordeleau and Graham (2010) the high proportion of liquid assets has positive

Management, Enterprise and Benchmarking in the 21st Century Budapest, 2017
99
effect on the profitability, however after a certain level, the effect weakens. The examined sample contained 65 North-American banks. Klaassen and Eeghen (2015) used a data of 23 years for examining the effect of different financial ratios on the asset and equity based profitability and created a performance scheme system. Schildbach and Wenzel (2013) highlighted the difference of the profitability between the European and North American banks. Here the development of the lending activity and the other constant revenues played an important role which already reached the pre-crisis levels.
2 Material and Method We downloaded the necessary data from the „Bankscope” database, provided by Bureau van Dijk which contains the financials of more than 30 000 credit institutes worldwide. Our selected timeframe covers the 2005-2014 period and focusing on 2 geographical regions, North-America and the European Union, in the latter the V4 countries are examined more deeply. We excluded all those banks where the data was not available for the whole term. The central banks were also excluded then we have selected the 400-400 largest European and North American entities according to total average assets and evaluated 184 banks of the V4 countries. The final sample contained only commercial banks.
We were looking for such regression method which allows the analysis of both the cross sectional and time series data, that’s why we choose the panel regression method. The panel models take into account the non-observed heterogeneity of the data, can be fixed or random effect, depending on the individual/temporal effects are considered as constant or variable. The regressive relation between the time series with n variable and T period is described by the following equation:
Yit = α +b Xit + i+it
where α means constant
Y is the dependent variable
β’s are the coefficients
X are the independent variables
i+it are the rezidums
From this we can set the following equation
Yi = α +b Xi + i+i , ahol
Yi = Σt Yit/Ti , Xi= Σt Xit/Ti , i =Σt it/Ti

Management, Enterprise and Benchmarking in the 21st Century Budapest, 2017
100
Subtracting the two equation from each other we get:
(Yit-Yi)=(Xit-Xi) bi+(it- i)
This examination was not performed for the whole sample, only the V4 banks were taken into consideration, and only those ones where all examined data were available. Thus our sample number decreased to 46. At the V4’s the crisis did not caused a structural fraction in the data, that’s why the panel method seemed to be applicable for the analysis. The calculations were done with the usage of the Stata software where we first declared the data as a panel data, and then we ran the two type of regression analysis. We used the Haussmann test in order to decide which one to choose. It examines whether there is a significant correlation between the regressors and the random effect or not. If there is, then the random effect has to be applied, if not the fix effect has to be selected.
In most of the cases the dependent variables were the average return on assets and average return on equity which is confirmed by the literature overview. In case of the independent variables we tried to involve more areas which might have effect on the profitability like the quality of the assets, the equity, the liquidity or the operation. From this reason we selected the following ratios:
Net Interest Margin
Total Capital Ratio
Impaired Loans/Gross Loans
Other Operating Incomes/Average Total Assets
Net Loans/Average Total Assets
Equity/Total Assets
Equity/Net Loans
Logarithm of the Total Assets
Yearly average Inflation
Yearly GDP Growth
3 Results
3.1 Results of the descriptive statistics In the first step we are looking for the answer that what kind of changes can be observed in the profitability from 2005 to 2014 in case of the commercial banks of

Management, Enterprise and Benchmarking in the 21st Century Budapest, 2017
101
the V4 countries. For measuring the profitability we used the well-known ratios valuating the income of the shareholders founds, the average return of equity. The other parallel ratio is used for balancing the distortion caused by the differences in the leverage during the usage of the ROAE.
Figure 1.
ROAE weighted by total assets of selected commercial banks of Visegrad countries with indication of interquartile range and median
Source: own calculations based on Bankscope data
As it is shown on the first figure, the V4 banks were quite profitable before the escalation of the financial crisis. It can be also followed that the return of equity went down to 5,2% in 2011 from the pre-crisis level of 19% which can be considered as a 72% absolute decrease. In the same period the return of assets ratio decreased to 0,8% from 1,7% which is a 53% absolute decline. The favorable tendencies of 2012 and the expectations of the recovery temporarily increased both ratios but the last two examined year brought another setback. Examining the different factors it can be concluded that the different development of the two examined profitability ratios is thanks to the decrease of the average leverage.
Figure 2.
Average ROAE of selected commercial banks by countries
Source: own calculations based on Bankscope data
The 2nd figure displays the ROAE ratio of the commercial banks by country. In Poland an in the Czech Republic the ratio decreased with one third in the examined years due to the financial crisis. The profitability of the banks after a

Management, Enterprise and Benchmarking in the 21st Century Budapest, 2017
102
heavy fluctuation went down with 42%. In the same time after 2009 the Hungarian decline was so dramatic that it was examined by the researchers of the Hungarian National Bank but probably will be a basis of many future researches.
Lets see the time series of the ROAA country by country.
Figure 3.
Average ROAA of selected commercial banks by countries
Source: own calculations based on Bankscope data
On the 3rd figure the nominal change is smaller but the tendencies are similar to the ROAA ratio. The equity based profitability of the Czech banks decreased from 1,5% to 1,3%, in Slovakia it was from 1,3% to 1,0% and in Poland the diminution was 0,3% from 1,8%. More significant was the decline of the equity based profitability of the Hungarian banks where it went down from 2,1% to -2,5%.
It can be concluded that the low performance of the V4 banks was strongly influenced by the Hungarian numbers. It makes it more interesting that the average leverage of the Hungarian banks is increased in the examined period which moderated de decrease of the ROAE with 5%.
In the following steps we extended the scope of the analysis to the North-American and European Union banks in order to see how they fit to the previously presented results. Let’s see first the evaluation of the ROAA and ROAE at 177 American banks.

Management, Enterprise and Benchmarking in the 21st Century Budapest, 2017
103
Figure 4.a.
ROAE weighted by total assets of selected American commercial banks with indication of interquartile range and median
Source: own calculations based on Bankscope data
Figure 4.b. ROAA weighted by total assets of selected American commercial banks with indication of
interquartile range and median
Source: own calculations based on Bankscope data
At the beginning of the examined period the return on equity was 14% (left axis) a bit less than at the V4’s. The decline of the profitability starts earlier and the measure is more drastic compared to the V4 banks. In the same time the signs of the recovery also appeared earlier however the 2014 level was 34% lower than before the crisis. The ROAA was also below the values that we have seen on the 1st figure and the decline was more powerful in 2009. The average profitability of the commercial banks was close to zero at the end of 2009 but we have to add that the standard deviation was high in the sample (the lowest value was -9,1%, the highest 8,8%).
The profitability of the Western European banks was examined on a sample of 127 commercial banks; the results can be seen on the 6th figure.
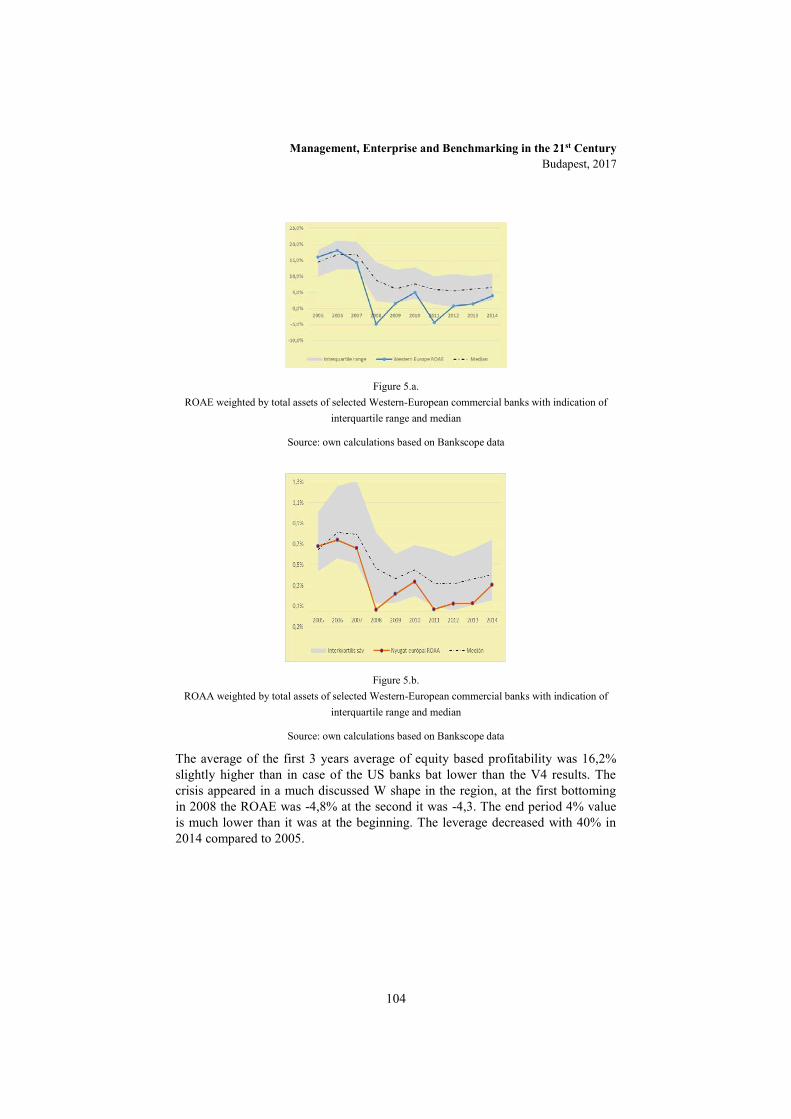
Management, Enterprise and Benchmarking in the 21st Century Budapest, 2017
104
Figure 5.a. ROAE weighted by total assets of selected Western-European commercial banks with indication of
interquartile range and median
Source: own calculations based on Bankscope data
Figure 5.b.
ROAA weighted by total assets of selected Western-European commercial banks with indication of interquartile range and median
Source: own calculations based on Bankscope data
The average of the first 3 years average of equity based profitability was 16,2% slightly higher than in case of the US banks bat lower than the V4 results. The crisis appeared in a much discussed W shape in the region, at the first bottoming in 2008 the ROAE was -4,8% at the second it was -4,3. The end period 4% value is much lower than it was at the beginning. The leverage decreased with 40% in 2014 compared to 2005.
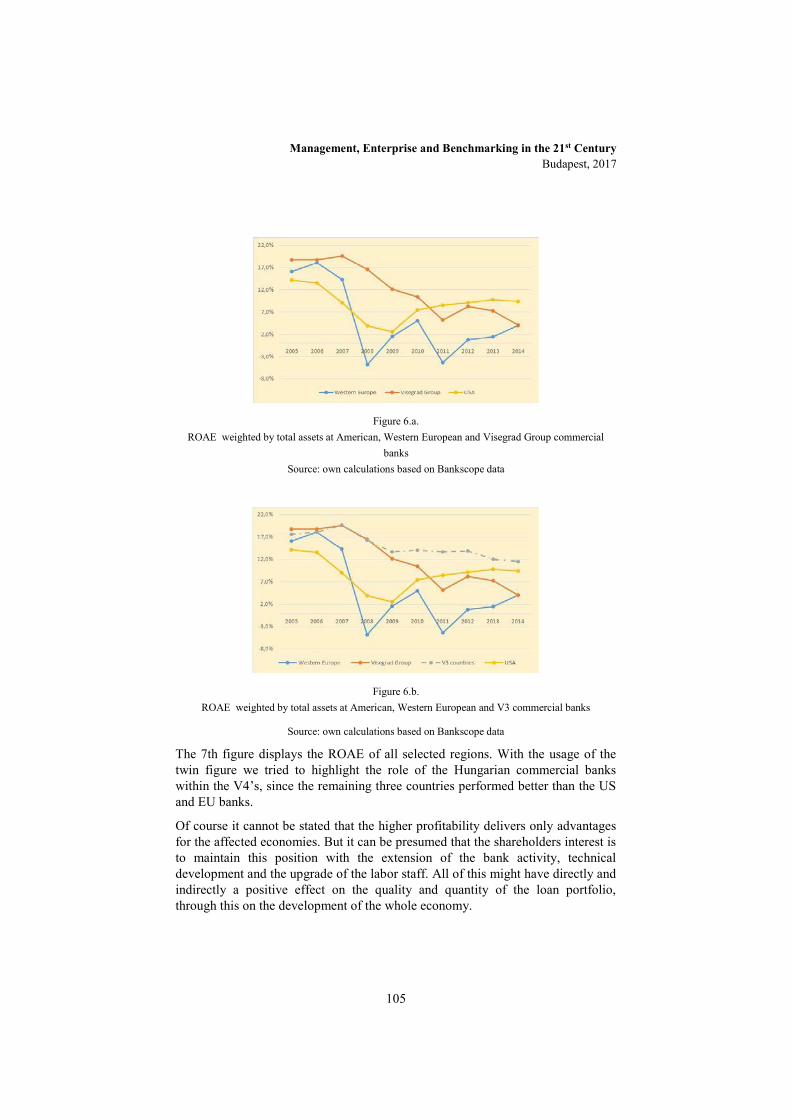
Management, Enterprise and Benchmarking in the 21st Century Budapest, 2017
105
Figure 6.a. ROAE weighted by total assets at American, Western European and Visegrad Group commercial
banks Source: own calculations based on Bankscope data
Figure 6.b. ROAE weighted by total assets at American, Western European and V3 commercial banks
Source: own calculations based on Bankscope data
The 7th figure displays the ROAE of all selected regions. With the usage of the twin figure we tried to highlight the role of the Hungarian commercial banks within the V4’s, since the remaining three countries performed better than the US and EU banks.
Of course it cannot be stated that the higher profitability delivers only advantages for the affected economies. But it can be presumed that the shareholders interest is to maintain this position with the extension of the bank activity, technical development and the upgrade of the labor staff. All of this might have directly and indirectly a positive effect on the quality and quantity of the loan portfolio, through this on the development of the whole economy.
Management, Enterprise and Benchmarking in the 21st Century Budapest, 2017
106
3.2 Results of the Panel Regression During the panel regression two models were performed, one for the ROAA and another for the ROAE dependent variables. According to the result of the Haussmann test, in both cases the fix effect model proved to be better.
The F test was significant in both cases, so we refuse the null hypothesis that there is no relation between the dependent and independent variables. R2: within = 0.4184 Number of observations 460
Between= 0.3814 Number of groups 46
Total= 0.4005
Variables Coefficients Stand. Err. t P>t [95% Conf. Interval]
TCR 0,147 0,117 1,26 0,21 -0,0830 0,3771
IMPG -1,991 0,133 -15,01 0,000 -2,2512 -1,7298
trans9 0,014 0,011 1,22 0,225 -0,0086 0,0364
NLT -0,050 0,073 -0,68 0,496 -0,1940 0,0942
ETA 0,741 0,301 2,46 0,014 0,1490 1,3340
ENL -0,035 0,032 -1,09 0,277 -0,0972 0,0279
LNA 2,371 2,006 1,18 0,233 -1,5733 6,3154
INF 1,100 0,335 3,29 0,001 0,4424 1,7576
GDP 0,127 0,204 0,62 0,532 -0,2731 0,5276
_cons -26,061 30,484 -0,85 0,393 -85,9872 33,8647 R2: within = 0.3991 Number of observations 460
Between = 0.4497 Number of groups 46
Total = 0.4242
Változók Koefficiensek Stand. Hiba t P>t [95% Conf. Interval]
TCR 0,024 0,011 2,220 0,027 0,003 0,045
IMPG -0,155 0,012 -12,700 0,000 -0,179 -0,131
trans9 0,001 0,001 0,780 0,436 -0,001 0,003
NLT -0,016 0,007 -2,410 0,016 -0,030 -0,003
ETA 0,218 0,028 7,830 0,000 0,163 0,272
ENL -0,013 0,003 -4,320 0,000 -0,018 -0,007
LNA 0,346 0,185 1,870 0,062 -0,017 0,710
INF 0,098 0,031 3,170 0,002 0,037 0,158
GDP 0,021 0,019 1,110 0,268 -0,016 0,058
_cons -5,042 2,810 -1,790 0,073 -10,565 0,482 Table 1.
Results of the panel regression
Source: Stata 13/own calculations
The total capital ratio proved to be significant and has a positive presage. The high value is not favorably by all means since the higher proportion of the solvency capital can be considered as abstraction of the resources. From many reasons we could think that the high proportion of the capital has positive effect on the profitability. The available capital act as a safety net during the investments

Management, Enterprise and Benchmarking in the 21st Century Budapest, 2017
107
(Athanasoglou et al. 2008), thus the financing of the assets will have also better conditions. According to Berger (1995) the increase of the capital can be a sign which intended to demonstrate the prosperity for the external environment and increase the trust.
The impaired loans/gross loans ratio was significantly negative and means that the bad loan portfolio has an effect on both dependent variables, and the high level of capital reserve has a negative effect on the profitability thus the effect harmonize with the expectations.
The equity/total assets were significant in case of both dependent variables. The direction is positive so the capitalization has a positive effect on the profitability, unlike the equity/net loans ratio which was significant for the ROAA however the change does not modify substantially the value of the dependent variable.
The positive effect of the inflation on the profitability anticipates the good forecasting ability of the bank management. If it’s effective, with the modification of the interest rate levels, the incomes can increase faster as the costs which will result is the context explained in the model (Athanassoglou et al, 2005). The positive relation between the profitability and the inflation was proved in more previous studies (Alexiou and Sofoklis 2009; García-Herreto et al. 2009; Pasiouras and Kosmidou 2007).
The net loans/total assets ratio has a negative coefficient in the model, the variable was only significant in case of the ROAA, and the direction slightly goes against the current conclusions since the profitability will grow with the higher amount of debt. According to Garcia and Herrero (2009) the higher operational costs which are caused by the high amount of debt can be balanced by the growth of the profit, till the determination of the interest rates is liberalized.
The explanatory power of the model was higher in case of the ROAE, here 41,8% of the deviations of the profitability were explained by the independent variables. At the ROAA it was a bit lower , 39,9%
Conclusions Our study tried to demonstrate the profitability influencing factors on the commercial banking sector focusing mainly on the V4 countries. In order to carry on a deep analysis we examined the data of nearly 1000 banks, in the panel regression we involved 46 of them thus it contained 460 observations. The results empirically proved that the significant variables were the same like in the previous studies in the same sector and period. During the process of the data several former context were confirmed for instance the low proportion of the impaired loans has a positive effect on the profitability because the allocative obligation caused by the bad payment behavior can have negative effect on the profitability.
Management, Enterprise and Benchmarking in the 21st Century Budapest, 2017
108
Our study is obviously limited, the conclusions are incomplete. Despite all of this we hope that our study contributed a bit to the understanding of the problem and will help to find a solution.
References
[1] Ábel I., Kovalszky Zs., Módos D. (2015): Hajlító csapások – Az állami segítség ára az Amerikai Egyesült Államok bankrendszerében. Hitelintézeti szemle, 14. évf. különszám, november, pp. 14,32.
[2] Alexiou, C., Sofoklis, V. (2009): Determinants of bank profitability: Evidence from the Greek banking sector. Economic Annals 182,pp 93,118.
[3] Athanasoglou, P. P., Brissimis, S. N., Delis, M. D. (2008): Bank,specific, industryspecific and macroeconomic determinants of bank profitability. Journal of International Financial Markets, Institutions and Money 18,pp 121,136.
[4] Barros, C. P., Ferreira, C., Willians, J. (2007): Analysing the determinants of performance of best and worst European banks: A mixed logit approach. Journal of Banking and Finance 31,pp 2189–2203.
[5] Barth, J., Caprio, G., Levine, R. (2004): Bank Regulation and Supervision:What works best? Journal of Financial Intermediation, 13(2),pp 205,248
[6] Bikker, J. A., Hu, H. (2002): Cyclical patterns in profits, provisioning and lending of banks and procyclicality of the new Basel capital requirements. Banca Nazionale del Lavaro Quarterly Review 55, pp 143,175.
[7] Bourke, P.(1989): Concentration and other determinants of bank profitability in Europe, North America and Australia. Journal of Banking and Finance 13, 65–79.
[8] Bordeleau E., Graham C. (2010): The Impact of Liquidity on Bank Profitability. From <http://www. bankof,canada. ca/wp,content/uploads>
[9] Fábián G., Hudecz A., Szigel G. (2010): A válság hatása a vállalati hitelállományokra Magyarországon és más kelet, közép, európai országokban (Hitelintézeti Szemle 5. sz.)
[10] García, H., Gavilá, S., Santabárbara, D. (2009): What explains the low profitability of Chinese banks? Journal of Banking and Finance 33,pp 2080,2092.
[11] Klaassen, P. , van Eeghen, I., Analyzing Bank Performance: Linking ROE, ROA and RAROC (2014): available at SSRN: http://ssrn.com/abstract=2389443 or http://dx.doi.org/10.2139/ssrn.2389443

Management, Enterprise and Benchmarking in the 21st Century Budapest, 2017
109
[12] Mikkelson, W. H., Megan P., Kshitij S., (1997): Ownership and Operating Performance of Companies that Go Public, Journal of Financial Economics 44, pp 281,307.
[13] Molyneux, P., J. Thornton (1992): Determinants of European bank profitability: A note. Journal of Banking and Finance 16 pp 1173,1178
[14] Pasiouras, F., Kosmidou, K. (2007). Factors influencing the profitability of domestic and foreign commercial banks in the European Union. Research in International Business and Finance 21, 222–237
[15] Popovici M. C. (2014): Measuring Banking Efficiency By Using ROAA And ROAE: Evidence From The European Union,CES Working Papers – Volume VI, Issue 1,pp 146,153
[16] Ross, S. A. (1977): The Determination of Financial Structure: The Incentive Signaling Approach, Bell Journal of Economics 8, pp 23,40.
[17] Schildbach, J., Wenzel, C. (2013): Bank performance in the US and Europe, Deutsche Bank DB research, pp 1,20
[18] Short, B. (1979): The relation between commercial bank profit rates and banking concentration in Canada, Western Europe, and Japan. Journal of Banking and Finance3 pp 209,219.
[19] Smirlock, M. (1985): Evidence ont he (Non) Relationship between Concentration and Profitability in Banking Journal of Money, Credit and Banking, 1985, vol. 17, issue 1, pp 69,83
[20] Várhegyi, É. (2011): Kettős szorításban: a magyar bankszektor helyzete és kilátásai. Hitelintézeti szemle, 11. évf. 1. sz.
[21] https://www.mnb.hu/letoltes/penzugyi,stabilitasi,jelentes,2015,majus.pdf Date of download: 2016. augusztus 8.
[22] Hosszú, Zs. (2016): Mennyi elég? http://www.napi.hu/magyar_gazdasag/mennyi_hitel_eleg.610581.html Date of download: 2016. szeptember 2.
Management, Enterprise and Benchmarking in the 21st Century Budapest, 2017
110
The Economic Recovery, including SMEs Sector, is Secured
Prof. Dr. Miroljub Hadžić Professor, SingidunumUniversity, Belgrade, Serbia, Faculty of Business
Petar Pavlović Senior Expert Adviser, Public Policy Secretariat, Government of The Republic of Serbia
Abstract: During the period 2009-2014 Serbia faced zero rate of growth. In the last two years it put the main economic problems, namely: the budget deficit, public debt and international debt, under controll. At the same time international and domestic demant somewhat increased while inflation rate staid at low rate and as a result it seems that economic recovery is now secured.Above all market reforms in some imporatnt areas got momentum. The reaction of small and medium scale enterpises and shops was positive and again more entrepreneurs started their business than quited.
The aim of the paper is twofold: firstly, to illuminate what are the main reasons for overall positive economic trends especially in SMEE sector and secondly, to elaborate why is important now to introduce measures in order to improve competitiveness of Serbian SMEs and how to do so.
Keywords: SMEE, market reform ,recovery, support
1 Introduction Prior to the crisis, which negatively affected Serbian economy at the end of 2008 and the beginning of 2009, SME sector experienced fast development and became important economic subject. It created 40% of total GDP, employed almost 2/3 of total employment and contributed with ½ into total export. This encouraging
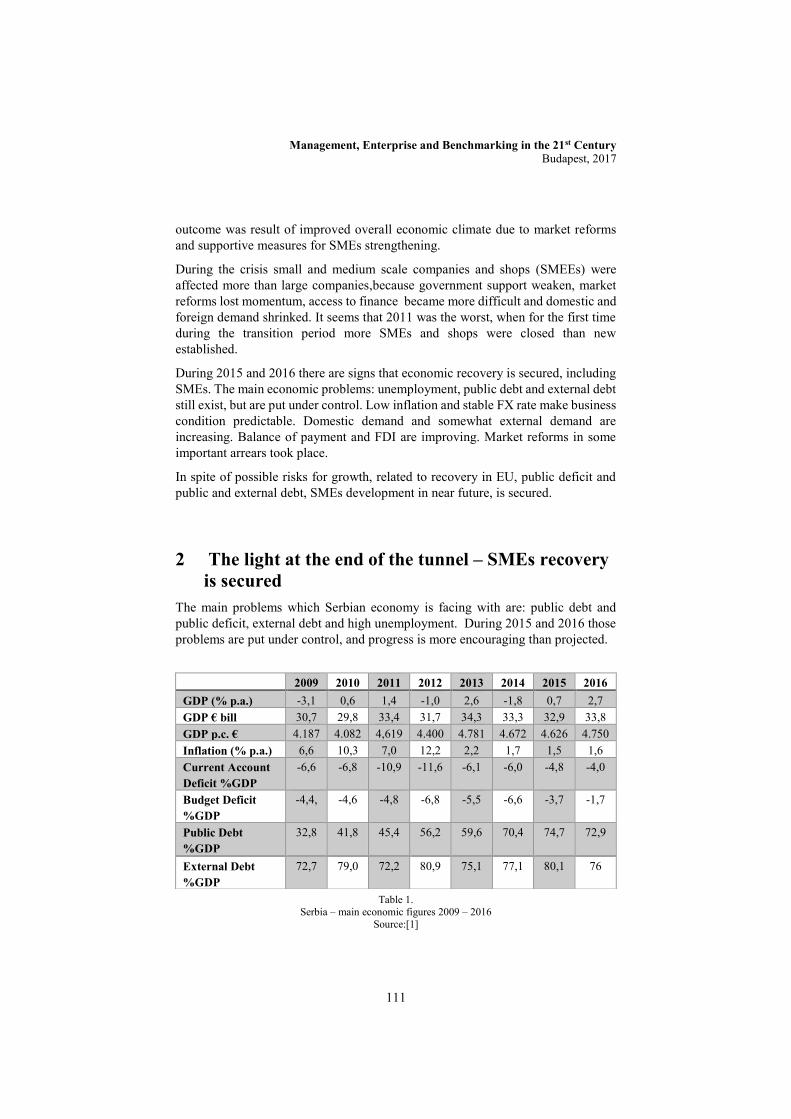
Management, Enterprise and Benchmarking in the 21st Century Budapest, 2017
111
outcome was result of improved overall economic climate due to market reforms and supportive measures for SMEs strengthening.
During the crisis small and medium scale companies and shops (SMEEs) were affected more than large companies,because government support weaken, market reforms lost momentum, access to finance became more difficult and domestic and foreign demand shrinked. It seems that 2011 was the worst, when for the first time during the transition period more SMEs and shops were closed than new established.
During 2015 and 2016 there are signs that economic recovery is secured, including SMEs. The main economic problems: unemployment, public debt and external debt still exist, but are put under control. Low inflation and stable FX rate make business condition predictable. Domestic demand and somewhat external demand are increasing. Balance of payment and FDI are improving. Market reforms in some important arrears took place.
In spite of possible risks for growth, related to recovery in EU, public deficit and public and external debt, SMEs development in near future, is secured.
2 The light at the end of the tunnel – SMEs recovery is secured
The main problems which Serbian economy is facing with are: public debt and public deficit, external debt and high unemployment. During 2015 and 2016 those problems are put under control, and progress is more encouraging than projected.
Table 1. Serbia – main economic figures 2009 – 2016
Source:[1]
2009 2010 2011 2012 2013 2014 2015 2016 GDP (% p.a.) -3,1 0,6 1,4 -1,0 2,6 -1,8 0,7 2,7 GDP € bill 30,7 29,8 33,4 31,7 34,3 33,3 32,9 33,8 GDP p.c. € 4.187 4.082 4,619 4.400 4.781 4.672 4.626 4.750 Inflation (% p.a.) 6,6 10,3 7,0 12,2 2,2 1,7 1,5 1,6 Current Account Deficit %GDP
-6,6 -6,8 -10,9 -11,6 -6,1 -6,0 -4,8 -4,0
Budget Deficit %GDP
-4,4, -4,6 -4,8 -6,8 -5,5 -6,6 -3,7 -1,7
Public Debt %GDP
32,8 41,8 45,4 56,2 59,6 70,4 74,7 72,9
External Debt %GDP
72,7 79,0 72,2 80,9 75,1 77,1 80,1 76

Management, Enterprise and Benchmarking in the 21st Century Budapest, 2017
112
At the end of third quart of 2016 external debt amounted 25,7 billion which was 0,5 billion less than at the end of 2015, due to repayment which was made by government mainly (374 mill while private debtors repaid 134 million). At the same time the share of external debt in GDP was 76%, which is encouraging improvement in comparison to its maximum (81% at the end of 2013)[1].In 2016 Budget deficit was 1,7% of GDP (while was 6,6 and 3,7% of GDP in 2015 and 2014, respectively). Total public debt (internal and external) was 24,8 billion €, or 72,9% of GDP (while was 75% at the end of 2015)[1]. Total employment increased 3% in 2016, mainly in private sector (5,3 % increase). At the same time unemployment is still serious problem, especially among young generations, but with decreasing trend (13,8% in the third quart of 2016)[1].
Inflation rate after years became comparable to EU level. Inflation rate was 1.6% in 2016 (1,5 % in 2015 and 1,7% in 2014). Moreover it was less than the lower limit targeted by National Bank of Serbia, as target was 4± 2%, so it was corrected down to 3± 1,5%,. Low inflation rate was result of low inflation pressure related to internal and external factors as well, namely oil prices, prices of agricultural products, low domestic and EU demand. Central Bank (NBS) additionally decided to put interest rate (referent interest rate is interest rate on state bonds repurchased in one week) down to 4%, as a part of monetary relaxation from May 2013 in which interest rate decreased by 7,75 pp[2]. FX rate of Dinar was stable as it depreciated 3,5% in the last four years, which was outcome of low inflation rate, high volume of FDI (1,6 bill € in 2016 and 1,8 bill € in 2015), stand - by arrangement with IMF, improved risk position of Serbia VS foreign creditors and more than enough FX reserves of NBS for intervention on FX market (amounted 10,2 billion€ at the end of 2016[2].
During the period 2009-2014 Serbia was faced with zero rate of GDP growth. Economic activity is now 2,4 % higher in comparison to pre - crisis period. In 2016 growth of economic activity was 2,7 % due to increase in industrial production (increase 4,7%), services (volume of retail trade increased 7,5% and tourism 13%), investment activities and export [1]. Projection of growth of GDP in 2016 was corrected upward, because of increase in economic activities and Balance of Payment improvement. In 2016 export volume was higher for 11,5 % and import 6,1 %, with increasing cover of value of import by export (77%). Trade balance was at the same time 4% of GDP and completely was covered by inflow of FDI.
Market reforms got momentum in recent period, especially in some important and sensitive areas. Namely, getting of construction permit is now improved, necessary time to get it is 30 days and procedure is in e-form. In the past it was one of the main obstacles in business, with time frame of more than one year. The Labor legal framework became more flexible, with more precise evidence of (un)employment and more powerful labor inspection. The Fiscal restructuring for the first time became strict and, although very painful, succeed to stop increase of public debt [3].
In spite of bright signs that economic recovery is secured and economic trends better than projected, there are some risks for growth in the next period. GDP increase in
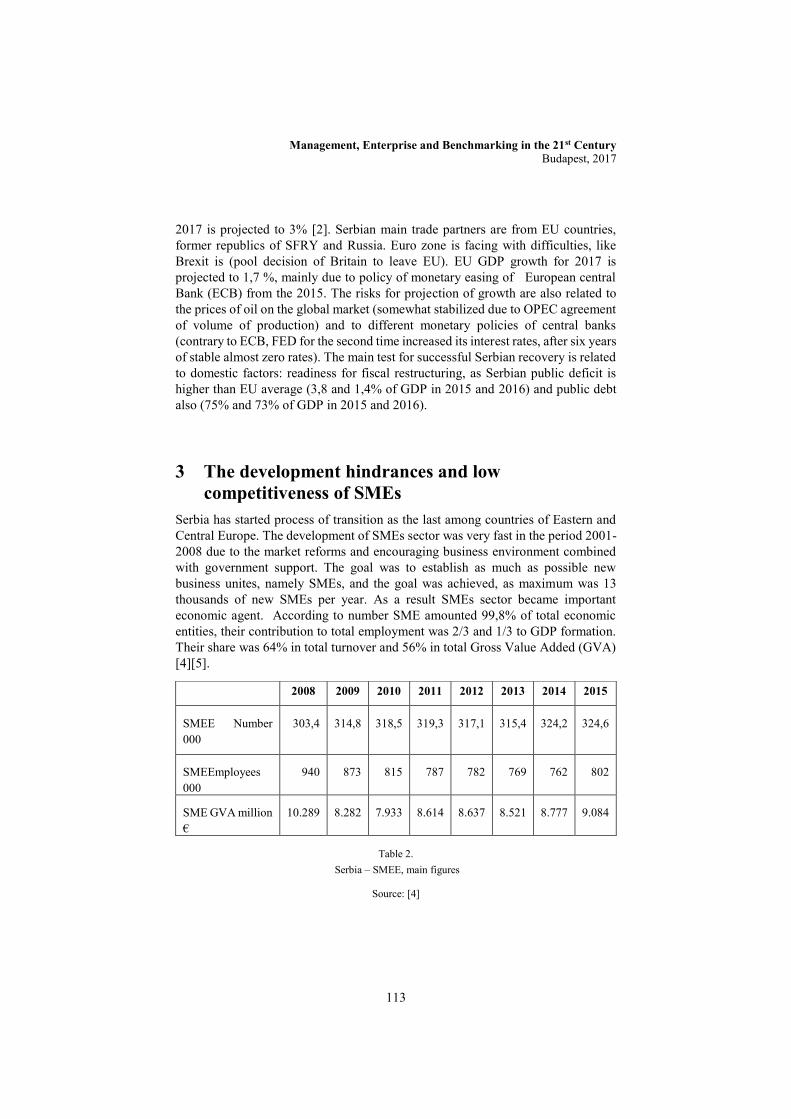
Management, Enterprise and Benchmarking in the 21st Century Budapest, 2017
113
2017 is projected to 3% [2]. Serbian main trade partners are from EU countries, former republics of SFRY and Russia. Euro zone is facing with difficulties, like Brexit is (pool decision of Britain to leave EU). EU GDP growth for 2017 is projected to 1,7 %, mainly due to policy of monetary easing of European central Bank (ECB) from the 2015. The risks for projection of growth are also related to the prices of oil on the global market (somewhat stabilized due to OPEC agreement of volume of production) and to different monetary policies of central banks (contrary to ECB, FED for the second time increased its interest rates, after six years of stable almost zero rates). The main test for successful Serbian recovery is related to domestic factors: readiness for fiscal restructuring, as Serbian public deficit is higher than EU average (3,8 and 1,4% of GDP in 2015 and 2016) and public debt also (75% and 73% of GDP in 2015 and 2016).
3 The development hindrances and low competitiveness of SMEs
Serbia has started process of transition as the last among countries of Eastern and Central Europe. The development of SMEs sector was very fast in the period 2001-2008 due to the market reforms and encouraging business environment combined with government support. The goal was to establish as much as possible new business unites, namely SMEs, and the goal was achieved, as maximum was 13 thousands of new SMEs per year. As a result SMEs sector became important economic agent. According to number SME amounted 99,8% of total economic entities, their contribution to total employment was 2/3 and 1/3 to GDP formation. Their share was 64% in total turnover and 56% in total Gross Value Added (GVA) [4][5].
Table 2. Serbia – SMEE, main figures
Source: [4]
2008 2009 2010 2011 2012 2013 2014 2015
SMEE Number 000
303,4
314,8 318,5 319,3 317,1 315,4 324,2 324,6
SMEEmployees 000
940 873 815 787 782 769 762 802
SME GVA million €
10.289 8.282 7.933 8.614 8.637 8.521 8.777 9.084
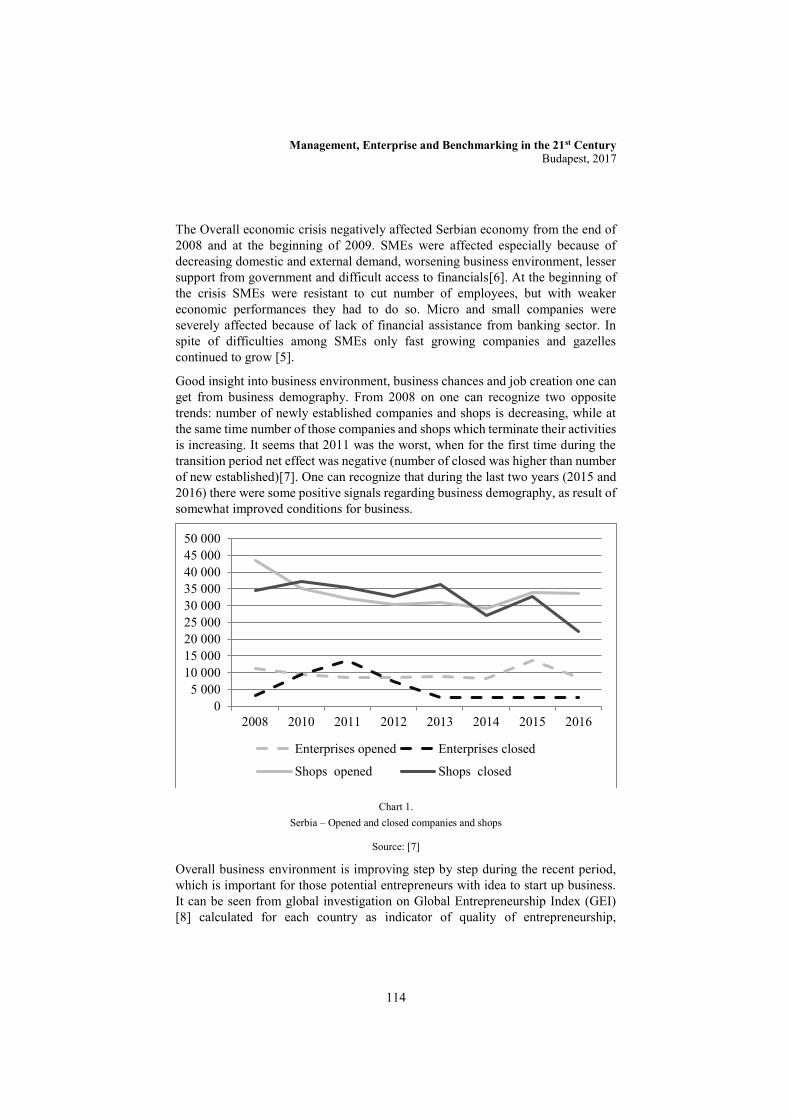
Management, Enterprise and Benchmarking in the 21st Century Budapest, 2017
114
The Overall economic crisis negatively affected Serbian economy from the end of 2008 and at the beginning of 2009. SMEs were affected especially because of decreasing domestic and external demand, worsening business environment, lesser support from government and difficult access to financials[6]. At the beginning of the crisis SMEs were resistant to cut number of employees, but with weaker economic performances they had to do so. Micro and small companies were severely affected because of lack of financial assistance from banking sector. In spite of difficulties among SMEs only fast growing companies and gazelles continued to grow [5].
Good insight into business environment, business chances and job creation one can get from business demography. From 2008 on one can recognize two opposite trends: number of newly established companies and shops is decreasing, while at the same time number of those companies and shops which terminate their activities is increasing. It seems that 2011 was the worst, when for the first time during the transition period net effect was negative (number of closed was higher than number of new established)[7]. One can recognize that during the last two years (2015 and 2016) there were some positive signals regarding business demography, as result of somewhat improved conditions for business.
Chart 1.
Serbia – Opened and closed companies and shops
Source: [7]
Overall business environment is improving step by step during the recent period, which is important for those potential entrepreneurs with idea to start up business. It can be seen from global investigation on Global Entrepreneurship Index (GEI) [8] calculated for each country as indicator of quality of entrepreneurship,
05 000
10 00015 00020 00025 00030 00035 00040 00045 00050 000
2008 2010 2011 2012 2013 2014 2015 2016
Enterprises opened Enterprises closed
Shops opened Shops closed

Management, Enterprise and Benchmarking in the 21st Century Budapest, 2017
115
individually and institutionally, especially for innovation and effect of entrepreneurship [9].Serbian GEI value is 23,1, ranked as the 72nd , which is two places better than the year earlier. Comparing to other countries within the Region of South East Europe Serbia is behind Montenegro and in front of FIROM. According to the investigation Serbia has comparative advantages related to better knowledge of entrepreneurs - beginners, linkages between entities and implementation of innovation and new technologies. Its drawbacks are: fewer chances to start business, low share of SMEs in medium and high tech sectors, low quality of human sources, scarce venture capital and low level of internationalization of SMEs [9].
Chart 2.
Global Entrepreneurship Index
Source: [9]
According to Doing Business Report 2017 Serbia belongs to top ten countries in market reforms [10]. It was ranked as the 47th while the year earlier was ranked as the 54th. The improved (e-form) and shorten procedure for construction permit was accessed as the main step forward (according to this Serbia improved its position from the 152nd to the 36th). The land registry was improved (Serbia moved from the 72nd to the 56th position) and business registry, as well (Serbia moved from the 62nd to the 42nd position). However, at the same time the Report labeled the legal
y = -1E-08x2 + 0,0016x + 9,2539R² = 0,7786
0,0
10,0
20,0
30,0
40,0
50,0
60,0
70,0
80,0
90,0
0 20000 40000 60000 80000 100000
GE
Inde
x 20
17
GDP pc PPP
USA
SwitzelandDenmark
GermanyFinland
Hungary
Serbia
Turkey

Management, Enterprise and Benchmarking in the 21st Century Budapest, 2017
116
environment and administrative procedures as bottlenecks (a contractual execution and electricity acces) [10].
In order to speed up and secure economic recovery the analysis of the main development hindrances was made [11]. In spite of improving business environment step by step and speeding up market reforms strong development hindrances still exist. The assumption is that sustainable growth and development are driven by private investments. So, the point is to find out what is constraining domestic private investment in Serbia. Firstly, administrative and regulatory burden toward private business are strong. Secondly, regulatory uncertainty is also important issue. Thirdly, information externalities prevent economic diversification and strengthening competitiveness. Fourthly, Access to finance is weak, especially for SMEs and start ups. Fifthly, human capital is constraints for knowledge intensive industries[10].
To check weather business environment is really improved, in which areas and how much, the best way is to ask entrepreneurs. It was done during September and October 2015 with thousand companies and shops [12].The survey included questions related to business results in the past and projections for near future, with important part related to market reforms realized in meantime. The main finding is that business environment is improved in some areas very much, in some areas improvements were modest, but in some areas there were backward steps.
Considerable improvement
Improvement No Improvement
Worsening
Tax and related duties on wages Construction permit Permit to start business Inspection control Court execution process GVA payment Corruption Inflation FX rate
Court procedure Para-fiscal duties Admin procedures Custom procedures Payment Public procurements Interest Credit issuing Collateral Informal economy Reform publicity
GVA rate Custom duties Credit issuing timing Bank reporting Fiscal admin
External financing Banks' loans Banks servicing Excise Real estate prices
Table 2. Serbia - Improvement of business environment 2011-2015
Source: [12]
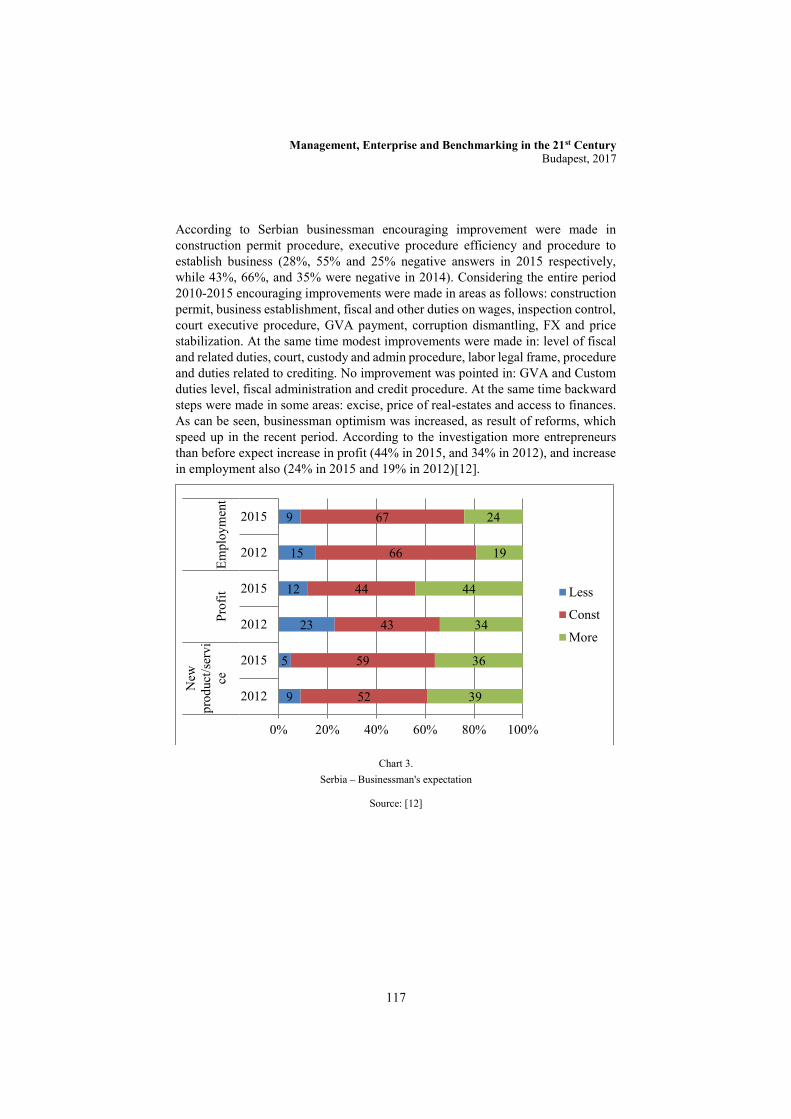
Management, Enterprise and Benchmarking in the 21st Century Budapest, 2017
117
According to Serbian businessman encouraging improvement were made in construction permit procedure, executive procedure efficiency and procedure to establish business (28%, 55% and 25% negative answers in 2015 respectively, while 43%, 66%, and 35% were negative in 2014). Considering the entire period 2010-2015 encouraging improvements were made in areas as follows: construction permit, business establishment, fiscal and other duties on wages, inspection control, court executive procedure, GVA payment, corruption dismantling, FX and price stabilization. At the same time modest improvements were made in: level of fiscal and related duties, court, custody and admin procedure, labor legal frame, procedure and duties related to crediting. No improvement was pointed in: GVA and Custom duties level, fiscal administration and credit procedure. At the same time backward steps were made in some areas: excise, price of real-estates and access to finances. As can be seen, businessman optimism was increased, as result of reforms, which speed up in the recent period. According to the investigation more entrepreneurs than before expect increase in profit (44% in 2015, and 34% in 2012), and increase in employment also (24% in 2015 and 19% in 2012)[12].
Chart 3.
Serbia – Businessman's expectation
Source: [12]
9
5
23
12
15
9
52
59
43
44
66
67
39
36
34
44
19
24
0% 20% 40% 60% 80% 100%
2012
2015
2012
2015
2012
2015
New
prod
uct/s
ervi
cePr
ofit
Empl
oym
ent
Less
Const
More
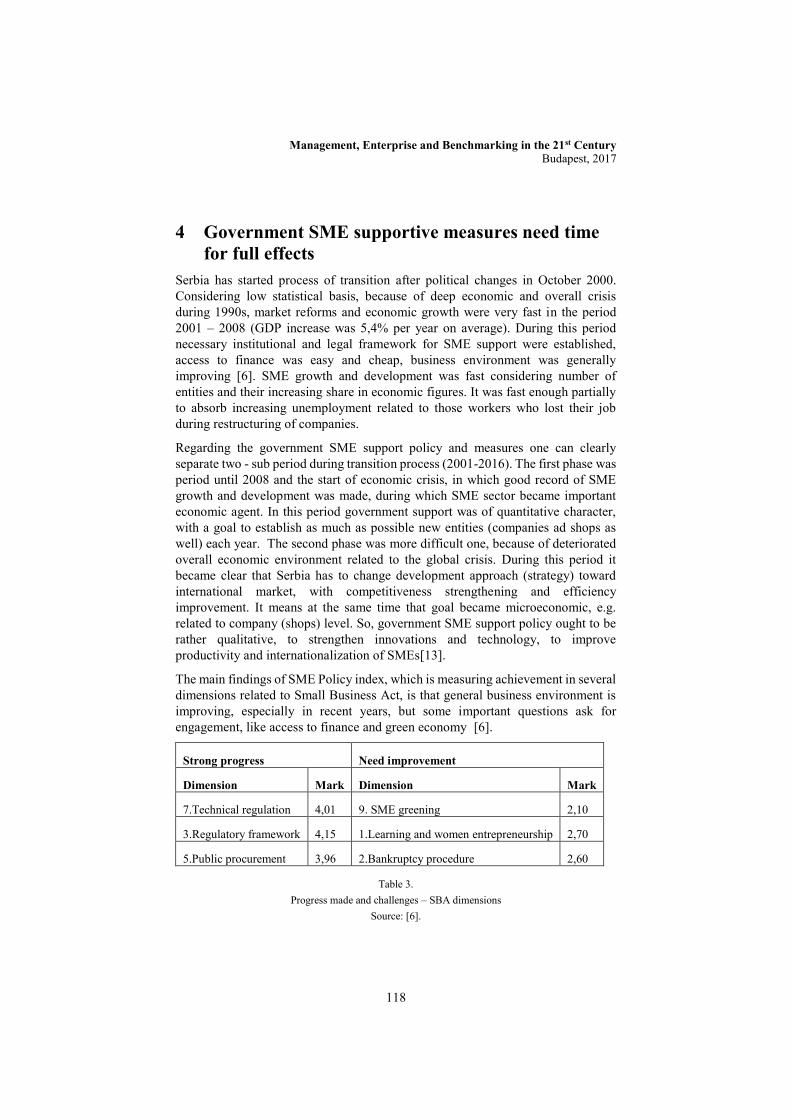
Management, Enterprise and Benchmarking in the 21st Century Budapest, 2017
118
4 Government SME supportive measures need time for full effects
Serbia has started process of transition after political changes in October 2000. Considering low statistical basis, because of deep economic and overall crisis during 1990s, market reforms and economic growth were very fast in the period 2001 – 2008 (GDP increase was 5,4% per year on average). During this period necessary institutional and legal framework for SME support were established, access to finance was easy and cheap, business environment was generally improving [6]. SME growth and development was fast considering number of entities and their increasing share in economic figures. It was fast enough partially to absorb increasing unemployment related to those workers who lost their job during restructuring of companies.
Regarding the government SME support policy and measures one can clearly separate two - sub period during transition process (2001-2016). The first phase was period until 2008 and the start of economic crisis, in which good record of SME growth and development was made, during which SME sector became important economic agent. In this period government support was of quantitative character, with a goal to establish as much as possible new entities (companies ad shops as well) each year. The second phase was more difficult one, because of deteriorated overall economic environment related to the global crisis. During this period it became clear that Serbia has to change development approach (strategy) toward international market, with competitiveness strengthening and efficiency improvement. It means at the same time that goal became microeconomic, e.g. related to company (shops) level. So, government SME support policy ought to be rather qualitative, to strengthen innovations and technology, to improve productivity and internationalization of SMEs[13].
The main findings of SME Policy index, which is measuring achievement in several dimensions related to Small Business Act, is that general business environment is improving, especially in recent years, but some important questions ask for engagement, like access to finance and green economy [6].
Strong progress Need improvement
Dimension Mark Dimension Mark
7.Technical regulation 4,01 9. SME greening 2,10
3.Regulatory framework 4,15 1.Learning and women entrepreneurship 2,70
5.Public procurement 3,96 2.Bankruptcy procedure 2,60
Table 3. Progress made and challenges – SBA dimensions
Source: [6].

Management, Enterprise and Benchmarking in the 21st Century Budapest, 2017
119
It was already mentioned that the finding is that the state is large and costly, while private sector is non – competitive [14]. Considering that after a few lost years when market reform were diminished, the market reform got momentum, it is necessary to continue with the reforming process especially in areas accessed as key bottle - necks, which stopping or slowing growth and development. As the economic growth has to be export led, the reforms would address constraints to investments in the tradable sectors and exports, access to finance for SME and start - ups, human capital for knowledge intensive industries and administrative and regulatory burden and uncertainty [17].
As fiscal deficit and public debt are the main macroeconomic problems it is necessary to continue with the fiscal consolidation. Public companies are at the very beginning of their restructuring, which have to speed up. Few dozens of still socially owned large companies also have to be restructured and sold (or closed) if one wants to cut government subsidies. In order to improve business environment further the legal framework have to be simplified and investments support system improved. For the research and innovation important, for supporting business innovation and addressing information externalities, is to adopt a new strategic and legal framework. A part of broaden reform should be improving the efficiency of managing educational system.
Conclusion SMEE sector in Serbia became an important economic agent during the period of fast growth and development between 2001-2008, in which Government support was of quantitative character, with idea to establish as much as possible new economic subjects each year. However, one can see that a critical number of SMEEs was not reached, so development of the entrepreneurial sector was not self sustained.
Serbian economy was hampered by global crisis and zero rate of growth of GDP was evidenced in the period 2009-2014. SMEEs were severely affected as domestic and foreign demand weakened, government support also and market reforms lost momentum. Only a teeny segment of fast growing SME and gazelles continued to grow.
During the recent period market reforms fastened, in some important areas were made brake through. More important, domestic and foreign demand recovered and Government put the main macro problems, like public deficit and debt under control successfully. As a result inflation rate is, for the first time, comparable to EU level and FX rate is stable. Now, Serbian development strategy has to be changed toward export oriented one. It means that government support for SMEE ought to be of qualitative sort and micro oriented, with idea to strengthen competitiveness, innovations and internationalization of SMEE.

Management, Enterprise and Benchmarking in the 21st Century Budapest, 2017
120
References
[1] Ministry of Finance of RS, Current macroeconomic situation, February 2017
[2] National Bank of Serbia, Report on Inflation, February 2017
[3] EBRD , Transition Report 2015/16
[4] Ministry of Economy of the RS, Report on SMEE 2015, Belgrade, December 2016
[5] EBRD, Diagnosing growth constraints in Southeast Europe: the case of Serbia, EBRD Working Paper No 148, 2014
[6] OECD, EU, EBRD, ETF, SME Index, Small Business Act Assessing , Western Balkans and Turkey 2016
[7] Statistical Office of the Republic of Serbia
[8] Acs Z.J., Autio E., Szerb L., National Systems of Entrepreneurship: Measurement Issues and Policy Implications, February, 2012
[9] Global Entrepreneurship Index, 2017
[10] World Bank, Doing Business Report 2017
[11] OECD, Diagnostic of key constraints to economic growth and implications for Economic Reform Program preparation, October 2015
[12] USAID, Business Enabling Project, Chamber of Commerce of RS, IPSOS Strategic Marketing, 2015
[13] Hadžić M., Pavlović P., The Need for the shift in supportive policy for SME Development, 54th European Congress of the Regional Science Association, ERSA 2014, “ Regional development & Globalization: Best practices”, Saint Petersburg, Russia, August 2014
[14] Hadžić M., Pavlović P., Finance for Serbian SME – Development Hindrance, International Conference on Management, Enterprise and Benchmarking, MEB 2016, Obuda University, Budapest, Hungary, 2016
[15] National Bank of Serbia, The Banking Sector , Report for the third quart of 2016
[16] World Bank, Doing Business Report 2015
[17] OECD, Economic Reform Program: Lessons learnt and the new process for 2016+, OECD, October 2015
Management, Enterprise and Benchmarking in the 21st Century Budapest, 2017
121
Digital Presence Index for the Examination of Small and Medium-sized Businesses
Miklós Hornyák University of Pécs, Faculty of Business and Economics
Abstract: With the spreading of the infocommunication technologies (ICT), the use thereof is becoming an increasingly important aspect of the competitiveness of businesses. With the deeper integration of these technologies, the corporate processes can be extended outside the boundaries of the given business [10]. The entry level of this process is the realization of online presence, the most obvious manifestation of which is the maintenance of a company website. Through the analysis thereof, the measurement of the competitiveness of the given business can be supported [13]. The analysis can be performed through technology and content-based approaches, but in both cases the identification and then the analysis of the websites requires significant human labour, which can be automatized with IT support [3] [15]. The technology-based approach places the emphasis on the examination of measurable values related to the website (e.g. the number, type of objects), thus it does not deal with the issues of design and usability [2]. In the course of our research we created a model for the examination of the online presence of small and medium-sized businesses. Through the technology-based, automated analysis of the websites we created a complex index (WebIX) consisting of three components which are also complex in themselves (speed, complexity, connection). In the research, we calculated the WebIX indicator through the automated, technical analysis of the hundreds of businesses included in Szerb’s HSMB database. Our aim, through the examination of a connection between the location of the businesses and the WebIX value, is the demonstration of a possible use of the WebIX, and the connection between physical environment and digital presence.
Keywords: competitiveness, small and medium-sized business, web analysis
1 Introduction
The aim of our research was the automated examination of the online presence of Hungarian small and medium-sized businesses. Our motivation was fundamentally influenced by the fact that the use of infocommunication services is beneficial for the improvement of productivity, thus it can be identified as an important element of competitiveness [14]. Furthermore, the increasingly deeper

Management, Enterprise and Benchmarking in the 21st Century Budapest, 2017
122
information technological integration of businesses is expected to result in fundamental changes in competitiveness [10]. In our research, we applied the systemic approach, which was also used previously, in the examination of competitiveness (Systemic Competitiveness) [9].
The paradigm shift that occurred in web technologies1 and their use generated a change regarding economy. It served as a transition from the earlier hit and link economy to “Like economy”. In the data-intensive approach of the “Like economy”, the flow of information is realised along the “friend” connections of the users, compared to the network of connections through conventional hyperlinks, created by designers. For the realization of this, the application of Web 2.0 technology is necessary [6].
Figure 1.
The model of digital maturity
source: own edition based on [5] [11]
However, according to the results of the research carried out by Bell Research, the Hungarian small and medium-sized businesses (SMB) live in the “digital bronze age”. Although they are open to new trends (e.g. cloud-based services) in addition to the basic IT investments introduced in previous years, their expertise is limited concerning ICT developments outside their core activities. The companies that stepped beyond the establishment of basic IT infrastructure, created a company website in 41% of the cases, while only 30% of these companies have a Facebook profile as well [1]. In many cases the company websites remind the user of the web solutions of early years, although the world has progressed from the Web 1.0
1 Web 1.0 websites manage the movement between websites through the hyperlink
defined by the designer of the page, while the Web 2.0 website is constructed along the connections resulting from the activities of users.

Management, Enterprise and Benchmarking in the 21st Century Budapest, 2017
123
solutions (“Web-as-information-source”) to the Web 2.0 solutions („Web-as-participation-platform”) in the past years. The main difference between them can be identified in the management of information [12]. On the basis of this division, in Hungary the prevalence of Web 1.0-type solutions is characteristic. The majority of Hungarian businesses only falls into the first three categories of the stages of Digital Maturity presented in Figure 1.
For the purpose of our examination, we applied our model created with the systemic approach for the company database created by Szerb and colleagues for the HSMB research [13]. On the basis of the above, we carried out the examination of online presence (WebIX) through the technical analysis of company websites, which is a process that is performed in the previously created system, in an automated way.
1.1. The possibilities of analysing the websites With the spreading of websites and the advancement of technology, the complexity of websites also increased. The websites can be analysed through a technological or content-based approach, but in both cases the identification, followed by the analysis of the websites requires significant human labour, which, however can be automated through IT support [3] [4] [15].
Surpassing the initial ability of storing static texts, the Web 1.0. sites appeared with dynamic contents, then they became capable of managing visual and interactive, multimedia objects. As a result, the loading time as the entry point of user experience has increased dramatically. Thus, early examinations basically focused on the measurement of performance, placing less importance of the study of content or design [2] [8].
Figure 2.
The scheme of the model of Butkiewicz source: own edition based on [2]

Management, Enterprise and Benchmarking in the 21st Century Budapest, 2017
124
Several tools can be found on the Internet performing the examination of Web 1.0 websites. The following main examination categories can be created through the analysis of the operation thereof,2 which are also complex in themselves: Performance, Mobile appearance, SEO (Search Engine Optimization), Security, User experience, and Compatibility. What poses a problem is that the tools assess the examined sites through their own scoring systems, and that they typically do not use weighting possibilities when applying the indicators within the main categories. The main problem of usage is the hiding of the examination method and technique of the indicator system consisting of the main categories.
Figure 2 shows the technology-based examination model created by Butkiewicz [2], whose uniqueness lies in its systemic approach. The model considers the subject of its examination, that is, the central website, to be part of a system, the “web-ecosystem”. This approach served as the basis of the conceptional model of our examination. In his model Butkiewicz places the emphasis on measurability, which he realizes by building on previous research – which focused on communication protocols and web flow – but also exceeding them, introducing a more complex system. He defines two different systems of criteria for the examination of complexity: server and content. In case of server type complexity, he analyses the network of objects embedded in the website, referring to external services and integrating the contents, functions available through those. In case of content complexity, besides the indicators of performance, he also means the examination of objects present on the website, responsible for appearance (CSS, scripts, images, etc.).
2 Conceptional model
We based the fundamental approach of the conceptual model created for our research on Butkiewicz’s model. We examined the websites as part of a system, and we created our examination criteria through using a reduced system of indicators, adjusted to the level of development of the Hungarian SMBs. The calculation of the indicators was carried out through the development of a unique software.
Figure 3 shows the conceptional model of WebIX created in a homomorphic way. By breaking down the two sub-indexes (Web 1.0, Web 2.0) in the model, four pillars can be created, three of which have been created with the Web 1.0 examination methods. These are Speed, Complexity and Appearance. The Web
2 https://website.grader.com/; https://developers.google.com/speed/pagespeed/insights/;
http://alexa.com https://varvy.com/pagespeed/; http://seositecheckup.com/tools/js-and-css-minification-test
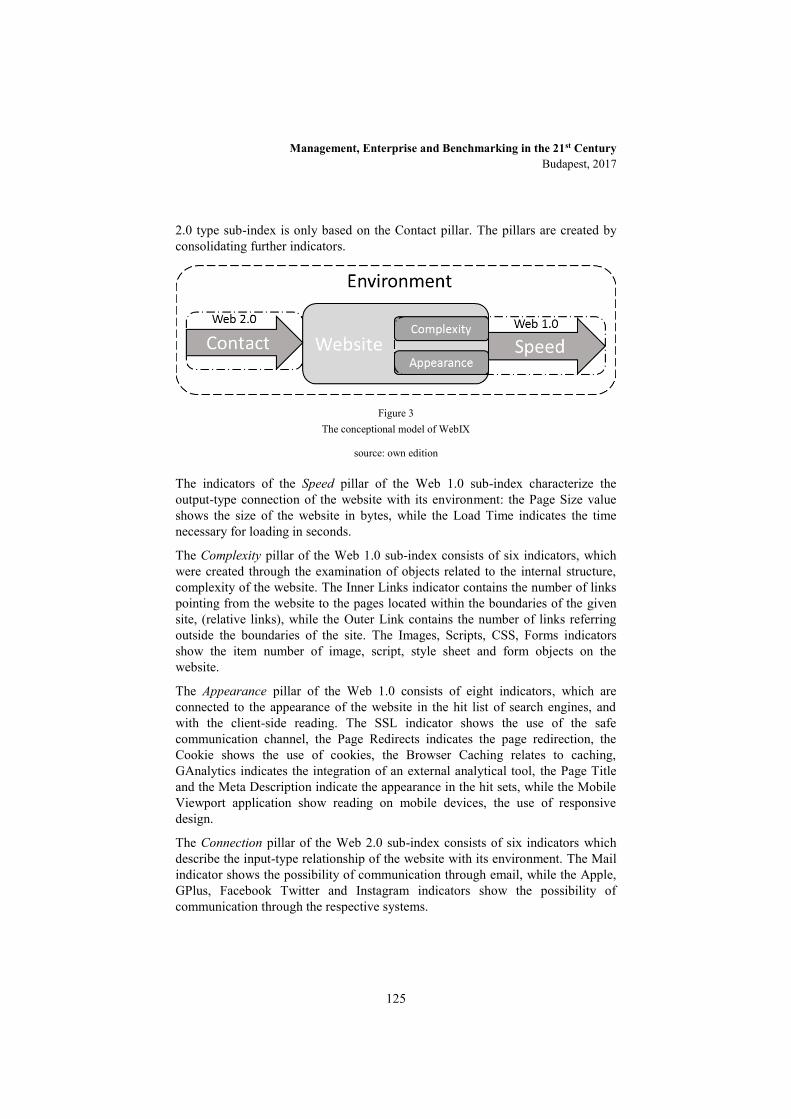
Management, Enterprise and Benchmarking in the 21st Century Budapest, 2017
125
2.0 type sub-index is only based on the Contact pillar. The pillars are created by consolidating further indicators.
Figure 3
The conceptional model of WebIX
source: own edition
The indicators of the Speed pillar of the Web 1.0 sub-index characterize the output-type connection of the website with its environment: the Page Size value shows the size of the website in bytes, while the Load Time indicates the time necessary for loading in seconds.
The Complexity pillar of the Web 1.0 sub-index consists of six indicators, which were created through the examination of objects related to the internal structure, complexity of the website. The Inner Links indicator contains the number of links pointing from the website to the pages located within the boundaries of the given site, (relative links), while the Outer Link contains the number of links referring outside the boundaries of the site. The Images, Scripts, CSS, Forms indicators show the item number of image, script, style sheet and form objects on the website.
The Appearance pillar of the Web 1.0 consists of eight indicators, which are connected to the appearance of the website in the hit list of search engines, and with the client-side reading. The SSL indicator shows the use of the safe communication channel, the Page Redirects indicates the page redirection, the Cookie shows the use of cookies, the Browser Caching relates to caching, GAnalytics indicates the integration of an external analytical tool, the Page Title and the Meta Description indicate the appearance in the hit sets, while the Mobile Viewport application show reading on mobile devices, the use of responsive design.
The Connection pillar of the Web 2.0 sub-index consists of six indicators which describe the input-type relationship of the website with its environment. The Mail indicator shows the possibility of communication through email, while the Apple, GPlus, Facebook Twitter and Instagram indicators show the possibility of communication through the respective systems.
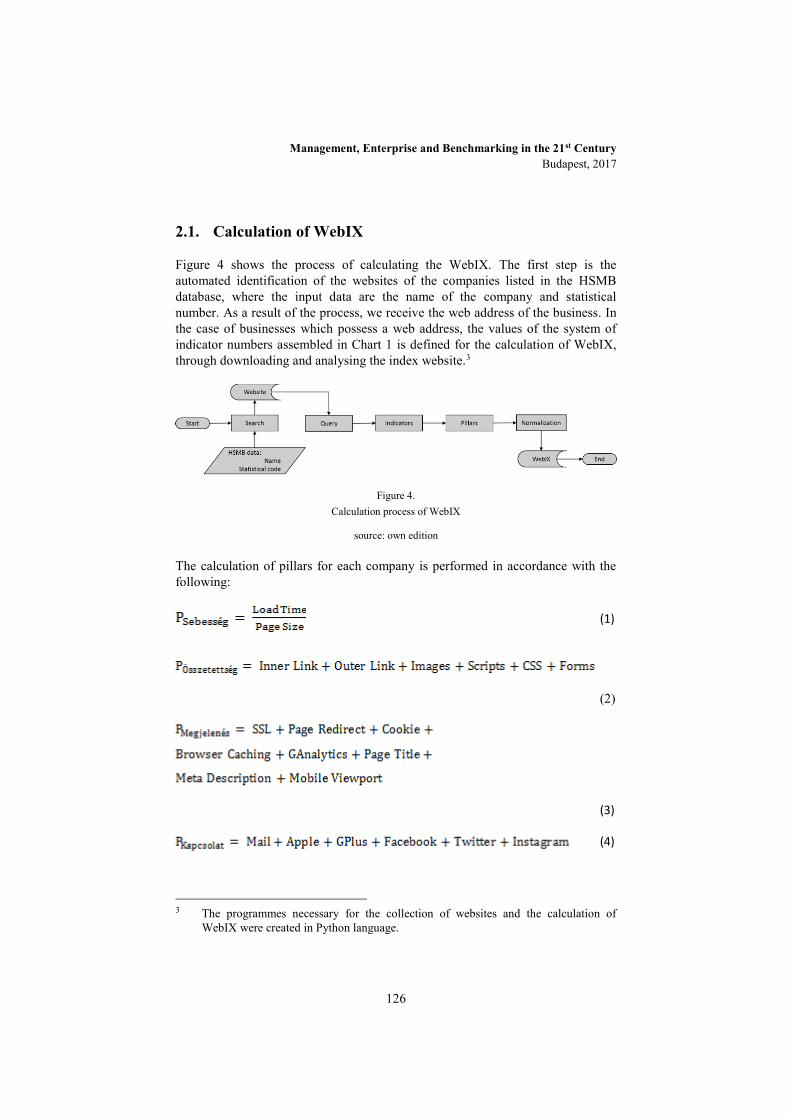
Management, Enterprise and Benchmarking in the 21st Century Budapest, 2017
126
2.1. Calculation of WebIX
Figure 4 shows the process of calculating the WebIX. The first step is the automated identification of the websites of the companies listed in the HSMB database, where the input data are the name of the company and statistical number. As a result of the process, we receive the web address of the business. In the case of businesses which possess a web address, the values of the system of indicator numbers assembled in Chart 1 is defined for the calculation of WebIX, through downloading and analysing the index website.3
Figure 4.
Calculation process of WebIX
source: own edition
The calculation of pillars for each company is performed in accordance with the following:
(1)
(2)
(3)
(4)
3 The programmes necessary for the collection of websites and the calculation of
WebIX were created in Python language.

Management, Enterprise and Benchmarking in the 21st Century Budapest, 2017
127
Indicator (scale) Pillar Sub-index Index
Page Size (byte) Speed (Load Time / Page Size)
Web 1.0
WebIX
Load Time (second)
Inner Links (pcs)
Complexity (SUM)
Outer Links (pcs)
Images (pcs)
Scripts (pcs)
CSS (pcs)
Forms (pcs)
SSL (0/1)
Appearance (SUM)
Page Redirect (0/1)
Cookie (0/1)
Browser Caching (0/1)
GAnalytics (0/1)
Page Title (<65)
Meta Description (<155)
Mobile Viewport (0/1)
Mail (0/1)
Connection (SUM)
Web 2.0
Apple (0/1)
GPlus (0/1)
Facebook (0/1)
Twitter (0/1)
Instagram (0/1)
Table 1. The system of indexes for WebIX, source
own edition
We calculated the indicators and pillars in case of each company included in the HSMB database which has web address. After the calculation of the pillar values,

Management, Enterprise and Benchmarking in the 21st Century Budapest, 2017
128
the normalization thereof between the values 0-1 was performed (range transformation, 95% percentile). The calculation of sub-indexes and the WebIX value was carried out as follows, with normalized pillar values:
(5)
(6)
(7)
3 Results
27% (226 businesses) of the sample of 849 SMBs listed in the HSMB database had a web address, out of which 12 websites were not available. The identification and loading of the website was successful in case of 25%, that is, 214 businesses of the complete sample.
Table 2 shows the distribution of indicators constituting the WebIX in case of the businesses included in the sample. It can be observed in the table that the businesses extremely undervalue the aspects of safety (SSL = 0%), and consider the SEO elements (Meta Description=89,72%, Page Title=87,85%), that is, good appearance in search engines important and pay attention to is. With regards to the usage of external services (GAnalytics = 15,89%) a significant possibility for improvement can be observed. The ignoration of Web 2.0 applications (Twitter = 6,54%, GPlus = 5,61%, Apple = 10,75%) outside the mainstream (Facebook = 25,33%). The support of alternative presentation devices (tablet, mobile) also holds significant room for improvement (Mobile=29,91%).
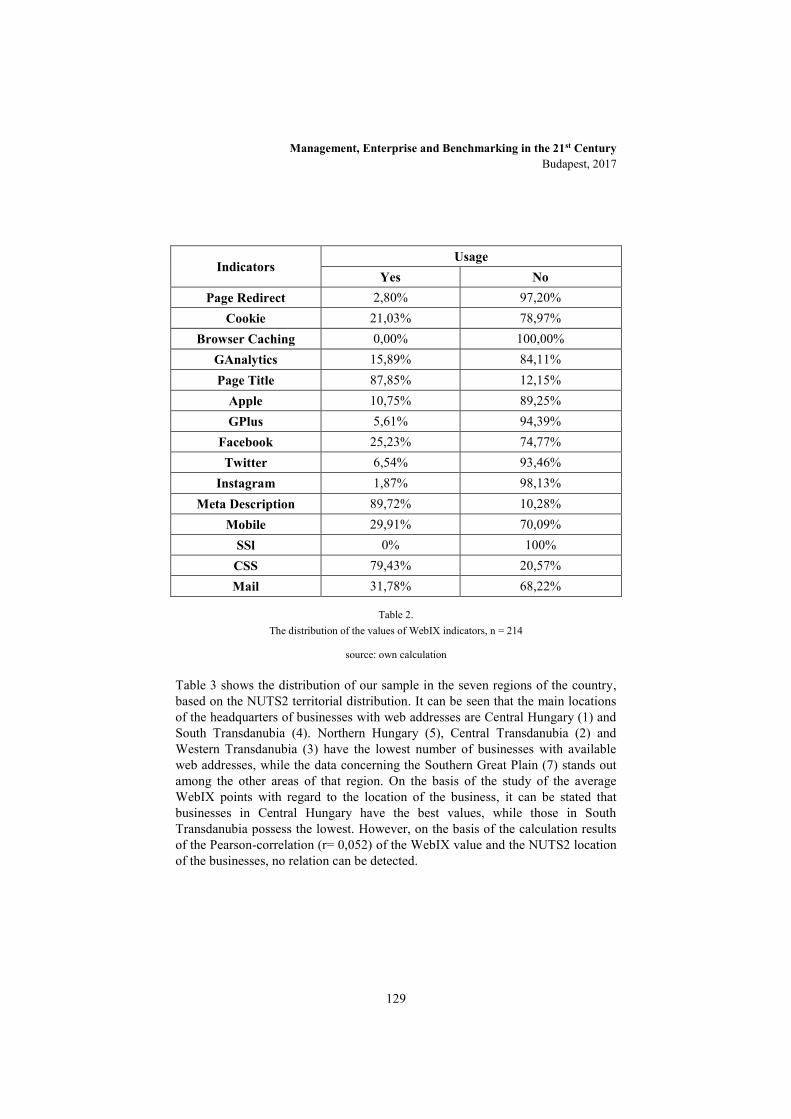
Management, Enterprise and Benchmarking in the 21st Century Budapest, 2017
129
Indicators Usage
Yes No Page Redirect 2,80% 97,20%
Cookie 21,03% 78,97% Browser Caching 0,00% 100,00%
GAnalytics 15,89% 84,11% Page Title 87,85% 12,15%
Apple 10,75% 89,25% GPlus 5,61% 94,39%
Facebook 25,23% 74,77% Twitter 6,54% 93,46%
Instagram 1,87% 98,13% Meta Description 89,72% 10,28%
Mobile 29,91% 70,09% SSl 0% 100% CSS 79,43% 20,57% Mail 31,78% 68,22%
Table 2. The distribution of the values of WebIX indicators, n = 214
source: own calculation
Table 3 shows the distribution of our sample in the seven regions of the country, based on the NUTS2 territorial distribution. It can be seen that the main locations of the headquarters of businesses with web addresses are Central Hungary (1) and South Transdanubia (4). Northern Hungary (5), Central Transdanubia (2) and Western Transdanubia (3) have the lowest number of businesses with available web addresses, while the data concerning the Southern Great Plain (7) stands out among the other areas of that region. On the basis of the study of the average WebIX points with regard to the location of the business, it can be stated that businesses in Central Hungary have the best values, while those in South Transdanubia possess the lowest. However, on the basis of the calculation results of the Pearson-correlation (r= 0,052) of the WebIX value and the NUTS2 location of the businesses, no relation can be detected.
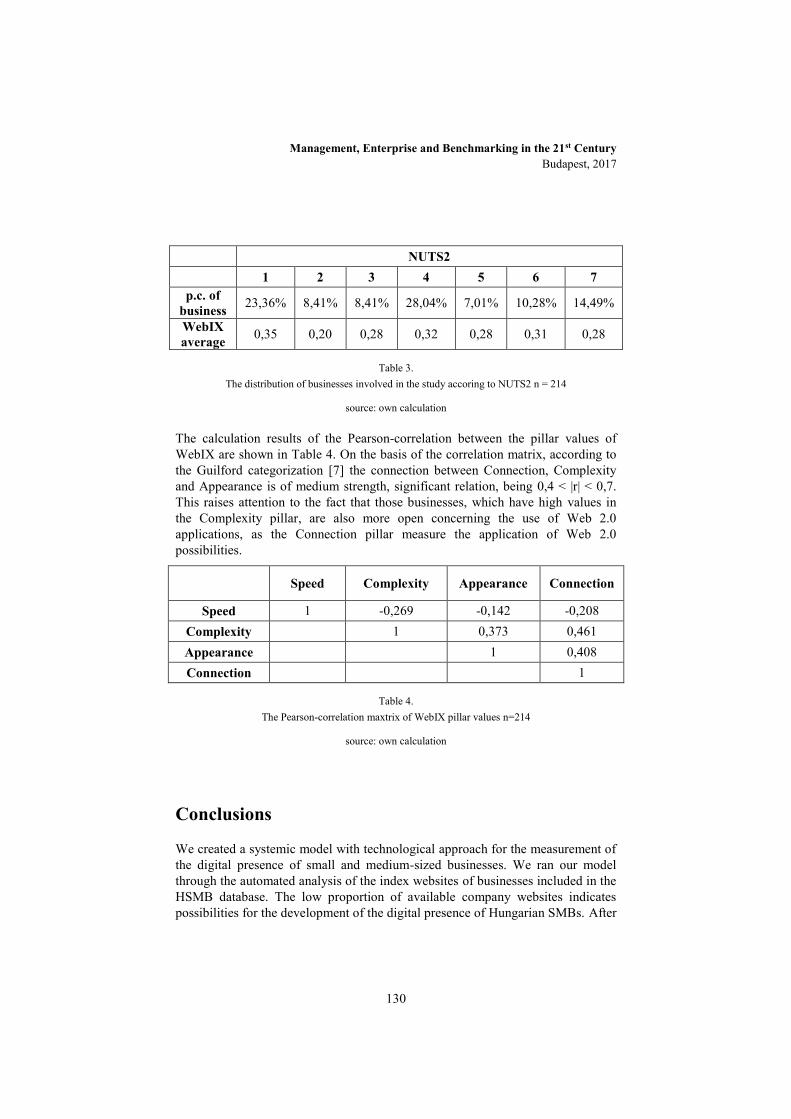
Management, Enterprise and Benchmarking in the 21st Century Budapest, 2017
130
NUTS2 1 2 3 4 5 6 7
p.c. of business 23,36% 8,41% 8,41% 28,04% 7,01% 10,28% 14,49%
WebIX average 0,35 0,20 0,28 0,32 0,28 0,31 0,28
Table 3. The distribution of businesses involved in the study accoring to NUTS2 n = 214
source: own calculation
The calculation results of the Pearson-correlation between the pillar values of WebIX are shown in Table 4. On the basis of the correlation matrix, according to the Guilford categorization [7] the connection between Connection, Complexity and Appearance is of medium strength, significant relation, being 0,4 < |r| < 0,7. This raises attention to the fact that those businesses, which have high values in the Complexity pillar, are also more open concerning the use of Web 2.0 applications, as the Connection pillar measure the application of Web 2.0 possibilities.
Speed Complexity Appearance Connection
Speed 1 -0,269 -0,142 -0,208 Complexity 1 0,373 0,461 Appearance 1 0,408 Connection 1
Table 4. The Pearson-correlation maxtrix of WebIX pillar values n=214
source: own calculation
Conclusions
We created a systemic model with technological approach for the measurement of the digital presence of small and medium-sized businesses. We ran our model through the automated analysis of the index websites of businesses included in the HSMB database. The low proportion of available company websites indicates possibilities for the development of the digital presence of Hungarian SMBs. After
Management, Enterprise and Benchmarking in the 21st Century Budapest, 2017
131
the analysis of the correlation relation between the pillars constituted by the WebIX, the significant role of the Connection pillar and its components revealed the openness of businesses towards the Web 2.0 developments. No Pearson’s correlation-based relationship can be identified between the NUTS2-level location of the businesses and the calculated WebIX values. Further possibilities for examination include the study of businesses in accordance with the given industry, and the deeper analysis of location at NUTS3 level.
References
[1] Bell Research: Magyar KKV-k a digitális bronzkorban, 2016, letöltés: 2016.10.26, forrás: http://www.itbusiness.hu/Fooldal/technology/aktualis_lapszam/megkerdeztuk/Magyar_KKV-k_a_digitalis_bronzkorban.html
[2] Butkiewicz, M., Madhyastha, H. V., Sekar, V. (2011): Understanding Website Complexity: Measurements, Metrics, and Implications, 2015, letöltés: 2015.12., forrás: https://web.eecs.umich.edu/~harshavm/papers/imc11.pdf
[3] Choudhary, J. and Roy, D.: Priority based Semantic Web Crawler, International Journal of Computer Applications, 2013 Volume 81 (15), pp. 10-13.
[4] Couldry, N., Fotopoulou, A. and Dickens, L.: Real social analytics: A contribution towards a phenomenology of a digital world, The British Journal of Sociology, 2016 Volume 67 (1), pp. 118-137.
[5] Gill, M. and VanBoskirk, S.: The Digital Maturity Model 4.0, Benchmarks: Digital Transformation Playbook, 2016, letöltés: 2017.02.24, forrás: https://forrester.nitro-digital.com/pdf/Forrester-s%20Digital%20MaturityModel%204.0.pdf
[6] Gerlitz, C. and Helmond, A.: The Like Economy: Social Buttons and the Data-Intensive Web, New Media & Society, 2013 15(8), pp. 1348–65.
[7] Guilford, J. P.: Creativity, American Psychologist, 1950 Volume 5, Issue 9, pp. 444–454.
[8] Heidrich, B. and Kása, R.and Sándorné Kriszt, É.: Behálózva, avagy a webalapú technológiák csoportos együttműködésre gyakorolt hatásának kvantitatív mérése, Statisztikai Szemle, 2015 93. (4), pp. 319-352.
[9] Meyer-Stamer, J.: Systemic Competitiveness and Local Economic Development, in Shamim Bodhanya (ed.): Large Scale Systemic Change: Theories, Modelling and Practices, Mesopartner, 2008 Duisburg
[10] Porter, M. E. and Heppelmann, J. E.: How Smart, Connected Products Are Transforming Companies, Harward Business Review, 2015 201 (114), pp. 96-114.
Management, Enterprise and Benchmarking in the 21st Century Budapest, 2017
132
[11] Solis, B.: The six stages of digital transformation maturity, 2015, letöltés: 2017.02.24, forrás: https://www.cognizant.com/whitepapers/the-six-stages-of-digital-transformation-maturity.pdf
[12] Song, F.W.:Theorizing Web 2.0., Information, Communication & Society, 2010 13(2), pp. 249–275.
[13] Szerb, L. et al.: Mennyire versenyképesek a magyar kisvállalatok? A magyar kisvállalatok (MKKV szektor) versenyképességének egyéni-vállalati szintű mérése és komplex vizsgálata, Marketing és Menedzsment 11/2014; XLVIII.(Különszám), pp. 3-21.
[14] Valentiny, P.: Az infókommunikációs technológiák szerepe a termelékenység változásában, Magyar Tudományos Akadémia Közgazdaságtudományi Intézet, 2004 Budapest
[15] Zheng, G. and Peltsverger, S.: Web Analytics Overview, In Encyclopedia of Information Science and Technology, Third Edition, Publisher: IGI Global, Editors: Mehdi Khosrow-Pour, 2015, letöltés: 2016.05.10, forrás: https://www.researchgate.net/publication/272815693_Web_Analytics_Overview

Management, Enterprise and Benchmarking in the 21st Century Budapest, 2017
133
Password Based Cryptography
Nertila Hoxha Óbuda University, Donát Bánki Faculty of Mechanical and Engineering, Hungary
Abstract: A password is not just a word or string of characters but is the most important factor used for user authentication to prove identity or access approval to gain access to a resource, which is to be kept secret from those not allowed access. As passwords are often chosen without paying much attention special care is required in the process of protection from attacks. A lot of systems attempt to derive a cryptographic key directly from a password and this is to dangerous for the security of users accounts. Password based cryptography is usually defined as some form of guarantee against brute force attacks. Nowadays exist many approaches about password based cryptography and a lot of researchers have given their contribution in this field. My aim is to analyze these approaches and to find the best techniques used for this kind of cryptography. We will see that some techniques should be improved and some other are relatively expensive.
Keywords: password based cryptography, public key cryptography, encryption schemes, protocols
1 Introduction In security protocols sometimes password and other weak secretes serve as cryptographic keys. Early research on the design and analysis of protocols based on weak secrets are focused on techniques for defending against guessing attacks . These techniques basically aim to ensure that plaintexts encrypted under passwords do not contain redundancy that can later be used to verify a password guess. [1] While this is a helpful guideline, its informal application need not guarantee security. As experience demonstrates conjecturing the security of a protocol, or arguing it only heuristically, is not sufficient. There are two approach for analyzing security protocols. The first approach is a formal methods or a symbolic approach. This approach adopts an theoretical view of executions. Messages are designed as elements of a term algebra constructed with symbolic operations that represent various cryptographic primitives. Parties operate on terms using a limited number of inference rules, sometimes generically known as the Dolev-Yao rules. The rules reflect a common understanding of the security of cryptographic primitives. For

Management, Enterprise and Benchmarking in the 21st Century Budapest, 2017
134
example, they say that the message encrypted in a ciphertext can be recovered only if the appropriate decryption key is known. Quite often, proofs that rely on these rules can be mechanized. Work done on symbolic models for password-based protocol has concentrated on extending the Dolev-Yao rules to guessing attacks. The second approach is the computational approach. It uses a concrete (bit level) representation, for protocol executions. The attacker is modeled as a powerful, arbitrary probabilistic polynomial-time Turing machine. Although proofs with this approach tend to be lengthy, difficult, and tedious, it is generally accepted that it provides strong guarantees. For the case of password-based protocols, work with the computational approach seems to have focused almost exclusively on the important use of passwords for authenticated key exchange. This work includes designing models and giving provably secure developments. Unusually, the security of password based encryption as a primitive has not been addressed. In this paper I want to do the analyze of protocols based on passwords using the cryptographic primitives such as symmetric encryption, asymmetric encryption, and encryption that uses passwords as keys. The first primitive is symbolic and it is based on an extension of the classical Dolev-Yao inference rules to include password-based encryption. The second primitive is computational and it is based on concrete implementations of the encryption operations. In security protocols, password-based encryption commonly servers for attaining authenticity instead than secrecy properties, although the use of the term “encryption”.
2 Related Work Regarding password based cryptography field there are many approaches and techniques developed by researchers both in practice and theory. As you can see above are mention some related work in this area.
A general approach to password based cryptography is given by Morris and Thompson. A method for protecting password tables is to combine a password with a salt to produce a key. The password derived a set of keys and the salt can be viewed as an index into this set and is not necessary to kept secret. [2]
Another approach is to construct key derivation techniques including [2] iteration count in the key derivation technique of to indicate how many times to iterate some underlying function by witch keys are derived. In a password based key derivation function the base key is a password and the other parameters are a salt value or an iteration count.
Password based message authentication is another method of cryptography. MAC confirm that the message send by sender has not been change during the way from sender to receiver. This method provides one key for the server and one for the client and both of them are known only from that specific server and that specific client.

Management, Enterprise and Benchmarking in the 21st Century Budapest, 2017
135
Hash-based message authentication code (HMAC) maintains one private key for the server and one for the client and this private key that known only to that specific server and that specific client. A unique HMAC is created by the client side, per demand to the server by hashing the request data with the private keys and posting it as part of a request. HMAC is more secure than Message Authentication Code (MAC) because the key and the message are hashed in independent steps. [3]
For generating a key from a password from hashing tables the technic of password based key derivation use a simple protocol for deriving a key from a password via hashing tables ,implements a pseudorandom function, such as hash-based message authentication code (HMAC), to the input password ahead with a salt value and to do the process a lot of times to create a derived key, which can then be used as a cryptographic key in consequent operations. The supplemental computational work creates password cracking much more difficult, and is known as key stretching. The number of iteration when the standard was written in the year 2000 was minimum 1000 ,and the parameter is destined to be increased over time as CPU speeds raise. In 2005 a Kerberos standard suggested 4096 iterations, [4]Apple iOS 3 used 2000, iOS 4 used 10000, [5] while in 2011 LastPass used 5000 iterations for JavaScript clients and 100000 iterations for server-side hashing. [6]Adding a salt to the password decreases the ability to use pre calculated hashes (rainbow tables) for intruders, and means that multiple passwords have to be proved one by one, not all at once. The standard suggests a salt length of at least 64 bits.
Password based Encryption method is based on the use of password derived keys for symmetric encryption scheme. This method provides a secure channel for password derived keys and also offers a good authentication. Password based encryption can be used as a protocol. [7] For a strong authentication various cryptographic protocols depend on passwords chosen by users. The users chose short and easily memorable passwords and in these cases the protocols are vulnerable to a dictionary attack because the space of passwords is small enough to be identified by an attacker. It is more effective then to create password-based protocols that prevent off-line dictionary attacks. [8] Was Gong et al. [9] the first that has study the password-based protocol problem. He used public-key encryption to watch across off-line password-guessing intrusions. Another important work[9] , which became the basis for many subsequent works is it of Bellovin and Merritt named Encrypted Key Exchange (EKE). SPEKE [10] and SRP [11] [12]are two protocols included in this work, but also exist a lot of papers who stady these protocols [13] [14] [15]. The model for the password-based protocol problem presented by Bellare et al. [16] represent a model for the password-based protocol problem and demand that their model is rich enough to deal with password guessing, breaking secrets, server compromise, and loss of session keys. Then based in many works the ideal-cipher model (random oracles) and the two-flow protocol at the core of EKE are secure. In their proposal to the IEEE P1363 Bellare and Rogaway [17] presented many instantiations (AuthA) of the ideal-cipher . A simplified version of

Management, Enterprise and Benchmarking in the 21st Century Budapest, 2017
136
AuthA is suggested by Bresson et al. [18] named One-Encryption-Key-Exchange (OEKE), and demonstrate that OEKE attain good security against dictionary intrusions in both the random oracle and ideal-cipher models under the computational Diffie–Hellman. Is Bellare that presented the ideal-cipher model. In this model |G| = |C|, and selecting a random function h from Ω amounts to giving the protocol (and the attacker) a perfect way to encipher strings in G: namely, for K ∈ {0, 1}∗, we set EK : G → C to be a random bijective function, and we let DK : {0, 1}∗ → G defined by DK(y) be the value x such that EK(x) = y, if y ∈ C, and undefined otherwise.
3 Password-based encryption protocols Password-based encryption protocols are designed to be secure even when the secret key or password shared between two users is drawn from a small set of values. [19] Some of these protocols are subject of guessing attacks and in these attacks may succeed that the adversary can reveal the password shared between two users during a online conversation. A theory developed and applied to provides security is the theory of multi-instace (mi) that offers the first proof-based support for the classical practice of salting in password-based cryptography. [20] Multi-instance security used only for a single instance aim to ensure security but represents a second line of defense . Mi-security as password based encryption is based on the PKC#5 [21] and encrypts a message M with a password pwd by choosing a random x bit salt sa, by extracting a key L ← KD(pw∥sa) and turning back S′ ← S∥sa where S ←$ E(L,M). E is a symmetric encryption scheme, (KDF) is the key-derivation function, and KD: {0, 1}∗ → {0, 1}n is the s-overlap iteration KD = Hs of a cryptographic hash function H: {0, 1}∗ → {0, 1}n. [9] The most of passwords chosen by people are often very week, However, passwords are often poorly chosen, dropping within a set D called a “dictionary” that is small enough to drain. The target password pwd can be recover by a brute-force attack (breaking the security of the encryption) using sN hashes where N = |D| is the size of the dictionary. Increasing s increments this achievement, describing the role of this iteration count, but s cannot be made too large without skeptically impacting the performance of password based encryption.[9] Different from the previous work Mi-security offers many application in the real world and is not a theoretically method. The explanation of mi-security provided for key derivation function is a simulation-based one motivated by indifferent frameworks [22] [23]. Exist two type of attackers, that in the real word and that in an ideal counterpart but in both, target passwords pwd1, . . . , pwdm and salts sa1, . . . , sam are randomly selected. In the real world, the attacker gets input (pwd1, sa1,KD(pw1∥sa1)), . . . , (pwdm, sam,KD(pwdm∥sa1)) and also gets an oracle for the RO hash function H used by KD [9]. In the ideal counterpart, the input is (pwd1,
Management, Enterprise and Benchmarking in the 21st Century Budapest, 2017
137
sa1,L1), . . . , (pwdm, sam,Lm) where the keysL1, . . . ,Lm are casually chosen, and the oracle is a simulator. The simulator used in this case can take a Test oracle that will steal a guess for a password and notify the simulator where it matches one of the target passwords. Necessarily, we need that when the number of queries creating by the attacker to the simulator is y and the number of queries creating by the simulator to its Test oracle is y/s. This constraint is critical to our proof of security amplification and a source of challenges in the proof.[9] Let turn to our main application, that of password based encryption as explain in PCSC#5 [10] where a conventional mode of operation CBC mode is combine with a password-based key derivation function (KDF). Officially , a (k, x, c)-KDF is a deterministic map KD: {0, 1}∗ × {0, 1}x →{0, 1},k t make use is a basic ideal primitive, s is the iteration count, which gives the multiplicative increment in work that should slow down brute force attacks.PKCS#5 describes two KDFs [10]. Based in this two models we can create a function Encode (pwd, sa) that explain how to encode its inputs onto {0, 1}∗ with easly calculable inverse Decode(W).
3.1 Password - based encryption schemes A password based encryption scheme is a symmetric encryption scheme where the keys are passwords and key generation is a password sampling algorithm. [ 9]Let KD be a (k, x, s)-KDF and let SE = (K, E,D) be an encryption scheme with K outputting consistently choose k-bit keys. Then we describe the password based encryption scheme SE[KD, SE] = (P, E,D) as pursue. Encryption E(pwd,M) is done via sa←$ {0, 1}x ; K ←KD(pwd, sa) ; S ←$ E(K,M), returning (sa,) as the ciphertext. Decryption recompense the key K by repeating the key derivation function and then put D. If the key derivation function is KD1 and the encryption scheme is CBC mode, then one acquire the first password based encryption scheme from PKCS#5 [10].
4 Security of Password Based Encryption Another important element for password based encryption is the security and after analyzing the protocols and schemes we can analyze the security of password based encryption as used in PKCS#5. To measures the security of Mi -security we use the following theorem. Theorem 1 Let m ≥ 1, let SE[KD, SE] = (P, E,D) be the encryption scheme built from an (k, x, s)- KDF KD and an encryption scheme SE = (K, E,D) with k-bit keys.[9] This theorem to measure the security uses the multi-user left-or-right security approach from ,when given access to multiple left-or-right oracles each using the same bit b.

Management, Enterprise and Benchmarking in the 21st Century Budapest, 2017
138
Let be A an attacker A that can make ρ14 queries to Enc(i, ·, ·) for each i ∈ {1, . . . ,m} and creating at most qc < m corruption queries, S a c-amplifying simulator. Then we have one message sampler M and attackers D, C, and B . To test the security and to find qc corruption queries : C creates a single query Enc(i, ·, ·) for each 1 ≤ i ≤ ρ. Also , C’s executing time equals tA+q · tS plus a small, absolute constant, and where tA is the executing time of A, and tS is the time needed by S to answer a query. Decisively , γ(M,mρ) ≤ m2ρ2/2s. In conclusion the theorem have a capacity to hold even when SE is only one-time secure ,which involves that the tests covers tools such as WinZip [24].
Conclusion In this paper we presented several approach about password based cryptography and the results of our analysis show that each method has its weaknesses. Is very important to be careful when designing or implementing password-based protocols and if we want to have security we should choose a strong password. A strong password and an good method of cryptography are the best technique for more security. For a cryptosystem, the objective is to find a virtual private key from a set of weak passwords held in deferent points, and this key should be strong and resistant to intrusions as any regular key. After the key can be used in a distributed manner without ever demanding its actual reestablishment. I proposed that such functionalities in the cryptography model should justifying all the design choices along the way of implementing them. References [1] Martin Abadi Bogdan Warinschi, "Password-Based Encryption
Analyzed,".
[2] B. Kaliski, "Password-Based Cryptography Specification," 2000.
[3] Techtarget Network. [Online]. http://searchsecurity.techtarget.com/definition/Hash-based-Message-Authentication-Code-HMAC
[4] Kenneth Rae, "Advanced Encryption Standard (AES) Encryption for Kerberos 5,".
[5] Advanced Password Cracking – Insight (ElcomSoft). Smartphone Forensics: Cracking BlackBerry Backup Passwords .
[6] LastPass Security. [Online]. https://blog.lastpass.com/2011/05/lastpass-security-notification.html/
Management, Enterprise and Benchmarking in the 21st Century Budapest, 2017
139
[7] Grégory Demay, Peter Gaži, Ueli Maurer, Björn Tackmann, "Per-Session Security, Password-Based Cryptography Revisited," , 2016, p. 32.
[8] D. Pointcheval, P. Rogaway M. Bellare. (2000) Authenticated key exchange secure against dictionary attacks, Lecture Notes.
[9] L. Gong, M. Lomas, R. Needham, J. Saltzer, "Protecting poorly chosen secrets from guessing attacks," , 1993, p. 8.
[10] D. Jablon. Strong password-only authentication key exchange.
[11] T.Wu, "The secure remote password protocol," in 1998 Internet Society Symp. on Network and Distributed Systems Security, San Diego, p. 4.
[12] T.Wu. SRP6: Improvements and refinements to the secure remote password protocol.
[13] P. Buhler, T. Eirich, M. Steiner, M. Waidner, "Secure password-based cipher suite for TLS," in Network and Distributed Systems Security, 2000.
[14] S. Halevi, H. Krawczyk. Public-key cryptography and password protocols, ACM Trans. Inform. System Security.
[15] S. Lucks, "Open key exchange: how to defeat dictionary attacks without encrypting public keys," in Security Protocols Workshop.
[16] D. Pointcheval, P. Rogaway M. Bellare. (2000) Authenticated key exchange secure against dictionary attacks Lecture Notes.
[17] M. Bellare, P. Rogaway. The AuthA protocol for password-based authenticated key exchange.
[18] E. Bresson, O. Chevassut, D. Pointcheval, "Security proofs for an efficient password-based key exchange," in 10th ACM Conf. on Computer and Communications Security, 2003, p. 9.
[19] Michel Abdalla, Pierre-Alain Fouque, David Pointcheval, "Password-Based Authenticated Key Exchange," in International Workshop on Theory and Practice in Public Key Cryptography
[20] Mihir Bellare Thomas Ristenpart Stefano Tessaro, "Multi-Instance Security and its Application to Password-Based Cryptography," in CRYPTO 2012, 2013, p. 30.
[21] "PKCS #5: Password-based cryptography standard (rfc 2898)," in RSA Data Security, Inc., 2000.
[22] J.-S. Coron, Y. Dodis, C. Malinaud, P. Puniya, "How to construct a hash function," in Advances in Cryptology, editor In V. Shoup, Ed., 2010.

Management, Enterprise and Benchmarking in the 21st Century Budapest, 2017
140
[23] U. M. Maurer, R. Renner, C. Holenstein, "Indifferentiability, impossibility results on reductions, and," in 1st Theory of Cryptography, 2004, p. 18.
[24] T. Kohno, "Attacking and repairing the winZip encryption scheme," in 11th Conference on Computer and Communications Security, 2004, p. 9.
[25] B. Kaliski, "Password-Based Cryptography Specification," 2000.
[26] "Multi-Instance Security and its Application to Password-Based Cryptography," , 201, p. 30.
[27] M. Bellare, A. Boldyreva, and S. Micali, , Advances in Cryptology , Ed., 2000.
[28] Zhu Zhao, Zhongqi Dong,YonggeWang, "Security analysis of a password-based authentication protocol proposed to IEEE 1363," , 2005, p. 8.
[29] S. Bellovin, M. Merritt, "Encrypted key exchange: password-based protocols secure against dictionary attacks," in 1992 IEEE Computer Society Conf. on Research in Security and Privacy, p. 8.
Management, Enterprise and Benchmarking in the 21st Century Budapest, 2017
141
Smartphone Security Threats
Esmeralda Kadëna, Ph.D Student Óbuda University, Donát Bánki Faculty of Mechanical and Safety Engineering, Hungary
Abstract: Nowadays the use of smartphones have become an inevitable part of our lives. The mobile revolution offers new ways of working, increasing efficiency and responsiveness of users in different environments. The concern is that with comfort and convenience also come security risks. Security is a key component in any mobile device management strategy. What might be convenient for users, might be convenient for attackers. Here the focus is on the human factor as the weakest link in this field. To develop this work I am concentrated in these research questions: “How users contribute to smartphone security threats?” and “How can we help on minimizing the risks that the use of smartphone brings?”. The aim is to provide an easy and concise view of different threats and possible solutions. I am based on reviewing literature to find the most common threats, to see how users contribute on them and how their solutions are introduced. By analyzing the findings there are given some estimations of the possible threats and suggestions for average users and enterprises to improve the security of daily life operations.
Keywords: Smartphone, Security, Threats, Human factor.
1 Introduction In recent years, the smartphone usage raised significantly. Thus because smartphones provide users with a wide range of services like phone calls, Internet services, sharing and keeping data, on/off-line games and some entertaining applications. Due to these services, a smartphone is faced with some challenges like security and privacy as well. Actually the dawn of the planet of the smartphones came in January 2007, when Steve Jobs, Apple’s chief executive, presented an object of plastic, metal and silicon in front of the Apple audience. He promised: “This will change everything” [1].
But before speaking about smartphones, is very important to understand mobile computing. This term is defined as the use of transportable computing devices with mobile communication technologies [2]. Mobile computing is a technology that

Management, Enterprise and Benchmarking in the 21st Century Budapest, 2017
142
allows for the transmission of data, voice, and video via a computer or any other wireless enabled device without having to be connected to a fixed physical link [3]. Connecting to a network is made of different methods such as internet, intranet, WAN, LAN, WLAN, and a number of other related methods.
The beginning of wireless and mobile computing technology is marked in 1894 when Guglielmo Marconi, the father of radio, produced radio waves over long distances. In 1958 was completed the first wireless network in Germany. In 1983 came Motorola, the first personal cellular phone in the world and he entered the mobile computing industry [3]. This invention simultaneously marked the creation of the commercial cellular service market. A smartphone contains an MNO1 [4] smartcard with a connection to a mobile network. Moreover, it has an open operating system that can be extended with third-party software. Since most of the operations smartphones perform are on the Internet, so it is necessary to ensure security and safety of data and information. We can use as authentication, a pattern like password, code password, PIN password, face/finger unlock [5]. Actually these are penetrated methods with such as brute forcing and guessing. A lot of Malware, Viruses and Trojans have been developed based on smartphones APIs (application program interface). Critically most of them look like safe software and some reliable applications (Gmail, Facebook, etc.) with GPS service in smartphone, collect information about the user such as location without his knowledge [6].
There are many smartphone operating systems available, such as Android, iOS, Microsoft Window Phones, Symbian and BlackBerry [5]. The most widely used smartphone OS is Android. According to Schulz and Plohmann in 2012, Android is the widely used smartphone operating system with better performance compared to other smartphone operating systems. Android OS is based on Linux OS architecture. The desktop operating systems and the versions of smartphone of such operating systems differ, especially in user interfaces and architecture of the system. Smartphone is nearly used for every kind of communication, to store a lot of personal and sensitive details like contacts, emails, credentials, to browse data/information from the World Wide Web [7].
Now, smartphones pair mobile phones with other devices such as PDAs, HD camera, media player, GPS navigation units and other data storage and processing devices. Even before mobile devices came with 3G and 4G compatibilities; but now such devices transformed into mobile computers with smart options like touch screen and laptop capabilities and easily can browse the Internet using wireless network and third party applications. Strategy Analytics expects that in 2020 will become available in Japan and South Korea, the first commercial 5G handsets. Then
1 An MNO smartcard is a smartcard inside the mobile device that is controlled by a
mobile network operator (MNO).
Management, Enterprise and Benchmarking in the 21st Century Budapest, 2017
143
it can be followed by the US and China in 2021. It is also expected that by 2025, 7% of worldwide mobile connections will be 5G [8]. So it is obvious that the rapid advancement in smartphone technology and the growth of the number of this devices make the security one of the biggest problems as the cybercriminals have “desire” for these devices as well. In the Symantec Internet Security Threat Report (ISTR) is presented that in 2013, 38 % of smartphone users have been victims of cybercrime [9].
But while talking about the security on this field we have to put human- factor in the first line. The user can influence over the mobile device. In most cases he can harm or prevent from harming himself. For an average user it is very important to understand some basics regarding the security solutions of his mobile device. Most of security mechanisms like application frameworks (i.e., the Java framework J2ME) and signature schemes for different trust levels might not be understood by the average user. An example is a phone that was locked for third-party software. And below we can see that in such cases they prefer to open the doors and skip the security mechanisms.
There are given some examples from Denning [10] and Anderson [11] of weak password use, documenting low security awareness, because the relationship between guessable passwords, successful attacks, and the role of the user is often unclear to users. Many security awareness are shown when they choose a password on mobile devices, short, especially consisting only in numbers. Moreover it has to be mentioned that the appreciation of the mobile device is lower than for desktop PCs, and that it is more seen as a disposable item [12]. Regarding their mobile devices, the security awareness can be considered lower than for PCs as well.
2 Related news/work Nielsen has reported that when looking at smartphone users by age, the highest percentage belongs to age 18-24, 98% of whom own smartphones, age 25-34 with a 97% ownership rate, followed by the group of 35-44 at 96%, making smartphones nearly used by everyone [13].
Based on past researches, privacy and security play roles in users’ installation decisions. The result from the interviewed people was that they were cautious when installing new software because of malware concerns [14]. In an experiment realized by Good et al., was found that people preferred applications with better privacy policies if the privacy is included in the cost of application functionality [15].
The beginning of the smartphone era can be called as the new millennium. There are a lot of articles written about smartphone security and the considerable threats on smartphones. Lot of them try to give a prediction on the future through a
Management, Enterprise and Benchmarking in the 21st Century Budapest, 2017
144
statement, for example “The wireless epidemic” [16], in 2008 “Is it finally time to worry about mobile malware?” [17], “Planet of the phones” in 2015 [18], etc. Based on the latest news, Check Point, the cybersecurity company discovered a “severe infection” in 38 new Android smartphones and which is more the malware were not downloaded into the devices but they arrived with pre-installed malware. Actually they belong to two companies which were not named [19].
Obviously these mean that more and more incidents are expected ever since these devices are gaining so popularity since started to become more powerful in terms of: increased processing power and memory increased data transmission capabilities of the mobile phone networks, and with open and third party extensible operating systems.
In 2010, IDC reported that for the first time smartphone sales surpassed PC sales [20]. Faced by this onslaught of devices and recognizing the productivity and cost benefits, organizations are increasingly implementing policies of bring-your-own device (BYOD). J. Gold Associates reports that about 25%-35% of enterprises have a BYOD policy, and they expect that to grow to over 50% over the next two years [21]. 40% of U.S. employees in large enterprises use their personal devices for work [22]. This makes sense as mobility evolves from a nice-to-have capability to a business advantage.
According to eMarketer, by 2020 the number of mobile phone users will climb to 4.78 billion while the user growth is slowing [8]. You can see below:
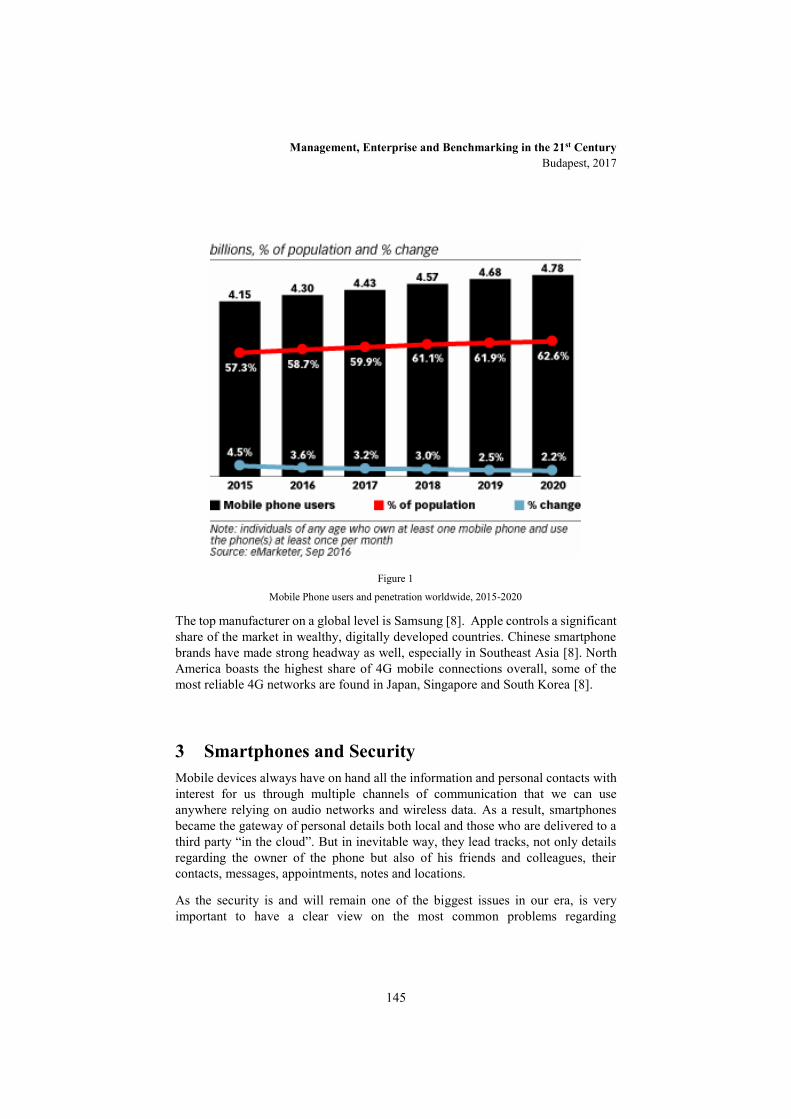
Management, Enterprise and Benchmarking in the 21st Century Budapest, 2017
145
The top manufacturer on a global level is Samsung [8]. Apple controls a significant share of the market in wealthy, digitally developed countries. Chinese smartphone brands have made strong headway as well, especially in Southeast Asia [8]. North America boasts the highest share of 4G mobile connections overall, some of the most reliable 4G networks are found in Japan, Singapore and South Korea [8].
3 Smartphones and Security Mobile devices always have on hand all the information and personal contacts with interest for us through multiple channels of communication that we can use anywhere relying on audio networks and wireless data. As a result, smartphones became the gateway of personal details both local and those who are delivered to a third party “in the cloud”. But in inevitable way, they lead tracks, not only details regarding the owner of the phone but also of his friends and colleagues, their contacts, messages, appointments, notes and locations.
As the security is and will remain one of the biggest issues in our era, is very important to have a clear view on the most common problems regarding
Figure 1
Mobile Phone users and penetration worldwide, 2015-2020

Management, Enterprise and Benchmarking in the 21st Century Budapest, 2017
146
smartphones. On the other hand, there is not a complete security model and it is not said that a unique possible model can give the flexibility of the medium and multiple configurable scenarios. Anyway there are settled some assumptions, policy and common mechanisms in commercial platforms proposed from Apple, Google, Microsoft and Research in Motion.
The owner of smartphone is considered as the partial administrator because usually some implemented security policies and relative mechanisms limit the proper owner. A second indirect assumption found on mayor part of the market players offers is that the supplier of the platform and potential partner are closely connected such as in some cases where telephone operators came as reliable and present “power”, capabilities in areas of the administrator. Shared assumptions between different platforms lead to similar security mechanisms although with many differences and characteristics such as the use of virtual environments for the abstraction of resources and application sandboxing mechanisms with a pronounced separation of privileges; a push towards the development of managed code, by compiling in the intermediate languages in Java and .NET environment to try to limit some of the problems resulting from programming errors; the explicit exposure of the resources required by applications and their run-time imposition by the system; the use of cryptographic protocols to ensure the origin of the installed applications and mechanisms for their installation.
When talking about privacy, is very important to define the concepts of Confidentiality, Integrity and Availability in relation with the characteristics of the smartphones and their operation systems, containing present the described view. Confidentiality is about preventing unauthorized disclosure of information, integrity is about preventing of unauthorized modification of information, and availability is about preventing unauthorized withholding of information or resources [23].
3.1 Data protection and Privacy
There are made a lot of studies regarding data protection and privacy with focus on users’ behaviors/practices. Boshmaf et al., analyzed the users’ need for protection and privacy in smartphones. They outlined the types of data that users want to protect and investigated users’ behavior in the protection of such of data. The result from 22 interviewed participants showed that users want to protect their data on smartphone but is not convenient to do it in practice [24]. Muslokhlove presents the problems of data protection against physical threats and possibility to conquer weak authentication. He resulted from the survey, that to increase the confidence of user and safety of smartphones a good solution might be upgrading the lock screen system in support of authentication and user’s accessibility and providing suitable security [25].
Management, Enterprise and Benchmarking in the 21st Century Budapest, 2017
147
Another study comes from Ghosh et al. They worked on user data, privacy and protection regarding semantic reasoning and user context modeling. The authors state that the privacy of users and smartphone under this framework are protected using embedded semantic policies based on the user's privacy and settings [26]. To execute the privacy policies on smartphone and to protect the data on an enterprise, Kodeswaran et al. showed a framework [27]. The authors defined their privacy policies of acceptable information flow on mobile devices. This flow of information is depended on the object involved in conforming IPC (Inter-Process Communication) and its data. Their framework design is based on policies for Android platform and the presented results measuring were executed by the framework.
The research of Onwubiko and Owens shows that employees compliance with security policies and guidelines is taken for granted in many companies. Instead they prefer a formalistic approach of the security [28]. Actually these provides some directives on where to extra resources should be used to improve the employees (regarding security awareness) as the most important line of the defense. Information security should be integrated into all processes of the business. Considering “Pareto Principle”, known as 80%-20% rule that states that 80% of the effects/output comes from the 20% of the investment/input [29]. In this case, maybe 20% is invested in technical security measures and formal controls to protect 80% of the undesirable effects that are threats. Whereas the human-factor is remaining the weakest link in security.
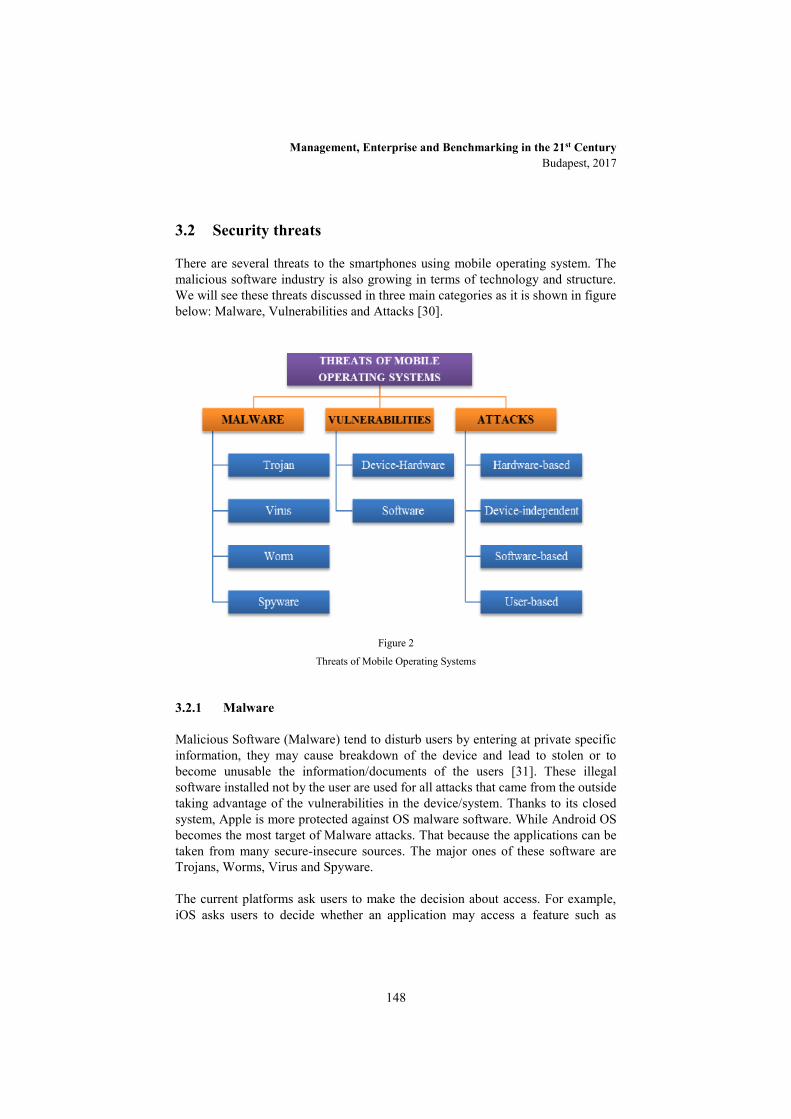
Management, Enterprise and Benchmarking in the 21st Century Budapest, 2017
148
3.2 Security threats
There are several threats to the smartphones using mobile operating system. The malicious software industry is also growing in terms of technology and structure. We will see these threats discussed in three main categories as it is shown in figure below: Malware, Vulnerabilities and Attacks [30].
3.2.1 Malware
Malicious Software (Malware) tend to disturb users by entering at private specific information, they may cause breakdown of the device and lead to stolen or to become unusable the information/documents of the users [31]. These illegal software installed not by the user are used for all attacks that came from the outside taking advantage of the vulnerabilities in the device/system. Thanks to its closed system, Apple is more protected against OS malware software. While Android OS becomes the most target of Malware attacks. That because the applications can be taken from many secure-insecure sources. The major ones of these software are Trojans, Worms, Virus and Spyware.
The current platforms ask users to make the decision about access. For example, iOS asks users to decide whether an application may access a feature such as
Figure 2
Threats of Mobile Operating Systems

Management, Enterprise and Benchmarking in the 21st Century Budapest, 2017
149
location, and Android asks them to agree to an install-time manifest of permissions requested by an application.
Unfortunately, these permission-granting approaches place too much obstacle on users. Most of them are often ignored or not understood by users [32] and permission prompts are disruptive to the user’s experience, teaching users to ignore and click through them [33]. As a consequence users unintentionally grant applications too many permissions and become vulnerable to applications that use the permissions in malicious or questionable ways (i.e., secretly sending SMS messages or leaking location information).
Trojan Trojan software aims not to spread themselves but to seize the management and the information of the device [34]. Here they differ from worms and viruses. Keyloggers are the most widely used spyware. It is transmitted under the cover of a file and the user can unintendedly activate. In that moment it has the entirely device in the background under control and not noticed by the user. For this reason, while downloading an application necessary for the smart devices, it is of big importance to search before it and to check if is a reliable software.
Worm Imagine you are at the airport/coffee bar/hotel and you want to find the free Wi-Fi. By scanning, your smartphone is going to show the Wi-Fi access points. Actually that is an easy channel for a hacker to inject malicious worm code into your smartphone. Worm is a kind of virus but does not require user interaction to reproduce itself. Worms are designed to spread through the network [34]. Transmitting forms: by SMS, MMS and activated by clicking on a file or opening a plug-in sent by e-mail, i.e social engineering. Worm penetrates using this vulnerability and integrates itself into a service running in the OS. Then it can act as a spy inside the device, send the required information to the center that is managed from itself, through creating an unnecessary data flow can cause clogging and slowing down in the Internet bandwidth and reduce the performance of the device. So, users tend to be careless and not pay attention.
Virus A malicious software which can penetrate into documents and send them elsewhere, distort their contents or making them unusable and making the hardware elements to slow down [34]. Infected programs should also be installed in other devices. In 2010 in China, a virus named “Zombie” infected more than 1 million smartphones by causing a loss amounting to $300,000 per day. This was followed also by data loss, data leakage and even disruption of the conversation [35]
Spyware They are used to collect information and data regarding a target subject. They specify that their usage is for advertising and promotional purposes (adware) or to

Management, Enterprise and Benchmarking in the 21st Century Budapest, 2017
150
offer better service to users (cookies), while what they do is collecting information about a person/organization and send to someone else without their permission (here works like a Trojan) [34]. It can be caused by malicious people and aimed at taking control of the devices infected.
According to McAfee mobile threat report [36], for iOS, the biggest threat in 2016 were as a result of applications with very aggressive adware while Google Play saw a number of applications infected with malware. In considerable studies by security firms, it is seen that malware software are not only used by hackers but also created by some profit-oriented "teams", i.e. in an incident in the year 2013, the Trojan “botnet Trojan-SMS.AndroidOS.Opfake.a” enabled the spread of the malware software “Backdoor.AndroidOS.Obad.a”. It send a spam containing the malware to its victim list [37]. CISCO published the top malware categories as it is shown in the figure below [38]:
As it is shown, Trojan software are represented with the highest rate, 64%.
3.2.2 Vulnerabilities
Vulnerabilities refers to the weaknesses occurring in the system security procedures, internal controls, design and applications among the security vulnerabilities in the device [34]. These vulnerabilities can be grouped under several headings but in this work they are classified in two major categories: Device-Hardware and Software.
Device-Hardware Here we can see two critical points. The first issue is when the smartphone may not receive the latest security updates. This came from the age of the device. The manufactures do not support those who are manufactured before a certain date.
Figure 3
Rates of Malware Software affecting Mobile Operating Systems
Management, Enterprise and Benchmarking in the 21st Century Budapest, 2017
151
The second issue, however, is the disability of the mobile devices to ensure the safety of the ports they use while connecting to a network or the Internet. The fact that the mobile devices are have no limit to navigate in the Internet and there is not any firewall to control this is an important vulnerability. An intruder can easily access to the mobile devices through this unsecure port and in such cases must be used “firewall” to protect these ports. As a consequence, while connecting to the mobile device, the user will be asked for a permission and will be able to see it. Taking in consider unauthorized changes ("jailbreaking" or " rooting") on the mobile devices which are not using a firewall. Jailbreaking is the method used for obtaining an application that does not belong to Apple or due to some restrictions from any other source cannot be downloaded. Through this method allows to have access to the OS of the mobile and as a result creates a vulnerability. Furthermore these devices do not receive the necessary security updates and become vulnerable to threats [39].
Software If the mobile OS is out of date it can lead to vulnerability also. Usually users don’t pay attention on messages to update their mobile OS. Another issue is related with downloading from the third party applications. Deficient API2 management is responsible for many malicious code infections. APIs are classified into Open APIs, third party application development and control APIs; used to remote maintenance. Controlled APIs have specific higher privileges to update system, file destruction, and information fetching. If attackers gain the APIs control, could easily initiate attacks and use the privileges of the APIs [40, 41].
Another important vulnerability come from the shared open source common components such as WebKit and Linux kernel. In order to reduce the costs (a common practice in large open systems, i.e., Android) these components have a reusable structure. A vulnerability has been discovered in WebKit or Linux, however, a patch was released in order to use in solving this problem. While in Apple's iPhone-like WebKit and BSD kernel derivative (Darwin) constitutes the common software components. At this point, the problem is not its reuse but where it is employed. According to this, Android put the patch model into practice with a little delay [42].
3.2.3 Attacks
Attacks are the interventions made from outside using a variety of vulnerabilities. The term “attacks” generally stands for the attacks made by the hackers to obtaining users’ private information without their knowledge. Figure below shows Kaspersky
2 API- “Application Programming Interface”: a set of commands, functions, protocols,
and objects that can be used from programmers to create software or interact with an external system. They are available for both desktop and mobile operating systems [54].
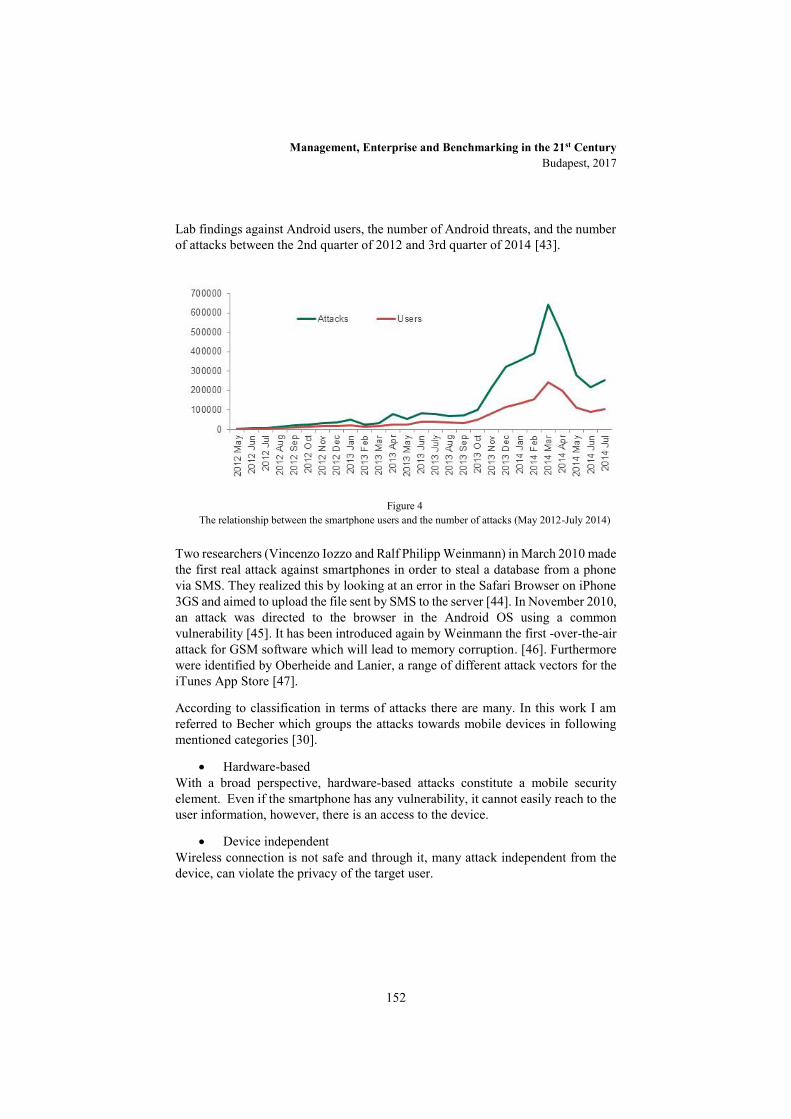
Management, Enterprise and Benchmarking in the 21st Century Budapest, 2017
152
Lab findings against Android users, the number of Android threats, and the number of attacks between the 2nd quarter of 2012 and 3rd quarter of 2014 [43].
Two researchers (Vincenzo Iozzo and Ralf Philipp Weinmann) in March 2010 made the first real attack against smartphones in order to steal a database from a phone via SMS. They realized this by looking at an error in the Safari Browser on iPhone 3GS and aimed to upload the file sent by SMS to the server [44]. In November 2010, an attack was directed to the browser in the Android OS using a common vulnerability [45]. It has been introduced again by Weinmann the first -over-the-air attack for GSM software which will lead to memory corruption. [46]. Furthermore were identified by Oberheide and Lanier, a range of different attack vectors for the iTunes App Store [47].
According to classification in terms of attacks there are many. In this work I am referred to Becher which groups the attacks towards mobile devices in following mentioned categories [30].
Hardware-based With a broad perspective, hardware-based attacks constitute a mobile security element. Even if the smartphone has any vulnerability, it cannot easily reach to the user information, however, there is an access to the device.
Device independent Wireless connection is not safe and through it, many attack independent from the device, can violate the privacy of the target user.
Figure 4 The relationship between the smartphone users and the number of attacks (May 2012-July 2014)

Management, Enterprise and Benchmarking in the 21st Century Budapest, 2017
153
Software-based These attacks are an important part of the technical vulnerabilities on smartphones. The increase in the number of mobile web browsers has led to an increase in the vulnerabilities used in this field.
User-based There are such attacks not technical. They are made through cheating without using malicious software which are direct to the smartphone users. These attacks made through “social engineering” and aimed at reaching to private information are very common today [48]. Anderson also discusses this topic in his book “Security Engineering” [11]. Social engineering becomes most important when there are no more technical vulnerabilities to exploit. So security depends on the user and the technical security mechanisms are effective and sufficient.
- Phishing Attacks: This kind of attack is formed by combining the words "Password" and "Fishing". This method is independent from OS and can be used in every type of devices. Attacks are made by directing the user to a false (imitation) website in order to steal private information (credentials, credit card information, user name or password). There are some varieties of this attack such as Similarity attack, Forwarding attack, Background attack and Notification attack [49].
- SSL Proxy Attacks: Secure Sockets Layer (SSL)/Transport Layer Security (TLS) encryption is a protocol that assures users and provides data security when implemented correctly. Today it is used in many applications such as internet banking. If it is not implemented correctly, applications may be threatened and unintended vulnerabilities occur. If this code is left uncontrolled, the settings can be changed undesirably and the information which were supposed to be safe and transmitted can be stolen through the path of communication [50].
- Camera based Vulnerabilities and Attacks: All smartphones have certain features like camera and touchscreen but also these functions can lead to attacks on smartphones. Users go to third party applications from the “app stores” or traditional websites. As the source application is a problem, users are at risk of installing malicious programs. As a result they can steal personal information or gain root access to their device [51, 52].
Management, Enterprise and Benchmarking in the 21st Century Budapest, 2017
154
4 Suggestions
It is very important for everyone to know how to use properly the smartphone and to create some basic security habits in order not to expose yourself. For an average user it is difficult to understand practical security mechanisms but some theoretical and basic knowledge is almost enough to be protected from the threats. The education and training form is the most important measure that should be used. Average users cannot be security experts at all, because it is the task of the security experts to protect the common user. What everyone should keep in mind is that these vulnerabilities and attacks will always exist, no matter what operating system you use. Here it is important the way you use it and what privacy layers you enforce.
Firstly when talking to security, trust is something that must be neglected. We must maintain physical control of the device, it can be loosen or stolen especially in public places. To keep intruders away screen lock should be activated. It is also important in case you lose or someone steal it, even you are careful with your things, there is no guarantee. A strong password for authentication also should be used. A long one, mixed chars number and letters is secure enough.
Do not “root” or “jailbreak” the mobile device, you must be careful with third party applications. Always use official application stores to download and install an application. You can disable the option to allow installation of third party apps. Be choosy when selecting and installing apps. A little research on apps before installing is very useful. The permissions for the installed apps should be checked and if something looks out of order then deny them access. Do not forget to make a spring cleanup of your apps. Have time to take a look over your apps and remove the ones you do not use anymore. Another thing that you can do is to update you apps. As we saw, the apps that remain out of date make your mobile device is more exposed to threats.
Beware of phishing. Do not trust on such as spam emails, link from an ad, messages from your friend’s social account that got hacked, etc., because by clicking on a link it will redirect you to an infected website. So is very important to not click on short, suspicious links for which you did not request. Attackers can use phishing techniques to steal your money, your identity and open credit card accounts in your name and much more. Even the strongest antivirus will protect you from phishing and malware. Take in consider to be sure that you are connecting only in secure wireless connection. That means to not use free or public Wi-Fi, especially when you are accessing sensitive data. Information sent via public networks can be accessed by they who know how to view it.

Management, Enterprise and Benchmarking in the 21st Century Budapest, 2017
155
Conclusions
In this work some theoretical and practical background was introduced with regard to security on the smartphones. Here the threats were categorized in three major groups: Malware, Vulnerabilities and Attacks. Both the number of threats and users were represented as a growing risk. As the users are the weakest link in the internet, they can influence on this concern. When it comes to the question who is responsible for the security of mobile devices, here is the main response. Based on the literature, some results were presented to this question. But yet the response is open.
The IT risks management entities in an organization have to put a special emphasis on the education of employees. Maybe the numerous security mechanisms are useful but when the user does not understand them it become a critical point. The first and most important thing is education from IT teachers and experts. Data privacy and threats are the major open issues of security. All users want to protect their data and they must beware to take measures for themselves. So, human factor is and will remain one of the biggest problems to the field of security.
Thinking that the future belongs to IoT (Internet of Things) where all the devices are interconnected, the security will become more and more in risk. With the rapidly growing field where development occurs at large scale it is hard to achieve 100% security, but the careful habits of smartphone users associated with learning and education can put them on the safe side.
And do not forget, be suspicious!
Management, Enterprise and Benchmarking in the 21st Century Budapest, 2017
156
References
[1] Leaders, "Planet of the phones - The smartphone is ubiquitous, addictive and transformative," TheEconomist, 2015.
[2] M. Rouse, "Nomadic Computing (Mobile Computing)," May 2007. [Online]. Available: http://searchmobilecomputing.techtarget.com/definition/nomadic-computing.
[3] D. Livingston, "Introduction & History of Mobile Computing," LinkedIn Corporation, 2013.
[4] techopedia, "What is a MNO? - definiton from techopedia," [Online]. Available: https://www.techopedia.com/definition/27804/mobile-network-operator-mno.
[5] N. Yildirim, R. Das and A. Varol, "A Research on Software Security Vulnerabilities of New Generation Smart Mobile Phones," in 2nd International Symposium on Digital Forensics and Security (ISDFS’14), 2014.
[6] A. Agrawal and A. Patidar, "Smart Authentication for Smart Phones," International Journal of Computer Science and Information Technologies, vol. 5, no. 4, pp. 4839-4843, 2014.
[7] P. Schulz and D. Plohmann, "Android Security - Common Attack Vectors," Institute of Computer Science: Rheinische Friedrich-Wilhelms-Universitat Bönn, Bönn, 2012.
[8] eMarketer, "Mobile Phone, Smartphone Usage Varies Globally," eMarketer, 23 November 2016.
[9] Symantec Corporation, "Internet Security Threat Report 2014," Symantec, 2014.
[10] D. E. Denning, Information Warfare and Security, New York: Addison-Wesley Professional , 1999.
[11] R. J. Anderson, Security Engineering: A Guide to Building Dependable Distributed Systems, 2nd ed., Indiana: Wiley Publishing, Inc., 2008.

Management, Enterprise and Benchmarking in the 21st Century Budapest, 2017
157
[12] E. Chin, A. P. Felt, V. Sekary and W. David, "Measuring User Confidence in Smartphone Security and Privacy," in Symposium on Usable Privacy and Security (SOUPS) 2012, Washington, DC, 2012.
[13] Nielsen Mobile Insight, "Millenials are top smartphone users," The Nielsen Company (US), LLC, 2016.
[14] R. Wash, "Folk Models of Home Computer Security," in Proc. of the Symposium on Usable Privacy and Security (SOUPS), 2010.
[15] N. Good, R. Dhamija, J. Grossklags, S. Aronovitz, D. Thaw, D. Mulligan and J. Konstan, "Stopping spyware at the gate: A user study of privacy, notice and spyware.," in Proc. of the Symposium On Usable Privacy and Security (SOUPS), 2005.
[16] J. Kleinberg, "The wireless epidemic," Nature, p. 287–288, 2007.
[17] G. Lawton, "Is It Finally Time to Worry about Mobile Malware?," 2008.
[18] Leaders, "Planet of the phones," The Economist, 2015.
[19] A. Mamiit, "New Android Smartphones Found To Be Already Infected By Malware: Are You At Risk?," Tech Times, 2017.
[20] C. Albanesius, "Smartphone Shipments Surpass PCs for First Time. What's Next?," PCmag, 2011.
[21] J. E. Gold, "Mobile device strategy bypassed as enterprises face tablet invasion," TechTarget, 2011.
[22] Gartner, "Gartner Says 40 Percent of U.S. Employees of Large Enterprises Use Personally Owned Devices for Work," Gartner.com, 21 October 2014.
[23] M. E. Whitman and H. Mattord, Principles of Information Security, Boston, MA: Course Technology, 2003.
[24] I. Muslukhov, Y. Boshmaf, C. Kuo, J. Lester and K. Beznosov, "Understanding Users’ Requirements for Data Protection in Smartphones," in IEEE 28th International Conference on Data Engineering Workshops, 2012.
[25] I. Muslokhlove, "Survey: Data Protection in Smartphones Against Physical Threats," University of British Columbia, Canada, 2012.
[26] D. Ghosh, A. Joshi, T. Finin and P. Jagtap, "Privacy Control in Smart Phones Using Semantically Rich Reasoning and Context Modeling," in IEEE Symposium on Security and Privacy Workshops, 2012.

Management, Enterprise and Benchmarking in the 21st Century Budapest, 2017
158
[27] P. Kodeswaran, V. Nandakumar, S. Kapoor, P. Kamaraju, A. Joshi and S. Mukherjea, "Securing Enterprise Data on Smartphones Using Run Time Information Flow Control," in IEEE 13th International Conference on Mobile Data Management.
[28] C. Onwubiko and T. J. Owens, "Situational Awareness in Computer Network Defence: Principles, Methods and Applications," IGI Global, 2012.
[29] G. Muzea, The Vital Few Versus the Trivial Many : Invest With the Insiders, Not the Masses, New Jersey: John Wiley & Sons, Inc., 2005.
[30] M. Becher, "Security of smartphones at the dawn of their ubiquitousness," University of Manheim, Cleves, 2009.
[31] A. Felt, M. Finifter, E. Chin, S. Hanna and D. Wagner, "A survey of mobile malware in the wild," in Proc. of the 1st ACM Workshop on Security and Privacy in Smartphones and Mobile Devices (SPSM), 2011.
[32] E. Ha, A. P. Felt, S. Egelman, A. Haney, E. Chin and D. Wagner, "Android Permissions: User Attention, Comprehension, and Behavior," in Proceedings of the Symposium on Usable Privacy and Security (SOUPS), Washington DC, 2012.
[33] S. Motiee, K. Hawkey and K. Beznosov, "Do Windows users follow the principle of least privilege? Investigating user account control practices.," in Proceedings of the 6th Symposium on Usable Privacy and Security (SOUPS), New York, 2010.
[34] H. Bidgoli, "Volume III: Threats, Vulnerabilities, Prevention, Detection and Management," in Handbook of Information Security, New Jersey, John Wiley & Sons, Inc., 2006, pp. 146-165.
[35] C. Gao and J. Liu, "Modeling and restraining mobile virus propagation," in IEEE Transactions on Mobile Computing, 2013.
[36] McAfee, "Mobile Threat Report 2016," McAfee.com, 2016.
[37] R. Unuchek and V. Chebyshev, "Mobile Malware Evolution: 2013," 2014.
[38] CISCO, "Cisco Annual Security Report," Cisco Systems, Inc. , 2014.
[39] P. Ruggiero and J. Foote, "Cyber Threats to Mobile Phones," United States Computer Emergency Readiness Team (US-CERT), 2011.
[40] R. Prodanovic´ and D. Simic´, "Survey of Wireless Security," Journal of Computing and Information Technology, vol. 15, no. 3, p. 237–255, 2007.
Management, Enterprise and Benchmarking in the 21st Century Budapest, 2017
159
[41] A. Kataria, T. Anjali and R. Venkat, "Quantifying smartphone vulnerabilities," in 2014 International Conference on Signal Processing and Integrated Networks (SPIN), 2014.
[42] T. Vidas, D. Votipka and N. Christin, "All Your Droid Are Belong to Us: A Survey of Current Android Attacks," in In Proceedings of the Fifth USENIX Conference on Offensive Technologies, Berkeley, CA, 2011.
[43] Kaspersky & INTERPOL, "Mobile Cyber Threats: Kaspersky Lab & INTERPOL Joint Report," media.kaspersky.com, 2014.
[44] A. Portnoy, "Pwn2Own wrap up and analysis," Journal Network Security, vol. 2010, no. 4, pp. 4-5, April 2010.
[45] M. Keith, "Google Android 2.0 < 2.1 - Reverse Shell Exploit".
[46] R. P. Weinmann, "All Your Baseband Are Belong to Us," Laboratory for Algorithmics, Cryptology & Computer Security- University of Luxembourg, Luxembourg, 2010.
[47] E. Mills, "Google pulls app that revealed Android flaw, issues fix," cnet.com, 2010.
[48] Symantec, "2016 Internet Security Threat Report," Symantec Website Security, 2016.
[49] C. Marforio, R. J. Masti, C. Soriente, K. Kostiainen and S. Capkun, "Personalized security indicators to detect application phishing attacks in mobile platforms," arXiv preprint arXiv:1502.06824, 24 February 2015.
[50] J. Hubbard, K. Weimer and Y. A. Chen, "Study of SSL Proxy attacks on Android and iOS mobile applications," in Consumer Communications and Networking Conference (CCNC), 2014.
[51] A. Pore and M. Bartere, "A Review on Camera Based Attacks on," International Journal of Computer Science and Technology, vol. 6, no. 1, pp. 88-92, January-March 2015.
Management, Enterprise and Benchmarking in the 21st Century Budapest, 2017
160
[52] M. Bartere and A. Pore, "Preventions and Features of Camera Based Attacks on Smart Phones," International Journal of Emerging Trends & Technology in Computer Science (IJETTCS), vol. 4, no. 4, p. 4846–4853, July - August 2015.
[53] Information Systems Audit and Control Association (ISACA), "Securing Mobile Devices," 2010. [Online]. Available: http://www.isaca.org/Knowledge-Center/Research/ResearchDeliverables/Pages/Securing-Mobile-Devices.aspx.
[54] TechTerms.com, "API (Application Programming Interface) Definiton," [Online]. Available: https://techterms.com/definition/api.

Management, Enterprise and Benchmarking in the 21st Century Budapest, 2017
161
Sale Opportunities of the Small-scale Producers at the Concentrated Food Commerce
Kiss Konrád [email protected]
Abstract:As the result of the market concentration, the most shares of the consumer-goods market are held by the shopping centres, above all by the multinational chain stores, in Hungary too. These chains get their suppliers competed with strict conditions. Taking part in their supply system is a difficult task and it can be extremely hard for the small-scale producers. The sale-opportunities and the market shares of the small producers have decreased because of the expansion of the market concentration. Taking part in “short supply chains “(SSCs)” or in sales based on cooperation for examples in producers’ organisation can mean alternative sale options for them. This study examines the opportunities offered by the short supply chains for their participants by content analysis and by using secondary sources. It presents that which are those producers or enterprise-types to whom the SSCs are the best sales options. The basic aim of the study is to compare the features of taking part in conventional supply chains and in SSCs, and to present a description about the characteristics of the short chains.
Keywords: supply chains, short supply chains, direct sales, small-scale producers, suppliers
1 Literature Review
1.1 Presenting the state of the concentration in the commerce
The beginning of the commercial concentration can be put at the 1950s and it took a half decade to proceed. This process is typical in the commerce of the developed countries and in a lot of developing countries as well (Dobos 2009). In Hungary the period of thes transformation has started in the middle of the 1990s and lasted till 2008, till the world economic crisis. (Kopcsay 2014) This process took place in every branch of the retail trade but it’s effect was definitely strong in the area of the food retail (Dobos 2009). The GfK’s (2016) study analysing the first half-year of 2016 shows that the units of the “modern retail trade;” the hypermarkets, the

Management, Enterprise and Benchmarking in the 21st Century Budapest, 2017
162
supermarkets and the discount stores own the most part of the consumer goods’ commercial shares (1. figure). The concomitant of this process is that the typically great numbered, small sized enterprises and the small stores perform only a low part of the trade comparing their great numbers. The trade is focused at the small-numbered, but great-sized units (Juhász et al. 2008). According to Jankuné and her contributors (2012), the spreading of the modern commercial channels became faster after 2000, furthermore it is probable that their spreading continues together with the forcing back of the traditional trade networks.
Figure 1. Market shares of the commercial channels
(Source: GfK 2016, own translation)
In parallel with the process of the market concentration, it is important to review the changes at the producers’ side too. The up that time vertically and horizontally strongly integrated product-path has been dissolved after the changeover, and structure of the agricultural production had been transformed. Instead of the previously typical farming on large scale, the “atomic,” small size farming became increasingly general. In this way, the smaller farmers could not make enough products on the proper volume with the same quality to be able to individually initiate price-negotations on the merits with the continuously increasing sized engrossers (Horváth 2010).
1.2. Alternative opportunities of the small producers By the withdrawal of the traditional trade channels the question arises that what happens with those producers who are selling their products in traditional ways and places. For economies of scale reasons they cannot sell their wares in the retail chain stores owning the greatest shares on the market. It is very hard for the small-scale producers to join to the supply system of the chains from abroad. Small producers are able to become their direct suppliers are
Management, Enterprise and Benchmarking in the 21st Century Budapest, 2017
163
rare (Kozák et al, 2010). Seres and Szabó (2009) pronounces that there is no future for the direct supply to the multinational chain stores by the small sized producers. Products for “market gaps,” or product for market areas are let free by the great sized market producers may mean exception. Thus the small sized producers having small-volumed products with non-humogenous quality cannot appear in big numbers as the suppliers of the great chains. In order to improve their importance on the markets, an opportunity for the small producers is to make cooperation, to participate in producers’ organisation, that is undoubtedly advantageous in the commerce. According to Seres and Szabó (2009) considerably more small-producer-made products get to the chains through other suppliers and producers organisations. On the other hand, producers-cooperations has been organised only in low numbers and in rudimentary forms in Hungary. According to the results of Baranyai and Szabó (2016. 157.p.) more than half (51%) of the responder farms do not participate at all in cooperations (out of 6.537 responder farms). Its general reasons are the willingness to cooperation is low in Hungary (Bódis 2016), the adaptability of the domestic farmers are weak (Dobos 2009), or they do not want to abandon their independence; they do not want to sale through cooperations (Juhász et al. 2008). Further reasons are the lack of informations about the cooperations and the lack of the cooperations offering opportunities to join and the former bad experiences. (Baranyai – Szabó 2016)
1.3 The importance of the short supply chains.
Hungary – realising the importance of the local producer sale - created a thematic subprogram in the rural development program in the period lasts from 2014 till 2020. The title of the subprogram is “Short Supply Chain Thematic Subprogram” which assists the producers getting to market, with a value of 26 mrd. HUFs, by supporting the short supply chains. As it is referred on the kormány.hu (the official webside of the Hungarian government) in Europe one has searched for the solution that promotes the producers’ greater participation in the benefit comes from the food chains. It’s main mode to shorten the supply chain – on the one hand by decreasing the numbers of the intermediary chain-participants, on the other hand by shortening the physical distances by creating trading points that can be found near to the producers (Internet 1). According to Szabó (2014), the supporting of the small producers is necessary because the “SSC’-producers’ self-organising ability is low, and their ability to enforce their interests is weak, and their competitiveness for applications is also weak. Cooperations – that mean solution in many points of view – are rare. The European Parliament and Commission’s Regulation on support for rural development defined the short supply chains on the following way: "short supply chain" means a supply chain involving a limited number of economic operators, committed to co-operation, local economic development, and close geographical and social relations between producers, processors and consumers” (Regulation (EU) No. 1305/2013, I. 347/499). At the judgement of the short supply chains it is considerable that

Management, Enterprise and Benchmarking in the 21st Century Budapest, 2017
164
however the shopping centres are the most popular trading channel, but according to Benedek and Balázs (2014) the interests in the local food and in the short supply chains has increased throughout the world. The participation in “SSCs” gives really an alternative for the small producers to improve their incomes, but this solution is not regular and do not happen automatically (Szabó-Juhász 2012). For this reason it can be used as an instrument of the rural development.
Renting and his contributors (2003; 339.p.) describes the practicable methods of the “short food supply chains” (SFSCs) on the following classifications:
- “Face-to-face SFSCs: farm shops, farmers markets, roadside sales, pick your own, box schemes, home deliveries, mail order, e-commerce.” (Csíkné and Lehota (2013), ranks the sales from automats also among the direct sales. )
- “Proximate SFSCs: farm shop groups; regional hallmarks, consumer cooperatives, community supported agriculture, thematic routes, special events, fairs, local shops, restaurants, tourist enterprises, “dedicated” retailers, catering for institutions, sales to emigrants.”
- “extended SFSCs: certification labels, production codes, reputation effects.”
According to Bareja-Wawryszuk and Golebiewski (2014) local food systems has an important role in the world food supply, and it “can become great alternative beneficial for consumers as well as for environment.” (77.p.) Referring to Mastronardi et al. (2015), taking part in SFSCs can make significant profit for the famers. They have direct input on price that can be determinated on autonomous way. (The positive features of the SFSCs and the direct sale is going to be explained in the following chapters.)
2 Material and Method
My research is based on literature reviews and content-analysis. It’s aim is to present the charasteristics of the short chain, especially of the direct sale. In Hungary the most common “short supply chain form” is the local market trade. I reviewed studies examining this subject in order to get a summary about the charasteristics of these trading ways. I focused primarly on the direct sale.

Management, Enterprise and Benchmarking in the 21st Century Budapest, 2017
165
3 Results
Examination of the short supply chains from the producers’ point of view The collective examination of these short chain types would be a definitely difficoult task. In the domestic literatures of this subject the works that examines the SSCs in a comprehensive way are rare because the individual studies mostly examines the SSC-types severally (Benedek 2014). According to Benedek and her contributors (2014) there is no such statistics that focus on the direct sales. Therefore I have pointed out the most significant form of the short supply chains in Hungary, and that are the local markets. On the basis of my experiences, the literatures deal jointly with the direct sale and that’s most wide-spreaded way, the sales on marketplaces. The information of the GfK (2016) indicates the withdrawal of the local market sales. In 2010, the proportion of the local market-visitor costumer households were 72%, and that dropped to 59% by the time period between 2015 July and 2016 June. This regression has been primarily caused by decrease of the rural consumers’ numbers. According to the GfK (2016), the fruits and vegetables have the most significant trade at the local markets. The features of the direct producer sales and the distribution in conventional chains are different. (Table 1.). (The studies that I utilised to edit this chart, mostly presents the features of the direct sale or sales in SSCs through the examples of the local market sales.)
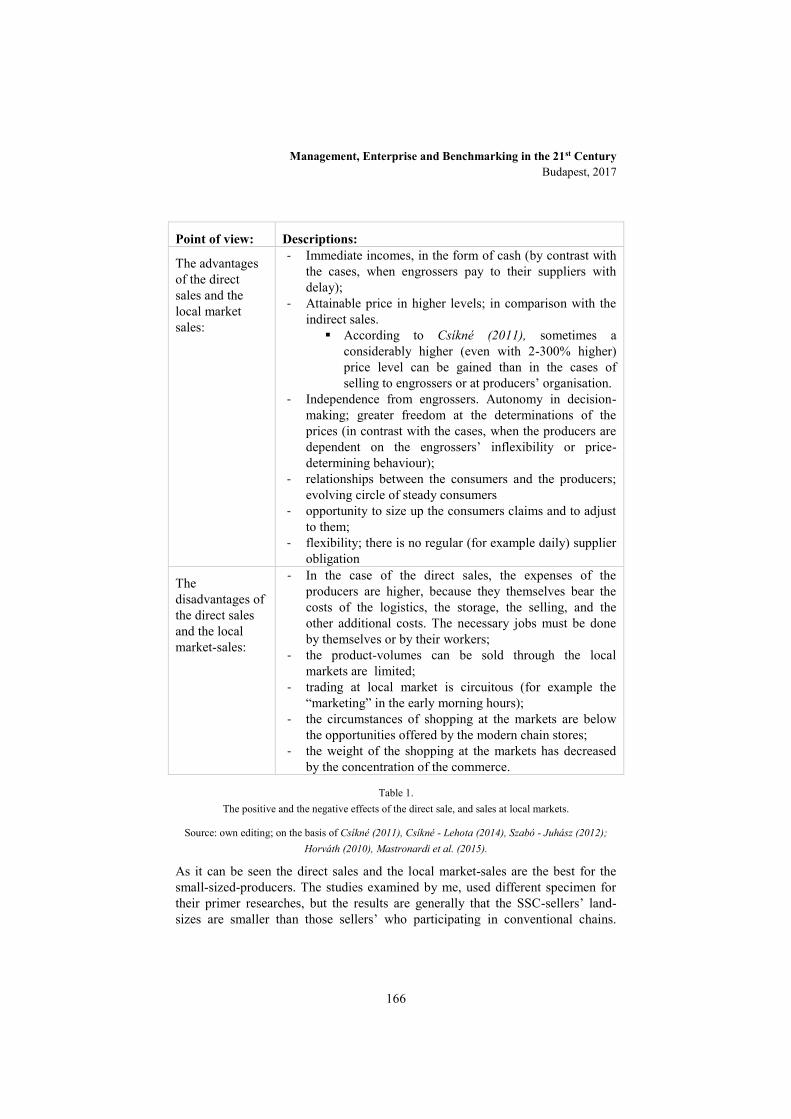
Management, Enterprise and Benchmarking in the 21st Century Budapest, 2017
166
Point of view: Descriptions:
The advantages of the direct sales and the local market sales:
- Immediate incomes, in the form of cash (by contrast with the cases, when engrossers pay to their suppliers with delay);
- Attainable price in higher levels; in comparison with the indirect sales.
According to Csíkné (2011), sometimes a considerably higher (even with 2-300% higher) price level can be gained than in the cases of selling to engrossers or at producers’ organisation.
- Independence from engrossers. Autonomy in decision-making; greater freedom at the determinations of the prices (in contrast with the cases, when the producers are dependent on the engrossers’ inflexibility or price-determining behaviour);
- relationships between the consumers and the producers; evolving circle of steady consumers
- opportunity to size up the consumers claims and to adjust to them;
- flexibility; there is no regular (for example daily) supplier obligation
The disadvantages of the direct sales and the local market-sales:
- In the case of the direct sales, the expenses of the producers are higher, because they themselves bear the costs of the logistics, the storage, the selling, and the other additional costs. The necessary jobs must be done by themselves or by their workers;
- the product-volumes can be sold through the local markets are limited;
- trading at local market is circuitous (for example the “marketing” in the early morning hours);
- the circumstances of shopping at the markets are below the opportunities offered by the modern chain stores;
- the weight of the shopping at the markets has decreased by the concentration of the commerce.
Table 1. The positive and the negative effects of the direct sale, and sales at local markets.
Source: own editing; on the basis of Csíkné (2011), Csíkné - Lehota (2014), Szabó - Juhász (2012); Horváth (2010), Mastronardi et al. (2015).
As it can be seen the direct sales and the local market-sales are the best for the small-sized-producers. The studies examined by me, used different specimen for their primer researches, but the results are generally that the SSC-sellers’ land-sizes are smaller than those sellers’ who participating in conventional chains.
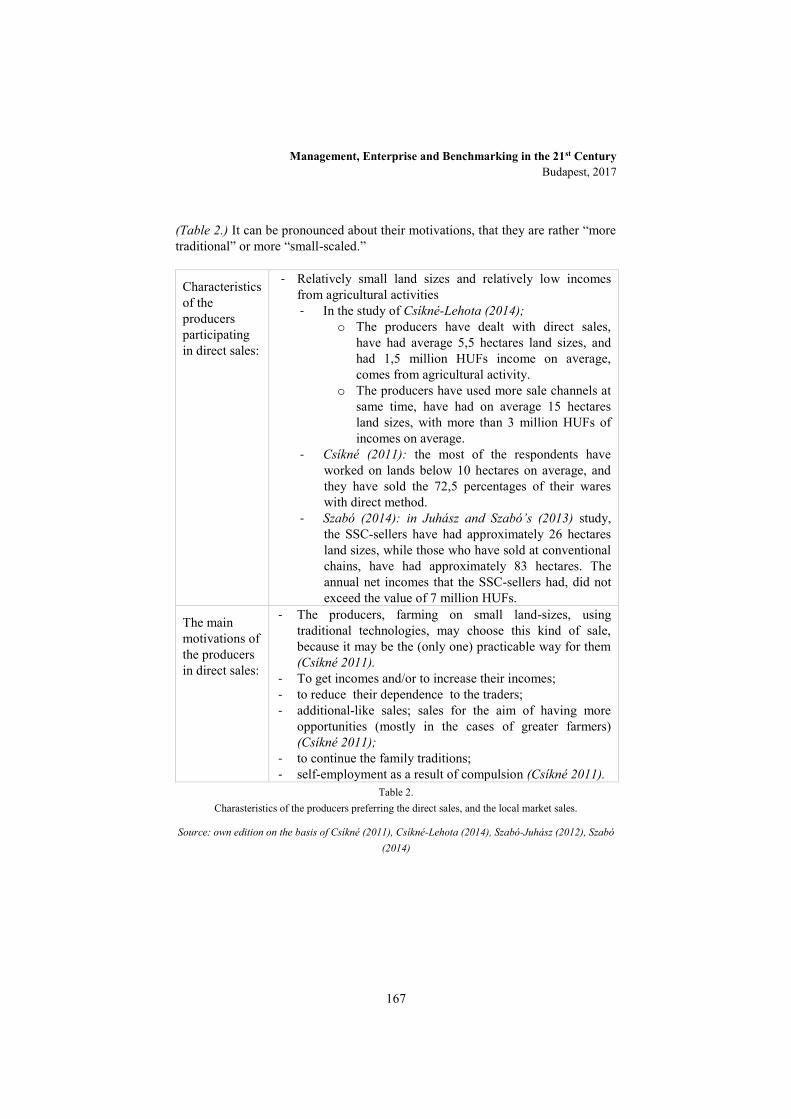
Management, Enterprise and Benchmarking in the 21st Century Budapest, 2017
167
(Table 2.) It can be pronounced about their motivations, that they are rather “more traditional” or more “small-scaled.”
Characteristics of the producers participating in direct sales:
- Relatively small land sizes and relatively low incomes from agricultural activities - In the study of Csíkné-Lehota (2014);
o The producers have dealt with direct sales, have had average 5,5 hectares land sizes, and had 1,5 million HUFs income on average, comes from agricultural activity.
o The producers have used more sale channels at same time, have had on average 15 hectares land sizes, with more than 3 million HUFs of incomes on average.
- Csíkné (2011): the most of the respondents have worked on lands below 10 hectares on average, and they have sold the 72,5 percentages of their wares with direct method.
- Szabó (2014): in Juhász and Szabó’s (2013) study, the SSC-sellers have had approximately 26 hectares land sizes, while those who have sold at conventional chains, have had approximately 83 hectares. The annual net incomes that the SSC-sellers had, did not exceed the value of 7 million HUFs.
The main motivations of the producers in direct sales:
- The producers, farming on small land-sizes, using traditional technologies, may choose this kind of sale, because it may be the (only one) practicable way for them (Csíkné 2011).
- To get incomes and/or to increase their incomes; - to reduce their dependence to the traders; - additional-like sales; sales for the aim of having more
opportunities (mostly in the cases of greater farmers) (Csíkné 2011);
- to continue the family traditions; - self-employment as a result of compulsion (Csíkné 2011).
Table 2. Charasteristics of the producers preferring the direct sales, and the local market sales.
Source: own edition on the basis of Csíkné (2011), Csíkné-Lehota (2014), Szabó-Juhász (2012), Szabó (2014)
Management, Enterprise and Benchmarking in the 21st Century Budapest, 2017
168
Conclusions It can be seen, that the conditions of the SSCs and the direct sale have different features than the participation in the conventional supply chains. The direct sales are suitable primarily for the small sized producers. In my opinion they are those, who can exploit these sale opportunities on the most profitable way. In this way, the small producers selling in low volumes have the opportunity to sell with higher prices. On the basis of the examined literatures, the income levels (come from agricultural activities) of the producers preferring this method are lesser than those producers’ who distributes at higher proportion in conventional chains. It must be remarked, that these groups have great differences in their commercial sizes, and in their land sizes. The direct sellers are not exposed to the conditions of the chain stores, but they take the cost and the tradingworks upon themselves. For example instead of the daily supplying they can decide how many days would they devote to the production and how many to the sales, balancing these two workprocesses. Evident disadvantages of the direct sales are the smaller market, the lower saleable product volumes, but these are relative disadvantages, because it depends on the sizes of the seller producers. However, on the basis of the literature, the consumers are interested in the SSCs, but for example, according to the information of the GfK, the importance of the local market trading (as the most significant SSC-method’) has been decreased.
References
[1] Baranyai Zs. - Szabó G. G. (2016): Kérdőíves felmérés a magyar gazdálkodók együttműködési aktivitásáról; In: Takácsné György Katalin (szerk.); Innovációs kihívások és lehetőségek 2014-2020 között: XV. Nemzetközi Tudományos Napok, ISBN: 978-963-9941-92-2 pp. 157-165.
[2] Bareja-Wawryszuk O. – Golebiewski J. (2014): Economicval, environmental and social significance of local food systems, in Review of Agricultural and Applied Economics (RAAE) (Number 2, 2014), ISSN 1336-9261, XVII., pp. 74-77.
[3] Benedek Zs. – Fertő I. – Barát L. – Tóth J. (2014): A termelői heterogenitás a rövid ellátási láncokban: a piacokon értékesítő gazdák jellemző különbségei, in: Gazdálkodás 58. évf., 4- sz. 2014. pp. 307-319.
[4] Benedek ZS. (2014): A rövid ellátási láncok hatásai – Összefoglaló a nemzetközi szakirodalom és a hazai tapasztalatok alapján. MTA-KRTK KTI, Műhelytanulmányok MT-DP 2014/8, 48 p.
[5] Benedek Zs. - Balázs B. (2014): A rövid ellátási láncok szocioökonómiai hatásai; in Külgazdaság – 58. évfolyam 5. szám., pp. 100-120.

Management, Enterprise and Benchmarking in the 21st Century Budapest, 2017
169
[6] Csíkné M. É. – Lehota J. (2013) Mezőgazdasági termelők értékesítési csatornaválasztási döntéseinek vizsgálata különös tekintettel a közvetlen értékesítésre. in Gazdálkodás, 2013.évf. 5.szám, pp 451-459.
[7] Csíkné M. É. (2011): Közvetlen értékesítés a zöldség-gyümölcs termelők körében; in Gazdálkodás, 55. évf. 5. sz. pp. 494-501.
[8] Dobos K. (2009): Kiskereskedelmi láncok és beszállítóik kapcsolata; in Közgazdasági Szemle - LVI. évf – 2009. február, pp. 155-175.
[9] GfK (2016): Sajtóközlemény – 2016. október 10. GfK: változatlan a vásárlók kereskedelmi csatornákhoz való hűsége; GfK Hungária, Budapest, 3 p.
[10] Horváth Z. (2010): A zöldség-gyümölcs teremlők együttműködése, a TÉSZ-ek értékesítési és gazdasági helyzetének vizsgálata; Doktori (PhD) értekezés; Gödöllő, 178. p.
[11] Jankuné K. Gy. – Stauder M. – Györe D. (2012): Az élelmiszer-kereskedelem termelékenysége és jövedelmezősége, Agrárgazdasági Kutatóintézet, Budepest; ISBN 978-963-491-582-9; ISSN 2061-8204; 148.p
[12] Juhász A. – Seres A.- Stauder M. (2008): A kereskedelem koncentrációja, Budapest, ISBN 978 963 06 5017 5, 135 p.
[13] Kopacsy L. (2014): Az élelmiszer kiskereskedelmi hálózatok megújuló stratégiái Magyarországon 2014-ben, in „Marketing megújulás” Marketing Oktatók Klubja 20. Konferenciája előadásai, Szeged 2014, ISBN: 978-963-306-312-5, pp. 73-83.
[14] Kozák A. – Seres A. – Szabó M. (2010): Sikeres kisárutermelők és egy sikeres termelési, értékesítési rendszer a zöldség-gyümölcs ágazatban 45. o.; in Magyar Tudományos Akadémia Közgazdaságtudományi Intézet – Műhelytanulmányok, 2010/04.
[15] Mastronardi L. – Marino D. – Cavallo A. – Gianelli A. (2015): Exploring the Role of Farmers in Short Food Supply Chains: The Case of Italy, in : International Food and Agribusiness Management Review (IFAMA) Volume 18 Issue 2, 2015 , pp. 109-130
[16] Regulation (EU) No. 1305/2013 OF THE EUROPEAN PARLIAMENT AND OF THE COUNCIL of 17 december 2013 - on support for rural

Management, Enterprise and Benchmarking in the 21st Century Budapest, 2017
170
development by the European Agricultural Fund for Rural Development (EAFRD) and repealing Council Regulation (EC) No 1698/2005 http://eur-lex.europa.eu/legal-content/EN/TXT/PDF/?uri=CELEX:32013R1305&from=hu downloaded: 2017.03.01.
[17] Renting H. – Marsden T. K. – Banks J. [2003]: Understanding Alternative Food Networks: Exploring the Role of Short Food Supply Chains in Rural Development. in Environment and Planning A. Vol. 35. No. 3., 20 p.
[18] Seres A. – Szabó M. (2009): Hazai zöldség-gyümölcs kisárutermelők nagy láncoknak történő értékesítési lehetőségei; in Gazdálkodás - 53. évf, 3. szám, pp 254 – 260.
[19] Szabó D. - Juhász A. (2012): A piacok szerepe és lehetőségei a hazai élelmiszer-ellátási láncban; in Gazdálkodás, - 56. évf., 3. szám. 217-229. o
[20] Szabó D. (2014): A rövid ellátási láncokban rejlő lehetőségek és veszélyek Magyarországon; Acta Carolus Robertus 4(2), Gyöngyös, pp. ISSN 2062-8269 109-118.,
a. referred by it: Juhász A. – Szabó D. (2013): A piacok jellemzői fogyasztói és termelői szemmel, Agrárgazdasági Könyvek, AKI, Budapest, 142.o.
Internet-references:
[Internet 1.]: a kormány.hu weboldala (2014.november.22): Huszonhat milliárd forint jut a termelők piacra jutásának segítésére; Date of the downloading: 2017.02.17.
http://www.kormany.hu/hu/miniszterelnokseg/agrar-videkfejlesztesert-felelos-allamtitkar/hirek/huszonhat-milliard-forint-jut-a-termelok-piacra-jutasanak-segitesere
[Internet 2.]: „Akcióban az Agrárkamara - Pénteken a Kopaszi-gátat, kedden a Hold utcai piacot szállta meg a NAK” Agrofórum Online; Bódis L. (2016). Date of the download: 2017.02.22
http://www.agroforum.hu/hirek/akcioban-az-agrarkamara-penteken-kopaszi-gatat-kedden-hold-utcai-piacot-szallta-meg-nak

Management, Enterprise and Benchmarking in the 21st Century Budapest, 2017
171
Customer Based Brand Equity Analysis: An Empirical Analysis to Geographical Origin
Elena Kokthi European University of Tirana, Albania
Faculty of Economy and Information Technology
Marketing and Management Department
Drita Kruja European University of Tirana, Albania Faculty of Economy and Information Technology Marketing and Management Department
Abstract:The objective of the present research is to examine origin bounded brand equity from a consumer perspective using disconfirmation of expectations approach. Origin equity was conceptualized in this paper as a combination of origin awareness and origin associations. Repeated measure Anova is used to analyse origin equity. Binary logit was used to get insight to the associations made to origin and demographics the effect in choosing one or other association. Disconfirmation of expectations theory comforts the use origin bounded equity as an extension of. customer brand equity Binary logit shows that expectations are not related to the associations made to origin while demographics show a significant effect. Older people associate origin with better taste, high income and young people relates origin with traditional aspects, low educated people with safety issues and females with high nutritional values. The Consumer based origin equity approach give insights in the process of product management and its success in the market. CBOE will help producers to better understand consumer behavior and increase the perceived performance of the product and consider the best differentiation quality scheme that fits to these preferences.
Key words: Disconfirmation of expectations, origin equity, logit regression,
Management, Enterprise and Benchmarking in the 21st Century Budapest, 2017
172
1 Introduction
Origin equity is important due to the competitive advantage conferred by the image of a geographical area. Several researches have been focused on origin and the impact of the later in brand equity but few of them have considered origin equity separately. Brands can compete on product attributes, pricing and distribution, but a unique origin that encompasses inimitable resources at the core of a product is a more long term driver of future marketing action (Spielmann, 2014). According to (Spielmann, 2014) origin bounded brands (OBBs) are defined as brands that use origin as their unique selling proposition.
Brand equity is considered as the most valuable assets that a company has (Best, 2012). High brand equity levels are known to lead to higher consumer preferences and purchase intentions (Cobb-Walgren, Ruble, & Donthu, 1995). According to Keller`s model (Keller, 2001), customer-based brand equity model (CBBE) can assist in the process of brand management, planning, implementing and brand strategies interpretation. This model can be used also to understand the effect of consumer characteristics in expectations and origin equity.
As previously mentioned region of origin is used as a unique selling position as considers the quality of a product inherent to its geographical area. High origin equity lay behind the quality product schemes of Europe such as the denomination of origin (protected denomination of origin PDO and geographical indications GI). According to Farquhar, (1989), the same as, high brand equity brings an opportunity for:1)successful extensions, 2)resilience against competitors,3)promotional pressures and 4)creation of barriers to competitive entry the same functions are performed by the place branding strategies such as GIs. Geographical indications the same as brands, establish their unique identity and awareness, creates cognitive associations, create a positive response and sustainable relationship with consumers. A conceptual framework for measuring customer origin based equity is developed to provide an integrative conceptualization of origin equity. This construct can be used to analyse denominations of origin from a consumer perspective, their equity and the sustainability of these quality schemes in the European market and abroad. This paper is structured as it follows: first section deals with literature review and gives insights in the concept of brand equity and how brand equity can be extended to origin equity. Second section presents the research design and statistical analysis. Results are presented in the fourth section and the paper concludes with discussion and conclusions.

Management, Enterprise and Benchmarking in the 21st Century Budapest, 2017
173
2 Literature review
Brand equity is defined as the set of associations and behaviours on the part of brand’s consumers, that permits the brand to earn greater volume or greater margins than it would without the brand name, and that gives the brand a strong, sustainable and differentiated advantage over competitors (Leuthesser, Kohli, & Harich, 1995). According to Aaker, (1996) brand equity can be expressed in a potential price premium, in loyal consumers, perceived comparative quality, perceived brand leadership, brand awareness etcetera. The same as brand equity, origin equity derives from the difference of origin cue assets and its liabilities. Although a variety of factors could influence and create origin attribute assets, some of them are the same with brand assets and makes the components of customer based origin equity (CBOE). Awareness, informational value, Emotional connections, price premiums and loyalty are some of the mentioned brand assets (Best, 2012). Awareness extended to origin means that regions with high awareness can more easily introduce new products under the umbrella of the region of origin because they are highly recognised by the consumer. Concerning informational value, several authors have considered the origin as added information, product origin serves as stimulus helping consumer to evaluate the product (Bilkey & Nes, 1982). In addition consumers makes little effort in product evaluation process and reduces the perceived risk (Acebron & Dopico, 2000).The value that a strong origin creates goes beyond functional benefits including psychological benefits especially when origin is linked to food safety issues (Dentoni, Tonsor, Calantone, & Peterson, 2009). Several authors consider origin as a cognitive cue used by consumers to infer beliefs regarding product attributes which might be experience attributes (taste) and credence attribute such as food safety (Verleigh 2001)(Dentoni, Tonsor, Calantone, & Peterson, 2009; Ittersum, 2001; Stefani, Romano, & Cavicchi, 2006; Van der Lans, Ittersum, De Cicco, & Loseby, 2001)(Ittersum, Candel, & Meulenberg, 2003). Also an origin that relates to consumers on an emotional level can be considered as highly valuable assets. Futhermore associations such as unique, exclusive, authentic and typical when referring to geographical origin are founded (Stolzenbach, Bredie, Christensen, & Byrne, 2013)(Philippidis, Kakarouglou, & Sanjuan 2002).
The ability to have price premiums is a valuable asset too. Price premium is defined as the amount a customer will pay for the brand in comparison with another brand offering similar benefits and it may be high or low and positive or negative depending on the two brands involved in the comparison (Aaker, 1996). Several authors studied the price premiums generated by origin (Bolliger & Réviron, 2008),Brugarolas, et al 2010)(Cortinas, Chcarro, Elorz, & Villanueva, 2007), (Kokthi&Kruja,2016),(Peterson Jolibert 1995),(Menapace, Colson, Grebitus, & Facendola, 2009) (Tudoran & Olsen, 2016).
However region of origin can also incur liabilities due to a) consumer dissatisfaction, b) reputations destructions, c) not uniform practices, d) negative

Management, Enterprise and Benchmarking in the 21st Century Budapest, 2017
174
associations created by the false name region claim etcetera (Kokthi et al 2016). According to (Best, 2009) although many marketing strategies are effective in attracting new customers, the business that satisfies them completely is the business that will keep them. Consumer satisfaction is a forward looking indicator to a product success that measure how well consumer will respond to the product in the future (Best, 2009). A not dissatisfied consumer can produce several economic consequences that lower profits and it can be worse when they communicate their dissatisfaction to others. Although not everyone who hears an unfavourable information is a potential buyer, the level of negative communication makes new consumer attraction more difficult and expensive (Best, 2009). To prevent a poor reputation develop from a mouth to mouth, producers engage in complaint processes. However in countries where the infrastructure of product complaints is not well developed this may not be a viable solution. Perceived quality-according to (Aaker, 1996) perceived quality synthesize all the perceptions and associations related to a given brand. This then raise the need to measure perceived quality since it is a good indicator of equity.
In the process of product evaluation when consumers taste a food product their perceptions are often biased by preconceived ideas about the product (Schifferstein,H 2001).These preconceived ideas are what we are expecting from the product to perform in reality and sensory perceptions are not independent from sensory expectations derived from the extrinsic cue (Deliza R & MacFie H.J.H, 1996; D’Hauteville, Fornerino, & Perrouty, 2006; D’Hauteville et al., 2006; Lange, Martin C., Chabanet C., Combris P., & Issanchou SL, 2002; Schifferstein & Mojet, 1999; Siret & Issanchou, 2000)(Caporale, Policastro, Carlucci, & Monteleone, 2006)(Stolzenbach et al., 2013) (Lagerkvist, Normann, & Åström,2017). Schifferstein H, (2001), provides a set of 3 alternatives to isolate sensory from no sensory preferences: 1) Blind test with the product, 2) Expectation test which provides non sensory information and 3) Full information test (provision of sensory and no sensory information regarding the product). The differences between scores or WTP measured respectively in the blind, expectation and full information can be used to measure origin equity.
Full information test score(F)-Expectation score(E)= Degree of Disconfirmation
Expectation test score(E)-Blind test score(B)=Degree of incongruence
Full information test score(F) - Blind test score(B)= Degree of Response shift
When the informational process refers to geographical origin of the product it has been reported that consumers indifferent between two products in the blind test revealed a strong sensory preference for products produced in specific areas in the full information test (Guerrero, Abad, and Aguera 2001).According to D’Hauteville et al., (2006) a strong region will be one which significantly improves the full evaluation of a product, i.e. an evaluation that combines sensory
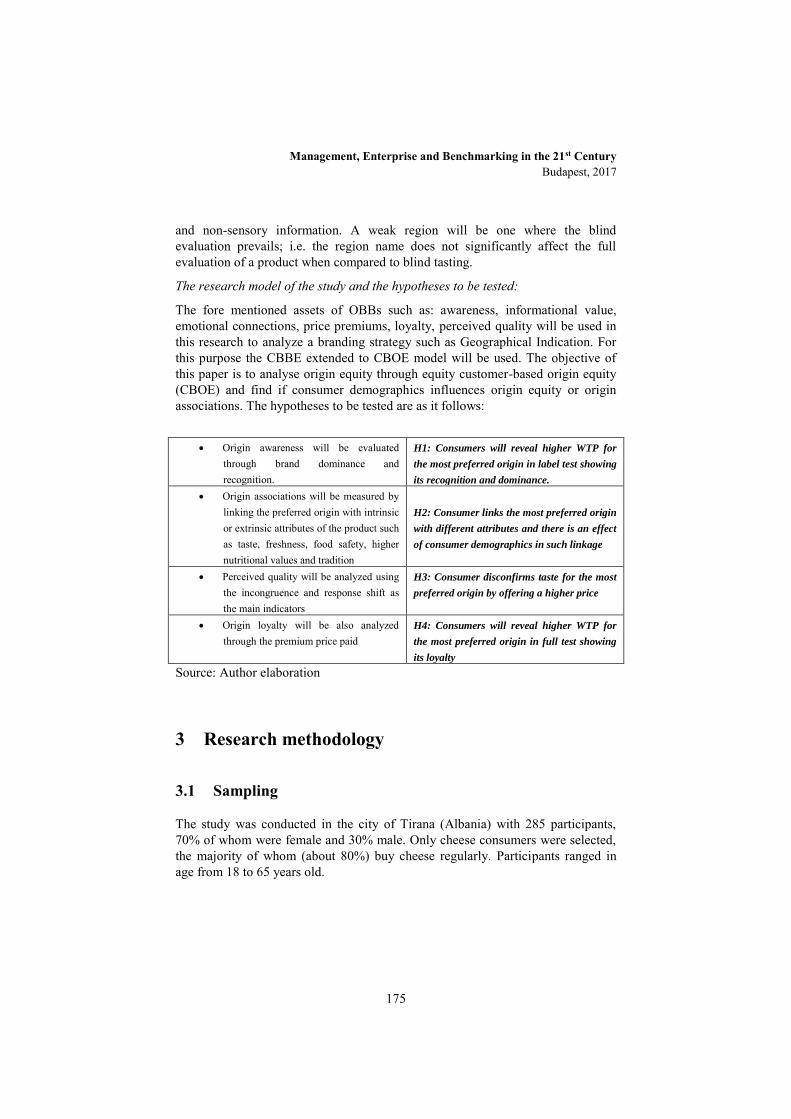
Management, Enterprise and Benchmarking in the 21st Century Budapest, 2017
175
and non-sensory information. A weak region will be one where the blind evaluation prevails; i.e. the region name does not significantly affect the full evaluation of a product when compared to blind tasting.
The research model of the study and the hypotheses to be tested:
The fore mentioned assets of OBBs such as: awareness, informational value, emotional connections, price premiums, loyalty, perceived quality will be used in this research to analyze a branding strategy such as Geographical Indication. For this purpose the CBBE extended to CBOE model will be used. The objective of this paper is to analyse origin equity through equity customer-based origin equity (CBOE) and find if consumer demographics influences origin equity or origin associations. The hypotheses to be tested are as it follows:
Origin awareness will be evaluated
through brand dominance and recognition.
H1: Consumers will reveal higher WTP for
the most preferred origin in label test showing
its recognition and dominance. Origin associations will be measured by
linking the preferred origin with intrinsic or extrinsic attributes of the product such as taste, freshness, food safety, higher nutritional values and tradition
H2: Consumer links the most preferred origin
with different attributes and there is an effect
of consumer demographics in such linkage
Perceived quality will be analyzed using the incongruence and response shift as the main indicators
H3: Consumer disconfirms taste for the most
preferred origin by offering a higher price
Origin loyalty will be also analyzed through the premium price paid
H4: Consumers will reveal higher WTP for
the most preferred origin in full test showing
its loyalty Source: Author elaboration
3 Research methodology
3.1 Sampling
The study was conducted in the city of Tirana (Albania) with 285 participants, 70% of whom were female and 30% male. Only cheese consumers were selected, the majority of whom (about 80%) buy cheese regularly. Participants ranged in age from 18 to 65 years old.

Management, Enterprise and Benchmarking in the 21st Century Budapest, 2017
176
Variables Description Mean Sd Gender 0 males, 1 females 0.69 0.45
Age Age categories 18-24, 25-34, 35-44, 45-54, 55-64, 65+
3.02 1.37
Education
Education levels (Low:1-8 years; Medium: 8-12 years; High: more than 12 years)
2.33 0.66
Incomes Euro/monthly
(€71-214, €215-428, €429-642, €643-857, €>857) 2.8 1.2
You link the extra payment for origin with:
Taste 1= no 0=yes 0.3 0.4
Traditional aspects 1= no 0=yes 0.7 0.4
Table 1. Survey variable description Source:Author elaboration
3.2 Research design
The experimental design places the respondent in three different situations regarding the level of information provided. Firstly, they evaluated the product after tasting it and gave a price for each of the cheeses tasted. An open-ended question was chosen for the purpose of the study:
What is the maximum amount of money that you are willing to pay for the cheese that you have just tasted? It was explained that their WTP should refer not to the stated prices they thought the product would cost in the dairy shop (minimarket, supermarket, diary production units) but to their maximum WTP during the test. Secondly, we presented to the participants a label for each cheese type. The order in which the labels were given was not the same as that of the cheeses in the blind test. The label provides only origin information. This time the question asked was: What is the maximum amount of money that you are willing to pay for the cheese that is produced in the region of Gjirokastër, Denmark, Kavaja and Fieri? The labels were offered separately in order to avoid comparison. A second set of prices was registered. Finally, the participants gave a price for each cheese type after tasting it again and matching each cheese type with its respective label.
The products used in the experiment are feta type cheeses. Gjirokastër cheese is produced by mixing different types of milk (cow, sheep and goat). The processing technology used is traditional. Also selected were two cheese types from regions that produce important quantities (Fier and Kavajë). The fourth type is a cow’s milk feta produced in Denmark. The participant did not have the possibility to recognize the products in the blind test. Sensory analysis was performed by
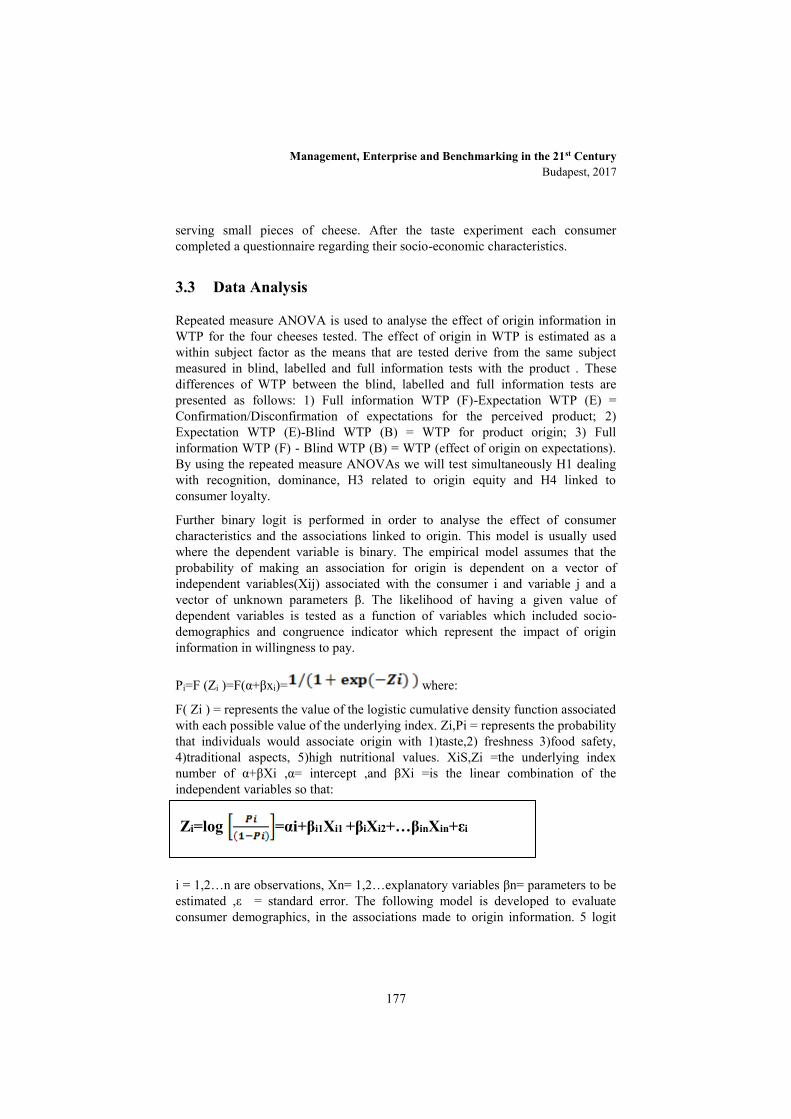
Management, Enterprise and Benchmarking in the 21st Century Budapest, 2017
177
serving small pieces of cheese. After the taste experiment each consumer completed a questionnaire regarding their socio-economic characteristics.
3.3 Data Analysis
Repeated measure ANOVA is used to analyse the effect of origin information in WTP for the four cheeses tested. The effect of origin in WTP is estimated as a within subject factor as the means that are tested derive from the same subject measured in blind, labelled and full information tests with the product . These differences of WTP between the blind, labelled and full information tests are presented as follows: 1) Full information WTP (F)-Expectation WTP (E) = Confirmation/Disconfirmation of expectations for the perceived product; 2) Expectation WTP (E)-Blind WTP (B) = WTP for product origin; 3) Full information WTP (F) - Blind WTP (B) = WTP (effect of origin on expectations). By using the repeated measure ANOVAs we will test simultaneously H1 dealing with recognition, dominance, H3 related to origin equity and H4 linked to consumer loyalty.
Further binary logit is performed in order to analyse the effect of consumer characteristics and the associations linked to origin. This model is usually used where the dependent variable is binary. The empirical model assumes that the probability of making an association for origin is dependent on a vector of independent variables(Xij) associated with the consumer i and variable j and a vector of unknown parameters β. The likelihood of having a given value of dependent variables is tested as a function of variables which included socio-demographics and congruence indicator which represent the impact of origin information in willingness to pay.
Pi=F (Zi )=F(α+βxi)= where:
F( Zi ) = represents the value of the logistic cumulative density function associated with each possible value of the underlying index. Zi,Pi = represents the probability that individuals would associate origin with 1)taste,2) freshness 3)food safety, 4)traditional aspects, 5)high nutritional values. XiS,Zi =the underlying index number of α+βXi ,α= intercept ,and βXi =is the linear combination of the independent variables so that:
where
i = 1,2…n are observations, Xn= 1,2…explanatory variables βn= parameters to be estimated ,ε = standard error. The following model is developed to evaluate consumer demographics, in the associations made to origin information. 5 logit
Zi=log =αi+βi1Xi1 +βiXi2+…βinXin+εi
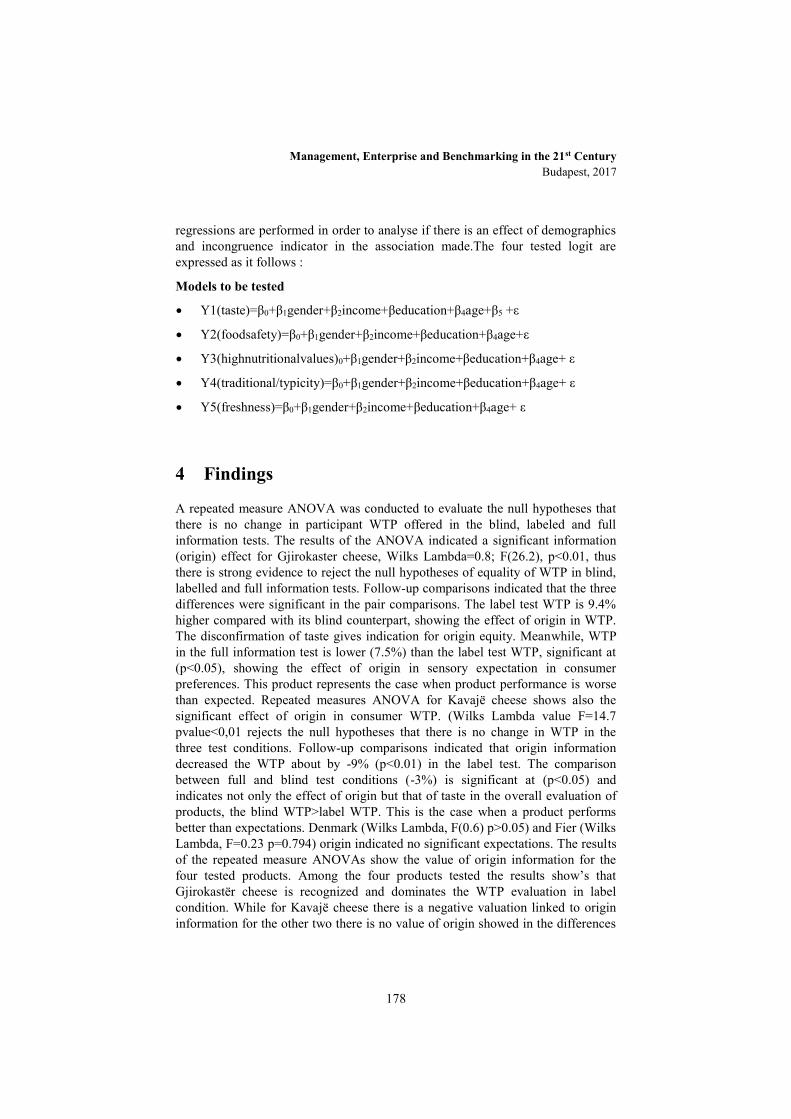
Management, Enterprise and Benchmarking in the 21st Century Budapest, 2017
178
regressions are performed in order to analyse if there is an effect of demographics and incongruence indicator in the association made.The four tested logit are expressed as it follows :
Models to be tested
Y1(taste)=β0+β1gender+β2income+βeducation+β4age+β5 +ε
Y2(foodsafety)=β0+β1gender+β2income+βeducation+β4age+ε
Y3(highnutritionalvalues)0+β1gender+β2income+βeducation+β4age+ ε
Y4(traditional/typicity)=β0+β1gender+β2income+βeducation+β4age+ ε
Y5(freshness)=β0+β1gender+β2income+βeducation+β4age+ ε
4 Findings
A repeated measure ANOVA was conducted to evaluate the null hypotheses that there is no change in participant WTP offered in the blind, labeled and full information tests. The results of the ANOVA indicated a significant information (origin) effect for Gjirokaster cheese, Wilks Lambda=0.8; F(26.2), p<0.01, thus there is strong evidence to reject the null hypotheses of equality of WTP in blind, labelled and full information tests. Follow-up comparisons indicated that the three differences were significant in the pair comparisons. The label test WTP is 9.4% higher compared with its blind counterpart, showing the effect of origin in WTP. The disconfirmation of taste gives indication for origin equity. Meanwhile, WTP in the full information test is lower (7.5%) than the label test WTP, significant at (p<0.05), showing the effect of origin in sensory expectation in consumer preferences. This product represents the case when product performance is worse than expected. Repeated measures ANOVA for Kavajë cheese shows also the significant effect of origin in consumer WTP. (Wilks Lambda value F=14.7 pvalue<0,01 rejects the null hypotheses that there is no change in WTP in the three test conditions. Follow-up comparisons indicated that origin information decreased the WTP about by -9% (p<0.01) in the label test. The comparison between full and blind test conditions (-3%) is significant at (p<0.05) and indicates not only the effect of origin but that of taste in the overall evaluation of products, the blind WTP>label WTP. This is the case when a product performs better than expectations. Denmark (Wilks Lambda, F(0.6) p>0.05) and Fier (Wilks Lambda, F=0.23 p=0.794) origin indicated no significant expectations. The results of the repeated measure ANOVAs show the value of origin information for the four tested products. Among the four products tested the results show’s that Gjirokastër cheese is recognized and dominates the WTP evaluation in label condition. While for Kavajë cheese there is a negative valuation linked to origin information for the other two there is no value of origin showed in the differences
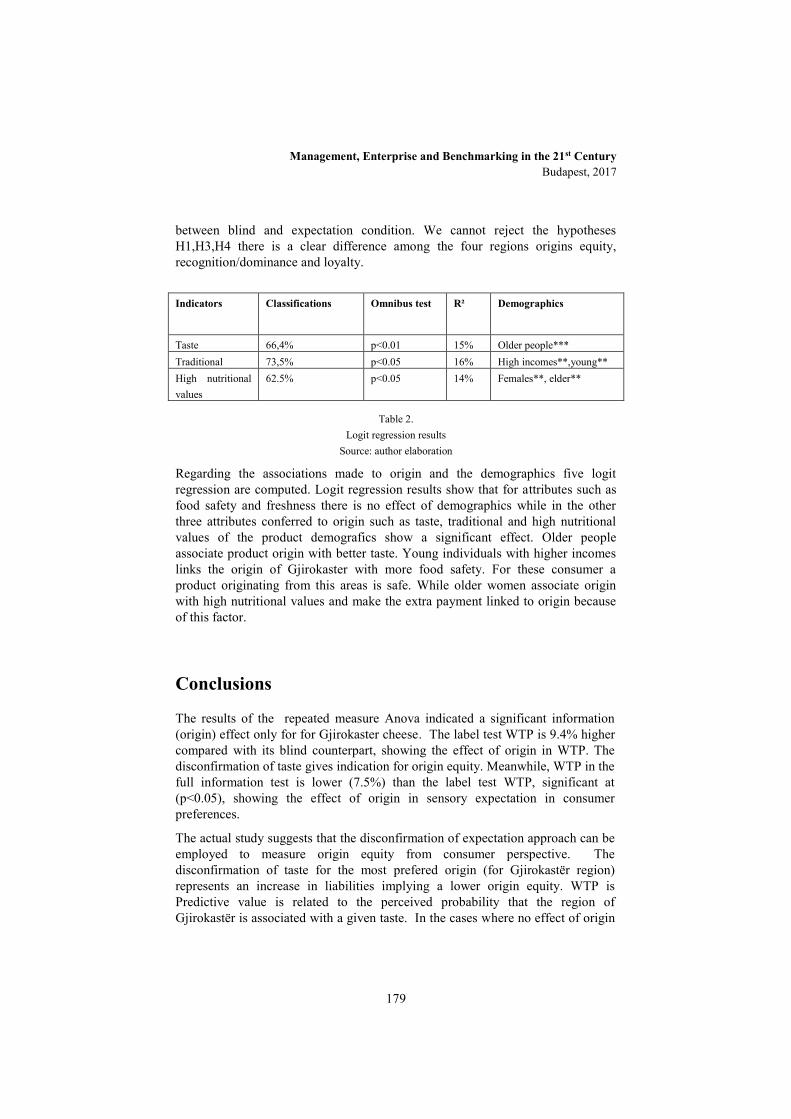
Management, Enterprise and Benchmarking in the 21st Century Budapest, 2017
179
between blind and expectation condition. We cannot reject the hypotheses H1,H3,H4 there is a clear difference among the four regions origins equity, recognition/dominance and loyalty.
Table 2. Logit regression results
Source: author elaboration
Regarding the associations made to origin and the demographics five logit regression are computed. Logit regression results show that for attributes such as food safety and freshness there is no effect of demographics while in the other three attributes conferred to origin such as taste, traditional and high nutritional values of the product demografics show a significant effect. Older people associate product origin with better taste. Young individuals with higher incomes links the origin of Gjirokaster with more food safety. For these consumer a product originating from this areas is safe. While older women associate origin with high nutritional values and make the extra payment linked to origin because of this factor.
Conclusions
The results of the repeated measure Anova indicated a significant information (origin) effect only for for Gjirokaster cheese. The label test WTP is 9.4% higher compared with its blind counterpart, showing the effect of origin in WTP. The disconfirmation of taste gives indication for origin equity. Meanwhile, WTP in the full information test is lower (7.5%) than the label test WTP, significant at (p<0.05), showing the effect of origin in sensory expectation in consumer preferences.
The actual study suggests that the disconfirmation of expectation approach can be employed to measure origin equity from consumer perspective. The disconfirmation of taste for the most prefered origin (for Gjirokastër region) represents an increase in liabilities implying a lower origin equity. WTP is Predictive value is related to the perceived probability that the region of Gjirokastër is associated with a given taste. In the cases where no effect of origin
Indicators Classifications Omnibus test R² Demographics
Taste 66,4% p<0.01 15% Older people*** Traditional 73,5% p<0.05 16% High incomes**,young** High nutritional values
62.5% p<0.05 14% Females**, elder**
Management, Enterprise and Benchmarking in the 21st Century Budapest, 2017
180
is observed (Fier and Denmark) where WTP in blind condition is equal with full information condition no prediction are made for the sensory properties.
This study also suggests that consumer associate origin with other indirect attributes such as taste, traditional and high nutritional values.
References
[1] Aaker, D. A. (1996). Measuring Brand Equity Across Products and Markets. California Management Review, 38, 102–120.
[2] Acebron, L. B., & Dopico, D. C. (2000). The importance of intrinsic and extrinsic cues to expected and experienced quality: an empirical application for beef. Food Quality and Preference, (11), 229–238.
[3] Best, R. J. (2009). Market-Based Management: Strategies for Growing Customer value and Profitability (5th ed.). Pearson Education Hall.
[4] Best, R. J. (2012). MARKET-BASED-MANAGEMENT: Strategies for Growing Customer Value and Profitability (6th ed.).
[5] Bilkey, W., & Nes, E. (1982). Country of Origin effects on Products evaluations. Journal of International Business Studies, Spring/Summer.
[6] Bolliger, C., & Réviron, S. (2008). Consumer Willingness to pay for Swiss Chicken Meat:An in store survey to link stated and revealed buying behaviour.
[7] Brugarolas, M., Poveda, A., & Carrasco, M. (2010). Aceptacion de productos agrarios proprios en los mercados locales: el aceite de oliva extra en la Comunidad Valenciana. Revista Espanola de Estudios Agrosociales y Pesqueros, (226), 207–224.
[8] Caporale, G., Policastro, S., Carlucci, A., & Monteleone, E. (2006). Consumer Expectations for Sensory Properties in Virgin Olive Oils. Food Quality and Preference, (17).
[9] Cobb-Walgren, C. ., Ruble, C. ., & Donthu, N. (1995). Brand Equity, Brand Preference and Purchase Intent. Journal of Advertising, 24(3), 25–40.
[10] Cortinas, M., Chcarro, R., Elorz, M., & Villanueva, M. L. (2007). La importancia del atributo origen en la eleccion de productos agroalimentarios. El caso del esparrago de Navarra, 7(13), 57–90.
[11] Deliza R, & MacFie H.J.H. (1996). The generation of sensory expectation by external cues and its effects on sensory perception and hedonic ratings: A review. Journal of Sensory Studies, (11).

Management, Enterprise and Benchmarking in the 21st Century Budapest, 2017
181
[12] Dentoni, D., Tonsor, G., Calantone, R. J., & Peterson, C. H. (2009). The direct and indirect Effects of Locally Grown on Consumers attitudes towards Agri-Food Products. Agricultural and Resource Economics Review, 38(3), 384–396.
[13] D’Hauteville, F., Fornerino, M., & Perrouty, J. P. (2006). Disconfirmation of Taste as a Measure of Region Origin Equity, an Experimental Study on Five French Regions, (11).
[14] Farquhar, P. H. (1989). Managing Brand Equity. Marketing Research, 1(3), 24–33.
[15] Hong, S., & Wyer, R. S. (1989). The Effect of Country of Origin and Product-Attribute Information on Product Evaluation: An Information Processing Perspective. Journal of Consumer Research, 16, 175–187.
[16] Ittersum, K. van. (2001). The role of region of origin in Consumer Decision Making and Choice. Retrieved from http://edepot.wur.nl/82514
[17] Ittersum, K. van, Candel, M. J. J. M., & Meulenberg, M. (2003). The influence fo the image of a product’s region of origin on product evaluation. Journal of Bussiness Research, 56, 215–226.
[18] Kokthi, E., & Kruja, D. (2016). Consumer Expectations for Geographical Origin: Eliciting Willingness to Pay (WTP) Using the Disconfirmation of Expectation Theory (EDT). Journal of Food Products Marketing, 1-17.
[19] Kokthi, E., Bermudez, I. V., & Limon, M. G. (2016). Predicting willingness to pay for geographical origin in Albania: a logistic approach/Prevoir la disposition a payer pour l'origine geographique en Albanie: une approche logistique. New Medit, 15(2), 63-70.
[20] Keller, K. L. (2001). Building Customer-Based Brand Equity: A Blueprint for Creating Strong Brands. Working paper.
[21] Lagerkvist, C. J., Normann, A., & Åström, A. (2017). Product satisfaction in food choice is multiple-reference dependent: Evidence from an in-store non-hypothetical consumer experiment on bread. Food Quality and Preference, 56, 8-17.
[22] Lange, C., Martin C., Chabanet C., Combris P., & Issanchou SL. (2002). Impact of information provided to consumer on their willingness to pay for Champagne : comparison with hedonic scores. Food Quality and Preference, (13), 597–608.
[23] Leuthesser, L., Kohli, C. ., & Harich, K. R. (1995). Brand Equity the Halo Effect Meausure, 29(4), 57–66.

Management, Enterprise and Benchmarking in the 21st Century Budapest, 2017
182
[24] Menapace, L., Colson, G., Grebitus, C., & Facendola, M. (2009). Consumer preferences for country-of-origin, geographical indication, and protected designation of origin labels.
[25] Pecqueur, B. (2001). Qualité et développement territorial: l’hypothèse du panier de biens et de services territorialisés. Économie rurale, 261(1), 37–49.
[26] Philippidis, G., Kakarouglou, I., & Sanjuan, A. I. (2002). Territorial product associations in Greece the case of olive oil.
[27] Schifferstein H. (2001). Effects of Products Beliefs on product perception and liking. In Food, people and society A europian perspective of consumer choices (pp. 73–96).
[28] Schifferstein, H. N. ., & Mojet, J. (1999). Asymmetry in the Disconfirmation of Expectations for Natural Yogurt, (32), 307–329.
[29] Siret, F., & Issanchou, S. (2000). Traditional process: Influence on sensory properties on consumer expectation and liking Application do pate de campagne. Food Quality and Preference, (11), 217–228.
[30] Spielmann, N. (2014). Brand equity for origin-bounded brands. J Brand Manag, 21(3), 189–201.
[31] Stefani, G., Romano, D., & Cavicchi, A. (2006). Consumer expectations,liking and willingness to pay for specialty foods: Do sensory characteristics tell the whole story? Food Quality and Preference, (17), 53–62.
[32] Stolzenbach, S., Bredie, W., Christensen, R., & Byrne, D. (2013). Impact of product information and repetead exposure on consumer liking,sensory perception and concept associations of local apple juice. Food Research International, (52), 91–98.
[33] Tudoran, A. A., & Olsen, S. O. (2016). Analyzing the returns of the first transaction satisfaction on intention to purchase and willingness to pay: Evidence for new food products. Journal of Consumer Behaviour.
[34] Van der Lans, I. A., Ittersum, K. van, De Cicco, A., & Loseby, M. (2001). The role of the region of origin and EU certificates of origin in consumer evaluation of food products. Europian Reviw of Agricultural Economics, 28(4), 451–477.
[35] Verleigh, P. W. . (2001). Country of Origin Effects on Consumer Product Evaluations. Retrieved from http://edepot.wur.nl/139407
Management, Enterprise and Benchmarking in the 21st Century Budapest, 2017
183
The Knowledge and Students’ Readiness to Join the Business Services Sector in Albania
Drita Kruja European University of Tirana, Albania Faculty of Economy and Information Technology Marketing and Management Department
Elena Kokthi European University of Tirana, Albania Faculty of Economy and Information Technology Marketing and Management Department
Abstract: This research focuses on the shared service centers (SSC) that represent the most developing part of the bussiness services sector. This research aims to analyze the career consciousness of the students, to measure the knowledge of the students about the sector and to analyze students’ readiness to join the business services sector. The target audience for the research was selected due to the fact that students represent a large pool for the SSC’s hiring activities. Findings suggest that: international exposure and reputation of the company plays the key role for students when selecting a certain company; money benefits and the possibilities of career growth when selecting a certain position, Students prefer careers in international companies and own business. Students who have a positive attitude towards the jobs in the SSCs, the main reason to start a career in the center is to have a good career start after graduation. The research provides insights on the Albanian labour market.
Keywords: Business service sector, shared services center, knowledge, readiness, talent .
Management, Enterprise and Benchmarking in the 21st Century Budapest, 2017
184
1 Introduction
The development of the tertiary sector during the last years became one of the most remarkable phenomenon of global development in the last century. Today one of the main tendencies in the world economy is the fast growth of the service sector. The world economy is still being transformed into a service dominated economy. According to the World Factbook 2015 (Central Intelligence Agency) the contribution of services industries to GDP globally is 63%, 70 % in European Union1 and 53%2 in Albania
Exactly this fact attracts the attention to pay a special consideration to this sector.
The figures for the employment in the service sector seem very significant. The tertiary sector represents more than 60 % of the active population employment in almost all developed countries and about 70 % in European Union. The greatest single source of new jobs will be found in private sector services, such as business and administrative services, and real estate, and also it is forecasted an increasing demand for higher-skilled workers, according to ILO World Economic and Social Outlook ( 2015).
This research focuses on the shared service centers that represent the most developing part of the bussiness services sector.
Research objectives are:
- To analyze the career consciousness of the students - To measure the knowledge of the students about the sector - To assess students’ preferences towards types of the companies, and area
they would like to work at - To analyze students’ readiness to join the business services sector - To analyze students’ attitudes towards the types of jobs offered by the
SSCs
2 Literature Review
Therefore the service sector becomes more and more a dominating factor in the world economy. Services are no longer considered as peripheral activities supporting the manufacturing sector, but the backbone of its economic performance. (Wirtz and Ehret, 2009, pg.391).
1 The World Bank Group, 2016 2 The World Bank Group, 2016

Management, Enterprise and Benchmarking in the 21st Century Budapest, 2017
185
The contribution of services is growing, because the manufacturers of capital goods extend their total offerings towards services and now their main competitive advantage is attributed to services rather than capital goods (Kruja, 2004; Gebauer, Paiola, and Edvardsson, 2010; Kowalkowski, Windahl, Kindström, and Gebauer, 2015; Wynstra, Spring, and Schoenherr, 2015. Rabetino, Kohtamäki, Lehtonen, and Kostama, 2015)
The variety of services has also changed positively. What influenced the continuous growth and the diversity of the offer of this sector? There were many factors, but we can only mention among those the main ones: Government policies, social changes, business trends, globalization, advances in information technology and communications ( Wirtz and Lovelock, 2016, pg 14).
2.1 Business services
A key driver of successful economies is their ecosystem of advanced, competitive, and innovative business services. (Wirtz and Lovelock, 2016, pg 14)).
Business services consist of a variety of knowledge-intensive and creative professional services (e.g., legal, accountancy, market research, consulting, design, and research & development), IT and technology-intensive services (e.g., data processing, database activities, and IT and communications infrastructure-related services) as well as diverse activities such as financial, labor recruitment and operational support services (e.g., industrial cleaning activities) (Barile, Saviano and Simone, 2015; Ženka, Novotný, Slach, and Ivan, 2015; Wirtz, Tuzovic, and Ehret, 2015).
The business services are usually implemented in service centers that can operate independent as a market service provider or as an organizational unit within the parent company (Marciniak, 2016, pg.192). This research deals with the shared service centers.
2.2 Shared services sector
According to Accenture around the globe, shared services has become the dominant operating model for business support services, with more than 75 percent of Fortune 500 companies having implemented shared services in some form.
Shared services is a new model for delivering corporate support, combining and consolidating of services from headquarters and business units into a distinct, market-efficient entity ( Booz-Allen&Hamilton, 1998, pg. 3).
The shared services are the consolidation of administrative or business support functions (such as HR transactions and HR support, finance and accounting, ICT
Management, Enterprise and Benchmarking in the 21st Century Budapest, 2017
186
services, purchasing, facilities, student services, manufacturing services, logistic services, medical services, procurement, etc.) from several departments into a single, standalone organizational entity that has one mission: to provide services as efficiently and effectively as possible. (Accenture, 2015; Strikwerda, 2014)
Typical statutory support for executive board, legal counsel, management development and strategy, and corporate control are consistently not allocated in a shared service center (Strikwerda, 2014, pg.3).
The consolidation of processes in business service centers (BSCs) allows companies to optimize the delivery of cost‐effective, flexible, reliable services to all “customers”, to processes transfer to less expensive locations, to accommodate growth and generate revenue (Boglind, Hallsten, & Thilander, 2011; McIvor, McCracken, and McHugh, 2011; Oshri, Kotlarsky, and Willcocks, 2015; Koval, Nabareseh, Klímek, and Chromjaková, 2016.).
Business service sector is one of the most developing areas in the CEE countries, and according to 2015 Global Shared Services survey of Deloitte 10% of World SSC are in Eastern Europe.
A great number of foreign companies choose these countries as the optimum nearshore location for their service provision, while the service companies that operate in the region already are expanding their operations. It means that business service sector is one of the most important employers in these countries among the recent graduates.
Talent attraction and retaining talent is a top priority; however companies still struggle to fill skilled positions. Employee talent is the key factor to sustaining our knowledge economy and remaining innovative and competitive. The professionals competencies of employees in shared services centers change quickly. In these conditions new skill sets and career paths in Shared Services are required.
According to Filippo Passerini (Former Group President Global Business Services and Chief Information Officer, Procter and Gamble) top 4 critical job skills for SSC employees are: Critical thinking, Complex problem solving, Decision making, and Active listening3.
3 http://www.ssonetwork.com/global-business-services/columns/10-trends-shaping-your-
sso-success

Management, Enterprise and Benchmarking in the 21st Century Budapest, 2017
187
3 Reshearch Methodology
3.1 Research Design
The primary and secondary research methods were applied in this study. The secondary data has been gathered from the literature review, focusing on previous work done in the field of business services sector and especially at the shared services centers. The primary and descriptive research method consisted of the use of survey and questionnaire techniques. The questionnaire has been conducted online, using Google forms, the online survey software.
3.2 Questionnaire Design
This study used a questionnaire as a measurement instrument. Every section of the questionnaire had both open- and closed-ended questions. The respondents were asked to rate, on a 5-point, Likert-type scale, the degree of agreement or disagreement, or the degree of their satisfaction or dissatisfaction with certain statements. The preliminary questionnaire was developed, and 12 students were asked to review the questions. No suggestions for change were received.
3.3 Sampling
This study was conducted in two universities of Albania, one public and one private. The questionnaire was sent to all students of these universities. The process of data collection lasted for 4 months. A total of 324 completed questionnaires were received.
4 Findings
The most of respondents were 20 - 25 years (78%). Among the respondents, 63% of them were female, and 37% were male. 82% of respondents had the average grade: good (4.4-3.5) and satisfactory (3.4-2.5). The primary field of your studies of them was Business, Finance, Marketing, Economics, Management (78%) and IT (22%). 81% of respondents speak 2 or 3 foreign languages, especially English, Italian and French. The strongest point of Albanian students is the knowledge of foreign languages.

Management, Enterprise and Benchmarking in the 21st Century Budapest, 2017
188
Respondents’ profiles
Valid Percent
How old are you?
20 - 25 years 78.0 26 - 30 years 14.7 over 30 years 7.3 Total 100.0
What is your gender? Female 63.3 Male 36.7 Total 100.0
What is the level of your education?
Bachelor 20.8 Professional Master 8.4 Master of Sciences 70.8 Total 100.0
How many foreign languages do you speak?
0 .9 1 12.0 2 53.7 3 27.8 4 or more 5.6 Total 100.0
What is the primary field of your studies?
Business, economics, management 66.7 IT 22.2 Other 11.1 Total 100.0
What is your average grade?
Excellent (5.0-4.5) 12.1 Good (4.4-3.5) 33.6 Satisfactory (3.4-2.5) 48.6 Poor (2.4-1.5) 5.6 Total 100.0
Table 1 Respondents’ profiles
57% of respondents would like to work in private sector, 38% in public sector (eg. local government, school) and 5% in non-profit sector (eg. fund). The respondents were asked to rate; on a 5-point, Likert-type scale, the degree of like or dislike (1- not at all, 5 - Very kindly) with If they get a job offer from private sector, what kind of company would you like to work for?
Minimum Maximum Mean Std. Deviation International company 1.00 5.00 4.5370 .93154 Own business 1.00 5.00 4.3019 1.17246 Family business 1.00 5.00 4.0000 1.24808 Start-up 1.00 5.00 3.0777 1.28863 Local business 1.00 5.00 2.9528 1.29749
Table 2 The type of company that students like to work
The students like to work at International company and Own business and they dislike to work at Local businesses.
When selecting a certain company, reputation of the company, good working athmosphere and career opportunity play the key role for students
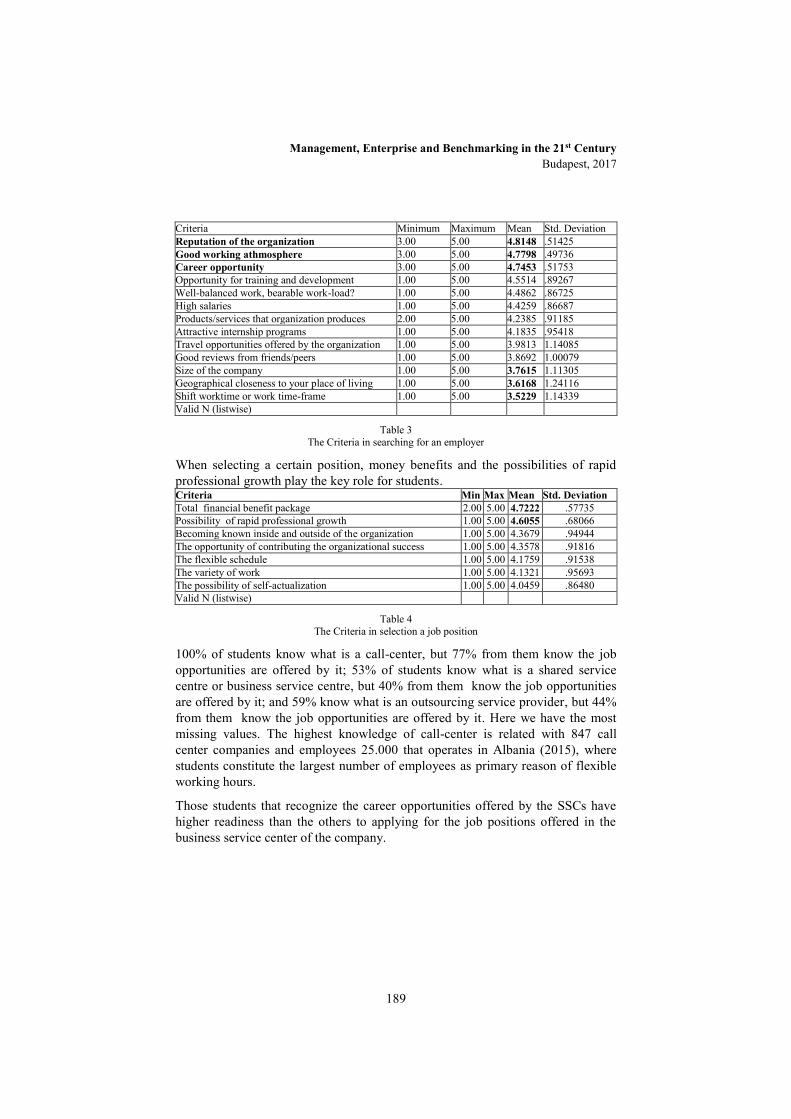
Management, Enterprise and Benchmarking in the 21st Century Budapest, 2017
189
Criteria Minimum Maximum Mean Std. Deviation Reputation of the organization 3.00 5.00 4.8148 .51425 Good working athmosphere 3.00 5.00 4.7798 .49736 Career opportunity 3.00 5.00 4.7453 .51753 Opportunity for training and development 1.00 5.00 4.5514 .89267 Well-balanced work, bearable work-load? 1.00 5.00 4.4862 .86725 High salaries 1.00 5.00 4.4259 .86687 Products/services that organization produces 2.00 5.00 4.2385 .91185 Attractive internship programs 1.00 5.00 4.1835 .95418 Travel opportunities offered by the organization 1.00 5.00 3.9813 1.14085 Good reviews from friends/peers 1.00 5.00 3.8692 1.00079 Size of the company 1.00 5.00 3.7615 1.11305 Geographical closeness to your place of living 1.00 5.00 3.6168 1.24116 Shift worktime or work time-frame 1.00 5.00 3.5229 1.14339 Valid N (listwise)
Table 3 The Criteria in searching for an employer
When selecting a certain position, money benefits and the possibilities of rapid professional growth play the key role for students. Criteria Min Max Mean Std. Deviation Total financial benefit package 2.00 5.00 4.7222 .57735 Possibility of rapid professional growth 1.00 5.00 4.6055 .68066 Becoming known inside and outside of the organization 1.00 5.00 4.3679 .94944 The opportunity of contributing the organizational success 1.00 5.00 4.3578 .91816 The flexible schedule 1.00 5.00 4.1759 .91538 The variety of work 1.00 5.00 4.1321 .95693 The possibility of self-actualization 1.00 5.00 4.0459 .86480 Valid N (listwise)
Table 4 The Criteria in selection a job position
100% of students know what is a call-center, but 77% from them know the job opportunities are offered by it; 53% of students know what is a shared service centre or business service centre, but 40% from them know the job opportunities are offered by it; and 59% know what is an outsourcing service provider, but 44% from them know the job opportunities are offered by it. Here we have the most missing values. The highest knowledge of call-center is related with 847 call center companies and employees 25.000 that operates in Albania (2015), where students constitute the largest number of employees as primary reason of flexible working hours.
Those students that recognize the career opportunities offered by the SSCs have higher readiness than the others to applying for the job positions offered in the business service center of the company.

Management, Enterprise and Benchmarking in the 21st Century Budapest, 2017
190
Do you know what job opportunities are offered by a shared service centres or business service centres?/ Will your decision be influenced if the vacancy is offered in the business service center of the company?
Mean (1-not influenced… 5-very influenced )
Std. Deviation
Yes 2.1818 1.25874 No 2.7188 1.32554 Total 2.5000 1.31393
Table 5 The crosstabulation between job opportunities
knowledge and decision to work at SSC
Students think that typical for shared service centres are: the flexible forms of employment, communication very well in more foreign languages and youthful working environment. Criteria Min Max Mean Std.
Deviation They support the flexible forms of employment (eg. part-time, telecommuting, etc.)? 1.00 5.00 4.0095 1.16434
You have to communicate very well in more foreign languages? 1.00 5.00 3.9444 1.20616 There is youthful working environment and low average age among the employees? 1.00 5.00 3.9065 1.17788
There is quite high staff turnover rate? 1.00 5.00 3.5370 1.24124 They are operating in well-equipped, modern office buildings? 1.00 5.00 3.4722 1.25645 The work is too monotonous there? 1.00 5.00 3.3704 1.39821 There are only few promotion opportunities there? 1.00 5.00 3.3396 1.25650 It matters less your degree and other academic results? 1.00 5.00 3.3178 1.65745 They intend to develop an work environment needs to Y- and Z-generation? 1.00 5.00 3.1143 1.16284
There is higher salary than the average there? 1.00 5.00 3.0833 1.12012 The working day is typically longer than 8 hours? 1.00 5.00 2.7037 1.40931 Valid N (listwise)
Table 6 Typical characteristics for shared service centres
If the position in target company from students offered in the shared service centre 75.5% it will not discourage and 24.5 will discourage to apply for it.
The primary reasons that discourage students to apply in the shared service centre are: career growth potential, the routine nature of the job and not sufficient salary.
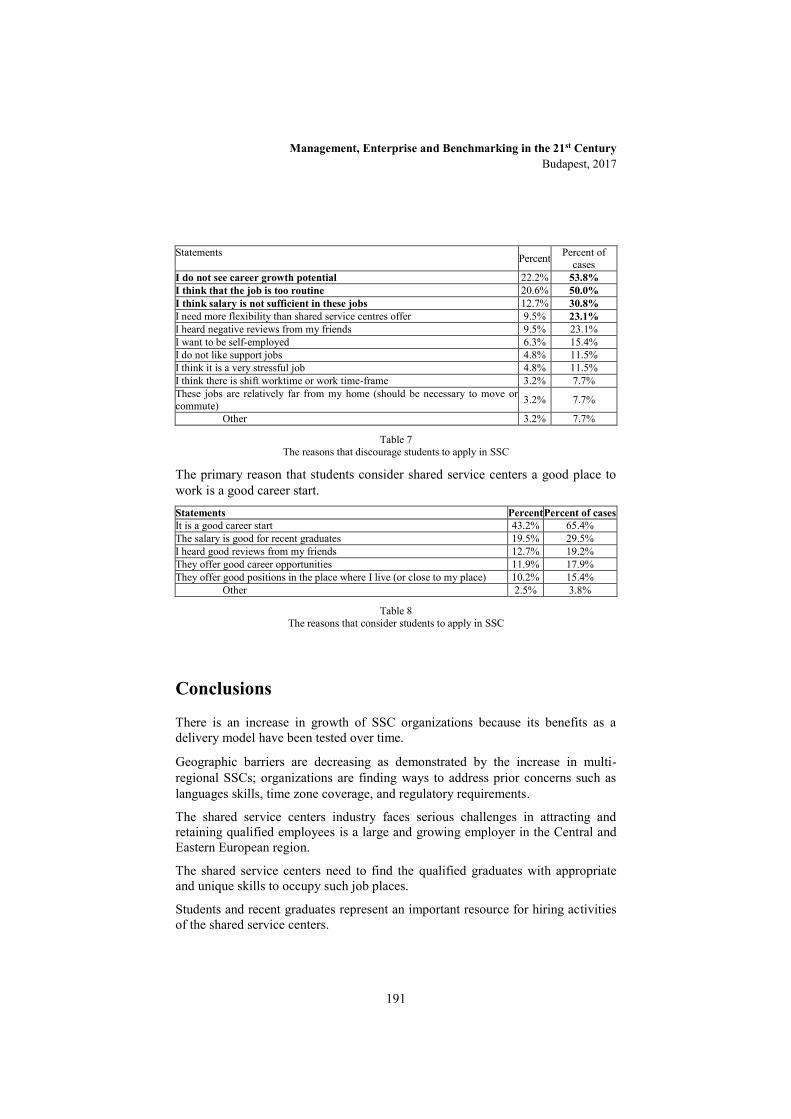
Management, Enterprise and Benchmarking in the 21st Century Budapest, 2017
191
Statements Percent Percent of
cases I do not see career growth potential 22.2% 53.8% I think that the job is too routine 20.6% 50.0% I think salary is not sufficient in these jobs 12.7% 30.8% I need more flexibility than shared service centres offer 9.5% 23.1% I heard negative reviews from my friends 9.5% 23.1% I want to be self-employed 6.3% 15.4% I do not like support jobs 4.8% 11.5% I think it is a very stressful job 4.8% 11.5% I think there is shift worktime or work time-frame 3.2% 7.7% These jobs are relatively far from my home (should be necessary to move or commute) 3.2% 7.7%
Other 3.2% 7.7%
Table 7 The reasons that discourage students to apply in SSC
The primary reason that students consider shared service centers a good place to work is a good career start. Statements Percent Percent of cases It is a good career start 43.2% 65.4% The salary is good for recent graduates 19.5% 29.5% I heard good reviews from my friends 12.7% 19.2% They offer good career opportunities 11.9% 17.9% They offer good positions in the place where I live (or close to my place) 10.2% 15.4% Other 2.5% 3.8%
Table 8 The reasons that consider students to apply in SSC
Conclusions
There is an increase in growth of SSC organizations because its benefits as a delivery model have been tested over time.
Geographic barriers are decreasing as demonstrated by the increase in multi-regional SSCs; organizations are finding ways to address prior concerns such as languages skills, time zone coverage, and regulatory requirements.
The shared service centers industry faces serious challenges in attracting and retaining qualified employees is a large and growing employer in the Central and Eastern European region.
The shared service centers need to find the qualified graduates with appropriate and unique skills to occupy such job places.
Students and recent graduates represent an important resource for hiring activities of the shared service centers.

Management, Enterprise and Benchmarking in the 21st Century Budapest, 2017
192
Albanian higher education students are not well aware of the career opportunities offered by business services sector.
The different service providers (outsourcing providers, shared service centers, call-centers) and their job opportunites are not distinguished from the most graduates too, therefore, complicate attraction of the graduates to the industry. We recommend for Human Resources professionals in the business services sector that the attraction strategy of graduate students must be the promotion of different service providers, their job opportunities, and the top 4 critical job skills (Critical thinking, Complex problem solving, Decision making and Active listening)
Based on these results an important recommendation is for Higher education institutions, that in their study programmes curriculum must to include these skills and competencies.
Acknowledgement
This research was made possible through the financial support of the European Institute "Pashko" of the European Education Initiative (EEI)".
References
[1] Accenture (2015). Evolution of shared services: a gulf cooperation council regional perspective. (Retrieved 01/24, 2017, from https://www.accenture.com/t20150523T053012__ w__/us-en/_acnmedia/Accenture/Conversion-Assets/DotCom/Documents/Global/PDF/ Strategy_5/Accenture-Evolution-of-Shared-Services.pdf).
[2] Barile, Sergio, Marialuisa Saviano, and Cristina Simone. "Service economy, knowledge, and the need for T-shaped innovators." World Wide Web 18, no. 4 (2015): 1177-1197.
[3] Deloitte Consulting LLP. 2015 Global Shared Services survey. March 2015
[4] Gebauer, Heiko, Marco Paiola, and Bo Edvardsson. "Service business development in small and medium capital goods manufacturing companies." Managing Service Quality: An International Journal 20.2 (2010): 123-139.
[5] Hamilton, Booz Allen. "Shared services: management fad or real value." (1998).
[6] http://www.ilo.org/global/about-the-ilo/newsroom/news/WCMS_339104/lang--en/index.htm.
Management, Enterprise and Benchmarking in the 21st Century Budapest, 2017
193
[7] Koval, Oksana, Stephen Nabareseh, Petr Klímek, and Felicita Chromjaková. "Demographic preferences towards careers in shared service centers: A factor analysis." Journal of Business Research 69.11 (2016): 4798-4803.
[8] Kowalkowski, Christian, Charlotta Windahl, Daniel Kindström, and Heiko Gebauer. "What service transition? Rethinking established assumptions about manufacturers' service-led growth strategies." Industrial Marketing Management 45 (2015): 59-69.
[9] Kruja, D. "The ex-post analyze for services in Northern Albania, as part of the Regional Development Plan". The part of the study "Regional economic and social development in Northern Albania and the European integration perspective. Trends in social and economic development in Northern Albania ( 2004). 106-131.
[10] Marci Wirtz, Jochen, Sven Tuzovic, and Michael Ehret. "Global business services: Increasing specialization and integration of the world economy as drivers of economic growth." Journal of Service Management 26.4 (2015): 565-587.
[11] Marciniak, Robert. "Maturity Models of Shared Services in Theory and Practice." Volume of Management, Enterprise and Benchmarking in the 21st century III (2016): 191-204.. McIvor, Ronan, Martin McCracken, and Marie McHugh. "Creating outsourced shared services arrangements: Lessons from the public sector." European Management Journal 29.6 (2011): 448-461.
[12] OECD (2016) Policy Brief On The Future Of Work. Automation and Independent Work in a Digital Economy. Retrieved 01/24, 2017, from. http://www.oecd.org/els/emp/Policy%20brief%20-%20Automation%20and%20Independent%20Work%20in%20a%20Digital%20Economy.pdf
[13] Oshri, Ilan, Julia Kotlarsky, and Leslie P. Willcocks. The Handbook of Global Outsourcing and Offshoring 3rd edition. Springer, 2015.
[14] Rabetino, Rodrigo, Marko Kohtamäki, Heini Lehtonen, and Hanna Kostama. "Developing the concept of life-cycle service offering." Industrial Marketing Management 49 (2015): 53-66.
[15] Strikwerda, J. "Shared service centers: from cost savings to new ways of value creation and business administration." In Shared services as a new organizational form, pp. 1-15. Emerald Group Publishing Limited, 2014..
[16] Wirtz, Jochen, and Michael Ehret. "Creative restruction–how business services drive economic evolution." European Business Review 21.4 (2009): 380-394.
[17] Wirtz, Jochen, Sven Tuzovic, and Michael Ehret. "Global business services: Increasing specialization and integration of the world economy as

Management, Enterprise and Benchmarking in the 21st Century Budapest, 2017
194
drivers of economic growth." Journal of Service Management 26.4 (2015): 565-587.
[18] Wynstra, Finn, Martin Spring, and Tobias Schoenherr. "Service triads: A research agenda for buyer–supplier–customer triads in business services." Journal of Operations Management 35 (2015): 1-20.
[19] Ženka, Jan, Josef Novotný, Ondřej Slach, and Igor Ivan. "Spatial distribution of knowledge-intensive business services in a small post-communist economy." Journal of the Knowledge Economy (2015): 1-22.

Management, Enterprise and Benchmarking in the 21st Century Budapest, 2017
195
How would You Decide on behalf of Your Friend?
Anita Kolnhofer-Derecskei [email protected]
“However, there is much individual heterogeneity and the interaction between altruists and
selfish individuals is vital to human cooperation.” (Fehr & Fischbacher, 2003)
Abstract: Several prominent economists have underlined that actors are often concerned about the well-being (or feelings) of others. It seems ‘homo oeconimicus’ is selfish/rational and acts like a Good Samaritan at the same time. But being a Good Samaritan and deciding about somebody else’s property is not a big deal. The aim of this study is to observe endowment heterogeneity in the case of a risky financial decision. Ownership and endowment effects were measured through using within-subjects design, i.e. two gambling situations were offered to subjects. Firstly, they should assess risks and allocate their own property. Secondly, they had to decide on behalf of one of their friends. This paper does not provide a theoretical summing up, but focuses on empirical findings. Using game experiment it was found that ownership plays a role in explaining the outcome of a risky financial situation.
Keywords: Endowment effect, Principal-Agent theory, altruism, Risk
1 Introduction Mainstream economic models do not take ownership deeply into consideration. After findings of Thaler (1980) endowment effect was observed widely. Endowment effect means that goods one owns are valued higher than other goods not held in endowment. This effect is mostly interpreted as the outcome of loss aversion (Kahneman & Tversky 1979). Actors value losses (negatively framed outcomes of a risky situation) higher than gains (outcome above the reference point) in the evaluation of options. Moreover, if somebody owns a product, the prospect of selling, it is equal to loss.
Management, Enterprise and Benchmarking in the 21st Century Budapest, 2017
196
But our assessment of what is a loss and what is a gain influences our decision. Reb and Connolly provided a meaningful summing up about mechanism, which drives endowment effect. The authors (2007) pointed out the difference between feelings of ownership (subjective) and factual ownership (objective). They compared these in the frame of two experiments. “In other words, it may require the development of a subjective sense of endowment, rather than a legal entitlement, for the reference point to shift. Once the reference point is shifted, loss aversion sets in and leads to higher valuations. In our experiments, this shift seems to have been triggered by possession, not factual ownership.” (p 112.) What about those who do not own an item but behave as an owner might? Like in the case of management. The principal-agent literature (Stiglitz 1989) is concerned with how the principal (like employer), can motivate his/her agent (namely the employee), to act in the principal’s interests. The main problem is that acting in somebody’s else interests can influence our values as well. According to Calabuig et al. (2016) the endowment effect disappears with punishment. However, authority and power can be one type of motivation. But, in this present paper, types and kinds of principals’ motivational tools were not taken into account, only assumed emotional engagement between principal (real owner) and agent (real subject of my study) (i. e. friendship linked them together). During the experiment this before aforementioned subjective ownership (responsibility) was shifted from the real subject to his or her friend. Both situations can be treated as risky. Last but not least, fairness (fair decisions) of subjects could be observed. At the same time, fair minded actors also have to be treated on field of economics. Falk et al. (2008) suggested that fair-minded persons are likely to have important economic effects. These models based decisions on properties and handled the players’ kindness. Due to this, how foreign students with various cultural backgrounds make decisions in a financially risky situation was explored.
2 Research questions and hypothesis
H1. The subjects respond differently when they need to decide about their own properties rather than about their friends’ properties. The answers (respondents) can be divided into the aforementioned groups.
These groups are the following: Indifferentists: are those who do not take risks for themselves or for their
friend. They choose the same safe options two times, i. e. in both cases. Good friends: are those who play risky themselves but avoid risks
answers on behalf of a good friend (protect their gains). The braves: are those who take risks in both situations (they are not
influenced by who the owner is.)
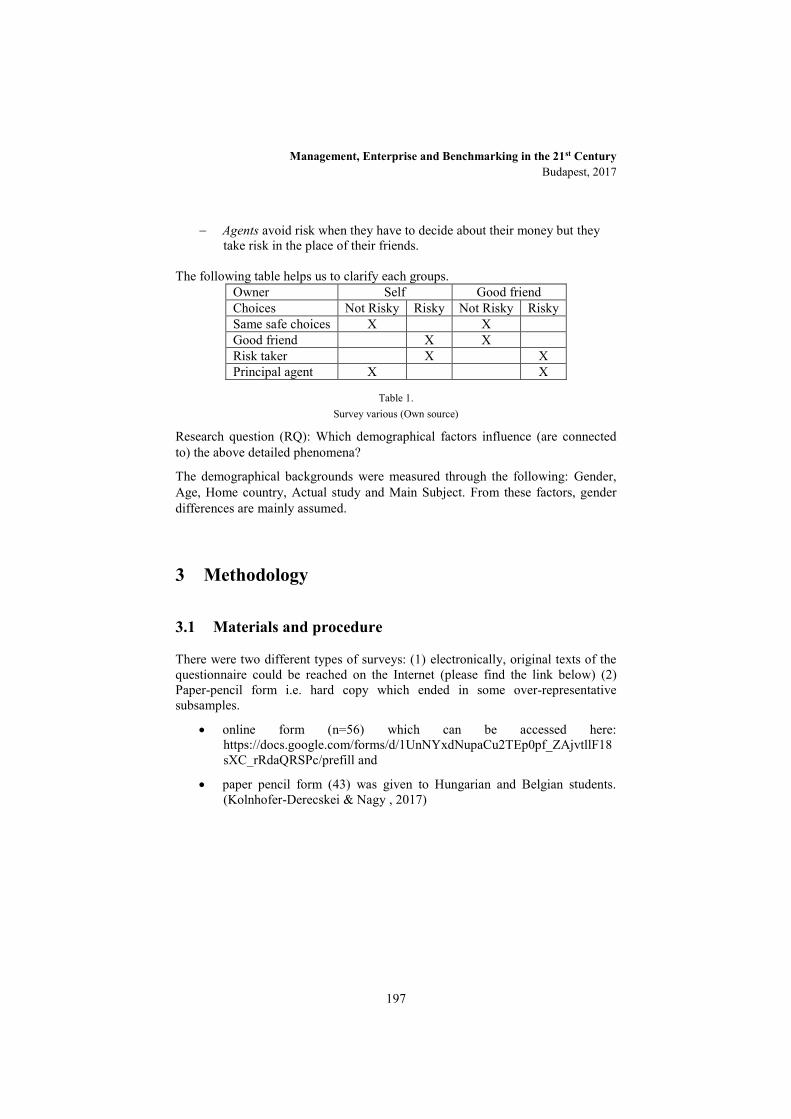
Management, Enterprise and Benchmarking in the 21st Century Budapest, 2017
197
Agents avoid risk when they have to decide about their money but they take risk in the place of their friends.
The following table helps us to clarify each groups.
Owner Self Good friend Choices Not Risky Risky Not Risky Risky Same safe choices X X Good friend X X Risk taker X X Principal agent X X
Table 1. Survey various (Own source)
Research question (RQ): Which demographical factors influence (are connected to) the above detailed phenomena?
The demographical backgrounds were measured through the following: Gender, Age, Home country, Actual study and Main Subject. From these factors, gender differences are mainly assumed.
3 Methodology
3.1 Materials and procedure
There were two different types of surveys: (1) electronically, original texts of the questionnaire could be reached on the Internet (please find the link below) (2) Paper-pencil form i.e. hard copy which ended in some over-representative subsamples.
online form (n=56) which can be accessed here: https://docs.google.com/forms/d/1UnNYxdNupaCu2TEp0pf_ZAjvtllF18sXC_rRdaQRSPc/prefill and
paper pencil form (43) was given to Hungarian and Belgian students. (Kolnhofer-Derecskei & Nagy , 2017)

Management, Enterprise and Benchmarking in the 21st Century Budapest, 2017
198
Online Group A Group B Total
Total number of subjects 34 34 68
Cancelled number 6 6 12
Accepted number of subjects 28 28 56
Paper/Pencil version Belgian Hungarian Total
Total number of subjects 26 17 43
Cancelled number 0 0 0
Accepted number of subjects 26 17 43
Total sample number 99
Table 2 Sample descriptions (Own source)
The questionnaire contained two different situation in two ways, online respondents received only two questions (one situation: Group A or Group B), namely this form was between subjects. Group A version was more risky, Group B contained also a sure option, due to this safe option it was not so risky.
In case of paper-pencil surveys it was a within subject situation because subjects received each questions (i.e. Group A & Group B). Both were faced with two decisions they should make themselves (as an owner) and in the place of one of their friends (as a non-owner). Original texts are in Appendix 1.
3.2 Sample
Due to the two types of survey two nationalities were over weighted: Hungarian and Belgian. Regarding gender, the sample was harmonized, which means 47 males and 52 females answered. Age distribution can be seen in Figure 1 and any other sample’s descriptions are in Appendix 2. This extrapolation does not require representativeness.
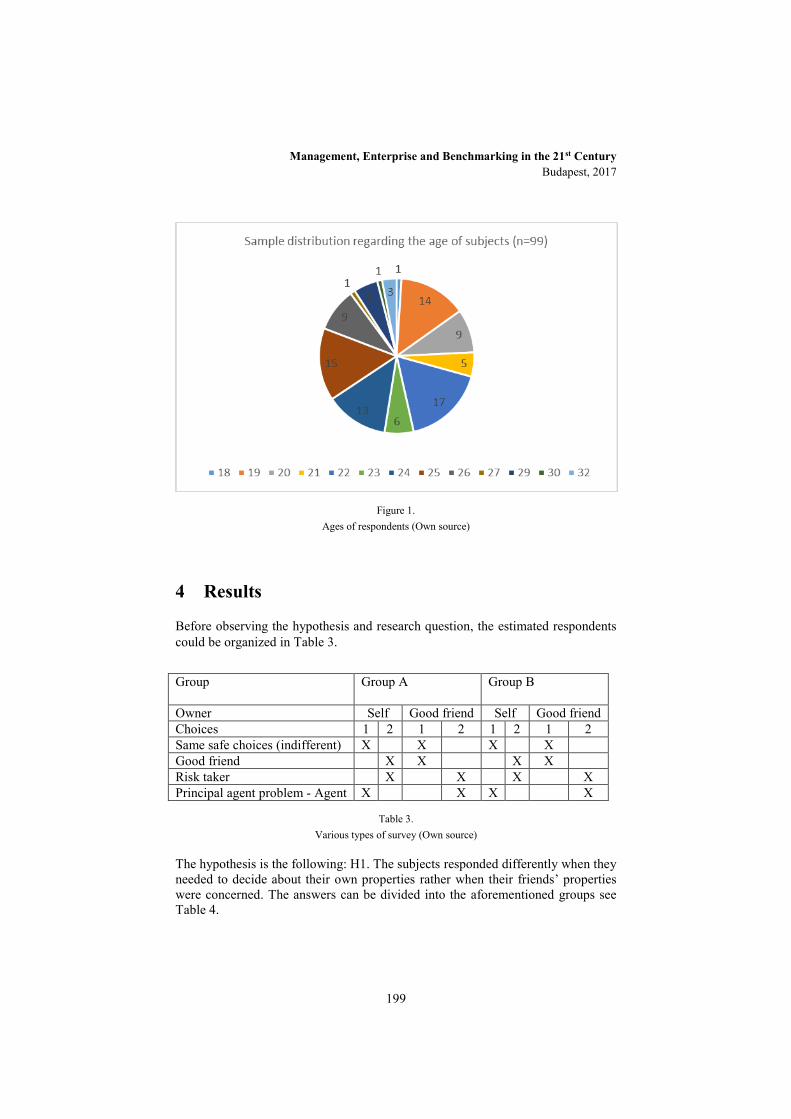
Management, Enterprise and Benchmarking in the 21st Century Budapest, 2017
199
Figure 1.
Ages of respondents (Own source)
4 Results
Before observing the hypothesis and research question, the estimated respondents could be organized in Table 3.
Group Group A
Group B
Owner Self Good friend Self Good friend Choices 1 2 1 2 1 2 1 2 Same safe choices (indifferent) X X X X Good friend X X X X Risk taker X X X X Principal agent problem - Agent X X X X
Table 3. Various types of survey (Own source)
The hypothesis is the following: H1. The subjects responded differently when they needed to decide about their own properties rather when their friends’ properties were concerned. The answers can be divided into the aforementioned groups see Table 4.
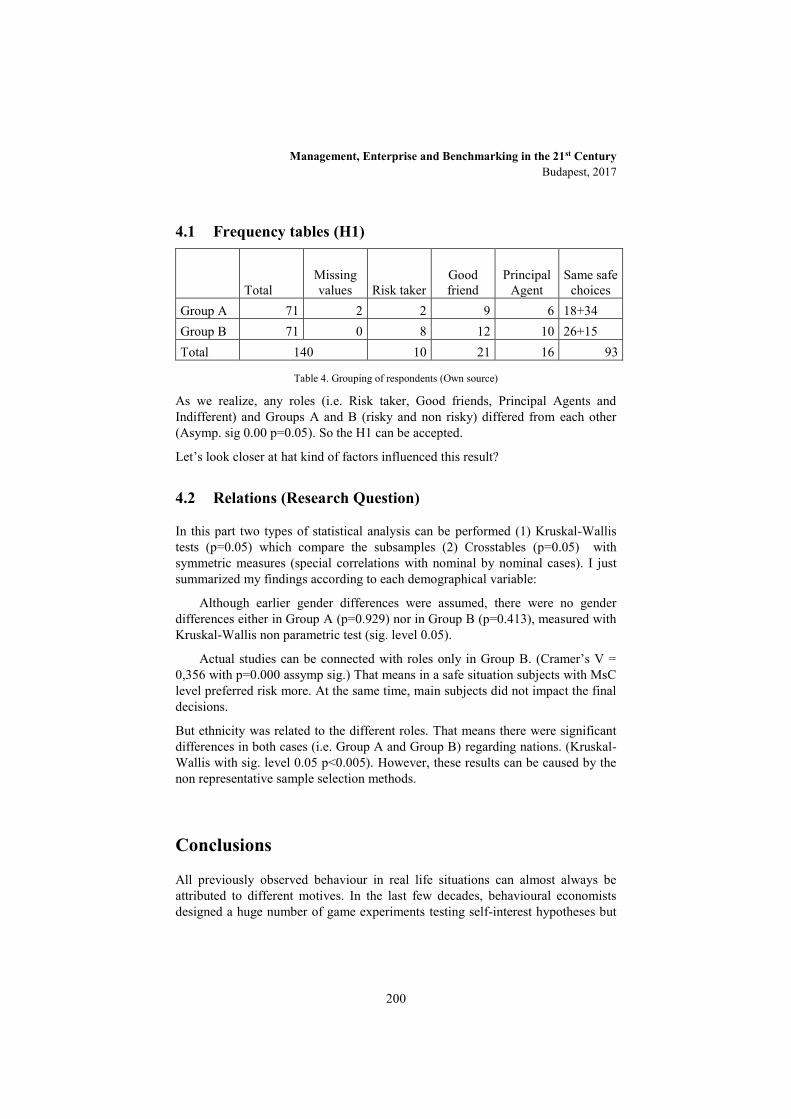
Management, Enterprise and Benchmarking in the 21st Century Budapest, 2017
200
4.1 Frequency tables (H1)
Total Missing values Risk taker
Good friend
Principal Agent
Same safe choices
Group A 71 2 2 9 6 18+34 Group B 71 0 8 12 10 26+15 Total 140 10 21 16 93
Table 4. Grouping of respondents (Own source)
As we realize, any roles (i.e. Risk taker, Good friends, Principal Agents and Indifferent) and Groups A and B (risky and non risky) differed from each other (Asymp. sig 0.00 p=0.05). So the H1 can be accepted.
Let’s look closer at hat kind of factors influenced this result?
4.2 Relations (Research Question)
In this part two types of statistical analysis can be performed (1) Kruskal-Wallis tests (p=0.05) which compare the subsamples (2) Crosstables (p=0.05) with symmetric measures (special correlations with nominal by nominal cases). I just summarized my findings according to each demographical variable:
Although earlier gender differences were assumed, there were no gender differences either in Group A (p=0.929) nor in Group B (p=0.413), measured with Kruskal-Wallis non parametric test (sig. level 0.05).
Actual studies can be connected with roles only in Group B. (Cramer’s V = 0,356 with p=0.000 assymp sig.) That means in a safe situation subjects with MsC level preferred risk more. At the same time, main subjects did not impact the final decisions.
But ethnicity was related to the different roles. That means there were significant differences in both cases (i.e. Group A and Group B) regarding nations. (Kruskal-Wallis with sig. level 0.05 p<0.005). However, these results can be caused by the non representative sample selection methods.
Conclusions
All previously observed behaviour in real life situations can almost always be attributed to different motives. In the last few decades, behavioural economists designed a huge number of game experiments testing self-interest hypotheses but

Management, Enterprise and Benchmarking in the 21st Century Budapest, 2017
201
mainly focused on smaller subpopulations or samples. Most of the games dealt with financial or gambling problems like this paper. My findings assume that people decide in different ways about their own property than about others’. According to Tversky and Kahneman (1974) probabilities (i.e. outcomes) and certainty influence our decision in a gamble. In the final results I need to underline that in the second situation the safe wins were more attractive for the subjects than feeling of risk. Due to this, in Group B they focused more on the amount of safe won (i.e. USD) than the probability of win options (i.e. percentage). In case of Group A it was reversed.
Acknowledgement
SUPPORTED BY THE ÚNKP-16-2/I. NEW NATIONAL EXCELLENCE PROGRAM OF THE MINISTRY OF HUMAN CAPACITIES.
References
[1] Calabuig, V. & Fatas, E. & Olcina, G. & Rodriguez-Lara, I. 2016. Carry a big stick, or no stick at all Punishment and endowment heterogeneity in the trust game. Journal of Economic Psychology 57 (2016) pp. 153–171
[2] Falk, A. & Fehr, E. & Fishbacher, U. 2008. Testing theories of fairness—Intentions matter. Games and Economic Behavior. Volume 62, Issue 1, January 2008, pp. 287-303
[3] Kolnhofer-Derecskei, A. & Nagy, V., 2017. Comparing risk definitions giving by Hungarian and Belgian Bachelor Students. Thinking together. In Press.
[4] Kolnhofer-Derecskei, A., & Nagy, V. 2016. Under Risk. Proceedings of FIKUSZ ’16 Symposium for Young Researchers, pp. 161-172 Online Available at: https://kgk.uni-obuda.hu/sites/default/files/16_Derecskei_Nagy.pdf [February 2017].
[5] Reb, J. & Conolly, T. 2007. Possession, feelings of ownership and the endowment effect. Judgment and Decision Making, Vol. 2, No. 2, April 2007, pp. 107–114
[6] Stiglitz, J. E. 1989. Principal and Agent In. Allocation, Information and Markets. Part of the series The New Palgrave pp 241-253
[7] Thaler, R. H. 1980. Toward a Positive Theory of Consumer Choice. Journal of Economic Behavior & Organization 1(1) March 1980. pp. 39-60
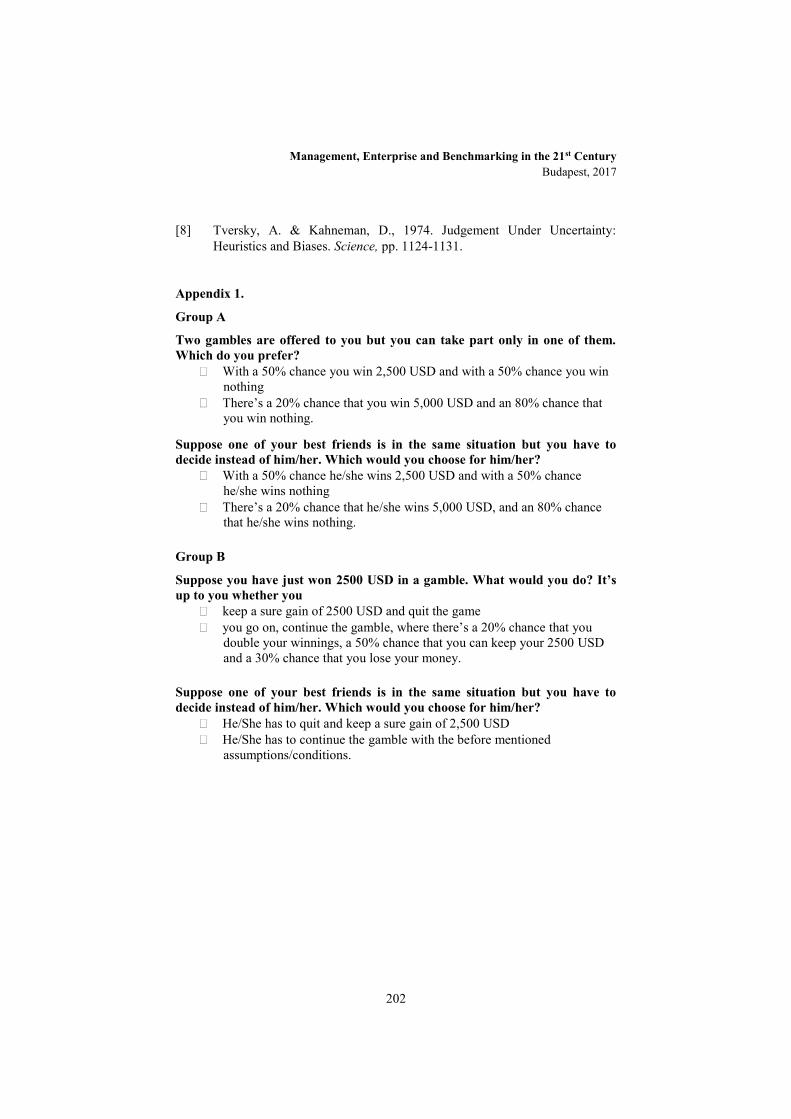
Management, Enterprise and Benchmarking in the 21st Century Budapest, 2017
202
[8] Tversky, A. & Kahneman, D., 1974. Judgement Under Uncertainty: Heuristics and Biases. Science, pp. 1124-1131.
Appendix 1.
Group A
Two gambles are offered to you but you can take part only in one of them. Which do you prefer?
With a 50% chance you win 2,500 USD and with a 50% chance you win nothing
There’s a 20% chance that you win 5,000 USD and an 80% chance that you win nothing.
Suppose one of your best friends is in the same situation but you have to decide instead of him/her. Which would you choose for him/her?
With a 50% chance he/she wins 2,500 USD and with a 50% chance he/she wins nothing
There’s a 20% chance that he/she wins 5,000 USD, and an 80% chance that he/she wins nothing.
Group B
Suppose you have just won 2500 USD in a gamble. What would you do? It’s up to you whether you
keep a sure gain of 2500 USD and quit the game you go on, continue the gamble, where there’s a 20% chance that you
double your winnings, a 50% chance that you can keep your 2500 USD and a 30% chance that you lose your money.
Suppose one of your best friends is in the same situation but you have to decide instead of him/her. Which would you choose for him/her?
He/She has to quit and keep a sure gain of 2,500 USD He/She has to continue the gamble with the before mentioned
assumptions/conditions.

Management, Enterprise and Benchmarking in the 21st Century Budapest, 2017
203
Appendix 2.
Homecountry
Frequency Percent Valid Afghanistan
2 2,0
Albania 2 2,0 Belgium 26 26,3 France 4 4,0 Germany 8 8,1 Hungary 30 30,3 Italy 2 2,0 Moldova 1 1,0 Poland 12 12,1 Romania 6 6,1 Serbia 1 1,0 Spain 1 1,0 Turkey 1 1,0 Ukraine 3 3,0 Total 99 100,0
Actual study
Frequency Percent Valid
Percent Cumulative
Percent Valid BSC/BA 69 69,7 69,7 69,7
MSC/MA 27 27,3 27,3 97,0 PHD 2 2,0 2,0 99,0 Don't know 1 1,0 1,0 100,0
Total 99 100,0 100,0

Management, Enterprise and Benchmarking in the 21st Century Budapest, 2017
204
Main Subject
Frequency Percent Valid
Percent Cumulative
Percent Valid Business and
administration 85 85,9 85,9 85,9
Engineering 12 12,1 12,1 98,0 Real estate 1 1,0 1,0 99,0 Law 1 1,0 1,0 100,0 Total 99 100,0 100,0

Management, Enterprise and Benchmarking in the 21st Century Budapest, 2017
205
Drivers of Trust - Some Experiences of an Empirical Survey at ’Paprikakertész’ Producer Organisation
Zoltán Kovács University of Szeged, Faculty of Engineering, 6724 Szeged, Mars tér 7.
Zsolt Baranyai Budapest Metropolitan University, 1148 Budapest Nagy Lajos kir. útja 1-9.,
Miklós Vásáry Budapest Metropolitan University, 1148 Budapest Nagy Lajos kir. útja 1-9.,
mvasary@metropolitan. hu
Abstract: The present study aims to identify those factors which contribute to the development of trust in a producer organisation. The focus of research is the empirical testing of a theoretical trust model. According to our results the theoretical model, which leads back trust to the faith in the loyalty and competence of the other party is, is essentially correct. Our calculations have definitely proved that high level of trust among partners is developed when their faith both in loyalty and competence has high values, too. The research, however, also revealed that the above mentioned two factors determine trust to a different extent: as regards trust among partners, the faith in competence is more important; while the trust in management is rather shaped by the faith in loyalty. The results have confirmed the outcomes of former surveys, which were carried out with the same methodological approach as the present research, thus the validity of Sholtes trust model has received further support.
Keywords: faith in competence, faith in loyalty, Sholtes, trust.
Management, Enterprise and Benchmarking in the 21st Century Budapest, 2017
206
1 Introduction
According to the related statistical data, the producer organisations have a key role in the coordination of product path in the major vegetable and fruit producing member states of the European Union. This is basically the result of an organic development. The POs in the vegetable-fruit sectors of the so-called EU15 countries have dominated the market from the second half of the 1990s and - as the result of a permanent expansion - they were responsible for one-third of the total vegetable-fruit market in 2000. This share had grown to more than 40% by 2010. The activity of individual countries is different, which means that the market share of POs from vegetable-fruit sales is quite differentiated: according to data from 2010 the Netherlands and Belgium are outstanding because the market share of these organisations is around 90%; but POs have significant market share – around 50% - in Ireland, the Czech Republic, Sweden and Germany, too. In case of the Mediterranean member countries – which have the highest product turnover – it has been revealed that recognized producer organisations sell about half of the produced vegetables and fruits (Spain and Italy) or even much less proportion (Portugal and Greece). Regarding Hungary, this rate is below 20% ((Biró – Rácz, 2015). Although – as far as we know - more recent international data are not available, it can be presumed that substantial changes or restructuring processes have not happened in the last few years in these countries. The estimated share in Hungary was around 20.11% in 2015 (Government of Hungary, 2016)
The weak role of Hungarian producer organisations, which is below the EU average in the coordination of vegetable-fruit product paths, can be due to several reasons. The black trade on the wholesale markets considerably hampers the strengthening of POs. (Szabó, 2012). It is a significant competitive disadvantage that while the sales on the wholesale markets often go without invoices and the produce is marketed without origin and quality checks; the POs have to thrive by observing the regulations (taxation, accounting, quality control, etc.). Unfortunately - in the hope of short-term gains - the members often utilize the „possibilities” offered by the black market. (Dudás, 2009)
Dudás (2009) regards the substantial administrative burden on producer organisations as further restricting factors. The permanent changes of the legal environment, which gives the framework for the operation, also render the planning of the operation more difficult. The author concludes that in spite of the fact that the vegetable-fruit sector in principle belongs to the less regulated sectors, the legislation regarding producer organisations is rather bureaucratic.
The examination of trust issues is one of the directions of research connected with producer organisations. Following some international examples (Hansen et al., 2002) Hungarian researchers also analysed the impact of trust within producer organisations. According to the research outcomes, the management of the producer organisations may improve the cohesion within the cooperation, the

Management, Enterprise and Benchmarking in the 21st Century Budapest, 2017
207
contentment felt by the members and their tenacity in the cooperation by increasing the liability of the organisation and strengthening the personal relations. (Dudás – Fertő, 2009).
The present research aims to further explore the area of trust and to provide new results to the topic. As it is fairly obvious, the performance of producer organisations set up for the coordination of the Hungarian vegetable and fruit sector is far behind the expectations; currently their development can rather be described as stagnation. It can also be clearly stated that trust is extremely important for the efficient operation and development of organisations, therefore it is important to reveal and identify those factors which play an important role in the formation and maintenance of trust. This was in the focus of our research, which was based on former research works in the same area (Baranyai et al. (2011) and Baranyai (2016)).
The study has the following structure: the next part briefly summarizes the research works dealing with trust, including the ad hoc trust model which provides the theoretical background of the current research. Following the introduction of research hypotheses, the „Material and Methods” chapter describes the data collection and evaluation connected with the research. Finally, the main outcomes of the research are introduced, as well as the subsequent conclusions based on them.
2 Theoretical background
Trust is especially important in human relations, which explains why it has been put in the centre of interest of several disciplines in the recent years. Trust, as the subject of research is a relatively new phenomenon in the field of economic sciences, although a large number of publications have been published and several trust approaches have been drafted in the last 25-30 years (e.g.: McAllister, 1995; Szabó, 2010; Hansen et al, 2002 and Dudás – Fertő (2009), Sholtes, 1998 etc.). This present study – on the basis of earlier research experiences (e.g. Baranyai et al. (2011) - takes the Sholtes trust model as its basis.
Sholtes (1998) placed trust in the matrix of loyalty and capability. Provided that faith both in loyalty and capability take up high values among partners, it can develop trust (Figure 1). This research work was carried out by using the relations found in the model.
Hypothesis
We have drafted and examined the following hypotheses in our research:
H1. Higher level of trust is developed if the faith in loyalty as well as in capability has high values among the partners.

Management, Enterprise and Benchmarking in the 21st Century Budapest, 2017
208
H2. The faith in the loyalty and capability of partners is equally important regarding the level of trust.
CAPABILITY
”I believe that my partner is well-trained and talented.”
low high
LOYALTY
”I believe that my partner likes me and will help me in the
future.”
high SYMPATHY TRUST
low MISTRUST RESPECT
Figure 1. Trust development between partners on the basis of the level of both loyalty felt towards each other
and perceived capability
Source: own edition on the basis of Sholtes (1998)
3 Material and methods
Our examinations are based on empirical databases: a questionnaire survey was carried out among the members of PAPRIKAKERT PO Producer and Sales Ltd between May and October 2015. Altogether 144 member farms provided information for the survey.
PAPRIKAKERT PO Producer and Sales Ltd (hereinafter referred to as PAPRIKAKERT) was founded with hardly more than 30 founding members on 11th May, 2009, in Pusztaottlaka, Békés County. The preliminary recognition was given to the PO in September 2009 and it was awarded final recognition in 2013. The membership of the organization, the land they use and the volume of products dynamically extended in the years following the foundation. By 2012 the number of members was almost 140; the area of land used by the members was more than 700 hectares, while the volume of the produced fruits and vegetables was about 13.5 thousand tons. On the basis of data from 2015, it can be declared that the number of members is around 300, the area of land used by members is almost 1,400 hectares, out of which about 1,000 hectares are used for vegetable and fruit production. The volume of goods produced in member farms amounts to 24,000 tons.
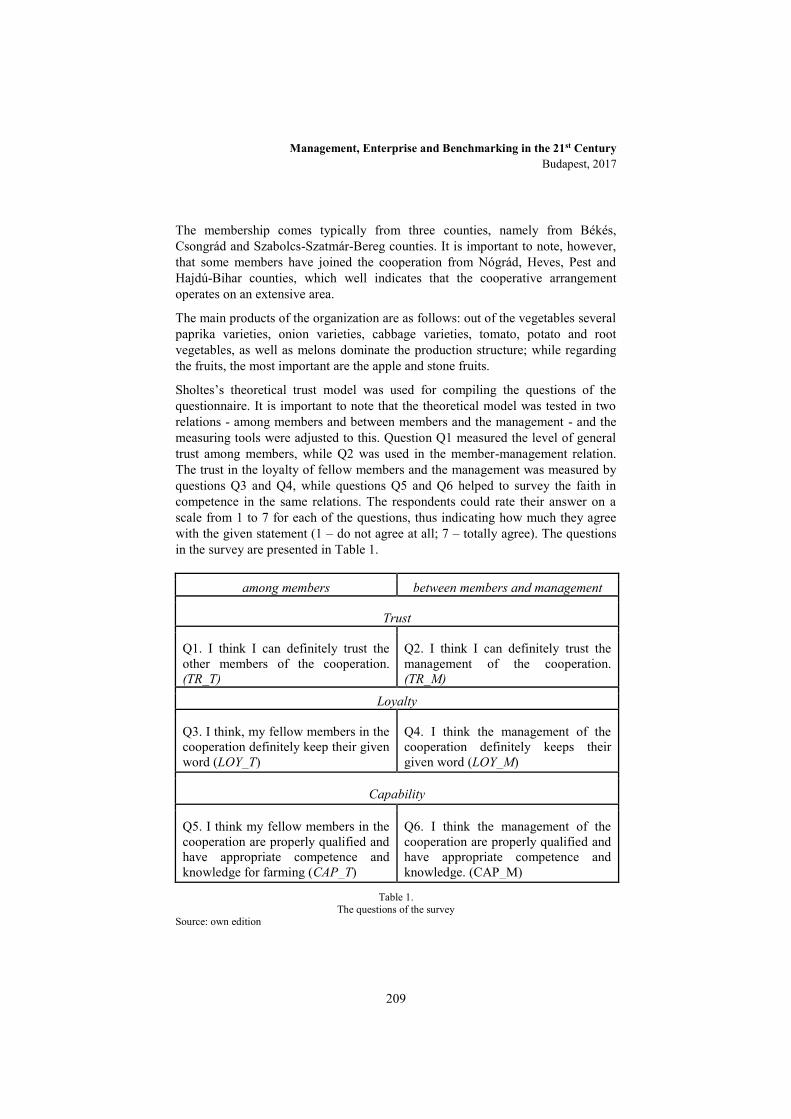
Management, Enterprise and Benchmarking in the 21st Century Budapest, 2017
209
The membership comes typically from three counties, namely from Békés, Csongrád and Szabolcs-Szatmár-Bereg counties. It is important to note, however, that some members have joined the cooperation from Nógrád, Heves, Pest and Hajdú-Bihar counties, which well indicates that the cooperative arrangement operates on an extensive area.
The main products of the organization are as follows: out of the vegetables several paprika varieties, onion varieties, cabbage varieties, tomato, potato and root vegetables, as well as melons dominate the production structure; while regarding the fruits, the most important are the apple and stone fruits.
Sholtes’s theoretical trust model was used for compiling the questions of the questionnaire. It is important to note that the theoretical model was tested in two relations - among members and between members and the management - and the measuring tools were adjusted to this. Question Q1 measured the level of general trust among members, while Q2 was used in the member-management relation. The trust in the loyalty of fellow members and the management was measured by questions Q3 and Q4, while questions Q5 and Q6 helped to survey the faith in competence in the same relations. The respondents could rate their answer on a scale from 1 to 7 for each of the questions, thus indicating how much they agree with the given statement (1 – do not agree at all; 7 – totally agree). The questions in the survey are presented in Table 1.
among members between members and management
Trust
Q1. I think I can definitely trust the other members of the cooperation. (TR_T)
Q2. I think I can definitely trust the management of the cooperation. (TR_M)
Loyalty
Q3. I think, my fellow members in the cooperation definitely keep their given word (LOY_T)
Q4. I think the management of the cooperation definitely keeps their given word (LOY_M)
Capability
Q5. I think my fellow members in the cooperation are properly qualified and have appropriate competence and knowledge for farming (CAP_T)
Q6. I think the management of the cooperation are properly qualified and have appropriate competence and knowledge. (CAP_M)
Table 1. The questions of the survey
Source: own edition

Management, Enterprise and Benchmarking in the 21st Century Budapest, 2017
210
We have used the following statistical methods in the research: descriptive statistics, t-tests, one-way ANOVA with Post Hoc Tests, hierarchical ANOVA and linear regression.
4 Results
The descriptive statistics of the variable set applied in the examinations are summarised in Table 2. The results statistically prove that the level of general trust in the member-management relation is higher than the trust among members.
The Sholtes model interprets trust in relation to the faith in loyalty and capability. The experiences prove that the items measuring the faith in capability received higher average scores in both relations than those used for measuring the level of loyalty. The higher value of faith in capabilities can be statistically proven in both cases. Another interesting experience is that the relation between each variable pairs (LOY_T – CAP_T and LOY_M – CAP_M) is only moderately strong, which means that the above discussed two approaches represent two different dimensions for the farmers.
Another conclusion to highlight was that the responding members of the producer organisation have more faith in the loyalty and competence of management than in that of their fellow members (4.98 vs. 4.69, and 5.31 vs. 5.29); this difference, however, was not significant in terms of statistics.
Variables Average Average CI95% St. Dev. Min/Max Lower Higher TR_T 5.06 4.58 5.52 1.86 1/7 TR_M 6.06 5.65 6.39 1.47 1/7 LOY_T 4.69 4.29 5.13 1.75 1/7 LOY_M 4.98 3.95 6.01 1.14 1/7 CAP_T 5.29 4.95 5.63 1.36 1/7 CAP_M 5.31 4.30 6.32 2.01 1/7
Table 2. Descriptive statistics of the variable set
Source: own calculation
In the next phase of research, the testing of Sholtes trust model was carried out. The LOY and CAP scales were divided into two parts (High and Low) by using the averages belonging to them. On the basis of this, 4 groups were formed and the general trust level (TR_T and TR_M) in member-member and member-management relations was studied in these groups (Table 3).

Management, Enterprise and Benchmarking in the 21st Century Budapest, 2017
211
The results in both relations confirm that the assumption based on the Sholtes trust model is basically correct: when the faith both in capabilities and loyalty has high (above average) values (Group 2), it is statistically proven that the average level of general trust will be higher than in any other group (5.77 and 6.65).
Although the average trust values are considerably lower than the average values in groups 1 and 4, but these differences cannot be regarded as statistically significant. There are no significant differences among TR averages in case of groups 1 and 4 either.
Faith in capability
(CAP_T and CAP_M) low high
Faith
in lo
yalty
(L
OY
_T
an
d L
OY
_M
) high
Group 1 (SYMPATHY)
TR_T-average: 3.41 (n=20) CI (95%): [2.16-4.66]
TR_M-average: 5.15 (n=12) CI (95%): [4.51-5.79]
Group 2 (TRUST)
TR_T-average: 5.77 (n=97) CI (95%): [5.39-6.15]
TR_M-average: 6.65 (n=99) CI (95%): [5.95-7.55]
low
Group 3 (MISTRUST)
TR_T-average: 2.05 (n=8) CI (95%): [1.46-2.64]
TR_M-average: 3.86 (n=14) CI (95%): [2.76-4.96]
Group 4 (RESPECT)
TR_T-average: 4.45 (n=19) CI (95%): [3.83-5.07]
TR_M-average: 5.29 (n=19) CI (95%): [4.48-5.74]
Table 3. Level of trust (TR_T és TR_M) in the Sholtes categories
Source: own calculation
It is important to note that the above examinations made with descriptive statistics have also been verified by one-way ANOVA statistical models and Post-Hoc tests (Games-Howell Post Hoc Test) and these tests have not given different results (Table 4). Of course, all these experiences do not mean that the trust model describes reality differently or the model cannot be validated. Hypothesis H1 is regarded as partly confirmed.
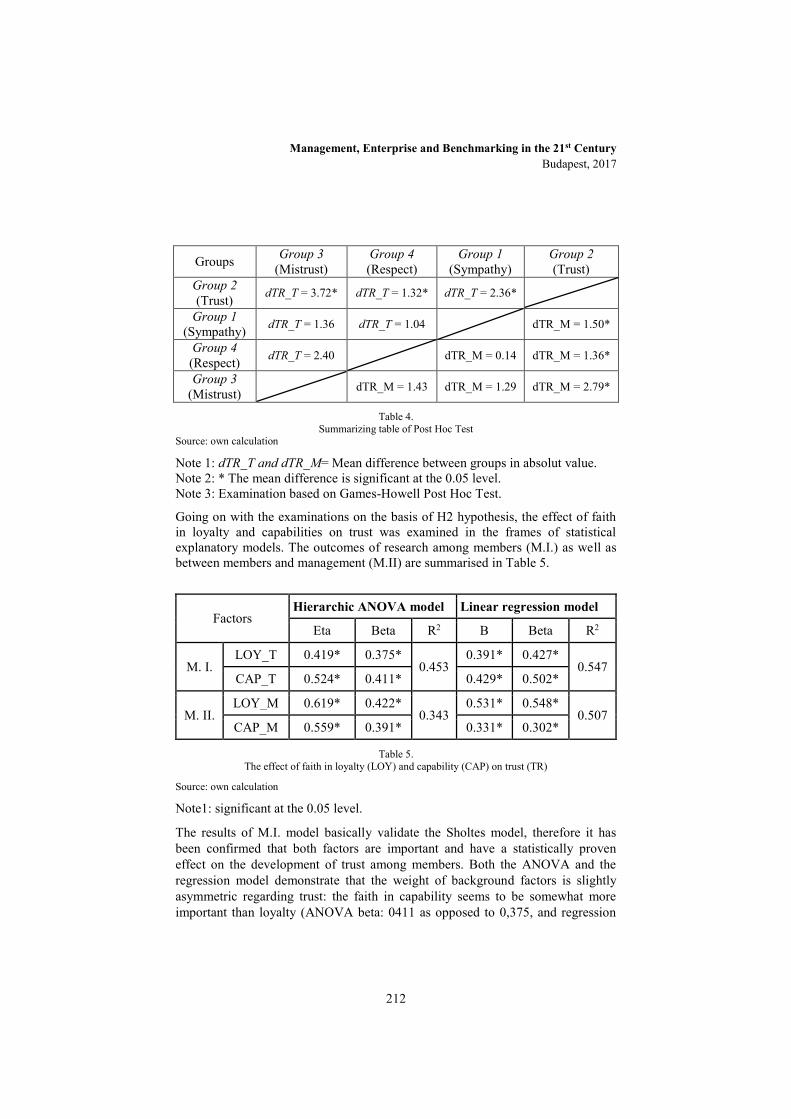
Management, Enterprise and Benchmarking in the 21st Century Budapest, 2017
212
Groups Group 3 (Mistrust)
Group 4 (Respect)
Group 1 (Sympathy)
Group 2 (Trust)
Group 2 (Trust) dTR_T = 3.72* dTR_T = 1.32* dTR_T = 2.36*
Group 1 (Sympathy) dTR_T = 1.36 dTR_T = 1.04 dTR_M = 1.50*
Group 4 (Respect) dTR_T = 2.40 dTR_M = 0.14 dTR_M = 1.36*
Group 3 (Mistrust) dTR_M = 1.43 dTR_M = 1.29 dTR_M = 2.79*
Table 4. Summarizing table of Post Hoc Test
Source: own calculation
Note 1: dTR_T and dTR_M= Mean difference between groups in absolut value. Note 2: * The mean difference is significant at the 0.05 level. Note 3: Examination based on Games-Howell Post Hoc Test.
Going on with the examinations on the basis of H2 hypothesis, the effect of faith in loyalty and capabilities on trust was examined in the frames of statistical explanatory models. The outcomes of research among members (M.I.) as well as between members and management (M.II) are summarised in Table 5.
Factors Hierarchic ANOVA model Linear regression model
Eta Beta R2 B Beta R2
M. I. LOY_T 0.419* 0.375*
0.453 0.391* 0.427*
0.547 CAP_T 0.524* 0.411* 0.429* 0.502*
M. II. LOY_M 0.619* 0.422*
0.343 0.531* 0.548*
0.507 CAP_M 0.559* 0.391* 0.331* 0.302*
Table 5. The effect of faith in loyalty (LOY) and capability (CAP) on trust (TR)
Source: own calculation
Note1: significant at the 0.05 level.
The results of M.I. model basically validate the Sholtes model, therefore it has been confirmed that both factors are important and have a statistically proven effect on the development of trust among members. Both the ANOVA and the regression model demonstrate that the weight of background factors is slightly asymmetric regarding trust: the faith in capability seems to be somewhat more important than loyalty (ANOVA beta: 0411 as opposed to 0,375, and regression

Management, Enterprise and Benchmarking in the 21st Century Budapest, 2017
213
beta: 0,502 vs. 0,427). It should also be noted that the differences traced in parameter values are not significant statistically.
The examinations in member-management relations (M.II.) also confirmed the trust model, but with slightly different outcomes: the explanatory models in this relation regarded the faith in loyalty more important in terms of trust. These differences, however, could not be regarded statistically significant either. Summing up the results of examinations, the H2 hypothesis can be regarded as confirmed.
Conclusions
The present study examined the factors affecting trust in a producer organisation. In the frames of this, a theoretical trust model has been tested. According to the experiences, the theoretical model, which leads back the trust to the faith in the loyalty and capability of the other party, is basically correct. It has been definitely confirmed that high-level trust among partners can be achieved if the faith both in loyalty and capability have high values. The research, however, has also revealed that the aforementioned two factors determine trust to different extents: in case of trust among members, the faith in capabilities is more important, while the trust in management is rather determined by the faith in loyalty.
According to the experiences it can be concluded that one of the possible ways of developing trust within the organisation and facilitating cooperation activity is the improvement of capability/qualification, for example by providing professional training for farmers and managers. The other way is to strengthen the loyalty of participants to each other by organising team building programs or events.
Of course, the research has its limits. The generalisation of the outcomes is hampered by the concentration of the sample (1 producer organisation) and the low number of elements (N=144). The results, however, considerably overlap with the results of Baranyai et al. (2013) and Baranyai (2016) achieved with the same methodology and this enables some generalization (Table 6).
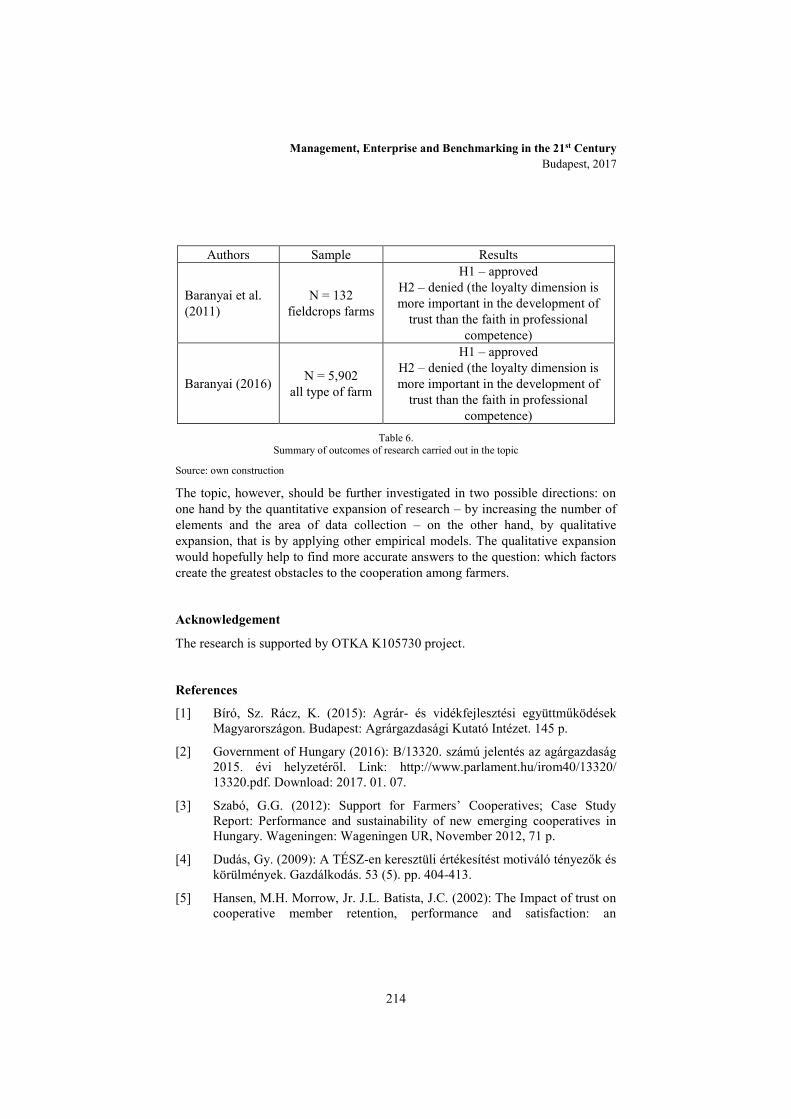
Management, Enterprise and Benchmarking in the 21st Century Budapest, 2017
214
Authors Sample Results
Baranyai et al. (2011)
N = 132 fieldcrops farms
H1 – approved H2 – denied (the loyalty dimension is more important in the development of
trust than the faith in professional competence)
Baranyai (2016) N = 5,902 all type of farm
H1 – approved H2 – denied (the loyalty dimension is more important in the development of
trust than the faith in professional competence)
Table 6. Summary of outcomes of research carried out in the topic
Source: own construction
The topic, however, should be further investigated in two possible directions: on one hand by the quantitative expansion of research – by increasing the number of elements and the area of data collection – on the other hand, by qualitative expansion, that is by applying other empirical models. The qualitative expansion would hopefully help to find more accurate answers to the question: which factors create the greatest obstacles to the cooperation among farmers.
Acknowledgement
The research is supported by OTKA K105730 project.
References
[1] Bíró, Sz. Rácz, K. (2015): Agrár- és vidékfejlesztési együttműködések Magyarországon. Budapest: Agrárgazdasági Kutató Intézet. 145 p.
[2] Government of Hungary (2016): B/13320. számú jelentés az agárgazdaság 2015. évi helyzetéről. Link: http://www.parlament.hu/irom40/13320/ 13320.pdf. Download: 2017. 01. 07.
[3] Szabó, G.G. (2012): Support for Farmers’ Cooperatives; Case Study Report: Performance and sustainability of new emerging cooperatives in Hungary. Wageningen: Wageningen UR, November 2012, 71 p.
[4] Dudás, Gy. (2009): A TÉSZ-en keresztüli értékesítést motiváló tényezők és körülmények. Gazdálkodás. 53 (5). pp. 404-413.
[5] Hansen, M.H. Morrow, Jr. J.L. Batista, J.C. (2002): The Impact of trust on cooperative member retention, performance and satisfaction: an
Management, Enterprise and Benchmarking in the 21st Century Budapest, 2017
215
exploratory study. International Food and Agribusiness Management Review. 5: 41-59.
[6] Dudás, Gy. Fertő, I. (2009): The effect of trust ont he performance and satisfaction of co-operative members at the „ZÖLD-TERMÉK” Producer Organisation. Gazdálkodás. 23. különkiadás. pp. 49-55.
[7] Baranyai, Zs. Béres, D. Szabó, G. G. Vásáry, M. Takács, I. (2011): Factors of trust in machinery sharing arrangements. Annals of the Polish Association of Agricultural and Agribusiness Economists 13:(6) pp. 18-22.
[8] Baranyai, Zs. (2016): Factors of trust in hungarian agriculture – Some experiences based on sholtes’ model. Annals of the Polish Association of Agricultural and Agribusiness Economists XVIII:(4) pp. 14-19.
[9] McAllister, D. J. (1995): Affect- and cognitive-based trust as foundations for interpersonal cooperation in organizations. Academy of Management Journal 38. pp. 24–59.
[10] Szabó, G. G. (2010): The importance and role of trust in agricultural marketing co-operatives. MTA – AKI, Budapest: Studies in Agricultural Economics, No. 112. pp. 5-22.
[11] Sholtes, P. R. (1998): The Leader's handbook: making things happen – Getting things done. New York: McGraw-Hill.
Management, Enterprise and Benchmarking in the 21st Century Budapest, 2017
216
Small Economy but Big Lessons: What India and Hungary can Learn from Outward Looking Model of Singapore?
Mamta Kumari Dept. of Humanities and Social Sciences Indian Institute of Technology Patna Bihta, Patna (India)
[email protected], [email protected]
Nalin Bharti Dept. of Humanities and Social Sciences Indian Institute of Technology Patna Bihta, Patna (India)
[email protected], [email protected]
Abstract: Economic growth is one of the most important jobs for any policy maker. This job becomes more challenging when an economy works in a more interconnected world. In such a globalized world, performances of many smaller economies are path breaking. So it is high time for many big economies of the world to revisit the growth model of smaller economies. Singapore’s outstanding industrial and trade policy have become a great example before the world. Every country’s growth pattern is unique in its own sense. This paper critically examines the three different countries viz. Singapore, India and Hungary’s trade and industrial policy. While observing several arguments that whether the successful result of similar development strategy for every country is possible or not, it is difficult to say that outward looking growth model of a small country like Singapore will certainly offer a big lesson for the smaller economy like Hungary and one of the world’s biggest economies India. It may be difficult to practice, but not impossible that following the growth path of Singapore, both the countries will be able to sustain tremendous growth and economic success. Singapore’s success story gives a valuable message that without government’s proactive role and other conducive factors, no country can progress.
Keywords: restricted industrialization, trade policy, industrialization process, country’s share of world exports
Management, Enterprise and Benchmarking in the 21st Century Budapest, 2017
217
Introduction Trade growth and industrialization progress both are the significant indicators of any country’s economic development. Since trade is considered as an engine of growth (Robertson, 1938) and industrialization is considered as a promoter of growth. Thus, it can be said that the success of an economy depends on both the effectiveness of trade policy, which regulates trade and industrialization process that promotes industrial development. Trade policy and industrialization process must be complementary to each other. Because, the prior objective of industrial policy is to promote trade, the primary objective of trade policy is to speed up the process of industrialization. The more trade policy and industrialization process of a country complements or supports each other, the more success in terms of growth, that country will experience. Tilman (2011) argued that one of the problems for developing and lower middle income countries is lack of coordination between their industrial policies and trade policies and others. At the present time, every economy’s goal is to have a long-run sustained growth. But, their way and strategies differ. As far as development strategy is concerned, there always remains big debate between the free traders, who advocate outward-looking export promotion strategies of industrialization, and the protectionists, who are proponents of inward- looking import substitution strategies (Michael and Stephen, 2003). Michael and Stephen (2003) called the promoters of inward looking strategies the trade pessimists and the proponents of export promotion policies the trade optimists.
Paul and Maurice (2009) defined import substitution industrialization process as the strategy of encouraging domestic industry by limiting imports of manufactured goods and protecting domestic manufacturers from international competition. Paul and Maurice (2009) also explained export promotion strategy as the strategy of encouraging more and more export of manufactured goods by adopting free trade policy rather than protectionist measures. Jagdish (1988) classified export-promoting trade strategy into two strategies: Export-promoting and ultra-export promoting trade strategy. Export- promoting trade strategy is defined as the situation, when the incentive to produce the exportable goods equals to produce the import-competing goods. When the incentive to produce exportable good exceeds that to produce the import-competing goods, this is the ultra-EP strategy. It is very clear that, today, Singapore is one of the highly advanced countries of the world. It emerged as newly industrialized economy at the forefront of developing countries. This economy is widely known for its effective and efficient development model. Hungary in recent years has shown tremendous progress in terms of trade and industrial development, but still it needs to develop more. India, which is considered as one of the fastest growing economies in the world, is still struggling to achieve higher productivity and efficiency led growth.
The paper focuses on studying strategies related to trade policy and industrialization process of the three different countries, India, Singapore (Asian countries one which is very big in terms of its size and another very small ) and Hungary (a Central and
Management, Enterprise and Benchmarking in the 21st Century Budapest, 2017
218
Eastern European Country). The paper also tries to answer the question, why Singapore is more advanced than India and Hungary at present. What kind of role, trade policy and industrialization process of these countries have played in their growth and development?
2 Literature review In the global scenario, 1950’s and 1960’s saw the high tide of import- substituting industrialization. Since late 1960’s, it has come under increasingly harsh criticism. By the late 1980’s, the critique of this policy has been widely accepted by economists. Meanwhile, developing countries had started liberalizing trade. Now the efforts have been shifted to promote more exports of manufacturing goods. Since late 1960’s, arguments regarding the export promotion, trade strategy had been started and is still continued. Meanwhile, a large number of empirical studies have been conducted focusing on the impact of export-promotion development strategy for economic growth. Econometric studies were conducted of the exports-growth relationships. Study by Robert (1967) confirmed that there is highly significant relation between export growth and increase in per capita GNP. It was found that 1% increase in per capita GNP is associated with a 3 % increase in exports. Another study by William (1981) included 55 middle income developing countries for the period 1960-1977, observed significant positive associations between growth and total exports. Bela (1985) found in a study of 43 developing countries during 1973-78 that export promotion policy has favorably affected growth performance. Jessie (1994) studied the significance of development level in determining export-growth relationships. The study suggested that export promotion strategy is not equally effective at all stages of the development cycle rather than at the intermediate development level.
Jagdish (1988) examined the old and new arguments that questioned the understanding of export-promotion strategy. While considering experiences from the studies on the advantages of the export promotion trade policy and examining several new sources of arguments concerning export promoting trade strategy, Jagdish (1988) concluded that an export promotion trade strategy remained the preferred option for every country and developing countries should adopt the policy in line with the industrialized countries. Tilman (2011) argued that the success of any industrial policy depends on how effectively it has been designed and implemented. The objectives and challenges for industrial policy in low and lower-middle income countries are quite different from those in higher income countries. The challenges for low income countries are to balance the patterns of development spatially, develop resource-efficient technologies, coordination failure, lack of monitoring, evaluations and other political checks and balances, fragmentation of the business community, lack of comparable strategic focus and political
Management, Enterprise and Benchmarking in the 21st Century Budapest, 2017
219
determination. Low and lower-middle-income countries need to pursue proactive industrial policies to achieve success.
While studying the industrial and trade policy of the three economies (India, Singapore and Hungary), it has been observed that Singapore has adopted an export promotion model since 1967. As far as India and Hungary are concerned, there are many similarities between the two in terms of trade protection and industrialization as both had adopted restricted industrialization until 1990 (Takács and Nalin, 2016). The study has taken into consideration three strands of theoretical literature.
The first strand of literature observes the role of industrial and trade policy in Singapore’s economic transformation. Singapore’s growth process and its economic strategies have seen the most attention from the development planners all around the world. Jagdish (1988) gave credit of substantial improvements in the export performance of Singapore for their shift to an export promotion trade strategy. Singapore’s industrialization policies are characterized by an export-oriented manufacturing led by the multinational corporations (MNCs). There were several state agencies for industrial development (H.A. Yun, 1994). Gundy et al. (2004) divided Singapore’s economic strategies into three categories: government’s strategic role, mobilization of its human capital, continuous development of infrastructure. Since 1980’s, the government proceeded towards development of high value added and high technology industries. So, the composition of exports also changed from low-skilled industrial products to high-skilled manufacturing products. At present, Singapore’s industrialization policy is directed towards achieving high technology economy and expanding external ties with the world. All in all, Singapore’s success became possible because of a right combination of state led social and economic policies and right place and timing of reforms. While studying the role of industrial and trade policy in the success of the East Asian economies (Singapore is one), Paul and Maurice (2009) were of the view that it is unfair to say that industrial policy was a key driving force behind Asian success. Also, it can be said that trade policy of these economies has permitted growth, but wrong to say that it caused growth.
The second strand of literature deals with the Hungarian trade policy and industrialization process. J. Drecin (1975) talked about the internal social and economic contradictions that restricted the country from achieving higher level of industrialization. They are: lack of qualified labor, its small internal market, social tensions among the masses because of low living standards. Industrial development in Hungary needs greater specialization and modernization of products, technological development and better international relations. Josef (1984) analyzed industrial policy of Hungary on the basis of four criteria: selecting industries for promotion, selecting markets for sale, allocating resources towards target sectors and achieving production and exports. It was concluded that Hungarian planners were not fully succeeded in all these criteria. Like Singapore, Hungary’s economic growth was also driven by expansion of exports and investments. Francoise (1996) examined the trade policy reforms of Central & Eastern European Countries
Management, Enterprise and Benchmarking in the 21st Century Budapest, 2017
220
(CEECs) including Hungary in details and made a comparison with China. Limited foreign trade reforms had been implemented in the 1970s and 1980s in the CEECs. Since 1989, complete trade reforms were adopted. Between 1989 and 1991, the trade monopoly was abolished, quantitative restrictions on imports sharply reduced or eliminated for most industrial products, tariff barriers were set at a low, or moderate level, currency convertibility was in progress, measures to attract foreign direct investments was adopted. CEECs’s approach towards trade reforms was trade liberalization and namely import liberalization aimed at integrating the European Union. Andrea et al. (2000) evaluated new trade policy orientation adopted by Hungary during 1990s and found it successful. It was argued that there were two basic objectives of the new policy: to be integrated with the world economy and, to establish trade relation with the European Union. In the 50’s and 60’s, forced industrialization development policy was adopted by Hungary. It wanted to achieve the condition of self- sufficiency and economic independence and to survive without any external assistance (Tabor, 2004 and J. Fazekas, 2008). Priyanka et al. (2013) discussed about the trade policy of Hungary and said that from 1950’s - 60’s till 90’s, restrictive economic policy remained continue.
The third strand of literature focuses on trade policy and industrial reforms of India. Thirukodikaval (1991) expressed the view that India’s trade and industrial policy have failed. The entire system of discretionary and quantitative restrictions on any economic activity must be abandoned once and for all. But, still in present scenario, India has not abandoned the restrictions completely. The question also arises that how India’s export promotion strategy should be for sustaining long term growth. G. M. Naidu et al. (1997) proposed an export promotion framework for India, while concerning the experiences of other countries that have adopted similar strategies. The study mentioned some problems in India’s export promotion strategy like, high level of government intervention, lack of coordination, clear objectives and vision, extensive duplication of efforts. Some more initiatives were suggested that must be taken for export promotion. Such initiatives are to increase country’s competitiveness through infrastructure development and maintenance, adopt a systematic approach to export development, minimize bureaucracy and promote entrepreneurship, develop partnerships between public and private organizations, promote effectiveness of programs, competing in R & D and quality, accountability of public and private organizations, etc. Arvind (2008) gave credit of Korea’s outstanding performance during the 1960s-70s to its outward oriented policy on the other hand provide a credit of India’s poor performance in its inward looking policy. Petia and Amit (2011) studied the impact of India’s trade reforms on firm productivity and found it positive. It was found that there were complementarities between trade liberalization and additional industrial policy reforms. Jagdish and Arvind (2013) pointed out the weaknesses of India’s industrial sector like, poor performance of labor intensive firms, small size of Indian firms, less of large and medium sized firms comprising industry and dominance of small sized firms. While discussing the history of India’s trade policy, Priyanka et al. (2013) notified that from 1947 till 1990, firstly the purpose of trade policy has been to restrict imports
Management, Enterprise and Benchmarking in the 21st Century Budapest, 2017
221
and boost exports, and in later years, to stimulate economic growth and export promotion via import liberalization. Since 1991, external trade liberalization has taken place, which resulted in a major shift in the growth of India’s trade.
In a nutshell, the above literature shows that there are empirical evidences of positive relations between export growth and growth in income or GNP. While focusing on theoretical as well as applied studies on trade and industrial policy of the three economies, it has been found that Singapore’s development strategy is much more synchronized and well structured than Hungary and India.
3 Materials and Methods An analytical approach has been adopted to critically evaluate the trade policy and industrialization pattern of the three countries. To clearly depict the trade performance of all the three countries, their export shares in world exports have been calculated. It is the percentage of a country's total exports in the world's total exports. This ratio is being used to evaluate the changes of a country’s share in world markets over time.
India’s share of world export is calculated as:
Ei= (Ix/ Wx) ×100
Where, Ix = India’s goods export in the world
Wx = Total goods export in world
Singapore’s share of world export is calculated as:
Es= (Sx/ Wx) ×100
Where, Sx = Singapore’s goods export in the world
Wx = Total goods export in world

Management, Enterprise and Benchmarking in the 21st Century Budapest, 2017
222
Hungary’s share of world export is calculated as:
Eh= (Hx/ Wx) ×100
Where, Hx= Hungary’s goods export in the world
Wx = Total goods export in world
The data for comparing economic performance of the three countries have been taken mostly from World Bank, World Economic Forum and IMD World Competitiveness center. For a comparative study of the trade policy and the industrialization process of the three countries, three main sources are- Ministry of trade and Industry of Singapore, the Hungarian Chamber of Commerce and Industry in Hungary, and Ministry of Commerce and Industry of India.
Singapore’s Trade Policy and Industrialization Process Before the 1960s, Singapore was a dependent nation. There was a lack of natural resources, hinterland and industry. The country was fully dependent on entrepot trade of the East India Company. There was no specific industrial strategy. In the first half of the 1960s, Singapore approach towards trade was somehow restrictive. In the latter half of the 1960s, Singapore adopted export promotion and outward oriented trade policy. The labor intensive industrialization process had been adopted and the focus was on building labor intensive industries. In 1970’s, the trade policy was directed towards increasing export potential. Export-oriented industrialization process has been adopted to attract FDI into the country to increase productive capacity. During 1980’s, industrialization process was aimed to enhance overall competitiveness of the economy compared to other regional economies. Since 1990s, the strategy has been to make Singapore’s firms more entrepreneurial and Singapore’s workforce more experts and to be competitive with international standards. After 2000s, innovation driven industrialization process has been adopted.
Hungary’ Trade Policy and Industrialization Process From 1945-1967, being a member of the Council for Mutual Economic Assistance (CMEA), restrictive trade practices have been adopted. Industrial policy has been forced from the center, that means planned and executed from the top down. No incentives were there to develop and produce competitive products by industrial units. In 1968, market-oriented reforms had been introduced by the New Economic Mechanism. Under this, state control was reduced. The focus was being given on developing priority sectors. Seeing the poor performance of production, attention was paid towards specialization, higher standard for products and management,
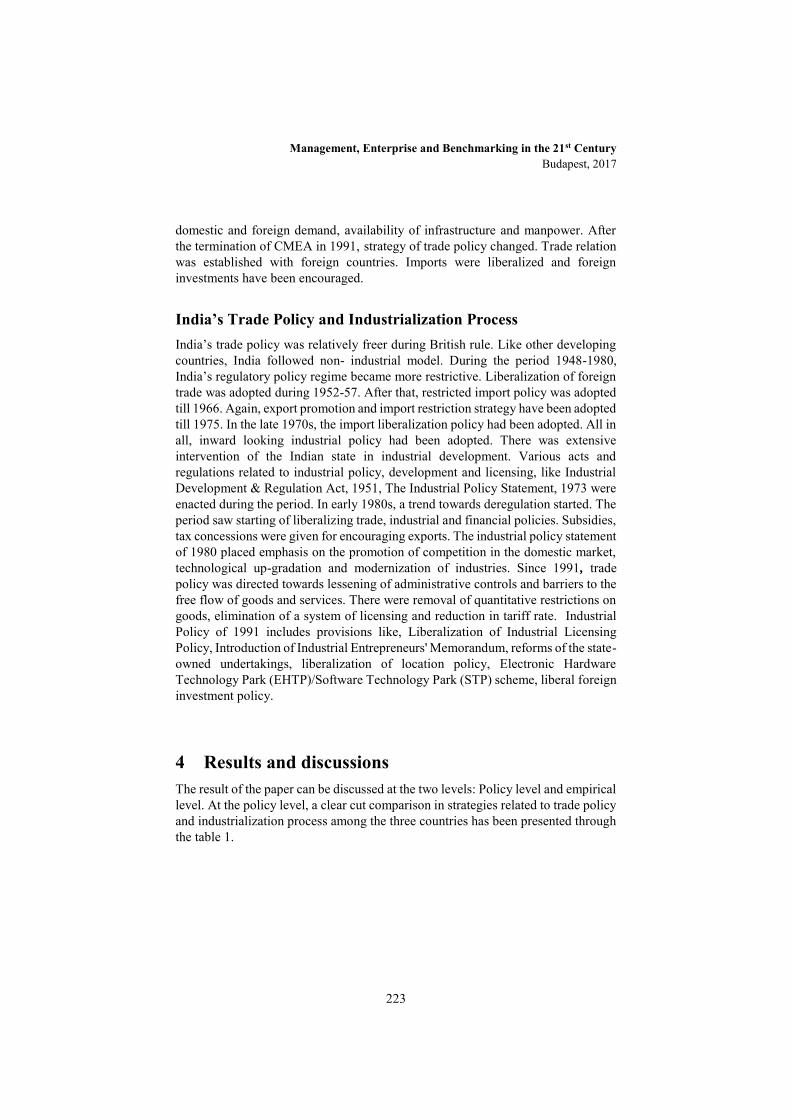
Management, Enterprise and Benchmarking in the 21st Century Budapest, 2017
223
domestic and foreign demand, availability of infrastructure and manpower. After the termination of CMEA in 1991, strategy of trade policy changed. Trade relation was established with foreign countries. Imports were liberalized and foreign investments have been encouraged.
India’s Trade Policy and Industrialization Process India’s trade policy was relatively freer during British rule. Like other developing countries, India followed non- industrial model. During the period 1948-1980, India’s regulatory policy regime became more restrictive. Liberalization of foreign trade was adopted during 1952-57. After that, restricted import policy was adopted till 1966. Again, export promotion and import restriction strategy have been adopted till 1975. In the late 1970s, the import liberalization policy had been adopted. All in all, inward looking industrial policy had been adopted. There was extensive intervention of the Indian state in industrial development. Various acts and regulations related to industrial policy, development and licensing, like Industrial Development & Regulation Act, 1951, The Industrial Policy Statement, 1973 were enacted during the period. In early 1980s, a trend towards deregulation started. The period saw starting of liberalizing trade, industrial and financial policies. Subsidies, tax concessions were given for encouraging exports. The industrial policy statement of 1980 placed emphasis on the promotion of competition in the domestic market, technological up-gradation and modernization of industries. Since 1991, trade policy was directed towards lessening of administrative controls and barriers to the free flow of goods and services. There were removal of quantitative restrictions on goods, elimination of a system of licensing and reduction in tariff rate. Industrial Policy of 1991 includes provisions like, Liberalization of Industrial Licensing Policy, Introduction of Industrial Entrepreneurs' Memorandum, reforms of the state-owned undertakings, liberalization of location policy, Electronic Hardware Technology Park (EHTP)/Software Technology Park (STP) scheme, liberal foreign investment policy.
4 Results and discussions The result of the paper can be discussed at the two levels: Policy level and empirical level. At the policy level, a clear cut comparison in strategies related to trade policy and industrialization process among the three countries has been presented through the table 1.

Management, Enterprise and Benchmarking in the 21st Century Budapest, 2017
224
Singapore Hungary India
Trade policy In the latter half of the 1960s, outward oriented trade policy has been adopted.
With the objective to promote free, fair, stable, strong, liberal and rule based trading system.
Restrictive trade policy has been adopted till 1990.
After 1990s, import and wage rate were liberalized.
Focused on expansion of exports and attracting foreign investments.
Restrictive trade policy till 1980
Trade liberalization, liberalization of industrial sectors stared from 1980s
After the LPG policy in 1991, the fully export oriented policy adopted. The economy became open to trade and investment.
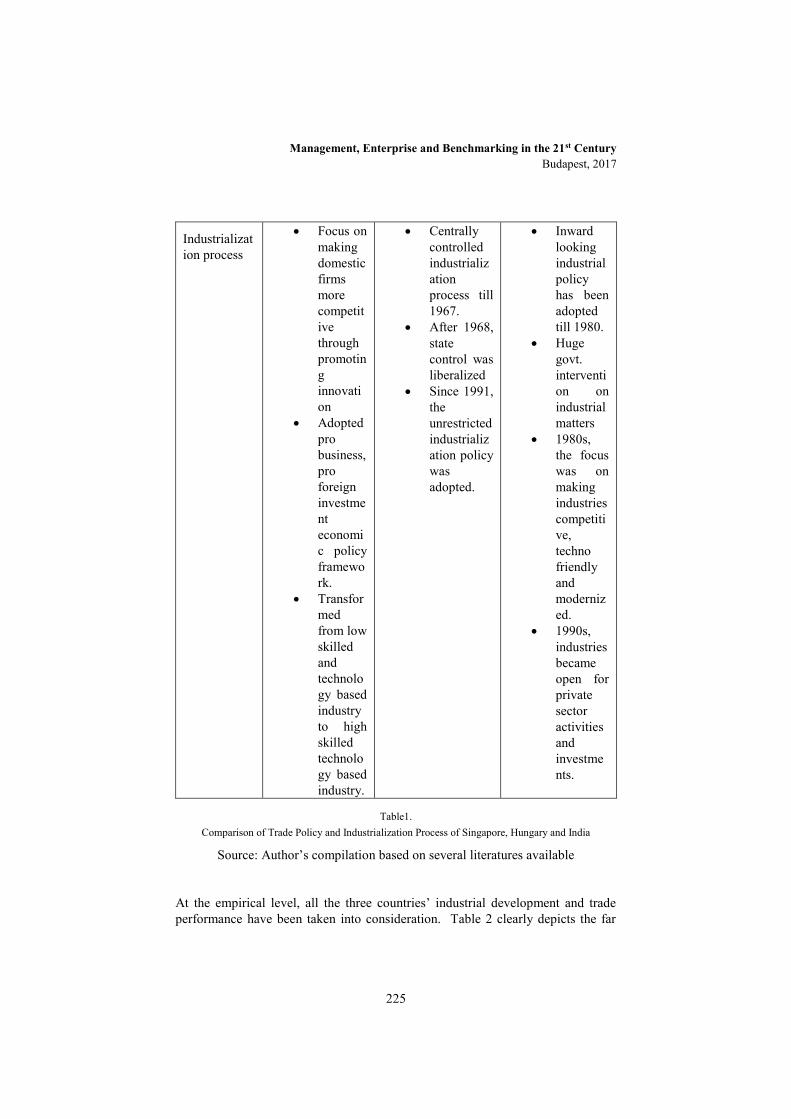
Management, Enterprise and Benchmarking in the 21st Century Budapest, 2017
225
Industrialization process
Focus on making domestic firms more competitive through promoting innovation
Adopted pro business, pro foreign investment economic policy framework.
Transformed from low skilled and technology based industry to high skilled technology based industry.
Centrally controlled industrialization process till 1967.
After 1968, state control was liberalized
Since 1991, the unrestricted industrialization policy was adopted.
Inward looking industrial policy has been adopted till 1980.
Huge govt. intervention on industrial matters
1980s, the focus was on making industries competitive, techno friendly and modernized.
1990s, industries became open for private sector activities and investments.
Table1. Comparison of Trade Policy and Industrialization Process of Singapore, Hungary and India
Source: Author’s compilation based on several literatures available
At the empirical level, all the three countries’ industrial development and trade performance have been taken into consideration. Table 2 clearly depicts the far
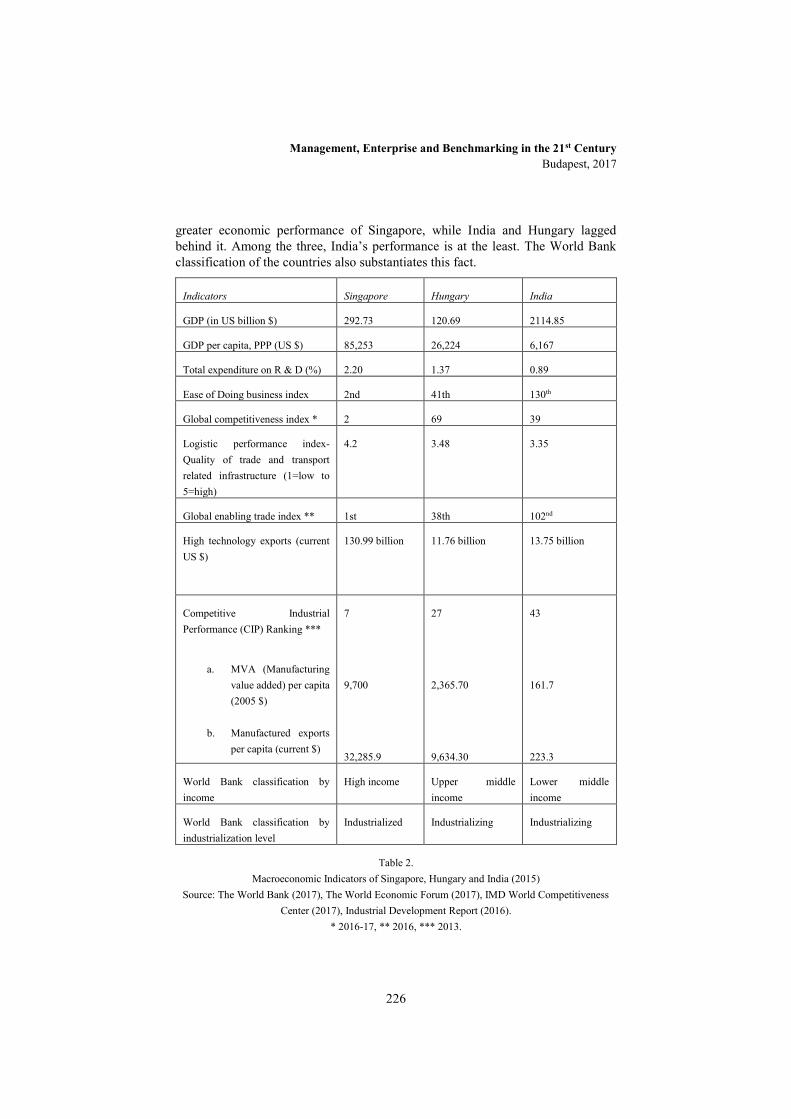
Management, Enterprise and Benchmarking in the 21st Century Budapest, 2017
226
greater economic performance of Singapore, while India and Hungary lagged behind it. Among the three, India’s performance is at the least. The World Bank classification of the countries also substantiates this fact.
Indicators Singapore Hungary India
GDP (in US billion $) 292.73 120.69 2114.85
GDP per capita, PPP (US $) 85,253 26,224 6,167
Total expenditure on R & D (%) 2.20 1.37 0.89
Ease of Doing business index 2nd 41th 130th
Global competitiveness index * 2 69 39
Logistic performance index-Quality of trade and transport related infrastructure (1=low to 5=high)
4.2 3.48 3.35
Global enabling trade index ** 1st 38th 102nd
High technology exports (current US $)
130.99 billion 11.76 billion 13.75 billion
Competitive Industrial Performance (CIP) Ranking ***
a. MVA (Manufacturing
value added) per capita (2005 $)
b. Manufactured exports per capita (current $)
7
9,700
32,285.9
27
2,365.70
9,634.30
43
161.7
223.3
World Bank classification by income
High income Upper middle income
Lower middle income
World Bank classification by industrialization level
Industrialized Industrializing Industrializing
Table 2. Macroeconomic Indicators of Singapore, Hungary and India (2015)
Source: The World Bank (2017), The World Economic Forum (2017), IMD World Competitiveness Center (2017), Industrial Development Report (2016).
* 2016-17, ** 2016, *** 2013.

Management, Enterprise and Benchmarking in the 21st Century Budapest, 2017
227
The composition of agriculture, industry and services in the GDP of Singapore, Hungary and India in value added terms has been shown in fig. 1, 2 and 3. From fig. 1, 2 and 3, it is clear that Singapore is in a more advanced state than India and Hungary. In Hungary, industry accounted for the highest share of its GDP in value added terms than the others two. This shows that Hungary’s industrialization process is in progress. In case of India, both industry and services sector accounted for a higher share of its GDP in value added terms. In Singapore, services accounted for the highest share of its GDP in value added terms than the others two. This shows that Singapore economy has moved to the later phase of development than India and Hungary.
Figure 1.
Percentage Contribution of sectors in Singapore’s GDP (2015)
Source: World Bank (2017)
Figure 2. Percentage Contribution of sectors in Hungary’s GDP (2015)
Source: World Bank (2017)
0,0426,4
73,56Agriculture, value added (%of GDP)Industry, value added (% ofGDP)
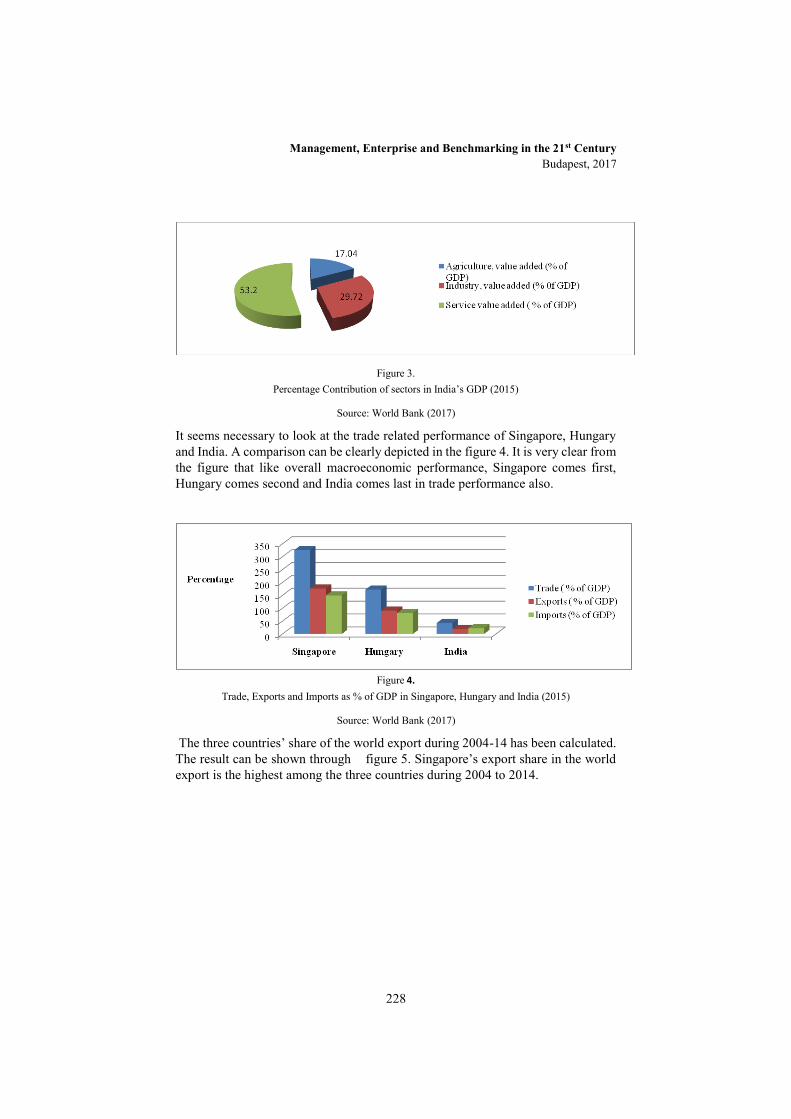
Management, Enterprise and Benchmarking in the 21st Century Budapest, 2017
228
Figure 3.
Percentage Contribution of sectors in India’s GDP (2015)
Source: World Bank (2017)
It seems necessary to look at the trade related performance of Singapore, Hungary and India. A comparison can be clearly depicted in the figure 4. It is very clear from the figure that like overall macroeconomic performance, Singapore comes first, Hungary comes second and India comes last in trade performance also.
Figure 4.
Trade, Exports and Imports as % of GDP in Singapore, Hungary and India (2015)
Source: World Bank (2017)
The three countries’ share of the world export during 2004-14 has been calculated. The result can be shown through figure 5. Singapore’s export share in the world export is the highest among the three countries during 2004 to 2014.
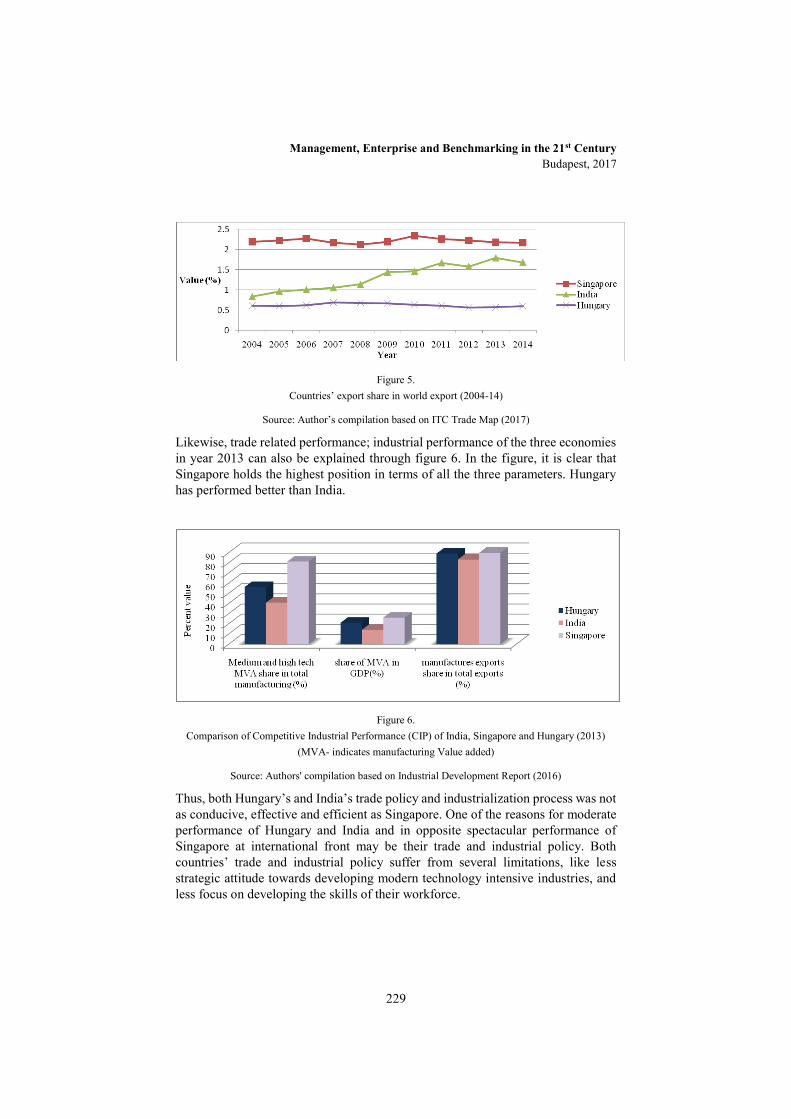
Management, Enterprise and Benchmarking in the 21st Century Budapest, 2017
229
Figure 5.
Countries’ export share in world export (2004-14)
Source: Author’s compilation based on ITC Trade Map (2017)
Likewise, trade related performance; industrial performance of the three economies in year 2013 can also be explained through figure 6. In the figure, it is clear that Singapore holds the highest position in terms of all the three parameters. Hungary has performed better than India.
Figure 6.
Comparison of Competitive Industrial Performance (CIP) of India, Singapore and Hungary (2013) (MVA- indicates manufacturing Value added)
Source: Authors' compilation based on Industrial Development Report (2016)
Thus, both Hungary’s and India’s trade policy and industrialization process was not as conducive, effective and efficient as Singapore. One of the reasons for moderate performance of Hungary and India and in opposite spectacular performance of Singapore at international front may be their trade and industrial policy. Both countries’ trade and industrial policy suffer from several limitations, like less strategic attitude towards developing modern technology intensive industries, and less focus on developing the skills of their workforce.
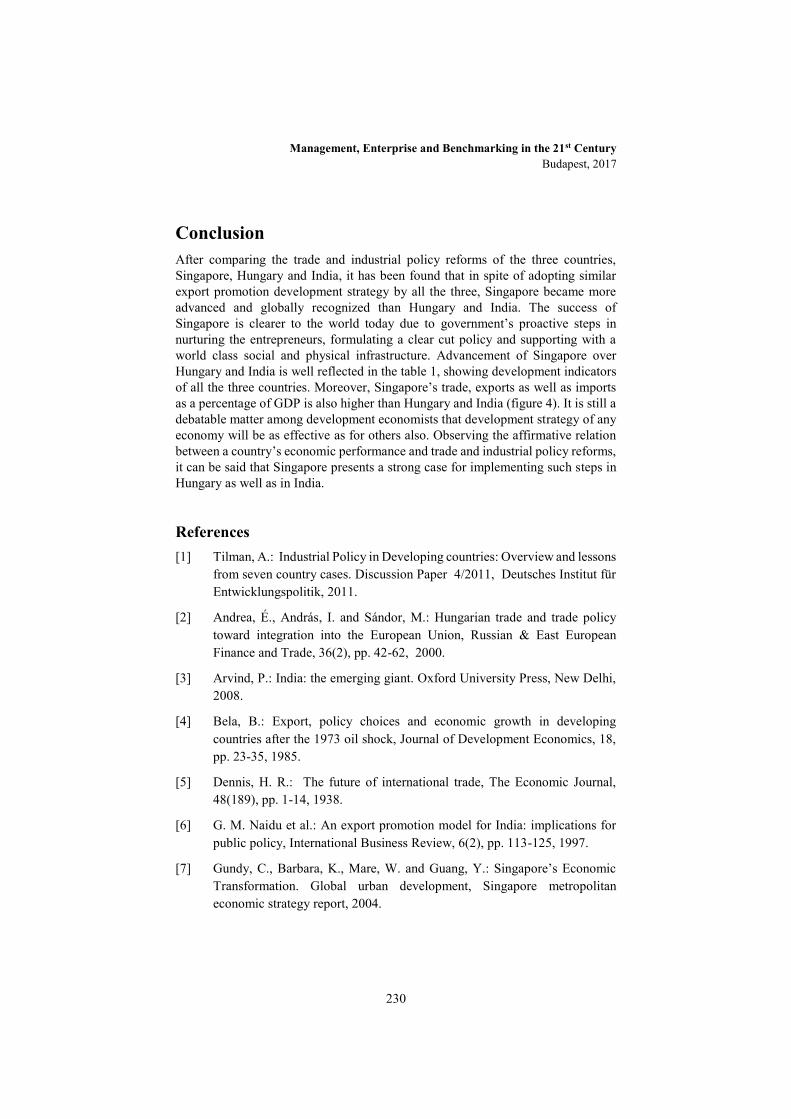
Management, Enterprise and Benchmarking in the 21st Century Budapest, 2017
230
Conclusion After comparing the trade and industrial policy reforms of the three countries, Singapore, Hungary and India, it has been found that in spite of adopting similar export promotion development strategy by all the three, Singapore became more advanced and globally recognized than Hungary and India. The success of Singapore is clearer to the world today due to government’s proactive steps in nurturing the entrepreneurs, formulating a clear cut policy and supporting with a world class social and physical infrastructure. Advancement of Singapore over Hungary and India is well reflected in the table 1, showing development indicators of all the three countries. Moreover, Singapore’s trade, exports as well as imports as a percentage of GDP is also higher than Hungary and India (figure 4). It is still a debatable matter among development economists that development strategy of any economy will be as effective as for others also. Observing the affirmative relation between a country’s economic performance and trade and industrial policy reforms, it can be said that Singapore presents a strong case for implementing such steps in Hungary as well as in India.
References [1] Tilman, A.: Industrial Policy in Developing countries: Overview and lessons
from seven country cases. Discussion Paper 4/2011, Deutsches Institut für Entwicklungspolitik, 2011.
[2] Andrea, É., András, I. and Sándor, M.: Hungarian trade and trade policy toward integration into the European Union, Russian & East European Finance and Trade, 36(2), pp. 42-62, 2000.
[3] Arvind, P.: India: the emerging giant. Oxford University Press, New Delhi, 2008.
[4] Bela, B.: Export, policy choices and economic growth in developing countries after the 1973 oil shock, Journal of Development Economics, 18, pp. 23-35, 1985.
[5] Dennis, H. R.: The future of international trade, The Economic Journal, 48(189), pp. 1-14, 1938.
[6] G. M. Naidu et al.: An export promotion model for India: implications for public policy, International Business Review, 6(2), pp. 113-125, 1997.
[7] Gundy, C., Barbara, K., Mare, W. and Guang, Y.: Singapore’s Economic Transformation. Global urban development, Singapore metropolitan economic strategy report, 2004.
Management, Enterprise and Benchmarking in the 21st Century Budapest, 2017
231
[8] H., A.Y.: The Political Process in Singapore’s New Industrialization, Social Justice, 21(2), pp. 83-109, 1994.
[9] IMD (World Competitiveness Center): Available at http://www.imd.org/wcc/wcy-world-competitiveness-yearbook/, 2017 (accessed 15.03.2017).
[10] Industrial Development Report, 2016: Available at https://www.unido.org/fileadmin/user_media_upgrade/Resources/Publications/EBOOK_IDR2016_FULLREPORT.pdf (accessed 10.03.2017).
[11] ITC Trade Map: Available at http://www.trademap.org/Bilateral_TS.aspx (accessed 19.03.2017).
[12] J. Drecin : Industrial Policy in Hungary, Acta Oeconomica, 14(23), pp. 187-205, 1975.
[13] J. Fazekas: History of European Integration – European Union law and institutions and legal systems. Novotni, Miskolc, 2008.
[14] Jagdish, B. and Arvind, P.: Why growth matters: how economic growth in India reduced poverty and the lessons for other developing countries, Public Affairs. New York, NY, 2013.
[15] Jagdish, B.: Export- promoting trade strategy: issues and evidence. IBRD/The World Bank, 1988.
[16] Jessie, P.: Export Growth, Economic Growth, and Development Levels: An Empirical Analysis, Geographical Analysis, 26 (1), pp. 37-55, 1994.
[17] Josef, C. B.: Industrial Policy in Hungary: Lessons for America, Cato Journal, 4(2). pp. 485-520, 1984.
[18] Françoise, L.: Trade Policy and trade patterns during transition: A Comparison between China and CEECs, CEPII. 1996.
[19] Michael, P. T. and Stephen, C. S.: Economic development, New Delhi, 2003, pp. 589-611.
[20] Paul, R. K. and Maurice, O.: International economics: theory and policy, New Delhi, 2009, pp. 250-265.
[21] Petia, T. and Amit, K.: Trade liberalization and firm productivity: The case of India, Review of Economics and Statistics, 93(3), pp. 995-1009, 2011.
[22] Priyanka, S., Nalin, B., Takacs, I., and Katalin, T. G.: Have trade policy reforms improved Indo-Hungarian trade? Some evidence from agriculture sector, Acta Agronomica Óváriensis, 55(2), pp. 61-75, 2013.
Management, Enterprise and Benchmarking in the 21st Century Budapest, 2017
232
[23] Robert, F. E.: The relation of exports and economic growth, Kyklos, 20, pp. 470-85, 1967.
[24] Tabor, P.: The economics of European integration, Hall Publishing, 2004.
[25] Takács, I. and Nalin, B.: FDI in Central and Eastern Europe’s (CEE) agribusiness: What lessons for India?, Foreign Trade Review, 51(2), pp. 113-146, 2016.
[26] The World Bank (Doing Business): Available at http://www.doingbusiness.org/rankings (accessed 12.02.2017)
[27] The World Bank: Available at http://data.worldbank.org/indicator (accessed 10.03.2017).
[28] Thirukodikaval, N.S.: Reform of Industrial and trade policy, Economic and Political Weekly, 26(37), pp. 2143-2145, 1991.
[29] William, G. T.: Growth and economic expansion in developing countries: Some empirical evidence, Journal of Development Economics, 9(1). pp. 121-130, 1981.
[30] World Economic Forum (Global Competitiveness Report 2016-17): Available at https://www.weforum.org/reports/the-global-competitiveness-report-2016-2017-1 (accessed 08.03.2017).
Management, Enterprise and Benchmarking in the 21st Century Budapest, 2017
233
Website Evaluation of the National Libraries (EU28)
György Losonczi [email protected]
This study addresses the issue of the competitive websites of the national libraries in the
EU28 era. Why is it important for the institutions to have a competitive website? Because
websites are the most important form of their online appearance, as a reflection of the
style, the activity and the reputation of the particular institution. The aim of the paper to
evaluate and find the differences of the websites of the national libraries.
Keywords: website evaluation. national libraries. competitiveness. online marketing. CW-
Index
Introduction
“Every business is an information business” P. Evans and T. Wurster leaders of the Boston Consulting Group said [1]. According to György Bögel information has always been an important competitive factor in the modern business world [2]. The websites carry information which means specific messages for the target groups. This study addresses the issue of the competitive websites of the national libraries. Why is it important for the institutions to have competitive websites? Because websites are the most important form of their online appearance, as a reflection of the style, the activity and the reputation of the particular institution [3] and SEO’s potential is only as high as the quality of the business or website [4]. Also, the relevance of the subject is legitimate because the one of the target group of my research is the Y generation, who is a student at University use the Internet, they collect every information from the internet and they are future employees [5].
In my study, I am evaluating the website from not only one aspect. Considering the concept of the competitiveness my examinations have been completed by CW-Index model to evaluate the websites.
Management, Enterprise and Benchmarking in the 21st Century Budapest, 2017
234
1 Theoretical Background
1.1 Overview of Website Evaluation
Many models, templates, checklists or other schemas for evaluating websites were developed for measuring the effectiveness of websites. The models around 1997 used the criteria from print media, mostly rely on the authority and reliability of websites [6] [7] [8]. Smith created 7 categories of criteria: scope, content, graphic and multimedia design, purpose and audience, reviews, workability and cost [9]. Gorski’s 7 criteria categories are relevance, appropriateness, credibility, bias, accuracy, accessibility, navigability and multiculturality [10]. The study of Áts et al. was based on the criteria of design, content, interactivity, security and technical solutions to evaluate the websites of Hungarian secondary schools in 2000 [11]. A few years later Spencer and Ruwoldt focusing on certain relevant aspects of marketing evaluated 68 university websites. They also analysed the content and link structure of these websites [3]. Website Evaluation Questionnaire (WEQ) was developed by Elling, Lent, and Menno. WEQ focused on usability and user-satisfaction with the following aspects: layout, content, and navigation [12]. In 2008 Edit Bányai and her research group developed a set of criteria for evaluating the websites of Hungarian Business Schools [13]. Matt Soace et al. in 2010 analysed 10 universities focusing on landing page navigation links [14].
The conclusion of the short overview of the evaluation models or criteria lists, that all of them are focusing on one main aspect such as usability, techniques, marketing or website development. There is no model that measures the competitiveness of the website especially for libraries at the moment as it needs more aspects and complexity. Studying the relevant literature and taking the above-mentioned facts and approaches into consideration more than 100 criteria have been defined for analysing the competitiveness of websites, developing the “Competitive Website Index” model (CW-Index) for website evaluation [15].
1.2 CW-Index
The CW-Index framework is made up many criteria based on relevant literature. The criteria are arranged in groups, which enables the system to be extended and weighed subsequently, thus making it flexible. The model of evaluation criteria as a “gauge” measures the competitiveness of the site, the result of measuring will create the competitiveness index of the website.
The components of the model of evaluation criteria have been determined from the following aspects: business strategy, marketing, the functional utility of the website, applied web technology, quality. The first two aspects are economical approaches (strategy, marketing), the purpose of which is to determine the

Management, Enterprise and Benchmarking in the 21st Century Budapest, 2017
235
adequate scope of information and to forward them to the target groups. Therefore the competitiveness of the website has been examined firstly from the aspect of the strategy [16]: determining the vision, concrete orientation (whom? what? how?) and measurability. The other two aspects (functionality of the website, applied web technology) are technical approaches that indicate the operative method of realization.
The model of the evaluation criteria has a strong hierarchical structure. The five sub-groups - which are summarized by the two main groups - are sorted into further categories (Figure 1).
Figure 1
CW-Index Website Evaluation Model (Source: Losonczi [15])
The criteria have been classified into two main categories with the title CONTENT and DEVELOPMENT. The system also reflects very well the already well-known questions of strategy: whom, what and how? To the question WHOM the answer can be found in the “Target Groups” category while the answer to the question WHAT appears in the category “General Information”. The question HOW is represented by the category “DEVELOPMENT”, which consist of three groups: functionality (“General Development”), visibility (“Visibility of the Website”), innovation (“Web 2.0 Technology”).
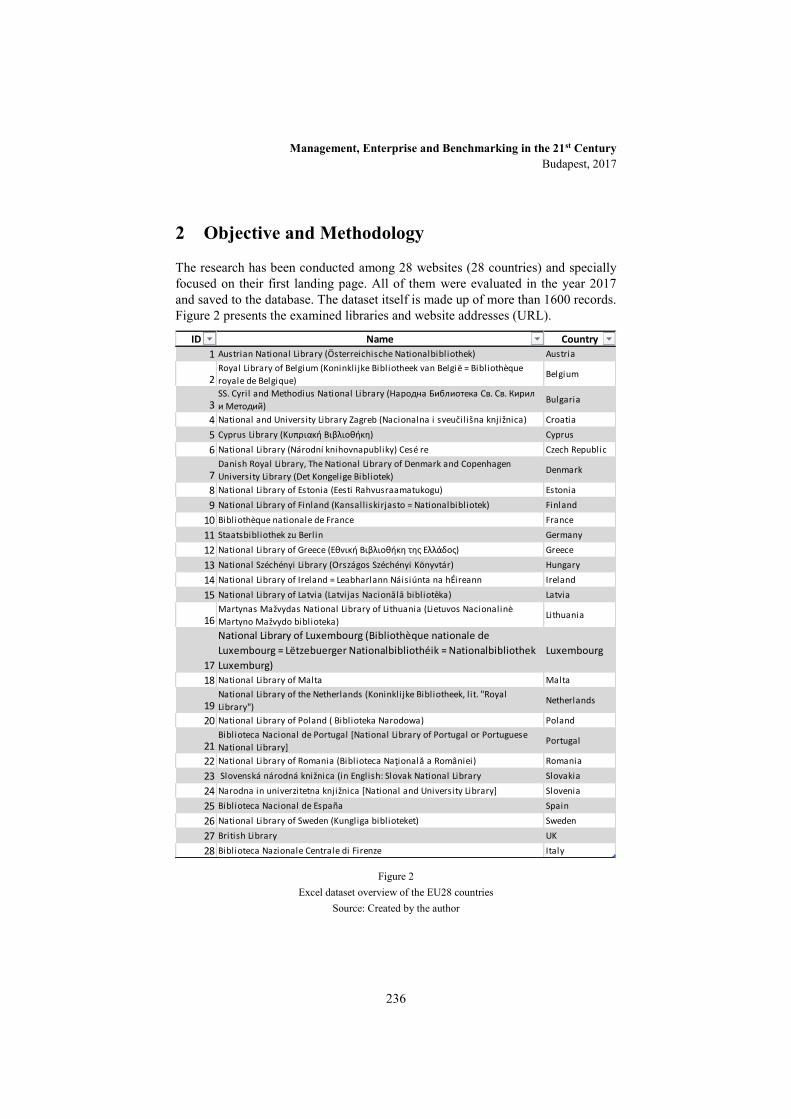
Management, Enterprise and Benchmarking in the 21st Century Budapest, 2017
236
2 Objective and Methodology
The research has been conducted among 28 websites (28 countries) and specially focused on their first landing page. All of them were evaluated in the year 2017 and saved to the database. The dataset itself is made up of more than 1600 records. Figure 2 presents the examined libraries and website addresses (URL).
ID Name Country
1 Austrian National Library (Österreichische Nationalbibliothek) Austria
2Royal Library of Belgium (Koninklijke Bibliotheek van België = Bibliothèque
royale de Belgique)Belgium
3SS. Cyril and Methodius National Library (Народна Библиотека Св. Св. Кирил
и Методий)Bulgaria
4 National and University Library Zagreb (Nacionalna i sveučilišna knjižnica) Croatia
5 Cyprus Library (Κυπριακή Βιβλιοθήκη) Cyprus
6 National Library (Národní knihovnapubliky) Cesé re Czech Republic
7Danish Royal Library, The National Library of Denmark and Copenhagen
University Library (Det Kongelige Bibliotek)Denmark
8 National Library of Estonia (Eesti Rahvusraamatukogu) Estonia
9 National Library of Finland (Kansalliskirjasto = Nationalbibliotek) Finland
10 Bibliothèque nationale de France France
11 Staatsbibliothek zu Berlin Germany
12 National Library of Greece (Εθνική Βιβλιοθήκη της Ελλάδος) Greece
13 National Széchényi Library (Országos Széchényi Könyvtár) Hungary
14 National Library of Ireland = Leabharlann Náisiúnta na hÉireann Ireland
15 National Library of Latvia (Latvijas Nacionālā bibliotēka) Latvia
16Martynas Mažvydas National Library of Lithuania (Lietuvos Nacionalinė
Martyno Mažvydo biblioteka)Lithuania
17
National Library of Luxembourg (Bibliothèque nationale de
Luxembourg = Lëtzebuerger Nationalbibliothéik = Nationalbibliothek
Luxemburg)
Luxembourg
18 National Library of Malta Malta
19National Library of the Netherlands (Koninklijke Bibliotheek, l it. "Royal
Library")Netherlands
20 National Library of Poland ( Biblioteka Narodowa) Poland
21Biblioteca Nacional de Portugal [National Library of Portugal or Portuguese
National Library]Portugal
22 National Library of Romania (Biblioteca Naţională a României) Romania
23 Slovenská národná knižnica (in English: Slovak National Library Slovakia
24 Narodna in univerzitetna knjižnica [National and University Library] Slovenia
25 Biblioteca Nacional de España Spain
26 National Library of Sweden (Kungliga biblioteket) Sweden
27 British Library UK
28 Biblioteca Nazionale Centrale di Firenze Italy Figure 2
Excel dataset overview of the EU28 countries Source: Created by the author
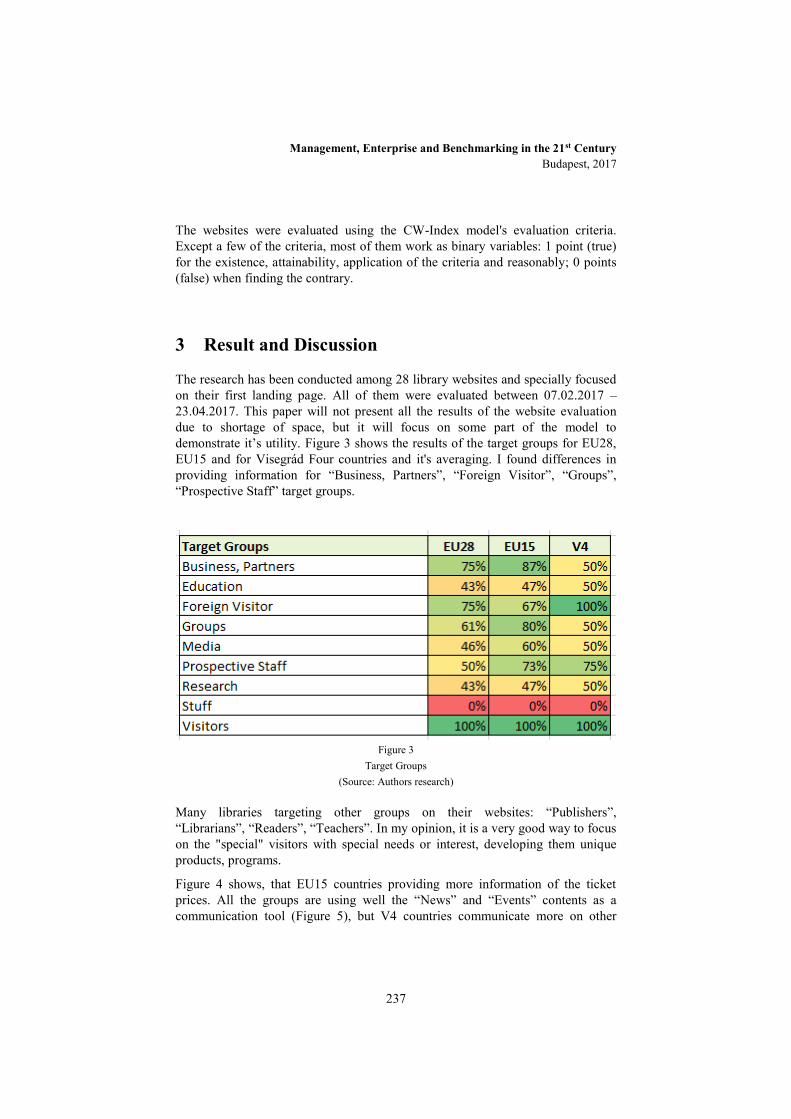
Management, Enterprise and Benchmarking in the 21st Century Budapest, 2017
237
The websites were evaluated using the CW-Index model's evaluation criteria. Except a few of the criteria, most of them work as binary variables: 1 point (true) for the existence, attainability, application of the criteria and reasonably; 0 points (false) when finding the contrary.
3 Result and Discussion
The research has been conducted among 28 library websites and specially focused on their first landing page. All of them were evaluated between 07.02.2017 – 23.04.2017. This paper will not present all the results of the website evaluation due to shortage of space, but it will focus on some part of the model to demonstrate it’s utility. Figure 3 shows the results of the target groups for EU28, EU15 and for Visegrád Four countries and it's averaging. I found differences in providing information for “Business, Partners”, “Foreign Visitor”, “Groups”, “Prospective Staff” target groups.
Figure 3 Target Groups
(Source: Authors research)
Many libraries targeting other groups on their websites: “Publishers”, “Librarians”, “Readers”, “Teachers”. In my opinion, it is a very good way to focus on the "special" visitors with special needs or interest, developing them unique products, programs.
Figure 4 shows, that EU15 countries providing more information of the ticket prices. All the groups are using well the “News” and “Events” contents as a communication tool (Figure 5), but V4 countries communicate more on other
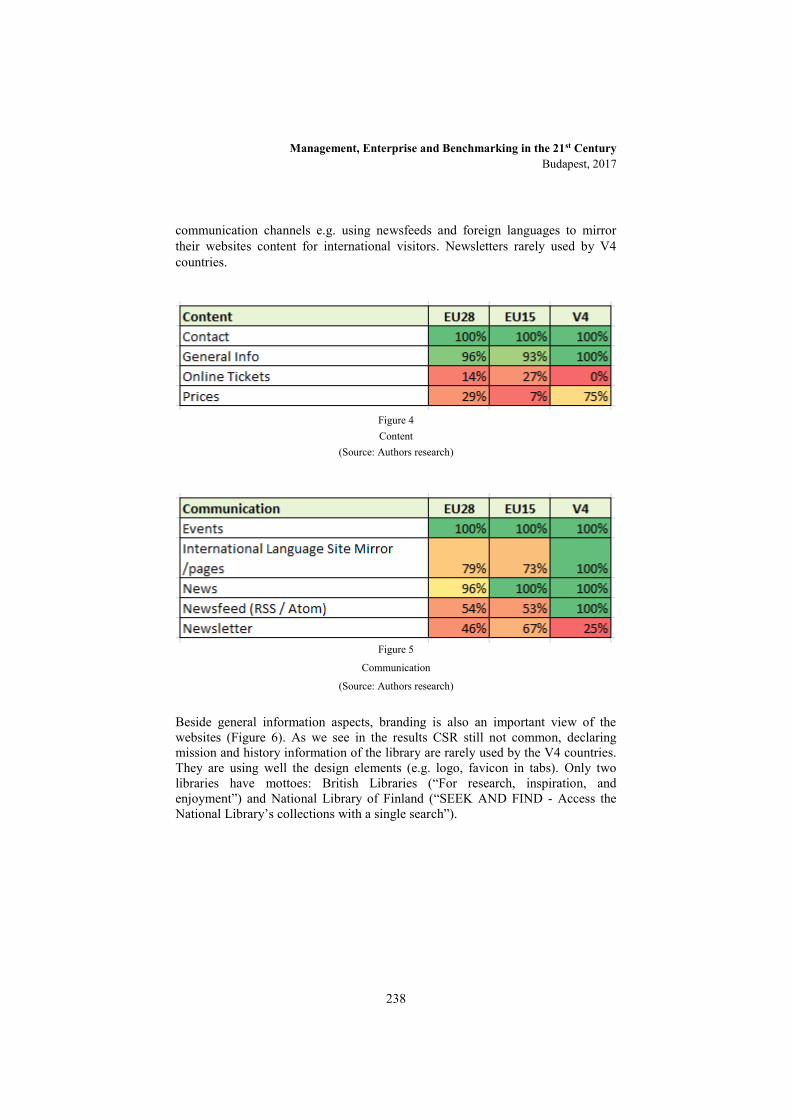
Management, Enterprise and Benchmarking in the 21st Century Budapest, 2017
238
communication channels e.g. using newsfeeds and foreign languages to mirror their websites content for international visitors. Newsletters rarely used by V4 countries.
Figure 4 Content
(Source: Authors research)
Figure 5
Communication
(Source: Authors research)
Beside general information aspects, branding is also an important view of the websites (Figure 6). As we see in the results CSR still not common, declaring mission and history information of the library are rarely used by the V4 countries. They are using well the design elements (e.g. logo, favicon in tabs). Only two libraries have mottoes: British Libraries (“For research, inspiration, and enjoyment”) and National Library of Finland (“SEEK AND FIND - Access the National Library’s collections with a single search”).
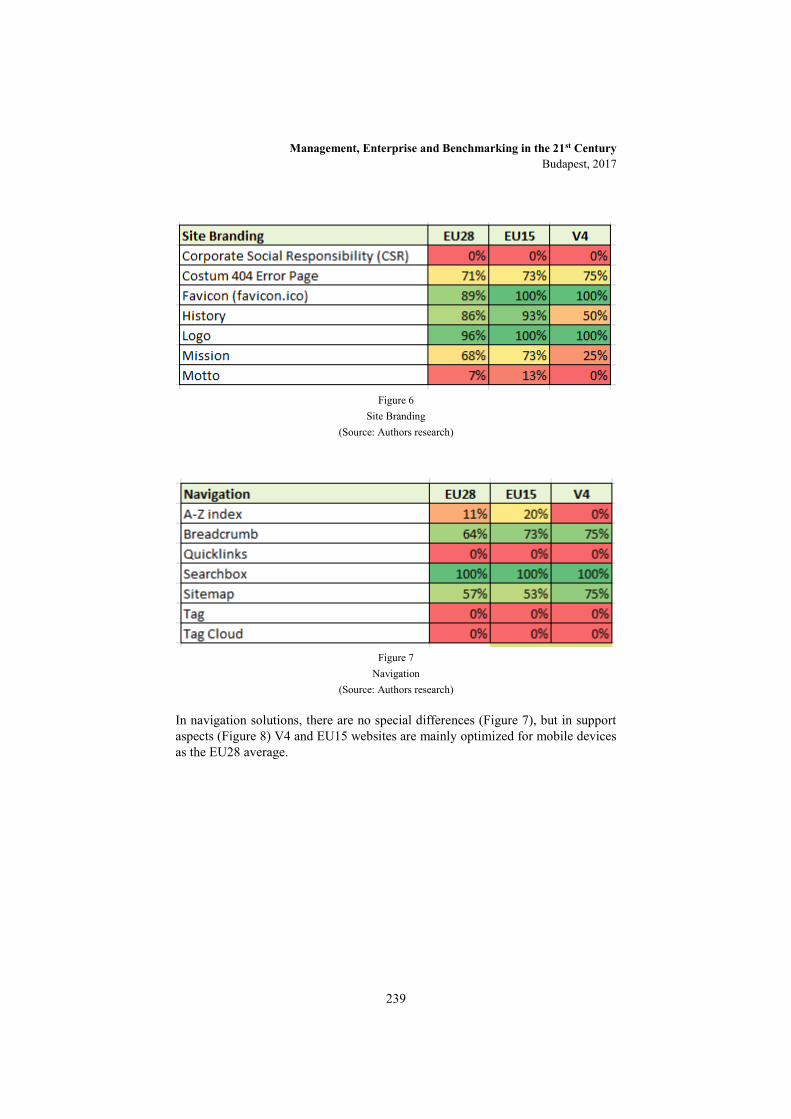
Management, Enterprise and Benchmarking in the 21st Century Budapest, 2017
239
Figure 6 Site Branding
(Source: Authors research)
Figure 7 Navigation
(Source: Authors research)
In navigation solutions, there are no special differences (Figure 7), but in support aspects (Figure 8) V4 and EU15 websites are mainly optimized for mobile devices as the EU28 average.
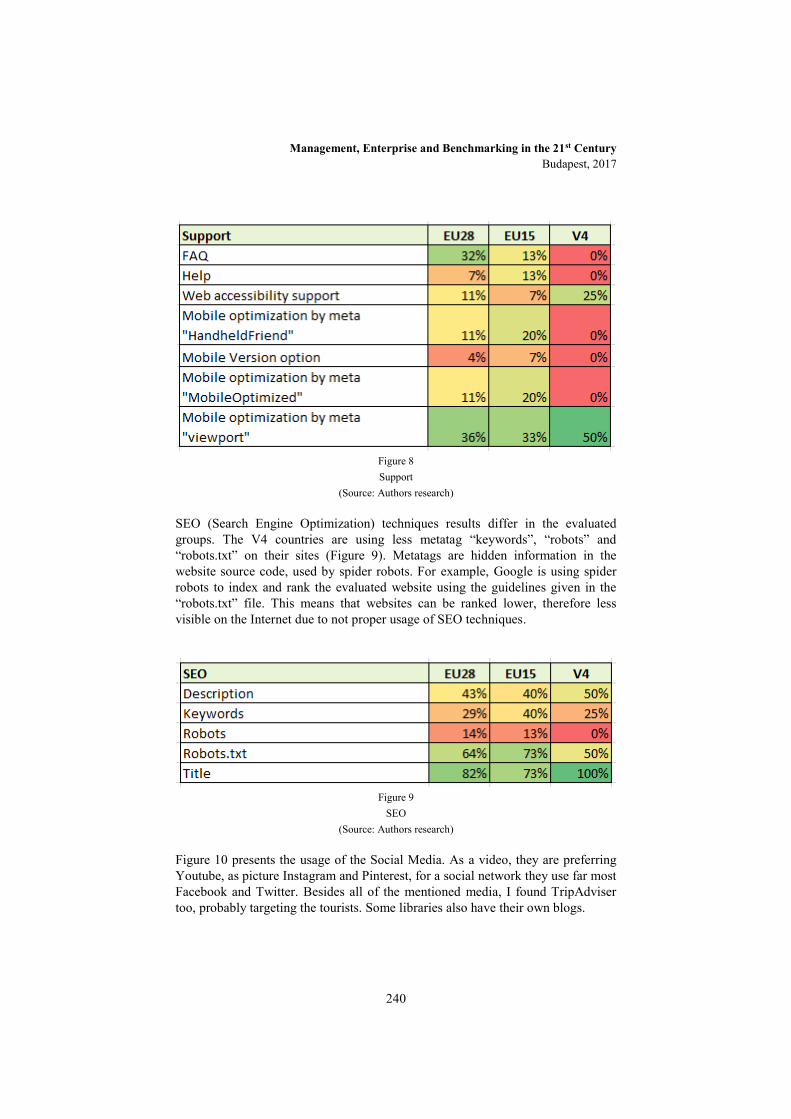
Management, Enterprise and Benchmarking in the 21st Century Budapest, 2017
240
Figure 8 Support
(Source: Authors research)
SEO (Search Engine Optimization) techniques results differ in the evaluated groups. The V4 countries are using less metatag “keywords”, “robots” and “robots.txt” on their sites (Figure 9). Metatags are hidden information in the website source code, used by spider robots. For example, Google is using spider robots to index and rank the evaluated website using the guidelines given in the “robots.txt” file. This means that websites can be ranked lower, therefore less visible on the Internet due to not proper usage of SEO techniques.
Figure 9 SEO
(Source: Authors research)
Figure 10 presents the usage of the Social Media. As a video, they are preferring Youtube, as picture Instagram and Pinterest, for a social network they use far most Facebook and Twitter. Besides all of the mentioned media, I found TripAdviser too, probably targeting the tourists. Some libraries also have their own blogs.
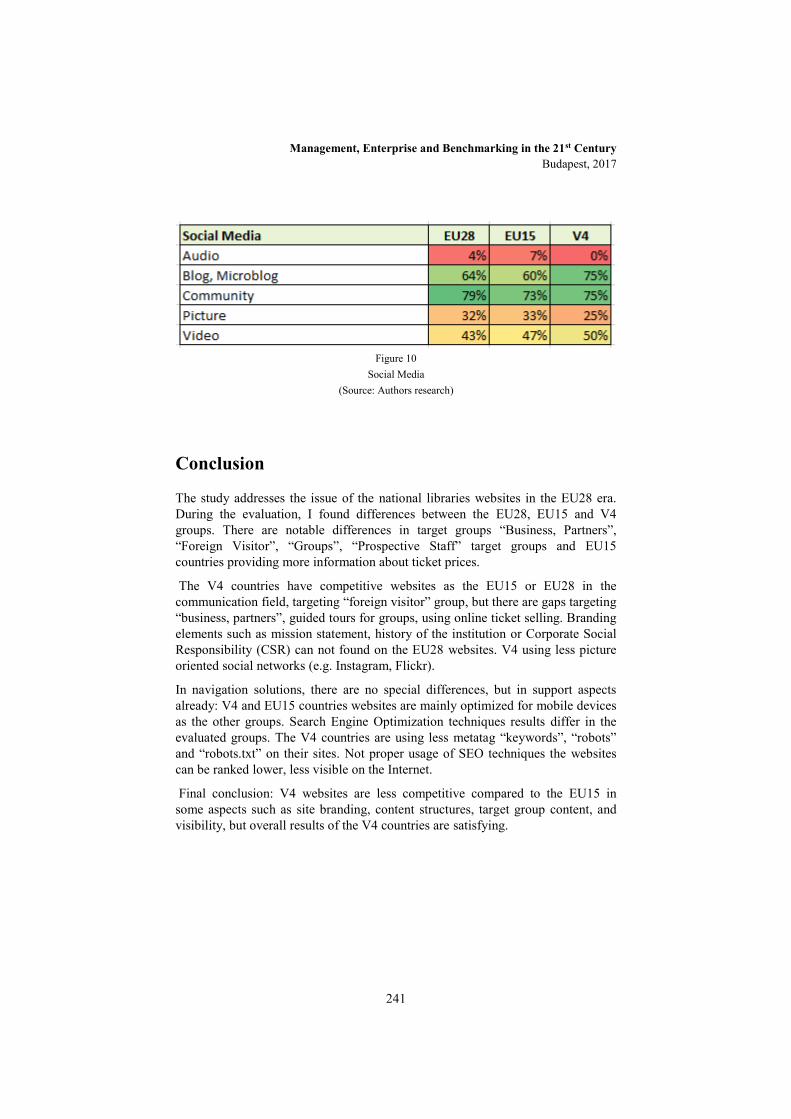
Management, Enterprise and Benchmarking in the 21st Century Budapest, 2017
241
Figure 10 Social Media
(Source: Authors research)
Conclusion
The study addresses the issue of the national libraries websites in the EU28 era. During the evaluation, I found differences between the EU28, EU15 and V4 groups. There are notable differences in target groups “Business, Partners”, “Foreign Visitor”, “Groups”, “Prospective Staff” target groups and EU15 countries providing more information about ticket prices.
The V4 countries have competitive websites as the EU15 or EU28 in the communication field, targeting “foreign visitor” group, but there are gaps targeting “business, partners”, guided tours for groups, using online ticket selling. Branding elements such as mission statement, history of the institution or Corporate Social Responsibility (CSR) can not found on the EU28 websites. V4 using less picture oriented social networks (e.g. Instagram, Flickr).
In navigation solutions, there are no special differences, but in support aspects already: V4 and EU15 countries websites are mainly optimized for mobile devices as the other groups. Search Engine Optimization techniques results differ in the evaluated groups. The V4 countries are using less metatag “keywords”, “robots” and “robots.txt” on their sites. Not proper usage of SEO techniques the websites can be ranked lower, less visible on the Internet.
Final conclusion: V4 websites are less competitive compared to the EU15 in some aspects such as site branding, content structures, target group content, and visibility, but overall results of the V4 countries are satisfying.

Management, Enterprise and Benchmarking in the 21st Century Budapest, 2017
242
References
[1] Evans, P., Wurster, T.: Blown to Bits, Harvard Business School Press, Boston, MA, 2000, pp. 9.
[2] Bőgel Gy.: Verseny az elektronikus üzletben – Melyik békából lesz herceg?, Műszaki Könyvkiadó, Budapest, Hungary.Spencer, C., Ruwoldt, M. 200. Navigation and content on university home pages, (Online), http://repository.unimelb.edu.au/10187/1141 (downloaded: 25/5/10 2010 9:14).Authors: Title, in Proceedings of …, place and date of edition, 2000, pp.
[3] Spencer, C., Ruwoldt, M.: Navigation and content on university home pages, (Online), http://repository.unimelb.edu.au/10187/1141 (downloaded: 25/5/10 2010 9:14).Authors: Title, in Proceedings of …, place and date of edition, 2000, pp.
[4] Ohye, M.: How to hire an SEO, [Online], Google Webmasters - Youtube Channel, https://www.youtube.com/watch?time_continue=6&v=piSvFxV_M04, 2017
[5] Kolnhofer-Derecskei, A., Reichner, R. Zs.: GenYus - Y generáció az Y generáció szemével, Vállalkozásfejlesztés a XXI. században VI. 2016, pp.229-242
[6] Leland, B.: Evaluating web sites: A guide for writers. (Online), http://www.wiu.edu/users/mfbhl/evaluate.htm (03. 12. 2007) (downloaded: 26/05/10 23:05), 1998
[7] Beck, S. E.: Evaluation Criteria. The Good, The Bad & The Ugly: or, Why It is a Good Idea to Evaluate Web Sources. (Online). http://lib.nmsu.edu/instruction/evalcrit.html (downloaded: 26/05/10 23:09), 1997
[8] Kapoun, J.: Five criteria for evaluating Web pages http://olinuris.library.cornell.edu/ref/research/webcrit.html, (Online), (downloaded: 25/5/10 2010 9:14), 1998
[9] Smith, A. G.: Testing the Surf: Criteria for Evaluating Internet Information Resources (Online), http://www.vuw.ac.nz/staff/alastair_smith/evaln/index.htm, (downloaded: 25/05/10 9:14), 1997
[10] Gorski, P.: Toward a Multicultural Approach for Evaluating Educational Web Sites, Multicultural Perspectives, (Online), http://edchange.org/multicultural/net/comps/eval.html (downloaded: 27/05/10 0:02), 1999
Management, Enterprise and Benchmarking in the 21st Century Budapest, 2017
243
[11] Áts, J., Bondor E., Kovács, L.: A magyar középiskolák honlapjainak elemzése, (Online), http://ofi.hu/tamop311/egyeb/hirek-090617/magyar-kozepiskolak (downloaded: 04/22/17. április), 2000
[12] Elling, S., Lentz, L., De Jong, M.: Website Evaluation Questionnaire: Development of a Research-Based Tool for Evaluating Informational Websites, M.A. Wimmer, H.J. Scholl, and A. Grönlund (ed..): EGOV, Springer-Verlag Berlin Heidelberg, LNCS 4656, 2007, 293–304 pp.
[13] Bányai E.: The Online Marketing of Hungarian Business Schools. (Online), http://www.gti.ktk.pte.hu/files/tiny_mce/File/LetolthetoPublikaciok/BanyaiE/Edit_Banyai_nonprofitmarketing.pdf (downloaded: 05/10/10 19:42), 2008
[14] Soave, M., Campbell, M. R., Frost, K.: Competitive Analysis of Five University Hub Websites, (Online), http://www.mattsoave.com/old/cogs187a/iu_ia_redo/comparisons.html ( 09/11/11 21:48), 2010
[15] Losonczi Gy: Magyar felsőoktatási intézmények honlapjainak versenyképesség vizsgálata nemzetközi viszonylatban.). In: Juhász L., E-CONOM. 3. évf. 1., 2014, pp. 139-156. Nyugat-magyarország Egyetem Kiadó (ISSN 2063-644X) http://dx.doi.org/10.17836/EC.2014.1.139
[16] Boda I.: Stratégiai menedzsment: célok, küldetés, (Online), http://www.inf.unideb.hu/~bodai/menedzs/strategiai_menedzsment.html (downloaded: 09/12/10 17:45), 2006
Management, Enterprise and Benchmarking in the 21st Century Budapest, 2017
244
Environmental Protection Expenditures and Effects of Environmental Governance of Sustainable Development in Manufacture Enterprise
Agata Mesjasz-Lech Czestochowa University of Technology, Faculty of Management
Abstract: The article concentrates on the effects of the environmental governance of
sustainable development. It examines the relationship between environmental protection
expenditures and the effects of the environmental governance of sustainable development.
In order to reduce the variables determining the number of effects the Principal Component
Analysis was used. Analyses are related to the European Union countries and cover the
2008-2014 period. The research is based on the industry sector. Over the whole analysed
period the positive trends in the effects of the environmental governance of sustainable
development were observed in the majority of the analysed countries. The results of the
analysis show that an increase in environmental protection expenditure is not always
followed by an increase in ecological effects.
Keywords: environmental protection expenditure, environmental governance, sustainable
development, industry sector
1 Introduction The concept of sustainable development is a solution to the deteriorating state of the environment, which is the result of human activity. The degradation of the environment, which is connected with a negative environmental impact, will be experienced in full by the future generations. The environmental degradation is often accompanied by economic growth [1, 2], which is connected with the growth of economic activities. They lead to increased emissions of carbon dioxide [3] and other pollutants. It is worth noting that the demand for the quality of the environment is continually growing [4], and societies willingly cover expenditures on environmental protection with the belief that the benefits of such activities outweight the outlays [5].

Management, Enterprise and Benchmarking in the 21st Century Budapest, 2017
245
A pro-environmental activity of enterprises involves considerable costs. Economic goals often stand in opposition to environmental goals. The growing environmental awareness of societies is a major factor behind decisions of businesses to acquire and use money on environmental protection. Therefore, it seems reasonable to evaluate the effects of pro-environmental activities and the efficiency of investments into them.
Outlays connected with environmental protection are the area of accounting which should go along the regulation 538/2014 on the European environmental economic accounts [6]. In order to reduce the emission of pollution and fees connected with it, businesses aim at reducing energy consumption and finance pollution reduction, invest into new methods, technologies, processes and appliances preventing or reducing emissions [7]. Environmental capital expenditures should not only be the result of pro-environmental duties stemming from legal regulations. They should also be an element of market competitiveness and other benefits of investments into technologies reducing pollution [8, 9, 10]. Such approach to the role of environmental protection expenditures follows from different types of reasons for pro-environmental activities: legal (responsibilities established by environmental law), economic (savings, finding new clients, improvement of the image, brand consolidation) and mental (transplanting personal respect for the environment into the enterprise) [11, 12]. Well prepared environmental protection regulations lead to better efficiency of resources as well as to increased innovativeness and competitiveness of companies [13].
Various processes used in industrial plants are among the main sources of air pollution [14]. Industry is especially harmful to the environment due to its high level of air pollutants emission. Therefore, plants take up activities which can reduce the negative effects of their operation on the environment. Accordingly, the goal of the article is to determine the influence of environmental protection expenditures on the effects of sustainable development of industry in the EU countries.
2 Measures of the environmental governance of sustainable development in plants in the EU
Integrated governance is the basis for the grouping of indexes of sustainable development of a country. It presupposes the coexistence of four orders: social, economic, environmental and institutional-political. The article concentrates on environmental governance because of the impact of plants on the environment. Environmental governance encompasses areas connected with the use of natural resources and activities reducing the negative impact of enterprises on the environment. The measures evaluating environmental governance in plants allow
Management, Enterprise and Benchmarking in the 21st Century Budapest, 2017
246
for an evaluation in terms of: climate change, electric energy sources and consumption, air pollution reduction, use of water resources, waste management.
The author assumed the following measures of the effects in terms of environmental governance:
Greenhouse gases emissions (in million tonnes of CO2 equivalent),
Sulphur oxides emission (in tonne),
Nitrogen oxides emission (in tonne),
Ammonia emission (in tonne),
Carbon monoxide emission (in tonne),
Non-methane volatile organic compounds emission (in tonne),
Methane emission (in tonne),
Nitrous oxide emission (in tonne),
Carbon dioxide emission (in tonne),
Particulates < 2.5µm emission (in tonne),
Particulates < 10µm emission (in tonne),
Electricity consumption (in GWh),
Generation of waste (in tonnes).
The evaluation concentrates on the EU countries. A selection of measurements for the analysis was dictated by the availability of relevant data.
The level of greenhouse gases emission can be treated as the measure determining climate change. Although there is an ongoing debate on the influence of greenhouse gases on climate change [15], the emission of these gases, and especially of carbon dioxide, has become a major ecological and political problem of the whole world [16]. The increase in the greenhouse gases emission is mainly related to the combustion of fossil fuels [17]. Fig. 1 shows greenhouse gases emission from fuel combustion in manufacturing industries and construction in European Union countries.
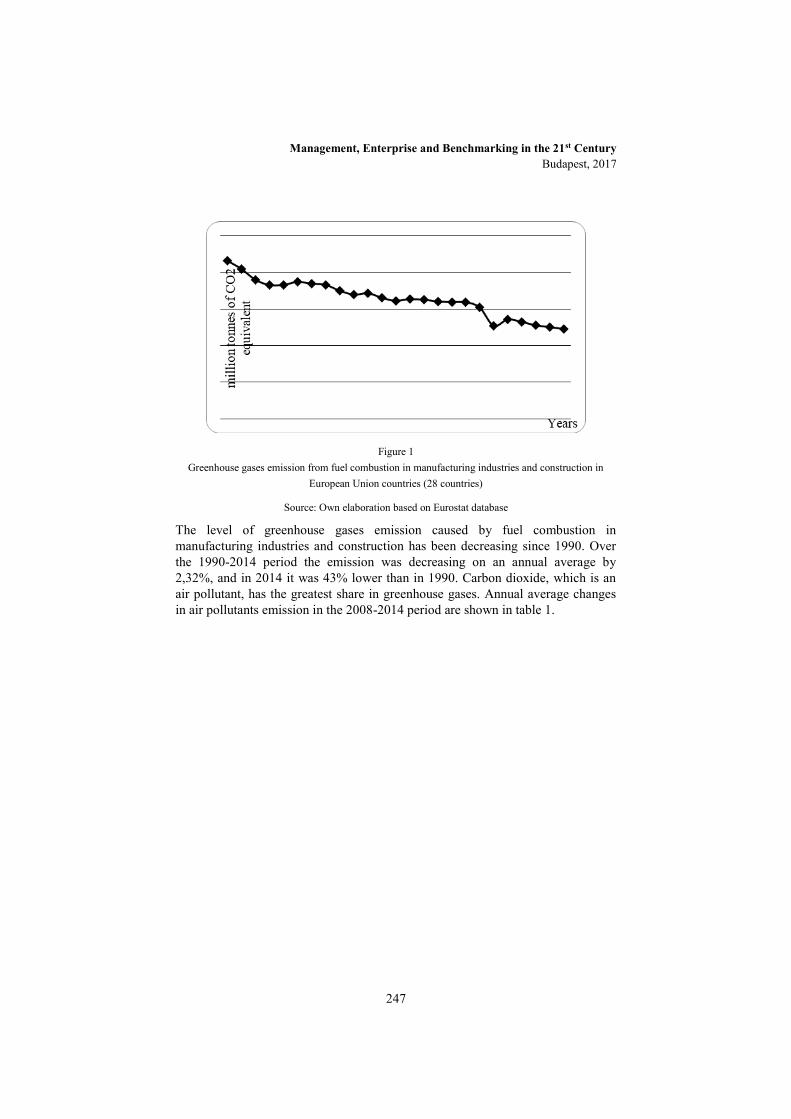
Management, Enterprise and Benchmarking in the 21st Century Budapest, 2017
247
Figure 1
Greenhouse gases emission from fuel combustion in manufacturing industries and construction in European Union countries (28 countries)
Source: Own elaboration based on Eurostat database
The level of greenhouse gases emission caused by fuel combustion in manufacturing industries and construction has been decreasing since 1990. Over the 1990-2014 period the emission was decreasing on an annual average by 2,32%, and in 2014 it was 43% lower than in 1990. Carbon dioxide, which is an air pollutant, has the greatest share in greenhouse gases. Annual average changes in air pollutants emission in the 2008-2014 period are shown in table 1.
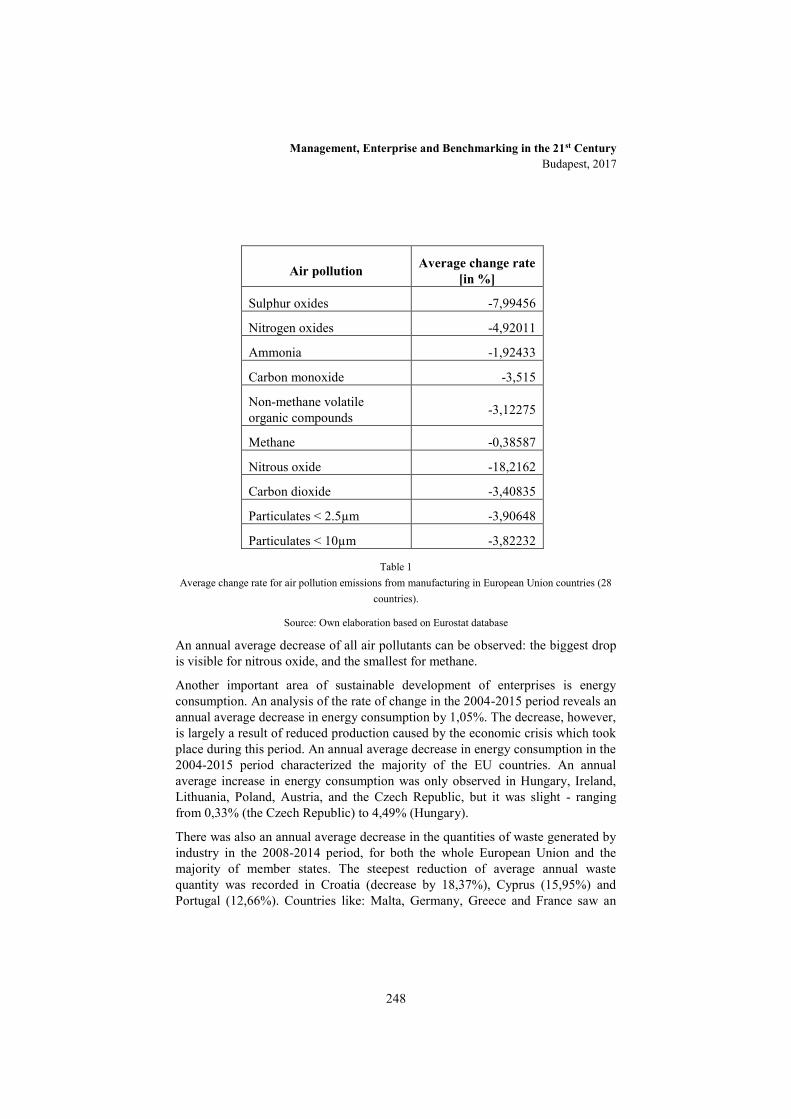
Management, Enterprise and Benchmarking in the 21st Century Budapest, 2017
248
Air pollution Average change rate [in %]
Sulphur oxides -7,99456
Nitrogen oxides -4,92011
Ammonia -1,92433
Carbon monoxide -3,515
Non-methane volatile organic compounds -3,12275
Methane -0,38587
Nitrous oxide -18,2162
Carbon dioxide -3,40835
Particulates < 2.5µm -3,90648
Particulates < 10µm -3,82232
Table 1 Average change rate for air pollution emissions from manufacturing in European Union countries (28
countries).
Source: Own elaboration based on Eurostat database
An annual average decrease of all air pollutants can be observed: the biggest drop is visible for nitrous oxide, and the smallest for methane.
Another important area of sustainable development of enterprises is energy consumption. An analysis of the rate of change in the 2004-2015 period reveals an annual average decrease in energy consumption by 1,05%. The decrease, however, is largely a result of reduced production caused by the economic crisis which took place during this period. An annual average decrease in energy consumption in the 2004-2015 period characterized the majority of the EU countries. An annual average increase in energy consumption was only observed in Hungary, Ireland, Lithuania, Poland, Austria, and the Czech Republic, but it was slight - ranging from 0,33% (the Czech Republic) to 4,49% (Hungary).
There was also an annual average decrease in the quantities of waste generated by industry in the 2008-2014 period, for both the whole European Union and the majority of member states. The steepest reduction of average annual waste quantity was recorded in Croatia (decrease by 18,37%), Cyprus (15,95%) and Portugal (12,66%). Countries like: Malta, Germany, Greece and France saw an

Management, Enterprise and Benchmarking in the 21st Century Budapest, 2017
249
annual average increase in the quantity of waste respectively by 9,16%, 7,31%, 0,72% and 0,17%.
3 Research methodology The analysis concentrated on values which were the basis for the evaluation of effects in terms of environmental governance of sustainable development in plants. The goal of the study was to determine the influence of environmental protection expenditures on the environmental effects of the industry sectors of EU countries. The discussed population consists of 23 countries of the European Union (with the exclusion of Denmark, Latvia, Luxembourg, Malta, the United Kingdom). The analysis covers the years 2008, 2010, 2012 and 2014. A selection of countries and measurements for the analysis was dictated by the availability and completeness of relevant data. The data come from the data base of the Statistical Office of the European Communities Eurostat [18].
The influence of environmental protection expenditures on environmental effects was determined with the use of simple relationship analysis methods. The force and direction of the influence was examined on the basis of the Pearson correlation coefficient. The analysis was carried out with the use of the Statistica 12.0 package.
Table 2 shows the data for the analysis, which determine the effects of the environmental governance of sustainable development.

Management, Enterprise and Benchmarking in the 21st Century Budapest, 2017
250
Area of environmental governance of
sustainable development
Variable
Climate changes Greenhouse gases emission [million tonnes of CO2 equivalent]
Air pollution
Sulphur oxides emission [tonne]
Nitrogen oxides emission [tonne]
Ammonia emission [tonne]
Carbon monoxide emission [tonne]
Non-methane volatile organic compounds emission [tonne]
Methane emission [tonne]
Nitrous oxide emission [tonne]
Carbon dioxide emission [tonne]
Particulates < 2.5µm emission [tonne]
Particulates < 10µm emission [tonne]
Energy use Electricity consumption [GWh]
Waste management Waste generated [tonnes]
Table 2 Statistical variables for the analysis
Source: Own elaboration
The author also assumed two variables determining environmental protection expenditure: Investment in equipment and plant for pollution control (in million Euro) and Investment in equipment and plant linked to cleaner technology, the so-called integrated technology (in million Euro).
In order to minimize the number and dimensionality of variables determining the effects of the environmental governance of sustainable development, the Principal Component Analysis (PCA) was applied. PCA was also required for the reason of a high level of correlation of some variables.

Management, Enterprise and Benchmarking in the 21st Century Budapest, 2017
251
4 Results The conclusion uniform for all discussed years is that there is one unobservable variable which is a combination of initial variables (the so called principal component). One principal component was distinguished on the basis of a scree test, irrespective of the scree's starting point. Table 3 presents the values of the analyzed variables as well as a part of the variance distinguished by the first principal component.
Year Eigenvalue of the first principal component
% of the variance distinguished by the first
principal component
2008 9,622474 74,01903
2010 9,403568 72,3351
2012 9,426871 72,51439
2014 9,532389 73,32607
Table 3 Eigenvalues for the analyzed variables
Source: Own elaboration
The component corresponding to the first and highest eigenvalue accounts for more than 72% of the total variance in each of analyzed years.
Eigenvectors were calculated for the obtained eigenvalues (table 4).

Management, Enterprise and Benchmarking in the 21st Century Budapest, 2017
252
Variable Eigenvector for the first factor
2008 2010 2012 2014
Greenhouse gas emission -0,311315 -0,310409 -0,311670 -0,309716
Sulphur oxides -0,293780 -0,277239 -0,284483 -0,290745
Nitrogen oxides -0,307977 -0,315824 -0,313985 -0,311427
Ammonia -0,187717 -0,171120 -0,190885 -0,193972
Carbon monoxide -0,279805 -0,276576 -0,297213 -0,288754
Non-methane volatile organic compounds
-0,304108 -0,302032 -0,306929 -0,306700
Methane -0,200560 -0,203415 -0,187076 -0,174067
Nitrous oxide -0,265876 -0,255554 -0,243519 -0,266367
Carbon dioxide -0,314914 -0,317353 -0,318132 -0,317191
Particulates < 2.5µm -0,266405 -0,265220 -0,250851 -0,245169
Particulates < 10µm -0,275854 -0,277004 -0,264933 -0,258348
Electricity consumption -0,301053 -0,300941 -0,300765 -0,300500
Generation of waste -0,261019 -0,291553 -0,292035 -0,297447
Table 4 Eigenvectors for the analyzed variables
Source: Own elaboration
Negative values of eigenvectors mean that the increase in the value of individual variables (effects) influences negatively the value of the first component. Therefore, the higher the energy consumption, waste quantity and the values of the emissions of individual pollutants, the lower the value of the first component.

Management, Enterprise and Benchmarking in the 21st Century Budapest, 2017
253
For the singled out variables the correlation coefficient which determines the force and direction of the relationship between environmental protection expenditures and the effects of the environmental governance of sustainable development which were described by one unobservable variable specified on the basis of PCA were estimated. The results are shown in table 5.
Pearson linear correlation coefficient between
Year
Investment in equipment and plant for pollution control and effects of
environmental governance of sustainable development
Investment in equipment and plant linked to cleaner technology and effects of
environmental governance of sustainable development
2008 -0,94603 -0,77398
2010 -0,94148 -0,81252
2012 -0,85012 -0,90534
2014 -0,8402 -0,89382
Table 5 Pearson linear correlation coefficient between environmental expenditures and effects of
environmental order of sustainable development (described by one unobservable variable specified on the basis of PCA)
Source: Own elaboration
All analyzed years show a high negative relationship between environmental protection expenditures and effects of environmental order of sustainable development expressed by the first component. This lets us conclude that investment in equipment and plant for pollution control and investment in equipment and plant linked to cleaner technology in the sector of industry in individual EU countries grow according to the values of individual effects. This relationship is to be expected as the volume of output should translate into the scale of the phenomenon. In order to find out if changes in outlays are followed by positive changes in the volume of effects, the correlation indexes between the determined dynamics indexes for individual variables were calculated. The results are presented in table 6.

Management, Enterprise and Benchmarking in the 21st Century Budapest, 2017
254
Pearson linear correlation coefficient between
Dynamics indexes
Changes in investment in equipment and plant for
pollution control and changes in effects of
environmental governance of sustainable development
Changes in investment in equipment and plant linked to cleaner technology and
changes in effects of environmental governance of sustainable development
Average change
rate -0,14656 -0,21675
Dynamics index
2010/2008 0,029072 -0,3076
Dynamics index
2012/2010 0,587832 0,265472
Dynamics index
2014/2012 -0,22721 0,192591
Dynamics index
2014/2010 -0,15319 -0,02864
Table 6 Pearson linear correlation coefficient between changes in environmental expenditures and changes in effects of environmental order of sustainable development (described by one unobservable variable
specified on the basis of PCA)
Source: Own elaboration
Analyzing the Pearson correlation coefficient between the dynamics of change in environmental protection expenditures and effects of environmental governance of sustainable development expressed by the first component, it is clear that the only statistically significant correlation occurs between changes in the value of investment in equipment and plant for pollution control and changes of the first component expressed by the dynamics index for the 2012 in relation to the year 2010. A positive correlation indicates that an increase in the dynamics index of investment in equipment and plant for pollution control causes a reduction of dynamics index for individual variables comprising the first component. This

Management, Enterprise and Benchmarking in the 21st Century Budapest, 2017
255
means that changes in environmental protection expenditures in the sector of industry of individual countries translate into positive changes in terms of the emission of air pollutants, energy consumption and the volume of generated waste. The lack of statistical relationships between variables changes expressed by the measures of dynamics means that expenditures have not brought bigger benefits, but have not caused negative changes in the analyzed effects either. In other words they prevented the value of the effects from deterioration in the consecutive years in comparison to the base year.
Conclusions The concept of sustainable development is the answer to the deteriorating state of the environment caused by human activity. Environmental impact degrades the environment which will likely become a burden for future generations. The concept of sustainable development aims at capturing the full picture of the civilizational development of societies. The premise of the concept is to use resources more effectively along the economic growth. Hence the need for an evaluation of the efficiency of activities which on one hand foster a constant development which caters to the needs of contemporary societies, and retain this opportunity for future generations on the other. Sustainable development is based on a combination of three groups of factors: economic, environmental and social. The article touches upon the environmental factors only.
In an effort to improve their competitiveness, gain more clients, grow sales and profits, enterprises make numerous pro-environmental investments. This way they reduce the negative impact on the environment and build a positive brand image. Over the 2008-2014 period positive trends in the effects of the environmental governance of sustainable development for the majority of the analysed countries were observed. Obtaining positive environmental effects requires financial outlays though. The analysis was carried out for expenditures expressed by investment in equipment and plant for pollution control and investment in equipment and plant linked to cleaner technology. Unfortunately the results of the analysis show that an increase in expenditure is not always followed by an increase in effects. It can be caused by factors such as a reduction of production volume in plants, socio-economic or political crises in individual countries or limiting the outlays on investment in equipment and plant for pollution control and linked to cleaner technology. The study concentrated only of environmental effects with the exclusion of economic and social effects. Accordingly, the research should be followed up by a detailed analysis of the relationships individually for distinguished areas of environmental governance. The study might also be complemented by an analysis of economic and social effects.

Management, Enterprise and Benchmarking in the 21st Century Budapest, 2017
256
Sustainable development has become one of the approaches to preventing excessive impact on all elements of the environment through a reasonable use of resources and environmental values with a subsequent determination of requirements helping maintain biological and landscape variety [19]. Even despite it is may be costly, undertaking pro-environmental activities should be an essential element of the functioning of businesses. It is important to remember that the effects of pro-environmental activities are often immeasurable, which makes it hard to connect the costs of their implementation with measurable economic benefit.
References
[1] Antoci Angelo, Borghesi Simone, Russu Paolo: Environmental defensive expenditures, expectations and growth, Population and Environment, 27, 2005, pp. 227–244.
[2] Shadbegian Ronald J., Gray Wayne B.: Pollution abatement expenditures and plant-level productivity: A production function approach, Ecological Economics, 54, 2005, pp. 196– 208
[3] Adewuyi Adeolu O.: Effects of public and private expenditures on environmental pollution: A dynamic heterogeneous panel data analysis, Renewable and Sustainable Energy Reviews, 65, 2016, pp. 489–506.
[4] Thiene Mara, Swait Joffre, Scarpa Riccardo: Choice set formation for outdoor destinations: The role of motivations and preference discrimination in site selection for the management of public expenditures on protected areas, Journal of Environmental Economics and Management, 81, 2017, pp. 152–173.
[5] Rogers Maureen F., Sinden Jack A., De Lacy T.: The Precautionary Principle for Environmental Management: A Defensive-expenditure Application, Journal of Environmental Management, 51, 1997, , pp. 343–360
[6] Broniewicz Elżbieta: Podaż usług w rachunku wydatków na ochronę środowiska w Polsce, Economics and Management, 4, 2014, pp. 217-229.
[7] Jeffrey Cynthia, Perkins Jon D.: The Relationship between Energy Taxation and Business Environmental Protection Expenditures in the European Union, The International Journal of Accounting, 49, (014, pp. 403–425.
[8] Silva-Gao Lucia: The Disclosure of Environmental Capital Expenditures: Evidence from the Electric Utility Sector in the USA, Corporate Social Responsibility and Environmental Management, 19, 2012, pp. 240-252.
Management, Enterprise and Benchmarking in the 21st Century Budapest, 2017
257
[9] Johnston Derek: An investigation of regulatory and voluntary environmental capital expenditures, Journal of Accounting and Public Policy, 24, 2005, pp. 175–206.
[10] Wang Wei-Kang, Lu Wen-Min, Wang Shun-Wen: The impact of environmental expenditures on performance in the U.S. chemical industry, Journal of Cleaner Production, 64, 2014, pp. 447-456.
[11] Nitkiewicz Tomasz: Ekologiczna ocean cyklu życia produktu w procesach decyzyjnych przedsiębiorstw produkcyjnych, Wydawnictwo politechniki Częstochowskiej, Częstochowa 2013.
[12] Seroka-Stolka Oksana: Czynniki implementacji dobrych praktyk środowiskowych w małych i średnich przedsiębiorstwach, Journal of Ecology and Health, 16/2, 2012, pp. 98-103.
[13] Wirth Carolyn, Chi Jing, Young Martin: The Economic Impact of Capital Expenditures: Environmental Regulatory Delay as a Source of Competitive Advantage? Journal of Business Finance & Accounting, 40(1) & (2), 2013, pp. 115–141.
[14] Zawada Marcin, Starostka-Patyk Marta: Energy efficiency in the context of low-stack emissions reduction on the example of the city of Czestochowa, Transportation Research Procedia, 16, 2016, pp. 587-597.
[15] Kijewska Anna, Bluszcz Anna: Analysis of greenhouse gas emissions in the European Union member states with the use of an agglomeration algorithm, Journal of Sustainable Mining, 2017, (an unedited manuscript that has been accepted for publication).
[16] Mondani Farzad, Aleagha Sepide, Khoramivafa Mahmud, Ghobadi Rozhin: Evaluation of greenhouse gases emission based on energy Consumption in wheat Agroecosystems, Energy Reports 3, 2017, pp. 37–45.
[17] Peter Christiane, Helming Katharina, Nendel Claas: Do greenhouse gas emission calculations from energy crop cultivation reflect actual agricultural management practices? – A review of carbon footprint calculators, Renewable and Sustainable Energy Reviews, 67, 2017, pp. 461–476.
[18] Statistical Office of the European Communities, http://ec.europa.eu/eurostat/data/database.
[19] Panfiluk Eugenia: Problemy zrównoważonego rozwoju w turystyce, Economy and Management, 2, 2011, p. 62.

Management, Enterprise and Benchmarking in the 21st Century Budapest, 2017
258
Banking Competitiveness
Éva Mester University of Szeged Faculty of Economics and Business Administration Doctoral School in Economics, H-6722 Szeged, Kálvária sgt. 1.,
Róbert Tóth Szent István University Faculty of Economics and Social Sciences, H-2100 Gödöllő, Páter K. út 1.,
Tímea Kozma Szent István University Faculty of Economics and Social Sciences, H-2100 Gödöllő, Páter K. út 1.,
Introduction Economic growth and competitiveness are two of the most analysed areas of economics, which have a direct influence on the welfare of both individuals and the whole society. Today, growing competition puts a new emphasis on corporate future orientation, more precisely, on future-oriented strategy-making. This, however, presupposes a better knowledge of an adequate corporate vision and of resources and action alternatives (Gyenge, 2016). “The 2008 financial and economic world crisis had and still has a significant effect on market participants. According to economic forecasts in 2013-14 the European economy is expected to stagnate, leading European countries are also predicting recession for the near future. Thus, the crisis resulted in not a temporary but an almost permanent situation that could last for several years still” (Karmazin et all., 2013; Túróczi, 2015). Therefore, economic participants need novel, innovative and active strategies to ensure efficient operations (Túróczi, 2016). In the 21st century’s turbulently changing economic environment the following development areas seem promising: optimisation of supply chain processes, process innovation, positioning systems and the development of business specific simulation procedures (Gyenge et all., 2016).
Management, Enterprise and Benchmarking in the 21st Century Budapest, 2017
259
Economic competition requires a well-functioning financial system: adequate and high quality financial services and an appropriate provision of sources for investments and operations. Banks are looking at peer-to-peer lending companies that lend money by eliminating traditional financial institutions with distrust. They do so for a reason: it is enough to take a look at the exponential growth in turnover figures.
Financial services in transferring that has emerged as a separate cast among startup companies and which aid online trade statements (fintech businesses), and the sharing economy model only appeared a few years ago. Yet, there is already a lot of money in this area, which demonstrates the success of companies structured thus. Despite the fact that the authorities look askance at sharing economy, it seems to be staying with us in the next few decades. Therefore, it is worth considering how it can restructure power relationships between companies and governments, employers and employees, banks and their customers.
However, today the key to the competitiveness of national economies is still the well-capitalised, stable, adequately profitable and solvent banking system, which, by means of its lending activities can improve economic competition, investments and employment figures.
This study aims at analysing the competitiveness of domestic banks, as well as presenting the new transactional platforms in the chosen sector and placing the model in the well-known theoretical framework of economics.
1 The current situation of the banking sector The Hungarian national economy is bank-centred. Alongside being bank-centred, it has to be emphasised that the Hungarian economy is based on banks, that is, the financial and capital markets are rather poor. Thus, the business sector relies heavily on the banking sector for more significant resources (Tóth, 2016). In this light, it is easy to see that banks play a vital role in the national economy. This entails that banking competitiveness has an effect on the competitiveness of the national economy. After the change of the political regimes rather different perceptions of banking competitiveness have emerged in different eras as well as for different individuals. Pensioners paying their bills by cheque, small entrepeneurs purchasing their utility vehicles through subsidised loans, business owners handling their financial matters via smart phones, private banking customers and big corporations all have their different interpretations. At the beginning of the 90s the subjective competitiveness of banks was measured in terms of the length of queues outside of bank branches, or, in the case of car leasing, after having been granted deferral of payment, in the amount of interest rate paid on loans. In these times banks symbolised wealth, welfare and extremely big failures at the same time (Ábel-Polivka, 1998). Experts considered financing banks as the ruling tendency inherited from the past, whereas service provider banks were seen as the way forward (Ábel-
Management, Enterprise and Benchmarking in the 21st Century Budapest, 2017
260
Polivka, 1997). In this period the average retail and SME-bank customer was traditionally fairly loyal to their service provider banks: in the EU-15 average accounts keeping time for retail customers was more than 10 years, for SMEs almost 9 years. For new member states it was less than 6 or 5 years, which, considering the fundamental changes in new banking systems over the past 15 years, was still relatively long (Kopint Foundation For Economic Research, Erzsébet Gém, 2008). Especially so, given compulsory tying, that is, the common practice of banks providing loans on condition of compulsory accounts keeping.
Besides consumer loyalty, in this period changing banks was hampered by its high costs: substantial account closing costs, administrative burdens of changing banks, as well as information asymmetry and low price transparency making it hard for consumers to compare the offered products and services (Kopint Foundation For Economic Research, Erzsébet Gém, 2008). Following the privatisation of banks one of the most welcome effects of strengthening market competition was the rapid improvement in the amount and standard of services. Banks having operated only in certain subareas started to offer a wider and wider range of commercial bank services for their customers by the end of the 90s, and in the noughties they enabled European standards of banking.
However, banking profitability still only meant interest margins and different types of interest incomes, which even alongside competition and significant costs expenditure on services failed to encourage banks to introduce more efficient management until the advent of the 2008 crisis. The economic crisis forced banks to a drastic cut and tightening of retail and SME loans, the substantial source withdrawal only further exacerbating the situation of the corporate sector, leading to additional bankruptcies. The amount of credit allocated to SMEs, apart from a few fluctuations, has been decreasing since 2008 (Mester et al., 2016). Regulatory shocks have gradually replaced market opportunities in banks, and instead of allocating new credits, the focus shifted to managing existing ones. The banking sector, predominantly in foreign ownership as of 2013, is still struggling to achieve owner and market competitor expectations on return.
Besides drastic credit cuts, digitalisation has fundamentally changed banking services and infrastructure. Banks’ offers are comparable at the click of a button, whether we are dealing with real estate loans, personal loans, personal or business bank accounts services, deposit rates, credit card services or currency quotation. Inter-bank transfers are immediate, and competition is only restricted by the extra costs of transaction duty. Today financial services are the most digitalised industry in the EU (see Figure 1.)
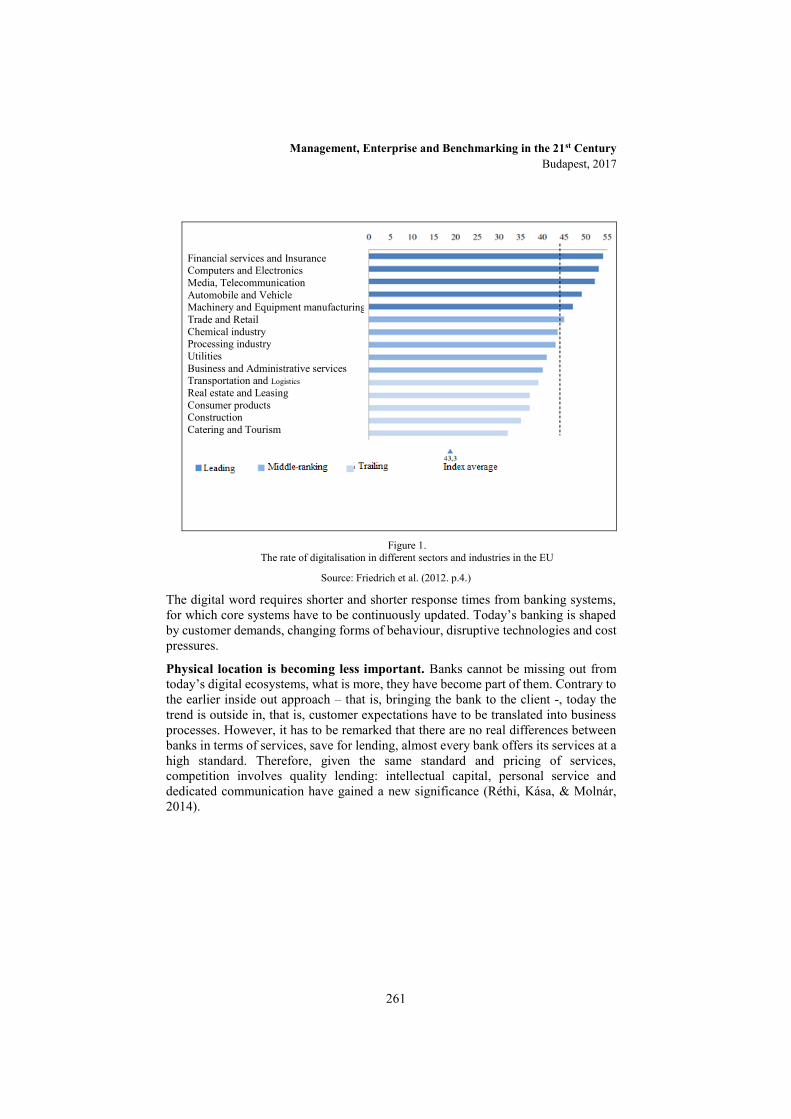
Management, Enterprise and Benchmarking in the 21st Century Budapest, 2017
261
Figure 1. The rate of digitalisation in different sectors and industries in the EU
Source: Friedrich et al. (2012. p.4.)
The digital word requires shorter and shorter response times from banking systems, for which core systems have to be continuously updated. Today’s banking is shaped by customer demands, changing forms of behaviour, disruptive technologies and cost pressures.
Physical location is becoming less important. Banks cannot be missing out from today’s digital ecosystems, what is more, they have become part of them. Contrary to the earlier inside out approach – that is, bringing the bank to the client -, today the trend is outside in, that is, customer expectations have to be translated into business processes. However, it has to be remarked that there are no real differences between banks in terms of services, save for lending, almost every bank offers its services at a high standard. Therefore, given the same standard and pricing of services, competition involves quality lending: intellectual capital, personal service and dedicated communication have gained a new significance (Réthi, Kása, & Molnár, 2014).
Financial services and Insurance Computers and Electronics Media, Telecommunication Automobile and Vehicle Machinery and Equipment manufacturing Trade and Retail Chemical industry Processing industry Utilities Business and Administrative services Transportation and Logistics Real estate and Leasing Consumer products Construction Catering and Tourism

Management, Enterprise and Benchmarking in the 21st Century Budapest, 2017
262
2 Banking competitiveness features
Table 1. summarises the most prominent features of current banking competitiveness.
skills and ability for constant renewal and immediate adaptation to changes; for this, continuous investment demands low operating costs developed risk management system establishing an adequate bonus scheme and margins ensuring adequate customer experience clear and transparent management concept and model innovative banking strategy predictable taxation and regulatory system
Table 1. The most important features of competitiveness in the current banking system
Source: Author’s own compilation
One of the major prerequisites for stable banking operations is adequate solvency, for which adequate profitability has to be ensured.
Macroeconomic factors (growth rate, inflation rate, stable macroeconomic environment, savings rate, credit demand), as well as competition in the bank sector in a certain country play a decisive role. Generally speaking, the stronger the competition, the less opportunities banks have to increase their income using a high interest margin, whereas weak competition enables them to pass on operational costs to clients and thus realise extra profit.
For measuring competition in the banking market, a wide spectrum of indicators, hypotheses and models are available in the international economic literature. Alongside the simplest variables for market structure and concentration (e.g.: Herfindahl-index, Concentration ratios) and profitability (ROA, ROE, interest margin, cost effectiveness, etc.) indicators, several studies estimated using empirical models developed for measuring banking market competition the strength of competition in different segments in the market1 (Kopint Foundation for Economic Research, Erzsébet Gém, 2008).
Sectoral return on assets (ROA) between 1994-2002 – save for 1999, reflecting the effect of the Russian crisis – exceeded EU levels. Real values of return on equity (ROE) were often negative in the 90s, but from 2000 on they showed return on capital. The continuous decrease of net interest income on assets (interest margin), as well as of gross income starting form the end of the 90s showed that banks had 1 Described by Erzsébet Gém (2008) in detail.

Management, Enterprise and Benchmarking in the 21st Century Budapest, 2017
263
less means to increase their income by a wide margin, whereas interest margin was still the double of the EU average in 2002, with gross income on assets showing the same difference. Taking the double EU average level ratio, it shows that Hungary reached higher profit despite a lower efficiency. At the end of 2002, in the Hungarian corporate banking market the loan-to-deposit ratio was 2.3% compared to the 3.4 % EU average, in the case of retail credit 12.8% compared 7%, whereas for market real estate loans 6.4% and 1.7% respectively (Várhegyi, 2003).
Due to restricted competition in these years, a number of Hungarian banks could obtain oligopolistic benefits in the retail and in conjunction the SME market (Bánfi, 2013).
In the second half of the noughties stronger competition was signalled by lower market concentration. Parallel to the balancing of market forces and the strengthening of contestability, cost effectiveness improved and financial intermediation costs decreased. In terms of the retail market, based on the CR3 and CR5 (the 3 and 5 biggest banks’ market shares) measures, the Hungarian banking system performed in the EU middle-level. Concentration also decreased in the other segments of the market, which showed a positive tendency for competition. In their efforts for market penetration the banks put a heavy emphasis on improving services and the underlying infrastructure, at the same time, in 2007, the growth rate of operational costs was much lower than in previous years (Kopint Foundation for Economic Research, Erzsébet Gém, 2008). It has to be remarked though that indicators calculated on the basis of accounting data have to be interpreted with care in any research dimension, as accounting evaluation policies are constantly changing all around the world. The rules of the Hungarian accounting system, for example, have been constantly changing since they came into force in 1992, in the context of harmonisation with the EU standards (Harsányi, Siklósi, Veress, 2013).
Return on assets and equity, however, remained well above the European average in the middle of the 2000s (see Table 2.)
Name 2004 2005 2006 2007 2008 2009 2010
Interest rebate (interest margin)
3,9 3,9 3,6 3,2 2,7 2,6 3
Commission 1,3 1,3 1,2 1,1 0,9 0,9 0,9
Operational costs -3 -2,9 -2,7 -2,7 -2,4 -2 -2,1
Impairment loss and special purpose asset changes
-0,4 -0,2 -0,4 -0,5 -0,5 -1,5 -1,2
ROA 1,98 1,94 1,89 1,49 0,91 0,72 0,13
ROE 23,4 22,7 22,3 17,5 11,2 8,91 1,44
Table 2. ROA and ROE in the Hungarian banking sector
Source: Hungarian Financial Supervisory Authority (HFSA), * Expressed as a percentage of total average assets
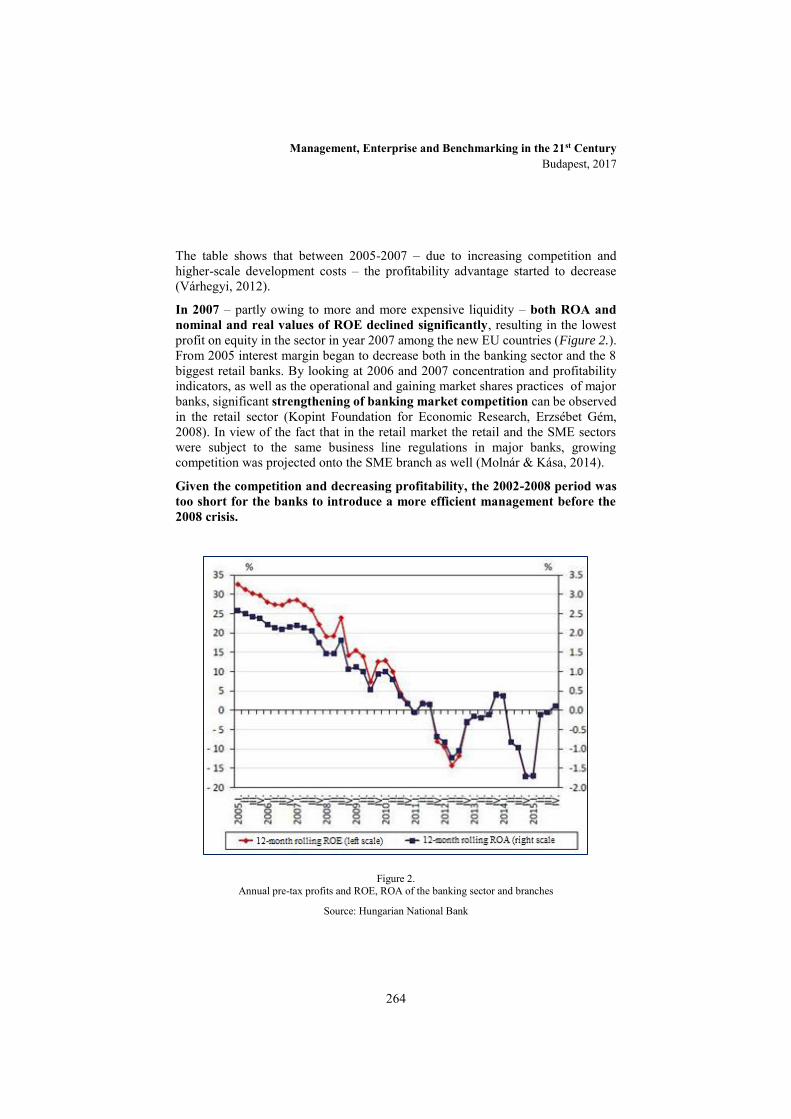
Management, Enterprise and Benchmarking in the 21st Century Budapest, 2017
264
The table shows that between 2005-2007 – due to increasing competition and higher-scale development costs – the profitability advantage started to decrease (Várhegyi, 2012).
In 2007 – partly owing to more and more expensive liquidity – both ROA and nominal and real values of ROE declined significantly, resulting in the lowest profit on equity in the sector in year 2007 among the new EU countries (Figure 2.). From 2005 interest margin began to decrease both in the banking sector and the 8 biggest retail banks. By looking at 2006 and 2007 concentration and profitability indicators, as well as the operational and gaining market shares practices of major banks, significant strengthening of banking market competition can be observed in the retail sector (Kopint Foundation for Economic Research, Erzsébet Gém, 2008). In view of the fact that in the retail market the retail and the SME sectors were subject to the same business line regulations in major banks, growing competition was projected onto the SME branch as well (Molnár & Kása, 2014).
Given the competition and decreasing profitability, the 2002-2008 period was too short for the banks to introduce a more efficient management before the 2008 crisis.
Figure 2. Annual pre-tax profits and ROE, ROA of the banking sector and branches
Source: Hungarian National Bank
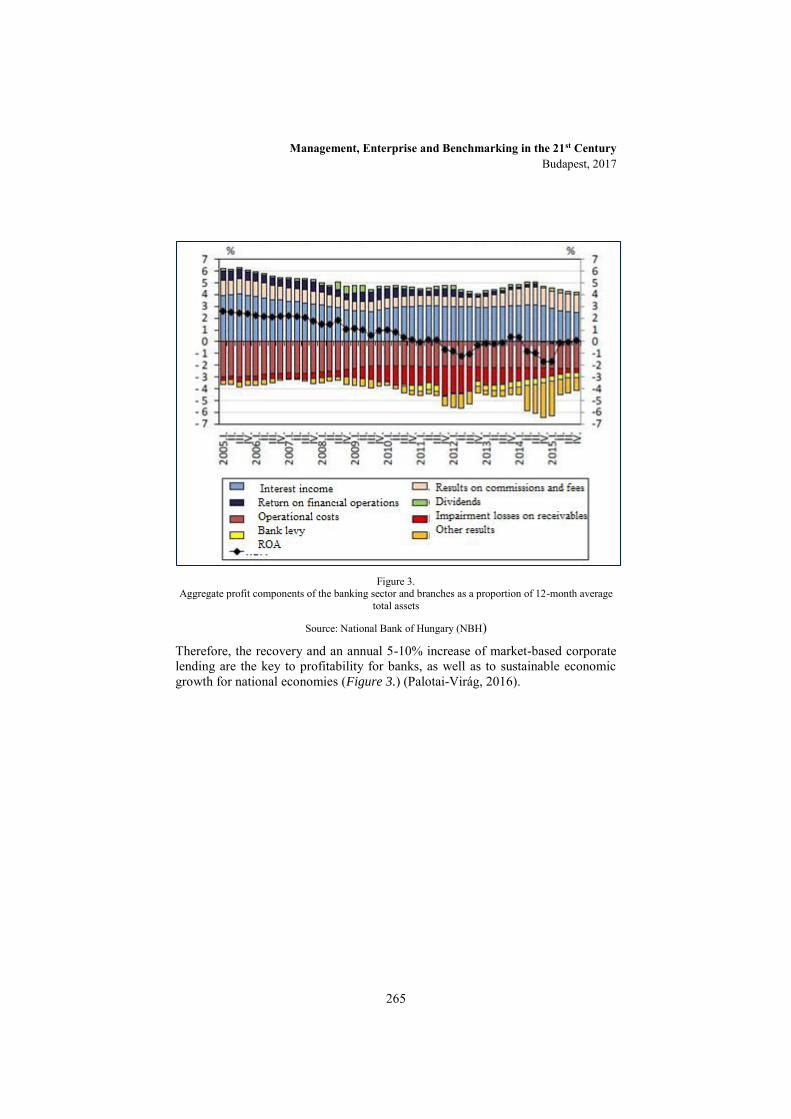
Management, Enterprise and Benchmarking in the 21st Century Budapest, 2017
265
Figure 3.
Aggregate profit components of the banking sector and branches as a proportion of 12-month average total assets
Source: National Bank of Hungary (NBH)
Therefore, the recovery and an annual 5-10% increase of market-based corporate lending are the key to profitability for banks, as well as to sustainable economic growth for national economies (Figure 3.) (Palotai-Virág, 2016).

Management, Enterprise and Benchmarking in the 21st Century Budapest, 2017
266
Figure 4.
Negative feedback between banks’ profitability and economic growth
Source: ECB
3 Banking competition/pricing In the empirical analysis of market structure components in competition, the 90s were dominated by the so called non-structural approach, in which the intensity of banking market competition is measured on the basis of banking market behaviour. At the same time the literature lists a number of cases where interest rate rigidity is not the result of lack of competition (see, e.g. Gual (2004)). A few examples are adverse selection due to information asymmetry in lending, high bank switching costs, or banks’ fears about portfolio deterioration resulting in them refraining from easing credit conditions. In the case of high risk credit products the high risk premium ratio in the interest rate does not necessarily allow for following market interest rate decrease. Pricing behaviour is often used in the analysis of competition intensity. One type – believed to be predominant in the noughties in certain segments of the Hungarian bank market – is the so called leader following model. According to the model following market leader banks, smaller market participants also set higher prices than competitive prices. It is also widespread to study ‘sticky’ interest rates, that is, how fast interest rates in a given bank market, or in the case of its different products adapt to the changes in money market interest rates (Kopint Foundation for Economic Research, Erzsébet Gém, 2008).
Obviously, the relevant literature in 2008 cannot have seen the coming of the credit crisis and the credit drying up. However, the preferential conditions of the Loans for Growth Program (the biggest advantages being fixed interest rate and achievable

Management, Enterprise and Benchmarking in the 21st Century Budapest, 2017
267
long-term maturities) have managed to have a beneficial effect on lending and borrowing willingness (Mester-Tóth, 2015; Kása, 2015).
Figure 5. aims at summarising the growth rate of the overall corporate and SME sector loan stocks.
Figure 5. The growth rate of the overall corporate and SME sector loan stocks
Source: Hungarian Central Statistical Office (HCSO), NBH
Note: Transaction-based, SME sector based on new data report as of fourth quarter 2015
The NBH program positively strengthened interest rate ’stickiness’, the Loans for Growth Program became the leader-following model and it was strengthened by the fact that banks’ lending willingness and risk-taking is not independent of the future of potential debtors’ interest rate burdens, which depends on interest rate levels, interest rate risk and possible exchange rate risk (Vonnák, 2015). The Loans for Growth Program made these risks calculable, stable, measurable and clear by offering stable long-term interest rate loans instead of market loans.
The Loans for Growth Program has brought about a sea change in domestic SME sector lending. Statistical data show a breaking trend in corporate, and thus SME-lending processes. While earlier years had witnessed a 4-6% loan stock shrinking, it has been practically stable since third quarter 2013, which can mainly be attributed to the Loans for Growth Program (NBH, 2015). The primary aim of the
Management, Enterprise and Benchmarking in the 21st Century Budapest, 2017
268
Loans for Growth Program is to stop the negative tendencies in corporate sector lending, strengthening financial stability and decreasing the external vulnerability of the Hungarian economy. Shrinking credit supply hinders economic growth (NBH, 2015). The Loans for Growth Program is a well-structured, strong program, which can boost market lending as well. In this light, a few questions arise for the future: banking sector stability, given the almost identical commission fees and ‘sticking’ interest margins, will be determined by the volume of allocated credits alongside an adequate cost management.
How will it fulfil its intermediary role needed for the proper functioning and growth of the domestic economy? What can commercial banks do (given, or instead of central intervention) for competitiveness?
Banks need to carry out a significant expansion in the credit and investment market: besides exploring new markets they have to reduce their costs in terms of returns, they have to implement further consolidations and network reduction measures. Most importantly, to facilitate growth, by improved risk assessment, trust must be strengthened: for the SME sector it can be promoted by banking market innovations, better understanding of the sector through structural and lifecycle assessment, and improved demands provisions (Mester-Tóth, 2015).
4 Shadow banking Many believe banking to be a complex, slow-to-react system, which rather dictates conditions, however, nowadays this in not the situation. Instead, most banks attempt to eradicate this image among their clients. This is aided by technological opportunities, which are present in both the banking and financial sectors.
Today competition does not lie in the amount of services, but rather in which bank in the market can provide the same service better, at a higher quality standard, in a more client-centred way. Competition and innovation must be accompanied by safety, which has to be observed by regulators.
The above view of the banking system (parallel to financial technological innovation, of course) might have contributed to the development of a shadow banking system - in the present environment of the financial sector –, which, according to experts, might decide the future of the financial system (Szakály, Kása, 2011).
The name shadow banking captures the essence of the underlying content well: a shadow is a dark area of space created behind an illuminated, non-transparent object, whose shape and size depend on the illuminated object itself. The financial interpretation of the concept also refers to this, since it denotes uncertainty, hard transparency and the complex structure which is characteristic of the banking system but is lurking in its shadow. Shadow banking is nothing but a concerted credit intermediation structure that involves entities and activities outside the
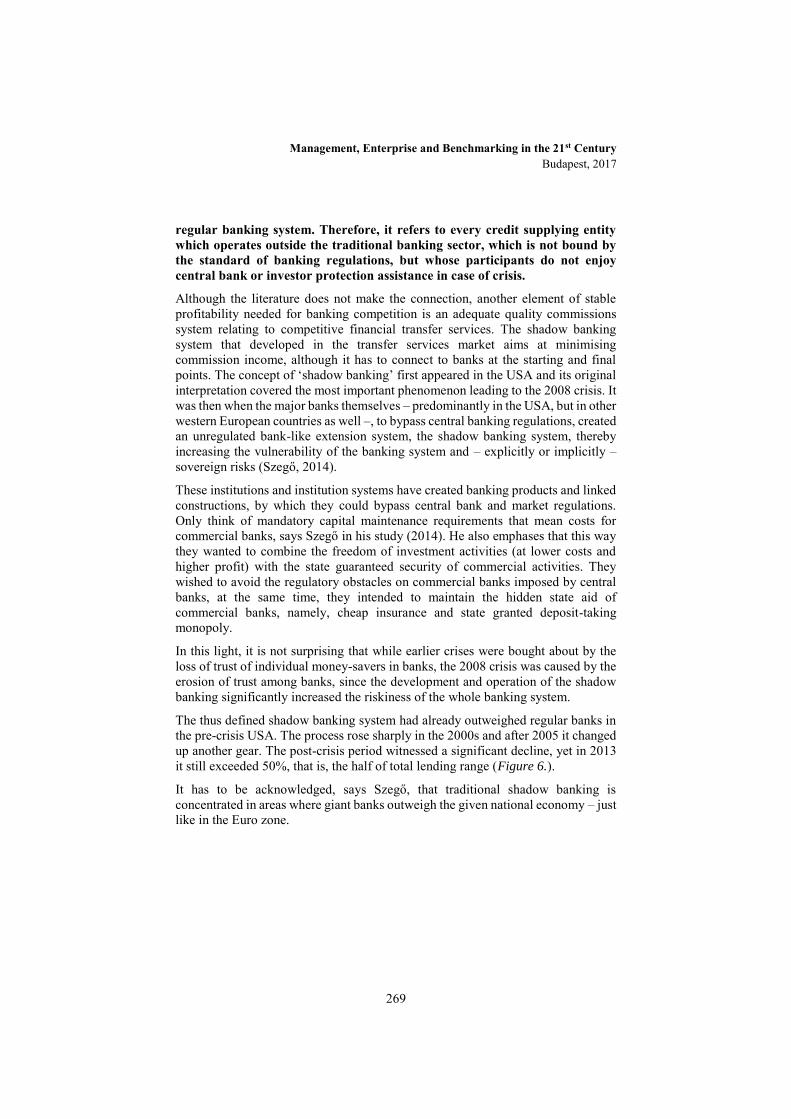
Management, Enterprise and Benchmarking in the 21st Century Budapest, 2017
269
regular banking system. Therefore, it refers to every credit supplying entity which operates outside the traditional banking sector, which is not bound by the standard of banking regulations, but whose participants do not enjoy central bank or investor protection assistance in case of crisis.
Although the literature does not make the connection, another element of stable profitability needed for banking competition is an adequate quality commissions system relating to competitive financial transfer services. The shadow banking system that developed in the transfer services market aims at minimising commission income, although it has to connect to banks at the starting and final points. The concept of ‘shadow banking’ first appeared in the USA and its original interpretation covered the most important phenomenon leading to the 2008 crisis. It was then when the major banks themselves – predominantly in the USA, but in other western European countries as well –, to bypass central banking regulations, created an unregulated bank-like extension system, the shadow banking system, thereby increasing the vulnerability of the banking system and – explicitly or implicitly – sovereign risks (Szegő, 2014).
These institutions and institution systems have created banking products and linked constructions, by which they could bypass central bank and market regulations. Only think of mandatory capital maintenance requirements that mean costs for commercial banks, says Szegő in his study (2014). He also emphases that this way they wanted to combine the freedom of investment activities (at lower costs and higher profit) with the state guaranteed security of commercial activities. They wished to avoid the regulatory obstacles on commercial banks imposed by central banks, at the same time, they intended to maintain the hidden state aid of commercial banks, namely, cheap insurance and state granted deposit-taking monopoly.
In this light, it is not surprising that while earlier crises were bought about by the loss of trust of individual money-savers in banks, the 2008 crisis was caused by the erosion of trust among banks, since the development and operation of the shadow banking significantly increased the riskiness of the whole banking system.
The thus defined shadow banking system had already outweighed regular banks in the pre-crisis USA. The process rose sharply in the 2000s and after 2005 it changed up another gear. The post-crisis period witnessed a significant decline, yet in 2013 it still exceeded 50%, that is, the half of total lending range (Figure 6.).
It has to be acknowledged, says Szegő, that traditional shadow banking is concentrated in areas where giant banks outweigh the given national economy – just like in the Euro zone.
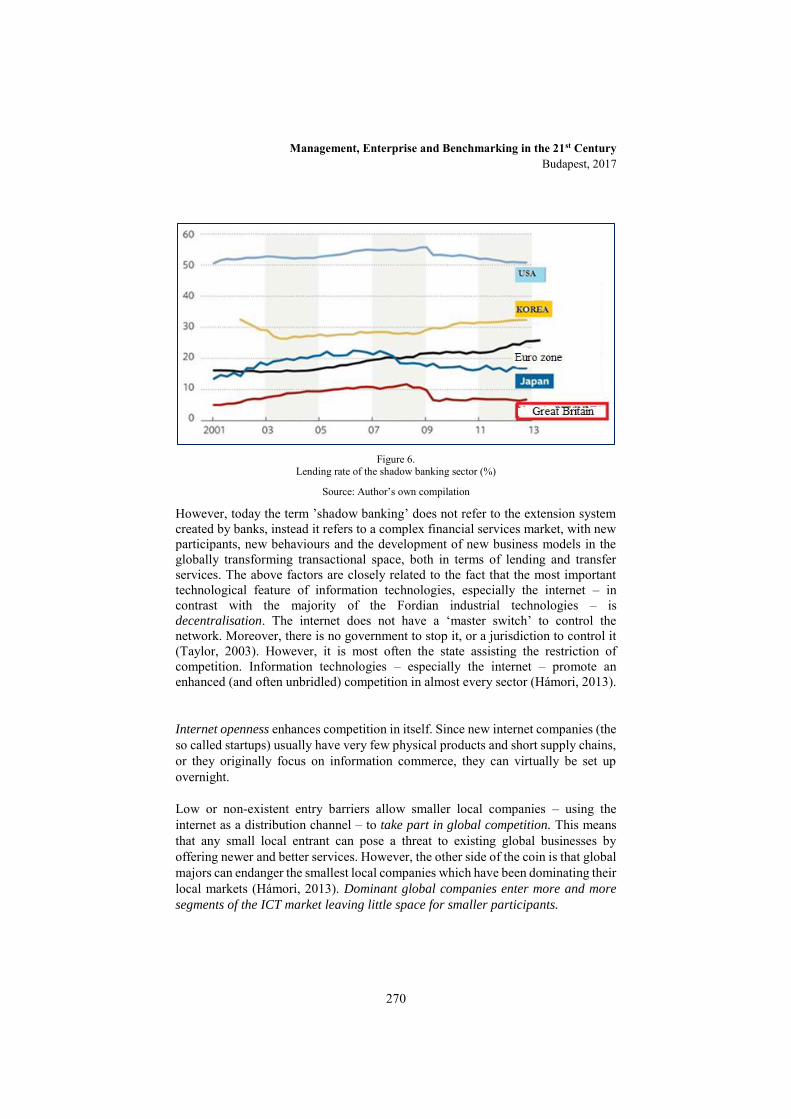
Management, Enterprise and Benchmarking in the 21st Century Budapest, 2017
270
Figure 6.
Lending rate of the shadow banking sector (%)
Source: Author’s own compilation
However, today the term ’shadow banking’ does not refer to the extension system created by banks, instead it refers to a complex financial services market, with new participants, new behaviours and the development of new business models in the globally transforming transactional space, both in terms of lending and transfer services. The above factors are closely related to the fact that the most important technological feature of information technologies, especially the internet – in contrast with the majority of the Fordian industrial technologies – is decentralisation. The internet does not have a ‘master switch’ to control the network. Moreover, there is no government to stop it, or a jurisdiction to control it (Taylor, 2003). However, it is most often the state assisting the restriction of competition. Information technologies – especially the internet – promote an enhanced (and often unbridled) competition in almost every sector (Hámori, 2013).
Internet openness enhances competition in itself. Since new internet companies (the so called startups) usually have very few physical products and short supply chains, or they originally focus on information commerce, they can virtually be set up overnight.
Low or non-existent entry barriers allow smaller local companies – using the internet as a distribution channel – to take part in global competition. This means that any small local entrant can pose a threat to existing global businesses by offering newer and better services. However, the other side of the coin is that global majors can endanger the smallest local companies which have been dominating their local markets (Hámori, 2013). Dominant global companies enter more and more
segments of the ICT market leaving little space for smaller participants.

Management, Enterprise and Benchmarking in the 21st Century Budapest, 2017
271
A typical example is collaborative ‘peer-to-peer lending’ or as it is called ‘marketplace lending’. Since 2010 in the USA the amount of loans in this form of lending has doubled every year, but it is also rapidly increasing in China, Australia and the UK (Bethlendi & Végh).
At first, it spread in regions marked by lack of capital, and in countries where there is a lack of available assets or the economy is struggling for some other reason.
A major advantage to ‘peer-to-peer lending’, P2P system-based technology is its ability to provide for short and long-term financing at lower than banking interest rate while at higher return rates.
The Lending Club, the biggest American P2P creditor has already executed several billion dollars-worth lending. It is a clear sign of showing the success of P2P. Restrictions have already been imposed: in the USA only legally registered investors owning a minimum of 1 million dollars in free capital can take part in P2P lending. P2P is generated by unprecedently low interest rates and strict post-crisis banking conditions. More significant are the spreading and development of networks and collaborative systems. Electronic systems efficiently eliminate the slow administrative and bureaucratic banking system. Also, they are faster and cheaper and usually available 24/7. They connect lenders who have extra sources to invest and borrowers in need of loans.
The model works by individuals giving money into a common fund to satisfy loan applications accepted by the system. The mechanism is similar to the one found in banks, however, it operates at lower costs. Therefore, depositors usually enjoy a higher interest rate than in a bank, whereas the applicant usually pays a lower interest than when taking out a bank loan. It is a risk factor, however, that depositors are not protected under the government’s deposit-guarantee scheme. At the same time, the system contains several safeguards resulting in a lower amount of unsecured credit than in large banks. The sole consequence of non-repayment is being excluded from the system. However, experience shows that there is less default in P2P than in banking systems (Tóth, 2015).
The world economic crisis undoubtedly contributed to the development of such systems, however, the spread of the internet was also a prerequisite. Collaborative lending still awaits the creation of its legal framework and legitimate environment. Wherever the practice has spread, legislation monitors and tries to regulate it, however, what a crisis situation would cause, remains to be seen. Some believe that the existence of the system was made possible by the American central bank cutting interest rates to near zero. Nonetheless, as soon as the interest rate increasing promised by the Fed begins, P2P investors’ attention is likely to be directed towards new investment vehicles (Tóth, 2015). It was a somewhat surprising fact that banks were not bothered by the appearance of P2P. Lending small loans to individuals and financing high-risk small enterprices seemed a rather non-profitable business. Yet, today, large European banks and investment banking houses overtly take part in the constitution of investment funds that invest in SMEs’ collaborative loans. The biggest collaborative creditors’ own several-hundred pounds worth funds become

Management, Enterprise and Benchmarking in the 21st Century Budapest, 2017
272
passive acquirers of collaborative creditors’ loans (Tőzsdefórum, 18 January 2016, 11.40 source: TF information).
The next figure (7.) shows shadow banking development and growth in one of Europe’s strongest economies, Germany.
Figure 7.
Structural developments of Germany’s shadow banking system
Source: EKB, Deutsche Bank, 2015
Shadow banking activity plays a significant role in the economic-financial system, since a few of its most important tasks are to
create additional financing sources, offer alternative investment opportunities besides traditional banking
practices, and offer a risk-sharing instrument for banks.
The environment of the financial sector as we know it today will be determined by the future expansion of the shadow banking system.
5 Summary – Will banks go out of fashion? As things are today, it is almost likely that in the future whenever we are in need of a sum of money we do not have at our disposal, it will be enough to press a few buttons on a mobile application to access it within a few minutes (Tóth, 2015). The major economic trends are becoming dominant in our lives, and banks also have to adapt to the changes (Karmazin, 2014).
In his study ‘The Nature of the Firm’ Ronald Coase British economist asks the questions: Why do companies exist? Why isn't the world a sea of individual contractors? One of Coase’s merits is stating that using the market coordination

Management, Enterprise and Benchmarking in the 21st Century Budapest, 2017
273
mechanisms has a cost. Thereby the concept of transactional costs was born (Kapás, 2000). Market regulations and coordination have their costs, it is difficult for buyers and sellers to find each other, if everyone were individual participants, an enormous amount of time would be spent writing up and observing contracts, and so on. Companies are the alternative to markets, and experience shows that they are a competitive alternative indeed. Based on Coase’s views and using the theories of economy, organisational theory and law Williamson (1993) created his significant theory: the market and an organisation differ along the five main categories: incentives, administrative control, the level of autonomous and cooperative adaptation, and the type of applicable contract law (Kapás, 2000).
Why are there still banks? Why can’t start-up companies take over lending? What we see is an extreme example of market and corporate model competition. Apparently, the novel market space efficiently fulfils its role, brings together buyers and sellers at lightning speed, transactions can easily be conducted in it, conditions can be adapted to the actual situation, it can maintain a balance, and it can distribute and coordinate resources and capacities. In other words, the market model armed with its modern technology has besieged the corporate model. Coase, however, would definitely call for caution here. The battle is not over yet. The old always find it hard to adapt but certainly will not surrender their position. Used wisely, the new technology might as well help them. We are in for a few surprises (Bőgel, 2016).
Literature
[1] Ábel I. – Polivka G. (1997): A versenyképességet befolyásoló tényezők a bankrendszerben, Budapesti Közgazdaságtudományi Egyetem Zárótanulmányok Z18 kötet, 8.oldal
[2] Ábel I. – Polivka G. (1998): A bankpiaci verseny Magyarországon a kilencvenes évek elején Közgazdasági Szemle, XLV. évf., 1998. június, 534 oldal.
[3] Bánfi Z. (2013): A retail bankpiaci verseny hatásai Magyarországon, különös tekintettel a lakossági forint- és devizaalapú jelzálog-hitelezésre, Doktori Értekezés, 11-12.oldal
[4] Bethlendi A. -Végh R. (2014): Közösségi finanszírozás-valós lehetőség-e a hazai kisvállalatok számára? (Hitelintézeti Szemle 13.évf. 4. szám 105.oldal)
[5] www.hitelintézeti szemle.hu/letöltés/5-bethlendivegh - 2.pdf
[6] Bőgel Gy. (2016): Mit szólna Coase?, Figyelő 2016/21 28-29 oldal
[7] Friedrich, R. – Le Merle, M. – Gröne, F. – Koster, A. (2012): Measuring Industry Digitalization Leaders and Laggards in the Digital Economy. Booz & Company, New York

Management, Enterprise and Benchmarking in the 21st Century Budapest, 2017
274
[8] Gém E. (2008): A versenyintenzitás mérése a retail banki szolgáltatások piacán, Kopint Konjuktura Kutatási Alapítvány, Kutatási jelentés 2008, június, projektvezető: Gém Erzsébet, 5-19 oldal)
[9] Gyenge B. – Kozma T. – Tóth R.(2016): Was ist das Geheimnis des Geschäftserfolgs nach der Krise? Geschäftsmodell im Unternehmen, Online recenzovaný časopis, Seye E-Studies, ISSN 1338-1598, http://ujs.sk/gtk/e-studies/
[10] Gyenge B. (2016): Szimuláció alkalmazása a vállalat gazdasági folyamatainak modellezésében; In. (szerk): Gyenge B. – Kozma T.: Folyamatmenedzsment kihívásai: Döntési pontok, kapcsolatok és együttműködési stratégiák a gyakorlatban, p. 120.
[11] Hámori B. (2013): Új szereplok és magatartásformák az átalakuló tranzakciós térben, Akadémiai Doktori Értekezés 35,79, 187-197 oldal
[12] Harsányi G.-Siklósi Á-Veress A. (2013): Értékelés a számvitelben
SZÁMVITEL ADÓ KÖNYVVIZSGÁLAT: SZAKMA 2013:(12) pp. 558-559.
[13] Kapás J. (2000): A tranzakciós költségek tana a vállalatelméletben,
Vezetéstudomány XXXI. évf. 10-12. oldal
[14] Karmazin Gy. (2014): A logisztika szerepe a gazdaságban. In: Magyar Csomagolási Évkönyv, Csomagolási és Anyagmozgatási Országos Szövetség, 28-29. oldal, ISSN: 2063-0867
[15] Karmazin Gy. – Szécsi G. – Gál I. – Nagy J. (2013): A hazai fuvarozók helyzete és kilátásai Európában. In: Chikán Attila (főszerk.): Logisztikai Híradó, XXIII. évfolyam 1. szám, 2013. február. Magyar Logisztikai, Beszerzési és Készletezési Társaság, Budapest, 38-40. old. ISSN: 2006-6333
[16] Katits Etelka (2002) – Pénzügyi döntések a vállalat életciklusában, KJK-Kerszöv. Kiadó, Budapest
[17] Katits Etelka (1998) - A vállalati tőkestruktúra, Janus Pannonius Egyetemi Kiadó, Budapest
[18] Katits Etelka, Szalka Éva (2015) – A magyar Top 100 pénzügyi elemzése 2008-2013 között, avagy a növekedési lehetőségek feltárása, Saldo Kiadó, Budapest
[19] Kása R. (2015): Approximating innovation potential with neurofuzzy robust model. Investigaciones Europeas de Dirección Y Economía de La Empresa, 21(1), 35–46.
[20] Kerekes M. (2012): A magyarországi kereskedelmi bankok jövedelmezőségének és hatékonyságának elemzése 2005 és 2010 között, Doktori Értekezés tézisei.
[21] Mester É. – Tóth R. (2015): A magyarországi kkv-k aktuális helyzete és

Management, Enterprise and Benchmarking in the 21st Century Budapest, 2017
275
finanszírozási lehetőségei – ECONOMICA 2015. 1. szám, ISSN 1585-6216
[22] Molnár L. – Kása R. (2014) Pénzintézeti percepciók az közép-magyarországi és az észak-magyarországi fogyasztók körében. In E. Hetesi & B. Révész (Eds.), Marketing megújulás (Marketing Renewal) (p. Paper 9). Szeged: Marketing Oktatók Klubja 20. Konferenciája.
[23] MNB (2016): Pénzügyi stabilitási jelentés. 2016. május, 9-12. oldal
[24] MNB (2016): Hitelezési folyamatok, 2016.február 7.oldal
[25] Palotai D. – Virág B. (2016): Versenyképesség és növekedés. Válasz Könyvkiadó, Budapest, 430-432. oldal.
[26] Pataki László, Széles Zsuzsanna, Baranyai Attila, Széles Z.(2014): External methods of financing for hungarian agricultural enterprises annals of the polish association of agricultural and agribusiness economists 5: pp. 191-195.
[27] Pataki László, Bárczi Judit, Földi Péter (2015): A jövőbeni teljesítmény előrejelzésének modellezése - maradványérték és tőke költség becslése, In: Resperger Richárd (szerk.) strukturális kihívások - reálgazdasági ciklusok Innovatív lehetőségek a valós és virtuális világokban (Programfüzet és előadáskivonatok): structural challenges - cycles in real business Innovative Possibilities in Real and Virtual Worlds (Program and Book of Abstracts). 104 p. , Konferencia helye, ideje: Sopron, Magyarország, 2015.11.12 Sopron: Nyugat-magyarországi Egyetem Kiadó, 2015. p. 53. 1 p , ISBN:978-963-334-264-0
[28] Réthi G. – Kása R. – Molnár L. (2014): A szolgáltatásminőség értelmezésének különbségei – percepcióvezérelt szolgáltatások minőségmodellje kialakításának első lépései. Prosperitas, 2(1), 26–42.
[29] Szegő Sz. (2014): A „cash and carry” pénzvilágától a többszintes pénzígérvényekig,
[30] Pénz-életvilág-pénzhálózati rendszerek, Polgári Szemle 2015.december -11.évfolyam 4-6 szám.
[31] Szakály D. – Kása R. (2011): Felderítés és vadászat: A paradigmaváltás új fókusza - A technomenedzsment térhódítása. Magyar Minőség, XX(5), 34–45.
[32] Tóth P. (2015): A bankok is kimennek a divatból? Gazdaság 133. Szám-2015.október
[33] Tóth R. (2016): A magyarországi kis-és közepes vállalkozások regionális különbségei, Nemzeti Közszolgálati Egyetem, In.: Prof. Dr. Csath Magdolna Dsc. (szerk.): Regionális versenyképességi tanulmányok, Nemzeti Közszolgálati Egyetem, 978-963-439-001-5, pp.143-178.
[34] Túróczi Imre (2015): Modern vezetői számviteli módszerek, kontrolling a
Management, Enterprise and Benchmarking in the 21st Century Budapest, 2017
276
logisztikában; In: Gyenge Balázs – Kozma Tímea (szerk.) (2015): Folyamatmenedzsment kihívásai; Döntési pontok, kapcsolatok és együttműködési stratégiák a gyakorlatban, Gödöllő, Szent István Egyetem, Gazdaság- és Társadalomtudományi Kar, Üzleti Tudományok Intézete, Tevékenység-menedzsment és Logisztika Tanszék, ISBN: 978-615-5570-02-5, pp.144.
[35] Túróczi Imre (2016): A versenyképességre ható tényezők a makrogazdaságban és a vállalkozások szintjén In: Gyenge Balázs, Kozma Tímea, Tóth Róbert (szerk.) Folyamatmenedzsment kihívásai: Versenyképességi tényezők a 21. században. 209 p. Budapest: PerfActa, 2016. pp. 37-49. (ISBN:978-963-12-7158-4)
[36] Várhegyi É. (2011): A magyar bankszektor szabályozása és versenyhelyzete a válságban Econ.core.hu/file/download/vesz2011/bankszektor.pdf. Letöltve: 2016.július 15.
[37] Várhegyi É. (2003): Bankverseny Magyarországon, Közgazdasági Szemle, L. évf., 2003. December, 1033–1035. oldal.
[38] Vonnák B. (2015): Növekedési Hitelprogram: kritikák és tények MNB kiadványok, Publikálás dátuma: 2015. március 13. 2.oldal.

Management, Enterprise and Benchmarking in the 21st Century Budapest, 2017
277
Water – the Essence of Growth
Zsuzsanna, Nagy-Kovács Óbuda University, Budapest, Hungary
Katalin, Prof. Dr. Takács-György Óbuda University, Budapest, Hungary
Water has played an important role in human history and civilization. The aim of this article is to demonstrate that water – with its specific features – is essential in economic development. In the first place it is deduce how water found its place among economic goods. Secondly, the demand and supply of our days is detailed with an outlook to imminent changes related to the growth of population and climate change. Finally, the role of water in development will be evolved considering the challenges and the means of a favourable outcome.
Keywords: water, economic growth, sustainability, climate change
Introduction
The wide spread of crisis in water management is well known among economists and water professionals. Though it has been recognized many decades ago, still the ultimate solution has yet to be found. This rises urging concerns as the role of water in economic development is becoming more and more evident.
Scientists, politicians, engineers try to determine different aspects of the problem with approaches from their field of proficiency. But the special features of water makes their work challenging: its ever changing availability, shrinking quantity and degrading quality transforms economic definitions and approaches.
Management, Enterprise and Benchmarking in the 21st Century Budapest, 2017
278
1 The economic concept of water
Water is one of the most common natural resource that can be found on Earth. Still, it has been hindered to establish its concrete place in economics for many centuries. To understand the complexity of the problem, one must look in detail into the concept of value and the many ways water is used. Obviously water as a commodity played an important role not only in the clarifying of the economic concept of value, but also in developing the necessary operational processes for measuring it.
1.1 Interpreting value in economics
To start with, it must be understood, that value has two separate meanings in economics: one is the value in use and the other is the value in exchange – with bearing in mind the comparison made by Smith between diamonds and water. According to Plato „only what is rare is valueable and water, which is the best of all things, is also the cheapest”. Both definitions tried to express that the market price of an item needs necessary not reflect its true value. Looking further, Dupuit and Marshall pointed out that even items having no market price at all can have a positive economic value – a remark that has been accepted in modern economics only in the second half of the XX. century when the method of non-market valuation emerged [1]
In particular, water has a very specific feature, notably its marginal value declines sharply: people would pay very high prices for drinking water, as they need it to survive but tend to appreciate it much less when water is abundant. Therefore drinking water is a good with generally high consumer surplus.
1.2 Water: an economic good
A broader understanding of economic goods can be interpreted in the following: people may value a natural resource out of considerations unrelated to their own immediate and direct use of it, they may wish to preserve a future option of satisfaction or would like to protect it for future generations. [1]. In the following an overview will show, how economics arrived to this concept.
Ward and Michelsen equate the economic value of water with its market price. They state, that „the economic values of water, defined by its price, serve as a guide to allocate water among alternative uses, potentially directing water and its complementary resources into uses in which they yield the greatest total economic return” [2].
A new approach was the extension of the economic concept of value to a broader class of items than just market commodities: anything could actually be a market

Management, Enterprise and Benchmarking in the 21st Century Budapest, 2017
279
good from which people derive satisfaction. This was formally demonstrated by Maler [3] when he showed that the modern formulation of the problem in terms of duality theory, carry over from the valuation of market goods to non-market items. His findings lead to the following conclusion: the natural environment is a common property.
At the 1992 International Conference on Water and the Environment the four Dublin Principles were declared. One of them holds that water has an economic value in all its competing uses and should be recognized as an economic good. The spectre of this sentence seemed to be wide: from “water is no different from any other economic good” [4] to “the Earth’s freshwater belongs to the Earth and all species [5]. Baumann and Boland is correct when they point out that water is a necessity. However, water is perceived as having a special significance that most other commodities do not possess: its special economic features.
Furthermore, water is both a private and a public good. By contrast, most of the other commodities associated with food, shelter and clothing are purely private goods and have no public goods aspect. The public good nature of water influenced its legal status: in Roman Law and to an extent of Civil Law systems, flowing waters are treated as common to everyone (res communis omnium) and are not capable of being owned. These waters can only be object of rights of use [6].
The specific features of water highlights, why the road presented above was so rocky. The mobility of water and the opportunity for sequential use and re-use make water relatively distinctive as commodity. By consequence, it is essential to find the tools to internalize the externality associated with the mobility and return flows.
The variability of water supply in terms of space, time, use and often quality had a major impact on the global prise of the good: the uneven distribution on the globe, the distribution of precipitation for a given region and the use for example in agriculture, where irrigation is needed only in well-defined periods of the year.
2 Uncertain supply
The challenges the world will face in adapting to water issues are enormous. According to many projections [6], as the water cycle is a closed dynamic system, the total volume of runoff will be relatively stable and the amount of global surface water remains fairly fixed. The problem roots in more complex aspects: these are the extremities that will cause major concerns. More frequent natural disasters are imminent: droughts, floods, uneven precipitation escalating in torrential rainfalls, higher water temperatures and all the consequences that are
Management, Enterprise and Benchmarking in the 21st Century Budapest, 2017
280
related to these tendencies. The changing environment obviously affects the water supply making it more unpredictable.
2.1 High and dry
Those countries which experience already considerable amount of water stress will become even more water scarce: the MENA region, Central Asia and Central America. Notably, much of the decline in runoff is projected in the least developed countries. When drought hits a region that is already water stressed, migration to the cities is induced: economic migrants head to the urbanized area, instead of seeking other alternatives for adaptation strategies. Drying events are thought to have fueled transboundary invasions back in the ancient times: China and Egypt experienced these threats that lead to political instability. Today, due to the delicate nature of war – where the process is generally costly and outcome is rather uncertain – even in transboundary water conflicts, disputes are mediated and peaceful resolution is facilitated on an international level. However, water conflicts within a country are much more widespread: water shocks are usually followed by spikes of violence leading to regime change in developing countries. No surprise, these are the areas, where population living on the edge reacts sensitively to the slightest decrease in income.[6] Hungary has a very privileged situation with its many affluents. However it must be considered that the amount of water entering the country is decreasing: according to the Hydroinfo databasis the average Danube level decreased by 1cm in average in the last 100 years.
2.2 When it’s too much
Floods cause a more visible and perhaps an even more rapidly growing toll. A recent study used meteorological data to reconstruct every country’s exposure to tropical cyclones during 1950-2008 [6]. It found that national incomes decline after a disaster an do not recover within 20 years. The results suggest that future cyclone activity would result in costs of about $10 trillion larger than previous estimates. What aggravates the situation even more is that the process of urbanization is the most dramatic in low- and middle-income countries: the number of dwellers is projected to grow by 2.5 billion people [6] mainly in flood-prone areas, deprived of municipal water, sanitation and flood protection.
In case of Hungary unprecedented floods raise major concerns: in 2013 historical flood records were registered along the Danube without severe consequences, for this time. But it is essential to bear in mind, that more than one quarter of Hungary’s population is served by piped water produced by river bank filtration – therefore flood protection should become a priority in water management in the country.
Management, Enterprise and Benchmarking in the 21st Century Budapest, 2017
281
The economic effects of water shocks are diverse. It can cause nutritional deficits or health impacts in young children, or income shocks that prevent families from investing in their education. The fetal origins hypothesis demonstrates – and mounting evidence shows – the important role that early-life conditions can have on future life success [7]. A less competent population with hindered economic background obviously decelerates or even detain growth.
2.3 Treasure underfoot
Aquifers contain about 30 percent of the available freshwater of Earth and act as a natural buffer against climate variability [6]. If protected and managed along with surface water, groundwater can do much in adapting to climate change. It loses negligible amount of water through evaporation and transpiration. Long retention time and slow response make it more buffered against environmental changes. However, the quality of ground water is influenced by climate change too: rising sealevels push seawater inland, resulting in quality issues.
To conclude the above presented it is essential to see, that in the present situation an improved water supply for the nearly one billion people around the globe is needed. But it should be considered too, that the world’s population is still increasing in those areas where water security is still a major issue to be resolved. Hungary is renowned internationally for being rich in groundwater. However recently it has been proved that the groundwater level is decreasing and the natural habitats in many parts of the country are becoming endangered.
3 Thirsty demand
The total amount of water demand has been challenging to define. The World Bank created a new perspective to determine the drivers of demand: farms, cities, energy and environment – called the expanded water nexus, represented in Figure 1. According to their concept in the coming three decades the global food system will require 40-50% more water, municipal and industrial water usage will increase by 50-70%, the energy sector is projected to experience a boost of 85% while the environment will receive even less and worse of water [6].

Management, Enterprise and Benchmarking in the 21st Century Budapest, 2017
282
Figure 1.
The expanded water nexus [6]
3.1 Meeting food security challenges
Water fits the definition of essential final good: no life is possible without water. Biologically human life is not possible without at least 5-10L/day per person of water. The UN and the WHO determined the limit 20L/day per person, while Gleick [8] argued that this limit was too low and advocated that the basic human need should be at least 50L/day per person. However, if we compare this necessary minimum, with the average water consumption in the developed world - about two magnitude of difference - it can be declared, that water demand grows sharply as life circumstances improve.
On the other hand it is important to see, that as life is impossible without any access to water, the problem for those, affected by water security issues are more related to quality. These two observations highlight the need to adopt a behavioural approach, where the focus is not on the need but rather on the amount of water that is covered by the willingness to be paid. World Bank has experience of studying the phenomenon. It proved that households spend considerably more on water – mainly to purchase water from vendors – than the expected 3-5% of income. The question therefore is how much people value piped, public water supply relative to the existing alternatives. Compared to electricity – another influential service - water is lagging behind [6].
Sustainably feeding 9 billion people by 2050 is one of the greatest challenges: food production needs to duplicate over this period while methods must be found that do not degrade natural resources [6]. The agriculture consumes already 70% of the available freshwater – being the single largest anthropogenic water user. Little additional surface water is available in many parts of the world. The increasing number of closed basins is becoming an urgent problem: groundwater

Management, Enterprise and Benchmarking in the 21st Century Budapest, 2017
283
aquifers are heavily exploited and groundwater abstraction requires approximately 30 percent more energy than surface water irrigation. This results in significantly higher greenhouse emissions: 4 to 6 percent of India’s total carbon emissions. Not to mention the water quality related problem of fertilizers: in the most developed parts of the globe phosphorus and nitrogen concentrations have already reached unsafe levels [6].
3.2 Changing cities and changing climate
Over half of the world’s population lives in cities that generate about 80 percent of global GDP. And the world keeps on to become even more urbanized: in the next three decades water demand is expected to increase by 50 to 70 percent. One in four cities worldwide experiences water insecurity. Flooding, heat waves and rising seas can degrade the quality of surface and ground water that can indirectly disrupt the urban economy. In Jakarta flood related financial losses reached $900 million in 2007, when a major flood occurred reaching 25% of the city. And things will get worse: the city confronts a sea-level rise of 60 cm or more over this century – the Northern parts of Jakarta are predicted to be 4 to 5m below sea level within 20 years [6].
3.3 Water for energy
Cleaner energy sources consume surprisingly high amount of water causing distinct trade-offs between the use of water and energy.
Surprisingly, the thirstiest business among the renewable energy sector is solar energy production. Desalination and water recycling are not economically feasible options for lower value added uses: desalinated water costs about 4 to 5 times more than treated surface water. Wind turbines are the best choice, if one considers water performance [6].
3.4 Environmental water requirements
Environment is the residual claimant of water resources: receiving what is left behind by the previous uses and much of this is polluted. It is estimated, that 20 to 50 percent of the total available water in each basin is required to maintain plant and animal life and sustain critical ecosystem services like water purification, while temperature changes will likely increase the needs of these ecosystems. It is especially challenging, how to determine the environmental water requirements – as each and every waterway has unique circumstances. The Australian experience is a very good example of environmental stewardship as smart water resource management can partly mitigate the environmental impacts [9].
Management, Enterprise and Benchmarking in the 21st Century Budapest, 2017
284
4 The fuel of economic growth
It is known that many of the world’s major cities owe their origin to their location along coasts or rivers where water-borne transportation was facilitated. However evidence is less obvious and more negative as of today while it is surprisingly difficult to measure the concrete benefits associated with an increment in water availability; these difficulties are clearly evident in the literature on water and economic development.
In 2015 the UN has determined seventeen Sustainable Development Goals with clean water and sanitation listed as the sixth. Considering the expanded water nexus presented in connection with demand, it can be deduced how all sectors of society are interlinked through the common currency of water. This is an essential cornerstone to start from while defining the relation between water availability and economic growth [10].
However, water shortages are becoming more obvious, much of the world’s water is used inefficiently by industry, cities and agriculture even in arid areas; and much of it is wasted without economic benefit, often with negative economic impacts. It seems that having an adequate supply of water might be a necessary but not a sufficient condition for economic growth: with areas lacking an adequate amount of water will not flourish economically. When water is in short supply, there will be changes in what is produced, where it is produced and the efficiency of production.
But vulnerability discourages major investments – especially water infrastructure related projects. This tendency affects the Poor, as their circumstances will not be ameliorated: poor households are less robust and more vulnerable and also tend to be located in higher risk areas, that are prone to be more affected to water related threats.
The third threat being climate change has important consequences as well. The expected global damages are small relative to the expected global GDP in 2050, ranging between 0,37-0,49, while significant variations exist between regions[6]. Western Europe and North America, where much global GDP is produced, experience negligible damages in most scenarios. The bulk of losses are in the Middle East, the Sahel and Central and East Asia and the magnitude of losses is largely driven by the level of the water deficit. The economic consequences are highly unequal with the worst effects in the driest regions.

Management, Enterprise and Benchmarking in the 21st Century Budapest, 2017
285
5 Balancing water
Water is a complex natural resource. About 1.6 billion people live in countries with physical water scarcity – a number that will double in only two decades. This results in an ever increasing constraint: demand for water is ever increasing, but supply remains fixed and more variable.
According to Karl-Göran Maler the basic cause of environmental degradation is the failure of the markets to deal adequatly with public goods [11]. It is therefore essential to find the way to allocate water to sectors and uses where demand and value added is greatest.
While in the World Bank report [6] it is stated that the problem of water is not one of economics but politics, not one of physical shortage but governance – where the generic problem of water is one of matching demand with supply, of ensuring that there is water of a suitable quality at the right location and the right time.
When governments respond to water shortages by boosting efficiency and allocating water to more highly-valued uses, losses decline dramatically and may even vanish. Improved water stewardship thus pays high economic dividends. Prudent water-management policies can do much to secure growth. This requires using market forces and prices to guide water allocation decisions. The benefits to managing water resources as a valuable economic resource are considerable. Water that is provided free, promotes and condones overuse and waste. More efficient water pricing, coupled with policies that safeguard the most marginal members of society, can therefore ensure that sufficient water is conserved and guarantee enough water to meet basic needs.
The prices paid by industry, agriculture and residential users are often unrelated. Furthermore the price of water that most users pay for water reflects its physical supply cost –capital and operating costs - and not its scarcity value. However, some countries – including Hungary – levy an abstraction charge for water these charges tend to cover rather administrative fees and are not based on an assessment of the economic value of the water being withdrawn.
Conclusions
According to those that have been summarized in this article, it can be understood that water is an economic good and that it has an obvious effect on economic growth. However, it is not a direct connection: it manifests through water availability and uncertainty that is becoming an ever increasing issue. Efficient allocation across water sources and uses are essentials for long term achievements while growing populations, rising incomes, and changing climate all three increase
Management, Enterprise and Benchmarking in the 21st Century Budapest, 2017
286
the competition for a limited resource. To alleviate the problem solution must be found by the means of economic models and effective policy programs must be established on a global level.
References
[1] W. M Haneman: The economic conception of water. University of California, Berkley, 2005
[2] Ward F.A. & Michelsen A.: The economic value of water in Agriculture: concepts and policy applications. Water policy, 4: 423-446, 2002
[3] Maler: Environmental Economics: A theocratical enquiry. John Hokins University Press for Resources for the Future
[4] Baumann, DD & Boland, JJ.: Urban water demand management planning. McGraw Hill
[5] Barlow & Clarke Blue Gold: The fight to stop corporate theft of the World’s Water. The New Press, 2002
[6] World Bank, Washington, 2016, “High and Dry: ClimateChange, Water and the Economy.” Executive Summary. World Bank, Washington DC. License:Creative Commons Attribution CC BY 3.0 IGO
[7] D. Almond: Killing me softly: The fetal origin hypothesis. J Econ Perspect. 2011 Summer; 25(3): 153–172.
[8] Gleick: The human right to water. Water Policy 1(5): pp487-503
[9] http://waterstewardship.org.au/ (downloaded on 2017.05.02.)
[10] http://www.un.org/sustainabledevelopment/sustainable-development-goals/ (downloaded on 2017.05.02.)
[11] Karl Göran Maler. Handbook of environmental economics, Volume 3, Pages 1105-1618, I1-I26 (2005)
Management, Enterprise and Benchmarking in the 21st Century Budapest, 2017
287
Revitalization as an Instrument of Local Development in Poland
Aleksander Noworól Jagiellonian University, ul. S. Łojasiewicza 4, 30-348 Krakow, Poland
Abstract: The paper presents a concept of treating revitalization (or urban regeneration) as one of the instruments of local development. The authors’ researches on developmental issues disclose information and communication technologies as the driving force for the institutional change, enhancing public participation in the local management of development. The nature of the local development vehicle consists in participatory governance. The revitalization of dysfunctional areas or districts can be an important element of such a process. During the year 2015, the Polish State adopted important regulations strengthening the social dimension of revitalization. However, the desk research and the consulting work conducted by the authors discloses that managerial instruments implemented under those regulations are not sufficient for stimulating the broader way of the development, limiting themselves to finding funds for local social policy.
Keywords: Revitalization, Local development, Instruments of territorial management, Public policy, Poland
Introduction
The paper presents a reflection on the process of revitalization in the context of the author’s own experience1 and the analysis of regulations introduced by the new Bill of Revitalization, known as the Bill, from the year 2015. The Bill has entirely changed the way that revitalization is understood and managed in the process of local development. Taking under consideration: (1) the author’s concept of what local development is, (2) rules and instruments of urban regeneration processes in Western Europe, the author deliberates on new managerial tools, showing not only the opportunities, but also – the deficits of current Polish regulations.
1 The Author, since 2004, with his own company, has prepared (as expert and manager)
many revitalization programs for, e.g.: Krakow, Częstochowa, Rzeszow, Bielsko-Biala, Jaworzno, Chrzanow, and others.

Management, Enterprise and Benchmarking in the 21st Century Budapest, 2017
288
1 Territorial Development at a Local Scale
Local development, according to previous publications of the author, is the process of steering territorial change, which – stimulating causative forces, such as: entrepreneurship, competitiveness and cooperation – leads to a new configuration of elements of the territorial system. This new configuration better conditions governing activities, i.e. more effectively and efficiently. The nature of the new arrangements involves:
Growth of complexity, diversity and flexibility of sub-systems, increasing their adaptable abilities,
Increase of abilities for self-regulation of subsystems,
Enhancement of creativity and pro-activity (innovation) of subsystems,
Adjustment of the dynamics of continuous and incremental change, according to the environmental conditions,
Intensification of reciprocal relations and contact with milieu, thru communication, exchange of goods and values and controlled expansion (Noworól, 2007, pp. 26–29).
The important element of such a broad understanding of development processes is the detection of the importance of an institutional dimension. J. Hausner indicated “…the development is the institutional transformation…” (Hausner, 2013, p. 61). It’s worth alighting on that institutional dimension of development, because just the nature of institutional change forms the background for perturbations and traps, which remain in the center of the present statement. The first decades of the 21st century carry an important change of the institutional order, triggered by the popularization of information and communication technologies (ICT). The influence of those phenomena is widely disclosed in literature (Castels, 2011; Dawson, 2008). It is worth impressing on us that in the era of popularization of social media (like Facebook) practices characterizing the information society have become more important. Processes like: despatialization, demassification, decentralization, denationalization, disintermediation and disaggregation, described by J.S. Brown and P. Duguid, are constantly present in people’s lives (Brown & Duguid, 2000, p. 22, 2001, p. 45). Especially disintermediation, consisting of the elimination of intermediaries and the ease of reaching the sources of the information, creates new opportunities for establishing relations between organizations that form different sectors (public, private, NGO) and between organizations and freelancers/individuals, who can become equivalent partners for organizations. This situation is favorable to the forming of partnership type relations, and also – a peculiar alienation of public bodies, formally responsible for territorial development. R.A.W. Rhodes has perceived that phenomenon already during the last decade of the 20th century. He has underlined that development of ICT produces the growth of the importance of self-organizing,
Management, Enterprise and Benchmarking in the 21st Century Budapest, 2017
289
inter-organizational networks. Within that still evolving reality, the governance should take account of organizations from outside of the public domain, and breaking boundaries among the different spheres: public, private and social. R.A.W. Rhodes prefigured that such phenomena would lead to game type interactions, based on trust and social capital, and controlled by rules negotiated by participants of the network. It means – major independence from the state (Rhodes, 1997, p. 53). It conduces to the institutional change of the management of development, as – apart from public authorities – there are new decision-making bodies within this process. So territorial development is influenced by the hybrid, i.e. 2-3 sectors, partnerships, set in different places of multilevel governing networks (Noworól, 2013b). This organizational disaggregation of management of development, built on contractual interactions instead of hierarchical schemes, can constitute – in the opinion of the author – the causative mechanism of territorial development. At the same time, disaggregation implies the change of the role of the state, being an upholder of the institutional order (Stankiewicz, 2012, p. 182).
2 Revitalization as the Local Growth Engine
During the year 2015, Polish Parliament (Sejm) adopted the Bill of Revitalization (Dz.U. 2015, 1777, with later amendments). The Bill has changed the way revitalization is treated by public as well as private bodies. According to the Bill, revitalization is the process of moving degraded urban areas out of the recessionary state. This process should be led in a complex way, thru the integrated activities undertaken in the favor of local community, spatial order and economy. Activities should be territorially concentrated, and conducted by the stakeholders of revitalization, based on the revitalization program. This definition properly reflects the essence of public intervention in urban areas, found as recessionary.
Revitalization became the subject of public discourse in Poland after integration with the European Union. In the year 2004, the prospects of financing urban regeneration projects started the vast interest in revitalization. Polish self-governments launched the process of programming and implementing regeneration projects. However, it was done in an imperfect way, as local governments treated revitalization more as an additional source of funds, justifying the infrastructure improvements with certain socio-economic deficits of the area or district.
As a result, a successful revitalization was observed in the case of the renewal of public places or public infrastructure, dedicated to the entire cities. Many interesting, well known in Poland, projects have really improved – in a way – the quality of life. However, those interventions only remotely have relevance to what should be of most importance – the quality of life in the recessionary areas or
Management, Enterprise and Benchmarking in the 21st Century Budapest, 2017
290
districts, featured by the social problems and marginalization. Such a situation had continued till the year 2015, when an important qualitative change – based on the Western Europe experience – had happened. Finally, Poland has learned from those countries, which started during the 1970s, a system of urban regeneration directed to improve the quality of life in the neglected quarters (Bryx & Jadach-Sepioło, 2009; Guzik, 2009; Noworól, 1991; Skalski, 2009).
As a matter of fact, the core of revitalization is a set of public interventions concentrated on solving social problems and – at the same time – on improving economic conditions as well as the quality of urban spaces. Revitalization, as an element of the process of re-urbanization (Paelinck & Klaassen, 1979) poses a challenge for public authorities, especially in the areas of the juxtaposition of many negative phenomena. There should be a transition from separate activities, correcting the image of public places (urban regeneration of market squares, parks) or eliminating deficits in the municipal infrastructure, to integrated undertakings, focused on the areas with different problems, usually burdened by social ones. Revitalization should show the way that problems can be solved or reduced.
Management of revitalization, as an instrument of local development, should take under consideration elements – listed above – characterizing the notion of development. Then, it is worth indicating the features of such a desired local system of management of revitalization.
1. Treating revitalization in the context of the growth of complexity, diversity, and flexibility of the management system, demands the creation of backgrounds for inter-organizational cooperation comprised of: public authorities, entrepreneurs (real estate owners) and other partners. That process should include relevant types of public bodies, of different managerial levels, provided their activities are oriented to improve the recessionary state of local communities. The experiences of Western countries demonstrate that the key element of animation of neglected districts should include organizations of civil society, such as:
Social organizations concentrated on aid, education, or social work,
Organizations supporting local business development and entrepreneurship,
Non-formalized groups of citizens,
Local leaders,
Non-governmental organizations oriented on intersectional and inter-organizational cooperation, like “cooperation networks”, “partnerships for development”, etc.
This process is connected with the disaggregation of structures and systems of management of revitalization. The relevant organizational tool is, the so-called “operator of revitalization” acting outside the structures of public administration.
Management, Enterprise and Benchmarking in the 21st Century Budapest, 2017
291
Another important element is a decentralization of managerial processes, thru using so-called “local offices”, “local centers”, located within “difficult” areas and facilitating contacts between inhabitants and managers of revitalization with constructive dialogue.
2. In respect to the next determinant of local development, being enhancing the ability to self-regulate, the managerial tool consists of decentralization and taking advantage of subsidiarity in public governance. It is related to the popularization of the model of leadership management. Such an approach relies on public confidence and the legal arrangements of the participation of the community in decision-making processes, relevant to revitalization. These new spheres of dialogue should use at least three forms of social participation:
Information, as the broad facilitation and sharing of knowledge concerning local matters,
Consultation, as a process of reciprocal flow of information between authorities and habitants,
Full participation, as a process consisting in the common structure of the future of the districts by authorities and habitants.
Processes of self-regulation and decentralization should use cooperation networks of various types, partnerships: public-public, public-social and public-private, and also a support system for the procurement of financial, pro-development sources.
3. The enhancement of innovation, drawn upon social pro-activeness, should consist in making linkages between strategic management and revitalization, understood as a set of integrated activities, oriented to deal with various branches or sectors. Besides the bonding of practices from socio-economic and land use planning, it is worth bringing to mind:
Proliferation of innovative forms of architectural and urban design with the participation of inhabitants,
Social innovations, being the form of creation and implementation of new ideas (products, services, action models) in order to satisfy social needs and to establish new social relations, based on cooperation. (Daszkiewicz, 2015, p. 1411)].
An innovative approach may also consist in creating complex financial schemes for revitalization projects, including European Union funds or private sources generated by local, regional and national stakeholders. Another element of management of revitalization is a promotion of new enterprising and prototype solutions. The key challenge in the domain of innovation is finding the formula of harmonious integration of two types of activities: the elimination of social exclusion and the stimulation of local economic growth.

Management, Enterprise and Benchmarking in the 21st Century Budapest, 2017
292
4. The adaptation of the dynamics of change in the management of revitalization is linked to an open and flexible approach to the modeling of public administrative structures in relation to external operator of revitalization and other stakeholders. It is all about adapting the way a process of revitalization is managed in respect to the changing needs and expectations of inhabitants, but also – of a progression of people’s understanding what the whole process means for inhabitants and local real estate owners.
5. The above mentioned methods of management of revitalization require a new attitude of governing bodies consisting of an interdisciplinary approach and multilevel cooperation of theoreticians, analysts, and finally – authorities and practitioners implementing goals and concepts of the recessionary area’s renewal. The key features of such cooperation are the openness and willingness to learn. An interdisciplinary knowledge, so important in animating the processes of local development, is the precondition for effective implementation of revitalization [see also: Noworól, 2010 ].
In summary, the types of activities, listed above, can potentially set revitalization in the heart of the development process’ animation, thru the desired institutional change, and in consequence – proliferation of the prototype solution, created with local society.
3 Revitalization in the Light of Current Policy of Polish State
During the year 2015, two key legal documents related to revitalization were adopted:
The Bill of Revitalization of October 9th, 2015 (Dz.U. 2015, poz. 1777 with later amendments) – called – the Bill, and
Guidelines of the Minister of Development in the field of revitalization in the operational programs for the years 2014-2020 (Minister Rozwoju, 2016)]2, called – the Guidelines.
Regarding the means of local development stimulation, it’s worth indicating the following regulations, induced by the Bill, and also – by the Guidelines:
The arrangement, that the preparation, the coordination, and the creation of conditions to conduct the revitalization, as well as its implementation in the scope of local community competences, constitute the legal
2 Pierwsza wersja Wytycznych pochodzi z 3.7.2015 i była regulacją Ministra
Infrastruktury i Rozwoju.
Management, Enterprise and Benchmarking in the 21st Century Budapest, 2017
293
assignment of local self-government. It means that a gmina (a local community) takes managerial control and responsibility of the revitalization. Such a solution excludes the way that revitalization is usually conducted in Western countries, where the operator / manager of revitalization is an entity situated outside of public administration, or a fiduciary corporation.
The formation of the institution of the “revitalization committee” is – in theory – the forum of cooperation and dialogue of the stakeholder with community authorities in order to prepare, execute, and evaluate the revitalization. However, the Bill sets a rule that the committee should act as an opinion maker and consulting body for the mayor. In such a position, the committee has a mediocre role in the process of community participation. Unfortunately, reducing the role of the committee to opinion making will limit opportunities to fulfill duties as a social co-manager of the process. The city (community) council in no way is obliged to follow the revitalization committee’s views or beliefs.
The role of social consultations has been increased in both quoted documents. The Bill regulates the consultation process in great detail, indicating its duration, scope of possible forms and the way of announcing and reporting. The Guidelines underline the reasonability of the implementation of instruments of full social participation, beyond consultations. On one side, it’s a step in right direction, enforcing municipal officials to gain new competences and to implement the inhabitants’ participation in the decision making process. However, the Bill enormously formalizes the consultation process, which by its nature, should be characterized by certain flexibility, resulting from local patterning. This formalization induces officials to adopt mock solutions, only apparently open to public dialogue, but in fact – limited to follow the letter of regulation and not its deeper meaning. So, many officials in public administration are focused on proving that regulations are correctly implemented, without thinking of the real effectiveness of consultation type activities.
The Bill features many regulations oriented to increase the effectiveness of revitalization. It concerns the real estate policy of local government, (preemption), taxes, rents in municipal houses and options for the co-financing of social municipal tenement houses. The Bill introduces two new instruments of revitalization in the shape of the special zone of revitalization and the land use plan of revitalization. The document regulates, in detail, situations demanding transfers of inhabitants during revitalization. These are necessary regulations, strengthening the position of the local government towards landlords, who frequently disrupt the processes of revitalization. Current observations of implementation of the Bill, and the author’s own experience in preparation of the revitalization

Management, Enterprise and Benchmarking in the 21st Century Budapest, 2017
294
programs, disclose that local authorities do not demonstrate the will to use those new solutions. Local politicians are afraid of broadening their legal competences because of possible conflicts with influential inhabitants or a possible rise of public expenditures (e.g. for preparation of land use plans). That precaution may limit the effectiveness of revitalization and threaten the formation of a sustainable means of moving degraded areas out of the recessionary state. The only stable way of thinking done by public authorities remains the search for European Union financial support.
The Bill imposes a necessity to conduct revitalization based on a communal revitalization program, described in detail in both new documents. Again, the preparation of this program becomes more the art of filling the legal expectations than a stimulus for development. On the other hand, in long run, those regulations can enhance local authority competences for solving social problems, but it demands a change of people’s attitudes and the organizational culture of public entities.
Conclusions
In conclusion it is necessary to claim that the programming and implementation of revitalization has recently come to Poland in a new phase, which – despite the presented objections – should be considered as favorable to social groups living in recessionary areas. Unfortunately, there is a risk, that the current legal status of revitalization, taking into consideration the organizational culture of Polish self-governments, may conflict with intentions of the lawmaker – as a temporary process, insufficiently stimulating local development. Even if the revitalization is still treated by public administration as a way to gain European financial sources, it becomes an important element of the social policy of the state and local self-governments. It’s a pity that the legal instruments of the management of revitalization, in parallel with administrative culture, create so many constraints for the deep engagement of people in the depicted process. It is important to convince inhabitants that the success of revitalization would result from integration of social activities with economic and environmental issues. This can be done uniquely through public dialogue and deliberation. The real challenge is managing local policy, and simultaneously working with local communities on both creating support for marginalized groups and preparing the means for economic development of districts. Without the latter, revitalization as an instrument of development and the legal assignment of the gmina, risks being only a legislative measure for gaining financial support, rather than being an important developmental tool.
Management, Enterprise and Benchmarking in the 21st Century Budapest, 2017
295
References
[1] Brown, J., Duguid, P. (2000). The Social Life of Information. Boston: Harvard Business School Press.
[2] Brown, J., Duguid, P. (2001). Structure and Spontaneity: Knowledge and Organization. In I. Nonaka & D. Teece (Eds.), Managing Industrial Knowledge. Creation, Transfer and Utilization. London, Thousand Oaks. New Delhi: SAGE Publications. pp. 44–67.
[3] Bryx, M., Jadach-Sepioło, A. (Eds.). (2009). Rewitalizacja miast w Niemczech. Kraków: Instytut Rozwoju Miast.
[4] Castels, M. (2011). Społeczeństwo sieci. Warszawa: Wydawnictwo Naukowe PWN.
[5] Daszkiewicz, M. (2015). Innowacje społeczne w kreowaniu atrakcyjności miast (eng. Social innovation in the creation of cities’ attractiveness). Logistyka, luty, pp. 1411–1418.
[6] Dawson, R. (2008). The Flow Economy – Opportunities and Risks in the New Convergence. In Living Networks. Leading Your Company, Customers, and Partners, Lulu Press Inc. pp. 124–147.
[7] Domański, B., Noworól, A. (Eds.). (2010). Małopolskie miasta – funkcje, potencjał i trendy rozwojowe. Kraków: Małopolskie Obserwato-rium Polityki Rozwoju, Urząd Marszałkowski Województwa Małopolskiego.
[8] Guzik, R. (Ed.). (2009). Rewitalizacja miast w Wielkiej Brytanii. Kraków: Instytut Rozwoju Miast.
[9] Hausner, J. (2013). Rozwój społeczno-gospodarczy. In J. Hausner, A. Karwińska, & J. Purchla (Eds.), Kultura a rozwój. Warszawa: Narodowe Centrum Kultury, pp. 23–38.
[10] Minister Rozwoju. (2016). Wytyczne w zakresie rewitalizacji w programach operacyjnych na lata 2014-2020 (2 sierpnia 2016 r.). Warszawa: Ministerstwo Rozwoju.
[11] Noworól, A. (1991). Rehabilitacja osiedli mieszkaniowych – studium na przykładzie Francji. Kraków: Politechnika Krakowska, seria Rewitalizacja, nr 7.
[12] Noworól, A. (2007). Planowanie rozwoju terytorialnego w skali regionalnej i lokalnej. Wydawnictwo UJ.
[13] Noworól, A. (2010). Aleksander Noworol Revitalization as a challenge of development policy. in: Noworól, A; Skalski, K. (Eds.), Contemporary understanding of revitalization in Poland. Kraków: Instytut of Public Affairs, Jagiellonian Uniwersity, pp. 9-26
[14] Noworól, A. (2013a). Ku nowemu paradygmatowi planowania terytorialnego. Warszawa: CeDeWu.

Management, Enterprise and Benchmarking in the 21st Century Budapest, 2017
296
[15] The Role of Hybrid Partnerships in the Management of Development, in: Kovacs I.P., Profiroiu C.M. (Eds.), The 21st NISPAcee Annual Conference: Regionalisation and Inter-regional Cooperation, May 16-18 2013, Belgrade, Serbia, NISPAcee, Bratislava 2014
[16] Paelinck, J. H. P., & Klaassen, L. L. H. (1979). Spatial Econometrics. Saxon House. Rhodes, R. (1997). Understanding Governance: Policy Networks, Governance, Reflexivity and Accountability. Buckingham: Open University Press.
[17] Skalski, K. (2009). Rewitalizacja we Francji. Zarządzanie przekształceniami obszarów kryzysowych w miastach. Kraków: Instytut Rozwoju Miast.
[18] Stankiewicz, W. (2012). Ekonomika instytucjonalna, Zarys wykładu (III). Warszawa.
[19] Ustawa z dnia 9 października 2015 r. o rewitalizacji, Dz.U. 2015, poz. 1777 z późn. zm. (Bill of Revitalization))

Management, Enterprise and Benchmarking in the 21st Century Budapest, 2017
297
Agricultural Land Protection – the Case of Slovakia
Lucia Palšová Faculty of European Studies and Regional Development, Slovak University of Agriculture in Nitra, Slovakia
Anna Bandlerová Faculty of European Studies and Regional Development, Slovak University of Agriculture in Nitra, Slovakia
Ina Melišková Faculty of European Studies and Regional Development, Slovak University of Agriculture in Nitra, Slovakia
Pavol Schwarcz Faculty of European Studies and Regional Development, Slovak University of Agriculture in Nitra, Slovakia
Abstract: This paper analyses the existing legislation governing the protection of agricultural land in Slovakia focusing on the protection of agricultural land through contributions as an economic instrument of protection of agricultural land. It assess the situation of the decrease of acreage of agricultural land at a time when the legislature did not use contributions for the protection of agricultural land against its usage for other than agricultural purpose and at a time when the contributions were re-used as an economic
Management, Enterprise and Benchmarking in the 21st Century Budapest, 2017
298
tool through which the usage of agricultural land for other than agricultural purposes is prevented.
Keywords: agricultural land, agricultural land protection, contributions - economic instrument
1 Introduction
According to the United Nations the land is a limited and irreplaceable natural resource with increasing substantial demands placed on it [1]. As a result of increasingly heavy pressure on land resources (e.g. housing, transport infrastructure, energy production, agriculture, and nature protection), agricultural production declines, the quantity and quality of land deteriorates, and there is increasing competition for access to land [2]. The competition for land resources creates serious risks of geopolitical imbalances both worldwide and in the EU. The EU will thus be even more dependent in future on its land resources – which include some of the most fertile soils in the world – and on their sustainable use .
Agricultural land represent one most vulnerable type of land resource. In the EU, more than 1,000 km² are subject to withdrawal every year for housing, industry, roads or recreational purposes. About half of this surface is actually 'sealed'. The availability of infrastructure varies considerably between regions, but in aggregate, every ten years we pave over a surface area equivalent to Cyprus [4].
Slovak law has paid particular attention to the protection of agricultural land for many decades as a result of the fact that the Slovak Republic has relatively little land of not the best quality on average, taking into account the population and the demands to ensure its nutrition [5].
A total size of land resources of the SR as of January 1, 2016 is 4,903,459 ha of land, of which 2,389,616 ha is agricultural land [6]. In the course of one calendar year in connection with changes of a permanent nature and specifying the measuring assessment we recorded a loss of 7425 ha of agricultural land [6]. A surface area of agricultural land is continuously shrinking. Over the last decade there was a decrease of 41,067 ha of agricultural land in Slovakia [6, 7].
Apart from the biological conservation of land the law as well as economic tools play an important role in the agricultural land protection. At present, there are these valid and commonly used economic instruments of the protection of agricultural land: charges for the removal and unauthorized withdrawal of agricultural land, taxes and land prices, subsidies and incentives leading to land protection but also the penalties for offenses in the field of land protection.
Management, Enterprise and Benchmarking in the 21st Century Budapest, 2017
299
2 Aims and materials
The aim of this paper is to analyse the current legislation protecting agricultural land in Slovakia focusing on the protection of agricultural land through contributions as an economic instrument of protection of agricultural land. It assess the situation of the decrease of acreage of agricultural land at a time when the legislature did not use contributions for the protection of agricultural land against its usage for other than agricultural purpose and at a time when the contributions were re-used as an economic tool through which the usage of agricultural land for other than agricultural purposes is prevented. The paper was worked out on the bases of materials collected in the frame of SULANET and ECAP EU project focused on legal tools of land protection (how legal tools effected land protection).
3 Discussion and results
The Slovak Republic is a country with a relatively small area of agricultural land, with a below-average area of agricultural land per 1 inhabitant. Currently, the per capita accounts for 0.44 ha of agricultural and 0.26 ha of arable land. In the world the ratio is 0.80 ha of agricultural and 0.27 ha of arable land [8].
There are various approaches to soil protection. Many of them have good scientific bases and are well managed in practice. They differ only in the efforts to point out that something is being done in this area. However, the truth is that we have moved only a little closer to the ideal state, in which the threats to soil are stopped or at least reduced to a professionally and socially acceptable level. This may be caused by what a well-known Russian diplomat, poet, and playwright, A. S. Griboyedov (1795-1829) called “gore ot uma” (woe from wit), or maybe Džatko and his work entitled “Stvoritelské dielo, clovek a udržatelný rozvoj stvorenstva” (Work of the Creator, Man and the Sustainable Development of the Created) was right when he said that “a man cannot understand the system he did not create, and therefore he must destroy and rebuild it at first to understand the limits within which it can be used”. The impulse for a new approach to the land protection was the Government Resolution no. 1141 [9], adopted on December 6, 2001, entitled "Principles of State Land Policy of the Slovak Republic" that directed to protection of the soil as a natural heritage of Slovakia. The resolution defined the soil as the top layer of eroded surface of the earth's crust containing water, air and living organisms. It defined individual functions of soil – organic functions (biomass production, filtration, neutralization and metabolism of substances in nature and maintenance of the ecological and genetic potential of living organisms) and functions

Management, Enterprise and Benchmarking in the 21st Century Budapest, 2017
300
associated with human activities (a part of the space base for socio-economic activities, supply of raw materials, cultural and natural heritage of the country).
Compared to the previous legal regulation, the resolution has a greater focus on organic function of soil. Stability of the soil organic matter also significantly depends on the natural resistance of the organic matter to decomposition which crucially depends on its internal structure, which was quite fittingly presented by Baldock and Skjemstad [10]. The resolution also points out negative effects of the intensification of agriculture in previous period, in particular soil compaction, the use of large and heavy agricultural machinery and economically motivated agricultural approaches (deficit in the use of organic fertilisers, rare cultivation of deep rooting plants). Several fundamental works have been published in order to clarify those problems. In the past, they were evaluated mainly in relation to crop yield. Emphasis was laid on the influence of heavy mechanisms that can affect soil to a depth of 30 cm and sometimes even deeper, i.e. to 50 cm or more [11].
Therefore the resolution stressed the importance of the proper use of the land respecting the principles and criteria of sustainable development communicating the protection of the quality and quantity of land. It reminds us that the land protection is carried out in the context of the protection of environmental components and the objective is to stabilize the area and volume of top quality land and prevent its unreasonable withdrawal. It is due an irreversible and immediate soil loss over time scales of hundreds of years and an increasing phenomenon in the current soil development [12]. The Ministry of Agriculture of the SR and local state administration bodies carried out the government management of land protection. The resolution highlighted the role of monitoring and a comprehensive information system on the status, characteristics and development of the land quality. This permanent and government supported creation of knowledge about land was also carried out as an obligation to contribute to the creation and updating of international documents on land. The resolution also focused on the international integration in which it is crucial to implement the principles applied in the European Union and other international principles and rules designed for protection and proper land usage. By this resolution the state land policy was declared clearly defining the principles and priorities of state related to land as an essential and non-renewable natural resource and a national wealth and heritage of future generations. By accepting the Principles of State Land Policy of the Slovak Republic the Government fulfilled the objective to implement initiatives to protect the land resonating world-wide but especially coming from the European Union.
As a response to the above mentioned resolution of the Government, the Law no. 220/2004 Coll. [13] was the adopted. The concept of agricultural land resources has been replaced by agricultural land. The law emphasized the protection of the environmental functions of agricultural land, ensuring the sustainable management and use, as it was declared in the Principles of State Land Policy. It defined basic legal concepts, specifying the agricultural land as the production potential land

Management, Enterprise and Benchmarking in the 21st Century Budapest, 2017
301
registered in the land register such as arable land, hop fields, vineyards, orchards, gardens and grasslands; the law also defined the concept of a credit soil-ecological units (CSEU-in Slovakia referred to as BPEJ) as the classification and identification figure for the quality and value of production-ecological potential of agricultural land in the soil habitat. The law established the obligation of each owner or user of agricultural land to protect agricultural land from degradation, erosion, compaction and hazardous materials. It defined the principles of sustainable usage of agricultural land, its management and protection and legally regulated the changes of types of land. In accordance with this legislation an authority for protection of agricultural land issues a decision to change the type of agricultural land to non-agricultural land, agricultural land or afforestation of agricultural land. At the same time the principles protecting agricultural land were introduced in the case when the land is used for non-agricultural purposes. Agricultural land could only be used for constructions and other non-agricultural purposes when necessary and in a reasonable scope. It was only possible to withdraw agricultural land permanently or temporarily, or use agricultural land for non-agricultural purposes for the period of one year including the restoration of land to the original condition. A permanent withdrawal of agricultural land was defined by the law as a permanent change of use of agricultural land with a permanent change of the land type in the land register. A temporary withdrawal was understood as a temporary change in the method of use of agricultural land for up to ten years that is reclaimed into original state. The authorities of the agricultural land protection were the Ministry of Agriculture (central body for the protection of agricultural land), Regional Land Office (a coordinator of cooperation with soil services) and District Land Office (made decisions in particular on the withdrawal of agricultural land, imposed fines and cooperated with soil services). These authorities carried out professional supervision in cooperation with the newly established soil services, obligated by law to implement surveillance and monitoring of agricultural land, keep an information database and process proposals for measures and expert opinions in accordance with the law. It was possible to impose fines for offenses in the field of protection of agricultural land. The amount of the fine was determined based mainly on the seriousness, manner and duration of the offense and the scope and extent of the damage or threat of the damage caused. A fine was imposed by the authority for the protection of agricultural land and the income from the fines constituted a revenue of the state budget. Each of the legislation which used the institute of contributions for the withdrawal of agricultural land at the same time also ordered a number of exceptions from the obligation to pay contributions. The exceptions related to approximately 70% of all agricultural land withdrawals [14] and thus, considered by the law makers, the contributions became unsystematic and undemocratic, leading to their abolition at the time. On one hand, the law abolished the contributions, on the other hand, it toughened the rules related to the agricultural land keeping. The categories and limit values were fixed relating to erosion, compaction, quality of soil organic matter, liming of agricultural land, the
Management, Enterprise and Benchmarking in the 21st Century Budapest, 2017
302
limit values for risk substances in agricultural land, by which we understand the value of maximum permitted levels of hazardous substances and the level of contamination. The fines were left as the only economic instrument for the protection of agricultural land against its withdrawal and usage for other than agricultural purposes. Adopting this approach the legislature expected a positive impact on the owners and users of agricultural land. A reduction of the state budget income from missing payments for withdrawal of agricultural land should have been partially offset by increased contributions and taxes from business activities on the occupied land.
It turned out that the abolition of contributions for the withdrawal of agricultural land for other than agricultural purposes did not produce the effect that the legislature expected at the time of adoption of the Law no. 220/2004 Coll., when the contributions were abolished and so five years after an amendment to the Law. 220/2004 Coll., was approved, namely the Law no. 219/2008 Coll. [15], with the effect from January 1, 2009. This amendment re-introduced the contributions but only for the withdrawal of agricultural land classified under the code CSEU to categories 1-4. Through the institute of contributions for the withdrawal of agricultural land as a system economic instrument of the protection of the best quality agricultural land the conditions for the withdrawal of agricultural land for non-agricultural constructions and other plans became more strict. Another positive impact of paying contributions was an increased revenue of the government and thus securing the financing activities of the Ministry of Agriculture of the Slovak Republic in the form of balance between the revenue and the expenditure of the budget of the Ministry of Agriculture of the Slovak Republic in the course of the financial year. By introducing of the contributions for the withdrawals the legislator planned to achieve three society-wide objectives, namely to safeguard and stabilize the area of the best quality agricultural land in Slovakia, guiding and if needed making investors of buildings to target to sites in Slovakia outside the Bratislava and Trnava region, the land of inferior quality (CSEU category 5-9) and less important for agricultural primary production, which will lower their contributions, and also to limit their land requirements for the necessary extent of the withdrawal and finally securing funds for the implementation of certain provisions of the law, such as activities related to the arrangement of the registration of agricultural land in the land registry with the actual situation in the field and on the creation of an information system on soils. The contributions for permanent or temporary withdrawal of agricultural land was to be paid by the one who proposed its use for other than agricultural purposes. In case of a permanent withdrawal it was a permanent change in the method of use of agricultural land with a permanent change in the land register and in case of a temporary withdrawal it was a temporary change in the method of use of agricultural land for a maximum of ten years. The land had to be reclaimed into the original condition. The obligation to pay contributions concerned also those who withdrew agricultural land without the decision of the authority for the protection of agricultural land. If the contribution was not paid on time, there was

Management, Enterprise and Benchmarking in the 21st Century Budapest, 2017
303
an obligation to pay a penalty for every commenced day of the delay amounting to 0.5% of the unpaid amount. Contributions as well as penalties were the revenue of the state budget. The law did not specify the amount of the contribution, however, in this regard the Slovak Government Regulation no. 376/2008 Coll. was adopted [16] establishing the amount of contribution and the method of payment. The amendment re-determined questions relating to the exemption from contributions for the withdrawal of agricultural land, but only if there was suitable land available in the cadastral territory classified under the CSEU code in category in 6-9.
Another important amendment to the Law no. 220/2004 Coll. was the Law no. 57/2013 Coll. [17], with effect from April 1, 2013. The reason for the adoption of the amendment was to adjust the direction and extent of the institute of the contribution for the withdrawal of the highest quality agricultural land in the appropriate cadastral area. The amendment was based on the need to protect the highest quality agricultural land by the institute of contributions in the cadastral area proportionally on the whole territory of the Slovak Republic by individual protection of certain specific CSEU codes in individual cadastral areas. The solution was an updated table of quality groups (CSEU codes) assigning a contribution for the withdrawal of agricultural land according to the quality of €/m 2 for each cadastral area within the territory of the SR. The contributions therefore had to be paid same like in the current legislation for each piece of agricultural land in Slovakia for all credit classes. A considerable extent of exceptions from the payment of the contributions for the withdrawal was abolished by the amendment because they accounted approximately 70% of all agricultural land withdrawals. A modification of the scope of exceptions was established by the Government Regulation of the Slovak Republic no. 58/2013 Coll. [18]. The regulation provided in addition to exemption from the contributions and the basic rate of the payment for the withdrawal of agricultural land and unauthorized agricultural land withdrawal, the list of the highest quality agricultural land in the cadastral territory according to the CSEU codes, the amount of contribution payment, the method of contribution payment and the contribution maturity. One of the exceptions to the payment of contributions for the agricultural land withdrawal was the case when a planning permission was issued, as a significant investment in the amount of at least one billion euros of the investment costs creating at least 2,000 new jobs during its implementation. According to the opinion of the European Commission the existence and application of the exemption from the contribution payment is an unlawful State aid and distorts competition. The legislature accepted objections of the European Commission and adopted an amendment to the Government Regulation no. 58/2013 Coll., namely the Regulation No. 363/2016 Coll. amending the Slovak Republic Government Regulation no. 58/2013 Coll. [19], leaving out the given provision of the law. Contributions for the agricultural land withdrawal were only incidental revenues and it was not possible to directly affect their amount by the instruments of the ministry. The main objective of the introduction of the statute
Management, Enterprise and Benchmarking in the 21st Century Budapest, 2017
304
of the contributions for the agricultural land withdrawal was the protection of the finest agricultural land in Slovakia and not the fulfilment of the state budget revenues. The contributions had especially a protective and guidance character. Moreover, during the economic and financial crisis, investment activities of most potential investors in our country were reduced and the performance of these revenues significantly stagnated. In those circumstances the performance of the income from the agricultural land withdrawal was risky and the Ministry of Agriculture and Rural Development of the Slovak Republic in this period several times attempted to reduce respectively abolish the budgeting of this income, but due to the economic crisis and its society-wide impact this was not unacceptable by the Slovak Ministry of Finance. Regional Land Offices and District Land Offices in accordance with the Law no.220/2004 Coll. on the protection and use of agricultural land and the Government Regulation no. 376/2008 regulating the amount and method of the payment of contributions for the withdrawal of agricultural land reached in 2010 revenues from contributions for the withdrawal of agricultural land in the amount of 1 126,671.97 € which is 99.23%, i.e. 561,158.37 € more in comparison with 2009 [20]. The revenue from contributions for the withdrawal of agricultural land, which in 2011 were budgeted in the budget revenue of the Office of the Ministry of Agriculture and Rural Development of the Slovak Republic has been implemented in accordance with the Law no. 220/2004 Coll. on the protection and use of agricultural land and the Government Regulation no. 376/2008 regulating the amount and method of the payment of contributions for the withdrawal of agricultural land by Regional Land Offices and District Land Offices. Based on the decisions issued in 2011 these authorities reached the revenue from contributions for the withdrawal of agricultural land in the amount of 980,527.79 €, a decrease of 12.97%, i.e. 146,144.18 € less compared to the previous year 2010 [21]. The revenue from contributions for the withdrawal of agricultural land are indeed regular income, but at the same time they are unstable in their amount as evidenced by the amount of income from the contributions of Regional Land Offices and District Land Offices in 2012 in the amount of 2 889,920.03 € which is compared to 2011 an increase of 194.73%, i.e. 1 909,392.24 € [22]. In 2013, district land offices reached an income of 1 035,046.79 € and therefore compared with the previous year it decreased by 64.18%, i.e. 1 854,873.24 € [23]. For a period of five years from the reintroduction of contributions for the withdrawal of agricultural land, i.e. from 2009 through 2013 the real income from the contributions reached the amount of 6 597,680.18 €. At present it is impossible to precisely quantify the amount of these revenues because these are influenced by various factors such as the number of applicants for the withdrawal of agricultural land, range and quality of soil, which will be withdrawn. Therefore, the reasonable estimate is mainly based on the actual implementation of these revenues in previous years. In the draft of the budget for 2014 and 2015, these revenues were budgeted in the Ministry of Agriculture and Rural Development of the Slovak Republic for both years in the amount of 504,130 €. The draft budget, however, in those years counted on the

Management, Enterprise and Benchmarking in the 21st Century Budapest, 2017
305
budgetary unmatched savings, which represented an increase in revenue from contributions for the withdrawal of agricultural land due to the cancellation of a significant number of exceptions from the duty to pay the contributions by 1 million € compared to the amount of the revenues budgeted in the draft budget [24, 25].
3.1 Shrinkage of agricultural land in Slovakia
The development of the structure of land resources in recent decades in Slovakia is characterized by a significant loss of agricultural land in connection with the intensive construction activities and reducing the importance of farming to the total gross domestic product.
Since 1950 there has been a decrease of more than 380,000 ha of agricultural land. The reason for this phenomenon is the preference of technical and economic benefits of agricultural land withdrawal for capital construction activities [25].
Figure 1
The area of agricultural land withdrawal in the period 2007-2015 (ha)
As demonstrated in Figure 1 the biggest agricultural land withdrawal in Slovakia was registered in 2008. This year was exceptional because it was the last year when the contributions for the agricultural land withdrawal were not paid. For the period of nine years, i.e. from 2007 to 2015 a total of 15,141.40 ha of agricultural land was withdrawn.

Management, Enterprise and Benchmarking in the 21st Century Budapest, 2017
306
Figure 2
The area of agricultural land withdrawal in the period 2007-2015 (ha) according to CSEU
In 2008, the most of agricultural land, i.e. 25% was withdrawn in the quality group 6, representing 1,152.49 ha. On the other hand, the least of agricultural land, i.e. 4% of the total was withdrawn in the quality group 1, representing 188.94 ha. In the quality groups 1-4, 1,611.38 ha was withdrawn and in the quality groups 5-9, 3,038.04 ha of agricultural land was withdrawn.
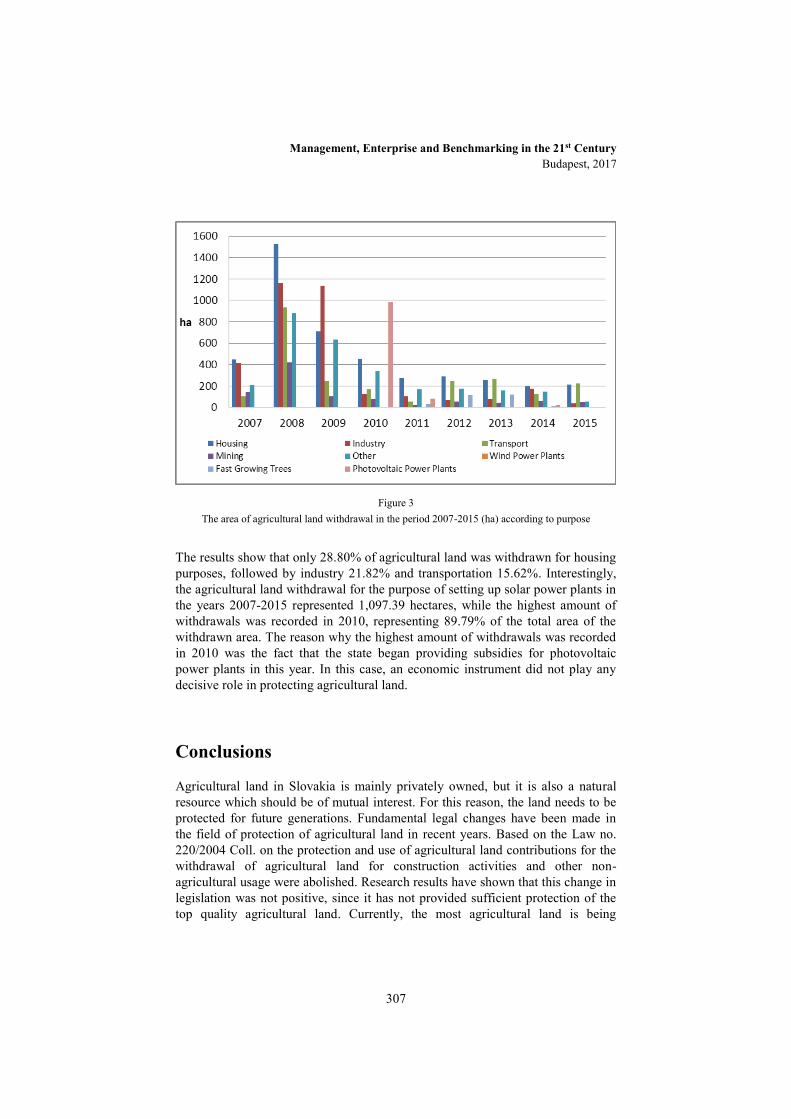
Management, Enterprise and Benchmarking in the 21st Century Budapest, 2017
307
Figure 3
The area of agricultural land withdrawal in the period 2007-2015 (ha) according to purpose
The results show that only 28.80% of agricultural land was withdrawn for housing purposes, followed by industry 21.82% and transportation 15.62%. Interestingly, the agricultural land withdrawal for the purpose of setting up solar power plants in the years 2007-2015 represented 1,097.39 hectares, while the highest amount of withdrawals was recorded in 2010, representing 89.79% of the total area of the withdrawn area. The reason why the highest amount of withdrawals was recorded in 2010 was the fact that the state began providing subsidies for photovoltaic power plants in this year. In this case, an economic instrument did not play any decisive role in protecting agricultural land.
Conclusions
Agricultural land in Slovakia is mainly privately owned, but it is also a natural resource which should be of mutual interest. For this reason, the land needs to be protected for future generations. Fundamental legal changes have been made in the field of protection of agricultural land in recent years. Based on the Law no. 220/2004 Coll. on the protection and use of agricultural land contributions for the withdrawal of agricultural land for construction activities and other non-agricultural usage were abolished. Research results have shown that this change in legislation was not positive, since it has not provided sufficient protection of the top quality agricultural land. Currently, the most agricultural land is being
Management, Enterprise and Benchmarking in the 21st Century Budapest, 2017
308
withdrawn for the purpose of housing, followed by industry and transportation. Having studied the period of the application of the law, which abolished the contributions as an economic instrument for the protection of agricultural land and the reintroduction period of the contributions it can be stated that higher loss of agricultural land occurred at a time when the contributions as an economic tool for the protection of agricultural land were not used. We believe that one way of protecting agricultural land against the degradation through its withdrawal for other than agricultural purposes is the full use of economic instruments. These include, in addition to the contributions, taxes, fees and charges. They apply in two main groups of payments, payments for environmental pollution and payments for the use of natural resources.
Acknowledgements
Results of the paper are based on the research tasks of the Jean Monnet Networks project no. 564651-EPP-1-2015-1-SK-EPPJMO-NETWORK “Sustainable Land Management Network“ and project ECAP No. 561590-EPP-1-2015-1-SK-EPPKA2-CBHE-JP. „These projects have been funded with the support of the European Commission. This publication only reflects the views of the author, and the Commission cannot be held responsible for any use which may be made of the information contained therein.“
References
[1] DEMO, M. a kol. 2007. Udržateľný rozvoj: život v medziach únosnej kapacity biosféry. Nitra : Slovenská poľnohospodárska univerzita v Nitre, 440 s. ISBN 978-80-8069-826-3.
[2] FAO/UNEP. 1999. The Future of Our Land. Facing the Challenge. Guidelines for Integrated Planning for Sustainable Management of Land Resources. FAO/UNEP, Rome in NTOSAI Working Group on Environmental Auditing (WGEA). 2013. Land Use and, Land Management, Practices in Environmental Perspective. ISBN 978-9949-9061-9-2 (PDF)
[3] The implementation of the Soil Thematic Strategy and ongoing activities, COM/2012/046 final. Report from the Commission to the European Parliament, the Council, the European Economic and Social Committee and the Committee of the Regions.
[4] Roadmap to a Resource Efficient Europe, COM/2011/0571 final. Communication from the Commission to the European Paliament, the Council, the Europena Economic and Social Committee and the Committee of the Committee of Regions.
Management, Enterprise and Benchmarking in the 21st Century Budapest, 2017
309
[5] ŠTEFANOVIČ, M. 2009. Právna úprava ochrany pôdy v Slovenskej republike. Česká společnost pro právo životního prostředí. [online], [cit. 2016-11-21]. Dostupné na: <http://www.cspzp.com/dokumenty/konference01/stefanovic.doc>.
[6] Štatistická ročenka o pôdnom fonde v SR podľa údajov katastra nehnuteľností k 1. januáru 2016. Bratislava : Úrad geodézie, kartografie a katastra Slovenskej republiky, 128 s. ISBN 978-80-89831-02-9.
[7] Štatistická ročenka o pôdnom fonde v SR podľa údajov katastra nehnuteľností k 1. januáru 2007. Bratislava : Úrad geodézie, kartografie a katastra Slovenskej republiky, 128 s. ISBN 978-80-22409-90-2.
[8] JAHNÁTEK, Ľ. a kol. 2016. Koncepcia podpory pre malých, mladých a rodinných farmárov. Ministerstvo pôdohospodárstva a rozvoja vidieka SR. [online], [cit. 2016-11-22]. Dostupné na: <http://www.mladyfarmar.sk/sites/default/files/6.2_koncepcia_podpory_pre_mmrf.pdf>.
[9] Uznesenie vlády Slovenskej republiky č. 1141 zo 6. decembra 2001 k návrhu zásad štátnej pôdnej politiky Slovenskej republiky.
[10] BALDOCK, J. A. – SKJEMSTAD, J. O. 1999. Soil organic carbon/soil organic matter. In: Soil Analysis: an Interpretation Manual (Peverill, K.I. – Sparov, L.A. – Reuter, D.J.), s. 159 - 170, CSIRO Publishing: Collingwood.
[11] VOORHEES, W. B. - NELSON, W. W. - RANDALL, G. W. 1986. Extend and persistence of subsoil compaction caused by heavy axle loads. Soil Sci.Soc. Amer. J. 50, s. 428 - 433.
[12] BLUM, W. E. H. 1990. The challenge of soil protection in Europe. Environmental Conservation 17. In: World Resources Institute, Account Overdue. Natural Resource Depreciation in Costa Rica. Oxford University Press. Oxford, New York.
[13] Zákon č. 220/2004 Z. z. o ochrane a využívaní poľnohospodárskej pôdy a o zmene zákona č. 245/2003 Z. z. o integrovanej prevencii a kontrole znečisťovania životného prostredia a o zmene a doplnení niektorých zákonov.
[14] Dôvodová správa k zákonu č. 220/2004 Z. z. o ochrane a využívaní poľnohospodárskej pôdy a o zmene zákona č. 245/2003 Z. z. o integrovanej prevencii a kontrole znečisťovania životného prostredia a o zmene a doplnení niektorých zákonov.

Management, Enterprise and Benchmarking in the 21st Century Budapest, 2017
310
[15] Zákon č. 219/2008 Z. z., ktorým sa mení a dopĺňa zákon č. 220/2004 Z. z. o ochrane a využívaní poľnohospodárskej pôdy a o zmene zákona č. 245/2003 Z. z. o integrovanej prevencii a kontrole znečisťovania životného prostredia a o zmene a doplnení niektorých zákonov v znení zákona č. 359/2007 Z. z.
[16] Nariadenie vlády Slovenskej republiky č. 376/2008 Z. z., ktorým sa ustanovuje výška odvodu a spôsob platenia odvodu za odňatie poľnohospodárskej pôdy.
[17] Zákon č. 57/2013 Z. z., ktorým sa mení a dopĺňa zákon č. 220/2004 Z. z. o ochrane a využívaní poľnohospodárskej pôdy a o zmene zákona č. 245/2003 Z. z. o integrovanej prevencii a kontrole znečisťovania životného prostredia a o zmene a doplnení niektorých zákonov v znení neskorších predpisov a o zmene a doplnení niektorých zákonov.
[18] Nariadenie vlády Slovenskej republiky č. 58/2013 Z. z. o odvodoch za odňatie a neoprávnený záber poľnohospodárskej pôdy.
[19] Nariadenie vlády Slovenskej republiky č. 363/2016 Z. z., ktorým sa mení a dopĺňa nariadenie vlády Slovenskej republiky č. 58/2013 Z. z. o odvodoch za odňatie a neoprávnený záber poľnohospodárskej pôdy v znení neskorších predpisov.
[20] Ministerstvo pôdohospodárstva a rozvoja vidieka Slovenskej republiky. 2010. Správa Ministerstva pôdohospodárstva a rozvoja vidieka Slovenskej republiky o hospodárení kapitoly. [online], [cit. 2016-11-24]. Dostupné na: <http://www.mpsr.sk/index.php?navID=801&navID2=801&sID=17&id=2096>.
[21] Ministerstvo pôdohospodárstva a rozvoja vidieka Slovenskej republiky. 2011. Správa Ministerstva pôdohospodárstva a rozvoja vidieka Slovenskej republiky o hospodárení kapitoly. [online], [cit. 2016-11-24]. Dostupné na: <http://www.mpsr.sk/index.php?navID=801&navID2=801&sID=17&id=2096>.
[22] Ministerstvo pôdohospodárstva a rozvoja vidieka Slovenskej republiky. 2012. Správa Ministerstva pôdohospodárstva a rozvoja vidieka Slovenskej republiky o hospodárení kapitoly. [online], [cit. 2016-11-24]. Dostupné na: <http://www.mpsr.sk/index.php?navID=801&navID2=801&sID=17&id=2096>.
[23] Ministerstvo pôdohospodárstva a rozvoja vidieka Slovenskej republiky. 2013. Správa Ministerstva pôdohospodárstva a rozvoja vidieka Slovenskej republiky o hospodárení kapitoly. [online], [cit. 2016-11-24]. Dostupné na: <http://www.mpsr.sk/index.php?navID=801&navID2=801&sID=17&id=2096>.

Management, Enterprise and Benchmarking in the 21st Century Budapest, 2017
311
[24] Ministerstvo pôdohospodárstva a rozvoja vidieka Slovenskej republiky. 2014. Správa Ministerstva pôdohospodárstva a rozvoja vidieka Slovenskej republiky o hospodárení kapitoly. [online], [cit. 2016-11-24]. Dostupné na: <http://www.mpsr.sk/index.php?navID=801&navID2=801&sID=17&id=2096>.
[25] Ministerstvo pôdohospodárstva a rozvoja vidieka Slovenskej republiky. 2015. Správa Ministerstva pôdohospodárstva a rozvoja vidieka Slovenskej republiky o hospodárení kapitoly. [online], [cit. 2016-11-24]. Dostupné na: <http://www.mpsr.sk/index.php?navID=801&navID2=801&sID=17&id=2096>.

Management, Enterprise and Benchmarking in the 21st Century Budapest, 2017
312
The Role and Impact of Fairness on Cooperation in Hungarian Metal and Machinery Supply Chains
Dr. Noémi Piricz
Associate professor and head of the Department of Management and Enterprise Sciences in the University of Dunaújváros, Hungary +36-25-551-203
Abstract: Our survey investigates fair behaviour on one hand from network perceptions
and on the other hands if ethical behaviour brings benefits for companies in their
relationships. The results of our qualitative research show that fair behaviour has certain
positives and actors perceive network effects as one of general conditions around them.
Keywords: business ethics, supply chain, business network
1 Introduction A business network can be approached by network of interactively connected business ties. On one hand the networks offer a natural arena for ethical issues while it colligates the divergent interests of actors1. This raises the question how much a company is able to give up its own goals and plans so as to support another business partner. But in this way business network can increase its members’ well-being because it believes and follows the importance of collective aims and interests2. On the other hand business relationships inside a network include ethical norms as mechanism of business management3.
The globalisation and spread and development of supply chains mean an obvious need and challenge to shift the focus of b2b investigations from relationship level 1 Halinen, Aino - Päivi Jokela (2014) Exploring Ethics in Business Networks:
Propositions for Future Research. IMP Conference Bordeaux, France 2 Ford, D. - Håkansson, H. - Johanson, J. (1986) How do companies interact, Industrial
Marketing and Purchasing, Vol. 1, No. 1, 26–41 3 Håkansson, H. – Snehota, I. (1995) (ed.) Developing relationships in business
networks, London, Routledge

Management, Enterprise and Benchmarking in the 21st Century Budapest, 2017
313
to network sphere4,5,6. In this study we set ethics and its more concrete form fairness into the spotlight and describe what existing research reveals about their importance for business networks.
Our study first shows a short summary of relevant literature. In the second part of our study we introduce the first findings of our survey when during course of in-depth interviews we ask Hungarian companies and advisors from metal and machinery industries about the roles of business ethics in their supply chains.
2 Literature review In this chapter we look through briefly the relevant literure of business ethics mainly from network aspects. Business ethics is a form of applied ethics. It includes not only the analysis of moral norms and moral values, but also attempts to apply conclusions of this analysis to the assortment of institutions, technologies, transactions, activities and pursuits that we call business7.
An early survey of 1300 leaders of totally 325 enterprises in Hungary in 1996 showed a quite mixed picture handling ethics on a firm level8. The researchers of this survey had the opinion that handling ethics at firm level was at early stage while about 10 per cents of respondents had their own ethical codex. Those firms showed more ethical behaviour which tried to achieve larger turnover in developed export markets. But according to their data the ethical behaviour of Western companies operating in Hungary were not outstanding in those years.
Hajnalka Csáfor9 found that the most important motivation of continuity of corporate social responsibility (CSR) of the interviewed large Hungarian firms was ‘to apply for their basic company values’. This result seems to confirm Szegedi’s10 view for strengthening ethical issues. In Csáfor’s survey other 4 Halinen, A. - Törnroos, J.-Å. (1998) The role of embeddedness in the evolution of
business networks, Scandinavian Journal of Management, Vol. 14, No. 3, 187–205 5 Veres L. (2008) Kihívások Kelet-Közép-Európa logisztikai versenyében, Közép–
Európai Közlemények 2008./2. I. évfolyam 2. szám, Szeged, 93-109. pp. ISSN: 1789-6339
6 Veres L. (2009) Regionális logisztikai rendszerAek, Közép-Európai Közlemények 2009./4-5. szám 150-157 pp., Szeged. ISSN: 1789-6339
7 Velasquez, M.G. (2012) Business Ethics - Concepts & Cases, Pearson Education, Inc. 8 Chikán A. (1997) Vállalatok és funkciók integrálója - Folyamatjellegű irányítás -
alprojekt záró tanulmánya. Budapesti Közgazdaságtudományi Egyetem, Vállalatgazdaságtan tanszék
9 Csáfor H. (2010) Mennyire felelősek az Észak-magyarországi régió vállalatai? Periodica Oeconomica, III. ÉVF. November p. 22–36
10 Miskolci Egyetem
Management, Enterprise and Benchmarking in the 21st Century Budapest, 2017
314
essential priorities were: ‘acting as ethical company’, ‘contribution to sustainable development’ and ‘maintenance of good reputation’ finally ‘getting more customers and new markets’. The investigated small- and medium sized enterprises (SMEs) represent a little bit different opinion. The SMEs think that ‘getting more customers and new markets’ is the most important and only after this aspect come “decrease of costs’, ‘maintenance of good reputation’. Finally they rank ‘acting as ethical company’ and ‘contribution to sustainable development’9. The two very different priority lists – based on sizes of respondents – prove that for SMEs the short term profitability plays a much more important role. We have found a cultural speciality during review of relevant Hungarian literature. When authors deal with issues of ethics they often focus on unethical behaviour or more concretely corruption (e.g.11, 12).
We use now Chikán’s13 definitions for supply chain: such value creating row of processes, which is necessary for establishment of certain product and service package and steps out the boundary of cooperating organizations in order to satisfy customer demands. The building stones of supply chains are the different kinds of organizations and their relationships. The conceptual framework of supply chain in Cooper et al’s14 view emphasizes the interrelated nature of supply chain management (SCM) and the need to proceed through several steps to design and successfully manage a supply chain.
Hámori et al.15 (2007) investigated the competitive and cooperative behaviours of companies and found that 63 per cents of respondents thought that cooperative attitude is low among economic actors and in 22 cases (28 per cents) identified lack of trust as result. The second frequent reason was lack of cooperation. Kolos et al.16 also find that such characters of inter-personal relationships as sincerity, reliability and readiness to help, have basic importance in evaluation of relationships. 11 Fazekas M., Tóth István János, Lawrence Peter King (2013): Anatomy of grand
corruption: A composite corruption risk index based on objective data. Corruption Research Centre Budapest
12 Czibik Ágnes, Hajdu Miklós, Makó Ágnes, Tóth István János, Várhalmi Zoltán (2011): Integritás és korrupciós kockázatok a magyar vállalati szektorban. MKIK Gazdaság- és Vállalkozáskutató Intézet, Budapest
13 Chikán, A. (2004): Vállalatgazdaságtan, Aula Kiadó Budapest 14 Cooper, M. C. - Lambert, D. M. - Pagh, J. D. (1997): Supply Chain Management:
More Than a New Name for Logistics. The International Journal of Logistics Management 8(1), 1–13
15 Hámori B. – Szabó K. – Derecskei A. – Hurta H. – Tóth L. (2007): Versengő és kooperatív magatartás az átalakuló gazdaságban, Közgazdasági Szemle (Journal of Economic Literature), LIV. évf. June, 579–601.
16 Kolos K. (ed.) (2006) Vállalatközi kapcsolatok és a versenyképesség összefüggései – Projekt záró-tanulmány, BUDAPESTI CORVINUS EGYETEM - VÁLLALATGAZDASÁGTAN INTÉZET, 44. sz. Műhelytanulmány
Management, Enterprise and Benchmarking in the 21st Century Budapest, 2017
315
In Hungary, after the dissolution of the Eastern Block the foreign ownership of total Hungarian economy was 11 % in 1992 and this rate achieved 41% by 2000 which is extremely high even in international comparison17. FDI had and still today has positive effects on Hungarian export and strengthened Hungary’s position in world economy. Between 1992 and 2004 Hungary welcomed totally 40.7 billion USD FDI. This amount per capita is three times higher than the Czech and Polish data18. So the companies with foreign ownership have achieved dominant role in most of the key sectors in Hungary. Multinational companies have found the country as an interesting option for investing and sourcing, for example in machinery industry firms of foreign ownership accounts for 78 %18 and skilled workforce has encouraged establishment of R&D centres19. The Hungarian automotive industry has developed on the base of the earlier manufacturing of trucks and buses. The location in the Central Europe with markets in the West and in the East, and the ability to offer manufacturing at a relatively low cost and good quality have been key in attracting business partners (The Central and Eastern European automotive market).
According to relevant publications ethics in business and ethical behaviour can offer various benefits, such as
acts to prevent a substantial harm to others20 contributes to successful performance21 generally has positive effects on diadic relationships22 increases profit22 generally has positive effects on diadic relationships23 results more stabile business relationships24
17 Kádár, Z. - Markovszky, S. (2004) “Külföldi működőtőke beáramlás
Magyarországon”, (Inflow of FDI in Hungary) Országos Tudományos Diákköri Konferencia, 1. díj.
18 Karsai, G. (1999) “A magyar gazdaság folyamatai, 1990-98” (The processes of the Hungarian economy between 1990 and 1998), Helyzetkép a TEP makro-forgatókönyveihez, Budapest
19 Farkas, Z. (2002) “Hopp és kopp”, HVG (Weekly World Economics in Hungarian) 09.12.2002
20 Robin, D. (2009) Towards an applied meaning for ethics in business, Journal of Business Ethics, Vol. 89, No. 1, 139–150
21 Ferrell, O. - Frederich, J. - Ferrell, L. (2012) Business ethics: Ethical decision making & cases (Vol. 9). Boston: Cengage Learning
22 Luo, Y. (2009): From gain-sharing to gain-generation: The quest for distributive justice in international joint ventures, Journal of International Management, Vol. 15, 343–356.
23 Halinen, A., Salmi, A. and Havila, V. (1999) From dyadic change to changing business networks: An analytical framework”, Journal of Management Studies, Vol. 36, No. 6, 779-794.
24 Luo, Y. (2006) Toward the micro- and macro-level consequences of interactional justice in cross-cultural joint ventures, Human Relations, Vol. 8, No. 59, 1019–1047.

Management, Enterprise and Benchmarking in the 21st Century Budapest, 2017
316
arouses larger satisfaction between the partners25 causess less conflicts26 leads to growing reputation26 improves long term competitiveness and economic performance.1
Therefore our research questions are simple: Is it worthy to act and behave ethically? Does it bring benefits? If so, what kind of advantages can managers expect from ethics?
3 Introduction of our empirical survey and findings Our empirical survey is the Hungarian pillar of a Finnish research in University of Turku where the methodology was developed and tested. We used depth interviews of qualitative methodology27 because of the very sensitive topic. In our study the depth interviews are semi-structured, which means there are quite detailed sub points and naturally it is not obligatory to answer each question. Our aim is to use out flexibility of this method28 and to give freedom for respondents to speak bravely about such a sensitive topic. Certainly we guarantee anonymity during data collection, analysis and publications as well.
In this paper we deal with the Hungarian research. (The international comparison see e.g. 29) The ten depth interviews were made in 2015-16. We want to analyse various issues of fair behaviour in metal and machinery supply chains so three interviews are made with experts and the rest with practitioners. When we talk to experts, they summarize their several decades’ experiences, which means in our survey much more than 10 organisations are included. These talks repsesent various sizes of companies and their main distribution markets are also different. A part of them sells their products only in domestic market but others produce dominantly for export markets. Empirical data was collected with interviews and the main informants in the companies were senior managers, CEOs and one
25 organizational contracts and justice in marketing channel relationships, Journal of
Business Research, Vol. 59, No. 2, 166–175 26 Christopher, M. - Gaudenzi, B. (2009) Exploiting knowledge across networks through
reputation management, Industrial Marketing Management, Vol. 38, No. 2, 191–197 27 Malhotra, Naresh K. (2007): Marketing research. Pearson 28 Yeung, Henry Wai-chung (1995) Qualitative Personal Interviews in International
Business Research: Some Lessons from a Study of Hong Kong Transnational Corporations. International Business Review Vol. 4, No. 3, pp. 313-339
29 Jokela, Päivi - Halinen, Aino - Piricz Noémi (2016) Competitive bidding and contracts - The impact of perceived fairness on relationship continuity among Finnish and Hungarian metal and machinery industry actors. IMP Conference, Poznan, Poland Conference Proceedings http://www.impgroup.org/paper_view.php?viewPaper=8829
Management, Enterprise and Benchmarking in the 21st Century Budapest, 2017
317
director of a board. Sensitivity also was a limitation in the study; the Hungarian companies in particular were hesitant to disclose their views to the researchers. We should add that respondents are successful firms. It seems to be logical that a successful – and possibly ethical – firm speaks with pleasure about these topics. Now the question is which was earlier: ethical behaviour or success?
3.1 General findings The Hungarian economy is after transition from the socialist system to the capitalist one. In the previous system (actually it was also a mixed system but in a different way) many factors were determined centrally and mostly state-owned companies had to fulfil the plans so ethics played smaller role. In the early 90’s foreign investors appeared and bought old-fashioned companies in mass privatisation. A few experienced Hungarian former-leaders started their own enterprises in small scales. If they have managed to survived their first years they can operate today. The majority of respondents are from this group. They started in small size in the early 90’s and now they are successful medium-sized firms with stable export markets.
As an expert says the companies that exist nowadays in the Hungarian metal and machinery sectors were established by foreign capital. They have foreign ownerships still today. They pay taxes in Hungary and contribute to the Hungarian GDP but no other effects can come out of their company gate. He also thinks they do not turn back their profit into the Hungarian economy like a normal domestic enterprise. Regarding suppliers they seem to prefer foreign suppliers.
The ethical behaviour can be more vital in asymmetric business ties where ownership and use of resources are unbalanced30. We see that asymmetric business relationships belong to hot topics but its network aspect is less investigated. Mouzas and Ford29 state that interactive dependency does not definitely mean equal access to resources and it may happen that even the actors have chosen this case and we confirm their view.
Almost each respondent shared an unethical case, for example: “If a competitor makes an offer with irrationally law prices, potential
buyers expect us to follow this. In spite of this, the firm which made this impossible offer went bankrupt soon after this deal.” (medium-sized firm)
“The car assemblers ask more at lower prices. For instance at first the assembler orders 100 pieces for 1000 units but later 10000 pieces for 50 units.” (TIER-1 supplier)
30 Mouzas, S. - Ford, D. (2007) Contracts in asymmetric relationships. The Proceedings
of the 22nd IMP Conference, Milan

Management, Enterprise and Benchmarking in the 21st Century Budapest, 2017
318
A buyer disappeared without payment. Another buyer instead of announcing its worsening financial situation,
starts quality complaining, and they not only postpone payment but cause additional quality inspection costs for supplier.
Business partners may cheat with taxes. This is unfair for competitiors because these cheaters can calculate at lower costs and become more competitive.
Certain buyers may expect extraordinary flexibility and even determine the supllier’s suppliers.
Despite these unetchical behaviours the general opinion is optimistic and companies think it is not general but rarerly happens. They try to learn from these and have a view that this belongs to risks of business.
We met an interesting but seemingly successful method how to handle the so called Chinese effect: A respondent explained that a Chinese competitor copied their product in a false quality and the buyer was not satisfied. So the (Western European) buyer turned to this Hungarian firm and asked to build and install the complex system in China. They did it and it works well now, the Hungarian firm controls it through a remote control system from Hungary. The Hungarian firm is not worrying of being coped again because on the one hand they cannot keep their system in store (but has to sell) and on the other the Hungarian firm is better (and has satisfied buyer) for the time being.
3.2 Respondents’ supply chain experiences We state that respondents are usually aware of various network affects. It seems that this is already a natural part of their environment. However we find another common feature of supply chains; this is the dominant role of the largest member of supply chain. This actor is generally located closest to the final customer. For example during procurement a large company receives the complex order and it gives many tasks further to its subcontractors and these subcontractors also give over some tasks to their subcontractors etc. In other case the car assembler gives almost final contact to the buyer – without any negotiations on it – and this position gives them both responsibility and power. It seems they practically instruct their suppliers. Certainly it is also the assembler’s interest that suppliers fulfil good performance but the car assemblers treat them severely.
It seems that size and position in the supply chain are the two most important factors which influence behaviour of companies in metal and manufacturing sectors. The leaders’ and owners’ personal attitude play another vital role.
Some typical answers to confirm our opinion:
Management, Enterprise and Benchmarking in the 21st Century Budapest, 2017
319
“We are medium-sized not only from statistical aspects but also due to our position in our supply chain. We are stressed from above and below and also sideways.”
“Our position in the ‘food chain’: we already have to finance our activity but the firms below us are unable to finance themselves.”
“Who is the dominant actor of supply chain? Just look at the direction of capital flow and you will immediately know it.”
“There is no freedom for anyone. The network affect is the system of conditions where I live in.”
“The impacts of multinationals are strong. They misuse their power including unwritten rules too.”
3.3 Does fair behaviour always pay off? We meet very various cases and opinions regarding partners’ fairness. Most of the respondents think it is beneficial: it brings respect from buyers, it is a good reference and in quality management it belongs to normal processes (e.g. in car industry supplier should indicate own quality problems as soon as it is detected in factory). However some respondents call attention to bad tendencies where unfair companies can flourish in markets as well.
Our respondents said concerning fairness: “The economic responsibility lasts to the point it does not conflict
interests.” “The aim is profit still today. The capitalist world operates like this. Only
there are some bargains due to the interest of social cooperation.” “The fair behaviour almost always pays off. In quality management there
is for example self-improvement what both our buyers and we practice towards our suppliers. This is good because if the customer recognizes a problem, comes here and it turns out that I have known that but did not mention, that is a much larger mistake.”
“We know there are certain partners who pay only if we ask payment before delivery.”
”I remember a case when a project was postponed one year because one subcontractor did not indicate serious problems and did not strive to cooperate.”
Conclusions
It is surprising and interesting when we inquire about competition, in most cases they start to speak about fairness. The opinions on general development of fairness is varying because some respondents explain negative tendencies and growing numbers of unfair stories while others identify positive changes in this field.

Management, Enterprise and Benchmarking in the 21st Century Budapest, 2017
320
Especially a respondent from quality insurance is optimistic and sees improvements. However a company owner simply says that he feels himself well when he behaves fairly. This means that market forces, economic logic just as well as internal needs can result ethical behaviour. Experts and the majority of managers agree that very unethical behaviour finally will have relevant consequences. But on contrary the very ethical companies will not reap their reward. This situation seems a little bit strange and does it give lesson to find the ‘optimal’ way somewhere between?
We understand that nowadays networking is a “conscious status” as it has been indicated by Kolos et al16. However this still operates in a little passive way. Firms are aware of network effects and interdependency. They also see when cooperation does not work and a few network actors withdraw some information but they do not think that they could play a more active role and they could develop and imrpove their network as well. They seem to be more active in their dyadic relationships.
Acknowledgement
Author gratefully thanks Professor Aino Halinen and Dr Päivi Jokela (both from University of Turku) for the possibility to participate in their research of ethics in business.
References
[1] Chikán A. (1997) Vállalatok és funkciók integrálója - Folyamatjellegű irányítás - alprojekt záró tanulmánya. Budapesti Közgazdaságtudományi Egyetem, Vállalatgazdaságtan tanszék
[2] Chikán A. (2004) Vállalatgazdaságtan, Aula Kiadó Budapest
[3] Christopher, M. - Gaudenzi, B. (2009) Exploiting knowledge across networks through reputation management, Industrial Marketing Management, Vol. 38, No. 2, 191–197
[4] Czibik Á. - Hajdu M. - Makó Á. - Tóth I. J. - Várhalmi Z. (2011) Integritás és korrupciós kockázatok a magyar vállalati szektorban. MKIK Gazdaság- és Vállalkozáskutató Intézet, Budapest
[5] Cooper, M. C. - Lambert, D. M. - Pagh, J. D. (1997) Supply Chain Management: More Than a New Name for Logistics. The International Journal of Logistics Management 8(1), 1–13
[6] Csáfor H. (2010) Mennyire felelősek az Észak-magyarországi régió vállalatai? Periodica Oeconomica, III. ÉVF. November p. 22–36
[7] Brown, J. R. – Cobb, A. T. – Lusch, R. F. (2006): The roles played by inter-organizational contracts and justice in marketing channel relationships, Journal of Business Research, Vol. 59, No. 2, 166–175
Management, Enterprise and Benchmarking in the 21st Century Budapest, 2017
321
[8] Farkas, Z. (2002) Hopp és kopp, HVG (Weekly World Economics in Hungarian) 09.12.2002
[9] Fazekas M. - Tóth I. J. - Lawrence Peter King (2013) Anatomy of grand corruption: A composite corruption risk index based on objective data. Corruption Research Centre Budapest
[10] Ferrell, O. - Frederich, J. - Ferrell, L. (2012): Business ethics: Ethical decision making & cases (Vol. 9). Boston: Cengage Learning
[11] Ford, D. - Håkansson, H. - Johanson, J. (1986) How do companies interact, Industrial Marketing and Purchasing, Vol. 1, No. 1, 26–41
[12] Håkansson, H. – Snehota, I. (1995) (ed.) Developing relationships in business networks, London, Routledge
[13] Halinen, A. - Törnroos, J.-Å. (1998) The role of embeddedness in the evolution of business networks, Scandinavian Journal of Management, Vol. 14, No. 3, 187–205
[14] Halinen, A. - Salmi, A. - Havila, V. (1999) From dyadic change to changing business networks: An analytical framework, Journal of Management Studies, Vol. 36, No. 6, 779-794.
[15] Halinen, A. - Päivi Jokela (2014) Exploring Ethics in Business Networks: Propositions for Future Research. IMP Conference Bordeaux, France
[16] Hámori B. – Szabó K. – Derecskei A. – Hurta H. – Tóth L. (2007) Versengő és kooperatív magatartás az átalakuló gazdaságban, Közgazdasági Szemle (Journal of Economic Literature), LIV. évf. June, 579–601.
[17] Jokela, Päivi - Halinen, A. – Piricz N. (2016) Competitive bidding and contracts - The impact of perceived fairness on relationship continuity among Finnish and Hungarian metal and machinery industry actors. IMP Conference, Conference Proceedings, Poznan, Poland http://www.impgroup.org/paper_view.php?viewPaper=8829
[18] Karsai, G. (1999) A magyar gazdaság folyamatai, 1990-98 (The processes of the Hungarian economy between 1990 and 1998), Helyzetkép a TEP makro-forgatókönyveihez, Budapest
[19] Kádár, Z. - Markovszky, S. (2004) Külföldi működőtőke beáramlás Magyarországon, (Inflow of FDI in Hungary) Országos Tudományos Diákköri Konferencia, 1. díj.
[20] Kolos K. (ed.) (2006) Vállalatközi kapcsolatok és a versenyképesség összefüggései – Projekt záró-tanulmány, BUDAPESTI CORVINUS EGYETEM - VÁLLALATGAZDASÁGTAN INTÉZET, 44. sz. Műhelytanulmány

Management, Enterprise and Benchmarking in the 21st Century Budapest, 2017
322
[21] Luo, Y. (2006) Toward the micro- and macro-level consequences of interactional justice in cross-cultural joint ventures, Human Relations, Vol. 8, No. 59, 1019–1047.
[22] Luo, Y. (2009) From gain-sharing to gain-generation: The quest for distributive justice in international joint ventures, Journal of International Management, Vol. 15, 343–356
[23] Malhotra, N. K. (2007) Marketing research. Pearson
[24] Mouzas, S. - Ford, D. (2007) Contracts in asymmetric relationships. The Proceedings of the 22nd IMP Conference, Milan
[25] Robin, D. (2009) Towards an applied meaning for ethics in business, Journal of Business Ethics, Vol. 89, No. 1, 139–150
[26] Szegedi K. (2001) A magyar vállalatok etikai érzékenysége. Ph.D. értekezés. Miskolci Egyetem
[27] Velasquez, M.G. (2012) Business Ethics - Concepts & Cases, Pearson Education, Inc.
[28] Veres L. (2008) Kihívások Kelet-Közép-Európa logisztikai versenyében, Közép–Európai Közlemények 2008./2. I. évfolyam 2. szám, Szeged, 93-109. pp. ISSN: 1789-6339
[29] Veres L. (2009) Regionális logisztikai rendszerek, Közép-Európai Közlemények 2009./4-5. szám 150-157 pp., Szeged. ISSN: 1789-6339
[30] Yeung, Henry Wai-chung (1995) Qualitative Personal Interviews in International Business Research: Some Lessons from a Study of Hong Kong Transnational Corporations. International Business Review Vol. 4, No. 3, pp. 313-339
Management, Enterprise and Benchmarking in the 21st Century Budapest, 2017
323
Management Consultancy in Hungary and in Croatia in Light of Empirical Research – Market and Human Factors
József Poór PhD, DSc, CMC Szent István University
Ferenc Zsigri PhD student Szent István University
Ildiko Csapó PhD student Szent István University
Anton Barasic, consultant Chronos Consulting
Abstract: “Management consultancy is in a rapidly changing world into which new players, disciplines and capabilities are continuously being integrated, where borders are constantly expanding and where horizons are receding to the point where our profession has now become a global network of businesses, covering a wide spectrum of areas which only a few years ago, was not imagined” (Jamieson et al; 2016). Over recent decades, technological and social progress have greatly enhanced the role of Business Consultants in the economy and pressure on consulting profession is ever increasing (Dötsch 2016). This study attempts to show some aspects of the Hungarian and the Croatian consulting markets and make comparisons as far as the two different databases allow.
Management, Enterprise and Benchmarking in the 21st Century Budapest, 2017
324
Consulting can earn trust by showing clients their weaknesses and deficiencies. Additionally, consultants are essential and consulting service is a knowledge sharing.
1 Management Consulting FEACO (2013) is one of the most comprehensive studies on European management consulting. Its definition of management consulting:
- a wide range of services,
- rendered by consultants legally independent from the clients,
- typically includes: identifying and investigating problems, recommending appropriate actions and assistance with the implementation of solutions.
The most typical management consulting service areas are:
- strategy consulting,
- organization, operations management,
- project management,
- change management,
- human resources consulting,
- knowledge management consulting,
- coaching, team coaching,
- information management consulting,
- development and integration,
- outsourcing.
2 General characteristics of the two countries examined
As macroeconomic environment has a profound impact on any trade it also shapes the character of consulting business. Let us begin with the comparison of the main economic and cultural characteristics of the two countries of our focus: Hungary and Croatia.

Management, Enterprise and Benchmarking in the 21st Century Budapest, 2017
325
1.1 Hungary
Socio-economic factors
The country's area is 93 030 square kilometres. Its population is 9,9M – ageing, decreasing due to unfavourable birth/death ratio and recently, emigration. Its total GDP amounts to 121 billion USD. GDP /capita is 12 200 USD (Global Competitiveness Report 2016/17). Wealth inequality (GINI index) is around the European average (EUROSTAT 2015). Human Development Index (HDI) – which is a combined indicator of life expectancy, quality of education and per capita income - i.e. how good a place is the country to live in – is in the last third of the European league.
Foreign Direct Investment (FDI)
The level of Total Foreign Direct Investment 92 billion USD. The biggest share (almost 75%) belonged to the service industry (napi.hu). FDI/capita is 9,3k USD. (knoema.com)
Competitiveness ranking
This section is based on the Global Competitiveness Report for 2016/17. In the interpretation of this report competitiveness means the ability of a country or region to produce efficiently marketable products and services. Competitiveness is facilitated by a great number of different constituents. These fall under three subindices:
- subindex A: basic requirements (institutions, infrastructure, macroeconomic environment, health and primary education)
- subindex B: efficiency enhancers (higher education and training, goods market efficiency, labour market efficiency, financial market development, technological readiness, market size)
- subindex C: innovation and sophistication factors (business sophistication, innovation).
Hungary's total ranking in the world's hall of fame is the 69th out of 138. While the country claims to target becoming an economy fuelled by innovation, the overall decline in its total score has been observed in the past years. In comparison with the best – most innovative – economies of Europe its innovation subindex is low and decreasing, efficiency enhancers subindex is stagnating and worst of all, basic requirements subindex – the factors that mean the entrance for any further development - has started to relapse, as well. The country, despite all slogans, appears to permanently head not for the innovative status but towards the opposite

Management, Enterprise and Benchmarking in the 21st Century Budapest, 2017
326
direction. The surveys of the study seem to identify the three biggest issues of daily operation as follows:
- policy instability,
- corruption,
- tax regulations.
Culture
The deculturizing and dehumanizing effect of globalization is not yet complete and there are still cultural differences among countries even in case of neighbouring European countries. Culture – being a humanizing force – is a pervasive rulebook of all activities in the given society. Thus, cultural gaps among countries result in differences in the ways companies work. Among other renowned scholars Gert Hofstede might be the most cited when things come to national cultures.
He measures national cultures alongside six dimensions:
- power distance: means the distribution of power within the society. How evenly is it spread? How large is the difference between big wigs and John Smiths’s ?
- individualism: Is it “I” or is it “we” that really matters. Is it the individual or the society that counts more?
- masculinity: is it the soft style that appears more rewarded or the tough one?
- uncertainty avoidance: how unwell people in a country tolerate uncertainty.
- long term orientation: Is today and the very near future the more important or the long-term future?
- indulgence: how ready are we to accept daily pleasures offered by life?
Hungary is characterized by mediocre power distance, high individualism, very high masculinity, mediocre long termism, and very low indulgence.
1.2 Croatia
Socio-economic factors
The country's area is 56 600 square kilometres. Its population is 4,2M – ageing, decreasing. Its total GDP amount to 49 billion USD. GDP /capita is 11 600 USD (Global Competitiveness Report 2016/17). Wealth inequality (GINI index) is around the European average (EUROSTAT 2015). Human Development Index (HDI) is in the last third of the European ranking.
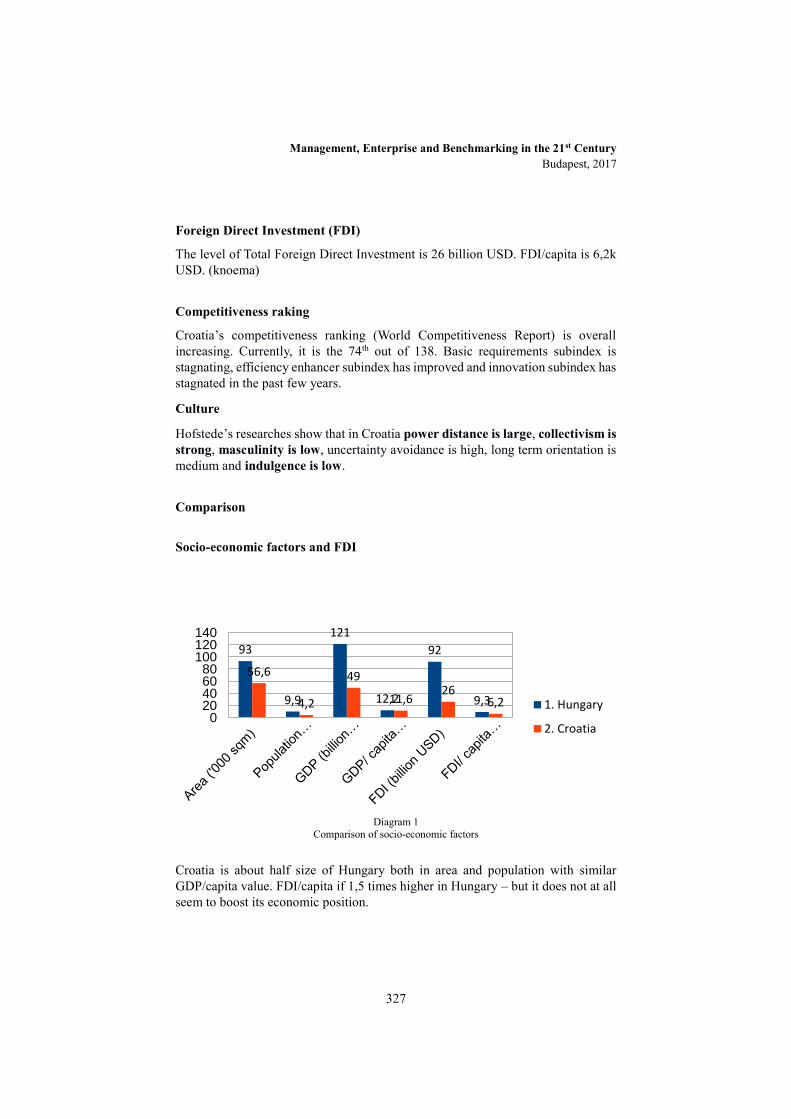
Management, Enterprise and Benchmarking in the 21st Century Budapest, 2017
327
Foreign Direct Investment (FDI)
The level of Total Foreign Direct Investment is 26 billion USD. FDI/capita is 6,2k USD. (knoema)
Competitiveness raking
Croatia’s competitiveness ranking (World Competitiveness Report) is overall increasing. Currently, it is the 74th out of 138. Basic requirements subindex is stagnating, efficiency enhancer subindex has improved and innovation subindex has stagnated in the past few years.
Culture
Hofstede’s researches show that in Croatia power distance is large, collectivism is strong, masculinity is low, uncertainty avoidance is high, long term orientation is medium and indulgence is low.
Comparison
Socio-economic factors and FDI
Croatia is about half size of Hungary both in area and population with similar GDP/capita value. FDI/capita if 1,5 times higher in Hungary – but it does not at all seem to boost its economic position.
Diagram 1
Comparison of socio-economic factors
93
9,9
121
12,2
92
9,3
56,6
4,2
49
11,626
6,20
20406080
100120140
1. Hungary
2. Croatia

Management, Enterprise and Benchmarking in the 21st Century Budapest, 2017
328
Culture
Power distance is remarkably smaller in Hungary, while individualism and masculinity are much higher. Uncertainty avoidance is equally high in both countries, long term orientation is equally medium and indulgence is low.
1.3 Consulting market
Croatia
Alpeza et al (2014) carried out a comprehensive study of the Croatian consulting market. The present section builds on their findings.
In Croatia, small and medium sized enterprises employ two thirds of all employees and produce over half of GDP. Still, their cumulated result is a significant net loss. Large companies – mainly multinationals – employ the rest of the people and cumulate an overall net profit. This leads the authors to the conclusion that there is a lot of room to improve business efficiency at SME’s, in other words this should be a target area for the consulting trade. Unfortunately, the overall poor profitability of the SME sector does not leave much money to spend on consultants. State subsidy would be necessary but this rarely happen.
The geographical distribution of consulting activities is heavily concentrated around Zagreb. This region alone accounts for more consulting firms than the rest of the whole country.
The total revenue of consulting business is 63M EUR. Half of this sum is generated by the top four consulting firms: KPMG. PWC, Deloitte and Austrotherm.
Diagram 2 Comparison of cultures

Management, Enterprise and Benchmarking in the 21st Century Budapest, 2017
329
Most consulting firms are in the MSME category. Within the MSME (micro, small and medium sized) consulting companies 82% is micro (with consultants less than 10), the rest is small or medium sized. The majority of these consulting firms are specialised in the following areas of consultancy:
- wholesale export/import
- construction
- tourism and entertainment.
Almost two thirds of them is oriented purely towards the domestic market.
The typical issues the consultants must deal with:
- various legal issues
- problems in financial management
- problems in sales and marketing
- searching for a loan
- HR issues
- problems relating to writing plans and projects.
78% of enterprises have not hired any consultant in the last three years and only 13% turned out to be repeated users.72% of users found consultants by recommendation or word of mouth. Any other channel is very unlikely.
Clients were less than satisfied with the performance of the applied consultant, only 43% would repeat the cooperation. Criteria of valuation of the consultant’s performance are:
- understanding of business problem,
- expertise, knowledge,
- speed of feedback,
- communication during cooperation,
- value perceived for the price,
- usefulness of cooperation,
- overall results.
The areas users were the least satisfied with: results (the last three of the above list). The conditions under which clients would consider using the services again:
- if they were sure to benefit from the services,

Management, Enterprise and Benchmarking in the 21st Century Budapest, 2017
330
- cheaper pricing of consultants,
- get a free sample advise first and than decide on the continuation of the cooperation.
Most respondents believe that if they decided to use a consultant it would be in connection with:
- issues in project and plan briefing,
- business planning,
- seeking business partner and investors,
- market research and marketing,
- saving energy and eco issues,
- IT and related issues.
Most clients see the usage of consultancy as a short term job. More than 60% expects a cooperation for a duration shorter than two years.
For Croatian consultants MSME segment should be a target for its large unexploited potential. A weakness is the insufficient number of consultants with specialised expertise. A threat: due to low entry barriers there are unskilled consultants who destroy the reputation of the consulting trade. Developing trust is a great challenge nyway.
Hungary
Overall turnover in the consultancy industry was 235 million EUR in 2012. With traditional consulting firms, atypical large consulting companies can be found, as well as a medium-, micro-, and mini-advisory enterprises. The Management Consulting clients fall under three sectors which are: industry, banking sector and public sector. The distribution of consultancy industry turnover is: 9%, banking and insurance 14%, public sector 31%. It should be noted, the public sector’s orders are slowly rising. The most developments were in the financial and insurance industry over the last five years.
According to the Hungarian Central Statistics Office, the total number of companies registered for business and management consultancy services in 2012 is 500 and the total number of employees is 4 580.
Most consulting firms are micro or small sized (69%) – (Poór 2013)
Typical areas of consulting are:
- operations and organizing,
Management, Enterprise and Benchmarking in the 21st Century Budapest, 2017
331
- project management,
- strategy,
- HR issues
- IT.
Main methods of consulting are:
- process consulting,
- advisory consulting and
- inquiry consulting (Józsa-Vinogradov-Poór 2016)
Over 70% of respondents claims that the reputation of consulting firms has not changed or deteriorated in the past 1-2 years. Most people (57%) expects no improvement or further deterioration in this area.
For the coming years, most respondents expect stagnation in revenue in most operational areas of consulting.
Competition amongst consulting firms ever intensifies. The extension of average projects is shrinking. Communication between clients and consultants should be improved.
Unskilled consultants have great responsibility in the unsatisfactory overall image of consulting profession. These weak consultants should be filtered out somehow.
Government policies and state subsidies have a tremendous impact on the consulting business. The situation of consulting is further aggravated by the unfavourable economic situation.
The lobbying power of consulting is slight. There are remarkable improvement opportunities in the cooperation, communication and two-way knowledge transfer between consultants and clients.
Conclusions While Hungary’s competitive position is in constant relapse, Croatia seems to be able to improve hers. Higher capital import does not appear to better Hungary’s economic health. Strong collective attitude might be a reason for Croatian advancements. People in both countries – for cultural reasons - are unprepared for happiness. Competitiveness is measured by the Global Competitiveness Report. There are authors who claim that this report tends to sometimes overvalue or undervalue actual competitiveness (Djogo-Stanisic 2016).

Management, Enterprise and Benchmarking in the 21st Century Budapest, 2017
332
The overall spending on consulting is a small fraction of what Western European countries spend on consulting services.
Large consulting firms rule the market of large clients leaving only small clients to small domestic consulting firms. MSME clients are having grave financial problems in both countries. Competition is ever strengthening, forcing consultants into miserable pricing or exaggerating promises of results. Post-bureaucratic managers have also become consultants within their companies (Sturdy-Wright-Wylie 2016).
Bronnenmayer-Wirtz.Göttel (2016) claim that critical success factors for management consulting are: originality (value), intensity of collaboration, common vision, consultant expertise and top management support.
Problems are exacerbated by the lack of thorough filtering out weak consultants. The operation of unskilled consultants cause remarkable harm to the reputation of serious consulting enterprises.
In consideration of the above issues, it is easy to see that consulting is far from flourishing in these countries.
References
[1] World Economic Forum (2016): The Global Competitiveness Report 2016/17 Retrieved from https://www.weforum.org/reports/the-global-competitiveness-report-2016-2017-1 17/03/2017
[2] Poór at al (2013) Feaco Survey - University of Pécs, Hungary , retrieved from http://www.feaco.org/industry/profession/startingajob 19/03/2017
[3] European Commission: Eurostat Retrieved from http://ec.europa.eu/eurostat 17/03/2017
[4] Knoema: Retrieved from www.knoema.com 17/03/2017
[5] Napi.hu: Ennyire szereti Magyarországot a külföldi tőke Retrieved from: http://www.napi.hu/magyar_gazdasag/ennyire_szereti_magyarorszagot_a/kulfoldi_toke.580047.html 17/03/2017
[6] Gert Hofstede: Cultural Dimensions Retrieved from: https://geert-hofstede.com/cultural-dimensions.html 17/03/2017
[7] Alpeza et al (2014) Croatia Consulting Market Study – CEPOR Croatia
[8] Poór at al (2014): A menedzsment tanácsadás helyzete Magyarországon - BKIK, Budapest

Management, Enterprise and Benchmarking in the 21st Century Budapest, 2017
333
[9] Dötsch (2016): From Solution Shop to Boutique Consulting? Capturing Recent Developments on the German Consulting Market - Management Dynamics in the Knowledge Economy; 2016, Vol. 4 Issue 2, p291-306, 16p
[10] Józsa-Vinogradov-Poór (2016): Analysis of Management Consulting Methods Based on Empirical Research in Hungary - Management (16487974); 2016, Vol. 29 Issue 2, p35-41, 7p
[11] Bronnenmayr-Wirtz-Göttel (2016): Determinants of Percieved Success in Management Consulting - Management Research Review; 2016, Vol. 39 Issue 6, p706-738, 33p
[12] Djogo-Stanisic (2016): Is the Global Competitiveness Report the right measure of macroeconomic competitiveness - Zbornik Radova Ekonomskog Fakulteta u Rijeci : Časopis za Ekonomsku Teoriju i Praksu, Vol 34, Iss 1, Pp 91-117 (2016) University of Rijeka, 2016.
[13] Sturdy-Wright-Wylie (2016): Managers as consultants: The hybridity and tensions of neo-bureaucratic management. Organization; Mar2016, Vol. 23 Issue 2, p184-205, 22p
Management, Enterprise and Benchmarking in the 21st Century Budapest, 2017
334
Inter-sectoral cooperation as a factor of the regional development
Renata Przygodzka [email protected]
Abstract: The aim of this article is to formulate an answer to the following question: which factors strengthen inter-sectoral cooperation and its significance in regional development? Due to the significant breadth and variety of forms of inter-sectoral cooperation, in this article an analysis was carried out primarily of the functioning of clusters in Poland. The main conlusion is, that the growth of cluster significance in regional development in Poland have no chance of being realised without the support of public funding both on a centralised and on a regional level.
Keywords: inter-sectoral cooperation, cluster, regional development, Poland
1 Introduction Inter-sectoral cooperation is increasingly often becoming the subject of research within the context of regional and local development. This is a result of the currently popular paradigm of development, based on an assumption of the significance of cooperation and innovation in creating positive change in the regional economy. Confirmation of this can be found in literature on the subject of spatial science, economics, social studies, and management. One of the best-known and often-cited conceptions of local development was proposed by A. Pichierri, who distinguished four main types of local growth [1]:
1. Endogenous development – based on maximising the use of local resources by local actors. This can be carried out in an area with the institutional and organisational possibilities to self-mobilise the human and financial resources and raw materials that are found in a given area in the appropriate quantities and of the appropriate quality.
2. Exogenous development – a process that is based on the utilisation of external resources by external entities. This occurs in areas in which there is a lack of local entities that are able to mobilise the local workforce, or where there is a lack of appropriate financial resources or raw materials. It is based on the utilisation of such external materials as: technology, capital, and sometimes raw materials, while simultaneously exploiting the local
Management, Enterprise and Benchmarking in the 21st Century Budapest, 2017
335
labour market, mainly because of its lower cost. The market outlet in this situation is typically external.
3. Development that stimulates internal resources – this is a type of situation in which local development results from the involvement of external entities, which utilise the resources of a given area. For instance, external firms can, thanks to their own capital and technology, involve local employees with the appropriate qualifications, as well as local raw materials. The effectiveness of global, external firms often results from their economic ties, which ensure promotion and sales in external markets.
4. Development that attracts external resources – based on the activation of local entities thanks to the availability of external resources, which usually take the form of financial resources or “know-how” – that is, knowledge, methods or training.
This division takes into account two types of factors concerning local development: resources and entities, as well as their origin (internal or external) and the relations between these factors. This division is influenced by not only classical, but also modern theories and conceptions of regional and local development. The classical theories, mainly localisation and economic base theories, were based on traditional growth factors such as raw materials, energy, workforce, distance from the market outlet, the responsiveness of the market outlet etc. Modern theories, however, in the search for growth and regional development stimulators, highlight the role of non-traditional factors increasingly often. The emergence of analyses of transactional costs and external effects has caused the cooperation of entities, networks and and cooperation to become the subjects of research – that is, assets or relational/specific resources [2] have gained in significance. S. Korenik and A. Zakrzewska-Półtorak highlight that in observing the conceptions of regional development from the turn of the 20th/21st century of, among others, P. Veltz, M. Fujit, R. Florid or B.A. Lundvall, we can notice that the basic direction of the evolution of regional development theory concerns the growth of the knowledge-based economy, “learning” regions and creative economies [3]. In these theories, different accents are placed regarding both factors and institutional conditions of development. With regard to the former, the most significance is currently placed on knowledge, technological advances, innovation, new services and new jobs, soft infrastructure, social capital, quality of life, cultural image and the inclusion of private funds in investments of public benefit. However with regard to the latter, significance is placed on activities that lead to a strategic link between economic and social development factors, as well as to a partnership for development, the formation of local cooperation networks, collaboration and the formation of clusters, which ultimately leads to the utilisation of regional heritage. J. Hausner and A. Giza-Poleszczuk underline that this approach strengthens the endogenisation of regional development, nevertheless it does not signify self-isolation, autarchic closure or finding oneself in the developmental backwaters. Partnership and joint management strengthens and empowers the population of the given territory, simultaneously opening it up to the exterior [4]. This means that the cooperation of various

Management, Enterprise and Benchmarking in the 21st Century Budapest, 2017
336
organisations, often belonging to different sectors, becomes an important regional development factor.
2 Objectives, material and methods The aim of this article is to formulate an answer to the following question: which factors strengthen inter-sectoral cooperation and its significance in regional development? The hypothesis that a basic condition of the positive effect of intersectoral cooperation on regional development is public financial support of partnerships that have arisen from this cooperation was adopted. This article provides an overview of the issue, however due to its interdisciplinary nature, in the search for an answer to the question posed in the research and the verification of the hypothesis, literature from the fields of management, public management, sociology, and economic and regional development theory was used. To shed light on the scale of the analysed phenomena occuring mainly in Poland, primarily used were results from the research of other authors as well as secondary source materials in the form of reports and studies carried out by Polish institutions, such as the Polish Agency for Regional Development or Main Statistical Office. Due to the significant breadth and variety of forms of inter-sectoral cooperation, in this article an analysis was carried out primarily of the functioning of clusters. This choice was supported primarily by the fact that in Poland, the history of clusters is relatively short, and their formation and functioning is to a large extent stimulated by finacial and administrative instruments.
3 Results of the research
3.1 Inter-sectoral coooperation and its theoretical aspects Cooperation, a term often used interchangeably with “collaboration”, is generally and colloquially understood as “the joint action of people, institutions or countries” [5]. However, the academic definition refers to relations and ties between entities, social groups or organisations, which we can be divided into three types based on the objectives of the cooperation [6]: 1) cooperation, that is, positive cooperation, 2) competition, that is, rivalry, 3) conflict, that is, negative cooperation. As far as this article is concerned, the basis for further discussion is cooperation defined as the realisation of objectives and functions as agreed in previous arrangements – that is, positive cooperation. The roots of this cooperation are in inter-organisational relations. According to L. Krzyżanowski, these relations take the form of inter-organisational connections or interactions, but only with regard to interactions can we speak of inter-organisational links [7]. These differ from other
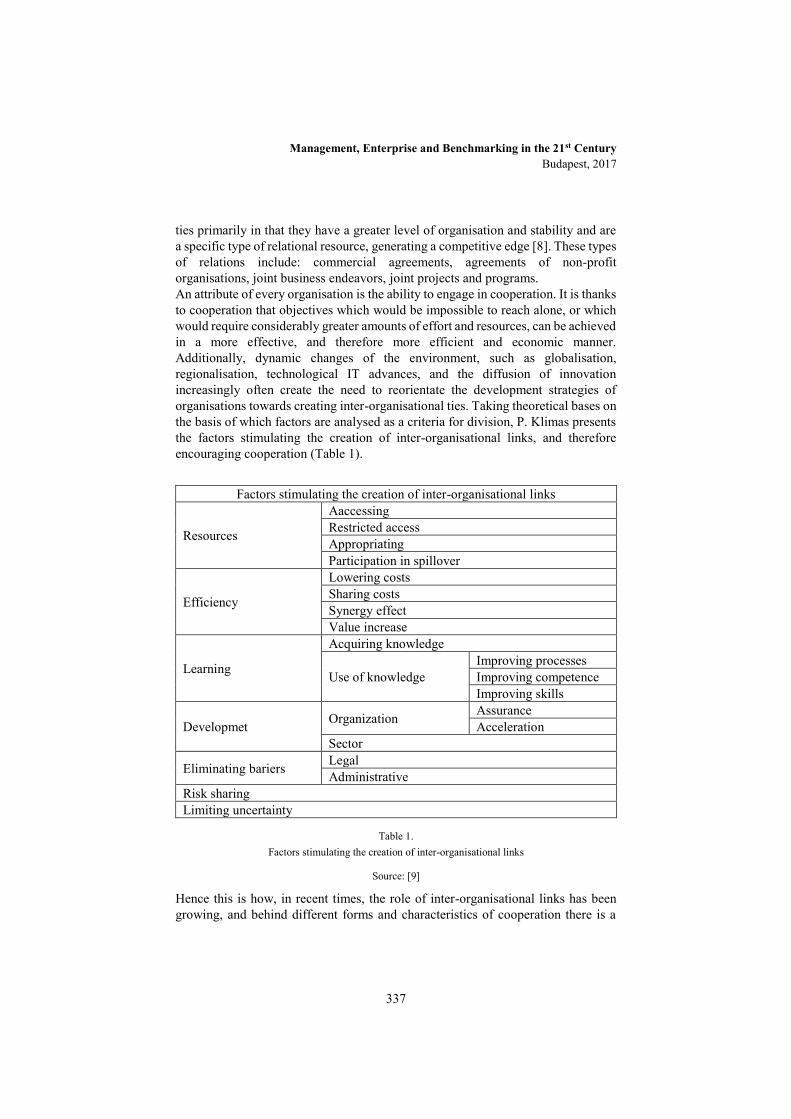
Management, Enterprise and Benchmarking in the 21st Century Budapest, 2017
337
ties primarily in that they have a greater level of organisation and stability and are a specific type of relational resource, generating a competitive edge [8]. These types of relations include: commercial agreements, agreements of non-profit organisations, joint business endeavors, joint projects and programs. An attribute of every organisation is the ability to engage in cooperation. It is thanks to cooperation that objectives which would be impossible to reach alone, or which would require considerably greater amounts of effort and resources, can be achieved in a more effective, and therefore more efficient and economic manner. Additionally, dynamic changes of the environment, such as globalisation, regionalisation, technological IT advances, and the diffusion of innovation increasingly often create the need to reorientate the development strategies of organisations towards creating inter-organisational ties. Taking theoretical bases on the basis of which factors are analysed as a criteria for division, P. Klimas presents the factors stimulating the creation of inter-organisational links, and therefore encouraging cooperation (Table 1).
Factors stimulating the creation of inter-organisational links
Resources
Aaccessing Restricted access Appropriating Participation in spillover
Efficiency
Lowering costs Sharing costs Synergy effect Value increase
Learning
Acquiring knowledge
Use of knowledge Improving processes Improving competence Improving skills
Developmet Organization Assurance Acceleration
Sector
Eliminating bariers Legal Administrative
Risk sharing Limiting uncertainty
Table 1. Factors stimulating the creation of inter-organisational links
Source: [9]
Hence this is how, in recent times, the role of inter-organisational links has been growing, and behind different forms and characteristics of cooperation there is a

Management, Enterprise and Benchmarking in the 21st Century Budapest, 2017
338
different logic, which depends on the type of organisations affected – businesses, public entities or NGOs. The cooperation of businesses stands out as no matter which kind of form it takes, competition can always be observed, only with businesses not engaging in this cooperation. However, the cooperation of public entities stems from their very essence, casuing obligatory cooperation, regulated by law, with other organisations, regardless or whether they belong to the same or different sectors. A similar situation can be observed in the case of social organisations, with one difference – in theory, decisions about cooperation with other organisations are fully voluntary and independent. Nevertheless, in reality the conditions in which these organisations function create a need for cooperation, as this often facilitates the achievement of their objectives. This means that inter-organisational cooperation increasingly often goes beyond the boundaries of individual sectors, taking the form of intersectoral cooperation. According to A. Kalegaonkar i L.D. Brown „inter-sectoral cooperation consists of bringing actors from the state, market and civil society sectors together to achieve mutual understanding on an issue and negotiate and implement mutually agreeable plans for tackling the issue once it is identified” [10]. The evolution of public management models has aided the popularisation and growth of inter-sectoral cooperation. In the Governance and New Public Governance models, the fundamental mechanism of achieving outlined strategic goals is turning to innovation and creating the appropriate conditions for inter-organisational and inter-sectoral cooperation [11]. In a model arrangment, cooperation can take the form of various types of formalised actions (letters of intent, contracts, alliances etc.) or those which are less formalised (dedicated meeting, professional forums, social and business networks etc.). As a temporary or permanent way of achieving common initiatives, it can also be a point of interest and engagement of two or more organisations, who value something more than just a transaction or contact. Nevertheless the key manifestation of cooperation are partnerships. These are defined in many ways and may take various forms1, however in literature their four fundamental characteristics are highlighted [12]:
- they are a coalition of more than one sector aiming to reach an agreement, - they have common objectives and stategies for achieving these objectives, - they share risk, resources and skills, - they enjoy mutual benefits and synergy.
A. Pawłowska, A. Gąsior-Niemiec and A. Kołomycew add another characteristic: a relatively equal status of partners [13]. S. Barczyk and A. Ochojski underline, 1
For example, one of the first definition proposed in the report of the OECD [23], according to which thepartnership is a formalized cooperation between several institutions, based on a legally concludedcontract or an informal agreement, the bindings in the context of cooperative and jointly adopted plans.
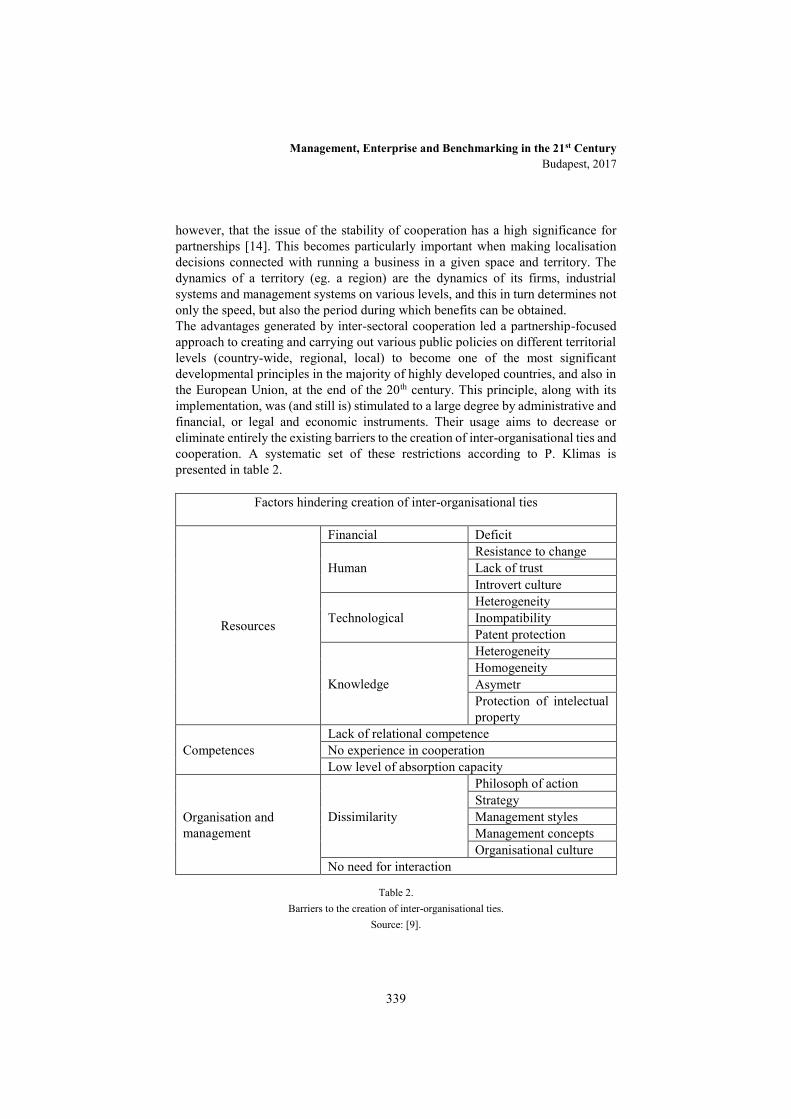
Management, Enterprise and Benchmarking in the 21st Century Budapest, 2017
339
however, that the issue of the stability of cooperation has a high significance for partnerships [14]. This becomes particularly important when making localisation decisions connected with running a business in a given space and territory. The dynamics of a territory (eg. a region) are the dynamics of its firms, industrial systems and management systems on various levels, and this in turn determines not only the speed, but also the period during which benefits can be obtained. The advantages generated by inter-sectoral cooperation led a partnership-focused approach to creating and carrying out various public policies on different territorial levels (country-wide, regional, local) to become one of the most significant developmental principles in the majority of highly developed countries, and also in the European Union, at the end of the 20th century. This principle, along with its implementation, was (and still is) stimulated to a large degree by administrative and financial, or legal and economic instruments. Their usage aims to decrease or eliminate entirely the existing barriers to the creation of inter-organisational ties and cooperation. A systematic set of these restrictions according to P. Klimas is presented in table 2.
Factors hindering creation of inter-organisational ties
Resources
Financial Deficit
Human Resistance to change Lack of trust Introvert culture
Technological Heterogeneity Inompatibility Patent protection
Knowledge
Heterogeneity Homogeneity Asymetr Protection of intelectual property
Competences Lack of relational competence No experience in cooperation Low level of absorption capacity
Organisation and management
Dissimilarity
Philosoph of action Strategy Management styles Management concepts Organisational culture
No need for interaction
Table 2. Barriers to the creation of inter-organisational ties.
Source: [9].
Management, Enterprise and Benchmarking in the 21st Century Budapest, 2017
340
Since supporting inter-sectoral cooperation requires the use of public funds, in this context an analysis of the benefits which stem from this cooperation becomes important – with regards to regions or territories this concerns not individual projects or initiatives, but the entirety of benefits that can be achieved by the given territory2. One type of benefits that has been reasonably well discussed in literature is those that arise from a concentration of firms in a given area and the effect of this on the development of regions. Theories of industrial districts, groups, clusters, innovation networks, “learning” regions and many others explain these dependencies, simultaneously indicating recommendations for public policies. The experiences of many other countries have led to a situation in which in the last 10 – 20 years in Poland, much attention has been given to the creation and functioning of clusters, and a specific instrument encouraging the development of regions has become cluster policy.
3.2 Clusters as an example of inter-sectoral cooperation on a regional level
A particular manifestation of inter-sectoral cooperation are clusters (groups, agglomerations)3. This is clearly underlined in the definition of a cluster, used in program documents in the polish system of the election of Key National Clusters. According to this definition, a cluster is “a geographical agglomeration of independent entities representing a particular economic specialisation, cooperating and competing with one another in a value chain. Cooperation in a cluster is formalised and carried out both vertically and horizontally, with the aim of reaching previously agreed-on common objectives. Clusters are a source of benefits and create a new value for all types of entities participating in the cooperation, such as businesses, universities and educational institutions, business environment institutions, public administration and other supporting organisations” [16]. Using this definition has allowed for a clear distinction of well-developed and efficiently functioning clusters in order to give them the title of Key National Clusters (of which there are currently 16) with the aim of helping them to acquire additional support for the implementation of projects that often cross national borders and in order to increase their competitiveness. In favour of this policy are primarily the need to strengthen the innovation and competitiveness of the Polish economy through intensified cooperation, interaction and the flow of knowledge in clusters, as well as supporting the development of strategic economic 2 Such research is carried out by GREMI, the European Innovation Environment
Research Group. The subjects of their interest are technological and organisational changes in certain territories, which result from the grouping of firms and innovative processes. Further on this topic [14].
3 The most well-known definition is that of M. E. Porter, according to which a cluster is a “geographical agglomeration of mutually linked firms, specialised suppliers, entities providing services, firms from related sectors and the institutions linked to them in individual fields, competing with each other but also cooperating” [15].

Management, Enterprise and Benchmarking in the 21st Century Budapest, 2017
341
specialisations, but also the need to concentrate public funds in those areas which will yield a considerable developmental impulse (above all in areas of so-called intelligent specialisation) [17]. The PARP report [18], which contains a detailed „inventory” of clusters in Poland, states that in Poland there are currently 134 clusters functioning (these are the clusters that took part in the study4). Established between the years 2003 – 2015, the majority (over 60%) are young clusters, that is, those which emerged in the years 2011 – 2015. The oldest clusters have been in existence for 12 years, and the average age of clusters is over 4 years. The low age of clusters in Poland points to the need to strengthen basic functions, such as building relationships and trust, the professionalisation of management and the creation and stable development of cluster structures. This in turn requires above all tremendous effort and engagement on the part of the coordinators of clusters, which, without public funding, is very difficult.5. This is supported by previous research carried out in 2010 [19], which shows that cluster initiatives functioning in Poland are quite strongly dependent on public financing, since the withdrawal of this funding often results in the ending of the initiative. This is also demonstrated by the fact that 47 active, formal clusters qualified to take part in the benchmarking, out of a total number of around 170-180 initiatives of various kinds that had been established in Poland before 2010. The geographical distribution of clusters reflects the economic potential of regions – 48% of clusters were identified in the four most developed voivodeships: mazowieckie (13 clusters), dolnośląskie (11), wielkopolskie (12) and śląskie (28 – the highest number in the country). This could suggest that these regions offer the best conditions for the establishment of structures of this type. It is also worth noting the significant, when compared to the remaining voivodeships, number of clusters identified in the podkarpackie and lubelskie voivodeships (12 and 11 respectively), which could be a result of support for the development process of clusters at both a regional and a national level (Operational Programme for the Development of Eastern Poland 2007 - 2013). In the identified cluster population, a total of 5 868 entities are active, whose number in each individual cluster ranges from 8 to 171 (average number of members: almost 44). Over 78% of these are businesses, 5.71% business environment institutions, 8.74% educational institutions and 7.53% other entities. The identified clusters have various different organisational and legal
4 These entities fulfil the criteria that characterise clusters to the largest degree. Aside
from them, during the research a group of 106 entities, which (on the basis of the information collected) had characteristics that would allow them to qualify as potential clusters, was singled out [18].
5 In this context it is worth underlining the opinion expressed by experts. “It must be remembered that the function of coordination has the characteristics of a public good – that is, it benefits all entities in a given agglomeration, including those which have not yet been established. This justifies the co-financing of coordinative functions from public funds, so that the activities of the coordinator are not limited to being of sole service to those entities which form the cluster initiative and pay the premiums.” [17].
Management, Enterprise and Benchmarking in the 21st Century Budapest, 2017
342
forms. The majority work on the basis of various types of contract, including agreements and consortiums (74) and in the form on associations (41). The remaining forms include limited liability companies (10), foundations (5), chambers of commerce (3) and one joint-stock company [18]. Clusters represent a large variety of sectors, from traditional to highly technological – in total 28 sectors/specialisations were distinguished. The majority of the clusters analysed were in the ICT sector (14%), followed by the energy and renewable energy sector (12%), construction (9%) and medicine, biomedicine and medical tourism (8%). Their regional differentiation generally corresponds to intelligent specialisations [18]. The research carried out also showed that clusters have a low rate of activity in terms of the number of projects carried out, which could be a sign of relatively weak business cooperation (developing a joint offer, distribution or a single standard product of the cluster). At the same time, a relatively weak area in Polish clusters is innovativeness and cooperation with the research and development sphere. Clusters also do not to a large degree take advantage of the potential offered by cooperation with foreign institutes or other clusters. This signifies that activities undertaken by cluster initiatives do not lead to an improvement of innovation or the competitiveness of their members6.
Conclusions In conclusion, it can be stated that past activities aimed at assisting the development of clusters in Poland primarily brought about an increase in awareness that clusters are one of the most significant factors of regional development which, allowing benefits typical for inter-sectoral cooperation to be reached, generates added value that strengthens the territory in which they function. The aim of this article was to formulate an answer to the question: which factors strengthen inter-sectoral cooperation and its significance in regional development? From a theoretical point of view, primarily all activities which lead to a reduction of barriers restricting the creation of inter-organisational links not only in the area of resources and competence, but also in issues surrounding organisation and management, should be indicated. However, from the point of view of the case study used in this article, in order for clusters to become a source of benefits not only for their members, but also for the environment, using M. Citkowski’s conclusions it should be indicated that areas such as the following should undergo verification [21]: a) the role of the coordinator of the cluster in shaping strategic network cooperation in each dimension of the cluster’s development; b) searching for and shaping the competencies of the cluster and its members in each phase of 6 However, research from other authors states that one of the main reasons why firms
enter clusters is the expectation of a rise in competitiveness and economic results [20].
Management, Enterprise and Benchmarking in the 21st Century Budapest, 2017
343
the cluster’s development; c) a measurement of the benefits linked with participation in a cluster. Also significant are: increasing the size of existing clusters, a clear growth in innovative processes and the internationalisation of clusters [22]. In general, a large proportion of the indicated conditions have no chance of being realised without the support of public funding both on a centralised and on a regional level. It can therefore be acknowledged that the hypothesis was verified positively.
References
[1] Pichierri A.: Concentration and Local Development, “International Journal of Regional Research”, Vol. 26, No. 4, 2002, pp. 689 – 706, cited by Nowak J.F.: Modernizacja lokalnej administracji publicznej a rozwój lokalny, Prace habilitacyjne No. 25, Wydawnictwo Akademii Ekonomicznej w Poznaniu, Poznań 2006.
[2] Jewtuchowicz A.: Terytorium i współczesne dylematy jego rozwoju, Wydawnictwo Uniwersytetu Łódzkiego, Łódź 2005, pp. 111.
[3] Korenik S., Zakrzewska-Półtorak A.: Teorie rozwoju regionalnego – ujęcie dynamiczne, Wydawnictwo Uniwesryetu Ekonomicznego we Wrocławiu, Wrocław 2011, pp. 86-87.
[4] Giza-Poleszczuk A., Hausner J. (ed.): The social economy in Poland. Achievements, barriers to growth and potential in light of research result, Foundation for Social and Economic Initiatives, Warsaw 2008.
[5] Słownik języka polskiego PWN http://sjp.pwn.pl/sjp/;2538059 [date of the access: 8th April 2017].
[6] Kożuch B.: Nauka o organizacji, CeDeWu.pl, Warszawa 2008, pp. 206.
[7] Krzyżanowski L.: Podstawy nauko o organizacji i zarządzaniu, Warszawa 1994, pp. 107.
[8] Krupski R.: Zasoby niematerialne jako główny składnik strategii przedsiębiorstwa działającego w turbulentnym, nieprzewidywalnym otoczeniu, „Organizacja i Kierowanie”, IA (159), 2014, pp. 87-98.
[9] Klimas P.: Przesłanki i bariery zawiązywania więzi organizacyjnych, „Problemy Zarządzania” vol. 1, no 1 (50), 2015, pp. 29-46.
[10] Kalegaonkar A., Brown L.D.: Intersectoral Cooperation: Lessons For Practice, IDR Reports, vol. 16 no. 2, 2000, pp. 2.
[11] Kożuch B., Sułkowski Ł. (ed.): Instrumentarium zarządzania publicznego, Difin SA, Warszawa 2015, pp. 35.
[12] McQaid R.W.: Theory of Organizational Partnerships: Partnership advantages, disadvantages and success factors [in:] Osborne S.P. (ed.): The

Management, Enterprise and Benchmarking in the 21st Century Budapest, 2017
344
New Public Governance? Emerging Perspectives on the Theory and Practice of Public Governance, Routledge, London-New York 2010, pp. 129.
[13] Pawłowska A., Gąsior-Niemiec A., Kołomycew A.: Partnerstwa międzysektorowe na obszarach wiejskich. Studium przypadku lokalnych grup działania w województwie podkarpackim, Wydawnictwo Naukowe Scholar, Warszawa 2014, pp. 24.
[14] Barczyk S., Ochojski A.: Aplikacje modelu Triple Helix w szwedzkich realiach zarządzania rozwojem lokalnym i regionalnym [w:] Brandenburg H.: Projekty lokalne i regionalne – współpraca: nauka – biznes – samorząd, Wydawnictwo Uniwersytetu Ekonomicznego w Katowicach, Katowice 2013, pp. 33.
[15] Porter M.E.: Porter o konkurencji, PWE, Warszawa 2001, pp. 246.
[16] Hołub-Iwan J., Wielec Ł.: Opracowanie systemu wyboru Krajowych Klastrów Kluczowych, PARP, Warszawa 2014, pp. 9.
[17] Dzierżanowski M . (ed.): Kierunki i założenia polityki klastrowej w Polsce do 2020 roku. Rekomendacje Grupy roboczej ds. polityki klastrowej, PARP, Warszawa 2012.
[18] Buczyńska G., Frączek D., Kryjom P.: Raport z inwentaryzacji klastrów w Polsce 2015, PARP, Warszawa 2016.
[19] Benchmarking klastrów w Polsce – 2010, PARP, Warszawa 2010.
[20] Haberla M.: Przesłanki tworzenia klastrów i inicjatyw klastrowych w Polsce oraz cele ich funckjonowania w świetle wyników badań własnych, Uniwersytet Ekonomiczny we Wrocławiu, Wrocław 2014, pp. 236.
[21] Citkowski M.: Polityka rozwoju klastrów w Polsce, BFKK, Białystok 2014.
[22] Plawgo B.: Benchmarking klastrów w Polsce – edycja 2014. Raport ogólny, PARP, Warszawa 2014.
[23] Local Partnerships for Rural Development, OECD, Paris 1990, pp.18.

Management, Enterprise and Benchmarking in the 21st Century Budapest, 2017
345
Strengthening the Resilience of Small and Medium-Sized Enterprises
Mirjana Radović Marković Full professor, Institute of Economic Sciences and Faculty of Business Economics and Entrepreneurship,Belgrade,Serbia
Muhammad Shoaib Farooq Assistant professor, Institute of Business & Management (IB&M), University of Engineering and Technology (UET), Lahore - Pakistan
Dušan Marković Professor,Belgrade Business School,Belgrade,Serbia
Abstract: In the global world, we live in, business environment is interdependent and
increasingly diverse speaking of culture. Therefore, operational risks exceed local and
regional limits, which results in the risk which is shared by companies in global environment.
However, not only can resilience be observed from the aspect of community, but also from
the aspect of organization. In this study, authors research only organizational aspects of
resilience. The goal of these researches is to indicate the significance of the need for
improving resilience and determining possibilities for its achievement. Qualitative methods,
as well as the extensive literature being a theoretical research frame have been used for this
purpose.
Key words: organizational resilience, theory of resilience, building resilience

Management, Enterprise and Benchmarking in the 21st Century Budapest, 2017
346
1 Introduction
Small and medium-sized enterprises create new jobs and contribute to economic development of each country. In globalization, enterprises are exposed to global economic “shocks”, which are unpredictable by nature and which affect their profitability. In order to be resilient, organizations should lean to strong leadership, comprehension of work environment and the ability to adapt and respond to fast changes. However, are they resilient enough to cope with operating in a risky and unpredictable business environment? We have tried to get the answer to this question as well as to determine possibilities for improvement of resilience of enterprises in this research. In other words, we have tried to determine under which conditions the sector of small and medium-sized enterprises can raise the level of resilience to all “shocks” coming from internal and external environment and ensure sustainable development.
1.1 Concept of Resilience
The concept of resilience is used to explain why so many endangered countries achieve relatively high level of GDP (gross domestic product) per capita i.e., how a national economy is able to return to the previous level speaking of the rate of economic growth and to achieve macroeconomic stability and microeconomic market efficiency. However, economic resilience of a country cannot be achieved unless organizations are also resilient to negative impacts. Therefore, many people see this as two sides of the same coin.
Singapore is usually mentioned as an example in literature, as a country highly exposed to external shocks which managed to achieve high rates of economic growth and high GDP per capita. This reality can be explained as the ability of Singapore to build its economic resilience.
Analyzing the case “Singapore” many professionals are aware of the fact that “the concept of resilience” need not imply an absolute getting back to the pre-existing condition, but it can indicate the ability to respond to challenges resulting from negative impacts and changes. This is confirmed by many researches indicating that “resilience” has an indirect impact on economic growth, private investments and employment. [1] goes on to argue that resilience has four domains:
• technical (The ability of systems to perform during and after disasters),
• organizational (The ability of organizations to take actions to reduce disaster impacts),
• social (The ability of the communities to lessen negative consequences of disaster). • economic (The capacity of enterprises and economies to absorb economic losses resulting from disaster).

Management, Enterprise and Benchmarking in the 21st Century Budapest, 2017
347
Accordingly, literature has been reviewed in order to observe this issue from the position of four above mentioned domains of resilience observation and analysis.
2 Theoretical Background
The term “resilience” originates from the English language and it can hardly be translated using one word as its meaning is multilayered. It might be best explained with the term “resistance to negative incentives” and the ability of a country’s economy to recover from external shocks of various nature, i.e. from structural changes caused by global market trends to negative impacts resulting from natural disasters and wars.
The term “resilience” was mentioned” firstly in 1973 [2] and this work represents a starting point for many studies on the concept of ecological endurance, as well as on many other forms of flexibility. Resilience or resistance of enterprises was defined [3] as the ability of an enterprise to cope with changes, adapt to and recover from negative impacts coming from business environment. He states that, in order to adapt to potential risks, enterprises must have a complex infrastructure management. The key is in the ability of the enterprise to estimate the degree of endangerment, realize mutual relations and interdependence between business activities, information and technologies in the enterprise [4]. Namely, countries having well developed business plans and action plan in case of risks of natural disasters, as well as programs for evaluation of resilience of an enterprise have shown higher resilience index than the countries which haven’t had such plans and programs. This concept is also present in interdisciplinary fields dealing with complex systems, such as enterprises, infrastructural systems and ecosystems [5].
In literature, social and organizational resilience are often analyzed separately. Despite this, to improve community resilience, it is important for organizations to make the link between resilience and organizational competitiveness, and to invest in resilience [6]. Speaking of the importance of organizational resilience we state that organizational resilience directly contributes to faster and more successful recovery of the community after the crisis or disaster.
Building a resilient enterprise should be a strategic initiative that changes the way a company operates and that increases its competitiveness [7]. These authors indicate that a company’s resilience can be achieved by reduction of vulnerability and increase of flexibility, which indicates the company’s ability to get back on “the right path” in case of disturbances.
Speaking of organizational resilience of small and medium-sized enterprises, some authors make difference between big and small enterprises [8]. They believe that
Management, Enterprise and Benchmarking in the 21st Century Budapest, 2017
348
small and medium-sized enterprises are more endangered than big enterprises i.e., that their resilience to climatic and other disasters is much smaller due to the fact that they usually are not insured against disasters and that they have limited access to loans, while a majority of them doesn’t have business continuity in emergency situations. Also, risk management is not incorporated in their business strategy and plans. Namely, bigger organizations are better organized than small and medium-sized organizations, they have more resources and greater technical knowledge. Furthermore, there are no strategic programs for operationalization of actions plans for small and medium enterprises. Statistical data also indicate that small and medium-sized enterprises are less resilient than big enterprises. However, small and medium-sized enterprises tend to be faster in giving responses, even if their response is not coordinated. The reason for this is highly simplified structure of decision-making. In addition to fast response to shocks, entrepreneurs should consider high rate of failure of small enterprises with regard to this and to pay more attention to liquidity, cash flows and seasonal fluctuations [9].
Literature on organizations also uses the term “resilience” as a versatile and multidimensional concept [10] . In the context of strategic management and changes, resilience is the ability of self-renewal over time through innovations [11]. Furthermore, building of organizational resilience is connected to employees and management [12] ,[13], [14] who work in the learning organization.
According to human resource management (HRM), an organization is resilient if people can respond to changes with minimum stress promptly and efficiently and these are positive possibilities of adaptation which separate competition. In the context of environmental changes / emergency management, resilient organizations are able to adapt to new conditions within which they become better and better [15], as well as to develop organizational systems which are capable of overcoming turbulent environmental conditions.
Resilience implies adaptation of corporate strategy [16], as well as a solution for organizations having high level of threat in all aspects of their work environment [8]. As it can be concluded from literature review, building of resilience is based on prompt perception of changes in the work environment and early adaptive responses. “This means that winners will be unbridled firms that are responsive to challenges and adroit in both creating opportunities and capturing them “[17].
3 Research Method
This research had an exploratory phase and it is qualitative study in its nature . The findings presented in this working paper are drawn from research conducted in January 2017 and based on an online survey.
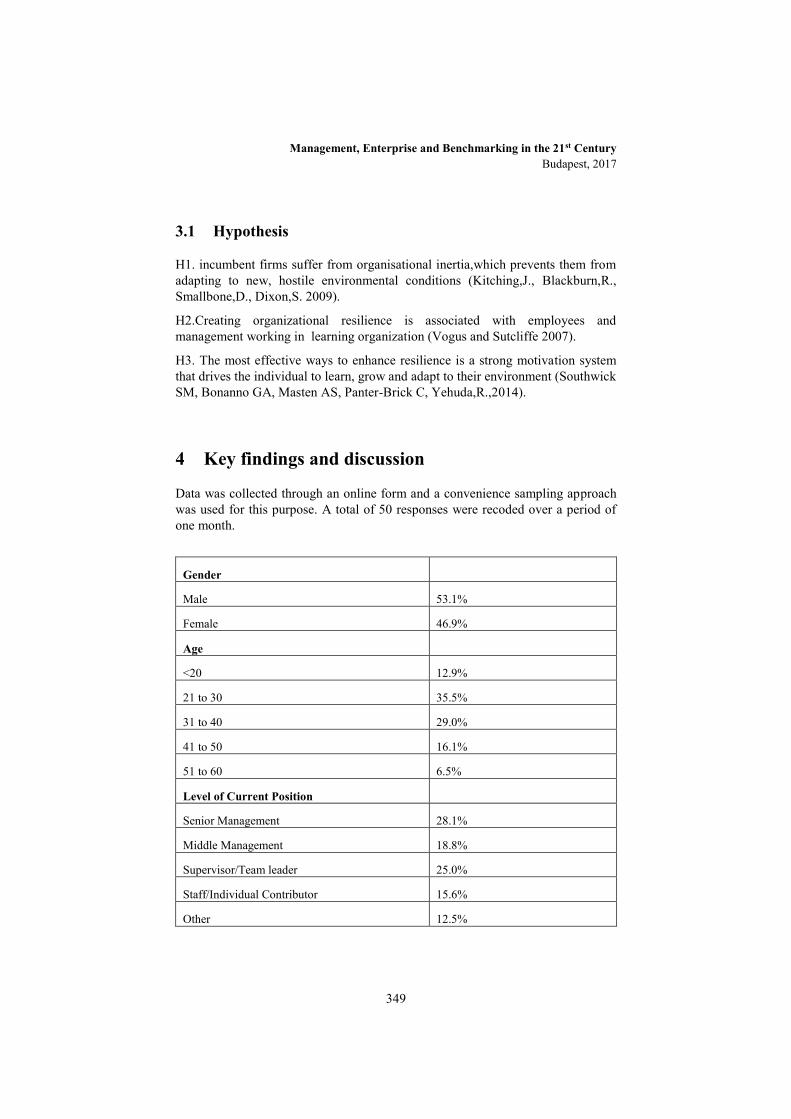
Management, Enterprise and Benchmarking in the 21st Century Budapest, 2017
349
3.1 Hypothesis
H1. incumbent firms suffer from organisational inertia,which prevents them from adapting to new, hostile environmental conditions (Kitching,J., Blackburn,R., Smallbone,D., Dixon,S. 2009).
H2.Creating organizational resilience is associated with employees and management working in learning organization (Vogus and Sutcliffe 2007).
H3. The most effective ways to enhance resilience is a strong motivation system that drives the individual to learn, grow and adapt to their environment (Southwick SM, Bonanno GA, Masten AS, Panter-Brick C, Yehuda,R.,2014).
4 Key findings and discussion
Data was collected through an online form and a convenience sampling approach was used for this purpose. A total of 50 responses were recoded over a period of one month.
Gender
Male 53.1%
Female 46.9%
Age
<20 12.9%
21 to 30 35.5%
31 to 40 29.0%
41 to 50 16.1%
51 to 60 6.5%
Level of Current Position
Senior Management 28.1%
Middle Management 18.8%
Supervisor/Team leader 25.0%
Staff/Individual Contributor 15.6%
Other 12.5%

Management, Enterprise and Benchmarking in the 21st Century Budapest, 2017
350
Years of Work Experience
<1 year 21.9%
1 - 2 years 15.6%
3 - 5 years 15.6%
6 - 10 years 21.9%
11- 15 years 15.6%
16+ years 9.4%
Table 1. Respondents by gender, age, level of current position and work experience
A total of 81 executives and staff members participated in the online survey.
The survey sample was: 46.9 % of respondents were senior executives and middle management. Among the respondents, most were persons aged between 21 and 30 (31.5%) and with work experience between 6 and 10 years (21.9 %) (Table 1).
A range of industries was represented, including financial services, accounting, education, information technology and professional services. In our study, respondents were from Serbia . Our survey consist of 15 questions, but we will discuss in our paper only replies on the selected questions which are crucial for our research..
The survey has shown that respondents identify unstable market as a key external factor that made a negative impact on their business in the last several years (Figure 1). However, the most of them consider lack of financial resources (37.5%) as a main internal circumstance (Figure 2).

Management, Enterprise and Benchmarking in the 21st Century Budapest, 2017
351
Figure 1
Event that made a negative impact
Source: Authors
Figure 2
Internal circumstances that made a negative impact
Source: Authors
According to our respondents, one of the most common is organizational active inertia and lack of human resources (21.9 %) (Figure 2). At Sull “active inertia is an organization’s tendency to follow established patterns of behavior—even in response to dramatic environmental shifts” [18].
The problem also lies in an inability of executives to take appropriate actions and managerial incompetence and lack of management and leadership skills in risk management (12.5%).
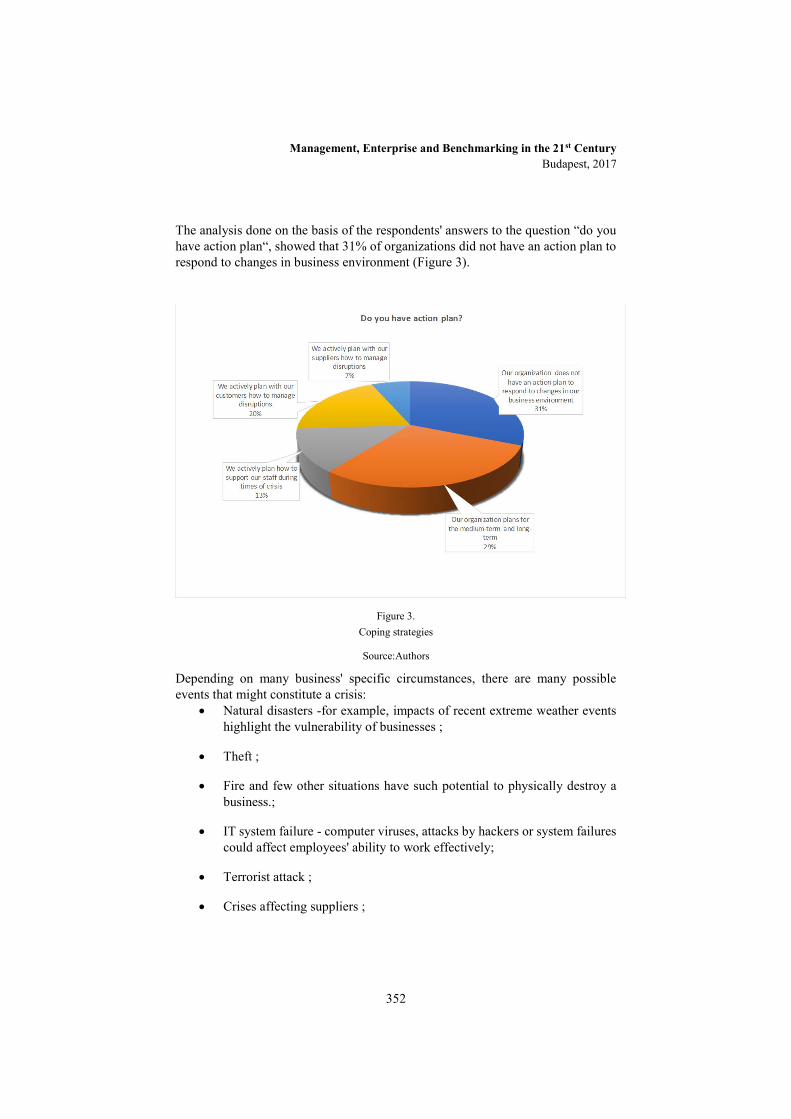
Management, Enterprise and Benchmarking in the 21st Century Budapest, 2017
352
The analysis done on the basis of the respondents' answers to the question “do you have action plan“, showed that 31% of organizations did not have an action plan to respond to changes in business environment (Figure 3).
Figure 3.
Coping strategies
Source:Authors
Depending on many business' specific circumstances, there are many possible events that might constitute a crisis:
Natural disasters -for example, impacts of recent extreme weather events highlight the vulnerability of businesses ;
Theft ;
Fire and few other situations have such potential to physically destroy a business.;
IT system failure - computer viruses, attacks by hackers or system failures could affect employees' ability to work effectively;
Terrorist attack ;
Crises affecting suppliers ;
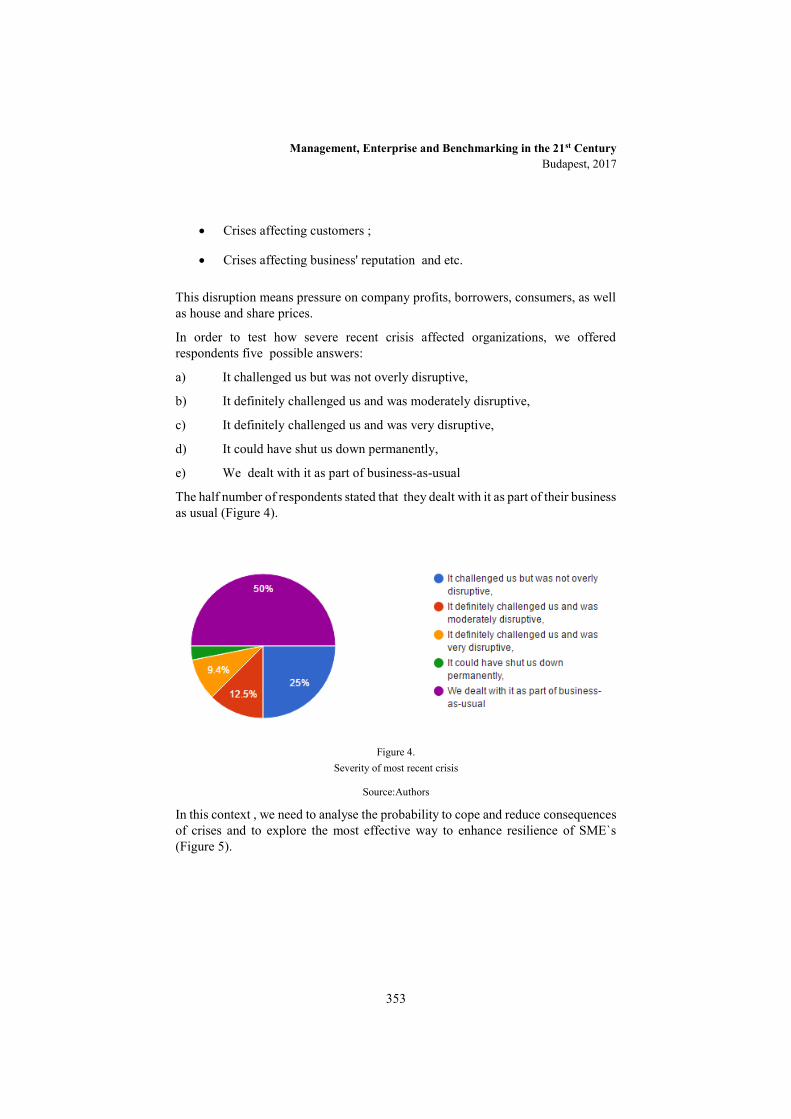
Management, Enterprise and Benchmarking in the 21st Century Budapest, 2017
353
Crises affecting customers ;
Crises affecting business' reputation and etc.
This disruption means pressure on company profits, borrowers, consumers, as well as house and share prices.
In order to test how severe recent crisis affected organizations, we offered respondents five possible answers:
a) It challenged us but was not overly disruptive,
b) It definitely challenged us and was moderately disruptive,
c) It definitely challenged us and was very disruptive,
d) It could have shut us down permanently,
e) We dealt with it as part of business-as-usual
The half number of respondents stated that they dealt with it as part of their business as usual (Figure 4).
Figure 4.
Severity of most recent crisis
Source:Authors
In this context , we need to analyse the probability to cope and reduce consequences of crises and to explore the most effective way to enhance resilience of SME`s (Figure 5).

Management, Enterprise and Benchmarking in the 21st Century Budapest, 2017
354
Figure 5.
Most effective ways to enhance resilience
Source:Author Based on our review, hypothesis H1 is partially confirmed. Namely , organizations do not only suffer from organizational inertia, which prevents them from adapting to new, hostile environmental conditions .The problem also lies in managerial incompetence and lack of management and leadership skills in risk management. The hypothesis H2 that creating organizational resilience is associated with employees and management working in learning organization (Vogus and Sutcliffe 2007) ,is confirmed by our respondents as well as . hypothesis H3. Namely,findings of our study have revealed that strong motivation system which can drives the individual to learn, grow and adapt to their environment and flexibility are the most effective ways to enhance resilience of small and medium sized enterprises. This opinion was expressed by as much as 44% of our respondents (Figure 5).
The organizations that refuse to learn and improve will one day become not relevant to the industry. According to this statement, we can mention example of Nokia. Its president used to say to his colleagues "we didn't do anything wrong, but somehow, we lost". However, they missed out on learning, they missed out on changing, and thus they lost the opportunity at hand to make it big.
Limitation of our research is sample size (81 respondents), which can influence our research outcomes. However, it is the first phase of our research. In the next phase, we shall expand our sample and add more questions in our survey.
Management, Enterprise and Benchmarking in the 21st Century Budapest, 2017
355
Conclusion Because the economic resilience needs to be strengthened, achieving economic resilience should be one of the overriding goal of the implementation of long-growth promoting government macroeconomic policies.
The main results of the study pointed out that boosting resilience to the risks of economic, social and environmental shocks should be a top priority and goal because the risks for the SME`s can have serious consequences on entire economies. In line with this, it is necessary through researching and introducing new ways of improving organizations, implementing change interventions and developing new best practice models to recover and adapt to changing circumstances. In this context, our research should have implications for researchers and policy-makers.
References
[1] Tierney, K. 2003. Conceptualising and Measuring Organizational and Community Resilience: Lessons from the Emergency Response Following the September 11, 2001 Attack on the World Trade Center, Preliminary paper 329. Newark: University of Delaware.
[2] Holling, C.S., 1973. Resilience and stability of ecological systems. Annual Review of Ecology and Systematics, 4, 1–23.
[3] Gallopin, G.C., 2006. Linkages between vulnerability, resilience, and adaptive capacity. Global Environmental Change, 16, 293–303.
[4] Gomes,R.2015. RESILIENCE AND ENTERPRISE ARCHITECTURE IN SMES, JISTEM J.Inf.Syst. Technol. Manag. vol.12 no.3 São Paulo Sept./Dec. 2015 (Retrived:January 10 ,2017.)
[5] Carpenter, S., et al., 2001. From metaphor to measurement: resilience of what to what? Ecosystems, 4, 765–781.
[6] Stephenson,A.2010. Benchmarking the resilience of organisations,University of Canterbury.
[7] Sheffi, Y. and Rice Jr, J. B. 2005. A supply chain view of the resilient enterprise. MIT Sloan Management Review, 47 (1), 41–48 (2005).
[8] Sullivan-Taylor, B., & Wilson, D. C. 2009. Managing the threat of terrorism in British travel and leisure organizations. Organization Studies, 30(2–3), 251–276.
[9] Smith,E.2016. Risk & Resilience Manager: Building Resilience in SME’s, Oakpark Security,United Kingdom. http://www.oaksec.co.uk/building-resilience-in-smes/ (Retrived: January 14,2017).

Management, Enterprise and Benchmarking in the 21st Century Budapest, 2017
356
[10] Ponomarov, S.Y. and Holcomb, M.C., 2009. Understanding the concept of supply chain resilience. International Journal of Logistics Management, 20 (1), 124–143.
[11] Reinmoeller, P., & Van Baardwijk, N. 2005. The link between diversity and resilience. MIT Sloan Management Review, 46(4), 61–65.
[12] Mallak, L., 1999. Toward a theory of organizational resilience. In: Portland International Conference on Technology and Innovation Management. PICMET. Portland, OR: IEEE.
[13] Patterson, E.S., et al., 2007. Collaborative cross-checking to enhance resilience. Cognition, Technology & Work, 9, 155–162.
[14] Vogus, T.J. and Sutcliffe, K.M. 2007. Organizational resilience: towards a theory and research age da. IEEE Conference on Systems, Man and Cyb
[15] Burnard, K., & Bhamra, R. 2011. Organisational resilience: Development of a conceptual framework for organizational responses. International Journal of Production Research, 49(18), 5581–5599
[16] Beermann, M. 2011. Linking corporate climate adaptation strategies with resilience thinking, Journal of Cleaner Production, Volume 19, Issue 8, May 2011, Pages 836–842.
[17] Radović-Marković,M . (2008) .Managing the organizational change and culture in the age of globalization, Journal of business economics and management, Taylor & Francis Group,Vol. 1 ,pp .3-11. http://www.tandfonline.com/doi/pdf/10.3846/1611-1699.2008.9.3-11 (Retrived: January 14,2017.)
[18] Sull,D. (199). Why Good Companies Go Bad? , Harvard Business Review. https://hbr.org/1999/07/why-good-companies-go-bad (Retrived: 20 March,2017).
Management, Enterprise and Benchmarking in the 21st Century Budapest, 2017
357
Mobile Application Security
Kata Rebeka Szűcs Business Development MSc, Keleti Faculty of Business and Management, Óbuda University
Regina Zsuzsánna, Reicher, Ph.D Keleti Faculty of Business and Management, Óbuda University
Abstract: Nowadays it’s hard to imagine life without Internet or mobile phones. Mobile technology is affecting almost every aspect of our lives, including health. This article is about today’s trend, mobile health, which aims to heal and promote health through mobile devices and infocommunication technology. After describing mHealth and security from various aspects we analyze a few questions from a survey we conducted in order to know our respondents habits regarding data security and mHealth applications.
Keywords: mHealth, mobile applications
1 Introduction In 1848, James W. Marshall was building a sawmill on the American River when he found flakes of gold in the water. Although he tried to keep this a secret, word spread, triggering the California Gold Rush of 1849. (Beilharz, 2017) Finding the valuable treasure in useless mud seems to be a challenge today, 150 years later, as well. We could call data today’s gold. Information society brought huge amounts of data which can hold high values if we know how to extract them. In the era of big data, we have to consider data as a resource with high value. Today’s people can barely imagine life without mobile phones and the Internet. Mobile technology has revolutionized our world, affecting almost every aspect of life. This way data can be accessed very quickly and easily anywhere.
Mobile software applications, also known as apps are one of the most important elements of this trend. Apple’s famous commercial, “There’s an app for that” shows that we can’t find a situation or problem in our lives without an app to help or track.
Management, Enterprise and Benchmarking in the 21st Century Budapest, 2017
358
In July, 2016 Android users could choose between 2.2 million apps, while Apple users could download from 2 million apps. On the third place, Windows Store held 669 thousand applications, Amazon Appstore 600 thousand and BlackBerry users could find 234 500 apps in their store. 2 years ago, in 2015, more than half of the world’s population were mobile users and the average daily time spent on accessing online content from a mobile device reached over 3 hours among youths. (statista.com, 2017) In December 2016 the most popular downloaded category were games (24.8%), followed by business (9.96%), education (8.55%), lifestyle (8.44%) and later on the list, health and fitness (2.97%). (statista.com, 2017)
2 MHealth The Mobile health sector is a new, fast growing sector connecting healthcare and information and communication technology. “It includes mobile applications designed to deliver health-related services through smart devices often processing personal information about health. mHealth applications also process a large volume of lifestyle and well-being information.” (Buttarelli & EDPS, 2015, old.: 2) Mhealth can also be used to promote the healthy lifestyle and to improve user’s lives.
With the spreading use of Internet, people tend to look up their symptoms, share their conditions on forums and seek their fellows’ advise on how to treat or live with their problems for example on sites such as PatientsLikeMe.com. This kind of information sharing is great, not only for patients but also for researchers who get insights from the site to help their work.
In his book, The patient will see you now, Eric Topol cardiologist argues that there are many changes in the field of healthcare which doctors and patient should know about. Along with many others he thinks patients should have access to their medical data which they own and be part of making the decisions affecting their own lives. He also thinks which I mentioned above that we should share our anonymous medical data for the benefit of humanity. Sharing data with others also can contribute to better treatment decisions. Medical data is usually used just for once, when it’s created and analyzed. We can imagine the possibilities of using this huge amount of historical data to find the best treatments for a patient. For example, IBM Watson, with artificial intelligence, uses several patient’s data and their treatment documentation to suggest treatment to a new patient suffering from cancer considering their status and comparing it to historical data of similar cases. The method enables patients to have the best personalized treatment available. This can bring patient and doctor closer together and save time for both.
This trend can also give a bigger responsibility, control and awareness to patients in their own healthcare and well-being, and can strengthen the emphasis on prevention instead of treatments. It also contributes to a better allocation of the

Management, Enterprise and Benchmarking in the 21st Century Budapest, 2017
359
workforce. If there are less patients and more healthy people, the quality of healthcare can improve, it can be more effective and sustainable and cost less. It can also help professionals to collect data, to monitor patients and researchers to find out more about certain diseases and find the best treatments.
We don’t have to just think about treating serious diseases when we think about mHealth. We also can include apps promoting a healthy lifestyle in this group. Before we go into this topic deeper, we have to remember today’s phenomenon, datafication (Cukier & Mayer-Schönberger, 2014)which is a modern trend to turn many aspects of our lives into data and later transforming it into new valuable forms. (Cukier & Mayer-Schönberger, 2014) Many people use apps which help them tracking their calorie intake, their water intake, their sleeping habits or their sport performance. We share personal data with these apps willingly hoping we can improve the quality of our lives, our performance, health and fitness, and that it can help us achieving our goals. In the era of web 2.0, also known as “social web”, we can connect to the Internet with our mobile devices (smartphones, tablets, wearable devices) from any locations, (Lupton, 2017), which helps to engage in datafication habits. Twitter, Facebook, Instagram, social media in general also enable us creating huge amounts of data. People tend to share personal information on social media. In many cases studies refer to the activity of producing and consuming contents at the same time as “prosuming” (Ritzer, Dean, & Jurgenson, 2017). Lastly, in this section explaining the leading factors of mHealth we have to mention the quantified self movement which means a group of people trying to improve and know themselves better by self-tracking and analyzing. There are several experiments which record data in order to achieve behavioral change and to understand what’s effecting our bodies. (For interesting experiences see http://quantifiedself.com/.) Many of us become members of this group without even knowing about its existence.
Opening App store or Play Store or any other application stores and searching for health and fitness apps can be overwhelming. There are thousands of apps from which we can choose, several of them are free. Well, we don’t have to pay for them with money, but we are paying them in a certain way. Without users’ willingness of paying for these apps there are a few new business models with advertising in focus. We provide our valuable data and in return we get free apps with questionable privacy and data handling policies. Users probably don’t know what exactly is their data used for and it seems regulators are not as fast as technology improves. Modern business requires collaboration and sharing of valuable sensitive information between participants. It’s becoming common sense that traditional security measures such as passwords and firewalls are not enough to protect data. This attitude leads companies to be strict with their own data protection policies, a habit we could embrace in our everyday life.
Nowadays mobiles and apps can be popular because of their on-the-go nature. Users like to get things done quickly, which means not spending much time on registration using a service, getting to know the privacy statements and their data’s
Management, Enterprise and Benchmarking in the 21st Century Budapest, 2017
360
way between companies and institutions. This attitude can lead to a situation where users are necessarily unaware of possible privacy breaches. (Fife & Orjuela, 2017) Therefore users’ individual responsibility is a must (and also considered as default from the app developers). We can easily understand that the era of big data and the Internet of things can reduce users’ control over their personal data but users are not the only participants in this chain that have to act in a responsible way. Developers have to recognize their duty, as they are creating apps which are affecting people’s health and treating users’ personal data, they have to be responsible. IT knowledge is not always enough to create these apps, it’s always good to consult with health professionals before issuing an app in this field. Regarding personal data handling, developers and governments have to be up to date and create regulations which protect these data. Transparency about data policy and data handling would also be welcome so users know exactly (or at least can look it up easily) what is done with their data.
There are quite a few types of apps from which we can choose in health and fitness section and lifestyle section is also worthy of checking. Here are a few examples of health promoting apps:
Food and weight: with these apps people can track their calorie intake in order to gain, maintain or lose weight.
Training apps: these can help people track their sport activities or even give them a personal training plan.
Drink water: users who forget to drink their daily dose of water can set reminders and get healthier.
Sleep tracker apps: these can analyze users’ sleep and might wake them at the right sate of their sleep.
Smoking cessation apps which help users to quit smoking and gives them the motivation to continue their process.
Mood tracker apps which can track users’ mood and give a good feedback. Women’s period tracker apps.
There are also a lot of apps effecting lifestyles? such as budget tracker apps or restaurant finder apps, but we don’t have to go this far, dating apps are parts of this group as well.
3 Survey analysis To understand the analysis better, we have to mention generations. A generation is a group of people born at the same time period which means they have to reach their important points of life (e.g. finishing education, getting married or having children). (Kolnhofer-Derecskei & Reicher, 2016) Although there are many articles and studies available in the field, we won’t go in details here. There are X, Y and Z generations. The X generation is born before 1982 (and after 1961) which means
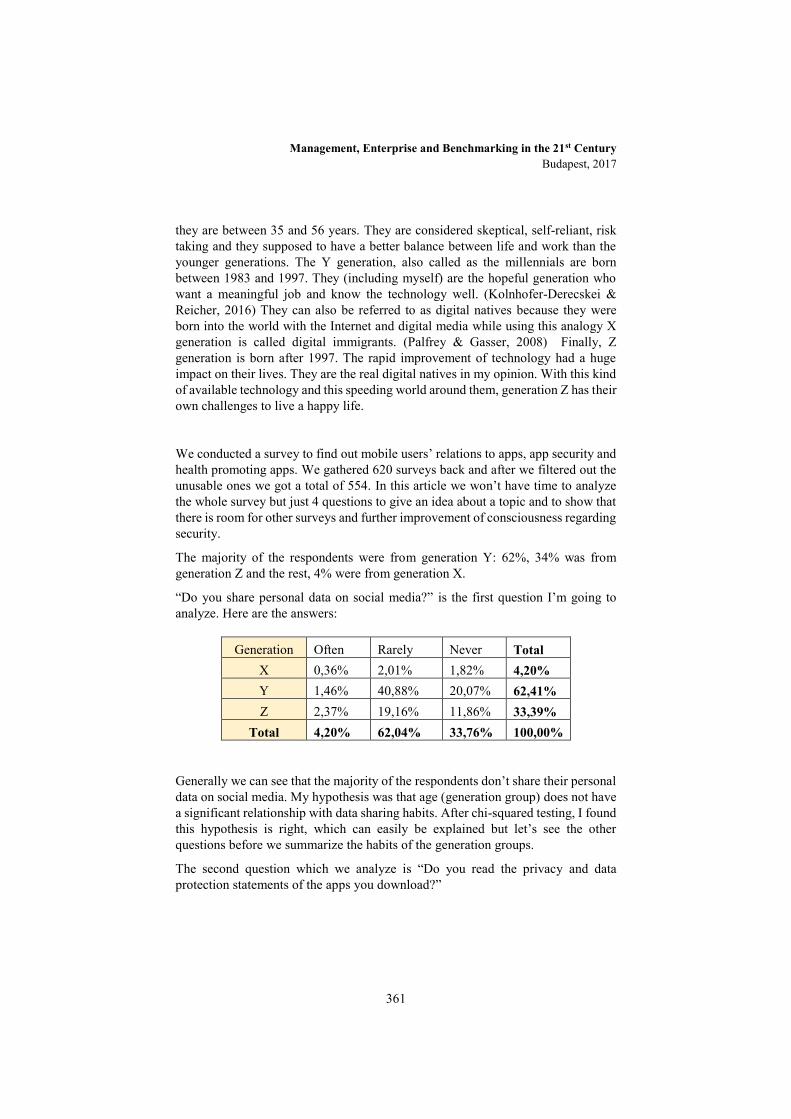
Management, Enterprise and Benchmarking in the 21st Century Budapest, 2017
361
they are between 35 and 56 years. They are considered skeptical, self-reliant, risk taking and they supposed to have a better balance between life and work than the younger generations. The Y generation, also called as the millennials are born between 1983 and 1997. They (including myself) are the hopeful generation who want a meaningful job and know the technology well. (Kolnhofer-Derecskei & Reicher, 2016) They can also be referred to as digital natives because they were born into the world with the Internet and digital media while using this analogy X generation is called digital immigrants. (Palfrey & Gasser, 2008) Finally, Z generation is born after 1997. The rapid improvement of technology had a huge impact on their lives. They are the real digital natives in my opinion. With this kind of available technology and this speeding world around them, generation Z has their own challenges to live a happy life.
We conducted a survey to find out mobile users’ relations to apps, app security and health promoting apps. We gathered 620 surveys back and after we filtered out the unusable ones we got a total of 554. In this article we won’t have time to analyze the whole survey but just 4 questions to give an idea about a topic and to show that there is room for other surveys and further improvement of consciousness regarding security.
The majority of the respondents were from generation Y: 62%, 34% was from generation Z and the rest, 4% were from generation X.
“Do you share personal data on social media?” is the first question I’m going to analyze. Here are the answers:
Generation Often Rarely Never Total X 0,36% 2,01% 1,82% 4,20% Y 1,46% 40,88% 20,07% 62,41% Z 2,37% 19,16% 11,86% 33,39%
Total 4,20% 62,04% 33,76% 100,00%
Generally we can see that the majority of the respondents don’t share their personal data on social media. My hypothesis was that age (generation group) does not have a significant relationship with data sharing habits. After chi-squared testing, I found this hypothesis is right, which can easily be explained but let’s see the other questions before we summarize the habits of the generation groups.
The second question which we analyze is “Do you read the privacy and data protection statements of the apps you download?”
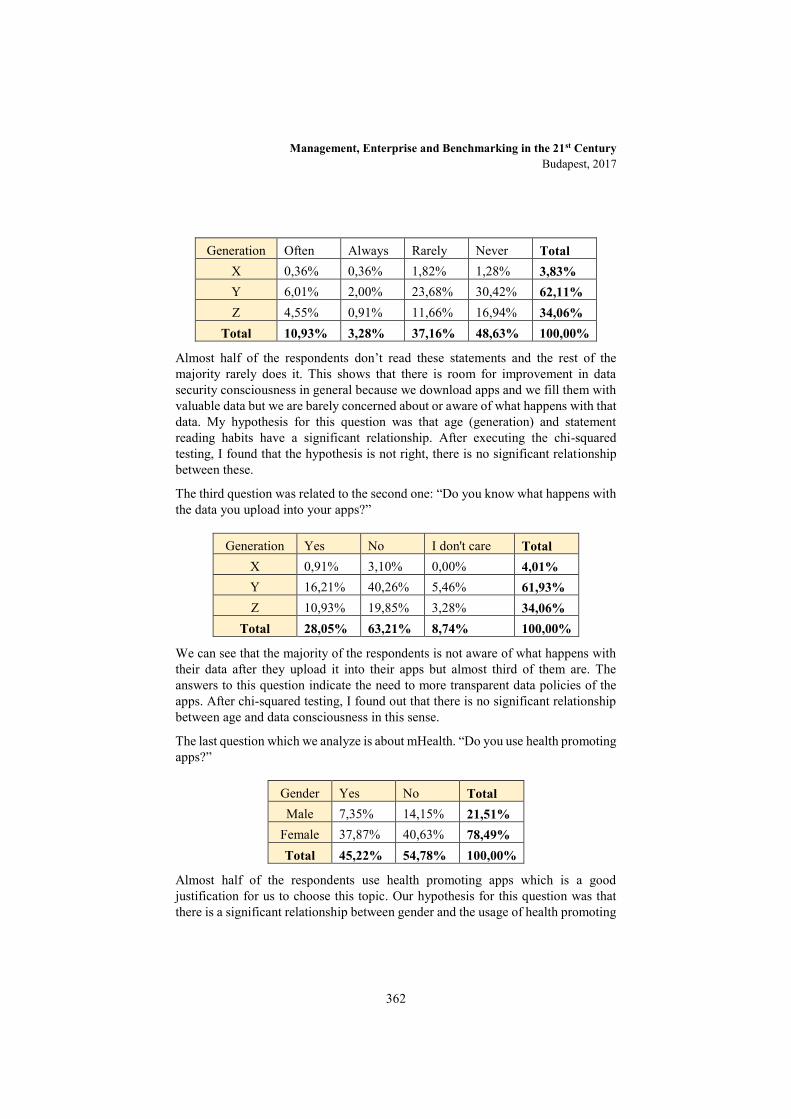
Management, Enterprise and Benchmarking in the 21st Century Budapest, 2017
362
Generation Often Always Rarely Never Total
X 0,36% 0,36% 1,82% 1,28% 3,83% Y 6,01% 2,00% 23,68% 30,42% 62,11% Z 4,55% 0,91% 11,66% 16,94% 34,06%
Total 10,93% 3,28% 37,16% 48,63% 100,00%
Almost half of the respondents don’t read these statements and the rest of the majority rarely does it. This shows that there is room for improvement in data security consciousness in general because we download apps and we fill them with valuable data but we are barely concerned about or aware of what happens with that data. My hypothesis for this question was that age (generation) and statement reading habits have a significant relationship. After executing the chi-squared testing, I found that the hypothesis is not right, there is no significant relationship between these.
The third question was related to the second one: “Do you know what happens with the data you upload into your apps?”
Generation Yes No I don't care Total X 0,91% 3,10% 0,00% 4,01% Y 16,21% 40,26% 5,46% 61,93% Z 10,93% 19,85% 3,28% 34,06%
Total 28,05% 63,21% 8,74% 100,00%
We can see that the majority of the respondents is not aware of what happens with their data after they upload it into their apps but almost third of them are. The answers to this question indicate the need to more transparent data policies of the apps. After chi-squared testing, I found out that there is no significant relationship between age and data consciousness in this sense.
The last question which we analyze is about mHealth. “Do you use health promoting apps?”
Gender Yes No Total Male 7,35% 14,15% 21,51%
Female 37,87% 40,63% 78,49% Total 45,22% 54,78% 100,00%
Almost half of the respondents use health promoting apps which is a good justification for us to choose this topic. Our hypothesis for this question was that there is a significant relationship between gender and the usage of health promoting
Management, Enterprise and Benchmarking in the 21st Century Budapest, 2017
363
apps. We found that this is correct. In our survey we see that mostly women use these kind of apps.
4 Summary In my opinion health promotion with mHealth apps is really popular nowadays and it’s starting to be a trend in Hungary as well. With the spreading of such apps which require users to share their personal information comes great responsibility. Users, providers and government have to be aware of the risks and have to handle data while respecting privacy. Consciousness and transparency are the two key words to solve this in my opinion. We have to admit that beyond the risks there are plenty of opportunities of mHealth which we have to seize to make the world a better place and people healthier.
References [1] Beilharz, A. (2017, 03 12). Coloma California. Retrieved from Coloma
California: https://www.coloma.com/california-gold-discovery/history/ [2] Buttarelli, G., & EDPS. (2015). Opinion 1/2015 Mobile Health, Reconciling
technological innovation with data protection. Brussels: European Data Protection Supervisor, EDPS.
[3] Cukier, K., & Mayer-Schönberger, V. (2014). Big Data. Budapest: HVG.
[4] Fife, E., & Orjuela, J. (2017, 03 01). International Journal of Engineering Business Management, EBSCO. Retrieved from The Privacy Calculus: Mobile Apps and: http://connection.ebscohost.com/c/articles/82679280/privacy-calculus-mobile-apps-user-perceptions-privacy-security
[5] Kolnhofer-Derecskei, A., & Reicher, R. (2016). Óbudai Egyetem. Retrieved from Vállalkozásfejlesztés a XXI. században VI: https://mail.google.com/mail/u/0/#inbox/15aed1379b653822
[6] KSH. (2016, 12 01). KSH. Retrieved from Az infokommunikációs technológiák és szolgáltatások helyzete Magyarországon, 2015: https://www.ksh.hu/docs/hun/xftp/idoszaki/ikt/ikt15.pdf
[7] Lupton, D. (2017, 03 10). Oxford Academic Journals. Retrieved from Health promotion in the digital era: a critical commentary: https://academic.oup.com/heapro/article-lookup/doi/10.1093/heapro/dau091

Management, Enterprise and Benchmarking in the 21st Century Budapest, 2017
364
[8] Palfrey, J., & Gasser, U. (2008). Born digital. New york: Basic books.
[9] Ritzer, G., Dean, P., & Jurgenson, N. (2017, 03 07). American Behavioral Scientist. Retrieved from The Coming of Age of the Prosumer : http://journals.sagepub.com/doi/abs/10.1177/0002764211429368
[10] statista.com. (2017, 03 12). statista.com. Retrieved from Most popular Apple App Store categories in December 2016, by share of available apps: https://www.statista.com/statistics/270291/popular-categories-in-the-app-store/
[11] statista.com. (2017, 03 12). Statista.com. Retrieved from Number of apps available in leading app stores as of June 2016: https://www.statista.com/statistics/276623/number-of-apps-available-in-leading-app-stores/
Management, Enterprise and Benchmarking in the 21st Century Budapest, 2017
365
Controlling in Germany from Practitioners’ and Students’ Point of View – An Empirical Time Series Analysis
Prof. Dr. Walter Ruda and Pierre G. Keller, M.Sc.1 Kaiserslautern University of Applied Sciences, Campus Zweibruecken German Center for Entrepreneurship Amerikastraße 1, D-66482 Zweibruecken, Germany Tel. +49-631-3724-5245 [email protected]; [email protected]
Abstract:This study examines the characteristics of controlling in German small and medium-sized enterprises (SMEs). Within this approach, differences and similarities of controller images, controlling organization structure and controller tasks from students’ and practitioners’ point of view are explained. The data gathering occurred since 2003 and is still ongoing, whereas the development of the discovered research subjects within a large time range is observable, promoting an empirical time series analysis. The study started questioning controllers in German enterprises, which were members of the RKW Baden-Wuerttemberg, in 2003, and started questioning students from the University of Applied Sciences Kaiserslautern, Campus Zweibruecken, (study course: business administration) and the University of Applied Sciences Mittelhessen, Campus Friedberg (study course: engineering) in 2006. Considerable overlaps concerning the organisational structure of the controlling divisions between the estimations of the students and the controllers could be found. The same result was observable within the description of typical controller images. Major differences between both interviewed groups occured within the evaluation of controller tasks. This fact leads to some possible implications for university teachings, which could explain this difference. Apart from that, several effects of sales volume and number of employees are shown within the paper. For future research, it would be interesting to spread the students’ survey in Germany to other Universities, which maybe have another curriculum within the study course business administration. Thus, the above mentioned difference within controlling tasks possibly could be explained. Furthermore, the curriculum of those universities, that reach more similar results with practitioners regarding controlling tasks, could be evaluated as superior regarding the relevance of the major fields of study.
Keywords: Controlling, Controllership, small and medium-sized enterprises, job description, image, task fields, personality traits, organisational structure.
1 At this point we would like to thank Ms. Michaela Mika, B.A., for her cooperation during the
creation of this article.
Management, Enterprise and Benchmarking in the 21st Century Budapest, 2017
366
1 Introduction The demands in controlling have changed quickly because of globalisation and digitalization. Latter implies great influence on industrial firms, as machines and products are increasingly connected to the internet (The Economist, 2015). Innovations, in particular, are granted with a vital role within digitalization, as they help to promote it (i.e. through knowledge spill-overs) (De Clercq, Hessels & Van Stel, 2008). In this context, research articles have already pointed out the special role of young and small companies, as they imply a high potential for innovations.; therefore, positive effects on economic growth as well as job creation can be made (Aleksejeva & Aleksejeva, 2015; Ammetller, Rodríguez-Ardura & Lladós-Masllorens, 2014; Hessels & Van Stel, 2011; Lerner, 2010; Rajaei, Yaghoubi & Donyaei, 2011; Welter, 2010). Through globalization, the chances for small and medium-sized enterprises (SMEs) are even more promoted. Nevertheless, the importance of financial safety – especially in smaller businesses – play a vital role in businesses, giving controllers an important task (Ruda & Christ, 2016). But what are the actual tasks of controllers in SMEs? How is a controlling organization structured? And how can we describe the image of a controller nowadays?
The following study focuses on the characterisation of the job description of controllers in German SMEs. For this study, the images and task fields of controllers as well as the organisational form of the controlling will be observed. Selected results of this study were presented and published on the MEB conferences in 2008, 2013 and 2015 in Budapest. The expectations were and still are the gathering of new empirical data, its statistical analysis and finally the delivery of new statistically proved input to the research and teaching community as well as to the companies.
2 Methodology: Sample and Data Analysis The methodology of the study is characterized through a differentiation of both the sample and the data analysis in two clusters; controlling practitioners and students. Within the observation, a comparison of the practitioners’ and students’ point of view according to several questions will occur over the sampling survey duration of 13 years – beginning in 2003 (Ruda & Grünhagen, 2009). Through this approach, the development of the job profile from different points of view can be observed, leading us to the following research question (RQ):
RQ 1: How can the image of a controller be described? Is this description changing? And do students and practitioners have different opinions?
RQ 2: What is the superior organizational form for the surveyed businesses? Are their opinions changing? And how do students evaluate this question?

Management, Enterprise and Benchmarking in the 21st Century Budapest, 2017
367
RQ 3: What are the actual tasks controllers have to do while fulfilling their job? Are those tasks changing and do students evaluate those tasks the same way as practitioners actually fulfill them?
RQ 4: Regarding the survey of practitioners, how does the size of the company possibly influence RQ 1, RQ 2 and RQ 3?
To answer those questions partly, a questionnaire for participants of the RKW Baden-Wuerttemberg was developed and applied from 2003 to 2015 by using specific questions. Within this time range, 168 questionnaires were filled out from practitioners, which represent the controller department of their enterprises.
The questionnaire was divided into two different parts. In the first part of the questionnaire, general data of the enterprises, like turnover and number of employees were collected. The data are useful to classify the companies on basis of the German code of commerce in small, medium and large enterprises and to serve as a basis of further evaluations with regard to effects of enterprises’ size on the results (see RQ 4). The second part of the questionnaire surveys the aspects mentioned in RQ 1-3:
Regarding RQ 1, practitioners had to rate seven different controlling images from 1 to 7, beginning with 1 for the most appropriate image and 7 for the worst one. Every number had to be used exactly one time. The different images are “guide”, “helmsman”, “Kontrolleur”, “track hound”, “number cruncher”, “nitpicker” and “braking force”.
To answer RQ 2, they had to answer the question, if their enterprises’ structure is centralized, hybrid type or decentralized.
According to RQ 3, they had to rate twelve different tasks they use in their job as controller, beginning with 1 for the mostly applied task and 12 for the least applied task. The several tasks are “reporting”, “operative planning”, “analysis of variances”, internal accounting”, “consulting/ coaching”, monitoring/surveillance”, “regulating tasks”, “financing”, “investment analysis”, “personnel management”, “tactical planning” and “strategical planning”.
For further answering of the research questions, student surveys took place at the University of Applied Sciences Kaiserslautern, Campus Zweibruecken, and the University of Applied Sciences Mittelhessen, Campus Friedberg from 2006 to 2016. In this case bachelor and master students – which were enrolled in presence and correspondence courses of studies as well as in full time and extra occupational – were considered from the subject areas business administration and engineering. Thus, possibly different outcomes from the subject areas could be detected. The questionnaire of the students differed slightly from that of the practitioners in content and structure:
Regarding RQ 1, students had to do exactly the same ranking of controlling images as practitioners.

Management, Enterprise and Benchmarking in the 21st Century Budapest, 2017
368
To answer RQ 2, they had to rank centralized, hybrid type and decentralized enterprise structure in the way of how useful they are. Every number had to be used exactly one time.
According to RQ 3, they had to rate the above mentioned tasks according to their relevance for controlling, beginning with 1 for the most relevant task and 12 for the least relevant task.
3 Results and Discussion The results of the study are selected and divided into the study subjects controlling image, enterprises’ structure and task fields of the controller. In each study subject, the results of the students are shown primarily, followed by the interviewed practitioners.
3.1 Image of the Controller Both the participants of the RKW Baden Wuerttemberg and the students assessed the image of the controller with the help of the above mentioned images and role models, which were described by Weber and Schäffer (2014). Whereas students just had to estimate their expectations of the controller’s image, the interviewed practitioners should assess their image at the colleagues with the parameters “very strong distinct”, “less distinct” and “not applicable” (Ruda & Dackiw, 2015). The cumulative results from 2006 to 2016 from the students’ point of view and from 2003 to 2015 from the practitioners’ point of view are shown in the following figure:
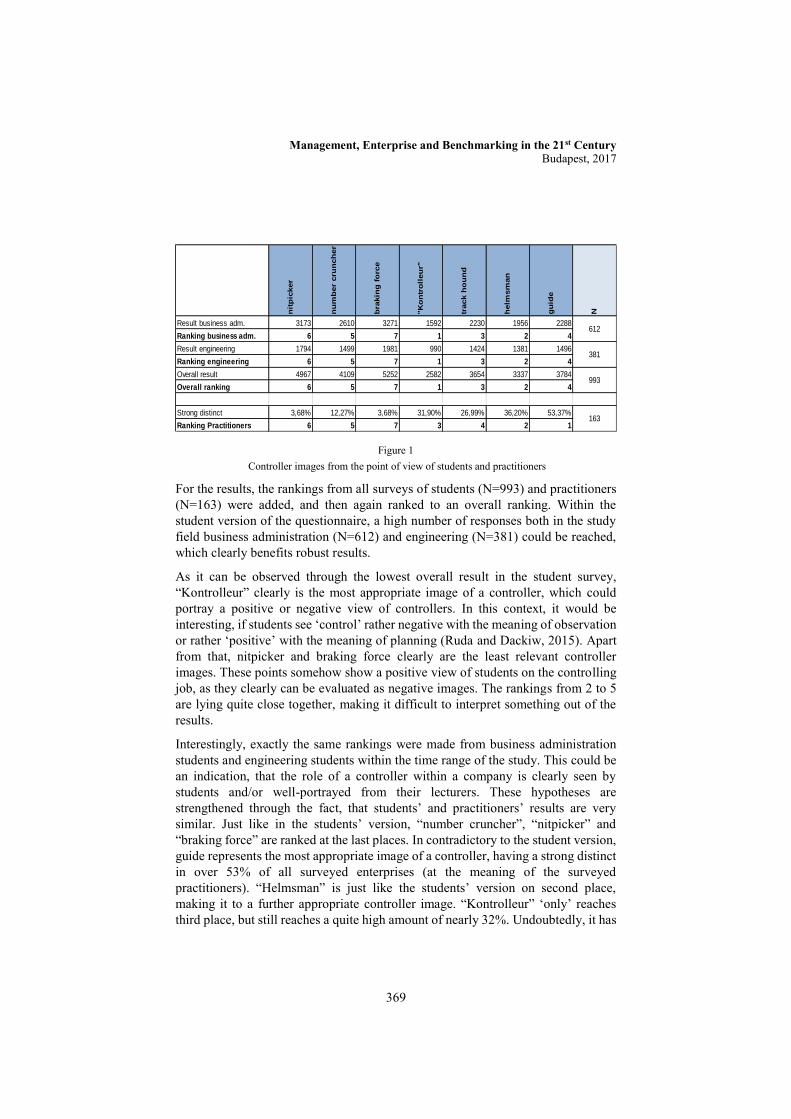
Management, Enterprise and Benchmarking in the 21st Century Budapest, 2017
369
Figure 1
Controller images from the point of view of students and practitioners
For the results, the rankings from all surveys of students (N=993) and practitioners (N=163) were added, and then again ranked to an overall ranking. Within the student version of the questionnaire, a high number of responses both in the study field business administration (N=612) and engineering (N=381) could be reached, which clearly benefits robust results.
As it can be observed through the lowest overall result in the student survey, “Kontrolleur” clearly is the most appropriate image of a controller, which could portray a positive or negative view of controllers. In this context, it would be interesting, if students see ‘control’ rather negative with the meaning of observation or rather ‘positive’ with the meaning of planning (Ruda and Dackiw, 2015). Apart from that, nitpicker and braking force clearly are the least relevant controller images. These points somehow show a positive view of students on the controlling job, as they clearly can be evaluated as negative images. The rankings from 2 to 5 are lying quite close together, making it difficult to interpret something out of the results.
Interestingly, exactly the same rankings were made from business administration students and engineering students within the time range of the study. This could be an indication, that the role of a controller within a company is clearly seen by students and/or well-portrayed from their lecturers. These hypotheses are strengthened through the fact, that students’ and practitioners’ results are very similar. Just like in the students’ version, “number cruncher”, “nitpicker” and “braking force” are ranked at the last places. In contradictory to the student version, guide represents the most appropriate image of a controller, having a strong distinct in over 53% of all surveyed enterprises (at the meaning of the surveyed practitioners). “Helmsman” is just like the students’ version on second place, making it to a further appropriate controller image. “Kontrolleur” ‘only’ reaches third place, but still reaches a quite high amount of nearly 32%. Undoubtedly, it has
nit
pic
ker
nu
mb
er
cru
nch
er
bra
kin
g f
orc
e
"K
on
tro
lleu
r"
track h
ou
nd
helm
sm
an
gu
ide
N
Result business adm. 3173 2610 3271 1592 2230 1956 2288
Ranking business adm. 6 5 7 1 3 2 4
Result engineering 1794 1499 1981 990 1424 1381 1496
Ranking engineering 6 5 7 1 3 2 4
Overall result 4967 4109 5252 2582 3654 3337 3784
Overall ranking 6 5 7 1 3 2 4
Strong distinct 3,68% 12,27% 3,68% 31,90% 26,99% 36,20% 53,37%
Ranking Practitioners 6 5 7 3 4 2 1
612
381
993
163
Management, Enterprise and Benchmarking in the 21st Century Budapest, 2017
370
to be considered, that the differences between students and practitioners also could be explained by the lower number of practitioners’ surveys (N=163) in contrast to the students, leading to less robust results.
Nevertheless, the influence of sales volume on controller images has been tested, leading to the following results:
The higher the sales volume, the less appropriate is the helmsman image (p = 0.6%).
No other controller image has been influenced significantly from the sales volume.
The higher the number of employees, the more appropriate is the braking force image (p = 4.24%).
No other controller image has been influenced significantly from the number of employees.
As the most and least important controller images from 2003 to 2016 became clear, the development of these images in the students’ version of the survey will be explained more detailed in the following figure:
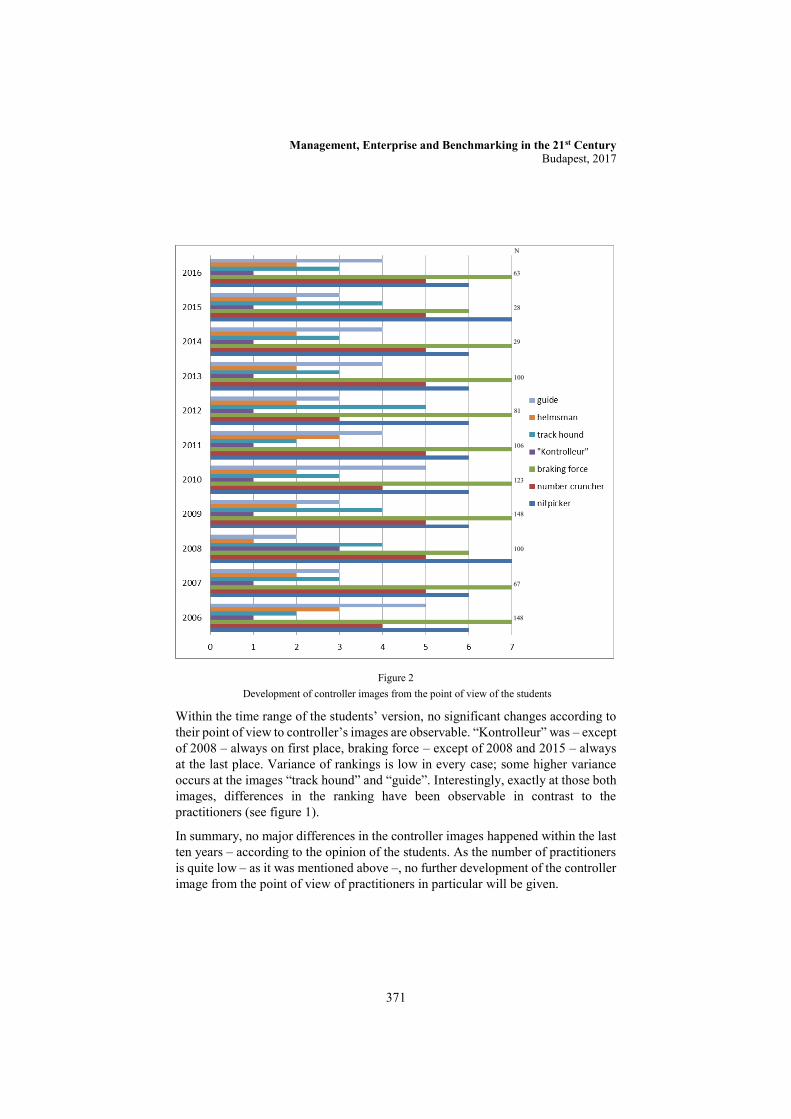
Management, Enterprise and Benchmarking in the 21st Century Budapest, 2017
371
Figure 2
Development of controller images from the point of view of the students
Within the time range of the students’ version, no significant changes according to their point of view to controller’s images are observable. “Kontrolleur” was – except of 2008 – always on first place, braking force – except of 2008 and 2015 – always at the last place. Variance of rankings is low in every case; some higher variance occurs at the images “track hound” and “guide”. Interestingly, exactly at those both images, differences in the ranking have been observable in contrast to the practitioners (see figure 1).
In summary, no major differences in the controller images happened within the last ten years – according to the opinion of the students. As the number of practitioners is quite low – as it was mentioned above –, no further development of the controller image from the point of view of practitioners in particular will be given.
63
28
29
100
81
106
123
148
100
67
148
N
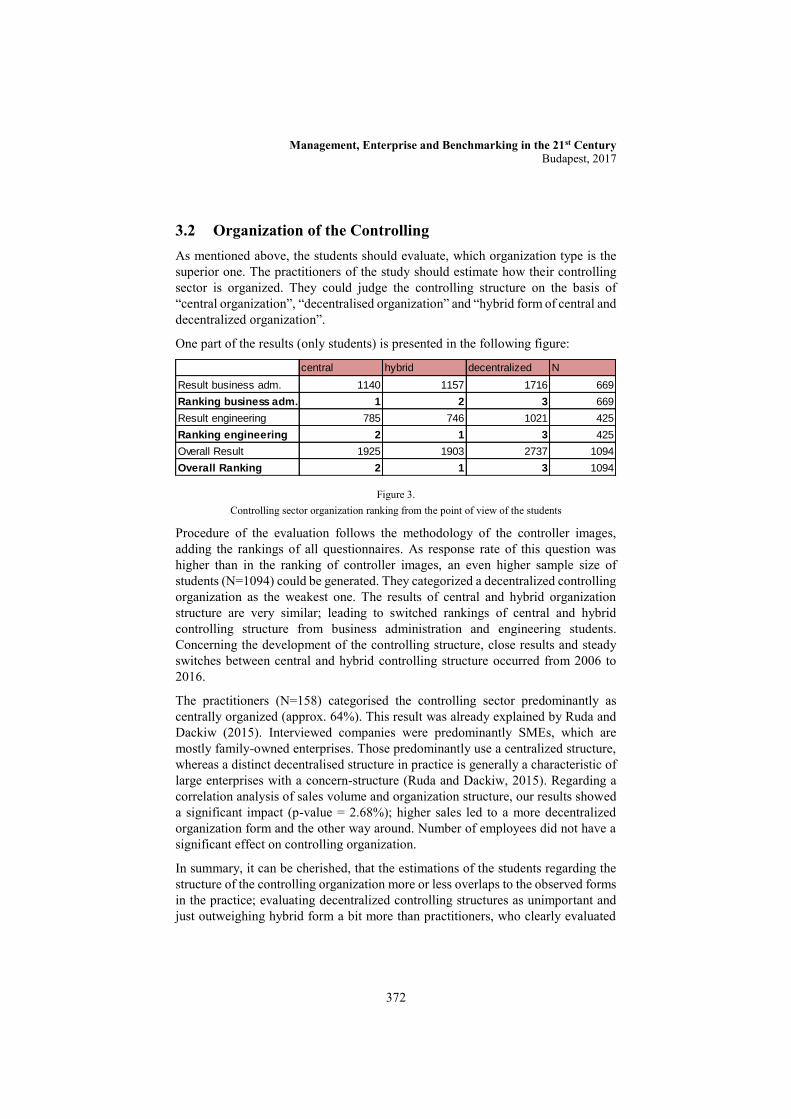
Management, Enterprise and Benchmarking in the 21st Century Budapest, 2017
372
3.2 Organization of the Controlling As mentioned above, the students should evaluate, which organization type is the superior one. The practitioners of the study should estimate how their controlling sector is organized. They could judge the controlling structure on the basis of “central organization”, “decentralised organization” and “hybrid form of central and decentralized organization”.
One part of the results (only students) is presented in the following figure:
Figure 3.
Controlling sector organization ranking from the point of view of the students
Procedure of the evaluation follows the methodology of the controller images, adding the rankings of all questionnaires. As response rate of this question was higher than in the ranking of controller images, an even higher sample size of students (N=1094) could be generated. They categorized a decentralized controlling organization as the weakest one. The results of central and hybrid organization structure are very similar; leading to switched rankings of central and hybrid controlling structure from business administration and engineering students. Concerning the development of the controlling structure, close results and steady switches between central and hybrid controlling structure occurred from 2006 to 2016.
The practitioners (N=158) categorised the controlling sector predominantly as centrally organized (approx. 64%). This result was already explained by Ruda and Dackiw (2015). Interviewed companies were predominantly SMEs, which are mostly family-owned enterprises. Those predominantly use a centralized structure, whereas a distinct decentralised structure in practice is generally a characteristic of large enterprises with a concern-structure (Ruda and Dackiw, 2015). Regarding a correlation analysis of sales volume and organization structure, our results showed a significant impact (p-value = 2.68%); higher sales led to a more decentralized organization form and the other way around. Number of employees did not have a significant effect on controlling organization.
In summary, it can be cherished, that the estimations of the students regarding the structure of the controlling organization more or less overlaps to the observed forms in the practice; evaluating decentralized controlling structures as unimportant and just outweighing hybrid form a bit more than practitioners, who clearly evaluated
central hybrid decentralized N
Result business adm. 1140 1157 1716 669
Ranking business adm. 1 2 3 669
Result engineering 785 746 1021 425
Ranking engineering 2 1 3 425
Overall Result 1925 1903 2737 1094
Overall Ranking 2 1 3 1094
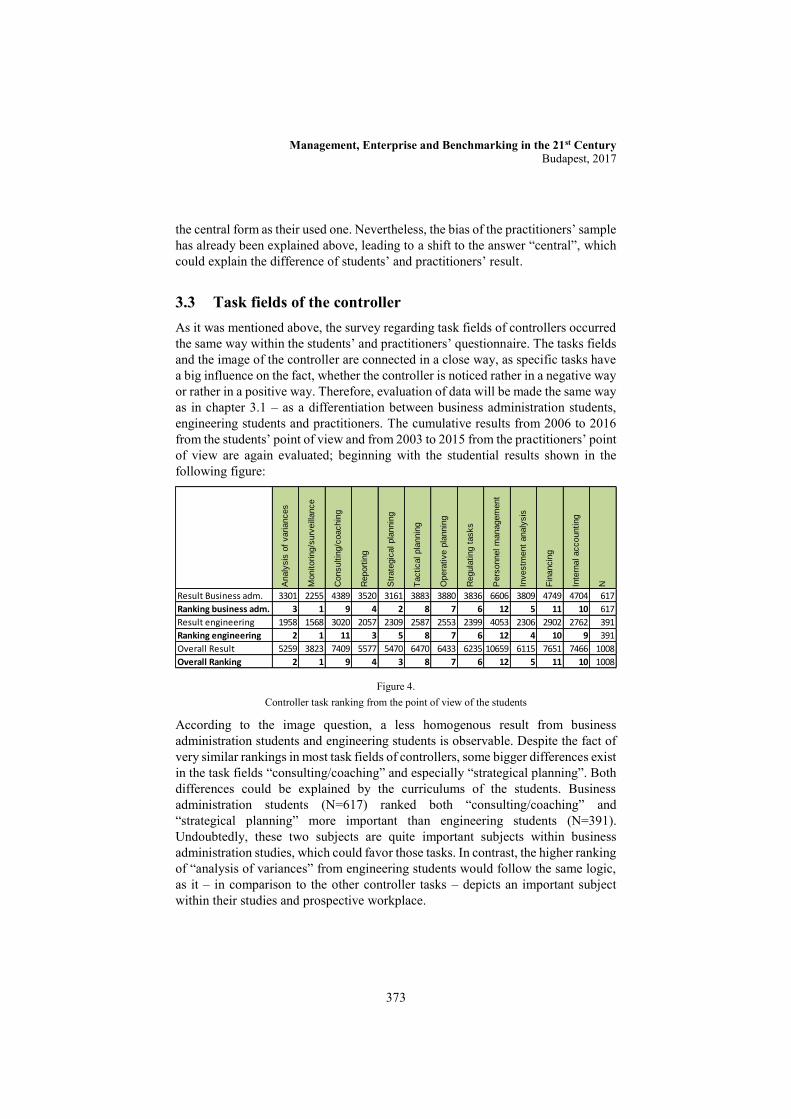
Management, Enterprise and Benchmarking in the 21st Century Budapest, 2017
373
the central form as their used one. Nevertheless, the bias of the practitioners’ sample has already been explained above, leading to a shift to the answer “central”, which could explain the difference of students’ and practitioners’ result.
3.3 Task fields of the controller As it was mentioned above, the survey regarding task fields of controllers occurred the same way within the students’ and practitioners’ questionnaire. The tasks fields and the image of the controller are connected in a close way, as specific tasks have a big influence on the fact, whether the controller is noticed rather in a negative way or rather in a positive way. Therefore, evaluation of data will be made the same way as in chapter 3.1 – as a differentiation between business administration students, engineering students and practitioners. The cumulative results from 2006 to 2016 from the students’ point of view and from 2003 to 2015 from the practitioners’ point of view are again evaluated; beginning with the studential results shown in the following figure:
Figure 4.
Controller task ranking from the point of view of the students
According to the image question, a less homogenous result from business administration students and engineering students is observable. Despite the fact of very similar rankings in most task fields of controllers, some bigger differences exist in the task fields “consulting/coaching” and especially “strategical planning”. Both differences could be explained by the curriculums of the students. Business administration students (N=617) ranked both “consulting/coaching” and “strategical planning” more important than engineering students (N=391). Undoubtedly, these two subjects are quite important subjects within business administration studies, which could favor those tasks. In contrast, the higher ranking of “analysis of variances” from engineering students would follow the same logic, as it – in comparison to the other controller tasks – depicts an important subject within their studies and prospective workplace.
Analy
sis
of
variances
Monitoring/s
urv
eill
ance
Consultin
g/c
oachin
g
Report
ing
Str
ate
gic
al pla
nnin
g
Tactical pla
nnin
g
Opera
tive p
lannin
g
Regula
ting t
asks
Pers
onnel m
anagem
ent
Investm
ent
analy
sis
Fin
ancin
g
Inte
rnal accounting
NResult Business adm. 3301 2255 4389 3520 3161 3883 3880 3836 6606 3809 4749 4704 617
Ranking business adm. 3 1 9 4 2 8 7 6 12 5 11 10 617
Result engineering 1958 1568 3020 2057 2309 2587 2553 2399 4053 2306 2902 2762 391
Ranking engineering 2 1 11 3 5 8 7 6 12 4 10 9 391
Overall Result 5259 3823 7409 5577 5470 6470 6433 6235 10659 6115 7651 7466 1008
Overall Ranking 2 1 9 4 3 8 7 6 12 5 11 10 1008
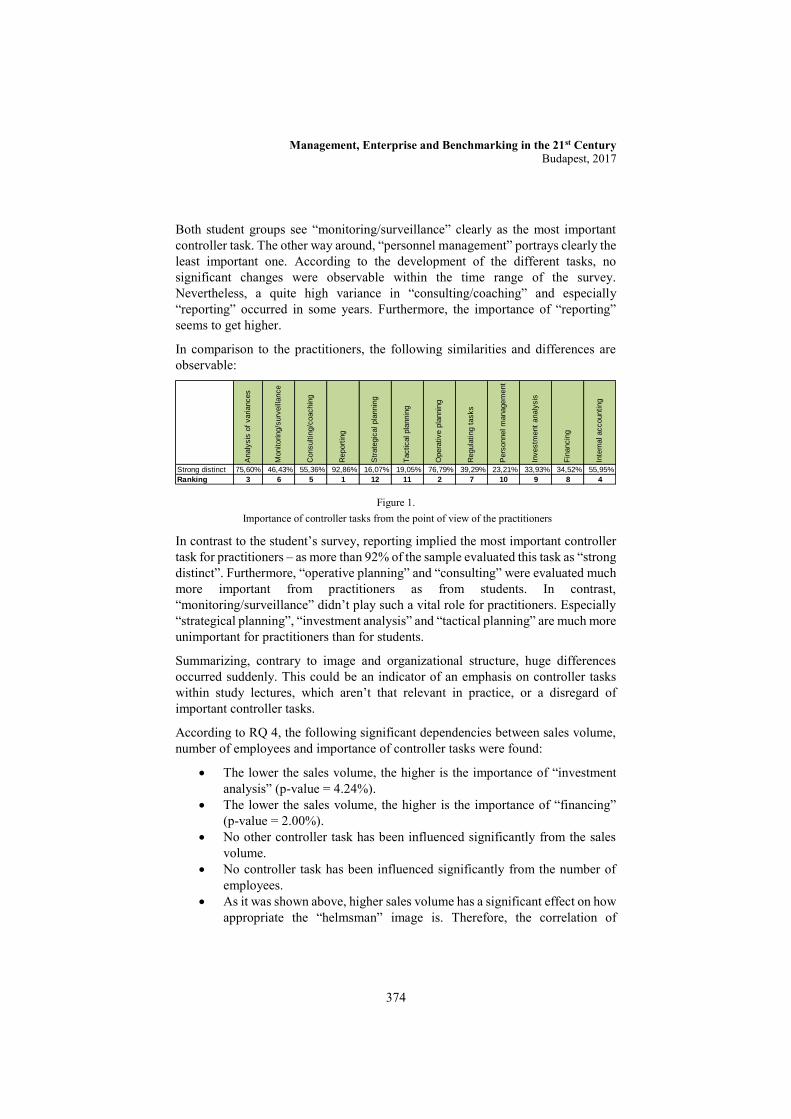
Management, Enterprise and Benchmarking in the 21st Century Budapest, 2017
374
Both student groups see “monitoring/surveillance” clearly as the most important controller task. The other way around, “personnel management” portrays clearly the least important one. According to the development of the different tasks, no significant changes were observable within the time range of the survey. Nevertheless, a quite high variance in “consulting/coaching” and especially “reporting” occurred in some years. Furthermore, the importance of “reporting” seems to get higher.
In comparison to the practitioners, the following similarities and differences are observable:
Figure 1. Importance of controller tasks from the point of view of the practitioners
In contrast to the student’s survey, reporting implied the most important controller task for practitioners – as more than 92% of the sample evaluated this task as “strong distinct”. Furthermore, “operative planning” and “consulting” were evaluated much more important from practitioners as from students. In contrast, “monitoring/surveillance” didn’t play such a vital role for practitioners. Especially “strategical planning”, “investment analysis” and “tactical planning” are much more unimportant for practitioners than for students.
Summarizing, contrary to image and organizational structure, huge differences occurred suddenly. This could be an indicator of an emphasis on controller tasks within study lectures, which aren’t that relevant in practice, or a disregard of important controller tasks.
According to RQ 4, the following significant dependencies between sales volume, number of employees and importance of controller tasks were found:
The lower the sales volume, the higher is the importance of “investment analysis” (p-value = 4.24%).
The lower the sales volume, the higher is the importance of “financing” (p-value = 2.00%).
No other controller task has been influenced significantly from the sales volume.
No controller task has been influenced significantly from the number of employees.
As it was shown above, higher sales volume has a significant effect on how appropriate the “helmsman” image is. Therefore, the correlation of
Analy
sis
of
variances
Monitoring/s
urv
eill
ance
Consultin
g/c
oachin
g
Report
ing
Str
ate
gic
al pla
nnin
g
Tactical pla
nnin
g
Opera
tive p
lannin
g
Regula
ting t
asks
Pers
onnel m
anagem
ent
Investm
ent
analy
sis
Fin
ancin
g
Inte
rnal accounting
Strong distinct 75,60% 46,43% 55,36% 92,86% 16,07% 19,05% 76,79% 39,29% 23,21% 33,93% 34,52% 55,95%
Ranking 3 6 5 1 12 11 2 7 10 9 8 4
Management, Enterprise and Benchmarking in the 21st Century Budapest, 2017
375
“helmsman” image and “investment analysis” and “finance” – which are also influenced through the sales volume – has been tested, with the result of an almost significant effect between “helmsman” and “investment analysis” (p-value = 8.95%), whereas “investment analysis” clearly has been insignificant.
Conclusions and Recommendation The aim of the study was to gain empirical data to define a job profile of controllers, who work in SMEs and to compare the expectations of students with that profile. Therefore, differences and similarities of the analytical results between students and practitioners have been pointed out.
With regard to RQ 1, the images of controllership like “braking force”, “number cruncher” or “nitpicker” have been on the rear ranks from both practitioners’ and students’ point of view; carrying all negative job images ad acta. “Kontrolleur” and “helmsman” were dominating within the studential sample, whereas “guide” and again “helmsman” were highest ranked within the practitioners’ survey. Furthermore, – according to the opinion of the students – no major differences in the controller images happened within the last ten years. At last, only marginal differences between students’ and practitioners’ opinions were observable.
According to RQ 2, practitioners categorised the controlling sector predominantly as centrally organized (approx. 64%). Nevertheless, a possible bias regarding the survey sample was mentioned in this context, which also could explain the minor deviation in comparison to the studential results. The estimations of the students regarding the organization of the controlling process are quite similar with the observed forms from the practitioners’ survey; both are evaluating decentralized controlling structures as unimportant.
The results of the students and practitioners have a lot of similarities, but also differ partially from each other; especially within RQ 3. Over the time of the sample range, few shifts occurred regarding the controller tasks. “Monitoring/surveillance” and “analysis of variances” from the students’ point of view as well as “reporting” and “operative planning” on the opinion of the practitioners play the most vital controlling tasks. Within this question, huge differences between students’ and practitioners’ point of view have been detected, and possible reasons have been explained.
According to RQ 4, some effects of the number of employees and especially the sales volume have been found, leading to different opinions regarding the organization form of the controlling (i.e., higher sales led to a more decentralized organization form), to a varying importance of the several controlling tasks and to different controller images, which are typical for those

Management, Enterprise and Benchmarking in the 21st Century Budapest, 2017
376
companies (i.e. the positive effect of higher numbers of employees on how appropriate the braking force image is).
The study has some limitations, which should not be neglected. The first limitation of the methodology is the size of the sample. The sample should be increased in terms of the practitioners’ survey. Furthermore, the data about the controller image has been gained out of the controllers’ own perspective (representing a company). However, the opinion of other employees would be interesting to validate the results. That approach would be feasible, as every practitioner had to name their company at the beginning of the survey. Even if this would be very challenging, a big chance to gain much more meaningful data would be possible.
References [1] Aleksejeva, V., & Aleksejeva, L. (2015). Analysis of interconnection
between small and medium sized enterprises and infrastructure in Latvia from 2009 to 2014. Regional Review/Regionalais Zinojums, (11), 29-43.
[2] Ammetller, G., Rodríguez-Ardura, I., & Lladós-Masllorens, J. (2014). Entrepreneurial decisions: Insights into the use of support services for new business creation. South African Journal Of Business Management, 45(4), 11.
[3] Does Deutschland do digital? Germany's industry. (2015, November 21). The Economist, 417(8965), 61(US). Retrieved from http://elibraryusa.state.gov/primo?url=http://go.galegroup.com.vlib.interchange.at/ps/i.do?p=SBRC&sw=w&u=wash89460&v=2.1&it=r&id=GALE%7CA450178185&asid=8303a8b2a0cd303821949ef41e086a35
[4] Hessels, J., & Van Stel, A. (2011). Entrepreneurship, export orientation, and economic growth. Small Business Economics, 37(2), 255-268. Retrieved from http://www.jstor.org.vlib.interchange.at/ stable/41486130.
[5] Lerner, J. (2010). The future of public efforts to boost entrepreneurship and venture capital. Small Business Economics, 35(3), 255-264. Retrieved from http://www.jstor.org.vlib. interchange.at/stable/40802563.
[6] Rajaei, Y., Yaghoubi, J., & Donyaei, H. (2011). Assessing effective factors in development of entrepreneurship in agricultural cooperatives of Zanjan province. Procedia-Social and Behavioral Sciences, 15, 1521-1525.
[7] Ruda, W. & Christ, F. (2016): Controlling, Zweibrücken.
[8] Ruda, W. & Dackiw, B. (2015): Controlling in Germany from the view of practitioners and students – An Empirical Study. Management, Enterprise and Benchmarking in the 21st Century (MEB 2015), 143-158.
Management, Enterprise and Benchmarking in the 21st Century Budapest, 2017
377
[8] Ruda, W. & Grünhagen, H., (2009): Das Berufsbild des Controllers im Mittelstand, Sternenfels.
[9] Weber, J. & Schäffer, U. (2014): Einführung in das Controlling, 14th ed., Stuttgart.
[10] Welter, F. (2010). Sustaining entrepreneurship and economic growth: Lessons in policy and industry innovations from Germany and India – Edited by Max Keilbach, Jagannadha Pawan Tamvada and David B. Audretsch. Papers In Regional Science, 89(1), 226-227. doi:10.1111/j.1435-5957.2009.00277.x

Management, Enterprise and Benchmarking in the 21st Century Budapest, 2017
378
Are we destined to produce and consume GMO plants
Adam Sadowski University of w Bialystok, Faculty of Economics and Management, ul. Warszawska 63, 15-062 Białystok
Jarosław Mioduszewski University of Warmia and Mazury in Olsztyn, Departament of Organization and Management, ul. Prawocheńskiego 3/101, 10-957 Olsztyn
e-mail: [email protected]
Abstract: For many centuries farming was treated only as a source of food. Farmers aimed
primarily at producing more and more food through using new technologies. Technologies
of GMO plants production are conditioned by the need of increasing production while
reducing use of pesticides. In the field of process innovations, the technologies using GM
plants are the source of intensive emotions. On one hand their production is required by the
times we live in, as there is a huge demand for soy products and biofuel on the market which
cannot be supplied by existing technologies. One should also consider the fact that, for a
significant group of farmers, technologies of the GM plants cultivation is the only option
guaranteeing them sufficient income to earn their living. On the other hand, a significant
part of consumers has a plethora of doubts about the GMO technologies. Therefore, it seems
that in the nearest future people will be forced to apply this kind of innovation in agriculture.
Keywords: agri-food production technology, GMO, biofuel.

Management, Enterprise and Benchmarking in the 21st Century Budapest, 2017
379
Introduction The agriculture plays a significant role in economic processes which, however, tends to be underestimated.1. Generally, this kind of economic activity is considered lesser to the dynamically developing world of technology, whereas farm production and processes it initiates perform various essential functions. For many centuries farming was treated only as a means of food production. Consecutive generations of farmers aimed primarily at producing more and more food through use of new varieties of plants and animals. However, the necessity of producing an increasing amount of food forces the agricultural sector to search for new ways of development which would consider constantly changing market and consumers’ needs.
The aim of this paper is to show the newest patterns in the development of agricultural sector and to consider its influence on modern agriculture and on the economic processes in natural environment. Production of GMO plants, which has been intensively introduced in the last years, was of particular interest to the authors. Development of technologies for cultivation of genetically modified plants is determined by necessity of increasing production while decreasing amount of used pesticides, however, demand is also increasing for food produced using natural methods, free from residual chemical byproducts.
1 Innovation of production in the environmental field Innovations play a significant role in socio-economic development, and the term itself has been through a long way. Initially innovations were considered a form of creating demand, while nowadays they are rather viewed as a kind of answer to people’s preferences. Such change in perception may result from the fact that it is not only technology that initiates the creation of an innovation. Observation of market, attitudes and social processes are equally important [5]. This also refers to broadly understood environment.
During the post-war period agriculture evolved mostly in the area of supply, which was caused by food shortages on European market. The intensification of production processes was especially important at that time in order to secure food security (figure 1). This was achieved by increasing the amount of pesticides used and intensive mineral fertilization. Parallelly to agricultural chemicalisation processes, research was undertaken and new, more efficient species of plants and livestock were introduced. These processes can be attributed to the first model of innovation, the science-driven innovation model. The distinctive feature of activities being undertaken at that time was limitation to strictly technical aspects
1 Results of the paper are based on the research tasks of the Jean Monnet Networks
project no. 564651-EPP-1-2015-1-SK- EPPJMO-NETWORK “Sustainable Land Management Network“

Management, Enterprise and Benchmarking in the 21st Century Budapest, 2017
380
of process innovation. As a result, the market was saturated with consumption goods which led to increase in stock and difficulties in disposing of it in the EEC region. This generated high operational costs of the economic system. Therefore, agriculture supporting programs were developed, which limited production and were better correlated with consumers’ needs. Thus, the market started gaining bigger influence on the offered goods, leading to emergence of market-driven innovations since 1970s. Market became the dominant factor in shaping economy and the producers focused more on meeting customers’ expectations such as higher quality products. Based on the aforementioned, various research were conducted in order to develop production technologies allowing for products with lower chemical (fertilizers, pesticides) contamination.
Figure 1
Arable land per capita (ha in use per person) (1961-2050)
Source: [3]
In consecutive decades, new conceptions of agricultural development appeared, focusing more on supplying the market with products that would meet customers’ expectations in aspects of quality and security. Many of the agricultural producers (particularly in Europe) formed a new field of changes and adjustments associated with innovations in agricultural production technology.
Unfortunately, in most of the agricultural areas, the dominant type of production remained the supply-driven farming, also known as (intensive, industrialized, classic, etc.). Due to multitude of controversies around the use of huge amounts of pesticides, a new solution was proposed, offering a model of integrated farming (integrated, harmonious, balanced, etc.). Such production system was first proposed in 1993 by COST (European Cooperation in Science and Technology). The use of pesticides and fertilizers in this system is lower than in intensive farming, and the production process is based on crop rotation and adjusting farming to the environmental conditions. This was an attempt at combining efficiency and ecology
Management, Enterprise and Benchmarking in the 21st Century Budapest, 2017
381
rules. In this case we can talk about a model of integrated innovation. This type of production assumes limitation of pesticides usage by 30-50% and consequential reduction of production by 3-7% [14].
The appearance of new information technologies also resulted in new tendencies in agricultural development in a form of high-tech agriculture. In this particular case, specialized information and navigation technologies and biotechnology are used, mostly in a form of genetic engineering. Unfortunately, it continues to resemble a form of conventional farming set on highly efficient production techniques based on intensive fertilization, significant amounts of pesticides and using microelectronics for steering the production processes. This particular model may also include precision farming, which uses GPS location system, as well as precise maps with information on soil fertility and other characteristics of the cultivated land [16].
In the recent years, agricultural farming and innovations therein follow various paths, creating new concepts of production and economical bonds between producers and consumers. These include: plant production for the energetic purposes, direct distribution channels of agricultural products, small processing industry in farms, creation of clusters in food production sector, etc. Moreover, we can observe various farming models with different approaches towards the issue of innovation.
2 Cultivating GM plants as an example of innovation One of the most innovative areas in farming, inciting most controversies, is production of GM (genetically modified) plants2. The situation is striking as agricultural producers, industry and research institutions are all interested in development of those technologies and their application on a massive scale. Simultaneously, customers, pro-ecological organizations and many others (including governments of particular countries) are opposing the idea and they are either not interested in introducing those technologies into production or outright block them.
Very intensive development of genetic engineering in the recent decades made it most expansive technology in the history of agriculture. The first attempts of genetic modifications referred to tobacco and were tried out in 1980’s, and the first product admitted to eating (1994) was tomato (Flavr Savr), which was characteristic for its’
2 GM plants are organisms, genetic material of which has been changed in an unnatural
way in order to get specific features: increased resistance to herbicides, insects or diseases, or in order to get features of higher quality (taste, smell, shape, color or durability in transport) – search [17].
Management, Enterprise and Benchmarking in the 21st Century Budapest, 2017
382
longer storing period. Unfortunately, lack of customers’ acceptation resulted in it being withdrawn from the market [11].
The GM production technology is eagerly accepted by farmers who can increase their profits through it. Other significant advantages are increasing food security and positive effects on power engineering, industry, etc. On the other hand, concerns arise over possible negative influence on consumers’ health, as well as undesired changes in the environment. Despite the fact that, so far, no proofs of direct negative results of consuming such food have been found3, the matter of safety creates emotions. Despite that, the GMO products keep appearing on consumers’ tables and are used as a base of fodder for many farm animals. Soybean, maize, cotton and canola are most commonly planted GM plants around the world, but various research are being conducted and in the nearest future we can expect new GMO plants to be created.
In a modern diet (especially in a diet of the Americans) poultry, pork or eggs or milk, produced from animals which did not consume fodder without GM soy meal, are difficult to find. Soy meal has become an essential component of fodders used to increase production level, and therefore production efficiency. Approximately 95% of traded soy meal is made of GM plants. In 2014 82% of soy production area were the GM plants, and soy made up 50% of total GM production worldwide.
The area of GM plants production has been increasing dynamically since mid-1990’s and achieved average yearly growth on the level of 30% (ca. 10 million hectares). Nonetheless, some sort of slowdown of the growth could be noticed in recent years, mainly in the developed countries. The cultivation of GM plants reached its peak in 2014, when 181,5 million hectares of farmlands were used for their production. In 2015, the area of GM crops dropped to the level of 179,7 million hectares (table 1). In recent years, the area of farmlands used for GM plants cultivation in the developed countries was stable and covered ca. 82 million hectares, while increasing dynamically in the developing countries to reach the level of 97,1 million hectares in 2015. The significance of this type of farming can be proved by the fact that GM plants cover around 13% of farmlands in total. The GM farming does not only concern the large farms. Every year, 18 million farmers (out of which 80% have a small farm) benefit from GM farming as it allows them to increase their production potential. This helps to limit areas of hunger and the constant excess is traded, thus improving the financial situation of the farmers [1].
3 Some of the research indicates that herbicides and toxins Bacillus thuringiensis
leftovers, which are not indifferent for people’s health, pervade to food consumed by humans – search [11].

Management, Enterprise and Benchmarking in the 21st Century Budapest, 2017
383
Year Hectares (milion) Year Hectares (milion) 1996 1.7 2006 102.0 1997 11.0 2007 114.3 1998 27.8 2008 125.0 1999 39.9 2009 134.0 2000 44.2 2010 148.0 2001 52.6 2011 160.0 2002 58.7 2012 170.3 2003 67.7 2013 175.2 2004 81.0 2014 181.5 2005 90.0 2015 179.7
Total 1964.6
Table 1 Global area of GM crops in 1996-2015
Source: [9].
Consumers’ resistance towards the GMO technologies used in agricultural production, and thus in food production, is clearly visible in Europe, unlike in the USA an in other countries. The USA is the global leader in producing GM plants and, at the same time, it leads in research for new GM plants, which are being produced on a massive scale. In 2015, the GMO farms covered around 71 million hectares (decrease by 2,2 million hectares in comparison to the preceding year) which made up for around 43% of total area of farms in the US. Maize, soybean, canola and cotton were mostly cultivated (figure 2). This was caused by the rise of biofuels market (ethanol fuel) and by the huge demand for high-protein soybean fodders. Only in the United States, the ethanol fuel production out of maize composes 40% of its production. The demand for GM soy resulted in around 95% grain trade and 85% soy meal trade being made up by GM plants.

Management, Enterprise and Benchmarking in the 21st Century Budapest, 2017
384
Figure 2
Principal crops – conventional and GM in 2015 in million hectares. Source: Own elaboration based on [12].
Apart from plants the dominating in the GM production, such as: maize, soybean, cotton and canola, other plants, such as: sugar beet, potato, pumpkin, papaya, lucerne (alfalfa) etc. are being produced on an industrial scale (table 2). In years 1996-2013 the total growth of income generated by farming GM plants reached the level of approximately 58,4 billion USD in the USA, and approximately 133,5 billion USD worldwide [4].
Moods connected with producing GM plants on a massive scale significantly lengthened the process of creating legislation which would allow this type of production in selected countries. Although the first attempts of creating a uniformed law on possibility of starting GM plants production in EU date back to the early 1990’s, they faced some serious obstacles as particular countries insisted that individual solutions are created, for example by creating GMO-free zones.
131,4
18,9 27,5 8,0
53,6
9… 8,5 24,0
0,0
50,0
100,0
150,0
200,0
Maize Soybean Canola CottonConventional GM
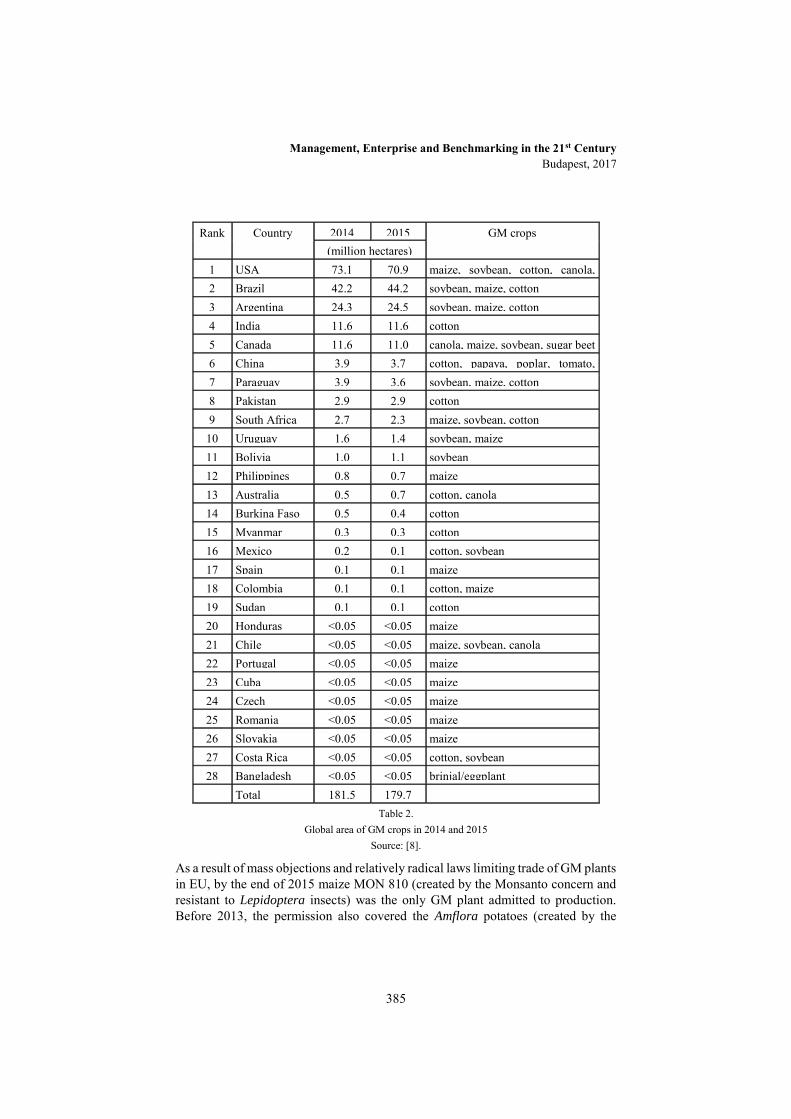
Management, Enterprise and Benchmarking in the 21st Century Budapest, 2017
385
Rank Country 2014 2015 GM crops (million hectares)
1 USA 73.1 70.9 maize, soybean, cotton, canola, sugar beet, lucerne (alfalfa), papaya, squash
2 Brazil 42.2 44.2 soybean, maize, cotton 3 Argentina 24.3 24.5 soybean, maize, cotton 4 India 11.6 11.6 cotton 5 Canada 11.6 11.0 canola, maize, soybean, sugar beet 6 China 3.9 3.7 cotton, papaya, poplar, tomato,
sweet pepper 7 Paraguay 3.9 3.6 soybean, maize, cotton 8 Pakistan 2.9 2.9 cotton 9 South Africa 2.7 2.3 maize, soybean, cotton
10 Uruguay 1.6 1.4 soybean, maize 11 Bolivia 1.0 1.1 soybean 12 Philippines 0.8 0.7 maize 13 Australia 0.5 0.7 cotton, canola 14 Burkina Faso 0.5 0.4 cotton 15 Myanmar 0.3 0.3 cotton 16 Mexico 0.2 0.1 cotton, soybean 17 Spain 0.1 0.1 maize 18 Colombia 0.1 0.1 cotton, maize 19 Sudan 0.1 0.1 cotton 20 Honduras <0.05 <0.05 maize 21 Chile <0.05 <0.05 maize, soybean, canola 22 Portugal <0.05 <0.05 maize 23 Cuba <0.05 <0.05 maize 24 Czech
Republic <0.05 <0.05 maize
25 Romania <0.05 <0.05 maize 26 Slovakia <0.05 <0.05 maize 27 Costa Rica <0.05 <0.05 cotton, soybean 28 Bangladesh <0.05 <0.05 brinjal/eggplant
Total 181.5 179.7
Table 2. Global area of GM crops in 2014 and 2015
Source: [8].
As a result of mass objections and relatively radical laws limiting trade of GM plants in EU, by the end of 2015 maize MON 810 (created by the Monsanto concern and resistant to Lepidoptera insects) was the only GM plant admitted to production. Before 2013, the permission also covered the Amflora potatoes (created by the
Management, Enterprise and Benchmarking in the 21st Century Budapest, 2017
386
BASF concern; they were the source of amylopectin starch, useful in papermaking industry and textile industry). Despite that, law was not as strict towards GMO products included in fodders and food and therefore these were admitted to import and processing. The admission referred to 32 types of maize, 12 types of soybean, 10 types of cotton, 4 types of canola and 1 type of sugar beet [6].
An approval of the regulation by the Council of the EU on March 2, 2015, according to which every GM plant which was intended to be cultivated in EU would have to go through two-stage verification, was the final touch of the long-lasting legislation process. Nevertheless, every member country was able to forbid cultivation of a GM plant by indicating one of the reasons: environment protection reasons, social or cultural reasons. Moreover, until October 3, 2015 particular members of the EU were allowed to inform European Commission about intention of forbidding GM farming (opt-out policy). 19 countries of the EU declared such intention: Austria, Belgium (the region of Wallonia), Bulgaria, Croatia, Cyprus, Denmark, France, Greece, the Netherlands, Lithuania, Luxemburg, Latvia, Malta, Germany, Poland, Slovenia, Hungary and Italy. In the Great Britain, nearly 100% of the area of Ireland and Wales, as well as around 50% of farm lands in England were under the prohibition of GMO production.
Poland is one of the biggest opponents of using GM plants and Polish law is constructed in a way that forbids cultivation and selling the GM products. In recent years, every action leads towards limiting possibilities of cultivating GM plants, and only the moratorium, which was the result of interest groups pressures (initially until January 2017), gave the possibility of using such plants as components of fodder4. Noticeably, activities towards finding an alternative fodder, which could be produced by the Polish producers, did not provide the desired outcome [15]. As a result, Polish government decided to extend the moratorium for launching GM fodders by 2 years (initially, the proposal was for 4-year extension) – until January 1, 2019 [13].
Moreover, the government bent down under the pressure of the European Union in terms of allowing GM farming in Poland. Such crops can be cultivated only in the selected areas and the permission has to be given by the Minister of Environment after receiving positive feedback for the proposition from the Minister of Agriculture and from proper local authorities. Additionally, a farmer potentially interested in GM production will have to receive declarations from all landowners of lands within the distance of 3 km from the area on which they plan to cultivate GM plants, stating that they approve of the cultivation. This should protect apiary owners in the area. Putting so many obstacles on the way may result in using the law for successful banning GM farming [10]. 4 Unfortunately in this case Poland has to respect the decision of the European
Committee which, by qualified majority of votes, will be allowed to permit the GMO production (decision will be valid 10 years). On the basis of such decision, products permitted for trade in one country will be allowed into trade in the entire EU.
Management, Enterprise and Benchmarking in the 21st Century Budapest, 2017
387
3 The significance of biotechnology and GM fodder for livestock production
The technological changes that took place in livestock production in recent years, were the result of internal and external agents. Firstly, agricultural producers gave up on the expensive fodder and the searched for cheaper production methods. Secondly, the BSE crisis resulted in a ban on using meat-and-bone meal for feeding livestock. Contrary, as the effect of the genetics’ development, new breeds of animals became more demanding in terms of fodder composition, though this further results in producing more low-fat meat. In this case, consumers’ influence on innovation process can be seen clearly, as they created demand for meat with lower fat content, which was reflected in research and development (R&D) of new species of pigs and cattle. Unfortunately, not all of the consumers liked the idea and part of them are still sentimental about “the good old flavours”. This is a result of the fact that products with higher fat content (which carries the flavour) from the past, were more probable to be remembered as extremely tasty in the consumers’ minds.
Contemporary rational feeding of the livestock requires fodder to consist of proper amount of valuable protein, energy value, minerals and vitamins. As a result of dismissing potatoes for fattening pigs, soy meal has become the most important ingredient of fodders. Unfortunately, fodders produced within Poland contains s only 30% protein coming from leguminous plants, canola or fish meal. In this situation, any possible withdrawal from using imported fodder which would contain GMO would mean significant losses for the farmers or need for significant changes in farming towards cultivating high-protein plants [6].
In case of feeding poultry, the situation looks very similar as in case of fodder for pigs and cattle made with GM plants. Currently, commercially crossed poultry requires balanced high-protein fodder, which cannot be obtained from natural grain. Noteworthy, using high-quality fodder, as well as genetic research, contributed to shortening the broilers production cycle to 5-6 weeks. As a result, in case of poultry breeding, producers are forced to use fodders based on post-extraction soy meal5. Otherwise, poultry producers would be forced to stop production or to switch to less efficient technologies. At the same time, Poland is the leader of poultry and eggs production in Europe. Polish producers account for approximately 40% of meat and 40% of chicken eggs in the EU.
In case of cattle breeding, high-protein fodders made of soybean are an irreplaceable source of energy. New high-efficiency cow breeds require balanced feeding and, basically, only the fodder protein found in post-extraction soy meal can provide sufficient health and productiveness of the animals. In case of cattle breeding, any possible alimentary errors can also lead to metabolic disorder, which might result
5 Statement of prof. A Rutkowski from UP in Poznań during a session of the Commission of Agriculture and Countryside Development on 27th January, 2016 [15].

Management, Enterprise and Benchmarking in the 21st Century Budapest, 2017
388
in drop of economic efficiency, as well as in higher emission of nitrogen to the environment [7].
4 Biofuel production The basic material used for 1st generation liquid biofuels are cereals, sugar cane and plant oils, which back in 20th century were used mostly for food and fodder production, and nowadays pose a serious competition. According to the data from the World Bank’s report from 2008, as an effect of increased demand for biofuel, especially in Europe and in the US, food prices rose. As F. O. Licht’s data indicate, in 2000-2014 bioethanol production rose over threefold, i.e. from the level of around 29 billion to 94 billion litres; and the biodiesel production rose 26 times to the level of 26 million tons (figure 3).
Figure 3.
Biodiesel production in million tons
Source: Own elaboration based on [2]
Despite the systematic increase in liquid biofuel production, their use is still relatively low in comparison to global liquid fuel use in transport. In the EU and the USA biofuels account for approximately 3-5% of supply. One of the main reasons of such distribution on the market is that biofuel production is significantly more expensive than that of mineral fuel. The high cost of biofuel production is mainly determined by costs of obtaining the material, as it makes up for 55-70% of its cost. One of the main directions chosen by various countries is to use biofuel universally, as they allow achieving set social goals such as environmental protection or
3,35,9
9,4
13,615,5 16,9
20,4 20,823,3
26,3
2,8 4,46,1 7,3 8,9 9,1 9,0 8,7 9,4 10,2
0,0
5,0
10,0
15,0
20,0
25,0
30,0
2005 2006 2007 2008 2009 2010 2011 2012 2013 2014
World EU

Management, Enterprise and Benchmarking in the 21st Century Budapest, 2017
389
increasing energetic safety for instance. These goals might be achieved by introducing fiscal-administrative regulations in the biofuel market. Commonly accepted and used tool is the requirement of mixing biofuels with mineral fuels, which is aimed at guaranteeing market for biofuels. Therefore, increasing the biofuel production has become one of the most important factors causing the increase of global production and trade of agricultural resources (cereals, oilseeds and plant oils). Although this contributed to increasing farmers’ income, higher demand also led to increases in food prices and had negative impact on food security, especially among people with low income in the developing countries. Tendencies to limit the support for biofuel (produced with 1st generation agricultural products) production, for the purpose of increasing the use of biofuels of further generations made out of non-alimentary minerals, are seen on global scale. The still-increasing competition for agricultural raw materials between alimentary and biofuel sectors can be expected to maintain high level of the prices on the market [2].
Summary Since the end of 20th century, innovation processes happening in the area of agriculture can be clearly noticed. These processes lead towards introducing more and more intensive production technologies such as: cultivating new types of plants and breeding more efficient livestock. This way, a satisfactory level of production has been achieved, nonetheless bringing some doubts about safety of the direct consumers. The leftovers of the pesticides and fertilizers became a threat for people’s health. Moreover, such intensive farm production is harmful for the surrounding environment.
In the field of process innovations, the technologies using GM (Genetically Modified) plants are the source of intensive emotions. Their production is required by the current circumstances, as huge demand for soy meal on the market and the demand for biofuel cannot be supplied by existing technologies. On the other hand, a significant part of consumers has a multitude of doubts about the GMO technologies. Relatively short period of their production, as well as lack of deep research, disallow unequivocal claims on their harmlessness for consumers. The fact that, for a significant group of farmers, cultivating the GM plants is the only option guaranteeing them sufficient income to earn their living, should also be considered. Therefore, in the nearest future, people will seemingly be forced to use this kind of innovation in agriculture.

Management, Enterprise and Benchmarking in the 21st Century Budapest, 2017
390
References
[1] Biotech/GM Crops Planted on Two Billion Hectares from 1996 to 2015 Farmers Reap >US$150 Billion from Advances in Biotech Crops over 20
Years http://www.isaaa.org/resources/publications/briefs/51/ pressrelease/default.asp, access date 27/12/2016.
[2] Bodył M., Łopaciuk W., Rosiak E., Szajner P.: Sytuacja na światowym rynku zbóż, roślin oleistych, cukru i biopaliw oraz jej wpływ na krajowe rynki produktów roślinnych i możliwości ich rozwoju (in:) (Szajner P. editor) Rolnictwo Polskie iUE 2020+. Wyzwania, Szanse, Zagrożenia, Propozycje, IERiGŻ-PIB, Warszawa 2015, pp 85.-115.
[3] Bruinsma J.: The resource outlook to 2050: by how much do land, water and crop yields need to increase by 2050? Food and Agriculture Organization of the United Nations. Economic and Social Development Department (2009) http://www.fao.org/3/a-ak971e.pdf, access date 21.04.2017.
[4] Brookes G., Barfoot P.: Global income and production impacts of using GM crop technology 1996-2013, “GM crops &Food”, 2015, Vol. 6, Iss. 1, p. 13-46.
[5] Drucker P.F.: Innovation and Entrepreneurship. Practices and Principles, PWE, Warsaw 1992, p. 43.
[6] Dzwonkowski W. (editor): Ekonomiczne aspekty substytucji śruty sojowej GM krajowymi roślinami białkowymi. Monografie Programu Wieloletniego no 45, IERiGŻ PIB, Warszawa 2016, pp. 124-145.
[7] Dzwonkowski W. (editor): Raport o sytuacji na światowym rynku roślin GMO i możliwościach substytucji genetycznie zmodyfikowanej soi krajowymi roślinami białkowymi w aspekcie bilansu paszowego. Monografie Programu Wieloletniego no 2, IERiGŻ PIB Warszawa 2015, p. 77.
[8] ISAAA Brief 49-2014: Executive Summary Global Status of Commercialized Biotech/GM Crops: 2014 http://www.isaaa.org/resources/publications/briefs/49/executivesummary/default.asp, ISAAA Brief 51-2015: Executive Summary, http://isaaa.org/resources/publications/briefs/51/executivesummary/default.asp, access date 21.04.2017.
[9] James C.: 20th Anniversary (1996 to 2015) of the Global Commercialization of Biotech Crops and Biotech Crop Highlights in 2015. ISAAA Brief No. 51. ISAAA: Ithaca, NY. http://www.isaaa.org/resources/publications/pocketk/16/default.asp, access date 21.04.2017.

Management, Enterprise and Benchmarking in the 21st Century Budapest, 2017
391
[10] Kuligowski Ł.: Uprawa roślin GMO - czy i na jakich zasadach będzie dozwolona w Polsce. http://www.rp.pl/Rolnicy/307069983-Uprawa-roslin-GMO---czy-i-na-jakich-zasadach-bedzie-dozwolona-w-Polsce.html#ap-1 and Uprawy GMO za zezwoleniem, http://www.rp.pl/Rolnicy/311249850-Uprawy-GMO-za-zezwoleniem.html#ap-1, access date 30/12/2016.
[11] Lisowska K.: Dr Katarzyna Lisowska: Genetically modified crops and food – pros and cons. GMO – Wiadomości, http://gmo.net.pl/doktor-katarzyna-lisowska-genetycznie-modyfikowane-uprawy-i-zywnosc-za-i-przeciw/, access date 29/12/2016.
[12] Pocket K No. 16: Biotech Crop Highlights in 2015, http://www.isaaa.org/resources/publications/ pocketk/16/default.asp, access date 21.04.2017.
[13] Senat bez poprawek do ustawy o przedłużeniu możliwości stosowania pasz z GMO. http://www.rp.pl/Rolnicy/311179933-Senat-bez-poprawek-do-ustawy-o-przedluzeniu-mozliwosci-stosowania-pasz-z-GMO.html#ap-1, access date 30/12/2016.
[14] System integrowany, http://radkowal.republika.pl/system_integrowany.htm, access date 4/01/2017
[15] Zalewski W.: PiS zmiękcza stanowisko ws. wykorzystania pasz GMO. http://gmo.blog.polityka.pl/2016/02/07/ pis-zmiekcza-stanowisko-ws-wykorzystania-pasz-gmo/, access date 29/12/2016.
[16] Zimny L.: Definicje i podziały systemów rolniczych, „Acta Agrophys”, 2007, Nr 10(2), s. 507-518, http://karnet.up.wroc.pl/~zimny/systemy.html, access date 4/01/2017.
[17] Żywność modyfikowana Online PWN Encyclopedia, http://encyklopedia.pwn.pl/haslo/zywnosc-modyfikowana;3942613.html, access date 13/12/2016.

Management, Enterprise and Benchmarking in the 21st Century Budapest, 2017
392
New Orientation on Entrepreneurship and Business Education at Petru Maior University of Tirgu Mures
Daniela Stefanescu Tirgu Mures, Livezeni Street no 69, code 540565
Abstract: Entrepreneurship education became very important in the last years, based on the entrepreneurs’ importance for the knowledge based economy, taking into consideration more and more the local characteristics and the need of creativity, innovation, and new business ideas. At Petru Maior University of Tirgu Mures, there are more than ten years of continuing preoccupation regarding the entrepreneurship and business education development. In this paper, we intend to analyse the changes and the specific approach about entrepreneurship education.
Keywords: higher education, entrepreneurship, entrepreneurial intention
1 Introduction Entrepreneurship education (EE) has an increasingly higher attention at the European level, and it was mentioned among the strategic initiatives of Europe 2020. Recently, the European Commission through „Entrepreneurship Action Plan 2020. Reigniting the Entrepreneurial spirit in Europe” (EC, 2013) has highlighted that the investment in EE represents one of the highest return investments, with the highest return that Europe can make. EE is defined as those activities of teaching and learning about entrepreneurship that involve "developing knowledge, skills, attitudes and personal qualities appropriate to the age and the development of pupils or students" (EC, 2002). Education, and especially EE could generate a positive effects on job creation, being a driving force in sustainable economic development and improvements in people’s standards of living. (Acs et al. 2014; Singer et al. 2015; EU 2015). As a consequence, in our university we were focus in the last years to adapt our curricula and to adjust to the new orientation at international level regarding EE. Petru Maior University (PMU) was founded in 1960 as a Pedagogical Institute (he Order of the Ministry of Education and Culture no. 3243/1960), and over the years has evolved and, nowadays, its structure contains three faculties on fields as
Management, Enterprise and Benchmarking in the 21st Century Budapest, 2017
393
follows: economics, law, engineering, literature and sciences. It is a public university and it offers studies of bachelor, master and doctoral programs. The first bachelor program on business education was created in 1993 as Enterprise Management, and only in 2000 was started the first master program on Business Administration. Based on the various study fields in our university, we have to assure the access to entrepreneurship education to all the students, regardless their main study field, such as engineering, literature, computer sciences or law. Our university was involved in numerous national and international projects, grants which were focused on entrepreneurship or business education, trying to cover many aspects of the process, in order to be approachable for students.
We have to underline that in Romania there are national standards that should be reached by all the universities and there are specializations very strictly established by the National Agency of or Quality Assurance in Higher Education (ARACIS). Based on the national list of possible specializations, the entrepreneurship doesn’t exists for bachelor or doctoral programs, only in the master case, where there is a widely area of programs. The situation is different regarding business administration field of studies, because there are few specializations under the “business administration” domain, such as: “Business administration”, “Economy of Trade, Tourism and Services”, “Enterprise economy”, “Business administration of trade, tourism, services”, another domain proper to the subject of business administration is “management”, and we can find as possible specializations, as follows: “Management” and “Management of rural sustainable development”. Regarding the doctoral studies, the domains and the specializations are very similar with bachelor programs.
2 Evolution of entrepreneurship and business education
The first initiative, at national level, in order to sustain students to become entrepreneurs was the Government Decision no 163/2003 regarding the fiscal facilities for students who want to start their own business, according to which the solicitors are remitted of initial costs of getting the authorizations. Based on this legal regulation, at our university level were organized studies about students’ private initiative in the first period after the GD no 163/2003 was adopted.
Over the years, taking into consideration the market evolution and the recommendations of national and international evaluation of higher education quality institutions, such as ARACIS or European University Association (EUA) , we tried to adept our curricula from all the specializations.

Management, Enterprise and Benchmarking in the 21st Century Budapest, 2017
394
During 2003-2007, a study1 regarding entrepreneurial initiatives of our students was realized, at the UPM. Some of the most important aspects discovered are as follows:
- 330 students applied to start a business based on GD no 166/2003;
- 280 enterprises were created, respectively 85% of all requests;
- 171 enterprises were still functioned in 2007.
The students’ entrepreneurs were distributed by faculty and sex, as it is shown in Figure 1. Based on Figure 1, it can be observed that FEJAS registered the highest percent of entrepreneurs’ students from the total, respectively, 41%, followed by the FE, with 36% and FSL with 23%. Regarding the number of female and male students, we can noticed that in the case of FEJAS and FSL female students are much more numerous than male students, 56% to 24% at FESAJ, and 27% to16% at FSL. A different situation has FE, where the percentage for mare entrepreneurs students is 48%, and for female students only 8%. Thus, the gap between the two groups of students is very large at FE, comparing to the others two faculties.
Figure 1
Entrepreneurs students distribution
Source: our own calculation, based on data from http://upm.ro/career_center/cc_rapoarte.htm/ accessed at 03.03.2017
When they were asked about the resources needed to start their own business, the answers obtained are presented in Figure 2.
1 Boarescu G., Report regarding students’ entrepreneurial initiave of Petru Maior
University/ http://upm.ro/career_center/cc_rapoarte.htm/ accessed at 03.03.2017

Management, Enterprise and Benchmarking in the 21st Century Budapest, 2017
395
Figure 2
Resources needed to start a business
Source: our own calculation, based on data from http://upm.ro/career_center/cc_rapoarte.htm/ accessed at 03.03.2017
Based on the students’ answers we can observe they consider as main problem the financial resources, on second the managerial skills, and at the same level of importance, 13%, material and human resources.
The domains of the starting business, as we can see in Figure 3, most of them, 73% are in the services sector, 22% in trade sector and only 5% in the industrial field.
Figure 3
Fields of the new business creation
Source: our own calculation, based on data from http://upm.ro/career_center/cc_rapoarte.htm/ accessed at 03.03.2017
The existing specializations accredited for the university year 2016-2017 are presented in Tabel 1, for all three levels: bachelor, master programs. The doctoral

Management, Enterprise and Benchmarking in the 21st Century Budapest, 2017
396
programs are organized only at Faculty of Letters and Sciences, in the domains of Literature studies and History.
Faculty Bachelor specializations
(3 or 4 years)
Master specializations
(1 or 2 years)
Faculty of
Engineering (FE)
The Technology of Mechanical
Engineering Quality Management Systems
Economical and Industrial
Engineering
Computer Graphics and Industrial
Design
Automation Applied Informatics Computer Aided Design and
Manufacturing
Electro-Energetic Systems
Engineering
Management of Energetic Systems
Automatic Systems of Managing
Industrial Processes
Faculty of
Sciences and
Letters (FSL)
Computer Science History of Literature and Literary
Criticism
Romanian Language and
Literature - English Language
and Literature
Anglo-American Studies. Intercultural
Perspectives
Applied Modern Languages Information Technology
Communication and Public
Relations
World History, International Systems
and Relations
History Elites, Culture and European
Construction Political Studies
Faculty of
Economics,
Juridical and
Administrative
Sciences (FEJAS)
Accountancy Business Management
Finance & Banking Business Administration of Trade,
Tourism and Services
Economy of Trade, Tourism and
Services Financial-Banking Administration
Management European Professional Master in Public
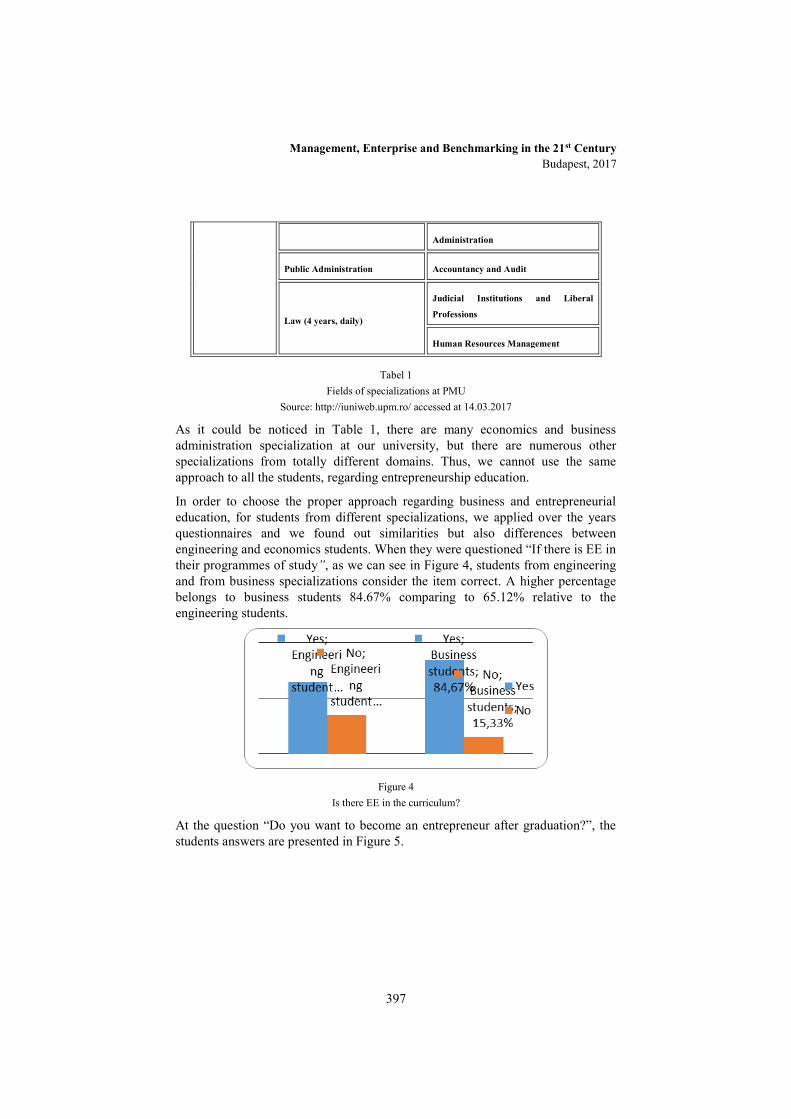
Management, Enterprise and Benchmarking in the 21st Century Budapest, 2017
397
Administration
Public Administration Accountancy and Audit
Law (4 years, daily)
Judicial Institutions and Liberal
Professions
Human Resources Management
Tabel 1 Fields of specializations at PMU
Source: http://iuniweb.upm.ro/ accessed at 14.03.2017
As it could be noticed in Table 1, there are many economics and business administration specialization at our university, but there are numerous other specializations from totally different domains. Thus, we cannot use the same approach to all the students, regarding entrepreneurship education.
In order to choose the proper approach regarding business and entrepreneurial education, for students from different specializations, we applied over the years questionnaires and we found out similarities but also differences between engineering and economics students. When they were questioned “If there is EE in their programmes of study”, as we can see in Figure 4, students from engineering and from business specializations consider the item correct. A higher percentage belongs to business students 84.67% comparing to 65.12% relative to the engineering students.
Figure 4
Is there EE in the curriculum?
At the question “Do you want to become an entrepreneur after graduation?”, the students answers are presented in Figure 5.
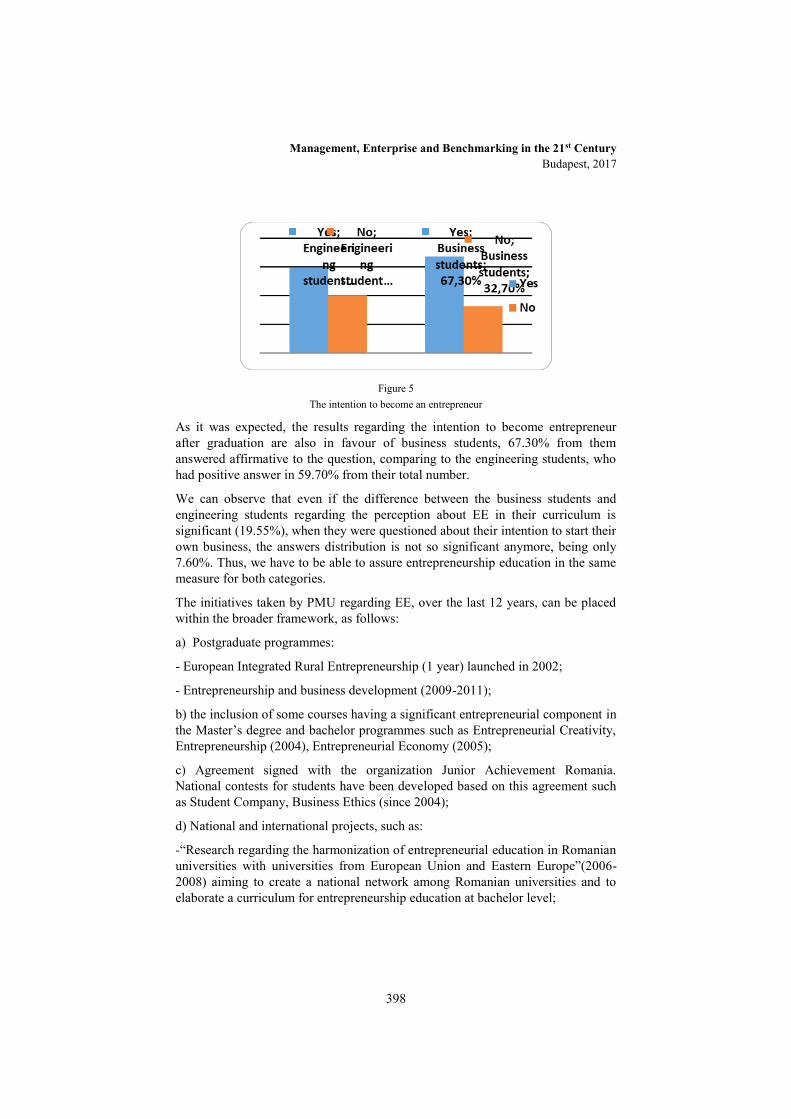
Management, Enterprise and Benchmarking in the 21st Century Budapest, 2017
398
Figure 5
The intention to become an entrepreneur
As it was expected, the results regarding the intention to become entrepreneur after graduation are also in favour of business students, 67.30% from them answered affirmative to the question, comparing to the engineering students, who had positive answer in 59.70% from their total number.
We can observe that even if the difference between the business students and engineering students regarding the perception about EE in their curriculum is significant (19.55%), when they were questioned about their intention to start their own business, the answers distribution is not so significant anymore, being only 7.60%. Thus, we have to be able to assure entrepreneurship education in the same measure for both categories.
The initiatives taken by PMU regarding EE, over the last 12 years, can be placed within the broader framework, as follows:
a) Postgraduate programmes:
- European Integrated Rural Entrepreneurship (1 year) launched in 2002;
- Entrepreneurship and business development (2009-2011);
b) the inclusion of some courses having a significant entrepreneurial component in the Master’s degree and bachelor programmes such as Entrepreneurial Creativity, Entrepreneurship (2004), Entrepreneurial Economy (2005);
c) Agreement signed with the organization Junior Achievement Romania. National contests for students have been developed based on this agreement such as Student Company, Business Ethics (since 2004);
d) National and international projects, such as:
-“Research regarding the harmonization of entrepreneurial education in Romanian universities with universities from European Union and Eastern Europe”(2006-2008) aiming to create a national network among Romanian universities and to elaborate a curriculum for entrepreneurship education at bachelor level;
Management, Enterprise and Benchmarking in the 21st Century Budapest, 2017
399
- “European EE” (2007-2009) aiming to implement and elaborate an optional module of entrepreneurial education for students attending bachelor or master programs in Engineering, IT, Physics, Chemistry, Biology, etc. This optional program was also destined, through a system of continuing education, to higher education graduates who wish to acquire knowledge and skills in the field of entrepreneurship, in order to start their own businesses. There have also been developed curricula for entrepreneurship education, books, methodologies and teaching aids appropriate to the implementation of the created curricula;
- “Spread The ART of going UP – STARTUP” (2014-2016) has as main objective the development of entrepreneurship and the familiarization of the project participants with concepts such as startup businesses, innovation and entrepreneurship through the cooperation with entrepreneurial, educational and public institutions from Greece, Italy, Portugal, Romania, Slovenia, Spain and Turkey.;
-“EQVET-US European Quality Assurance in VET towards new Eco Skills and Environmentally Sustainable Economy” (2014-2016);
(e) The International Summer School BEST (2011-2016);
(f) Introduction in all curricula from non-economic studies at least 2 courses related to entrepreneurship education (since 2015).
Conclusions Thus, it more attention needs paid to the “development of metacompetencies in students studying engineering, allowing them to operate effectively, fostering entrepreneurship and employability” (Ling and Venesaar 2015).
Our paper highlights that within PMU, there is a perception of a high level of EE among our students. The difference in perception between the engineering and business students underline the need to align, to a greater extent, the engineering curricula towards more diversified forms of EE, according to the fact that they already have a practical component, much more proper to entrepreneurial activities.
At the same time, it is necessary to provide the required knowledge on entrepreneurship and, in particular, the development of entrepreneurial skills based on appropriate teaching methods. Under these circumstances, an important role is held by those universities which should encourage the development of students' creative side, and arousing their interest in becoming entrepreneurs, considering self-employment as a viable career. Our results have important implications for both teaching and research of entrepreneurship. A special
Management, Enterprise and Benchmarking in the 21st Century Budapest, 2017
400
attention is needed to improve and develop higher entrepreneurship educations for engineering field.
Thus, universities are recognised to play an important role (EU 2012; Sieger et al. 2014; EU 2015) in increasing entrepreneurial intentions based on higher effectiveness of entrepreneurship education, as they can improve “human resource employability and the matching of skills to the labour market needs” (Herman, 2014).
References
[1] Ács, Z. J., Szerb L., and Autio, E. (2014), Global Entrepreneurship and Development Index 2014, Washington DC: USA, The Global Entrepreneurship and Development Institute
[2] Boarescu G., Report regarding students’ entrepreneurial initiave of Petru Maior University/ http://upm.ro/career_center/cc_rapoarte.htm/ accessed at 03.03.2017
[3] EC, 2000, The European Charter for Small Enterprises, [on line] Available at: http://ec.europa.eu/enterprise/policies/sme/files/charter/docs/charter_en.pdf [Accessed on 03 03 2017]
[4] EC, 2013, Entrepreneurship 2020 Action Plan. Reigniting the entrepreneurial spirit in Europe, [on line] Available at: <http://ec.europa.eu/enterprise/policies/sme/public-consultation/files/report-pub-cons-entr2020-ap_en.pdf> [Accessed on 03 03 2017]
[5] EU. (2012), Effects and impact of entrepreneurship programmes in higher education, Available from internet: http://ec.europa.eu/enterprise/policies/sme/promotingentrepreneurship/files/education/effects_impact_high_edu_final_report_en.pdf
[6] EU. (2015), Entrepreneurship Education: A road to success. A compilation of evidence on the impact of entrepreneurship education strategies and measures. Luxembourg: Publications Office of the European Union.
[7] Herman, E., and Georgescu, M.A. (2014), Entrepreneurial education in high school and its impact on choosing entrepreneurship, in Runcan, P.L., Rață, G. (Ed.), Social economics and entrepreneurship Cambridge Scholars Publishing, pp. 169-182)
[8] Ling, H., and Venesaar, U. (2015), Enhancing Entrepreneurship Education of Engineering Students for Increasing their Metacognitive Abilities: Analysis of Students’ Self-Assessments. Inzinerine Ekonomika-Engineering Economics, 26(3), pp. 333–342
Management, Enterprise and Benchmarking in the 21st Century Budapest, 2017
401
[9] Sieger, P., Fueglistaller, U. and Zellweger, T. (2014). Student Entrepreneurship across the Globe: A Look at Intentions and Activities. International Report of the GUESSS Project 2014. St.Gallen: Swiss Research Institute of Small Business and Entrepreneurship at the University of St.Gallen (KMU-HSG
[10] Singer, S., Amoros, J. E., and Arreola D. M. (2015), Global Entrepreneurship Monitor 2014 Global Report, Monterrey (Mexico): Global Entrepreneurship Research Association GERA
Management, Enterprise and Benchmarking in the 21st Century Budapest, 2017
402
Older Employees in Sustainable Human Resources Management
Šukalová Viera University of Žilina, Faculty of Operations and Economics of Transport and Communications,Univerzitna 1, 01026 Žilôina, Slovakia
Ceniga Pavel University of Žilina, Faculty of Operations and Economics of Transport and Communications,Univerzitna 1, 01026 Žilôina, Slovakia
Abstract: Europe's population is aging and also in Slovakia and is therefore expected that
this category of workers will increasingly numerous and labour market measures due to the
aging of the workforce must take into account these developments. Generally for older
workers considered employees over 50 years. In practice there are several problems in the
employment of older people, deficiencies in the management of these human resources,
unequal treatment and other risks in connection with work. The corporate governance is
necessary to take into account the current problems of older employees, their job
qualifications, specific problems of employment and labour risks and a proposal of
measures for improving the situation of older workers in terms of the management
company and from the perspective of the state. Post aims to identify and analyse some
aspects of the protection of older employees in the sustainable management of human
resources in the company and propose measures to improve the situation in this area.
Keywords: age, employee, risk, work, management, sustainability
1 Introduction The current civilization transformation is called the third wave (first wave - the agrarian revolution, the second wave - the Industrial Revolution), which proportionally exceeds the maturity of new technologies with high speed national borders and continents. It brings a number of positive as well as negative effects.
Management, Enterprise and Benchmarking in the 21st Century Budapest, 2017
403
Relatively static world of work since the beginning of the 21st century in our country becoming becomes irretrievably past. Labour market changes and changes at work require a highly skilled workforce able to work with new information technology, to master new instruments and tools, workflows, use the new key competence. Professional careers in the contemporary world of work have a different course, direction and momentum. They are associated with the preferences values, the interests, abilities and needs of individuals and internal career development depends on what opportunities exist in reality and how it is able to utilize the possibilities of the world of work, labour market opportunities or create them yourself. In this context has the important role also the age.Work and employment have undergone considerable changes mainly in the past quarter century. The relationship between employers and employees has been weakened considerably, as mass layoffs; job and career switching have all become common occurrences. The implicit psychological contract tying workers to employers has weakened. As a result, workers today face a new and evolving mix of challenges and opportunities in the flexible economy. For some it brings new opportunities, for others it increases risks, unemployment and disrupt career development. Aging could be called as a process of involution changes in physical, psychological, social, labour and health areas. [11] According to the aging of population in Europe and also in Slovakia; labour market measures due to the aging of the workforce must take into account these developments. The Europe 2020 strategy is also aimed at increasing the employment rate of the population aged 20-64 years to 75%. In order to achieve this, European citizens will have to work longer. Development agencies working in the elderly is primarily influenced by changes in the timing of retirement. Strategy for health and safety at work in the Slovak Republic in 2020 also paid attention to the issue of older workers. Generally for older workers considered employees over 50 years 1 (for different purposes is a borderline age older workers otherwise specified, usually over 50 years, egg. In the field of occupational health and safety is considered to be an older employee of a natural person over the age of 45 or 55 years. According Čornavičova is called the natural aging gradually flowing continuous process of change governing body over time. Initially, the change occurs quietly but in old age the signs of aging accelerate. [6] Aging can be associated with a decrease in physical performance, reduced visual, auditory function, more frequent negative emotions and survival of burnout. [10,12,13] In summary one can distinguish biological aging - age-related human organs Mental aging - associated with changes in personality traits and cognitive abilities Social aging - related to the change of social status and life of the program. According to demographic forecasts, the rising proportion of the population aged over 55 in 2020 to 30% in 2050 to extend more than 45%. [15] Our paper is focused on the problems connected with older employees at work, their protection, risks and equal opportunities and draft some of measures for the managerial work.
Management, Enterprise and Benchmarking in the 21st Century Budapest, 2017
404
2 Issue of equal tretament In the Slovak Republic it is of Equality in the Labour Code and the Anti-Discrimination Act.
2.1 Labour Code and the reality In Labour Code Article 1 establishes basics and principles in § 13 requires employers to comply with the principle of equal treatment for that specific rules are laid down in the Act. 365/2004 Coll. on equal treatment in certain areas and protection against discrimination and on amending and supplementing certain acts (Antidiscrimination Act) as amended. The results of a Eurobarometer survey in 2012 shows that, in general, is the most widespread form of discrimination in Slovakia is discrimination based on ethnic origin (56%), followed by discrimination arising from disability and sexual orientation (46%). In the EU, The most common reason discrimination age greater than 55 years (66%). [14] This survey can be further deduced that age discrimination in the workplace is the most commonly reported forms of age discrimination. The results show that approximately one of 20 people has personally experience with age discrimination in the workplace (6%) and other one of seven employers (15%) have witnessed such discrimination. It considers that older workers, employers do not perceive positive for important reason for leaving work market. It is interesting to note that in the selection of candidates with equal skills and is qualified by Slovaks criterion which penalizes the candidate most over age 55 years (62%). We must accept also the fact that older job seekers often apply for the wrong jobs. [4] Such mismatch may be reduced by job search assistance and intensified counselling. [5] One dimension of improving job search would be to discourage older workers from applying for jobs with deferred compensation and to help older workers find jobs with contemporaneous incentives.From the provisions of the Labour Code it indicates that the employer is in labour relations must treat their employees in accordance with the principle of equal treatment in employment and prohibits discrimination of employees according to the age.
2.2 Age and employees perception In relation to the age of Labour code protect young employees - employees under 15 years of age and children; older workers are not special group of employees like the young. For older workers can also in connection with § 8 paragraph. 1 point. b) of the Act no. 5/2004 Coll. on Employment Services as amended considered an employee who is older than 50 years. Pursuant to that provision for disadvantaged jobseekers considered citizen over 50 years. [3] The age limit of older workers is not clear, however, and should be based upon the employment of personnel. Except of course work capacity is necessary to consider the mental condition of the employee whether they can adapt to change and it is necessary to
Management, Enterprise and Benchmarking in the 21st Century Budapest, 2017
405
take into account the potential health problems. Such a border can be identified physical age; but the moment how long the employee subjectively feels proficient office regardless of his physical age; or objective findings health. However, while older workers in general may be essentially as productive as younger workers, the variation in productivity levels may be higher for older than for younger workers.[9] Goebel and Zwick (2013) obtain evidence that age-productivity profiles depend on specific human resource measures for older employees. They find that the relative productivity contribution of older workers is higher if firms provide specific equipment, create age-specific jobs or implement mixed-age working teams. Working time reductions and specific training do not appear to be associated with a higher productivity of older workers. [7,8]
2.3 Anti - Discrimination Act In the Slovak Republic it is of Equality in the Labour Code and the Anti-Discrimination Act. Labour Code, Article 1 of the Basic Principles as well as in § 13 requires employers to comply with the principle of equal treatment. The employer's labour relations must treat their employees in accordance with the principle of equal treatment in employment and prohibits age discrimination against (among other things). Infringement of the principle of equal treatment would not work if the different treatment is justified by the nature of occupational activities or the circumstances under which such activities are carried out, if this ground constitutes a genuine and determining occupational requirement, provided that the objective is legitimate and the requirement is proportionate (Article 1 Basic principles of the Labour Code. [1, 2] Pursuant to the Anti-Discrimination Act respecting the principle of equal treatment consists prohibition of age discrimination. The principle of equal treatment in employment and similar legal relations are regulated in § 6-8 of the Act. The principle of equal treatment is applied under the aforementioned law only in connection with the rights of persons pursuant to special legislation, in particular: Access to employment, occupation, other gainful activities or functions,
including requirements to recruitment and conditions and method of selection for employment,
Of employment and conditions of work including remuneration, promotion and dismissal.
Access to vocational training, advanced vocational training and participation in active labour market measures, including access to vocational guidance services and changing employment
Membership and activity in an organization of workers, employers' organizations and organizations associating persons of certain professions, including the benefits that these organizations provide to their members.
In terms of occupational health and ensuring its safety is important for the demands of working activities that he carries out are appropriate to its operational
Management, Enterprise and Benchmarking in the 21st Century Budapest, 2017
406
capacity and work capacity so as not to create an undue burden on any part of the human body, which could result in a risk or even injury. It is always necessary to consider specific person individually in the context of the work demands. It means to assess his competence in the relevant age in all the main functions of the human body with respect to the specific work to be performed, the requirements for its performance, the impact on working conditions and working environment.
3 Risk assessment of older workers at work With age are the differences between individuals deeper. In assessing risks should be considered work claims with respect to the performance capabilities of the individual and his health. As a result of the gap between individuals is necessary to adapt the workplace so as to address the needs arising from changes in functional capabilities based on the needs and status of each employee. Good design work conforms to all age groups with specific reference to older workers. Respect for the diversity of the workforce and its management in the workplace is now an important aspect relating to compliance with health and safety at work.
3.1 Specifics od risks according to the age The issue of older workers and specific risk management with regard to the age of an employee is not in Slovakia is still at the required level. It is necessary to pay greater attention to the specific risks to older employees. Risk management of older workers need to be aware that a group of 50+ operate the same dangers and threats may be different but the likelihood of accidents and their consequences. In implementing corrective and preventive actions, it is necessary to identify the factors of working environment, identify potential problems, and identify factors increasing the likelihood of an adverse event. For the greatest risks of working environment for older workers can be considered: • Unnatural working positions demanding position at work. • Physical effort and manual handling of heavy loads. • Time stress / work under pressure. • Atypical working hours. • Climatic conditions. • Sensory stimuli by recognizing the sensory stimuli (light, sound, touch, heat). It should be noted that even older employees are able to learn and acquire new job skills, unless we are given the opportunity and if you choose the appropriate methods of education. In terms of occupational health and safety it should be noted that although the older employee is meeting the demands of work, it may be the burden of the work at it subjectively higher than that of younger workers. Subjective response to the load in this case manifested in the form of greater stress
Management, Enterprise and Benchmarking in the 21st Century Budapest, 2017
407
the body and especially on the longer-term exposure can have negative effects on health. [14,15]
3.2 Special rules for risk assessment According to the Act no. 124/2006 Coll. on health and safety at work, as amended, the employer is obliged to carry out the risk assessment of all work activities and an assessment of resources to eliminate the risk or reduce it to an acceptable level value.In the employment of older workers must be considered when assessing the risk into account in addition to potential resources generated by the equipment or the environment, and the possible reduction of work capacity due to decreased functional capacity. This can be a source of undue increased burden of the body, which can lead to health hazards, respectively it may threaten the safety and security of the technological process. Some current legal standards directly take into account the age factor in health protection, for example. Government Regulation Nr. 281/2006 Coll. on the minimum safety and health requirements for the manual handling of loads, which sets out indicative weight values of loads depending on age and gender into account, moreover, the conditions of work; provides data for decision on tolerable burden on staff for the manual handling of loads. Annex 2 of the Government set out an indicative weight values both hands lifting and carrying of loads, the maximum weight of the load and the maximum daily mass for change for the men and women of different ages in the position of standing and with the favourable and unfavourable conditions lasting more than one hour per shift . Health Ministry Decree C.542 / 2007 Coll. on details of health protection against physical stress at work, mental workload and sensorial stress at work, which provides values of total physical activity with respect to gender and age range of 18-65 years. [3] The age range is divided into multiple groups, which take account of the effect of age on the physical function of the human capacity established permitted level of energy expenditure. Mental workload is assessed indirectly through the characteristics and working environment in terms of mental workload characteristics and subjective responses to employee workload.
3.3. Main psychosocial problems associated with the aging Functional capacity evaluation and assessment of work capacity / ability of the body due to age is the responsibility of occupational medicine in the field of physiology and psychology of work.Particularly serious and increasingly discussed becomes legally psychosocial risks. These are especially: • Insecure employment contracts in relation to the instability of the labour market, • Increased vulnerability of workers in the context of globalization (migration, relocation of production, broadcasting to work abroad), • New forms of employment and new types of employment and contracts, • Feelings of job insecurity and uncertainty about the failure of the employer,

Management, Enterprise and Benchmarking in the 21st Century Budapest, 2017
408
• Long working hours, • work intensification, • slimming manufacturing and outsourcing, • High emotional demands at work, • Imbalance in work and personal life. The risk assessment is necessary to take into account individual differences in functional ability, health and other aspects of diversity among employees, such as disability, gender, age, immigration status etc. Adaptation of the work of individual needs, skills and state of health should constitute a continuous and dynamic process over the life of man on the basis of appropriate risk assessment. This also includes the adaptation of work health status and needs of older workers. Age is one of the aspects of workforce diversity.
4 Chosen research results In relatively well developed Žilina region took place in 2016 a survey questionnaire regarding equal treatment of employees by 236 respondents older than 55 years ( 109 workers mentally and physically 127). 15 % of them are met after 50 years with discrimination when looking for work. 17% of respondents met at work with discrimination in the scheduling of the training programs, 15% were directly designated for the enterprise as unpromising. The pay gap is 21% of the respondents encountered discrimination when extra rewards. 29% reported as impossible promotion. 37% of physically working didn´t met with a tailored elimination of specific occupational risk in relation to age. In the simulated selection of the staff students of management would prefered by the same conditions and qualiofication of applicants younger workers under the age of 40 years; among older workers (over 50 years) they appreciated the social and communication skills, experience and expertise.The flexibility of younger employees they considered to be the best advantage.Due to the robotics and automation industry in Slovakia in the next ten years we can expect that this will have an impact on employment, which may be more relevant to older employees in production. The administration in turn will affect the employment of older workers progressing digitization. It is necessary to consider by the creation of work teams and for the eventual redundant of employees benefits of older emploees: a long-term experience, loyalty, less critical attitude, extensive personal and professional contacts, good knowledge of market competition, psychological maturity and reliability, responsibility, low turnover, favouring stable employment before building a career and a greater willingness to tolerate a certain restrictions on working conditions.
Management, Enterprise and Benchmarking in the 21st Century Budapest, 2017
409
5 Measures to promoting active aging in the sustainable workplace
Specific working conditions are determined at the enterprise level, so just steps from management can be considered as very important and directly affect work ability, functional capacity and culture of work. Improving of the aging problems at work is necessary according to the necessity to implement principles of sustainability in human resources management.
5.1 Daily management measures The daily management of the enterprise should take into account factors related to age, including working conditions and individual work tasks to all employees regardless of age could apply in the company in achieving its own objectives and goals of the enterprise. It is necessary to apply certain measures to support the working capacity of older employees; for example tools, equipment, technical and organizational conditions and the actual level of health and safety,improving working conditions and working environment (air quality and microclimate in the workplace etc.) Of course, employer has to reduce the risk of injury,to limit the manual transfer of loads and protect from harmful and stay updated by adverse factors at the workplace. Another measures are limitation of time pressure and implementation flexibility in working hours, improving the planning and the quality of work.
5.2 Measures in education In education, the need to focus particular attention on training in team skills, training quality and training to improve professional knowledge and skills.To maintain competence is constantly upgrading the skills and abilities Training to work with different types of special training for employees give older workers the opportunity to strengthen their skills. They should take into account the changes in of the learning process according to the age. Learning strategies, educational conditions, the use of video material, rest and timetables for the acquisition of knowledge is between younger and older employees different. The most important platform for learning is also self - learning. Important is the access of mangers: if they engage in lifelong learning and support it by providing training opportunities, one major obstacle to educate senior employees removed. Education is an important success factor of the active aging.
5.3 Motivation and communication Other measure is area of motivation, dialogue, values, attitudes and motivation. Some improvements are possible also in management and leadership skills. People
Management, Enterprise and Benchmarking in the 21st Century Budapest, 2017
410
should feel that they can trust their employer; they expect support in challenging and difficult working situations. The dialogue between managerss and employees should be a continuous process, not a one-off annual assessment interview. Employees will notice and appreciate fair treatment and zero tolerance of age discrimination. It is necessary to develop management and labour leaders,especially to improve communication, cooperation and participation, planning and the provision of feedback.
5.4 Harmonization of work and private life We think that very important are also measures in the field of harmonization of work and private life. It should also be borne in mind that is ultimately responsible for their employee’s values, attitudes and other personal factors. To focus their minds on the job, their internal opportunities and family matters, it is necessary to create a better, more sustainable balance of work and private life. We see great potential in using of flexible forms of employment.
Conclusions Aging is natural process in human life, but brings some problems into work career. Working conditions consist of work environment (physical, mental, social), work organization and working conditions, working time, work and community work tasks, as well as management. Research points to several shortcomings in the management of older workers; some of them could be eliminated by legislation more carefully, but the focus problem solving is based on enterprise management. Managers and supervisors play an important role because they have the power to organize and work practices individual workloads. All decisions and changes in work pass through their hands. They are also responsible for safety and health at work, including the assessment risks. In the risk assessment should be considered a functional individual differences skills and health personnel, inability to work, gender issues etc. workers and employees in all age groups are vulnerable to exposure to harmful work.Whereas the adaptation of work skills, abilities and health status individuals should be a continuous and dynamic process based on reasonable risk assessment, work adjustment health status and needs of older workers by not impose an unnecessary burden. Important are also measures that promote the health of employees, for example opportunities for recreation, reconditioning stays, rehabilitation and so on. It is possible to promote a healthy lifestyle in different ways e.g. promoting of healthy eating at the workplace and so on. Undertaking should be in the business the role and importance of active aging and to integrate it into the main objectives of enterprise policy and safety equipment; incorporate a program to promote active aging and working conditions of workers over 50. All internal corporate documents (work
Management, Enterprise and Benchmarking in the 21st Century Budapest, 2017
411
rules, organizational regulations, collective agreement, etc.) need to be handled with regard to gender equality and active aging and the needs of older workers. Proper business policy in this area and conscious approach all subjects of human resource management can bring positive effects for employees, for the enterprise and also for the whole society.
Acknowledgement
This article was prepared within the project VEGA 1/0696/16 Design of methodology for measuring quality of life in a regional context.
References
[1] Barancová, H.: Európske pracovné právo. Flexibilita a bezpečnosť pre 21.storočie. Sprint, Bratislava, 2010, 70p.
[2] Barancová, H.. Zákonník práce. Komentár. 2.vydanie.CH.Beck, Praha 2012, 92p.
[3] Barancová , H. et al.: Analýza pracovnoprávnej legislatívy Slovenskej republiky z pohľadu flexiistoty. I. etapa. 2009, p. 10.
[4] Bellmann, L.; Brussig, M.: Recruitment and job applications of older jobseekers from the establishments´ perspective. IZA Discussion Paper 2721. 2007
[5] Boockmann, B.; Brändle, T. : Integrating Older Employees into the Labour Market – Evidence from a German Labour Market Programme. CESifo DICE Report, 2015, vol. 13, issue 3, pages 59-64.
[6] Čornaničová , R.: Edukácia seniorov – vznik, rozvoj, podnety pre geragogiku. Bratislava : Vydavateľstvo UK, 1998, p.156.
[7] Goebel, C.; Zwick, T.: Are personnel measures effective in increasing productivity of old workers? Lab. Econ. 22, 80–93 (2013)
[8] Gruss, P. :Perspektivy stárnutí. Portál, Praha, 2009.
[9] Heyma, A., van der Werff, S., Nauta, A., van Sloten, G.: What makes older job-seekers attractive to employers. De Economist. 162, 397–414 (2014).
[10] Hrdlička, M., Kuric, J., Blatný, M.: Krize středního věku-úskalí a šance. Portál, Praha, 2006.
[11] Potašová , A., Golecká , L.: Intervening program for the aged: Reinforcement of accommodative behavior. In Studia psychologica, Vol. 46, no. 4 (2004), p. 311-315.

Management, Enterprise and Benchmarking in the 21st Century Budapest, 2017
412
[12] Říčan, P .: Cesta životem. 2 prepr. vyd., Portál, Praha 2004 s. 314-318
[13] Vagač, Ľ. a kol.: Trh práce, rizikové skupiny, diskriminácia, teória a prax. Štúdia v rámci Národného projektu Centrum sociálneho dialógu, Centrum vzdelávania MPSVR SR, Bratislava, 2011.
[14] Discrimination in the EU in 2012, Report. Available in: http://ec.europa.eu/public_opinion/archives/ebs/ebs_393_en.pdf
[15] Europe 2020 strategy , Európska komisia, European Commition. Available in:
[16] https://ec.europa.eu/info/strategy/european-semester/framework/europe-2020-strategy_en

Management, Enterprise and Benchmarking in the 21st Century Budapest, 2017
413
Green SMEs in the European Union
Dr. Antal Szabó [email protected]
Abstract:The paper presents the definition and concept of the green economy based on the concept of the United Nations Environment Program, which is improved human well-being and social equity, while significantly reducing environmental risks and ecological scarcities. The green economy incorporates means achieving sustainable economic development in areas as improving human well-being, increasing social equity, reducing environmental and ecological risks. The paper highlights the eco-innovation by the European Commission DG Environment and the project aiming to compile the Eco-Innovation Observatory. The holistic approach of the eco-innovation process is presented. The “green transformation” is a significant business opportunity for SMEs themselves as important suppliers of goods and services. The European Commission has recently prepared a Green Action Plan (GAP) for SMEs, which give a clear direction and framework for aims to (i) improve resource efficiency of European SMEs and (ii) support green entrepreneurship. The GAP aims to contribute to the re-industrialisation of Europe by enhancing SMEs competitiveness and supporting green business developments across all European regions Finally the paper presents the main European green entrepreneurship and business awards.
Keywords: Green economy, eco-innovation, Eco-Innovation Observatory, European Commission green action play, green SME awards
Motto:
“we do not inherit the Earth from our ancestors, we borrow it from our children”
Native American Proverb
Preface
With over 7.4 billion people in the world today, human consumption of natural resources has increased exponentially in recent years to the point where our natural resources are insufficient to keep up with demand. This ever-increasing human

Management, Enterprise and Benchmarking in the 21st Century Budapest, 2017
414
consumption, the solid waste produced by the world population as well as the industrial waste have engendered ecological scarcity and aggravated the deterioration of our environment. According to the Global Footprint Network, the humanity uses the equivalent of 1.5 planets to provide the resources we use and absorb our waste. This means that the Earth takes one year and six months to regenerate what we use in a year. In this respect the sustainability is a matter of life and death for people on the planet. It is a necessary must to end the overshoot, and consider the environmental issue – addition to keeping the peace as primary goal - as the most important task for the mankind.
1 The Green Economy
There is no single definition of the Green Economy. Instead, the Green Economy is viewed as a unifying articulation of Sustainable development.
United Nations defines the concept of a green economy “carries the promise of a new economic growth paradigm that is friendly to the earth’s ecosystems and can also contribute to poverty alleviation.”
Environment can no longer be treated in isolation from mainstream economic policy. In spite of this fact, in most cases, the environment continues to be addressed as a separate component without clear linkages to the social and economic aspects.
In 2011, the United Nations Environment Program - UNEP - has developed a working definition of a green economy as one that results in improved human well-being and social equity, while significantly reducing environmental risks and ecological scarcities. In its simplest expression, a green economy can be thought of as one which is low carbon, resource efficient and socially inclusive. [1]
In September 2015, the UN General Assembly formally established 17 Sustainable Development Goals (SDGs) to be addressed by 2030, thus providing a common framework for public and private stakeholders to set their agendas and define their policies and strategies over the next 15 years (See Exhibit). [2] The General Assembly also adopted the UNEP strategic paper on “An inclusive green economy: a summary for leaders” in which concepts such as “sharing, circularity, collaboration, solidarity, resilience, opportunity, and interdependence” pointed out. [3]
An Inclusive Green Economy is an alternative to today's dominant economic model, which generates widespread environmental and health risks, encourages wasteful consumption and production, drives ecological and resource scarcities and results in inequality. It is an opportunity to advance both sustainability and social
Management, Enterprise and Benchmarking in the 21st Century Budapest, 2017
415
equity as functions of a stable and prosperous financial system within the contours of a finite and fragile planet. It is a pathway towards achieving the 2030 Agenda for Sustainable Development, eradicating poverty while safeguarding the ecological thresholds, which underpin human health, well-being and development.
Critically, the concept of the green economy is not just “greening” economic sectors; it is a means of achieving the sustainable development in the following important areas:
• Improving human well-being: securing better healthcare, faith against the new infectious diseases, like HIV, Ebola virus disease and Zika virus -, preventive drugs measures, improving the education and safeguarding the job security;
• Increasing social equity: launching poverty alleviation programs and ensuring social, economic and financial inclusion;
• Reducing environmental risks: addressing climate change, managing deforestation and desertification, melting of the North Pole and Antarctic, the release of hazardous chemicals and pollutants, and excessive or mismanaged waste; and
• Reducing ecological scarcities: securing access to freshwater, natural resources and improving soil fertility.
Eric Usher, Head of the UN Environment Finance Initiative estimated, the for achieving the SDGs - the global action plan to end poverty, combat climate change and protect the environment - USD5 to 7 trillion needed through 2030. On 30 January 2017, nearly 20 leading banks, financial institutions and investors in Paris set standards sets USD6.6 trillion in assets as the Principles for Positive Impact Finance for sustainable investments.
In connection with the green economy the other important issue is the eco-innovation.
What is Eco-Innovation?
Any form of innovation aiming at significant and demonstrable progress towards the goal of sustainable development. This can be achieved either by reducing the environmental impact or achieving a more efficient and responsible use of resources. [5]
“Eco-innovation is any innovation that reduces the use of natural resources and decreases the release of harmful substances across the whole life-cycle.” [6]

Management, Enterprise and Benchmarking in the 21st Century Budapest, 2017
416
Eco-innovation projects will therefore aim to produce quality products with less environmental impact, whilst innovation can also include moving towards more environmentally friendly production processes and services. Ultimately they will contribute towards the reduction of greenhouse gases or the more efficient use of various resources. The idea of eco-innovation is very new.
In 2013, the European Commission DG Environment founded a project aiming to compile the Eco-Innovation Observatory (EIO). The EIO put together a guide is a practical and comprehensive introduction to eco-innovation addressed primarily to small and medium-sized enterprises (SMEs). [7] The booklet overviews emerging business opportunities eco-innovation has to offer to companies that reconsider business models, develop new products, technologies or services, or improve production processes.
As an eco-innovation we can consider a new start-up or product or making improvements in existing operations. Eco-innovation can focus on introduction of new technologies, but reating new services and introducing organisational changes are just as important. At its core, eco-innovation is about creating business models that are both competitive and respect the environment by reducing resource intensity of products and services.

Management, Enterprise and Benchmarking in the 21st Century Budapest, 2017
417
The Figure 1. demonstrates the reasons why do eco-innovation.
+
+ +
Figure 1. Reasons why do eco-innovation
Source: EIO 2013.
Circular Economy
What is the circular economy? A circular economy is an alternative to a traditional linear economy (make, use, dispose) in which we keep resources in use for as long as possible. The EU adopted the circular economy package on 2 December 2015. The Action Plan for the circular economy suggested action actions will contribute to "closing the loop" of product lifecycles through greater recycling and re-use, and bring benefits for both the environment and the economy. [8]
Saving material and energy costs New products and services: new markets New business models
Sustainable management of natural resources Tackling climate change Improving biodiversity and ecosystems
Enhancing quality of life Creating new and sustainable jobs
economy
environment
society
Material security Resources justice politics
Management, Enterprise and Benchmarking in the 21st Century Budapest, 2017
418
The adaptation of the circular economy offers considerable economic benefit. In 2017, the UK Waste and Resources Action Programme – WRAP – estimates that the UK businesses could benefit GBP 23 billion per year by low cost and improvement in efficient use of resources. McKinsey Global Institute estimates that total resource productivity opportunity could amount annual saving to society of USD2.9 trillion a year in 2030, at current market prices. [9]
To showcase the key deliverables achieved so far and to debate future deliverables with stakeholders, the Commission and the European Economic and Social Committee on 9-10 March 2017 organised a Circular Economy Conference. On this occasion the European Circular Economy Stakeholder Platform was announced.
2 The role of SMEs in greening the economy In 2014, within the EU-28, 26 million active enterprises existed with some 143 million persons employed. There were about 4 million jobs created from 2.6 million newly born enterprises, while in the same year the results show 3.5 job losses as a consequence of 2.3 million death businesses. 75.5% of all active businesses were in the service sector. By contrast, only 9.9 % of active enterprises were found in industry, even though these enterprises provided work for 23.6 % of the total number of persons employed. [10] SMEs account for more than 98 % of Europe’s businesses and provide more than 67 % of total employment in the Union and 58 % of gross value added.
In spite of no internationally agreed definition of green growth, there is consensus that it is a combination of economic growth and environmental sustainability. Improving the skills and training is a key challenge for SMEs, especially with regard to innovation and resource efficiency. However, inadequate access to risk capital, in particular at the start-up stages, continues to be one of the main obstacles to the creation and development of growth-oriented businesses;
The individual environmental footprint of the small enterprises may be low, their aggregate impact can, in some respects, exceed that of large businesses. The key sectors where SMEs have a significant environment impact include livestock farming, construction, metal finishing, waste treatment, food and drink industry, textile and leather manufacturing, etc.
SMEs account approximately for 64% of the industrial pollution in Europe. Sector variations are generally within the 60% to 70% range. Using employees as an indicator shows at an average of 64% of environmental impact originates from
Management, Enterprise and Benchmarking in the 21st Century Budapest, 2017
419
SMEs in the EU27 when looking at the four broad indicators (energy use; greenhouse gases; air emissions and waste or hazardous waste). [11]
The transition towards the green growth economy is highly demanding in particular on manufacturing firms, including SMEs, as they account for a large part of the world’s consumption of resources and generation of waste. SMEs in general do not perceive their own environmental impact as compared to large enterprises. SMEs lack information, resources, technical knowledges and expertise to implement green initiatives. The environmental commitments are mostly depend on the SME owners.
It is essential to identify the main barriers to green growth and eco-innovation, so based on these factors SMEs and entrepreneurs could fully participate in the transition towards sustainable economic patterns. It is also crucial that consistent policy strategies are identified and implemented to encourage SME investment in eco-innovation and sustainable practices, in both manufacturing and services.
At time being there are no many researches on SMEs’ main barriers for environmental awareness. As one of the best summaries see below by the European commission.
The aim and key success factor in greening economy for SMEs to the reduction of the environmental in both manufacturing as well as in. However, the willingness and capability of SMEs to adopt sustainable practices and seize green business opportunities generally face difficulties and resource constraints, which involved skill deficit and knowledge limitations. SMEs are often unaware of many financially attractive opportunities for environmental improvement. There is a widespread misperception that protecting the environment is associated with technical complexity, burdens and costs. Even when they are aware of the potential of better environmental performance to improve a firm’s competitiveness, a lack of appropriate skills and expertise commonly prevents firms from acting upon win-win opportunities.
According to OECD guide for green SMEs the “green transformation” is a significant business opportunity for SMEs themselves as important suppliers of goods and services. Indeed, the principal drivers for SMEs to adopt green practices are non-regulatory and include: [12]
The rising price of commodities and key raw materials;
Potential cost savings and competitive advantage; and
Market pressure from customers
The European Union considers the small businesses as priority in its policy and pushes governments across the EU introduce better regulation initiatives. The major policy initiatives for SME greening in the EU is The Small Business Act for

Management, Enterprise and Benchmarking in the 21st Century Budapest, 2017
420
Europe (2008), which was developed to establish the “Think Small First” approach to policy making and regulation and to promote SMEs’ growth. One of its ten high-profile principles is “enable SMEs to turn environmental challenges into opportunities” – a paradigm which lies at the heart of the transition to green growth.
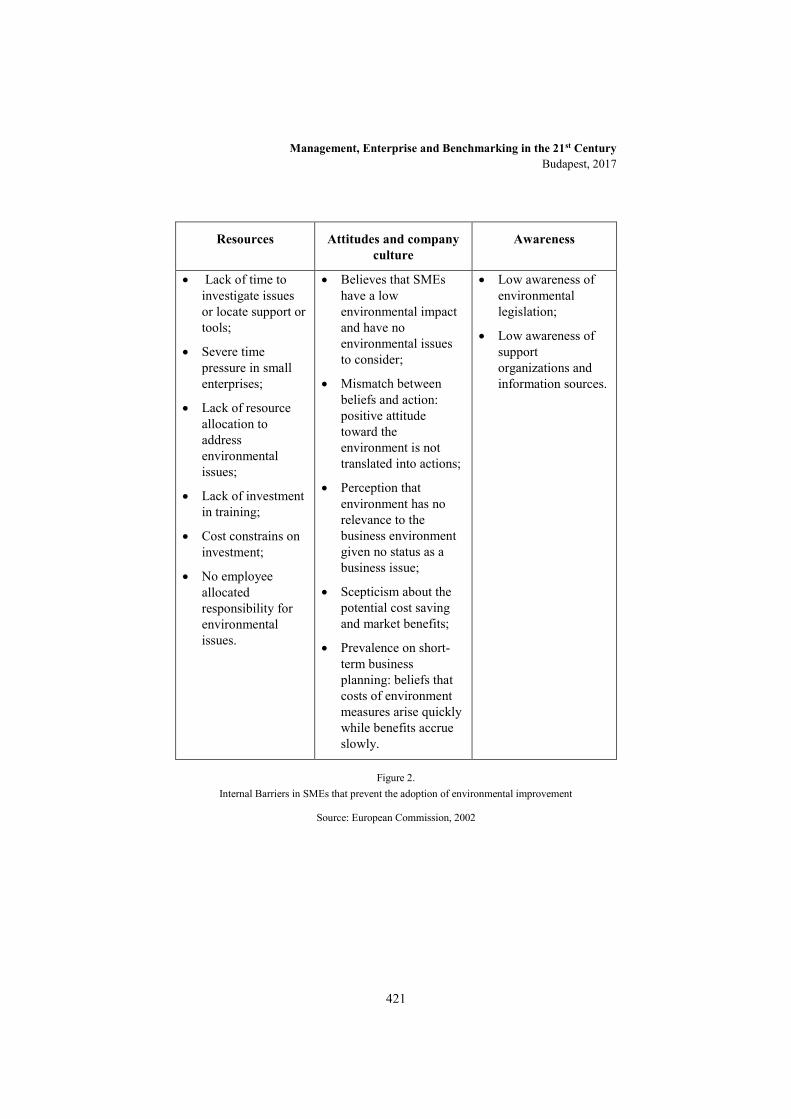
Management, Enterprise and Benchmarking in the 21st Century Budapest, 2017
421
Resources Attitudes and company culture
Awareness
Lack of time to investigate issues or locate support or tools;
Severe time pressure in small enterprises;
Lack of resource allocation to address environmental issues;
Lack of investment in training;
Cost constrains on investment;
No employee allocated responsibility for environmental issues.
Believes that SMEs have a low environmental impact and have no environmental issues to consider;
Mismatch between beliefs and action: positive attitude toward the environment is not translated into actions;
Perception that environment has no relevance to the business environment given no status as a business issue;
Scepticism about the potential cost saving and market benefits;
Prevalence on short-term business planning: beliefs that costs of environment measures arise quickly while benefits accrue slowly.
Low awareness of environmental legislation;
Low awareness of support organizations and information sources.
Figure 2. Internal Barriers in SMEs that prevent the adoption of environmental improvement
Source: European Commission, 2002

Management, Enterprise and Benchmarking in the 21st Century Budapest, 2017
422
3 EU Green Action Plan - GAP
The European Commission has committed itself to “rigorously assessing the impact of forthcoming legislation and administrative initiatives on SMEs (“SME test”) and taking relevant results into account when designing proposals”. The European Commission has recently prepared a Green Action Plan (GAP) for SMEs, which give a clear direction and framework for aims to:
• Improve resource efficiency of European SMEs;
• Support green entrepreneurship;
• Exploit the opportunities of greener value (supply) chains; and
• Facilitate market access for green SMEs. Source: EC, 2008; EC, 2014b
GAP is presented in complementarity with the Communication Green Employment Initiative. – Tapping into the job creation potential of the green economy, which proposes a roadmap for supporting green jobs creation across the EU, and with the Communication Resource Efficiency Opportunities in the Building Sector as well as with the Circular Economy Package and Waste Target Review.
The GAP aims to contribute to the re-industrialisation of Europe as advocated by the European Industrial Renaissance Communication (COM (2014) 14) and supported by the European Council, by enhancing SMEs competitiveness and supporting green business developments across all European regions, notably in view of the fact that, at this stage, significant differences in resource efficiency exist between sectors and Member States.
The European Commission document on Communication from the Commission to the European Parliament, the Council. the Europea Eonomic and Social Committee and the Committee of the Regions on the Green Action Plan for SMEs highlights why greening SMEs in important for more competitiveness and sustainability. [13]

Management, Enterprise and Benchmarking in the 21st Century Budapest, 2017
423
The Commission has set several objectives to be achieved through the following actions:
1 Provide European SMEs with practical information, advice and support on how to improve their resource efficiency in a cost-effective manner;
2 Support efficient technology transfer mechanism for green technologies;
3 Facilitate the access to finance for resource-related improvements and energy efficiency in SMEs
The GAP aims to contribute to the re-industrialisation of Europe as advocated by the European Industrial Renaissance Communication (COM (2014) 14) and supported by the European Council, by enhancing SMEs competitiveness and supporting green business developments across all European regions.
The Action Plan builds on the Eco-Innovation Action Plan (EcoAP) [14] which provides directions for eco-innovation policy and funding under the umbrella of the Europe 2020 strategy. A number of actions and instruments of the EcoAP are highly relevant for SMEs. Examples are
the European Innovation Scoreboard
the Eco-innovation Observatory
the European Forum on Eco-innovation
European Innovation Partnerships and financing instruments for eco-innovation under Horizon 2020.
The GAP sets out a series of objectives and lists actions that will be implemented at European level within the framework of the Multiannual Financial Framework 2014-2020.
The five major tasks of the GAP are the following:
3.1 Greening smes for more competitiveness and sustainability Improving resource efficiency in SMEs offers enormous potential for the reduction of production costs and for productivity gains. A better use of resources is calculated to represent an overall savings potential of €630 billion per year for European industry.’[15]
At least 93% of SMEs in the EU are taking at least one action to be more resource efficient which, in most cases, is a low-cost action. However, only 42% of SMEs that implement measures to improve resource efficiency has seen a reduction of their production costs. This indicates the necessity to provide guidance to SMEs on
Management, Enterprise and Benchmarking in the 21st Century Budapest, 2017
424
the cost-effectiveness of resource efficiency investments. The Commission has set several objectives to be achieved through the following actions:
Provide Europen SMEs with practical information, advice and support on how to improve their resource efficiently in a cost-effective manner;
Support efficient technology transfer mechanism for green technologies;
Facilitate the access to finance for resource-related improvements and energy efficiency in SMEs
3.2 Green entrepreneurship for the companies of the future SMEs need a favourable business environment, in which green ideas can be easily developed, financed and brought to the market. “Green entrepreneurship” should already be addressed in (higher) education, to prepare the mind-set of future green entrepreneurs. [16] Green entrepreneurship should also be encouraged by helping potential entrepreneurs in identifying business opportunities resulting from the move towards a resource efficient, low carbon economy, including through new creative forms of cooperation between businesses and academia. All forms of innovatin that foster green entrepreneurship should be supported.
The Commission has set several objectives to be achieved through the following actions:
Promote all forms of eco-innovation, icluding non-technical eco-innovation;
Facilitate business partnership, skills and knowledge for green entrepreneurship;
Expolit better role of clusters in support of eco-innovative SMEs.
3.3 Opportunities for SMEs in a greener value chain Re-manufacturing, repair, maintenance, recycling and eco-design have a great potential to become drivers of economic growth and job creation while, at the same time, making a contribution to addressing environmental challenges. Through innovation and the redesign of products and of production and business models companies can reduce the use of expensive primary raw materials and create less waste. The 60% of total waste in the EU which is not recycled, composted or re-used, offers economic opportunities for SMEs to capitalise on cross-sectoral value chains that make more efficient use of resources. [17]
The Commission has set several objectives to be achieved through the following actions:

Management, Enterprise and Benchmarking in the 21st Century Budapest, 2017
425
Address systemic barriers to cross-sectoral and cross-national value chain collaboration and business creation and cooperation, by facilitating the creation of service business models and the re-use of materials, products and waste;
Faciliate cross-sectoral collaboration in view of promoting the circular economy;
The forthcoming action on 'Cluster facilitated projects for new industrial value chains' under Horizon 2020 will allocate at least 75% of the total budget to support innovation in SMEs. It seeks to support cross-sectoral and cross-regional collaboration and innovation projects driven by SMEs by better integrating them into clusters and different value chains
3.4 Access to the markets for green SMEs The EU has a strategic interest to adequately tackle the major global environmental challenges such as climate change. With high economic growth and, in some cases, early stages of industrialisation, environmental depletion and emissions are growing at a high pace in many countries of the world.
The EU makes up roughly one third of the world market for environmental industries and is a net exporter. This world market is growing by 5% a year and is expected to triple by 2030, thus offering important opportunities for EU businesses. [18] However, few SMEs in the EU offer their green technologies, products or services in countries outside the EU. 87% of SMEs in the EU only sell in their national markets. [19] This lack of SME internationalisation is usually explained by the absence of a supportive framework that can help SMEs access foreign markets.
3.5 Governance The actions linked to this Green Action Plan for SMEs will be regularly
monitored, including the dedicated financial resources, in dialogue with SME stakeholders, and the effectiveness of the programmes will also be evaluated. Updated information on the actions will be provided through the Commission website.
The SME Performance Review monitors and assesses countries' progress in implementing the Small Business Act on an annual basis, including their performance in relation to its principle 9 'enabling SMEs to turn environmental challenges into business opportunities', thereby complementing the Green Action Plan monitoring. [20]

Management, Enterprise and Benchmarking in the 21st Century Budapest, 2017
426
4 Green Enterpreneurship Award
4.1 European Entrepreneurship Promotion Awards The European Enterprise Promotion Awards reward those who promote entrepreneurship and small business at the national, regional and local level. Initiatives from all EU countries, as well as Iceland, Serbia, and Turkey can take part in the competition. Since 2006, over 2,800 projects have entered the awards and together they have supported the creation of thousands of new companies. [21]
The competition has two stages. Applicants must first compete at national level to be eligible to compete at European level. For the national competition, each country will select two entries to be nominated for the European competition. A shortlist of nominees will be chosen by a European jury. All nominees from the national and European competitions will be invited to attend the awards ceremony.
In 2016, the winner of the category for support SME success to green markets was the Serbian “Lime Trees & Honey Bees for Sustainable Development of the Danube Micro-region” project strengthens the competitiveness of beekeeping in the Fruška Gora region and motivates young people to start beekeeping businesses. The project aims to increase the market share of Fruška Gora lime honey by investing in human resources and skills development, improved knowledge through scientific research, education and the introduction of new technologies. This project was founded by the European Union and the Austrian Development Agency. The project duration was 18 months. The project value was €222,658, out of which €171,915 was the grant amount.
How to get involved in the 2017 edition of the award see at https://ec.europa.eu/growth/smes/support/enterprise-promotion-awards/take-part_en.
4.2 Green Grog Award - GFA The Deloitte Central European Sustainability Report Award – the Green Frog Award - is an award for best sustainability reports. The contest aims to identify and reward excellence in corporate non-financial reporting in Central Europe. [22]
The Green Frog Award (GFA) was launched in 2000 in Hungary and step by step embraced by other CE countries (Balkans joined in 2009, Czech Republic in 2012, and Baltics in 2013). From 2015, the GFA consists of a national and regional level. Reports rewarded at the national level will be automatically nominated to the Central European level.
Management, Enterprise and Benchmarking in the 21st Century Budapest, 2017
427
Reports will be assessed according to these criteria:
1. Sustainability performance & strategic commitments
2. Materiality
3. Content
4. Structure and creativity in communication (getting the message across)
5. Impact measurement
6. Financial and non-financial data integration
The winner of the 2015 Sustainable Development Report was the Czech Plzeňský Prazdroj, a. s.
4.3 Green Economic Platform for SMEs - GreenEcoNet
The GreenEcoNet is the first global platform to support SMEs in the transition to a Green Economy, by providing:
Access to the best in class green solutions, products and services;
Access to the economic, financial and planning tools to transform their business into a green business;
Access to new market opportunities by showcasing solutions, products and services;
A space to have dialogue with policy makers and the research community involved in the green economy. [23]
GreenEcoNet is coordinated by a consortium of six leading research networks specialising in green economy transitions including the Stockholm Environment Institute (SEI), the Green Economy Coalition (GEC), the Dutch Joint Implement Network Climate and Sustainability, the Brussels based Centre for European Policy Studies (CEPS), Ecologic Institute and the University of Piraeus Research Centre (UPRC). The GreenEcoNet was funded by the European Commission through the Framework Programme 7 and its aim is to accelerate the uptake of green business practices across Europe.
4.4 European business awards for the environment
A growing number of businesses realise that protecting the environment is vital in maintaining Europe’s competitiveness. The European Business Awards for the Environment (EBAE) recognises these pioneers, celebrating those companies at the
Management, Enterprise and Benchmarking in the 21st Century Budapest, 2017
428
forefront of eco-innovation, or which have a respect for the environment at the very core of their business principles. [24]
The awards are held every second year (the next cycle is 2016-2017), and winners are recognised in the following four categories: management, product and services, process innovation, and international business cooperation, with a special mention for business and biodiversity.
Conclusion
The European Commission, EU Member States and non-member countries, their Governments, the business community and the civil society have to search for new directions and embrace an economic model which is as low-carbon user-friendly and environmentally sustainable. In addition this model also fight against the poverty and inequality, while explores new market opportunities not only for smart and progressive, but also for average SMEs.
Solutions are urgently needed. We do not have too much time. Business as usual is not an option: choosing to “kick the can down the road” over the next few years will bring unacceptable environmental and social strains accelerating the natural disasters by climate disasters, foreshadowing the danger of a possible world war for drinking water and generating the African and Asian mass-migration.
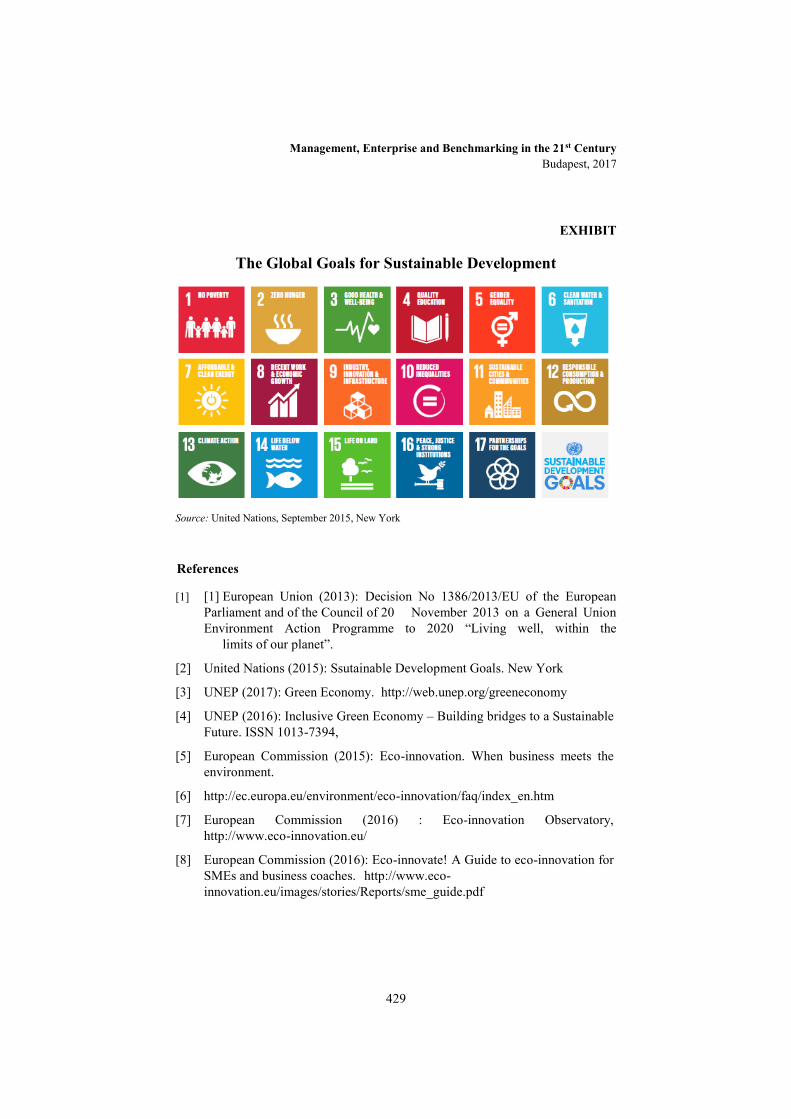
Management, Enterprise and Benchmarking in the 21st Century Budapest, 2017
429
EXHIBIT
The Global Goals for Sustainable Development
Source: United Nations, September 2015, New York
References
[1] [1] European Union (2013): Decision No 1386/2013/EU of the European Parliament and of the Council of 20 November 2013 on a General Union Environment Action Programme to 2020 “Living well, within the limits of our planet”.
[2] United Nations (2015): Ssutainable Development Goals. New York
[3] UNEP (2017): Green Economy. http://web.unep.org/greeneconomy
[4] UNEP (2016): Inclusive Green Economy – Building bridges to a Sustainable Future. ISSN 1013-7394,
[5] European Commission (2015): Eco-innovation. When business meets the environment.
[6] http://ec.europa.eu/environment/eco-innovation/faq/index_en.htm
[7] European Commission (2016) : Eco-innovation Observatory, http://www.eco-innovation.eu/
[8] European Commission (2016): Eco-innovate! A Guide to eco-innovation for SMEs and business coaches. http://www.eco-innovation.eu/images/stories/Reports/sme_guide.pdf
Management, Enterprise and Benchmarking in the 21st Century Budapest, 2017
430
[9] European Commission (2015): Communication on Closing the loop - An EU action plan for the Circular Economy COM(2015) 614 final, Brussels, 2.12.2015
[10] My Kinsey Global Institute (2011): Resource Revolution: Meeting of the world’s energy, materials, food and water needs.
[11] EUROSTAT (2017): Business demography statistics. http://ec.europa.eu/eurostat/statistics-explained/index.php/Business_demography_statistics
[12] Miller, K. et al (2011): First Assessment of the Environmental Assistance Programme for SMEs, ECAP
[13] OECD (2015): EaPGREEN : Environmental Policy Toolkit for Greening SMEs in the EU Eastern Partnership Countries
[14] European Commission: COM(2014) 440 final on Green Action Plan for SMEs. Enabling SMEs to turn environmental challenges into business opportunities. Brussels, 2.7.2014
[15] European Commission: Eco-Innovation at the heart of European policies.
[16] http://ec.europa.eu/environment/ecoap/
[17] "Guide to resource efficiency in manufacturing: Experiences from improving resource efficiency in manufacturing companies". Europe INNOVA (2012).
[18] Flash Eurobarometer (2013): SMEs, resource efficiency and green markets http:// ec.europa.eu/public_opinion/flash/fl_381_eapdf.
[19] Eurostat Waste Statistics (2011)
[20] IDEA Consult, ECORYS (2009): Study on the competitiveness of the EU eco-industry; Federal Ministry for the Environment, Nature Conservation and Nuclear Safety, 2009, "Greentech - Made in Germany 2.0"
[21] Flash Eurobarometer (2013): SMEs, resource efficiency and green markets ec.europa.eu/public_opinion/flash/fl_381_ea.pdf.
[22] For more information: http://ec.europa.eu/enterprise/policies/sme/facts-figures-analysis/performance- review/index_en.htm
[23] European Commission: European Entrepreneurship Promotion Award https://ec.europa.eu/growth/smes/support/enterprise-promotion-awards_en
[24] Deloitte: Central European Sustainability Report Award 2016
[25] https://www2.deloitte.com/ru/en/pages/risk/articles/2016/green-frog-award.html

Management, Enterprise and Benchmarking in the 21st Century Budapest, 2017
431
[26] GreenEcoNet: Connecting SMEs for a green economy. http://www.greeneconet.eu/
[27] European Commission: European Business Awards for the Environment. http://ec.europa.eu/environment/awards/about_ebae.html
Management, Enterprise and Benchmarking in the 21st Century Budapest, 2017
432
Fight between the Giant and the Dwarf - The Retirement Security Basics
Zsolt Szabó Óbuda University, Doctoral School on Safety and Security Sciences, Budapest, Hungary
Abstract: The reform of the pension system is a cardinal and noteworthy subject in all countries of the European Union and it is often discussed in various scientific meetings. These economic and social challenges necessitate long-term government strategies, which need to be modelled, tested and verified. The following study describes the present pillars of the Hungarian pension system and goes into detail about the problems of the mandatory social insurance system, using demographic and statistic data. The main objective of this essay is to present a possible scenario of changes in the pension benefits in Hungary. It applies various statistics and a research based on a questionnaire on economical attitudes. This study consists of three parts. The first part shows the retirement security basics. The second part presents the pillars of the Hungarian pension system and the achievements of pension modelling. The third part summarizes the theoretical basics and results of the research project “The role of self-care in our lives”.
Keywords: pension system, pension modelling, retirement security, self-care
1 The retirement security basics Hungarian pension system is based on two main pillars: the mandatory social insurance system and the voluntary funds [1]. The modern mandatory social insurance system is burdened by three serious problems which threaten the financial balance of the Hungarian pension system in the long run [2]:
• the radical ageing of the population (people become older and older)
• the low level of employment (there are more who get assistance and less who pay contributions)
• partial payment of contributions (the state pension system operates at a loss)
The pay as you go system means that the state gets a certain pension contribution from employees every month which is distributed as benefits next month among the pensioners. The problem is that the capital reserve is not ensured for the

Management, Enterprise and Benchmarking in the 21st Century Budapest, 2017
433
pensions to be distributed later, thus active employees only get a promise from the state to ensure their retirement benefit. Pension system experts realised as early as around 1990 that the pay as you go system was not sustainable for long with its existing conditions, the increase of the population would not be as considerable as it was after the second world war. They all predicted that birth rate would be set at a lower level, so fewer people would reach their earning years [3].
Besides the ageing of population there is the problem the low proportion of the actively employed population. Though the situation of the Hungarian job market generally improved in 2014, we still have to face various challenges. In the third quarter of 2014 full employment reached 62.8% (EU average being 65.5%), and unemployment rate was 7.4% among people 15-64 years old [4]. Improvement of the job market can be explained by the expansion of the public employment program and the increase of those having jobs in foreign countries. As far as long term employment and employment of young people is concerned, unemployment rate is still very high. Unemployment is a serious problem among women with young children and among the Roma community. During the last few years poverty has increased which indicates that the social safety cannot effectively decrease poverty. The social and educational systems do not really contribute to creating equal treatment and equal opportunities. The health care system, although it has gone through considerable transformation in the last few years, is faced with serious challenges. The health state of the population is rather poor and resources are not well exploited [5].
The first two tendencies require the increase of contribution rate, decrease of the proportion of pension/wages or the further increase of retirement age. The third tendency on the other hand needs making the pension system more attractive and making control stricter. The reasons of avoiding paying contributions are vaguely known and experts are carrying out researches to find them. The radical increase of the minimum wage requires the increase of contributions in certain segment of the shadow economy while in other segments there will be more unemployed and more people who do not pay contributions. Governments usually do not like to hear about this complex problem let alone openly discuss it [6] [7].
Hungary has the highest contributions for the minimum wages among all member countries of the Organisation for Economic Cooperation and Development (OECD) [8]. However minimum wages are not the highest in Hungary. The rate of state redistribution, especially tax centralisation exceeds by some percentage points the data of the neighbouring countries. To put it in other words, we have to pay more tax here in Hungary. An average Hungarian tax payer pays around 60% of his or her total income as a tax. 60% of all these high contributions are payed as welfare expenditure of which almost half is spent to pay pensions [9].
On the basis of charts 1, 2 and 3, it can be declared that the state will soon be unable to finance the rightful pensions of retired people from the contributions of active employed tax payers.

Management, Enterprise and Benchmarking in the 21st Century Budapest, 2017
434
(million) 2013 2050
Population 9,9 9,3
Active age (15-64) 6,75 5,426
Number of active 4,368 3,977
Number of elderly (65+) 1,5 2,3
Number of 55-64 1,2 1,1
Number of unemployed 0,2 0,2
Number of job holders 4,0 3,3
Chart 1. Change in population with number of unemployed and active job holders
Source: EPC, 2015
On the basis of the model for the pay as you go system The 2015 report of the European Committee describes a pre-calculation [5]. This report suggests that considering Hungarian conditions in 2013 there will not be sufficient amount of pension in the future even if the general attitude to saving changes. It also concludes that elderly people will not have enough income thus we have to opt for a form of self provision in order to have a sufficient level of income when we retire.
(%) 2013 2050
Active age 58,2 58,1
Rate of actives 64,7 73,3
Dependence rate of elderly (65+ / 15-64) 25 48
Activity rate of 55-64 41,8 77,9
Unemployment 10,3 7,5
Employment rate 58,0 67,8
Chart 2. Change in population with unemployment rate
Source: EPC, 2015
Pension systems should be improved so that they are suitable and sustainable throughout the European Union. In the last few years most of the member countries have transformed their pension systems due to the ageing of society. However as the recommendation report in 2014 suggests further reforms are needed to make pension systems more efficient and financially sustainable. The conformance of pension systems should also be preserved to supply proper income. Considering the trend of increasing life expectancy a more dynamic attitude has to be accepted to define the age of retirement. By systematically connecting mandatory retirement age to life expectancy there should be a balance between active and retirement years [5].
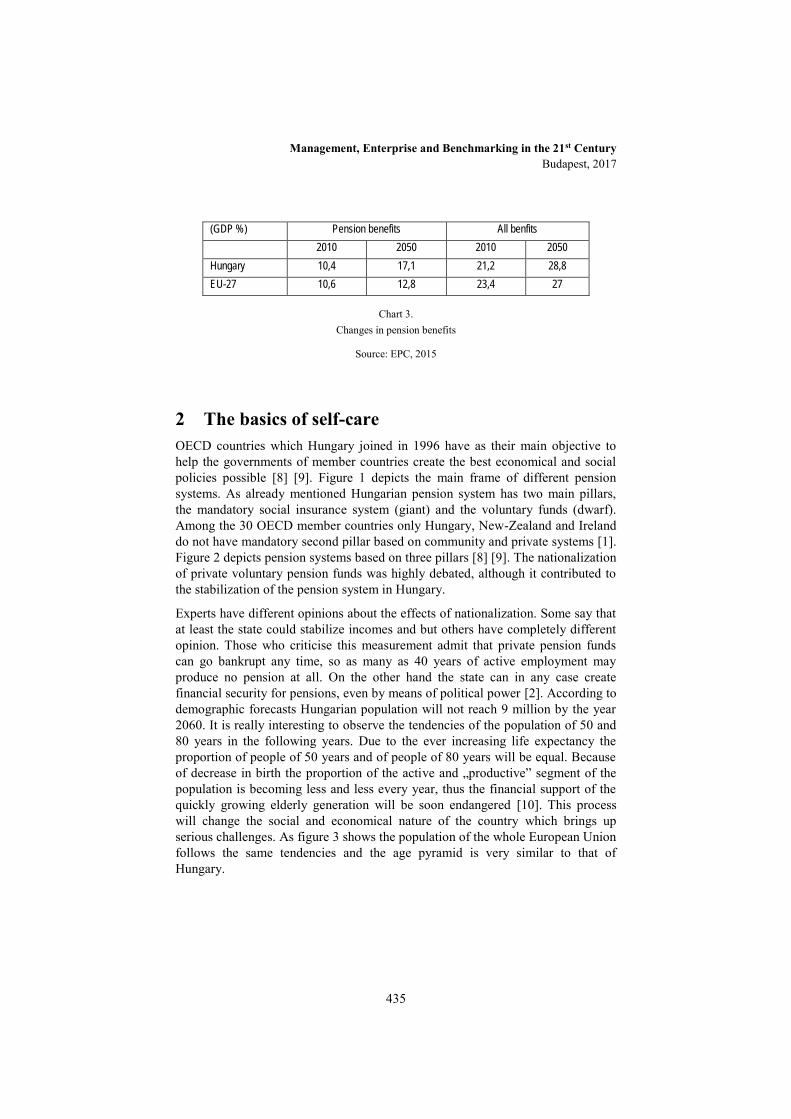
Management, Enterprise and Benchmarking in the 21st Century Budapest, 2017
435
(GDP %) Pension benefits All benfits
2010 2050 2010 2050
Hungary 10,4 17,1 21,2 28,8
EU-27 10,6 12,8 23,4 27
Chart 3. Changes in pension benefits
Source: EPC, 2015
2 The basics of self-care OECD countries which Hungary joined in 1996 have as their main objective to help the governments of member countries create the best economical and social policies possible [8] [9]. Figure 1 depicts the main frame of different pension systems. As already mentioned Hungarian pension system has two main pillars, the mandatory social insurance system (giant) and the voluntary funds (dwarf). Among the 30 OECD member countries only Hungary, New-Zealand and Ireland do not have mandatory second pillar based on community and private systems [1]. Figure 2 depicts pension systems based on three pillars [8] [9]. The nationalization of private voluntary pension funds was highly debated, although it contributed to the stabilization of the pension system in Hungary.
Experts have different opinions about the effects of nationalization. Some say that at least the state could stabilize incomes and but others have completely different opinion. Those who criticise this measurement admit that private pension funds can go bankrupt any time, so as many as 40 years of active employment may produce no pension at all. On the other hand the state can in any case create financial security for pensions, even by means of political power [2]. According to demographic forecasts Hungarian population will not reach 9 million by the year 2060. It is really interesting to observe the tendencies of the population of 50 and 80 years in the following years. Due to the ever increasing life expectancy the proportion of people of 50 years and of people of 80 years will be equal. Because of decrease in birth the proportion of the active and „productive” segment of the population is becoming less and less every year, thus the financial support of the quickly growing elderly generation will be soon endangered [10]. This process will change the social and economical nature of the country which brings up serious challenges. As figure 3 shows the population of the whole European Union follows the same tendencies and the age pyramid is very similar to that of Hungary.
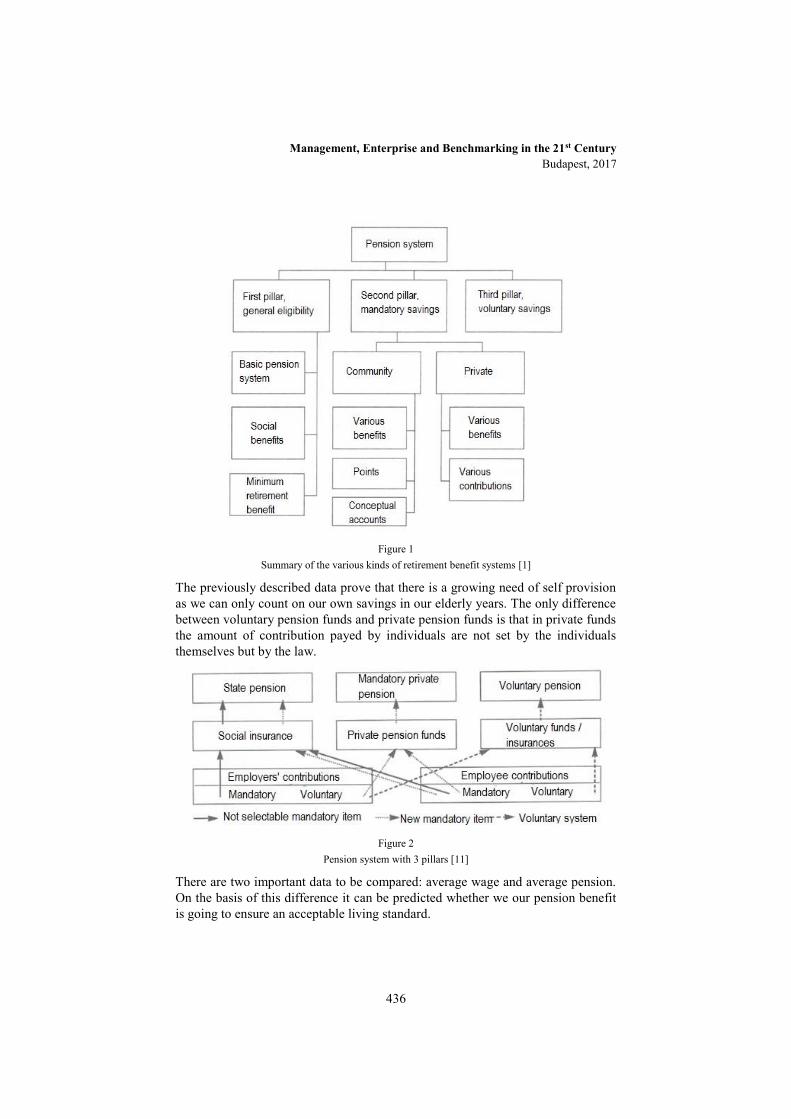
Management, Enterprise and Benchmarking in the 21st Century Budapest, 2017
436
Figure 1
Summary of the various kinds of retirement benefit systems [1]
The previously described data prove that there is a growing need of self provision as we can only count on our own savings in our elderly years. The only difference between voluntary pension funds and private pension funds is that in private funds the amount of contribution payed by individuals are not set by the individuals themselves but by the law.
Figure 2
Pension system with 3 pillars [11]
There are two important data to be compared: average wage and average pension. On the basis of this difference it can be predicted whether we our pension benefit is going to ensure an acceptable living standard.

Management, Enterprise and Benchmarking in the 21st Century Budapest, 2017
437
Figure 3
Age pyramid of total population of EU27, 2010-2050 [12]
Figure 4 show these tendencies in Hungary. Numbers are going to increase but there will always be a difference in the future, which means that average wage will be higher than average pension.
Figure 4
Average pension (blue), average wage private sector (red), average wage public sector (black), real income (yellow) (between 2000-2016) [10]
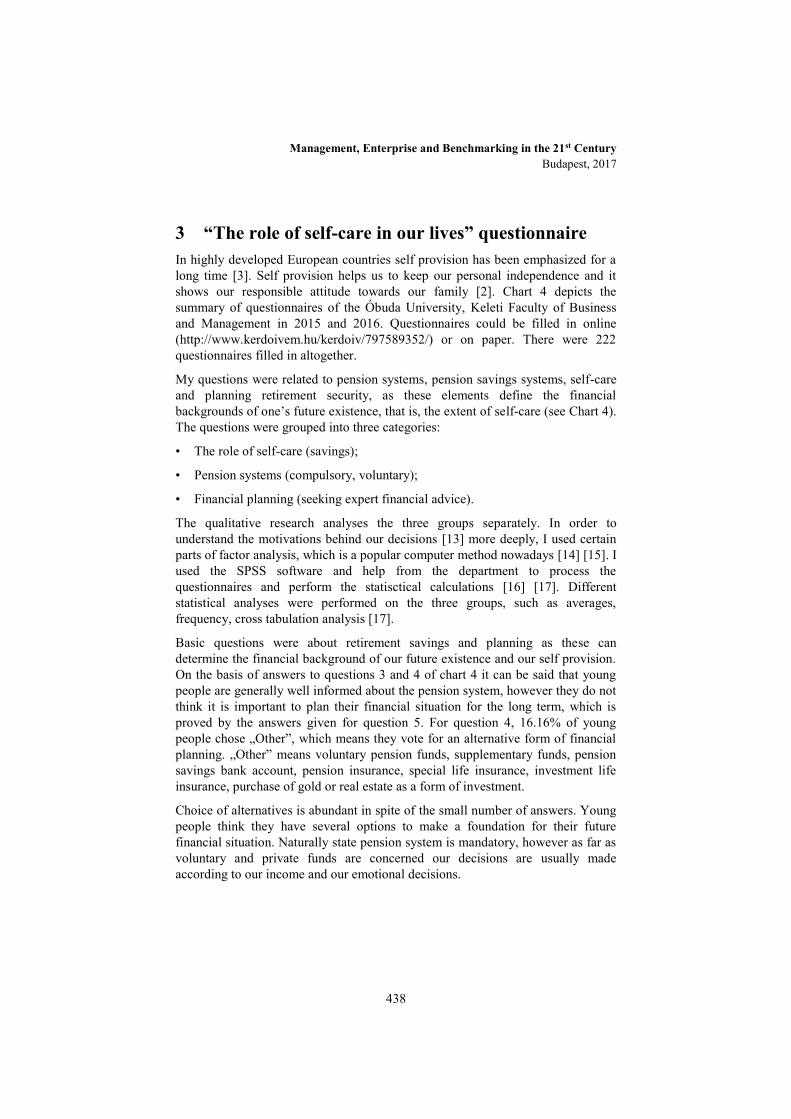
Management, Enterprise and Benchmarking in the 21st Century Budapest, 2017
438
3 “The role of self-care in our lives” questionnaire In highly developed European countries self provision has been emphasized for a long time [3]. Self provision helps us to keep our personal independence and it shows our responsible attitude towards our family [2]. Chart 4 depicts the summary of questionnaires of the Óbuda University, Keleti Faculty of Business and Management in 2015 and 2016. Questionnaires could be filled in online (http://www.kerdoivem.hu/kerdoiv/797589352/) or on paper. There were 222 questionnaires filled in altogether.
My questions were related to pension systems, pension savings systems, self-care and planning retirement security, as these elements define the financial backgrounds of one’s future existence, that is, the extent of self-care (see Chart 4). The questions were grouped into three categories:
• The role of self-care (savings);
• Pension systems (compulsory, voluntary);
• Financial planning (seeking expert financial advice).
The qualitative research analyses the three groups separately. In order to understand the motivations behind our decisions [13] more deeply, I used certain parts of factor analysis, which is a popular computer method nowadays [14] [15]. I used the SPSS software and help from the department to process the questionnaires and perform the statisctical calculations [16] [17]. Different statistical analyses were performed on the three groups, such as averages, frequency, cross tabulation analysis [17].
Basic questions were about retirement savings and planning as these can determine the financial background of our future existence and our self provision. On the basis of answers to questions 3 and 4 of chart 4 it can be said that young people are generally well informed about the pension system, however they do not think it is important to plan their financial situation for the long term, which is proved by the answers given for question 5. For question 4, 16.16% of young people chose „Other”, which means they vote for an alternative form of financial planning. „Other” means voluntary pension funds, supplementary funds, pension savings bank account, pension insurance, special life insurance, investment life insurance, purchase of gold or real estate as a form of investment.
Choice of alternatives is abundant in spite of the small number of answers. Young people think they have several options to make a foundation for their future financial situation. Naturally state pension system is mandatory, however as far as voluntary and private funds are concerned our decisions are usually made according to our income and our emotional decisions.
Management, Enterprise and Benchmarking in the 21st Century Budapest, 2017
439
Questions Answers Percentage
1. Gender
Male 138 62,2%
Female 84 37,8%
2. Age
below 28 118 53,2%
between 29-48 86 38,7%
above 48 18 8,1%
3. The role of self-care
Yes 126 56,8%
No 96 43,2%
4. Knowledge about the pension system
State pension
Yes 82 36,9%
No 144 63,1%
Private pension
Yes 60 27%
No 162 73%
Other possibilities
Yes 62 16,16%
No 160 83,84%
5. Financial planning
Yes 64 28,8%
No 158 71,2%
Total number of respondents 222 100%
Chart 4. “The role of self-care in our lives” questionnaire
Source: my own research, 2015 (N=222)
Management, Enterprise and Benchmarking in the 21st Century Budapest, 2017
440
Conclusions The actual pay as you go pension system is still quite popular although it has to face a serious crisis, so probably it will continue in some form or another. Experts opt for the mixed pension system but there is still no model everyone would accept as ideal. According to predictions the proportion of active tax payers and pensioners will drastically change. The problem of sustainability highly determines the possible models. The sustainability of the pension system is determined by the proportion of the employees, that is tax payers and pensioners, because pensioners receive their retirement benefit from the contributions of the active job holders. The two sides should be balanced from the point of view of macro economy. Some professional meeting and discussion are needed to try to solve the problem of retirement benefits irrespectively of politics or economical position. Research is mainly done at universities even in more developed countries while the state only plays a supportive role, as decision makers do not have time to work on new methods. Naturally the problems of the pension systems that various experts and government could not solve are not expected to be cleared up a simple essay. However it should be stated that there are possibilities to forecast the various effects of the retirement pension systems.
References
[1] Novoszáth, Péter: A társadalombiztosítás pénzügyei. Nemzeti Közszolgálati és Tankönyv Kiadó, 2014, pp. 1-244
[2] Holtzer Péter (szerk.): Jelentés. A nyugdíj és időskor kerekasztal tevékenységéről, 2010, MEH. NYIKA. pp. 1-452
[3] Augusztinovics Mária: Egy értelmes nyugdíjrendszer. Közgazdasági Szemle LXI. évf., 2014. október, Válogatás az elmúlt évtizedek írásaiból. pp. 1219-1239
[4] Pension Adequacy in the European Union 2010-2050: Report prepared jointly by the Directorate-General for Employment, Social Affairs and Inclusion of the European Commission and the Social Protection Committee. (23 May 2012). Hungary (HU) Country profile for the Pension Adequacy Report, Luxembourg: Publications Office of the European Union, 2012, ISBN 978-92-79-25951-7, doi:10.2767/77325, pp. 257-263
[5] The 2015 Ageing Report EUROPEAN ECONOMY: Economic and Financial Affairs, ISSN 1725-3217 (online), ISSN 0379-0991 (print). Economic and budgetary projections for the 28 EU Member States (2013-2060), pp. 366-368
[6] Nagy Imre Zoltán: A jövedelemeltitkolás okai, következményei és visszaszorítási lehetőségei különös tekintettel Magyarországra. Vállalkozásfejlesztés a XXI. században, 2011, Óbudai Egyetem, pp. 69-98

Management, Enterprise and Benchmarking in the 21st Century Budapest, 2017
441
[7] Varga János, Csiszárik-Kocsir Ágnes: Versenyképességi átrendeződés Közép-Kelet Európában, fókuszpontban a V4 országok, Kárpátmedencei versenyképesség. 6. Báthory - Brassai Konferencia Kötete, Óbudai Egyetem, 2015, pp. 316.-335
[8] Pensions at a Glance 2013: OECD and G20 indicators, ISBN: 978-92-64-20393-8, pp. 1-368
[9] Pensions at a Glance 2015: OECD and G20 indicators, ISBN: 978-92-64-24444-3, pp. 1-378
[10] KSH Demográfiai Helyzetkép, Magyarország 2014, pp. 1-40
[11] Bácskai Tamás, Király Júlia, Marmoly Judit, Májer Beáta, Sulyok-Pap Márta (szerk.): Bankról, pénzről, tőzsdéről. Válogatott előadások a Bankárképzőben, Budapest 1998, Bankárképző, ISBN: 9630360039, pp. 1-604
[12] Eurostat European Commission: Europe in figures, Eurostat yearbook 2011, Europe Direct is a service to help you find answers, Luxembourg: Publications Office of the European Union, 2010, ISBN 978-92-79-14884-2, ISSN 1681-4789, Doi: 10.2785/40830, Cat. No. KS-CD-10-220-EN-C pp. 1-664
[13] Hámori Balázs: Érzelemgazdaságtan, Kossuth Kiadó. Budapest 1998, pp. 16-20
[14] Ottó István: Hierarchikus faktoranalízis SPSS szoftverrel. Magyar Pedagógia 2003, 103. évf. 4. szám, pp. 447–458
[15] Mitev Ariel, Sajtos László: SPSS kutatási és adatelemzési kézikönyv. Budapest 2007, Alinea Kiadó, ISBN: 978-963-9659-08-7, pp. 1-404
[16] Czirfusz M., 2010. Faktoranalízis, a látszatmegoldás. Tér és Társadalom 24. évf. 2010/1. pp. 37-49
[17] Csiszárik-Kocsir Ágnes: A hazai vállalkozások által alkalmazott finanszírozási stratégiák egy kérdőíves kutatás eredményeinek tükrében. Budapest: Óbudai Egyetem, Keleti Károly Gazdasági Kar Gazdaság - és Társadalomtudományi Intézet "Vállalkozásfejlesztés a XXI. században V." című tanulmánykötet cikkei 2015. pp. 33-56

Management, Enterprise and Benchmarking in the 21st Century Budapest, 2017
442
George, Yoomurjak and the Tax - The Influence of Migration on Taxes
Gábor Tóth Óbuda University – Doctoral School on Safety and Security Sciences
Katalin Tóth Eötvös Lóránd University Faculty of Social Sciences
Abstract: “George couldn’t take his eyes off the little line. It was almost at the bottom of the screen – then seemed to pull up a tiny bit. It was still falling, but not quite so steeply. George stared – and it did it again. Someone behind him took a deep breath. George glanced at Eric – and saw that he was beaming in delight, his eyes flicking back and forth over the unceasing columns of numbers.
‘Not what we expected!’ Eric whispered to himself. ‘Not what we expected at all!’”
It is known from George and the Big Bang by Lucy & Stephen Hawking that the simulation of the Big Bang by Cosmos, the supercomputer has verified all are theories about time and space as we know them. Pushing the moral panic button is a Hungarian specialty, according to Professor Endre Sík, since such an expensive and long-lasting manipulation affecting all can hardly be found anywhere else in the world. It happened in a period when the tendency to view migration and terrorism as key problems increased significantly in the whole of Europe. What is the use of the budget when pushing the moral panic button results in growing xenophobia? The face of the moral panic button is Yoomurjak, who is a free and well-known brand (Eclipse of the Crescent Moon (Egri csillagok) is part of the national core curriculum), a Turk, a Muslim, an illegal trespasser, a kidnapper, a loser, disabled, scary and “cut by a Turkish child………” We start our analysis with the Muqaddimah, written by Ibn Khaldun, the 14th-century Muslim philosopher, and we arrive at researcher Stuart Rankin explaining the theory of the Big Bang. We have experimented with applying patterns described by the leading figure of Islamic economics in order to understand the effect migration and pushing the moral panic button have on taxes. During our work we may not get such a surprise as Professor Eric, when we find that rules we have known for centuries apply to the moral panic button as well.
Keywords: taxation, migration, yield, assessment, moral, army, jealousy, propaganda, authority

Management, Enterprise and Benchmarking in the 21st Century Budapest, 2017
443
1 The Methodology In our work we use primary and secondary data. First we analyse the Muqaddimah by Ibn Khaldun with the technique of qualitative content analysis then finalise our hypothesis which professor Endre Sík published in his 2016 non-scientific article ‘A hungarikum: the moral-panic-button’.
‘Content analysis is a research technique for making replicable and valid inference from text (or other meaningful matter)to the context of their use.’ (Krippendorff, 2004)
Through our analysis we strive to define with only a few key words what Ibn Khaldun thought about the economic, taxational and moral effects of emigration. After the statistical analysis of identified key words (word counting, frequency analysis), we analyze their context to describe their apparent and hidden content.
We compare the views of the 14th-century Islamic economist against Endre Sík’s non-scientific article and 21st statistics.
2 The Muqaddimah Ibn Khaldun (1332-1406) was born in an era that saw the rise and fall of small states. The Islamic empire was characterized by social and political motion in this period. His noble family left Spain when Ferdinand III occupied Seville. He was born in Tunis in 1332. Raised to be a scholarly Andalusian intellectual, he became familiar with contemporary Islamic science, art and poetry (Hoizen; 2009). His political career started at the age of 17, after his parents died of plague. He acted as a political advisor to the leaders of several North African countries (Turchin, 2007). By the 1370s he had become estranged from and disappointed with politics. He was highly critical of the contemporary traditions of historiography, and based his work Muqaddimah on much more rational grounds (Oláh, 2016).
‘Every subject that is understandable and real,’ - Khaldun says in his foreword to the Muqaddimah’s opening chapter, - ‘requires an individual discipline.’ (Khaldun, 1375).
He describes human civilization as an independent discipline which explains the phenomena and intensions resulting from the essence of society. His work deals with the management of an individual household or of a whole city. He considered his researches unique. The Muqaddimah is an effort toward the rational, and an attempt at realizing the account of historical events through a presentation of causes and effects. (Chapra; 2014)
Khaldun today is considered a pioneer of sociology and Islamic economics, and an outstanding figure of Islamic philosophy. (Tóth, 2015; Oláh, 2016)
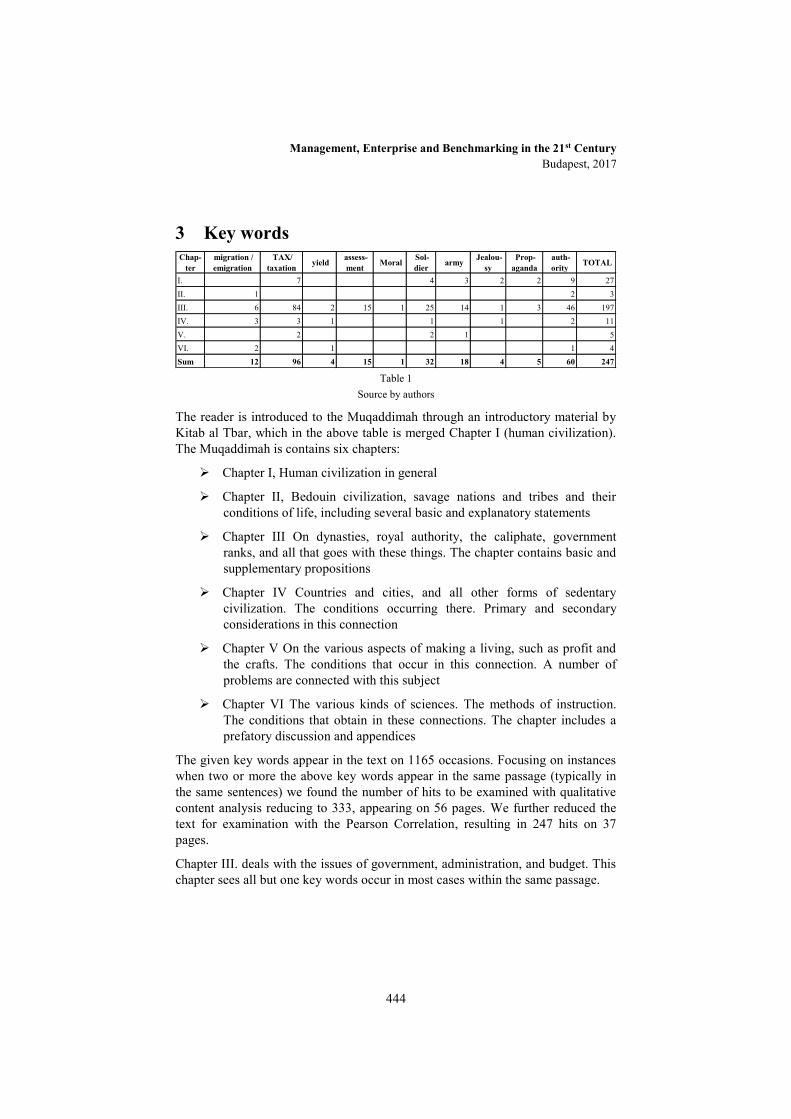
Management, Enterprise and Benchmarking in the 21st Century Budapest, 2017
444
3 Key words Chap-
ter migration / emigration
TAX/ taxation yield assess-
ment Moral Sol-dier army Jealou-
sy Prop-aganda
auth-ority TOTAL
I. 7 4 3 2 2 9 27II. 1 2 3III. 6 84 2 15 1 25 14 1 3 46 197IV. 3 3 1 1 1 2 11V. 2 2 1 5VI. 2 1 1 4Sum 12 96 4 15 1 32 18 4 5 60 247
Table 1 Source by authors
The reader is introduced to the Muqaddimah through an introductory material by Kitab al Tbar, which in the above table is merged Chapter I (human civilization). The Muqaddimah is contains six chapters:
Chapter I, Human civilization in general
Chapter II, Bedouin civilization, savage nations and tribes and their conditions of life, including several basic and explanatory statements
Chapter III On dynasties, royal authority, the caliphate, government ranks, and all that goes with these things. The chapter contains basic and supplementary propositions
Chapter IV Countries and cities, and all other forms of sedentary civilization. The conditions occurring there. Primary and secondary considerations in this connection
Chapter V On the various aspects of making a living, such as profit and the crafts. The conditions that occur in this connection. A number of problems are connected with this subject
Chapter VI The various kinds of sciences. The methods of instruction. The conditions that obtain in these connections. The chapter includes a prefatory discussion and appendices
The given key words appear in the text on 1165 occasions. Focusing on instances when two or more the above key words appear in the same passage (typically in the same sentences) we found the number of hits to be examined with qualitative content analysis reducing to 333, appearing on 56 pages. We further reduced the text for examination with the Pearson Correlation, resulting in 247 hits on 37 pages.
Chapter III. deals with the issues of government, administration, and budget. This chapter sees all but one key words occur in most cases within the same passage.
Management, Enterprise and Benchmarking in the 21st Century Budapest, 2017
445
4 Analysis of the Muqaddimah According to Ibn Khaldun’s observation, when the rule of a dynasty begins, the nomad Bedouin form of life is replaced by the settled form of life. The group solidarity typical of the former disappears, and henceforth the cohesive power of society is provided by political power. (Khaldun, 1375; Oláh, 2016). Political power can be created through the establishment of a mercenary army, whose qualities are defined by the tax system, the amount of gained income. The tax system depends on the efficiency of public administration and the people working in it, from decision-making politicians to civil servants. Authority and the tax systems vary depending on the capabilities of the people managing administration. The efficiency and social approval of the tax system are influenced by whether those in power govern the country respecting laws or bending them to their will.
Taxation is the legal income for the state. There is a wide range of tax burdens following, as described above, a rule that is well-defined in time: ‘It should be known that at the beginning of the dynasty, taxation yields a large revenue from small assessments. At the end of the dynasty, taxation yields a small revenue from large assessments’ (Khaldun, 1375)
In the beginning, the dynasty collects the taxes mandatory by religious law, which are maximized and of low amount. Low taxes have a stimulating effect, whereas high taxes have negative effects on the whole of the economy (Khaldun, 1375; Oláh, 2016). At the beginning of a dynasty lower state incomes cover the expenses. The solidarity of the Bedouin tribes is still alive, so it costs less to maintain a state and its army.
Throughout the life cycle of a dynasty expenses grow drastically, when the nomad habits wear off, luxury grows and taxes do not cover expenses anymore. Khaldun disapproves state expenses getting out of hand and encourages officials to practice self-criticism, presenting several historical examples. The development of civilization comes with growing state expenses. The ruling class has a growing need for luxury.
At this point, the dynasty is in the phase of decrepitude, its expenses are constantly rising, but it is unable to collect the taxes from more remote areas. ‘Now the ruler invents all kinds of new taxes levied on the various goods. He imposes a fixed amount of tax on market prices and on the value of goods carried through the city gates.’ In the last phase of a civilization burdens become so high that, as goods vanish, markets start to stagnate (Khaldun, 1375; Oláh, 2016).
Taxes ‘lay a heavy burden on the subjects, making them hunch.’ Continuous tax raises make the payment of taxes a ‘mandatory habit’ for subjects. ‘When the raises cross the line of reasonableness, subjects become resigned about activities for the expansion of the civilization, since a comparison of benefits against liabilities means benefits are so small subjects lose hope’ (Khaldun, 1375).

Management, Enterprise and Benchmarking in the 21st Century Budapest, 2017
446
Because of the growing levels of tax and the falling tax incomes, the ruling class in certain cases may try to increase its incomes by ‘interfering with trade and agriculture.’ In order to improve the balance of the budget, the government embarks upon agricultural activities and launches its goods on the market, leading to falling prices, loss of funds for market operators and further loss of tax revenues. This loss generates a rise in tax levels and tariffs appear.
If the government reduces its expenses and the ruling class provides the servants with smaller payments or spends its sources improperly, the purchasing power of the subjects drops, the market shrinks, which again leads to a loss of tax incomes (Khaldun, 1375; Oláh, 2016).
Khaldun did not support the government becoming a market operator. He considered the useful spending of tax incomes as a means of economic stimulus.
migration taxation yield assement moral soldier army jealousy propaganda authority
Pearson Correlation
1 -,197 -,161 Sig. (2-tailed)
,145 ,938 ,710 ,778 ,236 ,497 ,532 ,491 ,732
N 56 56 56 56 56 56 56 56 56 56Pearson Correlation
-,197 1 ,632** ,814** ,144 ,135
Sig. (2-tailed)
,145 ,000 ,000 ,700 ,291 ,322 ,882 ,908 ,782N 56 56 56 56 56 56 56 56 56 56Pearson Correlation
,632** 1 ,777** -,126 -,113Sig. (2-tailed)
,938 ,000 ,000 ,825 ,355 ,473 ,714 ,591 ,407N 56 56 56 56 56 56 56 56 56 56Pearson Correlation
,814** ,777** 1 Sig. (2-tailed)
,710 ,000 ,000 ,861 ,574 ,569 ,771 ,669 ,504N 56 56 56 56 56 56 56 56 56 56Pearson Correlation
1 -,110
Sig. (2-tailed)
,778 ,700 ,825 ,861 ,578 ,666 ,825 ,746 ,421N 56 56 56 56 56 56 56 56 56 56Pearson Correlation
-,161 ,144 -,126 1 ,149
Sig. (2-tailed)
,236 ,291 ,355 ,574 ,578 ,960 ,272 ,498 ,613N 56 56 56 56 56 56 56 56 56 56Pearson Correlation
,135 1 -,144 ,223
Sig. (2-tailed)
,497 ,322 ,473 ,569 ,666 ,960 ,691 ,291 ,099
N 56 56 56 56 56 56 56 56 56 56Pearson Correlation
,149 1,000 -,113Sig. (2-tailed)
,532 ,882 ,714 ,771 ,825 ,272 ,691 ,591 ,407N 56 56 56 56 56 56 56 56 56 56Pearson -,144 1 -,151Sig. (2-tailed)
,491 ,908 ,591 ,669 ,746 ,498 ,291 ,591 ,265
N 56 56 56 56 56 56 56 56 56 56Pearson Correlation
-,113 -,110 ,223 -,113 -,151 1Sig. (2-tailed)
,732 ,782 ,407 ,504 ,421 ,613 ,099 ,407 ,265N 56 56 56 56 56 56 56 56 56 56
jealousy
propaganda
authority
**. Correlation is significant at the 0.01 level (2-tailed).
Correlations
migration
taxation
yield
assement
moral
soldier
army
Table 2
Pearson correlation analysis source by authors
Throughout our examination, we considered the absolute value of the differences. In his work, Ibn Khaldun presented migration and emigration within the context of the civilization development of Arabic tribes and the rise and fall of states. The Pearson correlation coefficient highlighted deeper correlations within the text. Based on the correlation between taxation and yield, assessment and tax incomes
Management, Enterprise and Benchmarking in the 21st Century Budapest, 2017
447
Khaldun says taxation is the basis for the development of civilization. It is the key income source of the government to manage. Khaldun only has negative examples of other types of budgetary incomes, effecting both the economy and people’s financial state in a negative way.
The term migration appears in the Muqaddimah referring to the conditions of Bedouin tribes in the period before the founding of the state. Also, after the fall of the state, emigration is followed by immigration to another area.
Morals, although with little emphasis, clearly make it the responsibility of the state to revive society and take care of the economic conditions of the country.
Jealousy, propaganda and army are all correlated in the text with authority as the representative of power.
Khaldun says the state itself is dependent on tax incomes and the army. This statement is supported by the Pearson correlation coefficient, as well.
Wishing to analyze the hidden content of the Muqaddimah, we resorted to the word cloud technique.
Based on the results of the analysis we can say that from among the key words there are three that determine the Muqaddimah’s content. These are: taxation, army and authority.
We differentiated between the key words as being primary or secondary. The primary ones are the three above-mentioned words, and there are six others we may call secondary key words, determining the primary ones. We found that five of the key words describe the context of the Muqaddimah’s apparent and hidden content: taxation, yield, assessment, army, and authority.
Khaldun’s above opinion (‘the state itself is dependent on tax incomes and the army’), which we had determined from the hidden content of the text, was further confirmed by word cloud analysis.
The main theme of our analysis was taxation, determined by Chapter I, Chapter III and Chapter IV. We proved that political power can be created through the establishment of a mercenary army whose qualities are defined by the tax system, the amount of gained income.
After a content analysis of the Muqaddimah, we can say that the safety of a country depends on taxation, which is a key instrument of a government’s financial policy.
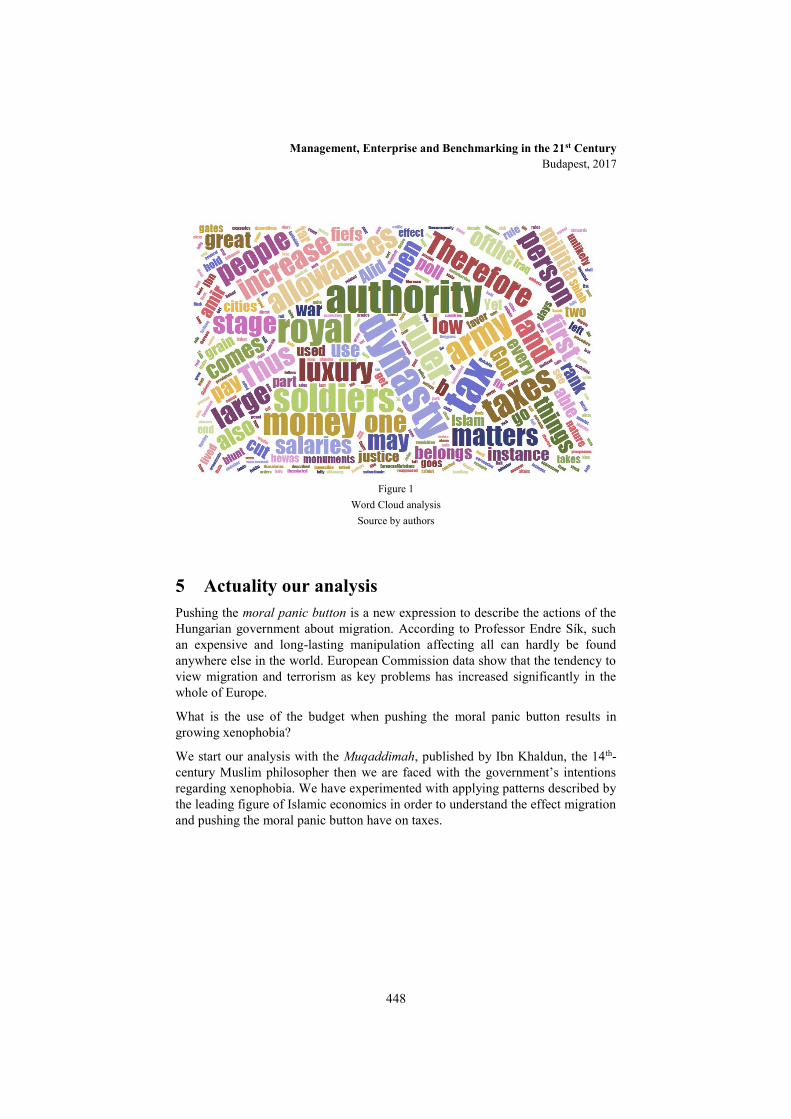
Management, Enterprise and Benchmarking in the 21st Century Budapest, 2017
448
Figure 1
Word Cloud analysis Source by authors
5 Actuality our analysis Pushing the moral panic button is a new expression to describe the actions of the Hungarian government about migration. According to Professor Endre Sík, such an expensive and long-lasting manipulation affecting all can hardly be found anywhere else in the world. European Commission data show that the tendency to view migration and terrorism as key problems has increased significantly in the whole of Europe.
What is the use of the budget when pushing the moral panic button results in growing xenophobia?
We start our analysis with the Muqaddimah, published by Ibn Khaldun, the 14th-century Muslim philosopher then we are faced with the government’s intentions regarding xenophobia. We have experimented with applying patterns described by the leading figure of Islamic economics in order to understand the effect migration and pushing the moral panic button have on taxes.

Management, Enterprise and Benchmarking in the 21st Century Budapest, 2017
449
6 Xenophobia today In the past 2 years xenophobia has grown stronger than ever before. The number of xenophobes was high in Hungary even before 2015, but at the same time the ratio of xenophiles was higher. TÁRKI Social Research Institute has carried out surveys about xenophobia since 1992. Their results show that the ratio of xenophiles reached a low in 2016, a mere 1%. The ratio of hesitant respondents was 46%, the lowest value of the past years, and the ratio of xenophobes in 2016 was the highest since 1992, incorporating 53% of the society. We can therefore state that more than half of the Hungarians overtly reject everyone and less than half of them are hesitant.
Figure 2
Ratio of xenophobe, xenophile and hesitant respondents, 1992–2016 (%) Sorce: Tárki Omnibusz 1992- 2016
The migration crisis started in 2015, by the summer the first refugees appeared at our borders. People left their homes in unprecedented numbers. Reaching our country, the situation came in handy for the government, having lost popularity in autumn 2014 and looking for a theme it could use to quickly regain people’s sympathy. Xenophobia seemed a theme like that. Through the media, the government started to penetrate people’s minds, trying to convince an already xenophobe nation with the message that migrants’ intention is to stay in the country, take Hungarians’ jobs and deplete the resources Hungarians had worked for (Sík, 2016).
A national consultation was conducted with rather suggestive questions making it clear for the respondents what they were supposed to answer and think about the topic. Parallelly, posters appeared, rather manipulating than informing the

Management, Enterprise and Benchmarking in the 21st Century Budapest, 2017
450
population. At the consultation the government received the answer it had expected, so posters flooded the country again.
Although the referendum on resettlement quotas was invalid, the government declared it to be valid and communicated it as a success. So the posters and hidden manipulation in TV and radio spots had had an influence on people, as a kind of moral panic was beginning to appear and xenophobia increased significantly in 2016. During the days of the Olympic Games, channel M1 showed TV spots of the referendum campaign 140 times, and M4 211 times, i.e. in 9 days 4,219 seconds of governmental advertisement was broadcast on M4, which is 20% of the total time for advertisements (Román, 2016).
Figure 3
what do you think are the two most important issues facing the EU at the moment? Source by European Commission, 2016 spring
All over Europe many politicians and daily newspapers questioned the actions of the Hungarian government, since being an EU country, Hungary has obligations – and there are certain obligations in a situation like that, which are defined by the Geneva Conventions.
We agree with Professor Endre Sík in that lashing up xenophobia was unnecessary. It is on the rise not only in our country, but all over Europe. The tendency to view migration and terrorism as key problems increased significantly in the whole of the EU. (Sík, 2016)
The data regarding Hungary are not outstanding. Pushing the moral panic button lashed up overt xenophobia, but since autumn 2015 there have not been asylum seekers in Hungary (Sík, 2016).
Management, Enterprise and Benchmarking in the 21st Century Budapest, 2017
451
7 Hypothesis The civilization disease of a country is budgetary overspending. These are groundless expenses that cannot be justified either from a moral point of view, or with a reference to their success. Ibn Khaldun identifies so-called governmental expenses of luxury in the decline phase of a dynasty. We classify pushing the moral panic button as an item of this category.
Conclusions Professor Endre Sík’s non-scientific article and also our analysis point out that pushing the moral panic button generated unjustified governmental expenses. The propaganda was effective (posters, press campaign), xenophobia did grow in Hungary. However, regarding xenophobia the whole of Europe produced similar data, and, while the Hungarian government was tenaciously stirring up the feelings of xenophobia, other European governments were not doing so, but were looking at the events in Hungary uncomprehendingly.
Based on data from TÁRKI, if the objective of the government was to increase xenophobia, it could have been reached in all certainty without pushing the moral panic button.
According to Ibn Khaldun’s standpoint expressed in Muqaddimah, luxury expenses in every case generate a budgetary deficit that cannot be covered by tax incomes. For such expenses the given government can only establish sources of income that will lead to the impoverishment of both the state and its citizens, and indirectly to the reduction of tax incomes.
Based on our examination this conclusion cannot be drawn. Our statement is that maintaining the moral panic button is an expense that is unaccountable regarding its results. We believe that it is exactly the same type of luxury expense as in the case of a 14th-century Islamic civilization maintaining the size of an army to consolidate its power that the raised tax incomes and tariffs cannot cover any more and keeping the balance of the budget indirectly leads to the impoverishment of the citizens.
Acknowledgement
The views expressed here are solely those of the authors and do not reflect those of an official statement.

Management, Enterprise and Benchmarking in the 21st Century Budapest, 2017
452
References
[1] Ibn Khaldun [1375]: The Muqaddimah. Translated by Franz Rosenthal, Bollingen Series, Princeton University Press. Princeton, N.Y. 1989. pp. 9-826.
[2] Lucy & Stephen Hawking: George and te Big Bang 2007, pp. 285-286.
[3] Sík E. Egy Hungarikum: a morálispánik-gomb (tanulmányterv) Mozgó világ October 2016, pp. 67-80.
[4] Chapra M. U. [2014]: Ibn Khaldun’s theory of development: Does it help explain the low performance of the present-day Muslim world?, Morality and Justice in Islamic Economics and Finance. Edward Elgar, Cheltenham.
[5] Hozien M. [2009]: Ibn Khaldun. His Life and Work. www.muslimphilosophy.com
[6] Kippendorf K.: Content Analysis, University of Pensilvania, SAGE publications second edition, pp.18.
[7] Oláh D.: Ibn Khaldun helye és szerepe a közgazdaági elmélettörténetében, Közgazdasági Szemle, LXIII. Évf., 2016. July-Augustus pp. 819-837.
[8] Román B.: 9 nap alatt 4219 másodperc félelem, Kreatív online journal, 2016. Augustus 19. www.kreativ.hu
[9] Tóth G.: Gazdagép Története, A fenntartható fejlődés új közgazdaságtana 2015, pp.42.
[10] Thurchin P. [2007]: War and Peace and War: The rise and Fall of Empires. Plume, New York.
Management, Enterprise and Benchmarking in the 21st Century Budapest, 2017
453
The Moral Hazard issues of the State-Aid Programs for SME’s
Gyorgy Vas1 [email protected]
Abstract: Adverse selection and moral hazard are empirical research themes for the SME’s financing after the local and international crises of the 90’s and recently after the world-crises starting in 2007. Although several empirical evidence is available for commercial and development banking related issues, the direct subsidies of the European Union and the partner states have not been investigated yet. Moral hazard has to be first generalized for state-aid related issues, incorporating the social surplus as value created by subsidized firms. As firm owners might transfer bank loans into private benefits, in case of direct subsidies firms utilize government funds without contributing to any increase in social surplus, i.e. we interpret moral hazard irrespective from private benefits and consider only the social surplus elements of the fund transfers.
Keywords: SME financing, Moral Hazard,
1 Introduction
The well known and established adverse selection and moral hazard phenomenon in SME financing will be extended and reformulated for state-aid related issues. First of all the direct government subsidy is regarded as state intervention, which is a fund transfer without any repayment2. The subsidy is granted for economic development purposes, which can be captured in social surplus, however it is highly complex to be measured properly. Further investigation should deliver a proper definition in order to start the empirical testing, this paper focuses only on generalization of moral hazard.
1 The publication was prepared within the Széchenyi 2020 program framework (EFOP-
3.6.1-16-2016-00013) under the European Union project titled: „Institutional developments for intelligent specialization at the Székesfehérvár Campus of Corvinus University of Budapest”.
2 In case of failure if the project does not meet the set of predefined criteria the firm is obliged to return the funds, otherwise if the project succeed no repayment is needed
Management, Enterprise and Benchmarking in the 21st Century Budapest, 2017
454
The theoretical research is based only on few articles, (Stiglitz & Weiss, 1981), (Holmstrom & Tirole, 1997). The first one is about defining the moral hazard phenomenon; the second creates a simple equilibrium model of credit explaining the role of different kind of credit constraints. These articles are the basis for further empirical investigation of adverse selection in case of SME bank financing proving the credit constraint or the credit rationing.
Empirical testing aims to show if credit constraint is present or is there any structural difference in the particular market which could explain the correlation between easy excess to credit and economic development. However, no empirical testing could be found for state aid related moral hazard issues.
SME’s represent 99,8 percent of number the companies, 70 percent of the workforce is employed and 60 percent of the total turnover can be assigned. The bank financing of SME’s is characterized by asymmetric information and adverse selection, which might be captured as a pro-cyclical market failure (Repullo & Suarez, 2013), indicating that banks lower credit lines to SME’s making them more vulnerable in case of economic downturn. Contra-cyclical behavior comes from state-owned development banks is regarded by (Beck, Thorsten, Demirgüç-Kunt, & Maksimovic, 2004) and (Griffith-Jones, Tyson, & Calice, 2011), whereas (Petersen & Rajan, 1995) summarize the potential of increase in management and financial knowledge of SME’s.
2 The Holmstrom-Tirole model
To find a framework for further investigating the moral hazard issues, we assume that companies are endowed with limited capital, and for financing there projects they excess the credit market. The non-equilibrium situation is the credit constraint, where banks are reluctant to give the required financing to SME’s, markets do not clear even with higher credit rates
As Holmstrom-Tirole pointed out increasing the interest rate will not clear the market it will only lead us to the moral hazard problem. (Berlinger E. J., 2015) (Berlinger, Lovas, & Juhász, 2016) and (Kállay & Vas G, 2017) contributed to further developing the original Holmstrom-Tirole model as they extended the model to state-aid related questions. The meaning of state-aid can be understood in several ways: it is first of all regarded as intervention of central government related body to directly support firms in order to achieve economic development purposes.
In the basic model there are three players: the firm, the financial intermediary and the investor. In the first period the financing decision is made, the legal contracts closed, while in the second period the investment returns are realized and settlement of all claims is taken place. All players are risk-neutral and have limited
Management, Enterprise and Benchmarking in the 21st Century Budapest, 2017
455
liabilities, i.e. the extent of the potential loss might only be equal to the original investment made. There are infinite number of firms with different sets of technologies, firms only differ in the initial set of own capital, indicated by A. Firms intend to invest I, therefore I-A financing is needed. Cummulated turnover
is denoted by for investment I with income 0 or R, for failure or success. The private benefit of the firms’ owners might increase in lack of proper incentives or monitoring. This is what we identify as moral hazard of the financing:
Successful projects do not generate private benefit, Ph denotes higher probability, then failed projects with lower probability Pl. In case of failure there are two different types of possible outcomes: firms’ owner realize low or high private benefit depending on the personal efforts executed by them. Expected rate of return on investment is denoted by γ, therefore
applies for economically viable project, if the firm owner aims successful projects rather than private benefits. If private benefit might be b or B, depending or low or high personal effort, we conclude that:
meaning that the project is not bankable. Expected net income plus private benefits are less than expected rate of return on initial investment.
3 Re-defining moral hazard of state subsidies
In case of SME bank financing the credit constraint is the consequence of adverse selection. Firms cannot excess the required amount of commercial bank financing, because banks are reluctant to give financing for those projects. Banks are considering SME’s not to be able to define profitable projects or they are suspicious that firms will use the available fund to cross-finance other projects. We might assume that firms would perform better if they would get the required amount of commercial bank financing, turnover would increase which would contribute to increase in profitability as well. This is the reason behind the government subsidy, to make available excess funds to SME’s to boost economic development. As we know that government subsidy distorts competition, it also changes firms’ behavior, what we call moral hazard.
The basic question arises as what would prevent firms to aim for subsidized project which would not be profitable to establish from own sources. This means
Management, Enterprise and Benchmarking in the 21st Century Budapest, 2017
456
that firms define project because of the cheap government money which is available from state (or equally European Union) sources. Or on the other hand subsidies might refinance more expensive corporate banking or other forms of own sources. Both cases are the materialization of moral hazard issues. State subsidy can be characterized as certain form of financing, in which case the repayment is expected to be the increase in social surplus. The moral hazard can be reformulated in that sense that firm owners aim for private benefit instead of increasing social surplus.
The major difference is the lack of repayment, therefore increasing social surplus is intended to be regarded as certain form of of repayment. In case of commercial bank financing the banks’ fund are transformed into private benefit as hidden action of firms’ owners, which is interpreted as moral hazard of financing. On one hand the theoretical fundamentals for capturing moral hazard should be reinterpreted as an issue of theory of games (Kállay & Vas, 2017), on the other hand empirical evidences should be presented. Currently there are several obstacles for empirically detecting moral hazard. First the social surplus can not be measured properly, which is definitely needed for empirical testing the phenomenon. Further theoretical research is needed to determine certain criteria for measuring social surplus on individual firms’ and more generally on macroeconomic levels.
The central government is interested in supporting projects in order to increase social surplus. Although it is not an easy task, as it is not easy for commercial banks to select the viable, profitable projects. Contemporary theoretical research consider indicators to value project’s profitability, however there are less effort invested into finding robust indicators signaling increase in social surplus. The central government is facing the growth problem of SME’s, therefore government authorities would like to make more financing opportunities available for firms. One type of this is government subsidy, which is intended to have accountable effect on economic development. The European Union defines government subsidy as state funds are given by state authorities to selected firms, which is used for achieving pre-defined economic development goals and finally increase social surplus. Domestically the emphasis of economic development policies are on improving the competitiveness of Hungarian SME’s, which might be achieved if the problems caused by the credit constraint is mitigated and excess funds of financing is granted for firms.
Management, Enterprise and Benchmarking in the 21st Century Budapest, 2017
457
4 Implications of moral hazard issues for economic development policies
There are three main types of government subsidies: first, the non-refundable cash transfers, with the purpose of increasing employment, investments and innovation. Firms make efforts to achieve pre-difiened goals, if succeeded the subsidy increases firms’ wealth. Second, several forms of tax benefits, which are direct forms of subsidies in a sense that firms do not have to consider paying public charges. Third, the refundable cash transfers, such as subsidized credit programs, guarantees or capital transfers. All forms of subsidies are similar making production expenses shrink, which might be the economic development effect.
There are several ways how government subsidies can have no real positive effect on social surplus within the legal framework, i.e. it is not our goal to analyze how malevolent firm owners intend to cheat. The real consequence of moral hazard is that even if firms follow the law and execute projects as contracted with the authorities social surplus will not be increased. This is not the fault of firm owners or the central governments, this is a long term non-equilibrium solution. Non-equilibrium in that sense that increasing the amount of subsidy will not clear the market, i.e. the social surplus will not be increased automatically.
If moral hazard can not be proven empirically without proper measurement methodology of social surplus, certain forms of appearance still can be detected. It is basic accounting evidence that government subsidy increases net sales of firms for the period of the lifetime of the investment, while profitability might not be effected because of the excess amortization. The total amount of subsidy is accounted as net sales over the period of the lifetime, ensuring that excess amortization will equal the amount of subsidy taken into consideration for the period. The increase in net sales is a positive externality but the real effect of it is still ambiguous.
We might conclude that the subsidy increases the wealth of firms giving room for owners to redistribute funds for other activities, therefore subsidized SME’s might invest less from own sources but rather might want to reinvest the subsidy. This is the same phenomenon what we could experience in case of TARP3 Sheng, (2016).
It is a consequence of that SME’s have higher expected rate on return for own sources than for the cheap government money. If subsidized SME’s do not reinvest they increase their savings, in that way government subsidies turn into excess funds. Simply firms develop projects because of the existence of cheap
3 TARP stands for Troubled Asset Relief Program, which is an initiative of the central
government in the USA, with the main purpose to mitigate the negative consequences of the toxic assets
Management, Enterprise and Benchmarking in the 21st Century Budapest, 2017
458
government money, in the real life from own sources or from commercial banking financing would never consider to invest. This might be regarded as the real economic development effect of the state-aid policies, however the right incentives have to be employed to ensure that firms select the projects with positive externality, i.e. they increase social surplus.
On the other hand if firms have commercial bank credits with less attractive conditions the first reasonable choice will be the repayment. Therefore SME’s without commercial bank financing represent lower moral hazard than those with high amount of loans. Since any type of commercial banking financing is more expensive than the government subsidy, it is an obvious choice for firms to consider redistribute funds instead of reinvesting them.
If the state wants to decrease moral hazard, it decreases the portfolio of eligible companies. Firms compete for state-aid funds, government authorities should monitor the execution of projects. Proper monitoring procedures can only mitigate moral hazard, since it is a hidden action. If we want to ensure that firms develop projects for increasing social surplus, there is the need to find effective procedures. The basic challenge is to theoretically establish the framework to measure the value of the social surplus.
Summarizing, we might conclude that there are two different forms of moral hazard: the first-type is when applying for subsidy while knowing that the social welfare will not be increased, while the second-type is applying for subsidy with the intent to refinance more expensive sources.
The original purpose of subsidizing SME’s was to increase competitiveness of the sector while making firms economically stronger. But we see that firms’ owners have different incentives than the authorities, they are more interested in increasing private benefits rather than contributing to achieve economic development goals. Finding the proper incentives is the key issue of all state-aid policies.
Theoretically moral hazard can be mitigated by introducing proper monitoring procedures. The main problem is finding what to monitor if we want to ensure the optimal increase in social surplus. This is the reason why further investigation is needed to detect how can firms’ economic activities boost social surplus.
Conclusions Government authorities make excess funds available for firms with constraint access to commercial bank credit lines in a form of non-refundable subsidies to achieve economic development goals. Whithout finding the right incentives to mitigate moral hazard issues the original purpose of state-aid will not be met. Detecting forms of moral hazard issues might be the first contribution to

Management, Enterprise and Benchmarking in the 21st Century Budapest, 2017
459
understand the real effects government subsidies. Further theoretical research is needed to analyze the real effect of state-aid on social surplus.
Acknowledgement
I would like to thank to Laszlo Kallay for making me clear the real economic nature of the moral hazard related issues of SME’s.
References
[1] Abbring, J. H., Chiappori, P.‐A., & Pinquet, J. (2003). "Moral hazard and dynamic insurance data.". Journal of the European Economic Association 1.4.
[2] Akerlof, G. (1995). "The market for “lemons”: Quality uncertainty and the market mechanism.". Essential Readings in Economics. Macmillan Education UK.
[3] Akerlof, G. A. (1970). The market for" lemons": Quality uncertainty and the market mechanism. . The quarterly journal of economics, 488-500.
[4] Arnold, L. G., & Riley, J. G. (2009). "On the possibility of credit rationing in the stiglitz-weiss model.". The American Economic Review.
[5] Banerjee, A. a. (2004). "Do firms Want to Borrow More." Testing Credit Constraints Using a Directed Lending Program. Massachusetts Institute of Technology. Proessed.
[6] Beck, T. (2007). "Financing constraints of SMEs in developing countries: Evidence, determinants and solutions." . KDI 36th Anniversary International Conference.
[7] Beck, Thorsten, Demirgüç-Kunt, A., & Maksimovic, V. (2004). "Bank competition and access to finance: International evidence.". Journal of Money, Credit and Banking.
[8] Berlinger, E. J. (2015). Az állami támogatás hatása a projektfinanszírozásra erkölcsi kockázat és pozitív externáliák mellett. Közgazdasági Szemle, 62(2), 139-171.
[9] Berlinger, E., Lovas, A., & Juhász, P. (2016). State subsidy and moral hazard in corporate financing. Central European Journal of Operations Reserach.
[10] Campello, Murillo, Graham, J., & Harvey, C. (2010). "The real effects of financial constraints: Evidence from a financial crisis.". Journal of Financial Economics 97.3.
[11] Carbo-Valverde, Santiago, Rodriguez-Fernandez, F., & Udell, G. (2009). "Bank market power and SME financing constraints.". Review of Finance 13.2.

Management, Enterprise and Benchmarking in the 21st Century Budapest, 2017
460
[12] EuropeanComission European commision. (n.d.). Forrás: Retrieved from ec.europa.eu:: http://ec.europa.eu/competition/legislation/treaties/ec/art88_en.html
[13] Griffith-Jones, S., Tyson, J., & Calice, P. (2011). The European Investment Bank and SMEs: Key Lessons for Latin America and the Caribbean. ECLAC.
[14] Hellmann, T. F., Murdock, K. C., & Stiglitz, J. E. (2000). "Liberalization, moral hazard in banking, and prudential regulation: Are capital requirements enough?.". American economic review.
[15] Holmstrom, B. (1979). "Moral hazard and observability.". The Bell journal of economics.
[16] Holmstrom, B., & Tirole, J. (1997). Financial intermediation, loanable funds, and the real sector. The Quarterly Journal of economics - JSTOR.
[17] Jaffee, D., & Stiglitz, J. (1990). "Credit rationing.". Handbook of monetary economics 2.
[18] Kállay, L. (2014). Állami támogatások és gazdasági teljesítmény| Támogatás-túladagolás a magyar gazdaságfejlesztésben? Közgazdasági Szemle - Közgazdasági Szemle Alapítvány.
[19] Kállay, L., & Vas (2017). The impact of state aid on social welfare. forthcoming.
[20] OECD. (2015). OECD SME and Entrepreneurship Outlook 2005. OECD Publishing,.
[21] Repullo, R., & Suarez, J. (2000). "Entrepreneurial moral hazard and bank monitoring: a model of the credit channel.". European Economic Review 44.10.
[22] Repullo, R., & Suarez, J. (2013). "The procyclical effects of bank capital regulation.". Review of Financial Studies 26.2.
[23] Sheng, J. ( (2016).). The Real Effects of Government Intervention: Firm-Level Evidence from TARP.
[24] Stiglitz, J. E., & Weiss, A. (1981). "Credit rationing in markets with imperfect information.". The American economic review 71.3.
[25] Tirole, J. (2009). Collective Moral Hazard. Maturity Mismatch and Systemic.
[26] Vives, X. (2010). "Competition and stability in banking.".
[27] Ylhäinen, I. (2010). "Persistence of government funding in small business finance." . Discussion Papers 1232 .
Management, Enterprise and Benchmarking in the 21st Century Budapest, 2017
461
The Importance of Regular Assessment at the Óbuda University
András Vass Student of Business Administration and Management, Keleti Faculty of Business and Management, Óbuda University
Péter Szikora Assistant lecturer, Keleti Faculty of Business and Management, Óbuda University
Abstract: In the last 25 years, the Hungarian higher education went through an enormous change. In the process the trend of education has changed from an elite training to the so called “mass production” of people with bachelor degree. Every corporation demands some kind of degree from their applicants, because of this most of the young adults study in higher education. While in the nineties students tended to have intrinsic motivation, nowadays they only have external motivation. Previous researches among the students of Keleti Faculty of Business and Management at Óbuda University showed that more than half of the them don’t know what they want to achieve in their life or after their graduation. Unfortunately, most of them don’t know how to deal with their “freedom” and have to learn the hole curriculum at the end of the semester. The purpose of this research is to prove how the frequency of assessment – changing from two a semester to a weekly regularity - influences those “wandering” students’ performance based on data gathered over the years among hundreds of students.
Keywords: Higher education, Continuous assessment, Self-motivation
1 Introduction In line with the CEDEFOP report knowledge is to determine the future wealth and wellbeing of societies (CEDEFOP). Public education, including higher education has a strategic role in the development and economic growth of the countries (Csiszárik-Kocsir et al, 2009a). The educational system is responsible for

Management, Enterprise and Benchmarking in the 21st Century Budapest, 2017
462
transferring and developing competencies, which are very important on the labour market (Csiszárik-Kocsir et al, 2009b; Borzán, 2010). Post-secondary education is promoted all over the world. Consequently, the number of students in higher education and those on the labour market with higher educational degree is ever growing, although in the recent two years this growth has slowed down in Hungary. Unfortunately, the increase of the educational niveau of the population has not been accompanied by a drastic increase in employment rate (Lazányi, 2014). Furthermore, the relative unemployment of those with higher education has even worsened in the 21st Century (KSH, 2013). The possible explanation of this contradiction is that the skills and competences offered by those with higher than secondary education do not match with the demand of the prospective employers (Lazányi, 2013). Another probable justification might lie in the ever decreasing level of knowledge of those with tertiary education. On the basis of the Hungarian Statistical Office’s data the number of those completing their tertiary education on schedule decreases year by year, even though, as presented above, the number of new students enrolled is still increasing (KSH, 2014). Accordingly, the increase in quantity is accompanied by a decrease in quality of students in higher education. The number of students enrolled in some kind of higher educational institution between 1990 and 2010 has been around 915 thousand, but only 65% of them (approximately 595 thousand) managed to graduate between 1993 and 2013. The main question is, are the students in higher education lacking such competencies that those enrolled had in tertiary education in the previous decades. Previous research showed (Szikora, 2011a) that in tertiary education only a small percentage of students really sees the point of studying. Around 60% of them only knows that they want to be in a higher educational institution, but when asked about what the reason behind their decision is, they do not know the answer. Another 20% enrolled, because some kind of external force, such as their parents or employers, forced them to enroll. A few students, only 5% of all of them wish to build and utilise social connections and networks, and only 15% of them is really willing to study and develop their skills. Another research (Szikora, 2011b) showed that only 30% of female and 34% of male students are dedicated, or eager to be involved in something other than studying, within the bounds of their HEI. Therefore, the majority of the students in higher education in is not motivated enough to gather new skills and competencies, but they wish to prolong their carefree life style, like before. According to this, higher educational institutions should reconsider their approach on education and performance measurement and create a system that matches the characteristics of the new generation of students (Szikora 2015).

Management, Enterprise and Benchmarking in the 21st Century Budapest, 2017
463
2 Theoretical background To understand the students’ behavior, we have to carefully look into what motivates them every day to attend their courses, and whether they are motivated at all? Students’ motivation is especially important during the university years because this phase also represents the last formal education many students receive before competing for work. During these years spent in higher education their sole purpose could be to develop their abilities and match them with specific needs of the labour market. For this reason, education and along these lines motivation of students during these years is of particular importance (Brewer, 2005). A lot of people get enough satisfaction from their work and take great pride in it. However, it seems students in higher education just do not seem to be motivated at school. Most of them simply see it as a nuisance and only study to survive and not to drop out of university. The reason behind such behaviour is motivation, or in this case the lack of it (Afzal et al, 2010). It is a well-known fact that almost nothing can be learned unless students are motivated on a consistent basis (Williams – Williams, 2010). In order for teachers to be able to create a drive for learning they must be well trained, to be capable of monitoring the whole educational process and dedicated enough to be responsive to their students (Palmer, 2007).
Graph 1. The ratio of those with higher than secondary education within various age groups
Source: KSH, 2016 The notion of motivation has been studied by management theorists and social psychologists for ages, in an attempt to identify successful approaches to management. Motivation is a theoretical construction representing the reason for individual needs, desires and actions. In line with this, a motive is what makes an
0%
5%
10%
15%
20%
25%
30%
35%
2003 2004 2005 2006 2007 2008 2009 2010 2011 2012 2013 2014 2015
25–34 25–34 25–34 25–34
Management, Enterprise and Benchmarking in the 21st Century Budapest, 2017
464
individual to act in a certain way, or at least develop an inclination for that specific behaviour (Pardee, 1990). Motivation theories can be classified in a number of ways, like Natural vs. Rational; Content based vs. Process based; or Intrinsic vs. Extrinsic. Douglas McGregor’s (1960) theory of X and Y type employees is a content based approach that incorporates both natural and rational, intrinsic and extrinsic motives. This theory introduces two different way of workforce motivation used in an organizational setting. According to McGregor, when employees like their work and job, and are willing to take responsibility their leaders do not necessarily supervise their subordinates for effective performance. Therefore, such (Y type) employees’ leaders should grant them independence, higher responsibility for work and opportunities for self-actualisation. In this kind of system, created for Y type subordinates, when provided with enough resources, trust and the right organizational circumstances employees will strive to work well, and their interests will be the same as the organization’s. This kind of approach is what most higher educational institutions are using currently (Borzán, 2005). Typical university teaching structure incorporates lectures and seminars, where students are introduced to both theoretical and practical knowledge. In order to support students’ work (in this case their study), universities should provide optimal conditions, such as classrooms, beamers and computers, libraries, labs, study halls. In return, students are responsible for their performance and knowledge acquisition. Although this would be expected, as it seems, this system does not function properly. This might be because of the false assumptions about the students’ behaviour and motivation. To keep on using the introduced terminology of McGregor, there is a high possibility that students in higher education are not type Y. Those who dislike or are not satisfied with their work and hence are inherently lazy, are different from those Y type people. McGregor labelled them as X types, thus to be productive, they require objectives, they have to rely on the threat of punishment to increase their inclination towards collaboration. In line with this, the Hungarian students should be regarded as X type people, when they are at a higher educational institution officially to increase their knowledge and develop their skills. They perceive their student status as a necessity, something they have to bear with, in order to receive some extrinsic motivation, like pocket-money from parents, or an appointment to a higher position in case of employees. “In this case there should be something (or someone) in the organization, for example in a HEI, that makes them to do their job, study and prepare for the lectures. However, this external motivation that is necessary for X type people are not prevalent in most HEI.” (Szikora, 2015a) The management style, likewise the teaching style of university teachers, are heavily influenced by the beliefs and assumptions about what motivates those they have to lead or teach: teachers think that if students detest studying, they will tend toward an authoritarian style of teaching with normal lectures and tight control. On the other hand, if they assume their students like to study for their own sake and

Management, Enterprise and Benchmarking in the 21st Century Budapest, 2017
465
take pride in it, then they will tend to adopt a more participative approach with conversations and joint projects (Jordan, 2008). All in all, a major change is needed in the organization’s processes if they want to increase the niveau and effectiveness of their study programs when the number of X type students enrolled is increasing. Therefore, the aim of this treatise is to identify the group of students who attend higher educational institutions at Óbuda University, and appear to be X types, and provide a solution for their lack of motivation for studying.
3 The first round of the research “Different aspects have to be taken into consideration while creating different analysis, which can be described by grouping of different data and information received from the connection to them.” (Pató, 2014) In order to be able to determine, whether the majority of the students really belongs to the X type of people, a 7 years long experiment has been introduced to test the reaction of participating students on continuous assessment. A subject, called “Vállalatgazdaságtan” (Business Economics) has been involved in this test, where usually more than 50% of the students failed to get a grade at the end of the semester. This subject was assessed in two rounds. First, students could be rewarded with a signature, based on their performance during the semester. Then those with a signature might sign up for and take the final exam (or retake it not more than twice in a given semester). In the first two years of the test period, students have been assessed only twice during the semester, which is 14 weeks long. Firstly at midterm and a second test at the end of the term. These assessments were the basis of acquirable signature. Students had to reach more than 60% in the combined score of the two tests, if that was achieved they could get the signature. Under such circumstances only 34% of the students could pass the subject with at least a pass in 2009 and 2010. Out of 207 students, only 97 managed to get the signature, but even from them 28 failed to graduate from the course. (For further details see Table. 1.) In the third year, in order to decrease the number of those failing the subject, weakly written test have been introduced as the first step of continuous assessment. Students had to reach 60% on average (not on each of the tests) to deserve the signature. With this change, the ratio of those who did not manage to get a signature dropped by 5%, and in the following year with another 17%. In addition to this the number of those who did not manage to get a grade, despite (on the basis of the 14 weekly and 2 larger tests) deserving a signature fell to 1 in each year (third to fifth year). At this point, a conscious decision has been made to keep on with the weekly assessment of the students from this subject. However, after the fourth year, in order to reduce the burden of the continuous assessment has put on the teachers the written test have been substituted with online tests (Szikora, 2015b), where students immediately after their test could get a feed-back on their current level of knowledge. The main
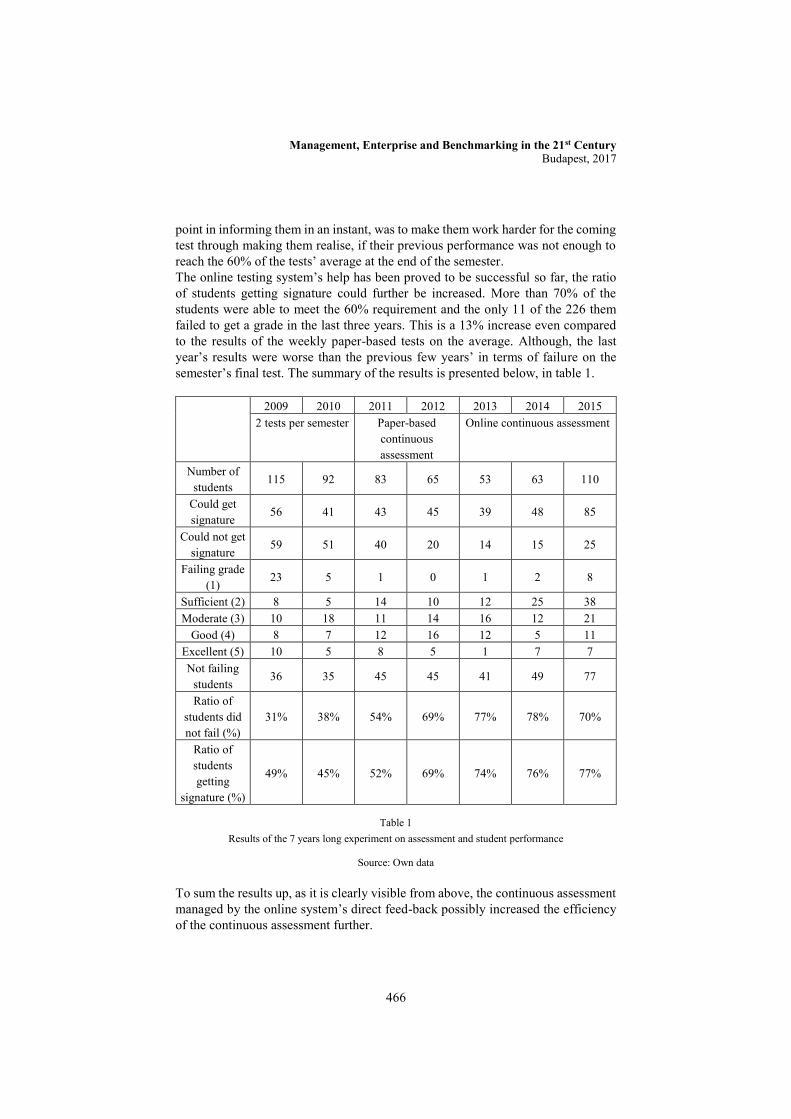
Management, Enterprise and Benchmarking in the 21st Century Budapest, 2017
466
point in informing them in an instant, was to make them work harder for the coming test through making them realise, if their previous performance was not enough to reach the 60% of the tests’ average at the end of the semester. The online testing system’s help has been proved to be successful so far, the ratio of students getting signature could further be increased. More than 70% of the students were able to meet the 60% requirement and the only 11 of the 226 them failed to get a grade in the last three years. This is a 13% increase even compared to the results of the weekly paper-based tests on the average. Although, the last year’s results were worse than the previous few years’ in terms of failure on the semester’s final test. The summary of the results is presented below, in table 1.
2009 2010 2011 2012 2013 2014 2015 2 tests per semester Paper-based
continuous assessment
Online continuous assessment
Number of students
115 92 83 65 53 63 110
Could get signature
56 41 43 45 39 48 85
Could not get signature
59 51 40 20 14 15 25
Failing grade (1)
23 5 1 0 1 2 8
Sufficient (2) 8 5 14 10 12 25 38 Moderate (3) 10 18 11 14 16 12 21
Good (4) 8 7 12 16 12 5 11 Excellent (5) 10 5 8 5 1 7 7 Not failing
students 36 35 45 45 41 49 77
Ratio of students did not fail (%)
31% 38% 54% 69% 77% 78% 70%
Ratio of students getting
signature (%)
49% 45% 52% 69% 74% 76% 77%
Table 1 Results of the 7 years long experiment on assessment and student performance
Source: Own data To sum the results up, as it is clearly visible from above, the continuous assessment managed by the online system’s direct feed-back possibly increased the efficiency of the continuous assessment further.

Management, Enterprise and Benchmarking in the 21st Century Budapest, 2017
467
The meaning of this is, when students facing a system operating on McGregor’s X type’s assumptions, their performance is far better than in a system, where evaluation of performance is not continuous and they should study regularly and develop their skills for their own sake. It is an important question, whether this data collected from only one subject is enough to measure the students’ real performance, and is it a solid proof that students are being X type of people rather than Y types. Whether they are aware of the fact of their X type behaviour or not, it is up to further investigation, as well as with this mentality they provoke corresponding behaviour from their teachers. This paper also describes this matter from another perspective, which might be the possible reason behind this passive attitude of the students’.
4 The second round of the research The previous research showed an interesting result. Between 2013 and 2014 the number of students passing the subject did not increase significantly and was stagnant. In the last year, as it was stated above, the ration even decreased. Therefore, it was time for a different type of investigation that inspected the students’ motives in studying. This research has been initiated in February 2015 among students of Business Economics, and continued in March 2016 including students from a subject called Organisational Behaviour in Practice. The research is not accurate regarding the ratio of students which subject they were attending, because it has not been asked in the questionnaire. The response rate was high due to the questionnaire has been filled during the seminars, it was over 90% (N=256). 34% of students were male (N=87) and 66% were female (N=169). Their age distribution of participants of the research is displayed on Graph 2.

Management, Enterprise and Benchmarking in the 21st Century Budapest, 2017
468
Graph 2 Age distribution of respondents
Source: Own data
According to their motivation it was surprising to see that the first reason for them for being at the university – from rating family, workplace expectation; wanting to know more; networking purpose; and still not know what to do – was networking as the most important. Unfortunately, more than 30% (N=83) of the students answered that it is true or partly true that they do not know what they wanted from life and they were attending university without any goal. (For further details see Graph 3.)
18-19
20-21
22-23
23+
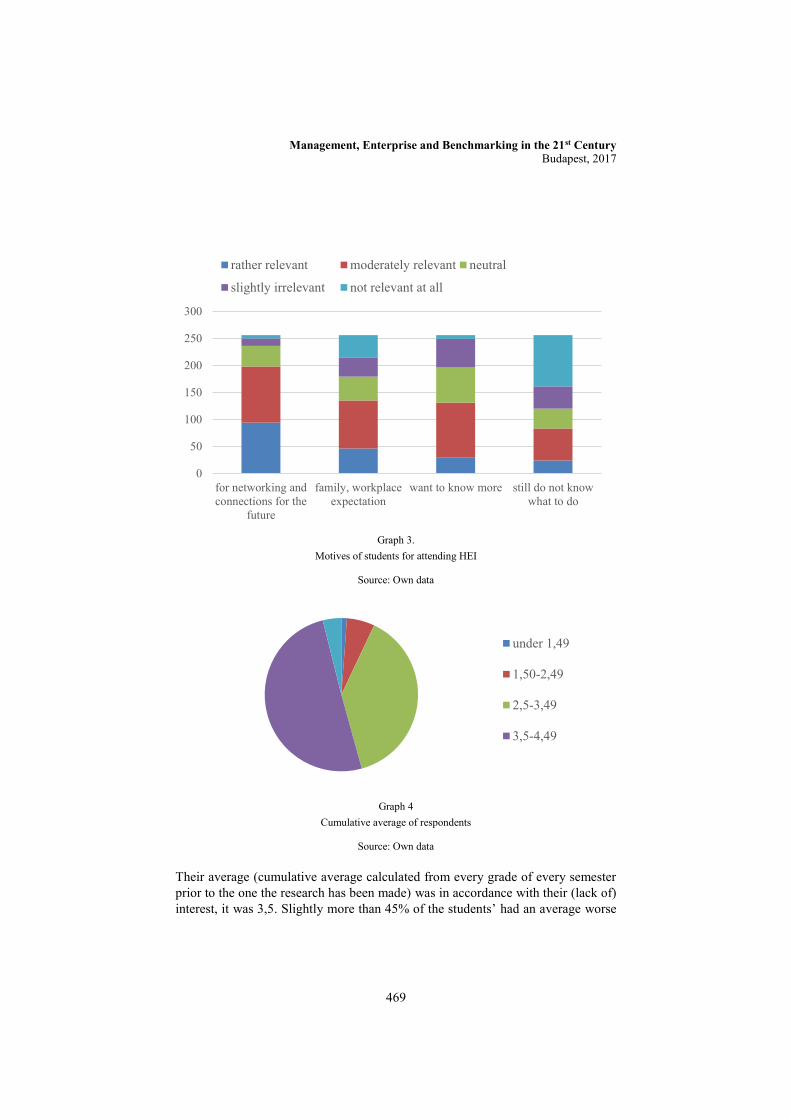
Management, Enterprise and Benchmarking in the 21st Century Budapest, 2017
469
Graph 3. Motives of students for attending HEI
Source: Own data
Graph 4 Cumulative average of respondents
Source: Own data
Their average (cumulative average calculated from every grade of every semester prior to the one the research has been made) was in accordance with their (lack of) interest, it was 3,5. Slightly more than 45% of the students’ had an average worse
under 1,49
1,50-2,49
2,5-3,49
3,5-4,49
0
50
100
150
200
250
300
for networking andconnections for the
future
family, workplaceexpectation
want to know more still do not knowwhat to do
rather relevant moderately relevant neutral
slightly irrelevant not relevant at all

Management, Enterprise and Benchmarking in the 21st Century Budapest, 2017
470
than 3,5. Fortunately, there were around 4% (N=10) who were above 4,5, meaning that they took their studies seriously. For additional details, see Graph 4. Unfortunately, if we look at their scientific and social activities, the picture is more disappointing. Only 8 of them has been involved in one or more scientific research in the university, and 20 of them in any kind of social task, such as advocacy or representation. However, in line with their motivation displayed on Graph 3, a relative big portion (42%) of them planned to be in a research, and a smaller one (9%) in student advocacy or representation in the future.
Graph 5. The respondents’ performance on the first 4 tests
Source: Own data
The students were also very diverse when it came to their performance on the weekly tests based on the first 4 weeks’ data in both semester (Graph 5). More than half of them could not perform above 50%, which is the minimum level for the signature on the first 4 tests. What is more, a significant number of students in the research (17,5%) did not manage to perform on their test above 29%, to be precise it was 45 students. The reason for this unfortunate fact might be found in the confession of the students attending these subjects, on whether they were continuously studying for the weekly tests. 41% (N=106) of them did answer honestly – owing to the anonym nature of the research – that he/she did not prepare for the tests on a weekly basis. In order to test, whether the students are able and willing to reflect on their studying habits, there was a question that asked, what would be their performance without the weekly assessment. Interestingly, 40% of the students realised that the continuous assessment helped them in improving their level of knowledge and their
0-29%
30-49%
50-79%
80-100%

Management, Enterprise and Benchmarking in the 21st Century Budapest, 2017
471
performance (Graph 6). In addition to this, if only the first years is taken into consideration, this ratio was at 50%.
Graph 6. Respondents’ opinion of their potential performance without continuous assessment
Source: Own data
The same conclusion can be drawn, if we regard their opinion on how many tests and assessments there should be in a semester in the two subjects for the best result. The majority of them preferred the weekly tests (47%), and surprisingly the second most favoured answer, which was that they should write 4 tests in a semester, was also picked by quite many people.
5 Conclusions As it is well illustrated by the previous two researches introduced shortly in this article, students are rather X type people. Most of them do not possess intrinsic motivation for studying, and requires the external motivation. The majority does not even know why they attend higher education, or they only do it because of some kind of expectation of their family or employer. Their performance is better, when assessed continuously. Interestingly, they are able to view themselves as students without interests and motivations, moreover, they are aware of the fact that without continuous assessment they would perform more poorly, or even fail, because of failed preparation for classes. This means, even those who possess characteristics of the Y type are happy, when being forced to study more frequently and do not ask for more responsibility in relation to their studies. Naturally, there are exceptions.
worse
the same asnow
better

Management, Enterprise and Benchmarking in the 21st Century Budapest, 2017
472
Present paper highlights the fact that although higher education is aimed at self-motivated, young adults and not underage youngsters, the prevalence of an outer force is unfortunately necessary at Óbuda University and probably other higher educational institutions. That is why, the system and the methodology of teaching and appraisal has to be modified, in order to meet the demands of the new generation of students.
References
[1] CEDEFOP, Skills Needs in Europe – Focus in 2020. Office for Official Publications of the European Communities, Luxemburg (2008)
[2] Csiszárik-Kocsir, Á., Medve, A., Beszédes számok – avagy a hazai középoktatás finanszírozási és hatékonysági jellemzői a nemzetközi eredmények tükrében. Humánpolitikai Szemle, 5, 2009., p. 45-58.
[3] Csiszrik-Kocsir, Á., Fodor, M., Szira, Z., Varga, E., A kompetenciák mérése az emberi erőforrás-menedzsmentben és az oktatásban., Humánpolitikai Szemle, 2009., 7-8, p. 132-140.
[4] Borzán, A., A pénzügyi főiskolai, valamint a pénzügyi és számviteli alapszakos képzés megítélése a hallgatói vélemények tükrében., Körös tanulmányok, Szent István Egyetem Gazdasági Kar, Békéscsaba, 2010., p. 6-13.
[5] Lazányi, K., What is the role of higher educational institutions in managing their students’ competencies?, Science Journal of Business and Management, 2014., 3(1-1) p. 46-52.
[6] KSH, A társadalmi Haladás Mutatószámrendszere. Központi Statisztikai Hivatal, http://www.ksh.hu/thm/tablak.html, 2013.
[7] Lazányi, K. Mi áll a munkaerő-piaci kereslet és kínálat kegyensúlyozatlanságának hátterében?: A közgazdászok helyzetének bemutatása, Munkaügyi Szemle, 57(3), 2013. p. 50-62.
[8] KSH: Oktatási adatok 2013/2014., Statisztikai Tükör, 2014. 39.
[9] Szikora, P., Tanítás, mint egy kooperatív dinamikus játék. In: Cser L., Herdon, M., (Eds.) Symposium of Informatika a felsőoktatsban, Debrecen: Debreceni Egyetem Informatikai Kar 2011. p. 947-954.
[10] Szikora, P., Tanítás értelmezhető-e, mint egy kooperatív dinamikus játék? In: Kadocsa, Gy., Rudas, J. I., (Eds.), 9th International Conference on
Management, Enterprise and Benchmarking in the 21st Century Budapest, 2017
473
Management, Enterprise and Benchmarking, Óbudai Egyetem, 2011. p. 379-386.
[11] Szikora, P. The Role of Ineluctability of continuous Assessment in Higher Education, 2015.
[12] Brewer, E. W., Professor’s Role in Motivating Students to Attend Class., Journal of Industrial Teacher Education, 2005. 42(3), p. 23-47.
[13] Afzal, H., Ali, I., Khan, M. A., Hamid, K., A Study of University Students’ Motivation and Its Relationship with Their Academic Performance, 2010. 5(4), p. 80-89.
[14] Williams, K. C., Williams, C. C., Five key ingredients for improving student motivation, Research in Higher Educational Journal. 2010. Vol 9. p. 1-23.
[15] Palmer, D., What is the Best Way to Motivate Students in Science? Teaching Science – The Journal of the Australian Science Teacher Association, 2007. 53(1), p. 38-42.
[16] Pardee, R. L., Motivation Theories of Maslow, Herzberg, McGregor & McClelland, A Literature Review of Selected Theories Dealing with Job Satisfaction and Motivation. 1990. ERIC, ED 316767
[17] Borzán, A., Az élethosszig tartó tanulás sajátosságai a Tessedik Sámuel Főiskola Gazdasági Főiskolai Karán., In Szigeti: A felnőttképzés jövője és módszertani kérdései. Az együttműködés fejlesztése a képzés, a szakképzés és kutatás területén: Phare CBC Magyarország-Ausztria 2002. Győr, 2005. p. 1-8.
[18] Jordan, A., Charlie, O., Stack, A., Approaches to Learning: A guide for Teachers: A Guide for Educators. Open University Press, Berkshire, 2008.
[19] Pató, B. Sz. G., A model consisted of 5 tetrahedral network, as a scientific research appliance. Social Educational Project of Improving Knowledge in Economics, Journal L’Association 1901 “SEPIKE”, 2014, 4, p. 63-68.
[20] Szikora, P., Alternative Computer Based Testing System, Practice and Theory in System Education, in Press, 2015.
Management, Enterprise and Benchmarking in the 21st Century Budapest, 2017
474
Stakeholder Approach in Business Education and Management Practice – The case of Hungary
Agnes Wimmer [email protected]
Reka Matolay [email protected]
The aim of the paper is to explore stakeholder orientations of companies operating in the Hungarian context. By doing so we are looking at the interrelationship of attention paid to stakeholders and the business performance of surveyed companies. Findings of the empirical study are then discussed in an educational context: based on the current management practices what business educators may learn in order to contribute to stakeholder orientations of the next generations of business decision makers.
Keywords: stakeholder approach, business performance, value creation, business education, Hungary
1 Introduction Teaching and research stakeholder relations have been playing a huge part of the academic life of the authors of this paper. Stakeholder approach was an early inspiration and guiding principle for both of us from the beginning: teaching Business Economics [4] as young academics from the early 1990-ies we had the opportunity to dive into this area. While both having business and management backgrounds we are coming from different fields. Corporate Finance, Value Creation and Business Performance on the one hand, Business Ethics, CSR and Sustainability on the other. Stakeholder approach was one of those areas always being at our crossroads.
By approaching stakeholders from these different angles we find interesting how our fields fertilize the topic in various ways. Building on the intersection of our interest, in this paper we are presenting the findings of a major competitiveness survey in Hungary with regard to stakeholder relations. We were interested in

Management, Enterprise and Benchmarking in the 21st Century Budapest, 2017
475
whether acting top managers in Hungary had the same interest in and commitment to stakeholders as us, academic professionals have. Beyond our research we were also interested in how we could connect our findings to our other academic mission, teaching. Thus, in this paper we are framing our research findings from an educational point of view too.
2 Research Background Our paper feeds in the long and contentful theoretical and managerial discussions of stakeholders [8], [11] and value creation. The interrelations of stakeholder value and shareholder value are discussed in a vast theoretical and empirical literature, in our paper we now focus on the reconcialiation of the two values. We aim to move toward the understanding of how stakeholder value and shareholder value can go hand in hand. We are building on the seminal works of Rappaport [17] and Jensen [12] in value creation, and we are utilizing the Performance Prism by Neely and his co-authors [15], [16] as a starting point of our empirical research.
First, let us quote Rappaport who „recognizes that the company’s long-term destiny depends on a financial relationship with each stakeholder that that has an interest in the company. (…) a value-creating company benefits not only its shareholders but the value of all other stakeholder claims, while all stakeholders are vulnerable when management fails to create shareholder value. Enlightened self-interest dictates shareholders and other stakeholders actively engage in a partnership of value creation.” [17]
Similarly, Jensen walks down the „enlightened” lane proposing the term enlightened value maximization. According to Jensen it is identical to enlightened stakeholder theory. In his exlanation he uses „much of the structure of stakeholder theory but accepts maximization of the longrun value of the firm as the criterion for making the requisite tradeoffs among its stakeholders.” [12] As a result of this „enlightened stakeholder theory, while focusing attention on meeting the demands of all important corporate constituencies, specifies long-term value maximization as the firm’s objective.” [12]
After highlighting some of the key notions of key authors in value creation let us turn our attention to the other side: how the fundamental theorist of stakeholders, Edward Freeman understands the above relationship. Agle et al describe this in the following way. Edward Freeman argues that „Milton Friedman, Oliver Williamson, and Michael Jensen are stakeholder-theorists. By saying that, I mean that if one understands the spiris of their work, some of the actual words they have recently said, and if we have a slightly more expressive idea of business than have most economists, then the tensions between economists and stakeholder theorists simply dissolve.”[1]
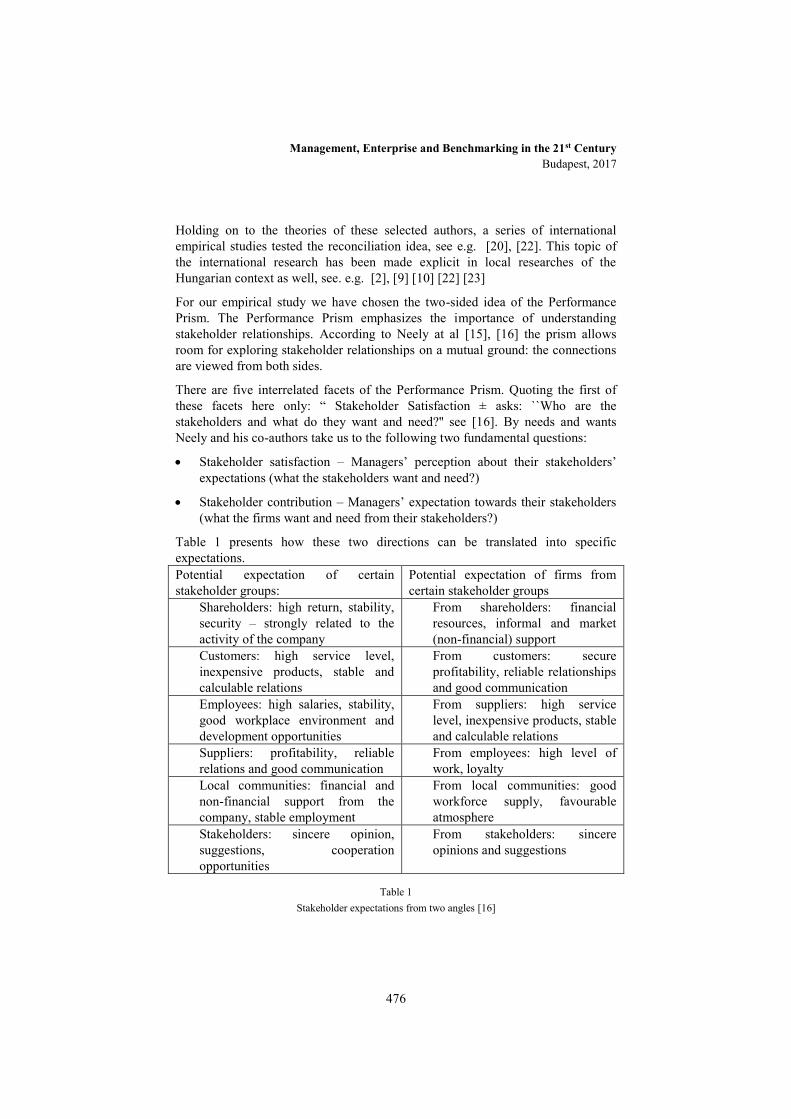
Management, Enterprise and Benchmarking in the 21st Century Budapest, 2017
476
Holding on to the theories of these selected authors, a series of international empirical studies tested the reconciliation idea, see e.g. [20], [22]. This topic of the international research has been made explicit in local researches of the Hungarian context as well, see. e.g. [2], [9] [10] [22] [23]
For our empirical study we have chosen the two-sided idea of the Performance Prism. The Performance Prism emphasizes the importance of understanding stakeholder relationships. According to Neely at al [15], [16] the prism allows room for exploring stakeholder relationships on a mutual ground: the connections are viewed from both sides.
There are five interrelated facets of the Performance Prism. Quoting the first of these facets here only: “ Stakeholder Satisfaction ± asks: ``Who are the stakeholders and what do they want and need?'' see [16]. By needs and wants Neely and his co-authors take us to the following two fundamental questions:
Stakeholder satisfaction – Managers’ perception about their stakeholders’ expectations (what the stakeholders want and need?)
Stakeholder contribution – Managers’ expectation towards their stakeholders (what the firms want and need from their stakeholders?)
Table 1 presents how these two directions can be translated into specific expectations. Potential expectation of certain stakeholder groups:
Potential expectation of firms from certain stakeholder groups
Shareholders: high return, stability, security – strongly related to the activity of the company
From shareholders: financial resources, informal and market (non-financial) support
Customers: high service level, inexpensive products, stable and calculable relations
From customers: secure profitability, reliable relationships and good communication
Employees: high salaries, stability, good workplace environment and development opportunities
From suppliers: high service level, inexpensive products, stable and calculable relations
Suppliers: profitability, reliable relations and good communication
From employees: high level of work, loyalty
Local communities: financial and non-financial support from the company, stable employment
From local communities: good workforce supply, favourable atmosphere
Stakeholders: sincere opinion, suggestions, cooperation opportunities
From stakeholders: sincere opinions and suggestions
Table 1 Stakeholder expectations from two angles [16]

Management, Enterprise and Benchmarking in the 21st Century Budapest, 2017
477
This two-sided approach of the Performance Prism led us to our research questions for the Hungarian context. We are enumerationg the research questions here, introducing our research methodology in chapter 3 and our findings in chapter 4:
Who counts? What are the stakeholder groups understood to be important in the Hungarian context?
What are the perceptions of managers regarding their stakeholders’ contribution and expectations towards the firm?
What is the relationship between stakeholder orientation and firm performance?
3 Methodology The empirical research is based on the data of ”In Global Competition” – micro-economic factors of the international competitiveness of the Hungarian economy” research program series organised by the Competitiveness Research Centre of Corvinus University of Budapest. During the past 20 years, a similarly structured survey was undertaken five times (in 1996, 1999, 2004, 2009 and 2013). Consequently wehad the opportunity to evaluate the path leading to the current situation and the changes of the competitiveness of Hungarian companies based on these similarly structured and sized database. The results of the previous surveys justify the validity of the research methodology. However, we would like to emphasize that the survey and its results reflect the opinion of the executives, not some objective truth [5].
In the course of the surveys executives in four managerial fields (chief executives, financial, manufacturing and commercial/marketing managers) from 300 companird responded to a comprehensive questionnaire. The survey included corporate data (facts provided by the companies) and managers’ self-evaluations and opinions, mainly by evaluation of different statements in a 5-point Likert-scale.
In this paper we present the findings of the competetiveness survey regarding stakeholder approaches of corporate respondents based on the last survey, elaborated in 2013, putting it into perspective by also relying on the survey data from 2004.
The sample of 300 companies (of the survey in 2013) consists of primarily medium sized manufacturing companies with mostly domestic ownership. 83% of the sample are small and medium sized companies, 17% of the companies are large firms. Almost 77% of the companies in the sample have dominantly Hungarian ownership (71% are in Hungarian private ownership, while the ratio of

Management, Enterprise and Benchmarking in the 21st Century Budapest, 2017
478
the state-owned companies in the sample is relatively low, it is around 6%), and the rest of the firms (23%) have dominant foreign ownership. Proportion of firms in processing industries is fairly high (approximately 45%), and commercial companies and firms operating in other service sectors are also have a great share in our sample (20% and 15% respectively). For a more detailed characteristics of the sample and relations between these characteristics see [7]
In the questionnaire we asked executives to evaluate various statements concerning their stakeholders’ importance in decision making and perceived needs and wants their different stakeholder groups (e.g. their perception about stakeholders’ opinion) as well as the needs and wants of their firm toward their stakeholder (i.e. expected stakeholder contribution). Responses were given on a 5-point Likert-scale (5 – totally agree and 1– totally disagree). Results of earlier surveys are presented in the following papers [9], [10], [22], [23]
4 Empirical findings In this chapter we are introducing the research findings regarding stakeholder approaches of business respondents as well as the implications of our findings to business education.
4.1 Stakeholder orientation In 4.1.1. we introduce the outcomes of our research based on the Likert-scale statements of coporate executives regarding the importance of various stakeholder groups. Our second set of findings – 4.1.2. – introduces how the expectations towards stakeholder groups match or dismatch the perceived expectations of the stakeholders toward the companies. Finally, we look at the interrelationships of stakeholder approach and corporate performance (see 4.1.3).
4.1.1 Importance of stakeholders
In our study, first we looked at the importance of stakeholders. Our aim was to explore who counts for the business decision makers in the Hungarian context. The importance of the following stakeholder groups have been detected: owners/shareholders, managers, non-managerial employees, consumers/buyers, suppliers, local communities, and the natural environment. Executives in the competiveness survey were responding to questions regarding the importance of the interests and opinions of these various stakeholder groups.
Figure 1 shows the rankings of the stakeholders based on the results in 2004 [9], [10], [22] and 2013.
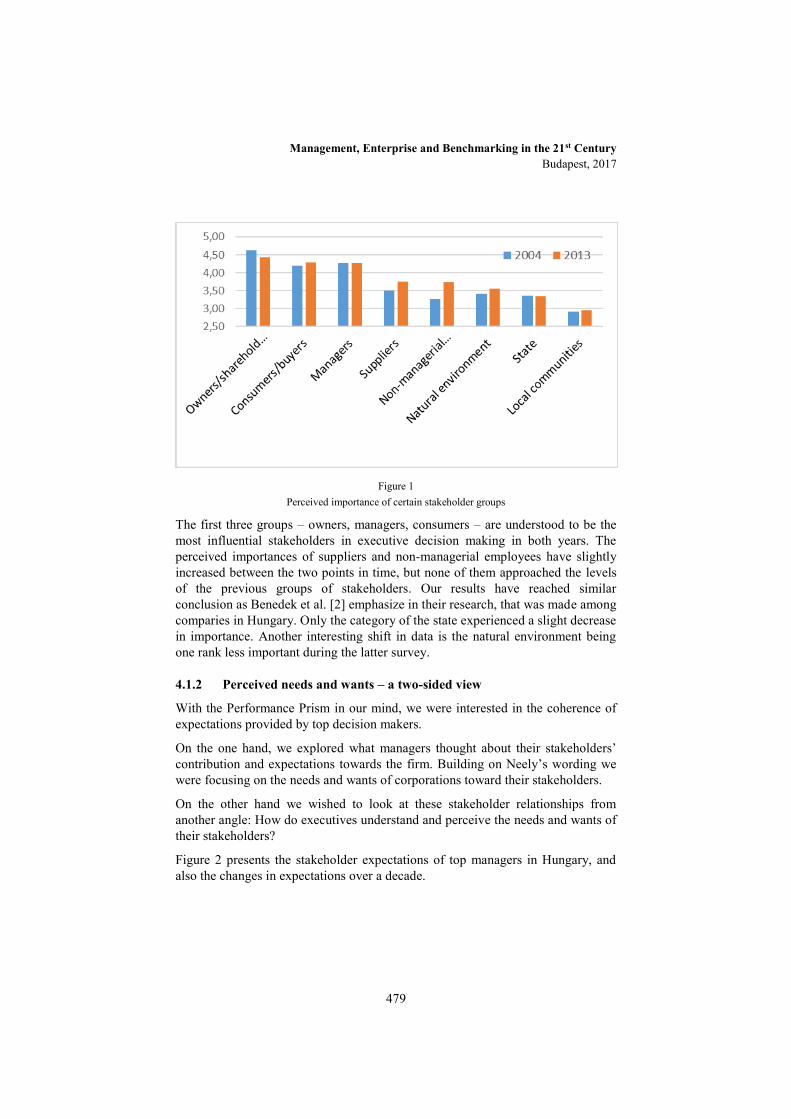
Management, Enterprise and Benchmarking in the 21st Century Budapest, 2017
479
Figure 1
Perceived importance of certain stakeholder groups
The first three groups – owners, managers, consumers – are understood to be the most influential stakeholders in executive decision making in both years. The perceived importances of suppliers and non-managerial employees have slightly increased between the two points in time, but none of them approached the levels of the previous groups of stakeholders. Our results have reached similar conclusion as Benedek et al. [2] emphasize in their research, that was made among comparies in Hungary. Only the category of the state experienced a slight decrease in importance. Another interesting shift in data is the natural environment being one rank less important during the latter survey.
4.1.2 Perceived needs and wants – a two-sided view
With the Performance Prism in our mind, we were interested in the coherence of expectations provided by top decision makers.
On the one hand, we explored what managers thought about their stakeholders’ contribution and expectations towards the firm. Building on Neely’s wording we were focusing on the needs and wants of corporations toward their stakeholders.
On the other hand we wished to look at these stakeholder relationships from another angle: How do executives understand and perceive the needs and wants of their stakeholders?
Figure 2 presents the stakeholder expectations of top managers in Hungary, and also the changes in expectations over a decade.

Management, Enterprise and Benchmarking in the 21st Century Budapest, 2017
480
Figure 2 Company’s needs and wants toward their stakeholder – The opinion of executives in Humgary
The highest expectation of top managers was directed to employees. Checking out the final bars of Figure 2 reveals that both in 2004 and 2013 high level work provided by employees is the number one expectation of executives. Loyalty of the same stakeholder group was perceived as far less important, especially in 2004. Over time this aspect showed a slight increase though.
Behind the employes we find the suppliers. Executive wants include high service level from them, and more and more stable relationships. Expectations toward the customers are ranked the lowest from among these three stakeholder groups. Securing profitability as well as maintaining reliable relationships and good communication became more important by the time of the 2013 survey, and in this growth the financial crisis might have played an important role. (Results from 2004 are based on [9], [10], [22].)
Figure 3 presents the supposed expectations of various stakeholders according to the opinion of executives.
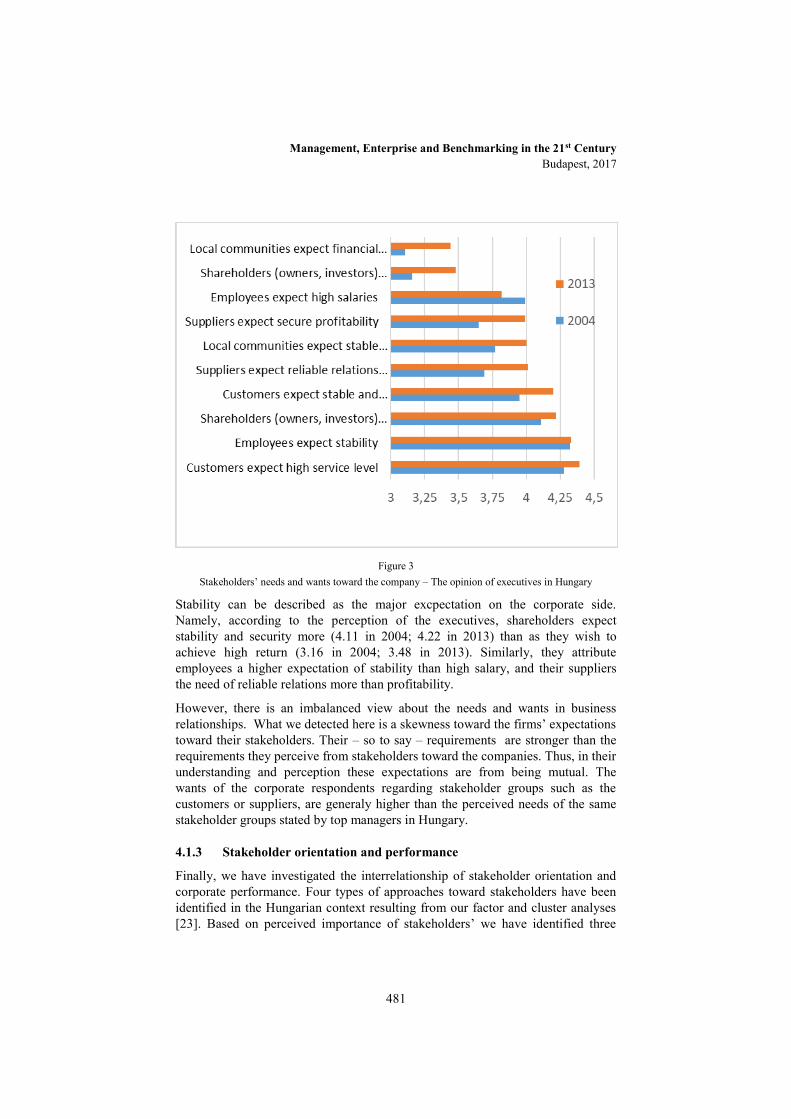
Management, Enterprise and Benchmarking in the 21st Century Budapest, 2017
481
Figure 3
Stakeholders’ needs and wants toward the company – The opinion of executives in Hungary
Stability can be described as the major excpectation on the corporate side. Namely, according to the perception of the executives, shareholders expect stability and security more (4.11 in 2004; 4.22 in 2013) than as they wish to achieve high return (3.16 in 2004; 3.48 in 2013). Similarly, they attribute employees a higher expectation of stability than high salary, and their suppliers the need of reliable relations more than profitability.
However, there is an imbalanced view about the needs and wants in business relationships. What we detected here is a skewness toward the firms’ expectations toward their stakeholders. Their – so to say – requirements are stronger than the requirements they perceive from stakeholders toward the companies. Thus, in their understanding and perception these expectations are from being mutual. The wants of the corporate respondents regarding stakeholder groups such as the customers or suppliers, are generaly higher than the perceived needs of the same stakeholder groups stated by top managers in Hungary.
4.1.3 Stakeholder orientation and performance
Finally, we have investigated the interrelationship of stakeholder orientation and corporate performance. Four types of approaches toward stakeholders have been identified in the Hungarian context resulting from our factor and cluster analyses [23]. Based on perceived importance of stakeholders’ we have identified three
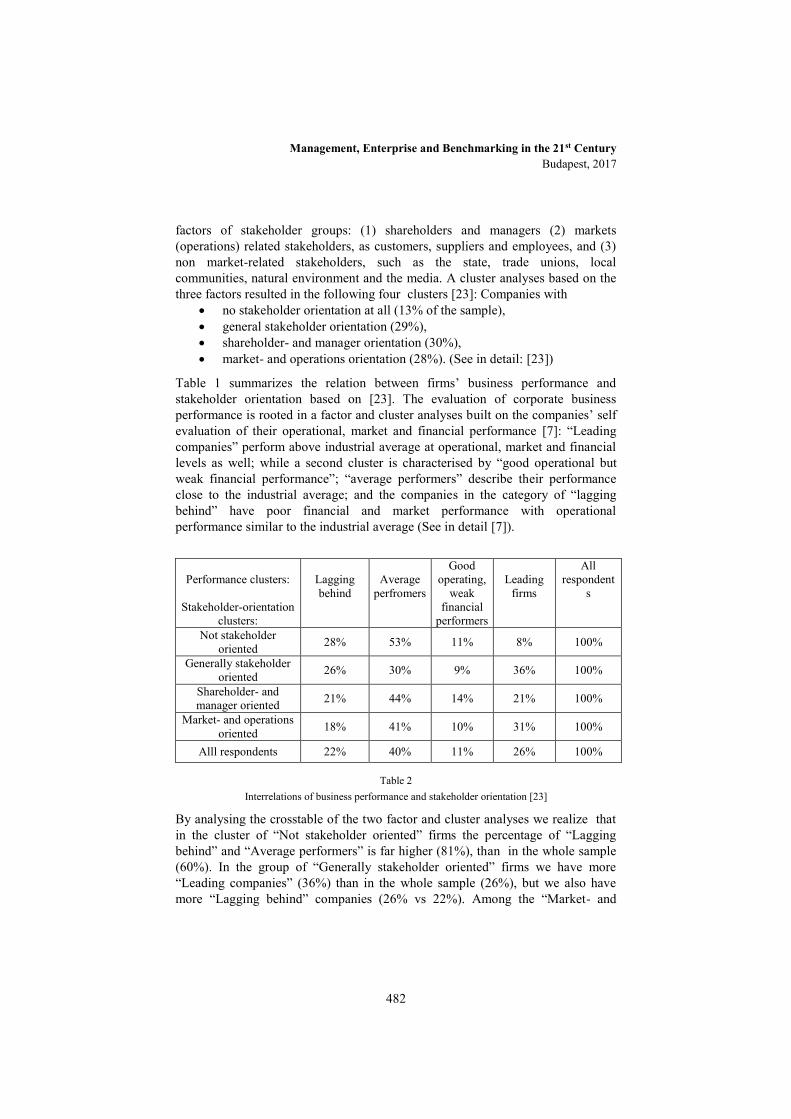
Management, Enterprise and Benchmarking in the 21st Century Budapest, 2017
482
factors of stakeholder groups: (1) shareholders and managers (2) markets (operations) related stakeholders, as customers, suppliers and employees, and (3) non market-related stakeholders, such as the state, trade unions, local communities, natural environment and the media. A cluster analyses based on the three factors resulted in the following four clusters [23]: Companies with
no stakeholder orientation at all (13% of the sample), general stakeholder orientation (29%), shareholder- and manager orientation (30%), market- and operations orientation (28%). (See in detail: [23])
Table 1 summarizes the relation between firms’ business performance and stakeholder orientation based on [23]. The evaluation of corporate business performance is rooted in a factor and cluster analyses built on the companies’ self evaluation of their operational, market and financial performance [7]: “Leading companies” perform above industrial average at operational, market and financial levels as well; while a second cluster is characterised by “good operational but weak financial performance”; “average performers” describe their performance close to the industrial average; and the companies in the category of “lagging behind” have poor financial and market performance with operational performance similar to the industrial average (See in detail [7]).
Performance clusters:
Stakeholder-orientation clusters:
Lagging behind
Average perfromers
Good operating,
weak financial
performers
Leading firms
All respondent
s
Not stakeholder oriented 28% 53% 11% 8% 100%
Generally stakeholder oriented 26% 30% 9% 36% 100%
Shareholder- and manager oriented 21% 44% 14% 21% 100%
Market- and operations oriented 18% 41% 10% 31% 100%
Alll respondents 22% 40% 11% 26% 100%
Table 2 Interrelations of business performance and stakeholder orientation [23]
By analysing the crosstable of the two factor and cluster analyses we realize that in the cluster of “Not stakeholder oriented” firms the percentage of “Lagging behind” and “Average performers” is far higher (81%), than in the whole sample (60%). In the group of “Generally stakeholder oriented” firms we have more “Leading companies” (36%) than in the whole sample (26%), but we also have more “Lagging behind” companies (26% vs 22%). Among the “Market- and
Management, Enterprise and Benchmarking in the 21st Century Budapest, 2017
483
operations oriented” firms we had found less “Lagging behind” (18% vs 22%), and more “Leading performers” (31% vs 26%) than in the overall sample. [23].
Orientation toward shareholders and managers brings about an average performance in all aspects of business performance or connected to a good market and operations performance while lagging behind in financial performance. The ratio of these groups in the latter cluster are higher than in the general sample. This refers to shareholder orientation being less fruitful without a market orientation.
We conclude that the lack of stakeholder orientation is related to weak or average perceived business performance on a higher scale than the average result. On the other hand, general stakeholder orientation without a focus is not necessarily enough to achieve good business performance. [23].
4.2 Business education connotations After describing the various perceptions and approaches of stakeholders let us turn our attention to management education. The mission of the businesss school the authors do teaching and research at focuses on the education of responsible leaders. Thus, understanding stakeholder theory and developing skills and competences of engaging stakeholders must be an integral part of our teaching and learning. Both CBS reports [3], [6] and research [13] have intended to explore activities, processes, outcomes and impacts of management education in this regard. Stakeholder approach has become a mainstream topic that cannot be missing from the curriculum of any business school today. It is embedded in various courses both explicitly an implicitly. We have even witnessed the positive change of moving away from stakeholder amangement toward stakeholder engagement.
(i) One of the major questions is whether the notion of stakeholder approach is also translated into the teaching of actual management tools of stakeholder orientation and engagement or this topic is left on the theoretical level. (ii) And if this knowledge regarding tools is transferred to students are we as educators also engage ourselves in developing the skills and competences for that in order to let student meaningfully practice these tools in their professional lives? (iii) Let us mention a final layer of questions here, which, actually can be connected to the 3rd element of intended learning outcomes: besides knowlegde and competences there are the attitudes. The question we are raising finally here is one of the major challenges even for the flagship schools in responsible management education. How well is stakeholder approach embedded in the curriculum? Namely, how mixed those messages regarding stakeholders are for the students?

Management, Enterprise and Benchmarking in the 21st Century Budapest, 2017
484
Conclusions Our major conclusion about business decision making regarding stakeholders in Hungary is the highly instrumental nature of it. This actually goes in line with the enlighted value creation approach: the relations with stakeholders need to serve the value creation on the coporate as well on the stakeholder levels. Companies in our sample, however, have a constrained view on stakeholders. Eventhough the focused and relatively strong interest in the opinion and expectations of stakeholder pays of – the positive relationship of buisness performance and stakeholder orientation exists to a certain extent –. not many companies are engaging in an open stakeholder orientation.
Our survey – due to its questionnaire based methodology – is limited in exploring the content and nature of stakeholder relationship in an in-depth way. However, what is a strikingly unequivocal research finding here:the imbalanced corporate view on expectations toward and from stakeholders.
When taking research findings into educational considerations, our main conclusion is teaching stakeholder orientation has been mainstreamed by now. Introducing the theories and management tools of stakeholder orientation and engagement in management education shall be more paralleled with developing relevant skills, competences and attitudes of future business decision makers.
References
[1] Agle, B. R., Donaldson, T., Freeman, R. E., Jensen, M. C., Mitchell, R. K., & Wood, D. J. (2008). Dialogue: Toward superior stakeholder theory. Business Ethics Quarterly, 18(02), 153-190.
[2] Benedek A, Takács I. & Takács-György K. (2013): Examining corporate social responsibility from a stakeholder viewpoint based on an empirical research, Zarzadzanie Publiczne: Uniwersytet Ekonomiczny W Krakowie, 3(23) pp. 309-319.
[3] BSIS (2013): The Responsibility of the National Champion, Business School Impact Surves Report for the EFMD.
[4] Chikán, A. (2017): Vállalatgazdaságtan (Business Economics), 5th ed.. Budapest: VTOA.
[5] Chikán, A., Czakó, E., & Zoltay-Paprika, Z. (Eds.). (2002). National competitiveness in global economy: the case of Hungary. Budapest: Akadémiai Kiadó.
[6] Corvinus Business School (2017): Responsible Management Education, PRME Sharing Information on Progress Report. Available at: http://www.unprme.org/reports/PRMECorvinus2017.pdf

Management, Enterprise and Benchmarking in the 21st Century Budapest, 2017
485
[7] Csesznák A. & Wimmer Á. (2014): Vállalati jellemzők és összefüggéseik: A „Versenyben a világgal” kutatási program 2013. évi felmérésében résztvevő vállalatok jellemzése, Budapest: BCE Vállalatgazdaságtan Intézet, Versenyképesség Kutató Központ.
[8] Donaldson, T., & Preston, L. E. (1995). The stakeholder theory of the corporation: Concepts, evidence, and implications. Academy of management Review, 20(1), 65-91.
[9] Esse, B., Szántó, R. & Wimmer, Á. (2011). Value Creation in the Light of the Stakeholder Approach – The Case of Hungary. 1st Interdisciplinary Conference on Stakeholders, Resources and Value creation. IESE Business School, 2011. június 7-8. Barcelona, Spain. 1-10.
[10] Esse, B., Szántó, R., & Wimmer, Á. (2012): Business relationships and relationships with stakeholders – Perception of Hungarian executives. THE IMP JOURNAL 6:(2) 98-108.
[11] Freeman, E. R. (1984): Stakeholder Management: Framework and Philosophy, in: Freeman, E. R. (1984): Strategic Management: A Stakeholder Approach, Boston: Pitman, pp. 52-82.
[12] Jensen, M. C. (2001). Value maximization, stakeholder theory, and the corporate objective function. Journal of applied corporate finance, 14(3), 8-21.
[13] Kazainé Ónodi, A (2012): The Future is in Our Hands: How does Business Schoolss’ Education affect Future Managers’s Value, In: Amann, K.. Makai, F. & Zackariasson, T. (ed.): New Perspectives on Management Education. Excel Books, New Delhi, 17-40.
[14] Matolay, R., & Wimmer, Á. (2008). Corporate Social and Business Performance. In: Csutora M. & Marjainé Szerényi Zs. (eds.): EMAN-EU 2008 Conference, 6-7 October: Sustainability and Corporate Responsibility Accounting – Measuring and Managing Business Benefits, Proceedings, Budapest, 39-42.
[15] Neely, A., Adams, C., & Crowe, P. (2001). The performance prism in practice. Measuring business excellence, 5(2), 6-13.
[16] Neely, A. D., Adams, C., & Kennerley, M. (2002). The performance prism: The scorecard for measuring and managing business success. London: Prentice Hall Financial Times.
[17] Rappaport, A. (1998). Creating shareholder value: a guide for managers and investors. 2nd ed. Simon and Schuster.
[18] Saáry S. (2016). A stakeholder kapcsolatok jellemzőinek vizsgálata kis-és középvállalati környezetben. Tanulmánykötet-Vállalkozásfejlesztés a XXI. században VI., 283-296.
Management, Enterprise and Benchmarking in the 21st Century Budapest, 2017
486
[19] Taghian, M., D’Souza, C., & Polonsky, M. (2015). A stakeholder approach to corporate social responsibility, reputation and business performance. Social Responsibility Journal, 11(2), 340-363.
[20] Tantalo, C., & Priem, R. L. (2014). Value creation through stakeholder synergy. Strategic Management Journal. 37: 314–329. doi:10.1002/smj.2337
[21] Tassone, V. & Eppink, H. (2016): The EnRRICH tool for educators: (Re-) Designing curricula in higher education from a “Responsible Research and Innovation” perspective. Deliverable of the ENRRICH project. Available at: http://www.livingknowledge.org/fileadmin/Dateien-Living-Knowledge/Dokumente_Dateien/EnRRICH/D2.3_The_EnRRICH_Tool_for_Educators.pdf
[22] Wimmer, Á. & Szántó, R. (2007). Performance Management and Value Creation – A Stakeholder approach. 4th Conference on Performance Management Control, CD-ROM, September 26-28., Nice.
[23] Wimmer, Á., Juhász P. & Matolay R. (2016): Érintett-szemlélet és üzleti teljesítmény (Stakeholder approach and business performance), In: Böcskei Elvira (ed.): Etikus közgazdasági gondolkodás és versenyképesség. Károli Gáspár Református Egyetem, 260-269.
Management, Enterprise and Benchmarking in the 21st Century Budapest, 2017
487
Globalization and India – CEN’s Trade with special reference to Men's Shirts
Toni Sharma, Nalin Bharti IIT Patna
Abstract: Post globalisation, India's trade to the majority of the developed countries in the world has increased significantly, out of which a significant part of the trade happens with Central European Nations (Austria, Czech Republic, Germany, Hungary, Poland, Slovak Republic, Slovenia and Switzerland). Trade between these two entities is highly complementary. There is scarce commonality between what India exports to Central European Nations (CEN) and vice versa. India is one of the biggest exporter of textiles and apparel in the world of which one fourth of India's exports happens with European Union. Post MFA, India's exports to CEN has been increasing gradually, notwithstanding the fact that India is not one of the 'preferred' nations for EU. It's interesting to note that India shares a more than cordial relation with most of the Central European Nations which implies a possibility of increased trade. Another fact is that India's apparel exports to the CEN forms a very small percentage of the total apparel imports of CEN. This percentage share can be increased with the help of better understanding and collaboration between India and CEN, both at the macro as well as the micro level. Keeping in line with this, the research paper focuses on India's apparel exports in general and men's shirts in particular. Men’s Shirts forms a significant part of total apparel exports of India but this product occupies the lowest rung in India's apparel export to CEN despite the fact that CEN imports men’s shirts in huge volumes. Men's Shirts hold a peculiar position in that there is a lower level of variation in terms of textiles used, the value additions, etc. as compared to other apparel categories. This simplicity is helpful when initiating a research in a particular area which can then be extended to more complex products. This research paper involves analysis of the trade between India and CEN for the ten year period (2006-07 to 2015-16) from which the effects of globalisation processes can be seen from close quarters. The data reveals that the export of men’s shirt from India to CEN is fairly correlated with the overall exports of India to CEN. The research reveals that India, being one of the favourite destination for global apparel sourcing for the entire world, can be used as a solution to the local problems of a few nations belonging to CEN which will act as a support amidst the turmoil facing Europe in the recent times.
Keywords: India, Central European Nations, textile and apparel trade, exports, globalisation, Men's shirts.
Management, Enterprise and Benchmarking in the 21st Century Budapest, 2017
488
1 Introduction
There have been major changes in the way individuals and nations have been trading with each other. Post World War II there have been a number of changes in the global trade and today with the advent of technology and free flow of information, the international trade has grown multiple times. The globe also saw the formation of international organisations like World Trade Organisation, IMF and others through efforts of the pioneering nations to bring the world together on a single platform in order to increase and improve trade by way of discussions and building consensus around the basic as well as critical issues.
Textiles and apparel happens to be the saviour for most of the developed and developing nations post-World War II. While the developed nations went on to build heavy industries accompanied with cutting edge technology, the labour intensive textile and apparel industry gradually shifted from the developed nations to the underdeveloped nations.
Central Europe and India are currently attracting significant attention because of the technological advantages, cost effectiveness, market demand and availability of resources. Both India and the CEN have tided through rough waters and maintained comparatively steady growth rates in bygone decade. Their strategy of concentrating on trade diversification in terms of commodities as well as partners, has paid off well. The trade data reveals that currently India and CEN are not prominent trade partners with each other despite the fact that India exports to CEN chiefly comprises of primary goods (garments and textiles, fabrics, yarns and footwear, etc.) while CEN supply to India is predominantly machinery and equipment, iron and steel, auto-components equipment for energy sector, pharmaceutical products and gold. It is clearly evident that trade between India and CEN are highly complementary and research suggests that even more opportunities can be taken in the future to promote greater amounts of exports from India to CEN. A closer look at the structure of the respective economies, the policy framework of the governments and their plan for the future shows that both India and CEN can capitalise on the immense possibilities to augment the mutual trade and investment for the benefit of both the regions. CEN can focus on India's stronghold in the fields of textiles and apparel, which, if explored further, can boost India's exports to Central Europe (Deloitte, 2014).
2 Literature Review
Globalization is reflected in the interconnectedness of the people and nations of the world, its emergence largely due attributed to the huge reduction in the transportation and communication costs, and the thawing away of the sovereign barriers to the movement of goods, services, people, knowledge and capital across the national limits (Stiglitz, 2003). Globalisation is commonly referred to the
Management, Enterprise and Benchmarking in the 21st Century Budapest, 2017
489
process by which national and regional economies, societies, and cultures have become integrated through the global network of trade, communication, immigration and transportation.
Globalization is the panacea, the potent force that brings with it the most desired social good for all parts of the globe, bringing down the anti-globalization movement. The developing and least developed nations may experience better levels of prosperity in terms of improved literacy rates, reduced child labor, and enrichment of women`s lives (Bhagwati, 2004). Globalisation today includes the integration of economies, industries, markets, cultures and policy-making around the world. Related to globalization are innumerous theories, ideas and concepts and till date there has been no consensus on a singular meaning of globalization.
Rarely used till few decades ago, globalization has today become an often used term. Globalization is the phenomenon, the single most potent reason why we continue to increasingly live in one world while we become more and more interdependent (Giddens, 2009). Globalisation today not only includes trade, foreign direct investment, international capital flows but also culture, media, technology, socio-cultural, political, and even biological factors, e.g. climate change. Roland Robertson (1997) through his work on glocalisation emphasised on the cultural globalisation. He stated, "Globalisation is the compression of the world and the intensification of consciousness of the world as a whole. Glocalisation is the means through which a global product is transformed into another shape in order to meet the needs of local consumers".
Globalisation is reflected in rapid pace with which the global economy has been aggregating in the recent times, the amalgamation which has essentially led to the rise of liberal global financial markets and multinational corporations. (Barnett and Cavanagh, 1994). One of the most potent and also the most important factor is the drastic decrease in the communications costs which has led to the emergence of IT and other services outsourced to low cost countries and thereby bringing to life global work teams in the true sense. Castells (1996) averred that globalisation finds its essence in the shift of emphasis from post-industrialism to informationalism, the technological basis of economic activity and social organisation.
The globe has witnessed unprecedented levels of immigration around the world, the movement primarily characterised by flow from the developing nations to the developed ones, especially to USA and Europe. Giddens (1990, 1999, 2009) defined globalisation as the intensification of worldwide social relations which link distant localities in such a way that local happenings are shaped by events occurring many miles away and vice versa. Giddens too primarily focused on the political, social and economic globalisation.
The world today is moving towards the free movement of factors of production in such a way so as to give rise to free markets which are characterised by its hyper competitiveness - for buying inputs from one big supplying market as well as for selling output to one big consuming market, both markets a part of one big free

Management, Enterprise and Benchmarking in the 21st Century Budapest, 2017
490
market. One of the proponents of globalisation, Friedman (1999) opined that globalization is fuelled by the principle of free-market capitalism. The underlying implication was laissez faire — if you let the market forces rule and if you open your economy and embrace free trade and competition, your economy shall become more capable and thereby thrive in the highly competitive environment.
It may be noted that globalizing processes affect and are affected by business and work organization, economics, socio-cultural resources, and the natural environment. Dalby (2007) said, "If you want humongous changes in economic, political and social sphere of a nation, globalization is the means to that end. It represents a gamut of changes that the various aspects of the society undergo". Interestingly, it has been seen that the academic and research community are divided on the premise that globalisation is good for the economy of a nation and the global markets as a whole. Not everyone is pro-globalisation and pro-free markets. Wallerstein (1989) showed through his analysis of the history of the capitalist world system that globalisation has brought about a skewed development in which economic and social disparities between sections of the world economy have increased rather than provided prosperity for all. Bhagwati (2008), although in favour of free trade went on to elaborate upon the adverse effects of preferential trade agreements being used by developed nations to thwart the opportunities which the developing nations had due to natural competencies. Being an avid proponent of free trade, Bhagwati (2002) cautioned the ill effects of providing unbridled free markets that had caused havoc in the developing nations by the entry of MNCs and financial conglomerates from the developed nations. Stiglitz (2003), in the same lines does not believe that globalization and technological changes are at the heart of differences in wealth in the U.S. While he promotes the idea that globalization and free markets are good for society if it is competitive, he states that the government needs to regulate it to be beneficial. Most of the researches related to Europe have focused on EU 28 which comprises of nations at various development stages. Keeping in view a more focused approach, the countries lying in the middle of Europe have been considered. Central European Nations, also referred to as Mittel Europa, Middle Europe or Median Europe is a group of nations that lie in the middle of Europe. The term Central European Nations (CEN) is not a formal entity and it is more so based on the history and socio-cultural and economic factors. Out of the various predominant definitions of CEN, the countries which are included in most of the definitions are Germany, Poland, the Czech Republic, Austria, Slovakia, Slovenia, and Hungary. Some definitions include Switzerland and Croatia and then there are other definitions which include many more countries which are more of an outlier to middle Europe. For simplicity sake, the countries that have been included are Austria, Czech Republic, Germany, Hungary, Poland, Slovak Republic, Slovenia and Switzerland.
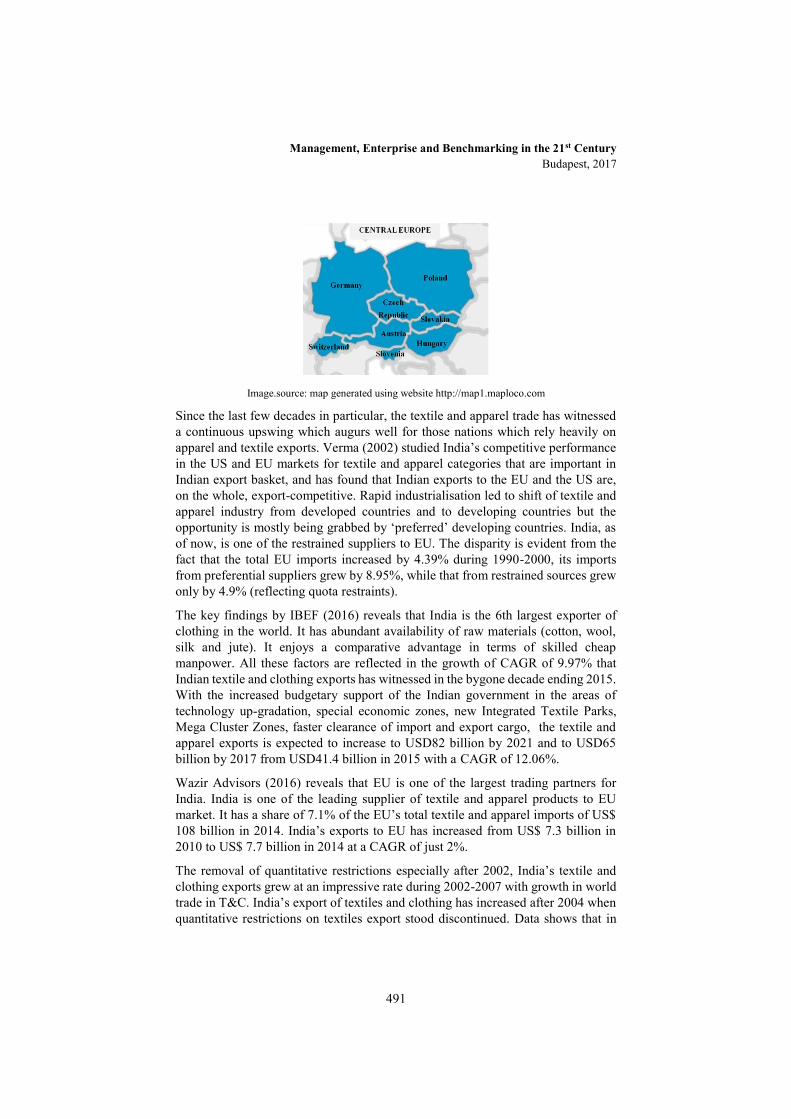
Management, Enterprise and Benchmarking in the 21st Century Budapest, 2017
491
Image.source: map generated using website http://map1.maploco.com
Since the last few decades in particular, the textile and apparel trade has witnessed a continuous upswing which augurs well for those nations which rely heavily on apparel and textile exports. Verma (2002) studied India’s competitive performance in the US and EU markets for textile and apparel categories that are important in Indian export basket, and has found that Indian exports to the EU and the US are, on the whole, export-competitive. Rapid industrialisation led to shift of textile and apparel industry from developed countries and to developing countries but the opportunity is mostly being grabbed by ‘preferred’ developing countries. India, as of now, is one of the restrained suppliers to EU. The disparity is evident from the fact that the total EU imports increased by 4.39% during 1990-2000, its imports from preferential suppliers grew by 8.95%, while that from restrained sources grew only by 4.9% (reflecting quota restraints). The key findings by IBEF (2016) reveals that India is the 6th largest exporter of clothing in the world. It has abundant availability of raw materials (cotton, wool, silk and jute). It enjoys a comparative advantage in terms of skilled cheap manpower. All these factors are reflected in the growth of CAGR of 9.97% that Indian textile and clothing exports has witnessed in the bygone decade ending 2015. With the increased budgetary support of the Indian government in the areas of technology up-gradation, special economic zones, new Integrated Textile Parks, Mega Cluster Zones, faster clearance of import and export cargo, the textile and apparel exports is expected to increase to USD82 billion by 2021 and to USD65 billion by 2017 from USD41.4 billion in 2015 with a CAGR of 12.06%.
Wazir Advisors (2016) reveals that EU is one of the largest trading partners for India. India is one of the leading supplier of textile and apparel products to EU market. It has a share of 7.1% of the EU’s total textile and apparel imports of US$ 108 billion in 2014. India’s exports to EU has increased from US$ 7.3 billion in 2010 to US$ 7.7 billion in 2014 at a CAGR of just 2%.
The removal of quantitative restrictions especially after 2002, India’s textile and clothing exports grew at an impressive rate during 2002-2007 with growth in world trade in T&C. India’s export of textiles and clothing has increased after 2004 when quantitative restrictions on textiles export stood discontinued. Data shows that in
Management, Enterprise and Benchmarking in the 21st Century Budapest, 2017
492
spite of the fact that all quotas have been completely removed, Indian textiles exporters are still facing trade barriers from EU (Chaudhary, 2014).
Khorana (2011) in her research reveals that other than the tariff barriers that are faced by Indian exports to CEN, non-tariff barriers (NTBs) also have been the major hurdle. NTBs are mostly related to technical regulations, compliance with higher than minimum specified chemical limits, testing and certification requirements, packing and labeling rules, framework to guarantee the health and safety of the consumer or protection of the environment. Such requirements raise prices of imports in a way that is equivalent to a tariff. These NTBs can be addressed through a collaborative review of regulatory divergence and similarities between the EU and India as partner countries in order to improve, harmonise, and make the regulatory environment more predictable.
EU has given GSP status to India. India and EU started negotiating a Broad-based Trade and Investment Agreement (BTIA) in 2007. Till date 15 rounds of negotiations have been completed. If the FTA between India and EU follows through the results shall be mutually beneficial. The study titled ‘Trade Sustainability Impact Assessment for the FTA between the EU and the Republic of India’ (by ECORYS Netherlands, CUTS and Centad) reveals that the impact of the EU-India FTA on the textiles and apparel sector in India will be significant in terms of increasing market share, investment in R&D, technology transfer, efficiency and production of economies of scale.
India's total share in EU's trade stands at a meager 1.5% that includes both imports and exports implying that freer trade with India is not going to pose as a potential threat to the EU economies. On the other hand, EU's share in India's economy stands at a robust figure of 25% imports and 21% exports. One of the facts that India has spread its attention to a larger geographical area over the decade has lead to a fall in the share of the EU since the early 1990s (Mohapatra, 2015). At this juncture, India is continuously making efforts to build its bridges with the individual nations and at the same time it is forging ties with the major trading blocs. It is the time when India and CEN can come together and build mutually beneficial agreements/arrangements to create mutual benefits that are sustainable in the long run.
3 Methodology
The primary aim of the paper is to analyse the data available from various sources pertaining to overall trade between (a) India and CEN, (b) India and World and (c) CEN and World. Data was extracted, sorted and fine tuned, the sources being primarily from Ministry of Commerce and Industry, Ministry of Textiles, Director General Foreign Trade, Government of India and global institutions viz. World

Management, Enterprise and Benchmarking in the 21st Century Budapest, 2017
493
Trade Organisation, World Bank and Europages to evaluate trends in exports of Men's or Boys' shirt (HS Code 6205) and analyse the various correlation including for example (i) growth of Men's or BOYS' shirt exports with growth of India's total exports and (ii) growth of Men's or Boys' shirt exports with growth of India's overall textile and apparel exports. The data related to overall export and import between India and CEN was also extracted for the 10 year period of 2006-07 to 2015-16 to see the correlation between the two.
Statistical correlation has been used to evaluate the various export-import data. One set of such correlations is amongst India's (a) Total Exports (b) Textile & Apparel exports and (c) Men's shirts exports. Another correlation that has been evaluated is the correlation between the trade patterns of the eight countries belonging to CEN. Further, the analysis includes the correlation between India's trade versus CEN's trade over the period 2006-07 to 2015-16. These analyses help illustrate the effects of globalisation at a product level/micro level and gauge how well globalisation upholds or does not uphold its spirit of providing local solutions to the global aspirations and challenges.
4 Findings
4.1 Global Trade (2005-15)
Globalisation despite its virtues and vices has lead to dramatic changes in the world trade, bringing increased trading activities amongst most of the enterprising nations which includes developed as well as developing nations. the proof lies in the trade figures. As per statistical data from WTO (2005), the global merchandise trade in 2005 stood at US$ 10.7 trillion which lead to a high of US$19.3 trillion in 2014 before dipping to US$16.6 trillion in 2015. The trade in commercial services followed a somewhat similar trend in the period 2005-2016 wherein the trade figure stood at US$ 2.5 trillion in 2005 reaching a high of US$ 4.9 trillion in 2014 before taking a bow to US$ 4.7 trillion in 2015. Globalisation seems to be one of the major factors which has lead to a major adjustments in the commodity prices as it declined during 2005-15. The world energy prices dropped by 45% in 2015 alone.
Contrary to the prevalent apprehensions about the vagaries of globalisation, Asia has done well along with Europe and North America and they together accounted for 88% in total merchandise trade of WTO members over the past ten years. Further, noteworthy is the fact that the share of developing economies in merchandise exports increased from 33% in 2005 to 42% in 2015. It is also peculiar to note that the exports from developing nations to developed nations has decreased from 55% to 43% during the decade whereas the exports amongst developing
Management, Enterprise and Benchmarking in the 21st Century Budapest, 2017
494
nations has increased from 41% to 52%. (One of the factors for this dramatic change is the emergence of innumerous regional trading agreements.)
4.2 India's foreign trade
India's total exports, as per Ministry of Commerce, Government of India, for the period FY2015-16 stood at approximately USD 262 billion exporting 10,378 commodities to 220 partners in the 12 month period. Region wise, the highest exports were made to North America (USD 56.7 bn) followed closely by European Union (USD 56 bn) with West Asia finishing third at USD 52.7 billion negating the belief that globalisation would lead to further inequality between the developing and developed nations and that post opening up of the economies, the developed nations will not let the goods and services of developing nations to enter their markets. The trade data clearly shows that India being a developing nation, the majority of its exports are to the developed nations. Country wise, the highest exports were made to USA (USD 50.5 bn) followed by UAE (USD 38.7 bn) and Hong Kong (USD 15.4 bn) at second and third position respectively. India being a developing nation, its overall exports has been growing at a CAGR of 10.93% from FY 2006-07 to FY 2015-16 where the export value in FY 2006-07 stood at USD 103 bn and in FY 2015-16 stood at USD 262 bn.
4.3 CEN's foreign trade
CEN, although being a part of Europe has a somewhat different composition as compared with overall Europe. Within CEN also, the countries that have been chosen are diverse in that Germany and Switzerland are very strong economies as compared with other countries including the newly formed Slovenia and Slovakia. The total exports by CEN as per Ministry of Commerce, Government of India to the world stood at US$ 3.95 trillion in 2006 and after reaching a high of US$ 5.8 trillion in 2014 it dipped to US$ 5.2 trillion. The trade data may not be very encouraging but these trade levels are despite the fact that the European Union has faced crisis after crisis in recent years. First it was the sovereign debt crisis, followed by bankruptcy and bailout measures of various sovereign states. Now the continent is reeling under an immigration and refugee crisis and Brexit has added to the list.
4.4 Global Textile Trade
The apparel industry is one of the first industries that ever came into being and it has guided all the other industries that came into existence thereafter. It's labour intensive industry which accommodates unskilled, semi-skilled and skilled labour force and requires comparatively very low levels of investments in machinery and equipments. This is one of the prime reasons why apparel manufacturing has been

Management, Enterprise and Benchmarking in the 21st Century Budapest, 2017
495
the mainstay in almost all the developing countries. India has been one of the forerunners in this industry in the latter half of the 20th century. Post formation of WTO, there have been significant changes seen in the international trade and economic policies. With the abolition of quota and removal of Multi Fiber Agreement (MFA), apparel manufacturing countries were able to provide efficient solutions to the apparel needs of the competitive textile and clothing global market, China, Bangladesh and India being the forerunners in the post MFA era.
4.5 Indian Textile and Apparel Trade
With textile industry being the largest employer in India, it is also contributes a significant portion (approx. 11%) of the total exports from India. India gained the market share in global textile trade primarily because of the fact that the textiles industry is labour intensive, requiring cheap labour with little prior experience. Due to this limited requirement of technical capabilities, textile trade currently employs about 40 million workers directly and further employs 60 million indirectly. India's overall textile exports during FY 2015-16 stood at US$ 40 billion. India's Textile & Apparel exports as pre WTO has been growing at a CAGR of 7.58% from FY 2006-07 to FY 2015-16 where the export value in FY 2005-06 reached USD 18.4 bn and in FY 2015-16 stood at USD 35.5 bn. India's Textile & Apparel exports to Central European Nations has been experiencing rough waters as the export figures as per Ministry of Commerce, Government of India stood at USD 2.37 bn in FY 2014-15 which fell to USD 2.2 bn in FY 2015-16.
4.6 Men's Shirts exports to CEN
Men's shirts is one of the major product category in the apparel exports from India to the EU. Amongst the EU-28’s Top 25 Imported T&A Commodities (ECORYS Netherlands, 2013) men's shirt occupies the fourth position. By virtue of being a men's product, the variations in this category is less than those demanded in women's wear. By focusing on men's shirts instead of any of the women's category the results of research shall be more accurate. The reason for higher accuracy has been illustrated by using the example of women's dress.
It may be noted that in case of India's exports of women's dress to the Western and Central European Nations, the growth rate of India's exports to Western European nations is more than exports to CEN. The underlying major reasons could be product related (fabric, value addition, quality, price, others) or it could be because of the trade relation that India has with the individual nations, or it could be a combination of both the factors. There could also be other factors which affect the trade between any two nations. The product related reasons could be that India can't make such women's wear (in terms of fabric, value addition, quality, price, others)
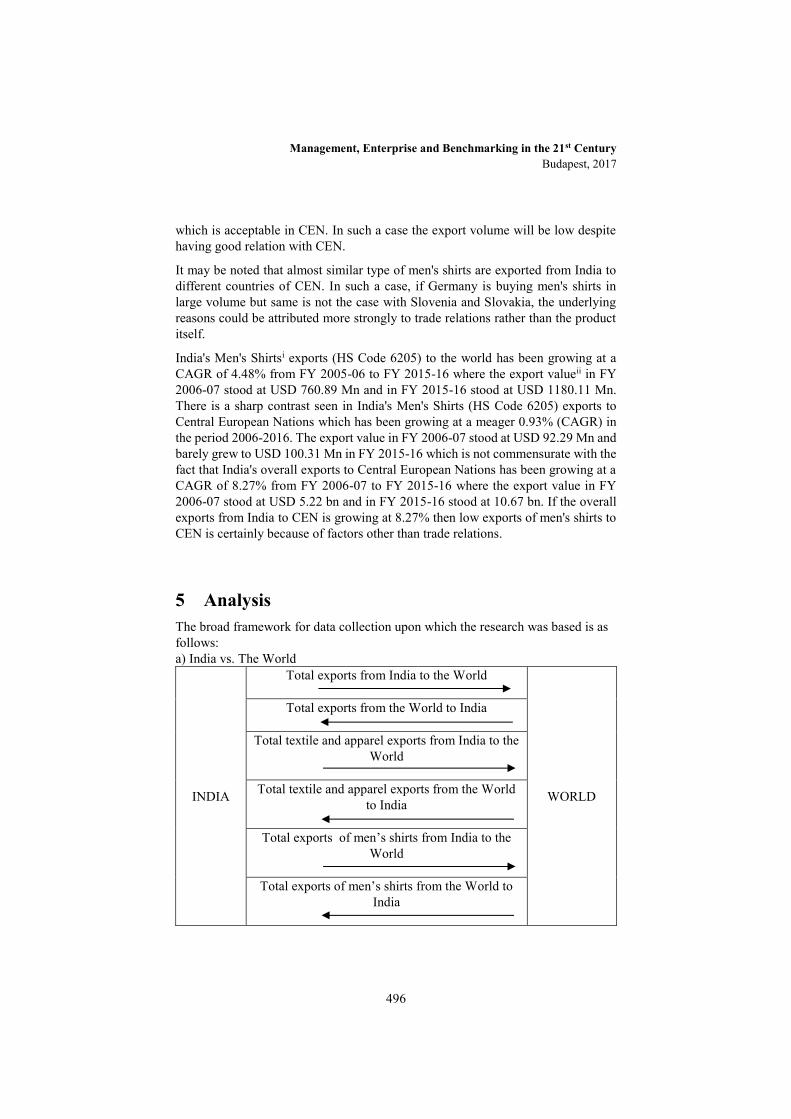
Management, Enterprise and Benchmarking in the 21st Century Budapest, 2017
496
which is acceptable in CEN. In such a case the export volume will be low despite having good relation with CEN.
It may be noted that almost similar type of men's shirts are exported from India to different countries of CEN. In such a case, if Germany is buying men's shirts in large volume but same is not the case with Slovenia and Slovakia, the underlying reasons could be attributed more strongly to trade relations rather than the product itself.
India's Men's Shirtsi exports (HS Code 6205) to the world has been growing at a CAGR of 4.48% from FY 2005-06 to FY 2015-16 where the export valueii in FY 2006-07 stood at USD 760.89 Mn and in FY 2015-16 stood at USD 1180.11 Mn. There is a sharp contrast seen in India's Men's Shirts (HS Code 6205) exports to Central European Nations which has been growing at a meager 0.93% (CAGR) in the period 2006-2016. The export value in FY 2006-07 stood at USD 92.29 Mn and barely grew to USD 100.31 Mn in FY 2015-16 which is not commensurate with the fact that India's overall exports to Central European Nations has been growing at a CAGR of 8.27% from FY 2006-07 to FY 2015-16 where the export value in FY 2006-07 stood at USD 5.22 bn and in FY 2015-16 stood at 10.67 bn. If the overall exports from India to CEN is growing at 8.27% then low exports of men's shirts to CEN is certainly because of factors other than trade relations.
5 Analysis The broad framework for data collection upon which the research was based is as follows: a) India vs. The World
INDIA
Total exports from India to the World
WORLD
Total exports from the World to India
Total textile and apparel exports from India to the World
Total textile and apparel exports from the World
to India
Total exports of men’s shirts from India to the World
Total exports of men’s shirts from the World to
India
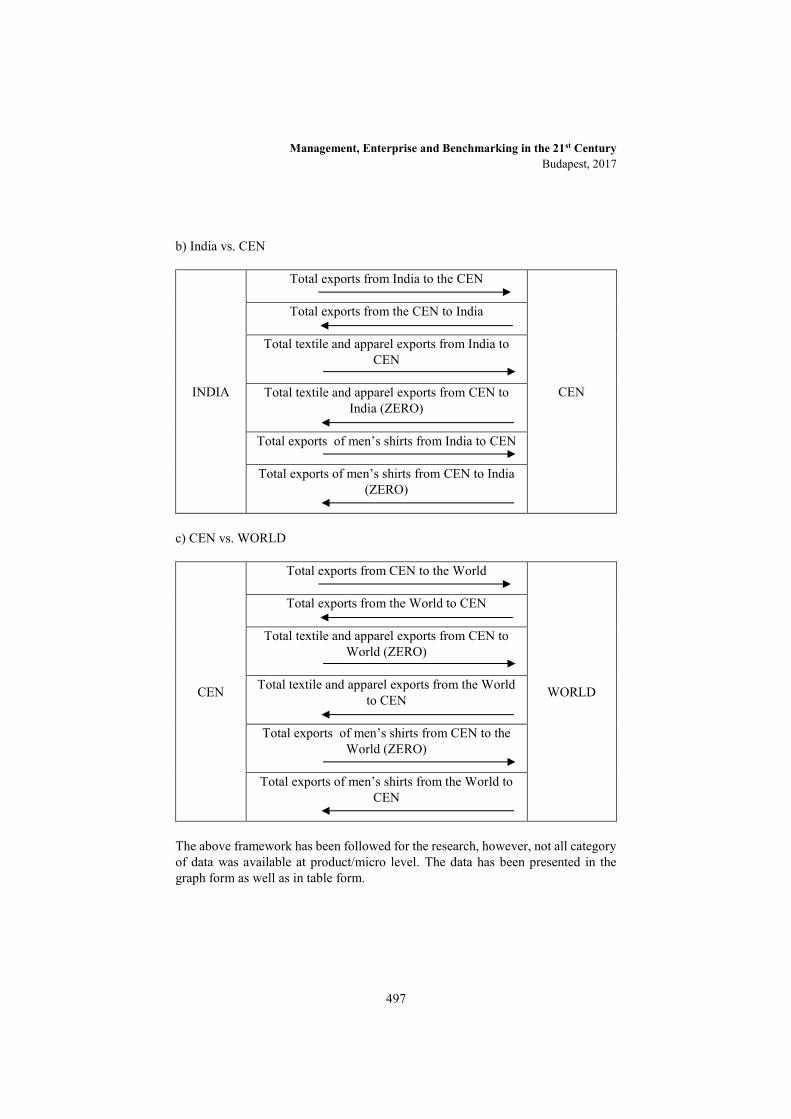
Management, Enterprise and Benchmarking in the 21st Century Budapest, 2017
497
b) India vs. CEN
INDIA
Total exports from India to the CEN
CEN
Total exports from the CEN to India
Total textile and apparel exports from India to CEN
Total textile and apparel exports from CEN to
India (ZERO)
Total exports of men’s shirts from India to CEN
Total exports of men’s shirts from CEN to India (ZERO)
c) CEN vs. WORLD
CEN
Total exports from CEN to the World
WORLD
Total exports from the World to CEN
Total textile and apparel exports from CEN to World (ZERO)
Total textile and apparel exports from the World
to CEN
Total exports of men’s shirts from CEN to the World (ZERO)
Total exports of men’s shirts from the World to
CEN
The above framework has been followed for the research, however, not all category of data was available at product/micro level. The data has been presented in the graph form as well as in table form.

Management, Enterprise and Benchmarking in the 21st Century Budapest, 2017
498
5.1 India's overall exports and imports to the world
Figure 1 India's overall merchandise trade - EXPORTS & IMPORTS
[Source: World Trade Organisation] It can be seen that India's overall exports to the world and import from the world have been steadily increasing marked by few downfalls in between. It may be noted here that the export and import figures have a very high correlation of 99%. This reflects one of the objectives of globalisation, that is, increased exports as well as imports for each country.
5.2 Overall exports of India to (a) CEN and (b) World
Figure 2a: India's total exports to CEN
[Source: Ministry of Commerce, Government of India]

Management, Enterprise and Benchmarking in the 21st Century Budapest, 2017
499
Figure 2b: India's total exports to the world
[Source: Ministry of Commerce, Government of India] It is evident that the exports from India to CEN over the 10-year period has seen an overall increase coupled with few dips in the volume. Similar trend can been seen in the figures pertaining to India's overall exports to the world. When the value of India's total exports to CEN is correlated with the value of India's overall exports to the world the value comes to a reasonably high figure of 96% correlation.
5.3 Apparel and Textiles exports of India to the world
Figure 3: India's total Textiles & Apparel exports to the world
[Source: World Trade Organisation]
It can be clearly seen the exports of Textiles & Apparel from India to the rest of the world has increased gradually and has doubled in a time span of 10 years with a CAGR of 6.78%.
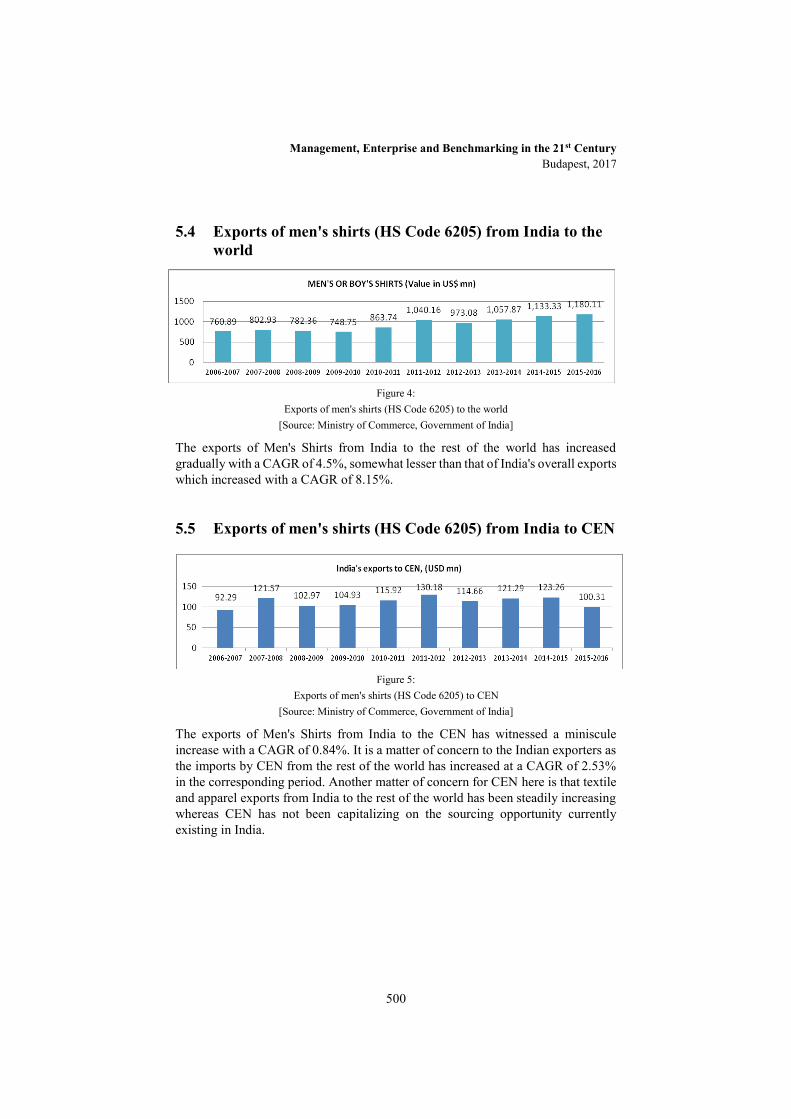
Management, Enterprise and Benchmarking in the 21st Century Budapest, 2017
500
5.4 Exports of men's shirts (HS Code 6205) from India to the world
Figure 4: Exports of men's shirts (HS Code 6205) to the world
[Source: Ministry of Commerce, Government of India]
The exports of Men's Shirts from India to the rest of the world has increased gradually with a CAGR of 4.5%, somewhat lesser than that of India's overall exports which increased with a CAGR of 8.15%.
5.5 Exports of men's shirts (HS Code 6205) from India to CEN
Figure 5: Exports of men's shirts (HS Code 6205) to CEN
[Source: Ministry of Commerce, Government of India]
The exports of Men's Shirts from India to the CEN has witnessed a miniscule increase with a CAGR of 0.84%. It is a matter of concern to the Indian exporters as the imports by CEN from the rest of the world has increased at a CAGR of 2.53% in the corresponding period. Another matter of concern for CEN here is that textile and apparel exports from India to the rest of the world has been steadily increasing whereas CEN has not been capitalizing on the sourcing opportunity currently existing in India.
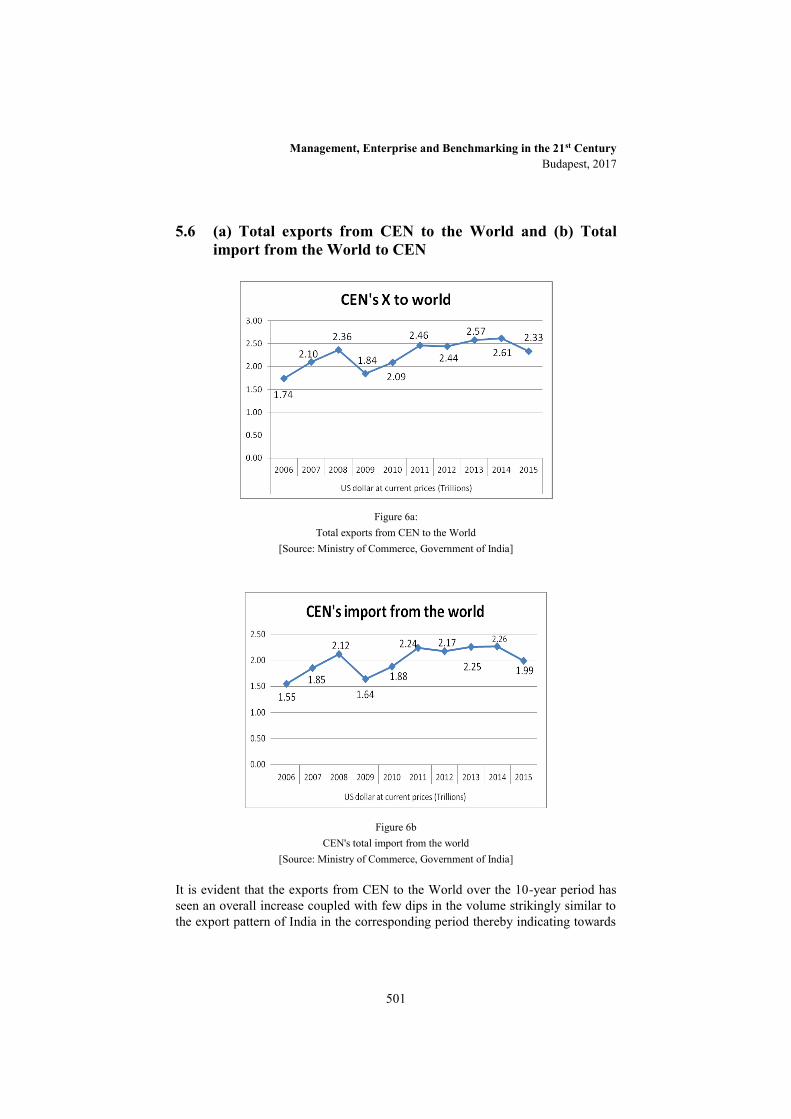
Management, Enterprise and Benchmarking in the 21st Century Budapest, 2017
501
5.6 (a) Total exports from CEN to the World and (b) Total import from the World to CEN
Figure 6a: Total exports from CEN to the World
[Source: Ministry of Commerce, Government of India]
Figure 6b CEN's total import from the world
[Source: Ministry of Commerce, Government of India]
It is evident that the exports from CEN to the World over the 10-year period has seen an overall increase coupled with few dips in the volume strikingly similar to the export pattern of India in the corresponding period thereby indicating towards
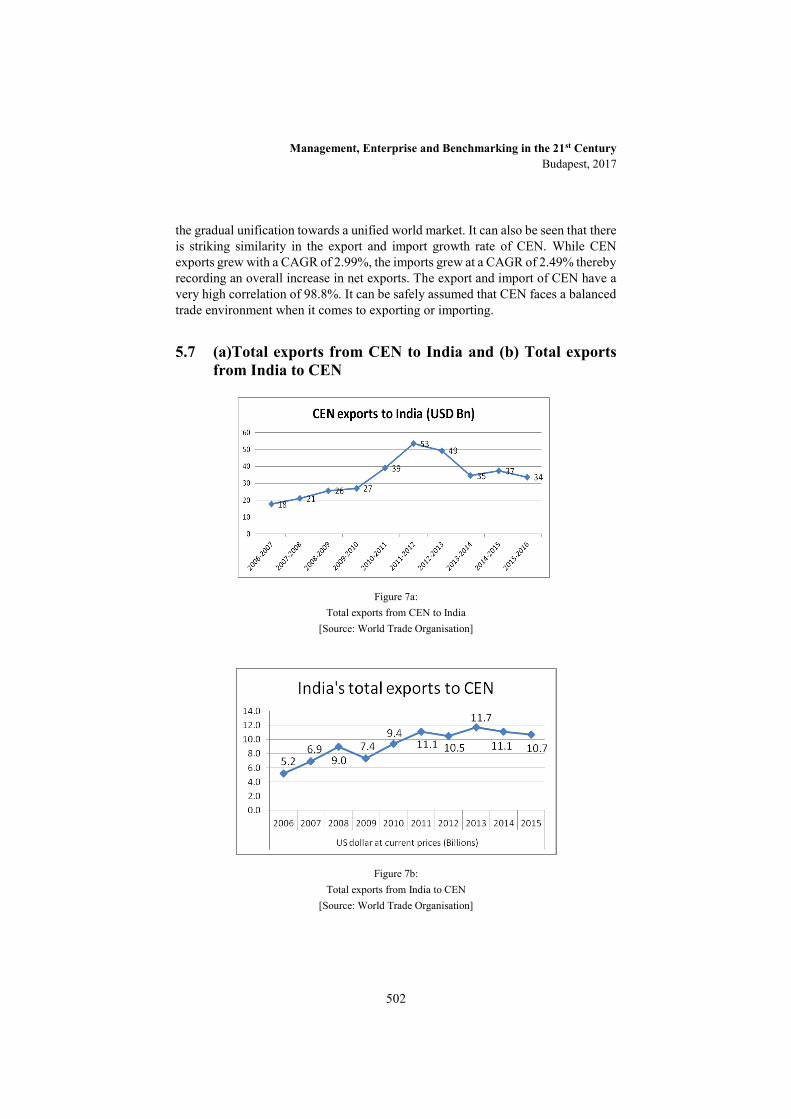
Management, Enterprise and Benchmarking in the 21st Century Budapest, 2017
502
the gradual unification towards a unified world market. It can also be seen that there is striking similarity in the export and import growth rate of CEN. While CEN exports grew with a CAGR of 2.99%, the imports grew at a CAGR of 2.49% thereby recording an overall increase in net exports. The export and import of CEN have a very high correlation of 98.8%. It can be safely assumed that CEN faces a balanced trade environment when it comes to exporting or importing.
5.7 (a)Total exports from CEN to India and (b) Total exports from India to CEN
Figure 7a: Total exports from CEN to India
[Source: World Trade Organisation]
Figure 7b: Total exports from India to CEN
[Source: World Trade Organisation]
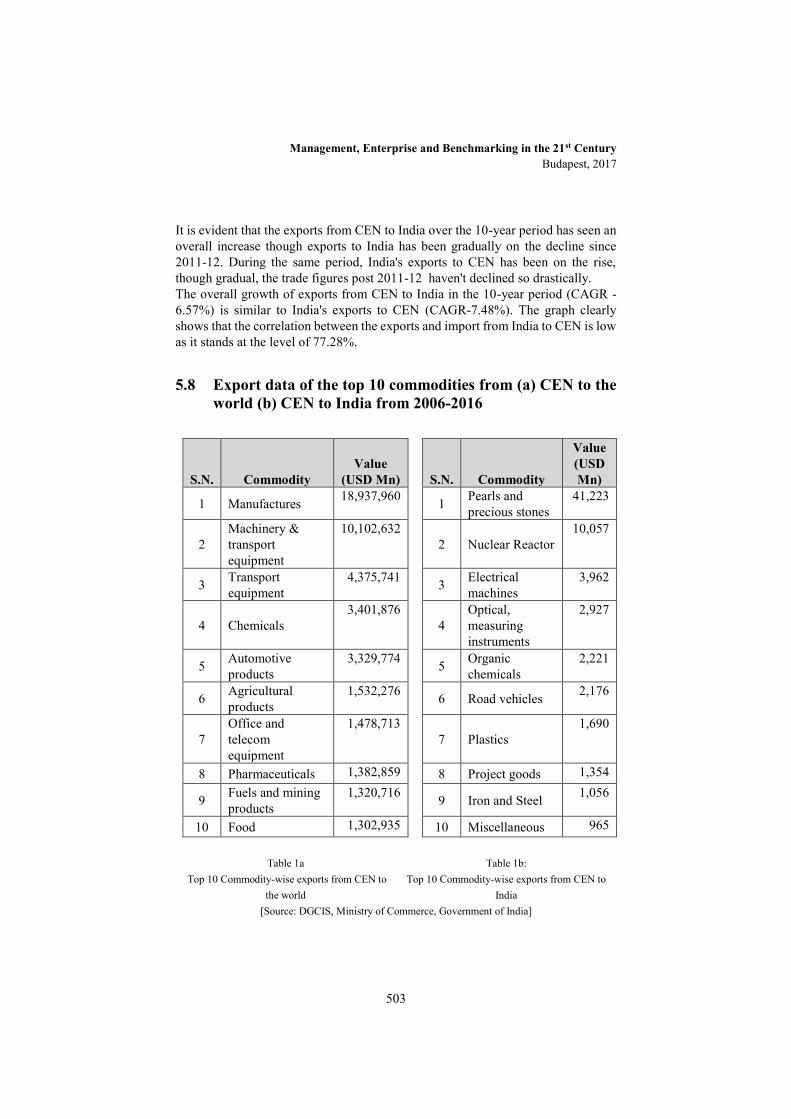
Management, Enterprise and Benchmarking in the 21st Century Budapest, 2017
503
It is evident that the exports from CEN to India over the 10-year period has seen an overall increase though exports to India has been gradually on the decline since 2011-12. During the same period, India's exports to CEN has been on the rise, though gradual, the trade figures post 2011-12 haven't declined so drastically. The overall growth of exports from CEN to India in the 10-year period (CAGR - 6.57%) is similar to India's exports to CEN (CAGR-7.48%). The graph clearly shows that the correlation between the exports and import from India to CEN is low as it stands at the level of 77.28%.
5.8 Export data of the top 10 commodities from (a) CEN to the world (b) CEN to India from 2006-2016
S.N. Commodity Value
(USD Mn)
S.N. Commodity
Value (USD Mn)
1 Manufactures 18,937,960 1 Pearls and precious stones
41,223
2 Machinery & transport equipment
10,102,632 2 Nuclear Reactor
10,057
3 Transport equipment
4,375,741 3 Electrical machines
3,962
4 Chemicals 3,401,876
4 Optical, measuring instruments
2,927
5 Automotive products
3,329,774 5 Organic chemicals
2,221
6 Agricultural products
1,532,276 6 Road vehicles 2,176
7 Office and telecom equipment
1,478,713 7 Plastics
1,690
8 Pharmaceuticals 1,382,859 8 Project goods 1,354
9 Fuels and mining products
1,320,716 9 Iron and Steel 1,056
10 Food 1,302,935 10 Miscellaneous 965
Table 1a Top 10 Commodity-wise exports from CEN to
the world
Table 1b: Top 10 Commodity-wise exports from CEN to
India [Source: DGCIS, Ministry of Commerce, Government of India]

Management, Enterprise and Benchmarking in the 21st Century Budapest, 2017
504
It is peculiar to see that the top 10 commodity being exported by CEN to the rest of the world has nothing in common with the top 10 commodities being exported by CEN to India.
5.9 Country-wise exports from Central European Nations to India over the 10-year period
The countries belonging to CEN are geographically located adjacent to each other and their factors of production carry greater commonality as compared with those of far of countries like countries in Asia. Given below are the graphic representation of the country wise exports to India.
(Figures in USD Mn)
YEAR
SN Country 2006-07
2007-08
2008-09
2009-10
2010-11
2011-12
2012-13
2013-14
2014-15
2015-16
1 AUSTRIA 457 586 702 789 817 1081
929 829 816 827
2 CZECH REPUBLIC
354 448 492 562 677 719 644 518 518 508
3 GERMANY 7553
9885
12006
10318
11891
15601
14326
12932
12788
12088
4 HUNGARY 117 114 190 195 343 437 263 220 240 243
5 POLAND 117 189 266 387 386 624 863 623 636 570
6 SLOVAK REP.
20 44 46 40 88 88 63 53 137 65
7 SLOVENIA 36 58 75 118 92 157 118 118 105 89
8 SWITZERLAND
9144
9758
11870
14698
24802
34759
32167
19311
22133
19299
CEN (Total) 17797
21081
25647
27109
39096
53467
49373
34604
37372
33688
Table 2: Country-wise exports from Central European Nations to India
[Source: Ministry of Commerce, Government of India]
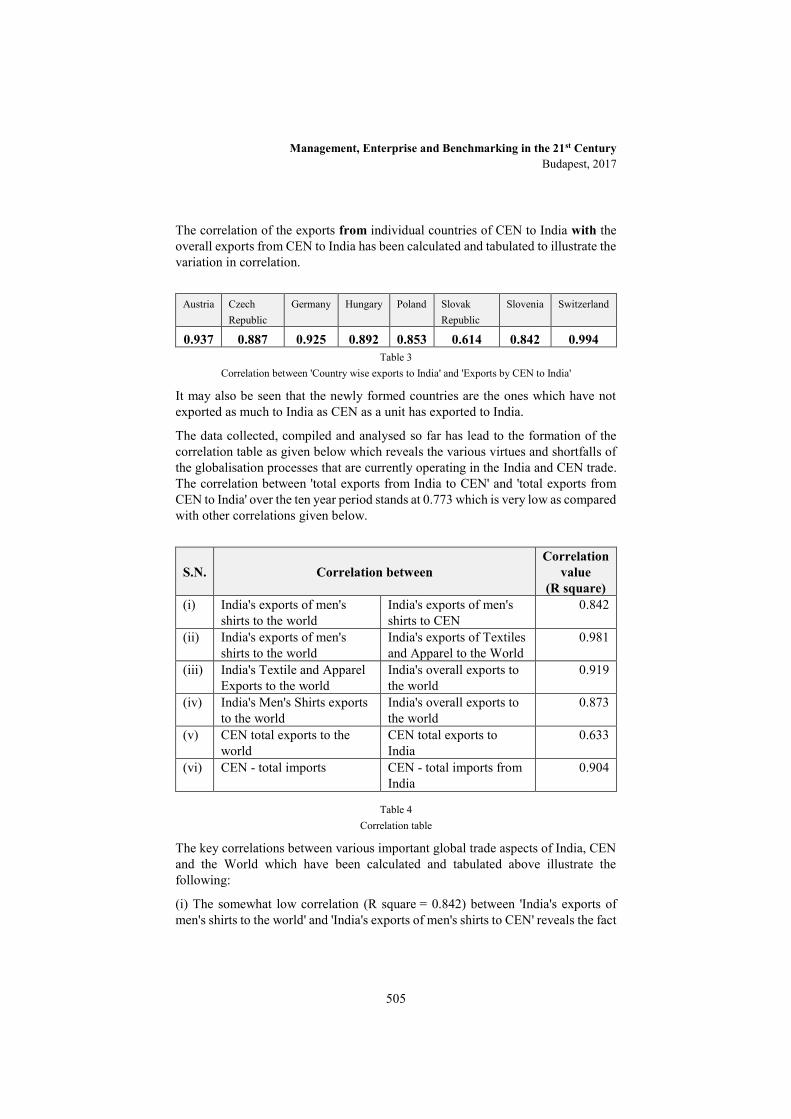
Management, Enterprise and Benchmarking in the 21st Century Budapest, 2017
505
The correlation of the exports from individual countries of CEN to India with the overall exports from CEN to India has been calculated and tabulated to illustrate the variation in correlation.
Austria Czech
Republic Germany Hungary Poland Slovak
Republic Slovenia Switzerland
0.937 0.887 0.925 0.892 0.853 0.614 0.842 0.994 Table 3
Correlation between 'Country wise exports to India' and 'Exports by CEN to India'
It may also be seen that the newly formed countries are the ones which have not exported as much to India as CEN as a unit has exported to India.
The data collected, compiled and analysed so far has lead to the formation of the correlation table as given below which reveals the various virtues and shortfalls of the globalisation processes that are currently operating in the India and CEN trade. The correlation between 'total exports from India to CEN' and 'total exports from CEN to India' over the ten year period stands at 0.773 which is very low as compared with other correlations given below.
S.N. Correlation between Correlation
value (R square)
(i) India's exports of men's shirts to the world
India's exports of men's shirts to CEN
0.842
(ii) India's exports of men's shirts to the world
India's exports of Textiles and Apparel to the World
0.981
(iii) India's Textile and Apparel Exports to the world
India's overall exports to the world
0.919
(iv) India's Men's Shirts exports to the world
India's overall exports to the world
0.873
(v) CEN total exports to the world
CEN total exports to India
0.633
(vi) CEN - total imports CEN - total imports from India
0.904
Table 4 Correlation table
The key correlations between various important global trade aspects of India, CEN and the World which have been calculated and tabulated above illustrate the following:
(i) The somewhat low correlation (R square = 0.842) between 'India's exports of men's shirts to the world' and 'India's exports of men's shirts to CEN' reveals the fact

Management, Enterprise and Benchmarking in the 21st Century Budapest, 2017
506
that India as a sourcing hub has not been optimally used by CEN for sourcing of Men's shirts.
(ii) India's exports of Men's shirts is highly correlated with the textile and apparel exports of India to the world which shows that India's policy towards textile and apparel in general and men's shirts in particular is balanced.
(iii) India's Textile and Apparel Exports to the world has a slightly lower correlation with India's overall exports to the world reflecting the unequal growth in exports of textile and apparel when compared with export growth of agricultural and industrial products and exports of services.
(iv) India's men's shirts exports performance shows a serious shortfall when compared with India's overall exports.
(v) A correlation of 0.633 shows a clear cut gap between the exports from CEN to the world and exports from CEN to India. This may be because of lack of strategic ties between India and CEN and other related reasons. India happens to be one of the biggest consuming nation in the world and the entire world is concentrating on India as an exports destination which CEN has not yet capitalized on so far.
(vi) The correlation between total imports by CEN from the world and imports by CEN from India seems high in that the imports of CEN have increased nearly as much as imports of CEN have increased from India, but looking at various other correlations, there seems many such opportunities which CEN can grab hold of for a rapid economic growth and better integration with world trade.
6 Results
The study clearly shows that the trade patterns of individual countries of CEN are similar to that of India though India is situated far away from CEN. The data also reveals that there is very low level of commonality between the major commodities that are exported from India to CEN and the major commodities exported from CEN to India. This shows that countries make and sell those products which it can produce efficiently and they procure the other products which other countries can produce cheaper, thereby validating the argument of trade dynamism through globalisation.
The research also makes it amply evident that local problems like cost cutting, efficient sourcing, faster lead-times, survival amidst fierce global competition, etc. are addressed by global solutions, in this case India has been already providing optimal solutions to apparel requirements of CEN which the newer formed countries have yet to take advantage of. This research is limited to one specific product category with the intent that it may lead to further researches that may include other textile products with higher levels of diversity or it may be extended to other sectors
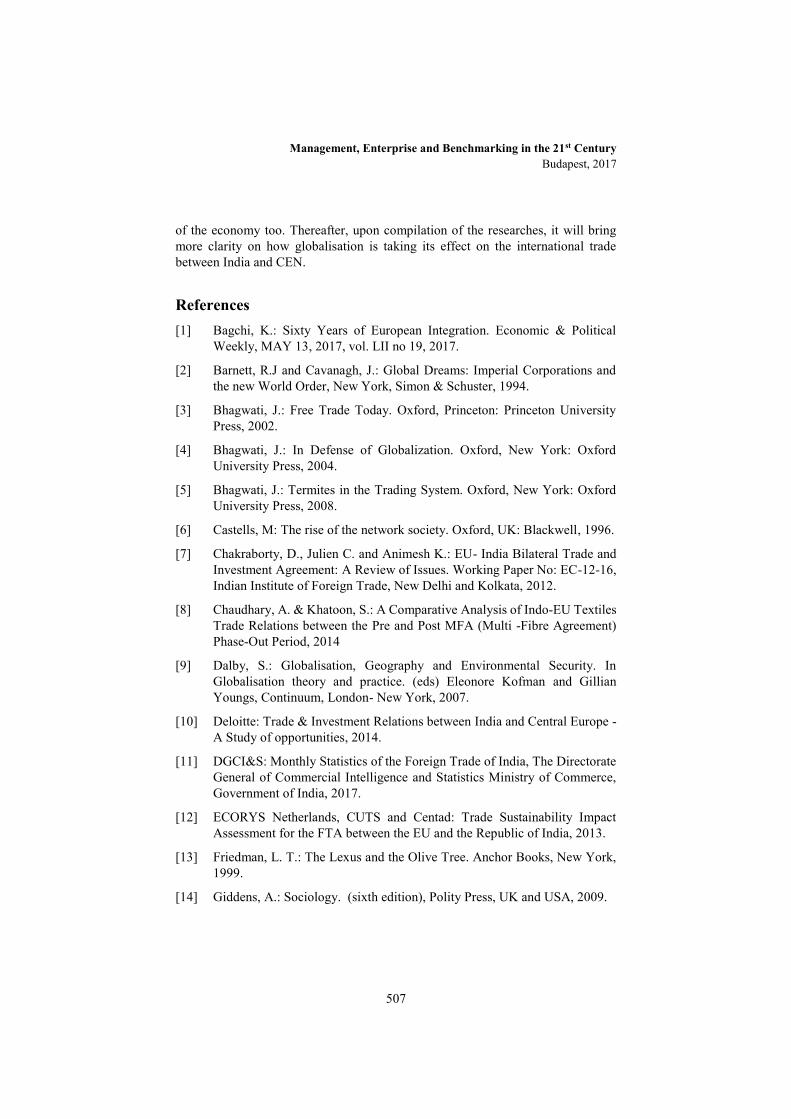
Management, Enterprise and Benchmarking in the 21st Century Budapest, 2017
507
of the economy too. Thereafter, upon compilation of the researches, it will bring more clarity on how globalisation is taking its effect on the international trade between India and CEN.
References [1] Bagchi, K.: Sixty Years of European Integration. Economic & Political
Weekly, MAY 13, 2017, vol. LII no 19, 2017.
[2] Barnett, R.J and Cavanagh, J.: Global Dreams: Imperial Corporations and the new World Order, New York, Simon & Schuster, 1994.
[3] Bhagwati, J.: Free Trade Today. Oxford, Princeton: Princeton University Press, 2002.
[4] Bhagwati, J.: In Defense of Globalization. Oxford, New York: Oxford University Press, 2004.
[5] Bhagwati, J.: Termites in the Trading System. Oxford, New York: Oxford University Press, 2008.
[6] Castells, M: The rise of the network society. Oxford, UK: Blackwell, 1996.
[7] Chakraborty, D., Julien C. and Animesh K.: EU- India Bilateral Trade and Investment Agreement: A Review of Issues. Working Paper No: EC-12-16, Indian Institute of Foreign Trade, New Delhi and Kolkata, 2012.
[8] Chaudhary, A. & Khatoon, S.: A Comparative Analysis of Indo-EU Textiles Trade Relations between the Pre and Post MFA (Multi -Fibre Agreement) Phase-Out Period, 2014
[9] Dalby, S.: Globalisation, Geography and Environmental Security. In Globalisation theory and practice. (eds) Eleonore Kofman and Gillian Youngs, Continuum, London- New York, 2007.
[10] Deloitte: Trade & Investment Relations between India and Central Europe - A Study of opportunities, 2014.
[11] DGCI&S: Monthly Statistics of the Foreign Trade of India, The Directorate General of Commercial Intelligence and Statistics Ministry of Commerce, Government of India, 2017.
[12] ECORYS Netherlands, CUTS and Centad: Trade Sustainability Impact Assessment for the FTA between the EU and the Republic of India, 2013.
[13] Friedman, L. T.: The Lexus and the Olive Tree. Anchor Books, New York, 1999.
[14] Giddens, A.: Sociology. (sixth edition), Polity Press, UK and USA, 2009.
Management, Enterprise and Benchmarking in the 21st Century Budapest, 2017
508
[15] Khorana, S.: Barriers to Exporting to the EU- Evidence from Textiles and Leather Goods Firms in India, 2011.
[16] Ministry of Textiles, Government of India: Annual Report, 2016.
[17] Ministry of Textiles, Government of India: Clothing and Textile Exports, 2015.
[18] Ministry of Textiles, Government of India: Existing and Prospective FTAs and their Impact on Indian Textiles Exports, a report prepared by Wazir Advisors, 2016.
[19] Mohapatra, D.R.: Trade and Investment Flows Between India and the European Union - Issues and Challenges, 2015.
[20] Robertson, R.:Glocalisation: Time-space and homogeneity-heterogeneity. In M. Featherstone, S. Lash & R. Robertson (Eds.), Global modernities Thousand Oaks, CA: Sage, 1997, pp 25-44.
[21] Stiglitz, J.: Globalization and its Discontents 1st edition, W. W. Norton & Company, 2003.
[22] Stiglitz, J.: The Price of Inequality 1st edition ; W. W. Norton & Company, New York, 2012.
[23] IBEF: Textile and Apparel, presentation prepared by TechSci, January 2016
[24] Verma, S.: Export Competitiveness of Indian Textile and Garment Industry, Working Paper No. 94, ICRIER, 2002.
[25] Wallerstein, I.: The Modern World-System III: The Second Era of Great Expansion of the Capitalist World Economy. New York: Academic Press, 1989.
[26] World Bank: Statistical Data, 2015.
[27] World Trade Organisation: Statistical Data, 2005
[28] World Trade Organisation: Statistical Data, 2016.
[29] World Trade Organization: Trade Profiles, 2016
i The reason for taking Men's Shirts is that the level of variation in terms of textiles used and the value additions are limited as compared with most of women's products - blouses, dresses, skirts, T-shirts. In the beginning, it makes more sense to take up a research based on a product which has lesser levels of complexities. Once a research has been done, based on the learning and feedback, it would subsequently help in constructing the framework for the research based on products having a higher level of complexity.

Management, Enterprise and Benchmarking in the 21st Century Budapest, 2017
509
ii Men's or Boys' Shirts exports data is taken from Ministry of Commerce, Government of India which is in the form of volume (quantity in pieces) and value in terms of US dollars. The data was culled out for each year falling in the aforementioned 10-year period using the HS Code 6205 for Men's or Boys' Shirts and values were taken and illustrated in the form of graphs and charts to gauge the trade patterns between India and CEN.