Management, Business, and Economics
174
Supported by Volume 5, Number 1, January - April 2018 Editors: Ungul Laptaned Ioannis Manikas Gilbert Nartea ISSN: 2408-1914 International Journal of Management, Business, and Economics IJMBE ● Impact of HR Practices on Employee Turnover and Job Satisfaction: Evidence from Pakistan Universities Ali Muhammad Mohmand and Malik Shakeel Khan .............................................................. 7 ● The Readability of Note Disclosures Daniel Tschopp, Doug Barney, and Passard C. Dean ......................................................... 29 ● Changing Tax Policy Impact on the Risk Level of Vietnam Wholesale and Retail Firms Dinh Tran Ngoc Huy ............................................................................................................ 41 ● Dependency of Human Resource Planning on Human Resource Information System: A Study on Banking Sector in Bangladesh Farha Sultana ...................................................................................................................... 57 ● Logistics Crunch: Analysis of Intermodal Containers Resource in Pre and Post China-Pakistan Economic Corridor’s Establishment Maisam Ali and Shahzad Khurram ...................................................................................... 71 ● Organizational Citizenship Behavior (OCB) Practices among the University Teachers: Bangladesh Perspective Mohammad Milon ................................................................................................................ 87 ● Management of Historic Site for Cultural Heritage Tourism: A Case Study of Wat Rajabopit Sathitmahasimaram Rajaworavihara, Bangkok Panot Asawachai ............................................................................................................... 103 ● Smart Bus Drivers: Fleet Management for Smart Workers Paradorn Khongmanee, Wuttipong Pongsuwan, and Suchai Thanawastien .................... 119 ● The Impact of Human Resource Practices on Task Performance of Employees in Electrical, Electronics and Telecommunications Industry Group in Thailand Praphan Chaikidurajai and Wassana Persalae ................................................................. 129 ● A Studio Based Approach for Enhancing Decisions of Poultry Farmers in East Africa Rebecca Pearl Tumwebaze and Henk G. Sol ................................................................... 143
-
Upload
khangminh22 -
Category
Documents
-
view
4 -
download
0
Transcript of Management, Business, and Economics

GRADUATECOLLEGE OF MANAGEMENT
SRIPATUM UNIVERSITY
Graduate College of ManagementSripatum University, Building 11, floor 11, 2410/2 Phaholyothin Road,Jatujak, Bangkok 10900, ThailandTel: (+66) 2579 1111 ext. 3000 - 4 Fax: (+66) 2579 1111 ext. 3011 E-Mail: [email protected]
Sripatum International CollegeSripatum University, Building 11, floor 8, 2410/2 Phaholyothin Road, Jatujak, Bangkok 10900, ThailandTel: (+66) 2579 1111 ext. 1017, 1018, 1308 Fax: (+66) 2558 6868 E-Mail: [email protected]
Supported bySripatum University2410/2 Phaholyothin Rd., Jatujak, Bangkok, 10900, ThailandTel.: +66 2 579 1111, Fax.: +66 2 558 6868E-mail: [email protected]: www.spu.ac.th
PresidentRutchaneeporn Pookayaporn Phukkamarn, Sripatum University, Thailand
Dean of Graduate College of ManagementVichit U-on, Sripatum University, Thailand
Advisory BoardChun-Ping Zeng, New York Institute of Technology, USAEric Ng, University of Southern Queensland, AustraliaJason David, Centennial College of Applied Arts & Technology, CanadaJohn Groth, Texas A&M, USAKirthana Shankar, Tokyo Institute of Technology, JapanOrna Lavi Eleuch, Osaka University of Economics, JapanRich Kim, Hanyang University, South KoreaSteve Byers, Idaho State University, USAYa Ling Kajalo, Helsinki School of Economics, FinlandZhenzhong Ma, University of Windsor, Canada, Canada
Editor-In-ChiefUngul Laptaned, Sripatum University, Thailand
Associate EditorIoannis Manikas, University of Wollongong in Dubai, United Arab Emirates
Guest EditorGilbert Nartea, Lincoln University, New Zealand
SecretariatPhongvitchulada Surakhan, Sripatum University, Thailand
Editorial BoardAnbalagan Krishnan, Curtin University of Technology, MalaysiaAnson Ka Keung Au, The University of Hong Kong, Hong KongC.Swarnalatha Raju, Anna University, IndiaChian-Son Westerlund, Helsinki School of Economics, FinlandChu Hui Steiner, Program Leader, University of Derby, IsraeliChun-Huw Escalante, University of Georgia, USADaniel Arif, The British University In Dubai, UAEHsun-Ming Lee, Texas State University - San Marcos, USAHuei-Zhen Gu, Lungwa University of Science and Technology, TaiwanI-Hua Bon, Universityersiti Tun Hussein Onn Malaysia, MalaysiaJaroslav Laukkanen, University of Kuopio, FinlandJasper Johnson, North Dakota State University, USALy-Fie Sugianto, Monash University, AustraliaMahesha Kapurubandara, University of Western Sydney, AustraliaMarc Lindblom, Helsinki School of Economics, FinlandStuart Garner, Edith Cowan University, AustraliaTakashi Koshida, Matsue National College of Technology, JapanTingyang Lewis Quynh Nhu, Vaasa University, Finland, FinlandVictoria Chen, National Chung Cheng University, TaiwanVineet Yamada, Nakamura Gakuen University, JapanWan-Shiou Hu, University of Western Sydney, AustraliaWen-Yen Edwards, University of Hawaii - Hilo, Hawaii, USAYikuan Lee, San Francisco State University, USAYing Sai, Loyola Marymount University, USAYungchih George Karjaluoto, University of Oulu, Finland
Supported by
PublisherSripatum University Press, Bangkok, Thailand
Copyright © 2018 Sripatum University
All right reserved.No part of this publication may be reproduced, stored in a retrieval system, or transmitted in any form or by any means, electronic, mechanical, photocopying, recording, or otherwise, without permission in writing from the editors.
ISSN: 2408-1914
Sripatum University, ThailandSripatum University is one of the oldest and most prestigious private universities in Bangkok, Thailand. Dr. Sook Pookayaporn established the university in 1970 under the name of "Thai Suriya College" in order to create opportunities for Thai youths to develop their potential. In 1987, the college was promoted to university status by the Ministry of University Affairs, and has since been known as Sripatum University. "Sripatum" means the "Source of Knowledge Blooming Like a Lotus" and was graciously conferred on the college by Her Royal Highness, the late Princess Mother Srinagarindra (Somdet Phra Srinagarindra Baromarajajanan). She presided over the official opening ceremony of SPU and awarded vocational certificates to the first three graduating classes. Sripatum University is therefore one of the first five private universities of Thailand. The university’s main goal is to create well-rounded students who can develop themselves to their chosen fields of study and to instill students with correct attitudes towards education so that they are enthusiastic in their pursuit of knowledge and self-development. This will provide students with a firm foundation for the future after graduation. The university's philosophy is "Education develops human resources who enrich the nation" which focuses on characteristics of Wisdom, Skills, Cheerfulness and Morality.
University of Greenwich, United KingdomThe University of Greenwich is a British university with campuses in south-east London and north Kent. These include the Greenwich Campus, located in the grounds of the Old Royal Naval College in the Royal Borough of Greenwich, London, England. It is the largest university in London by student numbers and the greenest in the UK as assessed by The People & Planet Green League. The university’s wide range of subjects includes architecture, business, computing, education, engineering, humanities, natural sciences, pharmacy and social sciences. It has a strong research focus and well-established links to the scientific community.
Lincoln University, New ZealandLincoln is New Zealand’s third oldest university. Founded in 1878 as a School of Agriculture, the organisation was linked to Canterbury College, welcoming its first intake of students in 1880. In 1896, with agriculture now well established as the mainstay of New Zealand’s exports, the School of Agriculture separated from Canterbury College and became Canterbury Agricultural College, with its own governing body and the ability to award degrees through the University of New Zealand. In 1961, the university was officially renamed Lincoln College, becoming a constituent college of the University of Canterbury. In 1990 Lincoln University formally separated from the University of Canterbury and became the self-governing national university that it is today. Internationally Lincoln University has academic alliances with complementary institutions in Asia, the Middle East, Europe and the Americas. These alliances support academic relationships and enhance educational opportunities for teaching staff, students and those undertaking advanced research.
Volume 5, Number 1, January - April 2018
ISSN: 2408-1914
Volume 5, N
umber 1, January - April 2018
Editors:Ungul Laptaned Ioannis ManikasGilbert Nartea
International Journal of Managem
ent, Business, and Economics
ISSN: 2408-1914
International Journal ofManagement, Business, and EconomicsIJMBE
International Journal ofManagement, Business, and EconomicsIJMBE
● Impact of HR Practices on Employee Turnover and Job Satisfaction: Evidence from Pakistan Universities
Ali Muhammad Mohmand and Malik Shakeel Khan.............................................................. 7
● The Readability of Note Disclosures Daniel Tschopp, Doug Barney, and Passard C. Dean ......................................................... 29
● Changing Tax Policy Impact on the Risk Level of Vietnam Wholesale and Retail Firms Dinh Tran Ngoc Huy ............................................................................................................ 41
● Dependency of Human Resource Planning on Human Resource Information System: A Study on Banking Sector in Bangladesh Farha Sultana ...................................................................................................................... 57
● Logistics Crunch: Analysis of Intermodal Containers Resource in Pre and Post China-Pakistan Economic Corridor’s Establishment Maisam Ali and Shahzad Khurram ...................................................................................... 71
● Organizational Citizenship Behavior (OCB) Practices among the University Teachers: Bangladesh Perspective Mohammad Milon ................................................................................................................ 87
● Management of Historic Site for Cultural Heritage Tourism: A Case Study of Wat Rajabopit Sathitmahasimaram Rajaworavihara, Bangkok Panot Asawachai ............................................................................................................... 103
● Smart Bus Drivers: Fleet Management for Smart Workers Paradorn Khongmanee, Wuttipong Pongsuwan, and Suchai Thanawastien .................... 119
● The Impact of Human Resource Practices on Task Performance of Employees in Electrical, Electronics and Telecommunications Industry Group in Thailand Praphan Chaikidurajai and Wassana Persalae ................................................................. 129
● A Studio Based Approach for Enhancing Decisions of Poultry Farmers in East Africa Rebecca Pearl Tumwebaze and Henk G. Sol ................................................................... 143
1International Journal ofManagement, Business, and EconomicsIJMBE
Welcome Address from President, Sripatum University
Welcome to the fifth volume of International Journal of Management, Business, and Economics (IJMBE). IJMBE is dedicated to increasing the depth of the subject across business disciplines with the ultimate aim of expanding knowledge of the subject. The IJMBE is a thrice peer-reviewed journal published by Graduate College of Management, Sripatum University; University of Greenwich; and Lincoln University.
In retrospect, Sripatum University, one of the oldest and most prestigious private universities in Thailand, was established in 1970 by Dr. Sook Pookayaporn by the name ” Sripatum College.” The name “Sripatum” meaning “Source of Knowledge Blooming like a Lotus” was conferred on the college by Her Royal Highness the Princess Mother. In 1987, the college was promoted to university status by the Ministry of University Affairs, and has since been known as Sripatum University. The university’s main goal is to create well-rounded students who can develop themselves to their chosen fields of study and to instill the students with correct attitudes towards education so that they are enthusiastic in their pursuit of knowledge and self-development.
To strive to be among the best, this first issue of the IJMBE is therefore instrumental for the most important academic growths to extend a high quality tradition in the education field to the world. The journal welcomes the submission of manuscripts that meet the general criteria of significance and scientific excellence, and will publish original articles in basic and applied research, case studies, critical reviews, surveys, opinions, commentaries and essays. It is hoped that this first issue will set a new benchmark in terms of academic publications. Through the support of our Editorial and Advisory Boards, I hope this journal could provide academic articles of the highest quality to all readers.
Dr. Rutchaneeporn Pookayaporn PhukkamarnPresident, Sripatum University

2 International Journal ofManagement, Business, and EconomicsIJMBE
It is appropriate to celebrate the continuity of an exciting and esteemed journal. The IJMBE will serve and provide a forum for exchange of ideas among business executives and academicians concerned with Management, Business, and Economics issues. With the rapid evolution of corporate business from international to global in recent years, general business has been one of the areas of greatest added complexity and concern for corporate managers. The IJMBE will be an academic journal combining academic inquiry and informed business practices. It will publish empirical, analytical, review, and survey articles, as well as case studies related to all areas of Management, Business, and Economics. A sentiment often expressed by practitioners is that academic research in general may not be addressing the most relevant questions in the real world.
It is fair to say that the IJMBE will publish high-quality applied-research papers. Nevertheless, studies that test important theoretical works and shed additional light on the issue with some business implications will also be solicited. Each submitted paper has been reviewed by several members of the IJMBE international editorial board and external referees. On the basis, we would like to thank all of them for their support with review process of submitted papers.
I cordially invite papers with theoretical research/conceptual work or applied research/applications on topics related to research, practice, and teaching in all subject areas of Management, Business, and Economics, or related subjects. I welcome paper submissions on the basis that the material has not been published elsewhere. The ultimate goal is to develop a journal that will appeal to both management and business practitioners. I expect the IJMBE to be an outstanding international forum for the exchange of ideas and results, and provide a baseline of further progress in the aforementioned areas.
Welcome Address from Dean, Sripatum University
Assoc. Prof. Dr. Vichit U-onDean, Graduate College of ManagementSripatum University

3International Journal ofManagement, Business, and EconomicsIJMBE
The Editors
Editor-In-Chief
Associate Editor
Guest Editor
Dr. Ungul Laptaned is an Assistant Professor in the Graduate College of Management, Sripatum University. He graduated with a Ph.D. in 2003 from the University of Nottingham, United Kingdom in the field of Manufacturing Engineering and Operations Management. Ungul has published over 60 proceedings and journal papers; for instances, Industrial Engineering Network, Asia Pacific Industrial Engineering and Management, International Association of Science and Technology for Development, Operations and Supply Chain Management, Intelligent Manufacturing System, Business and Information, etc. He served as a program chair and a steering committee for several domestic and international conferences. He was a journal editor of International Journal of Logistics and Transport, and Thai Researchers’ Consortium of Value Chain Management and Logistics Journal, and has consulted for several public organizations and industrial firms on logistics and supply chain management such as Thailand Research Fund, Phitsanulok Province, Public Warehouse Organization, Amatanakorn Industrial Estate, Wyncoast Industrial Park, Iron and Steel Institute of Thailand, Chacheongsao Province, JWD Infologistics Co., Ltd., Kerry Distribution (Thailand) Co., Ltd., TKL Logistics and Supply Chain Co., Ltd., and Ministry of Transport (Thailand).
Dr. Ioannis Manikas holds a Bachelor in Agriculture and a Master of Science in the field of logistics from Cranfield University. He holds a PhD from the Department of Agricultural Economics in AUTH and his primary interest includes supply chain management, logistics and agribusiness management. Dr Manikas has conducted research for projects regarding supply chain modelling, development of IT solutions for agrifood supply chain management and traceability both in Greece and the UK. He has a wide experience in the elaboration of research proposals under FP6, FP7, and Eurostars-Eureka funding mechanisms; lifelong learning oriented programmes such as Leonardo; and Interregional development programmes such as Interreg III and Interreg IV. His work as a self employed project manager and consultant in the agrifood sector includes the design and development of regional operational programmes; analysis of regional needs and respective development policies focused on rural and food production; definition of funding areas and financing resources; definition of strategic goals for regional development and formulation of respective performance monitoring systems; and assessment (ex-ante, on-going, ex-post) of the implementation of EC and national funding mechanisms in national and regional levels.
Dr. Gilbert Nartea is an Associate Professor in the Faculty of Commerce, Lincoln University, New Zealand. Dr. Nartea graduated a Master’s Degree from New England and a Ph.D. from Illinois, USA. He is a senior lecturer in Finance. His teaching interests are in the area of investments, futures and options, and finance, futures and options. The area of research interests area asset pricing, investment management, decision-analysis and risk management, and microfinance and poverty alleviation. He has published several papers in such journals as of Property Investment and Finance, International Journal of Managerial Finance, Asian Journal of Business and Accounting, Australian Journal of Agricultural and Resource Economics, Pacific Rim Property Research Journal, Review of Applied Economics, Review of Development Cooperation, American Journal of Agricultural Economics, and Journal of the American Society of Farm Managers and Rural Appraisers.

4 International Journal ofManagement, Business, and EconomicsIJMBE
Foreword
Welcome to the 1st issue of the 5th volume of International Journal of Management, Business, and Economics (IJMBE), the Editors received a number of papers from different countries such as Bangladesh, Netherlands, Pakistan, Taiwan, Thailand, Uganda, and United States of America. The received papers encompassed many areas of marketing, banking, economics, insurance and risk management, industrial and operation management, strategic management, and international and global business management. After the review process, a total of ten manuscripts were selected for publication.
The first article is authored by Ali Muhammad Mohmand and Malik Shakeel Khan, and named as “Impact of HR Practices on Employee Turnover and Job Satisfaction: Evidence from Pakistan Universities”. This research examines the impact of pertinent HR practices/policies upon a person’s job contentment and turnover in higher educational institutes. A special context of universities of KP have been chosen where numerous employees have developed job dissatisfaction and increased turnover because of deteriorating security conditions including but not limited to terrorism attacks, civil unrest, widespread diseases and unconductive working environment.
The second paper is examined by Daniel Tschopp, Doug Barney, and Passard C. Dean. Their paper is entitled “The Readability of Note Disclosures”. The purpose of financial reporting is to help users make informed decisions. Over time the reporting process has become more and more complex. Reporting standards and rules have increased both in terms of quantity and sophistication. Because of this, it is important to ask the question about the basic premise of financial reporting – is the information being reported by companies useful to its intended users.
The third article is authored by Dinh Tran Ngoc Huy, and is entitled “Changing Tax Policy Impact on the Risk Level of Vietnam Wholesale and Retail Firms”. This study analyzes the impacts of tax policy on market risk for the listed firms in the wholesale and retail industry during this period as it becomes necessary. First, by using quantitative and analytical methods to estimate asset and equity beta of total 9 listed companies in Viet Nam wholesale and retail industry with a proper traditional model.
In the fourth article, entitled “Dependency of Human Resource Planning on Human Resource Information System (HRIS): A Study on Banking Sector in Bangladesh”, is written by Farha Sultana. This study focuses on the Dependency of Human Resource Planning on Human Resource Information System (HRIS): A Study on Banking Sector in Bangladesh. The objective is to identify the contribution of HRIS in HR planning through HRIS recruiting and training & development subsystems as apparent by HR executives in Bangladesh banking sector.
In the fifth article, entitled “Logistics Crunch: Analysis of Intermodal Containers Resource in Pre and Post China Pakistan Economic Corridor’s Establishment” conducted by Maisam Ali and Shahzad Khurram. The author stated that intermodal containers are largely neglected area in extant literature on logistics. This study contributes to the literature by highlighting the significance of intermodal containers particularly in context of Pakistan.
The sixth article is conducted by Mohammad Milon, and is entitled “Organizational Citizenship Behavior (OCB) Practices among the University Teachers: Bangladesh Perspective”. The purpose of this study was to examine the OCB practices among university teachers in Bangladesh considering altruism, courtesy, conscientiousness, sportsmanship and civic virtue etc. In this research, the structural questionnaire was used for primary data that includes five dimensions on OCB.

5International Journal ofManagement, Business, and EconomicsIJMBE
Article number seven is written by Panot Asawachai, and is entitled “Management of Historic Site for Cultural Heritage Tourism: A Case Study of Wat Rajabopit Sathitmahasimaram Rajaworavihara, Bangkok”. This research aimed to review the heritage values and cultural significance of Wat Rajabopit Sathitmahasimaram Rajaworavihara, and the potential for cultural heritage tourism.
The eight article is conducted by Paradorn Khongmanee, Wuttipong Pongsuwan, and Suchai Thanawastien, and is entitled “Smart Bus Drivers: Fleet Management for Smart Workers”. This research is a part of an initiative to improve bus services supporting workers in Thai Industrial Estates. The study aims to find smarter transportation using internet-based technology.
Article number nine is entitled “The Impact of Human Resource Practices on Task Performance of Employees in Electrical, Electronics and Telecommunications Industry Group in Thailand”, and is examined by Praphan Chaikidurajai and Wassana Persalae. The purposes of this research were to study about the impact of human resource practices on task performance of employees in electrical, electronics and telecommunications industry group in Thailand.
Last but not the least, the article entitled “A Studio Based Approach for Enhancing Decisions of Poultry Farmers in East Africa” is examined by Rebecca Pearl Tumwebaze and Henk G. Sol. This design science research aimed at enhancing the decision making processes of poultry farmers in the volatile and complex East African business environment with a decision enhancement studio.
It is hoped that you will enjoy reading these articles and that they will generate responses and discussions that will help advance our knowledge of the field of Management, Business, and Economics. The Editors and the Editorial Board of the IJMBE would like to welcome your future submissions to make this journal your forum for sharing ideas and research work with all interested parties. Ungul Laptaned Editor-In-Chief
Ioannis Manikas Associate Editor
Gilbert Nartea Guest Editor
6 International Journal ofManagement, Business, and EconomicsIJMBE
Contents
Impact of HR Practices on Employee Turnover and Job Satisfaction: Evidence from Pakistan UniversitiesAli Muhammad Mohmand and Malik Shakeel Khan ........................................................................................................7
The Readability of Note DisclosuresDaniel Tschopp, Doug Barney, and Passard C. Dean ...................................................................................................29
Changing Tax Policy Impact on the Risk Level of Vietnam Wholesale and Retail FirmsDinh Tran Ngoc Huy ......................................................................................................................................................41
Dependency of Human Resource Planning on Human Resource Information System: A Study on Banking Sector in BangladeshFarha Sultana ................................................................................................................................................................57
Logistics Crunch: Analysis of Intermodal Containers Resource in Pre and Post China-Pakistan Economic Corridor’s EstablishmentMaisam Ali and Shahzad Khurram ................................................................................................................................71
Organizational Citizenship Behavior (OCB) Practices among the University Teachers: Bangladesh PerspectiveMohammad Milon ..........................................................................................................................................................87
Management of Historic Site for Cultural Heritage Tourism: A Case Study of Wat Rajabopit Sathitmahasimaram Rajaworavihara, BangkokPanot Asawachai .........................................................................................................................................................103
Smart Bus Drivers: Fleet Management for Smart WorkersParadorn Khongmanee, Wuttipong Pongsuwan, and Suchai Thanawastien ..............................................................119
The Impact of Human Resource Practices on Task Performance of Employees in Electrical, Electronics and Telecommunications Industry Group in ThailandPraphan Chaikidurajai and Wassana Persalae ...........................................................................................................129
A Studio Based Approach for Enhancing Decisions of Poultry Farmers in East AfricaRebecca Pearl Tumwebaze and Henk G. Sol .............................................................................................................143
Guide for Authors...................................................................................................................................................... 163

7International Journal ofManagement, Business, and EconomicsIJMBE
International Journal ofManagement, Business, and EconomicsIJMBE
Impact of HR Practices on Employee Turnover andJob Satisfaction: Evidence from Pakistan Universities
by
Ali Muhammad MohmandInstitute of Management Studies,University of Peshawar, Pakistan
Tel: +92 (0) 91 921 6668, E-mail: [email protected]
and
Malik Shakeel KhanInstitute of Management Studies,University of Peshawar, Pakistan
Abstract
This research examines the impact of pertinent HR practices/policies upon a person’s jobcontentment and turnover in higher educational institutes. A special context of universities of KPhave been chosen where numerous employees have developed job dissatisfaction and increasedturnover because of deteriorating security conditions including but not limited to terrorism attacks,civil unrest, widespread diseases and unconductive working environment. This has ultimatelycompelled them to leave their jobs and flee to other cities such as Islamabad and Karachi. Morespecifically, three HR policies i.e. employee participation, training and performance appraisal areanalysed to affect job satisfaction and turnover. A quantitative survey was conducted to assess joboutcomes of University teachers in multiple cities especially where living conditions havedeteriorated in the recent past. Respondents were segregated on the basis of age, income per month,designation and gender basis. Frequency analysis and Mean Average Scores are reported for eachconstruct. The regression results suggest a positive significant relation of employee participation andperformance appraisal with that of job satisfaction while a significant negative relation is found withturnover ratio. The study concludes that universities should focus on implementing HR policies andpractices effectively in workplace which will help retain employees and keep them motivated. Thiscan be one of the many effective strategies to retain workforce and discourage brain-drain out of thecountry. The study ends with acknowledging limitations and offering future research directions.
Keywords: HR Practices, Job Satisfaction, Turnover, Performance Appraisal, EmployeeParticipation
1. Introduction
Today’s organisations are generally engaged in seeking more effective ways to increaseproductivity and to keep abreast with the enhanced competition to uphold its unique identity in themarket. To achieve this very purpose they try to practically imply various tools and techniquesincluding but not limited to accounting, financing and human resource decisions. Among all thosetechniques and practices, the Human Resource (HR) Practices hold a supreme position that can playa vital role in the overall effectiveness and efficiency of an organization.

9International Journal ofManagement, Business, and EconomicsIJMBE
Impact of HR Practices on Employee Turnover andJob Satisfaction: Evidence from Pakistan Universities
by
Ali Muhammad MohmandInstitute of Management Studies,University of Peshawar, Pakistan
Tel: +92 (0) 91 921 6668, E-mail: [email protected]
and
Malik Shakeel KhanInstitute of Management Studies,University of Peshawar, Pakistan
Abstract
This research examines the impact of pertinent HR practices/policies upon a person’s jobcontentment and turnover in higher educational institutes. A special context of universities of KPhave been chosen where numerous employees have developed job dissatisfaction and increasedturnover because of deteriorating security conditions including but not limited to terrorism attacks,civil unrest, widespread diseases and unconductive working environment. This has ultimatelycompelled them to leave their jobs and flee to other cities such as Islamabad and Karachi. Morespecifically, three HR policies i.e. employee participation, training and performance appraisal areanalysed to affect job satisfaction and turnover. A quantitative survey was conducted to assess joboutcomes of University teachers in multiple cities especially where living conditions havedeteriorated in the recent past. Respondents were segregated on the basis of age, income per month,designation and gender basis. Frequency analysis and Mean Average Scores are reported for eachconstruct. The regression results suggest a positive significant relation of employee participation andperformance appraisal with that of job satisfaction while a significant negative relation is found withturnover ratio. The study concludes that universities should focus on implementing HR policies andpractices effectively in workplace which will help retain employees and keep them motivated. Thiscan be one of the many effective strategies to retain workforce and discourage brain-drain out of thecountry. The study ends with acknowledging limitations and offering future research directions.
Keywords: HR Practices, Job Satisfaction, Turnover, Performance Appraisal, EmployeeParticipation
1. Introduction
Today’s organisations are generally engaged in seeking more effective ways to increaseproductivity and to keep abreast with the enhanced competition to uphold its unique identity in themarket. To achieve this very purpose they try to practically imply various tools and techniquesincluding but not limited to accounting, financing and human resource decisions. Among all thosetechniques and practices, the Human Resource (HR) Practices hold a supreme position that can playa vital role in the overall effectiveness and efficiency of an organization.

10 International Journal ofManagement, Business, and EconomicsIJMBE
The association between HR practices and work satisfaction is researched extensively incontemporary management world. Following other researchers in Europe and America, Belzen(2009) examines this association in a Dutch sample. Another study put forward by Brown andHewood (2005) assert that employees’ productivity can also be increased rapidly by providing thembetter opportunities for their career development. The literature also shows the importance ofsupervisor in organization (Gregersen and Black, 1999; Shaffer et al., 1999) Furthermore, Selmer(2001) state that the role of a supervisor is like a bridge that links the workers with the uppermanagement of an organization.
The overall progress of the organization is one way or the other, influenced by prevalent HRpractices (Stavrou, 2005). The key to success for an organization is to implement or adopt the waysand means how to satisfy the current employees. Existing research offers theoretical foundations andframeworks which can be the bases for bringing more holistic solution to a local personnel problem.(Arumugam and Mojtahedzadeh, 2011). The personal satisfaction of the employees will lead to astrong commitment towards organization and eventually will lead to lesser levels of turnover.
The concept of remuneration is vital because according to Aswathappa, (2008) it constrainthe employees to stick to the job that yields more organizational productivity and less turn over.Remuneration is also another foundation building element that includes all the monetary and non-monetary incentives a worker receives in return of catering the services to an organization (Gary,2008, p. 390). It may be concluded that the organizational endmost success is more or less dependenton the HR practices in use by the firm. The Human resource management if done effectively canultimately lead to higher employee contentment and reduced turnover.
The focal point of research is to examine the impact of various HR practices and policies onemployee turnover and to determine and suggest an appropriate mix of strategies that can be put intopractice in order to reduce turnover in organizations. Job satisfaction is a vivid concept and is thefoundation of any organization’s success and prosperity. An organization flourishes only because ofits employees. Therefore keeping employees satisfied is of prime importance to the success oforganisations.
The proposed research inspects the impact of unmatchable complementary HR practices thatact as basis to employee’s satisfaction and lead to a progressive organizational output. To put theconcept into practice the study takes into account the teacher’s satisfaction in the context ofrenowned universities in Khyber Pakhtunkhwa Pakistan. Narrowing the discussion into specificoutlines, the research strives to achieve the following objectives.
To find out an association between the different HR practices, policies and work outcomessuch as work satisfaction and turnover ratios in higher education institutions (HEI’s) ofPakistan.
To examine as to what extent the levels of contentment and turnover ratios are determined byunderlying factors in the human resource policies of training, employee participation andperformance appraisal system.
To draw suggestive measures to accomplish an enhanced levels of job satisfaction andreduced turnover ratio amongst university employees in an environment of chaos andconflict, such as the one in prevalent KP Pakistan.
2. Review of Literature and Hypothesis
Job satisfaction is a crucial element in general organizational behaviour and its impact on theemployee’s overall performance is unavoidable. There are many contributors which plays their partactively to achieve the target including employee contribution, job specification, reimbursement,career management system, performance appraisements and selection criterion. A comprehensiveresearch model is therefore formulated which encapsulates the general workforce practices andinfluence of job satisfaction on the productivity and outcome of Malaysian industries in particular(Arumugam & Mojtahedzadeh, 2011).
An investigation conducted by Olusegun, (2013) in South West Nigeria on the universityemployees revealed that there is an obvious distinctiveness in the linear combination effect ofemployee satisfaction and turnover intents. A research study carried out by Khan et al. (2012) tookuniversity instructors and considered the three distinctive sectors of Pakistan including thegovernment, semi government and private sectors, revealed a gender bifurcated results. It wasobserved that female instructors are more likely to get influenced by the HR practices, whereas maleteachers are more interested in their work and usually get satisfaction out of it.
Another study done by Huselid, (1995) suggested on the bases of sample gathered fromaround 1000 firms, exhibiting the significance of economical and statistical impression overtransitional employee’s outgrowth and the corporate financial growth in both short and long runrespectively. The investigation regarding HR contribution reveals that the employee’s approach andoverall conduct is the outcome of HR practices and the way workers acknowledge the administration(Nishi, lepak & Schneider, 2008). A constructive association can be observed in between salarystrategies and work enhancement with job satisfaction/contentment, worker’s devotion with jobimprovement strategies and strategies related with work balancing (Roberto & Jaoquin, 2007).
The research also revealed the inverse relationship between worker’s commitment andplanned turnover. The influence of HRM practices with respect to HR outcomes targeting theGovernment banks operating in Sri Lanka was investigated by Rathanweera (2010). The collectionof data was done with the use of structured questionnaires in which the worker’s approaches towardsHR practices was analyzed. Sample based on 209 workers was gathered from various departments oftwo Sri Lankan Government banks. The conclusion reflected that HR practices are the foreseeinginstruments of worker’s contentment, commitment and withholding Rathanweera (2010).
Belzen, (2009) also studied the relationship between job satisfaction and HR practices ,according to him the improved HR practices powerfully influence the worker’s built in relevant jobcontentment. The research indicates that the organizations with higher and more advanced HRpractices finally yields to greater job satisfaction. An investigation done by Hussain and Rehman(2013) suggested that the association between HR practices and job security, training and inductionsare strongly participating in the retention process and influences employees to retain their serviceswith the organization. According to Mahmud and Idrish, (2011) the job related imbursements and indepth analysis of work are strong indicators predicting the intention of an employee to quit.
Another study carried out in Bangladesh by Absar, Azim, Balasundaram (2010) revealed asignificant relationship between improved HR strategies and the number of satisfied and dedicatedemployees. A study done by Mumtaz, Aslam and Ahmad, (2011) to find out the influence of HRpractices on job satisfaction of University instructors. The findings revealed that the mentioned set ofHR practices did not influence the teacher’s contentment which thus indicates that the other factorsare still to get unveiled impacting teacher’s satisfaction in general.

11International Journal ofManagement, Business, and EconomicsIJMBE
The association between HR practices and work satisfaction is researched extensively incontemporary management world. Following other researchers in Europe and America, Belzen(2009) examines this association in a Dutch sample. Another study put forward by Brown andHewood (2005) assert that employees’ productivity can also be increased rapidly by providing thembetter opportunities for their career development. The literature also shows the importance ofsupervisor in organization (Gregersen and Black, 1999; Shaffer et al., 1999) Furthermore, Selmer(2001) state that the role of a supervisor is like a bridge that links the workers with the uppermanagement of an organization.
The overall progress of the organization is one way or the other, influenced by prevalent HRpractices (Stavrou, 2005). The key to success for an organization is to implement or adopt the waysand means how to satisfy the current employees. Existing research offers theoretical foundations andframeworks which can be the bases for bringing more holistic solution to a local personnel problem.(Arumugam and Mojtahedzadeh, 2011). The personal satisfaction of the employees will lead to astrong commitment towards organization and eventually will lead to lesser levels of turnover.
The concept of remuneration is vital because according to Aswathappa, (2008) it constrainthe employees to stick to the job that yields more organizational productivity and less turn over.Remuneration is also another foundation building element that includes all the monetary and non-monetary incentives a worker receives in return of catering the services to an organization (Gary,2008, p. 390). It may be concluded that the organizational endmost success is more or less dependenton the HR practices in use by the firm. The Human resource management if done effectively canultimately lead to higher employee contentment and reduced turnover.
The focal point of research is to examine the impact of various HR practices and policies onemployee turnover and to determine and suggest an appropriate mix of strategies that can be put intopractice in order to reduce turnover in organizations. Job satisfaction is a vivid concept and is thefoundation of any organization’s success and prosperity. An organization flourishes only because ofits employees. Therefore keeping employees satisfied is of prime importance to the success oforganisations.
The proposed research inspects the impact of unmatchable complementary HR practices thatact as basis to employee’s satisfaction and lead to a progressive organizational output. To put theconcept into practice the study takes into account the teacher’s satisfaction in the context ofrenowned universities in Khyber Pakhtunkhwa Pakistan. Narrowing the discussion into specificoutlines, the research strives to achieve the following objectives.
To find out an association between the different HR practices, policies and work outcomessuch as work satisfaction and turnover ratios in higher education institutions (HEI’s) ofPakistan.
To examine as to what extent the levels of contentment and turnover ratios are determined byunderlying factors in the human resource policies of training, employee participation andperformance appraisal system.
To draw suggestive measures to accomplish an enhanced levels of job satisfaction andreduced turnover ratio amongst university employees in an environment of chaos andconflict, such as the one in prevalent KP Pakistan.
2. Review of Literature and Hypothesis
Job satisfaction is a crucial element in general organizational behaviour and its impact on theemployee’s overall performance is unavoidable. There are many contributors which plays their partactively to achieve the target including employee contribution, job specification, reimbursement,career management system, performance appraisements and selection criterion. A comprehensiveresearch model is therefore formulated which encapsulates the general workforce practices andinfluence of job satisfaction on the productivity and outcome of Malaysian industries in particular(Arumugam & Mojtahedzadeh, 2011).
An investigation conducted by Olusegun, (2013) in South West Nigeria on the universityemployees revealed that there is an obvious distinctiveness in the linear combination effect ofemployee satisfaction and turnover intents. A research study carried out by Khan et al. (2012) tookuniversity instructors and considered the three distinctive sectors of Pakistan including thegovernment, semi government and private sectors, revealed a gender bifurcated results. It wasobserved that female instructors are more likely to get influenced by the HR practices, whereas maleteachers are more interested in their work and usually get satisfaction out of it.
Another study done by Huselid, (1995) suggested on the bases of sample gathered fromaround 1000 firms, exhibiting the significance of economical and statistical impression overtransitional employee’s outgrowth and the corporate financial growth in both short and long runrespectively. The investigation regarding HR contribution reveals that the employee’s approach andoverall conduct is the outcome of HR practices and the way workers acknowledge the administration(Nishi, lepak & Schneider, 2008). A constructive association can be observed in between salarystrategies and work enhancement with job satisfaction/contentment, worker’s devotion with jobimprovement strategies and strategies related with work balancing (Roberto & Jaoquin, 2007).
The research also revealed the inverse relationship between worker’s commitment andplanned turnover. The influence of HRM practices with respect to HR outcomes targeting theGovernment banks operating in Sri Lanka was investigated by Rathanweera (2010). The collectionof data was done with the use of structured questionnaires in which the worker’s approaches towardsHR practices was analyzed. Sample based on 209 workers was gathered from various departments oftwo Sri Lankan Government banks. The conclusion reflected that HR practices are the foreseeinginstruments of worker’s contentment, commitment and withholding Rathanweera (2010).
Belzen, (2009) also studied the relationship between job satisfaction and HR practices ,according to him the improved HR practices powerfully influence the worker’s built in relevant jobcontentment. The research indicates that the organizations with higher and more advanced HRpractices finally yields to greater job satisfaction. An investigation done by Hussain and Rehman(2013) suggested that the association between HR practices and job security, training and inductionsare strongly participating in the retention process and influences employees to retain their serviceswith the organization. According to Mahmud and Idrish, (2011) the job related imbursements and indepth analysis of work are strong indicators predicting the intention of an employee to quit.
Another study carried out in Bangladesh by Absar, Azim, Balasundaram (2010) revealed asignificant relationship between improved HR strategies and the number of satisfied and dedicatedemployees. A study done by Mumtaz, Aslam and Ahmad, (2011) to find out the influence of HRpractices on job satisfaction of University instructors. The findings revealed that the mentioned set ofHR practices did not influence the teacher’s contentment which thus indicates that the other factorsare still to get unveiled impacting teacher’s satisfaction in general.
12 International Journal ofManagement, Business, and EconomicsIJMBE
Success of the firm is highly motivated by the effective implementation of HR practices(Stavrou, 2005). The concept proposed by Locke in 1976 was used by Haque and Taher, (2000) theyproposed that work satisfaction is an optimistic emotional feeling which can be attained from acomprehensive interpretation of the person’s work. The major determinants of job satisfactionincludes worker’s necessities and wants, social affiliations, management practices, job structure anddesign, reimbursement, long term chances (Moorhead and Griffin, 2001).
Huselid, Jackson and Schular (1995) proposed in their studies that high-progressive workpractices yields to lower turnover rate. Turnover is generally regarded as the number of employeesleaving the job. HRM practices and policies also increase appraisements, for instance provision offinancial incentives and opportunities of formal trainings enhances organizational output (Brown &Hewood, 2005). Mobley (1978) suggested that the intentions can fluctuate from the influence of anaffiliation between job satisfaction and turnover. Majority of investigators accepts the fact thatturnover intent is the last step of intentional turnover Mahmud and Idrish (2011).
3. Hypothesis
On the bases of the above literature the following hypothesis are developed for investigation.
H1: There will be a compelling association between employee participation and turnover.H2: There will be a compelling association between training and turnover.H3: There will be a significant association between Performance appraisal system andturnover.H4: There will be a compelling relationship between employee participation and jobsatisfaction.H5: There will be a significant relationship between training and job satisfaction.H6: There will be a compelling relationship between performance appraisal system and jobsatisfaction.
4. Research Methodology
Sample and Data Collection
The research is based on taking into account all major sector universities operating in theprovince of KP. Hence all universities are taken as the universe of study. There were 6 participantuniversities namely Sarhad University, Iqra National University (INU), Peshawar University,Malakand University, Kohat University and Bannu University. These universities were selected toconstitute a relatively representative sample of cities where there were increased incidences ofterrorism and unrest in the recent past. The sample consisted of 125 teachers of the above mentionedreputable institutions. This sample size was achieved with the help of physically administered surveyin each participating university. The process of data collection was performed with the support ofcolleagues in sister universities.
Statistical Model and Conceptual Framework
The representation is on the basis of ratios and percentages because the variables used wereof subjective nature. The statistical package for Social Sciences (SPSS) has been used for
interpretation of the collected data. For establishment of relativity in between defined variableswhich include employee participation, performance appraisal system, job satisfaction, training andturnover, the statistical techniques of correlation and regression are used. Regression analysisincorporates methods for modelling and analysing different dependent and independent variables. Itcan mathematically be expressed as
Y=Bo + B1X +...................+e
The equation showing relationship between job satisfaction, employee participation, trainingand performance appraisal.
Job satisfaction= Bo +B1(EP) +B2(T) + B3(PA)+........................e
Where,EP represents Employee ParticipationT represents trainingPA represents Performance AppraisalE represents the error termAnd B1 , B2 and B3 represents the coefficients of regression.
The equation defining the relationship between turnover, employee participation, training andperformance appraisal.
Turnover= Bo +B1(EP) +B2(T) + B3(PA)+........................e
EP represents employee participationT represents trainingPA represents performance appraisalE represents the error termAnd B1 , B2 and B3 represents the coefficients of regression
5. Conceptual Framework
Based on the literature, our research framework is shown in figure 1. The model depicts therelationship between HRM practices, turnover and job satisfaction. The HRM practices acts as anindependent variable (IDV) whereas turnover and job satisfaction reflects dependency on HRMpractices. Hence they are dependent variables (DV).

13International Journal ofManagement, Business, and EconomicsIJMBE
Success of the firm is highly motivated by the effective implementation of HR practices(Stavrou, 2005). The concept proposed by Locke in 1976 was used by Haque and Taher, (2000) theyproposed that work satisfaction is an optimistic emotional feeling which can be attained from acomprehensive interpretation of the person’s work. The major determinants of job satisfactionincludes worker’s necessities and wants, social affiliations, management practices, job structure anddesign, reimbursement, long term chances (Moorhead and Griffin, 2001).
Huselid, Jackson and Schular (1995) proposed in their studies that high-progressive workpractices yields to lower turnover rate. Turnover is generally regarded as the number of employeesleaving the job. HRM practices and policies also increase appraisements, for instance provision offinancial incentives and opportunities of formal trainings enhances organizational output (Brown &Hewood, 2005). Mobley (1978) suggested that the intentions can fluctuate from the influence of anaffiliation between job satisfaction and turnover. Majority of investigators accepts the fact thatturnover intent is the last step of intentional turnover Mahmud and Idrish (2011).
3. Hypothesis
On the bases of the above literature the following hypothesis are developed for investigation.
H1: There will be a compelling association between employee participation and turnover.H2: There will be a compelling association between training and turnover.H3: There will be a significant association between Performance appraisal system andturnover.H4: There will be a compelling relationship between employee participation and jobsatisfaction.H5: There will be a significant relationship between training and job satisfaction.H6: There will be a compelling relationship between performance appraisal system and jobsatisfaction.
4. Research Methodology
Sample and Data Collection
The research is based on taking into account all major sector universities operating in theprovince of KP. Hence all universities are taken as the universe of study. There were 6 participantuniversities namely Sarhad University, Iqra National University (INU), Peshawar University,Malakand University, Kohat University and Bannu University. These universities were selected toconstitute a relatively representative sample of cities where there were increased incidences ofterrorism and unrest in the recent past. The sample consisted of 125 teachers of the above mentionedreputable institutions. This sample size was achieved with the help of physically administered surveyin each participating university. The process of data collection was performed with the support ofcolleagues in sister universities.
Statistical Model and Conceptual Framework
The representation is on the basis of ratios and percentages because the variables used wereof subjective nature. The statistical package for Social Sciences (SPSS) has been used for
interpretation of the collected data. For establishment of relativity in between defined variableswhich include employee participation, performance appraisal system, job satisfaction, training andturnover, the statistical techniques of correlation and regression are used. Regression analysisincorporates methods for modelling and analysing different dependent and independent variables. Itcan mathematically be expressed as
Y=Bo + B1X +...................+e
The equation showing relationship between job satisfaction, employee participation, trainingand performance appraisal.
Job satisfaction= Bo +B1(EP) +B2(T) + B3(PA)+........................e
Where,EP represents Employee ParticipationT represents trainingPA represents Performance AppraisalE represents the error termAnd B1 , B2 and B3 represents the coefficients of regression.
The equation defining the relationship between turnover, employee participation, training andperformance appraisal.
Turnover= Bo +B1(EP) +B2(T) + B3(PA)+........................e
EP represents employee participationT represents trainingPA represents performance appraisalE represents the error termAnd B1 , B2 and B3 represents the coefficients of regression
5. Conceptual Framework
Based on the literature, our research framework is shown in figure 1. The model depicts therelationship between HRM practices, turnover and job satisfaction. The HRM practices acts as anindependent variable (IDV) whereas turnover and job satisfaction reflects dependency on HRMpractices. Hence they are dependent variables (DV).

14 International Journal ofManagement, Business, and EconomicsIJMBE
Personnel Practices (Ind. Variables) Dependent Variables
Figure 1 Association of HRM Practices, Job Satisfaction and Turnover
The variables that are considered in this research include HRM practices (performanceappraisal system, training and employee participation), job satisfaction and turnover.
Constructs and Measures
All of related constructs along with their measuring techniques are discussed below:
HR practices:The HRM practices reflect a positive relationship between organizational innovation, product
innovation, process innovation and administrative innovation. HRM practices were measured using5-items Likert scale ranging from 1 to 5 and representing two extreme ends of ‘strongly agree’ and‘strongly disagree’ respectively.
Job satisfaction:Job satisfaction is an integral part of HR practices as it influences and motivates employee to
contribute to the fullest in the productivity and effectiveness of an organization. Job satisfaction wasmeasured on 6-item scale formulated by Agho, Price and Mueller (1992). Each individualcomponent was measured on 5-item Likert scale ranging from 1 (Strongly agree) to 5 (Stronglydisagree).
Employee turnover:The term refers to the ratio of workers left and replaced by the new workers. This construct
has been measured by a 3-items scale invented by Vigoda in 1990. The scale ranging from 1(Strongly disagree) to 5 (Strongly agree) has been used.
EMPLOYEEPARTICIPATION
JOB SATISFACTION
TRAINING
TURNOVER
PERFORMANCEAPPRAISAL SYSTEM
6. Analysis and Results
Correlation analysis between HRM practices, job satisfaction and turnover
Table 1 Pearson Correlation with Respect to Age, Designation, Job Experience and Income
Gender.
Age. Design.
Experience.
Income.
Gender. 1.Age. O.O5
21
Design. O.O44
O.495**
1.
Experience.
O.OO3
O.667**
O.443**
1.
Income. O.O56
O.557**
O.548**
O.396** 1.
Table 2 Pearson Correlation with Respect to Dependent and Independent Variables
EmployeeContribution
Training&Induction
PerformanceAppraisalSystem
WorkSatisfaction
EmployeeTurnover
EmployeeContribution
1
Training&Induction
O.496** 1
Per. app system O.6O4** O.6O1** 1
Worksatisfaction
O.713** O.554** O.679** 1
Emp. turnover -O.422** -O.218* -0.412** -O.526** 1* Significance at O.O5 level (two-tailed)**Significance at O.O1 level (two-tailed)
Pearson Coefficient is a statistical tool for measuring the linear correlation between twovariables X and Y, giving a value between +1 and −1 inclusive, where 1 is total positive correlation, 0is no correlation, and −1 is total negative correlation. Table 1 and 2 demonstrates the PearsonCorrelation Coefficient for the researched variables and is utilized to compare the mean inaccordance with the designated demographic variables and all the other key factors with theconfidence interval of (p<0.01). The assumptions made about the variables correlation were standsignificant having value less than 0.01 except one counted as –0.218*. The negative sign is anindication of diminished turnover if the worker is provided with significant appraisal system, iscooperative, well equipped with his skills and is happy with the working environment. In theresearch paper the stark on the figure symbolizes the significance of correlation w.r.t the achievedconfidence interval which in our case is (P<0.05).

15International Journal ofManagement, Business, and EconomicsIJMBE
Personnel Practices (Ind. Variables) Dependent Variables
Figure 1 Association of HRM Practices, Job Satisfaction and Turnover
The variables that are considered in this research include HRM practices (performanceappraisal system, training and employee participation), job satisfaction and turnover.
Constructs and Measures
All of related constructs along with their measuring techniques are discussed below:
HR practices:The HRM practices reflect a positive relationship between organizational innovation, product
innovation, process innovation and administrative innovation. HRM practices were measured using5-items Likert scale ranging from 1 to 5 and representing two extreme ends of ‘strongly agree’ and‘strongly disagree’ respectively.
Job satisfaction:Job satisfaction is an integral part of HR practices as it influences and motivates employee to
contribute to the fullest in the productivity and effectiveness of an organization. Job satisfaction wasmeasured on 6-item scale formulated by Agho, Price and Mueller (1992). Each individualcomponent was measured on 5-item Likert scale ranging from 1 (Strongly agree) to 5 (Stronglydisagree).
Employee turnover:The term refers to the ratio of workers left and replaced by the new workers. This construct
has been measured by a 3-items scale invented by Vigoda in 1990. The scale ranging from 1(Strongly disagree) to 5 (Strongly agree) has been used.
EMPLOYEEPARTICIPATION
JOB SATISFACTION
TRAINING
TURNOVER
PERFORMANCEAPPRAISAL SYSTEM
6. Analysis and Results
Correlation analysis between HRM practices, job satisfaction and turnover
Table 1 Pearson Correlation with Respect to Age, Designation, Job Experience and Income
Gender.
Age. Design.
Experience.
Income.
Gender. 1.Age. O.O5
21
Design. O.O44
O.495**
1.
Experience.
O.OO3
O.667**
O.443**
1.
Income. O.O56
O.557**
O.548**
O.396** 1.
Table 2 Pearson Correlation with Respect to Dependent and Independent Variables
EmployeeContribution
Training&Induction
PerformanceAppraisalSystem
WorkSatisfaction
EmployeeTurnover
EmployeeContribution
1
Training&Induction
O.496** 1
Per. app system O.6O4** O.6O1** 1
Worksatisfaction
O.713** O.554** O.679** 1
Emp. turnover -O.422** -O.218* -0.412** -O.526** 1* Significance at O.O5 level (two-tailed)**Significance at O.O1 level (two-tailed)
Pearson Coefficient is a statistical tool for measuring the linear correlation between twovariables X and Y, giving a value between +1 and −1 inclusive, where 1 is total positive correlation, 0is no correlation, and −1 is total negative correlation. Table 1 and 2 demonstrates the PearsonCorrelation Coefficient for the researched variables and is utilized to compare the mean inaccordance with the designated demographic variables and all the other key factors with theconfidence interval of (p<0.01). The assumptions made about the variables correlation were standsignificant having value less than 0.01 except one counted as –0.218*. The negative sign is anindication of diminished turnover if the worker is provided with significant appraisal system, iscooperative, well equipped with his skills and is happy with the working environment. In theresearch paper the stark on the figure symbolizes the significance of correlation w.r.t the achievedconfidence interval which in our case is (P<0.05).

16 International Journal ofManagement, Business, and EconomicsIJMBE
Inspecting reliability
o understanding the reliability factor of this investigation, we performed reliability analysistechnique using SPSS. Table 3 presents the results of each dependent/independent variable.
Table 3 Results of Reliability Analysis of Variables
Variable Cronbach’s alpha RemarksWorker’s Contribution O.794 ReliableTraining & Induction O.839 ReliablePerformance AppraisalSystem
O.822 Reliable
Work Satisfaction O.811 ReliableTurnover O.854 Reliable
The interpretation considers five distinguished variables including Employee contribution,Training& Induction, Performance appraisal criteria, Work satisfaction and employee’s turnover inaccordance to a cut-off value of Cronbach’s alpha of 0.7 as suggested by Week (2000), andCronbach (1951).
From above depicted table it is quite clear that employee participation is interpreted as theleast reliable variable by possessing the Cronbach’s alpha of 0.794. Whereas all the otherconsecutive variable including training, performance appraisal system, job satisfaction and employeeturnover possess reliability in the order of 0.839, O.822, 0.811 and O.854 respectively. The positivepart is all of these variables qualify in the range of Cronbach’s alpha which makes the authenticity ofdata quite reliable and assures provision of exhibitive and helpful framework for the issue underconsideration.
Distributing respondents with respect to employee contribution, training, performanceappraisal, job satisfaction and turnover
The respondents are distributed with respect to the factors including employee contribution,training, performance appraisal system, job contentment/satisfaction and turnover.
All of them are studied individually along with the tabular analysis to get a clearer picture.
Table 4 Distribution of Respondents with Respect to Employee Contribution
Employee PerceptionS.No Item1. 2. 3. 4. 5.
MAS
1 You are a good contributor in yourinstitution’s affairs
6.(4.9)
5.(4.1)
17.(13.7)
66.(52.9)
31.(24.9)
3.8881
2 You are zealous regardingemployment at your presentinstitution.
1(0.8)
10(8.0)
28(22.4)
62(49.6)
24(19.2)
3.7840
3 You show concern in makingdecisions/policies at your institution.
26(20.8)
49(39.2)
18(14.4)
25(20.0)
7(5.6)
2.5040
4 Your institution provides you anopportunity to contribute in theformulation of academic policy.
30(24.0)
34(27.2)
17(13.6)
38(30.4)
6(4.8)
2.6480
5 Your University gives you anopportunity to practice leadershipskills.
27(21.6)
35(28.0)
29(23.2)
23(18.4)
11(8.8)
2.6480
6 Your university work place supportsteam oriented working practices.
11(8.8)
18(14.4)
25(20.0)
56(44.8)
15(12.0)
3.3680
7 Your institution welcomes creativefeedback and suggestions ofinstructors.
27(21.6)
34(27.2)
24(19.2)
31(24.8)
9(7.2)
2.6880
Aggregate Mean 3.07551 = strongly Disagree, 2 = Disagree, 3 = neutral, 4 = Agree, 5 = strongly Agree; MAS = meanaverage score
It is apparent from above findings that majority of the respondents lie in the 4th part of theLikert Scale. The result directs that the respondents from the universities of KP are in favour ofemployee contribution. The perception reflects a positive behaviour of employees which can finallybe seen in the self-fulfilment and turnover.
On the other hand a substantial number of respondents with neutral perception can also beseen along with some having negative perceptions. The evaluation of items 2, 6 and 1 reflects theapproval of the relevant perception as the MAS for that particular category is greater than 3.However items 3, 4, 5, and 7 with MAS<3 reflects a negative perception indicating a disagreementof employees about positive employee’s participation perception. The greatest MAS (3.8881) havebeen observed for the respondent’s perception with their contribution towards their job which willresult in greater satisfaction and diminished employee turnover.
Category 2 on the other hand depicts MAS (3.7840) which enlightens the zeal of employeestowards their workplace resulting in greater satisfaction and fewer intentions to leave the job.Followed by the category 6 with MAS (3.3680) which demonstrates the agreeableness ofrespondents towards their work and working environment in general. MAS (2.6880), MAS (2.5040),MAS (2.6480) highlights the idea of innovative feedback acceptance, involvement in strategicdecision making, chance to show leadership qualities and involvement in general policy formulation.All of them are more or less responsible for noticeable employee satisfaction and turnover. Items 7,3, 4 and 5 however represents negative recording of perception.
The general MAS picture though represents a positive feedback given by respondents inaccordance with their participation, satisfaction and turnover. In addition, generally it is observedthat greater empowerment, and involvement usually acts as motivational factors. A person will showgreater enthusiasm towards work or will act more participative if he will get a chance to think good /bad for the organizations and a free hand to make decisions accordingly.
1. With respect to training:Training plays a crucial part in employee’s growth and satisfaction as it opens uncountable
doors of success and polish work with unmatchable skills. Table 5 illustrates the distribution criteriaw.r.t training.
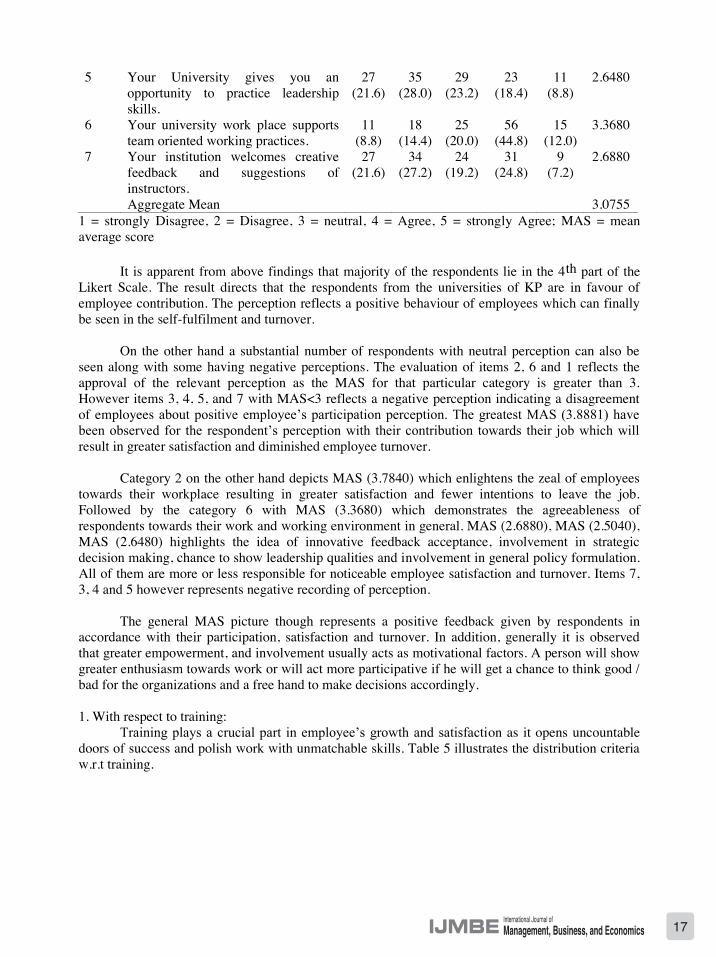
17International Journal ofManagement, Business, and EconomicsIJMBE
Inspecting reliability
o understanding the reliability factor of this investigation, we performed reliability analysistechnique using SPSS. Table 3 presents the results of each dependent/independent variable.
Table 3 Results of Reliability Analysis of Variables
Variable Cronbach’s alpha RemarksWorker’s Contribution O.794 ReliableTraining & Induction O.839 ReliablePerformance AppraisalSystem
O.822 Reliable
Work Satisfaction O.811 ReliableTurnover O.854 Reliable
The interpretation considers five distinguished variables including Employee contribution,Training& Induction, Performance appraisal criteria, Work satisfaction and employee’s turnover inaccordance to a cut-off value of Cronbach’s alpha of 0.7 as suggested by Week (2000), andCronbach (1951).
From above depicted table it is quite clear that employee participation is interpreted as theleast reliable variable by possessing the Cronbach’s alpha of 0.794. Whereas all the otherconsecutive variable including training, performance appraisal system, job satisfaction and employeeturnover possess reliability in the order of 0.839, O.822, 0.811 and O.854 respectively. The positivepart is all of these variables qualify in the range of Cronbach’s alpha which makes the authenticity ofdata quite reliable and assures provision of exhibitive and helpful framework for the issue underconsideration.
Distributing respondents with respect to employee contribution, training, performanceappraisal, job satisfaction and turnover
The respondents are distributed with respect to the factors including employee contribution,training, performance appraisal system, job contentment/satisfaction and turnover.
All of them are studied individually along with the tabular analysis to get a clearer picture.
Table 4 Distribution of Respondents with Respect to Employee Contribution
Employee PerceptionS.No Item1. 2. 3. 4. 5.
MAS
1 You are a good contributor in yourinstitution’s affairs
6.(4.9)
5.(4.1)
17.(13.7)
66.(52.9)
31.(24.9)
3.8881
2 You are zealous regardingemployment at your presentinstitution.
1(0.8)
10(8.0)
28(22.4)
62(49.6)
24(19.2)
3.7840
3 You show concern in makingdecisions/policies at your institution.
26(20.8)
49(39.2)
18(14.4)
25(20.0)
7(5.6)
2.5040
4 Your institution provides you anopportunity to contribute in theformulation of academic policy.
30(24.0)
34(27.2)
17(13.6)
38(30.4)
6(4.8)
2.6480
5 Your University gives you anopportunity to practice leadershipskills.
27(21.6)
35(28.0)
29(23.2)
23(18.4)
11(8.8)
2.6480
6 Your university work place supportsteam oriented working practices.
11(8.8)
18(14.4)
25(20.0)
56(44.8)
15(12.0)
3.3680
7 Your institution welcomes creativefeedback and suggestions ofinstructors.
27(21.6)
34(27.2)
24(19.2)
31(24.8)
9(7.2)
2.6880
Aggregate Mean 3.07551 = strongly Disagree, 2 = Disagree, 3 = neutral, 4 = Agree, 5 = strongly Agree; MAS = meanaverage score
It is apparent from above findings that majority of the respondents lie in the 4th part of theLikert Scale. The result directs that the respondents from the universities of KP are in favour ofemployee contribution. The perception reflects a positive behaviour of employees which can finallybe seen in the self-fulfilment and turnover.
On the other hand a substantial number of respondents with neutral perception can also beseen along with some having negative perceptions. The evaluation of items 2, 6 and 1 reflects theapproval of the relevant perception as the MAS for that particular category is greater than 3.However items 3, 4, 5, and 7 with MAS<3 reflects a negative perception indicating a disagreementof employees about positive employee’s participation perception. The greatest MAS (3.8881) havebeen observed for the respondent’s perception with their contribution towards their job which willresult in greater satisfaction and diminished employee turnover.
Category 2 on the other hand depicts MAS (3.7840) which enlightens the zeal of employeestowards their workplace resulting in greater satisfaction and fewer intentions to leave the job.Followed by the category 6 with MAS (3.3680) which demonstrates the agreeableness ofrespondents towards their work and working environment in general. MAS (2.6880), MAS (2.5040),MAS (2.6480) highlights the idea of innovative feedback acceptance, involvement in strategicdecision making, chance to show leadership qualities and involvement in general policy formulation.All of them are more or less responsible for noticeable employee satisfaction and turnover. Items 7,3, 4 and 5 however represents negative recording of perception.
The general MAS picture though represents a positive feedback given by respondents inaccordance with their participation, satisfaction and turnover. In addition, generally it is observedthat greater empowerment, and involvement usually acts as motivational factors. A person will showgreater enthusiasm towards work or will act more participative if he will get a chance to think good /bad for the organizations and a free hand to make decisions accordingly.
1. With respect to training:Training plays a crucial part in employee’s growth and satisfaction as it opens uncountable
doors of success and polish work with unmatchable skills. Table 5 illustrates the distribution criteriaw.r.t training.
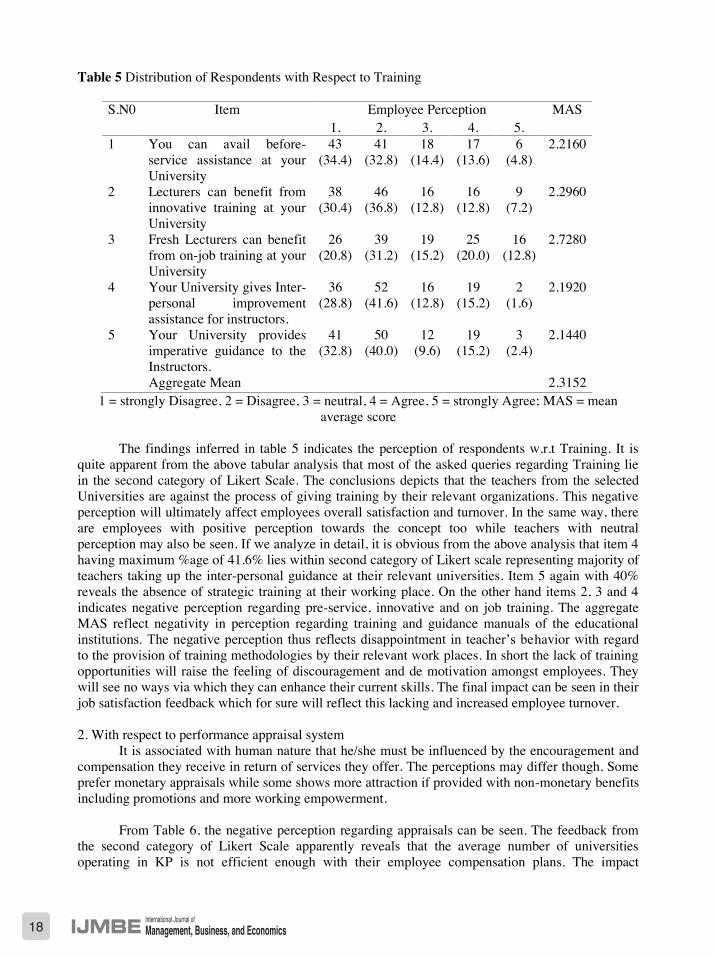
18 International Journal ofManagement, Business, and EconomicsIJMBE
Table 5 Distribution of Respondents with Respect to Training
Employee PerceptionS.N0 Item1. 2. 3. 4. 5.
MAS
1 You can avail before-service assistance at yourUniversity
43(34.4)
41(32.8)
18(14.4)
17(13.6)
6(4.8)
2.2160
2 Lecturers can benefit frominnovative training at yourUniversity
38(30.4)
46(36.8)
16(12.8)
16(12.8)
9(7.2)
2.2960
3 Fresh Lecturers can benefitfrom on-job training at yourUniversity
26(20.8)
39(31.2)
19(15.2)
25(20.0)
16(12.8)
2.7280
4 Your University gives Inter-personal improvementassistance for instructors.
36(28.8)
52(41.6)
16(12.8)
19(15.2)
2(1.6)
2.1920
5 Your University providesimperative guidance to theInstructors.
41(32.8)
50(40.0)
12(9.6)
19(15.2)
3(2.4)
2.1440
Aggregate Mean 2.31521 = strongly Disagree, 2 = Disagree, 3 = neutral, 4 = Agree, 5 = strongly Agree; MAS = mean
average score
The findings inferred in table 5 indicates the perception of respondents w.r.t Training. It isquite apparent from the above tabular analysis that most of the asked queries regarding Training liein the second category of Likert Scale. The conclusions depicts that the teachers from the selectedUniversities are against the process of giving training by their relevant organizations. This negativeperception will ultimately affect employees overall satisfaction and turnover. In the same way, thereare employees with positive perception towards the concept too while teachers with neutralperception may also be seen. If we analyze in detail, it is obvious from the above analysis that item 4having maximum %age of 41.6% lies within second category of Likert scale representing majority ofteachers taking up the inter-personal guidance at their relevant universities. Item 5 again with 40%reveals the absence of strategic training at their working place. On the other hand items 2, 3 and 4indicates negative perception regarding pre-service, innovative and on job training. The aggregateMAS reflect negativity in perception regarding training and guidance manuals of the educationalinstitutions. The negative perception thus reflects disappointment in teacher’s behavior with regardto the provision of training methodologies by their relevant work places. In short the lack of trainingopportunities will raise the feeling of discouragement and de motivation amongst employees. Theywill see no ways via which they can enhance their current skills. The final impact can be seen in theirjob satisfaction feedback which for sure will reflect this lacking and increased employee turnover.
2. With respect to performance appraisal systemIt is associated with human nature that he/she must be influenced by the encouragement and
compensation they receive in return of services they offer. The perceptions may differ though. Someprefer monetary appraisals while some shows more attraction if provided with non-monetary benefitsincluding promotions and more working empowerment.
From Table 6, the negative perception regarding appraisals can be seen. The feedback fromthe second category of Likert Scale apparently reveals that the average number of universitiesoperating in KP is not efficient enough with their employee compensation plans. The impact
definitely can be observed by the job satisfaction and employee’s turnover criterion. Item number 4though indicates an exception with percentage yield of 36.0 and shows positive perception as it iswithin the fourth category of Likert Scale. The maximum percentage is the proof that evaluation isthoroughly done in all the institutes of KPS. Surprisingly the second highest figure 32.8 with items 2and 5 indicates negative perception and lies in the second category of Likert Scale. This percentageasserts the investigated institutions seem productive in their response and appraisals given to thelecturers on the basis of their output. The inquired percentages 32.0 and 30.5 are in particular foritems 1 and 3 which again assert lacking in reward and promotion systems. Hence the aggregateMAS relative to the figure 2.7964 confirm the absence of proactive appraisal systems based on meritand concrete performance, which in return will influence the employee satisfaction and turnover.Concluding, in order to attain reduction in turnover and to enhance teacher’s output it is mandatoryto remunerate them according to their skills and performance.
Table 6 Distribution of Respondents with Respect to Performance Appraisal
Employee PerceptionS.NO Item1. 2. 3. 4. 5.
MAS
1 Your university providesplanned returns to you.
27(21.6)
40(32.0)
25(20.0)
28(22.4)
5(4.0)
2.5520
2 The management upliftsyou on achieving the settargets and rewards youaccordingly.
21(16.8)
41(32.8)
28(22.4)
31(24.8)
4(3.2)
2.6460
3 Promotions are given onpure merit.
20(16.0)
38(30.4)
30(24.0)
30(24.0)
7(5.6)
2.7280
4 Performance evaluationis the regular part of theprocess.
9(7.2)
17(13.6)
33(26.4)
45(36.0)
21(16.8)
3.4160
5 Lecturers are givenappraisals according totheir output.
27(21.6)
41(32.8)
21(16.8)
22(17.6)
14(11.2)
2.6400
Aggregate Mean 2.79641 = strongly Disagree, 2 = Disagree, 3 = neutral, 4 = Agree, 5 = strongly Agree; MAS = meanaverage score
3. With respect to job satisfaction:Job satisfaction plays a crucial role in employee’s satisfaction, productivity and employees
turnover. A worker satisfied with his/her working conditions, satisfied with the receivedfinancial/non-financial appraisals and the overall response of an organization towards his/her workwill definitely impact strong on the outcome of an organization.

19International Journal ofManagement, Business, and EconomicsIJMBE
Table 5 Distribution of Respondents with Respect to Training
Employee PerceptionS.N0 Item1. 2. 3. 4. 5.
MAS
1 You can avail before-service assistance at yourUniversity
43(34.4)
41(32.8)
18(14.4)
17(13.6)
6(4.8)
2.2160
2 Lecturers can benefit frominnovative training at yourUniversity
38(30.4)
46(36.8)
16(12.8)
16(12.8)
9(7.2)
2.2960
3 Fresh Lecturers can benefitfrom on-job training at yourUniversity
26(20.8)
39(31.2)
19(15.2)
25(20.0)
16(12.8)
2.7280
4 Your University gives Inter-personal improvementassistance for instructors.
36(28.8)
52(41.6)
16(12.8)
19(15.2)
2(1.6)
2.1920
5 Your University providesimperative guidance to theInstructors.
41(32.8)
50(40.0)
12(9.6)
19(15.2)
3(2.4)
2.1440
Aggregate Mean 2.31521 = strongly Disagree, 2 = Disagree, 3 = neutral, 4 = Agree, 5 = strongly Agree; MAS = mean
average score
The findings inferred in table 5 indicates the perception of respondents w.r.t Training. It isquite apparent from the above tabular analysis that most of the asked queries regarding Training liein the second category of Likert Scale. The conclusions depicts that the teachers from the selectedUniversities are against the process of giving training by their relevant organizations. This negativeperception will ultimately affect employees overall satisfaction and turnover. In the same way, thereare employees with positive perception towards the concept too while teachers with neutralperception may also be seen. If we analyze in detail, it is obvious from the above analysis that item 4having maximum %age of 41.6% lies within second category of Likert scale representing majority ofteachers taking up the inter-personal guidance at their relevant universities. Item 5 again with 40%reveals the absence of strategic training at their working place. On the other hand items 2, 3 and 4indicates negative perception regarding pre-service, innovative and on job training. The aggregateMAS reflect negativity in perception regarding training and guidance manuals of the educationalinstitutions. The negative perception thus reflects disappointment in teacher’s behavior with regardto the provision of training methodologies by their relevant work places. In short the lack of trainingopportunities will raise the feeling of discouragement and de motivation amongst employees. Theywill see no ways via which they can enhance their current skills. The final impact can be seen in theirjob satisfaction feedback which for sure will reflect this lacking and increased employee turnover.
2. With respect to performance appraisal systemIt is associated with human nature that he/she must be influenced by the encouragement and
compensation they receive in return of services they offer. The perceptions may differ though. Someprefer monetary appraisals while some shows more attraction if provided with non-monetary benefitsincluding promotions and more working empowerment.
From Table 6, the negative perception regarding appraisals can be seen. The feedback fromthe second category of Likert Scale apparently reveals that the average number of universitiesoperating in KP is not efficient enough with their employee compensation plans. The impact
definitely can be observed by the job satisfaction and employee’s turnover criterion. Item number 4though indicates an exception with percentage yield of 36.0 and shows positive perception as it iswithin the fourth category of Likert Scale. The maximum percentage is the proof that evaluation isthoroughly done in all the institutes of KPS. Surprisingly the second highest figure 32.8 with items 2and 5 indicates negative perception and lies in the second category of Likert Scale. This percentageasserts the investigated institutions seem productive in their response and appraisals given to thelecturers on the basis of their output. The inquired percentages 32.0 and 30.5 are in particular foritems 1 and 3 which again assert lacking in reward and promotion systems. Hence the aggregateMAS relative to the figure 2.7964 confirm the absence of proactive appraisal systems based on meritand concrete performance, which in return will influence the employee satisfaction and turnover.Concluding, in order to attain reduction in turnover and to enhance teacher’s output it is mandatoryto remunerate them according to their skills and performance.
Table 6 Distribution of Respondents with Respect to Performance Appraisal
Employee PerceptionS.NO Item1. 2. 3. 4. 5.
MAS
1 Your university providesplanned returns to you.
27(21.6)
40(32.0)
25(20.0)
28(22.4)
5(4.0)
2.5520
2 The management upliftsyou on achieving the settargets and rewards youaccordingly.
21(16.8)
41(32.8)
28(22.4)
31(24.8)
4(3.2)
2.6460
3 Promotions are given onpure merit.
20(16.0)
38(30.4)
30(24.0)
30(24.0)
7(5.6)
2.7280
4 Performance evaluationis the regular part of theprocess.
9(7.2)
17(13.6)
33(26.4)
45(36.0)
21(16.8)
3.4160
5 Lecturers are givenappraisals according totheir output.
27(21.6)
41(32.8)
21(16.8)
22(17.6)
14(11.2)
2.6400
Aggregate Mean 2.79641 = strongly Disagree, 2 = Disagree, 3 = neutral, 4 = Agree, 5 = strongly Agree; MAS = meanaverage score
3. With respect to job satisfaction:Job satisfaction plays a crucial role in employee’s satisfaction, productivity and employees
turnover. A worker satisfied with his/her working conditions, satisfied with the receivedfinancial/non-financial appraisals and the overall response of an organization towards his/her workwill definitely impact strong on the outcome of an organization.

20 International Journal ofManagement, Business, and EconomicsIJMBE
Table 7 Distribution of Respondents with Respect to Job Satisfaction
Employee PerceptionNo
Item1. 2. 3. 4. 5.
MAS
1 You are contented with your work at yourworkplace.
6(4.8)
20(16.0)
22(17.6)
58(46.4)
19(15.2)
3.5120
2 You are contented with your Management. 14(11.2)
35(28.0)
25(20.0)
40(32.0)
11(8.8)
2.9920
3 You are contented with your affiliation withyour subordinates at your workplace.
4(3.2)
6(4.8)
12(9.6)
69(55.2)
34(27.2)
3.9840
4 You are contented with your remuneration atUniversity.
21(16.8)
34(27.2)
26(20.8)
34(27.2)
10(8.0)
2.8240
5 You are contented with the available careerdevelopment opportunities at your workplace.
20(16.0)
48(38.4)
17(13.6)
34(27.2)
6(4.8)
2.6640
6 All-inclusive there is contentment on your partat University.
15(12.0)
24(19.2)
28(22.4)
46(36.8)
12(9.6)
3.1280
Aggregate Mean 3.1840
1 = strongly Disagree, 2 = Disagree, 3 = neutral, 4 = Agree, 5 = strongly Agree; MAS = meanaverage score
Table 7 demonstrates the affirmative feedback of respondents in accordance of their jobcontentment. The maximum percentage which is 55.2% is observed for third number item which isvisible in Likert scale’s fourth category, this elaborates that the relational aspect of an employeetowards other subordinates is satisfactory. 46.4 is the second highest percentage observed which isfor number 1 item, visible in the Likert scale’s fourth category that indicates that majority ofrespondents are actually contented with their organization.
The aggregate MAS depicts the positive feedback of workers which shows that they arehappy with their working environment and the reimbursements they receive in return. Other relevantqueries including interpersonal relations, overall contentment and work opportunities also reflectedthe efficiency of management towards their goals. Hence, if dealt with consistency and wisdom, themotive of increased satisfaction and reduced turnover can be successfully attained.
4. With respect of turnover:Turnover also plays an important role in organization’s overall success and productivity. A
firm showing rising trend towards turnover reflects inefficient HR practices. Table 8 demonstratesthe concept with respect of the study taken into account.
Table 8 Distribution of Respondents with Respect to Turnover
Employee PerceptionS.N0 Item1. 2. 3. 4. 5.
MAS
1. You often consider leavingcurrent job.
8.(6.5)
31.(24.9)
31.(24.9)
32.(25.7.)
23.(18.5)
3.2481
2. Next year you will joinsome other place to work.
9(7.2)
19(15.2)
26(20.8)
45(36.0)
26(20.8)
3.4800
3. Recently, you are interestedin various job offers innewspapers.
11(8.8)
20(16.0)
20(16.0)
39(31.2)
35(28.0)
3.5360
Aggregate Mean 3.42141 = strongly Disagree, 2 = Disagree, 3 = neutral, 4 = Agree, 5 = strongly Agree; MAS = meanaverage score
Table 8 again demonstrates the positive feedback of respondents with respect to the turnover.The maximum percentage can be seen for item number 2 which is 36.0% and visible in Likert scale’sfourth category, indicates that workers are looking for new opportunities around them. The secondhighest percentage seen so far is 31.2% representing item number 3 and lies in the fourth category ofLikert scale indicating that workers are referring to the newspapers to search the new opportunities.25.6% represents item number 1 and can be seen in the fourth category of Likert scale indicating theincreased willingness of employees to change their workplace. In general the analysis depicts thepositive perception and intention of employees to leave/ change their current jobs with MAS of3.1243.
The aggregate MAS of turnover though illustrated the positive feedback, but the negativity inresponses indicates that instructors would love to change their jobs if get a chance. The organizationsthus need to revise their hR policies which are influencing their employees to get motivated towardsother more attractive offerings. In short if universities make sure to take an initiative of improvementand tries to retain their teachers with more rewards/ promotions, empowerment, there would be fewerchances that instructors will change their workplace for material/immaterial benefits.
4. Overall MASS of variables:
Table 9 demonstrated the aggregate MAS of HR practices including employee participation,training and induction and appraisal system along with employee turnover and job satisfaction. Asmentioned above, some of the asked queries were replied negatively.
MAS reflecting these queries thus represents the ‘strongly agree’ or ‘strongly disagree’approaches of employees. The overall MAS as can be seen are slightly below 3. The overallperception of respondents was quite satisfactory except for two variables- Performance appraisalsystems and training and induction.

21International Journal ofManagement, Business, and EconomicsIJMBE
Table 7 Distribution of Respondents with Respect to Job Satisfaction
Employee PerceptionNo
Item1. 2. 3. 4. 5.
MAS
1 You are contented with your work at yourworkplace.
6(4.8)
20(16.0)
22(17.6)
58(46.4)
19(15.2)
3.5120
2 You are contented with your Management. 14(11.2)
35(28.0)
25(20.0)
40(32.0)
11(8.8)
2.9920
3 You are contented with your affiliation withyour subordinates at your workplace.
4(3.2)
6(4.8)
12(9.6)
69(55.2)
34(27.2)
3.9840
4 You are contented with your remuneration atUniversity.
21(16.8)
34(27.2)
26(20.8)
34(27.2)
10(8.0)
2.8240
5 You are contented with the available careerdevelopment opportunities at your workplace.
20(16.0)
48(38.4)
17(13.6)
34(27.2)
6(4.8)
2.6640
6 All-inclusive there is contentment on your partat University.
15(12.0)
24(19.2)
28(22.4)
46(36.8)
12(9.6)
3.1280
Aggregate Mean 3.1840
1 = strongly Disagree, 2 = Disagree, 3 = neutral, 4 = Agree, 5 = strongly Agree; MAS = meanaverage score
Table 7 demonstrates the affirmative feedback of respondents in accordance of their jobcontentment. The maximum percentage which is 55.2% is observed for third number item which isvisible in Likert scale’s fourth category, this elaborates that the relational aspect of an employeetowards other subordinates is satisfactory. 46.4 is the second highest percentage observed which isfor number 1 item, visible in the Likert scale’s fourth category that indicates that majority ofrespondents are actually contented with their organization.
The aggregate MAS depicts the positive feedback of workers which shows that they arehappy with their working environment and the reimbursements they receive in return. Other relevantqueries including interpersonal relations, overall contentment and work opportunities also reflectedthe efficiency of management towards their goals. Hence, if dealt with consistency and wisdom, themotive of increased satisfaction and reduced turnover can be successfully attained.
4. With respect of turnover:Turnover also plays an important role in organization’s overall success and productivity. A
firm showing rising trend towards turnover reflects inefficient HR practices. Table 8 demonstratesthe concept with respect of the study taken into account.
Table 8 Distribution of Respondents with Respect to Turnover
Employee PerceptionS.N0 Item1. 2. 3. 4. 5.
MAS
1. You often consider leavingcurrent job.
8.(6.5)
31.(24.9)
31.(24.9)
32.(25.7.)
23.(18.5)
3.2481
2. Next year you will joinsome other place to work.
9(7.2)
19(15.2)
26(20.8)
45(36.0)
26(20.8)
3.4800
3. Recently, you are interestedin various job offers innewspapers.
11(8.8)
20(16.0)
20(16.0)
39(31.2)
35(28.0)
3.5360
Aggregate Mean 3.42141 = strongly Disagree, 2 = Disagree, 3 = neutral, 4 = Agree, 5 = strongly Agree; MAS = meanaverage score
Table 8 again demonstrates the positive feedback of respondents with respect to the turnover.The maximum percentage can be seen for item number 2 which is 36.0% and visible in Likert scale’sfourth category, indicates that workers are looking for new opportunities around them. The secondhighest percentage seen so far is 31.2% representing item number 3 and lies in the fourth category ofLikert scale indicating that workers are referring to the newspapers to search the new opportunities.25.6% represents item number 1 and can be seen in the fourth category of Likert scale indicating theincreased willingness of employees to change their workplace. In general the analysis depicts thepositive perception and intention of employees to leave/ change their current jobs with MAS of3.1243.
The aggregate MAS of turnover though illustrated the positive feedback, but the negativity inresponses indicates that instructors would love to change their jobs if get a chance. The organizationsthus need to revise their hR policies which are influencing their employees to get motivated towardsother more attractive offerings. In short if universities make sure to take an initiative of improvementand tries to retain their teachers with more rewards/ promotions, empowerment, there would be fewerchances that instructors will change their workplace for material/immaterial benefits.
4. Overall MASS of variables:
Table 9 demonstrated the aggregate MAS of HR practices including employee participation,training and induction and appraisal system along with employee turnover and job satisfaction. Asmentioned above, some of the asked queries were replied negatively.
MAS reflecting these queries thus represents the ‘strongly agree’ or ‘strongly disagree’approaches of employees. The overall MAS as can be seen are slightly below 3. The overallperception of respondents was quite satisfactory except for two variables- Performance appraisalsystems and training and induction.

22 International Journal ofManagement, Business, and EconomicsIJMBE
Table 9 MAS of Variables
Attributes. Mean Average Score (MAS)Worker’s contribution. 3.O754Training & Induction. 2.3153Performance appraisal system. 2.7965Work contentment. 3.1841Turnover. 3.4214
Regression analysis
The software of regression analysis SPSS v. 20 was used for assessment of causal regressionbetween dependent and independent variables. In particular, the influences of HR practices such asemployee contribution, job contentment and turnover were thoroughly analyzed. It is perceptible asdata investigated was largely cross sectional in nature therefore the value of coefficient is anticipatedto come low. Due to this reason the basic dependency is on f-value, p-value and t- ratio.
Regression results for Employee contribution, job satisfaction and turnover
Table 10 demonstrates the regression analysis in association with employee contribution,work satisfaction and employee turnover. This is apparent from the tabular analysis that there ispositive affiliation amongst employee contribution and job satisfaction of the non-governmentinstitutions in KP. The evaluation of t-ratio is greater than 2 (T>2), p-value is significant withP<O.O5 and the overall significance obtained is 126.125 which is larger > 3.
Table 10 Regression Analysis between Employee Contribution, Job Satisfaction and Turnover
Independent variable Dependent Variables(Job Satisfaction) (Turnover)
B. T. P value B. T. P valueEmployee contribution .713 11.232 .0000 -.422 -5.142 .0000Job satisfaction R square= .507, F= 126.126Turnover R square= .178, F= 26.429
Table 10 shows that adequate lead is given to employee contribution which influences the jobsatisfaction reflecting positivity and hence significant. In all-inclusive percentage, the value obtainedfor R square for employee contribution is .507l which reflects that half of the employees’contentment is due to the workers participation and the remaining is caused by other factors. Thisevaluation clearly illustrates that the employee participation is a key contributor in enhancement ofworkers satisfaction. Contribution of workers increases workers motivation and faithfulness, whichultimately influences organization to achieve its goals successfully (khan et al., 2012).In similar vein, Scott, Bishop and Chen (2003) also assert that work satisfaction plays the role ofintermediary between the ingredients of contributory and conducive working environment andworker’s initiative to work professionally with other colleagues.
On the other hand employee contribution showed an inverse relation with job turnover. Theobtained T-ratio is larger than 2 (T<2) but negative, while p-value also reveals significance withP<O.O5 and the overall significance stands to be 26.429 which is >3. These calculations providesufficient evidence regarding employee contribution that has significant negative causation towardturnover. The R square is observed as .178 which indicates that worker’s contribution and turnover
are not affiliated directly with each other, which means if workers are empowered to contribute inuniversity affair they will be more satisfied and would least look at other options. Employee’scontribution is reflecting 17% change in turnover which reinforce the above explanation. In shortlesser employee participation will influence the turnover to get increase drastically.
Regression results for Training, Job satisfaction and Turnover
Table 11 Regression Analysis between Training, Job Satisfaction and Turnover
Independent Variable Dependent variable (Job Satisfaction) (Turnover)
B. T. P-value. B. T. P-value.Training & .553 7.352 .000 -.219 -2.484 .014Career dev.Job satisfaction R square= .305, F= 54.045Turnover R square= .048, F= 6.168
Table 11 assesses regression analysis in the light of training and development, job satisfactionand turnover. The analysis demonstrates a significant positive affiliation between training andinduction, work satisfaction. The interpretation of T-ratio is larger than 2 (T>2), p-value reflectssignificance with P<O.O5 and the total attained significance comes out to be 54.045, which again islarger than 3. From the above analysis a sufficient base is allotted to training which impacts worksatisfaction which in this case is positive come significant. The value for R-square obtained is 0.305that reflects 30% contribution in Job satisfaction. This finding illustrates that if institutions giveteachers more career development opportunities in the form of training, the result will reflect greatersatisfaction among teachers. The affiliation between employee’s satisfaction and training werediscussed several times in previous researches too. Bradley, Petrescu and Simmons (2004) assert thattraining and induction has quite significant influences on overall HR practices. Their investigationalso reveals that training enhances working abilities of an individual that ultimately affect the overallproductivity of an organization.
Unlike job satisfaction, training illustrates an inverse relationship with turnover. The attainedT-ratio value is larger than 2 (T<2) but is negative, p - value reflects significance P<O.O5 and thetotal significance achieved is 6 .168 which is larger than 3. From these calculations, the sufficientbase is given to training directing turnover that is significantly negative. The R- square for turnoveris 0.48 that indicates a very less training impact on turnover which in this case is less than 1%. Theinferences drawn thus depict that if provided with progressive career development options andtrainings, employees will intent less to leave their current jobs. Batt and Valcour (2003) investigatedthat high-participative practices including collaboration, anatomy and training and inductions refer toless turnover and increased output.

23International Journal ofManagement, Business, and EconomicsIJMBE
Table 9 MAS of Variables
Attributes. Mean Average Score (MAS)Worker’s contribution. 3.O754Training & Induction. 2.3153Performance appraisal system. 2.7965Work contentment. 3.1841Turnover. 3.4214
Regression analysis
The software of regression analysis SPSS v. 20 was used for assessment of causal regressionbetween dependent and independent variables. In particular, the influences of HR practices such asemployee contribution, job contentment and turnover were thoroughly analyzed. It is perceptible asdata investigated was largely cross sectional in nature therefore the value of coefficient is anticipatedto come low. Due to this reason the basic dependency is on f-value, p-value and t- ratio.
Regression results for Employee contribution, job satisfaction and turnover
Table 10 demonstrates the regression analysis in association with employee contribution,work satisfaction and employee turnover. This is apparent from the tabular analysis that there ispositive affiliation amongst employee contribution and job satisfaction of the non-governmentinstitutions in KP. The evaluation of t-ratio is greater than 2 (T>2), p-value is significant withP<O.O5 and the overall significance obtained is 126.125 which is larger > 3.
Table 10 Regression Analysis between Employee Contribution, Job Satisfaction and Turnover
Independent variable Dependent Variables(Job Satisfaction) (Turnover)
B. T. P value B. T. P valueEmployee contribution .713 11.232 .0000 -.422 -5.142 .0000Job satisfaction R square= .507, F= 126.126Turnover R square= .178, F= 26.429
Table 10 shows that adequate lead is given to employee contribution which influences the jobsatisfaction reflecting positivity and hence significant. In all-inclusive percentage, the value obtainedfor R square for employee contribution is .507l which reflects that half of the employees’contentment is due to the workers participation and the remaining is caused by other factors. Thisevaluation clearly illustrates that the employee participation is a key contributor in enhancement ofworkers satisfaction. Contribution of workers increases workers motivation and faithfulness, whichultimately influences organization to achieve its goals successfully (khan et al., 2012).In similar vein, Scott, Bishop and Chen (2003) also assert that work satisfaction plays the role ofintermediary between the ingredients of contributory and conducive working environment andworker’s initiative to work professionally with other colleagues.
On the other hand employee contribution showed an inverse relation with job turnover. Theobtained T-ratio is larger than 2 (T<2) but negative, while p-value also reveals significance withP<O.O5 and the overall significance stands to be 26.429 which is >3. These calculations providesufficient evidence regarding employee contribution that has significant negative causation towardturnover. The R square is observed as .178 which indicates that worker’s contribution and turnover
are not affiliated directly with each other, which means if workers are empowered to contribute inuniversity affair they will be more satisfied and would least look at other options. Employee’scontribution is reflecting 17% change in turnover which reinforce the above explanation. In shortlesser employee participation will influence the turnover to get increase drastically.
Regression results for Training, Job satisfaction and Turnover
Table 11 Regression Analysis between Training, Job Satisfaction and Turnover
Independent Variable Dependent variable (Job Satisfaction) (Turnover)
B. T. P-value. B. T. P-value.Training & .553 7.352 .000 -.219 -2.484 .014Career dev.Job satisfaction R square= .305, F= 54.045Turnover R square= .048, F= 6.168
Table 11 assesses regression analysis in the light of training and development, job satisfactionand turnover. The analysis demonstrates a significant positive affiliation between training andinduction, work satisfaction. The interpretation of T-ratio is larger than 2 (T>2), p-value reflectssignificance with P<O.O5 and the total attained significance comes out to be 54.045, which again islarger than 3. From the above analysis a sufficient base is allotted to training which impacts worksatisfaction which in this case is positive come significant. The value for R-square obtained is 0.305that reflects 30% contribution in Job satisfaction. This finding illustrates that if institutions giveteachers more career development opportunities in the form of training, the result will reflect greatersatisfaction among teachers. The affiliation between employee’s satisfaction and training werediscussed several times in previous researches too. Bradley, Petrescu and Simmons (2004) assert thattraining and induction has quite significant influences on overall HR practices. Their investigationalso reveals that training enhances working abilities of an individual that ultimately affect the overallproductivity of an organization.
Unlike job satisfaction, training illustrates an inverse relationship with turnover. The attainedT-ratio value is larger than 2 (T<2) but is negative, p - value reflects significance P<O.O5 and thetotal significance achieved is 6 .168 which is larger than 3. From these calculations, the sufficientbase is given to training directing turnover that is significantly negative. The R- square for turnoveris 0.48 that indicates a very less training impact on turnover which in this case is less than 1%. Theinferences drawn thus depict that if provided with progressive career development options andtrainings, employees will intent less to leave their current jobs. Batt and Valcour (2003) investigatedthat high-participative practices including collaboration, anatomy and training and inductions refer toless turnover and increased output.

24 International Journal ofManagement, Business, and EconomicsIJMBE
Regression results for Performance Appraisal, Job satisfaction and Turnover
Table 12 Regression Analysis between Performance Appraisal, Job Satisfaction and EmployeeTurnover
Independent Dependent variablesVariable (job satisfaction) (employee turnover)
B T P value B T P valuePAS .679 10.243 .0000 -.412 -4.998 .0000Job satisfaction R square= .461, F= 104.904Employee turnover R square= .168, F= 24.995
Table 12 depicts regression results for the independent variable, performance appraisal andtwo dependent variables i.e. job satisfaction and employee turnover. The table illustrates a positiveand significant affiliation between job satisfaction and performance appraisals which he receives inreturn. The value of T-ratio obtained is larger than 2 (T > 2). P value sows significance P<O.O5.Total significance seen so far is 104.904 (F > 3). The R square value is 0.460 which reflects thatperformance appraisal brings about 46% change in overall job satisfaction mechanism. This highyield of percentage depicts that if workers are provided with a rigorous appraisal system, they will beexpected to display greater motivation and satisfaction levels. This finding is in line withcontemporary research where for instance, Karimi et al. (2011) examined affiliation of worker’sperformance appraisal with satisfaction of employees and found a positive affiliation between thetwo.
When analysed with the second dependent variable, Performance appraisal depicted aninverse affiliation with turnover, however. The T - ratio value is larger than 2 (T >2) but negative. P-value shows a significance P<O.O5 and the total significance obtained is 24.995 (F > 3). From theabove interpreted calculations, sufficient base is allocated to performance appraisal directingemployee turnover that is negative and significant. The calculated r- square is 0.168 which showsthat there is around 17% change brought about by appraisal system in employee’s turnover. Thisresult infers that a stronger appraisal system will tend to lower the turnover rates among Universityemployees. It should be noted here that these findings are based on presumption of fair, nepotism-free appraisal system which is expected to enhance employee’s productivity and overall satisfaction.
7. Implications and Conclusion
In line with previous research on job satisfaction, this research too finds existence ofsignificant relationship between employees’ job satisfaction and employee turnover with that ofseveral HRM practices. Nevertheless, this relationship is found in a unique context of KP where anumber of factors such as terrorism, disasters, and deadly diseases have worsened security conditionsthus exacerbating the employee satisfaction among universities. The results revealed that an averageof 70% increase in job satisfaction and turnover is brought about by selected HR strategies likeemployee contribution, skill refinement, and performance appraisement system. This on the otherhand confirmed the dependability of the data collection. The conclusion drawn after the statisticalanalysis of the facts and figures is that there is an affirmative strong relation between HR strategiesand contentment of employees yet an adverse effect of HR strategies was found over the financialyield of professors of private and public sector universities of Peshawar and neighbouring cities.
The results obtained reveal that the professors of Universities of KP are passionate andenthusiastic to contribute in the university at their level best. Contrary to that, universities failed toprovide proper skills refinement, opportunities and performance appraisal system to the teachingcommunity. This kind of misconduct from the university side is bearing a negative impact oncontentment of their employees and consequently, they are being pushed towards other jobopportunities. In order to get the maximum output from their human resources, universities mustapply specific HR strategies adequately and competently. It is also concluded from the figures that tomake your employees contended and devoted towards the organization, performance appraisal andHR strategies (employee contribution and employee training) must be applied efficiently andeffectively.
The current research therefore bears widespread implications for HR strategies and policies ina special context of higher educational institutions. First, the KP universities should make bestpossible use of HRM strategies and policies in order to derive maximum performance and retainemployee turnover. Second, the stakeholders should focus on enhancing job satisfaction andreducing turnover to combat the negative perceptions in prevailing situations of terrorism and chaosin KP. It has been observed that faculty members in KP and Pakistan in general try to settle in anypossible foreign universities in middle-east, Europe and North-America in an escape from terrorismand decreased peace and security in the region. The findings of this research offer a viable strategy,amongst many other effective ones to overcome the problem of brain-drain from important academicpositions in the city. Third, the theoretical association of HR practices and job outcomes has showndiverging results to those of prior research. Moreover, this study has had several limitations toowhich are to be overcome by future researchers. For instance, the sample size need to be increasedmanifold so that wider generalizations can be offered. Finally, future research may also considercomparing the results across other cities of Pakistan and across international borders.
References
Abassi, SM & Hollman, KW. (2000). Turnover: the real bottom line, Public Personnel Management,2 (3), 333-42.
Abeysekera R. (2007). The impact of human resource management practices on marketing executiveturnover of leasing companies in Srilanka. A contemporary management research, 3 (3), 233-252.
Agho, A. O., Price, J. L., & Mueller, C. W. (1992). Discriminant validity of measures of jobsatisfaction, positive affectivity and negative affectivity. Journal of Occupational andOrganizational Psychology, 65(3), 185-195.
Absar M. M. N., Azim M. T., Balasundaram N., Akhter S. (2010). Impact of human resourcepractices on job satisfaction: evidence from manufacturing firms in Bangladesh, Economic scienceseries, LXII (2), 31-42.
Allen D. G., Shore L.M., Griffeth R.W. (2003). The role of perceived organizational support andsupportive human resource practices in the turnover process. Journal of Management, 29 (1), 99-118.
Arumugam.V.C. & Mojtahedzadeh.R. (2011). The Impact of HRM practices on financialperformance of Malaysian industries. International Research Journal of Finance and Economics, 80,49-54.

25International Journal ofManagement, Business, and EconomicsIJMBE
Regression results for Performance Appraisal, Job satisfaction and Turnover
Table 12 Regression Analysis between Performance Appraisal, Job Satisfaction and EmployeeTurnover
Independent Dependent variablesVariable (job satisfaction) (employee turnover)
B T P value B T P valuePAS .679 10.243 .0000 -.412 -4.998 .0000Job satisfaction R square= .461, F= 104.904Employee turnover R square= .168, F= 24.995
Table 12 depicts regression results for the independent variable, performance appraisal andtwo dependent variables i.e. job satisfaction and employee turnover. The table illustrates a positiveand significant affiliation between job satisfaction and performance appraisals which he receives inreturn. The value of T-ratio obtained is larger than 2 (T > 2). P value sows significance P<O.O5.Total significance seen so far is 104.904 (F > 3). The R square value is 0.460 which reflects thatperformance appraisal brings about 46% change in overall job satisfaction mechanism. This highyield of percentage depicts that if workers are provided with a rigorous appraisal system, they will beexpected to display greater motivation and satisfaction levels. This finding is in line withcontemporary research where for instance, Karimi et al. (2011) examined affiliation of worker’sperformance appraisal with satisfaction of employees and found a positive affiliation between thetwo.
When analysed with the second dependent variable, Performance appraisal depicted aninverse affiliation with turnover, however. The T - ratio value is larger than 2 (T >2) but negative. P-value shows a significance P<O.O5 and the total significance obtained is 24.995 (F > 3). From theabove interpreted calculations, sufficient base is allocated to performance appraisal directingemployee turnover that is negative and significant. The calculated r- square is 0.168 which showsthat there is around 17% change brought about by appraisal system in employee’s turnover. Thisresult infers that a stronger appraisal system will tend to lower the turnover rates among Universityemployees. It should be noted here that these findings are based on presumption of fair, nepotism-free appraisal system which is expected to enhance employee’s productivity and overall satisfaction.
7. Implications and Conclusion
In line with previous research on job satisfaction, this research too finds existence ofsignificant relationship between employees’ job satisfaction and employee turnover with that ofseveral HRM practices. Nevertheless, this relationship is found in a unique context of KP where anumber of factors such as terrorism, disasters, and deadly diseases have worsened security conditionsthus exacerbating the employee satisfaction among universities. The results revealed that an averageof 70% increase in job satisfaction and turnover is brought about by selected HR strategies likeemployee contribution, skill refinement, and performance appraisement system. This on the otherhand confirmed the dependability of the data collection. The conclusion drawn after the statisticalanalysis of the facts and figures is that there is an affirmative strong relation between HR strategiesand contentment of employees yet an adverse effect of HR strategies was found over the financialyield of professors of private and public sector universities of Peshawar and neighbouring cities.
The results obtained reveal that the professors of Universities of KP are passionate andenthusiastic to contribute in the university at their level best. Contrary to that, universities failed toprovide proper skills refinement, opportunities and performance appraisal system to the teachingcommunity. This kind of misconduct from the university side is bearing a negative impact oncontentment of their employees and consequently, they are being pushed towards other jobopportunities. In order to get the maximum output from their human resources, universities mustapply specific HR strategies adequately and competently. It is also concluded from the figures that tomake your employees contended and devoted towards the organization, performance appraisal andHR strategies (employee contribution and employee training) must be applied efficiently andeffectively.
The current research therefore bears widespread implications for HR strategies and policies ina special context of higher educational institutions. First, the KP universities should make bestpossible use of HRM strategies and policies in order to derive maximum performance and retainemployee turnover. Second, the stakeholders should focus on enhancing job satisfaction andreducing turnover to combat the negative perceptions in prevailing situations of terrorism and chaosin KP. It has been observed that faculty members in KP and Pakistan in general try to settle in anypossible foreign universities in middle-east, Europe and North-America in an escape from terrorismand decreased peace and security in the region. The findings of this research offer a viable strategy,amongst many other effective ones to overcome the problem of brain-drain from important academicpositions in the city. Third, the theoretical association of HR practices and job outcomes has showndiverging results to those of prior research. Moreover, this study has had several limitations toowhich are to be overcome by future researchers. For instance, the sample size need to be increasedmanifold so that wider generalizations can be offered. Finally, future research may also considercomparing the results across other cities of Pakistan and across international borders.
References
Abassi, SM & Hollman, KW. (2000). Turnover: the real bottom line, Public Personnel Management,2 (3), 333-42.
Abeysekera R. (2007). The impact of human resource management practices on marketing executiveturnover of leasing companies in Srilanka. A contemporary management research, 3 (3), 233-252.
Agho, A. O., Price, J. L., & Mueller, C. W. (1992). Discriminant validity of measures of jobsatisfaction, positive affectivity and negative affectivity. Journal of Occupational andOrganizational Psychology, 65(3), 185-195.
Absar M. M. N., Azim M. T., Balasundaram N., Akhter S. (2010). Impact of human resourcepractices on job satisfaction: evidence from manufacturing firms in Bangladesh, Economic scienceseries, LXII (2), 31-42.
Allen D. G., Shore L.M., Griffeth R.W. (2003). The role of perceived organizational support andsupportive human resource practices in the turnover process. Journal of Management, 29 (1), 99-118.
Arumugam.V.C. & Mojtahedzadeh.R. (2011). The Impact of HRM practices on financialperformance of Malaysian industries. International Research Journal of Finance and Economics, 80,49-54.

26 International Journal ofManagement, Business, and EconomicsIJMBE
Aswathappa, K. (2008). Human Resource Management: Text and Cases, Tata McGraw-HillPublishing Company Limited, Delhi.
Bame. (1993). Organizational characteristics and administrative strategies associated with staffturnover, Health Care Management Review, 18 (4), 70-86.
Batt R. and Valcour P. M. (2003). Human resource practices as predictors of work-family outcomesand employee turnover. Industrial relations: journal of economy and society, 42, 182-220.
Belzen M. V. (2009). The relation between bundled HR practices and employee job satisfaction inthe Dutch pharmacy sector. School of business and economics.
Bradley, S., Petrescu, A., & Simmons, R. (2004, May). The impacts of human resource managementpractices and pay inequality on workers' job satisfaction. In Western Economic Association 79thAnnual Conference Vancouver.
Brown, M., & Heywood, J. S. (2005). Performance appraisal systems: determinants and change.British Journal of Industrial Relations, 43(4), 659-679.
Dalton, D. & Todor, WD. (1981). Turnover, Transfer, Absenteeism: An Interdependent Perspective,Journal of Management, 19 (2), 193-220.
DeMicco FJ & Giridharan, J. (1987). Managing employee turnover in the hospitality industry, FIUHospitality Review, pp. 26-32.
Dyke, TV & Strick, S. (1990). Recruitment, selection and retention of managers in the hotel andrestaurant industry’, FIU Hospitality Review, pp. 1-9.
Delaney J. T. and Huselid M. A. (1996). The impact of human resource management practices onperceptions of organizational performance. The academy of management journal, 39 (4), 949-969.
Gary, D. (2008). A Framework for Human Resource Management. Pearson Education India.
Gregersen, H. B., & Black, J. S. (1999). The right way to manage expats. Harvard business review,77(2), 52-59.
Griffin, M., & Griffin, W. (2001). Organizational Behavior People and Organization, sixth EditionArizona state University. Managing Houghton Mifflin Company, Boston New York, 220-246.
Gurbuz S. (2009). The effect of high performance HR practices on employee’s job satisfaction.Istanbul university journal of the school of business administration, 38 (2), 110-123.
Hussain, T., & Rehman, S. S. (2013). Do Human Resource Management Practices InspireEmployees’ Retention? Research Journal of Applied Sciences, Engineering and Technology, 6 (19),3625-3633.
Huselid M. A. (1995). The impact of human resource management practices on turnover,productivity, and corporate financial performance. The academy of management journal, 38 (3), 635-672.
Karimi, R., Malik, M. I., & Hussain, S. (2011). Examining the relationship of performance appraisalsystem and employee satisfaction. International Journal of Business and Social Science, 2(22).
Khan, A. H., Nawaz, M. M., Aleem, M., & Hamed, W. (2012). Impact of job satisfaction onemployee performance: An empirical study of autonomous Medical Institutions of Pakistan. AfricanJournal of Business Management, 6(7), 2697.
Kevin, MM, Joan, LC & Adrian, JW. (2004). Organizational change and employee turnover,Personnel Review, 33 (2), 161-166.
Koys. D.J. (2001). Effects of Employees satisfaction, Organizational citizenship behaviour and Turnover on Organizational effectiveness: Unit level longitudinal study. Personnel Psychology, 54, 101–114.
Lee, F H and Lee, F Z. (2007). The relationships between HRM practices, leadership Style,competitive strategy and Business performance in Taiwanese steel industry, Proceedings of the 13thAsia pacific management conference, Melbourne, Australia, 953-971.
Meaghan, S & Nick, B. (2002). Voluntary turnover: knowledge management-friend or foe?, Journalof intellectual capacity, 3 (3), 303-322.
Mahmud K. and Idrish S. (2011). The impact human resource management practices on turnover ofbank employees in Bangladesh. World review of business research, 1(2), 71-83.
Mobley, W. H., Horner, S. O., & Hollingsworth, A. T. (1978). An evaluation of precursors ofhospital employee turnover. Journal of Applied psychology, 63(4), 408.
Mumtaz A., Khan I., Aslam H. D., Ahmad B. (2011). Impact of the HR practices on job satisfactionof university teachers: evidence from university in Pakistan. Industrial engineering letters, 1 (3).
Mudor H., Tooksoon P. (2011). Conceptual framework on the relationship between human resourcemanagement practices, job satisfaction and turnover. Journal of economics and behavioral studies, 2(2), 41-49.
Martin M. J. (2011). Influence of human resource practices on employee intention to quit.
Nishi L. H., Lepak D. P., Schneider B. (2008). Employee attributions of the “why” of HR practices:Their effects on employee attitudes & behaviors, and customer satisfaction. Personnel psychology,61, 503-545.
Olusegun, S. O. (2013). Influence of job satisfaction on turnover intentions of library personnel inSelected Universities in South West Nigeria.
Rathanweera, R. R. (2010). Do HRM practices impact employee’s satisfaction, commitment orRetention? (Empirical Studies of Sri Lankan public sector Banks). Published Master’s Thesis,University of Agder.
Roberto Luna-Arocus, Jaoquin Camps. (2007). A model of high performance work practices and turnover intentions. Personnel review, 37 (1), 26-46.

27International Journal ofManagement, Business, and EconomicsIJMBE
Aswathappa, K. (2008). Human Resource Management: Text and Cases, Tata McGraw-HillPublishing Company Limited, Delhi.
Bame. (1993). Organizational characteristics and administrative strategies associated with staffturnover, Health Care Management Review, 18 (4), 70-86.
Batt R. and Valcour P. M. (2003). Human resource practices as predictors of work-family outcomesand employee turnover. Industrial relations: journal of economy and society, 42, 182-220.
Belzen M. V. (2009). The relation between bundled HR practices and employee job satisfaction inthe Dutch pharmacy sector. School of business and economics.
Bradley, S., Petrescu, A., & Simmons, R. (2004, May). The impacts of human resource managementpractices and pay inequality on workers' job satisfaction. In Western Economic Association 79thAnnual Conference Vancouver.
Brown, M., & Heywood, J. S. (2005). Performance appraisal systems: determinants and change.British Journal of Industrial Relations, 43(4), 659-679.
Dalton, D. & Todor, WD. (1981). Turnover, Transfer, Absenteeism: An Interdependent Perspective,Journal of Management, 19 (2), 193-220.
DeMicco FJ & Giridharan, J. (1987). Managing employee turnover in the hospitality industry, FIUHospitality Review, pp. 26-32.
Dyke, TV & Strick, S. (1990). Recruitment, selection and retention of managers in the hotel andrestaurant industry’, FIU Hospitality Review, pp. 1-9.
Delaney J. T. and Huselid M. A. (1996). The impact of human resource management practices onperceptions of organizational performance. The academy of management journal, 39 (4), 949-969.
Gary, D. (2008). A Framework for Human Resource Management. Pearson Education India.
Gregersen, H. B., & Black, J. S. (1999). The right way to manage expats. Harvard business review,77(2), 52-59.
Griffin, M., & Griffin, W. (2001). Organizational Behavior People and Organization, sixth EditionArizona state University. Managing Houghton Mifflin Company, Boston New York, 220-246.
Gurbuz S. (2009). The effect of high performance HR practices on employee’s job satisfaction.Istanbul university journal of the school of business administration, 38 (2), 110-123.
Hussain, T., & Rehman, S. S. (2013). Do Human Resource Management Practices InspireEmployees’ Retention? Research Journal of Applied Sciences, Engineering and Technology, 6 (19),3625-3633.
Huselid M. A. (1995). The impact of human resource management practices on turnover,productivity, and corporate financial performance. The academy of management journal, 38 (3), 635-672.
Karimi, R., Malik, M. I., & Hussain, S. (2011). Examining the relationship of performance appraisalsystem and employee satisfaction. International Journal of Business and Social Science, 2(22).
Khan, A. H., Nawaz, M. M., Aleem, M., & Hamed, W. (2012). Impact of job satisfaction onemployee performance: An empirical study of autonomous Medical Institutions of Pakistan. AfricanJournal of Business Management, 6(7), 2697.
Kevin, MM, Joan, LC & Adrian, JW. (2004). Organizational change and employee turnover,Personnel Review, 33 (2), 161-166.
Koys. D.J. (2001). Effects of Employees satisfaction, Organizational citizenship behaviour and Turnover on Organizational effectiveness: Unit level longitudinal study. Personnel Psychology, 54, 101–114.
Lee, F H and Lee, F Z. (2007). The relationships between HRM practices, leadership Style,competitive strategy and Business performance in Taiwanese steel industry, Proceedings of the 13thAsia pacific management conference, Melbourne, Australia, 953-971.
Meaghan, S & Nick, B. (2002). Voluntary turnover: knowledge management-friend or foe?, Journalof intellectual capacity, 3 (3), 303-322.
Mahmud K. and Idrish S. (2011). The impact human resource management practices on turnover ofbank employees in Bangladesh. World review of business research, 1(2), 71-83.
Mobley, W. H., Horner, S. O., & Hollingsworth, A. T. (1978). An evaluation of precursors ofhospital employee turnover. Journal of Applied psychology, 63(4), 408.
Mumtaz A., Khan I., Aslam H. D., Ahmad B. (2011). Impact of the HR practices on job satisfactionof university teachers: evidence from university in Pakistan. Industrial engineering letters, 1 (3).
Mudor H., Tooksoon P. (2011). Conceptual framework on the relationship between human resourcemanagement practices, job satisfaction and turnover. Journal of economics and behavioral studies, 2(2), 41-49.
Martin M. J. (2011). Influence of human resource practices on employee intention to quit.
Nishi L. H., Lepak D. P., Schneider B. (2008). Employee attributions of the “why” of HR practices:Their effects on employee attitudes & behaviors, and customer satisfaction. Personnel psychology,61, 503-545.
Olusegun, S. O. (2013). Influence of job satisfaction on turnover intentions of library personnel inSelected Universities in South West Nigeria.
Rathanweera, R. R. (2010). Do HRM practices impact employee’s satisfaction, commitment orRetention? (Empirical Studies of Sri Lankan public sector Banks). Published Master’s Thesis,University of Agder.
Roberto Luna-Arocus, Jaoquin Camps. (2007). A model of high performance work practices and turnover intentions. Personnel review, 37 (1), 26-46.

28 International Journal ofManagement, Business, and EconomicsIJMBE
Rogg K. L., Schmidt D. B., Shull C., Schmitt N. (2001). Human resource practices, organizationalclimate and customer satisfaction. Journal of management, 27(4), 431-449.
Scott, D., Bishop, J. W., & Chen, X. (2003). An examination of the relationship of employeeinvolvement with job satisfaction, employee cooperation, and intention to quit in US investedenterprise in China. The International Journal of Organizational Analysis, 11(1), 3-19.
Stavrou Costea, E. (2005). The challenges of HRM towards organizational effectiveness. Journal ofEuropean industrial training, 29 (2), 112-134.
Shahzad K., Bashir S., Ramay M. I. (2008). Impact of HR practices on perceived performance ofuniversity teachers in Pakistan. International review of business research papers, 4 (2), 302-315.
Shaffer, M. A., Harrison, D. A., & Gilley, K. M. (1999). Dimensions, determinants, and differencesin the expatriate adjustment process. Journal of International Business Studies, 557-581.
Trevor C. O. and Nyberg A. J. (2008). Keeping your head count when all about you are losing theirs:downsizing, voluntary rates, and the moderating role of HR practices. The academy of managementjournal, 51(2), 259-276.
Week, B. (2000). Knowledge management and new organization forms: a framework for businessmodel innovation. Knowledge management and virtual organizations, 2-19.
Wright P.M., Gardner T. M., Moynihan L. M. (2003). The impact of HR practices on theperformance of business units. Human resource management journal, 13 (3), 21-36.
Zaini A., Nilufar A. and Syed S. A. (2009). The effects of HRM practices on business performanceamong private companies in Malaysia. International journal of business and management, 4 (6), 65-72.

29International Journal ofManagement, Business, and EconomicsIJMBE
Rogg K. L., Schmidt D. B., Shull C., Schmitt N. (2001). Human resource practices, organizationalclimate and customer satisfaction. Journal of management, 27(4), 431-449.
Scott, D., Bishop, J. W., & Chen, X. (2003). An examination of the relationship of employeeinvolvement with job satisfaction, employee cooperation, and intention to quit in US investedenterprise in China. The International Journal of Organizational Analysis, 11(1), 3-19.
Stavrou Costea, E. (2005). The challenges of HRM towards organizational effectiveness. Journal ofEuropean industrial training, 29 (2), 112-134.
Shahzad K., Bashir S., Ramay M. I. (2008). Impact of HR practices on perceived performance ofuniversity teachers in Pakistan. International review of business research papers, 4 (2), 302-315.
Shaffer, M. A., Harrison, D. A., & Gilley, K. M. (1999). Dimensions, determinants, and differencesin the expatriate adjustment process. Journal of International Business Studies, 557-581.
Trevor C. O. and Nyberg A. J. (2008). Keeping your head count when all about you are losing theirs:downsizing, voluntary rates, and the moderating role of HR practices. The academy of managementjournal, 51(2), 259-276.
Week, B. (2000). Knowledge management and new organization forms: a framework for businessmodel innovation. Knowledge management and virtual organizations, 2-19.
Wright P.M., Gardner T. M., Moynihan L. M. (2003). The impact of HR practices on theperformance of business units. Human resource management journal, 13 (3), 21-36.
Zaini A., Nilufar A. and Syed S. A. (2009). The effects of HRM practices on business performanceamong private companies in Malaysia. International journal of business and management, 4 (6), 65-72.
International Journal ofManagement, Business, and EconomicsIJMBE
The Readability of Note Disclosures
by
Daniel TschoppDepartment of Accounting, St. Leo University,
Saint Leo, Florida, USATel: 352-588-8238, E-mail: [email protected]
Doug BarneyDepartment of Accounting,
Indiana University Southeast, Indiana, USATel: 812-941-2532, E-mail: [email protected]
and
Passard C. DeanDepartment of Accounting and Finance,
St. Leo University, Saint Leo, Florida, USATel: 352-588-8313, E-mail: [email protected]
Abstract
The purpose of financial reporting is to help users make informed decisions. Over time thereporting process has become more and more complex. Reporting standards and rules have increasedboth in terms of quantity and sophistication. Because of this, it is important to ask the question aboutthe basic premise of financial reporting – is the information being reported by companies useful to itsintended users?. This article examines the financial statement notes of the 30 companies thatcomprise the Dow Jones Industrial Average. Readability tests are performed on the financialstatement notes for the years 2000, 2010 and 2015 to determine if the information being reported canbe used by the average user and if the level of complexity has changed over time. The resultsrevealed that the use of the passive voice in financial statement note disclosures have not changedover time. However, based on the Flesch Reading Ease score, the results revealed that over time thereadability of disclosures notes has decreased. The declining trend in readability of financialstatement note disclosures is a cause for concern because it is important the users of these statementsare able to understand the information provided to them so they can make the best decisions.
Keywords: Accounting, Note Disclosures, Readability Test
1. Introduction
The American Accounting Association’s Statement of Basic Accounting Theory describes theimportance of communication in the reporting process and how vital it is that information beingreported can be understood as part of the decision-making process (AAA, 1966). The FinancialAccounting Standards Board’s Statement of financial accounting concepts no. 1 states “Financialreporting should provide information that is useful to present and potential investors and creditorsand other users in making rational investment, credit, and similar decisions. The information should

31International Journal ofManagement, Business, and EconomicsIJMBE
The Readability of Note Disclosures
by
Daniel TschoppDepartment of Accounting, St. Leo University,
Saint Leo, Florida, USATel: 352-588-8238, E-mail: [email protected]
Doug BarneyDepartment of Accounting,
Indiana University Southeast, Indiana, USATel: 812-941-2532, E-mail: [email protected]
and
Passard C. DeanDepartment of Accounting and Finance,
St. Leo University, Saint Leo, Florida, USATel: 352-588-8313, E-mail: [email protected]
Abstract
The purpose of financial reporting is to help users make informed decisions. Over time thereporting process has become more and more complex. Reporting standards and rules have increasedboth in terms of quantity and sophistication. Because of this, it is important to ask the question aboutthe basic premise of financial reporting – is the information being reported by companies useful to itsintended users?. This article examines the financial statement notes of the 30 companies thatcomprise the Dow Jones Industrial Average. Readability tests are performed on the financialstatement notes for the years 2000, 2010 and 2015 to determine if the information being reported canbe used by the average user and if the level of complexity has changed over time. The resultsrevealed that the use of the passive voice in financial statement note disclosures have not changedover time. However, based on the Flesch Reading Ease score, the results revealed that over time thereadability of disclosures notes has decreased. The declining trend in readability of financialstatement note disclosures is a cause for concern because it is important the users of these statementsare able to understand the information provided to them so they can make the best decisions.
Keywords: Accounting, Note Disclosures, Readability Test
1. Introduction
The American Accounting Association’s Statement of Basic Accounting Theory describes theimportance of communication in the reporting process and how vital it is that information beingreported can be understood as part of the decision-making process (AAA, 1966). The FinancialAccounting Standards Board’s Statement of financial accounting concepts no. 1 states “Financialreporting should provide information that is useful to present and potential investors and creditorsand other users in making rational investment, credit, and similar decisions. The information should

32 International Journal ofManagement, Business, and EconomicsIJMBE
be comprehensible to those who have a reasonable understanding of business and economic activitiesand are willing to study the information with reasonable diligence” (FASB, 1978). These two basicguidelines are used as a starting point for this research to answer the question; is the informationbeing reported by companies useful to its intended users? To be useful the users must be able to readand understand what is being reported. To determine if this is happening this research focusesspecifically on financial statement note disclosures.
Financial statement note disclosures complement the financial statements providingadditional information to users aiding them in the decision-making process. Each note is sequencedby a number. Financial statement notes are intended to provide clarity to the financial statements.Some give more specific detail on accounting policies, standards, and methods of accounting used.Some notes are required by the Securities and Exchange Commission (SEC). Some notes expand ona specific line item in the financial statements giving the user more information. The notes serve as atool for users to examine additional information about a company instead of relying solely on thefinancial statements themselves.
The globalization of economies, the development of financial instruments to aid in riskmanagement, and the increase in accounting scandals have resulted in an increase in financialstatement note disclosures (Kieso et al., 2013). The increase in the amount of disclosures in terms ofnumber of disclosures, length of disclosures, and complexity of disclosures, has brought theirusefulness into question (Bloomfield, 2012; Lawrence, 2013; Morunga & Bradbury, 2012). There arealso differing opinions on whether the increase in financial statement note disclosures is a result ofthe development and implementation of new accounting standards or a result of how preparers applythe standards (Barker et al., 2013). Regardless of the reason for the increase in note disclosures thereremains a concern that the increase has made it difficult for the average user to interpret and makeinformed decisions from reading the notes. To assess this ability of financial statement users thisarticle looks at the readability of the notes.
This article examines the financial statement notes of the 30 companies that comprise theDow Jones Industrial Average. Readability tests are performed on the financial statement notes forthe years 2000, 2010 and 2015 to determine if the information being reported can be used by theaverage user and if the level of complexity has changed over time. The readability tests used foranalysis are the number of passive sentences, Flesch Reading Ease readability test, and Flesch-Kincaid readability test. If the readability levels are at the level of people “who have a reasonableunderstanding of business and economic activities and are willing to study the information withreasonable diligence” then there is no problem. If the readability levels have not changedsignificantly over time then there is no problem. However, if this is not the case thenrecommendations should be made to assist the intended user.
2. Research Methodology
The companies selected for this analysis were the 30 companies that comprised the DowJones Industrial Average (DJIA) in 2015. These companies were selected because they representleading companies in a wide variety of industries and are representative of the stock market. Inaddition, most of the companies that comprise the DJIA have been around for many years, resultingin the availability of time series data.
After the companies were selected annual reports were obtained for these companies for theyears 2015, 2010, and 2000. The annual reports were obtained from the SEC’s Edgar Database. The
SEC database only has annual reports dating back to the mid-1990s. Efforts were also made toobtain annual reports from 1990 and 1980 from ProQuest’s Historical Annual Reports Database andfrom contacting the companies directly. Only a select few had annual reports available and most ofthose were not able to be converted to a Word document.
Once the annual reports were obtained and converted into Word documents if necessary, theresearchers examined the readability of financial statement notes from each annual report using threemeasures – passive sentences, Flesch Reading Ease, and Flesch-Kincaid:
Passive Sentences (PS)
Passive sentences are not as clear and concise as active sentences. In a passive sentence thesubject of the sentence does not perform the action identified by the verb. Therefore, writers shoulduse passive sentences sparingly.
Flesch Reading Ease (FSE)
Rates text on a 100-point scale; the higher the score, the easier it is to understand thedocument. For most standard documents, aim for a score of approximately 60 to 70. The formulafor the Flesch Reading Ease score is:
206.835 – (1.015xASL) – (84.6xASW)
where:ASL = average sentence length (the number of words divided by the number of sentences)
ASW = average number of syllables per word (the number of syllables divided by the numberof words)
Retrieved April 4, 2017 from the Word Help Screen.
Flesch-Kincaid (F-KGL)
Measures the education level needed by readers as a necessary requirement to understand thedocument. This test rates text on a U.S. school grade level. For example, a score of 8.0 means thatan eighth grader can understand the document. For most documents, aim for a score ofapproximately 7.0 to 8.0.The formula for the Flesch-Kincaid Grade Level score is:
(.39xASL) + (11.8xASW)-15.59
Where:
ASL = average sentence length (the number of words divided by the number of sentences)ASW = average number of syllables per word (the number of syllables divided by the numberof words)
Retrieved April 4, 2017 from the Word Help Screen.

33International Journal ofManagement, Business, and EconomicsIJMBE
be comprehensible to those who have a reasonable understanding of business and economic activitiesand are willing to study the information with reasonable diligence” (FASB, 1978). These two basicguidelines are used as a starting point for this research to answer the question; is the informationbeing reported by companies useful to its intended users? To be useful the users must be able to readand understand what is being reported. To determine if this is happening this research focusesspecifically on financial statement note disclosures.
Financial statement note disclosures complement the financial statements providingadditional information to users aiding them in the decision-making process. Each note is sequencedby a number. Financial statement notes are intended to provide clarity to the financial statements.Some give more specific detail on accounting policies, standards, and methods of accounting used.Some notes are required by the Securities and Exchange Commission (SEC). Some notes expand ona specific line item in the financial statements giving the user more information. The notes serve as atool for users to examine additional information about a company instead of relying solely on thefinancial statements themselves.
The globalization of economies, the development of financial instruments to aid in riskmanagement, and the increase in accounting scandals have resulted in an increase in financialstatement note disclosures (Kieso et al., 2013). The increase in the amount of disclosures in terms ofnumber of disclosures, length of disclosures, and complexity of disclosures, has brought theirusefulness into question (Bloomfield, 2012; Lawrence, 2013; Morunga & Bradbury, 2012). There arealso differing opinions on whether the increase in financial statement note disclosures is a result ofthe development and implementation of new accounting standards or a result of how preparers applythe standards (Barker et al., 2013). Regardless of the reason for the increase in note disclosures thereremains a concern that the increase has made it difficult for the average user to interpret and makeinformed decisions from reading the notes. To assess this ability of financial statement users thisarticle looks at the readability of the notes.
This article examines the financial statement notes of the 30 companies that comprise theDow Jones Industrial Average. Readability tests are performed on the financial statement notes forthe years 2000, 2010 and 2015 to determine if the information being reported can be used by theaverage user and if the level of complexity has changed over time. The readability tests used foranalysis are the number of passive sentences, Flesch Reading Ease readability test, and Flesch-Kincaid readability test. If the readability levels are at the level of people “who have a reasonableunderstanding of business and economic activities and are willing to study the information withreasonable diligence” then there is no problem. If the readability levels have not changedsignificantly over time then there is no problem. However, if this is not the case thenrecommendations should be made to assist the intended user.
2. Research Methodology
The companies selected for this analysis were the 30 companies that comprised the DowJones Industrial Average (DJIA) in 2015. These companies were selected because they representleading companies in a wide variety of industries and are representative of the stock market. Inaddition, most of the companies that comprise the DJIA have been around for many years, resultingin the availability of time series data.
After the companies were selected annual reports were obtained for these companies for theyears 2015, 2010, and 2000. The annual reports were obtained from the SEC’s Edgar Database. The
SEC database only has annual reports dating back to the mid-1990s. Efforts were also made toobtain annual reports from 1990 and 1980 from ProQuest’s Historical Annual Reports Database andfrom contacting the companies directly. Only a select few had annual reports available and most ofthose were not able to be converted to a Word document.
Once the annual reports were obtained and converted into Word documents if necessary, theresearchers examined the readability of financial statement notes from each annual report using threemeasures – passive sentences, Flesch Reading Ease, and Flesch-Kincaid:
Passive Sentences (PS)
Passive sentences are not as clear and concise as active sentences. In a passive sentence thesubject of the sentence does not perform the action identified by the verb. Therefore, writers shoulduse passive sentences sparingly.
Flesch Reading Ease (FSE)
Rates text on a 100-point scale; the higher the score, the easier it is to understand thedocument. For most standard documents, aim for a score of approximately 60 to 70. The formulafor the Flesch Reading Ease score is:
206.835 – (1.015xASL) – (84.6xASW)
where:ASL = average sentence length (the number of words divided by the number of sentences)
ASW = average number of syllables per word (the number of syllables divided by the numberof words)
Retrieved April 4, 2017 from the Word Help Screen.
Flesch-Kincaid (F-KGL)
Measures the education level needed by readers as a necessary requirement to understand thedocument. This test rates text on a U.S. school grade level. For example, a score of 8.0 means thatan eighth grader can understand the document. For most documents, aim for a score ofapproximately 7.0 to 8.0.The formula for the Flesch-Kincaid Grade Level score is:
(.39xASL) + (11.8xASW)-15.59
Where:
ASL = average sentence length (the number of words divided by the number of sentences)ASW = average number of syllables per word (the number of syllables divided by the numberof words)
Retrieved April 4, 2017 from the Word Help Screen.

34 International Journal ofManagement, Business, and EconomicsIJMBE
Limitations of Readability Tests
These three readability tests are not flawless. There is no specific score that represents “thosewho have a reasonable understanding of business and economic activities”. There are no variablesthat take into account industry specific jargon or terminology. The limitations of their use arehighlighted in the passage below:
“Existing readability indices have similar problems with interpreting the discourse used inmost financial disclosures. For example, consider the words “management, “division,” and“company.” In some popular readability indices, these multi-syllable words would beconsidered “complex” and would increase the readability scores of the textual sample.However, most investors (either sophisticated investors or non-sophisticated investors) wouldlikely correctly interpret the meaning of these words in almost any financial disclosure. Thus,in the context of financial disclosures, most preexisting readability indices also have flawsthat could impede accounting and finance research” (Collins, 2012).
However, even with these limitations, the aforementioned readability tests are believed to bethe most commonly used and accepted readability tests that can yield the most consistent and reliableinformation.
3. Research Questions
The business and regulatory environment has grown more complex during the time periodexamined in this study. Consider just the advent of Sarbanes Oxley and its ensuing increasedregulation. After Sarbanes Oxley, publicly-traded companies, most certainly including the firms inthe Dow Jones Industrial list, must provide more evidence of meeting SOX regulations. Theseregulations generally took effect after 2002. Therefore, we would expect that there is the distinctpossibility that 10-K reports increased in disclosure complexity during the years following thepassage of Sarbanes Oxley. For the purposes of this study, this means that we can expect significantdifferences between the complexity of financial statements between 2000 and 2010.
The use of passive sentences increases the difficulty of understanding financial statements.While it would be beneficial for companies to make more use of active voice, there is reason tobelieve that the use of passive voice has changed. In fact, the use of increased regulatoryrequirements may well result in an increase in the use of passive voice in 10-Ks.
H1: The use of passive voice will increase over the years 2000, 2010, and 2015.
Increased regulatory requirements, like Sarbanes Oxley, in the wake of significant financialand audit failures (think Enron, Global Crossings, HealthSouth) resulted in publicly-tradedcompanies providing more information in their 10-Ks. This increased disclosure was significant anda subject of much ridicule by laissez-fair politicians. A move to reduce these regulatory burdens maydecrease 10-K reporting complexity in coming years, but during the years from 2000 to 2015regulatory burden increased. These increased regulatory requirements may lead to increaseddifficulty in readability and understanding.
H2: The Flesch Reading Ease score declined from 2000 to 2015.H3: The Flesch-Kincaid Grade Level measure increased from 2000 to 2015.
4. Results Analysis
Table 1 30 Dow Jones Industrial Average Companies for 2015 with Data from 2000, 2010, and 2015
COMPANY 2000 2010 2015
PS FREF-KGL PS FRE
F-KGL PS FRE
F-KGL
American Express Co0.30
17.10 15.70
0.34
16.50 17.10
0.33
15.10 17.60
Apple Inc0.28
18.80 15.60
0.31
14.50 17.90
0.34
14.90 17.90
Boeing Co0.36
15.70 16.80
0.30
16.20 17.60
0.33
18.70 16.60
Caterpillar Inc0.29
21.50 14.90
0.31
16.60 16.90
0.31
16.80 16.40
Cisco Systems Inc0.32
21.10 15.00
0.33
15.30
17..60
0.29
15.00 17.80
Chevron Corp0.19
22.40 15.20
0.30
15.90 16.60
0.29
15.20 17.00
DuPont0.36
18.60 15.70
0.29
18.40 15.70
0.29
14.10 17.20
Exxon Mobil Corp0.34
17.00 15.80
0.35
18.80 15.80
0.30
19.30 15.60
General Electric Co0.34
16.80 15.50
0.34
16.90 15.80
0.27
14.90 16.90
Goldman Sachs Group Inc0.31
17.60 16.40
0.21
18.30 16.70
0.30
15.50 17.10
Home Depot Inc0.32
19.70 16.00
0.32
15.20 17.70
0.34
14.40 18.00
IBM0.29
15.40 16.50
0.34
16.10 16.80
0.29
15.80 17.20
Intel Corp0.32
15.40 16.40
0.20
18.80 16.70
0.23
17.30 17.00
Johnson & Johnson0.19 9.50 15.80
0.33
20.40 15.80
0.29
16.90 16.80
Coca-Cola Co0.30
13.40 16.80
0.25
18.30 16.20
0.25
17.90 16.60
JPMorgan Chase and Co0.35
19.90 15.90
0.31
19.00 16.70
0.31
19.30 16.70
McDonald's Corp0.33
18.00 16.10
0.37
12.60 17.00
0.32
14.60 16.60
3M Co0.36 7.90 17.50
0.28
13.90 17.70
0.28
13.50 18.00
Merck & Co Inc0.22
20.20 15.80
0.30
15.30 17.60
0.31
14.60 17.50
Microsoft Corp0.28
18.10 17.10
0.32
19.90 16.00
0.36
18.70 16.10
Nike Inc0.28
17.80 14.90
0.26
14.20 17.40
0.28
15.90 17.40

35International Journal ofManagement, Business, and EconomicsIJMBE
Limitations of Readability Tests
These three readability tests are not flawless. There is no specific score that represents “thosewho have a reasonable understanding of business and economic activities”. There are no variablesthat take into account industry specific jargon or terminology. The limitations of their use arehighlighted in the passage below:
“Existing readability indices have similar problems with interpreting the discourse used inmost financial disclosures. For example, consider the words “management, “division,” and“company.” In some popular readability indices, these multi-syllable words would beconsidered “complex” and would increase the readability scores of the textual sample.However, most investors (either sophisticated investors or non-sophisticated investors) wouldlikely correctly interpret the meaning of these words in almost any financial disclosure. Thus,in the context of financial disclosures, most preexisting readability indices also have flawsthat could impede accounting and finance research” (Collins, 2012).
However, even with these limitations, the aforementioned readability tests are believed to bethe most commonly used and accepted readability tests that can yield the most consistent and reliableinformation.
3. Research Questions
The business and regulatory environment has grown more complex during the time periodexamined in this study. Consider just the advent of Sarbanes Oxley and its ensuing increasedregulation. After Sarbanes Oxley, publicly-traded companies, most certainly including the firms inthe Dow Jones Industrial list, must provide more evidence of meeting SOX regulations. Theseregulations generally took effect after 2002. Therefore, we would expect that there is the distinctpossibility that 10-K reports increased in disclosure complexity during the years following thepassage of Sarbanes Oxley. For the purposes of this study, this means that we can expect significantdifferences between the complexity of financial statements between 2000 and 2010.
The use of passive sentences increases the difficulty of understanding financial statements.While it would be beneficial for companies to make more use of active voice, there is reason tobelieve that the use of passive voice has changed. In fact, the use of increased regulatoryrequirements may well result in an increase in the use of passive voice in 10-Ks.
H1: The use of passive voice will increase over the years 2000, 2010, and 2015.
Increased regulatory requirements, like Sarbanes Oxley, in the wake of significant financialand audit failures (think Enron, Global Crossings, HealthSouth) resulted in publicly-tradedcompanies providing more information in their 10-Ks. This increased disclosure was significant anda subject of much ridicule by laissez-fair politicians. A move to reduce these regulatory burdens maydecrease 10-K reporting complexity in coming years, but during the years from 2000 to 2015regulatory burden increased. These increased regulatory requirements may lead to increaseddifficulty in readability and understanding.
H2: The Flesch Reading Ease score declined from 2000 to 2015.H3: The Flesch-Kincaid Grade Level measure increased from 2000 to 2015.
4. Results Analysis
Table 1 30 Dow Jones Industrial Average Companies for 2015 with Data from 2000, 2010, and 2015
COMPANY 2000 2010 2015
PS FREF-KGL PS FRE
F-KGL PS FRE
F-KGL
American Express Co0.30
17.10 15.70
0.34
16.50 17.10
0.33
15.10 17.60
Apple Inc0.28
18.80 15.60
0.31
14.50 17.90
0.34
14.90 17.90
Boeing Co0.36
15.70 16.80
0.30
16.20 17.60
0.33
18.70 16.60
Caterpillar Inc0.29
21.50 14.90
0.31
16.60 16.90
0.31
16.80 16.40
Cisco Systems Inc0.32
21.10 15.00
0.33
15.30
17..60
0.29
15.00 17.80
Chevron Corp0.19
22.40 15.20
0.30
15.90 16.60
0.29
15.20 17.00
DuPont0.36
18.60 15.70
0.29
18.40 15.70
0.29
14.10 17.20
Exxon Mobil Corp0.34
17.00 15.80
0.35
18.80 15.80
0.30
19.30 15.60
General Electric Co0.34
16.80 15.50
0.34
16.90 15.80
0.27
14.90 16.90
Goldman Sachs Group Inc0.31
17.60 16.40
0.21
18.30 16.70
0.30
15.50 17.10
Home Depot Inc0.32
19.70 16.00
0.32
15.20 17.70
0.34
14.40 18.00
IBM0.29
15.40 16.50
0.34
16.10 16.80
0.29
15.80 17.20
Intel Corp0.32
15.40 16.40
0.20
18.80 16.70
0.23
17.30 17.00
Johnson & Johnson0.19 9.50 15.80
0.33
20.40 15.80
0.29
16.90 16.80
Coca-Cola Co0.30
13.40 16.80
0.25
18.30 16.20
0.25
17.90 16.60
JPMorgan Chase and Co0.35
19.90 15.90
0.31
19.00 16.70
0.31
19.30 16.70
McDonald's Corp0.33
18.00 16.10
0.37
12.60 17.00
0.32
14.60 16.60
3M Co0.36 7.90 17.50
0.28
13.90 17.70
0.28
13.50 18.00
Merck & Co Inc0.22
20.20 15.80
0.30
15.30 17.60
0.31
14.60 17.50
Microsoft Corp0.28
18.10 17.10
0.32
19.90 16.00
0.36
18.70 16.10
Nike Inc0.28
17.80 14.90
0.26
14.20 17.40
0.28
15.90 17.40

36 International Journal ofManagement, Business, and EconomicsIJMBE
Pfizer Inc0.25
21.50 16.10
0.25
16.40 17.40
0.22 3.80 20.10
Procter & Gamble Co0.30
18.10 15.40
0.36
19.60 16.00
0.36
18.90 16.20
Travelers Companies Inc # # #0.29
13.70 17.80
0.31
11.70 18.30
UnitedHealth Group Inc0.10
21.50 14.20
0.31
16.50 17.10
0.30
13.40 17.40
United Technologies Corp0.35
13.30 16.40
0.31
15.40 16.80
0.30
10.20 18.10
Verizon Comm. Inc0.28
15.80 16.90
0.31
14.00 17.60
0.32
12.90 18.10
Visa Inc * * *0.27
18.90 16.40
0.28
18.20 16.60
Wal Mart Stores Inc0.39
18.40 15.90
0.30
16.60 16.80
0.29
17.20 16.90
Walt Disney Co0.30
14.70 17.20
0.28
14.60 17.30
0.30
15.90 17.00
* Visa became a public company in 2007.# Travelers was St. Paul Companies prior to 2005.
Table 1 above provides the raw data for the study. The table lists the 30 Dow Jones IndustrialAverage companies for 2015 with data from 2000, 2010, and 2015.
Table 2 Descriptive Data on the PS, FE, and F-KGL Measures for Each of the Years 2000, 2010, and2015
2000 2000 2000 2010 2010 2010 2015 2015 2015PS FRE FKGL PS FRE FKGL PS FRE FKGL
Mean .30 17.98 15.99 .30 16.56 16.88 .30 15.68 17.16Median
.30 17.95 15.95 .31 16.45 16.85 .30 15.35 17.05
Mode .30 21.5 16.40 .31 16.50 17.6 .29 14.90 16.60Range .29 9.1 3.3 .17 7.8 2.2 .13 9.1 2.7n 28 28 28 30 30 30 30 30 30
Table 2 provides descriptive data on the PS, FE, and F-KGL measures for each of the years2000, 2010, and 2015. While the results of the t-tests will show (below) that there was no significantchange in the percentage of passive sentences over the three years, the range of percentages ofpassive sentences tightened. In 2000 the percentage of passive sentences in corporate 10-Ks rangedfrom 10 to 39 percent. This range was 20 to 37 percent in 2010 and 23 top 36 percent in 2015.Thus, while the mean of passive sentence use remained at 30 percent over all three years, the rangeof the percentage reduced from 29 percent to 17 percent to 13 percent.
Table 3 T-Tests of Passive Sentence Readability Measures
observations tStat SignificancePS 2000 – PS 2010 28 -.10099 .45999PS 2000 – PS 2015 28 -.02694 .48932PS 2010 – PS 2015 30 -.16898 .43349
Table 3 provides the results of t-tests of Passive Sentence readability measures, comparingeach pair of years. According to the statistical results, there is no statistical difference in thefrequency of passive sentences between years. This result was expected based on an initial review ofthe descriptive data for passive sentence structure. The frequency of passive sentences was 30, 30.1,and 30 percent for the years 2000, 2010, and 2015 respectively. Thus, the results reject H1.
Table 4 FLESCH Reading Ease Score
observations tStat SignificanceFRE 2000 – FRE 2010 28 2.38990 .01022FRE 2000 – FRE 2015 28 3.71505 .00023FRE 2010 – FRE 2015 30 2.68393 .00595
Table 4 provides the results of Flesch Reading Ease Score. Flesch Reading Ease provides ascore from 0 to 100, with easier reading documents displaying higher scores. Ideally, FRE scoreswould increase over the years. This did not happen. Flesch Reading Ease scores decreasedsignificantly over the three years studied, indicating a significant increase in reading difficulty. Themean FRE scores for 2000, 2010, and 2015 were 17.98, 16.56, and 15.68. The decrease in scoreswas significant (p<.01) for each comparison and consistent over the years studied.Extremely values in the disclosure notes are not unusual. Below is a paragraph taken from one of thecompany’s financial statement note disclosures section of the financial report. The Flesch ReadingEase Score was 4.1. While this is an extremely low score, it is not unusual as the note disclosuresection in financial reports discusses technical accounting information for a company.
“In April 2014, the Financial Accounting Standards Board (FASB) issued revised guidance toreduce diversity in practice for reporting discontinued operations. Under the previous guidance, anycomponent of an entity that was a reportable segment, an operating segment, a reporting unit, asubsidiary or an asset group was eligible for discontinued operations presentation. The revisedguidance only allows disposals of components of an entity that represent a strategic shift (e.g.,disposal of a major geographical area, a major line of business, a major equity method investment orother major parts of an entity) and that have a major effect on a reporting entity's operations andfinancial results to be reported as discontinued operations. The revised guidance also requiresexpanded disclosure in the financial statements for discontinued operations as well as for disposals ofsignificant components of an entity that do not qualify for discontinued operations presentation. Theupdated guidance was effective for the quarter ending March 31, 2015. The adoption of this guidancedid not have any effect on the Company’s results of operations, financial position or liquidity.”

37International Journal ofManagement, Business, and EconomicsIJMBE
Pfizer Inc0.25
21.50 16.10
0.25
16.40 17.40
0.22 3.80 20.10
Procter & Gamble Co0.30
18.10 15.40
0.36
19.60 16.00
0.36
18.90 16.20
Travelers Companies Inc # # #0.29
13.70 17.80
0.31
11.70 18.30
UnitedHealth Group Inc0.10
21.50 14.20
0.31
16.50 17.10
0.30
13.40 17.40
United Technologies Corp0.35
13.30 16.40
0.31
15.40 16.80
0.30
10.20 18.10
Verizon Comm. Inc0.28
15.80 16.90
0.31
14.00 17.60
0.32
12.90 18.10
Visa Inc * * *0.27
18.90 16.40
0.28
18.20 16.60
Wal Mart Stores Inc0.39
18.40 15.90
0.30
16.60 16.80
0.29
17.20 16.90
Walt Disney Co0.30
14.70 17.20
0.28
14.60 17.30
0.30
15.90 17.00
* Visa became a public company in 2007.# Travelers was St. Paul Companies prior to 2005.
Table 1 above provides the raw data for the study. The table lists the 30 Dow Jones IndustrialAverage companies for 2015 with data from 2000, 2010, and 2015.
Table 2 Descriptive Data on the PS, FE, and F-KGL Measures for Each of the Years 2000, 2010, and2015
2000 2000 2000 2010 2010 2010 2015 2015 2015PS FRE FKGL PS FRE FKGL PS FRE FKGL
Mean .30 17.98 15.99 .30 16.56 16.88 .30 15.68 17.16Median
.30 17.95 15.95 .31 16.45 16.85 .30 15.35 17.05
Mode .30 21.5 16.40 .31 16.50 17.6 .29 14.90 16.60Range .29 9.1 3.3 .17 7.8 2.2 .13 9.1 2.7n 28 28 28 30 30 30 30 30 30
Table 2 provides descriptive data on the PS, FE, and F-KGL measures for each of the years2000, 2010, and 2015. While the results of the t-tests will show (below) that there was no significantchange in the percentage of passive sentences over the three years, the range of percentages ofpassive sentences tightened. In 2000 the percentage of passive sentences in corporate 10-Ks rangedfrom 10 to 39 percent. This range was 20 to 37 percent in 2010 and 23 top 36 percent in 2015.Thus, while the mean of passive sentence use remained at 30 percent over all three years, the rangeof the percentage reduced from 29 percent to 17 percent to 13 percent.
Table 3 T-Tests of Passive Sentence Readability Measures
observations tStat SignificancePS 2000 – PS 2010 28 -.10099 .45999PS 2000 – PS 2015 28 -.02694 .48932PS 2010 – PS 2015 30 -.16898 .43349
Table 3 provides the results of t-tests of Passive Sentence readability measures, comparingeach pair of years. According to the statistical results, there is no statistical difference in thefrequency of passive sentences between years. This result was expected based on an initial review ofthe descriptive data for passive sentence structure. The frequency of passive sentences was 30, 30.1,and 30 percent for the years 2000, 2010, and 2015 respectively. Thus, the results reject H1.
Table 4 FLESCH Reading Ease Score
observations tStat SignificanceFRE 2000 – FRE 2010 28 2.38990 .01022FRE 2000 – FRE 2015 28 3.71505 .00023FRE 2010 – FRE 2015 30 2.68393 .00595
Table 4 provides the results of Flesch Reading Ease Score. Flesch Reading Ease provides ascore from 0 to 100, with easier reading documents displaying higher scores. Ideally, FRE scoreswould increase over the years. This did not happen. Flesch Reading Ease scores decreasedsignificantly over the three years studied, indicating a significant increase in reading difficulty. Themean FRE scores for 2000, 2010, and 2015 were 17.98, 16.56, and 15.68. The decrease in scoreswas significant (p<.01) for each comparison and consistent over the years studied.Extremely values in the disclosure notes are not unusual. Below is a paragraph taken from one of thecompany’s financial statement note disclosures section of the financial report. The Flesch ReadingEase Score was 4.1. While this is an extremely low score, it is not unusual as the note disclosuresection in financial reports discusses technical accounting information for a company.
“In April 2014, the Financial Accounting Standards Board (FASB) issued revised guidance toreduce diversity in practice for reporting discontinued operations. Under the previous guidance, anycomponent of an entity that was a reportable segment, an operating segment, a reporting unit, asubsidiary or an asset group was eligible for discontinued operations presentation. The revisedguidance only allows disposals of components of an entity that represent a strategic shift (e.g.,disposal of a major geographical area, a major line of business, a major equity method investment orother major parts of an entity) and that have a major effect on a reporting entity's operations andfinancial results to be reported as discontinued operations. The revised guidance also requiresexpanded disclosure in the financial statements for discontinued operations as well as for disposals ofsignificant components of an entity that do not qualify for discontinued operations presentation. Theupdated guidance was effective for the quarter ending March 31, 2015. The adoption of this guidancedid not have any effect on the Company’s results of operations, financial position or liquidity.”

38 International Journal ofManagement, Business, and EconomicsIJMBE
Table 5 FLESCH KINCAID Grade Level Measure
observations tStat significanceFKGL 2000 – FKGL 2010 28 -4.62276 .00001FKGL 2000 – FKGL 2015 28 -6.03314 .00001FKGL 2010 – FKGL 2015 30 -2.87959 .00370
Table 5 provides the results of the Flesch Kincaid Grade Level measure. The F-KGLmeasure identifies the level of education needed to understand the document examined. Therefore,lower scores indicate easier reading. It would be desirable to see the F-KGL scores decrease over theyears, indicating that documents are getting easier to read. The F-KGL scores actually increasedsignificantly (p<.01) over the years studied. Initially, the grade level needed to understand financialstatement notes was the completion of an undergraduate college degree (16 years of education).Ultimately, 2015 financial statement notes require the equivalent of some (a little over one year) ofgraduate study for proper understanding.
The Flesch Kincaid Grade Level measure for the paragraph below taken from one of thecompanies in the research is 25.4. Like the paragraph shown in the Flesch Reading Ease, this is notunusual as accountants are writing about technical accounting issues.
“In preparing the consolidated financial statements, we use certain estimates andassumptions that affect reported amounts and disclosures, including amountsrecorded and disclosed in connection with acquisitions. These estimates andunderlying assumptions can impact all elements of our financial statements. Forexample, in the consolidated statements of income, estimates are used whenaccounting for deductions from revenues (such as rebates, chargebacks, salesallowances and sales returns), determining the cost of inventory that is sold,allocating cost in the form of depreciation and amortization, and estimatingrestructuring charges and the impact of contingencies. On the consolidatedbalance sheets, estimates are used in determining the valuation and recoverabilityof assets, such as accounts receivable, investments, inventories, deferred taxassets, fixed assets and intangible assets (including acquired in-process research& development (IPR&D) assets), and estimates are used in determining thereported amounts of liabilities, such as taxes payable, benefit obligations, accrualsfor contingencies, rebates, chargebacks, sales allowances and sales returns, andrestructuring reserves, all of which also impact the consolidated statements ofincome.”
5. Conclusion and Recommendation
The results support acceptance of H2 and H3, but not H1. The use of passive voice did notchange over the years examined. Apparently, there is no reason to anticipate that increasedregulation and the resulting increased regulatory disclosure will also result in the increased use ofpassive voice.
The data supported H2. The Flesch Reading Ease score decreased significantly over theyears examined. The FRE score decreased from 17.98 to 16.56 to 15.68 over the years 2000, 2010,and 2015 respectively, representing decreased readability. Not only was the decrease in readabilitysignificant, but it was consistent over the three years.
The data supported H3. As with H2, the Flesch-Kincaid Grade Level score indicated reducedreadability over the years studied. The score increased from 15.99 to 16.88 to 17.16 over the years2000, 2010, and 2015 respectively. Again, as with the FRE, the decreased readability was significantand consistent over the three years studied.
Apart from the results shown here, there is cause for concern with the trend. Readabilitysteadily decreased over the years examined in this study. If the trend continues then financialstatement readability will continue to decline.
References
American Accounting Association. 1966. A Statement of Basic Accounting Theory. Chicago, IL:American Accounting Association.
Barker, R., Barone, E., Birt, J., Gaeremynck, A. McGeachin, A. Marrton, J. & Moldovan, R. 2013.Response to the EAA FRSC to the EFRAG/ANC/FRC discussion paper: Towards a disclosureframework for the notes. Accounting in Europe, 10(2), 1-26. doi: 10.1080/17449480.2013.772715.
Barnett, A. and K. Leoffler. 1979. Readability of accounting and auditing messages. Journal ofBusiness Communication 16:49-59.
Bloomfield, R. 2012. A pragmatic approach to more efficient corporate disclosure. AccountingHorizons, 26 (2), 357-370. doi: 10.2308/acch-10261.
Braswell, D. 2000. Readability of Financial Statement Footnote Disclosures: A MultidimensionalInvestigation And Analysis. Dissertation. Southern Illinois University.
Collins, S. 2012. Creating a Fog: Can Plain English be used to Mislead Investors? The ClaremontGraduate University, ProQuest Dissertations Publishing.
Courtis, J.K. 1986. An investigation into financial report readability and corporate risk returnrelationships. Accounting and Business Research (Autumn): 285-294.
Courtis, J. K. 1995. Readability of Annual Reports: Western Versus Asian Evidence. Accounting,Auditing & Accountability Journal 8(2), 4–17.
Dzinkowski, R. 2006. The Road to Simplicity, Strategic Finance. pp. 41-43.
Financial Accounting Standards Board. 1978. Statement of financial accounting concepts no. 1:Objectives of financial reporting by business enterprises. Stanford, CT: FASB.
Healy, P. 1977. Can you understand the footnotes to financial statements? Accountants Journal(Julv): 219-222.
Kieso, D., Weygandt, J., Warfield, T., Young, N., Wiecek, I. & McConomy, B. 2013. IntermediateAccounting, 10th Canadian ed. Mississauga, Ontario: John Wiley & Sons Canada, Ltd.
Lawrence, A. (2013). Individual investors and financial disclosure. Journal of Accounting andEconomics, 56, 130-147. doi: 10.1016/j.jacceco.2013.05.001.

39International Journal ofManagement, Business, and EconomicsIJMBE
Table 5 FLESCH KINCAID Grade Level Measure
observations tStat significanceFKGL 2000 – FKGL 2010 28 -4.62276 .00001FKGL 2000 – FKGL 2015 28 -6.03314 .00001FKGL 2010 – FKGL 2015 30 -2.87959 .00370
Table 5 provides the results of the Flesch Kincaid Grade Level measure. The F-KGLmeasure identifies the level of education needed to understand the document examined. Therefore,lower scores indicate easier reading. It would be desirable to see the F-KGL scores decrease over theyears, indicating that documents are getting easier to read. The F-KGL scores actually increasedsignificantly (p<.01) over the years studied. Initially, the grade level needed to understand financialstatement notes was the completion of an undergraduate college degree (16 years of education).Ultimately, 2015 financial statement notes require the equivalent of some (a little over one year) ofgraduate study for proper understanding.
The Flesch Kincaid Grade Level measure for the paragraph below taken from one of thecompanies in the research is 25.4. Like the paragraph shown in the Flesch Reading Ease, this is notunusual as accountants are writing about technical accounting issues.
“In preparing the consolidated financial statements, we use certain estimates andassumptions that affect reported amounts and disclosures, including amountsrecorded and disclosed in connection with acquisitions. These estimates andunderlying assumptions can impact all elements of our financial statements. Forexample, in the consolidated statements of income, estimates are used whenaccounting for deductions from revenues (such as rebates, chargebacks, salesallowances and sales returns), determining the cost of inventory that is sold,allocating cost in the form of depreciation and amortization, and estimatingrestructuring charges and the impact of contingencies. On the consolidatedbalance sheets, estimates are used in determining the valuation and recoverabilityof assets, such as accounts receivable, investments, inventories, deferred taxassets, fixed assets and intangible assets (including acquired in-process research& development (IPR&D) assets), and estimates are used in determining thereported amounts of liabilities, such as taxes payable, benefit obligations, accrualsfor contingencies, rebates, chargebacks, sales allowances and sales returns, andrestructuring reserves, all of which also impact the consolidated statements ofincome.”
5. Conclusion and Recommendation
The results support acceptance of H2 and H3, but not H1. The use of passive voice did notchange over the years examined. Apparently, there is no reason to anticipate that increasedregulation and the resulting increased regulatory disclosure will also result in the increased use ofpassive voice.
The data supported H2. The Flesch Reading Ease score decreased significantly over theyears examined. The FRE score decreased from 17.98 to 16.56 to 15.68 over the years 2000, 2010,and 2015 respectively, representing decreased readability. Not only was the decrease in readabilitysignificant, but it was consistent over the three years.
The data supported H3. As with H2, the Flesch-Kincaid Grade Level score indicated reducedreadability over the years studied. The score increased from 15.99 to 16.88 to 17.16 over the years2000, 2010, and 2015 respectively. Again, as with the FRE, the decreased readability was significantand consistent over the three years studied.
Apart from the results shown here, there is cause for concern with the trend. Readabilitysteadily decreased over the years examined in this study. If the trend continues then financialstatement readability will continue to decline.
References
American Accounting Association. 1966. A Statement of Basic Accounting Theory. Chicago, IL:American Accounting Association.
Barker, R., Barone, E., Birt, J., Gaeremynck, A. McGeachin, A. Marrton, J. & Moldovan, R. 2013.Response to the EAA FRSC to the EFRAG/ANC/FRC discussion paper: Towards a disclosureframework for the notes. Accounting in Europe, 10(2), 1-26. doi: 10.1080/17449480.2013.772715.
Barnett, A. and K. Leoffler. 1979. Readability of accounting and auditing messages. Journal ofBusiness Communication 16:49-59.
Bloomfield, R. 2012. A pragmatic approach to more efficient corporate disclosure. AccountingHorizons, 26 (2), 357-370. doi: 10.2308/acch-10261.
Braswell, D. 2000. Readability of Financial Statement Footnote Disclosures: A MultidimensionalInvestigation And Analysis. Dissertation. Southern Illinois University.
Collins, S. 2012. Creating a Fog: Can Plain English be used to Mislead Investors? The ClaremontGraduate University, ProQuest Dissertations Publishing.
Courtis, J.K. 1986. An investigation into financial report readability and corporate risk returnrelationships. Accounting and Business Research (Autumn): 285-294.
Courtis, J. K. 1995. Readability of Annual Reports: Western Versus Asian Evidence. Accounting,Auditing & Accountability Journal 8(2), 4–17.
Dzinkowski, R. 2006. The Road to Simplicity, Strategic Finance. pp. 41-43.
Financial Accounting Standards Board. 1978. Statement of financial accounting concepts no. 1:Objectives of financial reporting by business enterprises. Stanford, CT: FASB.
Healy, P. 1977. Can you understand the footnotes to financial statements? Accountants Journal(Julv): 219-222.
Kieso, D., Weygandt, J., Warfield, T., Young, N., Wiecek, I. & McConomy, B. 2013. IntermediateAccounting, 10th Canadian ed. Mississauga, Ontario: John Wiley & Sons Canada, Ltd.
Lawrence, A. (2013). Individual investors and financial disclosure. Journal of Accounting andEconomics, 56, 130-147. doi: 10.1016/j.jacceco.2013.05.001.

40 International Journal ofManagement, Business, and EconomicsIJMBE
Lee, T.A. and D.P. Tweedie. 1975. Accounting information: An investigation of private shareholderusage. Accounting and Business Research (Autumn): 280-291.
Lehavy, R., Li, F., & Merkley, K. 2011. The Effect of Annual Report Readability on AnalystFollowing and the Properties of Their Earnings Forecasts. The Accounting Review, 86(3), 1087–1115.
Miller, B. P. (2010). The Effects of Reporting Complexity on Small and Large Investor Trading. TheAccounting Review, 85(6), 2107–2143.
Morunga, M. & Bradbury, M. 2012. The Impact of IFRS on Annual Report Length. AustralasianAccounting, Business and Finance Journal (AABFJ) 6 (5), 47 – 64. Retrieved fromhttp://ro.uow.edu.au/aabfj/vol6/iss5/.
Schroeder, N., R. Aggarwal, and C. Gibson. 1991. Financial reporting by Japanese firms on theNYSE: An analysis of linguistic content. Management International Review 31/3:233-251.
Securities and Exchange Commission. 1998. A plain English handbook: How to create clear SECdisclosure. Available at: http://www.sec.gov/pdf/handbook.pdf.
Smith, J.P. and N.P. Smith. 1971. Readability: A measure of performance of the communicationfunction of financial reporting. The Accounting Review 46 (July): 552-561.
Smith, M. and Taffler, R. 1984. Improving the communication function of published accountingstandards. Accounting and Business Research (Spring): 139-146.
Swanson, E.B. 1974. Management Information Systems: Appreciation and Involvement.Management Science 20:178-188.
Soper, F.J. & Dolphin Jr., R. 1964. Readability and Corporate Annual Reports. The AccountingReview, 39(2), 358–362.
Wells, S., Barney, D. K., & Tschopp, D. J. 2008. Complexity in U.S. GAAP. Journal of Business,Industry and Economics. 10, 57-80.
Zmud, R.W. 1978. An empirical investigation of the dimensionality of the concept of information.Decision Sciences 2:187-195.

41International Journal ofManagement, Business, and EconomicsIJMBE
Lee, T.A. and D.P. Tweedie. 1975. Accounting information: An investigation of private shareholderusage. Accounting and Business Research (Autumn): 280-291.
Lehavy, R., Li, F., & Merkley, K. 2011. The Effect of Annual Report Readability on AnalystFollowing and the Properties of Their Earnings Forecasts. The Accounting Review, 86(3), 1087–1115.
Miller, B. P. (2010). The Effects of Reporting Complexity on Small and Large Investor Trading. TheAccounting Review, 85(6), 2107–2143.
Morunga, M. & Bradbury, M. 2012. The Impact of IFRS on Annual Report Length. AustralasianAccounting, Business and Finance Journal (AABFJ) 6 (5), 47 – 64. Retrieved fromhttp://ro.uow.edu.au/aabfj/vol6/iss5/.
Schroeder, N., R. Aggarwal, and C. Gibson. 1991. Financial reporting by Japanese firms on theNYSE: An analysis of linguistic content. Management International Review 31/3:233-251.
Securities and Exchange Commission. 1998. A plain English handbook: How to create clear SECdisclosure. Available at: http://www.sec.gov/pdf/handbook.pdf.
Smith, J.P. and N.P. Smith. 1971. Readability: A measure of performance of the communicationfunction of financial reporting. The Accounting Review 46 (July): 552-561.
Smith, M. and Taffler, R. 1984. Improving the communication function of published accountingstandards. Accounting and Business Research (Spring): 139-146.
Swanson, E.B. 1974. Management Information Systems: Appreciation and Involvement.Management Science 20:178-188.
Soper, F.J. & Dolphin Jr., R. 1964. Readability and Corporate Annual Reports. The AccountingReview, 39(2), 358–362.
Wells, S., Barney, D. K., & Tschopp, D. J. 2008. Complexity in U.S. GAAP. Journal of Business,Industry and Economics. 10, 57-80.
Zmud, R.W. 1978. An empirical investigation of the dimensionality of the concept of information.Decision Sciences 2:187-195.
International Journal ofManagement, Business, and EconomicsIJMBE
Changing Tax Policy Impact on the Risk Levelof Vietnam Wholesale and Retail Firms
by
Dinh Tran Ngoc HuyPhD candidate, College of Business,
Chung Yuan Christian University,Taoyuan City, Taiwan
E-mail: [email protected]

Changing Tax Policy Impact on the Risk Levelof Vietnam Wholesale and Retail Firms
by
Dinh Tran Ngoc HuyPhD candidate, College of Business,Chung Yuan Christian University,
Taoyuan City, TaiwanE-mail: [email protected]
Abstract
Many financial markets including but not limit to, the emerging stock market in Viet Nam,have been affected by the financial crisis 2007-2009. This study analyzes the impacts of tax policyon market risk for the listed firms in the wholesale and retail industry during this period as itbecomes necessary. First, by using quantitative and analytical methods to estimate asset and equitybeta of total 9 listed companies in Viet Nam wholesale and retail industry with a proper traditionalmodel, we found out that the beta values, in general, for many companies are acceptable. Second,under 3 different scenarios of changing tax rates (20%, 25% and 28%), we recognized that there isnot large disperse in equity beta values, estimated at 0,646, 0,653 and 0,657.These values are muchlower than those of the listed VN construction firms. Third, by changing tax rates in 3 scenarios(25%, 20% and 28%), we recognized both equity and asset beta mean values have positiverelationship with the increasing levels of tax rate. Finally, this paper provides some outcomes thatcould provide companies and government more evidence in establishing their policies in governance.
Keywords: Equity Beta, Financial Structure, Financial Crisis, Risk, Tax Rate, Wholesale and Retail
1. Introduction
Together with the development of real estate and banking industry, during many recent years,Viet Nam wholesale and retail industry is considered as one of active economic sectors, which hascertain positive effect for the economy. This paper is organized as follow. The research issues andliterature review will be covered in next sessions 2 and 3, for a short summary. Then, methodologyand conceptual theories are introduced in session 4 and 5. Session 6 describes the data in empiricalanalysis. Session 7 presents empirical results and findings. Next, session 8 covers the analyticalresults. Then, session 9 presents analysis of risk. Lastly, session 10 will conclude with some policysuggestions. This paper also supports readers with references, exhibits and relevant web sources.
We mention some issues on the estimating of impacts of tax rates on beta for listed wholesaleand retail companies in Viet Nam stock exchange as following:Issue 1: Whether the risk level of wholesale and retail firms under the different changing scenarios oftax rates increase or decrease so much.Issue 2: Whether the disperse distribution of beta values become large in the different changingscenarios of tax rates estimated in the wholesale and retail industry.

43International Journal ofManagement, Business, and EconomicsIJMBE
Changing Tax Policy Impact on the Risk Levelof Vietnam Wholesale and Retail Firms
by
Dinh Tran Ngoc HuyPhD candidate, College of Business,Chung Yuan Christian University,
Taoyuan City, TaiwanE-mail: [email protected]
Abstract
Many financial markets including but not limit to, the emerging stock market in Viet Nam,have been affected by the financial crisis 2007-2009. This study analyzes the impacts of tax policyon market risk for the listed firms in the wholesale and retail industry during this period as itbecomes necessary. First, by using quantitative and analytical methods to estimate asset and equitybeta of total 9 listed companies in Viet Nam wholesale and retail industry with a proper traditionalmodel, we found out that the beta values, in general, for many companies are acceptable. Second,under 3 different scenarios of changing tax rates (20%, 25% and 28%), we recognized that there isnot large disperse in equity beta values, estimated at 0,646, 0,653 and 0,657.These values are muchlower than those of the listed VN construction firms. Third, by changing tax rates in 3 scenarios(25%, 20% and 28%), we recognized both equity and asset beta mean values have positiverelationship with the increasing levels of tax rate. Finally, this paper provides some outcomes thatcould provide companies and government more evidence in establishing their policies in governance.
Keywords: Equity Beta, Financial Structure, Financial Crisis, Risk, Tax Rate, Wholesale and Retail
1. Introduction
Together with the development of real estate and banking industry, during many recent years,Viet Nam wholesale and retail industry is considered as one of active economic sectors, which hascertain positive effect for the economy. This paper is organized as follow. The research issues andliterature review will be covered in next sessions 2 and 3, for a short summary. Then, methodologyand conceptual theories are introduced in session 4 and 5. Session 6 describes the data in empiricalanalysis. Session 7 presents empirical results and findings. Next, session 8 covers the analyticalresults. Then, session 9 presents analysis of risk. Lastly, session 10 will conclude with some policysuggestions. This paper also supports readers with references, exhibits and relevant web sources.
We mention some issues on the estimating of impacts of tax rates on beta for listed wholesaleand retail companies in Viet Nam stock exchange as following:Issue 1: Whether the risk level of wholesale and retail firms under the different changing scenarios oftax rates increase or decrease so much.Issue 2: Whether the disperse distribution of beta values become large in the different changingscenarios of tax rates estimated in the wholesale and retail industry.

44 International Journal ofManagement, Business, and EconomicsIJMBE
2. Literature Review
Smith (2004) mentions in Chicago, properties located in a designated TIF (tax incrementfinancing) district will exhibit higher rates of appreciation after the area is designated a qualifyingTIF district when compared to those properties selling outside TIF districts, and when compared toproperties that sell within TIF district boundaries prior to designation.
Robert et all (2011) recognized a significant positive relation between changes inintercorporate investment and changes in corporate marginal tax rates on ordinary income.Next, Ruud et all (2013) said that greater tax bias is associated with significantly higher aggregatebank leverage, and this in turn is associated with a significantly greater chance of crisis. Steven(2013) indicated that international tax reform is a major part of Business Tax Reform of the USPresident. And Both OECD and Europe Commission have recently released projects designed toaddress corporate tax evasion and profits shifting. Next, Omri (2013) suggested the US should adopta two-pronged corporate tax –residence test: the place where the corporation’s securities are listedfor public trading, or the place of the corporation’s central management and control.
Then, Sung, Mark and Laura (2013) also indicated that business property values are moreresponsive to changes in tax rates as compared to residential property. Finally, tax rate can beconsidered as one among many factors that affect business risk of real estate firms.
3. Conceptual Theory
The impact of fiscal policy on the economy
Tax policy is one among major fiscal policies. Corporate taxation might affect the output,income or compensation, as well as the revenue-raising capacity of both the tax system and thecompany.In a specific industry such as wholesale and retail industry, on the one hand, using tax policy with adecrease or increase in tax rate could affect tax revenues, profit after tax and financial results andcompensation and jobs of the industry. On the other hand, using tax policies could increase thefinancial results of this industry and therefore, affect the tax revenues, compensation and jobs.During and after financial crises such as the 2007-2009 crisis, there raises concerns about fiscalpolicies or public policies of many countries, in both developed and developing markets.
4. Research Methodology
The impacts from the financial crisis happened during the period 2007-2011; therefore, in thisstudy, we use the live data from the stock exchange market in Viet Nam (HOSE and HNX) duringthe four or five years period to estimate systemic risk results and tax impacts. In this study, analyticalresearch method is used and specially, tax rate scenario analysis method is used. Analytical data isfrom the situation of listed wholesale and retail firms in VN stock exchange and current tax rate is25%. Finally, we use the results to suggest policy for both these enterprises, relevant organizationsand government.
5. General Data Analysis
The research sample has total 9 listed firms in the wholesale and retail market with the livedata from the stock exchange. Firstly, we estimate equity beta values of these firms and use financialleverage to estimate asset beta values of them. Secondly, we change the tax rate from 25% to 28%and 20% to see the sensitivity of beta values. In 3 cases (rate = 20%, 25%, and 28%), asset beta meanis estimated at 0,349, 0,352 and 0,355. Also in 3 scenarios, we find out var of asset beta estimated at0,031 (almost the same, with a little decrease if tax rate increases to 28%) which shows small riskdispersion. Tax rate changes almost has no effect on asset beta var under financial leverage.
6. Empirical Research Findings and Discussion
In the below section, data used are from total 9 listed wholesale and retail companies on VNstock exchange (HOSE and HNX mainly). In the scenario 1, current tax rate is 25% which is used tocalculate market risk (beta). Then, two (2) tax rate scenarios are changed up to 28% and down to20%, compared to the current corporate tax rate.
Market risk (beta) under the impact of tax rate, includes: 1) equity beta; and 2) asset beta.
Scenario 1: current tax rate is 25%In the case of tax rate of 25%, all beta values of 9 listed firms on VN wholesale and retail
market as following:
Table 1 Market Risk of Listed Companies on VN Wholesale and Retail Market (t = 25%)
OrderNo.
Company stockcode Equity beta Asset beta (assume debt beta = 0)
1 HHS 0,728 0,4792 IMT 0,399 0,3863 TH1 0,409 0,1604 BSC 0,420 0,3425 PET 1,273 0,3516 BTT 0,829 0,6407 CMV 0,391 0,1268 PIT 1,012 0,5149 VT1 0,411 0,175
Scenario 2: tax rate increases up to 28%If corporate tax rates increases up to 28%, all beta values of total 9 listed firms on VN
wholesale and retail market as below:

45International Journal ofManagement, Business, and EconomicsIJMBE
2. Literature Review
Smith (2004) mentions in Chicago, properties located in a designated TIF (tax incrementfinancing) district will exhibit higher rates of appreciation after the area is designated a qualifyingTIF district when compared to those properties selling outside TIF districts, and when compared toproperties that sell within TIF district boundaries prior to designation.
Robert et all (2011) recognized a significant positive relation between changes inintercorporate investment and changes in corporate marginal tax rates on ordinary income.Next, Ruud et all (2013) said that greater tax bias is associated with significantly higher aggregatebank leverage, and this in turn is associated with a significantly greater chance of crisis. Steven(2013) indicated that international tax reform is a major part of Business Tax Reform of the USPresident. And Both OECD and Europe Commission have recently released projects designed toaddress corporate tax evasion and profits shifting. Next, Omri (2013) suggested the US should adopta two-pronged corporate tax –residence test: the place where the corporation’s securities are listedfor public trading, or the place of the corporation’s central management and control.
Then, Sung, Mark and Laura (2013) also indicated that business property values are moreresponsive to changes in tax rates as compared to residential property. Finally, tax rate can beconsidered as one among many factors that affect business risk of real estate firms.
3. Conceptual Theory
The impact of fiscal policy on the economy
Tax policy is one among major fiscal policies. Corporate taxation might affect the output,income or compensation, as well as the revenue-raising capacity of both the tax system and thecompany.In a specific industry such as wholesale and retail industry, on the one hand, using tax policy with adecrease or increase in tax rate could affect tax revenues, profit after tax and financial results andcompensation and jobs of the industry. On the other hand, using tax policies could increase thefinancial results of this industry and therefore, affect the tax revenues, compensation and jobs.During and after financial crises such as the 2007-2009 crisis, there raises concerns about fiscalpolicies or public policies of many countries, in both developed and developing markets.
4. Research Methodology
The impacts from the financial crisis happened during the period 2007-2011; therefore, in thisstudy, we use the live data from the stock exchange market in Viet Nam (HOSE and HNX) duringthe four or five years period to estimate systemic risk results and tax impacts. In this study, analyticalresearch method is used and specially, tax rate scenario analysis method is used. Analytical data isfrom the situation of listed wholesale and retail firms in VN stock exchange and current tax rate is25%. Finally, we use the results to suggest policy for both these enterprises, relevant organizationsand government.
5. General Data Analysis
The research sample has total 9 listed firms in the wholesale and retail market with the livedata from the stock exchange. Firstly, we estimate equity beta values of these firms and use financialleverage to estimate asset beta values of them. Secondly, we change the tax rate from 25% to 28%and 20% to see the sensitivity of beta values. In 3 cases (rate = 20%, 25%, and 28%), asset beta meanis estimated at 0,349, 0,352 and 0,355. Also in 3 scenarios, we find out var of asset beta estimated at0,031 (almost the same, with a little decrease if tax rate increases to 28%) which shows small riskdispersion. Tax rate changes almost has no effect on asset beta var under financial leverage.
6. Empirical Research Findings and Discussion
In the below section, data used are from total 9 listed wholesale and retail companies on VNstock exchange (HOSE and HNX mainly). In the scenario 1, current tax rate is 25% which is used tocalculate market risk (beta). Then, two (2) tax rate scenarios are changed up to 28% and down to20%, compared to the current corporate tax rate.
Market risk (beta) under the impact of tax rate, includes: 1) equity beta; and 2) asset beta.
Scenario 1: current tax rate is 25%In the case of tax rate of 25%, all beta values of 9 listed firms on VN wholesale and retail
market as following:
Table 1 Market Risk of Listed Companies on VN Wholesale and Retail Market (t = 25%)
OrderNo.
Company stockcode Equity beta Asset beta (assume debt beta = 0)
1 HHS 0,728 0,4792 IMT 0,399 0,3863 TH1 0,409 0,1604 BSC 0,420 0,3425 PET 1,273 0,3516 BTT 0,829 0,6407 CMV 0,391 0,1268 PIT 1,012 0,5149 VT1 0,411 0,175
Scenario 2: tax rate increases up to 28%If corporate tax rates increases up to 28%, all beta values of total 9 listed firms on VN
wholesale and retail market as below:

46 International Journal ofManagement, Business, and EconomicsIJMBE
Table 2 Market Risk of Listed Wholesale and Retail Firms (t = 28%)
OrderNo.
Company stockcode Equity beta Asset beta (assume debt beta = 0)
1 HHS 0,736 0,4852 IMT 0,399 0,3863 TH1 0,409 0,1604 BSC 0,423 0,3445 PET 1,273 0,3516 BTT 0,835 0,6447 CMV 0,401 0,1298 PIT 1,012 0,5149 VT1 0,423 0,180
Scenario 3: tax rate decreases down to 20%If corporate tax rate decreases down to 20%, all beta values of total 9 listed firms on the
wholesale and retail market in VN as following:
Table 3 Market Risk of Listed Wholesale and Retail Firms (t = 20%)
OrderNo.
Company stockcode Equity beta Asset beta (assume debt beta = 0)
1 HHS 0,715 0,4702 IMT 0,398 0,3853 TH1 0,409 0,1604 BSC 0,416 0,3385 PET 1,273 0,3516 BTT 0,819 0,6327 CMV 0,376 0,1218 PIT 1,012 0,5149 VT1 0,393 0,167
All three above tables and data show that values of equity and asset beta in the case ofincreasing tax rate up to 28% or decreasing rate down to 20% have small fluctuation.
Comparing statistical results in 3 scenarios of changing tax rate:
a. tax rate = 25%
Statistic results Equity betaAsset beta (assume debt
beta = 0) DifferenceMAX 1,273 0,640 0,6334MIN 0,391 0,126 0,2657MEAN 0,653 0,352 0,3002VAR 0,1069 0,0307 0,0761
Note: Sample size : 9
b. tax rate = 28%
Statistic results Equity betaAsset beta (assume
debt beta = 0) DifferenceMAX 1,273 0,644 0,6287MIN 0,399 0,129 0,2705MEAN 0,657 0,355 0,3022VAR 0,1058 0,0308 0,0750
Note: Sample size : 9
c. tax rate = 20%
Statistic results Equity betaAsset beta (assume debt
beta = 0) DifferenceMAX 1,273 0,632 0,6410MIN 0,376 0,121 0,2553MEAN 0,646 0,349 0,2970VAR 0,1086 0,0305 0,0781
Note: Sample size : 9
Based on above results, we find out:
Equity beta mean values in all 3 scenarios are little low (< 0,7) and asset beta mean values aresmall (< 0,4). In the case of current tax rate of 25%, equity beta value fluctuates in a wide range from0,391 (min) up to 1,273 (max) and asset beta fluctuates from 0,126 (min) up to 0,640 (max). We notethere is a big decrease in max asset beta value here. If corporate tax rate increases to 28%, equitybeta moves from 0,399 (min) up to 1,273 (max) and asset beta moves from 0,129 (min) up to 0,644(max). Hence, we note that there is a little increase in equity beta min value if corporate taxincreases. When tax rate decreases down to 20%, equity beta value changes from 0,376 (min) up to1,273 (max) and asset beta changes from 0,121 (min) up to 0,632 (max). So, there is small decreasein equity/asset beta min values when tax decreases in scenario 3.
Beside, Exhibit 7 informs us that in the case 28% tax rate, average equity beta value of 9listed firms increases up to 0,004 while average asset beta value of these 9 firms increase slightly upto 0,002. Then, when tax rate reduces to 20%, average equity beta value of 9 listed firms reduce to0,007 and average asset beta value down to 0,004.The below chart 1 shows us : when tax rate decreases down to 20%, average equity and asset betavalues decrease slightly (0,646 and 0,349) compared to those at the initial rate of 25% (0,653 and0,352). At the same time, when tax rate increases up to 28%, average equity and beta increasesslightly (to 0,657 and 0,355). However, the fluctuation of equity and asset beta values (0,109 and0,031) in the case of 20% tax rate is higher than or equal to (>=) the results in the rest 2 tax ratecases.

47International Journal ofManagement, Business, and EconomicsIJMBE
Table 2 Market Risk of Listed Wholesale and Retail Firms (t = 28%)
OrderNo.
Company stockcode Equity beta Asset beta (assume debt beta = 0)
1 HHS 0,736 0,4852 IMT 0,399 0,3863 TH1 0,409 0,1604 BSC 0,423 0,3445 PET 1,273 0,3516 BTT 0,835 0,6447 CMV 0,401 0,1298 PIT 1,012 0,5149 VT1 0,423 0,180
Scenario 3: tax rate decreases down to 20%If corporate tax rate decreases down to 20%, all beta values of total 9 listed firms on the
wholesale and retail market in VN as following:
Table 3 Market Risk of Listed Wholesale and Retail Firms (t = 20%)
OrderNo.
Company stockcode Equity beta Asset beta (assume debt beta = 0)
1 HHS 0,715 0,4702 IMT 0,398 0,3853 TH1 0,409 0,1604 BSC 0,416 0,3385 PET 1,273 0,3516 BTT 0,819 0,6327 CMV 0,376 0,1218 PIT 1,012 0,5149 VT1 0,393 0,167
All three above tables and data show that values of equity and asset beta in the case ofincreasing tax rate up to 28% or decreasing rate down to 20% have small fluctuation.
Comparing statistical results in 3 scenarios of changing tax rate:
a. tax rate = 25%
Statistic results Equity betaAsset beta (assume debt
beta = 0) DifferenceMAX 1,273 0,640 0,6334MIN 0,391 0,126 0,2657MEAN 0,653 0,352 0,3002VAR 0,1069 0,0307 0,0761
Note: Sample size : 9
b. tax rate = 28%
Statistic results Equity betaAsset beta (assume
debt beta = 0) DifferenceMAX 1,273 0,644 0,6287MIN 0,399 0,129 0,2705MEAN 0,657 0,355 0,3022VAR 0,1058 0,0308 0,0750
Note: Sample size : 9
c. tax rate = 20%
Statistic results Equity betaAsset beta (assume debt
beta = 0) DifferenceMAX 1,273 0,632 0,6410MIN 0,376 0,121 0,2553MEAN 0,646 0,349 0,2970VAR 0,1086 0,0305 0,0781
Note: Sample size : 9
Based on above results, we find out:
Equity beta mean values in all 3 scenarios are little low (< 0,7) and asset beta mean values aresmall (< 0,4). In the case of current tax rate of 25%, equity beta value fluctuates in a wide range from0,391 (min) up to 1,273 (max) and asset beta fluctuates from 0,126 (min) up to 0,640 (max). We notethere is a big decrease in max asset beta value here. If corporate tax rate increases to 28%, equitybeta moves from 0,399 (min) up to 1,273 (max) and asset beta moves from 0,129 (min) up to 0,644(max). Hence, we note that there is a little increase in equity beta min value if corporate taxincreases. When tax rate decreases down to 20%, equity beta value changes from 0,376 (min) up to1,273 (max) and asset beta changes from 0,121 (min) up to 0,632 (max). So, there is small decreasein equity/asset beta min values when tax decreases in scenario 3.
Beside, Exhibit 7 informs us that in the case 28% tax rate, average equity beta value of 9listed firms increases up to 0,004 while average asset beta value of these 9 firms increase slightly upto 0,002. Then, when tax rate reduces to 20%, average equity beta value of 9 listed firms reduce to0,007 and average asset beta value down to 0,004.The below chart 1 shows us : when tax rate decreases down to 20%, average equity and asset betavalues decrease slightly (0,646 and 0,349) compared to those at the initial rate of 25% (0,653 and0,352). At the same time, when tax rate increases up to 28%, average equity and beta increasesslightly (to 0,657 and 0,355). However, the fluctuation of equity and asset beta values (0,109 and0,031) in the case of 20% tax rate is higher than or equal to (>=) the results in the rest 2 tax ratecases.

48 International Journal ofManagement, Business, and EconomicsIJMBE
Figure 1 Comparing Statistical Results of Three (3) Scenarios of Changing Tax Rate
0,646
0,349
0,109
0,031
0,653
0,352
0,107
0,031
0,657
0,355
0,1058
0,0308
0,000 0,200 0,400 0,600 0,800
Equity betamean
Asset betamean
Equity betavar
Asset betavar
t = 28%t = 25%t = 20%
7. Risk Analysis
In the case of decreasing tax rate, (20%), the market and companies can receive more benefitssuch as generating more jobs and compensation, but the government budget can have deficit and thegovernment has to cut expenses. Changes in tax rates can have both positive and negative impacts onthe local market.In the case of increasing tax rate (28%), the government will have budget to finance publicexpenditures but the tax could reduce both demand and supply. Moreover, both the company and thefirm owner will have to pay taxes.
8. Conclusion and Policy Suggestion
In summary, the government continues to increase the effectiveness of building the legalsystem and regulation and macro policies supporting the plan of developing both the constructiontogether with the real estate market. The Ministry of Finance Continue to increase the effectivenessof fiscal policies and tax policies which are needed to combine with other macro policies at the sametime, although we could note that in this study when tax rate is going to increase from 20% to 28%,the value of equity beta mean also increases. The State Bank of Viet Nam continues to increase theeffectiveness of capital providing channels for both construction and real estate companies. Finally,this paper suggests implications for further research and policy suggestion for the Viet Namgovernment and relevant organizations, economists and investors from current market conditions.
Acknowledgements
My sincere thanks are for the editorial office and Lecturers/Doctors at Banking Universityand International University of Japan. Through the qualitative analysis, please kindly email me if anyerror found.
References
Ajinkya, Bijal., and Kumar, Mahesh., (2012), Taxation aspects of Mergers and Acquisitions, Asia-Pacific Tax Bulletin.
Dutt, Tanuj., and Mark, Humphery –Jenner., (2013), Stock Return Volatility, Operating Performanceand Stock Returns: International Evidence on Drivers of the “Low Volatility” Anomaly, Journal ofBanking and Finance.
Eugene, Fama F., and French, Kenneth R., (2004), The Capital Asset Pricing Model: Theory andEvidence, Journal of Economic Perspectives.
Flifel, Kaouther., (2012), Financial Markets between Efficiency and Persistence : EmpiricalEvidence on Daily Data, Asian Journal of Finance and Accounting.
Grullon, Gustavo., Lyandres, Evgeny., and Zhdanov, Alexei., (2012), Real Options, Volatility andStock Returns, Journal of Finance.
Hai, Nguyen Minh., Hien, Phan Tat., and Linh, Dang Huyen., (2013), Phân tích tác động của phá giátiền tệ đến tăng trưởng kinh tế VN thời kỳ 2000-2012, Journal of Economic Development.
Huy, Dinh T.N., (2012), Estimating Beta of Viet Nam listed construction companies groups duringthe crisis, Journal of Integration and Development.
Kimberly, Clausing A., (2012), In Search of Corporate Tax Incidence, Tax Law Review.Ling, Amy., (2013), Tax Issues Relating to Intangibles, Asia-Pacific Tax Bulletin.
Manos, M., and Chrysa, L., (2013), The Distributional Impact of The Greek Crisis in 2010, FiscalStudies.
Michael P., Matthias, S., and Hannes, W., (2013), Capital Structure, Corporate Taxation, and FirmAge, Fiscal Studies.
Pereiro, Luis E.,(2010), The Beta Dilemma in Emerging Markets, Journal of Applied CorporateFinance.
Saleem, Kashif., (2011), Time Varying Correlations between Stock and Bond Returns : EmpiricalEvidence from Russia, Asian Journal of Finance and Accounting.
49International Journal ofManagement, Business, and EconomicsIJMBE
Figure 1 Comparing Statistical Results of Three (3) Scenarios of Changing Tax Rate
0,646
0,349
0,109
0,031
0,653
0,352
0,107
0,031
0,657
0,355
0,1058
0,0308
0,000 0,200 0,400 0,600 0,800
Equity betamean
Asset betamean
Equity betavar
Asset betavar
t = 28%t = 25%t = 20%
7. Risk Analysis
In the case of decreasing tax rate, (20%), the market and companies can receive more benefitssuch as generating more jobs and compensation, but the government budget can have deficit and thegovernment has to cut expenses. Changes in tax rates can have both positive and negative impacts onthe local market.In the case of increasing tax rate (28%), the government will have budget to finance publicexpenditures but the tax could reduce both demand and supply. Moreover, both the company and thefirm owner will have to pay taxes.
8. Conclusion and Policy Suggestion
In summary, the government continues to increase the effectiveness of building the legalsystem and regulation and macro policies supporting the plan of developing both the constructiontogether with the real estate market. The Ministry of Finance Continue to increase the effectivenessof fiscal policies and tax policies which are needed to combine with other macro policies at the sametime, although we could note that in this study when tax rate is going to increase from 20% to 28%,the value of equity beta mean also increases. The State Bank of Viet Nam continues to increase theeffectiveness of capital providing channels for both construction and real estate companies. Finally,this paper suggests implications for further research and policy suggestion for the Viet Namgovernment and relevant organizations, economists and investors from current market conditions.
Acknowledgements
My sincere thanks are for the editorial office and Lecturers/Doctors at Banking Universityand International University of Japan. Through the qualitative analysis, please kindly email me if anyerror found.
References
Ajinkya, Bijal., and Kumar, Mahesh., (2012), Taxation aspects of Mergers and Acquisitions, Asia-Pacific Tax Bulletin.
Dutt, Tanuj., and Mark, Humphery –Jenner., (2013), Stock Return Volatility, Operating Performanceand Stock Returns: International Evidence on Drivers of the “Low Volatility” Anomaly, Journal ofBanking and Finance.
Eugene, Fama F., and French, Kenneth R., (2004), The Capital Asset Pricing Model: Theory andEvidence, Journal of Economic Perspectives.
Flifel, Kaouther., (2012), Financial Markets between Efficiency and Persistence : EmpiricalEvidence on Daily Data, Asian Journal of Finance and Accounting.
Grullon, Gustavo., Lyandres, Evgeny., and Zhdanov, Alexei., (2012), Real Options, Volatility andStock Returns, Journal of Finance.
Hai, Nguyen Minh., Hien, Phan Tat., and Linh, Dang Huyen., (2013), Phân tích tác động của phá giátiền tệ đến tăng trưởng kinh tế VN thời kỳ 2000-2012, Journal of Economic Development.
Huy, Dinh T.N., (2012), Estimating Beta of Viet Nam listed construction companies groups duringthe crisis, Journal of Integration and Development.
Kimberly, Clausing A., (2012), In Search of Corporate Tax Incidence, Tax Law Review.Ling, Amy., (2013), Tax Issues Relating to Intangibles, Asia-Pacific Tax Bulletin.
Manos, M., and Chrysa, L., (2013), The Distributional Impact of The Greek Crisis in 2010, FiscalStudies.
Michael P., Matthias, S., and Hannes, W., (2013), Capital Structure, Corporate Taxation, and FirmAge, Fiscal Studies.
Pereiro, Luis E.,(2010), The Beta Dilemma in Emerging Markets, Journal of Applied CorporateFinance.
Saleem, Kashif., (2011), Time Varying Correlations between Stock and Bond Returns : EmpiricalEvidence from Russia, Asian Journal of Finance and Accounting.

50 International Journal ofManagement, Business, and EconomicsIJMBE
EXHIBIT
Exhibit 1 – Interest rates in banking industry during crisis(source: Viet Nam commercial banks)
Year BorrowingInterest rates
DepositRates
Note
2011 18%-22% 13%-14%2010 19%-20% 13%-14%2009 9%-12% 9%-10%2008 19%-21% 15%-
16,5%2007 12%-15% 9%-11%
Approximately(2007: requiredreserves ratio at SBVis changed from 5%to 10%)(2009: specialsupporting interestrate is 4%)
Exhibit 2 – Basic interest rate changes in Viet Nam(source: State Bank of Viet Nam and Viet Nam economy)
Year Basic rate Note2011 9%2010 8%2009 7%2008 8,75%-14% Approximately,
fluctuated2007 8,25%2006 8,25%2005 7,8%2004 7,5%2003 7,5%2002 7,44%2001 7,2%-8,7% Approximately,
fluctuated2000 9%
Exhibit 3 – Inflation, GDP growth and macroeconomics factors(source: Viet Nam commercial banks and economic statistical bureau)
Year Inflation GDP USD/VND rate2011 18% 5,89% 20.6702010 11,75%
(Estimated atDec 2010)
6,5%(expected)
19.495
2009 6,88% 5,2% 17.0002008 22% 6,23% 17.7002007 12,63% 8,44% 16.1322006 6,6% 8,17%2005 8,4%Note approximately
Exhibit 4: GDP growth Việt Nam 2006-2010 (source: Bureau Statistic)
Exhibit 5: Top 40 among top 500 SMEs with the highest growth speed in 2012 (source: Vietnamnetand Viet Nam report)
Order Rank Company name CEO Tax code Industry
1 1CÔNG TY CP LÂM SẢNPISICO QUẢNG NAM
Phan VănCường 4000405162
Kinh doanh nông, lâmsản
2 2
CÔNG TY CP VÀNGBẠC ĐÁ QUÝ SJC CẦNTHƠ
Lê PhátVinh 1800636290 Vàng, bạc, đá quý
3 3CÔNG TY CP SỢI PHÚNAM
HoàngVănThám 3300491474 Sản xuất sợi, dệt
4 4
CÔNG TY CP VÀNGBẠC ĐÁ QUÝ BẾNTHÀNH
Tề TríDũng 300847936 Vàng, bạc, đá quý
5 5CÔNG TY CP MAYCHIẾN THẮNG
Ninh ThịTy 100101058 Ngành may
6 6CÔNG TY TNHH DULỊCH TRẦN VIỆT
NguyễnMạnhCương 301069809 Du lịch, khách sạn
7 7 N.A 2012701
8 8CÔNG TY TNHHTRUYỀN THÔNG ADT
ĐặngHuyThắng 100905796 Sản xuất khác
9 9CÔNG TY CP KẾT NỐINHÂN TÀI
Tiêu YếnTrinh 305202145
Kinh doanh tổng hợpkhác

51International Journal ofManagement, Business, and EconomicsIJMBE
EXHIBIT
Exhibit 1 – Interest rates in banking industry during crisis(source: Viet Nam commercial banks)
Year BorrowingInterest rates
DepositRates
Note
2011 18%-22% 13%-14%2010 19%-20% 13%-14%2009 9%-12% 9%-10%2008 19%-21% 15%-
16,5%2007 12%-15% 9%-11%
Approximately(2007: requiredreserves ratio at SBVis changed from 5%to 10%)(2009: specialsupporting interestrate is 4%)
Exhibit 2 – Basic interest rate changes in Viet Nam(source: State Bank of Viet Nam and Viet Nam economy)
Year Basic rate Note2011 9%2010 8%2009 7%2008 8,75%-14% Approximately,
fluctuated2007 8,25%2006 8,25%2005 7,8%2004 7,5%2003 7,5%2002 7,44%2001 7,2%-8,7% Approximately,
fluctuated2000 9%
Exhibit 3 – Inflation, GDP growth and macroeconomics factors(source: Viet Nam commercial banks and economic statistical bureau)
Year Inflation GDP USD/VND rate2011 18% 5,89% 20.6702010 11,75%
(Estimated atDec 2010)
6,5%(expected)
19.495
2009 6,88% 5,2% 17.0002008 22% 6,23% 17.7002007 12,63% 8,44% 16.1322006 6,6% 8,17%2005 8,4%Note approximately
Exhibit 4: GDP growth Việt Nam 2006-2010 (source: Bureau Statistic)
Exhibit 5: Top 40 among top 500 SMEs with the highest growth speed in 2012 (source: Vietnamnetand Viet Nam report)
Order Rank Company name CEO Tax code Industry
1 1CÔNG TY CP LÂM SẢNPISICO QUẢNG NAM
Phan VănCường 4000405162
Kinh doanh nông, lâmsản
2 2
CÔNG TY CP VÀNGBẠC ĐÁ QUÝ SJC CẦNTHƠ
Lê PhátVinh 1800636290 Vàng, bạc, đá quý
3 3CÔNG TY CP SỢI PHÚNAM
HoàngVănThám 3300491474 Sản xuất sợi, dệt
4 4
CÔNG TY CP VÀNGBẠC ĐÁ QUÝ BẾNTHÀNH
Tề TríDũng 300847936 Vàng, bạc, đá quý
5 5CÔNG TY CP MAYCHIẾN THẮNG
Ninh ThịTy 100101058 Ngành may
6 6CÔNG TY TNHH DULỊCH TRẦN VIỆT
NguyễnMạnhCương 301069809 Du lịch, khách sạn
7 7 N.A 2012701
8 8CÔNG TY TNHHTRUYỀN THÔNG ADT
ĐặngHuyThắng 100905796 Sản xuất khác
9 9CÔNG TY CP KẾT NỐINHÂN TÀI
Tiêu YếnTrinh 305202145
Kinh doanh tổng hợpkhác

52 International Journal ofManagement, Business, and EconomicsIJMBE
10 10CÔNG TY TNHH THIẾTLẬP
NguyễnHoàngẨn 1500441413
Sản xuất, kinh doanh,chế biến gạo, bột mỳ,ngũ cốc…
11 11
CÔNG TY TNHH-CHẾBIẾN THỦY SẢN VÀXNK TRANG KHANH
TrầnTuấnKhanh 1900287501
Nuôi trồng, chế biến,kinh doanh thuỷ sản vàcác sản phẩm thịt
12 12
CÔNG TY SẢN XUẤTTHƯƠNG MẠI VÀ ĐẦUTƯ TAM MINH
Lưu TuấnAnh 4300327589
Sản xuất đồ gỗ, nộithất
13 13
CÔNG TY TNHHTHƯƠNG MẠI SẢNXUẤT HÙNG HUY
Voòng AHoa 302259111
Sản xuất và gia cônggiầy, dép
14 14
CÔNG TY TNHHTHƯƠNG MẠI HOÀNGĐẠO
HồHoàngBách 301434963
Sản xuất, kinh doanhthuốc lá, nguyên liệuthuốc lá
15 15
CÔNG TY TNHHTHƯƠNG MẠI XÂYDỰNG DIỆU LONG
Đặng ThịLinhPhương 302000905
Kinh doanh tổng hợpkhác
16 16
CÔNG TY CP XÂYDỰNG NHÀ VÀ PHÁTTRIỂN HẠ TẦNG HÀNỘI
PhạmThanhNam 101370536
Xây dựng nhà và cáccông trình kỹ thuật dândụng; hoạt động xâydựng chuyên dụng
17 17
CÔNG TY CP XĂNGDẦU THƯƠNG MẠISÔNG TRÀ
NguyễnAnh 4300334642
Kinh doanh xăng dầu,khí đốt, nhiên liệu vàcác sản phẩm liên quan
18 18CÔNG TY CP SỢI PHÚTHẠNH
NguyễnVănCường 3300471069 Sản xuất sợi, dệt
19 19
CÔNG TY TNHH DULỊCH VÀ THƯƠNG MẠISÔNG HỒNG
Lê CôngHoàng 100237411
Kinh doanh xăng dầu,khí đốt, nhiên liệu vàcác sản phẩm liên quan
20 20CÔNG TY CP DẦUTHỰC VẬT BÌNH ĐỊNH
NguyễnThị ThùyGiao 4100399995
Sản xuất thực phẩmchế biến: sữa, đường,cà phê, dầu ăn, bánhkẹo…
21 21CÔNG TY CP VẬT TƯMỎ ĐỊA CHẤT
Lê NhậtTân 101453768
Kinh doanh tổng hợpkhác
22 22CÔNG TY TNHH MTVSÀI GÒN BẾN TRE
NguyễnNgọcMinhHùng 1300419650
Bán lẻ, kinh doanh siêuthị
23 23CÔNG TY TNHH HẢIVIỆT
NguyễnVăn Rỉ 3700443193
Kinh doanh nông, lâmsản
24 24CÔNG TY TNHH MAYPHÙ ĐỔNG
DươngĐứcThanh 100598947 Ngành may
25 25
CÔNG TY TNHHTHƯƠNG MẠI VÀDỊCH VỤ KỸ THUẬT
TrầnThanhBình 101507773
Sản xuất, kinh doanhôtô, phụ tùng ôtô

53International Journal ofManagement, Business, and EconomicsIJMBE
10 10CÔNG TY TNHH THIẾTLẬP
NguyễnHoàngẨn 1500441413
Sản xuất, kinh doanh,chế biến gạo, bột mỳ,ngũ cốc…
11 11
CÔNG TY TNHH-CHẾBIẾN THỦY SẢN VÀXNK TRANG KHANH
TrầnTuấnKhanh 1900287501
Nuôi trồng, chế biến,kinh doanh thuỷ sản vàcác sản phẩm thịt
12 12
CÔNG TY SẢN XUẤTTHƯƠNG MẠI VÀ ĐẦUTƯ TAM MINH
Lưu TuấnAnh 4300327589
Sản xuất đồ gỗ, nộithất
13 13
CÔNG TY TNHHTHƯƠNG MẠI SẢNXUẤT HÙNG HUY
Voòng AHoa 302259111
Sản xuất và gia cônggiầy, dép
14 14
CÔNG TY TNHHTHƯƠNG MẠI HOÀNGĐẠO
HồHoàngBách 301434963
Sản xuất, kinh doanhthuốc lá, nguyên liệuthuốc lá
15 15
CÔNG TY TNHHTHƯƠNG MẠI XÂYDỰNG DIỆU LONG
Đặng ThịLinhPhương 302000905
Kinh doanh tổng hợpkhác
16 16
CÔNG TY CP XÂYDỰNG NHÀ VÀ PHÁTTRIỂN HẠ TẦNG HÀNỘI
PhạmThanhNam 101370536
Xây dựng nhà và cáccông trình kỹ thuật dândụng; hoạt động xâydựng chuyên dụng
17 17
CÔNG TY CP XĂNGDẦU THƯƠNG MẠISÔNG TRÀ
NguyễnAnh 4300334642
Kinh doanh xăng dầu,khí đốt, nhiên liệu vàcác sản phẩm liên quan
18 18CÔNG TY CP SỢI PHÚTHẠNH
NguyễnVănCường 3300471069 Sản xuất sợi, dệt
19 19
CÔNG TY TNHH DULỊCH VÀ THƯƠNG MẠISÔNG HỒNG
Lê CôngHoàng 100237411
Kinh doanh xăng dầu,khí đốt, nhiên liệu vàcác sản phẩm liên quan
20 20CÔNG TY CP DẦUTHỰC VẬT BÌNH ĐỊNH
NguyễnThị ThùyGiao 4100399995
Sản xuất thực phẩmchế biến: sữa, đường,cà phê, dầu ăn, bánhkẹo…
21 21CÔNG TY CP VẬT TƯMỎ ĐỊA CHẤT
Lê NhậtTân 101453768
Kinh doanh tổng hợpkhác
22 22CÔNG TY TNHH MTVSÀI GÒN BẾN TRE
NguyễnNgọcMinhHùng 1300419650
Bán lẻ, kinh doanh siêuthị
23 23CÔNG TY TNHH HẢIVIỆT
NguyễnVăn Rỉ 3700443193
Kinh doanh nông, lâmsản
24 24CÔNG TY TNHH MAYPHÙ ĐỔNG
DươngĐứcThanh 100598947 Ngành may
25 25
CÔNG TY TNHHTHƯƠNG MẠI VÀDỊCH VỤ KỸ THUẬT
TrầnThanhBình 101507773
Sản xuất, kinh doanhôtô, phụ tùng ôtô
TESCO
26 26
CÔNG TY TNHHTHƯƠNG MẠI PHÚCTHÁI
Bùi XuânHuy 600346391
Kinh doanh xăng dầu,khí đốt, nhiên liệu vàcác sản phẩm liên quan
27 27CÔNG TY TNHH MINHĐĂNG
NguyễnThị CẩmNhung 2200258144
Nuôi trồng, chế biến,kinh doanh thuỷ sản vàcác sản phẩm thịt
28 28
CÔNG TY TNHHTHƯƠNG MẠI VÀDỊCH VỤ VẬN TẢINGỌC KHÁNH
TrầnNgọcHuân 4000377194
Kinh doanh xăng dầu,khí đốt, nhiên liệu vàcác sản phẩm liên quan
29 29
CÔNG TY TNHHTHƯƠNG MẠI DỊCHVỤ VÂN PHÁT
CaoNgọcAnh 303332212
Kinh doanh tổng hợpkhác
30 30
CÔNG TY CP VẬN TẢIVÀ DỊCH VỤPETROLIMEX NGHỆTĨNH
Võ VănTân 2900428497
Kinh doanh xăng dầu,khí đốt, nhiên liệu vàcác sản phẩm liên quan
31 31
CÔNG TY TNHHTHƯƠNG MẠI SẢNXUẤT TÂN BÌNH
Trần TríThức 3900326063
Sản xuất đồ gỗ, nộithất
32 32
CÔNG TY TNHHNGUYÊN LIỆU GIẤYDUNG QUẤT
NguyễnNị 4300308498
Sản xuất đồ gỗ, nộithất
33 33
CÔNG TY TNHH BỆNHVIỆN ĐA KHOA TƯNHÂN AN SINH
NgôĐăngSơn Anh 302774433 Sản xuất khác
34 34CÔNG TY TNHH INLỤA NHẤT PHƯƠNG
HuỳnhThịThanhThuỷ 301441840
Sản xuất giấy, in ấn,xuất bản
35 35CÔNG TY CP DẦU KHÍSÀI GÒN-PHÚ YÊN
TrầnCôngChưởng 4400344901
Kinh doanh xăng dầu,khí đốt, nhiên liệu vàcác sản phẩm liên quan
36 36CÔNG TY CP BÊ TÔNGĐĂNG HẢI
Phan VănKhanh 400619838
Sản xuấ t, kinh doanhvật liệu xây dựng: ximăng, gạch xây, đá,cát…
37 37CÔNG TY CP GIÀYBÌNH ĐỊNH
Võ NgọcThủy 4100258761
Sản xuất và gia cônggiầy, dép
38 38CÔNG TY CP ĐẦU TƯPHÁT TRIỂN THIÊN
Vũ VănTuyên 101536301
Sản xuất, kinh doanhvật liệu xây dựng: xi

54 International Journal ofManagement, Business, and EconomicsIJMBE
SƠN măng, gạch xây, đá,cát…
39 39HTX THƯƠNG MẠI ĐÔTHÀNH
HàngThanhDân 302804374
Kinh doanh thực phẩmchế biến: sữa, đường,cà phê, dầu ăn, bánhkẹo……
40 40CÔNG TY CP XÂYDỰNG TỔNG HỢP 269
TrươngDuyNiệm 3000244523
Xây dựng nhà và cáccông trình kỹ thuật dândụng; hoạt động xâydựng chuyên dụng
Exhibit 6: Risk and financial leverage of 9 listed wholesale and retail firms on VN stockexchange period 2007-2011
OrderNo.
Companystock code
Equitybeta
Asset beta(assume debt
beta = 0) NoteFinancialleverage
1 HHS 0,728 0,479 PIT as comparable 34,2%2 IMT 0,399 0,386 TH1 as comparable 3,4%3 TH1 0,409 0,160 60,8%4 BSC 0,420 0,342 FBA as comparable 18,7%5 PET 1,273 0,351 72,4%6 BTT 0,829 0,640 PIT as comparable 22,8%7 CMV 0,391 0,126 PIT as comparable 67,9%8 PIT 1,012 0,514 49,2%9 VT1 0,411 0,175 BTT as comparable 57,5%
Average 43,0%
Exhibit 7 – Increase/decrease risk level of listed wholesale and retail firms under changingscenarios of tax rates : 25%, 28%, 20% period 2007 - 2011
t = 25% t = 28% t = 20%
OrderNo.
Companystock code
Equitybeta
Assetbeta
Increase/Decrease(equitybeta)
Increase/Decrease(assetbeta)
Increase/Decrease(equitybeta)
Increase/Decrease(assetbeta)
1 HHS 0,728 0,479 0,008 0,005 -0,013 -0,0092 IMT 0,399 0,386 0,000 0,000 -0,001 -0,0013 TH1 0,409 0,160 0,000 0,000 0,000 0,0004 BSC 0,420 0,342 0,002 0,002 -0,004 -0,0035 PET 1,273 0,351 0,000 0,000 0,000 0,0006 BTT 0,829 0,640 0,006 0,005 -0,010 -0,0087 CMV 0,391 0,126 0,010 0,003 -0,015 -0,0058 PIT 1,012 0,514 0,000 0,000 0,000 0,0009 VT1 0,411 0,175 0,012 0,005 -0,018 -0,008
Average 0,004 0,002 -0,007 -0,004
Exhibit 8- Comparing statistical results of three (3) scenarios of changing tax rate of 104 listedconstruction firms
1,008
0,303
0,064
1,106
0,307 0,2530,306
0,064
1,014
0,308 0,296
0,064
0,000
0,200
0,400
0,600
0,800
1,000
1,200
EquityBetaMean
AssetBetaMean
EquityBetaVAR
AssetBetaVAR
t = 20%t = 25%t = 28%
Exhibit 9- VNI Index and other stock market index during crisis 2006-2010
0
1000
2000
3000
4000
5000
6000
7000
Thg1-0
6
Thg4-0
6
Thg7-0
6
Thg10
-06
Thg1-0
7
Thg4-0
7
Thg7-0
7
Thg10
-07
Thg1-0
8
Thg4-0
8
Thg7-0
8
Thg10
-08
Thg1-0
9
Thg4-0
9
Thg7-0
9
Thg10
-09
Thg1-1
0
Thg4-1
0
Thg7-1
0
VN IndexS&P 500SSE indexNIKKEI 225 (/0')TSEC (/0')KOSPICNT (/00')

55International Journal ofManagement, Business, and EconomicsIJMBE
SƠN măng, gạch xây, đá,cát…
39 39HTX THƯƠNG MẠI ĐÔTHÀNH
HàngThanhDân 302804374
Kinh doanh thực phẩmchế biến: sữa, đường,cà phê, dầu ăn, bánhkẹo……
40 40CÔNG TY CP XÂYDỰNG TỔNG HỢP 269
TrươngDuyNiệm 3000244523
Xây dựng nhà và cáccông trình kỹ thuật dândụng; hoạt động xâydựng chuyên dụng
Exhibit 6: Risk and financial leverage of 9 listed wholesale and retail firms on VN stockexchange period 2007-2011
OrderNo.
Companystock code
Equitybeta
Asset beta(assume debt
beta = 0) NoteFinancialleverage
1 HHS 0,728 0,479 PIT as comparable 34,2%2 IMT 0,399 0,386 TH1 as comparable 3,4%3 TH1 0,409 0,160 60,8%4 BSC 0,420 0,342 FBA as comparable 18,7%5 PET 1,273 0,351 72,4%6 BTT 0,829 0,640 PIT as comparable 22,8%7 CMV 0,391 0,126 PIT as comparable 67,9%8 PIT 1,012 0,514 49,2%9 VT1 0,411 0,175 BTT as comparable 57,5%
Average 43,0%
Exhibit 7 – Increase/decrease risk level of listed wholesale and retail firms under changingscenarios of tax rates : 25%, 28%, 20% period 2007 - 2011
t = 25% t = 28% t = 20%
OrderNo.
Companystock code
Equitybeta
Assetbeta
Increase/Decrease(equitybeta)
Increase/Decrease(assetbeta)
Increase/Decrease(equitybeta)
Increase/Decrease(assetbeta)
1 HHS 0,728 0,479 0,008 0,005 -0,013 -0,0092 IMT 0,399 0,386 0,000 0,000 -0,001 -0,0013 TH1 0,409 0,160 0,000 0,000 0,000 0,0004 BSC 0,420 0,342 0,002 0,002 -0,004 -0,0035 PET 1,273 0,351 0,000 0,000 0,000 0,0006 BTT 0,829 0,640 0,006 0,005 -0,010 -0,0087 CMV 0,391 0,126 0,010 0,003 -0,015 -0,0058 PIT 1,012 0,514 0,000 0,000 0,000 0,0009 VT1 0,411 0,175 0,012 0,005 -0,018 -0,008
Average 0,004 0,002 -0,007 -0,004
Exhibit 8- Comparing statistical results of three (3) scenarios of changing tax rate of 104 listedconstruction firms
1,008
0,303
0,064
1,106
0,307 0,2530,306
0,064
1,014
0,308 0,296
0,064
0,000
0,200
0,400
0,600
0,800
1,000
1,200
EquityBetaMean
AssetBetaMean
EquityBetaVAR
AssetBetaVAR
t = 20%t = 25%t = 28%
Exhibit 9- VNI Index and other stock market index during crisis 2006-2010
0
1000
2000
3000
4000
5000
6000
7000
Thg1-0
6
Thg4-0
6
Thg7-0
6
Thg10
-06
Thg1-0
7
Thg4-0
7
Thg7-0
7
Thg10
-07
Thg1-0
8
Thg4-0
8
Thg7-0
8
Thg10
-08
Thg1-0
9
Thg4-0
9
Thg7-0
9
Thg10
-09
Thg1-1
0
Thg4-1
0
Thg7-1
0
VN IndexS&P 500SSE indexNIKKEI 225 (/0')TSEC (/0')KOSPICNT (/00')

57International Journal ofManagement, Business, and EconomicsIJMBE
International Journal ofManagement, Business, and EconomicsIJMBE
Dependency of Human Resource Planning on Human ResourceInformation System: A Study on Banking Sector in Bangladesh
by
Farha SultanaBangladesh University of Business and Technology,
Dhaka, BangladeshTel: 01830127894, E-mail: [email protected]

Dependency of Human Resource Planning on Human ResourceInformation System: A Study on Banking Sector in Bangladesh
by
Farha SultanaBangladesh University of Business and Technology,
Dhaka, BangladeshTel: 01830127894, E-mail: [email protected]
Abstract
Human resource information system (HRIS) is not new perception. Its major role is in humanresource planning (HRP) which is required for selecting right people for the right place in anyorganization. Human Resource Information System (HRIS) has become one of most crucial systemsin the market. This study focuses on the Dependency of Human Resource Planning on HumanResource Information System (HRIS): A Study on Banking Sector in Bangladesh. The objective is toidentify the contribution of HRIS in HR planning through HRIS recruiting and training &development subsystems as apparent by HR executives in Bangladesh banking sector. Answersreceived from 60 respondents have been analyzed. Data have been collected using a structuredquestionnaire based on five point Likertscale. To test the hypotheses of the study some statisticalanalyses have been performed. These are Pearson correlations, Cronbach’s alpha reliability test andMultiple Regression Analysis. This study demonstrates HRIS requirements that increase theefficiency of HR planning.
Keywords: Human Resource Information System, Recruitment, Training and Development, HumanResource Planning
1. Introduction
Human Resources are the most key elements to any organization. Using of HRIS, HR staffrelieve out of paper related work when it is related to service sector and skilled related organizations.In Bangladesh, managing human resources plays a crucial role. The main purpose of Humanresource department is to manage people in a more efficient way. In the era of global transformation,service industries in Bangladesh have shown an incredible development over the last decade. For thisreason we have required huge number of efficient, competent, knowledgeable, energetic andenthusiastic staffs. With the development of science and technology, the world has shift towards amore integrated and interdependent global economy on continuous innovation to make work lifeeasier and new technology is continually being developed. This change requires organizationalevolve of the different types of technology which could improve the organizational success. It’s notresponsibility for HR to be the dusty repository of information locked in the office file which is notconverted into functional data. If organizations effectively manage HRIS than organizations, it willeasily keep more accurate and up-to-date information. An HRIS will help to increases in efficiencyand effectiveness when it comes to making any decisions in HR. This study conducted to find out theweather HRIS influence of human resource planning throughout recruitment, selection, training anddevelopment within the organization in private sector in Bangladesh.

59International Journal ofManagement, Business, and EconomicsIJMBE
Dependency of Human Resource Planning on Human ResourceInformation System: A Study on Banking Sector in Bangladesh
by
Farha SultanaBangladesh University of Business and Technology,
Dhaka, BangladeshTel: 01830127894, E-mail: [email protected]
Abstract
Human resource information system (HRIS) is not new perception. Its major role is in humanresource planning (HRP) which is required for selecting right people for the right place in anyorganization. Human Resource Information System (HRIS) has become one of most crucial systemsin the market. This study focuses on the Dependency of Human Resource Planning on HumanResource Information System (HRIS): A Study on Banking Sector in Bangladesh. The objective is toidentify the contribution of HRIS in HR planning through HRIS recruiting and training &development subsystems as apparent by HR executives in Bangladesh banking sector. Answersreceived from 60 respondents have been analyzed. Data have been collected using a structuredquestionnaire based on five point Likertscale. To test the hypotheses of the study some statisticalanalyses have been performed. These are Pearson correlations, Cronbach’s alpha reliability test andMultiple Regression Analysis. This study demonstrates HRIS requirements that increase theefficiency of HR planning.
Keywords: Human Resource Information System, Recruitment, Training and Development, HumanResource Planning
1. Introduction
Human Resources are the most key elements to any organization. Using of HRIS, HR staffrelieve out of paper related work when it is related to service sector and skilled related organizations.In Bangladesh, managing human resources plays a crucial role. The main purpose of Humanresource department is to manage people in a more efficient way. In the era of global transformation,service industries in Bangladesh have shown an incredible development over the last decade. For thisreason we have required huge number of efficient, competent, knowledgeable, energetic andenthusiastic staffs. With the development of science and technology, the world has shift towards amore integrated and interdependent global economy on continuous innovation to make work lifeeasier and new technology is continually being developed. This change requires organizationalevolve of the different types of technology which could improve the organizational success. It’s notresponsibility for HR to be the dusty repository of information locked in the office file which is notconverted into functional data. If organizations effectively manage HRIS than organizations, it willeasily keep more accurate and up-to-date information. An HRIS will help to increases in efficiencyand effectiveness when it comes to making any decisions in HR. This study conducted to find out theweather HRIS influence of human resource planning throughout recruitment, selection, training anddevelopment within the organization in private sector in Bangladesh.

60 International Journal ofManagement, Business, and EconomicsIJMBE
2. Literature Review
Human Resource Information System (HRIS)
HRIS is one of the most significant Management Information Systems, which contributes tohuman resource administration functions of an organization. HRIS initiatives have been worldlyaccepted as the best chance for improvement in any organization as well as in the banking andfinancial sector to accommodate the increasing demand and supply of fundamental services orbanking services in both the developed and developing countries (Ahmer, 2013)
HRIS, aptly claimed by Noe et al., (2007), as a computer system used to acquire, store,manipulate, analyze, retrieve, and distribute information related to human resources. According toBeadles et al. (2005), the use of HRIS has been advocated as an opportunity for human resource HRprofessionals to become strategic partners with top management.
HRIS and Human Resource Planning (HRP)
Pattanayak (2009) claimed that, the role of human resource planning is to integrate theplanning and control of human resources into the corporate level plans. As a consequence, allcapitals such as human capital, customer capital, and technological capital are used together in thegreatest possible combination. HR planning plays a vital part in an organization hiring the rightperson in the right job at the right time. If HRIS helps HR planning functions such as recruitment andselection, training and development and succession planning, organizations would increase acompetitive gain. HRIS or Human Resource Management Systems (HRMS) can support inidentifying skilled, competent and capable workers. Organizational recruiting sources such as directapplications, advertisements, public or private employment agencies, colleges, universities, etc. aregoing to be replaced by HRIS electronic recruiting facilities reducing the cost of the organizationHRIS skill inventory facilities can be used to store data in a skill database facilitating the selection ofthe most suitable candidates after analyzing their skills and qualifications according to the jobrequirement. Tao et al., said that (2006) training a significant strategic practice in the progress ofinternal capability. HRIS helps for Training Needs Analysis (TNA) to choose what training anddevelopment program might best meet the need, saving time and cost. TNA allows individuals toacquire at their own level, as well as learning only what they need to know in order to benefit theirwork said Eighteen, 1999. TNA is an outstanding HR tool, which assistances the organization tokeep a training record for each delegate, viewing skill levels before and after the training. Successionplanning is another important part of training and development which used to classify and recordhigh-potential employees who is working in the organization in order to fulfill the top managementpositions whenever they become vacant.
HRIS benefits and obstacles
Considering the last few decades, we can easily observe that the organization is monitoring,collecting, storing, and analyzing the human resources information with the use of HRIS software oranything that involves functionality for HRIS (Ball, 2001; Hussain, Wallace, & Cornelius, 2007).Many studies mentioned HRIS benefits as an example of improvement in accuracy, the cost savingand the timely and quick access to information through HR reports claimed by Ngai and Wat,2006.They also found how HRIS reduced the cost of an organization. How it maintained customersatisfaction, improved quality, and innovations. Almost all the HR applications involve the poweringof HRM activities (Ngai et al., 2006). Furthermore, Ngai and Wat (2006) found how the accuracy
and timeliness of HRIS varied according to operating, controlling, and planning HR activities. Thekey component in the support HRIS delivers for the firm’s HR strategy is the accessibility ofinformation as input for HR-relating decision-making processes (Beulen,2009). Ngai and Wat (2006)listed benefits of HRIS: increases competitiveness by improving HR operations, shifts the focus ofHR from the processing of transactions too strategic HRM, makes employees part of HRIS andreengineers the entire HR function of companies. Alvarez-Suescun (2007) pointed out that, HRIS asa competitive tool which can be used in the organizational HR department. Teo et al. (2007) foundsome same findings, departmental relative advantage, compatibility, top management support, size ofthe organization and HRIS expertise emerged as important variables discriminating between adoptersand non-adopters of HRIS.
HRIS usage
According to DeSanctis, 1986 explore that human resource planning, recruiting, and trainingare less common users within employee’s possibly reflecting greater use of the system for routinereporting than for decision support. If the strategy were to reduce cost, the system would have beenbased on management purposes. According to Kovach and Cathcart (1999), HRIS information couldbe used for administrative purposes, which reduced cost and time, and supported more logicaldecisions as well. HRIS functionality includes corporate communication, recruitment, selection,training, employee opinion survey, compensation, payroll services and employee verification as wellas general information (Ngai and Wat, 2006).
Training and development
The training and development involvement needed to be cautiously planned and applied andrelated to organizational goals and strategy, for the training investment to pay-off said Glaveli andKufidu, 2005.There are differences between training and development practices relative toorganization size, and small firms face unique barriers, including access to, time for, and the cost oftraining claimed by Sambrook, 2005.
Recruitment and selection
Recruitment represents the main employment activities that need to be efficiently andeffectively planned and directed for organizations to achieve achievement (Darrag et al., 2010). Heidentified recruitment as the process of determining potential applicants for real or expectedorganizational vacancies or, from another viewpoint, it is a link activity-bringing together those withjobs to fill and those seeking jobs. According to Selden et al. (2000) a number of research emphaseson the performance effects of human resource management practices, such as training, and selection.Darrag et al. (2010) and El-Kot and Leat (2008) have all studied recruitment and selection methodsin detail they have not focused their attention on how new technology, specially HRIS could enhanceand strengthen the recruitment and selection process of an organization. Selden et al. (2000) focusedon assessing the efficiency of human resource management system, present a framework andmethodology filling this knowledge gap. They addressed the ability to design an effective evaluationsystem given a set of criteria and made a survey instrument associated with the certain standards butthey did not try to measure the effectiveness of recruitment and selection features of Human resourcemanagement system. In consideration of little research in the adoption of HRIS that has been donepreviously, particularly in developing nations such as Bangladesh, exploratory studies were morejustifiable (Zikmund, Babin, Carr, & Griffin, 2010). The research has followed the convenience

61International Journal ofManagement, Business, and EconomicsIJMBE
2. Literature Review
Human Resource Information System (HRIS)
HRIS is one of the most significant Management Information Systems, which contributes tohuman resource administration functions of an organization. HRIS initiatives have been worldlyaccepted as the best chance for improvement in any organization as well as in the banking andfinancial sector to accommodate the increasing demand and supply of fundamental services orbanking services in both the developed and developing countries (Ahmer, 2013)
HRIS, aptly claimed by Noe et al., (2007), as a computer system used to acquire, store,manipulate, analyze, retrieve, and distribute information related to human resources. According toBeadles et al. (2005), the use of HRIS has been advocated as an opportunity for human resource HRprofessionals to become strategic partners with top management.
HRIS and Human Resource Planning (HRP)
Pattanayak (2009) claimed that, the role of human resource planning is to integrate theplanning and control of human resources into the corporate level plans. As a consequence, allcapitals such as human capital, customer capital, and technological capital are used together in thegreatest possible combination. HR planning plays a vital part in an organization hiring the rightperson in the right job at the right time. If HRIS helps HR planning functions such as recruitment andselection, training and development and succession planning, organizations would increase acompetitive gain. HRIS or Human Resource Management Systems (HRMS) can support inidentifying skilled, competent and capable workers. Organizational recruiting sources such as directapplications, advertisements, public or private employment agencies, colleges, universities, etc. aregoing to be replaced by HRIS electronic recruiting facilities reducing the cost of the organizationHRIS skill inventory facilities can be used to store data in a skill database facilitating the selection ofthe most suitable candidates after analyzing their skills and qualifications according to the jobrequirement. Tao et al., said that (2006) training a significant strategic practice in the progress ofinternal capability. HRIS helps for Training Needs Analysis (TNA) to choose what training anddevelopment program might best meet the need, saving time and cost. TNA allows individuals toacquire at their own level, as well as learning only what they need to know in order to benefit theirwork said Eighteen, 1999. TNA is an outstanding HR tool, which assistances the organization tokeep a training record for each delegate, viewing skill levels before and after the training. Successionplanning is another important part of training and development which used to classify and recordhigh-potential employees who is working in the organization in order to fulfill the top managementpositions whenever they become vacant.
HRIS benefits and obstacles
Considering the last few decades, we can easily observe that the organization is monitoring,collecting, storing, and analyzing the human resources information with the use of HRIS software oranything that involves functionality for HRIS (Ball, 2001; Hussain, Wallace, & Cornelius, 2007).Many studies mentioned HRIS benefits as an example of improvement in accuracy, the cost savingand the timely and quick access to information through HR reports claimed by Ngai and Wat,2006.They also found how HRIS reduced the cost of an organization. How it maintained customersatisfaction, improved quality, and innovations. Almost all the HR applications involve the poweringof HRM activities (Ngai et al., 2006). Furthermore, Ngai and Wat (2006) found how the accuracy
and timeliness of HRIS varied according to operating, controlling, and planning HR activities. Thekey component in the support HRIS delivers for the firm’s HR strategy is the accessibility ofinformation as input for HR-relating decision-making processes (Beulen,2009). Ngai and Wat (2006)listed benefits of HRIS: increases competitiveness by improving HR operations, shifts the focus ofHR from the processing of transactions too strategic HRM, makes employees part of HRIS andreengineers the entire HR function of companies. Alvarez-Suescun (2007) pointed out that, HRIS asa competitive tool which can be used in the organizational HR department. Teo et al. (2007) foundsome same findings, departmental relative advantage, compatibility, top management support, size ofthe organization and HRIS expertise emerged as important variables discriminating between adoptersand non-adopters of HRIS.
HRIS usage
According to DeSanctis, 1986 explore that human resource planning, recruiting, and trainingare less common users within employee’s possibly reflecting greater use of the system for routinereporting than for decision support. If the strategy were to reduce cost, the system would have beenbased on management purposes. According to Kovach and Cathcart (1999), HRIS information couldbe used for administrative purposes, which reduced cost and time, and supported more logicaldecisions as well. HRIS functionality includes corporate communication, recruitment, selection,training, employee opinion survey, compensation, payroll services and employee verification as wellas general information (Ngai and Wat, 2006).
Training and development
The training and development involvement needed to be cautiously planned and applied andrelated to organizational goals and strategy, for the training investment to pay-off said Glaveli andKufidu, 2005.There are differences between training and development practices relative toorganization size, and small firms face unique barriers, including access to, time for, and the cost oftraining claimed by Sambrook, 2005.
Recruitment and selection
Recruitment represents the main employment activities that need to be efficiently andeffectively planned and directed for organizations to achieve achievement (Darrag et al., 2010). Heidentified recruitment as the process of determining potential applicants for real or expectedorganizational vacancies or, from another viewpoint, it is a link activity-bringing together those withjobs to fill and those seeking jobs. According to Selden et al. (2000) a number of research emphaseson the performance effects of human resource management practices, such as training, and selection.Darrag et al. (2010) and El-Kot and Leat (2008) have all studied recruitment and selection methodsin detail they have not focused their attention on how new technology, specially HRIS could enhanceand strengthen the recruitment and selection process of an organization. Selden et al. (2000) focusedon assessing the efficiency of human resource management system, present a framework andmethodology filling this knowledge gap. They addressed the ability to design an effective evaluationsystem given a set of criteria and made a survey instrument associated with the certain standards butthey did not try to measure the effectiveness of recruitment and selection features of Human resourcemanagement system. In consideration of little research in the adoption of HRIS that has been donepreviously, particularly in developing nations such as Bangladesh, exploratory studies were morejustifiable (Zikmund, Babin, Carr, & Griffin, 2010). The research has followed the convenience

62 International Journal ofManagement, Business, and EconomicsIJMBE
sampling method which is cost effective and widely applied in information systems research (Eze,Manyeki, Yaw, & Har, 2011).
3. Research Objectives
Main Objective
The main objective of this study is to” Dependency of Human Resource Planning on HumanResource Information System (HRIS): A Study on Banking Sector in Bangladesh. There are somespecific Objectives of this study. The specific objectives of this study are as follows:1. To determine the contribution of HRIS recruitment subsystem of an organization.2. To explore the contribution of HRIS training and development subsystem of an organization.3. To find the overall contribution of HRIS in HR planning through HRIS recruiting and training anddevelopment subsystems of an organization.
Hypotheses
For research purposes, null and alternative hypotheses are developed as follows:
Hypothesis-1: Ho: There is no association between HRIS recruitment and the HumanResource Planning (HRP)
H-1: There is association between HRIS recruitment and the Human ResourcePlanning (HRP)
Hypothesis-2: Ho: There is no association between HRIS training and development and theHuman Resource Planning (HRP)
H-2: There is association between HRIS training and development and theHuman Resource Planning (HRP)
Hypothesis-3: Ho: There is no association between HRIS in HR planning through HRISrecruiting and training & development and the Human Resource Planning (HRP)
H-3: There is association between HRIS in HR planning through HRISrecruitment and training & development and the Human Resource Planning (HRP)
4. Data and Research Methodology
This study has a conclusive type of research. For the purpose of the study primary data hasbeen used. The variables which have been selected for the study as follows:
1. Independent variables: HRIS recruitment, HRIS training and development, HRIS in HRplanning through HRIS recruitment, training and development
2. Dependent variable: Human Resource Planning (HRP).
Population of the study comprised of HR executives who use HRIS to extract information toassist the top management of private bank in Bangladesh.
The sample consisted of 60 HR executive of different private banks in Bangladesh. There aremore than 57 Private banks in Bangladesh. It has very difficult for the researcher to visit each bankof Bangladesh. Hence four private banks have been conveniently selected and included in thesample. Researcher had to visit of the selected four branches of the private banks again and again.Researcher personally met with them to collect data.
A questionnaire consisting of fifty-three items to be responded on five-point Likert scale hasbeen used to collect data. Questionnaire has to prepared based on prior researches. The datacollection stage has very difficult for the researchers. The researchers distributed questionnaire to120 respondents but the researchers have able to get response from 60 respondents. In order toanalyze the data Cronbach’s alpha coefficient has been used to test the reliability of responses. Totest the hypotheses of the study some statistical analyses have been performed. These are Pearsoncorrelations and Multiple Regression Analysis.
5. Data Analysis, Discussion, and Findings
Multiple Regression Analysis, Results and Interpretation
Table 1 in Appendix A demonstrates the outcomes of the multiple regression analysis in thisstudy. The table shows the association between dependent variable and independent variables. Thecoefficient of determination R-square, F ratio, beta coefficient and t-statistics for the regressionmodel and summarized results of the dependent variable on the independent variables are describedbelow.
Table 1 in Appendix A demonstrates the outcomes an R-square of 0.679, which shows thatthe model is capable of explaining 67.90 percent of the variability of the human resource planning inthe sample of banking sector under study. The adjusted R-square indicates that 62.30 percent of thevariation in the dependent variable in the model used that is explained by variations in theindependent variables. The F value of 98.519 (which is significant at the 0.000 levels) indicates thatthe model significantly explained the variations in the efficiency of human resources planning. All ofthese values propose that a significant percentage of the variation in the efficiency of humanresources planning can be explained by the variations in the whole set of independent variables.
Hypotheses testing
Hypothesis 1:
The coefficient for HRIS recruitment is 0.829 which is statistically significant at the 0.000level (P < 0.01, two tailed). The outcome recommends that HRIS recruitment& selection hassignificant positive impact on HRP. Thus, null hypothesis is rejected and alternative hypothesis isaccepted.
The outcomes display in table 1 in Appendix A, R-square of 0.679, which shows that themodel is capable of explaining 67.90 percent of the variability of the human resource planning in thesample of banking sector under study. The adjusted R-square indicates that 62.30 percent of thevariation in the dependent variable in the model used here is explained by variations in theindependent variables. The F value of 98.519 (which is significant at the 0.000 levels) indicates thatthe model significantly explained the variations in the efficiency of human resources planning. All

63International Journal ofManagement, Business, and EconomicsIJMBE
sampling method which is cost effective and widely applied in information systems research (Eze,Manyeki, Yaw, & Har, 2011).
3. Research Objectives
Main Objective
The main objective of this study is to” Dependency of Human Resource Planning on HumanResource Information System (HRIS): A Study on Banking Sector in Bangladesh. There are somespecific Objectives of this study. The specific objectives of this study are as follows:1. To determine the contribution of HRIS recruitment subsystem of an organization.2. To explore the contribution of HRIS training and development subsystem of an organization.3. To find the overall contribution of HRIS in HR planning through HRIS recruiting and training anddevelopment subsystems of an organization.
Hypotheses
For research purposes, null and alternative hypotheses are developed as follows:
Hypothesis-1: Ho: There is no association between HRIS recruitment and the HumanResource Planning (HRP)
H-1: There is association between HRIS recruitment and the Human ResourcePlanning (HRP)
Hypothesis-2: Ho: There is no association between HRIS training and development and theHuman Resource Planning (HRP)
H-2: There is association between HRIS training and development and theHuman Resource Planning (HRP)
Hypothesis-3: Ho: There is no association between HRIS in HR planning through HRISrecruiting and training & development and the Human Resource Planning (HRP)
H-3: There is association between HRIS in HR planning through HRISrecruitment and training & development and the Human Resource Planning (HRP)
4. Data and Research Methodology
This study has a conclusive type of research. For the purpose of the study primary data hasbeen used. The variables which have been selected for the study as follows:
1. Independent variables: HRIS recruitment, HRIS training and development, HRIS in HRplanning through HRIS recruitment, training and development
2. Dependent variable: Human Resource Planning (HRP).
Population of the study comprised of HR executives who use HRIS to extract information toassist the top management of private bank in Bangladesh.
The sample consisted of 60 HR executive of different private banks in Bangladesh. There aremore than 57 Private banks in Bangladesh. It has very difficult for the researcher to visit each bankof Bangladesh. Hence four private banks have been conveniently selected and included in thesample. Researcher had to visit of the selected four branches of the private banks again and again.Researcher personally met with them to collect data.
A questionnaire consisting of fifty-three items to be responded on five-point Likert scale hasbeen used to collect data. Questionnaire has to prepared based on prior researches. The datacollection stage has very difficult for the researchers. The researchers distributed questionnaire to120 respondents but the researchers have able to get response from 60 respondents. In order toanalyze the data Cronbach’s alpha coefficient has been used to test the reliability of responses. Totest the hypotheses of the study some statistical analyses have been performed. These are Pearsoncorrelations and Multiple Regression Analysis.
5. Data Analysis, Discussion, and Findings
Multiple Regression Analysis, Results and Interpretation
Table 1 in Appendix A demonstrates the outcomes of the multiple regression analysis in thisstudy. The table shows the association between dependent variable and independent variables. Thecoefficient of determination R-square, F ratio, beta coefficient and t-statistics for the regressionmodel and summarized results of the dependent variable on the independent variables are describedbelow.
Table 1 in Appendix A demonstrates the outcomes an R-square of 0.679, which shows thatthe model is capable of explaining 67.90 percent of the variability of the human resource planning inthe sample of banking sector under study. The adjusted R-square indicates that 62.30 percent of thevariation in the dependent variable in the model used that is explained by variations in theindependent variables. The F value of 98.519 (which is significant at the 0.000 levels) indicates thatthe model significantly explained the variations in the efficiency of human resources planning. All ofthese values propose that a significant percentage of the variation in the efficiency of humanresources planning can be explained by the variations in the whole set of independent variables.
Hypotheses testing
Hypothesis 1:
The coefficient for HRIS recruitment is 0.829 which is statistically significant at the 0.000level (P < 0.01, two tailed). The outcome recommends that HRIS recruitment& selection hassignificant positive impact on HRP. Thus, null hypothesis is rejected and alternative hypothesis isaccepted.
The outcomes display in table 1 in Appendix A, R-square of 0.679, which shows that themodel is capable of explaining 67.90 percent of the variability of the human resource planning in thesample of banking sector under study. The adjusted R-square indicates that 62.30 percent of thevariation in the dependent variable in the model used here is explained by variations in theindependent variables. The F value of 98.519 (which is significant at the 0.000 levels) indicates thatthe model significantly explained the variations in the efficiency of human resources planning. All

64 International Journal ofManagement, Business, and EconomicsIJMBE
values recommend that a significant percentage of the variation in the efficiency of human resourcesplanning can be explained by the variations in the whole set of independent variables.
Hypothesis 2:
The coefficient for HRIS training & development is 0.747 which is statistically significant atthe 0.000 level (P<0.01, two tailed). The outcome suggests that HRI Straining & development hassignificant positive impact on HRP. Thus, null hypothesis is rejected and alternative hypothesis isaccepted.
The results show in Table 2 in Appendix A, R-square of 0.943, which indicates that themodel is capable of explaining 94.30 percent of the variability of the human resources efficiency inthe sample banking companies under study. The adjusted R-square indicates that 88.80 percent of thevariation in the dependent variable in the model used here is explained by variations in theindependent variables. The F value of 468.056 (which is significant at the 0.000 levels) indicates thatthe model significantly explained the variations in the efficiency of human resources.
Hypothesis 3:
The coefficient for HRIS training & development is 0.723 which is statistically significant atthe 0.000 level (P < 0.01, two tailed). The result suggests that common role in HRIS training&selection has significant positive impact on HRP. Thus, null hypothesis is rejected and alternativehypothesis is accepted.
To test the research hypotheses Pearson correlation and multiple regressions were used. Theresult in Table -3 in Appendix A demonstrate that, HRIS recruitment, HRIS training & developmentand HRIS in HR planning through HRIS recruitment and training &development has positiverelationship with Human resource planning (HRP). This study attempted to find the relationshipbetween the components of HRIS and HRP of banking sector in Bangladesh. To realize the role ofHRIS in banking sector, three research hypotheses were constructed. Pearson correlation was used totest the proposed research hypotheses of the study. The result of the study illustrated that each of thecomponents of HRIS is positively related to the HRP of banking sector in Bangladesh. As indicatedby the value of correlation coefficient 0.943, the findings showed that HRIS role in Recruitmentappeared as the most important component of HRIS in influencing HRP of Banking sector inBangladesh The correlation coefficient of the were 0.793 and 0.760 respectively, and they weresignificant at 1% level. Thus, this appears to indicate that HR training and common role in training&development tend to have lower influence on the HRP of banking sector in Bangladesh than. Overall,the results illustrated that their components have positive relation with HRP. Therefore, thecorrelation findings of the study supported the proposed first three research hypotheses.
6. Conclusion
In Bangladesh HRIS is in its initial stages. It is because; lot of reforming is going on in theindustry such as technological, infrastructure, and knowledge. Collected data presented that theavailable HRIS functions support the efficiency of organizational HR planning. In Bangladesh mostorganizations use HRIS for TNA and skill inventory. The widespread use of HRIS in Bangladeshiorganizations HRIS proved to be very effective in record keeping and daily reporting functions. Butit will be more effective if we are using HRIS in decision making process. Still, organizations are
unwilling to allocate high budget for HRIS development. The study intended at discovering the roleof Human Resources Information System (HRIS) in private banks in Bangladesh. The study exposedthat HRIS plays significant role in recruitment and selection, training & development in privatebanks. Use of HRIS is not used in vast in Bangladesh because lack of infrastructural development,high cost and insufficient training. The abolition of the difficulties in terms of infrastructure, costand training would enable the private banks to recruit and select right people for the right place,deliver appropriate training to them and to ensure better quality and sustainable growth.
References
Ahmer, Z. (2013). Adoption of human resource information systems innovation in Pakistaniorganizations. Journal of Quality and Technology Management, IX, 25–50.
Alvarez,Suescun, Emilio. (2007). Testing resource-based propositions about IS sourcing decisions.Industrial Management and Data Systems, 107 (6), 762-779.
Ball, K. S. (2001). The use of human resource information systems: A survey. Personnel Review, 30,677–693. doi:10.1108/EUM0000000005979
Beadles, Nicholas, Lowery, Christopher M.& Johns, Kim. (2005). The Impact of Human ResourceInformation Systems: An Exploratory Study in the Public Sector. 5(4), 39-46. [Online], Availablefrom www.iima.org/CIIMA/11%205.4_Beadles_39-46.pdf [Accessed on 3rd June 2010].
Darrag, Menatallah, Mohamed, Ahmed & Aziz, Hadia Abdel. (2010). Investigating recruitmentpractices and problems of multinational companies (MNCs) operating in Egypt. Practices andproblems of MNCs. 3(2), 99-116.
DeSanctis, Gerardlne. (1986). Human Resource Information Systems: A Current Assessment.Human Resource Systems.15-27.
Eighteen, Robert. (1999). Training needs analysis for IT training. Industrial and CommercialTraining.31(4), 149-152.
El, Kot;Ghada&Leat, Mike. (2008). A survey of recruitment and selection practices in EgyptEducation. EBS. 1(3), 200-212.
Eze, U., Manyeki, J., Yaw, L., & Har, L. (2011). Factors affecting internet banking adoption amongyoung adults: Evidence from Malaysia. Paper presented at the International Conference on SocialScience and Humanity, IPEDR, Singapore.
Glaveli, Niki &Kufidu, Stella. (2005). The old, the young and the restless: A comparative analysis ofthe impact of environmental change on training in four Greek banks. European BusinessReview.17(5), 441-459.
Hussain, Z., Wallace, J., & Cornelius, N. E. (2007). The use and impact of human resourceinformation systems on human resource management professionals. Information & Management, 44,74–89. doi:10.1016/j.im.2006.10.006

65International Journal ofManagement, Business, and EconomicsIJMBE
values recommend that a significant percentage of the variation in the efficiency of human resourcesplanning can be explained by the variations in the whole set of independent variables.
Hypothesis 2:
The coefficient for HRIS training & development is 0.747 which is statistically significant atthe 0.000 level (P<0.01, two tailed). The outcome suggests that HRI Straining & development hassignificant positive impact on HRP. Thus, null hypothesis is rejected and alternative hypothesis isaccepted.
The results show in Table 2 in Appendix A, R-square of 0.943, which indicates that themodel is capable of explaining 94.30 percent of the variability of the human resources efficiency inthe sample banking companies under study. The adjusted R-square indicates that 88.80 percent of thevariation in the dependent variable in the model used here is explained by variations in theindependent variables. The F value of 468.056 (which is significant at the 0.000 levels) indicates thatthe model significantly explained the variations in the efficiency of human resources.
Hypothesis 3:
The coefficient for HRIS training & development is 0.723 which is statistically significant atthe 0.000 level (P < 0.01, two tailed). The result suggests that common role in HRIS training&selection has significant positive impact on HRP. Thus, null hypothesis is rejected and alternativehypothesis is accepted.
To test the research hypotheses Pearson correlation and multiple regressions were used. Theresult in Table -3 in Appendix A demonstrate that, HRIS recruitment, HRIS training & developmentand HRIS in HR planning through HRIS recruitment and training &development has positiverelationship with Human resource planning (HRP). This study attempted to find the relationshipbetween the components of HRIS and HRP of banking sector in Bangladesh. To realize the role ofHRIS in banking sector, three research hypotheses were constructed. Pearson correlation was used totest the proposed research hypotheses of the study. The result of the study illustrated that each of thecomponents of HRIS is positively related to the HRP of banking sector in Bangladesh. As indicatedby the value of correlation coefficient 0.943, the findings showed that HRIS role in Recruitmentappeared as the most important component of HRIS in influencing HRP of Banking sector inBangladesh The correlation coefficient of the were 0.793 and 0.760 respectively, and they weresignificant at 1% level. Thus, this appears to indicate that HR training and common role in training&development tend to have lower influence on the HRP of banking sector in Bangladesh than. Overall,the results illustrated that their components have positive relation with HRP. Therefore, thecorrelation findings of the study supported the proposed first three research hypotheses.
6. Conclusion
In Bangladesh HRIS is in its initial stages. It is because; lot of reforming is going on in theindustry such as technological, infrastructure, and knowledge. Collected data presented that theavailable HRIS functions support the efficiency of organizational HR planning. In Bangladesh mostorganizations use HRIS for TNA and skill inventory. The widespread use of HRIS in Bangladeshiorganizations HRIS proved to be very effective in record keeping and daily reporting functions. Butit will be more effective if we are using HRIS in decision making process. Still, organizations are
unwilling to allocate high budget for HRIS development. The study intended at discovering the roleof Human Resources Information System (HRIS) in private banks in Bangladesh. The study exposedthat HRIS plays significant role in recruitment and selection, training & development in privatebanks. Use of HRIS is not used in vast in Bangladesh because lack of infrastructural development,high cost and insufficient training. The abolition of the difficulties in terms of infrastructure, costand training would enable the private banks to recruit and select right people for the right place,deliver appropriate training to them and to ensure better quality and sustainable growth.
References
Ahmer, Z. (2013). Adoption of human resource information systems innovation in Pakistaniorganizations. Journal of Quality and Technology Management, IX, 25–50.
Alvarez,Suescun, Emilio. (2007). Testing resource-based propositions about IS sourcing decisions.Industrial Management and Data Systems, 107 (6), 762-779.
Ball, K. S. (2001). The use of human resource information systems: A survey. Personnel Review, 30,677–693. doi:10.1108/EUM0000000005979
Beadles, Nicholas, Lowery, Christopher M.& Johns, Kim. (2005). The Impact of Human ResourceInformation Systems: An Exploratory Study in the Public Sector. 5(4), 39-46. [Online], Availablefrom www.iima.org/CIIMA/11%205.4_Beadles_39-46.pdf [Accessed on 3rd June 2010].
Darrag, Menatallah, Mohamed, Ahmed & Aziz, Hadia Abdel. (2010). Investigating recruitmentpractices and problems of multinational companies (MNCs) operating in Egypt. Practices andproblems of MNCs. 3(2), 99-116.
DeSanctis, Gerardlne. (1986). Human Resource Information Systems: A Current Assessment.Human Resource Systems.15-27.
Eighteen, Robert. (1999). Training needs analysis for IT training. Industrial and CommercialTraining.31(4), 149-152.
El, Kot;Ghada&Leat, Mike. (2008). A survey of recruitment and selection practices in EgyptEducation. EBS. 1(3), 200-212.
Eze, U., Manyeki, J., Yaw, L., & Har, L. (2011). Factors affecting internet banking adoption amongyoung adults: Evidence from Malaysia. Paper presented at the International Conference on SocialScience and Humanity, IPEDR, Singapore.
Glaveli, Niki &Kufidu, Stella. (2005). The old, the young and the restless: A comparative analysis ofthe impact of environmental change on training in four Greek banks. European BusinessReview.17(5), 441-459.
Hussain, Z., Wallace, J., & Cornelius, N. E. (2007). The use and impact of human resourceinformation systems on human resource management professionals. Information & Management, 44,74–89. doi:10.1016/j.im.2006.10.006

66 International Journal ofManagement, Business, and EconomicsIJMBE
Kovach, K.A., Hughes, A.A., Fagan, P., & Maggitti, P.G. (2002). Administrative and StrategicAdvantages of HRIS. Employment Relations Today, 29(2), 43-48.
Ngai, E.W.T;& Wat F.K.T. (2006). Human resource information systems: a review and empiricalanalysis. Human Resource Information Systems. 35(3), 297-314.
Noe, Hollenbeck & Gerhard, Wreight. (2007). Fundamentals of Human Resource Management, 2ndedition, The McGraw-Hill Companies.
Pattanayak, Biswajeet. (2009). Human Resource Management, 3rd edition, New Delhi, PHI LearningPrivate Limited.
Sambrook, Sally. (2005). Exploring succession planning in small, growing firms. Exploringsuccession planning.12(4), 579-594.
Selden, Sally, Coleman., Jacobson, Willow.,Ammar, Salwa H; and Wright, Ronald H. (2000). ANew Approach to Assessing Performance of State Human Resource Management Systems: A Multi-Level Fuzzy Rule-Based System. Public Personnel Administration. 20, 58-74.
Tao, Yu; Hui, Yeh, C. Rosa & Sheng I Sun. (2006). Improving training needs assessment processesvia the Internet: system design and qualitative study. Internet Research.16(4), 427-449.
Teo, Thompson, S.H., Lim, Ghee, Soon&Fedric, Sherin Ann. (2007). The adoption and diffusion ofhuman resources information systems in Singapore. Human Resources. 45, 44-62.
Zikmund, W. G., Babin, B. J., Carr, J. C., & Griffin, M. (2010). Business research methods (8th ed.).Victoria: SouthWestern, Cengage Learning.
Appendix A
Table 1 Model Summary (HRIS Role in Recruitment and Selection)
Model R Square SquareStd. Error ofthe Estimate
Durbin-Watson
0.793 0.629 0.623 0.31792 1.781ANOVA
Model Sum ofSquares df Mean Square F Sig.
Regression 9.958 1 9.958 98.519 0.000Residual 5.862 58 .101
Total 15.820 59Coefficients
Model UnstandardizedCoefficients
StandardizedCoefficients t Sig.
B Std.Error Beta
(Constant) .567 0.340 1.665 0.101HRIS
Recruitment&Selection
0.829 0.084 0.793 9.926 0.000**
*P < 0.05, twotailed, **P <
0.01, two tailedCranach’s
Alpha = 0.959 N = 53

67International Journal ofManagement, Business, and EconomicsIJMBE
Kovach, K.A., Hughes, A.A., Fagan, P., & Maggitti, P.G. (2002). Administrative and StrategicAdvantages of HRIS. Employment Relations Today, 29(2), 43-48.
Ngai, E.W.T;& Wat F.K.T. (2006). Human resource information systems: a review and empiricalanalysis. Human Resource Information Systems. 35(3), 297-314.
Noe, Hollenbeck & Gerhard, Wreight. (2007). Fundamentals of Human Resource Management, 2ndedition, The McGraw-Hill Companies.
Pattanayak, Biswajeet. (2009). Human Resource Management, 3rd edition, New Delhi, PHI LearningPrivate Limited.
Sambrook, Sally. (2005). Exploring succession planning in small, growing firms. Exploringsuccession planning.12(4), 579-594.
Selden, Sally, Coleman., Jacobson, Willow.,Ammar, Salwa H; and Wright, Ronald H. (2000). ANew Approach to Assessing Performance of State Human Resource Management Systems: A Multi-Level Fuzzy Rule-Based System. Public Personnel Administration. 20, 58-74.
Tao, Yu; Hui, Yeh, C. Rosa & Sheng I Sun. (2006). Improving training needs assessment processesvia the Internet: system design and qualitative study. Internet Research.16(4), 427-449.
Teo, Thompson, S.H., Lim, Ghee, Soon&Fedric, Sherin Ann. (2007). The adoption and diffusion ofhuman resources information systems in Singapore. Human Resources. 45, 44-62.
Zikmund, W. G., Babin, B. J., Carr, J. C., & Griffin, M. (2010). Business research methods (8th ed.).Victoria: SouthWestern, Cengage Learning.
Appendix A
Table 1 Model Summary (HRIS Role in Recruitment and Selection)
Model R Square SquareStd. Error ofthe Estimate
Durbin-Watson
0.793 0.629 0.623 0.31792 1.781ANOVA
Model Sum ofSquares df Mean Square F Sig.
Regression 9.958 1 9.958 98.519 0.000Residual 5.862 58 .101
Total 15.820 59Coefficients
Model UnstandardizedCoefficients
StandardizedCoefficients t Sig.
B Std.Error Beta
(Constant) .567 0.340 1.665 0.101HRIS
Recruitment&Selection
0.829 0.084 0.793 9.926 0.000**
*P < 0.05, twotailed, **P <
0.01, two tailedCranach’s
Alpha = 0.959 N = 53

68 International Journal ofManagement, Business, and EconomicsIJMBE
Tabl
e 2
Mod
el S
umm
ary
(HR
IS R
ole
in T
rain
ing
and
Dev
elop
men
t)
Mod
elR
RSq
uare
Adj
uste
d R
Squa
reSt
d. E
rror
of
the
Estim
ate
Dur
bin-
Wat
son
0.86
90.
755
0.75
10.
2585
41.
818
AN
OV
A
Mod
elSu
m o
fSq
uare
sdf
Mea
nSq
uare
FSi
g.R
egre
ssio
n11
.943
111
.943
98.5
190.
000
Res
idua
l3.
877
58.0
67To
tal
15.8
259
Coe
ffic
ient
s
Mod
el
Uns
tand
ardi
zed
Coe
ffic
ient
sSt
anda
rdiz
edC
oeff
icie
nts
tSi
g.
BSt
d.Er
ror
Bet
a(C
onst
ant)
1.18
90.
207
5.74
60.
000*
*H
RIS
train
ing&
deve
lopm
ent
0.74
70.
056
0.86
913
.367
0.00
0**
*P <
0.0
5, tw
o ta
iled,
**P
<0.
01, t
wo
taile
d

69International Journal ofManagement, Business, and EconomicsIJMBE
Tabl
e3
Mod
el S
umm
ary
(Com
mon
HR
IS ro
le in
Rec
ruiti
ng a
nd T
rain
ing
and
Dev
elop
men
t)
Mod
elR
R S
quar
eA
djus
ted
RSq
uare
0.94
30.
890
0.88
8A
NO
VA
Mod
elSu
m o
fSq
uare
sdf
Mea
nSq
uare
Reg
ress
ion
14.0
761
14.0
76R
esid
ual
1.74
458
.030
Tota
l15
.820
59C
oeff
icie
nts
Mod
elU
nsta
ndar
dize
dC
oeff
icie
nts
BSt
d. E
rror
(Con
stan
t).9
830.
138
Com
mon
role
Rec
ruitm
ent &
Trai
ning
0.72
30.
033
*P <
0.0
5, tw
o ta
iled,
**P
< 0
.01,
two
taile
d


71International Journal ofManagement, Business, and EconomicsIJMBE
International Journal ofManagement, Business, and EconomicsIJMBE
Logistics Crunch: Analysis of Intermodal Containers Resource inPre and Post China-Pakistan Economic Corridor’s Establishment
by
Maisam AliCapital University of Science and Technology
Kahota Road, Islamabad, PakistanE-mail: [email protected]
and
Shahzad KhurramAir University School of Management
Air University, Sector E-9, Islamabad, PakistanE-mail: [email protected]
Abstract
China Pakistan Economic Corridor would link Gawadar (a deep sea port on the southwesterncoast of Pakistan) with China, Central Asian States, Russia, Turkey and several other countries.Pakistan will, therefore, replace Hong Kong as an entrepôt. In addition to it, as a sixth most populouscountry, Pakistan’s domestic consumption is on rise. Resultantly, the overall trade particularly thetransit trade is expected to enormously grow in post China Pakistan Economic Corridor era.Notwithstanding, Pakistan appears less prepared in so far as international logistics is concerned.Having analyzed data retrieved from focus group and a variety of archival records, it can be safelysuggested that the quantity and quality of the intermodal containers is not sufficient to fulfill theexponentially rising trade needs. We also found Pakistan does not produce intermodal containerslocally. This area needs immediate attention from both public and private sectors, as shortage ofintermodal containers can potentially disrupt the regional trade.
Keywords: Intermodal Containers, Transportation, International Logistics
1. Introduction
International logistics is about designing and managing a co-ordinated system to control theflow of materials and products throughout the firm. Strategically, international logistics constitutes avery important area of the firm because these expenses can account for 10 per cent of their total costs(Rugman et al., 2006). Moreover, lack of reliability and trust caused by poor management oflogistics can have adverse consequences for the salability of the product (Mayinger, 2001). Onementionable development that helped international businesses resolve these and related issues is theintroduction of the intermodal container (Stern, 2010). Inter-modality helped to transfer goods in acontinuous flow through the entire transport chain, from origin to final destination, in the most cost-and time-effective way (Hayuth, 1994) thus, changed the landscape of entire international logistics(Arjen and Berg, 1998; Levinson, 2006).

73International Journal ofManagement, Business, and EconomicsIJMBE
Logistics Crunch: Analysis of Intermodal Containers Resource inPre and Post China-Pakistan Economic Corridor’s Establishment
by
Maisam AliCapital University of Science and Technology
Kahota Road, Islamabad, PakistanE-mail: [email protected]
and
Shahzad KhurramAir University School of Management
Air University, Sector E-9, Islamabad, PakistanE-mail: [email protected]
Abstract
China Pakistan Economic Corridor would link Gawadar (a deep sea port on the southwesterncoast of Pakistan) with China, Central Asian States, Russia, Turkey and several other countries.Pakistan will, therefore, replace Hong Kong as an entrepôt. In addition to it, as a sixth most populouscountry, Pakistan’s domestic consumption is on rise. Resultantly, the overall trade particularly thetransit trade is expected to enormously grow in post China Pakistan Economic Corridor era.Notwithstanding, Pakistan appears less prepared in so far as international logistics is concerned.Having analyzed data retrieved from focus group and a variety of archival records, it can be safelysuggested that the quantity and quality of the intermodal containers is not sufficient to fulfill theexponentially rising trade needs. We also found Pakistan does not produce intermodal containerslocally. This area needs immediate attention from both public and private sectors, as shortage ofintermodal containers can potentially disrupt the regional trade.
Keywords: Intermodal Containers, Transportation, International Logistics
1. Introduction
International logistics is about designing and managing a co-ordinated system to control theflow of materials and products throughout the firm. Strategically, international logistics constitutes avery important area of the firm because these expenses can account for 10 per cent of their total costs(Rugman et al., 2006). Moreover, lack of reliability and trust caused by poor management oflogistics can have adverse consequences for the salability of the product (Mayinger, 2001). Onementionable development that helped international businesses resolve these and related issues is theintroduction of the intermodal container (Stern, 2010). Inter-modality helped to transfer goods in acontinuous flow through the entire transport chain, from origin to final destination, in the most cost-and time-effective way (Hayuth, 1994) thus, changed the landscape of entire international logistics(Arjen and Berg, 1998; Levinson, 2006).

74 International Journal ofManagement, Business, and EconomicsIJMBE
Undoubtedly, in recent years Intermodal Containers sector witnessed a boom of research anddevelopment in terms of new intermodal techniques (Rugman et al., 2006). Notwithstanding,international logistics literature in this area is quite scarce. Intermodalism, in particular, has beenrarely examined in emerging economies context. This article fills this gap by examining the situationof intermodal containers in context of Pakistan. Such an examination is crucial for the field ofinternational logistics when trade pattern between East and West are drastically changing and similarpatterned change is taking place in terms of intermodal containers resource.
This study will, therefore, contribute to the extant literature on international logistics andparticularly Intermodalism. We draw on previous research to establish the significance of intermodalcontainers for international businesses. Moreover, data gathered through Focus group and archivalrecords helps us analyze the intermodal container resource in pre and post China Pakistan EconomicCorridor’s establishment. Our study has important implications for Academia, Government ofPakistan and China, MNEs and several other important stakeholders.
We have structured our study in the following format: In section titled Literature review, wediscuss the various types of transportation and issues therein. This helps us understand thesignificance of intermodal containers. In second section on methodology we briefly describe the datacollection and analysis through focus group and archival records. In section titled Research site, wetry to map the important stakeholders in intermodal sector of Pakistan and quantify the availableintermodal resource. Then we discuss the changing pattern of international and domestic trade and itsimplications for intermodal containers sector of Pakistan. We conclude with final remarks attowards the end.
2. Literature Review
While reviewing the literature we mainly focus on issues in traditional transport andsignificance of intermodal containers. We will first present the literature that deals with logistics andtypes of transportation.
Logistics: Global innovation management and knowledge management are seen to beincreasingly important to the long-run performance of all firms. The terms distributed innovation anddifferentiated networks are used to characterize how firms should learn globally and exploit thislearning globally to improve production processes and products in all markets (Nohria and Ghoshal,1997).
In recent years management of distribution as a branch of business science emanated aslogistics management (Graham, 1998), which is the process of planning, implementing, andcontrolling the efficient, effective flow and storage of goods, services and related information frompoint of origin to point of consumption for the purpose of conforming to customer requirements. It islike a cradle-to- grave analysis of the ordering, transport, and storage of the product or service beingproduced and of the inputs required producing it (Allen, 1997).
To benefit from the logistics management, countries have developed international logisticssystem which is the designing and managing of a system to control the flow of materials andproducts throughout the firm. This includes the inflow of materials, movement through theproduction process, and outflow to the wholesale/retail firm or final consumer. International logisticsis an important area of strategic consideration because these expenses can account for 10 per cent oftheir total costs (Rugman et al., 2006).
Transportation and its types: As a part of logistics the transportation has been explained as aprocess of conveying different types of goods from one point to another. Quantitatively, it is just onelargest of many functions that make up logistics and is the largest component of logistics costsestimated to be more than 40 percent of the distribution cost (Allen, 1997). Moreover, in terms ofproduction and distribution activity, it accounts for large movements of freight in all economies(Pisarski, 1981).
The transport network is made up of links like roads, railways or waterways on whichvehicles move and it also includes air mode which is more efficient. These links connect at theirnodes—i.e., infrastructures like terminals or logistics platforms where goods are loaded, unloaded,transshipped or processed in different ways (Rugman et al., 2006, and Marchis et al., 2011). Roadfreight transport is an important transport mode because of its excellent door-to-door performance interms of service quality (Wiegmans, 2010). Rail freight transport companies transport freight byusing rolling stock (wagons and locomotives) and the rail transport product market can be dividedaccording to the way the freight is transported (Wiegmans, 2007).
In ocean transportation mode firms can choose from a fairly wide variety of ocean carriers(Rugman et al, 2006). The three most common carriers are as follows:
Unconventional cargo vessels are used for shipping oversized and unusual cargoes. Roll-on-roll-off (RORO) vessels are ocean-going ferries that can carry trucks that drive onto
built-in ramps and roll off at the point of debarkation. Lighter aboard ship (LASH) vessel which consists of barges that are stored on the ship and
lowered at the point of destination.
However, one of the major problems in planning an ocean shipping strategy is the limitationscaused by the lack of ports and port services. In developing countries, for example, seaportssometimes lack the equipment necessary to load or unload container cargo, thus limiting thecountry’s ability to export and import. To cope up with this situation, in recent years a number ofthird world countries are working to improve their ports so they can become more active in theinternational trade arena (Rondinelli and Berry, 2000).
The third mode of transportation is the air transportation. Most countries have airports thatcan accommodate air freight. But the problem with this mode of transportation is its high cost.Although international air freight has grown dramatically over the last 30 years, it still accounts forless than 1 percent of the total volume of international shipments. It is used in trade more commonlyamong industrialized nations, and it is usually restricted to high-value items that must reach theirdestination on time.
Issues in traditional transport: Due to the modern technologies the traditional transportation—i.e., transportation before the Intermodalism—has failed to help firms meet their objectives. Thereare several reasons for traditional transportation to turn ineffective. For example, the period betweendeparture and arrival of a carrier can vary significantly, so one of the questions a firm must answeris: How quickly a delivery has to be made? A number of factors have to be taken into considerationwhile answering this question. One is the perishability of the product like Exotic flowers and time toreplenish the current stocks, for instance, in case of auto industry is another factor. Moreover,political considerations must also be taken into account when formulating the transportation strategy(Jackson et al., 2014).

75International Journal ofManagement, Business, and EconomicsIJMBE
Undoubtedly, in recent years Intermodal Containers sector witnessed a boom of research anddevelopment in terms of new intermodal techniques (Rugman et al., 2006). Notwithstanding,international logistics literature in this area is quite scarce. Intermodalism, in particular, has beenrarely examined in emerging economies context. This article fills this gap by examining the situationof intermodal containers in context of Pakistan. Such an examination is crucial for the field ofinternational logistics when trade pattern between East and West are drastically changing and similarpatterned change is taking place in terms of intermodal containers resource.
This study will, therefore, contribute to the extant literature on international logistics andparticularly Intermodalism. We draw on previous research to establish the significance of intermodalcontainers for international businesses. Moreover, data gathered through Focus group and archivalrecords helps us analyze the intermodal container resource in pre and post China Pakistan EconomicCorridor’s establishment. Our study has important implications for Academia, Government ofPakistan and China, MNEs and several other important stakeholders.
We have structured our study in the following format: In section titled Literature review, wediscuss the various types of transportation and issues therein. This helps us understand thesignificance of intermodal containers. In second section on methodology we briefly describe the datacollection and analysis through focus group and archival records. In section titled Research site, wetry to map the important stakeholders in intermodal sector of Pakistan and quantify the availableintermodal resource. Then we discuss the changing pattern of international and domestic trade and itsimplications for intermodal containers sector of Pakistan. We conclude with final remarks attowards the end.
2. Literature Review
While reviewing the literature we mainly focus on issues in traditional transport andsignificance of intermodal containers. We will first present the literature that deals with logistics andtypes of transportation.
Logistics: Global innovation management and knowledge management are seen to beincreasingly important to the long-run performance of all firms. The terms distributed innovation anddifferentiated networks are used to characterize how firms should learn globally and exploit thislearning globally to improve production processes and products in all markets (Nohria and Ghoshal,1997).
In recent years management of distribution as a branch of business science emanated aslogistics management (Graham, 1998), which is the process of planning, implementing, andcontrolling the efficient, effective flow and storage of goods, services and related information frompoint of origin to point of consumption for the purpose of conforming to customer requirements. It islike a cradle-to- grave analysis of the ordering, transport, and storage of the product or service beingproduced and of the inputs required producing it (Allen, 1997).
To benefit from the logistics management, countries have developed international logisticssystem which is the designing and managing of a system to control the flow of materials andproducts throughout the firm. This includes the inflow of materials, movement through theproduction process, and outflow to the wholesale/retail firm or final consumer. International logisticsis an important area of strategic consideration because these expenses can account for 10 per cent oftheir total costs (Rugman et al., 2006).
Transportation and its types: As a part of logistics the transportation has been explained as aprocess of conveying different types of goods from one point to another. Quantitatively, it is just onelargest of many functions that make up logistics and is the largest component of logistics costsestimated to be more than 40 percent of the distribution cost (Allen, 1997). Moreover, in terms ofproduction and distribution activity, it accounts for large movements of freight in all economies(Pisarski, 1981).
The transport network is made up of links like roads, railways or waterways on whichvehicles move and it also includes air mode which is more efficient. These links connect at theirnodes—i.e., infrastructures like terminals or logistics platforms where goods are loaded, unloaded,transshipped or processed in different ways (Rugman et al., 2006, and Marchis et al., 2011). Roadfreight transport is an important transport mode because of its excellent door-to-door performance interms of service quality (Wiegmans, 2010). Rail freight transport companies transport freight byusing rolling stock (wagons and locomotives) and the rail transport product market can be dividedaccording to the way the freight is transported (Wiegmans, 2007).
In ocean transportation mode firms can choose from a fairly wide variety of ocean carriers(Rugman et al, 2006). The three most common carriers are as follows:
Unconventional cargo vessels are used for shipping oversized and unusual cargoes. Roll-on-roll-off (RORO) vessels are ocean-going ferries that can carry trucks that drive onto
built-in ramps and roll off at the point of debarkation. Lighter aboard ship (LASH) vessel which consists of barges that are stored on the ship and
lowered at the point of destination.
However, one of the major problems in planning an ocean shipping strategy is the limitationscaused by the lack of ports and port services. In developing countries, for example, seaportssometimes lack the equipment necessary to load or unload container cargo, thus limiting thecountry’s ability to export and import. To cope up with this situation, in recent years a number ofthird world countries are working to improve their ports so they can become more active in theinternational trade arena (Rondinelli and Berry, 2000).
The third mode of transportation is the air transportation. Most countries have airports thatcan accommodate air freight. But the problem with this mode of transportation is its high cost.Although international air freight has grown dramatically over the last 30 years, it still accounts forless than 1 percent of the total volume of international shipments. It is used in trade more commonlyamong industrialized nations, and it is usually restricted to high-value items that must reach theirdestination on time.
Issues in traditional transport: Due to the modern technologies the traditional transportation—i.e., transportation before the Intermodalism—has failed to help firms meet their objectives. Thereare several reasons for traditional transportation to turn ineffective. For example, the period betweendeparture and arrival of a carrier can vary significantly, so one of the questions a firm must answeris: How quickly a delivery has to be made? A number of factors have to be taken into considerationwhile answering this question. One is the perishability of the product like Exotic flowers and time toreplenish the current stocks, for instance, in case of auto industry is another factor. Moreover,political considerations must also be taken into account when formulating the transportation strategy(Jackson et al., 2014).

76 International Journal ofManagement, Business, and EconomicsIJMBE
Reliability and trust are extremely important for shipments, where the difference of one daycould significantly influence the salability of the product (Rugman et al, 2006). Typically, an MNEwill use air shipments only when time is critical and/or the product has high value (Mayinger, 2001).Besides, the expense associated with shipping is a major consideration when choosing aninternational transportation mode. A major cost in break bulk shipping is time and labor spentbecause of loading and unloading ships at portside in ways that avoid damage to the goods(Levinson, 2006).
Intermodalism: To resolve the aforementioned issues innovation is needed. Innovation couldbe broadly divided into product/service development and process development. Former refers to newproduct/service development while the latter refers to innovation activities that improve the wayproducts/services are produced, making them quicker, cheaper, or better quality (Khan, 1989).
Continuous innovation lies at the heart of sustained competitive advantage, and managing iteffectively has a strong effect on international business (Rugman et al., 2006). Explaining theinnovation, Stern (2010) suggested that the first big thing that changed the landscape of internationallogistics was the introduction of the container. When we think about technology that changed theworld, we think about splendid things like the Internet. But if you try to figure out what happened toworld trade, there is a really strong case to be made that it was the container, which could be hauledoff a ship and put onto a truck or a train and moved on.
Following the container development, innovation brought more sophisticated form ofcontainers—i.e., intermodal containers. The intermodal containers are large size steel/iron boxesbuilt in different sizes and then join together in standard sizes to allow transportation of goodsthrough numerous mode of transportation like shipping, trucking, train and, rarely by airplane. It is asimple technology whose use is enormously increased and it has a profound social and economicimpact in the environment (Arjen and Berg, 1998; Levinson, 2006).
The concept of intermodal freight transport provides an innovative solution for realizingefficient and sustainable transport systems. By integrating and coordinating the use of differenttransport modes available in an intermodal freight transport network through an efficient ICT(information and communication technology) system, intermodal freight transport provides theopportunity to obtain an efficient use of the physical infrastructure as well as providing cost andenergy efficient transport services (Li et al., 2015). The objective of inter-modality is to transfergoods in a continuous flow through the entire transport chain, from origin to final destination, in themost cost- and time-effective way. (Hayuth, 1994).
Mahoney (1985) and Rugman et al. (2006) described that there had been a boom in the sectorof research and development of new intermodal techniques for movement of goods in the recentyears. That had been due primarily to the deregulation and computerization. One of the newtechniques is the modern container-port which is a factory where scale strains the limits of theimaginations. Every single day at major’s ports of the world thousands of containers arrive anddepart through truck or train. Loaded trucks stream through the gates and each gate have the scannerswhich read the unique number of each container and computers compare it against shipping and thendisplay it before the truck driver who gets information where to deliver the load. Tractor units arriveto hook up chassis and haul away containers that have just come off the ship and trains carryingdouble-stacked containers roll into an intermodal containers terminal which must be near the dock,where giant cranes straddle the train to remove containers one by one. Out bounded containersdestined for the rail yard to go more than 2,000 miles away with only the briefest of stops on theroute are assembled on the same track and loaded by the same cranes. And the same procedure is
repeated for the whole day even some times the 24hrs working have been observed on someterminals due to the load of work on those ports or terminals. This is the result of nearly seamlesssystem in shipping freight around the world (Lun et al., 2010).
Describing the intermodal containers in terms of cost, it is suggested that the intermodalcontainers system provides shippers with the opportunities to cut cost or save their money fromtransportation and spend that cost on other functions—e.g., to improve their marketing anddistribution (Mahoney, 1985; Rugman and Collinson, 2006). In addition to it, the intermodalcontainers freight is based on the principle of economies of scale that reduces cost per transportedunit. But it is also providing solution to the freight of low density and high quality goods when thequality requirements have to be met (Jackson et al., 2014).
Intermodal transport has a large market share for commodity flows over long distances, forseaport hinterland flows, for flows between production plants and to depots and for bulkcommodities and dangerous goods (Cardebring et al., 2000) with a focused used in surface transport– i.e., seaborne transport, road transport and railways (Jarzemskiene, 2007). Intermodal containersare providing one another cost effective tool that is packaging. It is important in ensuring that aproduct is shipped in a safe container and arrives undamaged. When goods are transported over along distance or to areas with climates different from the one where they are manufactured, thecontainer can prevent spoilage or leakage. Packaging is also important in reducing loading andunloading costs and minimizing theft and pilferage. As more goods are shipped internationally,packaging will continue to be a focal point of attention. Such considerations can help an MNEmaximize shipping space and minimize transportation costs (Rugman et al., 2006). Container shipsare used to carry standardized containers that can be simply loaded onto the carrier and thenunloaded at their destination, without any repackaging of the contents of the containers(Lewandowski, 2016).
Although, intermodal container carries substantial significance, we may not be able toprecisely quantify how much the container matters to the world economy and therefore to thePakistani economy. How much did it cost to send 1,000 Tons of wool from Punjab Pakistan toEurope in 1955 and how did that cost change as containerization came into use? Clearly thecontainerization has reduced the cost of moving freight from one place to another within the countryor worldwide. For example, the transportation cost is $8205 from Germany to China using hinterlandtransportation, but it is $4620 using multimodal transportation. In 1961, before the container wasinternationally used ocean freight costs accounted for 12 percent of the value of U.S. exports and 10percent of the value of U.S. imports. According to the staff of the Joint Economic Committee ofCongress these costs are more significant in many cases than governmental trade barrier (TR News,2001; Siddiqui, 2016).
3. Research Methodology
As suggested above, most of the research in international logistics has mainly examined thebenefits accrued to the national and global economy because of the use of Intermodal Containers.However, research that examines the changing patterns of global or regional trade vis-à-vis change incontainer resource has remained scarce. More importantly, this phenomenon has not been exploredin the context of emerging economies particularly China and Pakistan. This study, therefore, fillsthis gap by reporting the key information of the sector and predicting the quantity and quality ofintermodal containers in Post CPEC scenario, on the basis of recorded current situation of trade andintermodal containers resource in Pakistan.

77International Journal ofManagement, Business, and EconomicsIJMBE
Reliability and trust are extremely important for shipments, where the difference of one daycould significantly influence the salability of the product (Rugman et al, 2006). Typically, an MNEwill use air shipments only when time is critical and/or the product has high value (Mayinger, 2001).Besides, the expense associated with shipping is a major consideration when choosing aninternational transportation mode. A major cost in break bulk shipping is time and labor spentbecause of loading and unloading ships at portside in ways that avoid damage to the goods(Levinson, 2006).
Intermodalism: To resolve the aforementioned issues innovation is needed. Innovation couldbe broadly divided into product/service development and process development. Former refers to newproduct/service development while the latter refers to innovation activities that improve the wayproducts/services are produced, making them quicker, cheaper, or better quality (Khan, 1989).
Continuous innovation lies at the heart of sustained competitive advantage, and managing iteffectively has a strong effect on international business (Rugman et al., 2006). Explaining theinnovation, Stern (2010) suggested that the first big thing that changed the landscape of internationallogistics was the introduction of the container. When we think about technology that changed theworld, we think about splendid things like the Internet. But if you try to figure out what happened toworld trade, there is a really strong case to be made that it was the container, which could be hauledoff a ship and put onto a truck or a train and moved on.
Following the container development, innovation brought more sophisticated form ofcontainers—i.e., intermodal containers. The intermodal containers are large size steel/iron boxesbuilt in different sizes and then join together in standard sizes to allow transportation of goodsthrough numerous mode of transportation like shipping, trucking, train and, rarely by airplane. It is asimple technology whose use is enormously increased and it has a profound social and economicimpact in the environment (Arjen and Berg, 1998; Levinson, 2006).
The concept of intermodal freight transport provides an innovative solution for realizingefficient and sustainable transport systems. By integrating and coordinating the use of differenttransport modes available in an intermodal freight transport network through an efficient ICT(information and communication technology) system, intermodal freight transport provides theopportunity to obtain an efficient use of the physical infrastructure as well as providing cost andenergy efficient transport services (Li et al., 2015). The objective of inter-modality is to transfergoods in a continuous flow through the entire transport chain, from origin to final destination, in themost cost- and time-effective way. (Hayuth, 1994).
Mahoney (1985) and Rugman et al. (2006) described that there had been a boom in the sectorof research and development of new intermodal techniques for movement of goods in the recentyears. That had been due primarily to the deregulation and computerization. One of the newtechniques is the modern container-port which is a factory where scale strains the limits of theimaginations. Every single day at major’s ports of the world thousands of containers arrive anddepart through truck or train. Loaded trucks stream through the gates and each gate have the scannerswhich read the unique number of each container and computers compare it against shipping and thendisplay it before the truck driver who gets information where to deliver the load. Tractor units arriveto hook up chassis and haul away containers that have just come off the ship and trains carryingdouble-stacked containers roll into an intermodal containers terminal which must be near the dock,where giant cranes straddle the train to remove containers one by one. Out bounded containersdestined for the rail yard to go more than 2,000 miles away with only the briefest of stops on theroute are assembled on the same track and loaded by the same cranes. And the same procedure is
repeated for the whole day even some times the 24hrs working have been observed on someterminals due to the load of work on those ports or terminals. This is the result of nearly seamlesssystem in shipping freight around the world (Lun et al., 2010).
Describing the intermodal containers in terms of cost, it is suggested that the intermodalcontainers system provides shippers with the opportunities to cut cost or save their money fromtransportation and spend that cost on other functions—e.g., to improve their marketing anddistribution (Mahoney, 1985; Rugman and Collinson, 2006). In addition to it, the intermodalcontainers freight is based on the principle of economies of scale that reduces cost per transportedunit. But it is also providing solution to the freight of low density and high quality goods when thequality requirements have to be met (Jackson et al., 2014).
Intermodal transport has a large market share for commodity flows over long distances, forseaport hinterland flows, for flows between production plants and to depots and for bulkcommodities and dangerous goods (Cardebring et al., 2000) with a focused used in surface transport– i.e., seaborne transport, road transport and railways (Jarzemskiene, 2007). Intermodal containersare providing one another cost effective tool that is packaging. It is important in ensuring that aproduct is shipped in a safe container and arrives undamaged. When goods are transported over along distance or to areas with climates different from the one where they are manufactured, thecontainer can prevent spoilage or leakage. Packaging is also important in reducing loading andunloading costs and minimizing theft and pilferage. As more goods are shipped internationally,packaging will continue to be a focal point of attention. Such considerations can help an MNEmaximize shipping space and minimize transportation costs (Rugman et al., 2006). Container shipsare used to carry standardized containers that can be simply loaded onto the carrier and thenunloaded at their destination, without any repackaging of the contents of the containers(Lewandowski, 2016).
Although, intermodal container carries substantial significance, we may not be able toprecisely quantify how much the container matters to the world economy and therefore to thePakistani economy. How much did it cost to send 1,000 Tons of wool from Punjab Pakistan toEurope in 1955 and how did that cost change as containerization came into use? Clearly thecontainerization has reduced the cost of moving freight from one place to another within the countryor worldwide. For example, the transportation cost is $8205 from Germany to China using hinterlandtransportation, but it is $4620 using multimodal transportation. In 1961, before the container wasinternationally used ocean freight costs accounted for 12 percent of the value of U.S. exports and 10percent of the value of U.S. imports. According to the staff of the Joint Economic Committee ofCongress these costs are more significant in many cases than governmental trade barrier (TR News,2001; Siddiqui, 2016).
3. Research Methodology
As suggested above, most of the research in international logistics has mainly examined thebenefits accrued to the national and global economy because of the use of Intermodal Containers.However, research that examines the changing patterns of global or regional trade vis-à-vis change incontainer resource has remained scarce. More importantly, this phenomenon has not been exploredin the context of emerging economies particularly China and Pakistan. This study, therefore, fillsthis gap by reporting the key information of the sector and predicting the quantity and quality ofintermodal containers in Post CPEC scenario, on the basis of recorded current situation of trade andintermodal containers resource in Pakistan.
78 International Journal ofManagement, Business, and EconomicsIJMBE
This descriptive qualitative research mainly answers “What is going on in IntermodalContainers Sector of Pakistan?” We mainly relied on Focus group and analysis of archival records toanswer this question. Lead researcher had conducted a Focus group with key representatives of AllPakistan Shipping Association (APSA) at their central office (Please See Annexure 1). Before Focusgroup, a detailed review of archival records (including but not limited to) minutes of meetings,annual reports, articles, websites, news articles, press releases etc. was conducted. This reviewhelped us in identifying major stakeholders in Intermodal Containers sectors and in mapping theirrelationships.
A blend of archival record analysis and Focus group was chosen as it helped us a lot inunderstanding how major stakeholders think and provide deeper understanding of this phenomenon.There are several research strategies that can be employed to answer a descriptive question like theone that we have. One such strategy is Survey that generally poses respondents to closed endedquestions. This well-known research strategy has one important drawback that it limits the detailedfeedback that can be gained from respondents. Another method that can potentially supplementarchival record analysis and surveys is interviews. But conducting interviews was found quiteexpensive proposition exceeding the available resources. Therefore, group interview—i.e., Focusgroup (Krueger and Casey, 2009) gave us the opportunity to capture detailed information onintermodal containers sector of Pakistan more economically than individual interviews. Apart fromeconomy, group interaction was another important benefit of focus group. Secondary data onintermodal containers in Pakistan is virtually non-existent. Therefore, group interaction withrepresentatives of APSA gave us the opportunity to several key statistics and information.
Focus group was conducted for around two hours with APSA managing committee thatconsisted of members of executive council and industry representatives. Total of five person’s focusgroup was held at central office of APSA. Membership of APSA consists of shipping agents,consultants, chandlers, surveyors and consolidators among other entities. APSA has itsrepresentation on Pilotage Authority and also provides a commissioner for the Port Authority.Complying with advice of Krueger and Casey (2009), every effort was made to avoiddichotomous—i.e., Yes/No and right/wrong questions. Moreover, open-ended and think backquestions were more emphasized. Serendipitous questions were posed towards the end.
4. Results Analysis
According to information retrieved from focus group and archival material, the containerssector in Pakistan involves variety of stakeholders. The key stakeholders to mention here include:Port authorities, Container handling companies, Shipping services providers, Hinterland transporters,Freight forwarding agencies and Inland Container depot service providers.
Karachi International Container Terminal (KICT), Pakistan International Container Terminal(PICT), DP World Karachi (DP World), South Asia Pakistan Terminal (SAPT) and GawadarInternationals Limited (GIT), handle containers at Karachi port, Gawadar port and port Qasim inKarachi (Marine Group of Companies) (Please See Exhibit 1). The four categories of the governmentbodies that involve intermodal transport network are (1) Sea- Karachi port trust, Port QasimAuthority and Gawadar Port Authority, (2) Road- National Highway Authority, (3) Railway-Pakistan Railway and (4) Air- Civil Aviation Authority.
Table 1 Container Handling Firms at Gawadar, Karachi and Qasim Ports in Pakistan
Type of Company Container Handling Capacity (TEUs)KICT 1,000,000PICT 750,000
DP World 850,000SAPT 1,000,000Total 3,600,000
Note: Gawadar International Limited is not yet fully operational and carries handling capacity of500,000 TEUs.
This is in addition to the variety of firms involved in intermodal service infrastructure.Following constitutes the detail of these firms under various functional headings:
I. Port services: Pakistan International Container Terminal (PICT), Premier MercantileServices (Pvt.) Ltd (PMS) and Pakistan International Bulk Terminal (Pvt.) Ltd (PIBT).
II. Shipping services: Portlink International Services (Pvt.) Ltd (PIS).III. Hinterland Transport: Pakistan Intermodal limited (PIL) handle freight train and Marine
Logistics (Private) Limited (MLPL) handle road transport.IV. Freight forwarding: AMI Pakistan (Pvt.) Ltd (AMI).V. Inland container depot services: Marine International Container Terminal (Pvt.) Limited
(MICT)
Pakistan has three main ports– Karachi, Port Qasim, and Gawadar. However the Gawadar isunder construction but it is operational to some extent. The total handling capacity of these Ports isestimated at about 133 million tons, but investment in expansion is already under way.
Figure 1 Port Handling Capacity
ISO 6346 standard classifies a broad spectrum of container types with their specifications andattributes. Presently, the container type being used in Pakistan is the twenty foot equivalent Unitschamber. A twenty-foot equivalent unit is a measure of containerized cargo capacity equal to onestandard 20 foot (length) × 8 foot (width) × 8 foot in (height) container.
Information obtained through focus group and archival records shows that aside fromdifferent size options, the most important container types used in Pakistan are General-purpose dryvans, for boxes, cartons, cases, sacks, bales, pallets, drums, etc. So the containers in use in Pakistanare also classified in terms of their special interior layouts such as:
Bin Qasim PortCargo HandlingCapacity
� 13 Berths� 58 Million Tons
millionTonnes
Bin Qasim PortCargo HandlingCapacity
� 13 Berths� 58 Million Tons
Bin Qasim PortCargo HandlingCapacity
� 13 Berths� 58 Million Tons
Bin Qasim PortCargo HandlingCapacity
� 13 Berths� 58 Million Tons
Bin Qasim PortCargo HandlingCapacity
� 13 Berths� 58 Million Tons

79International Journal ofManagement, Business, and EconomicsIJMBE
This descriptive qualitative research mainly answers “What is going on in IntermodalContainers Sector of Pakistan?” We mainly relied on Focus group and analysis of archival records toanswer this question. Lead researcher had conducted a Focus group with key representatives of AllPakistan Shipping Association (APSA) at their central office (Please See Annexure 1). Before Focusgroup, a detailed review of archival records (including but not limited to) minutes of meetings,annual reports, articles, websites, news articles, press releases etc. was conducted. This reviewhelped us in identifying major stakeholders in Intermodal Containers sectors and in mapping theirrelationships.
A blend of archival record analysis and Focus group was chosen as it helped us a lot inunderstanding how major stakeholders think and provide deeper understanding of this phenomenon.There are several research strategies that can be employed to answer a descriptive question like theone that we have. One such strategy is Survey that generally poses respondents to closed endedquestions. This well-known research strategy has one important drawback that it limits the detailedfeedback that can be gained from respondents. Another method that can potentially supplementarchival record analysis and surveys is interviews. But conducting interviews was found quiteexpensive proposition exceeding the available resources. Therefore, group interview—i.e., Focusgroup (Krueger and Casey, 2009) gave us the opportunity to capture detailed information onintermodal containers sector of Pakistan more economically than individual interviews. Apart fromeconomy, group interaction was another important benefit of focus group. Secondary data onintermodal containers in Pakistan is virtually non-existent. Therefore, group interaction withrepresentatives of APSA gave us the opportunity to several key statistics and information.
Focus group was conducted for around two hours with APSA managing committee thatconsisted of members of executive council and industry representatives. Total of five person’s focusgroup was held at central office of APSA. Membership of APSA consists of shipping agents,consultants, chandlers, surveyors and consolidators among other entities. APSA has itsrepresentation on Pilotage Authority and also provides a commissioner for the Port Authority.Complying with advice of Krueger and Casey (2009), every effort was made to avoiddichotomous—i.e., Yes/No and right/wrong questions. Moreover, open-ended and think backquestions were more emphasized. Serendipitous questions were posed towards the end.
4. Results Analysis
According to information retrieved from focus group and archival material, the containerssector in Pakistan involves variety of stakeholders. The key stakeholders to mention here include:Port authorities, Container handling companies, Shipping services providers, Hinterland transporters,Freight forwarding agencies and Inland Container depot service providers.
Karachi International Container Terminal (KICT), Pakistan International Container Terminal(PICT), DP World Karachi (DP World), South Asia Pakistan Terminal (SAPT) and GawadarInternationals Limited (GIT), handle containers at Karachi port, Gawadar port and port Qasim inKarachi (Marine Group of Companies) (Please See Exhibit 1). The four categories of the governmentbodies that involve intermodal transport network are (1) Sea- Karachi port trust, Port QasimAuthority and Gawadar Port Authority, (2) Road- National Highway Authority, (3) Railway-Pakistan Railway and (4) Air- Civil Aviation Authority.
Table 1 Container Handling Firms at Gawadar, Karachi and Qasim Ports in Pakistan
Type of Company Container Handling Capacity (TEUs)KICT 1,000,000PICT 750,000
DP World 850,000SAPT 1,000,000Total 3,600,000
Note: Gawadar International Limited is not yet fully operational and carries handling capacity of500,000 TEUs.
This is in addition to the variety of firms involved in intermodal service infrastructure.Following constitutes the detail of these firms under various functional headings:
I. Port services: Pakistan International Container Terminal (PICT), Premier MercantileServices (Pvt.) Ltd (PMS) and Pakistan International Bulk Terminal (Pvt.) Ltd (PIBT).
II. Shipping services: Portlink International Services (Pvt.) Ltd (PIS).III. Hinterland Transport: Pakistan Intermodal limited (PIL) handle freight train and Marine
Logistics (Private) Limited (MLPL) handle road transport.IV. Freight forwarding: AMI Pakistan (Pvt.) Ltd (AMI).V. Inland container depot services: Marine International Container Terminal (Pvt.) Limited
(MICT)
Pakistan has three main ports– Karachi, Port Qasim, and Gawadar. However the Gawadar isunder construction but it is operational to some extent. The total handling capacity of these Ports isestimated at about 133 million tons, but investment in expansion is already under way.
Figure 1 Port Handling Capacity
ISO 6346 standard classifies a broad spectrum of container types with their specifications andattributes. Presently, the container type being used in Pakistan is the twenty foot equivalent Unitschamber. A twenty-foot equivalent unit is a measure of containerized cargo capacity equal to onestandard 20 foot (length) × 8 foot (width) × 8 foot in (height) container.
Information obtained through focus group and archival records shows that aside fromdifferent size options, the most important container types used in Pakistan are General-purpose dryvans, for boxes, cartons, cases, sacks, bales, pallets, drums, etc. So the containers in use in Pakistanare also classified in terms of their special interior layouts such as:
Bin Qasim PortCargo HandlingCapacity
� 13 Berths� 58 Million Tons
millionTonnes
Bin Qasim PortCargo HandlingCapacity
� 13 Berths� 58 Million Tons
Bin Qasim PortCargo HandlingCapacity
� 13 Berths� 58 Million Tons
Bin Qasim PortCargo HandlingCapacity
� 13 Berths� 58 Million Tons
Bin Qasim PortCargo HandlingCapacity
� 13 Berths� 58 Million Tons

80 International Journal ofManagement, Business, and EconomicsIJMBE
Rolling-floor containers, for difficult-to-handle cargo Garmentainers, for shipping garments on hangers (GOH) Ventilated containers. Essentially dry vans, but either passively or actively ventilated. For
instance for organic products requiring ventilation Temperature controlled – either insulated, refrigerated, and/or heated containers, for
perishable goods Tank containers, for liquids or gases. Frequently these are dangerous goods, and in the case
of gases one shipping unit may contain multiple gas bottles Bulk containers (sometimes bulktainers), either closed models with roof-lids, or hard or soft
open-top units for top loading, for instance for bulk minerals. Containerized coal carriers and"bin-liners" (containers designed for the efficient road and rail transportation of rubbish fromcities to recycling and dump sites) are used in Europe.
Open-top and open-side containers, for instance for easy loading of heavy machinery oroversize pallets. Open sides are also used for ventilating hardy perishables like apples orpotatoes.Platform based containers such as:
Flat-rack and bolster containers, for barrels, drums, crates, and any heavy or bulky out-of-gauge cargo, like machinery, semi-finished goods or processed timber. Empty flat-racks caneither be stacked or shipped sideways in another ISO container
Collapsible containers, ranging from flush folding flat-racks to fully closed ISO and CSCcertified units with roof and walls when erected.
Containers for Offshore use have a few different features, like pad eyes, and must meetadditional strength and design requirements, standards and certification, such as the DNV2.7-1 by Det Norske Veritas and the European standard EN12079: Offshore Containers andAssociated Lifting Sets.
A multitude of equipment, such as generators, has been installed in containers of differenttypes.
The rising importance of intermodal containers in Pakistan: In recent years, economiccorridors have emerged as an important tool of regional cooperation and development in a globalizedworld. Following the experience of regional economic integration through a network of transnationaleconomic corridors in the Greater Mekong Sub-region (GMS), similar initiatives are now beingpromoted in different parts of Asia to accelerate economic growth by linking backward regions withmore developed industrial centers and to improve access to markets through the integration of trans-border production networks (Ranjan, 2015). By 1979, the power center had shifted in China and theChinese economy was opening up under the new leadership of Deng Xiaoping. Deng’s main plank—i.e., the economic relation precedes all other forms of relationship—changed the dynamics ofChinese foreign policy, which shifted closer to Pakistan. By the 1980s, China had become the mosttrusted ally of Pakistan (Kayani et al., 2013). The relationships between the two countries becamestronger and stronger which resulted in the enhanced trade which was $1 billion in 1998, and afterFTA in year of 2006 the trade eventually reached $15.5 billion. So, this enhanced cooperation laidthe foundation of China-Pakistan economic corridor (VANDEWALLE, 2015).
In order to understand the significance of the CPEC and Intermodalism, the trade volumebefore the CPEC and when the CPEC is operationalized will have be considered. Not only the totaltrade of Pakistan is continuously growing (Please See Table 2) but a little fluctuation in the trend isalso being observed. Moreover, it is forecasted that the exports of Pakistan will rise to $76 Billion by2025 from the current level of approximately $25 Billion (Pakistan vision 2025, and SBP annualreport 2014, 2015).
Careful review of archival material shows the solid economic relationships between Pakistanand China evident from multiple free trade agreements and $ 48 Billion projects relating CPEC. Thetotal trade volume between the two reached to $15.15 billion marking an annual growth of 12.57% in2015 from $1 billion in 1998. Further both the governments have plans to increase the trade up to$18 billion till 2018. The trade will grow by 24% with china after the CPEC is being functional(Salman, 2015).
Most important here is transit trade (the trade which arises from the passage of goods throughone country or region to another). As suggested by one member of focus group “although the exactmonetary forecasts are not yet available but a good guestimate suggests an exponential rise in transittrade via Pakistan once the CPEC gets functional. For several economic and political reasons,Pakistan is going to replace Hong Kong as an entrepôt to China.” Declining trends are already there,in the past few decades the china physical goods export was high through Hong Kong but it isgradually declining with the passage of time. In 2012, for instance, while the Mainland's exportsexpanded by 28% year-on-year, Hong Kong's re-export growth was only 12%. At Hong Kong'scontainer ports, there has also been a sharp slowdown of throughput growth - from 8% in 2002 toonly 2% in 2012. According to the HKSAR government statistics, in 2015, 61% of re-exports wereof China origin” (Hong Kong Trade Development Council, 2007 and 2016).
Table 2 Trade Volume of Pakistan (2011-2016)
Year Exports Imports Balance of Trade(MillionRupees)
Total volume2011-2012 2,110,605.5 4,009,093.0 (1898487.5) 6119698.52012-2013 2,366,477.8 4,349,879.5 (1983401.7) 6716357.32013-2014 2,583,463.2 4,630,520.8 (2047057.6) 7213984.02014-2015 2,397,513.0 4,644,151.6 (2246638.6) 7041665.42015-2016 2,433,471.6 4,865,174.0 (2431702.4) 7298645.6
Source: SBP annual reports (2014, 2015).
Our focus group participants suggested that another factor that will contribute to the rise intransit trade through Pakistan is China’s oil needs being fulfilled through CPEC. Over 40% of theworld's oil is extracted from the Gulf region and Persian Gulf is used for its transportation. Bylinking Kashghar region in Western China with Gawadar in Southwest of Pakistan, China will reapnumber of economic and political benefits in terms of oil trade.
Our focus group discussion also revealed that, of the two major transit trade categories ofPakistan—i.e., CIS (Commonwealth of Independent States) and ECO (Economic CooperationOrganization)—where CIS transit has the capacity to transport 24.19 million tons while ECO transithas the capacity to handle and transport 74.09 million tons, will be routed through Pakistan. All thesefactors combined together will lead to exponential rise in transit trade and more use and handlingcapacity of intermodal containers.
As discussed above, the trade of Pakistan in pre CPEC era was less and it will remarkablygrow once CPEC is fully functional. Our focus group discussion is in line with the forecasts thatexports will exponentially grow in post CPEC era to reach $76 Billion implying that they will bethree times the exports today. Similarly the imports will increase in some proportion but theguestimates are not yet available (Pakistan vision, 2025). The trade with China alone, excludingtransit trade, is expected to increase by 24%. Therefore, imports, exports and transit trade will

81International Journal ofManagement, Business, and EconomicsIJMBE
Rolling-floor containers, for difficult-to-handle cargo Garmentainers, for shipping garments on hangers (GOH) Ventilated containers. Essentially dry vans, but either passively or actively ventilated. For
instance for organic products requiring ventilation Temperature controlled – either insulated, refrigerated, and/or heated containers, for
perishable goods Tank containers, for liquids or gases. Frequently these are dangerous goods, and in the case
of gases one shipping unit may contain multiple gas bottles Bulk containers (sometimes bulktainers), either closed models with roof-lids, or hard or soft
open-top units for top loading, for instance for bulk minerals. Containerized coal carriers and"bin-liners" (containers designed for the efficient road and rail transportation of rubbish fromcities to recycling and dump sites) are used in Europe.
Open-top and open-side containers, for instance for easy loading of heavy machinery oroversize pallets. Open sides are also used for ventilating hardy perishables like apples orpotatoes.Platform based containers such as:
Flat-rack and bolster containers, for barrels, drums, crates, and any heavy or bulky out-of-gauge cargo, like machinery, semi-finished goods or processed timber. Empty flat-racks caneither be stacked or shipped sideways in another ISO container
Collapsible containers, ranging from flush folding flat-racks to fully closed ISO and CSCcertified units with roof and walls when erected.
Containers for Offshore use have a few different features, like pad eyes, and must meetadditional strength and design requirements, standards and certification, such as the DNV2.7-1 by Det Norske Veritas and the European standard EN12079: Offshore Containers andAssociated Lifting Sets.
A multitude of equipment, such as generators, has been installed in containers of differenttypes.
The rising importance of intermodal containers in Pakistan: In recent years, economiccorridors have emerged as an important tool of regional cooperation and development in a globalizedworld. Following the experience of regional economic integration through a network of transnationaleconomic corridors in the Greater Mekong Sub-region (GMS), similar initiatives are now beingpromoted in different parts of Asia to accelerate economic growth by linking backward regions withmore developed industrial centers and to improve access to markets through the integration of trans-border production networks (Ranjan, 2015). By 1979, the power center had shifted in China and theChinese economy was opening up under the new leadership of Deng Xiaoping. Deng’s main plank—i.e., the economic relation precedes all other forms of relationship—changed the dynamics ofChinese foreign policy, which shifted closer to Pakistan. By the 1980s, China had become the mosttrusted ally of Pakistan (Kayani et al., 2013). The relationships between the two countries becamestronger and stronger which resulted in the enhanced trade which was $1 billion in 1998, and afterFTA in year of 2006 the trade eventually reached $15.5 billion. So, this enhanced cooperation laidthe foundation of China-Pakistan economic corridor (VANDEWALLE, 2015).
In order to understand the significance of the CPEC and Intermodalism, the trade volumebefore the CPEC and when the CPEC is operationalized will have be considered. Not only the totaltrade of Pakistan is continuously growing (Please See Table 2) but a little fluctuation in the trend isalso being observed. Moreover, it is forecasted that the exports of Pakistan will rise to $76 Billion by2025 from the current level of approximately $25 Billion (Pakistan vision 2025, and SBP annualreport 2014, 2015).
Careful review of archival material shows the solid economic relationships between Pakistanand China evident from multiple free trade agreements and $ 48 Billion projects relating CPEC. Thetotal trade volume between the two reached to $15.15 billion marking an annual growth of 12.57% in2015 from $1 billion in 1998. Further both the governments have plans to increase the trade up to$18 billion till 2018. The trade will grow by 24% with china after the CPEC is being functional(Salman, 2015).
Most important here is transit trade (the trade which arises from the passage of goods throughone country or region to another). As suggested by one member of focus group “although the exactmonetary forecasts are not yet available but a good guestimate suggests an exponential rise in transittrade via Pakistan once the CPEC gets functional. For several economic and political reasons,Pakistan is going to replace Hong Kong as an entrepôt to China.” Declining trends are already there,in the past few decades the china physical goods export was high through Hong Kong but it isgradually declining with the passage of time. In 2012, for instance, while the Mainland's exportsexpanded by 28% year-on-year, Hong Kong's re-export growth was only 12%. At Hong Kong'scontainer ports, there has also been a sharp slowdown of throughput growth - from 8% in 2002 toonly 2% in 2012. According to the HKSAR government statistics, in 2015, 61% of re-exports wereof China origin” (Hong Kong Trade Development Council, 2007 and 2016).
Table 2 Trade Volume of Pakistan (2011-2016)
Year Exports Imports Balance of Trade(MillionRupees)
Total volume2011-2012 2,110,605.5 4,009,093.0 (1898487.5) 6119698.52012-2013 2,366,477.8 4,349,879.5 (1983401.7) 6716357.32013-2014 2,583,463.2 4,630,520.8 (2047057.6) 7213984.02014-2015 2,397,513.0 4,644,151.6 (2246638.6) 7041665.42015-2016 2,433,471.6 4,865,174.0 (2431702.4) 7298645.6
Source: SBP annual reports (2014, 2015).
Our focus group participants suggested that another factor that will contribute to the rise intransit trade through Pakistan is China’s oil needs being fulfilled through CPEC. Over 40% of theworld's oil is extracted from the Gulf region and Persian Gulf is used for its transportation. Bylinking Kashghar region in Western China with Gawadar in Southwest of Pakistan, China will reapnumber of economic and political benefits in terms of oil trade.
Our focus group discussion also revealed that, of the two major transit trade categories ofPakistan—i.e., CIS (Commonwealth of Independent States) and ECO (Economic CooperationOrganization)—where CIS transit has the capacity to transport 24.19 million tons while ECO transithas the capacity to handle and transport 74.09 million tons, will be routed through Pakistan. All thesefactors combined together will lead to exponential rise in transit trade and more use and handlingcapacity of intermodal containers.
As discussed above, the trade of Pakistan in pre CPEC era was less and it will remarkablygrow once CPEC is fully functional. Our focus group discussion is in line with the forecasts thatexports will exponentially grow in post CPEC era to reach $76 Billion implying that they will bethree times the exports today. Similarly the imports will increase in some proportion but theguestimates are not yet available (Pakistan vision, 2025). The trade with China alone, excludingtransit trade, is expected to increase by 24%. Therefore, imports, exports and transit trade will

82 International Journal ofManagement, Business, and EconomicsIJMBE
exponentially grow and Pakistan would need approximately three times more intermodal containersof what it possess today.
Our focus group also revealed that “Total national container capacity of Pakistan is currentlyabout 3.6 million Twenty-foot-equivalent units (TEUs), but this is likely to grow to about 10 millionTEUs in the next five to ten years”. Moreover, focus group elaborated that although the intermodalcontainers capacity is increased yearly to meet the need, but with construction of Gawadar,Pakistan’s overall total national container handling capacity will grow sharply.
Presently, Pakistan offers twenty foot equivalent units’ capacity intermodal containers. Oneof the focus group participant suggested that “there are several high quality intermodal containersavailable with different sizes—e.g., 40, 45, 48 and 53 feet high cube containers with addedfeatures—e.g., temperature control mechanism, ventilation, shock absorption, water proofing etc.that are being used in developed countries.” These containers are also useful in multimodality andtheir demand is expected to rise in post CPEC era.
Summing it up, Pakistan will be playing role of bridge in South Asia for the transit trade.Also Pakistan is also signatory to several regional, free and preferential trade agreements.Resultantly, the country’s trade will grow sizably creating logistics crunch as available quantity andquantity of intermodal containers is sufficient to meet the future trade volumes. It is therefore,recommended, that government should immediately involve major stakeholders and prevent anycrises to emerge. We also recommend that a detailed feasibility study should be conducted to analyzethe prospects of domestic production of intermodal containers. As informed by our focus group thereis no intermodal production facility currently existing in Pakistan. High in unemployment and shortin foreign direct investment, this country can benefit from installation of such facility.
5. Conclusion
Intermodal containers are largely neglected area in extant literature on logistics. This studycontributes to the literature by highlighting the significance of intermodal containers particularly incontext of Pakistan. This sixth most populous country that is seen as one of world’s biggestconsumer market is replacing Hong Kong as an entrepôt to China. In post China Pakistan EconomicCorridor era, transit trade is expected to exponentially grow putting immense pressure on alreadyweak intermodal sector of the country. To understand the state of intermodal containers sector, wecollected and analyzed data that is collected from focus group and a variety of archival records. Ouranalysis suggests that the quantity and quality of the intermodal containers is not sufficient to fulfillthe exponentially rising trade needs.
Acknowledgements
We are thankful to officials and members of All Pakistan Shipping Association for theirsupport.
References
Allen, B. W. (1997). The logistics revolution and transportation, American Academy of Political andSocial Science, 553, 106-116.
Arjen, H., Geerke, C., and Berg, van Den. (1998). Gateways and intermodalism. Journal ofTransport Geography, 6 (1), 1–9.
Graham, G. M. (1998). Stability and competition in intermodal container shipping: finding a balance,Maritime Policy and Management, 25(2), 129-147.
Hayuth, Y. (1994). The overweight container problem and international intermodal transportation.Transport, 34(2), 18.
Hong Kong Trade Development Council. (2007). Hong Kong as a Trading Hub: Entrepot andBeyond, Retrieved from: http://economists-pick-research.hktdc.com/business-news/article/Economic-Forum/Hong-Kong-as-a-Trading-Hub-Entrep-ocirc-t-and-beyond/ef/en/1/1X000000/1X0034J5.htm (Accessed on 28 April, 2016).
Hong Kong Trade Development Council. (2016). Economic and Trade Information on Hong Kong,Retrieved from: http://hong-kong-economy-research.hktdc.com/business-news/article/Market-Environment/Economicand-Trade-Information-on-Hong-kong/etihk/en/1/1X000000/1X09OVUL.htm (Accessed on 16 March, 2016).
Jackson, R., Islam D. M. Z., Zunder, T. H., Schoemaker, J., and Dasburg, N. (2014). A marketanalysis of the low density high value goods flows in Europe. Selected Proceedings: 13th WorldConference on Transport Research (WCTR).
Jarzemskiene, I. (2007). The evolution of intermodal transport research and its developments issues.Transport, 22(4), 296.
Khan, A. M. (1989). Innovative and Non-innovative Small Firms: Types andcharacteristics. Management Science, 35 (5), 597–606.
Kayani, F. N., Ahmed, M., Shah, T. A., and Kayani, U. M. (2013). China-Pakistan EconomicRelations: Lessons for Pakistan, Pakistan Journal of Commerce and Social Sciences 2013, Vol. 7 (3),454- 462.
Lewandowski, K. (2016). Growth in the Size of Unit Loads and Shipping Containers from Antiqueto WWI. Packaging Technology and Science. 29 (8-9): 451–478.
Li, L., Xiao, L., Negenborn, R. R., and Schutter, B. D. (N.A). Pricing Intermodal Freight TransportServices: A cost plus pricing strategy. Springer International Publishing, 541-542.
Lun, V. H. Y., Lai, H. K., and Cheng, E. C. T. (2010) Shipping and logistics management, Springer:London.
Macharis, C., Caris, A., Jourquin, B., and Pekin, E. (2011). A decision support framework forintermodal transport policy. European Transport Research Review, 3(4), 167–178.

83International Journal ofManagement, Business, and EconomicsIJMBE
exponentially grow and Pakistan would need approximately three times more intermodal containersof what it possess today.
Our focus group also revealed that “Total national container capacity of Pakistan is currentlyabout 3.6 million Twenty-foot-equivalent units (TEUs), but this is likely to grow to about 10 millionTEUs in the next five to ten years”. Moreover, focus group elaborated that although the intermodalcontainers capacity is increased yearly to meet the need, but with construction of Gawadar,Pakistan’s overall total national container handling capacity will grow sharply.
Presently, Pakistan offers twenty foot equivalent units’ capacity intermodal containers. Oneof the focus group participant suggested that “there are several high quality intermodal containersavailable with different sizes—e.g., 40, 45, 48 and 53 feet high cube containers with addedfeatures—e.g., temperature control mechanism, ventilation, shock absorption, water proofing etc.that are being used in developed countries.” These containers are also useful in multimodality andtheir demand is expected to rise in post CPEC era.
Summing it up, Pakistan will be playing role of bridge in South Asia for the transit trade.Also Pakistan is also signatory to several regional, free and preferential trade agreements.Resultantly, the country’s trade will grow sizably creating logistics crunch as available quantity andquantity of intermodal containers is sufficient to meet the future trade volumes. It is therefore,recommended, that government should immediately involve major stakeholders and prevent anycrises to emerge. We also recommend that a detailed feasibility study should be conducted to analyzethe prospects of domestic production of intermodal containers. As informed by our focus group thereis no intermodal production facility currently existing in Pakistan. High in unemployment and shortin foreign direct investment, this country can benefit from installation of such facility.
5. Conclusion
Intermodal containers are largely neglected area in extant literature on logistics. This studycontributes to the literature by highlighting the significance of intermodal containers particularly incontext of Pakistan. This sixth most populous country that is seen as one of world’s biggestconsumer market is replacing Hong Kong as an entrepôt to China. In post China Pakistan EconomicCorridor era, transit trade is expected to exponentially grow putting immense pressure on alreadyweak intermodal sector of the country. To understand the state of intermodal containers sector, wecollected and analyzed data that is collected from focus group and a variety of archival records. Ouranalysis suggests that the quantity and quality of the intermodal containers is not sufficient to fulfillthe exponentially rising trade needs.
Acknowledgements
We are thankful to officials and members of All Pakistan Shipping Association for theirsupport.
References
Allen, B. W. (1997). The logistics revolution and transportation, American Academy of Political andSocial Science, 553, 106-116.
Arjen, H., Geerke, C., and Berg, van Den. (1998). Gateways and intermodalism. Journal ofTransport Geography, 6 (1), 1–9.
Graham, G. M. (1998). Stability and competition in intermodal container shipping: finding a balance,Maritime Policy and Management, 25(2), 129-147.
Hayuth, Y. (1994). The overweight container problem and international intermodal transportation.Transport, 34(2), 18.
Hong Kong Trade Development Council. (2007). Hong Kong as a Trading Hub: Entrepot andBeyond, Retrieved from: http://economists-pick-research.hktdc.com/business-news/article/Economic-Forum/Hong-Kong-as-a-Trading-Hub-Entrep-ocirc-t-and-beyond/ef/en/1/1X000000/1X0034J5.htm (Accessed on 28 April, 2016).
Hong Kong Trade Development Council. (2016). Economic and Trade Information on Hong Kong,Retrieved from: http://hong-kong-economy-research.hktdc.com/business-news/article/Market-Environment/Economicand-Trade-Information-on-Hong-kong/etihk/en/1/1X000000/1X09OVUL.htm (Accessed on 16 March, 2016).
Jackson, R., Islam D. M. Z., Zunder, T. H., Schoemaker, J., and Dasburg, N. (2014). A marketanalysis of the low density high value goods flows in Europe. Selected Proceedings: 13th WorldConference on Transport Research (WCTR).
Jarzemskiene, I. (2007). The evolution of intermodal transport research and its developments issues.Transport, 22(4), 296.
Khan, A. M. (1989). Innovative and Non-innovative Small Firms: Types andcharacteristics. Management Science, 35 (5), 597–606.
Kayani, F. N., Ahmed, M., Shah, T. A., and Kayani, U. M. (2013). China-Pakistan EconomicRelations: Lessons for Pakistan, Pakistan Journal of Commerce and Social Sciences 2013, Vol. 7 (3),454- 462.
Lewandowski, K. (2016). Growth in the Size of Unit Loads and Shipping Containers from Antiqueto WWI. Packaging Technology and Science. 29 (8-9): 451–478.
Li, L., Xiao, L., Negenborn, R. R., and Schutter, B. D. (N.A). Pricing Intermodal Freight TransportServices: A cost plus pricing strategy. Springer International Publishing, 541-542.
Lun, V. H. Y., Lai, H. K., and Cheng, E. C. T. (2010) Shipping and logistics management, Springer:London.
Macharis, C., Caris, A., Jourquin, B., and Pekin, E. (2011). A decision support framework forintermodal transport policy. European Transport Research Review, 3(4), 167–178.

84 International Journal ofManagement, Business, and EconomicsIJMBE
Mayinger, F. I. D. (2001). Mobility and Traffic in the 21st Century, Springer Berlin Heidelberg.
Nohria, N., and Ghoshal, S. (1997). The Differentiated Network: Organising MultinationalCorporations for Value Creation, San Francisco: Jossey-Bass.
Pakistan vision 2025, (2014). Ministry of planning commission, retrieved from: www.pc.gov.pk(Accessed on: 11 March, 2016).
Pisarski, E. A. (1981). Transportation, American Academy of Political and Social Science, 453, 70-95.
Rondinelli, D. and Berry, M. (2000). Multimodal Transportation, Logistics, and the Environment:Managing Interactions in a Global Economy, European Management Journal, Vol. 18, no. 4.
Ranjan, A. (May, 2015). The China-Pakistan Economic Corridor: India’s Options. 10, 1-5. Retrievedfrom: http://www.icsin.org/uploads/2015/06/05/31e217cf46cab5bd9f15930569843895.pdf(Accessed on: 5 March, 2015).
Rugman, A. M., Collinson, S., and Hodgetts, R. M. (2006). International Business (4th Edition ed.).London: McGraw-Hill, Inc.
Salman, A. (2015). Pakistan-China Economic Corridor: a cost-benefit analysis, Retrievedfrom:http://tribune.com.pk/story/880259/pakistan-china-economic-corridor-a-cost-benefit-analysis/(Accessed on: 5 March, 2015).
Siddiqui, A. (2016). New Face of Asia-Europe Trade: Retrieved from: www.tocevents-europe.com/images/speaker-presentations/Aasim-Siddiqui.pdf (Accessed on: March 04, 2016).
State Bank of Pakistan. (2014). Annual report.
State Bank of Pakistan. (2015). Annual report.
Stern, R. (2010). Comparative advantage, economic growth, the gains from trade and globalization,and computational trade modeling: Festschrift papers in honor of Alan V. Deardorff. University ofMichigan, Ann Arbor.
Economic corridor: Chinese official sets record straight. (March 2, 2015). The Express Tribune,Retrived from: http://tribune.com.pk/story/846370/economic-corridor-chinese-official-sets-record-straight/ (Accessed on: March 10, 2016).
Weigmans, B., and Konings, R. (2015). Intermodal Inland Waterway Transport: ModellingConditions Infl uencing Its Cost Competitiveness, The Asian Journal of Shipping and Logistics,31(2), 273–294.
Wiegmans, W. B., and Donders, A. R. T. (2007). Benchmarking European Rail Freight TransportCompanies, Transportation Journal, 46(2), 19-34.
Wiegmans, W. B., Hekkert, M., and Langstraat, M. (2007). Can Innovations in Rail FreightTransshipment Be Successful? Transport Reviews, 27 (1), 103-122.
TR News (2001) Bimonthly Issue, Transportation Research Board, National Research Council,Retrieved from: www.TRB.org, (Accessed on 06 April, 2016).
Appendix
Focus Group Participants
1. Chairman, Excutive Council, APSA2. Senior Vice Chairman, APSA3. Vice Chairman, APSA4. Representative, Pakistan International Container Terminal (Ltd).5. Representative, Pakistan Shaheen Container Services.6. Lead Author
Focus Group Questionnaire
1) How do you see the regional trade changing?2) How Pakistan China relationships may evolve in terms of trade?3) Who are major stakeholders of shipping industry?
What are existing shipping related facilities?How they are being upgraded?What is the capacity of each of these facilities?
4) Why Containers are growing important?What is the current amount of intermodal containers?
5) How CPEC would affect the intermodal containers?What is it expected in the future to increase?
6) Which kind of intermodal containers are operated in our country?7) Are these suited to the need of the transportation?8) Are these produced within country or bought from abroad?
Is it expected that the Intermodal Containers shall be produced within Pakistan?9) How much work has been done on intermodal containers to fulfill the future need when the
CPEC is functional?10) Does the intermodal containers sector has the capacity to manage the trade when CPEC is
fully functional?11) How intermodal containers would affect GDP of the country?

85International Journal ofManagement, Business, and EconomicsIJMBE
Mayinger, F. I. D. (2001). Mobility and Traffic in the 21st Century, Springer Berlin Heidelberg.
Nohria, N., and Ghoshal, S. (1997). The Differentiated Network: Organising MultinationalCorporations for Value Creation, San Francisco: Jossey-Bass.
Pakistan vision 2025, (2014). Ministry of planning commission, retrieved from: www.pc.gov.pk(Accessed on: 11 March, 2016).
Pisarski, E. A. (1981). Transportation, American Academy of Political and Social Science, 453, 70-95.
Rondinelli, D. and Berry, M. (2000). Multimodal Transportation, Logistics, and the Environment:Managing Interactions in a Global Economy, European Management Journal, Vol. 18, no. 4.
Ranjan, A. (May, 2015). The China-Pakistan Economic Corridor: India’s Options. 10, 1-5. Retrievedfrom: http://www.icsin.org/uploads/2015/06/05/31e217cf46cab5bd9f15930569843895.pdf(Accessed on: 5 March, 2015).
Rugman, A. M., Collinson, S., and Hodgetts, R. M. (2006). International Business (4th Edition ed.).London: McGraw-Hill, Inc.
Salman, A. (2015). Pakistan-China Economic Corridor: a cost-benefit analysis, Retrievedfrom:http://tribune.com.pk/story/880259/pakistan-china-economic-corridor-a-cost-benefit-analysis/(Accessed on: 5 March, 2015).
Siddiqui, A. (2016). New Face of Asia-Europe Trade: Retrieved from: www.tocevents-europe.com/images/speaker-presentations/Aasim-Siddiqui.pdf (Accessed on: March 04, 2016).
State Bank of Pakistan. (2014). Annual report.
State Bank of Pakistan. (2015). Annual report.
Stern, R. (2010). Comparative advantage, economic growth, the gains from trade and globalization,and computational trade modeling: Festschrift papers in honor of Alan V. Deardorff. University ofMichigan, Ann Arbor.
Economic corridor: Chinese official sets record straight. (March 2, 2015). The Express Tribune,Retrived from: http://tribune.com.pk/story/846370/economic-corridor-chinese-official-sets-record-straight/ (Accessed on: March 10, 2016).
Weigmans, B., and Konings, R. (2015). Intermodal Inland Waterway Transport: ModellingConditions Infl uencing Its Cost Competitiveness, The Asian Journal of Shipping and Logistics,31(2), 273–294.
Wiegmans, W. B., and Donders, A. R. T. (2007). Benchmarking European Rail Freight TransportCompanies, Transportation Journal, 46(2), 19-34.
Wiegmans, W. B., Hekkert, M., and Langstraat, M. (2007). Can Innovations in Rail FreightTransshipment Be Successful? Transport Reviews, 27 (1), 103-122.
TR News (2001) Bimonthly Issue, Transportation Research Board, National Research Council,Retrieved from: www.TRB.org, (Accessed on 06 April, 2016).
Appendix
Focus Group Participants
1. Chairman, Excutive Council, APSA2. Senior Vice Chairman, APSA3. Vice Chairman, APSA4. Representative, Pakistan International Container Terminal (Ltd).5. Representative, Pakistan Shaheen Container Services.6. Lead Author
Focus Group Questionnaire
1) How do you see the regional trade changing?2) How Pakistan China relationships may evolve in terms of trade?3) Who are major stakeholders of shipping industry?
What are existing shipping related facilities?How they are being upgraded?What is the capacity of each of these facilities?
4) Why Containers are growing important?What is the current amount of intermodal containers?
5) How CPEC would affect the intermodal containers?What is it expected in the future to increase?
6) Which kind of intermodal containers are operated in our country?7) Are these suited to the need of the transportation?8) Are these produced within country or bought from abroad?
Is it expected that the Intermodal Containers shall be produced within Pakistan?9) How much work has been done on intermodal containers to fulfill the future need when the
CPEC is functional?10) Does the intermodal containers sector has the capacity to manage the trade when CPEC is
fully functional?11) How intermodal containers would affect GDP of the country?


87International Journal ofManagement, Business, and EconomicsIJMBE
International Journal ofManagement, Business, and EconomicsIJMBE
Organizational Citizenship Behavior (OCB) Practicesamong the University Teachers: Bangladesh Perspective
by
Mohammad MilonDepartment of Human Resource Management,
Faculty of Business Administration,Jatiya Kabi Kazi Nazrul Islam University, Mymensingh, Bangladesh
E-mail. [email protected]

Organizational Citizenship Behavior (OCB) Practicesamong the University Teachers: Bangladesh Perspective
by
Mohammad MilonDepartment of Human Resource Management,
Faculty of Business Administration,Jatiya Kabi Kazi Nazrul Islam University, Mymensingh, Bangladesh
E-mail. [email protected]
Abstract
Organizational citizenship behavior (OCB) is crucial for university teachers to understand thekey dimensions that significantly and positively aid in creating the favorable behavior within theorganization. However, few comprehensive studies have shown how OCB can be practiced amongthe university teachers in Bangladesh. The purpose of this study was to examine the OCB practicesamong university teachers in Bangladesh considering altruism, courtesy, conscientiousness,sportsmanship and civic virtue etc. In this research, the structural questionnaire was used for primarydata that includes five dimensions on OCB. The study also uses secondary data for theoreticaldevelopment of the paper. For finding the result, the necessary statistical measures include 5 pointLikert scale, mean, and rank are used in this study. The research results show that the OCB practicesamong the university teachers are not enough satisfactory level. Under altruism the respondents werefound to have the highest scale of OCB practices regarding the statement: “I talk to other colleaguesbefore taking actions that might affect them” (1.89); under Courtesy, the statement was “I try toadjust the work schedule to other colleagues’ requests for time off” (2.13); under Conscientiousnessthe statement was “I spend extra time to help my students for preparing a presentation or paper”(1.91); under Sportsmanship the statement was “I always say good things about my colleagues infront of others” (1.86); under Civic Virtue the statement was “I attend actively in different events orpicnic arranged by the organization” (1.56). The study concluded that organizational citizenshipbehavior is pivotal factor for enhancing teaching performance.
Keywords: Organizational Citizenship Behavior, University Teacher
1. Introduction
In today’s cutthroat competitive world, non-tasks behaviors (OCBs) are one of significantfactors for organizational survival. Those organizations are more successful whose employeesperform duties beyond their formal contract. These altruistic acts are not part of any formal contractand have no any reward for this, yet, these acts are essential for smooth functioning of organizationsto enhance effectiveness (Bidwell, 1965). Therefore, today’s the concept OCB practice in teachingprofession (Izhar Oplatka, (2009) refers to all helping behaviors extended to colleagues, supervisors,and students, such as lending a colleague a hand with work overload or preparing specialassignments for higher and lower level students; and extended to the university at large, such assuggesting improvements in pedagogical issues or building a positive image to outsiders.

89International Journal ofManagement, Business, and EconomicsIJMBE
Organizational Citizenship Behavior (OCB) Practicesamong the University Teachers: Bangladesh Perspective
by
Mohammad MilonDepartment of Human Resource Management,
Faculty of Business Administration,Jatiya Kabi Kazi Nazrul Islam University, Mymensingh, Bangladesh
E-mail. [email protected]
Abstract
Organizational citizenship behavior (OCB) is crucial for university teachers to understand thekey dimensions that significantly and positively aid in creating the favorable behavior within theorganization. However, few comprehensive studies have shown how OCB can be practiced amongthe university teachers in Bangladesh. The purpose of this study was to examine the OCB practicesamong university teachers in Bangladesh considering altruism, courtesy, conscientiousness,sportsmanship and civic virtue etc. In this research, the structural questionnaire was used for primarydata that includes five dimensions on OCB. The study also uses secondary data for theoreticaldevelopment of the paper. For finding the result, the necessary statistical measures include 5 pointLikert scale, mean, and rank are used in this study. The research results show that the OCB practicesamong the university teachers are not enough satisfactory level. Under altruism the respondents werefound to have the highest scale of OCB practices regarding the statement: “I talk to other colleaguesbefore taking actions that might affect them” (1.89); under Courtesy, the statement was “I try toadjust the work schedule to other colleagues’ requests for time off” (2.13); under Conscientiousnessthe statement was “I spend extra time to help my students for preparing a presentation or paper”(1.91); under Sportsmanship the statement was “I always say good things about my colleagues infront of others” (1.86); under Civic Virtue the statement was “I attend actively in different events orpicnic arranged by the organization” (1.56). The study concluded that organizational citizenshipbehavior is pivotal factor for enhancing teaching performance.
Keywords: Organizational Citizenship Behavior, University Teacher
1. Introduction
In today’s cutthroat competitive world, non-tasks behaviors (OCBs) are one of significantfactors for organizational survival. Those organizations are more successful whose employeesperform duties beyond their formal contract. These altruistic acts are not part of any formal contractand have no any reward for this, yet, these acts are essential for smooth functioning of organizationsto enhance effectiveness (Bidwell, 1965). Therefore, today’s the concept OCB practice in teachingprofession (Izhar Oplatka, (2009) refers to all helping behaviors extended to colleagues, supervisors,and students, such as lending a colleague a hand with work overload or preparing specialassignments for higher and lower level students; and extended to the university at large, such assuggesting improvements in pedagogical issues or building a positive image to outsiders.

90 International Journal ofManagement, Business, and EconomicsIJMBE
Organizational citizenship behavior (OCB) was first introduced by (Organ, 1988) and hedefined OCB as an employee’s discretionary behaviors that directly promote the effectivefunctioning of an organization, independently of an employee's objective productivity. Moreover,Katz and Kahn (1978) pointed out that OCB is an ethical and self-justification tool that can play animportant role in any organizations. In the words of (Somech & Drach-Zahavy, 2000) OCBs arethose behaviors that go beyond specified role requirements and are directed toward the organizationas a unit, the team, and the individual, to promote organizational goals. This definition of teachers’OCBs practice emphasizes three main features of extra-role behavior (ERB). First, the behavior mustbe voluntary, that is, neither role-prescribed nor part of formal job duties. Second, the focus is onbehaviors that do not simply happen in an organization but are directed toward or seen as benefitingthe organization (Van Dyne, Cummings, & Parks, 1995). Third, by this definition, OCBs aremultidimensional by nature. Although most scholars agree on the multidimensionality of thisconstruct, a review of the literature reveals a lack of consensus about its dimensionality.
This study adopted the five-dimension construct of Organ (1988), which was developedspecifically for the context of university teaching. The five dimensions are (a) Altruism (helping newcolleagues and freely giving time to others), (b) Conscientiousness (efficient use of time and goingbeyond minimum expectations), (c) Sportsmanship (avoids complaining and whining), Courtesy(advance notices, reminders, and communicating appropriate information), Civic Virtue (serving oncommittees and voluntarily attending functions) promotes the interests of the organization.
Practicing OCBs among the university teachers are essential because only university cannotanticipate the entire array of behaviors needed for achieving goals through formally stated in-role jobdescriptions (George & Brief, 1992). Moreover, today, as educational systems move into an era ofglobalization and are required to work in a competitive and complex environment (BruceMacfarlane, 2007), the success of university mainly lean on teachers who are committed touniversity goals and values (Oplatka, 2006; Somech & Ron, 2007) and are more willing to go aboveand beyond the call of duty to contribute to successful change, that is, to engage in such OCBs. Inaddition, teachers can contribute to enhance university effectiveness though performing in-rolebehavior along with extra-role behavior. In this case, Burden (1982) state that OCBs consist ofpositive types of behavior that are not part of the formal job description, OCBs should be limited toERBs and be distinguished from IRBs. This distinction is meant to draw a line between the types of‘‘behaviors which are required or expected as part of performing the duties and responsibilities of theassigned role’’ (IRB) (VanDyne et al., 1995) and the types of behavior that go beyond the formalcontract (ERB). In summary, OCBs as psychological issues are difficult to measure empiricallybecause they are not stable, hard to quantify, and defined variously by different people (BruceMacfarlane, 2007)
Objectives of the Study
The main objective of this paper was to investigate the practice of OCBs among the universityteachers in Bangladesh. However, the most concrete directions covered in this study are:
1. To describe concept of Organizational Citizenship Behaviors (OCBs)2. To describe the dimensions of Organizational Citizenship Behaviors (OCBs).3. To know the perceptions of teachers about OCB practices4. To investigate the tendency of university teachers about OCB practices5. To provide some relevant suggestions on the basis of findings of the study.
Research Questions
To address the above stated research objectives, the following research questions are kept inmind throughout this study:
1. What is the latest definition of OCBs?2. What are the best dimensions of Organizational Citizenship Behaviors (OCBs?3. What are the teachers’ perceptions about OCBs in university level?4. What are the behavior patterns with the working environment of the university teachers?5. How to make OCB effective and why?
Statement of the Problem
As a university teacher and researcher, I have personally observed the fewer application ofOCB among the teachers who are working in different universities in Bangladesh. Lately, we havearound 140+ universities included both private and public according to the University GrandCommission (UGC) Website in our country. Moreover, as the universities are keeping a pivotal rolein higher education, it should be required a strong OCB practices among the teachers to assure a safeand sound academic environment for learning and creating a pool of talent with the global demand.But it is a matter of regret that, most of the universities’ teachers are not concern enough to apply thefive dimensions of OCB in their academia profession such as altruism (helping new colleagues andfreely giving time to others), courtesy (advance notices, reminders, and communicating appropriateinformation), conscientiousness (efficient use of time and going beyond minimum expectations),sportsmanship (avoids complaining and whining) and civic virtue (serving on committees andvoluntarily attending functions). As a result, the learning environment of university is gettinghampered due to less application of OCB.Consequent of this situation, this study was conducted to examine the OCB practices among theuniversity teachers in Bangladesh considering the five dimensions of OCB such as altruism,courtesy, conscientiousness, sportsmanship and civic virtue etc. for assuring effective learningenvironment.
2. Literature Review
Definition of Organizational Citizenship Behavior
Organizational Citizenship Behaviors (OCBs) are those discretionary behaviors thatemployees are willing to exhibit without expecting any kind of reward in return (Raghoebarsing,2011). It is one of the most important concepts in organizational effectiveness and efficiency onquality and productivity (Corcoran, 1981). In the word of (Organ 1988), OCB is defined as work-related behaviors that are discretionary, not related to the formal organizational reward system, and,in aggregate, promote the effective functioning of the organization. In addition, in the words of(Farahbod, Azadehdel, Rezaei, Nezhadi, 2012), OCB extends beyond the performance indicatorsrequired by an organization in a formal job description. Moreover, according to (Lovell, Kahn,Anton, Davidson, Dowling, et al., 1999) OCB reflects those actions performed by employees thatsurpass the minimum role requirements expected by the organization and promote the welfare of co-workers, work groups, and/or the organization. In this regard, Williams and Anderson (1991) arguethat OCB is into two types: (1) behaviors directed at specific individuals in the organization, such ascourtesy and altruism; and (2) behaviors concerned with benefiting the organization as a whole, suchas conscientiousness, sportsmanship and civic virtue. In view of (DiPaola. et al, 2005) OCBs includesome behaviors which are not imposed or stated in the job description of an employee, the behavior

91International Journal ofManagement, Business, and EconomicsIJMBE
Organizational citizenship behavior (OCB) was first introduced by (Organ, 1988) and hedefined OCB as an employee’s discretionary behaviors that directly promote the effectivefunctioning of an organization, independently of an employee's objective productivity. Moreover,Katz and Kahn (1978) pointed out that OCB is an ethical and self-justification tool that can play animportant role in any organizations. In the words of (Somech & Drach-Zahavy, 2000) OCBs arethose behaviors that go beyond specified role requirements and are directed toward the organizationas a unit, the team, and the individual, to promote organizational goals. This definition of teachers’OCBs practice emphasizes three main features of extra-role behavior (ERB). First, the behavior mustbe voluntary, that is, neither role-prescribed nor part of formal job duties. Second, the focus is onbehaviors that do not simply happen in an organization but are directed toward or seen as benefitingthe organization (Van Dyne, Cummings, & Parks, 1995). Third, by this definition, OCBs aremultidimensional by nature. Although most scholars agree on the multidimensionality of thisconstruct, a review of the literature reveals a lack of consensus about its dimensionality.
This study adopted the five-dimension construct of Organ (1988), which was developedspecifically for the context of university teaching. The five dimensions are (a) Altruism (helping newcolleagues and freely giving time to others), (b) Conscientiousness (efficient use of time and goingbeyond minimum expectations), (c) Sportsmanship (avoids complaining and whining), Courtesy(advance notices, reminders, and communicating appropriate information), Civic Virtue (serving oncommittees and voluntarily attending functions) promotes the interests of the organization.
Practicing OCBs among the university teachers are essential because only university cannotanticipate the entire array of behaviors needed for achieving goals through formally stated in-role jobdescriptions (George & Brief, 1992). Moreover, today, as educational systems move into an era ofglobalization and are required to work in a competitive and complex environment (BruceMacfarlane, 2007), the success of university mainly lean on teachers who are committed touniversity goals and values (Oplatka, 2006; Somech & Ron, 2007) and are more willing to go aboveand beyond the call of duty to contribute to successful change, that is, to engage in such OCBs. Inaddition, teachers can contribute to enhance university effectiveness though performing in-rolebehavior along with extra-role behavior. In this case, Burden (1982) state that OCBs consist ofpositive types of behavior that are not part of the formal job description, OCBs should be limited toERBs and be distinguished from IRBs. This distinction is meant to draw a line between the types of‘‘behaviors which are required or expected as part of performing the duties and responsibilities of theassigned role’’ (IRB) (VanDyne et al., 1995) and the types of behavior that go beyond the formalcontract (ERB). In summary, OCBs as psychological issues are difficult to measure empiricallybecause they are not stable, hard to quantify, and defined variously by different people (BruceMacfarlane, 2007)
Objectives of the Study
The main objective of this paper was to investigate the practice of OCBs among the universityteachers in Bangladesh. However, the most concrete directions covered in this study are:
1. To describe concept of Organizational Citizenship Behaviors (OCBs)2. To describe the dimensions of Organizational Citizenship Behaviors (OCBs).3. To know the perceptions of teachers about OCB practices4. To investigate the tendency of university teachers about OCB practices5. To provide some relevant suggestions on the basis of findings of the study.
Research Questions
To address the above stated research objectives, the following research questions are kept inmind throughout this study:
1. What is the latest definition of OCBs?2. What are the best dimensions of Organizational Citizenship Behaviors (OCBs?3. What are the teachers’ perceptions about OCBs in university level?4. What are the behavior patterns with the working environment of the university teachers?5. How to make OCB effective and why?
Statement of the Problem
As a university teacher and researcher, I have personally observed the fewer application ofOCB among the teachers who are working in different universities in Bangladesh. Lately, we havearound 140+ universities included both private and public according to the University GrandCommission (UGC) Website in our country. Moreover, as the universities are keeping a pivotal rolein higher education, it should be required a strong OCB practices among the teachers to assure a safeand sound academic environment for learning and creating a pool of talent with the global demand.But it is a matter of regret that, most of the universities’ teachers are not concern enough to apply thefive dimensions of OCB in their academia profession such as altruism (helping new colleagues andfreely giving time to others), courtesy (advance notices, reminders, and communicating appropriateinformation), conscientiousness (efficient use of time and going beyond minimum expectations),sportsmanship (avoids complaining and whining) and civic virtue (serving on committees andvoluntarily attending functions). As a result, the learning environment of university is gettinghampered due to less application of OCB.Consequent of this situation, this study was conducted to examine the OCB practices among theuniversity teachers in Bangladesh considering the five dimensions of OCB such as altruism,courtesy, conscientiousness, sportsmanship and civic virtue etc. for assuring effective learningenvironment.
2. Literature Review
Definition of Organizational Citizenship Behavior
Organizational Citizenship Behaviors (OCBs) are those discretionary behaviors thatemployees are willing to exhibit without expecting any kind of reward in return (Raghoebarsing,2011). It is one of the most important concepts in organizational effectiveness and efficiency onquality and productivity (Corcoran, 1981). In the word of (Organ 1988), OCB is defined as work-related behaviors that are discretionary, not related to the formal organizational reward system, and,in aggregate, promote the effective functioning of the organization. In addition, in the words of(Farahbod, Azadehdel, Rezaei, Nezhadi, 2012), OCB extends beyond the performance indicatorsrequired by an organization in a formal job description. Moreover, according to (Lovell, Kahn,Anton, Davidson, Dowling, et al., 1999) OCB reflects those actions performed by employees thatsurpass the minimum role requirements expected by the organization and promote the welfare of co-workers, work groups, and/or the organization. In this regard, Williams and Anderson (1991) arguethat OCB is into two types: (1) behaviors directed at specific individuals in the organization, such ascourtesy and altruism; and (2) behaviors concerned with benefiting the organization as a whole, suchas conscientiousness, sportsmanship and civic virtue. In view of (DiPaola. et al, 2005) OCBs includesome behaviors which are not imposed or stated in the job description of an employee, the behavior

92 International Journal ofManagement, Business, and EconomicsIJMBE
is relatively a matter of individual choice, such that its negligence is not commonly penalized. OCBsare usually beneficial organizational behaviors that cannot be enforced upon employees asobligations nor acquired by rewards or recompense from employees' gestures in the organization(Oplatka and Stundi, 2010).
It is recommended by Oplatka (2006) that employee who perform OCB are willing to doextra tasks and do not expect anything from their organizations, yet they will be happy by theprogress of their organization for instance punctuality, employees’ volunteering for activities that arenot required helping others etc. (Magdalena, 2014)). Sevi, E., (2010) inform that OCB has apositively relationship with the effective functioning of an organization. Magdalena (2014) considersthat OCBs are originally defined as extra work behaviors that are not listed among the traditional jobperformance measures which overly affect organizational success in the long run. According toO’Connor (2008), there are three types of citizenship behaviors in the organization: organizationalobedience, organizational loyalty, and organizational participation. OCB is defined by Daniels et al.,(2006) as extra behavior of doing tasks in work place other than routine employee tasks. OCB helpsorganization to increase its performance in long run as compared to short term. Ras, (2015) in hisstudy identified that OCB helps to encourage the employees to apply their maximum knowledge,skill and abilities in workplace which is closely related to achieve organizational goals effectivelyand efficiently.
Key Dimensions of OCB
Altruism
Altruism in simple words means helping or helpfulness (Organ, 1997). Altruism meanshelping other members of the organization in their tasks. For instance, voluntarily helping newemployees, helping co-workers who are overloaded, assisting workers who were absent, guidingemployees to accomplish difficult tasks et al. Smith, Organ, and Near (1983) defined altruism asvoluntary behaviors where an employee provides assistance to an individual with a particularproblem to complete his or her task under unusual circumstances. In the words of Podsakoff et al.(1997), altruism refers to a member helping other members of the organization in their work.Podsakoff et al. (2000) has demonstrated that altruism was significantly related to performanceevaluations and correspondingly, positive affectivity.
Conscientiousness
Conscientiousness is a discretionary behavior that goes well beyond the minimum rolerequirement level of the organization, such as obeying rules and regulations, not taking extra breaks,working extra-long days (MacKenzie et al, 2006). According to Organ et al. 2011),conscientiousness is a prototype of going well beyond minimally required levels of attendance,punctuality, and housekeeping, penchant towards conserving resources, and overall giving animpression of being a responsible citizen of the organization. If the employee is highly conscientiousit implies that he is highly responsible and needs less supervision (Podsakoff and MacKenzie, 1997).In the word of Organ, et al. (2006), conscientiousness is used to indicate that a particular individualis organized, self-disciplined, accountable and hardworking. O'Reilly & Chatman (1986) defined itas dedication to the job which exceed formal requirements such as working long hours, and volunteerto perform jobs besides duties.
Sportsmanship
Sportsmanship is defined as a willingness to tolerate the inevitable inconveniences andimpositions of work without complaining (Organ, 1990). It refers to person’s desire not to complainwhen experiencing the inevitable inconveniences and abuse generated in exercising a professionalactivity. Morrison (1994) state that sportsmanship refers to avoid complaining unnecessarily aboutthe difficulties faced in the workplace, being positive and tolerant towards problems experienced inthe workplace. In the word of (DiPaola, et al. 2001) sportsmanship is exhibition of willingness totolerate minor and temporary personnel inconveniences and impositions of work without grievances,complaints, appeals, accusations, or protest. This helps to conserve organizational energies foraccomplishment of task and to a large extent relieves managers of unnecessary load/stress (Organand Ryan, 1995, Organ, 1990). Organ (1988) defined sportsmanship as the behavior of warmlytolerating the irritations that are an unavoidable part of nearly every organizational setting. Podsakoffand MacKenzie (1997) publicized that good sportsmanship would enhance the morale of theemployees at the workplace and consequently reduce employee turnover.
Courtesy
Courtesy refers to the gestures that help others to prevent interpersonal problems fromoccurring, such as giving prior notice of the work schedule to someone who is in need, consultingothers before taking any actions that would affect them (Organ, 1990). Courtesy or gestures aredemonstrated in the interest of preventing creations of problems for co-workers such as leaving thecopier or printer in good condition for other workers’ use is an example of courtesy at work (Organ,Podsakoff, & MacKenzie, 2006). A courteous employee prevents managers from falling into thepattern of crisis management by making a since effort to avoid creating problems for co-workers(Podsakoff and MacKenzie, 1997). According to Belogolovsky and Somech (2010), courtesyincludes behaviors, which focus on the deterrence of problems and taking the necessary and timelysteps in order to lessen the effects of the problem in the future. In simple words, Bogler &bSomech,(2005), state that courtesy means the encouragement given by a member to other member/s of theorganization when they are demoralized and feel discouraged about their professional development.Research has shown that employees who exhibit courtesy would reduce inter group conflict andthereby abating the time spent on conflict management activities (Podsakoff et al., 2000). The mainidea of courtesy is avoiding actions that unnecessarily make colleagues’ work harder. It also includesgiving them enough notice to get prepared when there is an addition to their existing work load.
Civic virtue
Civic virtue refers to the constructive involvement in the political process of the organizationand contribution to this process by freely and frankly expressing opinions, attending meetings,discussing with colleagues the issues concerning the organization, and reading organizationalcommunications such as mails for the well-being of the organization (Podsakoff et al, 1990). Itshows willingness to participate actively in organization’s events, monitor organization’senvironment for threats and opportunities, to work out the best alternative for the organization. Thesebehaviors occur when employees reckon themselves with the organization and consider themselvesto be part of the organization. (Podsakoff et al, 2000). In other word civic virtue is defined assubordinate participation in organization political life and supporting the administrative function ofthe organization (Vey & Campbell, 2004). Civic virtue refers to the responsibility of the employeesto actively and willingly participate in the life of the firm such as attending meetings which are notrequired by the firm and keeping appraised with the changes in the organization (Organ, 1988).These behaviors reflect an employees’ recognition of being part of organization and accept the

93International Journal ofManagement, Business, and EconomicsIJMBE
is relatively a matter of individual choice, such that its negligence is not commonly penalized. OCBsare usually beneficial organizational behaviors that cannot be enforced upon employees asobligations nor acquired by rewards or recompense from employees' gestures in the organization(Oplatka and Stundi, 2010).
It is recommended by Oplatka (2006) that employee who perform OCB are willing to doextra tasks and do not expect anything from their organizations, yet they will be happy by theprogress of their organization for instance punctuality, employees’ volunteering for activities that arenot required helping others etc. (Magdalena, 2014)). Sevi, E., (2010) inform that OCB has apositively relationship with the effective functioning of an organization. Magdalena (2014) considersthat OCBs are originally defined as extra work behaviors that are not listed among the traditional jobperformance measures which overly affect organizational success in the long run. According toO’Connor (2008), there are three types of citizenship behaviors in the organization: organizationalobedience, organizational loyalty, and organizational participation. OCB is defined by Daniels et al.,(2006) as extra behavior of doing tasks in work place other than routine employee tasks. OCB helpsorganization to increase its performance in long run as compared to short term. Ras, (2015) in hisstudy identified that OCB helps to encourage the employees to apply their maximum knowledge,skill and abilities in workplace which is closely related to achieve organizational goals effectivelyand efficiently.
Key Dimensions of OCB
Altruism
Altruism in simple words means helping or helpfulness (Organ, 1997). Altruism meanshelping other members of the organization in their tasks. For instance, voluntarily helping newemployees, helping co-workers who are overloaded, assisting workers who were absent, guidingemployees to accomplish difficult tasks et al. Smith, Organ, and Near (1983) defined altruism asvoluntary behaviors where an employee provides assistance to an individual with a particularproblem to complete his or her task under unusual circumstances. In the words of Podsakoff et al.(1997), altruism refers to a member helping other members of the organization in their work.Podsakoff et al. (2000) has demonstrated that altruism was significantly related to performanceevaluations and correspondingly, positive affectivity.
Conscientiousness
Conscientiousness is a discretionary behavior that goes well beyond the minimum rolerequirement level of the organization, such as obeying rules and regulations, not taking extra breaks,working extra-long days (MacKenzie et al, 2006). According to Organ et al. 2011),conscientiousness is a prototype of going well beyond minimally required levels of attendance,punctuality, and housekeeping, penchant towards conserving resources, and overall giving animpression of being a responsible citizen of the organization. If the employee is highly conscientiousit implies that he is highly responsible and needs less supervision (Podsakoff and MacKenzie, 1997).In the word of Organ, et al. (2006), conscientiousness is used to indicate that a particular individualis organized, self-disciplined, accountable and hardworking. O'Reilly & Chatman (1986) defined itas dedication to the job which exceed formal requirements such as working long hours, and volunteerto perform jobs besides duties.
Sportsmanship
Sportsmanship is defined as a willingness to tolerate the inevitable inconveniences andimpositions of work without complaining (Organ, 1990). It refers to person’s desire not to complainwhen experiencing the inevitable inconveniences and abuse generated in exercising a professionalactivity. Morrison (1994) state that sportsmanship refers to avoid complaining unnecessarily aboutthe difficulties faced in the workplace, being positive and tolerant towards problems experienced inthe workplace. In the word of (DiPaola, et al. 2001) sportsmanship is exhibition of willingness totolerate minor and temporary personnel inconveniences and impositions of work without grievances,complaints, appeals, accusations, or protest. This helps to conserve organizational energies foraccomplishment of task and to a large extent relieves managers of unnecessary load/stress (Organand Ryan, 1995, Organ, 1990). Organ (1988) defined sportsmanship as the behavior of warmlytolerating the irritations that are an unavoidable part of nearly every organizational setting. Podsakoffand MacKenzie (1997) publicized that good sportsmanship would enhance the morale of theemployees at the workplace and consequently reduce employee turnover.
Courtesy
Courtesy refers to the gestures that help others to prevent interpersonal problems fromoccurring, such as giving prior notice of the work schedule to someone who is in need, consultingothers before taking any actions that would affect them (Organ, 1990). Courtesy or gestures aredemonstrated in the interest of preventing creations of problems for co-workers such as leaving thecopier or printer in good condition for other workers’ use is an example of courtesy at work (Organ,Podsakoff, & MacKenzie, 2006). A courteous employee prevents managers from falling into thepattern of crisis management by making a since effort to avoid creating problems for co-workers(Podsakoff and MacKenzie, 1997). According to Belogolovsky and Somech (2010), courtesyincludes behaviors, which focus on the deterrence of problems and taking the necessary and timelysteps in order to lessen the effects of the problem in the future. In simple words, Bogler &bSomech,(2005), state that courtesy means the encouragement given by a member to other member/s of theorganization when they are demoralized and feel discouraged about their professional development.Research has shown that employees who exhibit courtesy would reduce inter group conflict andthereby abating the time spent on conflict management activities (Podsakoff et al., 2000). The mainidea of courtesy is avoiding actions that unnecessarily make colleagues’ work harder. It also includesgiving them enough notice to get prepared when there is an addition to their existing work load.
Civic virtue
Civic virtue refers to the constructive involvement in the political process of the organizationand contribution to this process by freely and frankly expressing opinions, attending meetings,discussing with colleagues the issues concerning the organization, and reading organizationalcommunications such as mails for the well-being of the organization (Podsakoff et al, 1990). Itshows willingness to participate actively in organization’s events, monitor organization’senvironment for threats and opportunities, to work out the best alternative for the organization. Thesebehaviors occur when employees reckon themselves with the organization and consider themselvesto be part of the organization. (Podsakoff et al, 2000). In other word civic virtue is defined assubordinate participation in organization political life and supporting the administrative function ofthe organization (Vey & Campbell, 2004). Civic virtue refers to the responsibility of the employeesto actively and willingly participate in the life of the firm such as attending meetings which are notrequired by the firm and keeping appraised with the changes in the organization (Organ, 1988).These behaviors reflect an employees’ recognition of being part of organization and accept the
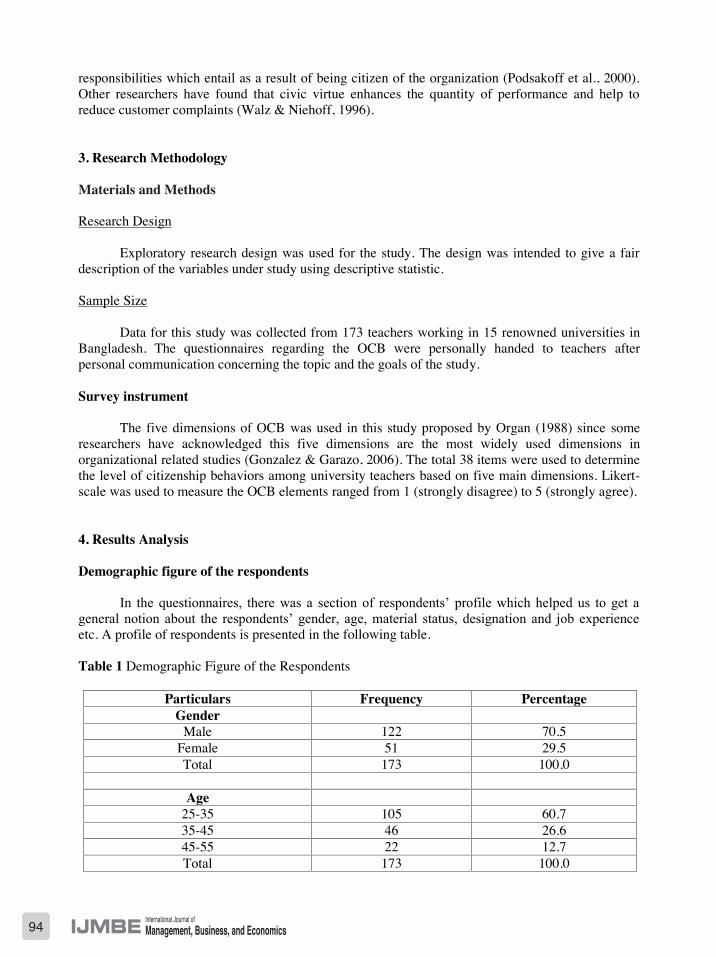
94 International Journal ofManagement, Business, and EconomicsIJMBE
responsibilities which entail as a result of being citizen of the organization (Podsakoff et al., 2000).Other researchers have found that civic virtue enhances the quantity of performance and help toreduce customer complaints (Walz & Niehoff, 1996).
3. Research Methodology
Materials and Methods
Research Design
Exploratory research design was used for the study. The design was intended to give a fairdescription of the variables under study using descriptive statistic.
Sample Size
Data for this study was collected from 173 teachers working in 15 renowned universities inBangladesh. The questionnaires regarding the OCB were personally handed to teachers afterpersonal communication concerning the topic and the goals of the study.
Survey instrument
The five dimensions of OCB was used in this study proposed by Organ (1988) since someresearchers have acknowledged this five dimensions are the most widely used dimensions inorganizational related studies (Gonzalez & Garazo, 2006). The total 38 items were used to determinethe level of citizenship behaviors among university teachers based on five main dimensions. Likert-scale was used to measure the OCB elements ranged from 1 (strongly disagree) to 5 (strongly agree).
4. Results Analysis
Demographic figure of the respondents
In the questionnaires, there was a section of respondents’ profile which helped us to get ageneral notion about the respondents’ gender, age, material status, designation and job experienceetc. A profile of respondents is presented in the following table.
Table 1 Demographic Figure of the Respondents
Particulars Frequency PercentageGender
Male 122 70.5Female 51 29.5Total 173 100.0
Age25-35 105 60.735-45 46 26.645-55 22 12.7Total 173 100.0
Marital statusSingle 99 57.2
Married 74 42.8Total 173 100.0
DesignationLecturer 105 60.7
Assistant professor 28 16.2Associate professor 23 13.3
Professor 17 9.8Total 173 100.0
Job experienceLess than one year 21 12.1
1-3 85 49.13-10 50 28.9
Above 10 years 17 9.8Total 173 100.0
Source: Field Survey
The above table shows the demographic figure of the respondents. It shows that most of themwere male (70.5%) and other were female, most of them were found in the age of 25-35 years(60.7%), a large amount of the respondents was in the position of lecturer (60.7%) and about half ofthe respondent were having the job experience of 1 to 3 years (49.1%)
Descriptive Statistics
In this study the descriptive statistics such as means, standard deviation, frequency andpercentages etc was done to process and analyze the collected data for finding the best possibleresults.
Table 2 Descriptive Statistics
Particulars Mean Std.Deviation
A. Altruism (helping new colleagues and freely giving time toothers)I give time to help colleagues with work related problems. 1.9075 .81598I support colleagues who have problems at work. 1.9306 1.19876I take time out of my day to help my new colleagues. 2.3121 1.34498I talk to other colleagues before taking actions that might affect them. 1.8960 1.17663I share my knowledge and expertise with other colleagues 2.0636 1.06285I highly welcome and assist my new colleagues in my organization. 2.1908 1.21690I help my new colleagues get oriented to the job. 2.3815 1.18817I give time to advice, coach, or mentor to my colleagues. 2.1098 1.29604B. Conscientiousness (efficient use of time and going beyond

95International Journal ofManagement, Business, and EconomicsIJMBE
responsibilities which entail as a result of being citizen of the organization (Podsakoff et al., 2000).Other researchers have found that civic virtue enhances the quantity of performance and help toreduce customer complaints (Walz & Niehoff, 1996).
3. Research Methodology
Materials and Methods
Research Design
Exploratory research design was used for the study. The design was intended to give a fairdescription of the variables under study using descriptive statistic.
Sample Size
Data for this study was collected from 173 teachers working in 15 renowned universities inBangladesh. The questionnaires regarding the OCB were personally handed to teachers afterpersonal communication concerning the topic and the goals of the study.
Survey instrument
The five dimensions of OCB was used in this study proposed by Organ (1988) since someresearchers have acknowledged this five dimensions are the most widely used dimensions inorganizational related studies (Gonzalez & Garazo, 2006). The total 38 items were used to determinethe level of citizenship behaviors among university teachers based on five main dimensions. Likert-scale was used to measure the OCB elements ranged from 1 (strongly disagree) to 5 (strongly agree).
4. Results Analysis
Demographic figure of the respondents
In the questionnaires, there was a section of respondents’ profile which helped us to get ageneral notion about the respondents’ gender, age, material status, designation and job experienceetc. A profile of respondents is presented in the following table.
Table 1 Demographic Figure of the Respondents
Particulars Frequency PercentageGender
Male 122 70.5Female 51 29.5Total 173 100.0
Age25-35 105 60.735-45 46 26.645-55 22 12.7Total 173 100.0
Marital statusSingle 99 57.2
Married 74 42.8Total 173 100.0
DesignationLecturer 105 60.7
Assistant professor 28 16.2Associate professor 23 13.3
Professor 17 9.8Total 173 100.0
Job experienceLess than one year 21 12.1
1-3 85 49.13-10 50 28.9
Above 10 years 17 9.8Total 173 100.0
Source: Field Survey
The above table shows the demographic figure of the respondents. It shows that most of themwere male (70.5%) and other were female, most of them were found in the age of 25-35 years(60.7%), a large amount of the respondents was in the position of lecturer (60.7%) and about half ofthe respondent were having the job experience of 1 to 3 years (49.1%)
Descriptive Statistics
In this study the descriptive statistics such as means, standard deviation, frequency andpercentages etc was done to process and analyze the collected data for finding the best possibleresults.
Table 2 Descriptive Statistics
Particulars Mean Std.Deviation
A. Altruism (helping new colleagues and freely giving time toothers)I give time to help colleagues with work related problems. 1.9075 .81598I support colleagues who have problems at work. 1.9306 1.19876I take time out of my day to help my new colleagues. 2.3121 1.34498I talk to other colleagues before taking actions that might affect them. 1.8960 1.17663I share my knowledge and expertise with other colleagues 2.0636 1.06285I highly welcome and assist my new colleagues in my organization. 2.1908 1.21690I help my new colleagues get oriented to the job. 2.3815 1.18817I give time to advice, coach, or mentor to my colleagues. 2.1098 1.29604B. Conscientiousness (efficient use of time and going beyond

96 International Journal ofManagement, Business, and EconomicsIJMBE
minimum expectations)I always try to spend extra time for my organization’s benefit 2.2832 1.24153I am punctual and attentive to my work 2.3353 1.35233I come in early or stay late without pays to complete my task. 2.2486 1.23964I am enthusiastic person to complete my office’s extra work andassignments
2.2428 1.41792
I work weekends or other days off to complete my task. 2.5260 1.27392I spend extra time to help my students for preparing a presentation orpaper
1.9133 1.20488
I do not take unnecessary time off work and extra breaks. 2.3064 1.23600I always obey organization’s rules and regulations even when no oneis watching
2.2139 1.31866
C. Sportsmanship (avoids complaining and whining)I sometimes tolerate the irritations of others as an unavoidable part ofmy organizational setting
2.3699 1.29022
I usually do not complain when experiencing the inevitableinconveniences and abuses generated in exercising a professionalactivity
2.1156 1.19516
I usually do not complain unnecessarily against my co-worker aboutthe work difficulties
2.2081 1.27249
I help my colleagues to learn new skills or share job knowledge 2.0694 1.17426I always tolerate minor and temporary personnel inconveniences andimpositions of work without grievances, complaints, appeals,accusations, or protest.
2.2659 1.29347
I avoid consuming a lot of time complaining about trivial matters 2.1965 1.34536I always show a compassionate ear when someone in a personal andwork problem.
2.2312 1.31351
I always say good things about my colleagues in front of others. 1.8613 1.00195D. Courtesy (advance notices, reminders, and communicatingappropriate information)I try to avoid creating problems for colleagues 2.2775 1.18783I try to help my colleagues when they are absent in organization 2.3006 1.39844I do not like to talk any negative that can hurt my colleagues 2.4913 1.26958I discuss with my colleagues before taking actions against others. 2.1387 1.33092I encourage my colleagues when they are down. 2.3642 1.34263I am always ready when any of my colleagues need someone tospeak out their problem.
2.2254 1.30341
I try to adjust the work schedule to other colleagues’ requests fortime off.
2.1329 1.15119
E. Civic Virtue (serving on committees and voluntarily attendingfunctions)I attend training sessions that I am encouraged to, but not required toattend.
2.2717 1.19162
I always tell outsiders good news about the organization 2.1965 1.08724I am willing to stand up to protect the reputation of the organization 2.1850 1.15154
I attend and actively participate in company meetings 2.2486 1.28115I am strongly committed to work in my organization 2.1387 1.39907I attend functions that are not required but help the company’s image 2.3584 1.20508I attend actively in different events or picnic arranged by theorganization
1.5665 .89080
Valid N (listwise)Note: The scale is: 1= strongly disagree, 2= disagree, 3= neutral, 4= agree, 5= strongly agree
The above table shows the descriptive statistics of the respondents’ tendencies to practice inthe organization.
Under altruism the respondents were found to have the highest scale of organizationalcitizenship behavior practices regarding the following statements: I talk to other colleagues beforetaking actions that might affect them (1.89); I give time to help colleagues with work relatedproblems (1.9); I support colleagues who have problems at work (1.93) and the scales regarding therest of the statements of altruism are given in the table.
Under Conscientiousness the respondents were found to have the highest scale oforganizational citizenship behavior practices regarding the following statements: I spend extra timeto help my students for preparing a presentation or paper (1.91); I always obey organization’s rulesand regulations even when no one is watching (2.21); I am enthusiastic person to complete myoffice’s extra work and assignments (2.24) and the scales regarding the rest of the statements ofConscientiousness are given in the table.
Under Sportsmanship the respondents were found to have the highest scale of organizationalcitizenship behavior practices regarding the following statements: I always say good things about mycolleagues in front of others.(1.86); I help my colleagues to learn new skills or share job knowledge(2.06); I usually do not complain when experiencing the inevitable inconveniences and abusesgenerated in exercising a professional activity (2.11) and the scales regarding the rest of thestatements of sportsmanship are given in the table.
Under Courtesy the respondents were found to have the highest scale of organizationalcitizenship behavior practices regarding the following statements: I try to adjust the work schedule toother colleagues’ requests for time off. (2.13); I discuss with my colleagues before taking actionsagainst others. (2.14); I am always ready when any of my colleagues need someone to speak out theirproblem. (2.22) and the scales regarding the rest of the statements of Courtesy are given in the table.
Under Civic Virtue the respondents were found to have the highest scale of organizationalcitizenship behavior practices regarding the following statements: I attend actively in different eventsor picnic arranged by the organization (1.56); I am strongly committed to work in my organization(2.14); I am willing to stand up to protect the reputation of the organization (2.18) and the scalesregarding the rest of the statements of Civic Virtue are given in the table.

97International Journal ofManagement, Business, and EconomicsIJMBE
minimum expectations)I always try to spend extra time for my organization’s benefit 2.2832 1.24153I am punctual and attentive to my work 2.3353 1.35233I come in early or stay late without pays to complete my task. 2.2486 1.23964I am enthusiastic person to complete my office’s extra work andassignments
2.2428 1.41792
I work weekends or other days off to complete my task. 2.5260 1.27392I spend extra time to help my students for preparing a presentation orpaper
1.9133 1.20488
I do not take unnecessary time off work and extra breaks. 2.3064 1.23600I always obey organization’s rules and regulations even when no oneis watching
2.2139 1.31866
C. Sportsmanship (avoids complaining and whining)I sometimes tolerate the irritations of others as an unavoidable part ofmy organizational setting
2.3699 1.29022
I usually do not complain when experiencing the inevitableinconveniences and abuses generated in exercising a professionalactivity
2.1156 1.19516
I usually do not complain unnecessarily against my co-worker aboutthe work difficulties
2.2081 1.27249
I help my colleagues to learn new skills or share job knowledge 2.0694 1.17426I always tolerate minor and temporary personnel inconveniences andimpositions of work without grievances, complaints, appeals,accusations, or protest.
2.2659 1.29347
I avoid consuming a lot of time complaining about trivial matters 2.1965 1.34536I always show a compassionate ear when someone in a personal andwork problem.
2.2312 1.31351
I always say good things about my colleagues in front of others. 1.8613 1.00195D. Courtesy (advance notices, reminders, and communicatingappropriate information)I try to avoid creating problems for colleagues 2.2775 1.18783I try to help my colleagues when they are absent in organization 2.3006 1.39844I do not like to talk any negative that can hurt my colleagues 2.4913 1.26958I discuss with my colleagues before taking actions against others. 2.1387 1.33092I encourage my colleagues when they are down. 2.3642 1.34263I am always ready when any of my colleagues need someone tospeak out their problem.
2.2254 1.30341
I try to adjust the work schedule to other colleagues’ requests fortime off.
2.1329 1.15119
E. Civic Virtue (serving on committees and voluntarily attendingfunctions)I attend training sessions that I am encouraged to, but not required toattend.
2.2717 1.19162
I always tell outsiders good news about the organization 2.1965 1.08724I am willing to stand up to protect the reputation of the organization 2.1850 1.15154
I attend and actively participate in company meetings 2.2486 1.28115I am strongly committed to work in my organization 2.1387 1.39907I attend functions that are not required but help the company’s image 2.3584 1.20508I attend actively in different events or picnic arranged by theorganization
1.5665 .89080
Valid N (listwise)Note: The scale is: 1= strongly disagree, 2= disagree, 3= neutral, 4= agree, 5= strongly agree
The above table shows the descriptive statistics of the respondents’ tendencies to practice inthe organization.
Under altruism the respondents were found to have the highest scale of organizationalcitizenship behavior practices regarding the following statements: I talk to other colleagues beforetaking actions that might affect them (1.89); I give time to help colleagues with work relatedproblems (1.9); I support colleagues who have problems at work (1.93) and the scales regarding therest of the statements of altruism are given in the table.
Under Conscientiousness the respondents were found to have the highest scale oforganizational citizenship behavior practices regarding the following statements: I spend extra timeto help my students for preparing a presentation or paper (1.91); I always obey organization’s rulesand regulations even when no one is watching (2.21); I am enthusiastic person to complete myoffice’s extra work and assignments (2.24) and the scales regarding the rest of the statements ofConscientiousness are given in the table.
Under Sportsmanship the respondents were found to have the highest scale of organizationalcitizenship behavior practices regarding the following statements: I always say good things about mycolleagues in front of others.(1.86); I help my colleagues to learn new skills or share job knowledge(2.06); I usually do not complain when experiencing the inevitable inconveniences and abusesgenerated in exercising a professional activity (2.11) and the scales regarding the rest of thestatements of sportsmanship are given in the table.
Under Courtesy the respondents were found to have the highest scale of organizationalcitizenship behavior practices regarding the following statements: I try to adjust the work schedule toother colleagues’ requests for time off. (2.13); I discuss with my colleagues before taking actionsagainst others. (2.14); I am always ready when any of my colleagues need someone to speak out theirproblem. (2.22) and the scales regarding the rest of the statements of Courtesy are given in the table.
Under Civic Virtue the respondents were found to have the highest scale of organizationalcitizenship behavior practices regarding the following statements: I attend actively in different eventsor picnic arranged by the organization (1.56); I am strongly committed to work in my organization(2.14); I am willing to stand up to protect the reputation of the organization (2.18) and the scalesregarding the rest of the statements of Civic Virtue are given in the table.

98 International Journal ofManagement, Business, and EconomicsIJMBE
5. Conclusion and Recommendation
The objective of study was to investigate the OCB practices among the university teachers inBangladesh. In this study, five dimensions of OCBs have been considered, suggested by the Organ(1988) to investigate OCB practices among the university teachers. The study reveals that all OCBdimensions were not exercised in the academia profession in Bangladesh. Most of the universityteachers are reluctant to carry on their extra works for the advancement of academic learningenvironment. It is obvious that OCB practices in the teaching area of Bangladesh has not beendeveloped now and there is the pressing need to create awareness among university teachers toestablish OCB practice with fairly for ensuring an efficient and effective learning environment. Thefollowing recommendations can be suggested for establishing perfect OCB practices among theuniversity teachers in Bangladesh.
1. The teachers can acquire lucid knowledge on organizational citizenship behavior to assure itsunanimous application for the betterment of learning environment.
2. The university can inspire to the teachers for being more reliable in their daily tasks bypracticing the main essence of altruism, conscientiousness, sportsmanship, curtesy and civicvalue.
3. Both the university and teachers can ensure a good participation in the OCB practice to bringbalance learning in the academic environment.
4. In altruism, teachers can be more co-operative to others being more reliable to work formaintaining conscientiousness. They can avoid complaining and whining as beingsportsmanship. In addition to, they can show the greater curtesy in communication andinformation dissemination to acquire a good civic virtue by doing voluntary functions.
5. Finally, the teachers should be spontaneous and clear hearted individual for practicing altruism,conscientiousness, sportsmanship, curtesy and civic virtue.
References
Belogolovsky, E. & Somech, A. (2010). Teachers’ organizational citizenship behavior: Examiningthe boundary between in-role behavior and extra-role behavior from the perspective of teachers,principals and parents. Teaching and Teacher Education, 26, 914-923.
Berliner, D. C. (1987). Ways of thinking about students and classrooms by more or less experiencedteachers.
Bidwell, C. E. (1965). The school as a formal organization. In J. G. March (Ed.), Handbook oforganizations. Chicago, IL: Rand McNally.
Bogler, R., & Somech, A. (2004). Influence of teacher empowerment on teachers’ organizationalcommitment, professional commitment and organizational citizenship behavior in schools. Teachingand Teacher Education, 20, 277–289.
Bruce Macfarlane, (2007) Defining and Rewarding Academic Citizenship: The implications forUniversity Promotions Policy, Journal of Higher Education Policy and Management, 29 (3), 261-273
Burden, P. R. (1982). Implications of teacher career development: New roles for teachers,administrators and professors. Action in Teacher Education, 4(4), 21–25.
Corcoran, E. (1981). Transition shock: The beginning teacher’s paradox. Journal of TeacherEducation, 32(3), 19–23.
DiPaola, M. F., & Hoy, W. K. (2005). School characteristics that foster organizational citizenshipbehavior. Journal of School Leadership, 15, 308–326.
DiPaola, M. F., & Tschannen-Moran, M. (2001). Organizational citizenship behavior in school andits relationship to school climate. Journal of School Leadership, 11, 424–447.
Farahbod, F., Azadehdel, M., Rezaei, M., Nezhadi, M., (2012), Organizational citizenship behavior:The role of organizational justice and leader–member exchange. Interdisciplinary journal ofcontemporary research in business. 3 (9), pp. 893-903.
George, J. M., & Brief, A. P. (1992). Feeling good doing good: A conceptual analysis of the mood atwork organizational spontaneity relationship. Psychological Bulletin, 112, 310–329.
Hutahayan, B., Astuti, E, S., Raharjo, K., and Hamid., (2013). The effect of Transformationalleadership, organizational culture, reward to organizational citizenship of employee behaviour at PTBarata Indonesia. Presero. Interdisciplinary Journal of Contemporary Research in Business, 5(6).
Izhar Oplatka, (2009),"Organizational citizenship behavior in teaching: The consequences forteachers, pupils, and the school", International Journal of Educational Management, Vol. 23 pp.375-389
Katz, D., & Kahn, R. L. (1966). The social psychology of organizations. New York: Wiley
Korkmaz, T. and Arpaci, E. (2009), “Relationship of organizational citizenship behavior withemotional intelligence”, Procedia Social & Behavioral Science. Vol. 1, pp. 2432-35.
Magdalena S., M., (2014) The effects of organizational citizenship behavior in the academicEnvironment, Procedia - Social and Behavioral Sciences, pp 738 – 742
Morrison, E. W. (1994). Role definitions and organizational citizenship behavior: The importance ofthe employee’s perspective. Academy of Management Journal, 37,1543–1567.
O’Connor, K. E. (2008). ‘‘You choose to care’’: Teachers, emotions and professional identity.Teaching and Teacher Education, 24, 117–126.
Oplatka, I and Stundi, M., (2010). The components and determinants of preschool teacherorganizational citizenship behavior. Emerald insight.25(3), pp223-236.
Oplatka, I. (2006). Going beyond role expectations: Toward an understanding of the determinantsand components of teacher organizational citizenship behavior. Educational AdministrationQuarterly, 42, 385–423.
O'Reilly, C. A., III, & Chatman, J. (1986) Organizational commitment and psychological attachment:The effects of compliance, identification, and internalization of prosocial behavior. Journal ofApplied Psychology, 71, 492-499.

99International Journal ofManagement, Business, and EconomicsIJMBE
5. Conclusion and Recommendation
The objective of study was to investigate the OCB practices among the university teachers inBangladesh. In this study, five dimensions of OCBs have been considered, suggested by the Organ(1988) to investigate OCB practices among the university teachers. The study reveals that all OCBdimensions were not exercised in the academia profession in Bangladesh. Most of the universityteachers are reluctant to carry on their extra works for the advancement of academic learningenvironment. It is obvious that OCB practices in the teaching area of Bangladesh has not beendeveloped now and there is the pressing need to create awareness among university teachers toestablish OCB practice with fairly for ensuring an efficient and effective learning environment. Thefollowing recommendations can be suggested for establishing perfect OCB practices among theuniversity teachers in Bangladesh.
1. The teachers can acquire lucid knowledge on organizational citizenship behavior to assure itsunanimous application for the betterment of learning environment.
2. The university can inspire to the teachers for being more reliable in their daily tasks bypracticing the main essence of altruism, conscientiousness, sportsmanship, curtesy and civicvalue.
3. Both the university and teachers can ensure a good participation in the OCB practice to bringbalance learning in the academic environment.
4. In altruism, teachers can be more co-operative to others being more reliable to work formaintaining conscientiousness. They can avoid complaining and whining as beingsportsmanship. In addition to, they can show the greater curtesy in communication andinformation dissemination to acquire a good civic virtue by doing voluntary functions.
5. Finally, the teachers should be spontaneous and clear hearted individual for practicing altruism,conscientiousness, sportsmanship, curtesy and civic virtue.
References
Belogolovsky, E. & Somech, A. (2010). Teachers’ organizational citizenship behavior: Examiningthe boundary between in-role behavior and extra-role behavior from the perspective of teachers,principals and parents. Teaching and Teacher Education, 26, 914-923.
Berliner, D. C. (1987). Ways of thinking about students and classrooms by more or less experiencedteachers.
Bidwell, C. E. (1965). The school as a formal organization. In J. G. March (Ed.), Handbook oforganizations. Chicago, IL: Rand McNally.
Bogler, R., & Somech, A. (2004). Influence of teacher empowerment on teachers’ organizationalcommitment, professional commitment and organizational citizenship behavior in schools. Teachingand Teacher Education, 20, 277–289.
Bruce Macfarlane, (2007) Defining and Rewarding Academic Citizenship: The implications forUniversity Promotions Policy, Journal of Higher Education Policy and Management, 29 (3), 261-273
Burden, P. R. (1982). Implications of teacher career development: New roles for teachers,administrators and professors. Action in Teacher Education, 4(4), 21–25.
Corcoran, E. (1981). Transition shock: The beginning teacher’s paradox. Journal of TeacherEducation, 32(3), 19–23.
DiPaola, M. F., & Hoy, W. K. (2005). School characteristics that foster organizational citizenshipbehavior. Journal of School Leadership, 15, 308–326.
DiPaola, M. F., & Tschannen-Moran, M. (2001). Organizational citizenship behavior in school andits relationship to school climate. Journal of School Leadership, 11, 424–447.
Farahbod, F., Azadehdel, M., Rezaei, M., Nezhadi, M., (2012), Organizational citizenship behavior:The role of organizational justice and leader–member exchange. Interdisciplinary journal ofcontemporary research in business. 3 (9), pp. 893-903.
George, J. M., & Brief, A. P. (1992). Feeling good doing good: A conceptual analysis of the mood atwork organizational spontaneity relationship. Psychological Bulletin, 112, 310–329.
Hutahayan, B., Astuti, E, S., Raharjo, K., and Hamid., (2013). The effect of Transformationalleadership, organizational culture, reward to organizational citizenship of employee behaviour at PTBarata Indonesia. Presero. Interdisciplinary Journal of Contemporary Research in Business, 5(6).
Izhar Oplatka, (2009),"Organizational citizenship behavior in teaching: The consequences forteachers, pupils, and the school", International Journal of Educational Management, Vol. 23 pp.375-389
Katz, D., & Kahn, R. L. (1966). The social psychology of organizations. New York: Wiley
Korkmaz, T. and Arpaci, E. (2009), “Relationship of organizational citizenship behavior withemotional intelligence”, Procedia Social & Behavioral Science. Vol. 1, pp. 2432-35.
Magdalena S., M., (2014) The effects of organizational citizenship behavior in the academicEnvironment, Procedia - Social and Behavioral Sciences, pp 738 – 742
Morrison, E. W. (1994). Role definitions and organizational citizenship behavior: The importance ofthe employee’s perspective. Academy of Management Journal, 37,1543–1567.
O’Connor, K. E. (2008). ‘‘You choose to care’’: Teachers, emotions and professional identity.Teaching and Teacher Education, 24, 117–126.
Oplatka, I and Stundi, M., (2010). The components and determinants of preschool teacherorganizational citizenship behavior. Emerald insight.25(3), pp223-236.
Oplatka, I. (2006). Going beyond role expectations: Toward an understanding of the determinantsand components of teacher organizational citizenship behavior. Educational AdministrationQuarterly, 42, 385–423.
O'Reilly, C. A., III, & Chatman, J. (1986) Organizational commitment and psychological attachment:The effects of compliance, identification, and internalization of prosocial behavior. Journal ofApplied Psychology, 71, 492-499.

100 International Journal ofManagement, Business, and EconomicsIJMBE
Organ, D. W. (1988). Organizational citizenship behaviors: The good soldier syndrome. Lexington,MA: Lexington Books.
Organ, D. W. (1990). The motivational basis of organizational citizenship behavior. Research inOrganizational Behavior, 12, 43–72.
Organ, D. W., Podsakoff, P. M., & MacKenzie, S. B. (2006). Organizational citizenship behavior: Itsnature, antecedents and consequences. Thousand Oaks, CA: Sage Publication.
Organ, D. W., Podsakoff, P. M., & Podsakoff, N. P. (2011). Expanding the criterion domain toinclude organizational citizenship behavior: Implications for employee selection. APA handbook ofindustrial and organizational psychology Vol. 2, pp. 281–323, Washington, DC: AmericanPsychological Association.
Organ, D. W., Podsakoff, P.M., Scott, B. M., (2005). Organizational citizenship behavior: Its nature,antecedents, consequence. Sage: Thousand Oaks.
Podsakoff, P. M., Ahearne, M. & Mackenzie, S. B. (1997). Organizational citizenship behavior andthe quantity and quality of work group performance. Journal of Applied Psychology, 82, 262-270.
Podsakoff, P.M, MacKenzie, S.B., Paine, J.B., Bachrach, D. G., (2000). Organizational citizenshipbehaviour: a critical review of the theoretical and empirical literature and suggestions for futureresearch. In Journal of Management, vol. 26., no. 3, 513-563.
Raghoebarsing,C (2011).Organizational Citizenship Behavior & work motivation in the granitemining industry in West-Suriname. Asian Social Science. [PDF].5(1).
Ras, N. L (2015) Organizational Citizenship Behaviors of Teachers: Antecedents, TransformationalLeadership, and Contradictions", Advances in Educational Administration, Vol. 13 pp. 61-85
Bogler and Somech, (2005),"Organizational citizenship behavior in school: How does it relate toparticipation in decision making?", Journal of Educational Administration, Vol. 43 pp. 420-438
Sevi,E.,(2010).Effects of organizational citizenship behavior on group performance Results from anagent-based simulation model. Emerald insight. [PDF].5(1). pp 25-37
Smith, C. A., Organ, D. & Near, Y. (1983). Organizational citizenship behavior: Its nature andantecedents. Journal of Applied Psychology, 68, 4, 653-663.
Somech, A., & Drach-Zahavy, A. (2000). Understanding extra-role behavior in schools: Therelationships between job satisfactions, sense of efficacy, and teachers’ extra-role behavior. Teachingand Teacher Education, 16, 649–659.
Somech, A., & Ron, I. (2007). Promoting organizational citizenship behavior in schools: The impactof individual and organizational characteristics. Educational Administration Quarterly, 5, 1–29.
Van Dyne, L., & Lepine, J. A. (1998). Helping and voice extra-role behaviors: Evidence of constructand predictive validity. Academy of Management Journal, 41, 108-119.
Vey, M. A., & Campbell, J. P. (2004). In-role or extra-role organizational citizenship behavior:Which are we measuring? Human Performance, 17, 119–135.
Williams, L. J., & Anderson, S. E. (1991). Job satisfaction and organizational commitment aspredictors of organizational citizenship and in-role behaviors. Journal of Management, 17, 3, 601–617.
Research Questionnaire
Part I: Necessary Information, please (√)
1. Gender: • Male • Female
2. Age: • 25-35 • 35-45 • 45-55
3. Marital Status: • Single • Married
4. Professional Status: • Lecturer • Assistant professor• Associate professor • Professor
5. Job Duration: • less than 1 year • 01 to 3 years • 3 to 10 years• More than 10 years
Part II. Organizational Citizenship Behavior Checklist (OCB-C) 38-Items
1= Strongly Disagree 2= Disagree 3= Neutral 4 = Agree 5= Strongly Agree
A. Altruism (helping new colleagues and freely giving time to others)1. I give time to help colleagues with work related problems. 1 2 3 4 52. I support colleagues who have problems at work. 1 2 3 4 53. I take time out of my day to help my new colleagues. 1 2 3 4 54. I talk to other colleagues before taking actions that might affect them. 1 2 3 4 55. I share my knowledge and expertise with other colleagues 1 2 3 4 56. I highly welcome and assist my new colleagues in my organization. 1 2 3 4 57. I help my new colleagues get oriented to the job. 1 2 3 4 58. I give time to advice, coach, or mentor to my colleagues. 1 2 3 4 5
B. Conscientiousness (efficient use of time and going beyond minimumexpectations)
9. I always try to spend extra time for my organization’s benefit 1 2 3 4 510. I am punctual and attentive to my work 1 2 3 4 511. I come in early or stay late without pays to complete my task. 1 2 3 4 512. I am enthusiastic person to complete my office’s extra work and
assignments1 2 3 4 5
13. I work weekends or other days off to complete my task. 1 2 3 4 514. I spend extra time to help my students for preparing a presentation or
paper1 2 3 4 5
15. I do not take unnecessary time off work and extra breaks. 1 2 3 4 5
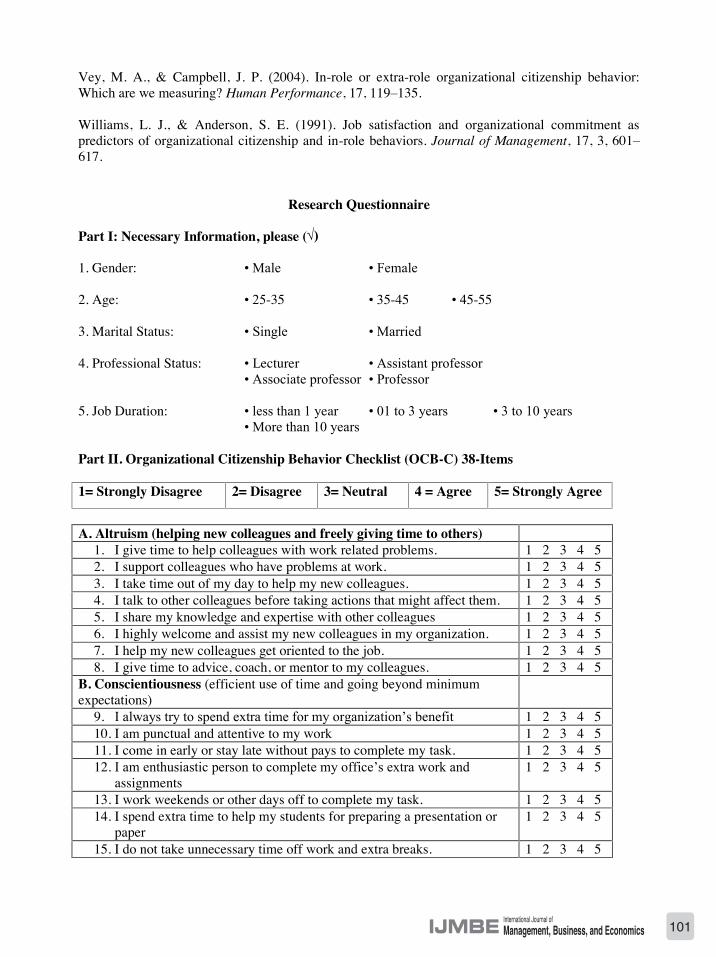
101International Journal ofManagement, Business, and EconomicsIJMBE
Organ, D. W. (1988). Organizational citizenship behaviors: The good soldier syndrome. Lexington,MA: Lexington Books.
Organ, D. W. (1990). The motivational basis of organizational citizenship behavior. Research inOrganizational Behavior, 12, 43–72.
Organ, D. W., Podsakoff, P. M., & MacKenzie, S. B. (2006). Organizational citizenship behavior: Itsnature, antecedents and consequences. Thousand Oaks, CA: Sage Publication.
Organ, D. W., Podsakoff, P. M., & Podsakoff, N. P. (2011). Expanding the criterion domain toinclude organizational citizenship behavior: Implications for employee selection. APA handbook ofindustrial and organizational psychology Vol. 2, pp. 281–323, Washington, DC: AmericanPsychological Association.
Organ, D. W., Podsakoff, P.M., Scott, B. M., (2005). Organizational citizenship behavior: Its nature,antecedents, consequence. Sage: Thousand Oaks.
Podsakoff, P. M., Ahearne, M. & Mackenzie, S. B. (1997). Organizational citizenship behavior andthe quantity and quality of work group performance. Journal of Applied Psychology, 82, 262-270.
Podsakoff, P.M, MacKenzie, S.B., Paine, J.B., Bachrach, D. G., (2000). Organizational citizenshipbehaviour: a critical review of the theoretical and empirical literature and suggestions for futureresearch. In Journal of Management, vol. 26., no. 3, 513-563.
Raghoebarsing,C (2011).Organizational Citizenship Behavior & work motivation in the granitemining industry in West-Suriname. Asian Social Science. [PDF].5(1).
Ras, N. L (2015) Organizational Citizenship Behaviors of Teachers: Antecedents, TransformationalLeadership, and Contradictions", Advances in Educational Administration, Vol. 13 pp. 61-85
Bogler and Somech, (2005),"Organizational citizenship behavior in school: How does it relate toparticipation in decision making?", Journal of Educational Administration, Vol. 43 pp. 420-438
Sevi,E.,(2010).Effects of organizational citizenship behavior on group performance Results from anagent-based simulation model. Emerald insight. [PDF].5(1). pp 25-37
Smith, C. A., Organ, D. & Near, Y. (1983). Organizational citizenship behavior: Its nature andantecedents. Journal of Applied Psychology, 68, 4, 653-663.
Somech, A., & Drach-Zahavy, A. (2000). Understanding extra-role behavior in schools: Therelationships between job satisfactions, sense of efficacy, and teachers’ extra-role behavior. Teachingand Teacher Education, 16, 649–659.
Somech, A., & Ron, I. (2007). Promoting organizational citizenship behavior in schools: The impactof individual and organizational characteristics. Educational Administration Quarterly, 5, 1–29.
Van Dyne, L., & Lepine, J. A. (1998). Helping and voice extra-role behaviors: Evidence of constructand predictive validity. Academy of Management Journal, 41, 108-119.
Vey, M. A., & Campbell, J. P. (2004). In-role or extra-role organizational citizenship behavior:Which are we measuring? Human Performance, 17, 119–135.
Williams, L. J., & Anderson, S. E. (1991). Job satisfaction and organizational commitment aspredictors of organizational citizenship and in-role behaviors. Journal of Management, 17, 3, 601–617.
Research Questionnaire
Part I: Necessary Information, please (√)
1. Gender: • Male • Female
2. Age: • 25-35 • 35-45 • 45-55
3. Marital Status: • Single • Married
4. Professional Status: • Lecturer • Assistant professor• Associate professor • Professor
5. Job Duration: • less than 1 year • 01 to 3 years • 3 to 10 years• More than 10 years
Part II. Organizational Citizenship Behavior Checklist (OCB-C) 38-Items
1= Strongly Disagree 2= Disagree 3= Neutral 4 = Agree 5= Strongly Agree
A. Altruism (helping new colleagues and freely giving time to others)1. I give time to help colleagues with work related problems. 1 2 3 4 52. I support colleagues who have problems at work. 1 2 3 4 53. I take time out of my day to help my new colleagues. 1 2 3 4 54. I talk to other colleagues before taking actions that might affect them. 1 2 3 4 55. I share my knowledge and expertise with other colleagues 1 2 3 4 56. I highly welcome and assist my new colleagues in my organization. 1 2 3 4 57. I help my new colleagues get oriented to the job. 1 2 3 4 58. I give time to advice, coach, or mentor to my colleagues. 1 2 3 4 5
B. Conscientiousness (efficient use of time and going beyond minimumexpectations)
9. I always try to spend extra time for my organization’s benefit 1 2 3 4 510. I am punctual and attentive to my work 1 2 3 4 511. I come in early or stay late without pays to complete my task. 1 2 3 4 512. I am enthusiastic person to complete my office’s extra work and
assignments1 2 3 4 5
13. I work weekends or other days off to complete my task. 1 2 3 4 514. I spend extra time to help my students for preparing a presentation or
paper1 2 3 4 5
15. I do not take unnecessary time off work and extra breaks. 1 2 3 4 5

102 International Journal ofManagement, Business, and EconomicsIJMBE
16. I always obey organization’s rules and regulations even when no one iswatching
1 2 3 4 5
C. Sportsmanship (avoids complaining and whining)17. I sometimes tolerate the irritations of others as an unavoidable part of
my organizational setting1 2 3 4 5
18. I usually do not complain when experiencing the inevitableinconveniences and abuses generated in exercising a professionalactivity
1 2 3 4 5
19. I usually do not complain unnecessarily against my co-worker aboutthe work difficulties
1 2 3 4 5
20. I help my colleagues to learn new skills or share job knowledge 1 2 3 4 521. I always tolerate minor and temporary personnel inconveniences and
impositions of work without grievances, complaints, appeals,accusations, or protest.
1 2 3 4 5
22. I avoid consuming a lot of time complaining about trivial matters 1 2 3 4 523. I always show a compassionate ear when someone in a personal and
work problem.1 2 3 4 5
24. I always say good things about my colleagues in front of others. 1 2 3 4 5D. Courtesy (advance notices, reminders, and communicatingappropriate information)
25. I try to avoid creating problems for colleagues 1 2 3 4 526. I try to help my colleagues when they are absent in organization 1 2 3 4 527. I do not like to talk any negative that can hurt my colleagues 1 2 3 4 528. I discuss with my colleagues before taking actions against others. 1 2 3 4 529. I encourage my colleagues when they are down. 1 2 3 4 530. I am always ready when any of my colleagues need someone to speak
out their problem.1 2 3 4 5
31. I try to adjust the work schedule to other colleagues’ requests for timeoff.
1 2 3 4 5
E. Civic Virtue (serving on committees and voluntarily attendingfunctions)
32. I attend training sessions that I am encouraged to, but not required toattend.
1 2 3 4 5
33. I always tell outsiders good news about the organization 1 2 3 4 534. I am willing to stand up to protect the reputation of the organization 1 2 3 4 535. I attend and actively participate in company meetings 1 2 3 4 536. I am strongly committed to work in my organization 1 2 3 4 537. I attend functions that are not required but help the company’s image 1 2 3 4 538. I attend actively in different events or picnic arranged by the
organization1 2 3 4 5
103International Journal ofManagement, Business, and EconomicsIJMBE
16. I always obey organization’s rules and regulations even when no one iswatching
1 2 3 4 5
C. Sportsmanship (avoids complaining and whining)17. I sometimes tolerate the irritations of others as an unavoidable part of
my organizational setting1 2 3 4 5
18. I usually do not complain when experiencing the inevitableinconveniences and abuses generated in exercising a professionalactivity
1 2 3 4 5
19. I usually do not complain unnecessarily against my co-worker aboutthe work difficulties
1 2 3 4 5
20. I help my colleagues to learn new skills or share job knowledge 1 2 3 4 521. I always tolerate minor and temporary personnel inconveniences and
impositions of work without grievances, complaints, appeals,accusations, or protest.
1 2 3 4 5
22. I avoid consuming a lot of time complaining about trivial matters 1 2 3 4 523. I always show a compassionate ear when someone in a personal and
work problem.1 2 3 4 5
24. I always say good things about my colleagues in front of others. 1 2 3 4 5D. Courtesy (advance notices, reminders, and communicatingappropriate information)
25. I try to avoid creating problems for colleagues 1 2 3 4 526. I try to help my colleagues when they are absent in organization 1 2 3 4 527. I do not like to talk any negative that can hurt my colleagues 1 2 3 4 528. I discuss with my colleagues before taking actions against others. 1 2 3 4 529. I encourage my colleagues when they are down. 1 2 3 4 530. I am always ready when any of my colleagues need someone to speak
out their problem.1 2 3 4 5
31. I try to adjust the work schedule to other colleagues’ requests for timeoff.
1 2 3 4 5
E. Civic Virtue (serving on committees and voluntarily attendingfunctions)
32. I attend training sessions that I am encouraged to, but not required toattend.
1 2 3 4 5
33. I always tell outsiders good news about the organization 1 2 3 4 534. I am willing to stand up to protect the reputation of the organization 1 2 3 4 535. I attend and actively participate in company meetings 1 2 3 4 536. I am strongly committed to work in my organization 1 2 3 4 537. I attend functions that are not required but help the company’s image 1 2 3 4 538. I attend actively in different events or picnic arranged by the
organization1 2 3 4 5
International Journal ofManagement, Business, and EconomicsIJMBE
Management of Historic Site for Cultural Heritage Tourism:A Case Study of Wat Rajabopit Sathitmahasimaram Rajaworavihara, Bangkok
by
Panot AsawachaiCollege of Tourism and Hospitality,
Sripatum University, Bangkok, ThailandTel: +66877739963, E-mail: [email protected]

Management of Historic Site for Cultural Heritage Tourism:A Case Study of Wat Rajabopit Sathitmahasimaram Rajaworavihara, Bangkok
by
Panot AsawachaiCollege of Tourism and Hospitality,
Sripatum University, Bangkok, ThailandTel: +66877739963, E-mail: [email protected]
Abstract
This research aimed to review (1) the heritage values and cultural significance of WatRajabopit Sathitmahasimaram Rajaworavihara, and (2) the potential for cultural heritage tourism.Critical to the aims was the assumption of acknowledging the importance of promoting betterunderstanding for tourists and community of the place, the associated role of conservationmanagement plans, cooperation between the stakeholders, and appropriate interpretation andpresentation of heritage resources. Wat Rajabopit Sathitmahasimaram Rajaworavihara is a valuablehistoric site that still maintains its cultural significance which is one important key factor to indicatewhy such place is worth conserving. The temple is located on the Rattanakosin island in Bangkok. Itwas built by King Chalalongkorn (King Rama V) in 1869 following the royal tradition that eachmonarch would have a temple marking his reign. This temple reflects the historical evidence ofprosperity in architecture influenced by the west while Thai identity was not distorted. Itssignificances were identified and analyed to understand its congenital values to the tourists and localresidents of the place in terms of aesthetic, historic, social and scientific perspectives. These valuessupport the notion of Wat Rajabopit Sathitmahasimaram Rajaworavihara sustaining its identity.However, there are no management plans to promote cultural heritage tourism and conserve culturalheritage significance in Wat Rajabopit Sathitmahasimaram Rajaworavihara today. There is, therefore,a need to provide better understanding of the temple’s significance to tourists through the inceptionof management plans which will provide for tourism, conserve the significance of cultural heritagevalues, and also enhance community involvement as well as providing economic benefit. Proposedmanagement plan for cultural heritage tourism at Wat Rajabopit and its communities is also proposedfor creating sustainable tourism. Finally, Wat Rajabopit Sathitmahasimaram Rajaworavihara isencounting a number of problems threatening its significance including garbage, noise and airpollution, insufficient knowledge of conservation, and erecting tall buildings that block the view ofhistorical temples. Therefore, the government, all members in the community and stakeholders aremajor participants for futurte actions to address those problems. In order to get achieve a strongholdof the community in the sustainable way. Wat Rajabopit Sathitmahasimaram Rajaworavihara has avery high potential for Cultural Heritage Tourism as well as Historical Tourism, because of itscultural heritage value.
Keywords: Cultural Heritage Tourism, Local Heritage, Management of Historic Site, ManagementPlan

105International Journal ofManagement, Business, and EconomicsIJMBE
Management of Historic Site for Cultural Heritage Tourism:A Case Study of Wat Rajabopit Sathitmahasimaram Rajaworavihara, Bangkok
by
Panot AsawachaiCollege of Tourism and Hospitality,
Sripatum University, Bangkok, ThailandTel: +66877739963, E-mail: [email protected]
Abstract
This research aimed to review (1) the heritage values and cultural significance of WatRajabopit Sathitmahasimaram Rajaworavihara, and (2) the potential for cultural heritage tourism.Critical to the aims was the assumption of acknowledging the importance of promoting betterunderstanding for tourists and community of the place, the associated role of conservationmanagement plans, cooperation between the stakeholders, and appropriate interpretation andpresentation of heritage resources. Wat Rajabopit Sathitmahasimaram Rajaworavihara is a valuablehistoric site that still maintains its cultural significance which is one important key factor to indicatewhy such place is worth conserving. The temple is located on the Rattanakosin island in Bangkok. Itwas built by King Chalalongkorn (King Rama V) in 1869 following the royal tradition that eachmonarch would have a temple marking his reign. This temple reflects the historical evidence ofprosperity in architecture influenced by the west while Thai identity was not distorted. Itssignificances were identified and analyed to understand its congenital values to the tourists and localresidents of the place in terms of aesthetic, historic, social and scientific perspectives. These valuessupport the notion of Wat Rajabopit Sathitmahasimaram Rajaworavihara sustaining its identity.However, there are no management plans to promote cultural heritage tourism and conserve culturalheritage significance in Wat Rajabopit Sathitmahasimaram Rajaworavihara today. There is, therefore,a need to provide better understanding of the temple’s significance to tourists through the inceptionof management plans which will provide for tourism, conserve the significance of cultural heritagevalues, and also enhance community involvement as well as providing economic benefit. Proposedmanagement plan for cultural heritage tourism at Wat Rajabopit and its communities is also proposedfor creating sustainable tourism. Finally, Wat Rajabopit Sathitmahasimaram Rajaworavihara isencounting a number of problems threatening its significance including garbage, noise and airpollution, insufficient knowledge of conservation, and erecting tall buildings that block the view ofhistorical temples. Therefore, the government, all members in the community and stakeholders aremajor participants for futurte actions to address those problems. In order to get achieve a strongholdof the community in the sustainable way. Wat Rajabopit Sathitmahasimaram Rajaworavihara has avery high potential for Cultural Heritage Tourism as well as Historical Tourism, because of itscultural heritage value.
Keywords: Cultural Heritage Tourism, Local Heritage, Management of Historic Site, ManagementPlan

106 International Journal ofManagement, Business, and EconomicsIJMBE
1. Introduction
Bangkok, Thailand’s capital, is a famous destination of cultural heritage tourism. Manycultural and historical resources in Bangkok such as religious buildings, museums and palaces aregrabbed the interest from international visitors around the world. Wat Phrasrirattana Sassadaram, orthe temple of the Emerald Buddha, situated within the Grand Palace, is the most famous andimportant attraction site in Bangkok. This temple could be considered to be primary or “Icon”attraction that will bring tourists to Bangkok. Moreover, primary attraction sites can be also denotedas major sites of the first rank architecturally and their importance in cultural significance. Secondaryattraction sites are appealed to tourists once they are already at a destination and are examined as theoptions or choices for their time. Secondary attraction sites also can be of considerable interest,definitely worth seeing if in town and worth half a day’s travelling if outside the town. Wat Rajabopitis one of Buddhist temples in Bangkok which are considered as a secondary attraction site.
Wat Rajabopit Sathitmahasimaram Rajaworavihara (Wat Rajabopit) is located between FuangNakorn Road and Usadang Road. It is also near the Ministry of Interior. This temple was built byKing Chulalongkorn in 1868 (B.E.2412) – the second year of his reign – when he was 17 years old.He wished to follow the ancient custom of his predecessors. This means it has been an ancientcustom for a king to have a temple built during his reign. He also intended to erect new monasteriesin compensation for the loss of the old ones which means he intended to bring prototype of temple’splan from Ayutthaya period back to his reign. King Rama V founded this monastery of the ancientThai and European styles to be distinguished from others and dedicated it to the monks of theDhammayut Order, the strict new sect, founded by his father, King Mongkut (King Rama IV). Thus,he gave the temple’s name as “Wat Rajabopit” which means the temple is constructed by the king.
Wat Rajabopit does not have a very large compound. The temple is divided into 3 sectionswhich are the ordination hall (Ubosot), chapel (Phra Viharn) and main stupa (Phra Chedi) in thenorth, the monk’s living quarters in the south, and royal cemetery (the garden) in the west close toUsadang Road. The layout makes the principal stupa the focal point, with the ordination hall in thenorth, the chapel in the south, and two entrance ways in the east and west. All four buildings areconnected by a circular gallery that encloses the terrace round the principal stupa. The whole groupstands on the same platform raised to about one meter in height and enclosed within a low boundarywall. At the edges of the platform are found eight small pavilions.
Source: Panot Asawachai (2017)
Figure 1 Layout of Wat Rajabopit
Figure 1 illustrates the layout of Wat Rajabopit which the principle stupa is the focal point,the ordination hall in the north, the chapel in the south, and two entrance ways in the east and west.All four buildings are connected by a circular gallery that encloses the terrace round the principalstupa.
However, tourism at Wat Rajabopit is only operated by the monks who live at this temple. Ithas not been seriously boosted as cultural heritage tourist attraction. Nowadays, there is no anyprocess to manage this historic site in order to support tourists as well as conserve the authenticity ofthe place and the community. According to there is no any mangement plan at this temple, it iscaused the negative impacts such as environmental problems and insufficient knowledge ofconservation of historic site. Therefore, management of historic site for cultural heritage tourism isessential for promoting Wat Rajabopit sustainbly.
Objectives
1. To review and analyze cultural significance and heritage values of Wat Rajabopit as it isone of Thailand’s heritage and cultural sources.
2. To study the process of management for cultural heritage tourism at Wat Rajabopit.3. To outline conservation and management plans for collaboration between the stakeholders.
Scope of the study
1. Area of study: This research focused on Wat Rajabopit Sathitmahasimaram Rajaworaviharaand its community.
Wat Rajabopit Sathitmahasimaram Rajaworavihara is located in 90 Fuang Nakorn Road,Wang Burapha Phirom Sub District, Phra Nakorn District in Bangkok. It is suited between FuangNakorn Road and Usadang Road ( Khlong Ku Muang Derm Road ), near the Ministry of Interior.This temple is surrounded by two major communities which are Ti Thong community and Trok Morcommunity. Its community landscape is located at the east of Ku Muang Derm canal, with the siteboundaries connecting close to Chao Phraya River.
2. Focus of the research: investigating and outlining cultural heritage management towardcultural heritage tourism in Wat Rajabopit and its community.
3. Target groups: spilted into three groups of stakeholders which are consisted of monks wholive in Wat Rajabopit and local residents, private and government agencies, and tourists.
4. Examining and discovering: addressing both tangible and intangble heritage values.Tangible includes heritage buildings and infrastructure. Intangible includes culture, beliefs, way oflife, and other related aspects.
2. Research Methodology
This research was focused on qualitative method. Qualitative method aims to gather an in-depth understanding of issues studied. In this case, research instruments of this research were carriedout as follows:
(1) Literature research(2) Field observation(3) In-depth interview(4) Interview, focus group meeting, participatory research

107International Journal ofManagement, Business, and EconomicsIJMBE
1. Introduction
Bangkok, Thailand’s capital, is a famous destination of cultural heritage tourism. Manycultural and historical resources in Bangkok such as religious buildings, museums and palaces aregrabbed the interest from international visitors around the world. Wat Phrasrirattana Sassadaram, orthe temple of the Emerald Buddha, situated within the Grand Palace, is the most famous andimportant attraction site in Bangkok. This temple could be considered to be primary or “Icon”attraction that will bring tourists to Bangkok. Moreover, primary attraction sites can be also denotedas major sites of the first rank architecturally and their importance in cultural significance. Secondaryattraction sites are appealed to tourists once they are already at a destination and are examined as theoptions or choices for their time. Secondary attraction sites also can be of considerable interest,definitely worth seeing if in town and worth half a day’s travelling if outside the town. Wat Rajabopitis one of Buddhist temples in Bangkok which are considered as a secondary attraction site.
Wat Rajabopit Sathitmahasimaram Rajaworavihara (Wat Rajabopit) is located between FuangNakorn Road and Usadang Road. It is also near the Ministry of Interior. This temple was built byKing Chulalongkorn in 1868 (B.E.2412) – the second year of his reign – when he was 17 years old.He wished to follow the ancient custom of his predecessors. This means it has been an ancientcustom for a king to have a temple built during his reign. He also intended to erect new monasteriesin compensation for the loss of the old ones which means he intended to bring prototype of temple’splan from Ayutthaya period back to his reign. King Rama V founded this monastery of the ancientThai and European styles to be distinguished from others and dedicated it to the monks of theDhammayut Order, the strict new sect, founded by his father, King Mongkut (King Rama IV). Thus,he gave the temple’s name as “Wat Rajabopit” which means the temple is constructed by the king.
Wat Rajabopit does not have a very large compound. The temple is divided into 3 sectionswhich are the ordination hall (Ubosot), chapel (Phra Viharn) and main stupa (Phra Chedi) in thenorth, the monk’s living quarters in the south, and royal cemetery (the garden) in the west close toUsadang Road. The layout makes the principal stupa the focal point, with the ordination hall in thenorth, the chapel in the south, and two entrance ways in the east and west. All four buildings areconnected by a circular gallery that encloses the terrace round the principal stupa. The whole groupstands on the same platform raised to about one meter in height and enclosed within a low boundarywall. At the edges of the platform are found eight small pavilions.
Source: Panot Asawachai (2017)
Figure 1 Layout of Wat Rajabopit
Figure 1 illustrates the layout of Wat Rajabopit which the principle stupa is the focal point,the ordination hall in the north, the chapel in the south, and two entrance ways in the east and west.All four buildings are connected by a circular gallery that encloses the terrace round the principalstupa.
However, tourism at Wat Rajabopit is only operated by the monks who live at this temple. Ithas not been seriously boosted as cultural heritage tourist attraction. Nowadays, there is no anyprocess to manage this historic site in order to support tourists as well as conserve the authenticity ofthe place and the community. According to there is no any mangement plan at this temple, it iscaused the negative impacts such as environmental problems and insufficient knowledge ofconservation of historic site. Therefore, management of historic site for cultural heritage tourism isessential for promoting Wat Rajabopit sustainbly.
Objectives
1. To review and analyze cultural significance and heritage values of Wat Rajabopit as it isone of Thailand’s heritage and cultural sources.
2. To study the process of management for cultural heritage tourism at Wat Rajabopit.3. To outline conservation and management plans for collaboration between the stakeholders.
Scope of the study
1. Area of study: This research focused on Wat Rajabopit Sathitmahasimaram Rajaworaviharaand its community.
Wat Rajabopit Sathitmahasimaram Rajaworavihara is located in 90 Fuang Nakorn Road,Wang Burapha Phirom Sub District, Phra Nakorn District in Bangkok. It is suited between FuangNakorn Road and Usadang Road ( Khlong Ku Muang Derm Road ), near the Ministry of Interior.This temple is surrounded by two major communities which are Ti Thong community and Trok Morcommunity. Its community landscape is located at the east of Ku Muang Derm canal, with the siteboundaries connecting close to Chao Phraya River.
2. Focus of the research: investigating and outlining cultural heritage management towardcultural heritage tourism in Wat Rajabopit and its community.
3. Target groups: spilted into three groups of stakeholders which are consisted of monks wholive in Wat Rajabopit and local residents, private and government agencies, and tourists.
4. Examining and discovering: addressing both tangible and intangble heritage values.Tangible includes heritage buildings and infrastructure. Intangible includes culture, beliefs, way oflife, and other related aspects.
2. Research Methodology
This research was focused on qualitative method. Qualitative method aims to gather an in-depth understanding of issues studied. In this case, research instruments of this research were carriedout as follows:
(1) Literature research(2) Field observation(3) In-depth interview(4) Interview, focus group meeting, participatory research

108 International Journal ofManagement, Business, and EconomicsIJMBE
Literature research: The researcher had conducted a through literature search from books,academic journal, research reports, government data, daily newspapers and the Internet. The researchwas focused on topics relevant to the study. This literature research helps for basic understandingand background of temples’ contexts from the past until today. Furthermore, information or data ofwhat this temple was involved into the government policy of promoting cultural heritage tourismwere also observed.
Field observation: The research had made an inventory of cultural heritage significance thathad relevance to cultural heritage tourism at this temple and its communities by observation andphotographic recordings. Field data sheets had prepared to facilitate field data collection. Relevanttemple’s antique collections, if available, were examined to determine the changes in culturalheritage significance and values of this temple and the temple’s communities over time.
In-depth interview: This was undertaken with the abbot, monks, leaders of localcommunities, government organizations’ officers, academics, private-sector operations, visitors andpeople working in architecture. All interviews were recorded by using a portable tape recorder (ifpermitted by the respondents) to avoid any disruptions caused by note taking.
Interview / focus group meeting / participatory research: The research approached localresidents in the communities that are nearby the temple to solicit their personal opinion about thecultural heritage significance and values of the temple. The researcher also participated in religiousand cultural ceremonies and festivals that reflect the communities’ cultures.
3. Analysis of Data
As all interviews were undertaken in Thai language, the collected data was transcribed andtranslated into English. To reduce bias and misunderstandings arising from translations, theresearcher refered translation-related concerns to some English native speakers in Thailand. Analysisthe results were comprehend into these topics:
- Analysis of value and cultural significance of the temple which is including aesthetic,historic, social and scientific values.
-Determining the positive and negative impacts of cultural heritage tourism development oncultural heritage significances and values of the temple.
- Consideration and development of policies for the management recommendations ondeveloping and managing the cultural heritage significances and values of the temple and itscommunities.
Cultural significance analysis
According to Australia ICOMOS (1999, p.12), Cultural significance is a concept which helpsin estimating the value of places. The places that are likely to be of significance are those which helpan understanding of the past or enrich the present, and which will be of value to future generations.The adjectives used in definitions of cultural significance are aesthetic, historic, scientific and socialvalues. For this temple, cultural significance is found in each value as follows:
Value Wat RajabopitAestheticValue
1.) The outer walls of the ordination hall, principle stupa and chapel are coveredwith beautiful glazed coloured tiles. These glazed coloured tiles are consisted of5 colours which are called in Thai as “Benjarong”. The design of these glazedcoloured tiles was designed by Thais and they were sent to China for producing.Moreover, the designs of these tiles are floral and Tepanoms (angles in theposture of paying respect) designs.2.) Doors and windows of the ordination hall are decorated on the outside withmother-of-pearl inlays in symmetrical designs showing 5 royal insignias such asKnight of Ancient and Auspicious Order of the Nine Gems and Knight of TheMost Illustrious Order of The Royal House of Chakri. The workmanship isexquisite.3.) The interior of the ordination hall is decorated in Western style (Gothicarchitecture). The decoration of the ceiling and walls can be seen as in the palaceat Versailles in France. The walls are made of stucco with designs showing KingChulalongkorn’s initial, and the symbol of the supreme power.
Source: Panot Asawachai, 2017
Figure 2 Beautiful Glazed Coloured Tiles
Figure 2 illustrates the beautiful glazed coloured tiles are designed in pattern of floral andTepanoms designs.

109International Journal ofManagement, Business, and EconomicsIJMBE
Literature research: The researcher had conducted a through literature search from books,academic journal, research reports, government data, daily newspapers and the Internet. The researchwas focused on topics relevant to the study. This literature research helps for basic understandingand background of temples’ contexts from the past until today. Furthermore, information or data ofwhat this temple was involved into the government policy of promoting cultural heritage tourismwere also observed.
Field observation: The research had made an inventory of cultural heritage significance thathad relevance to cultural heritage tourism at this temple and its communities by observation andphotographic recordings. Field data sheets had prepared to facilitate field data collection. Relevanttemple’s antique collections, if available, were examined to determine the changes in culturalheritage significance and values of this temple and the temple’s communities over time.
In-depth interview: This was undertaken with the abbot, monks, leaders of localcommunities, government organizations’ officers, academics, private-sector operations, visitors andpeople working in architecture. All interviews were recorded by using a portable tape recorder (ifpermitted by the respondents) to avoid any disruptions caused by note taking.
Interview / focus group meeting / participatory research: The research approached localresidents in the communities that are nearby the temple to solicit their personal opinion about thecultural heritage significance and values of the temple. The researcher also participated in religiousand cultural ceremonies and festivals that reflect the communities’ cultures.
3. Analysis of Data
As all interviews were undertaken in Thai language, the collected data was transcribed andtranslated into English. To reduce bias and misunderstandings arising from translations, theresearcher refered translation-related concerns to some English native speakers in Thailand. Analysisthe results were comprehend into these topics:
- Analysis of value and cultural significance of the temple which is including aesthetic,historic, social and scientific values.
-Determining the positive and negative impacts of cultural heritage tourism development oncultural heritage significances and values of the temple.
- Consideration and development of policies for the management recommendations ondeveloping and managing the cultural heritage significances and values of the temple and itscommunities.
Cultural significance analysis
According to Australia ICOMOS (1999, p.12), Cultural significance is a concept which helpsin estimating the value of places. The places that are likely to be of significance are those which helpan understanding of the past or enrich the present, and which will be of value to future generations.The adjectives used in definitions of cultural significance are aesthetic, historic, scientific and socialvalues. For this temple, cultural significance is found in each value as follows:
Value Wat RajabopitAestheticValue
1.) The outer walls of the ordination hall, principle stupa and chapel are coveredwith beautiful glazed coloured tiles. These glazed coloured tiles are consisted of5 colours which are called in Thai as “Benjarong”. The design of these glazedcoloured tiles was designed by Thais and they were sent to China for producing.Moreover, the designs of these tiles are floral and Tepanoms (angles in theposture of paying respect) designs.2.) Doors and windows of the ordination hall are decorated on the outside withmother-of-pearl inlays in symmetrical designs showing 5 royal insignias such asKnight of Ancient and Auspicious Order of the Nine Gems and Knight of TheMost Illustrious Order of The Royal House of Chakri. The workmanship isexquisite.3.) The interior of the ordination hall is decorated in Western style (Gothicarchitecture). The decoration of the ceiling and walls can be seen as in the palaceat Versailles in France. The walls are made of stucco with designs showing KingChulalongkorn’s initial, and the symbol of the supreme power.
Source: Panot Asawachai, 2017
Figure 2 Beautiful Glazed Coloured Tiles
Figure 2 illustrates the beautiful glazed coloured tiles are designed in pattern of floral andTepanoms designs.

110 International Journal ofManagement, Business, and EconomicsIJMBE
Source: Panot Asawachai (2017)
Figure 3 Doors and Windows of the Ordination Hall
Figure 3 illustrates doors and windows of the ordination hall are decorated on the outsidewith mother-of-pearl inlays in symmetrical designs showing 5 royal insignias.
Source: Panot Asawachai (2017)
Figure 4 Interior of the Ordination Hall
Figure 4 illustrates the interior of the ordination hall is decorated in Western style (Gothicarchitecture).

111International Journal ofManagement, Business, and EconomicsIJMBE
Source: Panot Asawachai (2017)
Figure 3 Doors and Windows of the Ordination Hall
Figure 3 illustrates doors and windows of the ordination hall are decorated on the outsidewith mother-of-pearl inlays in symmetrical designs showing 5 royal insignias.
Source: Panot Asawachai (2017)
Figure 4 Interior of the Ordination Hall
Figure 4 illustrates the interior of the ordination hall is decorated in Western style (Gothicarchitecture).
Value Wat RajabopitHistoricValue
1.) Found west of the temple, this has a great number of memorials in variousstyles such as Thai and Cambodian stupas and some are in Gothic style. Thesememorials are repositories for the ashes from the cremations of the royal familymembers who are of direct descent from King Chulalongkorn. These royal familymembers are important for Thai history such as one memorial contains the ash ofPrince Mahidol of Songkla who is the father of His Majesty King BhumibolAdulyadej (the present king). This is the first time in Thai history that there is aroyal cemetery. This royal cemetery is influenced by Western culture but, it isadapted to Thai culture.2.) King Chulalongkorn continued the modernization policies, which started in thereign of King Mongkut and it benefited the country as whole such as reformingthe administration, installing foreign advisers in government departments andimproving the army. This is an important historical event in Thai history. Thereare some components at this temple that are related with these modernizationpolicies such as on the gate shutters of the temple are carved soldiers of the Corpsof Royal Pages attired in European style uniforms.3.) As this temple is responsible for bringing together Western and Thai arts.Inspite of the fact that the interior decoration of the main ordination hall followsGothic architecture, this surprisingly matches very well with the exterior, thedesign of which bases on an ancient Thai architecture. So, that is made this templeunique. This temple is the first temple of a first-class royal temple which can beshown the mixture between Thai and European architecture. As the conclusion, Itis an important event in the history of Thai architecture.
Source: Panot Asawachai (2017)
Figure 5 Royal Cemetery of Wat Rajabopit
Figure 5 illustrates the Royal Cemetery of Wat Rajabopit is in Western influence.
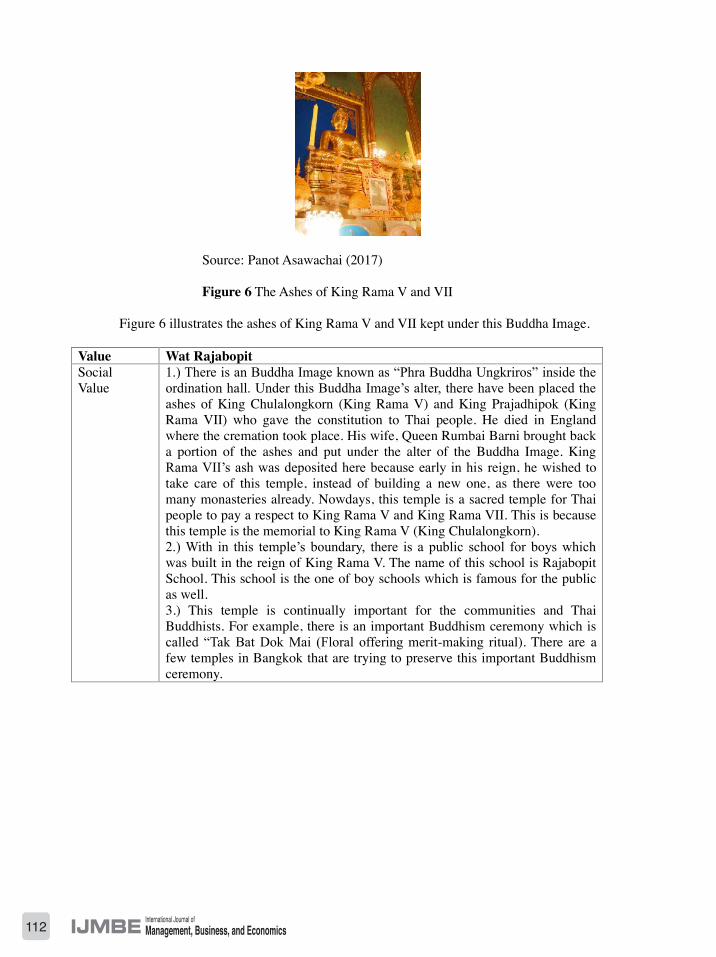
112 International Journal ofManagement, Business, and EconomicsIJMBE
Source: Panot Asawachai (2017)
Figure 6 The Ashes of King Rama V and VII
Figure 6 illustrates the ashes of King Rama V and VII kept under this Buddha Image.
Value Wat RajabopitSocialValue
1.) There is an Buddha Image known as “Phra Buddha Ungkriros” inside theordination hall. Under this Buddha Image’s alter, there have been placed theashes of King Chulalongkorn (King Rama V) and King Prajadhipok (KingRama VII) who gave the constitution to Thai people. He died in Englandwhere the cremation took place. His wife, Queen Rumbai Barni brought backa portion of the ashes and put under the alter of the Buddha Image. KingRama VII’s ash was deposited here because early in his reign, he wished totake care of this temple, instead of building a new one, as there were toomany monasteries already. Nowdays, this temple is a sacred temple for Thaipeople to pay a respect to King Rama V and King Rama VII. This is becausethis temple is the memorial to King Rama V (King Chulalongkorn).2.) With in this temple’s boundary, there is a public school for boys whichwas built in the reign of King Rama V. The name of this school is RajabopitSchool. This school is the one of boy schools which is famous for the publicas well.3.) This temple is continually important for the communities and ThaiBuddhists. For example, there is an important Buddhism ceremony which iscalled “Tak Bat Dok Mai (Floral offering merit-making ritual). There are afew temples in Bangkok that are trying to preserve this important Buddhismceremony.
Source: Panot Asawachai (2017)
Figure 7 Archaeological Evidence of Thai Architectural History
Figure 7 illustrates the temple can be shown the archaeological evidence of Thai architecturalhistory that is blended between Thai and Western architectures.
Value Wat RajabopitScientific 1.) King Rama V had this temple built to mark his reign. It took over
twenty year to complete the temple. This temple is a mixture of Thaiand Western styles. It shows an awakening interest in new ideas ofWestern architecture and a desire to experiment with it. As theconclusion, this temple can be shown the archaeological evidence ofThai architectural history that is blended between Thai and westernarchitectures.
Current Management of Wat Rajabopit Sathitmahasimaram Rajaworavihara
At the present, Wat Rajabopit Sathitmahasimaram Rajaworavihara does not formally enage intourism. Before taking a look at the current management of the temple, there must take a look at thepotential benefit of promoting Wat Rajabopit as a tourist destination for promoting the benefits oftourism to the temple and its communities.
The first potential benefit of promoting Wat Rajabopit as a tourist destination is to create theawareness of public value’s importance and to conserve it. “Public value” or “Community heritagevalue” is terms sometimes used to refer to those elements of significance of heritage places that aremost generally valued by communities and society as a whole. The public value is consisted ofhistoric, aesthetic and social attributes. These attributes can create a sense of place which isimportant to national or local self-identity. Thai people from the past to present generations remindWat Rajabopit as a memorial place of King Rama V and King Rama VII. Many visitors including thecommunities around this temple appreciate the temple’s aesthetic value such as mother-of-pearlinlaid designs on the doors and window panels, and the five-coloured ceramic tiles decorating thetemple’s exterior decoration. The temple also has major historical value due to its role in the historyof Thai architecture when it’s blending between the local and foreign architectures. All theseattributes contribute to the reasons why the communities and Thai people value this temple as a

113International Journal ofManagement, Business, and EconomicsIJMBE
Source: Panot Asawachai (2017)
Figure 6 The Ashes of King Rama V and VII
Figure 6 illustrates the ashes of King Rama V and VII kept under this Buddha Image.
Value Wat RajabopitSocialValue
1.) There is an Buddha Image known as “Phra Buddha Ungkriros” inside theordination hall. Under this Buddha Image’s alter, there have been placed theashes of King Chulalongkorn (King Rama V) and King Prajadhipok (KingRama VII) who gave the constitution to Thai people. He died in Englandwhere the cremation took place. His wife, Queen Rumbai Barni brought backa portion of the ashes and put under the alter of the Buddha Image. KingRama VII’s ash was deposited here because early in his reign, he wished totake care of this temple, instead of building a new one, as there were toomany monasteries already. Nowdays, this temple is a sacred temple for Thaipeople to pay a respect to King Rama V and King Rama VII. This is becausethis temple is the memorial to King Rama V (King Chulalongkorn).2.) With in this temple’s boundary, there is a public school for boys whichwas built in the reign of King Rama V. The name of this school is RajabopitSchool. This school is the one of boy schools which is famous for the publicas well.3.) This temple is continually important for the communities and ThaiBuddhists. For example, there is an important Buddhism ceremony which iscalled “Tak Bat Dok Mai (Floral offering merit-making ritual). There are afew temples in Bangkok that are trying to preserve this important Buddhismceremony.
Source: Panot Asawachai (2017)
Figure 7 Archaeological Evidence of Thai Architectural History
Figure 7 illustrates the temple can be shown the archaeological evidence of Thai architecturalhistory that is blended between Thai and Western architectures.
Value Wat RajabopitScientific 1.) King Rama V had this temple built to mark his reign. It took over
twenty year to complete the temple. This temple is a mixture of Thaiand Western styles. It shows an awakening interest in new ideas ofWestern architecture and a desire to experiment with it. As theconclusion, this temple can be shown the archaeological evidence ofThai architectural history that is blended between Thai and westernarchitectures.
Current Management of Wat Rajabopit Sathitmahasimaram Rajaworavihara
At the present, Wat Rajabopit Sathitmahasimaram Rajaworavihara does not formally enage intourism. Before taking a look at the current management of the temple, there must take a look at thepotential benefit of promoting Wat Rajabopit as a tourist destination for promoting the benefits oftourism to the temple and its communities.
The first potential benefit of promoting Wat Rajabopit as a tourist destination is to create theawareness of public value’s importance and to conserve it. “Public value” or “Community heritagevalue” is terms sometimes used to refer to those elements of significance of heritage places that aremost generally valued by communities and society as a whole. The public value is consisted ofhistoric, aesthetic and social attributes. These attributes can create a sense of place which isimportant to national or local self-identity. Thai people from the past to present generations remindWat Rajabopit as a memorial place of King Rama V and King Rama VII. Many visitors including thecommunities around this temple appreciate the temple’s aesthetic value such as mother-of-pearlinlaid designs on the doors and window panels, and the five-coloured ceramic tiles decorating thetemple’s exterior decoration. The temple also has major historical value due to its role in the historyof Thai architecture when it’s blending between the local and foreign architectures. All theseattributes contribute to the reasons why the communities and Thai people value this temple as a

114 International Journal ofManagement, Business, and EconomicsIJMBE
public value. As the conclusion, promoting this temple as a tourist destination can be created thepublic awareness of temple’s significances that can be conserved the public value for this temple.
The second potential benefit is economic benefit. Promoting tourism into this temple can bebrought “Tourism development”. Tourism development can bring improved income and livingstandards for local people. It stimulates the economy in the communities by creating demand forcommunities’ producing and through infrastructure development projects. Creating jobs for localpeople may be associated directly such as local tour guide or managerial positions; or in supportingtourism industry like food production or retail suppliers. Some locals are hired as permanentemployees to take care of this temple. There are two important communities around this temple. Oneis called “Ti Thong (making a gold leaf) community” and another one is “Trok Mor (making apottery pot) community”. Some families at Ti Thong community nowadays still produce and sellgold leaves. Gold leaf is gold that has been hammered into extremely thin sheets and is often usedfor gilding. In Thailand, it is common in temples around the country to see sculptures of Buddha andother religious figures covered in small squares of gold leaf. This is because this action of applyinggold leaf relates to the concept of making merit which is of core concern to Thai Buddhist. In thepast, Trok Mor community used to be a community that produced pottery pots. Nowadays, Trok Morcommunity is a lively electronic market, jewelry producers and selling necessities of Buddhistmonks. Tourism development which brings economic benefit to these communities’ means increasedspending in the communities generated from visitors or tourism businesses can directly andindirectly promote the viability of local businesses. Nevertheless, infrastructure including roads,parks and other public spaces can be developed and improved both for visitors and local residentsthrough increased tourism activity in the communities. This is also the economic benefit fromtourism development as well.
The pride of communities from presenting this temple as a tourism destination can begenerated through tourism. This is the third potential benefit which is counted as “Social benefit”. Apositive sense of community identity can be reinforced and tourism can encourage local communitiesto maintain their traditions and identity. Wat Rajabopit is the pride of the communities and the nationas a whole. This is because there are many important components and contents which make thistemple unique. For example, the golden Buddha image in meditation on a marble pedestal locatedinside the ordination hall is the Phra Buddha Angkhirot, constructed by King Rama IV late his reign.It was intended for the Phra Pathom Chedi but the king died before putting the plan into effect. Then,King Rama V had it put here as the principle image of the ordination hall in 1872. This Buddhaimage is shown the western influence. This means a more realistic image of the Buddha wasinvented, which became more human. The sculptural features of the Buddha image have a foldedrobe and having no skull-protuberance or ushnisha on the head. This Buddha image is designed formatching with the interior decoration of the ordination hall. That makes this temple unique anddifferent from the other temples in Bangkok. This unique can be brought the pride of the communityand the nation as a whole.
According to data received by in-depth interview and field observation, this researchindicates the following factors are significant for Wat Rajabopit SathitmahasimaramRajaworavihara’s management.
1) Way of life
According to Thai customs, there is a variety of practices including religious activities held atthe temple, such as making merits, listening the sermon, Buddhist ordination ceremony, and animportant Buddhism ceremony which is called “Tak Bat Dok Mai (Floral offering merit-making
ritual). Furthermore, these beliefs and practises are transferred from generations to generations.These can be regards as intangible heritage of the temple and communities and can be last very longtime.
2) Tourism facilities
- Car park: there is no official car park for the tourists who want to visit this temple. It isgenerally known, all tourists’ vehicles should park at the provided car park free of charge around thearea of temple. However, some tourists use public transports such as taxi and public bus to access tothis temple.
- Accommodation is not available for tourists in the temple’s communities.- Toilet facilities: there is one station public toilet availble in the temple compound. The toilet
is adquately separated for male and female.- Information center: there is no official information center in the temple compound at this
moment. However, a 67 –year-old assistant to the abbot, Phra Promnumi personally makes his monkresident as information center of Wat Rajabopit Sathitmahasimaram Rajaworavihara. The touristswho would like to visit the temple as a group tour should send the letter for asking the permissionfrom him first.
- Interpretation: Nowadays, the interpretation at Wat Rajabopit is “rich in objects but poor ininterpretation”. This temple has many interesting and important fabrics that are related with culturalsignificance. However, the interpretation process for educating and communicating is not foreseen itsimportance. There are a few information boards for informing the temple’s history inside the temple.These information boards are not given the details of cultural significances of this temple. They justprovide general information of temple’s history. This can not be enhanced the visitor experience andconserved the pride of the communities and nation.
- Food shop/restaurant: There are many food shops and local restaurants available around thetemple. Tourists can find them easily. However, most shops are opened only in the evening period ofa day. Most of them run between 17.00-21.00 hrs.
- Safety: there are security guards managed by the temple available everyday from 7.00-20.00hrs.
3) Tourism activities
Wat Rajabopit Sathitmahasimaram Rajaworavihara is now promoting a cultural tourismprogram at the temple that is highly relevant to Thai’s belief, which pays respecting to the ashes ofKing Rama V and VII kept under under the Buddha Image’s alter inside the ordination hall. Thiscultural tourism program is very successful because of an increasing number of tourists. Moreover,other tourism activity seasonally organized by the monks is “Tak Bat Dok Mai (Floral offeringmerit-making ritual). This Buddhism ceremony is widely known among Thai tourists which isalways held in every Octorber.
4) Resources
There are two main sources of money for looking after of Wat Rajabopit SathitmahasimaramRajaworavihara.
4.1 The fund from Crown Property Bureau is the main fund for renovating the historicbuildings inside the temple compound and also developing the infrastructure inside the temple.
4.2 Donation: this fund is responsible for sanitation, infrastructure, education, and otherpublic services.

115International Journal ofManagement, Business, and EconomicsIJMBE
public value. As the conclusion, promoting this temple as a tourist destination can be created thepublic awareness of temple’s significances that can be conserved the public value for this temple.
The second potential benefit is economic benefit. Promoting tourism into this temple can bebrought “Tourism development”. Tourism development can bring improved income and livingstandards for local people. It stimulates the economy in the communities by creating demand forcommunities’ producing and through infrastructure development projects. Creating jobs for localpeople may be associated directly such as local tour guide or managerial positions; or in supportingtourism industry like food production or retail suppliers. Some locals are hired as permanentemployees to take care of this temple. There are two important communities around this temple. Oneis called “Ti Thong (making a gold leaf) community” and another one is “Trok Mor (making apottery pot) community”. Some families at Ti Thong community nowadays still produce and sellgold leaves. Gold leaf is gold that has been hammered into extremely thin sheets and is often usedfor gilding. In Thailand, it is common in temples around the country to see sculptures of Buddha andother religious figures covered in small squares of gold leaf. This is because this action of applyinggold leaf relates to the concept of making merit which is of core concern to Thai Buddhist. In thepast, Trok Mor community used to be a community that produced pottery pots. Nowadays, Trok Morcommunity is a lively electronic market, jewelry producers and selling necessities of Buddhistmonks. Tourism development which brings economic benefit to these communities’ means increasedspending in the communities generated from visitors or tourism businesses can directly andindirectly promote the viability of local businesses. Nevertheless, infrastructure including roads,parks and other public spaces can be developed and improved both for visitors and local residentsthrough increased tourism activity in the communities. This is also the economic benefit fromtourism development as well.
The pride of communities from presenting this temple as a tourism destination can begenerated through tourism. This is the third potential benefit which is counted as “Social benefit”. Apositive sense of community identity can be reinforced and tourism can encourage local communitiesto maintain their traditions and identity. Wat Rajabopit is the pride of the communities and the nationas a whole. This is because there are many important components and contents which make thistemple unique. For example, the golden Buddha image in meditation on a marble pedestal locatedinside the ordination hall is the Phra Buddha Angkhirot, constructed by King Rama IV late his reign.It was intended for the Phra Pathom Chedi but the king died before putting the plan into effect. Then,King Rama V had it put here as the principle image of the ordination hall in 1872. This Buddhaimage is shown the western influence. This means a more realistic image of the Buddha wasinvented, which became more human. The sculptural features of the Buddha image have a foldedrobe and having no skull-protuberance or ushnisha on the head. This Buddha image is designed formatching with the interior decoration of the ordination hall. That makes this temple unique anddifferent from the other temples in Bangkok. This unique can be brought the pride of the communityand the nation as a whole.
According to data received by in-depth interview and field observation, this researchindicates the following factors are significant for Wat Rajabopit SathitmahasimaramRajaworavihara’s management.
1) Way of life
According to Thai customs, there is a variety of practices including religious activities held atthe temple, such as making merits, listening the sermon, Buddhist ordination ceremony, and animportant Buddhism ceremony which is called “Tak Bat Dok Mai (Floral offering merit-making
ritual). Furthermore, these beliefs and practises are transferred from generations to generations.These can be regards as intangible heritage of the temple and communities and can be last very longtime.
2) Tourism facilities
- Car park: there is no official car park for the tourists who want to visit this temple. It isgenerally known, all tourists’ vehicles should park at the provided car park free of charge around thearea of temple. However, some tourists use public transports such as taxi and public bus to access tothis temple.
- Accommodation is not available for tourists in the temple’s communities.- Toilet facilities: there is one station public toilet availble in the temple compound. The toilet
is adquately separated for male and female.- Information center: there is no official information center in the temple compound at this
moment. However, a 67 –year-old assistant to the abbot, Phra Promnumi personally makes his monkresident as information center of Wat Rajabopit Sathitmahasimaram Rajaworavihara. The touristswho would like to visit the temple as a group tour should send the letter for asking the permissionfrom him first.
- Interpretation: Nowadays, the interpretation at Wat Rajabopit is “rich in objects but poor ininterpretation”. This temple has many interesting and important fabrics that are related with culturalsignificance. However, the interpretation process for educating and communicating is not foreseen itsimportance. There are a few information boards for informing the temple’s history inside the temple.These information boards are not given the details of cultural significances of this temple. They justprovide general information of temple’s history. This can not be enhanced the visitor experience andconserved the pride of the communities and nation.
- Food shop/restaurant: There are many food shops and local restaurants available around thetemple. Tourists can find them easily. However, most shops are opened only in the evening period ofa day. Most of them run between 17.00-21.00 hrs.
- Safety: there are security guards managed by the temple available everyday from 7.00-20.00hrs.
3) Tourism activities
Wat Rajabopit Sathitmahasimaram Rajaworavihara is now promoting a cultural tourismprogram at the temple that is highly relevant to Thai’s belief, which pays respecting to the ashes ofKing Rama V and VII kept under under the Buddha Image’s alter inside the ordination hall. Thiscultural tourism program is very successful because of an increasing number of tourists. Moreover,other tourism activity seasonally organized by the monks is “Tak Bat Dok Mai (Floral offeringmerit-making ritual). This Buddhism ceremony is widely known among Thai tourists which isalways held in every Octorber.
4) Resources
There are two main sources of money for looking after of Wat Rajabopit SathitmahasimaramRajaworavihara.
4.1 The fund from Crown Property Bureau is the main fund for renovating the historicbuildings inside the temple compound and also developing the infrastructure inside the temple.
4.2 Donation: this fund is responsible for sanitation, infrastructure, education, and otherpublic services.
116 International Journal ofManagement, Business, and EconomicsIJMBE
Budget is mostly spent on conservation of historic buildings inside the temple compound.Budget allocation for developing and promoting tourism activities is insignificant.
5) Stakeholder
Stakeholders for relevant to the cultural heritage tourism in Wat RajabopitSathitmahasimaram Rajaworavihara at present can be divided into three parts as follows :
5.1 Government sector: the municipality of Phra Nakorn district is a representative, which isofficially authorized to provide tourism information to the tourists and improve better quality ofenvironment around the temple’s area. The municipality also collaborates with Tourism Authority ofThailand (TAT) for tourism promotion. Moreover, Department of Fine Arts is also involved forconservation of historic buildings inside the temple compound and Crown Property is responsible forproviding funds for conservation.
5.2 Abbot and monks of Wat Rajabopit Sathitmahasimaram Rajaworavihara : this keystakeholder is more suitable to play the role of organizing cultural heritage tourism at Wat Rajabopitbecause they are as a cultural heritage center of the temple.
5.3 Communities: this party is also the main important key stakeholder to take role ofecourageing conservation and promoting tourism at the temple.
Proposed Management Plan for Cultural Heritage Tourism
According to current management of Wat Rajabopit Sathitmahasimaram Rajaworavihara, WatRajabopit should improve the interpretation program. This is for communicating the values and allmeanings of cultural heritage site by encouraging individuals and communities to reflect on theirown perceptions of the site. All media to communicate include publications, signs, self-guidedactivities, visitor centers, audio-visual devices and indoor and outdoor exhibits (Hall, C.M. &McArthur, S. 1996, p. 91). The interpretation programs at Wat Rajabopit should be established;
1.1 Setting a visitor service centerThis visitor service center should be included both service and interpretation areas at the
same place. The service area is for providing snacks, drinks, toilet, and rest area. The interpretationarea is the area to provide some background knowledge of Wat Rajabopit and the importantsignificances of this temple. As the conclusion, this visitor service center is established as anassisting tool of the process of transferring useful information to visitors. However, it should beoperated by community as well. This is because community participation in providing visitor servicecenter will be brought the community’s pride.
1.2 Signage improvement and developmentSigns and information boards can be a direct technique to reach visitor’s understanding.
Signage can be a link between the community, messages and visitors. All signs are valuable tools toget visitors understand the site in same direction. Furthermore, the signage should be attached to theappropriate location and it should be provided both in Thai and English. The signage and informationboards should be located around the temple and nearby such as entrance of the temple. The signageand information boards should inform visitors know what exists and what is important inside thetemple’s area.
1.3 Developing potential mediaThe media to facilitate visitors at pre-visit, on site and post-visit should be developed such as
publication, visual media and web page. Nowadays, there is no any web page providing for this
temple. This should be improved suddenly as for providing pre-visiting and post-visit experience tothe visitors.
1.4 Establishing Wat Rajabopit’s local museumGrouping traditional objects with a basis of similarity (temple’s document, religious objects,
communities’ offering objects to the temple and etc.) is recommended. There are a lot of interestingobjects at this temple such as the Buddhist scriptures which King Rama V specially gave to thistemple. So, that is why there should have a local museum inside the temple. This is an other way tobuild interpretation program to the visitors. All objects should be explained their history andsignificance with obvious informative signs in both Thai and English. Furthermore, prohibited signsshould be regulated for all people such as no touching objects, no smoking, no shoes. Nowadays,there is no any local museum operated inside the temple.
1.5 Traffic and transportation managementCoaches and heavy vehicles are not allowed inside the temple due to their heavy weight and
compaction of soil. Normally, the visitors who want to visit this temple have to take publictransportations such as bus and taxi and take a walk to this temple because there is no the car parknearby. So, the best solution of this problem is to suggest the traveling route of walk. This is becausethe visitors can experience the other place nearby this temple at the same time. The routing should bestarted from The Grand Palace - The City Pillar shrine – Wat Rajapradit – Wat Rajabopit.
5. Discussion and Conclusion
Wat Rajabopit is a secondary attraction sites. This is because secondary attraction is appealedto tourists once they are already at a destination and are examined as the options or choices for theirtime. Secondary attraction sites also can be of considerable interest, definitely worth seeing if intown and worth half a day’s travelling if outside the town. Wat Rajabopit is one of Buddhist templesin Bangkok which are considered as an interesting temple and have much special significance. WatRajabopit was built in the secoud year of the reign of King Rama V and it is considered as a first-class Royal temple. The temple’s layout is unique. The ordination hall, monks’ resident quarter andthe garden are well separated. The attractive feature of this temple lies in the utilization of fivecolours glazed tiles, decorated on the walls, pillars and the stupa. This results in a unique work of art.The temple is thus responsible for bringing together Western and Eastern arts. This temple is knownas “Outside is Thai, but inside is European”. This temple is rich in cultural significances, which areaesthetic, historic, scientific and social values. The potential benefits of promoting Wat Rajabopit asa tourist destination are to create the awareness of public value’s importance and to conserve it.Secondly, promoting tourism into this temple can be brought “Tourism development”. Tourismdevelopment can bring improved income and living standards for local people. This can be countedas “Economic benefit”. Thirdly, the pride of communities from presenting this temple as a tourismdestination can be generated through tourism. This is the third potential benefit which is counted as“Social benefit”. Furthermore, Wat Rajabopit is needed to improve the interpretation process. This isbecause the interpretation at Wat Rajabopit is “rich in objects but poor in interpretation”. Theinterpretation program at this temple should be involved: 1) setting a visitor service center, 2)signage improvement and development, 3) developing potential media, 4) establishing WatRajabopit’s local museum, and 5) traffic and transportation management.

117International Journal ofManagement, Business, and EconomicsIJMBE
Budget is mostly spent on conservation of historic buildings inside the temple compound.Budget allocation for developing and promoting tourism activities is insignificant.
5) Stakeholder
Stakeholders for relevant to the cultural heritage tourism in Wat RajabopitSathitmahasimaram Rajaworavihara at present can be divided into three parts as follows :
5.1 Government sector: the municipality of Phra Nakorn district is a representative, which isofficially authorized to provide tourism information to the tourists and improve better quality ofenvironment around the temple’s area. The municipality also collaborates with Tourism Authority ofThailand (TAT) for tourism promotion. Moreover, Department of Fine Arts is also involved forconservation of historic buildings inside the temple compound and Crown Property is responsible forproviding funds for conservation.
5.2 Abbot and monks of Wat Rajabopit Sathitmahasimaram Rajaworavihara : this keystakeholder is more suitable to play the role of organizing cultural heritage tourism at Wat Rajabopitbecause they are as a cultural heritage center of the temple.
5.3 Communities: this party is also the main important key stakeholder to take role ofecourageing conservation and promoting tourism at the temple.
Proposed Management Plan for Cultural Heritage Tourism
According to current management of Wat Rajabopit Sathitmahasimaram Rajaworavihara, WatRajabopit should improve the interpretation program. This is for communicating the values and allmeanings of cultural heritage site by encouraging individuals and communities to reflect on theirown perceptions of the site. All media to communicate include publications, signs, self-guidedactivities, visitor centers, audio-visual devices and indoor and outdoor exhibits (Hall, C.M. &McArthur, S. 1996, p. 91). The interpretation programs at Wat Rajabopit should be established;
1.1 Setting a visitor service centerThis visitor service center should be included both service and interpretation areas at the
same place. The service area is for providing snacks, drinks, toilet, and rest area. The interpretationarea is the area to provide some background knowledge of Wat Rajabopit and the importantsignificances of this temple. As the conclusion, this visitor service center is established as anassisting tool of the process of transferring useful information to visitors. However, it should beoperated by community as well. This is because community participation in providing visitor servicecenter will be brought the community’s pride.
1.2 Signage improvement and developmentSigns and information boards can be a direct technique to reach visitor’s understanding.
Signage can be a link between the community, messages and visitors. All signs are valuable tools toget visitors understand the site in same direction. Furthermore, the signage should be attached to theappropriate location and it should be provided both in Thai and English. The signage and informationboards should be located around the temple and nearby such as entrance of the temple. The signageand information boards should inform visitors know what exists and what is important inside thetemple’s area.
1.3 Developing potential mediaThe media to facilitate visitors at pre-visit, on site and post-visit should be developed such as
publication, visual media and web page. Nowadays, there is no any web page providing for this
temple. This should be improved suddenly as for providing pre-visiting and post-visit experience tothe visitors.
1.4 Establishing Wat Rajabopit’s local museumGrouping traditional objects with a basis of similarity (temple’s document, religious objects,
communities’ offering objects to the temple and etc.) is recommended. There are a lot of interestingobjects at this temple such as the Buddhist scriptures which King Rama V specially gave to thistemple. So, that is why there should have a local museum inside the temple. This is an other way tobuild interpretation program to the visitors. All objects should be explained their history andsignificance with obvious informative signs in both Thai and English. Furthermore, prohibited signsshould be regulated for all people such as no touching objects, no smoking, no shoes. Nowadays,there is no any local museum operated inside the temple.
1.5 Traffic and transportation managementCoaches and heavy vehicles are not allowed inside the temple due to their heavy weight and
compaction of soil. Normally, the visitors who want to visit this temple have to take publictransportations such as bus and taxi and take a walk to this temple because there is no the car parknearby. So, the best solution of this problem is to suggest the traveling route of walk. This is becausethe visitors can experience the other place nearby this temple at the same time. The routing should bestarted from The Grand Palace - The City Pillar shrine – Wat Rajapradit – Wat Rajabopit.
5. Discussion and Conclusion
Wat Rajabopit is a secondary attraction sites. This is because secondary attraction is appealedto tourists once they are already at a destination and are examined as the options or choices for theirtime. Secondary attraction sites also can be of considerable interest, definitely worth seeing if intown and worth half a day’s travelling if outside the town. Wat Rajabopit is one of Buddhist templesin Bangkok which are considered as an interesting temple and have much special significance. WatRajabopit was built in the secoud year of the reign of King Rama V and it is considered as a first-class Royal temple. The temple’s layout is unique. The ordination hall, monks’ resident quarter andthe garden are well separated. The attractive feature of this temple lies in the utilization of fivecolours glazed tiles, decorated on the walls, pillars and the stupa. This results in a unique work of art.The temple is thus responsible for bringing together Western and Eastern arts. This temple is knownas “Outside is Thai, but inside is European”. This temple is rich in cultural significances, which areaesthetic, historic, scientific and social values. The potential benefits of promoting Wat Rajabopit asa tourist destination are to create the awareness of public value’s importance and to conserve it.Secondly, promoting tourism into this temple can be brought “Tourism development”. Tourismdevelopment can bring improved income and living standards for local people. This can be countedas “Economic benefit”. Thirdly, the pride of communities from presenting this temple as a tourismdestination can be generated through tourism. This is the third potential benefit which is counted as“Social benefit”. Furthermore, Wat Rajabopit is needed to improve the interpretation process. This isbecause the interpretation at Wat Rajabopit is “rich in objects but poor in interpretation”. Theinterpretation program at this temple should be involved: 1) setting a visitor service center, 2)signage improvement and development, 3) developing potential media, 4) establishing WatRajabopit’s local museum, and 5) traffic and transportation management.

118 International Journal ofManagement, Business, and EconomicsIJMBE
References
Australia ICOMOS (1999), The Burra Charter, The Australia ICOMOS Charter for Places ofCultural Significance.
Chonlavit Sutunyarak (2012). “Management of Historic Site for Cultural Heritage Tourism: CaseStudy of Ban Sakhla Community, Samutprakarn Province”. Journal of the International Program inArchitectural Heritage Management and Tourism, 2(March): 69-72.
Chulalongkorn University, Continuing Education Center (2002). A Survey of Thai Arts andArchitectural Attractions: A Manual for Tourist Guides. 5th ed. Bangkok: ChulalongkongUniversityPrinting House.
Hall, C.M. & McArthur, S. (1996). Strategic planning: Integrating people and places throughparticipation. In C. M. Hall and S. McArthur (eds) Heritage Management in Australia and NewZealand: The Human Dimension. Melbourne: Oxford University Press.
Mertens, Brian and Nithi Sthapitanonda (2005). Architecture of Thailand: A guide to traditional andcontemporary forms. Bangkok: Asia Books.
Pearson, Michael and Sullivan, Sharon (2001). Looking After Heritage Places: The Basics ofHeritage Planning for Managers, Landowners and Administrators. 4th ed. Malaysia: MelbourneUniversity Press.
Subhaggo Bhikkhu (1964). The Royal Rajabopit Temple. Bangkok: Sang Silpa Press.
Timothy, Dallen J. and Nyaupane Gyan P. (2009). Cultural Heritage and Tourism in DevelopingWorld. New York: Routledge.
119International Journal ofManagement, Business, and EconomicsIJMBE
References
Australia ICOMOS (1999), The Burra Charter, The Australia ICOMOS Charter for Places ofCultural Significance.
Chonlavit Sutunyarak (2012). “Management of Historic Site for Cultural Heritage Tourism: CaseStudy of Ban Sakhla Community, Samutprakarn Province”. Journal of the International Program inArchitectural Heritage Management and Tourism, 2(March): 69-72.
Chulalongkorn University, Continuing Education Center (2002). A Survey of Thai Arts andArchitectural Attractions: A Manual for Tourist Guides. 5th ed. Bangkok: ChulalongkongUniversityPrinting House.
Hall, C.M. & McArthur, S. (1996). Strategic planning: Integrating people and places throughparticipation. In C. M. Hall and S. McArthur (eds) Heritage Management in Australia and NewZealand: The Human Dimension. Melbourne: Oxford University Press.
Mertens, Brian and Nithi Sthapitanonda (2005). Architecture of Thailand: A guide to traditional andcontemporary forms. Bangkok: Asia Books.
Pearson, Michael and Sullivan, Sharon (2001). Looking After Heritage Places: The Basics ofHeritage Planning for Managers, Landowners and Administrators. 4th ed. Malaysia: MelbourneUniversity Press.
Subhaggo Bhikkhu (1964). The Royal Rajabopit Temple. Bangkok: Sang Silpa Press.
Timothy, Dallen J. and Nyaupane Gyan P. (2009). Cultural Heritage and Tourism in DevelopingWorld. New York: Routledge.
International Journal ofManagement, Business, and EconomicsIJMBE
Smart Bus Drivers: Fleet Management for Smart Workers
by
Paradorn Khongmanee1, Wuttipong Pongsuwan2, and Suchai Thanawastien3
School of Liberal Arts, Shinawatra University,Bangkok, Thailand
E-mail: [email protected], [email protected], [email protected]

Smart Bus Drivers: Fleet Management for Smart Workers
by
Paradorn Khongmanee1, Wuttipong Pongsuwan2, and Suchai Thanawastien3
School of Liberal Arts, Shinawatra University,Bangkok, Thailand
E-mail: [email protected], [email protected], [email protected]
Abstract
This research is a part of an initiative to improve bus services supporting workers in ThaiIndustrial Estates. The study aims to find smarter transportation using internet-based technology.This kind of service would be for factory workers that travel to work inside of large industrial estatesthat are typically far from an organized public transportation system. Factories with a largeworkforce must maintain a large fleet of shuttle buses to provide adequate transportation, createeffective routes, make central transit points and create standard “Pick Up” times, thus making it moreconvenient for the workers transiting to work. In this study, an application called "Wherever” usedon a Smart Phone is introduced to address the problem of picking up and transporting employeesfrom different pick up points on several routes. The goal of using “Wherever” is to have all of theemployees arrive at the same location at the same time. This report demonstrates how useful this newapplication is for this purpose.
Keywords: Smart Driver, Smart Worker, Mobile Application, Smart Transportation
1. Introduction
Thailand currently has several industrial estates and factories having more than 500permanent workers that live in several areas surrounding the factory. Some workers find it very easyto find transportation from their residence to work, but others have it more difficult due to the lack ofsupport from a public transportation system.
This is very difficult for the factory to manage traditional working hours and implementproductivity plans if all workers take separate modes of travel to get to work and arrive at varioustimes. Some arrive early and others arrive late. To solve this issue, most factories provide shuttle busservices to pick up each employee at their residence, a predetermined gathering point or otherspecific pick-up points along main routes. The factory will setup a main point and a pick-up point forthe bus drivers and workers to understand where to be at the proper time and place for efficient pickup and transfer of employees. Management will inform their workers of these options and enablethem to select which option is the most convenient for their situation.
There are many factors that can impact the bus service timing such as delays caused bymechanical breakdown, ever-changing traffic conditions, vehicle accidents, weather conditions likeheavy rain, flooding, and personal issues. These unforeseen causes make the bus driver and workersmiss the scheduled transport times. Since there is no contact between drivers and workers, workersmiss their buses and the drivers don’t know where the workers are. Either there are no workers whenthe bus arrives or there is no bus for the workers to board. Moreover, the drivers cannot wait at the
121International Journal ofManagement, Business, and EconomicsIJMBE
Smart Bus Drivers: Fleet Management for Smart Workers
by
Paradorn Khongmanee1, Wuttipong Pongsuwan2, and Suchai Thanawastien3
School of Liberal Arts, Shinawatra University,Bangkok, Thailand
E-mail: [email protected], [email protected], [email protected]
Abstract
This research is a part of an initiative to improve bus services supporting workers in ThaiIndustrial Estates. The study aims to find smarter transportation using internet-based technology.This kind of service would be for factory workers that travel to work inside of large industrial estatesthat are typically far from an organized public transportation system. Factories with a largeworkforce must maintain a large fleet of shuttle buses to provide adequate transportation, createeffective routes, make central transit points and create standard “Pick Up” times, thus making it moreconvenient for the workers transiting to work. In this study, an application called "Wherever” usedon a Smart Phone is introduced to address the problem of picking up and transporting employeesfrom different pick up points on several routes. The goal of using “Wherever” is to have all of theemployees arrive at the same location at the same time. This report demonstrates how useful this newapplication is for this purpose.
Keywords: Smart Driver, Smart Worker, Mobile Application, Smart Transportation
1. Introduction
Thailand currently has several industrial estates and factories having more than 500permanent workers that live in several areas surrounding the factory. Some workers find it very easyto find transportation from their residence to work, but others have it more difficult due to the lack ofsupport from a public transportation system.
This is very difficult for the factory to manage traditional working hours and implementproductivity plans if all workers take separate modes of travel to get to work and arrive at varioustimes. Some arrive early and others arrive late. To solve this issue, most factories provide shuttle busservices to pick up each employee at their residence, a predetermined gathering point or otherspecific pick-up points along main routes. The factory will setup a main point and a pick-up point forthe bus drivers and workers to understand where to be at the proper time and place for efficient pickup and transfer of employees. Management will inform their workers of these options and enablethem to select which option is the most convenient for their situation.
There are many factors that can impact the bus service timing such as delays caused bymechanical breakdown, ever-changing traffic conditions, vehicle accidents, weather conditions likeheavy rain, flooding, and personal issues. These unforeseen causes make the bus driver and workersmiss the scheduled transport times. Since there is no contact between drivers and workers, workersmiss their buses and the drivers don’t know where the workers are. Either there are no workers whenthe bus arrives or there is no bus for the workers to board. Moreover, the drivers cannot wait at the

122 International Journal ofManagement, Business, and EconomicsIJMBE
meeting points for long periods of time and maintain the schedule. In addition, workers who wait inremote areas for long periods of time have higher risks of robbery or other crimes. Consequently,workers miss their buses and must find alternative ways to go to the factory by themselves. Thiscauses greater travel expenses and higher risks along the way.
To find a solution, the researcher has developed a Mobile Application to be installed into themobile phones of the bus drivers and workers to develop efficiency of service using GPS thuscreating smart drivers, smart workers and smart transportation. This Mobile Application providesindependent information for each shuttle bus in real time. Thus, allowing the smart workers to knownot only the location of the buses on their service route, but specifically the projected time the buseswill be at the pick up points. This program allows smart workers to estimate when the shuttle buseswill arrive at the different locations, thereby helping them to manage their way to the pick up pointson time. In case they miss their targeted bus, they can still find their way to the nearest alternativeroute or find other buses, which are the more economical and safe way to travel. Another benefit forthe smart driver is ability to check the application and predict the number of smart workers at eachpick-up point. This allows them to manage their driving time more efficiently and reduce timewasted waiting if no passengers are at or to arrive at this at the pick-up point.
2. Literature Review
The problem of receiving goods and shipments (pickup and delivery problems, PDP) refer tothe scheduling of vehicles and place of delivery. Each vehicle must travel from one location toanother and the operating cost on all routes will decrease through sharing the shortest path. However,PDP often makes errors, causing problems to salesmen. The problem is often due to mistakes inroute planning of shipments (Vehicle Routing Problem, VRP). PDP is the starting point fordetermining the origin and destination points. All these routes should converge along the same path.The goal is assigning or grouping the travel routes to reduce transportation costs while operatingunder certain restrictions and limitations, such as traffic conditions on the road as well as otherfactors.
Today’s public transport system is more flexible. Workers can specify the desired point whenthey get on a bus and the service buses can divert from usual routes to get workers to where theyneed to go. This system demands a response system (Demand Response Transit, DRT). Althoughhaving fixed route is a good transport system, it is not flexible for travel and takes more time. DRTsystem is more flexible, but more expensive because the “pick up” or service points are specified byits customers.
The problem of DRT system has been extensively investigated and solutions have beenproposed for more than three decades since Wilson et al (1971). They input details of passengers intothe shuttle bus route to solve the problem of Mobile Allowance Shuttle Transit (MAST). This is anefficient operating system for managing travel expenses, which combines the flexibility of the DRTsystem with the low-cost static route service system.
One form of MAST deals with the problem of transporting workers. The problem is trying tothe load all the factory worker passengers waiting at the regular bus stations and taking them to thefactories ahead of their assigned work schedule. Then, at the end of the day, passenger information issent to the buses.
Umit Yuceer, in his article, offers a solution of formatting the service by dividing the traveldistances into sections.
Other issues related to the problem of passenger transportation are the integration ofequipment to receive internet transmissions (Internet of Things, or IOT) and sensors. The mostimportant device is a GPS module that will facilitate the positioning of both buses and passengerstogether with the estimated arrival time (ETA) at the appointed pick up or service point.
To accomplish this mission, the team created an application to solve the problem of sendingand receiving workers from their places of employment. This application allows the bus drivers totrack and share travel information with their passengers on various routes. With the downloadedapplication, passengers can see the status of the buses and anticipate the arrival times at the pick upor meeting point.
3. Implementing the “Wherever” Application
The use of applications tracking buses using smart phones was developed from Apache2 onthe Ubuntu server, Java, php, SQL and H2 database management system. They use viewers andcontroller programs developed by the Inventor II App and Android Studio, through the followingprinciples:
1. Application program for control the tracking which is installed on a mobile phone of thebus drivers.2. Application for workers to monitor and view bus traffic (Bus viewer)3. Server for information management with Internet connection (www.wetrack.online:8082).
Figure 1 System Operation, Make Satellites at Top Center,Arrows to Bus and Workers Map in Middle of Bus and Worker (Above Server)
Workers and Drivers can download the application from Google Play Store in the Androidsystem or they can access in to Chrome browser in IOS system. When the users turn the applicationon, it will simultaneously track and display the movement of the shuttle buses on each route and thelocation of the smart workers and smart drivers. It can calculate and estimate the arrival time of the
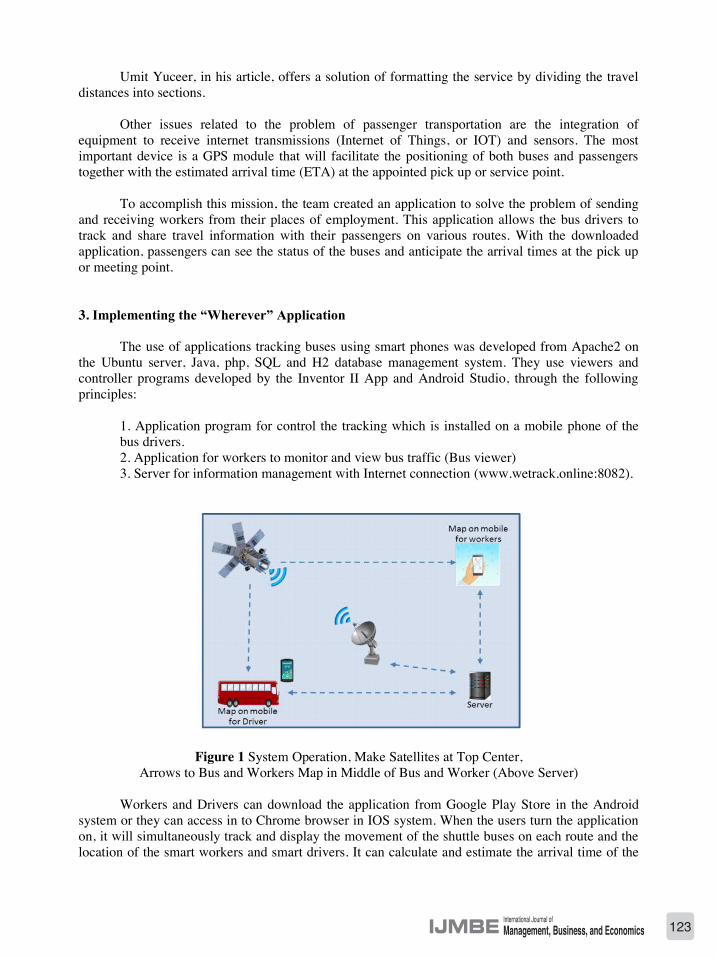
123International Journal ofManagement, Business, and EconomicsIJMBE
meeting points for long periods of time and maintain the schedule. In addition, workers who wait inremote areas for long periods of time have higher risks of robbery or other crimes. Consequently,workers miss their buses and must find alternative ways to go to the factory by themselves. Thiscauses greater travel expenses and higher risks along the way.
To find a solution, the researcher has developed a Mobile Application to be installed into themobile phones of the bus drivers and workers to develop efficiency of service using GPS thuscreating smart drivers, smart workers and smart transportation. This Mobile Application providesindependent information for each shuttle bus in real time. Thus, allowing the smart workers to knownot only the location of the buses on their service route, but specifically the projected time the buseswill be at the pick up points. This program allows smart workers to estimate when the shuttle buseswill arrive at the different locations, thereby helping them to manage their way to the pick up pointson time. In case they miss their targeted bus, they can still find their way to the nearest alternativeroute or find other buses, which are the more economical and safe way to travel. Another benefit forthe smart driver is ability to check the application and predict the number of smart workers at eachpick-up point. This allows them to manage their driving time more efficiently and reduce timewasted waiting if no passengers are at or to arrive at this at the pick-up point.
2. Literature Review
The problem of receiving goods and shipments (pickup and delivery problems, PDP) refer tothe scheduling of vehicles and place of delivery. Each vehicle must travel from one location toanother and the operating cost on all routes will decrease through sharing the shortest path. However,PDP often makes errors, causing problems to salesmen. The problem is often due to mistakes inroute planning of shipments (Vehicle Routing Problem, VRP). PDP is the starting point fordetermining the origin and destination points. All these routes should converge along the same path.The goal is assigning or grouping the travel routes to reduce transportation costs while operatingunder certain restrictions and limitations, such as traffic conditions on the road as well as otherfactors.
Today’s public transport system is more flexible. Workers can specify the desired point whenthey get on a bus and the service buses can divert from usual routes to get workers to where theyneed to go. This system demands a response system (Demand Response Transit, DRT). Althoughhaving fixed route is a good transport system, it is not flexible for travel and takes more time. DRTsystem is more flexible, but more expensive because the “pick up” or service points are specified byits customers.
The problem of DRT system has been extensively investigated and solutions have beenproposed for more than three decades since Wilson et al (1971). They input details of passengers intothe shuttle bus route to solve the problem of Mobile Allowance Shuttle Transit (MAST). This is anefficient operating system for managing travel expenses, which combines the flexibility of the DRTsystem with the low-cost static route service system.
One form of MAST deals with the problem of transporting workers. The problem is trying tothe load all the factory worker passengers waiting at the regular bus stations and taking them to thefactories ahead of their assigned work schedule. Then, at the end of the day, passenger information issent to the buses.
Umit Yuceer, in his article, offers a solution of formatting the service by dividing the traveldistances into sections.
Other issues related to the problem of passenger transportation are the integration ofequipment to receive internet transmissions (Internet of Things, or IOT) and sensors. The mostimportant device is a GPS module that will facilitate the positioning of both buses and passengerstogether with the estimated arrival time (ETA) at the appointed pick up or service point.
To accomplish this mission, the team created an application to solve the problem of sendingand receiving workers from their places of employment. This application allows the bus drivers totrack and share travel information with their passengers on various routes. With the downloadedapplication, passengers can see the status of the buses and anticipate the arrival times at the pick upor meeting point.
3. Implementing the “Wherever” Application
The use of applications tracking buses using smart phones was developed from Apache2 onthe Ubuntu server, Java, php, SQL and H2 database management system. They use viewers andcontroller programs developed by the Inventor II App and Android Studio, through the followingprinciples:
1. Application program for control the tracking which is installed on a mobile phone of thebus drivers.2. Application for workers to monitor and view bus traffic (Bus viewer)3. Server for information management with Internet connection (www.wetrack.online:8082).
Figure 1 System Operation, Make Satellites at Top Center,Arrows to Bus and Workers Map in Middle of Bus and Worker (Above Server)
Workers and Drivers can download the application from Google Play Store in the Androidsystem or they can access in to Chrome browser in IOS system. When the users turn the applicationon, it will simultaneously track and display the movement of the shuttle buses on each route and thelocation of the smart workers and smart drivers. It can calculate and estimate the arrival time of the

124 International Journal ofManagement, Business, and EconomicsIJMBE
bus at each meeting point accurately, thus reducing the wait time at each point. Moreover, it allowssmart workers to choose the best route or the closest meeting point with minimal time and cost.
Figure 2 The Application operation
To understand how the Application is used, the system must be explained to the workerscurrently using the bus service. Communicating about the application, the operating system and howto use it, will require the set of procedures as follows:
1. Application developers will train and educate Human Resource officers how to usethe new program.2. Human Resources will train supervisors, workers and bus drivers. They will describethe current operation of the bus service prior to the deployment of the new application.3. Explain how the application can be installed into their phones and how the trackingsystem works.4. Install the mobile application for the workers and kick off the operation.5. Provide application user manuals to workers currently using the shuttle buses andexplain how the use of this new application will benefit them.6. Monitor use, provide feedback and fine-tune the bus service and application usinginformation from both workers and drivers.
Figure 3 Workflow of implementation
After the launch this application, the researcher sent questionnaires to the users. 365 out ofthe 400 persons responded and 95% of the application usage results found that most of the userswere satisfied with the application for the following reasons:
Figure 4 Application Feedback

125International Journal ofManagement, Business, and EconomicsIJMBE
bus at each meeting point accurately, thus reducing the wait time at each point. Moreover, it allowssmart workers to choose the best route or the closest meeting point with minimal time and cost.
Figure 2 The Application operation
To understand how the Application is used, the system must be explained to the workerscurrently using the bus service. Communicating about the application, the operating system and howto use it, will require the set of procedures as follows:
1. Application developers will train and educate Human Resource officers how to usethe new program.2. Human Resources will train supervisors, workers and bus drivers. They will describethe current operation of the bus service prior to the deployment of the new application.3. Explain how the application can be installed into their phones and how the trackingsystem works.4. Install the mobile application for the workers and kick off the operation.5. Provide application user manuals to workers currently using the shuttle buses andexplain how the use of this new application will benefit them.6. Monitor use, provide feedback and fine-tune the bus service and application usinginformation from both workers and drivers.
Figure 3 Workflow of implementation
After the launch this application, the researcher sent questionnaires to the users. 365 out ofthe 400 persons responded and 95% of the application usage results found that most of the userswere satisfied with the application for the following reasons:
Figure 4 Application Feedback

126 International Journal ofManagement, Business, and EconomicsIJMBE
Benefits for the worker
1. Saves time waiting for buses because the application estimates the exact time of arrival.Moreover, the application is “user friendly”. Anyone can quickly learn how to use it.2. Saves on travel expenses getting to the meeting point because workers can select theshortest and fastest route from their place of accommodations.3. Prevents the danger of waiting at high-risk areas and walking late at night or dawn.Workers can manage their time better by leaving their accommodation and arrive at thepick up point just before the bus.4. Lets the worker know whether they have missed the bus or not, so that they can get tothe next pick up point or find an alternative way to work.
Benefits for the bus driver
1. Eliminate wait time at pick up points without workers.2. Ability to view workers the application at a certain pickup on point even if thelocation is crowded with other bus service passengers.3. Using and viewing a simple application interface that does not interfere with driving.
4. Conclusion and Recommendation
The efficiency and performance of this application is dependent upon these key factors:
1. Both drivers and passengers must use Smart phones with at least 3G data connectionsthat are sufficient for the application.
2. Both drivers and workers must turn on GPS receiver to connect to link the signal of thesmart driver and smart worker for satellite tracking.
There is a common misunderstanding among bus drivers and workers that turning on the GPSsignal or launching this application will consume too much power from the battery and use costlycellular data. In fact, both the GPS and application launching use less than 2 KB of data per day andminimal battery usage while using the application. This information must be explained to users, sothey can have a better understanding of the system and its effect on their data plans. In addition, thedrivers are worried that turning on the GPS signal all the time will cause them to lose their privacyby having their movements tracked. To address this, the researchers will develop the GPS “turnon/turn off” switch system to run automatically at user-selected times. This will likely result in bettercooperation among the drivers and encourage use of the application. For the future development ofthis application and proposed fixes, the information will be gathered and communicated from thecompany directly to the users. In conclusion, the data sharing of the user findings is the best way toprove the benefits of using the “Wherever” application.
References
Gulnara Roll, Domenica Carriero (2015), Smart urban solutions for transition and developingcountries, Project Document, UNECE (United Nation Economics Commission for Europe).
Toth P, Vigo D (2002), the vehicle routing problem. Monographs on discrete mathematics andapplications, Vol. 9. SIAM, Philadelphia.
Lu, Q. and Dessouky, M. (2004). “An exact algorithm for the multiple vehicle pickup and deliveryproblem,” Transportation Science, 38, 503-514.
Luca Quadrifoglio and Wen Lu, “Multiple –vehicle mobility allowance shuttle transit (MAST)system: an Analytical model to select the fleet size and a scheduling heuristic,” Final Report, DOTGrant No. DTRT06-G-0044, June 2012, Texas Transport Institute, Texas A&M University System.
Gidófalvi, G. et al. Instant Social Ride-Sharing. In Proc. 15th World Congress on IntelligentTransport Systems, p 8, Intelligent Transportation Society of America (2008).
Kelley, K. L. (2007). Casual Carpooling-Enhanced. Journal of Public Transportation 10, 4, 119.
M. W. P. Savelsbergh, M. Sol, (1995). The General Pickup and Delivery Problem. TransportationScience 29(1):17-29.
Wilson, N.H.M. et al. (1971). “Scheduling algorithms for a dial-a-ride System”, M.I.T, UrbanSystems Laboratory, Technical Report USL TR-70-13.
Umit Yuceer, An employee transporting problem, Journal of Industrial Engineering International2013, Spinger Open Journal.
Pengfei Zhou, Yuanqing Zheng and Mo Li (2012). How long to wait?: predicting bus arrival timewith mobile phone based participatory sensing, Proceeding: MobiSys '12 Proceedings of the 10thinternational conference on Mobile systems, applications, and services Pages 379-392, ACM NewYork, NY, USA ©2012.
Shital Mohol and Amit Pavanikar, Ganesh Dhage (2014). GPS Vehicle Tracking System,International Journal of Emerging Engineering Research and Technology Volume 2, Issue 7, October2014, PP 71-75 ISSN2349-4.
Pongsuwan Wuttipong, Khongmanee Paradorn, Smart Transportation for Smart Labor, Proceeding inICMFE 2016, 8th International Conference on Management Finance and Entrepreneurship, 16th -17th January 2016, Bangkok, Thailand.
App Inventor 2 | Explore MIT App Inventor from http://appinventor.mit.edu/explore/tutorial-version/app-inventor-2.html.
Android Studio (2018). The Official IDE for Android from https://developer.android.com/studio/index.html? gclid=COeXjZ2E9c0CFQ8kaAod5cwNgg.

127International Journal ofManagement, Business, and EconomicsIJMBE
Benefits for the worker
1. Saves time waiting for buses because the application estimates the exact time of arrival.Moreover, the application is “user friendly”. Anyone can quickly learn how to use it.2. Saves on travel expenses getting to the meeting point because workers can select theshortest and fastest route from their place of accommodations.3. Prevents the danger of waiting at high-risk areas and walking late at night or dawn.Workers can manage their time better by leaving their accommodation and arrive at thepick up point just before the bus.4. Lets the worker know whether they have missed the bus or not, so that they can get tothe next pick up point or find an alternative way to work.
Benefits for the bus driver
1. Eliminate wait time at pick up points without workers.2. Ability to view workers the application at a certain pickup on point even if thelocation is crowded with other bus service passengers.3. Using and viewing a simple application interface that does not interfere with driving.
4. Conclusion and Recommendation
The efficiency and performance of this application is dependent upon these key factors:
1. Both drivers and passengers must use Smart phones with at least 3G data connectionsthat are sufficient for the application.
2. Both drivers and workers must turn on GPS receiver to connect to link the signal of thesmart driver and smart worker for satellite tracking.
There is a common misunderstanding among bus drivers and workers that turning on the GPSsignal or launching this application will consume too much power from the battery and use costlycellular data. In fact, both the GPS and application launching use less than 2 KB of data per day andminimal battery usage while using the application. This information must be explained to users, sothey can have a better understanding of the system and its effect on their data plans. In addition, thedrivers are worried that turning on the GPS signal all the time will cause them to lose their privacyby having their movements tracked. To address this, the researchers will develop the GPS “turnon/turn off” switch system to run automatically at user-selected times. This will likely result in bettercooperation among the drivers and encourage use of the application. For the future development ofthis application and proposed fixes, the information will be gathered and communicated from thecompany directly to the users. In conclusion, the data sharing of the user findings is the best way toprove the benefits of using the “Wherever” application.
References
Gulnara Roll, Domenica Carriero (2015), Smart urban solutions for transition and developingcountries, Project Document, UNECE (United Nation Economics Commission for Europe).
Toth P, Vigo D (2002), the vehicle routing problem. Monographs on discrete mathematics andapplications, Vol. 9. SIAM, Philadelphia.
Lu, Q. and Dessouky, M. (2004). “An exact algorithm for the multiple vehicle pickup and deliveryproblem,” Transportation Science, 38, 503-514.
Luca Quadrifoglio and Wen Lu, “Multiple –vehicle mobility allowance shuttle transit (MAST)system: an Analytical model to select the fleet size and a scheduling heuristic,” Final Report, DOTGrant No. DTRT06-G-0044, June 2012, Texas Transport Institute, Texas A&M University System.
Gidófalvi, G. et al. Instant Social Ride-Sharing. In Proc. 15th World Congress on IntelligentTransport Systems, p 8, Intelligent Transportation Society of America (2008).
Kelley, K. L. (2007). Casual Carpooling-Enhanced. Journal of Public Transportation 10, 4, 119.
M. W. P. Savelsbergh, M. Sol, (1995). The General Pickup and Delivery Problem. TransportationScience 29(1):17-29.
Wilson, N.H.M. et al. (1971). “Scheduling algorithms for a dial-a-ride System”, M.I.T, UrbanSystems Laboratory, Technical Report USL TR-70-13.
Umit Yuceer, An employee transporting problem, Journal of Industrial Engineering International2013, Spinger Open Journal.
Pengfei Zhou, Yuanqing Zheng and Mo Li (2012). How long to wait?: predicting bus arrival timewith mobile phone based participatory sensing, Proceeding: MobiSys '12 Proceedings of the 10thinternational conference on Mobile systems, applications, and services Pages 379-392, ACM NewYork, NY, USA ©2012.
Shital Mohol and Amit Pavanikar, Ganesh Dhage (2014). GPS Vehicle Tracking System,International Journal of Emerging Engineering Research and Technology Volume 2, Issue 7, October2014, PP 71-75 ISSN2349-4.
Pongsuwan Wuttipong, Khongmanee Paradorn, Smart Transportation for Smart Labor, Proceeding inICMFE 2016, 8th International Conference on Management Finance and Entrepreneurship, 16th -17th January 2016, Bangkok, Thailand.
App Inventor 2 | Explore MIT App Inventor from http://appinventor.mit.edu/explore/tutorial-version/app-inventor-2.html.
Android Studio (2018). The Official IDE for Android from https://developer.android.com/studio/index.html? gclid=COeXjZ2E9c0CFQ8kaAod5cwNgg.


129International Journal ofManagement, Business, and EconomicsIJMBE
International Journal ofManagement, Business, and EconomicsIJMBE
The Impact of Human Resource Practices onTask Performance of Employees in Electrical, Electronics
and Telecommunications Industry Group in Thailand
by
Praphan ChaikidurajaiGraduate College of Management
Sripatum University, Bangkok, ThailandE-mail: [email protected]
and
Wassana PersalaeGraduate Student, Graduate College of Management
Sripatum University, Bangkok, ThailandE-mail: [email protected]
Abstract
The purposes of this research were to study about the impact of human resource practices on taskperformance of employees in electrical, electronics and telecommunications industry group in Thailand.The research methodology is the survey research by using questionnaires to collect data from sample(including staff at executive level, specialist level and officer level of human resource work groupfrom 29 companies, who were willing to give information, in electrical, electronics andtelecommunications industry group in Thailand). Accidental or convenience sampling random wasapplied in this research. The questionnaires were verified for content validity by experts, tried out thereliability with 30 tests by using Cronbrach’s alpha coefficiency was 0.979. The statistical analyseswere frequency, percentage, mean, standard deviation and multiple regressions. The research resultsshow that human resource practices in terms of training/development, promotion, compensation,benefit and job security affecting task performance of employees in electrical, electronics andtelecommunications industry group in Thailand.
Keywords: Human Resource Practices, Task Performance
1. Introduction
The human resource specialists give the opinions that human resource is able to work toachieve the organization's goal as well as to create value of organization. Therefore, people inorganization is the critical factor to create capacity and competitive opportunities for organization byusing strategic operation to achieve specified goal of organization (Thanya Pholanan, 2003). There arevarious research studies supported that human resources practices are able to apply in humanresource department which develop and effect positive task performance of employees andorganization (Shih, Chiang, & Hsu 2011; Gong, Chang, & Cheung 2010). Besides, the author had anopportunity to work with the Federation of Thai Industries in the project of wage and welfare ofindustrial sector in Thailand. Therefore, the author has an in researching on a topic of "The Impact of

131International Journal ofManagement, Business, and EconomicsIJMBE
The Impact of Human Resource Practices onTask Performance of Employees in Electrical, Electronics
and Telecommunications Industry Group in Thailand
by
Praphan ChaikidurajaiGraduate College of Management
Sripatum University, Bangkok, ThailandE-mail: [email protected]
and
Wassana PersalaeGraduate Student, Graduate College of Management
Sripatum University, Bangkok, ThailandE-mail: [email protected]
Abstract
The purposes of this research were to study about the impact of human resource practices on taskperformance of employees in electrical, electronics and telecommunications industry group in Thailand.The research methodology is the survey research by using questionnaires to collect data from sample(including staff at executive level, specialist level and officer level of human resource work groupfrom 29 companies, who were willing to give information, in electrical, electronics andtelecommunications industry group in Thailand). Accidental or convenience sampling random wasapplied in this research. The questionnaires were verified for content validity by experts, tried out thereliability with 30 tests by using Cronbrach’s alpha coefficiency was 0.979. The statistical analyseswere frequency, percentage, mean, standard deviation and multiple regressions. The research resultsshow that human resource practices in terms of training/development, promotion, compensation,benefit and job security affecting task performance of employees in electrical, electronics andtelecommunications industry group in Thailand.
Keywords: Human Resource Practices, Task Performance
1. Introduction
The human resource specialists give the opinions that human resource is able to work toachieve the organization's goal as well as to create value of organization. Therefore, people inorganization is the critical factor to create capacity and competitive opportunities for organization byusing strategic operation to achieve specified goal of organization (Thanya Pholanan, 2003). There arevarious research studies supported that human resources practices are able to apply in humanresource department which develop and effect positive task performance of employees andorganization (Shih, Chiang, & Hsu 2011; Gong, Chang, & Cheung 2010). Besides, the author had anopportunity to work with the Federation of Thai Industries in the project of wage and welfare ofindustrial sector in Thailand. Therefore, the author has an in researching on a topic of "The Impact of

132 International Journal ofManagement, Business, and EconomicsIJMBE
Human Resource Practices on Task Performance of Employees in Electrical, Electronics andTelecommunications Industry Group in Thailand".
2. Literature Review and Hypothesis
There were similar aspects of human resource practices in human resource management.Therefore, this research is to collect and summarize four aspects of human resource practices whichalso covers the aspect of human resource management by reviewing the literatures of variousauthors, for example, Nai-Wen Chi & Carol Yeh-Yan Lin, 2010; Gong Chang, & Cheung, 2010;Gitell, Seidner & Wimbush, 2010; Chuang, & Liao 2010 and Shih, Chiang & Hsu, 2011 etc. Thefour main human resource practices are:
1. Human resource selection is the organizational selection process to choose the mostqualified and suitable person from all candidates for the specified position by having a verifiedstandard for recruitment and selection process as well as the ability test in relevant to operation.
2. Training, development and promotion mean the organization has often surveyedfor the needs of employees’ training as well as having a clear and cover all employees' levelincluding general working skill, professional skill, first orientation training, an activity or learningprocess for increasing knowledge, skill, potential as well as personal attitudes in the organization tomatch with the current position and to support the future work for work efficiency and effectiveness.Having a future planning in professional career path of employees and focusing on how to promoteemployees by internal human resource selection when having job vacancy rather than externalrecruitment.
3. Performance appraisal means organization has regularly evaluated performance ofemployees according to specified policy. There is a clear and specified measurement, method toevaluate the ability of each employee by considering on quantities and qualities of work which thesupervisor has already recorded or observed or considered according to specified time asconsideration measurement. There are a benefit for employees and employees’ development byhaving announcement of performance appraisal’s result to employees within timeframe.
4. Compensation, benefits and job security are the ability to pay money for employeesin terms of salary, cost of living, position allowance which are paid every months including welfare,other services and activities which organized by organization for comfortable work, job security,certain guarantee in life or other benefits aside from regular compensation.
A-longkorn Mesutha and Smith Satchachukorn (2542 : 174-175) identified the meaningof task performance of employees in organization that the result from work results by employees inorganization both direct and indirect way which assigned by supervisors to achieve the fifteenorganization’s goals as follow:
1. Quantity means the amount of work’s results under efficiency and effectiveness;2. Quality means working according to the rules; the works have positive results and
benefits for everyone as well as organization3. Work Knowledge means the employees have knowledge and understanding of work
process to achieve the goal4. Equipment Skill means the knowledge of using material and equipment with the adequate
understanding and regulation as well as helping together to maintain the equipment and concerning aboutcaution
5. Ability to learn new task means fast and right understanding of learning new jobs6. Work Responsibility means the attention in work and the awareness of
how important of work and always finish work on time7. Human Relation means employees can work and have good relationship with
colleagues8. Punctuality means the respect of work time policy and regulation9. Communication means clear, easy and understandable model and system of
communication throughout the organization10. Creativity means employees must have developing new idea or working
process to be related to the change by using creativity to be guideline of work11. Cooperation and Coordination means co-operation to achieve goal of work and
activity together12. Behavior and work according to the regulation means appropriate behavior according
to the rules and regulations13. Reliability means ability to work right according to the assignment with
efficient result14. Problem solving and decision making means thinking system, analysis or intelligence
to create thing related to employees’ work performance15. Self-development means to be always continue having self-knowledge and
development related to work
Ahmad Aref Almazari (2014) conducted the research on the impact of Human ResourcePractices on Task Performance in Bank of Saudi Arabia found out that the aspect of jobcharacteristic process, performance appraisal, compensation and human resources planning haveimpact on task performance of employees in Bank of Saudi Arabia.
Nazim Ali et all (2014) conducted the research on the impact of Human Resource Practiceson Task Performance of Empirical Evidence from Public Sector Universities of Malakand Division,KPK, Pakistan found out that human resource practices in term of training, development, promotion,performance appraisal, compensation and benefit have the positive impact on task performance.
Momena Akhter (2013) conducted the research on the impact of Human Resource Practiceson Task Performance of one company in Bangladesh found out that training and development andcareer development have the positive impact on task performance.
Kerstin Alfes, Amanda Shantz and Catherine Truss (2012) studied on the relationshipbetween Human Resource Practices and Task Performance through medium variation of trust onemployer. The research had conducted from 613 respondents (employees and their direct managersin service organizations of UK). The trust on employers is the medium of relationship betweenHuman Resource Practices and Task Performance.

133International Journal ofManagement, Business, and EconomicsIJMBE
Human Resource Practices on Task Performance of Employees in Electrical, Electronics andTelecommunications Industry Group in Thailand".
2. Literature Review and Hypothesis
There were similar aspects of human resource practices in human resource management.Therefore, this research is to collect and summarize four aspects of human resource practices whichalso covers the aspect of human resource management by reviewing the literatures of variousauthors, for example, Nai-Wen Chi & Carol Yeh-Yan Lin, 2010; Gong Chang, & Cheung, 2010;Gitell, Seidner & Wimbush, 2010; Chuang, & Liao 2010 and Shih, Chiang & Hsu, 2011 etc. Thefour main human resource practices are:
1. Human resource selection is the organizational selection process to choose the mostqualified and suitable person from all candidates for the specified position by having a verifiedstandard for recruitment and selection process as well as the ability test in relevant to operation.
2. Training, development and promotion mean the organization has often surveyedfor the needs of employees’ training as well as having a clear and cover all employees' levelincluding general working skill, professional skill, first orientation training, an activity or learningprocess for increasing knowledge, skill, potential as well as personal attitudes in the organization tomatch with the current position and to support the future work for work efficiency and effectiveness.Having a future planning in professional career path of employees and focusing on how to promoteemployees by internal human resource selection when having job vacancy rather than externalrecruitment.
3. Performance appraisal means organization has regularly evaluated performance ofemployees according to specified policy. There is a clear and specified measurement, method toevaluate the ability of each employee by considering on quantities and qualities of work which thesupervisor has already recorded or observed or considered according to specified time asconsideration measurement. There are a benefit for employees and employees’ development byhaving announcement of performance appraisal’s result to employees within timeframe.
4. Compensation, benefits and job security are the ability to pay money for employeesin terms of salary, cost of living, position allowance which are paid every months including welfare,other services and activities which organized by organization for comfortable work, job security,certain guarantee in life or other benefits aside from regular compensation.
A-longkorn Mesutha and Smith Satchachukorn (2542 : 174-175) identified the meaningof task performance of employees in organization that the result from work results by employees inorganization both direct and indirect way which assigned by supervisors to achieve the fifteenorganization’s goals as follow:
1. Quantity means the amount of work’s results under efficiency and effectiveness;2. Quality means working according to the rules; the works have positive results and
benefits for everyone as well as organization3. Work Knowledge means the employees have knowledge and understanding of work
process to achieve the goal4. Equipment Skill means the knowledge of using material and equipment with the adequate
understanding and regulation as well as helping together to maintain the equipment and concerning aboutcaution
5. Ability to learn new task means fast and right understanding of learning new jobs6. Work Responsibility means the attention in work and the awareness of
how important of work and always finish work on time7. Human Relation means employees can work and have good relationship with
colleagues8. Punctuality means the respect of work time policy and regulation9. Communication means clear, easy and understandable model and system of
communication throughout the organization10. Creativity means employees must have developing new idea or working
process to be related to the change by using creativity to be guideline of work11. Cooperation and Coordination means co-operation to achieve goal of work and
activity together12. Behavior and work according to the regulation means appropriate behavior according
to the rules and regulations13. Reliability means ability to work right according to the assignment with
efficient result14. Problem solving and decision making means thinking system, analysis or intelligence
to create thing related to employees’ work performance15. Self-development means to be always continue having self-knowledge and
development related to work
Ahmad Aref Almazari (2014) conducted the research on the impact of Human ResourcePractices on Task Performance in Bank of Saudi Arabia found out that the aspect of jobcharacteristic process, performance appraisal, compensation and human resources planning haveimpact on task performance of employees in Bank of Saudi Arabia.
Nazim Ali et all (2014) conducted the research on the impact of Human Resource Practiceson Task Performance of Empirical Evidence from Public Sector Universities of Malakand Division,KPK, Pakistan found out that human resource practices in term of training, development, promotion,performance appraisal, compensation and benefit have the positive impact on task performance.
Momena Akhter (2013) conducted the research on the impact of Human Resource Practiceson Task Performance of one company in Bangladesh found out that training and development andcareer development have the positive impact on task performance.
Kerstin Alfes, Amanda Shantz and Catherine Truss (2012) studied on the relationshipbetween Human Resource Practices and Task Performance through medium variation of trust onemployer. The research had conducted from 613 respondents (employees and their direct managersin service organizations of UK). The trust on employers is the medium of relationship betweenHuman Resource Practices and Task Performance.
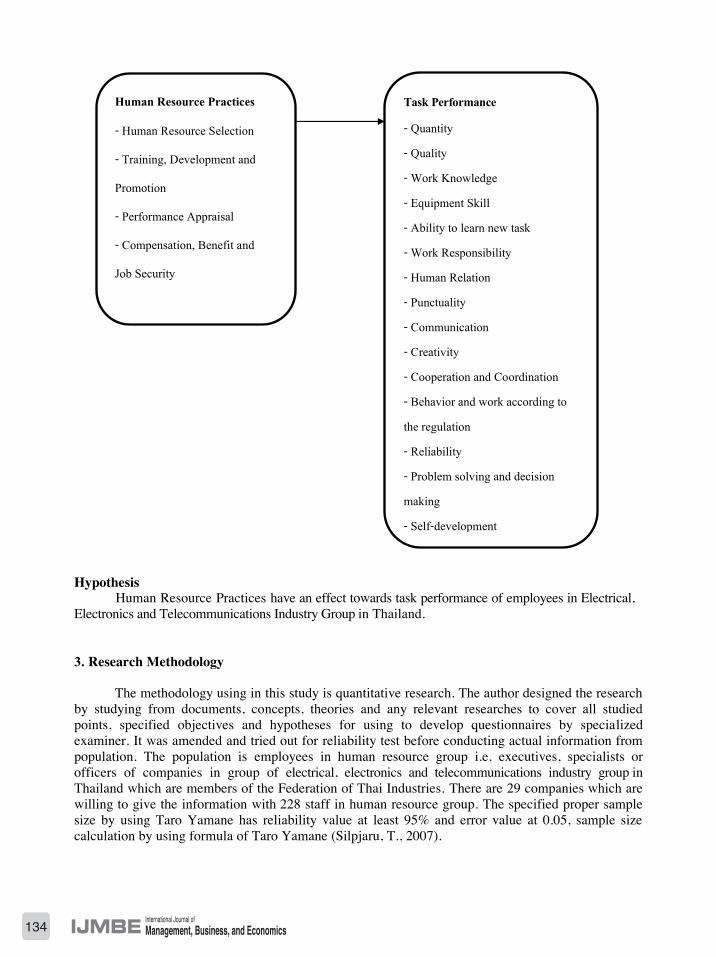
134 International Journal ofManagement, Business, and EconomicsIJMBE
HypothesisHuman Resource Practices have an effect towards task performance of employees in Electrical,
Electronics and Telecommunications Industry Group in Thailand.
3. Research Methodology
The methodology using in this study is quantitative research. The author designed the researchby studying from documents, concepts, theories and any relevant researches to cover all studiedpoints, specified objectives and hypotheses for using to develop questionnaires by specializedexaminer. It was amended and tried out for reliability test before conducting actual information frompopulation. The population is employees in human resource group i.e. executives, specialists orofficers of companies in group of electrical, electronics and telecommunications industry group inThailand which are members of the Federation of Thai Industries. There are 29 companies which arewilling to give the information with 228 staff in human resource group. The specified proper samplesize by using Taro Yamane has reliability value at least 95% and error value at 0.05, sample sizecalculation by using formula of Taro Yamane (Silpjaru, T., 2007).
Human Resource Practices
- Human Resource Selection
- Training, Development and
Promotion
- Performance Appraisal
- Compensation, Benefit and
Job Security
Task Performance
- Quantity
- Quality
- Work Knowledge
- Equipment Skill
- Ability to learn new task
- Work Responsibility
- Human Relation
- Punctuality
- Communication
- Creativity
- Cooperation and Coordination
- Behavior and work according to
the regulation
- Reliability
- Problem solving and decision
making
- Self-development
n = N 1 + Ne2
when n = Sample sizeN = Total amount of population using for this studye = Acceptable error value is equal to 0.05
stand for formulan = 228
1 + (228 x 0.052)n = 145.22
Thus, the sample size of this study is 145 respondents.
Using random sampling by nonprobability sampling and accidental sampling with group of145 staff in human resource group from 29 companies which are willing to give information. Theresearcher created questionnaires from development and analysis of questions from related literaturereviews which having content validity by 3 experts’ opinions to examine content validity. The testedcontent validity of questionnaire was tried out with 30 employees. Then, using the result to calculatefor reliability with Cronbach’s Alpha coefficient by using the criterion of questions havingCronbach’s Alpha coefficient from 0.70 and above which will be convinced that the question hasreliability. The result of reliability value is at 0.979. The statistics using for data analysis are Frequencyand Percentage to analyze a general information of respondents. Mean ( x ) and Standard Deviation(S.D.) are used for human resource practices and task performance analyses. Multiple RegressionAnalysis are used for the impact of human resource practices on task performance of employees inelectrical, electronics and telecommunications industry group in Thailand.
4. Results and Discussion
There were 125 staff or 86.21% of sample size, who completed the questionnaire, respondedthe questionnaire back from 29 companies. Most of the respondents are 99 female or 79.2%. 66staff or 52.8% are in the age between 22 and less than 35 years old. 62 staff or 49.6% are single.88 staff or 70.4% graduated in the bachelor degree. 56 staff or 44.8% are officer level. 64 staff or51.2% are in electronics industry. 56 staff or 44.8% of most respondents have experienced in theircurrent companies about 1-less than 6 years. 68 staff or 54.4% have the average income at THB15,000-less than 30,000.
Table 1 Mean ( x ) and Standard Deviation (S.D.) of the Average of Human Resource Practices andOCB.
Human Resource Practices x S.D. Interpretation1. Your company emphasizes on human resourceselection to have a person with the rightqualification for the job.
3.96 .665 high
2. Your company has clear standard for jobapplication and recruitment.
3.80 .660 high
3. Your company has an intensive selection ofhuman resource by using ability test of any aspecti.e. working skills and ability to learn.
3.71 .811 high
4. Your company has an intensive first-orientation 3.73 .723 high

135International Journal ofManagement, Business, and EconomicsIJMBE
HypothesisHuman Resource Practices have an effect towards task performance of employees in Electrical,
Electronics and Telecommunications Industry Group in Thailand.
3. Research Methodology
The methodology using in this study is quantitative research. The author designed the researchby studying from documents, concepts, theories and any relevant researches to cover all studiedpoints, specified objectives and hypotheses for using to develop questionnaires by specializedexaminer. It was amended and tried out for reliability test before conducting actual information frompopulation. The population is employees in human resource group i.e. executives, specialists orofficers of companies in group of electrical, electronics and telecommunications industry group inThailand which are members of the Federation of Thai Industries. There are 29 companies which arewilling to give the information with 228 staff in human resource group. The specified proper samplesize by using Taro Yamane has reliability value at least 95% and error value at 0.05, sample sizecalculation by using formula of Taro Yamane (Silpjaru, T., 2007).
Human Resource Practices
- Human Resource Selection
- Training, Development and
Promotion
- Performance Appraisal
- Compensation, Benefit and
Job Security
Task Performance
- Quantity
- Quality
- Work Knowledge
- Equipment Skill
- Ability to learn new task
- Work Responsibility
- Human Relation
- Punctuality
- Communication
- Creativity
- Cooperation and Coordination
- Behavior and work according to
the regulation
- Reliability
- Problem solving and decision
making
- Self-development
n = N 1 + Ne2
when n = Sample sizeN = Total amount of population using for this studye = Acceptable error value is equal to 0.05
stand for formulan = 228
1 + (228 x 0.052)n = 145.22
Thus, the sample size of this study is 145 respondents.
Using random sampling by nonprobability sampling and accidental sampling with group of145 staff in human resource group from 29 companies which are willing to give information. Theresearcher created questionnaires from development and analysis of questions from related literaturereviews which having content validity by 3 experts’ opinions to examine content validity. The testedcontent validity of questionnaire was tried out with 30 employees. Then, using the result to calculatefor reliability with Cronbach’s Alpha coefficient by using the criterion of questions havingCronbach’s Alpha coefficient from 0.70 and above which will be convinced that the question hasreliability. The result of reliability value is at 0.979. The statistics using for data analysis are Frequencyand Percentage to analyze a general information of respondents. Mean ( x ) and Standard Deviation(S.D.) are used for human resource practices and task performance analyses. Multiple RegressionAnalysis are used for the impact of human resource practices on task performance of employees inelectrical, electronics and telecommunications industry group in Thailand.
4. Results and Discussion
There were 125 staff or 86.21% of sample size, who completed the questionnaire, respondedthe questionnaire back from 29 companies. Most of the respondents are 99 female or 79.2%. 66staff or 52.8% are in the age between 22 and less than 35 years old. 62 staff or 49.6% are single.88 staff or 70.4% graduated in the bachelor degree. 56 staff or 44.8% are officer level. 64 staff or51.2% are in electronics industry. 56 staff or 44.8% of most respondents have experienced in theircurrent companies about 1-less than 6 years. 68 staff or 54.4% have the average income at THB15,000-less than 30,000.
Table 1 Mean ( x ) and Standard Deviation (S.D.) of the Average of Human Resource Practices andOCB.
Human Resource Practices x S.D. Interpretation1. Your company emphasizes on human resourceselection to have a person with the rightqualification for the job.
3.96 .665 high
2. Your company has clear standard for jobapplication and recruitment.
3.80 .660 high
3. Your company has an intensive selection ofhuman resource by using ability test of any aspecti.e. working skills and ability to learn.
3.71 .811 high
4. Your company has an intensive first-orientation 3.73 .723 high
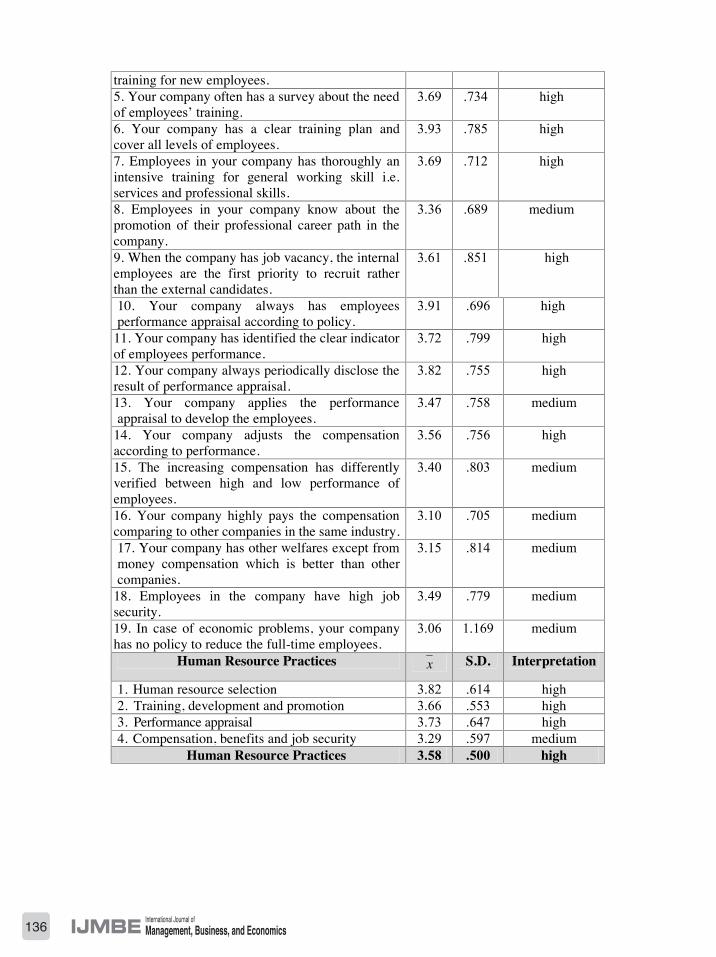
136 International Journal ofManagement, Business, and EconomicsIJMBE
training for new employees.5. Your company often has a survey about the needof employees’ training.
3.69 .734 high
6. Your company has a clear training plan andcover all levels of employees.
3.93 .785 high
7. Employees in your company has thoroughly anintensive training for general working skill i.e.services and professional skills.
3.69 .712 high
8. Employees in your company know about thepromotion of their professional career path in thecompany.
3.36 .689 medium
9. When the company has job vacancy, the internalemployees are the first priority to recruit ratherthan the external candidates.
3.61 .851 high
10. Your company always has employeesperformance appraisal according to policy.
3.91 .696 high
11. Your company has identified the clear indicatorof employees performance.
3.72 .799 high
12. Your company always periodically disclose theresult of performance appraisal.
3.82 .755 high
13. Your company applies the performanceappraisal to develop the employees.
3.47 .758 medium
14. Your company adjusts the compensationaccording to performance.
3.56 .756 high
15. The increasing compensation has differentlyverified between high and low performance ofemployees.
3.40 .803 medium
16. Your company highly pays the compensationcomparing to other companies in the same industry.
3.10 .705 medium
17. Your company has other welfares except frommoney compensation which is better than othercompanies.
3.15 .814 medium
18. Employees in the company have high jobsecurity.
3.49 .779 medium
19. In case of economic problems, your companyhas no policy to reduce the full-time employees.
3.06 1.169 medium
Human Resource Practices x S.D. Interpretation
1. Human resource selection 3.82 .614 high2. Training, development and promotion 3.66 .553 high3. Performance appraisal 3.73 .647 high4. Compensation, benefits and job security 3.29 .597 medium
Human Resource Practices 3.58 .500 high

137International Journal ofManagement, Business, and EconomicsIJMBE
training for new employees.5. Your company often has a survey about the needof employees’ training.
3.69 .734 high
6. Your company has a clear training plan andcover all levels of employees.
3.93 .785 high
7. Employees in your company has thoroughly anintensive training for general working skill i.e.services and professional skills.
3.69 .712 high
8. Employees in your company know about thepromotion of their professional career path in thecompany.
3.36 .689 medium
9. When the company has job vacancy, the internalemployees are the first priority to recruit ratherthan the external candidates.
3.61 .851 high
10. Your company always has employeesperformance appraisal according to policy.
3.91 .696 high
11. Your company has identified the clear indicatorof employees performance.
3.72 .799 high
12. Your company always periodically disclose theresult of performance appraisal.
3.82 .755 high
13. Your company applies the performanceappraisal to develop the employees.
3.47 .758 medium
14. Your company adjusts the compensationaccording to performance.
3.56 .756 high
15. The increasing compensation has differentlyverified between high and low performance ofemployees.
3.40 .803 medium
16. Your company highly pays the compensationcomparing to other companies in the same industry.
3.10 .705 medium
17. Your company has other welfares except frommoney compensation which is better than othercompanies.
3.15 .814 medium
18. Employees in the company have high jobsecurity.
3.49 .779 medium
19. In case of economic problems, your companyhas no policy to reduce the full-time employees.
3.06 1.169 medium
Human Resource Practices x S.D. Interpretation
1. Human resource selection 3.82 .614 high2. Training, development and promotion 3.66 .553 high3. Performance appraisal 3.73 .647 high4. Compensation, benefits and job security 3.29 .597 medium
Human Resource Practices 3.58 .500 high
Task Performance x S.D. Interpretation1. Employees can work efficiency andeffectiveness.
3.62 .680 high
2. Employees can work on customer’srequirements or specifications and the results arepositive rather than negative image of thecompany.
3.74 .659 High
3. Employees have the knowledge andunderstanding of their related duties and tasks aswell as understand how and steps to perform verywell.
3.81 .668 high
4. Employees have the knowledge and the expertisein the use of materials and equipment related totask performance, as well as the safety precautionsin the use regularly.
3.78 .670 high
5.Employees have the ability to learn new tasksquickly and to understand correctly.
3.64 .653 high
6. Employees work hard, be responsible for theirjob, be regard to the importance of the work andbe trying to get the job done on their schedule alltime.
3.75 .656 high
7. Employees have good relationships with othersand work with their colleagues or subordinates aswell and have a mind to help others willingly.
3.77 .674 high
8. Employees come to work on time and haveconsistency to work punctuality all the year.
3.66 .742 high
9. Employees can communicate and clarify thestory or idea to others simple and to the point.
3.55 .724 high
10. Employees have developed new ideas or newwork process to comply with changes by using asa guide in the operation.
3.51 .768 high
11. Employees have to cooperate and coordinatewith others involved to achieve the operation goals.
3.68 .679 high
12. Employees have their behaviors appropriatelyand work according to the rules or regulations ofthe company.
3.65 .699 high
13. Employees can work carefully, theirperformances are reliable and supervisors don’tneed to be closely controlled.
3.60 .648 high
14. Employees have the ability to analyze andsolve problems and make decisions in their workcorrectly and timely.
3.48 .758 medium
15. Employees have development or seekknowledge for themselves regularly to be aware oftheir work or related work.
3.53 .779 high
Task Performance x S.D. การแปลคา
1. Quantity 3.62 .680 high2. Quality 3.74 .659 high3. Work Knowledge 3.81 .668 high

138 International Journal ofManagement, Business, and EconomicsIJMBE
4. Equipment Skill 3.78 .670 high5. Ability to learn new task 3.64 .653 high6. Work Responsibility 3.75 .656 high7. Human Relation 3.77 .674 high8. Punctuality 3.66 .742 high9. Communication 3.55 .724 high10. Creativity 3.51 .768 high11. Cooperation and Coordination 3.68 .679 high12. Behavior and work according to the regulation 3.65 .699 high13. Reliability 3.60 .648 high14. Problem solving and decision making 3.48 .758 medium15. Self-development 3.53 .779 high
Task Performance 3.65 .571 high
Table 1 represents Mean ( x ) and Standard Deviation (S.D.) show mean and standarddeviation of Human Resource Practices and Task Performance in electrical, electronics andtelecommunications industry group in Thailand. From table 1, it was found out that therespondents have the opinion towards human resource practices at high level of the average x =3.58. When analyzing each aspect, it was found out that there are some aspects having high level ofthe average, for example, human resource selection has the maximum average at x = 3.82; thesecond level is performance appraisal at x = 3.73; and training, development and promotion are at x= 3.66 accordingly. Other aspects are in the medium level, for example, compensation, benefits andjob security are at x = 3.29. Moreover, it was found out that the respondents have the opiniontowards task performance at high level of the average x = 3.65. When analyzing each aspect, it wasfound out that there are some aspects having high level of the average, for example, WorkKnowledge has the maximum average at x = 3.81; the second level is Equipment Skill at x = 3.78;Human Relation is x = 3.77; Task Responsibility is x = 3.75; Quality is x = 3.74; Co-operation andCo-ordination is x = 3.68; Punctuality is x = 3.66; Behavior and work according to the regulation isx = 3.65; Ability to learn new task is x = 3.64; Quantity is x = 3.62; Creditability and Trust is x =3.60; Communication is x = 3.55; Self Development is x = 3.53; and Creativity is x = 3.51accordingly. Other aspects are in the medium level i.e. Problem Solving and Decision Making is x =3.48. Human resource practices in the aspect of human resource selection have high and highest levelof average. Therefore, the sample sees that the organization focuses on human resource selection toget the knowledge, skill and right characteristic of employees to match with the positions. Training,development and promotion of employees have high level of the average by specified planning,verified training, and covered all levels of employees. When analyzing each clause, it was found outthat “Employees in your company know about the promotion of their professional career path in thecompany” has medium level of the average. It shows that there might be lack of the suggestion inrelevant to the ascent of career path in the organization. Although, performance appraisal has highlevel of the average, which shows that performance appraisal is defined as an indicator ofemployees’ performance. When analyzing each clause, it shows that “Your company applies theperformance appraisal to develop the employees” has medium level of the average. It shows thatperformance appraisal’s result is not used to revise the compensation rate as expected.
For the aspect of compensation, benefits and job security, it has medium level of average.When analyzing each clause, it shows that “In case of the company facing the economic problems,your company has no policy to reduce full time employees” has the lowest level of the average. It
shows that when company having the problems, they shall have policy to reduce full time employeesfor reducing the operation cost. “Your company highly pays the compensation comparing to othercompanies in the same industry” and “Your company has other welfares except from financialcompensation which is better than other companies” have second-lowest level of the average. Itshows that the sample shall see compensation and welfare have been paid with the same rate as othercompanies in the same industry. Moreover, with higher rate of cost of living, the employees shallfeel that compensation and welfare shall not be enough for higher expenses because they generallyput a lot of effort and inner strength in working for company. They need both financial compensationand other compensations to be enough for cost of living. Besides, they need job security forcumulative income to support themselves and families. For the question of “The increasingcompensation has differently verified between high and low performance of employees”, it hasaccordingly lower level of the average. It means that the higher level of compensation shall have nodistinctively different between high and low task performances of employees. This shall show theopinion of employees why they have to work hard to get high performance since the level ofcompensation will be the same as people who have low performance. Employees who have highperformance feel respond for working and get low performance. It is implied to the unfairness ofcompensation rate. “Employees in the company have high job security” has the last lowest level ofaverage. It shows the relationship with the previous statement when the company get lost revenue,the full time employees shall be reduced. The sample shall see that there is no job security in theorganization. The employees shall be afraid of job security because of high business competition andeconomic regression. It shall have an impact on task performance.
Table 2 Results of multiple regression analysis between Human Resource Practices and TaskPerformance
Variables Beta( β ) pConstant .957 *P=.0001. Human ResourceSelection
.138 P=.146
2. Training,Development andPromotion
.212 *P=.043
3. PerformanceAppraisal
.180 P=.075
4. Compensation,Benefits and JobSecurity
.256 *P=.006
R2 .434Adjusted R2 .415F-value 22.962*
*** significant at the level 0.001 ** significant at the level 0.01 * significant at the level 0.05
Table 2 represents the multiple regression analysis between human resource practices andtask performance. As seen from the coefficient of determination, Adjusted R2, accounted for 41.5% oftask performance and training, development and promotion : β = .212, p < .05; compensation,benefits and job security: β = .256, p < .05. It shows that support Hypothesis just only training,

139International Journal ofManagement, Business, and EconomicsIJMBE
4. Equipment Skill 3.78 .670 high5. Ability to learn new task 3.64 .653 high6. Work Responsibility 3.75 .656 high7. Human Relation 3.77 .674 high8. Punctuality 3.66 .742 high9. Communication 3.55 .724 high10. Creativity 3.51 .768 high11. Cooperation and Coordination 3.68 .679 high12. Behavior and work according to the regulation 3.65 .699 high13. Reliability 3.60 .648 high14. Problem solving and decision making 3.48 .758 medium15. Self-development 3.53 .779 high
Task Performance 3.65 .571 high
Table 1 represents Mean ( x ) and Standard Deviation (S.D.) show mean and standarddeviation of Human Resource Practices and Task Performance in electrical, electronics andtelecommunications industry group in Thailand. From table 1, it was found out that therespondents have the opinion towards human resource practices at high level of the average x =3.58. When analyzing each aspect, it was found out that there are some aspects having high level ofthe average, for example, human resource selection has the maximum average at x = 3.82; thesecond level is performance appraisal at x = 3.73; and training, development and promotion are at x= 3.66 accordingly. Other aspects are in the medium level, for example, compensation, benefits andjob security are at x = 3.29. Moreover, it was found out that the respondents have the opiniontowards task performance at high level of the average x = 3.65. When analyzing each aspect, it wasfound out that there are some aspects having high level of the average, for example, WorkKnowledge has the maximum average at x = 3.81; the second level is Equipment Skill at x = 3.78;Human Relation is x = 3.77; Task Responsibility is x = 3.75; Quality is x = 3.74; Co-operation andCo-ordination is x = 3.68; Punctuality is x = 3.66; Behavior and work according to the regulation isx = 3.65; Ability to learn new task is x = 3.64; Quantity is x = 3.62; Creditability and Trust is x =3.60; Communication is x = 3.55; Self Development is x = 3.53; and Creativity is x = 3.51accordingly. Other aspects are in the medium level i.e. Problem Solving and Decision Making is x =3.48. Human resource practices in the aspect of human resource selection have high and highest levelof average. Therefore, the sample sees that the organization focuses on human resource selection toget the knowledge, skill and right characteristic of employees to match with the positions. Training,development and promotion of employees have high level of the average by specified planning,verified training, and covered all levels of employees. When analyzing each clause, it was found outthat “Employees in your company know about the promotion of their professional career path in thecompany” has medium level of the average. It shows that there might be lack of the suggestion inrelevant to the ascent of career path in the organization. Although, performance appraisal has highlevel of the average, which shows that performance appraisal is defined as an indicator ofemployees’ performance. When analyzing each clause, it shows that “Your company applies theperformance appraisal to develop the employees” has medium level of the average. It shows thatperformance appraisal’s result is not used to revise the compensation rate as expected.
For the aspect of compensation, benefits and job security, it has medium level of average.When analyzing each clause, it shows that “In case of the company facing the economic problems,your company has no policy to reduce full time employees” has the lowest level of the average. It
shows that when company having the problems, they shall have policy to reduce full time employeesfor reducing the operation cost. “Your company highly pays the compensation comparing to othercompanies in the same industry” and “Your company has other welfares except from financialcompensation which is better than other companies” have second-lowest level of the average. Itshows that the sample shall see compensation and welfare have been paid with the same rate as othercompanies in the same industry. Moreover, with higher rate of cost of living, the employees shallfeel that compensation and welfare shall not be enough for higher expenses because they generallyput a lot of effort and inner strength in working for company. They need both financial compensationand other compensations to be enough for cost of living. Besides, they need job security forcumulative income to support themselves and families. For the question of “The increasingcompensation has differently verified between high and low performance of employees”, it hasaccordingly lower level of the average. It means that the higher level of compensation shall have nodistinctively different between high and low task performances of employees. This shall show theopinion of employees why they have to work hard to get high performance since the level ofcompensation will be the same as people who have low performance. Employees who have highperformance feel respond for working and get low performance. It is implied to the unfairness ofcompensation rate. “Employees in the company have high job security” has the last lowest level ofaverage. It shows the relationship with the previous statement when the company get lost revenue,the full time employees shall be reduced. The sample shall see that there is no job security in theorganization. The employees shall be afraid of job security because of high business competition andeconomic regression. It shall have an impact on task performance.
Table 2 Results of multiple regression analysis between Human Resource Practices and TaskPerformance
Variables Beta( β ) pConstant .957 *P=.0001. Human ResourceSelection
.138 P=.146
2. Training,Development andPromotion
.212 *P=.043
3. PerformanceAppraisal
.180 P=.075
4. Compensation,Benefits and JobSecurity
.256 *P=.006
R2 .434Adjusted R2 .415F-value 22.962*
*** significant at the level 0.001 ** significant at the level 0.01 * significant at the level 0.05
Table 2 represents the multiple regression analysis between human resource practices andtask performance. As seen from the coefficient of determination, Adjusted R2, accounted for 41.5% oftask performance and training, development and promotion : β = .212, p < .05; compensation,benefits and job security: β = .256, p < .05. It shows that support Hypothesis just only training,

140 International Journal ofManagement, Business, and EconomicsIJMBE
development, promotion, compensation, benefits and job security have an effect towards taskperformance with significantly at 0.05.
For the aspect of development, training and promotion have an effect towards taskperformance with significantly at 0.05. It was found out that the development, training and promotionhave high level of the average X = 3.66 and task performance have high level of the average too X= 3.65. It shows that if the executive focus on more training, development and promotion, theemployees do more task performance also, thus which conforms to the research study of MomenaAkhter (2013) studied HRM Practices and its Impact on Employee Performance: A Study of theCement Industry in Bangladesh. It was found out that employee training and development of theCement Industry in Bangladesh have statistic significantly positive relationship with taskperformance.
For the aspect of compensation, benefits and job security have an effect towards taskperformance with significantly at 0.05. It was found out that the compensation, benefits and jobsecurity have medium level of the average X = 3.29 and task performance have high level of theaverage too X = 3.65. It shows that if the executive focus on more compensation, benefits and jobsecurity, the employees do more task performance also, thus which conforms to the research study ofNazim Ali (2014) Impact of Human Resource Management Practices on Employees’ outcomes(Empirical Evidence from Public Sector Universities of Malakand Division, KPK, Pakistan). It wasfound out that compensation of the Public Sector Universities of Malakand Division, KPK, Pakistanhave statistic significantly positive relationship with task performance of employees because it is theimportant motivation for the performance of employees within the organization.
5. Conclusion and Implications
1. In case of facing economic problems, the executive of company should solve the problemswith others solutions rather than using reduction of full time employees’ policy. It will create highjob security’s feeling for employees, collaboration in the activities arranged by the organization,expressing the useful opinions for the company, accepting the changing knowledge and strictlyfollowing the company’s regulation as well as respecting and be punctual for the appointment. If thecompany has tried various methods but could not solve the problems, it could be solved by cuttingoff the salary and compensation by level of position. If the person has high position level, the salarymust be more reduced to recover company’s crisis.
2. The executive should pay the proper compensation and benefits apart from moneycompensation or better payment than others comparing with companies in the same industry. It isalso created job security of employees in organization which has an impact on task performance.
3. The executive should increase the compensation of employees who do a good job byclearly different from employees who do a bad job
4. The executive should build up the employees’ sense of duty in both operation and how touse human resource to organization efficiency.
5. The executive should have the training and development continued because of the impacton employees’ task performance. It also creates the potential of employees in the organization'shuman capital or assets of the company more than the cost of the company.
6. The executive should consider the compensation and benefits in all aspects of the companyto evaluate from employees’ task performance and compare the our company’s compensation andbenefits with the other company in the same industry in order to create an incentive to work.
6. Future Research
1. There should be a study of other variables which might have an impact on taskperformance i.e. work motivation and human resource strategy etc.
2. There should be a study of human resource practices and task performance of employees inother industries which are willing to give information for further research.
References
Ahmad Aref Almazari (2014). The Impact of Affective Human Resources Management Practices ontask performance of the Saudi Bank. Society of Interdisciplinary Business Research(www.sibresearch.org) ISSN: 2304-1013 (Online); 2304-1269.
Chuang, C. H., & Liao, H. (2010). Strategic Human resource Management in service context: Takingcare of business by taking care of employees and customers. Personnel Psychology 63, 1: 153-196.
Gitell, J.H., Seidner, R., & Wimbush, J. (2010). A Relational Model of How High-Performancework systems Work, Organization Science 21, 2: 490-506.
Gong, Y., Chang, S., & Cheung, S. (2010). High performance work system and collective OCB: Acollective social exchange perspective. Human Resource Management Journal 20: 119-137.
Kerstin Alfes, Amanda Shantz and Catherine Truss. (2012). The link between perceived HRMpractices, performance and well-being: The moderating effect of trust in the employer. HumanResource Management Journal, 22 (4), 409-427.
Momena Akhter. (2013). HRM Practices and its Impact on Employee Performance: A Study of theCement Industry in Bangladesh. Global Disclosure of Economics and Business, Volume 2, No 2(2013).
Nai-Wen Chi & Carol Yeh-Yan Lin, (2010). Beyond the High-Performance Paradigm: Exploring theCurvilinear Relationship between High-performance Work System and Organizational Performancein Taiwanese Manufacturing Firms. British Journal of Industrial Relations 49, 3: 486-514.
Nazim Ali. (2014). Impact of Human Resource Management Practices on Employees’ outcomes(Empirical Evidence from Public Sector Universities of Malak and Division, KPK, Pakistan). LifeScience Journal. 2014;11(4s): 68-77.
Silpjaru, T. (2007). The Research and Data Analysis by SPSS [7th edition]. Bangkok: V. Inter Print.
Shih, H.A., Chiang, Y.H. & Hsu, C.C. (2011). High performance work system & HCN performance.Journal of Business Reviews 66, 4: 540-564.
Thanya Pholanun (2003). The Emphasis on Human Resource: Guideline for the creation ofemployees’ satisfaction. (2nd edition). Bangkok: Innographic.
A-longkorn Mesutha and Smith Satchachukorn (1999). Personnel Management. Bangkok: KasetsartUniversity Press.

141International Journal ofManagement, Business, and EconomicsIJMBE
development, promotion, compensation, benefits and job security have an effect towards taskperformance with significantly at 0.05.
For the aspect of development, training and promotion have an effect towards taskperformance with significantly at 0.05. It was found out that the development, training and promotionhave high level of the average X = 3.66 and task performance have high level of the average too X= 3.65. It shows that if the executive focus on more training, development and promotion, theemployees do more task performance also, thus which conforms to the research study of MomenaAkhter (2013) studied HRM Practices and its Impact on Employee Performance: A Study of theCement Industry in Bangladesh. It was found out that employee training and development of theCement Industry in Bangladesh have statistic significantly positive relationship with taskperformance.
For the aspect of compensation, benefits and job security have an effect towards taskperformance with significantly at 0.05. It was found out that the compensation, benefits and jobsecurity have medium level of the average X = 3.29 and task performance have high level of theaverage too X = 3.65. It shows that if the executive focus on more compensation, benefits and jobsecurity, the employees do more task performance also, thus which conforms to the research study ofNazim Ali (2014) Impact of Human Resource Management Practices on Employees’ outcomes(Empirical Evidence from Public Sector Universities of Malakand Division, KPK, Pakistan). It wasfound out that compensation of the Public Sector Universities of Malakand Division, KPK, Pakistanhave statistic significantly positive relationship with task performance of employees because it is theimportant motivation for the performance of employees within the organization.
5. Conclusion and Implications
1. In case of facing economic problems, the executive of company should solve the problemswith others solutions rather than using reduction of full time employees’ policy. It will create highjob security’s feeling for employees, collaboration in the activities arranged by the organization,expressing the useful opinions for the company, accepting the changing knowledge and strictlyfollowing the company’s regulation as well as respecting and be punctual for the appointment. If thecompany has tried various methods but could not solve the problems, it could be solved by cuttingoff the salary and compensation by level of position. If the person has high position level, the salarymust be more reduced to recover company’s crisis.
2. The executive should pay the proper compensation and benefits apart from moneycompensation or better payment than others comparing with companies in the same industry. It isalso created job security of employees in organization which has an impact on task performance.
3. The executive should increase the compensation of employees who do a good job byclearly different from employees who do a bad job
4. The executive should build up the employees’ sense of duty in both operation and how touse human resource to organization efficiency.
5. The executive should have the training and development continued because of the impacton employees’ task performance. It also creates the potential of employees in the organization'shuman capital or assets of the company more than the cost of the company.
6. The executive should consider the compensation and benefits in all aspects of the companyto evaluate from employees’ task performance and compare the our company’s compensation andbenefits with the other company in the same industry in order to create an incentive to work.
6. Future Research
1. There should be a study of other variables which might have an impact on taskperformance i.e. work motivation and human resource strategy etc.
2. There should be a study of human resource practices and task performance of employees inother industries which are willing to give information for further research.
References
Ahmad Aref Almazari (2014). The Impact of Affective Human Resources Management Practices ontask performance of the Saudi Bank. Society of Interdisciplinary Business Research(www.sibresearch.org) ISSN: 2304-1013 (Online); 2304-1269.
Chuang, C. H., & Liao, H. (2010). Strategic Human resource Management in service context: Takingcare of business by taking care of employees and customers. Personnel Psychology 63, 1: 153-196.
Gitell, J.H., Seidner, R., & Wimbush, J. (2010). A Relational Model of How High-Performancework systems Work, Organization Science 21, 2: 490-506.
Gong, Y., Chang, S., & Cheung, S. (2010). High performance work system and collective OCB: Acollective social exchange perspective. Human Resource Management Journal 20: 119-137.
Kerstin Alfes, Amanda Shantz and Catherine Truss. (2012). The link between perceived HRMpractices, performance and well-being: The moderating effect of trust in the employer. HumanResource Management Journal, 22 (4), 409-427.
Momena Akhter. (2013). HRM Practices and its Impact on Employee Performance: A Study of theCement Industry in Bangladesh. Global Disclosure of Economics and Business, Volume 2, No 2(2013).
Nai-Wen Chi & Carol Yeh-Yan Lin, (2010). Beyond the High-Performance Paradigm: Exploring theCurvilinear Relationship between High-performance Work System and Organizational Performancein Taiwanese Manufacturing Firms. British Journal of Industrial Relations 49, 3: 486-514.
Nazim Ali. (2014). Impact of Human Resource Management Practices on Employees’ outcomes(Empirical Evidence from Public Sector Universities of Malak and Division, KPK, Pakistan). LifeScience Journal. 2014;11(4s): 68-77.
Silpjaru, T. (2007). The Research and Data Analysis by SPSS [7th edition]. Bangkok: V. Inter Print.
Shih, H.A., Chiang, Y.H. & Hsu, C.C. (2011). High performance work system & HCN performance.Journal of Business Reviews 66, 4: 540-564.
Thanya Pholanun (2003). The Emphasis on Human Resource: Guideline for the creation ofemployees’ satisfaction. (2nd edition). Bangkok: Innographic.
A-longkorn Mesutha and Smith Satchachukorn (1999). Personnel Management. Bangkok: KasetsartUniversity Press.


143International Journal ofManagement, Business, and EconomicsIJMBE
International Journal ofManagement, Business, and EconomicsIJMBE
A Studio Based Approach for EnhancingDecisions of Poultry Farmers in East Africa
by
Rebecca Pearl TumwebazeMinistry of Agriculture, Animal Industry and Fisheries,
Entebbe, UgandaTel: +256790865433, E-mail: [email protected]
and
Henk G. SolUniversity of Groningen,Groningen, Netherlands
Tel: +31653212446, E-mail: [email protected]
Abstract
The poultry industry in East Africa has been growing tremendously in the last decades with ashift in trends from previous subsistence agricultural systems which focused more on catering forhouseholds to commercial enterprises focusing on increased production and profitability.Commercialization in the poultry industry and generally in the agriculture sector has increasinglybecome popular in East Africa, mainly as an entrepreneurial response to income growth in theregion. Commercialization of the poultry industry has also been influenced by the increasedpopularity of chicken and eggs in boosting protein nutrition and economic empowerment of peopleon the African continent. The last decade has seen economies of the East African region come upwith innovative ways of boosting and supporting poultry farms and other agricultural enterprises togrow in scale. But while poultry farms in East Africa are faced with a wide range of opportunitiesand prospects, they have also been faced with various challenges which threaten further growth andsustainability of the industry. Such challenges include compromised quality of inputs, unstableeconomies, lack of sufficient regulation of the industry, inadequate information availability, highdisease prevalence and limited application of technology. Such challenges define the volatile andcomplex business environment that poultry farmers in East Africa operate in, which equally impactstheir ability to make effective and timely decisions. While East African governments have up scaledtheir efforts towards supporting the growth of the poultry industry, the farmers’ decision makingcapabilities are hindered by the complexities that come with the challenges in their decision makingenvironments. Hence, this design science research aimed at enhancing the decision making processesof poultry farmers in the volatile and complex East African business environment with a decisionenhancement studio as advanced by Keen and Sol (2008).
Keywords: Decision Enhancement, Decision Enhancement Studio, Decision Making, DesignScience, Poultry, Poultry Farming

145International Journal ofManagement, Business, and EconomicsIJMBE
A Studio Based Approach for EnhancingDecisions of Poultry Farmers in East Africa
by
Rebecca Pearl TumwebazeMinistry of Agriculture, Animal Industry and Fisheries,
Entebbe, UgandaTel: +256790865433, E-mail: [email protected]
and
Henk G. SolUniversity of Groningen,Groningen, Netherlands
Tel: +31653212446, E-mail: [email protected]
Abstract
The poultry industry in East Africa has been growing tremendously in the last decades with ashift in trends from previous subsistence agricultural systems which focused more on catering forhouseholds to commercial enterprises focusing on increased production and profitability.Commercialization in the poultry industry and generally in the agriculture sector has increasinglybecome popular in East Africa, mainly as an entrepreneurial response to income growth in theregion. Commercialization of the poultry industry has also been influenced by the increasedpopularity of chicken and eggs in boosting protein nutrition and economic empowerment of peopleon the African continent. The last decade has seen economies of the East African region come upwith innovative ways of boosting and supporting poultry farms and other agricultural enterprises togrow in scale. But while poultry farms in East Africa are faced with a wide range of opportunitiesand prospects, they have also been faced with various challenges which threaten further growth andsustainability of the industry. Such challenges include compromised quality of inputs, unstableeconomies, lack of sufficient regulation of the industry, inadequate information availability, highdisease prevalence and limited application of technology. Such challenges define the volatile andcomplex business environment that poultry farmers in East Africa operate in, which equally impactstheir ability to make effective and timely decisions. While East African governments have up scaledtheir efforts towards supporting the growth of the poultry industry, the farmers’ decision makingcapabilities are hindered by the complexities that come with the challenges in their decision makingenvironments. Hence, this design science research aimed at enhancing the decision making processesof poultry farmers in the volatile and complex East African business environment with a decisionenhancement studio as advanced by Keen and Sol (2008).
Keywords: Decision Enhancement, Decision Enhancement Studio, Decision Making, DesignScience, Poultry, Poultry Farming

146 International Journal ofManagement, Business, and EconomicsIJMBE
1. Introduction
There has been steady growth of the poultry industry across the East African. Like most ofAfrica, poultry production in the East African region has been largely subsistence with theindigenous chicken accounting for about 70% of the total flock in the region (FAO, 2013; FAO,2011; Kyarisiima et al, 2004). However, in recent years, this trend has significantly changed withincreasing poultry flock numbers and more commercial farms being registered across East Africa(FAO, 2011). With an increasing number of commercial poultry farmers, there is need to focus onhow to come up with innovative ways of boosting and supporting poultry farms and otheragricultural enterprises to grow in scale (FAO, 2011). It is no wonder that East African governmentshave up scaled their efforts towards supporting the growth of commercial agriculture enterprisesincluding those engaging in poultry production through policy e.g. Uganda’s Plan for Modernizationof Agriculture (PMA), which seeks to convert subsistence farming into commercial farming (Ekou,2013) and Rwanda’s framework for livestock development which seeks to enhance commerciallivestock enterprises. In spite of these efforts as well as prospects and opportunities of the poultryindustry in the East African region, poultry farmers are faced with challenges which threaten furthergrowth and sustainability of the industry e.g. unstable input prices and quality (Katongole et al.,2013; 2011; wide gap between local demand and supply of grandparent stocks (FAO, 2009), lack ofsufficient regulation (Msoffe and Ngulube, 2015; FAO, 2009), inadequate information availability(FAO, 2009) and limited use of technologies (World Bank, 2008) among others. Msoffe andNgulube (2015) and Karanja (2014) also observed that these challenges are further aggravated byinadequate management competences among farmers which is mainly caused by a lack of adequatesystems and approaches to guide farmers in decision making especially in the context of thechallenges in the East African poultry industry business environment. It is against this backgroundthat this study focused on enhancing the decision processes made by poultry farmers in East Africaconsidering the volatile and challenging business environment in which they operate.
2. Literature Review
Decision Processes on Poultry Farmers in East Africa: Theoretical Perspectives
Decision processes that lack agility and quality have a tremendous impact on poultry farmmanagement. Mintzberg et al. (1976) defined a decision process as a set of actions and dynamicfactors that begin with the identification of an incentive for action and ends with a specificcommitment to action. From literature, it was observed that an individual farmer’s goals, values,experiences, networks, expertise, personal norms and attitudes are highly reflected in the decisionsthey make (Osinga, 2015; Aregu, 2014; Nair, 2006). In East Africa, poultry farming is still evolvingfrom previous subsistence/backyard systems to commercial systems (FAO, 2011), and this may havean influence on farmer attitudes and experiences. The challenges faced by the industry in the regionalso have a direct influence on the decision processes of poultry farmers and the kind of decisionsthey finally make. These challenges cause farmers to make decisions under conditions of uncertainty.For example a poultry farmer making a decision in an inadequately regulated business environmentis bound during the decision making process.
Further to the above, poultry farmers may rely on heuristic practices of decision making. Aspointed out by Marsh (2002), heuristics are cognitive short cuts which enable decision makers tomake evaluations based on one or a few simple rules, thereby, avoiding the processing and time costsrelated to exploring an exhaustive set of possibilities. The volatile nature of the poultry industry inthe region compels poultry farmers to use heuristic rules in decision making to simplify mental tasksinto simpler ones. Jager and Janssen (2012) proposed Consumat, a set of four decision strategies
based on their consumers studies: repetition (do as you always do), imitation (do as your close peersdo), inquiring (study what all peers do and do as the majority do), and optimizing (calculate allalternatives and choose the best). It is plausible to assume that poultry farmers use similar kinds ofheuristics when faced with their complex decisions and related decision processes. By applyingConsumat to decisions in the context of poultry farm management, two key issues are apparent: 1)the focus of the poultry farmer in decision making is more on the decision making process and notthe final decision; and 2) the views and experiences of stakeholders in the poultry farmers’ decisionmaking arena are important to the farmers’ decision making process. These two issues are key ifpoultry farmers’ decisions have to be enhanced. This makes the decision enhancement concept (Keenand Sol, 2008) a viable approach for poultry farmers’ decision making processes considering theirinfluences.
2. Decision Enhancement: A Studio Based Approach
Decision Enhancement (DE) is grounded from sound theory and proven practice that isunderpinned by the application of principles and tools for implementing Decision Support Systems(DSS). Keen and Sol (2008) define DE as a “management lens or way to look out at the dynamic andvolatile domains of complex private and public sector decision-making and, increasingly, theirinterdependencies and necessary collaborations”. DE aims at enhancing decision making processesthrough professional practices that fuse human skills and technology; bringing together the best ofexecutive judgment and experience with the best computer modeling, information management andanalytic methods while facilitating scenario building and evaluation, collaboration and simulation torehearse the future (Keen and Sol, 2008).
Keen and Sol (2008) instituted decision enhancement following a studio-based approach asan improvement in the decision support systems research field focusing on ill-structured andcomplex decisions termed as decisions that matter. The concept of a studio is defined as afacilitative, interactive environment or shared space or forum designed around a process orprocesses, that contain a set of integrated tools/technologies that enable stakeholders (people) tointeractively collaborate to generate and analyze possible solutions to a given problem (Keen andSol, 2008). Studios facilitate decision making processes by providing a collaborative and interactivework space using suites (i.e. integrated sets of technology) and sets of guidelines. Suites containdomain specific information and communication services, which form building blocks and supportrecipes for repeatable processes (Katumba, 2016; Keen and Sol., 2008). Studios and suites compriseof services to the people that make the decisions but not a technical product as is with decisionsupport systems (Keen and Sol, 2008).
The concept of DE is not new to solving complex problems in East Africa. Severalresearchers addressing decision making challenges in various domains have applied decisionenhancement successfully. Mulira (2007) designed a studio that supports inter-organizational servicesystems in volatile environments. This studio enhances decision making within inter-organizationalservice systems among independent actors with diverse, technical infrastructure and scarceresources. Amiyo (2012) handled a complex situation of increased demand for business processagility in organizations in Uganda and developed a Business Process Agility Decision EnhancementStudio (BPA-DES) that provides business process analysis, simulation, collaboration andcommunication services. With the increased demand for business process agility in organizations,Amiyo’s BPA-DES supports continuous business process improvement and enhances organizations’ability by enabling timely identification of improvement opportunities. Ssemaluulu (2012) designedand evaluated a studio for assessing information systems (IS) success in developing countries. Thisstudio enables managers and other users of IS to collaborate in assessing IS with an aim of avoiding

147International Journal ofManagement, Business, and EconomicsIJMBE
1. Introduction
There has been steady growth of the poultry industry across the East African. Like most ofAfrica, poultry production in the East African region has been largely subsistence with theindigenous chicken accounting for about 70% of the total flock in the region (FAO, 2013; FAO,2011; Kyarisiima et al, 2004). However, in recent years, this trend has significantly changed withincreasing poultry flock numbers and more commercial farms being registered across East Africa(FAO, 2011). With an increasing number of commercial poultry farmers, there is need to focus onhow to come up with innovative ways of boosting and supporting poultry farms and otheragricultural enterprises to grow in scale (FAO, 2011). It is no wonder that East African governmentshave up scaled their efforts towards supporting the growth of commercial agriculture enterprisesincluding those engaging in poultry production through policy e.g. Uganda’s Plan for Modernizationof Agriculture (PMA), which seeks to convert subsistence farming into commercial farming (Ekou,2013) and Rwanda’s framework for livestock development which seeks to enhance commerciallivestock enterprises. In spite of these efforts as well as prospects and opportunities of the poultryindustry in the East African region, poultry farmers are faced with challenges which threaten furthergrowth and sustainability of the industry e.g. unstable input prices and quality (Katongole et al.,2013; 2011; wide gap between local demand and supply of grandparent stocks (FAO, 2009), lack ofsufficient regulation (Msoffe and Ngulube, 2015; FAO, 2009), inadequate information availability(FAO, 2009) and limited use of technologies (World Bank, 2008) among others. Msoffe andNgulube (2015) and Karanja (2014) also observed that these challenges are further aggravated byinadequate management competences among farmers which is mainly caused by a lack of adequatesystems and approaches to guide farmers in decision making especially in the context of thechallenges in the East African poultry industry business environment. It is against this backgroundthat this study focused on enhancing the decision processes made by poultry farmers in East Africaconsidering the volatile and challenging business environment in which they operate.
2. Literature Review
Decision Processes on Poultry Farmers in East Africa: Theoretical Perspectives
Decision processes that lack agility and quality have a tremendous impact on poultry farmmanagement. Mintzberg et al. (1976) defined a decision process as a set of actions and dynamicfactors that begin with the identification of an incentive for action and ends with a specificcommitment to action. From literature, it was observed that an individual farmer’s goals, values,experiences, networks, expertise, personal norms and attitudes are highly reflected in the decisionsthey make (Osinga, 2015; Aregu, 2014; Nair, 2006). In East Africa, poultry farming is still evolvingfrom previous subsistence/backyard systems to commercial systems (FAO, 2011), and this may havean influence on farmer attitudes and experiences. The challenges faced by the industry in the regionalso have a direct influence on the decision processes of poultry farmers and the kind of decisionsthey finally make. These challenges cause farmers to make decisions under conditions of uncertainty.For example a poultry farmer making a decision in an inadequately regulated business environmentis bound during the decision making process.
Further to the above, poultry farmers may rely on heuristic practices of decision making. Aspointed out by Marsh (2002), heuristics are cognitive short cuts which enable decision makers tomake evaluations based on one or a few simple rules, thereby, avoiding the processing and time costsrelated to exploring an exhaustive set of possibilities. The volatile nature of the poultry industry inthe region compels poultry farmers to use heuristic rules in decision making to simplify mental tasksinto simpler ones. Jager and Janssen (2012) proposed Consumat, a set of four decision strategies
based on their consumers studies: repetition (do as you always do), imitation (do as your close peersdo), inquiring (study what all peers do and do as the majority do), and optimizing (calculate allalternatives and choose the best). It is plausible to assume that poultry farmers use similar kinds ofheuristics when faced with their complex decisions and related decision processes. By applyingConsumat to decisions in the context of poultry farm management, two key issues are apparent: 1)the focus of the poultry farmer in decision making is more on the decision making process and notthe final decision; and 2) the views and experiences of stakeholders in the poultry farmers’ decisionmaking arena are important to the farmers’ decision making process. These two issues are key ifpoultry farmers’ decisions have to be enhanced. This makes the decision enhancement concept (Keenand Sol, 2008) a viable approach for poultry farmers’ decision making processes considering theirinfluences.
2. Decision Enhancement: A Studio Based Approach
Decision Enhancement (DE) is grounded from sound theory and proven practice that isunderpinned by the application of principles and tools for implementing Decision Support Systems(DSS). Keen and Sol (2008) define DE as a “management lens or way to look out at the dynamic andvolatile domains of complex private and public sector decision-making and, increasingly, theirinterdependencies and necessary collaborations”. DE aims at enhancing decision making processesthrough professional practices that fuse human skills and technology; bringing together the best ofexecutive judgment and experience with the best computer modeling, information management andanalytic methods while facilitating scenario building and evaluation, collaboration and simulation torehearse the future (Keen and Sol, 2008).
Keen and Sol (2008) instituted decision enhancement following a studio-based approach asan improvement in the decision support systems research field focusing on ill-structured andcomplex decisions termed as decisions that matter. The concept of a studio is defined as afacilitative, interactive environment or shared space or forum designed around a process orprocesses, that contain a set of integrated tools/technologies that enable stakeholders (people) tointeractively collaborate to generate and analyze possible solutions to a given problem (Keen andSol, 2008). Studios facilitate decision making processes by providing a collaborative and interactivework space using suites (i.e. integrated sets of technology) and sets of guidelines. Suites containdomain specific information and communication services, which form building blocks and supportrecipes for repeatable processes (Katumba, 2016; Keen and Sol., 2008). Studios and suites compriseof services to the people that make the decisions but not a technical product as is with decisionsupport systems (Keen and Sol, 2008).
The concept of DE is not new to solving complex problems in East Africa. Severalresearchers addressing decision making challenges in various domains have applied decisionenhancement successfully. Mulira (2007) designed a studio that supports inter-organizational servicesystems in volatile environments. This studio enhances decision making within inter-organizationalservice systems among independent actors with diverse, technical infrastructure and scarceresources. Amiyo (2012) handled a complex situation of increased demand for business processagility in organizations in Uganda and developed a Business Process Agility Decision EnhancementStudio (BPA-DES) that provides business process analysis, simulation, collaboration andcommunication services. With the increased demand for business process agility in organizations,Amiyo’s BPA-DES supports continuous business process improvement and enhances organizations’ability by enabling timely identification of improvement opportunities. Ssemaluulu (2012) designedand evaluated a studio for assessing information systems (IS) success in developing countries. Thisstudio enables managers and other users of IS to collaborate in assessing IS with an aim of avoiding

148 International Journal ofManagement, Business, and EconomicsIJMBE
potential failures of IS. Ejiri (2012) handled a complex situation of enhancing start-up processes ofsmall medium enterprises in rural Uganda with a decision enhancement studio, which consists ofservices for participants in an interactive environment. This studio facilitates the mining knowledgeservice centres in their enterprise start up role in Uganda and could also be equally helpful incountries with similar contexts. Mirembe (2015) on the other hand used the decision enhancementapproach to design the ThreNet tool to address the practical challenges of coordinating actors duringthe threat analysis process. The ThreNet tool provides recipes to security experts on how to inferthreat likelihood of vulnerabilities and threats, threat business impact and return on investments inthreat mitigation controls. Katumba (2016) developed a decision enhancement studio to supportsector managers at the strategic, tactical and operational levels to enhance decisions in assetmanagement among water utilities. These studies substantiate DE as a credible approach forincreasing decision process agility in volatile and complex environments. This study is based on thepremise that a decision enhancement studio can be instrumental in facilitating poultry farmers’decision making agility considering the complex and volatile business environment in which theyoperate.
3. Research Methodology
This research was carried out following the philosophies of design science research (Hevnerand Chatterjee, 2010) and engaged scholarship (Van de Ven, 2007). The choice is because of thesignificance of both philosophies in addressing key challenges within the information systemsdiscipline in a way that addresses the gap between practice and theory. Engaged Scholarship is “aparticipative form of research for obtaining the different perspectives of key stakeholders(researchers, users, clients, sponsors and practitioners) in studying complex problems” (Van de Ven,2007); while Design Science is a “research paradigm in which a designer answers questions relevantto human problems via the creation of innovative artefacts” (Hevner & Chatterjee, 2010).
Design Science Research embodies three closely related cycles, namely, the relevance cycle,the design cycle and the design cycle. Following the relevance cycle, the researcher explored 13poultry farms as case studies in order to gain an understanding of farmers’ decision making practicesand processes within the context of their areas of operation. Multiple cases in exploration offered arobust framework for data collection (Remenyi et al., 1998) and gave the researcher a ‘helicopterview’ of the problem landscape (Rowley, 2002). A structured interview guide was used to gatherinformation on decision making practices, processes, influences, challenges and needs. The casestudies were further beefed with focus group discussions which brought together poultry farmers andtheir various stakeholders. In this study, focus groups were adopted to obtain different perspectiveson findings from case studies from stakeholders of the poultry industry; examining participants’shared understanding, gaining deeper insights on participants’ views, attitudes, beliefs andmotivation; and gaining insights into the ways in which individuals are influenced by others with inthe discussions (Litoselliti, 2003). Following the research strategy of abduction, data collected wasanalysed and generalised to the East African context. In the rigor cycle, existing literature wasreviewed in order to affirm the research problem and identify tools and techniques that would beused to design the decision enhancement studio for poultry farmers. In the design cycle, the studiofunctional requirements from the relevance cycle and the tools and techniques identified in the rigorcycle were used in designing the poultry decision enhancement studio (PDES). In the spirit ofengaged scholarship (Van de Ven, 2007), poultry farmers and their stakeholders were engagedthrough focus group meetings throughout the design cycle to ensure that the PDES addressed theneeds of the farmers and the poultry industry as well. The studio was then evaluated to ascertain itsperceived usefulness and perceived usability in enhancing poultry farmers’ decisions.
4. Results Analysis
Design of the Poultry Decision Enhancement Studio
From both the relevance and rigor cycles, insights, ideas and concepts relevant for designingthe PDES were abstracted. From these, the following considerations for the design of the PDES wereadopted. (i) The design should facilitate collaboration and networking among stakeholders of thepoultry industry because their views enhance poultry farmers’ decision making processes. (ii) Thedesign should enable interdependence of decisions across the processes of poultry farm managementi.e. planning, purchasing, rearing, marketing and collaboration. This is because of the inter-relatednature of these processes and consequently their corresponding decisions. (iii) The design shouldencompass the three major perspectives of a decision enhancement studio (people, process,technology). (iv) The design should facilitate a transparent and regulated environment through whichfarmers can operate and make decisions. (v) The design should support documentation of farmers’experiences and farm information because these can be a good basis for decisions making. (vi) Thedesign should enable information interpretation and analysis since poultry farmers’ decisions arehighly influenced by the information they have. (vii) The design should provide guidelines to poultryfarmers on flock handling and decision making on key performance indicators of flock and farmmanagement.
Basing the above considerations, figure 1 below presents an overview of the design of thePDES and its corresponding suites. PDES emphasizes the interaction of the five inter-relatedprocesses of poultry farm management of planning, purchasing, rearing, marketing andcollaboration. The design particularly emphasizes the importance of the continuous interaction of theprocesses and possible overlaps in the decisions made across the processes. These processes arehighly integrated and do not exist in isolation. In the PDES design, the interaction of the poultryfarm management processes encompasses the three major perspectives of a decision enhancementstudio (i.e. people, processes and technology) as shown in Figure 1 and described in the nextsections.
Figure 1 The Poultry Decision Enhancement Studio Design (PDES)

149International Journal ofManagement, Business, and EconomicsIJMBE
potential failures of IS. Ejiri (2012) handled a complex situation of enhancing start-up processes ofsmall medium enterprises in rural Uganda with a decision enhancement studio, which consists ofservices for participants in an interactive environment. This studio facilitates the mining knowledgeservice centres in their enterprise start up role in Uganda and could also be equally helpful incountries with similar contexts. Mirembe (2015) on the other hand used the decision enhancementapproach to design the ThreNet tool to address the practical challenges of coordinating actors duringthe threat analysis process. The ThreNet tool provides recipes to security experts on how to inferthreat likelihood of vulnerabilities and threats, threat business impact and return on investments inthreat mitigation controls. Katumba (2016) developed a decision enhancement studio to supportsector managers at the strategic, tactical and operational levels to enhance decisions in assetmanagement among water utilities. These studies substantiate DE as a credible approach forincreasing decision process agility in volatile and complex environments. This study is based on thepremise that a decision enhancement studio can be instrumental in facilitating poultry farmers’decision making agility considering the complex and volatile business environment in which theyoperate.
3. Research Methodology
This research was carried out following the philosophies of design science research (Hevnerand Chatterjee, 2010) and engaged scholarship (Van de Ven, 2007). The choice is because of thesignificance of both philosophies in addressing key challenges within the information systemsdiscipline in a way that addresses the gap between practice and theory. Engaged Scholarship is “aparticipative form of research for obtaining the different perspectives of key stakeholders(researchers, users, clients, sponsors and practitioners) in studying complex problems” (Van de Ven,2007); while Design Science is a “research paradigm in which a designer answers questions relevantto human problems via the creation of innovative artefacts” (Hevner & Chatterjee, 2010).
Design Science Research embodies three closely related cycles, namely, the relevance cycle,the design cycle and the design cycle. Following the relevance cycle, the researcher explored 13poultry farms as case studies in order to gain an understanding of farmers’ decision making practicesand processes within the context of their areas of operation. Multiple cases in exploration offered arobust framework for data collection (Remenyi et al., 1998) and gave the researcher a ‘helicopterview’ of the problem landscape (Rowley, 2002). A structured interview guide was used to gatherinformation on decision making practices, processes, influences, challenges and needs. The casestudies were further beefed with focus group discussions which brought together poultry farmers andtheir various stakeholders. In this study, focus groups were adopted to obtain different perspectiveson findings from case studies from stakeholders of the poultry industry; examining participants’shared understanding, gaining deeper insights on participants’ views, attitudes, beliefs andmotivation; and gaining insights into the ways in which individuals are influenced by others with inthe discussions (Litoselliti, 2003). Following the research strategy of abduction, data collected wasanalysed and generalised to the East African context. In the rigor cycle, existing literature wasreviewed in order to affirm the research problem and identify tools and techniques that would beused to design the decision enhancement studio for poultry farmers. In the design cycle, the studiofunctional requirements from the relevance cycle and the tools and techniques identified in the rigorcycle were used in designing the poultry decision enhancement studio (PDES). In the spirit ofengaged scholarship (Van de Ven, 2007), poultry farmers and their stakeholders were engagedthrough focus group meetings throughout the design cycle to ensure that the PDES addressed theneeds of the farmers and the poultry industry as well. The studio was then evaluated to ascertain itsperceived usefulness and perceived usability in enhancing poultry farmers’ decisions.
4. Results Analysis
Design of the Poultry Decision Enhancement Studio
From both the relevance and rigor cycles, insights, ideas and concepts relevant for designingthe PDES were abstracted. From these, the following considerations for the design of the PDES wereadopted. (i) The design should facilitate collaboration and networking among stakeholders of thepoultry industry because their views enhance poultry farmers’ decision making processes. (ii) Thedesign should enable interdependence of decisions across the processes of poultry farm managementi.e. planning, purchasing, rearing, marketing and collaboration. This is because of the inter-relatednature of these processes and consequently their corresponding decisions. (iii) The design shouldencompass the three major perspectives of a decision enhancement studio (people, process,technology). (iv) The design should facilitate a transparent and regulated environment through whichfarmers can operate and make decisions. (v) The design should support documentation of farmers’experiences and farm information because these can be a good basis for decisions making. (vi) Thedesign should enable information interpretation and analysis since poultry farmers’ decisions arehighly influenced by the information they have. (vii) The design should provide guidelines to poultryfarmers on flock handling and decision making on key performance indicators of flock and farmmanagement.
Basing the above considerations, figure 1 below presents an overview of the design of thePDES and its corresponding suites. PDES emphasizes the interaction of the five inter-relatedprocesses of poultry farm management of planning, purchasing, rearing, marketing andcollaboration. The design particularly emphasizes the importance of the continuous interaction of theprocesses and possible overlaps in the decisions made across the processes. These processes arehighly integrated and do not exist in isolation. In the PDES design, the interaction of the poultryfarm management processes encompasses the three major perspectives of a decision enhancementstudio (i.e. people, processes and technology) as shown in Figure 1 and described in the nextsections.
Figure 1 The Poultry Decision Enhancement Studio Design (PDES)

150 International Journal ofManagement, Business, and EconomicsIJMBE
PDES consists of five suites of different technology enablers. The major decisions supportedby the PDES suites include decisions on planning; decisions on input purchasing; decisions involvedin day to day flock rearing including health and nutrition management and decisions on marketing. Inthe suites, factors affecting the above decisions have been put into consideration. These include:information, regulation, farmers’ social networks, skills and experiences of stakeholders amongothers.
As guided by Gregor and Hevner (2013), the construction of the PDES and its description interms of design principles and technological rules are steps in the process of developing acomprehensive body of knowledge. The PDES design is thus described in terms of the “ways of”framework consisting of the way of thinking, way of governance, way of working and way ofmodelling (Selingmann et al., 1989; Sol, 1988). The choice of this framework is based on theexperience of several researchers in information systems (Katumba, 2016; Mirembe, 2015; Aregu,2014; Ejiri, 2012; Amiyo, 2012; De Vreede and Briggs, 2005), who were able to successfullyemploy the framework in the design, development and implementation of information systems,approaches, methods, frameworks and solutions to problems in various domains.
The way of thinking depicts the concepts and theoretical foundations to enhance poultryfarmers’ decisions as well as expressing the underlying philosophy. The line of thought in thisresearch is that the decision enhancement concept (Keen & Sol, 2008) can enhance decisionprocesses of poultry farmers. The PDES design integrates the perspectives of a decisionenhancement studio into the five inter-related processes of poultry farm management with an aim ofguiding and enhancing poultry farmers’ decisions. The PDES was proposed following the decisionenhancement framework, which was advanced by Keen and Sol (2008) for solving human decisionchallenges involving complex and uncertain problems. Based on insights from Keen and Sol (2008),we define the PDES as a prescriptive environment which enhances decision making in poultry farmmanagement through providing guidelines and interpreted and analysed information for farmersand/or farm managers, promoting collaboration of the poultry industry stakeholders and enablingtransparency and regulation of the industry. The way of thinking of the PDES is based on theinteraction of the three major perspectives of a decision enhancement studio i.e people, process andtechnology (Keen and Sol, 2008). The way of governance expresses the managerial aspects of thePDES. Keen and Sol (2008) refer to this as the governance architecture, which may includeguidelines, regulations and/or shared facilities. The PDES is grounded by such guidelines for allplayers to facilitate all activities of the PDES community. The way of modelling identifies themodels that were used for decision making (Katumba, 2016; Van de Kar, 2004; Sol, 1982). In theway of modelling of the PDES, graphical and visual representations of the poultry rearing processesparticularly mirroring the key performance indicators of flock management were considered becausethese were of interest to poultry farmers as per findings from exploration and literature. The way ofworking denotes the steps that are followed in using the PDES for decision enhancement. In the wayof working of the PDES, activity flow diagrams were utilised to describe the steps that lead todecision making with in each of the poultry farm management processes. This defined the decisionmaking process for each of the inter-related processes shown in figure 1. Each of these processesrepresent the five suites that provide the required functionality of the PDES i.e planning, purchasing,rearing, marketing and collaboration suites.
The PDES Suites and Services
PDES consists of five suites of different technology enablers. The Planning suite enhancespoultry farmers’ planning decisions using three key services: information, market exploration andbudgeting. These services facilitate poultry farmers to access relevant information concerning
poultry farm management and poultry flocks, explore market environments and budget for flockcycles in the farm. The purchasing suite enhances poultry farmers’ decisions concerning when topurchase inputs, where to purchase inputs, how to get purchased inputs to the farm premises and howto manage purchased inputs once at the farm. It is embedded with two services i.e. Suppliercatalogue and Inventory management. The rearing suite is concerned with the day to day processmonitoring of flock and facilitates poultry farm management through services of flock registration,record management and monitoring of key performance indicators that impact flock growth. Themarketing suite is concerned with enhancing famers’ decisions relating to the sale of the outputs ofpoultry farms. It provides services of advertising and buyer access. Lastly, the collaboration suiteenhances continuous collaboration among stakeholders of the poultry industry whose roles, skills andexperience can be tapped during a farmers’ decision making processes. The suite promotesinteraction and networking of all actors and across all the processes on the PDES. The PDES suites,services and supporting guidelines subsequently enhance decision making during poultry farmmanagement by facilitating collaboration, transparency, regulation, visualization, informationinterpretation and analysis.
Instantiation of the PDES
Following the design described above, the PDES was instantiated to practically provide acollaborative and facilitative environment for poultry farmers and their stakeholders. There hasalready been lower than expected uptake of farming technologies (Bewley, 2010), mainly due to afocus on technology development without an accompanying effort by researchers to understand thechallenges of on-farm application (Kutter et al., 2011). To counter this, requirements and designconsiderations for the PDES were based on both literature and exploration as discussed in subsequentsections of this article. Owing to the low technology adoption widely reported among Africanfarmers (World Bank, 2007), focus was particularly put on ensuring perceived benefit and credibilityas well as user friendly designs throughout the instantiation of the PDES. Against this background,the studio architecture of the PDES was based on insights from Service Oriented Architecture (SOA)principles (Aregu, 2014; Amiyo, 2012; Kamoun, 2007). The integration of SOA principles enabledthe building of applications with good levels of flexibility, agility and simplification (Aregu, 2014;Keen and Sol, 2008; Kamoun, 2007). Based on the SOA principles, instantiation involved cross-platform implementation, loose coupling and set up of well-defined interfaces. The PDES wasinstantiated using several programming languages that included; Hyper Text Mark-up Language(HTML); JavaScript web development languages; Cascading Style Sheets (CSS); MySQL and PHPhypertext Preprocessor (PHP).
The PDES is a web-based system that is hosted on a remote server and connected to a remoteMySQL database. This is to enable the different users to access the studio on their devices at anylocation and anytime. The PDES runs in a web browser and is compatible with browsers such asMozilla Firefox, Internet Explorer, Opera and Google Chrome. Therefore, any user with a webbrowser can be able to access the studio. The PDES is hosted under the domain namehttp://www.poultrydes.com (see figure 2) and allows different users to create accounts whichundergo a verification process as part of the PDES’ role in addressing the challenge of inadequateregulation which was noted in this study. Users include poultry farmers, input suppliers, outputbuyers, poultry health experts and the different regulators of the industry. Upon log in by a registeredfarmer, the five suites are presented on the left hand side vertical menu in the studio. Each menu itemrepresents a suite and these are clickable (in form of links). Upon clicking a particular suite, anexpandable dropdown menu with services and sub-suites of the suite is displayed. The clicked linkbecomes active by giving a grey background to the main link and dropdown links thus this enablesthe user to easily view and track their activities on the studio. When a user clicks on a particular

151International Journal ofManagement, Business, and EconomicsIJMBE
PDES consists of five suites of different technology enablers. The major decisions supportedby the PDES suites include decisions on planning; decisions on input purchasing; decisions involvedin day to day flock rearing including health and nutrition management and decisions on marketing. Inthe suites, factors affecting the above decisions have been put into consideration. These include:information, regulation, farmers’ social networks, skills and experiences of stakeholders amongothers.
As guided by Gregor and Hevner (2013), the construction of the PDES and its description interms of design principles and technological rules are steps in the process of developing acomprehensive body of knowledge. The PDES design is thus described in terms of the “ways of”framework consisting of the way of thinking, way of governance, way of working and way ofmodelling (Selingmann et al., 1989; Sol, 1988). The choice of this framework is based on theexperience of several researchers in information systems (Katumba, 2016; Mirembe, 2015; Aregu,2014; Ejiri, 2012; Amiyo, 2012; De Vreede and Briggs, 2005), who were able to successfullyemploy the framework in the design, development and implementation of information systems,approaches, methods, frameworks and solutions to problems in various domains.
The way of thinking depicts the concepts and theoretical foundations to enhance poultryfarmers’ decisions as well as expressing the underlying philosophy. The line of thought in thisresearch is that the decision enhancement concept (Keen & Sol, 2008) can enhance decisionprocesses of poultry farmers. The PDES design integrates the perspectives of a decisionenhancement studio into the five inter-related processes of poultry farm management with an aim ofguiding and enhancing poultry farmers’ decisions. The PDES was proposed following the decisionenhancement framework, which was advanced by Keen and Sol (2008) for solving human decisionchallenges involving complex and uncertain problems. Based on insights from Keen and Sol (2008),we define the PDES as a prescriptive environment which enhances decision making in poultry farmmanagement through providing guidelines and interpreted and analysed information for farmersand/or farm managers, promoting collaboration of the poultry industry stakeholders and enablingtransparency and regulation of the industry. The way of thinking of the PDES is based on theinteraction of the three major perspectives of a decision enhancement studio i.e people, process andtechnology (Keen and Sol, 2008). The way of governance expresses the managerial aspects of thePDES. Keen and Sol (2008) refer to this as the governance architecture, which may includeguidelines, regulations and/or shared facilities. The PDES is grounded by such guidelines for allplayers to facilitate all activities of the PDES community. The way of modelling identifies themodels that were used for decision making (Katumba, 2016; Van de Kar, 2004; Sol, 1982). In theway of modelling of the PDES, graphical and visual representations of the poultry rearing processesparticularly mirroring the key performance indicators of flock management were considered becausethese were of interest to poultry farmers as per findings from exploration and literature. The way ofworking denotes the steps that are followed in using the PDES for decision enhancement. In the wayof working of the PDES, activity flow diagrams were utilised to describe the steps that lead todecision making with in each of the poultry farm management processes. This defined the decisionmaking process for each of the inter-related processes shown in figure 1. Each of these processesrepresent the five suites that provide the required functionality of the PDES i.e planning, purchasing,rearing, marketing and collaboration suites.
The PDES Suites and Services
PDES consists of five suites of different technology enablers. The Planning suite enhancespoultry farmers’ planning decisions using three key services: information, market exploration andbudgeting. These services facilitate poultry farmers to access relevant information concerning
poultry farm management and poultry flocks, explore market environments and budget for flockcycles in the farm. The purchasing suite enhances poultry farmers’ decisions concerning when topurchase inputs, where to purchase inputs, how to get purchased inputs to the farm premises and howto manage purchased inputs once at the farm. It is embedded with two services i.e. Suppliercatalogue and Inventory management. The rearing suite is concerned with the day to day processmonitoring of flock and facilitates poultry farm management through services of flock registration,record management and monitoring of key performance indicators that impact flock growth. Themarketing suite is concerned with enhancing famers’ decisions relating to the sale of the outputs ofpoultry farms. It provides services of advertising and buyer access. Lastly, the collaboration suiteenhances continuous collaboration among stakeholders of the poultry industry whose roles, skills andexperience can be tapped during a farmers’ decision making processes. The suite promotesinteraction and networking of all actors and across all the processes on the PDES. The PDES suites,services and supporting guidelines subsequently enhance decision making during poultry farmmanagement by facilitating collaboration, transparency, regulation, visualization, informationinterpretation and analysis.
Instantiation of the PDES
Following the design described above, the PDES was instantiated to practically provide acollaborative and facilitative environment for poultry farmers and their stakeholders. There hasalready been lower than expected uptake of farming technologies (Bewley, 2010), mainly due to afocus on technology development without an accompanying effort by researchers to understand thechallenges of on-farm application (Kutter et al., 2011). To counter this, requirements and designconsiderations for the PDES were based on both literature and exploration as discussed in subsequentsections of this article. Owing to the low technology adoption widely reported among Africanfarmers (World Bank, 2007), focus was particularly put on ensuring perceived benefit and credibilityas well as user friendly designs throughout the instantiation of the PDES. Against this background,the studio architecture of the PDES was based on insights from Service Oriented Architecture (SOA)principles (Aregu, 2014; Amiyo, 2012; Kamoun, 2007). The integration of SOA principles enabledthe building of applications with good levels of flexibility, agility and simplification (Aregu, 2014;Keen and Sol, 2008; Kamoun, 2007). Based on the SOA principles, instantiation involved cross-platform implementation, loose coupling and set up of well-defined interfaces. The PDES wasinstantiated using several programming languages that included; Hyper Text Mark-up Language(HTML); JavaScript web development languages; Cascading Style Sheets (CSS); MySQL and PHPhypertext Preprocessor (PHP).
The PDES is a web-based system that is hosted on a remote server and connected to a remoteMySQL database. This is to enable the different users to access the studio on their devices at anylocation and anytime. The PDES runs in a web browser and is compatible with browsers such asMozilla Firefox, Internet Explorer, Opera and Google Chrome. Therefore, any user with a webbrowser can be able to access the studio. The PDES is hosted under the domain namehttp://www.poultrydes.com (see figure 2) and allows different users to create accounts whichundergo a verification process as part of the PDES’ role in addressing the challenge of inadequateregulation which was noted in this study. Users include poultry farmers, input suppliers, outputbuyers, poultry health experts and the different regulators of the industry. Upon log in by a registeredfarmer, the five suites are presented on the left hand side vertical menu in the studio. Each menu itemrepresents a suite and these are clickable (in form of links). Upon clicking a particular suite, anexpandable dropdown menu with services and sub-suites of the suite is displayed. The clicked linkbecomes active by giving a grey background to the main link and dropdown links thus this enablesthe user to easily view and track their activities on the studio. When a user clicks on a particular

152 International Journal ofManagement, Business, and EconomicsIJMBE
service, the corresponding web page containing the content about the selected menu item is loadedand displayed. For each of the suites, the main instantiation issues were the technology tools used toprovide the services and how to ensure that the services are easily accessible to users.
Figure 2 A Screen Shot of the PDES Dashboard in a Farmer’s Account
Below is a full description of the instantiated PDES suites and services:
Planning Suite:
In the PDES, the planning suite provides farmers with relevant information and tools to planfor their farm businesses. The suite provides three key services of rearing information, market reportsand budgeting. When the user clicks the Planning suite, the dropdown menu with Rearinginformation, Market Reports and Budget services is displayed. Under the “Rearing Information”service, relevant information concerning poultry farm management and flock management ispresented in horizontal tabs which enable the user to switch between different sections on the sameweb page. Each tab represents a section of different rearing information which poultry farmersrequire not only at planning but throughout their processes of farm management. This informationhas been split into small units or learning objects and the text is accompanied by images to facilitatefarmer understanding. Each section has various sub-sections shown by tabs on a dropdown menuwhich is displayed when the user clicks on the Arrow Down Caret (icon) next to the main sectiontitle. Tabs were used because the user is able to access sections or switch between sections withoutnecessarily loading the pages afresh, hence avoiding high data costs. The “Market Reports” servicewas particularly designed to enhance farmers to explore their market environments during planningand overall management of farm and flocks. As noted by Keen and Sol (2008), the notion of decisionenhancement focusses on keeping the decision maker in the loop and not taking them out of thedecision making process. The “Market Reports” service provides farmers with a market guide oncosts of different poultry farm inputs and outputs. In this service, MySQL database tables werecreated on an online server for each of the items (both inputs and outputs) involved in poultry farmmanagement (e.g day old chicks, feeds, feeders, eggs, chicken etc.). The first time the user logs intothe system, they are presented with HTML tables of different items with columns showing the
types/categories of items and columns of costs. The users are allowed to update these costs basing ontheir different locations and operating environments. Every table has a button to update its contentwhenever the user has finished entering/updating the table item(s). When a user clicks the ‘update’button, the MySQL tables for the particular item is updated. This is done with the help of PHP scriptswhich post the user data into the online database. With this service, farmers are able to explore theirmarket environments if the costs provided by the studio don’t match their plans. Nonetheless, thestudio is continuously updated with average costs of the different inputs and outputs to guide farmerdecision making during the planning process. The “Budget” service facilitates farmers to prepareworking budgets for flock cycles because budgets inform decision making. When a farmer clicks onthe budget service, the studio displays a web page that contains a budget generation engine withbudgets Tabs. The budget generation engine allows the user to select a category/type of poultrywhich the farmer is interested in from a dropdown menu. The farmer then enters the number of birdshe/she wishes to plan for and clicks the “compute” button. The service helps the farmer to generate abudget based on the information provided as well as the costs of inputs and outputs as derived fromthe “Market Reports” service. The farmer can save the generated budget to the database under aname of their choice by entering a name and clicking the “save budget” button. By saving a budget,farmers are able to adopt a preferred budget for a particular flock cycle when they choose to. Thisbudget guides in monitoring of expenditure and income of a particular flock cycle. This budget canbe referred to by farmers throughout rearing and the studio uses the budget information to providefarmers with updates on expenditure and income of flocks in comparison to initial budget plans.
The Purchasing Suite:
The purchasing suite enhances poultry farmers’ decisions concerning purchase of farm inputsas well as inventory management. This suite has two key services i.e. “Supplier Catalogue” and“Inventory Management” services. When a user clicks on the Purchasing suite, a dropdown menucontaining ‘Supplier catalogue’, ‘My orders’ and ‘My inventory’ links is displayed and activated.The ‘Supplier Catalogue’ service is a one-stop centre where poultry farmers can find and interactwith all registered suppliers of their farm inputs. When a farmer clicks the supplier catalogue, theweb page loads and the studio automatically fetches all the suppliers whose accounts have beenapproved from the remote database and displays them on this web page. Data is fetched by PHPscripts and displayed by HTML. After loading the content of the web page, a dynamic search engineis displayed at the top of the page. The engine uses the “sortable” JavaScript plugin to perform anautomated search such that as the user types in the textbox, it automatically filters the supplier listand displays suppliers with characteristics that match the provided input. Farmers can searchsuppliers by location or product. This enhances the farmer’s decision in selecting a supplier as he/sheonly has to view a smaller number of suppliers who are relevant to the farmer’s needs at the time.Suppliers and their details are displayed on “data cards” with each data card representing a singlesupplier. The data cards provide summarised information about suppliers, the goods and servicesthey offer as well as their ratings on the studio. Ratings are generated from suppliers’ ability to meetregulation requirements as well as their ability to meet the expectations of customers served on thestudio. After successful purchase, the studio provides farmers with a “Review your supplier” formwhere farmers can share their views about their interactions with a supplier. These include quality ofservice/product offered and ability to meet service level agreements. After using the suppliers’products/services for three months, the studio again notifies farmers to do another review of theirsuppliers focussing on ‘after sales service’. The ratings are captured in the studio to guide decisionsabout other transactions of other farmers who may want to make decisions based on these views.When a farmer clicks a particular data card, a web page containing supplier detailed information,such as products, order forms and shopping cart is displayed. Here each product is also presented onits own data card. To order for an item, one enters quantity they want to purchase and clicks the
153International Journal ofManagement, Business, and EconomicsIJMBE
service, the corresponding web page containing the content about the selected menu item is loadedand displayed. For each of the suites, the main instantiation issues were the technology tools used toprovide the services and how to ensure that the services are easily accessible to users.
Figure 2 A Screen Shot of the PDES Dashboard in a Farmer’s Account
Below is a full description of the instantiated PDES suites and services:
Planning Suite:
In the PDES, the planning suite provides farmers with relevant information and tools to planfor their farm businesses. The suite provides three key services of rearing information, market reportsand budgeting. When the user clicks the Planning suite, the dropdown menu with Rearinginformation, Market Reports and Budget services is displayed. Under the “Rearing Information”service, relevant information concerning poultry farm management and flock management ispresented in horizontal tabs which enable the user to switch between different sections on the sameweb page. Each tab represents a section of different rearing information which poultry farmersrequire not only at planning but throughout their processes of farm management. This informationhas been split into small units or learning objects and the text is accompanied by images to facilitatefarmer understanding. Each section has various sub-sections shown by tabs on a dropdown menuwhich is displayed when the user clicks on the Arrow Down Caret (icon) next to the main sectiontitle. Tabs were used because the user is able to access sections or switch between sections withoutnecessarily loading the pages afresh, hence avoiding high data costs. The “Market Reports” servicewas particularly designed to enhance farmers to explore their market environments during planningand overall management of farm and flocks. As noted by Keen and Sol (2008), the notion of decisionenhancement focusses on keeping the decision maker in the loop and not taking them out of thedecision making process. The “Market Reports” service provides farmers with a market guide oncosts of different poultry farm inputs and outputs. In this service, MySQL database tables werecreated on an online server for each of the items (both inputs and outputs) involved in poultry farmmanagement (e.g day old chicks, feeds, feeders, eggs, chicken etc.). The first time the user logs intothe system, they are presented with HTML tables of different items with columns showing the
types/categories of items and columns of costs. The users are allowed to update these costs basing ontheir different locations and operating environments. Every table has a button to update its contentwhenever the user has finished entering/updating the table item(s). When a user clicks the ‘update’button, the MySQL tables for the particular item is updated. This is done with the help of PHP scriptswhich post the user data into the online database. With this service, farmers are able to explore theirmarket environments if the costs provided by the studio don’t match their plans. Nonetheless, thestudio is continuously updated with average costs of the different inputs and outputs to guide farmerdecision making during the planning process. The “Budget” service facilitates farmers to prepareworking budgets for flock cycles because budgets inform decision making. When a farmer clicks onthe budget service, the studio displays a web page that contains a budget generation engine withbudgets Tabs. The budget generation engine allows the user to select a category/type of poultrywhich the farmer is interested in from a dropdown menu. The farmer then enters the number of birdshe/she wishes to plan for and clicks the “compute” button. The service helps the farmer to generate abudget based on the information provided as well as the costs of inputs and outputs as derived fromthe “Market Reports” service. The farmer can save the generated budget to the database under aname of their choice by entering a name and clicking the “save budget” button. By saving a budget,farmers are able to adopt a preferred budget for a particular flock cycle when they choose to. Thisbudget guides in monitoring of expenditure and income of a particular flock cycle. This budget canbe referred to by farmers throughout rearing and the studio uses the budget information to providefarmers with updates on expenditure and income of flocks in comparison to initial budget plans.
The Purchasing Suite:
The purchasing suite enhances poultry farmers’ decisions concerning purchase of farm inputsas well as inventory management. This suite has two key services i.e. “Supplier Catalogue” and“Inventory Management” services. When a user clicks on the Purchasing suite, a dropdown menucontaining ‘Supplier catalogue’, ‘My orders’ and ‘My inventory’ links is displayed and activated.The ‘Supplier Catalogue’ service is a one-stop centre where poultry farmers can find and interactwith all registered suppliers of their farm inputs. When a farmer clicks the supplier catalogue, theweb page loads and the studio automatically fetches all the suppliers whose accounts have beenapproved from the remote database and displays them on this web page. Data is fetched by PHPscripts and displayed by HTML. After loading the content of the web page, a dynamic search engineis displayed at the top of the page. The engine uses the “sortable” JavaScript plugin to perform anautomated search such that as the user types in the textbox, it automatically filters the supplier listand displays suppliers with characteristics that match the provided input. Farmers can searchsuppliers by location or product. This enhances the farmer’s decision in selecting a supplier as he/sheonly has to view a smaller number of suppliers who are relevant to the farmer’s needs at the time.Suppliers and their details are displayed on “data cards” with each data card representing a singlesupplier. The data cards provide summarised information about suppliers, the goods and servicesthey offer as well as their ratings on the studio. Ratings are generated from suppliers’ ability to meetregulation requirements as well as their ability to meet the expectations of customers served on thestudio. After successful purchase, the studio provides farmers with a “Review your supplier” formwhere farmers can share their views about their interactions with a supplier. These include quality ofservice/product offered and ability to meet service level agreements. After using the suppliers’products/services for three months, the studio again notifies farmers to do another review of theirsuppliers focussing on ‘after sales service’. The ratings are captured in the studio to guide decisionsabout other transactions of other farmers who may want to make decisions based on these views.When a farmer clicks a particular data card, a web page containing supplier detailed information,such as products, order forms and shopping cart is displayed. Here each product is also presented onits own data card. To order for an item, one enters quantity they want to purchase and clicks the

154 International Journal ofManagement, Business, and EconomicsIJMBE
“Add to cart” button. The studio then computes the amount payable depending on orders presentedand the prices set by the supplier. The orders are reviewed by the supplier who may choose respondto the order as per terms agreed by both parties. The progress of orders as per response from thesupplier is captured into a remote database with the help of PHP scripts. The ‘My Orders’ button,displays information about a farmers’ orders e.g pending, rejected, accepted but pending payments,accepted and pending delivery or delivered. PHP is used here to fetch the information that wasposted in the “Supplier Catalogue” and HTML displays the content in a user friendly and easy tounderstand table format. A “Loop” is done through the database table in order to fetch all the ordersby the given user. Using the “My Orders” button, a farmer is able to know the status of his/her ordersand undertake necessary actions such as payments, delivery or pick up plans and preparation ofstorage space. Once the orders are successfully delivered to the farm, they are registered into thefarm inventory and the “Inventory Management” service tracks them from there on. The InventoryManagement service supports farmers to manage stock in their inventories. Using this service,poultry farmers are able register all purchases as they enter inventory, monitor how stocks are put touse and alert the farmer at the appropriate time for restocking before stocks run out to enhance thedecisions concerning purchase or optimal utilisation. This service enables poultry farmers tomaintain control over their inventories as well as make informed decisions concerning any purchasesor utilization of farm inputs.
Rearing Suite:
The rearing suite provides day to day guidelines of flock handling for poultry farmers. Thissuite provides two services of process monitoring and record keeping and is also embedded with thefeed mixing and health management sub-suites. When a user clicks the rearing link, a dropdownmenu showing flock registration, my farm records, KPI reports, feed mixing and health managementare displayed. The flock registration link gives a web page with tabs for registering farm flockbatches and viewing all registered flock batches. A flock batch is considered as a group of day oldchicks that are brought into the farm on the same day and reared together till sell off. Farms can haveone or various flock batches. On the studio, the registered flock batches are presented in a simple-to-read HTML table containing summarised information on the flocks as fetched from the database.The user can click the “view more” icon and get a modal pop up with details of the selected flockbatch. To register new flock, a farmer clicks the flock registration link and updates the studio withinformation concerning the new flock batch received at the farm. Depending on the informationregistered, the rearing suite generates standard guidelines for the particular flock for its entire flocklifecycle according to key performance indicators (KPI) of flock growth. The studio simplifies thisdetailed content to ease farmer understanding by presenting it in an easy-to-read format of simplegraphs. The key performance indicators were provided by farmers during exploration. They includebody weight, feeding pattern, mortality rates, water consumption, production rates, lighting amongothers. Besides this initial registration, farmers are able to use this suite to keep all relevant recordsconcerning the farm. On a daily basis, farmers or their delegated assistants are encouraged to take amoment to observe flock and make key observations, which are recorded on this service. Duringexploration, we noted that farmers believe they have salient knowledge and like to make decisionsbased on their personal observations of flock. This service equips farmers to observe flock and takenote of important information concerning flock.
The feed mixing sub-suite guides farmers to generate workable feed formulations for flock.While the purchasing suite encourages farmers to purchase quality and trustable whole feed, thefeed-mixing suite was designed and instantiated to address farmers who may still prefer to mix theirown feeds. When a user clicks on the feed mixing sub-suite, the studio automatically fetches andselects the latest or last registered flock for the user in order to carry out the computations. The user
has the ability to alter the flock by clicking on the dropdown at the top right hand side of the webpage. This presents the user with flocks that exist in the database to select the one for whom he wantsto generate a feed formulation. When a flock is chosen, the system automatically computes the age ofthe flock by using the current date and the hatching date that was provided by the user during flockregistration. Based on the details of the selected flock batch, a feed mixing generation engine and anHTML table for displaying the results are generated and displayed on the web page. The user canthen provide the sub-suite with specific information such as how many kilograms of feed he/sheintends to mix before clicking the “Generate” button. The system computes and displays an HTMLtable with the feed mixtures according to the selected flock’s unique characteristics.
The health management sub-suite is a one-stop centre for all poultry health concerns. Thesub-suite provides vaccination schedules for flocks and alerts farmers in time to performvaccinations, deworming and other mandatory health procedures of flock. The sub-suite alsoprovides a symptom checker, which guides farmers to make key observations of any symptoms ofchicken and provides relevant attention points which a farmer can take about observed symptoms.On this sub-suite, farmers are also able to contact an online poultry health expert and upload picturesfor relevant advice from the expert. When the Health Management link is clicked, a web page withTabs is displayed. The Tabs include: Vaccination schedule, Local vet listing, Symptoms checker,Self-diagnosis, Poultry diseases, Drugs, and Consult expert.
Marketing Suite:
The marketing suite enhances farmers’ market decisions. It has two main services: a buyerscatalogue and advertising board. When a farmer clicks on the marketing suite, the buyers catalogue,advertisement board and farm sale records are displayed in a dropdown menu. The buyers cataloguedisplays a web page containing registered buyers of poultry farm outputs. The web page hasclickable data cards that contain the buyer information. These are similar to the ones used in thesupplier catalogue of the purchasing suite. When a data card is clicked, more detailed informationabout a given buyer is fetched and loaded on another web page. The buyers’ catalogue is a one-stopmarket where farmers can sell their farm products or outputs. In this market, farmers are able tovirtually interface with vetted buyers of farm produce, agree on service level agreements andcomplete their sales without the need for traditional forms of marketing and selling. The PDESmarket is an open and transparent market where farmers are availed with full market information andprices are set by market forces. It is a practical solution to problems of informal markets whichimpact farmer decision making processes as noted during exploration. The marketing suite also hasan advertisement service where farmers can advertise their products so that buyers are able to readilyfind them and contact them online to finalize sale agreements before proceeding to buy. When afarmer clicks on the advertisements service, an HTML form is displayed on the web page. This formallows the user to create an advert and save it into the database by clicking the “post advert” button.The saved data will then be fetched and accessed by potential buyers. On this same page, the studiofetches the previously posted adverts and displays them together with the potential buyers to enablethe user track their posted adverts. The marketing suite is also embedded with a sales managementoption which fetches and displays an HTML table on a web page comprising of all the informationabout the sales recorded by the user. To save a record, the user clicks the “Record new farm sale”button. The web page expands and displays an HTML form that the user fills in and submits to thedatabase by clicking the “save” button. Sales management allows farmers to keep all records of salesas these can be used for decision making at different stages of farm management. The sales on thissuite are reconciled with the adopted working budget in the planning suite which helps the farmer toreview progress of a particular flock batch as far as planned income versus actual income isconcerned.
155International Journal ofManagement, Business, and EconomicsIJMBE
“Add to cart” button. The studio then computes the amount payable depending on orders presentedand the prices set by the supplier. The orders are reviewed by the supplier who may choose respondto the order as per terms agreed by both parties. The progress of orders as per response from thesupplier is captured into a remote database with the help of PHP scripts. The ‘My Orders’ button,displays information about a farmers’ orders e.g pending, rejected, accepted but pending payments,accepted and pending delivery or delivered. PHP is used here to fetch the information that wasposted in the “Supplier Catalogue” and HTML displays the content in a user friendly and easy tounderstand table format. A “Loop” is done through the database table in order to fetch all the ordersby the given user. Using the “My Orders” button, a farmer is able to know the status of his/her ordersand undertake necessary actions such as payments, delivery or pick up plans and preparation ofstorage space. Once the orders are successfully delivered to the farm, they are registered into thefarm inventory and the “Inventory Management” service tracks them from there on. The InventoryManagement service supports farmers to manage stock in their inventories. Using this service,poultry farmers are able register all purchases as they enter inventory, monitor how stocks are put touse and alert the farmer at the appropriate time for restocking before stocks run out to enhance thedecisions concerning purchase or optimal utilisation. This service enables poultry farmers tomaintain control over their inventories as well as make informed decisions concerning any purchasesor utilization of farm inputs.
Rearing Suite:
The rearing suite provides day to day guidelines of flock handling for poultry farmers. Thissuite provides two services of process monitoring and record keeping and is also embedded with thefeed mixing and health management sub-suites. When a user clicks the rearing link, a dropdownmenu showing flock registration, my farm records, KPI reports, feed mixing and health managementare displayed. The flock registration link gives a web page with tabs for registering farm flockbatches and viewing all registered flock batches. A flock batch is considered as a group of day oldchicks that are brought into the farm on the same day and reared together till sell off. Farms can haveone or various flock batches. On the studio, the registered flock batches are presented in a simple-to-read HTML table containing summarised information on the flocks as fetched from the database.The user can click the “view more” icon and get a modal pop up with details of the selected flockbatch. To register new flock, a farmer clicks the flock registration link and updates the studio withinformation concerning the new flock batch received at the farm. Depending on the informationregistered, the rearing suite generates standard guidelines for the particular flock for its entire flocklifecycle according to key performance indicators (KPI) of flock growth. The studio simplifies thisdetailed content to ease farmer understanding by presenting it in an easy-to-read format of simplegraphs. The key performance indicators were provided by farmers during exploration. They includebody weight, feeding pattern, mortality rates, water consumption, production rates, lighting amongothers. Besides this initial registration, farmers are able to use this suite to keep all relevant recordsconcerning the farm. On a daily basis, farmers or their delegated assistants are encouraged to take amoment to observe flock and make key observations, which are recorded on this service. Duringexploration, we noted that farmers believe they have salient knowledge and like to make decisionsbased on their personal observations of flock. This service equips farmers to observe flock and takenote of important information concerning flock.
The feed mixing sub-suite guides farmers to generate workable feed formulations for flock.While the purchasing suite encourages farmers to purchase quality and trustable whole feed, thefeed-mixing suite was designed and instantiated to address farmers who may still prefer to mix theirown feeds. When a user clicks on the feed mixing sub-suite, the studio automatically fetches andselects the latest or last registered flock for the user in order to carry out the computations. The user
has the ability to alter the flock by clicking on the dropdown at the top right hand side of the webpage. This presents the user with flocks that exist in the database to select the one for whom he wantsto generate a feed formulation. When a flock is chosen, the system automatically computes the age ofthe flock by using the current date and the hatching date that was provided by the user during flockregistration. Based on the details of the selected flock batch, a feed mixing generation engine and anHTML table for displaying the results are generated and displayed on the web page. The user canthen provide the sub-suite with specific information such as how many kilograms of feed he/sheintends to mix before clicking the “Generate” button. The system computes and displays an HTMLtable with the feed mixtures according to the selected flock’s unique characteristics.
The health management sub-suite is a one-stop centre for all poultry health concerns. Thesub-suite provides vaccination schedules for flocks and alerts farmers in time to performvaccinations, deworming and other mandatory health procedures of flock. The sub-suite alsoprovides a symptom checker, which guides farmers to make key observations of any symptoms ofchicken and provides relevant attention points which a farmer can take about observed symptoms.On this sub-suite, farmers are also able to contact an online poultry health expert and upload picturesfor relevant advice from the expert. When the Health Management link is clicked, a web page withTabs is displayed. The Tabs include: Vaccination schedule, Local vet listing, Symptoms checker,Self-diagnosis, Poultry diseases, Drugs, and Consult expert.
Marketing Suite:
The marketing suite enhances farmers’ market decisions. It has two main services: a buyerscatalogue and advertising board. When a farmer clicks on the marketing suite, the buyers catalogue,advertisement board and farm sale records are displayed in a dropdown menu. The buyers cataloguedisplays a web page containing registered buyers of poultry farm outputs. The web page hasclickable data cards that contain the buyer information. These are similar to the ones used in thesupplier catalogue of the purchasing suite. When a data card is clicked, more detailed informationabout a given buyer is fetched and loaded on another web page. The buyers’ catalogue is a one-stopmarket where farmers can sell their farm products or outputs. In this market, farmers are able tovirtually interface with vetted buyers of farm produce, agree on service level agreements andcomplete their sales without the need for traditional forms of marketing and selling. The PDESmarket is an open and transparent market where farmers are availed with full market information andprices are set by market forces. It is a practical solution to problems of informal markets whichimpact farmer decision making processes as noted during exploration. The marketing suite also hasan advertisement service where farmers can advertise their products so that buyers are able to readilyfind them and contact them online to finalize sale agreements before proceeding to buy. When afarmer clicks on the advertisements service, an HTML form is displayed on the web page. This formallows the user to create an advert and save it into the database by clicking the “post advert” button.The saved data will then be fetched and accessed by potential buyers. On this same page, the studiofetches the previously posted adverts and displays them together with the potential buyers to enablethe user track their posted adverts. The marketing suite is also embedded with a sales managementoption which fetches and displays an HTML table on a web page comprising of all the informationabout the sales recorded by the user. To save a record, the user clicks the “Record new farm sale”button. The web page expands and displays an HTML form that the user fills in and submits to thedatabase by clicking the “save” button. Sales management allows farmers to keep all records of salesas these can be used for decision making at different stages of farm management. The sales on thissuite are reconciled with the adopted working budget in the planning suite which helps the farmer toreview progress of a particular flock batch as far as planned income versus actual income isconcerned.

156 International Journal ofManagement, Business, and EconomicsIJMBE
Collaboration Suite:
The collaboration suite is a place where stakeholders of the poultry industry can engage oneanother and network. The suite has three services for all users of the PDES: The PDES timeline, theChatroom and Poultry news as displayed on the drop down menu of the suite. The PDES Timeline isan intersection of users on the PDES. This service taps into the advance of social networking, whichhas been proven to help people build flexible relationships with remote talent (Archak, 2010) as wellas support crowd sourcing of new ideas (Di Gangi and Wasko, 2009). When a user goes to the PDEStimeline, different information that has been shared by other users is displayed on this web page. TheTimeline is open for all users to post their views, share experiences, blog and discuss issues ofconcern in an open and all-involving manner. The PDES timeline also allows users to uploadpictures to make experience sharing even more rational. Users can comment on a particular post byclicking the “comment” button. The chatroom service allows users to hold private chats withindividuals and also facilitates group meetings. When one clicks the chatroom link, a web pagecontaining the various users of the system is displayed. Each user is presented on a data card. Eachdata card has a “send message” button that enables the user to initiate a private conversation with auser of choice. The studio uses the “auto-load” and “non-load” JavaScript plugin to fetch and displaythe sent message in the chat space between the two parties without repeatedly loading the web pagethroughout the conversation. The user also has the ability to create or initiate a group chat. This isachieved by clicking on the “Create new group” link under the “GROUPS” section on the rightsidebar. To initiate a group conversation, the user clicks on the group name. The studio with the helpof the “auto-load” JavaScript plugin keeps on updating and displaying the activity of the users on thesystem by providing the status in the right sidebar. This also uses the “Sortable” plugin that enablethe user to perform a dynamic search in the user list as the user types in the characters in the textbox.All conversations are fetched and displayed on the main chatroom web page which is displayed onclicking the “chatroom” link. To create a virtual group meeting, one is required to enter details aboutthe meeting (i.e. date, time and planned duration), meeting agenda and then proceed to inviteselected invitees for the meeting. Invitations are then sent to the inboxes and dashboard alerts of allinvited users. At the time of meeting, all attendees are able to type and submit their views forconsideration by others. The facilitator of the meeting manages the entire meeting process by callingthe meeting to order, guiding the discussion, activating the meeting agenda at different times to guidethe discussion and finally calling the meeting to adjournment or close. Thereafter, the PDESautomatically provides all attendees with a report detailing the entire meeting proceedings. Finally,the Poultry News service is a repository for all current news concerning the poultry industry. Thisnews can be handy in updating users about issues concerning the industry. The system fetchesrandom poultry news across the internet. This is achieved through sending an “HTTP request” withkeywords that are used to compare, match and filter content that is displayed on the web page.
Evaluation of the PDES
The Technology Acceptance Model (Davis, 1989) suggests that when users are presentedwith a particular information technology, a number of factors, notably perceived usefulness andperceived usability influence their decisions of how and when they will use the technology. Keen andSol (2008) also mention the constructs of usefulness and usability as important in studio evaluation.The PDES was evaluated for perceived usefulness and perceived usability to establish the possibilityof it being put to use to address the decision making needs and challenges of poultry farmers in EastAfrica. The concept of usefulness in the PDES evaluation involved understanding whether the PDESconstituted valuable tools to enhance poultry farmers’ decision making processes while usabilityfocused on the user-system axis.
For evaluation, the study employed a multi-method approach involving practicalexperimentation of the PDES by poultry farmers and expert evaluation by domain experts from thefields of information systems and poultry farming. The evaluation of the PDES involved 20 poultryfarmers and 79 domain experts. The primary method for the evaluation was interviews facilitated bytwo separate questionnaires for the two groups of evaluation participants.
From the evaluation, we can conclude that poultry farmers agreed that the PDES has thepotential to achieve its objective of enhancing poultry farmers’ decisions and is easy to use. From theresults, we also note that the farmers opined that usability can be better achieved with meticuloustraining. Domain experts also highly perceived the PDES design and the studio as useful and usablein addressing the poultry farmers’ decision making challenges. Evaluators generally observed thatthe PDES was a good input for the poultry industry and had the potential to solve the decisionmaking challenges of poultry farmers.
Nonetheless, we also note that participants raised concerns about the general low use ofcomputers and internet at farms across East Africa and raised concerns about the option of an offlinePDES. Despite the enormous spread of the internet, this shows that the benefits of the internet havenot impacted poultry farmers in the region like other economic activities. The spread of internetusage is generally associated with positive economic outcomes such as trade and economic growth(Elgin, 2013). In Uganda alone, internet users grew tremendously from 5.7 million people in 2012 to8.5 million people in 2014. The use of an online based PDES therefore will be part of the ICTrevolution and therefore a technological development that poultry farmers can embrace especially ifits usefulness and usability have been confirmed.
The importance of lobbying governments to support the efficient running of PDES throughimplementation of the regulatory environment envisioned by the studio was another concern raisedby evaluators. While there has been an apparent disconnect between scientific knowledge andimplementation in many fields (Cockburn et al., 2016), it has mainly been attributed to mismatchesbetween the knowledge that researchers generate and that which practitioners require in theirdecision making and practice (Van Kerkhoff and Lebel 2006, McNie 2007). The evaluation of thePDES confirms those poultry farmers’ requirements in decision making and practice can beaddressed by the PDES if it is put to use by farmers and their stakeholders. In recent years, the EastAfrican countries have promoted policy frameworks to support the agriculture sectors (FAO, 2009)and the PDES is one of several ways that governments can implement policies aimed at improvingthe poultry industry.
5. Conclusion and Recommendation
This study originated from a need to improve management competences of poultry farmers inEast Africa by enhancing their decision making processes. Design science research should makeclear contributions to the real world application environment from which the research problem oropportunity is drawn in addition to knowledge contribution (Hevner et al., 2004). Van de Ven andJohnson (2006) also emphasized that engaged scholarship should not only facilitate the relevance ofresearch for practice but also contribute significantly to advancing research knowledge in a givenproblem domain. From the perspectives of both engaged scholarship and design science, which arethe guiding philosophies of this research, contribution to science and practice are important. Hevneret al (2004) also noted that additions to the knowledge base as a result of design science research caninclude any extensions made to original theories and methods during the research.

157International Journal ofManagement, Business, and EconomicsIJMBE
Collaboration Suite:
The collaboration suite is a place where stakeholders of the poultry industry can engage oneanother and network. The suite has three services for all users of the PDES: The PDES timeline, theChatroom and Poultry news as displayed on the drop down menu of the suite. The PDES Timeline isan intersection of users on the PDES. This service taps into the advance of social networking, whichhas been proven to help people build flexible relationships with remote talent (Archak, 2010) as wellas support crowd sourcing of new ideas (Di Gangi and Wasko, 2009). When a user goes to the PDEStimeline, different information that has been shared by other users is displayed on this web page. TheTimeline is open for all users to post their views, share experiences, blog and discuss issues ofconcern in an open and all-involving manner. The PDES timeline also allows users to uploadpictures to make experience sharing even more rational. Users can comment on a particular post byclicking the “comment” button. The chatroom service allows users to hold private chats withindividuals and also facilitates group meetings. When one clicks the chatroom link, a web pagecontaining the various users of the system is displayed. Each user is presented on a data card. Eachdata card has a “send message” button that enables the user to initiate a private conversation with auser of choice. The studio uses the “auto-load” and “non-load” JavaScript plugin to fetch and displaythe sent message in the chat space between the two parties without repeatedly loading the web pagethroughout the conversation. The user also has the ability to create or initiate a group chat. This isachieved by clicking on the “Create new group” link under the “GROUPS” section on the rightsidebar. To initiate a group conversation, the user clicks on the group name. The studio with the helpof the “auto-load” JavaScript plugin keeps on updating and displaying the activity of the users on thesystem by providing the status in the right sidebar. This also uses the “Sortable” plugin that enablethe user to perform a dynamic search in the user list as the user types in the characters in the textbox.All conversations are fetched and displayed on the main chatroom web page which is displayed onclicking the “chatroom” link. To create a virtual group meeting, one is required to enter details aboutthe meeting (i.e. date, time and planned duration), meeting agenda and then proceed to inviteselected invitees for the meeting. Invitations are then sent to the inboxes and dashboard alerts of allinvited users. At the time of meeting, all attendees are able to type and submit their views forconsideration by others. The facilitator of the meeting manages the entire meeting process by callingthe meeting to order, guiding the discussion, activating the meeting agenda at different times to guidethe discussion and finally calling the meeting to adjournment or close. Thereafter, the PDESautomatically provides all attendees with a report detailing the entire meeting proceedings. Finally,the Poultry News service is a repository for all current news concerning the poultry industry. Thisnews can be handy in updating users about issues concerning the industry. The system fetchesrandom poultry news across the internet. This is achieved through sending an “HTTP request” withkeywords that are used to compare, match and filter content that is displayed on the web page.
Evaluation of the PDES
The Technology Acceptance Model (Davis, 1989) suggests that when users are presentedwith a particular information technology, a number of factors, notably perceived usefulness andperceived usability influence their decisions of how and when they will use the technology. Keen andSol (2008) also mention the constructs of usefulness and usability as important in studio evaluation.The PDES was evaluated for perceived usefulness and perceived usability to establish the possibilityof it being put to use to address the decision making needs and challenges of poultry farmers in EastAfrica. The concept of usefulness in the PDES evaluation involved understanding whether the PDESconstituted valuable tools to enhance poultry farmers’ decision making processes while usabilityfocused on the user-system axis.
For evaluation, the study employed a multi-method approach involving practicalexperimentation of the PDES by poultry farmers and expert evaluation by domain experts from thefields of information systems and poultry farming. The evaluation of the PDES involved 20 poultryfarmers and 79 domain experts. The primary method for the evaluation was interviews facilitated bytwo separate questionnaires for the two groups of evaluation participants.
From the evaluation, we can conclude that poultry farmers agreed that the PDES has thepotential to achieve its objective of enhancing poultry farmers’ decisions and is easy to use. From theresults, we also note that the farmers opined that usability can be better achieved with meticuloustraining. Domain experts also highly perceived the PDES design and the studio as useful and usablein addressing the poultry farmers’ decision making challenges. Evaluators generally observed thatthe PDES was a good input for the poultry industry and had the potential to solve the decisionmaking challenges of poultry farmers.
Nonetheless, we also note that participants raised concerns about the general low use ofcomputers and internet at farms across East Africa and raised concerns about the option of an offlinePDES. Despite the enormous spread of the internet, this shows that the benefits of the internet havenot impacted poultry farmers in the region like other economic activities. The spread of internetusage is generally associated with positive economic outcomes such as trade and economic growth(Elgin, 2013). In Uganda alone, internet users grew tremendously from 5.7 million people in 2012 to8.5 million people in 2014. The use of an online based PDES therefore will be part of the ICTrevolution and therefore a technological development that poultry farmers can embrace especially ifits usefulness and usability have been confirmed.
The importance of lobbying governments to support the efficient running of PDES throughimplementation of the regulatory environment envisioned by the studio was another concern raisedby evaluators. While there has been an apparent disconnect between scientific knowledge andimplementation in many fields (Cockburn et al., 2016), it has mainly been attributed to mismatchesbetween the knowledge that researchers generate and that which practitioners require in theirdecision making and practice (Van Kerkhoff and Lebel 2006, McNie 2007). The evaluation of thePDES confirms those poultry farmers’ requirements in decision making and practice can beaddressed by the PDES if it is put to use by farmers and their stakeholders. In recent years, the EastAfrican countries have promoted policy frameworks to support the agriculture sectors (FAO, 2009)and the PDES is one of several ways that governments can implement policies aimed at improvingthe poultry industry.
5. Conclusion and Recommendation
This study originated from a need to improve management competences of poultry farmers inEast Africa by enhancing their decision making processes. Design science research should makeclear contributions to the real world application environment from which the research problem oropportunity is drawn in addition to knowledge contribution (Hevner et al., 2004). Van de Ven andJohnson (2006) also emphasized that engaged scholarship should not only facilitate the relevance ofresearch for practice but also contribute significantly to advancing research knowledge in a givenproblem domain. From the perspectives of both engaged scholarship and design science, which arethe guiding philosophies of this research, contribution to science and practice are important. Hevneret al (2004) also noted that additions to the knowledge base as a result of design science research caninclude any extensions made to original theories and methods during the research.

158 International Journal ofManagement, Business, and EconomicsIJMBE
This study applied the decision enhancement approach of Keen and Sol (2008), which isgrounded in the theory of decision support systems, to poultry farm management following thedesign science and engaged scholarship research philosophies. Decision enhancement has previouslybeen applied to various complex situations in research within the East African region (e.g. Katumba,2016; Mirembe, 2015; Aregu, 2014; Habinka, 2012; Amiyo, 2012). The successful application of thedecision enhancement approach to the different contexts substantiated its effectiveness in addressingdecision making challenges in the context of East Africa and the wider developing region.
From literature, it was noted that previous researchers from various disciplines havedeveloped poultry farming systems and approaches focusing on specific aspects of poultry farms andcustomizing them to their different contexts, giving farmers a diversity of approaches and systems.Examples of these include disease management (Stevenson et al., 2007; Sanson et al., 1993), flockreplacement (Negash, 2012), performance management (Ramsden and Gibbons, 2009),environmental management (Karmakar, 2007) and farm performance (Xiao et al., 2011). While thesesystems and approaches have been valuable additions to the body of knowledge and practice, thisresearch identified a lack of a more encompassing approach which addresses the poultry farmmanagement processes together considering their inter-relatedness and the consequential nature ofpoultry farmers’ decisions across these processes. This research fills this gap because the PDESdesign addresses the five processes of poultry farm management together thereby supporting theirinter-relatedness and consequential nature of the decisions involved. The PDES design therefore is acontribution to the body of knowledge in poultry farm management and decision making. Tofacilitate its application, the PDES design was instantiated into the PDES studio. The PDES studio isa facilitative, interactive environment in which poultry farmers’ decisions are enhanced. PDESfacilitates collaboration of farmers and other poultry industry stakeholders, provides guidance forfarmer decisions, addresses challenges of complexity in the business environment such as inadequateregulation and interprets and analyses relevant information for farmers. Accordingly, the PDES is apractical contribution to society.
Future research will focus on possible generalization of the PDES design to address thedecision making challenges in other livestock sectors such as dairy, piggery, rabbit farming, etc.
References
Amiyo, M. R. (2012). Decision enhancement and business process agility. PhD Thesis. University ofGroningen.
Archak, K. (2010). Money, glory and cheap talk: Analysing strategic behaviour of contestants insimultaneous crowd sourcing contests on TopCoder.com. Proceedings of the 19th InternationalConference on World Wide Web (pp. 21-30). ACM.
Aregu, R. (2014). Market and price decision enhancement services for farmers in Uganda. PhDThesis. University of Groningen.
Bewley, J. (2010). Precision dairy farming: Advanced analysis solution for future profitability. Paperpresented at the 1st North American conference on precision dairy management. Toronto, Canada.
Cockburn, J., Rouget, M., Slotow, R., Roberts, D., Boon, R., Douwes, E., Mutanga, O. (2016). Howto build science-action partnerships for local land-use planning and management: Lessons fromDurban, Soth Africa. Ecology and Society, 21(1).
Costello, G., & Donnellan, B. (2012). Proposing a meta-theoretical framework for innovationresearch. Social Innovation for Competitiveness, Organisational Performance and Human ExcellenceEuropean Academy of Management (EURAM) 2012 Conference. Rotterdam.
Davis, F. D. (1989). Perceived usefulness, perceived ease of use and user acceptance of InformationTechnology. MIS Quarterly, 13(3), 319-339.
De Vreede, G. J., & Briggs, R. O. (2005). Collaboration engineering: Designing repeatable processesfor high value collaboration tasks. Proccedings of the 38th Annual Hawaii International Conferenceon Systems Sciences. IEEE.
Demeke, S. (2008). Ethiopia: Poultry sector country review. FAO.
Di Gangi, P. M., & Wasko, M. (2009). Open innovation through online communities. In KnowledgeManagement and Organisational Learning (pp. 199-213). Springer.
Ejiri, A. H. (2012). A decision enhancement studio for starting a miners' enterprise in Uganda. . PhDThesis. University of Groningen.
Ekou, J. (2013). Eradicating extreme poverty among the rural poor in Uganda through poultry andcattle improvement programmes - A review. Journal of Development and Agricultural Economics5(11), 444-449.
Elgin , C. (2013). Internet usage and the shadow economy: Evidence from panel data. EconomicSystems, 111-121.
FAO. (2009). The state of the food and agriculture livestock in balance. Rome, Italy: Food andAgriculture Organisation of the United Nations.
FAO. (2011). Opportunities of poultry breeding programmes for family production in developingcountries: The bird for the poor. e-conference of the International Network for Family PoultryDevelopment.FAO. (2013). FAO Statistics: Food and Agricultural Organisation of the United Nations.http://faostat.fao.org/site/573/default.aspx#ancor.
Gregor, S., & Hevner, A. R. (2013). Positioning and presenting design science research formaximum impact. MIS Quarterly, 37(2), 337-355.
Hevner, A., & Chatterjee, S. (2010). Design research in information systems: Theory and practice.Springer Science and Business Media.
Hevner, A., & Chatterjee, S. (2010). Design Science Research in Information Systems. Springer.
Hevner, R. A., Salvatore, T. M., Jinsoo, P., & Sudha, R. (2004). Design science in informationsystems research. MIS Quarterly, 28(1), 75-105.
Jager, W., & Janssen, M. A. (2012, September). An updated conceptual framework for integratedmodelling of humaan decision making: The Consumat II. Workshop Complexity in the Real World@ ECCS 2012.

159International Journal ofManagement, Business, and EconomicsIJMBE
This study applied the decision enhancement approach of Keen and Sol (2008), which isgrounded in the theory of decision support systems, to poultry farm management following thedesign science and engaged scholarship research philosophies. Decision enhancement has previouslybeen applied to various complex situations in research within the East African region (e.g. Katumba,2016; Mirembe, 2015; Aregu, 2014; Habinka, 2012; Amiyo, 2012). The successful application of thedecision enhancement approach to the different contexts substantiated its effectiveness in addressingdecision making challenges in the context of East Africa and the wider developing region.
From literature, it was noted that previous researchers from various disciplines havedeveloped poultry farming systems and approaches focusing on specific aspects of poultry farms andcustomizing them to their different contexts, giving farmers a diversity of approaches and systems.Examples of these include disease management (Stevenson et al., 2007; Sanson et al., 1993), flockreplacement (Negash, 2012), performance management (Ramsden and Gibbons, 2009),environmental management (Karmakar, 2007) and farm performance (Xiao et al., 2011). While thesesystems and approaches have been valuable additions to the body of knowledge and practice, thisresearch identified a lack of a more encompassing approach which addresses the poultry farmmanagement processes together considering their inter-relatedness and the consequential nature ofpoultry farmers’ decisions across these processes. This research fills this gap because the PDESdesign addresses the five processes of poultry farm management together thereby supporting theirinter-relatedness and consequential nature of the decisions involved. The PDES design therefore is acontribution to the body of knowledge in poultry farm management and decision making. Tofacilitate its application, the PDES design was instantiated into the PDES studio. The PDES studio isa facilitative, interactive environment in which poultry farmers’ decisions are enhanced. PDESfacilitates collaboration of farmers and other poultry industry stakeholders, provides guidance forfarmer decisions, addresses challenges of complexity in the business environment such as inadequateregulation and interprets and analyses relevant information for farmers. Accordingly, the PDES is apractical contribution to society.
Future research will focus on possible generalization of the PDES design to address thedecision making challenges in other livestock sectors such as dairy, piggery, rabbit farming, etc.
References
Amiyo, M. R. (2012). Decision enhancement and business process agility. PhD Thesis. University ofGroningen.
Archak, K. (2010). Money, glory and cheap talk: Analysing strategic behaviour of contestants insimultaneous crowd sourcing contests on TopCoder.com. Proceedings of the 19th InternationalConference on World Wide Web (pp. 21-30). ACM.
Aregu, R. (2014). Market and price decision enhancement services for farmers in Uganda. PhDThesis. University of Groningen.
Bewley, J. (2010). Precision dairy farming: Advanced analysis solution for future profitability. Paperpresented at the 1st North American conference on precision dairy management. Toronto, Canada.
Cockburn, J., Rouget, M., Slotow, R., Roberts, D., Boon, R., Douwes, E., Mutanga, O. (2016). Howto build science-action partnerships for local land-use planning and management: Lessons fromDurban, Soth Africa. Ecology and Society, 21(1).
Costello, G., & Donnellan, B. (2012). Proposing a meta-theoretical framework for innovationresearch. Social Innovation for Competitiveness, Organisational Performance and Human ExcellenceEuropean Academy of Management (EURAM) 2012 Conference. Rotterdam.
Davis, F. D. (1989). Perceived usefulness, perceived ease of use and user acceptance of InformationTechnology. MIS Quarterly, 13(3), 319-339.
De Vreede, G. J., & Briggs, R. O. (2005). Collaboration engineering: Designing repeatable processesfor high value collaboration tasks. Proccedings of the 38th Annual Hawaii International Conferenceon Systems Sciences. IEEE.
Demeke, S. (2008). Ethiopia: Poultry sector country review. FAO.
Di Gangi, P. M., & Wasko, M. (2009). Open innovation through online communities. In KnowledgeManagement and Organisational Learning (pp. 199-213). Springer.
Ejiri, A. H. (2012). A decision enhancement studio for starting a miners' enterprise in Uganda. . PhDThesis. University of Groningen.
Ekou, J. (2013). Eradicating extreme poverty among the rural poor in Uganda through poultry andcattle improvement programmes - A review. Journal of Development and Agricultural Economics5(11), 444-449.
Elgin , C. (2013). Internet usage and the shadow economy: Evidence from panel data. EconomicSystems, 111-121.
FAO. (2009). The state of the food and agriculture livestock in balance. Rome, Italy: Food andAgriculture Organisation of the United Nations.
FAO. (2011). Opportunities of poultry breeding programmes for family production in developingcountries: The bird for the poor. e-conference of the International Network for Family PoultryDevelopment.FAO. (2013). FAO Statistics: Food and Agricultural Organisation of the United Nations.http://faostat.fao.org/site/573/default.aspx#ancor.
Gregor, S., & Hevner, A. R. (2013). Positioning and presenting design science research formaximum impact. MIS Quarterly, 37(2), 337-355.
Hevner, A., & Chatterjee, S. (2010). Design research in information systems: Theory and practice.Springer Science and Business Media.
Hevner, A., & Chatterjee, S. (2010). Design Science Research in Information Systems. Springer.
Hevner, R. A., Salvatore, T. M., Jinsoo, P., & Sudha, R. (2004). Design science in informationsystems research. MIS Quarterly, 28(1), 75-105.
Jager, W., & Janssen, M. A. (2012, September). An updated conceptual framework for integratedmodelling of humaan decision making: The Consumat II. Workshop Complexity in the Real World@ ECCS 2012.

160 International Journal ofManagement, Business, and EconomicsIJMBE
Kamoun, F. (2007). A roadmap towards the convergence of business process management andservice oriented architecture. ACM, Ubiquity, 8(14).
Karanja, G. M. (2014). Influence of management practices on sustainability of youth incomegenerating projectsin Kangema District, Murang'a County, Kenya. International Journal of Educationand Research, 2(2), 1-12.
Karmakar, S., Lague, C., Agnew, J., & Landry, H. (2007). Integrated decision support system (DSS)for manure management: A review and perspective. Computer and Electronics in Agriculture, 57(2),190-201.
Katongole , C. B., Sabiiti, E., Bareeba, F., & Ledin, I. (2011). Utilisation of market crop wastes asanimal feed in urban and peri-urban livestock production in Uganda. Journal of SustainableAgriculture, 329-342.
Katongole, C. B., Nambi-Kasozi, J., Lumu, R., Bareeba, F., Presto, M., Ivarsson, E., & Lindberg, J.E. (2013). Strategies for coping with feed scarcity among urban and peri-urban livestock farmers inKampala, Uganda. Journal of Agriculture and Rural Development in the Tropics and Subtropics(JARTS), 113(2), 165-174.
Katumba, P. M. (2016). A decision enhancement studio for water asset management. PhD Thesis.University of Groningen.
Keen, P. G., & Sol, H. G. (2008). Decision enhancement services: Rehearsing the future fordecisions that matter. IOS Press.
Kingori, A. M. (2011). Review of the factors that influence egg fertility and hatchability in poultry.International Journal of Poultry Science 10, 483-492.
Kutter, T., Tiemann, S., Siebert, R., & Fountas, S. (2011). The role of communication andcooperation in the adoption of precision farming. Precision Agriculture, 12(1), 2-17.
Kyarisiima, C. C., Kugonza, D. R., & Twesigye, C. K. (2004). The potential role of Ugandanindigenous chicken in poverty alleviation. The Uganda Journal Vol. 50:, 85-90.
Litoselliti, L. (2003). Using focus groups in research. London: Continuum.
March, J. G. (2010). Primer on decision making: How decisions happen. New York: Simon andSchuster.
McNie, E. (2007). Reconciling the supply of scientific information with user demands: An analysisof the problem and review of literature. Environmental Science, 10(1), 17-38.
Mintzberg, H., Rasinghani, D., & Theoret, A. (1976). The structure of unstructured decision process.Administrative Science Quarterly, 21(2), 246-275.
Mirembe, D. P. (2015). The threat nets approach to information systems security risk analysis. PhDThesis. University of Groningen.
Msoffe, G., & Ngulube, P. (2015). Information needs of poultry farmers in selected rural areas ofTanzania. Information Development. doi:026666915587749.
Mulira, N. K. (2007). Implementing inter-organisational service systems: An approach for emergingnetworks in volatile contexts. PhD Thesis. Delft University of Technology.
Nair, R. R. (2006). Agricultural information service for the farmers and the public: A study. ILABulletin, 42(5), 5-12.
NBS. (2014). Statistical Abstract. National Bureau of Standards. The United Republic of Tanzania.
Negash, H. Y. (2012). Using Management Insformation in Broiler Supply Chains. PhD Thesis.Wageningen University.
Osinga, S. A. (2015). The knowledge management arena: Agent-based modelling of the pig sector.PhD Thesis. Wageningen University.
Ramsden, J., & Gibbons, J. M. (2009). Modelling agri-environment interactions and trade-offs usingFarm-adopt-integration of models, investigation of scale, dynamics and uncertainty. Aspects ofApplied Biology: Integrated Agricultural Systems: Methodologies, modelling and measuring, 123-130.
Remenyi, D., Williams, B., Money, A., & Swartz, E. (1998). Doing Research in Business andManagement. London: Sage Publications.
RoK. (2007). Kenya integrated household budget survey (KIHBS) 2005/6 Vol. 1. Nairobi: Republicof Kenya.
Rowley, J. (2002). Using case studies in research. Management Research News, 25(1), 16-27.
Sanson, R. (1993). The developmeent of a decision support system for animal disease emergency.PhD Thesis. Massey University.
Selingmann, P. S., Wijers, G. M., & Sol, H. G. (1989). Analysing the structure of informationsystems methodologies: An alternative approach. First Dutch Conference on Information Systems.
Sol, H. G. (1988). Information systems development: A problem solving approach. Proceedings of1988 INTEC symposium, system analysis and design: A research strategy. Antlanta, Georgia USA.
Ssemaluulu, P. (2012). An instrument to assess information systems success in developing countries.The Netherlands: PhD Thesis. The University of Groningen.
Stevenson, M., Sanson, R., Miranda, A., Lawrence, K., & Morris, R. (2007). Decision supportsystems for monitoring and maintaining health in food animaal populations. New Zealand VeterinaryJournal, 55, 264-272.
Trostle, R., & Seeley, R. (2013). Developing countries dominate world demand for agriculturalproducts. USDA Economic Research Service.

161International Journal ofManagement, Business, and EconomicsIJMBE
Kamoun, F. (2007). A roadmap towards the convergence of business process management andservice oriented architecture. ACM, Ubiquity, 8(14).
Karanja, G. M. (2014). Influence of management practices on sustainability of youth incomegenerating projectsin Kangema District, Murang'a County, Kenya. International Journal of Educationand Research, 2(2), 1-12.
Karmakar, S., Lague, C., Agnew, J., & Landry, H. (2007). Integrated decision support system (DSS)for manure management: A review and perspective. Computer and Electronics in Agriculture, 57(2),190-201.
Katongole , C. B., Sabiiti, E., Bareeba, F., & Ledin, I. (2011). Utilisation of market crop wastes asanimal feed in urban and peri-urban livestock production in Uganda. Journal of SustainableAgriculture, 329-342.
Katongole, C. B., Nambi-Kasozi, J., Lumu, R., Bareeba, F., Presto, M., Ivarsson, E., & Lindberg, J.E. (2013). Strategies for coping with feed scarcity among urban and peri-urban livestock farmers inKampala, Uganda. Journal of Agriculture and Rural Development in the Tropics and Subtropics(JARTS), 113(2), 165-174.
Katumba, P. M. (2016). A decision enhancement studio for water asset management. PhD Thesis.University of Groningen.
Keen, P. G., & Sol, H. G. (2008). Decision enhancement services: Rehearsing the future fordecisions that matter. IOS Press.
Kingori, A. M. (2011). Review of the factors that influence egg fertility and hatchability in poultry.International Journal of Poultry Science 10, 483-492.
Kutter, T., Tiemann, S., Siebert, R., & Fountas, S. (2011). The role of communication andcooperation in the adoption of precision farming. Precision Agriculture, 12(1), 2-17.
Kyarisiima, C. C., Kugonza, D. R., & Twesigye, C. K. (2004). The potential role of Ugandanindigenous chicken in poverty alleviation. The Uganda Journal Vol. 50:, 85-90.
Litoselliti, L. (2003). Using focus groups in research. London: Continuum.
March, J. G. (2010). Primer on decision making: How decisions happen. New York: Simon andSchuster.
McNie, E. (2007). Reconciling the supply of scientific information with user demands: An analysisof the problem and review of literature. Environmental Science, 10(1), 17-38.
Mintzberg, H., Rasinghani, D., & Theoret, A. (1976). The structure of unstructured decision process.Administrative Science Quarterly, 21(2), 246-275.
Mirembe, D. P. (2015). The threat nets approach to information systems security risk analysis. PhDThesis. University of Groningen.
Msoffe, G., & Ngulube, P. (2015). Information needs of poultry farmers in selected rural areas ofTanzania. Information Development. doi:026666915587749.
Mulira, N. K. (2007). Implementing inter-organisational service systems: An approach for emergingnetworks in volatile contexts. PhD Thesis. Delft University of Technology.
Nair, R. R. (2006). Agricultural information service for the farmers and the public: A study. ILABulletin, 42(5), 5-12.
NBS. (2014). Statistical Abstract. National Bureau of Standards. The United Republic of Tanzania.
Negash, H. Y. (2012). Using Management Insformation in Broiler Supply Chains. PhD Thesis.Wageningen University.
Osinga, S. A. (2015). The knowledge management arena: Agent-based modelling of the pig sector.PhD Thesis. Wageningen University.
Ramsden, J., & Gibbons, J. M. (2009). Modelling agri-environment interactions and trade-offs usingFarm-adopt-integration of models, investigation of scale, dynamics and uncertainty. Aspects ofApplied Biology: Integrated Agricultural Systems: Methodologies, modelling and measuring, 123-130.
Remenyi, D., Williams, B., Money, A., & Swartz, E. (1998). Doing Research in Business andManagement. London: Sage Publications.
RoK. (2007). Kenya integrated household budget survey (KIHBS) 2005/6 Vol. 1. Nairobi: Republicof Kenya.
Rowley, J. (2002). Using case studies in research. Management Research News, 25(1), 16-27.
Sanson, R. (1993). The developmeent of a decision support system for animal disease emergency.PhD Thesis. Massey University.
Selingmann, P. S., Wijers, G. M., & Sol, H. G. (1989). Analysing the structure of informationsystems methodologies: An alternative approach. First Dutch Conference on Information Systems.
Sol, H. G. (1988). Information systems development: A problem solving approach. Proceedings of1988 INTEC symposium, system analysis and design: A research strategy. Antlanta, Georgia USA.
Ssemaluulu, P. (2012). An instrument to assess information systems success in developing countries.The Netherlands: PhD Thesis. The University of Groningen.
Stevenson, M., Sanson, R., Miranda, A., Lawrence, K., & Morris, R. (2007). Decision supportsystems for monitoring and maintaining health in food animaal populations. New Zealand VeterinaryJournal, 55, 264-272.
Trostle, R., & Seeley, R. (2013). Developing countries dominate world demand for agriculturalproducts. USDA Economic Research Service.

162 International Journal ofManagement, Business, and EconomicsIJMBE
Van de Kar, E. A. (2004). Designing mobile information services: An approach for organisations in avalue network. PhD Thesis. Delft University of Technology.
Van de Ven, A. (2007). Engaged Scholarship: A guide for organisational and social research. OxfordUniversity Press.
van Kerkhoff, L., & Lebel, L. (2006). Linking knowledge and action for sustainable development.Annual Review of Environment and Resources, 31(1), 445-477.
World Bank. (2007). World development report: Agriculture for development. The World Bank.
World Bank. (2008). Awakening Africa's sleeping giant: Prospects for commercial agriculture southof the Sahara. Agriculture and Rural development Unit, The World Bank.
Xiao, J., Wang, H., Shi, L., Lv, M., & Ma, H. (2011). The development of decision support systemsfor the production of layer. International Conference on Computer and Computing Technologies inAgriculture (pp. 161-168). Springer.

163International Journal ofManagement, Business, and EconomicsIJMBE
Van de Kar, E. A. (2004). Designing mobile information services: An approach for organisations in avalue network. PhD Thesis. Delft University of Technology.
Van de Ven, A. (2007). Engaged Scholarship: A guide for organisational and social research. OxfordUniversity Press.
van Kerkhoff, L., & Lebel, L. (2006). Linking knowledge and action for sustainable development.Annual Review of Environment and Resources, 31(1), 445-477.
World Bank. (2007). World development report: Agriculture for development. The World Bank.
World Bank. (2008). Awakening Africa's sleeping giant: Prospects for commercial agriculture southof the Sahara. Agriculture and Rural development Unit, The World Bank.
Xiao, J., Wang, H., Shi, L., Lv, M., & Ma, H. (2011). The development of decision support systemsfor the production of layer. International Conference on Computer and Computing Technologies inAgriculture (pp. 161-168). Springer.
Guide for Authors
International Journal of Management, Business, and Economics (IJMBE) is published by Sripatum University, University of Greenwich, and Lincoln University. It is published thrice yearly in a spring, summer, and fall edition and is directed toward the needs of academia, practitioners, executives, researchers, students, and the general public interested in business management (i.e., Marketing, Service Management, Innovation and Design in Business, Finance, Banking, Accounting, Economics, Insurance and Risk Management, Production, Industrial and Operation Management, Strategic Management and Management, International and Global Business Management, Entrepreneurships, Organization Behaviour, Business Ethics, Business Law, Business System, Hospitality and Tourism Management, Human Resource Management, and Office and Facility Management).
EDITORIAL POLICY
The IJMBE is designed as a forum for current research, opinions, and identification of trends in business management. The opinions expressed are those of the authors and do not necessarily reflect the opinions of the Editors, the Editorial Review Board, or Sripatum University, University of Greenwich, and Lincoln University.
The copyright of all published material belongs to Sripatum University, with future use rights reserved. This, however, does not limit the author’s right to use his or her own material.
ObjectivesThe editorial objectives of IJMBE are to advance knowledge and science and to stimulate greater thought and effort in the fields of business management, and by providing readers with:
• Novel and useful information;• New business management theory or techniques;• Research explaining about business management thought and practice;• Articles in subject areas which have significant current impact on thought and practice in business management.
ContentThe IJMBE will mainly consider for publication three types of articles:
1. Articles that report empirical research on business management issues.2. Articles that report on the development of methodologies and techniques that can enhance business management
decision making.3. Articles that report the application of decision tools to generic or specific business management problems.
Manuscripts should be between 4,000 and 6,000 words, typically 15-20 single-spaced, typewritten pages. Articles of shorter length are also acceptable. Only rarely will it be possible to publish a manuscript of more than 6,000 words.
ReviewArticles are considered for publication if they have not been published or accepted for publication elsewhere and are not being concurrently considered elsewhere. Authors will usually be notified of acceptance, rejection, or need for revision within 16 weeks of submission.
No manuscript is accepted for IJMBE until it has been reviewed by the Editor or one of the Associate Editors and at least two outside reviewers who are experts in their respective fields.

164 International Journal ofManagement, Business, and EconomicsIJMBE
All manuscripts are judged on their contribution to the advancement of the science and/or practice of business management. The editors expect all manuscripts to follow accepted standards for scholarly work. Manuscripts are judged not only on depth and scope of ideas presented and their contribution to the field, but also on their clarity, organization, readability, and comprehensibility.
Manuscripts should be written in a manner that is interesting and readable to both practitioners and academics. It is beneficial to include a section regarding managerial implications and discussion of the consequences of applying the proposed ideas. Technical terms should be defined.
MANUSCRIPT PREPARATION
Manuscripts should be typed single-spaced in 12-point type using Times Roman or similar type. Use single spacing in endnote references. Please allow the text to wrap, rather than entering a RETURN or LINEFEED after every line.
Manuscripts should be submitted electronically, preferably in Microsoft Word, to the Editors at the following e-mail address: [email protected], [email protected]. It is not possible to submit an electronic copy, send four (4) copies of the manuscript to the Editors. Non-electronic submissions require more time to administer, so authors should be aware that the processing time for their manuscripts will be longer.
The sections of the manuscript should be placed in the following order: Cover page, Title page, Authors, Abstract (on a page by itself) and Body, Illustrations, Citation, References, and Appendices.
Cover PageThe cover page should include the title of the manuscript and the authors’ name(s) in the order in which they will be printed. The following information should be provided for each co-author: name, title, university/company name, mailing address, telephone number, facsimile number, and e-mail address. Please indicate which co-author will serve as the primary contact for the Journal.
In addition to any acknowledgment of financial or technical assistance, this page should include each author’s title, present position, and complete address and telephone number. Please keep professional titles succinct.
Title PageType the title in bold type, all caps, single-spaced, and centered across the top of the first page, in 14 point Times New Roman, as illustrated above.
AuthorsThe author(s), affiliation(s), mailing address(es), and e-mail address(es) should be single-spaced and centered on the line below the title, in 12 point bold Times New Roman for the author(s), and in normal Times New Roman for the remainders. One line space should be used to separate author(s) from the paper title. Please do not use titles such as Dr., Professor, etc.
Abstract (on a page by itself), and BodyIntroduce the paper with an abstract of approximately 100-200 words, in 12 point Times New Roman. Begin with the centered heading “Abstract”. All body paragraphs should begin flush left (no paragraph indent) and right justified.

165International Journal ofManagement, Business, and EconomicsIJMBE
Single-space the body of the paper. Use 12 point Times New Roman throughout. Figures and tables should be placed as close as possible to where they are cited. First-level headings state the table or figure number. All tables and images should be embedded into the file and sized appropriately. All photographs should be sampled at 300 dpi (dots per inch). Keep in mind that web graphics are typically sampled at 72 dpi. Photographs must be properly sized and positioned in the body of the paper.
Illustrations (Tables and Figures)Each illustration should be numbered consecutively within its series type (Table 1, Table 2, Figure 1, Figure 2). If illustrations appear in appendices, they should be numbered consecutively, but separately from body illustrations (e.g., Table A-1, Figure A-1). In the text, refer to tables and figures by their numbers. Avoid using “above,” “below,” “preceding,” and similar terms. All Tables and Figures must have titles. Titles for each Table and Figure should be descriptive but not lengthy. The title should be in bold letters at the top of the Table or Figure.
Tables and Figures should be called “Table” or “Figure” and should be followed by a blank line and then the title for the table or figure also in bold letters at the top of the table or figure.
For Journal purposes, tables and figures are defined as follows: a table is comprised of rows and columns of numbers and/or text; a figure is a chart, graph, diagram, map, drawing, or any other non-text item that is not a table. Tables should be typed in the following style:
General DesignFor more effective communication and better quality reproduction when printed, tables and figures should be kept as simple and uncluttered as possible, while conveying all necessary information.
DetailsFootnotes should appear directly below illustrations, flush with the left edge, and they should be designated by small letters, rather than asterisks or numerals. Column or row heads should be footnoted only if the footnote applies to all items in the column or row. Complete source information must be provided for illustrations copied or derived from other sources. This complete information should be provided and an author-date citation should be given in a source note on the illustration. (Source notes are sized and placed like footnotes, below any footnotes for the illustration.)
If elements on an illustration are not labelled, but represent certain categories, items, or amounts, a complete key (legend) should be included. Make sure that necessary measures of statistical significance are reported with each illustration. Designate units (percent, dollars, hours, etc.) in column and row headings (tables) or in element labels or keys (figures). Separate from each figure, give numerical values for all points, bars, pie slices, etc., so that they can be readily reproduced by the typesetter, if necessary. Double-check formulae and mathematical terms and equations for consistency, readability, and accuracy. Add extra space between characters to clarify and separate the terms, and be sure that sub and superscript relationships are clear. Check for opening and closing parenthesis and brackets. Write the names of Greek and special characters in the margin.
Use tab indents or column alignment, rather than spaces, to align columns and indent headings.
English (USA) spelling should be used; foreign terms not commonly used in English (USA) should be italicized.

166 International Journal ofManagement, Business, and EconomicsIJMBE
Regarding Mathematical NotationThe percent sign (%) should be used in text and in tables. Mathematical notation must be clear within the text and illustrations. All equations must be very clearly typed. Display (separate line) equations should be aligned to the left margin. Italic type is used for letters in equations, except for trigonometric functions and logarithm abbreviations, which are plain (normal) type. Matrices and vectors are in boldface type. (If these cannot be typed in italic and boldface, italic type can be indicated by a hand-drawn straight underline and boldface by a wavy underline). Unusual and Greek symbols should be typed in the text using the Symbol capability. If no Symbol capability is possible, such special characters should be identified by name in a marginal note. (This is important; the editor may be not familiar with these symbols and may have difficulty producing the correct one without a marginal note.) For equations that might be too long to type in a 6” column, indicate appropriate breaks.
CitationThe IJMBE follows the reference format of Academy of Management Journal. This format is available at the AMJ’s websitehttp://aom.pace.edu/amjnew/style_guide.html. The use of footnotes is discouraged.
ReferencesReferences are to be listed alphabetically, last name first, followed by publication date in parentheses. Use full first name, not just initials. The reference list should be typed single-spaced in 12-point type. Please let the Endnotes wrap rather than using tabs or returns at the end of internal lines. Do not use indents, tabs, or symbols to delineate your paragraphs. Instead, use two hard returns between each reference.
Proceedings/Journal Articles:U-on, V. (2015), “Marketing Logistics in the Asean Economics Community: A Conceptual Model,” In Proceedings of the International Conference on Management, Business, and Economics & the 3rd International Conference on Tourism, Transport, and Logistics, February 12-14, 2015, Rydges Sydney Central, Sydney, Australia.
Lukason, O. and Hoffman, R. C. (2014), “Firm Bankruptcy Probability and Causes: An Integrated Study,” International Journal of Business and Management, Vol. 9, No. 11, p. 80-91.
Books:Morden, T. (2007), “Principles of Strategic Management” (3 Eds.), Ashgate Publishing: Burlington, USA.
Authors are responsible for the accuracy of their references. Check them carefully. Readers’ questions and comments about incomplete and inaccurate References will be referred to the article authors with a follow-up by the Editor. All authors of a referenced work should be listed; et al. should not be used in the Reference list. Undefined acronyms should not be used.
AppendicesIf any mathematical proof or development is used but not critical to the exposition of the main argument of the manuscript, authors should include it in an appendix. An appendix may also be used for the mathematical material that may be beyond the level of the average reader.

167International Journal ofManagement, Business, and EconomicsIJMBE
PermissionsSubmitting a manuscript to IJMBE constitutes an assignment of copyright to the Journal and a guarantee that the work is original. It also indicates that the author(s) owns it, and that no part of it has been previously published in substantially the same form, that it is not being published or considered for publication elsewhere, and that any use of others’ materials is by permission or falls within fair use standards of copyright law. The author(s) is responsible for obtaining any necessary permission from copyright holders and for paying any necessary fees. Extensive paraphrasing is considered disguised copying; permission is required.
Portions of an item, such as some of the data from a table, or part of a graphic representation of a model, can be used without permission if they are properly credited with full and exact source information and do not comprise a significant portion of the submitted article. Copies of written permissions should be submitted with the final manuscript.
Electronic SubmissionManuscripts should be submitted electronically, preferably in Microsoft Word, to the Editors at the following e-mail address: [email protected], [email protected]. If it is not possible to submit an electronic copy, send three (3) copies of the manuscript to the Editors. Non-electronic submissions require more time to administer, so authors should be aware that the processing time for their manuscripts will be longer.
When the authors are notified of acceptance, they will be asked to provide the final, accepted version of the article on in electronic format containing the article text files.
MANUSCRIPT SUBMISSION
All correspondence regarding submission of manuscripts should be directed to:
Ungul Laptaned, Editor-In-Chief, Graduate College of Management, Sripatum University, Bangkok, Thailand, Tel.: +66 2 561 3001, Fax.: +66 2 561 1721, E-mail: [email protected], [email protected].
Ioannis Manikas, Associate Editor, Department of Systems Management and Strategy, University of Greenwich, Greenwich, United Kingdom, Tel.: +44 20 8331 9000, Fax.: +44 20 8331 8145, E-mail: [email protected].
and
Gilbert Nartea, Guest Editor, Faculty of Commerce, Lincoln University, Lincoln, Canterbury, New Zealand, Tel.: +64 3 325 2811, Fax.: +64 3 325 3850, E-mail: [email protected].


Publishing Agreement
This agreement comes into effect if your Article is accepted for publication.
1. The undersigned thereby transfers any and all rights including all copyright right in the under-captioned paper in full-length version as well as the summary/abstract version(s) to International Journal of Management, Business, and Economics, known as IJMBE.
2. The Author warrants that the Article is the Author’s original work, has not been published before, and is not currently under consideration for publication elsewhere; and that the Article contains no libelous or unlawful statements and that it in no way infringes the right of others, and that the Author, as the owner of the copyright, is entitled to make this assignment.
3. If the Article was prepared jointly by more than one author, the Author warrants that he/she has been authorized by all co-authors to sign this agreement on their before behalf. The undersigned represents that he/she has the authority to sign this copyright agreement.
Please sign and date the document in black or blue ink.
Article Title: ___________________________________________________________________________________
Name (Print):__________________________________________________________________________________ Signed by the Author:___________________________________________________________________________ Date:________________________________________________________________________________________
Please return the completed and signed original form by mail, fax, or mail a scanned copy of the signed original to
SecretariatPhongvitchulada SurakhanSripatum University, Bangkok, ThailandTel.: +66 2 561 3001, Fax.: +66 2 561 1721E-mail: [email protected]: www.ijmbe.net

Please enter my annual subscription to International Journal of Management, Business, and Economics (IJMBE), including 3 issues for the year_____________Vol_____________No_____________
Institutional US$ 100.00Individual US$ 50.00Students US$ 25.00Single Copy US$ 15.00
Name:______________________________________________________________________________________ Address:________________________________________________________________________________
Tel:___________________Fax:___________________E-mail:__________________________________________
City:_________________________________________Country:_________________________________________
Payment Method
Cash Cheque Enclosed Bank Transfer
Payment can be made via our transfer account:Transfer to Bank: Thai Military BankBranch: Sripatum UniversityAccount Name: Sripatum UniversityAccount No: 032-2-24873-3Type of A/C: Saving Swift Code: TMBKTHBPlease allow 6-8 weeks for delivery.Please send your receipt to the journal address.
______________________________ Signature
SecretariatPhongvitchulada SurakhanSripatum University, Bangkok, ThailandTel.: +66 2 561 3001, Fax.: +66 2 561 1721E-mail: [email protected]: www.ijmbe.net
Supported by
Volume 5, Number 1, January - April 2018
Editors:Ungul Laptaned Ioannis ManikasGilbert Nartea
ISSN: 2408-1914
International Journal ofManagement, Business, and EconomicsIJMBE
● Impact of HR Practices on Employee Turnover and Job Satisfaction: Evidence from Pakistan Universities
Ali Muhammad Mohmand and Malik Shakeel Khan.............................................................. 7
● The Readability of Note Disclosures Daniel Tschopp, Doug Barney, and Passard C. Dean ......................................................... 29
● Changing Tax Policy Impact on the Risk Level of Vietnam Wholesale and Retail Firms Dinh Tran Ngoc Huy ............................................................................................................ 41
● Dependency of Human Resource Planning on Human Resource Information System: A Study on Banking Sector in Bangladesh Farha Sultana ...................................................................................................................... 57
● Logistics Crunch: Analysis of Intermodal Containers Resource in Pre and Post China-Pakistan Economic Corridor’s Establishment Maisam Ali and Shahzad Khurram ...................................................................................... 71
● Organizational Citizenship Behavior (OCB) Practices among the University Teachers: Bangladesh Perspective Mohammad Milon ................................................................................................................ 87
● Management of Historic Site for Cultural Heritage Tourism: A Case Study of Wat Rajabopit Sathitmahasimaram Rajaworavihara, Bangkok Panot Asawachai ............................................................................................................... 103
● Smart Bus Drivers: Fleet Management for Smart Workers Paradorn Khongmanee, Wuttipong Pongsuwan, and Suchai Thanawastien .................... 119
● The Impact of Human Resource Practices on Task Performance of Employees in Electrical, Electronics and Telecommunications Industry Group in Thailand Praphan Chaikidurajai and Wassana Persalae ................................................................. 129
● A Studio Based Approach for Enhancing Decisions of Poultry Farmers in East Africa Rebecca Pearl Tumwebaze and Henk G. Sol ................................................................... 143
Subscription Form

GRADUATECOLLEGE OF MANAGEMENT
SRIPATUM UNIVERSITY
Graduate College of ManagementSripatum University, Building 11, floor 11, 2410/2 Phaholyothin Road,Jatujak, Bangkok 10900, ThailandTel: (+66) 2579 1111 ext. 3000 - 4 Fax: (+66) 2579 1111 ext. 3011 E-Mail: [email protected]
Sripatum International CollegeSripatum University, Building 11, floor 8, 2410/2 Phaholyothin Road, Jatujak, Bangkok 10900, ThailandTel: (+66) 2579 1111 ext. 1017, 1018, 1308 Fax: (+66) 2558 6868 E-Mail: [email protected]
Supported bySripatum University2410/2 Phaholyothin Rd., Jatujak, Bangkok, 10900, ThailandTel.: +66 2 579 1111, Fax.: +66 2 558 6868E-mail: [email protected]: www.spu.ac.th
PresidentRutchaneeporn Pookayaporn Phukkamarn, Sripatum University, Thailand
Dean of Graduate College of ManagementVichit U-on, Sripatum University, Thailand
Advisory BoardChun-Ping Zeng, New York Institute of Technology, USAEric Ng, University of Southern Queensland, AustraliaJason David, Centennial College of Applied Arts & Technology, CanadaJohn Groth, Texas A&M, USAKirthana Shankar, Tokyo Institute of Technology, JapanOrna Lavi Eleuch, Osaka University of Economics, JapanRich Kim, Hanyang University, South KoreaSteve Byers, Idaho State University, USAYa Ling Kajalo, Helsinki School of Economics, FinlandZhenzhong Ma, University of Windsor, Canada, Canada
Editor-In-ChiefUngul Laptaned, Sripatum University, Thailand
Associate EditorIoannis Manikas, University of Wollongong in Dubai, United Arab Emirates
Guest EditorGilbert Nartea, Lincoln University, New Zealand
SecretariatPhongvitchulada Surakhan, Sripatum University, Thailand
Editorial BoardAnbalagan Krishnan, Curtin University of Technology, MalaysiaAnson Ka Keung Au, The University of Hong Kong, Hong KongC.Swarnalatha Raju, Anna University, IndiaChian-Son Westerlund, Helsinki School of Economics, FinlandChu Hui Steiner, Program Leader, University of Derby, IsraeliChun-Huw Escalante, University of Georgia, USADaniel Arif, The British University In Dubai, UAEHsun-Ming Lee, Texas State University - San Marcos, USAHuei-Zhen Gu, Lungwa University of Science and Technology, TaiwanI-Hua Bon, Universityersiti Tun Hussein Onn Malaysia, MalaysiaJaroslav Laukkanen, University of Kuopio, FinlandJasper Johnson, North Dakota State University, USALy-Fie Sugianto, Monash University, AustraliaMahesha Kapurubandara, University of Western Sydney, AustraliaMarc Lindblom, Helsinki School of Economics, FinlandStuart Garner, Edith Cowan University, AustraliaTakashi Koshida, Matsue National College of Technology, JapanTingyang Lewis Quynh Nhu, Vaasa University, Finland, FinlandVictoria Chen, National Chung Cheng University, TaiwanVineet Yamada, Nakamura Gakuen University, JapanWan-Shiou Hu, University of Western Sydney, AustraliaWen-Yen Edwards, University of Hawaii - Hilo, Hawaii, USAYikuan Lee, San Francisco State University, USAYing Sai, Loyola Marymount University, USAYungchih George Karjaluoto, University of Oulu, Finland
Supported by
PublisherSripatum University Press, Bangkok, Thailand
Copyright © 2018 Sripatum University
All right reserved.No part of this publication may be reproduced, stored in a retrieval system, or transmitted in any form or by any means, electronic, mechanical, photocopying, recording, or otherwise, without permission in writing from the editors.
ISSN: 2408-1914
Sripatum University, ThailandSripatum University is one of the oldest and most prestigious private universities in Bangkok, Thailand. Dr. Sook Pookayaporn established the university in 1970 under the name of "Thai Suriya College" in order to create opportunities for Thai youths to develop their potential. In 1987, the college was promoted to university status by the Ministry of University Affairs, and has since been known as Sripatum University. "Sripatum" means the "Source of Knowledge Blooming Like a Lotus" and was graciously conferred on the college by Her Royal Highness, the late Princess Mother Srinagarindra (Somdet Phra Srinagarindra Baromarajajanan). She presided over the official opening ceremony of SPU and awarded vocational certificates to the first three graduating classes. Sripatum University is therefore one of the first five private universities of Thailand. The university’s main goal is to create well-rounded students who can develop themselves to their chosen fields of study and to instill students with correct attitudes towards education so that they are enthusiastic in their pursuit of knowledge and self-development. This will provide students with a firm foundation for the future after graduation. The university's philosophy is "Education develops human resources who enrich the nation" which focuses on characteristics of Wisdom, Skills, Cheerfulness and Morality.
University of Greenwich, United KingdomThe University of Greenwich is a British university with campuses in south-east London and north Kent. These include the Greenwich Campus, located in the grounds of the Old Royal Naval College in the Royal Borough of Greenwich, London, England. It is the largest university in London by student numbers and the greenest in the UK as assessed by The People & Planet Green League. The university’s wide range of subjects includes architecture, business, computing, education, engineering, humanities, natural sciences, pharmacy and social sciences. It has a strong research focus and well-established links to the scientific community.
Lincoln University, New ZealandLincoln is New Zealand’s third oldest university. Founded in 1878 as a School of Agriculture, the organisation was linked to Canterbury College, welcoming its first intake of students in 1880. In 1896, with agriculture now well established as the mainstay of New Zealand’s exports, the School of Agriculture separated from Canterbury College and became Canterbury Agricultural College, with its own governing body and the ability to award degrees through the University of New Zealand. In 1961, the university was officially renamed Lincoln College, becoming a constituent college of the University of Canterbury. In 1990 Lincoln University formally separated from the University of Canterbury and became the self-governing national university that it is today. Internationally Lincoln University has academic alliances with complementary institutions in Asia, the Middle East, Europe and the Americas. These alliances support academic relationships and enhance educational opportunities for teaching staff, students and those undertaking advanced research.
Volume 5, Number 1, January - April 2018
ISSN: 2408-1914
Volume 5, N
umber 1, January - April 2018
Editors:Ungul Laptaned Ioannis ManikasGilbert Nartea
International Journal of Managem
ent, Business, and Economics
ISSN: 2408-1914
International Journal ofManagement, Business, and EconomicsIJMBE
International Journal ofManagement, Business, and EconomicsIJMBE
● Impact of HR Practices on Employee Turnover and Job Satisfaction: Evidence from Pakistan Universities
Ali Muhammad Mohmand and Malik Shakeel Khan.............................................................. 7
● The Readability of Note Disclosures Daniel Tschopp, Doug Barney, and Passard C. Dean ......................................................... 29
● Changing Tax Policy Impact on the Risk Level of Vietnam Wholesale and Retail Firms Dinh Tran Ngoc Huy ............................................................................................................ 41
● Dependency of Human Resource Planning on Human Resource Information System: A Study on Banking Sector in Bangladesh Farha Sultana ...................................................................................................................... 57
● Logistics Crunch: Analysis of Intermodal Containers Resource in Pre and Post China-Pakistan Economic Corridor’s Establishment Maisam Ali and Shahzad Khurram ...................................................................................... 71
● Organizational Citizenship Behavior (OCB) Practices among the University Teachers: Bangladesh Perspective Mohammad Milon ................................................................................................................ 87
● Management of Historic Site for Cultural Heritage Tourism: A Case Study of Wat Rajabopit Sathitmahasimaram Rajaworavihara, Bangkok Panot Asawachai ............................................................................................................... 103
● Smart Bus Drivers: Fleet Management for Smart Workers Paradorn Khongmanee, Wuttipong Pongsuwan, and Suchai Thanawastien .................... 119
● The Impact of Human Resource Practices on Task Performance of Employees in Electrical, Electronics and Telecommunications Industry Group in Thailand Praphan Chaikidurajai and Wassana Persalae ................................................................. 129
● A Studio Based Approach for Enhancing Decisions of Poultry Farmers in East Africa Rebecca Pearl Tumwebaze and Henk G. Sol ................................................................... 143