management accounting semester - vi, academic year 2020 - 21
75
STUDY MATERIAL FOR B.COM CS MANAGEMENT ACCOUNTING SEMESTER - VI, ACADEMIC YEAR 2020 - 21 Page 1 of 75 UNIT CONTENT PAGE No I NATURE AND SCOPE OF MANAGEMENT ACCOUNTING 02 II RATIO ANALYSIS 09 III FUNDS FLOW STATEMENT 29 IV CASH FLOW STATEMENT 44 V CAPITAL BUDGETING 57
-
Upload
khangminh22 -
Category
Documents
-
view
0 -
download
0
Transcript of management accounting semester - vi, academic year 2020 - 21
STUDY MATERIAL FOR B.COM CS MANAGEMENT ACCOUNTING SEMESTER - VI, ACADEMIC YEAR 2020 - 21
Page 1 of 75
UNIT CONTENT PAGE No
I NATURE AND SCOPE OF MANAGEMENT ACCOUNTING 02 II RATIO ANALYSIS 09 III FUNDS FLOW STATEMENT 29 IV CASH FLOW STATEMENT 44 V CAPITAL BUDGETING 57
STUDY MATERIAL FOR B.COM CS MANAGEMENT ACCOUNTING SEMESTER - VI, ACADEMIC YEAR 2020 - 21
Page 2 of 75
UNIT - I NATURE AND SCOPE OF MANAGEMENT ACCOUNTING INTRODUCTION Financial accounting is concerned with recording transactions and preparing financial and other reports to be used internally by management and externally by investors, creditors, potential investors, and government agencies. Management accounting, on the other hand, is primarily concerned with providing information for use by people within the organization. DEFINITIONS OF MANAGEMENT ACCOUNTING
1. Anglo-American Council on Productivity: "Management Accounting is the presentation of accounting information in such a ways as to assist management in the creation of policy and the day-to -day operation of an undertaking.
2. Robert N. Anthony: "Management Accounting is concerned with accounting information that is useful to management"
3. T.G. Rose: "Management Accounting is the adaptation and analysis of accounting information and its diagnosis and explanation in such a way as to assist management."
4. J. Batty: ―Management Accoun ng is the term used to describe the accounting methods, systems and techniques which, coupled with special knowledge and ability, assist management in its task of maximizing profits or minimizing losses‖.
5. The Institute of Chartered Accountants of India: "Such of its techniques and procedures by which accounting mainly seeks to aid the management collectively have come to be known as management accounting."
6. The Institute of Cost & Works Accountants of India: it defines Management Accounting as "a system of collection and presentation of relevant economic information relating to an enterprise for planning. Controlling and decision making.''
7. The American Accounting Association: "Management Accounting includes the methods and concepts necessary for effective planning, for choosing among alternative business actions and for control through the evaluation and interpretation of performances."
NATURE OF MANAGEMENT ACCOUNTING The following are the main characteristics of management accounting: i. Providing Accounting Information. Management accounting is based on accounting information. The collection and classification of data is the primary function of accounting department. The accounting data is used for reviewing various policy decisions. Management accounting is a service function and ft provides necessary information to different levels of management ii. Cause and Effect Analysis. Financial accounting is limited to the preparation of profit and loss accounting and finding out the ultimate result. If there is a profit the factors directly influencing the profitability are also studied. So the study of cause and effect relationship is possible in management accounting. iii. Use of Special Techniques and Concepts. Management accounting uses special techniques and concepts to make accounting data more useful. The techniques usually used include financial planning and analysis, standard costing, budgetary control, marginal costing, project appraisal, control accounting, etc. The type of technique to be used will be determined according to the situation and necessity.
STUDY MATERIAL FOR B.COM CS MANAGEMENT ACCOUNTING SEMESTER - VI, ACADEMIC YEAR 2020 - 21
Page 3 of 75
iv. Taking important decisions: management accounting helps in taking various important decisions. It supplies necessary information to the management which may base its decisions on it. v. Achieving of Objectives. In management accounting, the accounting information is used in such a way that it helps in achieving organizational objectives. vi. No Fixed Norms Followed. In financial accounting certain rules are followed for preparing different accounting books. On the other hand, no specific rules are followed in management accounting vii. Increase in efficiency: The purpose of using accounting information is to increase efficiency the concern. The efficiency can be achieved by setting up goals for each department or section. viii. Supplies Information and not Decision. The management accountant supplies information management. The decisions are to be taken by the top management. It is only to guide and not to supply decisions. ix. Concerned with Forecasting. The management accounting is concerned with the future. It helps the management in planning and forecasting. SCOPE OF MANAGEMENT ACCOUNTING The following facts of management accounting are of a great significance and form the scope of this subject. 1. Financial Accounting. Financial accounting deals with the historical data. The recorded facts about an organization are useful for planning the future course of action.
2. Cost Accounting. Cost accounting provides various techniques for determining cost of manufacturing products or cost of providing service. It uses financial data for finding out cost of various jobs, products or processes.
3. Financial Management: Financial management is concerned with the planning and controlling of the financial resources of the firm. It deals with raising of funds and their effective utilization.
4. Budgeting and Forecasting. Budgeting means expressing the plans, policies and goals of the enterprise for a definite period in future.
5. Inventory Control. Inventory is used to denote stock of raw materials, goods in the process of manufacture and finished products.
6. Reporting to Management One of the functions of management accountant is to keep the management informed of various activities of the concern so as to assist it in controlling the enterprise. The reports are presented in the form of graphs, diagrams, index numbers or other statistical techniques so as to make them easily understandable. The management accountant sends interim reports to the management and these reports may be monthly, quarterly, half-yearly.
7. Interpretation of Data. The management accountant interprets various financial statements to the management. These statements give an idea about the financial and earning position of the concern. These statements may be
8. Control procedures and Methods. Control procedures and methods are needed to use various factors of production in a most economical way.
9. Internal Audit. Internal audit system is necessary to judge the performance of every department. The actual performance of every department and individual is compared with the pre-determined standards.
STUDY MATERIAL FOR B.COM CS MANAGEMENT ACCOUNTING SEMESTER - VI, ACADEMIC YEAR 2020 - 21
Page 4 of 75
10. Tax Accounting. In the present complex tax systems, tax planning is an important part of management accounting. Income statements are prepared and tax liabilities are calculated. The management is informed about the tax burden from central government state government and local authorities.
11. Office Services. Management accountant may be required to control an office. He will be expected to deal with data processing, filing, copying, duplicating, communicating, etc. He will also be reporting about the utility of different office machines.
LIMITATIONS OF MANAGEMENT ACCOUNTING 1. Based on Accounting Information: Management accounting is based on data supplied by financial and cost accounting. Historical data is used to make future decisions. 2. Lack of Knowledge: The use of management accounting requires the knowledge of a number of related subjects. Management should be conversant with accounting principles, statistics, economics, principles of management etc., and only then management accounting can be effectively utilized.
3. Intuitive Decisions: Intuitive decisions limit the usefulness of management accounting. 4. Not an Alternative to Administration:Management accounting does not provide an
alternative to administration 5. Top Heavy Structure: The installation of a management accounting system needs an
elaborate organizational system. Smaller units cannot afford to use this system because of heavy cost.
6. Evolutionary Stage: Management accounting is only in a developmental stage, it has not yet reached a final stage. The techniques and tools used by this system give varying and differing results.
7. Personal Bias: Personal prejudices and bias affect the objectivity of decisions. 8. Psychological Resistance: The installation of management accounting involves basic
change in organizational set up. New rules and regulations are also required to be framed which affect a number of personnel.
FUNCTIONS OF MANAGEMENT ACCOUNTING Some of the functions of management accounting are given as follows: 1. Planning and Forecasting: Management fixes various targets to be achieved by the
business in near future. Planning and forecasting are essential for achieving business objectives. One of the important functions of the management accounting is to help management in planning for short-term and long term periods and also in making forecasts for the future. Management accountants use various techniques such as budgeting, standard costing, marginal costing, fund flow statements, probability and trend ratios, etc. for fixing targets. So management accounting tools are useful in planning and forecasting.
2. Modification of Data: Management accounting helps in modifying accounting data. The information is modified in such a way that it becomes useful for the management. If sales data is required, it can be classified according to product area, season-wise, type of customers and time taken for getting payments. Management accountant classifies and modifies information according to the requirements of the management.
3. Financial Analysis and Interpretation: Management accountant undertakes the job of presenting financial data in a simplified way. Management accountant analyses and interprets financial data in a simple way and presents it in a non-technical language. He
STUDY MATERIAL FOR B.COM CS MANAGEMENT ACCOUNTING SEMESTER - VI, ACADEMIC YEAR 2020 - 21
Page 5 of 75
gives facts and figures about various policies and evaluates them in monetary terms. He gives his opinion about various alternative courses of action so that h; becomes easy for the management to take a decision.
4. Facilitates Managerial Control: Management accounting is very useful in controlling performance. All accounting efforts are directed towards control of the enterprise. The standards of various departments and individuals are set-up. The actual performance is recorded and deviations are calculated. It enables the management to assess the performance of everyone in the organization. Performance evaluation is -possible through standard costing and budgetary control which are an integral part of management accounting.
5. Communication: Management accounting establishes communication within the organization and with the outside world. The management accountant prepares reports for the benefit of different levels of management and employees.
6. Use of Qualitative Information: The field of management accounting is not restricted to the use of monetary data only. It collects and uses qualitative information also. While preparing a production budget, management accountant may not only use past production figures, but he may rely on the assessment of persons dealing with production, productivity reports, consumer surveys and many other business documents.
7. Co-ordination: The co-ordination among different departments is essential for smooth running of the concern. Management accountant acts as a co-ordinator among different financial departments through budgeting and financial reports.
8. Helpful in taking Strategic Decisions: Management accounting helps in taking strategic decisions. It supplies analytical information regarding various alternatives and the choice of management is made easy.
9. Supplying Information to Various Levels of Management: Management accountant feeds information to different levels of management so that further decisions are taken. The supply of adequate information at the proper time will increase efficiency of the management.
TOOLS AND TECHNIQUES OF MANAGEMENT ACCOUNTING The tools and techniques used in management accounting are discussed as follows 1. Financial Policy and Accounting: The proportion between share capital and loans should also be decided. All these decisions are very important and management accounting provides techniques for financial planning.
2. Analysis of Financial Statements: The analysis of financial statements is meant to classify and present the data in such a way that it becomes useful for the management.
3. Historical Cost Accounting: The system of recording actual cost data on or after the date when it has been incurred is known as historical cost accounting.
4. Budgetary Control: It is a system which uses budgets as a tool for planning and control. 5. Standard Costing: Standard costing is an important technique for cost control purposes.
In standard costing system, costs are determined in advance. The determination of standard cost is based on a systematic analysis of prevalent conditions.
6. Marginal Costing: This is a method of costing which is concerned with changes in costs resulting The measuring rod of efficiency of a concern should be a return on capital
STUDY MATERIAL FOR B.COM CS MANAGEMENT ACCOUNTING SEMESTER - VI, ACADEMIC YEAR 2020 - 21
Page 6 of 75
employed. It should from changes m the volume of production. Under this system, cost of product is divided into marginal (variable) be consistently and fixed cost.
7. Decision Accounting: Decision taking involves a choice from various alternatives. 8. Revaluation Accounting: This is also known a Replacement Accounting. The
preservation of capital in the business is the main object of management. The profits are calculated in such a way that capital is preserved in real terms;
9. Control Accounting: Control accounting is not a separate accounting system. Different systems have their control devices and these are used in control accounting.
10. Management Information Systems: With the development of electronic devices for recording and classifying data, reporting to management has considerably improved.
RELATIONS OF MANAGEMENT ACCOUNTING WITH FINANCIAL ACCOUNTING Financial accounting is concerned with the recording of day-to-day transactions of the business. On the other hand, management accounting uses financial accounts and taps other sources of information too. The accounts are used in such a way that they are helpful to the management in planning and forecasting various policies. The main points of distinction are discussed as below: Object: The object of financial accounting is to record various transactions with the purpose of maintaining accounts and to know the financial positionand to find out profit loss the end of the financial year. These records are useful to shareholders, creditors, bankers, debenture holders, etc. On the other hand, management accounting is essential to help management in formulating policies and plans. Nature: Financial accounting is mainly concerned with the historical data. Managementaccounting projected or estimated figure are used. Subject-matter: Financial accounting is concerned with assessing the results of the whole business while management accounting deals separately with different units, departments and cost centers. In financial accounting overall performance is judged, while in management accounting the results of different departments are evaluated separately to find out their performance differently. Compulsion: The preparation of financial accounts is compulsory. Management accounting-is not compulsory. Precision: In management accounting no emphasis is given to actual figures. The approximate figures are considered more useful than the exact figures. In financial accounting only actual figures are recorded. Reporting:

STUDY MATERIAL FOR B.COM CS MANAGEMENT ACCOUNTING SEMESTER - VI, ACADEMIC YEAR 2020 - 21
Page 7 of 75
Financial accounts are prepared to find out profitability and financial position of the concern. These reports are useful for outsiders like bankers, investors, shareholders, Government agencies, etc. Management accounting reports are meant for internal use only. Description: Only those things are recorded in financial accounting which can be measured in monetary terms. Management Accounting uses both monetary and non-monetary events. Quickness: Reporting of management accounting is very quick. Management is fed with reports at regular intervals. Various figures are required to take managerial decisions at different levels of management. On the other hand, reporting of financial accounting is slow and time consuming. Accounting Principles: Financial accounts are governed by the generally accepted principles and conventions. No set principles are followed in management accounting. Period: Financial accounts are prepared for a particular period. Management accountant supplies information from time to time during the whole year. These are no specific periods for which, management accounts are prepared. Publication: Financial accounts like profit and loss account and balance sheet are published for the benefit of the public. Under companies law every registered company is supposed to supply a copy of Profit and Loss Account add Balance Sheet to the Registrar of Companies at the end of the financial year. Management accounting statements are prepared for the benefit of the management only and these are not published. Audit: Financial accounts can be got audited. It is not possible to get management accounts audited. RELATIONSHIP BETWEEN COST AND MANAGEMENT ACCOUNTING The following are the main points of distinction between COST and MANAGEMENT accounting: Object: The purpose of management accounting is to provide information to the management for planning and co-ordinating the activities of the business. Scope: The scope of management accounting is very wide. Cost accounting deals primarily with cost ascertainment. Nature: Management accounting is generally concerned with the projection of figures for future. The policies and-plans are prepared for providing future guidelines. Cost accounting uses both past and present figures. Data used:

STUDY MATERIAL FOR B.COM CS MANAGEMENT ACCOUNTING SEMESTER - VI, ACADEMIC YEAR 2020 - 21
Page 8 of 75
Only quantitative aspect is recorded in cost accounting. Management accounting uses both quantitative and qualitative information. Development: The development of cost accounting is related to industrial revolution. Management accounting has developed only in the last thirty years.
STUDY MATERIAL FOR B.COM CS MANAGEMENT ACCOUNTING SEMESTER - VI, ACADEMIC YEAR 2020 - 21
Page 9 of 75
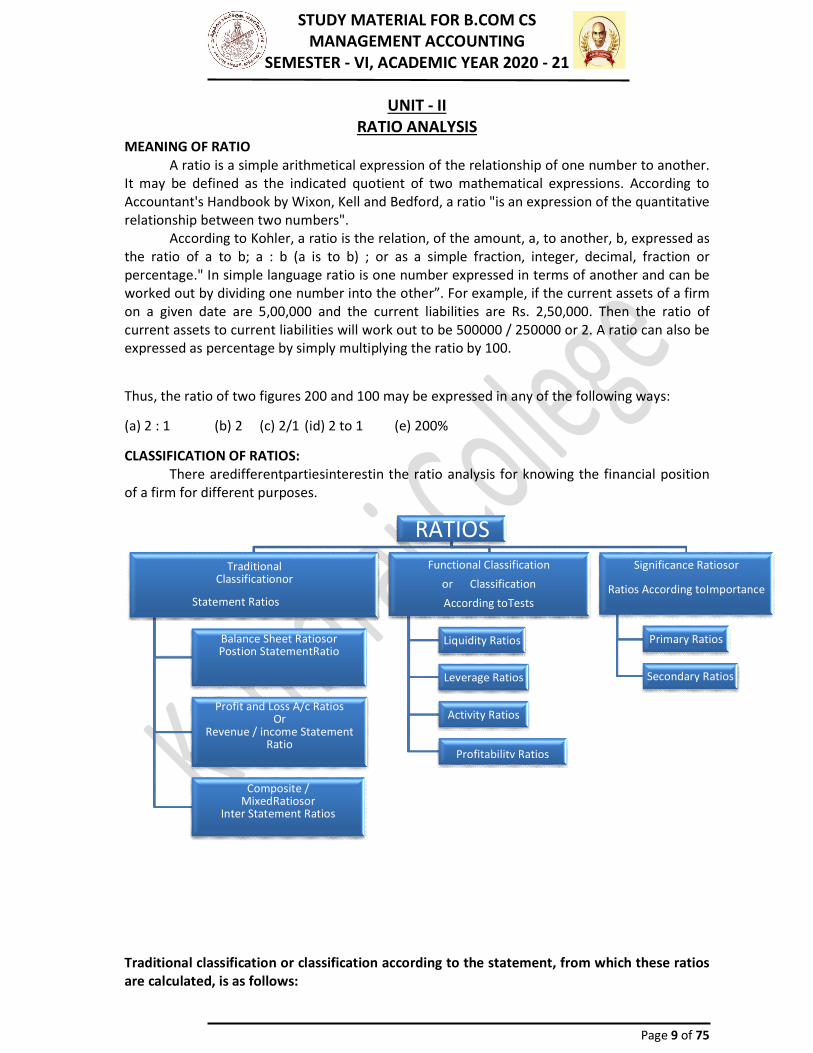
UNIT - II RATIO ANALYSIS MEANING OF RATIO A ratio is a simple arithmetical expression of the relationship of one number to another. It may be defined as the indicated quotient of two mathematical expressions. According to Accountant's Handbook by Wixon, Kell and Bedford, a ratio "is an expression of the quantitative relationship between two numbers". According to Kohler, a ratio is the relation, of the amount, a, to another, b, expressed as the ratio of a to b; a : b (a is to b) ; or as a simple fraction, integer, decimal, fraction or percentage." In simple language ratio is one number expressed in terms of another and can be worked out by dividing one number into the other”. For example, if the current assets of a firm on a given date are 5,00,000 and the current liabilities are Rs. 2,50,000. Then the ratio of current assets to current liabilities will work out to be 500000 / 250000 or 2. A ratio can also be expressed as percentage by simply multiplying the ratio by 100. Thus, the ratio of two figures 200 and 100 may be expressed in any of the following ways: (a) 2 : 1 (b) 2 (c) 2/1 (id) 2 to 1 (e) 200% CLASSIFICATION OF RATIOS: There aredifferentpartiesinterestin the ratio analysis for knowing the financial position of a firm for different purposes.
Traditional classification or classification according to the statement, from which these ratios are calculated, is as follows:
Traditional Classificationor Statement Ratios
RATIOS Functional Classification
or Classification According toTests
Significance Ratiosor Ratios According toImportance
Balance Sheet Ratiosor Postion StatementRatio Liquidity Ratios Primary Ratios Leverage Ratios Secondary Ratios
Profit and Loss A/c Ratios Or Revenue / income Statement Ratio Activity Ratios
Profitability Ratios Composite / MixedRatiosor Inter Statement Ratios

STUDY MATERIAL FOR B.COM CS MANAGEMENT ACCOUNTING SEMESTER - VI, ACADEMIC YEAR 2020 - 21
Page 10 of 75
Balance Sheet or Position Statement Ratios: Balance Sheet ratios deal with the relationship between two balance sheet items, e.g. the ratio of current assets to current liabilities, or the ratio of proprietors' funds to fixed-assets. Profit and Loss Account or Revenue/Income Statements Ratios: These ratios deal with the relationship between two profit and loss account items, e.g., the ratio of gross profit to sales, or the ratio of net profit to sales. Composite/Mixed Ratios or Inter Statement Ratios: These ratios exhibit the relation between a profit and loss account on income statement item and a balance sheet item, e.g., stock turnover ratio, or the ratio of total assets to sales. Functional Classification or Classification According to Tests Liquidity Ratios: These are the ratios which measure the short-term solvency or financial position of a firm: These ratios are calculated to comment upon the short-term paying capacity of a concern or the firm's ability to meet its current obligations. The various liquidity ratios are: current ratio, liquid ratio and absolute liquid ratio. Long-term Solvency and Leverage Ratios:
Traditional Classification or Statement Ratios
Balance Sheet RatiosOrPosition Statement Ratio
Current RatioLiquid Ratio(acid Test or Quick Ratio)Absolute Liquidity RatioDebt Equity RatioPreparatory RatioCapital Gearing RatioAssets -Proprietorship RatioCapital Inventory to Working Capital RatioRatio of current Assets to Fixed Assets
Gross profit RatioOperating RatioOperating Profit RatioNet Profit Ratio
Cash Profit RatioExpenses Ratio
Interest Coverage Ratio
Profit and Loss A/c Ratios orRevenue / income Statement Ratio Composite / Mixed Ratios Inter Statement Ratios
Stock Turnover RatioDebtors Turnover
Payable Turnover RatioFixed Assets Turnover Ratio
Return on EquityReturn on Shareholders' Funds
Return on Capital EmployedCapital Turnover Ratio
Working Capital Turnover RatioReturn on Total Resources
Total Assets Turnover
STUDY MATERIAL FOR B.COM CS MANAGEMENT ACCOUNTING SEMESTER - VI, ACADEMIC YEAR 2020 - 21
Page 11 of 75
Long-term solvency ratios convey a firm's ability to meet the interest costs and repayments schedules of its long-term obligations e.g. Debt Equity Ratio and Interest Coverage Ratio. The leverage ratios can further be classified as: a. Financial Leverage, b. Operating Leverage, c. Composite Leverage. Activity Ratios: Activity ratios are calculated to measure the efficiency with which the resources of a firm have been employed. These ratios are also called turnover ratios. Profitability Ratios: These ratios measure the results of business operations or overall performance and effectiveness of the firm, e.g., gross profit ratio, operating ratio or return on capital employed. ANALYSIS and interpretations of different ratios: The short-term creditors of a company like suppliers of goods of credit and commercial banks providing short-term loan, are primarily interested in knowing the company's ability to meet its current or short-term obligations as and when these become due. The short-term obligations of a firm can be met only when there are sufficient liquid assets. Therefore, a firm must ensure that it does not suffer from lack of liquidity or the capacity to pay its current obligations. Two types of ratios can be calculated for measuring short-term financial position or short-term solvency of a firm: a) Liquidity Ratios b) Current Assets Movement or Efficiency Ratios. a)LIQUIDITY RATIOS Liquidity refers to the ability of a concern to meet its current obligations as and when these become due. The short-term obligations are met by realising amounts from current, floating or circulating assets. These should be convertible into cash for paying obligations of short-term nature. If current assets can pay off current liabilities, then liquidity position will be satisfactory. On the other hand, if current liabilities may not be easily met out of current assets en liquidity position will be bad. The following ratios can be calculated: 1. Current Ratio 2. Quick or Acid Test or Liquid Ratio 3. Absolute Liquid Ratio or Cash Position Ratio b)CURRENT RATIO Current ratio may be defined as the relationship between current assets and current liabilities. This ratio, also known as working capital ratio, is a measure of general liquidity and is most widely used to make the analysis of a short-term financial position or liquidity of a firm. It is calculated by dividing the total of current assets by total of the current liabilities. CurrentRatio= Current Assets / CurrentLiabilities Or Current Assets : CurrentLiabilities The two basic components of this ratio are:

STUDY MATERIAL FOR B.COM CS MANAGEMENT ACCOUNTING SEMESTER - VI, ACADEMIC YEAR 2020 - 21
Page 12 of 75
Current assets and current liabilities: Current assets include cash and those assets which can be easily converted into cash within a short period of time generally, one year/ such as marketable securities, bills receivables, sundry debtors, inventories, work-in-progress, etc. Prepaid expenses should also be included in current assets because they represent payments made in advance which will not have to be paid in near future. Current Liabilities are those obligations which are payable within a short period of generally one year and include outstanding expenses, bills payables, sundry creditors, accrued expenses, short-term advances, income-tax payable, dividend payable, etc. Bank over-draft. COMPONENTS OF CURRENT RATIO
S.N Current Assets Current Liabilities 1 Cash in Hand Outstanding Expenses/Accrued Expenses 2 Cash at Bank Bills Payable 3 Marketable Securities (Short-term) Sundry Creditors 4 Short-term Investments Short-term Advances 5 Bills Receivable Income-tax Payable 6 Sundry Debtors Dividends Payable 7 Inventories (stocks) Bank Overdraft (if not a permanent arrangement) 8 Work-in-process 9 Prepaid Expenses
As a convention the minimum of 'two to one ratio' is referred to as a banker's rule of thumb or arbitrary standard of liquidity for a firm. A ratio equal or near to the rule of thumb of 2 : 1 i.e., current assets double the current liabilities is considered to be satisfactory. SIGNIFICANCE AND LIMITATIONS OF CURRENT RATIO Current ratio is a general and quick measure of liquidity of a firm. It represents the 'margin of safety' or cushion' available to the creditors and other current liabilities. It ismost widely used for making short-term analysis of the financial position or short-term solvency of a firm. Current Ratio: It is a crude ratio because it measures only the quantity and not the quality of Current assets. Window Dressing: Valuation of current assets and window dressing is another problem of current. Current assets and liabilities are manipulated in such a way that current ratio loses its significance. Window dressing may be indulged in the following ways: Over-valuation of closing stock.

STUDY MATERIAL FOR B.COM CS MANAGEMENT ACCOUNTING SEMESTER - VI, ACADEMIC YEAR 2020 - 21
Page 13 of 75
Calculation of Current Ratio: This ratio is calculated by comparing current assets with current liabilities. Take for example, current assets of a concern as Rss.250000 and current liabilities as Rs. 100000; current ratio will be calculated as follows: Current Ratio = Current Assets / Current Liabilities Current Ratio = 250000 / 100000 = 2.5 The current ratio of 2.5 means that current assets are 2.5 times of current liabilities. This ratio can also be presented as 2.5:1. In current ratio, current liabilities are taken as 1 and current assets are given in comparison to it. Illustration Calculate current ratio from the following information: Rs. Rs. Stock 60,000 Sundry Creditors 20,000 Sundry Debtors 70,000 Bills Payable 15,000 Cash Balances 20,000 Tax Payable 18,000 Bills Receivables 30,000 Outstanding Expenses 7,000 Prepaid Expenses 10,000 Bank Overdraft 25,000 Land and Building 1,00,000 Debentures 75,000 Goodwill 50,000
Solution: Current Ratio = Current Assets / Current Liabilities Current Assets = Rs. 60,000 + 70,000 + 20,000 + 30,000 + 10,000 = Rs. 1,90,000 Current Liabilities = Rs. 20,000 + 15,000 + 18,000 + 7,000 + 25,000 = Rs. 85,000 Current Ratio = 1,90,000 / 85,000 = 2.24:1 QUICK OR ACID TEST OR LIQUID RATIO Quick Ratio, also known as Acid Test or Liquid Ratio, is a more rigorous test of liquidity than the current ratio. The term 'liquidity' refers to the ability of a firm to pay its short-term obligations as and when they become due. Quick ratio may be defined as the relationship between quick/liquid assets and current or liquid liabilities. Quick / Liquid or Acid Test Ratio = Quick or Liquid Assets / Current Liabilities
Components of Quick/Liquid Ratio Quick/Liquid Assets Current Liabilities Cash in hand Outstanding or accrued Cash at bank expenses Bills payable
STUDY MATERIAL FOR B.COM CS MANAGEMENT ACCOUNTING SEMESTER - VI, ACADEMIC YEAR 2020 - 21
Page 14 of 75
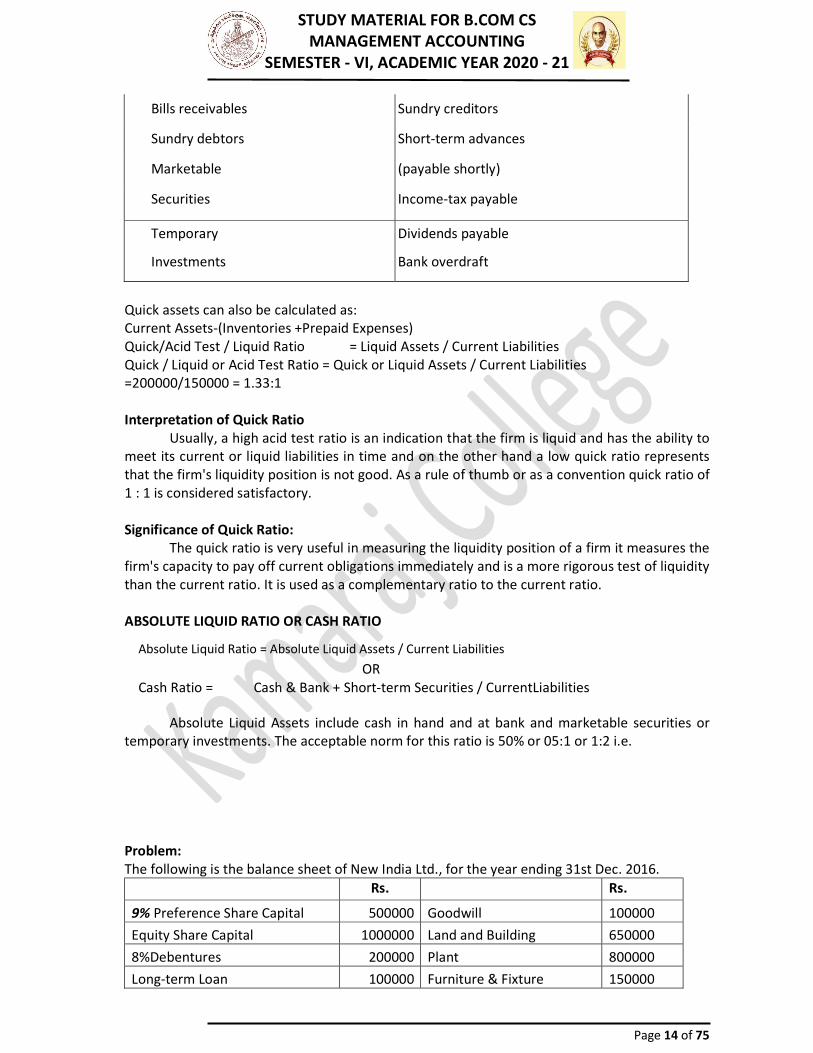
Quick assets can also be calculated as: Current Assets-(Inventories +Prepaid Expenses) Quick/Acid Test / Liquid Ratio = Liquid Assets / Current Liabilities Quick / Liquid or Acid Test Ratio = Quick or Liquid Assets / Current Liabilities =200000/150000 = 1.33:1 Interpretation of Quick Ratio Usually, a high acid test ratio is an indication that the firm is liquid and has the ability to meet its current or liquid liabilities in time and on the other hand a low quick ratio represents that the firm's liquidity position is not good. As a rule of thumb or as a convention quick ratio of 1 : 1 is considered satisfactory. Significance of Quick Ratio: The quick ratio is very useful in measuring the liquidity position of a firm it measures the firm's capacity to pay off current obligations immediately and is a more rigorous test of liquidity than the current ratio. It is used as a complementary ratio to the current ratio. ABSOLUTE LIQUID RATIO OR CASH RATIO Absolute Liquid Ratio = Absolute Liquid Assets / Current Liabilities
OR Cash Ratio = Cash & Bank + Short-term Securities / CurrentLiabilities Absolute Liquid Assets include cash in hand and at bank and marketable securities or temporary investments. The acceptable norm for this ratio is 50% or 05:1 or 1:2 i.e. Problem: The following is the balance sheet of New India Ltd., for the year ending 31st Dec. 2016. Rs. Rs. 9% Preference Share Capital 500000 Goodwill 100000 Equity Share Capital 1000000 Land and Building 650000 8%Debentures 200000 Plant 800000 Long-term Loan 100000 Furniture & Fixture 150000
Bills receivables Sundry creditors Sundry debtors Short-term advances Marketable (payable shortly) Securities Income-tax payable Temporary Investments
Dividends payable Bank overdraft

STUDY MATERIAL FOR B.COM CS MANAGEMENT ACCOUNTING SEMESTER - VI, ACADEMIC YEAR 2020 - 21
Page 15 of 75
Bills Payable 60000 Bills Receivables 70000 Sundry Creditors 70000 Sundry Debtors 90000 Bank Overdraft 30000 Bank Balance 45000 Outstanding Expenses 5000 Short-term Investments 25000
Prepaid expenses 5000 Stock 30000 1965000 1965000 From the balance sheet calculate a. Current Ratio b. Acid Test Ratio c. Absolute Liquid Ratio Solution: a) Current Ratio = Current Assets / Current Liabilities Current Assets = Rs. 70000 + Rs. 90000 + Rs. 45000 + Rs. 25000 + Rs.5000 + Rs. 30000 = Rs. 265000 Current Liabilities = Rs. 60000 + Rs. 70000 + Rs. 30000 + Rs. 5000 = Rs. 165000 Current Ratio = 265000 / 165000 = 1.61 b) Acid Test Ratio = Liquid Assets / Current liabilities Liquid Assets = Rs. 70000 + Rs. 90000 + Rs. 45000 + Rs. 25000= Rs. 230000 Stock and prepaid Expenses have been excluded from current assets in order to arrive at liquid assets. Current Liabilities = Rs. 165000 Acid Test Ratio = Rs. 230000 / Rs. 165000 = 1.39 c) Absolute Liquid Ratio = Absolute Liquid Ratio / Current Liabilities Absolute Liquid Assets = Rs. 45000 + Rs. 25000 = Rs. 70000 Absolute Liquid Ratio = 70000 / 165000 = 0.42 Problem: The following information of a company is given : Current Ratio, 2.5 : 1 : Acid-test ratio, 1.5 : 1; Current liabilities Rs. 50000 Find out: a) Current Assets b) Liquid Assets c) Inventory Solution: a) Current Ratio = Current Assets / Current Liabilities 2.5 = Current assets / Rs. 50000 Current Assets = 50000 x 2.5 = Rs. 125000 b) Acid Test Ratio = Liquid Assets / Current liabilities 1.5 = Liquid Assets / Rs. 50000 Liquid Assets = 50000 x 1.5 = Rs. 75000 c) Inventory = Current Assets – Liquid Assets = Rs. 125000 – Rs. 75000 = Rs. 50000 Problem: Given: Current Ratio = 2.8 Acid –test Ratio = 1.5
STUDY MATERIAL FOR B.COM CS MANAGEMENT ACCOUNTING SEMESTER - VI, ACADEMIC YEAR 2020 - 21
Page 16 of 75
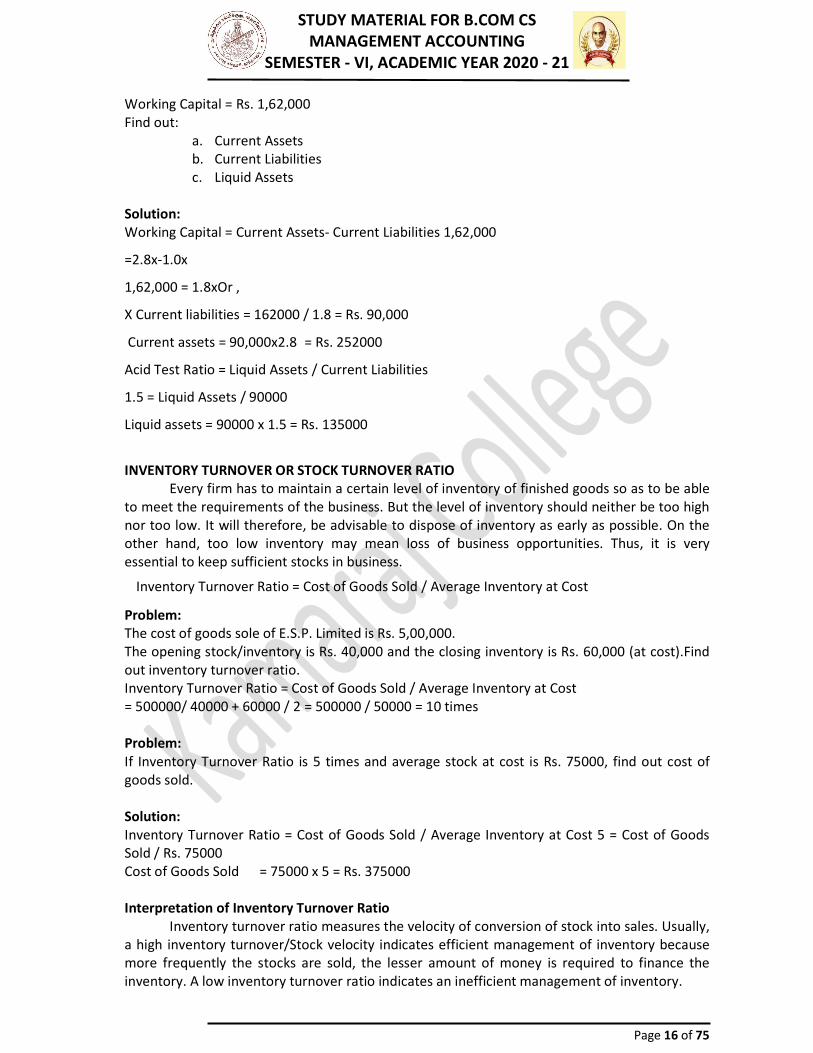
Working Capital = Rs. 1,62,000 Find out: a. Current Assets b. Current Liabilities c. Liquid Assets Solution: Working Capital = Current Assets- Current Liabilities 1,62,000 =2.8x-1.0x 1,62,000 = 1.8xOr , X Current liabilities = 162000 / 1.8 = Rs. 90,000 Current assets = 90,000x2.8 = Rs. 252000 Acid Test Ratio = Liquid Assets / Current Liabilities 1.5 = Liquid Assets / 90000 Liquid assets = 90000 x 1.5 = Rs. 135000 INVENTORY TURNOVER OR STOCK TURNOVER RATIO Every firm has to maintain a certain level of inventory of finished goods so as to be able to meet the requirements of the business. But the level of inventory should neither be too high nor too low. It will therefore, be advisable to dispose of inventory as early as possible. On the other hand, too low inventory may mean loss of business opportunities. Thus, it is very essential to keep sufficient stocks in business.
Inventory Turnover Ratio = Cost of Goods Sold / Average Inventory at Cost Problem: The cost of goods sole of E.S.P. Limited is Rs. 5,00,000. The opening stock/inventory is Rs. 40,000 and the closing inventory is Rs. 60,000 (at cost).Find out inventory turnover ratio. Inventory Turnover Ratio = Cost of Goods Sold / Average Inventory at Cost = 500000/ 40000 + 60000 / 2 = 500000 / 50000 = 10 times Problem: If Inventory Turnover Ratio is 5 times and average stock at cost is Rs. 75000, find out cost of goods sold. Solution: Inventory Turnover Ratio = Cost of Goods Sold / Average Inventory at Cost 5 = Cost of Goods Sold / Rs. 75000 Cost of Goods Sold = 75000 x 5 = Rs. 375000 Interpretation of Inventory Turnover Ratio Inventory turnover ratio measures the velocity of conversion of stock into sales. Usually, a high inventory turnover/Stock velocity indicates efficient management of inventory because more frequently the stocks are sold, the lesser amount of money is required to finance the inventory. A low inventory turnover ratio indicates an inefficient management of inventory.
STUDY MATERIAL FOR B.COM CS MANAGEMENT ACCOUNTING SEMESTER - VI, ACADEMIC YEAR 2020 - 21
Page 17 of 75
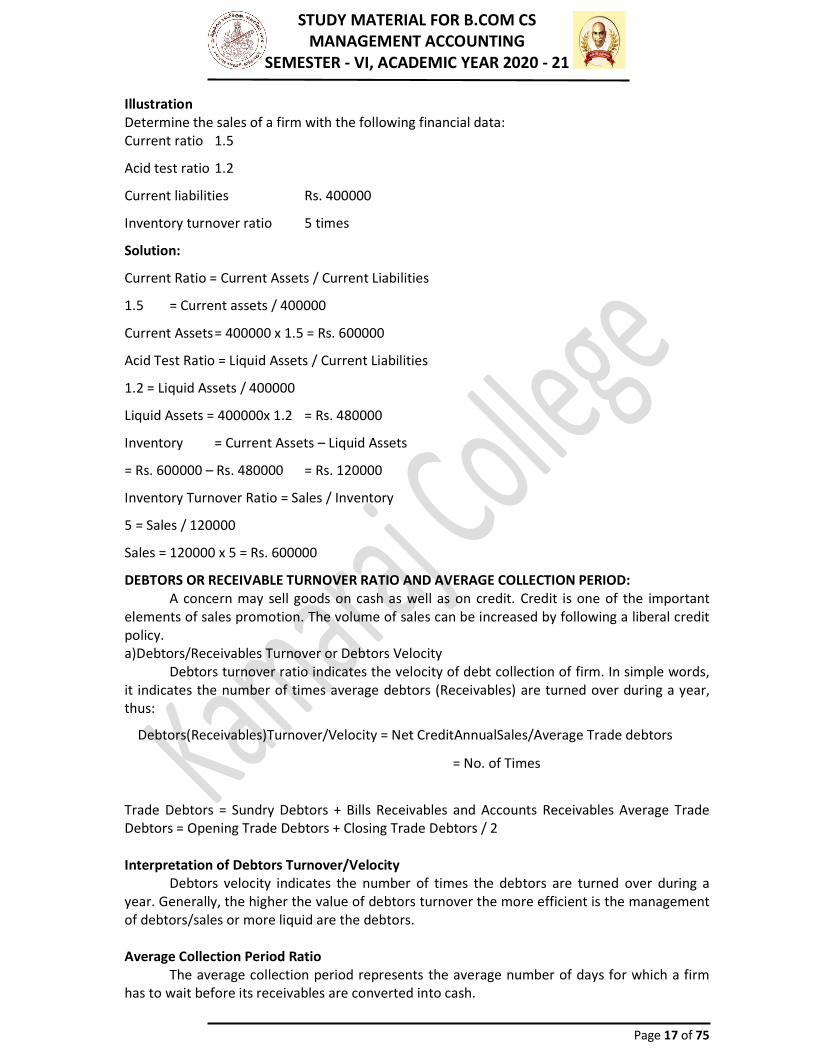
Illustration Determine the sales of a firm with the following financial data: Current ratio 1.5 Acid test ratio 1.2 Current liabilities Rs. 400000 Inventory turnover ratio 5 times Solution: Current Ratio = Current Assets / Current Liabilities 1.5 = Current assets / 400000 Current Assets = 400000 x 1.5 = Rs. 600000 Acid Test Ratio = Liquid Assets / Current Liabilities 1.2 = Liquid Assets / 400000 Liquid Assets = 400000x 1.2 = Rs. 480000 Inventory = Current Assets – Liquid Assets = Rs. 600000 – Rs. 480000 = Rs. 120000 Inventory Turnover Ratio = Sales / Inventory 5 = Sales / 120000 Sales = 120000 x 5 = Rs. 600000 DEBTORS OR RECEIVABLE TURNOVER RATIO AND AVERAGE COLLECTION PERIOD: A concern may sell goods on cash as well as on credit. Credit is one of the important elements of sales promotion. The volume of sales can be increased by following a liberal credit policy. a)Debtors/Receivables Turnover or Debtors Velocity Debtors turnover ratio indicates the velocity of debt collection of firm. In simple words, it indicates the number of times average debtors (Receivables) are turned over during a year, thus:
Debtors(Receivables)Turnover/Velocity = Net CreditAnnualSales/Average Trade debtors = No. of Times
Trade Debtors = Sundry Debtors + Bills Receivables and Accounts Receivables Average Trade Debtors = Opening Trade Debtors + Closing Trade Debtors / 2 Interpretation of Debtors Turnover/Velocity Debtors velocity indicates the number of times the debtors are turned over during a year. Generally, the higher the value of debtors turnover the more efficient is the management of debtors/sales or more liquid are the debtors. Average Collection Period Ratio The average collection period represents the average number of days for which a firm has to wait before its receivables are converted into cash.

STUDY MATERIAL FOR B.COM CS MANAGEMENT ACCOUNTING SEMESTER - VI, ACADEMIC YEAR 2020 - 21
Page 18 of 75
The ratio can be calculated as follows: AverageCollectionPeriod = Average Trade Debtors (Drs+B/R)/Sales per day
= Average Trade Debtors x No. of Working Days / Net sales Find out a) Debtors Turnover B) Average Collection period from the following information: 31st March2015
Rs. 31st March 2016
Rs. Annual credit sales 500000 600000 Debtors in the beginning 80000 100000 Debtors at the end 100000 120000
Days to be taken for the year: 360. Solution: Average Debtors = Opening Debtors + ClosingDebtors / 2 Debtors Turnover Net Credit Annual Sales / AverageDebtors Year 2007 Year 2008
Average Debtors 80,000+1,00,000 / 2 1.00,000+1,20,000 / 2 = Rs. 90,000 Rs. 1,10,000 (a) Debtors Turnover 5,00,000 / 90,000 6,00,000 / 1,10,000 5.56 times 5.45 times (b) Average CollectionPeriod No. of Working Days / Debtors
Turnover
Year 2007 Year 2008 Average Collection Period = 360 / 5.56 360 / 5.45 = 64.7 days
= 65 days (approximately) = 66.05 days = 66 days (appx.)
The analysis for creditor’s turnover is basically the same as of debtor’s turnover ratio except that in place of trade debtors, the trades creditors are taken as one of the components of the ratio and in place of average daily sales, average daily purchases are taken as the other component of the ratio. Same as debtor’s turnover ratio, creditors turnover ratio can be calculated in two forms: CREDITORS/PAYABLES TURNOVER RATIO =Net Credit Annual Purchases / Average Trade Creditors AVERAGE PAYMENT PERIOD RATIO=Average Trade Creditors (Creditors + Bills Payable) / Average Daily
STUDY MATERIAL FOR B.COM CS MANAGEMENT ACCOUNTING SEMESTER - VI, ACADEMIC YEAR 2020 - 21
Page 19 of 75
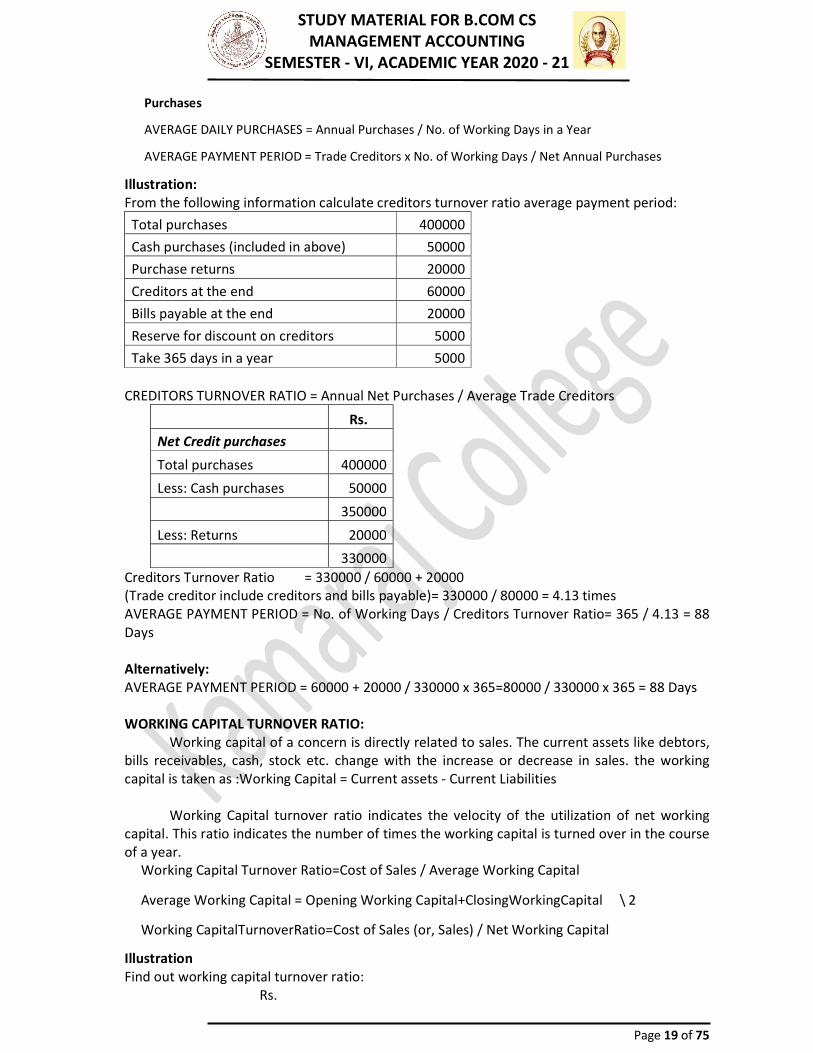
Purchases AVERAGE DAILY PURCHASES = Annual Purchases / No. of Working Days in a Year AVERAGE PAYMENT PERIOD = Trade Creditors x No. of Working Days / Net Annual Purchases
Illustration: From the following information calculate creditors turnover ratio average payment period: Total purchases 400000 Cash purchases (included in above) 50000 Purchase returns 20000 Creditors at the end 60000 Bills payable at the end 20000 Reserve for discount on creditors 5000 Take 365 days in a year 5000
CREDITORS TURNOVER RATIO = Annual Net Purchases / Average Trade Creditors Rs. Net Credit purchases Total purchases 400000 Less: Cash purchases 50000
350000 Less: Returns 20000
330000 Creditors Turnover Ratio = 330000 / 60000 + 20000 (Trade creditor include creditors and bills payable)= 330000 / 80000 = 4.13 times AVERAGE PAYMENT PERIOD = No. of Working Days / Creditors Turnover Ratio= 365 / 4.13 = 88 Days Alternatively: AVERAGE PAYMENT PERIOD = 60000 + 20000 / 330000 x 365=80000 / 330000 x 365 = 88 Days WORKING CAPITAL TURNOVER RATIO: Working capital of a concern is directly related to sales. The current assets like debtors, bills receivables, cash, stock etc. change with the increase or decrease in sales. the working capital is taken as :Working Capital = Current assets - Current Liabilities Working Capital turnover ratio indicates the velocity of the utilization of net working capital. This ratio indicates the number of times the working capital is turned over in the course of a year. Working Capital Turnover Ratio=Cost of Sales / Average Working Capital
Average Working Capital = Opening Working Capital+ClosingWorkingCapital \ 2 Working CapitalTurnoverRatio=Cost of Sales (or, Sales) / Net Working Capital
Illustration Find out working capital turnover ratio: Rs.
STUDY MATERIAL FOR B.COM CS MANAGEMENT ACCOUNTING SEMESTER - VI, ACADEMIC YEAR 2020 - 21
Page 20 of 75
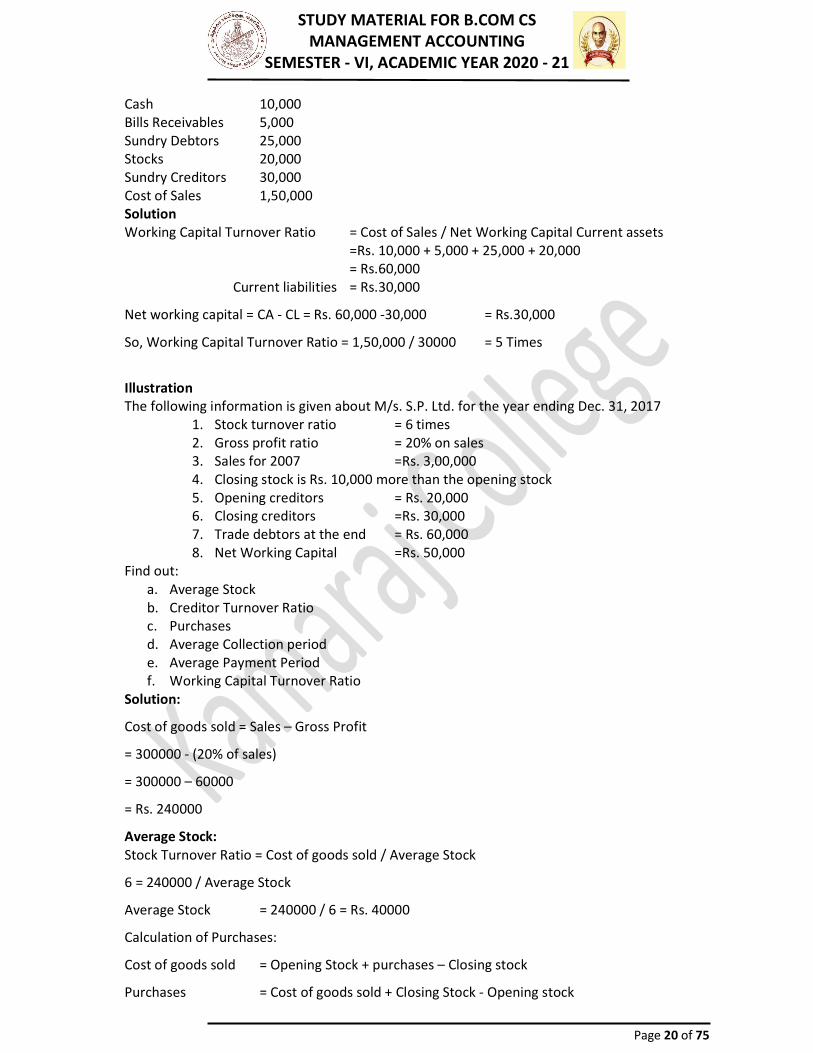
Cash 10,000 Bills Receivables 5,000 Sundry Debtors 25,000 Stocks 20,000 Sundry Creditors 30,000 Cost of Sales 1,50,000 Solution Working Capital Turnover Ratio = Cost of Sales / Net Working Capital Current assets =Rs. 10,000 + 5,000 + 25,000 + 20,000 = Rs.60,000 Current liabilities = Rs.30,000 Net working capital = CA - CL = Rs. 60,000 -30,000 = Rs.30,000 So, Working Capital Turnover Ratio = 1,50,000 / 30000 = 5 Times Illustration The following information is given about M/s. S.P. Ltd. for the year ending Dec. 31, 2017 1. Stock turnover ratio = 6 times 2. Gross profit ratio = 20% on sales 3. Sales for 2007 =Rs. 3,00,000 4. Closing stock is Rs. 10,000 more than the opening stock 5. Opening creditors = Rs. 20,000 6. Closing creditors =Rs. 30,000 7. Trade debtors at the end = Rs. 60,000 8. Net Working Capital =Rs. 50,000 Find out: a. Average Stock b. Creditor Turnover Ratio c. Purchases d. Average Collection period e. Average Payment Period f. Working Capital Turnover Ratio Solution: Cost of goods sold = Sales – Gross Profit = 300000 - (20% of sales) = 300000 – 60000 = Rs. 240000 Average Stock: Stock Turnover Ratio = Cost of goods sold / Average Stock 6 = 240000 / Average Stock Average Stock = 240000 / 6 = Rs. 40000 Calculation of Purchases: Cost of goods sold = Opening Stock + purchases – Closing stock Purchases = Cost of goods sold + Closing Stock - Opening stock

STUDY MATERIAL FOR B.COM CS MANAGEMENT ACCOUNTING SEMESTER - VI, ACADEMIC YEAR 2020 - 21
Page 21 of 75
Average Stock = Opening Stock + Closing stock / 2 Since, Closing stock is Rs. 10000 more than the opening stock so, Rs. 40000 = Opening Stock + (Rs. 10000 + opening stock) / 2 Rs. 80000 = 2 Opening stock + Rs. 10000 Opening stock = 70000 / 2 = Rs. 35000 Closing stock = 35000+10000 = Rs.45000 Purchases = 240000 + 45000 + 35000 = Rs.250000 Credit Turnover Ratio = Net annual Credit Purchases / Average Trade Creditors All purchases are taken as credit purchases = 250000 / (20000+30000 / 2) Credit turnover ratio = 250000 / 25000 = 10 Times Average Payment Period = Average Trade Creditors x No. of Working days/ Net Annual Purchases = 25000 / 250000 x 365 = 36.5 days or 37 days Average collection period = Average Trade Debtors x No. of Working Days / Net Annual Sales = 60000 x 365 / 300000 = 73 Days Working Capital Turnover Ratio = Cost of Goods Sold / Net Working Capital = 240000 / 50000 = 4.8 times. ANALYSIS OF LONG-TERM FINANCIAL POSITION OR TESTS OF SOLVENCY The term 'solvency' refers to the ability of a concern to meet its long term obligations. The long-term indebtedness of a firm includes debenture holders, financial institutions providing medium and long-term loans and other creditors selling goods on installment basis. ANALYSIS OF LONG-TERM FINANCIAL POSITION OR TEST OF SOLVENCY Capital Structure Ratios 1. Debt-Equity Ratio. 2. Funded-Debt to Total Capitalization Ratio. 3. Proprietary Ratio or Equity Ratio.) 4. Solvency Ratio or Ratio of Total Liabilities to Total Assets. 5. Fixed Assets to Net Worth or Proprietor's Funds Ratio. DEBT-EQUITY RATIO Debt-Equity Ratio, also known as External -Internal Equity Ratio is calculated to measure the relative claims of outsiders and the owners (i.e., shareholders) against the firm's assets. This ratio indicates the relationship between the external equities or the outsiders funds and the internal equities or the shareholders' funds, thus: Debt- Equity Ratio = Outsiders Funds / Shareholders' Funds or Debt to Equity Ratio =External Equities / Internal Equities The two basic components of the ratio are outsiders' funds, i.e., external equities and share holders’ funds, i.e., internal equities. The outsiders' funds include all debts/liabilities to outsiders. Long- termDebt to Shareholders' Funds (Debt-Equity Ratio) = Long term Debt / Shareholders

STUDY MATERIAL FOR B.COM CS MANAGEMENT ACCOUNTING SEMESTER - VI, ACADEMIC YEAR 2020 - 21
Page 22 of 75
Illustration Liabilities
Rs. Assets Rs. 2,000 Equity Shares of Rs. 100 each 200000 Fixed Assets 400000 1,000 9% Preference Shares of Rs. 100 each 100000 Current Assets 200000 1,000 10% Debentures of Rs. 100 each 100000 Reserves: General Reserve 50000 Reserves for contingencies 50000 Current liabilities 100000
Calculate Debt-Equity Ratio. Solution: Debt - Equity Ratio = Outsiders‘ Fund / Shareholders‘ Funds =100000 (Debentures) + 100000(Current Liabilities) / 200000 +100000+ 50000+50000 = 200000 / 400000 = 1:2 Debt Equity Ratio = Long term Debt / Shareholder’s Funds = 100000 / 400000 = 1:4 Interpretation of Debt-Equity Ratio The debt-equity ratio is calculated to measure the extent to which debt financing has been used a business. The ratio indicates the proportionate claims of owners and the outsiders against the firm‘s assets. PROPRIETORY RATIO OR EQUITY RATIO A variant to the debt-equity ratio is the proprietary ratio which is also known as equity ratio or shareholders to total equities ratio or net worth to Total asset ratio. This ratio establishes the relationship between shareholders‘ funds to total assets of the firm. The ratio of proprietors‘ funds to total funds proprietors outsiders‘ funds or total funds or total assets is an important ratio for determining long-term solvency of a firm. Proprietary Ratio or Equity Ratio = Shareholder‘s Funds / Total Assets If shareholder's funds are Rs. 4,00,000 and total assets are Rs. 6,00,000. Proprietary Ratio or Equity Ratio = 400000 / 600000 = 2.3 Interpretation of Equity Ratio As equity ratio represents the relationship of owner's funds to total assets, higher the ratio or the share of the shareholders in the total capital of the company, better is the long-term solvency position of the company. SOLVENCY RATIO OR THE RATIO OF TOTAL LIABILITIES TO TOTAL ASSETS This ratio is a small variant of equity ratio and can be simply calculated as 100-equity ratio, i.e., continuing the example taken for the equity ratio, solvency ratio = 100 - 66.67 or say 33.33%. The ratio indicates the relationship between the total liabilities to outsiders to total assets of a firm and can be calculated as follows: Solvency Ratio = Total Liabilities to Outsiders / Total Assets
STUDY MATERIAL FOR B.COM CS MANAGEMENT ACCOUNTING SEMESTER - VI, ACADEMIC YEAR 2020 - 21
Page 23 of 75
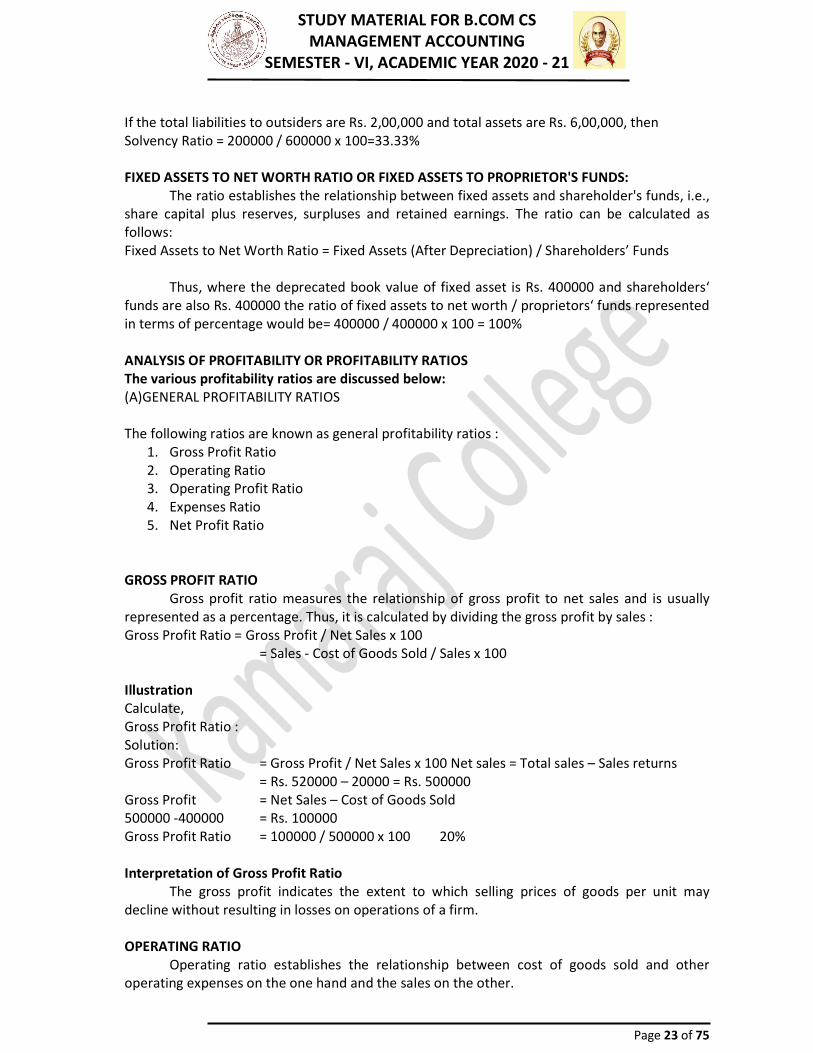
If the total liabilities to outsiders are Rs. 2,00,000 and total assets are Rs. 6,00,000, then Solvency Ratio = 200000 / 600000 x 100=33.33% FIXED ASSETS TO NET WORTH RATIO OR FIXED ASSETS TO PROPRIETOR'S FUNDS: The ratio establishes the relationship between fixed assets and shareholder's funds, i.e., share capital plus reserves, surpluses and retained earnings. The ratio can be calculated as follows: Fixed Assets to Net Worth Ratio = Fixed Assets (After Depreciation) / Shareholders’ Funds Thus, where the deprecated book value of fixed asset is Rs. 400000 and shareholders‘ funds are also Rs. 400000 the ratio of fixed assets to net worth / proprietors‘ funds represented in terms of percentage would be= 400000 / 400000 x 100 = 100% ANALYSIS OF PROFITABILITY OR PROFITABILITY RATIOS The various profitability ratios are discussed below: (A)GENERAL PROFITABILITY RATIOS The following ratios are known as general profitability ratios : 1. Gross Profit Ratio 2. Operating Ratio 3. Operating Profit Ratio 4. Expenses Ratio 5. Net Profit Ratio GROSS PROFIT RATIO Gross profit ratio measures the relationship of gross profit to net sales and is usually represented as a percentage. Thus, it is calculated by dividing the gross profit by sales : Gross Profit Ratio = Gross Profit / Net Sales x 100 = Sales - Cost of Goods Sold / Sales x 100 Illustration Calculate, Gross Profit Ratio : Solution: Gross Profit Ratio = Gross Profit / Net Sales x 100 Net sales = Total sales – Sales returns = Rs. 520000 – 20000 = Rs. 500000 Gross Profit = Net Sales – Cost of Goods Sold 500000 -400000 = Rs. 100000 Gross Profit Ratio = 100000 / 500000 x 100 20% Interpretation of Gross Profit Ratio The gross profit indicates the extent to which selling prices of goods per unit may decline without resulting in losses on operations of a firm. OPERATING RATIO Operating ratio establishes the relationship between cost of goods sold and other operating expenses on the one hand and the sales on the other.
STUDY MATERIAL FOR B.COM CS MANAGEMENT ACCOUNTING SEMESTER - VI, ACADEMIC YEAR 2020 - 21
Page 24 of 75
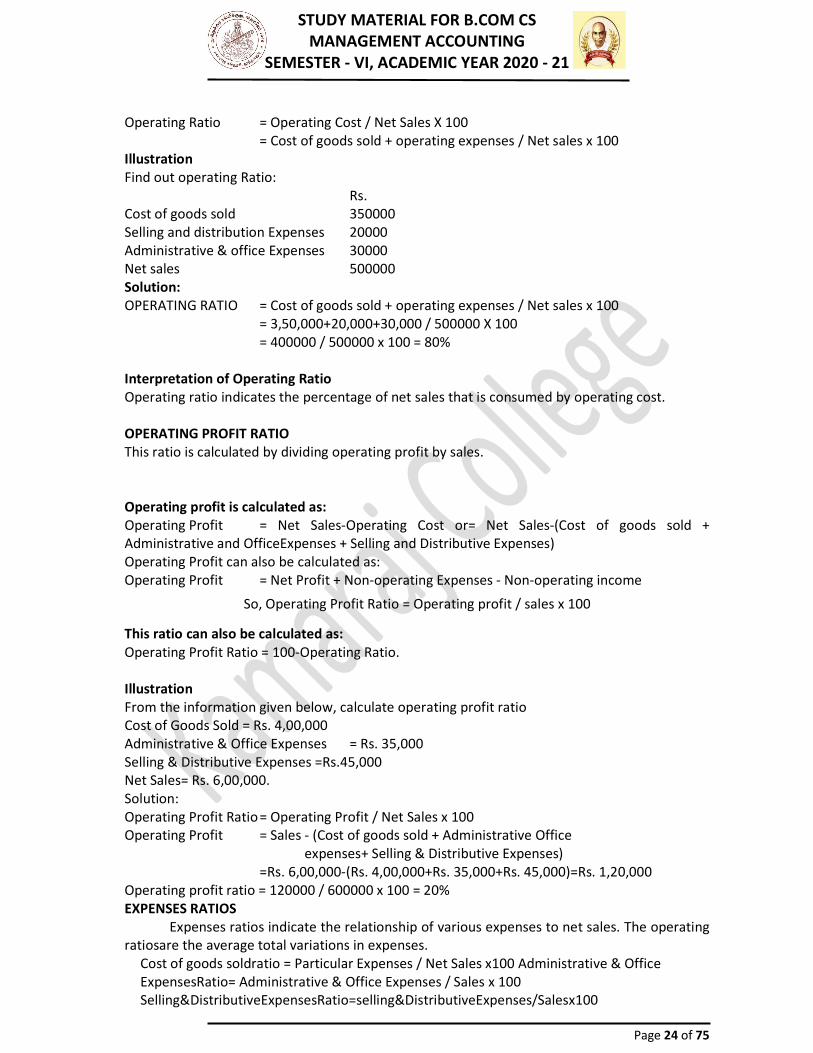
Operating Ratio = Operating Cost / Net Sales X 100 = Cost of goods sold + operating expenses / Net sales x 100 Illustration Find out operating Ratio: Rs. Cost of goods sold 350000 Selling and distribution Expenses 20000 Administrative & office Expenses 30000 Net sales 500000 Solution: OPERATING RATIO = Cost of goods sold + operating expenses / Net sales x 100 = 3,50,000+20,000+30,000 / 500000 X 100 = 400000 / 500000 x 100 = 80% Interpretation of Operating Ratio Operating ratio indicates the percentage of net sales that is consumed by operating cost. OPERATING PROFIT RATIO This ratio is calculated by dividing operating profit by sales. Operating profit is calculated as: Operating Profit = Net Sales-Operating Cost or= Net Sales-(Cost of goods sold + Administrative and OfficeExpenses + Selling and Distributive Expenses) Operating Profit can also be calculated as: Operating Profit = Net Profit + Non-operating Expenses - Non-operating income So, Operating Profit Ratio = Operating profit / sales x 100
This ratio can also be calculated as: Operating Profit Ratio = 100-Operating Ratio. Illustration From the information given below, calculate operating profit ratio Cost of Goods Sold = Rs. 4,00,000 Administrative & Office Expenses = Rs. 35,000 Selling & Distributive Expenses =Rs.45,000 Net Sales= Rs. 6,00,000. Solution: Operating Profit Ratio = Operating Profit / Net Sales x 100 Operating Profit = Sales - (Cost of goods sold + Administrative Office expenses+ Selling & Distributive Expenses) =Rs. 6,00,000-(Rs. 4,00,000+Rs. 35,000+Rs. 45,000)=Rs. 1,20,000 Operating profit ratio = 120000 / 600000 x 100 = 20% EXPENSES RATIOS Expenses ratios indicate the relationship of various expenses to net sales. The operating ratiosare the average total variations in expenses. Cost of goods soldratio = Particular Expenses / Net Sales x100 Administrative & Office ExpensesRatio= Administrative & Office Expenses / Sales x 100 Selling&DistributiveExpensesRatio=selling&DistributiveExpenses/Salesx100

STUDY MATERIAL FOR B.COM CS MANAGEMENT ACCOUNTING SEMESTER - VI, ACADEMIC YEAR 2020 - 21
Page 25 of 75
Non-OperatingExpensesRatio = Non-Operating Expenses / Sales x100 NET PROFIT RATIO Net Profit ratio establishes a relationship between net profit (after taxes) and sales, and indicates the efficiency of the management m manufacturing, selling, administrative and other activities of the firm This ratio is the overall measure of firm's profitability and is calculated as: Net Profit Ratio = Net Profit after Tax / Net Sales x 100 Net profit Ratio = Net Operating Profit / Net Sales x 100 Illustration: Following is the Profit and Loss Account to Royal Matrix Ltd. for the ended 31st December 2016. Dr. Rs. Cr. Rs. To Opening stock 100000 By Sales 560000 To Purchases 350000 By Closing stock 100000 To Wages 9000 To Gross profit c/d 201000
660000 660000 To Administrative expenses 20000 By Gross profit b/d 201000 To Selling and distribution expenses 89000 By Interest on investments
(outside business) 1000
To Non-operating expenses 30000 By ProfitonsalesofInvestments 8000 To Net profit 80000
219000 219000 Calculate: 1. Gross profit Ratio 2. Net profit Ratio 3. Operating Ratio 4. Operating profit Ratio 5. Administrative Expenses Ratio. Solution: 1.Gross profit = Gross profit / Net sales x 100 = 201000 / 560000 x 100 = 35.9% 2.Net profit ratio = Net profit (after tax) / Net sales x 100 = 80000 / 560000 x 100 = 14.3% Alternatively, Net Profit Ratio = Net operating profit /Net sales x 100 = (80000 + 30000) – (10000 + 8000)/ 560000 x 100 = 92000 / 560000 x 100 = 16.4% 3.Operating Ratio = Cost of goods sold + operating Exp. / Net sales Cost of goods sold = Op. stock + Purchases + Wages - Closing Stock = 100000+350000 + 9000 – 100000 = Rs. 359000 Operating Expenses = Administrative + Selling & Distribution Exp.

STUDY MATERIAL FOR B.COM CS MANAGEMENT ACCOUNTING SEMESTER - VI, ACADEMIC YEAR 2020 - 21
Page 26 of 75
= 20000 + 89000 = 109000 Operating Ratio = 359000 + 109000 / 560000 x 100 = 83.6% 4.Operating profit Ratio = 100 – Operating Ratio = 100 – 83.6% = 16.4% 5.Administrative Expenses Ratio = Administrative Expense / Net sales x 100 = 20000 / 560000 x 100 = 3.6% USE OF RATIO ANALYSIS The ratio analysis is one of the most powerful tools of financial analysis. It is used as a device to analyses and interprets the financial health of enterprise. Ratios have wide applications and are of immense use today. Managerial Uses of Ratio Analysis a. Helps in decision-making: Financial statements are prepared primarily for decision-making. b. Helps in financial forecasting and planning: Ratio Analysis is of much help in financial forecasting and planning. c. Helps in communicating: The financial strength and weakness of a firm are communicated in a more easy and understandable manner by the use of ratios. d. Helps in co-ordination: Ratios even help in co-ordination which is of utmost importance in effective business management. e. Helps in Control: Ratio analysis even helps in making effective control of the business. Utility to Shareholders/Investors: An investor in the company will like to assess the financial position of the concern where he is going to invest His first interest will be, the security of his investment and then a return in the form of dividend of interest. Utility to Creditors: The creditors or suppliers extend short-term credit to the concern. They are interested to know whether financial position of the concern warrants their payments at a specified time or not. Utility to Employees: The employees are also interested in the financial position of the concern especially profitability. Their wage increases and amount of fringe benefits are related to the volume of profits earned by the concerns. Utility to Government: Government is interested to know the overall strength of the industry. Various financial statements published by industrial units are used to calculate ratios for determining short financial position of the concerns. LIMITATIONS OF RATIO ANALYSIS: Limited Use of a Single Ratio: "A single ratio, usually, does not convey much of a sense. To make better interpretation a number of ratios have to be calculated which is likely to confuse the analyst than help making any meaningful conclusion”.
STUDY MATERIAL FOR B.COM CS MANAGEMENT ACCOUNTING SEMESTER - VI, ACADEMIC YEAR 2020 - 21
Page 27 of 75
Lack of adequate standards: There are no well accepted standards or rules of thumb for all ratios which can be accepted as norms. It renders interpretation of the ratios difficult. Inherent Limitations of Accounting: Like financial statements, ratios also suffer from the inherent weakness of accounting records such as their historical nature. Change of Accounting Procedure: Change in accounting procedure by a firm often makes ratio analysis misleading. Window Dressing: Financial statements can easily be window dressed to present a better picture of its financial and profitability position to outsiders. Personal Bias: Ratiosare only means of financial analysis and not an end in itself. Ratios have to be interpreted and different people may interpret the same ratio in different ways. Uncomparable: Not only industries differ in their nature but also the firms of the similar business widely differ in their size and accounting procedures, etc. It makes comparison of ratios difficult and misleading. Absolute Figures Distortive: Ratios devoid of absolute figures may prove distortive as ratio analysis is primarily a quantitative analysis and not a qualitative analysis. Price Level Changes: While making ratio analysis, no consideration is made to the changes in price levels and this makes the interpretation of ratios invalid. Ratios no Substitutes: Ratio analysis is merely a tool of financial statements. Hence, ratios become useless if separated from the statements from which they are computed. Clues not Conclusions: Ratios provide only clues to analysts and not for conclusions. These ratios have to be interpreted by these experts and there are no standard rules for interpretation.

STUDY MATERIAL FOR B.COM CS MANAGEMENT ACCOUNTING SEMESTER - VI, ACADEMIC YEAR 2020 - 21
Page 28 of 75
UNIT - III FUNDS FLOW STATEMENT The Funds Flow Statement is a statement which shows the movement of funds and is a report of the financial operations of the business undertaking. It indicates various means by which funds were obtained during a particular period and the ways in which these funds were employed In simple words, it is a statement of sources and applications of funds. MEANING AND DEFINITION OF FUNDS FLOW STATEMENT Funds Flow Statement is a method by which we study changes in the financial position of a business enterprise between beginning and ending financial statements dates. It is a statement showing sources and uses of funds for a period of time. Foulke defines this statements as: A statement of sources and application of funds is a technical device designed to analyses the changes in the financial condition of a business enterprise between two dates. In the words of Anthony - The funds flow statement describes the sources from which additional funds were derived and the use to which these sources were put. Funds flow statement is called by various names such as Sources and Application of Funds Statement of Changes in Financial Position. USES OF FUNDS FLOW STATEMENT A funds flow statement is an essential tool for the financial analysis and is of primary importance to the financial management. The basic purpose of a funds flow statement is to reveal the changes in the working capital on the two balance sheet dates. It also describes the sources from which additional working capital has been financed and the uses to which working capital has been applied. The uses of funds flow statement can be well followed from its various uses given below: a. It helps in the analysis of financial operations. The financial statements reveal the net effect of various transactions on the operational and financial position of a concern. b. It throws light on many perplexing questions of general interest which otherwise may be difficult to be answered. c. It helps in the formation of a realistic dividend policy d. It helps in the proper allocation of resources. e. It acts as a future guide. f. It helps in appraising the use of working capital. g. It helps knowing the overall creditworthiness of a firm. PROCEDURE FOR PREPARING A FUNDS FLOW STATEMENT The preparation of a funds flow statement consists of two parts: a. Statement or Schedule of Charges in Working Capital. b. Statement of Sources and Application of Funds. a.Statement or Schedule of Changes in Working Capital:

STUDY MATERIAL FOR B.COM CS MANAGEMENT ACCOUNTING SEMESTER - VI, ACADEMIC YEAR 2020 - 21
Page 29 of 75
Working Capital means the excess of current assets over current liabilities. Statement of changes in working capital is prepared to show the changes in the working capital between the two balance sheet dates. This statement is prepared with the help of current assets and current liabilities derived from the two balance sheets. As, Working Capital = Current Assets - Current Liabilities. So, I. An increase in current assets increases working capital. II. A decrease in current assets decreases, working capital. III. An increase in current liabilities decreases working capital IV. A decrease in current liabilities increases working capital. Statement of Schedule of Changes in Working Capital
Effect on Working Capital Particulars Previous Year Current Year Increase Decrease
Current Assets: Cash in hand Cash at bank Bills Receivable Sundry Debtors Temporary Investments Stocks/Inventories Prepaid Expenses Accrued Incomes Total Current Assets Current Liabilities: Bills Payable Sundry Creditors Outstanding Expenses Bank Overdraft Short-term advances Dividends Payable Proposed dividends* Provision for taxation* Total Current Liabilities Working Capital (CA-CL) Net Increase or Decrease in Working Capital
Illustration: Prepare a Statement of changes in Working Capital from the following Balance Sheets of SSM and Company Limited.

STUDY MATERIAL FOR B.COM CS MANAGEMENT ACCOUNTING SEMESTER - VI, ACADEMIC YEAR 2020 - 21
Page 30 of 75
BalanceSheets as at December31 Liabilities 2015 Rs. 2016 Rs. Assets 2015 Rs. 2016 Rs.
Equity Capital 5,00,000 5,00,000 Fixed Assets 6,00,000 7,00,000 Debentures 3,70,000 4,50,000 Long-term
Investments 2,00,000 1,00,000 Tax Payable 77,000 43,000 Work-in-Progress 80,000 90,000 AccountsPayable 96,000 1,92,000 Stock-in-trade 1,50,000 2,25,000 Interest Payable 37,000 45,000 Accounts 70,000 1,40,000
Receivable DividendPayable 50,000 35,000 Cash 30,000 10,000
1130000 1265000 1130000 1265000 Solution:
STATEMENT OF CHANGES IN WORKING CAPITAL Effect on Working Capital Particulars 2006 Rs. 2007 Rs. Increase Rs. Decrease Rs. Current Assets: Cash 30,000 10,000 --- 20,000 Accounts Receivable 70,000 1,40,000 70,000 --- Stock-in-trade 1,50,000 2,25,000 75,000 --- Work-in-progress 80,000 90,000 10,000 ---
3,30,000 4,65,000 --- --- Current Liabilities : Tax Payable 77,000 43,000 34,000 --- Accounts Payable 96,000 1,92,000 --- 96,000 Interest Payable 37,000 45,000 --- 8,000 Dividend Payable 50,000 35,000 15,000 ---
2,60,000 3,15,0000 --- --- Working Capital (CA-CL) Net 70,000 1,50,000 --- --- Increase in Working Capital 80,000 --- --- 80,000
1,50,000 1,50,000 2,04,000 2,04,000 Illustration: From the following balance sheets of Bharat Company prepare a statement show in changes in Working Capital. 31st Dec 2016 Rs. 31st Dec 2015Rs.
STUDY MATERIAL FOR B.COM CS MANAGEMENT ACCOUNTING SEMESTER - VI, ACADEMIC YEAR 2020 - 21
Page 31 of 75
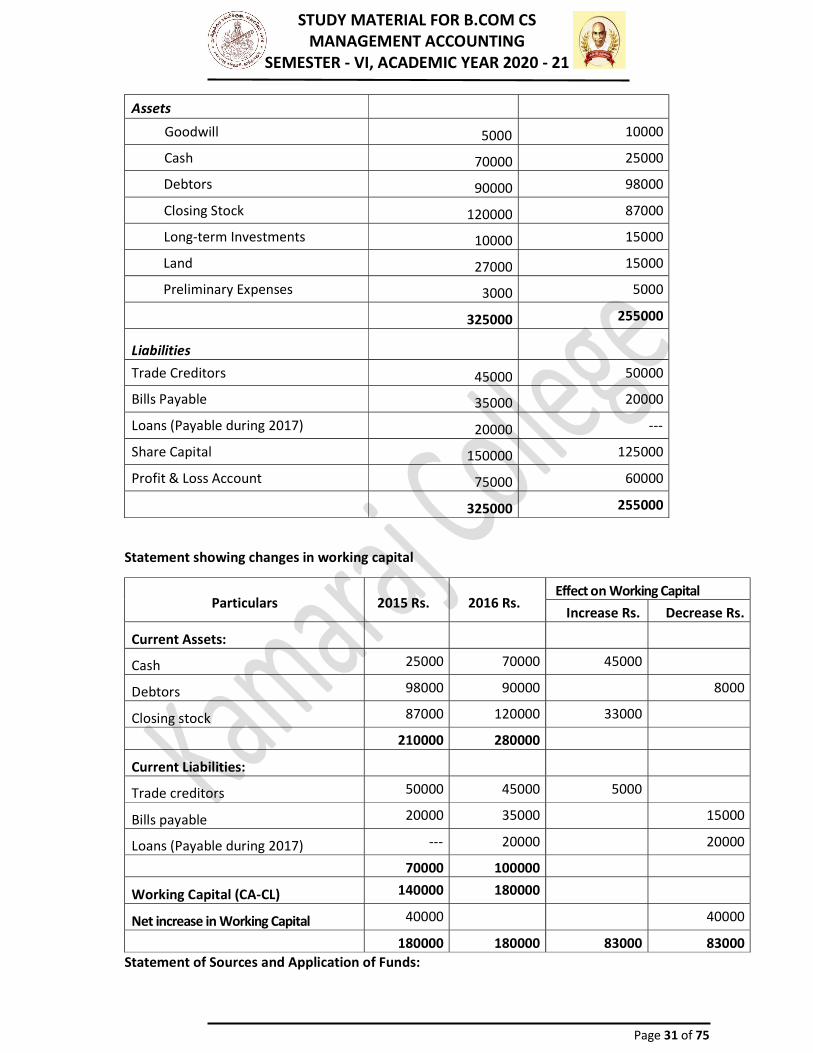
Assets Goodwill 5000 10000 Cash 70000 25000 Debtors 90000 98000 Closing Stock 120000 87000 Long-term Investments 10000 15000 Land 27000 15000 Preliminary Expenses 3000 5000
325000 255000 Liabilities Trade Creditors 45000 50000 Bills Payable 35000 20000 Loans (Payable during 2017) 20000 --- Share Capital 150000 125000 Profit & Loss Account 75000 60000
325000 255000 Statement showing changes in working capital
Particulars 2015 Rs. 2016 Rs. Effect on Working Capital Increase Rs. Decrease Rs.
Current Assets: Cash 25000 70000 45000 Debtors 98000 90000 8000 Closing stock 87000 120000 33000
210000 280000 Current Liabilities: Trade creditors 50000 45000 5000 Bills payable 20000 35000 15000 Loans (Payable during 2017) --- 20000 20000
70000 100000 Working Capital (CA-CL) 140000 180000 Net increase in Working Capital 40000 40000
180000 180000 83000 83000 Statement of Sources and Application of Funds:
STUDY MATERIAL FOR B.COM CS MANAGEMENT ACCOUNTING SEMESTER - VI, ACADEMIC YEAR 2020 - 21
Page 32 of 75
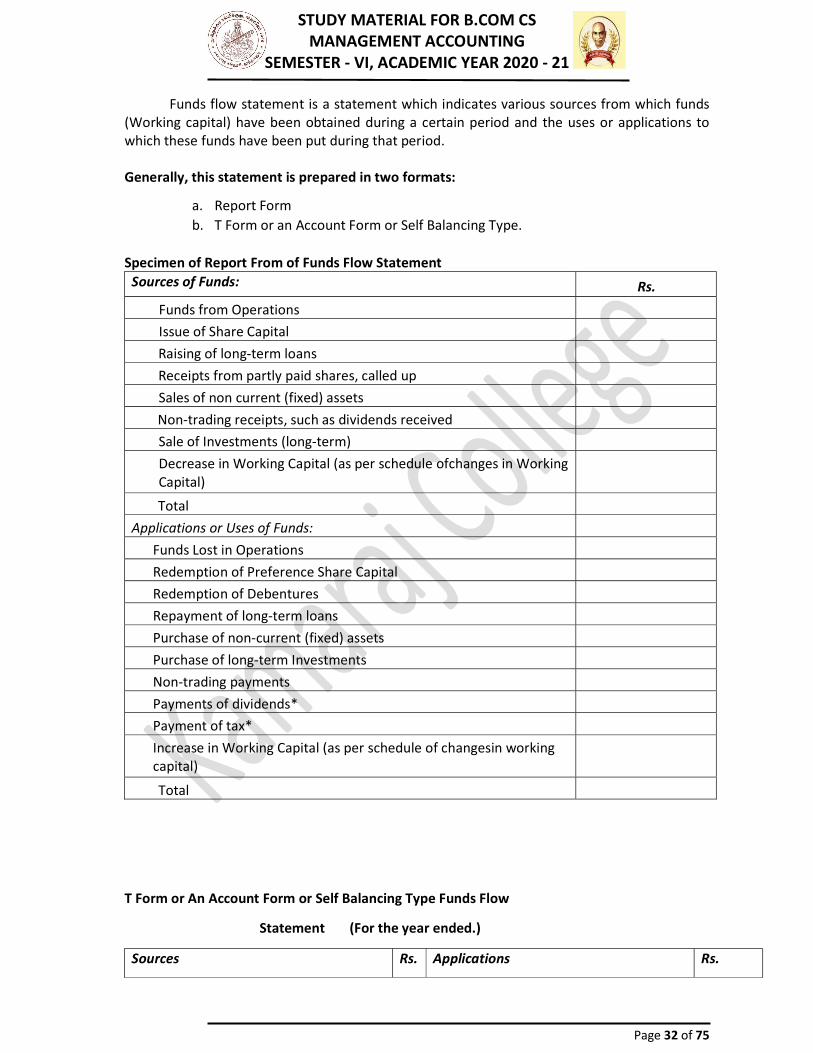
Funds flow statement is a statement which indicates various sources from which funds (Working capital) have been obtained during a certain period and the uses or applications to which these funds have been put during that period. Generally, this statement is prepared in two formats: a. Report Form b. T Form or an Account Form or Self Balancing Type.
Specimen of Report From of Funds Flow Statement Sources of Funds: Rs.
Funds from Operations Issue of Share Capital Raising of long-term loans Receipts from partly paid shares, called up Sales of non current (fixed) assets Non-trading receipts, such as dividends received Sale of Investments (long-term) Decrease in Working Capital (as per schedule ofchanges in Working Capital) Total
Applications or Uses of Funds: Funds Lost in Operations Redemption of Preference Share Capital Redemption of Debentures Repayment of long-term loans Purchase of non-current (fixed) assets Purchase of long-term Investments Non-trading payments Payments of dividends* Payment of tax* Increase in Working Capital (as per schedule of changesin working capital) Total
T Form or An Account Form or Self Balancing Type Funds Flow Statement (For the year ended.)
Sources Rs. Applications Rs.
STUDY MATERIAL FOR B.COM CS MANAGEMENT ACCOUNTING SEMESTER - VI, ACADEMIC YEAR 2020 - 21
Page 33 of 75
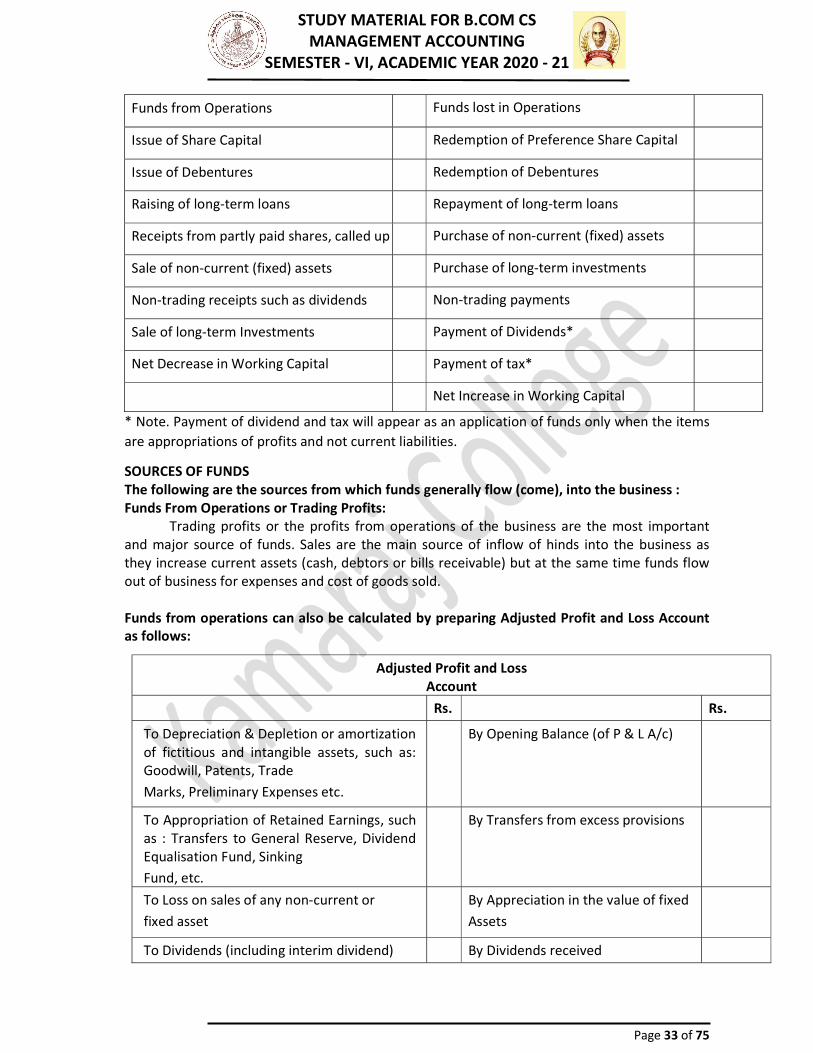
Funds from Operations Funds lost in Operations Issue of Share Capital Redemption of Preference Share Capital Issue of Debentures Redemption of Debentures Raising of long-term loans Repayment of long-term loans Receipts from partly paid shares, called up Purchase of non-current (fixed) assets Sale of non-current (fixed) assets Purchase of long-term investments Non-trading receipts such as dividends Non-trading payments Sale of long-term Investments Payment of Dividends* Net Decrease in Working Capital Payment of tax*
Net Increase in Working Capital * Note. Payment of dividend and tax will appear as an application of funds only when the items are appropriations of profits and not current liabilities. SOURCES OF FUNDS The following are the sources from which funds generally flow (come), into the business : Funds From Operations or Trading Profits: Trading profits or the profits from operations of the business are the most important and major source of funds. Sales are the main source of inflow of hinds into the business as they increase current assets (cash, debtors or bills receivable) but at the same time funds flow out of business for expenses and cost of goods sold. Funds from operations can also be calculated by preparing Adjusted Profit and Loss Account as follows:
Adjusted Profit and Loss Account Rs. Rs.
To Depreciation & Depletion or amortization of fictitious and intangible assets, such as: Goodwill, Patents, Trade Marks, Preliminary Expenses etc.
By Opening Balance (of P & L A/c)
To Appropriation of Retained Earnings, such as : Transfers to General Reserve, Dividend Equalisation Fund, Sinking Fund, etc.
By Transfers from excess provisions
To Loss on sales of any non-current or fixed asset
By Appreciation in the value of fixed Assets
To Dividends (including interim dividend) By Dividends received
STUDY MATERIAL FOR B.COM CS MANAGEMENT ACCOUNTING SEMESTER - VI, ACADEMIC YEAR 2020 - 21
Page 34 of 75
To Proposed Dividend (if not taken as a current liability)
By Interest on investments
To Provision for taxation (if not taken as a current liability)
By Profit on sale of fixed or non-current Assets
To Closing balance (of P & L A/c) By Funds from Operations (balancing figure in case debit side exceeds credit side)
To Fundslost in Operations (balancing figure, in case credit side exceeds the debit side)
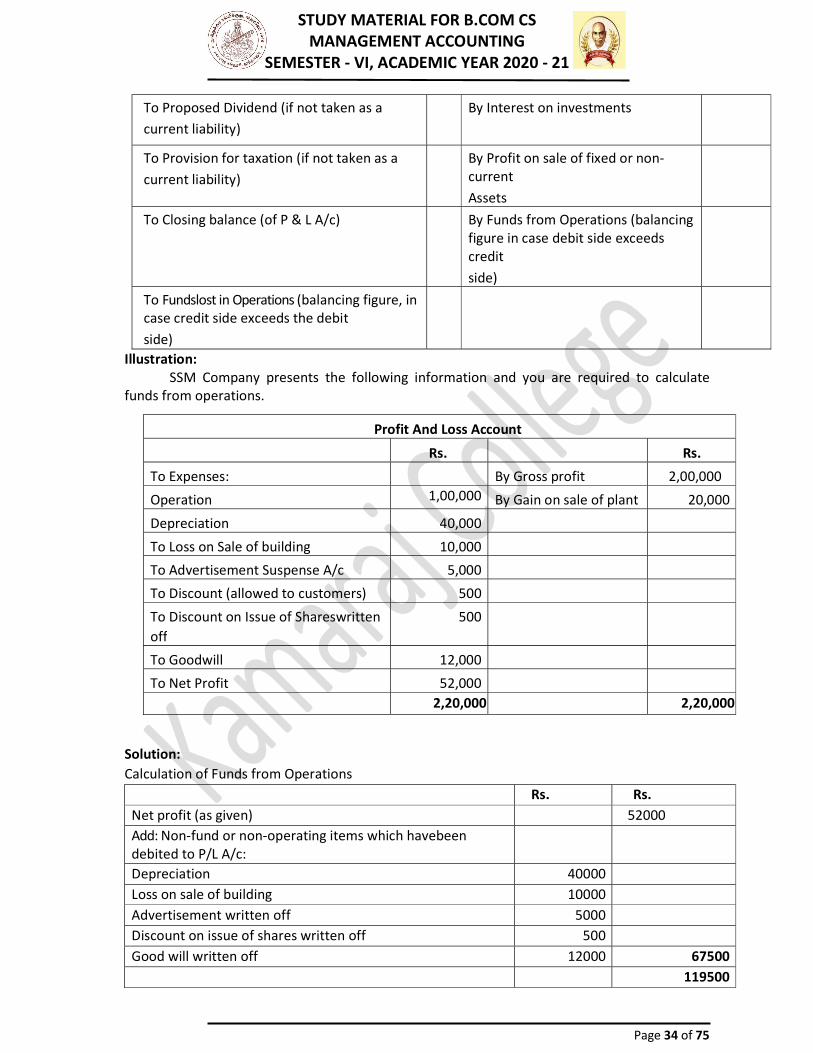
Illustration: SSM Company presents the following information and you are required to calculate funds from operations. Profit And Loss Account
Rs. Rs. To Expenses: By Gross profit 2,00,000 Operation 1,00,000 By Gain on sale of plant 20,000 Depreciation 40,000 To Loss on Sale of building 10,000 To Advertisement Suspense A/c 5,000 To Discount (allowed to customers) 500 To Discount on Issue of Shareswritten off
500 To Goodwill 12,000 To Net Profit 52,000
2,20,000 2,20,000 Solution: Calculation of Funds from Operations Rs. Rs. Net profit (as given) 52000 Add: Non-fund or non-operating items which havebeen debited to P/L A/c: Depreciation 40000 Loss on sale of building 10000 Advertisement written off 5000 Discount on issue of shares written off 500 Good will written off 12000 67500
119500
STUDY MATERIAL FOR B.COM CS MANAGEMENT ACCOUNTING SEMESTER - VI, ACADEMIC YEAR 2020 - 21
Page 35 of 75
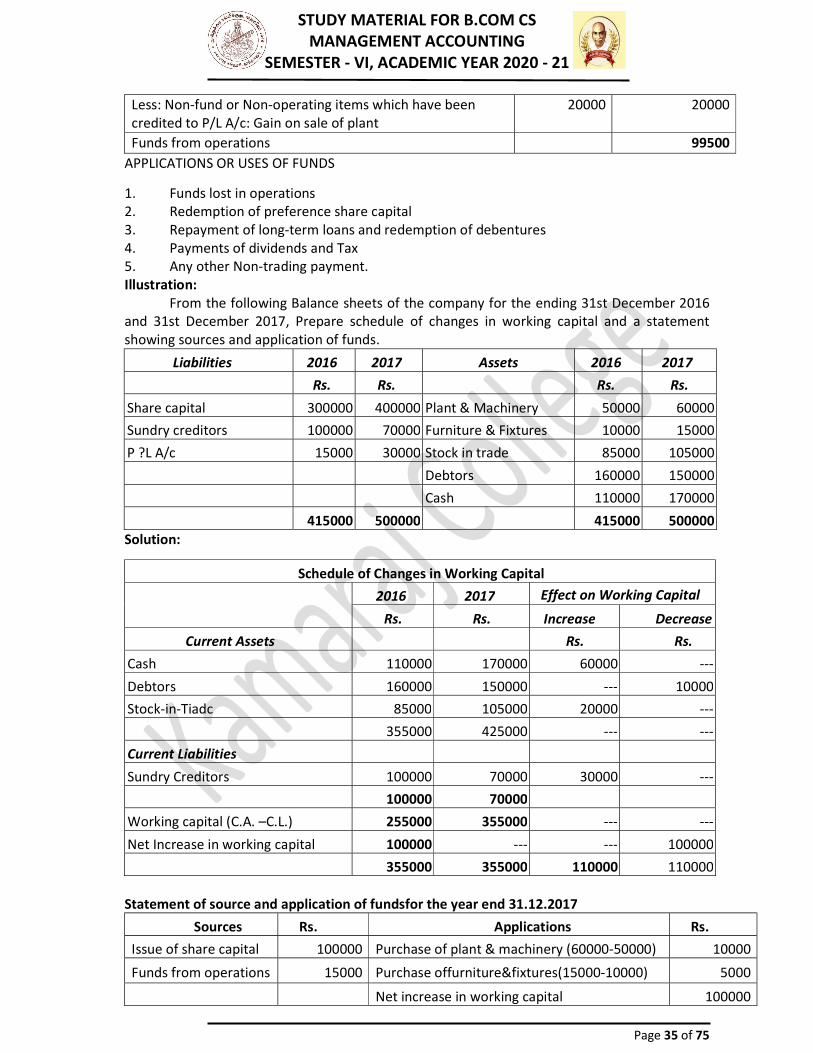
Less: Non-fund or Non-operating items which have been credited to P/L A/c: Gain on sale of plant 20000 20000 Funds from operations 99500
APPLICATIONS OR USES OF FUNDS 1. Funds lost in operations 2. Redemption of preference share capital 3. Repayment of long-term loans and redemption of debentures 4. Payments of dividends and Tax 5. Any other Non-trading payment. Illustration: From the following Balance sheets of the company for the ending 31st December 2016 and 31st December 2017, Prepare schedule of changes in working capital and a statement showing sources and application of funds.
Solution: Schedule of Changes in Working Capital
2016 2017 Effect on Working Capital Rs. Rs. Increase Decrease
Current Assets Rs. Rs. Cash 110000 170000 60000 --- Debtors 160000 150000 --- 10000 Stock-in-Tiadc 85000 105000 20000 --- 355000 425000 --- --- Current Liabilities Sundry Creditors 100000 70000 30000 --- 100000 70000 Working capital (C.A. –C.L.) 255000 355000 --- --- Net Increase in working capital 100000 --- --- 100000 355000 355000 110000 110000 Statement of source and application of fundsfor the year end 31.12.2017
Sources Rs. Applications Rs. Issue of share capital 100000 Purchase of plant & machinery (60000-50000) 10000 Funds from operations 15000 Purchase offurniture&fixtures(15000-10000) 5000
Net increase in working capital 100000
Liabilities 2016 2017 Assets 2016 2017 Rs. Rs. Rs. Rs. Share capital 300000 400000 Plant & Machinery 50000 60000 Sundry creditors 100000 70000 Furniture & Fixtures 10000 15000 P ?L A/c 15000 30000 Stock in trade 85000 105000 Debtors 160000 150000 Cash 110000 170000 415000 500000 415000 500000
STUDY MATERIAL FOR B.COM CS MANAGEMENT ACCOUNTING SEMESTER - VI, ACADEMIC YEAR 2020 - 21
Page 36 of 75
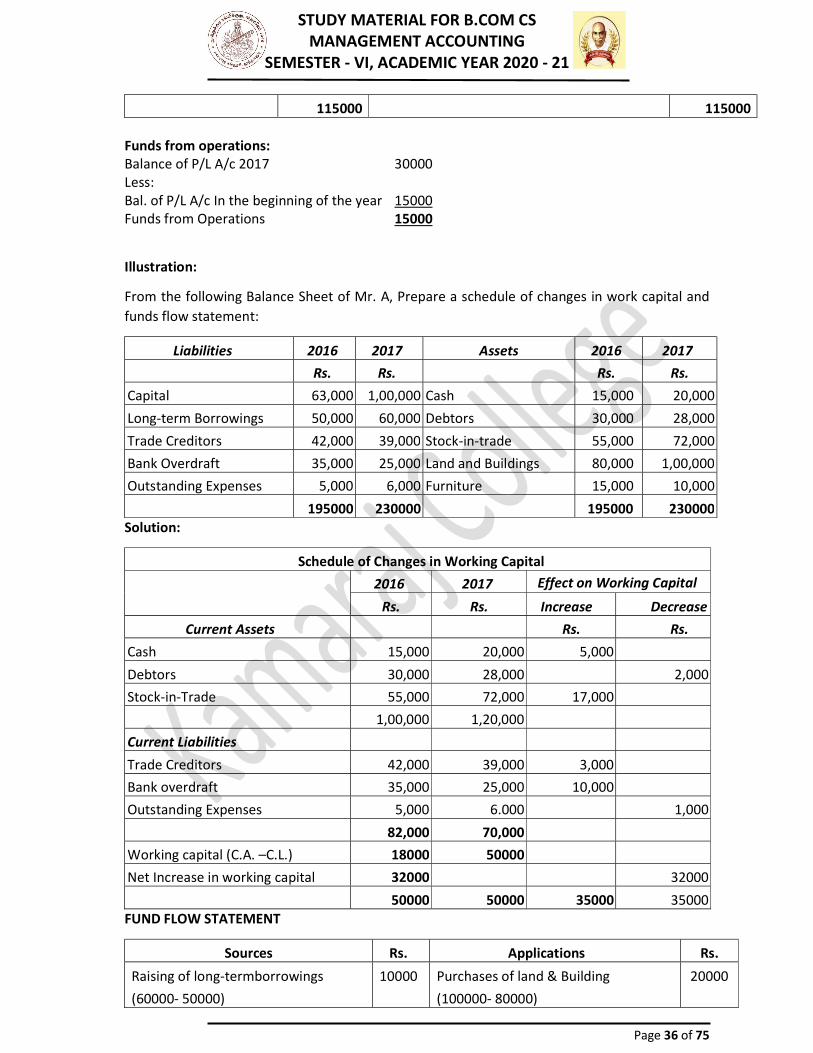
115000 115000 Funds from operations: Balance of P/L A/c 2017 30000 Less: Bal. of P/L A/c In the beginning of the year 15000 Funds from Operations 15000 Illustration: From the following Balance Sheet of Mr. A, Prepare a schedule of changes in work capital and funds flow statement:
Liabilities 2016 2017 Assets 2016 2017 Rs. Rs. Rs. Rs. Capital 63,000 1,00,000 Cash 15,000 20,000 Long-term Borrowings 50,000 60,000 Debtors 30,000 28,000 Trade Creditors 42,000 39,000 Stock-in-trade 55,000 72,000 Bank Overdraft 35,000 25,000 Land and Buildings 80,000 1,00,000 Outstanding Expenses 5,000 6,000 Furniture 15,000 10,000 195000 230000 195000 230000 Solution:
Schedule of Changes in Working Capital 2016 2017 Effect on Working Capital
Rs. Rs. Increase Decrease Current Assets Rs. Rs.
Cash 15,000 20,000 5,000 Debtors 30,000 28,000 2,000 Stock-in-Trade 55,000 72,000 17,000 1,00,000 1,20,000 Current Liabilities Trade Creditors 42,000 39,000 3,000 Bank overdraft 35,000 25,000 10,000 Outstanding Expenses 5,000 6.000 1,000 82,000 70,000 Working capital (C.A. –C.L.) 18000 50000 Net Increase in working capital 32000 32000 50000 50000 35000 35000 FUND FLOW STATEMENT
Sources Rs. Applications Rs. Raising of long-termborrowings (60000- 50000)
10000 Purchases of land & Building (100000- 80000)
20000
STUDY MATERIAL FOR B.COM CS MANAGEMENT ACCOUNTING SEMESTER - VI, ACADEMIC YEAR 2020 - 21
Page 37 of 75
Sales of furniture (15000-10000) 5000 Net increase in working capital 32000 Funds from operations 37000
52000 52000 Working Notes: Long term Borrowings A/c Rs. Rs. To Balance C/d 60000 By Balance b/d 50000
By Cash (balancing figures) 10000 60000 60000 Furniture A/c Rs. Rs. To Balance b/d 15000 By cash-sale (balancing figure) 5000
By Balance c/d 10000 15000 15000 Land and Building A/c Rs. Rs. To Balance b/d 80000 To cash-purchase (Bal.Fig.) 20000 By Balance c/d 100000
100000 100000 Capital A/c Rs. Rs. To balance c/d 100000 By balance b/d 63000
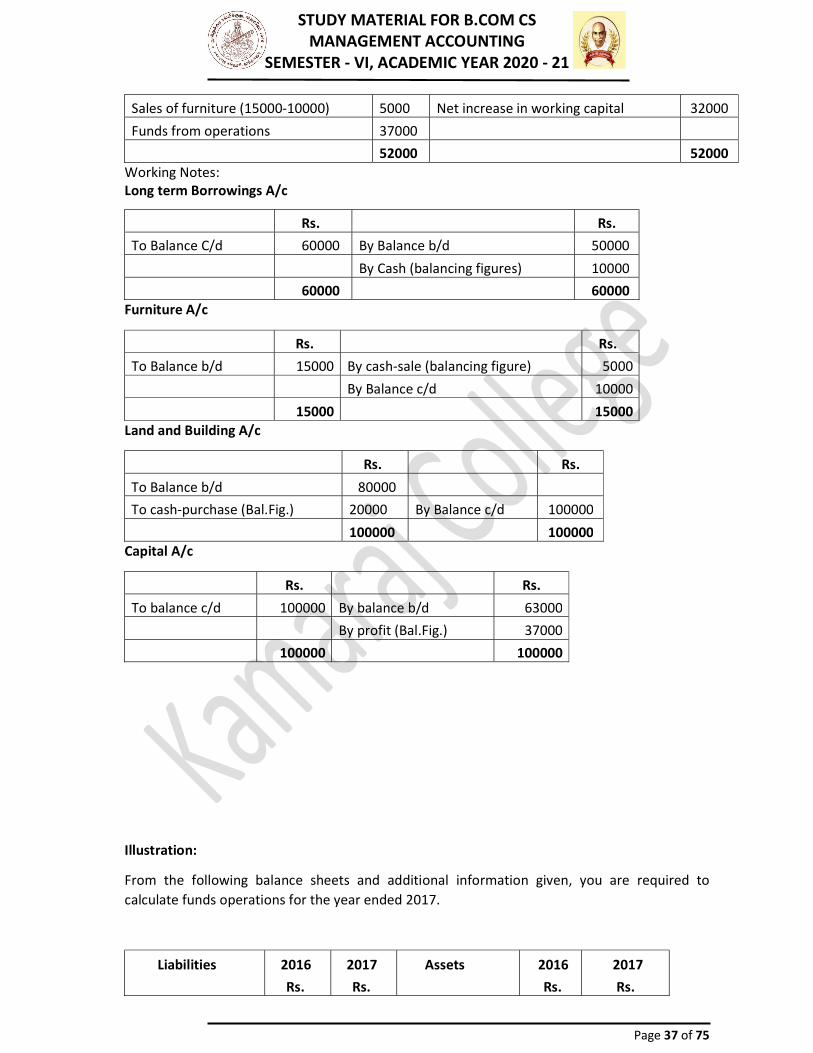
By profit (Bal.Fig.) 37000 100000 100000 Illustration: From the following balance sheets and additional information given, you are required to calculate funds operations for the year ended 2017.
Liabilities 2016 Rs.
2017 Rs.
Assets 2016 Rs.
2017 Rs.

STUDY MATERIAL FOR B.COM CS MANAGEMENT ACCOUNTING SEMESTER - VI, ACADEMIC YEAR 2020 - 21
Page 38 of 75
Share capital 100000 150000 Land &buildings 100000 95000 General reserve 30000 30000 Plant &Machinery 80000 90000 Profit & loss a/c 20000 22000 Stocks 70000 110000 6% Debentures 80000 80000 Debtors 20000 25000 Creditors 65000 58000 Investments --- 10000 Provision for tax 5000 10000 Cash 10000 10000
Goodwill 20000 10000 300000 350000 300000 350000 Additional information:
a. During 2017, dividends of Rs. 15000 were paid. b. Depreciation written off plant and machinery amounted to Rs. 6000 and no depreciation
has been charged on land and buildings. c. Provision for tax made during the year Rs. 5000. d. Profit on sale of machinery Rs. 2000.
Solution: Calculation of funds from operations
Rs. Rs. Closing balance of P/L A/c given in the B/S 22000 Add: Non-fund or non operating items already debited to P/L A/c: Depreciation 6000 Dividends 15000 Provision for tax 5000 Goodwill 10000 36000 Less: Non-fund or non operating items already credited to P/L A/c: Profit on sale of machinery 2000 Opening balance of P/L A/c (given in B/S) 20000 22000 Funds from operations 36000
Provision for tax has been treated as a non-current liability. Goodwill written off during the year is Rs. 20000- Rs. 10000 = Rs. 10000 Alternatively: ADJUSTED PROFIT AND LOSS ACCOUNT
ADJUSTED PROFIT AND LOSS ACCOUNT Rs. Rs. To depreciation 6000 By opening balance 20000 To dividends 15000 By profit on sale of machinery 2000 To provision for tax 5000 By funds from operations (bal.fig.) 36000 To goodwill 10000

STUDY MATERIAL FOR B.COM CS MANAGEMENT ACCOUNTING SEMESTER - VI, ACADEMIC YEAR 2020 - 21
Page 39 of 75
To closing balance 22000 58000 58000 Illustration From the following balance sheets of A & Co Ltd., you are required to show any increase or decrease in working capital and sources and applications thereof:
Liabilities As at 31.12.16 Rs.
As at 31.12.17 Rs.
Assets As at 31.12.16 Rs.
As at 31.12.17 Rs.
Equity share capital 240000 360000 Land 166200 339600 Share premium 24000 36000 Machinery 106800 153900 General reserve 18000 27000 Furniture 7200 4500 Profit and Loss Account 58500 62400 Stock 66300 78000 8% Debentures --- 78000 Debtors 109500 117300 Provision for taxation 29400 32700 Bank 14400 12000 Creditors 100500 109200
470400 705300 470400 705300 Depreciation written off during the year: On machinery Rs. 38400 On furniture Rs. 1200 Solution:
STATEMENT OF SOURCES AND APPLICATIONS OF FUNDS
Sources Rs. Applications Rs. Issue of share capital 120000 Purchase of land & building 173400 Share premium 12000 Purchase of machinery 85500
2016 Rs.
2017 Rs.
Increase in W.C.
Decrease in W.C.
Current Assets: Stock 66300 78000 11700 Bank 109500 117300 7800 Debtors 14400 12000 --- 190200 207300 2400 Current Liabilities: Creditors 100500 109200 8700 Provision for taxation 29400 32700 3300 129900 141900 Working Capital 60300 65400 Net Increase in W.C. 5100 5100 65400 65400 19500 19500

STUDY MATERIAL FOR B.COM CS MANAGEMENT ACCOUNTING SEMESTER - VI, ACADEMIC YEAR 2020 - 21
Page 40 of 75
Issue of debentures 78000 Net increase in W.C. 5100 Sale of furniture 1500 Funds from operations 52500
264000 264000 Working Notes:
Machinery A/c Rs. Rs. To balance B/d 106800 By depreciation 38400 To purchase during the year (Bal. Fig.)
85500 By balance c/d 153900 192300 192300
Land & Buildings A/c To balance B/d 166200 By balance c/d 339600 To purchase during the year (Bal. Fig.)
173400 339600 339600
Furniture A/c To balance B/d 7200 By depreciation 1200
By cash-sale (bal. fig.) 1500 By balance c/d 4500 7200 7200
Adjusted Profit & Loss A/c To transfer to Reserves 9000 By balance b/d 58500 To Depreciation on machinery 38400 By funds from operation 52500 To Depreciation on furniture 1200 To Balance C/d 62400
111000 111000 Illustration:
LIABILITIES 2016 2017 ASSETS 2006 2007 Share Capital 600000 800000 Plant & Machinery (at cost) Rs. Rs. Debentures 200000 300000 Land & Building (at cost) 400000 645000 Profit and Loss A/c 125000 250000 Stock 300000 400000 Creditors 115000 90,000 Bank 300000 350000 Provision for bad and doubtful debts 6000 3,000 Preliminary Expenses 20000 40000 Provision for Depreciation Debtors 7000 6000
STUDY MATERIAL FOR B.COM CS MANAGEMENT ACCOUNTING SEMESTER - VI, ACADEMIC YEAR 2020 - 21
Page 41 of 75
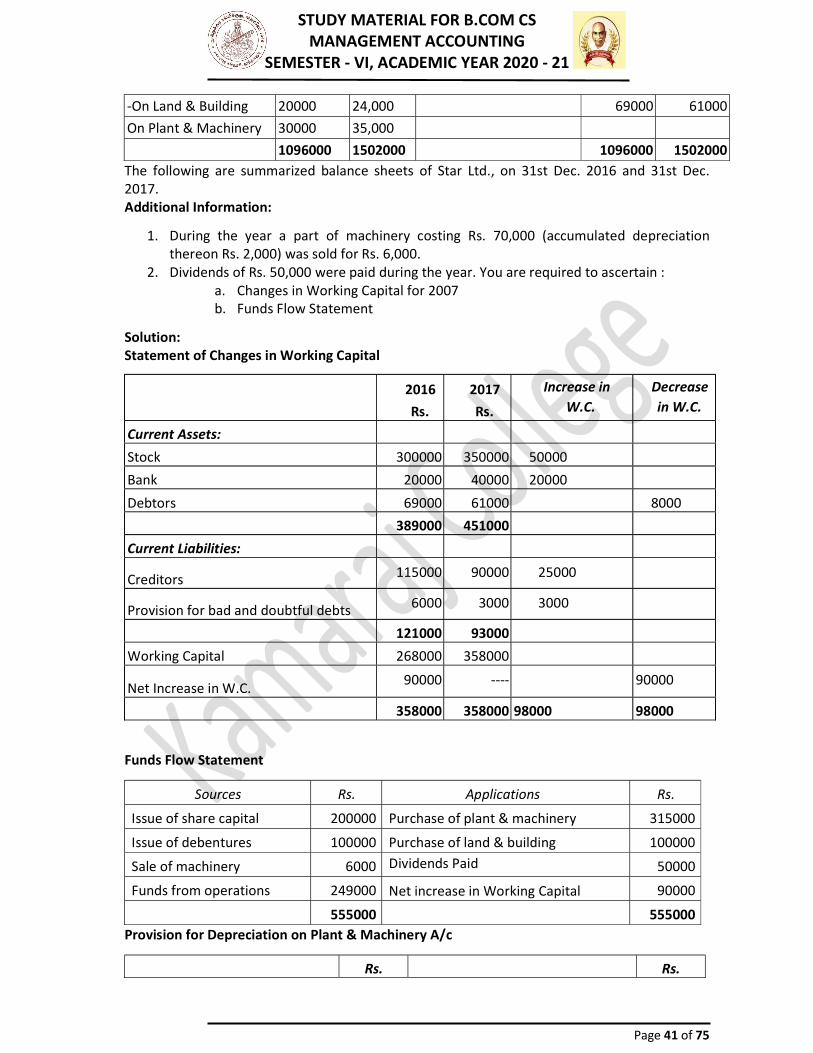
The following are summarized balance sheets of Star Ltd., on 31st Dec. 2016 and 31st Dec. 2017. Additional Information: 1. During the year a part of machinery costing Rs. 70,000 (accumulated depreciation thereon Rs. 2,000) was sold for Rs. 6,000. 2. Dividends of Rs. 50,000 were paid during the year. You are required to ascertain : a. Changes in Working Capital for 2007 b. Funds Flow Statement
Solution: Statement of Changes in Working Capital 2016
Rs. 2017 Rs.
Increase in W.C.
Decrease in W.C.
Current Assets: Stock 300000 350000 50000 Bank 20000 40000 20000 Debtors 69000 61000 8000 389000 451000 Current Liabilities: Creditors 115000 90000 25000 Provision for bad and doubtful debts 6000 3000 3000 121000 93000 Working Capital 268000 358000 Net Increase in W.C. 90000 ---- 90000 358000 358000 98000 98000 Funds Flow Statement
Sources Rs. Applications Rs. Issue of share capital 200000 Purchase of plant & machinery 315000 Issue of debentures 100000 Purchase of land & building 100000 Sale of machinery 6000 Dividends Paid 50000 Funds from operations 249000 Net increase in Working Capital 90000
555000 555000 Provision for Depreciation on Plant & Machinery A/c Rs. Rs.
-On Land & Building 20000 24,000 69000 61000 On Plant & Machinery 30000 35,000 1096000 1502000 1096000 1502000

STUDY MATERIAL FOR B.COM CS MANAGEMENT ACCOUNTING SEMESTER - VI, ACADEMIC YEAR 2020 - 21
Page 42 of 75
To Plant & Machinery A/c (Dep. On machinery sold)
2000 By Balance b/d 30000 To Balance c/d 35000 By Adjusted P/L A/c
(Dep. Provided) (bal. fig.) 7000
37000 37000 Provision for Depreciation on Land&Building A/c
To Balance c/d 24000 By Balance b/d 20000 By AdjustedP/LA/c (bal.fig.) 4000 24000 24000
Plant & Machinery A/c To Balance b/d 4,00,000 By Cash (sale) 6,000 ToCash-Purchases(bal.fig) 3,15,000 By-Provision for Dep. 2,000
By Adjusted P/L A/c (Losson sale)
62,000 By Balance c/d 6,45,000 7,15,000 7,15,000
Adjusted Profit and Loss Account To provision for depreciation: By balance c/d 125000 Plant & machinery 7000 By Funds from operations 249000 Land and building 4000 To Preliminary Expenses written off
1000 To Dividend 50000 To Loss on sale of machinery 62000 To Balance c/d 250000
374000 374000
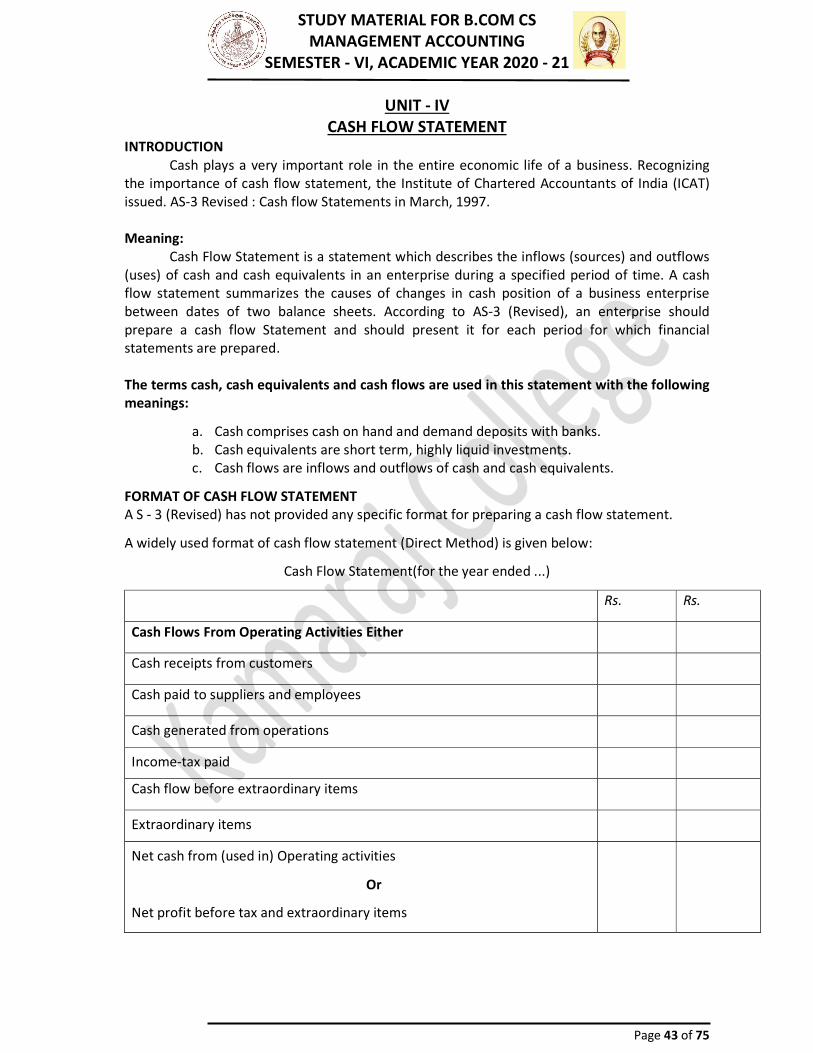
STUDY MATERIAL FOR B.COM CS MANAGEMENT ACCOUNTING SEMESTER - VI, ACADEMIC YEAR 2020 - 21
Page 43 of 75
UNIT - IV CASH FLOW STATEMENT INTRODUCTION Cash plays a very important role in the entire economic life of a business. Recognizing the importance of cash flow statement, the Institute of Chartered Accountants of India (ICAT) issued. AS-3 Revised : Cash flow Statements in March, 1997. Meaning: Cash Flow Statement is a statement which describes the inflows (sources) and outflows (uses) of cash and cash equivalents in an enterprise during a specified period of time. A cash flow statement summarizes the causes of changes in cash position of a business enterprise between dates of two balance sheets. According to AS-3 (Revised), an enterprise should prepare a cash flow Statement and should present it for each period for which financial statements are prepared. The terms cash, cash equivalents and cash flows are used in this statement with the following meanings:
a. Cash comprises cash on hand and demand deposits with banks. b. Cash equivalents are short term, highly liquid investments. c. Cash flows are inflows and outflows of cash and cash equivalents. FORMAT OF CASH FLOW STATEMENT A S - 3 (Revised) has not provided any specific format for preparing a cash flow statement. A widely used format of cash flow statement (Direct Method) is given below:
Cash Flow Statement(for the year ended ...) Rs. Rs. Cash Flows From Operating Activities Either Cash receipts from customers Cash paid to suppliers and employees Cash generated from operations Income-tax paid Cash flow before extraordinary items Extraordinary items Net cash from (used in) Operating activities
Or Net profit before tax and extraordinary items
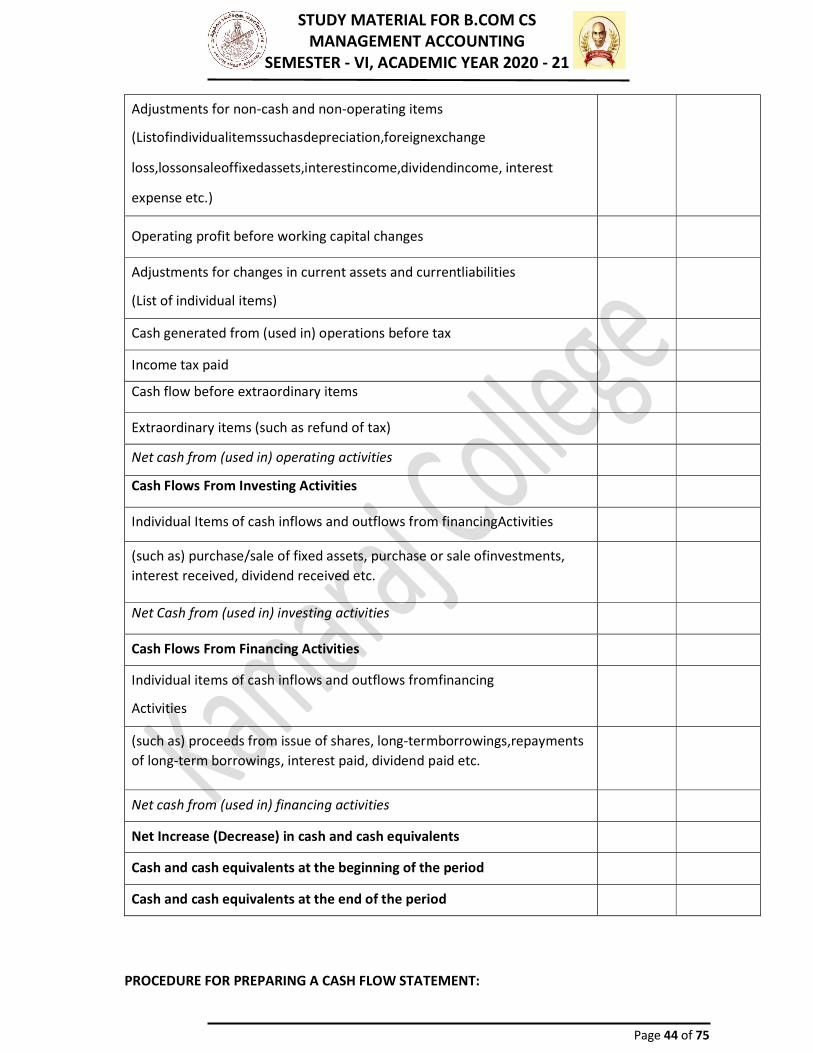
STUDY MATERIAL FOR B.COM CS MANAGEMENT ACCOUNTING SEMESTER - VI, ACADEMIC YEAR 2020 - 21
Page 44 of 75
Adjustments for non-cash and non-operating items (Listofindividualitemssuchasdepreciation,foreignexchange loss,lossonsaleoffixedassets,interestincome,dividendincome, interest expense etc.)
Operating profit before working capital changes Adjustments for changes in current assets and currentliabilities (List of individual items)
Cash generated from (used in) operations before tax Income tax paid Cash flow before extraordinary items Extraordinary items (such as refund of tax) Net cash from (used in) operating activities Cash Flows From Investing Activities Individual Items of cash inflows and outflows from financingActivities (such as) purchase/sale of fixed assets, purchase or sale ofinvestments, interest received, dividend received etc.
Net Cash from (used in) investing activities Cash Flows From Financing Activities Individual items of cash inflows and outflows fromfinancing Activities
(such as) proceeds from issue of shares, long-termborrowings,repayments of long-term borrowings, interest paid, dividend paid etc.
Net cash from (used in) financing activities Net Increase (Decrease) in cash and cash equivalents Cash and cash equivalents at the beginning of the period Cash and cash equivalents at the end of the period
PROCEDURE FOR PREPARING A CASH FLOW STATEMENT:
STUDY MATERIAL FOR B.COM CS MANAGEMENT ACCOUNTING SEMESTER - VI, ACADEMIC YEAR 2020 - 21
Page 45 of 75
Cash flow statement is not a substitute of income statement, i.e., a profit arid loss account, and a balance sheet. It provides additional information and explains the reasons for changes in cash and cash equivalents, derived from financial statements at two points of time. The preparation of a cash flow statement involves the following steps: Step 1Compute the net increase or decrease in cash and cash equivalents by makinga comparison of these accounts given in the comparative balance sheets. Step 2Calculate the net cash flow provided (used in) operating activities by analysing the profit and loss account, balance sheet and additional information. There are two methods of converting net income into net cash flows from operating activities : the direct method and the indirect method. Step 3 Calculate the net cash flow from investing activities. Step 4 Calculate the net cash flow from financing activities. Step 5 Prepare a formal cash flow statement highlighting the net cash flow from(used in) operating, investing and financing activities separately. Step 6 Make an aggregate of net cash flows from the three activities and ensure that the total net cash flow is equal to the net increase or decrease in cash and cashequivalents as calculated in Step 1. Step 7 Report significant non-cash transactions that did not involve cash or cash equivalents in a separate schedule to the cash flow statement e.g., purchase of machinery against issue of share capital or redemption of debentures inexchange for share capital. METHODS OF CALCULATING CASH FLOWS FROM (USED IN) OPERATING ACTIVITIES: There are two methods of reporting cash flows from operating activities: the direct method and the indirect method. 1.The Direct Method Under the direct method, cash receipts (inflows) from operating revenues and cash payments (outflows) for operating expenses are calculated to arrive at cash flows from operating activities. The difference between the cash receipts and cash payments is the net cash flow provided by (or used in) operating activities. The following are the examples of cash receipts and cash payments (called cash flows) resulting from activities:
a. Cash receipts from the sale of goods and the rendering of services; b. Cash receipts from royalties, fees, commissions and other revenues; c. Cash payment to suppliers for goods and services; d. Cash payment to and on behalf of employees; e. Cash receipts and cash payment of an insurance enterprise for premiums and
claims, annuities and other policy benefits; f. Cash payments or refund of income taxes unless they can be specifically
identified with financing and investing activities; g. Cash receipts and payments relating to future contracts, forward contracts,
option contracts and swap contracts when the contracts are held for dealing or trading purposes.
The information about major classes of gross cash receipts and gross cash payments may be obtained either:
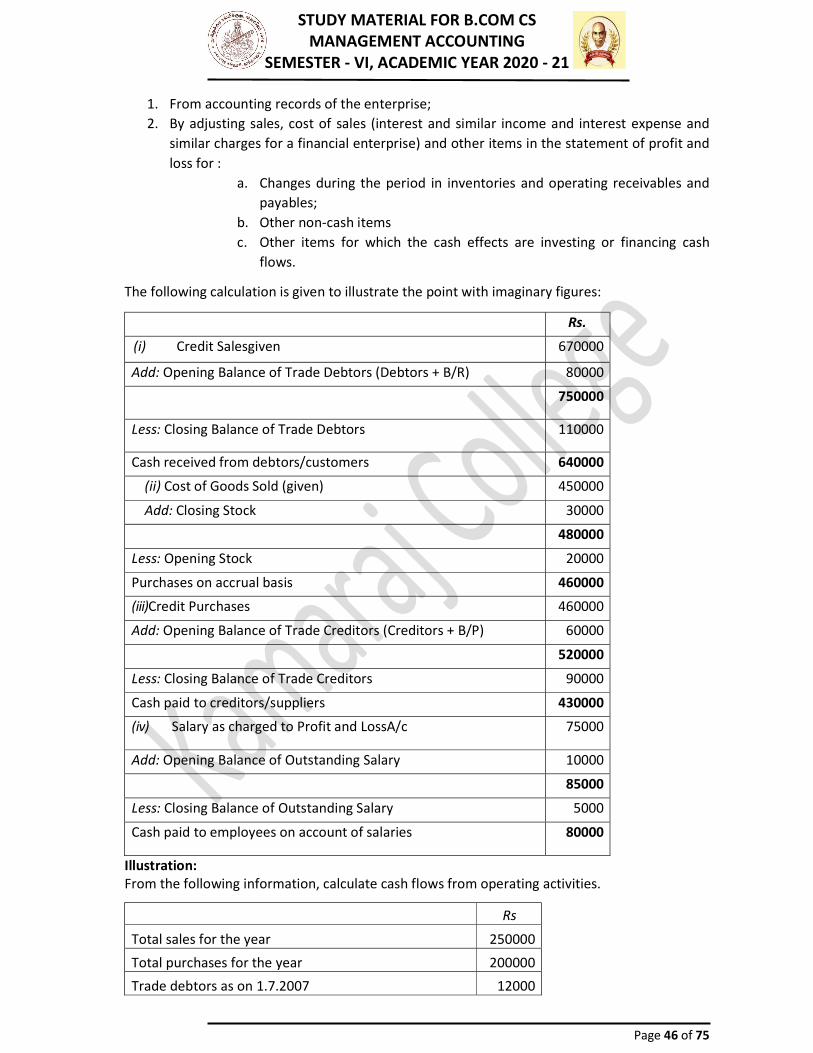
STUDY MATERIAL FOR B.COM CS MANAGEMENT ACCOUNTING SEMESTER - VI, ACADEMIC YEAR 2020 - 21
Page 46 of 75
1. From accounting records of the enterprise; 2. By adjusting sales, cost of sales (interest and similar income and interest expense and
similar charges for a financial enterprise) and other items in the statement of profit and loss for :
a. Changes during the period in inventories and operating receivables and payables;
b. Other non-cash items c. Other items for which the cash effects are investing or financing cash
flows. The following calculation is given to illustrate the point with imaginary figures: Rs.
(i) Credit Salesgiven 670000 Add: Opening Balance of Trade Debtors (Debtors + B/R) 80000
750000 Less: Closing Balance of Trade Debtors 110000 Cash received from debtors/customers 640000
(ii) Cost of Goods Sold (given) 450000 Add: Closing Stock 30000
480000 Less: Opening Stock 20000 Purchases on accrual basis 460000 (iii)Credit Purchases 460000 Add: Opening Balance of Trade Creditors (Creditors + B/P) 60000
520000 Less: Closing Balance of Trade Creditors 90000 Cash paid to creditors/suppliers 430000 (iv) Salary as charged to Profit and LossA/c 75000 Add: Opening Balance of Outstanding Salary 10000
85000 Less: Closing Balance of Outstanding Salary 5000 Cash paid to employees on account of salaries 80000
Illustration: From the following information, calculate cash flows from operating activities. Rs Total sales for the year 250000 Total purchases for the year 200000 Trade debtors as on 1.7.2007 12000

STUDY MATERIAL FOR B.COM CS MANAGEMENT ACCOUNTING SEMESTER - VI, ACADEMIC YEAR 2020 - 21
Page 47 of 75
Trade creditors as on 1.7.2007 14500 Trade debtors as on 30.6.2008 20800 Trade creditors as on 30.6.2008 21600 Total operating expenses for the year 10200 Outstanding expenses as on 1.7.2007 1800 Prepaid expenses as on 1.7.2007 1500 Outstanding expenses as on 30.6.2008 2400 Prepaid expenses as on 30.6.2008 2200 Income tax paid during the year 2000
Solution: Cash flows from operating activities
Cash receipts from customers (working Note: 1) 241200 Cash paid to supplies and employees (working note: 2) 203200 Cash generated from operations 38000 Income tax paid 2000 Net cash flows from operating activities 36000
Working notes: Calculate of cash receipts from customers:
1.Calculation of cash receipts from customers : Rs. Sales for the year 2,50,000 Add : Trade debtors as on 1.7.2007 12.000
2,62,000 Less : Trade debtors as on 30.6.2008 20.800 Cash receipts from customers 2.41.200 2.Calculation of cash paid to suppliers and employees : Total purchases for the year 2,00,000 Add : Trade creditors as on 1.7.2007 14.500
2,14,500 Less : Trade creditors as on 30.6.2008 21.600 Cash paid to creditors for purchase of goods (a) 1.92.900 Total operating expenses for the year 10,200 Add : Outstanding expenses as on 1.7.2007 1.800
12,000 Less : Outstanding expenses as on 30.6.2008 2.400
9,600 Add : Prepaid expenses as on 30.6.2008 2.200
11,800
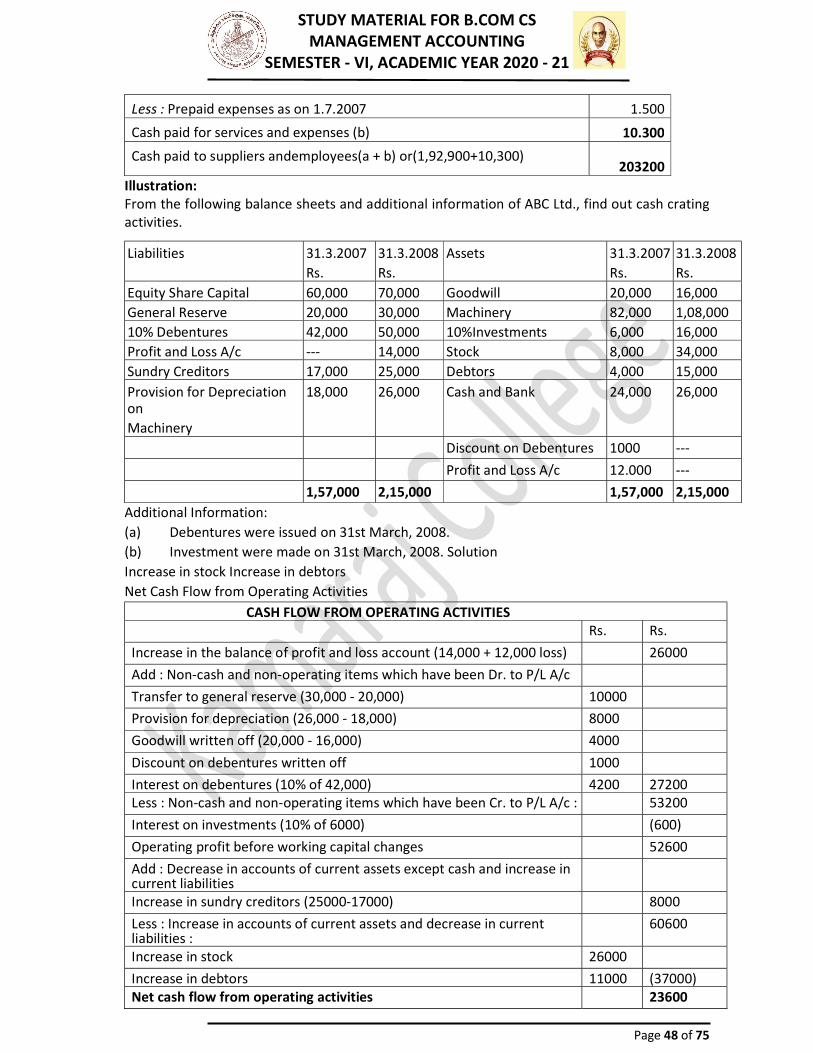
STUDY MATERIAL FOR B.COM CS MANAGEMENT ACCOUNTING SEMESTER - VI, ACADEMIC YEAR 2020 - 21
Page 48 of 75
Less : Prepaid expenses as on 1.7.2007 1.500 Cash paid for services and expenses (b) 10.300 Cash paid to suppliers andemployees(a + b) or(1,92,900+10,300) 203200
Illustration: From the following balance sheets and additional information of ABC Ltd., find out cash crating activities. Liabilities 31.3.2007
Rs. 31.3.2008 Rs.
Assets 31.3.2007 Rs.
31.3.2008 Rs.
Equity Share Capital 60,000 70,000 Goodwill 20,000 16,000 General Reserve 20,000 30,000 Machinery 82,000 1,08,000 10% Debentures 42,000 50,000 10%Investments 6,000 16,000 Profit and Loss A/c --- 14,000 Stock 8,000 34,000 Sundry Creditors 17,000 25,000 Debtors 4,000 15,000 Provision for Depreciation on Machinery
18,000 26,000 Cash and Bank 24,000 26,000
Discount on Debentures 1000 --- Profit and Loss A/c 12.000 --- 1,57,000 2,15,000 1,57,000 2,15,000 Additional Information: (a) Debentures were issued on 31st March, 2008. (b) Investment were made on 31st March, 2008. Solution Increase in stock Increase in debtors Net Cash Flow from Operating Activities
CASH FLOW FROM OPERATING ACTIVITIES Rs. Rs. Increase in the balance of profit and loss account (14,000 + 12,000 loss) 26000 Add : Non-cash and non-operating items which have been Dr. to P/L A/c Transfer to general reserve (30,000 - 20,000) 10000 Provision for depreciation (26,000 - 18,000) 8000 Goodwill written off (20,000 - 16,000) 4000 Discount on debentures written off 1000 Interest on debentures (10% of 42,000) 4200 27200 Less : Non-cash and non-operating items which have been Cr. to P/L A/c : 53200 Interest on investments (10% of 6000) (600) Operating profit before working capital changes 52600 Add : Decrease in accounts of current assets except cash and increase in current liabilities Increase in sundry creditors (25000-17000) 8000 Less : Increase in accounts of current assets and decrease in current liabilities : 60600 Increase in stock 26000 Increase in debtors 11000 (37000) Net cash flow from operating activities 23600

STUDY MATERIAL FOR B.COM CS MANAGEMENT ACCOUNTING SEMESTER - VI, ACADEMIC YEAR 2020 - 21
Page 49 of 75
Illustration: CASH FLOWS FROM INVESTING ACTIVITIES Calculate net cash flows from investing activities from the following information: 31.3.2016 31.3.2017 Buildings (w.d.v.) 600000 750000 Additional information: Building costing Rs. 100000 on which Rs. 30000 had accumulated as depreciation was sold Rs. 60000. Depreciation charged on buildings for the year ended 31.3.2017 Rs. 50000. Solution: Building A/c
Rs. Rs. To balance b/d 600000 By cash (sale) 60000 To cash (purchase – bal.fig.) 270000 By P/L a/c (loss) 10000
By depreciation 50000 By balance c/d 750000 870000 870000 CALCULATION OF NET CASH FLOWS FROM INVESTING ACTIVITIES Rs. Rs. Sale of buildings 60000 Purchase of buildings (270000) Net cash used in investing activities (210000)
Illustration: CASH FLOWS FROM FINANCING ACTIVITIES From the information given below, calculate cash flows from financing activities. 2016 Rs. 2017 Rs. Equity share capital 200000 300000 8% debentures 100000 50000 Securities premium 20000 30000 Bank loan (long-term) --- 100000 Additional information: Interest paid on debentures Rs. 8000. Solution: CALCULATION OF CASH FLOWS FROM FINANCING ACTIVITIES CALCULATION OF CASH FLOWS FROM FINANCING ACTIVITIES
Rs. Rs. Issue of share capital 100000 Redemption of debentures (50000) Proceeds from securities premium 10000 Raising of Bank Loan 100000 Interest on Debentures paid (8000) Net Cash Flows From Financing Activities 152000
Illustration:

STUDY MATERIAL FOR B.COM CS MANAGEMENT ACCOUNTING SEMESTER - VI, ACADEMIC YEAR 2020 - 21
Page 50 of 75
From the summary Cash Amount of Sunny Ltd. prepare Cash Flow Statement for the year ended 31st March, 2017 in accordance with AS-3 (Revised) using the direct method. The company does not have any cash equivalents. Summary Cash Account (For the year ended 31.3.2017) Receipts Rs. '000 Payments Rs. '000 Balance on 1.4.2007 100 Payment of suppliers 4000 Issue of equity shares 600 Purchase of fixed assets 400 Receipts from customers 5600 Overhead expenses 400 Sale of fixed assets 200 Wage and salaries 200
Taxation 500 Dividend 100 Repayment of bank loan 600 Balance on 31.3.2008 300 6500 6500 CASH FLOW STATEMENT(for the year ended 31.3.2017) Rs.‘000 Rs.‘000 CASH FLOWS FROM OPERATING ACTIVITIES Cash receipts from customers 5600 Cash paid to suppliers and employees (4000+400+200) (4600) Cash generated from operations 1000 Income tax paid (500) Cash flow from operating activities 500 CASH FLOW FROM INVESTING ACTIVITIES Sale of fixed assets 200 Purchase of fixed assets (400) Net cash used in investing activities (200) CASH FLOWS FROM FINANCING ACTIVITIES Issue of equity shares 600 Dividend paid (100) Repayment of bank loan (600) Net cash used in financing activities (100) Net increase in cash and cash equivalents 200 Cash and cash equivalents at the beginning of the period 100 Cash and cash equivalents at the end of the period 300
CASH FLOWS FROM FINANCING ACTIVITIES Issue of equity shares 600 Dividend paid (100) Repayment of bank loan (600) Net cash used in financing activities (100) Net increase in cash and cash equivalents 200 Cash and cash equivalents at the beginning of the period 100 Cash and cash equivalents at the end of the period 300
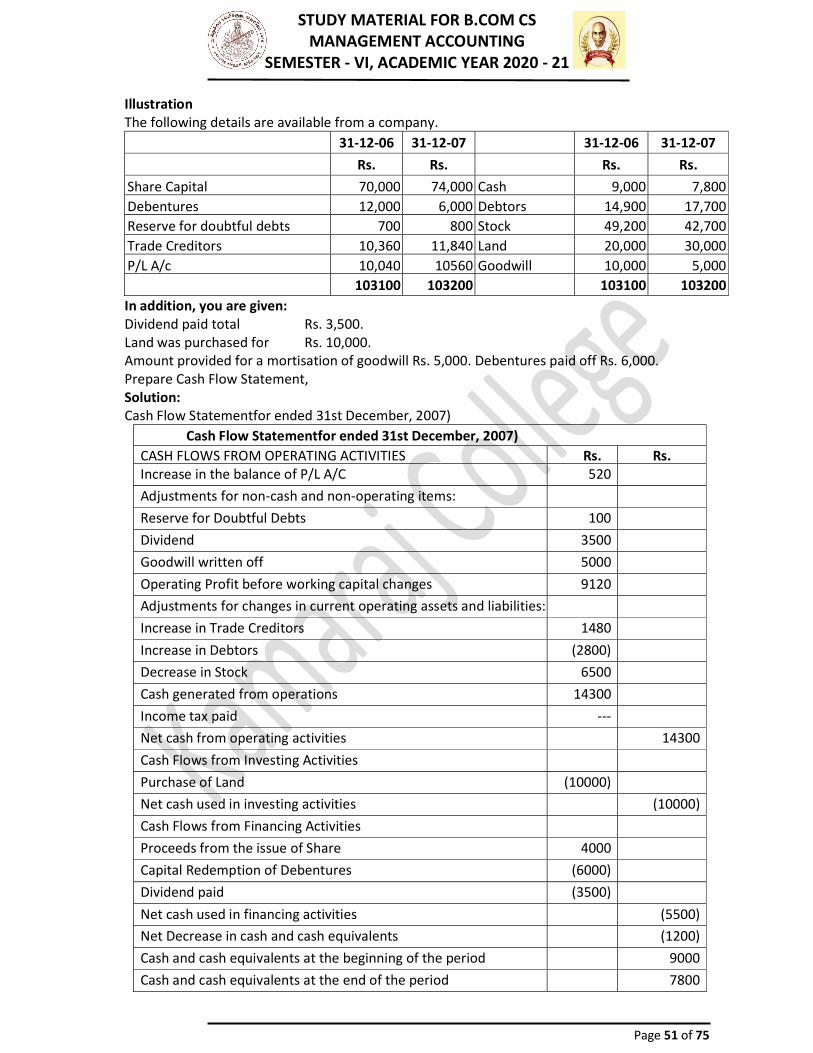
STUDY MATERIAL FOR B.COM CS MANAGEMENT ACCOUNTING SEMESTER - VI, ACADEMIC YEAR 2020 - 21
Page 51 of 75
Illustration The following details are available from a company. 31-12-06 31-12-07 31-12-06 31-12-07 Rs. Rs. Rs. Rs. Share Capital 70,000 74,000 Cash 9,000 7,800 Debentures 12,000 6,000 Debtors 14,900 17,700 Reserve for doubtful debts 700 800 Stock 49,200 42,700 Trade Creditors 10,360 11,840 Land 20,000 30,000 P/L A/c 10,040 10560 Goodwill 10,000 5,000 103100 103200 103100 103200 In addition, you are given: Dividend paid total Rs. 3,500. Land was purchased for Rs. 10,000. Amount provided for a mortisation of goodwill Rs. 5,000. Debentures paid off Rs. 6,000. Prepare Cash Flow Statement, Solution: Cash Flow Statementfor ended 31st December, 2007)
Cash Flow Statementfor ended 31st December, 2007) CASH FLOWS FROM OPERATING ACTIVITIES Rs. Rs. Increase in the balance of P/L A/C 520 Adjustments for non-cash and non-operating items: Reserve for Doubtful Debts 100 Dividend 3500 Goodwill written off 5000 Operating Profit before working capital changes 9120 Adjustments for changes in current operating assets and liabilities: Increase in Trade Creditors 1480 Increase in Debtors (2800) Decrease in Stock 6500 Cash generated from operations 14300 Income tax paid --- Net cash from operating activities 14300 Cash Flows from Investing Activities Purchase of Land (10000) Net cash used in investing activities (10000) Cash Flows from Financing Activities Proceeds from the issue of Share 4000 Capital Redemption of Debentures (6000) Dividend paid (3500) Net cash used in financing activities (5500) Net Decrease in cash and cash equivalents (1200) Cash and cash equivalents at the beginning of the period 9000 Cash and cash equivalents at the end of the period 7800
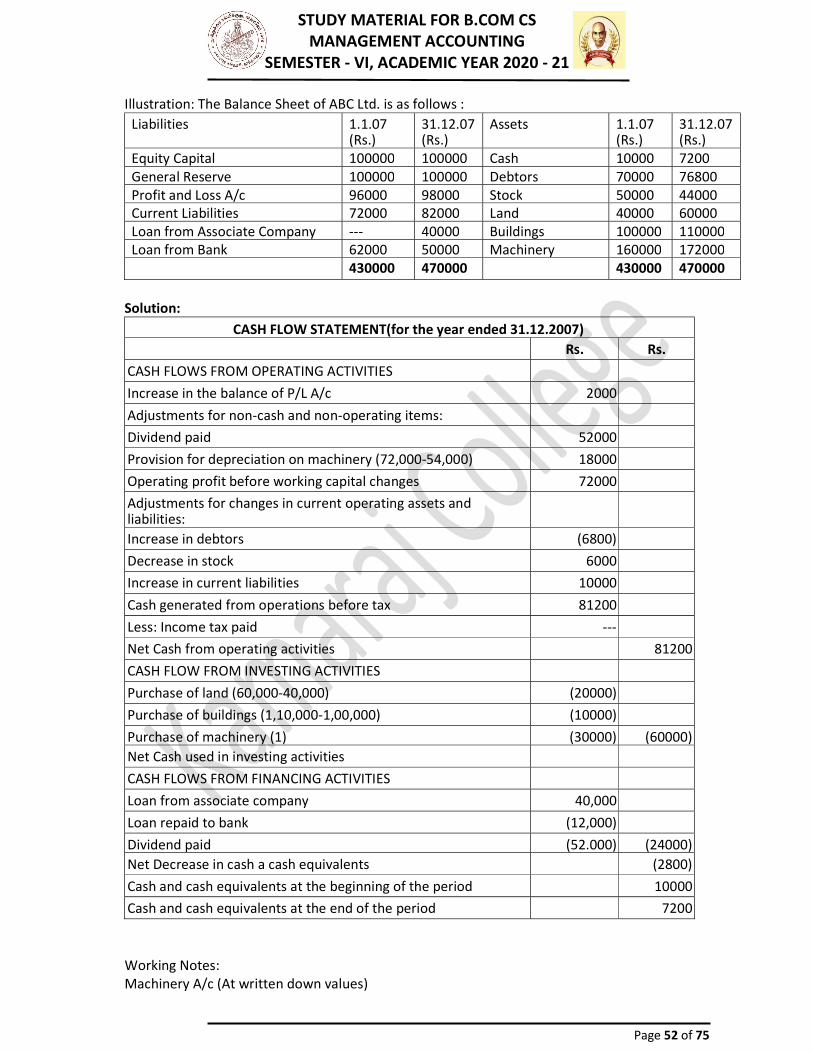
STUDY MATERIAL FOR B.COM CS MANAGEMENT ACCOUNTING SEMESTER - VI, ACADEMIC YEAR 2020 - 21
Page 52 of 75
Illustration: The Balance Sheet of ABC Ltd. is as follows : Liabilities 1.1.07 (Rs.) 31.12.07 (Rs.) Assets 1.1.07 (Rs.) 31.12.07 (Rs.) Equity Capital 100000 100000 Cash 10000 7200 General Reserve 100000 100000 Debtors 70000 76800 Profit and Loss A/c 96000 98000 Stock 50000 44000 Current Liabilities 72000 82000 Land 40000 60000 Loan from Associate Company --- 40000 Buildings 100000 110000 Loan from Bank 62000 50000 Machinery 160000 172000
430000 470000 430000 470000 Solution:
CASH FLOW STATEMENT(for the year ended 31.12.2007) Rs. Rs. CASH FLOWS FROM OPERATING ACTIVITIES Increase in the balance of P/L A/c 2000 Adjustments for non-cash and non-operating items: Dividend paid 52000 Provision for depreciation on machinery (72,000-54,000) 18000 Operating profit before working capital changes 72000 Adjustments for changes in current operating assets and liabilities: Increase in debtors (6800) Decrease in stock 6000 Increase in current liabilities 10000 Cash generated from operations before tax 81200 Less: Income tax paid --- Net Cash from operating activities 81200 CASH FLOW FROM INVESTING ACTIVITIES Purchase of land (60,000-40,000) (20000) Purchase of buildings (1,10,000-1,00,000) (10000) Purchase of machinery (1) (30000) (60000) Net Cash used in investing activities CASH FLOWS FROM FINANCING ACTIVITIES Loan from associate company 40,000 Loan repaid to bank (12,000) Dividend paid (52.000) (24000) Net Decrease in cash a cash equivalents (2800) Cash and cash equivalents at the beginning of the period 10000 Cash and cash equivalents at the end of the period 7200 Working Notes: Machinery A/c (At written down values)

STUDY MATERIAL FOR B.COM CS MANAGEMENT ACCOUNTING SEMESTER - VI, ACADEMIC YEAR 2020 - 21
Page 53 of 75
Rs. Rs. To Balance b/d 160000 By Depreciation(72,000-54,000) 18000 To Cash-purchased (bal. fig.) 30000 By Balance c/d 172000 190000 190000 Illustration: The Balance Sheets of M/S A and B on 1.1.2017 and 31.12.2017 were as follows. LIABILITIES 1.1.2017 31.12.2017 ASSETS 1.1.2017 31.12.2017 Creditors 1,20,000 1,32,000 Cash 30,000 21,000 Mrs A's Loan 75,000 Debtors 90,000 1,50,000 Loan from Bank 1,20,000 1,50,000 Stock 1,05,000 75,000 Capital 3,75,000 4,59,000 Machinery 2,40,000 1,65,000 Land 1,20,000 1,50,000 Building 1,05,000 1,80,000 6,90,000 7,41,000 6,90,000 7,41,000
During the year a machine costing Rs. 30,000 (accumulated depreciation Rs. 9,100 was sold for Rs. 15,000. The provision for depreciation against machinery as on 1.1.2007 was Rs. 75,000 and on 31.12.2007 Rs.1,20,000. Net profit for the year 2007 amounted to Rs. 1,35,000. Prepare Cash Flow Statement Solution: Cash Flow Statement(for the year ended 31.12.2007)
Rs. Rs. CASH FLOWS FROM OPERATING ACTIVITIES Net profit for the year (Working Note 3) 135000 Adjustments for non-cash and non-operating items: 6000 Loss on sale of machinery 54000 Depreciation provided during the year 195000 Operating profit before working capital changes Adjustments for changes in current operating assets and liabilities: Increase in debtors (60000) Decrease in stock 30000 Increase in creditors 12000 Cash generated from operations 177000 Less: Income tax paid --- Net Cash from operating activities 177000 CASH FLOWS FROM INVESTING ACTIVITIES Sale of machinery 15000 Purchase of land (30000) Purchase of building (75000) Net cash used in investing activities (90000) CASH FLOWS FROM FINANCING ACTIVITIES

STUDY MATERIAL FOR B.COM CS MANAGEMENT ACCOUNTING SEMESTER - VI, ACADEMIC YEAR 2020 - 21
Page 54 of 75
Repayment of Mrs. A's Loan (75000) Loan from bank 30000 Drawings from capital (see capital account) (51000) Net cash used in financing activities (96000) Net Decrease in cash and cash equivalents (9000) Cash and cash equivalents at the beginning of the period 30000 Cash and cash equivalents at the end of the period 21000 Workings: Provision for depreciation A/c Rs. Rs. To depreciation on machinery sold 9000 By balance b/d 75000 To balance b/d 120000 By profit and loss A/c (depreciation provided during the year ) 54000
129000 129000 Machinery A/c (At cost) Rs. Rs. To balance b/d (240000+75000) 315000 By provision for depreciation (Dep. On Machinery sold) 9000
By cash (sale) 15000 By loss on sale 6000 By balance c/d (165000+12000) 285000 315000 315000 Capital A/c Rs. Rs. To drawings (Bal. fig.) 51000 By balance b/d 375000 To balance c/d 459000 By net profit (given) 135000
510000 510000 TRADING AND PROFIT AND LOSS ACCOUNT for the year ending 31st March, 1998
Dr. Rs. Cr. Rs. To Purchases 20,000 By Sales 30,000 To Wages 5,000 To Gross Profit c/d 5,000 30,000 30,000 To Salaries 1,000 By Gross Profit/b/d 5,000 To Rent 1,000 By Profit on saleout building To Depreciation onPlant 1,000 BookValue 10,000 To Goodwill written off 1,000 To Net Profit 5,500
10,000 10,000 Calculate the cash from operations.
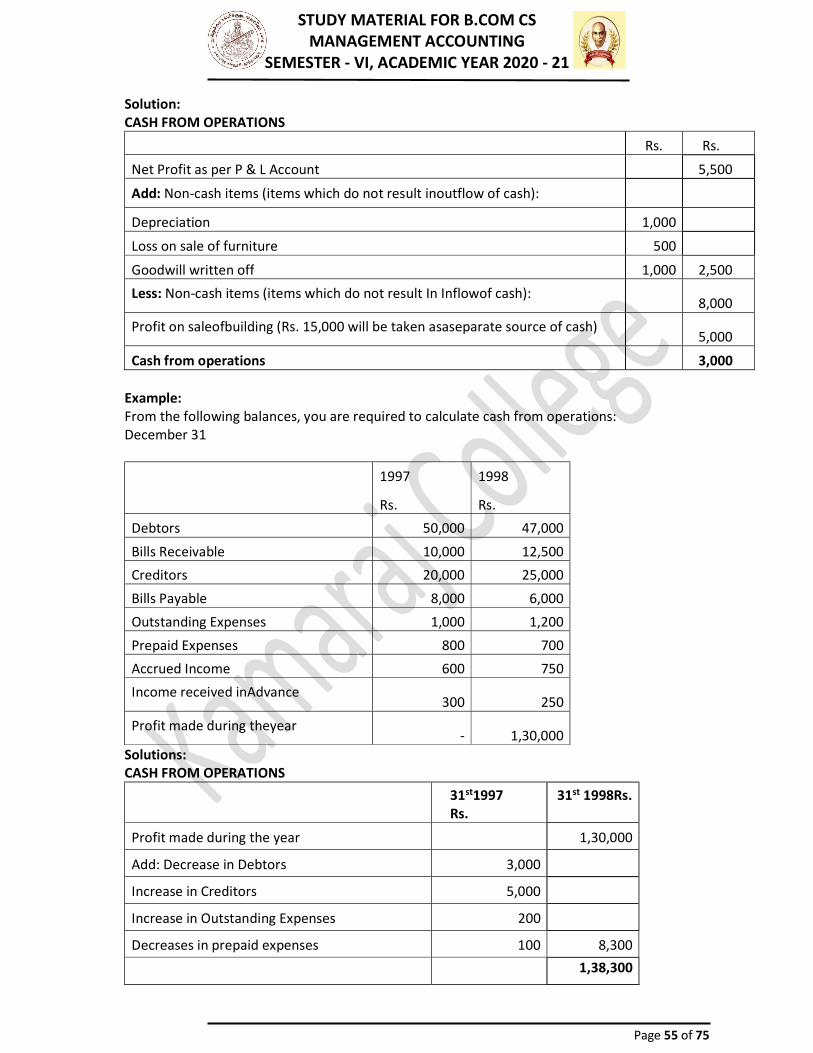
STUDY MATERIAL FOR B.COM CS MANAGEMENT ACCOUNTING SEMESTER - VI, ACADEMIC YEAR 2020 - 21
Page 55 of 75
Solution: CASH FROM OPERATIONS Rs. Rs. Net Profit as per P & L Account 5,500 Add: Non-cash items (items which do not result inoutflow of cash): Depreciation 1,000 Loss on sale of furniture 500 Goodwill written off 1,000 2,500 Less: Non-cash items (items which do not result In Inflowof cash): 8,000 Profit on saleofbuilding (Rs. 15,000 will be taken asaseparate source of cash) 5,000 Cash from operations 3,000
Example: From the following balances, you are required to calculate cash from operations: December 31 1997
Rs. 1998 Rs.
Debtors 50,000 47,000 Bills Receivable 10,000 12,500 Creditors 20,000 25,000 Bills Payable 8,000 6,000 Outstanding Expenses 1,000 1,200 Prepaid Expenses 800 700 Accrued Income 600 750 Income received inAdvance 300 250 Profit made during theyear - 1,30,000
Solutions: CASH FROM OPERATIONS 31st1997 Rs. 31st 1998Rs. Profit made during the year 1,30,000 Add: Decrease in Debtors 3,000 Increase in Creditors 5,000 Increase in Outstanding Expenses 200 Decreases in prepaid expenses 100 8,300
1,38,300
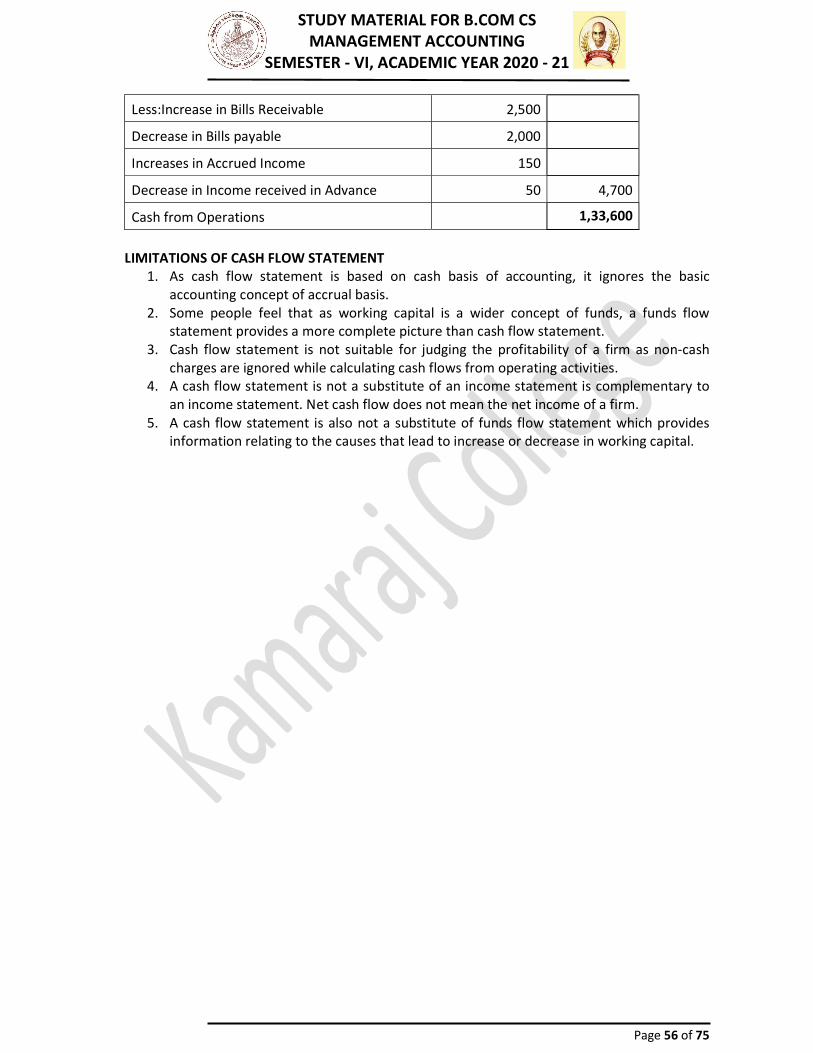
STUDY MATERIAL FOR B.COM CS MANAGEMENT ACCOUNTING SEMESTER - VI, ACADEMIC YEAR 2020 - 21
Page 56 of 75
Less:Increase in Bills Receivable 2,500 Decrease in Bills payable 2,000 Increases in Accrued Income 150 Decrease in Income received in Advance 50 4,700 Cash from Operations 1,33,600
LIMITATIONS OF CASH FLOW STATEMENT 1. As cash flow statement is based on cash basis of accounting, it ignores the basic accounting concept of accrual basis. 2. Some people feel that as working capital is a wider concept of funds, a funds flow statement provides a more complete picture than cash flow statement. 3. Cash flow statement is not suitable for judging the profitability of a firm as non-cash charges are ignored while calculating cash flows from operating activities. 4. A cash flow statement is not a substitute of an income statement is complementary to an income statement. Net cash flow does not mean the net income of a firm. 5. A cash flow statement is also not a substitute of funds flow statement which provides information relating to the causes that lead to increase or decrease in working capital.
STUDY MATERIAL FOR B.COM CS MANAGEMENT ACCOUNTING SEMESTER - VI, ACADEMIC YEAR 2020 - 21
Page 57 of 75
UNIT - V CAPITAL BUDGETING MEANING OF CAPITAL BUDGETING Capital budgeting is the process of making investment decisions in capital expenditures. A capital expenditure may be defined as an expenditure the benefits of which are expected to be received over period of time exceeding one year. The main characteristic of a capital expenditure is that the expenditure is incurred at one point of time whereas benefits of the expenditure are realized at different points of time in future. In simple language we may say that a capital expenditure is an expenditure incurred for acquiring or improving the fixed assets, the benefits of which are expected to be received over a number of years in future. The following are some of the examples of capital expenditure: NEED AND IMPORTANCE OF CAPITAL BUDGETING i. Large Investments. Capital budgeting decisions, generally, involve large investment of funds. But the funds available with the firm are always limited and the demand for funds far exceeds the resources. Hence, it is very important for a firm to plan and control its capital expenditure. ii. Long-term Commitment of Funds. Capital expenditure involves not only large amount of funds but also funds for long-term or more or less on permanent basis. The long-term commitment of funds increases the financial risk involved in the investment decision. Greater the risk involved, greater is the need for careful planning of capital expenditure, i.e. Capital budgeting. iii. Irreversible Nature. The capital expenditure decisions are of irreversible nature. Once the decision for acquiring a permanent asset is taken, it becomes very difficult to dispose of these assets without incurring heavy losses. iv. Long-term Effect on Profitability. Capital budgeting decisions have a long-4erm and significant effect on the profitability of a concern. Not only the present earnings of the firm are affected by the investments in capital assets but also the future growth and profitability of the firm depends upon the investment decision taken today. An unwise decision may prove disastrous and fatal to the very existence of the concern. Capital budgeting is of utmost importance to avoid over investment or under investment in fixed assets. v. Difficulties of Investment Decisions. The long term investment decisions are difficult to be taken because (I) decision extends to a series of years beyond the current accounting period, (ii) uncertainties of future and (iii) higher degree of risk. vi. National Importance. Investment decision though taken by individual concern is of national importance because it determines employment, economic activities and economic growth. Thus, we may say that without using capital budgeting techniques a firm may involve itself in a losing project. Proper timing of purchase, replacement, expansion and alternation of assets is essential. CAPITAL BUDGETING PROCESS Capital budgeting is a complex process as it involves decisions relating to the investment of current funds for the benefit to the achieved in future and the future is always uncertain. However, the following procedure may be adopted in the process of capital budgeting :
STUDY MATERIAL FOR B.COM CS MANAGEMENT ACCOUNTING SEMESTER - VI, ACADEMIC YEAR 2020 - 21
Page 58 of 75
1. Identification of Investment Proposals: The capital budgeting process begins with the identification of investment proposals. The proposal or the idea about potential investment opportunities may originate from the top management or may come from the rank and file worker of any department or from any officer of the organisation. The departmental head analyses the various proposals in the light of the corporate strategies and submits the suitable proposals to the Capital Expenditure Planning Committee in case of large organizations or to the officers concerned with the process of long-term investment decisions. 2. Screening the Proposals: The Expenditure Planning Committee screens the various us proposals received from different departments. The committee views these proposals from various angles to ensure that these are in accordance with the corporate strategies or selection criterion of the firm and also do not lead to departmental imbalances. 3. Evaluation of Various Proposals: The next step in the capital budgeting process is to evaluate the profitability of various proposals. There are many methods which may be used for this purpose such as payback period method, rate of return method, net present value method, internal rate of return method etc. All these methods of evaluating profitability of capital investment proposals have been discussed in detail separately in the following pages of this chapter. It should, however, be noted that the various proposals to the evaluated may be classified as: 1. independent proposals 2. contingent or dependent proposals and 3. mutually exclusive proposals. Independent proposals are those which do not compete with one another and the same may be either accepted or rejected on the basis of a minimum return on investment required. The contingent proposals are those whose acceptance depends upon the acceptance of one or more other proposals, e.g., further investment in building or machineries may have to be undertaken as a result of expansion programme. Mutually exclusive proposals are those which compete with each other and one of those may have to be selected at the cost of the other. Fixing Priorities: After evaluating various proposals, the unprofitable or uneconomic proposals may be rejected straight away. But it may not be possible for the firm to invest immediately in all the acceptable proposals due to limitation of funds. Hence, it is very essential to rank the various proposals and to establish priorities after considering urgency, risk and profitability involved therein. Final Approval and Preparation of Capital Expenditure Budget: Proposals meeting the evaluation and other criteria are finally approved to be included in the Capital Expenditure Budget. However, proposals involving smaller investment may be decided at the lower levels for expeditious action. The capital expenditure budget lays down the amount of estimated expenditure to be incurred on fixed assets during the budget period. Implementing Proposal: Preparation of a capital expenditure budgeting and incorporation of a particular proposal in the budget does not itself authorise to go ahead with the implementation of the project. A request for authority to spend the amount should further be made to the Capital
STUDY MATERIAL FOR B.COM CS MANAGEMENT ACCOUNTING SEMESTER - VI, ACADEMIC YEAR 2020 - 21
Page 59 of 75
Expenditure Committee which may like to review the profitability of the project in the changed circumstances. Further, while implementing the project, it is better to assign responsibilities for completing the project within the given time frame and cost limit so as to avoid unnecessary delays and cost over runs. Network techniques used in the project management such as PERT and CPM can also be applied to control and monitor the implementation of the projects. Performance Review: The last stage in the process of capital budgeting is the evaluation of the performance of the project. The evaluation is made through post completion audit by way of comparison of actual expenditure on the project with the budgeted one, and also by comparing the actual return from the investment with the anticipated return. The unfavorable variances, if any should be looked into and the causes of the same be identified so that corrective action may be taken in future. METHODS OF CAPITAL BUDGETING OR EVALUATION OF INVESTMENT PROPOSALS At each point of time a business firm has a number of proposals regarding various projects in which it can invest funds. But the funds available with the firm are always limited and it is not possible to invest funds in all the proposals at a time. Hence, it is very essential to select from amongst the various competing proposals,those which give the highest benefits. The crux of the capital budgeting is the allocation of available resources to various proposals. There are many considerations, economic as well as non-economic, which influence the capital budgeting decisions. The crucial factor that influences the capital budgeting decision is the profitability of the prospective investment Yet the risk involved in the proposal cannot be ignored because profitability and risk are directly related, i.e.higher the profitability, the greater the risk and vice-versa. There are many methods of evaluating profitability of capital investment proposals. The various commonly used methods are as follows: (A)Traditional methods: 1. Pay-back Period Method or Pay out or Pay off Method 2. Improvement of Traditional Approach to Pay Back Period Method 3. Rate of Return Method or Accounting Method (B)Time -adjusted method or discounted Methods: 4. Net present Value Method. 5. Internal Rate of Return Method. 6. Profitability Index Method. 1.PAY-BACK PERIOD METHOD The 'Pay back' sometimes called as pay out or pay off period method represents the period in which the total investment in permanent assets pays back itself. This method is based on the principle mat every capital expenditure pays itself back within a certain period out of the additional earnings generated from the capital assets. Thus, it measures the period of time for the original cost of a project to be recovered from the additional earnings of the project itself. Under this method, various investments are ranked according to the length of their payback period in such a manner that the investment with a shorter payback period is preferred to the one which has longer pay back period.
STUDY MATERIAL FOR B.COM CS MANAGEMENT ACCOUNTING SEMESTER - VI, ACADEMIC YEAR 2020 - 21
Page 60 of 75
In case of evaluation of a single project it is adopted if it pays back for itself within a period specified by the management and if the project does not pay back itself within the period specified by the management then it is rejected. The pay-back period can be ascertained in the following manner: a. Calculate annual net earnings (profits) before depreciation and after taxes; these are called annual cash inflows. b. Divide the initial outlay (cost) of the project by the annual cash inflow, where the project generates constant annual cash inflows. Thus, where the project generates constant cash inflows: Pay-back period = Cash Outlay of the Project or Original Cost of the Asset / Annual Cash Inflows
Where the annual cash inflows (Profit before depreciation and after taxes) are unequal, the payback period can be found by adding up the cash inflows until the total is equal to the initial cash outlay of project or original cost of the asset. Illustration: A project costs Rs.1,00,000 and yields an annual cash inflow of Rs. 20,000 for 8 years. Calculate its pay-back period. Solution: The Pay-back period for the project is as follows: Pay -back Period = Initial Outlay of the Project / Annual Cash Inflow = 100000 / 20000 = 5Years Illustration: Determine the pay-back period for a project which requires a cash outlay of Rs. 10,000 and generates cash inflows of Rs.2,000, Rs.4,000,Rs.3,000 and Rs.2,000 in the first, second, third and fourth year respectively. Solution: Total Cash Outlay = Rs. 10,000 Total Cash Inflow for the first 3 years = Rs. 2,000+4,000+3,000=Rs. 9,000 Up to the third year the total cost is not recovered but the total cash inflows for the four years are Rs.9,000+2,000= Rs. l1000 i.e. Rs. 1,000 more than the cost of the project. So the payback period is somewhere between 3 and 4 years. Assuming that the cash inflows occur evenly throughout the year, the time required to recover Rs. 1,000 will be 1,000/2,000) 12=6 months. Hence payback period is 3 years and 6 months. Illustration: A project cost Rs. 5,00,000 and yields annually a profit of Rs.80,000 after depreciation @ 12%p.a. but before tax of 50%. Calculate the Payback period. Solution: Rs.
STUDY MATERIAL FOR B.COM CS MANAGEMENT ACCOUNTING SEMESTER - VI, ACADEMIC YEAR 2020 - 21
Page 61 of 75
Profit before tax 80,000 Less tax® 50% 40,000 Profit after tax 40,000 Add back depreciation @ 12% on Rs.5,00,000 60.000 Profit before depreciation but after tax or Annual Cash Inflow 1.00.000 Pay back period = Cost of the Project / Annual Cash Inflow = 500000 / 100000 = 5years. Advantages of Pay-back Period Method 1. The main advantage of this method is that it is simple to understand and easy to calculate. 2. It saves in cost, it requires lesser time and labour as compared to other methods of capital budgeting. 3. In this method, as a project with a shorter pay-back period is preferred to the one having a longer pay-back period, it reduces the loss through obsolescence and is more suited to the developing countries, like India, which are in the process of development and have quick obsolescence. 4. Due to its short term approach, this method is particularly suited to a firm which has shortage of cash or whose liquidity position is not particularly good. 5. Disadvantages of Pay-back Method Though pay-back period method is the simplest, oldest and most frequently used method, it suffers from the following limitations: 6. It does not take into account the cash inflows earned after the payback period and hence the true profitability of the projects cannot be correctly assessed. 7. This method ignores the time value of money and does not consider the magnitude and timing of cash inflows. In spite of the above mentioned limitations, this method can be used in evaluating the profitability of short term and medium term capital investment proposals. 8. It does not take into consideration the cost of capital which is a very important factor in making sound investment decisions. 9. It may be difficult to determine the minimum acceptable pay-back period, it is usually, a subjective decision. 10. It treats each asset individually in isolation with other assets which is not feasible in real practice. 11. Pay-back period method does not measure the true profitability of the project as the period considered under this method is limited to a short period only and not the full life of the asset. RATE OF RETURN METHOD This method takes into account the earnings expected from the investment over their whole life. It is known as Accounting Rate of Return method for the reason that under this method, the Accounting concept of profit (net profit after tax and depreciation) is used rather than cash inflows. According to this method, various projects are ranked, in order of the rate of earnings or rate of return. The project with the higher rate of return is selected as compared to the one with lower rate of return. This method can also be used to make decision as to accepting or rejecting a proposal. The expected return is determined and the project which has a higher rate of return than the minimum rate specified by the firm called the cut off rate, is

STUDY MATERIAL FOR B.COM CS MANAGEMENT ACCOUNTING SEMESTER - VI, ACADEMIC YEAR 2020 - 21
Page 62 of 75
accepted and the one which gives a lower expected rate of return than the minimum rate is rejected. Average rate of return method: Under this method average profit after tax and depreciation is calculated and then it is divided by the total capital outlay or total investment in the project. In the words, establishes the relationship between average annual profits to total investments. Average Rate of Return =Total profits (after dep. &taxes) / Net Investment in the project X No. of years of profits X 100 (OR)
Average Annual Profits / Net Investment in the project X 100 Illustration: A project requires an investment of Rs. 500000 and has a scrap value of Rs. 20000after five years. It is expected to yield profits after depreciation and taxes during the five years amounting to Rs. 40000, Rs. 60000, Rs. 70000, Rs. 50000 and Rs. 20000. Calculate the average rate of return on the investment. Solution: Total profit = 40000 + 60000 + 70000 + 50000 + 20000 = Rs. 240000 Average profit = Rs. 240000 / 5 = Rs. 48000 Net Investment in the project = Rs. 500000 – 20000 (Scrap value) = Rs. 480000. Average Rate of Return = Average Annual profit / Net Investment in the project X 100 = 48000 / 480000 X 100 = 10% Advantages of Rate of Return Method a. It is very simple to understand and easy to operate. b. It uses the entire earnings of a project in calculating rate of return and not only the earnings upto pay-back period and hence gives a better view of profitability as compared to pay-back period method. c. As this method is based upon accounting concept of profits, it can be readily calculated from the financial data. Disadvantages of Rate of Return Method a. This method also like pay-back period method ignores the time value of money as the profits earned at different points of time are given equal weight by averaging the profits. It ignores the fact that a rupee earned today is of more value than a rupee earned an year after, or so. b. It does not take into consideration the cash flows which are more important than the accounting profits. c. It ignores the period in which the profits are earned as a 20% rate of return in 272 years may be considered to be better than 18% rate of return for 12 years. This is not proper because longer the term of the project, greater is the risk involved. d. This method cannot be applied to a situation where investment in a project is to be made in parts. TIME-ADJUSTED OR DISCOUNTED CASH FLOW METHODS : The traditional methods of capital budgeting i.e. pay-back method as well as accounting rate of return method, suffer from the serious limitations that give equal weight to present and
STUDY MATERIAL FOR B.COM CS MANAGEMENT ACCOUNTING SEMESTER - VI, ACADEMIC YEAR 2020 - 21
Page 63 of 75
future flow of incomes. These methods do not take into consideration the time value of money, the fact that a rupee earned today has more value than a rupee earned after five years. The time-adjusted or discounted cash flow methods take into account the profitability and also the time value of money. These methods also called modern methods of capital budgeting are becoming increasingly popular day by day. Following are the discounted cash flow methods; NET PRESENT VALUE METHOD The net present value method is a modern method of evaluating investment proposals. This method takes into consideration the time value of money and attempts to calculate the return on investments by introducing the factor of time element. It recognizes the fact that a rupee earned today is worth more than the same rupee earned tomorrow. The net present values of all inflows and outflows of cash occurring during the entire life of the project is determined separately for each year by discounting these flows by the firm's cost of capital or a pre-determined rate. The following are the necessary steps to be followed for adopting the net present value method of evaluating investment proposals: 1. First of all determine an appropriate rate of interest that should be selected as the minimum required rate of return called 'cut -off rate or discount rate. The rate should be a minimum rate of return below which the investor considers that it does not pay him to invest. The discount rate should be either the actual rate of interest in the market on long-term loans or it should reflect the opportunity cost o capital of the investor. 2. Compute the present value of total investment outlay, i.e. cash outflows at the determined discount rate. If the total investment is to be made in the initial year, the present value shall be the same as the cost of investment. 3. Compute the present values of total investment proceeds, i.e., cash inflows, (profit before depreciation and after tax) at the above determined discount rate. 4. Calculate the net present value of each project by subtracting the present value of cash inflows from the present value of cash outflows for each project. 5. If the net present value is positive or zero, i.e., when present value of cash inflows either exceeds or is equal to the present values of cash outflows, the proposal may be accepted. But in case the present value of inflows is less than the present value of cash outflows, the proposal should be rejected. 6. To select between mutually exclusive projects, projects should be ranked in order of net present values, i.e. the first preference should be given to the project having the maximum positive net present value. For clear understanding, a portion of the table is re produced below: PRESENT VALUE TABLE
(Present value of Rel payable or receivable Annually for N years) Year 8% 10% 12% 14% 15% 20%
01 0.92593 0.90909 0.89286 0.87719 0.86957 0.83333
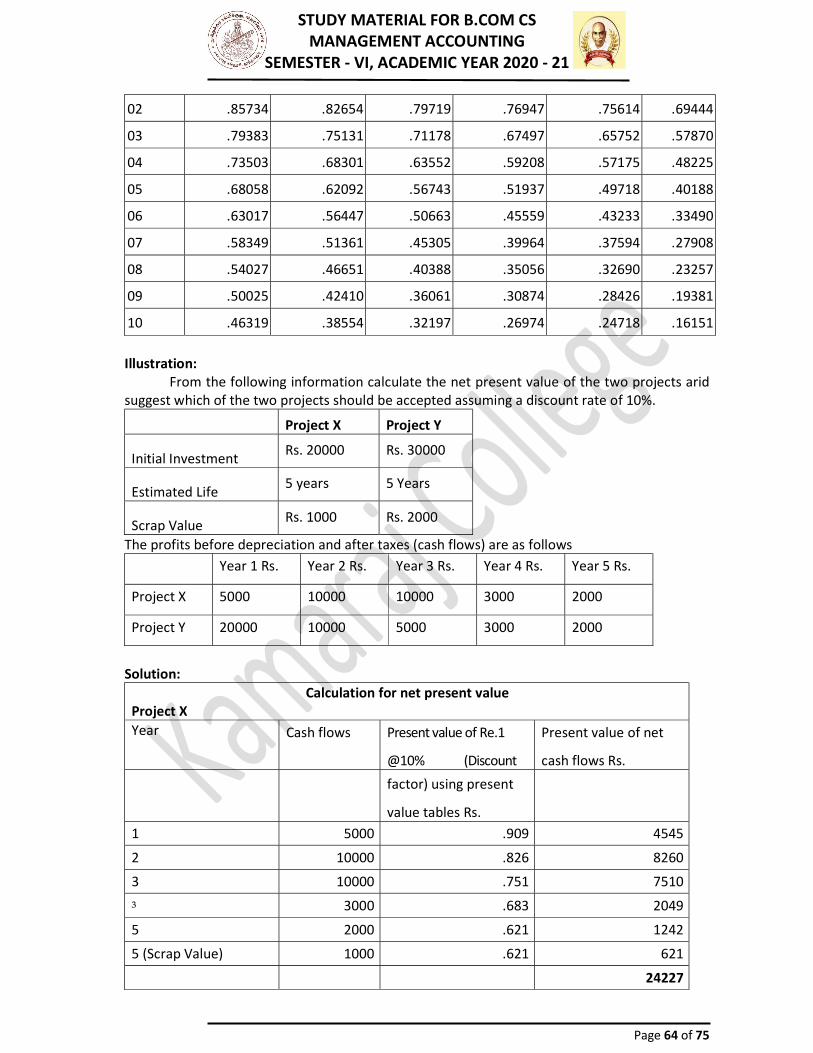
STUDY MATERIAL FOR B.COM CS MANAGEMENT ACCOUNTING SEMESTER - VI, ACADEMIC YEAR 2020 - 21
Page 64 of 75
02 .85734 .82654 .79719 .76947 .75614 .69444 03 .79383 .75131 .71178 .67497 .65752 .57870 04 .73503 .68301 .63552 .59208 .57175 .48225 05 .68058 .62092 .56743 .51937 .49718 .40188 06 .63017 .56447 .50663 .45559 .43233 .33490 07 .58349 .51361 .45305 .39964 .37594 .27908 08 .54027 .46651 .40388 .35056 .32690 .23257 09 .50025 .42410 .36061 .30874 .28426 .19381 10 .46319 .38554 .32197 .26974 .24718 .16151 Illustration: From the following information calculate the net present value of the two projects arid suggest which of the two projects should be accepted assuming a discount rate of 10%. Project X Project Y Initial Investment Rs. 20000 Rs. 30000 Estimated Life 5 years 5 Years Scrap Value Rs. 1000 Rs. 2000
The profits before depreciation and after taxes (cash flows) are as follows Year 1 Rs. Year 2 Rs. Year 3 Rs. Year 4 Rs. Year 5 Rs. Project X 5000 10000 10000 3000 2000 Project Y 20000 10000 5000 3000 2000
Solution: Calculation for net present value Project X
Year Cash flows Present value of Re.1 @10% (Discount
Present value of net cash flows Rs.
factor) using present value tables Rs.
1 5000 .909 4545 2 10000 .826 8260 3 10000 .751 7510 ³ 3000 .683 2049 5 2000 .621 1242 5 (Scrap Value) 1000 .621 621
24227

STUDY MATERIAL FOR B.COM CS MANAGEMENT ACCOUNTING SEMESTER - VI, ACADEMIC YEAR 2020 - 21
Page 65 of 75
Present value of all cash inflows 24227 Less: Present value of initial investment 20000 Net present value 4227
Calculation for net present value
Project Y Year Cash flows Present value of Re.1
@10% (Discount factor) usingpresent value tables Rs.
Present value of net cash flows Rs.
1 20000 .909 18180 2 10000 .826 8260 3 5000 .751 3755 4 3000 .683 2049 5 2000 .621 1242 5 (Scrap Value) 2000 .621 1242
34728 Present value of all cash inflows 34728 Less: Present value of initial investment 30000 Net present value 4728
We find that net present value of project Y is higher than the net present value of project X and hence it is suggested that project Y should be selected. Advantages of the Net Present Value Method The advantages of the net present value method of evaluating investment proposals are as follows: a. It recognizes the time value of money and is suitable to be applied in a situation with uniform cash outflows and uneven cash inflows or cash flows at different periods of time. b. It takes into account the earnings over the entire life of the project and the true profitability of the investment proposal can be evaluated. c. It takes into consideration the objective of maximum profitability. Disadvantages of the Net Present Value Method The net present value method suffers from the following limitations: a. As compared to the traditional methods, the net present value method is more difficult to understand and operate. b. It may not give good results while comparing projects with unequal lives as the project having higher net present value but realized in a longer life span may not be as desirable as a project having something lesser net present value achieved in a much shorter span of life of the asset.

STUDY MATERIAL FOR B.COM CS MANAGEMENT ACCOUNTING SEMESTER - VI, ACADEMIC YEAR 2020 - 21
Page 66 of 75
c. In the same way as above, it may not give good results while comparing projects with unequal investment of funds. d. It is not easy to determine an appropriate discount rate. INTERNAL RATE OF RETURN METHOD The internal rate of return method is also a modern technique of capital budgeting that takes into account the time value of money. It is also known as 'time adjusted rate of return' discounted cash flow' 'discounted rate of return,' 'yield method,' and 'trial and error yield method'. In the net present value method the net present value is determined by discounting the future cash flows of a-project at a predetermined or specified rate called the cut-off rate. But under the internal an rate of return method, the cash flows of a project are discounted at a suitable rate by hit and trial method, which equates the net present value so calculated to the amount of the investment. Under this method, since the discount rate is determined internally, this method is called as the internal rate of return method. The internal rate of return can be defined as that rate of discount at which the present value of cash-inflows is equal to the present value of cash outflows. It can be determined with the help of the following mathematical formula. C= A1 / (1+r)1 + A2 / (1+r)2 + A3 / (1+r)3 + ……… +An / (1+r)n
Where, C = Initial Outlay at time Zero. A1, A2, A3….An = Future net cash flows at different periods. 1,2,3…= number of years r = rate of discount of internal rate of return. The internal rate of return can also be determined with the help of present value tables. The following steps are required to practice the internal rate of return method. a. Determine the future net cash flows during the entire economic life of the project. The cash inflows are estimated for future profits before depreciation but after taxes. b. Determine the rate of discount at which the value of cash inflows is equal to the present value of cash outflows. This may be determined as explained after step (4). c. Accept the proposal if the internal rate of return is higher than or equal to the minimum required rate of return, i.e. the cost of capital or cut off rate and reject the proposal if the internal rate of return is lower than the cost of cut-off rate. d. In case of alternative proposals select the proposal with the highest rate of return as long as the rates are higher than the cost of capital or cut-off-rate. DETERMINATION OF INTERNAL RATE OF RETURN (IRR) When the annual net cash flows are equal over the life of the asset: Firstly, find out present value factor by dividing initial outlay (cost of the investment) by annual cash flow, ie., Present Value Factor = Initial outlay / Annual Cash Flow
Illustration: Initial Outlay Rs.50,000 Life of the asset 5 years Estimated Annual Cash -flow Rs. 12,500 Calculate the internal rate of return. Solution: Present Value Factor = Initial outlay / Annual Cash Flow

STUDY MATERIAL FOR B.COM CS MANAGEMENT ACCOUNTING SEMESTER - VI, ACADEMIC YEAR 2020 - 21
Page 67 of 75
= 50,000/ 12500 = 4 Consulting Present Value Annuity tables for 5 years periods at Present Value Factor of 4, Internal Rate of Return = 8% approx When the annual cash flows are unequal over the life of the asset: In case annual cash flows are unequal over the life of the asset, the internal rate of return cannot be determined according to the technique suggested above. In such cases, the internal rate of return is calculated by hit and trial and that is why this method is also known as hit and trial yield method. We may start with any assumed discount rate and find out the total present value of cash outflows which is equal to the cost of the initial investment where total investment is to be made in the beginning. The rate, at which the total present value of all cash inflows equals the initial outlay, is the internal rate of return. Several discount rates may have to be tried until the appropriate rate is found. The calculation process may be summed up as follows: 1. Prepare the cash flow table using an arbitrary assumed discount rate to discount the net cash flows to the present value. 2. Find out the Net Present Value by deducting from the present value of total cash flows calculated in (i) above the initial cost of the investment. 3. If the Net Present Value (NPV) is positive, apply higher rate of discount. 4. If the higher discount rate still gives a positive net present value, increase the discount rate further until the NPV becomes negative. 5. If the NPV is negative at this higher rate, the internal rate of return must be between these two rates: Illustration: Initial Investment Rs. 60000 Life of the Asset 4 years Estimated Net Annual Cash Flows : Rs. 1st Year 15000 2nd Year 20000 3rd Year 30000 4th Year 20000
Calculate Internal Rate of Return. Solution: Cash Flow Table at Various Assumed Discount Rates of 10% 12% 14% & 15% Year Annual
Cash Discount rate
10% Discount rate
12% Discount rate
14% Discount rate
15% Flow P.V.F. P.V. P.V.F. P.V. P.V.F. P.V. P.V.F. P.V. Rs. Rs. Rs. Rs. Rs. 1. 15.000 .909 13,635 .892 13,380 .877 13,155 .869 13,035
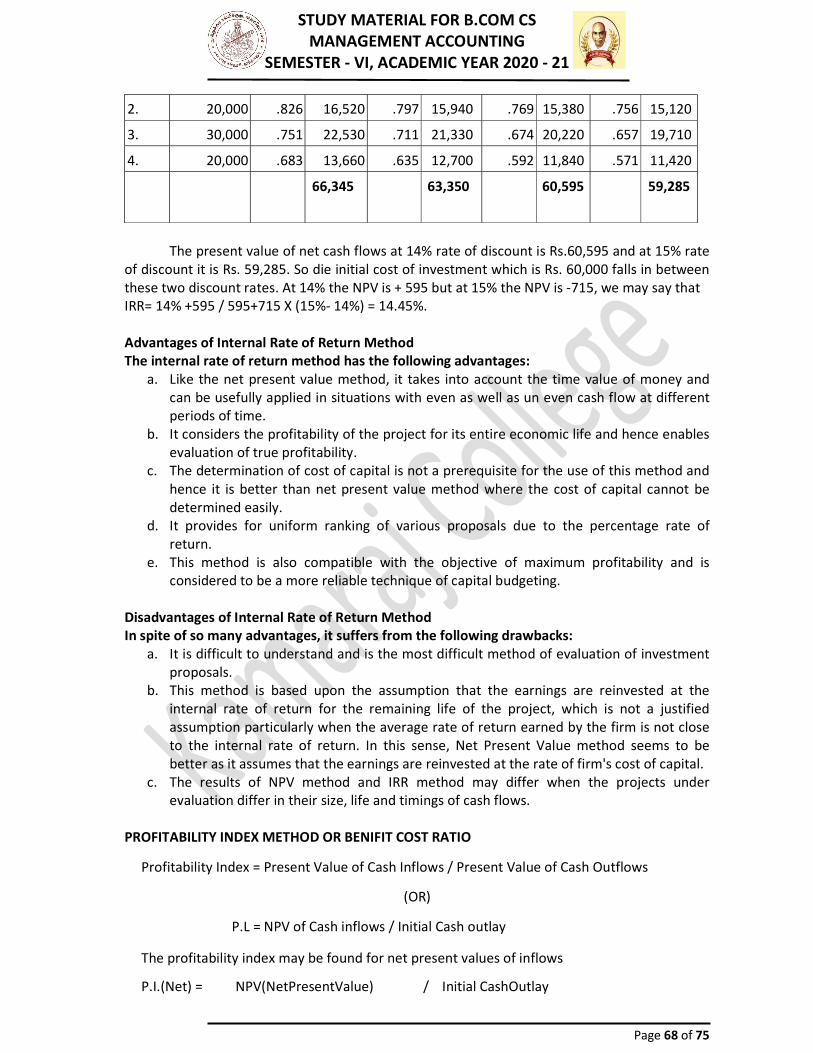
STUDY MATERIAL FOR B.COM CS MANAGEMENT ACCOUNTING SEMESTER - VI, ACADEMIC YEAR 2020 - 21
Page 68 of 75
2. 20,000 .826 16,520 .797 15,940 .769 15,380 .756 15,120 3. 30,000 .751 22,530 .711 21,330 .674 20,220 .657 19,710 4. 20,000 .683 13,660 .635 12,700 .592 11,840 .571 11,420 66,345 63,350 60,595 59,285 The present value of net cash flows at 14% rate of discount is Rs.60,595 and at 15% rate of discount it is Rs. 59,285. So die initial cost of investment which is Rs. 60,000 falls in between these two discount rates. At 14% the NPV is + 595 but at 15% the NPV is -715, we may say that IRR= 14% +595 / 595+715 X (15%- 14%) = 14.45%. Advantages of Internal Rate of Return Method The internal rate of return method has the following advantages: a. Like the net present value method, it takes into account the time value of money and can be usefully applied in situations with even as well as un even cash flow at different periods of time. b. It considers the profitability of the project for its entire economic life and hence enables evaluation of true profitability. c. The determination of cost of capital is not a prerequisite for the use of this method and hence it is better than net present value method where the cost of capital cannot be determined easily. d. It provides for uniform ranking of various proposals due to the percentage rate of return. e. This method is also compatible with the objective of maximum profitability and is considered to be a more reliable technique of capital budgeting. Disadvantages of Internal Rate of Return Method In spite of so many advantages, it suffers from the following drawbacks: a. It is difficult to understand and is the most difficult method of evaluation of investment proposals. b. This method is based upon the assumption that the earnings are reinvested at the internal rate of return for the remaining life of the project, which is not a justified assumption particularly when the average rate of return earned by the firm is not close to the internal rate of return. In this sense, Net Present Value method seems to be better as it assumes that the earnings are reinvested at the rate of firm's cost of capital. c. The results of NPV method and IRR method may differ when the projects under evaluation differ in their size, life and timings of cash flows. PROFITABILITY INDEX METHOD OR BENIFIT COST RATIO
Profitability Index = Present Value of Cash Inflows / Present Value of Cash Outflows (OR)
P.L = NPV of Cash inflows / Initial Cash outlay The profitability index may be found for net present values of inflows P.I.(Net) = NPV(NetPresentValue) / Initial CashOutlay

STUDY MATERIAL FOR B.COM CS MANAGEMENT ACCOUNTING SEMESTER - VI, ACADEMIC YEAR 2020 - 21
Page 69 of 75
It is also a time -adjusted method of evaluating the investment proposals. Profitability index also called as Benefit-Cost Ratio (B/C) or 'Desirability factor' is the relationship between present value of cash inflows and the present value of cash outflows. Thus the net profitability index can also be found as Profitability Index (gross)minus one. The proposal is accepted if the profitability index is more than one and is rejected in case the profitability index is less than one. The various projects are ranked under this method in order of their profitability index,-in such a manner that one with higher profitability index is ranked higher than the other with lower profitability index. Advantages and Disadvantages of Profitability Index Method: The method is a slight modification of the Net Present Value Method. The net present value method has one major drawback that it is not easy to rank projects on the basis of this method particularly when the costs of the projects differ significantly. To evaluate such projects, the profitability index method is most suitable. The other advantages and disadvantages of this method are the same as those of net present value method. Illustration: The initial cash outlay of a project is Rs. 50;000 and it generates cash inflows of Rs. 20,000, Rs. 15,000 Rs.25,000 and Rs. 10,000 in four years. Using present value index method, appraise profitability of the proposed investment assuming 10% rate of discount. Solution: Calculations of Present Values Index
and Profitability
Year Cash inflows Rs. Present Value Factor @10%
Present Value Rs.
1. 20,000 .909 18,180 2. 15,000 .826 12,390 3. 25.000 .751 18,775 4. 10,000 .683 6.830
56,175 Rs.
Total Present Value 56,175 Less: Initial Outlay 50,000 Net Present Value 6.175
Profitably Index(gross) = Present Value of Cash Inflows / Initial Cash Outlay = 56712 / 50000 = 1.1235 As the P.I is higher than 1, the proposal can be accepted. Net Profitability Index= NPV / Initial Cash Outlay = 6175 / 50,000 = .1235 or N.P.I. = 1.1235-1=0.1235. At the net profitability index is positive, the proposal can be accepted. COMPARISON BETWEEN NPV AND IRR (NPV Vs. IRR)
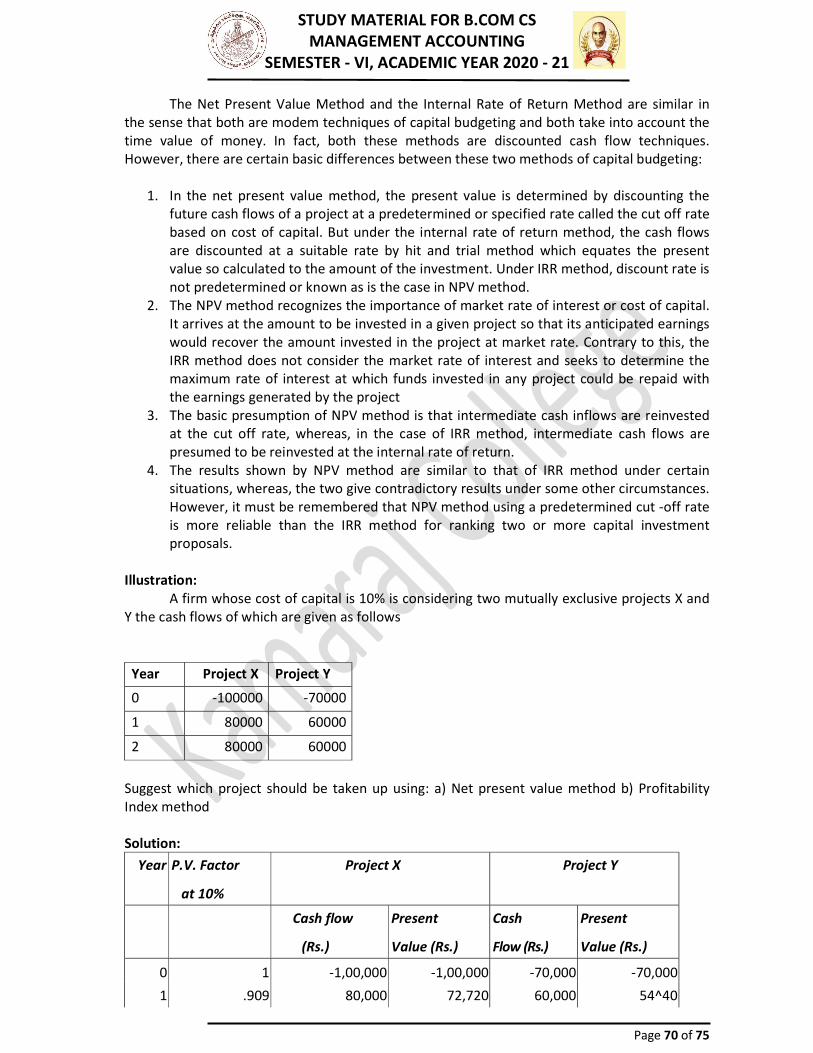
STUDY MATERIAL FOR B.COM CS MANAGEMENT ACCOUNTING SEMESTER - VI, ACADEMIC YEAR 2020 - 21
Page 70 of 75
The Net Present Value Method and the Internal Rate of Return Method are similar in the sense that both are modem techniques of capital budgeting and both take into account the time value of money. In fact, both these methods are discounted cash flow techniques. However, there are certain basic differences between these two methods of capital budgeting: 1. In the net present value method, the present value is determined by discounting the future cash flows of a project at a predetermined or specified rate called the cut off rate based on cost of capital. But under the internal rate of return method, the cash flows are discounted at a suitable rate by hit and trial method which equates the present value so calculated to the amount of the investment. Under IRR method, discount rate is not predetermined or known as is the case in NPV method. 2. The NPV method recognizes the importance of market rate of interest or cost of capital. It arrives at the amount to be invested in a given project so that its anticipated earnings would recover the amount invested in the project at market rate. Contrary to this, the IRR method does not consider the market rate of interest and seeks to determine the maximum rate of interest at which funds invested in any project could be repaid with the earnings generated by the project 3. The basic presumption of NPV method is that intermediate cash inflows are reinvested at the cut off rate, whereas, in the case of IRR method, intermediate cash flows are presumed to be reinvested at the internal rate of return. 4. The results shown by NPV method are similar to that of IRR method under certain situations, whereas, the two give contradictory results under some other circumstances. However, it must be remembered that NPV method using a predetermined cut -off rate is more reliable than the IRR method for ranking two or more capital investment proposals. Illustration: A firm whose cost of capital is 10% is considering two mutually exclusive projects X and Y the cash flows of which are given as follows Year Project X Project Y 0 -100000 -70000 1 80000 60000 2 80000 60000
Suggest which project should be taken up using: a) Net present value method b) Profitability Index method Solution: Year P.V. Factor
at 10% Project X Project Y
Cash flow (Rs.)
Present Value (Rs.)
Cash Flow (Rs.)
Present Value (Rs.)
0 1 -1,00,000 -1,00,000 -70,000 -70,000 1 .909 80,000 72,720 60,000 54^40

STUDY MATERIAL FOR B.COM CS MANAGEMENT ACCOUNTING SEMESTER - VI, ACADEMIC YEAR 2020 - 21
Page 71 of 75
2 .826 80,000 66080 60,000 49,560 Net Present Value (NPV) 38,800 34,100 Profitability Index (PI) = 138,800/ 1,04,100 / Present value of cash 1,00,000 70.000 Inflows / Present value of cash =1.39 =1.49 Outflows Suggestion: According to Net Present Value method project X is acceptable because of its higher Illustration: (Pay Back Period Method) Moon Ltd. is producing articles mostly by manual labour and is considering to replace it a new machine. There are two alternative models M and N of the new machine. Prepare a statement of liability showing the payback period from the following information: Machine M Machine N Estimated life of machine 4 years 5 years Cost of machine Rs 90,000 Rs 1,80,000 Estimated savings in scrap 5,000 8,000 Estimated savings in directWages 60,000 80,000 Additional cost of maintenance
8,000 10,000
Additional cost ofSupervision 12,000 18,000 Solution Machine M [Rs] Machine N [Rs] Estimated savings perAnnum Scrap 5000 8000 Direct wages 60000 80000 Total savings[a] 65000 88000 Additional cost per annum Maintenance 8000 10000 Supervision 12000 18000 Total additional cost[b] 20000 28000 Net savings or annual cashinflows[a-b] 45000 60000 Pay back period =initially outlay of the project/ annual cash inflow
90000/45000=2 years 180000/60000=3 years

STUDY MATERIAL FOR B.COM CS MANAGEMENT ACCOUNTING SEMESTER - VI, ACADEMIC YEAR 2020 - 21
Page 72 of 75
As payback period in case of machine M is less than that in case of machine N, machine M is recommended. Note. Tax has been ignored as the rate of tax has not been given. ADVANTAGES OF PAYBACK PERIOD METHOD The main advantage of method is that it is simple to understand and easy to calculate. It saves in cost, it requires lesser time and labour as compared to other methods of capital budgeting. DISADVANTAGES It ignores time value of money. It doesn‘t take into account cost of capital. Illustration: (Average Rate of Return Method) Calculate the average rate of return for projects A and B from the following Project A Project B Investments Rs. 20000 Rs. 30000 Expected life[no salvagevalue] 4years 5years Projected net income[after interest, depreciation andtaxes]
Years Project A Rs Project B Rs 1 2000 3000 2 1500 3000 3 1500 2000 4 1000 1000 5 1000
6000 10000 If the required rate of return is 12percent which project should be undertaken SOLUTION Project A Rs Project B Rs Total profit[afterdepreciation ,interest and taxes]
6000 10000 Average profit 6000/4=1500 10000/4=2000 Net investment on theProject 20000 30000 Average rate of return 1500/20000*100 2000/30000*100 Average annual profit /net investment in the project*100
7.5 percent 6.66percent
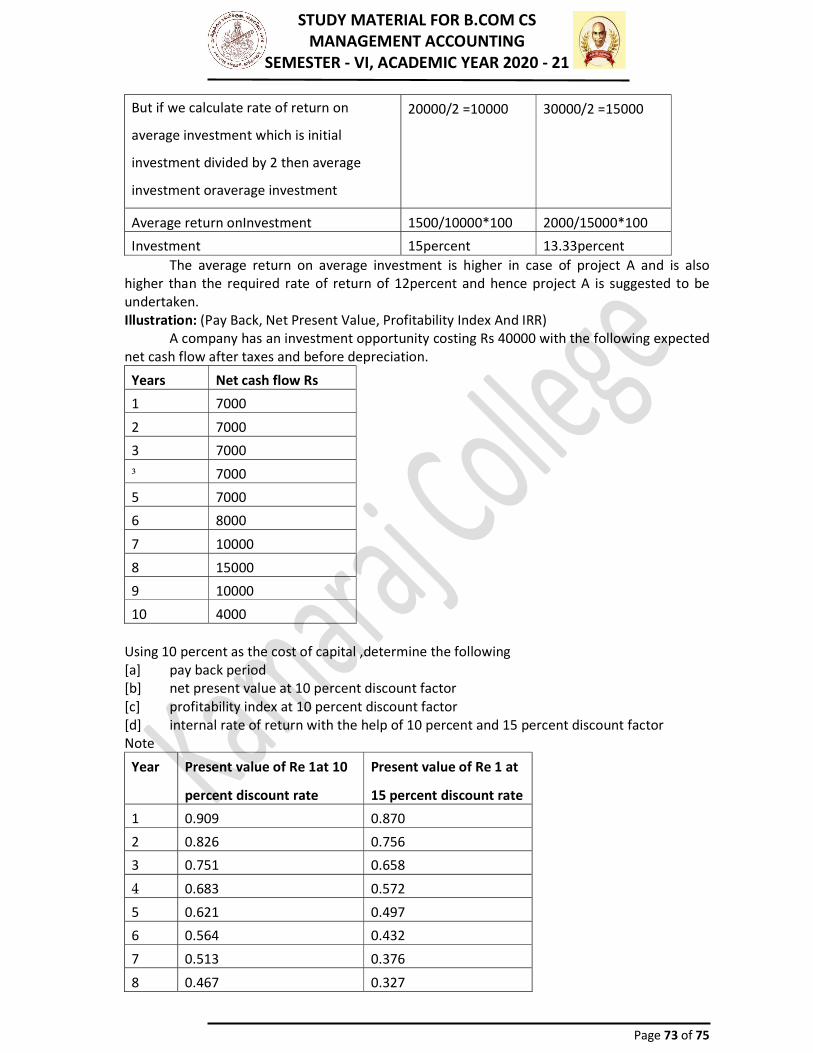
STUDY MATERIAL FOR B.COM CS MANAGEMENT ACCOUNTING SEMESTER - VI, ACADEMIC YEAR 2020 - 21
Page 73 of 75
But if we calculate rate of return on average investment which is initial investment divided by 2 then average investment oraverage investment
20000/2 =10000 30000/2 =15000
Average return onInvestment 1500/10000*100 2000/15000*100 Investment 15percent 13.33percent
The average return on average investment is higher in case of project A and is also higher than the required rate of return of 12percent and hence project A is suggested to be undertaken. Illustration: (Pay Back, Net Present Value, Profitability Index And IRR) A company has an investment opportunity costing Rs 40000 with the following expected net cash flow after taxes and before depreciation. Years Net cash flow Rs 1 7000 2 7000 3 7000 ³ 7000 5 7000 6 8000 7 10000 8 15000 9 10000 10 4000
Using 10 percent as the cost of capital ,determine the following [a] pay back period [b] net present value at 10 percent discount factor [c] profitability index at 10 percent discount factor [d] internal rate of return with the help of 10 percent and 15 percent discount factor Note Year Present value of Re 1at 10
percent discount rate Present value of Re 1 at 15 percent discount rate
1 0.909 0.870 2 0.826 0.756 3 0.751 0.658 4 0.683 0.572 5 0.621 0.497 6 0.564 0.432 7 0.513 0.376 8 0.467 0.327

STUDY MATERIAL FOR B.COM CS MANAGEMENT ACCOUNTING SEMESTER - VI, ACADEMIC YEAR 2020 - 21
Page 74 of 75
9 0.424 0.284 10 0.386 0.247
Solution: [A] CALCULATION OF PAY BACK PERIOD Cash outlay of the project 40000 Total cash inflow for the first five years 35000 Balanceof cash outlay left to bepaidback in the 6th year 5000 Cash inflow for 6th year 8000 So the payback period is between 5th and6th years 5years+5000/8000=5*5/8
[B] CALCULATION OF NET PRESENT VALUE AT 10 PERCENT DISCOUNT RATE Year [col1] Net cash inflow
[col2] Rs Present value at discount rate of 10 percent [col3]
Present value [col2*col3] Rs
1 7000 0.909 6363 2 7000 0.826 5782 3 7000 0.751 5257 4 7000 0.683 4781 5 7000 0.621 4347 6 8000 0.564 4512 7 10000 0.513 5130 8 15000 0.467 7005 9 10000 0.424 4240 10 4000 0.386 1544
Total 48961 Net present value =present value of inflow-cost of the investment =Rs48961-40000=8961 [C]CALCULATION OF PROFITABILITY INDEX @ 10% DISCOUNT RATE Profitability index =present value of cash inflows/cost of investment =48961/40000=1.22 [d] CALCULATION OF INTERNAL RATE OF RETURN As the net present value [calculate in [b]above] is positive ,we must calculate net present value at a higher rate of discount i.e. 15 percent as given
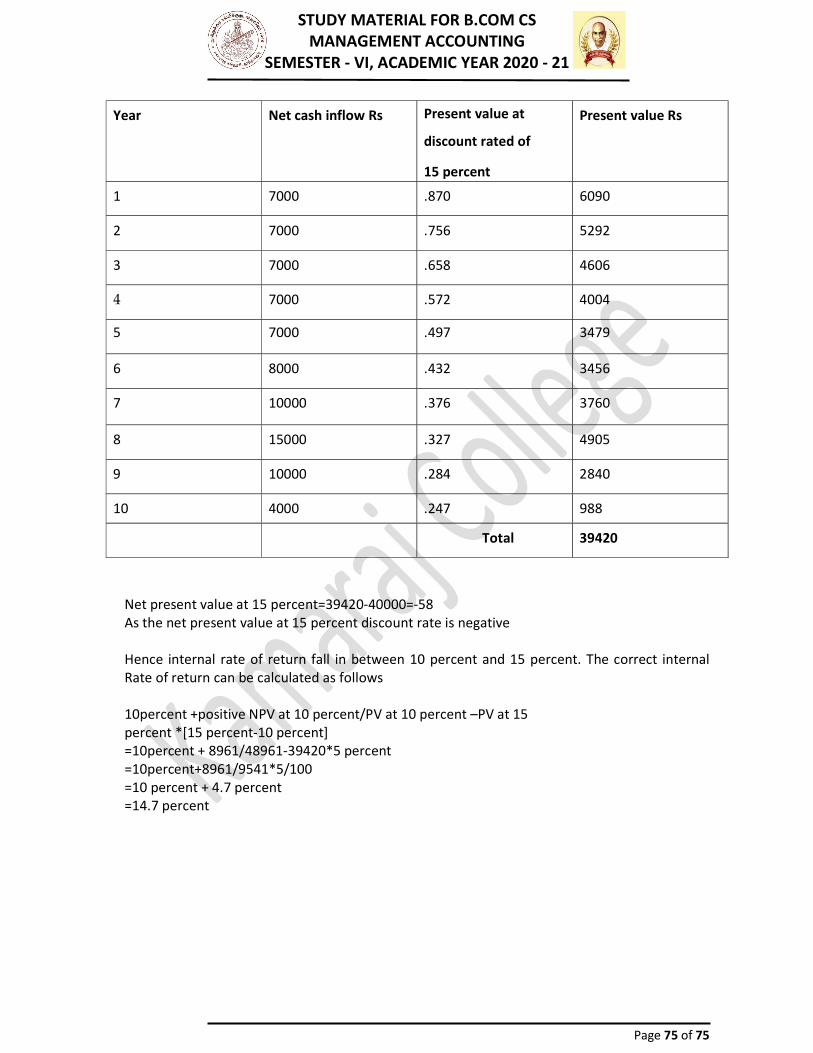
STUDY MATERIAL FOR B.COM CS MANAGEMENT ACCOUNTING SEMESTER - VI, ACADEMIC YEAR 2020 - 21
Page 75 of 75
Net present value at 15 percent=39420-40000=-58 As the net present value at 15 percent discount rate is negative Hence internal rate of return fall in between 10 percent and 15 percent. The correct internal Rate of return can be calculated as follows 10percent +positive NPV at 10 percent/PV at 10 percent –PV at 15 percent *[15 percent-10 percent] =10percent + 8961/48961-39420*5 percent =10percent+8961/9541*5/100 =10 percent + 4.7 percent =14.7 percent
Year Net cash inflow Rs Present value at discount rated of 15 percent
Present value Rs
1 7000 .870 6090 2 7000 .756 5292 3 7000 .658 4606 4 7000 .572 4004 5 7000 .497 3479 6 8000 .432 3456 7 10000 .376 3760 8 15000 .327 4905
9 10000 .284 2840 10 4000 .247 988 Total 39420