Mammal indicator species for protected areas and managed forests in a landscape conservation area of...
19
1 23 Biodiversity and Conservation ISSN 0960-3115 Volume 20 Number 1 Biodivers Conserv (2010) 20:1-17 DOI 10.1007/ s10531-010-9851-8 Mammal indicator species for protected areas and managed forests in a landscape conservation area of northern India
Transcript of Mammal indicator species for protected areas and managed forests in a landscape conservation area of...
1 23
Biodiversity andConservation ISSN 0960-3115Volume 20Number 1 Biodivers Conserv (2010)20:1-17DOI 10.1007/s10531-010-9851-8
Mammal indicator species for protectedareas and managed forests in a landscapeconservation area of northern India

1 23
Your article is protected by copyright and
all rights are held exclusively by Springer
Science+Business Media B.V.. This e-offprint
is for personal use only and shall not be self-
archived in electronic repositories. If you
wish to self-archive your work, please use the
accepted author’s version for posting to your
own website or your institution’s repository.
You may further deposit the accepted author’s
version on a funder’s repository at a funder’s
request, provided it is not made publicly
available until 12 months after publication.

ORI GIN AL PA PER
Mammal indicator species for protected areasand managed forests in a landscape conservationarea of northern India
Pradeep K. Mathur • Harish Kumar • John F. Lehmkuhl •
Anshuman Tripathi • Vishwas B. Sawarkar • Rupak De
Received: 8 June 2009 / Accepted: 1 April 2010 / Published online: 14 April 2010� Springer Science+Business Media B.V. 2010
Abstract There is a realization that managed forests and other natural areas in the
landscape matrix can and must make significant contributions to biodiversity conservation.
Often, however, there are no consistent baseline vegetation or wildlife data for assessing
the status of biodiversity elements across protected and managed areas for conservation
planning, nor is there a rapid and efficient means to acquire those data. We used a unified
vegetation classification and simple animal sampling design to describe the patterns of
abundance of selected mammals as indicator, or characteristic, species in different vege-
tation types and protected areas vs. managed forest units in the Terai Conservation Area
(TCA) in northern Uttar Pradesh state, India. We quantified the relative abundance of 15
P. K. Mathur (&) � H. Kumar � A. Tripathi � V. B. SawarkarDepartment of Landscape Level Planning and Management, Wildlife Institute of India,Post Box # 18, Chandrabani, Dehra Dun, Uttarakhand 248 001, Indiae-mail: [email protected]
J. F. LehmkuhlPacific Northwest Research Station, USDA Forest Service,1133 N. Western Avenue, Wenatchee, WA 98801, USAe-mail: [email protected]
R. DeUttar Pradesh Forest Department, 17-Rana Pratap Marg, Lucknow, Uttar Pradesh, Indiae-mail: [email protected]
Present Address:H. KumarTerai Arc Landscape, World Wildlife Fund-India, Pilibhit, Uttar Pradesh, India
Present Address:A. TripathiNational Mineral Development Corporation Ltd., Donimalai Iron Ore Mines,Donimalai Township, Bellary, Karnataka 583118, India
Present Address:V. B. Sawarkar464 Rasta Peth, Near Power House, Pune, Maharashtra, India
123
Biodivers Conserv (2011) 20:1–17DOI 10.1007/s10531-010-9851-8
Author's personal copy

mammals of conservation concern from dung counts in vegetation sampling plots within
122 sample patches in 13 vegetation types and 4 management units. Assemblages of
species differed both among vegetation types and among management units. Species
assemblages in the two protected areas differed strongly from those in two managed
forests. Grasslands in protected areas were the most species diverse among vegetation
types and had several indicator species. Protected forests were dominated by chital (Axisaxis) and nilgai (Boselaphus tragocamelus) in a second species group. A third species
group in open grasslands and savannas in managed forests was characterized by cattle (Bostaurus) and Indian hare (Lepus nigricollis). Protected areas clearly are the core conser-
vation area of the TCA for their relatively high habitat value and species diversity, and
their protected status minimizes human disturbance. Impacts of human use are high in
managed forests, indicating their compromised value for biodiversity conservation. Our
simple assessment methodology gives managers a simple way to assess the status of
important mammals across landscape conservation units.
Keywords Grasslands � India � Indicator species � Managed forests �Monitoring � Protected areas � Sal forest
Introduction
Large reserves and corridors in reserve networks long have been considered the keystone
biodiversity conservation strategy (e.g., Noss and Harris 1986; Noss and Cooperrider
1994). Yet, there is the realization that managed forests and other semi-natural areas in the
landscape matrix can and must make significant contributions to biodiversity conservation
(Everett and Lehmkuhl 1996; Reid 1996; Salwasser et al. 1996; Sawarkar 2005; Franklin
and Lindenmayer 2009). Several issues hinder the integration of protected areas and
managed forests into a cohesive conservation unit (Everett and Lehmkuhl 1996; Sawarkar
2005). First, goals, objectives, and consequent practices may differ. Second, there often is
no consistent baseline vegetation or wildlife data for assessing the status and contribution
of biodiversity elements across allocations and the impacts of different management
objectives: hence, no basis for effective conservation planning. Although coarse-filter
approaches that conserve general vegetation communities or animal habitats are vital, fine-
filter baseline data on species of concern are vital for effective conservation planning and
management (Hunter et al. 1988; Haufler et al. 1996; Lambeck 1997; Lindenmayer et al.
2002). We address the second issue in this paper.
India has a well-established network of protected areas and managed forests that are
managed by state forest departments under different administrative divisions in collabo-
ration with the national Indian Forest Service. Forest reserves for sustainable extraction of
wood and forage were established across India during the late 1800s and early 1900s, and
the Indian Forest Service was established to develop a core of professional foresters
(Saxena 2002). During the last half of the twentieth century an impressive network of
protected areas as national parks and wildlife sanctuaries was carved from managed forest
reserves, and that protected area network continues to grow (Rodgers et al. 2000). Cur-
rently, 21% of India is classified as forested (FSI 2003), but only 24% of the forested land
is in protected areas (MoEF 2008). Under the mandate of the Biological Diversity Act of
2002 foresters have begun to develop landscape-scale strategies for integrating biodiversity
and social issues in management plans that encompass protected areas, managed forests,
2 Biodivers Conserv (2011) 20:1–17
123
Author's personal copy
and matrix (De 2001; Sawarkar 2005). Yet, the lack of consistent baseline assessments of
habitats and species across administrative units hinders that integration (Sawarkar 2005).
Pilot projects in four diverse Indian ecosystems assessed the issues and developed
landscape-scale strategies for integrating protected and managed forests into formal con-
servation areas (Mathur et al. 2002; Lehmkuhl et al. 2006). One of those pilot projects
focused on the remaining Terai forests and grasslands in the premier protected areas and
managed forests of northern Uttar Pradesh (U.P.) state (Kumar et al. 2002). The Terai is a
biodiversity-rich area of forests and tall grasslands in the alluvial floodplains of the Ganga
River that extends east–west at the base of the Himalaya through southern Nepal and the
northern Indian states of Uttarakhand, U.P., Bihar, and West Bengal (Mathur 2000). It is
part of the Terai-Bhabhar biogeographic sub-division of the Upper Gangetic biotic prov-
ince in the Gangetic Plains biogeographic zone (Rodgers et al. 2000).
In the past, the Terai ecosystem was a continuous belt of tropical moist deciduous
forests interspersed with tall wet grasslands and numerous swamps (Mathur 2000; Wi-
kramanayake et al. 2004). This area now is highly fragmented by densely populated and
rich agricultural land, and is one of the most affected ecosystems of India (Rodgers et al.
2000). Nevertheless, remnant portions of the Terai region in Uttarakhand, U.P., Bihar, and
West Bengal plus similar habitats in the Brahmaputra River valley of Assam state, remain
as complex and dynamic natural ecosystems and are a biodiversity-rich region in India.
These protected areas and adjacent managed forests are international conservation
strongholds for several threatened or endangered species, most notably tiger (Pantheratigris tigris), greater one-horned rhinoceros (Rhinoceros unicornis), Asian elephant
(Elephas maximus), Asian wild buffalo (Bubalus bubalis), swamp deer (Rucervusduvaucelii duvaucelii), pygmy hog (Porcula salvania), hispid hare (Caprolagus hispidus),
and Bengal florican (Hubaropsis bengalensis). Historically, the diversity and biomass of
large herbivores in an intact Terai ecosystem equaled or exceeded many of the famous
wildlife areas of East Africa (Lehmkuhl 1994).
The Terai Conservation Area (TCA) designated by Kumar et al. (2002) in northern U.P.
has two core protected areas, Dudwa National Park and Kishanpur Wildlife Sanctuary, two
managed forest units (North and South Kheri Forest Divisions), and the intervening agri-
cultural matrix. In addition to encompassing varied environments, the constituent units are
under different management objectives, administration, and levels of human disturbance.
Human disturbance varies from little to none, except tourist use, in national parks, to some
allowable grazing and produce collection in wildlife sanctuaries, to timber harvest, silvi-
cultural operations, and grazing in managed forests. Wildlife habitat relationships might vary
not only with vegetation types, or habitat, but with management allocation and the corre-
sponding amount of human use (De 2001). No common vegetation classification scheme
existed for both protected areas and managed forests, and there was no common process or
methodology for rapid wildlife assessments and monitoring. If landscape conservation areas
like the TCA are to be successful in the critical integration of the matrix and protected areas
(Prugh et al. 2008; Franklin and Lindenmayer 2009), then rapid and efficient collection and
analysis of baseline data on vegetation condition and animal distribution and habitat use
across units is critical for further planning efforts, including coarse- and fine-filter approaches
(e.g., focal species) (Lambeck 1997; Lindenmayer et al. 2002).
Our goal was to develop a rapid field assessment and data analysis methodology that
could be integrated with standard timber, or vegetation, inventory procedures to quantify
baseline wildlife habitat relationships among management allocations and determine how
allocations uniquely contribute to or hinder conservation of wildlife species. Our primary
objective was to describe the patterns of abundance of selected mammals of management
Biodivers Conserv (2011) 20:1–17 3
123
Author's personal copy
concern as indicator, i.e. characteristic, species in different vegetation types and
management allocations (i.e., protected areas vs. managed forest units) of the TCA with
different management and disturbance histories. We hypothesized that mammal occurrence
would be most strongly affected by vegetation type, and that management allocation
(protected vs. managed) and associated levels of human disturbance would have a
modifying affect on occurrence.
Materials and methods
Study area
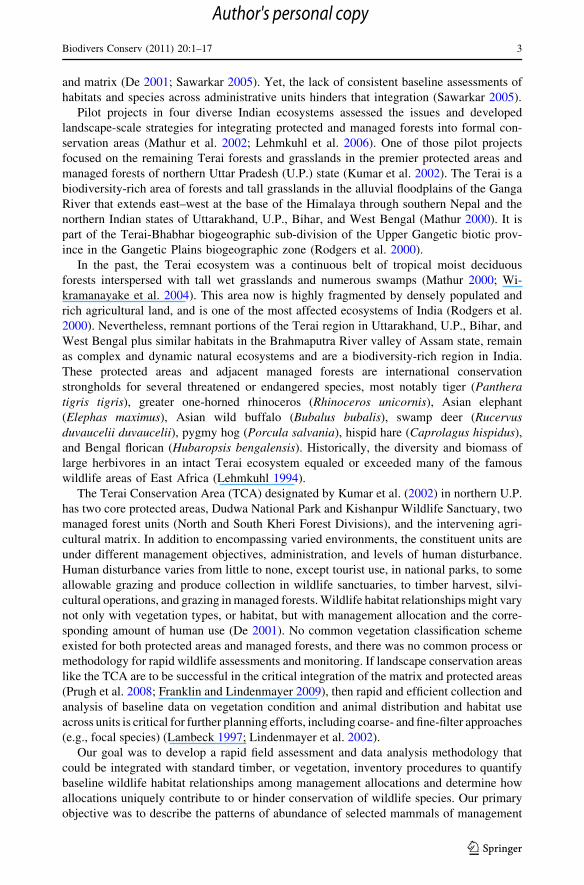
The TCA covers 7,900 km2 between latitude N 27�490 and 28�430 and longitude E 80�010
and 81�180 in Lakhimpur Kheri, Pilibhit, Shahjahanpur and Bhairach districts of U.P. state
(Fig. 1). The protected areas of Dudwa National Park (DNP, 680 km2) and Kishanpur
Wildlife Sanctuary (KWLS, 203 km2), and managed forests (MFs) of North Kheri and
South Kheri Forest Divisions (NKFD, 318 km2, and SKFD, 415 km2) occur within a
matrix of private agricultural and government revenue lands. The forests in DNP are well
protected and were last worked for timber production 30 years ago, while timber man-
agement of forests in KWLS stopped about 15 years ago (De 2001). Forests in NKFD and
SKFD are still being worked conservatively for timber production and are under high
biotic pressure for subsistence grazing, fuelwood collection, and other uses.
The TCA is on the flat alluvial flood plains of the Suheli, Mohana and Sharda Rivers.
The elevation ranges from 143 to 183 m. The soils of the TCA are a recent alluvial
formation of the Gangetic Plains (Singh 1965). Different forests in TCA cover 73% of the
Fig. 1 Location of study area in the Terai Conservation Area of northern Uttar Pradesh, India
4 Biodivers Conserv (2011) 20:1–17
123
Author's personal copy
non-agricultural areas (Table 1). Sal (Shorea robusta) forests account for 45% of the
forested area, with most in the protected DNP and managed SKFD units. Moist mixed
deciduous forest, tropical semi-evergreen, and seasonal swamp forests occupy 12.4% of the
area. Early-seral Acacia/Dalbergia and Tamarix communities occupy 8.4% of the young
floodplain terraces. Dry upland and wet lowland grasslands occur on 13% of the natural
areas, primarily in DNP. Plantations of primarily eucalyptus occur on 7.7% of the area,
mostly in SKFD. A detailed description of vegetation in the TCA can be found in Kumar
et al. (2002).
The climate of the study area is a tropical monsoon type and experiences three distinct
seasons: cool-dry winter (mid-October to mid-March), hot-dry summer (mid-March to
mid-June), and warm-wet monsoon (mid-June to mid-October). The month of January is
the coldest with mean maximum temperature of 20�C and mean minimum temperature of
9�C. The months of May and June are hottest with the mean maximum temperature rising
up to 43�C. Annual rainfall is about 150 cm (De 2001).
Sampling design
We stratified sampling of non-wetland vegetation patches by natural vegetation types,
management unit, and patch size. Thirteen vegetation types (9 forest types, Tamarix scrub,
dry upland and wet lowland grasslands, and plantations of varying ages) were identified
from a vegetation map based on the classification of IRS 1B LISS II satellite images
(Table 1) (Kumar et al. 2002). Patches of varying sizes in each vegetation type and
management unit were delineated. We allocated samples within vegetation types to ensure
representative samples of different patch sizes in each of the four management units
(Table 1). In the case of varying types of S. robusta forest, large, medium, and small patches
were [2000 ha, 1000–2000 ha and \1000 ha area, respectively. In other categories of
forests and grasslands, large, medium, and small patches were [500 ha, 100–500 ha, and
\100 ha area, respectively. Altogether, we sampled 122 patches in 13 vegetation types
(Table 1).
We sub-sampled each sample patch with 20 m 9 20 m quadrats laid out along tran-
sects. The size of the quadrat was based on species-area curves (Mueller-Dombois and
Ellenberg 1974) to meet vegetation sampling objectives (Kumar et al. 2002). In general, a
minimum of 10 quadrats was used to sample the smallest forest patches (*50 ha).
Quadrats were distributed at 200-m intervals within patches along transects of varying
length (2–3.5 km) to systematically cover the patch. Vegetation was measured at each plot
and is reported elsewhere (Kumar et al. 2002). The presence of wildlife dung for each
species was recorded in the subsample quadrats. Sampling occurred during November
1997 to February 2001. A total of 1,967 vegetation quadrats were subsampled in the 122
sample patches.
We calculated an index of animal abundance as the percentage frequency of occurrence
of a species in each sample patch as the number of subsample quadrats with old or fresh
dung divided by the total number of quadrats. We recorded data for 15 mammals of
conservation or management concern: tiger (Panthera tigris tigris), sloth bear (Melursusursinus), honey badger (Mellivora capensis), elephant (Elephas maximus), nilgai
(Boselaphus tragocamelus), sambar (Rusa unicolor), swamp deer (Rucervus duvauceliiduvaucelii), chital (Axis axis), barking deer (Muntiacus muntjak), blackbuck (Antelopecervicapra), hog deer (Axis porcinus), wild boar (Sus scrofa), Indian hare (Lepusnigricollis), hispid hare (Caprolagus hispidus), and cattle (Bos taurus). Tiger, elephant, and
hispid hare are Endangered, sloth bear and swamp deer are Vulnerable, blackbuck is Near
Biodivers Conserv (2011) 20:1–17 5
123
Author's personal copy

Tab
le1
Are
aan
dp
erce
nta
ge
of
veg
etat
ion
typ
esin
man
agem
ent
un
its
and
the
nu
mb
ero
fsa
mple
pat
ches
inth
efo
ur
man
agem
ent
un
its
of
the
Ter
aiC
on
serv
atio
nA
rea,
Utt
arP
rad
esh
,In
dia
Veg
etat
ion
type
DN
PK
WL
SN
KF
DS
KF
DS
tudy
area
km
2%
type
%unit
nkm
2%
type
%unit
nkm
2%
type
%unit
nkm
2%
type
%unit
nkm
2%
unit
n
Gra
ssla
nd
Dry
gra
ssla
nd
43
77.3
6.3
51
2.5
0.7
32
3.0
0.5
110
17.2
2.3
256
3.2
11
Wet
gra
ssla
nd
82
49.3
12.0
630
18.1
14.8
235
20.9
10.9
319
11.7
4.7
2166
9.6
13
Subto
tal
125
56.4
18.3
11
31
14.2
15.5
537
16.4
11.4
429
13.2
7.0
4222
12.8
24
Fore
sts
Aca
cia/D
alb
ergia
97.9
1.4
2–
––
–80
67.3
25.2
530
24.8
7.1
2119
6.9
6
Tam
ari
xsc
rub
––
––
39.9
1.2
28
30.8
2.4
215
59.3
3.6
225
1.5
9
Pla
nta
tions
34
25.5
5.0
712
8.9
5.8
33
2.5
1.1
284
63.1
20.1
6132
7.7
18
Mois
tm
ixed
dec
iduous
58
36.3
8.5
48
5.2
4.1
275
47.0
23.7
519
11.6
4.5
2160
9.3
13
Tro
pic
alse
mi-
ever
gre
en11
100.0
1.6
2–
––
––
––
––
––
–11
0.6
2
Sea
sonal
swam
p21
47.5
3.0
36
14.6
3.1
26
13.2
1.7
111
24.5
2.6
443
2.5
10
Shore
aopen
176
50.5
25.9
449
13.9
23.8
27
2.0
2.2
1117
33.6
28.2
7348
20.2
14
Shore
am
oder
ate
130
46.0
19.0
557
20.1
27.9
3–
––
–95
33.8
23.0
4281
16.3
12
Shore
aden
se91
100.0
13.4
6–
––
––
––
––
––
–91
5.3
6
Shore
am
ixed
10
59.2
1.5
27
40.8
3.5
2–
––
––
––
–17
1.0
4
Chan
dar
Shore
a–
––
–22
77.6
10.9
2–
––
–6
1.5
1.5
229
1.7
4
Subto
tal
539
42.9
79.3
35
163
13.0
80.3
18
179
14.2
56.3
16
376
29.9
90.6
29
1,2
57
73.0
98
Wet
landsa
Sw
amps
644.7
0.8
212.2
0.7
543.1
1.6
00.8
0.0
12
0.7
Riv
ers
10
19.6
1.5
35.6
1.4
34
68.3
10.8
36.5
0.7
50
2.9
San
dy
Ban
ks
10.7
0.1
45.8
2.1
63
84.3
19.8
79.2
1.6
75
4.3
Tota
l680
100.0
46
203
100.0
23
318
100.0
20
415
100.0
33
1,7
26
100.0
122
Man
agem
ent
unit
sar
eth
eP
rote
cted
Are
asof
Dudw
aN
atio
nal
Par
k(D
NP
)an
dK
ishan
pur
Wil
dli
feS
anct
uar
y(K
WL
S),
and
the
man
aged
fore
sts
of
the
Nort
hK
her
iF
ore
stD
ivis
ion
(NK
FD
)an
dth
eS
outh
Kher
iF
ore
stD
ivis
ion
(SK
FD
)a
Wet
lands
wer
enot
sam
ple
d,
but
thei
rar
eas
giv
enher
efo
ra
com
ple
tedes
crip
tion
of
the
study
area
6 Biodivers Conserv (2011) 20:1–17
123
Author's personal copy
Threatened, and honey badger is at Lower Risk on the IUCN Red List (IUCN 2009), and
all are accorded Schedule I (highest) protection under the Wildlife (Protection) Act of India
(WPA) (MoEF 1972). Nilgai, sambar, chital, barking deer, hog deer, and wild boar are all
IUCN Lower Risk species with Schedule III (lowest) protection under the WPA; but, these
species have critical management importance as either a WPA Schedule I species (honey
badger), or as primary prey species of the tiger (De 2001). Cattle are of interest because
their occurrence impacts native wild ungulate species through potential competition and
human disturbance (De 2001). Indian hares are important prey for avian and small
mammalian carnivores and a likely indicator species in scrubby disturbed habitats. Species
taxonomy followed Wilson and Reeder (2005).
Data analysis
We used non-parametric methods for analysis of ecological communities to examine the
relationships between relative animal abundance, vegetation type, management unit, and
patch size. Typical methods for modeling resource use by individual species, such as
general linear models (Manly et al. 2002) or occupancy modeling (MacKenzie et al. 2006),
were problematic because the sampling design included many empty cells (e.g., not all
vegetation types were found in every management unit), the data included many zero
values (i.e., animals not found in a vegetation type or management unit), and data for
species had messy frequency distributions. Those types of data are well suited for com-
munity analysis methods (McCune and Grace 2002). All analysis was done with PCORD
software (McCune and Mefford 1999).
We used Multi-Response Permutation Procedures (MRPP) to test the hypothesis of no
difference in species composition among groups, i.e., among vegetation types and among
management units (Zimmerman et al. 1985; Biondini et al. 1988). An A statistic measured
the grouping ‘‘effect size’’, or distinctiveness of groups, on a scale of 0–1. Values of
A [ 0.3 are considered fairly high. Monte Carlo permutations calculated probabilities for
differences between groups.
A primary method for summarizing relative abundance data was Indicator Species
Analysis (ISA), which identified indicator, or characteristic, species found mostly in a
single type and present in the majority of the sites belonging to a group (Dufrene and
Legendre 1997). ISA combined information on both species relative abundance and rel-
ative frequency across sample patches to estimate indicator values for each species in each
group (i.e., vegetation type, management unit, patch size). The maximum indicator value
of an item within cover types was tested for statistical significance against the random
expectation calculated by Monte Carlo permutation.
We also used two-way cluster analysis of species and sample patches to graphically
examine relationships among species and sample units representing different vegetation
types and management units (McCune and Mefford 1999). Data were represented in a two-
way dendrogram with species as columns and samples as rows. Relative abundance for
species in each sample was coded by a grey-scale gradient, with black indicating 100%
relative abundance in the sample patch. Management unit status was examined by
manipulating the topology of the dendrogram to group sample patches (McCune and
Mefford 1999). Outlines were drawn around the 3 main groups that were evident in the
cluster dendrogram as defined by a 50% cutoff in information remaining in the sample
dataset.
We accepted a significance level of P B 0.10 for all statistical analyses. Although less
conservative than P B 0.05, we considered a = 0.10 to be an acceptable chance of Type I
Biodivers Conserv (2011) 20:1–17 7
123
Author's personal copy
error for ecological field studies that also allowed for reduced Type II error and was well
within the bounds of statistical convention (Zar 1999). A significant difference is implied
where a difference among means is reported in the text for a priori comparisons.
Results
Dung of the selected mammal species was present in about 50% of the 1,967 subsample
quadrats in 122 sample patches. Assemblages of species differed both among vegetation
types (A = 0.231, P \ 0.001) and among management units (A = 0.125, P \ 0.001).
Based on the relative size of A statistics, vegetation type had a nearly 29 stronger effect on
species occurrence compared to management unit. Species assemblages in the protected
areas of DNP and KWLS differed somewhat in composition (A = 0.010, P = 0.103)
(Table 2, Fig. 2). Chital and hog deer were important indicator species in both protected
areas, but DNP had a much stronger diversity of grassland species compared to KWLS.
Nilgai were commonly found with chital in forests of both protected areas (Fig. 2).
The collective assemblage of species in both protected areas differed strongly from that
of the managed forests of NKFD and SKFD (A \ 0.09, P \ 0.001), primarily in the
absence of cattle and Indian hare (Fig. 2). Species composition in the two managed forest
units themselves differed (A = 0.069, P \ 0.001), mostly in the presence of wild boar and
Indian hare (Fig. 2). Species composition was not affected by the size of patch that was
sampled (A = 0.002, P = 0.556); but swamp deer, sloth bear, and hispid hare were
indicator species of large sample patches (P B 0.051).
Three obvious and sensible patterns of species clustering among vegetation types and
management units were evident at the 50% value of information remaining (Table 2,
Fig. 2). The dry upland grasslands and wet lowland grasslands were the most species
diverse among vegetation types and had several indicator (characteristic) species (Table 2,
top section of Fig. 2). Hog deer, swamp deer, hispid hare, and honey badger were grassland
indicator species. Wild boar and sloth bear also had their highest indicator values in the
combined grassland types. These grassland species were most indicative of protected areas,
mostly DNP where 56% of the grassland occurred. Chital also were relatively abundant in
grasslands, but also were abundant in protected forests.
A second group dominated by chital and nilgai described an assemblage of species in
forests of protected areas (middle group of Fig. 2). No species was a specific indicator of a
particular forest type. However, chital a generalist using both grasslands and forests,
tended to be most abundant in closed-canopy sal forest (Table 2). Nilgai was a forest-
dependent species that favored open-canopy sal and other forests. Barking deer reached
their highest abundance in closed-canopy sal forests of DNP.
A third species group characterized the mammal assemblage wherever cattle were
present in most managed forests and some grasslands (Table 2, bottom group of Fig. 2).
Grasslands, Tamarix scrub on fresh riverbed alluvium, open Acacia/Dalbergia savanna on
secondary river terraces, plantations, and open or moderate-canopy sal forest were typical
vegetation types in managed forest areas that were used by this group. Indian hare and wild
boar were other indicator species that seemed compatible with cattle grazing. Nilgai also
was associated with this species group, mostly where cattle were found in open sal and
other forests.
Tiger used a broad array of vegetation types and management units, but was not sig-
nificantly characteristic of any vegetation type or management unit (Table 2, Fig. 2).
Elephant sign likewise was not associated with any particular vegetation type, but was
8 Biodivers Conserv (2011) 20:1–17
123
Author's personal copy

Ta
ble
2In
dic
ato
rv
alues
of
un
gula
tean
dm
amm
alia
nca
rniv
ore
spec
ies
inv
eget
atio
nty
pes
and
man
agem
ent
un
its
inth
eT
erai
Co
nse
rvat
ion
Are
a,U
ttar
Pra
des
h
Com
mon
nam
e(c
ode)
Veg
etat
ion
types
Mgm
t.unit
s
Dry
gra
ssla
nd
(Gra
ss)
Wet
gra
ssla
nd
(Gra
ss)
Tam
ari
xsc
rub
(Tam
)
Aca
cia
/
Dalb
ergia
(Kha)
Pla
nta
tion
(Pla
)
Mix
ed
dec
id.
fore
st
Mix
)
Tro
p.
sem
i-
ever
gre
en
(TS
E)
Sea
sonal
swam
p
fore
st
(SS
w)
Shore
aopen
(Sao
)
Shore
am
oder
ate
(Sam
)
Shore
acl
ose
d
(Sac
)
Shore
ach
ander
(Sah
)
Shore
am
ixed
(Sax
)
Dudw
a
Nat
ional
Par
k
(DP
)
Kis
han
pur
San
ctuar
y
(KS
)
N.
Kher
i
Div
isio
n
(ND
)
S.
Kher
i
ivis
ion
(SD
)
Chit
al(C
H)
11
51
31
12
54
11
11
811
39
41
4
Hog
dee
r(H
D)
32
30
41
13
15
Sw
amp
dee
r(S
D)
24
34
19
3
Wil
dboar
(WB
)
918
91
12
1
Slo
thbea
r
(SB
)
514
115
His
pid
har
e
(HH
)
14
15
524
Honey
bad
ger
(HB
)
31
211
Tig
er(T
I)3
714
51
26
64
Ele
phan
t
(EL
)
36
11
21
14
3
Bar
kin
g
dee
r(B
D)
515
16
514
11
Nil
gai
(NI)
13
94
17
613
716
17
410
22
Sam
bar
(SA
)7
2
Bla
ckbuck
(BB
)
11
6
India
nhar
e
(IH
)
38
35
32
26
2
Cat
tle
(CA
)5
621
25
33
22
41
160
21
Biodivers Conserv (2011) 20:1–17 9
123
Author's personal copy
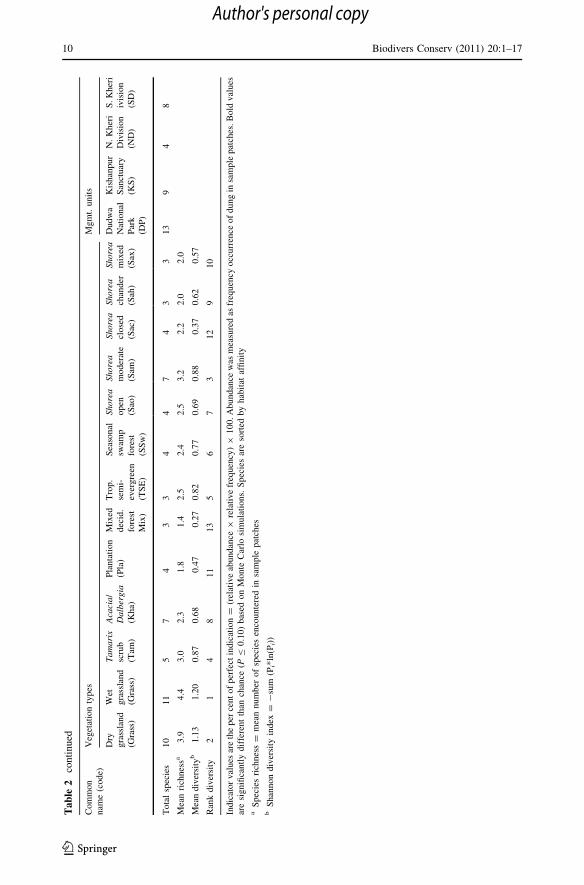
Ta
ble
2co
nti
nu
ed
Com
mon
nam
e(c
ode)
Veg
etat
ion
types
Mgm
t.unit
s
Dry
gra
ssla
nd
(Gra
ss)
Wet
gra
ssla
nd
(Gra
ss)
Tam
ari
xsc
rub
(Tam
)
Aca
cia
/
Dalb
ergia
(Kha)
Pla
nta
tion
(Pla
)
Mix
ed
dec
id.
fore
st
Mix
)
Tro
p.
sem
i-
ever
gre
en
(TS
E)
Sea
sonal
swam
p
fore
st
(SS
w)
Shore
aopen
(Sao
)
Shore
am
oder
ate
(Sam
)
Shore
acl
ose
d
(Sac
)
Shore
ach
ander
(Sah
)
Shore
am
ixed
(Sax
)
Dudw
a
Nat
ional
Par
k
(DP
)
Kis
han
pur
San
ctuar
y
(KS
)
N.
Kher
i
Div
isio
n
(ND
)
S.K
her
i
ivis
ion
(SD
)
Tota
lsp
ecie
s10
11
57
43
34
47
43
313
94
8
Mea
nri
chnes
sa3.9
4.4
3.0
2.3
1.8
1.4
2.5
2.4
2.5
3.2
2.2
2.0
2.0
Mea
ndiv
ersi
tyb
1.1
31.2
00.8
70.6
80.4
70.2
70.8
20.7
70.6
90.8
80.3
70.6
20.5
7
Ran
kdiv
ersi
ty2
14
811
13
56
73
12
910
Indic
ator
val
ues
are
the
per
cent
of
per
fect
indic
atio
n=
(rel
ativ
eab
undan
ce9
rela
tive
freq
uen
cy)
9100.A
bundan
cew
asm
easu
red
asfr
equen
cyocc
urr
ence
of
dung
insa
mple
pat
ches
.B
old
val
ues
are
signifi
cantl
ydif
fere
nt
than
chan
ce(P
B0.1
0)
bas
edon
Monte
Car
losi
mula
tions.
Spec
ies
are
sort
edby
hab
itat
affi
nit
ya
Spec
ies
rich
nes
s=
mea
nnum
ber
of
spec
ies
enco
unte
red
insa
mple
pat
ches
bS
han
non
div
ersi
tyin
dex
=-
sum
(Pi*
ln(P
i))
10 Biodivers Conserv (2011) 20:1–17
123
Author's personal copy

Information Remaining (%)0 25 50 75 100
100
7550
250
GraK1-16GraK1-12GraK1-15GraK2-14GraD1-8GraD2-5GraD3-6GraD3-3GraD3-2GraD2-1GraD2-4GraD3-7GraD2-10GraD1-9GraK3-13MixD1-3SaoD2-3TSED2-1SaoD3-2SamD2-3MixD2-1SSwK1-5PlaD1-1SaxD1-2SaoS1-12SaoS1-11SamS2-12PlaK2-12SSwN2-10SaoK2-5SamD2-5SacD2-3SacD3-2SamD1-4SamK2-7SamS1-9MixD3-2SamD3-2SSwD2-1SaoD1-4SaoD3-1PlaK3-8SamK2-8SamK2-6SamD3-1TSED1-2PlaK1-11SacD1-5SaoK1-6SacD3-4SahS1-3SahK2-1SamS3-11SahK1-2MixK1-6PlaD3-6SSwD1-2PlaD1-5SSwD2-3MixK2-5SacD3-4SaxK1-4SaoN3-2PlaD1-2SaxK1-3SacD1-1SSwK2-4SSwS1-9PlaD2-4SaxD1-1PlaD1-3GraD1-11KhaD2-7KhaD3-6GraN1-22GraN1-23GraN1-24GraN2-21GraS1-19GraS1-17TamN2-3KhaN3-3KhaN3-2TamK1-2TamK2-1TamN1-4KhaN2-4KhaN3-1PlaS2-17MixS1-7MixS2-8PlaS2-16SaoS2-9SSwS1-7SaoS1-7SSwS2-6SaoS2-8SSwS2-8PlaS1-15PlaS1-18SaoS1-10SaoS1-13GraS1-18MixN1-12MixN1-13PlaN2-19MixN2-9PlaS3-13KhaN2-5KhaS1-9MixN2-10PlaN1-20TamS1-5GraS2-20KhaS2-8MixN3-11TamS1-6PlaS2-14SahS1-4SamS2-10
CH
HD
SD
WB
SB
HH
HB
BB
SA
TI
EL
BD
NI
IH CA
Management Unit
DNP KWLS SKFD
Matrix Coding
MaxMin
NKFD
Fig. 2 Two-way dendrogram ofspecies (columns) and samplepatches for 13 vegetation typesand 4 management units in theTerai Conservation Area, UttarPradesh, India. Relativeabundance for species in eachsample was quantified as thepercentage of subplots with dungcounts in a sample patch, and iscoded by a grey-scale gradientwith black indicating 100%relative abundance and light greyindicating low abundance in theindicated sample patch. Outlineswere drawn around the 3 maingroups that were evident in thecluster dendrogram and definedby a 50% cutoff in informationremaining in the sample dataset.Row labels are a combination ofvegetation code (see Table 2) andplot number
Biodivers Conserv (2011) 20:1–17 11
123
Author's personal copy
mostly found in open grassland and Tamarix scrub vegetation (Table 2). Unlike tiger,
however, elephant sign was highly characteristic of the protected area DNP.
DNP had by far the most indicator species (Table 2). Swamp deer, sloth bear, hispid
hare, honey badger, elephant, and barking deer were strong indicator species of the DNP
protected area. Chital and hog deer were indicator species for KWLS. Collectively these
eight species characterized the protected areas. Indicator species of the managed forest
areas were cattle, Indian hare, and wild boar. Nilgai also had high indicator values in
managed forests, but similar to values in DNP.
Discussion
We found support for our hypothesis that vegetation has a primary influence over
important mammal species distributions, and that management allocation and its varied
level of human disturbance also was important. DNP was clearly the core conservation area
of the TCA for its relatively high species diversity and high indicator values for many
species, and its protected status that minimizes human disturbance. Much of that intrinsic
value can be ascribed to the grassland communities, which have been long recognized as
local biodiversity hot spots (Bell and Oliver 1992; Lehmkuhl 1994; Mathur et al. 2003) and
are the primary reason many of these areas have been protected in south Asia (Rodgers
et al. 2000). Hog deer (Dhungel and O’Gara 1991; Timmins et al. 2008), swamp deer
(Duckworth et al. 2008), and hispid hare (Oliver 1980; Maheswaran and Smith 2008) are
well recognized obligate grassland species and are of important conservation concern in
this area (Rodgers et al. 2000).
Grasslands also were important habitat for wild boar, sloth bear, and honey badger, but
only the later two were characteristic of DNP. Sloth bear is a creature of mixed deciduous
forests, scrub and grassland (Joshi et al. 1995; Menon 2003), and the apparent protection
from humans, for whom sloth bear are both aggressive and dangerous, made DNP a
stronghold area. Joshi et al. (1995) also found grasslands to be the primary habitat for sloth
bears in the similar Chitwan National Park, Nepal. The honey badger is an uncommon, but
widespread and little studied species in India, that uses a variety of open scrubby and
forested habitats (Prater 1971; Menon 2003), and is most abundant in the semi-arid regions
of northwestern India (Hussain 1999), which includes the study area. Based on our data,
honey badgers in the TCA find dry grasslands to be their primary habitat, perhaps because
of the open structure and relatively sandy soils for easy digging while foraging or making
dens (Prater 1971). Wild boar are a common species in grassland and open habitats, and are
persistent crop raiders (Prater 1971); they were most characteristic of wet grasslands in
NKFD, possibly because the pattern of small constituent forest patches in the NKFD set in
the agricultural matrix afforded ample opportunity for shelter and food. Elephant abun-
dance was relatively high in the grasslands of DNP, where it was characteristically found
as an indicator species.
Grasslands, mostly wet grasslands, comprised *16% of the KWLS and were also likely
a strong factor in the diversity of species in KWLS, despite KWLS being the smallest unit
in the TCA. Protected area status and contiguity of area likely were other important factors
in the diversity of detected species in the KWLS. Both KWLS and DNP are single con-
tiguous blocks of habitats with strict protective enforcement denying human access;
whereas, the managed NKFD and SKFD units are comprised of many small (NKFD) to
medium-large subunits imbedded as fragments in the agricultural matrix, so have high
12 Biodivers Conserv (2011) 20:1–17
123
Author's personal copy

human activity as a result of easy human access, permitted access for grazing and other
uses, and active timber management programs (Kumar et al. 2002).
The impact of human disturbance was perhaps best seen in the distribution of chital
across the TCA vegetation types and management units. Chital were found very broadly
across the grassland, and semi-evergreen and sal forest vegetation types, as others have
observed in the Terai (Dinerstein 1979; Mishra 1982; Moe and Wegge 1994), but almost
exclusively in the protected areas of the TCA. The size of the unit had little to do with
chital presence as shown by a strong indicator value in KWLS, which was the smallest
unit. The relatively large blocks of sal forest with low edge in SKFD compared to NKFD
may have contributed to relatively higher use of SKFD compared to NKFD among the
managed forest units.
Menon (2003) describes poaching and cattle grazing as the chief conservation threats to
chital. That chital are sensitive to human use and the presence of cattle is supported by the
near absence of chital in managed forest units, where cattle was among the strongest
indicators species. In addition to harassment, competition for forage with cattle could also
be having an impact. If managers were able to control human use or cattle grazing in
managed forest units, then chital populations might be expected to increase and provide
abundant prey for tiger. That would benefit tiger conservation, and may reduce depredation
on cattle and incidents of attacks on humans.
Nilgai was the second most common and widespread ungulate after chital. In contrast to
chital, nilgai were a predominantly open forest animal that was found in both protected
area and managed forest units. In nearby (*75 km) and similar Bardia National Park,
Nepal, chital was the most abundant ungulate and together with nilgai constituted the
major wild herbivore biomass (Dinerstein 1980). The presence of cattle seemed to have
very little influence on occurrence of nilgai, and the species is known to be well suited to
open patchy forests in disturbed landscapes (Khan 1994, 1995; Bagchi et al. 2003; Menon
2003). The high abundance of cattle in Acacia/Dalbergia forest, Tamarix scrub, and upland
and lowland grasslands can be attributed to the availability of forage, water, and proximity
to village areas.
Tiger sign was found broadly in the protected areas and in the NKFD managed forests,
but the indicator value was not significantly high in any one unit. Correlations of tiger
indicator values and the 2 major prey species, chital and nilgai, showed some interesting
patterns that managers should note. Tiger, chital, and nilgai sign were highest in the
relatively uncommon tropical semi-evergreen forest, which is found along stream and pond
riparian areas only in DNP, where it makes up only 1.6% of the area. The presence of free
water, and productive rich and moist soils (Kumar et al. 2002) make this an attractive
vegetation type for the two major ungulate prey species of tiger, hence also for the tiger.
Because of the relatively small area of this type, only two plots were observed, so results
should be considered tentative. However, the more heavily sampled seasonal swamp forest
(n = 10), which is similar to semi-evergreen forest (Kumar et al. 2002), had patterns of
abundance of chital, nilgai, and tiger similar to semi-evergreen forest. Tiger sign was also
relatively abundant in Tamarix scrub, where the likely prey species was cattle based on
indicator values and the absence of other prey species.
This research was an initial step in documenting patterns of wildlife occurrence across
the disparate units of the TCA in conjunction with vegetation sampling. The wildlife
occurrence data were collected as secondary data to the primary vegetation sampling
(Kumar et al. 2002); as such, the wildlife data had limitations on the type of analysis that
could be performed. As opposed to conventional dung counts in plots or strips to estimate
dung or animal density (reviewed by Marques et al. 2001), we recorded simple presence or
Biodivers Conserv (2011) 20:1–17 13
123
Author's personal copy
absence of dung in subplots, then indexed abundance in sample patches as the percentage
of subplots with dung. Analysis was similar to what could be done with the vegetation
percentage cover data using community ecology techniques (McCune and Grace 2002).
Our methodology was simple but effective in quantifying patterns of relative occurrence
among vegetation types and management units. It could easily be incorporated in the
comprehensive field inventories that are standard practice in managed forests (Sawarkar
2005). We were unable, however, to estimate the density of animals, or the specific time
period or season to which our data applied.
Recent efforts to prepare a Tiger Conservation Plan for the National Tiger Conservation
Authority (India) have resulted in a consistent and rigorous methodology to map vegetation
and quantify and monitor patterns of tiger and prey distributions across protected area and
managed forest conservation units (Gopal et al. 2007). The comprehensive methodology
includes mark-recapture and occupancy methods to document the distribution and numbers
of tigers and other carnivores, and line-transect and pellet-count methods to quantify
abundance of large tiger prey (Jhala and Qureshi 2005; Gopal et al. 2007). To date,
regional scale patterns of occurrence in forested areas have been reported (Jhala et al.
2008). Our results provide TCA managers with smaller patch-scale data for local vege-
tation types and management status that provides a fine-scale view of wildlife distribution
patterns.
We believe the ecological scope of the research results is not limited just area of the
TCA, but applies certainly to the 15 protected areas and their surrounding managed forests,
and managed forests in general, with similar habitats and species in the Indian and
Nepalese Terai at the base of the Himalayas. This region is an internationally recognized
biodiversity hot spot with many recognized endangered habitats and species, chief among
them the tiger (Wikramanayake et al. 2004). The implications of human use and cattle in
managed forests (and protected areas too) and the associated exclusion of chital has
implications throughout peninsular India where chital are probably the most abundant
primary prey of endangered tigers (Jhala et al. 2008).
Complete faunal inventories are difficult, time-consuming and costly (Lawton et al.
1998), therefore monitoring of the status of all species operationally is impossible for most
natural resource managers (Baldi 2003). Many managers and researchers want to identify
practical indicator or focal species (Lambeck 1997) that can be monitored efficiently and
extrapolated reliably to understand the impacts of management. Our results provide a
starting point for selecting which species to monitor. In a push for monitoring efficiency,
however, it should not be forgotten that little is known about the distribution, population
status, ecology, and effects of management of the large number of less conspicuous plant
and animal species that make up the bulk of biodiversity in the TCA (Hore and Uniyal
2008b). These species form the base of the intricate food webs and ecosystems that support
the well-known species on which management typically is focused and should be con-
sidered for monitoring patterns of biodiversity (Hore and Uniyal 2008a).
Acknowledgements This study was part of a major collaborative project between the Wildlife Institute ofIndia and the USDA Forest Service. Financial support [Grant No. FG-In-780 (In-FS-120)] received from theUS Dept. of Agriculture, Far Eastern Regional Research Office (FERRO) of the U.S. Embassy, New Delhi,is acknowledged. We gratefully acknowledge encouragement and support received from Dr. JamesR. Stevenson, Mr. G.K. Gupta and Mrs. Usha Kapur of FERRO. We are also grateful to Mr. P.R. Sinha,Director, WII; Chief Wildlife Warden, Uttar Pradesh; and Field Director, Dudwa Tiger Reserve foradministrative support and field logistics. We thank all other team members and collaborators of the projectfor their valuable inputs at various stages.
14 Biodivers Conserv (2011) 20:1–17
123
Author's personal copy

References
Bagchi S, Goyal SP, Sankar K (2003) Niche relationships of an ungulate assemblage in a dry tropical forest.J Mammal 84:981–988
Baldi A (2003) Using higher taxa as surrogates of species richness: a study based on 3700 Coleoptera,Diptera, and Acari species in Central-Hungarian reserves. Basic Appl Ecol 4:589–593
Bell D, Oliver W (1992) Northern Indian tall grasslands: management and species conservation with specialreference to fire. In: Singh K, Singh J (eds) Tropical ecosystems: ecology and management. WileyEastern Limited, New Delhi
Biondini ME, Mielke PW Jr, Berry KJ (1988) Data-dependent permutation techniques for the analysis ofecological data. Vegetatio 75:161–168
De R (2001) Management plan of the Dudwa Tiger Reserve (2000–2001 to 2009–2010). Wildlife Preser-vation Organization. Uttar Pradesh Forest Department, Lucknow, India
Dhungel SK, O’Gara BW (1991) Ecology of the hog deer in Royal Chitwan National Park, Nepal. WildlMonogr 119:1–40
Dinerstein E (1979) Ecological survey of the Royal Karnali Bardia Wildlife Reserve, Nepal. Part 2: habitat-animal interactions. Biol Conserv 16:265–300
Dinerstein E (1980) An ecological survey of the Royal Karnali-Bardia Wildlife Reserve, Nepal. Part 3:ungulate populations. Biol Conserv 18:5–37
Duckworth J, Kumar S, Pokheral C, Baral S, Timmins R (2008) Rucervus duvaucelii. IUCN red list ofthreatened species. http://www.iucnredlist.org. Cited 13 April 2009
Dufrene M, Legendre P (1997) Species assemblages and indicator species: the need for a flexible asym-metrical approach. Ecol Monogr 67:345–366
Everett RL, Lehmkuhl JF (1996) An emphasis-use approach to conserving biodiversity. Wildl Soc Bull24:192–199
Franklin JF, Lindenmayer DB (2009) Importance of matrix habitats in maintaining biological diversity. ProcNatl Acad Sci USA 106:349–350
FSI (2003) State of forest report 2003. Forest Survey of India (Ministry of Envrionment and Forests),Dehradun
Gopal R, Sinha PR, Mathur VB, Jhala YV, Qureshi Q (2007) Guidelines for preparation of tiger conser-vation Plan. National Tiger Conservation Authority, Ministry of Environment and Forests. NTCA/01/07, New Delhi
Haufler JB, Mehl CA, Roloff GJ (1996) Using a coarse-filter approach with species assessment for eco-system management. Wildl Soc Bull 24:200–208
Hore U, Uniyal VP (2008a) Use of spiders (Araneae) as indicator for monitoring of habitat conditions inTerai Conservation Area, India. Indian Forester 134:1371–1380
Hore U, Uniyal VP (2008b) Diversity and composition of spider assemblages in five vegetation types of theTerai Conservation Area, India. J Arachnol 36:251–258
Hunter ML Jr, Jacobson GJ Jr, Webb TI (1988) Paleoecology and the coarse-filter approach to maintainingbiological diversity. Conserv Biol 2:375–385
Hussain SA (1999) Mustelids, viverrids, and herpestids of India: species profiles and conservation status. In:Hussain SA (ed) mustellids, viverrids, and herpestids of India. ENVIS Bulletin: Wildlife and protectedareas 2. Wildlife Institute of India, Dehra Dun
IUCN (2009) IUCN red list of threatened species. Version 2009.2. http://www.iucnredlist.org. Cited 03November 2009
Jhala YV, Qureshi Q (2005) Monitoring tigers, co-predators, prey and their habitats. Project Tiger Direc-torate and Wildlife Institute of India. Dehra Dun
Jhala YV, Gopal R, Qureshi Q (eds) (2008) Status of tigers, co-predators, and prey in India. National TigerConservation Authority and Wildlife Institute of India. TR08/001, Dehra Dun
Joshi AR, Garshelis DL, Smith JLD (1995) Home ranges of sloth bears in Nepal: implications for con-servation. J Wildl Manage 59:204–214
Khan JA (1994) Food habits of ungulates in dry tropical forests of Gir Lion Sanctuary, Gujarat, India. ActaTheriol 39:185–193
Khan JA (1995) Conservation and management of Gir Lion Sanctuary and National Park, Gujarat, India.Biol Conserv 73:183–188
Kumar H, Mathur PK, Lehmkuhl JF, Khati DVS, De R, Longwah W (2002) Management of forests in Indiafor biological diversity and forests productivity, a new perspective—Volume VI: Terai ConservationArea (TCA), WII-USDA Forest Service Collaborative Project Report Wildlife Institute of India. DehraDun
Biodivers Conserv (2011) 20:1–17 15
123
Author's personal copy
Lambeck RJ (1997) Focal species: a multi-species umbrella for nature conservation. Conserv Biol 11:849–856
Lawton JH, Naeem S, Thompson LJ, Hector A, Crawley MJ (1998) Biodiversity and ecosystem function:getting the Ecotron experiment in its correct context. Funct Ecol 12:848–852
Lehmkuhl JF (1994) A classification of subtropical riverine grassland and forest in Chitwan National Park,Nepal. Vegetatio 111:29–43
Lehmkuhl JF, Mathur PK, Sawarkar VB, Holthausen R, Marcot BG, Raphael MG (2006) Managing Indianforests for biological diversity and productivity. In: McNeely JA, McCarthy TM, Smith A, Olsvig-Whittaker L, Wikramanayake ED (eds) Conservation biology in Asia. Society for ConservationBiology Asia Section and Resources Himalaya Foundation, Kathmandu, Nepal
Lindenmayer DB, Manning AD, Smith PL et al (2002) The focal-species approach and landscape resto-ration: a critique. Conserv Biol 16:338–345
MacKenzie D, Nichols J, Royle J, Pollock KH, Bailey LL, Hines JE (2006) Occupancy estimation andmodeling: inferring patterns and dynamics of species occurrence. Elsevier, Amsterdam
Maheswaran G, Smith A (2008) Caprolagus hispidus. IUCN red list of threatened species. http://www.iucnredlist.org. Cited 13 April 2009
Manly B, McDonald T, Thomas D, Erickson W (2002) Resource selection by animals: statistical design andanalysis for field studies. Springer, New York
Marques FFC, Buckland ST, Goffin D, Dixon CE, Borchers DL, Mayle BA, Peace AJ (2001) Estimatingdeer abundance from line transect surveys of dung: sika deer in southern Scotland. J Appl Ecol 38:349–363
Mathur PK (2000) Status of research and monitoring in protected areas of Indian Terai—an overview. In:Richard C, Basnet K, Sah JP, Raut Y (eds) Grassland ecology and management in protected areas ofNepal. Volume 2: technical and status papers on grasslands of Terai protected areas InternationalCentre for Integrated Mountain Development. Kathmandu, Nepal
Mathur PK, Lehmkuhl JF, Sawarkar VB (tech coords) (2002) Management of forests in India for biologicaldiversity and forests productivity, a new perspective. Volume I: concepts, approaches and projectoverview. WII-USDA Forest Service Collaborative Project Report, Wildlife Institute of India,Dehra Dun
Mathur PK, Kumar H, Lehmkuhl JF (2003) Terai grasslands—diversity, management and conservationperspective. ENVIS Bull 1:1–28
McCune B, Grace J (2002) Analysis of ecological communities. MjM Software Design. Gleneden Beach,Oregon, USA
McCune B, Mefford M (1999) Multivariate analysis of ecological data, version 4.17. MjM Software.Gleneden Beach, Oregon, USA
Menon V (2003) A field guide to Indian mammals. Dorling Kindersley (India), New DelhiMishra HR (1982) Balancing human needs and conservation in Nepal’s Royal Chitwan National Park.
Ambio 11:246–251Moe SR, Wegge P (1994) Spacing behaviour and habitat use of axis deer (Axis axis) in lowland Nepal. Can J
Zool 72:1735–1744MoEF (1972) The Wildlife (Protection Act), 1972 (http://moef.nic.in/modules/rules-and-regulations/
wildlife/)MoEF (2008) National biodiversity action plan. Ministry of Environment and Forests. Government of India,
New DelhiMueller-Dombois D, Ellenberg H (1974) Aims and methods of vegetation ecology. John Wiley and Sons,
New YorkNoss R, Cooperrider A (1994) Saving nature’s legacy: protecting and restoring biodiversity. Island Press,
Washington, DCNoss RF, Harris LD (1986) Nodes, networks, and MUMs: preserving diversity at all scales. Environ Manage
10:299–309Oliver W (1980) The pygmy hog: the biology and conservation of the pygmy hog and the hispid hare.
Special Scientific Report No. 1. The Jersey Wildlife Preservation Trust, Jersey, UKPrater SH (1971) The book of Indian animals, 3rd edn. Bombay Natural History Society, Mumbai, IndiaPrugh LR, Hodges KE, Sinclair ARE, Brashares JS (2008) Effect of habitat area and isolation on fragmented
animal populations. Proc Natl Acad Sci USA 105:20770–20775Reid W (1996) Beyond protected areas: changing perceptions of ecological management objectives. In:
Szaro R, Johnston D (eds) Biodiversity in managed landscapes. Oxford University Press, New YorkRodgers WA, Panwar HS, Mathur VB (2000) Wildlife protected area network in India: a review. Wildlife
Institute of India, Dehra Dun
16 Biodivers Conserv (2011) 20:1–17
123
Author's personal copy

Salwasser H, Caplan JA, Cartwright CW, Doyle AT, Kessler WB, Marcot BG, Stritch L (1996) Conservingbiodiversity through ecosystem management. In: Szaro R, Johnston D (eds) Biodiversity in managedlandscapes. Oxford University Press, New York
Sawarkar VB (2005) Planning wildlife management in protected areas and managed landscapes. WildlifeInstitute of India and Natraj Publishers, Dehra Dun
Saxena NC (2002) The Indian Forest Service. Centre for Sustainable Development. Lal Bahadur ShastriNational Academy of Administration, Mussoorie
Singh L (1965) The Terai region of the U.P.: a study in human geology. Ram Narayan Lal Beni PrasadPublishers, Allahabad
Timmins RJ, Duckworth JW, Kumar NS, Islam MA, Baral HS, Long B, Maxwell A (2008) Axis porcinus.IUCN red list of threatened species. http://www.iucnredlist.org. Cited 13 April 2009
Wikramanayake E, McKnight M, Dinerstein E, Joshi A, Gurung B, Smith D (2004) Designing a conser-vation landscape for tigers in human-dominated environments. Conserv Biol 18:839–844
Wilson DE, Reeder DM (eds) (2005) Mammal species of the world. A taxonomic and geographcal refer-ence, 3rd edn. Johns Hopkins University Press, Baltimore, Maryland
Zar J (1999) Biostatistical analysis. Prentice-Hall, Upper Saddle River, New JerseyZimmerman G, Goetz H, Mielke P (1985) Use of an improved statistical method for group comparisons to
study effects of prairie fire. Ecology 66:606–611
Biodivers Conserv (2011) 20:1–17 17
123
Author's personal copy


![[Human and wild mammal parasitosis in French Guiana]](https://static.fdokumen.com/doc/165x107/633660bb02a8c1a4ec022a28/human-and-wild-mammal-parasitosis-in-french-guiana.jpg)