malcolm baldrige - 2016 national quality award application
73
MALCOLM BALDRIGE 2016 NATIONAL QUALITY AWARD APPLICATION Photo by Silva Aerial Technologies
-
Upload
khangminh22 -
Category
Documents
-
view
0 -
download
0
Transcript of malcolm baldrige - 2016 national quality award application

i City of Fort Collins
MALCOLM BALDRIGE20
16
NATIONAL QUALITY AWARD APPLICATION
Pho
to b
y Si
lva
Aer
ial T
echn
olog
ies

ii City of Fort Collins
Malcolm Baldrige National Quality Award Eligibility and Application Forms2016 Eligibility Certification Form i-xiiCity of Fort Collins Organizational Chart xiiiPage A-1 of the Application Form xivGlossary of Terms and Abbreviations xv-xvi
Preface: Organizational ProfileP.1 Organizational Description xvii-xviiiP.2 Organizational Situation xviii-xx
Category 1: Leadership1.1 Senior Leadership 11.2 Governance and Societal Responsibilities 4
Category 2: Strategic Planning2.1 Strategy Development 62.2 Strategy Implementation 9
Category 3: Customer Focus3.1 Voice of the Customer 123.2 Customer Engagement 14
Category 4: Measurement, Analysis, and Knowledge Management4.1 Measurement, Analysis, and Improvement of Organizational Performance 164.2 Knowledge Management, Information, and Information Technology 19
Category 5: Workforce Focus5.1 Workforce Environment 225.2 Workforce Engagement 25
Category 6: Operations Focus6.1 Work Processes 28 6.2 Operational Effectiveness 29
Category 7: Results7.1 Product and Process Results 32 7.2 Customer-Focused Results 367.3 Workforce-Focused Results 417.4 Leadership and Governance Results 447.5 Budgetary, Financial, and Market Results 49
Table of Contents

i City of Fort Collins

ii City of Fort Collins

iii City of Fort Collins

iv City of Fort Collins

v City of Fort Collins

vi City of Fort Collins

vii City of Fort Collins

viii City of Fort Collins

ix City of Fort Collins

x City of Fort Collins

xi City of Fort Collins
xii City of Fort Collins

xiii City of Fort Collins

xiv City of Fort Collins

xv City of Fort Collins
6Ds Training Course: Six Disciplines of Breakthrough Learning
ADA: Americans with Disabilities Act
AMI: Advanced Metering Infrastructure
APPA: American Public Power Association
AQI: Air Quality Index
ASCSU: Associated Students of Colorado State University
AWWA: American Water Works Association
BART: Budget Analysis and Reporting Tool
BFO: Budgeting for Outcomes
BLT: Budget Leadership Team
BRT: Bus Rapid Transit
Cable 14: City operated public affairs cable TV station
CAO: City Attorney’s Office
CC: Community College
CDC: Centers for Disease Control
CDL: Commercial Drivers License
CFO: Chief Financial Officer
CM: City Manager
CityNet: In-house intranet website
CSWT: Citywide Safety and Wellness Team
COOP: Continuity of Operations Plan
COT: Customer Outreach Team
CPIO: Communications and Public Involvement Office
CPM: Center for Performance Measurement
CRB: Citizen Review Board
CRM: Customer Relationship Management
CSU: Colorado State University
DART: Days Away, Restricted or Transferred
DBA: Downtown Business Association
DDA: Downtown Development Authority
DOT: Department of Transportation
EAP: Employee Assistance Program
ELT: Executive Lead Team
EOP: Emergency Operations Plan
EC: Employee Committee
ECS: Employee and Communication Services
EF: Employee Factor
EH: Economic Health
E/I: Emotional Intelligence
EPA: Environmental Protection Agency
EPIC: Edora Pool and Ice Center
Enterprise Fund: used for services provided to the public on a user charge basis, similar to the operation of a commercial enterprise. Water and sewage utilities are examples.
ERP: Enterprise Resource Planning
FCMOD: Fort Collins Museum of Discovery
FEMA: Federal Emergency Management Agency
FERC: Federal Energy Regulatory Commission
FTA: Federal Transit Administration
FTC: Federal Trade Commission
FTE: Full-time equivalent
GFOA: Government Finance Officers Association
GEMS: Greenhouse Gas Emissions Management System
Government Fund: account for “governmental-type activities”. Governmental type activities include services largely funded through non-exchange revenues (taxes are the most common example).
HPG: High Performing Government
HOA: Homeowners Association
HOI: Housing Opportunity Index
HR: Human Resources
ICMA: International City/County Management Association
IGA: Intergovernmental Agreement
ICS: Incident Command System
ISO: International Organization for Standardization
ISS: Internal Services Survey
Issues and Answers: quarterly internal information sharing session
IT: Information Technology
JDE: JD Edwards
KFCG: Keep Fort Collins Great
KP: Key Process
LEPC: Local Emergency Planning Committee
LL: Leadership Link
Lead 1.0: An emerging leaders program for City staff
Lead 4.0: Executive leadership program
Glossary of Terms

xvi City of Fort Collins
LEPC: Local Emergency Planning Committee
LLAC: Local Legislative Affairs Committee
MAX: Mason Express
MOR: Monthly Operating Report
MVV: Mission, Vision, Values
NCEDC: Northern Colorado Economic Development Corporation
NEO: New Employee Orientation
NFCBA: North Fort Collins Business Association
NIMS: National Incident Management System
NOAA: National Oceanic and Atmospheric Administration
NAC: Northside Aztlan Center
OEM: Office of Emergency Management
Open Book: An online tool designed to disclose detailed expenses for all City departments; provides financial transparency to members of the community.
Open Records, Open Records Requests: The Colorado Open Records Act requires that city managers and other employees make any public record available for inspection and copying within three business days of a request for that record.
PDCA: Plan, Do, Check, Act
PDT: Planning, Development and Transportation
PE Teams: Performance Excellence Teams
PFA: Poudre Fire Authority
PM: Particulate Matter
Policy: A policy is a statement to guide actions toward a desired outcome.
PRPA: Platte River Power Authority
PSD: Poudre School District
PUC: Public Utilities Commission
Q14: Employee Engagement Survey
QPA: Quarterly Performance Alignment
QSAR: Quarterly Service Area Reviews
Qual-Serve: Benchmarking Program through AWWA
Quasi-Judicial Board: Citizen Board that has specific powers delegated to it based on City Code or Charter; includes Planning and Zoning Board, Zoning Board of Appeals and Building Review Board.
RFRs: Request for Results
RMI: Rocky Mountain Innosphere
RMPEx: Rocky Mountain Performance Excellence
SA: Service Area
SAIDI: System Average Interruption Duration Index
SAIFI: System Average Interruption Frequency Index
SARs: Service Area Requests
SCADA: Supervisory Control and Data Acquisition
SBDC: Small Business Development Center
SFCBA: South Fort Collins Business Association
SIT: Strategic Issues Team
SP: Strategic Plan
SPP: Strategic Planning Process
SSA: Sustainability Service Area
SSD: Social Sustainability Department
Statutory City: A Colorado city that is governed by state statutes and is not empowered to address issues of local concern through its own ordinances.
SWAT: Special Weapons and Tactics
SWOT: Strengths, Weaknesses, Opportunities and Threats
TBLAM: Triple Bottom Line Analysis Matrix
T/R: Talent|Reward
TRIR: Total Reportable Injury Rates
Talk It Up: Monthly meetings with departments to discuss issues with the City Manager.
TLG: Transforming Local Government
TMP: Transportation Master Plan
TBL: Triple Bottom Line
UniverCity: A collaboration among CSU, the City and other business partners.
URA: Urban Renewal Authority
USDA: US Department of Agriculture
Utilities: Services provided by Fort Collins Utilities, providing electric, water, wastewater and stormwater services as defined by the certificated service territory.
VOC: Voice of the Customer
VPN: Virtual Private Network
World Class People: Employee recognition program; employees nominate coworkers for recognition as employees who meet the organization’s high expectations for customer service.

xvii City of Fort Collins
City of Fort Collins: Organizational ProfileP.1 Organizational DescriptionThe City of Fort Collins, Colorado, is a full-service municipal corporation operating under a home rule Council-Manager form of government that has grown from a small agricultural community into a major employment and retail center for Northern Colorado. With a median age of 29.3 and a median family income of more than $76,341, residents are well-educated, engaged and passionate. This dynamic, attractive city has for more than a decade been recognized by independent national organizations as a best place to live, start a business, develop a career, retire and live healthy (Fig. 7.4-19). Located 60 miles north of Denver, Fort Collins is home to Colorado State University (CSU), several large high-tech employers, and leading businesses in the microbrew industry. The community has access to outdoor activities and local cultural amenities, and is renowned for its bike-friendly, small-town feel.
P.1a Organizational EnvironmentP.1a(1) Product Offerings The City of Fort Collins’ main product offerings are its public services, called outcome areas (Figure P.1-1). In 2005, the City and City Council created the outcome areas to provide a variety of audiences a simple way to understand the City’s key areas of focus and resources [BFO 2.2a(3)]. Over the years, the outcome areas have grown to be of significant importance beyond resource allocation. The outcome areas are the City’s product offerings as well as key work systems; each of the seven outcome areas has delivery mechanisms for providing services with senior leader, and work and support process alignment, and key performance measures.
The public services are of equal relative importance to the success of the City, but unlike many other cities that have private or districted utilities, the City of Fort Collins has chosen to provide utility services to ensure those services will remain efficient, cost effective and community focused. The high quality of life residents, businesses and visitors enjoy is the result of the City’s focus on the environment, strong enthusiasm for health and the outdoors, extensive park and open space systems and a flourishing downtown district.
P.1a(2) Vision & Mission The City of Fort Collins is an organization committed to high quality public service and is a nationally recognized leader in providing those services through leading-edge management practices. In 2005, the City adopted an organization-wide mission to provide exceptional service for an exceptional community. The Leadership System (Figure P.2-2) provides a structure for fulfilling the mission, vision and values that begins with listening to the community and delivering services that matter most to its members. As a best practice city government focused on using data to support decisions and continuous improvement, the City capitalizes on its core competency of commitment to the community and links individual goals to the City’s vision and mission (Figure P.1-2).
Figure P.1-1: Main Product Offerings and Product Delivery Mechanisms
KEY OUTCOME AREA PRODUCT DELIVERY MECHANISMS
COMMUNITY & NEIGHBORHOOD
LIVABILITY
Affordable Housing Services, Health & Safety, Nuisance Abatement Services,
Planning, Neighborhood ServicesCULTURE &
RECREATIONRecreation Programs/Facilities, Cultural Facilities, Parks, Natural Areas, Trails
ECONOMIC HEALTH
Planning, Economic Development Services, Historic Preservation, Utilities
ENVIRONMENTAL HEALTH
Water/Wastewater Utilities, Natural Resources Programs, Climate Action Plan
HIGH PERFORMING GOVERNMENT
Leadership, Civic Engagement, Financial Services, Human Resources, Information
Technology, Facilities, Fleet Services
SAFE COMMUNITY Police, Electric Utility and Stormwater Utility
TRANSPORTATION Roads, Bridges, Transit, Bike & Pedestrian Programs and Facilities
Figure P.1-2: Core Competency and Mission, Vision, Values
CORE COMPETENCY MISSION VISION VALUES
Commitment to the community
Exceptional service for an
exceptional community
To provide world-class municipal services through
operational excellence
and a culture of innovation
Outstanding Service
Innovation & CreativityRespectIntegrityInitiative
Collaboration & Teamwork
Stewardship
Figure P.1-3: Key Engagement Factors
GROUP KEY DRIVERS OF ENGAGEMENT
Employees (Regular, Contractual, Hourly)
· Clear expectations · Meaningful work · Development & growth opportunities · Accountability · Appreciation
Community Volunteers · Meaningful work · Giving back to the community· Appreciation
Boards & Commissions · Love of community· Passion for the topic
Figure P.1-4: Staff Profile
EMPLOYEE STATUS
Regular (classified/unclassified management) Contractual HourlyTotal
1239241,0872,350
GENDER FemaleMale
42%58%
TENURE- REGULAR
0–5 Years 6–15 Years 16–25 Years 26+ Years
32%35%20%13%
TENURE - HOURLY AND CONTRACTUAL
0–5 Years 6–15 Years 16–25 Years25+ Years
81%15% 2% 1%
ETHNICITYWhite Hispanic Other
88% 9% 3%

xviii City of Fort Collins
P.1a(3) Workforce Profile Fort Collins is home to CSU and several significant business industry clusters including innovation economy, bioscience, software/hardware, clean energy, water innovation, uniquely Fort Collins and craft brewing. As an employer of choice, the City attracts highly qualified individuals to become part of an innovative, community-focused organization. The City’s workforce includes employees and community volunteers (including Board and Commission members), with key engagement factors highlighted in Figure P.1-3. Figure P.1-4 profiles the 2,350 regular, contractual or hourly employees. Contractual employees are hired for specified periods of time and sign annual contracts; hourly employees are hired for part-time and seasonal work. Educational requirements for employees are job specific and noted on all role summaries. All positions require a high school diploma or GED, and many require special certifications or advanced degrees. The City has one bargaining unit representing the 207 classified Police employees. There have been no significant changes in the workforce composition.
Volunteers are segmented into community volunteers and Board and Commission members. Community volunteers are those who may volunteer for a one-time event and can be non-recurring in their services. Boards and Commissions include individuals who sit on citizen advisory boards, commissions and authorities [P.1b(1)] and provide significant resources to the organization. Volunteers supplement staff, provide citizen engagement in City services, and represent the City’s population, ranging from high school students to retirees. Volunteers are matched to assignments by their experience and areas of interest and have no minimum educational requirement. They receive training specific to their assignment.
An extensive safety and risk management program addresses the wide variety of safety needs for the workforce in very diverse professions from public safety to field and office work [6.2c].
A nationally recognized employee wellness program motivates employees toward healthy lifestyle choices and ultimately increases productivity and cost savings for the City [5.1b(1)].
P.1a(4) Assets The City of Fort Collins is committed to maintaining high quality facilities and best practice technologies and equipment to deliver services (Figure P.1-5).
P.1a(5) Regulatory Requirements With an extensive variety of City services, many functions are regulated by the federal and state governments. Federal agencies such as the Environmental Protection Agency (EPA), Federal Energy Regulatory Commission (FERC) and the Federal Emergency Management Agency (FEMA) provide environmental regulation and oversight. State and federal agencies have also established transportation facility standards (e.g., Colorado State Access Control Code), “Red Flag” privacy rules set forth by the Federal Trade Commission (FTC) and state financial reporting regulations. The City is committed to meeting or exceeding these standards (Figure 1.2-1).
Figure P.1-5: Facilities & AssetsMAJOR FACILITIES• Community infrastructure (roads, utilities, parks, trails, sidewalks,
natural areas, urban forest, bridges)
• Community facilities (recreation facilities, performing arts center, pools, libraries, gardens, Museum of Discovery)
• General government facilities (administrative offices, customer service offices, support facilities)
TECHNOLOGIES• Community engagement technology (e.g., fcgov.com, Channel 14,
Access Fort Collins)
• IT infrastructure with enterprise-wide financial & office technologies
• Technological control systems (Utilities Supervisory Control and Data Acquisition [SCADA], Traffic Control)
• Public safety technologies (e.g., state-of-the-art dispatch system, mobile data terminals in police vehicles and mobile command unit)
• Applications & infrastructure for specific operational needs
EQUIPMENT• Fleet (heavy/light duty equipment, vehicles & buses) with automatic
vehicle locators
• Alternative fuel vehicles (hybrid, electric, bio-diesel)
P.1b Organizational Relationships P.1b(1) Organizational Structure As a home rule city, Fort Collins operates under the policy direction of a publicly elected mayor and six elected district City Council members (see glossary for definition of Policy). By charter, all elected officials are non-partisan. As the community’s legislative body, the Council focuses on its charter duties, such as enacting City ordinances, appropriating funds to conduct City business and providing policy direction to City staff. The Council appoints the City Manager, City Attorney and Municipal Court Judge who oversee all other City employees.
Charged with day-to-day operations, the City Manager implements the City Council’s policy direction through his direct reports (Deputy City Manager, Chief Financial Officer, Police Chief, Utilities Executive Director, and the Assistant City Manager/Information, Employee and Communication Services) and the eight-member Executive Leadership Team (ELT). ELT includes the City Manager and direct reports; the Planning, Development and Transportation Director; the Assistant City Manager/Community Services Director; and the Chief Sustainability Officer.
The City has 27 citizen advisory boards, commissions and authorities consisting of approximately 230 volunteer members. Board members are appointed by the Council (with the exception of the Citizen Review Board, which advises the City Manager and the Chief of Police). Boards and Commissions are established for the purpose of studying and making recommendations to City Council on issues within the board’s area of expertise. There is no difference between a Board and a Commission, but seven of them are quasi-judicial and have decision-making powers, meaning their duties include applying existing laws to specific facts concerning one person or a small number of people rather than the entire City, such as re-zoning, building review, or landmark preservation.

xix City of Fort Collins
P.1b(2) The City’s key customer groups are residents (citizens) and businesses. Figure P.1-6 lists their key requirements. The City’s relationship with its customer groups is unique because the residents are directly involved in the city government through the boards and commissions. Businesses contribute to the success of the City by attracting residents to their services, creating employment opportunities, and generating tax revenue. The City pays constant attention to its customer groups and has multiple approaches for listening to them and responding to their requirements [Figure 3.1a(1)].
P.1b(3) Suppliers & Partners The City’s ability to partner and collaborate with other governmental, private and non-profit agencies has played a role in its ability to weave a community that continues to earn local and national accolades. Key suppliers, partners and collaborators, and their relationship with the City are highlighted in Figure P.1-7.
P.2 Organizational Situation P.2a Competitive Environment P.2a(1) Competitive Position The City of Fort Collins is the largest municipality in the region (158,600 residents). With the three other cities of Greeley (95,000 residents), Longmont (86,000 residents) and Loveland (68,000 residents), as well as several other smaller communities, there are a total of 550,000 residents in Larimer and Weld Counties. In past years, Fort Collins was the regional retail and business center for north-central Colorado. In recent years, the surrounding regional communities have grown rapidly, adding retail, convention
Figure P.1-6: Key Customer Requirements
REQUIREMENTCUSTOMER GROUP
Residents Businesses
High quality, reliable services ✓ ✓Community amenities ✓ ✓Accuracy ✓ ✓Responsiveness & transparency ✓ ✓
and tourism facilities that have impacted sales and lodging tax revenues for the City of Fort Collins. Though the City works cooperatively with these neighboring communities, the City also competes with them for this revenue, as well as revenue from other taxes, fees and grants. Competition with neighboring communities also arises for business development/redevelopment, primary employers/jobs, expansion opportunities, and highly qualified workers.
Favoring a compact urban form, Fort Collins has a deliberate strategy to limit growth to its physical boundaries. This land-use philosophy means the City has not aggressively annexed low-cost land near interstate interchanges, which other communities have developed as regional retail centers.
Due to the limited taxing capacity of the community, the City also finds itself in competition with other tax-funded entities (schools, county, library district) for voter approval of local ballot measures.
P.2a(2) Competitiveness Changes The City has a strong financial position with a low debt ratio, strong financial reserves and is in the top 3% of Moody’s ratings [Fig. 7.5-4]. These factors – combined with a low overall cost for local government services (Price of Government), a high quality of life, an educated workforce, and national status as a highly desirable community – place Fort Collins in a strong competitive position. As the home of a large research university, innovation permeates the community. In 2015, the “Places of Invention,” the latest exhibition from the Smithsonian’s Lemelson Center for the Study of Invention and Innovation at the National Museum of American History, opened with Fort Collins as one of six communities representing what can happen when the right mix of inventive people, resources and inspiring surroundings come together and spark invention and innovation. Furthermore, technologies from university research and collaborations, such as the Rocky Mountain Innosphere, can become viable businesses that create employment opportunities.
Figure P.1-7: Key Types of Suppliers, Partners & Collaborators
SUPPLIERS PARTNERS COLLABORATORSROLE IN WORK SYSTEMS Delivery of supplies Design of services
Performance ImprovementDelivery of services Performance Improvement
ROLE IN ENHANCING COMPETITIVENESS Competitive pricing Collaboration Collaboration
COMMUNICATION MECHANISMS
Regular meetings, board membership, Memoranda of Understanding, Intergovernmental Agreements (IGA), automated purchasing notification, electronic data interchange, email, phone
Regular meetings, board membership, Memoranda of Understanding, IGAs, automated purchasing notification, electronic data interchange, email, phone
Regular meetings, board membership, Memoranda of Understanding (MOU), IGAs, automated purchasing notification, electronic data interchange, email, phone
ROLE IN INNOVATION New products or services Best practice sharing,
development of new servicesSubject matter expertise, development of new services
SUPPLY CHAIN REQUIREMENTS
On-time delivery, fair & competitive pricing, quality products, accuracy
Accurate & timely information, availability, high quality services
Accurate & timely information, availability
EXAMPLES Platte River Power Authority, Fuel Hill Petroleum
Poudre School District, Larimer County, University of Colorado Health, Colorado State University, PFA, DDA
Poudre River Public Library, DBA, NCBA, MBA, FC Housing Authority, CDOT, Water Districts

xx City of Fort Collins
P.2a(3) Comparative Data Fort Collins is a data-driven organization. Collection of performance data to identify opportunities for improvement is a key element in the Budgeting for Outcomes (BFO) process. Budget “offers,” or proposed services, contain performance measures that help evaluate the effectiveness of spending decisions.
Examples of sources for comparative data within the industry include:
• National Research Center Citizen Survey• ICMA Center for Performance Measurement• Mountain States Employers Council (public/private)• Police Benchmark Cities• American Public Power Association• American Water Works Association Key sources of comparative data from outside the industry include:
• United States Bureau of Labor Statistics• Standard & Poor’s Bond Rating• United States Census Bureau Limitations that affect all comparative data include variation in data collection methodology, timeliness in reporting, lack of results sharing between organizations, comparisons reported only to norms or top 25 percent, and the cost of participation in national databases. Comparative data for municipal services are subject to additional limitations. Fort Collins, as a full-service city, provides utilities, recreation programs and public safety, while other communities may contract for those services, or have districts that provide the service. Another challenge is the lack of data collection in other communities. Fort Collins has worked to address these limitations by participating in organizations such as the International City/County Management Association’s (ICMA) Center for Performance Measurement (CPM), which works to standardize data collection methods.
P.2b Strategic Context Key strategic challenges and advantages are presented in Figure P.2-1.
P.2c Performance Improvement System The City builds on its core competencies to be a best practice city government by using data to support and guide continual improvement.
Figure P.2-1: Strategic Challenges & Advantages
CHALLENGES ADVANTAGES1. Fluctuating revenue stream2. Attracting, retaining and developing high quality employees3. Balancing competing citizen desires and changing
customer expectations 4. Transitioning from a large town to a small city including
housing that is affordable (live where you work), and transportation-traffic issues
1. Supportive and engaged community2. Engaged elected and appointed officials3. Culture of excellence and continuous improvement driven by Mission, Vision
and Values4. Engaged and committed employees5. Collaboration with local partners such as Poudre School District, CSU,
Larimer County6. Strategic and leveraged investments in infrastructure and amenities, strong
history of planning and action/implementation7. National recognitions for the quality of life
The key elements of the City’s performance improvement system are displayed in the Leadership System (Figure P.2-2). The Leadership System uses the voice of the community (represented by the citizens, City Council and Boards/Commissions) to set an inspiring Mission, Vision and Values (MVV) that clearly define the established direction of the City for the community and the workforce [1.1a(1)]. Long-term and short-term goals are developed through strategic planning, master plans and Plan Fort Collins, and support key organizational goals established by the City Council for each of the seven outcome areas [2.1a(1)]. The seven outcome area goals guide the supporting service area goals with key projects and services, identified and resourced in concert with the community’s input through the innovative BFO process [2.2a(3)]. The workforce uses the resulting department action plans to set individual annual performance objectives and performance improvement plans [5.2a]. Goal attainment is monitored by collecting data on the established goals with leadership review of results on daily, weekly, monthly, quarterly and annual schedules [4.1b].
Performance improvement methods, such as International Organization for Standardization (ISO) Standards and Plan Do Check Act (PDCA), are used by the City at the department and team levels [4.1c, 6.1]. The City conducts ongoing organizational self-assessments using Baldrige criteria and functional teams, and uses external evaluations such as ISO Examiners, Federal Regulators and the City Council/ Community (through the Service Area Requests [SARs] process). At the beginning of each category, a figure is included that highlights improvements made to key processes from evaluative reviews and the drive for continual improvement.
Additionally, the City of Fort Collins uses a Sustainability Assessment framework and Sustainability Assessment Tool[6.1b(3)] that are designed to help identify key sustainability issues and encourage the development of mitigation strategies early in the planning process. Assessment results are reported to City Council using the Sustainability Assessment Summary (SAS) and are attached to agenda materials for work sessions and regular council meetings. This process ensures one aspect of the triple bottom line does not dominate the decision-making process and mitigates impacts when trade-offs are unavoidable.

xxi City of Fort Collins
COMMUNITY & CITY COUNCIL 3.1a
IMPROVE PROCESSES 4.1c, 6.1
Continuous Improvement
MEASUREMENT & ANALYSIS 4.1
Performance MeasurementMOR Review
Financial MOR ReviewQuarterly Service Area Report (QSAR)
PLAN FORT COLLINS 2.1a(1)
BUDGETING FOR OUTCOMES 2.2a(3)
Capital Improvement PlanningWorkforce Planning
INDIVIDUAL GOALS 5.2a
Talent ManagementTotal Rewards
Safety
SERVICE PLAN & DELIVERY 2.2a, 4.2b, 6.2b
ProcurementIT Systems
Council Prioirty / Agenda Planning
City Plan/Master PlansCity Strategic Plan
Public Engagement
VISION
MISSION
VALUES
Figure P.2-2: Leadership System

1 City of Fort Collins
Figure 1.1-1: Deploying the MVV
Empl
oyee
s
Volu
ntee
rs,
B
& C
Part
ners
Res
iden
ts
Bus
ines
ses
Col
labo
rato
rs
Supp
liers
Role Summaries ● ●NEO ●Talent|Reward ●Meeting Agendas ●Website ● ● ● ● ● ● ●CityNet ● ●Posters in meeting rooms & public places ● ● ● ● ● ● ●
SIT/LL & All Supervisors Mtgs ●Leadership Competencies ●Contracts ● ●Community & BFO Scorecards ● ● ● ● ● ● ●State of the City ● ● ● ● ● ● ●Goal Cards ● ●
1 Leadership1.1 Senior Leadership 1.1a(1) Vision & Values The vision and values of the organization were originally created in 2005 through a series of meetings with staff focus groups and dialogue facilitated by the City Manager and Executive Leadership Team (ELT) members. Since that time, the Mission, Vision and Values (MVV) have been reviewed by ELT with the City Council and with all supervisors at their respective annual retreats. In 2013, ELT revised the vision to its current version, which more accurately reflects the City’s commitment to the community. ELT presented the revision to staff focus groups for feedback and to all supervisors at the April semi-annual work session. The MVV are reviewed at the summer semi-annual ELT retreat when pre-planning of the biennial strategic planning process begins [2.1a(1)].Senior leaders deploy the MVV to the workforce, citizens, businesses, suppliers, partners and collaborators through specific communication mechanisms (Figure 1.1-1) and through the Leadership System (Figure P.2-2). The City’s leadership system aligns the organization toward achieving the City’s vision of World Class Services by using the MVV as the foundation for the City’s biennial strategic planning and Budgeting for Outcomes (BFO) processes.ELT actions reflect a personal commitment to the values: Outstanding Service: ELT members personally follow up with citizen questions and concerns. They ensure inquiries are directed to the appropriate ELT or staff member for response. In 2012, ELT improved the budget proposal process by adding citizens to the BFO Results Teams for direct citizen input into funding for services. In 2014, a second citizen was added to each team.Innovation & Creativity: ELT members participate in improvement teams and seek improvement methodologies. ELT also creates venues for innovation and creativity such as: 1) Futures Committee for cultivating innovative ideas, 2) CityWorks 101, where citizens learn about city government, 3) Chief Sustainability Officer position to focus on innovative methods for social, economic and environmental sustainability, and 4) BFO process for considering funding for innovative services. ELT members volunteer their time in support of innovation. For instance, the CFO sits on the board of Rocky Mountain Innosphere, a hub for entrepreneurial activity, and the Deputy City Manager sits on the board of the Fort Collins Museum of Discovery (FCMOD). The City Manager teaches courses at the University of Colorado-Denver on Innovation and Operational Excellence, and is on the National Board leading the Alliance for Innovation.Respect: ELT members model respect in all their interactions. They use respectful language in conversations and written communications, send thank you cards, publicly praise the workforce in forums such as Issues & Answers, send cards or call staff during times of need or celebration, support the World Class People program recipients and acknowledge work anniversaries (The City Manager personally congratulates staff for milestone anniversaries and at annual awards ceremonies).Integrity: ELT members personally commit to integrity through active participation in Lead 4.0, transparency of key performance results, policy development (for inappropriate staff behavior and conflicts of interest) and Open Book for all financial records. They seek feedback on their commitment
to integrity through a 360 survey that includes an ethics assessment. The DiSC Profile System helps ELT members learn communication approaches that support integrity. After the 2014 spring All Supervisors meeting, several ELT members committed to not talking on the phone while driving. The City Manager also signed the FocusDriven contract.Initiative: ELT members show initiative through improvement efforts that integrate key processes such as BFO and strategic planning, organizational support for learning and development, and policy and program development and implementation. They also develop their leadership competencies to include skills like alignment/strategic thinking, and development of self and others.Collaboration & Teamwork: ELT supports teamwork and collaboration through the Leadership Competencies. They create a framework for a culture of collaboration and teamwork through participation on multidisciplinary teams, such as the Employee Engagement team, the Employee Committee that provides direct feedback to the City Manager, BFO Results Teams, the Strategic Issues Team (SIT) and Leadership Link (LL) that meet to provide input and deploy information back to the organization. ELT members lead committees, have lunch with employees for dialogues/forums, and personally present trainings and “Talk It Up” sessions.Stewardship: ELT members participate on numerous boards, committees and foundations. They personally analyze the City’s budget for variances. As stewards of the City’s resources, ELT initiated the Triple Bottom Line Analysis Method (in 2014 the method transferred to the Sustainability Assessment Tool [SAT]), a method for considering the environmental, social and economic aspects of decision-making, at both staff and elected official levels. The Purchasing Policy, set by ELT, states expenditure limits and ensures internal and external audits are completed. 1.1a(2) Promoting Legal & Ethical Behavior ELT’s actions demonstrate their commitment to legal and ethical behavior:• Supporting Open Records, which authorize citizens to explore
City actions and ethical accounting practices• Enforcing and reviewing changes to personnel policies related
to conduct and performance• Upholding the Municipal Charter, which provides guidelines
for the Council-Manager form of government

2 City of Fort Collins
• Supporting transparency in operations, such as City Council meetings, where ELT members respond to real-time citizen and Council inquiries, and writing newspaper columns detailing how the City is protecting the community’s best interests
• Demonstrating a commitment to the City’s value of integrity [1.1a(1)]
• Ensuring that NEO establishes ethical and legal expectations of new employees
• Personally addressing ethical and legal complaints and ensuring thorough investigation and resolution [1.2b(2)]
• Supporting the creation of an Ethics Core team, which developed a Citywide ethics “Raise the Bar” program, including a hotline, training and policy
ELT further promotes an environment requiring legal and ethical behavior by supporting initiatives that enhance financial transparency and demonstrate a commitment to the ethical use of the community’s resources. Open Book and BFO give the community tools for holding the City, and ultimately the City Manager and ELT, accountable. The Citizen Review Board (CRB) gives citizens a chance to question and hold Police Services accountable for its treatment of residents. Many members of ELT, including the City Manager and Deputy City Manager, are members of professional organizations, such as ICMA, that require adherence to and modeling of ethical codes.1.1a(3) Creating a Successful Organization ELT uses the City’s Leadership System (Figure P.2-2) as the framework for creating a successful organization. The Leadership System focuses on the present and future through the SPP that aligns plans and goals across the organization. Using MBNQA feedback, the City identified 16 key processes (KPs) embedded within the Leadership System, and then assigned ELT responsibility for each one to ensure they are evaluated for needed improvements. To improve organizational performance and achieve performance leadership, ELT develops goals that set expectations for high and improved performance, creates and modifies action plans for attaining goals, and uses the Monthly Operating Report (MOR) to monitor action plans and review results. Recent improvements to the MOR include adding safety measures and consolidating the MOR from more than 100 pages to 50 pages to provide a more focused assessment. Additionally in 2015, a Financial MOR was implemented for a separate focus on financial reporting, and in 2016 a Council Priority dashboard will be added to the MOR. Cycles of Improvement (Figure 1.1-2) demonstrate the City’s efforts toward systematic continuous improvement.ELT supports organizational learning by engaging in performance excellence activities, such as PE Teams (2011-2013), multidisciplinary teams, the Rocky Mountain Performance Excellence program (RMPEx), and the Malcolm Baldrige National Quality Award program (MBNQA), and by ensuring key processes, such as BFO and SPP, are evaluated with appropriate improvements made after each development cycle. To support personal learning, ELT attends conferences and workshops and participates in local, regional and national boards; the Lead 4.0 program; and a pre-360 and post-360 assessment survey. Organizational learning for the workforce through training and development is described in 5.2b(1). ELT creates a workforce culture that delivers a consistently positive customer experience and fosters customer engagement by establishing clear direction and deploying
a customer-focused mission: exceptional service for an exceptional community. The SPP and BFO processes are deliberately designed to focus on delivering value to the community [2.1a(1)], the recently implemented Quarterly Performance Alignment (QPA) process aligns goals in support of the mission-driven strategy, and staff development/training opportunities reinforce a customer-focused culture.By setting world-class performance goals and engaging stake-holders in achieving those goals, ELT creates an environment of innovation and intelligent risk taking [4.1a(1)]. The systematic business development and BFO structure prompt staff to research leading practices and think innovatively when developing and enhancing programs. Innovation Funds allow all levels of the organization to submit innovative ideas for funding. Additionally, a grassroots Innovation Team emerged in 2012 as the result of an employee blog post on CityNet. The grassroots team of 20 staff developed an Innovation Model, which ELT supported. This grassroots movement identified the need for a more structured approach to innovation and resulted in a cross-functional team participating in the ICMA/TLG Innovation Academy in 2014-2015. This team transitioned into the FC Innovates team that meets quarterly and coordinates three action teams.To ensure agility, ELT uses BFO and SPP to collect internal and external data relevant to current and future strategies. ELT and the Council collaboratively decide whether the organization needs to alter its path in response to environmental changes, in which case ELT assigns responsibility and deploys the changes to the appropriate service area for implementation. Annually, budget exceptions are reviewed by senior leaders and Council to enable mid-cycle agility [2.2a(6)], and a contingency fund, accessed by
Figure 1.1-2: Leadership Learning Cycles 2005 Created vision, values
2006 Implemented BFOStarted Leadership Link Meetings
2007 Started SIT Meetings
2011
ELT meeting agenda focus changeImplemented All Supervisors MeetingsDeveloped Sustainability Service AreaImplemented Lead 1.0 and 4.0 (and 360 evaluations)Implemented Futures Committee
2012Implemented MORDeveloped Leadership SystemGrassroots Innovation Team
2013
Updated VisionCouncil onboarding included City strategic planAdded 360 evaluations for 94 managersCompleted Citywide Risk AssessmentDeveloped Quarterly Council Work Plan ReviewImplemented Community Dashboard
2014
Added another class for Lead 1.0 – 30 participantsCitywide Strategic Planning Process Implemented Title VI Training Developed Innovation Academy TeamImplemented Ethics Core Team
2015
Innovation Team transitioned into FC InnovatesImplemented Inaugural Employee Recognition WeekImplemented Ethics Program “Raise the Bar”Implemented Ethics HotlineImplemented QSAR process2015 Lead 1.0 Class – 26 participantsBegan semi-annual ELT Planning Retreats
2016 Implemented Lead 2.0 & 3.0 Added Council Priority Dashboard to the MORImplementing Policy Development Process

3 City of Fort Collins
Council approval, is available for immediate need. For example, the 2012 High Park Fire devastated hundreds of acres outside Fort Collins with potential impact on the City’s watershed for the next decade. Using contingency funds, the City rebuilt the landscape, including wood shred mulching, directional tree felling and enhancements for protection of the Poudre River pipeline. ELT personally participates in succession planning and developing future organizational leaders through the Lead 4.0 and 1.0 programs. Lead 4.0 is a one-year leadership development program for executives. Through the program, ELT members participate in 360 assessments, executive coaching and classroom activities. The most recent example is the promotion of a Utilities Interim Director into the role of Utilities Executive Director. Also, the Planning, Development and Transportation Director was promoted into her executive role from an internal management position, and the Assistant City Manager/Information and Employee Services Director, who completed a master’s degree program, was given additional responsibilities as an ELT member. Lead 1.0 offers a series of leadership topics for managers and emerging leaders. Each participant leads a project presented to ELT at a final graduation and celebration. Individuals are selected to participate in the Lead 1.0 and 4.0 based on leadership potential. Based on initial success, including several graduates who have earned new positions (Figure 7.3-16), another level, Lead 3.0, was budgeted for 2013-2014, and Lead 2.0 for 2015-2016. ELT members also mentor young leaders through the City’s intern programs, and through the City Managers Group, which was created to mentor future City government leaders.1.1b(1) Communication ELT communicates with and engages the workforce, (including volunteers: citizens, Council, boards and commissions) and key customers (Figure 1.1-3). Staff engagement and frank, two-way communication begin at New Employee Orientation (NEO), when the City Manager asks what brought them to the City, and includes a personal commitment to make the City the best place they have ever worked. He shares personal, cell and business phone numbers for employees to use any time they have a criticism or a compliment. Monthly, ELT members personally visit work areas throughout the City to hold “Talk It Up” sessions, where staff members have an opportunity to ask questions and get updates. The Employee Committee chair and co-chair meet with the City Manager to discuss the employees’ perspectives; quarterly Issues & Answers sessions enable staff to ask questions directly to the City Manager in a live setting; and ELT members participate in ride-alongs to experience staff work routines. The City Manager’s Monthly Report is sent to City Councilmembers and is posted on fcgov.com for all citizens and staff.Social media is a key communication tool. ELT uses email, CityNet (intranet), and fcgov.com (internet), which are updated daily with messages about City activities [3.1a(1)]. In May 2014, for the launch of the MAX Bus Rapid Transit grand opening event, one particular City Facebook post had a viral reach of at least 50,000 people. Access Fort Collins relays citizen requests for response by trained staff members and has tracking and categorizing capabilities for organizational learning. ELT communicates key decisions appropriate for the audience, content, the need for organizational change, and time sensitivity:• Strategic decisions use the strategic deployment process [2.2],
weekly Council leadership planning meetings, and Tuesday Council meetings and work sessions
• An annual State of the City event, which attracts hundreds of citizens and staff members, and highlights the previous year’s accomplishments and future direction
• If the decision is time sensitive, the City Manager sends an all-staff email or ELT may convene a LL meeting to support consistent messaging for leader communication to staff
• Quarterly Issues & Answers; semi-annual All Supervisors meetings; and weekly ELT, quarterly SIT and bimonthly LL meetings offer additional venues for communicating key decisions related to organizational performance, strategic direction and workforce issues
ELT takes an active role in motivating the workforce through a culture of celebration that reinforces high performance, customer focus and achievement of organizational goals. In addition to active participation in the formal performance management system [5.2a(4)], which rewards individuals for high
Figure 1.1-3: ELT Communication Methods
Method Frequency
Empl
oyee
s
Volu
ntee
rs*
Key
C
usto
mer
s
2-w
ay
Issues & Answers Quarterly ● ●Talk It Up sessions Monthly ● ●
Walk-arounds Twice monthly ● ●
City Manager email notes and videos
Monthly, or as needed ● ●
NEO Monthly ● ●
PE Teams Monthly ● ●
Fort Shorts Monthly ●
Employee Blog Ongoing ● ●
Leadership Meetings (SIT/LL/All
Supervisors)
Bi-monthly (LL) & quarterly (SIT),
Semi-annual (All Supervisors)
● ●
Leadership Retreats Biennially ● ●Annual Service Awards, Holiday
Party, PicnicAnnually ●
State of the City Annually ● ● ●Report to the Community Annually ● ● ●
City Council Meetings Bi-weekly ● ●
City Council Retreats Annually ● ●
City Council Work Sessions Bi-weekly ● ● ●
Boards & Commissions Monthly ● ● ● ●
fcgov.com Ongoing ● ● ● ●
City News Monthly ● ● ● ●
Cable 14 Ongoing ● ● ● ●
CityView Twice monthly ● ● ● ●
Facebook, Twitter, YouTube, Chatter Ongoing ● ● ●
PSD, CSU, Larimer County Meeting Quarterly ● ● ● ●
City, CSU Leadership Committee Quarterly ● ● ● ●
Meetings with public and private
executivesOngoing ● ● ● ●
Board memberships (PFA, FCMOD, DDA,
DBA, etc.)Ongoing ● ● B,C,P ●
LEGENDB=Business; C=Citizen; P=Partner *Volunteers includes Council, Boards and Commissions, and Community Volunteers

4 City of Fort Collins
organizational performance, ELT hosts and participates in reward and recognition opportunities:• World Class People recognizes high performing employees• Annual holiday celebration featuring employee service
anniversary awards• Serving staff at the annual picnic • Service Area and department accomplishments celebrations• Employee Recognition Week activities held in May1.1b(2) Focus on Action ELT creates a focus on action to accomplish the City’s mission, improve its performance, enable innovation and intelligent risk taking, and attain its vision through the leadership system (P.2-2), the biennial SPP and BFO [2.1a(1)]; Talent|Reward; Total Rewards [5.2a(4)]; and the Performance Measurement system [4.1a(1)]. Through these processes, ELT aligns the organization with the MVV and strategic objectives, allocates resources to projects that are critical to achieving the strategic objectives, and rewards staff for achieving them. Key performance is reviewed monthly to identify needed actions, to monitor operations, gauge progress toward the strategic objectives and validate strategy. Bi-monthly Council meetings and Council work sessions further reinforce the focus on performance and completion of actions. Citizen input into the BFO process creates and balances value by focusing on results and priorities established by citizens [2.1a(1), Step 5], and in 2011 the Futures Committee was formed to assist City Councilmembers in their decision-making process. The Committee’s goal is to position the City in the distant future (30-plus years) for achievable successes, integrating community desires with known fiscal, social and environmental data.1.2 Governance & Societal Responsibilities1.2a(1) Governance System As a public organization subject to extensive open meeting and records requirements, there are checks and balances to ensure responsible governance: • Citizens hold Councilmembers and ELT accountable for their
actions. Citizens address policymakers and management in two-way communication directly during Council meetings, at Council work sessions, at committee meetings, at board meetings and through Access Fort Collins [3.2b(2)].
• Accountability for the strategic plan is realized through the BFO process (2.1a(1)- Step 5). Once budget offers are approved, the initiatives are monitored weekly at Leadership meetings; monthly at MOR updates when ELT reviews project, policy and initiative status updates; quarterly in Council work plan reviews; and at six-month intervals in the Agenda Planning Calendar process, policy and plan review.
• The City ensures fiscal accountability through the Open Book tool on the City’s website that provides detailed, easily accessible information on all City expenditures. The City’s budget is discussed, scrutinized, and finalized in public meetings with City Council, and with citizen boards [2.1a(1)].
• To ensure transparency in operations, Councilmembers stand for election by citizens every four years, while the Mayor stands for election every two years. Annual financial disclosures from elected officials include information regarding income sources, real estate ownership, creditors, business interests, and offices/directorships held by the elected official Ethics Review Board.
• Independence and effectiveness of internal and external audits are ensured by having the City’s finances reviewed annually
with the auditors selected, hired and reporting to the City Council, not City staff.
• Protection of stakeholder interests is transparent through publicly provided reports that track the City’s performance, ensuring stakeholder engagement via public planning and community engagement methods of community open houses, Council hearings, board hearings, and neighborhood contacts.
• Succession planning for the City Manager is in the Municipal Code and Charter.
1.2a(2) Performance Evaluation The performances of the City Manager, City Attorney and Municipal Judge are monitored by the City Council through twice-yearly reviews. In addition, the Council provides daily and weekly feedback to their direct employees about individual performance and the performance of City staff. Every ELT member participates annually in the Talent|Reward performance review system, as do all City employees, and the City Manager meets monthly with each ELT member to review key performance goals [5.2a(4)]. The City Manager is a credentialed Certified Public Manager with ICMA and that process requires a 360 performance review with follow-up. He also has weekly one-on-one meetings with Council members to review his organizational performance, and ELT members meet weekly with the Council Leadership Planning team to prepare for the City Council meetings and work sessions. The Council formally evaluates the performance of the City Manager twice each year, with executive compensation based on accomplishing established goals.Citizens evaluate the Councilmembers through the election process, the Ethics Review Committee, the end-of-term report, and ongoing listening sessions. Citizens provide direct feedback at the weekly Council meetings and through the SARs process. This feedback is used to guide Council decisions. As a cycle of improvement based on Council input and review of key processes, the 2015-2016 SPP includes a strategic objective to develop a Council evaluation. ELT evaluates and improves the leadership system annually using internal evaluation (360 reviews) and external feedback from the Baldrige Excellence Program. Evaluations and improvements on an individual basis use the Talent|Reward annual performance review. Also, since ELT is a team-based, peer accountability model, Council follow-up; new issues/concerns; and Hot, Help & Well provide ongoing evaluation of leadership weekly at ELT meetings. Recently, the ELT identified a need for their team development. In 2015, ELT implemented semi-annual retreats that incorporate strategic and team development agenda items, including a team E/I assessment that determines their strengths and opportunities as an executive team.1.2b(1) Legal & Regulatory Behavior Since the City operates in a highly regulated environment, adverse impacts of City operations on society are first addressed by enforcing local, state, and federal laws and regulations through external reporting and monitoring agencies, such as the Public Utilities Commission (PUC), and through the internal Environmental Regulatory Affairs Program. Both internal and external audits of City programs ensure that the City is complying with all laws and regulations, and then, to support the vision, finding ways to improve the community now and in the future. Through annual reporting and participation in local, regional, state and federal agencies, such as the National Incident Management System

5 City of Fort Collins
(NIMS), USDA, CDC, and the National Wildlife Resource Center, the City develops approaches to protect the loss of life and property, and reduce harm to the environment [6.2c(2)]. To anticipate public concerns, the City creates forums for community dialogue that provide information and gather feedback on how the City addresses topics that could potentially have an adverse impact on society. The numerous listening methods (Figure 3.1-2) afford opportunities for citizens to be involved holding the City accountable for its actions. Ensuring sustainability of natural resources and proactively preparing for environmental impacts are areas of emphasis for the City. Considerations of community impact both now and into the future are integrated in the City’s policies (specifically the Environmental Policy) and processes. The City offers ClimateWise, a program that helps local businesses and organizations reduce greenhouse gas emissions through conservation efforts, and 90 percent of the electrical lines are placed underground. The City is a NOAA-designated “Storm Ready Community” and works closely with the Office of Emergency Management (OEM) and FEMA to ensure emergency preparedness. Additionally, the City implemented a green purchasing program in 2013 (6.2b).Figure 1.2-1 lists key processes and goals for meeting and surpassing regulatory and legal requirements, and addressing risks associated with City operations.1.2b(2) Ethical Behavior Besides the approaches noted in 1.1a(2), key processes and indicators of enabling and monitoring ethical behavior include:• Leaders are held accountable in annual performance evaluations
for modeling the behavior expected of all employees. • Ethics is part of the ELT 360 assessment.• Leaders are trained in ethics at the semi-annual All
Supervisors meetings. • Employee expectations are clearly defined by Personnel
Procedures and Policies and reinforced through NEO, training opportunities, and in conversations with managers and program leaders. Individual breaches in ethical behavior result in progressive discipline or termination, as appropriate.
• All employees are held accountable for ethical behavior through internal and external review. For example, Administrative Policy updates verification is tracked electronically to ensure that the workforce has knowledge of the policy change. Citizen complaints related to ethical
violations, questions and allegations are tracked, investigated and acted upon, if appropriate, through an investigations division of the Human Resources Department and through the Internal Affairs Division of Police Services. In matters involving Police Services, an independent Citizen Review Board investigates complaints for merit. An Early Warning System (EWS) database documents incidents regarding use of force, vehicle pursuits, or policy violations and provides leadership a dashboard of each police officer’s key behaviors to track performance, identify training needs and address risks associated with police operations.
• The City has a policy and review system for outside employment and conflicts of interest.
• In 2015, the Raise the Bar ethics program launched, including NAVEX, an ethics complaint tracking system. All supervisors were trained on its use.
• In 2015, Volunteer Policies and Procedures (for internal staff) and a Handbook (for volunteers) were created and include a “Code of Conduct.” A volunteer waiver requires that volunteers have read the handbook and agree to abide by it. Additionally, the Boards and Commissions Manual includes “Conflict of Interest Guidelines.”
• Procurement Policies and Procedure Manual for suppliers include Public Purchasing Ethics that guide City employees to appropriate ethical standards and vendor requirements.
As a cycle of improvement, the Council Ethics Committee improved the process for receiving ethical complaints. Concerns from the public (residents and businesses) go directly to the Ethics Committee without initial Council review. This ensures faster resolution. Key measures for enabling and monitoring ethical behavior include: Council signs a code of conduct and a conflict of interest at the beginning of their term; Boards and Commissions members complete training that includes an ethical element, as well as conflict of interest; 360 assessments include an ethical component; and all supplier contracts include adherence to confidentiality. 1.2c(1) Societal Well-Being Through its commitment to “constantly make our community a better place,” the City considers societal wellbeing and benefit as part of strategy and daily operations, and contributes to the well-being of its environmental, social and economic systems including:• Three of the seven Outcome Areas are committed to
Figure 1.2-1: Compliance & Risk Management (Figure 7.4-8)FUNCTION REQUIREMENTS PROCESSES GOALS
FinancialGovernment Accounting Standards Board, Internal Revenue Service, Federal Office of Management & Budget (OMB), federal grant requirements
Pcard & cash audits, bank reconciliation, grant compliance audits
100% compliance
Risk Management & Safety OSHA, CDOT, Federal Transit Administration (FTA) Work site, process & policy 100% compliance
Environmental Environmental Protection Agency, Colorado Department of Public Health and Environment
Listserve notices for new regulations, internal & external audits
100% compliance
EmploymentDepartment of Labor (FLSA, FML, ADA, EEOC); Dept. of Health & Human Services (HIPAA); Federal Trade Commission (Fair Credit Reporting Act); Colorado Civil Rights Commission
Compliance training, policy reviews/audits, legal consultation & support, dedicated HR staff
100% compliance
0 sustained violations for all requirements
Development & Facility Operations
Building Codes, Code of Federal Regulation, Fort Collins Green Code Amendments Code review & adoption 100% compliance
Public Records Colorado Open Records Act Access Fort Collins 100%Emergency Management Federal Emergency Management Agency (FEMA), NOAA Designation as Storm-
Ready Community Designation

6 City of Fort Collins
sustainability through economic, social and environmental health. As a cycle of improvement the Community and Neighborhood Livability outcome was renamed to Neighborhood Livability and Social Health to better reflect a focus on societal wellbeing.
• Strategies such as the Climate Action Plan (CAP), Economic Strategic Plan and Social Sustainability Strategic Plan align the City strategic objectives and provide daily action plans.
• Investing in and conserving the natural environment through Natural Areas, Parks and Urban Forestry programs.
• Providing numerous recreational and wellness opportunities for all populations at world-class facilities (Senior Center, Northside Aztlan Center, EPIC) and recreational classes through the Recreation Department.
• Partnerships with other local organizations, including Colorado State University (CSU), the Downtown Business Association (DBA), Poudre School District, Larimer County, and numerous non-profit organizations, allowing the City to maximize and leverage each partner’s core competencies to the maximum benefit of citizens.
• The Plan Fort Collins process – the City’s comprehensive community planning process illustrating how the community envisions Fort Collins over the next 25 years and beyond – gathers input on issues that influence the quality of life in our community, including the natural and built environment, and the health and wellness of our citizens. It aligns with MasterPlanning and the BFO process. The BFO process, with associated action plans and funding, ensures that the strategy for societal well-being is incorporated into daily operations.
• Implementation of regulatory compliance programs to ensure that the organization complies with all local, state and federal environmental requirements.
• Sustainability initiatives including “Utilities for the 21st Century” and the Action Plan for sustainability, establish measurable targets for optimizing natural, financial, and human resources.
• Programs and policies that conserve natural resources including green building codes, sustainable water supply policies, air quality programs and greenhouse gas emissions
plans and policies.• BFO, which ensures the services requested by the community
are adequately resourced.• Use of an SAT [formerly used by the triple bottom line
methodology-TBLAM 6.1b(3)], a standardized tool to evaluate the impact of City services and decisions on the environment, the community’s fiscal health and societal well-being.
• Recognizing that the types of products and services the City purchases have inherent social, environmental and economic impacts, in 2013 Purchasing added a position to implement sustainable purchasing practices (6.2b).
• In 2014, “Practice Environmental Stewardship” was added to Organizational Priorities on the employee goal cards.
1.2c(2) Community Support The City actively supports and strengthens its key community of residents and businesses through the contributions noted in 1.2c(1),and through direct interactions with City Council and staff, Boards and Commissions, comprehensive planning processes (e.g., Plan Fort Collins), and the numerous forums and opportunities for public involvement (Figure 1.1-3). To determine areas for organizational involvement, the City asks residents and businesses what is important to them via the biennial citizen survey and customer satisfaction surveys, and provides numerous opportunities for customers to provide input and get involved in the public process. In 2012, a Public Engagement Spectrum was designed to improve the efficiency of communicating with the public. As a recent improvement during the 2013-2014 SPP, the Communications and Public Involvement Office (CPIO)—a department charged with public information dissemination, communication strategies and public involvement—provided outreach for hard-to-reach populations by going to more than two dozen locations to interview citizens in poverty, seniors, college students, high school students, business owners, Low English Proficiency, homeless and Boards and Commissions members. In addition, ELT and the workforce personally commit to improving key communities and building community sustainability through leadership and membership positions in service and professional organizations.
2 Strategic Planning2.1 Strategy Development2.1a(1) Strategic Planning Process The City’s seven-step SPP is an issues-based process occurring on a two-year cycle (Figure 2.1-2). The SPP, conducted by the Strategic Planning Core Team, ELT, BFO Team Chairs, and City Council, identifies strategic objectives for the seven outcome areas that align withPlan Fort Collins. Plan Fort Collins is the comprehensive planfor the City and illustrates how the City is envisioned in the next25 years and beyond. It is reviewed and updated every five to six years to respond to significant trends and changes in economic, physical, social or political conditions in Fort Collins. Strategic objectives address a short- and long-termplanning horizon of two to five years. To provide transformational change and prioritization of change initiatives, operational flexibility and organizational agility in response to new opportunities or unforeseen community changes, Council reviews, checks for alignment and adds priorities to initiatives within the strategic plan in the middle of each two-year cycle, in May after the Council election. If Council revises initiatives,
City staff adjust established City processes to support the budget and service area plans [2.2a(6)]. ELT reviews the MOR monthly for results that may indicate emerging issues and needed actions, and community members bring emerging issues to weekly Council meetings and work sessions. In 2015-2016, as a cycle of improvement, a Council Priority Dashboard was added to the MOR to assist in the monthly status check. The SPP begins in October of each odd calendar year of the two-year cycle. The SP Core Team conducts “roadshows” to educate the organization about the SPP. Step 1: Gather Inputs City departments submit strategic plan inputs – detailed descriptions of departmental issues of concern supported by trend data, master plans and service need projections. The SP Core Team collects inputs from citizens through the results of the statistically valid Citizen Survey, as well as targeted public outreach events and input on City Council priorities. In 2015, public outreach was expanded from 16 groups to more than 24 groups and input was developed into a summary report for reference during planning.
7 City of Fort Collins
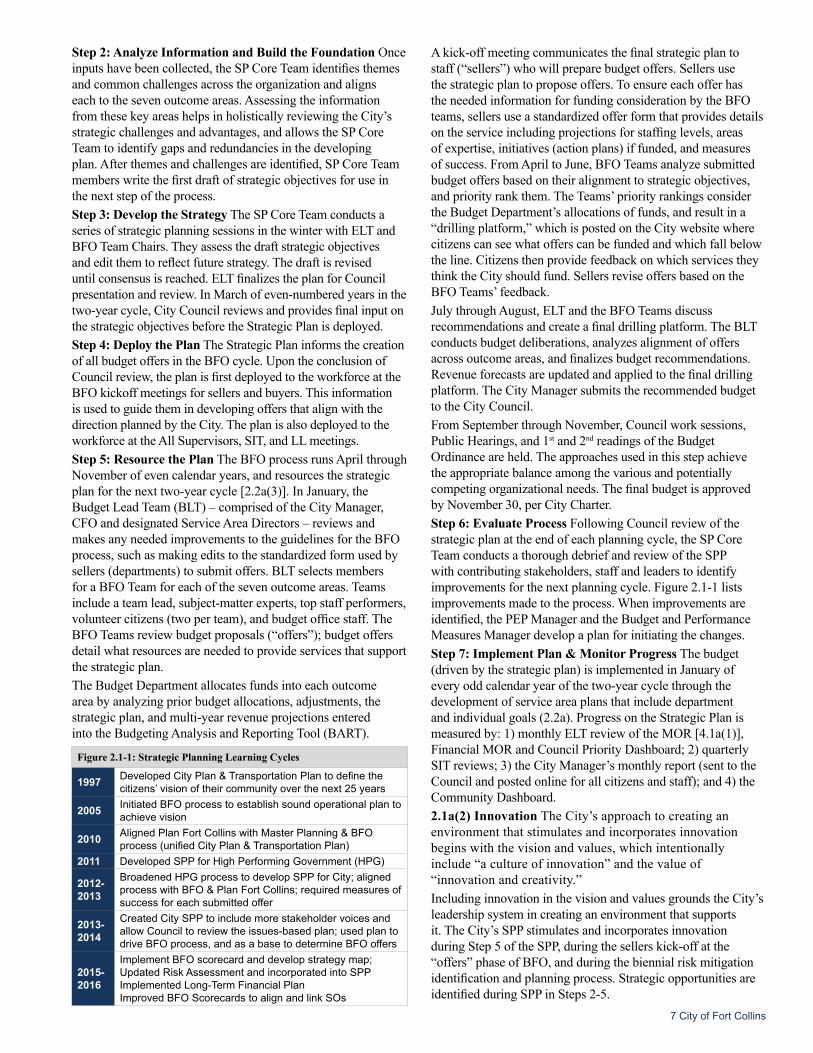
Figure 2.1-1: Strategic Planning Learning Cycles
1997 Developed City Plan & Transportation Plan to define the citizens’ vision of their community over the next 25 years
2005 Initiated BFO process to establish sound operational plan to achieve vision
2010 Aligned Plan Fort Collins with Master Planning & BFO process (unified City Plan & Transportation Plan)
2011 Developed SPP for High Performing Government (HPG)
2012-2013
Broadened HPG process to develop SPP for City; aligned process with BFO & Plan Fort Collins; required measures of success for each submitted offer
2013-2014
Created City SPP to include more stakeholder voices and allow Council to review the issues-based plan; used plan to drive BFO process, and as a base to determine BFO offers
2015-2016
Implement BFO scorecard and develop strategy map; Updated Risk Assessment and incorporated into SPPImplemented Long-Term Financial PlanImproved BFO Scorecards to align and link SOs
Step 2: Analyze Information and Build the Foundation Once inputs have been collected, the SP Core Team identifies themes and common challenges across the organization and aligns each to the seven outcome areas. Assessing the information from these key areas helps in holistically reviewing the City’s strategic challenges and advantages, and allows the SP Core Team to identify gaps and redundancies in the developing plan. After themes and challenges are identified, SP Core Team members write the first draft of strategic objectives for use in the next step of the process. Step 3: Develop the Strategy The SP Core Team conducts a series of strategic planning sessions in the winter with ELT and BFO Team Chairs. They assess the draft strategic objectives and edit them to reflect future strategy. The draft is revised until consensus is reached. ELT finalizes the plan for Council presentation and review. In March of even-numbered years in the two-year cycle, City Council reviews and provides final input on the strategic objectives before the Strategic Plan is deployed. Step 4: Deploy the Plan The Strategic Plan informs the creation of all budget offers in the BFO cycle. Upon the conclusion of Council review, the plan is first deployed to the workforce at the BFO kickoff meetings for sellers and buyers. This information is used to guide them in developing offers that align with the direction planned by the City. The plan is also deployed to the workforce at the All Supervisors, SIT, and LL meetings.Step 5: Resource the Plan The BFO process runs April through November of even calendar years, and resources the strategic plan for the next two-year cycle [2.2a(3)]. In January, the Budget Lead Team (BLT) – comprised of the City Manager, CFO and designated Service Area Directors – reviews and makes any needed improvements to the guidelines for the BFO process, such as making edits to the standardized form used by sellers (departments) to submit offers. BLT selects members for a BFO Team for each of the seven outcome areas. Teams include a team lead, subject-matter experts, top staff performers, volunteer citizens (two per team), and budget office staff. The BFO Teams review budget proposals (“offers”); budget offers detail what resources are needed to provide services that support the strategic plan. The Budget Department allocates funds into each outcome area by analyzing prior budget allocations, adjustments, the strategic plan, and multi-year revenue projections entered into the Budgeting Analysis and Reporting Tool (BART).
A kick-off meeting communicates the final strategic plan to staff (“sellers”) who will prepare budget offers. Sellers use the strategic plan to propose offers. To ensure each offer has the needed information for funding consideration by the BFO teams, sellers use a standardized offer form that provides details on the service including projections for staffing levels, areas of expertise, initiatives (action plans) if funded, and measures of success. From April to June, BFO Teams analyze submitted budget offers based on their alignment to strategic objectives, and priority rank them. The Teams’ priority rankings consider the Budget Department’s allocations of funds, and result in a “drilling platform,” which is posted on the City website where citizens can see what offers can be funded and which fall below the line. Citizens then provide feedback on which services they think the City should fund. Sellers revise offers based on the BFO Teams’ feedback. July through August, ELT and the BFO Teams discuss recommendations and create a final drilling platform. The BLT conducts budget deliberations, analyzes alignment of offers across outcome areas, and finalizes budget recommendations. Revenue forecasts are updated and applied to the final drilling platform. The City Manager submits the recommended budget to the City Council.From September through November, Council work sessions, Public Hearings, and 1st and 2nd readings of the Budget Ordinance are held. The approaches used in this step achieve the appropriate balance among the various and potentially competing organizational needs. The final budget is approved by November 30, per City Charter.Step 6: Evaluate Process Following Council review of the strategic plan at the end of each planning cycle, the SP Core Team conducts a thorough debrief and review of the SPP with contributing stakeholders, staff and leaders to identify improvements for the next planning cycle. Figure 2.1-1 lists improvements made to the process. When improvements are identified, the PEP Manager and the Budget and Performance Measures Manager develop a plan for initiating the changes.Step 7: Implement Plan & Monitor Progress The budget (driven by the strategic plan) is implemented in January of every odd calendar year of the two-year cycle through the development of service area plans that include department and individual goals (2.2a). Progress on the Strategic Plan is measured by: 1) monthly ELT review of the MOR [4.1a(1)], Financial MOR and Council Priority Dashboard; 2) quarterly SIT reviews; 3) the City Manager’s monthly report (sent to the Council and posted online for all citizens and staff); and 4) the Community Dashboard.2.1a(2) Innovation The City’s approach to creating an environment that stimulates and incorporates innovation begins with the vision and values, which intentionally include “a culture of innovation” and the value of “innovation and creativity.”Including innovation in the vision and values grounds the City’s leadership system in creating an environment that supports it. The City’s SPP stimulates and incorporates innovation during Step 5 of the SPP, during the sellers kick-off at the “offers” phase of BFO, and during the biennial risk mitigation identification and planning process. Strategic opportunities are identified during SPP in Steps 2-5.

8 City of Fort Collins
Figure 2.1-3: Sample SPP Inputs Participants: C-Citizen, Co-Council, S-Staff, L-LeadersINTERNAL INPUTS EXTERNAL INPUTSWorkforce trends (L)Q14 results (S,L)ELT weekly meetings (L)Financial data (C,Co,S,L)Department-level trends and challenges (S)Risk Assessment (S,L)Master Plans (C,Co,S,L)City Plan (C,Co,S,L)Area-Specific Strategic Plans (e.g. CAP, Economic Health) (C,Co,S,L)Long-Term Financial Plan (S, L)
City Council workshop and 6-Month Agenda Calendar (Co)One-on-one meetings with City Councilmembers and City Manager (L,Co)Service Area surveys (C)Citizen Survey (C)Community Dashboard (Co,C)Plan Fort Collins - demographic information (Co,C)Partner outreach (C)Boards and Commissions plans (C,Co)Target population citizen outreach (C)Regulatory Changes
Gather Inputs
Analyze Information and Build
the Foundation
Develop the
Strategy Deploy the Plan
Resource the Plan
Evaluate Process, Implement and Monitor
Figure 2.1-2: Strategic Planning Process
The iterative process described in Steps 2 and 3, when the SP Core Team gathers information and then conducts a series of strategic planning sessions, identifies opportunities. Steps 4 and 5 evaluate which are intelligent risks for pursuing, and the BFO process resources them.A culture of innovation is further supported by having a process to evaluate innovative ideas that fall outside the strategic planning process. For example: interdisciplinary teams use established criteria to allocate up to $50,000 (in three different funds) for new ideas. For large, high-risk projects, the City has an eight-step process to decide which projects are intelligent risks for pursuing (Figure 2.1-4).The City’s strategic opportunities for large, high risk projects that are currently in this process include: Broadband, water storage, developing and maintaining adequate public infrastructure, and growth management. 2.1a(3) Strategy Considerations Relevant data and information are collected from a variety of stakeholder sources and used by ELT for strategy considerations (Figure 2.1-3).Strategic challenges and advantages were first established by ELT during a work session at the All Supervisors meeting in August 2011. They are now reviewed during each SPP cycle during Steps 1 and 2 when the information gathered by the SP Core Team provides an environmental assessment. That information is used to review and update strategic challenges and advantages to reflect the City’s current environment.Risks to the City’s future success are considered throughout the SPP using results from analysis and the information provided from service areas (Figure 2.1-3). To evaluate the fiscal condition over time based on fundamental assumptions, the Finance Department completes an extensive financial analysis using forecasting methodologies including correlation analysis and historical trending to produce differing revenue scenarios. This is used by leaders during the SPP process to identify appropriate SOs that are then used during BFO to ensure adequate funding.Potential changes in the regulatory environment are assessed during Step 1 of the SPP, as departments gather internal and external information for their inputs.By intentionally using information from a variety of sources during SPP, and completing an environmental assessment and a SWOT analysis, potential blind spots are avoided during strategic discussions. Budgeting adequate resources and aligning services around the seven outcome areas ensures the City’s ability to execute the strategic plan. Plan Fort Collins contains action plans and
potential funding sources for longer-term strategies. The BFO process executes short-term strategy and allocates resources to create a government that works better and costs less, focusing on results and priorities established by citizens [2.1a(1), Step 5]. Financial Services reviews actual and projected revenues, which feed directly into a SWOT analysis. In addition, the City completes an HR market analysis of compensation/benefits, and projects financial and capital needs through a capital planning process. However, even in the best of planning circumstances, the City does not operate in a static environment, so the budget exception process provides for initiative changes (2.2b).
Figure 2.1-4 Intelligent Risk Process Steps
Project idea presented to City Manager
CM discusses the idea with the appropriate SA Directors
Assigned project team defines the scope
Project team researches funding
Project lead presents project plan to ELT
Risk assessment is completed
Project plan is presented to Council
Council reviews, adds input, and approves to next step

9 City of Fort Collins
2.1a(4) Work Systems & Core Competencies The City’s seven outcome areas are the key work systems (P.1-1). The work systems were identified by the City Council at the initiation of the BFO process in 2005 through a series of focus groups and meetings that included citizens, City Council and staff. The outcome areas are reviewed every two years by City Council and ELT during the SP update to ensure continued alignment to Plan Fort Collins and citizen priorities, which are directly aligned to strategic objectives in Step 5 of the SPP BFO process. Decisions on which key services will be provided externally are determined during the BFO process when staff submits offers that include assessment of outsourcing opportunities based on whether the City has the expertise and capacity to provide the service, and a cost/ benefit analysis of using external sources. Potential suppliers for outsourcing services go through the Purchasing Division’s rigorous RFP approval process, which ensures that suppliers are qualified and have the needed core competencies (6.2b). The City’s core competencies were first determined in 2010during a facilitated work session with ELT and the PE Team members. They are reviewed annually and in 2014 team members from the PE Strategy Team and the SP Core Teamdetermined the current core competency. Future core competencies and work systems are identified during the five-year review of Plan Fort Collins. The City Charter and City Code define roles and functions across the organization.2.1b(1) Key Strategic Objectives The City’s key strategic goals and objectives, as well as the timetable for achieving them, are shown in Figure 2.1-5. The strategic goals and objectives were most recently updated in 2015, so there are no key planned changes for 2016 that are not already included. 2.1b(2) Strategic Objective Considerations The strategic goals and objectives address strategic challenges and leverage the City’s core competencies, strategic advantages and strategic opportunities (Figure 2.1-5). The SPP, BFO, and the process for reviewing and updating Plan Fort Collins every five years balance the short- and longer-term planning horizons. The process of developing the City’s strategic objectives achieves appropriate balance among varying and potentially competing organizational needs by using the public outreach process to solicit and include input from a wide variety of stakeholders, such as citizens (HPG Strategic Objective Fig. 2.1-5) , City Council (Policy Development Process that was developed in 2015 and is being implemented in 2016), and Boards/Commissions and staff. The City achieves balance of competing interests through seven outcome areas (and the associated SOs) that provide distinct areas of focus for citizen review and input. During Step 5 of the SPP, BLT reviews and vets offers among the outcome areas that may compete for dollars. BFO offers are also posted online for citizen and business input, and Council has the final word for offers that are budgeted. Input is also considered by including subject-matter experts, top performers and citizens on BFO Teams; CPIO outreach to the same 24 groups that participated in SP input; holding focus groups for Plan Fort Collins updates; and developing partnerships that facilitate communication, such as the DDA and CityWorks 101. 2.2 Strategy Implementation2.2a(1) Action Plans The City’s action plans are called initiatives. Initiatives are programs and services proposed in the
budget offers (standardized online form that requires a summary of actions that will be taken to justify the dollars requested), and are aligned with strategic objectives. The key short- and longer-term initiatives and their relation to the strategic goals and objectives are displayed in Figure 2.1-5. Key initiatives identified in SPP Step 5 are assigned ELT leads who are responsible for defining actions, timelines and resources. 2.2a(2) Action Plan Implementation Once approved through the BFO process, initiatives are deployed by ELT to the appropriate Service Area/Department for implementation. Based on the initiatives, Service Area Directors prepare one-year plans with department goals, and individuals assigned responsibility within the plan write corresponding goals into Talent|Reward [5.2a(4)]. Key suppliers and partners are included in initiative implementation through the City staff member assigned to the initiative, and City leaders meet with partners throughout the year to exchange information on initiatives. As a cycle of improvement, in 2016 the ELT began holding annual meetings with key partners to discuss City performance and initiatives, and current and future issues of the partners. To ensure that key outcomes of the initiatives are sustained, the City allocates adequate resources [2.2a(3)], modifies initiatives as needed (2.2b), monitors results relative to goal (4.1b), and Finance completes a strategic risk analysis for each department using a four-step process: 1) Review alignment of SOs with service area strategy, 2) review prior risks and identify current risks, 3) complete a nine-box risk map based on magnitude probability of occurrence, and 4) develop mitigation plans for priority risks.2.2a(3) Resource Allocation The City is financed through taxes, fees, federal programs and grants. To ensure financial and other resources are available to support the achievement of the initiatives, the City adopts a financial plan using the BFO process [2.1a(1), Step 5] and checks and adjusts financial forecasts to project a realistic expectation for sufficient funds. This thorough, systematic BFO process for resource allocation is a Government Finance Officers Association (GFOA) best practice. Financial reports are also analyzed against projections [2.2a(6)]. The budget is managed closely by all divisions. If initiative changes impact resources (e.g., new initiatives identified by new Council after elections), directors submit budget and action plan adjustment requests (2.2b). The City manages financial risk through the Finance Revenue Policy. Based on revenue projections and input from the Council, the Finance Department improved the policy to address its financial strategic challenge by establishing guiding principles for revenue diversification. The guiding principles provide a basis for decision-making. 2.2a(4) Workforce Plans ELT recognizes that the City’s workforce must be of the highest quality in order to capitalize on the core competency of commitment to the community and achieve the SOs. As part of the SPP, strategic objectives for the workforce are developed in the High Performing Government key outcome area (Fig. 2.1-5), and then the BFO process [2.2a(3)] deploys the SOs for action planning including projections for staffing levels and needed areas of expertise. New initiatives require a workforce plan. For example, at Utilities, the Smart Grid project (Advanced Meter Installation) has eliminated the need for meter readers. The workforce plan to address this change began during the early planning stages.

10 City of Fort Collins
Figure 2.1-5: City of Fort Collins Strategic Plan
LEGEND CC= Core CompetencyST= Short Term
SC=Strategic ChallengesLT= Long Term SA= Strategic Advantages
KEY OUTCOMES 2.1b(1)
Sample Strategic Objectives (ST & LT)2.1b(1)
Sample LT & ST Initiatives (Action Plans)
2.2a(1)
KEY PERFORMANCE MEASURES
2.2a(5)
Short-Term
Target 2.2b
Long-Term
Target 2.2b
COMMUNITY & NEIGHBORHOOD LIVABILITY
Provide a high quality built environment and support quality, diverse neighborhoods (CC)
SA 1, 5, 7, SC 3, 4
• Improve access to a broad range of quality housing that is safe, accessible and affordable. (ST,LT)Maintain and enhance attractive neighborhoods through City services, innovative enforcement techniques, and voluntary compliance with City codes and regulations. (ST,LT)
• Foster positive and respectful neighbor relationships and open communication, as well as provide and support conflict resolution. (ST)
1. Renewal of Neighborhoods in a State of Change
2. Additional Funding for Affordable Housing Fund
3. Multicultural Community Planning, Outreach and Programming
4. Social Sustainability programs and services
5. Sustainable Neighborhoods Pilot Program
Housing Opportunity Index (7.5-5) 66%
Stay above 66%
Affordable Housing Units Inventory (7.5-5) 3,137
6% of overall
inventory
Number of Noise Complaints (7.1-1) 509 Less than
500
Response Time for Graffiti Removal (7.1-12) 2.0 Less than
2 days
Voluntary Code Compliance (7.1-2) 90.0% Maintain
95%
CULTURE & RECREATION
Provide diverse cultural and recreational amenities (CC)
SA 1, 4, 5, 6, 7, SC 3
• Improve low and moderate income citizen access to, and participation in, City programs and facilities. (ST,LT)
• Develop effective marketing strategies that drive optimal attendance and revenue. (ST)
• Promote a healthy community and responsible access to nature. (ST, LT)
1. Opportunity Program/Fund (Museum)
2. Museum Marketing and Client Services Support
3. Building on Basics (BOB) Park Improvements
4. Art in Public Places Program5. Vida Sana Program
GSC – Participation (7.2-22) 72,770 Maintain
Golf Courses Participation (7.2-22) 81,820
Increase by 1% per
year
Lincoln Center Participation (7.2-22)
140,000 Maintain
MOD Total Participation (7.2-22) 130,000 100,000
Natural Areas Programs Cumulative Participation per Capita (7.2-22)
8.0% Maintain 8%
Paved Trails Number of Visits (7.1-18) 1,716,272 Increase
by 2%
Recreation Programs Participation (7.2-22) 1,633,676
Increase by 1% per
year
ECONOMIC HEALTH
Promote a healthy, sustainable economy reflecting community values (CC)
SA 1, 2, 6, 7, SC 1
• Improve policies and programs to retain, expand, incubate and attract primary employers where consistent with City goals. (ST)
• Support workforce development and community amenities initiatives that meet the needs of employers within the city. (ST)
• Maintain utility systems and services, infrastructure integrity and stable, competitive rates. (ST, LT)
1. Envision Fort Collins2. Land Readiness Analysis
and Strategic Plan3. Support Larimer Small
Business Development Center
4. Industry Cluster Support andDevelopment5. Utilities Capital Project:
Computerized MaintenanceManagement System6. East Mulberry Corridor Plan
and AnnexationImpacts7. Urban Renewal Authority
Commitments & Bond Payments
Commercial Vacancy Rates (7.5-8) 5.0% 5.0%
Local Unemployment Rate (7.5-9) 5.0% 5%
New Commercial Permit Dollar Volume per Capita (7.5-7)
$140.00 maintain
New Residential Permit Unit Volume (7.5-6) 1,250 1,500
Electric System Average Interruption Duration Index (SAIDI/SAIFI) (7.1-5)
22:0514.47 APPA-
Top 25%

11 City of Fort Collins
Figure 2.1-5: City of Fort Collins Strategic Plan Continued
ENVIRONMENTAL HEALTH
Promote, protect and enhance a healthy & sustainable environment (CC)
SA 2, 3, 5, 6, 7, SC 3, 4
• Improve wildlife habitat and the ecosystems of the Poudre River and other urban streams. (ST, LT)
• Implement indoor and outdoor air quality improvement initiatives. (ST, LT)
• Reduce Green House Gas emissions by creating a built environment focused on green building and mobile emission reductions. (LT)
• Protect water quality; implement appropriate conservation efforts and long-term water storage capability. (LT)
• Conserve and restore habitat and land. (ST, LT)
1. Poudre River Restoration2. Municipal Climate Adaptation
Planning3. Air Quality Program Support4. Phase II of Community
Recycling Center5. Utilities: Water Conservation6. Natural Areas Stewardship
Community Energy Use (7.4-11) -10% -20%
AQI - Fine particulate Matter 2.5 microns (PM 2.5) (7.4-12)
95.0% 100%
Outdoor Air Quality Index (AQI) – Ozone (7.4-13) 75.0% 100%
Wastewater Treatment Effectiveness Rate [7.4a(3)]
100% 100%
HIGH PERFORMING GOVERNMENT
Deliver an efficient, innovative, transparent, effective and collaborative city government (CC)
SA 1-7, SC 1-4
• Improve organizational capability and effectiveness. (ST)
• Align similar jobs and skillsets across the organization to address succession planning and career progression. (ST)
• Strengthen methods of public engagement and reach all segments of the community. (ST)
• Optimize the use of information technology to drive efficiency and productivity, and to improve services. (ST)
• Enhance the use of performance metrics to assess results. (ST)
• Achieve safety goals through implementation of safety initiatives. (ST)
• Implement leading-edge and innovative practices for achieving quality and performance excellence across all Service Areas. (ST)
1. Leadership Development Program
2. Finance Organizational Assessment
3. Customer Relationship Management System Execution
4. Citywide Volunteer Program Manager and Program
5. Occupational Health Medical Monitoring
6. Municipal Innovation Fund7. Tools and Support for Efficient
and Effective Communication8. Council Training and
Engagement
Accuracy of Budgeted Expenses (7.5-2)
$406.69 million
ON TARGET
Actual Revenue Compared to Budget (7.5-1)
$414.69 million
ON TARGET
Response Time for Access Fort Collins (7.4-3) 3.0 3.0
City Employee Safety - Days Away Restricted or Transferred (DART) Rate YTD (7.3-5)
2.5 1.1
City Employee Safety – Total Recordable Injury Rate (TRIR) YTD (7.3-5)
4.7 1.8
City Employee Turnover Rate (7.3-1) 8% 8%
SAFE COMMUNITY
Provide a safe place to live, work, learn and play (CC)
SA 1, 2, 4, 5, 6, SC 4
• Provide facilities and training capabilities to enable a high-caliber police force. (ST, LT)
• Optimize the use of technology to drive efficiency, productivity and customer service. (ST)
• Protect life and property with natural, aesthetically pleasing stormwater facilities through building codes and development regulations. (ST)
• Use data to focus police efforts on reducing crime and disorder within community. (ST)
1. Police Funding for Training Facility Design
2. Utilities Capital Project: UV Disinfection System
3. Utilities Capital Project: Stormwater NECCO
4. Utilities Capital Project: Emergency Operations Center
5. Police Patrol Specialized Units
Drinking Water Compliance Rate [7.4a(3)] 100% 100%
Number of Injuries/Fatal Traffic Crashes (7.1-11) 70 <TREND
Part 1 Crimes per Capita Compared to Cities of Similar Size (7.1-8)
75.0% 90%
Average Quarterly response Time of Police Priority 1 Calls (7.1-9)
5 minutes 5 minutes
TRANSPORTATION
Provide for safe and reliable multi-modal travel to, from and throughout the city (CC)
SA 2, 4, 6, SC 4
• Improve safety of all modes of travel. (ST, LT)
• Improve transit availability and grow ridership. (ST)
• Create and implement long-term transportation planning to enhance citizens’ mobility, support environmental goals, and help local and regional transportation networks operate at a high level of efficiency. (LT)
• Support efforts to achieve climate action goals by reducing mobile emissions and supporting multiple modes of transportation. (ST, LT)
1. Street Oversizing Program2. Transfort Sunday Service3. Prospect Road Enhanced
Travel Corridor Plan4. West Elizabeth Enhanced
Travel Corridor Master Plan5. Transportation Air Quality
Impacts Guidance Manual
Lane Miles of Roadway Pavement Improved (7.1-3)
130 miles Maintain
Transfort Fixed Route Passengers per Revenue Hour (7.1-4)
23.90 ON TARGET
Cumulative Transfort Fixed Route Ridership (7.1-4) 2,858,000 ON
TARGET

12 City of Fort Collins
The staff directly impacted were notified of the changes to their role, and as a result, either left the organization or transitioned to another position within Utilities. The City also has processes in place for potential changes in workforce capability and capacity resulting from initiatives [5.1a(4)].2.2a(5) Performance Measures Key performance measures for tracking achievement of strategic goals and objectives are established through the BFO process, which requires staff to identify measures of success for each offer. These measures populate the Community Dashboard, which is posted online for public access and reviewed quarterly by ELT. Establishing department and individual goals that support organizational goals [2.2a(2)] ensures alignment across the City.2.2a(6) Performance Projections The Budget and Performance Measurement Manager and the Revenue and Project Manager project City performance for the two-year budget period. These projections are integrated into the BFO Scorecard, the
Community Dashboard and Plan Fort Collins. Monitoring the strategic plan, MOR, Community Dashboard and BFO Scorecard ensures the City is progressing toward world-class outcomes. Currently, the City’s projected performance compares favorably with established targets and goals. However, if performance gaps are identified, ELT identifies leaders to develop actions to close the gap [4.1a(1)]. 2.2b Action Plan Modification If circumstances require a shift in initiatives (action plans), modifications occur during scheduled Plan Fort Collins updates (longer term) and during weekly ELT meetings (short term). For accountability, modifications are assigned to the applicable ELT member. Modifications that impact a department’s budget are resourced through a budget revision process. For more pressing, urgent changes, departments may submit budget changes to Council during regular or bi-weekly Council meetings.
3 Customer Focus3.1 Voice of the Customer3.1a(1) Listening to Current Customers Approaches to how the City actively listens, interacts with, and observes residents and businesses to obtain actionable information have been expanded, improved and refined over the years (Fig. 3.1-1). Key sources for listening and interacting are: 1) the Citizen Survey [3.1b(1)], 2) Utilities Survey [3.1b(1)], 3) BFO [2.2a(3)], 4) SPP [1.2c(1)], and 5) the process for updating Plan Fort Collins [2.1b(2)]. The City also partners with the DDA, meets monthly with the Chamber’s Local Legislative Affairs Committee (LLAC), and Economic Health and Utilities connect daily with the top 10 key accounts, and weekly with the top 25. City staff also conducts in-person surveys during community events (e.g., Colorado Brewers’ Festival, NewWestFest) and on weekends to understand why and from where people come to Fort Collins, which helps obtain information on potential
customers. Listening and interaction methods vary appropriately for businesses: 1) the key customer accounts program focuses on industrial and large commercial accounts, 2) business collaboratives (DDA, NFCBA, DBA and SFCBA) target small/medium-sized businesses, 3) the City-initiated and funded Target Industry Clusters focus on geographic concentrations of interconnected companies and institutions in a particular field, and 4) the Community Liaison, a collaboration between the City and CSU, develops programs and outreach to businesses. Utilities Customer Accounts, Economic Health, and Finance Auditors interact with businesses. Utilities identifies new business sites through sales tax data and initiates visitation within the first two months, and since 2012 has performed bi-annual customer accounts meetings to assist customers with information on the performance of the utilities in providing safe, reliable and cost-effectives services. Since 2012, Economic Health staff has collaborated with the Fort Collins Chamber of Commerce and the Northern Colorado Economic Development Corporation (NCEDC) conducting Kitchen Cabinet Breakfast meetings with business executives to learn about their business challenges. Challenges identified are researched and those substantiated through data result in the City’s EH department developing action plans to address the issue. Social media and web-based technologies have added opportunities to gain actionable data. The City’s fcgov.com website launched a major revision in 2013 and again in 2016 to better serve the citizens and it is kept current for the tech-savvy community (4.2b). The City uses web surveys, Access Fort Collins, fcgov.com website, department-specific webpages, Facebook, Twitter and email to provide information and listen to customers. Recognizing the need for citizens to stay in touch throughout communities, the City participates in Nextdoor.com, an online networking site for neighbors to interact with each other.Timely and actionable information through direct interactions and observations occurs through sources such as weekly Council meetings, Council work sessions, and Council listening sessions, and vary by customer group (Figure 3.1-2) and method, including observing customers across service offerings (Figure 3.1-3). To ensure appropriate response, the City’s standardized Public Engagement Spectrum tool provides guidance on the level and type of response to citizen and
Figure 3.1-1: Customer Focus Learning Cycles2002 Created SARs Process 2006 Began the Citizen Survey and State of the City
presentation2007 CityWorks 101 inaugural class2008 Created Community Scorecard2009 Implemented Open Book and improved Social Media 2010 Keep Fort Collins Great (KFCG) tax initiative passed2011 Access Fort Collins/SARs Tracking Tool, Business
Retention & Expansion Survey introduced2012 Developed Public Engagement Spectrum, involved
citizens in BFO process, hired Economic Health Analyst, started Neighborhood Enforcement Team, created Social Sustainability Department
2013 Launched the Community Dashboard, Peer City Project, Updated the Development Review Process to include neighborhoods, hired a Civic Engagement Liaison
2014 Added Community Outreach and Input in the 2013-2014 Strategic Planning and BFO processes, added a BFO webpage for community participation in BFO offers, began social media plan revision, Implemented Sugar (CRM) in Environmental Services, Implemented a new mobile-friendly website
2015 Completed customer segmentation study in Utilities, Increased social media accounts (e.g., Police Services, Lincoln Center), Completed Public Engagement Strategic Plan and Public Engagement Online Guide
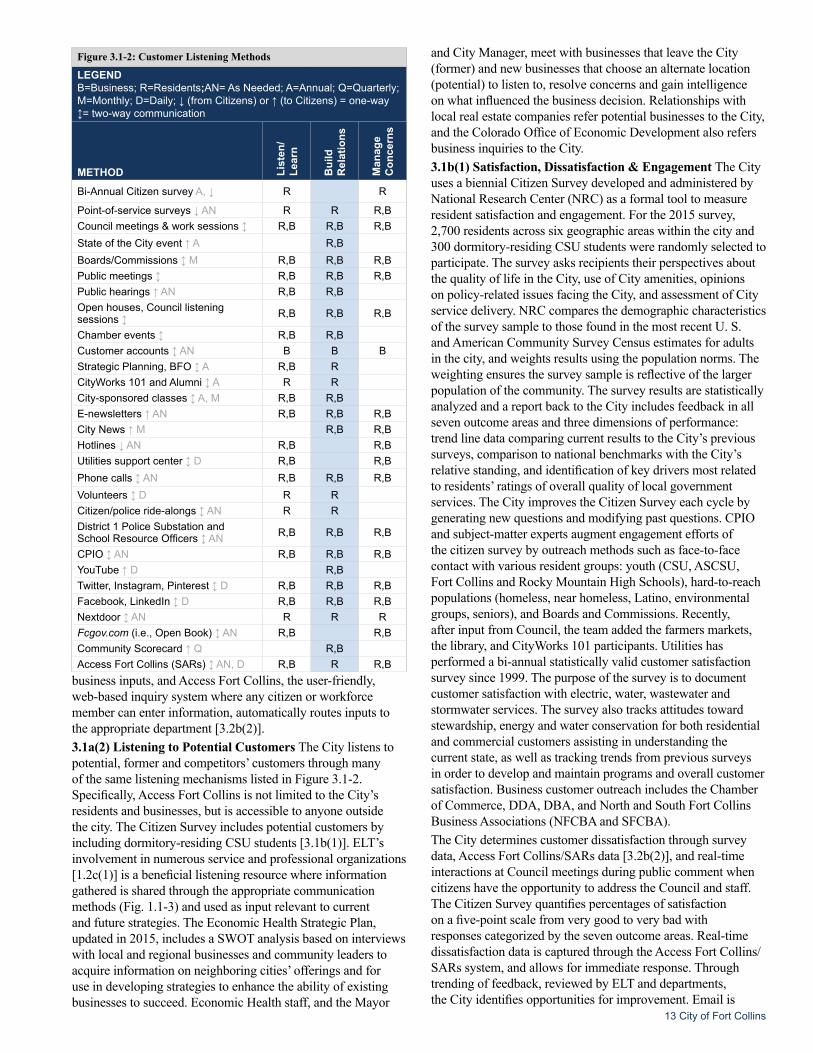
13 City of Fort Collins
business inputs, and Access Fort Collins, the user-friendly, web-based inquiry system where any citizen or workforce member can enter information, automatically routes inputs to the appropriate department [3.2b(2)].3.1a(2) Listening to Potential Customers The City listens to potential, former and competitors’ customers through many of the same listening mechanisms listed in Figure 3.1-2. Specifically, Access Fort Collins is not limited to the City’s residents and businesses, but is accessible to anyone outside the city. The Citizen Survey includes potential customers by including dormitory-residing CSU students [3.1b(1)]. ELT’s involvement in numerous service and professional organizations [1.2c(1)] is a beneficial listening resource where information gathered is shared through the appropriate communication methods (Fig. 1.1-3) and used as input relevant to current and future strategies. The Economic Health Strategic Plan, updated in 2015, includes a SWOT analysis based on interviews with local and regional businesses and community leaders to acquire information on neighboring cities’ offerings and for use in developing strategies to enhance the ability of existing businesses to succeed. Economic Health staff, and the Mayor
and City Manager, meet with businesses that leave the City (former) and new businesses that choose an alternate location (potential) to listen to, resolve concerns and gain intelligence on what influenced the business decision. Relationships with local real estate companies refer potential businesses to the City, and the Colorado Office of Economic Development also refers business inquiries to the City. 3.1b(1) Satisfaction, Dissatisfaction & Engagement The City uses a biennial Citizen Survey developed and administered by National Research Center (NRC) as a formal tool to measure resident satisfaction and engagement. For the 2015 survey, 2,700 residents across six geographic areas within the city and 300 dormitory-residing CSU students were randomly selected to participate. The survey asks recipients their perspectives about the quality of life in the City, use of City amenities, opinions on policy-related issues facing the City, and assessment of City service delivery. NRC compares the demographic characteristics of the survey sample to those found in the most recent U. S. and American Community Survey Census estimates for adults in the city, and weights results using the population norms. The weighting ensures the survey sample is reflective of the larger population of the community. The survey results are statistically analyzed and a report back to the City includes feedback in all seven outcome areas and three dimensions of performance: trend line data comparing current results to the City’s previous surveys, comparison to national benchmarks with the City’s relative standing, and identification of key drivers most related to residents’ ratings of overall quality of local government services. The City improves the Citizen Survey each cycle by generating new questions and modifying past questions. CPIO and subject-matter experts augment engagement efforts of the citizen survey by outreach methods such as face-to-face contact with various resident groups: youth (CSU, ASCSU, Fort Collins and Rocky Mountain High Schools), hard-to-reach populations (homeless, near homeless, Latino, environmental groups, seniors), and Boards and Commissions. Recently, after input from Council, the team added the farmers markets, the library, and CityWorks 101 participants. Utilities has performed a bi-annual statistically valid customer satisfaction survey since 1999. The purpose of the survey is to document customer satisfaction with electric, water, wastewater and stormwater services. The survey also tracks attitudes toward stewardship, energy and water conservation for both residential and commercial customers assisting in understanding the current state, as well as tracking trends from previous surveys in order to develop and maintain programs and overall customer satisfaction. Business customer outreach includes the Chamber of Commerce, DDA, DBA, and North and South Fort Collins Business Associations (NFCBA and SFCBA).The City determines customer dissatisfaction through survey data, Access Fort Collins/SARs data [3.2b(2)], and real-time interactions at Council meetings during public comment when citizens have the opportunity to address the Council and staff. The Citizen Survey quantifies percentages of satisfaction on a five-point scale from very good to very bad with responses categorized by the seven outcome areas. Real-time dissatisfaction data is captured through the Access Fort Collins/SARs system, and allows for immediate response. Through trending of feedback, reviewed by ELT and departments, the City identifies opportunities for improvement. Email is
Figure 3.1-2: Customer Listening Methods
LEGEND B=Business; R=Residents;AN= As Needed; A=Annual; Q=Quarterly; M=Monthly; D=Daily; ↓ (from Citizens) or ↑ (to Citizens) = one-way↕= two-way communication
METHOD List
en/
Lear
n
Bui
ld
Rel
atio
ns
Man
age
Con
cern
s
Bi-Annual Citizen survey A, ↓ R R
Point-of-service surveys ↓ AN R R R,BCouncil meetings & work sessions ↕ R,B R,B R,BState of the City event ↑ A R,BBoards/Commissions ↕ M R,B R,B R,BPublic meetings ↕ R,B R,B R,BPublic hearings ↑ AN R,B R,BOpen houses, Council listening sessions ↕ R,B R,B R,B
Chamber events ↕ R,B R,BCustomer accounts ↕ AN B B BStrategic Planning, BFO ↕ A R,B RCityWorks 101 and Alumni ↕ A R RCity-sponsored classes ↕ A, M R,B R,BE-newsletters ↑ AN R,B R,B R,BCity News ↑ M R,B R,BHotlines ↓ AN R,B R,BUtilities support center ↕ D R,B R,BPhone calls ↕ AN R,B R,B R,BVolunteers ↕ D R RCitizen/police ride-alongs ↕ AN R RDistrict 1 Police Substation and School Resource Officers ↕ AN R,B R,B R,B
CPIO ↕ AN R,B R,B R,BYouTube ↑ D R,BTwitter, Instagram, Pinterest ↕ D R,B R,B R,BFacebook, LinkedIn ↕ D R,B R,B R,BNextdoor ↕ AN R R RFcgov.com (i.e., Open Book) ↕ AN R,B R,BCommunity Scorecard ↑ Q R,BAccess Fort Collins (SARs) ↕ AN, D R,B R R,B

14 City of Fort Collins
responded to immediately. For example, in the 2014 BFO outreach effort, a citizen sent an email to the City noting they were not satisfied with the online BFO process that only allowed citizens to support or not support BFO enhancements, versus all of the offers. The CPIO team responded and improved the process by adding all offers for citizens to review. Departments that sell products/services have approaches for capturing customer satisfaction and engagement related to specific services. For instance, the City’s public transit system, Transfort, measures engagement through ridership levels. The Utilities Service Area conducts a point-of-service survey with all utility customers, and the City uses voter participation in municipal elections and attendance at public meetings to determine engagement. Low participation prompts departments to evaluate causes and develop strategies for improvement [3.1b(1)]. One indication of high customer satisfaction and engagement is the passage of the Keep Fort Collins Great (KFCG) tax increase. This voter-approved tax increase is an endorsement of the City’s effectiveness and stewardship of the community’s resources. For businesses, the City’s listening approaches [3.1a(1)] gather real-time information for satisfaction and dissatisfaction and the City collaborates with the Fort Collins Chamber of Commerce, NFCBA, DDA, the Small Business Development Center (SBDC), and the Larimer County Workforce Center to resolve issues. To determine better ways to serve business customers, the City has a collaborative Customer Outreach Team (COT), with representatives from Economic Health, PDT, and Utilities, which meets quarterly to share information and discuss business issues, trends and coordinate upcoming events.3.1b(2) Satisfaction Relative to Competitors The City receives customer satisfaction results relative to other organizations through the Citizen Survey [3.1b(1)]. City results are benchmarked against 30 Front Range cities and more than 300 cities in the national NRC database. The customer listening methods (Figure 3.1-2) provide information on citizens’ and businesses’ satisfaction with the City’s services compared to other cities’ (competitors’) services.3.2 Customer Engagement 3.2a(1) Product Offerings The City’s Customer Service Team,one of the PE teams, first determined key customer requirements for service offerings in 2012 (Figure P.1-6). They are revised biennially, if needed, by reviewing the previously identified requirements learned from the customer listening methods (Figure 3.1-2). Product offerings are determined through ongoing outreach efforts noted in 3.1 and culminated in the SPP Steps 1-5.Adapting and identifying services to meet the requirements and exceed the expectations of the customer, as well as creating new services to attract new customers and expand relationships with current customers, begins with analyzing data collected through the listening methods and monitoring results on the Community Dashboard, BFO Scorecard and MOR. The strategic planning process [2.1a(1)], the culture of innovation [2.1a(2)], and BFO [2.1a(1), step 5] are vehicles used to modify, reduce, create, add and expand services. Recent innovations made as a result of listening to the customer include offering park reservations through the City’s website, custom packages and electronic ticketing for cultural productions, and electronic payment options for parking
citations. In an innovation for businesses, Parking Services partnered with the DBA to offer a variety of parking permit options such as the “shared/carpool permit,” which enables multiple employees working different shifts for one business to share one parking permit. 3.2a(2) Customer Support The City creates approaches for customers to seek information and support and conduct business that meet the differing needs and preferences of the citizens and businesses (Figure 3.2-1). A primary focus of information sharing and customer service is the City’s national award-winning website. The website provides 24/7 access to public records, information regarding City services, e-commerce services (e.g., registrations, bill paying) and a wide variety of reports. Also, Cable 14 on television streams Council meetings live every Tuesday with archives posted on the website. Opportunities for customers to give feedback on services and support are highlighted in Figure 3.1-2 and include resources for citizens who do not have electronic access, such as adding fliers to utility bills, outreach phone calls, fliers and notices posted on doors, and publicly available computers (library and senior centers). There are also resources for deploying immediate information, such as during the September 2013 flood when the Emergency Operations Center communicated important updates via the City Facebook and Twitter pages and set up a webpage specifically for flood information, and the City’s Facebook page communicated information on the new MAX service in May 2014, with a viral reach of almost 50,000.Many of the City’s support mechanisms are mandated in the City Code and City Charter, but the City goes beyond the
Figure 3.1-3: Opportunities for Observing and Interacting with CustomersKEY OUTCOME/SERVICE MECHANISM
COMMUNITY & NEIGHBORHOOD LIVABILITY
Code enforcement, neighborhood meetings and events, mediation and restorative justice sessions, classes and trainings, open houses for planning and development, listening sessions
CULTURE & RECREATION
Park rangers, recreational facilities and events, Fort Collins 150
ECONOMIC HEALTH
ClimateWise, Kitchen Cabinet Breakfasts, business visits, Small Business Development Center’s Leading Edge, InnovatioNews, Fort Collins Bike Alliance, Interbike, NetZero Cities, Smart Grid Live 2012
ENVIRONMENTAL HEALTH
Residential Environmental Program Series, EnvirOvation annual event, energy assessments, Healthy Sustainable Homes program
HIGH PERFORMING GOVERNMENT
Council meetings and work sessions, staff liaisons on Boards and Commissions, BFO results teams, tax audits, strategic planning and BFO outreach, CityWorks 101, listening sessions
SAFE COMMUNITY
Police officers, patrol officers, School Resource Officers, pay utilities, water assessments, crime prevention, citizen review board, energy assessments
TRANSPORTATION
Traffic operations, “Ask Joe,” Transfort (frequent surveys and ongoing data collection), neighborhood meetings, open houses, department call centers (esp. Streets and Traffic), direct outreach (Streets, Traffic, Parking Services)

15 City of Fort Collins
minimum mandates and provides Access Fort Collins/SARs, the Citizen Survey, Plan Fort Collins and the BFO process to determine key support mechanisms. The City listens to its broad range of customers and investigates best practices and national trends in order to continually create, improve and further develop innovative services that exceed customer expectations and meet future needs and requirements. A recent improvement is the addition of a compliance coordinator who focuses efforts to increase inclusiveness of minority groups including providing persons with limited English proficiency meaningful language access to City services, programs and activities through interpretation services (both in person and telephonic) and translation of vital documents. Training and tools for providing these services are provided to all City customer support personnel. The Utilities Service Area is piloting two types of residential electric Time-of-Use rates to determine if the price signal is effective in managing equity and conservation while maintaining revenue. To ensure City staff understands customer support requirements, new employees receive clear direction during NEO when the City Manager presents the concept of and commitment to world-class City services [1.1b(1)]. Customer support and service are reinforced by the Strategic Plan and the expectation that each staff member has a customer service goal that is supported and reviewed as part of their goals in the Performance Management system, Talent|Reward [5.2a(4)]. 3.2a(3) Customer Segmentation Customer groups and market segments are determined during Step 1 of the SPP when point-of-service customer data is reviewed and market segments are considered for future planning. In 2015, the Utilities Customer Connections Department completed a segmentation study to target customers’ needs associated with various segments, such as residential (age and size of home, number of occupants, etc.) and businesses (commercial, large commercial and industrial). The City uses extensive customer and service data (Figure 2.1-3) to validate/identify customer groups and segments. For example, as strategic planning began for the 2015-2016 two-year cycle [2.1a(1)], the SP Team (with input from the BFO Chairs, ELT members and Council) gathered data from focus groups, including the CPIO outreach efforts that captured hard-to-reach populations [3.1b(1)], boards and commissions members, and customer surveys. The customer information was deployed at the ELT/BFO Chair strategy meetings, Boards and Commissions meetings and at Council strategy meetings. The SP Team used this information to analyze issues that may impact the 2015-2016 budget and operational plans. Based on these outreach efforts, additional outreach groups were identified and added, such as low income seniors and businesses in the southern part of the City. For revenue-producing departments, market data relates directly to what is or is not selling, and the customer information is used to evaluate current and future needs, and adjust product and service offerings. Comparing data to local and regional price ceilings assists in determining pricing levels. For example, the Lincoln Center staff received feedback from their customers that they expect to pay less in Fort Collins than in Denver for the same show and, thus, set prices accordingly. To identify business segments, the City works closely with the Chamber of Commerce and the NCEDC and uses retention and expansion surveys, interviews and follow-up. The City considers two key business segments – industrial/large commercial accounts and small businesses.
3.2b(1) Relationship Management Building and managing customer relationships for the City takes many forms because of the City’s diverse services. Some services, such as Utilities, have a “sole source” relationship with customers and therefore focus on improving satisfaction and meeting changing needs rather than growing market share. Other departments must compete directly with private service providers, such as recreation and culture programs. To acquire customers and build market share, the City:• Markets services such as the Lincoln Center, educational
classes and business promotions to surrounding communities. • Establishes the City website with comprehensive information
about use and access to City services [3.2a(2)].• Created the positions of Economic Health Manager and
Key Account Representatives to respond to inquiries of new businesses and special needs of existing businesses.
• Supports high profile events such as the annual NewWestFest music festival, Tour de Fat, USA Pro Challenge and Neighborhood Night Out.
• Provides a “sense of place” through trails, parks, public arts, gardens, bike friendly amenities, and access to nature.
• Offers business incentives and initiatives on a case-by-case basis to retain or help major employers expand, such as Woodward Governor, Foothills Mall and Activity Center, RMI, Avago, Hewlett Packard and Front Range Village.
• Develops a diverse, partnership-based bicycle community that enlists many organizations and individuals in programs focused on safety and education.
Brand image is managed and enhanced by 1) gathering customer input through numerous listening venues to understand why citizens and businesses choose Fort Collins, and then developing strategy (SPP) and service offerings (BFO) to support what the customer values, 2) establishing processes to recruit, hire, place, retain and manage [5.1a(2), 5.2a(4)] a workforce that lives the core competency of Commitment to the Community and fulfills the mission of exceptional service for an exceptional community, and 3) having CPIO for active, positive media presence. CPIO also manages the City’s logo/image to ensure consistency of display so it is recognizable and represents the high standards of the City, and develops marketing/informational media such as strategic outreach videos, Fort Collins Faces, CityView programs, the Innovation Series and a sense of place to enhance branding.To retain and increase engagement with customers, meet their requirements and exceed their expectations, the City:• Supports numerous venues for customers to seek and access
information (Figure 3.2-1)• Provides Access Fort Collins for immediate response to
customer requests/concerns [3.2b(2)]• Develops venues for customer engagement such as Plan Fort
Collins, BFO, UniverCity, State of the City, CityWorks 101 and IdeaLab
• Conducts monthly business rounding where the Mayor and City Manager visit local businesses to interact and listen to feedback, and thank them for doing business in Fort Collins
• Provides 875 acres of developed park land including six community parks and 49 neighborhood/pocket parks, along with more than 100 miles of recreational trails and 35,000 acres of Natural Areas in and around the city.

16 City of Fort Collins
Other activities to increase customer engagement include the City’s designation as a Platinum Bike Community; Downtown Art Program, including painted pianos for public use, improved alleys, and Downtown art walk; Nature in the City program; Poudre River restoration; FortZED; Parks Lagoon Series; annual CityWorks 101 program; free energy efficiency assessments and programs; and ClimateWise, with more than 300 participating businesses.The City’s use of social media enhances engagement, builds relationships, and manages and advances the City brand. In 2015, the City designed a new web page on fcgov.com that shows all social media accounts on one page. The City’s Facebook page contains current information on upcoming events; links to current issues, such as flood preparation and progress on road repairs, conservation efforts, and how to apply for citizen education programs such as the Citizen Police Academy; and notes of appreciation to citizens. Staff monitors the site and sends applicable responses to create positive relationships. In addition, the City uses YouTube to post items such as the Mayoral and City Council election forum, display the City’s beautiful parks, promote Fort Collins as a vacation destination, and highlight excellent services, such as the water treatment process.3.2b(2) Complaint Management The City has two main systems for managing complaints – Access Fort Collins/SARs, and the Police Services process.Access Fort Collins/SARs – Any citizen or City employee can enter a complaint, comment, inquiry or request for service into the user-friendly, web-based Access Fort Collins system. To ensure complaints are resolved promptly, the system assigns a case number, sends the customer an acknowledgement and estimated resolution time (no more than 10 business days), and routes the case to the appropriate department or individual. The SARs administrator tracks feedback and final resolution of submissions from the City Manager or Council Members. These submissions have no more than a five-day turnaround time. All departments resolve issues as quickly, completely and consistently as possible, with an emphasis on maintaining a positive relationship with the customer. The system aggregates Access Fort Collins submissions for use in driving improvement. The special projects lead in CPIO develops quarterly Access Fort Collins summary reports, and sends results to the appropriate departments. Department managers put actions in place. Police Services – FCPD has a stand-alone policy to address complaints and internal affairs investigations. Complaints
involving an employee’s work performance are forwarded to the first-line supervisor. If the issue can be resolved by the supervisor, the issue is documented accordingly and the matter is closed. If the complaint is not resolved, then it is formally documented and may include an internal affairs investigation. If an investigation is completed, the citizen is informed of the results. In criminal conduct allegations and use of force complaints, cases are generally investigated by the internal affairs sergeant. The CRB reviews the investigation and makes recommendations to the City Manager and Chief of Police. In cases requiring discipline, an intervention plan may be developed to address and improve officer performance. Annually, all statistics related to complaints are reported to the CRB and benchmarked against 25 cities of similar size and organization. As a cycle of improvement, in 2014 FCPS implemented a survey process (through the National Police Research Platform) to gain feedback from citizens about their experience when interacting with police officers. To avoid similar complaints in the future, complaint data is reviewed within 24 hours (SARs), monthly (Police CRB) or quarterly (Access Fort Collins) to determine trends. If a trend is identified (SARs), the system administrator notifies the appropriate department and actions are implemented. Police Services uses an early intervention system (EIS) to track trends in complaints. The threshold for intervention is designed to allow for corrections in a timely manner. A multi-faceted approach is applied to identify trends so they are mitigated in the future.
Figure 3.2-1: Key Support MechanismsCITIZENS BUSINESSES
OBTAIN INFORMATION
Website, public meetings, social media, Council meetings, library, published documents, hotlines, CityNews, Public Hearings, Channel 14, annual State of the City, newspapers, Boards and Commissions, City Works
Website, public meetings, social media, Council meetings, face-to-face meetings, economic health manager, key account representatives, finance auditors, e-commerce, public hearings
OBTAIN SERVICES
Website, walk-ins, published documents, service delivery mechanisms (P.1-1), phone
Website, walk-ins, ClimateWise program, economic health manager specialist, key account representatives, City-sponsored classes (e.g., Sales tax training, landlord training, HOA training), phone
4 Measurement, Analysis & Knowledge Management4.1 Measurement, Analysis & Improvement of Organizational Performance4.1a(1) Performance Measurement How the City uses data and information to track daily operations and overall organizational performance is displayed in Figure 4.1-3. The City selects, collects, and aligns data and information for tracking daily operations and organizational performance, including progress relative to the Strategic Outcomes through the Community Dashboard, Business Plan metrics through the
ClearPoint system, and the BFO process. The initial Community Dashboard was built in 2013 by staff working with ELT and the City Council Futures Committee to identify key performance measures for each Service Area. A project team evaluated the list of measures for alignment with the seven key Outcomes (Figure 2.1-5), and with the offers from sellers developed during the BFO process. The resulting key organizational performance measures comprise the Community Dashboard (Figure 4.1-2). Each Dashboard measure has an assigned data owner. The owners define each metric, identify available benchmarks, and establish targets based on historical performance and/or benchmarks. City Budget staff gathers and updates the results
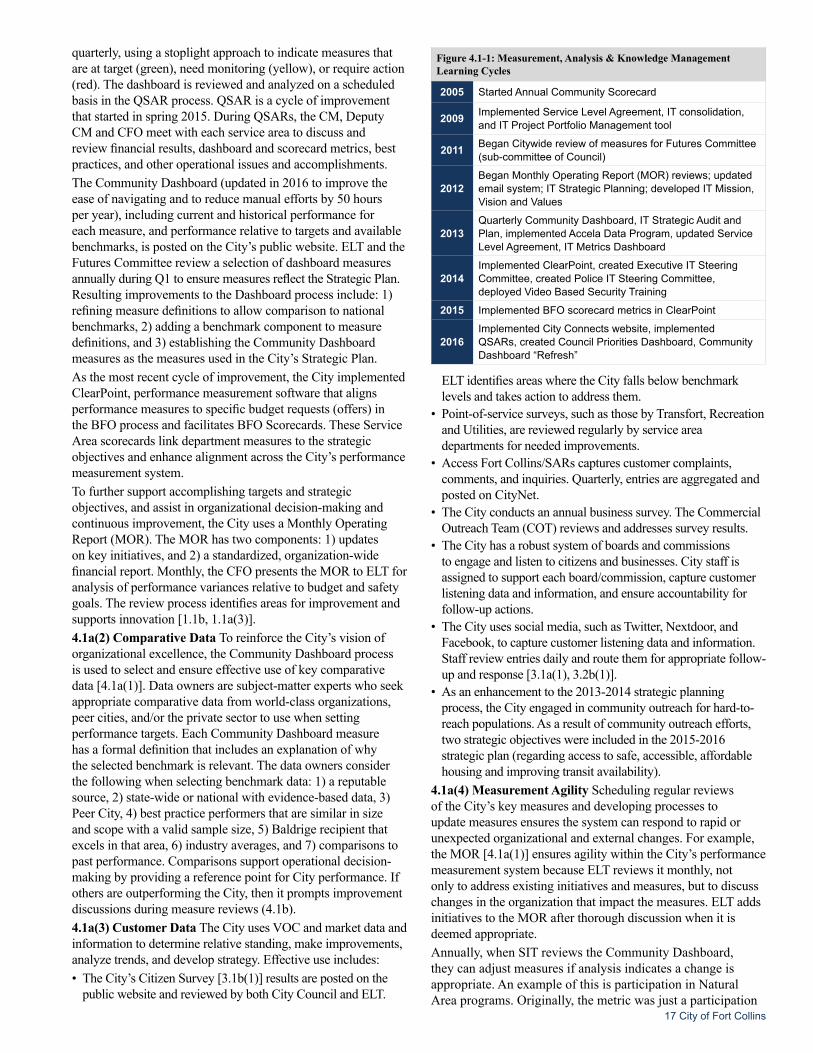
17 City of Fort Collins
Figure 4.1-1: Measurement, Analysis & Knowledge Management Learning Cycles
2005 Started Annual Community Scorecard
2009 Implemented Service Level Agreement, IT consolidation, and IT Project Portfolio Management tool
2011 Began Citywide review of measures for Futures Committee (sub-committee of Council)
2012Began Monthly Operating Report (MOR) reviews; updated email system; IT Strategic Planning; developed IT Mission, Vision and Values
2013Quarterly Community Dashboard, IT Strategic Audit and Plan, implemented Accela Data Program, updated Service Level Agreement, IT Metrics Dashboard
2014Implemented ClearPoint, created Executive IT Steering Committee, created Police IT Steering Committee, deployed Video Based Security Training
2015 Implemented BFO scorecard metrics in ClearPoint
2016Implemented City Connects website, implemented QSARs, created Council Priorities Dashboard, Community Dashboard “Refresh”
quarterly, using a stoplight approach to indicate measures that are at target (green), need monitoring (yellow), or require action (red). The dashboard is reviewed and analyzed on a scheduled basis in the QSAR process. QSAR is a cycle of improvement that started in spring 2015. During QSARs, the CM, Deputy CM and CFO meet with each service area to discuss and review financial results, dashboard and scorecard metrics, best practices, and other operational issues and accomplishments.The Community Dashboard (updated in 2016 to improve the ease of navigating and to reduce manual efforts by 50 hours per year), including current and historical performance for each measure, and performance relative to targets and available benchmarks, is posted on the City’s public website. ELT and the Futures Committee review a selection of dashboard measures annually during Q1 to ensure measures reflect the Strategic Plan. Resulting improvements to the Dashboard process include: 1) refining measure definitions to allow comparison to national benchmarks, 2) adding a benchmark component to measure definitions, and 3) establishing the Community Dashboard measures as the measures used in the City’s Strategic Plan.As the most recent cycle of improvement, the City implemented ClearPoint, performance measurement software that aligns performance measures to specific budget requests (offers) in the BFO process and facilitates BFO Scorecards. These Service Area scorecards link department measures to the strategic objectives and enhance alignment across the City’s performance measurement system. To further support accomplishing targets and strategic objectives, and assist in organizational decision-making and continuous improvement, the City uses a Monthly Operating Report (MOR). The MOR has two components: 1) updates on key initiatives, and 2) a standardized, organization-wide financial report. Monthly, the CFO presents the MOR to ELT for analysis of performance variances relative to budget and safety goals. The review process identifies areas for improvement and supports innovation [1.1b, 1.1a(3)].4.1a(2) Comparative Data To reinforce the City’s vision of organizational excellence, the Community Dashboard process is used to select and ensure effective use of key comparative data [4.1a(1)]. Data owners are subject-matter experts who seek appropriate comparative data from world-class organizations, peer cities, and/or the private sector to use when setting performance targets. Each Community Dashboard measure has a formal definition that includes an explanation of why the selected benchmark is relevant. The data owners consider the following when selecting benchmark data: 1) a reputable source, 2) state-wide or national with evidence-based data, 3) Peer City, 4) best practice performers that are similar in size and scope with a valid sample size, 5) Baldrige recipient that excels in that area, 6) industry averages, and 7) comparisons to past performance. Comparisons support operational decision-making by providing a reference point for City performance. If others are outperforming the City, then it prompts improvement discussions during measure reviews (4.1b).4.1a(3) Customer Data The City uses VOC and market data and information to determine relative standing, make improvements, analyze trends, and develop strategy. Effective use includes:• The City’s Citizen Survey [3.1b(1)] results are posted on the
public website and reviewed by both City Council and ELT.
ELT identifies areas where the City falls below benchmark levels and takes action to address them.
• Point-of-service surveys, such as those by Transfort, Recreationand Utilities, are reviewed regularly by service area departments for needed improvements.
• Access Fort Collins/SARs captures customer complaints, comments, and inquiries. Quarterly, entries are aggregated and posted on CityNet.
• The City conducts an annual business survey. The Commercial Outreach Team (COT) reviews and addresses survey results.
• The City has a robust system of boards and commissions to engage and listen to citizens and businesses. City staff is assigned to support each board/commission, capture customer listening data and information, and ensure accountability for follow-up actions.
• The City uses social media, such as Twitter, Nextdoor, and Facebook, to capture customer listening data and information. Staff review entries daily and route them for appropriate follow-up and response [3.1a(1), 3.2b(1)].
• As an enhancement to the 2013-2014 strategic planning process, the City engaged in community outreach for hard-to-reach populations. As a result of community outreach efforts, two strategic objectives were included in the 2015-2016 strategic plan (regarding access to safe, accessible, affordable housing and improving transit availability).
4.1a(4) Measurement Agility Scheduling regular reviews of the City’s key measures and developing processes to update measures ensures the system can respond to rapid or unexpected organizational and external changes. For example, the MOR [4.1a(1)] ensures agility within the City’s performance measurement system because ELT reviews it monthly, not only to address existing initiatives and measures, but to discuss changes in the organization that impact the measures. ELT adds initiatives to the MOR after thorough discussion when it is deemed appropriate.Annually, when SIT reviews the Community Dashboard, they can adjust measures if analysis indicates a change is appropriate. An example of this is participation in Natural Area programs. Originally, the metric was just a participation

18 City of Fort Collins
Figure 4.1-2: Community Dashboard
OUTCOME MEASURE TARGET
COMMUNITY & NEIGHBORHOOD LIVABILITY
Housing Opportunity Index (7.5-5) 66%Affordable Housing Units Inventory (7.5) 3,137Number of Noise Complaints (7.1-1) 509Response Time for Graffiti Removal (7.1-12) 2.0
Voluntary Code Compliance (7.1-2) 90%
CULTURE & RECREATION
GSC - Total Participation (7.2-22) 72,770Golf Courses - Total Participation (7.2-22) 81,820Lincoln Center - Total Participation (7.2-22) 140,000
MOD - Total Participation (7.2-22) 130,000Natural Areas Programs - Cumulative Participation per Capita (7.2-22) 8.0%
Paved Trails - Number of Visits (7.1-18) 1,716,272Recreation Programs - Total Participation (7.2-22) 1,633,676
ECONOMIC HEALTH
Commercial Vacancy Rates (7.5-8) 5.0%Local Unemployment Rate (7.5-9) 5.0%New Commercial Permit Dollar Volume per Capita (7.5-7) $140.00
New Residential Permit (7.5-6) 1,250Electric System Average Interruption Duration Index (SAIDI) in Minutes (7.1-5) 22:05
ENVIRONMENTAL HEALTH
Community Energy Use (7.4-11) -10%%Outdoor Air Quality Index (AQI) - Fine Particulate Matter (7.4-12) 95.0%
Outdoor Air Quality Index (AQI) - Ozone (7.4-13) 75.0%
HIGH PERFORMING GOVERNMENT
Accuracy of Budgeted Expenses (7.5-2) $406.69 (millions)
Actual Revenue Compared to Budget (7.5-1)
$414.69(millions)
Response Time for Access Fort Collins (7.4-3) 3.0 days
City Employee Safety - Days Away Restricted or Transferred (DART) (7.3-5) 2.5 days
City Employee Safety – Total Recordable Injury Rate (TRIR) YTD (7.3-5) 4.7
City Employee Turnover Rate (7.3-1) 8%
SAFE COMMUNITY
Drinking Water Compliance Rate [7.4a(3)] 100%
Number of Injuries/Fatal Crashes (7.1-11) 70Average Quarterly Response Time of Police Priority 1 Calls (7.1-9) 5 minutes
Part 1 Crimes per Capita Compared to Cities of Similar Size (7.1-8) 75%
TRANSPORTATION
Cumulative Lane Miles of Roadway Pavement Improved (7.1-3) 130 miles
Transfort Fixed Route Passengers per Revenue Hour (7.1-4) 23.9
Cumulative Transfort Fixed Route Ridership (7.1-4) 2,858,000
number, but after adding benchmarks that included larger communities, the measure was improved to a per capita measure.4.1b Performance Analysis & Review The City reviews organizational performance and capabilities through scheduled review and analysis of key performancemeasures (Figure 4.1-3). The Community Dashboard (Figure 4.1-2) and the MOR [4.1a(1)] assess organizational success, financial health, and progress relative to initiatives and action plans, with comparisons to benchmarks. QSARs, an improvement in the review process implemented in 2015, are conducted with leaders from each Service Area, the City Manager, Deputy City Manager and the CFO. The review analyzes data, action plan results and issues from the previous quarter to assist in evaluating if conclusions made previously are still valid. City Council formally reviews key performance measures during the BFO process and informally during scheduled work sessions, Council Work Plan quarterly status reports (Council dashboard), the Policy and Plan Review Schedule, and staff updates throughout the year. The City Manager prepares a Monthly Report that is deployed to the organization and posted on fcgov.com for the community. An annual KFCG report is sent to the Council and posted on fcgov.com to update the community on the specific dollars allocated in the current budget cycle for the KFCG voter-approved tax. The City can respond rapidly to changing organizational needs and challenges in the operating environment because of the frequency of City Council and ELT scheduled meetings that focus on performance and completion of action: 1) Tuesday Council meetings and work sessions, 2) weekly Council leadership planning meetings, and 3) City Manager’s weekly 1:1 meetings with Councilmembers to review the organization.4.1c(1) Best Practices The City built an infrastructure to promote sharing best practices across the organization. ELT, SIT and LL meetings intentionally bring together leaders from all departments to share successes and identify best practices for adoption or adaption across the City. Other methods include identification by the All Supervisors’ planning team and during QSARs. Agendas prompt the identification of best practices through the Hot, Help & Well technique. The City identifies external best practices through participation in trade organizations such as ICMA, conferences such as Transforming Local Government (TLG), RMPEx Quest, the Baldrige Quest for Excellence, and through participation in quality certifications (ISO 14001, AWWA Directors Award for quality drinking water, CASTA award, Transfort, Police accreditation). These are shared at LL and SIT meetings, and on CityNet. For example, several ELT members and managers visited the City of Denver to observe their performance improvement methodology after attending their presentation at RMPEx Quest, and incorporated process improvements into the City’s PDCA process. Also, when Elevations received the Baldrige award in 2015, the City visited their business to learn about their best practices for documenting process and used it when identifying the City’s key processes.Best practices are implemented through 1) the All Supervisors
meeting where the planning team chooses organizational best practice projects/programs to highlight and/or train on, 2) the BFO vetting process, which funds documented best practices in framing performance strategies and goals, 3) ELT, SIT and LL agendas that include project and program briefings along with time for Hot, Help & Well, a technique for sharing current issues, requests for assistance, and innovation and successes, 4) the Employee Blog and Thank You Board, which are used to share best practices, 6) the City Manager quarterly video

19 City of Fort Collins
Figure 4.1-3: Organizational Performance ReviewMEASURES FREQUENCY* REVIEWED BY ANALYSES USECommunity Dashboard Q ELT, QSAR Performance relative to target &
benchmark, trendingAction plan modification, resource reallocation, performance improvement
BFO Scorecard Q ELT, SA Leaders,
QSAR Performance relative to targets Action plan modification, resource reallocation, performance improvement
MOR, Financial MOR
M ELT Variance to budget, drill down by service area & department
Action plan modification, resource reallocation, performance improvement
Access Fort Collins D, Q Designee, SIT Aggregation, trending Service recovery, service design & improvement
Productivity D Managers Variance to budget, trending Staffing adjustments, capability & capacity planning
Staffing D Managers Variance to budget, trending Staffing adjustments, capability & capacity planning
Revenue D ELT Variance to budget, trending, drill down by service area & department
Resource reallocation, financial planning, performance improvement
Budget M ELT Variance to budget, trending, drill down by service area & department
Resource reallocation, financial planning, performance improvement
Customer Satisfaction M ELT, Managers,
Staff Trending, gap analysis Action plan development, service design & improvement
Employee Engagement B ELT, Managers,
StaffTrending, drill down by department, correlation analysis, gap analysis Action plan development
Community Satisfaction A ELT, Council Performance relative to benchmark,
correlation analysis, gap analysisAction plan development, service design & improvement, strategic planning
Business Satisfaction A ELT, COT, EH Trending, gap analysis Action plan development, service recovery,
service design & improvement, strategic planning*Frequency: Daily (D), Weekly(W), Monthly (M), Quarterly (Q), Biannually (B), Annually (A)
messages that highlight best practices, 7) QSARs and 8) EnvirOvation, an annual ClimateWise showcase of sharing best practices among the business community so they can learn from each other and implement solutions within their businesses.4.1c(2) Future Performance The City projects the organization’s future performance and uses the information for key strategic and operational decisions:• As part of the budget process, the CFO forecasts revenues for
the two-year budget window and re-adjusts the budget.• Utilities, which requires significant long-term capital
investments, annually forecasts revenues and expenses and reviews them with Council as part of the process for setting rates for the coming year. These projections support development of the Utilities’ long-term plan for capital needs.
• The 6-Month Agenda Planning Calendar is an approach that utilizes a rolling schedule to track projected performance against current performance (4.1b).
• As a cycle of improvement, a long-term financial plan and a ten-year Capital Improvement Plan (CIP) were implemented in 2015.
The Budget and Performance Measurement Manager and the Revenue and Project Manager project City performance that is integrated into the BFO Performance Report, the Community Dashboard and Plan Fort Collins. Monitoring the strategic plan, MOR, Community Dashboard and BFO Scorecard ensures the City is progressing toward desired outcomes. If there are differences between what is projected and what is occurring, ELT identifies leaders to develop actions to close the gap (2.2b).4.1c(3) Continuous Improvement & Innovation ELT and SIT identify organizational priorities for improvement and opportunities for innovation through review of the Community Dashboard, QSAR and MOR [4.1a(1)]. Key performance measures that are “red” result in analysis to determine causes for the variance, with further ELT/SIT discussion at the weekly
ELT meetings. ELT prioritizes needed actions based on the results of the analysis and on additional factors, such as the City’s ability to impact a particular measure (high-medium-low). Improvement priorities and opportunities are communicated for deployment during quarterly SIT meetings, and bi-monthly LL meetings. Those leaders deploy the opportunity to work groups and communicate directly with suppliers, partners and collaborators as appropriate for needed action. The addition of the QSAR process has resulted in identifying improvements such as Utilities adding the measure of System Average Interruption Frequency Index (SAIFI) in addition to System Average Interruption Duration Index, (SAIDI) and Police changing some key measures from annual to quarterly reporting.
4.2 Knowledge Management, Information & Information Technology4.2a(1) Knowledge Management The City manages organizational knowledge as follows: • Workforce knowledge and information are collected and
transferred through 1) an integrated information system that includes collaboration software, electronic document management, and email, 2) the City Connects website - a resource website to connect staff with resources such as project management, PDCA, Talent|Reward, Public Engagement Guide and FC Innovates, 3) staff and leadership meetings structured to cascade information, 4) Citywide policies (e.g., administrative, personnel and Council agenda process) documented and published on CityNet, 5) Talent Management learning and development approaches [5.2b(1)] with cross-training and documentation of processes in written format, and 6) communication methods highlighted in Figures 1.1-3 and 4.2-1. Additionally, every position in the City has a written, detailed job description that includes required knowledge, skills and abilities. The electronic Talent|Reward system, enables employees to register for learning and

20 City of Fort Collins
development opportunities, view training transcripts and complete assigned online training modules. All staff has access to JD Edwards EnterpriseOne (JDE) to view sick days, vacation hours, and current and past paycheck stubs.
• To blend and correlate data from different sources to build new knowledge the City uses the ClearPoint process that includes community dashboard and business level metrics for referencing and analysis. Specific software applications provide data for day-to-day operations and resource allocation by supplying real-time analytics, such as utilities monitoring demand and making adjustments to avoid delays in service and Police monitoring volume of calls and using that information for forecasting scheduling. Recreation and cultural facilities analyze historical data of participation rates, identify seasonal and daily patterns and forecast future use to plan accordingly (Fig. 4.2-1).
• Knowledge transfer from and to customers, suppliers, partners and collaborators occurs through fcgov.com and through a
Figure 4.2-1: Data & Information Availability LEGEND: E= External audience: customers, suppliers, partners & collaborators I= Internal audience: workforce E I
fcgov.com Online applications, such as road closures, performance measures, recreational opportunities and updates on construction projects ♦ ♦
CityDocs A website that provides query access to more than 1.2 million scanned documents pertaining to a variety of elements of City operations ♦ ♦
CityNet Intranet web portal that provides easy access to information, policies and needed forms ♦
Email Employees and Councilmembers have email accounts. Email is used frequently by Citizens to staff or Councilmembers. ♦ ♦
Newspaper, radio and media Information on current events, meetings and services ♦
Issues & Answers Information shared at all-employee meetings led by City Manager; employees attend in person and through video stream. ♦
Talent|Reward Online program that identifies Citywide and individual goals, tracks progress and documents training and other processes ♦
Cable 14 Live and streamed video captures City Council meetings and other public forums ♦ ♦Publications, written materials Reports to the community, brochures, handouts, maps, promotional materials ♦ ♦Open Book & finance portal Ensures financial transparency to community ♦ ♦Citizen Portal – Development Building permit and development review project detail ♦ ♦Crime Statistics and Mapping Community crime statistics and mapping ♦
Online Mapping Provide a variety of community-related data by means of mapping applications that function on desktop, tablet and smartphone ♦ ♦
Online Codes and Charter Searchable text of municipal code, charter and land use code ♦ ♦Online subscriptions Newsletters, monthly reports, City Council voting results ♦ ♦Face-to-face interactions Can include meetings, site visits, events and classes ♦ ♦Knowledge Showcase Lunch-and-learn sessions for all staff ♦Access Fort Collins Customer relationship management system ♦Community Scorecard Annual report to the community containing a range of data ♦ ♦Social networking sites Current news ♦ ♦Online subscriptions Newsletters, monthly reports, City Council voting results ♦ ♦Recreator Electronic version, paper version of available classes or programs ♦Active Directory Access to specified resources ♦VPN Access to specified resources ♦e-Bill An easy-to-use, secure way to view and pay utility bills and access “Monitor My Use” ♦Idea Lab A website where the community can share thoughts and feedback about Fort Collins ♦ ♦Cityworks Asset management system for the City’s Streets and Traffic departments ♦
Accela Land Management Business process management system for the City’s land management activities within Development Review, Building and Code Compliance areas ♦ ♦
Hanson Customer Info System Customer information and billing system for Utilities customers ♦ ♦WebTrac & RecTrac Recreation activities registration system for the community ♦ ♦JDE Financial and personnel system for the City ♦Enterprise Reporting Reporting services that provide access to multiple City systems, e.g., queries ♦Community Dashboard A dashboard of performance measures updated quarterly that tracks the City’s progress ♦ ♦Tiburon - Police A dispatch, mobile communications and records management system ♦Web portal - Utilities Energy and water consumption information and bill pay ♦ ♦
variety of media employed by the departments (Fig. 4.2-1)• To capture knowledge from customers, the City utilizes its
customer listening mechanisms (Figure 3.1-2). Knowledge is captured from suppliers, partners and collaborators through 1) contracts, 2) surveys, 3) in-person discussions such as monthly business rounding [3.2b(1)], bi-monthly Council meetings, bi-monthly Council work sessions, and 4) Cable 14 archives and hard-copy documents that serve as effective tools for transferring relevant knowledge to customers, partners and collaborators. Purchasing policies and requests for proposals, published on fcgov.com, provide detailed expectations and procedures for suppliers. Citizens can download forms, view Council and board meetings and Council packets, query permitting data, view crime rates and accident reports, purchase Lincoln Center tickets and pay utility bills electronically. GIS is integrated into the City website to provide visitors access to special information. FCMaps provides current, timely and local geographic information in an easy-to-use viewer. FCMaps is

21 City of Fort Collins
mobile-friendly and works well on tablets and smartphones as well as desktop browsers. Businesses can access sales tax licensing, bids and RFP requests or view past results. The 350+ClimateWise business partners utilize the website for information on classes, assessments and best practices on sustainable methods. The City implemented Idea Lab in 2013, a new website specifically designed to capture thoughts, ideas and feedback, and to create a space for community discussions. Assembly and transfer of relevant knowledge for use in innovation and strategic planning processes is accomplished as described in Steps 1-5 of SPP [2.1a(1)] and the City’s approach to creating an environment for innovation [2.1a(2)].4.2a(2) Organizational Learning The City uses its knowledge and resources to embed learning in operations:• The City reviews key performance measures to monitor
operations and identify opportunities for improvement [1.1a(3), 4.1b].
• The City’s structured meeting approach, including LL, All Supervisors meetings, and the Hot, Help & Well agenda item, deploys best practices across the organization.
• The City supports leader and staff participation in professional organizations to identify best practices locally and nationally.
• The City performs annual Baldrige-based state and national self-assessments, resources site visits and has a PEP Manager to facilitate work within Performance Excellence Teams to make improvements identified in the feedback reports. The City also supports staff in serving as examiners.
• Key processes are evaluated for process improvements – for example, at the conclusion of SPP and BFO, or the completion of a major project such as MAX, and after City emergencies such as the High Park fire, the City embeds learning by completing reviews and report-outs to identify strengths and needed improvements.
• QSARs provide organizational performance reviews and knowledge transfer between Service Areas and leaders.
• QPA provides the opportunity to learn between staff and their supervisor.
• Customized learning occurs throughout the City. For example, Streets provides a “snow rodeo” each fall to prepare staff for snow removal, the HelpDesk uses learning modules to assist City staff with IT knowledge, Police use “premise knowledge” to provide historical information when they go to a site.
• Policy acknowledgement through JDE assures all staff sign off on new or updated policies.
4.2b(1) Data & Information Quality The City manages data and information to ensure:• Accuracy &Validity: For accuracy, only trained individuals
receive authorization to input data, with additional safeguards such as drop-down lists to limit free text, character and value control limits, and error message alerts. Validity is ensured through sign-on authority for tracking input data to the user level, and major systems such as E911, Police Records, JDE, Accela, Ventyx, RecTrac, Cityworks, AMFC systems, Maximo, Asset Management and SIRE have full, internal audit capabilities. Validity is also ensured through the selection process for data and information [4.1a(1)].
• Integrity: Data users monitor checks and balances to ensure data integrity. For example, the P-card process went through PDCA process improvement that resulted in adding a module
in JDE for a consistent process. Integrity also encompasses the completeness of information; programs are designed with required data fields.
• Currency: With broad network, wireless and Internet access throughout the City, an enterprise reporting platform, and real-time information for all critical line-of-business applications, timely access to data and information (Figure 4.2-1) is available when and where it is needed. Computers at staff work locations and the addition of electronic tablets and smartphones make information mobile and timely. Data and information also have timelines for updates so that information is not lagging.
4.2b(2) Data & Information Security The City ensures security of sensitive and privileged data and information by creating levels of security through policies, password access for multiple secure systems, limited staff access to HR and other sensitive information, and content filtering tools. Critical line-of-business applications require authentication, and computer system access requires two-level password identification. Strong passwords are enforced and required to be changed every 90 days. Hardware and software tools such as firewalls, encryption of wireless transmissions, and intrusion detection systems facilitate overall computer system security. IT engages in assessments to discover opportunities for improvements. Annually, external auditors evaluate City financial and primary revenue generation processes and systems. The City contracts with independent expert contractors to evaluate security for improvement such as evaluating and performing intrusion detection on systems related to the City’s smart meter infrastructure, assessing the Police Department’s E911/Records Management systems, and evaluating the City’s technology infrastructure and related management practices, which resulted in implementing improvements such as new HelpDesk software, improved desktop deployments and upgrades to wireless services.The workforce receives training on IT security issues of password confidentiality, logging out of a computer before leaving and awareness of who may be able to look over a computer user’s shoulder and see screen displays. IT grants access to specific software modules and screens on a job-specific basis and removes access codes for terminated staff on last day of employment. Computer screens time out when left unattended. Since 2013 Human Resources has provided a training program from the SANS Institute called “Securing the Human.” The program contains 43 short, end-user level instructional videos that teach and promote security-aware behavior of staff. Topics include safer use of email, internet browsing, passwords, physical security, data destruction, insider threats and hacking.In addition to all of the above, to oversee cybersecurity, the City subscribes to a service that contains black lists for identifying malicious sites. 4.2b(3) Data & Information Availability The City makes needed data and information appropriately available and accessible to the workforce, suppliers, partners, collaborators and customers as highlighted in Figure 4.2-1. User-friendly formats include access tabs, drop-down menus, online help/directions, highlighting frequently accessed information, embedded links and easy-to-read font sizes. Data is available by a variety of means and through multiple platforms. An
22 City of Fort Collins
enterprise reporting program creates opportunities for data from a variety of systems and applications to be delivered and presented in standardized reporting tools and formats. Updates to systems such as JDE, the City’s ERP system, allow that system to be accessed via tablets. Finally, the City’s website takes advantage of responsive web design techniques. This ensures that City information via the web is tailored for the device in use by the customer, whether that is a traditional PC, tablet or smartphone.4.2b(4) Hardware & Software Properties The City uses multiple approaches to ensure that hardware and software are reliable, secure and user-friendly.To ensure reliability, IT negotiates a “Service Level Agreement” across the City’s line of business that sets expectations for cycle time by types of activity and creates the schematic for managing IT staff resources. For instance, a minor problem affecting one person has a 24-hour service standard, while a major problem affecting scores of employees will be addressed immediately. IT monitors a “Server Scheduled Uptime” report daily and replaces hardware through a life-cycle planning process. To ensure the consistency of the user experience, staff assists in the selection process for software and hardware, and participates in pilot projects, system updates, and training sessions. Trained super-users support implementation. To track user friendliness, IT administers a Customer Satisfaction Survey, comprised of a daily “How are we doing” survey and an annual “ISS.” Data are reviewed monthly by department leaders and staff, and are used to drive improvement across the organization. Approaches to ensure hardware and software security are described in 4.2b(2).4.2b(5) Emergency Availability Approaches for ensuring availability of hardware and software systems, data and information in the event of an emergency are outlined in the City’s Emergency Operations Plan (EOP) [6.2c(2)]. IT maintains the availability of all production systems and protects data assets in normal operating and emergency conditions. Key operating practices to ensure emergency availability include:
5 Workforce Focus 5.1 Workforce Environment5.1a(1) Capability & Capacity The City’s departments assess workforce capability and capacity for integration into the BFO and SPP processes [2.1a(1)]. Each department evaluates staffing and resource plans and completes budget requests (BFO offers) to define staffing resources that support a specified level of service; this includes evaluating needed skills, competencies and certifications for existing and new or enhanced services. To project day-to-day staffing needs, departments assess day-to-day staffing levels using seasonal and historical trends and adjust to levels for low and peak demands. To ensure resources are appropriate, departments quarterly use JD Edwards information that shows FTE, payroll and financial data. For emergency staffing, Continuity of Government (COG) plans identify required essential personnel [6.2c(2)]. Council determines capability needs for Boards and Commissions (volunteers) through City Code, which is verified in specific by-laws [5.1a(4)]; capacity is defined by outlining qualifications and time commitments, which is then used to recruit volunteers [5.1a(2)].
Capacity and capability needs for community volunteers used within departments or during special events are determined annually by the volunteer point person within the specific department who analyzes the previous year and uses the information to adjust accordingly. During the 2013 SPP, a volunteer coordination team formed to evaluate best practices and gaps in community volunteer recruitment, onboarding, engagement and recognition and resulted in approval of a BFO offer for a volunteer coordinator, who was then hired in 2015.5.1a(2) New Workforce Members The City’s nine-step, standardized recruiting and hiring process (Figure 5.1-2) is a collaboration among HR and Service Area Directors and has been evaluated and improved (Figure 5.1-1). The Recruitment Specialist begins the process by interviewing the hiring manager to review the position and establish a template-based timeline and checklist, including assigned responsibilities. Recruiting approaches include internal notices, website postings and advertising, with innovative approaches such as intern programs, professional organizations and social media (e.g., job boards, LinkedIn, Twitter). Applicants are screened using
• Redundant architecture for core switching, mirrored data sets on Storage Area Networks, data backup in disk-to-disk structures to facilitate quick restoration, and deep archive tape backups seven miles from the source data center.
• UPS backup of telephone system and generator power backup for key datacenter, police and utilities operations.
• VHF/UHF radio communications network for Utility Services.• Hardware contracts with external vendors allow
emergency support during a disaster for all infrastructures including network equipment, telecommunications, radio communications and application servers.
• Disaster recovery site for Advanced Meter Fort Collins.• UPS backup for Data Center and Disaster Recovery Site with
secure access and two core switches configured as one logical switch for seamless network transfer in event of single site failure.
• Cisco SmartNet maintenance contract on network hardware with critical infrastructure coverage 24/7.
• The EOP Plan is reviewed and updated annually to reflect changes in state or federal mandates and lessons learned from drills and actual emergencies.
• Mobile Device Management system that manages the configuration, applications and security on mobile devices that are able to access the organization’s network.
• Password rotations and use of strong passwords required on all City applications.
• A “cloud first” strategy for the implementation of new systems that serves to look for systems and services that are provided through cloud-based providers in order to decrease time-to-deployment, increase flexibility, decrease risk, and limit on-site infrastructure growth.
• The development of a Business Continuity Plan was funded for 2016, which will provide specific detail and direction for the prioritized recovery and support of systems in the event of an emergency. This plan will also assess the current situation and identify the need for adjustments to the existing infrastructure that supports the recovery of systems.

23 City of Fort Collins
Figure 5.1-1: Workforce Focus Learning Cycles2002 Implemented learning and development program2010 Updated pay policies, wellness website and JDE2011 Implemented Lead 4.0
2012Added safety indicators to the MOR, implemented HR Interactive Dashboard Implemented Internal Services Survey
2013
Implemented employee goal cards, updated performance management processes, implemented EconoHealth (Wellness Dashboard), deployed “Stay Informed, Stay Involved” bookmark, implemented Career Wow!, expanded 360 Leadership Development PlanPiloted Lead 1.0
2014
Implemented recruitment management applicant tracking system (Cornerstone)Implemented a volunteer coordination group Implemented Annual Lead 1.0 class
2015
Added Lead 2.0 for supervisor-level leadersOpened CityCare (on-site medical clinic)Completed Comp and Career StudyCreated “Stay Interview” toolkitImplemented Employee Recognition WeekDeveloped Total Rewards FrameworkImplemented QPA processHired Volunteer CoordinatorDeveloped Volunteer Handbook, Database, and implemented Volunteer Agreement
job requirements to select final candidates. After extending a conditional offer, HR completes background checks, drug testing and fit-for-duty or workplace evaluations and sends a New Hire Packet to the hiring manager, who notifies IT, Payroll, and any other job-specific support departments (e.g., Risk Management for safety equipment). New hires attend NEO within one month of hire. To support retention, departments use training and orientation supported by customized orientation checklists and a formal check-in after six months on the job. In 2014, in a cycle of improvement to streamline the process, HR implemented Cornerstone, a recruitment management applicant tracking software program. HR held focus groups of hiring managers during the discovery process and identified a need for a better screening process and communication with the applicants. The improvement features an automated screening function and efficiencies to onboarding by sending email messages to the appropriate internal staff such as IT, Operations Services (for name badges), Payroll (for JDE) and Parking Services (for passes). The applicant also receives an email with organizational information and start-up paperwork. Ensuring that the City’s workforce represents the diverse ideas, cultures and thinking of the community begins with recruiting and hiring by: 1) considering a wide range of candidates for open positions; 2) inviting a cross-section of the workforce to participate in peer interviews; 3) using multiple recruitment tools such as job fairs, local newspapers, workforce centers, non-profit agencies, libraries and professional associations; and 4) frequently publishing job openings in professional publications and national media to attract the best and brightest in specific fields. The City adheres to equal opportunity employee standards. To retain diverse members of the workforce, the City has benefits and policies that support diverse needs, offers flexible hours and work schedules, and uses cross-functional teams that are intentionally built to represent employees with differing perspectives. The City uses the DiSC Personal Profile System to identify differing employee strengths. In 2013, 10 facilitators were certified to administer the DiSC throughout the organization, and in 2014, six facilitators received a more in-depth team training program called GroupsWork to train teams on teamwork skills required by all high performance groups.Volunteer Boards and Commission members are recruited annually in the fall to fill vacant positions, and mid-year vacancy interviews occur for resignations. To ensure diversity of ideas, expertise and community representation 1) members only serve two full terms, 2) the four-year terms are staggered, 3) members may not serve concurrently on more than one board or commission, and 4) City employees are restricted in their service on any board. Notice of openings is posted on fcgov.com and interested citizens complete an application. Those who best meet the defined recommended qualifications are interviewed by representatives of varying perspectives: the City Manager, Mayor, Mayor Pro Tem and two Councilmembers. To support retention, new members complete training within six months of appointment, with a checklist for effectiveness, and annually all members are required to attend training in regard to structure and operation of City government, and their legal and ethical duties. Volunteers in other areas of the City are recruited through area-specific newsletters and the “FC Volunteer” webpage that describes volunteer needs and has an online
application process to fit the needs of individuals who may wantto volunteer one time, or for a longer-term commitment. TheVolunteer Handbook assists departments in consistently deploying information needed by volunteers such as policies, safety, guiding principles, code of conduct and a volunteer agreement that is signed before beginning volunteering. Longer-term volunteers follow job-specific descriptions and receive department training.5.1a(3) Work Accomplishment The City manages its workforce according to the City Charter and City Code, which define roles and functions across the organization, including those for Boards and Commissions. To accomplish the work of the organization, work is managed, organized and aligned through departments within the seven key outcomes (P.1-1). Some departments provide services directly to customers (e.g., Police Services) while others provide functions to support the work of other departments (e.g., Purchasing). Employees work in collaboration across department lines using cross-functional teams to accomplish work and capitalize on the City’s core competency of commitment to the community. The cross-functional teams work on strategic initiatives and projects to achieve both short- and long-term action plans [2.2a(2)]. The City reinforces a customer and business focus by: 1) implementing goal cards that align individual goals with organizational strategies and priorities, and 2) annually evaluating every employee on competencies that support a customer and business focus [5.2a(4)]. Creating a workforce that exceeds performance expectations begins with hiring the right candidates through the hiring process (Figure 5.1-1) and continues through the performance management system [5.2a(4)]. The annual evaluation identifies development opportunities to assist employees in improving performance. The organization’s compensation process includes financial incentives that recognize and reward individuals who exceed performance expectations. Each board and commission accomplishes the work of the

24 City of Fort Collins
Figure 5.1-2: Workforce Focus Learning Cycles
Figure 5.1-3: Workplace Environment WORKPLACE FACTOR MEASURE Targets
WELLNESS
Average number of Well Days earned per participant
>2.17.3-9
Number of employees who enroll in Well Days Incentive Program and complete the pre-program survey
>7617.3-9
SECURITY
Security Assessments for each City building
Employee badges with levels of security access
100%
100%
ACCESSIBILITY Reasonable accommodations completed 100%
organization by having distinct functions, following bylaws, and writing an annual work plan for the following year that defines how their goals and current, ongoing and upcoming projects align with the seven outcome areas, strategic plan and Council’s work plan. Their open, monthly meetings include time for public input, which capitalizes on the core competency of commitment to the community, and Council liaison and staff liaison roles assist in resources for a customer and business focus. The Boards and Commissions receive scheduled reviews by the Council. Volunteers in other areas of the City accomplish work according to job-specific descriptions and departmental training. 5.1a(4) Workforce Change Management The City prepares the workforce for changing capability and capacity needs through systematic communication and support processes. As soon as a change in capability and capacity is identified, ELT engages in transparent and frequent communication using mechanisms highlighted in 1.1b(1). As part of the SPP, ELT members develop plans to address new capability and capacity requirements. These plans include learning and development opportunities to help the workforce gain needed skills and competencies [5.2c(1)]. When City staffing needs expand (e.g., when 20 new positions were funded through the Keep Fort Collins Great [KFCG] initiative), the systematic BFO process identifies new positions [2.2a(4)] and the recruiting and hiring process fills them [5.1a(2)].To prevent workforce reductions, the City addresses temporary or fluctuating capability and capacity needs through cross training, and contract and seasonal workers. If workforce reductions become necessary, such as when automated technology replaced meter readers, the City uses a Reduction in Force (RIF) process and decision tree, including frequent and pro-active communication, severance pay, career counseling, and outplacement services. Changes in organizational structure begin at the ELT level. Once a change is identified, ELT discusses and approves the change and project plan at their weekly meeting. Communication to the organization occurs through two-way communication at leadership meetings (LL, SIT and All Supervisors). Depending on the scope of the change, various methods, such as change management programs like GroupsWork, are administered. The Utilities Customer Connections Department (CCD) went through a yearlong optimization process where a project plan was developed, approved by ELT and implemented.Because Boards and Commissions are written into City Code, when the Council identifies a need to increase or decrease the number of members or boards, a request to Council with support of two Councilmembers is submitted for inclusion on the Council agenda for discussion.5.1b(1) Workplace Environment The City ensures workplace environmental factors such as health, security and accessibility through: 1) the Wellness Program; 2) the Safety, Security and Risk Management (SSRM) team and department- specific safety teams; and 3) workplace policies and procedures. Standard operating procedures specific to individual departments address
differing workplace environments. Key performance measures and targets are highlighted in Figure 5.1-3. Health: The City offers employees a comprehensive package of health and welfare benefits on a cost-share basis. As a component of the total benefit/compensation program, the organization supports an incentivized wellness program to encourage and reinforce healthy practices and behaviors. It offers employees health risk assessments, collects and tracks benefit claims and health risk data, conducts needs and interest surveys, and administers a pre-/post-program survey. Staff has access to health and wellness services (Figure 5.1-4).Security: The City has a range of practices and procedures to ensure a secure environment for employees and the public. The safety and wellness programs, together with facilities management policies, ensure implementation of security practices, including identification badges for all employees, a sign-in process at secured facilities, emergency/evacuation plans for various threats, access control of all exterior doors via key fob, master key system for control of interior doors, panic alarms for high-risk areas, and video security cameras in select locations. Facility and computer access is granted on a job-specific basis, through a hire and fire process that ensures timeliness and consistency across the organization. The City also contracts for after-hours security patrols, maintains cyber security [4.2b(2)], provides organization-wide safety and security training, designs the work environment to ensure safety (e.g., plexiglass barriers), and performs background checks, as well as pre-employment and random drug testing. Security is assessed and improvements made to keep staff safe including 1) creating a Vortex Team (a core group of staff that responds to and assesses security risks identified by staff members), 2) completing City’s Security Assessments for each City building resulting in installation of teller windows in the transit center, and remodeling the City Clerk’s Office and City Manager’s Office with enhanced safety precautions, and 3) dedicating the All Supervisors meeting to safety, including a presentation by a SWAT colleague who trains on safety awareness and planning across the country. Accessibility: The City recognizes physical, technological, and attitudinal accessibility, and provides individualized support
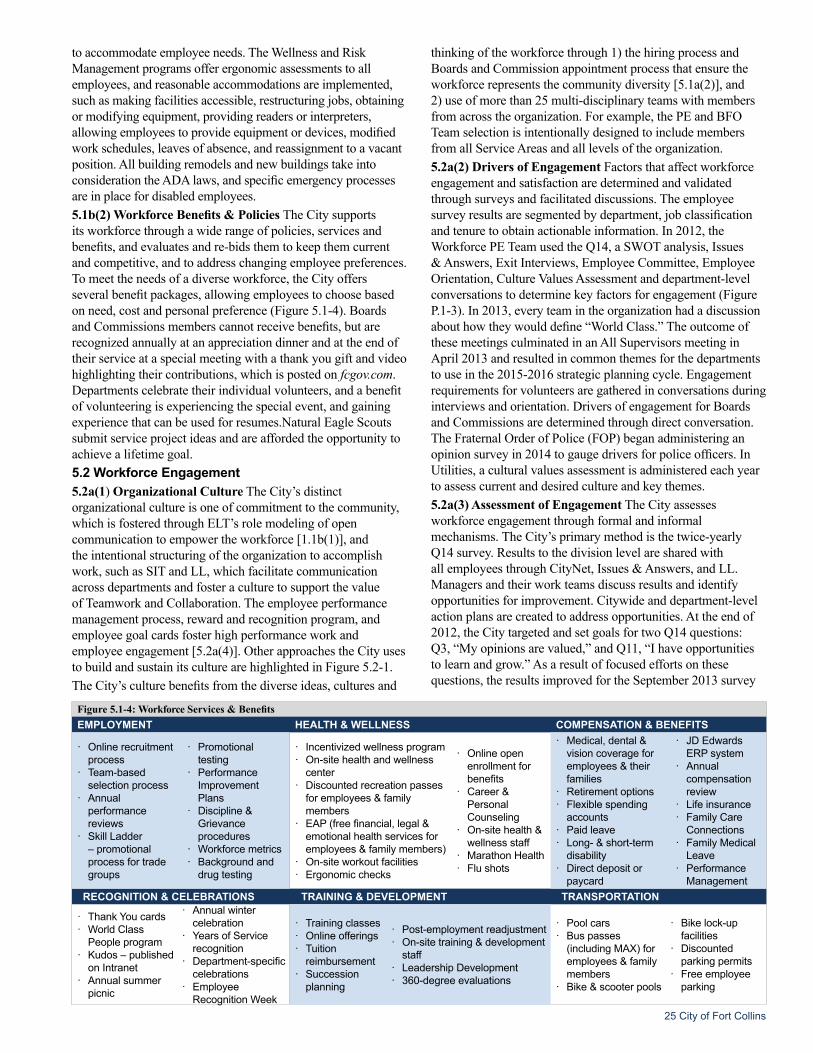
25 City of Fort Collins
Figure 5.1-4: Workforce Services & BenefitsEMPLOYMENT HEALTH & WELLNESS COMPENSATION & BENEFITS
· Online recruitment process
· Team-based selection process
· Annual performance reviews
· Skill Ladder – promotional process for trade groups
· Promotional testing
· Performance Improvement Plans
· Discipline & Grievance procedures
· Workforce metrics· Background and
drug testing
· Incentivized wellness program· On-site health and wellness
center· Discounted recreation passes
for employees & family members
· EAP (free financial, legal & emotional health services for employees & family members)
· On-site workout facilities· Ergonomic checks
· Online open enrollment for benefits
· Career & Personal Counseling
· On-site health & wellness staff
· Marathon Health· Flu shots
· Medical, dental & vision coverage for employees & their families
· Retirement options· Flexible spending
accounts· Paid leave· Long- & short-term
disability · Direct deposit or
paycard
· JD Edwards ERP system
· Annual compensation review
· Life insurance· Family Care
Connections· Family Medical
Leave· Performance
ManagementRECOGNITION & CELEBRATIONS TRAINING & DEVELOPMENT TRANSPORTATION
· Thank You cards· World Class
People program· Kudos – published
on Intranet· Annual summer
picnic
· Annual winter celebration
· Years of Service recognition
· Department-specific celebrations
· Employee Recognition Week
· Training classes· Online offerings · Tuition
reimbursement· Succession
planning
· Post-employment readjustment· On-site training & development
staff· Leadership Development· 360-degree evaluations
· Pool cars· Bus passes
(including MAX) for employees & family members
· Bike & scooter pools
· Bike lock-up facilities
· Discounted parking permits
· Free employee parking
to accommodate employee needs. The Wellness and Risk Management programs offer ergonomic assessments to all employees, and reasonable accommodations are implemented, such as making facilities accessible, restructuring jobs, obtaining or modifying equipment, providing readers or interpreters, allowing employees to provide equipment or devices, modified work schedules, leaves of absence, and reassignment to a vacant position. All building remodels and new buildings take into consideration the ADA laws, and specific emergency processes are in place for disabled employees. 5.1b(2) Workforce Benefits & Policies The City supports its workforce through a wide range of policies, services and benefits, and evaluates and re-bids them to keep them current and competitive, and to address changing employee preferences. To meet the needs of a diverse workforce, the City offers several benefit packages, allowing employees to choose based on need, cost and personal preference (Figure 5.1-4). Boards and Commissions members cannot receive benefits, but are recognized annually at an appreciation dinner and at the end of their service at a special meeting with a thank you gift and video highlighting their contributions, which is posted on fcgov.com. Departments celebrate their individual volunteers, and a benefit of volunteering is experiencing the special event, and gaining experience that can be used for resumes.Natural Eagle Scouts submit service project ideas and are afforded the opportunity to achieve a lifetime goal.5.2 Workforce Engagement 5.2a(1) Organizational Culture The City’s distinct organizational culture is one of commitment to the community, which is fostered through ELT’s role modeling of open communication to empower the workforce [1.1b(1)], and the intentional structuring of the organization to accomplish work, such as SIT and LL, which facilitate communication across departments and foster a culture to support the value of Teamwork and Collaboration. The employee performance management process, reward and recognition program, and employee goal cards foster high performance work and employee engagement [5.2a(4)]. Other approaches the City uses to build and sustain its culture are highlighted in Figure 5.2-1.The City’s culture benefits from the diverse ideas, cultures and
thinking of the workforce through 1) the hiring process and Boards and Commission appointment process that ensure the workforce represents the community diversity [5.1a(2)], and 2) use of more than 25 multi-disciplinary teams with members from across the organization. For example, the PE and BFO Team selection is intentionally designed to include members from all Service Areas and all levels of the organization.5.2a(2) Drivers of Engagement Factors that affect workforce engagement and satisfaction are determined and validated through surveys and facilitated discussions. The employee survey results are segmented by department, job classification and tenure to obtain actionable information. In 2012, the Workforce PE Team used the Q14, a SWOT analysis, Issues & Answers, Exit Interviews, Employee Committee, Employee Orientation, Culture Values Assessment and department-level conversations to determine key factors for engagement (Figure P.1-3). In 2013, every team in the organization had a discussion about how they would define “World Class.” The outcome of these meetings culminated in an All Supervisors meeting in April 2013 and resulted in common themes for the departments to use in the 2015-2016 strategic planning cycle. Engagement requirements for volunteers are gathered in conversations during interviews and orientation. Drivers of engagement for Boards and Commissions are determined through direct conversation. The Fraternal Order of Police (FOP) began administering an opinion survey in 2014 to gauge drivers for police officers. In Utilities, a cultural values assessment is administered each year to assess current and desired culture and key themes.5.2a(3) Assessment of Engagement The City assesses workforce engagement through formal and informal mechanisms. The City’s primary method is the twice-yearly Q14 survey. Results to the division level are shared with all employees through CityNet, Issues & Answers, and LL. Managers and their work teams discuss results and identify opportunities for improvement. Citywide and department-level action plans are created to address opportunities. At the end of 2012, the City targeted and set goals for two Q14 questions: Q3, “My opinions are valued,” and Q11, “I have opportunities to learn and grow.” As a result of focused efforts on these questions, the results improved for the September 2013 survey

26 City of Fort Collins
Figure 5.2-1: Fostering High Quality Public Service
OPEN COMMUNICATION· Fort Shorts employee newsletter· Issues & Answers· Talk It Up sessions with the City Manager· All-employee emails· Cable 14· Departmental all-employee meetings· Employee Committee· CityNet· Good News Items - City Council· Video messages from City Manager
HIGH PERFORMANCE WORK· Management teams (ELT, SIT, LL, All Supervisors)· BFO, PE, other cross-functional teams· QPA process and goal linkage through Talent|Reward to the
organization’s goals· City Connections Team· Community Scorecard· Police Rewards Program· Vision/Mission/Values Statement· Open Book· Access Fort Collins
ENGAGED WORKFORCE· Annual Employee Recognition Week· Years of Service recognition program· Q14 employee survey· CityWorks 101· Thank You cards· Employee blog· Incentives for participation: Wellness, Safety Bucks· World Class People program· Employee holiday event· “Kudos” column on CityNet· Annual FC Innovates Event
and were maintained in spring 2014. Based on the 2014 Spring Survey results, the City focused on Q13, “I am able to maintain a healthy balance between my work and my personal life,” and Q8, “My team is recognized for their efforts.”Informal approaches used to understand engagement are staffmeetings, employee event participation, the Employee Committee, community involvement, employee focus groups, day-to-day interactions with employees, Talk It Up sessions and two-way communication approaches (Figure 1.1-2). In 2014, Board and Commission volunteers provided input into the SPP, BFO, and meetings to discuss and assess the current Board and Commission structure and ways to improve citizen engagement. As a result, the City increased learning opportunities for Board and Commission members to a quarterly basis. Other indicators to assess and improve workplace engagement include turnover rate, safety indicators and formal grievances. Safety and turnover are monitored monthly through the MOR process. The methods and measures are segmented by Service Area and department. For example, monitoring safety indicators revealed a higher incidence of safety issues in the Streets department. As a result, the Streets department developed an internal safety team to raise awareness and determine root causes of accidents. 5.2a(4) Performance Management The City uses an integrated performance management system called Talent|Reward where each employee submits individual goals that align with organization-wide goals, competencies (job-specific and in support of organizational core competency), core values and department goals. The HR manager and staff assess the process annually for improvements to make it more efficient and integrate it with other key processes that support high performance work and engagement.As a result of the assessment, using feedback from leaders, a flat percentage that leaders are able to use for pay increases was added, and in 2016 a Quarterly Performance Alignment (QPA) process began that established quarterly goal meetings between staff and their immediate supervisor. The transition in Q4 2015, gave supervisors and managers an opportunity to “practice” the new process and close out 2015 evaluations. QPA focuses on behaviors and results, and enables supervisors to spend more time in two-way communication, evaluating goals on a scale of “on track,” “outperforming” or “needs improvement” and affords the opportunity for coaching. Likewise, each employee’s manager is reviewed against both individual and team goals. This extends throughout the organization to the City Manager’s performance review by the City Council, which includes overall organizational performance results, twice-yearly employee survey results, and service requests from citizens throughout the community [1.2a(2)]. A key component of the Talent|Reward performance management tool is setting individual goals that support the achievement of action plans of the organization, including customer focus. To further support high performance work and employee engagement, the performance management process includes opportunities to define career goals and develop performance improvement plans. As part of the process, employees and managers identify training opportunities to achieve goals.Boards and Commissions complete reviews with Council on a scheduled rotating basis prior to the annual recruitment process
to show alignment to the seven outcome areas and their annual work plan progress, and to provide feedback to Council on the size of the Board and effectiveness of communication with Council with suggested improvements. Each Board is required by January 31 to submit an annual report on the work of the previous 12 months. Compensation is based on the performance of the individual and ties directly to the results of the Talent|Reward review. Compensation is assessed annually to determine necessary pay changes. City positions have a Job Analysis Questionnaire (JAQ) identifying essential duties, knowledge, skills, abilities, certifications and level of education necessary to perform the job. Point values are assigned to the JAQ, the job is placed in the appropriate job scale, and a formal job description is created. The City maintains membership in the Mountain States Employers Council, which provides an annual market analysis. Pay grades are set from market analysis data and adjusted to remain competitive. The City’s reward and recognition program includes non-monetary practices that acknowledge the contribution of the individual (Figure 5.1-4) Incentive practices include bonuses and/or ongoing pay increases based on exceptional performance. The Wellness program also provides incentives. 5.2b(1) Learning & Development System To support the organization’s needs and the personal development of employees, since 2002 the City has had a formal training and development program. Training and development offerings are determined by HR completing an initial needs assessment with follow-up surveys, and feedback from ELT, departments

27 City of Fort Collins
Figure 5.2-2: Learning & DevelopmentORGANIZATIONAL FACTOR
SAMPLE OPPORTUNITIES
Performance Improvement & Innovation
6D’s training coursePDCA Training (Q4-2014)Innovation BFO OfferTechnology Courses
Ethics
Ethics component of Lead 1.0; ethics training at All Supervisor; Code of Ethics-Living our Values, which was developed by Utilities; Title VI Training for Leaders
Customer FocusTraining All Supervisors – semiannual Customer service initiative in accounting/payroll and finance training
Action Plans/Strategic Challenges
Sustainability coursesTraining at All Supervisors meetingStrategic Plan inputs
and employees that is acquired from HR Roadshows, monthly emails, and department and leadership meetings. For example, technology classes were added based on feedback from staff responding to the monthly Learning & Development Opportunities emails. HR aligns identified training needs with the organization’s core competency, strategic challenges and short- and longer-term action plans (Figure 5.2-2), and training is developed using the Six Disciplines of Breakthrough Learning Model (6 D’s model). Employees are informed about training and development opportunities through Talent|Reward, the Learning and Development Catalog, the HR Road Show, email alerts, CityNet and staff meetings. In 2013, the City joined forces with Larimer County, Poudre School District and CSU to expand learning and development opportunities through a Lead 1.0 pilot program. The intensive training program for emerging leaders included participants from each of the four organizations. The popular training has grown within the City since 2014 with an expanded version of the Lead 1.0 program offered to accommodate more participants (Figure 7.3-16).Additionally, 90 management-level leaders completed an extensive learning program including 360-degree assessments and professional coaching. To ensure transfer of knowledge from departing workforce members, the City has a Knowledge Transfer guide, including an off-boarding checklist. Departing workforce members are sometimes contracted back to assist in special projects and train their replacements. The Boards and Commissions’ rotating terms ensure transfer of knowledge. 5.2b(2) Learning & Development Effectiveness The City uses the Kirkpatrick model to evaluate the effectiveness of learning activities. All classes undergo Level 1 evaluations, and Supervisor Summit classes undergo Level 2 evaluations. Lead 1.0 and 4.0 undergo Levels 3 and 4 (ROI). The City also tracks the hours of training and number of classes offered to employees as part of the ICMA-CPM. HR monitors and tracks personnel policy issues relative to an employee’s training history. The Wellness Program, which includes targeted learning opportunities, is evaluated through a pre/post survey.The City relates findings from workforce engagement assessments to key business results during Step 1 of the Strategic Planning process. The Assistant City Manager/Information and Employee Services, HR Director and HR Managers identify related workforce engagement data that correlate with business results and communicate this information to the Strategic Planning Core Team [2.1a(1)]. For example, the Citizen Survey results regarding “rating city
employees” are above the national average and correlate with the Q14 overall high engagement scores. Workforce engagement is also a key indicator of employees’ focus on the customer and the desire to deliver exceptional service; therefore, engagement is correlated with customer service, and the core competency of commitment to the community. PDCA training was added as an outcome of the HPG 7.7 strategic objective (Figure 2.1-4), along with Sustainability Assessment Tool (SAT) training to integrate economic, environmental and social criteria during decision-making. 5.2c(3) Career Progression Staff career progression begins with setting goals at performance reviews. Staff and supervisors discuss and document plans for growth opportunities within the organization, and collaboratively manage progress, learning and development opportunities, coaching, mentoring, conferences and paid professional organization memberships that support the plans. The City regularly promotes from within. Seven of the 10 ELT members were internally promoted, and 36 out of 44 SIT members. Interns who want to move into staff positions are also supported. Select departments, such as Utility Services, implement succession planning and knowledge transfer when key positions and skill sets are expected to see significant employee turnover in the near future. CareerWow!, in place since 2013, provides a self-paced, online career exploration program for all employees. The City rolled out the “Stay Interview” Toolkit to SIT in 2014, and a Comp & Career Path study was completed in January 2015 to improve performance management, compensation and career management. Many of the Boards and Commissions members attended CityWorks 101 [1.1a(1)] and then applied for appointment.
6 Operations Focus 6.1 Work Processes 6.1a(1) Product & Process Requirements Product and process requirements are determined by multi-disciplinary teams during product and process design [6.1a(2)]. The team approach fosters employee engagement and a culture of innovation. Teams analyze customer input on service needs, expectations and requirements gathered through annual resident and business surveys, Council meetings, boards and commissions, the Access Fort Collins/SARs process, employee input, focus groups and benchmarks (Figure 2.1-3). Key work processes, requirements
and measures support integration throughout the City by aligning them to the seven outcome areas ( Figure 6.1-2), which are the City’s key work systems [2.1a(4)].6.1a(2) Design Concepts The City’s core competency of commitment to the community is realized through design of products and work processes. The City designs services and work processes to meet all key requirements by aligning product delivery mechanisms with the seven key outcome areas (Figure P.1-1), and by department leaders managing the key work and support processes to support those outcome areas (Figure 6.1-2). For integration that ensures all requirements are

28 City of Fort Collins
Figure 6.1-1: Learning Cycles 2008 · Implemented Everbridge Emergency Notification System2009 · Adopted Environmental Policy
2011
· Resourced Performance Excellence Program · Earned NOAA designation as a Storm Ready Community, ISO 14001 Certification for Drake Water Reclamation Center & RMPEx Award-Foothills Level
2012
· Initiated sustainable purchasing · Developed pre-sediment basin for water quality · Earned ISO 14001 Certification for Mulberry Water Reclamation Facility
· Implemented PE Teams based on Baldrige Criteria· Added DART and RAF to MOR· Launched police case management tracking system · Updated purchasing policies and procedures · PDT Reorganization· Updated GEMS· Developed Operations Manual for Sustainability Services
2013
· Initiated BFO Improvement · Installed encrypted radio system· Implemented data-driven policing · Implemented portal for Council documents· Developed business assistance agreements· Developed URA policies and procedures
2014
· Completed safety assessment and began developing an organizational safety plan
· Developed and piloted a PDCA training program· Earned ISO 140001 Certification for Streets EMS
2015· Received Directors level from AWWA-Partnership for Safe Water (15 years in a row)
· Implemented Policy Development Process
met: 1) the Key Outcome areas are integrated into SPP, 2) BFO [2.1a(1)] identifies the need for new technology when offers are developed, 3) organizational knowledge is utilized through the formation of the BFO teams, and 4) metrics associated with the BFO offers provide results for the delivery of a product/service. The potential need for agility in developing a new product or service is addressed not only through BFO, but also through the City’s process to decide which strategic opportunities are intelligent risks for pursuing [2.1a(2)] and action plan modification (2.2b).6.1b(1) Process Implementation The City’s organizational structure of service units and departments reporting to service area leaders (ELT), and the process of departments setting goals each year that align with the City’s goals, BFO priorities, and the City master plan, ensures that day-to-day operations meet the key work process requirements. These goals cascade through the organization, from the City Manager through each service area and department to the individual employee. Monitoring the results of the measures and taking corrective action when indicated ensures day-to-day operations meet the requirements. Performance measures of key work processes are displayed in Figure 6.1-2. Various daily electronic tracking resources are used by managers to track day-to-day operations, including an event management system (Parks), Tiburon Computer Aided Dispatch (Police Services), Clear Point (Finance), Recruitment and Selection Status Sheet (HR), Water Treatment Facility Daily Status Reports (Utilities), FCTrip (PDT), street maintenance schedule (PDT-Streets) and Sysaid ticketing system (IT). 6.1b(2) Support Processes The City’s key support processes comprise the outcome area of the High Performing Government work system and are determined by state law authorizing cities to provide “municipal services” (Figure 6.1-2). The key support
processes provide internal services for all work areas. Day-to-day operation of these processes is managed as described in 6.1b(1). 6.1b(3) Product & Process Improvement The City utilizes the Performance Excellence criteria as a framework for annually assessing the organization as a whole, identifying areas for improvement and reducing variability across the City. Cross-functional teams use the Baldrige Criteria to identify areas for improvement and develop solutions. The QSAR discussions are used by the Service Areas to discuss gaps and process improvement opportunities, and in Q3 2016 current PDCA projects and their status will be part of the agenda. Performance improvement methods such as ISO standards (two water treatment and streets facilities are certified, and 12 staff completed auditor training in 2016) and PDCA are utilized at the department and team levels, as deemed appropriate for a specific industry (e.g., wastewater treatment) or improvement need (e.g., improving Access Fort Collins). The City’s application of the ISO 14001 Criteria identified recycling as an improvement priority based on a scoring matrix that considers scale, probability, duration of impact, cost and department scope. Thus, the City is developing a recycling action plan. Also, based on internal survey results, an HR stakeholder team used PDCA to improve the effectiveness of the performance management process [5.2a(4)]. Citizen feedback prompted staff to develop a Citizen’s Guide to Development Review and improve online transparency, thus enhancing the City’s core competency of “commitment to our community.” As a learning cycle, the City re-deployed a PDCA training program for the workforce that incorporated an A3 and Lean tools. The City also uses the Sustainability Assessment Tool (formerly known as TBLAM), a method for detailed analysis and benefit-cost accounting that considers the environmental, social and economic aspects of an issue. It was used to consider new floodplain regulations and alternative water treatment methods.6.1c Innovation Management The City manages innovation through the SPP process [2.1a(1,2)]. During the BFO process, “sellers” consider the strategic objectives that include providing innovative solutions and programming into their offers. BFO teams pursue strategic opportunities that determine intelligent risks by ensuring the offer meets strategic objectives. Offers are prioritized based on criteria and need, but depending upon funds available, not all offers may be funded. If an offer is not funded through the budget, the City has Innovation Funds where staff submit an application for team review and consideration of funding based on pre-established criteria [2.1a(2)]. The BFO process (includes products, programs and/or services) and the resulting drilling platform are utilized to discontinue opportunities at the appropriate time and to enhance support for higher-priority opportunities. The City received the J. Robert Havlick Award for Innovation in Local Government recognizing its Sustainability Service Area (SSA) that focuses on the environment, economic health, and social sustainability efforts under the direction of the Chief Sustainability Officer. As a result of the annual assessment of key processes, innovation management was improved through the nine-step Policy Development Process (PDP). A policy is a statement developed by Council to guide actions toward those most likely to achieve a desired outcome. Policy helps in making decisions among alternatives because it guides choices based on the impact

29 City of Fort Collins
they will have. The process assists in not only identifying which offers to accept during the BFO process, but also which opportunities to discontinue pursuing at the appropriate time to enhance support for higher-priority opportunities. PDP steps include: 1) Issue Identified (by citizen, City workforce, Council, and/or Boards & Commissions), 2) Problem statement/scoping/timing identified (Is it the City’s role? Is there Council support? Is it resourced? Is the timing right? How big is the problem? Does issue align with the strategic plan? Would a policyeffort move the needle? Is this a new initiative? How do priorities shift?), 3) Effort moves forward, assigned a project manager/team, 4) Policy option formulated (research issue; gather input from stakeholders, public, Boards & Commissions, Leadership), 5) Complete Council deliberations through work sessions on scope agreement and direction, in regular meetings for decision making. Steps 4 and 5 can go through several iterations before proceeding to 6) recommended action, pause for community review, 7) Council decision, 8) implementation, and 9) evaluation.6.2 Operational Effectiveness6.2a Process Efficiency and Effectiveness The City controls overall costs of operations through multiple mechanisms, including monthly MOR financial tracking (Figures 4.1-2, 3) and BFO [2.a(1)]. BFO includes a cost analysis of submitted budget offers to ensure thoughtful stewardship of tax dollars. City departments prepare budgets and monitor actual performance compared to budget on a monthly basis for both revenue and expenses. If costs are close to exceeding budget, managers implement cost-containment measures. If revenues are lagging behind projections, an analysis is done to determine the impact on reserves. The Finance Department revises projections as necessary, and annually for SPP to determine adequacy of reserves.To avoid costly duplication of administrative functions, the City centralizes support services of Finance, IT, CPIO, HR, City Clerk’s Office, Operations and Purchasing. Purchasing coordinates a competitive bidding process for supplies and manages discounted, organization-wide contracts. Departments establish area-specific productivity and efficiency goals, such as Operation Services tracking mechanics’ and technicians’ productivity as well as “comebacks” for fleet vehicles. The water and wastewater utilities monitor performance relative to efficiency indicators identified and tested by the QualServe Benchmarking Program through the AWWA. To prevent defects, service errors and rework, the City uses standardization (SOP’s, service manuals, checklists), automation (policy acknowledgement, travel expense reports) and technology (JDE, Minute Traq) when appropriate. To minimize the cost of inspections, tests and audits, the City utilizes preventative maintenance programs, as well as external evaluations such as ISO Examiners, Federal Regulators and the City Council/Community (through the SARs process). To balance the need for cost control with the needs of customers, leaders and City Council annually review a strategic financial plan for each utility. The plans guide revenue (rates), requirements and expenses. 6.2b Supply-Chain Management The City’s Purchasing Department manages the supply chain in accordance with well-defined policies and guidelines that ensure 1) stewardship of public funds; 2) standardized, robust, competitive purchasing
practices; 3) fair and equitable consideration of all participants; 4) qualified suppliers positioned to enhance performance and customer satisfaction; and 5) green/sustainable purchases. Buying consortiums, such as the State of Colorado cooperative purchases and Office Depot, are used to leverage economies of scale. RFP and bid processes are used for other selections – RFPs when the award will be based on more criteria than price; bids when items have easily definable characteristics. Cross-functional assessment teams, consisting of the project manager, buyer, and three to four subject area experts/stakeholders, evaluate RFPs using a scored selection process based on weighted criteria. The project manager and buyer review bids, choosing the lowest responsible and responsive supplier [e.g., capable and qualified to perform the work (“responsible”) and meets all of the bid requirements (“responsive”)]. DocuSign efficiently manages the contract process flow utilizing electronic routing for approvals, signatures and distribution. The City’s legal department reviews and approves all contracts, and the use of standardized agreement templates ensures legal compliance, reduces rework and streamlines the review process. All federally funded projects are checked for debarred suppliers using the U. S. Government’s System for Award Management. Recent improvement of supply chain management resulted in adding an e-procurement system that greatly expanded the vendor base and thus competition to deliver the highest quality products and services at the lowest total cost. Project managers measure and evaluate suppliers’ performance against bid specifications and RFP requirements, and poor-performing suppliers are given specific feedback on how to improve. Most construction contracts include liquidated damages for late project completion and contracts for services often include performance requirements. For example, emergency medical services includes liquidated damages based on response time, quarterly performance meetings and a required annual continuous improvement plan. Alternate delivery method processes are frequently utilized for construction contracts. This methodology engages the City, consultants and contractors at the onset of a project to work collaboratively with a team approach and common goals with frequent daily feedback.Project managers provide specific needed improvements to poor-performing suppliers and those who do not improve have their contracts terminated. Most contracts are written for a one-year term with annual renewals up to four years. Ninety days out from renewal, Purchasing contacts project managers to verify the vendor’s performance and determine if the contract will be renewed.Recent improvements to the process that support the City’s strong commitment to sustainability and stewardship include: establishing criteria for green/sustainable purchases and metrics for reporting spend analytics, an internal Sustainable Purchasing webpage with integration with the Enviro Portal, enrollment in the State Electronics Challenge to pursue Gold Certification for total lifecycle management of electronics, reduction in the use of desktop printers and centralizing management of multi-function devices (MFDs), and mandating Citywide the use of 30 percent post-recycle content (PCR) paper.6.2c(1) Safety The City provides a safe operating environment by 1) planning and creating a safe environment that reinforces

30 City of Fort Collins
that safety matters as much as getting the job done, 2) educating, 3) inspection/audit, and 4) analyzing and improving. The City Manager personally met with more than 300 employees on how to provide a safe operating environment, with information used for a Safety Strategic Plan. Accident Prevention:• Monthly review of safety indicators by ELT and department
safety teams with appropriate follow-up• “See Something, Say Something” promotes reporting of all
near misses and incidents for root cause analysis• Job descriptions define employee role-specific safety needs• Risk Management and department safety teams coordinate
new employee safety orientation and on-site training for teams on required safety topics, and personal security (e.g. active shooter/intruder)
• Employee competency of safety in annual performance reviews• Hazard Reduction Fund to resource alleviation of potential
hazards identified by departments • Safety Committee shares safety stories, vets ideas, and provides
feedback and training opportunities• Safety Nets weekly communications on safety topics• City Manager video on safetyInspection:• Safety Plan assesses the City and outlines action items • Dedicated Safety, Security & Risk Management (SSRM)
Team inspects one service area location per quarter with the employees for learning; findings monitored for completion, and after-action reviews for serious injuries
• Citywide Safety and Wellness Team (CSWT) meets monthly to identify safety and wellness needs, serves as a conduit to exchange ideas and best practices across departments
• Voluntarily complies with OSHA regulations; often exceeds standards on personal protective equipment, safety eyewear and footwear, and encourages staff to wear this equipment at home when performing hazardous tasks
• Extensive DOT compliance program seen as a benchmark with a dedicated DOT Safety Specialist to ensure compliance including drug and alcohol testing, recordkeeping and sleep apnea education and screening. Safety and liability audits include administrative safety reviews and hazard assessments
Root-Cause Analysis of Failures:• Robust, multi-pronged reporting approach for near-miss/
safety concerns. Reporting tools include online, telephone hotline, pencil and paper, texting and Access Fort Collins. Tracked in ClearPoint by the City Safety Specialist; progress reported as a leading indicator metric on the MOR.
• Incident action review process includes summary report for sharing. Incidents identified, investigated and root cause identified by Risk Management and the appropriate managers. Information and procedure changes communicated at supervisor briefings and deployed to all employees in the involved work area.
Recovery:• After-action review completed on safety incidents to ensure
communication of the event and prevent recurrence.• Occupational Health Clinic created onsite in 2015 staffed with
an Occupational Health Nurse to provide a medical resource
for all staff 24/7, triage injuries, and ensure expeditious care with an active return-to-work modified duty program.
• Safety policies and procedures developed for the City and for department-specific application.
• All written policies and processes around Safety, Security and Risk Management reviewed annually for updating, resulting in improvement of processes such as initiating safety through inclusion of design and procurement standards on safety and security into specifications.
6.2c(2) Emergency Preparedness The City ensures workplace preparedness for disasters or emergencies through the EOP, OEM, and facility-specific emergency procedures and evacuation plans. The EOP ensures continuity of essential services and includes a plan for recovery, including IT systems [4.2b(5)]. The plan is reviewed and updated annually to reflect changes in state or federal mandates and lessons learned from drills and actual emergencies. First responders and other key City staff have NIMS training and are required to participate in annual drills. A Disaster Council uses the federal Incident Command System (ICS) to set policy, and the Emergency Support Functions use the ICS to lead operations during emergencies. Additionally, the Disaster Council and other leaders participated in customized training exercises at the National Emergency Management Institute to learn procedures for responding to all forms of man-made and natural disasters. As a major emergency responder, the City works cooperatively with other critical response and recovery organizations, such as those that maintain and operate infrastructure and utilities, governmental agencies at all levels, and community organizations. The City maintains a Continuity of Operations Plan (COOP) that outlines actions to ensure the continuation of critical business operations, including information systems and relocation of selected personnel and functions. Both the EOP and the COOP are exercised annually either through an actual incident or a drill. The City participates in regular regional emergency readiness exercises within the Northern Colorado region and at the state level through the Local Emergency Planning Committee (LEPC). State-of-the-art modalities such as webEOC and Mobile Command Vehicles allow public safety teams to provide critical services to residents in a disaster. The City implemented Everbridge, an emergency notification system to communicate critical information to customers during an emergency. The City can call, email or text home, cell or business phones, as well as receiving devices for the hearing impaired. In the event of a disaster or emergency, the City leverages its suppliers and partners to augment staff. The Director of Purchasing is a member of the City’s Emergency Operations Center (EOC) responsible for rapid mobilization of suppliers and partners. The City’s purchasing code includes an exemption to the requirement to competitively bid materials, professional services, services or construction that are required to address an emergency or disaster, and maintains work order agreements with suppliers identified for rapid deployment for debris removal, hauling, tree cutting/grinding, snow removal, equipment and vehicle rentals, asphalt, cement, and other commodities and services.
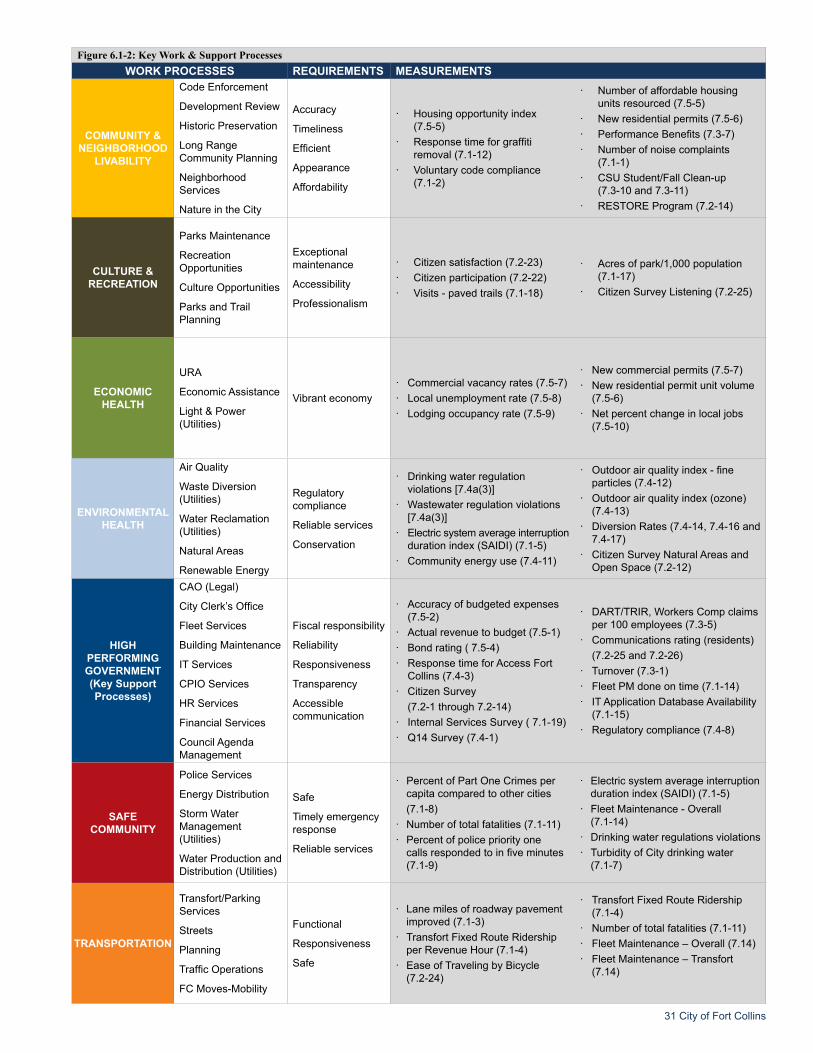
31 City of Fort Collins
Figure 6.1-2: Key Work & Support ProcessesWORK PROCESSES REQUIREMENTS MEASUREMENTS
COMMUNITY &NEIGHBORHOOD
LIVABILITY
Code Enforcement
Development Review
Historic Preservation
Long Range Community Planning
Neighborhood Services
Nature in the City
Accuracy
Timeliness
Efficient
Appearance
Affordability
· Housing opportunity index (7.5-5)
· Response time for graffiti removal (7.1-12)
· Voluntary code compliance (7.1-2)
· Number of affordable housing units resourced (7.5-5)
· New residential permits (7.5-6)· Performance Benefits (7.3-7)· Number of noise complaints
(7.1-1)· CSU Student/Fall Clean-up
(7.3-10 and 7.3-11)· RESTORE Program (7.2-14)
CULTURE &RECREATION
Parks Maintenance
Recreation Opportunities
Culture Opportunities
Parks and Trail Planning
Exceptional maintenance
Accessibility
Professionalism
· Citizen satisfaction (7.2-23)· Citizen participation (7.2-22)· Visits - paved trails (7.1-18)
· Acres of park/1,000 population (7.1-17)
· Citizen Survey Listening (7.2-25)
ECONOMIC HEALTH
URA
Economic Assistance
Light & Power (Utilities)
Vibrant economy· Commercial vacancy rates (7.5-7)· Local unemployment rate (7.5-8)· Lodging occupancy rate (7.5-9)
· New commercial permits (7.5-7)· New residential permit unit volume
(7.5-6)· Net percent change in local jobs
(7.5-10)
ENVIRONMENTALHEALTH
Air Quality
Waste Diversion (Utilities)
Water Reclamation (Utilities)
Natural Areas
Renewable Energy
Regulatory compliance
Reliable services
Conservation
· Drinking water regulation violations [7.4a(3)]
· Wastewater regulation violations [7.4a(3)]
· Electric system average interruption duration index (SAIDI) (7.1-5)
· Community energy use (7.4-11)
· Outdoor air quality index - fine particles (7.4-12)
· Outdoor air quality index (ozone) (7.4-13)
· Diversion Rates (7.4-14, 7.4-16 and 7.4-17)
· Citizen Survey Natural Areas and Open Space (7.2-12)
HIGH PERFORMINGGOVERNMENT(Key Support Processes)
CAO (Legal)
City Clerk’s Office
Fleet Services
Building Maintenance
IT Services
CPIO Services
HR Services
Financial Services
Council Agenda Management
Fiscal responsibility
Reliability
Responsiveness
Transparency
Accessible communication
· Accuracy of budgeted expenses (7.5-2)
· Actual revenue to budget (7.5-1)· Bond rating ( 7.5-4)· Response time for Access Fort
Collins (7.4-3)· Citizen Survey
(7.2-1 through 7.2-14)· Internal Services Survey ( 7.1-19)· Q14 Survey (7.4-1)
· DART/TRIR, Workers Comp claims per 100 employees (7.3-5)
· Communications rating (residents) (7.2-25 and 7.2-26)
· Turnover (7.3-1)· Fleet PM done on time (7.1-14)· IT Application Database Availability
(7.1-15)· Regulatory compliance (7.4-8)
SAFE COMMUNITY
Police Services
Energy Distribution
Storm Water Management (Utilities)
Water Production and Distribution (Utilities)
Safe
Timely emergency response
Reliable services
· Percent of Part One Crimes per capita compared to other cities (7.1-8)
· Number of total fatalities (7.1-11)· Percent of police priority one
calls responded to in five minutes (7.1-9)
· Electric system average interruption duration index (SAIDI) (7.1-5)
· Fleet Maintenance - Overall (7.1-14)
· Drinking water regulations violations· Turbidity of City drinking water
(7.1-7)
TRANSPORTATION
Transfort/Parking Services
Streets
Planning
Traffic Operations
FC Moves-Mobility
Functional
Responsiveness
Safe
· Lane miles of roadway pavement improved (7.1-3)
· Transfort Fixed Route Ridership per Revenue Hour (7.1-4)
· Ease of Traveling by Bicycle (7.2-24)
· Transfort Fixed Route Ridership (7.1-4)
· Number of total fatalities (7.1-11)· Fleet Maintenance – Overall (7.14)· Fleet Maintenance – Transfort
(7.14)

32 City of Fort Collins
7.1 Product and Process Results 7.1a Customer-Focused Product and Process Results
Figure 7.1-1 Noise Complaints
568 480 566 536
0
200
400
600
800
2012 2013 2014 2015
Figure 7.1-1 Noise Complaints - Noise can impact the City’s quality of life, especially given Fort Collins’ demographic makeup. The volume of complaints is seasonal, impacted by the college student population, which has increased 19% in the past three years.
Figure 7.1-2 Voluntary Code Compliance
0% 20% 40% 60% 80%
100%
2012 2013 2014 2015 Fort Collins Boulder, CO Westminster, CO Coral Springs, FL
0% 20% 40% 60% 80%
100%
2008 2010 2012 2013 2015 Fort Collins National Comparison Front Range Comparison
Figure 7.1-2 Voluntary Code Compliance - Code compliance contributes to the preservation, maintenance and enhancement of neighborhoods and is an indicator of the City’s attractiveness and feeling of safety in neighborhoods. The City is proactive in enforcement, which results in compliance and the outcome of citizen satisfaction.
Figure 7.1-3 Lane Miles Improved
113 152 131 117
0 30 60 90
120 150
2012 2013 2014 2015
Lane
Mile
s
0%
20%
40%
60%
80%
100%
2008 2010 2012 2013 2015 Fort Collins National Comparison Front Range Comparison
Figure 7.1-3 Lane Miles Improved - Lane miles improved is tracked to measure the City’s commitment to providing safe, well-maintained streets. Proper maintenance reduces future maintenance costs by extending the life of the pavement, thereby maximizing the investment. The slight decreases in 2014 and 2015 are due to the redirection of budget monies toward 2016 concrete repairs, which allowed for completion of concrete prep work before the resurfacing treatments, and created scheduling space allowing for better control of the schedule and increased public outreach.
Figure 7.1-4 Fixed-Route Ridership, Revenue, and Satisfaction
2,15
6,77
5
2,27
1,73
2
2,34
4,37
6
2,61
1,64
2
3,26
6,19
4
0
500,000
1,000,000
1,500,000
2,000,000
2,500,000
3,000,000
3,500,000
2011 2012 2013 2014 2015
0%
20%
40%
60%
80%
100%
2008 2010 2012 2013 2015 Fort Collins National Comparison Front Range Comparison
28.85 29.12 25.78 27.38
0
5
10
15
20
25
30
2012 2013 2014 2015
Passen
gers
Passengers per Revenue Hour
Figure 7.1-4 Fixed Route Ridership, Revenue, and Satisfaction - Tracking total fixed-route ridership allows Transfort to assess quarterly and annual performance, and adjust accordingly to create the outcome of customer satisfaction. Transfort fixed-route passengers per revenue hour results have exceeded the Transit Administration National Transit Database (NTD) industry standard even after adding 32% more service on the road in 2014. While passenger expense per passenger decreased by 8% from 2014 to 2015, total ridership increased by 25%.
Outperforms Front Range and National Benchmarks
25% Increase in customers
Citizen Response - Quality of Street Maintenance in Fort Collins
Citizen Response - Ease of Traveling by Public Transportation
Outperforms Front Range and National Benchmarks
Outperforms National Benchmark

33 City of Fort Collins
Figure 7.1-5 SAIDI/SAIFI
73 40 55 109
0 40 80
120 160 200
2012 2013 2014 2015
Min
utes
Fort Collins Annual Front Range Comparison
1.15 1.21 1.73
0.00
1.00
2.00
3.00
4.00
2013 2014 2015
Freq
uenc
y
Fort Collins Annual Front Range Comparison
0% 20% 40% 60% 80%
100%
2012 2013 2015 Fort Collins National Comparison
Figure 7.1-5 SAIDI/SAIFI - SAIDI/SAIFI tracks outage and equipment failure data to guide the use of funding and direct efforts for system additions and infrastructure replacement projects that improve system reliability. Increased outages are related to a single type of cable that failed in 2015, and account for 9.75 SAIDI minutes. Efforts are currently underway to mitigate future cable failures of this type.
7.1b Work Process Effectiveness Results7.1b(1) Process Effectiveness and Efficiency
Figure 7.1-6 Innovation - The City continually pursues innovative solutions that result in outcomes demonstrating improved effectiveness and efficiency of services. Examples of innovations that have impacted results are shown in Figure 7.1-6.
Figure 7.1-7 Water Quality and Satisfaction
0.02
7 0.
025
0.02
6 0.
030
0.03
2 0.
031
0.03
1 0.
030
0.03
1 0.
034
0.03
1 0.
031
0.03
4 0.
031
0.02
7 0.
024
0.000
0.010
0.020
0.030
0.040
Mar
-12
Jun-
12
Sep-
12
Dec-
12
Mar
-13
Jun-
13
Sep-
13
Dec-
13
Mar
-14
Jun-
14
Sep-
14
Dec-
14
Mar
-15
Jun-
15
Sep-
15
Dec-
15
Turb
idity
(Uni
ts)
1.60
1.38
1.59
1.19
1.45
1.27
1.11
1.01
1.24
1.08
0
1
2
2006
20
07
2008
20
09
2010
20
11
2012
20
13
2014
20
15 C
ompl
aint
s/1,
000
cust
omer
s
0%
25%
50%
75%
100%
2008 2010 2012 2013 2015 Fort Collins National Average Front Range Average
Figure 7.1-7 Water Quality and Satisfaction - Water quality (turbidity level) demonstrates the clarity, purity and high quality of the treated water leaving the Water Treatment Facility. The City monitors quality indicators with targets that are more rigid than federal standards. Turbidity values less than 0.10 ntu also show compliance with the City’s voluntary participation in the Partnership for Safe Water, which has stricter drinking water standards than state or federal regulations and results in customer satisfaction that outperforms national and state comparisons.
Figure 7.1-8 Part I Crimes
0% 20% 40% 60% 80%
100%
2012 2013 2014 2015
Nat
iona
l Pe
rcen
tile
Ran
k
0% 20% 40% 60% 80%
100%
2008 2010 2012 2013 2015 Fort Collins National Comparison Front Range Comparison
Figure 7.1-8 Part I Crimes - Crimes per capita is a measure often used as a leading social indicator of community safety. This data is collected from every law enforcement agency in the country and reported by the FBI. For the past five years the City has experienced a steady decline in the total Part I crimes compared to cities of similar size (source: FBI, Group II Cities).
Figure 7.1-6 InnovationInnovation FigureCumulative Transfort Fixed Ridership (MAX) 7.1-4
Traffic Accidents (traffic control) Average Travel Speeds/Time on Arterial Speeds 7.1-11
Snow removal (liquid deicer) 7.1-13
Stormwater and Floodplain Management 7.1-21
Quality of Natural Areas and Open Space 7.2-12
Bicycle Friendly Driver Program 7.2-24
Community Energy Use 7.4-11
Community Solid Wastewater Diversion Rate 7.4-14
Forestry Waste Wood diverted from landfill 7.4-16
Tons of recycled or composted material including cardboard 7.4-18
Citizen Response - Quality of Electric Services in Fort Collins
Sustained High Satisfaction
Citizen Response - Quality of Water in Fort Collins
1st in the Nation and Front Range
Citizen Response - Fort Collins as a Safe Place to Live
Outperforms Front Range and National Benchmarks

34 City of Fort Collins
Figure 7.1-9 Police Response
66% 67% 56% 60%
0%
20%
40%
60%
80%
100%
2012 2013 2014 2015
Responses in less than 5 Minutes
0%
25%
50%
75%
100%
2008 2010 2012 2013 2015 Fort Collins National Comparison Front Range Comparison
Figure 7.1-9 Police Response - Emergent response is a primary function of police. The response policy, geographic configuration, staffing levels and deployment strategies provide the framework for a reasonable and low response time to Priority I calls.
Figure 7.1-10 Part I Crimes Cleared
18%
18%
20%
23%
28%
26%
30%
0% 5%
10% 15% 20% 25% 30%
2009 2010 2011 2012 2013 2014 2015 Fort Collins National Benchmark
Figure 7.1-10 Part I Crimes Cleared - FCPS’ Part I Crimes cleared results have improved the last three years as a result of reexamining reporting and recording policies and procedures and learning from on-site visits to benchmark cities. The updated policies and implementation of new procedures create impressive results that now consistently surpass benchmarks.
Figure 7.1-11 Fatalities
2.7
2.0
2.0 3.
2
2.5
5.0 5.5
3.8 5.
7
3.4
5.6
4.8
4.5
0 1 2 3 4 5 6
2011 2012 2013 2014 2015
Fata
litie
s pe
r 10
0,00
0 Po
pula
tion
Fort Collins Colorado Cities Peer Cities*
*Cities with comparable populations. 2015 Benchmarks N/A
Figure 7.1-11 Fatalities - Safe travel in Fort Collins is an important component of quality of life. The City has observed an increasing traffic volume trend beginning in 2013. Realizing that traffic crashes tend to have contributing factors from three areas (human factors, vehicle design/maintenance, and roadway/environment), the City applies a 3 E’s approach to traffic safety: engineering, enforcement and education
Figure 7.1-12 Response Time for Graffiti Removal
0%
20%
40%
60%
80%
100%
2008 2010 2012 2013 2015 Fort Collins National Comparison Front Range Comparison
Figure 7.1-12 Response Time for Graffiti Removal - The Graffiti Abatement Team continues to meet the challenge of abating graffiti within two days of reporting. The team assists property owners by making courtesy notifications, providing removal products, supplying information on removal techniques, and offering removal assistance. The team abates private property issues for the owners 70% of the time, which reduces duplicate reporting and the amount of time that the graffiti remains visible. Since 2011, this method has increased the amount of graffiti being documented and abated, while at the same time reducing both response time for service and the number of SARs being reported by Councilmembers.
Figure 7.1-13 Pot Hole and Snow Removal Response
48 48 48 48 28 37 43
89
45 42 47 42
0 20 40 60 80
100
Q1 201
3
Q2 201
3
Q3 201
3
Q4 201
3
Q1 201
4
Q2 201
4
Q3 201
4
Q4 201
4
Q1 201
5
Q2 201
5
Q3 201
5
Q4 201
5
# H
ours
1.66 2.20
4.29
2.32 2.38 1.90
2.80
0
2
4
6
2009 2010 2011 2012 2013 2014 2014
# H
ours
0%
20%
40%
60%
80%
100%
2008 2010 2012 2013 2015 Fort Collins National Comparison Front Range Comparison
Figure 7.1-13 Pot Hole and Snow Removal Response - The City’s goal is to fill all potholes within 48 hours of reporting; the public assists in reporting through 1) the pothole hotline, 2) Streets Department access and 3) Access Fort Collins. The quicker potholes are filled and snow is removed, the faster safety hazards are mitigated, road conditions are improved for all modes of transportation, and citizen satisfaction increases. Citizen satisfaction with street maintenance outperforms national and Front Range city comparisons.
Citizen Response - Quality of Police Response Time
Citizen Response - Community’s Visual Attractiveness
Top 5% in the Nation
Citizen Response - Quality of Street Maintenance
Average Time to Clear Snow from Arterial Roadways
Pot Holes: From Time Reported to Being Fixed
Outperforms Front Range and National Benchmarks

35 City of Fort Collins
Figure 7.1-14 Fleet Maintenance - Operations Services provides fleet maintenance for City vehicles required for critical jobs such as Transfort and Police Services. The 30-day target is met through a three-step process: pre-notifying the users of when their unit is due for service, cooperative and efficient scheduling with the users, and utilizing trained staff and efficient service processes in the shops. The City follows the nationally recognized parameter used by the Federal Transit Administration that defines “on time” as a 10% window around the manufacturer’s recommended maintenance interval. The fleet services program has received “The 100 Best Fleets in America” recognition for the past four years.
Figure 7.1-15 and 7.1-16 IT Availability and ISS
99.0% 99.2% 99.4% 99.6% 99.8%
100.0%
2012
2013
2014
2015
2012
2013
2014
2015
2012
2013
2014
2015
2012
2013
2014
2015
Application Database Email Internet Server
0%
50%
100%
2011
2012
2013
2014
2015
2011
2012
2013
2014
2015
2011
2012
2013
2014
2015
Quality Timeliness Performance
Figure 7.1-15 and Figure 7.1-16 IT Availability and ISS - IT is committed to the City’s digital utility and operates an efficient maintenance program, which includes scheduled monthly maintenance on weekends, to ensure data, application and email availability. The result is availability above 99.95%.
Figure 7.1-17 Acres Parks
7.44
7.35
7.26
7.23
7.03
7.10
6.85
6.26
6.44
0
50,000
100,000
150,000
200,000
0 1 2 3 4 5 6 7 8
2007
20
08
2009
20
10
2011
20
12
2013
20
14
2015
Population
Acr
es/1
,000
Pop
ulat
ion
Actual FC Population
Figure 7.1-17 Acres Parks - The Park Planning & Development Department allots 2.5 acres for every 1,000 people for neighborhood parks, which tend to be smaller in scope, and provide balance amid Fort Collins’ growth, and 4.5 acres for every 1,000 people for community parks which are larger with more amenities and blend active and passive areas. Park Planning results indicate the plans have exceeded target.
Figure 7.1-18 Paved Trail Visits
1,9
22,3
29
1,5
67,8
84
2,0
38,3
11
100,000
600,000
1,100,000
1,600,000
2,100,000
2013 2014 2015
Figure 7.1-18 Paved Trail Visits - Paved trail visits provides an indication of the popularity of trails which, in turn, indicates how well the trail system is meeting the needs of the community. The Parks and Recreation Policy Plan updates engage citizens in creating the vision for the trail system.Figure 7.1-19 ISS Results - The Internal Services Survey (ISS) is a collaborative effort between National Research Center, Inc. (NRC) and the International City/County Management Association (ICMA) that is an indicator of an efficiently run government. The ISS consists of questions asking employees to rate the quality and timeliness of a variety of internal support services, as well as the job the various departments do at supporting goals and anticipating needs. All departments have beneficial trends in results and several outperform national benchmarks.
Figure 7.1-14 Fleet Maintenance
Month Wood Street / 906 Vine Shops
Streets Shop Transfort Overall
2013 92% 87% 100% 93%2014 88% 95% 100% 94%2015 80% 93% 100% 91%
Figure 7.1-19 ISS Results 2015 2014 2013 2012
Department
Qua
lity
Tim
elin
ess
Perfo
rman
ce
Qua
lity
Tim
elin
ess
Perfo
rman
ce
Qua
lity
Tim
elin
ess
Perfo
rman
ce
Qua
lity
Tim
elin
ess
Perfo
rman
ce
CPIO 81% 78% 71% 71% 66% 61% 77% 73% 62% 85% 85% 73%Operations 78%*† 78%*† 75% 73% 72% 70% 72% 74% 71% 73% 73% 66%Human Resources 77%* 76%* 69% 72% 73% 68% 78% 79% 73% 76% 79% 69%Financial Services 79%* 80%* 78% 80% 79% 74% 83% 83% 81% 78% 79% 76%IT Services 86%* 86%* 82% 84% 83% 80% 79% 78% 77% 68% 68% 66%*Outperforms Benchmarks †Facility maintenance and repair services
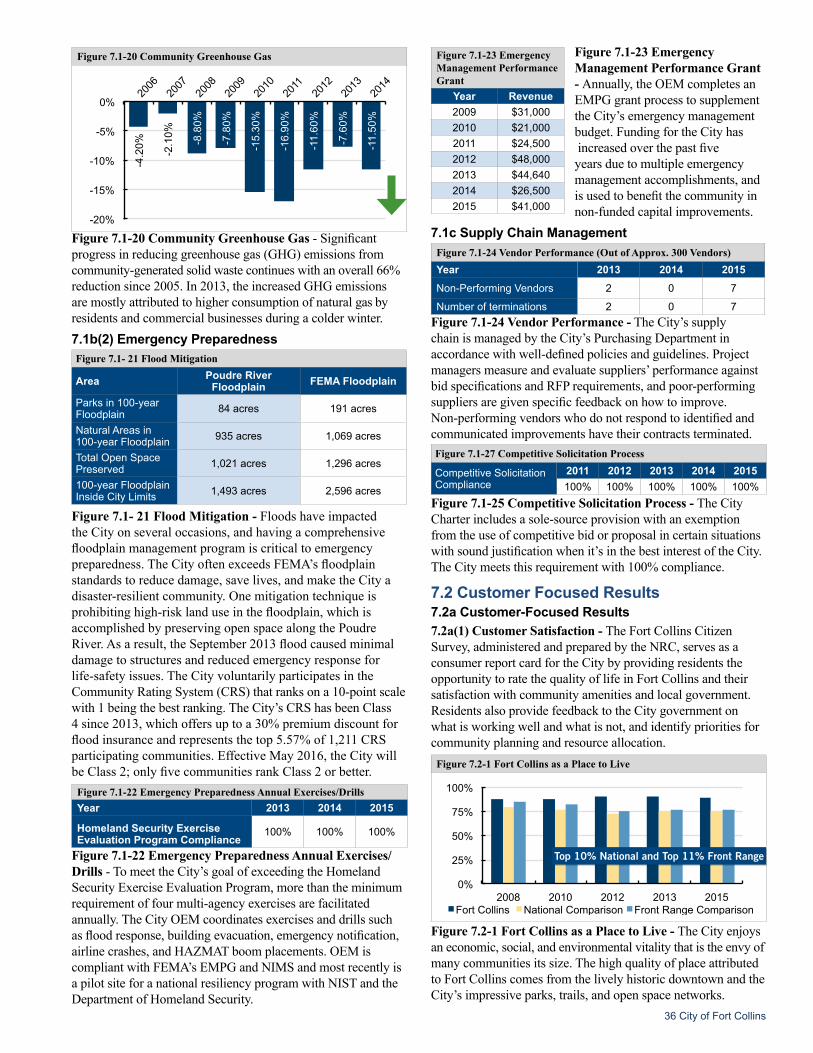
36 City of Fort Collins
Figure 7.1-20 Community Greenhouse Gas
-4.2
0%
-2.1
0%
-8.8
0%
-7.8
0%
-15.
30%
-16.
90%
-11.
60%
-7.6
0%
-11.
50%
-20%
-15%
-10%
-5%
0% 20
06
2007
20
08
2009
20
10
2011
20
12
2013
20
14
Figure 7.1-20 Community Greenhouse Gas - Significant progress in reducing greenhouse gas (GHG) emissions from community-generated solid waste continues with an overall 66% reduction since 2005. In 2013, the increased GHG emissions are mostly attributed to higher consumption of natural gas by residents and commercial businesses during a colder winter.7.1b(2) Emergency Preparedness
Figure 7.1- 21 Flood Mitigation - Floods have impacted the City on several occasions, and having a comprehensive floodplain management program is critical to emergency preparedness. The City often exceeds FEMA’s floodplain standards to reduce damage, save lives, and make the City adisaster-resilient community. One mitigation technique is prohibiting high-risk land use in the floodplain, which is accomplished by preserving open space along the Poudre River. As a result, the September 2013 flood caused minimal damage to structures and reduced emergency response for life-safety issues. The City voluntarily participates in the Community Rating System (CRS) that ranks on a 10-point scale with 1 being the best ranking. The City’s CRS has been Class 4 since 2013, which offers up to a 30% premium discount for flood insurance and represents the top 5.57% of 1,211 CRS participating communities. Effective May 2016, the City will be Class 2; only five communities rank Class 2 or better.
Figure 7.1-22 Emergency Preparedness Annual Exercises/Drills - To meet the City’s goal of exceeding the Homeland Security Exercise Evaluation Program, more than the minimum requirement of four multi-agency exercises are facilitated annually. The City OEM coordinates exercises and drills such as flood response, building evacuation, emergency notification, airline crashes, and HAZMAT boom placements. OEM is compliant with FEMA’s EMPG and NIMS and most recently is a pilot site for a national resiliency program with NIST and the Department of Homeland Security.
Figure 7.1-22 Emergency Preparedness Annual Exercises/DrillsYear 2013 2014 2015
Homeland Security Exercise Evaluation Program Compliance
100% 100% 100%
Figure 7.1-23 Emergency Management Performance Grant - Annually, the OEM completes an EMPG grant process to supplement the City’s emergency management budget. Funding for the City has increased over the past five years due to multiple emergency management accomplishments, and is used to benefit the community in non-funded capital improvements.
7.1c Supply Chain Management
Figure 7.1-24 Vendor Performance - The City’s supply chain is managed by the City’s Purchasing Department in accordance with well-defined policies and guidelines. Project managers measure and evaluate suppliers’ performance against bid specifications and RFP requirements, and poor-performing suppliers are given specific feedback on how to improve. Non-performing vendors who do not respond to identified and communicated improvements have their contracts terminated.
Figure 7.1-25 Competitive Solicitation Process - The City Charter includes a sole-source provision with an exemption from the use of competitive bid or proposal in certain situations with sound justification when it’s in the best interest of the City. The City meets this requirement with 100% compliance.
7.2 Customer Focused Results 7.2a Customer-Focused Results 7.2a(1) Customer Satisfaction - The Fort Collins Citizen Survey, administered and prepared by the NRC, serves as a consumer report card for the City by providing residents the opportunity to rate the quality of life in Fort Collins and their satisfaction with community amenities and local government. Residents also provide feedback to the City government on what is working well and what is not, and identify priorities for community planning and resource allocation.
Figure 7.2-1 Fort Collins as a Place to Live
0%
25%
50%
75%
100%
2008 2010 2012 2013 2015 Fort Collins National Comparison Front Range Comparison
Figure 7.2-1 Fort Collins as a Place to Live - The City enjoysan economic, social, and environmental vitality that is the envy ofmany communities its size. The high quality of place attributed to Fort Collins comes from the lively historic downtown and the City’s impressive parks, trails, and open space networks.
Figure 7.1-24 Vendor Performance (Out of Approx. 300 Vendors)Year 2013 2014 2015Non-Performing Vendors 2 0 7
Number of terminations 2 0 7
Figure 7.1-27 Competitive Solicitation Process
Competitive Solicitation Compliance
2011 2012 2013 2014 2015100% 100% 100% 100% 100%
Figure 7.1- 21 Flood Mitigation
Area Poudre River Floodplain FEMA Floodplain
Parks in 100-year Floodplain 84 acres 191 acres
Natural Areas in 100-year Floodplain 935 acres 1,069 acres
Total Open Space Preserved 1,021 acres 1,296 acres
100-year Floodplain Inside City Limits 1,493 acres 2,596 acres
Figure 7.1-23 Emergency Management Performance Grant
Year Revenue2009 $31,000 2010 $21,000 2011 $24,500 2012 $48,000 2013 $44,640 2014 $26,500 2015 $41,000
Top 10% National and Top 11% Front Range

37 City of Fort Collins
Figure 7.2-2 Overall Quality of Life
0%
25%
50%
75%
100%
2008 2010 2012 2013 2015 Fort Collins National Comparison Front Range Comparison
Figure 7.2-2 Overall Quality of Life - Fort Collins Residents’ perceptions of their quality of life and the quality of their neighborhood are central to gauging community livability.
Figure 7.2-3 Fort Collins as a Place to Work
0%
25%
50%
75%
100%
2008 2010 2012 2013 2015 Fort Collins National Comparison Front Range Comparison
Figure 7.2-3 Fort Collins as a Place to Work - The health of the local economy provides the backbone of a thriving community. The City ranked first among 30 Front Range communities.
Figure 7.2-4 Availability of Job Opportunities
0%
25%
50%
75%
100%
2008 2010 2012 2013 2015 Fort Collins National Comparison Front Range Comparison
Figure 7.2-4 Availability of Job Opportunities - Residents indicate they have greater access to jobs within Fort Collins. Results for this measure outperform national and Front Range comparison cities, and have continued to increase as a result of the City’s efforts to diversify the economy and provide more direct assistance to businesses. NerdWallet, a consumer advocacy website that considers income, affordability, population growth and unemployment in its ratings, identified Fort Collins as the second-best place for job seekers in Colorado.
Figure 7.2-5 Quality of Culture and Recreation
0%
25%
50%
75%
100%
2008 2010 2012 2013 2015 Fort Collins National Comparison Front Range Comparison
Figure 7.2-5 Quality of Culture and Recreation - Culture and recreation help our residents lead enriched and healthy lives, and supports overall community wellness. The citizens ranked the City in the national top 10%.
Figure 7.2-6 Visual Attractiveness
0%
25%
50%
75%
100%
2008 2010 2012 2013 2015 Fort Collins National Comparison Front Range Comparison
Figure 7.2-7 Air Quality
0%
25%
50%
75%
100%
2008 2010 2012 2013 2015 Fort Collins National Comparison Front Range Comparison
Figure 7.2-8 Sewer
0%
25%
50%
75%
100%
2012 2013 2015 Fort Collins National Comparison Front Range Comparison
Figure 7.2-6 through Figure 7.2-8 Visual Attractiveness - Citizens continue to rate the City well above the national and Front Range comparisons for community visual attractiveness, sewer services and air quality.
Figure 7.2-9 Quality of Drinking Water
0%
25%
50%
75%
100%
2008 2010 2012 2013 2015 Fort Collins National Comparison Front Range Comparison
Figure 7.2-9 Quality of Drinking Water - The City ranked first against national benchmarks for quality of drinking water and the community expects it for the taste and the purity (for brewing and technology uses). The Water Treatment Facility is a good steward of natural resources, and an environmental leader with a formal Environment Management System (EMS) that is certified to conform to the ISO 14001:2004 standard. The facility participates in the Colorado Industrial Energy Challenge, sponsored by the Colorado Governor’s Energy Office and the U.S. DOE, and has conducted technical energy audits and engineering studies resulting in recommendations that yielded significant reductions in energy usage and cost savings. An independent national review team from the Partnership for Safe Water noted they were “particularly impressed with the adoption of high productivity tools (leak detection team, Smart Meters, CMMS, and calibrated hydraulic model)” to ensure pure drinking water.
Top 10% National and Front Range
1st in Front Range and Top 10% National
Top 10% National and Front Range
Top 10% National and Front Range
1st in Front Range, National Top 15%
1st in Front Range, National Top 1%
1st Nationally and Front Range
1st in Front Range and Top 10% National

38 City of Fort Collins
Figure 7.2-10 Code Enforcement
0%
25%
50%
75%
100%
2008 2010 2012 2013 2015 Fort Collins National Comparison Front Range Comparison
Figure 7.2-10 Code Enforcement - The City has policies and procedures to encourage code compliance. Code Compliance Inspectors proactively monitor neighborhoods to identify violations before a complaint is logged and quickly respond to complaints received. As a result, our citizens are very satisfied with the code enforcement efforts.
Figure7.2-11 Emergency Preparedness
0%
20%
40%
60%
80%
100%
2012 2013 2015 Fort Collins National Comparison Front Range Comparison
Figure 7.2-11 Emergency Preparedness - Emergency preparedness for the City includes participation in community-wide drills, such as a MAX bus disaster drill conducted with the local hospital, training programs and outreach efforts. The City partners with Larimer County on a countywide hazard mitigation plan. The citizens rate the City’s quality of emergency preparedness very high.
Figure 7.2-12 Natural Areas and Open Space
0%
20%
40%
60%
80%
100%
2008 2010 2012 2013 2015
Fort Collins National Comparison Front Range Comparison
Figure 7.2-12 Natural Areas and Open Space - The floods of September 2013 were devastating to nearby communities, but Fort Collins experienced less damage to infrastructure, homes and businesses in part due to conserved land along the river that helped absorb flood waters. Natural Areas partnered with Fort Collins Utilities and Xcel Energy to purchase three tracts on the Poudre River to contribute to stormwater management and habitat. Additionally, more than 1,000 engaged volunteers participated in one-day service learning projects such as trail building, tree planting, or litter clean-up. These volunteers maintained 15 miles of trail, picked up 320 bags of trash, and planted more than 550 trees, shrubs and willows.
Figure 7.2-13 Crime Prevention
0%
20%
40%
60%
80%
100%
2008 2010 2012 2013 2015 Fort Collins National Comparison Front Range Comparison
Figure 7.2-13 Crime Prevention - In order to participate in and contribute to their community, residents must have a sense of personal safety in their environment, as well as confidence in the quality of public safety services. Fort Collins outperforms the national and Front Range benchmarks.
Figure 7.2-14 RESTORE
100.
0%
100.
0%
99.6
%
99.6
%
100.
0%
0.0%
20.0%
40.0%
60.0%
80.0%
100.0%
2011 2012 2013 2014 2015
Figure 7.2-14 RESTORE - The City provides Restorative Justice Services (RJS) that include the RESTORE Program for shoplifting offenses and the Restorative Justice Conferencing Program (RJCP) for all other offenses. The RESTORE Program provides a voluntary opportunity for young people who have shoplifted to deal with their charge in a way that is meaningful to themselves and the community. Satisfaction with the program is monitored to make improvements.
Figure 7.2-15 Utilities Customer Satisfaction: Customer Needs
0%
20%
40%
60%
80%
100%
2007 2010 2011 2013 2015 Residential Commercial
Figure 7.2-15 Utilities Customer Satisfaction - Customer Needs consists of combining attributes (aggregate score) surveyed for factors related to interactions with the Utilities staff such as providing courteous/helpful customer service, employees with the knowledge to answer questions and resolve problems, answering billing questions quickly, and connecting your call to the right person quickly.
National Top 10%, Front Range Top 15%
1st in the Front Range and National Top 1%
1st Nationally and Front Range
1st Nationally and Front Range

39 City of Fort Collins
Figure 7.2-16 Utilities Customer Satisfaction
93%
93%
95%
86%
86%
84%
87%
89%
90%
86%
0%
20%
40%
60%
80%
100%
2007 2010 2011 2013 2015 Residential Commercial
Figure 7.2-16 Utilities Customer Satisfaction - Fort Collins Utilities has conducted bi-annual customer satisfaction research since 1999 for both residential and business customers on providing good value in regards to the delivery of utilities (electric, stormwater and water). The surveys are statistically valid information on customer perceptions regarding Utilities’ services. From 1999-2011 the methodology was a telephone survey, in 2013 the methodology changed to an online survey resulting in some variability in data and demographics. Staff uses survey findings as input to strategy and tactical actions related to marketing and customer service improvements such as a recent enhancement to implement a program for solar rebates.
Figure 7.2-17 Supporting Business Benchmarks
0%
25%
50%
75%
100%
2008 2010 2012 2013 2015 Fort Collins National Comparison
Figure 7.2-17 Supporting Business Benchmarks - Fort Collins ranks first among national comparisons for supporting businesses and continues to receive national recognitions for its business friendliness. Comparisons were not available in 2015.
Figure 7.2-18 City Government - When rating seven differentaspects of government performance, citizens respond positivelyto the City’s overall direction and encouragement of sustainability in the community with comparisons that outperform national and Front Range comparisons. Fort Collins is ranked among the top three jurisdictions in the nation for welcoming citizen involvement, listening to citizens, and managing and planning for growth.
Figure 7.2-19 Abatement of Greenhouse Gases through ClimateWise
-60,
524
-81,
094
-69,
673
-66,
347
-82,
428
-95,
872
-113
,091
-134
,574
-148
,677
-162
,245
-171
,461
-178
,000
(200,000)
(150,000)
(100,000)
(50,000)
0 20
03 20
04 20
05 20
06 20
07 20
08 20
09 20
10 20
11 20
12 20
13 20
14
Figure 7.2-19 Abatement of Greenhouse Gases through ClimateWise - ClimateWise is a free, voluntary program to help businesses combine operational efficiency with GHG reduction through conservation of water, wastewater, energy and transportation. These actions result in cost savings for the businesses. The popular program continues to grow and currently has 362 partner businesses.
7.2a(2) Customer Engagement
Figure 7.2-20 Rebate Program Participation
1,28
4
1,10
1
1,12
6
1,27
3
1,30
4
1,55
6
1,45
2
0
1,000
2,000
2009 2010 2011 2012 2013 2014 2015
# Qualified Applicants
Figure 7.2-20 Rebate Program Participation - The rebate program is designed to assist low-income individuals, families and seniors living within the city limits. It includes a rebate to qualified residents for sales tax paid on food during the previous year. The program also includes a rebate available to low-income senior and disabled residents for property tax or rent and Fort Collins utilities paid the previous year.
Figure 7.2-21 Opening Day Revenue
0%
20%
40%
60%
80%
100%
2008 2010 2012 2013 2015 Fort Collins National Comparison
Figure 7.2-21 Opening Day Revenue - Opening day revenue demonstrates community engagement and is used to gauge outreach efforts for community knowledge of recreational activities. Revenue has increased for seven consecutive years demonstrating effective outreach efforts such as the Recreator publication and social media.
Figure 7.2-18 City Government 2015 2013 2012 2010 2008
Encouraging sustainability in the community 69%*** 73% 69% NA NA
Overall direction of the City 68%* 70% 67% 61% 54%Welcoming Citizen involvement 71%* 67% 64% 54% 56%Quality of services 84%* 87% 85% 78% 77%Managing and planning for growth 58%* 56% 54% 48% 36%
Listening to Citizens 61%** 53% 50% 44% 41%Efficient operation of programs and services 58%*** 65% 59% 53%
*Top 10% Nation **1st in Nation and Front Range ***No comparisons available
Outperforms National by 15%
Absolute Decrease in MT CO2e per year
Increasing Trend

40 City of Fort Collins
Figure 7.2-22 Recreation Participation - Participation rates for culture and recreation programs provide an indication of the popularity of City facilities, which, in turn, indicate how well the City is meeting the needs of the community. The targets are used for planning purposes and are appropriately adjusted for consideration of seasonal activities and to account for new program development. Figure 7.2-23 Culture and Recreation Satisfaction - Culture and recreation provide opportunities for residents to participate in their community and enhance their quality of life. Several of the results rank either first or in the national top 10%.
Figure 7.2-24 Ease of Traveling by Bicycle
0%
20%
40%
60%
80%
100%
2008 2010 2012 2013 2015 Fort Collins National Comparison Front Range Comparison
Figure 7.2-24 Ease of Traveling by Bicycle – Bicycling is part of the fabric of life in Fort Collins. Recognized as one of the best cities in the United States for bicycling, Fort Collins is rated a Platinum-level Bicycle Friendly Community by the League of American Bicyclists, and ranked among the top 10 best U.S. cities for bicycling by Bicycling Magazine. Through the efforts of dedicated citizens, City leaders, staff, and the business community, a new Bicycle Master Plan was created and adopted by City Council.
Figures 7.2-25 and Figure 7.2-26 Listening to Citizens
0%
20%
40%
60%
80%
100%
2008 2010 2012 2013 2015 Fort Collins National Comparison Front Range Comparison
10 26
39
0
10
20
30
40
50
2013* 2014 2015 # of Sessions
*2013 listeneing sessions started in August, 2013
Figures 7.2-25 and Figure 7.2-26 Listening to Citizens - How well the citizens perceive the City listens and welcomes their involvement are indicators of responsiveness and transparency of information. The Council’s Listening Sessions support these efforts and demonstrate a continuous commitment to the community, engagement, and effective use of the voice of the customer.
Figure 7.2-22 Recreation Participation
Facility2015-Q4 2014-Q4 2013-Q4
Actual Target Actual Target Actual TargetGardens on Spring Creek 65,395 72,770 70,651 61,647 59,851 50,000 Golf Courses 82,436 81,820 81,469 78,000 77,812 78,000 Lincoln Center 141,168 140,000 161,896 130,000 166,207 130,000 MOD 144,009 130,000 141,738 130,000 167,958 80,000 Natural Areas 11.4% 8.0% 11.4% 8.0% 7.6% 8.0%Paved Trails 2,038,311 1,716,272 1,567,884 1,671,150 1,922,329 1,600,000 Recreation Programs 1,574,500 1,633,676 1,576,280 1,710,969 1,725,257 1,543,670
Figure 7.2- 23 Culture and Recreation Satisfaction
Facility2015 2013 2012 2010 2008
Fort Collins National Benchmark Fort Collins National
Benchmark Fort Collins National Benchmark Fort Collins National
Benchmark Fort Collins National Benchmark
Gardens on Spring Creek 90% NA 91% NA 89% NA 87% NA 91% NA
Golf Courses** 79% 69% 79% 63% 78% 66% 77% 70% 79% 74%
Lincoln Center 84% NA 85% NA 82% NA 77% NA 79% NA
MOD* 84% 73% 83% 67% 78% 64% 71% 68% 70% 76%Natural Areas* 88% 58% 87% 63% 86% 65% 85% 70% 84% 71%Paved Trails* 89% 71% 88% 64% 87% 63% 86% 69% 86% 74%Recreation Programs*** 85% 62% 86% 61% 84% 60% 83% 64% 81% 67%
Parks** 87% 71% 87% 72% 86% 70% 84% 74% 85% 77%*Ranked first in the Citizen Survey National Comparison **National Top 10% *** Outperforms National

41 City of Fort Collins
two years of employment. To impact turnover the City utilizes retention strategies such as promoting a total rewards approach that emphasizes meaningful work, flexibility and career options; improving the skills of managers and leaders throughout the organization; and ensuring that compensation, benefit and reward programs are market competitive.
Figure 7.3-2 Turnover Police Services
256
270
279
288
286
0%
2%
4%
6%
8%
10%
0
50
100
150
200
250
300
2011 2012 2013 2014 2015
Turnover Hea
dcou
nt
Average Headcount Turnover Rate
Figure 7.3-2 Turnover Police Services - FCPS is a destination police department, receiving approximately 300 applications for every open position. Retention efforts to maintain a culture of accountability, professional growth and training hours contribute to retaining high caliber police officers.
Figure 7.3-3 Certifications - Ensuring the workforce is capable of performing their assigned responsibilities is demonstrated through certifications and licensure. The City maintains 100% compliance for certifications and licensed positions that are a requirement of the job. Some of the roles include skill ladders where several certifications can be acquired in order to move up the skill ladder.
Figure 7.2-27 Cluster Data (Business) - The City supports business by coordinating activities, outreach and information to industry clusters. Economic Health serves as a resource for cluster managers on best practices and strategies for development; fosters collaboration among academia, the private sector, the public sector and non-profits to promote an entrepreneurial culture; and provides financial support through an annual application process. As a result of these approaches, the number of cluster participants has increased along with the number of jobs created. 2015 numbers are available in June 2016.
7.3 Workforce-Focused Results7.3a Workforce Results7.3a(1) Workforce Capability and Capacity
Figure 7.3-1 Overall Turnover
0%
5%
10%
15%
2011 2012 2013 2014 2015
Turn
over
Rat
e
Fort Collins Loveland Denver
22 33 48 53
84 100
1,150
1,200
1,250
1,300
1,350
0
50
100
150
200
2013 2014 2015 Retirement Non-Rertirement Average Headcount
Figure 7.3-1 Overall Turnover - The City is committed to being an employer of choice. The City’s annual turnover rates are projected to increase over the next few years as baby boomers are replaced by workers who change jobs more frequently, and City workers retire. One-third of the separations in 2015 were due to retirement. The public sector is particularly vulnerable with 37% of local government workers age 50 or over compared to 28% for the private sector (Pew Research Center). In addition to Baby Boomer retirements, a recent Monster.com survey found that 30% of external new hires leave their positions in the first
Figure 7.2-27 Cluster Data (Business) 2011 2012 2013 2014Sector Firms Employees Firms Employees Firms Employees Firms EmployeesBioscience 44 925 43 937 50 1,001 51 1,023Clean Energy 19 2,502 19 2,243 25 2,165 29 2,158Hardware 16 3,462 17 3,240 18 3,302 18 3,243Software 179 1,283 214 1,531 248 1,774 312 2,026Water 24 650 28 681 31 664 34 744 Total 282 8,822 321 8,632 372 8,906 444 9,194
Figure 7.3-3 Certifications ComplianceCertification 2012 2013 2014 2015Water/Wastewater Operations Certificate 100% 100% 100% 100%Line workers-Apprentice program 100% 100% 100% 100%Police officers- Colorado POST Certified 100% 100% 100% 100%DOT regulated CDL ex. Transfort, L & P Line Workers, Streets, Water Field Crews (Step 1), Natural Areas, Parks, Fleet, etc
100% 100% 100% 100%
DOT regular regulated non CDL (within 30 days of identification of need for certification) ex. Facilities, Fleet, Recreation, Parks, Police
100% 100% 100% 100%
Water Field Operators Certification (Step One minimum) 90% 90% 90% 90%
Civil Engineer II -Engineering Certifications FE* 100% 100% 100% 100%
Civil Engineer III- Engineering License PE* 100% 100% 100% 100%

42 City of Fort Collins
Figure 7.3-4 Recruitment
5,14
0 7,11
2 11,4
12
10,1
92
10,7
60
6,66
6 19,1
62
0
100
200
300
0
4,000
8,000
12,000
2009 2010 2011 2012 2013 2014 2015 Applications Posted requisitions Average Days to Fill
Figure 7.3-4 Recruitment - Capability and capacity needs of the workforce are reviewed quarterly. When positions become open the City uses a standardized recruiting and hiring process developed through collaboration with HR and Service Area Directors. Time to fill positions is tracked to ensure the right candidate is hired in a timely manner. 7.3a(2)Workforce Climate
Figure 7.3-5 DART and TRIR
Area 2015 2014 2013 2012DART (Cases) 5.1 4.6 3.6 3.2DART - Public Entities Benchmark 2.3 2.3 2.4 2.5TRIR 7.6 6.9 7.1 6.2
TRIR - Public Entities Benchmark NA until end of 2016 5.4 5.7 6.1
Figure 7.3-5 DART and TRIR - The City voluntarily participates in the annual OSHA survey, and Department of Labor benchmarking report. The Days Away, Restricted or Transferred (DART) and Total Reportable Injury Rates (TRIR) represent the severity of employee on-the-job injuries. The City is involved at all levels in continuous improvement efforts, including changing behavior and building a sustainable proactive safety culture. TRIR has improved for Q1 2016.
Figure 7.3-6 Monthly Operational and Custodial Inspection Scores - To maintain a safe and clean work environment, the City completes monthly inspections of municipal buildings. Use of the iServiceDesk expedites requests for services or maintenance.
Figure 7.3-7 Performance of Benefits
0%
25%
50%
75%
100%
2011 2012
2013 2014
2015 2011
2012 2013
2014 2015
Quality Timeliness Target
Figure 7.3-7 Performance of Benefits - Timely and high quality benefits create a culture where employees feel valued. HR proactively communicates benefit information through road shows, Issues & Answers, NEO, open enrollment, and the website. Staff input also leads to benefit enhancements such as the implementation of The Lifestyle Management Program to promote preventative care. In 2016, the City increased the number of hourly employees to the benefit plan.
Figure 7.3-6 Monthly Operation and Custodial Inspection Scores
Custodial - Cultural
Custodial - Police
Custodial - General Fund
2012 99.62% 99.69% 99.40%2013 99.79% 99.24% 99.42%2014 97.98% 99.15% 98.06%2015 96.76% 97.87% 96.89%
Figure 7.3-8 Engagement Survey
Q14 Survey Question
March Sept March Sept March Sept March Sept March Sept Sept 2015
2011 2011 2012 2012 2013 2013 2014 2014 2015 2015 Classified Hourly UnClassified Management
I know what my supervisor needs from me.- EF-clear expectations
84% 85% 84% 84% 85% 86% 88% 83% 85% 85% 85% 86% 97%
My supervisor or someone in the City cares about me. EF-appreciation
74% 77% 77% 76% 78% 79% 80% 80% 82% 79% 76% 80% 97%
I believe my opinions are valued. EF-meaningful work
67% 66% 65% 63% 66% 66% 67% 65% 68% 69% 67% 68% 93%
I have a trusted friend in the City in whom I can confide.
66% 67% 69% 68% 66% 68% 72% 71% 72% 68% 66% 70% 75%
I get the chance to do what I do best, almost every day in my job. EF- accountability
71% 72% 73% 70% 71% 71% 72% 73% 74% 74% 71% 75% 94%
My work team is recognized for their efforts. EF- appreciation
60% 59% 57% 60% 60% 63% 62% 60% 63% 63% 61% 60% 81%
I have the materials and equipment to do my job.
76% 75% 75% 72% 76% 77% 78% 74% 79% 76% 75% 76% 90%

43 City of Fort Collins
7.3a(3) Workforce EngagementFigure 7.3-8 Engagement Survey - The City uses a Q14 employee engagement assessment tool. The survey is distributed twice per year, in the spring and in the fall and is based on the Gallup Q12 National survey questions. The results include segmentation for classified, hourly and unclassified management. Other segmentations are available on site and align with the organizational structure from Service Areas through departments, divisions and, in some areas, work groups.
Figure 7.3-9 Wellness Participation
0
500
1,000
1,500
2,000
2006 2007
2008 2009
2010 2011
2012 2013
2014 2015
Total Wellness Days WD Registrants
Figure 7.3-9 Wellness Participation - The benefits of the City investing in the health and wellness of the workforce are demonstrated in decreasing health claim costs. As a result of increased awareness of health and wellness, total well days and participation have consistently increased for 10 consecutive years.
Figure 7.3-10 and 7.3-11 CSU Student/Fall Clean-Up
132
614
576 1,
200
1,00
0
1,20
0
1,50
0
1,27
4
0
500
1,000
1,500
2,000
2008 2009 2010 2011 2012 2013 2014 2015
# CSU student/staff that participated in program
Figure 7.3-10 and 7.3-11 CSU Student/Fall Clean-Up
79 91 130 160 171 176 191
231
0
50
100
150
200
250
2008 2009 2010 2011 2012 2013 2014 2015 # of resident projects
Figures 7.3-10 and 7.3-11 CSU Student/Fall Clean-Up - As the community grows, there is more need for assistance in the elderly and/or physically limited resident community. The City actively engages CSU student volunteers to contribute back to their community through the fall clean-up program. This also is instrumental in developing good relationships among the students and long-term community residents.
Figure 7.3-12 Volunteers
8,668
11,017
153,940
169,946
145,000
150,000
155,000
160,000
165,000
170,000
175,000
0
2,000
4,000
6,000
8,000
10,000
12,000
2014 2015
# of vounteers # of hours
Figure 7.3-12 Volunteers - In 2014, the City hired a Volunteer Coordinator who implemented a new tracking system for an accurate count of community volunteers, especially those who may volunteer for a one-time event and can be non-recurring in their services, but demonstrate citizen engagement for future interactions. Fort Collins has the 7th largest volunteer rate (38%) of any mid-size city in the U.S.7.3(a)4 Workforce DevelopmentFigure 7.3-13 Learning and Development - The City provides learning and development opportunities for staff and encourages participation in a variety of training courses that support career development and learning. As a result, satisfaction has a five-year improving trend.
Figure 7.3-13 Learning and Development
2011 2012 2013 2014 2015 Sep-15
March Sept March Sept March Sept March Sept March Sept Classified Hourly Unclassified Management
I believe my supervisor, or someone at work is committed to my career development- EF- Dev & growth opportunities
58% 59% 61% 61% 64% 66% 68% 65% 68% 67% 62% 74% 95%
Within the last six months, the City has provided me opportunities to learn and grow. EF- Dev & growth opportunities
60% 62% 68% 65% 70% 75% 73% 73% 76% 77% 77% 76% 89%

44 City of Fort Collins
Figure 7.3-14 Police Officer Training
0
50
100
150
200
2010 2011 2012 2013 2014
Trai
ning
Hou
rs
Fort Collins Irving, TX Coral Springs, FL Lakewoood, CO Benchmark Cities
Figure 7.3-14 Police Officer Training - The City prepares police officers through multiple training programs. Highly trained, efficient officers who perform high risk, high liability roles throughout Fort Collins create a feeling of safety for our citizens, and demonstrate a commitment to our community. 2015 results and comparisons will be available in May 2016.
Figure 7.3-15 Training Hours
0
10,000
20,000
30,000
40,000
2009 2010 2011 2012 2013 2014 2015
Figure 7.3-15 Training Hours - To further engage the workforce, the City offers internal learning opportunities. The number of hours and types of classes offered has improved for the last three years. In the past year, the City’s semiannual All Supervisors event has seen a 12% increase in exceeding expectations for “Rating the Day.”
7.3-16 Lead 1.0 Program Participation - Through collaboration, the City of Fort Collins, Larimer County and Poudre School District began a leadership development program in April 2011. Since graduating its first class in 2012, the City has advanced careers for the emerging leaders from this program.
Figure 7.3-16 Lead 1.0 Program Participation
Year # Participants # Promotions# Job
Reclassifications or Acting in
leadership role2012 7 3 22014 25 10 62015 24 5 7
Figure 7.3-17 Internal Promotions - ELT consists of 10 members and the Management Intern. The existing team includes six members who have been promoted from within the organization, including the City Manager and the Fire Chief. Leadership development programs such as Lead 4.0, 360 Assessments and professional coaching provided internal training and opportunities for growth and advancement.
7.4 Leadership and Governance Results7.4a Leadership, Governance and Societal Responsibility Results7.4a(1) Leadership
Figure 7.4-1 My Role and the City’s Mission and Vision - City leaders are committed to a culture of “the It, the We and the I,” where the It is about the mission, vision and values; the We is about “working together” with colleagues; and the I is about “my role” in the organizational success. This culture is shared at NEO, with staff during Issues & Answers, and with leaders at the LL meeting, and contributes to strong results from all segments of the organization.
Figure 7.4-2 Q14 Commitment to Quality and Productivity Improvement
0% 25% 50% 75%
100%
Spr
ing
12
Fall
12
Spr
ing
13
Fall
13
Spr
ing
14
Fall
14
Spr
ing
15
Fall
2015
S
prin
g 12
Fa
ll 12
S
prin
g 13
Fa
ll 13
S
prin
g 14
Fa
ll 14
S
prin
g 15
Fa
ll 20
15
Colleagues are committed to doing quality work (Q9) Colleagues seek ways to improve productivity (Q10) Target
Figure 7.4-2 Q14 Commitment to Quality and Productivity Improvement - City leaders create a world class culture though the vision, mission and values, and by holding staff accountable to high standards. Staff rates the culture of quality and productivity, and consistently respond that colleagues are committed to quality and seek ways to improve productivity.
Figure 7.4-1 My Role and the City’s Mission and Vision
0%
20%
40%
60%
80%
100%
Fall 2012 Spring 2013 Fall 2013 Spring 2014 Fall 2014 Spring 2015 Fall 2015 Comm & Ops ECS PDT Financial Services SSA Utilities Police Overall

45 City of Fort Collins
Figure 7.4-3 Response Time for Access Fort Collins
-
2,000
4,000
6,000
0
2
4
6
8
10
2012 2013 2014 2015
#casesDay
s
Access Fort Collins Avg Response Time # cases submitted
Figure 7.4-3 Response Time for Access Fort Collins - The City web application, Access Fort Collins, enables citizens to quickly submit questions and requests for service. The response time goal for the City is three business days. The system is highly utilized and the response times remain impressive.
7.4a(2) Governance To develop trust in government and municipal spending, the City implemented Open Book/Open City, a completely transparent site on fcgov.com where citizens can see firsthand how the City is being governed. In addition, KFCG is posted online for citizens to assure them that dollars are spent in line with the voter requirements.
Figure 7.4-4 Voter Tax Initiatives - It’s not often that citizens vote for increased taxes and when they do it demonstrates support and trust in the governance system. The City has a strong history of voter-approved tax initiatives. Working together, the community and local government identify community enhancements such as Open Space Yes!, Street Maintenance and KFCG. When residents voted for the Building on Basics (BOB) tax initiative in 2005, a quarter-cent tax, they chose to invest locally and improve quality of life. This initiative, along with Street Maintenance, was passed again in 2015 with an 80% and 84% “yes” vote, respectively. The outcomes will last for generations.
Figure 7.4-5 External Financial Audits - The City Charter and state law require an annual audit by independent certified public accountants selected by the City Council. For 26 consecutive
Figure 7.4-5 External Financial Audits
Audit Compliance 2010 2011 2012 2013 2014Material Weaknesses 0 1 0 0 0
Significant Deficiencies 0 0 1 0 0
Other Instances of Noncompliance 2 0 2 0 0
Key Findings Resolved 2 1 3 0 0
years the Government Finance Officers Association of the United States and Canada (GFOA) awarded a Certificate of Achievement for Excellence in Financial Reporting to the City for its comprehensive annual financial report. To receive this prestigious recognition, the City must publish an easily readable and efficiently organized comprehensive annual report. This report must satisfy both applicable legal requirements and accounting principles generally accepted in the United States. In connection with the annual audit the City is provided a Report on Internal Control over Financial Reporting and on Compliance and Other Matters performed in accordance with Government Auditing Standards. All findings reported in previous years were corrected in the subsequent year and were not repeated after review by the auditor. 2015 results will be available in June 2016.
Figure 7.4-6 City’s Overall Performance
0%
20%
40%
60%
80%
100%
2008 2010 2012 2013 2015 Fort Collins National Comparison Front Range Comparison
Figure 7.4-6 City’s Overall Performance - The citizens of Fort Collins rate the City in the national top 10% for the overall direction, an indicator of trust in leadership and governance, and strategy development.
Figure 7.4-7 Intelligent Risk Results - The City’s commitment to the community is to assess and implement intelligent risks within established timelines and allocated resources. The City excels in assessing, managing and implementing these projects (Figure 2.1-4 Intelligent Risk Process Steps).
Figure 7.4-7 Intelligent Risk Results Strategic Alignment Project Step in Risk
Assessment
Strategic Plan
2015-2016
Evaluate the role of the City to provide Broadband service to the community
Currently in Step 3
Halligan Reservoir Enlargement Project to acquire water storage capacity
Currently in Step 8
Direct and guide growth in the community
Varies according to current planning effort
Strategic Plan
2013-2014
MAX – mass transit project
Completed on-time and under budget
Mall Expansion to increase tax revenue
Currently on time and on budget
Woodward Governor to expand business& employment opportunities for citizens
Currently on time and on budget
Advanced Meter Fort Collins to upgrade mechanical electrical and water meters
Currently on time and on budget
Figure 7.4-4 Voter Tax Initiatives
Initiative Year Voter Approved
KFCG 2011-2021 YesBOB 2006-2015 YesBOB II 2016-2025 YesStreets Maintenance Program 2006-2025 YesOpen Space yes! 2006-2030 YesBuilding Community Choice
1997-2005 Yes(3 separate ¼ cents)
National Top 10%

46 City of Fort Collins
Figure 7.4-9 Pollution Control Laboratory Certification
0%
20%
40%
60%
80%
100%
2005
20
06
2007
20
08
2009
20
10
2011
20
12
2013
20
14
2015
Actual CDPHE Laboratory Certification Actual DMRQA Laboratory Certification
Figure 7.4-9 Pollution Control Laboratory Certification - The National Pollutant Discharge Elimination System (NPDES) permit program controls water pollution by regulating point sources that discharge pollutants into waters of the United States. The Colorado Department of Public Health and Environment requires certification under the Safe Drinking Water Act, the NPDES program, and to provide credible, accurate laboratory data to support environmental and health-related decisions and needs of the Water and Wastewater Utilities. The City’s DMRQA and CDPHE laboratories fulfill policies and procedures to maintain certification through semiannual onsite inspection and annual performance testing. The City of Fort Collins Water Lab is one of five municipalities (Aurora, Denver, Colorado Springs, Ute Water Conservancy District-Grand Junction) in the state to attain certification for trace metals, Nitrate/Nitrite/Fluoride, TOC, VOC (V2, V3), TTHM, Chlorite, TCR, and LT2. Other municipalities have labs, but their certification list is limited. 7.4a(4) EthicsOath of Office: 100% Compliance - Before entering the duties of the office or employment, each member of Council, the City Manager, the City Attorney, the City Clerk, the Judge of the Municipal Court, and each director of a service area take an oath or affirmation that he or she will support the Constitution of the United States, the Constitution of the State of Colorado, the City Charter, and the ordinances of the City of Fort Collins, and that he or she will faithfully perform the duties of the office or position. Included in the City Charter - Section 9 is a conflicts of interest definition. Boards and Commissions - This segment of our volunteers plays an important role as ambassadors of the City. The City currently has 27 standing boards, commissions and authorities consisting of approximately 230 volunteer members. All board members are appointed by the Fort Collins City Council and serve without compensation. Their purpose is to acquire and study information in specific areas and make recommendations to City Council. There is a 100% completion rate for orientation and training of new members that includes completing and signing off on education that includes legal and ethical topics. Figure 7.4-10 Staff Terminations for Policy Violations - The City has a “no tolerance” culture for ethical violations that includes terminations for non-disclosure of violations that occur outside of the workplace.
Figure 7.4-10 Staff Terminations for Policy ViolationsYear 2015 2014 2013 *Segmented by
Service Area AOSTotal* 14 10 8
Figure 7.4-8 Compliance with Key Regulatory Requirements
RegulationCompliance Rate
2012 2013 2014 2015
Fina
ncia
l
Government Accounting Standards Board
Compliant Compliant Compliant (Audit in process)
Internal Revenue Service
No violations
No violations
No violations
No viloations
Federal Office of Management & Budget
Compliant Compliant Compliant Compliant
Safe
ty &
Ris
k M
anag
emen
t OSHA Voluntarily Compliant
Voluntarily Compliant
Voluntarily Compliant
Voluntarily Compliant
CDOT 100% 100% 100% 100%Federal Transit Administration (FTA)
100% 100% 100% 100%
Envi
ronm
enta
l Environmental Protection Agency
100% 100% 100% 100%
Colorado Department of Public Health and Environment
100% 100% 100% 100%
Empl
oym
ent
Department of Labor (FLSA, FML, ADA, EEOC)
No violations
No violations
No violations
No viloations
Dept. of Health & Human Services
No violations
No violations
No violations
No violations
Federal Trade Commission (Fair Credit Reporting Act)
No violations
No violations
No violations
No violations
Colorado Civil Rights Commission
No violations
No violations
No violations
No violations
Dev
elop
men
t &
Faci
lity
Ope
ratio
ns Building Codes 100% 100% 100% 100%
Code of Federal Regulation
100% 100% 100% 100%
Fort Collins Green Code Amendments
100% 100% 100% 100%
Publ
ic
Rec
ords Colorado
Open Records Act
100% 100% 100% 100%
Emer
genc
y M
anag
emen
t
FEMA Compliant Compliant Compliant Compliant
NOAA Designated storm ready community in 2011, and recertifed in 2015
7.4a(3) Law and regulation Meeting and surpassing regulatory and legal requirements is demonstrated in Figure 7.4-8, External Financial Audits (Figure 7.4-5), and zero drinking water violations for the water treatment facility for the past three years.
Figure 7.4-8 Regulation Table - The City meets and exceeds state and federal regulations.
1 of 5 municipalities in Colorado exceeding certification requirements
trunyan
Highlight
trunyan
Highlight
trunyan
Highlight
trunyan
Highlight
trunyan
Highlight
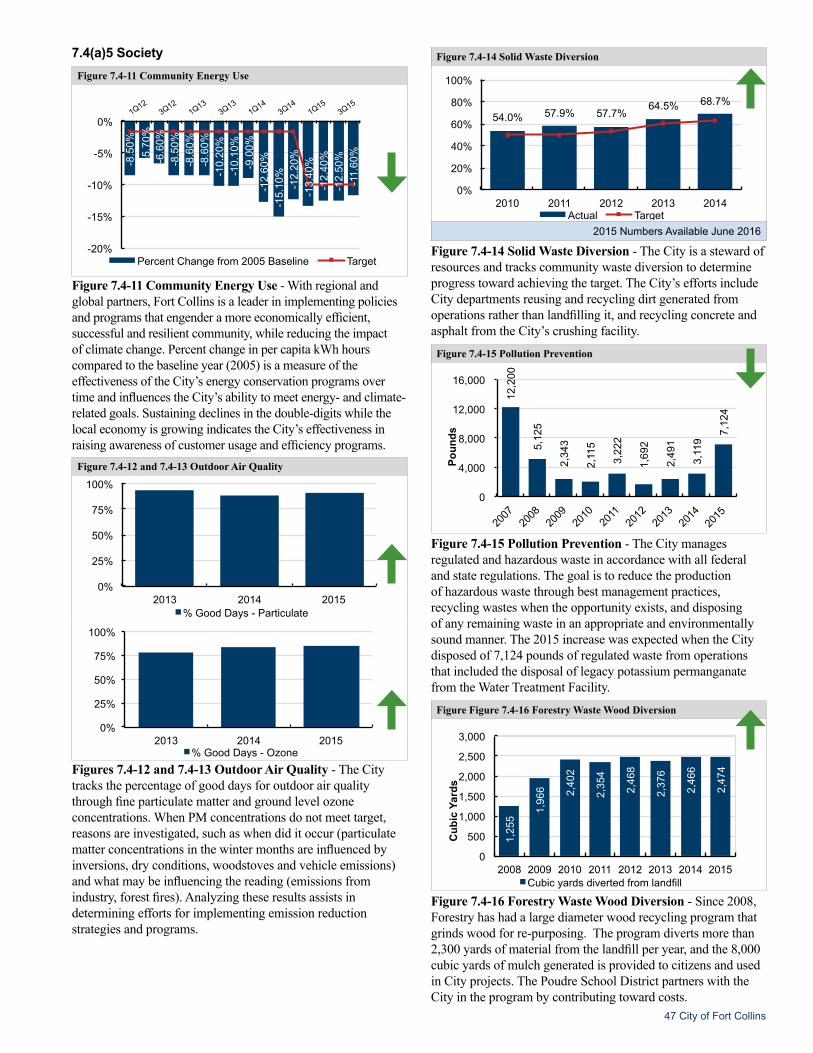
47 City of Fort Collins
7.4(a)5 SocietyFigure 7.4-11 Community Energy Use
-8.5
0%
-5.7
0%
-6.6
0%
-8.5
0%
-8.6
0%
-8.6
0%
-10.
20%
-1
0.10
%
-9.0
0%
-12.
60%
-1
5.10
%
-12.
20%
-1
3.40
%
-12.
40%
-1
2.50
%
-11.
60%
-20%
-15%
-10%
-5%
0% 1Q12
3Q12 1Q13
3Q13 1Q14
3Q14 1Q15
3Q15
Percent Change from 2005 Baseline Target
Figure 7.4-11 Community Energy Use - With regional and global partners, Fort Collins is a leader in implementing policies and programs that engender a more economically efficient, successful and resilient community, while reducing the impact of climate change. Percent change in per capita kWh hours compared to the baseline year (2005) is a measure of the effectiveness of the City’s energy conservation programs over time and influences the City’s ability to meet energy- and climate-related goals. Sustaining declines in the double-digits while the local economy is growing indicates the City’s effectiveness in raising awareness of customer usage and efficiency programs.
Figure 7.4-12 and 7.4-13 Outdoor Air Quality
0%
25%
50%
75%
100%
2013 2014 2015 % Good Days - Particulate
0%
25%
50%
75%
100%
2013 2014 2015 % Good Days - Ozone
Figures 7.4-12 and 7.4-13 Outdoor Air Quality - The City tracks the percentage of good days for outdoor air quality through fine particulate matter and ground level ozone concentrations. When PM concentrations do not meet target, reasons are investigated, such as when did it occur (particulate matter concentrations in the winter months are influenced by inversions, dry conditions, woodstoves and vehicle emissions) and what may be influencing the reading (emissions from industry, forest fires). Analyzing these results assists in determining efforts for implementing emission reduction strategies and programs.
Figure 7.4-14 Solid Waste Diversion
54.0% 57.9% 57.7% 64.5% 68.7%
0%
20%
40%
60%
80%
100%
2010 2011 2012 2013 2014 Actual Target
2015 Numbers Available June 2016
Figure 7.4-14 Solid Waste Diversion - The City is a steward of resources and tracks community waste diversion to determine progress toward achieving the target. The City’s efforts include City departments reusing and recycling dirt generated from operations rather than landfilling it, and recycling concrete and asphalt from the City’s crushing facility.
Figure 7.4-15 Pollution Prevention
12,2
00
5,12
5
2,34
3
2,11
5
3,22
2
1,69
2
2,49
1
3,11
9 7,
124
0
4,000
8,000
12,000
16,000
2007
20
08
2009
20
10
2011
20
12
2013
20
14
2015
Poun
ds
Figure 7.4-15 Pollution Prevention - The City manages regulated and hazardous waste in accordance with all federal and state regulations. The goal is to reduce the production of hazardous waste through best management practices, recycling wastes when the opportunity exists, and disposing of any remaining waste in an appropriate and environmentally sound manner. The 2015 increase was expected when the City disposed of 7,124 pounds of regulated waste from operations that included the disposal of legacy potassium permanganate from the Water Treatment Facility.
Figure Figure 7.4-16 Forestry Waste Wood Diversion
1,25
5 1,
966
2,40
2
2,35
4
2,46
8
2,37
6
2,46
6
2,47
4
0
500
1,000
1,500
2,000
2,500
3,000
2008 2009 2010 2011 2012 2013 2014 2015
Cub
ic Y
ards
Cubic yards diverted from landfill
Figure 7.4-16 Forestry Waste Wood Diversion - Since 2008, Forestry has had a large diameter wood recycling program that grinds wood for re-purposing. The program diverts more than 2,300 yards of material from the landfill per year, and the 8,000 cubic yards of mulch generated is provided to citizens and used in City projects. The Poudre School District partners with the City in the program by contributing toward costs.
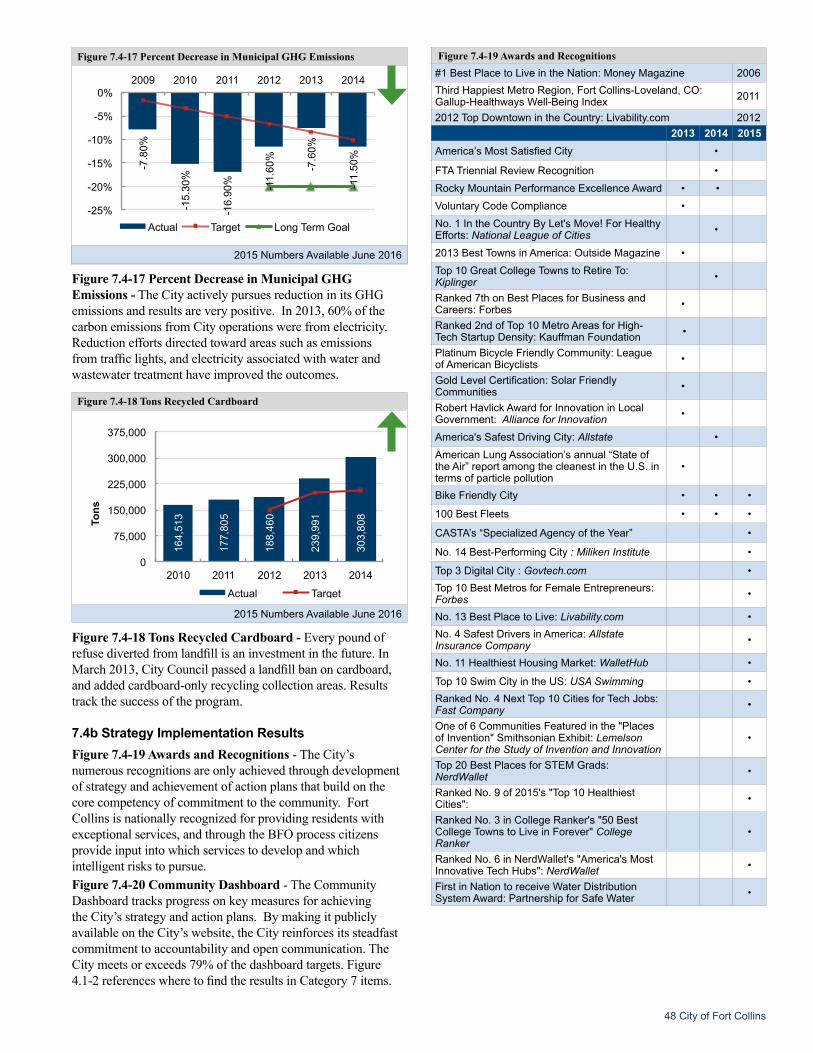
48 City of Fort Collins
Figure 7.4-17 Percent Decrease in Municipal GHG Emissions
-7.8
0%
-15.
30%
-16.
90%
-11.
60%
-7.6
0%
-11.
50%
-25%
-20%
-15%
-10%
-5%
0% 2009 2010 2011 2012 2013 2014
Actual Target Long Term Goal
2015 Numbers Available June 2016
Figure 7.4-17 Percent Decrease in Municipal GHG Emissions - The City actively pursues reduction in its GHG emissions and results are very positive. In 2013, 60% of the carbon emissions from City operations were from electricity. Reduction efforts directed toward areas such as emissions from traffic lights, and electricity associated with water and wastewater treatment have improved the outcomes.
Figure 7.4-18 Tons Recycled Cardboard
164,
513
177,
805
188,
460
239,
991
303,
808
0
75,000
150,000
225,000
300,000
375,000
2010 2011 2012 2013 2014
Tons
Actual Target
2015 Numbers Available June 2016
Figure 7.4-18 Tons Recycled Cardboard - Every pound of refuse diverted from landfill is an investment in the future. In March 2013, City Council passed a landfill ban on cardboard, and added cardboard-only recycling collection areas. Results track the success of the program.
7.4b Strategy Implementation Results Figure 7.4-19 Awards and Recognitions - The City’s numerous recognitions are only achieved through development of strategy and achievement of action plans that build on the core competency of commitment to the community. Fort Collins is nationally recognized for providing residents with exceptional services, and through the BFO process citizens provide input into which services to develop and which intelligent risks to pursue. Figure 7.4-20 Community Dashboard - The Community Dashboard tracks progress on key measures for achieving the City’s strategy and action plans. By making it publicly available on the City’s website, the City reinforces its steadfast commitment to accountability and open communication. The City meets or exceeds 79% of the dashboard targets. Figure 4.1-2 references where to find the results in Category 7 items.
Figure 7.4-19 Awards and Recognitions#1 Best Place to Live in the Nation: Money Magazine 2006Third Happiest Metro Region, Fort Collins-Loveland, CO: Gallup-Healthways Well-Being Index 2011
2012 Top Downtown in the Country: Livability.com 2012 2013 2014 2015America’s Most Satisfied City •
FTA Triennial Review Recognition •Rocky Mountain Performance Excellence Award • •Voluntary Code Compliance • No. 1 In the Country By Let's Move! For Healthy Efforts: National League of Cities •
2013 Best Towns in America: Outside Magazine • Top 10 Great College Towns to Retire To: Kiplinger •
Ranked 7th on Best Places for Business and Careers: Forbes •
Ranked 2nd of Top 10 Metro Areas for High-Tech Startup Density: Kauffman Foundation •
Platinum Bicycle Friendly Community: League of American Bicyclists •
Gold Level Certification: Solar Friendly Communities •
Robert Havlick Award for Innovation in Local Government: Alliance for Innovation •
America's Safest Driving City: Allstate •American Lung Association’s annual “State of the Air” report among the cleanest in the U.S. in terms of particle pollution
•
Bike Friendly City • • •
100 Best Fleets • • •
CASTA’s “Specialized Agency of the Year” •
No. 14 Best-Performing City : Miliken Institute •
Top 3 Digital City : Govtech.com •Top 10 Best Metros for Female Entrepreneurs: Forbes •
No. 13 Best Place to Live: Livability.com •No. 4 Safest Drivers in America: Allstate Insurance Company •
No. 11 Healthiest Housing Market: WalletHub •
Top 10 Swim City in the US: USA Swimming •Ranked No. 4 Next Top 10 Cities for Tech Jobs: Fast Company •
One of 6 Communities Featured in the "Places of Invention" Smithsonian Exhibit: Lemelson Center for the Study of Invention and Innovation
•
Top 20 Best Places for STEM Grads: NerdWallet •
Ranked No. 9 of 2015's "Top 10 Healthiest Cities": •
Ranked No. 3 in College Ranker's "50 Best College Towns to Live in Forever" College Ranker
•
Ranked No. 6 in NerdWallet's "America's Most Innovative Tech Hubs": NerdWallet •
First in Nation to receive Water Distribution System Award: Partnership for Safe Water •
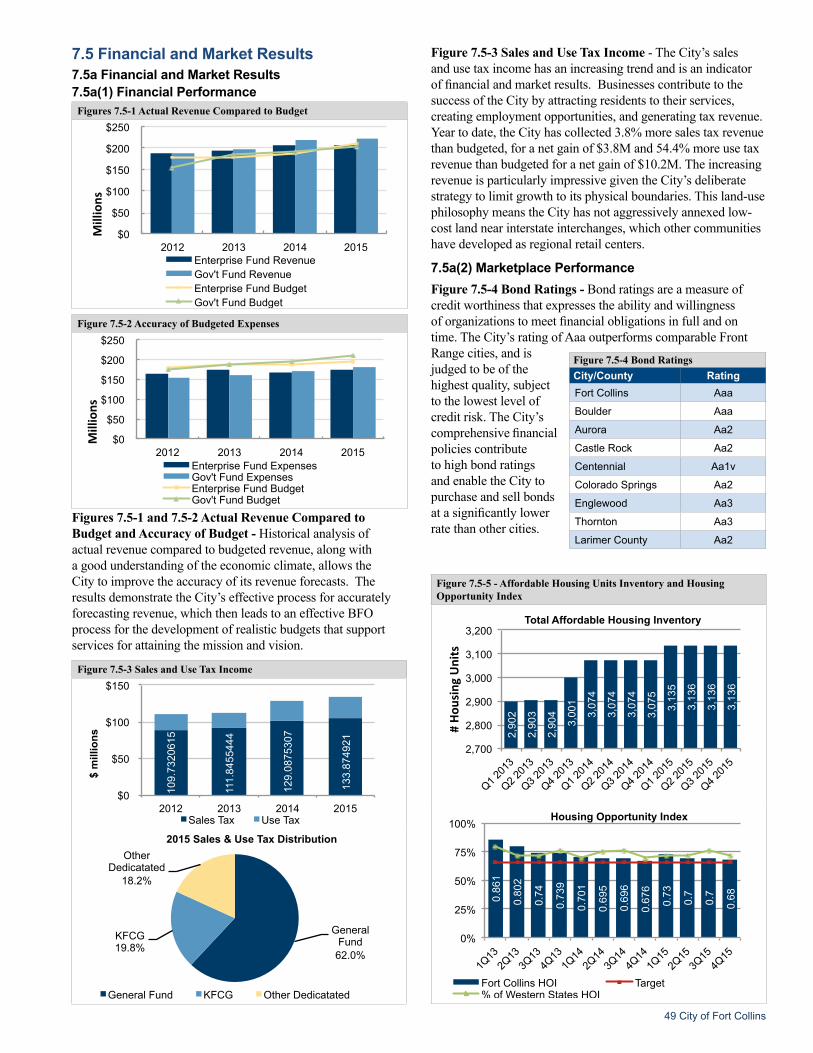
49 City of Fort Collins
Figure 7.5-3 Sales and Use Tax Income - The City’s sales and use tax income has an increasing trend and is an indicator of financial and market results. Businesses contribute to the success of the City by attracting residents to their services, creating employment opportunities, and generating tax revenue. Year to date, the City has collected 3.8% more sales tax revenue than budgeted, for a net gain of $3.8M and 54.4% more use tax revenue than budgeted for a net gain of $10.2M. The increasing revenue is particularly impressive given the City’s deliberate strategy to limit growth to its physical boundaries. This land-use philosophy means the City has not aggressively annexed low-cost land near interstate interchanges, which other communities have developed as regional retail centers.
7.5a(2) Marketplace PerformanceFigure 7.5-4 Bond Ratings - Bond ratings are a measure of credit worthiness that expresses the ability and willingness of organizations to meet financial obligations in full and on time. The City’s rating of Aaa outperforms comparable Front Range cities, and is judged to be of the highest quality, subject to the lowest level of credit risk. The City’s comprehensive financial policies contribute to high bond ratings and enable the City to purchase and sell bonds at a significantly lower rate than other cities.
Figure 7.5-5 - Affordable Housing Units Inventory and Housing Opportunity Index
2,90
2
2,90
3
2,90
4
3,00
1
3,07
4
3,07
4
3,07
4
3,07
5
3,13
5
3,13
6
3,13
6
3,13
6
2,700
2,800
2,900
3,000
3,100
3,200
Q1 201
3
Q2 201
3
Q3 201
3
Q4 201
3
Q1 201
4
Q2 201
4
Q3 201
4
Q4 201
4
Q1 201
5
Q2 201
5
Q3 201
5
Q4 201
5
#Ho
usingUnits
Total Affordable Housing Inventory
0.86
1
0.80
2
0.74
0.73
9
0.70
1
0.69
5
0.69
6
0.67
6
0.73
0.7
0.7
0.68
0%
25%
50%
75%
100%
1Q13
2Q13
3Q13
4Q13
1Q14
2Q14
3Q14
4Q14
1Q15
2Q15
3Q15
4Q15
Fort Collins HOI Target % of Western States HOI
7.5 Financial and Market Results7.5a Financial and Market Results7.5a(1) Financial Performance
Figures 7.5-1 Actual Revenue Compared to Budget
$0
$50
$100
$150
$200
$250
2012 2013 2014 2015
Millions
Enterprise Fund Revenue Gov't Fund Revenue Enterprise Fund Budget Gov't Fund Budget
Figure 7.5-2 Accuracy of Budgeted Expenses
$0
$50
$100
$150
$200
$250
2012 2013 2014 2015
Millions
Enterprise Fund Expenses Gov't Fund Expenses Enterprise Fund Budget Gov't Fund Budget
Figures 7.5-1 and 7.5-2 Actual Revenue Compared to Budget and Accuracy of Budget - Historical analysis of actual revenue compared to budgeted revenue, along with a good understanding of the economic climate, allows the City to improve the accuracy of its revenue forecasts. The results demonstrate the City’s effective process for accurately forecasting revenue, which then leads to an effective BFO process for the development of realistic budgets that support services for attaining the mission and vision.
Figure 7.5-3 Sales and Use Tax Income
109.
7320
615
111.
8455
444
129.
0875
307
133.
8749
21
$0
$50
$100
$150
2012 2013 2014 2015
$ m
illio
ns
Sales Tax Use Tax
General Fund 62.0%
KFCG 19.8%
Other Dedicatated
18.2%
2015 Sales & Use Tax Distribution
General Fund KFCG Other Dedicatated
Figure 7.5-4 Bond RatingsCity/County RatingFort Collins Aaa
Boulder Aaa
Aurora Aa2
Castle Rock Aa2
Centennial Aa1v
Colorado Springs Aa2
Englewood Aa3
Thornton Aa3
Larimer County Aa2
Housing Opportunity Index

50 City of Fort Collins
Figure 7.5-5 - Affordable Housing Units Inventory and Housing Opportunity Index - The City invests in affordable housing to preserve family stability, and increase neighborhood diversity and quality. The City’s Competitive Process provides funding for projects in the four priority goals: 1) increase theinventory of affordable rental units, 2) preserve existing affordable housing units, 3) increase housing and facilities for people with special needs, and 4) provide financial assistance for first-time homebuyers. The goal for 2016 is to retain all affordable units and to add 2% or more units to the inventory of affordable housing based on the previous year. The Housing Opportunity is a percentage of all new and existing homes sold in the last quarter that were affordable to families earning the area median income. Fort Collins is a highly desirable living location; the slight decrease in HOI is market demand impacting home prices.
Figure 7.5-6 New Residential Permits
1,12
7
1,39
3
1,41
7
976
173
498
919
892
456
377
417
372
736
1,02
3
772
693
0
500
1,000
1,500
2012 2013 2014 2015
Fort Collins Greeley Longmont Loveland
Figure 7.5-6 New Residential Permits - Residential construction activity provides a measure of the impact of economic activity on the community’s population. As economic activity increases residential construction may increase; a lack of increase may signify a rise in the number of employees who commute into the community. The City’s results continue to outperform its closest cities.
Figure 7.5-8 Commercial Vacancy Rates
0% 1% 2% 3% 4% 5% 6% 7% 8% 9%
Q1 2012
Q2 2012
Q3 2012
Q4 2012
Q1 2013
Q2 2013
Q3 2013
Q4 2013
Q1 2014
Q2 2014
Q3 2014
Q4 2014
Q1 2015
Q2 2015
Q3 2015
Q4 2015
Fort Collins Industrial Vacancy Rates Fort Collins Office Vacancy Rates Fort Collins Retail Vacancy Rates
Figure 7.5-7 New Commercial Permit Dollar Volume per Capita
$0
$200
$400
$600
$800
$1,000
2012 2013 2014 2015 Fort Collins Greeley
Figure 7.5-7 New Commercial Permit Dollar Volume per Capita - New commercial construction value measures the market’s reaction to economic activity and the capacity of the City’s market to react to job growth. The City continues to attract job opportunities and outperforms the closest city of comparable size.Figure 7.5-8 Commercial Vacancy Rates - Commercial property use provides a measure of economic activity and economic capacity. As the vacancy rate drops additional commercial space may be necessary to capture economic activity that results in tax revenue. The City’s recent Mall Expansion project (Figure 7.4-7 Intelligent Risk) is in the leasing phase and the vacancy rate is projected to correct.
Figure 7.5-9 Unemployment Rate
6.33
%
5.43
%
4.10
%
3.33
%
8.08
%
7.33
%
6.18
%
5.30
%
8.01
%
6.95
%
5.23
%
4.05
%
0%
2%
4%
6%
8%
10%
2012 2013 2014 2015 Fort Collins US Colorado Target
Figure 7.5-9 Unemployment Rate - The unemployment rate is a top-line economic metric providing an overall understanding of economic activity in a community and is used as the primaryindicator of economic success and resiliency of a community. The City’s unemployment rate has decreased for four consecutive years and continues to be lower than state and national comparisons.