Making the Investment Case for Social Protection: Discussion paper on the methodological challenges...
64
Making the investment case for social protection Methodological challenges with lessons learnt from a recent study in Cambodia Office of Research Working Paper WP-2013-06 | May 2013 UNICEF Office of Research Cécile Cherrier, Franziska Gassmann, Andrés Mideros Mora, Pierre Mohnen
Transcript of Making the Investment Case for Social Protection: Discussion paper on the methodological challenges...
Making the investment case
for social protection Methodological challenges with
lessons learnt from a recent study in Cambodia
Office of Research Working Paper
WP-2013-06 | May 2013
UNICEF Office of Research
Cécile Cherrier, Franziska Gassmann,
Andrés Mideros Mora, Pierre Mohnen
2
OFFICE OF RESEARCH WORKING PAPERS
UNICEF Office of Research Working Papers are intended to disseminate initial research contributions
within the programme of work, addressing social, economic and institutional aspects of the realization
of the human rights of children.
The findings, interpretations and conclusions expressed in this paper are those of the authors and do
not necessarily reflect the policies or views of UNICEF.
The text has not been edited to official publications standards and UNICEF accepts no responsibility for
errors.
Extracts from this publication may be freely reproduced with due acknowledgement. Requests to
utilize larger portions or the full publication should be addressed to the Communication Unit at
For readers wishing to cite this document we suggest the following form:
Cherrier, C., Gassmann, F., Mideros Mora, A. and Mohnen, P. (2013). ‘Making the Investment Case for
Social Protection: Methodological challenges with lessons learnt from a recent study in Cambodia’,
Working Paper 2013-06. UNICEF Office of Research, Florence.
© 2013 United Nations Children’s Fund (UNICEF)
May 2013
ISSN: 1014-7837
3
THE UNICEF OFFICE OF RESEARCH
In 1988 the United Nations Children’s Fund (UNICEF) established a research centre to support its advocacy
for children worldwide and to identify and research current and future areas of UNICEF’s work. The prime
objectives of the Office of Research are to improve international understanding of issues relating to
children’s rights and to help facilitate full implementation of the Convention on the Rights of the Child in
developing, middle-income and industrialized countries.
The Office aims to set out a comprehensive framework for research and knowledge within the
organization, in support of its global programmes and policies. Through strengthening research
partnerships with leading academic institutions and development networks in both the North and South,
the Office seeks to leverage additional resources and influence in support of efforts towards policy reform
in favour of children.
Publications produced by the Office are contributions to a global debate on children and child rights issues
and include a wide range of opinions. For that reason, some publications may not necessarily reflect
UNICEF policies or approaches on some topics. The views expressed are those of the authors and/or
editors and are published in order to stimulate further dialogue on child rights.
The Office collaborates with its host institution in Florence, the Istituto degli Innocenti, in selected areas of
work. Core funding is provided by the Government of Italy, while financial support for specific projects is
also provided by other governments, international institutions and private sources, including UNICEF
National Committees.
Extracts from this publication may be freely reproduced with due acknowledgement. Requests to translate
the publication in its entirety should be addressed to: Communications Unit, [email protected].
For further information and to download or order this and other publications, please visit the website at
www.unicef-irc.org.
Correspondence should be addressed to:
UNICEF Office of Research - Innocenti
Piazza SS. Annunziata, 12
50122 Florence, Italy
Tel: (+39) 055 20 330
Fax: (+39) 055 2033 220
www.unicef-irc.org
The text has not been edited to official publications standards and UNICEF accepts no responsibility for errors.
4
MAKING THE INVESTMENT CASE FOR SOCIAL PROTECTION:
METHODOLOGICAL CHALLENGES WITH LESSONS LEARNT FROM A RECENT STUDY IN CAMBODIA
Cécile Cherrier, Franziska Gassmann, Andrés Mideros Mora, Pierre Mohnen
Maastricht Graduate School of Governance / UNU-MERIT, Maastricht University
Abstract. The focus in this paper is on non-contributory social transfers which are considered to be the main
social protection instruments targeted specifically at poor and vulnerable households, and which are
financed from general government revenues. Eligibility for non-contributory transfers does not depend on
employment records and contributions made in the past. The aim of the paper is to take stock of the main
experiences and unpack some of the common questions raised in relation to the use of ex-ante cost-benefit
analyses for the promotion and design of non-contributory social protection policies and programmes in
developing countries. We conclude by highlighting a number of important questions, suggesting critical
conditions for carrying out and using such analyses successfully, and proposing directions for future
research.
Keywords: social protection, social transfers, poverty, cost-benefit analyses, vulnerable households
Acknowledgements: We would like to acknowledge the financial support of the UNICEF Office of Research
for preparing this paper. We also thank the following colleagues who have provided comments, inputs and
contributions: Enrique Delamonica, Victoria Colamarco, Jennifer Yablonski, Natalia Elena Winder-Rossi, Elena
Gaia, Roberto Benes, Samman J. Thapa, Mariana Stirbu, Rémy Pigois (UNICEF); Krzysztof Hagemejer, Luis
Frota (ILO); Michael Cichon (International Council of Social Welfare); Benjamin Davis (FAO); Matthew
Greenslade (DFID); Anthony Hodges, Clare O’Brien, Luca Pellerano, Fidelis Hove (Oxford Policy
Management); Anna McCord (Overseas Development Institute); Keetie Roelen (Institute of Development
Studies); Nicholas Taylor (European Commission); Nicola Hypher (Save the Children); Nicholas Freeland.
Acknowledgments are also due to all the attendants of the Seminar “Making the Investment Case for Social
Protection” on 18 March 2013 in Florence, Italy. Last but not least, our appreciation goes to UNICEF country
office in Cambodia which commissioned the initial study on Estimates of Rates of Return of Social Protection
Instruments in Cambodia. It triggered the broader discussion discussed in the current paper.
The findings, interpretations and conclusions expressed in this paper remain the responsibility of the authors
and do not necessarily reflect the policies or views of UNICEF.
5
TABLE OF CONTENTS
Acronyms 7
1. Introduction 8
2. Making the case for non-contributory social protection 10 2.1 Usual advocacy strategies and their limits 10 2.2 Increased interest in ex-ante cost analyses to inform social protection policy 11 2.3 Non-contributory social protection as an economic investment 14 3. Conducting ex-ante cost analyses for social transfers in developing countries: an analytical review of methodological approaches 18 3.1 Defining the range of policy options to be analysed 18 3.2 Quantifying costs 19 3.3 Quantifying impacts 21 3.4 Comparing impacts and costs 27 4. Estimating rates of return of social transfers: lessons learnt from Cambodia 30 4.1 Overview: policy context, methodological approach and key findings 30 4.2 Methodological advances and limitations 35 4.3 Research process and research uptake 39 5. Discussing policy implications and future research 41 5.1 Informing national social protection policies 41 5.2 Final considerations on the use of cost-benefit analyses 47 6. Final remarks 50 Appendix 1 Overview of main models used for ex-ante cost analyses in non-contributory social protection policy 51
References 56 List of Boxes
Box 1. Assumptions 38 Box 2. Cost analyses in efforts to shape social protection policies in Mozambique 42 Box 3. Cost analyses in efforts to shape social protection policies in Senegal 43 Box 4. The origins of Lesotho’s Old Age Pension scheme 46
List of Figures Figure 1. Non-contributary social protection and socioeconomic development: a framework of analysis 16 Figure 2. Cash transfers, ‘Value for Money’ and results chain 34
6
List of Tables Table 1. Different types of cost analysis for different purposes 13 Table 2. Summary of estimates for economic growth impact of social protection (micro, meso and macro levels) 24 Table 3. Basic social transfer package selected from the NSPS 32 Table 4. Main results of regression models using CSES 2004 and 2009 for Cambodia 34 Table 5. Dynamic microsimulation of a basic social transfer package in Cambodia: benefits, costs and returns 35
7
ACRONYMS
ADePT Automated Development Economics Poverty Tables
CARD Cambodian Council for Agricultural and Rural Development
CCT Conditional Cash Transfer
CEE/CIS Central and Eastern Europe and the Commonwealth of Independent States
CSES Cambodian Socio-Economic Survey
CTR Cost-Transfer Ratio
DALY Disability Adjusted Life Year
DFID Department for International Development of the British Government
ECD Early Childhood Development
FAO Food and Agriculture Organization of the United Nations
GEM General Equilibrium Model
ILO International Labour Office
IMF International Monetary Fund
LEWIE Local economy-wide impact evaluation
LGE Local General Equilibrium
MBB Marginal Budgeting for Bottlenecks
MDG Millennium Development Goals
MGSoG Maastricht Graduate School of Governance
MoRES Monitoring Results for Equity
NPV Net Present Value
NSPS Cambodian National Social Protection Strategy for the Poor and Vulnerable
ODA Official Development Assistance
ODI Overseas Development Institute
OPM Oxford Policy Management
PMT Proxy Means Test
RAP Rapid Assessment Protocol
RGC Royal Government of Cambodia
RoR Rate of Return
SAM Social Accounting Matrix
SPER Social Protection Expenditure Reviews
SPF Social Protection Floor
UN United Nations
UNAIDS Joint United Nations Programme on HIV/AIDS
UNICEF United Nations Children’s Fund
VfM Value for Money
WFP United Nations World Food Programme
8
1. INTRODUCTION
Social protection can be defined as the ‘set of public and private policies and programmes aimed at
preventing, reducing and eliminating economic and social vulnerabilities to poverty and
deprivation’ (UNICEF 2012, p. 14). It comprises various types of instruments, and includes social
insurance systems, labour market policies, and other social transfers. The focus in this paper is on
non-contributory social transfers which are considered to be the main social protection
instruments targeted specifically at poor and vulnerable households, and which are financed from
general government revenues. Eligibility for non-contributory transfers does not depend on
employment records and contributions made in the past.1 Social protection represents a strategy
for reducing income poverty and inequality. It is essentially a demand-side approach that can
complement and increase the effectiveness of supply-side investments in sectors such as health,
education, and water and sanitation, towards reducing disparities and gaps and fostering equitable
socioeconomic development.
Social protection is gaining momentum in the development discourse. Recent commitments by the
United Nations and the G20 to support the expansion of social protection in developing countries
marked a new turning point in efforts to ensure a minimum level of protection to all citizens of the
world (CEB 2009; G20 2011; ILO 2011). But while new forms of social protection have developed
quickly in Latin America, progress in other parts of the developing world remains slow (ILO 2010).
Many governments are yet to be convinced that non-contributory social protection can be a
worthwhile public investment generating positive economic returns. In a context of global
recession, resources are (even) more limited and policymakers are under additional scrutiny to
present convincing investment cases and demonstrate best value for money.
Recent years saw an increased use of cost analysis approaches in the area of social protection. Ex-
ante analyses are conducted with the aim of indicating which types of non-contributory social
protection intervention are affordable (cost-feasibility analysis), which option delivers a given level
of benefit for the lowest cost (cost-efficiency analysis), or which design option yields the highest
level of effectiveness for a given cost (cost-effectiveness analysis). Determining whether benefits of
a given intervention can be expected to be larger than its costs, or estimating rates of return of
public investments in social protection is much more complex. Cost-benefit analyses raise
numerous methodological challenges, as for example: social protection interventions have
multidimensional impacts; empirical evidence on the long-term impacts of social protection
remains limited; impacts may be difficult to quantify in monetary terms. There is still a gap in terms
of linking costing studies and outcome assessments of social protection programmes.
A recent study, commissioned by UNICEF Cambodia and carried out by the Maastricht Graduate
School of Governance, represents a unique attempt to carry out an ex-ante return on investment
analysis in the social protection sector. In that study, Mideros et al. (2012) provide an ex-ante
estimate of the rate of return to investment in social transfers in Cambodia. The study provides
important lessons on viable approaches for making the investment case for non-contributory social
protection. It also raises a number of methodological questions that justify careful assessment and
discussion.
1 Note that transfers can be in cash or in kind.
9
The purpose of this discussion paper is to take stock of the main experiences and unpack some of
the common questions raised in relation to the use of ex-ante cost-benefit analyses for the
promotion and design of non-contributory social protection policies and programmes in developing
countries. It considers the following questions: What is the rationale for the increased interest in
cost-benefit analyses? What are the main methodological issues associated to cost-benefit
analyses and how have they been tackled? What is the scope to go beyond short-term cost-benefit
analyses focused on immediate effects, and estimate rates of return of public investments in social
transfers in the medium and long terms? Are there any risks associated with an increased reliance
on cost-benefit analyses? Are there any alternatives to the traditional approach to cost-benefit
studies?
The paper is organised as follows. We first briefly discuss approaches for making the case for non-
contributory social protection, and present the rationale for using ex-ante cost analyses (Section 0).
Turning to methodological issues, we review some of the main approaches currently used for
estimating ex-ante costs and benefits of social transfer schemes in developing countries (Section
0). These first two sections aim at providing a common language and understanding of cost-benefit
analysis-related issues, making the discussion accessible to all social protection professionals, even
those unfamiliar with socio-economic modelling. We then zoom in on the study recently conducted
in Cambodia, presenting its methodology and key findings, and discussing methodological
breakthroughs and limitations (Section 0). Subsequently, we engage in a discussion on the possible
way forward, looking both at the methodological options to take these types of studies to the next
level, and at the potential for rate-of-return analyses to influence policy decision-making (Section
0). We conclude by highlighting a number of important questions, suggesting critical conditions for
carrying out and using such analyses successfully, and proposing directions for future research.
10
2. MAKING THE CASE FOR NON-CONTRIBUTORY SOCIAL PROTECTION
Extending social protection can prove extremely challenging in developing countries where needs
are widespread but resources scarce. The frequent predominance of the informal sector coupled
with high rates of poverty and inequality requires alternatives to formal social insurance systems
that rely on withholding taxes and contributions on employment income. It calls for the
introduction of non-contributory forms of social protection in order to protect the livelihoods of
the poor and vulnerable and mitigate the effects of uninsured risks for those outside the formal
labour markets. But, confronted with limited fiscal space and lack of familiarity with non-
contributory social protection instruments, many governments have made little progress in the
extension of social protection. Investments in social assistance remain far behind in the developing
world, and by and large have not contributed to systematically building a system of social
protection provision, interventions remaining ad-hoc and often temporary (ILO 2010). In reaction
to this situation, many development partners have engaged in various strategies to promote the
use of non-contributory social protection instruments in developing countries. In this section, we
briefly review the limits of some traditional strategies that social protection advocates have used in
national fiscal and economic debates. We then discuss the increased interest among development
partners in cost analysis approaches to promote and inform social protection policy, and we
examine frameworks for conceptualising non-contributory social protection as an economic
investment.
2.1 Usual advocacy strategies and their limits
Making the case for non-contributory social protection is needed for advocating the introduction
of social transfer schemes in countries where there are none or only sporadic ones, or advocating
for a reform of existing schemes – for instance regressive general subsidies in Senegal and many
other countries, or institution-based social protection in CEE/CIS. A whole range of arguments may
be advanced. They include: social justice and human rights; poverty reduction and risk
management; economic growth and capital-based production; political stability and state-building
(see for instance Freeland and Cherrier 2012, Chapter 3).
The human rights argument is at the core of the Social Protection Floor initiative, conceptual
catalyst for the international community to advocate and support the development of a ‘set of
basic social rights, services and facilities that the global citizen should enjoy’ (ILO and WHO 2009b,
p. 4). Social protection is a human right, as stated in articles 22 and 25 of the Universal Declaration
of Human Rights (UN 1948) and article 9 of the International Covenant on Economic, Social and
Cultural Rights (UN 1966). The rights-based justification for non-contributory social protection
implies seeing social assistance as an entitlement eligible citizens can claim, and no longer as hand-
outs provided on a discretionary basis (Devereux 2011). In this perspective, social protection is no
longer a political option, but rather an obligation for the States and the international governance
structures. In this sense, the case for social protection can be made from the responsibility of
states to provide social protection (Cichon et al. 2011). But human rights arguments alone have
rarely been sufficient to influence policymakers in countries. Limited domestic resources do not
allow ensuring all basic human rights at once, and priorities necessarily need to be set. Often,
additional arguments would be needed to move social protection higher up the national
development agenda.
11
Another strategy for making the case for social protection has been to present theoretical
arguments and empirical evidence on the impact of social transfers on poverty reduction and
human development. The international evidence base on the multidimensional impacts of social
transfers is growing quickly, in particular for social cash transfers – see for instance EPRI (2010),
Barrientos and Niño-Zarazúa (2010) and Arnold et al. (2011). But while such generic advocacy
messages may be useful to raise awareness on the potential of non-contributory social protection,
they present obvious limits. Because social protection remains fairly new in many parts of the
developing world, empirical evidence often has to be drawn from experiences in other countries.
To date, most of the high quality studies on social transfers come from Latin America, a quite
specific context. Although social transfers have proven to be an effective mechanism to reduce
income deprivation, inequality and access to basic social services, their effects largely depend on
programme design features – transfer form, benefit level, targeting strategy, etc. – as well as
implementation arrangements, administrative capacity and complementary policies. For instance,
reviewing studies linking nutritional status to interventions involving cash transfers in Latin
American, Asian and African developing countries, Manley et al. (2012) found mixed evidence: the
weighted average of all impact estimates was very close to zero.
Responding to the lack of national empirical evidence, many international aid actors have launched
social transfer pilot projects in an attempt to demonstrate that innovative forms of social transfers
can be implemented and can generate very positive results, and eventually influence national
policies. Experience in Eastern and Southern Africa suggests that this pilot project approach has
limitations in promoting the institutionalisation of social transfers (Devereux et al. 2010; Niño-
Zarazúa et al. 2010). Misalignment with national policy priorities, weak impact evaluation methods,
disconnection with the national policymaking process, are among the factors that may explain this
disappointing situation. Furthermore, even confronted with a very efficient pilot project,
policymakers would often argue that they need more information on the scalability and financial
sustainability of the piloted model. Demonstrating efficacy (whether it works or not) or even
efficiency (how well it works) alone cannot be enough.
In a context of global recession, policymakers (either in developing countries or donor agencies)
are required to present ever stronger and more convincing arguments to justify public spending.
They need to demonstrate value for money to taxpayers (either donor country or national
taxpayers). Furthermore, securing sustainable financing for social protection has become a critical
area of concern, given the recent fiscal consolidation that many countries are undergoing following
a period of fiscal expansion and stimulus in response to the economic crisis (IMF 2011). The
prospects of making initial commitments that cannot be sustained over time raise social, economic
and political risks. This situation pushes social protection advocates to engage more actively in
national fiscal and economic debates and develop the ability to analyse the fiscal sustainability and
comparative cost-effectiveness of non-contributory social protection.
2.2 Increased interest in ex-ante cost analyses to inform social protection policy
In a context characterised by huge needs and limited resources, policymakers are concerned with
obtaining the most ‘bang’ for any ‘bucks’ that are spent. This is the purpose of cost analysis
approaches: ‘to provide a method for choosing among alternatives in order to select those that are
able to accomplish a given result most parsimoniously.’(Levin and McEwan 2001, p. 1) Recent years
12
saw a growing attention paid to ensuring ‘best value for money’, in particular among development
partners. As a result, terms such as cost-effectiveness, cost-efficiency and return on investment
have become buzzwords. These related yet different terms are often mistakenly used
interchangeably, and to avoid any confusion, we offer in Table 1 an overview of this terminology.
In the social protection field in particular, a number of cost analysis approaches have been
increasingly applied, namely:
Cost-feasibility analyses to assess levels of affordability. Cost feasibility analysis is the most
basic form of cost analysis. It aims at providing estimates of costs alone, and determining
on a Yes or No basis whether something can be afforded. If the cost of any option exceeds
the resources that are available, there is no point in doing any further analysis. When
considering several options, it allows a pre-selection excluding the ones that appear
beyond reach. To apprehend the level of affordability, the total cost of the option (in
monetary terms) when the programme is at scale – i.e. the initial and the continuing costs–
is estimated. This is usually then expressed as a share of the Gross Domestic Product
(GDP). It may also be helpful to express the total annual cost of a policy option as a share
of the national budget, taxable base or Official Development Aid (ODA). Analysing the
evolution of the fiscal burden (usually expressed as a percentage of GDP) over time is
useful to apprehend financial sustainability – see for instance ILO (2008).
Cost-efficiency analyses to improve process. For a given objective, several social protection
policy options can be envisioned. For instance, to improve access to food, various policy
options can be considered, such as targeted food rations, food vouchers, cash transfers, or
mixed transfers. A comparative cost-efficiency analysis can help define which policy option
to opt for, estimating costs to deliver a given output for alternative options. Such analyses
can be useful to fine-tune an existing scheme, for instance comparing alternative delivery
mechanisms – see for instance Cherrier (2009).
Comparative cost-effectiveness analyses to select policy options. Cost-effectiveness analyses
are used to inform the choice between two or more policy options to achieve a given
objective—for instance, to achieve school enrolment, improve access to health care, etc.
Most ex-ante studies on social transfers focus on quantifying what could be expected in
terms of poverty reduction or Millennium Development Goals (MDG). This type of
simulation forms the basis for advocacy efforts aimed at convincing national governments
to invest in social protection– see for instance Gassmann and Behrendt (2006), or to
reform the current system – see for instance Gassmann (2011, 2012).
Cost-benefit analyses to assess whether benefits can exceed costs. Cost-benefit analysis
combines all the different benefits of a programme onto one scale (usually a monetary
scale) and shows the ratio of the combined benefits to cost. Cost-benefit analysis will,
where feasible, provide an answer to the question: Is the programme worth its cost? A
comparative cost-benefit analysis would answer the question: Which of the options has
the highest benefit/cost ratio? Of course, this is only possible when all values involved can
be converted into monetary terms, which is challenging in the case of ethical, psychological
or social benefits of social protection – see for instance Gassmann et al. (2009).
13
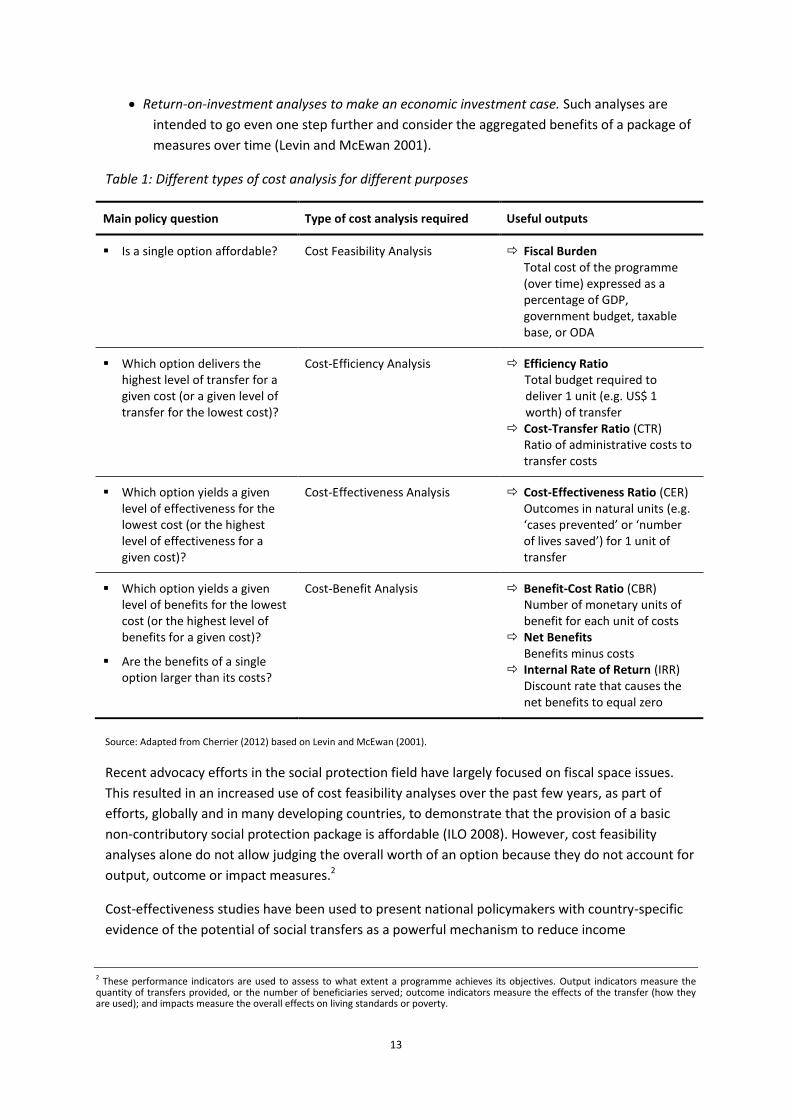
Return-on-investment analyses to make an economic investment case. Such analyses are
intended to go even one step further and consider the aggregated benefits of a package of
measures over time (Levin and McEwan 2001).
Table 1: Different types of cost analysis for different purposes
Main policy question Type of cost analysis required Useful outputs
Is a single option affordable? Cost Feasibility Analysis Fiscal Burden Total cost of the programme (over time) expressed as a percentage of GDP, government budget, taxable base, or ODA
Which option delivers the highest level of transfer for a given cost (or a given level of transfer for the lowest cost)?
Cost-Efficiency Analysis Efficiency Ratio Total budget required to deliver 1 unit (e.g. US$ 1 worth) of transfer
Cost-Transfer Ratio (CTR) Ratio of administrative costs to transfer costs
Which option yields a given level of effectiveness for the lowest cost (or the highest level of effectiveness for a given cost)?
Cost-Effectiveness Analysis
Cost-Effectiveness Ratio (CER) Outcomes in natural units (e.g. ‘cases prevented’ or ‘number of lives saved’) for 1 unit of transfer
Which option yields a given level of benefits for the lowest cost (or the highest level of benefits for a given cost)?
Are the benefits of a single option larger than its costs?
Cost-Benefit Analysis Benefit-Cost Ratio (CBR) Number of monetary units of benefit for each unit of costs
Net Benefits Benefits minus costs
Internal Rate of Return (IRR) Discount rate that causes the net benefits to equal zero
Source: Adapted from Cherrier (2012) based on Levin and McEwan (2001).
Recent advocacy efforts in the social protection field have largely focused on fiscal space issues.
This resulted in an increased use of cost feasibility analyses over the past few years, as part of
efforts, globally and in many developing countries, to demonstrate that the provision of a basic
non-contributory social protection package is affordable (ILO 2008). However, cost feasibility
analyses alone do not allow judging the overall worth of an option because they do not account for
output, outcome or impact measures.2
Cost-effectiveness studies have been used to present national policymakers with country-specific
evidence of the potential of social transfers as a powerful mechanism to reduce income
2 These performance indicators are used to assess to what extent a programme achieves its objectives. Output indicators measure the quantity of transfers provided, or the number of beneficiaries served; outcome indicators measure the effects of the transfer (how they are used); and impacts measure the overall effects on living standards or poverty.
14
deprivation and inequality, and to promote human development. Such studies would look at one
outcome at a time: poverty headcount, school attendance etc. But social transfers are praised
because they can help achieve multiple objectives. The attempt of capturing this multidimensional
effect in one measure may be helpful to make the case for social transfers.
Because social transfers are paid by taxpayer contributions (either in the developing country or in a
donor country), the return on investment question is particularly sensitive, even more so when
countries face the double challenge of having to extend social protection measures and improve
social services and basic infrastructure. Finding the right balance between demand- and supply-
side investments is a difficult task. Alternative investments need to be discounted against each
other as different government sectors are competing with one another. Developing an economic
argument for social transfers requires looking both at cost-effectiveness in the short term, to
assess whether costs can be justified by the expected impacts for human and economic
development, as well as cost-effectiveness – and when appropriate cost-benefit– in the long term.
Cost-benefit analyses may provide robust estimations about the different benefits of social
transfers and clarify the linkages with economic performance. They may help convince
policymakers that social transfers are not only ‘social’ but can also be a worthwhile economic
investment. Some development partners have even promoted the idea of a development planning
matrix (or big ‘development calculator’) to model the impact of a set of strategies (cash transfers,
health insurance, education, livelihoods, etc.) on a set of objectives (poverty reduction, risk
management, literacy, health, productivity growth, economic growth, etc.) – thus modeling intra-
as well as inter-sectoral linkages (Miller and Samson 2012).
Having a closer look at the links between government spending, social protection, human
development, poverty and inequality, and economic growth can help make a stronger case for
non-contributory social protection investments. It may help move beyond the current state of
debate where the ‘productive’ nature of certain types of social protection investments is
questioned.
2.3 Non-contributory social protection as an economic investment
Social protection has a direct objective in terms of social outcomes and human development, but it
is also linked with economic development, and, hence, can be regarded as an economic
investment. Several authors have articulated an economic justification for non-contributory social
protection on the basis of theoretical mechanisms and international evidence linking non-
contributory social transfers and pro-poor economic growth (see for instance ILO 2005; DFID 2006;
Barrientos and Scott 2008; OECD 2009; Samson and Cherrier 2009, Annexe 5; Barrientos and Niño-
Zarazúa 2010; Barrientos et al. 2010; Arnold et al. 2011; Barrientos 2012). Alderman and Yemtsov
(2012) actually argue that there is a shift in the economists’ view on social protection, which is now
increasingly seen as an instrument that can contribute towards economic growth. In line with this
statement, it is interesting to see that the World Economic Forum (2012) has recently made the
case for a new approach to growth, emphasising the importance of employment and social
protection. Social protection is no longer seen as a cost to the economy but as a source of
resilience in tough times, as a support for growth and productivity in good times, and as a general
mechanism for socioeconomic inclusion.
15
Alderman and Yemtsov (2012) identify three main pathways through which social transfers can
support economic growth, namely: ‘(i) individual level (building and protecting human capital, and
other productive assets, empowering poor individuals to invest or to adopt higher return
strategies), (ii) local economy effects (enhancing community assets and infrastructure, positive
spillovers from beneficiaries to non-beneficiaries), (iii) overall economy level (acting as stabilizers
of aggregate demand, improving social cohesion and making growth-enhancing reforms more
politically feasible).’ Barrientos (2012) examines a framework to analyse the links between social
transfers and economic growth at the micro-level, based on international evidence from impact
evaluation studies.
From an analytical perspective of socioeconomic development, proposed by Szirmai (2012), it is
possible to identify the links between social protection, economic performance and socioeconomic
outcomes. Proximate sources of economic growth are those directly related with economic output
and include disembodied technological change (i.e. advances in technological knowledge that are
not incorporated in any specific production factor), capital accumulation and labour productivity.
Social transfers have proved to generate positive effects on both human and physical capital
accumulations. Intermediate sources of development include trends in national and international
demand, economic, social and technological policies, and changes in the terms of trade. Social
protection as a social and economic policy is also a stabilizer of internal demand. Lastly, ultimate
sources of development are related with geographic conditions, demographic trends, social
attitudes and capabilities, political and social institutions and class and power relations, among
others. In this sense, social protection fosters social cohesion and socio-economic inclusion. Finally,
it is important to note that the relations among these levels are neither linear nor unidirectional
(Szirmai 2012).
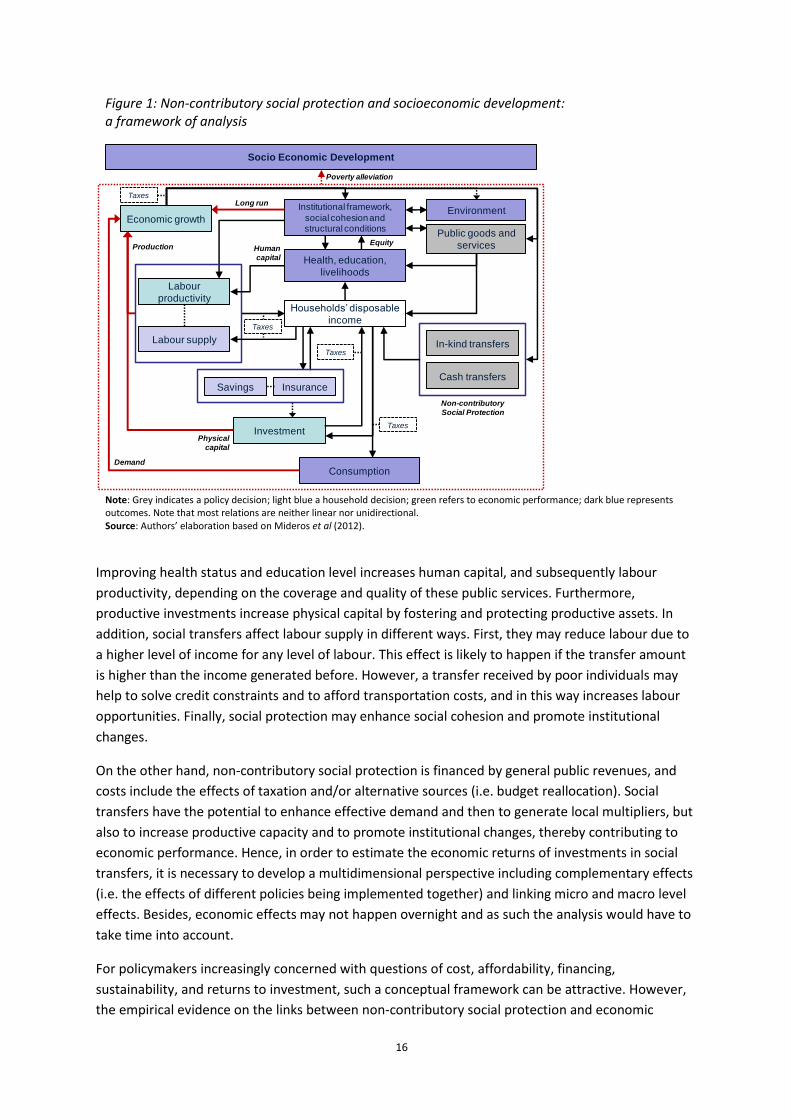
Building on this literature, we offer an analytical framework of the links between non-contributory
social transfers and socioeconomic development (Figure 1). Economic returns of non-contributory
social protection investments can be measured by the effect on economic growth, while the costs
include both the resources directly invested in the transfers and those indirectly included in the
distortionary effects of taxes and/or social security contributions. Non-contributory social transfers
directly affect household disposable income (i.e. distributional effects), and as such household
consumption. However, social transfers also affect household behaviour through income and non-
income effects. Additional and/or secure income encourages households to invest in health,
education, livelihoods and productive activities. Moreover, the transfer design may further
encourage certain decisions (e.g. by conditionality and transfers mechanisms).
16
Figure 1: Non-contributory social protection and socioeconomic development: a framework of analysis
Note: Grey indicates a policy decision; light blue a household decision; green refers to economic performance; dark blue represents outcomes. Note that most relations are neither linear nor unidirectional. Source: Authors’ elaboration based on Mideros et al (2012).
Improving health status and education level increases human capital, and subsequently labour
productivity, depending on the coverage and quality of these public services. Furthermore,
productive investments increase physical capital by fostering and protecting productive assets. In
addition, social transfers affect labour supply in different ways. First, they may reduce labour due to
a higher level of income for any level of labour. This effect is likely to happen if the transfer amount
is higher than the income generated before. However, a transfer received by poor individuals may
help to solve credit constraints and to afford transportation costs, and in this way increases labour
opportunities. Finally, social protection may enhance social cohesion and promote institutional
changes.
On the other hand, non-contributory social protection is financed by general public revenues, and
costs include the effects of taxation and/or alternative sources (i.e. budget reallocation). Social
transfers have the potential to enhance effective demand and then to generate local multipliers, but
also to increase productive capacity and to promote institutional changes, thereby contributing to
economic performance. Hence, in order to estimate the economic returns of investments in social
transfers, it is necessary to develop a multidimensional perspective including complementary effects
(i.e. the effects of different policies being implemented together) and linking micro and macro level
effects. Besides, economic effects may not happen overnight and as such the analysis would have to
take time into account.
For policymakers increasingly concerned with questions of cost, affordability, financing,
sustainability, and returns to investment, such a conceptual framework can be attractive. However,
the empirical evidence on the links between non-contributory social protection and economic
Households’ disposable
income
Cash transfers
Health, education,
livelihoods
In-kind transfers
Labour
productivity
Savings
Economic growth
ConsumptionDemand
Production
Institutional framework,
social cohesion and structural conditions
Long run
EquityHuman
capital
Socio Economic Development
Poverty alleviation
Investment
Environment
Non-contributory
Social Protection
Public goods and
services
Labour supply
Insurance
Taxes
Taxes
Taxes
Taxes
Physical
capital
17
growth is inconclusive, and many knowledge gaps remain. Because non-contributory social transfer
schemes are relatively new in developing countries, there is little empirical evidence on their long-
term effects, let alone cost-benefit ratio. Hence, there is an increasing demand for ex-ante
assessments of the returns to investments in non-contributory social protection, in order to
generate evidence for the policymaking process.
***
Concluding remarks: Arguments in favour of non-contributory social protection have evolved from
hand-outs (discretionary) to human rights (obligation) to pro-poor economic growth (essential
investment). There is a growing tendency to see social protection as economic investment but this is
not yet supported by strong empirical evidence. There is a growing interest for ex-ante assessment of
economic returns.
18
3. CONDUCTING EX-ANTE COST ANALYSES FOR SOCIAL TRANSFERS IN DEVELOPING COUNTRIES: AN ANALYTICAL REVIEW OF METHODOLOGICAL APPROACHES
Different approaches have been used in different parts of the world to assess ex-ante costs and
effects of non-contributory social protection. These range from back-of-the-envelope calculations
to advanced expert modelling – see Appendix 1 for an overview of the main models developed to
date. Here, we focus on one specific instrument of non-contributory social protection. Social
transfers include measures providing in-kind or in-cash transfers with the objectives of reducing
poverty, inequality and vulnerability by enhancing consumption smoothing, helping people to
manage risks, and redistributing income between groups and over the life cycle (Gassmann 2011).
This form of social protection is still rather new in the developing world, and remains a matter of
tense debate. Despite strong positive evidence on their impact, national policymakers may be
reluctant to introduce social transfers because they normally imply a long-term commitment (i.e.
financial sustainability); they are seen as a ‘non-productive’ form of assistance; they are feared to
create dependency; they are feared to be unpopular because they are dependent on the support
of (better-off) taxpayers. This explains why, to date, most ex-ante cost analyses have focused on
social transfer policy options. In this section, we review in turn the four main steps for carrying out
a (comparative) cost analysis: defining the (range of) policy option(s) to be analysed; quantifying
costs; quantifying impacts; and comparing impacts and costs. We stress some key methodological
issues arising in each step, and review how different authors have approached them.
3.1 Defining the range of policy options to be analysed
We adopt here the perspective of development partners operating at the national level and
assisting national governments in their decision whether to mobilise (further) domestic resources
in social protection and which social protection instrument(s) to use given their specific priorities.
Most developing countries are yet to engage national resources in large-scale social transfer
programmes. Their main question is whether to invest in this type of social protection
programmes, and which social transfer instrument(s) to use given their specific priorities. In these
countries, development partners are often in a position where they have to advocate for non-
contributory social protection programmes, and assist in defining which option to opt for. They
need to lift national governments’ reluctance, in terms of fiscal sustainability and dependency.
Defining the set of alternative policy options to be analysed requires: setting the objective(s);
generating options; identifying feasible options; and establishing the counterfactual. Many studies
implicitly or explicitly consider the main objective to be the reduction of monetary poverty and
inequality. Some studies, particularly those advocating for child-sensitive social protection, would
also consider the improvement of child outcomes (for instance education, health, nutrition and
child labour) or progress towards socioeconomic development goals.
In their global study aimed at demonstrating the feasibility of a basic social protection package in
low-income countries, the ILO (2008) used the Basic Social Protection Tool to estimate the cost and
impact of a standard set of policies in terms of poverty gap reduction: old-age pensions; child
benefits; health care; social assistance/employment scheme. The first ILO models were generic
with pre-defined scenarios and a pre-defined poverty impact module. Increasingly, studies tend to
be country-specific, and assess policy against objectives set in the country’s national social
protection strategy. For instance, the construction of the ILO’s new model (Rapid Assessment
19
Protocol) goes hand in hand with a dialogue process involving national authorities and other actors
dealing with social protection.
Alternative options may be generated based on an articulated theory of change,3 international
empirical evidence, national experiments, etc. It is useful to set clear criteria beforehand for
reviewing and pre-selecting alternative options. For instance, DFID Pakistan used the following
criteria to assess the feasibility of each cash transfer option considered to reduce poverty and
increase school attendance and retention: ensure that the bottom two quintiles living in poverty
are reached (exclusion errors); ensure non-eligible households do not benefit (inclusion errors);
fiscal sustainability; political buy-in (provincial level as well as federal); and scalability (DFID 2012c).
Depending on the specific question the analysis aims to answer, the counterfactual would be the
absence of social transfers (a ‘do nothing’ scenario), the current policy in place, or an alternative
policy option such as food subsidies. Establishing a counterfactual is essential as it is the benchmark
against which all costs and benefits of other policy options are articulated and compared.
Involving policymakers at an early stage in the study appears essential to ensure all possible
alternatives are considered. Ideally, non-contributory social protection policy options should be
compared with other types of interventions expected to reach the defined objective. However,
many studies, due to methodological and data constraints, solely consider cash transfer policy
options. Also, some studies aimed at making the case for child-sensitive social protection would
only consider child-targeted options. However in southern Africa for instance, old age pensions
have proven to have a positive impact on children (due to the existence of a missing generation
caused by the HIV pandemic), be more affordable, and sometimes more politically acceptable.
3.2 Quantifying costs
An ex-ante cost analysis of social transfer policy options needs to estimate the total incremental
costs at scale. Estimates would usually be based on the following basic ingredients: number of
eligible persons/households; benefit level; administrative costs (including costs of targeting,
transfer delivery, monitoring, etc.); costs of any attached activity (e.g. complementary counselling,
public works, etc.). However, the actual drivers of costs for social cash transfers would typically be:
selection of beneficiaries (targeting costs); delivery costs (overheads, service provision, cost of
transfer, grievance mechanism, monitoring and information system, evaluation); in case of
conditionality, additional costs on the supply side (health, education, nutrition); monitoring
conditionality costs (e.g. if children in school to approve payments, spot checks); transaction costs
to the family (opportunity costs, transport costs, other); and actual transfer amount received by
the beneficiary.
Different approaches have been used to produce ex-ante estimates of social transfer
programme/policy costs, ranging from back-of-the-envelope calculations to simple mathematical
modelling to static and dynamic microsimulation. The Pensions Calculator (HelpAge 2010), the
Social Protection Financing Model (DFID et al. 2011), the Basic Social Protection Costing Tool (ILO
2007), and the Social Protection Floor Costing Tool (UNICEF and ILO 2010) are examples of very
3 For more information see http://www.theoryofchange.org/about/what-is-theory-of-change/
20
easy-to-use tools aimed at providing policymakers with rough estimates of costs very rapidly,
based on national statistics. The Social Protection Floor Costing Tool was used for instance in
Argentina, Madagascar and Senegal. It remains obviously very limited and the ILO subsequently
developed the Rapid Assessment Protocol (RAP), a more time-demanding but flexible and more
robust model. The construction of the model goes hand in hand with a dialogue process involving
national stakeholders. The model can be used in early and intermediate stages of the national
dialogue process to test different tailor-made benefit designs and policy options, and analyse fiscal
space. The ILO Rapid Assessment Protocol Plus (RAP+) uses household-level data to provide users
with a more refined estimate of the number of beneficiaries targeted and the cost of the benefits
proposed. It also allows the user to assess the hypothetical impact of alternative benefit packages
on the poverty headcount and the poverty gap. The RAP+ has now been used in a number of
countries including El Salvador, Indonesia and Burkina Faso (Behrendt 2011; Bonnet and Behrendt
2011; ILO and IMF 2012).
The estimation of administrative costs is a critical point. Usual assumptions are 5% of transfer costs
for simple design (e.g. old age pension) and 10% for more complex design (e.g. poverty-targeted
cash transfers). However, there is little ex-post evidence on this percentage. Some well-established
programmes have low administrative costs: only 2% for the Lesotho old age pension, although this
is thought to underestimate central administrative costs (Ellis et al. 2009); 5% for Mexico’s
PROGRESA programme in 2000, four years after it was launched (Caldés et al. 2004). Evidence from
CEE/CIS indicates that the administrative costs for targeting alone range between 0.6 and 6.3% of
total programme costs (Grosh et al. 2008, p. 94). Hodges et al. (2011) note that programmes of this
type in low-income Africa tend to have much higher administrative costs, because they are more
recent, they still have large fixed start-up costs, and have not yet achieved economies of scale.
Another factor is that the African programmes often provide lower transfer levels than in the
middle-income Latin American countries. There are now efforts to collect this information more
systematically (ODI 2012).
Another important point needs to be made around the distribution of costs. A cost analysis would
usually require calculating net costs to each constituency. For instance, in the case of social
transfer schemes, costs could be split between: government; donor; local administration; private
sector; beneficiaries; and non-beneficiaries (Levin and McEwan 2001; Dhaliwal et al. 2012). Most
studies would only look at costs incurred by the implementing agency. It is thus often assumed that
there are no transaction costs (opportunity costs, transport costs, etc.) for the beneficiary
households. However, these transaction costs determine how much the benefit of the cash is
incremental to the family, i.e. how much net additional money it will have to buy goods and invest
with. In Pakistan, DFID factored in about 4% of costs to families (to account for transport and other
transaction costs) noting that these should fall moderately as payment systems become more
efficient and families are better able to plan ahead (DFID 2012c). Cherrier (2009) also factored in
transaction costs when assessing the cost-efficiency of alternative food-based and cash-based
social transfer policy options.
Overall, there tends to be an ‘optimism bias’ when estimating costs, a commonly observed
phenomenon whereby ‘appraisers tend to overstate benefits, and understate timings and costs,
both capital and operational’ (Treasury Green Book cited in DFID 2009). A way to deal with this bias
21
is to use empirical observations of past optimism bias to make adjustments. However, in the case
of social transfer policy, the body of evidence on programme costs is still limited.
The issue of social protection costing (and financing) has received a lot of attention over the recent
years (McCord and Hagen-Zanker 2011). In particular, key development partners involved in this
issue recently agreed to further work on cost modelling and microsimulation towards the
preparation of a review that provides insight into the models currently available, outlining
technical specifications and intended uses, as well as guidance on appropriate model selection.
They also recognised the need to agree on ‘common definitions for key terms used for the
assessment of the cost of social protection provision to facilitate analytical research coherence
(e.g. leakage, inclusion and exclusion errors, administrative cost) … including agreement
regarding inclusion of indirect costs, e.g. cost of adhering to conditions and compliance
monitoring.’ (ODI 2012, p. 5) In this aspect, Oxford Policy Management is about to finish a ‘Social
Budget’ for South Africa using a static tax-benefit micro-simulation tool to forecast social
expenditures and combine this tool with some rudimentary poverty/inequality measures of the
impact of these social expenditures (Powel et al. 2011).
In general, costs are expected to decrease over time, as social protection instruments are there not
only to reduce seasonal poverty, but also to generate mechanisms to alleviate structural poverty
through human capital accumulation and economic security. However, the cost of old-age benefits
may increase because population is ageing, and new investments in complementary services such
as healthcare and education may be necessary given an increasing demand as a result of changes
in social protection programmes. Models would often not account for these costs and they would
not consider what impacts social protection programmes might have that may reduce overall costs
(for example, better household nutrition may lead to a reduced demand for healthcare). Finally,
social protection investments are complementary with other policies such as basic infrastructure,
economic inclusion and general productivity, which may be taken into account for a
comprehensive costing study.
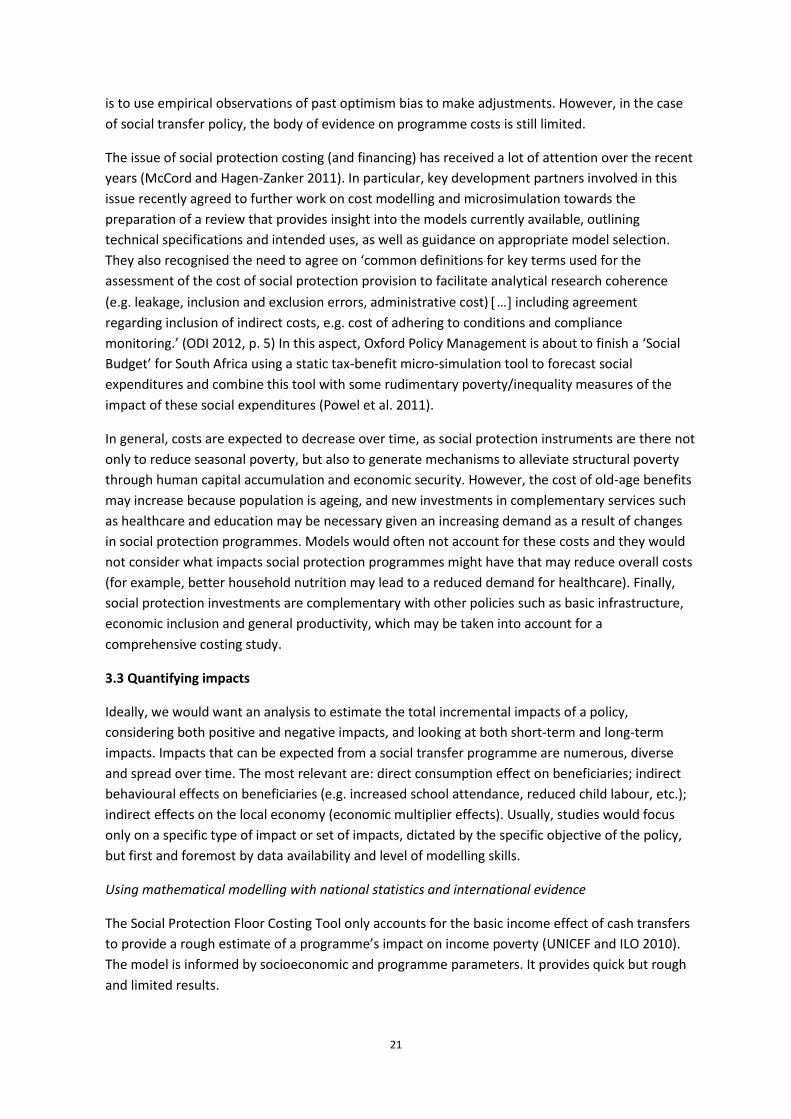
3.3 Quantifying impacts
Ideally, we would want an analysis to estimate the total incremental impacts of a policy,
considering both positive and negative impacts, and looking at both short-term and long-term
impacts. Impacts that can be expected from a social transfer programme are numerous, diverse
and spread over time. The most relevant are: direct consumption effect on beneficiaries; indirect
behavioural effects on beneficiaries (e.g. increased school attendance, reduced child labour, etc.);
indirect effects on the local economy (economic multiplier effects). Usually, studies would focus
only on a specific type of impact or set of impacts, dictated by the specific objective of the policy,
but first and foremost by data availability and level of modelling skills.
Using mathematical modelling with national statistics and international evidence
The Social Protection Floor Costing Tool only accounts for the basic income effect of cash transfers
to provide a rough estimate of a programme’s impact on income poverty (UNICEF and ILO 2010).
The model is informed by socioeconomic and programme parameters. It provides quick but rough
and limited results.
22
When developing a business case for the support of social transfer programmes, DFID aimed at
considering other types of impacts using simple mathematical modelling (DFID 2011b, a). This is
done on the basis of various assumptions on the size of the beneficiary population, benefit level,
international ex-post evidence on impact, etc. In Nigeria, DFID considered the following monetised
benefits: consumption distributional dividend; welfare (health and nutrition); productivity gains
(households/adults; children aged 2-15; children aged under 2) – as well as the following non-
monetised benefits and risks: financial inclusion; social cohesion and gender; fiduciary risk and
clientelism. The estimate of the likely reduction in infant and child mortality is drawn from
estimates produced by Bhutta et al. (2008) according to which full coverage of nutrition
interventions can reduce mortality by up to 25% between birth and 36 months, and promoting
breastfeeding can reduce under-five mortality by up to 8% (DFID 2012a).
In Pakistan, DFID used a family model to capture benefits based on: the global evidence base;
statistics from the national household survey on the allocation of expenditure of families; the
standard use of funds, as articulated in a rapid baseline appraisal of beneficiaries (DFID 2012c). In
Gaza, DFID quantified immediate consumption benefits as well as welfare (quality of life) benefits
due to improved nutrition using disability-adjusted life years (DALYs)4 – secondary monetary
benefits in the form of avoided future medical costs were not modelled (Shah 2011).
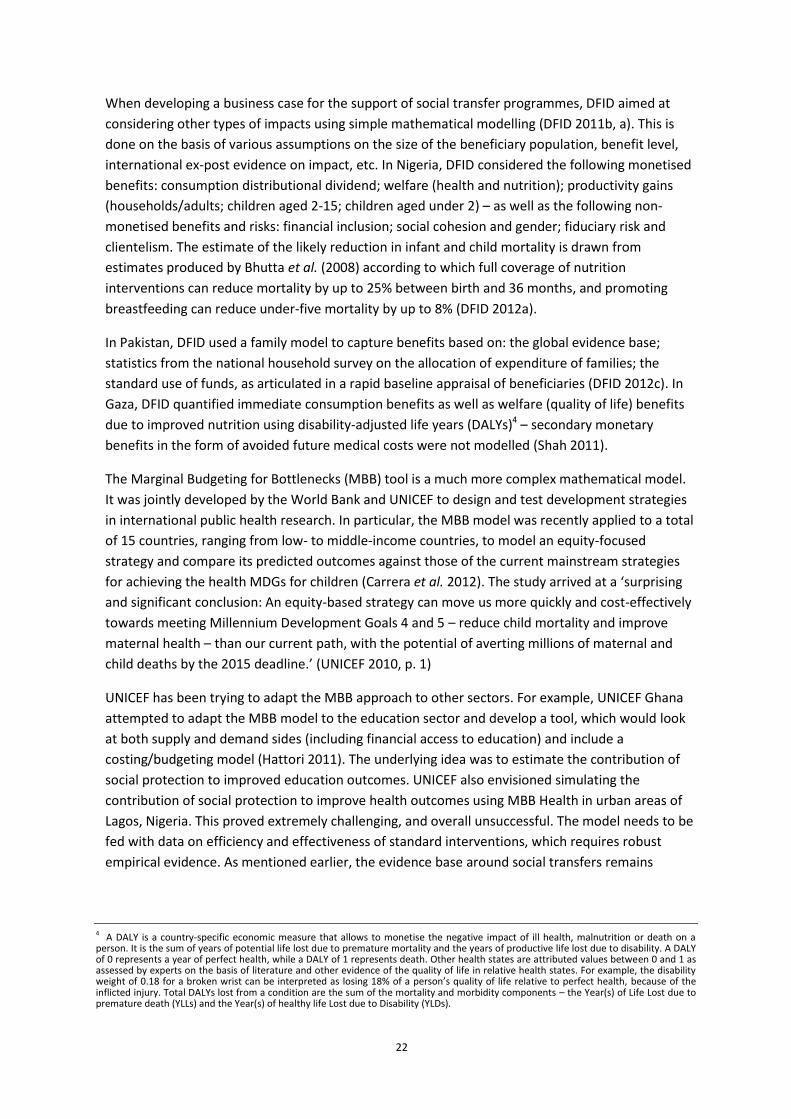
The Marginal Budgeting for Bottlenecks (MBB) tool is a much more complex mathematical model.
It was jointly developed by the World Bank and UNICEF to design and test development strategies
in international public health research. In particular, the MBB model was recently applied to a total
of 15 countries, ranging from low- to middle-income countries, to model an equity-focused
strategy and compare its predicted outcomes against those of the current mainstream strategies
for achieving the health MDGs for children (Carrera et al. 2012). The study arrived at a ‘surprising
and significant conclusion: An equity-based strategy can move us more quickly and cost-effectively
towards meeting Millennium Development Goals 4 and 5 – reduce child mortality and improve
maternal health – than our current path, with the potential of averting millions of maternal and
child deaths by the 2015 deadline.’ (UNICEF 2010, p. 1)
UNICEF has been trying to adapt the MBB approach to other sectors. For example, UNICEF Ghana
attempted to adapt the MBB model to the education sector and develop a tool, which would look
at both supply and demand sides (including financial access to education) and include a
costing/budgeting model (Hattori 2011). The underlying idea was to estimate the contribution of
social protection to improved education outcomes. UNICEF also envisioned simulating the
contribution of social protection to improve health outcomes using MBB Health in urban areas of
Lagos, Nigeria. This proved extremely challenging, and overall unsuccessful. The model needs to be
fed with data on efficiency and effectiveness of standard interventions, which requires robust
empirical evidence. As mentioned earlier, the evidence base around social transfers remains
4 A DALY is a country-specific economic measure that allows to monetise the negative impact of ill health, malnutrition or death on a person. It is the sum of years of potential life lost due to premature mortality and the years of productive life lost due to disability. A DALY of 0 represents a year of perfect health, while a DALY of 1 represents death. Other health states are attributed values between 0 and 1 as assessed by experts on the basis of literature and other evidence of the quality of life in relative health states. For example, the disability weight of 0.18 for a broken wrist can be interpreted as losing 18% of a person’s quality of life relative to perfect health, because of the inflicted injury. Total DALYs lost from a condition are the sum of the mortality and morbidity components – the Year(s) of Life Lost due to premature death (YLLs) and the Year(s) of healthy life Lost due to Disability (YLDs).
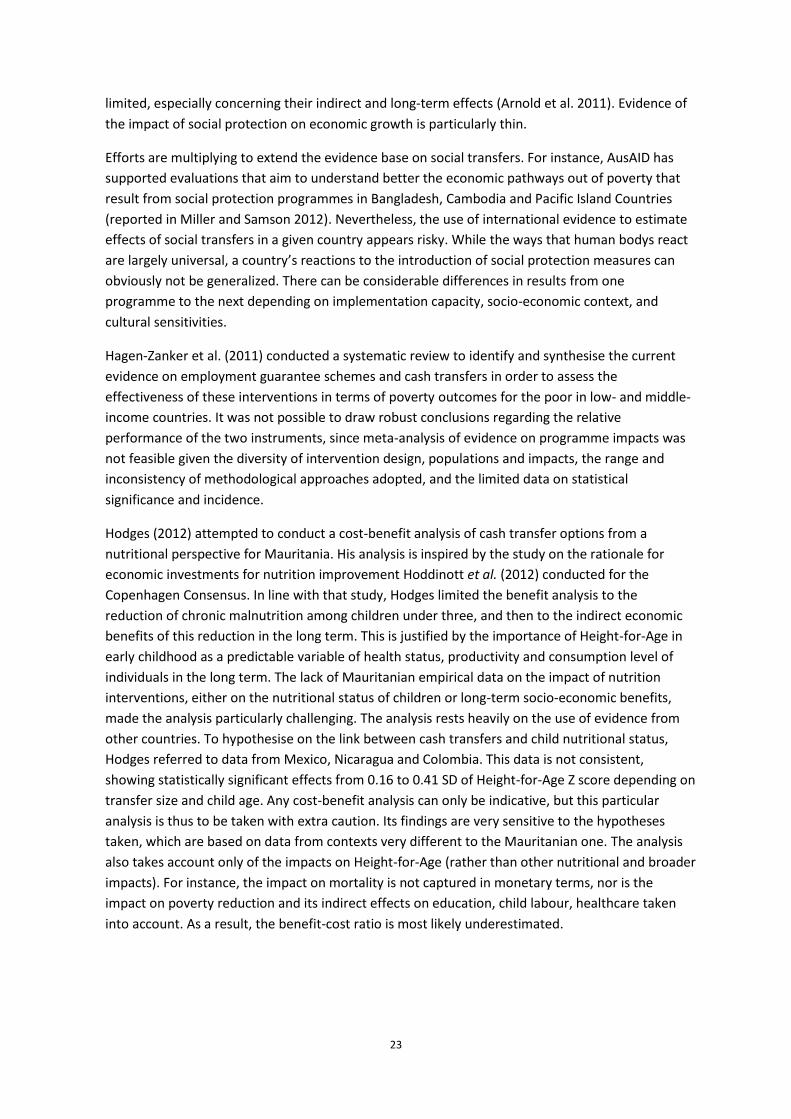
23
limited, especially concerning their indirect and long-term effects (Arnold et al. 2011). Evidence of
the impact of social protection on economic growth is particularly thin.
Efforts are multiplying to extend the evidence base on social transfers. For instance, AusAID has
supported evaluations that aim to understand better the economic pathways out of poverty that
result from social protection programmes in Bangladesh, Cambodia and Pacific Island Countries
(reported in Miller and Samson 2012). Nevertheless, the use of international evidence to estimate
effects of social transfers in a given country appears risky. While the ways that human bodys react
are largely universal, a country’s reactions to the introduction of social protection measures can
obviously not be generalized. There can be considerable differences in results from one
programme to the next depending on implementation capacity, socio-economic context, and
cultural sensitivities.
Hagen-Zanker et al. (2011) conducted a systematic review to identify and synthesise the current
evidence on employment guarantee schemes and cash transfers in order to assess the
effectiveness of these interventions in terms of poverty outcomes for the poor in low- and middle-
income countries. It was not possible to draw robust conclusions regarding the relative
performance of the two instruments, since meta-analysis of evidence on programme impacts was
not feasible given the diversity of intervention design, populations and impacts, the range and
inconsistency of methodological approaches adopted, and the limited data on statistical
significance and incidence.
Hodges (2012) attempted to conduct a cost-benefit analysis of cash transfer options from a
nutritional perspective for Mauritania. His analysis is inspired by the study on the rationale for
economic investments for nutrition improvement Hoddinott et al. (2012) conducted for the
Copenhagen Consensus. In line with that study, Hodges limited the benefit analysis to the
reduction of chronic malnutrition among children under three, and then to the indirect economic
benefits of this reduction in the long term. This is justified by the importance of Height-for-Age in
early childhood as a predictable variable of health status, productivity and consumption level of
individuals in the long term. The lack of Mauritanian empirical data on the impact of nutrition
interventions, either on the nutritional status of children or long-term socio-economic benefits,
made the analysis particularly challenging. The analysis rests heavily on the use of evidence from
other countries. To hypothesise on the link between cash transfers and child nutritional status,
Hodges referred to data from Mexico, Nicaragua and Colombia. This data is not consistent,
showing statistically significant effects from 0.16 to 0.41 SD of Height-for-Age Z score depending on
transfer size and child age. Any cost-benefit analysis can only be indicative, but this particular
analysis is thus to be taken with extra caution. Its findings are very sensitive to the hypotheses
taken, which are based on data from contexts very different to the Mauritanian one. The analysis
also takes account only of the impacts on Height-for-Age (rather than other nutritional and broader
impacts). For instance, the impact on mortality is not captured in monetary terms, nor is the
impact on poverty reduction and its indirect effects on education, child labour, healthcare taken
into account. As a result, the benefit-cost ratio is most likely underestimated.
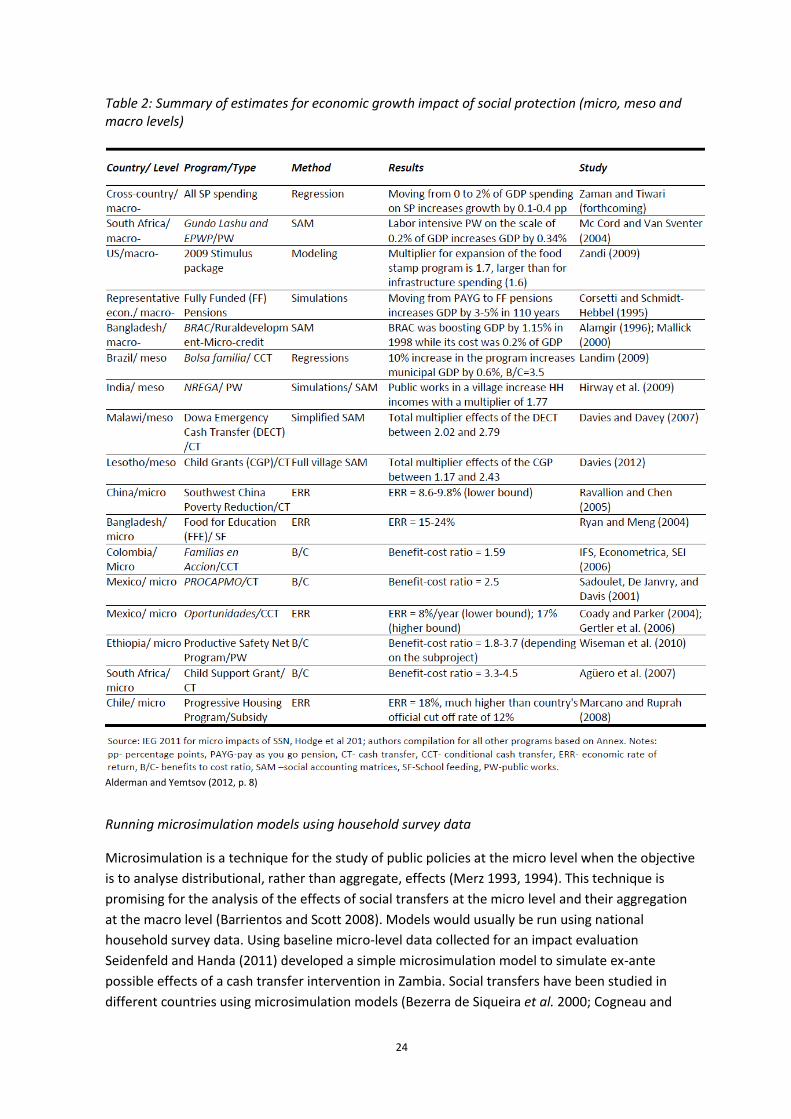
24
Table 2: Summary of estimates for economic growth impact of social protection (micro, meso and macro levels)
Alderman and Yemtsov (2012, p. 8)
Running microsimulation models using household survey data
Microsimulation is a technique for the study of public policies at the micro level when the objective
is to analyse distributional, rather than aggregate, effects (Merz 1993, 1994). This technique is
promising for the analysis of the effects of social transfers at the micro level and their aggregation
at the macro level (Barrientos and Scott 2008). Models would usually be run using national
household survey data. Using baseline micro-level data collected for an impact evaluation
Seidenfeld and Handa (2011) developed a simple microsimulation model to simulate ex-ante
possible effects of a cash transfer intervention in Zambia. Social transfers have been studied in
different countries using microsimulation models (Bezerra de Siqueira et al. 2000; Cogneau and
25
Robilliard 2000; Atkinson et al. 2002; Cogneau et al. 2003; Creedy et al. 2003; Annabi et al. 2005;
Gassmann and Behrendt 2006; Wong et al. 2008; de Souza Ferreira et al. 2010; Llambi et al. 2011;
Vandeninden 2012). However, most of these studies use static microsimulation and they
concentrate on distributional effects (i.e. poverty reduction and inequality decline) or on specific
static effects such as labour participation and schooling (Bourguignon et al 2003).
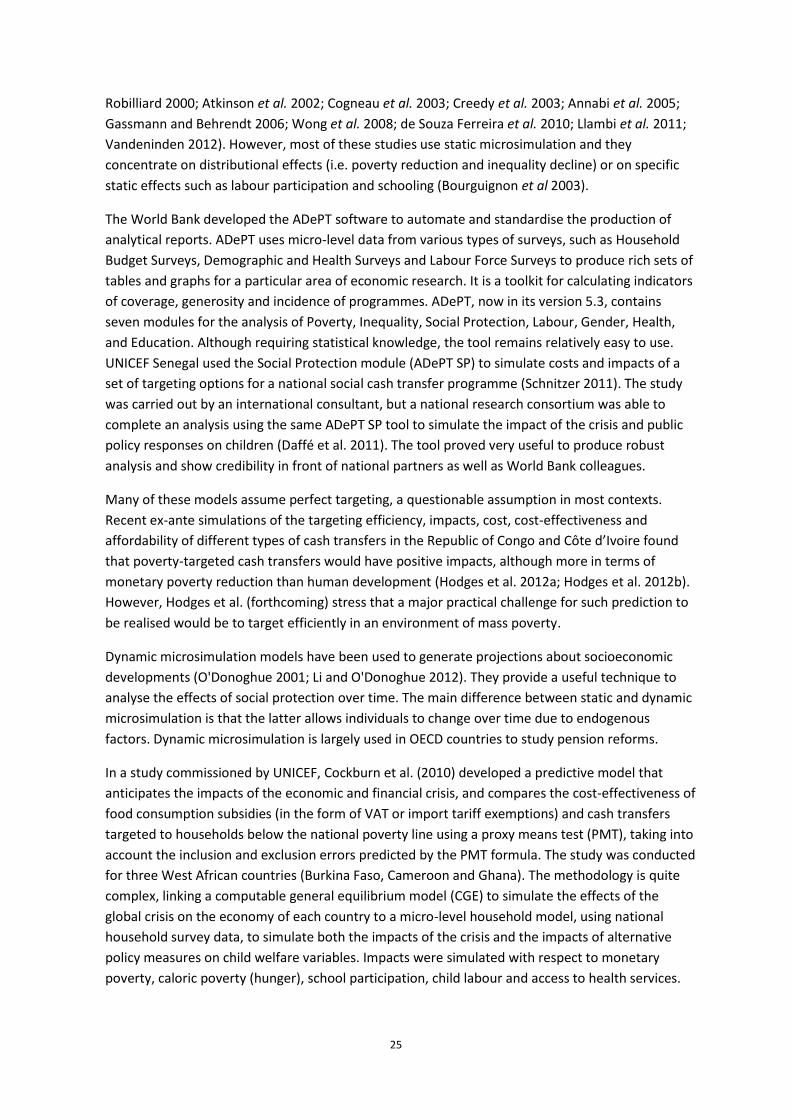
The World Bank developed the ADePT software to automate and standardise the production of
analytical reports. ADePT uses micro-level data from various types of surveys, such as Household
Budget Surveys, Demographic and Health Surveys and Labour Force Surveys to produce rich sets of
tables and graphs for a particular area of economic research. It is a toolkit for calculating indicators
of coverage, generosity and incidence of programmes. ADePT, now in its version 5.3, contains
seven modules for the analysis of Poverty, Inequality, Social Protection, Labour, Gender, Health,
and Education. Although requiring statistical knowledge, the tool remains relatively easy to use.
UNICEF Senegal used the Social Protection module (ADePT SP) to simulate costs and impacts of a
set of targeting options for a national social cash transfer programme (Schnitzer 2011). The study
was carried out by an international consultant, but a national research consortium was able to
complete an analysis using the same ADePT SP tool to simulate the impact of the crisis and public
policy responses on children (Daffé et al. 2011). The tool proved very useful to produce robust
analysis and show credibility in front of national partners as well as World Bank colleagues.
Many of these models assume perfect targeting, a questionable assumption in most contexts.
Recent ex-ante simulations of the targeting efficiency, impacts, cost, cost-effectiveness and
affordability of different types of cash transfers in the Republic of Congo and Côte d’Ivoire found
that poverty-targeted cash transfers would have positive impacts, although more in terms of
monetary poverty reduction than human development (Hodges et al. 2012a; Hodges et al. 2012b).
However, Hodges et al. (forthcoming) stress that a major practical challenge for such prediction to
be realised would be to target efficiently in an environment of mass poverty.
Dynamic microsimulation models have been used to generate projections about socioeconomic
developments (O'Donoghue 2001; Li and O'Donoghue 2012). They provide a useful technique to
analyse the effects of social protection over time. The main difference between static and dynamic
microsimulation is that the latter allows individuals to change over time due to endogenous
factors. Dynamic microsimulation is largely used in OECD countries to study pension reforms.
In a study commissioned by UNICEF, Cockburn et al. (2010) developed a predictive model that
anticipates the impacts of the economic and financial crisis, and compares the cost-effectiveness of
food consumption subsidies (in the form of VAT or import tariff exemptions) and cash transfers
targeted to households below the national poverty line using a proxy means test (PMT), taking into
account the inclusion and exclusion errors predicted by the PMT formula. The study was conducted
for three West African countries (Burkina Faso, Cameroon and Ghana). The methodology is quite
complex, linking a computable general equilibrium model (CGE) to simulate the effects of the
global crisis on the economy of each country to a micro-level household model, using national
household survey data, to simulate both the impacts of the crisis and the impacts of alternative
policy measures on child welfare variables. Impacts were simulated with respect to monetary
poverty, caloric poverty (hunger), school participation, child labour and access to health services.
26
A similar model was applied in Côte d’Ivoire (Hodges et al. 2012b) and Burkina Faso (Cockburn et
al. 2012).
In most cases, the models employed do not take into account second-round effects and thus are
not appropriate for predicting the long-term impacts of programmes. As soon as a household
receives a cash transfer, it usually spends it. This transmits the transfer’s impacts from the
beneficiary household to others inside and outside the local economy, including households not
eligible for the transfer. Understanding the full range of impacts that social transfers may have on
income-generating activities and local markets may help address concerns about dependency traps
and medium-term fiscal sustainability, and increase political buy-in. The ‘From Protection to
Production Project’5 has been supporting attempts for modelling economic multiplier effects of
cash transfers (Filipski and Taylor 2012; Taylor 2012). Filipski and Taylor (2012) modelled local
general equilibrium (LGE) effects in addition to the direct impact of the programme on the
beneficiary households. Local economy-wide impact evaluation (LEWIE) is designed to capture the
full impact of government programmes (as well as other exogenous shocks) on local economies.
Davies and Davey (2008) analysed the impact of an emergency cash transfer programme on the
local economy in rural Malawi. The results are of interest given the growing use of cash transfers as
development aid and the increasing popularity of such transfers as a form of social protection
across sub-Saharan Africa. Using a (local) form of social accounting matrix (SAM), they found that
there are widespread benefits for the regional economy as a whole (with multiplier estimates of
2.02 to 2.45) and for certain groups in particular. Small farmers and small businesses gain particular
advantage as this is where poorer households’ purchases are focused; education and health also
benefit. Such payments can also help to support the regional economy during the most ‘lean’
periods of the year.
Using macro models
Macro-level analysis can be used to test the effect of social protection expenditure on economic
growth and other social outcomes at the cross-country level, using regression analysis (see for
instance Atkinson 1999; Arjona et al 2003). However, results are not conclusive, in part because of
the lack of sufficiently large and comprehensive data sets. Furthermore, intermediate effects
cannot be studied using aggregate data without losing important information about people’s
circumstances. A second alternative is to use computable general equilibrium models (CGE) to
analyse the economic effect of social transfers (see for instance Vos et al 2008). This technique is
strong to study consistencies with taxation, public expenditure and economic growth, while it is
weak to analyse the impact of specific programmes and social transfers at the individual and
household levels (Barrientos and Scott 2008). Moreover, CGE models assume a fixed economic
structure over time limiting the interpretation of effects during economic transitions (Cockburn et
al. 2012). However, they allow modelling changes over time and including synergy effects of
introducing policies for complementary objectives at the same time (see for instance Behrman
5 The ‘From Protection to Production’ (PtoP) project (http://www.fao.org/economic/PtoP/en/) is a collaborative effort with FAO, UNICEF, Save the Children UK and the University of North Carolina financially supported by DFID and the World Bank. The project forms part of the larger Transfer Project (http://www.cpc.unc.edu/projects/transfer), an innovative research and learning initiative, which supports improved knowledge and practice on social transfers in sub-Saharan Africa.
27
(2000)). Finally, macro models can be used to generate certain parameters as for example
economic growth and productivity, to align microsimulation models.
3.4 Comparing impacts and costs
Cost of inaction
Social protection can generate several economic benefits and costs, which should be properly
estimated to analyse its return. However, the alternative of doing nothing may be costly as well.
Holzer et al. (2008) attempted to assess the aggregate annual costs of child poverty to the United
States economy. They reviewed research studies that estimate the statistical association between
children growing up in poverty and their earnings, propensity to commit crime, and quality of
health later in life, and estimates of the costs that crime and poor health impose on the economy.
Their results suggest that childhood poverty each year: i) reduces productivity and economic
output by an amount equal to 1.3% of GDP; ii) raises the costs of crime by 1.3% of GDP; and iii)
raises health expenditures and reduces the value of health by 1.2% of GDP.
Hirsch (2008) brings together three strands of evidence on the impact and costs of child poverty in
Britain: review of research evidence to describe some of the consequences of child poverty that
are likely to have repercussions for society; estimates of the effects of the consequences of child
poverty on social spending– a cost to taxpayers – based on the observation of different levels of
social spending in small areas with different levels of child poverty; and estimates of the costs to
the economy of the lower productive capacity and earnings of adults who faced poverty as
children. This creates both a cost to the public purse through foregone tax revenues and extra
spending on benefits and tax credits, and also a wider economic cost in terms of reduced economic
activity associated with reduced production and private earnings. The conclusion is that child
poverty costs the country at least £ST 25 billion a year. Moreover, the World Bank (2006) estimates
the GDP lost to malnutrition to run as high as 2-3% in China and India for instance.
Cost-efficiency
Cost-efficiency analysis focuses on the relationship between (discounted) programme
administrative costs and (discounted) programme outputs, in the case of cash transfer
programmes taken to be the amount of cash transfers delivered to beneficiaries. Cost efficiency is
to be used with caution: high administrative cost-efficiency may in practice mask shortcomings in
the transfer programme that negatively affect performance. Grosh et al. (2008, p. 391) suggest
that ‘anything beyond about 12 to 15% of total costs bears close examination to see why
administrative costs are relatively high.’
28
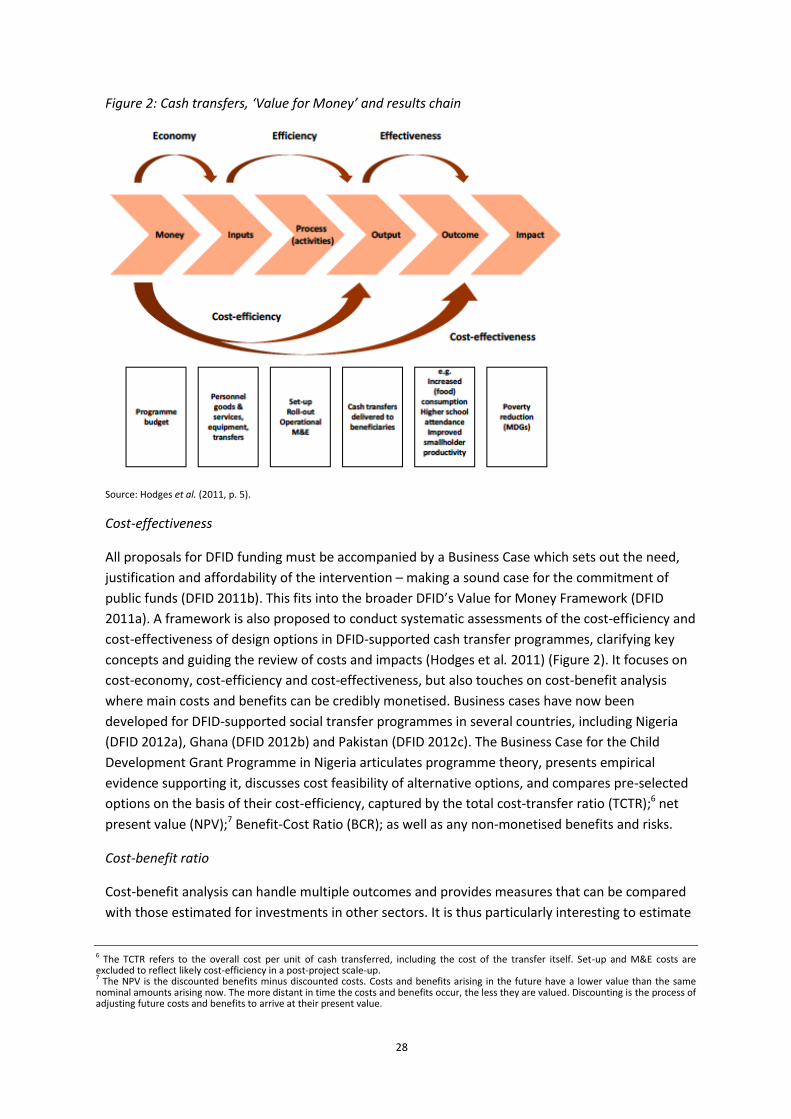
Figure 2: Cash transfers, ‘Value for Money’ and results chain
Source: Hodges et al. (2011, p. 5).
Cost-effectiveness
All proposals for DFID funding must be accompanied by a Business Case which sets out the need,
justification and affordability of the intervention – making a sound case for the commitment of
public funds (DFID 2011b). This fits into the broader DFID’s Value for Money Framework (DFID
2011a). A framework is also proposed to conduct systematic assessments of the cost-efficiency and
cost-effectiveness of design options in DFID-supported cash transfer programmes, clarifying key
concepts and guiding the review of costs and impacts (Hodges et al. 2011) (Figure 2). It focuses on
cost-economy, cost-efficiency and cost-effectiveness, but also touches on cost-benefit analysis
where main costs and benefits can be credibly monetised. Business cases have now been
developed for DFID-supported social transfer programmes in several countries, including Nigeria
(DFID 2012a), Ghana (DFID 2012b) and Pakistan (DFID 2012c). The Business Case for the Child
Development Grant Programme in Nigeria articulates programme theory, presents empirical
evidence supporting it, discusses cost feasibility of alternative options, and compares pre-selected
options on the basis of their cost-efficiency, captured by the total cost-transfer ratio (TCTR);6 net
present value (NPV);7 Benefit-Cost Ratio (BCR); as well as any non-monetised benefits and risks.
Cost-benefit ratio
Cost-benefit analysis can handle multiple outcomes and provides measures that can be compared
with those estimated for investments in other sectors. It is thus particularly interesting to estimate
6 The TCTR refers to the overall cost per unit of cash transferred, including the cost of the transfer itself. Set-up and M&E costs are excluded to reflect likely cost-efficiency in a post-project scale-up. 7 The NPV is the discounted benefits minus discounted costs. Costs and benefits arising in the future have a lower value than the same nominal amounts arising now. The more distant in time the costs and benefits occur, the less they are valued. Discounting is the process of adjusting future costs and benefits to arrive at their present value.
29
economic returns to investments. Interestingly, however, DFID’s Investment Committee decided
against introducing a standard hurdle rate of return for DFID interventions. It was judged that the
diversity in the DFID portfolio makes it difficult to produce comparable measures of what
constitutes good value for money for many interventions (DFID 2011a).
Several studies estimated the cost of achieving a certain objective, as for example reducing the
poverty gap by one percentage point – see for instance Schnitzer (2011) for such an analysis using
the ADePT model. However, this is actually just a special form of cost-effectiveness analysis, and it
only captures the immediate effects of social transfers. The greatest challenge for cost-benefit
analysis is the task of assigning monetary values to all possible effects of an investment (see for
instance Fujiwara and Campbell (2011)). One way that this problem has been handled in the
literature is to evaluate benefits in terms of their impact on economic growth.
Assessing economic returns to investing in youth, Knowles and Behrman (2003, p. xvi) rejected this
approach because of ‘its inability to address all issues related to efficiency (including efficiency
issues related to economic growth) and its complete neglect of distributional issues (including
across generations in the form of how much current consumption should be reduced in order to
increase consumption by future generations). Instead, the review opts for a definition of benefits
that is based on direct productivity effects, whenever possible, but that falls back, when necessary,
on an alternative indirect method of valuing benefits that is based on the cost of the least-cost
alternative investment that secures the same effect.’ Instead, Knowles and Behrman (2003)
developed a life-cycle approach using cost-benefit analysis to calculate the economic returns to
investments in youth.
In order to estimate mid- and long-term effects of social transfers, Mideros et al. (2012) estimated
the economic rate of return on investments in social transfers as the relation between the
incremental benefit (difference between policy and baseline scenario) on total household
consumption and the cost of the proposed social transfer package. They approximate benefits on
total household consumption by the sum of direct distributional effects and behavioural income
effects. Using a dynamic microsimulation model, they estimate the effects of cash transfers on
household consumption and human capital accumulation, and then aggregate the effects to
estimate long-term economic impacts. This study opens a new door for the evaluation of social
protection and their effects on socioeconomic development. Results and methodological issues are
discussed in the next section.
***
Concluding remarks: A lot of work has been done in the past, which generated a large evidence
base. It mainly focused on static, immediate effects and on costs and affordability, since benefits
are often perceived as ‘immaterial’. Still, there is a general understanding that the arguments in
favour of social protection are not yet convincing enough for national policy makers of developing
countries. There is a need to establish a compelling link between costs and benefits, taking into
account the time needed to earn the investments back, hence, to treat social protection as a
business case.
30
4. ESTIMATING RATES OF RETURN OF SOCIAL TRANSFERS: LESSONS LEARNT FROM CAMBODIA
The Maastricht Graduate School of Governance, with financial support from UNICEF Cambodia,
recently conducted a research project aimed at estimating rates of return of social protection. In
the final project report, Mideros et al. (2012) present estimates of the potential effects, benefits
and costs of the implementation of different policy scenarios, which are in line with the newly
adopted Cambodian national social protection strategy.8 The study builds on an ex-ante costing
study conducted by the ILO, and focuses on non-contributory social protection instruments
targeted at poor persons in rural areas covering various life-cycle risks. It uses country-specific
information to generate evidence on the potential effects of social transfers on human capital
investments and labour market participation. It further combines static and dynamic
microsimulation models to calculate effects on poverty and inequality, human capital accumulation
and household disposable income, over time. Furthermore, it estimates rates of return on
economic development in terms of total household consumption. To our knowledge, this study
represents the first attempt to estimate economic rates of return of public investments in social
protection. In this section, we present a summary of this research project, and discuss
methodological aspects as well as lessons to be drawn.
4.1 Overview: policy context, methodological approach and key findings
Following a national policy exercise started in the wake of the 2008 food, fuel and financial crisis,
the Royal Government of Cambodia (RGC) adopted in 2011 its National Social Protection Strategy
for the Poor and Vulnerable (NSPS). The document outlines a long-term vision and strategic
framework for the development and extension of social protection in Cambodia, taking into
consideration the different dimensions of social protection and risk profiles of the poor and
vulnerable. The NSPS aims to ‘contribute not only to the rehabilitation and stability of the economy
in the near future, but also to the enhancement of human capital indicators, including those on
education, health and livelihoods development, towards the longer-term achievement of the
Cambodian Millennium Development Goals in 2015’ (RGC 2011). The RGC considers it to be an
important complement to its overall vision of achieving growth with equity.
The design of a consolidated and extended social protection system along the strategic framework
defined by the NSPS will require further planning, policy formulation and resource mobilisation to
lead from strategy towards implementation. As part of this planning process, a preliminary
financial assessment of alternative policy options that are likely to be considered was conducted. It
aimed to determine resource requirements and to develop, together with development partners, a
financing plan for the medium- and long-term implementation of the NSPS. A first task consisted in
selecting the range of policy options to be considered in this assessment. To limit the scope of the
exercise, it was decided to relate the assessment exclusively to social protection benefits provided
in the form of cash transfers, including pensions and wages (for public works programmes). On the
basis of consultations with stakeholders in Cambodia, a series of policy options was selected for
each strategic objective of the NSPS. A preliminary financial assessment of the NSPS ranges the
expected costs between 3.7% and 6.7% of GDP, covering cash transfers for the poor, pregnant
8 The full report is available for free download from the Maastricht Graduate School of Governance website: http://mgsog.merit.unu.edu/publications/external_policy_reports/2012_rates_return_combodia.pdf.
31
women, children (0-2 and 6-11), public works for the poor, social pensions for the poor and
pensions for disabled persons (Hennicot 2012). In the likely perspective of new fiscal space
emerging, NSPS building blocks can thus be expected to be affordable in the long run. But since
funding will remain constrained in the near future, it was recommended to adopt a step-by-step
approach where selected programmes are given priority.
Mideros et al. (2012) focus on the expected benefits of the NSPS. Their study aims to identify
affordable and cost-effective policy options within the framework of the NSPS, and estimate social
and economic benefits and economic rates of return over time. It is intended to contribute to
efforts to make a case for budgetary allocations to social protection instruments, presenting them
as an investment rather than a cost. The study focuses on four non-contributory social protection
policy options selected on the basis of their priority under the NSPS, data availability, modelling
feasibility and policy relevance: cash transfers, social pensions, scholarships, and public works. It
uses micro data at the individual and household level from the Cambodian Socio-Economic Survey
(CSES) 2004 and 2009. The analysis is conducted in three main steps. First, a static microsimulation
model is used to estimate the direct (distributional) effects of social transfers on poverty and
inequality, measured by changes in household consumption. Second, empirical regression models
are used to estimate the behavioural (income) effects of social transfers on education (school
attendance), health (nutrition) and labour decisions (labour participation and labour supply), as
well as the returns of school achievement (years of schooling) on household disposable income
(approximated by household consumption). Third, a dynamic microsimulation model is used to
estimate the economic rates of return of a basic social transfer package over 20 periods based on
the effects on household consumption.
Step 1 – Estimating the direct effects of social transfers on poverty and inequality
For each of the four selected policy options, different scenarios are considered based on current
design proposals and costing studies. Scenarios differ on two variables: targeting strategy based on
poverty conditions, location and age; and benefit level defined as a percentage of the poverty line
for rural areas. Administrative costs are fixed at 10% of total transfer costs for cash transfers, social
pensions and scholarships, and 50% of non-wage costs for public works.
A static microsimulation model, using CSES 2009 data, is used to estimate the effects of each
scenario on poverty headcount, poverty gap, poverty severity and inequality (using the Gini
coefficient) in terms of household consumption. Among the four policy options considered, cash
transfers for poor children appear to be the most effective with respect to all four indicators. Social
pensions are the second most effective option to reduce the poverty headcount and inequality.
The poverty headcount is reduced by between 12.1% and 13.7% for cash transfers for poor
children, and by between 5.3% and 5.6% for social pensions, depending on the respective scenario.
Scholarships for primary education are the second most effective policy option to reduce the
poverty gap (by 4.9%) and poverty severity (by 8.3%).
When effects are compared to costs, scholarships for lower secondary education appear to be the
most cost-effective option to reduce the poverty headcount (15.5% per GDP percentage point
invested), followed by social pensions in rural areas (14.8% per GDP percentage point invested).
Cash transfers to poor children are the most cost-effective option to reduce the poverty gap (by
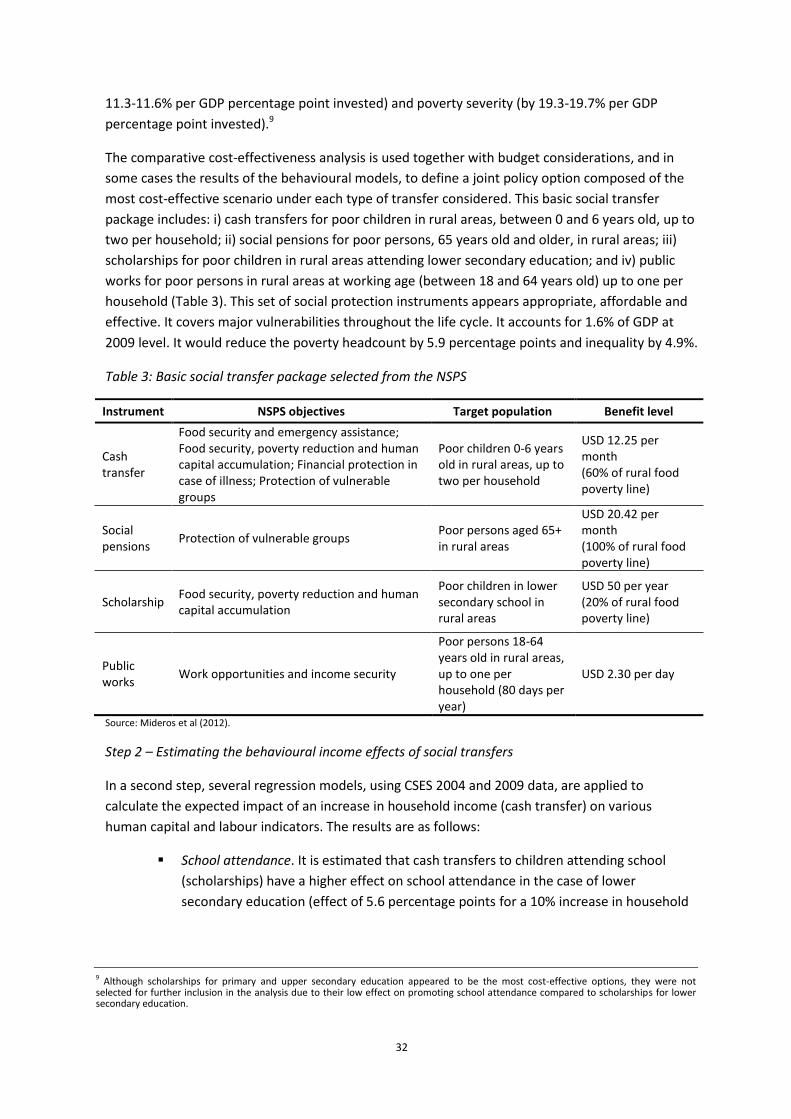
32
11.3-11.6% per GDP percentage point invested) and poverty severity (by 19.3-19.7% per GDP
percentage point invested).9
The comparative cost-effectiveness analysis is used together with budget considerations, and in
some cases the results of the behavioural models, to define a joint policy option composed of the
most cost-effective scenario under each type of transfer considered. This basic social transfer
package includes: i) cash transfers for poor children in rural areas, between 0 and 6 years old, up to
two per household; ii) social pensions for poor persons, 65 years old and older, in rural areas; iii)
scholarships for poor children in rural areas attending lower secondary education; and iv) public
works for poor persons in rural areas at working age (between 18 and 64 years old) up to one per
household (Table 3). This set of social protection instruments appears appropriate, affordable and
effective. It covers major vulnerabilities throughout the life cycle. It accounts for 1.6% of GDP at
2009 level. It would reduce the poverty headcount by 5.9 percentage points and inequality by 4.9%.
Table 3: Basic social transfer package selected from the NSPS
Instrument NSPS objectives Target population Benefit level
Cash transfer
Food security and emergency assistance; Food security, poverty reduction and human capital accumulation; Financial protection in case of illness; Protection of vulnerable groups
Poor children 0-6 years old in rural areas, up to two per household
USD 12.25 per month (60% of rural food poverty line)
Social pensions
Protection of vulnerable groups Poor persons aged 65+ in rural areas
USD 20.42 per month (100% of rural food poverty line)
Scholarship Food security, poverty reduction and human capital accumulation
Poor children in lower secondary school in rural areas
USD 50 per year (20% of rural food poverty line)
Public works
Work opportunities and income security
Poor persons 18-64 years old in rural areas, up to one per household (80 days per year)
USD 2.30 per day
Source: Mideros et al (2012).
Step 2 – Estimating the behavioural income effects of social transfers
In a second step, several regression models, using CSES 2004 and 2009 data, are applied to
calculate the expected impact of an increase in household income (cash transfer) on various
human capital and labour indicators. The results are as follows:
School attendance. It is estimated that cash transfers to children attending school
(scholarships) have a higher effect on school attendance in the case of lower
secondary education (effect of 5.6 percentage points for a 10% increase in household
9 Although scholarships for primary and upper secondary education appeared to be the most cost-effective options, they were not selected for further inclusion in the analysis due to their low effect on promoting school attendance compared to scholarships for lower secondary education.
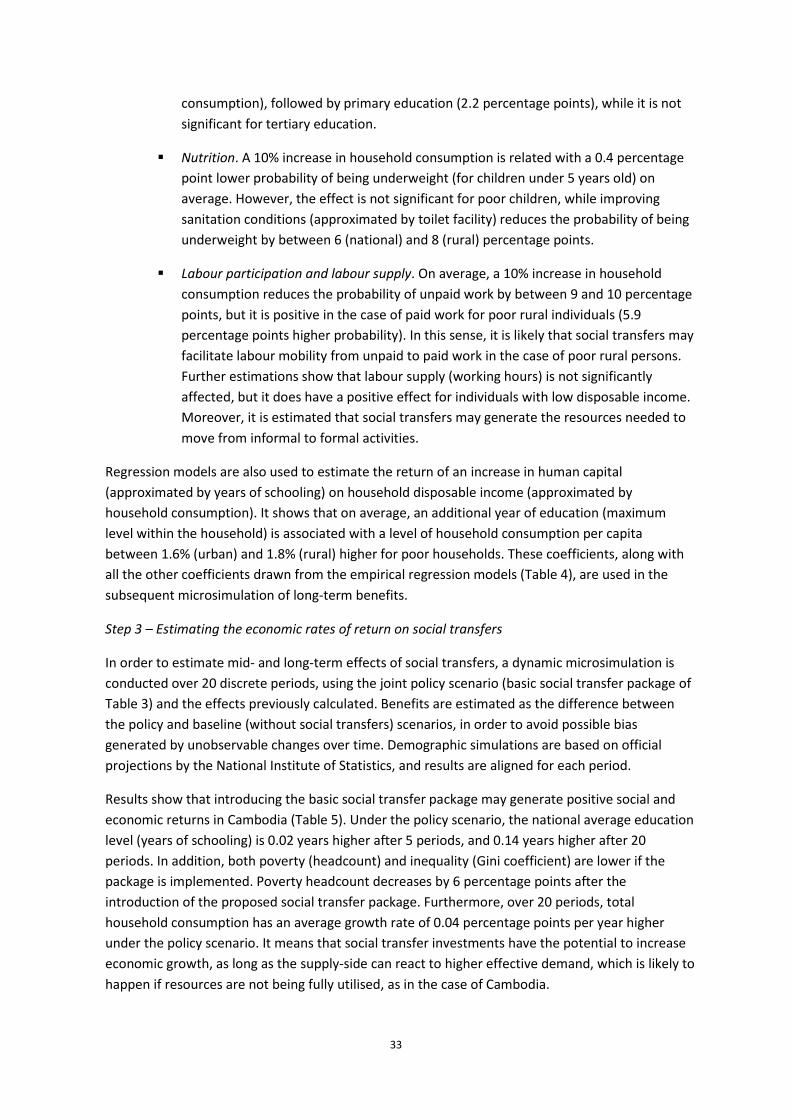
33
consumption), followed by primary education (2.2 percentage points), while it is not
significant for tertiary education.
Nutrition. A 10% increase in household consumption is related with a 0.4 percentage
point lower probability of being underweight (for children under 5 years old) on
average. However, the effect is not significant for poor children, while improving
sanitation conditions (approximated by toilet facility) reduces the probability of being
underweight by between 6 (national) and 8 (rural) percentage points.
Labour participation and labour supply. On average, a 10% increase in household
consumption reduces the probability of unpaid work by between 9 and 10 percentage
points, but it is positive in the case of paid work for poor rural individuals (5.9
percentage points higher probability). In this sense, it is likely that social transfers may
facilitate labour mobility from unpaid to paid work in the case of poor rural persons.
Further estimations show that labour supply (working hours) is not significantly
affected, but it does have a positive effect for individuals with low disposable income.
Moreover, it is estimated that social transfers may generate the resources needed to
move from informal to formal activities.
Regression models are also used to estimate the return of an increase in human capital
(approximated by years of schooling) on household disposable income (approximated by
household consumption). It shows that on average, an additional year of education (maximum
level within the household) is associated with a level of household consumption per capita
between 1.6% (urban) and 1.8% (rural) higher for poor households. These coefficients, along with
all the other coefficients drawn from the empirical regression models (Table 4), are used in the
subsequent microsimulation of long-term benefits.
Step 3 – Estimating the economic rates of return on social transfers
In order to estimate mid- and long-term effects of social transfers, a dynamic microsimulation is
conducted over 20 discrete periods, using the joint policy scenario (basic social transfer package of
Table 3) and the effects previously calculated. Benefits are estimated as the difference between
the policy and baseline (without social transfers) scenarios, in order to avoid possible bias
generated by unobservable changes over time. Demographic simulations are based on official
projections by the National Institute of Statistics, and results are aligned for each period.
Results show that introducing the basic social transfer package may generate positive social and
economic returns in Cambodia (Table 5). Under the policy scenario, the national average education
level (years of schooling) is 0.02 years higher after 5 periods, and 0.14 years higher after 20
periods. In addition, both poverty (headcount) and inequality (Gini coefficient) are lower if the
package is implemented. Poverty headcount decreases by 6 percentage points after the
introduction of the proposed social transfer package. Furthermore, over 20 periods, total
household consumption has an average growth rate of 0.04 percentage points per year higher
under the policy scenario. It means that social transfer investments have the potential to increase
economic growth, as long as the supply-side can react to higher effective demand, which is likely to
happen if resources are not being fully utilised, as in the case of Cambodia.
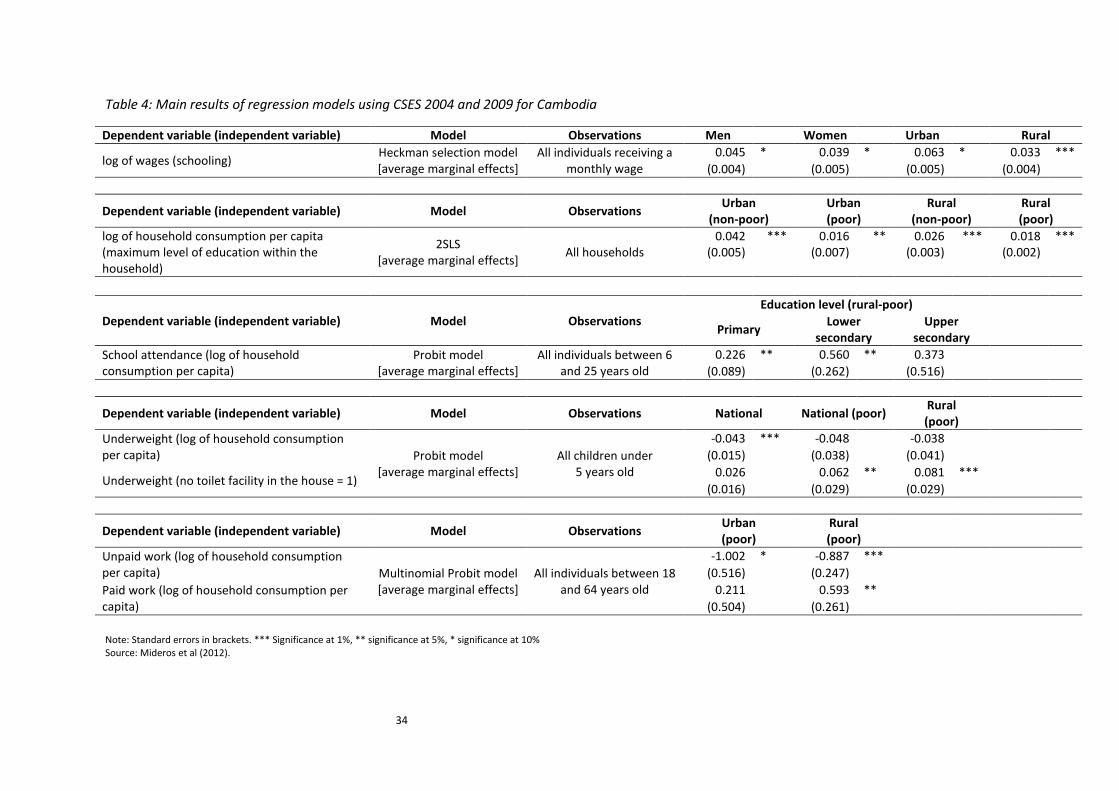
34
Table 4: Main results of regression models using CSES 2004 and 2009 for Cambodia
Dependent variable (independent variable) Model Observations Men Women Urban Rural
log of wages (schooling) Heckman selection model [average marginal effects]
All individuals receiving a monthly wage
0.045 * 0.039 * 0.063 * 0.033 ***
(0.004) (0.005) (0.005) (0.004)
Dependent variable (independent variable) Model Observations Urban
(non-poor) Urban (poor)
Rural (non-poor)
Rural (poor)
log of household consumption per capita (maximum level of education within the household)
2SLS [average marginal effects]
All households 0.042
(0.005) ***
0.016
(0.007) **
0.026
(0.003) ***
0.018
(0.002) ***
Dependent variable (independent variable) Model Observations
Education level (rural-poor)
Primary
Lower secondary
Upper secondary
School attendance (log of household consumption per capita)
Probit model [average marginal effects]
All individuals between 6 and 25 years old
0.226 ** 0.560 ** 0.373
(0.089) (0.262) (0.516)
Dependent variable (independent variable) Model Observations National National (poor) Rural (poor)
Underweight (log of household consumption per capita) Probit model
[average marginal effects] All children under
5 years old
-0.043 *** -0.048
-0.038
(0.015)
(0.038)
(0.041)
Underweight (no toilet facility in the house = 1) 0.026
0.062 ** 0.081 ***
(0.016) (0.029) (0.029)
Dependent variable (independent variable) Model Observations Urban (poor)
Rural (poor)
Unpaid work (log of household consumption per capita) Multinomial Probit model
[average marginal effects] All individuals between 18
and 64 years old
-1.002 * -0.887 ***
(0.516)
(0.247)
Paid work (log of household consumption per capita)
0.211
0.593 **
(0.504) (0.261)
Note: Standard errors in brackets. *** Significance at 1%, ** significance at 5%, * significance at 10% Source: Mideros et al (2012).
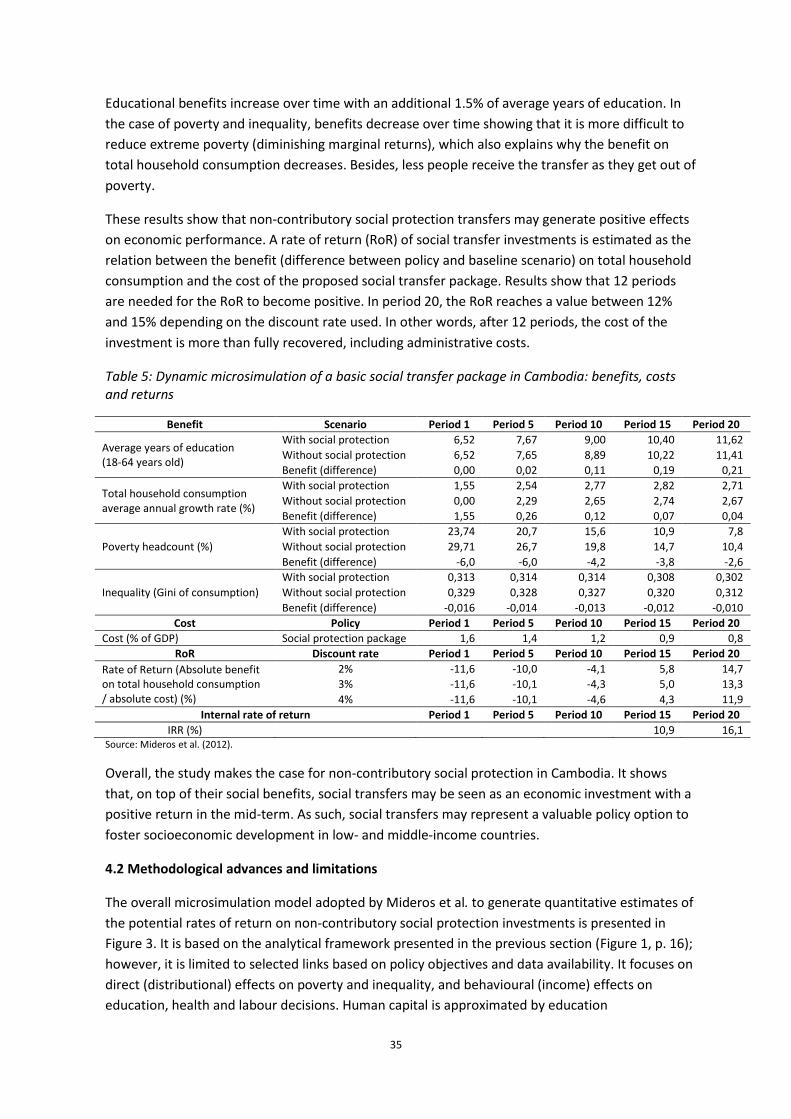
35
Educational benefits increase over time with an additional 1.5% of average years of education. In
the case of poverty and inequality, benefits decrease over time showing that it is more difficult to
reduce extreme poverty (diminishing marginal returns), which also explains why the benefit on
total household consumption decreases. Besides, less people receive the transfer as they get out of
poverty.
These results show that non-contributory social protection transfers may generate positive effects
on economic performance. A rate of return (RoR) of social transfer investments is estimated as the
relation between the benefit (difference between policy and baseline scenario) on total household
consumption and the cost of the proposed social transfer package. Results show that 12 periods
are needed for the RoR to become positive. In period 20, the RoR reaches a value between 12%
and 15% depending on the discount rate used. In other words, after 12 periods, the cost of the
investment is more than fully recovered, including administrative costs.
Table 5: Dynamic microsimulation of a basic social transfer package in Cambodia: benefits, costs and returns
Benefit Scenario Period 1 Period 5 Period 10 Period 15 Period 20
Average years of education (18-64 years old)
With social protection 6,52 7,67 9,00 10,40 11,62
Without social protection 6,52 7,65 8,89 10,22 11,41
Benefit (difference) 0,00 0,02 0,11 0,19 0,21
Total household consumption average annual growth rate (%)
With social protection 1,55 2,54 2,77 2,82 2,71
Without social protection 0,00 2,29 2,65 2,74 2,67
Benefit (difference) 1,55 0,26 0,12 0,07 0,04
Poverty headcount (%)
With social protection 23,74 20,7 15,6 10,9 7,8
Without social protection 29,71 26,7 19,8 14,7 10,4
Benefit (difference) -6,0 -6,0 -4,2 -3,8 -2,6
Inequality (Gini of consumption)
With social protection 0,313 0,314 0,314 0,308 0,302
Without social protection 0,329 0,328 0,327 0,320 0,312
Benefit (difference) -0,016 -0,014 -0,013 -0,012 -0,010
Cost Policy Period 1 Period 5 Period 10 Period 15 Period 20
Cost (% of GDP) Social protection package 1,6 1,4 1,2 0,9 0,8
RoR Discount rate Period 1 Period 5 Period 10 Period 15 Period 20
Rate of Return (Absolute benefit on total household consumption / absolute cost) (%)
2% -11,6 -10,0 -4,1 5,8 14,7
3% -11,6 -10,1 -4,3 5,0 13,3
4% -11,6 -10,1 -4,6 4,3 11,9
Internal rate of return Period 1 Period 5 Period 10 Period 15 Period 20
IRR (%)
10,9 16,1 Source: Mideros et al. (2012).
Overall, the study makes the case for non-contributory social protection in Cambodia. It shows
that, on top of their social benefits, social transfers may be seen as an economic investment with a
positive return in the mid-term. As such, social transfers may represent a valuable policy option to
foster socioeconomic development in low- and middle-income countries.
4.2 Methodological advances and limitations
The overall microsimulation model adopted by Mideros et al. to generate quantitative estimates of
the potential rates of return on non-contributory social protection investments is presented in
Figure 3. It is based on the analytical framework presented in the previous section (Figure 1, p. 16);
however, it is limited to selected links based on policy objectives and data availability. It focuses on
direct (distributional) effects on poverty and inequality, and behavioural (income) effects on
education, health and labour decisions. Human capital is approximated by education
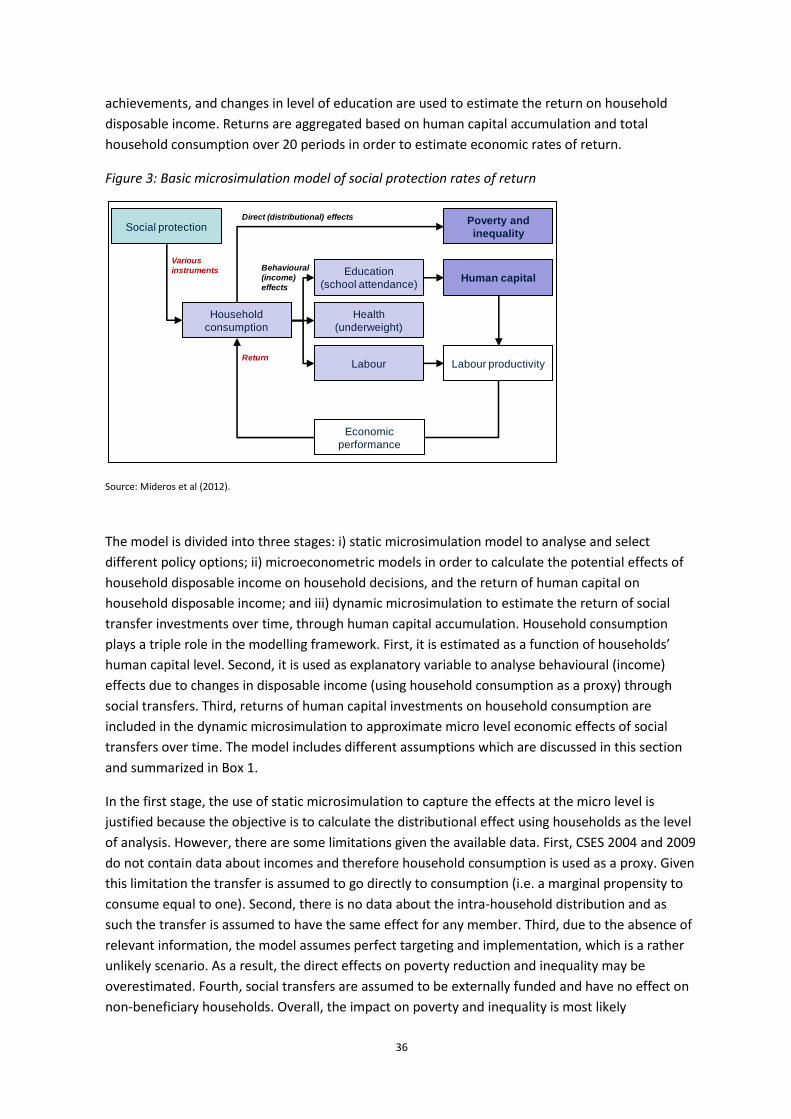
36
achievements, and changes in level of education are used to estimate the return on household
disposable income. Returns are aggregated based on human capital accumulation and total
household consumption over 20 periods in order to estimate economic rates of return.
Figure 3: Basic microsimulation model of social protection rates of return
Source: Mideros et al (2012).
The model is divided into three stages: i) static microsimulation model to analyse and select
different policy options; ii) microeconometric models in order to calculate the potential effects of
household disposable income on household decisions, and the return of human capital on
household disposable income; and iii) dynamic microsimulation to estimate the return of social
transfer investments over time, through human capital accumulation. Household consumption
plays a triple role in the modelling framework. First, it is estimated as a function of households’
human capital level. Second, it is used as explanatory variable to analyse behavioural (income)
effects due to changes in disposable income (using household consumption as a proxy) through
social transfers. Third, returns of human capital investments on household consumption are
included in the dynamic microsimulation to approximate micro level economic effects of social
transfers over time. The model includes different assumptions which are discussed in this section
and summarized in Box 1.
In the first stage, the use of static microsimulation to capture the effects at the micro level is
justified because the objective is to calculate the distributional effect using households as the level
of analysis. However, there are some limitations given the available data. First, CSES 2004 and 2009
do not contain data about incomes and therefore household consumption is used as a proxy. Given
this limitation the transfer is assumed to go directly to consumption (i.e. a marginal propensity to
consume equal to one). Second, there is no data about the intra-household distribution and as
such the transfer is assumed to have the same effect for any member. Third, due to the absence of
relevant information, the model assumes perfect targeting and implementation, which is a rather
unlikely scenario. As a result, the direct effects on poverty reduction and inequality may be
overestimated. Fourth, social transfers are assumed to be externally funded and have no effect on
non-beneficiary households. Overall, the impact on poverty and inequality is most likely
Household
consumption
Poverty and
inequality
Education
(school attendance)
Health
(underweight)
Labour
Human capital
Labour productivity
Social protection
Economic
performance
Various
instruments
Return
Direct (distributional) effects
Behavioural
(income)
effects
37
overestimated. These limitations can be solved if more detailed micro data is available at the
household level, and when social transfers have been implemented over a certain period of time in
order to generate empirical results about targeting and design effects.
The second stage includes several microeconometric models. Regressions are estimated
differentiating between urban and rural, and poor and non-poor individuals, in order to obtain
specific coefficients to include in the dynamic microsimulation model. Data from different CSES
waves are pooled in order to increase the number of observations and to obtain average effects
over time in Cambodia. In all cases, also in the case of probit models, average marginal effects are
estimated. The following models are estimated.
First, returns of human capital on household consumption (as a proxy for disposable income) are
estimated at the household level, because CSES does not include individual income nor
consumption data. In this sense, a classical Mincer equation is adjusted following Jolliffe (2002),
using household maximum level of education as the explanatory variable. In order to avoid
endogeneity, the model is estimated by two stages least squares (2SLS) using different
instruments.
Second, the effect of higher disposable income on the likelihood of attending school is estimated
using a probit model, while household consumption (the explanatory variable) follows from the
previous model in order to deal with endogeneity. The effect of higher disposable income on the
probability to attend school is estimated differentiating between urban and rural, and poor and
non-poor households, as well as between education levels. However, the model is probabilistic
rather than behavioural because of data limitations. This problem may be solved with individual
data about income, in order to generate a more sophisticated reduced form, including the
opportunity cost of going to school – see for instance, Bourguignon et al. (2003). Furthermore,
non-income behavioural effects (e.g. conditionality and other design conditions) are not studied.
Third, a similar model is estimated for children under five years old, in order to calculate the
relation between higher disposable income and the probability of being malnourished. Here
disposable income is assumed to be exogenous but a different set of control variables is included.
As in the previous case the model is probabilistic, but the effect of increasing household
consumption is not significant for poor rural children.
Fourth, the effect on labour participation and labour supply is estimated using different
multinomial, Heckman and tobit models. The objective is to analyse the potential effect of social
transfers on labour decisions. All models deal as best as possible with endogeneity and selectivity
and include the available control variables. All the models could be improved using behavioural
equations to analyse opportunity costs, but as mentioned previously more specific individual data
is needed to include opportunity costs. Besides, using empirical effects derived from impact
evaluations from nation-wide programmes could improve the robustness of the coefficients to be
included in the microsimulation models.
The third stage is a dynamic microsimulation model including three modules: demography, human
capital accumulation and household consumption based on the effects estimated in the previous
stage. First, a demographic simulation model is developed using age-specific mortality rates and
differentiating between men and women and urban and rural individuals in order to obtain
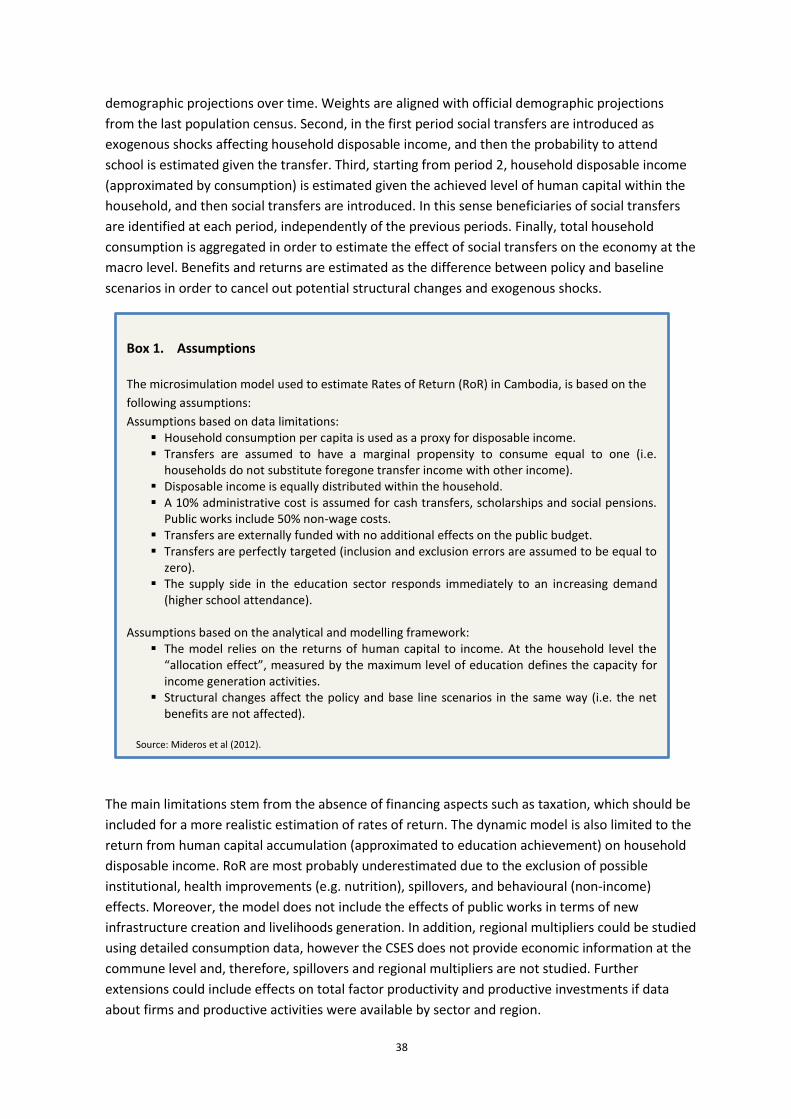
38
demographic projections over time. Weights are aligned with official demographic projections
from the last population census. Second, in the first period social transfers are introduced as
exogenous shocks affecting household disposable income, and then the probability to attend
school is estimated given the transfer. Third, starting from period 2, household disposable income
(approximated by consumption) is estimated given the achieved level of human capital within the
household, and then social transfers are introduced. In this sense beneficiaries of social transfers
are identified at each period, independently of the previous periods. Finally, total household
consumption is aggregated in order to estimate the effect of social transfers on the economy at the
macro level. Benefits and returns are estimated as the difference between policy and baseline
scenarios in order to cancel out potential structural changes and exogenous shocks.
The main limitations stem from the absence of financing aspects such as taxation, which should be
included for a more realistic estimation of rates of return. The dynamic model is also limited to the
return from human capital accumulation (approximated to education achievement) on household
disposable income. RoR are most probably underestimated due to the exclusion of possible
institutional, health improvements (e.g. nutrition), spillovers, and behavioural (non-income)
effects. Moreover, the model does not include the effects of public works in terms of new
infrastructure creation and livelihoods generation. In addition, regional multipliers could be studied
using detailed consumption data, however the CSES does not provide economic information at the
commune level and, therefore, spillovers and regional multipliers are not studied. Further
extensions could include effects on total factor productivity and productive investments if data
about firms and productive activities were available by sector and region.
Box 1. Assumptions
The microsimulation model used to estimate Rates of Return (RoR) in Cambodia, is based on the
following assumptions:
Assumptions based on data limitations: Household consumption per capita is used as a proxy for disposable income. Transfers are assumed to have a marginal propensity to consume equal to one (i.e.
households do not substitute foregone transfer income with other income). Disposable income is equally distributed within the household. A 10% administrative cost is assumed for cash transfers, scholarships and social pensions.
Public works include 50% non-wage costs. Transfers are externally funded with no additional effects on the public budget. Transfers are perfectly targeted (inclusion and exclusion errors are assumed to be equal to
zero). The supply side in the education sector responds immediately to an increasing demand
(higher school attendance).
Assumptions based on the analytical and modelling framework: The model relies on the returns of human capital to income. At the household level the
“allocation effect”, measured by the maximum level of education defines the capacity for income generation activities.
Structural changes affect the policy and base line scenarios in the same way (i.e. the net benefits are not affected).
Source: Mideros et al (2012).
39
Despite the aforementioned limitations, this study provides an analytical and methodological
framework to move forward to make the business case for social protection. Nevertheless, it is
important to note that the study does not attempt to analyse a specific effect, nor to study a
detailed policy design which can be done using different methodologies, but to estimate potential
economic returns in the medium and long term. In this sense the study deals with multiple effects,
which are commonly analysed independently, while at the same time it provides information about
costs and benefits. Of course, the model uses coefficients calculated from specific country data. It
would have to be estimated for other countries, controlling as much as possible for their specific
framework conditions. Moreover, the model estimates effects on human development variables
but also economic returns which are normally not analysed due to methodological restrictions.
Three main limitations should be tackled in future studies. First, it is necessary to include financing
aspects and their repercussions on costs and benefits. Second, it is important to account for supply
side effects. This could be done by linking a microsimulation model at the firm level or aligning the
model with a macro model. Finally, results should be compared with alternative economic
investments in order to support informed policy decisions. However, while it is necessary to
improve the model it is important to be careful with methodological complexities and to keep the
model understandable for a general public and in order to have real influence on the policy making
process.
4.3 Research process and research uptake
The study was executed in close cooperation with the Social Protection Coordination Unit (SPCU)
of the Council for Agricultural and Rural Development (CARD) and UNICEF Cambodia. It is part of a
country initiative to foster research on social protection and is guided by RGC’s NSPS. As stated by
the authors, the study ‘provides evidence to support the design and implementation of the NSPS
by estimating potential rates of return using ex-ante microsimulation techniques.’ (Mideros et al.
2012, p. 83). The first step, coordinated by UNICEF, was to meet different partners to collect data
and understand the different views and perceptions of various stakeholders regarding social
protection in Cambodia. Furthermore, most of the research was done in-situ allowing for the
regular involvement of stakeholders in the discussion of assumptions and policy options. A peer
review process at various stages of the analysis ensured critical feedback by academic scholars and
experts from international organisations. The report was validated in three different workshops
with several development partners and ministries, including a final meeting with line cabinet
members in September 2012. Next steps were established by the government to use the report
together with the ILO costing studies to define specific actions for the implementation of the NSPS.
Furthermore the report was commented by UNICEF, the World Bank and the Asian Development
Bank (ADB), which are potential donors for the NSPS. They consider this study as an important step
to make the investment case for social protection in Cambodia. The study proposes an affordable
(1.6% to 0.85 of GDP in period 1 and 20, respectively) basic package of social protection covering
main life-cycle risks. It includes cash transfers for poor children, scholarships and public works –
options already prioritized by the government –and promotes social pensions in order to approach
a social protection floor.
***
40
Concluding remarks: Overall, the study makes the case for non-contributory social protection in
Cambodia, as well as in other developing countries. It shows that, on top of their social benefits,
social transfers may be seen as an economic investment with a positive return in the mid-term. As
such, social transfers may represent a valuable policy option to foster socioeconomic development
in low- and middle-income countries. Modelling social transfers in a comprehensive way is data
demanding, but there is a possibility to move forward to the estimation of rates of return using
microsimulation models which can be designed to include different effects which are normally
excluded in other methodological approaches. In the following section, we present and discuss
possible policy implications for UNICEF and its partners.
41
5. DISCUSSING POLICY IMPLICATIONS AND FUTURE RESEARCH
This discussion paper is focused on the use of ex-ante cost-benefit analyses to make the
investment case for non-contributory social protection. More specifically, this type of exercise can
be approached from three different angles: i) as a method to help fill the global knowledge gap
about the linkages of social protection with economic performance (the academic’s perspective); ii)
as an instrument to inform an evidence-based policy process (the policymaker’s perspective); and
iii) as a tool to mobilise extra resources for social protection – or possibly, to promote a certain
approach to social protection (the advocate’s perspective). Of course, these perspectives and
objectives would often be convergent. However, it is important to keep these different
perspectives in mind when assessing the appropriateness and usefulness of the exercise.
In the previous section we have illustrated the usefulness and the richness of a cost-benefit
analysis that takes various sorts of impacts into account and evaluates the direct and indirect costs
and benefits of particular policy measures. It helps understanding the effects of social protection
policies, evaluating their effectiveness and efficiency and hopefully convincing decision makers of
the opportunity of their interventions. In this section, we proceed to take a reality check in
recognition of the fact that economic analysis is just one component of decision making, that cost-
benefit analyses have their limitations, and that more work needs to be done. First, we examine
the role cost-benefit analyses may actually play in national policymaking processes. Secondly, we
reflect on a number of possible risks attached to an overuse of (or overreliance on) ex-ante cost-
benefit analyses to inform public policy, and third, we point to some potentially interesting
complementary research areas.
5.1 Informing national social protection policies
As interest for cost-benefit analyses seems to be growing, there is a need to better understand the
role such analyses may actually play in national policymaking processes, and clarify the conditions
for such analyses to be truly useful to decision-makers. To our knowledge, there has not been any
specific study looking at the role of cost-benefit analysis findings in the shaping of national social
protection policy in developing countries. Nor has there been any thorough assessment of the
needs and demand for such studies.
Here, we present and discuss a few cases that help touch on and illustrate some of these issues.
We discuss the potential for cost analyses in general, of which cost-benefit analysis is a particular
case, to provide useful inputs to decision-making processes in regard to the implementation of
non-contributory social protection in developing countries. Also, considering in particular the
methodological challenges, cost implications and skills required to conduct such analyses, we
confront such an approach to some other potential ways of influencing policymakers and support
the extension of social protection policies.
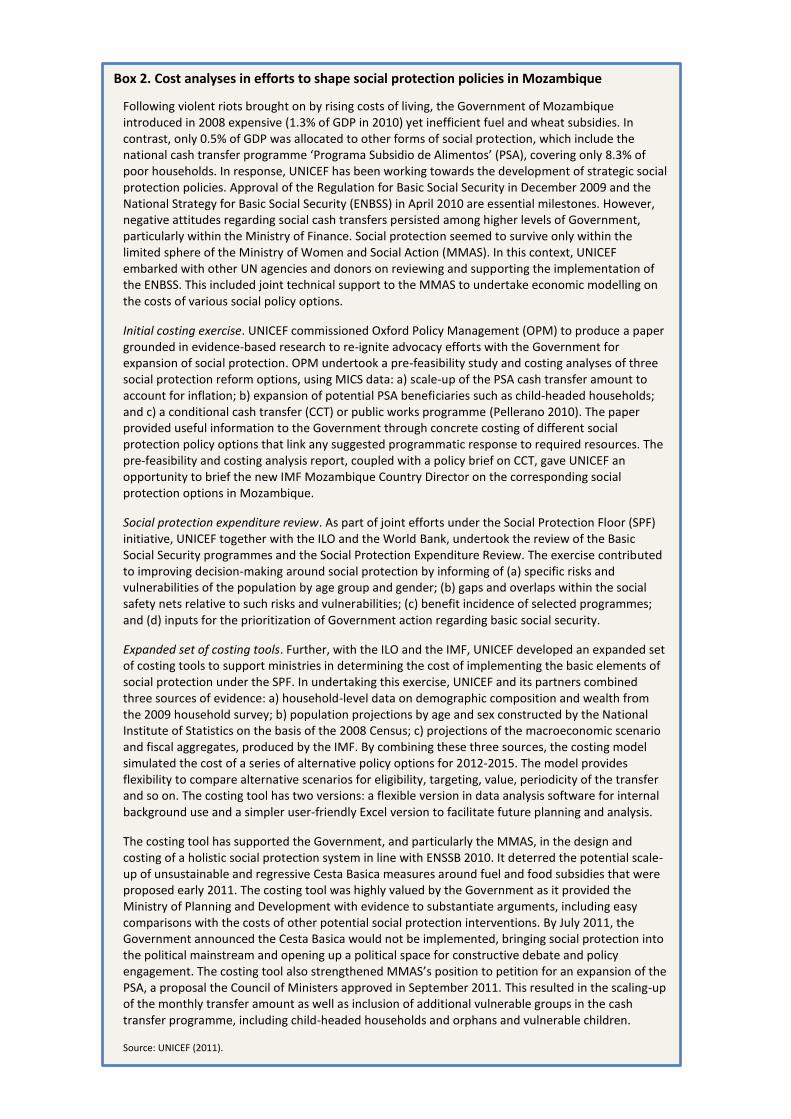
42
Box 2. Cost analyses in efforts to shape social protection policies in Mozambique
Following violent riots brought on by rising costs of living, the Government of Mozambique introduced in 2008 expensive (1.3% of GDP in 2010) yet inefficient fuel and wheat subsidies. In contrast, only 0.5% of GDP was allocated to other forms of social protection, which include the national cash transfer programme ‘Programa Subsidio de Alimentos’ (PSA), covering only 8.3% of poor households. In response, UNICEF has been working towards the development of strategic social protection policies. Approval of the Regulation for Basic Social Security in December 2009 and the National Strategy for Basic Social Security (ENBSS) in April 2010 are essential milestones. However, negative attitudes regarding social cash transfers persisted among higher levels of Government, particularly within the Ministry of Finance. Social protection seemed to survive only within the limited sphere of the Ministry of Women and Social Action (MMAS). In this context, UNICEF embarked with other UN agencies and donors on reviewing and supporting the implementation of the ENBSS. This included joint technical support to the MMAS to undertake economic modelling on the costs of various social policy options.
Initial costing exercise. UNICEF commissioned Oxford Policy Management (OPM) to produce a paper grounded in evidence-based research to re-ignite advocacy efforts with the Government for expansion of social protection. OPM undertook a pre-feasibility study and costing analyses of three social protection reform options, using MICS data: a) scale-up of the PSA cash transfer amount to account for inflation; b) expansion of potential PSA beneficiaries such as child-headed households; and c) a conditional cash transfer (CCT) or public works programme (Pellerano 2010). The paper provided useful information to the Government through concrete costing of different social protection policy options that link any suggested programmatic response to required resources. The pre-feasibility and costing analysis report, coupled with a policy brief on CCT, gave UNICEF an opportunity to brief the new IMF Mozambique Country Director on the corresponding social protection options in Mozambique.
Social protection expenditure review. As part of joint efforts under the Social Protection Floor (SPF) initiative, UNICEF together with the ILO and the World Bank, undertook the review of the Basic Social Security programmes and the Social Protection Expenditure Review. The exercise contributed to improving decision-making around social protection by informing of (a) specific risks and vulnerabilities of the population by age group and gender; (b) gaps and overlaps within the social safety nets relative to such risks and vulnerabilities; (c) benefit incidence of selected programmes; and (d) inputs for the prioritization of Government action regarding basic social security.
Expanded set of costing tools. Further, with the ILO and the IMF, UNICEF developed an expanded set of costing tools to support ministries in determining the cost of implementing the basic elements of social protection under the SPF. In undertaking this exercise, UNICEF and its partners combined three sources of evidence: a) household-level data on demographic composition and wealth from the 2009 household survey; b) population projections by age and sex constructed by the National Institute of Statistics on the basis of the 2008 Census; c) projections of the macroeconomic scenario and fiscal aggregates, produced by the IMF. By combining these three sources, the costing model simulated the cost of a series of alternative policy options for 2012-2015. The model provides flexibility to compare alternative scenarios for eligibility, targeting, value, periodicity of the transfer and so on. The costing tool has two versions: a flexible version in data analysis software for internal background use and a simpler user-friendly Excel version to facilitate future planning and analysis.
The costing tool has supported the Government, and particularly the MMAS, in the design and costing of a holistic social protection system in line with ENSSB 2010. It deterred the potential scale-up of unsustainable and regressive Cesta Basica measures around fuel and food subsidies that were proposed early 2011. The costing tool was highly valued by the Government as it provided the Ministry of Planning and Development with evidence to substantiate arguments, including easy comparisons with the costs of other potential social protection interventions. By July 2011, the Government announced the Cesta Basica would not be implemented, bringing social protection into the political mainstream and opening up a political space for constructive debate and policy engagement. The costing tool also strengthened MMAS’s position to petition for an expansion of the PSA, a proposal the Council of Ministers approved in September 2011. This resulted in the scaling-up of the monthly transfer amount as well as inclusion of additional vulnerable groups in the cash transfer programme, including child-headed households and orphans and vulnerable children.
Source: UNICEF (2011).
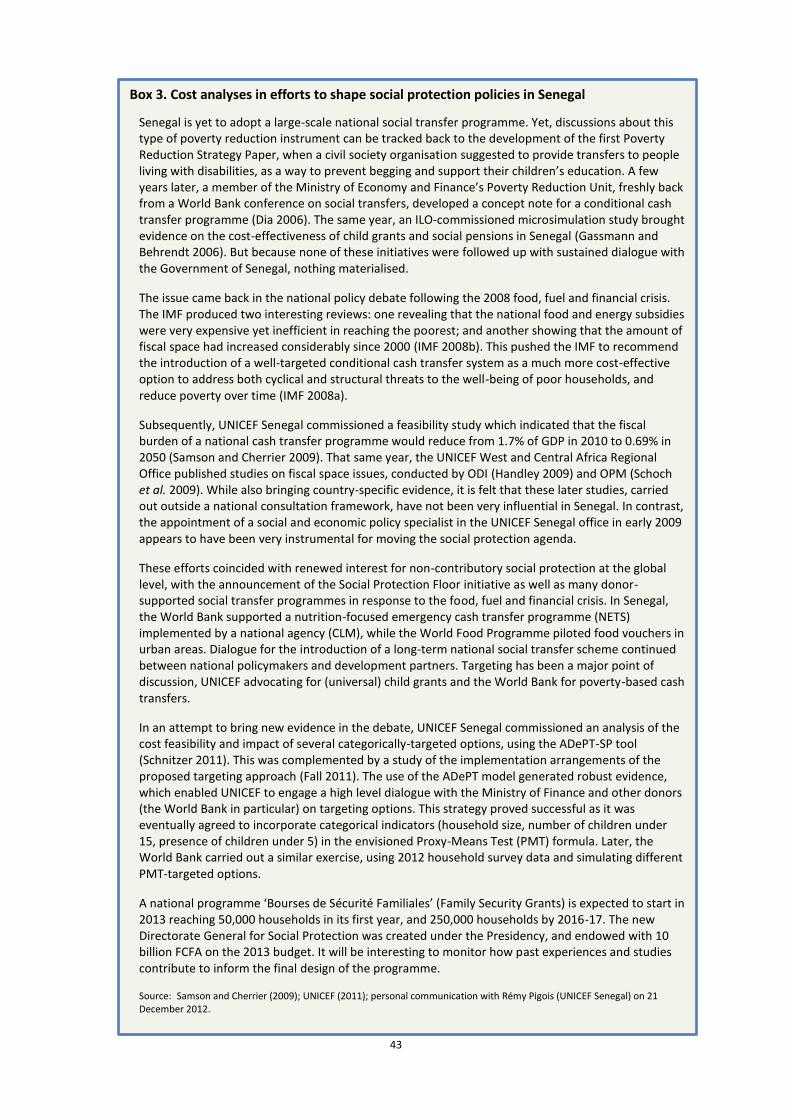
43
Box 3. Cost analyses in efforts to shape social protection policies in Senegal
Senegal is yet to adopt a large-scale national social transfer programme. Yet, discussions about this type of poverty reduction instrument can be tracked back to the development of the first Poverty Reduction Strategy Paper, when a civil society organisation suggested to provide transfers to people living with disabilities, as a way to prevent begging and support their children’s education. A few years later, a member of the Ministry of Economy and Finance’s Poverty Reduction Unit, freshly back from a World Bank conference on social transfers, developed a concept note for a conditional cash transfer programme (Dia 2006). The same year, an ILO-commissioned microsimulation study brought evidence on the cost-effectiveness of child grants and social pensions in Senegal (Gassmann and Behrendt 2006). But because none of these initiatives were followed up with sustained dialogue with the Government of Senegal, nothing materialised.
The issue came back in the national policy debate following the 2008 food, fuel and financial crisis. The IMF produced two interesting reviews: one revealing that the national food and energy subsidies were very expensive yet inefficient in reaching the poorest; and another showing that the amount of fiscal space had increased considerably since 2000 (IMF 2008b). This pushed the IMF to recommend the introduction of a well-targeted conditional cash transfer system as a much more cost-effective option to address both cyclical and structural threats to the well-being of poor households, and reduce poverty over time (IMF 2008a).
Subsequently, UNICEF Senegal commissioned a feasibility study which indicated that the fiscal burden of a national cash transfer programme would reduce from 1.7% of GDP in 2010 to 0.69% in 2050 (Samson and Cherrier 2009). That same year, the UNICEF West and Central Africa Regional Office published studies on fiscal space issues, conducted by ODI (Handley 2009) and OPM (Schoch et al. 2009). While also bringing country-specific evidence, it is felt that these later studies, carried out outside a national consultation framework, have not been very influential in Senegal. In contrast, the appointment of a social and economic policy specialist in the UNICEF Senegal office in early 2009 appears to have been very instrumental for moving the social protection agenda.
These efforts coincided with renewed interest for non-contributory social protection at the global level, with the announcement of the Social Protection Floor initiative as well as many donor-supported social transfer programmes in response to the food, fuel and financial crisis. In Senegal, the World Bank supported a nutrition-focused emergency cash transfer programme (NETS) implemented by a national agency (CLM), while the World Food Programme piloted food vouchers in urban areas. Dialogue for the introduction of a long-term national social transfer scheme continued between national policymakers and development partners. Targeting has been a major point of discussion, UNICEF advocating for (universal) child grants and the World Bank for poverty-based cash transfers.
In an attempt to bring new evidence in the debate, UNICEF Senegal commissioned an analysis of the cost feasibility and impact of several categorically-targeted options, using the ADePT-SP tool (Schnitzer 2011). This was complemented by a study of the implementation arrangements of the proposed targeting approach (Fall 2011). The use of the ADePT model generated robust evidence, which enabled UNICEF to engage a high level dialogue with the Ministry of Finance and other donors (the World Bank in particular) on targeting options. This strategy proved successful as it was eventually agreed to incorporate categorical indicators (household size, number of children under 15, presence of children under 5) in the envisioned Proxy-Means Test (PMT) formula. Later, the World Bank carried out a similar exercise, using 2012 household survey data and simulating different PMT-targeted options.
A national programme ‘Bourses de Sécurité Familiales’ (Family Security Grants) is expected to start in 2013 reaching 50,000 households in its first year, and 250,000 households by 2016-17. The new Directorate General for Social Protection was created under the Presidency, and endowed with 10 billion FCFA on the 2013 budget. It will be interesting to monitor how past experiences and studies contribute to inform the final design of the programme.
Source: Samson and Cherrier (2009); UNICEF (2011); personal communication with Rémy Pigois (UNICEF Senegal) on 21 December 2012.
44
Cost analyses may be very useful to support national policymaking processes. Essentially, it helps
package an advocacy discourse for social protection into the language of people in charge of
budget allocation, primarily concerned with value for money and financial sustainability. In
Mozambique, the development of a costing tool by UNICEF enhanced the capacity of the ministry
in charge of social affairs to engage with the Council of Ministers, and particularly with the Ministry
of Finance, and make the financial case for an extension of the scope for implementation of the
national social protection strategy (Box 2). In Senegal, the use of the ADePT model enabled UNICEF
to produce robust evidence and engage a high-level dialogue with the Ministry of Finance and the
World Bank (Box 3). In Ukraine, conducting cost analyses may be the required next step to bring
UNICEF’s policy and advocacy efforts to the next level. So far, UNICEF has been quite successful in
promoting an integrated approach to social protection. These efforts, including a study by Baskott
et al. (2011), contributed to the adoption of a reform plan for the national social protection
system. But, even though law and standards were adopted, no budget was allocated, in part due to
the significant cost implications attached to the reform plan. In this context, it may be appropriate
for UNICEF to engage in cost analyses to provide a basis for further policy dialogue with national
decision-makers.
A number of initial lessons emerge from these recent experiences in regard to the necessary
conditions for cost analyses to be useful in supporting the extension of efficient, effective and
sustainable social protection systems. First, the analysis needs to be part of a whole policy dialogue
process, and follow-up with sustained in-country support. Second, timing is important. In
Mozambique and Senegal, the strong partnerships built over time in the process with key
ministries and development partners have proved invaluable as opportunities for high-level
advocacy emerged as a result of the economic crisis. Third, the alternative policy options
considered should be defined in close consultation with national stakeholders. An early
involvement of decision-makers in the research process tends to increase research uptake. Fourth,
the methodology used needs to be robust and transparent. An over-simplistic model, or a very
partial approach (for instance, using inappropriate assumptions to favour a preferred result),
would not be credible enough to provide a solid basis for discussion. Also, studies would need to
be not only valid but such that their intended audiences believe that they are valid. This may
require extra care about avoiding (apparent) conflict of interest (Scriven 1991).
In Egypt, Jordan and Morocco, UNICEF has recently engaged in an ambitious partnership with the
PEP network to prepare investment cases for social protection. This is part of efforts to ensure
that, as governments undergo subsidy reforms, the impacts on children are understood and
anticipated, and the planned compensation packages are pro-children. The studies are expected to
consider different pro-children social protection policy options and assess, on one hand, costs
alone, on the other hand, impacts on social returns and cost-effectiveness but only in terms of
poverty and inequality reduction.10
In South Africa, the Department of Social Development only recently started to develop different
types of micro-simulation tools aimed at estimating the cost of the programmes. Many of these
models are static rather than dynamic micro-simulation tools. This situation prevails in much of the
10 Personal communication with Roberto Benes (UNICEF MENARO) on 31 January 2013.
45
Southern Africa Development Community. Oxford Policy Management, supported by the Centre
for the Analysis of South African Social Policy at the University of Oxford, is just about to finish a
Social Budget for South Africa. They use a static tax-benefit micro-simulation tool to forecast social
expenditures, combined with some rudimentary poverty/inequality measures of the impact of
these social expenditures.11 This lack of cost-benefit analysis tool did not stop the country from
gradually expanding a now well-established social protection system. Political will in the first place,
financial feasibility, and subsequent positive evidence of impact (as documented by Samson et al.
(2004) for instance) might have been the key ingredients for policymakers to invest in social
protection.
In Latin America, the evidence of positive impacts of social transfers on food consumption, school
enrolment, healthcare, stunting, child labour, and illness rates, which has been widely circulated,
has been crucial to building political support and ultimately led to the programme’s expansion
(Miller and Samson 2012). Generating robust context-specific empirical evidence of impact appears
crucial to build political support for schemes and secure government and donor commitment to
sustain and expand social protection programmes. This suggests that another promising strategy to
promote social protection would be for development partners to further help develop an
evaluation culture among national policymakers, as well as in-country know-how and capacities to
use robust research methods to investigate both impacts and processes of social protection
programmes, and generate local evidence.
But before evidence of impact, leaders’ ideology and charisma may actually be key factors
supporting the expansion of social protection. In Brazil, the momentum of the 2003 elections and
President Lula da Silva’s strong political will to eradicate hunger throughout the country was at the
origin of the establishment and progressive consolidation of the integrated ‘Fome Zero’ strategy,
within which the influential ‘Bolsa Família’ scheme was developed. Interestingly, this strategy was
built on existing programmes, rather than from scratch. This suggests that acknowledging and
capitalising on what exists might be more successful than trying to transplant innovative solutions
from elsewhere.
11 Personal communication with Fidelis Hove (OPM) on 20 December 2012.
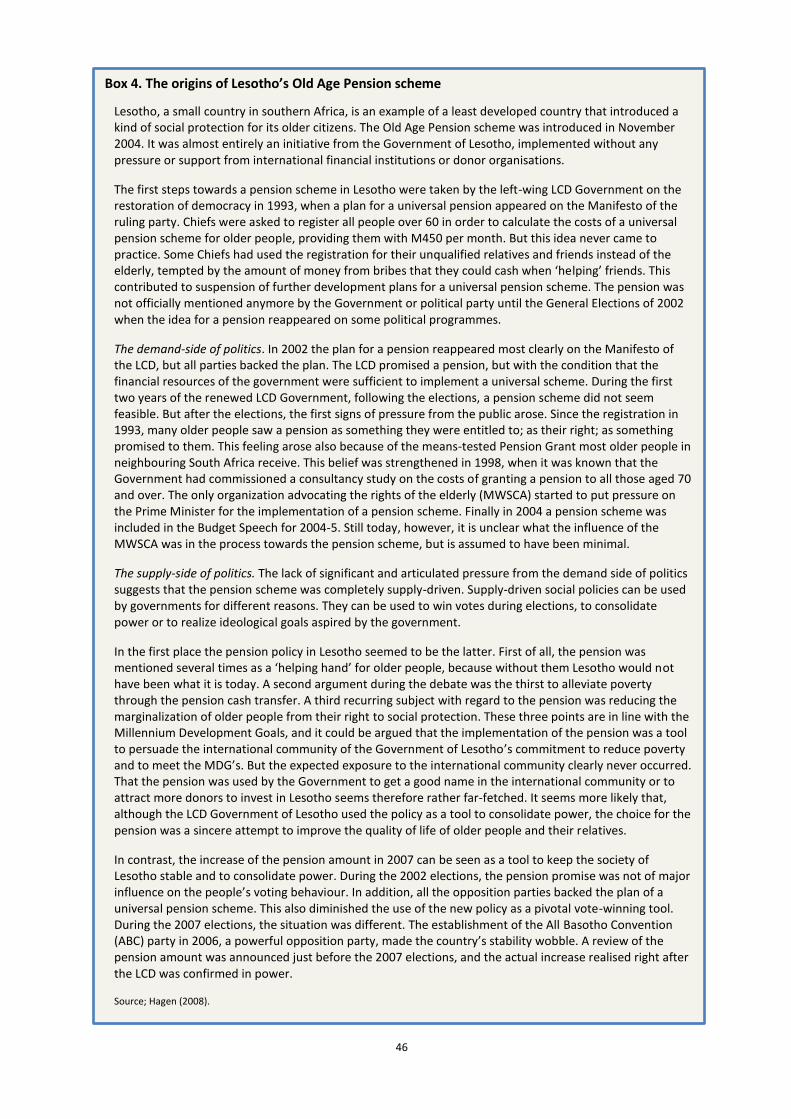
46
Box 4. The origins of Lesotho’s Old Age Pension scheme
Lesotho, a small country in southern Africa, is an example of a least developed country that introduced a kind of social protection for its older citizens. The Old Age Pension scheme was introduced in November 2004. It was almost entirely an initiative from the Government of Lesotho, implemented without any pressure or support from international financial institutions or donor organisations.
The first steps towards a pension scheme in Lesotho were taken by the left-wing LCD Government on the restoration of democracy in 1993, when a plan for a universal pension appeared on the Manifesto of the ruling party. Chiefs were asked to register all people over 60 in order to calculate the costs of a universal pension scheme for older people, providing them with M450 per month. But this idea never came to practice. Some Chiefs had used the registration for their unqualified relatives and friends instead of the elderly, tempted by the amount of money from bribes that they could cash when ‘helping’ friends. This contributed to suspension of further development plans for a universal pension scheme. The pension was not officially mentioned anymore by the Government or political party until the General Elections of 2002 when the idea for a pension reappeared on some political programmes.
The demand-side of politics. In 2002 the plan for a pension reappeared most clearly on the Manifesto of the LCD, but all parties backed the plan. The LCD promised a pension, but with the condition that the financial resources of the government were sufficient to implement a universal scheme. During the first two years of the renewed LCD Government, following the elections, a pension scheme did not seem feasible. But after the elections, the first signs of pressure from the public arose. Since the registration in 1993, many older people saw a pension as something they were entitled to; as their right; as something promised to them. This feeling arose also because of the means-tested Pension Grant most older people in neighbouring South Africa receive. This belief was strengthened in 1998, when it was known that the Government had commissioned a consultancy study on the costs of granting a pension to all those aged 70 and over. The only organization advocating the rights of the elderly (MWSCA) started to put pressure on the Prime Minister for the implementation of a pension scheme. Finally in 2004 a pension scheme was included in the Budget Speech for 2004-5. Still today, however, it is unclear what the influence of the MWSCA was in the process towards the pension scheme, but is assumed to have been minimal.
The supply-side of politics. The lack of significant and articulated pressure from the demand side of politics suggests that the pension scheme was completely supply-driven. Supply-driven social policies can be used by governments for different reasons. They can be used to win votes during elections, to consolidate power or to realize ideological goals aspired by the government.
In the first place the pension policy in Lesotho seemed to be the latter. First of all, the pension was mentioned several times as a ‘helping hand’ for older people, because without them Lesotho would not have been what it is today. A second argument during the debate was the thirst to alleviate poverty through the pension cash transfer. A third recurring subject with regard to the pension was reducing the marginalization of older people from their right to social protection. These three points are in line with the Millennium Development Goals, and it could be argued that the implementation of the pension was a tool to persuade the international community of the Government of Lesotho’s commitment to reduce poverty and to meet the MDG’s. But the expected exposure to the international community clearly never occurred. That the pension was used by the Government to get a good name in the international community or to attract more donors to invest in Lesotho seems therefore rather far-fetched. It seems more likely that, although the LCD Government of Lesotho used the policy as a tool to consolidate power, the choice for the pension was a sincere attempt to improve the quality of life of older people and their relatives.
In contrast, the increase of the pension amount in 2007 can be seen as a tool to keep the society of Lesotho stable and to consolidate power. During the 2002 elections, the pension promise was not of major influence on the people’s voting behaviour. In addition, all the opposition parties backed the plan of a universal pension scheme. This also diminished the use of the new policy as a pivotal vote-winning tool. During the 2007 elections, the situation was different. The establishment of the All Basotho Convention (ABC) party in 2006, a powerful opposition party, made the country’s stability wobble. A review of the pension amount was announced just before the 2007 elections, and the actual increase realised right after the LCD was confirmed in power.
Source; Hagen (2008).
Source: Hagen (2008).
47
Lesotho is another case where leadership, in this case Prime Minister Mosisili’s headship, was
decisive for the expansion of social protection. Furthermore, it is the interesting case of a country
faced with limited resources, which nevertheless introduced, without donor support, a national
social transfer programme. The political environment played a major role during the formulation
and implementation process of the pension policy (Hagen 2008) (Box 4).
These cases are reminders, if needed, that policymaking is a very complex matter and that
evidence on the rates of return on investment is only one element among many that may help
trigger the expansion of a social protection system. Cost-benefit analyses may be an influencing
factor. But other considerations, such as path dependency, local preferences and acceptability, and
local capacities will also affect the choice of an approach and specific social protection instruments.
And we could legitimately suspect that most decisions around social protection are based on
political considerations much more than on (allegedly dispassionate) investment analyses.
Ultimately the sustainability of social protection programmes is an issue of political economy.12A
review of successful experiences where research results did inform policy suggests that a research
strategy needs to be informed by the policy/political context (and respond to specific
policymakers’ needs) for evidence to inform policy (Carden 2009). Adopting a ‘demand-driven’
approach to building and analysing the evidence base would be more likely to support evidence-
informed policy (Miller and Samson 2012). This suggests that carrying out a proper political
economy analysis might be a useful exercise to develop a capacity to read and work with the
environment (who are the supporters and what is their agenda, who needs to be influenced and
how, what evidence may be needed, etc.) and define research agenda and advocacy (research
uptake) strategy accordingly. For instance, considerations about long-term economic impacts may
be valuable to high-level civil servants, civil society and social lobbyists, but less so to politicians
(who work on short political cycles). Further, it highlights the need to research more the social
(social cohesion) and political (support from the electorate) returns of social protection, in addition
to economic (pro-poor growth) ones, if the ultimate objective is to generate political will for the
expansion of social protection.13
5.2 Final considerations on the use of cost-benefit analyses
Cost-benefit analyses can help better understand how social protection investments may generate
economic returns in the mid- and long-term. This may influence policymakers all around the world
to promote social protection floors for the poor and vulnerable. But the rising interest for cost-
benefit analyses demands to take into account different aspects. Here, we briefly review a few of
them:
Risk of a narrow focus on poverty reduction. Some authors challenge what they see as the
emerging social protection paradigm: a strong focus on poverty reduction and on providing
support to the poorest; a focus on risk and vulnerability; cash transfer as the policy
instrument of choice; a preference for means-testing; and a disconnection between the
12 For a discussion of the political economy aspects of social protection, see, e.g., Graham (2002), Tabor (2002), Andrews et al. (2012). 13 Interestingly, UNRISD recently launched a research project on the ‘politics of domestic resource mobilization for social development’. The project seeks to contribute to global debates on the political and institutional contexts that enable poor countries to mobilize domestic resources for social development. It will examine the processes and mechanisms that connect the politics of resource mobilization and demands for social provision; changes in state-citizen and donor-recipient relations associated with resource mobilization and allocation; and governance reforms that can lead to improved and sustainable revenue yields and services. For more information, visit: http://www.unrisd.org/80256B3C005BB128/(httpProjects)/D8BC0D08FA1BD10BC125795F004C812F?OpenDocument.
48
social and the broader economic aspects of development policy-making (Adésínà 2010;
Barrientos 2010; Deacon 2010). Therefore, it is important to estimate economic benefits
(rates of return) in the mid- and long-term and to analyse their implications at the macro
level.
Risk of promoting a fragmented approach to social protection. The case has been argued
from a conceptual level for the need to move towards integrated social protection system
approaches (UNICEF 2012; World Bank 2012). Simple cost-benefit analyses might push
users to consider and discuss social transfer policy options on their own, without
considering any synergies with social services for instance. However, the multiple effects of
social transfers may be estimated considering that if implemented together with other
complementary policies benefits and returns may be higher.
Risk of distracting attention from implementation research. The operationalisation of a
systems-approach to social protection remains unclear and requires further research.
Deaton (2010) argues that learning about development requires investigating mechanisms:
‘Finding out about how people in low-income countries can and do escape from poverty is
unlikely to come from the empirical evaluation of actual projects or programs, whether
through randomized trials or econometric methods that are designed to extract defensible
causal inferences, unless such analysis tries to discover why projects work rather than
whether they work – however important the latter might be for purposes of auditing.’ In
this perspective comparative analyses may be useful to identify under what conditions
different social protection investments should be chosen.
Risk of distracting attention from political economy. Linked to the above, and as already
mentioned, more attention needs to be paid to political economy issues. The use of cost-
benefit analyses to inform policies should not distract development partners from policy
processes. Cost-benefit analyses and the estimation of rates of return should be utilized to
answer specific questions raised during the policy process. Several agencies are developing
work on the political economy of social protection, exploring the importance of factors
other than cost, on programme performance, and financing.
Furthermore, the use of cost-benefit analysis as part of efforts to convince national decision-
makers to allocate (more) resources to non-contributory social protection should avoid a linear
perspective of policymaking processes. The intervention strategy promoted in the Social Protection
Floor manual as a whole tends to reflect a linear approach to policy (ILO and WHO 2009a). Such an
approach ‘assumes that policymakers approach the issues rationally, going through each logical
stage of the process, and carefully considering all relevant information. … There is much evidence
to suggest that this model is far from reality.’ (Sutton 1999, p. 9) Several studies already suggest
serious limitations in the capacity of development partners to promote local ownership around
social transfers, and recommend paying more attention to political dimensions (Hickey et al. 2009;
Holmqvist 2010; Niño-Zarazúa et al. 2010; Schüring and Lawson-McDowall 2011).
Structural models, like the RoR analysis for Cambodia, have the potential to incorporate other
social and economic effects. They extend the analysis from a pure focus on costs to the potential
benefits to be gained, though mainly in economic terms. Research could also be launched to assess
the possibility of adopting alternative approaches and methods for an analysis of perceived ‘costs’
49
and ‘impacts’ as experienced by citizens. Furthermore, the consideration of marginal social welfare
weights attributed to redistribution would allow the reflection of a society’s view for justice (Saez
and Stantcheva, 2013). Additional income for poor individuals (receiving a social transfer) may
more than compensate the loss of non-poor individuals (paying for social transfers) in terms of
social welfare. As mentioned, there are other aspects that could justify a social protection policy,
including social and political impacts (community cohesion, citizens’ happiness, etc.). The use of
complex modelling for cost-benefit analyses might also present the risk of over-relying on expert
knowledge to inform policy, at the expense of citizens’ engagement in policymaking processes. A
cost-utility analysis approach, including participatory research methods could be investigated as a
complementary way to generate greater local buy-in, more innovative context-specific thinking,
and better attention to political returns (citizens’ satisfaction).
***
Concluding remarks: Making the investment case of non-contributory social protection may help to
fill a global knowledge gap, and to mobilize resources. However, the effects on social outcomes and
a human rights perspective should not be neglected as arguments to push in favour of social
protection. Different methodologies can be used for ex-ante analyses of social protection
interventions, the choice depending on the objectives of the study. There is no one methodology to
answer all questions, and any model is eventually just a simplification of real life. Ex-ante cost
analyses can indeed influence policy makers but early involvement and follow up is needed to
guarantee implementation. In the end, investing in social protection remains a matter of political
economy. Without political will, social protection will not be advanced irrespective of the available
evidence.
50
6. FINAL REMARKS
Social protection includes different sets of public and private interventions to prevent, reduce and
eliminate economic risks and social vulnerabilities. Social protection is a human right as stated in
articles 22 and 25 of the Universal Declaration of Human Rights. Currently, social protection is
getting increasing support for implementation and scaling up in developing countries. However,
the presence of informal labour markets and low coverage rates calls for the introduction of non-
contributory schemes to guarantee a basic protection level for everybody.
Despite the large literature about positive effects on social outcomes, many governments are yet
to be convinced. In this sense it is especially important to discuss different methodological
approaches that can help to provide information for the policy decisions. Ex-ante cost analysis is
being increasingly used, but there is still a gap with respect to the economic returns of social
protection investments. Social protection may help protect human capital and other productive
assets, generate local economy effects, stabilize aggregate demand, and improve social cohesion
and institutional changes.
A lot of analytical work has been done over the past contributing to a large evidence base. It mainly
focused on static, immediate effects, which is not per se a shortcoming. It mainly focused on costs
and affordability, since benefits are often perceived as ‘immaterial’. Still, there is a general
understanding that the arguments in favour of social protection are not yet convincing enough for
national policy makers of developing countries. There is a need to establish a compelling link
between costs and benefits, taking into account the time needed to earn the investments back.
Hence, to treat social protection as a business case.
A recent study estimates rates of return for non-contributory social protection in Cambodia. It
shows that, on top of their social benefits, social transfers may be seen as an economic investment
with a positive return in the mid-term. As such, social transfers may represent a valuable policy
option to foster socioeconomic development in low- and middle-income countries. Modelling
social transfers in a comprehensive way is data demanding, but there is a possibility to move
forward to the estimation of rates of return using microsimulation models which can be designed
to include different effects which are normally excluded in other methodological approaches. The
study provides a useful analytical and methodological framework which can be expanded and
replicated in different countries. However, modelling economic returns of social protection is
highly data demanding, while at the same time it needs a balance between robustness and
simplicity to influence policy decisions.
Making the investment case of non-contributory social protection may help fill a global knowledge
gap and mobilize resources. However, the effects on social outcomes and a human rights
perspective should not be neglected as an argument to push in favour of social protection.
Different methodologies can be used for ex-ante analysis of social protection interventions, the
choice depending on the objectives of the study. There is no one methodology to answer any
questions, and any model is just a simplification of real life. Ex-ante cost analysis can indeed
influence policy makers but early involvement and follow up is needed to guarantee
implementation. In the end, investing in social protection remains a matter of political will.
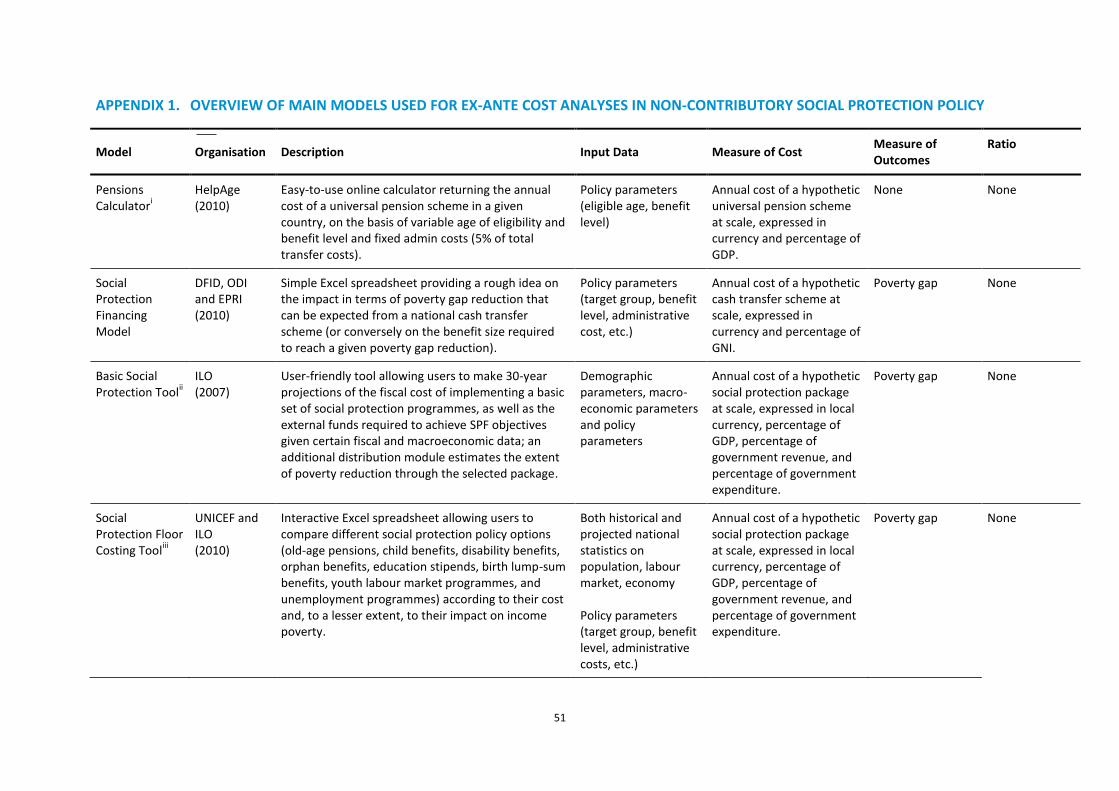
51
APPENDIX 1. OVERVIEW OF MAIN MODELS USED FOR EX-ANTE COST ANALYSES IN NON-CONTRIBUTORY SOCIAL PROTECTION POLICY
Model Organisation Description Input Data Measure of Cost Measure of Outcomes
Ratio
Pensions Calculator
i
HelpAge (2010)
Easy-to-use online calculator returning the annual cost of a universal pension scheme in a given country, on the basis of variable age of eligibility and benefit level and fixed admin costs (5% of total transfer costs).
Policy parameters (eligible age, benefit level)
Annual cost of a hypothetic universal pension scheme at scale, expressed in currency and percentage of GDP.
None None
Social Protection Financing Model
DFID, ODI and EPRI (2010)
Simple Excel spreadsheet providing a rough idea on the impact in terms of poverty gap reduction that can be expected from a national cash transfer scheme (or conversely on the benefit size required to reach a given poverty gap reduction).
Policy parameters (target group, benefit level, administrative cost, etc.)
Annual cost of a hypothetic cash transfer scheme at scale, expressed in currency and percentage of GNI.
Poverty gap None
Basic Social Protection Tool
ii
ILO (2007)
User-friendly tool allowing users to make 30-year projections of the fiscal cost of implementing a basic set of social protection programmes, as well as the external funds required to achieve SPF objectives given certain fiscal and macroeconomic data; an additional distribution module estimates the extent of poverty reduction through the selected package.
Demographic parameters, macro-economic parameters and policy parameters
Annual cost of a hypothetic social protection package at scale, expressed in local currency, percentage of GDP, percentage of government revenue, and percentage of government expenditure.
Poverty gap None
Social Protection Floor Costing Tool
iii
UNICEF and ILO (2010)
Interactive Excel spreadsheet allowing users to compare different social protection policy options (old-age pensions, child benefits, disability benefits, orphan benefits, education stipends, birth lump-sum benefits, youth labour market programmes, and unemployment programmes) according to their cost and, to a lesser extent, to their impact on income poverty.
Both historical and projected national statistics on population, labour market, economy Policy parameters (target group, benefit level, administrative costs, etc.)
Annual cost of a hypothetic social protection package at scale, expressed in local currency, percentage of GDP, percentage of government revenue, and percentage of government expenditure.
Poverty gap None
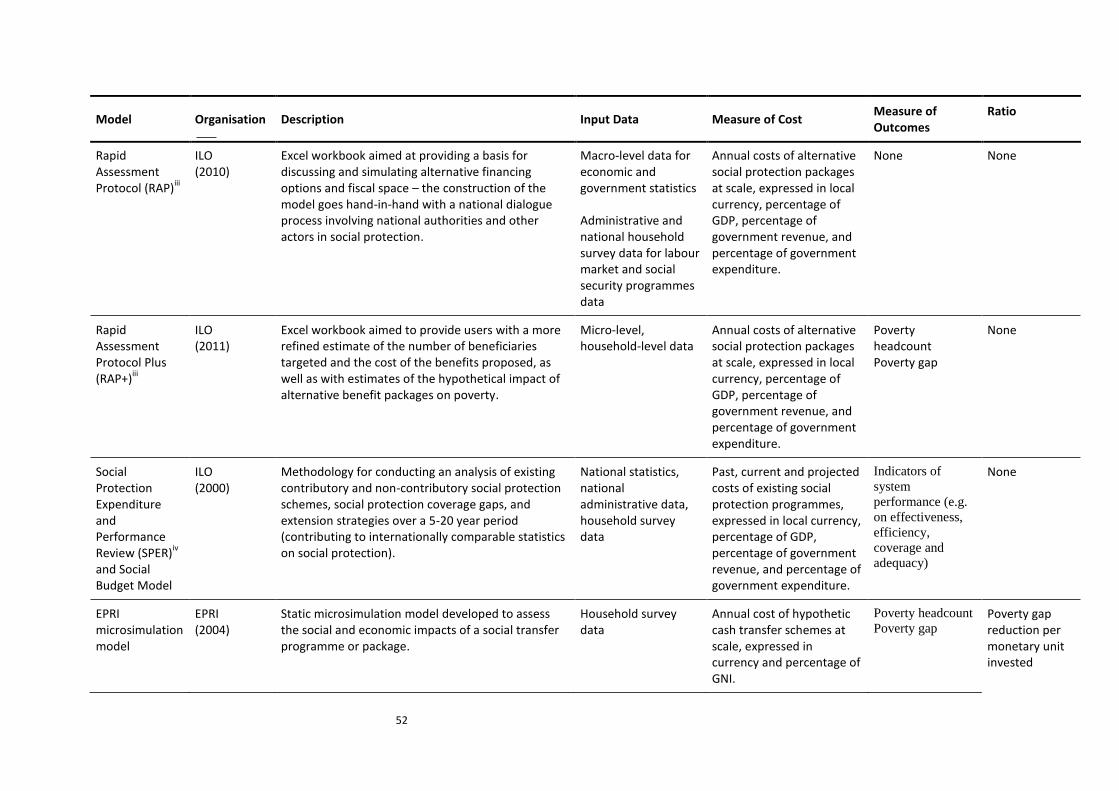
52
Model Organisation Description Input Data Measure of Cost Measure of Outcomes
Ratio
Rapid Assessment Protocol (RAP)
iii
ILO (2010)
Excel workbook aimed at providing a basis for discussing and simulating alternative financing options and fiscal space – the construction of the model goes hand-in-hand with a national dialogue process involving national authorities and other actors in social protection.
Macro-level data for economic and government statistics Administrative and national household survey data for labour market and social security programmes data
Annual costs of alternative social protection packages at scale, expressed in local currency, percentage of GDP, percentage of government revenue, and percentage of government expenditure.
None None
Rapid Assessment Protocol Plus (RAP+)
iii
ILO (2011)
Excel workbook aimed to provide users with a more refined estimate of the number of beneficiaries targeted and the cost of the benefits proposed, as well as with estimates of the hypothetical impact of alternative benefit packages on poverty.
Micro-level, household-level data
Annual costs of alternative social protection packages at scale, expressed in local currency, percentage of GDP, percentage of government revenue, and percentage of government expenditure.
Poverty headcount Poverty gap
None
Social Protection Expenditure and Performance Review (SPER)
iv
and Social Budget Model
ILO (2000)
Methodology for conducting an analysis of existing contributory and non-contributory social protection schemes, social protection coverage gaps, and extension strategies over a 5-20 year period (contributing to internationally comparable statistics on social protection).
National statistics, national administrative data, household survey data
Past, current and projected costs of existing social protection programmes, expressed in local currency, percentage of GDP, percentage of government revenue, and percentage of government expenditure.
Indicators of
system
performance (e.g.
on effectiveness,
efficiency,
coverage and
adequacy)
None
EPRI microsimulation model
EPRI (2004)
Static microsimulation model developed to assess the social and economic impacts of a social transfer programme or package.
Household survey data
Annual cost of hypothetic cash transfer schemes at scale, expressed in currency and percentage of GNI.
Poverty headcount
Poverty gap Poverty gap reduction per monetary unit invested
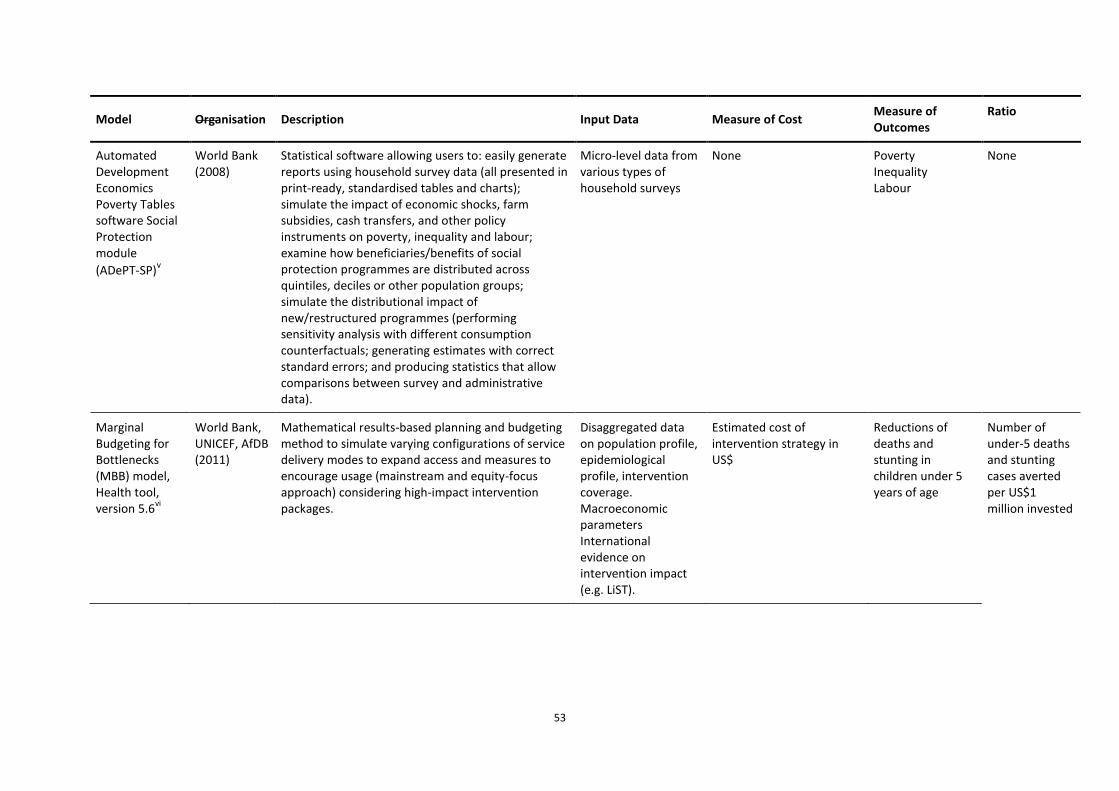
53
Model Organisation Description Input Data Measure of Cost Measure of Outcomes
Ratio
Automated Development Economics Poverty Tables software Social Protection module
(ADePT-SP)v
World Bank (2008)
Statistical software allowing users to: easily generate reports using household survey data (all presented in print-ready, standardised tables and charts); simulate the impact of economic shocks, farm subsidies, cash transfers, and other policy instruments on poverty, inequality and labour; examine how beneficiaries/benefits of social protection programmes are distributed across quintiles, deciles or other population groups; simulate the distributional impact of new/restructured programmes (performing sensitivity analysis with different consumption counterfactuals; generating estimates with correct standard errors; and producing statistics that allow comparisons between survey and administrative data).
Micro-level data from various types of household surveys
None Poverty Inequality Labour
None
Marginal Budgeting for Bottlenecks (MBB) model, Health tool, version 5.6
vi
World Bank, UNICEF, AfDB (2011)
Mathematical results-based planning and budgeting method to simulate varying configurations of service delivery modes to expand access and measures to encourage usage (mainstream and equity-focus approach) considering high-impact intervention packages.
Disaggregated data on population profile, epidemiological profile, intervention coverage. Macroeconomic parameters International evidence on intervention impact (e.g. LiST).
Estimated cost of intervention strategy in US$
Reductions of deaths and stunting in children under 5 years of age
Number of under-5 deaths and stunting cases averted per US$1 million invested
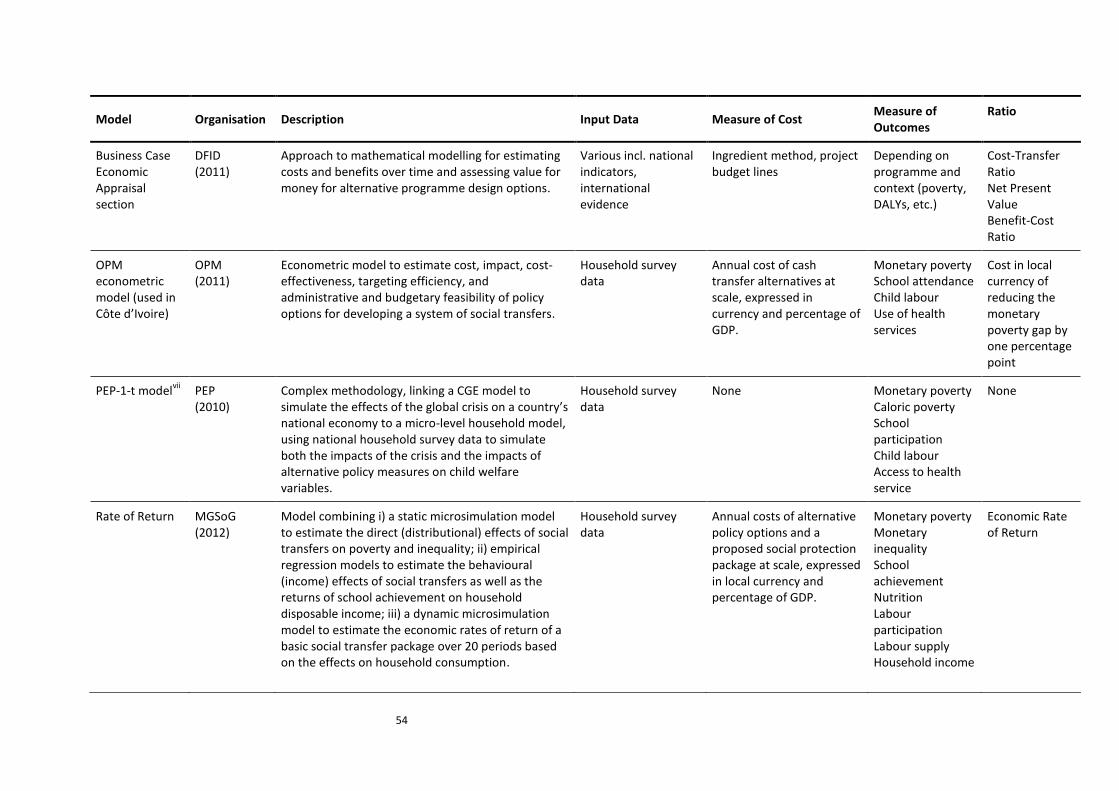
54
Model Organisation Description Input Data Measure of Cost Measure of Outcomes
Ratio
Business Case Economic Appraisal section
DFID (2011)
Approach to mathematical modelling for estimating costs and benefits over time and assessing value for money for alternative programme design options.
Various incl. national indicators, international evidence
Ingredient method, project budget lines
Depending on programme and context (poverty, DALYs, etc.)
Cost-Transfer Ratio Net Present Value Benefit-Cost Ratio
OPM econometric model (used in Côte d’Ivoire)
OPM (2011)
Econometric model to estimate cost, impact, cost-effectiveness, targeting efficiency, and administrative and budgetary feasibility of policy options for developing a system of social transfers.
Household survey data
Annual cost of cash transfer alternatives at scale, expressed in currency and percentage of GDP.
Monetary poverty School attendance Child labour Use of health services
Cost in local currency of reducing the monetary poverty gap by one percentage point
PEP-1-t modelvii
PEP (2010)
Complex methodology, linking a CGE model to simulate the effects of the global crisis on a country’s national economy to a micro-level household model, using national household survey data to simulate both the impacts of the crisis and the impacts of alternative policy measures on child welfare variables.
Household survey data
None Monetary poverty Caloric poverty School participation Child labour Access to health service
None
Rate of Return MGSoG (2012)
Model combining i) a static microsimulation model to estimate the direct (distributional) effects of social transfers on poverty and inequality; ii) empirical regression models to estimate the behavioural (income) effects of social transfers as well as the returns of school achievement on household disposable income; iii) a dynamic microsimulation model to estimate the economic rates of return of a basic social transfer package over 20 periods based on the effects on household consumption.
Household survey data
Annual costs of alternative policy options and a proposed social protection package at scale, expressed in local currency and percentage of GDP.
Monetary poverty Monetary inequality School achievement Nutrition Labour participation Labour supply Household income
Economic Rate of Return
55
i For more information on the Pensions Calculator, visit: http://www.pension-watch.net/about-social-pensions/about-social-pensions/social-pensions-database/
ii For more information on the Basic Social Protection Tool, visit: http://www.socialsecurityextension.org/gimi/gess/ShowTheme.do?tid=447
iii For more information on the ILO Costing and Assessment Tools, visit: http://www.socialprotectionfloor-gateway.org/24.htm
iv For more information on the SPER, visit: http://www.ilo.org/public/english/protection/secsoc/areas/stat/spers.htm
v For more information on ADePT, visit: http://www.worldbank.org/adept
vi For more information on the MBB tool, visit: http://www.devinfolive.info/mbb/mbbsupport/
vii For more information on the PEP-1-t model, visit: http://www.pep-net.org/programs/mpia/pep-standard-cge-models/pep-1-t-single-country-recursive-dynamic-version/
56
REFERENCES
Adésínà, J. (2010). 'Rethinking the Social Protection Paradigm: Social Policy in Africa’s Development. Promoting Resilience through Social Protection in Sub-Saharan Africa'. Dakar, Senegal, 28-30 June 2010, European Report of Development.
Alderman, H. and R. Yemtsov (2012). Productive Role of Safety Nets. Social Protection and Labor Discussion Paper No.1203. Background Paper for the World Bank 2012-2022 Social Protection and Labor Strategy. Washington DC, World Bank.
Annabi, N., F. Cissé, et al. (2005). Trade Liberalization, Growth and Poverty in Senegal: A Dynamic Microsimulation CGE Model Analysis. Working Paper 05-12. Montreal, CIRPEE.
Arnold, C., T. Conway and M. Greenslade (2011). "Cash Transfers: Evidence Paper". London, Department for International Development.
Atkinson, T., F. Bourguignon, et al. (2002). "Microsimulation of Social Policy in the European Union: Case Study of the European Minimum Pension." Economica 69(274): 229-243.
Barrientos, A. (2010). Social Protection and Poverty. Social Policy and Development Programme Paper Number 42. Geneva, United Nations Research Institute for Social Development.
Barrientos, A. (2012). "Social transfers and growth: What do we know? What do we need to find out?" World Development 40(1): 11-20.
Barrientos, A. and M. Niño-Zarazúa (2010). Effects of non-contributory social transfers in developing countries: A compendium. Working Paper. Geneva, International Labour Office.
Barrientos, A., M. Niño-Zarazúa and M. Maitrot (2010). Social Assistance in Developing Countries Database, Version 5.0. Manchester, Brooks World Poverty Institute.
Barrientos, A. and J. Scott (2008). Social Transfers and Growth: A Review. BWPI Working Paper 5. Manchester, Brooks World Poverty Institute.
Baskott, J., J. Rogers, et al. (2011). Social protection systems to provide adequate support to the most vulnerable children and their families and prevent family separation in three countries of CEE/CIS - Ukraine country report. Oxford, Oxford Policy Management.
Behrendt, C. (2011). ILO basic social protection costing models and policy implications. ODI International Conference on Financing Social Protection in LICs: Finding the Common Ground, London, 26-27 May 2011.
Behrman, J. R. (2000). Literature Review on Interactions between Health, Education and Nutrition and the Potential Benefits of Intervening Simultaneously in All Three. Washington, DC, International Food Policy Research Institute.
Bezerra de Siqueira, R., H. Immervoll, et al. (2000). On Simulating Brazil's Tax Benefits System Using a Multi-country Microsimulation Framework.
Bhutta, Z. A., T. Ahmed, et al. (2008). "What works? Interventions for maternal and child undernutrition and survival." Lancet 371: 417-440.
Bonnet, F. and C. Behrendt (2011). Impacts of social protection on poverty reduction, Effective Course 13. Social Security Summer School, ILO-ITC Turin.
57
Bourguignon, F., F. H. G. Ferreira and P. G. Leite (2003). "Conditional Cash Transfers, Schooling and Child Labor: Micro-Simulating Brazil's Bolsa Escola Program." The World Bank Economic Review 17(2): 229-254.
Caldés, N., D. Coady and J. A. Maluccio (2004). The cost of poverty alleviation transfer programs: a comparative analysis of three programs in Latin America. FCND Discussion Paper No. 174. Washington, DC, International Food Policy Research Institute.
Carden, F. (2009). Knowledge to Policy: Making the most of development research. London, Sage Publications.
Carrera, C., A. Azrack, et al. (2012). "The comparative cost-effectiveness of an equity-focused approach to child survival, health, and nutrition: a modelling approach." Lancet 380(9850): 1341-1351.
CEB (United Nations System Chief Executives Board for Coordination) (2009). CEB Issue Paper: The global financial crisis and its impact on the work of the UN system. Geneva, CEB.
Cherrier, C. (2009). Exploring alternative delivery models for UNRWA's Social Safety Net Programme. Amman, United Nations Relief and Works Agency for Palestine Refugees in the Near East.
Cherrier, C. (2012). Expansion accelerator or brake on innovation? The increasing use of cost analyses to inform social protection policy in developing countries.
Cichon, M., C. Behrendt and V. Wodsak (2011). The UN Social Protection Floor Initiative. Turning the Tide at the ILO Conference 2011. International Policy Analysis. Berlin, Friedrich-Ebert-Stiftung.
Cockburn, J., I. Fofana and L. Tiberti (2010). Simulating the impact of the global economic crisis and policy responses on children in West and Central Africa. MPIA Working Paper 2010-10. Quebec, Poverty and Economic Policy Research Network.
Cockburn, J., H. Maisonnave, et al. (2012). Espace fiscal et dépenses publiques pour les enfants au Burkina Faso. Quebec, Partnership for Economic Policy, UNICEF.
Cogneau, D., M. Grimm and A.-S. Robilliard (2003). Evaluating Poverty Reduction Policies. The Contribution of Microsimulation Techniques. New International Poverty Reduction Strategies. J.-P. Clinn, M. Razafrindrakato and F. Roubaud. London, Routledge Books.
Cogneau, D. and A.-S. Robilliard (2000). Growth, Distribution and Poverty in Madagascar: Learning from a Microsimulation Model in a General Equilibrium Framework. Microsimulation as a tool for the evaluation of public policies: methods and applications. A. Spadaro. Bilbao, Fundacion BBVA: 73-113.
Creedy, J., G. LKalb and R. Scutella (2003). Income Distribution in Discrete Hours Behavioural Microsimulation Models: An Illustration of the Labour Supply and Distributional Effects of Social Transfers. Working Paper No. 23/03. Melbourne, Melbourne Institute.
Daffé, G., F. Cissé, et al. (2011). Evaluation des impacts des crises et des réponses politiques mises en oeuvre au Sénégal : Situation des enfants et simulations de politiques de protection sociale. Dakar, Consortium pour la Recherche Economique et Sociale (CRES) and United Nations Children's Fund (UNICEF).
Davies, S. and J. Davey (2008). "A regional multiplier approach to estimating the impact of cash transfers on the market: The case of cash transfers in rural Malawi." Development Policy Review 26(1): 91-111.
58
de Souza Ferreira, J. B., C. V. dos Santos and S. M. do Prado Lima (2010). "Tax Reform, Income Distribution and Poverty in Brazil: An Applied General Equilibrium Analysis." Journal of Microsimulation 3(1): 114-117.
Deacon, B. (2010). Global Social Floor or Global Social Investment: from the ‘global politics of poverty alleviation’ to ‘the global politics of welfare state (re)building’. Experiences and lessons from social protection programmes across the developing world: what role for EU? Paris, France, 17-18 June 2010, European Report of Development.
Deaton, A. (2010). "Instruments, randomization, and learning about development." Journal of Economic Literature 48(2): 424-455.
Devereux, S. (2011). Social protection: from handouts to social justice. Poverty Matters Blog, 17 May 2011. The Guardian.
Devereux, S., M. Davies, et al. (2010). Social Protection in Africa: Where Next? Brighton, the Centre for Social Protection (CSP) at the Institute of Development Studies (IDS), the Social Protection Programme at the Overseas Development Institute (ODI), the School of International Development at the University of East Anglia (UEA-DEV), and the Regional Hunger and Vulnerability Programme (RHVP).
DFID (Department for International Development) (2006). Social protection and economic growth in poor countries. Social Protection Briefing Note Series Number 4. London, Department for International Development.
DFID (2009). A strengthened approach to Economic Appraisals. How to Note, London, Department for International Development.
DFID (2011a). DFID's Approach to Value for Money (VfM). London, Department for International Development.
DFID (2011b). Writing a Business Case, How to Note. London, Department for International Development.
DFID (2012a). Child Development Grant Programme (CDGP). Abuja, Department of International Development.
DFID (2012b). LEAP - Business Case. Accra, Department for International Development.
DFID (2012c). Pakistan National Cash Transfer Programme: Reducing poverty, getting poor children into school. Business Case. Islamabad, Department of International Development.
DFID (Department for International Development), ODI (Overseas Development Institute) and EPRI (Economic Policy Research Institute) (2011). Social Protection Financing Model (version 1.0, 24 March 2011).
Dhaliwal, I., E. Duflo, et al. (2012). Comparative Cost-Effectiveness Analysis to Inform Policy in Developing Countries: A General Framework with Applications for Education. Cambridge, MA, Abdul Latif Jameel Poverty Action Lab (J-PAL), MIT.
Dia, I. (2006). Contrat pour l’Education. Programme Prestations sociales conditionnelles aux femmes pour l’éducation des enfants.
Ellis, F., S. Devereux and P. White (2009). Social protection in Africa. Cheltenham, Edward Elgar Publishing.
59
EPRI (Economic Policy Research Institute) (2010). "Social Transfers Evidence Base." from http://socialtransfersevidence.org/.
Fall, A. (2011). Appui technique à l'Initiative Nationale de Protection Sociale pour la conception et la formulation du ciblage des bénéficiaires de la composante Transferts Monétaires Sociaux, Rapport final. Dakar, United Nations Children's Fund, Ministère de la Famille et des Organisations Féminines.
Filipski, M. J. and E. J. Taylor (2012). "A Simulation Impact Evaluation of Rural Income Transfers in Malawi and Ghana." Journal of Development Effectiveness 4(1): 109-129.
Freeland, N. and C. Cherrier (2012). Social transfers in the fight against hunger: A resource for development practitioners. E. Commission. Reference Document N°14. Luxemburg, Publications Office of the European Union.
Fujiwara, D. and R. Campbell (2011). Valuation Techniques for Social Cost-Benefit Analysis: Stated Preferences, Revealed Preference and Subjective Well-Being Approaches. A Discussion of the Current Issues. London, HM Treasury, Department for Work and Pensions.
G20 (2011). 2011 Report of the Development Working Group. Paris, G20 France 2011.
Gassmann, F. (2011). To what extent does the existing safety net protect the poor. Poverty and Social Impact Analysis Series. Washington DC, World Bank.
Gassmann, F. (2012). Switching the Lights Off: The Impact of Energy Tariff Increases on Households in the Kyrgyz Republic. UNU-MERIT Working Paper 2012-066. Maastricht, UNU-MERIT.
Gassmann, F. and C. Behrendt (2006). Cash benefits in low-income countries: Simulating the effects on poverty reduction for Senegal and Tanzania. Issues in Social Protection, Discussion paper 15. Geneva, International Labour Office.
Gassmann, F., D. Tobis, et al. (2009). Cost-benefit analysis of child protection policies in Tajikistan. Dushanbe, Maastricht Graduate School of Governance.
Graham, C. (2002). Public Attitudes Matter: A Conceptual Frame for Accounting for Political Economy in Safety Nets and Social Assistance Policies. Washington D.C., The World Bank.
Grosh, M., C. del Ninno, et al. (2008). For Protection & Promotion. The Design and Implementation of Effective Safety Nets. Washington, DC, World Bank.
Hagen, K. (2008). The Old Age Pension in Lesotho: An examination of the institutional impact. Amsterdam, WorldGranny and University of Utrecht.
Hagen-Zanker, J., A. McCord and R. Holmes (2011). Systematic Review of the Impact of Employment Guarantee Schemes and Cash Transfers on the Poor. London, Overseas Development Institute.
Handley, G. (2009). Fiscal space for strengthened social protection in West and Central Africa. Dakar, United Nations Children's Fund (UNICEF) and Overseas Development Institute (ODI).
Hattori, H. (2011). Note on Development and Application of Bottleneck Analysis Tool in Education in Ghana. Accra, United Nations Children's Fund.
HelpAge (2010). "Pensions Calculator" found at http://www.pension-watch.net/about-social-pensions/about-social-pensions/social-pensions-database/.
60
Hickey, S., R. Sabates-Wheeler, et al. (2009). Promoting Social Transfers: DFID and the Politics of Influencing. London, Department for International Development.
Hirsch, D. (2008). Estimating the costs of child poverty. York, Joseph Rowntree Foundation.
Hoddinott, J. F., M. Rosegrant and M. Torero (2012). Challenge Paper, Hunger and Malnutrition, Investments to reduce hunger and undernutrition. Paper prepared for 2012 Global Copenhagen Consensus. Washington DC, Copenhagen Consensus Center.
Hodges, A. (2012). Cas d'investissement sur la nutrition en Mauritanie, Analyse coût-bénéfice du PAIN. Final report, 13 December 2012. Oxford, Oxford Policy Management.
Hodges, A., G. Notten, et al. (forthcoming). "Are cash transfers a realistic policy tool for poverty reduction in Sub-Saharan Africa? Evidence from Congo-Brazzaville and Côte d'Ivoire."
Hodges, A., C. O'Brien and L. Ganga (2012a). Strengthening social protection for families and children in the Republic of Congo. Social and Economic Policy Working Paper. New York, United Nations Children's Fund.
Hodges, A., C. O'Brien, et al. (2012b). Cadre de Développement de la Stratégie Nationale de Protection Sociale en Côte d'Ivoire. Tome 2: Une première analyse du rôle, de l'impact, des coûts et de la faisabilité de diverses options de programmes de transferts sociaux monétaires. Abidjan, Oxford Policy Management, UNICEF, Gouvernement de la République de Côte d'Ivoire.
Hodges, A., P. White and M. Greenslade (2011). Guidance for DFID country offices on measuring and maximising value for money in cash transfer programmes, Toolkit and explanatory text. London, Department for International Development.
Holmqvist, G. (2010). External Financing of Social Protection – Opportunities and Risks. Dakar 28-30 June 2010, ERD.
Holzer, H. J., D. Whitmore Schanzenbach, et al. (2008). "The economic costs of childhood poverty in the United States." Journal of Children and Poverty 14(1): 41-61.
ILO (International Labour Office) (2005). Social protection as a productive factor. ILO Governing Body, 294th Session, Committee on Employment and Social Policy, Fourth Item on the Agenda, For Debate and Guidance. Geneva, International Labour Office.
ILO (2007). Determining the Cost of Social Protection Measures. Description of an electronic tool that provides assistance for determining these costs in a user friendly way. Geneva, International Labour Organisation.
ILO (2008). Can low-income countries afford basic social security? Social Security policy Briefings, Paper 3. Geneva, International Labour Office.
ILO (2010). World Social Security report 2010: providing coverage in the time of crisis and beyond. Geneva, International Labour Office.
ILO (2011). Report VI: Social security for social justice and a fair globalization, Recurrent discussion on social protection (social security) under the ILO Declaration on Social Justice for a Fair Globalization. International Labour Conference, 100th Session Geneva, International Labour Office.
ILO (International Labour Office) and IMF (International Monetary Fund) (2012). Towards effective and fiscally sustainable Social Protection Floors, preliminary Draft 10 May 2012.
61
ILO (International Labour Office) and WHO (World Health Organization) (2009a). Social Protection Floor Initiative, Manual and strategic framework for joint UN country operations, Version 01a. Geneva, International Labour Office and World Health Organization.
ILO (2009b). The Social Protection Floor. A joint Crisis Initiative of the UN Chief Executives Board for Co-ordination on the Social Protection Floor. Geneva, International Labour Office.
IMF (International Monetary Fund) (2008a). Senegal: Selected Issues. IMF Country Report No. 08/221. Washington DC, International Monetary Fund.
IMF (2008b). Senegal: Staff Report for the 2008 Article IV Consultation, First Review Under the Policy Support Instrument, and Request for Waiver of Assessment Criteripn and Modification of Assessment Criteria – Staff Report. IMF Country Report No. 08/209. Washington DC, International Monetary Fund.
IMF (2011). World Economic Outlook (WEO): Slowing Growth, Rising Risks. Washington, DC, International Monetary Fund.
Jolliffe, D. (2002). "Whose education matter in the determination of households income? Evidence from a developing country." Economic Development and Cultural Change 50(2): 287-312.
Levin, H. M. and P. J. McEwan (2001). Cost-effectiveness analysis. Thousand Oaks, CA, Sage.
Li, J. and C. O'Donoghue (2012). A Methodological Survey of Dynamic Microsimulation Models. Working Paper Series 2012-002. Maastricht, UNU-MERIT.
Llambi, C., S. Laens, et al. (2011). Assessing the Impact of the 2007 Tax Reform on Poverty and Inequality in Uruguay. MPIA Working Paper 2011-04. Laval, Partnership for Economic Policy.
Manley, J., S. Gitter and V. Slavchevska (2012). How effective are cash transfer programmes at improving nutritional status? A rapid evidence assessment of programmes' effects on anthropometric outcomes. Working Paper Series. London, EPPI-Centre, Social Science Research Unit, Institute of Education, University of London: 94.
McCord, A. and J. Hagen-Zanker (2011). ODI International Conference on Financing Social Protection in LICs: Finding the Common Ground. May 2011. Conference report. London, Overseas Development Institute.
Merz, J. (1993). Microsimulation as an Instrument to Evaluate Economic and Social Programme. Discussion Paper No. 5. Lüneburg, FFB.
Merz, J. (1994). Microsimulation – A Survey of Methods and Applications for Analysing Economic and Social Policy. MPRA Paper No. 7232. Munich, Munich University Library.
Mideros, A., F. Gassmann and P. Mohnen (2012). Estimation of rates of return of social protection instruments in Cambodia: A case for non-contributory social transfers, Maastricht Graduate School of Governance.
Miller, E. and M. Samson (2012). HIV-sensitive Social Protection: State of the Evidence 2012 in Sub-Saharan Africa. Report commissioned by UNICEF. Cape Town, Economic Policy Research Institute.
Niño-Zarazúa, M., A. Barrientos, et al. (2010). "Social protection in sub-Saharan Africa: Will the green shoots blossom?" Brooks World Poverty Institute, The University of Manchester, MPRA Paper No. 22422.
62
O'Donoghue, C. (2001). "Dynamic Microsimulation. A Methodological Survey." Brazilian Electronic Journal of Economics 4(2).
ODI (Overseas Development Institute) (2012). Inter-Agency Social Protection Financing Workshop, 6th November 2012, Co-hosted by the Overseas Development Institute (ODI), the World Bank (WB) and the UK Department for International Development (DFID). Meeting Report. London, Overseas Development Institute.
OECD (Organisation for Economic Cooperation and Development) (2009). Promoting Pro-Poor Growth: Social Protection. Paris, Organisation for Economic Cooperation and Development.
Pellerano, L. (2010). Pre-feasibility and costing analysis of three short-term social protection reform options for UNICEF Mozambique. Oxford, Oxford Policy Management.
Powel, M., F. Hove and D. Moutloatse (2011). Developing a Social Budget for South Africa. Special IARIW-SSA Conference on Measuring National Income, Wealth, Poverty, and Inequality in African Countries. Cape Town, South Africa, September 28-October 1, 2011.
RGC (Royal Government of Cambodia) (2011). National Social Protection Strategy for the Poor and the Vulnerable. Phnom Penh, Royal Government of Cambodia.
Saez, E. and S. Stantcheva (2013). Generalized Marginal Welfare Weights for Optimal Tax Theory. NBER Working Paper Series, no. 18835. Cambridge, National Bureau of Economic Research.
Samson, M. and C. Cherrier (2009). Feasibility study for a social cash transfer programme as a lead instrument in child-centred social protection in Senegal. Dakar, United Nations Children's Fund.
Samson, M., U. Lee, et al. (2004). The Social and Economic Impact of South Africa's Social Security System. Cape Town, Economic Policy Research Institute.
Schnitzer, P. (2011). Design options, cost and impacts of a cash transfer program in Senegal: Simulation results. Dakar, United Nations Children's Fund.
Schoch, M., F. Merttens, et al. (2009). Children in Poverty Reduction Strategy Papers and Budgets, West and Central Africa. Dakar, United Nations Children's Fund (UNICEF) and Oxford Policy Management (OPM).
Schüring, E. and J. Lawson-McDowall (2011). "Social Protection in Zambia — Whose Politics?" IDS Bulletin 42(6): 21-27.
Scriven, M. (1991). Evaluation Thesaurus. Fourth Edition. London, Sage Publications.
Seidenfeld, D. and S. Handa (2011). Zambia's Child Grant Program: baseline Report. Washington DC, American institutes for Research.
Shah, V. (2011). Gaza Social Protection and Food Security Programme, Economic Appraisal, Section C of Appraisal Case for the Business Case documents.
Sutton, R. (1999). The policy process: an overview. London, Overseas Development Institute.
Szirmai, A. (2012). Proximate, Intermediate and Ultimate Causality: Theories and Experiences of Growth and Development. UNU-MERIT Working Paper Series 2012-032. Maastricht, UNU-MERIT.
Tabor, S. R. (2002). Assisting the Poor with Cash: Design and Implementation of Social Transfer Programs. Social Protection Discussion Paper Series No. 0223. Washington, DC, World Bank.
63
Taylor, E. J. (2012). A Methodology for Local Economy-wide Impact Evaluation (LEWIE) of Cash Transfers. Prepared for the United Nations Food and Agriculture Organization, Project MTF/RAF/464/UK - From Protection to Production: The Role of Social Cash Transfers in Fostering Broad Based Economic Development, with funding from DFID and the World Bank.
UN (United Nations General Assembly) (1948). Universal Declaration of Human Rights, 10 December 1948, 217 A (III). New York, United Nations.
UN (1966). International Covenant on Economic, Social and Cultural Rights, 16 December 1966, Treaty Series, vol. 993, p. 3. New York, United Nations.
UNICEF (2010). Narrowing the gaps to meet the goals. New York, United Nations Children's Fund.
UNICEF (2011). Knowledge for Action: Emerging experiences in child-focused Social and Economic Policy, Selected innovations and lessions learned from UNICEF programmes, Volume 2. New York, United Nations Children's Fund.
UNICEF (2012). Integrated Social Protection Systems: Enhancing Equity for Children, UNICEF Social Protection Strategic Framework. New York, United Nations Children's Fund.
UNICEF and ILO (International Labour Office) (2010). UNICEF-ILO Social Protection Floor Costing Tool. Explanatory Note.
Vandeninden, F. (2012). A Simulation of Social Pensions in Europe. Working Paper Series 2012-08. Maastricht, UNU-MERIT.
Wong, S., R. Arguello and K. Rivera (2008). Fiscal Policies and Increased Trade Openness: Poverty Impacts in Ecuador. MPIA Working Paper 2008-19. Laval, Partnership for Economic Policy.
World Bank (2006). Repositioning nutrition as central to development: A strategy for large-scale action. Washington DC, World Bank.
World Bank (2012). Managing Risk, Promoting Growth. Developing Systems for Social Protection in Africa. The World Bank's Africa Social Protection Strategy 2012-2022. Washington DC, World Bank.
World Economic Forum (2012). The case for an integrated model of growth, employment and social protection, Global agenda council on employment and social protection. Geneva, World Economic Forum.
64
i For more information on the Pensions Calculator, visit: http://www.pension-watch.net/about-social-pensions/about-social-pensions/social-pensions-database/
ii For more information on the Basic Social Protection Tool, visit:
http://www.socialsecurityextension.org/gimi/gess/ShowTheme.do?tid=447
iii For more information on the ILO Costing and Assessment Tools, visit:
http://www.socialprotectionfloor-gateway.org/24.htm
iv For more information on the SPER, visit:
http://www.ilo.org/public/english/protection/secsoc/areas/stat/spers.htm
v For more information on ADePT, visit: http://www.worldbank.org/adept
vi For more information on the MBB tool, visit: http://www.devinfolive.info/mbb/mbbsupport/
vii For more information on the PEP-1-t model, visit: http://www.pep-net.org/programs/mpia/pep-
standard-cge-models/pep-1-t-single-country-recursive-dynamic-version/
UNICEF Office of Research
UNICEF Office of Research
Piazza SS. Annunziata, 12
50122 Florence, Italy
Tel: +39 055 20330
Fax: +39 055 2033 220
www.unicef-irc.org
© The United Nations Children’s Fund (UNICEF)