Making songs 3D printable by connecting music to shapes
31
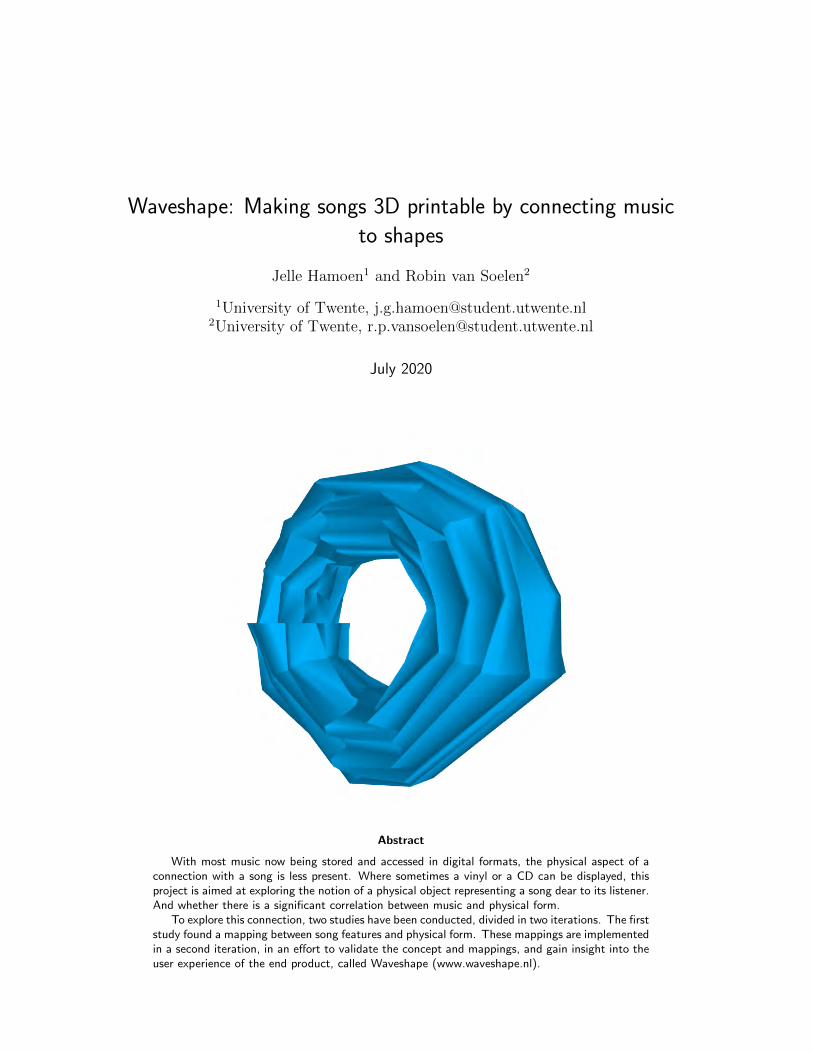
Waveshape: Making songs 3D printable by connecting music to shapes Jelle Hamoen 1 and Robin van Soelen 2 1 University of Twente, [email protected] 2 University of Twente, [email protected] July 2020 Abstract With most music now being stored and accessed in digital formats, the physical aspect of a connection with a song is less present. Where sometimes a vinyl or a CD can be displayed, this project is aimed at exploring the notion of a physical object representing a song dear to its listener. And whether there is a significant correlation between music and physical form. To explore this connection, two studies have been conducted, divided in two iterations. The first study found a mapping between song features and physical form. These mappings are implemented in a second iteration, in an effort to validate the concept and mappings, and gain insight into the user experience of the end product, called Waveshape (www.waveshape.nl).
-
Upload
khangminh22 -
Category
Documents
-
view
1 -
download
0
Transcript of Making songs 3D printable by connecting music to shapes
Waveshape: Making songs 3D printable by connecting music
to shapes
Jelle Hamoen1 and Robin van Soelen2
1University of Twente, [email protected] of Twente, [email protected]
July 2020
Abstract
With most music now being stored and accessed in digital formats, the physical aspect of aconnection with a song is less present. Where sometimes a vinyl or a CD can be displayed, thisproject is aimed at exploring the notion of a physical object representing a song dear to its listener.And whether there is a significant correlation between music and physical form.
To explore this connection, two studies have been conducted, divided in two iterations. The firststudy found a mapping between song features and physical form. These mappings are implementedin a second iteration, in an effort to validate the concept and mappings, and gain insight into theuser experience of the end product, called Waveshape (www.waveshape.nl).

Contents
1 Introduction 3
2 Background and related work 4
3 Pilot study 6
4 First prototype 12
5 First evaluation 15
6 Second prototype 20
7 Second evaluation 23
8 Conclusion 28
9 Reflection 28
2

1 Introduction
Often a song can bring back a lot of memories and personal experiences. In the age of music streaming,these songs and their memories might get lost in the overwhelming amount of music that is availableon the internet. This report focuses on ways to make songs tangible and therefore making it easier tostore and keep them. The proposed solution to this problem is to create a tool that analyzes music,and according to its features, automatically generates a unique 3d printable model.
During this project, the relations between sounds, emotions and shapes will be explored and appliedto the generation of aesthetically pleasing and coherent 3D models.
1.1 Motivation
Having a physical object to connect a song that one holds dear can be of great value to that person.Exploring a song through a new set of senses (vision and touch), might transcend ones emotionalattachment to that song when compared to the same song when it is only heard. Besides serving asan enhancement to the experience of the song, it can also serve as reminder to the existence of thesong or just as an aesthetically pleasing collector’s item.
Establishing a connection between physical form and music can learn us more about how differentsenses are related and learning how to bridge the gap between these senses might serve as a valuablecontribution to the field of multi sensory design and research.
1.2 Research questions
The first step to creating a tool that transforms songs into a unique and 3D printable shape is to find alink between audio and shapes. To be able to find and overlap between audio and shapes, both soundand shapes will be reduced to their parameters. The goal is to find parameters that describe soundand shapes accurately and discover how these parameters overlap with each other. Therefore, the firstquestion that will be answered is:
• What is the best mapping between audio features and shape parameters?
To already get a sense on how people perceive music and how they would translate this perceptioninto a shape, a pilot study will be conducted. This will be done through a survey. After the pilot study,the project will make use of two iterations. During both iterations a prototype will be developed andevaluated.
The results of the pilot study will be used in the development of the first prototype. This prototypeshould be able to generate shapes based on certain parameters and will be used to answer the firstresearch question by allowing users to create their own mapping between music and shapes.
Once a sufficient mapping between the two domains has been constructed, a fully rounded appli-cation will be created using this information. This application will be used to answer the following twoquestions:
• What is the current status of the usability of the product?
• How well do the generated shapes match the songs?
After these two iterations are completed, there will hopefully be a foundation for a product thatwill be useful and usable.
1.3 Keywords
Music, 3d printing, Design, Arousal, Valence
3
2 Background and related work
Before designing and conducting any experiment it is a good idea to get an overview on the state ofthe art and existing literature on the relevant subjects.
2.1 Music and emotion
Reducing songs to parameters is a common task when working with music recommendation systemsor audio visualizers. In this report we assume that a listener’s perception of a song can be splitinto two categories: Descriptive and emotive parameters. The descriptive parameters of a song havemeasurable properties. Examples of these are volume, pitch, timbre and tempo. Emotive parametersare not physically measurable and often specific to the listener. Examples of emotive parameters includethe emotion a song evokes and the memories it triggers.
Despite the fact that emotion is not physically measurable, due to technological advancements itbecomes possible to extract emotional information.There are three main methods of retrieving emotionfrom music [11]. One method is to create a contextual text analysis of the song, which requiresbrowsing the internet in order to find labels, reviews and other documents that might discuss themood of the song. Another method is to do an emotional text analysis of the lyrics. The use ofNLP methods, using for example Support Vector Machines (SVM’s), retrieved interesting results .Extracting emotional information from lyrics has had several applications. [9][17]. However, becauseof the dis-ambiguity of music lyrics, the retrieved emotion from the lyrics was not always in line withthe emotion the music evoked. [3] [16]. The third method of extracting emotion from music is to do acontent based audio analysis, which requires analysing the audio and assigning an emotion accordingto its features. Due to advancements in the field of machine learning, computers are able to moreaccurately plot the emotion of a song onto the valence/arousal plane [18]. The valence/arousal planeis one of the most common methods used for objectively transcribing emotion.
There is already quite some work being done on content based audio analysis. One of the mostextensive applications is one implemented by Spotify. Spotify has created an API that allows users toaccess any song on their platform and to retrieve a list of audio features they have extracted. Examplesof these features include valence, energy, tempo and danceability. Spotify extracts these features byletting professionals assign these values to a small set of songs and then extends this using machinelearning [14]. Besides the global features, the Spotify API also automatically divides a song into severalsegments and assigns features like the loudness or tempo to each of these segments.
2.2 Music, emotion, color, and shape
Reducing shapes to parameters is an important task for parametric shape generation. In this reportwe distinguish between the color of the shape and how the shape is formed. Examples of shapeparameters are the symmetry, roughness and edginess. All these aspects have been proven to evokecertain emotions [5]. In figure 1 several shape parameters are grouped by valence and arousal.
While shapes and audio do not share any physical properties they do share an emotive property.Based on the fact that emotion can be retrieved from both audio and shapes, establishing a connectionbetween them by using emotion as a bridge seems like a possible approach. Creating a connectionbetween audio and shapes through emotion has already been done. For example, the system ”In aState” takes the audio from a live piano performance, retrieves the emotions from this and generatesvisuals that are being projected on a stage [12]. A connection audio and visuals does not have tobe established using emotion. A popular application of this connection is the audio visualizer. Audiovisualizers are mostly lines and colors moving on the beat of the music, with the aim to providesomething to look at while listening to music. The most iconic usage of this are the visualisationswhich were being shown in the old versions of Windows media player (Figure 2). However, mostaudio visualizers that do not use emotion as a bridge heavily rely on the temporal domain to make theconnection make sense.
4

Figure 1: Shape parameters mapped to the valence arousal scale. [5]
Figure 2: audio visualisation within old version of Windows media player
2.3 Making music tangible
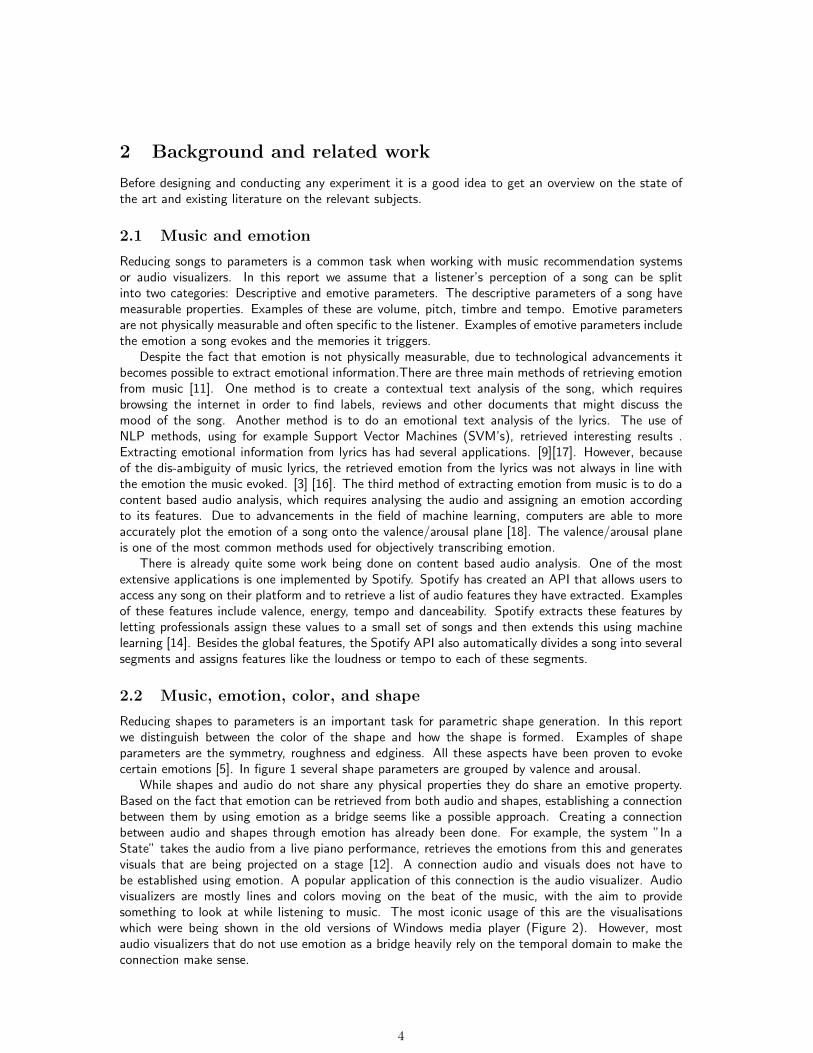
There is already some work being done on transforming data into 3D prints. Using the physical data likethe heartbeat of a person and 3D printing this, made people more conscious about their involvementin physical activity and illustrated different levels of engagement with the artifacts [10]. Figure 3 showsan example of a 3d printed interpretation of spoken word, which was part of an art project by Inmi Leeand Kyle McDonald. There is also a lot of research done on the relationship between 3d shapes andemotions, for example [1], which tries to map this relationship using fuzzy logic, after evaluation thismethod showed a high correlation between the two domains. Another interesting application of makingsound tangible is the Laughter Blossom [19]. Which is an artificial plant whose blossom recognizes andacts upon laughter.
5
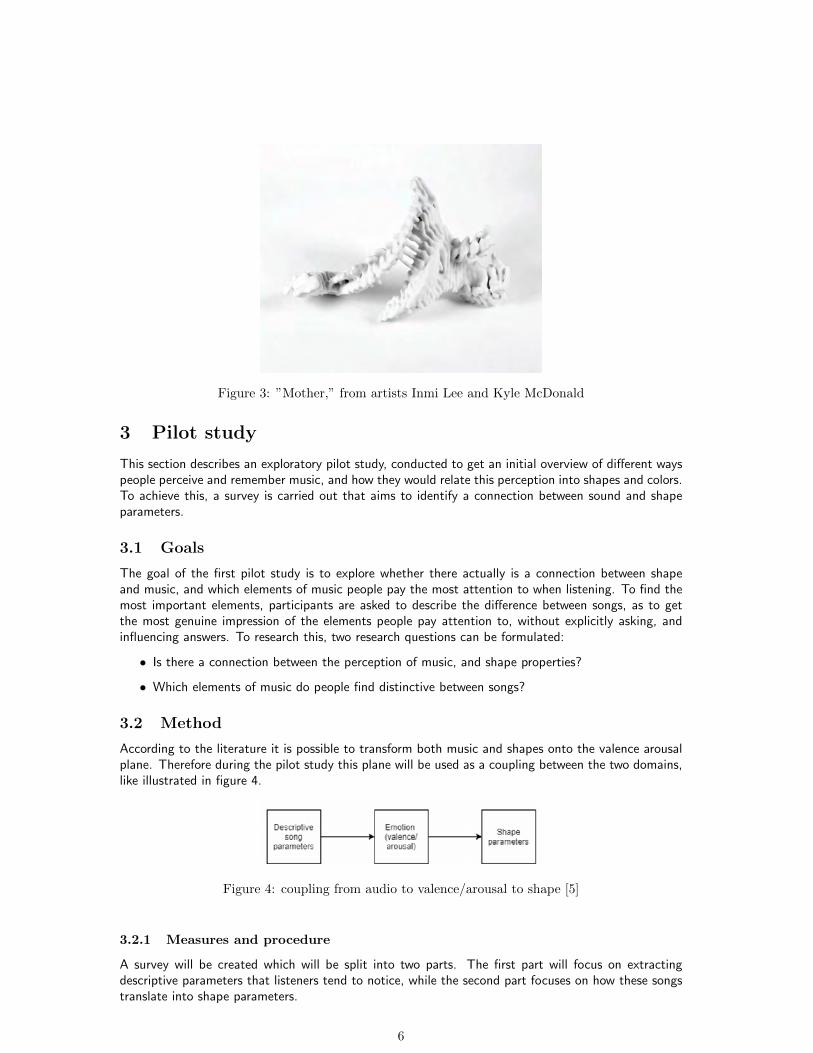
Figure 3: ”Mother,” from artists Inmi Lee and Kyle McDonald
3 Pilot study
This section describes an exploratory pilot study, conducted to get an initial overview of different wayspeople perceive and remember music, and how they would relate this perception into shapes and colors.To achieve this, a survey is carried out that aims to identify a connection between sound and shapeparameters.
3.1 Goals
The goal of the first pilot study is to explore whether there actually is a connection between shapeand music, and which elements of music people pay the most attention to when listening. To find themost important elements, participants are asked to describe the difference between songs, as to getthe most genuine impression of the elements people pay attention to, without explicitly asking, andinfluencing answers. To research this, two research questions can be formulated:
• Is there a connection between the perception of music, and shape properties?
• Which elements of music do people find distinctive between songs?
3.2 Method
According to the literature it is possible to transform both music and shapes onto the valence arousalplane. Therefore during the pilot study this plane will be used as a coupling between the two domains,like illustrated in figure 4.
Figure 4: coupling from audio to valence/arousal to shape [5]
3.2.1 Measures and procedure
A survey will be created which will be split into two parts. The first part will focus on extractingdescriptive parameters that listeners tend to notice, while the second part focuses on how these songstranslate into shape parameters.
6

During the first part of the survey participants will be given two songs with a distinct difference inone of the axes on the valence/arousal plane. They will be asked as an open question to describe allthe differences they hear between these two songs. This way it becomes possible to find the parametersthat most likely result in a change on this axis of the valence/arousal scale.
Then, during the second part of the study participants are being asked to map shapes and colorsto four individual songs. Participants will be given a song and a set of options for shapes and colorsto choose from. We have chosen to investigate the effect of three shape parameters, these parametersare based on Figure 1, and the accompanying related work [5]:
• Curvature - Round vs. Angular
• Size/proportions - Small vs. Large
• Symmetry - Symmetrical vs. Unsymmetrical
We have chosen five different colors based on a study that links emotion to shapes [20]. The twoquestions per song in the second part can be viewed in figure 5. As an optional input we created thepossibility for participants to draw and upload their own interpretation of the music. This will providean overview of different translations from songs into visuals that can serve as an inspiration for thedesign of the system.
Figure 5: Shape parameter options
3.2.2 Stimuli
We have chosen eight different songs to compare. These were chosen based on the classification ofsongs to a valence/energy scale visible in 6. These songs are paired based on being opposites on eitherthe energy scale or the valence scale, while the other parameter stays consistent. These pairs are:
• Ace of Spades (Motorhead) - My Immortal (Evanescence). Different energy level, low valence.
• Can’t Stop the Feeling (Justin Timberlake) - Dont Worry Be Happy (Bobby McFerrin). Differentenergy level, high valence.
• Heart Shaped Box (Nirvana) - Happy (Pharell Williams). High energy level, different valence.
• Same mistake (James Blunt) - La Mer (Charles Trenet). Low energy level, different valence.
During the second part, the same eight songs will be shown to the participant but now individually.
7

Figure 6: Music classification by energy and valence [8]
3.2.3 Participants
For this study, participants are students from Dutch technical Universities. The aim is to have anequal distribution in gender, and an age range within 18-28. A desired amount of participants wouldbe around 20 persons.
3.3 Results
Nine responses were collected during this pilot study. Participants were recruited from fellow studentsin our direct network. Participants are aged 21-28 and m/f ratio is 4/5. The full responses are visiblein Appendix A. We went through the open answers of the first part and retrieved the most occurringdescriptive parameters. This was done by manually categorizing results.
3.3.1 Song pair 1: Different energy level, low valence
• Difference in tempo: fast vs slow
• Difference in dynamics: loud vs soft
• Difference in timbre: Loud drums/guitars vs piano/strings
• Vocals: rough vs smooth
3.3.2 Song pair 2: Different energy level, high valence
• Difference in timbre
• Instrumentation: electronic vs old sounding
• Fullness: large band vs intimate
• Difference in tempo
• Difference in dynamics
3.3.3 Song pair 3: High energy level, different valence
• Difference in dynamics: Changing dynamics vs constant
• Instrumentation: raw vs polished
• Voice: rough vs smooth
• Voice pitch: Low vs high
8
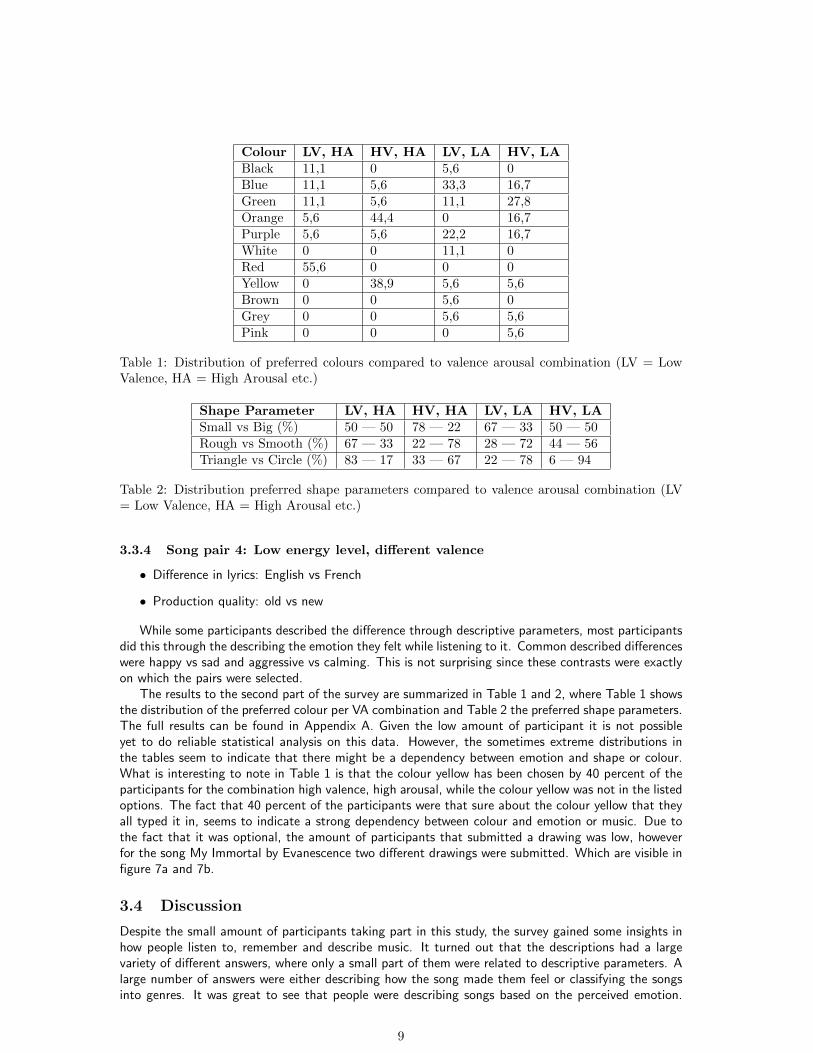
Colour LV, HA HV, HA LV, LA HV, LABlack 11,1 0 5,6 0Blue 11,1 5,6 33,3 16,7Green 11,1 5,6 11,1 27,8Orange 5,6 44,4 0 16,7Purple 5,6 5,6 22,2 16,7White 0 0 11,1 0Red 55,6 0 0 0Yellow 0 38,9 5,6 5,6Brown 0 0 5,6 0Grey 0 0 5,6 5,6Pink 0 0 0 5,6
Table 1: Distribution of preferred colours compared to valence arousal combination (LV = LowValence, HA = High Arousal etc.)
Shape Parameter LV, HA HV, HA LV, LA HV, LASmall vs Big (%) 50 — 50 78 — 22 67 — 33 50 — 50Rough vs Smooth (%) 67 — 33 22 — 78 28 — 72 44 — 56Triangle vs Circle (%) 83 — 17 33 — 67 22 — 78 6 — 94
Table 2: Distribution preferred shape parameters compared to valence arousal combination (LV= Low Valence, HA = High Arousal etc.)
3.3.4 Song pair 4: Low energy level, different valence
• Difference in lyrics: English vs French
• Production quality: old vs new
While some participants described the difference through descriptive parameters, most participantsdid this through the describing the emotion they felt while listening to it. Common described differenceswere happy vs sad and aggressive vs calming. This is not surprising since these contrasts were exactlyon which the pairs were selected.
The results to the second part of the survey are summarized in Table 1 and 2, where Table 1 showsthe distribution of the preferred colour per VA combination and Table 2 the preferred shape parameters.The full results can be found in Appendix A. Given the low amount of participant it is not possibleyet to do reliable statistical analysis on this data. However, the sometimes extreme distributions inthe tables seem to indicate that there might be a dependency between emotion and shape or colour.What is interesting to note in Table 1 is that the colour yellow has been chosen by 40 percent of theparticipants for the combination high valence, high arousal, while the colour yellow was not in the listedoptions. The fact that 40 percent of the participants were that sure about the colour yellow that theyall typed it in, seems to indicate a strong dependency between colour and emotion or music. Due tothe fact that it was optional, the amount of participants that submitted a drawing was low, howeverfor the song My Immortal by Evanescence two different drawings were submitted. Which are visible infigure 7a and 7b.
3.4 Discussion
Despite the small amount of participants taking part in this study, the survey gained some insights inhow people listen to, remember and describe music. It turned out that the descriptions had a largevariety of different answers, where only a small part of them were related to descriptive parameters. Alarge number of answers were either describing how the song made them feel or classifying the songsinto genres. It was great to see that people were describing songs based on the perceived emotion.
9

(a) Submission 1 (b) Submission 2
Figure 7: Submitted drawings
This enforces the idea of reducing music to the valence/arousal scale as a method to map it to shapes.The fact that genres were mostly used to describe the differences between the songs was not surprising.Genres can be seen as a commonly occurring set of various descriptive parameters (instrumentation,tempo, lyrical themes etc.) that is more approachable than listing these individual parameters.
From the responses two often occurring categories of descriptive parameters could be extracted.Where the most common category was the timbre of the sound. Timbre can be seen as the combinationof overtones related to a tone. This combination of overtones explains why an acoustic guitar soundsdifferent from a piano for example. In the results two types of timbre differences are apparent. One isa difference in instrumentation and the other a difference in vocals. What was interesting is that mostof the responses which are relating to the timbre used terminology that could be applied to shapes aswell. An often occurring described contrast was rough versus smooth, which is directly applicable tothe texture of shapes as well. Other mentioned contrasts like full and intimate or raw and polishedare also applicable to the visual domain. This backs up the assumption that converting a song into ashape is possible, but also indicates that doing this by transforming it into the valence/arousal scalemight mean that some information gets lost.
Another descriptive parameter that has been mentioned multiple times was the difference in tempo.However, it was only mentioned in the songs with contrasting arousal. This could indicate that thereis a relation between arousal and tempo.
Unfortunately due to the limited number of submissions of this survey, it is hard to draw validconclusions through statistics. However the results seem to indicate that there is a general consensusbetween participants on certain colours and parameters. Examples of these are the colour red for Lowvalence/high arousal songs or the preference for circles for high valence/low arousal songs that hasbeen chosen by 91 percent of the participants. Also the fact that almost 40 percent of the participantshad such a strong opinion that they wrote the colour yellow as an additional option, seems to indicatea strong correlation between colour and emotion. However this has to be further investigated in thefirst iteration to say this for sure.
3.5 Conclusion
This survey was a useful method to uncover how people perceive and describe music. The method oftransforming musical parameters into the valence/arousal plane seems to work, however it might bethe case that some information gets lost in this conversion. Therefore it might be wise to in additionto the valence/arousal mappings, add extra mappings between other features as well.
This pilot study shows potential, but is not conclusive enough to draw strong conclusions. However,the insights into which factors are of importance to participants can be used to select features andmake design decisions in order to get a deeper understanding of the relationship between some more
10

important song parameters and a physical shape.
11

4 First prototype
The following chapter describes the development of the first prototype. From the pilot study it becameapparent that transforming the musical data towards the valence/arousal plane and using this pointon the plane as the data source for creating a shape, showed potential. However chances might bethat in this process some relevant information might get lost. Therefore this iteration will focus onfinding a mapping between music parameters and shape parameters. The research question that willbe investigated is:
• What is the best mapping of music and shape parameters?
This question will be explored through building and testing a working prototype that creates shapesbased on a mapping between audio features and shape parameters. This prototype will be tested withhuman participants, and subsequently evaluated.
4.1 Specification
This section will focus on defining some of the important (design) requirements and technical possi-bilities and limitations before starting the implementation phase.
4.1.1 Requirements
In order to answer the research question it is necessary to create a prototype that is able to generatea 3D shape based on a set of parameters. These parameters need to be able to be mapped to a setof audio features which should be automatically extracted from a piece of music. It also needs to bepossible to create shapes using different configurations of parameters.
After a shape is created it should be possible to manually adjust it, this way it is possible to trackhow different people would change the configuration, which allows for precise feedback on the currentmapping between parameters.
4.1.2 Auditory features
Since the prototype has to map audio features with shape features, it is necessary to look at differentparameters that can be extracted from the audio and at the parameters that are required for generatinga shape. Assuming that the audio features that can be retrieved using the Spotify API is an almostcomplete list of the global parameters that are possible to extract from a song, the following featurescan be used for the prototype. These are our interpretation, for the technical specifications see theSpotify Api website [15].
• Duration: The duration of the song in milliseconds
• Acousticness: The amount of use of acoustic instruments
• Instrumentalness: Whether the song has vocals or is an instrumental
• Loudness: The volume of the song
• Speechiness: The amount of vocals in a song
• Time signature: How many beats are in a time measure
• Tempo: The tempo of the song (in bpm)
• Valence: Whether the song is considered
• Danceability: How inviting the song is to dance to
• Energy (Arousal): The amount of energy in a song
• Sections: This splits the song into different sections
• Loudness: The loudness per section
12
4.1.3 Shape design
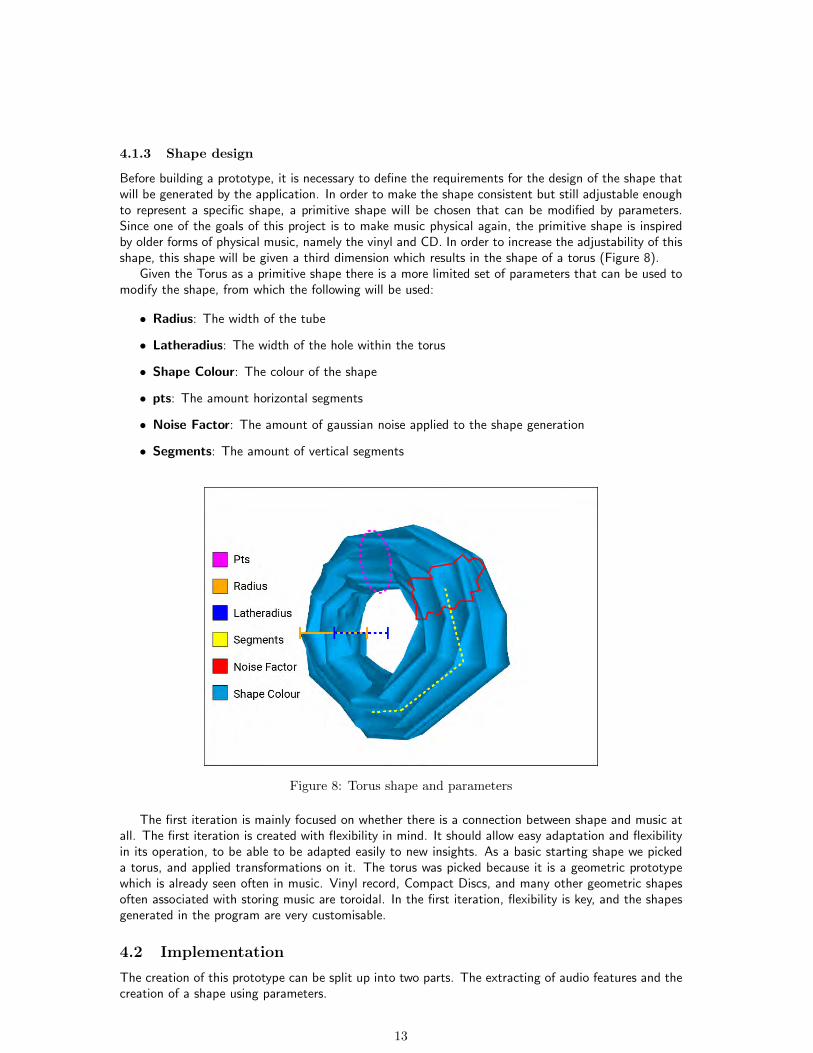
Before building a prototype, it is necessary to define the requirements for the design of the shape thatwill be generated by the application. In order to make the shape consistent but still adjustable enoughto represent a specific shape, a primitive shape will be chosen that can be modified by parameters.Since one of the goals of this project is to make music physical again, the primitive shape is inspiredby older forms of physical music, namely the vinyl and CD. In order to increase the adjustability of thisshape, this shape will be given a third dimension which results in the shape of a torus (Figure 8).
Given the Torus as a primitive shape there is a more limited set of parameters that can be used tomodify the shape, from which the following will be used:
• Radius: The width of the tube
• Latheradius: The width of the hole within the torus
• Shape Colour: The colour of the shape
• pts: The amount horizontal segments
• Noise Factor: The amount of gaussian noise applied to the shape generation
• Segments: The amount of vertical segments
Figure 8: Torus shape and parameters
The first iteration is mainly focused on whether there is a connection between shape and music atall. The first iteration is created with flexibility in mind. It should allow easy adaptation and flexibilityin its operation, to be able to be adapted easily to new insights. As a basic starting shape we pickeda torus, and applied transformations on it. The torus was picked because it is a geometric prototypewhich is already seen often in music. Vinyl record, Compact Discs, and many other geometric shapesoften associated with storing music are toroidal. In the first iteration, flexibility is key, and the shapesgenerated in the program are very customisable.
4.2 Implementation
The creation of this prototype can be split up into two parts. The extracting of audio features and thecreation of a shape using parameters.
13

4.2.1 Audio feature extraction
The audio features will be extracted using the Spotipy API [15]. A program will be made in Pythonthat takes an artist and title and creates a dictionary filled with the corresponding audio features in it.To be able to communicate with the shape generation program, a socket server has been made thatcontinuously runs. When new features are requested, the shape generation program connects to theserver and sends a query of an artist and title in order to get the dictionary with features back.
4.2.2 Shape generation
The first iteration of the product is created through the use of the open source java graphics libraryand IDE processing [7]. This program is based on Java and features a simplified environment to createJava or OpenGL graphics. Data on songs is gathered using the Spotify API [15], accessed through theuse of a Python back-end and Spotipy [4] . This Python back-end communicates with the Java appletthrough the use of sockets.
The segments extracted from the Spotify API are used to create the segments of the Toroid shape.The number and length of the segments correspond with the sections of the song. This should help tomake the shape more recognisable and provide a coherence between different shapes.
14

5 First evaluation
In order to test the prototype and answer the research questions, a survey is made to test the imple-mentation of the prototype. The goal of this survey is to test several mappings between the music andshape parameters.
5.1 Method
Experiment Design: The survey will be split into two parts. The first part is aimed at choosing oneout of several generated shapes of the same song using different mappings, where different propertiesare connected to different shape parameters. During the second part the participants can download theprototype and create a unique shape corresponding to a song themselves, which is done by adjustingseveral sliders. .
Participants: Participants between the ages of twenty and forty will be chosen as participants, sincethey are most likely the target audience of the application. The goal is to get between 20 and 40individual participants to fill out the survey, in order to be able to draw valid conclusions and performa statistical analysis.
5.1.1 Part 1: Comparing generated shapes
In this part, different mappings between parameters will be compared to each other. Three differentmappings have been created based on our expectations of what might be valid mappings. Thesemappings are visible in Table 3. During the survey the participant will be given a song together withfour generated shapes to choose from. Out of these four shapes, three will be created using theparameters retrieved from the Spotify API but using the different mappings as shown in table 3 andone will be created using random integers as shape parameters. When the subsequent API values arelarger, the value of the coupled shape parameters increase, and vice versa. In total four different songswill be given to participants, and participants are then asked to consider the four mappings and choosethe most fitting one. After each song, the participant has the opportunity to motivate their decisionin a text field. The songs will be chosen based on a broad contrast in valence and arousal, based onfigure 6. The chosen songs are:
• Nirvana - Heart Shaped Box
• Justin Timberlake - Can’t Stop the Feeling
• James Blunt - Same Mistake
• Bobby McFerrin - Don’t worry, Be Happy
Mapping 1 Mapping 2 Mapping 3Radius Loudness Loudness LoudnessLatheradius Length (s) Length (s) Length (s)Shape colour Valence Energy Valencepts Energy Valence EnergyNoise factor Energy Acousticness Danceability
Table 3: Mappings between parameters
To analyse the retrieved data, an ANOVA test will be performed to figure out if one mapping ispreferred significantly. Additionally, a word cloud of the answers to the optional motivation box will bemade to gain insight into what participants were focusing on when trying to map a shape to a song.
15

5.1.2 Part 2: Generating shapes by moving sliders
In this part an embedded version of our application will be provided in which the user can generatetheir own shape according to how they think it would best match the given song. Four songs will beprovided. The songs will be chosen based on a broad contrast of features, based on figure 6. We pickedfour songs which are placed as far as possible in each quadrant of the table, as to form contrasts inthe Arousal Valence plane. The chosen songs are:
• Motorhead - Ace of Spades
• Pharell Williams - Happy
• Evanescence - My Immortal
• Charles Trenet - La mer
The generated shapes will be analysed by performing an ANOVA to see if there is any correlationbetween the songs and the different parameters. Additionally, the shapes will be recreated and putinto a collage to be able to manually analyse the common patterns in the creation of shapes.
5.2 Results
5.2.1 Part 1
The full responses of the first part can be found in Appendix B. A word cloud using the most commonwords in the open questions of the survey is created to retrieve get some insights in the way participantslink music to visuals, this word cloud is visible in Figure 9.
Figure 9: Wordcloud of answers
The frequency of each chosen mapping is shown in Table 4.
5.2.2 Part 2
The generated images created by the participants for each song have been put in different collages toget an idea of the most occurring patterns within each song, These collages are visible in Figure 10.Additionally an ANOVA has been performed to get some insights in which parameters are significantlycorrelated with a difference in Valence and Arousal. The results of this ANOVA can be found in Figure
16

Mapping Frequency Percent1 15 17,92 24 28,63 25 29,84 20 23,8Total 84 100
Table 4: Frequency of chosen mappings
(a) Motorhead - Ace ofSpades 1
(b) Charles Trenet - LaMer 2
(c) Pharell Williams -Happy
(d) Evanesence - MyImmortal
Figure 10: Generated shapes per song
?? and Figure 11. From these ANOVA results can be derived every parameter except the latheradiuswas significant.
Parameter SignificanceColour 0,006Latheradius 0,456Radius 0,004Noise factor 0,000Pts 0,007
Table 5: ANOVA results
5.3 Discussion
This study gave some interesting insights into the people’s perception of how music can be linked toshape parameters. This section will discuss some insights that can be gained from the retrieved data.Allowing participants to generate their own interpretation of how a song would relate to the givenshape parameters, turned out to be a very useful method for defining the user’s perception of howthese parameters would relate to songs with differences in valence and arousal levels.
However, from Figure 4 it becomes clear that the first part of the survey was not really successful,since the chosen mappings are very equally distributed. This is most likely due to the similaritybetween the shapes the participants could choose from. Only small variations had been chosen betweenthe different mappings in order to get a better insight into the effects on the individual parameters.Unfortunately, this resulted into a set of images that looked too much alike. But given the fact thatoption 4 (the random option) is only chosen 23 percent of the time, it indicates that the assignedmappings perform better than a random initialisation.
The word cloud made out of the answers of the open questions in the first part of the surveyindicates that the most common reasoning for matching songs to shapes is to find words that apply
17

Figure 11: Multiple comparisons Anova results part 2
to both music as shapes. The use of these words already became apparent when analysing the resultsfrom the pilot study.
When analysing the generated images one of the first things that stands out is the difference incolours between the different songs. Especially the difference between the songs Ace of Spades (Figure10a) and Happy (Figure 10c) is quite prominent. When looking at the ANOVA results (Figure ??), itbecomes clear that the colour parameter is significant, but only between these two songs (Figure 11).However when analysing the generated images, one could argue that the song My Immortal (Figure10d) has more cool tones and the song La Mer (Figure 10b) more happy/warm ones. It is interestingto see that these colours correlate to the standard ideas of which colours match to which emotion.This is also backed up by other research. A study investigating the correlation between colours andmusic also came to the conclusion that colour association was influenced by emotion [13]. The resultsfrom the interviews conducted during this research also resulted in some of the same colours as duringthis research.
When looking at the ANOVA results in figure ?? it appears that every parameter is significant,except the latheradius. This means that there is no significance between this parameter and the valenceor arousal of a song. The latheradius parameter was originally coupled to the loudness of the song persegment. This is now justified by the fact that it would not make sense to couple this parameter toeither the valence or arousal.
Looking at the ANOVA results there appears to be a strong significance for the noise factor.However when looking at Figure 11, it becomes clear that this significance is mostly due to the factthat the song Ace of Spades by Motorhead has a way higher noise factor than any of the other songs.Given the fact that the second highest noise factor is the song Happy by Pharell Williams, the noisefactor is most likely related to the arousal of the song. One of the often used words to describe thissong by Motorhead was the word rough, interesting enough the texture of the shape becomes morerough when the noise factor is increased. This could also indicate that the noise factor is correlatedwith the feature of a song that makes it ”rough”. Besides Motorhead another song that was oftendescribed as rough was the song Heart Shaped Box by Nirvana, which also scored low on valence andhigh on arousal. This could indicate that this combination of a low valence and high arousal leads tothe feeling of roughness in a song and therefore would positively correlate to the noise factor of theshape.
The results indicate that the radius of the shape also was significant between songs of differentvalence and arousal. However from Figure 11 it becomes clear that the two songs with the biggestradius were contrasting to each other on both the valence as the arousal scale. This could indicate
18

Figure 12: Colours based on position on valence arousal scale [13]
that there might be an underlying parameter that varies between the different songs that is explainingthe difference in radius per song.
Since the starting point of the parameters for the shapes were already based on the songs, theresults might be a bit skewed towards the initialisation of the shapes. This might be because theparticipants might not have touched certain sliders which would leave them in their initialised position.However, given the fact that the standard deviation of every parameter is sufficiently large, we canassume that most participants have been adjusting every parameter.
5.3.1 Deployment
Initially, the application was first implemented in a fully functioning Java application, with the goalof running the application in a browser window. However, unbeknownst to us Java web apps hadbeen phased out completely as of a few years ago [2]. This presented us with the challenge of howto deploy and test the application. Especially because physical testing was made impractical due tothe COVID-19 pandemic and accompanying “intelligent” lockdown. For the research on the secondapplication, an adapted applet was shipped which used preconfigured JSON files instead of the actualSpotify API.
5.4 Conclusion
The goal of this iteration was to find a logical mapping between audio features and shape parameters.For four out of five shape parameters there appeared to be a significant difference between the answersper song (see figure 11), which indicates that the valence and arousal might have an effect on theseparameters. Based on the previously discussed results the mapping as shown in Table 6 can be seen asa logical conclusion. There are still some uncertainties like the radius that are not yet explained andthat combined with the fact that some of the parameters discussed were not completely leaning intoone direction it is still a wise idea to test the accuracy of this mapping.
19

MappingRadius LoudnessLatheradius Length (s)Shape colour Valence + Energypts EnergyNoise factor Energy (+ valence)Segments Segments from API
Table 6: Final mapping between parameters
6 Second prototype
Thanks to the previous iteration there now exists an idea on how to create a mapping between soundfeatures and shape parameters. During the second iteration, the mapping between parameters will beapplied to a fully working prototype. While the first iteration was more focused on the fundamentals,the second iteration is aimed at refinement of the concept, and increasing the span of the picturepainted in this project. In the previous iteration some insight was gained on how certain aspects of ashape are perceived in conjunction with different valence and arousal levels. In the second iteration,we take a look at what a full product and user experience might look like. The goal of this iterationis to test the usability of the product and how well the generated shapes actually represent the music.Therefore the research questions that will be explored during this iteration will be:
• What is the current status of the usability of the product?
• How well do the generated shapes match the songs?
These questions will be explored by creating and testing a fully functional web-based prototype.
6.1 Specification
To get a solid idea of how this product would be perceived by its users, a website will be made that canbe publicly accessed and will have all the necessary functionality for a fully rounded user experience.Before starting to build this website it is sensible to first establish some requirements for the system.This section will go over some of the most important requirements,
6.1.1 Technical requirements
This version of the system should allow us to test and experience the entire concept. A user shouldbe able to input a title and artist of any song, and the application should be able to generate a shapeaccordingly.
The generation of this shape should be done using the mapping that was derived from the firstevaluation. According to these results the shape color and size were quite personal and defining topeople, therefore the shape color and size have to be customizable after the shape has been generated.The valence will be used to initialize the radius, which then afterwards can be adjusted.
When a user is content with a shape, the user should be able to download the object file (.OBJ)which a user can print or use themselves, or potentially order it to be printed elsewhere and be deliveredby mail.
6.1.2 Design requirements
The application has two main screens. The Entry screen, where the user can make a query and will beinformed about the project. The second main screen is the page where the shape can be viewed andcustomised. A background gradient is used to draw users to the actionable buttons on the right, andprovide aesthetic value.
20

Some reference geometry can be toggled on and off. The reference geometry in question is acompact disk case. We believe that this allows people to get a clear idea of the size of the object usinga thematically appropriate, well known object with set dimensions.
6.2 Implementation
The frontend client uses p5.js to serve pre generated shapes (OBJ), and the user can change theparameters mentioned above. The system uses a flask[source] backend to serve web pages and callbackend applications. When a request is made using a title and artist, a SQL database is queried tosee if the shape has been generated before. If so, the shape is served directly. If the song has not beenqueried before, the Spotify/Spotipy API is called via the backend. Subsequently, the data is transferredto a Java application, and the app is called from the command line. The generated shape is added tothe asset collection and served to the client.
The shape now lives client side in the user’s browser. The user can make personalised modificationsto the shape, pick the size and color, and subsequently download or order it. The ordering and printingof such a shape would most likely be conducted by a 3rd party fulfillment company. There are a numberof companies offering mail order 3d prints, and fulfillment. Some examples are larger companies likeshapeways [a], 3d hubs [b], or local partners. For now, this commercial aspect is not implemented, asthis piece is still ongoing research. However, the amount of clicks on both buttons is tracked, alongwith the number of views to have an indication on how many people would want to buy or downloada shape.
(a) https://www.shapeways.com/
(b) https://www.3dhubs.com/
6.2.1 Deployment
The application now known as Waveshape (www.waveshape.nl) is a Flask based application runningon a Virtual Private Server (VPS). Using a combination of uWSGI and NGINX, the website is servedefficiently. When a title and artist are given to the application, the application first checks whether ashape has previously been generated in a SQL table. If the shape already exists, the shape file is sentdirectly to the front-end. Otherwise, the flask back-end executes a processing sketch adapted from thefirst iteration, and sends the newly generated file to the front-end.
21

Figure 13: The home screen and entry point of the application
6.2.2 Screenshots
This section contains some screenshot of the application, which can also be found on www.waveshape.nl.
22

Figure 14: The shape screen, here users interact with the generated shape
7 Second evaluation
In order to test the renewed prototype and answer the research questions a set of user tests will beconducted to evaluate the current status of the application.
7.1 Method
Participants: For this study people between the ages of twenty and forty were asked to participate,since this is most likely the target group of the application. It is widely assumed that five participantsis sufficient for a user testing, although some studies prove that it is not enough to uncover mostproblems [6]. But since the prototype is fairly simple in its amount of features, five to ten participantswill most likely be sufficient.
Experiment design: Due to the current situation regarding the COVID-19 developments, the usertests will be done virtually. There will be two separate evaluations in order to answer the two differentresearch questions. To uncover more about the usability and user experience of the application, a usertest will be conducted to find out more about the flaws, shortcomings and positive aspects. Addition-ally to the user test, a small quiz will be made where the generated shapes have to be mapped to thecorrect song. This will be done to get an overview of how recognisable the generated shapes are.
7.1.1 Part 1: User experience
The user test will be held virtually using Skype. During the test, participants will be asked to visit ourwebsite and try to perform a view tasks. These tasks will be:
• Create a shape of a song you like
• Download the 3D object file
After the participants have performed these action, which we not expect to be a challenge, we willask them if they want to continue to try out the application with different songs. We will observe thoseactions as well. When the participants are done, a survey/interview will be used where we will askthem a number questions to get an insight into their reasoning for performing certain actions. Thesequestions are:
• Do you think the shapes represent the song?
23

Question Song Arousal ValencePART 11 Hegedu, Bor, Palinka - Bohemian Betyars 95 94
In Love and War - XamVolo 9 70Raining Blood - Slayer 100 4Sometimes It Snows in April - Prince 6 6
2 Give the Drummer Some - Nickodemus 90 92Formula - Aphex Twin 88 12Sweet Jane - Cowboy Junkies 20 81To Build A Home - Cinematic Orchestra 12 7
3 We Didn’t Start the Fire - Billy Joel 90 92Hide and Seek - Imogen Heap 17 9I Like It - The Marias 18 76Maps - The Yeah Yeah Yeahs 94 16
PART 21 I Walk the Line - Johnny Cash 35 71
Barreleye - Mark Lettieri 78 65Into You - Ariane Grande 73 37Time To Send Someone Away 31 35
2 I’ll Follow The Sun - The Beatles 31 63We Found Love - Rihanna 77 60Around - KNOWER 79 17Madness - Muse 42 22
3 Fields of Gold - Sting 34 32Feel Good Inc. - Gorillaz 71 77If I Had A Gun - Noel Gallaghers High Flying Birds 74 21Send It On - D’Angelo 26 34
Table 7: Songs chosen for survey based on valence/arousal
• What do you think about the concept?
• What do you think about the quality of the application?
• What do you think about the intuitiveness of the application?
The user test and interview will be manually documented by writing down the actions and answersof the participants.
7.1.2 Part 2: Song matching
To evaluate the final mapping between the parameters that resulted from the previous iteration, asmall survey will be created that will ask the participants to choose the song that they think is used togenerate the shape. Since the results of iteration 1 indicate that the valence and arousal values makea big difference in the shape generation, the songs will be chosen based on their differences in valenceand arousal. The valence and arousal (energy) values will be retrieved using the API from Spotify.There will be a total of four songs per question and two sets of three questions in total. In the firstset, the values of valence and arousal are chosen to be very extreme, while at the second set thesedifferences will be milder. The areas on the valence/arousal plane that will be considered for bothsections are visible in Figure 15. Expected is that the first set will be easier to answer. The chosensongs per question are visible in Table 7.
24

Figure 15: Areas of valence and arousal that will be considered for each set of questions. Blue:First set, Yellow: Second set
7.2 Results
In total 9 responses were recorded for the online quiz (part 2), recruited from our network. Theaverage score participants achieved was 7.67 out of 24 points, with a range between 6 and 10 points.Additionally, seven user tests were conducted (part 1). The notes from these user tests can be foundin Appendix C. A summary with some observations is given in this chapter.
7.2.1 Do you think the shapes represent the song?
For this question, results were mixed, 2 thought the shape represented the song well, 1 response wasambivalent, and 4 persons thought the shape did not represent the song.
7.2.2 What do you think about the concept?
People were positive about the concept, but were unsure of what to do with the product.
7.2.3 What do you think about the quality of the application?
Overall participants thought the application was of good quality. Some improvements were suggested:
• Elaborate on the website content
• Sometimes the page had to be reloaded to make the shape work properly
• Add a loading bar
• Label sliders better
• Show where spelling errors are in the search bar
• Make the application only have one search bar, not separate artist and title boxes
7.2.4 What do you think about the intuitiveness of the application?
Participants were positive about the usability of the website. They could find the needed buttons easily,and could use the application. Users also commented on the points raised in the previous question.
25
7.3 Discussion
The results of this evaluation gave some great insights into the current status of the application from auser perspective and into how recognisable the shapes generated by the mapping used in this iterationare.
The results from the survey indicate that the recognisability of the shapes is far lower than wasexpected. The amount of correct answers is just slightly higher than a random guess. However, someshapes were answered very accurate, an example of this is the shape corresponding to Raining Blood bySlayer which got a hundred percent accuracy. This song is very similar in its features and feel comparedto the song Ace of Spades by Motorhead which was used in the previous iteration in order to definethe correct mapping. It could be the case that the mapping that was created out of the first iterationis not universal enough and only works accurately with songs similar to the ones that were discussedduring the first iteration.
The results of the user test were far more positive towards the application. What was specificallyinteresting was, that when the participants were asked whether they thought the shapes resembled thesong, most of them saw a relationship between the song and the shape, which is in contrast with theresults of the survey. The fact that the relationship between a song and its corresponding shape is onlyacknowledged when both components are revealed, seems to indicate that there is no inherent relationbetween a song and a shape but that one attaches meaning to the shape when it is placed next to asong. Or in some cases putting the two together will amplify an inherent relationship between songand shape. This means that the actual shape might not be as important as previously thought, sinceapparently a large part of the relationship between sound and shapes comes from the meaning derivedfrom the context the two components are placed in.
However, some people did not really see a correlation between the shape and the song. It wasinteresting to see that some people who at first did not see any correlation started seeing a connectionwhen they tried it out with multiple songs. This is most likely due to the limitation of sticking to thetorus shape, every shape that is generated is essentially the same shape, it is only the details that makethis shape unique. There was some critique on these details as well. A large part of visualizing thearousal in a song is done through the amount of noise. Some participants thought this noise was tospiky to represent certain styles of music. They thought this noise represented a more electronic musicstyle while they used a classic rock song as input.
This is one of the downsides of using the valence and arousal scale as a mapping between the musicand the shape. The interpretation of the shape becomes very abstract. A lot of participants started toover-analyze how the shape was constructed, which resulted in some confusion for the participants. Forfuture work it might be a good idea to look into a way to combine the use of the valence/arousal withsome more descriptive features, which would make it easier to confirm that a shape indeed correspondsto a certain song.
The usability of the website turned out to be decent, which was expected given the limited amountof screens and functions of the application. What was not that clear to the users was the fact thatthe sliders that change the color and size were not labeled. However, after adjusting these sliderstheir functions became clear immediately. Nevertheless, adding labels would increase the clarity of thewebsite. Additionally, since the loading time of generating a shape was sufficiently large, a participantsuggested the addition of a loading bar when the shape is generating.
Participants were impressed with the quality of the website and liked the idea of 3D printing oneof the shapes. It was clear for the participants how to download the shape, however it was not soclear what to do once the obj. file was downloaded. With the exception of one participant with abackground in 3D modelling who imported the object in a 3D modelling software and made a beautifulrender out of it, which can be seen in Figure 16. Nevertheless, for a final application it would be agood idea to either make a tutorial on how to 3D print the downloaded file with a 3D printer or printthe shapes ourselves and ship and sell them.
In general the participants liked the concept of the application and really enjoyed looking at thedifferent results for different songs. However, they did not have the need to use it to 3D print theirown shapes, since they would not know what to do with it. This could mean it might be a good ideato look into either adding a functionality or purpose to the 3D printable object to make the incentive
26

Figure 16: Render made by participant during user tests (Credit: Pepijn Peeters)
of printing it better or into re-branding the application into an exploratory tool.
27

8 Conclusion
Overall, this project has been an interesting journey into investigating the relationship between songsand shapes. According to the user tests the current website is fairly easy to use and the songs matchthe shapes despite the poor results from the quiz, since most likely the connection is only establishedonce both the song and the shape are given. To increase the usability the labels have to be added tothe sliders and more clarity should be given on how to 3D print the actual shapes.
During the course of this project we have used the valence/arousal plane as a general guidelineto classify songs and map them towards the parameters of the shape. This approach gave quite agood insight into the general feel of the song. However, reducing musical data like this, might havecaused some important data and associations to get lost which the evaluation of iteration 2 seemed toindicate. For future work it might be interesting to investigate a mapping between songs and shapesusing for example the lyrics or the instrumentation.
Since the participants liked exploring the results of different songs using the website, but thedesire to actually print the shape was quite low, creating an incentive to 3D print the shape wouldbe interesting to research. An example of such an incentive could be the addition of an NFC chipto the shape, which has a link to the song on Spotify. This would make the product resemble theoriginal physicalisations of music, like cds and vinyls, on which it was based on even more. A morelow-technology solution to creating an incentive for 3D printing would be to create accessories to storethe 3D prints in. This could nudge the users into starting a collection. Also, during the evaluationsessions a participant suggested the idea of incorporating the musical artists into the development ofthe shapes. When the artist has a say into how the shape is generated it would correlate more withhis intentions and the public would have more incentive to buy/download it.
We found that using the website as a medium to distribute the application works well. Accordingto our evaluation and the user testing the website is of sufficient quality to be kept online. We arecurious to see if and how the program will be used be used in the future.
9 Reflection
This project has been a very broad experience, covering many aspects of the Interaction Technologyspace. We covered almost all areas, from the economical side to going deep into configuring webservers and applications, to doing user studies and distilling principles. It also gave a great taster onhow research is conducted within the faculty, including things like ethics procedures. However, thisproject also posed a number of unanticipated challenges.
Firstly, during the project, the Covid-19 pandemic hit. This made many of the planned activitiesimpractical or impossible. We believe that this has caused most of the delays. Usually, we wouldhave conducted user test in person, which would have been more efficient than conducting a surveythrough an online platform. This has most likely caused a delay of a number of weeks. However, wecould adapt to the situation, and manage as good as possible. Additionally, it was harder to reachparticipants than expected. Usually, many participants could be recruited face to face, for example inDesignLab. Physical recruitment was off the table, so we had to rely on recruitment via social mediawithin our network, who were also all dealing with the lockdown in their own ways. However, manycame through and participated enthusiastically, for which we remain ever grateful.
Secondly, during the implementation of the second iteration, some unexpected issues came up withthe server running the application. The last bit of delay was filled with staring at and negotiating witha bash prompt and ever evolving error messages and disfunction. Eventually, however, we managedto get the website up and working to a deployable standard. It did teach us that there are stillmany particularities in deploying a web application to an actual server environment in comparisonto a development environment. Many things that worked fine in the development version failed inproduction. Including, but not limited to many particularities in running OpenGL and Java.
Finally, the course this project is a part of was aimed at projects executed by teams of four. Wedid the project with the two of us. While it still was manageable, some more finesse could potentiallybe applied if more collaborators would have been part of this project. However, cooperation went
28

smoothly with the two of us, also throughout the lockdown. Decisions were made in conjunction, andwork was done mostly separately due to the working conditions. This method, while maybe not asefficient as face to face cooperation, was more than satisfactory to get work done on the project.
All in all, this project has been a very educational experience, and we believe to have achievedgood results, despite some challenges and setbacks. This project has been a great opportunity to digin deep into a subject and create something close to our hearts, alongside being of great educational,and developmental value.
9.1 Acknowledgements
We would like to acknowledge the continued support our teacher and supervisor throughout the project,and throughout extraordinary circumstances. Additionally, we would like to thank all the participantsof our studies, without whom this research would not have been possible.
29

References
[1] Sofiane Achiche and Saeema Ahmed. “Mapping shape geometry and emotions using fuzzylogic”. In: International Design Engineering Technical Conferences and Computers and In-formation in Engineering Conference. Vol. 43284. 2008, pp. 387–395.
[2] Peter Bright. Oracle deprecates the Java browser plugin, prepares for its demise. Ed. byARS Technica. 2016. url: https://arstechnica.com/information-technology/2016/01/oracle- deprecates- the- java- browser- plugin- prepares- for- its- demise/.(accessed: 16.07.2020).
[3] RH Chen et al. “Content based music emotion analysis and recognition”. In: Proc. of 2006International Workshop on Computer Music and Audio Technology. Vol. 68275. 2006, p. 2.
[4] Paul Lamere (plamere) et. Co. Spotipy. url: https://spotipy.readthedocs.io/en/2.13.0/. (accessed: 16.07.2020).
[5] Martin Daniel Cooney and Maria Luiza Recena Menezes. “Design for an art therapy robot:An explorative review of the theoretical foundations for engaging in emotional and creativepainting with a robot”. In: Multimodal Technologies and Interaction 2.3 (2018), p. 52.
[6] Laura Faulkner. “Beyond the five-user assumption: Benefits of increased sample sizes inusability testing”. In: Behavior Research Methods, Instruments, & Computers 35.3 (2003),pp. 379–383.
[7] Processing Foundation. Processing 3.3.1. url: https : / / processing . org/. (accessed:30.06.2020).
[8] Jacek Grekow. “Music emotion maps in the arousal-valence space”. In: From content-basedmusic emotion recognition to emotion maps of musical pieces. Springer, 2018, pp. 95–106.
[9] Adit Jamdar et al. “Emotion analysis of songs based on lyrical and audio features”. In: arXivpreprint arXiv:1506.05012 (2015).
[10] Rohit Ashok Khot, Larissa Hjorth, and Florian’Floyd’ Mueller. “Understanding physicalactivity through 3D printed material artifacts”. In: Proceedings of the SIGCHI Conferenceon Human Factors in Computing Systems. 2014, pp. 3835–3844.
[11] Youngmoo E Kim et al. “Music emotion recognition: A state of the art review”. In: Proc.ismir. Vol. 86. 2010, pp. 937–952.
[12] Adinda Rosa van’t Klooster and Nick Collins. “In A State: Live Emotion Detection andVisualisation for Music Performance.” In: NIME. 2014, pp. 545–548.
[13] PerMagnus Lindborg and Anders K Friberg. “Colour association with music is mediated byemotion: Evidence from an experiment using a CIE Lab interface and interviews”. In: PloSone 10.12 (2015), e0144013.
[14] Plotting Music’s Emotional Valence, 1950-2013. url: https://web.archive.org/web/20170422195736/http://blog.echonest.com/post/66097438564/plotting-musics-
emotional-valence-1950-2013. (accessed: 25.06.2020).
[15] Spotify. Spotify API. url: https://developer.spotify.com/documentation/web-api/.(accessed: 10.06.2020).
[16] Yunqing Xia, Linlin Wang, and Kam-Fai Wong. “Sentiment vector space model for lyric-based song sentiment classification”. In: International Journal of Computer Processing OfLanguages 21.04 (2008), pp. 309–330.
[17] Dan Yang and Won-Sook Lee. “Music emotion identification from lyrics”. In: 2009 11thIEEE International Symposium on Multimedia. IEEE. 2009, pp. 624–629.
[18] Yi-Hsuan Yang and Homer H Chen. “Machine recognition of music emotion: A review”. In:ACM Transactions on Intelligent Systems and Technology (TIST) 3.3 (2012), pp. 1–30.
30

[19] S Yoon et al. “Laughter Blossom: A Prototype of Laughter Interaction Design”. In: Proc.IASDR 13 (2013).
[20] zan. The Shapes of Emotions. url: https://hi.stamen.com/the-shapes-of-emotions-72c3851143e2. (accessed: 25.06.2020).
31