Making change last: Applying the NHS III Sustainability Model in healthcare
10
RESEARCH Open Access Making change last: applying the NHS institute for innovation and improvement sustainability model to healthcare improvement Cathal Doyle * , Cathy Howe, Thomas Woodcock, Rowan Myron, Karen Phekoo, Chris McNicholas, Jessica Saffer and Derek Bell Abstract The implementation of evidence-based treatments to deliver high-quality care is essential to meet the healthcare demands of aging populations. However, the sustainable application of recommended practice is difficult to achieve and variable outcomes well recognised. The NHS Institute for Innovation and Improvement Sustainability Model (SM) was designed to help healthcare teams recognise determinants of sustainability and take action to embed new practice in routine care. This article describes a formative evaluation of the application of the SM by the National Institute for Health Research Collaboration for Leadership in Applied Health Research and Care for Northwest London (CLAHRC NWL). Data from project teams’ responses to the SM and formal reviews was used to assess acceptability of the SM and the extent to which it prompted teams to take action. Projects were classified as ‘engaged,’‘partially engaged’ and ‘non-engaged. ’ Quarterly survey feedback data was used to explore reasons for variation in engagement. Score patterns were compared against formal review data and a ‘diversity of opinion’ measure was derived to assess response variance over time. Of the 19 teams, six were categorized as ‘engaged,’ six ‘partially engaged,’ and seven as ‘non-engaged.’ Twelve teams found the model acceptable to some extent. Diversity of opinion reduced over time. A minority of teams used the SM consistently to take action to promote sustainability but for the majority SM use was sporadic. Feedback from some team members indicates difficulty in understanding and applying the model and negative views regarding its usefulness. The SM is an important attempt to enable teams to systematically consider determinants of sustainability, provide timely data to assess progress, and prompt action to create conditions for sustained practice. Tools such as these need to be tested in healthcare settings to assess strengths and weaknesses and findings disseminated to aid development. This study indicates the SM provides a potentially useful approach to measuring teams’ views on the likelihood of sustainability and prompting action. Securing engagement of teams with the SM was challenging and redesign of elements may need to be considered. Capacity building and facilitation appears necessary for teams to effectively deploy the SM. Keywords: Sustainability, Implementation * Correspondence: [email protected] NIHR CLAHRC for Northwest London, 4th Floor Lift Bank D, Chelsea & Westminster Hospital, 369 Fulham Road, London SW10 9NH, UK Implementation Science © 2013 Doyle et al.; licensee BioMed Central Ltd. This is an open access article distributed under the terms of the Creative Commons Attribution License (http://creativecommons.org/licenses/by/2.0), which permits unrestricted use, distribution, and reproduction in any medium, provided the original work is properly cited. Doyle et al. Implementation Science 2013, 8:127 http://www.implementationscience.com/content/8/1/127
Transcript of Making change last: Applying the NHS III Sustainability Model in healthcare
ImplementationScience
Doyle et al. Implementation Science 2013, 8:127http://www.implementationscience.com/content/8/1/127
RESEARCH Open Access
Making change last: applying the NHS institutefor innovation and improvement sustainabilitymodel to healthcare improvementCathal Doyle*, Cathy Howe, Thomas Woodcock, Rowan Myron, Karen Phekoo, Chris McNicholas, Jessica Safferand Derek Bell
Abstract
The implementation of evidence-based treatments to deliver high-quality care is essential to meet the healthcaredemands of aging populations. However, the sustainable application of recommended practice is difficult to achieveand variable outcomes well recognised. The NHS Institute for Innovation and Improvement Sustainability Model (SM)was designed to help healthcare teams recognise determinants of sustainability and take action to embed newpractice in routine care. This article describes a formative evaluation of the application of the SM by the NationalInstitute for Health Research Collaboration for Leadership in Applied Health Research and Care for Northwest London(CLAHRC NWL).Data from project teams’ responses to the SM and formal reviews was used to assess acceptability of the SM andthe extent to which it prompted teams to take action. Projects were classified as ‘engaged,’ ‘partially engaged’ and‘non-engaged.’ Quarterly survey feedback data was used to explore reasons for variation in engagement. Scorepatterns were compared against formal review data and a ‘diversity of opinion’ measure was derived to assessresponse variance over time.Of the 19 teams, six were categorized as ‘engaged,’ six ‘partially engaged,’ and seven as ‘non-engaged.’ Twelve teamsfound the model acceptable to some extent. Diversity of opinion reduced over time. A minority of teams usedthe SM consistently to take action to promote sustainability but for the majority SM use was sporadic. Feedbackfrom some team members indicates difficulty in understanding and applying the model and negative viewsregarding its usefulness.The SM is an important attempt to enable teams to systematically consider determinants of sustainability, providetimely data to assess progress, and prompt action to create conditions for sustained practice. Tools such as these needto be tested in healthcare settings to assess strengths and weaknesses and findings disseminated to aid development.This study indicates the SM provides a potentially useful approach to measuring teams’ views on the likelihood ofsustainability and prompting action. Securing engagement of teams with the SM was challenging and redesign ofelements may need to be considered. Capacity building and facilitation appears necessary for teams to effectivelydeploy the SM.
Keywords: Sustainability, Implementation
* Correspondence: [email protected] CLAHRC for Northwest London, 4th Floor Lift Bank D, Chelsea &Westminster Hospital, 369 Fulham Road, London SW10 9NH, UK
© 2013 Doyle et al.; licensee BioMed Central Ltd. This is an open access article distributed under the terms of the CreativeCommons Attribution License (http://creativecommons.org/licenses/by/2.0), which permits unrestricted use, distribution, andreproduction in any medium, provided the original work is properly cited.
Doyle et al. Implementation Science 2013, 8:127 Page 2 of 10http://www.implementationscience.com/content/8/1/127
BackgroundThe implementation of evidence-based treatments ortechnological innovations that demonstrate the deliveryof high-quality care at acceptable cost is essential if weare to meet the healthcare demands of aging populations[1]. However, evidence suggests efforts to introduceevidence-based new practice frequently fail to apply itin a sustainable way, resulting in variable outcomes [2-4].The National Health Service (NHS) Institute for
Innovation and Improvement Sustainability Model [5](SM) was designed to help teams implementing newpractice in their workplace to address this problem. Itaims to enable teams to recognize and self-assess againstkey variables in their local context that determine whethera new practice is likely to be sustained and to prompttimely action to increase the likelihood of this beingachieved. Sustainability in this context means the con-tinuation or the integration of new practice within anorganization whereby it has become a routine part of caredelivery and continues to deliver desired outcomes [6-8].The SM is a self-assessment tool that details ten key
determinants or ‘key factors’ that increase the likelihoodof sustainability and continuous improvement. The modelwas developed using information gathered from varioussources. A review of management literature related tosustainability and research involving project leaders,directors, clinicians, and global health care experts withina national NHS Improvement Program initially identifiedover 100 factors considered to be important ingredientsfor sustaining change. Through focus groups and othermeans, 250 NHS staff and health care experts were asked
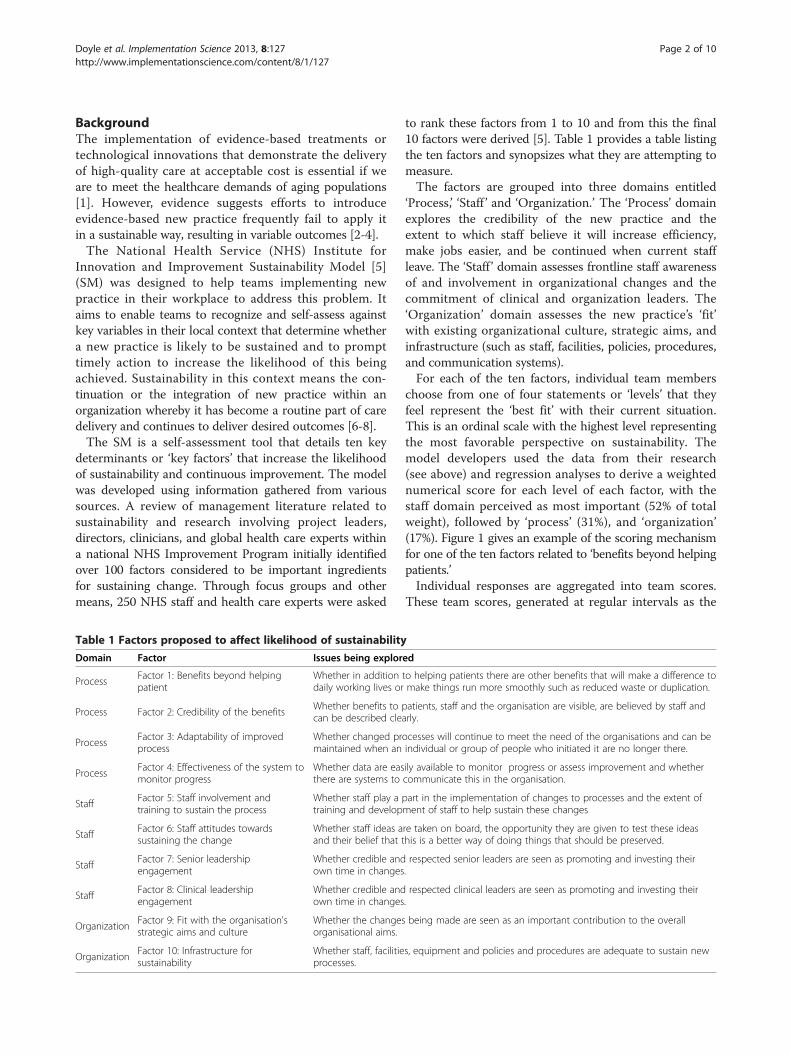
Table 1 Factors proposed to affect likelihood of sustainability
Domain Factor Issues being explor
ProcessFactor 1: Benefits beyond helpingpatient
Whether in additiondaily working lives or
Process Factor 2: Credibility of the benefitsWhether benefits to pcan be described cle
ProcessFactor 3: Adaptability of improvedprocess
Whether changed prmaintained when an
ProcessFactor 4: Effectiveness of the system tomonitor progress
Whether data are easthere are systems to
StaffFactor 5: Staff involvement andtraining to sustain the process
Whether staff play atraining and develop
StaffFactor 6: Staff attitudes towardssustaining the change
Whether staff ideas aand their belief that t
StaffFactor 7: Senior leadershipengagement
Whether credible andown time in changes
StaffFactor 8: Clinical leadershipengagement
Whether credible andown time in changes
OrganizationFactor 9: Fit with the organisation'sstrategic aims and culture
Whether the changesorganisational aims.
OrganizationFactor 10: Infrastructure forsustainability
Whether staff, facilitieprocesses.
to rank these factors from 1 to 10 and from this the final10 factors were derived [5]. Table 1 provides a table listingthe ten factors and synopsizes what they are attempting tomeasure.The factors are grouped into three domains entitled
‘Process,’ ‘Staff ’ and ‘Organization.’ The ‘Process’ domainexplores the credibility of the new practice and theextent to which staff believe it will increase efficiency,make jobs easier, and be continued when current staffleave. The ‘Staff ’ domain assesses frontline staff awarenessof and involvement in organizational changes and thecommitment of clinical and organization leaders. The‘Organization’ domain assesses the new practice’s ‘fit’with existing organizational culture, strategic aims, andinfrastructure (such as staff, facilities, policies, procedures,and communication systems).For each of the ten factors, individual team members
choose from one of four statements or ‘levels’ that theyfeel represent the ‘best fit’ with their current situation.This is an ordinal scale with the highest level representingthe most favorable perspective on sustainability. Themodel developers used the data from their research(see above) and regression analyses to derive a weightednumerical score for each level of each factor, with thestaff domain perceived as most important (52% of totalweight), followed by ‘process’ (31%), and ‘organization’(17%). Figure 1 gives an example of the scoring mechanismfor one of the ten factors related to ‘benefits beyond helpingpatients.’Individual responses are aggregated into team scores.
These team scores, generated at regular intervals as the
ed
to helping patients there are other benefits that will make a difference tomake things run more smoothly such as reduced waste or duplication.
atients, staff and the organisation are visible, are believed by staff andarly.
ocesses will continue to meet the need of the organisations and can beindividual or group of people who initiated it are no longer there.
ily available to monitor progress or assess improvement and whethercommunicate this in the organisation.
part in the implementation of changes to processes and the extent ofment of staff to help sustain these changes
re taken on board, the opportunity they are given to test these ideashis is a better way of doing things that should be preserved.
respected senior leaders are seen as promoting and investing their.
respected clinical leaders are seen as promoting and investing their.
being made are seen as an important contribution to the overall
s, equipment and policies and procedures are adequate to sustain new
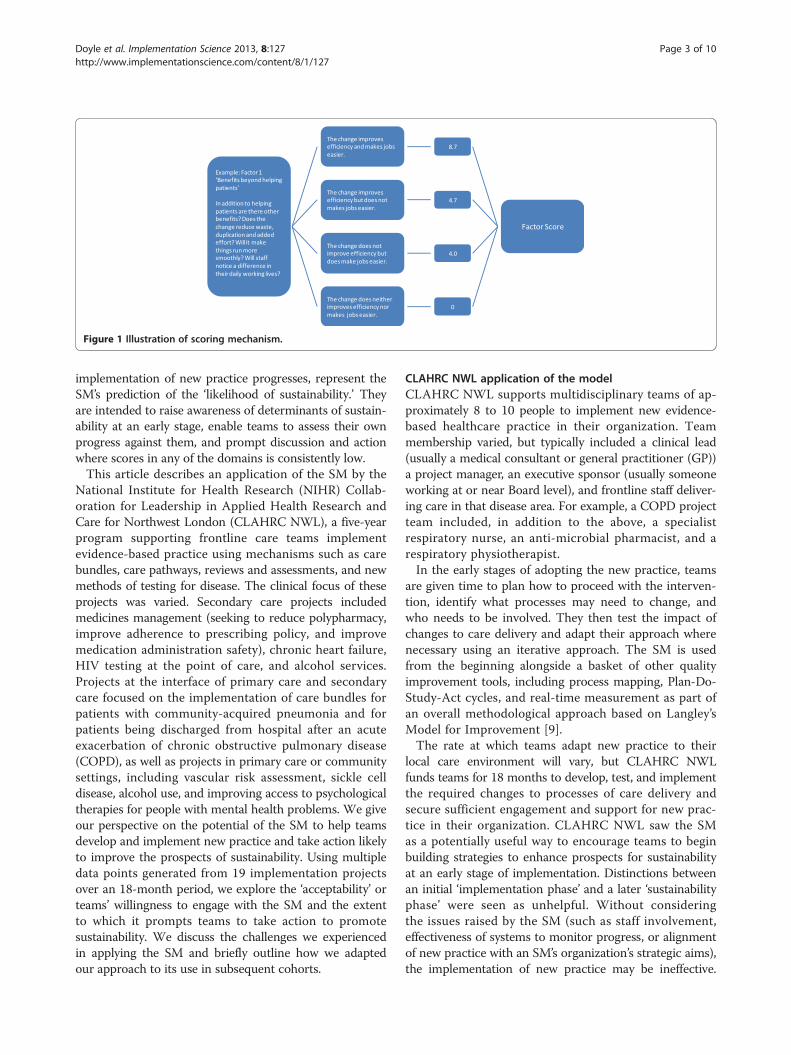
Figure 1 Illustration of scoring mechanism.
Doyle et al. Implementation Science 2013, 8:127 Page 3 of 10http://www.implementationscience.com/content/8/1/127
implementation of new practice progresses, represent theSM’s prediction of the ‘likelihood of sustainability.’ Theyare intended to raise awareness of determinants of sustain-ability at an early stage, enable teams to assess their ownprogress against them, and prompt discussion and actionwhere scores in any of the domains is consistently low.This article describes an application of the SM by the
National Institute for Health Research (NIHR) Collab-oration for Leadership in Applied Health Research andCare for Northwest London (CLAHRC NWL), a five-yearprogram supporting frontline care teams implementevidence-based practice using mechanisms such as carebundles, care pathways, reviews and assessments, and newmethods of testing for disease. The clinical focus of theseprojects was varied. Secondary care projects includedmedicines management (seeking to reduce polypharmacy,improve adherence to prescribing policy, and improvemedication administration safety), chronic heart failure,HIV testing at the point of care, and alcohol services.Projects at the interface of primary care and secondarycare focused on the implementation of care bundles forpatients with community-acquired pneumonia and forpatients being discharged from hospital after an acuteexacerbation of chronic obstructive pulmonary disease(COPD), as well as projects in primary care or communitysettings, including vascular risk assessment, sickle celldisease, alcohol use, and improving access to psychologicaltherapies for people with mental health problems. We giveour perspective on the potential of the SM to help teamsdevelop and implement new practice and take action likelyto improve the prospects of sustainability. Using multipledata points generated from 19 implementation projectsover an 18-month period, we explore the ‘acceptability’ orteams’ willingness to engage with the SM and the extentto which it prompts teams to take action to promotesustainability. We discuss the challenges we experiencedin applying the SM and briefly outline how we adaptedour approach to its use in subsequent cohorts.
CLAHRC NWL application of the modelCLAHRC NWL supports multidisciplinary teams of ap-proximately 8 to 10 people to implement new evidence-based healthcare practice in their organization. Teammembership varied, but typically included a clinical lead(usually a medical consultant or general practitioner (GP))a project manager, an executive sponsor (usually someoneworking at or near Board level), and frontline staff deliver-ing care in that disease area. For example, a COPD projectteam included, in addition to the above, a specialistrespiratory nurse, an anti-microbial pharmacist, and arespiratory physiotherapist.In the early stages of adopting the new practice, teams
are given time to plan how to proceed with the interven-tion, identify what processes may need to change, andwho needs to be involved. They then test the impact ofchanges to care delivery and adapt their approach wherenecessary using an iterative approach. The SM is usedfrom the beginning alongside a basket of other qualityimprovement tools, including process mapping, Plan-Do-Study-Act cycles, and real-time measurement as part ofan overall methodological approach based on Langley’sModel for Improvement [9].The rate at which teams adapt new practice to their
local care environment will vary, but CLAHRC NWLfunds teams for 18 months to develop, test, and implementthe required changes to processes of care delivery andsecure sufficient engagement and support for new prac-tice in their organization. CLAHRC NWL saw the SMas a potentially useful way to encourage teams to beginbuilding strategies to enhance prospects for sustainabilityat an early stage of implementation. Distinctions betweenan initial ‘implementation phase’ and a later ‘sustainabilityphase’ were seen as unhelpful. Without consideringthe issues raised by the SM (such as staff involvement,effectiveness of systems to monitor progress, or alignmentof new practice with an SM’s organization’s strategic aims),the implementation of new practice may be ineffective.
Doyle et al. Implementation Science 2013, 8:127 Page 4 of 10http://www.implementationscience.com/content/8/1/127
For example, a team may prefer to work in isolationinitially to get their new practice ‘right,’ but if they neglectto involve the right people (such as frontline staff or keymanagers) at an early stage the viability of new practice inthat organizational setting may be undermined. Teams areintroduced to the SM during initial training sessions andasked to complete it at the start of the project to establisha baseline and subsequently every three months through-out the funded period. Team members anonymously entertheir responses using an online reporting tool softwaresystem designed by CLAHRC NWL that generates meanoverall team scores for each factor and domain and barcharts comparing these against maximum possible scores.Teams are asked to set aside 5 to 10 minutes in routine
meetings to discuss their sustainability scores and todecide what if any actions can be taken to address anyfactor identified as potential barriers to long-term success.Quarterly completion was chosen to coincide with thequarterly Collaborative Learning and Delivery (CLD)events run by CLAHRC NWL to enable teams to getaway from their work environment at regular intervals.Data from the SM are intended to inform team discussionson progress to date and next steps. The scores are alsodisplayed at these events to provide an opportunity toshare learning with other teams.Regular completion of the SM is designed to help cap-
ture changing perspectives over time as the challenges toimplementation become clear and as team membershipchanges [10]. Completion by most of the team helps ensurea balance of views across professions, disciplines, andhierarchies. This is important given the variation in SMscores in a previous study that showed frontline clinicianswere less optimistic in their scoring than managerial orother support staff [11].Because aspects of the SM entailed a judgment of
sorts on fellow team members (in particular where teammembers are asked to assess the quality of leadership),anonymous completion of the SM was considered im-portant to enable all team members to express opinionswithout fear of repercussions.
MethodsA prerequisite for the successful application of the SM inhealthcare settings is the willingness of teams to engage—to complete scores, assess results, and take actionwhere scores indicate a risk of the new practice theyare introducing not being sustained. One also needs tohave confidence in the validity of the measurementunderlying the SM—that the measures used ‘accuratelyrepresent the concept being assessed’ [12].As part of a formative evaluation of the SM to assess
the extent to which these prerequisites for successfulapplication appeared to have been met, we triangulated
different sets of data available to us as managers of thiscollaborative program. The teams’ engagement with theSM was assessed using three criteria. The first was thenumber of sustainability scores registered (assessed throughthe recording of scores in an online software tool designedby CLAHRC NWL). The second and third criteria areevidence of consideration or discussion of the issues raisedby the SM scores and action taken to address concerns onsustainability raised by the SM. For example, if a team’sSM scores indicated concerns over staff involvement (withlow scores in the ‘staff ’ domain), then evidence of actiontaken to increase involvement (such as training sessionsor staff involvement in the design of new practice) wouldcount towards assessment of engagement.Evidence of discussion and action relating to sustain-
ability are primarily derived from coding of minutesof ‘two-way’ reviews (where project teams meet withCLAHRC NWL staff for two-hour discussions every sixmonths) and ‘end of project’ reports provided by theteams. Using these data and tacit knowledge of theproject acquired through routine regular contact, twoCLAHRC NWL staff rate teams independently and com-pare findings. Differences of opinion were discussed in thewider CLAHRC NWL team until a group consensus wasachieved.To illustrate the types of actions taken in response to
SM scores to improve the prospects for sustainability, anexample of a project designed to improve the prescribingfor the elderly is used. In the early stages of the project,the areas highlighted by SM scores as having the greatestpotential for improvement were ‘effectiveness of thesystem to monitor change’ (in the Process domain) and‘staff involvement and training’ (in the Staff domain).To improve systems to monitor change, the team workedwith CLAHRC NWL to set up a system to regularlymeasure patients checked for medication they were using,and adverse drug reactions (ADRs), where medicationswere stopped or the dose was reduced. These data wereused by the project team to monitor progress, to feedback to directorates within the hospital to raise theprofile of the work, and to illustrate potential costsavings of improved prescribing and reduced ADRs.To improve engagement of frontline staff, the teamdelivered teaching and training sessions, disseminatedawareness-raising material (such as posters and handouts),sent group emails, engaged staff in a Delphi exercise onthe design of a tool to record patients’ medication, andensured key frontline staff were included in the projectteam. Senior staff were engaged through invitations tojoin the project team, presentations at meetings regularlyattended by managerial and senior clinical staff, andpublicizing of the work through hospital communicationchannels such as newsletters. A Medication Passport,designed with the input of patients, was endorsed by
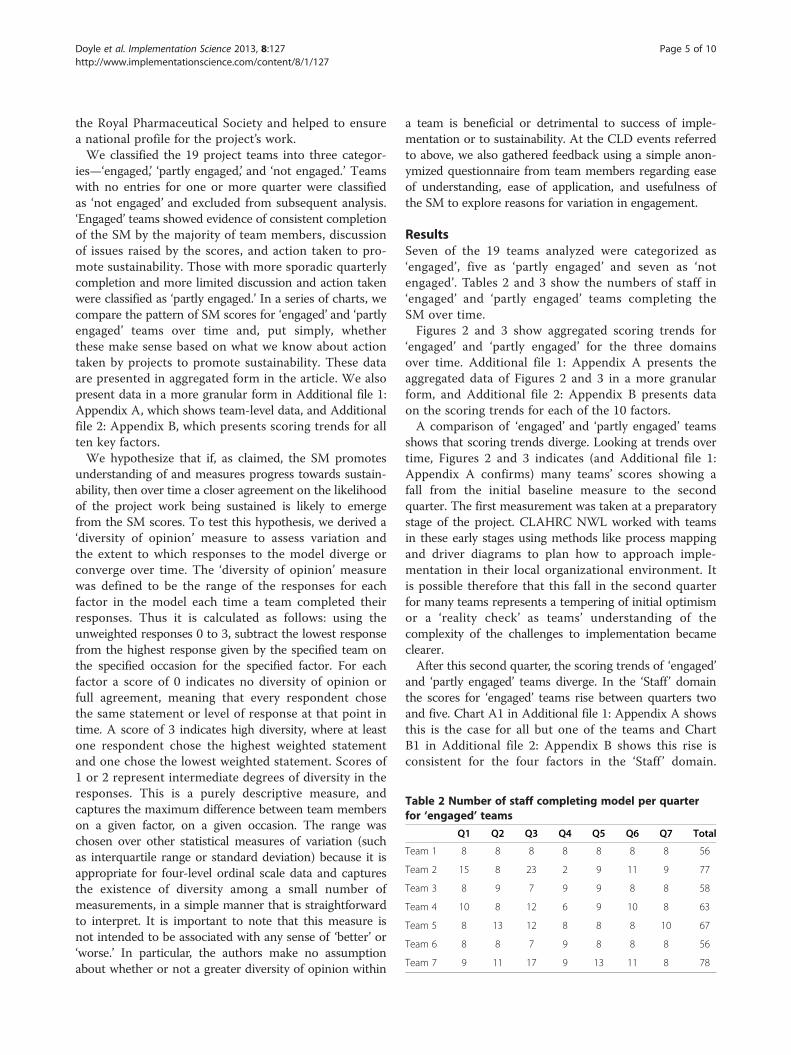
Table 2 Number of staff completing model per quarterfor ‘engaged’ teams
Q1 Q2 Q3 Q4 Q5 Q6 Q7 Total
Team 1 8 8 8 8 8 8 8 56
Team 2 15 8 23 2 9 11 9 77
Team 3 8 9 7 9 9 8 8 58
Team 4 10 8 12 6 9 10 8 63
Team 5 8 13 12 8 8 8 10 67
Team 6 8 8 7 9 8 8 8 56
Team 7 9 11 17 9 13 11 8 78
Doyle et al. Implementation Science 2013, 8:127 Page 5 of 10http://www.implementationscience.com/content/8/1/127
the Royal Pharmaceutical Society and helped to ensurea national profile for the project’s work.We classified the 19 project teams into three categor-
ies—‘engaged,’ ‘partly engaged,’ and ‘not engaged.’ Teamswith no entries for one or more quarter were classifiedas ‘not engaged’ and excluded from subsequent analysis.‘Engaged’ teams showed evidence of consistent completionof the SM by the majority of team members, discussionof issues raised by the scores, and action taken to pro-mote sustainability. Those with more sporadic quarterlycompletion and more limited discussion and action takenwere classified as ‘partly engaged.’ In a series of charts, wecompare the pattern of SM scores for ‘engaged’ and ‘partlyengaged’ teams over time and, put simply, whetherthese make sense based on what we know about actiontaken by projects to promote sustainability. These dataare presented in aggregated form in the article. We alsopresent data in a more granular form in Additional file 1:Appendix A, which shows team-level data, and Additionalfile 2: Appendix B, which presents scoring trends for allten key factors.We hypothesize that if, as claimed, the SM promotes
understanding of and measures progress towards sustain-ability, then over time a closer agreement on the likelihoodof the project work being sustained is likely to emergefrom the SM scores. To test this hypothesis, we derived a‘diversity of opinion’ measure to assess variation andthe extent to which responses to the model diverge orconverge over time. The ‘diversity of opinion’ measurewas defined to be the range of the responses for eachfactor in the model each time a team completed theirresponses. Thus it is calculated as follows: using theunweighted responses 0 to 3, subtract the lowest responsefrom the highest response given by the specified team onthe specified occasion for the specified factor. For eachfactor a score of 0 indicates no diversity of opinion orfull agreement, meaning that every respondent chosethe same statement or level of response at that point intime. A score of 3 indicates high diversity, where at leastone respondent chose the highest weighted statementand one chose the lowest weighted statement. Scores of1 or 2 represent intermediate degrees of diversity in theresponses. This is a purely descriptive measure, andcaptures the maximum difference between team memberson a given factor, on a given occasion. The range waschosen over other statistical measures of variation (suchas interquartile range or standard deviation) because it isappropriate for four-level ordinal scale data and capturesthe existence of diversity among a small number ofmeasurements, in a simple manner that is straightforwardto interpret. It is important to note that this measure isnot intended to be associated with any sense of ‘better’ or‘worse.’ In particular, the authors make no assumptionabout whether or not a greater diversity of opinion within
a team is beneficial or detrimental to success of imple-mentation or to sustainability. At the CLD events referredto above, we also gathered feedback using a simple anon-ymized questionnaire from team members regarding easeof understanding, ease of application, and usefulness ofthe SM to explore reasons for variation in engagement.
ResultsSeven of the 19 teams analyzed were categorized as‘engaged’, five as ‘partly engaged’ and seven as ‘notengaged’. Tables 2 and 3 show the numbers of staff in‘engaged’ and ‘partly engaged’ teams completing theSM over time.Figures 2 and 3 show aggregated scoring trends for
‘engaged’ and ‘partly engaged’ for the three domainsover time. Additional file 1: Appendix A presents theaggregated data of Figures 2 and 3 in a more granularform, and Additional file 2: Appendix B presents dataon the scoring trends for each of the 10 factors.A comparison of ‘engaged’ and ‘partly engaged’ teams
shows that scoring trends diverge. Looking at trends overtime, Figures 2 and 3 indicates (and Additional file 1:Appendix A confirms) many teams’ scores showing afall from the initial baseline measure to the secondquarter. The first measurement was taken at a preparatorystage of the project. CLAHRC NWL worked with teamsin these early stages using methods like process mappingand driver diagrams to plan how to approach imple-mentation in their local organizational environment. Itis possible therefore that this fall in the second quarterfor many teams represents a tempering of initial optimismor a ‘reality check’ as teams’ understanding of thecomplexity of the challenges to implementation becameclearer.After this second quarter, the scoring trends of ‘engaged’
and ‘partly engaged’ teams diverge. In the ‘Staff ’ domainthe scores for ‘engaged’ teams rise between quarters twoand five. Chart A1 in Additional file 1: Appendix A showsthis is the case for all but one of the teams and ChartB1 in Additional file 2: Appendix B shows this rise isconsistent for the four factors in the ‘Staff ’ domain.

Table 3 Number of staff completing model per quarterfor ‘partly engaged’ teams
Q1 Q2 Q3 Q4 Q5 Q6 Q7 Total
Team 8 8 9 7 8 4 2 4 42
Team 9 13 7 6 2 1 3 3 35
Team 10 8 10 10 6 6 8 5 53
Team 11 7 6 7 10 8 6 6 50
Team 12 5 4 8 1 1 5 3 27
Doyle et al. Implementation Science 2013, 8:127 Page 6 of 10http://www.implementationscience.com/content/8/1/127
This is consistent with the tendency for these engagedteams to take more action related to the ‘Staff ’ domain inthis period than ‘partly engaged’ teams. Typical actionsto promote sustainability in this domain include: repeatedefforts to raise awareness of initiatives beyond staff projectteam members; gaining the endorsement and support ofclinical and managerial staff for their work; identifyingthrough trial and error what group of staff are bestplaced to assume responsibility for implementing newpractice in the long-run and targeting this group forcapacity building, and training to promote skills in de-livering the improvements; involving staff and patientsupon whom successful implementation depends in thedesign of systems and processes to promote ownershipbeyond the team; dissemination of work to local, national,and international audiences through conferences andother means to raise the profile and promote the cred-ibility of their work with senior clinical and managerialstaff in their own organizations.Scoring trends for the ‘Process’ domain are also con-
sistent with project activity. As part of the CLAHRCNWL’s program, all teams received training and ongoingsupport to apply quality improvement methods to ex-periment with and iteratively adapt their new practiceto fit with processes of care delivery. Teams used theseto experiment with changes to care delivery processesinitially on a small scale, measure impact through Plan-Do-Study-Act cycles and statistical process control, and
Figure 2 Trends in domain scores for ‘engaged’ teams.
refine or adapt their approach to implementation wherenecessary to fit with existing processes of care deliveryin their organization. CLAHRC NWL helped teams todefine process measures and set up computerized on-line systems to enable weekly monitoring of progress.A greater tendency for ‘engaged’ teams to focus onprocess-related issues is consistent with their higherSM scores in this domain. The comparatively higherscores in the ‘Organization’ domain for ‘engaged’ teamsalso reflect action to raise the profile of their workamong senior managers and clinicians and to showhow successful implementation of project work cancontribute to that organization’s aims.Interestingly, for many ‘engaged’ teams, particularly in
the Staff domain, there is a fall in teams’ scores in thepenultimate quarter of measurement The precise reasonsfor this would need more detailed research, but we suggestthis may be another ‘reality check’ as the 18-month projectfunding nears completion.It is important to state that it is possible the patterns
in Figures 2 and 3 are in fact random. Without a statis-tical analysis it is not possible to rule this out. However,the scoring trends are in general consistent with activitywithin the ‘engaged’ teams related to sustainability. Simi-larly, the lower scores for ‘partly engaged’ teams—teamsthat completed the SM every quarter, but took littleaction to promote sustainability—are consistent with whatone would expect to see with more limited activity. Wepresent these findings not as definitive proof of validity,but as one source of data that gave us confidence asmanagers of this program in the validity of the model.This confidence was reinforced by the analysis of diver-
sity of opinion. Figure 4 combines results from all 12 ‘en-gaged’ or ‘partly engaged’ teams projects and shows howthe distribution of diversity of opinion changes over time.As time progresses, there is a shift towards more agree-
ment within project teams, represented in the figure asa shift towards the left in the distribution. For us, this

Figure 3 Scoring trends for ‘partly engaged’ teams.
Doyle et al. Implementation Science 2013, 8:127 Page 7 of 10http://www.implementationscience.com/content/8/1/127
indicates what one would expect to see with a validmodel—a growing consensus on the prospects for sus-tainability (positive or negative) as the funding perioddraws to a close. This does not mean to suggest thatconsensus or diversity of opinion is a good or bad thing,simply that a clear pattern of emerging consensus is ap-parent from this analysis.Every six months we asked team members to rate the
ease of understanding and application of the model andits usefulness. Figure 5 shows ratings falling considerablyas time progresses. Given the challenges we encountered inengaging some teams, negative feedback is not surprising,although the extent shown in Figure 5 was not expected.Because responses are anonymized, it is not possible toassess the proportion of responses in Figure 5 came from‘engaged,’ ‘partly engaged,’ and ‘non-engaged’ teams. Also,the feedback forms provided very limited information on
Figure 4 ‘Diversity of opinion’ analysis. At each point in time, the distrib0 (full agreement) to 3 (maximum diversity of opinion). Distributions that adiversity of opinion than negatively skewed distributions (higher frequencie
the reasons for these ratings. However, in the discussionsection, we offer some possible explanations based onour ongoing contact and periodic discussions with teammembers.
DiscussionAs managers of this collaborative program, we aimed toassess strengths and weaknesses of the SM when appliedin clinical settings. To the best of our knowledge this isthe first study describing the use of the SM by teams tohelp promote sustainability and it explores, as advocatedin a previous study of the SM, ‘whether the SM couldbe used to diagnose and address sustainability problemsin real time’ [10]. It provides a template for how theSM’s effectiveness can be assessed and how it can beused to support teams to focus on factors that affectsustainability.
ution shows the frequency of occurrence of each diversity score fromre positively skewed (higher frequencies in low scores) indicate lesss in high scores).
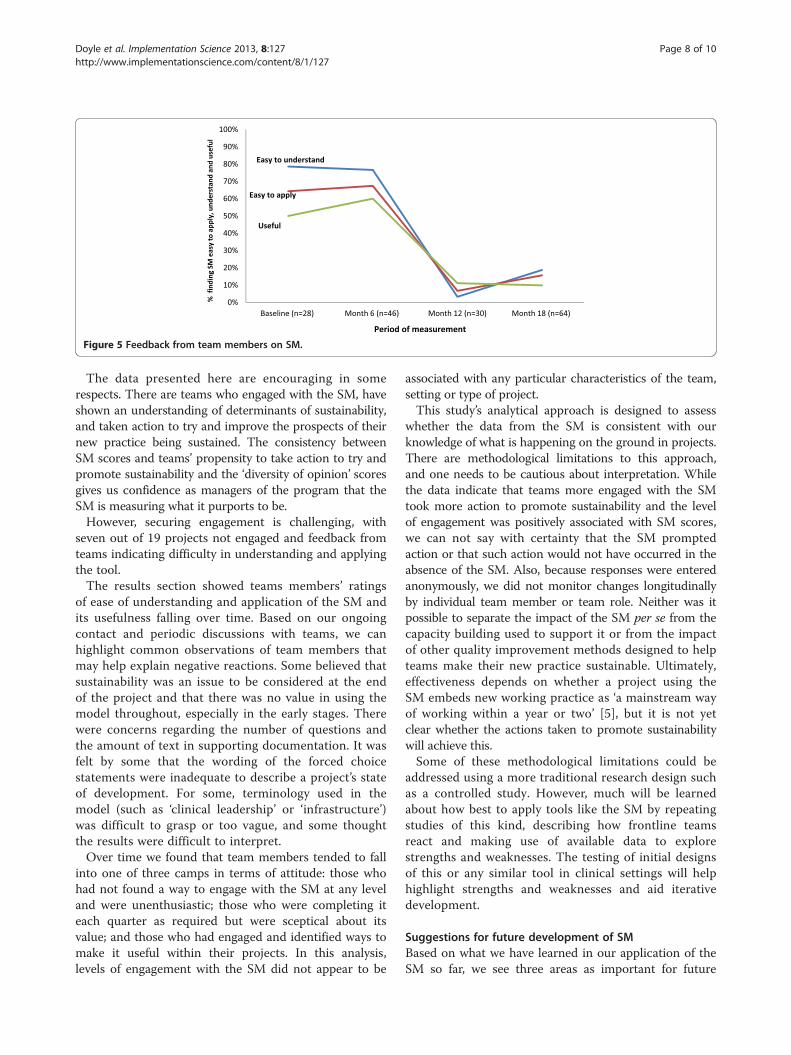
Figure 5 Feedback from team members on SM.
Doyle et al. Implementation Science 2013, 8:127 Page 8 of 10http://www.implementationscience.com/content/8/1/127
The data presented here are encouraging in somerespects. There are teams who engaged with the SM, haveshown an understanding of determinants of sustainability,and taken action to try and improve the prospects of theirnew practice being sustained. The consistency betweenSM scores and teams’ propensity to take action to try andpromote sustainability and the ‘diversity of opinion’ scoresgives us confidence as managers of the program that theSM is measuring what it purports to be.However, securing engagement is challenging, with
seven out of 19 projects not engaged and feedback fromteams indicating difficulty in understanding and applyingthe tool.The results section showed teams members’ ratings
of ease of understanding and application of the SM andits usefulness falling over time. Based on our ongoingcontact and periodic discussions with teams, we canhighlight common observations of team members thatmay help explain negative reactions. Some believed thatsustainability was an issue to be considered at the endof the project and that there was no value in using themodel throughout, especially in the early stages. Therewere concerns regarding the number of questions andthe amount of text in supporting documentation. It wasfelt by some that the wording of the forced choicestatements were inadequate to describe a project’s stateof development. For some, terminology used in themodel (such as ‘clinical leadership’ or ‘infrastructure’)was difficult to grasp or too vague, and some thoughtthe results were difficult to interpret.Over time we found that team members tended to fall
into one of three camps in terms of attitude: those whohad not found a way to engage with the SM at any leveland were unenthusiastic; those who were completing iteach quarter as required but were sceptical about itsvalue; and those who had engaged and identified ways tomake it useful within their projects. In this analysis,levels of engagement with the SM did not appear to be
associated with any particular characteristics of the team,setting or type of project.This study’s analytical approach is designed to assess
whether the data from the SM is consistent with ourknowledge of what is happening on the ground in projects.There are methodological limitations to this approach,and one needs to be cautious about interpretation. Whilethe data indicate that teams more engaged with the SMtook more action to promote sustainability and the levelof engagement was positively associated with SM scores,we can not say with certainty that the SM promptedaction or that such action would not have occurred in theabsence of the SM. Also, because responses were enteredanonymously, we did not monitor changes longitudinallyby individual team member or team role. Neither was itpossible to separate the impact of the SM per se from thecapacity building used to support it or from the impactof other quality improvement methods designed to helpteams make their new practice sustainable. Ultimately,effectiveness depends on whether a project using theSM embeds new working practice as ‘a mainstream wayof working within a year or two’ [5], but it is not yetclear whether the actions taken to promote sustainabilitywill achieve this.Some of these methodological limitations could be
addressed using a more traditional research design suchas a controlled study. However, much will be learnedabout how best to apply tools like the SM by repeatingstudies of this kind, describing how frontline teamsreact and making use of available data to explorestrengths and weaknesses. The testing of initial designsof this or any similar tool in clinical settings will helphighlight strengths and weaknesses and aid iterativedevelopment.
Suggestions for future development of SMBased on what we have learned in our application of theSM so far, we see three areas as important for future
Doyle et al. Implementation Science 2013, 8:127 Page 9 of 10http://www.implementationscience.com/content/8/1/127
effective application of the SM—content, design, andfacilitation.
ContentMany determinants of sustainability proposed in theSM are consistent with those identified in other studies.For example, Shediac-Rizkallah and Bone [13] emphasizesimilar variables such as: whether a new practice is sup-ported by evidence for its effectiveness; the fit betweenthe intervention and the host organization’s missionand operating routines; the presence of an internalchampion to advocate for the program; leadership andwhether the program’s key staff or clients believe it to bebeneficial; compatibility with an organization’s mission,capacities, and operating procedures’ and risks posed bystaff turnover. It is also consistent with a conceptualframework by Edwards et al. that emphasizes human andtechnical resources, opportunities for staff participation,and the alignment of new practice with the organization’sstrategic goals and its added value [14]. Sadof emphasizesthe importance of measurement of patient outcomes todemonstrate the importance of the new practice to thehost organization [15].However, there is scope to expand the variables consid-
ered. We agree with Scheirer’s argument for a strongeremphasis on the political and economic environment asthe context for long-term sustainability [8]. The applica-tion of the SM in the United Kingdom (UK) is taking placeat a time of severe fiscal constraint and large-scalereorganization. For example, the projects included inthis article took place at the same time as a drive tofind efficiency savings (of £20 billion by 2015 nationally)amid economic upheaval in the UK. From a sustainabilityperspective, attempts to implement practice were com-promised through staff turnover, concerns of frontlinestaff for their jobs, and management time that couldbenefit the development of new practice being monopo-lized by work to achieve these efficiencies [16]. In somecases, participants were uncertain of the continued survivalof their organizational units. Future versions of the modelmay need to incorporate questions on the favorabilityof external political and economic factors such as these.Another determinant of sustainability that we believeshould be more prominent in frameworks of this kindis patient and public engagement, which may be just asimportant as staff involvement for sustainability. Thefocus on the fit of new practice with the processes androutines of healthcare organizations risks overlookingwhether such new practice meets the needs of patients.Aspects of a similar tool designed for public health pro-grams by the Washington University of St Louis could beincorporated into future versions of the model [17]. Whilethis tool covers much of the same ground as the SM (suchas staff awareness and engagement, leadership, adaptability
of new practice, and the fit of new practice within theorganization’s systems), it includes questions areas ofenquiry that could help to address some of the short-comings highlighted here, such as whether new practice‘exists in a supportive economic environment’ and theextent of community involvement.
DesignConcerns were expressed by staff over aspects of theSM’s design that should be considered in future work.The SM is an ambitious attempt to get teams to applycomplex ideas, many of which will be unfamiliar tofrontline staff. It requires respondents to consider fourstatements covering ten separate factors affecting sustain-ability, compare their collective scores against maximumpossible scores, and consider what action could or needsto be taken. Future work may be needed to simplify thestructure to lighten the ‘cognitive load.’ A more user-friendly design and further development of questionwording may help reduce some of the resistance. It maybe useful to compare the SM’s design with WashingtonUniversity’s approach, which poses five questions in eightseparate domains with a 7-point scale [17].
FacilitationFacilitation of the SM is key to enabling teams to betterunderstand the concepts underpinning the model andencourage teams to apply it. It is important to note thatthe work described in this study was undertaken in theearly stage of a five-year program. Since then, theCLAHRC NWL team have gained more experience incommunicating key messages and supporting the appli-cation of the SM. We developed novel approaches totraining and facilitation in using the SM. On realizingthat a didactic approach (with a plenary speaker presentingtheory) was having limited success, we changed the waywe introduced the SM to subsequent cohorts. This in-cluded the use of peer exemplars and allowing teams tobrainstorm issues from their experience that may affectsustainability and mapping these to the SM to demonstrateits relevance to their experience. To some teams we alsooffered facilitated discussion within routine meetings. Weobserved meetings and mapped the subject matter of teamdiscussions to the factors in the SM. We recommendedways to increase uptake and use of the SM includingcompleting the model at the beginning of the meeting,having administrative support enter the responses duringthe meeting, and having a later slot on the agenda todiscuss the results. Teams are also set challengessuch as ‘stakeholder mapping’ exercises to help identifykey people that need to be engaged to help promotesustained practice. Attempts to implement the SM else-where will need to factor this type of facilitation intotheir strategy.
Doyle et al. Implementation Science 2013, 8:127 Page 10 of 10http://www.implementationscience.com/content/8/1/127
ConclusionResearch has increased our knowledge of what facilitatesor impedes the sustained application of evidence-basedinterventions in local organizational settings [8]. The SMis an important attempt to apply this knowledge toimprove the success rate of implementation and delivermore consistent improvements in patient care. It does thisby enabling healthcare teams implementing new practiceto systematically consider key determinants of sustain-ability in their organizational environment, provide timelydata to assess progress, and prompt action to createconditions for sustained practice. Tools like these needto be tested and assessed for effectiveness in clinicalsettings and refined where necessary to help make progressin this area.
Additional files
Additional file 1: Appendix A. Domain scores by team.
Additional file 2: Appendix B. Scoring trends by the ten key factors.
Competing interestsThere are no competing interests in this article.
Authors’ contributionsCD led the conception, design and drafting of the paper, TW, CH led onanalysis and interpretation of data and RM, CM, KP and JS made substantialcontributions to conception and design of the paper. All authors read andapproved the final manuscript.
FundingFunding was provided by the NIHR CLAHRC for Northwest London.
DisclaimerThis article presents independent research commissioned by the NationalInstitute for Health Research (NIHR) under the Collaborations for Leadershipin Applied Health Research and Care (CLAHRC) program for North WestLondon. The views expressed in this publication are those of the authorsand not necessarily those of the NHS, the NIHR or the Department of Health.
Received: 7 March 2013 Accepted: 23 September 2013Published: 26 October 2013
References1. Department of Health: Innovation, health and wealth: accelerating adoption
and diffusion in the NHS department of health. Department of Health; 2011.2. Scheirer MA: Is sustainability possible? a review and commentary on
empirical studies of program sustainability. Am J Eval 2005, 26(3):320–347.3. Stirman SW, Kimberly J, Cook N, Cook N, AC Castro F, Charns M: The
sustainability of new programs and innovations: a review of theempirical literature and recommendations for future research.Implement Sci 2012, 7(17).
4. Ham C, Kipping R, McLeod H: Redesigning work processes in health care:lessons from the national health service. Milbank Q 2003, 81(3):415–439.
5. Maher L, Gustafson D, Evans A: NHS Sustainability Model. NHS Institute forInnovation and Improvement; 2010. www.institute.nhs.uk/sustainability.
6. Pluye P, Potvin L, Denis J-L: Making public health programs last:conceptualizing sustainability. Eval Program Plann 2004, 27(2):121–133.
7. Levitt B, March J: Organizational learning. Annu Rev Sociol 1988, 14:319–340.8. Scheirer MA, Dearing JW: An agenda for research on the sustainability of
public health programs. Am J Public Health 2011, 101(11):2059–2067.9. Langley G, Nolan K, Nolan T, Norman C: L. P. The Improvement Guide: a
practical approach to enhancing organisational performance. San Francisco:Jossey Bass Publishers; 1996.
10. Garside P, Garside P: Organisational context for quality: lessons from thefields of organisational development and change management. Qual HealthCare 1998, 7:58–515.
11. Ford JH II, Krahn D, Wise M, Oliver KA: Measuring sustainability within theveterans administration mental health system redesign initiative. QualityManagement in Healthcare 2011, 20(4):263–279.
12. Campbell SM, Braspenning J, Hutchinson A, Marshall MN: Researchmethods used in developing and applying quality indicators in primarycare. BMJ 2003, 326(7393):816–819.
13. Shediac-Rizkallah MC, Bone LR: Planning for the sustainability of community-based health programs: conceptual frameworks and future directions forresearch, practice and policy. Health Educ Res 1998, 13(1):87–108.
14. Edwards JC, Feldman PH, Sangl J, Polakoff D, Stern G, Casey D:Sustainability of partnership projects: a conceptual framework andchecklist. Joint Comm J Qual Patient Saf 2007, 33(12):37–47.
15. Sadof MD, Boschert KA, Brandt SJ, Motyl AP: An analysis of predictors ofsustainability efforts at the Inner-City Asthma intervention sites: after thefunding is gone. Ann Allergy Asthma Immunol 2006, 97(1):S31–S35.
16. Smith R: Cuts being made to frontline NHS services survey reveals. London:The Daily Telegraph; 2010.
17. Washington University in St Louis: The Program Sustainability AssessmentTool. St Louis, MO: Washington University; 2012.
doi:10.1186/1748-5908-8-127Cite this article as: Doyle et al.: Making change last: applying the NHSinstitute for innovation and improvement sustainability model tohealthcare improvement. Implementation Science 2013 8:127.
Submit your next manuscript to BioMed Centraland take full advantage of:
• Convenient online submission
• Thorough peer review
• No space constraints or color figure charges
• Immediate publication on acceptance
• Inclusion in PubMed, CAS, Scopus and Google Scholar
• Research which is freely available for redistribution
Submit your manuscript at www.biomedcentral.com/submit