Major Technical Project (MTP) - 2019 - IIT Mandi
67
Major Technical Project (MTP) - 2019 School of Computing & Electrical Engineering IIT Mandi Himachal Pradesh MTP Coordinators Dr. Hitesh Shrimali ([email protected]) Dr. Sriram Kailasam ([email protected])
-
Upload
khangminh22 -
Category
Documents
-
view
3 -
download
0
Transcript of Major Technical Project (MTP) - 2019 - IIT Mandi

Major Technical Project (MTP) - 2019
School of Computing & Electrical Engineering
IIT Mandi Himachal Pradesh
MTP Coordinators
Dr. Hitesh Shrimali ([email protected])Dr. Sriram Kailasam ([email protected])


School of Computing and Electrical Engineering
presents
Proceedings
of
Abstracts and Posters
MAJOR TECHNICAL PROJECTS
Computer Science Engineering
&
Electrical Engineering
2015-19 batch
Dr. HITESH SHRIMALI | Faculty Advisor, B. Tech. Electrical Engineering
Dr. SRIRAM KAILASAM | Faculty Advisor, B. Tech. Computer Science and Engineering
May 2019

ABSTRACTS
Automated Detection of Dicentric Chromosomes
Kishore Kumar Singh
Every individual in this world is exposed to a certain amount of radiation everyday mostly in
extremely small doses. As an occupational hazard, military personnel, emergency responders,
industrial workers and astronauts are exposed to relatively large doses of radiation. Radiation
overexposure is a concern for medical management. Since clinical signs and symptoms of radiation
exposure is dependent on both the absorbed radiation dose and time after the exposure. No specific
medical test is available for detection of low dose(that is the permissible limit for occupational
workers. Any excess radiation dose above this limit can potentially increase the possibility of health
consequences which becomes deterministics with increasing doses. Cytogenetic biodosimetry is the
process of estimating absorbed dose of radiation by calculating the frequency of dicentric
chromosomes per metaphase. The process is completely manual from blood sample collection to
laboratory processing and reading slides. The scoring of metaphase slides is time consuming and
requires at least a day after the slide is prepared (3rd day after blood collection). This requires
specialized skill and competency and in any laboratory such persons are limited in number. In case
of a large scale radiation disaster, the assessment of triage cannot be handled by manual
biodosimetry. For this process, a faster diagnosis system is required. This can be achieved by
automating the scoring and quantification of dicentric chromosomes in captured images of
metaphases.

Charging for E-rickshaw Applications
Gourav Bhatt and Shrawan
With growing concerns for environmental protection E-vehicles are gaining popularity all
over the world. But due to lack in infrastructure especially in India the large scale usage of E-
vehicles is very difficult in present time. Auto-rickshaws and E-rickshaws which is a sub
category of e-vehicles are three Wheeler’s mainly used for transport in south asian countries. E-
rickshaws has many advantages as compared to auto-rickshaws like low investment cost and its
environmental friendly nature. There is a large market for e-rickshaws in India but there are no
rules and regulations set by the government and the rules which are there are not followed.
Presently there are large number of e-rickshaws operating in the urban cities of India but their
problems are still unaddressed. In the present design of e-rickshaw the charger is separate from
vehicle and contains a very complex circuit. The input current taken by the charger from the grid
injects lot of harmonics into the system which are much more than the limit set by IEEE for total
harmonic distortion meaning there the circuit for power factor correction in the charger is not
working properly if there or else there is nothing for power factor correction in the charger. The
conventional method for power factor correction is by using the boost converter and regulating
the inductor current to shape it same as the voltage to reduce the distortion in the current
waveform. We have used two loop control for current and voltage regulation using pwm such
that the duty cycle will change in order to shape the current wave as sinusoidal. The experimental
setup which we have done is for this method. The same method can be used for power factor
correction in charger with the same control strategy. The design of on board charger has been
discussed in which instead of boost converter we are using thee motor windings in interleaved
design. This improves the efficiency of the system and makes the system more compact. The
design is done keeping the integrated charger in mind meaning the work can be extended to
make also controller for bldc motor which uses inverter for switching. At single time only one
operation is done. This design is much simpler than the present design and more efficient too.
The results which we have got prove that the control strategy which we have used reduces the
harmonics below the level given by IEEE standards.

Design of an 8 bit 1 GSps continuous time sigma delta modulator
Himanshu Kumar
Supervisor: Dr. Hitesh Shrimali
This work presents a continuous time sigma delta modulator with a resolution of 8-bit, oper-
ating at 1 GS/s. The traditional operational amplifier used in this modulator to make the in-
tegrator is replaced by an inverter based AB push pull op-amp for high bandwidth and en-
ergy efficiency. Dynamic comparator is used for sampling and comparison of data and act-
ing as an 1-bit quantizer. Resistive dac is used to transfer 1-bit modulated data to input for
feedback. The continuous time sigma delta modulator has been designed using 28 nm FD-
SOI technology with supply voltage of 0.9 V and sampling speed of 1GS/s. The designed
ADC achieves a peak SNR of 46 dB. The design achieves 7.35 effective number of bits
(ENOB) with 2 mW of power consumption. The figure of merit for designed modulator is
11.8 fJ/conversion.
Keywords: Modulator, continuous time sigma delta (CTSD), operational amplifier,
comparator

EEG Based Image Classification
Abhishek Pal
Guides: Dr. Arnav Bhavsar, Dr. Varun Dutt Our work explores the classification of Images based upon the electroencephalogram(EEG) signal which are generated in response to external visual stimuli, and identify if these response contain features that are class specific. We apply deep learning methods to learn the class discriminative features present in the data, and further try to improve upon the current benchmark. We also propose channel-selection and feature learning methods for EEG data which can be applied to other time series paradigm. We create a new dataset by conducting experiments using a protocol which will takes into consideration other cognitive aspect of human visual process. We further apply our machine learning algorithm to obtain encouraging performance on the in-house dataset.

Hyperloop
Munish(B15223)
May 19, 2019
Abstract
Keywords :Magnetic levitation, Linear feedback control systems, Systemperformance, Nonlinear control system, flux observer, adaptive control, slidingmode controlThis project is about the construction and control of Hyperloop. Theconstruction is done such that a Maglev train travels inside partially vacuumtubes. The Maglev train travels lev- itated above the track at about a heightof 10 mm. This part of the project is to control the levitation of the maglevpod above the track. Control techniques like linear PID control and Adaptivesliding mode control and their implementation to the magnetic levitationsystem have been discussed and simulated in Matlab. The two control schemesare compared in the thesis. Linear PID control and the adaptive sliding modecontrol have been also imple- mented onto the actual hardware setup usingArduino as the controller.
1

Portfolio Optimization With Backtesting and Rebalancing Techniques
Abstract
The objective is to find an optimal portfolio i.e. the set of assets in which
investment can be made to obtain better returns and the percentage of
investment to be made in each asset, according to risk constraints that would
yield maximum return. Portfolio optimization makes use of Markowitz’s Portfolio
Theory to make a set of optimal portfolios, which contains maximum return
portfolios for every given level of risk. This set of portfolios is called Efficient
frontier. This project contains optimization with different constraints and
algorithms to get various efficient frontiers to suit the need of investor and to
choose better optimization algorithm. Optimization is followed by choosing few
portfolios from efficient frontier to backtest the portfolio and investing strategy
to optimize the returns. Along with Backtesting this thesis focuses on detailed
analysis of contribution of individual assets to weights, returns and risk in the
portfolio. This analysis will enable user to tweak the weights to be invested in
different portfolios and get a portfolio which is optimal to investors risk tolerance
and other constraints that investor might want to apply. Backtesting is followed
by Rebalancing the Portfolio which keeps the returns consistently increasing and
try to avoid big drawdowns to get better yields.

Design and Implementation of Wireless Power
Transfer
Piyush Anand (B15226), Pankaj Upadhyay(B15323)
May 19, 2019
Abstract
Global warming is the most threatening phenomena in the present time and isalso one of the cause of climate change. The emission of greenhouse gases fromfuel based vehicles is causing a significant contribution to global warming. Todeal with this engineers have come up with the idea of electric vehicles. Ascharging time of the battery is one of the main reason against thecommercialization of electric vehicles, wireless power transfer as technology forthe fast charging of electric vehicles has become the topic of great interests formany electric vehicle manufacturing giants. The desired wireless chargingsystem must have high power rating along with high efficiency. In this project,LLC resonant converter was investigated and a wireless power transfer basedon LLC topology was made. Coils for the WPT system were made and theparameters were find out using a number of experiments.Keywords : LLC Converter, Soft Switching, Resonance Compensation
1

Abstract
Our project is on the control of doubly fed induction generator for grid stability. For wind power energy systems generally DFIG is used. As more and more conventional generating systems are getting replaced by the renewable ones the grid stability is reducing. Our project focuses on the control of DFIG and to implement a technique for grid stability. We have studied the basic working principle of DFIG and it’s control strategies. First the MATLAB model with control of active and reactive power is implemented. Further this project contains the introduction about virtual inertia and the control technique to implement it. At last results and conclusions are discussed. Keywords: Doubly fed Induction Generator (DFIG), Vector Control, Indirect current control, Wind energy, Virtual Inertia.

Project title: Investigation of Digital Platforms (DSP, dSPACE, FPGA) for use in Power Electronic Systems
Members: Sumit Patidar (B15237) and Himanshu Mewara (B15215)
Supervisor: Dr. Bhakti Madhav Joshi
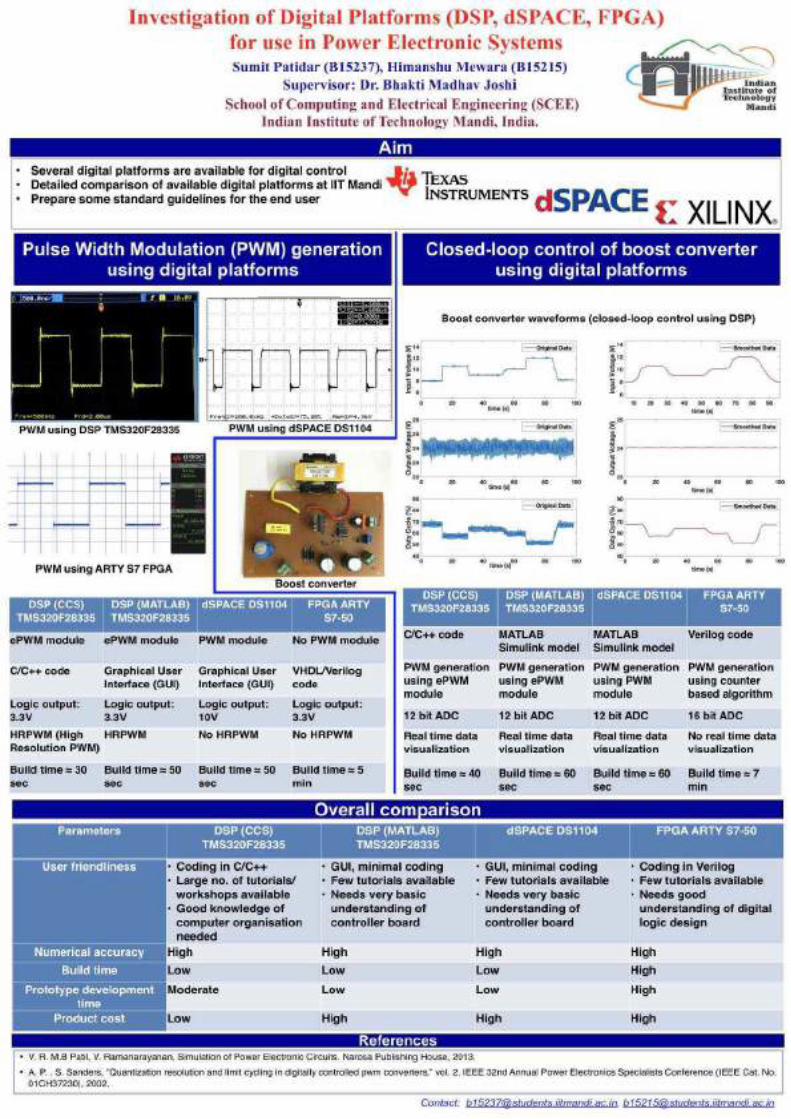
Abstract:Digital control has become very popular in the last decade and is widely used in the closed-loop control of power electronic systems. Due to plenty of digital platforms available, it is often tricky to choose particular digital platform for implementation of the controller. In this project, the comparison of digital platforms (available at IIT Mandi) is made based on certain parameters and we have come up with some standard guidelines to help the end users in the selection of digital platforms. For comparison of digital platforms, implementation of Pulse Width Modulation (PWM) and complete closed-loop control of boost converter is done using DSP TMS320F28335, dSPACE DS1104, and FPGA Arty S7-50 controller boards.
Reconfigurable Cache Architecture
Nemani Sri Hari (B15224) J.Raghunath (B15216)
May 18, 2019
Abstract
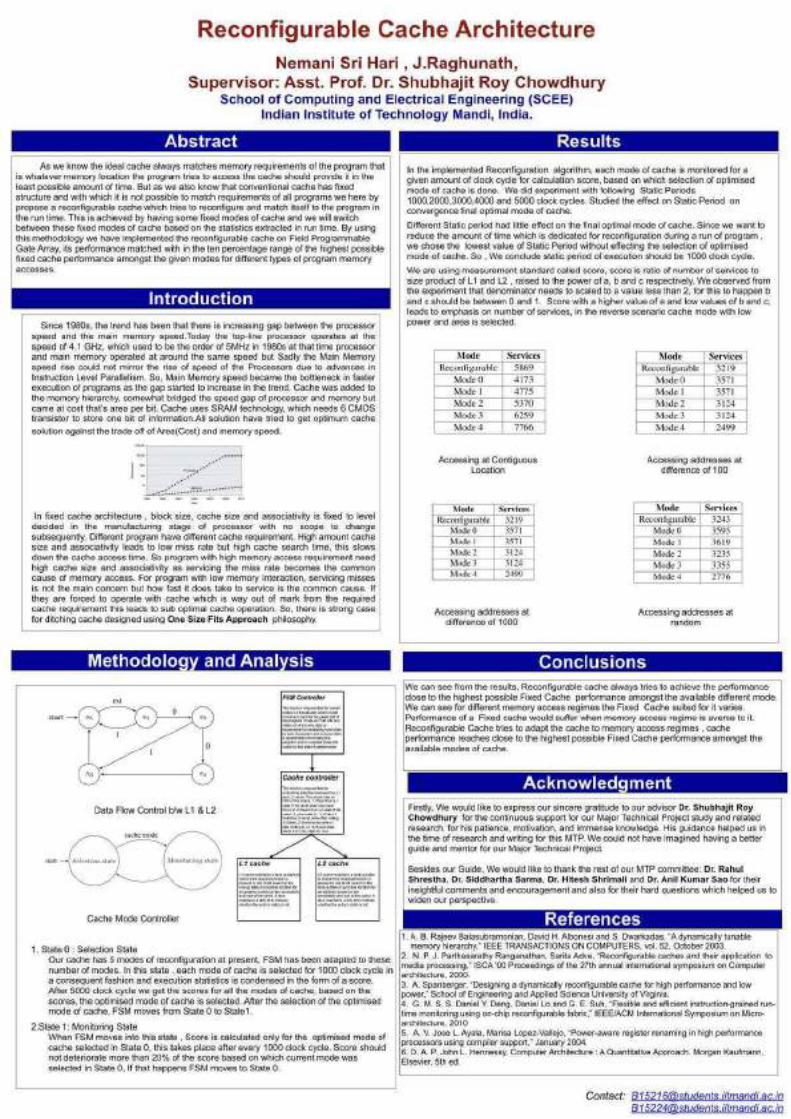
Keywords : Reconfigurable cache, Field Programmable Gate Array, Cache Aswe know the ideal cache always matches memory requirements of the programthat is whatever memory location the program tries to access the cache shouldprovide it in the least possible amount of time. But as we also know thatconventional cache has fixed structure and with which it is not possible tomatch requirements of all programs we here by propose a reconfigurable cachewhich tries to reconfigure and match itself to the program in the run time.This is achieved by having some fixed modes of cache and we will switchbetween these fixed modes of cache based on the statistics extracted in runtime. By using this methodology we have implemented the reconfigurable cacheon Field Programmable Gate Array, its performance matched with in the tenpercentage range of the highest possible fixed cache performance amongst thegiven modes for different types of program memory accesses.
1

Development and Evaluation of Forecasting Methods for Soil
Movements Prediction on Tangni Data-Set
Abhijeet Sharma (B15102)
Land slide occurrences are pretty common in Himalayan region. These landslides are
single major agent of destruction of Infrastructure and is responsible for countless Human
life. Thus, it is very important to predict soil movements before-hand. In this thesis, we have
analysed various classical approaches including different moving average statistical models,
and various Modern approaches to tackle our problem. Also, we have focused on feasibility
of these approaches on Real-World data. Different prediction models are applied on soil
movements (in degrees) data collected from Tangni Hill located in chamoli, India. The soil
movements have been collected in the form of Time-Series, from five different sensor, over a
period of 78 weeks. From our experimentation, Its been derived that when models are applied
individually on sensors, moving average models SARIMA out-performed LSTM based
models by a large gap. It should also be noted that LSTM based models were able to explain
data more concisely.

DECEPTION IN CYBER SECURITY
Vaibhav Agarwal, Aksh Gautam
Mentor: Dr. Varun Dutt
Cyber-attacks are targeting government, industries, banking, and e-commerce business at
an alarming rate. The cyber criminals use advance cyber-attacks e.g. sql injection, phishing,
Trojans, ransom wares to breach the network and gain access to sensitive information. The
growing threat of cyber-attacks on critical cyber organizations reveal the urgent need for finding
methods that enhance network security. Deception, an art of making someone believe in
something that is not true, may provide a promising realtime solution against cyber-attacks. In
this project, we propose a human-in-the-loop real-world simulation tool called HackIT, which
could be configured to create different cyber-security scenarios involving deception. We study
how researchers can use HackIT to create networks of different sizes; use deception and
configure different webservers as honeypots; and, create any number of fictitious ports, services,
fake operating systems, and fake files on honeypots. We investigated the effects of several factors
such as timing of deception, network-size, network-type in different hacking scenarios. We used
Reconnaissance deception systems (RDS) approach to invalidate the information collected by
hacker during the probing phase. The RDS approach was compared with simple Non-RDS and
combination of the former two approaches which consisted of 40 hosts per configuration. Only
25% of the hosts were real while the remaining hosts were honeypots.

Cross Sensor Fingerprint matching
Akash Agrawal (B15303)Supervisor: Prof. Aditya Nigam
Singular point (or Corepoint) of a fingerprint image are special locations having high
curvature properties.
Corepoint Localization in fingerprints is useful for:
1. Reliable feature extraction.
2. Fingerprint Recognition.
3. Feature indexing in database.
The existing techniques for Corepoint localization don’t work well for noisy images.
Moreover, they are only trained to give good results on FVC dataset (having considerably good
quality images) and not on low quality fingerprint images. We are generally asked for fingerprint
scanning multiple times to be able to better register. To make this authentication process more
robust and faster, we can find the corepoint on the fingerprint image and register them to get
better results.
I have made a deep learning model called SP-NET (One Shot
Singular-Point Detector). SP-NET is a novel end-to-end deep network to
detect singular point on a fingerprint image. The proposed model finds out
the singular point (or corepoint) on given a fingerprint image in one go
ensuring fast authentication process. It handles all the noise, blurriness etc.
in the image. The model has been tested on three databases viz. FVC2002
DB1_A, FVC2002 DB2_A and FPL30K and has been found to achieve true
detection rate of 98.75%, 97.5% and 92.72% respectively, which is better
than any other state-of-the-art technique. The work is finally submitted in
BMVC 2019 organized by Cardiff University, UK. Figure 1: Corepoint marked on a fingerprint image

Fault Tolerance in Distributed Systems
Abhishek (B15103) and Abhishek Tiwari (B15238)Supervisor: Dr. Sriram Kailasam
Formal Concept Analysis (FCA) is a method of data analysis using the conceptual
model of data sets and its related attribute sets. S. Kailasam et.al [1] discusses a dynamic load
balancing based approach for Distributed Formal Concept Analysis. The approach given by
them lacks fault-tolerance in the system. This Major Technical Project study aims to develop
a fault-tolerance implementation of the Distributed Formal Concept Analysis approach given
in [1]. A fault-tolerance system is implemented using Apache ZooKeeper as the coordination
system, Apache Kafka as the messaging system. The fault-tolerance approach used in the
implementation is of a checkpointing nature and aims to resolve failures of nodes in the
distributed system.
[1] S. Patel, U. Agarwal, and S. Kailasam. "A Dynamic Load Balancing Scheme for Distributed Formal Concept Analysis." 2018 IEEE 24th International Conference on Parallel and Distributed Systems (ICPADS), pp. 489-496. IEEE, 2018.

Music Composition using Deep Learning Indresh Kumar Gupta (B15317)
Dr. Arnav Bhavsar
The goal of the project is to generate chord progression for a lead guitar sequence. Previous works on this field are focused on generating piano music. Piano music is
easier to convert to audio than guitar music as generated MIDI files could directly be converted using soundfonts without losing the feel of a piano.
Other than piano music, people have also explored generation of electronic music and percussion. The most challenging part of the problem is to imitate the feel of an acoustic guitar.
3 approaches were explored to achieve the goal. First using transfer learning on existing models. Second using raw audio files as input as well as output. Third using encoded input and output vectors with pre-processing and post-processing.
To imitate guitar sound, actual audio signals of notes on guitar are used. These signals are then mixed to generate the guitar sound. Using notes instead of chords provide the model scalability.

MTP Abstract
Modelling decisions from experience using machine learning techniques
Sujay Khandagale (B15217)
In a setting where complete description of the incentive program about risky prospects is known, people make decisions based upon this description known as decisions from description. Whereas in the absence of convenient descriptions about risky prospects, people have to make decisions based upon their previous experience with similar situations known as decisions from experience. For example, for crossing a busy street, a person relies on his previous experiences when he had crossed the street safely. Decisions from experience are found to be markedly different from decisions from description. Classical studies in behavioural decision making have focused on modelling decisions from description. However, little is known about modelling decisions from experience. This project focuses on how machine learning algorithms like deep learning, statistical machine learning and instance-based learning may account for modelling these decisions from experience. Thus, the MTP will be an in-depth evaluation of different machine learning approaches in accounting for people’s experiential decisions.

MTP – Generating Masterprints
Aayush Mishra (B15101)
Supervision – Dr. Aditya Nigam
Abstract: With the advent of powerful smartphones, biometrics have become the most popular
means of subject authentication in recent years. People store a lot of important and private
data in their smartphones, security of which is crucial. In this research, we aim to find
vulnerabilities in such biometric security systems by using masterprints to attack them. Like
master keys, masterprints are biometric keys that can be used to authenticate a lot of people.
To generate fake images, we used a Self-Attention Generative Adversarial Network. We then
used Covariance Matric Adaptation – Evolution Strategy to find masterprints in the space of
fake images. We were successfully able to generate and use these masterprints on standard
matching systems for Fingerprint and IRIS datasets. We found that Fingerprint datasets are
more prone to such attacks and also propose that these vulnerabilities be tackled using
adversarial machine learning.

MACHINE LEARNING IN ASTRONOMY We are in an era in which data-collection rates have increased exponentially. In this period, astronomy is experiencing in which numerous astronomical surveys are releasing data publicly in order to analyze the data. This high volume and complex data has lead astronomers a long way away from tracking and analyzing the night sky with bare eye. With advancements in the field of machine learning and deep learning, automation with the help of computers can help to tackle various problem like classifying, predicting, forecasting, etc. Higher computational powers of today’s processors enable us to handle high volume of data being collected by modern astronomical satellites. In this document, we present MiraPy, a package developed specially for python. In this version of MiraPy, we have tried to account for various different astronomical data with the help of machine learning and deep learning. Components included in the first version of MiraPy are X-Ray Binary classification, ATLAS variable star data classification, OGLE variable star light-curve classification, HTRU1 dataset classification and Astronomical image reconstruction using encoder-decoder. Submitted By: Supervisor: Swapnil Sharma Dr. Arnav Bhavsar

Abstract
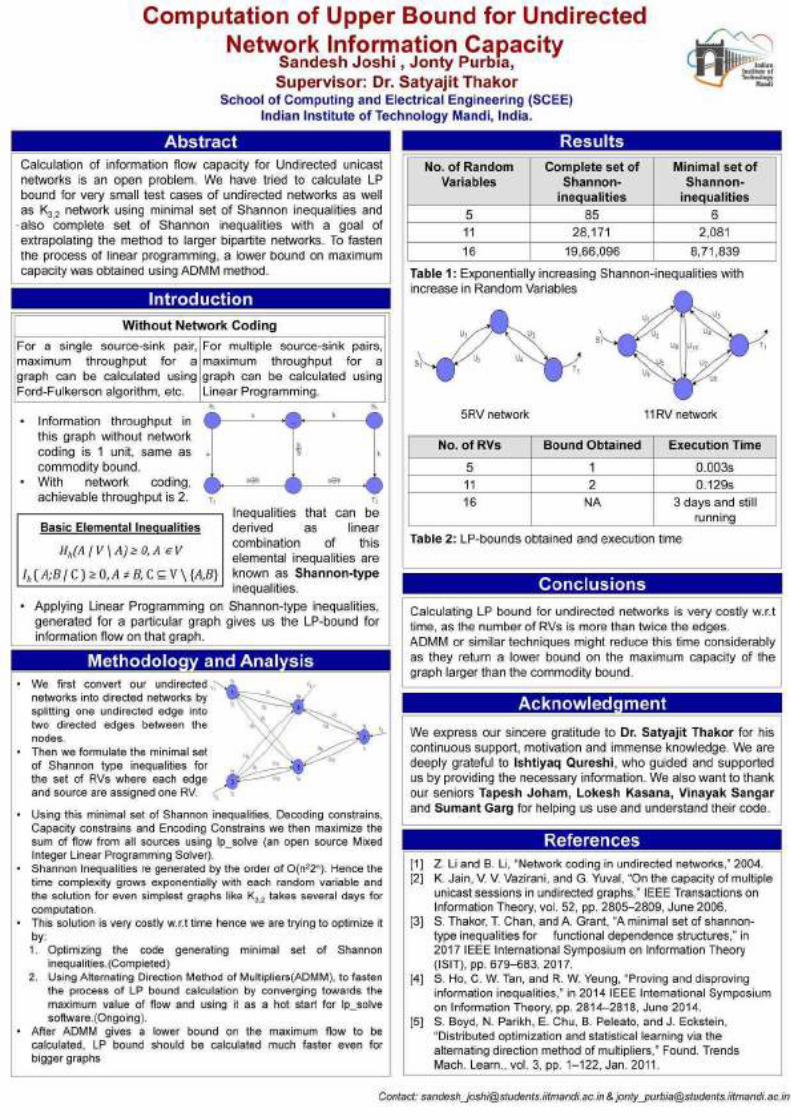
Calculation of information flow capacity for undirected unicast networks is an open problem.
We have tried to calculate LP bound for K3,2 network using minimal set of Shannon inequalities.
We are using an open source mixed integer linear programming software. But the lp_solve
software was taking too long to solve that Linear Programming problem due to the sheer
number of inequalities, so we decided to calculate LP bound for very small test cases of
undirected networks to verify our code. For above mentioned small test cases, we also
calculated the LP bound using the complete set of Shannon inequalities to further verify the
outcome obtained when we used the minimal set of Shannon-inequalities. We also tried a new
method to calculate LP bound on the small test cases in which we are using the complete set of
Shannon-inequalities and applying Alternating direction method of multipliers or ADMM
method on it to get a better start point for lp_solve software to start solving the linear
programming problem. The ADMM method should give a lower bound on the maximum
capacity of the network if flow is maximised. Hence aADMM application is our current goal.

3D Gait RecognitionMohit Sharma (B15118)
Gait has been proven as an important biometric trait for the identification ofhumans. In recent years, there have been excellent improvements in the field ofgait recognition that has made it quite robust and accurate. Gait of anindividual is unique, and robust and can help detect individual from distance,but capturing it depends on multiple factors, like the clothing, lightconditions etc, but most importantly the variation of viewpoint. I have proposedan approach based on 3D parametric baed mathematical feature representation ofthe body. The approach uses 3D convolutions and LSTMs on the above featuresextracted from a frame of a person. The convolutions helps to learn the spatialfeatures and the LSTMs learns the temporal features. This is the first timeanyone has used parametric models for the gait recognition. I have alsoproposed an approach based on the 3D Voxel representation of the human body.

Music Composition using Deep Learning Indresh Kumar Gupta (B15317)
Dr. Arnav Bhavsar
The goal of the project is to generate chord progression for a lead guitar sequence. Previous works on this field are focused on generating piano music. Piano music is
easier to convert to audio than guitar music as generated MIDI files could directly be converted using soundfonts without losing the feel of a piano.
Other than piano music, people have also explored generation of electronic music and percussion. The most challenging part of the problem is to imitate the feel of an acoustic guitar.
3 approaches were explored to achieve the goal. First using transfer learning on existing models. Second using raw audio files as input as well as output. Third using encoded input and output vectors with pre-processing and post-processing.
To imitate guitar sound, actual audio signals of notes on guitar are used. These signals are then mixed to generate the guitar sound. Using notes instead of chords provide the model scalability.

Self Learning Biped Robot Kushagra Singhal
Supervisor : Dr. Aditya Nigam, Dr. Arpan Gupta
Abstract: Over the past decades, many machine learning algorithms have been developed to achieve autonomous operation and intelligent decision making for many complex and challenging control problems. Amongst many such complex control problems, stable bipedal walking has been the most challenging problem. The stability of the biped robot is the main concern. Control systems require high level of mathematical computations and perfect knowledge of both the robot and environment parameters which is not always feasible. Also, self learning algorithms have an edge over conventional control theory in case of dynamic environments. The task was to make a real biped learn to walk on its own through several of its trial and errors, without any prior knowledge of itself or the world dynamics. A virtual biped model and an environment was built using a robotics simulator, OpenAI Gym. The simulated model was trained to walk on even as well as uneven terrain using various reinforcement learning algorithms viz. Deep Q Network (DQN), Deep Deterministic Policy Gradient (DDPG) and Asynchronous Advantage Actor Critic (A3C). Out of these, A3C performed the best and the virtual biped learnt to walk on even as well as uneven terrains. After it learnt walking in simulation, the same set of commands were transferred to a real biped model via socket communication which were further fine tuned by training the real biped model in real environment. The autonomous walking of the biped was successfully achieved for planar surfaces. More robust hardware model was required to make it walk on uneven terrains.

Increasing demand for high field magnetic resonance (MR) scanner indicates the
need for high-quality MR images for accurate medical diagnosis. However, high
cost of high-field MR imaging instead, motivate a need for algorithms to enhance
images from low field scanners. In our work, we have tried out various
approaches to process the given low field (3T) MR image slices to reconstruct the
corresponding high field (7T-like) slices. Our first framework involved a simple
encoder-decoder architecture with skip connections. In order to improve that, we
introduced a global residual layer on top of the encoder-decoder. Global residual
layer performs 1x1 convolutions on the image. The performance was further
improved by introducing an hourglass network in which image is down-sampled
and up-sampled again and again which helps the network to learn the features at
various scales. We have also proposed and evaluated another network
architecture which is same as that of the encoder-decoder network coupled with
the Content Loss network. The loss function of this network incorporates and tries
to optimize both the content loss component and the MSE loss component. This
was done to regularize the network and remove the blurriness effect caused by
the MSE loss. The proposed algorithm outperforms the state of the art approach.
Also, there are different modalities within MR imaging. MRI imaging can be
utilized to interpret the distinct nature of tissues, characterized by two relaxation
times namely T1 and T2 producing contrasting yet related information. The
acquisition of T2 MRI image takes a long time, as compared to T1 MRI image. So,
to reduce the acquisition time of T2 image, there is a need to develop some
algorithm with the help of which we can generate the T2 image given the T1
image quickly and accurately. So, in our project have also worked on to reduce
the acquisition time of T2 modality image and our method have outperformed
the state the art approach significantly.
MR Image Enhancement and Modality Transformation
Sanidhya Aggarwal, Adnaan Nazir

Unobtrusive User Authentication On Mobile Devices Using Multimodal Biometrics
Abstract:
With the prevalent use of smart phones in sensitive applications, unobtrusive methods for continuously verifying the identity of the user have become critical. Unobtrusive or continuous user authentication is an approach to mitigate the limitation of conventional one-time login procedures or password confrontation by constantly verifying user's identity and automatically locking the system once a change in user identity has been detected. It is necessary for the system to periodically collect some identification information about user via. already existing sensors such as accelerometer, gyroscope, touch-pad, camera, magnetometer, global positioning system (GPS) sensor and microphones. This imposes one-phone-one-user (1P2) system to handle the threats encountered by persasive mobile devices. The system will use information extracted from behavioral traits (gait, touch gesture, key stroke dynamics) and physiological traits (face, periocular, ear). The project proposes to identify and authencate individuals on one physiological trait - face for face recognition using the Facenet Siamese Network and one behavioral trait - gait using Siamese Network with various classifiers to find out which gives the best accuracy. For the Face Recognition an android application was created by Qualeams with real time training on face images of person who is in front of the camera. The gait data comprised of 3D signals collected from in-built accelerometer, gyrscope and magnetometer sensors of a OnePlus6 Smart Phone. The data was passed through the Siamese network to get embeddings which were passed through the SVM, Random Forest and Multi Layer Perceptron classifiers for getting the results.
Submitted By:- Mehul Raj Kumawat (B15321)

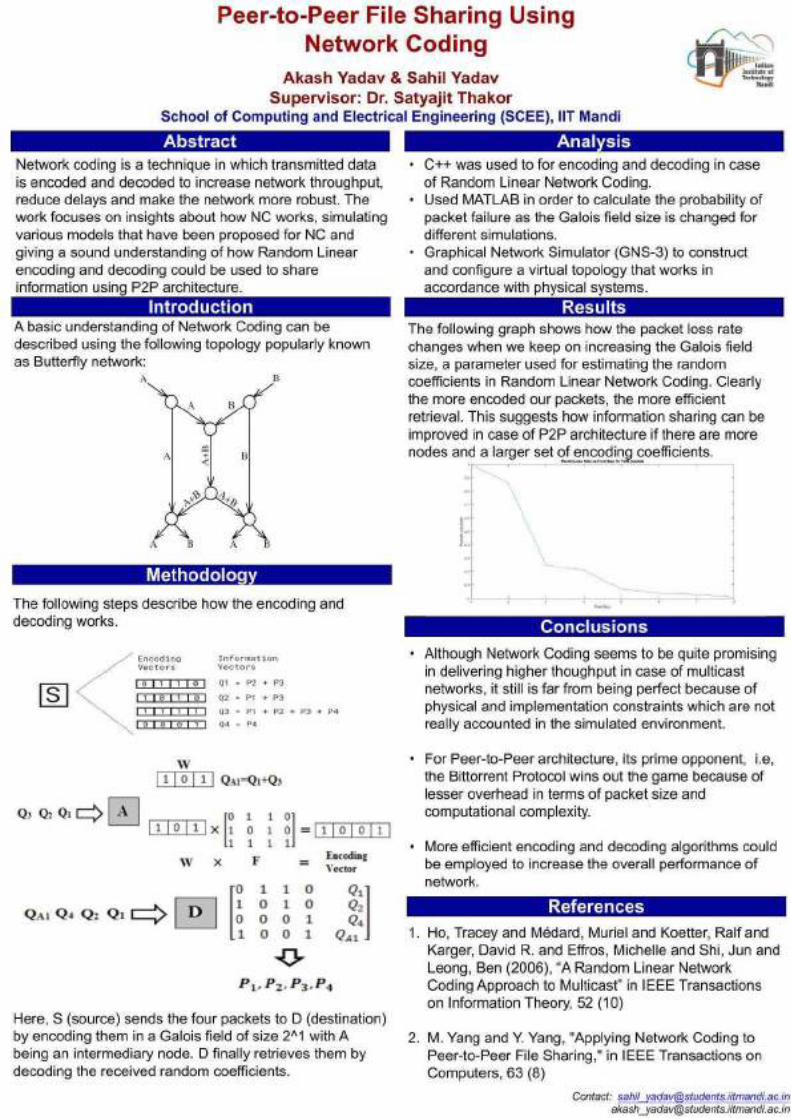
Peer-to-Peer File Sharing Using Network Coding Group Members: Akash Yadav (B15105), Sahil Yadav (B15130) Supervisor: Dr. Satyajit Thakor Project Name: Peer-to-Peer File Sharing Using Network Coding Abstract: Network Coding has been an emerging field in information theory in
recent past. A number of real life applications have been found
promising for deploying NC-based techniques. One such application is
that of peer-to-peer (P2P) file sharing protocol using network coding.
Although there have been significant developments in P2P architecture
with various types of methods, the project is a novel approach to a
simple configuration of sending packets from a source to given receivers
in a fixed topology by encoding them at source nodes and decoding at
the destination nodes.
The work focuses on insights about how Network Coding works,
simulating various models that have been proposed for Peer-to-Peer file
sharing using Network Coding and giving a sound understanding of how
Random Linear Network Coding (a type of Network Coding) and
decoding could be used to finally design and implement a prototype
application for the functionality.

Real Time Automatic Speech Recognition System for Transcription of
Video Lectures
Akash Sharma (B15206) and Mamta Bhagia (B15117) Supervisor: Dr. AD Dileep
School of Computing and Electrical Engineering (SCEE) Indian Institute of Technology Mandi, India.
Project Abstract In this project we present a novel implementation of an automatic real time speech recognition system for the transcription of video/audio lectures. The novel approach focuses on maximising parallelisation of tasks in the speech recognition process to minimise latency of the system. The same has been achieved by developing a multi-threaded system in python using the concepts of threadpools, etc to ensure maximum parallelisation while taking care of possible race conditions. The speech recognition software uses the Kaldi toolkit's ASpIRE model as the speech engine at the backend. The ASpIRE model has been trained to improve its accuracy in transcribing video/audio data in the technical domain. Our approach relies on creating overlapping segments of the input media file which are then used to generate overlapping transcriptions. We then use a dynamic programming based algorithm (modified word edit distance algorithm with backtracking ) to obtain the final transcriptions using the overlapping transcriptions which we then try to display in real time. Another important feature of our proposed system is that the developed software is modular and hence if required the speech engine running at the backend can be replaced with another if need arises. The implementation includes the complete Graphical User Interface (GUI) including the media player developed to play input Video lectures along with their subtitles in a real time fashion.

Multi-Query Optimization Pranav(B15227), Sagar(B15233), Hitesh(B15232)
A stream is an abstraction of unbounded sequence of data. Under this project we are working on answering Aggregate Continuous Queries (ACQs) which are expressed by a range, stride and an aggregate operator. Data Stream Management Systems (DSMS) are meant to provide an efficient implementation of ACQs on streaming data. The clients initially register their queries and DSMS runs these queries and updates the results. In this project, we propose two distributed topologies - Baseline topology and Distributed SlickDeque topology to answer the ACQs efficiently. We also propose SimWeaveShare, a cost based optimiser that exploits weavability to optimise the shared processing of ACQs using Simulated Annealing. Our experimental analysis shows SimWeaveShare outperforms other implementation of query clustering techniques presently available. Our experiments show that the throughput and latency of both the architecture is highly dependent on Range, Slide of the queries and the input stream rate. To cater this problem, we also propose an Auto Scaling Module to autoscale the architecture. Moreover, in order to take decisions on auto scaling we need to predict the incoming load. For such prediction we are incorporating numerous interdependent variables like CPU temp, CPU load, CPU Utilization, Query Plan, Throughput, Latency etc which are dependent among each other over multiple time steps. Data Stream Management Systems (DSMS) were designed to be at the heart of
every monitoring system, from environmental and network monitoring, to disease outbreak prediction, financial market analysis and study of cosmic phenomenon.
DSMSs efficiently handle unbounded streams with large volumes of data and large numbers of continuous queries (i.e., exhibit scalability).
Aggregate Continuous Queries (ACQs) are the most common way of performing analysis over streaming data.
ACQs are characterised by Slide, Window and an Operator. To achieve maximum sharing across ACQs, certain works like FlatFIT,
SlickDeque have proposed to build a shared execution plan combining all the ACQs.
Our goal is to build a distributed framework to answer ACQs which - 1. utilises both Task Parallelism and Data Parallelism
2. increases in-ordered throughput

3. decrease latency
.

POSTERS
Himanshu Kumar, Supervisor: Prof. Hitesh Shrimali
School of Computing and Electrical Engineering (SCEE)Indian Institute of Technology Mandi, India.
Contact: [email protected]
.
Abstract Results
References
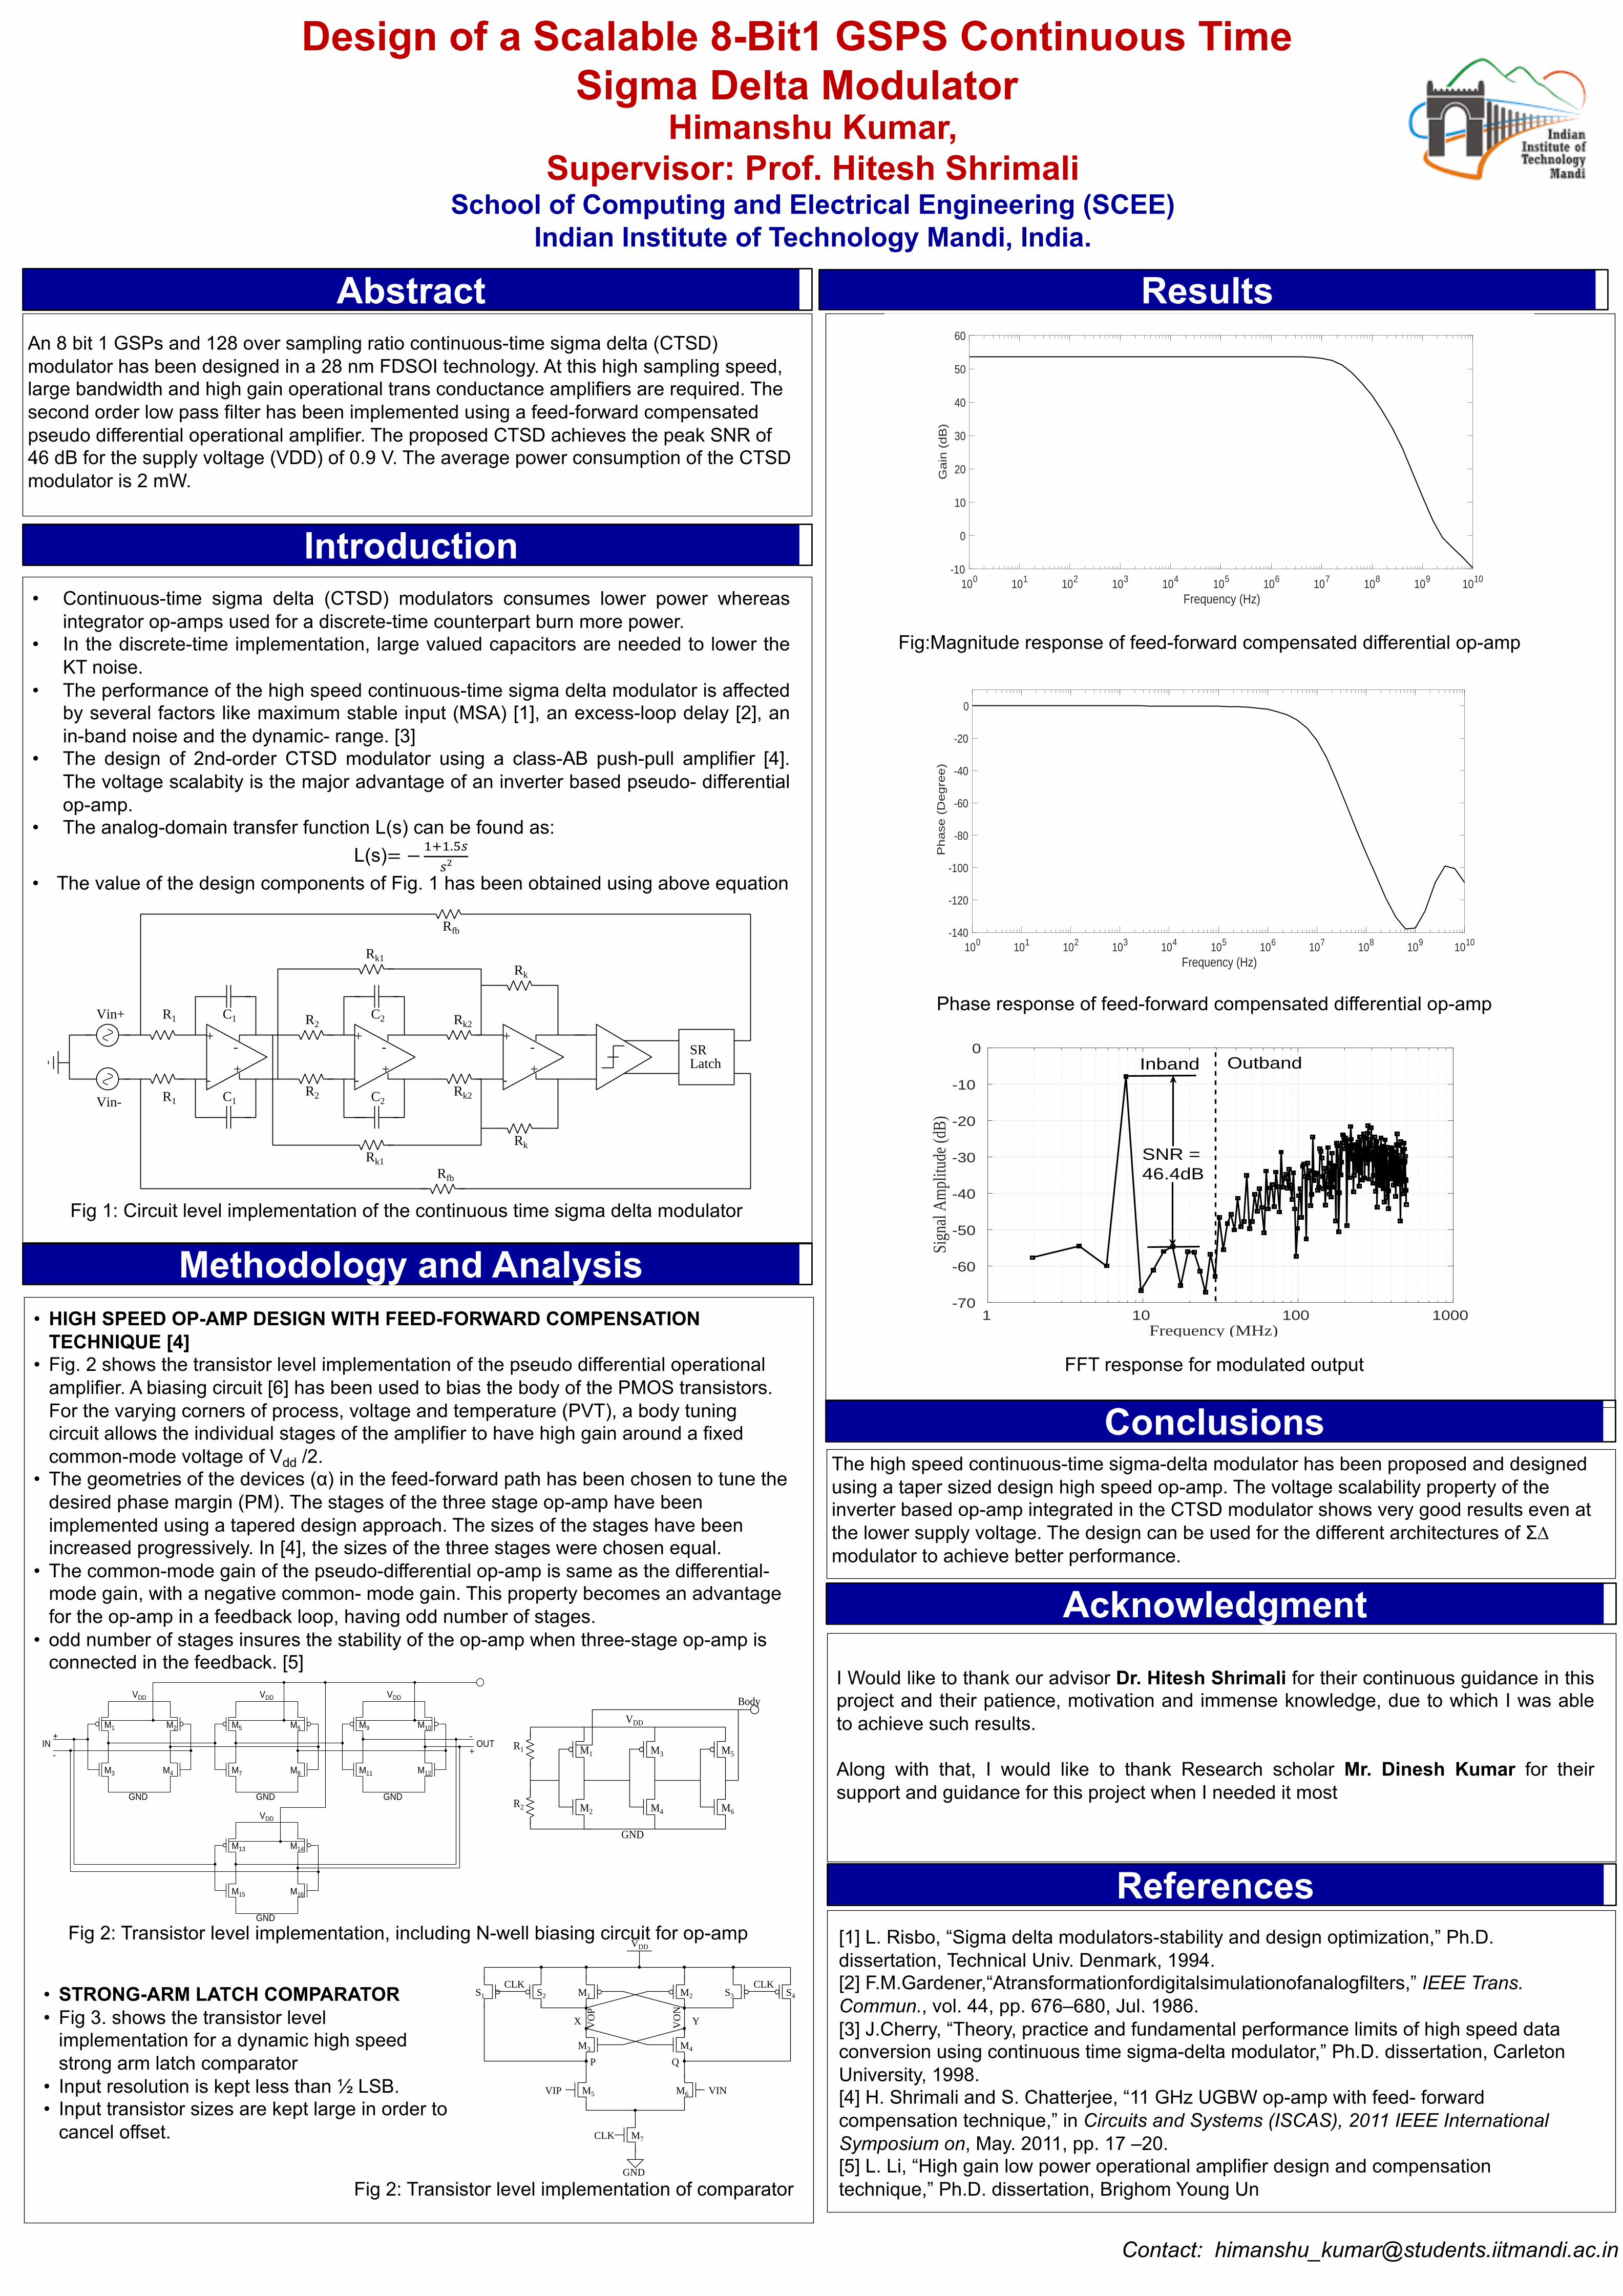
Design of a Scalable 8-Bit1 GSPS Continuous Time Sigma Delta Modulator
The high speed continuous-time sigma-delta modulator has been proposed and designed using a taper sized design high speed op-amp. The voltage scalability property of the inverter based op-amp integrated in the CTSD modulator shows very good results even at the lower supply voltage. The design can be used for the different architectures of Σ∆ modulator to achieve better performance.
Conclusions
Methodology and Analysis• HIGH SPEED OP-AMP DESIGN WITH FEED-FORWARD COMPENSATION
TECHNIQUE [4]• Fig. 2 shows the transistor level implementation of the pseudo differential operational
amplifier. A biasing circuit [6] has been used to bias the body of the PMOS transistors. For the varying corners of process, voltage and temperature (PVT), a body tuning circuit allows the individual stages of the amplifier to have high gain around a fixed common-mode voltage of Vdd /2.
• The geometries of the devices (α) in the feed-forward path has been chosen to tune the desired phase margin (PM). The stages of the three stage op-amp have been implemented using a tapered design approach. The sizes of the stages have been increased progressively. In [4], the sizes of the three stages were chosen equal.
• The common-mode gain of the pseudo-differential op-amp is same as the differential-mode gain, with a negative common- mode gain. This property becomes an advantage for the op-amp in a feedback loop, having odd number of stages.
• odd number of stages insures the stability of the op-amp when three-stage op-amp is connected in the feedback. [5]
Introduction• Continuous-time sigma delta (CTSD) modulators consumes lower power whereas
integrator op-amps used for a discrete-time counterpart burn more power.• In the discrete-time implementation, large valued capacitors are needed to lower the
KT noise.• The performance of the high speed continuous-time sigma delta modulator is affected
by several factors like maximum stable input (MSA) [1], an excess-loop delay [2], anin-band noise and the dynamic- range. [3]
• The design of 2nd-order CTSD modulator using a class-AB push-pull amplifier [4].The voltage scalabity is the major advantage of an inverter based pseudo- differentialop-amp.
• The analog-domain transfer function L(s) can be found as:L(s)= −#$#.&'
'(
• The value of the design components of Fig. 1 has been obtained using above equation
Acknowledgment
I Would like to thank our advisor Dr. Hitesh Shrimali for their continuous guidance in thisproject and their patience, motivation and immense knowledge, due to which I was ableto achieve such results.
Along with that, I would like to thank Research scholar Mr. Dinesh Kumar for theirsupport and guidance for this project when I needed it most
An 8 bit 1 GSPs and 128 over sampling ratio continuous-time sigma delta (CTSD) modulator has been designed in a 28 nm FDSOI technology. At this high sampling speed, large bandwidth and high gain operational trans conductance amplifiers are required. The second order low pass filter has been implemented using a feed-forward compensated pseudo differential operational amplifier. The proposed CTSD achieves the peak SNR of 46 dB for the supply voltage (VDD) of 0.9 V. The average power consumption of the CTSD modulator is 2 mW.
+
-
-
+
+
-
-
+
+
-
-
+
R1
R1
R2
R2
Rk1
Rk1
Rk2
Rk2
Rk
Rk
C2
C2
C1
C1
SRLatch
Rfb
Rfb
Vin+
Vin-
VDD
GND
VDD
GND
VDD
GND
VDD
GND
OUT-
+
M1 M2
M3 M4
M5
M7
M6
M8
M9 M10
M11 M12
M13 M14
M16M15
IN+
- M1 M3 M5
M6M4M2
R1
R2
VDD
Body
GND
VDD
GND
M1 M2 S3 S4
M4M3
M5 M6
M7
S1 S2
CLK
CLK CLK
VIP VIN
VO
P
VO
N
X Y
P Q
100 101 102 103 104 105 106 107 108 109 1010
Frequency (Hz)
-10
0
10
20
30
40
50
60
Ga
in (
dB
)
Fig:Magnitude response of feed-forward compensated differential op-amp
100 101 102 103 104 105 106 107 108 109 1010
Frequency (Hz)
-140
-120
-100
-80
-60
-40
-20
0
Phase (
Degre
e)
Phase response of feed-forward compensated differential op-amp
1 10 100 1000Frequency (MHz)
-70
-60
-50
-40
-30
-20
-10
0
Sign
al A
mpl
itude
(dB)
Inband Outband
SNR =46.4dB
FFT response for modulated output
Fig 1: Circuit level implementation of the continuous time sigma delta modulator
Fig 2: Transistor level implementation, including N-well biasing circuit for op-amp
Fig 2: Transistor level implementation of comparator
• STRONG-ARM LATCH COMPARATOR• Fig 3. shows the transistor level
implementation for a dynamic high speed strong arm latch comparator
• Input resolution is kept less than ½ LSB.• Input transistor sizes are kept large in order to
cancel offset.
[1] L. Risbo, “Sigma delta modulators-stability and design optimization,” Ph.D. dissertation, Technical Univ. Denmark, 1994. [2] F.M.Gardener,“Atransformationfordigitalsimulationofanalogfilters,” IEEE Trans. Commun., vol. 44, pp. 676–680, Jul. 1986. [3] J.Cherry, “Theory, practice and fundamental performance limits of high speed data conversion using continuous time sigma-delta modulator,” Ph.D. dissertation, Carleton University, 1998. [4] H. Shrimali and S. Chatterjee, “11 GHz UGBW op-amp with feed- forward compensation technique,” in Circuits and Systems (ISCAS), 2011 IEEE International Symposium on, May. 2011, pp. 17 –20. [5] L. Li, “High gain low power operational amplifier design and compensation technique,” Ph.D. dissertation, Brighom Young Un
Gourav Bhatt , Shrawan Kumar Supervisor: Dr. Narsa Reddy Tummuru
School of Computing and Electrical Engineering (SCEE) Indian Institute of Technology Mandi, India.
Contact: [email protected] [email protected]
With growing concerns for environmental protection E-vehicles are gaining popularity all over the world. But due to lack in infrastructure especially in India the large scale usage of E-vehicles is very difficult in present time. E-Rickshaws which is a sub category of E-Vehicle are gaining popularity due to their advantages over auto rickshaws especially low cost. But as there are no rules and regulations regarding their usage so there are many problems with their present design. One such problem is that the charger takes peaky current with a lot of harmonics as input from grid and we have worked on this problem in the project.
Abstract Results
[1] K. W. E. Cheng, “Recent development on electric vehicles,” in 2009 3rd International Conference on Power Electronics Systems and Applications (PESA), pp. 1–5, May 2009. [2] J. C. Gamazo-Real, E. Vzquez-Snchez, and J. Gmez-Gil, “Position and speed control of brushless dc motors using sensorless techniques and application trends,” Sensors, vol. 10, no. 7, pp. 6901–6947, 2010.
References
Charging for E-Rickshaw Applications
The control strategy used for power factor correction in e-rickshaw charger is same as one used in power factor correction by boost converter which is the conventional way. The same method can be extended in making an e-rickshaw charger using the motor windings as inductances thus help in making an on board charger.
Conclusions Methodology and Analysis
Introduction
• The peaky waveform of current is not desirable as it leads to high total harmonic distortion. Harmonics lead to more losses and reduce the overall efficiency of the system. For the same real power the rms current flowing in the circuit increases.
Acknowledgment
We would like to express our gratitude to our project guide Dr Narsa Reddy Tummuru for his constant support and guidance. We would also like to thank the evaluation committee for their valuable suggestions and at last we want to thank M-Tech student Virendra Singh who has helped us a lot in completing the project.
• In order to check the peaky nature of current we tried to see the input waveforms during charging of E-Rickshaw present in our campus with the help of power analyser. We got THD of 76.4% in the input current.
• The main reasons of harmonics is the diode bridge rectifier connected with a capacitive load, The non linear nature of diode forces the current to be zero whenever the diode is reverse biased.
• The control method uses two
closed loops • The inner loop to shape the
sinusoidal input current • The outer loop to regulate the
output voltage • The two switches and diodes
combined make an interleaved boost converter.
• The two switches are operated by giving them a phase shift of 180 degrees.
• The duty cycle of the switches is changed by the control loops to regulate the output voltage and current.
The experimental setup for power factor correction using conventional method of using boost converter is shown in the figure. Results obtained are shown in the next section.
Fig.1 : Peaky current wave
Fig.2 : Main cause of peaky current wave
Fig.3 : Dual Control loop, PS – Phase Shift CM – Current Measurement VM – Voltage Measurement UT – Unity Template
Fig.4 : Experimental Setup
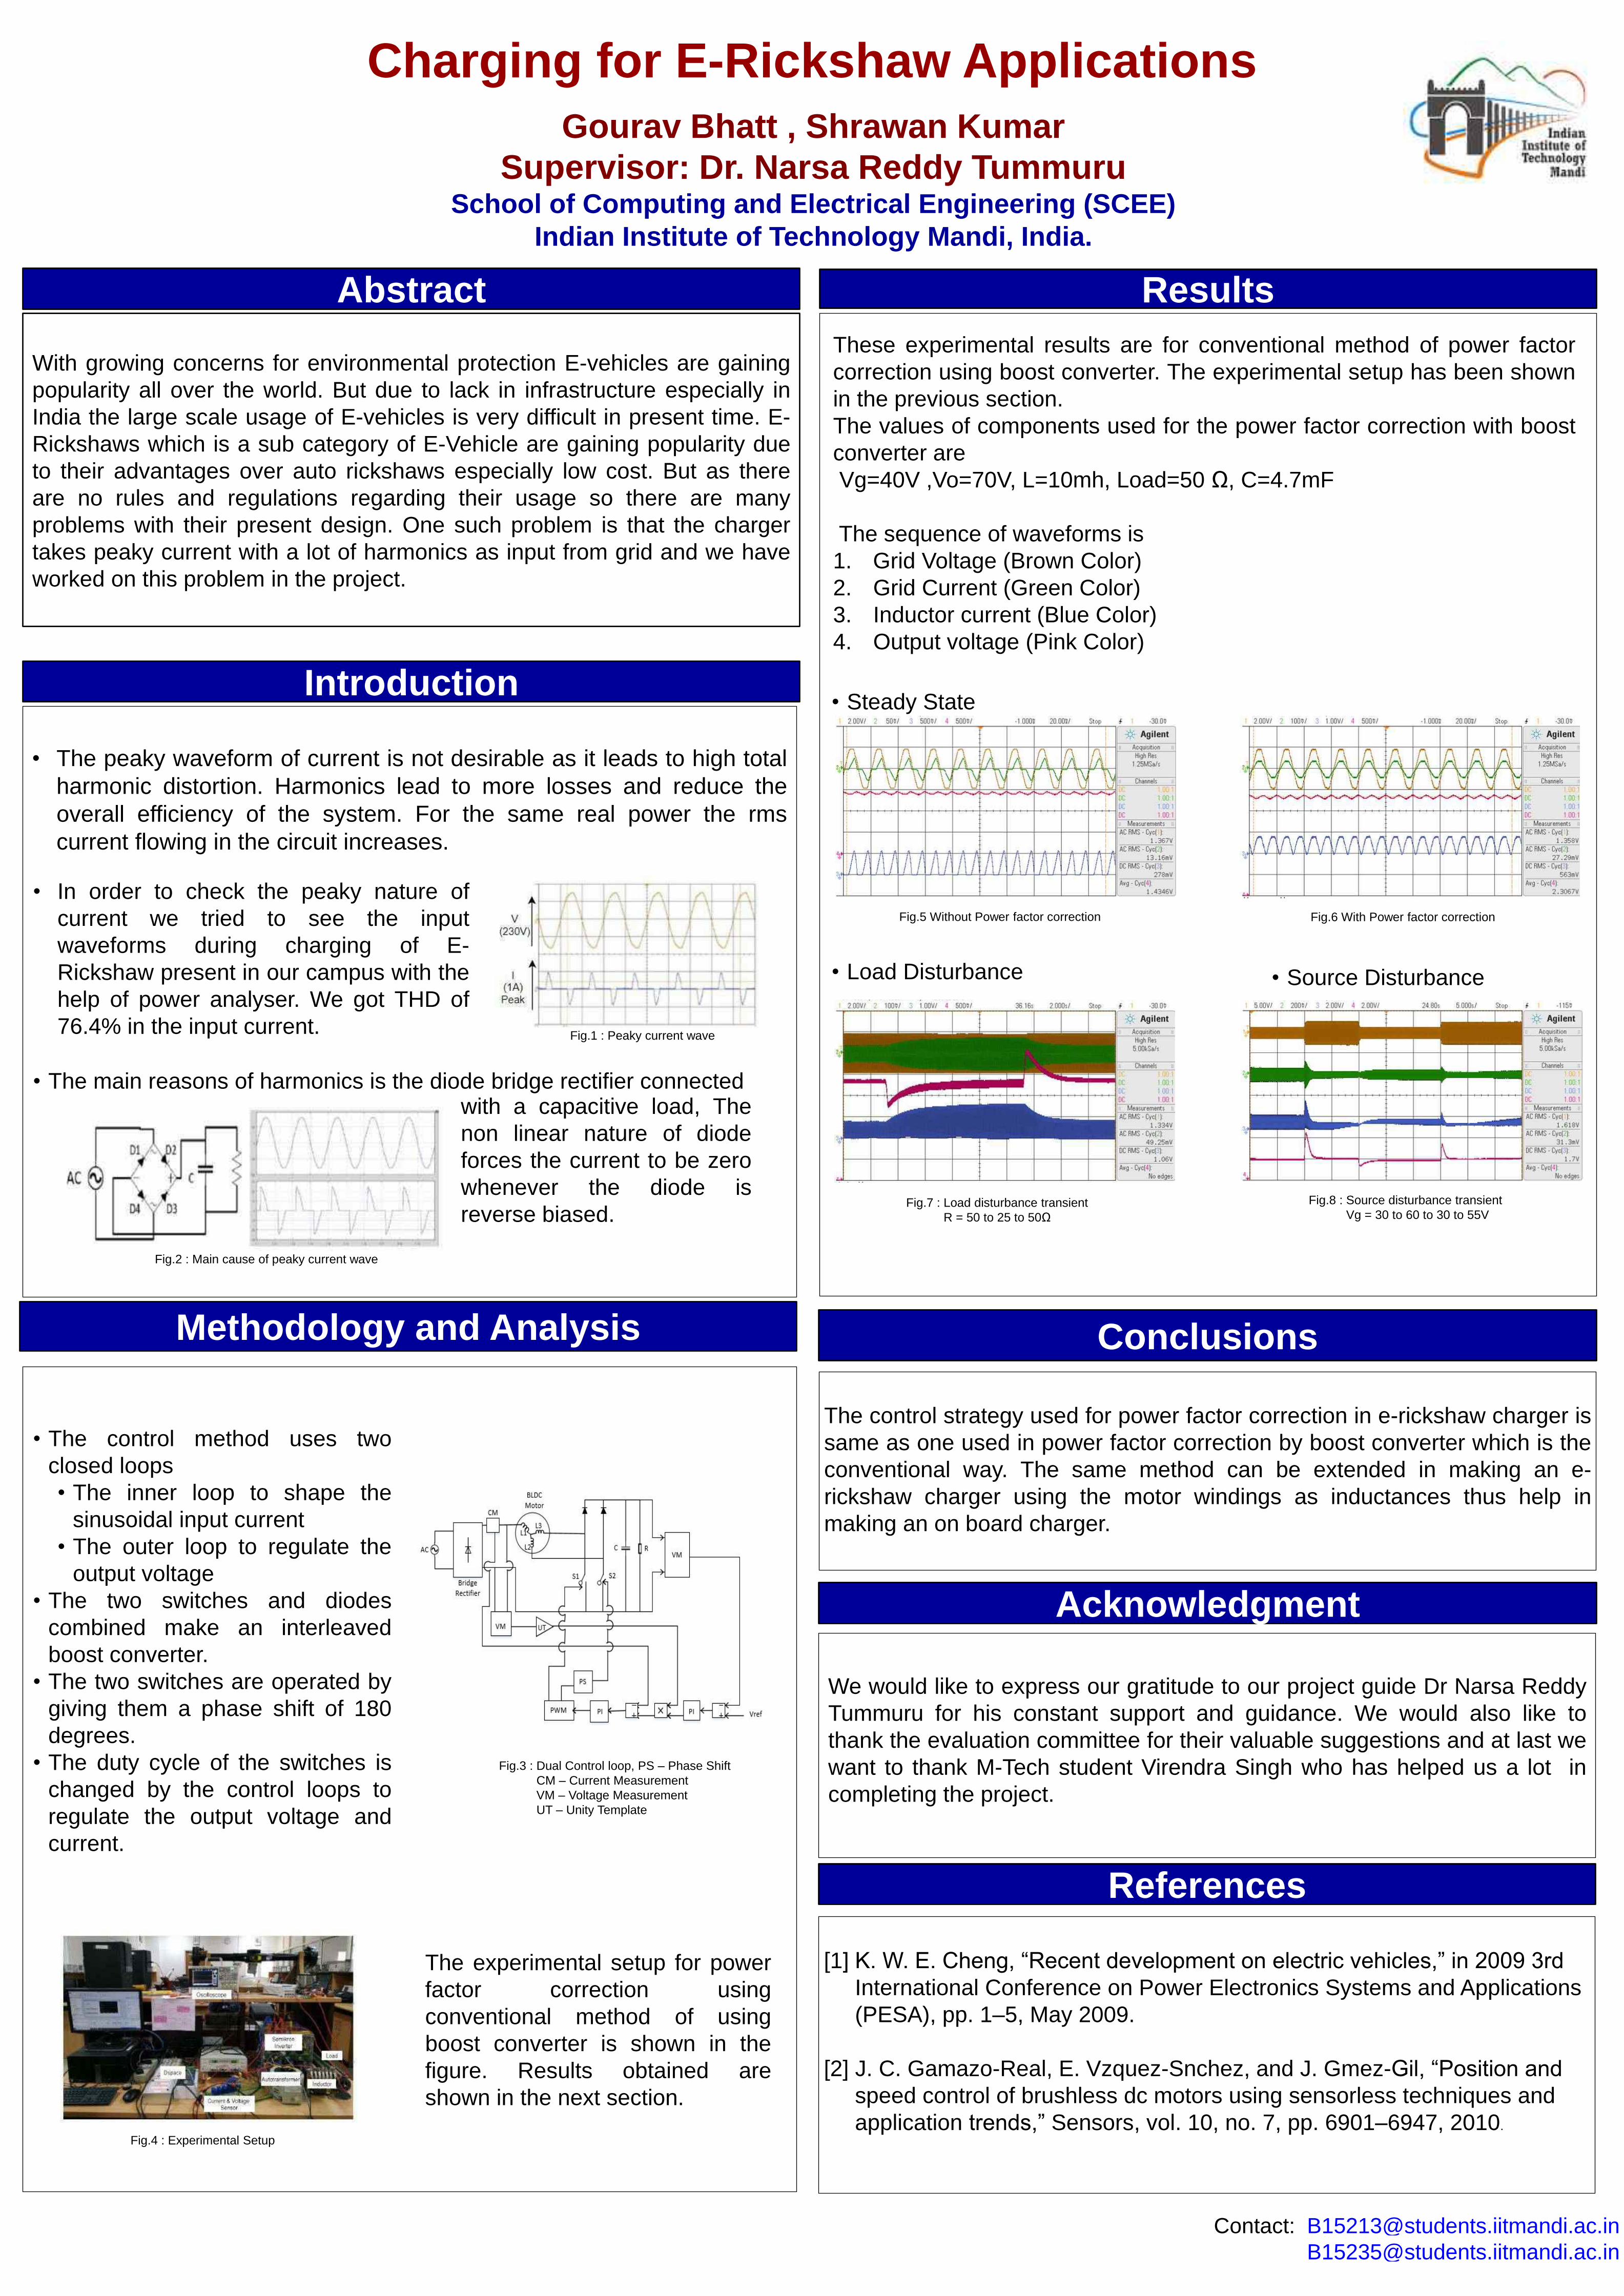
These experimental results are for conventional method of power factor correction using boost converter. The experimental setup has been shown in the previous section. The values of components used for the power factor correction with boost converter are Vg=40V ,Vo=70V, L=10mh, Load=50 Ω, C=4.7mF The sequence of waveforms is 1. Grid Voltage (Brown Color) 2. Grid Current (Green Color) 3. Inductor current (Blue Color) 4. Output voltage (Pink Color)
• Steady State
• Load Disturbance
Fig.5 Without Power factor correction Fig.6 With Power factor correction
Fig.7 : Load disturbance transient R = 50 to 25 to 50Ω
Fig.8 : Source disturbance transient Vg = 30 to 60 to 30 to 55V
• Source Disturbance

Abhishek Pal Supervisor: Dr. Arnav Bhavsar, Dr. Varun Dutt School of Computing and Electrical Engineering (SCEE)
Indian Institute of Technology Mandi, India.
Contact:[email protected]
Abstract Results
[1] C. Spampinato, S. Palazzo, I. Kavasidis, D. Giordano, M. Shah, and N. Souly Deep learning human mind for automated visual classification. arXiv preprint arXiv:1609.00344 , Sep, 2016.
[2] Alberto Bozal, Xavier Giro-i-Nieto Personalized Image Classification from EEG Signals using Deep Learning, 2016-2017
2) Ren Li, Jared S. Johansen, Hamad Ahmed, Thomas V. Ilyevsky, Ronnie B Wilbur, Hari M Bharadwaj, and Jeffrey Mark Siskind Training on the test set? An analysis of Spampinato et al. IEEE transactions on pattern analysis and machine intelligence JANUARY 2019
References
EEG Based Image Classification
The feature learning and channels selection methodology achieved better and comparable performance to 128 channel Raw data.
Such method can be applied to other paradigms of time series data analysis. The chance performance of our classifiers and overfitting suggest that the model
isn’t able to generalize well over the test and validation set owing to the limited number of training samples.
The achieved validation accuracy of 90% and saturating of model above 70% validation accuracy suggest that it’s still quite possible to achieve a good performance, given sufficient data and collected with a correct experiment protocol.
Conclusions
Methodology and Analysis
Result on new collected dataIntroduction
Humans have always been fascinated by ability to read mind and this has led to extensive studies in field of cognitive science.
One such area which has gained great attention in recent years is the ”EEG based Classification” .
Being easier to use and having a high temporal resolution Electroencephalography(EEG) is preferred over other methods for recording brain activities.
Advances in Machine Learning and deep learning have made it possible to model more complex cognitive process.
Studies in Neuro Science have showed that event-related potential(ERP) contain information encoding about dozens of visual object categories.
Recent works have tried to learn class discriminative feature from Raw EEG data which unlike ERP suffers from lot of noise.
Acknowledgment I will like to thank my Guides Dr. Arnav Bhavsar and Dr. Varun Dutt who gave me
an opportunity to work upon this project and for guiding and continuous support. I would like to thank my Akash Rao at ACS Lab for helping me in acquisition of
data and Rahul Mishra at MANAS Lab for helping me on Machine Learning tasks.
The work applies deep learning methodology for classification of images using EEG data. We suggest methods to select the most relevant channels among the existing
128 channels, and feature learning to learn useful and compact representation of the existing EEG Data.
We capture our own EEG data for the image classification task. Experiment with deep learning methods on the new acquired data.
In an EEG data each samples are not independent, one can not disregard the temporal relation between data points.
We validate the previous obtained results on the data on LSTM classifier, and further improve upon this work by proposing 1DCNN Autoencoder based feature learning and channels selection based on entropy analysis.
Number of Classes 40/30
Number of Images per class 50
Numer of subjects 6
Time for rach Image 500ms
Total Data
Train 7335 (64%)
validation 1834 (16%)
Test 2296 (20%)
We perform data acquisition with a new protocol which include perception, recall and feedback phase.
The acquired data is filtered and epochs are extracted, these epochs are finally labelled.
Total Number of Classes 10
Number of Images per class 25
Total Images 250
Visualization Order Random
Time for each Image 500 ms
Time for Recall 10 s
Feedback Duraction 3 s
Pause before Image 3 s
Average Experiment Duration 40 min
We train classifiers such as LSTM and 1DCNN which take into consideration the temporal dynamics of the data.
We train the classifier on binary and ten class data, parameters such as number of layers, output nodes, learning rate, batch normalization were tweaked.
The best performance on various time window with different parameters are reported under the results section.
LSTM Classifier
Feature learning Autoencoder
1DCNN Classifier
Total Data
Train 200
validation 20
Test 230
Data set used Test Accuracy128 channels Raw EEG Data 89.06%
32 selected channel Raw EEEG Data 87.06%
128 channel feature learned data 97.89
Time Window Validation Accuracy Test Accuracy[100:300] 71% 45%
[300:500] 58% 43.33%
[500:700] 65% 56.67%
[700:900] 73.75% 63.33%
[900:1100] 70.0% 33.33%
Time Window Validation Accuracy Test Accuracy[100:300] 80% 51.33%
[300:500] 81.25% 42.67%
[500:700] 76% 48.66
[700:900] 77% 54.00%
Classifier Train Accuracy Validation AccuracyLSTM 64.23% 56.38%
1DCNN 61.95% 55.07%
Performance over overlapped window data for binary class
Best 1DCNN Classifier Accuracy over binary classes
Best LSTM Classifier Accuracy over binary classes
EEG data corresponding to two different class for a subject
LSTM Classifier Result on existing 128 channel Raw EEG Data

Anuksha Jain, Pulkit SapraSupervisor: Prof. Dileep A.D.
School of Computing and Electrical Engineering (SCEE)Indian Institute of Technology Mandi, India.
Contact: [email protected][email protected]
Globalization has resulted in increase in the number of people who speak multiple languages. Multilingual people often use the practice of code-switching (alternating between 2 or more
languages) to amplify and emphasize certain points. To improve the performance of Automatic Speech Recognition (ASR) and make Interactive
Voice Response Systems (IVR) more human-friendly, segmentation and identification of languages in speech samples becomes crucial.
Our task is split into 2 parts Built a robust language identification model. Use this as tool to perform language diarization (change point detection in code switched
speech)
1. Abstract 3. Methodology and Analysis
S. Gupta, A. D. Dileep, and V. Thenkanidiyoor, “Segment-level pyramid match kernels forthe classification of varying length patterns of speech using svms,” in 2016 24th EuropeanSignal Processing Conference (EUSIPCO),pp. 2030–2034, Aug 2016.
Fér, Radek et all, “Multilingually Trained Bottleneck Features in Spoken Language Recognition” (2017).
Wei-keng Liao, “ Parallel k-means data clustering”, 2005. Y. Muthusamy, R. Cole, and B. T. Oshika, “The ogi multi-language telephone speech corpus,” A. Baby, A. L. Thomas, N. L. Nishanthi, and T. Consortium, “Resources for indian languages,”
2016
7. References
Spoken Language Identification and Language Diarization in a Code Switch Conversation
Achieved significant improvement over the state of the art techniques in language identification.
LID-seq-senones carry more language discriminative information as compared to Bottleneck Features (BNF) as they combine phonetic content over a large duration.
Cross-corpus training that these features are sensitive to intersession variabilities. Ideal speedup was obtained when Segment Level Pyramid Match Kernel was implemented
using multithreading thereby reducing training time significantly.
5. Conclusions4. Results
c
2. Introduction
6. AcknowledgmentWe would like to express our gratitude to our Mentor Dr. Dileep A.D. who gave us the opportunity to explore the problem of language diarization in the field of speech. Working on this project enlightened us about several things ranging from dynamic kernels to parallel computing. We had to take a deep dive into the concepts of speech processing, Language Identification, Parallel Programming and Machine learning in order to successfully complete this project.
Language Classification using Bottleneck Neural Network
Language Classification using BLSTM based Network
Parallelisation using OpenMP (Thread level parallelism)
Objective: To compute the kernel score between every pair of input files. In this implementation, each thread computes
the score for one row of the matrix. Kernel matrix is symmetric, i.e., the score
between two files has to be computed once. In the example below, each thread would compute for the shaded part in the respective row.
Since work division is not uniform, dynamic scheduling is used.
Parallelisation using CUDAObjective: To compute the kernel score between every pair of input files for larger volumes of data For computing the score for each
input with respect to the others, a batch system is used.
Batches of a smaller sample of input files are stored.
These batches of data are then sent to the GPU from the host.
Kernel score is computed for this batch and returned to the host.
Representation Dataset No. of Training Samples
Number of test samples
Accuracy
BNF + GSPMK-SVM
OGI-TS 400 400 73.06%
LSS + GSPMK-SVMLSS + GSPMK-SVM
OGI-TSOGI-TS
400800
16501650
82.12%85.70%
LSS + GSPMK-SVM
IITM-IL 400 4400 99.56%
System Accuracy
LSS_OGI_IL 95.25%
LSS_IL_OGI 31.5%
Language Diarization Dataset for code-switching between 2 different
Indian Languages - Hindi and Kannada was created.
Mono-lingual files at low energy points in the audio signal were trimmed and concatenated.
The Language Diarizer was built as a language classifier where each LID Senone was classified into respective language. (Each speech sample consists of multiple LID Senones)
Parallelisation Results
- Speedup = Time taken by best sequential code / Time taken by parallel code- 4 Core Machine
Objectives : Perform language classification using SVM with a Sequence Kernel ( GMM-based segment
level pyramid match kernel ). Reduce training time by parallelising kernel computation. Build a language diarizer using language identification as the tool.
Scope: Bottleneck network was already built and monolingually (English) & multilingually trained with
IARPA Babel Program Data. Language Identification Model is trained for 2 different datasets (10 & 11 output languages
respectively) Language Diarization model is limited to code switching between Hindi and Kannad samples.
Background :
GMM based Segment Level Pyramid Match Kernel Speech is of varying length, where each
sample consists of different number of feature vectors
Hence ‘dynamic kernels’ are used to compute similarity score between these samples.
Bottleneck Neural Network is a topology of a neural network, where one of the hidden layers has a much lower dimension than its surrounding layers. The network is trained for its primary task (in our case phone state classification), bottleneck features are then tapped from this layer. They contain phonetic content which have been utilised for language identification.
Results for BNF and LID Senones tested on OGI-TS and IITM-IL datasets
To study the effect of intersession variability,Tamil (from OGI-TS dataset) was tested on a model trained on Indian Languages (another dataset) and vica-versa.
Cross Corpus Results
TSNE plot for LID Senones

Abhishek Sonal Lokesh Bairwa [email protected] [email protected]
Supervisor: Prof. Bharat Singh Rajpurohit School of Computing and Electrical Engineering (SCEE)
Indian Institute of Technology Mandi, India.
.
Abstract
Results
References
Doubly Fed Induction Generator Control for Grid Stability
Conclusions
Methodology and Analysis
• The virtual inertia control starts at t = 2s hence at t = 2s we see two different curves of frequency deviation. At t = 4s a sharp frequency dip can be seen.
Introduction
[1] Abad, Gonzalo & Iwanski, Grzegorz. (2014). Properties and Control of a Doubly Fed Induction Machine. Power Electronics for Renewable Energy Systems, Transportation and Industrial Applications. [2] R. Ghosh, N. R. Tummuru, B. S. Rajpurohit, and A. Monti, “Virtual inertia by using renewable energy sources: Mathematical representation and control strategy,” Manuscript submitted for publication., page. 6,May 2019.
• By implementing vector control scheme we can control stator’s active and reactive power independently.
• DC-Link capacitor voltage was controlled by indirect current control method. • Virtual inertia control helped in reducing the frequency dip under sudden load
change. • From the results it was verified that the equivalent inertia constant can be
increased by increasing the value of DC-link capacitor. .
Our project presents the implementation of control schemes to control Doubly Fed Induction Generator (DFIG) so that our wind energy system(which make the frequency events worse) can contribute in improving grid stability. The project implements vector control method for active and reactive power control. For grid stability virtual inertia is implemented. By the help of results it is shown that with proper control, super-capacitor can provide an optimal amount of inertia support thus increasing the overall frequency stability of the power system.
• In near future, for many countries Renewable energy sources (RESs) will contribute most of the energy or whole energy.
• Though RES has many advantages but due to lack of rotating inertia it is making frequency issues worse.
• RES need to be accompanied with an energy storage element and virtual inertia control to act like a synchronous machine.
• It helps RES to participate in frequency regulation where RES can mimic the frequency droop characteristic of the synchronous generator.
• The control of DFIG for grid stability mainly consists of 3 methods vector control, indirect current control and virtual inertia implementation.
• Vector Control: Based for Rotor side converter to control reactive and active
power where reference current is generated using the power equations and the error between the actual current is used to control the rotor side converter.
𝑃𝑠 = 1.5 𝑉𝑑𝑠 𝐼𝑑𝑟 (𝐿𝑚/𝐿𝑠)
𝑄𝑠 = 1.5 𝑉𝑑𝑠1
𝜔𝑠 ∗ 𝐿𝑠− 𝐼𝑞𝑟(𝐿𝑚/𝐿𝑠)
• Indirect Current Control: For working of RSC we need the grid side converter to
fix the DC link voltage. Indirect current control method compares the reference and the actual values of the grid current to control the DC link voltage.
• Virtual Inertia Implementation: If 𝐻𝑒 is the equivalent inertia constant of renewable energy source then from reference [3]
𝐻𝑒 =10−6 𝑓𝑛𝑜𝑚 𝑐 𝑣𝑑𝑐 ∆v𝑑𝑐
2 𝑃𝑅𝐸𝑆 ∆𝑓 𝑀𝐽/𝑀𝑉𝐴
• Generally, ∆v𝑑𝑐𝑚𝑎𝑥 ≤ 0.15 𝑣𝑑𝑐𝑟𝑎𝑡𝑒𝑑 , ==≫ ∆v𝑑𝑐 ≈ 𝑘𝑒 ∆𝑓
Block Diagram for control of Grid side converter
• The frequency dip starts at t=4s. With virtual inertia implemented we clearly see that the frequency dip has reduced.
• At c = 7.5mF, Pres = 1MVA ,
Vdcrated = 4000V, Pbase = 10MVA the frequency drop reduced by 0.028 Hz.
• From the result we see that frequency regulation is better in system having super-capacitance 7.5mF than system with super-capacitor 3.5mF.
• This shows that inertia
constant can be increased by increasing super-capacitor value.
Synchronous
Machine
10 MVA; 11kV
Load 1 10 MW
Load 2 3 MW
PRES 1 MVA; 2.5kV
DC-Link Capacitor 7.5 mF
DC-Link Voltage 4000 V
Sampling Time
Period
Ts = 40 μsec
Real Time Simulator OPAL-
RT(OP4510)
Power system Block Diagram
Simulation Setup Parameters

Kishore Kumar Singh Supervisor: Dr. Anil Kumar Sao
School of Computing and Electrical Engineering (SCEE)Indian Institute of Technology Mandi, India.
Contact: [email protected]
Every individual in this world is exposed to a certain amount of radiation everyday mostly in extremely small doses.
As an occupational hazard, military personnel, emergency responders, industrial workers and astronauts are exposed to a relatively large dose of radiation.
Cytogenetic biodosimetry is the process of estimating absorbed dose of radiation by calculating the frequency of dicentric chromosomes per metaphase (Dicentric Chromosome assay).
The process is completely manual from blood sample collection to laboratory processing and reading slides. The scoring of metaphase slides is time consuming and requires at least a day after the slide is prepared (3rd
day after blood sample collection). A faster diagnosis system is required in case of a large scale radiation disaster. This can be achieved by
automating the scoring and quantification of dicentric chromosomes in captured images of metaphases.
Abstract Results
A. O. Mustapha, J. Patel, and I. Rathore, “Assessment of human exposures to natural sources of radiation in kenya,” Radiation protection dosimetry, vol. 82, no. 4, pp. 285– 292, 1999.
H. Evans, K. Buckton, G. Hamilton, and A. Carothers, “Radiation-induced chromosome aberrations in nuclear-dockyard workers,” Nature, vol. 277, no. 5697, p. 531, 1979.
F. H. Attix, Introduction to radiological physics and radiation dosimetry. John Wiley & Sons, 2008. R. C. Wilkins, H. Romm, T.-C. Kao, A. A. Awa, M. A. Yoshida, G. K. Livingston, M. S. Jenkins, U. Oestreicher, T.
C. Pellmar, and P. G. Prasanna, “Interlaboratory comparison of the dicentric chromosome assay for radiation biodosimetry in mass casualty events,” Radiation research, vol. 169, no. 5, pp. 551–560, 2008.
A. Buades, B. Coll, and J.-M. Morel, “A review of image denoising algorithms, with a new one,” Multiscale Modeling & Simulation, vol. 4, no. 2, pp. 490–530, 2005.
P. L. Rosin, “Unimodal thresholding,” Pattern recognition, vol. 34, no. 11, pp. 2083– 2096, 2001. C. Michaelis, R. Ciosk, and K. Nasmyth, “Cohesins: chromosomal proteins that prevent premature separation of
sister chromatids,” Cell, vol. 91, no. 1, pp. 35–45, 1997.
References
Automated Detection of Dicentric Chromosomes in Captured Metaphase Images
ConclusionsMethodology and Analysis
Introduction
AcknowledgmentI owe deep gratitude to my project guide Dr. Anil K. Sao and Dr. Arnav Bhavsar for including me in the team for this project and providing necessary information and guiding me whenever needed despite their busy schedule. I am grateful to my examiners Dr. Renu M. Rameshan and Dr. Shubhajit Roy Chowdhury for providing valuable feedbacks during evaluation and being a positive critic of my work. I am highly indebted to my training guide Dr. N.K. Chaudhury, Sc ’G’ for providing me an opportunity to carry out the training and this project work at INMAS, DRDO under his noble guidance and constant supervision during the entire 6 weeks of my internship. I am grateful to Mr. Muhammad Ubadah for providing valuable suggestions and being a supportive team member. I would like to thank Dr. Ravi Soni, Mr. Amit Alok and Ms. Shuchi Baghi for providing images with annotations for initiation of this work and Ms. Anjali Sharma for helping me during the hands on biodosimetry training. I am thankful to Mr. Sandeep Choudhury and Ms. Akanchha Tripathi for their selfless help and guidance. I would like to express my gratitude to the scientists at INMAS who took keen interest in the project and gave important feedback. I am thankful to my family members and friends for their constant support, encouragement and motivation. They gave me a sense of purpose which made me strive to do better everyday.
When a person is exposed to radiation, various changes occur at genetic level.
Usually chromosomes in living systems have a single centromere but in case of double strand breaks induced by radiation, dicentric chromosomes occur in divided cells along with other aberrations.
These structural changes thus become signature of absorbed radiation dose as the frequency of dicentric chromosomes per metaphase cells is found to be quadratic with increasing radiation dose.
Dicentric chromosome is radiation specific and its frequency is dependent on radiation dose absorbed and thus this assay is the Gold standard and recommended by IAEA and WHO.
The metaphase images are ranked on a scale of 10 depending on factors such as number of chromosome in a spread, separation between arms, number of overlapping chromosomes and number of spreads in an image.
When the sum of intensity of each pixel along the width is plotted against the height of the chromosome, two different kinds of plots are observed for monocentric and dicentric chromosomes respectively.
Monocentric chromosomes produce a single peak along the height of the centromere.
Dicentric chromosomes produce two peaks.
Error : 0.99 %
Samples from two different sources were analyzed. Out of about 600 annotated images shared by INMAS, 317 were among the top 5 ranks.
Error : 0.94 %
Better ranked images produce more accurate result. For a larger dataset, machine learning models can be used for better results.
Results for top 100 ranked images. Error : 0.13 %

Aayush MishraSupervisor: Prof. Aditya Nigam
School of Computing and Electrical Engineering (SCEE)Indian Institute of Technology Mandi, India.
Contact: [email protected]
With the advent of powerful smartphones, biometrics have become the mostpopular means of subject authentication in recent years. People store a lotof important and private data in their smartphones, security of which iscrucial. In this research, we aim to find vulnerabilities in such securitysystems by finding masterprints. Like master keys, masterprints arebiometric keys that can be used to authenticate a lot of people. We weresuccessfully able to generate and use these masterprints on standardmatching systems for Fingerprint and IRIS datasets. We also propose thatthese vulnerabilities be tackled using adversarial machine learning.
Abstract Results
1. P. Bontrager, A. Roy, J. Togelius, N. Memon, and A. Ross, “Deepmasterprints: Generating masterprintsfor dictionary attacks via latent variable evolution,” in 2018 IEEE 9th International Conference on
Biometrics Theory, Applications and Systems (BTAS), pp. 1–9, IEEE, 2019.2. N. Kohli, D. Yadav, M. Vatsa, R. Singh, and A. Noore, “Synthetic iris presentation attack using idcgan,”
in 2017 IEEE International Joint Conference on Biometrics (IJCB), pp. 674–680, Oct 2017.3. I. Goodfellow, J. Pouget-Abadie, M. Mirza, B. Xu, D. Warde-Farley, S. Ozair, A. Courville, and Y. Bengio, “Generative adversarial nets,” in Advances in neural information processing systems, pp. 2672–
2680, 2014.4. H. Zhang, I. Goodfellow, D. Metaxas, and A. Odena, “Self-attention generative adversarial networks,”
arXiv preprint arXiv:1805.08318, 2018.5. N. Hansen, S. D. Mller, and P. Koumoutsakos, “Reducing the time complexity of the derandomized
evolution strategy with covariance matrix adaptation (cma-es),” Evolutionary Computation, vol. 11, pp. 1–
18, March 2003.
References
Generating Masterprints
We find that fingerprints are highly susceptible to attacks from masterprints. Our method was able to fool a standard authentication system easily. Adversarial training can be used to help these systems become less prone to such attacks. On the other hand, IRIS is a trickier biometric to beat. We generated samples from our distribution that matched a few of the subjects, but not as substantial as fingerprints. The large structural variations in the IRIS portion of each subject makes them immune to such attacks.
Conclusions
Methodology and Analysis
Introduction• Having seen the popularity and wide-spread usage of fingerprint
authentication systems, finding vulnerabilities in their security isimportant. Fingerprint authentication systems are known to be vulnerableto presentation attacks [1]. We explored how to beat such systems bygenerating fingerprint images and finding masterprints among them.
• Presentation attacks on IRIS systems are not explored in that detail [2].We hypothesized that masterprints exist for IRIS as well and employedthe same previous method to test this hypothesis. We compiled ourfindings and showed how IRIS is a better choice for biometric systemsbecause of its immunity to such attacks.
AcknowledgmentThis work would not have been possible without the constant motivationfrom Professor Aditya Nigam. Training of GANs is quite tricky and subject toluck in terms of finding suitable hyperparameters, initializations and eventraining sequences. Only after tons of experiments, we were able togenerate IRIS images.We would also like to thank Parinaya Chaturvedi to provide the IRISmatching system used to test our method’s results on the IRIS dataset.
• Identifying masterprints from thelearnt distributions was done usingCovariance Matrix Adaptation –
Evolution Strategy [5]. In eachstep of this algorithm, a populationof samples is generated andevaluated using a fitnessfunction. The parameters of thedistribution to generate samplesare updated according to thescores each sample receives. Thisis done until convergence. Foundmasterprints are then tested onstandard matching systems to seewhich how many identities theyare able to assume.
• Generative AdversarialNetworks [3] are usedto approximate realdata distributions. Thiscan be used togenerate new unseenimages by samplingfrom that distribution.SA-GAN [4] was usedto generate images.
• Fingerprints are cropped andgenerated samples are directlyused for testing. IRIS images haveto be segmented (separating theIRIS from the whole input image)and then generated. They need tobe normalized after that fortesting (the matching networkuses normalized input images).This is done to get only themeaningful information from theIRIS image.
• Masterprints for the Fingerprint dataset was generated easily and a single image could match with ~25% of the people in the dataset.
• Generating IRIS was trickier as whole images could not be used because of irrelevant textures.
• Fake segmented images were generated well but a masterprint could not be found in them which was as effective as in the Fingerprint case. Class-wise attacks were possible however.

Sujay Khandagale (B15217)Supervisor: Prof. Varun Dutt
School of Computing and Electrical Engineering (SCEE)Indian Institute of Technology Mandi, India.
Contact: [email protected]
In the absence of convenient descriptions about risky prospects, peoplehave to make decisions based upon their previous experience with similarsituations. For example, for crossing a busy street, a person relies on hisprevious experiences when he had crossed the street safely. This projectfocuses on how machine learning algorithms like instance-based learning,deep learning and statistical machine learning may account for modellingthese decisions from experience. Thus, this MTP project is an in-depthevaluation of different machine learning approaches in accounting forpeople’s experiential decisions.
AbstractØData acquisition: Experiment conducted with 80 participants, 60
problems. Data from 40 participants used to create train set and from the other 40 to create the test set.
ØResults :
Dataset and Results
1. R. Hertwig and I. Erev, “The description-experience gap in risky choice,” Trends in Cognitive Sciences, vol. 13, no. 12, pp. 517 – 523, 2009.
2. R. Frey, “The role of cognitive aging and task complexity in exploratory behavior.” [Online; accessed October 10, 2018].
3. N. Sharma and V. Dutt, “Modeling decisions from experience: How models with a set of parameters for aggregate choices explain individual choices,” Journal of Dynamic Decision Making, vol. 3, 2017.
References
Modelling decisions from experience using machine learning techniques
Ø In this work we studied the applicability of machine learning models at modelling decisions from experience which has not been done before
Ø We found that although the LSTM model performed the best among the ML models, however it could not beat the instance-based learning (IBL) model described in [3].
Ø In the future work, other ensemble methods could be explored.
ConclusionsMethodology and Analysis
IntroductionØ Complete description of the incentive program about risky prospects –
decisions from descriptionØ Absence of any description about the incentive program about risky
prospects – decisions from experience (DFE)Ø Information search is an important aspect of DFE research [1]
Ø Sampling paradigm [1] proposed to study peoples information searchand consequential decisions
Ø Participant samples as many choices as he wants and once pleasedwith his choices, makes a final consequential choice
Ø Example sampling: 1,-0.3 0, -0.3 1, -0.3 => 1Ø No existing literature studying how well can machine learning models
account for decisions from experience
Ø We model the task as a multi-variate time-series classification problemØ Deep Models :
ü Multivariate LSTM networkü Multilayer Perceptron
Ø Statistical Models :ü Seasonal Auto-Regressive Integrated Moving Average (SARIMA)
• We use the SARIMAX variant where X refers to the exogenousvariable
Ø Classical ML methods :ü K Nearest Neighbor Classifierü Support Vector Classificationü Decision Trees Classifierü Gaussian Process Classifier
AcknowledgmentI would like to express my sincere gratitude to my advisor, Prof. VarunDutt for his continuous support on my MTP project, for his patience,motivation and immense knowledge. I would also like to thank Prof. Dutt’sPhD students Ms. Neha Sharma and Ms. Shruti Kaushik for helping meout in conducting various experiments throughout the project. Lastly, Iwould like to thank Prof. A.D Dileep and Prof. Arnav Bhavsar for givingvaluable feedback during the evaluation presentations.
Figure 1: Sampling paradigm. [2]
ML Model Test Accuracy Best Model Configuration Long Short Term Memory 67.02 2 LSTM layers, 30 neurons per
layer, 8 lookback periodMultilayer Perceptron 61.54 2 Fully connected layers with 30
neurons in each layerSARIMA 57.34 [0, 0, 1] [0, 0, 0, 0] c
K Nearest Neighbor 57.50 N_neighbors = 7Support Vector Classifier 57.43 Linear kernel, C = 0.1Decision Trees Classifier 55.13 --
Gaussian Process Classifier 58.02 --
Lookback window size LSTM accuracy1 61.042 62.344 64.688 67.02
10 66.3420 65.42
Figure 4: Comparison of the best test accuracy achieved by the various models
Figure 5: Variation of LSTM accuracy with lookback period
Figure 7: Variation of KNN accuracy with number of neighbors
Figure 8: Variation of SVM accuracy with the kernel function used
Figure 6: SARIMA hyperparameters ([p, d, q] [P, D, Q] t) variation range
Figure 2: LSTM model architecture
Figure 3: Architecture of the MLP model
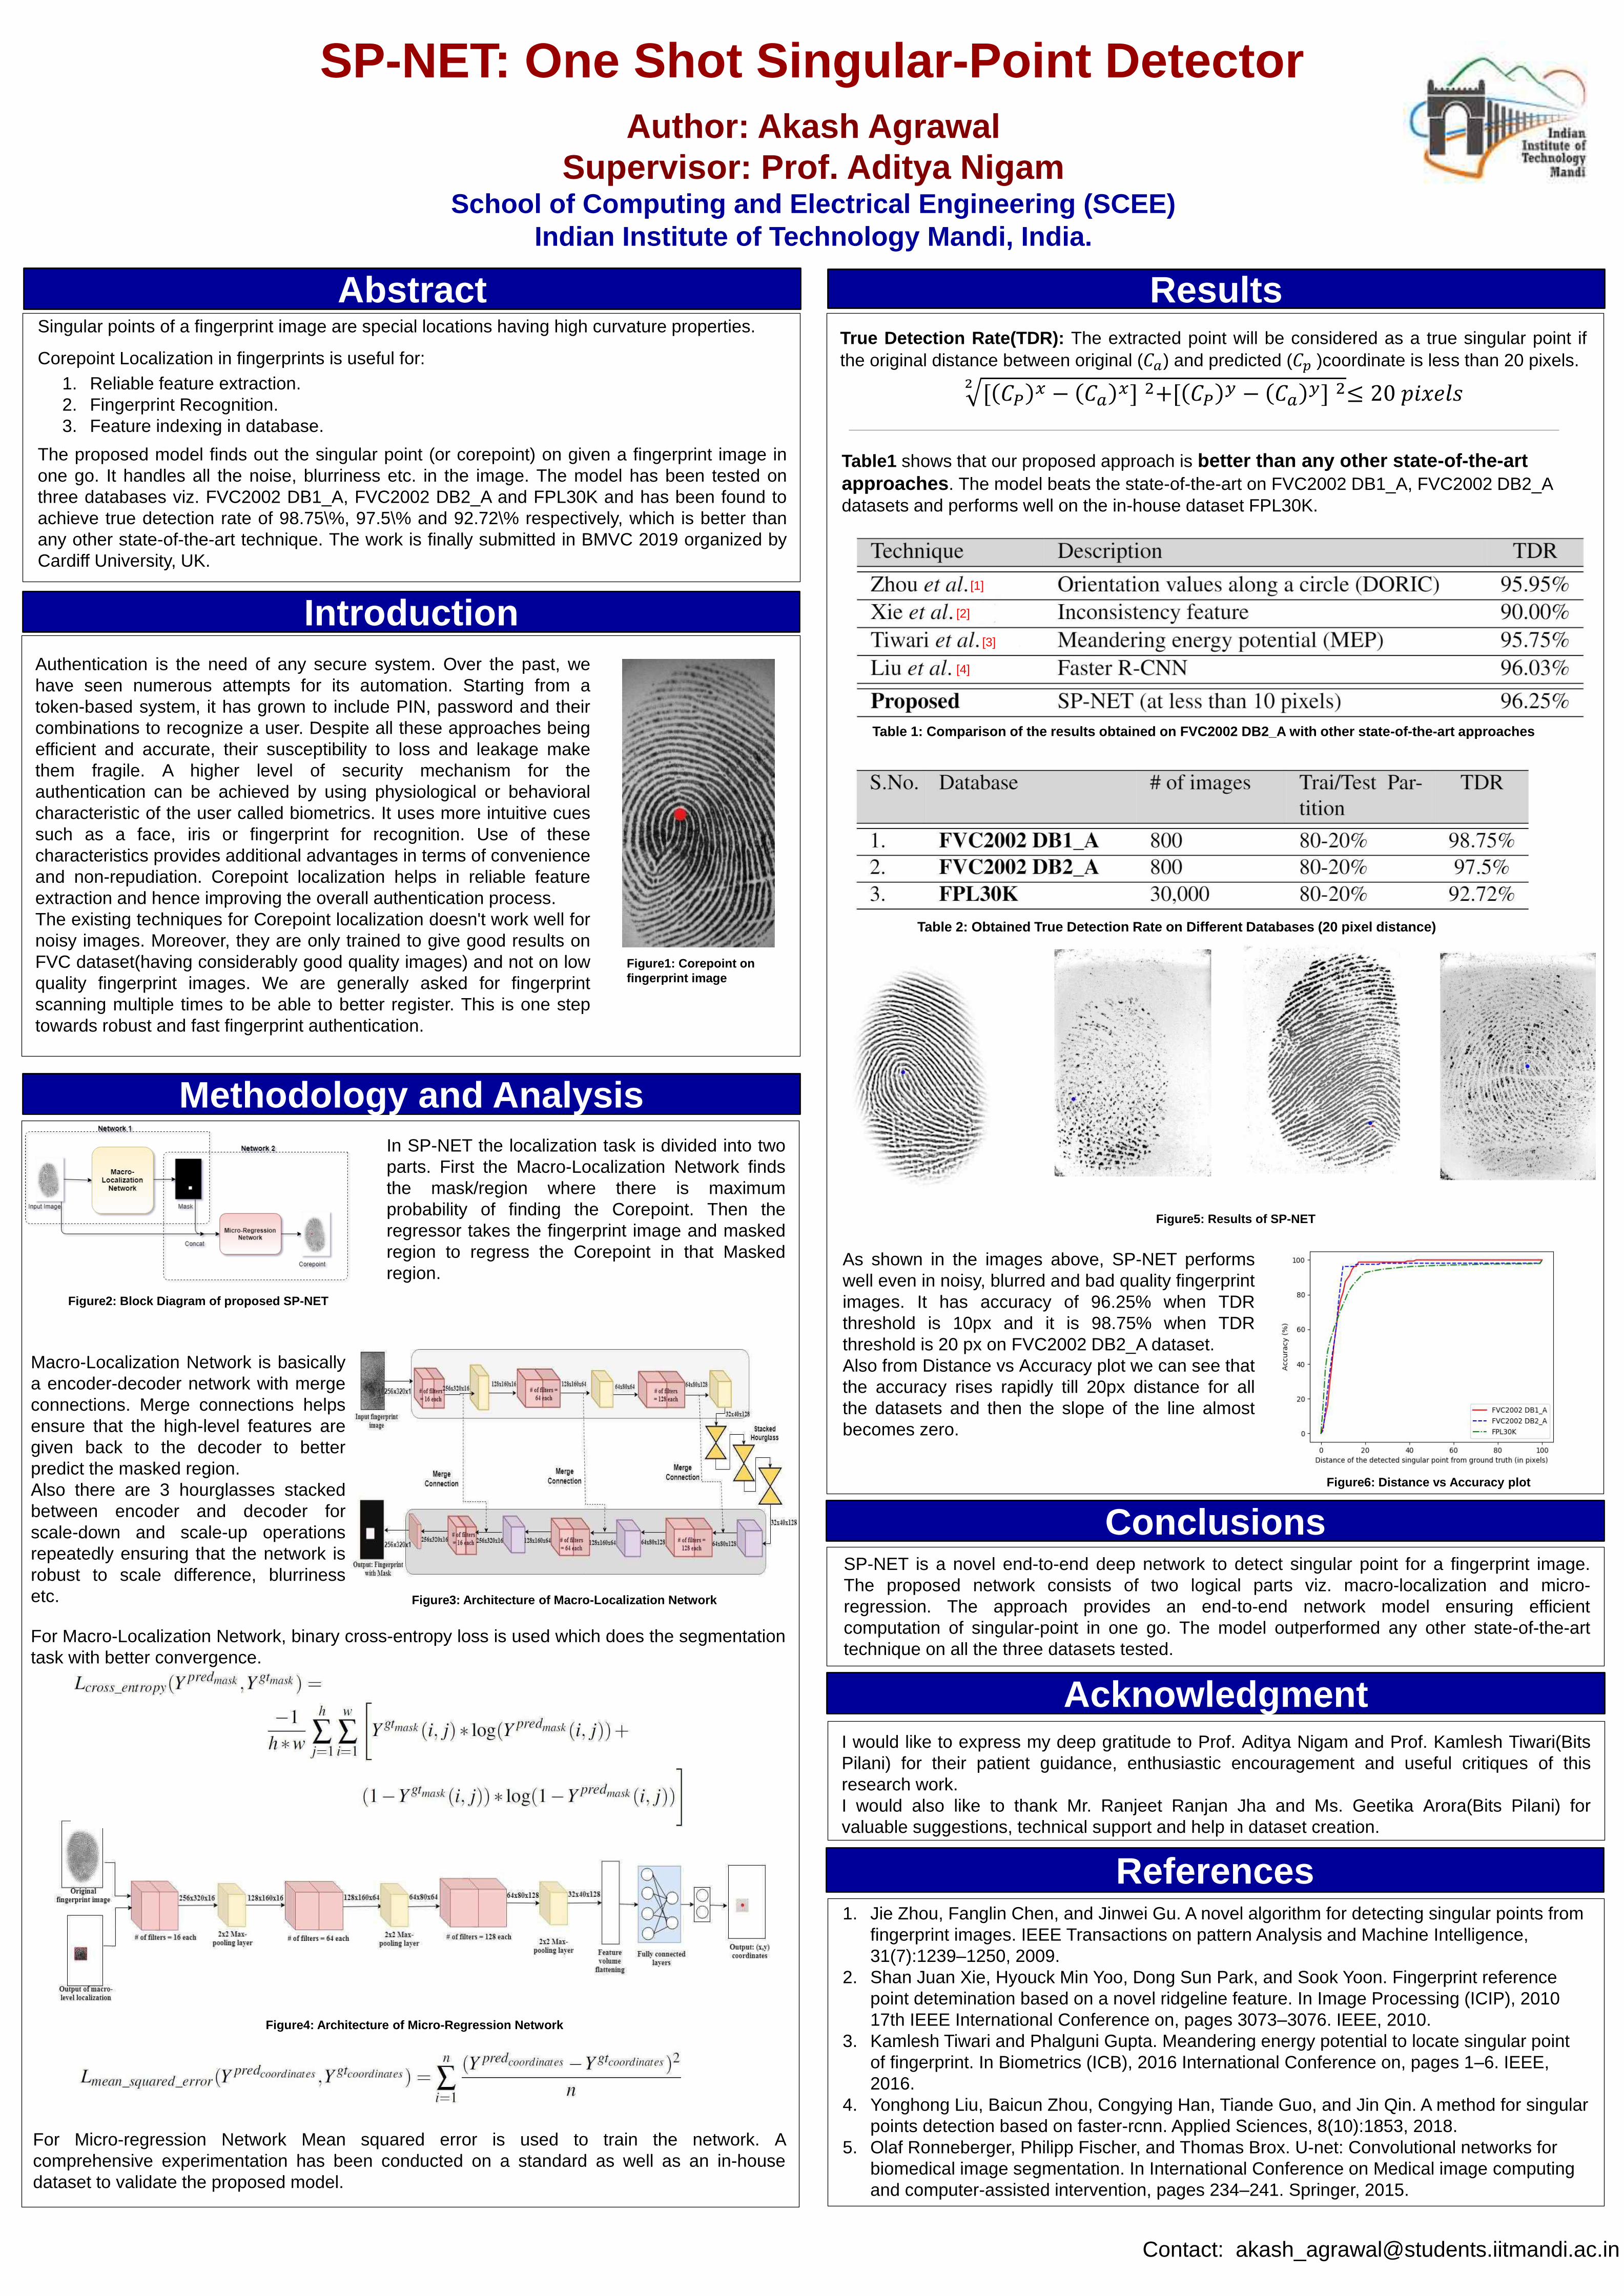
Author: Akash Agrawal Supervisor: Prof. Aditya Nigam
School of Computing and Electrical Engineering (SCEE)Indian Institute of Technology Mandi, India.
Contact: [email protected]
Abstract Results
References
SP-NET: One Shot Singular-Point Detector
Conclusions
Methodology and Analysis
True Detection Rate(TDR): The extracted point will be considered as a true singular point ifthe original distance between original (𝐶𝑎) and predicted (𝐶𝑝 )coordinate is less than 20 pixels.
2[ 𝐶𝑃
𝑥 − 𝐶𝑎𝑥] 2+[ 𝐶𝑃
𝑦 − 𝐶𝑎𝑦] 2≤ 20 𝑝𝑖𝑥𝑒𝑙𝑠
Introduction
Acknowledgment
Table 1: Comparison of the results obtained on FVC2002 DB2_A with other state-of-the-art approaches
Table 2: Obtained True Detection Rate on Different Databases (20 pixel distance)
SP-NET is a novel end-to-end deep network to detect singular point for a fingerprint image.The proposed network consists of two logical parts viz. macro-localization and micro-regression. The approach provides an end-to-end network model ensuring efficientcomputation of singular-point in one go. The model outperformed any other state-of-the-arttechnique on all the three datasets tested.
Singular points of a fingerprint image are special locations having high curvature properties.
Corepoint Localization in fingerprints is useful for:1. Reliable feature extraction.2. Fingerprint Recognition.3. Feature indexing in database.
In SP-NET the localization task is divided into twoparts. First the Macro-Localization Network findsthe mask/region where there is maximumprobability of finding the Corepoint. Then theregressor takes the fingerprint image and maskedregion to regress the Corepoint in that Maskedregion.
Figure2: Block Diagram of proposed SP-NET
Macro-Localization Network is basicallya encoder-decoder network with mergeconnections. Merge connections helpsensure that the high-level features aregiven back to the decoder to betterpredict the masked region.Also there are 3 hourglasses stackedbetween encoder and decoder forscale-down and scale-up operationsrepeatedly ensuring that the network isrobust to scale difference, blurrinessetc. Figure3: Architecture of Macro-Localization Network
Figure4: Architecture of Micro-Regression Network
For Macro-Localization Network, binary cross-entropy loss is used which does the segmentationtask with better convergence.
Figure1: Corepoint on fingerprint image
Table1 shows that our proposed approach is better than any other state-of-the-art approaches. The model beats the state-of-the-art on FVC2002 DB1_A, FVC2002 DB2_A datasets and performs well on the in-house dataset FPL30K.
Figure5: Results of SP-NET
As shown in the images above, SP-NET performswell even in noisy, blurred and bad quality fingerprintimages. It has accuracy of 96.25% when TDRthreshold is 10px and it is 98.75% when TDRthreshold is 20 px on FVC2002 DB2_A dataset.Also from Distance vs Accuracy plot we can see thatthe accuracy rises rapidly till 20px distance for allthe datasets and then the slope of the line almostbecomes zero.
1. Jie Zhou, Fanglin Chen, and Jinwei Gu. A novel algorithm for detecting singular points from fingerprint images. IEEE Transactions on pattern Analysis and Machine Intelligence, 31(7):1239–1250, 2009.
2. Shan Juan Xie, Hyouck Min Yoo, Dong Sun Park, and Sook Yoon. Fingerprint reference point detemination based on a novel ridgeline feature. In Image Processing (ICIP), 2010 17th IEEE International Conference on, pages 3073–3076. IEEE, 2010.
3. Kamlesh Tiwari and Phalguni Gupta. Meandering energy potential to locate singular point of fingerprint. In Biometrics (ICB), 2016 International Conference on, pages 1–6. IEEE, 2016.
4. Yonghong Liu, Baicun Zhou, Congying Han, Tiande Guo, and Jin Qin. A method for singular points detection based on faster-rcnn. Applied Sciences, 8(10):1853, 2018.
5. Olaf Ronneberger, Philipp Fischer, and Thomas Brox. U-net: Convolutional networks for biomedical image segmentation. In International Conference on Medical image computing and computer-assisted intervention, pages 234–241. Springer, 2015.
I would like to express my deep gratitude to Prof. Aditya Nigam and Prof. Kamlesh Tiwari(BitsPilani) for their patient guidance, enthusiastic encouragement and useful critiques of thisresearch work.I would also like to thank Mr. Ranjeet Ranjan Jha and Ms. Geetika Arora(Bits Pilani) forvaluable suggestions, technical support and help in dataset creation.
Figure6: Distance vs Accuracy plot
The proposed model finds out the singular point (or corepoint) on given a fingerprint image inone go. It handles all the noise, blurriness etc. in the image. The model has been tested onthree databases viz. FVC2002 DB1_A, FVC2002 DB2_A and FPL30K and has been found toachieve true detection rate of 98.75\%, 97.5\% and 92.72\% respectively, which is better thanany other state-of-the-art technique. The work is finally submitted in BMVC 2019 organized byCardiff University, UK.
For Micro-regression Network Mean squared error is used to train the network. Acomprehensive experimentation has been conducted on a standard as well as an in-housedataset to validate the proposed model.
Authentication is the need of any secure system. Over the past, wehave seen numerous attempts for its automation. Starting from atoken-based system, it has grown to include PIN, password and theircombinations to recognize a user. Despite all these approaches beingefficient and accurate, their susceptibility to loss and leakage makethem fragile. A higher level of security mechanism for theauthentication can be achieved by using physiological or behavioralcharacteristic of the user called biometrics. It uses more intuitive cuessuch as a face, iris or fingerprint for recognition. Use of thesecharacteristics provides additional advantages in terms of convenienceand non-repudiation. Corepoint localization helps in reliable featureextraction and hence improving the overall authentication process.The existing techniques for Corepoint localization doesn't work well fornoisy images. Moreover, they are only trained to give good results onFVC dataset(having considerably good quality images) and not on lowquality fingerprint images. We are generally asked for fingerprintscanning multiple times to be able to better register. This is one steptowards robust and fast fingerprint authentication.
[1]
[2]
[3]
[4]

Abhishek and Abhishek Tiwari Supervisor: Dr. Sriram Kailasam
School of Computing and Electrical Engineering (SCEE)Indian Institute of Technology Mandi, India.
Contact: [email protected], [email protected]
Formal Concept Analysis (FCA) is a method of data analysis using the conceptual
model of data sets and its related attribute sets. S. Kailasam et.al [1] discusses a
dynamic load balancing based approach for Distributed Formal Concept Analysis. The
approach given by them lacks fault-tolerance in the system. This Major Technical
Project study aims to develop a fault-tolerance implementation of the Distributed
Formal Concept Analysis approach given in [1]. A fault-tolerance system is
implemented using Apache ZooKeeper as the coordination system, Apache Kafka as
the messaging system. The fault-tolerance approach used in the implementation is of
a checkpointing nature and aims to resolve failures of nodes in the distributed system.
.
Abstract Methodology and Analysis
[1] S. Patel, U. Agarwal, and S. Kailasam. "A Dynamic Load Balancing Scheme for Distributed Formal Concept Analysis." 2018 IEEE 24th International Conference on Parallel and Distributed Systems (ICPADS), pp. 489-496. IEEE, 2018.
[2] U. Priss, “Formal concept analysis in information science,” Annual review of information science and technology, vol. 40, no. 1, pp. 521–
543, 2006.
[3] P. Hunt, M. Konar, F. P. Junqueira, and B. Reed, “Zookeeper: Wait-free coordination for internet-scale systems.,” USENIX annual technical conference, vol. 8, Boston, MA, USA, 2010.
[4] W. Gropp and E. Lusk, “Fault tolerance in message passing interface programs,” The International Journal of High Performance Computing Applications, vol. 18, no. 3, pp. 363–372, 2004
References
Fault Tolerance in Distributed Formal Concept Analysis
We have implemented master and worker fault tolerance in the previous Dynamic Load
Distribution based approach for Formal Concept Analysis (FCA) [1]. The
implementation encountered overheads compared to the previous approach without
fault tolerance. This overhead was expected due to the additional overhead of the new
frameworks and the compensation for fault tolerance guarantee. The overhead trend
seems to increase with the number of processes. Also, when faults are introduced
within the system, the overheads increase with the number of processes.
Conclusions
Results
Fig : (from top to bottom in left direction) Performance overheads compared to previous
approach, Master Faults and Worker Faults overhead compared to normal working without faults
Introduction• Formal Concept Analysis (FCA) is a method of data analysis using the conceptual
model of data sets and its related attribute sets. Objects in the physical and artificial
world can be easily described in terms of attribute-value pairs.
• FCA algorithms are high computationally intensive algorithms. Hence, there is a
need for load balancing approach for FCA analysis.
• The Distributed Formal Concept Analysis method in [1] uses Linear time Closed
itemset Miner Algorithm (LCM) for FCA analysis.
• The distributed method in [1] utilises a two-phase approach – Static Load Balancing
(SLB) and Dynamic Load Balancing (DLB). Both the solutions are master and
worker based solutions.
Fig: Static Load Balancing Fig: Dynamic Load Balancing
• Apache ZooKeeper is a distributed service which helps maintaining configuration,
synchronization over a distributed system [11]. It has a UNIX-like data storage
system. The implementation uses ZooKeeper for coordination messages among the
master and the worker.
• Apache Kafka is a distributed streaming platform. It follows a publish subscribe
model for streams of records, similar to a message queue or enterprise system. The
implementation uses Kafka for message passing and work transfer between the
master and the worker.
• The implementation has a master which distributes the initial work among the
workers. Once the worker finishes its initial quota of work, it can steal other worker’s
work by coordinating with the master. This coordination uses ZooKeeper and the
message passing among the workers uses Kafka message queues.
• We have used Mushroom dataset for our performance testing. The Mushroom data
set contains data of 8124 edible and poisonous mushrooms of the families agaricusand lepiota. It is many-valued categorical data with attributes describing properties
such as stalk shape, cap colour and habitat. The following table gives some
characteristics of the data in question.
• For testing the fault overheads, we have introduced fail-stop failures in the system
after the Static Load Distribution (SLB) is completed.
AcknowledgmentWe would like to express our sincere gratitude to our advisor and mentor Dr.Sriram
Kailasam for his continuous support throughout our Major Technical Project. We got to
learn a lot under his guidance, he gave us immense motivation, enthusiasm and
knowledge during the whole project. He also helped us in overcoming hurdles and
challenges whenever we got stuck, and through continuous encouragement and
discussion helped us achieve our objective.
Dataset Attribute Objects Concepts FeatureMushroom 23 8124 238710 sparse

Akash Sharma (B15206) and Mamta Bhagia (B15117)Supervisor: Dr. AD Dileep
School of Computing and Electrical Engineering (SCEE)Indian Institute of Technology Mandi, India.
The project presents the implementation of an automatic real time speech recognition system for the transcription of video/audio lectures.
The novel approach focuses on maximising parallelisation of tasks in the speech recognition process to minimise latency of the system.
Achieved by developing a multi-threaded system in python using the concepts of thread pools, etc to ensure maximum parallelisation while taking care of possible race conditions.
Kaldi toolkit's ASpIRe [4] model used as backend speech engine is trained to improve accuracy in transcribing video/audio data in the technical domain.
.
Abstract
Results
1. M. Mohri, F. Pereira, and M. Riley, “Weighted finite-state transducers in speech recognition”, Comput. Speech Lang. vol. 16, pp. 69–88, Jan. 2002.
2. D. Povey, V. Peddinti, D. Galvez, P. Ghahremani, V. Manohar, X. Na, Y. Wang, and S. Khudanpur, “Purely sequence-trained neural networks for asr based on lattice-free mmi,” pp. 2751–2755, 09 2016.
3. “N-gram models.”https://web.stanford.edu/~jurafsky/slp3/3.pdf4. Kaldi and D. Povey, “Aspire chain model.” http://kaldi-asr.org/models/m1
References
Real Time Automatic Speech Recognition System for Transcription of Video Lectures
Conclusion
A real time speech recognition system for the transcription of video lectures was developed.
Parallelism and several optimizations carried out to reduce system latency.
The WER of the backend engine was improved.
Future Scope
The ASpIRE model can be trained further to improve accuracy. Development of a splitting software better than ffmpeg to reduce
system latency. By using other backend speech engines the applications of the
software can be extended to other domains.
Conclusions
Methodology and Analysis
Methodology and approach
Approach involves creating overlapping segments of input file. Dynamic programming based algorithm to correct overlapping
transcriptions
Thread level parallelism used to generate transcriptions of multiple segments simultaneously while parallely displaying segments.
System Workflow
Backend Engine - Kaldi toolkit’s ASpIRE Model
Kaldi's ASpIRE model used at backend of software to provide transcriptions.
Performance of ASpiRE model improved by training the n-gram[3] language model using technical corpus.
Training of ASpIRE model
Text corpus - 17 lecture hours from 4 different courses. SRILM software used to create a 3-gram language model with
Kneser-Ney Smoothing
Introduction
Problem Statement and Objective
The main objectives of this project are :1. To create an end to end system for real-time transcription of
video/audio lectures.2. Optimizing software to reduce system latency.3. Training Backend Engine to improve transcription accuracy.4. Designing and developing a complete system with a graphical user
interface.
Scope
1. Software currently limited to Transcription of video/audio lectures. 2. Major focus on parallelising the speech recognition process to
reduce latency.
Applications
1. The software can immensely benefit hearing impaired students and other students who find subtitles helpful.
2. The transcriptions generated by the software can be used by search engine to find relevant information.
3. Can be used for monitoring video/audio content (for content filtering, security purposes, etc)
Fig 3. Workflow of the speech recognition software
Fig 4. FSA representing grammar of a 2-gram model [1]
Fig 2. Approach using overlapping audio segments
Fig 1. Objective of project
Contact: [email protected]
Late
ncy
(in s
econ
ds)
Late
ncy
(in s
econ
ds)
Duration of file (in minutes) Duration of file (in minutes)
Late
ncy
(in s
econ
ds)
Late
ncy
(in s
econ
ds)
Duration of file (in minutes) Duration of file (in minutes)
System Latency Results
Fig 5. Comparing latency based performance of real time and non real time system.
Identifying Cause of Latency
Fig 6.The splitting software acts as the bottleneck to the performance of the software
System Word Error Rate (WER) ResultsTest Data - 30 hours of NPTEL lectures from 6 different Courses


Sanidhya Aggarwal, Adnaan Nazir Supervisor: Dr. Arnav Bhavsar, Dr. Aditya Nigam
School of Computing and Electrical Engineering (SCEE)Indian Institute of Technology Mandi, India.
Contact: [email protected]: [email protected]
• Increasing demand for high field magnetic resonance (MR) scanner indicates the need for high-quality MRimages for accurate medical diagnosis.
• However, cost constraints, instead, motivate a need for algorithms to enhance images from low field scanners.We have tried out a few approaches to process the given low field (3T) MR image slices to reconstruct thecorresponding high field (7T-like) slices.
• Our first framework involved a simple encoder-decoder architecture with skip connections. In order to improvethat, we introduced a global residual layer on top of the encoder-decoder.
• Global residual layer performs 1x1 convolutions on the image.• The performance was further improved by introducing an hourglass network in which image is down-sampled and
up-sampled again and again which helps the network to learn the features at various scales.• We have also proposed and evaluated another network architecture which is that of the encoder-decoder
network coupled with the Content Loss network.• The loss function of this network incorporates and tries to optimize both the content loss component and the MSE
loss component.• The proposed algorithm outperforms the state of the art approach. We tried the same approaches to transform
the T1 modality image to T2 modality and again outperformed the state of the art algorithms. This has lead to asignificant improvement in the acquisition time of the T2 modality
Abstract Results
References
MR Image Enhancement and Modality Transformation
• Over the course of our project, we have achieved quite a significant improvement over the state of the art results inboth 3T-7T image reconstruction and T1-T2 image reconstruction as it can be seen from the above table.
• For the T1-T2 domain, we have tried out various approaches and proposed a novel architecture of the encoder-decoder network combined with the Reconstruction module on top of it.
• For the 3T-7T domain, our architecture of encoder-decoder network coupled with the Content Loss networkperformed the best.
• The perceptual quality of reconstructed images is very close to the ground truth, and it has negligible artifacts.• It can reconstruct 3D T2WI in approximately 42 and 46 seconds with out using any information about T1WI and
with under-sampled T2WI, respectively.• As discussed above, SSIM, MAE and PSNR indicate negligible quantitative loss
Conclusions
Methodology and Analysis
Introduction• Medical imaging is the technique and process of creating visual representations of the interior of a body for
clinical analysis and medical intervention.• Medical imaging field has gained a lot of importance in the recent times and is being used extensively, especially
in the healthcare sector• They play a pivotal role in diagnosing some of the most acute diseases e.g. Cancer, Cardiovascular Diseases etc.
• Magnetic resonance Imaging (MRI) is an imaging technique that has been playing an important role inneuroscience research for studying brain images.
• The resolution of the MR image depends on the acquired voxel size. A smaller voxel size leads to a betterresolution, which can in turn aid clinical diagnosis. But the strength of the magnetic field puts a lower bound onthe voxel size to maintain a good signal to noise ratio(SNR).
• The most commonly used MRI machine has a magnetic field of 3T. But it contains very less information ascompared to a 7T MR image which is very expensive and not easily available.
• Approximately 40,000 3T machines in the world compared to around 200 7T machines.• A clear and detailed MRI helps doctors in diagnosing the disease correctly and in time.Also,• There are different modalities within MR imaging.• MRI imaging can be utilized to interpret the distinct nature of tissues, characterized by two relaxation times
namely T1 and T2 producing contrasting yet related information.• The acquisition of T2 MRI image takes a long time, as compared to T1 MRI image.• So, to reduce the acquisition time of T2 image, there is a need to develop some algorithm with the help of which
we can generate the T2 image given the T1 image quickly and accurately.
So, in our project, we aimed at solving the above two problems:-
1) Algorithmically enhancing the low field 3T image to a high filed 7T image2) Transform the T1 modality image to the T2 modality image in order to reduce the acquisition time of T2.
AcknowledgmentWe would like to express a special thanks to our guides- Dr. Arnav Bhavsar and Dr. Aditya Nigam who gaveus the opportunity to work on this important project in the field of Medical imaging. The project wouldn’t havebeen possible without their constant guidance and support. To accomplish this project, we had to take a deepdive into the concepts of medical imaging and deep learning in order to accurately design the architecture of thenetwork.
The base network –
• Simple encoder-decoder architecture with skip connections
• Input: 3 channel 3T image 1st – The image itself 2nd – X-grad image 3rd – Y-grad image
Hourglass network with RM(3T-7T) –
• Hourglass network stacked between the encoder-decoder network
• Reconstruction module put on top of above specified network
• Final output is the weighted addition of both bottom and above network
T1-T2 MR Image Modality transformation
• This network architecture worked the best for T1-T2 image transformation
• A downgraded version of T2 is passed to the Reconstruction module
• T1 image is passed to Domain Adaptation module.
• Final output is the weightedaddition of both bottom and above network
• A downgraded version of T2 has to be passed to overcome the problem of artifacts.
Encoder-decoder with RMSimple Encoder-Decoder Hourglass with RM Auto-encoder with Content loss
3T – 7T MR Image Reconstruction Results
T1 – T2 MR Image Modality Transformation ResultsResults for T1-T2 with only Hourglass network
T1 T2 – GT T2 - predicted
Slice no. 100
Slice no. 150Slice no. 100
T1 T2 – GT T2 - predicted
Results for T1-T2 with Hourglass and Reconstruction module network
Performance parameters
HG HG+SR(T1+T2/4)
HG+SR(T1+T2/8)
HG+SR(T1+T2/16)
MAE 0.0047 0.000489 0.000619 0.000649
PSNR 34.08 57.13 53.926 51.278
SSIM 0.9859 0.999948 0.999945 0.999912
Overall Results for T1-T2
Network Used MAE PSNR
Dense Net 0.033 30.6
State of the art results
• Zhu, Jun-Yan, et al. "Unpaired image-to-image translation using cycle-consistent adversarial networks." arXivpreprint (2017)
• Goodfellow, Ian, et al. "Generative adversarial nets." Advances in neural information processing systems. 2014• Xiang, L., Chen, Y., Chang, W., Zhan, Y., Lin, W., Wang, Q., Shen, D.: Ultra-fast t2-weighted mr reconstruction
using complementary t1-weighted information. In MICCAI 2018 - 21st International Conference, 2018,Proceedings. pp. 215–223
• Huang, Y., Shao, L., Frangi, A.F.: Cross-modality image synthesis via weakly coupled and geometry co-regularized joint dictionary learning. IEEE Transactions on Medical Imaging (2018)
• Nguyen, H.V., Zhou, S.K., Vemulapalli, R.: Cross-domain synthesis of medical images using efficient location-sensitive deep network. In: MICCAI (2015)
• Sharma, Aditya, et al. "Learning to Decode 7T-like MR Image Reconstruction from 3T MR Images." arXivpreprint arXiv:1806.06886 (2018)
• Kaur, Prabhjot, et al. "MR-Srnet: Transformation of Low Field MR Images to High Field MR Images." 2018 25thIEEE International Conference on Image Processing (ICIP). IEEE, 2018
• Photo-Realistic Single Image Super-Resolution Using a Generative Adversarial Network
Our Results
T1 T2 – GT T2 - predicted
Slice no. 100 (T1 + T2/16)
T1 T2 – GT T2 - predicted T1 T2 – GT T2 - predicted
Performance Parameters
Auto-encoder(State of the art)
Auto-encoder with SR
Hourglass Hourglass with SR
Auto-encoderwith Content loss
PSNR(db)
Variance
36.0717
0.2055
42.97263
1.695539
42.6470223
1.9136867
43.2812246
1.8013342
44.3533028
1.211292
Avg SSIM
Variance
0.9879772
0.0000098
0.990329
0.000009
0.9891011
0.0000107
0.9919269
0.0000093
0.9911166
0.000084
Performance Parameters
Auto-encoder(state of the art)
Auto-encoder with SR
Hourglass Hourglass with SR
Auto-encoderwith Content loss
PSNR(db)
variance
35.23897
0.468931
42.22986
1.747995
39.363649
1.430195
40.256915
0.803068
42.925607
1.497899
Avg SSIM
variance
0.982652
0.490234
0.990130
0.000012
0.984619
0.000027
0.986188
0.000012
0.991700
0.000008
Robustness Analysis
3T 7T 7T - predicted
T1 T2 – GT T1 – Mask T2-Pred
Slice no. 150(T1 + T2/8)
Hourglass Network –
• An hourglass network stacked between the above encoder-decoder network
Problem with the Middle slicesPredicted Images
Images Predicted by all Models Results for all Models
Epoch wise PSNR values
Slice wise loss

Archit Kumar (B15405), Rajanish Kumar Upadhyay (B15126), Supervisor: Dr. Satyajit Thakor
School of Computing and Electrical Engineering (SCEE)Indian Institute of Technology Mandi, India.
The capacity region determination for Multi-access channel although having a single letter representation is a non-convex rank one constraint optimisation problem due to non-convexity of constraint set. For Discrete Memoryless channel the capacity can be approximated to arbitrary precision using Blahut-Arimoto algorithm. The finding of exact value of capacity in MAC channels is computationally intensive owing to absence of polynomial time algorithms but upper bound and lower bounds can be found by relaxing the constraint set and converting it into a convex optimisation problem. The different convex optimisation methods like Newton’s method, Interior point method are visited. Analytical approach to solve the optimisation problem using Karush-Kuhn Tucker conditions is also followed. .
Abstract Results and Comparison
References
Computation of Sum-Capacity of Discrete Memoryless Multiple-Access Channels
ConclusionsMethodology and Analysis
Introduction
AcknowledgmentWe would like to thank Dr. Satyajit Thakor for guiding the project, Dr. Siddharta Sarma for advising us and Mr. Dauood Saleem for helping us in the project as TA.
M. Rezaeian and A. Grant, “A generalization of arimoto-blahut algorithm,” in Information Theory, 2004. ISIT 2004. Proceedings. International Symposium on, p. 181, IEEE, 2004.
E. Calvo, D. P. Palomar, J. R. Fonollosa, and J. Vidal, “On the computation of the capacity region of the discrete mac,” IEEE Transactions on Communications, vol. 58, no. 12, pp. 3512–3525, 2010.
D. J. MacKay, Information Theory, Inference, and Learning Algorithms. Cambridge University Press, 2003.
Y. Watanbe, “The total capacity of two-user multiple-access channel with binary output” IEEE Trans. Information Theory, vol. 42, no. 5, pp. 1453–1465, 1996.
El Gamal, A., & Kim, Y. (2011). Network Information Theory. Cambridge: Cambridge University Press. doi:10.1017/CBO9781139030687
BASIC TERMINOLOGIES: Information IX(ak): Self-information of the
event x = ak. IX(ak) = -log PX(ak)
Mutual Information I(X;Y): Reduction in uncertainty of the occurrence of the event X by the occurrence of event Y.I(X;Y) = ∑x,yPXY(x,y)log
[PXY(x,y)/PX(x)PY(y)] Capacity C: Maximum rate of information
transmission in the presence of noise. Ctotal= maxPi(Xi) I(XM;Y)
Capacity region: Convex hull of achievable rate pairs (R1,R2) satisfying:
0 ≤ R1 ≤ I(X1;Y|X2) 0 ≤ R2 ≤ I(X2;Y|X1) R1 + R2 ≤ I(X1X2;Y)
Parameterized convex hull: Convexity of capacity region is established. Supporting hyperplane theorem parameterizes the convex hull for θ ∈ [0, 1] as follows:
maximize: θR1 + (1 − θ)R2
NEED AND MOTIVATION: Exploit DMAC’s operational
significance. Alleviate computational burden in
practical MAC scheme quantification.
Guide rate maximizing structured codings.
ALGORITHMS IN LITERATURE:
For sum-capacity computation: Blahut-Arimoto Algorithm
For Capacity region bound: Polygon method. Rank-one constrained convex optimization
MULTIPLE ACCESS CHANNELS
Multi-access Channel: A type of multi-terminal channel, multiple senders transmit multiple messages over a shared medium to one destination
The capacity region for channels like Binary symmetric is easy and fast to compute using algorithms such as Blahut-Arimoto algorithm but for channels like MAC where capacity region determination is not feasible, inner and outer bounds are found using relaxation methods.
We implemented the pentagon method to get the near optimal results. It is desired to get more strict upper bound on capacity region.
The problem needs to be written into a Second-order conic program format to use the existing open source convex optimisation solver softwares which can be visited in future works. Future works can also look at inner bound computation, which is contigent
on the progress made by relaxation methods. This project gives a better understanding of how optimisation theory
applies in information theory.
BINARY SYMMETRIC CHANNEL
BA ALGORITHM ANALYTICS Threshold: decides result precision.
In theory, the sum-capacity of DMACs can be computed to arbitrary precision.
In practice, the decimal digits offered by the language of implementation limits the computation.
For the project C++ with precision 15 decimal digits was used (when using the variable type double).
Mathematical Limitation: the logarithm decays sharply with its input leading to Denominator becoming zero. Handling: Either ignore such inputs or use a default
placeholder value in their lieu. Parameters used:
Binary Symmetric : iterations = 102 error = 10-2. Generic DMACs: iterations = 104, error = 10-6.
Robust implementation: Future works can obtain desired results as parameters are user-controlled.
ANALYTICS FOR THE PENTAGON METHOD Discontinuities: Since computationally
rounding-off certain achievable Ri’s results in computing the same points multiple times, and missing points where rates for one of the users in negligent, the hull doesn’t emulate theoretical predictions to the letter, horizontally.
BINARY SYMMETRIC CHANNEL Sum capacity = user capacity
(since, number of users = 1) The result presented herewith,
looks at the variation of capacity, C with flipping probability f with a given input probability characterised by r.
It is observed that the capacity varies symmetrically with the error possibility f.
Inference: It must however be noted that beyond the critical value f = 0.5, the capacity achieved may not carrying useful information since more than half of the input bits are complemented.
Reasoning: Mathematically, the mutual information characterization doesn’t discriminate between the two cases.
1 - f fF 1 - f
Channel transmission matrix
P = 1 - f f f 1 - f Input X = [ p 1 - p ] Capacity of channel
C
GENERIC DISCRETE MEMORYLESS MACs For the general DMACs, the example considered is two senders
with one receivers. Each sender has two symbols in their alphabet. The receiver has three symbols in its alphabet.
On observing the convergence of the BA algorithm, it is noted that the function f, used in re-estimation of sender input distributions plays a significant role in convergence of the procedure.
In particular, with the square root function the initial convergence is rapid, which then overshoots the capacity and smoothens to the capacity after rippling around it for few iterations. Whereas, the exponential function brings about smooth convergence in about 5 times the number of iterations used by the former function.
CHANNEL TRANSITION MATRIX: 0.2, 0.3, 0.5
0.7, 0.2, 0.1
0.5, 0.1, 0.4
0.3, 0.4, 0.3
OUTER BOUND OF CAPACITY REGION FOR GENERIC DMAC The time-sharing argument for
channel utilization generalizes time division by allowing senders to transmit simultaneously at different non-zero rates.
This argument allows for the capacity region to be convex, and makes the polygon method applicable.
The results produce a region with each point in the region corresponding to a possible time-sharing arrangement between the users.
Further the result approximates the outer bound achieved by relatively sophisticated techniques, such as randomization and marginalization.
There are, however discrepancies, since the input simplexes considered for other methods in recent literature are better sampled than our procedure. Outer bound: achieved v/s Outer bound: expected
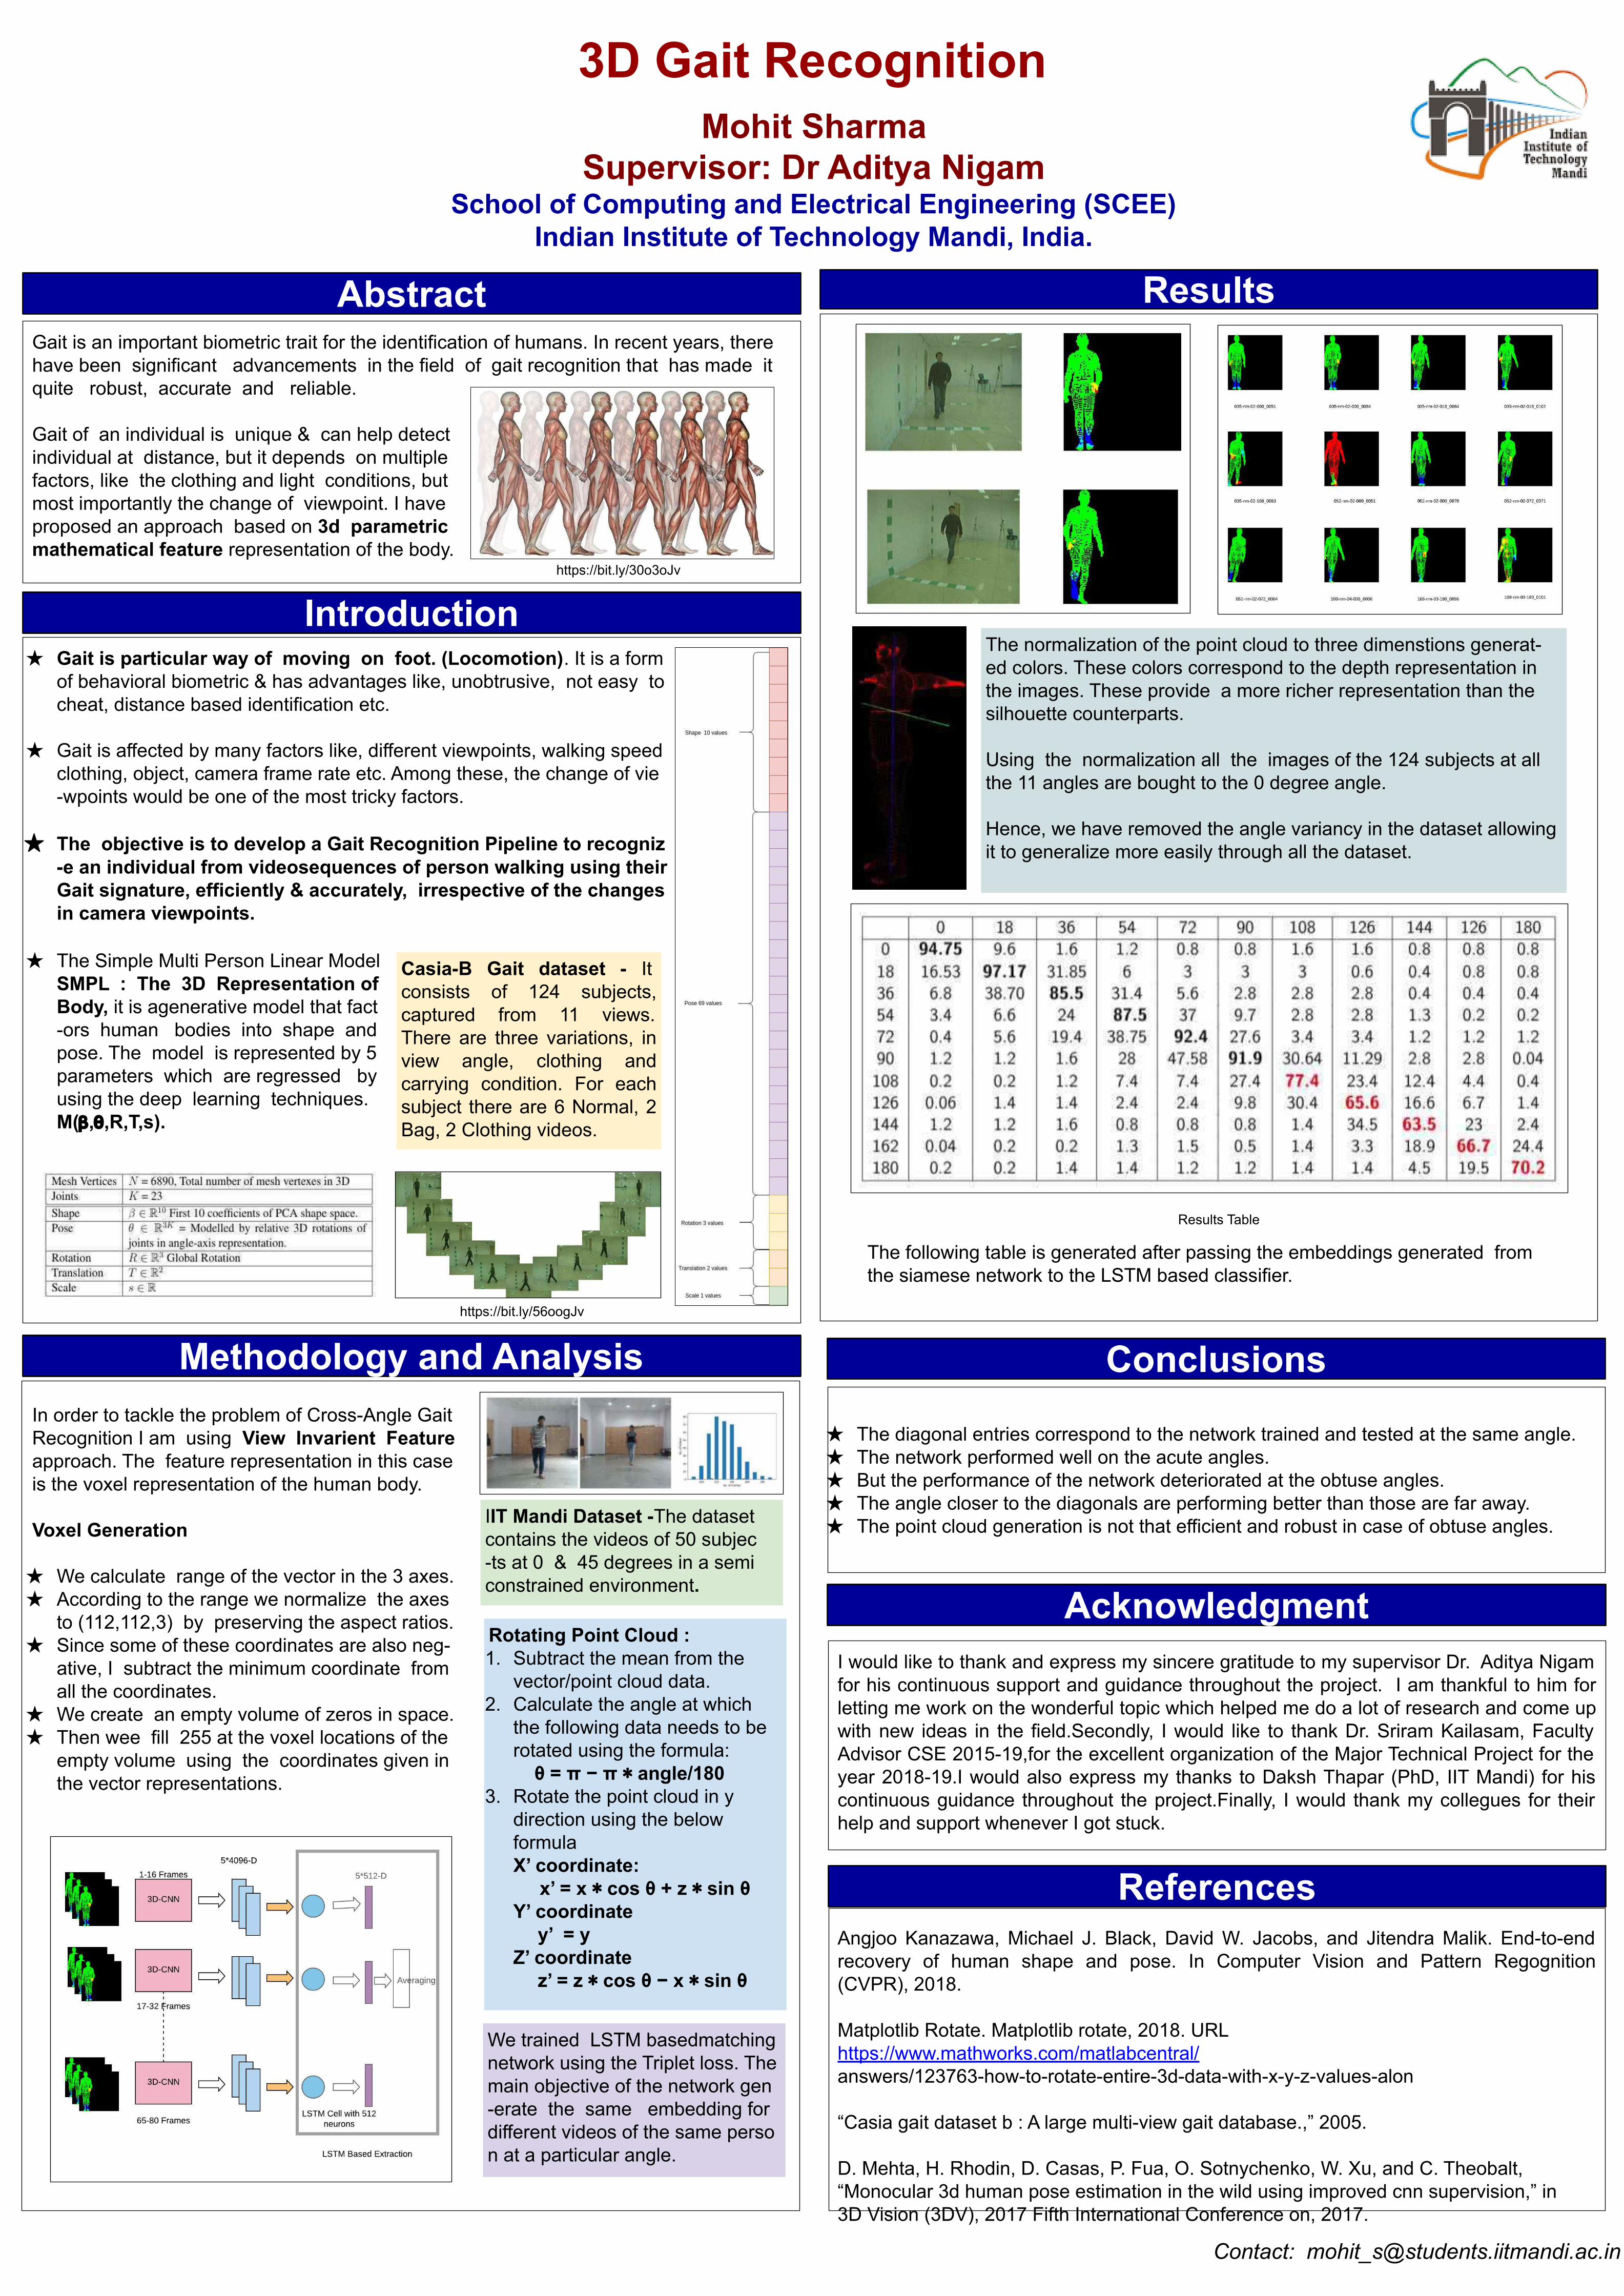
Mohit Sharma Supervisor: Dr Aditya Nigam
School of Computing and Electrical Engineering (SCEE)Indian Institute of Technology Mandi, India.
Contact: [email protected]
Gait is an important biometric trait for the identification of humans. In recent years, there have been significant advancements in the field of gait recognition that has made it quite robust, accurate and reliable.
Gait of an individual is unique & can help detect individual at distance, but it depends on multiple factors, like the clothing and light conditions, but most importantly the change of viewpoint. I haveproposed an approach based on 3d parametric mathematical feature representation of the body.
.
Abstract Results
References
3D Gait Recognition
The diagonal entries correspond to the network trained and tested at the same angle. The network performed well on the acute angles. But the performance of the network deteriorated at the obtuse angles. The angle closer to the diagonals are performing better than those are far away. The point cloud generation is not that efficient and robust in case of obtuse angles.
ConclusionsMethodology and Analysis
Introduction Gait is particular way of moving on foot. (Locomotion). It is a form
of behavioral biometric & has advantages like, unobtrusive, not easy tocheat, distance based identification etc.
Gait is affected by many factors like, different viewpoints, walking speedclothing, object, camera frame rate etc. Among these, the change of vie-wpoints would be one of the most tricky factors.
The objective is to develop a Gait Recognition Pipeline to recogniz-e an individual from videosequences of person walking using theirGait signature, efficiently & accurately, irrespective of the changesin camera viewpoints.
The Simple Multi Person Linear ModelSMPL : The 3D Representation of Body, it is agenerative model that fact-ors human bodies into shape andpose. The model is represented by 5 parameters which are regressed byusing the deep learning techniques.M(𝝱,𝝷,R,T,s).
In order to tackle the problem of Cross-Angle GaitRecognition I am using View Invarient Featureapproach. The feature representation in this caseis the voxel representation of the human body.
Voxel Generation
We calculate range of the vector in the 3 axes. According to the range we normalize the axes
to (112,112,3) by preserving the aspect ratios. Since some of these coordinates are also neg-
ative, I subtract the minimum coordinate fromall the coordinates.
We create an empty volume of zeros in space. Then wee fill 255 at the voxel locations of the
empty volume using the coordinates given in the vector representations.
AcknowledgmentI would like to thank and express my sincere gratitude to my supervisor Dr. Aditya Nigam for his continuous support and guidance throughout the project. I am thankful to him for letting me work on the wonderful topic which helped me do a lot of research and come up with new ideas in the field.Secondly, I would like to thank Dr. Sriram Kailasam, Faculty Advisor CSE 2015-19,for the excellent organization of the Major Technical Project for the year 2018-19.I would also express my thanks to Daksh Thapar (PhD, IIT Mandi) for his continuous guidance throughout the project.Finally, I would thank my collegues for their help and support whenever I got stuck.
Angjoo Kanazawa, Michael J. Black, David W. Jacobs, and Jitendra Malik. End-to-end recovery of human shape and pose. In Computer Vision and Pattern Regognition (CVPR), 2018.
Matplotlib Rotate. Matplotlib rotate, 2018. URL https://www.mathworks.com/matlabcentral/ answers/123763-how-to-rotate-entire-3d-data-with-x-y-z-values-alon
“Casia gait dataset b : A large multi-view gait database.,” 2005.
D. Mehta, H. Rhodin, D. Casas, P. Fua, O. Sotnychenko, W. Xu, and C. Theobalt,“Monocular 3d human pose estimation in the wild using improved cnn supervision,” in3D Vision (3DV), 2017 Fifth International Conference on, 2017.
Results Table
Casia-B Gait dataset - It consists of 124 subjects, captured from 11 views. There are three variations, in view angle, clothing and carrying condition. For each subject there are 6 Normal, 2 Bag, 2 Clothing videos.
IIT Mandi Dataset -The dataset contains the videos of 50 subjec -ts at 0 & 45 degrees in a semi constrained environment.
The following table is generated after passing the embeddings generated fromthe siamese network to the LSTM based classifier.
Rotating Point Cloud :1. Subtract the mean from the
vector/point cloud data.2. Calculate the angle at which
the following data needs to be rotated using the formula: θ = π − π ∗ angle/180
3. Rotate the point cloud in y direction using the below formulaX’ coordinate: x’ = x ∗ cos θ + z ∗ sin θY’ coordinate
y’ = yZ’ coordinate
z’ = z ∗ cos θ − x ∗ sin θ
We trained LSTM basedmatching network using the Triplet loss. The main objective of the network gen -erate the same embedding for different videos of the same perso n at a particular angle.
https://bit.ly/30o3oJv
The normalization of the point cloud to three dimenstions generat-ed colors. These colors correspond to the depth representation in the images. These provide a more richer representation than thesilhouette counterparts.
Using the normalization all the images of the 124 subjects at all the 11 angles are bought to the 0 degree angle.
Hence, we have removed the angle variancy in the dataset allowing it to generalize more easily through all the dataset.
https://bit.ly/56oogJv
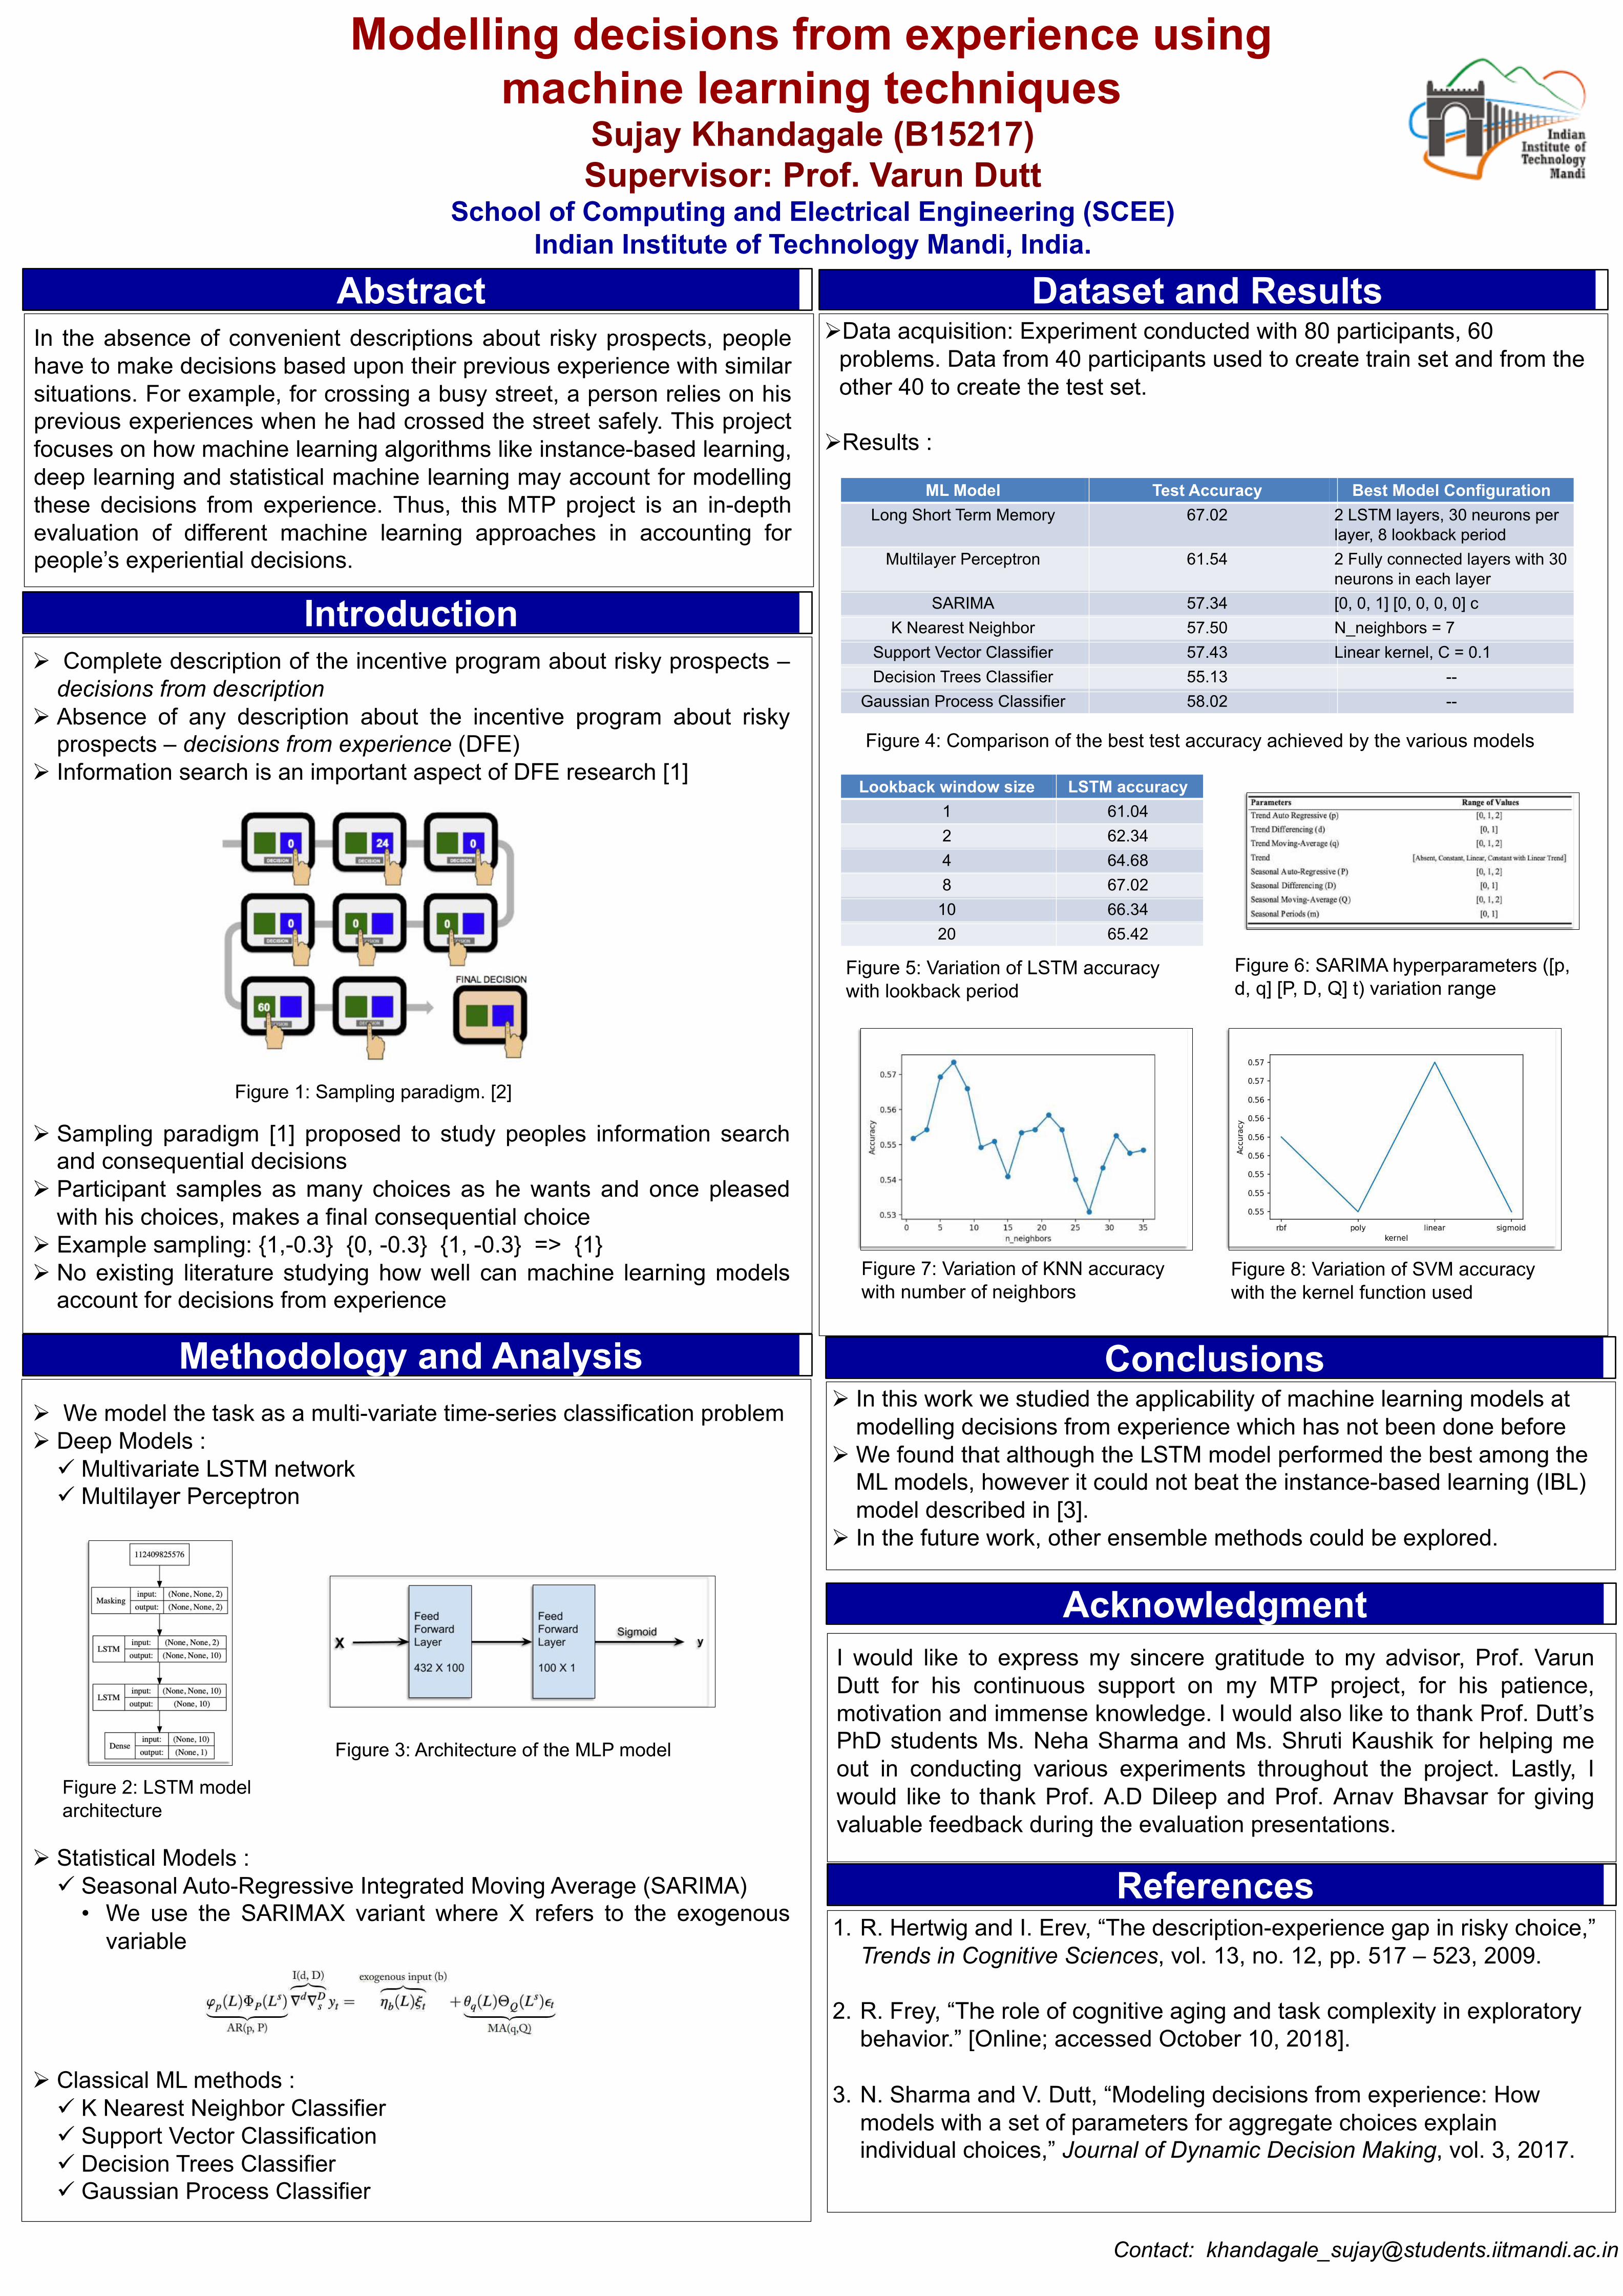
Sujay Khandagale (B15217)Supervisor: Prof. Varun Dutt
School of Computing and Electrical Engineering (SCEE)Indian Institute of Technology Mandi, India.
Contact: [email protected]
In the absence of convenient descriptions about risky prospects, peoplehave to make decisions based upon their previous experience with similarsituations. For example, for crossing a busy street, a person relies on hisprevious experiences when he had crossed the street safely. This projectfocuses on how machine learning algorithms like instance-based learning,deep learning and statistical machine learning may account for modellingthese decisions from experience. Thus, this MTP project is an in-depthevaluation of different machine learning approaches in accounting forpeople’s experiential decisions.
AbstractØData acquisition: Experiment conducted with 80 participants, 60
problems. Data from 40 participants used to create train set and from the other 40 to create the test set.
ØResults :
Dataset and Results
1. R. Hertwig and I. Erev, “The description-experience gap in risky choice,” Trends in Cognitive Sciences, vol. 13, no. 12, pp. 517 – 523, 2009.
2. R. Frey, “The role of cognitive aging and task complexity in exploratory behavior.” [Online; accessed October 10, 2018].
3. N. Sharma and V. Dutt, “Modeling decisions from experience: How models with a set of parameters for aggregate choices explain individual choices,” Journal of Dynamic Decision Making, vol. 3, 2017.
References
Modelling decisions from experience using machine learning techniques
Ø In this work we studied the applicability of machine learning models at modelling decisions from experience which has not been done before
Ø We found that although the LSTM model performed the best among the ML models, however it could not beat the instance-based learning (IBL) model described in [3].
Ø In the future work, other ensemble methods could be explored.
ConclusionsMethodology and Analysis
IntroductionØ Complete description of the incentive program about risky prospects –
decisions from descriptionØ Absence of any description about the incentive program about risky
prospects – decisions from experience (DFE)Ø Information search is an important aspect of DFE research [1]
Ø Sampling paradigm [1] proposed to study peoples information searchand consequential decisions
Ø Participant samples as many choices as he wants and once pleasedwith his choices, makes a final consequential choice
Ø Example sampling: 1,-0.3 0, -0.3 1, -0.3 => 1Ø No existing literature studying how well can machine learning models
account for decisions from experience
Ø We model the task as a multi-variate time-series classification problemØ Deep Models :
ü Multivariate LSTM networkü Multilayer Perceptron
Ø Statistical Models :ü Seasonal Auto-Regressive Integrated Moving Average (SARIMA)
• We use the SARIMAX variant where X refers to the exogenousvariable
Ø Classical ML methods :ü K Nearest Neighbor Classifierü Support Vector Classificationü Decision Trees Classifierü Gaussian Process Classifier
AcknowledgmentI would like to express my sincere gratitude to my advisor, Prof. VarunDutt for his continuous support on my MTP project, for his patience,motivation and immense knowledge. I would also like to thank Prof. Dutt’sPhD students Ms. Neha Sharma and Ms. Shruti Kaushik for helping meout in conducting various experiments throughout the project. Lastly, Iwould like to thank Prof. A.D Dileep and Prof. Arnav Bhavsar for givingvaluable feedback during the evaluation presentations.
Figure 1: Sampling paradigm. [2]
ML Model Test Accuracy Best Model Configuration Long Short Term Memory 67.02 2 LSTM layers, 30 neurons per
layer, 8 lookback periodMultilayer Perceptron 61.54 2 Fully connected layers with 30
neurons in each layerSARIMA 57.34 [0, 0, 1] [0, 0, 0, 0] c
K Nearest Neighbor 57.50 N_neighbors = 7Support Vector Classifier 57.43 Linear kernel, C = 0.1Decision Trees Classifier 55.13 --
Gaussian Process Classifier 58.02 --
Lookback window size LSTM accuracy1 61.042 62.344 64.688 67.02
10 66.3420 65.42
Figure 4: Comparison of the best test accuracy achieved by the various models
Figure 5: Variation of LSTM accuracy with lookback period
Figure 7: Variation of KNN accuracy with number of neighbors
Figure 8: Variation of SVM accuracy with the kernel function used
Figure 6: SARIMA hyperparameters ([p, d, q] [P, D, Q] t) variation range
Figure 2: LSTM model architecture
Figure 3: Architecture of the MLP model

Author: Akash Agrawal Supervisor: Prof. Aditya Nigam
School of Computing and Electrical Engineering (SCEE)Indian Institute of Technology Mandi, India.
Contact: [email protected]
Abstract Results
References
SP-NET: One Shot Singular-Point Detector
Conclusions
Methodology and Analysis
True Detection Rate(TDR): The extracted point will be considered as a true singular point ifthe original distance between original (𝐶𝑎) and predicted (𝐶𝑝 )coordinate is less than 20 pixels.
2[ 𝐶𝑃
𝑥 − 𝐶𝑎𝑥] 2+[ 𝐶𝑃
𝑦 − 𝐶𝑎𝑦] 2≤ 20 𝑝𝑖𝑥𝑒𝑙𝑠
Introduction
Acknowledgment
Table 1: Comparison of the results obtained on FVC2002 DB2_A with other state-of-the-art approaches
Table 2: Obtained True Detection Rate on Different Databases (20 pixel distance)
SP-NET is a novel end-to-end deep network to detect singular point for a fingerprint image.The proposed network consists of two logical parts viz. macro-localization and micro-regression. The approach provides an end-to-end network model ensuring efficientcomputation of singular-point in one go. The model outperformed any other state-of-the-arttechnique on all the three datasets tested.
Singular points of a fingerprint image are special locations having high curvature properties.
Corepoint Localization in fingerprints is useful for:1. Reliable feature extraction.2. Fingerprint Recognition.3. Feature indexing in database.
In SP-NET the localization task is divided into twoparts. First the Macro-Localization Network findsthe mask/region where there is maximumprobability of finding the Corepoint. Then theregressor takes the fingerprint image and maskedregion to regress the Corepoint in that Maskedregion.
Figure2: Block Diagram of proposed SP-NET
Macro-Localization Network is basicallya encoder-decoder network with mergeconnections. Merge connections helpsensure that the high-level features aregiven back to the decoder to betterpredict the masked region.Also there are 3 hourglasses stackedbetween encoder and decoder forscale-down and scale-up operationsrepeatedly ensuring that the network isrobust to scale difference, blurrinessetc. Figure3: Architecture of Macro-Localization Network
Figure4: Architecture of Micro-Regression Network
For Macro-Localization Network, binary cross-entropy loss is used which does the segmentationtask with better convergence.
Figure1: Corepoint on fingerprint image
Table1 shows that our proposed approach is better than any other state-of-the-art approaches. The model beats the state-of-the-art on FVC2002 DB1_A, FVC2002 DB2_A datasets and performs well on the in-house dataset FPL30K.
Figure5: Results of SP-NET
As shown in the images above, SP-NET performswell even in noisy, blurred and bad quality fingerprintimages. It has accuracy of 96.25% when TDRthreshold is 10px and it is 98.75% when TDRthreshold is 20 px on FVC2002 DB2_A dataset.Also from Distance vs Accuracy plot we can see thatthe accuracy rises rapidly till 20px distance for allthe datasets and then the slope of the line almostbecomes zero.
1. Jie Zhou, Fanglin Chen, and Jinwei Gu. A novel algorithm for detecting singular points from fingerprint images. IEEE Transactions on pattern Analysis and Machine Intelligence, 31(7):1239–1250, 2009.
2. Shan Juan Xie, Hyouck Min Yoo, Dong Sun Park, and Sook Yoon. Fingerprint reference point detemination based on a novel ridgeline feature. In Image Processing (ICIP), 2010 17th IEEE International Conference on, pages 3073–3076. IEEE, 2010.
3. Kamlesh Tiwari and Phalguni Gupta. Meandering energy potential to locate singular point of fingerprint. In Biometrics (ICB), 2016 International Conference on, pages 1–6. IEEE, 2016.
4. Yonghong Liu, Baicun Zhou, Congying Han, Tiande Guo, and Jin Qin. A method for singular points detection based on faster-rcnn. Applied Sciences, 8(10):1853, 2018.
5. Olaf Ronneberger, Philipp Fischer, and Thomas Brox. U-net: Convolutional networks for biomedical image segmentation. In International Conference on Medical image computing and computer-assisted intervention, pages 234–241. Springer, 2015.
I would like to express my deep gratitude to Prof. Aditya Nigam and Prof. Kamlesh Tiwari(BitsPilani) for their patient guidance, enthusiastic encouragement and useful critiques of thisresearch work.I would also like to thank Mr. Ranjeet Ranjan Jha and Ms. Geetika Arora(Bits Pilani) forvaluable suggestions, technical support and help in dataset creation.
Figure6: Distance vs Accuracy plot
The proposed model finds out the singular point (or corepoint) on given a fingerprint image inone go. It handles all the noise, blurriness etc. in the image. The model has been tested onthree databases viz. FVC2002 DB1_A, FVC2002 DB2_A and FPL30K and has been found toachieve true detection rate of 98.75\%, 97.5\% and 92.72\% respectively, which is better thanany other state-of-the-art technique. The work is finally submitted in BMVC 2019 organized byCardiff University, UK.
For Micro-regression Network Mean squared error is used to train the network. Acomprehensive experimentation has been conducted on a standard as well as an in-housedataset to validate the proposed model.
Authentication is the need of any secure system. Over the past, wehave seen numerous attempts for its automation. Starting from atoken-based system, it has grown to include PIN, password and theircombinations to recognize a user. Despite all these approaches beingefficient and accurate, their susceptibility to loss and leakage makethem fragile. A higher level of security mechanism for theauthentication can be achieved by using physiological or behavioralcharacteristic of the user called biometrics. It uses more intuitive cuessuch as a face, iris or fingerprint for recognition. Use of thesecharacteristics provides additional advantages in terms of convenienceand non-repudiation. Corepoint localization helps in reliable featureextraction and hence improving the overall authentication process.The existing techniques for Corepoint localization doesn't work well fornoisy images. Moreover, they are only trained to give good results onFVC dataset(having considerably good quality images) and not on lowquality fingerprint images. We are generally asked for fingerprintscanning multiple times to be able to better register. This is one steptowards robust and fast fingerprint authentication.
[1]
[2]
[3]
[4]
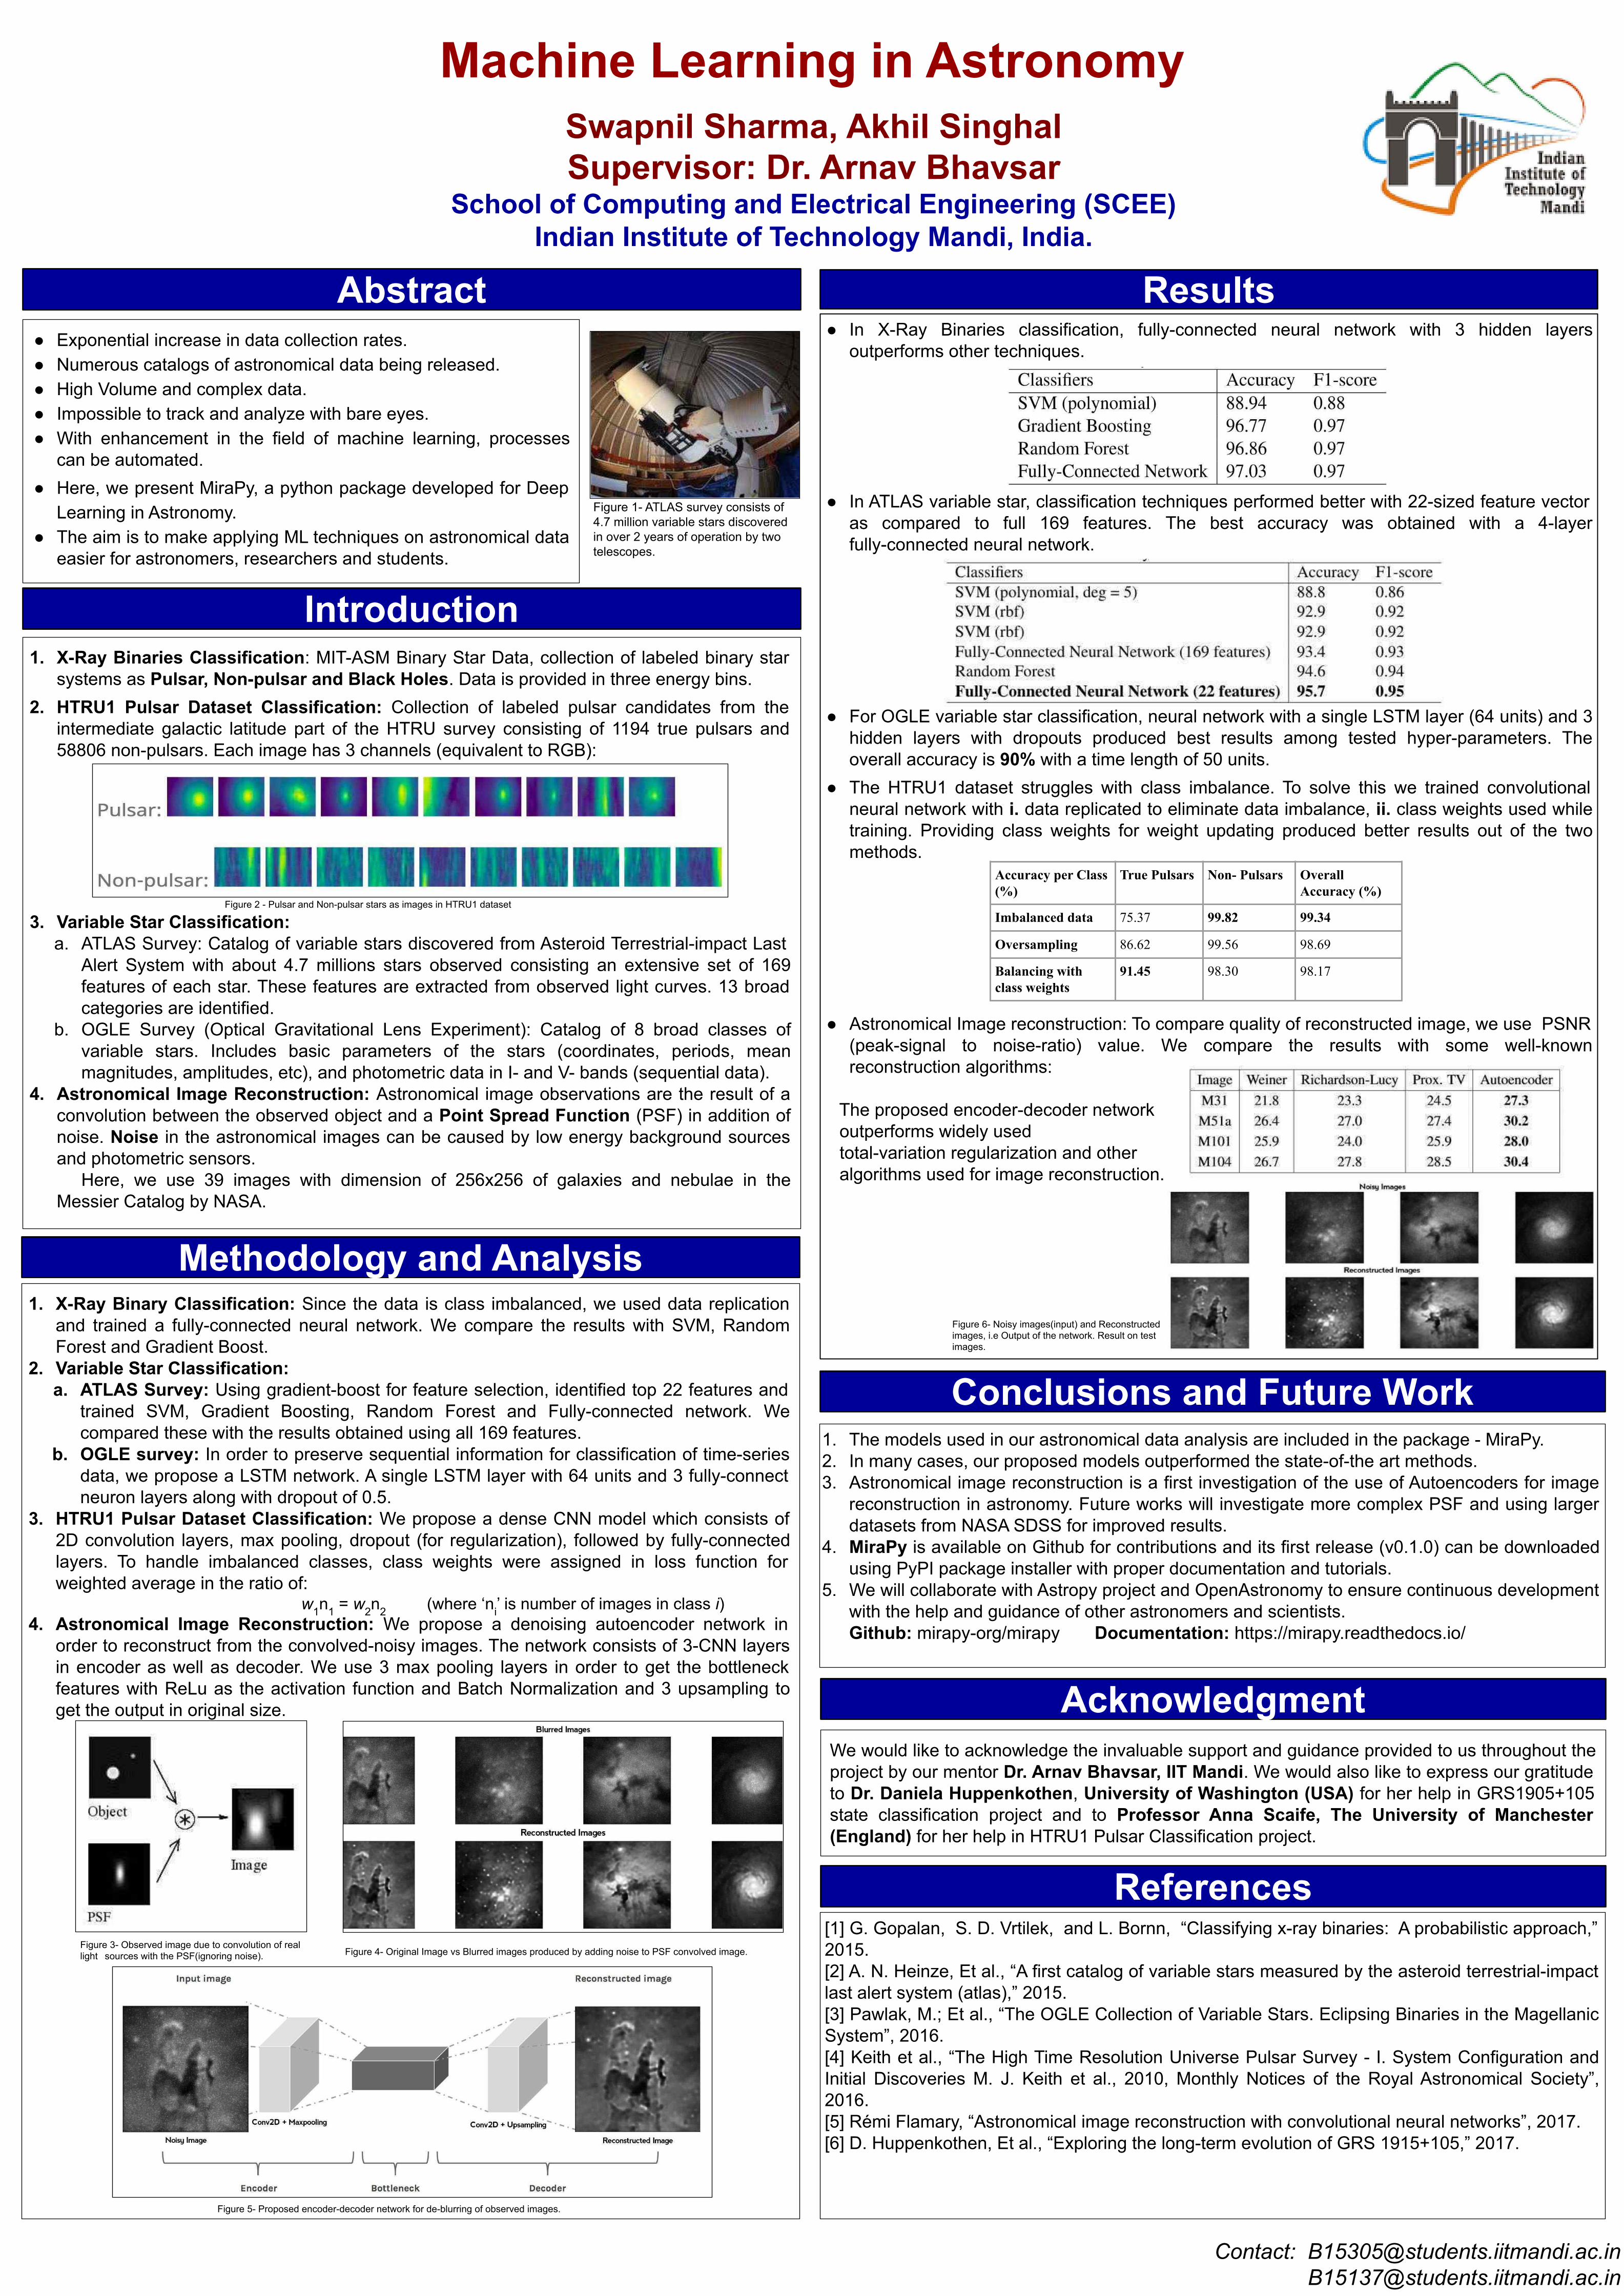
Swapnil Sharma, Akhil SinghalSupervisor: Dr. Arnav Bhavsar
School of Computing and Electrical Engineering (SCEE)Indian Institute of Technology Mandi, India.
Contact: [email protected]@students.iitmandi.ac.in
Exponential increase in data collection rates. Numerous catalogs of astronomical data being released. High Volume and complex data. Impossible to track and analyze with bare eyes. With enhancement in the field of machine learning, processes
can be automated. Here, we present MiraPy, a python package developed for Deep
Learning in Astronomy. The aim is to make applying ML techniques on astronomical data
easier for astronomers, researchers and students.
Abstract In X-Ray Binaries classification, fully-connected neural network with 3 hidden layers
outperforms other techniques.
In ATLAS variable star, classification techniques performed better with 22-sized feature vector as compared to full 169 features. The best accuracy was obtained with a 4-layer fully-connected neural network.
For OGLE variable star classification, neural network with a single LSTM layer (64 units) and 3 hidden layers with dropouts produced best results among tested hyper-parameters. The overall accuracy is 90% with a time length of 50 units.
The HTRU1 dataset struggles with class imbalance. To solve this we trained convolutional neural network with i. data replicated to eliminate data imbalance, ii. class weights used while training. Providing class weights for weight updating produced better results out of the two methods.
Astronomical Image reconstruction: To compare quality of reconstructed image, we use PSNR (peak-signal to noise-ratio) value. We compare the results with some well-known reconstruction algorithms:
The proposed encoder-decoder network outperforms widely used total-variation regularization and other algorithms used for image reconstruction.
Results
[1] G. Gopalan, S. D. Vrtilek, and L. Bornn, “Classifying x-ray binaries: A probabilistic approach,” 2015.[2] A. N. Heinze, Et al., “A first catalog of variable stars measured by the asteroid terrestrial-impact last alert system (atlas),” 2015.[3] Pawlak, M.; Et al., “The OGLE Collection of Variable Stars. Eclipsing Binaries in the Magellanic System”, 2016.[4] Keith et al., “The High Time Resolution Universe Pulsar Survey - I. System Configuration and Initial Discoveries M. J. Keith et al., 2010, Monthly Notices of the Royal Astronomical Society”, 2016.[5] Rémi Flamary, “Astronomical image reconstruction with convolutional neural networks”, 2017.[6] D. Huppenkothen, Et al., “Exploring the long-term evolution of GRS 1915+105,” 2017.
References
Machine Learning in Astronomy
1. The models used in our astronomical data analysis are included in the package - MiraPy.2. In many cases, our proposed models outperformed the state-of-the art methods.3. Astronomical image reconstruction is a first investigation of the use of Autoencoders for image
reconstruction in astronomy. Future works will investigate more complex PSF and using larger datasets from NASA SDSS for improved results.
4. MiraPy is available on Github for contributions and its first release (v0.1.0) can be downloaded using PyPI package installer with proper documentation and tutorials.
5. We will collaborate with Astropy project and OpenAstronomy to ensure continuous development with the help and guidance of other astronomers and scientists.Github: mirapy-org/mirapy Documentation: https://mirapy.readthedocs.io/
Conclusions and Future Work
Methodology and Analysis1. X-Ray Binary Classification: Since the data is class imbalanced, we used data replication
and trained a fully-connected neural network. We compare the results with SVM, Random Forest and Gradient Boost.
2. Variable Star Classification: a. ATLAS Survey: Using gradient-boost for feature selection, identified top 22 features and
trained SVM, Gradient Boosting, Random Forest and Fully-connected network. We compared these with the results obtained using all 169 features.
b. OGLE survey: In order to preserve sequential information for classification of time-series data, we propose a LSTM network. A single LSTM layer with 64 units and 3 fully-connect neuron layers along with dropout of 0.5.
3. HTRU1 Pulsar Dataset Classification: We propose a dense CNN model which consists of 2D convolution layers, max pooling, dropout (for regularization), followed by fully-connected layers. To handle imbalanced classes, class weights were assigned in loss function for weighted average in the ratio of:
w1n1 = w2n2 (where ‘ni’ is number of images in class i)4. Astronomical Image Reconstruction: We propose a denoising autoencoder network in
order to reconstruct from the convolved-noisy images. The network consists of 3-CNN layers in encoder as well as decoder. We use 3 max pooling layers in order to get the bottleneck features with ReLu as the activation function and Batch Normalization and 3 upsampling to get the output in original size.
Introduction1. X-Ray Binaries Classification: MIT-ASM Binary Star Data, collection of labeled binary star
systems as Pulsar, Non-pulsar and Black Holes. Data is provided in three energy bins. 2. HTRU1 Pulsar Dataset Classification: Collection of labeled pulsar candidates from the
intermediate galactic latitude part of the HTRU survey consisting of 1194 true pulsars and 58806 non-pulsars. Each image has 3 channels (equivalent to RGB):
3. Variable Star Classification:a. ATLAS Survey: Catalog of variable stars discovered from Asteroid Terrestrial-impact Last
Alert System with about 4.7 millions stars observed consisting an extensive set of 169 features of each star. These features are extracted from observed light curves. 13 broad categories are identified.
b. OGLE Survey (Optical Gravitational Lens Experiment): Catalog of 8 broad classes of variable stars. Includes basic parameters of the stars (coordinates, periods, mean magnitudes, amplitudes, etc), and photometric data in I- and V- bands (sequential data).
4. Astronomical Image Reconstruction: Astronomical image observations are the result of a convolution between the observed object and a Point Spread Function (PSF) in addition of noise. Noise in the astronomical images can be caused by low energy background sources and photometric sensors.
Here, we use 39 images with dimension of 256x256 of galaxies and nebulae in the Messier Catalog by NASA.
AcknowledgmentWe would like to acknowledge the invaluable support and guidance provided to us throughout the project by our mentor Dr. Arnav Bhavsar, IIT Mandi. We would also like to express our gratitude to Dr. Daniela Huppenkothen, University of Washington (USA) for her help in GRS1905+105 state classification project and to Professor Anna Scaife, The University of Manchester (England) for her help in HTRU1 Pulsar Classification project.
Figure 1- ATLAS survey consists of 4.7 million variable stars discovered in over 2 years of operation by two telescopes.
Figure 4- Original Image vs Blurred images produced by adding noise to PSF convolved image.Figure 3- Observed image due to convolution of real light sources with the PSF(ignoring noise).
Figure 5- Proposed encoder-decoder network for de-blurring of observed images.
Accuracy per Class (%)
True Pulsars Non- Pulsars Overall Accuracy (%)
Imbalanced data 75.37 99.82 99.34
Oversampling 86.62 99.56 98.69
Balancing with class weights
91.45 98.30 98.17
Figure 6- Noisy images(input) and Reconstructed images, i.e Output of the network. Result on test images.
Figure 2 - Pulsar and Non-pulsar stars as images in HTRU1 dataset

Author: Parinaya Chaturvedi Supervisor: Dr. Aditya Nigam
School of Computing and Electrical Engineering (SCEE)Indian Institute of Technology Mandi, India.
Contact: [email protected]
A reliable personal recognition based on ear and iris biometrics is highly in demand due to it’s vast application in automated surveillance, law enforcement, etc. Existing methods can achieve satisfactory performance, but the performance needs to be further improved to meet the expectations for wider range of deployments. A robust ear and iris recognition systems are proposed using curvature gabor filters, horizontal and vertical convolutional filters, spatio-temporal feature patterns and occlusion mask modelling. The proposed ear recognition system have shown significant improvement over the existing state of the art models. Our proposed model have outperformed classic state-of-the-art ear recognition approaches on UND dataset with 100% CRR and 0.0% EER. The proposed iris recognition systems are trained to extract discriminative spatial iris features.These systems have shown potential for future improvement through current results.
Abstract Results
[1] Thapar D., Jaswal G., Nigam A.: FKIMNet: A Finger Dorsal Image Matching Network Comparing Component (Major, Minor and Nail) Matching with Holistic (Finger Dorsal) Matching. CoRR abs/1904.01289 (2019)[2] Nigam, A., Gupta, P.: Robust Ear Recognition Using Gradient Ordinal Relationship Pattern. ACCV Workshops (3) 2014: 617-632.[3] Omara, Ibrahim & Li, Feng & Zhang, Hongzhi & Zuo, Wangmeng. (2016). A Novel Geometric Feature Extraction Method for Ear Recognition. Expert Systems with Applications. 65. 10.1016/j.eswa.2016.08.035.[4] Latha, L. (2013). Efficient person authentication based on multi-level fusion of ear scores. Biometrics, IET. 2. 97-106. 10.1049/iet-bmt.2012.0049.
References
Viewpoint Invariant Biometric Matching
The proposed ear recognition systems have shown promising results and improvement from existing state-of-the-art techniques. 4 publicly available ear datasets, UND, IITD, IITK and USTB have been considered for performance analysis. The techniques used in proposed model have potential to outperform existing methods in IITD and USTB datasets. Our model was used uniformly for all datasets without any data-specific parameter tuning exhibiting generalization capabilities. The proposed iris recognition system based on methods II and III performs satisfactorily on LAMP dataset. Further extensions of this work should focus on methods II, III and IV for improving iris recognition systems.
Conclusions
Methodology and AnalysisMethod I : Siaamese Triplet Network with Gabor Filter Preinitialisation for Ear datasets
To detect features in ear datasets, we introduced curves in traditional gabor filters so that ear curvature pattern can be detected using these filters. Following is the gabor filter equation [1]
where c is the curvature parameter which is responsible forthe modulation of curvature in these filters.(c=0.01 in our case)Figure on the right side shows the model architecture used for training on ear datasets. The filters that are mentioned non-trainable are initialised and fixed by these curvature gabor filters.
Method II : Horizontal and Vertical filters for iris dataset in Siamese Triplet Network with Adaptive Distance Margin
Iris images contain distinguished textural features. Vertical filters are applied to extract textural features and horizontal filters for learning relationships among different textural features.The model generates an iris-code embedding of size 128. Training is done using Siamese Triplet Network to learn intraclasssimilarities and interclass dissimilarities.As the training process progresses, the number of hard triplets reduce. A triplet that was considered hard in initial epochs will not be considered the same in later epochs as the distance b/wtheir embeddings differ. In order to overcome this, we have used the concept of adaptive distance margin. The model architectureFigure [1] is shown at bottom.
Method III : Bistream Siamese Triplet Network with horizontal and vertical filters and Occlusion Mask Modelling for iris Dataset
After visualising the filter activations of above model, we observed that few filters tend to learn the features corresponding to theocclusions due to eyelid and eyelashes. To make the network learn to inattention the features corresponding to occluded regions, we came up with a novel architecture where we introduce bi-streamed model consisting of previous model as first stream and second stream of occlusion mask modelling. We fix the parameters trained in the above model in first stream and generate iris-mask in the second stream followed by feature multiplication at different stages.
Method IV : Spatio-Temporal Feature Pattern Learning using 3D-conv filters, LSTM and Siamese Triplet Network : The proposed model is motivated by the idea of imitating the human perception towards biometric recognition. Humans tend to find patterns by looking at specific regions and learn the spatial relationship between the local features. Spatially warped images are fed to conv3D filters to learn various temporal features. These features are then fed to LSTM to learn complex relationships among temporal features. LSTM followed by Dense layer returns an embedding of the image. Now, to learn similarity siamese triplet network is trained. The results of the proposed model in the current method is not very good but has a scope of significant improvement.
Introduction Biometric authentication have 2 broad categories i.e., Identification and Verification. Such type
of recognition is best done using matching networks. My work was mainly focused on improvement of existing performance of matching networks and solve the problem of viewpoint variance in these networks using novel architecture and latest advancements in deep learning. Extraction of relevant features and metric based learning of similarity between images are the 2 major steps in order to match images. Extraction of relevant features can be done using convolutional filters and metric based learning by Siamese Triplet network. We tried many different novel architectures and tested all of them for different biometric trait’s datasets like knuckle, iris, ear and fingerprints. I have mainly focused here about the methodologies and results for iris and ear datasets. For ear recognition system, we have used UND, IITD, IITK and USTB datasets. In UND ear dataset, there are 114 subjects with 3 images per subject. For training we used 35 images that are augmentations of 2 images per subject. In IITD and IITK ear datasets, there are 125 subjects each with 3 images per subject. For iris recognition system we have used LAMP dataset. In LAMP iris dataset, there are 783 subjects with 20 images per subject. For training we used 35 images that are augmentations of 10 images per subject. Other 10 images are kept for testing purposes. All of the models that we have proposed use Siamese triplet network for training where we have used Hinge Triplet Loss after comparison of performance by various losses such as Contrastive Triplet Loss, Log-scale weighted contrastive triplet loss, Log-scale weighted hinge triplet loss.
AcknowledgmentI would like to acknowledge the help and support provided by Dr. Aditya Nigam and Daksh Thapar for in-depth discussion of various models and techniques regarding iris based recognition system. I would also like to thank Aman Kamboj sir and Dr. Aditya Nigam for providing intricate details regarding ear based recognition system.
UND IITD IITK USTB
State-of-Art CRR 98.18 [2] 98.93 [2] NA 98.3 [3] [4]
EER 2.42 [2] 1.05 [2] NA 0.03 [4]
Method I : Our Model
CRR 100 92.98 94.34 86.66EER 0.0 1.99 2.44 1.69
Results on Ear datasets :
Results on Iris Lamp dataset :CRR EER
Method II: Horizontal and Vertical filters
97.8 1.49
Method III : Bistream Network 93.7 3.62
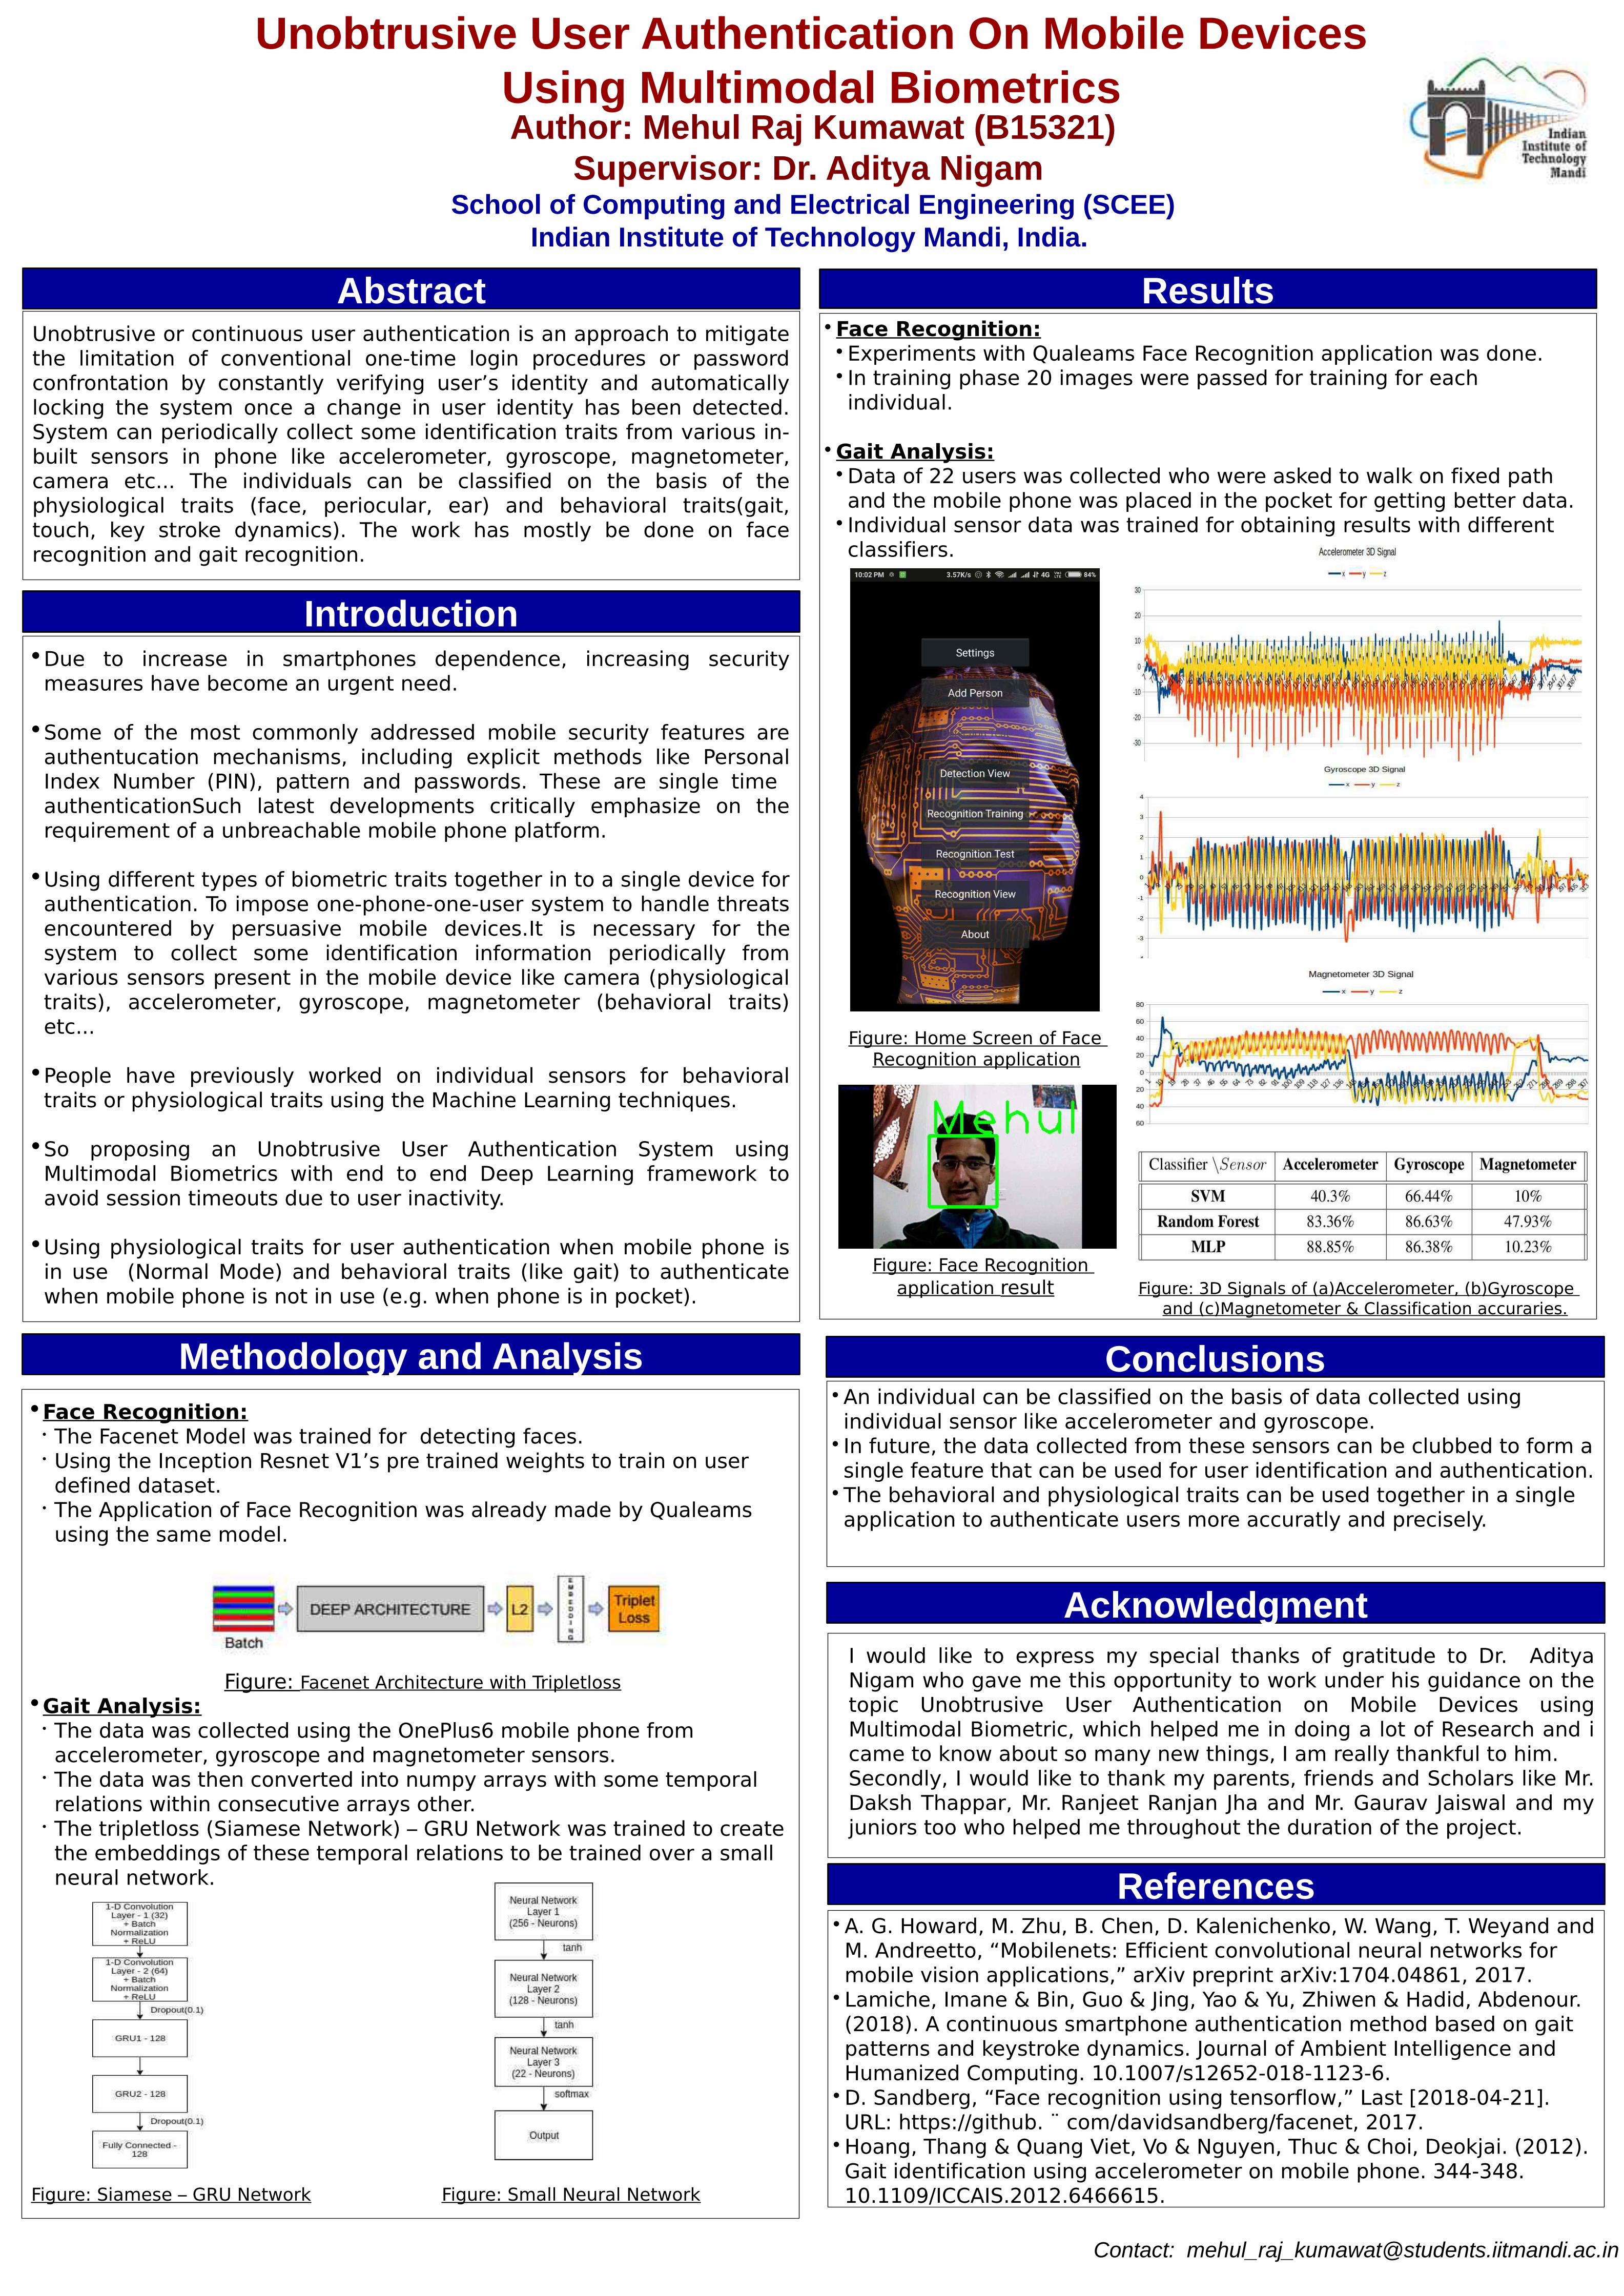
Author: Mehul Raj Kumawat (B15321)Supervisor: Dr. Aditya Nigam
School of Computing and Electrical Engineering (SCEE)Indian Institute of Technology Mandi, India.
Contact: [email protected]
Unobtrusive or continuous user authentication is an approach to mitigate the limitation of conventional one-time login procedures or password confrontation by constantly verifying user’s identity and automatically locking the system once a change in user identity has been detected. System can periodically collect some identification traits from various in-built sensors in phone like accelerometer, gyroscope, magnetometer, camera etc... The individuals can be classified on the basis of the physiological traits (face, periocular, ear) and behavioral traits(gait, touch, key stroke dynamics). The work has mostly be done on face recognition and gait recognition.
Abstract Results
A. G. Howard, M. Zhu, B. Chen, D. Kalenichenko, W. Wang, T. Weyand and M. Andreetto, “Mobilenets: Efficient convolutional neural networks for mobile vision applications,” arXiv preprint arXiv:1704.04861, 2017.
Lamiche, Imane & Bin, Guo & Jing, Yao & Yu, Zhiwen & Hadid, Abdenour. (2018). A continuous smartphone authentication method based on gait patterns and keystroke dynamics. Journal of Ambient Intelligence and Humanized Computing. 10.1007/s12652-018-1123-6.
D. Sandberg, “Face recognition using tensorflow,” Last [2018-04-21]. URL: https://github. ¨ com/davidsandberg/facenet, 2017.
Hoang, Thang & Quang Viet, Vo & Nguyen, Thuc & Choi, Deokjai. (2012). Gait identification using accelerometer on mobile phone. 344-348. 10.1109/ICCAIS.2012.6466615.
References
Unobtrusive User Authentication On Mobile Devices Using Multimodal Biometrics
An individual can be classified on the basis of data collected using individual sensor like accelerometer and gyroscope.
In future, the data collected from these sensors can be clubbed to form a single feature that can be used for user identification and authentication.
The behavioral and physiological traits can be used together in a single application to authenticate users more accuratly and precisely.
ConclusionsMethodology and AnalysisFace Recognition:
The Facenet Model was trained for detecting faces. Using the Inception Resnet V1’s pre trained weights to train on user defined dataset.
The Application of Face Recognition was already made by Qualeams using the same model.
Figure: Facenet Architecture with TripletlossGait Analysis:
The data was collected using the OnePlus6 mobile phone from accelerometer, gyroscope and magnetometer sensors.
The data was then converted into numpy arrays with some temporal relations within consecutive arrays other.
The tripletloss (Siamese Network) – GRU Network was trained to create the embeddings of these temporal relations to be trained over a small neural network.
Figure: Siamese – GRU Network Figure: Small Neural Network
Face Recognition:Experiments with Qualeams Face Recognition application was done. In training phase 20 images were passed for training for each individual.
Gait Analysis:Data of 22 users was collected who were asked to walk on fixed path and the mobile phone was placed in the pocket for getting better data.
Individual sensor data was trained for obtaining results with different classifiers.
Figure: Home Screen of Face Recognition application
Figure: Face Recognition application result Figure: 3D Signals of (a)Accelerometer, (b)Gyroscope
and (c)Magnetometer & Classification accuraries.
IntroductionDue to increase in smartphones dependence, increasing security measures have become an urgent need.
Some of the most commonly addressed mobile security features are authentucation mechanisms, including explicit methods like Personal Index Number (PIN), pattern and passwords. These are single time authenticationSuch latest developments critically emphasize on the requirement of a unbreachable mobile phone platform.
Using different types of biometric traits together in to a single device for authentication. To impose one-phone-one-user system to handle threats encountered by persuasive mobile devices.It is necessary for the system to collect some identification information periodically from various sensors present in the mobile device like camera (physiological traits), accelerometer, gyroscope, magnetometer (behavioral traits) etc...
People have previously worked on individual sensors for behavioral traits or physiological traits using the Machine Learning techniques.
So proposing an Unobtrusive User Authentication System using Multimodal Biometrics with end to end Deep Learning framework to avoid session timeouts due to user inactivity.
Using physiological traits for user authentication when mobile phone is in use (Normal Mode) and behavioral traits (like gait) to authenticate when mobile phone is not in use (e.g. when phone is in pocket).
AcknowledgmentI would like to express my special thanks of gratitude to Dr. Aditya Nigam who gave me this opportunity to work under his guidance on the topic Unobtrusive User Authentication on Mobile Devices using Multimodal Biometric, which helped me in doing a lot of Research and i came to know about so many new things, I am really thankful to him. Secondly, I would like to thank my parents, friends and Scholars like Mr. Daksh Thappar, Mr. Ranjeet Ranjan Jha and Mr. Gaurav Jaiswal and my juniors too who helped me throughout the duration of the project.

Abhijeet SharmaSupervisor: Prof. Varun Dutt
School of Computing and Electrical Engineering (SCEE)Indian Institute of Technology Mandi, India.
Contact: [email protected]
Land slide occurrences are pretty common in Himalayan region. These landslides aresingle major agent of destruction of Infrastructure and is responsible for countless Humanlife. Thus it is very important to predict soil movements before-hand. In this thesis, wehave analysed various classical approaches including different moving average statisticalmodels, and various Modern approaches to tackle our problem. Also, we have focused onfeasibility of these approaches on Real-World data. Different prediction models areapplied on soil movements (in degrees) data collected from Tangni Hill located in chamoli,India. The soil movements have been collected in the form of Time-Series, from five
different sensor, over a period of 78 weeks. From our experimentation, Its been derivedthat when models are applied individually on sensors, moving average models SARIMAout-performed LSTM based models by a large gap. It should also be noted that LSTMbased models were able to explain data more concisely.
Abstract Results
1. Chaturvedi, P., Srivastava, S., & Kaur, P. B. (2017). Landslide Early Warning System Development Using Statistical Analysis of Sensors’ Data at Tangni Landslide,
Uttarakhand, India. In Proceedings of Sixth International Conference on Soft Computing for Problem Solving (pp. 259-270). Springer, Singapore
2. P. Kumar, Priyanka, A. Pathania, S. Agarwal, Varun Dutt (Unpublished) Prediction of weekly soil movements using moving-average and support-vector methods: A case-study in Chamoli, India.
References
Development and Evaluation of Forecasting Methods for Soil Movements Prediction on Tangni Data-Set
From the comparison and analyses of different models, we concluded that LSTM in general can be used for soil movements predictions. Comparing it from classical side, if we can apply the models individually then SARIMAX model performs better than the LSTMs model, but this do lead to Model explosion problem. On the other hand LSTM models can used to represent and predict soil movements more generally with some expense on prediction error.
ConclusionsMethodology and AnalysisOur data-set consists of soil moments for Tangni-Hill from 5 different bore-holes. Thisdataset is weekly time spaced over a period of 78 Weeks. From these 78 weeks of data,we will be using the first 62 weeks of data for training, and will keep the rest 16 weeks fortesting and evaluating our different models.
Available Techniques• Fitting Individual Model on Different Bore-Hole Time Series• Fitting a General Model on All Bore-Hole Time Series
Classical Approach To Time Series ForecastingWe applied Classical moving average models such as SARIMA, so that to compare it withmodern deep-learning techniques. We used SARIMA model and applied it Individually ondifferent Bore-holes
Time-Series Forecasting to Supervised Learning ModelOur Original Problem statement is a Time-Series Forecasting problem, but to predictvalues, via LSTMs (Deep-Learning Technique), we need to convert our problem into asupervised learning problem. Supervised learning technique requires us to transform ourdata into INPUT(X) to a Corresponding OUTPUT(Y).For this, we can use past-values topredict future values.
Keep Above techniques in mind, We have studied following models on our data-set• Classical Model:
• SARIMAX• Modern Deep-Learning Techniques
• VANILA LSTM• STACKED LSTM• BI-DIRECTIONAL LSTM• ENCODER-DECODER LSTM• CNN-LSTM• CONV-LSTM• MULTI-LAYER PERCEPTRON
Following results were observed for different Models. The figures shown below, are for bore-hole 5.
IntroductionLand slide occurrences are pretty common in Himalayan region. These landslides aresingle major agent of destruction of Infrastructure and is responsible for countlessHuman life. Thus it is hour of need to develop cheap monitoring and predictionsystem of the soil movements. These systems can be installed at various hill prone areas used to monitor and predict soil movements, through which different concernedauthorities can be informed before hand and necessary actions could be taken. Thiswill help to minimize and prevent to an extent, loss to both infrastructure and Humanlife.
Tangri Hill is in Chamoli district of Uttarakhand, India. Geographically speaking ,it islocated on the northern Himalayan region, at latitude 30.27’ 54.3”N and longitudes79.27’ 26.3” E, at an altitude of 1450 meter. As seen in Figure 1B, the landslide islocated on National Highway 58, which connects Ghaziabad in Uttar Pradesh near NewDelhi with Badrinath and Mana Pass in Uttarakhand. The geology of this area consistsof slate and dolomite rocks [1]. The landslide slope is 30 above the road level and 42below the road level.
AcknowledgmentI have taken efforts in this project. However, it would not have been possible without thekind support and help of many individuals and the institution. I would like to extend mysincere thanks to all of them.
I am highly indebted to Dr. Varun Dutt for their constantsupervision and motivation as well as for providing necessary information and guidanceregarding the project and also for their support in completing the project. I would like toexpress my gratitude towards Praveen (MTech), Ankush (MTech) and Priyanka(MTech) for helping me throughout the project.
Abhijeet Sharma
Fig. 1. (A) Location of the study area. (B) The Tangni landslide on Google Maps.
TIME-STAMP BORE-HOLE SENSOR-DEPTH DATA-PLOT12/14/2012 11:00 1 3 61.8964
12/15/2012 5:00 4 12 61.6697
Table 1: Sample data points from the data-set
MODEL-NAME Avg. RMSE
SARIMAX (INDIVITUALLY) 0.34312
CONV-LSTM 0.59936
MULTI-LAYER-PERCEPTRON 0.59732
ENCODER-DECODER-LSTM 0.62450
CNN-LSTM 0.67792
VANILA-LSTM 0.82609
BIDIRECTIONAL-LSTM 0.87315
STACKED-LSTM 1.94784
Table 2: Average RMSE (Best) for different models