MAIN REPORT - Education Review Office, Nepal
172
Naonal Assessment of Student Achievement 2018 MAIN REPORT (Report on the National Assessment of Student Achievement in Mathematics and Nepali for Grade 5) Government of Nepal Ministry of Education, Science and Technology Education Review Office (ERO) Sanothimi, Bhaktapur 2019 (2076 BS)
-
Upload
khangminh22 -
Category
Documents
-
view
3 -
download
0
Transcript of MAIN REPORT - Education Review Office, Nepal

National Assessment of Student Achievement 2018
MAIN REPORT(Report on the National Assessment of Student Achievement in
Mathematics and Nepali for Grade 5)
Government of NepalMinistry of Education, Science and Technology
Education Review Office (ERO)Sanothimi, Bhaktapur
2019 (2076 BS)
National Assessment of Student Achievement 2018
Main Report(Report on the National Assessment of Student Achievement in
Mathematics and Nepali for Grade 5)
Government of NepalMinistry of Education, Science and Technology
Education Review Office (ERO)Sanothimi, Bhaktapur
2019 (2076 BS)
Written byProf. Dr. Basudev Kafle with Shyam Prasad Acharya and Deviram Acharya
Data analysed byDr. Bishnu Khanal with Shyam Prasad Acharya, Deviram Acharya
Language Edited byProf. Dr. Basudev Kafle and Ms Kunti Adhikari
National Assessment of Student Achievement 2018: Main Report(Report on the National Assessment of Student Achievement in Mathematics and Nepali for Grade 5)
This main report of NASA 2018 is written by Prof. Dr. Basudev Kafle with Shyam Prasad Acharya and Deviram AcharyaData analysed Dr. Bishnu Khanal with Shyam Prasad Acharya, Deviram Acharya
Year of Publication: 2019 (2076BS)
© Education Review Office 2019All rights reserved. Interested person and agency may download, display, print and reproduce this material in unaltered form only for personal and non-commercial use or use within the organisation by acknowledging the source.
Contact:Education Review OfficeSanothimi, Bhaktapur, NepalPhone: +977-1-6636518, 6634362Email: [email protected]: www.ero.gov.np
Printed at:
- iii -
FOREWORD
National Assessment of Student Achievement (NASA) communicates the status of student achievements and suggests the measures for improving the students' learning outcome. The assessment provides evidence to the policy makers to formulate practical and implementable educational policies in national and sub-national level.
In Nepal, the Education Review Office (ERO) started NASA since 2011. The first national assessment was carried out in Grade 8 for Nepali, Mathematics and Social Studies. In later years, Grade 3, 5 and 8 assessments have been conducted in a periodic basis. During the School Sector Reform Plan (2009-2015), two rounds of assessment (Grade 3, 5, and 8) were administered. During the School Sector Development Plan (2016-2022/23) two rounds of assessment (Grade 5, 8 and 10) will be administered. NASA 2018 is the first and baseline assessment administered during the SSDP period for grade 5.
NASA is a curriculum-based systematic evaluation of student learning outcomes. An analysis of the curriculum to develop an assessment framework is the first step while carrying out this assessment. This framework works as an assessed curriculum that helps to operationalize the abstract learning objectives into practical sense.
This is the main report of NASA 2018 for Grade 5 in Mathematics and Nepali subjects. The assessment was conducted in the national representative sample of 28381 students from 1400 schools of Nepal with an almost equal number of schools and students in each of the three subjects, considering seven provinces as explicit strata. Three versions of standardized tests together with the background information questionnaire to the sample students, teacher questionnaire to subject teachers and school survey questionnaire to the head teachers were administered in each school. Data were analysed in such a way that along with presenting overall mean score and proficiency levels, the relation between the achievement scores and various influencing factors was demonstrated with the use of the background information questionnaire. Analysis and comparison of the results were done using the Item Response Theory (IRT) and the parameters of linking items. Results are presented in a transformed scale of student latent ability (θ) with 500 mean and 50 standard deviation. The results presented in this report are the generalized results over the defined population and they provide the evidence of the level of learning. Generalization of the results was possible with the use of the multi-stage probability sampling, that is Probability Proportional

- iv -
to Size (PPS) sampling method, which is widely appreciated method in educational research.
Throughout the process of tools development, test administration, data analysis and report writing, several stakeholders, teachers, experts and researches have contributed in different many ways. I acknowledge the collaboration and participation of the subject teachers, experts, subject committee members, and assessment committee members. My sincere thanks go to the previous ERO head Dr. Lekhnath Paudel, undersecretary Mr Hemraj Pokhrel and Prahlad Aryal, Mathematics subject committee chaired by Professor Dr Hari Upadhyaya, Nepali subject committee chaired by Professor Dr. Parasmani Bhandari. This report appeared in this form after the rigorous efforts of the officers at ERO Mr Shyam Prasad Acharya and Mr Deviram Acharya who have been heavily involved in the research tasks from tools development and working for report writing. I would like to thank the consulting firm, Centre for Educational Research and Social Development as well as Council and Council for their contribution. I am grateful to all the ERO staffs including undersecretary Mr Hari Aryal, Mr Uttar Kumar Parajuli and the officers Mr Prakash Kumar Kharel and Mr Lavdev Bhatta who were directly and indirectly involved in various phases of this assessment.
I highly appreciate the contribution of Professor Dr Basudev Kafle and Technical Officer Ms Kunti Adhikari for the language edit. I would like extend my thanks to the personnel from various Central Level Agencies and the Ministry of Education, Science and Technology for their contribution during the program and budgeting phase, monitoring of test administration and tools development. I acknowledge the role of the World Bank in supporting the capacity development of the human resource involved in this large-scale assessment.
I commend this report to education policy makers, programme designers, teachers, educators and community members and researchers for their reference in improving students’ learning. I hope this report will be a milestone for improving quality of education at school level in Nepal.
Mr. Tek Narayan Pandey Director General Education Review Office

- v -
EXECUTIVE SUMMARY
ContextIn the beginning of 2018, the Education Review Office assessed the learning
outcomes of grade 5 in Mathematics and Nepali. The prime objective of this assessment were to prepare the baseline data for School Sector Development Plan (SSDP) and compare the learning achievement of 2018 with the previous cycle of NASA (2015) to ensure quality education in school system. Altogether 28381 students, 1400 teachers, 1400 head teachers from 1400 schools participated in this assessment. National assessment has been well accepted as a means of measuring quality of education (TIMSS & PIRLS, 2008) that provides both quantitative and descriptive form of information on student achievement which after is considered as an output of the teaching learning process and its quality (World Bank, 1996). It provides basic information for policy makers, politicians, and the broader educational community and informs policy makers about the key aspects of the system" (Greaney & Kellaghan, 2008b, p. 7, ERO, 2013). In this context, ERO has its roadmap to conduct two round NASA of grade 5, 8 and 10 to assess and ensure the quality of education and trends of learning achievement within SSDP period. This NASA 2018 is the first cycle assessment of grade 5 of Mathematics and Nepali subjects in SSDP where as it is a third cycle after the establishment of ERO in 2010.
Objectives of NASA 2018The main aim of NASA is to provide policy feedback through the assessment
of learning and identify the trends of learning over the time. NASA 2018 has the following objectives:
a. To identify the current level of Grade 5 students’ achievement in Mathematics and Nepali,
b. To identify variations in student achievement by gender, province, identity with geography, types of school, ethnicity, home language, socio-economic status,
c. To explore the factors that influence student achievement,d. To identify trend in student learning and produce the baseline data for comparison
in the future,e. To strengthen the capacity of the education system in conducting national
assessment,

- vi -
f. To provide the Ministry of Education, Science and Technology with recommendations for policy formulation to improve quality and ensure equity, particularly in school education.
MethodologyThree set of questions with background information questionnaire were asked in
each subject. All sets were linked with anchor items. The ERO has used Item Response Theory to assess the latent ability of students using various contextual variables to explain those latent traits of the students. NASA 2018 has used advanced procedure to bring rigor to data analysis by generalizing the results in national level and province levels through 7 explicit strata and various other implicit strata. Use of Replicate Module for estimating the population parameters and Weighted Likelihood Estimation (WLE) for analysis of individual student level and reporting are the instances of the advancement. Furthermore, the advancement of procedures has also been noticed in the sampling methods. A Probability Proportional to Size (PPS) sampling procedure has been used for selecting the schools as Principal Sample Unit (PSU), the school clusters. Student achievement at province level and national level is reported in a transformed scale with mean 500 and standard deviation 50 by using the formula:
Average scale score = 500 + plausible value * 50
or, Average scale score = 500 + logit * 50
Assessment results have shown that the national average achievement is 500 in both subjects. However, it does not mean that both subjects have been equally learnt. This report presents the results in terms of what the students can and cannot perform, the existing gap between the written curriculum and the achieved curriculum, and the number of students who have developed their ability in a minimum competency level.
Major Findings and Recommendations1. Huge mass of students is at the underperforming level: As the study indicates,
32 out of 100 students fall below basic level (Pre-basic) in Mathematics achieving only 5% of the tested curriculum and the basic level (level 1, about 40%) students have achieved only 28% of the tested curriculum. More than 70% students have achieved only below 28% of the tested curriculum in Mathematics indicating a huge mass of students underperforming in this subject. The proficient level (level 2, 24%) students achieved 62% of the tested curriculum and advance level (level
- vii -
3, 4%) students achieved 96% of the tested curriculum. It seems that only 28% of the students have adequate knowledge and skills in Mathematics curriculum. The gap in the achievement of curriculum between below basic level (5%) and advance level students (96%) is 91% indicating remarkably high inequality in the classroom. Similarly, in Nepali, 20% students who are at below basic level (Pre-basic) achieved only 18% of the tested curriculum and 35% students achieved only 38% of the tested curriculum in Nepali, who are at basic level (level 1). As 30% students fall in proficient level and 15% in advance level, altogether 45 of 100 students have adequate knowledge and skills of the tested curriculum in Nepali. This shows that 55% of the students, a big mass of the students in Nepali, represent the underperforming group. And 45 of 100 students have adequate knowledge and skills of the tested curriculum as 30% students fall in proficient level and 15% in advance level. Altogether, 55% of the students, a big mass of the students in Nepali, represent the underperforming group. The proficient level students achieved 60% of the tested curriculum and the advance level students achieved 88% of the tested curriculum. The gap in the achievement of the curriculum between below basic level (18%) and advance level students (88%) is 70% indicating high inequality in the classroom.Recommendation: As basic level is assumed to be a minimum competency level, a campaign of "no child should be left behind basic level" should be initiated effectively to develop minimum competency level in the students. Teachers should provide the students with many opportunities to learn in many ways and through various means. Existing mis-match between the written curriculum and achieved curriculum urges the need to review the national curriculum, teaching methods, teacher motivation system, learning environment and the evaluation system.
2. Huge gap between the provinces and districts has been noticed. Such gap increases disparity in learning achievement among the groups of students.Recommendation: All the community schools should provide equal opportunity to the students for learning. A minimum standard for physical infrastructure, learning opportunities, resources, incentives and retention of good teachers under teacher management should be set to bring uniformity in the achievement level of the students. Retention of good teachers has relation with increased learning achievement of students. Learning difficulties of students in all schools should be identified and then addressed by remedial teaching. Regular follow up support and monitoring mechanism should be strengthened to enhance learning.
- viii -
3. Students can perform better irrespective of their SES and home language: The Socio-Economic Status of student’s family has low effect in Mathematics and medium effect in Nepali Language. Many students have performed better despite their unfavourable low socio-economic status; this indicates that the socio-economic background of the students does not exclusively determine the learning achievement. Province 2 has majority of students with low SES, but they have achieved the higher position in Mathematics compared to other provinces. And similar is the situation with Nepali language as well.Recommendation: As students can perform better irrespective of their SES and home language, focus on the study and practice on the part of student is a principal measure to boost their learning achievement. In all community schools, minimum learning materials, library facility and students' clubs, numeracy promotion program and reading programs should be made available to promote students’ performance.
4. There is a minimum gap in learning achievement between boys and girls.Recommendation: Reduced and minimum gap between boys and girls should be maintained with more focus on providing girls with equal opportunity. The existing gap can best be addressed through affirmative action such as scholarship, girls friendly environment, and receptive teacher behaviour.
5. Wide gap between the type of schools has been noticed: There is a wide gap in learning achievement between community and institutional schools. The students from institutional schools have out-performed the community schools with a gap of 30 scale score in Mathematics and 34 in Nepali.Recommendation: Upgrading of community schools to increase their academic performance should be initiated as a regular targeted intervention by the government. Co-curricular activities should include Mathematics or number games, reading and writing, literature, contemporary issues and challenges as part of the curriculum for all community schools. Remedial teaching and individualized instruction should also be implemented for the targeted students.
6. Bullying is affecting learning in the schools: A high number (53%) of the students were bullied in the school by their peers and others. The performance of the bullied students was found lower than that of those who were not bullied. The gap is 31 scale score in Nepali and 22 in Mathematics.Recommendation: Local governments together with the schools should
- ix -
regularly monitor the school to maintain peace, discipline and regulations as well as cohesive environment among the students. "No bullying" movement should be initiated by the school in consultation with and involvement of the local community. Active focal person in the school, psycho-social counselling service and child club activity against bullying are the other activities that the school can provide to minimize bullying in the schools.
7. Feedback to the students in homework has positive relationship with learning achievement: The students who were provided with regular homework and feedback from the teacher performed better than those who were not provided homework and feedback in both subjects. About 7% community school teachers never provided homework and feedback to the students in Nepali subject.Recommendation: Teacher's performance evaluation should be strongly linked with students’ performance. Providing homework and feedback in certain subjects (perceived to be difficult) in the form of scaffolding in the schools, continuous assessment service, criterion-based assessment for teaching-learning, formative evaluation system and regular communication with parents about their children’s performance, some instructional activities directly influence students’ learning achievement.
8. Students at right age performed better: Students studying in grade 5 at appropriate age (11 years) performed better than the under or over age students. The gap was found 9 scale score in Mathematics and 11 in Nepali. Similar trend was noticed in the previous study as well. This further means that age wise grade or grade wise age or age appropriate enrollment ensures higher learning achievement.Recommendation: Net enrollment practice at the basic level education should be maintained and increased by admitting appropriate age students in the appropriate grades in schools. Age appropriate level of students can learn smoothly with their peers of equal age.
9. After-school activities determine student learning achievement: Students' involvement in study during their after-school time has a relation with their performance. The students' who spent about one to two hours' after-school time in the activities like household chores, watching TV, and playing performed better. On the other hand, the students who spent more than two hours of their after-school time in those activities other than study performed relatively lower. The gap was found 17 scale score in Nepali and 16 in Mathematics.
- x -
Recommendation: All schools should make their parents aware of the influence of children’s involvement in study with their performance. Besides being involved in entertainment and household chores, the students should be encouraged to study not only the textbooks based on the curriculum but also the literature books, reference books and other extra-curricular materials as well.
10. Many students do not have a sense of Mathematics: In Mathematics, students below minimum learning level have quite limited knowledge and skills in Mathematics. Around 50% of them do not have any sense of reading and writing numbers and number operation. With this limited knowledge and skills, they cannot calculate and solve Mathematical problems. Some of them are able to choose correct answers when options are given in the MCQ items. Mostly, they are unable to perform any Mathematical subjective calculations independently.Recommendation: Students experiencing difficulty with learning the numbers and Mathematical calculation should be provided with learning opportunity to developing minimum Mathematical skills and competencies. The teachers should be made accountable to their students' performance. An action needs to be taken if the teachers fail to develop their students’ minimum level of competencies. Not only the teachers’ performance but also the performance of the Principals of such schools with below minimum learning level of students should be linked up with their career path. The schools with such lower achievement level should be made responsible to develop short term and long-term learning improvement strategies and actions. To monitor the progress of the implementation of the planned strategies, regular standardized tests should be administered and local level monitoring and supervision mechanism should be ensured. Besides, the primary level teachers should be equipped with national level short-term practical, school based professional training to advance their content knowledge and pedagogical skills.
11. More than half of the students are struggling with the simple Mathematical calculations: Basic level (level 1) students have superficial knowledge and skills in most of the Mathematical contents. However, they are struggling with calculations. They are able to identify the ordered pair of a point, square pattern in dots, the sum of decimal numbers, the place of a digit in numbers, the relation of kilogram and gram and the numbers, mixed fraction and type of angles. But they also have a limited knowledge of formula for volume and area, they cannot estimate the angle shown in figure and cannot identify the relation between decimal and fraction. They can read the table and bar graphs to take simple information
- xi -
but cannot draw conclusion by comparing the data. They can solve very simple problems of unitary methods, subtract small same denominator fractions, round numbers in the nearest tenth of a decimal number. They can also recognize limited square numbers and express Mathematical sentence in Mathematical language to calculate. They can also subtract a univariate one-degree Algebraic term from another, find the value of x in one variable equation and subjective, can simplify Algebraic expression (univariate) in Algebra. However, they cannot perform grade level Mathematical calculations independently.Recommendation: The knowledge of basic level contents is essential to be able to grasp the Mathematical content. Therefore, the teachers should focus on the development of basic level contents among all students. In addition to these skills, the students should be prepared to solve simple grade appropriate Mathematical calculations independently. To improve learning achievement, an emphasis should be laid on the underperforming students instantly through the application of problem-solving method.
12. In Nepali language, the students below level 1 can read only a few words or sentences but they cannot write the sentences independently.Recommendation: Such underperforming (below level 1) students should be involved more on the activities such as reading and writing words and sentences and describing familiar events independently. Language teaching should focus on meaningful reading and comprehension exercises rather than on reciting the paragraphs in the textbook and rote learning the answers.
13. Decreasing trend of students' performance in Mathematics:Recommendation: A diagnostic study about the challenges in teaching and learning culture should be carried out. The factors responsible for reduced learning achievement should be identified and disseminated. The involvement of parents and community members should be ensured in making the schools accountable for their student's low performance level.
14. The achievement and gap related results of NASA 2018 are quite similar to the results of NASA 2012 and 2015 : The consistent recurring results not only proves the reliability of the NASA study, but also indicates that interventions were not sufficient in improving the quality of learning in the school level.Recommendation: MOEST should review the existing plan and policies from the quality concerns.
- xii -
15. Overall Recommendation: As a final step of National Assessment, MOEST should initiate Post-NASA policy review and intervention plan at the national level, sub-national level, and implementing agency level of the education system.

- xiii -
Table of Contents
Executive Summary ......................................................................................... vContext ............................................................................................................. vObjectives of NASA 2018 ............................................................................... vMethodology .................................................................................................... viMajor Findings and Recommendations ........................................................... viTable of contents .............................................................................................. xiiiAcronyms/abbreviations .................................................................................. xv
Chapter I : An overview of the national assessment of student achievement, 2018.................................................................................................................. 11. Introduction ............................................................................................ 1
1.1 National Assessment of Student Achievement .............................. 21.2 Evolution of NASA in Nepal ........................................................ 21.3 NASA Cycle .................................................................................. 41.4 Objectives of NASA 2018............................................................. 51.5 Distinct Features of NASA 2018 .................................................. 5
Chapter 2 : Methodology .............................................................................. 72.1 Sampling ................................................................................................. 7
2.1.1 Target Sampling Frame ................................................................. 72.1.2 Population ..................................................................................... 82.1.3 Sample Size ................................................................................... 82.1.4 Sample Design and Stratification .................................................. 102.1.5 Selection of the Schools and the Students .................................... 112.1.6 School Weight ............................................................................... 122.1.7 Student Weight .............................................................................. 13
2.2 Test Administration and Supervision ...................................................... 142.3 Analysis Methods ................................................................................... 152.4 Tools Development, their Reliability and Validity ................................. 16
2.4.1 Assessment Framework ................................................................ 162.4.2 Framework for Mathematics ......................................................... 172.4.3 Specification of Items.................................................................... 232.4.4 Framework for Nepali Subject ...................................................... 24

- xiv -
2.5 Item Development and Selection ............................................................ 292.5.1 Item development workshop ......................................................... 292.5.2 Pre-test of Test Items ..................................................................... 292.5.3 Item Booklet, Scoring Key and OMR Design .............................. 302.5.4 Preparation of the scoring scheme and guidelines ........................ 302.5.5 Review of test booklets and scoring schemes ............................... 312.5.6 Preparation of item Register ......................................................... 31
2.6 Background Variables ............................................................................. 332.7 Test Administration ................................................................................ 362.8 Item Parameter Estimation, Item Review and Calibration ..................... 372.9 Reliability and Validity ........................................................................... 38
2.9.1 Reliability ...................................................................................... 382.9.2 Validity .......................................................................................... 38
2.10 Item Parameters ...................................................................................... 392.11 Plausible Values (PVs) ........................................................................... 412.12 Comparing the Overall Results of NASA 2018 with the Results of 2018 432.13 Provincial Results ................................................................................... 43
Chapter 3 : Results in Mathematics at National Level ............................... 473.1 Introduction ............................................................................................ 473.2 Wright-map of student ability and item difficulty in Mathematics ........ 473.3 Plausible Values, their Mean and Standard Error ................................... 493.4 Defining Proficiency Levels in Mathematics ......................................... 493.5 Distribution of Students by Proficiency Levels ...................................... 523.6 Minimum Level of Achieved Curriculum .............................................. 543.7 Overall Mean Score by Province ............................................................ 553.8 Results by Gender, Ethnicity and Home Language ................................ 573.9 Results by Types of Schools ................................................................... 603.10 Results by Various Influencing Factors .................................................. 61
Chapter 4 : Results in Nepali at National Level .......................................... 734.1 Introduction ............................................................................................ 734.2 Wright-map of Student Ability and Item Difficulty in Nepali ................ 734.3 Plausible Values, their Mean and Standard Error ................................... 744.4 Defining Proficiency Levels for Nepali .................................................. 754.5 Distribution of students by Proficiency Levels ...................................... 774.6 Minimum Level of Achieved Curriculum .............................................. 78
- xv -
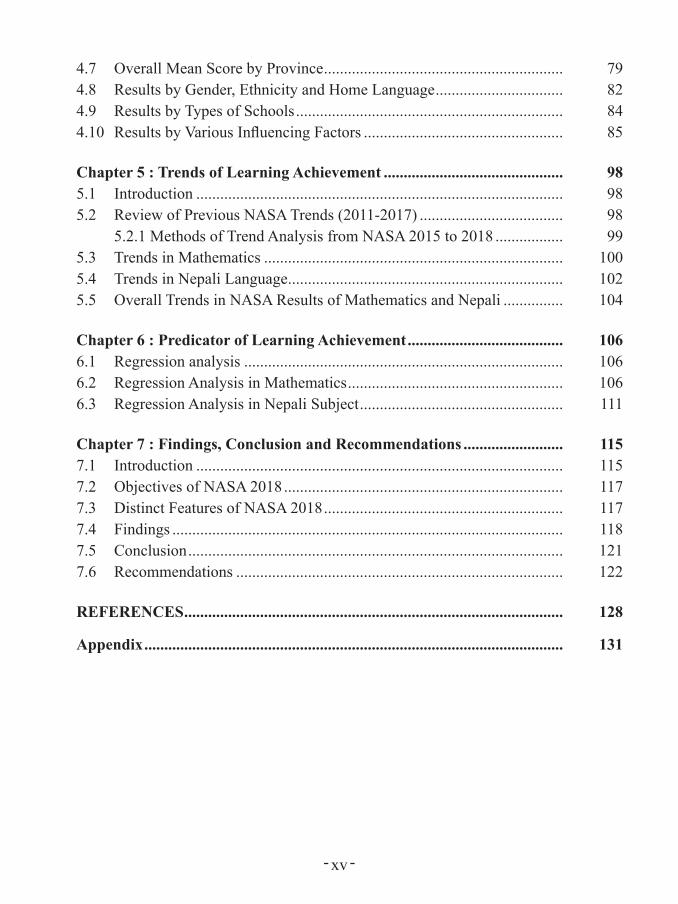
4.7 Overall Mean Score by Province ............................................................ 794.8 Results by Gender, Ethnicity and Home Language ................................ 824.9 Results by Types of Schools ................................................................... 844.10 Results by Various Influencing Factors .................................................. 85
Chapter 5 : Trends of Learning Achievement ............................................. 985.1 Introduction ............................................................................................ 985.2 Review of Previous NASA Trends (2011-2017) .................................... 98
5.2.1 Methods of Trend Analysis from NASA 2015 to 2018 ................. 995.3 Trends in Mathematics ........................................................................... 1005.4 Trends in Nepali Language ..................................................................... 1025.5 Overall Trends in NASA Results of Mathematics and Nepali ............... 104
Chapter 6 : Predicator of Learning Achievement ....................................... 1066.1 Regression analysis ................................................................................ 1066.2 Regression Analysis in Mathematics ...................................................... 1066.3 Regression Analysis in Nepali Subject ................................................... 111
Chapter 7 : Findings, Conclusion and Recommendations ......................... 1157.1 Introduction ............................................................................................ 1157.2 Objectives of NASA 2018 ...................................................................... 1177.3 Distinct Features of NASA 2018 ............................................................ 1177.4 Findings .................................................................................................. 1187.5 Conclusion .............................................................................................. 1217.6 Recommendations .................................................................................. 122
REFERENCES ............................................................................................... 128
Appendix ......................................................................................................... 131


- xvii -
List of Table
Table 1.1 NASA Cycles Completed and Planned ...................................... 3Table 2.1 Sample students from community and institutional schools ...... 11Table 2.2 Province wise number of sample schools .................................. 12Table 2.3 Content domains for Mathematics in Grade 5 ........................... 19Table 2.4 Content areas, criteria and standards for Mathematics, Grade 5 22Table 2.5 Representation of various cognitive domains in the test for
Grade 5 in Mathematics ............................................................. 23Table 2.6 Table of specification for item selection .................................... 23Table 2.7 कक्षा ५ को नेपषाली विषयको क्ेत्र र विषयिस्तु ........................................ 25Table 2.8 नेपषाली विषयको आधषार, स्र र ्ह ...................................................... 27Table 2.9 कक्षा ५ नेपषालीमषा संज्षानषातमक क्ेत्र र अङ्कभषार ...................................... 28Table 2.10 कक्षा ५ को उपलव्ध परीक्णकषा लषावि प्रश्नहरूको विविष्ीकरण.................. 28Table 2.11 Number of schools and students participating in pre-test .......... 29Table 2.12 Example of item analysis and decision in the pre-test of
Mathematics items ..................................................................... 30Table 2.13 Example of Item register of Mathematics .................................. 32Table 2.14 Student background variables/variable blocks ........................... 34Table 2.15 Reliability of item booklets in Mathematics .............................. 38Table 2.16 Reliability of item booklets in Nepali ........................................ 38Table 2.17 Number of items asked in various content area based on the
weightage given by Mathematics curriculum ............................ 38Table 2.18 Number of items asked in various content area based on the
weightage given by Nepali curriculum ...................................... 39Table 2.19 Example of item parameters (Mathematics) .............................. 39Table 2.20 PVs and RWGT (example from Grade 5 Nepali) ...................... 42Table 3.1 Standard Error of five plausible variables in Mathematics ........ 49Table 3.2 Proficiency levels and the score range in Mathematics ............. 49Table 3.3 A summary of minimum proficiency level in all four levels. .... 50Table 3.4 Distribution of the students in various proficiency levels and
their Standard Error .................................................................... 52Table 3.5 Mathematical presentation of the achieved curriculum ............. 55Table 3.6 Performance of the students in Mathematics at province level
by gender. ................................................................................... 58Table 3.7 Percentage of support received from various sources ................ 67
- xviii -
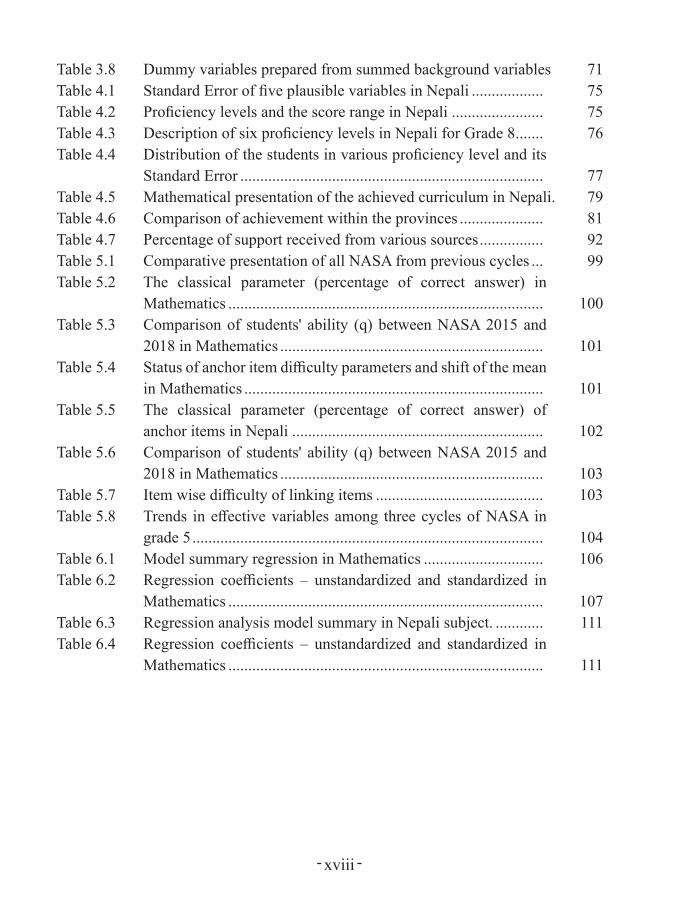
Table 3.8 Dummy variables prepared from summed background variables 71Table 4.1 Standard Error of five plausible variables in Nepali .................. 75Table 4.2 Proficiency levels and the score range in Nepali ....................... 75Table 4.3 Description of six proficiency levels in Nepali for Grade 8 ....... 76Table 4.4 Distribution of the students in various proficiency level and its
Standard Error ............................................................................ 77Table 4.5 Mathematical presentation of the achieved curriculum in Nepali. 79Table 4.6 Comparison of achievement within the provinces ..................... 81Table 4.7 Percentage of support received from various sources ................ 92Table 5.1 Comparative presentation of all NASA from previous cycles ... 99Table 5.2 The classical parameter (percentage of correct answer) in
Mathematics ............................................................................... 100Table 5.3 Comparison of students' ability (q) between NASA 2015 and
2018 in Mathematics .................................................................. 101Table 5.4 Status of anchor item difficulty parameters and shift of the mean
in Mathematics ........................................................................... 101Table 5.5 The classical parameter (percentage of correct answer) of
anchor items in Nepali ............................................................... 102Table 5.6 Comparison of students' ability (q) between NASA 2015 and
2018 in Mathematics .................................................................. 103Table 5.7 Item wise difficulty of linking items .......................................... 103Table 5.8 Trends in effective variables among three cycles of NASA in
grade 5 ........................................................................................ 104Table 6.1 Model summary regression in Mathematics .............................. 106Table 6.2 Regression coefficients – unstandardized and standardized in
Mathematics ............................................................................... 107Table 6.3 Regression analysis model summary in Nepali subject. ............ 111Table 6.4 Regression coefficients – unstandardized and standardized in
Mathematics ............................................................................... 111

- xix -
List of Figure
Figure 1.1 NASA process cycle ................................................................... 4Figure 2.1 Conceptual diagram of population for sampling frame ............. 7Figure 2.2 Sampling districts ....................................................................... 10Figure 2.3 Example of Sample weight calculation ...................................... 14Figure 2.4 Data analysis process of NASA 2018 ........................................ 15Figure 2.5 Replicate module used to calculate the Standard Estimate of
Univariate Statistics using PVs in Mathematics ........................ 16Figure 2.6 Framework for the background information for NASA 2017 .... 33Figure 2.7 Example of item characteristics curve in Mathematics .............. 40Figure 2.8 Example of item characteristics curve in Nepali ........................ 40Figure 3.1 Wright map showing person and item in the same scale ........... 48Figure 3.2 Distribution of number of students (%) in different levels......... 53Figure 3.3 Provincial level mean achievement scores in Mathematics ....... 56Figure 3.4 District wise mean achievement score ....................................... 56Figure 3.5 Mean score in Mathematics by gender at national level ............ 57Figure 3.6 Mean score in Mathematics by ethnicity ................................... 59Figure 3.7 Mean score in Mathematics by home language ......................... 60Figure 3.8 Mean score in Mathematics by types of schools ........................ 60Figure 3.9 Mean score in Mathematics by level of mother's education ...... 61Figure 3.10 Mean score in Mathematics by level of father's education ........ 62Figure 3.11 Mean score in Mathematics by age group .................................. 63Figure 3.12 Relationship of learning achievement with mother's occupation 64Figure 3.13 Mean score in Mathematics by father's occupation ................... 65Figure 3.14 Achievement by after school activities ...................................... 66Figure 3.15 Achievement by after school support ......................................... 67Figure 3.16 The percentage of students who experienced different types of
bullying ...................................................................................... 68Figure 3.17 Influence of the experience with bullying on learning achievement 69Figure 3.18 Mean score in Mathematics by the availability of textbook ...... 69Figure 3.19 Teacher's feedback on students' homework and achievement .... 70Figure 3.20 Relation between SES and Schools' Mean Score in Mathematics 72Figure 4.1 Wright map showing person and item in the same scale ........... 74Figure 4.2 Student percentage by proficiency levels in Nepali ................... 77Figure 4.3 Provincial level mean achievement scores in Nepali ................. 80
- xx -
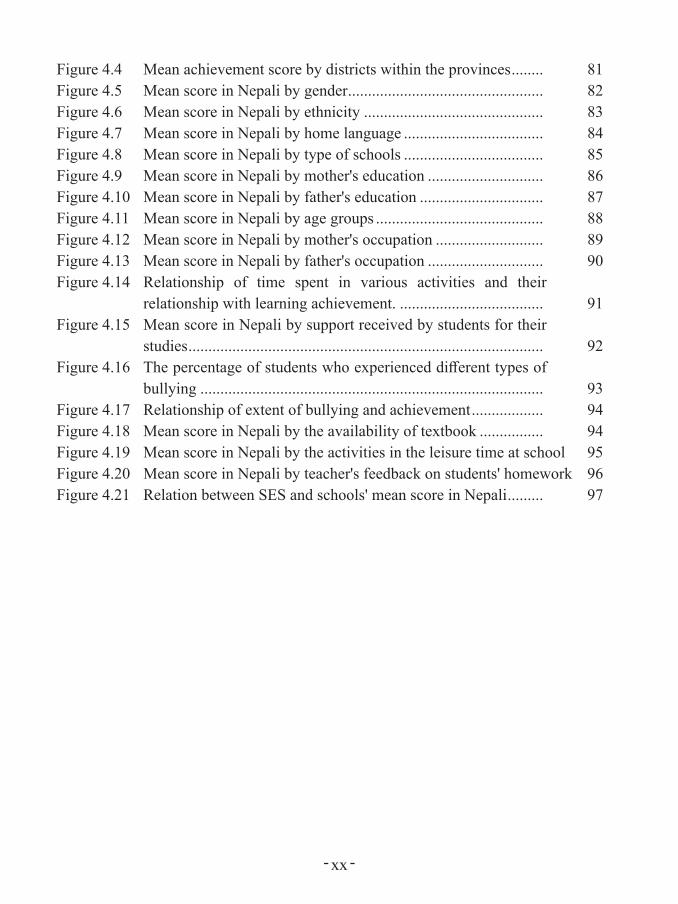
Figure 4.4 Mean achievement score by districts within the provinces ........ 81Figure 4.5 Mean score in Nepali by gender ................................................. 82Figure 4.6 Mean score in Nepali by ethnicity ............................................. 83Figure 4.7 Mean score in Nepali by home language ................................... 84Figure 4.8 Mean score in Nepali by type of schools ................................... 85Figure 4.9 Mean score in Nepali by mother's education ............................. 86Figure 4.10 Mean score in Nepali by father's education ............................... 87Figure 4.11 Mean score in Nepali by age groups .......................................... 88Figure 4.12 Mean score in Nepali by mother's occupation ........................... 89Figure 4.13 Mean score in Nepali by father's occupation ............................. 90Figure 4.14 Relationship of time spent in various activities and their
relationship with learning achievement. .................................... 91Figure 4.15 Mean score in Nepali by support received by students for their
studies ......................................................................................... 92Figure 4.16 The percentage of students who experienced different types of
bullying ...................................................................................... 93Figure 4.17 Relationship of extent of bullying and achievement .................. 94Figure 4.18 Mean score in Nepali by the availability of textbook ................ 94Figure 4.19 Mean score in Nepali by the activities in the leisure time at school 95Figure 4.20 Mean score in Nepali by teacher's feedback on students' homework 96Figure 4.21 Relation between SES and schools' mean score in Nepali ......... 97
- xxi -
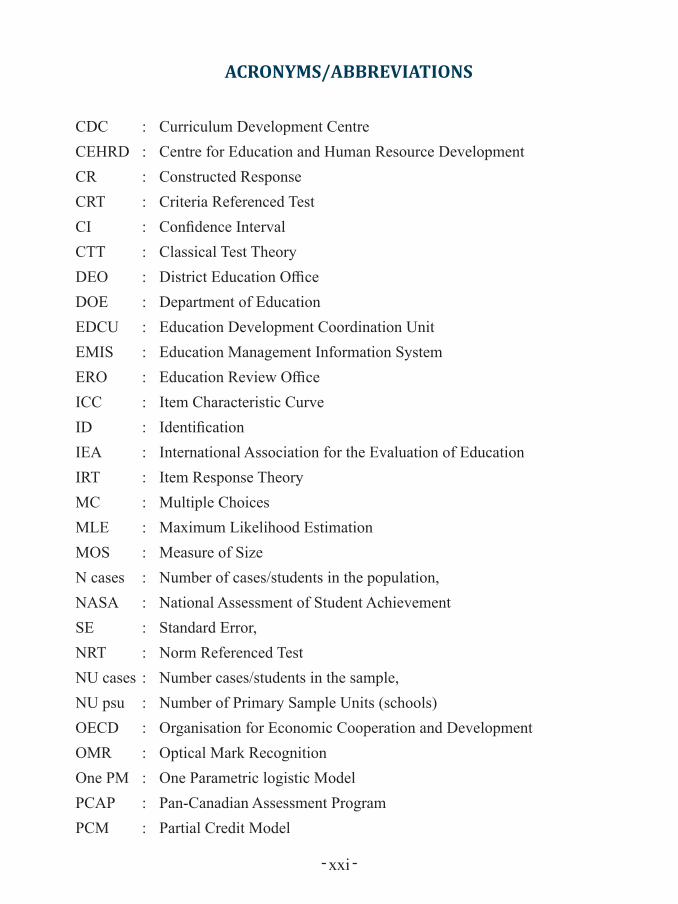
ACRONYMS/ABBREVIATIONS
CDC : Curriculum Development CentreCEHRD : Centre for Education and Human Resource DevelopmentCR : Constructed ResponseCRT : Criteria Referenced TestCI : Confidence IntervalCTT : Classical Test TheoryDEO : District Education OfficeDOE : Department of EducationEDCU : Education Development Coordination UnitEMIS : Education Management Information SystemERO : Education Review OfficeICC : Item Characteristic CurveID : IdentificationIEA : International Association for the Evaluation of EducationIRT : Item Response TheoryMC : Multiple ChoicesMLE : Maximum Likelihood EstimationMOS : Measure of SizeN cases : Number of cases/students in the population,NASA : National Assessment of Student AchievementSE : Standard Error,NRT : Norm Referenced TestNU cases : Number cases/students in the sample,NU psu : Number of Primary Sample Units (schools)OECD : Organisation for Economic Cooperation and DevelopmentOMR : Optical Mark RecognitionOne PM : One Parametric logistic ModelPCAP : Pan-Canadian Assessment ProgramPCM : Partial Credit Model
- xxii -
PISA : Programme for International Student AssessmentPPS : Probability Proportionate to SizePRC : Printing Ready CopyPSU : Primary Sample UnitPV : Plausible ValueRWGT : Replicable WeightSE : Standard ErrorSPSS : Statistical Package for Social ScienceSR : Selected ResponseSRS : Simple Random SamplingSSDP : School Sector Development ProgrammeTIF : Test Information FunctionTIMSS : Trends in International Mathematics and Science StudyWLE : Weighted Likelihood Estimation

- 1 -
CHAPTER I
AN OVERVIEW OF THE NATIONAL ASSESSMENT OF STUDENT ACHIEVEMENT, 2018
1. IntroductionIn this report, chapter 1 presents an overall introduction of the National
Assessment of Student Achievement (NASA), its historical overview and objectives. In chapter 2, methodological chapter, the report has attempted to explore the contextual variables, tools and technologies used during the overall study and also explains the contextual variables used like geography, ethnicity, gender, language and economic status etc. Chapter 3 presents the basic result by contextual variables, chapter 4 compares the NASA 2018 cycle with the previous 2015 cycle and trends of learning achievements. Finally in chapter 5, a summary of findings, conclusion and recommendations are presented in the form of an executive summary.
This is a report on the national assessment of Grade five students in Mathematics and Nepali subjects conducted by the Education Review Office (ERO) in 2018. The report of the assessment is based on the curriculum-based standardized test. A comparative presentation is made in all the sub-chapters focussing on province wise results as explicit strata and other variable specific results as implicit strata like the type of schools, gender, ethnicity, language, in a disaggregated form.
The assessment was conducted in 24 sample districts, 1400 schools and 32262 students. The major aim of NASA is to provide valid and reliable information on student learning achievement at grade five of basic education level with policy feedback to the Ministry of Education, Science and Technology. Specifically, NASA provides feedback to the teachers, schools, curriculum developers, program and policy executing agencies for the needed reform. A repeated cycle of NASA provides information on the trend of student learning and other contextual variables that provide pathways for the review and design for policy and program.
More specifically, the assessment answers the questions like: How well are the students learning? Is there an evidence of particular strengths and weaknesses in students' leaning? Do certain sub-groups of students perform poorly? What factors are associated with student achievement? Do the achievements of students change over the time? (Grenaney & Kellaghan, 2007). This report has highlighted the related
- 2 -
issues and problems, and made some recommendations to the policy makers and other stakeholders.
1.1 National Assessment of Student AchievementGlobally, it has been well accepted that the means of measuring the quality
of education is the students' achievement (TIMSS & PIRLS, 2008). The national assessment provides both quantitative and descriptive form of information on student achievement, which after is considered as an output of the teaching learning process and its quality (World Bank, 1996). National assessment thus provides basic information for policy makers, politicians, and the broader educational community (ERO, 2013). Further, "it provides data for a type of national education audit carried out to inform policy makers about the key aspects of the system" (Greaney & Kellaghan, 2008b, p. 7, ERO, 2013). It is argued that the achievement of the students in a curriculum area be aggregated to provide an estimate of the achievement level in the education system as a whole at a particular age or grade level (Greaney & Kellaghan, 2008b; NASA, 2013). NASA is also a popular means of determining the achievement of curriculum and finding the gaps between the written curriculum and the taught curriculum. So, it is useful for making policy decisions especially when decisions are to be made in relation to the optimum utilisation of resources (EDSC, 2008). It provides evidence for policy makers on availability of textbooks, class size, and number of years of teacher training. Therefore, every country has accepted that it is "systematic, regular measure of learning achievement in a country that is designed to assist policy making" (Lockheed et al. cited in EDSC, 2008, pp. 19, NASA 2013).
1.2 Evolution of NASA in NepalAssessment practice is found to have started from the last years of the decade of
1980s in Nepal. However, the Ministry of Education has formally started the National Assessment since 1995 and continued it up to 2010 in a small scale. Large scale NASA was administered under the Ministry of Education since 2011 AD. Four NASA cycles were completed during the School Sector Reform Plan (SSRP) and two including NASA 2018 were completed during the School Sector Development Plan (SSDP). In both the plans, NASA is considered as a tool to measure the quality of education for making the educational institutions accountable to achieving the educational goals.
NASA studies are conducted for both backward and forward-looking purposes. The backward-looking purpose is concerned mainly with building a database to
- 3 -
analyse both the strengths and weaknesses of educational policies and practices that affect students’ learning achievement (ERO, 2018).
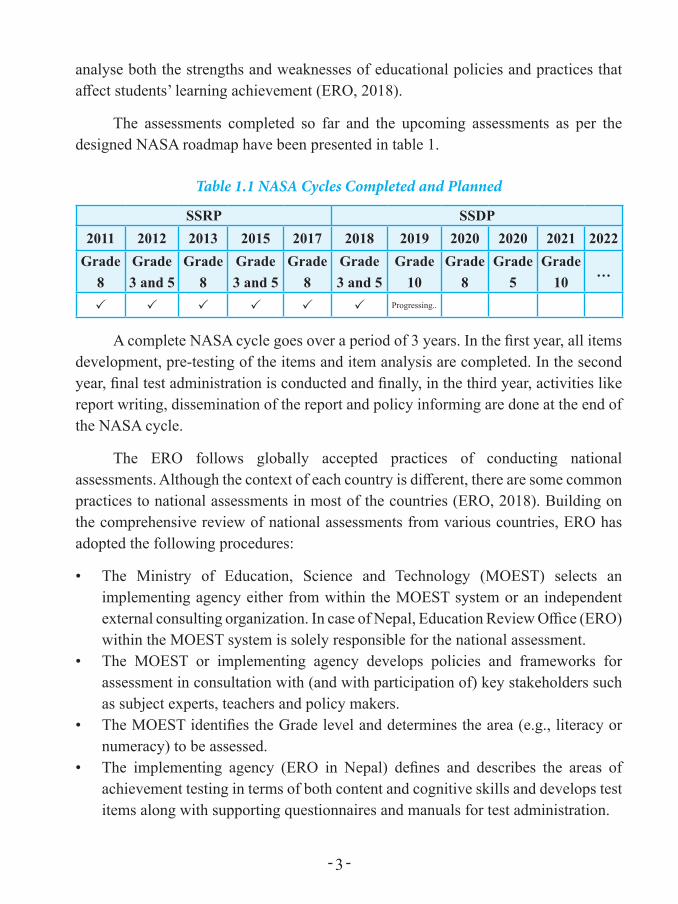
The assessments completed so far and the upcoming assessments as per the designed NASA roadmap have been presented in table 1.
Table 1.1 NASA Cycles Completed and Planned
SSRP SSDP2011 2012 2013 2015 2017 2018 2019 2020 2020 2021 2022
Grade 8
Grade 3 and 5
Grade 8
Grade 3 and 5
Grade 8
Grade 3 and 5
Grade 10
Grade 8
Grade 5
Grade 10
…
Progressing..
A complete NASA cycle goes over a period of 3 years. In the first year, all items development, pre-testing of the items and item analysis are completed. In the second year, final test administration is conducted and finally, in the third year, activities like report writing, dissemination of the report and policy informing are done at the end of the NASA cycle.
The ERO follows globally accepted practices of conducting national assessments. Although the context of each country is different, there are some common practices to national assessments in most of the countries (ERO, 2018). Building on the comprehensive review of national assessments from various countries, ERO has adopted the following procedures:
• The Ministry of Education, Science and Technology (MOEST) selects an implementing agency either from within the MOEST system or an independent external consulting organization. In case of Nepal, Education Review Office (ERO) within the MOEST system is solely responsible for the national assessment.
• The MOEST or implementing agency develops policies and frameworks for assessment in consultation with (and with participation of) key stakeholders such as subject experts, teachers and policy makers.
• The MOEST identifies the Grade level and determines the area (e.g., literacy or numeracy) to be assessed.
• The implementing agency (ERO in Nepal) defines and describes the areas of achievement testing in terms of both content and cognitive skills and develops test items along with supporting questionnaires and manuals for test administration.
- 4 -
ERO• Pilots the test items with the support of external experts and reviews their
validity, appropriateness and sensitivity in terms of gender, ethnicity and culture.
• Ensures that the assessment instruments are reliable and valid.• Selects the samples schools, arranges for printing the test papers and other
relevant materials; and communicates with the schools and teachers for test administration.
• Orients the test administrators (focal persons, head teachers and teachers), and then administers the test and survey questionnaires in the selected schools.• Collects test scores and other necessary information, cleans the data as
needed and analyses them.• Prepares draft report/s which is/are reviewed by relevant subject
committees and external experts.• Prepares and disseminates final report/s through various means such as
publication and the mass media.• Finally, the MOEST, implementing agency and relevant stakeholders study
the report/s of national assessment and identify major areas for policy reforms (ERO, 2017, 2018).
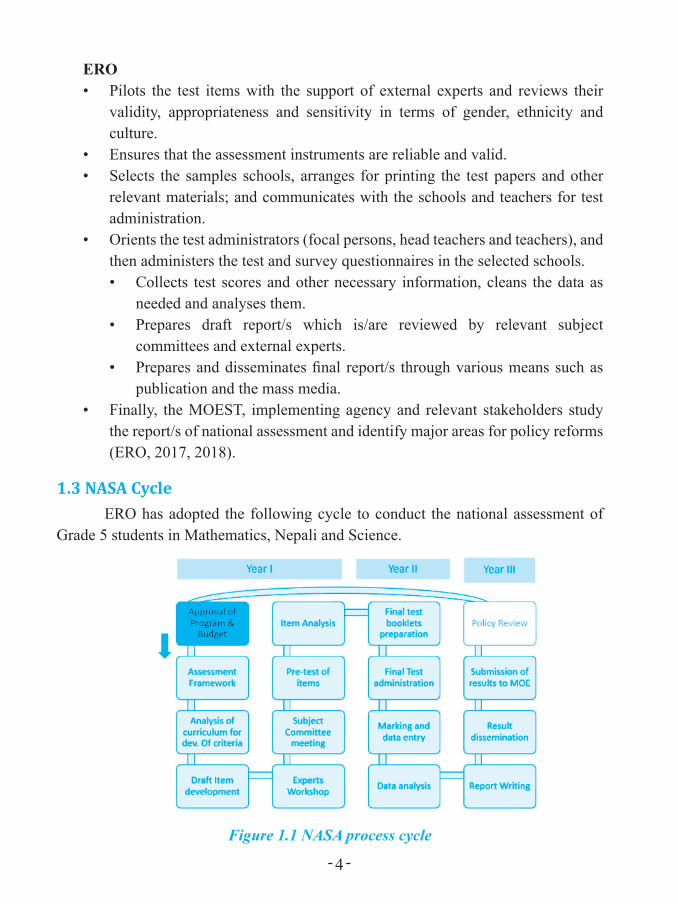
1.3 NASA Cycle ERO has adopted the following cycle to conduct the national assessment of
Grade 5 students in Mathematics, Nepali and Science.
Figure 1.1 NASA process cycle

- 5 -
The above figure presents the major steps taken in planning, designing, administering and reporting of the assessment. NASA process cycle begins with an approval of the required budget and programme and goes through the series of assessment procedures: development of the assessment framework, criteria and standards, items and questionnaires; piloting, analysing and selecting the items; designing the test booklets; administrating the test; scoring and preparing data; calibrating items and equating the tests; analysing and setting proficiency levels; and reporting and disseminating the results.
1.4 Objectives of NASA 2018The purpose of this assessment is to provide feedback to the Ministry of Education,
Science and Technology to improve the quality of school education. This assessment does not report individual students’ performance, nor does it compare the proficiencies of each individual student and school. Rather, it provides the national and provincial level results as well as the differences in the achievement scores in relation to various influencing factors such as socioeconomic status, home language, and identity with geographical region. More specifically, NASA 2018 has the following objectives:
a. To identify the current level of Grade 5 students achievement in Mathematics and Nepali.
b. To identify variations in student achievement by gender, province, identity with geography, types of school, ethnicity, home language, socio-economic status.
c. To explore factors that influence student achievement.d. To identify the trend in student learning and produce the baseline data for the
future for comparing.e. To strengthen the capacity of the education system in conducting national
assessment.f. To provide the Ministry of Education, Science and Technology with
recommendations for policy making to improve quality and equity, particularly in school education.
1.5 Distinct Features of NASA 2018The ERO has used Item Response Theory to assess the latent ability of students
using various contextual variables to explain those latent traits of the students. This assessment has used advanced procedure to bring rigor to data analysis by generalizing the results in national level and province levels through 7 explicit strata and various

- 6 -
other implicit strata. Use of Replicate Module for estimating the population parameters and Weighted Likelihood Estimation (WLE) for analysis of individual student level and reporting are the examples of its advancement. Furthermore, the advancement of procedures has also been noticed in sampling methods. A Probability Proportional to Size (PPS) sampling procedure has been used in selecting the schools as Principal Sample Unit (PSU), the school clusters. Reporting of student achievement at province level and national level is done in a transformed scale with mean 500 and standard deviation 50 by using the formula:
Average scale score = 500 + plausible value * 50or, Average scale score = 500 + logit * 50
If readers want to extract the WLE of latent ability, they can use:
average latent ability (logit) of any group =average score - 500
50
The distinct features of this report are:1. A comparative presentation of NASA 2018 and 2015 by using IRT methods and
rigorous process2. Trends of the results over all NASA cycles of grade 53. Learning level descriptors prepared through a rigorous analysis4. A gap in learning between the written curriculum and the taught curriculum in the
form of achieved curriculum is presented.
- 7 -
Chapter 2
Methodology
This chapter presents the process adopted for sampling, assessment framework, tools development, setting contextual variables and determining the reliability and validity of the tools. It also presents the statistical tools and techniques used in data analysis and comparing the NASA 2018 data to previous NASA 2015. Moreover, various formula, symbols and techniques used in data analysis and reporting are described in greater details in this chapter.
2.1 Sampling
2.1.1 Target Sampling FrameSampling is a process of selecting a set of data from the population by using a
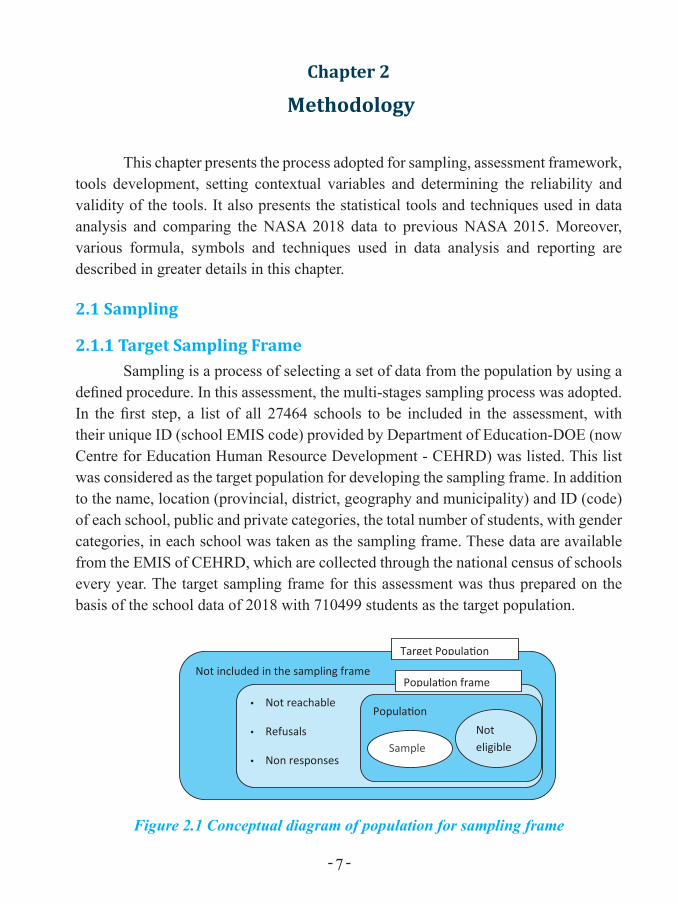
defined procedure. In this assessment, the multi-stages sampling process was adopted. In the first step, a list of all 27464 schools to be included in the assessment, with their unique ID (school EMIS code) provided by Department of Education-DOE (now Centre for Education Human Resource Development - CEHRD) was listed. This list was considered as the target population for developing the sampling frame. In addition to the name, location (provincial, district, geography and municipality) and ID (code) of each school, public and private categories, the total number of students, with gender categories, in each school was taken as the sampling frame. These data are available from the EMIS of CEHRD, which are collected through the national census of schools every year. The target sampling frame for this assessment was thus prepared on the basis of the school data of 2018 with 710499 students as the target population.
Not included in the sampling frame
• Not reachable
• Refusals
• Non responses
Popula�on
Sample
Not eligible
Popula�on frame
Target Popula�on
Figure 2.1 Conceptual diagram of population for sampling frame
- 8 -
2.1.2 Population
The population of the study is the schools running the classes up to Grade 5. However, some of the schools did not report the number of students (zero students) and such schools were excluded from the population frame. After the exclusion of non-student school, the schools with less than 10 students were also excluded as the non-eligible schools. Then the population of this assessment reached 21093 schools at national level. Sample cluster schools were selected from those schools, by using Probability Proportional to Size (PPS) sampling method. Thus the population for this assessment covered all students enrolled at Grade five taken randomly from primary sampling units (PSUs). The exclusion of the schools was defined by following criteria:
• Schools having less than 10 students• Students who did not respond the test items (during data cleaning)• Schools at very remote distance or unreachable at the time of assessment• Schools which do not have students in Grade 5
2.1.3 Sample SizeThe educational survey research studies suggest that the sampling precision
requirements should be satisfied by a simple random sample (SRS) of 384 students for the main criterion variable. This size of simple random sample of students yields 95% of confidence interval for the student-level estimate with 3% of confidence interval (Margin error). However, a perfect random sampling is not an easy task in such a large-scale national assessment. The sampling design includes the combination of different sampling techniques in different stages, including stratification, clustering and random selection of students. For this, the design effect due to the multi-stage sampling has to be calculated and adjusted while selecting the sample size.
In this assessment, actual sample size of this assessment was calculated in multi-stage sampling methods. Intra-class correlation was taken from the recently administered survey of grade 3. Taking intra-class correlation r = 0.25 (NASA, 2015) and school cluster size (C) equal to 25, the design effect (deff) was calculated by using the formula given:
Where: Deff = Design effectC = the size of the cluster (number of students within the school who will be assessed in a subject) r = Intra-class correlation

- 9 -
Now, to calculate the Clustered Sample Size (CSS), using the formula
Where Effective Sample Size (ESS; that is equivalent to a Simple Random Sample size). Taking 384 as sufficient sample, CSS is equal to 2688. Now by adjusting the student non-response by 3% and school non-participation by 3%, total number of students has become 2856. This number of students is equal to 114 school clusters and 25 PSU size.
To produce sufficient number of samples, at least 114 schools per province and even more than this number can be included in some strata (provinces) as sample. Hence altogether, 7*114 = 799 schools are determined to be valid number for the assessment. However, intra-class correlation is more than 0.25 in grade 5 or above grades. So, taking design effect = 10, sample cluster number becomes 163 by the same formula. By 7*163 = 1142 number of schools are defined as an adequate sample of schools. For assuring sufficient school size and addressing the diversity of community and institutional schools, 1400 schools were taken as the sample PSU.
There are other methods as well for calculating the sample size. One of the other formula for taking the required sample size is
nc = n* × deff,
where nc is the required sample size, n* is the effective sample size for simple random sampling (srs), and Deff is the design effect. Deff = 1 + (C —1), where C is the population size, (Rho) = Intra-class correlation.
Putting the value of design effect, Deff = 10, as a multi-stage cluster sampling at the national level might have a design effect of 10 or higher (Murphy & Schulz, 2006), the minimum sample size of students is estimated as:
nc = 400 × 10 = 4000, implies, 4000/25 = 160 schools. For seven provinces, 7 * 160 = 1120 schools.
From the above both methods, a minimum number of PSU does not exceed 1120 schools. This number is also very close to the above calculation. Hence 1400 PSU is a sufficient number also for this National Assessment.

- 10 -
2.1.4 Sample Design and Stratification
The sample design for NASA 2018 Grade 5 assessment was a multi-stage by the selection of schools from each explicit stratum (province). In Nepal, seven provinces are politically divided entities of the country, which govern educational administration within their region in their own. A sufficient number of samples taken from the provinces will ensure the generalizability or the results. The selection of districts from each geographical location was done randomly to incorporate Himal, Hill and Terai areas as far as possible. The Primary Sampling Unit (PSU) schools (clusters), were selected within the district by using PPS method. The selected 24 districts from all 7 provinces are presented in the following figure 2.2:
Figure 2.2 Sampling districts
Among the 77 districts, five districts from Province 1: Bhojpur, Dhankuta, Okhaldhunga, Jhapa and Panchthar; three districts from Province 2: Mahottari, Rautahat, Siraha; five districts from Province 3: Sindhuli, Kavre, Chitwan, Nuwakot, and Lalitput; three districts from Gandaki province: Syangja, Lamjung, Parvat; three districts from Province 5: Bardiya, Pyuthan, Gulmi; three districts from Karnali province: Kalikot, Salyan, Humla and two districts from Sudur Paschim province: Bajura and baitadi were selected randomly.

- 11 -
2.1.5 Selection of the Schools and the StudentsFrom the population, a total 32262 students were taken as the sample. However,
28,381 students participated in the assessment. The minimum sample for the province having the smallest number of student population was fixed to be 1060 per subject. Viewing the different sizes of schools, the maximum sample size was fixed to be 25 per school, which is called Measure of Size (MOS).
In the case of a sample school having more than 25 students, the students were selected by using a random sampling method otherwise all the students were taken as the samples with defined number of students. More specifically, the number of students sampled from each of the selected schools was of two different ways: (i) If the size of the students was less than or equal to the expected sample size (MOS), all the students were sampled. (ii) When the size of the students was greater than the expected size, the required number of the students was selected randomly. The probability of selection of a particular student from schools was always the same.
Because of school replacement and student non-response adjustment, calculation sample weight by PPS sampling methods was completed. In the raw database, some records were background information only and some were subjective test item response only with unidentified unique ID or school were deleted from the database. So, finalized and cleaned data by removing duplicate cases, outliers and invalid entries was as per given in following table 2.1.
Table 2.1 Sample students from community and institutional schools
ProvinceMath Nepali Grand
TotalCommunity Institutional Total Community Institutional TotalProv. 1 1847 984 2831 2040 755 2795 5626Prov. 2 1470 269 1739 1602 211 1813 3552Prov. 3 2335 1609 3944 2224 1672 3896 7840Gandaki 829 770 1599 799 818 1617 3216Prov. 5 1608 335 1943 1617 297 1914 3857Karnali 1045 26 1071 995 117 1112 2183Far-western 992 55 1047 994 66 1060 2107Total 10126 4048 14174 10271 3936 14207 28381
In the above table 2.1, it can be seen that the number of schools selected from every province was not the same. While selecting the schools, they were selected as the primary sampling unit (PSU) from each province with a minimum of 54 schools from

- 12 -
each province for one subject. However, provinces with higher number of schools and students have proportionally greater number of sample schools and students. School selection within a district was done by using a PPS sampling method by sorting out the list of schools from the selected districts. Sorting of institutional and community schools within the district, was an implicit stratum. In addition to preparing the list of sample schools, a list of replacement schools was also prepared. During the orientation programme about NASA administration to the district focal persons, the final list of the sample schools was prepared, choosing the schools from the list of replacement schools upon requirement. The number of school clusters sampled from seven provinces are listed in table 2.2.
Table 2.2 Province wise number of sample schools
ProvincesMath Nepali
TotalCommunityschools
Institutionalschools
Communityschools
Institutionalschools
Prov. 1 96 45 111 32 284Prov. 2 68 13 72 9 162Prov. 3 125 68 123 72 388Gandaki 52 34 49 36 171Prov. 5 74 15 72 14 175Karnali 54 2 50 5 111Far-western 51 3 52 3 109Total 520 180 529 171 1400
2.1.6 School WeightSchool level base weights were calculated using the formula:
BWisc =
Npop
nsc× Nimos
where Npop was the population size (students), nsc was the total number of schools sampled within each explicit stratum; and Nimos was the measure of size (MOS) assigned to the school (i). School level base weights were calculated for all sampled schools that satisfied the condition for eligible students actually participating in the study. For example, in mathematics, altogether 650 schools were sampled, out of which 1 school did not participate in testing due to some unavoidable circumstance. For this, a school-level non-response adjustment was calculated separately for each explicit stratum, using the formula:
- 13 -
Scadj = nsc
npsc ,
where nsc is the total number of originally sampled schools; and npsc was the number of schools that actually participated.
The final school weight was then calculated with non-participation adjustment to the base school weight. The final school weight was then equal to the product of the school base weight and non-participation adjustment,
Wsc = BWisc×Scadj
2.1.7 Student WeightFor schools with 25 grade five students, student base weight was 1; and for
schools with more than 28 students and fewer, the base weight was calculated using the formula:
BWst =Nst
nst ,
where Nst was the total number of students at Grade 5 in the sampled school and nst as the number of sample students from the class.
A student non-participation adjustment was calculated for any school that had at least one student who was sampled and was eligible to do the test but did not participate for some reason. This was calculated with the formula:
Stadj =nst
npst ,
where nst was the number of sample students and npst was the number of students who participated in the particular school.
The final student weight of a particular school (say, ith school) is then equal to the product of the student base weight and non-participation adjustment: Wi
st = BWist
×Stadj
The final weight is thus the adjustment between the product of the school and student final weights: Wi= Wi
sc ×Wist. For example, see the sample weight calculated
in figure 2.3

- 14 -
Figure 2.3 Example of Sample weight calculation
2.2 Test Administration and SupervisionTest administrators for the NASA 2018 were appointed from Resource persons,
School Supervisors, and Headteachers. The appointed administrators were trained to administer standardized National Assessment as per the NASA test administration guidelines. For the support and inspection of the test administration, a teacher from the schools who were not teaching the assessed subject in the particular school were also appointed. For other support, two other support staffs were assigned in the test administration in a school.
For monitoring and supervision of the NASA test administration, three types of monitors were mobilized. Some from civil servants at central level agencies of the Ministry who were appointed by ERO and some were appointed by EDCU. A team for supervisors was mobilized for immediate support and monitoring of the process in every sample district. In bullet points, the test administration process followed has been summarized below:
• One school participated in only one subject.• Subject teachers were not allowed in the test administration hall, rather they were
assigned to provide response on Teacher's Background Information Questionnaire.• Test administration centre head oriented their students, support staffs and invigilator
to ensure smooth test administration.• Clear instruction to the students was provided to write with their full efforts in a
low-stake environment.• After the test administration the head teachers also responded on the background
- 15 -
information questionnaire provided to them.• To maintain the confidentiality of the test items, no one was allowed to copy the
papers, take the pictures of the paper, or keep the test papers in the school.• After the test administration was over, booklets were collected in the EDCU by
consulting firm. Each school submitted their monitoring report, test administrator's report and list of participated and non-participated student/school list as well.
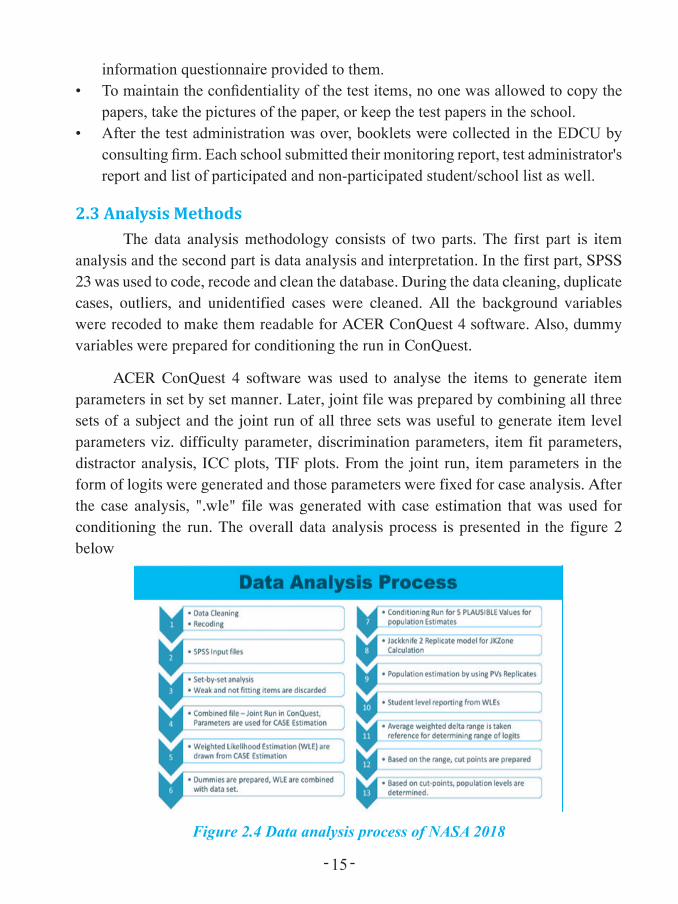
2.3 Analysis MethodsThe data analysis methodology consists of two parts. The first part is item
analysis and the second part is data analysis and interpretation. In the first part, SPSS 23 was used to code, recode and clean the database. During the data cleaning, duplicate cases, outliers, and unidentified cases were cleaned. All the background variables were recoded to make them readable for ACER ConQuest 4 software. Also, dummy variables were prepared for conditioning the run in ConQuest.
ACER ConQuest 4 software was used to analyse the items to generate item parameters in set by set manner. Later, joint file was prepared by combining all three sets of a subject and the joint run of all three sets was useful to generate item level parameters viz. difficulty parameter, discrimination parameters, item fit parameters, distractor analysis, ICC plots, TIF plots. From the joint run, item parameters in the form of logits were generated and those parameters were fixed for case analysis. After the case analysis, ".wle" file was generated with case estimation that was used for conditioning the run. The overall data analysis process is presented in the figure 2 below
Figure 2.4 Data analysis process of NASA 2018

- 16 -
After the estimation of WLE and Plausible values (5 PVs), a process of replicate weights was used to estimate standard errors of population estimates. The figure below shows an example of Replicate module used in NASA 2018. [See ERO (2017) for detail process and formula used]
A sample of front end of estimating population parameters from replicate module is presented in figure below:
Figure 2.5 Replicate module used to calculate the Standard Estimate of Univariate Statistics using PVs in Mathematics
2.4 Tools Development, their Reliability and Validity
2.4.1 Assessment FrameworkCurriculum based test items were developed based on the Assessment
Framework. The assessment framework is a plan of content, item type, content domain and proportion of test items to be included. It is a blueprint of whole standardized assessment of NASA.
- 17 -
The assessment framework was developed before designing the test and developing the test items. The assessment framework was developed to:
provide a clear guideline for a sound assessment approach to inform policy makers and the other concerned stakeholders on quality of education. It includes domains to be assessed, the statement of criteria together with standards, specification of items, framework for contextual variables to be considered while conducting an assessment and brief guidelines for assessment design. (ERO, 2017)
The assessment framework has identified and described the domains and constructs to be assessed in Mathematics and Nepali subjects. It has also proposed a framework for designing background questionnaires for students, teachers and head teachers. In addition, it has presented a brief guideline on overall methodological approach to be adopted for the assessment.
2.4.2 Framework for MathematicsThe objectives, general in nature, are elaborated in each grade for making them
more specific. The following are the detail learning objectives specified in the national curriculum for grade 5 (CDC, 2008):
1. Measure the angles from 00 to 1800 in the difference of 15 degree.2. Measure the angles and sides of a given triangle and quadrilateral.3. Classify triangles according to the measures of sides and angles.4. Identify cub, cuboidal and cylindrical solids.5. Count and read the numbers greater than a crore.6. Identify/recognize and write the place value of digits used in the number greater
than a crore in Nepali.7. Read and write the number up to million in English.8. Identify prime and composite numbers from 1 to 100.9. Rounding of numbers up to the nearest thousands.10. (a) Calculate the square of 1 to 10 and the cube of 1 to 5;
(b) Calculate the square root of the square numbers from 1 to 100 and the cube root of the cubic numbers from 1 to 125.
11. Factorize 3-digit numbers by using a prime factor method and construct prime factors tree.
12. Solve the numerical and daily life problems by using any of two operations among -, +, × and ÷ together with two brackets {( )}.
13. Multiply and divide the units of time and solve related verbal problems.
- 18 -
14. Solve the verbal problems related to rupees and paisa.15. Multiply and divide distance and solve the related verbal problems.16. Estimate the length, breadth, height of the given object, and estimate the distance
of places from the surroundings of house or school.17. Calculate the perimeter of rectangles (by using formula).18. Calculate the area of rectangular objects and solve the simple verbal problems.19. Multiply and divide litre and millilitre and solve the related verbal problems.20. Calculate the volume of cuboid by using formula.21. Multiply and divide gram and kilogram and solve the weight related simple
problems.22. Estimate the weight of any object and identify the relation between kilogram and
quintal.23. Convert mixed numeral and improper fractions into each other.24. Add and subtract mixed numerals (up to two terms) and find the product of simple
fractions.25. Solve the verbal problems related to addition and subtraction of fraction.26. Convert fraction and decimal from each other (up to three digit from decimal)27. Add and subtract decimal numbers (three numbers after decimal) and solve the
simple problems related to daily life.28. Round off decimal numbers to the nearest place.29. Convert fractions and percentage into each other and solve the simple daily life
related problems on percentage.30. Solve the problems by using a unitary method.31. Calculate the simple interest by using a unitary method.32. Read and prepare simple bills.33. Identify the information from a family budget description.34. Derive information and conclusions from tabulated information.35. Present information in simple bar graphs.36. Plot ordered pairs in a graph (first quadrant only).37. Present a given set by using set notation { }.
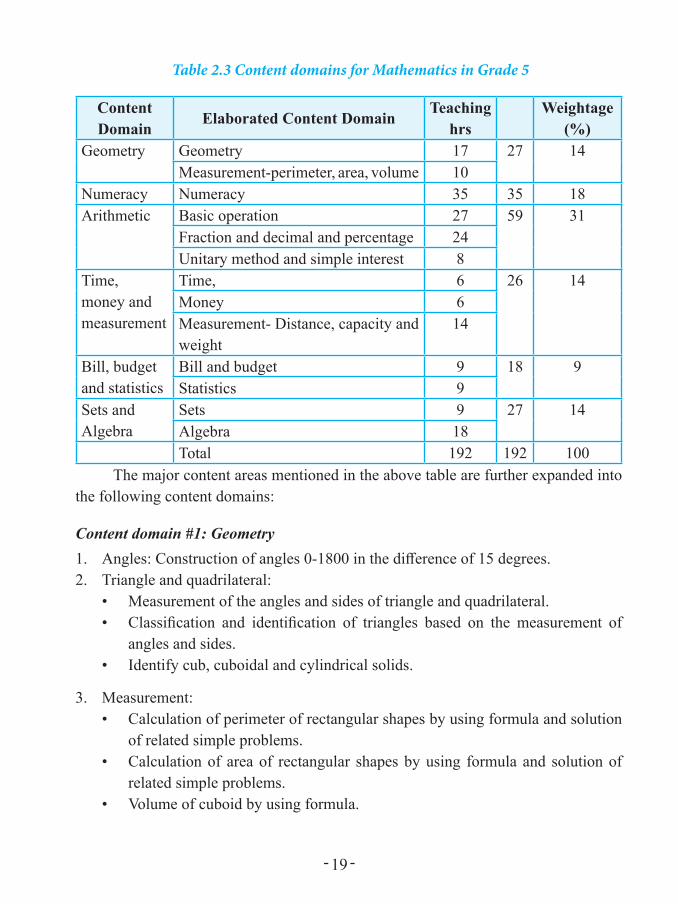
The content domains and their weightage drawn from the curriculum are presented in Table below. To reduce the number of content domains, some of the content areas included in the curriculum are reorganised and regrouped in the table. The numbers of content domains are regrouped and reorganised from 9 to 6. For example, perimeter, area and volume from the areas of measurement are all included within the domain of geometry.
- 19 -
Table 2.3 Content domains for Mathematics in Grade 5
Content Domain
Elaborated Content DomainTeaching
hrsWeightage
(%)Geometry Geometry 17 27 14
Measurement-perimeter, area, volume 10Numeracy Numeracy 35 35 18Arithmetic Basic operation 27 59 31
Fraction and decimal and percentage 24Unitary method and simple interest 8
Time, money and measurement
Time, 6 26 14Money 6Measurement- Distance, capacity and weight
14
Bill, budgetand statistics
Bill and budget 9 18 9Statistics 9
Sets and Algebra
Sets 9 27 14Algebra 18Total 192 192 100
The major content areas mentioned in the above table are further expanded into the following content domains:
Content domain #1: Geometry1. Angles: Construction of angles 0-1800 in the difference of 15 degrees.2. Triangle and quadrilateral:
• Measurement of the angles and sides of triangle and quadrilateral.• Classification and identification of triangles based on the measurement of
angles and sides.• Identify cub, cuboidal and cylindrical solids.
3. Measurement:• Calculation of perimeter of rectangular shapes by using formula and solution
of related simple problems.• Calculation of area of rectangular shapes by using formula and solution of
related simple problems.• Volume of cuboid by using formula.

- 20 -
Content domain #2: Numeracy1. Counting and writing the place value of the numbers greater than crores.2. Counting and writing the numbers in English up to a million.3. Identifying prime and composite numbers from 1 to 100.4. Rounding off a number in required places.5. Squaring numbers (1 to 10) and cubing numbers (1 to 5) and their roots.6. Factorization of numbers (the number up to three digits) into their prime factors.
Content domain #3: Arithmetic1. Four simple problems: Numerical and verbal problems involving any two
operations among +, -, × and ÷; and two brackets {( )}.2. Fraction and decimal:
• Conversion of mixed numbers and improper fractions into each other.• Addition and subtraction of mixed numbers (two fractions only).• Multiplication of fraction (only two fractions).• Solution of simple problems related to addition and subtraction of fractions
(involving only two fractions).• Conversion of decimal and fraction into one another (up to three places of
decimal).• Addition and subtraction of decimal numbers (up to three places of decimal).• Solution of simple problems involving addition and subtraction of fractions.• Rounding off a decimal number to the required places.
3. Percentage:• Understanding the meaning of percentage and conversion of fraction and
percentage to each other.• Solution of simple problems related to percentage.
4. Unitary method and simple interest:• Calculation of simple household transactions by using a unitary method.• Solution of simple problems on simple interest by using a unitary method.
Content domain #4: Time, money and measurement1. Multiplication and division of the units of time and solving related simple problems.2. Addition, subtraction, multiplication and division of money and the solution of
related problems.3. Multiplication and division of litre and millilitre and solution of the related simple
problems.
- 21 -
4. Multiplication and division of gram and kilogram and solution of the related simple problems.
5. Multiplication and division of distance and solution of the related simple problems.6. Estimation of length, breadth and height of objects.7. Conversion of kilogram and quintal to each other.8. Estimation of weight of various goods and objects.
Content domain #5: Bill, budget and statistics1. Reading simple bills.2. Drawing conclusions from the tabulated information.3. Presenting simple information in a bar graph.4. Identifying a point using ordered pairs (only in the first quadrant).
Content domain #6: Sets and Algebra1. Writing sets by using set notations and words.2. Conversing simple verbal problems involving addition and subtraction into
algebraic expressions (involving only two terms).3. Solving simple linear equations of one variable by using axioms of equality.
Criteria and Standards for Grade 5 MathematicsAs mentioned earlier, four standards pre-basic, basic, proficient and advanced
have been identified in a hierarchical order of the level of competency (from lower to higher). Accordingly, levels 1, 2, 3 and 4 are defined in a hierarchy of depth or complexity of knowledge, skills and application in each of 36 criteria for Grade 5 in Mathematics. Table 2.2.3 shows the content areas, criteria and standards. The test items for NASA 2018 were developed using these criteria and standards.
[See: Assessment framework 2017 for grade 5 for detail]
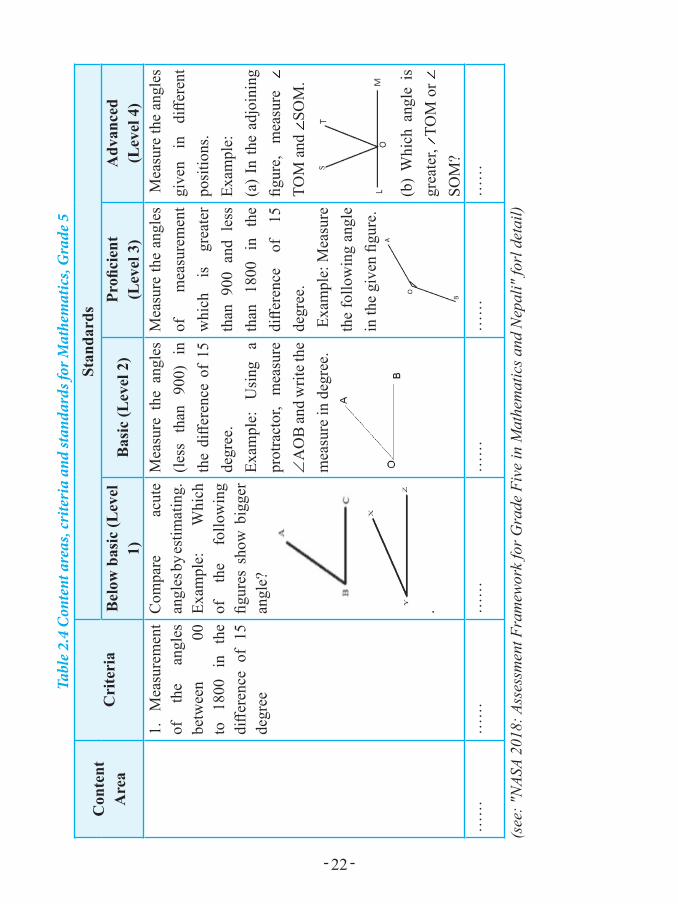
- 22 -
Tabl
e 2.4
Con
tent
are
as, c
rite
ria
and
stan
dard
s for
Mat
hem
atic
s, G
rade
5
Con
tent
A
rea
Cri
teri
aSt
anda
rds
Bel
ow b
asic
(Lev
el
1)B
asic
(Lev
el 2
)Pr
ofici
ent
(Lev
el 3
)A
dvan
ced
(Lev
el 4
)1.
M
easu
rem
ent
of
the
angl
es
betw
een
00
to
1800
in
th
e di
ffere
nce
of 1
5 de
gree
Com
pare
ac
ute
angl
es by
estim
atin
g.Ex
ampl
e:
Whi
ch
of
the
follo
win
g fig
ures
sho
w b
igge
r an
gle?
.
Mea
sure
the
ang
les
(less
th
an
900)
in
th
e di
ffere
nce
of 1
5 de
gree
.Ex
ampl
e:
Usi
ng
a pr
otra
ctor
, m
easu
re
∠A
OB
and
writ
e the
m
easu
re in
deg
ree.
Mea
sure
the
angl
es
of
mea
sure
men
t w
hich
is
gr
eate
r th
an 9
00 a
nd l
ess
than
18
00
in
the
diffe
renc
e of
15
de
gree
. E
xam
ple:
Mea
sure
th
e fo
llow
ing
angl
e in
the
give
n fig
ure.
Mea
sure
the
angl
es
give
n in
di
ffere
nt
posi
tions
.Ex
ampl
e:(a
) In
the
adjo
inin
g fig
ure,
m
easu
re
TOM
and
SO
M.
(b)
Whi
ch a
ngle
is
grea
ter,
TOM
or
SOM
?…
……
……
……
……
……
…
(see
: "N
ASA
2018
: Ass
essm
ent F
ram
ewor
k fo
r Gra
de F
ive
in M
athe
mat
ics a
nd N
epal
i" fo
rl d
etai
l)
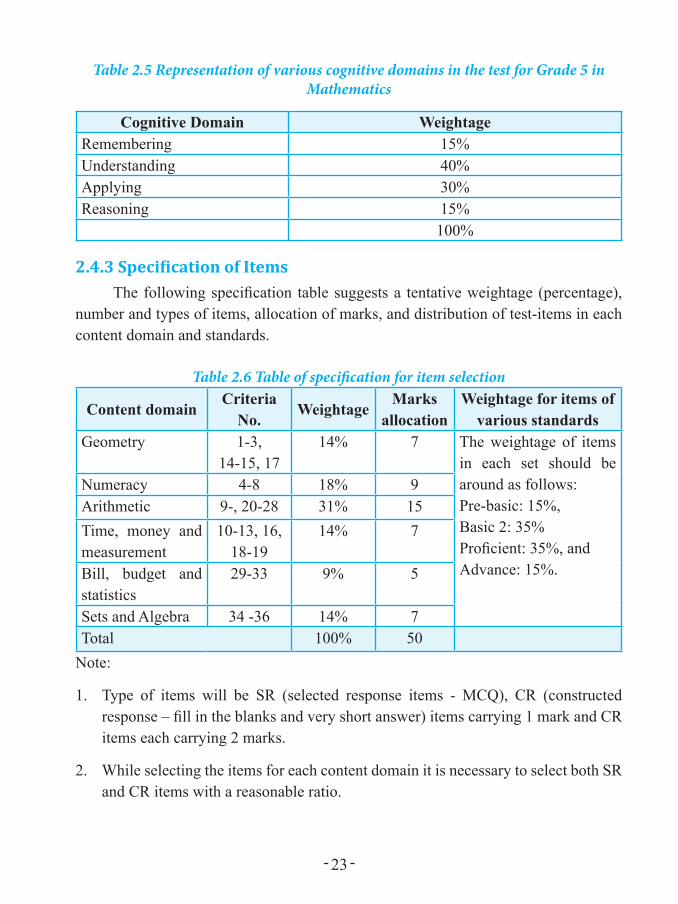
- 23 -
Table 2.5 Representation of various cognitive domains in the test for Grade 5 in Mathematics
Cognitive Domain WeightageRemembering 15%Understanding 40%Applying 30%Reasoning 15%
100%
2.4.3 Specification of ItemsThe following specification table suggests a tentative weightage (percentage),
number and types of items, allocation of marks, and distribution of test-items in each content domain and standards.
Table 2.6 Table of specification for item selection
Content domainCriteria
No.Weightage
Marks allocation
Weightage for items of various standards
Geometry 1-3,14-15, 17
14% 7 The weightage of items in each set should be around as follows:Pre-basic: 15%,Basic 2: 35%Proficient: 35%, andAdvance: 15%.
Numeracy 4-8 18% 9Arithmetic 9-, 20-28 31% 15Time, money and measurement
10-13, 16, 18-19
14% 7
Bill, budget and statistics
29-33 9% 5
Sets and Algebra 34 -36 14% 7Total 100% 50
Note:
1. Type of items will be SR (selected response items - MCQ), CR (constructed response – fill in the blanks and very short answer) items carrying 1 mark and CR items each carrying 2 marks.
2. While selecting the items for each content domain it is necessary to select both SR and CR items with a reasonable ratio.

- 24 -
2.4.4 Framework for Nepali Subject
ljifoIf]q klxrfg (Defining the content domain)sIff % sf ljBfyL{sf] ;Ifdtfn] cfwf/e"t txsf] sIff kfFr;Ddsf] ;Ifdtf hgfpg] ePsfn]
ljifoj:t'sf] If]q klxrfg ubf{ tNnf sIffb]lvsf] pWj{ (upward) ;Ifdtfsf] ;d]t ljrf/ ug{'kg]{ x'G5 . oxL s'/fnfO{ ljrf/ u/]/ ljifo If]qsf] klxrfg ug{sf nflu k|fylds txsf] kf7Øj|mdn] lgwf{/0f u/]sf] g]kfnL ljifosf] txut ;fwf/0f p2]Zo pNn]v ul/Psf] 5 . kf7Øj|mddf k|fylds txsf] cWoog k"/f u/]kl5 g]kfnL efiffdf ljBfyL{x¿ lgDglnlvt sfo{ ug{ ;Sg]5g\ egL txut ;fwf/0f p2]Zox¿ pNn]v ul/Psf] 5 M
-s_ ;'gfO ;LkljleGg k|sf/sf lgb]{zgx¿ ;'g]/ ;f]xLcg';f/ ug{ .s'g} ljifoj:t'sf] j0f{g, 5nkmn cflb Wofgk"j{s ;'g]/ ltgsf] cy{ / cfzo a'emL k|ltlj|mof
hgfpg .afnsyf, afnuLt, sljtf cflb cfgGb lng] u/L ;'Gg .
-v_ af]nfO ;LkzAbx¿ z'4 / :ki6;Fu pRrf/0f u/L :jfefljs ultsf ;fy af]Ng .b]v];'g]sf / cg'ej u/]sf s'/f l;nl;nf ldnfO{ atfpg .s'/fsfgL, 5nkmn cflbdf cfˆgf s'/f ws gdfgL lzi6 9ª\un] /fVg .
-u_ k9fO ;Lkg]kfnL efiffdf n]lvPsf ;/n kf7\o;fdu|Lx¿ ult / olt ldnfO{ :ki6 ¿kdf k9\g .;–;fgf ;"rgf ljj/0f k9]/ cfzo a'‰g .;/n afn;flxTosf /rgfx¿ ?lr lnO{ k9\g .
-3_ n]vfO ;Lk7Ls b"/Ldf afGsL ldnfP/ cIf/ n]Vg .b]v];'g]sf / cg'ej u/]sf s'/fx¿ l;nl;nf ldnfP/ z'4;Fu n]Vg .cfˆgf] cg'ejsf ;]/f]km]/f]sf ljifodf 5f]6f lnlvt /rgf tof/ ug{ .
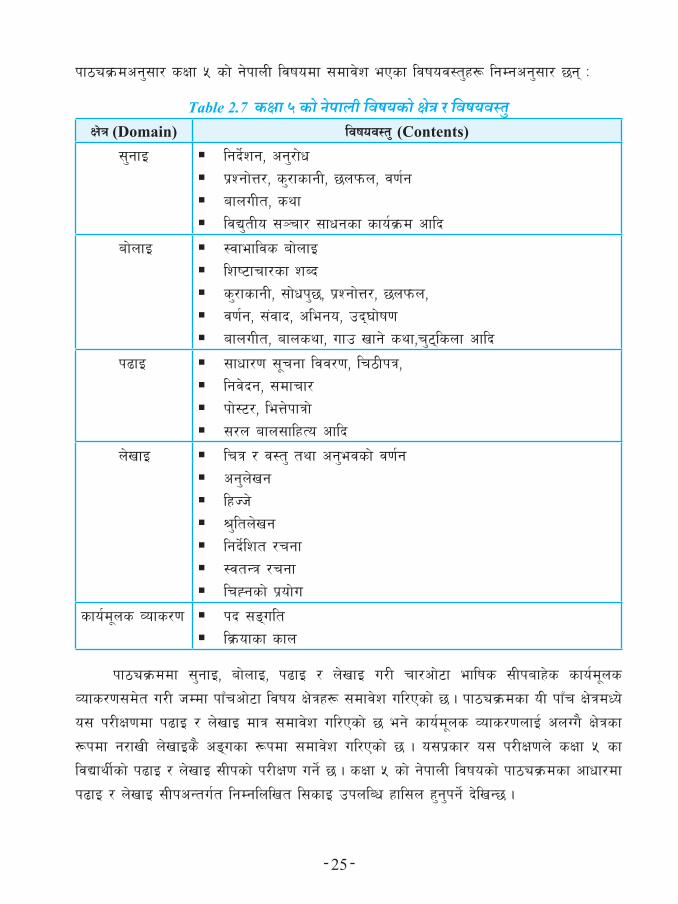
- 25 -
kf7Øj|mdcg';f/ sIff % sf] g]kfnL ljifodf ;dfj]z ePsf ljifoj:t'x¿ lgDgcg';f/ 5g\ M
Table 2.7 कक्षा ५ को नेपषाली विषयको के्त्र र विषयिस त्ुIf]q (Domain) ljifoj:t'' (Contents)
;'gfO lgb]{zg, cg'/f]wk|Zgf]Q/, s'/fsfgL, 5nkmn, j0f{gafnuLt, syfljB'tLo ;~rf/ ;fwgsf sfo{j|md cflb
af]nfO :jfefljs af]nfOlzi6frf/sf zAbs'/fsfgL, ;f]wk'5, k|Zgf]Q/, 5nkmn,j0f{g, ;+jfb, clego, pb\3f]if0fafnuLt, afnsyf, ufp vfg] syf,r'6\lsnf cflb
k9fO ;fwf/0f ;"rgf ljj/0f, lr7Lkq,lgj]bg, ;dfrf/kf]:6/, leQ]kfqf];/n afn;flxTo cflb
n]vfO lrq / j:t' tyf cg'ejsf] j0f{gcg'n]vglxHh]>'ltn]vglgb]{lzt /rgf:jtGq /rgflrXgsf] k|of]u
sfo{d"ns Jofs/0f kb ;ª\ultlj|mofsf sfn
kf7Øj|mddf ;'gfO, af]nfO, k9fO / n]vfO u/L rf/cf]6f eflifs ;Lkafx]s sfo{d"ns
Jofs/0f;d]t u/L hDdf kfFrcf]6f ljifo If]qx¿ ;dfj]z ul/Psf] 5 . kf7Øj|mdsf oL kfFr If]qdWo]
o; k/LIf0fdf k9fO / n]vfO dfq ;dfj]z ul/Psf] 5 eg] sfo{d"ns Jofs/0fnfO{ cnUu} If]qsf
¿kdf g/fvL n]vfOs} cª\usf ¿kdf ;dfj]z ul/Psf] 5 . o;k|sf/ o; k/LIf0fn] sIff % sf
ljBfyL{sf] k9fO / n]vfO ;Lksf] k/LIf0f ug]{ 5 . sIff % sf] g]kfnL ljifosf] kf7Øj|mdsf cfwf/df
k9fO / n]vfO ;LkcGtu{t lgDglnlvt l;sfO pknlAw xfl;n x'g'kg{] b]lvG5 .
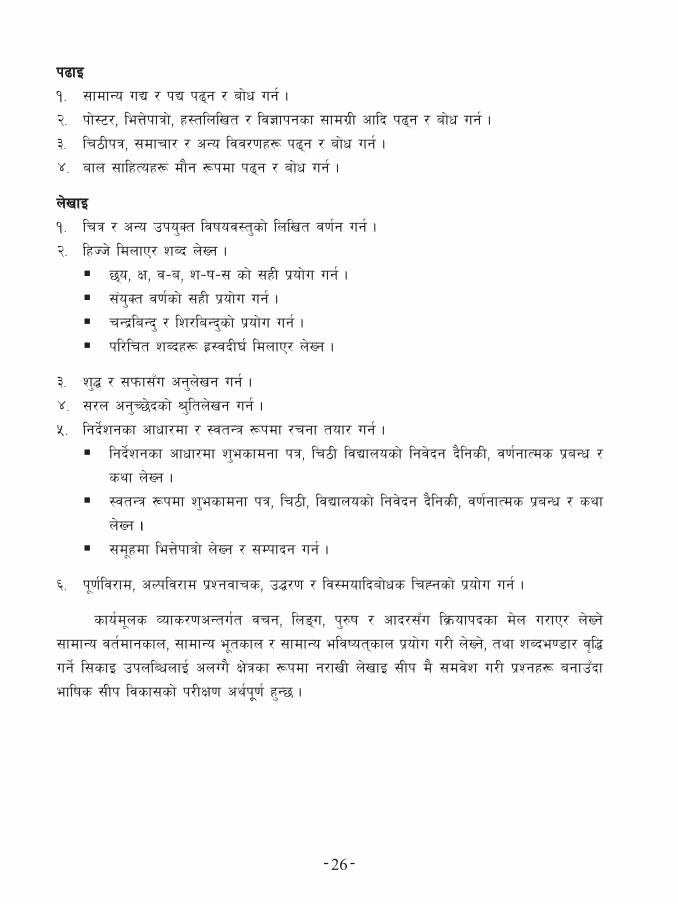
- 26 -
k9fO
!= ;fdfGo uB / kB k9\g / af]w ug{ .
@= kf]:6/, leQ]kfqf], x:tlnlvt / lj1fkgsf ;fdu|L cflb k9\g / af]w ug{ .
#= lr7Lkq, ;dfrf/ / cGo ljj/0fx¿ k9\g / af]w ug{ .
$= afn ;flxTox¿ df}g ¿kdf k9\g / af]w ug{ .
n]vfO
!= lrq / cGo pko'St ljifoj:t'sf] lnlvt j0f{g ug{ .
@= lxHh] ldnfP/ zAb n]Vg .
5\o, If, j–a, z–if–; sf] ;xL k|of]u ug{ .
;+o'St j0f{sf] ;xL k|of]u ug{ .
rGb|laGb' / lz/laGb'sf] k|of]u ug{ .
kl/lrt zAbx¿ x|:jbL3{ ldnfP/ n]Vg .
#= z'4 / ;kmf;Fu cg'n]vg ug{ .
$= ;/n cg'R5]bsf] >'ltn]vg ug{ .
%= lgb]{zgsf cfwf/df / :jtGq ¿kdf /rgf tof/ ug{ .
lgb]{zgsf cfwf/df z'esfdgf kq, lr7L ljBfnosf] lgj]bg b}lgsL, j0f{gfTds k|aGw /
syf n]Vg .
:jtGq ¿kdf z'esfdgf kq, lr7L, ljBfnosf] lgj]bg b}lgsL, j0f{gfTds k|aGw / syf
n]Vg .
;d"xdf leQ]kfqf] n]Vg / ;Dkfbg ug{ .
^= k"0f{lj/fd, cNklj/fd k|Zgjfrs, p4/0f / lj:doflbaf]ws lrXgsf] k|of]u ug{ .
sfo{d"ns Jofs/0fcGtu{t jrg, lnª\u, k'?if / cfb/;Fu lj|mofkbsf d]n u/fP/ n]Vg]
;fdfGo jt{dfgsfn, ;fdfGo e"tsfn / ;fdfGo eljiot\sfn k|of]u u/L n]Vg], tyf zAbe08f/ j[l4
ug]{ l;sfO pknlAwnfO{ cnUu} If]qsf ¿kdf g/fvL n]vfO ;Lk d} ;dj]z u/L k|Zgx¿ agfpFbf
eflifs ;Lk ljsf;sf] k/LIf0f cy{k""0f{ x'G5 .
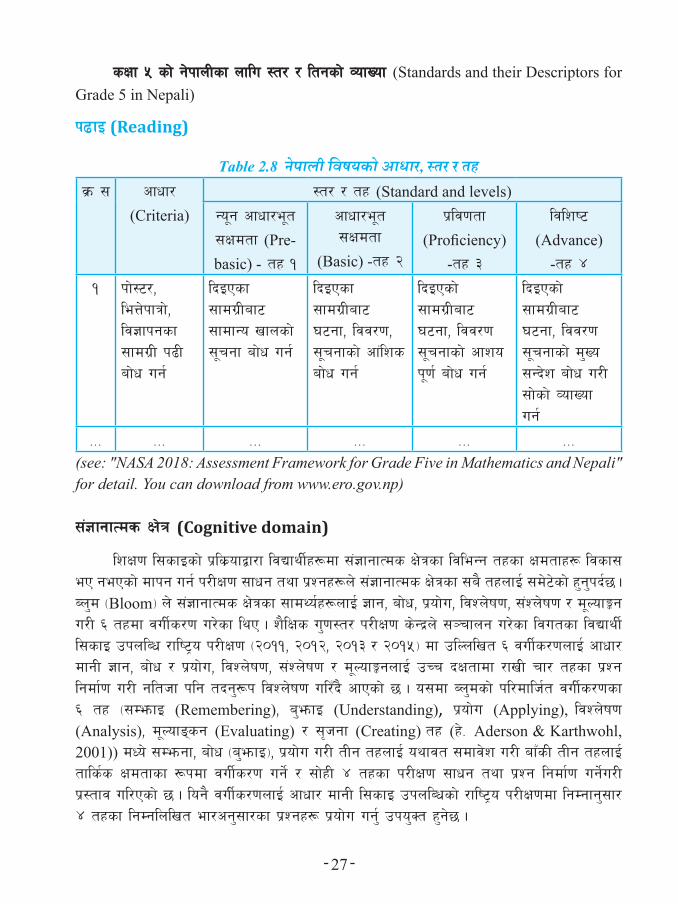
- 27 -
sIff % sf] g]kfnLsf nflu :t/ / ltgsf] JofVof (Standards and their Descriptors for Grade 5 in Nepali)
k9fO (Reading)
Table 2.8 नेपषाली विषयको आधषार, स्र र ्हj|m ; cfwf/
(Criteria):t/ / tx (Standard and levels)
Go"g cfwf/e"t
;Ifdtf (Pre- basic) - tx !
cfwf/e"t ;Ifdtf
(Basic) -tx @
k|lj0ftf
(Proficiency) -tx #
ljlzi6
(Advance) -tx $
! kf]:6/, leQ]kfqf], lj1fkgsf ;fdu|L k9L af]w ug{
lbOPsf ;fdu|Laf6 ;fdfGo vfnsf] ;"rgf af]w ug{
lbOPsf ;fdu|Laf6 36gf, ljj/0f, ;"rgfsf] cf+lzs af]w ug{
lbOPsf] ;fdu|Laf6 36gf, ljj/0f ;"rgfsf] cfzo k"0f{ af]w ug{
lbOPsf] ;fdu|Laf6 36gf, ljj/0f ;"rgfsf] d'Vo ;Gb]z af]w u/L ;f]sf] JofVof ug{
=== === === === === ===(see: "NASA 2018: Assessment Framework for Grade Five in Mathematics and Nepali" for detail. You can download from www.ero.gov.np)
;+1fgfTds If]q (Cognitive domain)
lzIf0f l;sfOsf] k|ls|ofåf/f ljBfyL{x¿df ;+1fgfTds If]qsf ljleGg txsf Ifdtfx¿ ljsf; eP gePsf] dfkg ug{ k/LIf0f ;fwg tyf k|Zgx¿n] ;+1fgfTds If]qsf ;a} txnfO{ ;d]6]sf] x'g'kb{5 . An'd -Bloom_ n] ;+1fgfTds If]qsf ;fdYo{x¿nfO{ 1fg, af]w, k|of]u, ljZn]if0f, ;+Zn]if0f / d"NofÍg u/L ^ txdf juL{s/0f u/]sf lyP . z}lIfs u'0f:t/ k/LIf0f s]Gb|n] ;~rfng u/]sf ljutsf ljBfyL{ l;sfO pknlAw /fli6«o k/LIf0f -@)!!, @)!@, @)!# / @)!%_ df plNnlvt ^ juL{s/0fnfO{ cfwf/ dfgL 1fg, af]w / k|of]u, ljZn]if0f, ;+Zn]if0f / d"NofÍgnfO{ pRr bIftfdf /fvL rf/ txsf k|Zg lgdf{0f u/L glthf klg tbg'¿k ljZn]if0f ul/Fb} cfPsf] 5 . o;df An'dsf] kl/dflh{t juL{s/0fsf ^ tx -;DemfO (Remembering), a'emfO (Understanding), k|of]u (Applying), ljZn]if0f (Analysis), d"Nofª\sg (Evaluating) / ;[hgf (Creating) tx (x]= Aderson & Karthwohl, 2001)) dWo] ;Demgf, af]w -a'emfO_, k|of]u u/L tLg txnfO{ oyfjt ;dfj]z u/L afFsL tLg txnfO{ tfls{s Ifdtfsf ¿kdf juL{s/0f ug]{ / ;f]xL $ txsf k/LIf0f ;fwg tyf k|Zg lgdf{0f ug]{u/L k|:tfj ul/Psf] 5 . log} juL{s/0fnfO{ cfwf/ dfgL l;sfO pknlAwsf] /fli6«o k/LIf0fdf lgDgfg';f/ $ txsf lgDglnlvt ef/cg';f/sf k|Zgx¿ k|of]u ug{' pko'St x'g]5 .
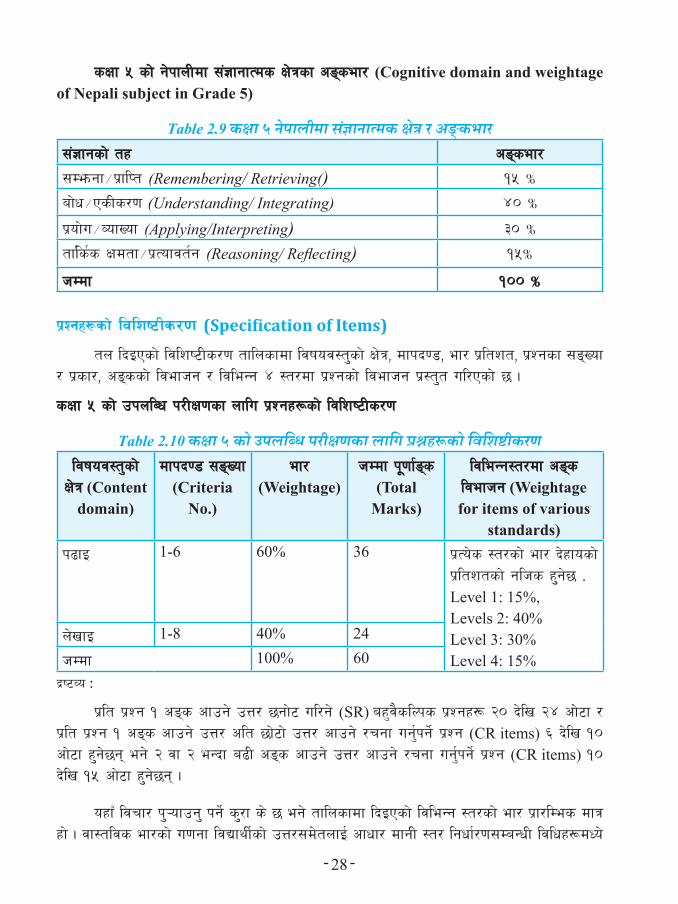
- 28 -
sIff % sf] g]kfnLdf ;+1fgfTds If]qsf cª\sef/ (Cognitive domain and weightage of Nepali subject in Grade 5)
Table 2.9 कक्षा ५ नेपषालीमषा सजं्षानषातमक के्त्र र अङ्कभषार;+1fgsf] tx cª\sef/
;Demgf÷k|flKt (Remembering/ Retrieving() !% Ü
af]w÷PsLs/0f (Understanding/ Integrating) $) Ü
k|of]u÷JofVof (Applying/Interpreting) #) Ü
tfl{s{s Ifdtf÷k|Tofjt{g (Reasoning/ Reflecting) !%Ü
hDdf !)) Ü
k|Zgx¿sf] ljlzi6Ls/0f (Specification of Items)
tn lbOPsf] ljlzi6Ls/0f tflnsfdf ljifoj:t''sf] If]q, dfkb08, ef/ k|ltzt, k|Zgsf ;ª\Vof / k|sf/, cª\ssf] ljefhg / ljleGg $ :t/df k|Zgsf] ljefhg k|:t''t ul/Psf] 5 .
sIff % sf] pknlAw k/LIf0fsf nflu k|Zgx¿sf] ljlzi6Ls/0f
Table 2.10 कक्षा ५ को उपलव्ध परीक्णकषा लषावि प्रश्नहरूको विविष्ीकरणljifoj:t'sf]
If]q (Content domain)
dfkb08 ;ª\Vof (Criteria
No.)
ef/ (Weightage)
hDdf k""0ff{ª\s (Total
Marks)
ljleGg:t/df cª\s ljefhg (Weightage for items of various
standards)k9fO 1-6 60% 36 k|To]s :t/sf] ef/ b]xfosf]
k|ltztsf] glhs x''g]5 .Level 1: 15%,Levels 2: 40%Level 3: 30%Level 4: 15%
n]vfO 1-8 40% 24
hDdf 100% 60b|i6Jo :
k|lt k|Zg ! cª\s cfpg] pQ/ 5gf]6 ul/g] (SR) ax'j}slNks k|Zgx¿ @) b]lv @$ cf]6f / k|lt k|Zg ! cª\s cfpg] pQ/ clt 5f]6f] pQ/ cfpg] /rgf ug'{kg]{ k|Zg (CR items) ^ b]lv !) cf]6f x''g]5g\ eg] @ jf @ eGbf a9L cª\s cfpg] pQ/ cfpg] /rgf ug'{kg]{ k|Zg (CR items) !) b]lv !% cf]6f x''g]5g\ .
oxfF ljrf/ k''¥ofpg'' kg{] s''/f s] 5 eg] tflnsfdf lbOPsf] ljleGg :t/sf] ef/ k|f/lDes dfq xf] . jf:tljs ef/sf] u0fgf ljBfyL{sf] pQ/;d]tnfO{ cfwf/ dfgL :t/ lgwf{/0f;DaGwL ljlwx¿dWo]

- 29 -
s'g} Ps ljlw k|of]u u/L k|To]s :t/sf] cfwf/ cª\s (Cut score) af6 lgwf{/0f ug''{kg{]5 . dfly ;''emfj ul/Psf] juL{s/0f / ef/n] Psflt/ k|To]s :t/sf nflu k|Zgx¿ 5gf]6 ug{ ;xof]u ub{5 . k|Zgkq ljsf; / 5gf}6 ubf{ $ cf]6f :t/sf ;fy} ;+1fgfTds If]qsf] ;d]t k|ltlglwTj x'g' cfjZos 5 .
2.5 Item Development and Selection
2.5.1 Item development workshopItem development process began with an one-day orientation to the well trained
item writers on test items development followed by workshop to write draft items by school and university teachers. After computer setting of those developed items, expert workshop was organized. Experts in the workshop reviewed the items to ensure their alignment with curriculum framework and also checked the level and appropriateness of the items.
After the experts’ workshop edited the items, the subject committee workshop finalized the test item booklets. After the subject committee workshop, final language editing and layout design were done before printing them in a secured press.
2.5.2 Pre-test of Test ItemsTo generate item parameters for every items, they were pre-tested on 300
students. Altogether six versions were pretested in the pre-test sample districts and schools. The pre-test was done in the following number of schools and students:
Table 2.11 Number of schools and students participating in pre-test
S. No. SubjectNo. of sets
pilotedNo. schools
pilotedNo. of students
participated1 Mathematics 6 80 18002 Nepali 6 80 1800
Total 12 160 3600
After the pre-test, items were analysed to produce item parameters. Those parameters were
• difficulty,• item-rest correlation,• internal consistency and• distractors analysis

- 30 -
Tab
le 2
.12
Exam
ple o
f ite
m a
naly
sis a
nd d
ecis
ion
in th
e pre
-tes
t of M
athe
mat
ics i
tem
s
Item
_cod
eSe
tcr
iteri
aL
evel
Are
a/
Dom
ain
Item
de
scri
ptio
n/
cont
ent
Cog
nitiv
e le
vel
Item
ty
peM
axim
umM
ean
P va
lue
Item
res
t co
rrel
atio
nFu
llm
arks
Key
1.1.
1.4
D1
1G
eom
etry
Mea
sure
men
t of
ang
leU
nder
stan
ding
SR1
0.50
0.50
0.28
1B
3.3.
1.3
E3
1G
eom
etry
Cla
ssif
icat
ion
of tr
iang
leU
nder
stan
ding
SR1
0.52
0.52
0.31
1C
3.4.
2.2
F4
2N
umer
acy
Nat
iona
l pl
ace
valu
e sy
stem
Rem
embe
ring
SR1
0.59
0.59
0.40
1B
6.7.
3.5
F7
3N
umer
acy
Squa
re
and
cube
num
ber
App
lyin
gSR
10.
350.
350.
301
B
7.6.
1.2
B6
1N
umer
acy
Rou
ndin
g off
Und
erst
andi
ngSR
10.
520.
520.
351
D
……
……
……
……
……
……
……
2.5.
3 It
em B
ookl
et, S
cori
ng K
ey a
nd O
MR
Des
ign
Sele
cted
item
s, in
eac
h su
bjec
t, w
ere
arra
nged
into
thre
e bo
okle
ts w
ith s
ome
linki
ng it
ems
betw
een
the
book
lets
. Sc
orin
g ke
ys fo
r SR
item
s an
d sc
orin
g sc
hem
es fo
r CR
item
s w
ere
prep
ared
for e
ach
book
let.
Bas
ed o
n th
e bo
okle
ts a
nd
scor
ing
sche
mes
, OM
R sh
eets
wer
e de
sign
ed to
use
for d
ata
gene
ratio
n an
d en
try p
roce
ss.
2.5.
4 Pr
epar
atio
n of
the
scor
ing
sche
me
and
guid
elin
esA
grou
p of t
each
ers a
nd ex
perts
of th
e res
pect
ive s
ubje
cts w
orke
d for
com
pila
tion,
revi
ew an
d fina
lizat
ion o
f the
scor
ing
sche
mes
for e
ach
subj
ect.
For m
ultip
le c
hoic
e an
d ot
her s
elec
ted
resp
onse
(SR
) typ
es o
f ite
ms,
answ
er k
eys w
ere
revi
ewed
- 31 -
and reconfirmed. For created response types of items, the possible answers as well as marks to be provided in each step were reviewed and confirmed. For dichotomised items, conditions for 0 and 1 credit were clearly specified. For CR items with partial credit conditions, each of the credits 0, 1, 2 and so on were clearly mentioned. Along with the preparation of scoring scheme for each subject, some guidelines for scoring were also prepared. Rubrics were developed including score distribution, in various skills of writing and levels of proficiency.
2.5.5 Review of test booklets and scoring schemesAt the final stage of item selection and item booklet preparation, subject
committee of each subjects reviewed the items and item booklets by editing the items, confirming the data, and formatting the items. The committees prepared the final test booklets which were then sent for preparing Printing Ready Copy (PRC). The subject committees also reviewed the scoring schemes.
While selecting the items and preparing the test booklets for the final test, the following criteria were considered:
• Curriculum based• Coverage of all contents areas• Proper representation of various cognitive domains• Assessing the various levels of proficiencies• Items having a range of difficulties from p-value 0.15 to 0.90• Proper discrimination power of the items, item rest correlation r>0.02• Comparability with previous NASA and TIMSS
2.5.6 Preparation of item RegisterWorking with subject experts, ERO prepared an item register in each subject in
an excel sheet. Item ID (unique), item descriptor for each item and scoring keys for MC items and various credits as well as description of each credit of CR items were included in the item register. The following is the example of an item register:
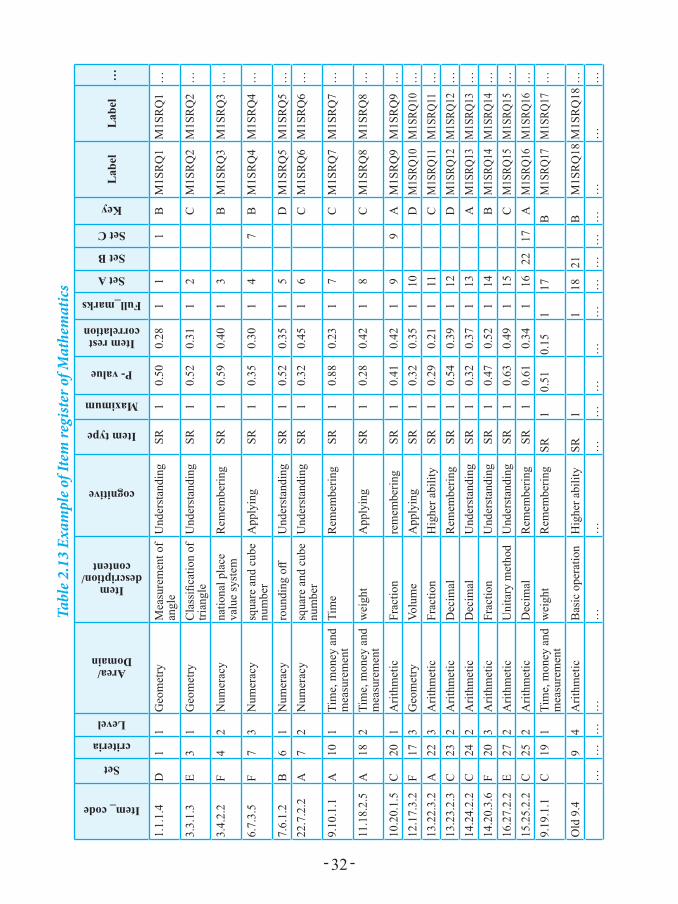
- 32 -
Tabl
e 2.1
3 Ex
ampl
e of I
tem
regi
ster
of M
athe
mat
ics
Item_ code
Set
criteria
Level
Area/ Domain
Item description/
content
cognitive
Item type
Maximum
P- value
Item rest correlation
Full_marks
Set A
Set B
Set C
Key
Lab
elL
abel
…
1.1.
1.4
D1
1G
eom
etry
Mea
sure
men
t of
angl
eU
nder
stan
ding
SR1
0.50
0.28
11
1B
M1S
RQ
1M
1SR
Q1
…
3.3.
1.3
E3
1G
eom
etry
Cla
ssifi
catio
n of
tri
angl
eU
nder
stan
ding
SR1
0.52
0.31
12
CM
1SR
Q2
M1S
RQ
2…
3.4.
2.2
F4
2N
umer
acy
natio
nal p
lace
va
lue
syst
emR
emem
berin
gSR
10.
590.
401
3B
M1S
RQ
3M
1SR
Q3
…
6.7.
3.5
F7
3N
umer
acy
squa
re a
nd c
ube
num
ber
App
lyin
gSR
10.
350.
301
47
BM
1SR
Q4
M1S
RQ
4…
7.6.
1.2
B6
1N
umer
acy
roun
ding
off
Und
erst
andi
ngSR
10.
520.
351
5D
M1S
RQ
5M
1SR
Q5
…22
.7.2
.2A
72
Num
erac
ysq
uare
and
cub
e nu
mbe
rU
nder
stan
ding
SR1
0.32
0.45
16
CM
1SR
Q6
M1S
RQ
6…
9.10
.1.1
A10
1Ti
me,
mon
ey a
nd
mea
sure
men
tTi
me
Rem
embe
ring
SR1
0.88
0.23
17
CM
1SR
Q7
M1S
RQ
7…
11.1
8.2.
5A
182
Tim
e, m
oney
and
m
easu
rem
ent
wei
ght
App
lyin
gSR
10.
280.
421
8C
M1S
RQ
8M
1SR
Q8
…
10.2
0.1.
5C
201
Arit
hmet
icFr
actio
nre
mem
berin
gSR
10.
410.
421
99
AM
1SR
Q9
M1S
RQ
9…
12.1
7.3.
2F
173
Geo
met
ryVo
lum
eA
pply
ing
SR1
0.32
0.35
110
DM
1SRQ
10M
1SRQ
10…
13.2
2.3.
2A
223
Arit
hmet
icFr
actio
nH
ighe
r abi
lity
SR1
0.29
0.21
111
CM
1SRQ
11M
1SRQ
11…
13.2
3.2.
3C
232
Arit
hmet
icD
ecim
alR
emem
berin
gSR
10.
540.
391
12D
M1S
RQ12
M1S
RQ12
…14
.24.
2.2
C24
2A
rithm
etic
Dec
imal
Und
erst
andi
ngSR
10.
320.
371
13A
M1S
RQ13
M1S
RQ13
…14
.20.
3.6
F20
3A
rithm
etic
Frac
tion
Und
erst
andi
ngSR
10.
470.
521
14B
M1S
RQ14
M1S
RQ14
…16
.27.
2.2
E27
2A
rithm
etic
Uni
tary
met
hod
Und
erst
andi
ngSR
10.
630.
491
15C
M1S
RQ15
M1S
RQ15
…15
.25.
2.2
C25
2A
rithm
etic
Dec
imal
Rem
embe
ring
SR1
0.61
0.34
116
2217
AM
1SRQ
16M
1SRQ
16…
9.19
.1.1
C19
1Ti
me,
mon
ey a
nd
mea
sure
men
tw
eigh
tR
emem
berin
gSR
10.
510.
151
17B
M1S
RQ17
M1S
RQ17
…
Old
9.4
94
Arit
hmet
icB
asic
ope
ratio
nH
ighe
r abi
lity
SR1
118
21B
M1S
RQ
18M
1SR
Q18
……
……
……
……
……
……
……
……
……
…

- 33 -
2.6 Background VariablesThe ERO has developed a framework for collecting background information
through the questionnaires after studying students, teachers, and school survey instruments used in various international assessments such as Programme for International Student Assessment (PISA), Trends in International Mathematics and Science Study (TIMSS), and Pan-Canadian Assessment Program (PCAP) together with the tools used in previous NASA conducted by ERO in timeline with some discussions with academicians, practitioners, parents, teachers and the students. Besides, student attitude scale used in previous NASA was revised and used. The following figure shows the overall framework adopted for background information questionnaires used in the study.
Student Learning
Economic factors:-
of the school- Cooperation
with business- Financial
support from home
- Family income - Occupation of
the parents
Teacher factors:- Classroom actions- Background education and
teaching skills- Cooperation with other
teachers- Use of teaching materials- Mastery of the subject matter - Use of audio-visual aids - Teacher’s regularity- Scolding students- Many topics covered in short
time- Frequently out/ absent from
class
Physical factors:- Physical environment- Safety- Cooperation with local
actors/organization- Size of the school- eludehcs emit fo noitatnemelpmI- School programme- Library references- Space and facilities in the library
Leadership factors:- Leadership culture and skills of
principal- Atmosphere/Ethos in the school- Grouping in the school- Instructional leadership- Shared leadership- Trust in principal - Teacher’s professional community- Focused instruction- Student achievement
Peer group factors:- Social environment- Bullying- Interest groups- Atmosphere in the
classroom- Peer pressure
Demographic factors:- Language group- Geographical position- Urban/Rural area- Ethnicity- Age - Religion - Average size of a family
Students' personal factors:- Individual differences- Gender- Social interaction skills - Interest in the subjects-
seeing/hearing etc.- Truancy or unexplained
absence
Home factors:- Socio-demographic
background- Support to studies - Housing – own home,
rental, hostel etc.- Parent-child relationship
Source: ERO, 2018, p. 84
Figure 2.6 Framework for the background information for NASA 2017
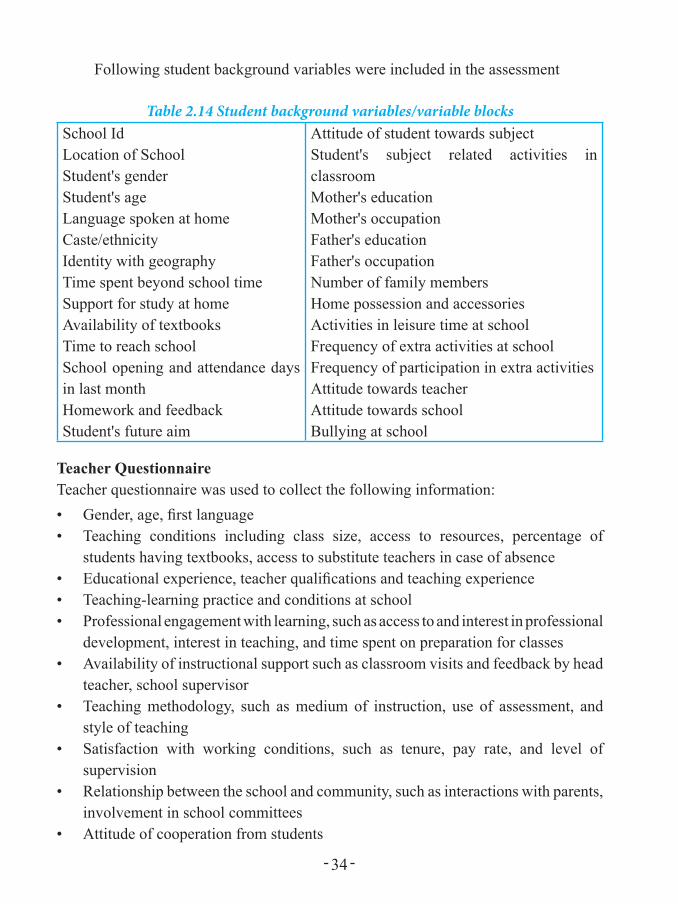
- 34 -
Following student background variables were included in the assessment
Table 2.14 Student background variables/variable blocksSchool IdLocation of SchoolStudent's genderStudent's ageLanguage spoken at homeCaste/ethnicityIdentity with geographyTime spent beyond school timeSupport for study at homeAvailability of textbooksTime to reach schoolSchool opening and attendance days in last monthHomework and feedbackStudent's future aim
Attitude of student towards subjectStudent's subject related activities in classroomMother's educationMother's occupationFather's educationFather's occupationNumber of family membersHome possession and accessoriesActivities in leisure time at schoolFrequency of extra activities at schoolFrequency of participation in extra activitiesAttitude towards teacherAttitude towards schoolBullying at school
Teacher QuestionnaireTeacher questionnaire was used to collect the following information:• Gender, age, first language• Teaching conditions including class size, access to resources, percentage of
students having textbooks, access to substitute teachers in case of absence• Educational experience, teacher qualifications and teaching experience• Teaching-learning practice and conditions at school• Professional engagement with learning, such as access to and interest in professional
development, interest in teaching, and time spent on preparation for classes• Availability of instructional support such as classroom visits and feedback by head
teacher, school supervisor• Teaching methodology, such as medium of instruction, use of assessment, and
style of teaching• Satisfaction with working conditions, such as tenure, pay rate, and level of
supervision• Relationship between the school and community, such as interactions with parents,
involvement in school committees• Attitude of cooperation from students
- 35 -
Headteacher QuestionnaireQuestionnaire for headteachers was used to collect the following information:• Gender and age• Educational and management experience and qualifications• School environment, including the quality of buildings and facilities, as well as
availability of resources• School records, such as fluctuations in student number, student and teacher
absenteeism• Professional engagement of school leadership, such as access to and interest in
professional development and interest in education• Leadership style and use of time• Assessment of teachers' work• Satisfaction with working conditions• Relationship with the community
Students' Attitude Survey In order to find the relation between attitude of students towards the subject and
achievement, the attitude survey questionnaire was administered. The questionnaire was adapted from shortened version of FSMAS, Fennema Sherman Mathematics Attitude Scales (Fennama & Sherman, 1976). The attitude survey questionnaire was included in the students’ background information questionnaire. The following are the statements used to identify the attitude of students towards the subject:
Self-confidence1. Studying Mathematics makes me feel nervous.2. I am always under a terrible strain in a math class.3. I am able to solve Mathematical problems without much difficulty.
Value4. Mathematics is important in everyday life.5. Mathematics is one of the most important subjects for people to study.6. High school math courses will be very helpful to me no matter what I decide to
study.
Enjoyment7. I have usually enjoyed studying Mathematics in school.8. Mathematics is dull and boring.
- 36 -
9. I am happier in a Mathematics class than in any other classes.
Motivation10. I would like to avoid using Mathematics in college.11. I am willing to take more than the required classes of Mathematics.12. I plan to take as much courses of Mathematics as I can during my education.
Socio-economic Status (SES) SurveyThe questionnaire to assess the socio-economic status of the family was included
in the students' background questionnaire. The aggregate of the students' responses to the questions on the following seven factors indicates the SES of the student’s family.
• Two variables related to parental education, including mother's and father's education;
• Two variables related to parental occupation, including mother’s and father’s occupation;
• Availability of various home accessories;• Availability of home possessions; and• Type of school (public or private) attended by student.
2.7 Test AdministrationPreparation for test administration begins with printing, packing and delivery
of test items and background questionnaires. ERO conducted a one-day orientation on test administration and test booklet collection process to the head teachers of each sample school in 26 districts. With the help of two teachers, the head teacher of each sample school administered the test. Subject teacher and head teacher of the sample school (in which test was administered) filled teachers' and head teachers' questionnaires respectively. Then students' answer sheets as well as teacher's and head teacher's responses were collected in the scoring centre in Kathmandu. The process followed for the purpose of test administration is described in this section.
For completion of the works, some of the tasks of test administration were outsourced to a consulting firm, while others were carried out by the DEOs and the schools. The sub-headings that follow deal with the tasks and process adopted to accomplish the work of test administration of NASA 2018.
Following activities were completed before administering the test to maintain peace and security in a low-stake environment.

- 37 -
• Delivery of head teacher guidelines for test administration. These guidelines mentioned every steps of test administration on what to do and what not to do .
• Delivery of test booklets in the sample schools.• Orientation to the district level head teachers and monitors.• Test administration arrangement by allocating monitoring team to the centres,
scheduling test administration.• Random selection of the test taker students where the number of sample students
was less than the number of students required in the sample class.
Test administration had two parts: in the first part, background questionnaire of students, head teacher and corresponding subject teacher was administered. After completion of the background information questionnaire response by the students, a ten-minute break was scheduled. After the 10 minutes break, two hour test administration was completed. To ensure proper administration of the test, monitoring and sample school visits were conducted by different agencies during the test administration. Educational Development Coordination Unit - EDCU (the then District Education Office) not only managed the whole process of test administration, but also monitored the administration process at school level. The ERO also sent at least one person to each district to facilitate and monitor the administration of the test. Besides, the consulting firm also monitored the process of test administration. After the test administration, the consulting company collected the booklets and delivered them to the Kathmandu centre. After collecting the answer sheets in the Kathmandu centre, data preparation was completed by adopting the following steps:
• Optical Mark Reader (OMR) sheet development and printing• Answer sheet coding and marking and scrutiny• OMR input of the scores and cleaning the data• Submission of clean data and marked answer sheets to the ERO
2.8 Item Parameter Estimation, Item Review and CalibrationItem parameter estimation of each item was carried out and the items were
reviewed accordingly. During the analysis, decisions were made on whether or not to use any particular item in the analysis. Classical as well as IRT parameters were estimated to review the items. Item parameters in IRT were used not only for item selection but also to estimate students' latent ability. Based on the item parameters of linking items, three versions of tests were calibrated and these three sets were integrated into single set for analysis. Item parameter estimation, item review and calibration of
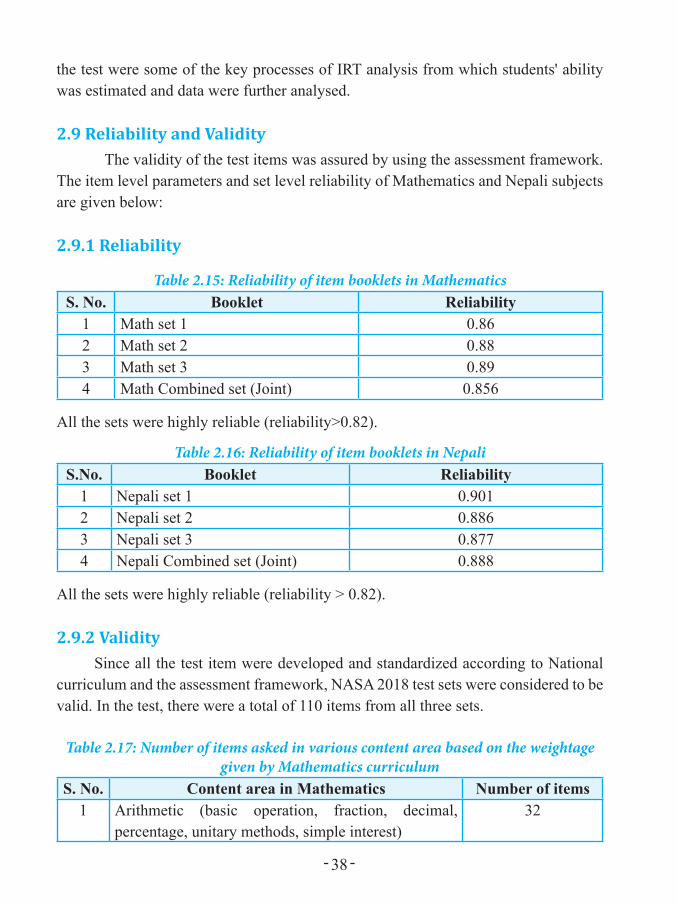
- 38 -
the test were some of the key processes of IRT analysis from which students' ability was estimated and data were further analysed.
2.9 Reliability and ValidityThe validity of the test items was assured by using the assessment framework.
The item level parameters and set level reliability of Mathematics and Nepali subjects are given below:
2.9.1 Reliability
Table 2.15: Reliability of item booklets in MathematicsS. No. Booklet Reliability
1 Math set 1 0.862 Math set 2 0.883 Math set 3 0.894 Math Combined set (Joint) 0.856
All the sets were highly reliable (reliability>0.82).
Table 2.16: Reliability of item booklets in NepaliS.No. Booklet Reliability
1 Nepali set 1 0.9012 Nepali set 2 0.8863 Nepali set 3 0.8774 Nepali Combined set (Joint) 0.888
All the sets were highly reliable (reliability > 0.82).
2.9.2 ValiditySince all the test item were developed and standardized according to National
curriculum and the assessment framework, NASA 2018 test sets were considered to be valid. In the test, there were a total of 110 items from all three sets.
Table 2.17: Number of items asked in various content area based on the weightage given by Mathematics curriculum
S. No. Content area in Mathematics Number of items1 Arithmetic (basic operation, fraction, decimal,
percentage, unitary methods, simple interest)32
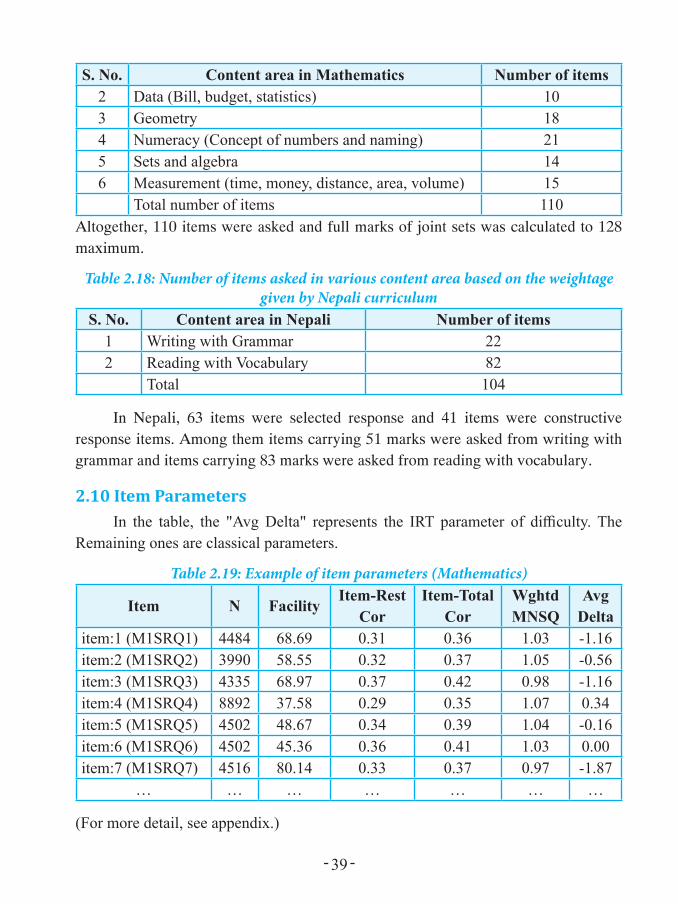
- 39 -
S. No. Content area in Mathematics Number of items2 Data (Bill, budget, statistics) 103 Geometry 184 Numeracy (Concept of numbers and naming) 215 Sets and algebra 146 Measurement (time, money, distance, area, volume) 15
Total number of items 110Altogether, 110 items were asked and full marks of joint sets was calculated to 128 maximum.
Table 2.18: Number of items asked in various content area based on the weightage given by Nepali curriculum
S. No. Content area in Nepali Number of items1 Writing with Grammar 222 Reading with Vocabulary 82
Total 104
In Nepali, 63 items were selected response and 41 items were constructive response items. Among them items carrying 51 marks were asked from writing with grammar and items carrying 83 marks were asked from reading with vocabulary.
2.10 Item ParametersIn the table, the "Avg Delta" represents the IRT parameter of difficulty. The
Remaining ones are classical parameters.
Table 2.19: Example of item parameters (Mathematics)
Item N FacilityItem-Rest
CorItem-Total
CorWghtd MNSQ
Avg Delta
item:1 (M1SRQ1) 4484 68.69 0.31 0.36 1.03 -1.16item:2 (M1SRQ2) 3990 58.55 0.32 0.37 1.05 -0.56item:3 (M1SRQ3) 4335 68.97 0.37 0.42 0.98 -1.16item:4 (M1SRQ4) 8892 37.58 0.29 0.35 1.07 0.34item:5 (M1SRQ5) 4502 48.67 0.34 0.39 1.04 -0.16item:6 (M1SRQ6) 4502 45.36 0.36 0.41 1.03 0.00item:7 (M1SRQ7) 4516 80.14 0.33 0.37 0.97 -1.87
… … … … … … …
(For more detail, see appendix.)
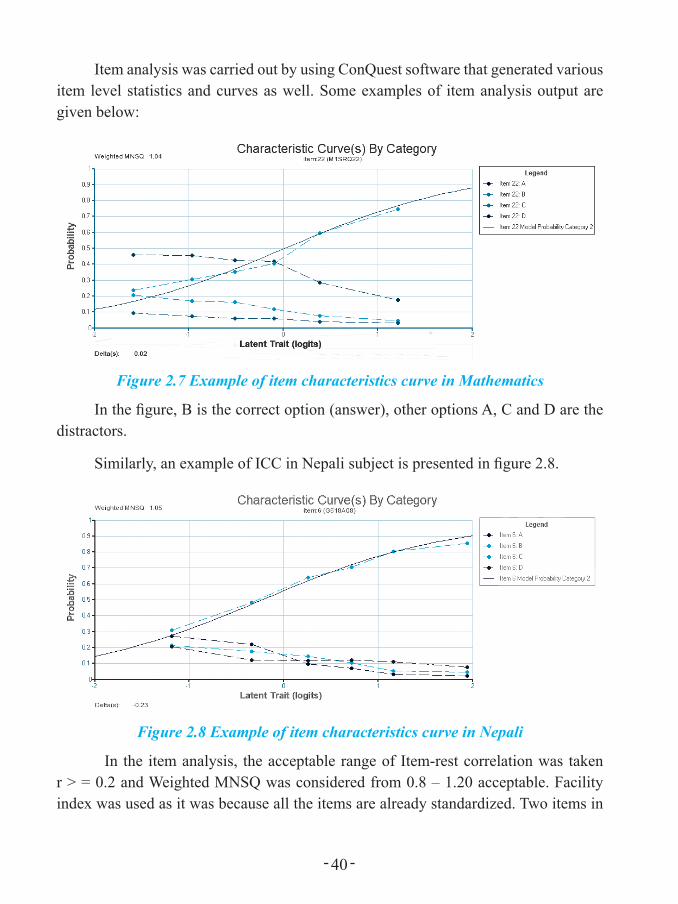
- 40 -
Item analysis was carried out by using ConQuest software that generated various item level statistics and curves as well. Some examples of item analysis output are given below:
Figure 2.7 Example of item characteristics curve in Mathematics
In the figure, B is the correct option (answer), other options A, C and D are the distractors.
Similarly, an example of ICC in Nepali subject is presented in figure 2.8.
Figure 2.8 Example of item characteristics curve in Nepali
In the item analysis, the acceptable range of Item-rest correlation was taken r > = 0.2 and Weighted MNSQ was considered from 0.8 – 1.20 acceptable. Facility index was used as it was because all the items are already standardized. Two items in
- 41 -
Mathematics from set-2 (item number 3 and 4) were discarded because of out of range MNSQ and negative item-rest correlation. The produced ICCs were used to analyse the item's appropriateness in the model.
2.11 Plausible Values (PVs)Plausible values (PVs) improve precision of prediction ability for the population
estimates. The PVs are calculated with conditioning background variables and some school related index. Conditioning provides unbiased estimates for modelled parameters. In this assessment, five plausible values (PV1 – PV5) were used to estimate population ability.
In this context, Yamamoto & Kulick (2000) mention that the PVs approach "uses students’ responses to the items together with all background data in order to estimate directly the characteristics of student populations and sub-populations" (cited in Laukaitytė, 2016, p. 9). But, PVs are not individual test scores; they are the measures of the performance of population.
It produces unbiased estimate of population parameters if assumption of scaling is reasonable, but it is not fair to use it for level of student ability.
The following inputs were prepared to generate the PVs:• Case estimation using weighted likelihood estimation (WLE)• Provinces• School type• Group with highest frequency is set to zero before using conditioning.• School mean index of WLE, etc.
The following table is an example of plausible values in Nepali subject drawn by conditioning run:
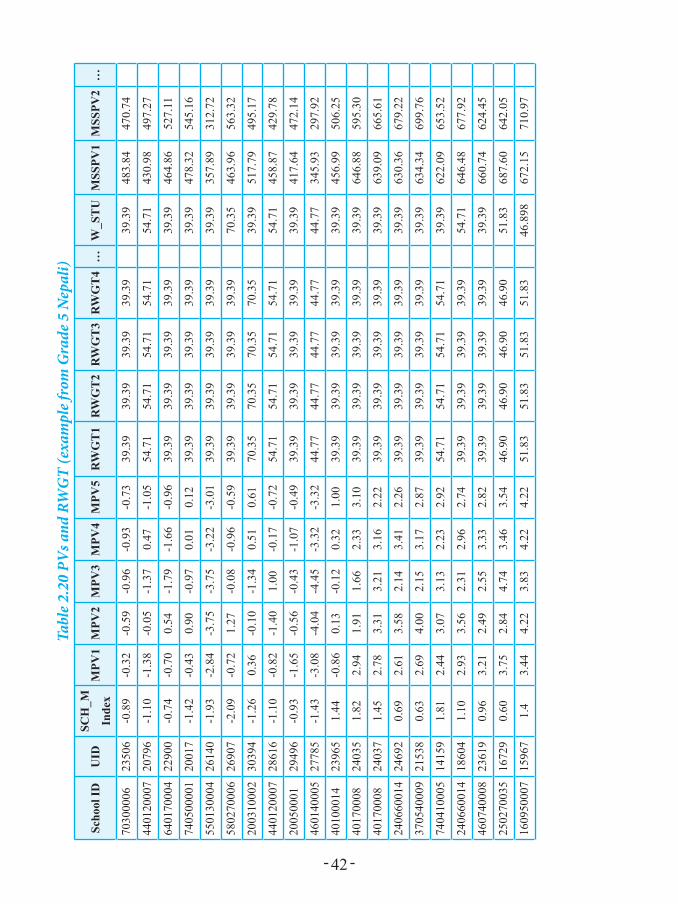
- 42 -
Tabl
e 2.2
0 PV
s and
RW
GT
(exa
mpl
e fro
m G
rade
5 N
epal
i)
Scho
ol ID
UID
SCH
_M
Inde
xM
PV1
MPV
2M
PV3
MPV
4M
PV5
RW
GT
1R
WG
T2
RW
GT
3R
WG
T4
…W
_ST
UM
SSPV
1M
SSPV
2…
7030
0006
2350
6-0
.89
-0.3
2-0
.59
-0.9
6-0
.93
-0.7
339
.39
39.3
939
.39
39.3
939
.39
483.
8447
0.74
4401
2000
720
796
-1.1
0-1
.38
-0.0
5-1
.37
0.47
-1.0
554
.71
54.7
154
.71
54.7
154
.71
430.
9849
7.27
6401
7000
422
900
-0.7
4-0
.70
0.54
-1.7
9-1
.66
-0.9
639
.39
39.3
939
.39
39.3
939
.39
464.
8652
7.11
7405
0000
120
017
-1.4
2-0
.43
0.90
-0.9
70.
010.
1239
.39
39.3
939
.39
39.3
939
.39
478.
3254
5.16
5501
3000
426
140
-1.9
3-2
.84
-3.7
5-3
.75
-3.2
2-3
.01
39.3
939
.39
39.3
939
.39
39.3
935
7.89
312.
72
5802
7000
626
907
-2.0
9-0
.72
1.27
-0.0
8-0
.96
-0.5
939
.39
39.3
939
.39
39.3
970
.35
463.
9656
3.32
2003
1000
230
394
-1.2
60.
36-0
.10
-1.3
40.
510.
6170
.35
70.3
570
.35
70.3
539
.39
517.
7949
5.17
4401
2000
728
616
-1.1
0-0
.82
-1.4
01.
00-0
.17
-0.7
254
.71
54.7
154
.71
54.7
154
.71
458.
8742
9.78
2005
0001
2949
6-0
.93
-1.6
5-0
.56
-0.4
3-1
.07
-0.4
939
.39
39.3
939
.39
39.3
939
.39
417.
6447
2.14
4601
4000
527
785
-1.4
3-3
.08
-4.0
4-4
.45
-3.3
2-3
.32
44.7
744
.77
44.7
744
.77
44.7
734
5.93
297.
92
4010
0014
2396
51.
44-0
.86
0.13
-0.1
20.
321.
0039
.39
39.3
939
.39
39.3
939
.39
456.
9950
6.25
4017
0008
2403
51.
822.
941.
911.
662.
333.
1039
.39
39.3
939
.39
39.3
939
.39
646.
8859
5.30
4017
0008
2403
71.
452.
783.
313.
213.
162.
2239
.39
39.3
939
.39
39.3
939
.39
639.
0966
5.61
2406
6001
424
692
0.69
2.61
3.58
2.14
3.41
2.26
39.3
939
.39
39.3
939
.39
39.3
963
0.36
679.
22
3705
4000
921
538
0.63
2.69
4.00
2.15
3.17
2.87
39.3
939
.39
39.3
939
.39
39.3
963
4.34
699.
76
7404
1000
514
159
1.81
2.44
3.07
3.13
2.23
2.92
54.7
154
.71
54.7
154
.71
39.3
962
2.09
653.
52
2406
6001
418
604
1.10
2.93
3.56
2.31
2.96
2.74
39.3
939
.39
39.3
939
.39
54.7
164
6.48
677.
92
4607
4000
823
619
0.96
3.21
2.49
2.55
3.33
2.82
39.3
939
.39
39.3
939
.39
39.3
966
0.74
624.
45
2502
7003
516
729
0.60
3.75
2.84
4.74
3.46
3.54
46.9
046
.90
46.9
046
.90
51.8
368
7.60
642.
05
1609
5000
715
967
1.4
3.44
4.22
3.83
4.22
4.22
51.8
351
.83
51.8
351
.83
46.8
9867
2.15
710.
97
- 43 -
2.12 Comparing the Overall Results of NASA 2018 with the Results of 2018
To find the trend of learning achievement, linking items' percentage of correct answer is reported in the first step. Then, for the IRT based reporting, linking items of NASA 2015 and 2018 are separately calibrated to generate the item parameters. Separate item parameters are generated by using one parameter Rash Model. From those parameters latent ability of both years' students was calculated. Then comparison by using latent ability (WLE) and item parameter difficulty of those items were separately used to find the achievement gap. By using WLE and item parameters, achievement gap is found to determine consistency in the result.
Trends of NASA cycle results over the years are presented based on the following methods:1. A comparative item wise classical parameter (percentage of correct answer) is
reported between both years.2. Average score of WLE 2015 Vs WLE 2018 is reported.3. Shift in mean by using mean shift calculation by difficulty parameters is used.
2.13 Provincial ResultsProvincial results are prepared separately in each subject. The provincial results
provide the opportunity of comparing the results in major variables. In each subject, provincial report begins with comparing overall mean scores of provinces followed by the mean scores in relation to various influencing variables on the achievement of students.


RESULTS AT NATIONAL LEVEL


- 47 -
CHAPTER 3
RESULTS IN MATHEMATICS AT NATIONAL LEVEL
3.1 IntroductionIn this chapter, the basic results of population estimates drawn from the responses
of 28381 students from 24 districts and 1400 schools are presented. Population estimates presented in this chapter are based on the five plausible values drawn from WLE and conditioning variables like school mean index, student background variables, student weights, provinces, gender. The population mean/achievement score is presented in all basic results with either standard error or in confidence interval (CI). In most of the bar-charts, the confidence interval of the population mean is represented by a line with cap in both ends. Such population estimates do not represent the individual level results. Thus, all the achievement scores reported are the weighted mean scores weighted by adjusted student weights, and the difference is reported at confidence level of 95%. The standard errors and confidence intervals were estimated to identify whether the difference in mean was statistically significant.
The students' ability scores were transformed into mean 500 and standard deviation of 50. This reporting has always national mean score fixed at 500 points to compare any two or more groups. The formula for transforming the student ability (logits or θ) was:
Average score = 500 + logits * 50Variation of average score comes from the variation in the logits (latent ability of
students/WLE). The five PVs are also generated based on the logits.
3.2 Wright-map of student ability and item difficulty in MathematicsThe Wright-map is organized as two vertical histograms. The left side shows
candidates and the right side shows the items. The left side of the map shows the distribution of the measured ability of the candidates from most able at the top to least able at the bottom. The items on the right side of the map are distributed from the most difficult at the top to the least difficult at the bottom. In the following figure, student ability (θ) in the left and NASA 2018 items to the right are plotted in the same scale. When a person and an item lies at the same level, probability of responding that item by the particular person is 50%. Figure 3.1 presents the NASA 2018 Mathematics Wright-map.

- 48 -
Figure 3.1 Wright map showing person and item in the same scale
To the left side, an 'X' represents 87 students, their latent ability is given in the logit scale ranging from -2 or less to +2 or more. The distribution of students against the items asked (item numbers are shown to the right side) reveals that most of the items were difficult for the students. Although items were pre-tested and based on the grade 5 curriculum, most of the students are lagging behind below the average latent
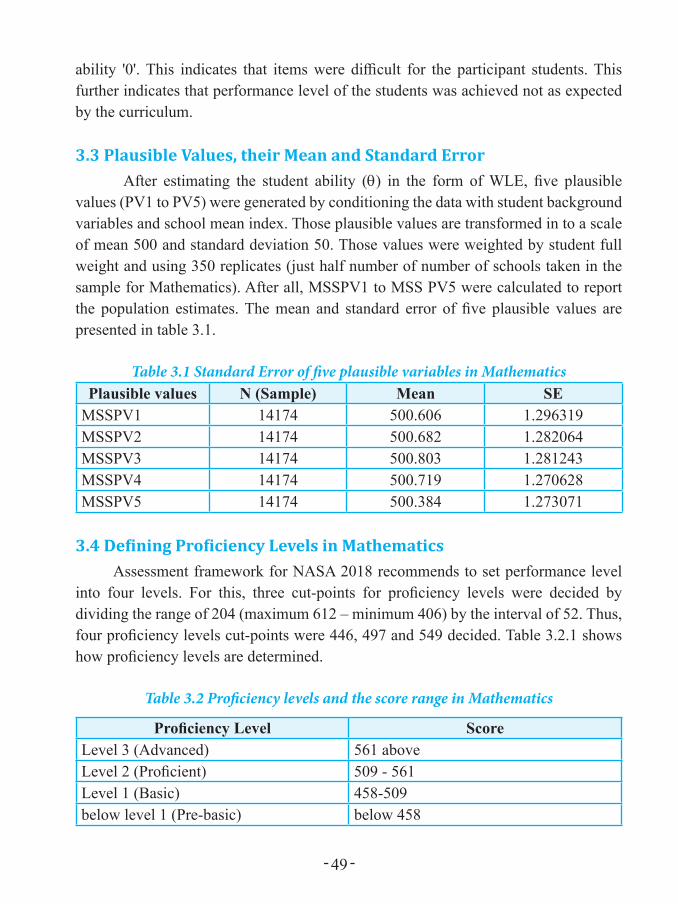
- 49 -
ability '0'. This indicates that items were difficult for the participant students. This further indicates that performance level of the students was achieved not as expected by the curriculum.
3.3 Plausible Values, their Mean and Standard ErrorAfter estimating the student ability (θ) in the form of WLE, five plausible
values (PV1 to PV5) were generated by conditioning the data with student background variables and school mean index. Those plausible values are transformed in to a scale of mean 500 and standard deviation 50. Those values were weighted by student full weight and using 350 replicates (just half number of number of schools taken in the sample for Mathematics). After all, MSSPV1 to MSS PV5 were calculated to report the population estimates. The mean and standard error of five plausible values are presented in table 3.1.
Table 3.1 Standard Error of five plausible variables in MathematicsPlausible values N (Sample) Mean SE
MSSPV1 14174 500.606 1.296319MSSPV2 14174 500.682 1.282064MSSPV3 14174 500.803 1.281243MSSPV4 14174 500.719 1.270628MSSPV5 14174 500.384 1.273071
3.4 Defining Proficiency Levels in MathematicsAssessment framework for NASA 2018 recommends to set performance level
into four levels. For this, three cut-points for proficiency levels were decided by dividing the range of 204 (maximum 612 – minimum 406) by the interval of 52. Thus, four proficiency levels cut-points were 446, 497 and 549 decided. Table 3.2.1 shows how proficiency levels are determined.
Table 3.2 Proficiency levels and the score range in Mathematics
Proficiency Level ScoreLevel 3 (Advanced) 561 aboveLevel 2 (Proficient) 509 - 561Level 1 (Basic) 458-509below level 1 (Pre-basic) below 458

- 50 -
Based on the descriptions of items that correspond to each of the above proficiency levels in item-person map in Mathematics together with subject experts' judgment, the descriptions of students' four level proficiency have been defined. These descriptions of four proficiency levels in Mathematics for Grade 5 indicate what a student at particular competency level can do in Mathematics.
Internationally, students who cross 67% of their achievement are considered as Minimally Accepted Candidate. Replicating the same concept in determining the minimum acceptance level of learning in those four proficiency levels is possible. However, in this assessment, around 50% items were objective and almost equal weightage was given to subjective items. So, in this analysis 50% correct answer was supposed to be threshold of minimum accepted proficiency for any of the four levels. From this point of view, student response on every item was analysed to find the response rate of those four level students. For this, at the first step, below level 1 (pre-basic) items were detected then, level 1, level 2 and level 3 respectively. In such a rigor, all the items were assigned to different four levels to draw proficiency descriptors. Table 3.3 specifies the minimum proficiency level of all four level students in a descriptive form.
Table 3.3 A summary of minimum proficiency level in all four levels.Level Score What students can typically do
Below level 1: pre-basic
below 458
Below level 1 students have quite limited knowledge and skills in Mathematics. Around 50% of them do not have any sense of reading and writing number and number operation. Around half of them could have superficial knowledge of number and number operation. However, they cannot calculate and solve Mathematical problems. Only half of them have some knowledge of time like hour and minutes, day and hour, month and years. Some of them are able to choose correct answer when options are given in MCQ items. Almost all of them can not perform any Mathematical subjective calculations independently.
Level 1:Basic
509 - 458
Basic level students have superficial knowledge and skills in most of the Mmathematical contents, however, they are struggling with calculations. They can identify the ordered pair of a point, square pattern in dots, sum of decimal numbers, place of a digit in numbers, relation of kg and gram and recognize
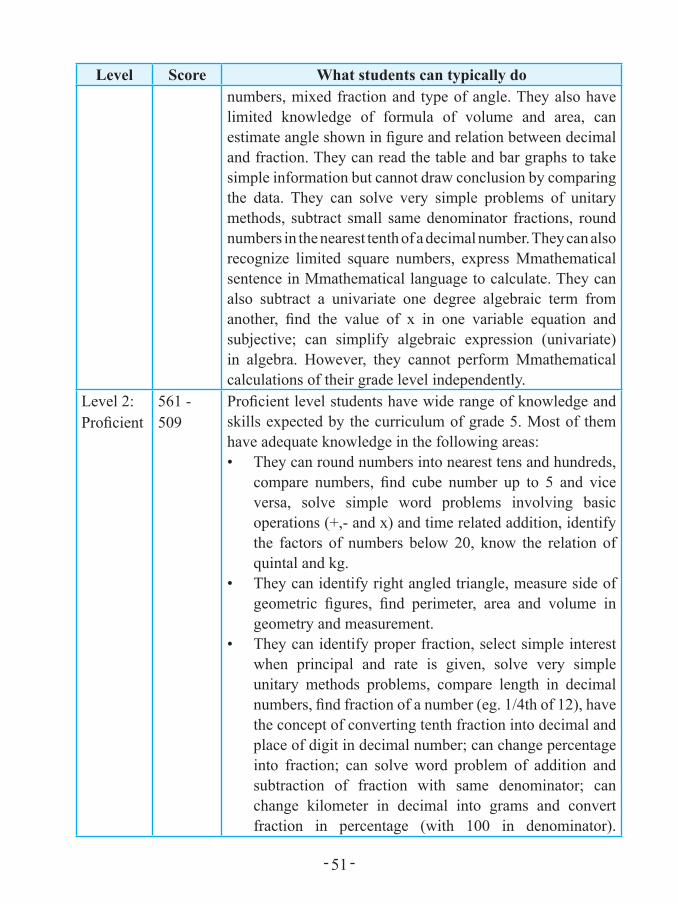
- 51 -
Level Score What students can typically donumbers, mixed fraction and type of angle. They also have limited knowledge of formula of volume and area, can estimate angle shown in figure and relation between decimal and fraction. They can read the table and bar graphs to take simple information but cannot draw conclusion by comparing the data. They can solve very simple problems of unitary methods, subtract small same denominator fractions, round numbers in the nearest tenth of a decimal number. They can also recognize limited square numbers, express Mmathematical sentence in Mmathematical language to calculate. They can also subtract a univariate one degree algebraic term from another, find the value of x in one variable equation and subjective; can simplify algebraic expression (univariate) in algebra. However, they cannot perform Mmathematical calculations of their grade level independently.
Level 2: Proficient
561 - 509
Proficient level students have wide range of knowledge and skills expected by the curriculum of grade 5. Most of them have adequate knowledge in the following areas:• They can round numbers into nearest tens and hundreds,
compare numbers, find cube number up to 5 and vice versa, solve simple word problems involving basic operations (+,- and x) and time related addition, identify the factors of numbers below 20, know the relation of quintal and kg.
• They can identify right angled triangle, measure side of geometric figures, find perimeter, area and volume in geometry and measurement.
• They can identify proper fraction, select simple interest when principal and rate is given, solve very simple unitary methods problems, compare length in decimal numbers, find fraction of a number (eg. 1/4th of 12), have the concept of converting tenth fraction into decimal and place of digit in decimal number; can change percentage into fraction; can solve word problem of addition and subtraction of fraction with same denominator; can change kilometer in decimal into grams and convert fraction in percentage (with 100 in denominator).
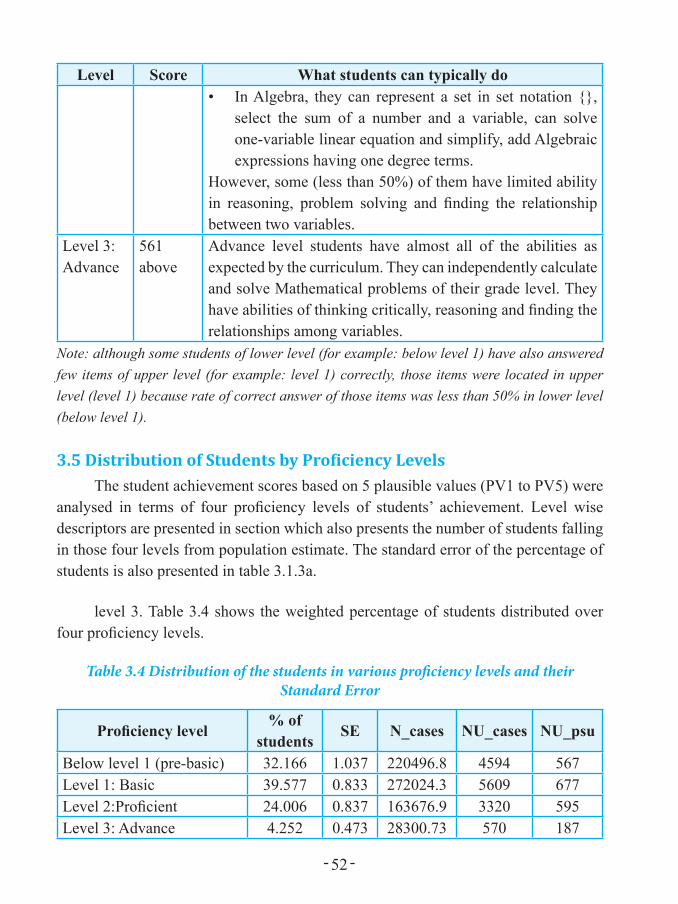
- 52 -
Level Score What students can typically do• In Algebra, they can represent a set in set notation {},
select the sum of a number and a variable, can solve one-variable linear equation and simplify, add Algebraic expressions having one degree terms.
However, some (less than 50%) of them have limited ability in reasoning, problem solving and finding the relationship between two variables.
Level 3: Advance
561 above
Advance level students have almost all of the abilities as expected by the curriculum. They can independently calculate and solve Mathematical problems of their grade level. They have abilities of thinking critically, reasoning and finding the relationships among variables.
Note: although some students of lower level (for example: below level 1) have also answered few items of upper level (for example: level 1) correctly, those items were located in upper level (level 1) because rate of correct answer of those items was less than 50% in lower level (below level 1).
3.5 Distribution of Students by Proficiency LevelsThe student achievement scores based on 5 plausible values (PV1 to PV5) were
analysed in terms of four proficiency levels of students’ achievement. Level wise descriptors are presented in section which also presents the number of students falling in those four levels from population estimate. The standard error of the percentage of students is also presented in table 3.1.3a.
level 3. Table 3.4 shows the weighted percentage of students distributed over four proficiency levels.
Table 3.4 Distribution of the students in various proficiency levels and their Standard Error
Proficiency level% of
studentsSE N_cases NU_cases NU_psu
Below level 1 (pre-basic) 32.166 1.037 220496.8 4594 567Level 1: Basic 39.577 0.833 272024.3 5609 677Level 2:Proficient 24.006 0.837 163676.9 3320 595Level 3: Advance 4.252 0.473 28300.73 570 187
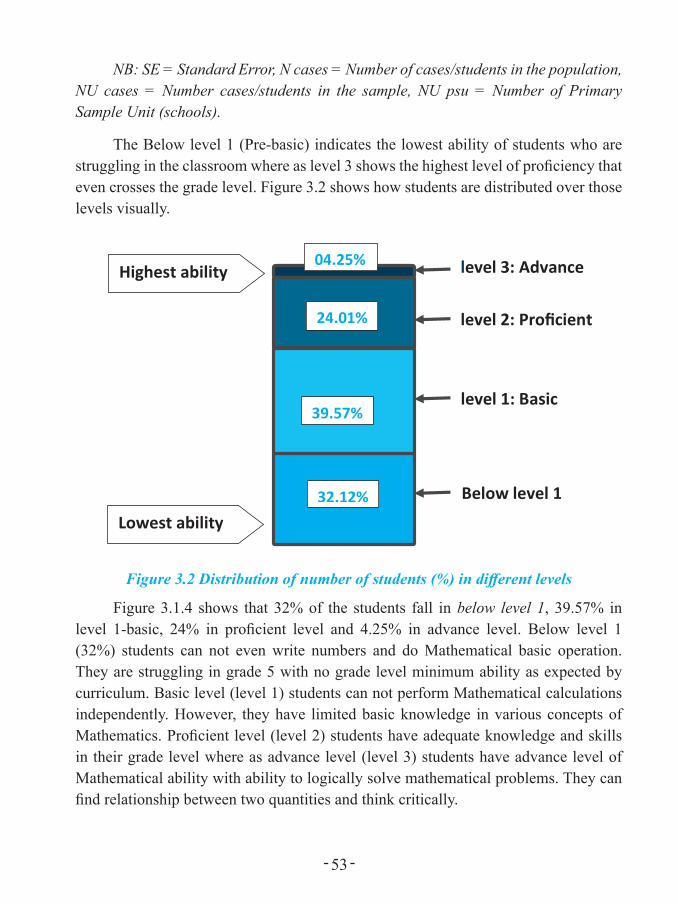
- 53 -
NB: SE = Standard Error, N cases = Number of cases/students in the population, NU cases = Number cases/students in the sample, NU psu = Number of Primary Sample Unit (schools).
The Below level 1 (Pre-basic) indicates the lowest ability of students who are struggling in the classroom where as level 3 shows the highest level of proficiency that even crosses the grade level. Figure 3.2 shows how students are distributed over those levels visually.
32.12%
39.57%
04.25%
24.01%
Below level 1
level 1: Basic
level 2: Proficient
level 3: Advance
Lowest ability
Highest ability
Figure 3.2 Distribution of number of students (%) in different levels
Figure 3.1.4 shows that 32% of the students fall in below level 1, 39.57% in level 1-basic, 24% in proficient level and 4.25% in advance level. Below level 1 (32%) students can not even write numbers and do Mathematical basic operation. They are struggling in grade 5 with no grade level minimum ability as expected by curriculum. Basic level (level 1) students can not perform Mathematical calculations independently. However, they have limited basic knowledge in various concepts of Mathematics. Proficient level (level 2) students have adequate knowledge and skills in their grade level where as advance level (level 3) students have advance level of Mathematical ability with ability to logically solve mathematical problems. They can find relationship between two quantities and think critically.
- 54 -
From total number of students, 28.26% of them have adequate mathematical knowledge and skills who lie in proficient level (24.01%) and advance level (4.25%). Students in basic level (39.56%) have limited basic mathematical concept however they can not perform Mathematical calculations of their grade independently. 32 out of 100 students do not get sense of what is taught in the classroom of the total as they lie in below basic level (32.12%). They are struggling with Mathematical concepts and are left behind. Hence, more than 70% of the students are below the level of competencies expected by the curriculum.
3.6 Minimum Level of Achieved CurriculumThe assessed curriculum is that which is reflected by the assessment or
evaluation. It can be either formative or summative evaluation of the students. Assessed curriculum is a tested curriculum by school, national or international organization based on the written curriculum/intended curriculum. It is valuable because it enables the educational organizations and stakeholders to evaluate the impact of written and taught curriculum upon students. It determines the level of the learned curriculum. Research (e.g. Berliner, 1984; Turner, 2003) indicates that the mismatch between assessed and taught curricula has serious consequences (cited in MeshGuide). This section presents the level of learning in the form of achieved curriculum in terms of percentage. In this analysis, it is assumed that every test item is equivalent in the sense that each of them represents a learning objective mentioned in the written curriculum.
As mentioned in sub-section 3.4, 67% correct response can be considered as cut-score for being minimally proficient at any level. As in this assessment, around half number of items were objective type (MCQ) and half of them were subjective. 50% correct responses are considered as the threshold of minimum level of accepted proficiency at any of the four levels. Hence, test items were organized in terms of at least 50% correctly answered items or more at each level of students. Based on this criterion, all the items were re-allocated into four levels. From this rigorous analysis, performance descriptors were developed.
In every level of the proficiency, there are ranges of students from being very weak performers to the highest performers. Considering 50% as the threshold of minimum proficiency of any four levels, percentage of learning was Mathematically calculated based on the number of items answered correctly. Mathematical value of achieved curriculum is thus given in table 3.5.

- 55 -
Table 3.5 Mathematical presentation of the achieved curriculum
Performance level Achieved curriculumBelow Basic level (32% students) 5% of the curriculumBasic level (39.57% students) 28% of the curriculumProficient level (24% students) 62% of the curriculumAdvance level (4% students) 96% of the curriculum
Table 3.5 reveals that 32 students out of 100 fall below basic level who have achieved only 5% of the tested curriculum (% of items). Similarly, only 28% curriculum is achieved by basic level students. Altogether, 71% students are under the 28% achievement of the tested curriculum in Mathematics. This huge mass of the students represents underperforming group. The proficient level students achieved 62% of the tested curriculum and advance level students achieved 96% of the tested curriculum. It shows that only 29% of the students have achieved adequate knowledge and skills in Mathematics. The gap in achievement against curriculum objectives between below basic level (5%) and advance level students (96%) is 91%. This reveals that inequality in learning in the classroom is remarkably high.
3.7 Overall Mean Score by ProvinceIn the Federal context, Nepal is divided into seven provinces and 753 local
government units. While selecting the schools as Principal Sample Units (PSU), provinces were treated as strata. The average scores reported in this section are the transformed/scale score at 500 national average. National mean is taken as a reference to compare the provincial mean. Those provinces whose average score is above the mean score are recognized as better performing provinces whereas below 500 are assumed to be low performing.
The mean score of achievement reported here is based on the plausible values as mentioned in introduction chapter. In the figure 3.1.4, a vertical dotted line represents the national mean score of achievement and horizontal bars represent the achievement scores by province.
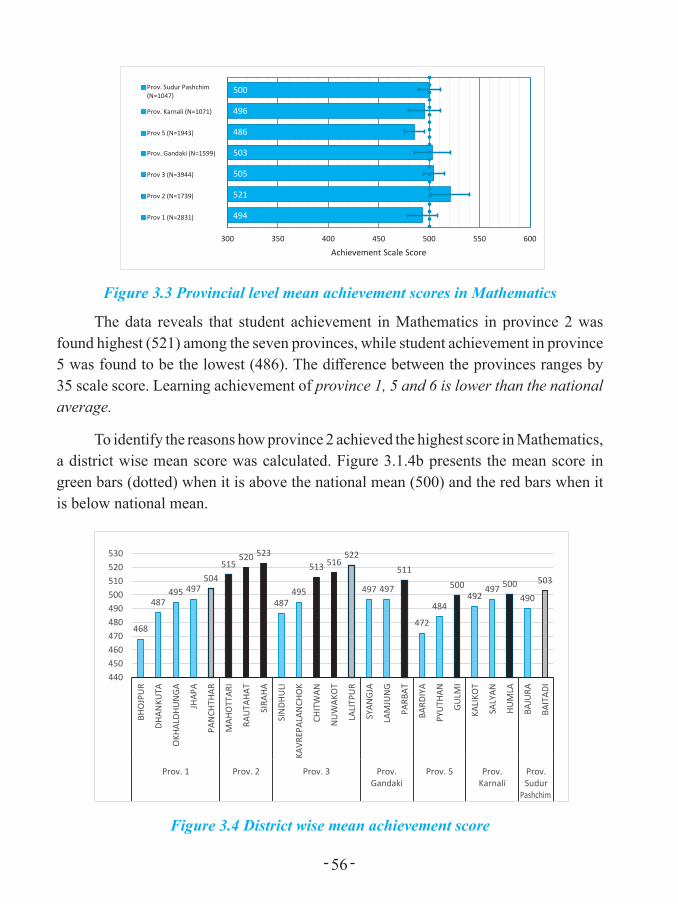
- 56 -
Figure 3. 3 Provincial level mean achievement scores in Mathematics
494
521
505
503
486
496
500
300 350 400 450 500 550 600
Achievement Scale Score
Prov. Sudur Pashchim(N=1047)
Prov. Karnali (N=1071)
Prov 5 (N=1943)
Prov. Gandaki (N=1599)
Prov 3 (N=3944)
Prov 2 (N=1739)
Prov 1 (N=2831)
Figure 3.3 Provincial level mean achievement scores in Mathematics
The data reveals that student achievement in Mathematics in province 2 was found highest (521) among the seven provinces, while student achievement in province 5 was found to be the lowest (486). The difference between the provinces ranges by 35 scale score. Learning achievement of province 1, 5 and 6 is lower than the national average.
To identify the reasons how province 2 achieved the highest score in Mathematics, a district wise mean score was calculated. Figure 3.1.4b presents the mean score in green bars (dotted) when it is above the national mean (500) and the red bars when it is below national mean.
468
487495 497
504515
520 523
487495
513 516522
497 497
511
472
484
500492
497 500490
503
440450460470480490500510520530
BHO
JPU
R
DHAN
KUTA
OKH
ALDH
UN
GA
JHAP
A
PAN
CHTH
AR
MAH
OTT
ARI
RAU
TAHA
T
SIRA
HA
SIN
DHU
LI
KAVR
EPAL
ANCH
OK
CHIT
WAN
NU
WAK
OT
LALI
TPU
R
SYAN
GJA
LAM
JUN
G
PARB
AT
BARD
IYA
PYU
THAN
GULM
I
KALI
KOT
SALY
AN
HUM
LA
BAJU
RA
BAIT
ADI
Prov. 1 Prov. 2 Prov. 3 Prov.Gandaki
Prov. 5 Prov.Karnali
Prov.Sudur
Pashchim
Figure 3.4 District wise mean achievement score

- 57 -
Figure 3.4 shows that out of 24 districts, only 10 districts' mean score was above the national mean (500). In province 2, all three districts had higher mean score than the national mean, Mahottari (512), Rautahat (520) and Siraha (523). The lowest achieving province was province 5 in which mean score of Bardiya (472), Salyan (484) were below national mean and only Gulmi (500) was just equal to national mean. Moreover, the lowest achiever district comes from province 1 that is Bhojpur (468) which was nearly equal to the below level 1. This indicates that Bhojpur district students were struggling with Mathematics learning. Similar was the situation in Bardia from Province 5 (474 score). Sindhuli from Province 3 had the lowest performance (487 score). Variation in achievement between the districts was high (55 scale score).
3.8 Results by Gender, Ethnicity and Home LanguageFrom equity concern of learning, gender, ethnicity and home language are
considered to be the important variables in learning. In this section, achievement scores of various groups have been compared.
a. Achievement by GenderFor the equal level of learning to take place, girls and boys should have equal
opportunity and support in their study. In the background questionnaire, students had reported their gender. In this data, there were 6855 (48.4%) boys, 6978 (48.6%) girl and 2.4% students did not reveal their gender. Based on this sample, the weighted mean score is presented in figure 3.5.
501
499
300 350 400 450 500 550Achievement Scale Score
Girl (N=6978)
Boy (N=6855)
Figure 3.5 Mean score in Mathematics by gender at national level
The analysis of data from a gender lens, demonstrates that boy students’ achievement score (501) was higher than the mean score of girl students (499). Thus,
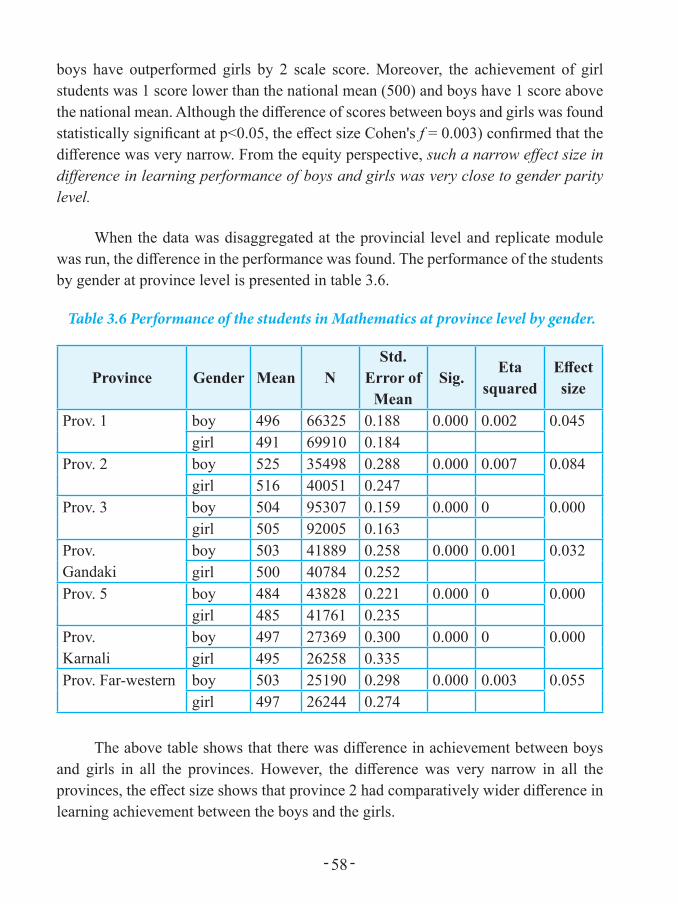
- 58 -
boys have outperformed girls by 2 scale score. Moreover, the achievement of girl students was 1 score lower than the national mean (500) and boys have 1 score above the national mean. Although the difference of scores between boys and girls was found statistically significant at p<0.05, the effect size Cohen's f = 0.003) confirmed that the difference was very narrow. From the equity perspective, such a narrow effect size in difference in learning performance of boys and girls was very close to gender parity level.
When the data was disaggregated at the provincial level and replicate module was run, the difference in the performance was found. The performance of the students by gender at province level is presented in table 3.6.
Table 3.6 Performance of the students in Mathematics at province level by gender.
Province Gender Mean NStd.
Error of Mean
Sig.Eta
squaredEffect size
Prov. 1 boy 496 66325 0.188 0.000 0.002 0.045girl 491 69910 0.184
Prov. 2 boy 525 35498 0.288 0.000 0.007 0.084girl 516 40051 0.247
Prov. 3 boy 504 95307 0.159 0.000 0 0.000girl 505 92005 0.163
Prov.Gandaki
boy 503 41889 0.258 0.000 0.001 0.032girl 500 40784 0.252
Prov. 5 boy 484 43828 0.221 0.000 0 0.000girl 485 41761 0.235
Prov.Karnali
boy 497 27369 0.300 0.000 0 0.000girl 495 26258 0.335
Prov. Far-western boy 503 25190 0.298 0.000 0.003 0.055girl 497 26244 0.274
The above table shows that there was difference in achievement between boys and girls in all the provinces. However, the difference was very narrow in all the provinces, the effect size shows that province 2 had comparatively wider difference in learning achievement between the boys and the girls.
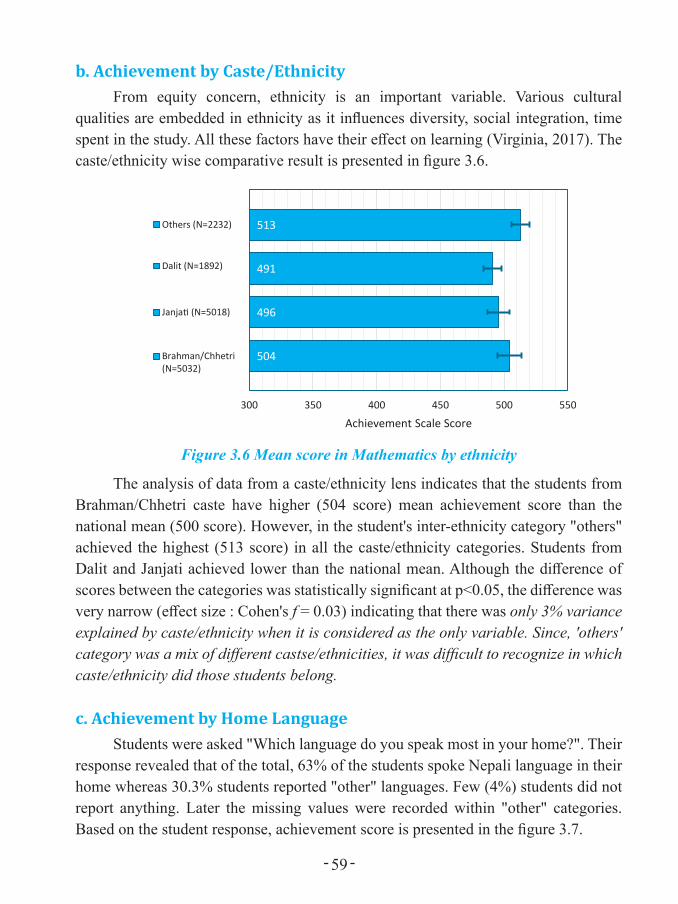
- 59 -
b. Achievement by Caste/EthnicityFrom equity concern, ethnicity is an important variable. Various cultural
qualities are embedded in ethnicity as it influences diversity, social integration, time spent in the study. All these factors have their effect on learning (Virginia, 2017). The caste/ethnicity wise comparative result is presented in figure 3.6.
504
496
491
513
300 350 400 450 500 550
Achievement Scale Score
Others (N=2232)
Dalit (N=1892)
Janja� (N=5018)
Brahman/Chhetri(N=5032)
Figure 3.6 Mean score in Mathematics by ethnicity
The analysis of data from a caste/ethnicity lens indicates that the students from Brahman/Chhetri caste have higher (504 score) mean achievement score than the national mean (500 score). However, in the student's inter-ethnicity category "others" achieved the highest (513 score) in all the caste/ethnicity categories. Students from Dalit and Janjati achieved lower than the national mean. Although the difference of scores between the categories was statistically significant at p<0.05, the difference was very narrow (effect size : Cohen's f = 0.03) indicating that there was only 3% variance explained by caste/ethnicity when it is considered as the only variable. Since, 'others' category was a mix of different castse/ethnicities, it was difficult to recognize in which caste/ethnicity did those students belong.
c. Achievement by Home LanguageStudents were asked "Which language do you speak most in your home?". Their
response revealed that of the total, 63% of the students spoke Nepali language in their home whereas 30.3% students reported "other" languages. Few (4%) students did not report anything. Later the missing values were recorded within "other" categories. Based on the student response, achievement score is presented in the figure 3.7.
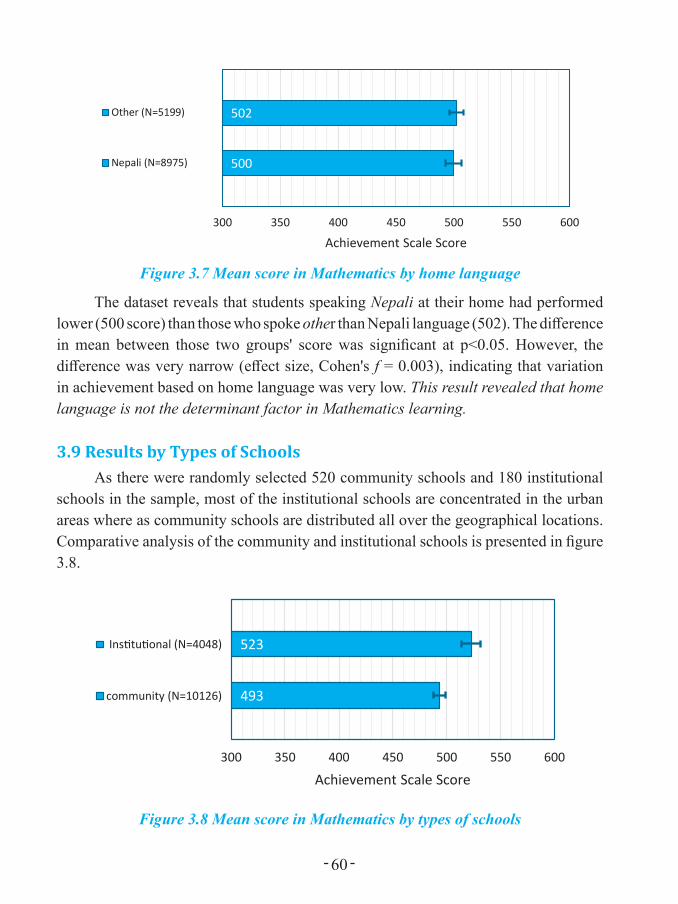
- 60 -
500
502
300 350 400 450 500 550 600
Achievement Scale Score
Other (N=5199)
Nepali (N=8975)
Figure 3.7 Mean score in Mathematics by home language
The dataset reveals that students speaking Nepali at their home had performed lower (500 score) than those who spoke other than Nepali language (502). The difference in mean between those two groups' score was significant at p<0.05. However, the difference was very narrow (effect size, Cohen's f = 0.003), indicating that variation in achievement based on home language was very low. This result revealed that home language is not the determinant factor in Mathematics learning.
3.9 Results by Types of SchoolsAs there were randomly selected 520 community schools and 180 institutional
schools in the sample, most of the institutional schools are concentrated in the urban areas where as community schools are distributed all over the geographical locations. Comparative analysis of the community and institutional schools is presented in figure 3.8.
493
523
300 350 400 450 500 550 600
Achievement Scale Score
Ins�tu�onal (N=4048)
community (N=10126)
Figure 3.8 Mean score in Mathematics by types of schools

- 61 -
The mean score was found 493 in the case of community schools and 523 in institutional schools. The score of community schools had remained significantly lower than both the national mean and institutional schools whose achievement was distinctly above the national mean. With the difference of 30 scale score, the gap between the two types of schools was significantly different at p<0.05. The difference was alarming as the gap between community and institutional schools was very high (effect size, Cohen's f = 0.26).
3.10 Results by Various Influencing FactorsEducational researches inform that various contextual variables influence
learning of students. In this research also many contextual variables were incorporated. The variables like student's personal variables, home related variables, socio-economic variables, attitude scales, school and teacher related variables were included and administered. The comparative analysis results are discussed below under respective headings.
a. Parents’ Education and Students’ Learning AchievementStudents were asked about their parents' education level, specifically whether
they are illiterate, just literate, Grade 10, Grade 12, Bachelor's, and Master's or above degree holders. In this analysis, mother's educational level was related with achievement level as presented in figure 2.9.
493
499
499
512
516
522
520
300 350 400 450 500 550 600
Achievement Scale Score
Masters or above
Bachelors (N=408)
Grade 12 (N=991)
grade 10 (N=1653)
Grade 8 (N=2502)
Literate (N=3484)
Illitrate (N=4095)
Figure 3.9 Mean score in Mathematics by level of mother's education

- 62 -
The dataset reveals that mother's education has positive effect on student learning achievement. Illitrate mother's children has the lowest achievement (493) whereas Bachelors degree mother's children have the highest achievement score (522). The difference in achievement associated with mother's education was significant at p<0.05. The difference was medium (effect size, Cohen's f = 0.13).
Similarly, father's education was also positively related with learning achievement. The educational level of father corresponding with their children's learning achievement is presented in figure 2.10.
492
495
497
507
513
522
527
300 350 400 450 500 550 600
Achievement Scale Score
Masters or above(N=412)
Bachelors (N=583)
Grade 12 (N=1577)
grade 10 (N=2356)
Grade 8 (N=3015)
Literate (N=2993)
Illitrate (N=2365)
Figure 3.10 Mean score in Mathematics by level of father's education
The above figure reveals that father's education had positive effect on student's learning achievement. Illiterate father's children had lowest achievement (492) whereas Master's degree holder parents' children had the highest score (527). The difference in achievement based on different levels of father's education was significant at p<0.05 and the difference was moderate (effect size, Cohen's f = 0.19).
b. Students’ Learning Achievement by Age GroupAs a background variable, students were asked to report their age. The reported
ages were grouped into six age groups— 9 or below, 10, 11, 12, 13 and 14 or above. The majority of students (4545) were of 12 years old. The smallest group of students was of the age of 10 and 9 or below. The influence of age on learning achievement can
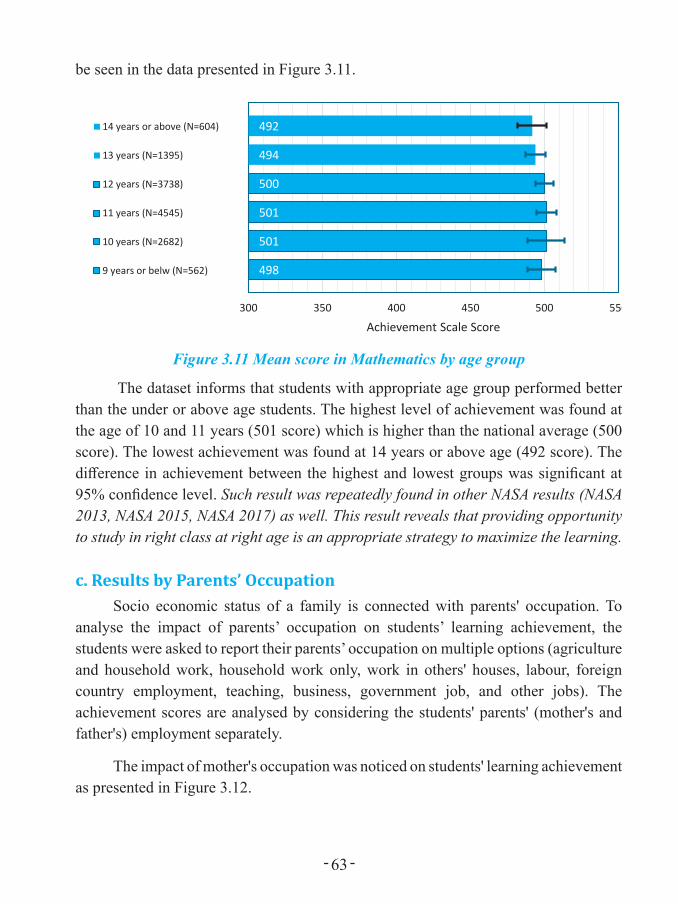
- 63 -
be seen in the data presented in Figure 3.11.
498
501
501
500
494
492
300 350 400 450 500 550
Achievement Scale Score
3.11
14 years or above (N=604)
13 years (N=1395)
12 years (N=3738)
11 years (N=4545)
10 years (N=2682)
9 years or belw (N=562)
Figure 3.11 Mean score in Mathematics by age group
The dataset informs that students with appropriate age group performed better than the under or above age students. The highest level of achievement was found at the age of 10 and 11 years (501 score) which is higher than the national average (500 score). The lowest achievement was found at 14 years or above age (492 score). The difference in achievement between the highest and lowest groups was significant at 95% confidence level. Such result was repeatedly found in other NASA results (NASA 2013, NASA 2015, NASA 2017) as well. This result reveals that providing opportunity to study in right class at right age is an appropriate strategy to maximize the learning.
c. Results by Parents’ OccupationSocio economic status of a family is connected with parents' occupation. To
analyse the impact of parents’ occupation on students’ learning achievement, the students were asked to report their parents’ occupation on multiple options (agriculture and household work, household work only, work in others' houses, labour, foreign country employment, teaching, business, government job, and other jobs). The achievement scores are analysed by considering the students' parents' (mother's and father's) employment separately.
The impact of mother's occupation was noticed on students' learning achievement as presented in Figure 3.12.
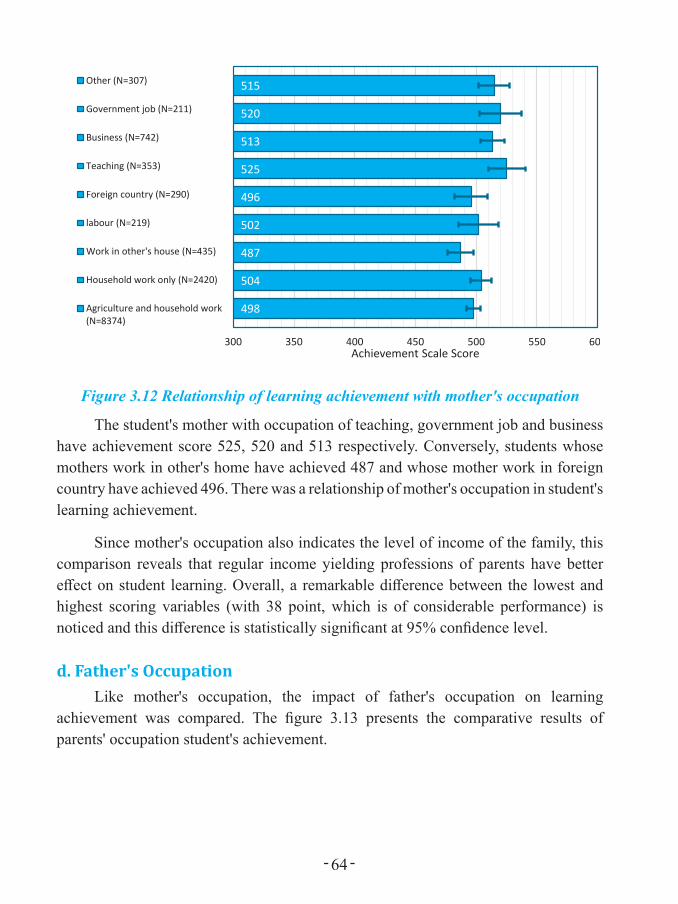
- 64 -
Figure 3. 12 Relationship of learning achievement with mother's occupation
498
504
487
502
496
525
513
520
515
300 350 400 450 500 550 600Achievement Scale Score
Other (N=307)
Government job (N=211)
Business (N=742)
Teaching (N=353)
Foreign country (N=290)
labour (N=219)
Work in other's house (N=435)
Household work only (N=2420)
Agriculture and household work(N=8374)
Figure 3.12 Relationship of learning achievement with mother's occupation
The student's mother with occupation of teaching, government job and business have achievement score 525, 520 and 513 respectively. Conversely, students whose mothers work in other's home have achieved 487 and whose mother work in foreign country have achieved 496. There was a relationship of mother's occupation in student's learning achievement.
Since mother's occupation also indicates the level of income of the family, this comparison reveals that regular income yielding professions of parents have better effect on student learning. Overall, a remarkable difference between the lowest and highest scoring variables (with 38 point, which is of considerable performance) is noticed and this difference is statistically significant at 95% confidence level.
d. Father's OccupationLike mother's occupation, the impact of father's occupation on learning
achievement was compared. The figure 3.13 presents the comparative results of parents' occupation student's achievement.
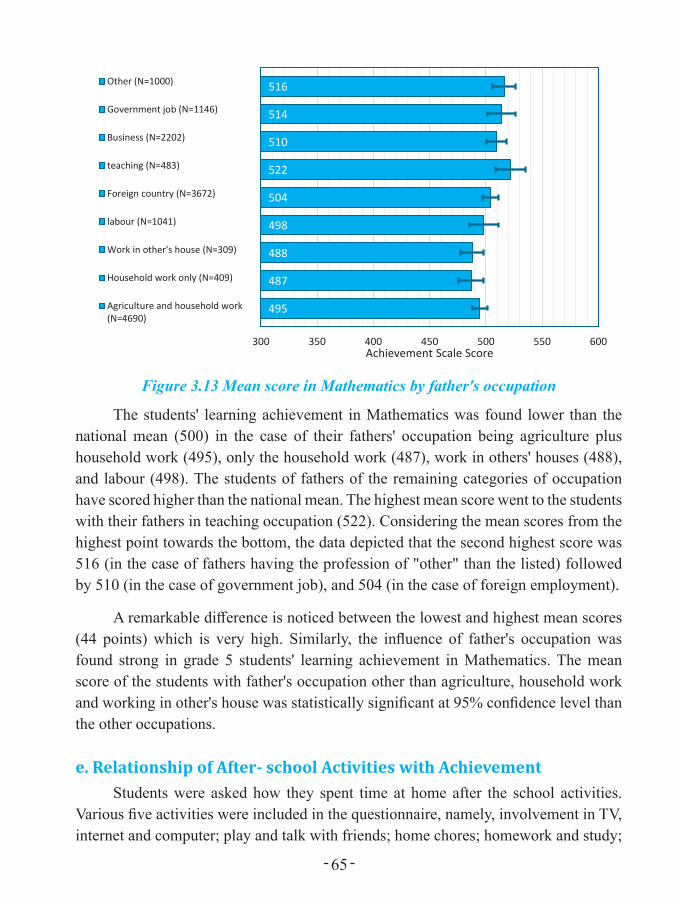
- 65 -
Figure 3. 13 Mean score in Mathematics by father's occupation
495
487
488
498
504
522
510
514
516
300 350 400 450 500 550 600Achievement Scale Score
Other (N=1000)
Government job (N=1146)
Business (N=2202)
teaching (N=483)
Foreign country (N=3672)
labour (N=1041)
Work in other's house (N=309)
Household work only (N=409)
Agriculture and household work(N=4690)
Figure 3.13 Mean score in Mathematics by father's occupation
The students' learning achievement in Mathematics was found lower than the national mean (500) in the case of their fathers' occupation being agriculture plus household work (495), only the household work (487), work in others' houses (488), and labour (498). The students of fathers of the remaining categories of occupation have scored higher than the national mean. The highest mean score went to the students with their fathers in teaching occupation (522). Considering the mean scores from the highest point towards the bottom, the data depicted that the second highest score was 516 (in the case of fathers having the profession of "other" than the listed) followed by 510 (in the case of government job), and 504 (in the case of foreign employment).
A remarkable difference is noticed between the lowest and highest mean scores (44 points) which is very high. Similarly, the influence of father's occupation was found strong in grade 5 students' learning achievement in Mathematics. The mean score of the students with father's occupation other than agriculture, household work and working in other's house was statistically significant at 95% confidence level than the other occupations.
e. Relationship of After- school Activities with AchievementStudents were asked how they spent time at home after the school activities.
Various five activities were included in the questionnaire, namely, involvement in TV, internet and computer; play and talk with friends; home chores; homework and study;

- 66 -
work for wages; read and study other books. The time intervals were given as: a. I don't give time, b. less than one hour, c. upto 3 hours d. more than 3 hours. Based on the students’ response categories in x-axis and the group achievement in y-axis, their engagement is plotted.
Figure 3.14 shows the relationship of time spent in after school activities with their relationship with the learning achievement.
Figure 3. 14 Achievement by after school activities
493
506
488491
505
508505
494
489
489485
490
495
500
505
510
0 1 2 3 4 5
a. Involve in TV, internet, computer b. play and talk
c. Home chores d. Homework and study
e. Work for wage f. Read other books
1 1 I don’t give �me less than one hour up to 3 hours more than 3 hours
Figure 3.14 Achievement by after school activities
The above figure presents the fact that students who spent up to 3 or less hours in any activities do not have much variation in learning achievement. The students who spent more time in wage making work have a decreasing achievement with the time. For example, those who did not spend time in wage making scored 505 while those who spent 3 or more hours in wage making scored 489.
To improve the learning, the data suggest that spending up to 2 hours in the activities such as playing, watching TV, using computer, internet, chatting is beneficial. But the students should focus on study and homework without being involved in other activities after two hours..
f. Results by the After-school Support in StudyStudents require after-school support for increasing their learning. Based on this
assumption, the students were asked about the person who supports them the most in the after-school activities. The percentage of students' response on those who provide them support is presented in figure 3.7.
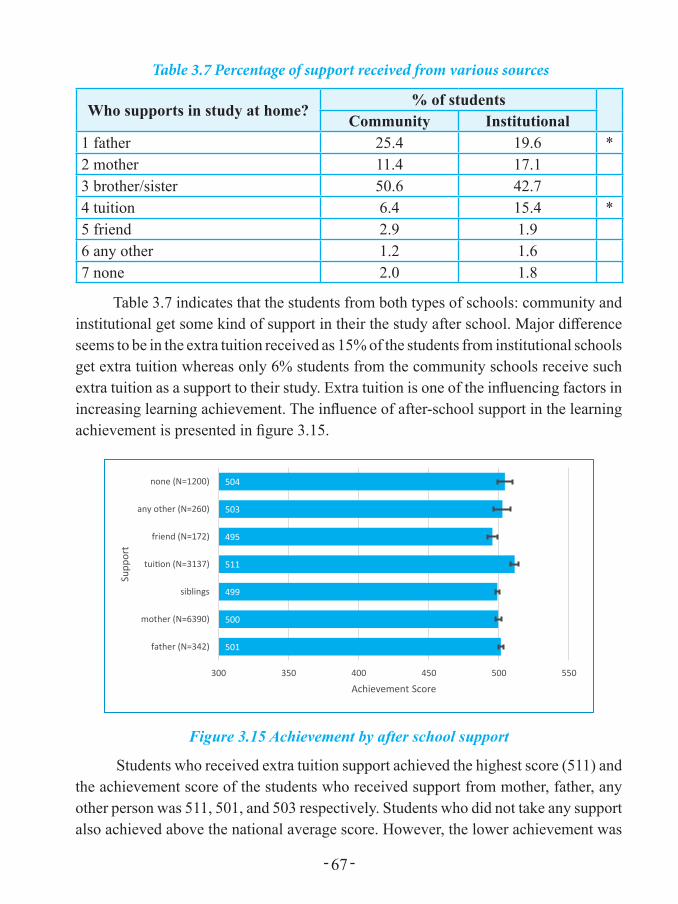
- 67 -
Table 3.7 Percentage of support received from various sources
Who supports in study at home?% of students
Community Institutional1 father 25.4 19.6 *2 mother 11.4 17.13 brother/sister 50.6 42.74 tuition 6.4 15.4 *5 friend 2.9 1.96 any other 1.2 1.67 none 2.0 1.8
Table 3.7 indicates that the students from both types of schools: community and institutional get some kind of support in their the study after school. Major difference seems to be in the extra tuition received as 15% of the students from institutional schools get extra tuition whereas only 6% students from the community schools receive such extra tuition as a support to their study. Extra tuition is one of the influencing factors in increasing learning achievement. The influence of after-school support in the learning achievement is presented in figure 3.15.
Figure 3. 15 Achievement by after school support
501
500
499
511
495
503
504
300 350 400 450 500 550
father (N=342)
mother (N=6390)
siblings
tui�on (N=3137)
friend (N=172)
any other (N=260)
none (N=1200)
Achievement Score
Supp
ort
Figure 3.15 Achievement by after school support
Students who received extra tuition support achieved the highest score (511) and the achievement score of the students who received support from mother, father, any other person was 511, 501, and 503 respectively. Students who did not take any support also achieved above the national average score. However, the lower achievement was
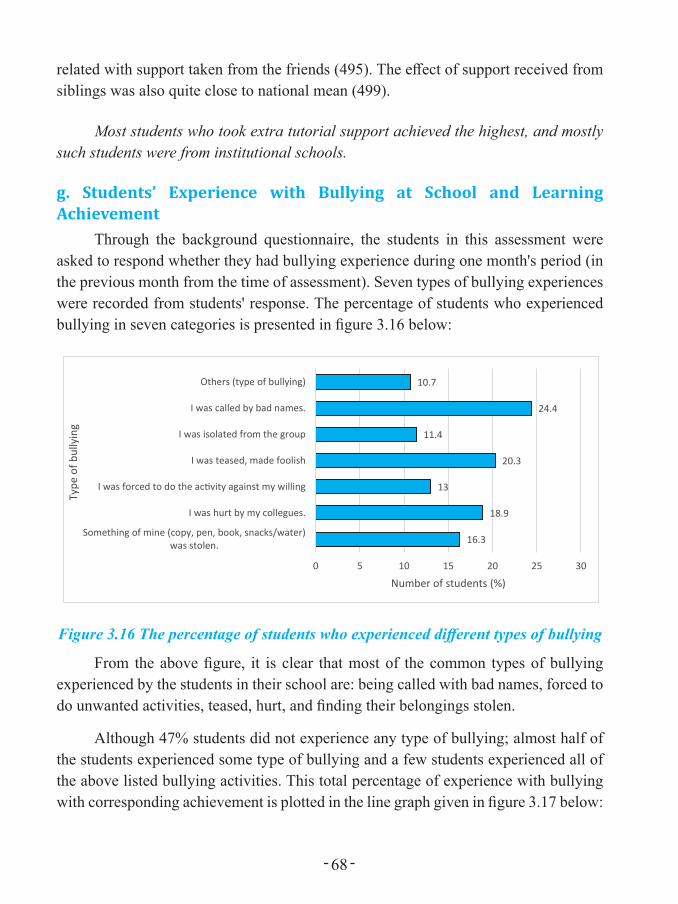
- 68 -
related with support taken from the friends (495). The effect of support received from siblings was also quite close to national mean (499).
Most students who took extra tutorial support achieved the highest, and mostly such students were from institutional schools.
g. Students’ Experience with Bullying at School and Learning Achievement
Through the background questionnaire, the students in this assessment were asked to respond whether they had bullying experience during one month's period (in the previous month from the time of assessment). Seven types of bullying experiences were recorded from students' response. The percentage of students who experienced bullying in seven categories is presented in figure 3.16 below:
Figure 3. 16 The percentage of students who experienced different types of bullying
16.3
18.9
13
20.3
11.4
24.4
10.7
0 5 10 15 20 25 30
Something of mine (copy, pen, book, snacks/water)was stolen.
I was hurt by my collegues.
I was forced to do the ac�vity against my willing
I was teased, made foolish
I was isolated from the group
I was called by bad names.
Others (type of bullying)
Number of students (%)
Type
of b
ully
ing
Figure 3.16 The percentage of students who experienced different types of bullying
From the above figure, it is clear that most of the common types of bullying experienced by the students in their school are: being called with bad names, forced to do unwanted activities, teased, hurt, and finding their belongings stolen.
Although 47% students did not experience any type of bullying; almost half of the students experienced some type of bullying and a few students experienced all of the above listed bullying activities. This total percentage of experience with bullying with corresponding achievement is plotted in the line graph given in figure 3.17 below:

- 69 -
Figure 3. 17 Influence of the experience with bullying on learning achievement
501498
497494
492
482479.477
465
470
475
480
485
490
495
500
505
14% 29% 43% 57% 71% 86% 100%
Achi
evem
ent
Severity of bullying
Figure 3.17 Influence of the experience with bullying on learning achievement
The above figure 3.1.7g presents that as bullying increases, achievement decreases. The frequency of experience with bullying and the learning achievement has negative relationship. There should be a good strategy to minimize bullying in schools to increase the learning achievement of the students.
h. Results by the Availability of TextbookIn this study, students were asked whether they had Mathematics textbook. Their
response showed that the majority of students in this study had textbooks while some of them (652) reported that they did not have Mathematics textbook. The response of students and their corresponding achievement score is presented in figure 3.18 below:
Figure 3. 18 Mean score in Mathematics by the availability of textbook
500
490
300 350 400 450 500 550 600
Achievement Scale Score
no (N=652)
yes (N=13036)
Figure 3.18 Mean score in Mathematics by the availability of textbook

- 70 -
The results, as presented in Figure 3.1.7h, show that the students who did not have textbooks achieved 490 mean score which looks remarkably lower than the national mean score. But the students having access to the textbook were able to achieve 500, which is equal to the national mean score. The difference between the mean scores of these two groups is found statistically significant. Out of 652 students who did not have text book, 441 students were from community schools. Although, only few students did not have textbook, it should be ensured that all students have a textbook with them.
i. Results by Feedback Provided on Students' HomeworkThe students were asked to mention how often their teachers provide them
homework and how often the teachers provide them feedback on their homework. 51.2% students reported that their teachers provide homework occasionally and 42.7% reported that teacher provide homework regularly. Some students (6%) did not respond on this question. The students were asked how often their teachers provide them feedback on their homework. In the response, 66% reported “occasionally” and 34% reported “regularly”. Figure 3.18 presents the comparison of achievement score of the students based on the feedback provided by their teachers on their homework.
Figure 3. 19 Teacher's feedback on students' homework and achievement
501
495
488
300 350 400 450 500 550
Achievement Scale Score
never (N=220)
some �mes (N=2061)
Regularly (N=11128)
Figure 3.19 Teacher's feedback on students' homework and achievement
The data presented in Figure 3.18 shows that the mean score of the students who received feedback regularly on their homework was higher (501) than of those who
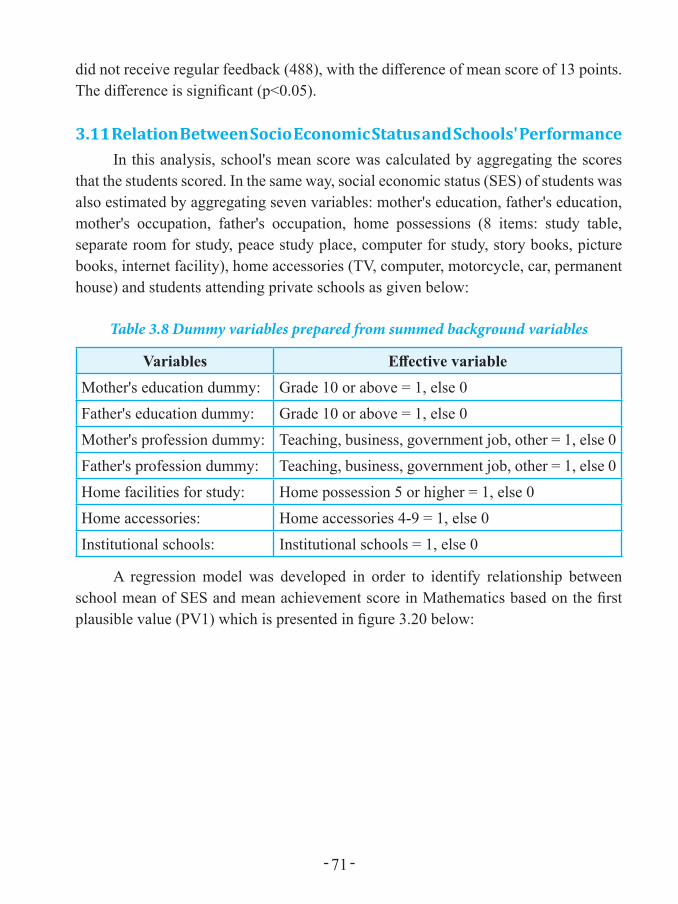
- 71 -
did not receive regular feedback (488), with the difference of mean score of 13 points. The difference is significant (p<0.05).
3.11 Relation Between Socio Economic Status and Schools' PerformanceIn this analysis, school's mean score was calculated by aggregating the scores
that the students scored. In the same way, social economic status (SES) of students was also estimated by aggregating seven variables: mother's education, father's education, mother's occupation, father's occupation, home possessions (8 items: study table, separate room for study, peace study place, computer for study, story books, picture books, internet facility), home accessories (TV, computer, motorcycle, car, permanent house) and students attending private schools as given below:
Table 3.8 Dummy variables prepared from summed background variables
Variables Effective variableMother's education dummy: Grade 10 or above = 1, else 0Father's education dummy: Grade 10 or above = 1, else 0Mother's profession dummy: Teaching, business, government job, other = 1, else 0Father's profession dummy: Teaching, business, government job, other = 1, else 0Home facilities for study: Home possession 5 or higher = 1, else 0Home accessories: Home accessories 4-9 = 1, else 0Institutional schools: Institutional schools = 1, else 0
A regression model was developed in order to identify relationship between school mean of SES and mean achievement score in Mathematics based on the first plausible value (PV1) which is presented in figure 3.20 below:

- 72 -
Figure 3.20 Relation between SES and Schools' Mean Score in Mathematics
The scattered plot in the above Figure 3.1.8 shows that the schools with high SES (average SES value of students) concentrated more on relatively high mean score and the schools with low SES concentrated more on relatively low mean score. However, there are some cases of high SES schools having relatively low mean scores. Similarly, there are some cases of low SES schools with relatively a high mean score.
This plot further indicates that most of the institutional schools have high SES students compared to community schools. It is however to be noted that SES explains only 11% of the variation in student achievement in the schools.

- 73 -
Chapter 4.
RESULTS IN NEPALI AT NATIONAL LEVEL
4.1 IntroductionThe actual number of students who participated in NASA 2018 in Nepali was
14207. The collected data was analyzed by ACER ConQuest 4 software for IRT and other regular analysis was done by using SPSS and Excel tools. Results are presented in the form of proficiency levels, their descriptions and comparative form. Comparisons are made on the basis of groups formed from background information such as provinces, socioeconomic status, ethnicity, gender, home language, school type, identity with geography, school and classroom practices, and home environment.
The students' ability scores were estimated by IRT methods and these ability scores were transformed into a scale score with the national mean score of 500 and 50 standard deviation. Hence, the national mean score was fixed at 500 point for the purpose of analysing the overall test scores.
The test scores were first drawn from the sample students and analysed considering the sample weight. Population parameters were then estimated by using replicate module to generalize in whole population of grade 5 students in the country at 95% confidence level. The standard errors and confidence intervals of mean scores were estimated during the analysis and the confidence intervals were estimated to identify the statistical significant of comparable means.
4.2 Wright-map of Student Ability and Item Difficulty in NepaliThe Wright-map is organized into two vertical histograms: the left side shows
candidates and the right side shows the items. The left side of the map shows the distribution of the measured ability of the candidates from most able at the top to least able at the bottom. The items on the right side of the map are distributed from the most difficult at the top to the least difficult at the bottom. In the following figure, student ability (θ) in the left and NASA 2018 items to the right are plotted in the same scale. When a person and an item lie at the same level, probability of making that item by particular person is 50%. Figure 4.1 presents the NASA 2018 Nepali Wright-map.

- 74 -
Figure 4.1 Wright map showing person and item in the same scale
To the left side, an 'X' represents 76.9 students and their latent ability is given in the logit scale ranging from -2 or less to +2 or more. The distribution of students against the items asked to students (item numbers are shown on the right side) reveals that most of the items were difficult for the students. Although the items were based on grade 5 curriculum, many students are lagging behind below the average latent ability '0'.
4.3 Plausible Values, their Mean and Standard ErrorAfter estimating the student ability (θ) in the form of WLE, five plausible values
(PV1 to PV5) were generated by conditioning the data with student background variables and school mean index. Those plausible values were transformed in to a
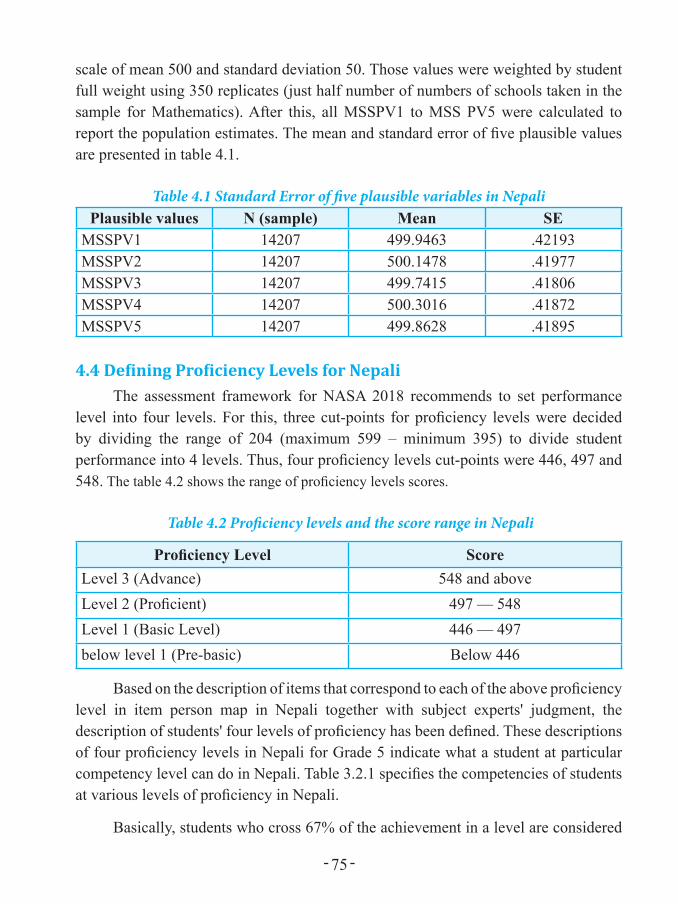
- 75 -
scale of mean 500 and standard deviation 50. Those values were weighted by student full weight using 350 replicates (just half number of numbers of schools taken in the sample for Mathematics). After this, all MSSPV1 to MSS PV5 were calculated to report the population estimates. The mean and standard error of five plausible values are presented in table 4.1.
Table 4.1 Standard Error of five plausible variables in NepaliPlausible values N (sample) Mean SE
MSSPV1 14207 499.9463 .42193MSSPV2 14207 500.1478 .41977MSSPV3 14207 499.7415 .41806MSSPV4 14207 500.3016 .41872MSSPV5 14207 499.8628 .41895
4.4 Defining Proficiency Levels for NepaliThe assessment framework for NASA 2018 recommends to set performance
level into four levels. For this, three cut-points for proficiency levels were decided by dividing the range of 204 (maximum 599 – minimum 395) to divide student performance into 4 levels. Thus, four proficiency levels cut-points were 446, 497 and 548. The table 4.2 shows the range of proficiency levels scores.
Table 4.2 Proficiency levels and the score range in Nepali
Proficiency Level ScoreLevel 3 (Advance) 548 and aboveLevel 2 (Proficient) 497 — 548Level 1 (Basic Level) 446 — 497below level 1 (Pre-basic) Below 446
Based on the description of items that correspond to each of the above proficiency level in item person map in Nepali together with subject experts' judgment, the description of students' four levels of proficiency has been defined. These descriptions of four proficiency levels in Nepali for Grade 5 indicate what a student at particular competency level can do in Nepali. Table 3.2.1 specifies the competencies of students at various levels of proficiency in Nepali.
Basically, students who cross 67% of the achievement in a level are considered
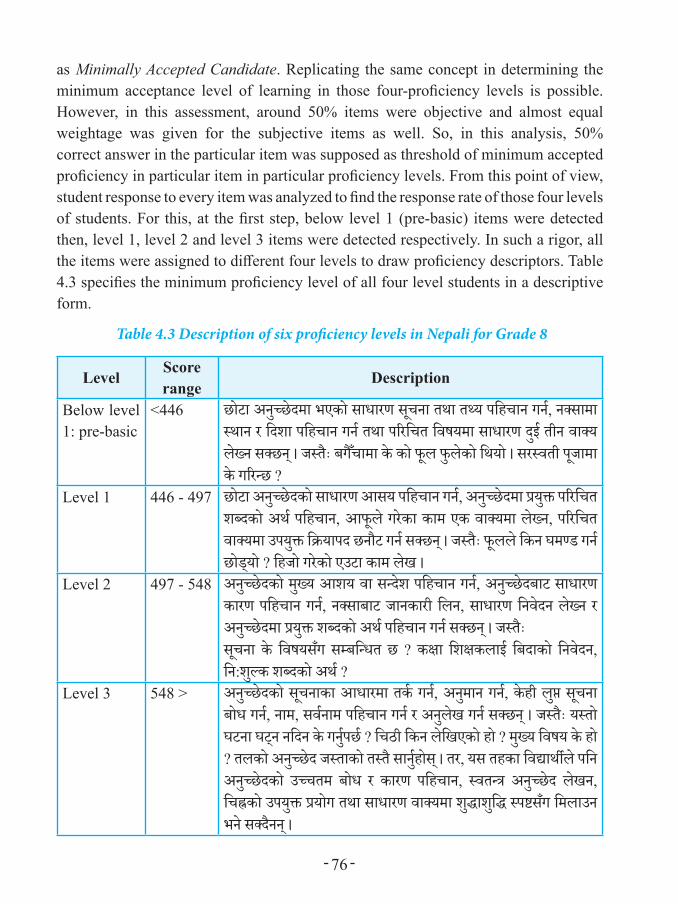
- 76 -
as Minimally Accepted Candidate. Replicating the same concept in determining the minimum acceptance level of learning in those four-proficiency levels is possible. However, in this assessment, around 50% items were objective and almost equal weightage was given for the subjective items as well. So, in this analysis, 50% correct answer in the particular item was supposed as threshold of minimum accepted proficiency in particular item in particular proficiency levels. From this point of view, student response to every item was analyzed to find the response rate of those four levels of students. For this, at the first step, below level 1 (pre-basic) items were detected then, level 1, level 2 and level 3 items were detected respectively. In such a rigor, all the items were assigned to different four levels to draw proficiency descriptors. Table 4.3 specifies the minimum proficiency level of all four level students in a descriptive form.
Table 4.3 Description of six proficiency levels in Nepali for Grade 8
LevelScore range
Description
Below level 1: pre-basic
<446 छोटषा अनतुचछेदमषा भएको सषाधषारण सचूनषा ्थषा ्थय पवहचषान िन्न, नकसषामषा सथषान र वदिषा पवहचषान िन्न ्थषा पररवच् विषयमषा सषाधषारण दतुई ्ीन िषाकय लेखन सकछन ्। जस त्ैः बितचँषामषा के को फूल फतु लेको वथयो । सरसि्ी पजूषामषा के िररनछ ?
Level 1 446 - 497 छोटषा अनतुचछेदको सषाधषारण आसय पवहचषान िन्न, अनतुचछेदमषा प्रयतुक्त पररवच् ि्दको अथ्न पवहचषान, आफूले िरेकषा कषाम एक िषाकयमषा लेखन, पररवच् िषाकयमषा उपयतुक्त वरियषापद छनौट िन्न सकछन ्। जस त्ैः फूलले वकन घमण्ड िन्न छो््डयो ? वहजो िरेको एउटषा कषाम लेख ।
Level 2 497 - 548 अनतुचछेदको मतुखय आिय िषा सनदिे पवहचषान िन्न, अनतुचछेदबषाट सषाधषारण कषारण पवहचषान िन्न, नकसषाबषाट जषानकषारी वलन, सषाधषारण वनिेदन लेखन र अनतुचछेदमषा प्रयतुक्त ि्दको अथ्न पवहचषान िन्न सकछन ्। जस त्ैःसचूनषा के विषयसँि समबवनध् छ ? कक्षा विक्कलषाई वबदषाको वनिेदन, वन:ितुलक ि्दको अथ्न ?
Level 3 548 > अनतुचछेदको सचूनषाकषा आधषारमषा ्क्न िन्न, अनतुमषान िन्न, केही लतुप्त सचूनषा बोध िन्न, नषाम, सि्ननषाम पवहचषान िन्न र अनतुलेख िन्न सकछन ्। जस त्ैः यस्ो घटनषा घट्न नवदन के िनतु्नपछ्न ? वचठी वकन लेवखएको हो ? मतुखय विषय के हो ? ्लको अनतुचछेद जस्षाको ्स त् सषानतु्नहोस ्। ्र, यस ्हकषा विद्षाथथीले पवन अनतुचछेदको उचच्म बोध र कषारण पवहचषान, सि्नत्र अनतुचछेद लेखन, वचह्नको उपयतुक्त प्रयोि ्थषा सषाधषारण िषाकयमषा ितुद्षाितुवद् सपष्सँि वमलषाउन भने सकदतनन ्।
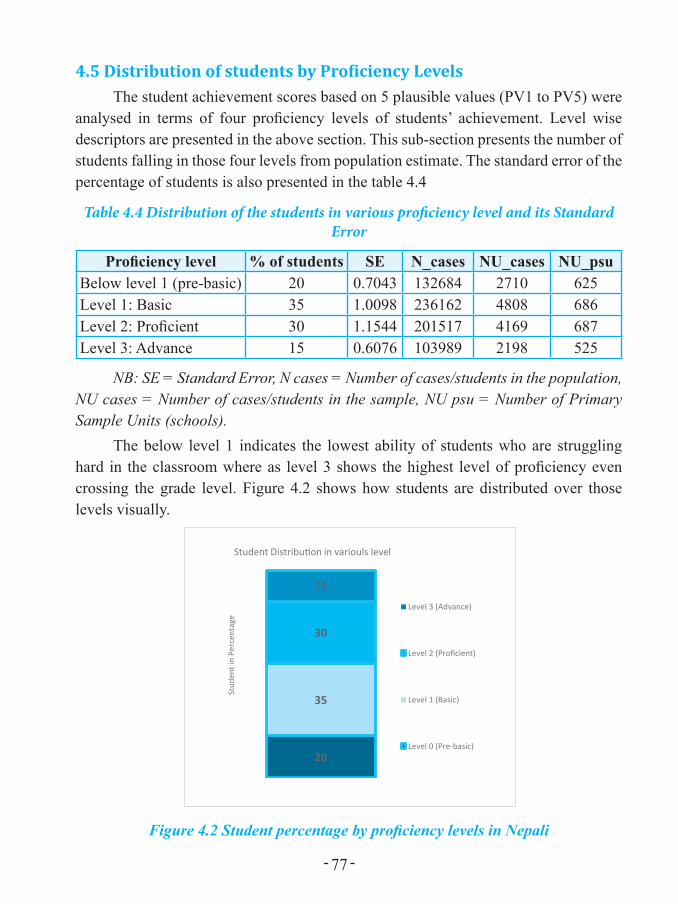
- 77 -
4.5 Distribution of students by Proficiency LevelsThe student achievement scores based on 5 plausible values (PV1 to PV5) were
analysed in terms of four proficiency levels of students’ achievement. Level wise descriptors are presented in the above section. This sub-section presents the number of students falling in those four levels from population estimate. The standard error of the percentage of students is also presented in the table 4.4
Table 4.4 Distribution of the students in various proficiency level and its Standard Error
Proficiency level % of students SE N_cases NU_cases NU_psuBelow level 1 (pre-basic) 20 0.7043 132684 2710 625Level 1: Basic 35 1.0098 236162 4808 686Level 2: Proficient 30 1.1544 201517 4169 687Level 3: Advance 15 0.6076 103989 2198 525
NB: SE = Standard Error, N cases = Number of cases/students in the population, NU cases = Number of cases/students in the sample, NU psu = Number of Primary Sample Units (schools).
The below level 1 indicates the lowest ability of students who are struggling hard in the classroom where as level 3 shows the highest level of proficiency even crossing the grade level. Figure 4.2 shows how students are distributed over those levels visually.
Figure 4. 2 Student percentage by proficiency levels in Nepali
20
35
30
15
Stud
ent i
n Pe
rcen
tage
Student Distribu�on in variouls level
Level 3 (Advance)
Level 2 (Proficient)
Level 1 (Basic)
Level 0 (Pre-basic)
Figure 4.2 Student percentage by proficiency levels in Nepali

- 78 -
Figure 4.2 shows that 20% of the students are in below level 1, 35% in level 1-basic, 30% in proficiency level and 15% in advance level. Below level 1 (20%) students can pick some direct information from very short text but can not understand the meaning of the text well. There are 35%, 30% and 15% students at basic level, proficient level and advance level respectively. Basic level students have minimum level (below average) of understanding required to grasp the knowledge and skills taught in the classroom.
4.6 Minimum Level of Achieved CurriculumThe assessed curriculum is reflected by the assessment or evaluation. It can be
formative or summative evaluation of the students. Assessed curriculum is a tested curriculum by school, national or international organization based on the written curriculum/intended curriculum. It is valuable because it enables the educational organizations and stakeholders to evaluate the impact of written and taught curriculum on students. It determines the level of the learned curriculum. Research (e.g. Berliner, 1984; Turner, 2003) indicates that the mismatch between Assessed and Taught Curricula has serious consequences (cited in MeshGuide). This section therefore presents the level of learning in the form of achieved curriculum in terms of percentage. Every test item is equivalent in the sense that each of them represents a learning objective mentioned in the written curriculum.
Practically, 67% correct responses can be considered as cut-score for being minimally proficient at any level. As in this assessment, around half number of items were objective type (MCQ) and half of them were subjective, 50% correct response are considered as the threshold of minimum level of accepted proficiency at any of the four levels. Hence, test items were organized in terms of at least 50% or more correctly answered in each level students. Based on this norm, all the items were re-allocated into four level. From this rigorous analysis, performance descriptors were developed. In every level of the proficiency, there are ranges of students from being very weak performers to highest performers. Thus considering 50% correct answer as a threshold of minimum proficiency of any four levels, percentage of learning was Mathematically calculated based on the number of items answered correctly. Mathematical value of achieved curriculum is thus given in the table 4.5.

- 79 -
Table 4.5 Mathematical presentation of the achieved curriculum in Nepali.
Performance level Achieved curriculum (%)Below Basic level (20% students) 18 % of the curriculumBasic level (35% students) 38 % of the curriculumProficient level (30% students) 60 % of the curriculumAdvance level (15% students) 88 % of the curriculum
In Nepali, assessment framework covers reading and writing which can be measured from the paper-pencil tests. This test does not cover listening and speaking skills at all. Grammar and vocabulary are embodied in reading and writing test itself. Based on the items asked, in Nepali, 20 out of 100 students achieved only 18% of the tested curriculum and 38 out of 100 students achieved only 38% of the tested curriculum. 45 out of 100 students have adequate knowledge and skills of tested curriculum as 30% students fall in proficient level and 15% students fall in advance level. Altogether 55%, a big mass of the students represent underperforming group. The proficient level students achieved 60% of the tested curriculum and advance level students achieved 88% of the tested curriculum. The gap in achieved curriculum between below basic level (18%) and advance level students (88%) is 70%. This indicates that inequality in the classroom is very high. Overall, 61% students are below 40% of the learning achievement as per the tested curriculum. Hence, about 55% of the students are below the expected level of the competencies defined by the curriculum in reading and writing in Nepali.
4.7 Overall Mean Score by ProvinceIn the Federal context, Nepal is divided into seven provinces. The PPS sampling
method was adopted to select the PSU and provinces were treated as the strata. The average scores reported in this section are the transformed/scale score at 500 national average. National mean is taken as a reference to compare the provincial mean. Those provinces whose average score is above the measure are recognized as better performing provinces whereas those below 500 are assumed to be low performing. In the figure 3.1.4, a vertical dotted line represents the national mean score of achievement and horizontal bars represent the provincial level achievement scores. Figure 4.3 presents the comparison of student achievement in mean scale score.
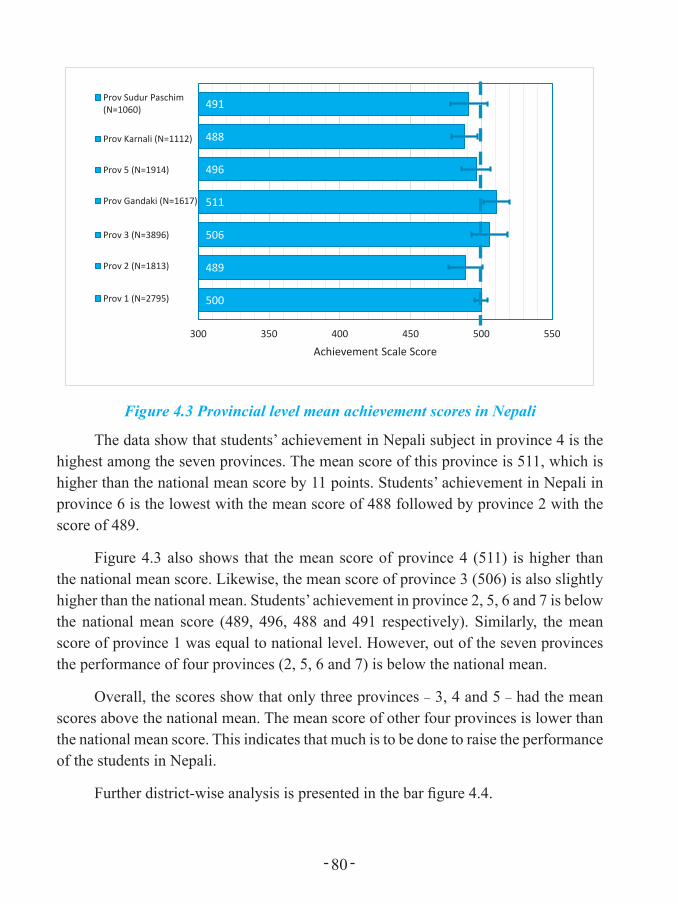
- 80 -
Figure 4. 3 Provincial level mean achievement scores in Nepali
500
489
506
511
496
488
491
300 350 400 450 500 550
Achievement Scale Score
Prov Sudur Paschim(N=1060)
Prov Karnali (N=1112)
Prov 5 (N=1914)
Prov Gandaki (N=1617)
Prov 3 (N=3896)
Prov 2 (N=1813)
Prov 1 (N=2795)
Figure 4.3 Provincial level mean achievement scores in Nepali
The data show that students’ achievement in Nepali subject in province 4 is the highest among the seven provinces. The mean score of this province is 511, which is higher than the national mean score by 11 points. Students’ achievement in Nepali in province 6 is the lowest with the mean score of 488 followed by province 2 with the score of 489.
Figure 4.3 also shows that the mean score of province 4 (511) is higher than the national mean score. Likewise, the mean score of province 3 (506) is also slightly higher than the national mean. Students’ achievement in province 2, 5, 6 and 7 is below the national mean score (489, 496, 488 and 491 respectively). Similarly, the mean score of province 1 was equal to national level. However, out of the seven provinces the performance of four provinces (2, 5, 6 and 7) is below the national mean.
Overall, the scores show that only three provinces – 3, 4 and 5 – had the mean scores above the national mean. The mean score of other four provinces is lower than the national mean score. This indicates that much is to be done to raise the performance of the students in Nepali.
Further district-wise analysis is presented in the bar figure 4.4.
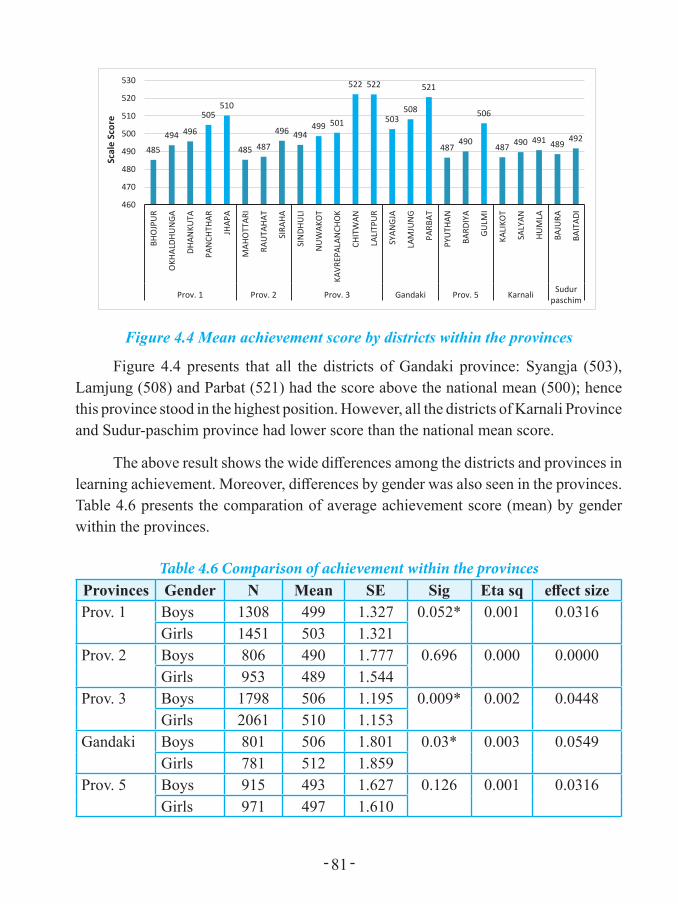
- 81 -
Figure 4. 4 Mean achievement score by districts within the provinces
485
494 496
505 510
485 487
496 494 499 501
522 522
503 508
521
487 490
506
487 490 491 489 492
460
470
480
490
500
510
520
530
BHO
JPU
R
OKH
ALDH
UN
GA
DHAN
KUTA
PAN
CHTH
AR
JHAP
A
MAH
OTT
ARI
RAU
TAHA
T
SIRA
HA
SIN
DHU
LI
NU
WAK
OT
KAVR
EPAL
ANCH
OK
CHIT
WAN
LALI
TPU
R
SYAN
GJA
LAM
JUN
G
PARB
AT
PYU
THAN
BARD
IYA
GULM
I
KALI
KOT
SALY
AN
HUM
LA
BAJU
RA
BAIT
ADI
Prov. 1 Prov. 2 Prov. 3 Gandaki Prov. 5 Karnali Sudurpaschim
Scal
e Sc
ore
Figure 4.4 Mean achievement score by districts within the provinces
Figure 4.4 presents that all the districts of Gandaki province: Syangja (503), Lamjung (508) and Parbat (521) had the score above the national mean (500); hence this province stood in the highest position. However, all the districts of Karnali Province and Sudur-paschim province had lower score than the national mean score.
The above result shows the wide differences among the districts and provinces in learning achievement. Moreover, differences by gender was also seen in the provinces. Table 4.6 presents the comparation of average achievement score (mean) by gender within the provinces.
Table 4.6 Comparison of achievement within the provincesProvinces Gender N Mean SE Sig Eta sq effect sizeProv. 1 Boys 1308 499 1.327 0.052* 0.001 0.0316
Girls 1451 503 1.321Prov. 2 Boys 806 490 1.777 0.696 0.000 0.0000
Girls 953 489 1.544Prov. 3 Boys 1798 506 1.195 0.009* 0.002 0.0448
Girls 2061 510 1.153Gandaki Boys 801 506 1.801 0.03* 0.003 0.0549
Girls 781 512 1.859Prov. 5 Boys 915 493 1.627 0.126 0.001 0.0316
Girls 971 497 1.610

- 82 -
Provinces Gender N Mean SE Sig Eta sq effect sizeKarnali Boys 500 490 2.072 0.384 0.001 0.0316
Girls 600 488 1.884Sudur Paschim
Boys 507 492 2.045 0.235 0.001 0.0316Girls 546 489 1.950
* indicates difference is significant.
From the figure 4.6 reveals that provinces 1, 3 and Gandaki have significant difference in mean (p<0.05) between the achievement of boys and girls. In those provinces, girls outperformed boys in achievement. However, difference in mean is very narrow as shown by the effect size (effect size varies 0.03 to 0.05). Such narrow difference shows that boys and girls had almost equal performance.
4.8 Results by Gender, Ethnicity and Home LanguageFrom the equity concern of learning; gender, ethnicity and home languages are
considered to be the important variables. In this section, achievement scores of various groups have been compared.
a. Achievement by GenderFor the equal level of learning to take place, girls and boys should have equal
opportunity and support in their study. In the background questionnaire, students had reported their gender. In this data, there were 6635 (46.7%) boys, 7363 (51.8%) girls and 209 (1.5%) students did not report their gender. Based on this sample, the weighted mean score is presented in figure 4.5.
Figure 4. 5 Mean score in Nepali by gender
499
501
300 350 400 450 500 550Achievement Scale Score
Girl (N=7363)
Boy (N=6635)
Figure 4.5 Mean score in Nepali by gender
The analysis of data in terms of gender shows that girl students’ mean achievement
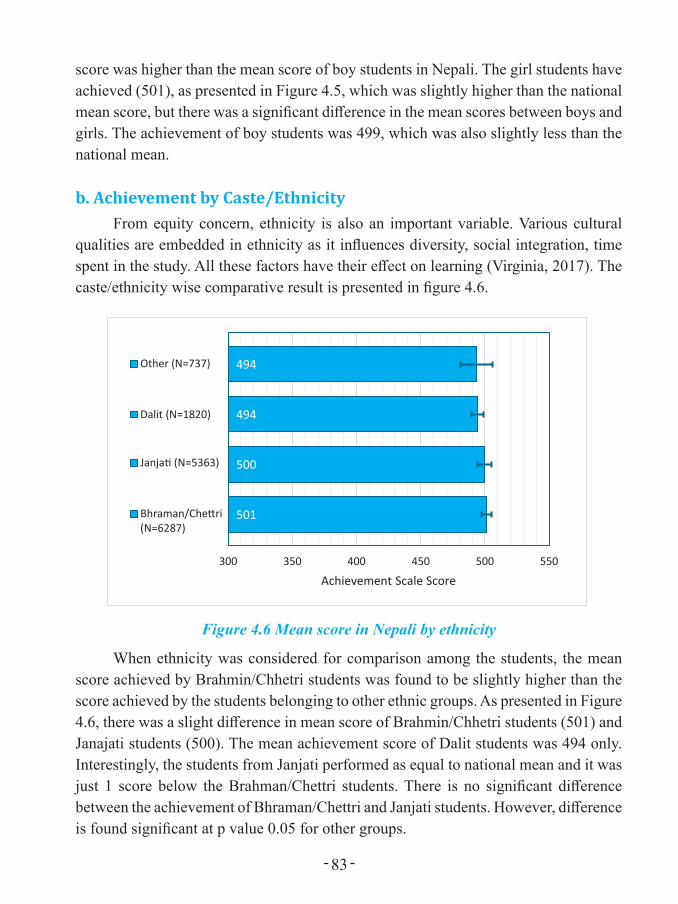
- 83 -
score was higher than the mean score of boy students in Nepali. The girl students have achieved (501), as presented in Figure 4.5, which was slightly higher than the national mean score, but there was a significant difference in the mean scores between boys and girls. The achievement of boy students was 499, which was also slightly less than the national mean.
b. Achievement by Caste/EthnicityFrom equity concern, ethnicity is also an important variable. Various cultural
qualities are embedded in ethnicity as it influences diversity, social integration, time spent in the study. All these factors have their effect on learning (Virginia, 2017). The caste/ethnicity wise comparative result is presented in figure 4.6.
Figure 4. 6 Mean score in Nepali by ethnicity
501
500
494
494
300 350 400 450 500 550
Achievement Scale Score
Other (N=737)
Dalit (N=1820)
Janja� (N=5363)
Bhraman/Che�ri(N=6287)
Figure 4.6 Mean score in Nepali by ethnicity
When ethnicity was considered for comparison among the students, the mean score achieved by Brahmin/Chhetri students was found to be slightly higher than the score achieved by the students belonging to other ethnic groups. As presented in Figure 4.6, there was a slight difference in mean score of Brahmin/Chhetri students (501) and Janajati students (500). The mean achievement score of Dalit students was 494 only. Interestingly, the students from Janjati performed as equal to national mean and it was just 1 score below the Brahman/Chettri students. There is no significant difference between the achievement of Bhraman/Chettri and Janjati students. However, difference is found significant at p value 0.05 for other groups.

- 84 -
c. Achievement by Home LanguageStudents were asked, "Which language do you speak most in your home?” Their
response reveals that of the total, 64.3% of the students spoke Nepali language in their home whereas 29.4% students reported "other" languages. Few (6.3%) students did not report anything. Based on the student response, achievement score is presented in the figure 4.7.
Figure 4. 7 Mean score in Nepali by home language
504
492
300 350 400 450 500 550
Achievement Scale Score
Other (N=4181)
Nepali (N=9137)
Figure 4.7 Mean score in Nepali by home language
The data show that there is a variation in the mean score in terms of students’ linguistic background as well. The students with Nepali as their home language achieved higher than the students whose home language was other than Nepali. As seen in Figure 4.7, the mean score of the students who spoke Nepali as their home language is 504, which was higher than the national mean score. But the mean score of the students speaking other languages at home was 492 only, which is low compared to the national mean score. Significance test for difference of mean shows that the difference in the achievement of the Nepali speaking students was remarkably higher than that of other students.
4.9 Results by Types of SchoolsThere were 10271 sample students who participated in the testing program from
community schools and 3936 students from institutional schools. The achievement score of types by schools is presented in figure 4.8.

- 85 -
Figure 4. 8 Mean score in Nepali by type of schools
491
525
300 350 400 450 500 550 600
Achievement Scale Score
Ins�tu�onal (N=3936)
community (N=10271)
Figure 4.8 Mean score in Nepali by type of schools
The mean scores of the students from these two types of schools were found to be 491 and 525, respectively. The score of community schools remained lower than the national mean, while that of institutional schools was distinctly above the national mean. As the difference between the two means was 34 score, it was statistically significant at p<0.05.
4.10 Results by Various Influencing FactorsIn order to understand the influence of various factors on students’ achievement,
the test scores were analysed in terms of parents’ education and occupation, students’ age, time spent in household chores, support they received in studies, effect of bullying, and the use of free time.
a. Parents’ Education and Students’ Learning AchievementIn order to identify the impact of parents’ education on students’ learning
achievement, they were asked (in the background questionnaire) to report their parents’ education by choosing a response from multiple options (illiterate, just literate, Grade 8, Grade 10, Grade 12, Bachelor's, and Master's degree holders or above).
Out of 14207 students, 3278 reported that their mothers were ‘just literate’ while 4097 of them reported their mothers to be ‘illiterate’. Similarly, 1601 of them mentioned that their mothers had a qualification of Grade 10 while 1100 of them reported their mother’s qualification being Grade 12. Likewise, the mothers of 437 students had Bachelor’s and the mothers of 180 of them had Master’s level educational qualifications.
As presented in Figure 3.8, mother’s education had an impact on students’

- 86 -
learning achievement. The mean score of the students whose mothers were ‘illiterate’ was 491, which was lower than the national mean score. The students’ achievements whose mothers were ‘just literate’ and Grade 10 qualification, had achieved 494 and 514 score respectively. Likewise, the mean scores of the students whose mothers have Grade 12 and Bachelor’s qualifications were 516 and 525 respectively. The students whose mothers have the educational qualification of Master’s degree and above have achieved 527, and interestingly this was not any better than the students of mothers with Bachelors degree. This implies that mothers having Bachelor’s degree qualification have remarkably contributed to students’ learning achievement in the case of Nepali subject in Grade 5.
The difference in mean achievement was statistically significant among the student groups based on the level of mother’s education at 95% confidence level.
Figure 4. 9 Mean score in Nepali by mother's education
491
498
503
514
516
525
527
300 350 400 450 500 550 600
Achievement Scale Score
Master (N=180)
Bachelor (N=437)
Grade 12 (N=1100)
Grade 10 (N=1601)
Grade 8 (N=2545)
Literate (N=3278)
Illiterate (N=4097)
Figure 4.9 Mean score in Nepali by mother's education
The data further show that 2275 students’ fathers were “illiterate”, and 2942 students’ fathers were “just literate”. Likewise, 3081, 2248, and 1632 of the students’ fathers had the qualification of Grade 8, Grade 10, and Grade 12, respectively. Altogether 612 and 428 students had fathers with Bachelor’s and Master’s degree qualifications, respectively.
As presented in Figure 4.10, fathers’ education influenced the mean score of the students in some notable ways. As the data show, the students whose fathers were illiterate had achieved 487 mean score, which is lower than the national mean score.

- 87 -
The mean scores of the students whose fathers were ‘just literate’ and the students whose fathers have the qualification of Grade 8 scored below the national mean. The highest score was achieved by the students whose fathers had a Master’s degree (527) which was higher than the mean score of the students whose fathers had Grade 12 (511) and Bachelor’s degree qualifications (519).
487
496
498
510
511
519
527
300 350 400 450 500 550
Achievement Scale Score
Master (N=428)
Bachelor (N=612)
Grade 12 (N=1632)
Grade 10 (N=2248)
Grade 8 (N=3081)
Literate (N=2942)
Illiterate (N=2275)
Figure 4. 10 Mean score in Nepali by father's education Figure 4.10 Mean score in Nepali by father's education
There are statistically significant differences between the mean scores of students from all of the groups at 95% confidence level. The comparison of the influence of parental education went more in favour of father's education than mother's education.
b. Students’ Learning Achievement by Age GroupsThe students were also asked to report their age for the analysis of the relationship
between their age and their learning achievement. As the data show, the students were grouped into six age groups: 9 and below, 10, 11, 12, 13 and 14 and above. Majority of students (4656) were 11 years old while 4075 were 12 years old. Similarly, 2427 and 548 students were of 10 and 9 years and below respectively. Students' learning achievement by age groups is presented in figure 4.11 below:
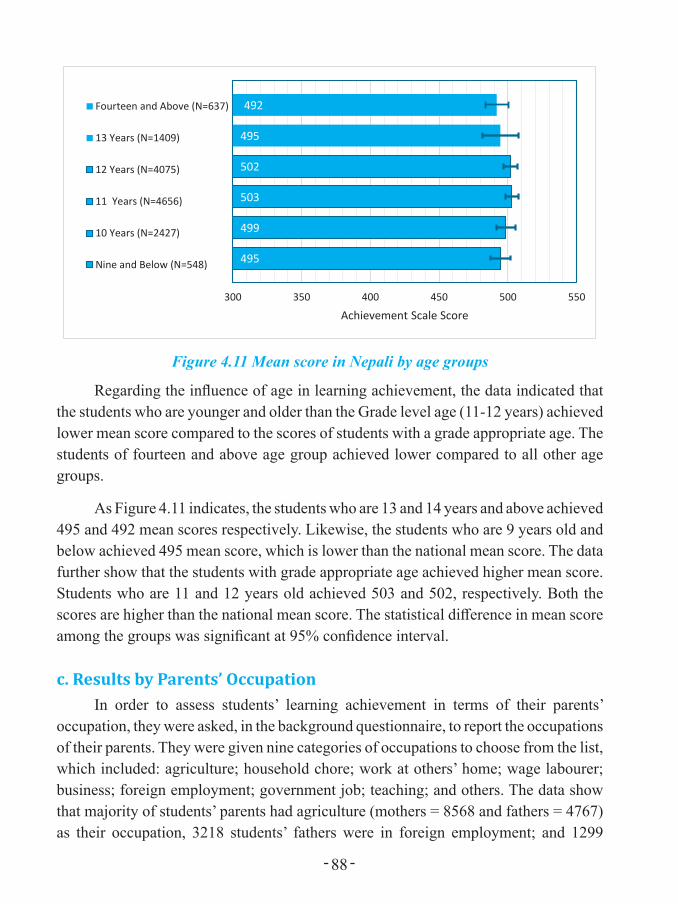
- 88 -
Figure 4. 11 Mean score in Nepali by age groups
495
499
503
502
495
492
300 350 400 450 500 550
Achievement Scale Score
Fourteen and Above (N=637)
13 Years (N=1409)
12 Years (N=4075)
11 Years (N=4656)
10 Years (N=2427)
Nine and Below (N=548)
Figure 4.11 Mean score in Nepali by age groups
Regarding the influence of age in learning achievement, the data indicated that the students who are younger and older than the Grade level age (11-12 years) achieved lower mean score compared to the scores of students with a grade appropriate age. The students of fourteen and above age group achieved lower compared to all other age groups.
As Figure 4.11 indicates, the students who are 13 and 14 years and above achieved 495 and 492 mean scores respectively. Likewise, the students who are 9 years old and below achieved 495 mean score, which is lower than the national mean score. The data further show that the students with grade appropriate age achieved higher mean score. Students who are 11 and 12 years old achieved 503 and 502, respectively. Both the scores are higher than the national mean score. The statistical difference in mean score among the groups was significant at 95% confidence interval.
c. Results by Parents’ OccupationIn order to assess students’ learning achievement in terms of their parents’
occupation, they were asked, in the background questionnaire, to report the occupations of their parents. They were given nine categories of occupations to choose from the list, which included: agriculture; household chore; work at others’ home; wage labourer; business; foreign employment; government job; teaching; and others. The data show that majority of students’ parents had agriculture (mothers = 8568 and fathers = 4767) as their occupation, 3218 students’ fathers were in foreign employment; and 1299

- 89 -
students reported that their fathers owned a business. Likewise, 2353 and 699 students mentioned that their mothers had household responsibility and business as their occupation respectively.
As presented in Figure 4.12, the test scores of the students whose mothers were farmers and worked at others’ homes were lower than the national mean score. The mean scores of the students in these categories were 497 and 485 respectively. The students whose mothers were teachers and government job holders had achieved higher mean score than the students of mothers in other categories. The scores for the students of these categories are 528 and 518 respectively.
Figure 4. 12 Mean score in Nepali by mother's occupation
497
506
485
495
505
528
518
518
491
300 350 400 450 500 550 600
Household and agriculture (N=8568)
Household work only (N=2353)
Work in other's house (N=338)
Labour (N=193)
Work in foreign country (N=288)
Teaching (N=376)
Business (N=699)
Government job (N=238)
Other (N=1154)
Acheivement Scale Score
Figure 4.12 Mean score in Nepali by mother's occupation
Figure 4.12 shows that the students with their mothers as wage labourers achieved 495. Likewise, the students whose mothers were either in business or in government job achieved equal score of 518.
d. Father's OccupationLike mother's occupation, the relation between the student’s father’s occupation
and learning achievement was compared. Figure 4.13 presents the comparative results of the impact of father’s occupation on student's achievement.

- 90 -
Figure 4. 13 Mean score in Nepali by father's occupation
491
494
484
498
505
519
515
520
497
300 350 400 450 500 550
Household and agriculture (N=4767)
Household work only (N=549)
Work in other's house (N=483)
Labour (N=760)
Work in foreign country (N=3218)
Teaching (N=417)
Business (N=1299)
Government job (N=806)
Others (N=1908)
Acheivement Scale Score
Figure 4.13 Mean score in Nepali by father's occupation
Figure 4.13 shows that the test scores of students whose fathers are farmers; work at others’ home; and have household responsibilities, are lower than the national mean score. The mean scores of the students in these categories were found to be 491, 494, and 484 respectively. The students whose fathers are teachers and government job holders, achieved higher mean score (519 and 520) than the students whose fathers belong to other occupational categories (497).
Figure 4.13 further shows that the students whose fathers are in foreign employment achieved the mean score 505. Likewise, the students whose fathers are business persons achieved the mean score 515.
e. Relationship of After-school Activities with AchievementThe students were asked how they spent time at home. Various four activities
were included in the questionnaire, namely, involvement in TV, internet and computer; play and talking with friends; home chores; homework and study. The time intervals were given as: a. I don't give time, b. less than one hour, c. up to 3 hours. more than 3 hours. Based on the students' response categories in x-axis and the group achievement in y-axis, the result is plotted in figure 4.14.
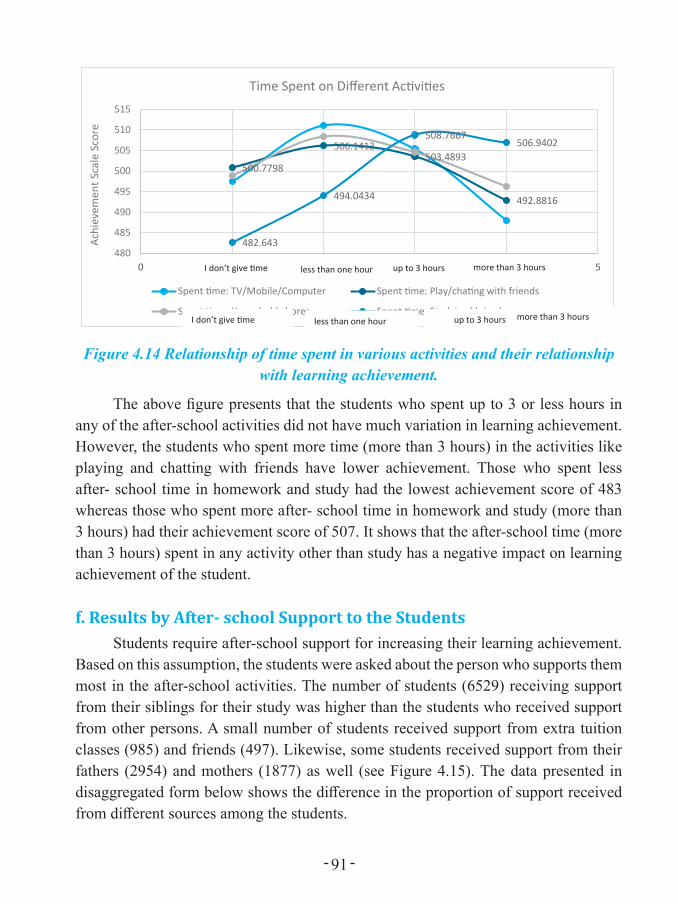
- 91 -
Figure 4. 14 Relationship of time spent in various activities and their relationship with learning achievement.
500.7798
506.1413503.4893
492.8816
482.643
494.0434
508.7667506.9402
480
485
490
495
500
505
510
515
0 1 2 3 4 5
erocS elacS tnemeveihcA
Time Spent on Different Ac�vi�es
Spent �me: TV/Mobile/Computer Spent �me: Play/cha�ng with friends
Spent �me: Household chores Spent �me: Studying/doing homework
I don’t give �me less than one hour up to 3 hours more than 3 hours
I don’t give �me less than one hour up to 3 hours more than 3 hours
Figure 4.14 Relationship of time spent in various activities and their relationship with learning achievement.
The above figure presents that the students who spent up to 3 or less hours in any of the after-school activities did not have much variation in learning achievement. However, the students who spent more time (more than 3 hours) in the activities like playing and chatting with friends have lower achievement. Those who spent less after- school time in homework and study had the lowest achievement score of 483 whereas those who spent more after- school time in homework and study (more than 3 hours) had their achievement score of 507. It shows that the after-school time (more than 3 hours) spent in any activity other than study has a negative impact on learning achievement of the student.
f. Results by After- school Support to the StudentsStudents require after-school support for increasing their learning achievement.
Based on this assumption, the students were asked about the person who supports them most in the after-school activities. The number of students (6529) receiving support from their siblings for their study was higher than the students who received support from other persons. A small number of students received support from extra tuition classes (985) and friends (497). Likewise, some students received support from their fathers (2954) and mothers (1877) as well (see Figure 4.15). The data presented in disaggregated form below shows the difference in the proportion of support received from different sources among the students.
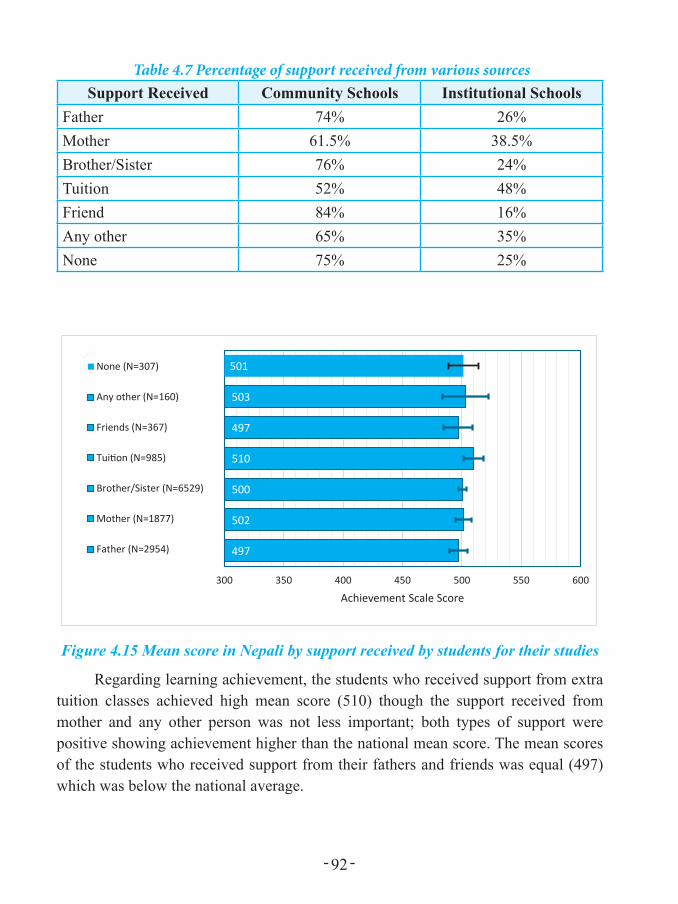
- 92 -
Table 4.7 Percentage of support received from various sourcesSupport Received Community Schools Institutional Schools
Father 74% 26%Mother 61.5% 38.5%Brother/Sister 76% 24%Tuition 52% 48%Friend 84% 16%Any other 65% 35%None 75% 25%
Figure 4. 15 Mean score in Nepali by support received by students for their studies
497
502
500
510
497
503
501
300 350 400 450 500 550 600
Achievement Scale Score
None (N=307)
Any other (N=160)
Friends (N=367)
Tui�on (N=985)
Brother/Sister (N=6529)
Mother (N=1877)
Father (N=2954)
Figure 4.15 Mean score in Nepali by support received by students for their studies
Regarding learning achievement, the students who received support from extra tuition classes achieved high mean score (510) though the support received from mother and any other person was not less important; both types of support were positive showing achievement higher than the national mean score. The mean scores of the students who received support from their fathers and friends was equal (497) which was below the national average.

- 93 -
g. Students’ Experience with Bullying at School and Learning Achievement
Through the background questionnaire, the students in this assessment were asked to respond whether they had bullying experience during one month's period (in the previous month from the time of assessment). Bullying experience has influenced student's achievement score. Seven types of bullying experiences were recorded from students' response. Figure 4.16 presents the percentage of students experiencing different types of bullying and those without such experience. The figure depicts that 52% of students experienced at least one type of bullying in their school. When the mean scores of the students experiencing different types of bullying was compared, it was found that bullied students had a poorer learning achievement than those who were not bullied. It indicates that experience with bullying negatively influences students' achievements.
Figure 4. 16 The percentage of students who experienced different types of bullying
16.7
18.6
13
18.7
11.2
22.1
8.7
0 5 10 15 20 25
Bullying at school: Something of mine (pen, copy, book) wasstolen
Bullying at school: Other friends hits me physically
Bullying at school: Friends ask me to do not favorable task
Bullying at school: Other Friends chea�ng me in differentway
Bullying at school: Other friends exclude me in differentac�vity
Bullying at school: Call me by nickname
Bullying at school: I felt also other misbehavior.
Bullying incidents in percentage
Figure 4.16 The percentage of students who experienced different types of bullying
There exists negative relation between the incidents of bullying experienced by the students and their achievement. The students who did not experience any bullying incidents scored 503 while the students who experienced 5 incidents of bullying scored up to 491. However, the percentage of students experiencing 100% bullying was very low (1.06%).
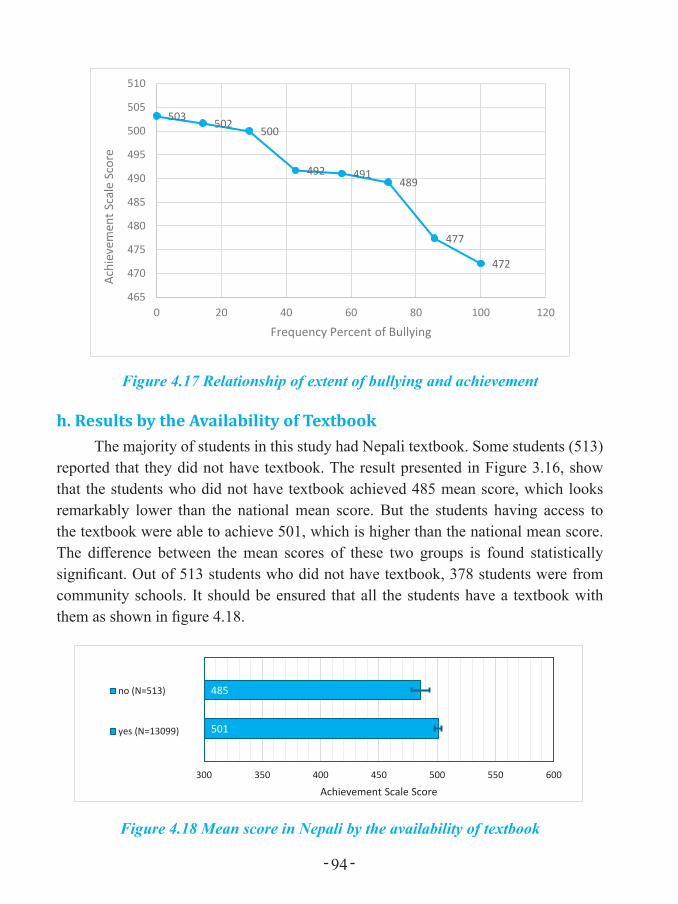
- 94 -
503 502500
492 491489
477
472
465
470
475
480
485
490
495
500
505
510
0 20 40 60 80 100 120
Achi
evem
ent S
cale
Sco
re
Frequency Percent of Bullying
Figure 4.17 Relationship of extent of bullying and achievement
h. Results by the Availability of TextbookThe majority of students in this study had Nepali textbook. Some students (513)
reported that they did not have textbook. The result presented in Figure 3.16, show that the students who did not have textbook achieved 485 mean score, which looks remarkably lower than the national mean score. But the students having access to the textbook were able to achieve 501, which is higher than the national mean score. The difference between the mean scores of these two groups is found statistically significant. Out of 513 students who did not have textbook, 378 students were from community schools. It should be ensured that all the students have a textbook with them as shown in figure 4.18.
Figure 4. 18 Mean score in Nepali by the availability of textbook
501
485
300 350 400 450 500 550 600
Achievement Scale Score
no (N=513)
yes (N=13099)
Figure 4.18 Mean score in Nepali by the availability of textbook
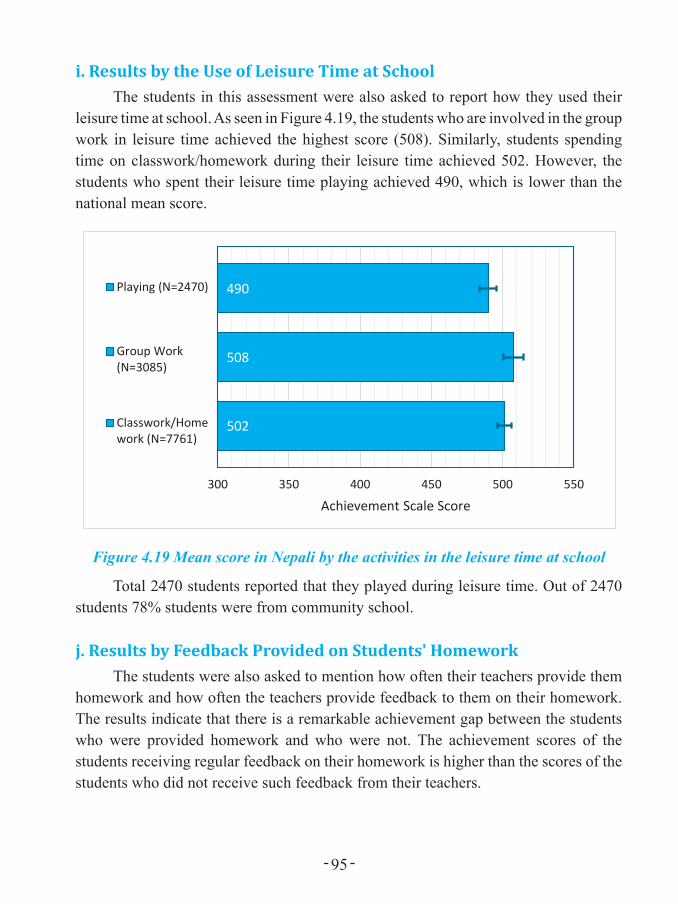
- 95 -
i. Results by the Use of Leisure Time at SchoolThe students in this assessment were also asked to report how they used their
leisure time at school. As seen in Figure 4.19, the students who are involved in the group work in leisure time achieved the highest score (508). Similarly, students spending time on classwork/homework during their leisure time achieved 502. However, the students who spent their leisure time playing achieved 490, which is lower than the national mean score.
Figure 4. 19 Mean score in Nepali by the activities in the leisure time at school
502
508
490
300 350 400 450 500 550
Achievement Scale Score
Playing (N=2470)
Group Work(N=3085)
Classwork/Homework (N=7761)
Figure 4.19 Mean score in Nepali by the activities in the leisure time at school
Total 2470 students reported that they played during leisure time. Out of 2470 students 78% students were from community school.
j. Results by Feedback Provided on Students' HomeworkThe students were also asked to mention how often their teachers provide them
homework and how often the teachers provide feedback to them on their homework. The results indicate that there is a remarkable achievement gap between the students who were provided homework and who were not. The achievement scores of the students receiving regular feedback on their homework is higher than the scores of the students who did not receive such feedback from their teachers.

- 96 -
Figure 4. 20 Mean score in Nepali by teacher's feedback on students' homework
501
500
482
300 350 400 450 500 550
Achievement Scale Score
never (N=185)
some �mes (N=2666)
every day (N=10564)
Figure 4.20 Mean score in Nepali by teacher's feedback on students' homework
The data presented in Figure 4.20 show that the mean score of the students who received feedback regularly is higher (501) than who did not receive regular feedback (482), with the difference of mean score of 19 point.
4.11 Relation between SES and Schools' Mean ScoreSocial economic status of students (SES) was estimated by aggregating the
seven variables: mother's education, father's education, mother's occupation, father's occupation, home possessions, home accessories and students attending private schools. A regression model was developed in order to identify relation between mean of each SES variables and the students’ mean score in Nepali. The R2 value was found 0.34, means the school performance explained by their SES at 34 %. The following two-dimensional scatter (Figure 4.21) plot has been generated by plotting the school mean of SES and school mean of achievement.
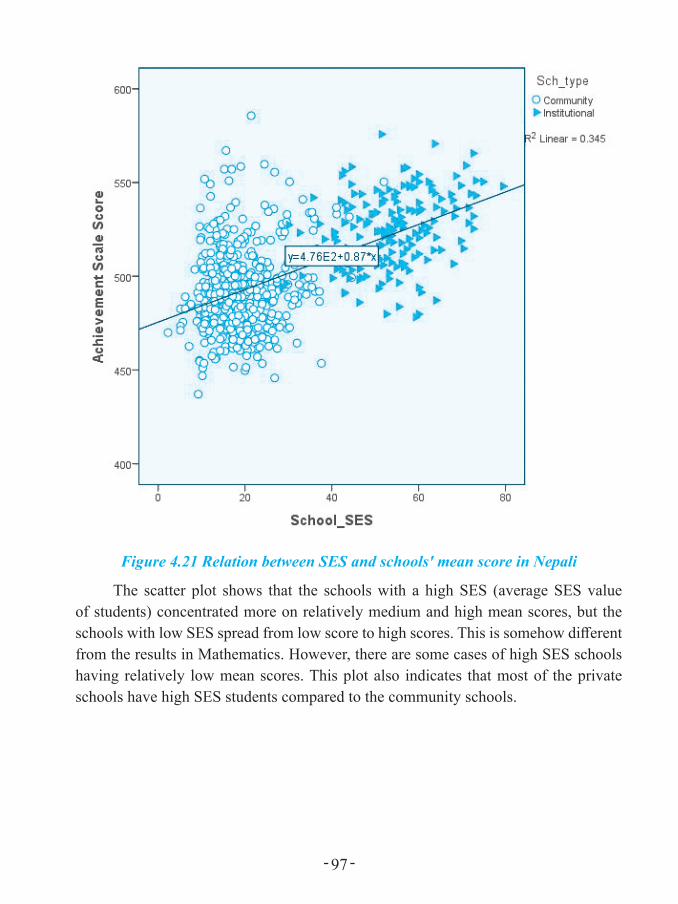
- 97 -
Figure 4.21 Relation between SES and schools' mean score in Nepali
The scatter plot shows that the schools with a high SES (average SES value of students) concentrated more on relatively medium and high mean scores, but the schools with low SES spread from low score to high scores. This is somehow different from the results in Mathematics. However, there are some cases of high SES schools having relatively low mean scores. This plot also indicates that most of the private schools have high SES students compared to the community schools.
- 98 -
Chapter 5
TRENDS OF LEARNING ACHIEVEMENT
5.1 IntroductionThis chapter presents the trends of learning achievement in grade 5 over the
years of NASA cycles. A short review of trends in learning achievement in grade 3, 5 and 8 in previous cycles is made in this subsection. In the next section, a comparison of learning achievement in NASA 2018 with NASA 2015 is presented.
Educational plans SSRP and SSDP have recognised NASA as a means of determining the progress in learning (SSRP, 2009-2016; SSDP, 2016). Since 2011 ERO has been conducting assessment in Nepali, English, Mathematics, Science and Social Studies (depends on year and grade). NASA is a valid tool to examine progress over the years. In all the NASA cycles from 2011, Item Response Theory was used to analyse the data and compare the results. However, in 2017, comparison was based on the Classical Test Theory because of technical limitations. In NASA 2018, comparison was made by using IRT – two methods: mean shift method and student average achievement score (latent ability). For the general audience, a table of classical parameter is also presented.
5.2 Review of Previous NASA Trends (2011-2017)The Ministry of Education, Science and Technology (MoEST) implemented
various programs during SSRP and SSDP to improve access, equity and quality in education. As a result, Nepal has achieved a remarkable progress in access and equity in education. Net enrolment rate of basic level (Grade 1-5) has reached 97.2. Efforts have been made during SSRP and SSDP to ensure the quality. A comparative presentation of NASA results of grade 3, 5, and 8 of different subjects is shown in table 5.1

- 99 -
Table 5.1 Comparative presentation of all NASA from previous cycles
SSRP Period achievement in percent (%) SSDPGrade/year
Subjects
Grade 3 Grade 5 Grade 8 Grade 8NASA 2012
NASA 2015
NASA 2012
NASA 2015
NASA 2011
NASA 2013
NASA2017*
Nepali 63 52 60 46 49 48 500ŸMath 60 45 53 48 43 35 500English ˗ ˗ 45 47Science ˗ ˗ ˗ ˗ ˗ 41 500Social ˗ ˗ ˗ ˗ 49 ˗ ˗
Note: The symbol '' indicates decreased, '' indicate increased, '*' indicates that scores are expressed in transformed scale. The shaded column indicates the base year's achievement.
This table 5.1 summarizes the trends of results from previous cycle of national assessments. Except in Nepali subject in Grade 8 (2017), the achievement in Mathematics, Science and Nepali subject has dropped. Repeated results of NASA indicate that during the SSRP period, learning achievement level has not improved, although the enrolment rate has increased.
5.2.1 Methods of Trend Analysis from NASA 2015 to 2018To find the trend of learning achievement, linking items' percentage of correct
answers are reported in the first step. Then, for the IRT based reporting, linking items of NASA 2015 and 2018 are separately calibrated to generate the item parameters. Separate item parameters are generated by using one parameter Rash Model. From those parameters, latent ability of both years' students are calculated. Afterwards, comparison by using Weighted Latent Estimates (WLE) and item parameter "difficulty" of those linking items are separately used to find the achievement gap. By using WLE and item difficulty, achievement gap was found to be consistent in the result.
More specifically,1. A comparative item wise classical parameter (percentage of correct answer) is
reported between both years.2. Average score of WLE 2015 vs WLE 2018 is reported.3. Shift in mean by using mean shift calculation is done by difficulty parameters.
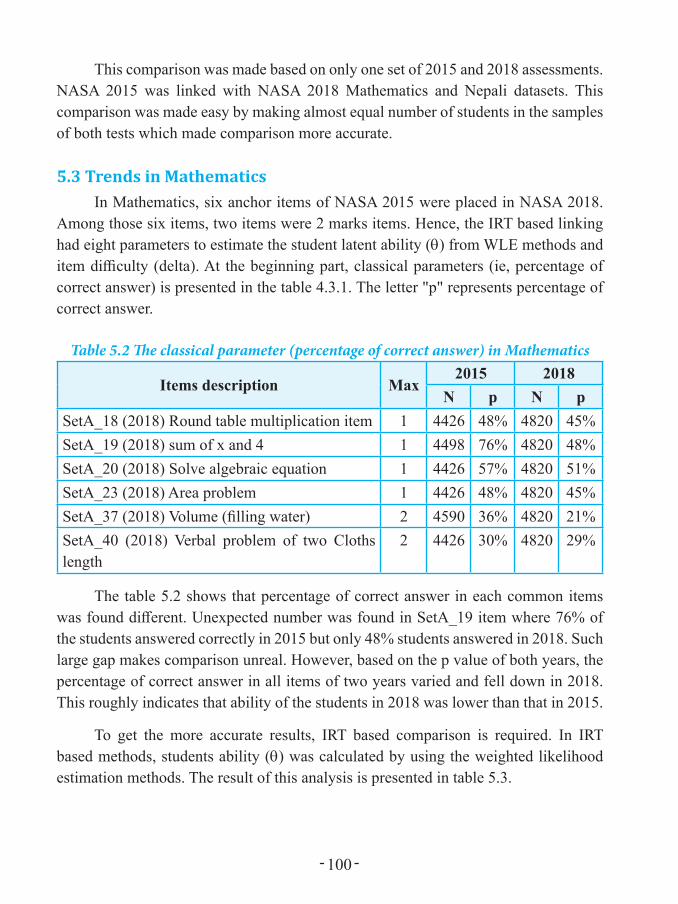
- 100 -
This comparison was made based on only one set of 2015 and 2018 assessments. NASA 2015 was linked with NASA 2018 Mathematics and Nepali datasets. This comparison was made easy by making almost equal number of students in the samples of both tests which made comparison more accurate.
5.3 Trends in MathematicsIn Mathematics, six anchor items of NASA 2015 were placed in NASA 2018.
Among those six items, two items were 2 marks items. Hence, the IRT based linking had eight parameters to estimate the student latent ability (θ) from WLE methods and item difficulty (delta). At the beginning part, classical parameters (ie, percentage of correct answer) is presented in the table 4.3.1. The letter "p" represents percentage of correct answer.
Table 5.2 The classical parameter (percentage of correct answer) in Mathematics
Items description Max2015 2018
N p N pSetA_18 (2018) Round table multiplication item 1 4426 48% 4820 45%SetA_19 (2018) sum of x and 4 1 4498 76% 4820 48%SetA_20 (2018) Solve algebraic equation 1 4426 57% 4820 51%SetA_23 (2018) Area problem 1 4426 48% 4820 45%SetA_37 (2018) Volume (filling water) 2 4590 36% 4820 21%SetA_40 (2018) Verbal problem of two Cloths length
2 4426 30% 4820 29%
The table 5.2 shows that percentage of correct answer in each common items was found different. Unexpected number was found in SetA_19 item where 76% of the students answered correctly in 2015 but only 48% students answered in 2018. Such large gap makes comparison unreal. However, based on the p value of both years, the percentage of correct answer in all items of two years varied and fell down in 2018. This roughly indicates that ability of the students in 2018 was lower than that in 2015.
To get the more accurate results, IRT based comparison is required. In IRT based methods, students ability (θ) was calculated by using the weighted likelihood estimation methods. The result of this analysis is presented in table 5.3.

- 101 -
Table 5.3 Comparison of students' ability (q) between NASA 2015 and 2018 in Mathematics
Test Year N Minimum Maximum Mean Std. ErrorNASA 2015 4590 -1.38 1.6 0.0045 0.01075NASA 2018 4820 -1.66 1.52 -0.4492 0.01186Difference -0.4537
The average latent ability of the students based on the analysed items was 0.0045 and -4429 in the year 2015 and 2018 respectively. The average ability of the students in NASA 2018 was declining than in NASA 2015 by 0.4537. In the table, the negative sign in the ‘difference’ row indicates the declining ability.
The third method of comparing student ability between the years was done by using the difficulty of anchor items. As difficulty declines, it indicates that ability is raised and vice versa. Table 5.4 presents the status of anchor item difficulty to diagnose the mean shift in anchor items.
Table 5.4 Status of anchor item difficulty parameters and shift of the mean in Mathematics
Item descriptionAverage delta (NASA 2015)
Average delta (NASA 2018)
item SetA_19_SetB24 0.19937 -0.56359item SetA_20 -1.24176 -0.62139item SetA_23 -0.21803 0.26618item SetA_37_Set3Q31 0.17756 0.43703 item SetA_40 (1) 0.5338 0.1374Item SetA_40 (2) 0.49798 0.36539item SetB_11 (1) 0.83371 0.33952item SetB_11 (2) 0.57826 1.00755Mean difficulty 1.36089 1.36809Mean difficulty 0.30242 0.30402Mean Shift - 0.0016
In the table 5.4 shows the difficulty (average delta) of linking items with partial credits of NASA 2015 and 2018 in two columns. Comparing the average difficulty of each item, change is fluctuating by items. However, in average, delta (difficulty) in the

- 102 -
NASA 2018 has increased by 0.0016 than in the difficulty in 2015. This small increase in average difficulty of the test items indicates that ability of the students has slightly decreased in 2018 than in 2015 in Mathematics.
All the three methods have presented a consistent decrease in learning achievement from 2015 to 2018. This difference in student ability (-0.4537) is significant (p<0.05), but the difference is moderate (effect size = 0.29). It reveals that there is a notable decrease in student ability from 2015 to 2018 based on the sample data.
5.4 Trends in Nepali LanguageIn Nepali reading and writing, eight anchor items of NASA 2015 were placed in
NASA 2018. Among those eight items, two items were partial credit marks items with maximum score 4 and 3. Hence, the IRT based linking has 14 parameters to estimate the student latent ability (θ) from WLE methods and item difficulty (delta). In the first, classical parameters (ie, percentage of correct answer) are presented in the table 5.5. The letter "p" represents percentage of correct answer.
Table 5.5 The classical parameter (percentage of correct answer) of anchor items in Nepali
Items description
MaxNASA 2015 NASA 2018
N p N pG5LQ2a 1 4526 77% 4847 77%G5LQ2b 1 4526 76% 4847 73%G5LQ2c 1 4526 66% 4847 58%G5LQ2d 1 4526 71% 4585 65%G5LQ6a 1 4517 38% 4673 69%G5LQ6b 1 4517 54% 4673 51%G5LQ12 4 4517 33% 3471 30%G5LQ14 3 4312 37% 3009 45%
The table 5.5 presents the percentage of correct answer in all items which shows that the percentage of correct answer varies from item to item. So, this does not present the clear picture of trends of rise and fall in the results.
In first IRT based method, student's ability (θ) was estimated by using the weighted likelihood estimation, which is presented in 5.6.
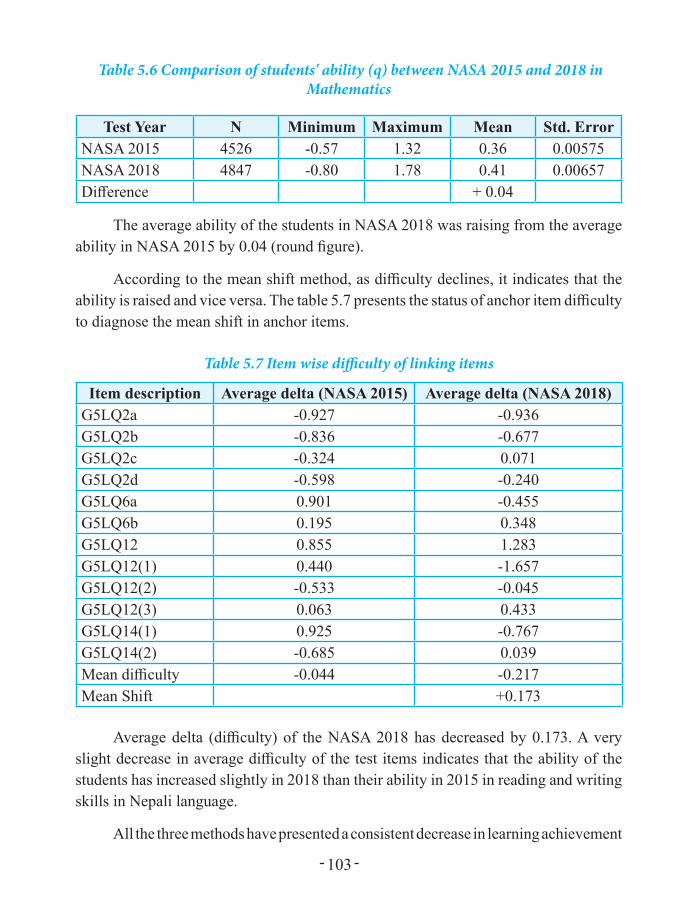
- 103 -
Table 5.6 Comparison of students' ability (q) between NASA 2015 and 2018 in Mathematics
Test Year N Minimum Maximum Mean Std. ErrorNASA 2015 4526 -0.57 1.32 0.36 0.00575NASA 2018 4847 -0.80 1.78 0.41 0.00657Difference + 0.04
The average ability of the students in NASA 2018 was raising from the average ability in NASA 2015 by 0.04 (round figure).
According to the mean shift method, as difficulty declines, it indicates that the ability is raised and vice versa. The table 5.7 presents the status of anchor item difficulty to diagnose the mean shift in anchor items.
Table 5.7 Item wise difficulty of linking items
Item description Average delta (NASA 2015) Average delta (NASA 2018)G5LQ2a -0.927 -0.936G5LQ2b -0.836 -0.677G5LQ2c -0.324 0.071G5LQ2d -0.598 -0.240G5LQ6a 0.901 -0.455G5LQ6b 0.195 0.348G5LQ12 0.855 1.283G5LQ12(1) 0.440 -1.657G5LQ12(2) -0.533 -0.045G5LQ12(3) 0.063 0.433G5LQ14(1) 0.925 -0.767G5LQ14(2) -0.685 0.039Mean difficulty -0.044 -0.217Mean Shift +0.173
Average delta (difficulty) of the NASA 2018 has decreased by 0.173. A very slight decrease in average difficulty of the test items indicates that the ability of the students has increased slightly in 2018 than their ability in 2015 in reading and writing skills in Nepali language.
All the three methods have presented a consistent decrease in learning achievement
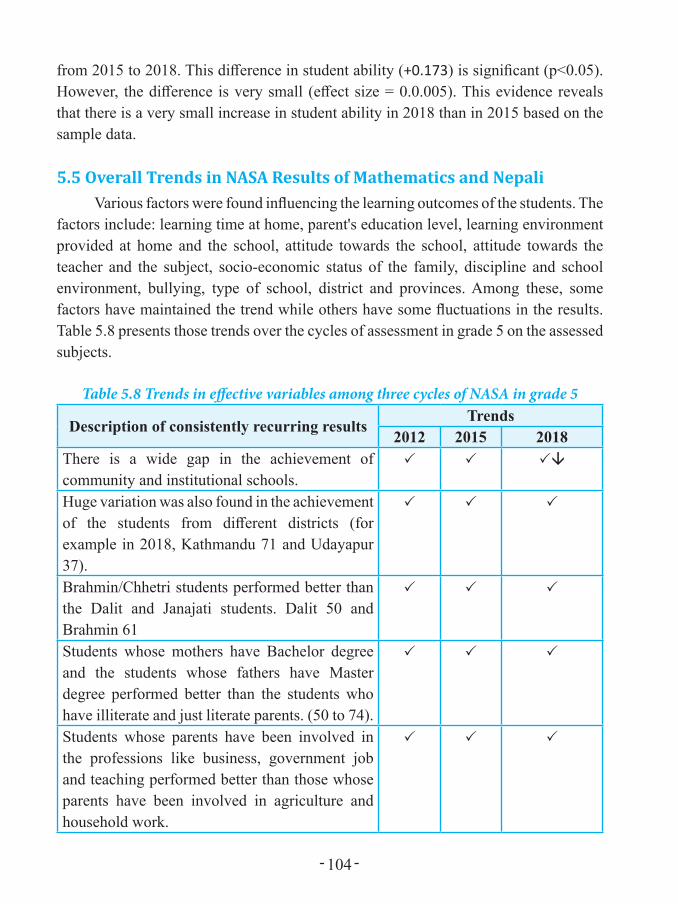
- 104 -
from 2015 to 2018. This difference in student ability (+0.173) is significant (p<0.05). However, the difference is very small (effect size = 0.0.005). This evidence reveals that there is a very small increase in student ability in 2018 than in 2015 based on the sample data.
5.5 Overall Trends in NASA Results of Mathematics and NepaliVarious factors were found influencing the learning outcomes of the students. The
factors include: learning time at home, parent's education level, learning environment provided at home and the school, attitude towards the school, attitude towards the teacher and the subject, socio-economic status of the family, discipline and school environment, bullying, type of school, district and provinces. Among these, some factors have maintained the trend while others have some fluctuations in the results. Table 5.8 presents those trends over the cycles of assessment in grade 5 on the assessed subjects.
Table 5.8 Trends in effective variables among three cycles of NASA in grade 5
Description of consistently recurring resultsTrends
2012 2015 2018There is a wide gap in the achievement of community and institutional schools.
Huge variation was also found in the achievement of the students from different districts (for example in 2018, Kathmandu 71 and Udayapur 37).
Brahmin/Chhetri students performed better than the Dalit and Janajati students. Dalit 50 and Brahmin 61
Students whose mothers have Bachelor degree and the students whose fathers have Master degree performed better than the students who have illiterate and just literate parents. (50 to 74).
Students whose parents have been involved in the professions like business, government job and teaching performed better than those whose parents have been involved in agriculture and household work.
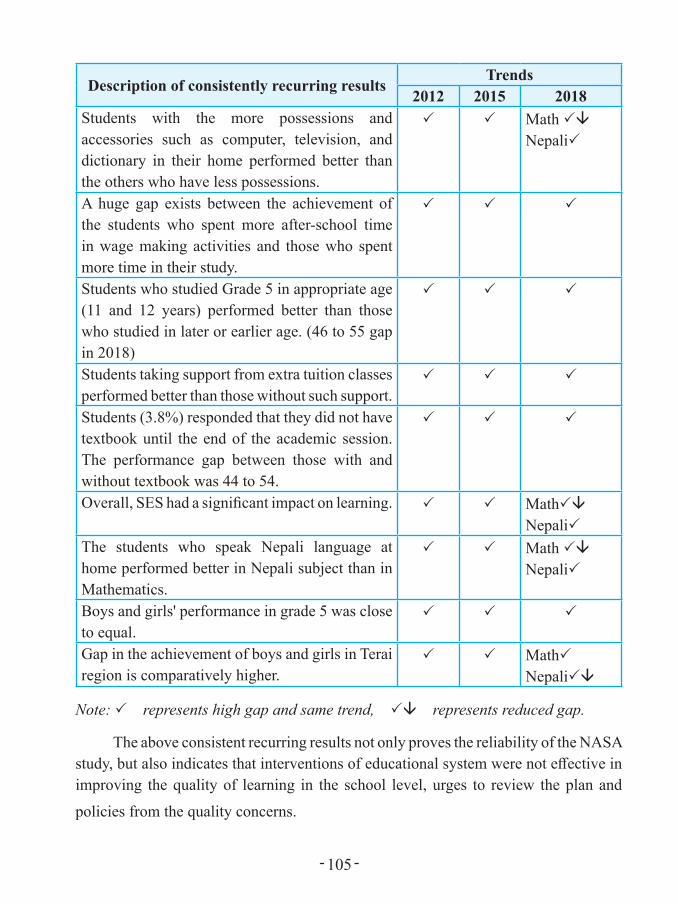
- 105 -
Description of consistently recurring resultsTrends
2012 2015 2018Students with the more possessions and accessories such as computer, television, and dictionary in their home performed better than the others who have less possessions.
Math Nepali
A huge gap exists between the achievement of the students who spent more after-school time in wage making activities and those who spent more time in their study.
Students who studied Grade 5 in appropriate age (11 and 12 years) performed better than those who studied in later or earlier age. (46 to 55 gap in 2018)
Students taking support from extra tuition classes performed better than those without such support.
Students (3.8%) responded that they did not have textbook until the end of the academic session. The performance gap between those with and without textbook was 44 to 54.
Overall, SES had a significant impact on learning. MathNepali
The students who speak Nepali language at home performed better in Nepali subject than in Mathematics.
Math Nepali
Boys and girls' performance in grade 5 was close to equal.
Gap in the achievement of boys and girls in Terai region is comparatively higher.
MathNepali
Note: represents high gap and same trend, represents reduced gap.
The above consistent recurring results not only proves the reliability of the NASA study, but also indicates that interventions of educational system were not effective in improving the quality of learning in the school level, urges to review the plan and
policies from the quality concerns.
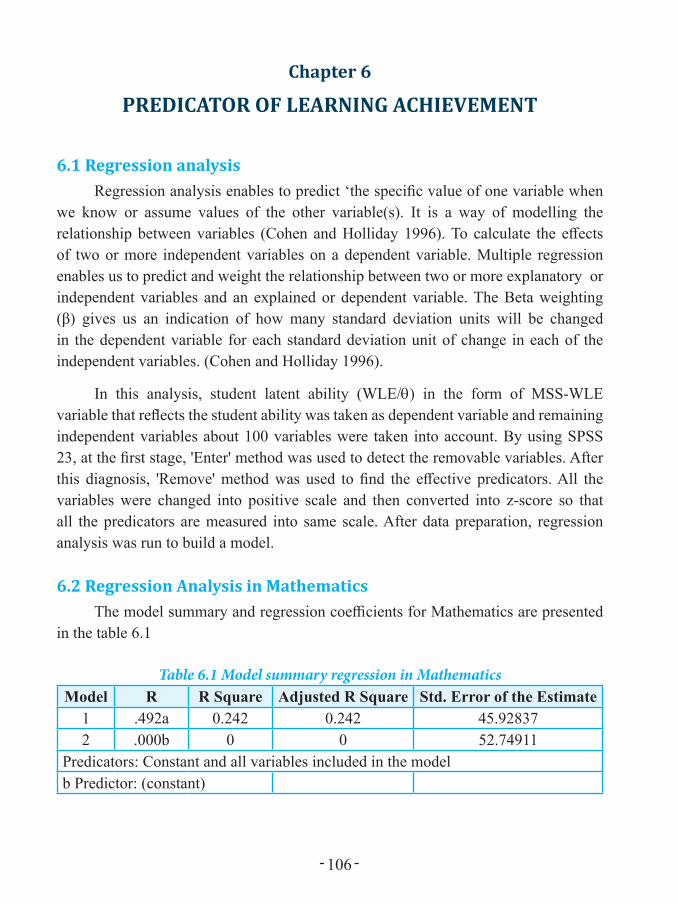
- 106 -
Chapter 6
PREDICATOR OF LEARNING ACHIEVEMENT
6.1 Regression analysisRegression analysis enables to predict ‘the specific value of one variable when
we know or assume values of the other variable(s). It is a way of modelling the relationship between variables (Cohen and Holliday 1996). To calculate the effects of two or more independent variables on a dependent variable. Multiple regression enables us to predict and weight the relationship between two or more explanatory or independent variables and an explained or dependent variable. The Beta weighting (β) gives us an indication of how many standard deviation units will be changed in the dependent variable for each standard deviation unit of change in each of the independent variables. (Cohen and Holliday 1996).
In this analysis, student latent ability (WLE/θ) in the form of MSS-WLE variable that reflects the student ability was taken as dependent variable and remaining independent variables about 100 variables were taken into account. By using SPSS 23, at the first stage, 'Enter' method was used to detect the removable variables. After this diagnosis, 'Remove' method was used to find the effective predicators. All the variables were changed into positive scale and then converted into z-score so that all the predicators are measured into same scale. After data preparation, regression analysis was run to build a model.
6.2 Regression Analysis in MathematicsThe model summary and regression coefficients for Mathematics are presented
in the table 6.1
Table 6.1 Model summary regression in MathematicsModel R R Square Adjusted R Square Std. Error of the Estimate
1 .492a 0.242 0.242 45.928372 .000b 0 0 52.74911
Predicators: Constant and all variables included in the modelb Predictor: (constant)

- 107 -
Table 6.2 Regression coefficients – unstandardized and standardized in Mathematics
SN Predicators (converted into z-score)Unstan. Coeff.
Stan. Coeff. t Sig.
B SE Beta1 (Constant) 479 0.142 3378.4 0.0002 Gender (1 = boys, 2 = girls) -3.42 0.133 -0.065 -25.79 0.0003 Student age (9years to 16 or above) 0.59 0.140 0.011 4.23 0.0004 Home language (1 = Nepali, 2 = other) 1.42 0.148 0.025 9.58 0.0005 Geographical identity (1 = Madhesi, 2 =
hilly, 3 = Himali)-3.25 0.146 -0.058 -22.27 0.000
6 Time spent in home: watch TV, internet, mobile, computer
1.54 0.148 0.027 10.42 0.000
7 Time spent in home: play and talk with friends
1.66 0.142 0.030 11.72 0.000
8 Time spent in home: Household chores -0.60 0.145 -0.011 -4.13 0.0009 Time spent in home: Study and do
homework6.50 0.156 0.110 41.82 0.000
10 Time spent in home: Work for wages -3.75 0.160 -0.063 -23.49 0.00011 Time spent in home: Read other books 1.58 0.144 0.028 11.00 0.00012 After school support for study in home 0.47 0.136 0.009 3.48 0.00113 Do you have the text book of Mathematics? 2.35 0.149 0.040 15.79 0.00014 Home to school distance -2.40 0.134 -0.045 -17.91 0.00015 Does your teacher give homework? 0.71 0.152 0.013 4.64 0.00016 Does teacher give feedback? 0.85 0.148 0.015 5.77 0.00017 Your aim (1 = teacher, 2 = govt service, 3
= private job, 4 business, 5 foreign job, 6 farmer 7 other)
3.26 0.134 0.066 24.26 0.000
18 Perceived utility of Math: learning Math is useful for my household calculations.
0.89 0.156 0.015 5.71 0.000
19 Perceived utility of Math: Learning Math helps in larning other subjects
0.46 0.148 0.008 3.10 0.002
20 Perceived utility of Math: I like to practice Math
2.09 0.161 0.036 12.94 0.000
21 Perceived utility of Math:I have to do better in Math for job and work
0.07 0.155 0.001 0.47 0.641
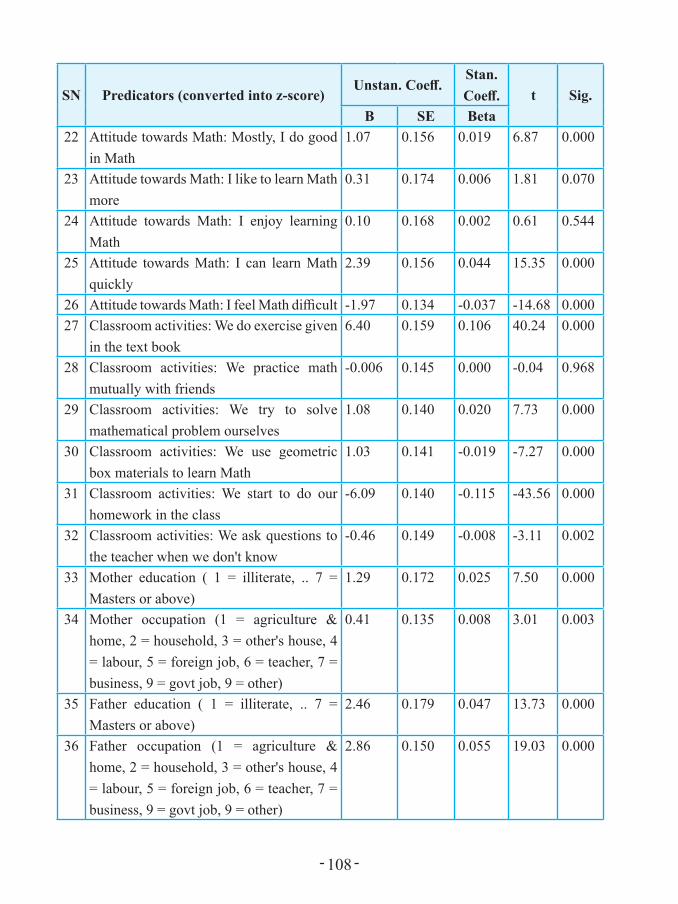
- 108 -
SN Predicators (converted into z-score)Unstan. Coeff.
Stan. Coeff. t Sig.
B SE Beta22 Attitude towards Math: Mostly, I do good
in Math1.07 0.156 0.019 6.87 0.000
23 Attitude towards Math: I like to learn Math more
0.31 0.174 0.006 1.81 0.070
24 Attitude towards Math: I enjoy learning Math
0.10 0.168 0.002 0.61 0.544
25 Attitude towards Math: I can learn Math quickly
2.39 0.156 0.044 15.35 0.000
26 Attitude towards Math: I feel Math difficult -1.97 0.134 -0.037 -14.68 0.00027 Classroom activities: We do exercise given
in the text book6.40 0.159 0.106 40.24 0.000
28 Classroom activities: We practice math mutually with friends
-0.006 0.145 0.000 -0.04 0.968
29 Classroom activities: We try to solve mathematical problem ourselves
1.08 0.140 0.020 7.73 0.000
30 Classroom activities: We use geometric box materials to learn Math
1.03 0.141 -0.019 -7.27 0.000
31 Classroom activities: We start to do our homework in the class
-6.09 0.140 -0.115 -43.56 0.000
32 Classroom activities: We ask questions to the teacher when we don't know
-0.46 0.149 -0.008 -3.11 0.002
33 Mother education ( 1 = illiterate, .. 7 = Masters or above)
1.29 0.172 0.025 7.50 0.000
34 Mother occupation (1 = agriculture & home, 2 = household, 3 = other's house, 4 = labour, 5 = foreign job, 6 = teacher, 7 = business, 9 = govt job, 9 = other)
0.41 0.135 0.008 3.01 0.003
35 Father education ( 1 = illiterate, .. 7 = Masters or above)
2.46 0.179 0.047 13.73 0.000
36 Father occupation (1 = agriculture & home, 2 = household, 3 = other's house, 4 = labour, 5 = foreign job, 6 = teacher, 7 = business, 9 = govt job, 9 = other)
2.86 0.150 0.055 19.03 0.000
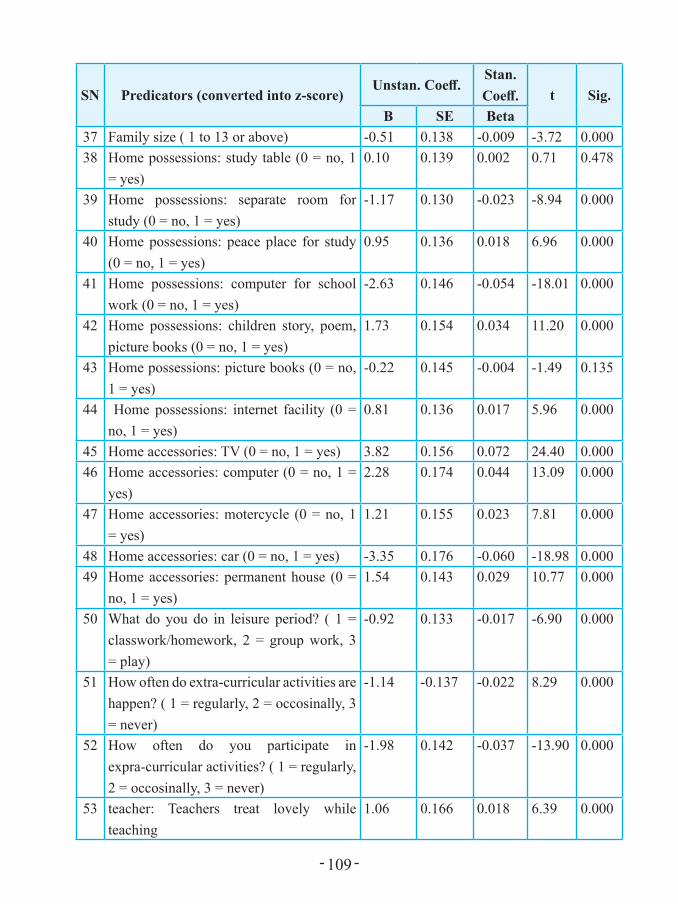
- 109 -
SN Predicators (converted into z-score)Unstan. Coeff.
Stan. Coeff. t Sig.
B SE Beta37 Family size ( 1 to 13 or above) -0.51 0.138 -0.009 -3.72 0.00038 Home possessions: study table (0 = no, 1
= yes)0.10 0.139 0.002 0.71 0.478
39 Home possessions: separate room for study (0 = no, 1 = yes)
-1.17 0.130 -0.023 -8.94 0.000
40 Home possessions: peace place for study (0 = no, 1 = yes)
0.95 0.136 0.018 6.96 0.000
41 Home possessions: computer for school work (0 = no, 1 = yes)
-2.63 0.146 -0.054 -18.01 0.000
42 Home possessions: children story, poem, picture books (0 = no, 1 = yes)
1.73 0.154 0.034 11.20 0.000
43 Home possessions: picture books (0 = no, 1 = yes)
-0.22 0.145 -0.004 -1.49 0.135
44 Home possessions: internet facility (0 = no, 1 = yes)
0.81 0.136 0.017 5.96 0.000
45 Home accessories: TV (0 = no, 1 = yes) 3.82 0.156 0.072 24.40 0.00046 Home accessories: computer (0 = no, 1 =
yes)2.28 0.174 0.044 13.09 0.000
47 Home accessories: motercycle (0 = no, 1 = yes)
1.21 0.155 0.023 7.81 0.000
48 Home accessories: car (0 = no, 1 = yes) -3.35 0.176 -0.060 -18.98 0.00049 Home accessories: permanent house (0 =
no, 1 = yes)1.54 0.143 0.029 10.77 0.000
50 What do you do in leisure period? ( 1 = classwork/homework, 2 = group work, 3 = play)
-0.92 0.133 -0.017 -6.90 0.000
51 How often do extra-curricular activities are happen? ( 1 = regularly, 2 = occosinally, 3 = never)
-1.14 -0.137 -0.022 8.29 0.000
52 How often do you participate in expra-curricular activities? ( 1 = regularly, 2 = occosinally, 3 = never)
-1.98 0.142 -0.037 -13.90 0.000
53 teacher: Teachers treat lovely while teaching
1.06 0.166 0.018 6.39 0.000

- 110 -
SN Predicators (converted into z-score)Unstan. Coeff.
Stan. Coeff. t Sig.
B SE Beta54 teacher: Teachers do not scold us 1.59 0.153 0.029 10.43 0.00055 teacher: Teachers don't use corporal
punishment0.50 0.143 0.009 3.47 0.001
56 Teachers care us equally 1.11 0.180 -0.019 -6.19 0.00057 Teachers answer while asking confused
questions-1.13 0.178 -0.019 -6.34 0.000
58 Teachers give homework -1.03 0.183 -0.018 -5.62 0.00059 Teachers provide feedback by checkign
homework0.34 0.179 0.006 1.88 0.060
60 Teachers teach full time in the class. 0.63 0.160 0.012 3.94 0.00061 I like to come and stay in school 1.17 0.186 0.018 6.27 0.00062 Students in my school try to do their best -0.76 0.160 -0.014 -4.76 0.00063 There is facility to play, drinking water
and toilet-0.07 0.175 -0.001 -0.42 0.675
64 I participate in child club and children programs
-1.85 0.142 -0.035 -13.03 0.000
65 Bullying: my belongings (copy/pen/book/water pot) was stolen.
0.68 0.161 0.011 4.20 0.000
66 Bullying: I was hit or hurt by other student(s)
-2.63 0.155 -0.046 -16.97 0.000
67 Bullying: fellow students kept outside without involving me in activities
-3.95 0.169 -0.064 -23.32 0.000
68 Bullying: I was made fun of or called names
0.69 0.162 0.012 4.23 0.000
69 Bullying: fellow students kept outside without involving me in activities
0.21 0.181 0.003 1.18 0.240
70 Bullying: I was made to do things I didn't want to do by other students.
-1.97 0.148 -0.037 -13.27 0.000
Note: unstan Coeff. = Unstandardized coefficients, SE = Standard Error, Stan. Coeff = Standardized coefficients
The table 6.2 reveals many predicators (positive and negative) of learning achievement in Mathematics.

- 111 -
6.3 Regression Analysis in Nepali SubjectLike in chapter 6.2 Nepali background variables were converted into z-score
before running regression analysis. The model summary of the regression in Nepali subject is given in table 6.3.
Table 6.3 Regression analysis model summary in Nepali subject.Model Summary
Model R R Square Adjusted R Square Std. Error of the Estimate1 .409a .168 .157 46.69798
Predicators: constant and independent variables.
Exactly in similar manner as in Mathematics, the predicators and regression coefficients of Nepali achievement are presented in table 6.4
Table 6.4 Regression coefficients – unstandardized and standardized in Mathematics
SN Predicators (z-score)Unstan Coeff.
BetaStan. Coeff.
tB SE
1 (Constant) 500.44 0.72 696.76 0.0002 bq3: Students' gender 1.79 0.83 0.03 2.16 0.0313 bq4: Students' age 0.71 0.72 0.01 0.99 0.3204 bq5: Language spoken at home -1.76 0.73 -0.03 -2.41 0.0165 bq6: Ethnicity 0.06 0.65 0.00 0.10 0.9246 bq7a: Time spent on TV, Internet, Mobile,
Computer-5.69 0.81 -0.10 -7.03 0.000
7 bq7b: Time spent on playing and chatting with friends
-4.75 0.90 -0.08 -5.29 0.000
8 bq7c: Time spent on household chores -1.48 0.91 -0.03 -1.63 0.1049 bq7d: Time spent on studying/doing homework 0.44 0.82 0.01 0.53 0.59310 bq8: Support for study beyond school time 0.52 0.75 0.01 0.70 0.48211 bq9: Availability of Nepali textbook 1.58 1.00 0.02 1.57 0.11612 bq10: Time to reach school -2.29 0.89 -0.04 -2.57 0.01013 bq11: Homework provided by Nepali teacher 0.42 1.02 0.01 0.41 0.68114 bq12: Feedback provided in homework 2.01 1.06 0.03 1.90 0.05715 bq13: Student's' future aim 1.90 0.76 0.03 2.50 0.012

- 112 -
SN Predicators (z-score)Unstan Coeff.
BetaStan. Coeff.
tB SE
16 bq14a_Utility: Learn Nepali help me to read & write
2.24 0.98 0.03 2.28 0.023
17 bq14b_Utility: I should do well in Nepali for other subject learning
-2.81 1.19 -0.04 -2.35 0.019
18 bq14c_Utility: I like story and poem in Nepali 3.52 1.27 0.05 2.77 0.00619 bq14d_Utility: I need to be competent in
Nepali to get a good job1.51 1.21 0.02 1.25 0.212
20 bq15a: Attitude towards Nepali Learning: Often performed good in Nepali
-0.59 1.05 -0.01 -0.57 0.572
21 bq15b: Attitude towards Nepali Learning: Want to learn Nepali more at school
-1.30 1.19 -0.02 -1.09 0.278
22 bq15c: Attitude towards Nepali Learning: I Enjoy learning Nepali
0.62 1.12 0.01 0.56 0.577
23 bq15d: Attitude towards Nepali Learning: I Can learn Nepali quickly
2.22 1.01 0.03 2.21 0.027
24 bq15e: Attitude towards Nepali Learning: Nepali is difficult for me
3.42 0.78 0.06 4.39 0.000
25 bq16a: Classroom activities In Nepali: Do exercise as given lesson
0.64 1.13 0.01 0.56 0.573
26 bq16b: Classroom activities In Nepali: Read/write in small group of friends
-1.86 1.15 -0.03 -1.63 0.104
27 bq16c: Classroom activities In Nepali: Make sentence Our self
0.69 1.15 0.01 0.60 0.547
28 bq16d: Classroom activities In Nepali: Read the lesson with aloud
-1.02 1.07 -0.02 -0.95 0.341
29 bq16e: Classroom activities In Nepali: Start homework at the classroom
-2.00 0.97 -0.03 -2.06 0.039
30 bq16f: Classroom activities In Nepali: Ask the teacher for difficult task
5.55 1.03 0.08 5.38 0.000
31 bq17: Mother's education 2.79 0.86 0.05 3.24 0.00132 bq18: Mother's occupation 1.18 0.79 0.02 1.48 0.13833 Zscore: bq19: Father's education 1.46 0.89 0.03 1.64 0.10134 Zscore: bq20: Father's occupation 4.15 0.78 0.08 5.33 0.00035 bq21: Number of family member -0.93 0.64 -0.02 -1.45 0.14636 bq22a: Home possession: Table for reading 0.76 0.70 0.02 1.09 0.276

- 113 -
SN Predicators (z-score)Unstan Coeff.
BetaStan. Coeff.
tB SE
37 bq22b: Home possession: Separate room -0.01 0.66 0.00 -0.01 0.99338 bq22c: Home possession: Peace place to read 1.21 0.69 0.02 1.75 0.08039 bq22d: Home possession: Computer -1.20 0.72 -0.03 -1.66 0.09640 bq22e: Home possession: Children story,
magazine and poems0.69 0.76 0.01 0.91 0.362
41 bq22f: Home possession: Pictorial book 0.03 0.76 0.00 0.03 0.97442 bq22g: Home possession: Other reference
book2.48 0.74 0.05 3.34 0.001
43 bq22h: Home possession: Internet facility 2.55 0.75 0.05 3.41 0.00144 bq23a: Home accessories: Television 1.87 0.90 0.04 2.07 0.03945 bq23b: Home accessories: Computer -1.65 1.04 -0.03 -1.58 0.11546 bq23c: Home accessories: Motorcycle -0.10 0.94 0.00 -0.10 0.91847 bq23d: Home accessories: Car -3.09 0.97 -0.06 -3.20 0.00148 bq23e: Home accessories: Permanent house 1.68 0.85 0.03 1.99 0.04749 bq24: Activities in leisure time at school -1.38 1.01 -0.02 -1.36 0.17450 bq25: Frequency of extra activities at school -0.71 1.07 -0.01 -0.66 0.50751 bq26: Frequency of participation in extra
activities-1.10 1.06 -0.02 -1.04 0.297
52 bq27a. teacher: Teachers treat lovely while teaching
0.25 0.86 0.00 0.29 0.771
53 bq27d. teacher: Teachers care us equally 2.11 0.86 0.04 2.46 0.01454 bq27e. teacher: Teachers answer while asking
confused questions2.06 0.92 0.04 2.25 0.025
55 bq27f. teacher: Teachers give homework 1.27 0.89 0.02 1.43 0.15356 bq27g. teacher: Teachers provide feedback by
checking homework0.84 0.89 0.02 0.95 0.345
57 bq28c. School: There is facility to play, drinking water and toilet
1.97 0.80 0.03 2.48 0.013
58 bq29a. bullying: my belongings (copy, pen, book, water pot. etc) was stolen.
-0.46 0.76 -0.01 -0.60 0.548
59 bq29b.Incidents: I was hit or hurt by other student(s)
-1.22 0.80 -0.02 -1.52 0.128
60 bq29c. Incidents: fellow students kept outside without involving me in activities
-3.01 0.85 -0.05 -3.56 0.000
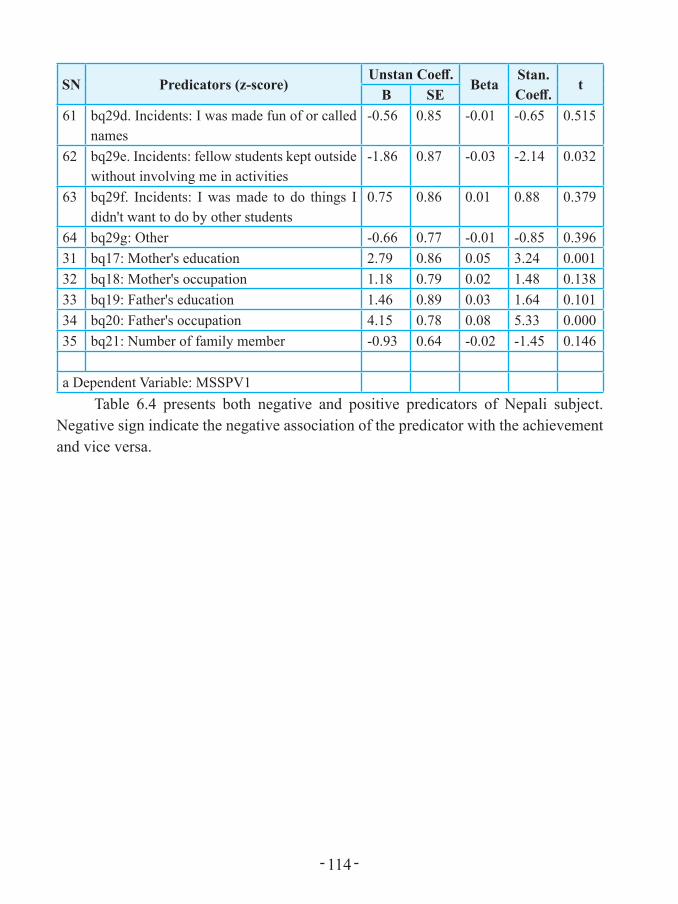
- 114 -
SN Predicators (z-score)Unstan Coeff.
BetaStan. Coeff.
tB SE
61 bq29d. Incidents: I was made fun of or called names
-0.56 0.85 -0.01 -0.65 0.515
62 bq29e. Incidents: fellow students kept outside without involving me in activities
-1.86 0.87 -0.03 -2.14 0.032
63 bq29f. Incidents: I was made to do things I didn't want to do by other students
0.75 0.86 0.01 0.88 0.379
64 bq29g: Other -0.66 0.77 -0.01 -0.85 0.39631 bq17: Mother's education 2.79 0.86 0.05 3.24 0.00132 bq18: Mother's occupation 1.18 0.79 0.02 1.48 0.13833 bq19: Father's education 1.46 0.89 0.03 1.64 0.10134 bq20: Father's occupation 4.15 0.78 0.08 5.33 0.00035 bq21: Number of family member -0.93 0.64 -0.02 -1.45 0.146
a Dependent Variable: MSSPV1Table 6.4 presents both negative and positive predicators of Nepali subject.
Negative sign indicate the negative association of the predicator with the achievement and vice versa.
- 115 -
Chapter 7
FINDINGS, CONCLUSION AND RECOMMENDATIONS
7.1 IntroductionGlobally, National Assessment of Student Achievement (NASA) has been well
accepted as a means of measuring quality of education through students' achievement (TIMSS & PIRLS, 2008). National assessment provides both quantitative and descriptive form of information on student achievement which is considered as an output of the teaching learning process and its quality (World Bank, 1996). National assessment thus provides basic information for policy makers, politicians, and the broader educational community (ERO, 2013). Further, "it provides data for a type of national education audit carried out to inform policy makers about the key aspects of the system" (Greaney & Kellaghan, 2008b, p. 7, ERO, 2013). It is argued that the achievement of the students in a curriculum area be aggregated to provide an estimate of the achievement level in the education system as a whole at a particular age or grade level (Greaney & Kellaghan, 2008b; NASA, 2013). NASA is also a popular means of determining the achievement of curriculum and finding the gaps between written curriculum and taught curriculum. So, it is useful for making policy decisions especially when decisions are to be made in relation to the optimum utilisation of resources (EDSC, 2008). It provides evidence for policy makers on availability of textbooks, class size, and number of years of teacher training. Therefore, every country has accepted that it is "systematic, regular measure of learning achievement in a country that is designed to assist policy making" (Lockheed et al. cited in EDSC, 2008, pp. 19, NASA 2013).
In Nepal, the national assessment practice is found to have started from the last years of the decade of 1980s. However, the Ministry of Education formally started National Assessment since 1995 and continued it up to 2010 in a small scale. Large scale NASA was administrated under the Ministry of Education since 2011 AD. Four NASA cycles were completed during the School Sector Reform Plan and two under the School Sector Development Plan including NASA 2018. In both the plans, NASA is considered as a tool to measure quality of education and making educational institutions accountable to achieving the educational goals.
NASA studies are conducted for both backward and forward-looking purposes. The backward-looking purpose is concerned mainly with building a database to

- 116 -
analyse both the strengths and weaknesses of educational policies and practices that affect students’ learning achievement (ERO, 2018).
A complete NASA cycle goes over a period of 3 years. In the first year, all items development, pre-testing of the items and item analysis are completed. In the second year, final test is administered and finally, the activities including report writing, dissemination of the report and policy informing are done during the third year of NASA cycle.
The ERO follows globally accepted practices of conducting national assessments. Although the context of each country is different, there are some common practices to national assessments in most of the countries (ERO, 2018). Building on the comprehensive review of national assessments from various countries, ERO has adopted the following procedures:
• The Ministry of Education, Science and Technology (MOEST) selects an implementing agency either from within the MOEST system or an independent external consulting organization. In case of Nepal, Education Review Office (ERO) within the MOEST system is solely responsible for the national assessment.
• The MOEST or implementing agency develops policies and frameworks for assessment in consultation with (and with participation of) key stakeholders such as subject experts, teachers and policy makers.
• The MOEST identifies the Grade level and determines the area (e.g., literacy or numeracy) to be assessed.
• The implementing agency (ERO in Nepal) defines and describes the areas of achievement testing in terms of both content and cognitive skills and develops test items along with supporting questionnaires and manuals for test administration.
ERO• Pilots the test items with the support of external experts and reviews their
validity, appropriateness and sensitivity in terms of gender, ethnicity and culture.
• Ensures that the assessment instruments are reliable and valid.• Selects the samples schools, arranges for printing the test papers and other
relevant materials; and communicates with the schools and teachers for test administration.
• Orients the test administrators (focal persons, head teachers and teachers), and then administers the test and survey questionnaires in the selected schools.

- 117 -
• Collects test scores and other necessary information, cleans the data as needed and analyses them.
• Prepares draft report/s which is/are reviewed by relevant subject committees and external experts.
• Prepares and disseminates final report/s through various means such as publication and the mass media.
• Finally, the MOEST, implementing agency and relevant stakeholders study the report/s of national assessment and identify major areas for policy reforms (ERO, 2017, 2018).
7.2 Objectives of NASA 2018The purpose of this assessment is to provide feedback to the Ministry of Education,
Science and Technology to improve the quality of school education. This assessment does not report individual students’ performance, nor does it compare the proficiencies of each individual student and school. Rather, it provides the national and provincial level results as well as the differences in the achievement scores in relation to various influencing factors such as socioeconomic status, home language, and identity with geographical region. More specifically, NASA 2018 has the following objectives:
a. To identify the current level of Grade 5 students’ achievement in Mathematics and Nepali
b. To identify variations in student achievement by gender, province, identity with geography, types of school, ethnicity, home language, socio-economic status
c. To explore the factors that influence student achievementd. To identify trend in student learning and produce the baseline data for the future
for comparisone. To strengthen the capacity of the education system in conducting national
assessmentf. To provide the Ministry of Education, Science and Technology with
recommendations for policy making to improve quality and ensure equity, particularly in school education.
7.3 Distinct Features of NASA 2018The ERO has used Item Response Theory to assess the latent ability of students
using various contextual variables to explain those latent traits of the students. This assessment has used advanced procedure to bring rigor to data analysis by generalizing the results in national level and province levels through 7 explicit strata and various

- 118 -
other implicit strata. Use of Replicate Module for estimating the population parameters and Weighted Likelihood Estimation (WLE) for analysis of individual student level and reporting are the examples of its advancement. Furthermore, the advancement of procedures has also been noticed in sampling methods. A Probability Proportional to Size (PPS) sampling procedure has been used in selecting the schools as Principal Sample Unit (PSU), the school clusters. Reporting of student achievement at province level and national level is done in a transformed scale with mean 500 and standard deviation 50 by using the formula:
Average scale score = 500 + plausible value * 50
or, Average scale score = 500 + logit * 50
If readers want to extract the WLE of latent ability, they can use:
average latent ability (logit) of any group =average score - 500
50
The distinct features of this report are:1. A comparative analysis of NASA 2018 and 2015 by using IRT methods and
rigorous process is adopted.2. Trends of results over all NASA cycles of grade 5 are presented.3. Learning level descriptors are prepared through a rigorous analysis.4. A gap in learning between written curriculum and taught curriculum in the form of
achieved curriculum is presented.
7.4 FindingsThe major findings of National Assessment of Student Achievement study 2018
are as follows:
1. In Mathematics, 32 students out of 100 fall below basic level who have achieved only 5% of the tested curriculum and only 28% curriculum is achieved by basic level students. More than 70% students are under the 28% achievement of the tested curriculum in Mathematics. This huge mass of the students represents underperforming group. The proficient level students achieved 62% of the tested curriculum and advance level students achieved 96% of the tested curriculum. The data informs that only 29% of the students have adequate knowledge and skills in Mathematics curriculum. The gap in achieved curriculum between below basic level (5%) and advance level students (96%) is 91%. This indicates that inequality in the classroom is remarkably high.
- 119 -
Similarly, in Nepali, 20 out of 100 students achieved only 18% of the tested curriculum and 40 out of 100 students achieved only 38% of the tested curriculum. 45 out of 100 students have adequate knowledge and skills of tested curriculum as 30% students fall in proficient level and 15% students fall in advance level. Altogether, 55% of the students, a big mass represents underperforming group. The proficient level students achieved 60% of the tested curriculum and advance level students achieved 88% of the tested curriculum. The gap in achieved curriculum between below basic level (18%) and advance level students (88%) is 70%. This indicates that inequality in the classroom is very high.
2. Students’ learning is found questionable. Twenty% students in Nepali and 32% in Mathematics have achievements below the basic level. The level below basic means the students are not able to answer even very easy questions satisfactorily.
3. Learning disparity is another critical finding of the study. There is huge gap between the achievements of the students from different provinces. Students from Province 1 and Karnali Province performed lower than the others in Mathematics and Nepali subjects. In case of Province 2, the achievement in Nepali was lower than the achievement in Mathematics.
4. Comparison of the results between boys and girls shows that boys’ performance was higher than that of girls in Mathematics, but in Nepali, girls performed slightly better than the boys. The gap is found consistent with the previous NASA study. The gap between boys’ and girls’ performance is found to be the highest in Province 2 than in other provinces.
5. Comparison of the student's performance by the type of schools shows that the students from institutional schools performed better than the students from community schools. The gap was found to be 30 scale score in Mathematics and 34 in Nepali.
6. Other studies (NASA 2011, 2013) have shown a strong correlation between the SES and student achievement. However, the result of NASA 2018 has shown that majority of Province 2 students in spite of their lower SES achieved the highest in Mathematics among the students from all 7 provinces. This is an encouraging finding that shows the possibility of students to perform better despite their low socio-economic status.
7. About 4 % of the students did not receive the textbooks even towards the end of the academic session. Students without textbooks performed lower than those with the textbooks in the class.
8. A high number of (52%) students were bullied in the school by their peers and
- 120 -
others. The performance of the bullied students was found to be lower than that of those who were not bullied. The gap was 31 scale score in Nepali and 22 in Mathematics.
9. The students receiving support in their study from home were found to have diverse result. The students with extra tutorial support outside the school performed better in Mathematics and Nepali than those who did not receive such support.
10. The students who were provided with regular homework and feedback on regular basis from the teachers performed better than those who were not provided homework and feedback. About 7% community school teachers never provided homework and feedback to the students in Nepali subject.
11. Parental educational qualification is one of the determining factors to boost students' performance. The mothers with Bachelor's degree and fathers with Master's degree qualification had their children perform quite better in both the subjects than those having lower educational qualification. The gap between an illiterate father and a Master's degree holding father was 35 scale score in Mathematics.
12. Parental profession is also another significant influencing factor in students' performance. Parents involved in business, teaching and government job had their children perform better than those engaged in agriculture, household work and any other profession. The gap among the parental groups was 38 scale score in Mathematics and 37 in Nepali.
13. The students who studied grade 5 at appropriate age (11years) performed better than the under or over age students. The gap was found 9 scale score in Mathematics and 11 in Nepali. It indicates that repeating the grade does not help the students perform better.
14. The students' time spent on study has direct relation with the improvement of their performance. The students who spent about 1-2 hours of after-school time in a day in the activities such as household chores, watching TV, and playing performed higher while the students spending more than 2 hours of after-school time in a day in the activities other than study, performed comparatively lower. The gap was found 17 scale score in Nepali and 16 in Mathematics.
15. The achievement and gap related results of NASA 2018 are quite similar to the results of NASA 2012 and 2015. The consistent recurring results not only proves the reliability of the NASA study, but also indicates that interventions of educational system were not effective in improving the quality of learning in the school level, urges to review the plan and policies from the quality concerns.

- 121 -
7.5 ConclusionThe prime objective of the national assessment is to inform the policy makers
for setting realistic agenda and ensuring implementation, monitoring and evaluation of educational policies. The policies have focused on curriculum, pedagogy, teaching learning practice and assessment. Using learning assessment result for betterment of policies and their implementation is not a straightforward activity; it demands rigorous discussion at various levels of policy making and implementation with evidence to support it.
National Assessment of Student Achievement results are indicative of several crucial issues that warrant concerted efforts to improve entire teaching learning practices with a focus on the classroom delivery. Efforts need to be made by all stakeholders and the entire government system from their respective areas to ensure the placement of all students in minimal acceptance level (level 1). No one should be left behind the learning level 1 so that further progression from their level can also be ensured.
There exists a wide gap in the learning achievement of the students from among different province, level, district, school type, language (Nepali), and socio-economic status. The students are lagging behind in learning many of basic mathematical concepts and the similar situation is noted in Nepali. Differentiated instruction, individual support and learning ensuring strategies are some of the measures that can be applied in the classroom teaching learning practice.
The teachers are the key actors to improve the classroom teaching learning practice. They are expected to be conversant with different strategies to facilitate learning and teaching that should be meaningfully used to enhance students’ learning. Similarly, teacher capacity development program/training (pre-service as well as in-service) should have a balanced focus on the content as well as pedagogy. A total of 32 % of grade 5 students being below the basic level in Mathematics and 20% in Nepali is quite revealing. Easy tasks like recognizing number, performing basic operations in Mathematics and simple text comprehension as well as dictation in Nepali are such simple areas of learning where the students have been lagging behind. This further raises concerns toward the teaching learning being practised in our schools.
There are disparities in learning achievement between different provinces. Province 1 and Karnali province students, for instance, have low performances than their counterparts in other provinces. In the case of province 2, performance in Mathematics was found better than in Nepali. This suggests that provincial government and local

- 122 -
governments have to make contextually strategic policies to reduce learning disparity. Monitoring learning on regular basis and providing adequate support to schools (financial as well as physical) can ensure better performance. Provincial governments, for instance, can develop their own contextual policies and programs for improving learning status of the province.
Students’ learning is influenced by various factors and is contingent on a number of elements. The collected information from the students in this study informs that assigning homework and providing feedback, utilization of leisure in school, students' engagement in group work, no bullying in the school, and providing more time for study at home are the favourable factors to improve performance in both the subjects. In particular, home language has a visible influence on Nepali and taking support from extra tuition classes in Mathematics has been found to be meaningful. Parents' occupation and education have influenced student's achievement differently in different subjects. Parents in teaching and business profession have better learning students as they can provide meaningful support and multiple opportunities for their children. In such a case, the schools need to focus on students from low socio-economic status and the disadvantaged groups in order to ensure their equitable access to quality education.
The study findings reveal that there are a number of issues to be addressed to improve classroom learning. The urge is there for all the stakeholders to be aware about required change in the existing classroom practices. Local governments can set learning achievement targets and take appropriate actions to meet them. These strategies are possible through planned policy change that aims at transforming the schools into real learning organizations.
7.6 Recommendations1. Huge mass of students is at the underperforming level: As the study indicates,
32 out of 100 students fall below basic level (Pre-basic) in Mathematics achieving only 5% of the tested curriculum and the basic level (level 1, about 40%) students have achieved only 28% of the tested curriculum. More than 70% students have achieved only below 28% of the tested curriculum in Mathematics indicating a huge mass of students underperforming in this subject. The proficient level (level 2, 24%) students achieved 62% of the tested curriculum and advance level (level 3, 4%) students achieved 96% of the tested curriculum. It seems that only 29% of the students have adequate knowledge and skills in Mathematics curriculum. The gap in the achievement of curriculum between below basic level (5%) and

- 123 -
advance level students (96%) is 91% indicating remarkably high inequality in the classroom. Similarly, in Nepali, 20% students who are at below basic level (Pre-basic) achieved only 18% of the tested curriculum and 35% students achieved only 38% of the tested curriculum in Nepali, who are at basic level (level 1). As 30% students fall in proficient level and 15% in advance level, altogether 45 of 100 students have adequate knowledge and skills of the tested curriculum in Nepali. This shows that 55% of the students, a big mass of the students in Nepali, represent the underperforming group. And 45 of 100 students have adequate knowledge and skills of the tested curriculum as 30% students fall in proficient level and 15% in advance level. Altogether, 55% of the students, a big mass of the students in Nepali, represent the underperforming group. The proficient level students achieved 60% of the tested curriculum and the advance level students achieved 88% of the tested curriculum. The gap in the achievement of the curriculum between below basic level (18%) and advance level students (88%) is 70% indicating high inequality in the classroom.
Recommendation: As basic level is assumed to be a minimum competency level, a campaign of "no child should be left behind basic level" should be initiated effectively to develop minimum competency level in the students. Teachers should provide the students with many opportunities to learn in many ways and through various means. Existing mis-match between the written curriculum and achieved curriculum urges the need to review the national curriculum, teaching methods, teacher motivation system, learning environment and the evaluation system.
2. Huge gap between the provinces and districts has been noticed. Such gap increases disparity in learning achievement among the groups of students.
Recommendation: All the community schools should provide equal opportunity to the students for learning. A minimum standard for physical infrastructure, learning opportunities, resources, incentives and retention of good teachers under teacher management should be set to bring uniformity in the achievement level of the students. Retention of good teachers has relation with increased learning achievement of students. Learning difficulties of students in all schools should be identified and then addressed by remedial teaching. Regular follow up support and monitoring mechanism should be strengthened to enhance learning.
3. Students can perform better irrespective of their SES and home language: The Socio-Economic Status of student’s family has low effect in Mathematics and medium effect in Nepali Language. Many students have performed better

- 124 -
despite their unfavourable low socio-economic status; this indicates that the socio-economic background of the students does not exclusively determine the learning achievement. Province 2 has majority of students with low SES, but they have achieved the higher position in Mathematics compared to other provinces. And similar is the situation with Nepali language as well.
Recommendation: As students can perform better irrespective of their SES and home language, focus on the study and practice on the part of student is a principal measure to boost their learning achievement. In all community schools, minimum learning materials, library facility and students' clubs, numeracy promotion program and reading programs should be made available to promote students’ performance.
4. There is a minimum gap in learning achievement between boys and girls.
Recommendation: Reduced and minimum gap between boys and girls should be maintained with more focus on providing girls with equal opportunity. The existing gap can best be addressed through affirmative action such as scholarship, girls friendly environment, and receptive teacher behaviour.
5. Wide gap between the type of schools has been noticed: There is a wide gap in learning achievement between community and institutional schools. The students from institutional schools have out-performed the community schools with a gap of 30 scale score in Mathematics and 34 in Nepali.
Recommendation: Upgrading of community schools to increase their academic performance should be initiated as a regular targeted intervention by the government. Co-curricular activities should include Mathematics or number games, reading and writing, literature, contemporary issues and challenges as part of the curriculum for all community schools. Remedial teaching and individualized instruction should also be implemented for the targeted students.
6. Bullying is affecting learning in the schools: A high number (53%) of the students were bullied in the school by their peers and others. The performance of the bullied students was found lower than that of those who were not bullied. The gap is 31 scale score in Nepali and 22 in Mathematics.
Recommendation: Local governments together with the schools should regularly monitor the school to maintain peace, discipline and regulations as well as cohesive environment among the students. "No bullying" movement should be initiated by the school in consultation with and involvement of the local community. Active

- 125 -
focal person in the school, psycho-social counselling service and child club activity against bullying are the other activities that the school can provide to minimize bullying in the schools.
7. Feedback to the students in homework has positive relationship with learning achievement: The students who were provided with regular homework and feedback from the teacher performed better than those who were not provided homework and feedback in both subjects. About 7% community school teachers never provided homework and feedback to the students in Nepali subject.
Recommendation: Teacher's performance evaluation should be strongly linked with students’ performance. Providing homework and feedback in certain subjects (perceived to be difficult) in the form of scaffolding in the schools, continuous assessment service, criterion-based assessment for teaching-learning, formative evaluation system and regular communication with parents about their children’s performance, some instructional activities directly influence students’ learning achievement.
8. Students at right age performed better: Students studying in grade 5 at appropriate age (11 years) performed better than the under or over age students. The gap was found 9 scale score in Mathematics and 11 in Nepali. Similar trend was noticed in the previous study as well. This further means that age wise grade or grade wise age or age appropriate enrollment ensures higher learning achievement.
Recommendation: Net enrollment practice at the basic level education should be maintained and increased by admitting appropriate age students in the appropriate grades in schools. Age appropriate level of students can learn smoothly with their peers of equal age.
9. After-school activities determine student learning achievement: Students' involvement in study during their after-school time has a relation with their performance. The students' who spent about one to two hours' after-school time in the activities like household chores, watching TV, and playing performed better. On the other hand, the students who spent more than two hours of their after-school time in those activities other than study performed relatively lower. The gap was found 17 scale score in Nepali and 16 in Mathematics.
Recommendation: All schools should make their parents aware of the influence of children’s involvement in study with their performance. Besides being involved in entertainment and household chores, the students should be encouraged to study not only the textbooks based on the curriculum but also the literature books,
- 126 -
reference books and other extra-curricular materials as well.
10. Many students do not have a sense of Mathematics: In Mathematics, students below minimum learning level have quite limited knowledge and skills in Mathematics. Around 50% of them do not have any sense of reading and writing numbers and number operation. With this limited knowledge and skills, they cannot calculate and solve Mathematical problems. Some of them are able to choose correct answers when options are given in the MCQ items. Mostly, they are unable to perform any Mathematical subjective calculations independently.
Recommendation: Students experiencing difficulty with learning the numbers and Mathematical calculation should be provided with learning opportunity to developing minimum Mathematical skills and competencies. The teachers should be made accountable to their students' performance. An action needs to be taken if the teachers fail to develop their students’ minimum level of competencies. Not only the teachers’ performance but also the performance of the Principals of such schools with below minimum learning level of students should be linked up with their career path. The schools with such lower achievement level should be made responsible to develop short term and long-term learning improvement strategies and actions. To monitor the progress of the implementation of the planned strategies, regular standardized tests should be administered and local level monitoring and supervision mechanism should be ensured. Besides, the primary level teachers should be equipped with national level short-term practical, school based professional training to advance their content knowledge and pedagogical skills.
11. More than half of the students are struggling with the simple Mathematical calculations: Basic level (level 1) students have superficial knowledge and skills in most of the Mathematical contents. However, they are struggling with calculations. They are able to identify the ordered pair of a point, square pattern in dots, the sum of decimal numbers, the place of a digit in numbers, the relation of kilogram and gram and the numbers, mixed fraction and type of angles. But they also have a limited knowledge of formula for volume and area, they cannot estimate the angle shown in figure and cannot identify the relation between decimal and fraction. They can read the table and bar graphs to take simple information but cannot draw conclusion by comparing the data. They can solve very simple problems of unitary methods, subtract small same denominator fractions, round numbers in the nearest tenth of a decimal number. They can also recognize limited square numbers and express Mathematical sentence in Mathematical language to calculate. They can

- 127 -
also subtract a univariate one-degree Algebraic term from another, find the value of x in one variable equation and subjective, can simplify Algebraic expression (univariate) in Algebra. However, they cannot perform grade level Mathematical calculations independently.
Recommendation: The knowledge of basic level contents is essential to be able to grasp the Mathematical content. Therefore, the teachers should focus on the development of basic level contents among all students. In addition to these skills, the students should be prepared to solve simple grade appropriate Mathematical calculations independently. To improve learning achievement, an emphasis should be laid on the underperforming students instantly through the application of problem-solving method.
12. In Nepali language, the students below level 1 can read only a few words or sentences but they cannot write the sentences independently.
Recommendation: Such underperforming (below level 1) students should be involved more on the activities such as reading and writing words and sentences and describing familiar events independently. Language teaching should focus on meaningful reading and comprehension exercises rather than on reciting the paragraphs in the textbook and rote learning the answers.
13. Decreasing trend of students' performance in Mathematics:
Recommendation: A diagnostic study about the challenges in teaching and learning culture should be carried out. The factors responsible for reduced learning achievement should be identified and disseminated. The involvement of parents and community members should be ensured in making the schools accountable for their student's low performance level.
14. The achievement and gap related results of NASA 2018 are quite similar to the results of NASA 2012 and 2015 : The consistent recurring results not only proves the reliability of the NASA study, but also indicates that interventions were not sufficient in improving the quality of learning in the school level.
Recommendation: MOEST should review the existing plan and policies from the quality concerns.
15. Overall Recommendation: As a final step of National Assessment, MOEST should initiate Post-NASA policy review and intervention plan at the national level, sub-national level, and implementing agency level of the education system.
- 128 -
REFERENCESACARA. (2017). NAP Sample Assessment Science Literacy Technical Report: Sydney:
Australian Curriculum Assessment and Reporting Authority (ACARA).An, Xinming and Yung, Yiu-Fai. (2014). Paper SAS364-2014 Item Response Theory:
What it is and how you can Use the IRT Procedure to Apply it. Retrieved from https://support.sas.com/resources/papers/proceedings14/SAS364-2014.pdf.
Baker, F.B. (2001). The Basics of Item Response Theory. ERIC Clearinghouse on Assessment and Evaluation. Retieved from http://echo.edres.org:8080/irt/baker/final.pdf.
CDC. (2013). Lower Secondary Curriculum. Sanothimi: CDC (Curriculum Development Centre).
CDC. (2014). National Curriculum Framework. Sanothimi: Author.Chalmers, P. P. (2012). A Multidimensional Item Response Theory Package for
the R Environment. Journal of Statistical Software, Volume 48, Issue 6. http://www.jstatsoft.org/ York University.
CMEC (2014). PCAP 2013: Report on the Pan-Canadian Assessment of Science, Reading, and Mathematics. Toronto: CMEC.
Cohen, L. and Holliday, M. (1996) Practical Statistics for Students. London: Paul Chapman.
ERO. (2013). Report of National Assessment of Student Achievement 2011, Grade 8. Sanothimi: Education Review Office.
ERO. (2015). Report of National Assessment of Student Achievement 2012, Grade 3 and 5. Sanothimi: Education Review Office.
ERO. (2015a). Report of National Assessment of Student Achievement 2013, Grade 8. Sanothimi: Education Review Office.
ERO. (2016). Report of National Assessment of Student Achievement 2015, Grade 3 and 5. Sanothimi: Education Review Office.
ERO. (2017). NASA 2017: Assessment Framework for Grade 5 in Mathematics and Nepali. Sanothimi: Education Review Office.
Fennema, E., & Sherman, J.A. (1976). Fennema-Sherman Mathematics Attitudes Scales: Instruments designed to measure attitudes toward the learning of mathematics by females and males. Journal for Research in Mathematics Education, 7, 324-326. doi: 10.2307/748467.
Greaney. V. and Kellaghan, T. (2007). Assessing National Achievement Levels in
- 129 -
Education [edited]. Washington DC: The World Bank.IEA. (2016). Methods and Procedures in TIMSS 2015. Martin, M.O., Mullis, V. S.
and Hooper, M. (edited. Boston: International Association for the Evaluation of Educational (IEA).
Kathryn O’Grady, K. and Houme, K. (2015). PCAP 2013: Technical Report. Toronto: Council of Ministers of Education, Canada.
Laukaitytė, Inga. (2016). Statistical Modeling in International Large-scale Assessments. Department of Statistics Umeå School of Business and Economics.
Le, Dai-Trang. (2013). Applying Item Response Theory Modeling in Educational Research. Owa State University.
Lewis, T. (2015). Replication Techniques for Variance Approximation, Paper 2601-2015. University of Maryland.
Masters, G. M. and Wright, B. D. (1997). The Partial Credit Model. In W. J. Van der Linden and R. K. Hambleton (edit), Handbook of Modern Item Response Theory, pp 110-122. New York, Springer.
Meinck, S. (2015). Computing Sampling Weights in Large-scale Assessments in Education. Survey Insights: Methods from the Field, Weighting: Practical Issues and ‘How to’ Approach. Retrieved from http://surveyinsights.org/?p=5353.
Murphy, M. & Schulz, W. (2006). Sampling for National Surveys in Education. Victoria, Australia: Australian Council for Educational Research (ACER).
Murphy, Paud; Greaney, Vincent; Lockheed, Marlaine E.; Rojas, Carlos [editors] (1996). National assessments: testing the system (English). EDI learning resources series. Washington, D.C: The World Bank http://documents.worldbank.org/curated/en/920211468743345819/National-assessments-testing-the-system
OECD. (2009). PISA Data Analysis Manual, SPSS, Second Edition. Retrieved from https://www.ipi.lu.lv/fileadmin/_migrated/content_uploads/Datu_analizes_rk.pdf.
OECD. (2016). PISA 2015: Technical Report. Retrieved from http://www.oecd.org/pisa/data/2015-technical-report/.
OECD. (2017). PISA 2015 Assessment and Analytical Framework (Science, Reading, Mathematic, Financial Literacy and Collaborative Problem Solving). Retrieved from www.oecd-ilibrary.org/education/pisa-2015-assessment-and....
Pant L. B., Singh, G. B. and Poudel, L. N. (2016). NASA 2017: Assessment Framework for Grade 8 in Mathematics, Nepali and Science. Sanothimi: Education Review Office.
- 130 -
Sudal, L. A. and Sudol, C. (2010). Analysing Test Items: Using Item Response Theory to Validate Assessments. Proceedings of the 41st ACM technical symposium on Computer science education, pp 436-440. Retrieved from http://ims.mii.lt/ims/konferenciju_medziaga/SIGCSE%2710/docs/p436.pdf. Verhelst, N.D. &. Verstralen, H.H.F.M. (2008). Some Considerations on the Partial Credit Model. Psicologica (2008), 29, 229-254.
Von Davier, M, Gonzalez, E, & Mislevy, R. J. (2009). What are plausible values and why are they useful? In M Von Davier & D Hastedt (Eds.), IERI Monograph Series: Issues and methodologies in large scale assessments (Vol. 2, pp. 9–36). Hamburg, Germany: IERI Institute.
Xie, Qingshu, Zhang, MacroSys Ting (2017). Analyses Using Achievement Levels Based on Plausible Values AIR - NAEP Working Paper #2017-02 NCES Data R Project Series #01 American Institutes for Research.
Yamamoto, K., & Kulick, E. (2000). Scaling Methodology and Procedures for the TIMSS Mathematics and Science Scales. In M.O. Martin, K.D. Gregory, & S.E. Stemler (Eds.), TIMSS 1999 technical report. Chestnut Hill, MA: Boston College.
Yansaneh, I. S. (2003). Construction and use of sample weights. United Nations Secretariate.
Zieky, M. & Perie, M. (2006). A Primer on Setting Cut Scores on Tests of Educational Achievement. Educational Testing Service (ETS).
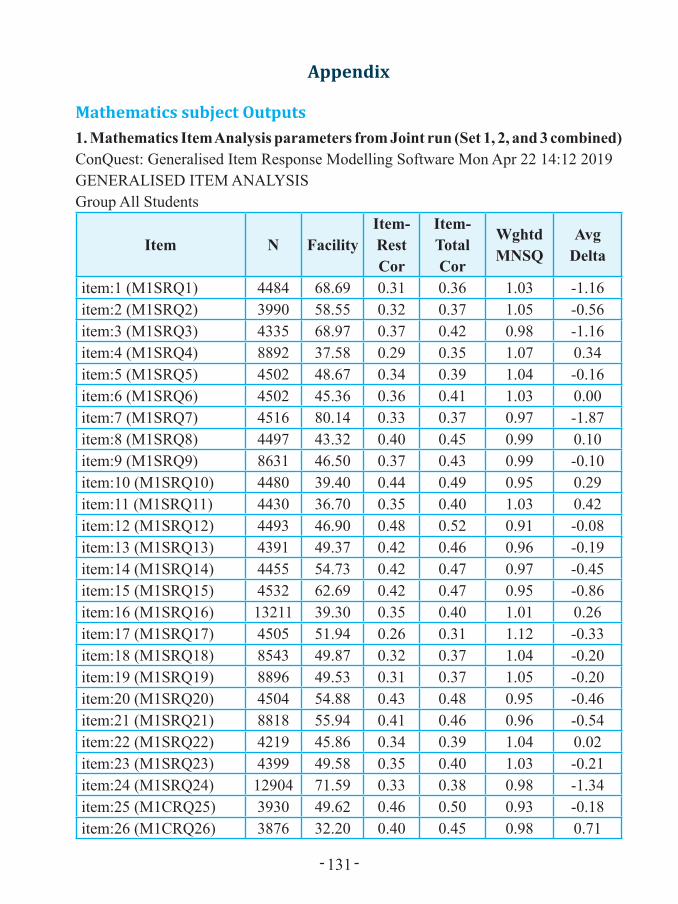
- 131 -
Appendix
Mathematics subject Outputs1. Mathematics Item Analysis parameters from Joint run (Set 1, 2, and 3 combined)ConQuest: Generalised Item Response Modelling Software Mon Apr 22 14:12 2019GENERALISED ITEM ANALYSISGroup All Students
Item N FacilityItem-Rest Cor
Item-Total Cor
Wghtd MNSQ
Avg Delta
item:1 (M1SRQ1) 4484 68.69 0.31 0.36 1.03 -1.16item:2 (M1SRQ2) 3990 58.55 0.32 0.37 1.05 -0.56item:3 (M1SRQ3) 4335 68.97 0.37 0.42 0.98 -1.16item:4 (M1SRQ4) 8892 37.58 0.29 0.35 1.07 0.34item:5 (M1SRQ5) 4502 48.67 0.34 0.39 1.04 -0.16item:6 (M1SRQ6) 4502 45.36 0.36 0.41 1.03 0.00item:7 (M1SRQ7) 4516 80.14 0.33 0.37 0.97 -1.87item:8 (M1SRQ8) 4497 43.32 0.40 0.45 0.99 0.10item:9 (M1SRQ9) 8631 46.50 0.37 0.43 0.99 -0.10item:10 (M1SRQ10) 4480 39.40 0.44 0.49 0.95 0.29item:11 (M1SRQ11) 4430 36.70 0.35 0.40 1.03 0.42item:12 (M1SRQ12) 4493 46.90 0.48 0.52 0.91 -0.08item:13 (M1SRQ13) 4391 49.37 0.42 0.46 0.96 -0.19item:14 (M1SRQ14) 4455 54.73 0.42 0.47 0.97 -0.45item:15 (M1SRQ15) 4532 62.69 0.42 0.47 0.95 -0.86item:16 (M1SRQ16) 13211 39.30 0.35 0.40 1.01 0.26item:17 (M1SRQ17) 4505 51.94 0.26 0.31 1.12 -0.33item:18 (M1SRQ18) 8543 49.87 0.32 0.37 1.04 -0.20item:19 (M1SRQ19) 8896 49.53 0.31 0.37 1.05 -0.20item:20 (M1SRQ20) 4504 54.88 0.43 0.48 0.95 -0.46item:21 (M1SRQ21) 8818 55.94 0.41 0.46 0.96 -0.54item:22 (M1SRQ22) 4219 45.86 0.34 0.39 1.04 0.02item:23 (M1SRQ23) 4399 49.58 0.35 0.40 1.03 -0.21item:24 (M1SRQ24) 12904 71.59 0.33 0.38 0.98 -1.34item:25 (M1CRQ25) 3930 49.62 0.46 0.50 0.93 -0.18item:26 (M1CRQ26) 3876 32.20 0.40 0.45 0.98 0.71
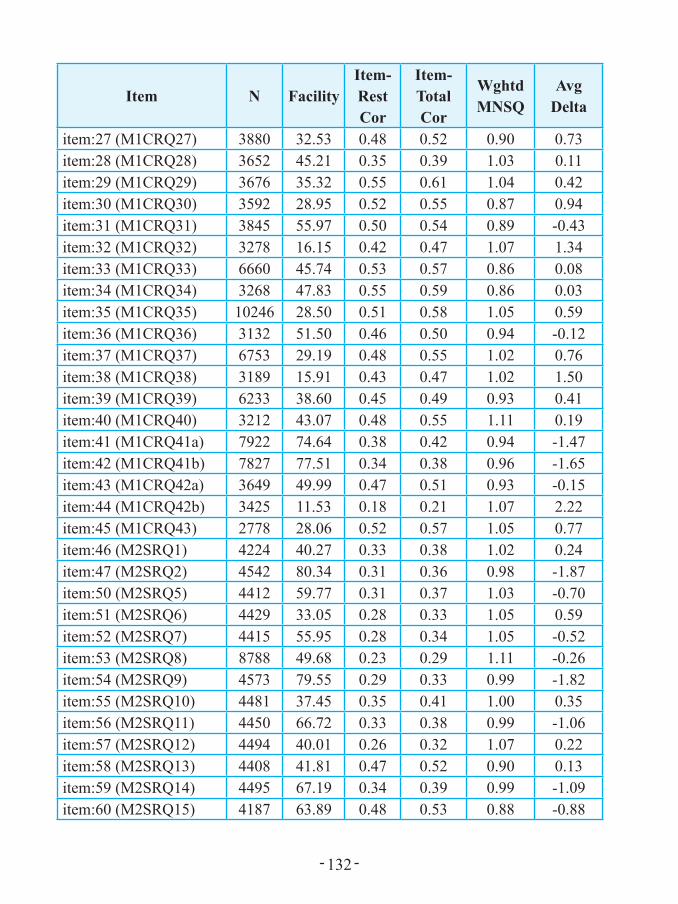
- 132 -
Item N FacilityItem-Rest Cor
Item-Total Cor
Wghtd MNSQ
Avg Delta
item:27 (M1CRQ27) 3880 32.53 0.48 0.52 0.90 0.73item:28 (M1CRQ28) 3652 45.21 0.35 0.39 1.03 0.11item:29 (M1CRQ29) 3676 35.32 0.55 0.61 1.04 0.42item:30 (M1CRQ30) 3592 28.95 0.52 0.55 0.87 0.94item:31 (M1CRQ31) 3845 55.97 0.50 0.54 0.89 -0.43item:32 (M1CRQ32) 3278 16.15 0.42 0.47 1.07 1.34item:33 (M1CRQ33) 6660 45.74 0.53 0.57 0.86 0.08item:34 (M1CRQ34) 3268 47.83 0.55 0.59 0.86 0.03item:35 (M1CRQ35) 10246 28.50 0.51 0.58 1.05 0.59item:36 (M1CRQ36) 3132 51.50 0.46 0.50 0.94 -0.12item:37 (M1CRQ37) 6753 29.19 0.48 0.55 1.02 0.76item:38 (M1CRQ38) 3189 15.91 0.43 0.47 1.02 1.50item:39 (M1CRQ39) 6233 38.60 0.45 0.49 0.93 0.41item:40 (M1CRQ40) 3212 43.07 0.48 0.55 1.11 0.19item:41 (M1CRQ41a) 7922 74.64 0.38 0.42 0.94 -1.47item:42 (M1CRQ41b) 7827 77.51 0.34 0.38 0.96 -1.65item:43 (M1CRQ42a) 3649 49.99 0.47 0.51 0.93 -0.15item:44 (M1CRQ42b) 3425 11.53 0.18 0.21 1.07 2.22item:45 (M1CRQ43) 2778 28.06 0.52 0.57 1.05 0.77item:46 (M2SRQ1) 4224 40.27 0.33 0.38 1.02 0.24item:47 (M2SRQ2) 4542 80.34 0.31 0.36 0.98 -1.87item:50 (M2SRQ5) 4412 59.77 0.31 0.37 1.03 -0.70item:51 (M2SRQ6) 4429 33.05 0.28 0.33 1.05 0.59item:52 (M2SRQ7) 4415 55.95 0.28 0.34 1.05 -0.52item:53 (M2SRQ8) 8788 49.68 0.23 0.29 1.11 -0.26item:54 (M2SRQ9) 4573 79.55 0.29 0.33 0.99 -1.82item:55 (M2SRQ10) 4481 37.45 0.35 0.41 1.00 0.35item:56 (M2SRQ11) 4450 66.72 0.33 0.38 0.99 -1.06item:57 (M2SRQ12) 4494 40.01 0.26 0.32 1.07 0.22item:58 (M2SRQ13) 4408 41.81 0.47 0.52 0.90 0.13item:59 (M2SRQ14) 4495 67.19 0.34 0.39 0.99 -1.09item:60 (M2SRQ15) 4187 63.89 0.48 0.53 0.88 -0.88

- 133 -
Item N FacilityItem-Rest Cor
Item-Total Cor
Wghtd MNSQ
Avg Delta
item:61 (M2SRQ16) 4436 50.45 0.42 0.47 0.94 -0.27item:62 (M2SRQ17) 4469 46.90 0.47 0.51 0.90 -0.11item:63 (M2SRQ18) 4454 19.62 0.23 0.27 1.05 1.39item:64 (M2SRQ19) 8838 35.44 0.31 0.37 1.03 0.43item:65 (M2CRQ20) 8861 49.99 0.37 0.42 0.98 -0.27item:66 (M2SRQ23) 4387 48.30 0.32 0.38 1.03 -0.16item:67 (M2SRQ25) 4438 36.50 0.45 0.50 0.91 0.40item:68 (M2SRQ26) 4377 42.22 0.15 0.21 1.18 0.13item:69 (M2CRQ28) 8073 38.85 0.40 0.48 1.15 0.20item:70 (M2CRQ29) 5360 30.86 0.42 0.46 0.94 0.83item:71 (M2CRQ30) 3941 59.69 0.31 0.41 1.32 -0.53item:72 (M2CRQ31) 3646 40.92 0.48 0.53 0.90 0.27item:73 (M2CRQ32) 3765 24.12 0.41 0.47 1.10 0.88item:74 (M2SRQ33) 3332 19.69 0.42 0.46 0.91 1.46item:75 (M2CRQ34) 3140 32.90 0.47 0.51 0.91 0.69item:76 (M2CRQ35) 3466 20.20 0.45 0.51 0.99 1.16item:77 (M2CRQ36) 3348 47.07 0.45 0.50 0.93 -0.04item:78 (M2CRQ38) 3024 19.20 0.48 0.53 0.99 1.10item:79 (M2CRQ40a) 3856 78.19 0.35 0.39 0.95 -1.69item:80 (M2CRQ40b) 3613 43.90 0.35 0.40 1.01 0.09item:81 (M2CRQ42) 7166 60.91 0.47 0.52 0.89 -0.74item:82 (M2CRQ43) 3661 43.32 0.46 0.55 1.12 0.01item:83 (M3SRQ2) 3763 51.37 0.34 0.40 1.01 -0.27item:84 (M3SRQ3) 3580 53.74 0.29 0.35 1.05 -0.42item:85 (M3SRQ4) 4336 56.20 0.36 0.42 0.99 -0.58item:86 (M3SRQ5) 4277 60.72 0.35 0.41 0.99 -0.79item:87 (M3SRQ6) 4204 42.65 0.39 0.45 0.97 0.07item:88 (M3SRQ11) 4338 36.75 0.29 0.36 1.05 0.35item:89 (M3SRQ12) 4346 55.48 0.37 0.43 0.99 -0.55item:90 (M3SRQ13) 4283 65.44 0.34 0.39 0.98 -1.04item:91 (M3SRQ14) 4363 75.84 0.28 0.33 1.01 -1.63item:92 (M3SRQ15) 4410 72.47 0.33 0.39 0.98 -1.43
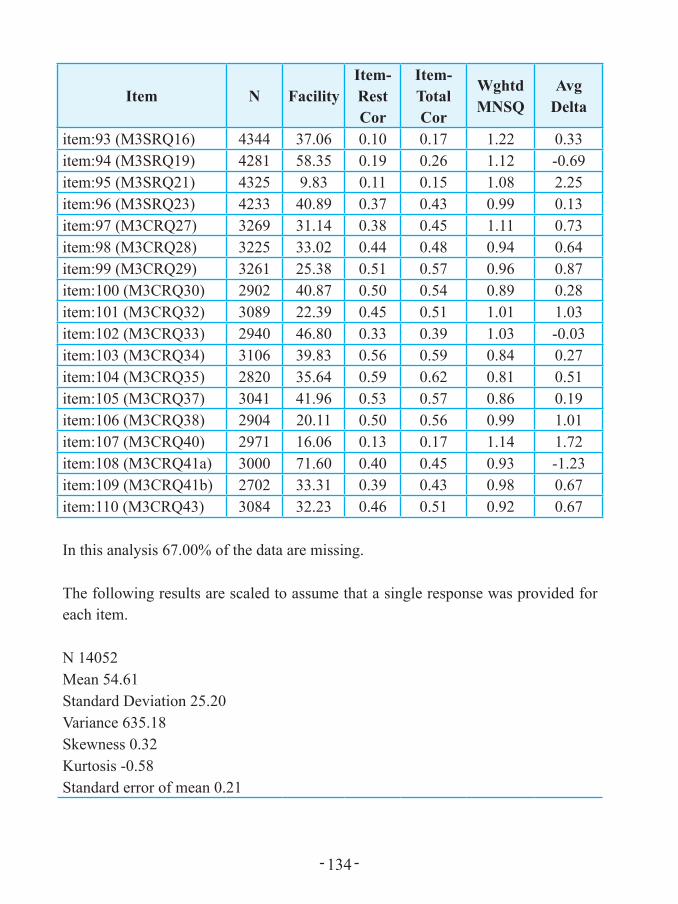
- 134 -
Item N FacilityItem-Rest Cor
Item-Total Cor
Wghtd MNSQ
Avg Delta
item:93 (M3SRQ16) 4344 37.06 0.10 0.17 1.22 0.33item:94 (M3SRQ19) 4281 58.35 0.19 0.26 1.12 -0.69item:95 (M3SRQ21) 4325 9.83 0.11 0.15 1.08 2.25item:96 (M3SRQ23) 4233 40.89 0.37 0.43 0.99 0.13item:97 (M3CRQ27) 3269 31.14 0.38 0.45 1.11 0.73item:98 (M3CRQ28) 3225 33.02 0.44 0.48 0.94 0.64item:99 (M3CRQ29) 3261 25.38 0.51 0.57 0.96 0.87item:100 (M3CRQ30) 2902 40.87 0.50 0.54 0.89 0.28item:101 (M3CRQ32) 3089 22.39 0.45 0.51 1.01 1.03item:102 (M3CRQ33) 2940 46.80 0.33 0.39 1.03 -0.03item:103 (M3CRQ34) 3106 39.83 0.56 0.59 0.84 0.27item:104 (M3CRQ35) 2820 35.64 0.59 0.62 0.81 0.51item:105 (M3CRQ37) 3041 41.96 0.53 0.57 0.86 0.19item:106 (M3CRQ38) 2904 20.11 0.50 0.56 0.99 1.01item:107 (M3CRQ40) 2971 16.06 0.13 0.17 1.14 1.72item:108 (M3CRQ41a) 3000 71.60 0.40 0.45 0.93 -1.23item:109 (M3CRQ41b) 2702 33.31 0.39 0.43 0.98 0.67item:110 (M3CRQ43) 3084 32.23 0.46 0.51 0.92 0.67
In this analysis 67.00% of the data are missing.
The following results are scaled to assume that a single response was provided for each item.
N 14052Mean 54.61Standard Deviation 25.20Variance 635.18Skewness 0.32Kurtosis -0.58Standard error of mean 0.21
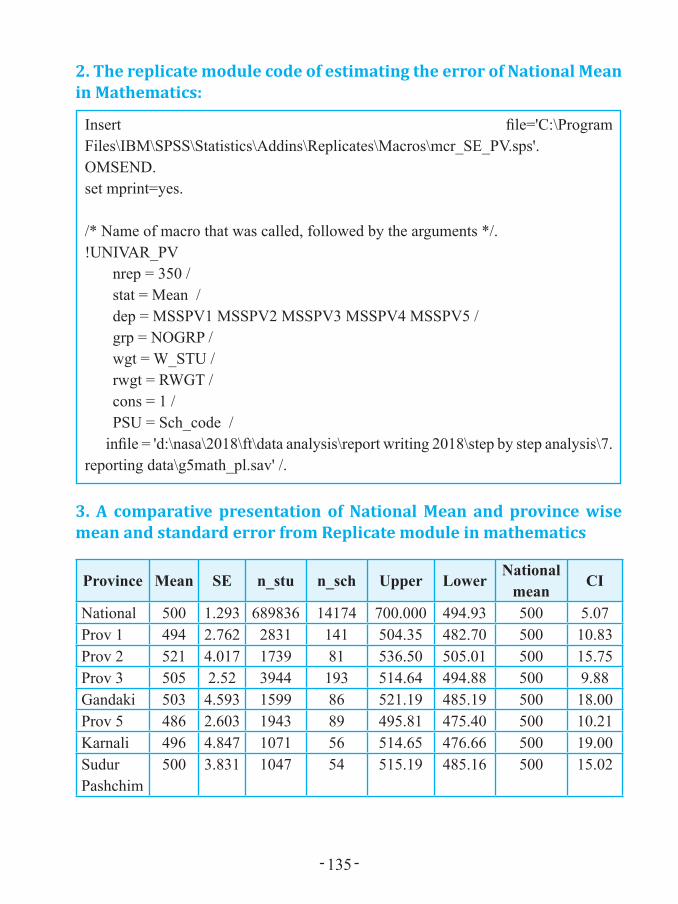
- 135 -
2. The replicate module code of estimating the error of National Mean in Mathematics:
Insert file='C:\Program Files\IBM\SPSS\Statistics\Addins\Replicates\Macros\mcr_SE_PV.sps'.OMSEND.set mprint=yes.
/* Name of macro that was called, followed by the arguments */.!UNIVAR_PV nrep = 350 / stat = Mean / dep = MSSPV1 MSSPV2 MSSPV3 MSSPV4 MSSPV5 / grp = NOGRP / wgt = W_STU / rwgt = RWGT / cons = 1 / PSU = Sch_code / infile = 'd:\nasa\2018\ft\data analysis\report writing 2018\step by step analysis\7. reporting data\g5math_pl.sav' /.
3. A comparative presentation of National Mean and province wise mean and standard error from Replicate module in mathematics
Province Mean SE n_stu n_sch Upper LowerNational
meanCI
National 500 1.293 689836 14174 700.000 494.93 500 5.07Prov 1 494 2.762 2831 141 504.35 482.70 500 10.83Prov 2 521 4.017 1739 81 536.50 505.01 500 15.75Prov 3 505 2.52 3944 193 514.64 494.88 500 9.88Gandaki 503 4.593 1599 86 521.19 485.19 500 18.00Prov 5 486 2.603 1943 89 495.81 475.40 500 10.21Karnali 496 4.847 1071 56 514.65 476.66 500 19.00Sudur Pashchim
500 3.831 1047 54 515.19 485.16 500 15.02

- 136 -
4. Standard Error of Percentage of students in various levels. in Mathematics
Proficiency level% of
studentsSE N_cases NU_cases NU_psu
Level 0: Pre-basic 32.166 1.037 220496.8 4594 567Level 1: Basic 39.577 0.833 272024.3 5609 677Level 2: Proficient 24.006 0.837 163676.9 3320 595Level 3: Advance 4.252 0.473 28300.73 570 187
5. Gender wise National achievement in MathematicsGender Mean SE n_stu CI
Boy 501 1.436 6855 5.627Girl 499 1.443 6978 5.657Missing 521 1.982 341
6. Ethnicity wise National achievement in MathematicsEthnicity Mean SE n_stu N_cases CI
Brahman/Chhetri 504 1.810 5032 240716.00 7.10Janjati 496 1.810 5018 250417.00 7.09Dalit 491 2.152 1892 95288.00 8.44Others 513 2.398 2232 103415.00 9.40
7. National Mean score by age group in Mathematics
Age Mean SE n_stu CI9 years or belw 498 3.204 562 12.56010 years 501 1.782 2682 6.98411 years 501 1.580 4545 6.19212 years 500 1.753 3738 6.87313 years 494 2.513 1395 9.85314 years or above 492 2.855 604 11.192
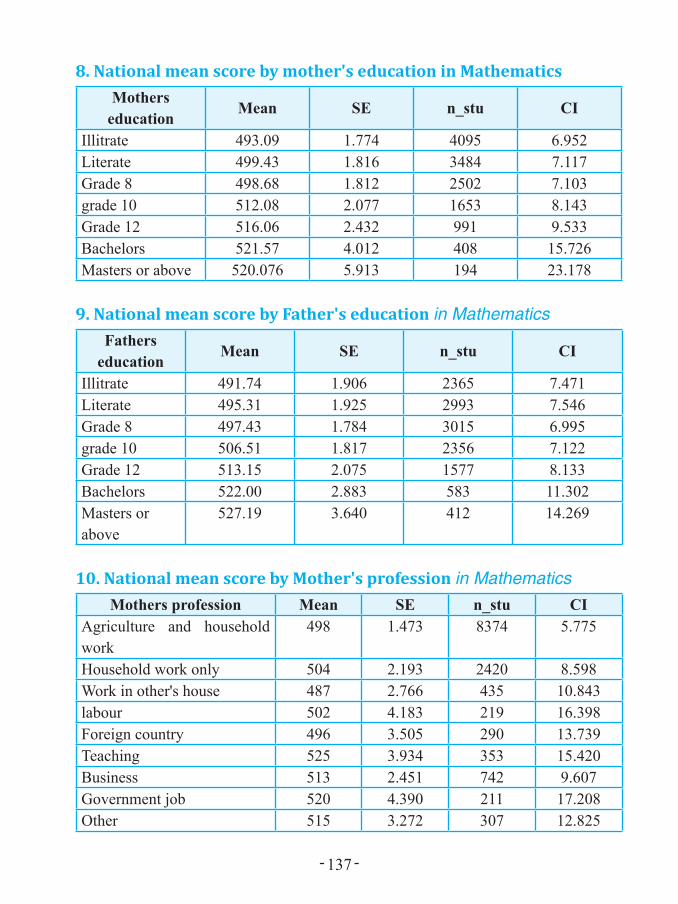
- 137 -
8. National mean score by mother's education in MathematicsMothers
educationMean SE n_stu CI
Illitrate 493.09 1.774 4095 6.952Literate 499.43 1.816 3484 7.117Grade 8 498.68 1.812 2502 7.103grade 10 512.08 2.077 1653 8.143Grade 12 516.06 2.432 991 9.533Bachelors 521.57 4.012 408 15.726Masters or above 520.076 5.913 194 23.178
9. National mean score by Father's education in MathematicsFathers
educationMean SE n_stu CI
Illitrate 491.74 1.906 2365 7.471Literate 495.31 1.925 2993 7.546Grade 8 497.43 1.784 3015 6.995grade 10 506.51 1.817 2356 7.122Grade 12 513.15 2.075 1577 8.133Bachelors 522.00 2.883 583 11.302Masters or above
527.19 3.640 412 14.269
10. National mean score by Mother's profession in MathematicsMothers profession Mean SE n_stu CI
Agriculture and household work
498 1.473 8374 5.775
Household work only 504 2.193 2420 8.598Work in other's house 487 2.766 435 10.843labour 502 4.183 219 16.398Foreign country 496 3.505 290 13.739Teaching 525 3.934 353 15.420Business 513 2.451 742 9.607Government job 520 4.390 211 17.208Other 515 3.272 307 12.825

- 138 -
11. National mean score by father's profession in MathematicsFathers occupation Mean SE n_stu CI
Agriculture and household work 494.70 1.672 4690 6.554Household work only 486.99 2.861 409 11.216Work in other's house 487.72 2.555 309 10.014labour 498.38 3.385 1041 13.270Foreign country 504.36 1.805 3672 7.076teaching 521.96 3.346 483 13.116Business 509.88 2.281 2202 8.941Government job 513.99 3.106 1146 12.176Other 516.15 2.623 1000 10.284missing 477.64 2.149 530 483.925
12. National mean scores by support after school to students in Mathematics
Support to the students
Mean SE n_stu CI
1 father 501.43 1.8668 342 7.3182 mother 499.52 2.2038 6390 8.6393 brother/sister 498.93 1.5214 1733 5.9644 tuition 511.21 3.0172 3137 11.8275 friend 495.40 3.3265 172 13.0406 any other 502.52 6.0789 260 23.8297 none 504.33 5.4709 1200 21.446
13. National mean score by home language in MathematicsLanguage Mean SE n_stu CI
Nepali 499.70 1.510 8975 5.919Other 502.23 1.865 5199 7.312
14. National mean score by type of schools in MathematicsType of school Mean SE n_stu CIcommunity 492.95 1.441 10126 5.647 Institutional 522.84 2.261 4048 8.864

- 139 -
15. Mean score by involvement in after- school activity in Mathematics
Time given
a. Involve in TV,
internet, computer
b. play and talk
c. Home chores
d. Homework and study
e. Work
for wage
f. Read other books
Not given time 493 495 494 488 505 491Less than one hour 506 502 503 491 494 504Up to 3 hours 499 503 503 505 489 507More than 3 hours 493 489 494 508 489 496
16. Disaggregated mean score of sample districts in MathematicsProvince Districts Disaggregated meanProv. 1 BHOJPUR 468
DHANKUTA 487OKHALDHUNGA 495JHAPA 497PANCHTHAR 504
Prov. 2 MAHOTTARI 515RAUTAHAT 520SIRAHA 523
Prov. 3 SINDHULI 487KAVREPALANCHOK 495CHITWAN 513NUWAKOT 516LALITPUR 522
Prov. Gandaki
SYANGJA 497LAMJUNG 497PARBAT 511
Prov. 5 BARDIYA 472PYUTHAN 484GULMI 500
Prov. Karnali
KALIKOT 492SALYAN 497HUMLA 500
Prov. Far-western BAJURA 490BAITADI 503
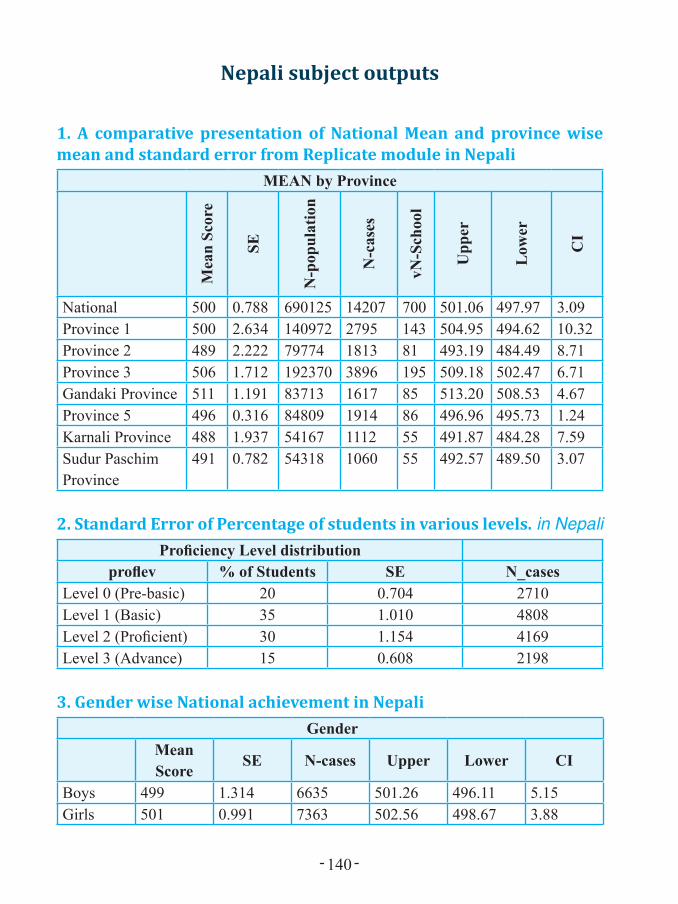
- 140 -
Nepali subject outputs
1. A comparative presentation of National Mean and province wise mean and standard error from Replicate module in Nepali
MEAN by ProvinceM
ean
Scor
e
SE
N-p
opul
atio
n
N-c
ases
vN-S
choo
l
Upp
er
Low
er
CI
National 500 0.788 690125 14207 700 501.06 497.97 3.09Province 1 500 2.634 140972 2795 143 504.95 494.62 10.32Province 2 489 2.222 79774 1813 81 493.19 484.49 8.71Province 3 506 1.712 192370 3896 195 509.18 502.47 6.71Gandaki Province 511 1.191 83713 1617 85 513.20 508.53 4.67Province 5 496 0.316 84809 1914 86 496.96 495.73 1.24Karnali Province 488 1.937 54167 1112 55 491.87 484.28 7.59Sudur Paschim Province
491 0.782 54318 1060 55 492.57 489.50 3.07
2. Standard Error of Percentage of students in various levels. in NepaliProficiency Level distribution
proflev % of Students SE N_casesLevel 0 (Pre-basic) 20 0.704 2710Level 1 (Basic) 35 1.010 4808Level 2 (Proficient) 30 1.154 4169Level 3 (Advance) 15 0.608 2198
3. Gender wise National achievement in Nepali Gender
Mean Score
SE N-cases Upper Lower CI
Boys 499 1.314 6635 501.26 496.11 5.15Girls 501 0.991 7363 502.56 498.67 3.88
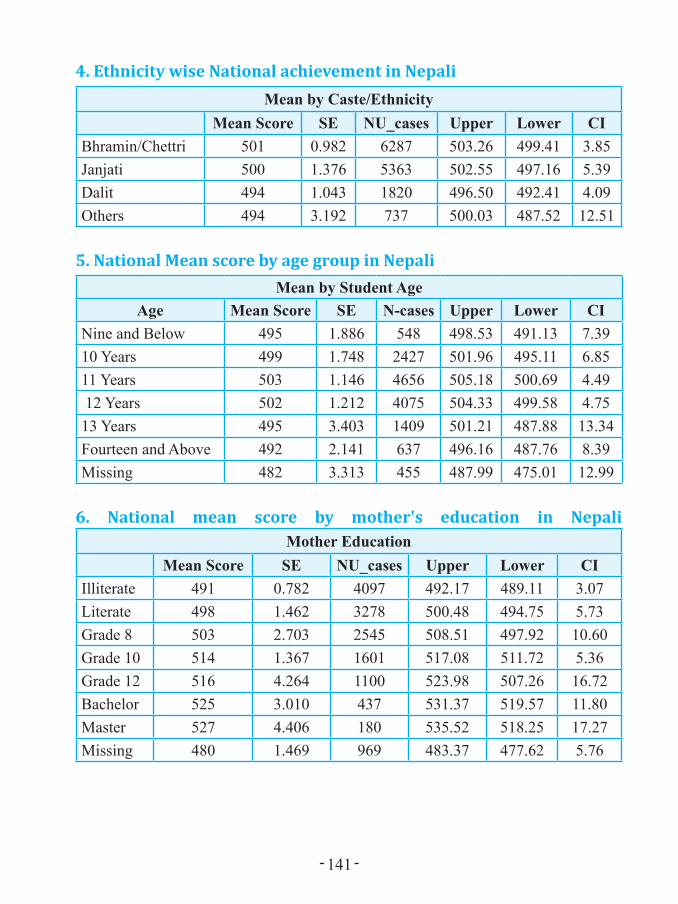
- 141 -
4. Ethnicity wise National achievement in NepaliMean by Caste/Ethnicity
Mean Score SE NU_cases Upper Lower CIBhramin/Chettri 501 0.982 6287 503.26 499.41 3.85Janjati 500 1.376 5363 502.55 497.16 5.39Dalit 494 1.043 1820 496.50 492.41 4.09Others 494 3.192 737 500.03 487.52 12.51
5. National Mean score by age group in NepaliMean by Student Age
Age Mean Score SE N-cases Upper Lower CINine and Below 495 1.886 548 498.53 491.13 7.3910 Years 499 1.748 2427 501.96 495.11 6.8511 Years 503 1.146 4656 505.18 500.69 4.49 12 Years 502 1.212 4075 504.33 499.58 4.7513 Years 495 3.403 1409 501.21 487.88 13.34Fourteen and Above 492 2.141 637 496.16 487.76 8.39Missing 482 3.313 455 487.99 475.01 12.99
6. National mean score by mother's education in NepaliMother Education
Mean Score SE NU_cases Upper Lower CIIlliterate 491 0.782 4097 492.17 489.11 3.07Literate 498 1.462 3278 500.48 494.75 5.73Grade 8 503 2.703 2545 508.51 497.92 10.60Grade 10 514 1.367 1601 517.08 511.72 5.36Grade 12 516 4.264 1100 523.98 507.26 16.72Bachelor 525 3.010 437 531.37 519.57 11.80Master 527 4.406 180 535.52 518.25 17.27Missing 480 1.469 969 483.37 477.62 5.76

- 142 -
7. National mean score by Father's education in Nepali
Father EducationMean Score SE N-cases Upper Lower CI
Illiterate 487 1.317 2275 489.92 484.76 5.16Literate 496 2.652 2942 500.73 490.33 10.40Grade 8 498 1.369 3081 500.56 495.19 5.37Grade 10 510 1.132 2248 512.61 508.17 4.44Grade 12 511 1.187 1632 513.51 508.86 4.65Bachelor 519 1.891 612 523.18 515.77 7.41Master 527 2.882 428 532.25 520.95 11.30Missing 483 1.673 989 486.47 479.91 6.56
8. National mean score by Mother's profession in NepaliMother Occupation
Mean Score
Std. Error of
MeanN-cases Upper Lower CI
Household and agriculture 497 0.525 8568 497.76 495.70 2.06Household work only 506 1.072 2353 508.39 504.19 4.20Work in other's house 485 2.623 338 490.53 480.25 10.28Labour 495 3.302 193 501.34 488.39 12.95Work in foreign country 505 3.043 288 511.29 499.36 11.93Teaching 528 2.821 376 533.17 522.12 11.06Business 518 1.901 699 521.77 514.32 7.45Government job 518 3.445 238 525.09 511.59 13.50Other 491 1.474 1154 493.75 487.98 5.78
9. National mean score by father's profession in NepaliFather Occupation
Mean Score
Std. Error of Mean
N-cases Upper Lower CI
Household and agriculture
491 0.684 4767 492.61 489.92 2.68
Household work only 494 2.004 549 497.49 489.64 7.85Work in other's house 484 2.034 483 488.26 480.29 7.97
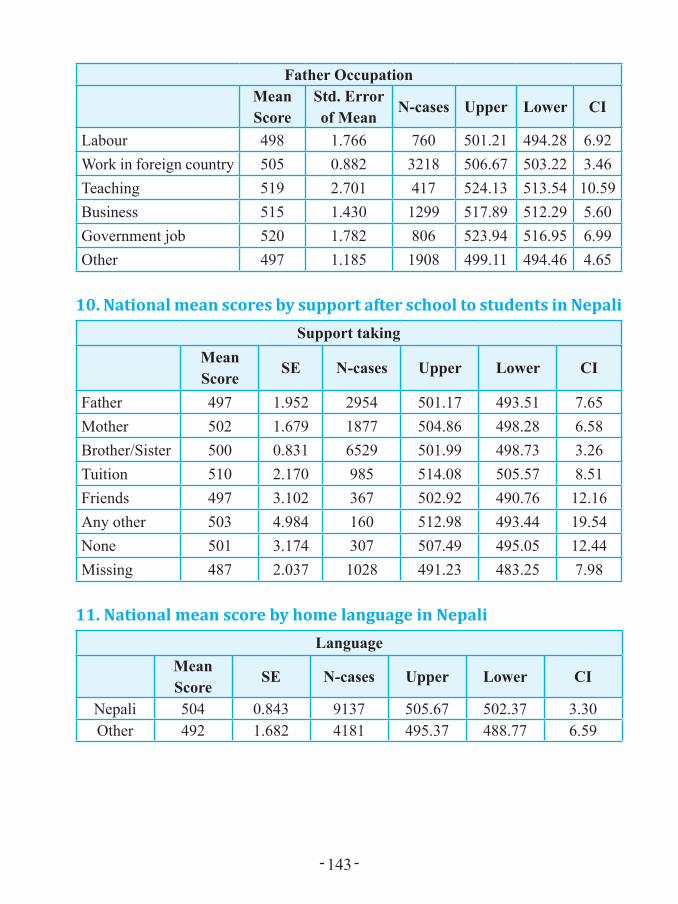
- 143 -
Father OccupationMean Score
Std. Error of Mean
N-cases Upper Lower CI
Labour 498 1.766 760 501.21 494.28 6.92Work in foreign country 505 0.882 3218 506.67 503.22 3.46Teaching 519 2.701 417 524.13 513.54 10.59Business 515 1.430 1299 517.89 512.29 5.60Government job 520 1.782 806 523.94 516.95 6.99Other 497 1.185 1908 499.11 494.46 4.65
10. National mean scores by support after school to students in NepaliSupport taking
Mean Score
SE N-cases Upper Lower CI
Father 497 1.952 2954 501.17 493.51 7.65Mother 502 1.679 1877 504.86 498.28 6.58Brother/Sister 500 0.831 6529 501.99 498.73 3.26Tuition 510 2.170 985 514.08 505.57 8.51Friends 497 3.102 367 502.92 490.76 12.16Any other 503 4.984 160 512.98 493.44 19.54None 501 3.174 307 507.49 495.05 12.44Missing 487 2.037 1028 491.23 483.25 7.98
11. National mean score by home language in NepaliLanguage
Mean Score
SE N-cases Upper Lower CI
Nepali 504 0.843 9137 505.67 502.37 3.30Other 492 1.682 4181 495.37 488.77 6.59

- 144 -
12. National mean score by type of schools in NepaliSchool Type
Mean Score SE N-cases Upper Lower CICommunity 491 0.995 10271 493.36 489.46 3.90Institutional 525 1.112 3936 526.69 522.33 4.36
13. Mean score by involvement in after- school activity in Nepali
Time Given
Time spent on TV, Internet,
Mobile, Computer
Time spent on playing and chating with
friends
Time spent on
household chores
Time spent on studying/
doing homework
Not Given Time 497 501 499 483Less than One hour 511 506 508 494One to three hour 505 503 505 509More thatn three hour
488 493 496 507
Missing 480 479 480 481
14. Disaggregated mean score of sample districts in NepaliMean by District
Province DistrictMean Score
SE N-cases Upper Lower CI
Province 1 BHOJPUR 485 2.013 446 489.29 481.40 7.89DHANKUTA 496 2.190 447 500.01 491.43 8.58JHAPA 510 1.546 1062 513.36 507.30 6.06OKHALDHUNGA 494 2.805 324 499.06 488.07 10.99PANCHTHAR 505 2.174 516 509.31 500.79 8.52
Province 2 MAHOTTARI 485 2.061 530 489.46 481.38 8.08RAUTAHAT 487 1.794 706 490.61 483.57 7.03SIRAHA 496 2.131 577 500.24 491.88 8.35
Province 3 CHITWAN 522 1.724 874 525.63 518.87 6.76KAVREPALANCHOK 501 1.691 873 503.85 497.22 6.63LALITPUR 522 1.833 810 525.82 518.63 7.19NUWAKOT 499 1.991 568 502.62 494.82 7.80SINDHULI 494 1.765 771 497.25 490.33 6.92
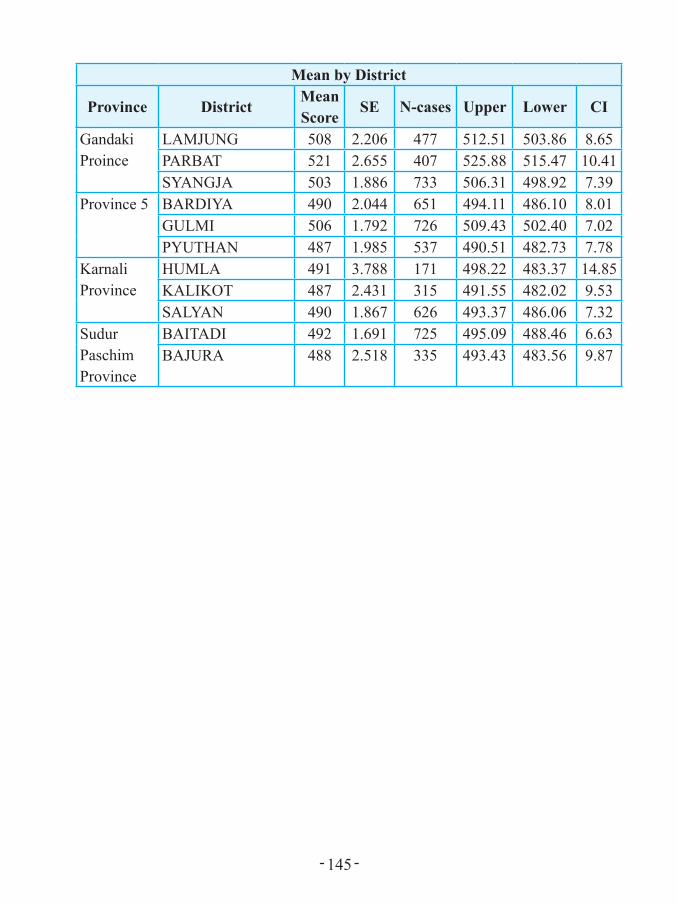
- 145 -
Mean by District
Province DistrictMean Score
SE N-cases Upper Lower CI
Gandaki Proince
LAMJUNG 508 2.206 477 512.51 503.86 8.65PARBAT 521 2.655 407 525.88 515.47 10.41SYANGJA 503 1.886 733 506.31 498.92 7.39
Province 5 BARDIYA 490 2.044 651 494.11 486.10 8.01GULMI 506 1.792 726 509.43 502.40 7.02PYUTHAN 487 1.985 537 490.51 482.73 7.78
Karnali Province
HUMLA 491 3.788 171 498.22 483.37 14.85KALIKOT 487 2.431 315 491.55 482.02 9.53SALYAN 490 1.867 626 493.37 486.06 7.32
Sudur Paschim Province
BAITADI 492 1.691 725 495.09 488.46 6.63BAJURA 488 2.518 335 493.43 483.56 9.87
- 146 -
Annex 2: Test Administration Guidelines
ljBfyL{ pknlAwsf] /fli6«o k/LIf0f, @)&$ -sIff %_ ;~rfngsf nflu k|wfgfWofksnfO{ dfu{bz{g
ljBfyL{ pknlAwsf] /fli6«o k/LIf0f, @)&$ -sIff %_ ;~rfngsf nflu k|wfgfWofksn] lgDgfg';f/sf] Joj:yfkg tyf ;xhLs/0f ug'{kg]{5 M
1. k/LIf0f @)&$ kmfu'g !( ut] lbgsf] !! b]lv !M#) ah];Dd tf]lsPsf] ljBfyL{ ;ª\Vofdf ;~rfng ug{'kg{] 5 .
2. of] k/LIf0fn] ljBfyL{nfO{ kf;÷km]n ug]{{ jf lzIfs÷ljBfnosf] d"Nofª\sg ug{] geO{ ljBfyL{n] lbPsf pQ/sf cfwf/df l;sfO pknlAwsf] /fli6«o :t/ lgwf{/0f / z}lIfs ;'wf/sf nflu ;xof]u ub{5 . o; k/LIf0faf6 ljleGg cfwf/df pknlAwsf] t'ngf ug{, l;sfOsf sf/s tTjx¿ klxrfg ug{ / l;sfO pknlAw Go"g tyf pRr ePsf ljBfnosf aLrdf ePsf leGgtfx¿ Kflxrfg ug{ ;xof]u k'Ub5 . k/LIf0fsf] o:tf] dxÎjnfO{ Wofg lbO{ of] k/LIf0fdf ljBfyL{n] hfg]sf s'/f ;xL, :jR5 Pjd\ dof{lbt ¿kn] n]Vg] jftfj/0f l;h{gf ug'{ kg]{5 .
3. k|Zgsf] pQ/ lbgsf nflu ljBfyL{nfO{ s;}n] klg l;sfpg] jf ;3fpg] ug{'xF'b}g eg] ljBfyL{x¿n] klg k/LIf0f cjlwdf cfk;df s'/fsfgL tyf 5nkmn ug{'xF'b}g .
4. o; k/LIf0fdf k|ZgfjnLsf] uf]kgLotf cToGt} dxÎjk"0f{ kIf xf] . s'g} k|Zgkq ljBfno jf lzIfsn] /fVg], s'g} k|Zg jf k|Zgkq s'g} dfWodn] ;fg{] jf skL ug{], kmf]6f] lvRg] jf kmf]6f]skL ug{] h:tf s'g} klg sfo{ ug{'x'Fb}g . z}lIfs u'0f:t/ k/LIf0f s]Gb| -ERO_ åf/f ljBfnonfO{ pknAw u/fOPsf k|Zgkqx¿dWo] s]xL k|of]u gePdf ;'/lIft ;fy k|Zg k|fKt ePs} vfddf vfdaGbL u/L k7fpg'kg]{5 . k|ZgfjnL x/fPdf, kmf]6f] lvlrPsf] jf kmf]6f]skL u/L /flvPsf] kfOPdf ;+nUgnfO{ lgodfg';f/ ljefuLo sf/jfxL x'g] kIfdf ;r]t u/fpg], k|of]u ePsf / gePsf ;a} k|ZgfjnL clgjfo{ ¿kdf uGtL u/L lkmtf{ ug'{kg]{5 .
5. k/LIf0f ;~rfng ePsf] ;dodf ;DalGwt ljifosf] ljifo lzIfs k/LIf0f ;~rfng ePsf] sIffdf k|j]z gu/L cGo lzIfsx¿af6 k/LIf0f ;~rfng ug'{kg]{5 . t/ ljBfnodf h'g ljifosf] k/LIf0f ;~rfng x'g] xf] ;f] ljifosf] lzIfsn] g} lzIfs k|ZgfjnL eg'{kg]{5 .
6. ljBfnodf k|fKt ePsf k|ZgfjnL ;ª\VofeGbf ljBfyL{ ;ª\Vof a9L ePdf Random Sampling ljlwaf6 tf]lsPsf] ;ª\Vofdf ljBfyL{ 5gf}6 u/L k/LIf0f ;~rfng ug]{ Joj:yf ldnfpg'kg]{5 . ljBfyL{ 5gf]6 ubf{ 5fq / 5fqfsf] cg'kft ldnfpg'kg]{5 .
7. k|ZgfjnLdf b'O{ cf]6f v08 /x]sf 5g\ . klxnf] v08df ljBfyL{sf] JolStut tyf kfl/jfl/s ljj/0f;DaGwL k|ZgfjnL / bf];|f] v08df ljifout k|Zgx¿ /x]sf 5g\ . klxnf] v08sf k|ZgfjnLdf lg/LIfsn] ljBfyL{nfO{ cfjZos ;xof]u ug{ ;Sg]5g\ . ;a} ljBfyL{n] klxnf] v08sf] k|ZgfjnL el/;s]kl5 k|ZgfjnL oyf:yfgdf /fVg nufO{ % b]lv !) ldg]6;Dd a]|s lbO{ ;a}nfO{ Pp6} ;doaf6 bf];|f] v08sf] ljifout k|Zgx¿ -ul0ft, g]kfnL / lj1fgdWo] s'g}

- 147 -
Ps ljifosf k|Zkqx¿ x'g]5g\_ xn ug]{ u/L k/LIf0f ;'? u/fpg'kg]{5 .
8. k/LIf0fdf ;xefuL x'g] x/]s ljBfyL{sf] nflu Pp6f sfnf] d;L ePsf] Ps} lsl;dsf] 86k]g ljBfnon] pknAw u/fO{ -ljBfnonfO{ pknAw u/fOPsf] d;nGbaf6 vl/b ug]{_ ;f]xL 86k]g k|of]u u/L pQ/ n]Vg] Joj:yf ldnfpg'kg]{5 .
9. k|Zgsf] pQ/ n]Vgsf] nflu k|ZgfjnLdf g} vfnL 7fpF lbOPsf] 5 . ;fdfGotof ljBfyL{nfO{ yk v];|f pQ/k'l:tsf cfjZos kb}{g . t/ s'g} ljBfyL{n] yk pQ/k'l:tsf v];|fsf nflu dfu]df ljBfnon] g} pknAw u/fpg'kg]{5 .
10. Pp6f a]~rdf a9Ldf @ hgf dfq ljBfyL{ a:g] u/L a;fO Joj:yf ldnfpg'kg]{5 .
11. k|To]s ljifodf # lsl;dsf k|Zgkqsf ;]6x¿ -Versions_ pknAw u/fOPsf] 5 . ul0ftdf k|Zgsf lsl;dnfO{ M1, M2 / M3; g]kfnLdf N1, N2 / N3 tyf lj1fgdf S1, S2 / S3 ;ª\s]t ul/Psf] 5 .
12. k|ZgfjnL ljt/0f ubf{ # cf]6} lsl;dsf ;]6x¿ j|mdzM kg]{ u/L ljt/0f ug'{kg]{5 . -tnsf] lrqdf ul0ft ljifodf k|ZgfjnL ljt/0fsf] Pp6f gd"gf lbOPsf] 5 . _
M-1 M-2 M-1 M-2
M-3 M-1 M-3 M-1
M-2 M-3 M-2 M-3
13. ljBfyL{n] pQ/ n]lv;s]kl5 lg/LIfsn] k|To]s ljBfyL{sf el/Psf] k|ZgfjnL / pQ/k'l:tsf b'j}nfO{ ;Fu} l:6r ug'{kg]{5 .
14. k|ZgfjnLdf s'g} q'6L e]l6Pdf k|=c=÷lg/LIfsn] cfk\mgf] k|ltj]bgdf ;'emfj ;+nUg u/L k7fpg'kg]{5 t/ k|Zgx¿ ;Rofpg] jf tTsfn s'g} lgsfodf ;f]wvf]h jf va/ ug'{ cfjZos 5}g .
15. k/LIf0f ;dfKt ePkl5 pQ/k'l:tsf tTsfn vfdaGbL u/L l56f] / ;'/lIft dfWodaf6 lhNnf lzIff sfof{nodf a'emfpg'kg]{5 . pQ/k'l:tsfx¿ aGb ul/Psf] vfdsf] aflx/ k|fKt ePsf, k|of]u ePsf / k|of]u geO{ lkmtf{ ePsf k|Zgkqsf] ;ª\Vof tyf ljBfnosf] sf]8 pNn]v ug{'kg{]5 .
16. pQ/k'l:tsf ;Fu} k|WffgfWofks / lzIfsåf/f el/Psf k|ZgfjnL klg lhNnf lzIff sfof{nodf a'emfpg' kg]{5 .
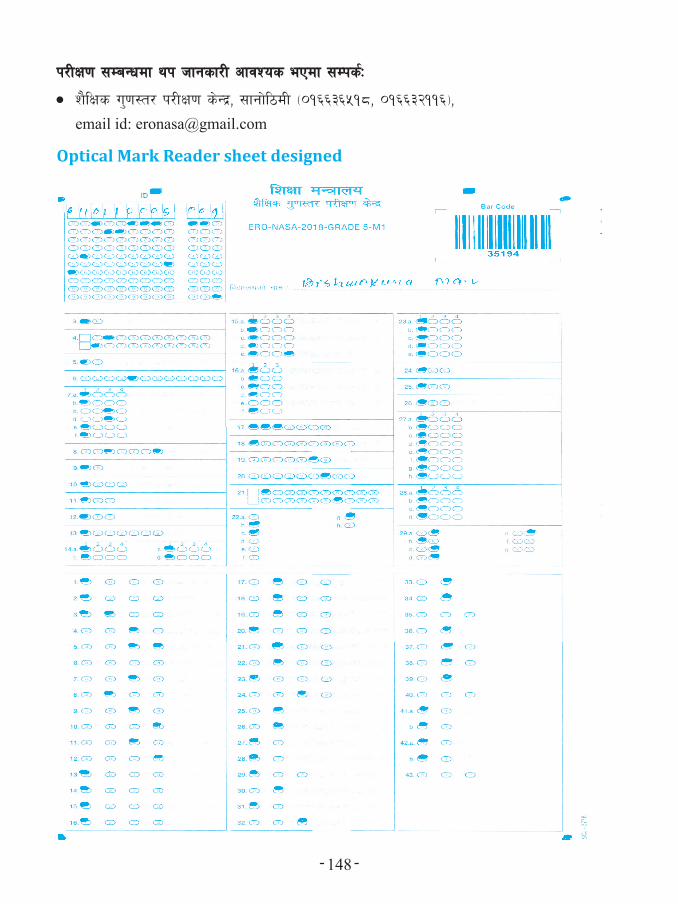
- 148 -
k/LIf0f ;DaGwdf yk hfgsf/L cfjZos ePdf ;Dks{M
• z}lIfs u'0f:t/ k/LIf0f s]Gb|, ;fgf]l7dL -)!^^#^%!*, )!^^#@!!^_,
email id: [email protected]
Optical Mark Reader sheet designed