KEMENTERIAN PELAJARAN MALAYSIA DUNIA SAINS DAN TEKNOLOGI DRAF
Upload
khangminh22Category
view
0download
0
MaHTASMalaysian Health Technology Assessment Section
MEDICAL DEVELOPMENT DIVISIONMINISTRY OF HEALTH
MOH/P/PAK/431.19(RR)-eHEALTH TECHNOLOGYASSESSMENT REPORTK E M E N T E R I A N K E S I H A T A H M A L A Y S I A
NEWSNATIONAL EARLY WARNING SCORE
NATIONAL
EARLY
WARNING
SCORE


HEALTH TECHNOLOGYASSESSMENT REPORT
NATIONAL EARLY WARNING SCORE
(NEWS)
HEALTH TECHNOLOGY ASSESSMENT SECTION (MaHTAS)MEDICAL DEVELOPMENT DIVISION
MINISTRY OF HEALTH


HE
AL
TH
TE
CH
NO
LO
GY
AS
SE
SS
ME
NT
RE
PO
RT
HE
AL
TH
TE
CH
NO
LO
GY
AS
SE
SS
ME
NT
SE
CT
ION
(M
aH
TA
S)
ME
DIC
AL
DE
VE
LO
PM
EN
T D
IVIS
ION
, M
INIS
TR
Y O
F H
EA
LT
H
v
NA
TIO
NA
L E
AR
LY
WA
RN
ING
SC
OR
E (
NE
WS
)
DISCLAIMER
This Health Technology Assessment has been developed from analysis, interpretation and synthesis of scientific research and/or technology assessment conducted by other organisations. It also incorporates, where available, Malaysian data, and information provided by experts to the Ministry of Health Malaysia. While effort has been made to do so, this document may not fully reflect all scientific research available. Additionally, other relevant scientific findings may have been reported since completion of the review.
Please contact: [email protected] if you would like further information.
Published by Malaysian Health Technology Assessment Section, (MaHTAS)Medical Development Division, Ministry of Health MalaysiaLevel 4, Block E1, Complex E, Precinct 1Federal Government Administrative Centre62590, Putrajaya, MalaysiaTel: 603 88831246Fax: 603 8883 1230
CopyrightThe copyright owner of this publication is the Malaysian Health Technology Assessment Section (MaHTAS), Medical Development Division, Ministry of Health Malaysia. Content may be reproduced in any number of copies and in any format or medium provided that a copyright acknowledgement to the Malaysian Health Technology Assessment Section (MaHTAS) is included and the content is not changed, not sold, nor used to promote or endorse any product or service, and not used in an inappropriate or misleading context.
ISBN: 978-967-2173-98-4
Available on the MOH website: http://www.moh.gov.my/index.php/pages/view/1749
This HTA report was endorsed in HTA & CPG Council Meeting Bil. 2/2019 on 4 November 2019.
This report should be referenced as follows:
Erni ZR, Syful Azlie MF, Junainah S, Jusoh AC, Maw PT, Suresh Kumar C, Idrose A, Zawawi ZA, Salleh SM, Judin AM, Peng LS, Hanifah NH, Hamzah LK. National Early Warning Score. Health Technology Assessment Report. Ministry of Health, Malaysia. 2020. ISBN: 978-967-2173-98-4

vi
HE
AL
TH
TE
CH
NO
LO
GY
AS
SE
SS
ME
NT
RE
PO
RT
HE
AL
TH
TE
CH
NO
LO
GY
AS
SE
SS
ME
NT
SE
CT
ION
(MaH
TA
S)
ME
DIC
AL
DE
VE
LO
PM
EN
T D
IVIS
ION
, MIN
IST
RY
OF
HE
AL
TH
NA
TIO
NA
L E
AR
LY
WA
RN
ING
SC
OR
E (N
EW
S)
AUTHORS
DR. ERNI ZURINA BINTI ROMLI Senior Principle Assistant DirectorHealth Technology Assessment Section (MaHTAS)Medical Development DivisionMinistry of Health Malaysia
MR. SYFUL AZLIE BIN MD FUZI Principle Assistant Director Health Technology Assessment Section (MaHTAS)Medical Development DivisionMinistry of Health Malaysia
INFORMATION SPECIALIST
MR. MOHD THOLIB BIN IBRAHIM Medical Assistant Officer Health Technology Assessment Section (MaHTAS)Medical Development DivisionMinistry of Health Malaysia

HE
AL
TH
TE
CH
NO
LO
GY
AS
SE
SS
ME
NT
RE
PO
RT
HE
AL
TH
TE
CH
NO
LO
GY
AS
SE
SS
ME
NT
SE
CT
ION
(M
aH
TA
S)
ME
DIC
AL
DE
VE
LO
PM
EN
T D
IVIS
ION
, M
INIS
TR
Y O
F H
EA
LT
H
vii
NA
TIO
NA
L E
AR
LY
WA
RN
ING
SC
OR
E (
NE
WS
)
EXPERT COMMITTEE
Datuk Dr Alzamani Mohamad Idrose Senior Consultant Emergency MedicineHospital Kuala Lumpur
Professor Dr Tan Maw Pin Senior Consultant Geriatrics MedicineFaculty of MedicineUniversity of Malaya
Dr Mohd Asri Che Jusoh Head of Department and Senior Consultant General SurgeryHospital Kuala Krai, Kelantan
Dr Azizol Mohamad@Mohd Judin Head of Department and Senior Consultant Anaesthesiologist Hospital Kuala Krai, Kelantan
Dr Mohd Shukruddeen Salleh Head of Department and Senior Consultant Emergency Medicine Hospital Kuala Krai, Kelantan
Dr Zairuddin Abdullah Zawawi Consultant Orthopaedic Surgery Hospital Raja Perempuan Zainab II Kota Bharu, Kelantan
Dr Suresh Kumar a/l Chidambaram Head of Department and Senior Consultant Infectious DiseaseDepartment of General MedicineHospital Sungai Buloh
Dr Peng Leong ShianEmergency Medicine PhysicianHospital Port Dickson, Negeri Sembilan
Mdm Lili Khuzaimah Hamzah Chief Nurse Department of General Surgery Hospital Kuala Krai, Kelantan
Mdm Norsiati Habuan Hanifah Chief Nurse Department of General Medicine Hospital Sg Buloh, Selangor
Dr Junainah Sabirin(Public Health Physician)Deputy Director Health Technology Assessment Section (MaHTAS)Medical Development Division, Ministry of Health Malaysia

viii
HE
AL
TH
TE
CH
NO
LO
GY
AS
SE
SS
ME
NT
RE
PO
RT
HE
AL
TH
TE
CH
NO
LO
GY
AS
SE
SS
ME
NT
SE
CT
ION
(MaH
TA
S)
ME
DIC
AL
DE
VE
LO
PM
EN
T D
IVIS
ION
, MIN
IST
RY
OF
HE
AL
TH
NA
TIO
NA
L E
AR
LY
WA
RN
ING
SC
OR
E (N
EW
S)
EXTERNAL REVIEWERS
Dato’ Dr Mahiran bt Mustafa Head of Service and Senior Consultant Infectious DiseaseHospital Raja Perempuan Zainab II, Kota Bharu, Kelantan
Dato’ Dr. Mohamed Yusof b Hj Abdul Wahab Head of Service and Senior Consultant General Surgery Hospital Tengku Ampuan Rahimah, Selangor
Dr Hidayah Shafie Consultant Emergency Medicine Emergency and Trauma Department Hospital Kuala Lumpur
Dr Fausto CatenaChief Department of Emergency and General SurgeryParma University Hospital, Italy
Dr Federico CoccoliniTrauma, Emergency and General SurgeryPisa University Hospital, Pisa, Italy

HE
AL
TH
TE
CH
NO
LO
GY
AS
SE
SS
ME
NT
RE
PO
RT
HE
AL
TH
TE
CH
NO
LO
GY
AS
SE
SS
ME
NT
SE
CT
ION
(M
aH
TA
S)
ME
DIC
AL
DE
VE
LO
PM
EN
T D
IVIS
ION
, M
INIS
TR
Y O
F H
EA
LT
H
ix
NA
TIO
NA
L E
AR
LY
WA
RN
ING
SC
OR
E (
NE
WS
)
ACKNOWLEDGEMENT
The authors of this Health Technology Assessment Report would like to express their gratitude and appreciation to the following for their contribution and assistance:
• Health Technology Assessment and Clinical Practice Guidelines Council
• Technical Advisory Committee for Health Technology Assessment
• Medical Department, Hospital Sg Buloh and Faculty of Medicine, University Malaya
• MR. MOHD THOLIB BIN IBRAHIM from MaHTAS for his contribution in retrieval of the evidence
DISCLOSURE
The authors of this report have no competing interest in this subject and the preparation of this report is totally funded by the Ministry of Health, Malaysia.

x
HE
AL
TH
TE
CH
NO
LO
GY
AS
SE
SS
ME
NT
RE
PO
RT
HE
AL
TH
TE
CH
NO
LO
GY
AS
SE
SS
ME
NT
SE
CT
ION
(MaH
TA
S)
ME
DIC
AL
DE
VE
LO
PM
EN
T D
IVIS
ION
, MIN
IST
RY
OF
HE
AL
TH
NA
TIO
NA
L E
AR
LY
WA
RN
ING
SC
OR
E (N
EW
S)
EXECUTIVESUMMARY
Background
Reduction in the incidence of hospital adverse events and the number of preventable deaths in hospital has been the major focus of many quality improvement initiatives worldwide. It is a reflection on the capacity of the healthcare service in delivering high quality care to the patients. ‘Catastrophic’ medical or sentinel events which include in-hospital cardiopulmonary arrests and deterioration in the patient’s clinical condition are often preceded by a steady accumulation of small clinical clues or a period of abnormal physiological status of the patient. In numerous studies, this abnormality was reflected on recorded patient’s vital signs (blood pressure, heart rate, respiratory rate and temperature) suggesting that potential serious complications or adverse events in patient outcomes can be avoided if they were anticipated early. Recording patient’s physiological observations is considered part of daily routine management in hospital either in acute hospital setting like in emergency department or in general ward setting. It is currently based mostly on intermittent measurements of basic parameters; blood pressure, heart rate, temperature and oxygen saturation by nursing staffs. Several hours can pass between such measurements and patient deterioration can go unnoticed especially on busy wards or during the night. Early Warning Scores (EWSs) are clinical bedside decision support tools used by care teams to potentially predict a patient’s risk of deterioration and facilitate changes in management. Currently, it has been implemented across a variety of specialties and international settings.
At present, there has not been a formal adoption of single standardised EWS at national level that can be used across Malaysian healthcare system. While the few have adopted EWS either in its original version or adapted versions, tailored to their personalised hospital needs, majority of local hospitals are still using a conventional observation chart with routine four basic vital signs monitoring. Consistent use of a single nationally agreed EWS system as a tool for detection and response to clinical deterioration in adult patients will ensure that all patients are objectively assessed in the same way, regardless of the clinical expertise of the clinician or where the patient is assessed. This will ensure that the severity of illness and the rate of deterioration can be explicitly stated and understood throughout the entire Malaysian healthcare system. Hence, this Health Technology Assessment (HTA) was requested by Head of Department and Senior Consultant of General Surgery from Kuala Krai Hospital, Kelantan, to assess the effectiveness, safety, economic and organisational impacts of National Early Warning Score (NEWS) as standardised approach for the detection of and response to clinical deterioration in patients with acute illness.
Technical features
The NEWS is based on an aggregate scoring system in which a score is allocated to physiological measurements. Six simple physiological parameters form the basis of the scoring system: i) Respiratory rate ii) Oxygen saturations iii) Temperature iv) Systolic blood pressure v) Pulse rate vi) Level of consciousness. A score is allocated to each as they are measured, the magnitude of the score reflecting how extreme the parameter varies from the norm. The individual scores are then combined. Depending on the total score, the escalation of care is linked to recommendations on the frequency of observations and the urgency of clinical review.
Policy Question
Should National Early Warning Score (NEWS) be implemented in Ministry of Health (MOH) hospitals to improve safety, efficiency and standardisation of patient care?

HE
AL
TH
TE
CH
NO
LO
GY
AS
SE
SS
ME
NT
RE
PO
RT
HE
AL
TH
TE
CH
NO
LO
GY
AS
SE
SS
ME
NT
SE
CT
ION
(M
aH
TA
S)
ME
DIC
AL
DE
VE
LO
PM
EN
T D
IVIS
ION
, M
INIS
TR
Y O
F H
EA
LT
H
xi
NA
TIO
NA
L E
AR
LY
WA
RN
ING
SC
OR
E (
NE
WS
)
Objectives
i. To assess the effectiveness and safety of NEWS in timely detection of patient’s clinical deterioration by evaluating its predictive ability and impact on patient’s clinical outcomes
ii. To determine the economic implications of a nationally implemented Early Warning Score system
iii. To evaluate the organisational, ethical, legal and social implications of NEWS implementation
Research Questions
i. How effective and safe is NEWS as a clinical decision support tools, in predicting patient’s clinical deterioration?
ii. What is the estimated economic impact of NEWS implementation in minimizing occurrence of adverse events and preventable hospital mortality?
iii. What are the organisational, ethical, legal and social issues related to NEWS implementation?
Methods
Electronic databases were searched for published literatures pertaining to NEWS. The following electronic databases were searched through the Ovid interface: Ovid MEDLINE®
In-process and other Non-indexed citations and Ovid MEDLINE® 1946 to September 9, 2019, EBM Reviews - Cochrane Central Register of Controlled Trials – August 2019, EBM Reviews - Cochrane Database of Systematic Reviews - 2005 to September 5, 2019, EBM Reviews - Health Technology Assessment – 4th Quarter 2016, EBM Reviews – NHS Economic Evaluation Database 1st Quarter 2016. Searches were also run in PubMed and CINAHL. Google was used to search for additional web-based materials and information. No limits were applied. Additional articles were identified from reviewing the references of retrieved articles. The search strategies used in the major databases are provided in Appendix 1. The searches were undertaken on 3 April 2019 and 13 August 2019 using the same strategies. Supplementary searches were undertaken between 21 May 2019 and 13 August 2019. Last search was conducted on 9 September 2019.
Results and Conclusion
A total of 3084 records were identified through the Ovid interface, PubMed and CINAHL databases. Additional 25 articles were identified from references of retrieved articles. After removal of 1407 irrelevant and duplicate articles, 1677 tittles were screened. Of these, 114 relevant abstracts were retrieved in full text. After reading, appraising and applying the inclusion and exclusion criteria, 79 full text articles were included for qualitative synthesis. A total of 35 full text articles were excluded due to irrelevant study design (n=5), irrelevant population (n=11), irrelevant outcome measure(s) (n=7), validation study of other models (8), master degree dissertation of quality improvement (n=3) and no full text article in English (n=1). The 79 full text articles comprised of one HTA, two systematic review, seven randomised control trials (RCTs), 51 cohort studies, one case-control, four pre-post intervention studies, three audit survey/cross-sectional studies, seven qualitative study and three economic evaluation studies.

xii
HE
AL
TH
TE
CH
NO
LO
GY
AS
SE
SS
ME
NT
RE
PO
RT
HE
AL
TH
TE
CH
NO
LO
GY
AS
SE
SS
ME
NT
SE
CT
ION
(MaH
TA
S)
ME
DIC
AL
DE
VE
LO
PM
EN
T D
IVIS
ION
, MIN
IST
RY
OF
HE
AL
TH
NA
TIO
NA
L E
AR
LY
WA
RN
ING
SC
OR
E (N
EW
S)
Effectiveness
1. Discriminative Ability and Predictive Validity
NEWS
There was a substantial fair level of evidence to suggest;
Emergency department
vv The NEWS was an effective assessment tool to identify and triage the patient for the most appropriate acute care assessments and interventions.
vv The NEWS was a good predictor for serious adverse events (mortality and unanticipated ICU admission) in adult patients of varying severity of illness presenting to emergency department. It was able to rapidly predict prognosis and evaluate disease progression of critical patients in resuscitation room.
vv The performance of NEWS was superior than quick Sequential Organ Failure Assessment (qSOFA), Systemic Inflammatory Response Sydrome criteria (SIRS) and Modified Early Warning score (MEWS), in risk-stratifying patients with suspected infection or sepsis and predicting death and unanticipated ICU admission in this subpopulation. Table-based aggregate weighted systems, such as NEWS, were more predictive and robust compared with tally-based single parameter scores such as qSOFA and SIRS.
vv However, NEWS may not be the optimum scoring system for all patient subgroups. The NEWS showed moderate predictive ability for patient with community acquired pneumonia and low accuracy for in-hospital mortality in critically ill geriatric patients.
General wards
vv The NEWS assessed on ward admission was able to risk stratify clinical deterioration and a good predictor of in-hospital serious adverse outcomes.
vv NEWS discriminates high risk patients in a heterogenic general ward population independently of multiple confounding factors (age, gender, cumulative comorbidity, admission characteristic).
vv The NEWS outperformed 33 other widely used Early Warning Scores (EWSs) for combined outcome of death, cardiac arrest and unanticipated ICU admission within 24 hours in the general population of patients.
vv Between non-elective surgical patients and non-elective medical patients, NEWS had almost equal discriminative ability for prediction of serious adverse events.
vv The NEWS accurately discriminates patients at risk of death, admission to the intensive care unit, or cardiac arrest within a 24-hour period for a range of liver-related diagnoses.
vv A local study showed that NEWS was able to independently predict death or unanticipated ICU admission with an excellent prognostic performance (AUROC 0.905, p<0.001) in general surgical and orthopaedic wards. A score of 5 or more had the optimal sensitivity (87%) and specificity (91.3%) with PPV of 26.9% to predict serious adverse events in general ward (OR 2.828; 95%CI 1.632, 4.902). The number needed to screen at this threshold was 3.6.
vv National Early Warning Score was identified as independent predictor of early clinical deterioration 24 hours after ICU discharge and readmission to ICU or High Dependency Unit (HDU). A NEWSdc > 7 showed the best sensitivity (93.6%) and specificity (82.2%) to detect early clinical deterioration 24 hours after ICU discharge.
vv The NEWS also had reasonable discrimination for any ICU patient’s discharge location within 24 hours of admission to any ICU specialty. Hence, it could potentially be applied within a universal discharge planning tool for ICU, improving patient safety at the point of discharge (reduce the likelihood of both

HE
AL
TH
TE
CH
NO
LO
GY
AS
SE
SS
ME
NT
RE
PO
RT
HE
AL
TH
TE
CH
NO
LO
GY
AS
SE
SS
ME
NT
SE
CT
ION
(M
aH
TA
S)
ME
DIC
AL
DE
VE
LO
PM
EN
T D
IVIS
ION
, M
INIS
TR
Y O
F H
EA
LT
H
xiii
NA
TIO
NA
L E
AR
LY
WA
RN
ING
SC
OR
E (
NE
WS
)
premature discharge and discharge delay by allowing care providers adequate time to plan accordingly).
vv However, the NEWS system, whilst beneficial, lacks sensitivity and specificity in subpopulations of older adult patients (with/without comorbidity, high frailty index), patients with chronic obstructive pulmonary diseases (COPD) and oncology patients at risk of deterioration.
Pre-hospital setting
vv In pre-hospital setting whereby NEWS was calculated using parameters recorded on the scene or prior ambulance transfer, NEWS showed good discriminative performance for both short term and long term mortality, and ICU admission from ED.
vv A threshold level of 7 was associated with increased risk for the combined outcome of death or critical care unit escalation within 48 hours of hospital admission.
vv Pre-hospital NEWS had better diagnostic accuracy in cases where the initial dispatch code was specified as trauma.
vv Pre-hospital NEWS had poor prognostic performance for in-hospital mortality in elderly patients.
vv Among pre-hospital patients with suspected infection, an elevated NEWS, was associated with increased levels of adverse outcomes (ICU admission within 48 hours of presentation and/ or 30-day mortality). The aggregated total NEWS score was, significantly superior to qSOFA at identifying patients at combined risk. A NEWS of medium or high clinical risk could be used according to sepsis guideline to prompt clinicians to further investigate for organ dysfunction, to initiate or escalate therapy as appropriate, and to consider referral to critical care or increase the frequency of monitoring.
NEWS2
vv In predicting 24 hours mortality among patients with documented or at risk of type 2 respiratory failure, NEWS2 did not show superior performance to original NEWS. The NEWS2 did not improve discrimination for unanticipated ICU admission, cardiac arrest or combined outcomes compared to NEWS either.
vv In acute exacerbation of chronic obstructive pulmonary disease (AECOPD) cohort, NEWS2 at admission did not outperform the original NEWS.
vv In pre-hospital setting, NEWS2 had the best prognostic performance [AUROC of 0.896 (95%CI 0.82, 0.95)], in comparison with other EWS namely EWS [Early Warning Score (EWS), Modified Early Warning Score (MEWS), Vital-PAC Early Warning Score (ViEWS), Hamilton Early Warning Score (HEWS) and Scottish Early Warning Score (SEWS).
vv The NEWS2 accurately predicted in-hospital mortality particularly among patients with suspected infection. At the critical threshold (≥ 5), the NEWS2 had sensitivity of 84.5% (95%CI 82.8, 86.2) and specificity of 49.0% (95%CI 47.4, 50.7). The number needed to examine (NNE) was 2.20 (95%CI 2.16, 2.25). NEWS2 was superior to qSOFA for screening for sepsis with organ dysfunction, infection-related mortality or intensive care due to an infection both among infected patients and among undifferentiated patients at emergency departments.
2. Impact on clinical outcome (NEWS and NEWS2)vv Despite having good prognostic performance of death and ICU admission, the
implementation of NEWS has not yet been reported to have any change in overall patient outcomes (survival rate, serious adverse events rate, ICU mortality rate).

xiv
HE
AL
TH
TE
CH
NO
LO
GY
AS
SE
SS
ME
NT
RE
PO
RT
HE
AL
TH
TE
CH
NO
LO
GY
AS
SE
SS
ME
NT
SE
CT
ION
(MaH
TA
S)
ME
DIC
AL
DE
VE
LO
PM
EN
T D
IVIS
ION
, MIN
IST
RY
OF
HE
AL
TH
NA
TIO
NA
L E
AR
LY
WA
RN
ING
SC
OR
E (N
EW
S)
Safety
There was fair level of evidence to suggest;
vv Accuracy of NEWS scoring decreased significantly with increasing score or worsening physiological derangement and it had become a safety concern.
vv The NEWS that were calculated incorrectly had implications for trigger actions and associated clinical care. Increased mortality trend was observed among patients who received an incorrect response.
vv Patients admitted at the weekend had a worse clinical response [adjusted OR 4.15 (95%CI 2.24, 7.69), p<0.001].
vv Non-adherence to NEWS escalation protocol at one or several levels was associated with the occurrence of serious adverse events.
Economic evaluation
There was no retrievable evidence on cost-effectiveness. However, there were one cost analysis and two budget impact analysis conducted on implementation of NEWS. They suggested that the NEWS leads to cost and/or efficiency savings. If this trend is continuous and savings can be realised, it could be hypothesized that NEWS may indeed be cost effective.
Organisational implication There was fair level of evidence to suggest:
vv Length of stay (LOS) was found to be significantly correlated with NEWS, where median LOS was more than doubled for a NEWS score >7 compared with a score of 0–4.
vv Level of workload was inversely associated with NEWS scoring or threshold level. A NEWS score of 3 as a trigger would have increased doctors workload by 40% with only a small increase in the number of detected adverse outcomes per day (a 3% improvement in detection) whereas NEWS threshold of 5 would generate lower workload and higher detection rates (medical: workload 12.3%, detection 70.2%; surgical: workload 6.1%, detection 60.6%).
vv Reduced sensitivity of the triggering system and the overall effectiveness of the NEWS were likely to be caused by poor recording of vital signs, incorrect calculations and non-adherence to the escalation protocol.
vv Chart design affected the speed and accuracy of documentation. The use of graphical display and avoiding visual clutter, and the use of overlapping graphical displays of data helped to improve adherence.
vv Interdisciplinary, multimodal and follow-up educational programmes were most effective in improving adherence rate.
vv Improved efficiency and accuracy of recording vital sign parameters and compliance with escalation protocols were seen with automation of EWS.
Ethical and legal issues
There was evidence to suggest that in overcoming ethical and legal challenges of performing predictive analytics on healthcare, developing a governance structure at the earliest phase of model development is recommended in order to guide patients and participating stakeholders across the process. Liability issues such as failure to obtain crucial knowledge of patient’s medical history due to dependency on predictive model to make clinical decision which lead to harm, overriding an alert or recommendation or following the recommendations of faulty predictive analytic model should be anticipated and preventive measures should be put in place. Ethical issue surrounding doctor-patient relationship whereby the treatment approach could be shifted from catering to individual patient’s best interest to the

HE
AL
TH
TE
CH
NO
LO
GY
AS
SE
SS
ME
NT
RE
PO
RT
HE
AL
TH
TE
CH
NO
LO
GY
AS
SE
SS
ME
NT
SE
CT
ION
(M
aH
TA
S)
ME
DIC
AL
DE
VE
LO
PM
EN
T D
IVIS
ION
, M
INIS
TR
Y O
F H
EA
LT
H
xv
NA
TIO
NA
L E
AR
LY
WA
RN
ING
SC
OR
E (
NE
WS
)
interest of healthcare organization in maximizing population based health should be foreseen.
Social implication
There was evidence to suggest that understanding the organisational culture, systems, practices, barriers and facilitators and the stakeholders’ perceptions and interactions with the NEWS pre-implementation is important. The success of NEWS intervention depends on human interaction with the system and understanding the variable organisational practices; this involved understanding how the nursing staff incorporate the EWS system into their daily work routines and how they feel the system works for them. Organisations also need to address power hierarchy between medial teams to reduce delays in response to deteriorating patients. A ‘whole system’ approach incorporating a EWS, well designed chart, communication tool, decision aides, evidence based care bundles, Rapid Response Team (RRT), bedside evaluation, education, reinforcement and audit is most effective at identifying and responding to deteriorating patients. A poor-quality implementation likely to worsen patient care.
Recommendations
Based on the findings of this review, NEWS may have a role in the early identification of deteriorating patient and can be used for adult non-obstetric patients within the hospital system to improve safety and efficiency of patient care through standardisation of early warning score application. The following considerations should be taken into account in the development of national approach of early warning score in order to ensure its effective implementation;
vv A requirement for systems approach supported by appropriate governance as NEWS is a system-level complex intervention. The emphasis should be given on regular reinforcement and auditing to promote high levels adherence to NEWS to ensure effectiveness.
vv For effective escalation of care, the appropriate trigger levels should be set and a mechanism should be in place to ensure that the appropriate individuals with higher NEW scores are reviewed promptly by health care professionals with critical care competencies and diagnostic skills.
vv Ensuring regular training and continuous education of all health care providers using NEWS; such training and education should include: interdisciplinary in person simulations/case-reviews; be multimodal, and inclusion of regular reinforcement.
vv In healthcare settings where automated healthcare service is available, the potential use of electronic data capture, EWS triggering, notification and tracking of outcomes should be carefully considered. The implementation of electronic NEWS should be initiated as a pilot programme before expansion to other hospitals.
vv In settings that still utilize manual system in delivering services to patients, a structured manual approach (paper-based NEWS) would be a more suited
choice.

xvi
HE
AL
TH
TE
CH
NO
LO
GY
AS
SE
SS
ME
NT
RE
PO
RT
HE
AL
TH
TE
CH
NO
LO
GY
AS
SE
SS
ME
NT
SE
CT
ION
(MaH
TA
S)
ME
DIC
AL
DE
VE
LO
PM
EN
T D
IVIS
ION
, MIN
IST
RY
OF
HE
AL
TH
NA
TIO
NA
L E
AR
LY
WA
RN
ING
SC
OR
E (N
EW
S)
Abbreviations
AMU Acute medical unit
APACHE II Acute Physiology and Chronic Health Evaluation Score II
ARLD Alcohol-related liver disease
ASA American Society of Anesthesiologists classification of physical status
AUROC Area Under the Receiver Operating Characteristic Curve
BIA Budget Impact Analysis
CAP Community acquired pneumonia
CCI Charlson Comorbidity Index
CI Confidence Interval
ED Emergency Department
EMS Emergency Medical Services
ESI Emergency Severity Index
EWS Early Warning Score
GDP Gross domestic product
HDU High dependency unit
HEWS Hamilton Early Warning Score
ICU Intensive care unit
LOS Length of stay
MEDS Mortality in Emergency Department Sepsis
MEES Mainz Emergency Evaluation Score
MEWS Modified Early Warning Score
MTS Manchester Triage Scale
MV Mechanical ventilation
NEWS National Early Warning Score
NPSA National Patient Safety Agency
NPV Negative Predictive Value
OR Odd ratio
PARS Patient at Risk Score
PEDS Prince of Wales Emergency Department Score
PIRF-14 Post-ICU respiratory failure before day 14
PIRO Predisposition/ Infection/Response/Organ Dysfunction Score
PPV Positive predictive value
PSI Pneumonia Severity Index
RCPL Royal College of Physicians of London
REMS Rapid Emergency Medicine Score
RRT Rapid Response Team
SAPS Simplified Acute Physiology Score
SCS Simple Clinical Score
SEWS Scottish Early Warning Score
SIRS Systemic Inflammatory Response Syndrome criteria
SOFA Sequential Organ Failure Assessment
qSOFA quick Sequential Organ Failure Assessment
T2RF Type 2 respiratory failure
THERM The Resuscitation Management score
TTS Track and Trigger System
ViEWS Vitalpac Early Warning Score

HE
AL
TH
TE
CH
NO
LO
GY
AS
SE
SS
ME
NT
RE
PO
RT
HE
AL
TH
TE
CH
NO
LO
GY
AS
SE
SS
ME
NT
SE
CT
ION
(M
aH
TA
S)
ME
DIC
AL
DE
VE
LO
PM
EN
T D
IVIS
ION
, M
INIS
TR
Y O
F H
EA
LT
H
xvii
NA
TIO
NA
L E
AR
LY
WA
RN
ING
SC
OR
E (
NE
WS
)
TABLE OFCONTENTS
Disclaimer v
Authors vi
Expert committee vii
External reviewers vii
Acknowledgement and Disclosure ix
Executive summary x
Abbreviations xvi
1.0 BACKGROUND 1
2.0 TECHNICAL FEATURES 3
3.0 POLICY QUESTION 10
4.0 OBJECTIVE 10
5.0 METHODS 10
6.0 RESULTS 13
6.1 Effectiveness 24
6.1.1 Discriminative Ability and Predictive Validity 24
6.1.2 Impact on clinical outcomes 52
6.2 Safety 53
6.3 Economic evaluation 55
6.4 Organisational 57
6.4.1 Impact on resources 57
6.4.2 Impact on work process 57
6.4.3 Education and training 59
6.4.4 EWS Implementation 59
6.4.5 Clinical Guidelines Published Internationally 66
6.5 Ethical and legal issues 67
6.6 Social implications 69
6.7 An overview of NEWS: the Malaysian Context 74
7.0 DISCUSSION 80
8.0 CONCLUSION 82
9.0 RECOMMENDATIONS 85
10.0 REFERENCES 86
11.0 APPENDICES 92
Appendix 1 - Hierarchy of evidence for effectiveness studies 92
Appendix 2 - Health Technology Assessment Protocol 93
Appendix 3 - Search strategy 102
Appendix 4 - Evidence table 103

1
HE
AL
TH
TE
CH
NO
LO
GY
AS
SE
SS
ME
NT
RE
PO
RT
HE
AL
TH
TE
CH
NO
LO
GY
AS
SE
SS
ME
NT
SE
CT
ION
(MaH
TA
S)
ME
DIC
AL
DE
VE
LO
PM
EN
T D
IVIS
ION
, MIN
IST
RY
OF
HE
AL
TH
NA
TIO
NA
L E
AR
LY
WA
RN
ING
SC
OR
E (N
EW
S)
HEALTH TECHNOLOGY ASSESSMENT (HTA) NATIONAL EARLY WARNING SCORE
1.0 BACKGROUND
Reduction in the incidence of hospital adverse events and the number of preventable deaths in hospital has been the major focus of many quality improvement initiatives worldwide. It is a reflection on the capacity of the healthcare service in delivering high quality care to the patients. In 2016, approximately 24% of all deaths in the UK were considered preventable (141,101 deaths out of 597,206).1 About one-third of potentially preventable deaths in the UK relate to poor clinical monitoring.2 The total number of deaths in EU that could have potentially been prevented through effective medical interventions was just over 1.2 million in 2015.3 According to a newly published analysis led by Harvard Medical School, eight million largely preventable deaths from lack of high quality medical care cost $6 trillion in lost economic welfare in low- and middle-income countries. If current conditions persist, low- and middle-income countries could lose collectively $11 trillion in gross domestic product (GDP) by 2030.4
‘Catastrophic’ medical or sentinel events which include in-hospital cardiopulmonary arrests and deterioration in the patient’s clinical condition are often preceded by a steady accumulation of small clinical clues or a period of abnormal physiological status of the patient. In numerous studies, this abnormality was reflected on recorded patient’s vital signs (blood pressure, heart rate, respiratory rate and temperature) suggesting that potential serious complications or adverse events in patient outcomes can be avoided if they were anticipated early.5-10 Research suggests that patients suffering from a cardiac and/or respiratory arrest usually display physiological deviations (changes in vital signs and/or mental status) at least eight hours prior to their need for more intensive care.10 A study reported that 86% of code blue events or rapid response team (RRT) activation could have been predicted beforehand, with a median advanced warning time of 11.5 hours.9
Recording patient’s physiological observations is considered part of daily routine management in hospital either in acute hospital setting like in emergency department or in general ward setting. It is currently based mostly on intermittent measurements of basic parameters; blood pressure, heart rate, temperature and oxygen saturation by nursing staffs. Several hours can pass between such measurements and patient deterioration can go unnoticed especially on busy wards or during the night.11 Analysis of 576 deaths reported to the UK National Patient Safety Agency’s (NPSA) National Reporting and Learning System (NRLS) over a one year period identified that 11% were as a result of deterioration not recognised or acted upon.12 According to the report produced by the UK NPSA, contributing factors for failure to recognise and respond to patient’s clinical deterioration were observations not being taken or poorly documented, observations causing concern not being reported, early signs of deterioration not being recognised or misinterpreted and not responding appropriately.12 These were often due to demanding workloads, poor staffing level, time limitation and communication failure between teams.13, 14 Studies revealed that this failure had led to delays in diagnosis, treatment or referral, resulting in increased patient morbidity, mortality and admission to intensive care units or cardiac arrests, which were preventable.15-19
In order to address these challenges, hospitals require robust escalation of care processes to ensure that worsening conditions in patients are recognised and treated. A high quality response is essential to stop the potential transition from an initial serious complication to a progressive cascade of adverse occurrences

HE
AL
TH
TE
CH
NO
LO
GY
AS
SE
SS
ME
NT
RE
PO
RT
HE
AL
TH
TE
CH
NO
LO
GY
AS
SE
SS
ME
NT
SE
CT
ION
(M
aH
TA
S)
ME
DIC
AL
DE
VE
LO
PM
EN
T D
IVIS
ION
, M
INIS
TR
Y O
F H
EA
LT
H
2
NA
TIO
NA
L E
AR
LY
WA
RN
ING
SC
OR
E (
NE
WS
)
that can lead to preventable patient harm and death, or ‘failure to rescue’. Current nursing practise (routine vital signs observation) in hospitals is not sensitive enough to detect a deteriorating or critically ill patient at an early stage. Providing clinical staffs with the tools they need, to be aware of those patients who are deteriorating fast will be a significant step forward. Early warning scores (EWS) are clinical bedside decision support tools used by care teams to potentially predict a patient’s risk of deterioration and facilitate changes in management. Currently, it has been implemented across a variety of specialties and international settings.
1.1 Local Background and Context
In Malaysia, Ministry of Health is the major provider of healthcare services in public sector and consists of 144 hospitals (including special medical institutions namely Rehabilitation Hospital, Women & Children Hospital, National Leprosy Control Centre, Institute of Respiratory Medicine, National Cancer Institute and Psychiatric Institutions) with a total inpatient bed capacity of 42 302.20 A total of 57 831 doctors and 106 289 nurses are currently working in public and private healthcare facilities, delivering services for patients, with a doctor and nurse to population ratio of 1:554 and 1:302, respectively.20 There are challenges in sustaining the quality and patient safety in Malaysia. As the population increases, demand for healthcare increases as well.21 The highly subsidised government healthcare services with inequitable distribution of resources, changing in pattern of diseases and rising costs have resulted in heavy workload and long waiting time for patients to receive treatment.21 Nowadays, patients are better informed and have an expectation that the care they receive is evidence based, effective, safe and of high quality. Advances in medical technology are constantly pushing the healthcare providers for better services but at great cost. According to Malaysia Health Systems Research Key Findings 2016, 219 deaths for every 100 000 population in Malaysia can be prevented with better healthcare.22
In order to elevate patient care and outcomes, a number of Ministry of Health hospitals as well as private hospitals have introduced EWS into their routine nursing practice for monitoring patient’s clinical parameters as one of the strategic steps to strengthen its ability to better serve patients while easing the tasks of the hospital’s personnel and management team. Early warning score is mostly used in general adult medical and surgical wards. In recent years, some of these hospitals mainly private hospitals started transitioning their EWS from paper observation charts to electronic platforms. University Malaya Medical Centre (UMMC) has become the first public hospital in the country to implement a warning score system that is fully integrated into its electronic patient management system.23 Penang Adventist Hospital and Bagan Specialist Centre in Penang are two examples of private hospitals that have adopted fully automated early warning scoring system.24,25
At present, there has not been a formal adoption of single standardised EWS at national level that can be used across Malaysian healthcare system. While the few have adopted EWS either in its original version or adapted versions, tailored to their personalised hospital needs, majority of local hospitals are still using a conventional observation chart with routine four basic vital signs monitoring. The staff use their clinical judgement regarding the frequency of observations and adjust where necessary. Consistent use of a single nationally agreed EWS system as a tool for detection and response to clinical deterioration in adult patients will ensure that all patients are objectively assessed in the same way, regardless of the clinical expertise of the clinician or where the patient is assessed. This will ensure that the severity of illness and the rate of deterioration can be explicitly stated and understood throughout the entire Malaysian healthcare system. Hence, this Health Technology Assessment (HTA) was requested by Head of Department and Senior Consultant of General Surgery from Kuala Krai Hospital, Kelantan, to assess the effectiveness, safety, economic and organisational impacts of National Early

3
HE
AL
TH
TE
CH
NO
LO
GY
AS
SE
SS
ME
NT
RE
PO
RT
HE
AL
TH
TE
CH
NO
LO
GY
AS
SE
SS
ME
NT
SE
CT
ION
(MaH
TA
S)
ME
DIC
AL
DE
VE
LO
PM
EN
T D
IVIS
ION
, MIN
IST
RY
OF
HE
AL
TH
NA
TIO
NA
L E
AR
LY
WA
RN
ING
SC
OR
E (N
EW
S)
Warning Score (NEWS) as standardised approach for the detection of and response to clinical deterioration in patients with acute illness.
2.0 TECHNICAL FEATURES
2.1 Early Warning Scores/Systems (EWS) 26-28
Early Warning Scores/Systems, also referred to as ‘Track and Trigger Systems’, are simple scoring systems for bedside monitoring, to serve as clinical support tools using routinely collected vital sign data. The scoring tools have been established in acute clinical care settings to facilitate early detection of deterioration by categorising a patient’s severity of illness and prompting nursing staff to request a medical review at specific trigger points utilising a structured communication tool while following a definitive escalation plan. They were developed initially as paper based approach then later moved to electronic platform.
In its simplest form, Early Warning/Track and Trigger Systems require an efficient data collection mechanism to ‘track’ physiological signs or changes followed by a data analysis algorithm to generate an early ‘trigger’ to intervene and escalate care. Overall, these systems focus on combating the problem of “failure to rescue”; they are then broken down into issues of “failure to identify” (afferent limb) and “failure to escalate” (efferent limb). The afferent limb of the system is meant to identify patient deterioration and trigger a response indicating the need for a higher level of care. The efferent limb is the response to the trigger—delivered through higher levels of monitoring and care or a rapid response/medical emergency team. (Figure 1) Numerous EW/TTS are used internationally to detect patients at risk of deteriorating. They are broadly divided into single parameter, multiple parameter and aggregate weighted systems, which are shown in the Table 1.
Data
Vital Signs
Physical Exam
NeurologicalStatus
LaboratoryValues
Test Results
Action
IncreasedMonitoring
ClinicalEscalation
ProviderNotification
Rapid ResponseTeam
EFFER
EN
T LIM
BAFF
ER
EN
T L
IM
B
EARLYWARNING
SCORE TRACKAND SYSTEM
WARDPATIENT
PAPER BASED DATA ENTRYAND SCORE CALCULATIOM
ELECTRONIC MEDICALRECORD WITH AUTOMATEDSCORING SYSTEMS
DIGITAL DATA ENTRYAND SCORE CALCULATION
Figure 1: A schematic representation of early warning/track-and -trigger systems demonstrating the afferent and efferent limbs of the system.28

HE
AL
TH
TE
CH
NO
LO
GY
AS
SE
SS
ME
NT
RE
PO
RT
HE
AL
TH
TE
CH
NO
LO
GY
AS
SE
SS
ME
NT
SE
CT
ION
(M
aH
TA
S)
ME
DIC
AL
DE
VE
LO
PM
EN
T D
IVIS
ION
, M
INIS
TR
Y O
F H
EA
LT
H
4
NA
TIO
NA
L E
AR
LY
WA
RN
ING
SC
OR
E (
NE
WS
)
Table 1: Types of Early Warning System
System Characteristics
Single parameter system
Periodic observation of selected vital signs or laboratory values that are compared with a simple set of criteria with predefined thresholds, with a response algorithm being activated when any single criterion is met.
vv Thresholds for classifying the values as abnormal are not uniform among hospitals and scoring systems are chosen somewhat arbitrarily based on local preferences and expertise.
vv Examples: qSOFA, SIRS
Multiple parameter system
Response algorithm requires more than one criterion to be met or differs according to the number of criteria met.
vv Example: shock index (SI)—heart rate divided by systolic blood pressure
Aggregate scoring system
Weighted scores are assigned to physiological values and compared with predefined trigger thresholds.vv Examples: NEWS, MEWS, ViEWS
2.2 Electronic early warning systems29
While commercial electronic early warning systems may comprise a wide range of features, there are four core elements that are common to all systems.
a. Electronic reporting (information capture) of vital sign parameters at the bedside using a mobile, user-friendly platform
b. Computer learning systems that calculate the early warning scorec. Escalation of care when appropriated. Communication of the actions to be taken/or have been taken to address
deteriorating vital sign and patient parameters.
When an electronic early warning system is introduced into a setting, the threshold parameters are usually set in line with national or local guidelines for early warning scores and escalation protocols.
2.3 National Early Warning Score (NEWS)26
National Early Warning Score was developed in 2012, through collaborative work of Royal College of Physicians (RCP) and National Health Service (NHS) Trusts in UK on the basis of there should be a national system for recognising very sick patients whose condition is deteriorating and who need more intensive medical or nursing care. It is a pragmatic approach, with a key emphasis on system-wide standardisation and the use of physiological parameters that are already routinely measured in hospitals and in prehospital care, recorded on a standardised clinical chart. The NEWS is an adjunct to decision making, used in combination with clinical judgement and communicated across the care pathway. NEWS does not replace disease-specific validated scoring systems but highly recommended to be used alongside these validated scoring systems as dictated by patient need. It offers the following features;

5
HE
AL
TH
TE
CH
NO
LO
GY
AS
SE
SS
ME
NT
RE
PO
RT
HE
AL
TH
TE
CH
NO
LO
GY
AS
SE
SS
ME
NT
SE
CT
ION
(MaH
TA
S)
ME
DIC
AL
DE
VE
LO
PM
EN
T D
IVIS
ION
, MIN
IST
RY
OF
HE
AL
TH
NA
TIO
NA
L E
AR
LY
WA
RN
ING
SC
OR
E (N
EW
S)
vv a standardised method to characterise acute illness severity
vv a standardised method to detect patient deterioration
vv a common language of illness severity
vv system-wide unitary documentation - instantly recognisable
vv a standardised system for education, training and accreditation for all staff in the local healthcare system
Based on EWS concept, it is used to quickly determine the degree of illness of a patient and simplify trend tracking, enabling a more timely response using a common language across hospitals nationally. The principles of the NEWS highlight a key triad consists of early detection, speed of response and competencies of the responder(s) that determine the clinical outcomes (hospital mortality, cardiac arrest, admission to critical care).
In 2017, NEWS was updated to NEWS2 to include additional features (Chart 1);
vv Observation chart re-odered to reflect the resuscitation council ABCDE format
vv Chart colours changed from red/amber/green as they were not ideal for staff with red/green colour blindness. (Chart 1)
vv New section for scoring oxygen saturations for patients with hypercapnic respiratory failure (SpO
2
Scale 2). (Figure 2)
vv “New confusion / delirium” added and scores 3. (Figure 3)
vv Strong emphasis use of NEWS to raise suspicion of potential sepsis as a cause for a NEWS score of 5 or more. (Chart 3)

HE
AL
TH
TE
CH
NO
LO
GY
AS
SE
SS
ME
NT
RE
PO
RT
HE
AL
TH
TE
CH
NO
LO
GY
AS
SE
SS
ME
NT
SE
CT
ION
(M
aH
TA
S)
ME
DIC
AL
DE
VE
LO
PM
EN
T D
IVIS
ION
, M
INIS
TR
Y O
F H
EA
LT
H
6
NA
TIO
NA
L E
AR
LY
WA
RN
ING
SC
OR
E (
NE
WS
)
Physiologicalparameter
Score
3 2 1 0 1 2 3
Respiration rate(per minute)
≤8 9-11 12-20
Sp02Scale 1 (%) ≤ 91 92-93 94-95 ≥95 93-94
on oxygen95-96
on oxygen≥ 97
on oxygen
Sp02Scale 2 (%) ≤ 83 84-85 86-87
88-92≥ 93 on air
Air or oxygen Oxygen Air
Systelic blood pressure (mmHg)
≤ 90 91-100 101-110 111-219 ≥ 220
Pulse(per minute)
≤ 40 41-50 51-90 91-110 111-130 ≥ 131
Consciouness Alert CVPU
Temperature (0C) ≤ 35.0 35.1-36.0 36.1-38.0 38.1-39.0 ≥ 39.1
Physiologicalparameter
Score
3 2 1 0 1 2 3
Respiration rate ≤8 9-11 12-20 21 - 24 ≥ 25
Oxygen Saturations
≤ 91 92-93 94-95 ≥95
Any Supplemental Oxygen
Yes No
Temperature ≤ 35 35.1 -36.0 36.1 - 38.0 38.1 - 39.0 ≥ 39.1
Systolic BP ≤ 90 91-100 101-110 111-219 ≥ 220
Heat Rate ≤ 40 41-50 51-90 91-110 111-130 ≥ 131
Level of Conscousness
A V,P, or U
NEWS (2012) NEWS2 (2017)
Chart 1: Physiological Parameter Score Chart
Six simple physiological parameters form the basis of the NEWS scoring system.
1. Respiratory rate 2. Oxygen saturation 3. Systolic blood pressure 4. Pulse rate 5. Level of consciousness or new confusion 6. Temperature
A score is allocated to physiological measurements already undertaken when patients present to, or are being monitored in hospital, with the magnitude of the score reflecting how extremely the parameter varies from the norm. The score is then aggregated. The score is uplifted by 2 points for people requiring supplemental oxygen to maintain their recommended oxygen saturation. The clinical parameters [6 vital signs as well as the AVPU scale (“alert, voice, pain, unresponsive”)] produces an aggregate score between 0 and 20. (Chart 1)
NEW Score Clinical Risk Response
Aggregate score 0-4 Low Ward - based response
Red scoreScore of 3 in any individual parameter
Low - medium Urgent ward - based response*
Aggregate score 5-6 Medium Key threshold for urgent response*
Aggregate score 7 or more High Urgent or emergency response**
Chart 2: NEWS Thresholds and Triggers

7
HE
AL
TH
TE
CH
NO
LO
GY
AS
SE
SS
ME
NT
RE
PO
RT
HE
AL
TH
TE
CH
NO
LO
GY
AS
SE
SS
ME
NT
SE
CT
ION
(MaH
TA
S)
ME
DIC
AL
DE
VE
LO
PM
EN
T D
IVIS
ION
, MIN
IST
RY
OF
HE
AL
TH
NA
TIO
NA
L E
AR
LY
WA
RN
ING
SC
OR
E (N
EW
S)
NEWS recommends four trigger levels for a clinical alert requiring clinician assessment based on the NEWS (Chart 2) :
v LOW score: an aggregate NEW score of 1–4 v A single red score: an extreme variation in an individual physiological parameter
(a score of 3 in any one parameter, which is colour-coded red on the NEWS chart)
v MEDIUM score: an aggregate NEW score of 5 or 6. A NEW score of 5 or more is a key threshold and is indicative of potential serious acute clinical deterioration and the need for an urgent clinical response
v HIGH score: an aggregate NEW score of 7 or more.
NEWS recommends that these triggers should determine the urgency of the clinical response and the clinical competency of the responder(s). (Chart 3)
Chart 3: Clinical response to the NEWS trigger threshold
NEWS recommends the use of the standardised NEWS observation chart for the routine recording of clinical observations, across the hospitals. The NEWS chart is colour-coded to provide both visual and numeric prompts to aid identification of abnormal clinical parameters. It is recognised that the rest of the chart area will be customised to reflect other key parameters not incorporated in the NEWS, eg urine output and pain scores, according to the clinical environment. (Chart 4)

HE
AL
TH
TE
CH
NO
LO
GY
AS
SE
SS
ME
NT
RE
PO
RT
HE
AL
TH
TE
CH
NO
LO
GY
AS
SE
SS
ME
NT
SE
CT
ION
(M
aH
TA
S)
ME
DIC
AL
DE
VE
LO
PM
EN
T D
IVIS
ION
, M
INIS
TR
Y O
F H
EA
LT
H
8
NA
TIO
NA
L E
AR
LY
WA
RN
ING
SC
OR
E (
NE
WS
)
Chart 4: NEWS Observation Chart

9
HE
AL
TH
TE
CH
NO
LO
GY
AS
SE
SS
ME
NT
RE
PO
RT
HE
AL
TH
TE
CH
NO
LO
GY
AS
SE
SS
ME
NT
SE
CT
ION
(MaH
TA
S)
ME
DIC
AL
DE
VE
LO
PM
EN
T D
IVIS
ION
, MIN
IST
RY
OF
HE
AL
TH
NA
TIO
NA
L E
AR
LY
WA
RN
ING
SC
OR
E (N
EW
S)
Figure 2: Using NEWS2 in COPD with Hypercapnic Respiratory failure - safer oxygen use
A C V P U
C = acute confusion or deliriumC = potent sign of acute clinical deterioration
Score = 3
Figure 3: NEWS 2 Acute Confusion/Delirium
In order to support the safe adoption of NEWS2, NHS Improvement has produced a resource pack. (Figure 4)
Figure 4: NHS Resource Pack, E-Learning Platform and NEWS Apps iOS and Android
NHS NEWS2 Resource Pack
https://improvement.nhs.uk/news-alerts/safe-adoption-of-NEWS2/

HE
AL
TH
TE
CH
NO
LO
GY
AS
SE
SS
ME
NT
RE
PO
RT
HE
AL
TH
TE
CH
NO
LO
GY
AS
SE
SS
ME
NT
SE
CT
ION
(M
aH
TA
S)
ME
DIC
AL
DE
VE
LO
PM
EN
T D
IVIS
ION
, M
INIS
TR
Y O
F H
EA
LT
H
10
NA
TIO
NA
L E
AR
LY
WA
RN
ING
SC
OR
E (
NE
WS
)
3.0 POLICY QUESTION
Should National Early Warning Score (NEWS) be implemented in Ministry of Health (MOH) hospitals to improve safety, efficiency and standardisation of patient care?
4.0 OBJECTIVE
4.1 To assess the effectiveness and safety of NEWS in timely detection of patient’s clinical deterioration by evaluating its predictive ability and impact on patient’s clinical outcomes
4.2 To determine the economic implications of a nationally implemented Early Warning Score system
4.3 To evaluate the organisational, ethical, legal and social implications of NEWS implementation
Research Questions
iv. How effective and safe is NEWS as clinical decision support tools, in predicting patient’s clinical deterioration?
v. What is the estimated economic impact of NEWS implementation in minimizing occurrence of adverse events and preventable hospital mortality?
vi. What are the organisational, ethical, legal and social issues related to NEWS implementation?
5.0 METHODS
5.1 Literature search strategy
Electronic database was searched for published literatures pertaining to NEWS. The following electronic databases were searched through the Ovid interface: Ovid MEDLINE® In-process and other Non-indexed citations and Ovid MEDLINE® 1946 to September 9, 2019, EBM Reviews - Cochrane Central Register of Controlled Trials – August 2019, EBM Reviews - Cochrane Database of Systematic Reviews - 2005 to September 5, 2019, EBM Reviews - Health Technology Assessment – 4th Quarter 2016, EBM Reviews – NHS Economic Evaluation Database 1st Quarter 2016. Searches were also run in PubMed and CINAHL. Google was used to search for additional web-based materials and information. No limits were applied. Additional articles were identified from reviewing the references of retrieved articles. The search strategies used in the major databases are provided in Appendix 1. The searches were undertaken on 3 April 2019 and 13 August 2019 using the same strategies. Supplementary searches were undertaken between 21 May 2019 and 13 August 2019. Last search was conducted on 9 September 2019.

11
HE
AL
TH
TE
CH
NO
LO
GY
AS
SE
SS
ME
NT
RE
PO
RT
HE
AL
TH
TE
CH
NO
LO
GY
AS
SE
SS
ME
NT
SE
CT
ION
(MaH
TA
S)
ME
DIC
AL
DE
VE
LO
PM
EN
T D
IVIS
ION
, MIN
IST
RY
OF
HE
AL
TH
NA
TIO
NA
L E
AR
LY
WA
RN
ING
SC
OR
E (N
EW
S)
5.2 Study selection
Based on the policy question the following inclusion and exclusion criteria were used:
5.2.1 Inclusion criteria
a Population i. All adult patients (aged 16 years old and above) in pre-hospital and hospital settings
ii. Healthcare staffs who are involved in delivering the intervention
b Intervention National Early Warning Score
c Comparator i. Other established scoring system designed to identify deteriorating patients [ie Patient at Risk (PAR) score, Physiological Scoring Systems (PSS), Vital Sign Score (VSS), BioSign]
ii. Standard/Usual care (Standard Observation Charts) iii. Clinical judgementiv. No comparator
d Outcomes i. Effectiveness• Predictive ability to detect clinical deterioration
- model discrimination for outcomes of mortality, cardiopulmonary arrest and unanticipated ICU admission
• Patient’s clinical outcomes - in-hospital mortality - cardiovascular (CV) events (cardiac arrest, acute coronary
syndrome, cardiogenic shock) ii. Safety
• Adverse events [Adoption issues ie. inconsistency in NEWS application among staffs and across medical specialties, the inaccuracies and miscalculations related to manual data collection leading to inappropriate clinical response or misalerts.]
iii. Economic impacts• Cost effectiveness analysis• Cost utility analysis• Cost benefit analysis• Cost analysis• Any other measure of economic outcomes
iv. Organisational issues• Resource utilisation
- Length of hospital stay (LOS)- Admission to ICU- Use of Rapid Response or Code Team Training/Education
• Change in work process- Workload- Compliance rate
• NEWS application adaptability- in resource limited settings- cross specialty application
• Opportunity for automation(electronic charting and scoring system for NEWS)
v. Ethical and legal issuesvi. Social implication [Nursing staff and doctors]
• Acceptance• Attitude• Satisfaction• Experience
e Study design HTA reports, systematic review with meta- analysis, systematic review, randomised controlled trial (RCT), cohort, case-control, cross-sectional, qualitative studies and economic evaluation studies.
e English full text articles

HE
AL
TH
TE
CH
NO
LO
GY
AS
SE
SS
ME
NT
RE
PO
RT
HE
AL
TH
TE
CH
NO
LO
GY
AS
SE
SS
ME
NT
SE
CT
ION
(M
aH
TA
S)
ME
DIC
AL
DE
VE
LO
PM
EN
T D
IVIS
ION
, M
INIS
TR
Y O
F H
EA
LT
H
12
NA
TIO
NA
L E
AR
LY
WA
RN
ING
SC
OR
E (
NE
WS
)
5.2.2 Exclusion criteria
a. Studies that involved subgroup populations: obstetric and paediatric patients
b. Study design: Animal study, laboratory study, narrative reviewc. Non-English full text articles
Based on the above inclusion and exclusion criteria, study selection was carried out independently by two reviewers. Disagreement will be resolved by discussion.
5.3 Critical Appraisal of Literature
Assessment of risk of bias in included studies The methodological quality of all the relevant full text articles retrieved was assessed using the Critical Appraisal Skills Programme (CASP) tool by two reviewers depending on the type of the study design (systematic reviews, economic evaluation, cohort and case control studies).30 For systematic review the criteria assessed include selection of studies, assessment of quality of included studies, heterogeneity of included studies. For randomised control trial, The Cochrane Collaboration’s tool was utilised. The criteria assessed by this tool were randomisation, allocation concealment, blinding, explanation on loss to follow-up, and intention to treat analysis.31 For non-randomised experimental studies, with and without control group, Joanna Briggs Institute (JBI) Critical Appraisal Checklist for Quasi-Experimental and NIH Quality Assessment Tool for Before-After (Pre-Post studies) were utilised.32, 33 For cohort study, the criteria assessed were selection of the cohort, accurate measurement of exposure and outcome, confounding factors, follow-up adequacy and length. For case control study, the criteria assessed were selection of the cases and control, accurate measurement of exposure, blinding and confounding factors. For economic evaluation, the criteria assessed include comprehensive description of competing alternatives, effectiveness established, effects of intervention identified, measured and valued appropriately, relevant resources and health outcome costs identified, measured in appropriate units and valued credibly, discounting, incremental analysis of the consequences and costs of alternative performed and sensitivity analysis performed. The Cochrane’s Collaboration Tool is as in Appendix 5. All full text articles were graded based on guidelines from the U.S./Canadian Preventive Services Task Force (Appendix 1).34
5.4 Analysis and Synthesis of Evidence
5.4.1 Data extraction strategy
The following data were extracted:
i. Details of methods and study population characteristicsii. Detail of intervention and comparatorsiii. Details of individual outcomes specified
Data were extracted from selected studies by a reviewer using a pre- designed data extraction form and checked by another reviewer. Disagreements was resolved by discussion.
We reported the c-statistic (AUROC value), with 95% confidence interval when available, to describe model discrimination. The AUROC which is equivalent to the area under the receiver operating characteristic curve, is the proportion of times the model correctly discriminates a pair of high- and low-risk individuals.35 The AUROC value of 0.5 indicates the model performs no better than chance;

13
HE
AL
TH
TE
CH
NO
LO
GY
AS
SE
SS
ME
NT
RE
PO
RT
HE
AL
TH
TE
CH
NO
LO
GY
AS
SE
SS
ME
NT
SE
CT
ION
(MaH
TA
S)
ME
DIC
AL
DE
VE
LO
PM
EN
T D
IVIS
ION
, MIN
IST
RY
OF
HE
AL
TH
NA
TIO
NA
L E
AR
LY
WA
RN
ING
SC
OR
E (N
EW
S)
AUROC value of 0.6 to 0.7 indicates poor discriminative ability, AUROC value of 0.7 to 0.8 indicates modest or acceptable discriminative ability, 0.8 to 0.9 as good discriminative ability and a threshold of greater than 0.9 indicates excellent discriminative ability. 36, 37 If the AUROC value was not reported, other operational statistics such as sensitivity, specificity and predictive values were extracted for representative risk score cut-offs when available.
5.4.2 Methods of data synthesis
Data were synthesized qualitatively focusing on NEWS model discrimination, the populations in which the NEWS model has been tested, impact of NEWS model implementation on health outcomes and resource utilisation, economic and social impacts of NEWS model implementation. Data on the outcome measures were presented in tabulated format with narrative summaries. A meta-analysis of prognostic accuracy studies that reported AUROC value for mortality outcomes was performed. For computing meta-analysis summary estimates, we combined eligible studies’ data using Stata 15 statistic software. A random-effects model was applied. We assessed statistical heterogeneity using the Cochran Q test by calculating I2 values (I2 >75% considered to be high level of heterogeneity).38 When heterogeneity was substantial (I2>75%), we investigated the sources of heterogeneity by determining the effect of important modifiers: sample details (type and quantity), study design and risk for bias, and the effect of the imputed data. The pooled estimates with 95% Confidence Interval (CI) were reported as appropriate. Statistical significance was set at p value less than 0.05 for all outcomes.
6.0 RESULTS
6.1 Search results
A total of 3084 records were identified through the Ovid interface, PubMed and CINAHL databases. Additional 25 articles were identified from references of retrieved articles. After removal of 1407 irrelevant and duplicate articles, 1677 tittles were screened. Of these, 114 relevant abstracts were retrieved in full text. After reading, appraising and applying the inclusion and exclusion criteria, 79 full text articles were included for qualitative synthesis. A total of 35 full text articles were excluded due to irrelevant study design (n=5), irrelevant population (n=11), irrelevant outcome measure(s) (n=7), validation study of other models (8), master degree dissertation on quality improvement(n=3) and no full text article in English (n=1). The 79 full text articles comprised of one HTA, two systematic review, seven randomised control trials (RCTs), 51 cohort studies, one case-control, four pre-post intervention studies, three audit survey/cross-sectional studies, seven qualitative study and three economic
evaluation studies. The selection of studies is showed in Figure 5.

HE
AL
TH
TE
CH
NO
LO
GY
AS
SE
SS
ME
NT
RE
PO
RT
HE
AL
TH
TE
CH
NO
LO
GY
AS
SE
SS
ME
NT
SE
CT
ION
(M
aH
TA
S)
ME
DIC
AL
DE
VE
LO
PM
EN
T D
IVIS
ION
, M
INIS
TR
Y O
F H
EA
LT
H
14
NA
TIO
NA
L E
AR
LY
WA
RN
ING
SC
OR
E (
NE
WS
)
Figure 5: Flow chart of study selection
HTA National Early Warning Score
16
irrelevant outcome measure(s) (n=7), validation study of other models (8), master degree dissertation on quality improvement(n=3) and no full text article in English (n=1). The 79 full text articles comprised of one HTA, two systematic review, seven randomised control trials (RCTs), 51 cohort studies, one case-control, four pre-post intervention studies, three audit survey/cross-sectional studies, seven qualitative study and three economic evaluation studies. The selection of studies is showed in Figure 5.
Figure 5: Flow chart of study selection
Number of records identified through electronic databases
searching (n=3084)
Number of additional records identified from other
sources (n=25)
Number of records after duplicates removed (n=1677)
Number of records screened (n=1677)
Number of of records excluded (n=1563)
Number of full text articles assessed for eligibility
(n=114)
Number of full text article excluded (n=35); § Irrelevant study design(5) § Irrelevant population(11) § Irrelevant outcome
measure(s)(7) § Validation of other model(8) § Master dissertation on
quality improvement (3) § No English full text
article(1)
Number of full articles included in qualitative synthesis (n=79)
Number of full articles included in quantitative synthesis
(meta-analysis) (n=15)

15
HE
AL
TH
TE
CH
NO
LO
GY
AS
SE
SS
ME
NT
RE
PO
RT
HE
AL
TH
TE
CH
NO
LO
GY
AS
SE
SS
ME
NT
SE
CT
ION
(MaH
TA
S)
ME
DIC
AL
DE
VE
LO
PM
EN
T D
IVIS
ION
, MIN
IST
RY
OF
HE
AL
TH
NA
TIO
NA
L E
AR
LY
WA
RN
ING
SC
OR
E (N
EW
S)
Ch
ara
cte
rist
ics
of
inclu
de
d s
tud
ies
Se
ttin
g 1
: E
me
rge
ncy D
ep
art
me
nt
Stu
dy
(Y
ear)
Co
un
try
Stu
dy
De
sig
nN
um
be
r o
f p
art
icip
an
tsT
yp
e o
f st
ud
y
po
pu
lati
on
Me
an
/Me
dia
n*
Ag
e (
ye
ars
)C
om
para
tor
Ou
tco
me
Me
asu
res
Re
po
rte
d
Ou
tco
me
(s)
Wu
yta
ck F
et
al. (
20
17)
Irela
nd
Syst
em
ati
c
Revie
w4
8 s
tud
ies;
16
2-1
024
Hete
rog
en
ou
sN
ot
rep
ort
ed
27 o
ther
EW
Ss
vv
In-h
osp
ital m
ort
alit
yvv
Co
mb
ined
ou
tco
me o
f d
eath
an
d
ICU
ad
mis
sio
nA
UR
OC
Kiv
ipu
ro e
t al.
(20
18)
Fin
lan
dP
rosp
ecti
ve
co
ho
rt13
54
Hete
rog
en
ou
s6
5*
Co
ntr
ol N
EW
S
(lo
w r
isk)/
Clin
ical
jud
gem
en
t
vv
In-h
osp
ital m
ort
alit
yvv
30
-day m
ort
alit
yA
UR
OC
, O
R
Ala
m e
t al.
(20
15)
Neth
erl
an
ds
Pro
specti
ve
co
ho
rt274
Hete
rog
en
ou
s6
0E
merg
en
cy
Severi
ty In
dex
(ES
I)
vv
30
-day m
ort
alit
yvv
Ho
spit
al ad
mis
sio
nvv
ICU
ad
mis
sio
nvv
Len
gth
of
stay
AU
RO
C
Liu
F e
t al.
(20
15)
Ch
ina
Pro
specti
ve C
oh
ort
54
0H
ete
rog
en
ou
s6
5C
linic
al ju
dg
em
en
tvv
24
-ho
ur
mo
rtalit
yA
UR
OC
, O
R
Bil
be
n B
et
al.
(20
16)
No
rway
Pro
specti
ve
Co
ho
rt24
6R
esp
irato
ry
dis
tress
ed
p
ati
en
ts7
1*M
an
ch
est
er
Tri
ag
e
Scale
(M
TS
)
vv
90
-day,
30
-day
vv
an
d in
-ho
spit
al su
rviv
al
vv
90
-day m
ort
alit
yA
UR
OC
, O
R
Sb
iti-
Ro
hr
D
et
al. (
20
16)
Sw
itzerl
an
dP
rosp
ecti
ve
Co
ho
rt9
25
Co
nfi
rmed
CA
P73
*P
SI an
d C
UR
B-6
5
vv
All-
cau
se m
ort
alit
y w
ith
in 6
years
fo
llow
-up
vv
ICU
ad
mis
sio
n, em
pyem
a a
nd
u
np
lan
ned
ho
spit
al re
ad
mis
sio
n
occu
rrin
g w
ith
in 3
0 d
ays
aft
er
ad
mis
sio
n
AU
RO
C, O
R
Du
nd
ar
ZD
et
al. (
20
19)
Tu
rkey
Retr
osp
ecti
ve
Co
ho
rt4
55
Geri
atr
ic p
ati
en
ts77
Lacta
te, N
EW
S-L
vv
In-h
osp
ital m
ort
alit
yA
UR
OC
, se
nsi
tivit
y,
specifi
cit
y
Yu
an
WC
et
al. (
20
18)
Ch
ina
Retr
osp
ecti
ve
Co
ho
rt6
21
Hete
rog
en
ou
s6
5M
EW
S,
APA
CH
E II
vv
ICU
ad
mis
sio
nvv
28
-day m
ort
alit
y
AU
RO
C,
Sen
siti
vit
y,
Sp
ecifi
cit
y
Le
e S
B e
t al.
(20
19)
Ko
rea
Retr
osp
ecti
ve
co
ho
rt8
1 5
20
Hete
rog
en
ou
s6
4*
TR
EW
S, M
EW
S,
RE
MS
vv
24
-ho
ur, 4
8-h
ou
r, 7
- d
ay a
nd
30
-d
ay m
ort
alit
yA
UR
OC
, O
R
Ke
ep
JW
et
al. (
20
15)
UK
Retr
osp
ecti
ve
co
ho
rt5
00
Su
specte
d
severe
sep
sis
an
d s
ep
tic s
ho
ck
47*
Man
ch
est
er
Tri
ag
e
Syst
em
(M
TS
)
vv
Dete
cti
on
of
at
risk
fo
r se
vere
se
psi
s an
d s
ep
tic s
ho
ck a
t E
D
tria
ge
AU
RO
C,
Sen
siti
vit
y,
Sp
ecifi
cit
y,
PP
V, N
PV

HE
AL
TH
TE
CH
NO
LO
GY
AS
SE
SS
ME
NT
RE
PO
RT
HE
AL
TH
TE
CH
NO
LO
GY
AS
SE
SS
ME
NT
SE
CT
ION
(M
aH
TA
S)
ME
DIC
AL
DE
VE
LO
PM
EN
T D
IVIS
ION
, M
INIS
TR
Y O
F H
EA
LT
H
16
NA
TIO
NA
L E
AR
LY
WA
RN
ING
SC
OR
E (
NE
WS
)
Se
ttin
g 1
: E
me
rge
ncy D
ep
art
me
nt
Stu
dy
(Y
ear)
Co
un
try
Stu
dy
De
sig
nN
um
be
r o
f p
art
icip
an
tsT
yp
e o
f st
ud
y
po
pu
lati
on
Me
an
/Me
dia
n*
Ag
e (
ye
ars
)C
om
para
tor
Ou
tco
me
Me
asu
res
Re
po
rte
d
Ou
tco
me
(s)
Co
rfie
ld e
t al.
(20
14)
UK
Pro
specti
ve
co
ho
rt20
03
Sep
sis
pati
en
ts
base
d o
n S
IRS
cri
teri
a72*
Co
ntr
ol N
EW
S
vv
48
-ho
ur
ICU
ad
mis
sio
nvv
30
-day m
ort
alit
y (
in-h
osp
ital)
vv
Co
mb
ined
en
dp
oin
t o
f IC
U
ad
mis
sio
n a
nd
/or
mo
rtalit
y
AU
RO
C, O
R
Usm
an
OA
et
al. (
20
19)
US
AR
etr
osp
ecti
ve
co
ho
rt9
30
Su
specte
d s
ep
sis
47
SIR
S, q
SO
FA
vv
Tri
ag
e d
ete
cti
on
of
severe
sep
sis
an
d s
ep
tic s
ho
ck
vv
Sep
sis-
rela
ted
mo
rtalit
yvv
All-
cau
se m
ort
alit
y
AU
RO
C,
Sen
siti
vit
y,
Sp
ecifi
cit
y
Bri
nk A
et
al.
(20
19)
Neth
erl
an
ds
Retr
osp
ecti
ve
co
ho
rt8
20
4S
usp
ecte
d s
ep
sis
57*
SIR
S, q
SO
FA
vv
10-d
ay m
ort
alit
yvv
30
-day m
ort
alit
y
AU
RO
C,
Sen
siti
vit
y,
Sp
ecifi
cit
y
Ch
urp
ek M
M
et
al.
(20
17)
US
Retr
osp
ecti
ve
co
ho
rt3
0 6
77
Pati
en
ts w
ith
su
spic
ion
of
infe
cti
on
58
ME
WS
, S
IRS
, q
SO
FA
vv
In-h
osp
ital m
ort
alit
yvv
Co
mp
osi
te o
utc
om
e
(death
or
ICU
tra
nsf
er)
AU
RO
C,
Sen
siti
vit
y,
Sp
ecifi
cit
y
Se
ttin
g 2
: G
en
era
l W
ard
Stu
dy
(Y
ear)
Co
un
try
Stu
dy
De
sig
nN
um
be
r o
f p
art
icip
an
tsT
yp
e o
f st
ud
y
po
pu
lati
on
Me
an
/Me
dia
n*
Ag
e (
ye
ars
)C
om
para
tor
Ou
tco
me
Me
asu
res
Re
po
rte
d
Ou
tco
me
(s)
Sm
ith
GB
et
al. (
20
13)
UK
Pro
specti
ve
co
ho
rt
35
58
5
pati
en
t ep
iso
des
Acu
te m
ed
ical
pati
en
ts6
83
3 o
ther
EW
S
vv
Card
iac a
rrest
, u
nan
ticip
ate
d
ICU
ad
mis
sio
n, d
eath
an
d a
ny o
f th
e o
utc
om
es
wit
hin
24
ho
urs
of
ad
mis
sio
n
AU
RO
C
Bad
riy
ah
T e
t al. (
20
14)
UK
Retr
osp
ecti
ve
co
ho
rt
35
58
5
pati
en
t ep
iso
des
Acu
te m
ed
ical
pati
en
ts6
8D
TE
WS
vv
24
-ho
ur
mo
rtalit
y, c
ard
iac a
rrest
an
d u
nan
ticip
ate
d IC
U a
dm
issi
on
AU
RO
C
Jarv
is S
et
al.
(20
15)
UK
Retr
osp
ecti
ve
co
ho
rt
45
678
ep
iso
des
of
care
Gen
era
l w
ard
ad
mis
sio
nN
ot
rep
ort
ed
Co
ntr
ol N
EW
S
vv
24
-ho
ur
mo
rtalit
y, c
ard
iac a
rrest
an
d u
nan
ticip
ate
d IC
U a
dm
issi
on
OR
Ko
vacs
C e
t al.
(20
16)
UK
Pro
specti
ve
co
ho
rt
87 3
99
ad
mis
sio
ns
(35
174
su
rgic
al
ad
mis
sio
n
an
d 5
2 2
25
m
ed
ical
ad
mis
sio
n)
Med
ical an
d
surg
ical p
ati
en
tsS
urg
ical -
57
Med
ical -
68
Clin
ical ju
dg
em
en
tvv
24
-ho
ur
mo
rtalit
y, c
ard
iac a
rrest
an
d u
nan
ticip
ate
d IC
U a
dm
issi
on
AU
RO
C
Ab
bo
tt T
EF
et
al. (
20
16)
UK
Pro
specti
ve
co
ho
rt3
22
Hete
rog
en
ou
s m
ed
ical p
ati
en
ts6
3C
on
tro
l N
EW
S,
blo
od
gas
vari
ab
les
vv
Co
mp
osi
te m
ort
alit
y o
r cri
tical
care
un
it e
scala
tio
n w
ith
in 4
8
ho
urs
of
ho
spit
al ad
mis
sio
nvv
Ho
spit
al le
ng
th o
f st
ay
OR

17
HE
AL
TH
TE
CH
NO
LO
GY
AS
SE
SS
ME
NT
RE
PO
RT
HE
AL
TH
TE
CH
NO
LO
GY
AS
SE
SS
ME
NT
SE
CT
ION
(MaH
TA
S)
ME
DIC
AL
DE
VE
LO
PM
EN
T D
IVIS
ION
, MIN
IST
RY
OF
HE
AL
TH
NA
TIO
NA
L E
AR
LY
WA
RN
ING
SC
OR
E (N
EW
S)
Se
ttin
g 2
: G
en
era
l W
ard
Stu
dy
(Y
ear)
Co
un
try
Stu
dy
De
sig
nN
um
be
r o
f p
art
icip
an
tsT
yp
e o
f st
ud
y
po
pu
lati
on
Me
an
/Me
dia
n*
Ag
e (
ye
ars
)C
om
para
tor
Ou
tco
me
Me
asu
res
Re
po
rte
d
Ou
tco
me
(s)
Sp
an
gfo
rs M
e
t al. (
20
19)
Den
mark
Retr
osp
ecti
ve
co
ho
rt11
07
Hete
rog
en
ou
s p
op
ula
tio
n w
ith
d
evia
tin
g v
ital
sig
n (
NE
WS
≥1)
66
*C
on
tro
l N
EW
Svv
In-h
osp
ital m
ort
alit
yvv
30
-day m
ort
alit
yA
UR
OC
, O
R
Sp
ag
no
lli
et
al. (
20
17)
Italy
Pro
specti
ve
co
ho
rt26
77
Hete
rog
en
ou
s m
ed
ical p
ati
en
ts72*
Co
ntr
ol N
EW
Svv
In-h
osp
ital m
ort
alit
yvv
Un
an
ticip
ate
d IC
U a
dm
issi
on
vv
Co
mb
ined
ou
tco
me
OR
Le
e Y
S e
t al.
(20
18)
Ko
rea
Retr
osp
ecti
ve
co
ho
rt13
00
Hete
rog
en
ou
s 6
2C
linic
al ju
dg
em
en
tvv
In-h
osp
ital m
ort
alit
yA
UR
OC
, H
azard
rati
o
(HR
)
Ro
be
rts
D e
t al. (
20
17)
Sw
ed
en
Retr
osp
ecti
ve
co
ho
rt3
58
In-h
osp
ital
card
iac a
rrest
(I
HC
A)
pati
en
ts
67%
ag
ed
less
th
an
70
years
o
ldC
linic
al ju
dg
em
en
t
vv
30
-day s
urv
ival
vv
NE
WS
-ag
gre
gra
te s
co
re
pre
vale
nce w
ith
in 1
2 h
ou
rs
befo
re IH
CA
OR
Tir
kko
ne
n J
et
al. (
20
14)
Fin
lan
dP
oin
t p
revale
nce
stu
dy
615
Hete
rog
en
ou
s6
5*
Co
nven
tio
nal
dic
ho
tom
ised
cri
teri
a
vv
30
-day m
ort
alit
yvv
60
-day m
ort
alit
yO
R
Eccle
s S
R e
t al.
(20
14)
UK
Pro
specti
ve
co
ho
rt19
6P
ati
en
t w
ith
ch
ron
ic
hyp
oxaem
ia70
CR
EW
Svv
30
-day m
ort
alit
yA
UR
OC
Ho
dg
son
LE
e
t al. (
20
17)
UK
Retr
osp
ecti
ve
co
ho
rt9
42
AE
CO
PD
74*
CR
EW
S, S
alf
ord
-N
EW
Svv
In-h
osp
ital m
ort
alit
y
AU
RO
C,
Sen
siti
vit
y,
Sp
ecifi
cit
y
PP
V, N
PV
Fo
rste
r S
et
al. (
20
18)
UK
Retr
osp
ecti
ve
co
ho
rt6
09
1P
ati
en
ts w
ith
re
spir
ato
ry
dis
ease
63
Lo
cal E
WS
vv
Pro
jecte
d w
ork
load
vv
Sen
siti
vit
y a
nd
sp
ecifi
cit
y in
p
red
icti
ng
mo
rtalit
y b
ase
d o
n
ou
tco
me w
ith
in 2
4 h
ou
rs o
f a
sco
re b
ein
g r
eco
rded
.
Sen
siti
vit
y,
Sp
ecifi
cit
y
Gru
dzin
ska F
S
et
al. (
20
19)
UK
Retr
osp
ecti
ve
co
ho
rt15
45
Ho
spit
aliz
ed
co
mm
un
ity
acq
uir
ed
p
neu
mo
nia
(C
AP
) p
ati
en
ts
76
*C
UR
B6
5,
Lac-C
UR
B-6
5,
qS
OFA
sco
re
vv
ICU
ad
mis
sio
nvv
In-h
osp
ital m
ort
alit
yvv
30
-day m
ort
alit
yvv
Len
gth
of
inp
ati
en
t st
ay
AU
RO
C,
sen
siti
vit
y,
specifi
cit
y
PP
V, N
PV
,LR
+,
LR
-
Hy
de
s T
J e
t al. (
20
18)
UK
Retr
osp
ecti
ve
co
ho
rt4
770
Liv
er
dis
ease
p
ati
en
ts57
Clin
ical ju
dg
em
en
tvv
24
-ho
ur
in-h
osp
ital m
ort
alit
y,
un
an
ticip
ate
d IC
U a
dm
issi
on
, o
r card
iac a
rrest
AU
RO
C

HE
AL
TH
TE
CH
NO
LO
GY
AS
SE
SS
ME
NT
RE
PO
RT
HE
AL
TH
TE
CH
NO
LO
GY
AS
SE
SS
ME
NT
SE
CT
ION
(M
aH
TA
S)
ME
DIC
AL
DE
VE
LO
PM
EN
T D
IVIS
ION
, M
INIS
TR
Y O
F H
EA
LT
H
18
NA
TIO
NA
L E
AR
LY
WA
RN
ING
SC
OR
E (
NE
WS
)
Se
ttin
g 2
: G
en
era
l W
ard
Stu
dy
(Y
ear)
Co
un
try
Stu
dy
De
sig
nN
um
be
r o
f p
art
icip
an
tsT
yp
e o
f st
ud
y
po
pu
lati
on
Me
an
/Me
dia
n*
Ag
e (
ye
ars
)C
om
para
tor
Ou
tco
me
Me
asu
res
Re
po
rte
d
Ou
tco
me
(s)
Co
oksl
ey
T e
t al. (
20
12)
UK
Retr
osp
ecti
ve
co
ho
rt8
40
On
co
log
ic
pati
en
ts6
3*
ME
WS
vv
CC
U a
dm
issi
on
vv
30
-day m
ort
alit
yA
UR
OC
Up
pan
isako
rn
S e
t al. (
20
17)
Th
aila
nd
Pro
specti
ve
co
ho
rt4
40
ICU
dis
ch
arg
ed
p
ati
en
ts6
1*A
PA
CH
E II
vv
Clin
ical d
ete
rio
rati
on
(acu
te
resp
irato
ry f
ailu
re o
r cir
cu
lato
ry
sho
ck)
wit
hin
24
ho
ur
aft
er
dis
ch
arg
e f
rom
th
e IC
U
AU
RO
C,
sen
siti
vit
y,
specifi
cit
y
Kle
pst
ad
PK
e
t al. (
20
19)
No
rway
Retr
osp
ecti
ve
co
ho
rt
124
Gast
roin
test
inal
surg
ical p
ati
en
ts
aft
er
tran
sfer
fro
m a
n IC
U/
HD
U
66
SA
PS
II
vv
In-h
osp
ital m
ort
alit
yvv
Read
mis
sio
n t
o IC
UO
R
Ch
en
YC
et
al.
(20
19)
Taiw
an
Retr
osp
ecti
ve
co
ho
rt
272
Eld
erl
y p
ati
en
ts
wit
h M
V u
se
an
d s
uccess
ful
libera
tio
n f
rom
M
V a
nd
IC
U
(IC
Um
v-l
ib)
81
SO
FA
, S
IRS
, q
SO
FA
vv
Po
st-I
CU
resp
irato
ry f
ailu
re
befo
re d
ay 1
4 (
PIR
F-1
4)
req
uir
ing
re
inst
itu
tio
n o
f M
V
AU
RO
C,
sen
siti
vit
y,
specifi
cit
y O
R
Jarv
is e
t al.
(20
15)
UK
Retr
osp
ecti
ve
co
ho
rt
64
,28
5
ep
iso
des
of
care
Hete
rog
en
ou
s6
23
4 o
ther
EW
Ss
vv
24
-ho
ur
mo
rtalit
yA
UR
OC
Zaid
i H
et
al.
(20
19)
US
Retr
osp
ecti
ve
co
ho
rt28
,523
IC
U p
ati
en
tsN
ot
rep
ort
ed
-vv
Dis
ch
arg
e lo
cati
on
fo
r a p
ati
en
t le
avin
g t
he IC
U.
AU
RO
C
Ab
bo
tt e
t al.
(20
15)
UK
Pro
specti
ve
co
ho
rt4
53
Med
ical p
ati
en
ts6
1PA
RS
vv
Co
mp
osi
te o
f cri
tical care
ad
mis
sio
n o
r m
ort
alit
y w
ith
in 4
8
ho
urs
of
ad
mis
sio
nvv
Ho
spit
al le
ng
th o
f st
ay
OR
Kh
wan
nim
it B
e
t al. (
20
19)
Th
aila
nd
Retr
osp
ecti
ve
co
ho
rt15
89
Sep
sis
pati
en
ts6
3*
ME
WS
, S
OFA
,SO
S,
qS
OFA
vv
In-h
osp
ital m
ort
alit
yvv
ICU
mo
rtalit
yvv
30
-day m
ort
alit
yvv
Mu
lti-
org
an
failu
re
AU
RO
C,
sen
siti
vit
y,
specifi
cit
y
Yu
et
al.
(20
14)
US
Nest
ed
case
-co
ntr
ol
328
Pati
en
t d
iag
no
sed
wit
h
infe
cti
on
67*
SO
FA
, P
IRO
,SC
S,
ME
DS
, M
EW
S,
SA
PS
II,
APA
CH
E II,
RE
MS
vv
0-1
2 h
ou
r m
ort
alit
yvv
12-2
4 h
ou
r m
ort
alit
yvv
24
-48
ho
ur
mo
rtalit
yvv
48
-72 h
ou
r m
ort
alit
y
AU
RO
C,
sen
siti
vit
y,
specifi
cit
y, O
R

19
HE
AL
TH
TE
CH
NO
LO
GY
AS
SE
SS
ME
NT
RE
PO
RT
HE
AL
TH
TE
CH
NO
LO
GY
AS
SE
SS
ME
NT
SE
CT
ION
(MaH
TA
S)
ME
DIC
AL
DE
VE
LO
PM
EN
T D
IVIS
ION
, MIN
IST
RY
OF
HE
AL
TH
NA
TIO
NA
L E
AR
LY
WA
RN
ING
SC
OR
E (N
EW
S)
Se
ttin
g 3
: P
re-h
osp
ital
Se
ttin
g
Stu
dy
(Y
ear)
Co
un
try
Stu
dy
De
sig
nN
um
be
r o
f p
art
icip
an
tsT
yp
e o
f st
ud
y
po
pu
lati
on
Me
an
/Me
dia
n*
Ag
e (
ye
ars
)C
om
para
tor
Ou
tco
me
Me
asu
res
Re
po
rte
d
Ou
tco
me
(s)
Sil
co
ck D
J e
t al.
(20
15)
UK
Retr
osp
ecti
ve
co
ho
rt16
84
Hete
rog
en
ou
s
No
t re
po
rted
(N
o a
ccess
to
su
pp
lem
en
tary
fi
les)
Clin
ical ju
dg
em
en
t
vv
48
-ho
ur
mo
rtalit
yvv
48
-ho
ur
ICU
ad
mis
sio
nvv
Co
mb
ined
en
dp
oin
t o
f 4
8-h
ou
r m
ort
alit
y o
r IC
U
ad
mis
sio
nvv
30
-day m
ort
alit
y
AU
RO
C,
Sen
siti
vit
y,
Sp
ecifi
cit
y,
PP
V, N
PV
, R
isk r
ati
o
(RR
)
Ab
bo
tt T
EF
et
al. (
20
18)
UK
Retr
osp
ecti
ve
co
ho
rt18
9H
ete
rog
en
ou
s6
1C
linic
al ju
dg
em
en
t
vv
Co
mp
osi
te o
f d
eath
or
cri
tical care
un
it e
scala
tio
n
wit
hin
48
h o
f h
osp
ital
ad
mis
sio
nvv
Len
gth
of
ho
spit
al st
ay
OR
Pir
ne
sko
ski
J
et
al.
(20
19)
Fin
lan
dR
etr
osp
ecti
ve
co
ho
rt3
5 8
00
Med
ical an
d
Tra
um
a p
ati
en
ts6
6C
linic
al ju
dg
em
en
tvv
24
-ho
ur
, 7-d
ay a
nd
30
-day
mo
rtalit
y o
f E
MS
desp
atc
hA
UR
OC
, O
R
Ho
ikka M
et
al.
(20
18)
Fin
lan
dP
rosp
ecti
ve
co
ho
rt12
426
Hete
rog
en
ou
s6
3C
linic
al ju
dg
em
en
tvv
24
-ho
ur
an
d 3
0-d
ay
mo
rtalit
y
RR
Sen
siti
vit
y,
specifi
ciit
y,
PP
Vs,
NP
Vs,
L
R+
, L
R-
Sh
aw
J e
t al.
(20
17)
UK
Retr
osp
ecti
ve
co
ho
rt28
7H
ete
rog
en
ou
s6
3S
tan
dard
clin
ical
ob
serv
ati
on
vv
Inte
racti
on
eff
ects
betw
een
in
itia
l an
d fi
nal N
EW
S s
co
res
an
d d
isp
osi
tio
n (
dis
ch
arg
ed
, ad
mit
ted
to
a w
ard
, IT
U o
r d
ied
)
OR
Mit
sun
ag
a T
et
al. (
20
19)
Jap
an
Retr
osp
ecti
ve
co
ho
rt220
4E
lderl
y p
ati
en
ts
(>6
5 y
ears
old
)78
ME
WS
vv
Ad
mis
sio
n a
nd
in
-ho
spit
al
mo
rtalit
y
AU
RO
C,
Sen
siti
vit
y,
Sp
ecifi
cit
y,
OR
Sil
co
ck D
J e
t al.
(20
18)
Sco
tlan
dR
etr
osp
ecti
ve
co
ho
rt17
13S
usp
ecte
d
infe
cti
on
58
qS
OFA
vv
30
-day m
ort
alit
yvv
48
-ho
ur
ICU
ad
mis
sio
n
vv
Co
mb
ined
en
dp
oin
t o
f 4
8
h. IC
U a
dm
issi
on
or
30
-day
mo
rtalit
y
AU
RO
C, O
R

HE
AL
TH
TE
CH
NO
LO
GY
AS
SE
SS
ME
NT
RE
PO
RT
HE
AL
TH
TE
CH
NO
LO
GY
AS
SE
SS
ME
NT
SE
CT
ION
(M
aH
TA
S)
ME
DIC
AL
DE
VE
LO
PM
EN
T D
IVIS
ION
, M
INIS
TR
Y O
F H
EA
LT
H
20
NA
TIO
NA
L E
AR
LY
WA
RN
ING
SC
OR
E (
NE
WS
)
NE
WS
2
Stu
dy
(Y
ear)
Co
un
try
Stu
dy
De
sig
nN
um
be
r o
f p
art
icip
an
tsS
ett
ing
Typ
e o
f st
ud
y
po
pu
lati
on
Me
an
/Me
dia
n*
Ag
e (
ye
ars
)C
om
para
tor
Ou
tco
me
Me
asu
res
Re
po
rte
d
Ou
tco
me
(s)
Pim
en
tel
MA
F e
t al. (
20
19)
UK
Retr
osp
ecti
ve
co
ho
rt25
1 26
6G
en
era
l w
ard
Pati
en
t at
risk
o
r d
ocu
men
ted
Typ
e 2
R
esp
irato
ry
Failu
re (
T2R
F)
68
*N
EW
S
vv
In-h
osp
ital m
ort
alit
y,
un
an
ticip
ate
d IC
U
ad
mis
sio
n a
nd
card
iac
arr
est
wit
hin
24
ho
urs
AU
RO
C
Ho
dg
son
LE
et
al. (
20
18)
UK
Retr
osp
ecti
ve
co
ho
rt23
61
Gen
era
l w
ard
AE
CO
PD
74N
o
co
mp
ara
tor
vv
Nu
mb
er
of
pati
en
ts
recla
ssifi
ed
to
lo
wer
risk
g
rou
ps
by N
EW
S2 b
oth
in
th
ose
wh
o s
urv
ived
an
d in
th
ose
wh
o d
ied
d
uri
ng
th
eir
ho
spit
al
ad
mis
sio
n.
Med
ian
an
d
inte
rqu
art
ile
ran
ges
Ech
ev
arr
ia C
et
al. (
20
19)
UK
Pro
specti
ve
co
ho
rt26
45
Gen
era
l w
ard
CO
PD
73
NE
WS
vv
In-h
osp
ital m
ort
alit
y
AU
RO
C,
Sen
siti
vit
y,
Sp
ecifi
cit
y,
PP
V, N
PV
Fe
rnan
do
SM
et
al.(2
019
)C
an
ad
aR
etr
osp
ecti
ve
co
ho
rt5
49
1G
en
era
l w
ard
Pati
en
ts w
ith
su
specte
d
infe
cti
on
67
HE
WS
vv
In-h
osp
ital m
ort
alit
yvv
Nu
mb
er
need
ed
to
exam
ine (
NN
E)
AU
RO
C,
Sen
siti
vit
y,
Sp
ecifi
cit
y
Me
llh
am
mar
L e
t al. (
20
19)
Sw
ed
en
Retr
osp
ecti
ve
co
ho
rt8
43
Em
erg
en
cy
Dep
art
men
t
Pati
en
ts w
ith
su
specte
d
infe
cti
on
Co
ho
rt A
– 7
0C
oh
ort
B -
76
qS
OFA
vv
Co
mp
osi
te o
utc
om
e
of
sep
sis
wit
h o
rgan
d
ysf
un
cti
on
vv
Infe
cti
on
-rela
ted
m
ort
alit
y a
nd
in
ten
sive
care
du
e t
o a
n in
fecti
on
w
ith
in 7
2 h
ou
rs
AU
RO
C,
Sen
siti
vit
y,
Sp
ecifi
cit
y
Mart
in-
Ro
dri
gu
ez F
et
al. (
20
19)
Sp
ain
Pro
specti
ve
co
ho
rt s
tud
y10
54
Pre
-ho
spit
al
sett
ing
Hete
rog
en
ou
s6
8*
Clin
ical
jud
gem
en
t
vv
Mo
rtalit
y f
rom
an
y
cau
se w
ith
in 4
8 h
ou
rs,
stra
tifi
ed
by t
he level o
f h
osp
ital tr
iag
e a
ssig
ned
in
th
e E
D.
vv
7-d
ay a
nd
30
-day
mo
rtalit
y
Sen
siti
vit
y,
Sp
ecifi
cit
y,
PP
V, N
PV
,L
R+
, L
R-
Mart
in-
Ro
dri
gu
ez F
et
al. (
20
19)
Sp
ain
Pro
specti
ve
co
ho
rt s
tud
y3
49
Pre
-ho
spit
al
sett
ing
H
ete
rog
en
ou
s6
6E
WS
, M
EW
S,
ViE
WS
,HE
WS
, S
EW
Svv
48
-ho
ur
mo
rtalit
y
AU
RO
C,
Sen
siti
vit
y,
Sp
ecifi
cit
y,
LR
+,L
R-

21
HE
AL
TH
TE
CH
NO
LO
GY
AS
SE
SS
ME
NT
RE
PO
RT
HE
AL
TH
TE
CH
NO
LO
GY
AS
SE
SS
ME
NT
SE
CT
ION
(MaH
TA
S)
ME
DIC
AL
DE
VE
LO
PM
EN
T D
IVIS
ION
, MIN
IST
RY
OF
HE
AL
TH
NA
TIO
NA
L E
AR
LY
WA
RN
ING
SC
OR
E (N
EW
S)
Risk of bias assessment
+ Indicates YES (low risk of bias)
? Indicates UNKNOWN risk of bias
- Indicates NO (high risk of bias)
Assessment for Systematic Review Using Critical Appraisal Skills Programme (CASP) Checklist
Criteria assessed
EFFECTIVENESS:EMERGENCY DEPARTMENT A
uth
or
loo
k
for
ap
pro
pri
ate
p
ap
er?
Sele
cti
on
of
stu
die
s (a
ll re
levan
t st
ud
ies
inclu
ded
?)
Ass
ess
men
t o
f q
ualit
y o
f in
clu
ded
stu
die
s?
If t
he r
esu
lts
of
the r
evie
w h
ave
been
co
mb
ined
, is
it
reaso
nab
le
to d
o s
o
(hete
rog
en
eit
y)?
Wuytack F et al.45 + + + +
SAFETY
HTA HIQA 28 + + + +
ORGANISATIONAL ISSUES
Smith ME et al.17 + + + +
Figure 6: Summary of risk of bias assessment for systematic review
Assessment for Randomised Controlled Trial Using Cochrane Collaboration Tools
Criteria assessed
EFFECTIVENESS:HEALTH OUTCOME
Ad
eq
uate
se
qu
en
ce
gen
era
tio
n
Allo
cati
on
co
ncealm
en
t
Blin
din
g o
f p
art
icip
an
ts
an
d p
ers
on
nel
Inco
mp
lete
o
utc
om
e d
ata
ad
dre
ssed
Fre
e o
f se
lecti
ve
rep
ort
ing
Fre
e o
f o
ther
bia
s
Haegdorens F et al.90 + ? ? + + +
ORGANISATIONAL ISSUES
Liaw SY et al. 98 + + ? + + +
Cornish L et al.101 + ? - + + ?
Fung et al.102 + ? - + + +
Christofidis MJ et al.103 + ? - + + +
Christofidis MJ et al.104 + ? - + + +
Christofidis MJ et al.105 + ? - + + +
Figure 7: Summary of risk of bias assessment for Randomised Controlled Trial Assessment for Before-After (Pre-Post) Studies With No Control Group Using NIH Quality Assessment Tool

HE
AL
TH
TE
CH
NO
LO
GY
AS
SE
SS
ME
NT
RE
PO
RT
HE
AL
TH
TE
CH
NO
LO
GY
AS
SE
SS
ME
NT
SE
CT
ION
(M
aH
TA
S)
ME
DIC
AL
DE
VE
LO
PM
EN
T D
IVIS
ION
, M
INIS
TR
Y O
F H
EA
LT
H
22
NA
TIO
NA
L E
AR
LY
WA
RN
ING
SC
OR
E (
NE
WS
)
Criteria assessed
EFFECTIVENESS:CLINICAL OUTCOME
Qu
est
ion
or
ob
jecti
ve c
learl
y s
tate
d?
Elig
ibili
ty/s
ele
cti
on
cri
teri
a f
or
stu
dy
po
pu
lati
on
cle
arl
y d
esc
rib
ed
?
Were
part
icip
an
ts r
ep
rese
nta
tive f
or
tho
se
wh
o w
ou
ld b
e e
ligib
le f
or
the t
est
/ se
rvic
e/
inte
rven
tio
n in
th
e p
op
ula
tio
n o
f in
tere
st?
Were
all
elig
ible
part
icip
an
ts t
hat
met
the
pre
specifi
ed
en
try c
rite
ria e
nro
lled
?
Sam
ple
siz
e s
uffi
cie
ntl
y larg
e t
o p
rovid
e
co
nfi
den
ce in
fin
din
gs?
Test
/serv
ice/i
nte
rven
tio
n
cle
arl
y d
esc
rib
ed
an
d d
eliv
ere
d c
on
sist
en
tly?
Ou
tco
me m
easu
res
pre
specifi
ed
, valid
, re
liab
le, an
d a
ssess
ed
co
nsi
sten
tly?
Peo
ple
ass
ess
ing
th
e o
utc
om
e m
easu
res
b
lind
ed
to
part
icip
an
ts e
xp
osu
re/
inte
rven
tio
ns?
Lo
ss t
o f
ollo
w-u
p a
fter
base
line 2
0%
or
less
? L
oss
to
fo
llow
-up
acco
un
ted
fo
r in
th
e
an
aly
sis?
Sta
tist
ical m
eth
od
s exam
ine c
han
ges
in
ou
tco
me m
easu
res
fro
m b
efo
re t
o a
fter
inte
rven
tio
n?
p v
alu
e?
Ou
tco
me m
easu
res
taken
mu
ltip
le
tim
es
befo
re a
nd
aft
er
inte
rven
tio
n?
Use
in
terr
up
ted
tim
e-s
eri
es
desi
gn
If in
terv
en
tio
n c
on
du
cte
d a
t g
rou
p level,
did
sta
tist
ical an
aly
sis
take in
to a
cco
un
t o
f in
div
idu
al le
vel d
ata
to
dete
rmin
e e
ffects
at
gro
up
level?
Farenden S et al.92 + + + + ? + + - ? + + +
Sutherasan Y et al.93 + + + + + + + - + + + +
ORGANISATIONAL ISSUES
Merriel A et al. 100 + + + + + + + ? + + + +
Mestrom E et al. 106 + + + + ? + + ? + + + +
Figure 8: Summary of risk of bias assessment for Pre-Post Intervention Studies
Assessment for Cohort Studies Using Critical Appraisal Skills Programme (CASP) Checklist
Criteria assessed
EFFECTIVENESS:EMERGENCY DEPARTMENT
Sele
cti
on
of
co
ho
rt
Exp
osu
re
accu
rate
ly
measu
red
Ou
tco
me
accu
rate
ly
measu
red
Co
nfo
un
din
g
facto
rs
Fo
llow
-up
of
sub
jects
Kivipuro et al.39 + + + + +
Alam et al. 40 + + + ? +
Liu F et al.41 + + + + +
Bilben B et al.42 + + + + +
Sbiti-Rohr D et al.43 + + + + +
Dundar ZD et al.44 + + + ? +
Yuan WC et al.46 + + + ? +
Lee SB et al.47 + + + + +
Keep JW et al.48 + + + ? +
Corfield et al.49 + + + + +
Usman OA et al.50 + + + ? +
Brink A et al.51 + + + + +
Churpek MM et al.52 + + + ? +
EFFECTIVENESS: GENERAL WARD
Smith GB et al. 53 + + + ? +
Badriyah T et al.54 + + + ? +

23
HE
AL
TH
TE
CH
NO
LO
GY
AS
SE
SS
ME
NT
RE
PO
RT
HE
AL
TH
TE
CH
NO
LO
GY
AS
SE
SS
ME
NT
SE
CT
ION
(MaH
TA
S)
ME
DIC
AL
DE
VE
LO
PM
EN
T D
IVIS
ION
, MIN
IST
RY
OF
HE
AL
TH
NA
TIO
NA
L E
AR
LY
WA
RN
ING
SC
OR
E (N
EW
S)
Criteria assessed
EFFECTIVENESS:EMERGENCY DEPARTMENT S
ele
cti
on
of
co
ho
rt
Exp
osu
re
accu
rate
ly
measu
red
Ou
tco
me
accu
rate
ly
measu
red
Co
nfo
un
din
g
facto
rs
Fo
llow
-up
of
sub
jects
Jarvis S et al. 55 + + + ? +
Kovacs C et al.56 + + + ? +
Abbott TEF et al.36 + + + + +
Spangfors M et al.57 + + + ? +
Spagnolli et al.58 + + + ? +
Lee YS et al. 59 + + + + +
Roberts D et al.60 + + + + +
Eccles SR et al.62 + + + ? +
Hodgson LE et al.63 + + + ? +
Forster S et al.64 + + + + +
Grudzinska FS et al.65 + + + ? +
Hydes TJ et al66 + + + ? +
Cooksley T et al.67 + + + + +
Uppanisakorn S et al.68 + + + + +
Klepstad PK69 + + + + +
Chen YC et al.70 + + + + +
Jarvis et al. 72 + + + ? +
Zaidi H et al.71 + + + + +
Abbott et al.73 + + + + +
Khwannimit B et al.75 + + + ? +
Criteria assessed
EFFECTIVENESS:PRE-HOSPITAL SETTING
Sele
cti
on
of
co
ho
rt
Exp
osu
re
accu
rate
ly
measu
red
Ou
tco
me
accu
rate
ly
measu
red
Co
nfo
un
din
g
facto
rs
Fo
llow
-up
of
sub
jects
Silcock DJ et al.76 + + + + +
Abbott TEF et al.77 + + + + +
Pirneskoski J et al.78 + + + + +
Hoikka M et al.79 + + + ? +
Shaw J et al.80 + + + + +
Mitsunaga T et al.81 + + + + +
Silcock DJ et al.82 + + + ? +
EFFECTIVENESS: NEWS2
Pimentel MAF et al.83 + + + ? +
Hodgson LE et al.84 + + + ? +
Echevarria C et al.85 + + + + +
Fernando SM et al.86 + + + + +

HE
AL
TH
TE
CH
NO
LO
GY
AS
SE
SS
ME
NT
RE
PO
RT
HE
AL
TH
TE
CH
NO
LO
GY
AS
SE
SS
ME
NT
SE
CT
ION
(M
aH
TA
S)
ME
DIC
AL
DE
VE
LO
PM
EN
T D
IVIS
ION
, M
INIS
TR
Y O
F H
EA
LT
H
24
NA
TIO
NA
L E
AR
LY
WA
RN
ING
SC
OR
E (
NE
WS
)
Mellhammar L et al.87 + + + + +
Martin-Rodriguez F et al.88 + + + ? +
Martin-Rodriguez F et al.89 + + + + +
SAFETY
Kolic I et al. 95 + + + + +
Petersen JA et al.96 + + + ? +
Figure 9: Summary of risk of bias assessment for Cohort Studies
Assessment for Case-Control Studies Using Critical Appraisal Skills Programme (CASP) Checklist
Criteria assessed
EFFECTIVENESS:GENERAL WARD S
ele
cti
on
case
s an
d c
on
tro
l
Exp
osu
re a
ccu
-ra
tely
measu
red
Co
nfo
un
din
g
facto
rs
Yu et al.74 + + +
Figure 10: Summary of risk of bias assessment for Case Control Studies
6.2 Effectiveness
6.2.1 Discriminative Ability and Predictive Validity
Emergency Department
Kivipuro M et al (2018) investigated the performance of NEWS to predict in-hospital and 30-day mortality among a heterogeneous cohort of 1354 patients in a large tertiary referral center’s multidisciplinary ED.39 level II-2 In this prospective cohort study, the patients were followed up after admission to the general wards. The NEWS and outcome of the patients were compared among those patients admitted to ICU directly from ED (EDICU), triaged from ED to general ward with subsequent ICU admission within 72 hours (EDwardICU) and those who did not require intensive care during their first 72 hours of hospital stay following general ward admission (EDward). A higher ED-NEWS was associated with in-hospital mortality (OR 1.26, 95%CI 1.11,1.42; AUROC 0.75, 95%CI 0.64,0.86, p<0.001) and 30-day mortality (OR 1.27, 95%1.17,1.39; AUROC 0.78, 95%CI 0.71,0.84, p<0.001) irrespective of age and comorbidity. There were 64 patients in EDICU group, 12 patients in EDwardICU group and 1,278 patients in EDward group with median ED-NEWSs of 7, 3 and 2 (p< 0.001), respectively. After the first 24 hours in wards, median NEWSs of the EDwardICU patients had substantially increased as compared with EDward patients (6 vs. 2, p< 0.001). There were no statistical differences in last NEWS before ICU admission between the EDICU and EDwardICU patients (7 vs. 8, p = 0.534), or in ICU severity-of-illness scores or patient outcomes. The ability of NEWS to discriminate between survivors and non-survivors was acceptable.39 level II-2
The performance of NEWS in emergency department (ED) was studied by Alam N et al. (2015) using a prospective cohort design and the authors found that among adult patients presenting at the ED, the NEWS score measured at different time points could further risk stratify ED patients within higher Emergency Severity Index (ESI) risk categories, for hospital admission, death and need for Intensive Care Unit (ICU)

25
HE
AL
TH
TE
CH
NO
LO
GY
AS
SE
SS
ME
NT
RE
PO
RT
HE
AL
TH
TE
CH
NO
LO
GY
AS
SE
SS
ME
NT
SE
CT
ION
(MaH
TA
S)
ME
DIC
AL
DE
VE
LO
PM
EN
T D
IVIS
ION
, MIN
IST
RY
OF
HE
AL
TH
NA
TIO
NA
L E
AR
LY
WA
RN
ING
SC
OR
E (N
EW
S)
admission.40 level II-2 The three time points were arrival at ED (T0), one hour after arrival at the ED (T1) and at transfer to hospital ward or ICU when applicable (T2). The AUROCs (95%CI) for NEWS for hospital admission at T0, T1, T2 was respectively 0.664 (95%CI 0.599, 0.728), 0.687 (95%CI 0.620, 0.754), 0.697 (95%CI 0.609,0.786). The AUROCs (95%CI) for NEWS for 30 day mortality at T0, T1 and T2 was respectively 0.768 (95%CI 0.618, 0.919), 0.867 (95%CI 0.769, 0.964), 0.767 (95%CI 0.568, 0.966). Length of stay and ICU admission were significantly correlated with NEWS, at all of the measured time points. Median length of stay more than doubled for a score more than seven compared with a score of 0–4. Sixteen percent of patients with aggregate scores of seven or more was admitted to ICU as compared to 2.3% of patients who had an aggregate score of 0–4. The NEW score could be used to longitudinally monitor patients throughout their stay in the ED and in the hospital.40 level II-2
In the Chinese context, Liu et al. (2015) demonstrated NEW scores of seven or more were associated with increased risk of death (OR=16.8; 95%CI 6.6,42.9).41 level II-2 Data on 540 consecutive Emergency ICU (EICU) patients were collected in a single centre prospective cohort study. The AUROC for death within 24 hours of admission was 0.848 (95%CI 0.792, 0.902, p<0.001). The discriminative ability of NEWS was good for patients with neurological, cardiovascular and respiratory diseases. 41 level II-2 (Table 1)
Table 1: AUROCs for NEWS ability to predict 24 hours mortality among people with different primary diseases.
Primary Disease n AUROC (95% CI) P value
Neurological 188 0.873 (0.796-0.951) 0.000
Cardiovascular 176 0.874 (0.780-0.967) 0.000
Respiratory 70 0.870 (0.765-0.975) 0.001
Gastrointestinal 45 0.576 (0.135-1.000) 0.720
A cohort study by Bilben B et al. (2016) evaluated the effectiveness of NEWS in adult patients emergently presenting in a Norwegian ED with respiratory distress as main symptom.42 The authors wanted to investigate the correlation between NEWS and disease severity and hospital resource use in this population of patients. It was reported that NEWS correlated closely with triage category and maximum in-hospital level of care (ED, ward, high-dependency unit, ICU). (Figure 11) Controlled for age, ASA score (comorbidities status), and COPD, a higher NEWS (NEWS ≥ 5) on ED arrival predicted poorer 90-day survival (17% deaths) (OR 0.835, 95%CI 0.725–0.954). The AUROCs for NEWS for 90-day mortality on ED arrival was 0.809. Increased NEWS (NEWS ≥ 5) also correlated with decreased in-hospital and 30-day survival (6.5% and 11% deaths respectively) and a decreased probability for home-dwelling patients to
be discharged directly home (Figure 12).42 level II-2

HE
AL
TH
TE
CH
NO
LO
GY
AS
SE
SS
ME
NT
RE
PO
RT
HE
AL
TH
TE
CH
NO
LO
GY
AS
SE
SS
ME
NT
SE
CT
ION
(M
aH
TA
S)
ME
DIC
AL
DE
VE
LO
PM
EN
T D
IVIS
ION
, M
INIS
TR
Y O
F H
EA
LT
H
26
NA
TIO
NA
L E
AR
LY
WA
RN
ING
SC
OR
E (
NE
WS
)
Figure 11: National Early Warning Score (NEWS) calculated on ED arrival versus A Manchester Triage Scale category (MTS) (MTS1 immediate-red; MTS2 very urgent_orange; MTS3 urgent_yellow; MTS4 standard_green; MTS5 non- urgent_blue) and B Maximum level of care during hospital stay, in 246 patients presenting with respiratory distress. Boxes comprise 25th–75th percentiles with median value shown, whiskers display 10th and 90th percentiles.
Figure 12: Survival plot of patients presenting in the ED with respiratory distress, 109 patients with NEWS <5 (blue line) on arrival and 137 patients with NEWS ≥5 (red line). Shaded areas display 95 % confidence areas. A higher NEWS value on ED arrival was associated with decreased long-term survival.
In the 6-year multicentre retrospective cohort study involving a large population of adult patients (n=925) with community-acquired pneumonia (CAP) from six tertiary care ED, Sbiti-Rohr D et al. (2016) investigated the accuracy of the NEWS to predict all-cause mortality and adverse clinical outcomes [intensive care unit (ICU) admission, empyema and unplanned hospital readmission all occurring within 30 days after admission].43 level II-2 For the 30-day mortality, an increase in NEWS category was associated with a 16% increase in odds for reaching the event (OR 1.16, 95% 1.07,1.27, p=0.001). However, NEWS showed a low mortality discrimination with AUROC 0.65 (95%CI 0.58,0.72). Combining NEWS with standard CAP risk scores; pneumonia severity index (PSI) or CURB-65 in a statistical model did not improve the prognostic performance. For adverse clinical outcomes, NEWS was a moderate predictor, particularly ICU admission [OR 1.29 (95%CI 1.20,1.39)], and to a lesser degree for empyema [OR 1.16 (95%CI 1.04,1.29)] within 30 days after admission in patients presenting with CAP to the ED. It did not well predict rehospitalisation within 30 days of initial admission. The NEWS AUROC for ICU admission, empyema and rehospitalisation were 0.73 (95%CI 0.67, 0.78), 0.64 (95%CI 0.54,0.73) and 0.58 (95%CI 0.49, 0.66), respectively.43 level II-2

27
HE
AL
TH
TE
CH
NO
LO
GY
AS
SE
SS
ME
NT
RE
PO
RT
HE
AL
TH
TE
CH
NO
LO
GY
AS
SE
SS
ME
NT
SE
CT
ION
(MaH
TA
S)
ME
DIC
AL
DE
VE
LO
PM
EN
T D
IVIS
ION
, MIN
IST
RY
OF
HE
AL
TH
NA
TIO
NA
L E
AR
LY
WA
RN
ING
SC
OR
E (N
EW
S)
Dundar ZD et al (2019) conducted a retrospective cohort study and reported a poor predictive performance of NEWS for in-hospital mortality among critically ill geriatric ED patients (65 years of age or older); AUROC 0.686 (95%CI 0.628, 0.744).44 level II-2 Combination of NEWS and the first lactate level measured in ED (NEWS-L) improved the prognostic power [AUROC 0.714 (95% CI 0.658, 0.770) however NEWS-L still not a powerful predictor to make definitive clinical decisions for critically ill geriatric ED patients.44 level II-2
Comparison with other established EWS or track and trigger system (TTS)
Wuytack F et al. (2017) in a systematic review of 47 studies revealed that there were 28 different EWS been used in ED worldwide.45 level I National Early Warning Score ranked sixth, behind The Resuscitation Management score (THERM), the Worthington EWS, MEES (Mainz Emergency Evaluation Score), PEDS (Prince of Wales Emergency Department Score) and Modified Early Warning Score (MEWS) in predicting the composite output of ICU admission or death of critically ill ED patients. Overall, PEDS, VIEWS-L and NEWS scores appeared relatively better at predicting mortality, providing excellent discrimination ability (AUROC ≥ 0.8). Finding suggested MEWS had a relatively lower ability to predict mortality compared to the four scores mentioned above, with only some studies indicating acceptable discriminatory ability (AUROC >0.7) and other studies indicating a lack of discriminatory ability (AUROC <0.7). The exception was one study that found excellent discriminatory ability of MEWS for the outcome in-hospital mortality (AUROC 0.89).45 level I (Table 2)
Table 2: Type of EWS and their predictive values in heterogenous ED population
EWS assessedAUROC by outcome
Combined outcome of death and ICU admission
THERM 0.84 (95% CI 0.79,0.88)
Worthing 0.78 (95% CI 0.72,0.83)
MEWS 0.76-0.73 (95% CI 0.71-0.67,0.81-0.79)
MEES 0.75 (95% CI 0.69,0.80)
PEDS 0.75 (95% CI 0.69,0.80)
NEWS 0.71 (95% CI 0.64,0.76)
REMS 0.70 (95% CI 0.64,0.76)
SCS 0.70 (95% CI 0.64,0.76)
MEDS 0.59 (95% CI 0.52.0.6)
Mortality
PEDS 0.90 (95% CI 0.86,0.93)
NEWS 0.87-0.77 (95% CI 0.77-0.57,0.96-0.97)
VIEWS-L 0.83 (95% CI 0.77,0.91)
MEWS 0.89-0.63 (95% CI 0.84-0.61,0.94-0.65)
RTS 0.77 (95% CI 0.72,0.81)
REMS 0.77-0.70 (95% CI 0.72-0.64,0.82-0.75)
Abbreviations: THERM = The Resuscitation Management score, MEWS = Modified Early Warning Score, MEES = Mainz Emergency Evaluation Score, PEDS = Prince of Wales Emergency Department Score, REMS = Rapid Emergency Medicine Score, SCS = Simple Clinical Score, MEDS = Mortality in the Emergency Department Sepsis score, ViEWS-L = Vitalpac Early Warning Score combined with lactate, RTS = Revised Trauma Score.

HE
AL
TH
TE
CH
NO
LO
GY
AS
SE
SS
ME
NT
RE
PO
RT
HE
AL
TH
TE
CH
NO
LO
GY
AS
SE
SS
ME
NT
SE
CT
ION
(M
aH
TA
S)
ME
DIC
AL
DE
VE
LO
PM
EN
T D
IVIS
ION
, M
INIS
TR
Y O
F H
EA
LT
H
28
NA
TIO
NA
L E
AR
LY
WA
RN
ING
SC
OR
E (
NE
WS
)
A retrospective cohort study conducted by Yuan WC et al. (2018) sought to compare the predictive performance of NEWS with MEWS and the Acute Physiology and Chronic Health Evaluation (APACHE) II for predicting disease progression and prognosis.46 level II-2 A total of 621 cases from ED resuscitation room was included in the final analysis, which comprised of 258 cases with neurological disease (18.8%), 117 cases with cardiovascular disease (18.8%), 95 cases with respiratory disease (15.4%), 67 cases with digestive diseases (10.8%), 46 cases with urinary system disease (7.4%) and 38 cases of others and unknown diseases (6.1%). There were 563 cases of survivors (91%) and 58 cases of non-survivors (9%). The probability of ICU admission and mortality of patients significantly increase with the increased NEWS, MEWS and APACHE II scores (p<0.01). The predictive ability of NEWS for ICU admission was lower (AUROC 0.760; sensitivity 58.7%, specificity 79.3%) than the APACHE II score (AUROC 0.817; sensitivity 76.1%, specificity 74.1%), but higher than MEWS (AUROC 0.729; sensitivity 64.5%, specificity 68.7%). The study also reported similar performance result for the 28-day mortality prediction among heterogenous ED patients; APACHE II (AUROC 0.883; sensitivity 81.0%, specificity 78.0%), NEWS (AUROC 0.827; sensitivity 84.5%, specificity 66.7%) and MEWS (AUROC 0.723, sensitivity 56.9%, specificity 79.4%).46
level II-2
Lee SB et al. (2019) using a retrospective cohort study, compared the prognostic performance of NEWS with Triage in Emergency Department Early Warning Score (TREWS), Modified Early Warning Score (MEWS) and Rapid Emergency Medicine Score (REMS).47 level II-2 This seven years cohort study, involving 81 520 adult ED patients (≥ 16 years old), aimed to assess the prognostic power for in-hospital mortality within 24 hours, 48 hours, seven days and 30 days of arrival at the ED. National Early Warning Score showed superior performance in predicting in-hospital mortality compared to MEWS and REMS, but inferior to TREWS for patients arriving at the ED as shown in Table 3.47 level II-2
Table 3: Comparison of the NEWS, TREWS, MEWS and REMS
Mortality Outcomes AUROC 95%CI
Mortality within 24hours
TREWS 0.910 (0.907 - 0.914)
NEWS 0.884 (0.880 - 0.888)
MEWS 0.865 (0.861 - 0.869)
REMS 0.825 (0.820 - 0.829)
Mortality within 48hours
TREWS 0.899 (0.895 - 0.903)
NEWS 0.874 (0.870 - 0.878)
MEWS 0.851 (0.846 - 0.855)
REMS 0.815 (0.810 - 0.819)
Mortality within 7 days
TREWS 0.876 (0.872 - 0.880)
NEWS 0.848 (0.844 - 0.853)
MEWS 0.820 (0.815 - 0.825)
REMS 0.787 (0.782 - 0.792)
Mortality within 30 days
TREWS 0.832 (0.828 - 0.837)
NEWS 0.813 (0.808 - 0.818)
MEWS 0.779 (0.774 - 0.784)
REMS 0.748 (0.742 - 0.753)

29
HE
AL
TH
TE
CH
NO
LO
GY
AS
SE
SS
ME
NT
RE
PO
RT
HE
AL
TH
TE
CH
NO
LO
GY
AS
SE
SS
ME
NT
SE
CT
ION
(MaH
TA
S)
ME
DIC
AL
DE
VE
LO
PM
EN
T D
IVIS
ION
, MIN
IST
RY
OF
HE
AL
TH
NA
TIO
NA
L E
AR
LY
WA
RN
ING
SC
OR
E (N
EW
S)
NEWS and sepsis in Emergency Department (ED)
In the retrospective, single-centre cohort study conducted by Keep JW et al. (2015) in a high volume ED in London, an aggregate NEWS score of ≥3 performed best for the identification of patients with severe sepsis and septic shock.48 level II-2 For the identification of a patient at risk of severe sepsis and septic shock; NEWS AUROC =0.89 (95%CI 0.84, 0.94)[NEWS ≥3: Sensitivity=92.6%, Specificity=77%, PPV=18.7%, NPV=99.5% for sepsis; NEWS ≥4, Sensitivity=74.1%, Specificity=86.5%, PPV=23.8%, NPV=98.3%]. Authors noted that a NEWS ≥3 at ED triage may be the trigger to systematically screen for septic shock, obtain an early serum lactate and where appropriate start fluid resuscitation and antibiotic therapy.48 level II-2The use of NEWS in patients (n=2003) with sepsis in the ED (n=20 Scottish EDs) was evaluated by Corfield et al. (2014) in prospective cohort study, revealing an association between increased NEW scores on arrival and adverse outcomes (intensive care unit referral and mortality).49 level II-2 The authors noted that for each rise in NEWS category there was an associated increased risk of mortality when compared to the lowest category: for 30-day mortality, the age-adjusted ORs for NEWS categories compared to the baseline category (≤4) 5–6: OR 1.95, 95%CI 1.21, 3.14 (p=0.01); 7–8: OR 2.26, 95%CI 1.42, 3.61 (p<0.00); 9–20: OR 5.64, 95%CI 3.70, 8.60 (p<0.00). The predictive ability of NEWS for 30-day in-hospital mortality were AUROC NEWS: 0.70 (95%CI 0.67, 0.74) and AUROC age-adjusted NEWS: 0.73 (95%CI 0.70, 0.76). For ICU admission within 48 hours the age-adjusted ORs for NEWS categories compared to the baseline category (≤4) 5–6: OR 1.22, 95%CI 0.59, 2.54 (p=0.59); 7–8: OR 2.01, 95%CI 1.02, 3.97 (p=0.04); 9–20: OR 5.76, 95%CI 3.22, 10.31 (p<0.01). The predictive values for ICU admission within 48 hours of attendance were AUROC NEWS: 0.67 (95%CI 0.61, 0.72) and AUROC age-adjusted NEWS: 0.61 (95%CI 0.56, 0.67). The NEWS AUROC characteristics for the combined endpoint of ICU and/or mortality were NEWS: 0.70 (95%CI 0.67, 0.73); AUROC age-adjusted NEWS: 0.71(95%CI 0.68,0.74). The positive predictive value illustrates that 27% of patients with a NEWS of 7 were admitted to the ICU within 2 days and/or died within 30 days. For a NEWS of 9 this rose to 35%. The use of NEWS could facilitate patient pathways to ensure triage to a high acuity area of the ED and senior clinician involvement at an early stage.49 level II-2
The predictive ability of NEWS for severe sepsis and septic shock in ED triage setting was compared to Systemic Inflammatory Response Syndrome (SIRS) and quick Sepsis-related Organ Failure Assessment (qSOFA) in two retrospective cohort studies. Based on data analysis of 930 ED septic patients in an urban, US tertiary-care academic center, Usman OA et al. (2019) found that NEWS was most accurate for triage detection of severe sepsis and septic shock (AUROC=0.9, 0.88, 0.81), septic shock (AUROC=0.93, 0.88, 0.84), and sepsis-related in-hospital mortality (AUROC=0.95, 0.89, 0.87) for NEWS, SIRS, and qSOFA, respectively (p<0.01 for NEWS versus SIRS and qSOFA) (Figure 13).50 level II-2 The sensitivity of NEWS≥4, SIRS≥2 and qSOFA≥2 to detect severe sepsis and septic shock were 84.2% (95%CI 81.5, 86.5%), 86.1% (95%CI 83.6, 88.2%), and 28.5% (95%CI 25.6, 31.7%) and specificities were 85.0% (95%CI 84.8, 85.3%), 79.1% (95%CI 78.9, 79.3%), and 98.9% (95%CI 98.8, 99.0%), respectively.50 Based on the studied institution’s volume and sepsis prevalence, for the detection of severe sepsis and septic shock relative to NEWS (cutoff ≥4), qSOFA (cutoff ≥2) would have missed approximately five positive cases per week and SIRS (cutoff ≥2) would have inappropriately flagged approximately nine cases per day. The authors also found that table-based aggregate weighted systems, such as NEWS, were more predictive and robust compared with tally-based single parameter scores such as qSOFA and SIRS. National Early Warning Score may offer scoring flexibility relative to SIRS and qSOFA by allowing for the creation of multiple severity categories. Patients flagged as “moderate risk” (NEWS between 4-8) may suggest obtaining a lactic acid, whereas patients flagged as “high risk” (NEWS≥9) may benefit from the rapid mobilization of bundled resources and early ICU consultation.50 A Dutch study by Brink A et al. (2019) using a larger population of participants (n=8204) evaluated the predictive performance of NEWS for 10-day and 30-day mortality after ED presentation.51 level

HE
AL
TH
TE
CH
NO
LO
GY
AS
SE
SS
ME
NT
RE
PO
RT
HE
AL
TH
TE
CH
NO
LO
GY
AS
SE
SS
ME
NT
SE
CT
ION
(M
aH
TA
S)
ME
DIC
AL
DE
VE
LO
PM
EN
T D
IVIS
ION
, M
INIS
TR
Y O
F H
EA
LT
H
30
NA
TIO
NA
L E
AR
LY
WA
RN
ING
SC
OR
E (
NE
WS
)
II-2 The similarity of findings with US study was seen whereby NEWS outperformed qSOFA and SIRS in predicting in-hospital mortality; 10-day mortality [AUC (95% CI): 0.837 (0.812, 0.861), 0.744 (0.708, 0.78) and 0.646 (0.613, 0.679) respectively] and 30-day mortality [0.779 (0.755, 0.804), 0.697 (0.667, 0.726) and 0.631 (0.605, 0.656) respectively].51 level II-2 The study, similarly also reported qSOFA showed the highest specificity, followed by NEWS and SIRS. Sensitivity was highest in SIRS, followed by NEWS and qSOFA. However, in contrast with US study, the cut-off value of ≥7 for NEWS was used in this study.
Figure 13: Prediction Across Disease Severity
A retrospective cohort study conducted by Churpek MM et al. (2017) did similar comparison with NEWS and in addition, MEWS was also included as one of the comparators.52 level II-2 The study included 30 677 patients whereby 60% first met the suspicion of infection criteria in the ED. Suspected infection was defined as either (1) any culture order followed by an intravenous (IV) antibiotic within 72 hours or (2) an IV antimicrobial followed by a culture order within 24 hours. The time of the culture order or IV antimicrobial administration was denoted as the time of suspicion of infection, whichever came first. Discrimination for in-hospital mortality and composite outcome (death or ICU stay) were evaluated. The relationship among the scores was also compared between ward and ED subgroups. The accuracy in predicting in-hospital mortality was highest for NEWS (AUROC 0.77; 95%CI 0.76, 0.79), followed by MEWS (AUROC 0.73; 95%CI 0.71, 0.74), qSOFA (AUROC 0.69; 95%CI 0.67,0.70), and lowest for SIRS (AUROC 0.65; 95%CI 0.63, 0.66) (p < 0.01 for all pairwise comparisons).52 For those who experienced the composite outcome (death or ICU stay; n = 7 385), the median time to the outcome after time of first suspicion of infection was 14 hours [interquartile range, (IQR)6–66 hours], and 71% of patients who experienced the composite outcome did so within 48 hours. Using the highest non-ICU score of patients, NEWS ≥8 had a sensitivity of 67% and specificity of 66% for the composite outcome compared with 59% and 70% for MEWS ≥5, 91% and 13% for SIRS≥2, 54% and 67% for qSOFA ≥2, respectively. The relationship among the scores was consistent when comparing the ward and ED subgroups, with the AUCs being slightly lower on the wards.52 level II-2 (Figure 14)

31
HE
AL
TH
TE
CH
NO
LO
GY
AS
SE
SS
ME
NT
RE
PO
RT
HE
AL
TH
TE
CH
NO
LO
GY
AS
SE
SS
ME
NT
SE
CT
ION
(MaH
TA
S)
ME
DIC
AL
DE
VE
LO
PM
EN
T D
IVIS
ION
, MIN
IST
RY
OF
HE
AL
TH
NA
TIO
NA
L E
AR
LY
WA
RN
ING
SC
OR
E (N
EW
S)
Figure 14: Discrimination of the different algorithms for predicting in-hospital mortality using each patient’s highest score by location (solid squares represent point estimates, and error bars represent 95% confidence intervals). ED = emergency department; MEWS = Modified Early Warning Score; NEWS = National Early Warning Score; qSOFA = quick Sepsis -related Organ Failure Assessment; SIRS = Systemic Inflammatory Response Syndrome.
Weighted pooled result for mortality outcomes
The pooled AUROC values for NEWS showed good discriminative power for 24 hours mortality [AUROC 0.88 (95%CI 0.85,0.90), I2 38.9%], in-hospital mortality [AUROC 0.70 (95%CI 0.65,0.75), I2 1.7%) and 30-day mortality for heterogenous [AUROC 0.81 (95%CI 0.81,0.82), I2 5%) population of ED patients. (Figure 15) High heterogeneity was observed when we pooled studies involving suspected infection or sepsis population with studies from heterogenous population. Hence we decided not to include these studies in our final analysis.
Test for overall effect Z=39.15, p<0.001
Figure 15: The pooled estimate of AUROC values for 24-hour mortality, in-hospital mortality and 30-day mortality for heterogenous ED population

HE
AL
TH
TE
CH
NO
LO
GY
AS
SE
SS
ME
NT
RE
PO
RT
HE
AL
TH
TE
CH
NO
LO
GY
AS
SE
SS
ME
NT
SE
CT
ION
(M
aH
TA
S)
ME
DIC
AL
DE
VE
LO
PM
EN
T D
IVIS
ION
, M
INIS
TR
Y O
F H
EA
LT
H
32
NA
TIO
NA
L E
AR
LY
WA
RN
ING
SC
OR
E (
NE
WS
)
General ward
In a prospective cohort study, Smith GB et al. (2013) used a large vital signs database (n=198,755 observation sets) collected from 35,585 consecutive, completed acute medical admissions to evaluate the NEWS: heart rate; diastolic and systolic blood pressure; respiratory rate; oxygen saturation; temperature; and mental status using the Alert-Verbal-Painful-Unresponsive (AVPU) scale or the Glasgow Coma Score (GCS).53 level II-2 The NEWS score had an AUROC of 0.894 (95%CI 0.887, 0.902), 0.857 (95%CI 0.847, 0.868) and 0.722 (95%CI 0.685, 0.759) as a predictor of death, cardiac arrest and unanticipated ICU admission, respectively, within 24 hours of the observed score. This study did not report sensitivity at different specificities or show the AUROC curve for death, cardiac arrest and unanticipated ICU admission to estimate these data. However, as an example of the risk for a false positive, approximately 97% of patients with a NEWS value of 8 (of 20 possible points) did not die with 24 hours.53 level II-2
For validation of NEWS among medical patients, Badriyah T et al. (2014) used Decision-Tree analysis to construct a decision-tree EWS (DTEWS) from a database of 198,755 vital signs observation sets collected from 35,585 consecutive, completed acute adult (>16 years) medical admissions within 24 hours of a given vital sign observation.54 level II-2 The outcomes of DTEWS and NEWS were similar for mortality, cardiac arrest and unanticipated ICU admission: NEWS AUROC=0.894 (95%CI 0.88, 0.902), 0.722 (95%CI 0.685,0.759), 0.857 (0.847, 0.868); DTEWS AUROC=0.899 (95% CI 0.982, 0.907). 0.708 (0.669, 0.747), 0.862 (0.852, 0.872), respectively. The decision-tree technique independently validates the composition and weightings of NEWS (Figure 16).54 level II-2
Figure 16: The “EWS efficiency curve”, distribution of DTEWS and NEWS values, and their relationships to the primary outcome of cardiac arrest, unanticipated intensive care unit admission or death, each within 24 hours of a given vital signs. This compares the number of “triggers” that are generated at different values of DTEWS and NEWS. It demonstrates that the curves for DTEWS and NEWS are almost identical in shape and position; however the individual EWS values are positioned differently along their efficiency curves. For instance, the detection of ∼83% of those who will die within 24 hours of a given EWS value requires a response to only 25% of either DTEWS or EWS values. However to achieve this, the trigger point for DTEWS must be 5, whilst that for NEWS must be 4.

33
HE
AL
TH
TE
CH
NO
LO
GY
AS
SE
SS
ME
NT
RE
PO
RT
HE
AL
TH
TE
CH
NO
LO
GY
AS
SE
SS
ME
NT
SE
CT
ION
(MaH
TA
S)
ME
DIC
AL
DE
VE
LO
PM
EN
T D
IVIS
ION
, MIN
IST
RY
OF
HE
AL
TH
NA
TIO
NA
L E
AR
LY
WA
RN
ING
SC
OR
E (N
EW
S)
Jarvis S et al. (2015a) in a retrospective cohort study, using 10 000 observation sets randomly selected for analysis of the 24 hours risk of serious clinical outcomes (death, cardiac arrest and unanticipated ICU admission).55 level II-2 The study found for all outcomes, an aggregate NEWS score of 5 was associated with a significantly higher risk than that of an aggregate score of 3 (with single vital sign scoring of 3); risk of death and any adverse outcome was significantly higher for a NEWS score of 5 than an aggregate score of 4 or 3 (with single vital sign scoring 3). Odds of adverse outcomes increased (almost doubled) with each increase of 1 point in the aggregate NEWS scores. Where a single vital sign had a score of 3, the odds increased, but not significantly. (Table 4) (Figure 17) Authors noted that escalation of care to a doctor when any component of NEWS scores 3 compared to when aggregate NEWS values ≥5, would have increased doctors workload by 40% with only a small increase in the number of detected adverse outcomes from 2.99 to 3.08 per day (a 3% improvement in detection).55 level II-2
Table 4: Risk (expressed as the odd ratio, compared to an aggregate NEWS value of 5
Figure 17: Risk of an adverse outcome within 24hours of an observation set scoring 3,4 or 5 on the NEWS. For those scoring 3 or 4, risks are split by whether the score included a single component score of 3.
When investigating which components most frequently contribute a NEWS value of 3 (and their associated risks), the authors found that a score of 3 for a single vital sign in NEWS is too low by itself to indicate imminent risk of adverse effect (with the exception of temperature ≤35°C). An alternative NEWS protocol would be to increase frequency of observation within these patients, but not to escalate care only on one vital sign score of 3. An individual score of 3 for low temperature (≤35°C) was the only single vital sign that significantly increased risk of adverse outcomes above that of an aggregate score of 5. But this was rare therefore loss of consciousness as a single vital sign was a better measure of risk; however risk was not significantly higher that an aggregate score of 5 (Figure 18). 55 level II-2

HE
AL
TH
TE
CH
NO
LO
GY
AS
SE
SS
ME
NT
RE
PO
RT
HE
AL
TH
TE
CH
NO
LO
GY
AS
SE
SS
ME
NT
SE
CT
ION
(M
aH
TA
S)
ME
DIC
AL
DE
VE
LO
PM
EN
T D
IVIS
ION
, M
INIS
TR
Y O
F H
EA
LT
H
34
NA
TIO
NA
L E
AR
LY
WA
RN
ING
SC
OR
E (
NE
WS
)
Figure 18: Prevalence of and risks associated with vital sign measurements responsible for the single component score of 3 in observation sets with NEWS values of 3 or 4, for a range of outcomes. Dashed horizontal lines indicate the risk associated with an aggregate NEWS score of 5 (shaded area is the 95% CI).
The ability of NEWS to discriminate death, cardiac arrest and unanticipated ICU admission within 24 hours for surgical and medical patients was compared by Kovacs C et al. (2016) in a prospective cohort study.56 level II-2 The analysis of 2,017,455 observation sets (792 889 surgical observation sets and 1,174,574 medical observation sets) revealed that NEWS performed equally well, or better, for surgical as for medical patients. For death within 24 hours the AUROC for surgical admissions was 0⋅914 (95%CI 0⋅907, 0⋅922), compared with 0⋅902 (95%CI 0⋅898, 0⋅905) for medical admissions. For the combined outcome of any of death, cardiac arrest or unanticipated ICU admission, the AUROC was 0⋅874 (95%CI 0⋅868, 0⋅880) for surgical admissions and 0⋅874 (95%CI 0⋅871, 0⋅877) for medical admissions. NEWS is a poorer discriminator of cardiac arrest, compared with the other outcomes studied [medical: AUROC 0⋅747 (95%CI 0⋅857, 0⋅870), surgical: AUROC 0⋅762 (95%CI 0⋅853, 0⋅868)].56 level II-2 EWS efficiency curve for NEWS using the combined outcome, within 24 hours of an observation set had shown that a NEWS value of 5 would trigger urgent assessment of the medical patients which would result in the detection of 70⋅2% (NEWS of at least 7: 48⋅7%t) of combined outcomes. A NEWS value of 4 would have a similar efficiency (detection of 70⋅9% of combined outcomes) for admissions to surgical specialties. Based on the findings, it was suggested a NEWS value of at least 5 should trigger an urgent assessment by a clinician with core competencies to assess acutely ill patients, and a NEWS value of 7 or more should prompt emergency assessment by a clinical team with critical care competencies.56 level II-2
A prospective cohort study of adult medical admissions to a single-centre was conducted by Abbott TEF et al. (2016) reported outcomes of composite mortality or critical care escalation within 48 hours of hospital admission (n=322) and hospital length of stay (LOS) (n=310) associated with predictive ability NEWS versus combination of NEWS and blood gas variables (lactate, glucose and base-excess).36 level II-2 This study represented ward-based care patients with a broad spectrum of medical presentations. NEWS alone was more strongly associated with death or critical care unit escalation within 48 hours of hospital admission (OR 1.46,p<0.01) (as shown in Table 5) and a reasonable predictor of the mentioned outcomes (AUROC 0.74, p<0.01). The authors indicated that NEWS was a poor predictor of hospital LOS

35
HE
AL
TH
TE
CH
NO
LO
GY
AS
SE
SS
ME
NT
RE
PO
RT
HE
AL
TH
TE
CH
NO
LO
GY
AS
SE
SS
ME
NT
SE
CT
ION
(MaH
TA
S)
ME
DIC
AL
DE
VE
LO
PM
EN
T D
IVIS
ION
, MIN
IST
RY
OF
HE
AL
TH
NA
TIO
NA
L E
AR
LY
WA
RN
ING
SC
OR
E (N
EW
S)
as no association between NEWS alone or any combination of NEWS and blood gas variables with hospital LOS was identified. Hence, data from this study did not support using blood gas variables in combination with NEWS for risk stratification as neither method increased the strength of association of NEWS with either outcome measure.36 level II-2
Table 5: Association between the sum of NEWS and biomarkers, with primary outcome measure (critical care admission or death within 48 hours)
* H-L Hosmer-Lemeshow statistic for goodness of fit, presented with p-value
The results of two studies indicate that the NEWS risk classification can be used to predict in-hospital mortality in a mixed patient population. Spangfors M et al. (2019) using a retrospective cohort study, demonstrated the NEWS risk classification has good predictive capabilities on mortality.57 level II-2 The sum of points is then related to the level of risk for the patient: low-risk = 0-4 points, medium-risk = 5-6 points or 3 points in one individual parameter and high-risk = ≥7 points. The NEWS risk classification was significantly higher among those who died before hospital discharge and within 30 days of discharge compared to those who did not. Medium (NEWS 5-6) and high-risk (NEWS≥7) was significantly associated with a 2.11 (95%CI 1.27, 3.51, p=0.004) and 3.40 (95%CI 1.90, 6.01, p<0.001) increase in odds of in-hospital death compared to low-risk (0-4), respectively. For 30-day mortality, medium and high-risk was significantly associated with a 1.98 (95%CI 1.32, 2.97, p=0.001) and 3.19 (95%CI 1.97, 5.18, p<0.001) increase in odds of death compared to low-risk, respectively.57 level
II-2 Spagnolli et al. (2017) in a prospective cohort single centre study have shown that medical patients, classified as NEWS medium-risk (NEWS 5-6) upon hospital ward admission had a more than three-fold increase in odds of in-hospital mortality and a nine-fold increase, if classified as NEWS high-risk (NEWS ≥7).(Figure 19)58 level II-2 Spangfors M et al. acknowledged the difference in odds ratio between the two studies was due to the variation in patients’ distribution across three NEWS risk categories. Spagnolli et al. had fewer medium-risk patients (11%) than high-risk patients (17 %) compared to medium (27 %) and high-risk patients (11 %) in the study by Spangfors M et al.57, 58 level II-2

HE
AL
TH
TE
CH
NO
LO
GY
AS
SE
SS
ME
NT
RE
PO
RT
HE
AL
TH
TE
CH
NO
LO
GY
AS
SE
SS
ME
NT
SE
CT
ION
(M
aH
TA
S)
ME
DIC
AL
DE
VE
LO
PM
EN
T D
IVIS
ION
, M
INIS
TR
Y O
F H
EA
LT
H
36
NA
TIO
NA
L E
AR
LY
WA
RN
ING
SC
OR
E (
NE
WS
)
Figure 19: Relative distribution of the NEWS on admission and relationship with evaluated outcomes
Another study conducted in a single Korean medical centre by Lee YS et al. (2018) using retrospective cohort design also showed that the NEWS was effective in predicting in-hospital mortality (AUROC 0.765; 95%CI 0.659, 0.846) among general wards patients via risk stratification at the time of admission.59 level II-2 Based on the Kaplan Meier survival curves, the survival time of patients who are at high risk according to NEWS was significantly shorter than that of patients who are at low risk (p<0.001). Results of the multivariate Cox proportional hazards regression analysis showed that the hazard ratios of patients who are at medium and high risk based on NEWS were 2.6 and 4.7, respectively (p<0.001). In addition, the study showed that the predictive performance of NEWS can be further improved with combination model that used other factors, such as age and diagnosis. (NEWS: 0.765; combination model: 0.861; p<0.005) (Table 6).59 level II-2
Table 6: Prognostic capabilities of NEWS and other factors for in-hospital mortality
Models AUC value (95%CI) p valuea p valueb p valuec
I 0.765 (0.659–0.846) reference
II 0.821 (0.735-0.888) 0.046 reference
III 0.837 (0.756-0.900) 0.020 0.182 reference
IV 0.861 (0.793-0.917) 0.005 0.138 0.138
Model I : trigger thresholds for the NEWS only; Model II : trigger thresholds for the NEWS and age Model III: trigger thresholds for the NEWS, age and medical reason for admission Model IV: trigger thresholds for the NEWS, age, medical reason for admission and cancer Comparison of AUCs between aModel I and other models, bModels II,III and IV, cModels III and IV were tested using the Boot-strap method.
A retrospective cohort study conducted by Roberts D et al. (2017) assessed the preceding NEWS [within 12 hours before in-patient cardiac arrest (IHCA)] and its association with 30-day survival after an IHCA.60 level II-2 In all 358 patients suffered an IHCA during one year study period, the overall 30-day survival rate was 30%. Lower survival rates was associated with higher NEWS [survival rates were 47% among those with low NEWS (NEWS 0-4), 20% among those with medium NEWS (NEWS≥5) and 10% among those with high NEWS (NEWS≥7)]. Combinations with ≥90% mortality ratio, were found for patients with at least 2 points on two of the

37
HE
AL
TH
TE
CH
NO
LO
GY
AS
SE
SS
ME
NT
RE
PO
RT
HE
AL
TH
TE
CH
NO
LO
GY
AS
SE
SS
ME
NT
SE
CT
ION
(MaH
TA
S)
ME
DIC
AL
DE
VE
LO
PM
EN
T D
IVIS
ION
, MIN
IST
RY
OF
HE
AL
TH
NA
TIO
NA
L E
AR
LY
WA
RN
ING
SC
OR
E (N
EW
S)
following parameters in any combination: high respiratory rate, oxygen saturation <90%, high heart rate and low systolic blood pressure. Further, a ≥2-point score on at least three of the four above mentioned parameters formed a lethal triad with 100% mortality. Patients with a medium NEWS had a more than fourfold chance of dying in their IHCA compared to those with a low NEWS (adjusted OR 4.43, 95% CI 1.81, 10.83). Likewise, patients with a high NEWS had tenfold chance of dying of their IHCA compared to those with a low NEWS (adjusted OR 9.88, 95%CI 2.77, 35.26). 60 level II-2
Tirkkonen J et al. (2014) in a point prevalence study using data of patients on general wards (n=615) found that NEWS score ≥ 5 or if the weighted score for any individual vital sign was 3 was associated with an increased odds of mortality at 30 and 60 day: NEWS score ≥5 30-day mortality: OR 11.8 (95%CI 4.26, 32.6); NEWS score ≥7 30-day mortality: OR 11.4 (95%CI 4.40, 29.6); NEWS score ≥5 60-day mortality OR 5.55 (95%CI 2.91–10.6); NEWS score ≥7 60-day mortality: OR 6.42 (95%CI 2.92, 14.1).61 level III A score of 7–8 increased the risk for death at 30 days independently 25-fold; a score of 9–10 increased the risk 45-fold. (Figure 20) The risk of serious adverse event (medical emergency team activation, cardiac arrest, emergency ICU admission or death): NEWS score ≥5 OR 14.7 (4.32–50.2); NEWS score ≥7 OR 7.45 (2.39–23.3). Following adjustment of confounding factors [age, gender, admission type (elective/emergency), background (surgical/medical), surgery within 48 hours of assessment, preceding intensive care unit admission and Charlson comorbidity index], NEWS cumulative score was able to detect high risk ward patients regardless of multiple factors affecting patient outcome in a population without treatment limitation.61 level III
Figure 20: Odds ratios of different National Early Warning Score values with 95%CI for 30- day mortality as compared with patients with a total score of 0. All odds ratios are adjusted for patient age, gender, admission type (elective/emergency), background (surgical/medical), surgery within 48 hours of assessment, preceding intensive care unit admission and Charlson comorbidity index. The scale of odds ratios (left) is logarithmic.

HE
AL
TH
TE
CH
NO
LO
GY
AS
SE
SS
ME
NT
RE
PO
RT
HE
AL
TH
TE
CH
NO
LO
GY
AS
SE
SS
ME
NT
SE
CT
ION
(M
aH
TA
S)
ME
DIC
AL
DE
VE
LO
PM
EN
T D
IVIS
ION
, M
INIS
TR
Y O
F H
EA
LT
H
38
NA
TIO
NA
L E
AR
LY
WA
RN
ING
SC
OR
E (
NE
WS
)
NEWS and respiratory disease
Eccles SR et al. (2014) in prospective cohort study showed that patients with chronic hypoxaemia (CH), defined as those with target oxygen saturations of 88–92%, had persistently high NEWS during stability/at discharge causing unnecessary triggers and alarm fatigue for this patient group, whilst identifying the sickest patients.(Figure 21)62 level II-2 It was observed that NEWS lacked specificity for chronic hypoxaemia patients. This is likely to be due to the respiratory variables in NEWS. Chronic hypoxaemia patients, in whom lower oxygen saturations are acceptable and indeed desirable, it is not logical to score highly on NEWS for oxygen saturations when these are within the target range. However, NEWS had a good predictive value for 30-day mortality for chronic hypoxaemia patients during stability/at discharge [AUROC 0.876 (95%CI 0.788, 0.963)]. 62 level II-2
Figure 21: Distribution of NEWS scores for chronic hypoxaemia (CH) and other (O) patients
during stability/at discharge
Validation study of the NEWS for patients with acute exacerbation chronic obstructive pulmonary disease (AECOPD) was performed by Hodgson LE et al. (2017) using retrospective cohort design.63 level II-2 Prognostic prediction of NEWS for in-patient mortality was compared between AECOPD patients and general acute medical unit (AMU) patients. The study reported modest discrimination of NEWS to predict mortality in AECOPD cohort. The study also demonstrated similar discrimination to an AMU cohort [AECOPD cohort: AUROC NEWS 0.74 (95%CI 0.66, 0.82) versus AMU cohort: AUROC NEWS 0.77 (95%CI 0.75, 0.78)]. However, at suggested cut-offs of 5 and 7 points in the AECOPD cohort specificity to predict mortality and positive predictive value (PPV) values of the NEWS were lower compared to the AMU cohort, though sensitivity at the same cut-offs was higher. (Table 7) 63 level II-2
Table 7: Prediction of in-patient mortality by admission score.
NEWS threshold CohortSensitivity (%)
(95%CI)Specificity (%)
(95%CI)PPV (%)(95%CI)
NPV (%)(95%CI)
≥5COPD 76 (61-88) 57 (54-61) 8 (5-11) 98 (97-99)
AMU 43 (40-46) 90 (90-91) 17 (16-19) 97 (97-97)
≥7COPD 60 (43-74) 80 (77-83) 12 (8-18) 98 (96-99)
AMU 25 (23-28) 96 (96-97) 25 (22-28) 96 (96-97)
Sensitivity, specificity, PPV, NPV (with 95% confidence intervals) at RCP suggested NEWS thresholds of 5 points & 7 points for 1st AECOPD admission (n=942) using NEWS, CREWS, Salford-NEWS scores & the NEWS for the AMU cohort (n=20,415). AMU - acute medical unit patients, PPV - positive predictive value, NPV - negative predictive value.

39
HE
AL
TH
TE
CH
NO
LO
GY
AS
SE
SS
ME
NT
RE
PO
RT
HE
AL
TH
TE
CH
NO
LO
GY
AS
SE
SS
ME
NT
SE
CT
ION
(MaH
TA
S)
ME
DIC
AL
DE
VE
LO
PM
EN
T D
IVIS
ION
, MIN
IST
RY
OF
HE
AL
TH
NA
TIO
NA
L E
AR
LY
WA
RN
ING
SC
OR
E (N
EW
S)
A single centre retrospective cohort study was conducted by Forster S et al. (2018), analysing the sensitivity and specificity of NEWS in predicting imminent in-hospital mortality in an unselected respiratory population and in a subgroup analysis of patients with COPD and the number of mandatory escalations generated.64 level II-2 NEWS demonstrated higher sensitivity for predicting death within 24 hours, offset by reduced specificity, in comparison to locally adapted EWS. (Table 17) The result showed that at the scores’ cut points for escalation, NEWS would have generated an eightfold increase in mandatory workload due to a lower specificity. (Figure 22) 64 level
II-2
Table 8: Workload predictions and sensitivity and specificity in predicting death within 24 hours for NEWS and local EWS
Unselected respiratory population
Chronic Obstructive Pulmonary Disease
Figure 22: Graph of sensitivity versus alerts created for NEWS and local EWS

HE
AL
TH
TE
CH
NO
LO
GY
AS
SE
SS
ME
NT
RE
PO
RT
HE
AL
TH
TE
CH
NO
LO
GY
AS
SE
SS
ME
NT
SE
CT
ION
(M
aH
TA
S)
ME
DIC
AL
DE
VE
LO
PM
EN
T D
IVIS
ION
, M
INIS
TR
Y O
F H
EA
LT
H
40
NA
TIO
NA
L E
AR
LY
WA
RN
ING
SC
OR
E (
NE
WS
)
Grudzinska FS et al. (2019) sought to evaluate whether NEWS, pneumonia-specific (CURB65, Lac-CURB-65) or generic sepsis (qSOFA) were most accurate at predicting adverse outcomes among hospitalized community acquired pneumonia (CAP) patients.65 level II-2 At admission, NEWS≥5 identified 79% of those who died within 30 days while for CURB65 ≥2, Lac-CURB-65 ≥moderate (CURB65=2 and/or lactate 2.0–4.0 mmol/L) and qSOFA ≥2 identified 85.0%, 96.4% and 40.3% of patients with CAP, respectively. Pneumonia-specific tools provide better discrimination of patients at high risk of adverse outcome than NEWS or generic sepsis tools [AUROC CURB65 0.69, Lac-CURB-65 0.68, NEWS 0.63 and qSOFA 0.62. Lac-CURB-65, using ‘moderate’ as the cut-off, had the greatest sensitivity and negative predictive value (NPV), 96.4% and 95.6%, respectively. While having acceptable sensitivity to predict 30-day mortality, NEWS≥5 had a low specificity (39.9%) for mortality prediction among CAP patients (PPV 23.4%, NPV 89.1%).65 level II-2
NEWS and liver disease
Hydes TJ et al.(2018) demonstrated in their retrospective cohort study, NEWS as accurate discriminator of short-term (less 24 hours) deterioration of inpatients with liver disease with its performance being highest in alcohol-related(ARLD).66 level II-2 The short term deterioration occurring within 24 hours of an observation set were in-hospital mortality, unanticipated ICU admission or cardiac arrest. The NEWS identified patients with primary, non-primary and no diagnoses of liver disease (control group-patients not allocated any liver disease codes during their episodes of care during or prior to the study) with AUROC values of 0.873 (95%CI 0.860, 0.886), 0.898 (95%CI 0.891, 0.905), and 0.879 (95%CI 0.877, 0.881), respectively. High AUROC values were also obtained for all clinical subgroups; the NEWS identified patients with ARLD with an AUROC value of 0.927 (95% CI, 0.912–0.941).66 level II-2
NEWS prediction in oncology
A retrospective cohort study was performed by Cooksley T et al. (2012) at a specialist oncology hospital in UK.67 level II-2 Data on 840 oncology patients were analysed to assess the effectiveness of two early warning scores, NEWS and MEWS in predicting critical care admission and 30-day mortality. The 30-day mortality data include patients who were transferred to the hospice or for terminal care at home and died within this period. The reason for admission during the study period ranging from admission for chemotherapy or radiotherapy treatment, unwell after recent treatment, receiving other treatment to surgery. Both NEWS and MEWS had poor discriminatory value in identifying oncological patients at risk of deterioration and requiring critical care admission. The AUROC value of NEWS to predict critical care admission was 0.59 (p<0.001) and for MEWS was 0.55 (p<0.05). The 30-day mortality AUROC value of NEWS equaled 0.62 (p<0.001) and for MEWS 0.60 (p<0.05).67 level II-2
NEWS prediction at post-intensive care unit discharge
A prospective cohort study conducted by Uppanisakorn S et al. (2017) aimed to determine the ability of NEWS at ICU discharge (NEWS
dc) to predict the development
of clinical deterioration (acute respiratory failure or circulatory shock) within 24 hours.68 level II The NEWS was immediately recorded before discharge. The incidence of early clinical deterioration after ICU discharge was 14.8%. The findings indicated that NEWS
dc was an independent predictor for early clinical deterioration after ICU
discharge (OR 2.54; 95%CI 1.98, 3.26; p<0.001). The AUROC of NEWSdc
was 0.92 ± 0.01 (95%CI 0.89, 0.94, p<0.001). A NEWS
dc > 7 showed the best sensitivity (93.6%)
and specificity (82.2%) to detect early clinical deterioration 24 hours after ICU discharge.68 level II
Another retrospective cohort study with similar interest conducted by Klepstad PK et al. (2019), involving population of gastrointestinal patients transferred from ICU/

41
HE
AL
TH
TE
CH
NO
LO
GY
AS
SE
SS
ME
NT
RE
PO
RT
HE
AL
TH
TE
CH
NO
LO
GY
AS
SE
SS
ME
NT
SE
CT
ION
(MaH
TA
S)
ME
DIC
AL
DE
VE
LO
PM
EN
T D
IVIS
ION
, MIN
IST
RY
OF
HE
AL
TH
NA
TIO
NA
L E
AR
LY
WA
RN
ING
SC
OR
E (N
EW
S)
high dependency unit (HDU) to general ward.69 level II-2 In this study, the NEWS values were collected during patients’ stay in general ward and the clinical deterioration of interest were death or readmission to ICU. No patients died unexpectedly at the ward and ICU/HDU readmission was 16%. The NEWS values increased by a mean of 0.15 points per hour (intercept 3.7, p<0.001) before ICU/HDU readmission according to the linear mixed effect model. NEWS at transfer from ICU was the only factor that predicted readmission (OR 1.32; 95%CI 1.01, 1.72; p=0.04) at the time of admission to the ward.69 level II-2
Evaluation of NEWS as predictor of post-ICU respiratory failure in older ICU patients (≥60 years) who were successfully weaned from mechanical ventilation (MV) and discharged to the general ward from ICU was conducted by Chen YC et al. (2019) by utilising retrospective cohort design.70 level II-2 The present study had 8.5% of the older patients with successful liberation from MV and ICU (ICU
mv-lib) developing post-
ICU respiratory failure before day 14 (PIRF-14). The post-ICU in-hospital mortality rates were 47.8% and 6.8% in patients with and without PIRF-14 (adjusted OR 12.597, 95%CI 4.368, 36.331). National Early Warning Score on discharge was identified as independent predictor of PIRF-14 in this studied population. Patient with escalating NEWS levels had increasing rates of PIRF-14. Those with a NEWS of ≥10 had 2.6 fold increased risk of PIFR-14 (adjusted OR 2.642, 95%CI 1.001, 6.976). Patients with a NEWS of <10 and PIRF-14 had a sevenfold increased risk of mortality as compared with the reference group without both factors (adjusted OR 7.729, 95%CI 1.155, 51.703). Patients with a NEWS of ≥10 and subsequent PIRF-14 had a 15-fold elevated risk of mortality as compared with the reference group (adjusted OR 15.418, 95% CI 4.344, 54.720).70 level II-2
Zaidi H et al. (2019) in a retrospective cohort study utilising a large vital signs database (n = 2, 723, 055) collected from 28,523 critical care admissions from surgical (SICU), coronary (CCU), cardiac surgery recovery (CSRU), medical (MICU) and trauma surgical (TSICU) intensive care patients with a single complete admission (patient was admitted to ICU and later discharged without returning to another ICU), demonstrated that the NEWS was able to discriminate a patient by discharge location (home; hospital ward; nursing facility; hospice and death) within 24 hours of admission to any ICU specialty.71 level II-2 A reasonable discriminative ability of NEWS across five different ICU specialties for any discharge location was reported. The NEWS has greater ability to discriminate patients in the Coronary Care Unit (CCU) and Cardiac Surgery Recovery Unit (CSRU) compared to other ICU specialties.(Figure 23 and 24) The NEWS AUROC (95%CI) at 24 hours following admission: all patients 0.727 (0.709, 0.745); Coronary Care Unit (CCU) 0.829 (0.821, 0.837); Cardiac Surgery Recovery Unit (CSRU) 0.844 (0.838, 0.850); Medical Intensive Care Unit (MICU) 0.778 (0.767, 0.791); Surgical Intensive Care Unit (SICU) 0.775 (0.762, 0.788); Trauma Surgical Intensive Care Unit (TSICU) 0.765 (0.751, 0.773). The authors did not report on NEWS cut off values for different type of discharge locations.71 level II-2
Figure 23: ICU specialty and discharge Figure 24: NEWS discrimination within Cardiac Surgery Recovery Unit

HE
AL
TH
TE
CH
NO
LO
GY
AS
SE
SS
ME
NT
RE
PO
RT
HE
AL
TH
TE
CH
NO
LO
GY
AS
SE
SS
ME
NT
SE
CT
ION
(M
aH
TA
S)
ME
DIC
AL
DE
VE
LO
PM
EN
T D
IVIS
ION
, M
INIS
TR
Y O
F H
EA
LT
H
42
NA
TIO
NA
L E
AR
LY
WA
RN
ING
SC
OR
E (
NE
WS
)
Comparison with other established EWS or track and trigger system (TTS)
Based on published findings from validation study conducted Smith et al. (2013), NEWS had greater discriminatory ability compared to other 33 EWSs that were in use at the time of the study to predict unanticipated ICU admission or death but not cardiac arrest within 24 hours of a vital signs dataset among medical admissions.53 level II-2 [NEWS: AUROC (95%CI) 0.894 (0.887, 0.902) for death, 0.857 (0.847, 0.868) for unanticipated ICU admission, 0.722 (0.685, 0.759) cardiac arrest, 0.873 (0.866, 0.879) for combined outcome] [AUROCs (95% CI) for the other 33 EWSs were 0.813 (0.802, 0.824) to 0.858 (0.849, 0.867) for death, 0.570 (0.553, 0.568) to 0.827 (0.814, 0.840) for unanticipated ICU admission, 0.611 (0.568, 0.654) to 0.710 (0.675, 0.745) for cardiac arrest and 0.736 (0.727, 0.745) to 0.834 (0.826, 0.842) for combined outcome]. 53 level II-2
Jarvis et al. (2015b) also found that NEWS performed the best of all 35 EWSs when predicting risk of death within 24 hours.72 level II-2 The top three EWS (using all observation data) were NEWS AUROC=0.898; MEWS AUROC=0.862; Worthing AUROC=0.861 and the lowest was Centiles AUROC=0.783. 72 level II-2
Abbott et al. (2015) using a prospective, observational cohort study design (n=445; n=16 met the primary outcome) found that NEWS was more strongly associated with the composite endpoint of critical care admission or death within the first 48 hours of the hospital stay compared to Patient at Risk Score (PARS); NEWS OR 1.54, (95%CI 1.26, 1.91, p <0.001); PARS OR 1.42 (95%CI 1.00, 2.05, p = 0.056).73 level II-2 Every one point increase in NEWS was associated with a 55% increased risk. Analysis of individual NEWS thresholds identified that a score of ≥3 was associated with the composite end point (OR 8.12, p<0.001). Both NEWS and PARS were poor predictors of hospital length of stay. Neither score was correlated with hospital length of stay. 73 level II-2
Yu et al. (2014) using retrospective nested case-control design, examined and compared the ability of nine prediction scores (SOFA), Predisposition/ Infection/Response/Organ Dysfunction Score (PIRO), ViEWS-National Early Warning Score System, SCS, MEDS, MEWS, SAPS II, APACHE II and REMS) to estimate the risk of clinical deterioration.74 level II-2 NEWS ranked third behind SOFA and PICO in predicting clinical deterioration in non-ICU patients in general medical wards, during 0 and 12 hours prior to the deterioration. Although SOFA performed the best, this was not significantly higher than PIRO, NEWS, SCS, MEDS or MEWS. At the 0- to 12-hour interval before clinical deterioration, all scores except REMS performed with acceptable discrimination (AUROC ≥0.70) and had almost similar AUROC. However, at the 12- to 72-hour intervals, all scores, with the exception of MEDS, no longer performed with acceptable discrimination for mortality (AUROC <0.70). For all models, average scores of cases increased closer to time of clinical deterioration (p <0.05). For the MEWS, SAPS II, APACHE II and REMS scoring models, this increase was detected as early as 12 to 24 hours before deterioration (p <0.05). (Table 9) 74 level II-
2 A subgroup analysis, using mortality as the endpoint had shown at the 0- to 12-hour interval, seven of the eight scores performed similarly and had an AUROC of greater than 0.80 (SOFA AUC 0.83, NEWS 0.81, PIRO 0.87, SCS 0.83, MEDS 0.85, MEWS 0.82, SAPS II 0.83 and APACHE II 0.80). However, at the 12- to 72-hour intervals, only MEDS continued to predict for mortality with excellent discrimination (AUC >0.80). In this subgroup analysis, the clinical decision rule performed even better, with a sensitivity of 79% and a specificity of 72% when predicting for mortality. Even after baseline differences between cases and controls were adjusted for, patients who met the clinical decision rule criteria are much more likely to die during hospitalization compared with patients who did not (adjusted OR 13.3, 95%CI 5.3, 33.3) (Table 10).74 level II-2

43
HE
AL
TH
TE
CH
NO
LO
GY
AS
SE
SS
ME
NT
RE
PO
RT
HE
AL
TH
TE
CH
NO
LO
GY
AS
SE
SS
ME
NT
SE
CT
ION
(MaH
TA
S)
ME
DIC
AL
DE
VE
LO
PM
EN
T D
IVIS
ION
, MIN
IST
RY
OF
HE
AL
TH
NA
TIO
NA
L E
AR
LY
WA
RN
ING
SC
OR
E (N
EW
S)
Table 9: Comparison of AUROC for nine scoring systems
Score 0-12 hours 12-24 hours 24-48 hours 48-72 hours
SOFA 0.78a (0.74-0.81) 0.68a (0.63-0.73) 0.66 (0.60-0.71) 0.64 (0.57-0.71)
PIRO 0.76 (0.72-0.79) 0.66 (0.61-0.71) 0.66 (0.61-0.72) 0.68 (0.61-0.75)
ViEWS (NEWS) 0.75 (0.71-0.79) 0.67 (0.62-0.72) 0.64 (0.58-0.69) 0.66 (0.59-0.73)
SCS 0.74 (0.70-0.78) 0.67 (0.62-0.72) 0.63 (0.57-0.69) 0.63 (0.56-0.71)
MEDSb 0.74 (0.70-0.78) 0.68 (0.63-0.73) 0.69a (0.63-0.74) 0.71a (0.64-0.78)
MEWS 0.73 (0.69-0.77) 0.66 (0.61-0.71) 0.59 (0.53-0.65) 0.60 (0.52-0.67)
SAPS II 0.73 (0.69-0.77) 0.67 (0.61-0.72) 0.61 (0.55-0.67) 0.60 (0.53-0.68)
APACHE II 0.72 (0.68-0.76) 0.66 (0.61-0.71) 0.61 (0.55-0.67) 0.60 (0.52-0.67)
REMS 0.67 (0.62-0.71) 0.63 (0.57-0.68) 0.55 (0.49-0.61) 0.59 (0.52-0.66)
aDenotes best performing score at each time interval. bScores where AUC at 0 to 12 hours is NOT significantly higher than AUC at 12 to 24 hours, 24 to 48 hours, and 48 to 72 hours. APACHE II, Acute Physiology and Chronic Health Evaluation Score II; MEDS, Mortality in Emergency Department Sepsis; MEWS, Modified Early Warning Score; PIRO, Predisposition/Infection/ Response/Organ Dysfunction Score; REMS, Rapid Emergency Medicine Score; SAPS II, Simplified Acute Physiology Score II; SCS, Simple Clinical Score; SOFA, Sequential Organ Failure Assessment; ViEWS, VitalPac National Early Warning Score.
Table 10: Comparison of AUROC for the nine scoring systems when using mortality as the endpoint.
Score 0-12 hours 12-24 hours 24-48 hours 48-72 hours
SOFA 0.83 (0.77-0.88) 0.76 (0.69-0.83) 0.75 (0.67-0.83) 0.74 (0.64-0.83)
PIRO 0.87 (0.82-0.92) 0.79 (0.73-0.86) 0.76 (0.68-0.84) 0.78 (0.69-0.86)
ViNEWS 0.81 (0.76-0.87) 0.77 (0.70-0.84) 0.72 (0.64-0.81) 0.78 (0.70-0.87)
SCS 0.83 (0.78-0.89) 0.78 (0.71-0.85) 0.74 (0.66-0.83) 0.74 (0.65-0.84)
MEDS 0.85 (0.79-0.90) 0.81 (0.74-0.87) 0.81 (0.74-0.89) 0.82 (0.74-0.90)
MEWS 0.82 (0.77-0.88) 0.77 (0.70-0.84) 0.70 (0.62-0.79) 0.73 (0.64-0.83)
SAPS II 0.83 (0.77-0.89) 0.77 (0.70-0.84) 0.74 (0.65-0.82) 0.74 (0.65-0.84)
APACHE II 0.80 (0.74-0.86) 0.75 (0.67-0.82) 0.73 (0.64-0.81) 0.74 (0.64-0.83)
REMS 0.75 (0.65-0.79) 0.70 (0.63-0.78) 0.63 (0.53-0.72) 0.64 (0.54-0.75)
Areas under the receiver operating characteristic curves along with 95% confidence intervals are displayed. Analysis was applied to the subgroup of cases that died during hospitalization (n = 110) along with their corresponding controls (n = 110)
Based on retrospective cohort study conducted by Hydes TJ et al. (2017), a direct comparison made between NEWS with 34 other EWS systems revealed that NEWS was the most discriminating for 24 hours risk of death, ICU admission and cardiac arrest in patients with primary or non-primary diagnostic codes for liver disease. (Table 11) 66 level II-2

HE
AL
TH
TE
CH
NO
LO
GY
AS
SE
SS
ME
NT
RE
PO
RT
HE
AL
TH
TE
CH
NO
LO
GY
AS
SE
SS
ME
NT
SE
CT
ION
(M
aH
TA
S)
ME
DIC
AL
DE
VE
LO
PM
EN
T D
IVIS
ION
, M
INIS
TR
Y O
F H
EA
LT
H
44
NA
TIO
NA
L E
AR
LY
WA
RN
ING
SC
OR
E (
NE
WS
)
Table 11: The top five EWS based on AUROC values for adverse outcomes for patients with a primary or non-primary diagnosis of liver disease
EWSPrimary diagnosis of liver disease Non-primary diagnosis of liver disease
AUROC 95% CI AUROC 95% CI
NEWS 0.873 0.860 - 0.886 0.898 0.891 - 0.905
PARS 0.843 0.829 - 0.857 0.862 0.853 - 0.871
Worthing 0.840 0.826 - 0.855 0.844 0.835 - 0.854
LEWS 0.839 0.825 - 0.853 0.860 0.851 - 0.869
SEWS 0.836 0.822 - 0.851 0.860 0.851 - 0.870
PARS=Patient-at-Risk Score;LEWS=Leeds Early Warning Score;SEWS= standardised early warning scoring system
Khwannimit B et al. (2019) did a comparison of prediction accuracy between three EWS (NEWS, MEWS, SOS) with both the qSOFA and SOFA for adverse outcomes among sepsis patients admitted to the ICU.75 level II-2 This retrospective cohort study showed that the SOFA presented the best predictive ability for in-hospital and 30-day mortality as well as multiple organ failures among sepsis patients admitted to the ICU. The NEWS provided the lowest AUROC value. For predicting ICU mortality, SOS presented the highest AUROC, followed by SOFA, MEWS, NEWS and qSOFA. The results established that only SOS has comparable accuracy as a SOFA score to predict mortality in ICU sepsis patients. (Table 12) 75 level II-2
Table 12: The area under the receiving operating characteristic curve with 95%CI of early warning scores, qSOFA and SOFA score to predict hospital, ICU and 30-day mortality and multiple organ failures
Scores Hospital mortality ICU mortality 30-day mortalityMultiple organ
failures
SOFA0.880
(0.863-0.896)0.867
(0.849-0.885)0.876
(0.859-0.893)0.978
(0.972-0.984)
SOS0.878
(0.861-0.894)0.875
(0.858-0.892)0.873
(0.856-0.889)0.831
(0.807-0.855)
MEWS0.858
(0.840-0.876)0.861
(0.842-0.879)0.854
(0.835-0.872)0.779
(0.752-0.805)
qSOFA0.847
(0.829-0.864)0.812
(0.794-0.830)0.842
(0.825-0.860)0.776
(0.748-0.803)
NEWS0.833
(0.813-0.852)0.825
(0.805-0.846)0.829
(0.809-0.848)0.799
(0.771-0.827)
ICU: intensive care unit; MEWS: Modified Earning Warning Score; NEWS: National Early Warning Score; qSOFA: quick Sequential Organ Failure Assessment; SAPS: Simplified Acute Physiology Score; SOFA: Sequential Organ Failure Assessment; SOS: Search Out Severity.
Weighted pooled result for mortality outcomes
In a pooled AUROC analysis of NEWS in general ward population, there was a trend of AUROC showing good to excellent prognostic performance for short and long term mortality outcomes [AUROC for 24-hour mortality 0.77-0.90 (95%CI 0.73-0.90, 0.86-0.90), AUROC for in-hospital mortality 0.79 (95%CI 0.72, 0.86)) and AUROC for 30-day mortality 0.83 (95%CI 0.81, 0.86)]. However, pooling of studies for 24-hour mortality outcome produced statistically significant heterogeneity (I2 91.4%, p<0.001). Sensitivity analysis showed this highly heterogenous outcome was associated with combining the results from studies conducted in different type of highly specified subpopulation of ward patients, attributed to significant physiological differences between each subpopulation. (Figure 25)

45
HE
AL
TH
TE
CH
NO
LO
GY
AS
SE
SS
ME
NT
RE
PO
RT
HE
AL
TH
TE
CH
NO
LO
GY
AS
SE
SS
ME
NT
SE
CT
ION
(MaH
TA
S)
ME
DIC
AL
DE
VE
LO
PM
EN
T D
IVIS
ION
, MIN
IST
RY
OF
HE
AL
TH
NA
TIO
NA
L E
AR
LY
WA
RN
ING
SC
OR
E (N
EW
S)
Test for overall effect Z=85.87, p<0.001
Figure 25: The pooled estimate of AUROC values for 24-hour mortality, in-hospital mortality and 30-day mortality for general ward patients
Pre-hospital setting
A retrospective cohort study conducted by Silcock DJ et al. (2015) sought to evaluate the validity of the NEWS in unselected prehospital patients.76 level II-2 The calculation of NEWS was done using parameters recorded prior to ambulance transfer to hospital. The study demonstrated that the discriminative performance of NEWS was good for 24 hours mortality [AUROC 0.855 (95%CI 0.69,1)], 48 hours mortality [AUROC 0.871 (95%CI 0.75, 0.98)] and 30 day mortality [AUROC 0.740 (95%CI 0.661, 0.819)], ICU admission [AUROC 0.774 (95%CI 0.657, 0.890)] and a combined outcome of 48 hours mortality or ICU admission [AUROC 0.815 (95%CI 0.730, 0.990)]. For the combined endpoint of death in the Emergency Department (ED) or admission directly to ICU from the ED, the AUROC was 0.889 (95%CI 0.823, 0.957). Elevated NEWS was associated with a higher incidence of adverse outcomes. Across the whole range of patient presentations, patients with a NEWS≥7 had 11% chance of death or ICU admission within 48 hours. The medium-risk NEWS group was associated with a statistically significant increase in ICU admission (RR=2.466, 95%CI 1.0, 6.09), but not in-hospital mortality relative to the low risk group. The high risk NEWS group had significant increases in 48 hours mortality [RR 35.32 (95%CI 10.08, 123.7)], 30 day mortality [RR 6.7 (95%CI 3.79, 11.88)] and ICU admission [RR 5.43 (2.29–12.89)]. 76 level
II-2

HE
AL
TH
TE
CH
NO
LO
GY
AS
SE
SS
ME
NT
RE
PO
RT
HE
AL
TH
TE
CH
NO
LO
GY
AS
SE
SS
ME
NT
SE
CT
ION
(M
aH
TA
S)
ME
DIC
AL
DE
VE
LO
PM
EN
T D
IVIS
ION
, M
INIS
TR
Y O
F H
EA
LT
H
46
NA
TIO
NA
L E
AR
LY
WA
RN
ING
SC
OR
E (
NE
WS
)
Abbott TEF et al. (2018) performed a retrospective cohort study of adult patients admitted to a single UK teaching hospital with acute medical presentations, brought to hospital by ambulance.77 level II-2 The authors aimed to determine the association of pre-hospital NEWS with the combined outcome of death or critical care unit escalation within 48 hours of hospital admission and hospital length of stay. Pre-hospital NEWS and admission to hospital NEWS were both associated with the combined outcome of death or critical care unit escalation within 48 hours of hospital admission (OR 1.25; 95%CI 1.04, 1.51; p = 0.02 and OR 1.52; 95%CI 1.18, 1.97, p < 0.01 respectively). Patients with a pre-hospital NEWS of 7 or more had a four-fold increase in the odds of death or critical care unit admission compared to patients with a pre-hospital NEWS of 4 or less. Neither pre-hospital nor admission NEWS were associated with hospital length of stay (r2=5.1%, p=0.48 and r2=5.2%, p=0.92 respectively). This study identified a moderate correlation between ambulance NEWS and admission NEWS – in 83% of cases NEWS at both time points was the same (r = 0.44, p < 0.01). Where the scores were different, ambulance NEWS was greater in the majority of cases suggesting an improvement in clinical condition between pre-hospital assessment and medical ward admission. 77 level II-2
In a retrospective cohort study conducted by Pirneskoski J et al. (2019), the prognostic accuracy of pre-hospital NEWS for predicting 24 hours mortality of Emergency Medical Services (EMS) dispatch was assessed using large population based database.78 level II-2 The primary outcome of death within 24 hours of EMS dispatch occurred in 378 (1.1%) cases. The secondary outcomes of death within 7 and 30 days occurred in 857 (2.4%) and 1607 (4.5%) of cases respectively. The AUROC for primary outcome of death within 24 hours was 0.840 (95%CI 0.823, 0.858). Subgroup analysis suggested that NEWS had better prognostic accuracy in cases where the initial dispatch code was specified as trauma [AUROC 0.901 (95%CI 0.859, 0.942)]. Prehospital NEWS score has a good specificity (77.1%) and sensitivity (77%) for prediction of death within 24 hours of EMS dispatch with highest Youden’s index for 24 hours mortality at a threshold of 7 points (increase in mortality for patients with higher NEWS scores of >7). For secondary outcomes of death within 7 and 30 days, the AUROCs were 0.809 (95%CI 0.795, 0.823) and 0.758 (95%CI 0.747, 0.770) respectively. Based on logistic regression model of performance of NEWS parameters in predicting 24 hours mortality of EMS despatch, the most significant single NEWS parameter was heart rate ≤40 min∼1 with OR 5.41 (95%CI 1.78, 13.9; p< 0.001).78 level II-2
A prospective cohort study by Hoikka M et al. (2018) reported twofold accuracy of using NEWS in the prehospital patient population to predict 24 hours mortality.79 The high risk NEWS category could predict 8 in 10 early deaths within 24 hours, but failed to acceptably predict 30-day mortality due to a high rate of false negatives. (Table 13) The increase in 24 hours mortality occurred with NEWS value greater than 12.(Figure 26) The study did not report on AUROC value.79 level II-2
Table 13: Mortality (24 hours and 30-day) at high, medium and low risk classes categorized according to the pre-hospital NEWS.
NEWS class
nHigh718
Medium2550
24 hours mortality
Sensitivity (95%CI)Specificity (95%CI)PPVNPVPLRNLR
80.1% (73.7%, 85.5%)95.4% ( 95.0%, 95.8%)21.3%99.7%17.360.21
89.0% ( 83.7%, 93.1%)80.6% ( 79.8%, 81.3%)6.7%99.8%4.580.14
30-day mortality
Sensitivity (95%CI)Specificity (95%CI)PPVNPVPLRNLR
42.4% (38.3%, 46.6%)96.0%(95.6%, 96.3%)33.2%97.2%10.490.60
63.0%(58.8%, 67.0%)81.5%(80.8%, 82.2%)13.8%97.9%3.400.46
95% CI 95% confidence interval, PPV positive predictive value, NPV negative predictive value, PLR positive likelihood ratio, NLR negative likelihood ratio

47
HE
AL
TH
TE
CH
NO
LO
GY
AS
SE
SS
ME
NT
RE
PO
RT
HE
AL
TH
TE
CH
NO
LO
GY
AS
SE
SS
ME
NT
SE
CT
ION
(MaH
TA
S)
ME
DIC
AL
DE
VE
LO
PM
EN
T D
IVIS
ION
, MIN
IST
RY
OF
HE
AL
TH
NA
TIO
NA
L E
AR
LY
WA
RN
ING
SC
OR
E (N
EW
S)
Figure 26: The distribution of pre-hospital NEWS values and the relation with 24 hours and 30 day mortality
Shaw J et al. (2017) conducted a retrospective cohort study involving 287 patients who were treated by ambulance service and transported to hospital, to determine the association between pre-hospital NEWS derived from ambulance service clinical observations and hospital ED disposition.80 level II-2 The authors found strong associations between NEWS calculated from ambulance service clinical records and the severity of the patient’s condition as indicated by a proxy measure of patient disposition. Those with a higher NEWS risk category were more likely to be admitted to the ICU or die, whereas those with a low risk category were more likely to be discharged from the ED. (Table 14) 80 level II-2
Table 14: Patient disposition by NEWS clinical risk level
Patient disposition
NEWS clinical risk level Discharged from ED Admitted to ward Admitted to ICU Died in ED
Low (score 0-4) 81(81%) 65 (65%) 8 (14%) 4 (13%)
Medium (score 5-6) 16 (16%) 25 (25%) 19 (33%) 7 (24%)
High (score ≥7) 3 (3%) 10 (10%) 30 (53%) 19 (63%)
Total 100 100 57 30
A comparison was made between the effectiveness of NEWS and MEWS in pre-hospital setting by Mitsunaga T et al. (2019) in the retrospective cohort study.81 level II-2 The authors sought to evaluate the predictive ability of pre-hospital NEWS (pNEWS) and the pre-hospital MEWS (pMEWS) for admission to ward or ICU and in-hospital mortality in elderly patients (age 65 years old and older ) presented to the ED by ambulance. The study demonstrated the low utility of the pNEWS and the pMEWS as predictor of admission to ward or ICU and in-hospital mortality in elderly patients. The value of the pNEWS was also compared with that of the ED NEWS (eNEWS) and ED MEWS (eMEWS). The eNEWS and the eMEWS predicted admission and in-hospital mortality more accurately. The AUROC of the eNEWS was significantly greater than that of the eMEWS for predicting admission and in-hospital mortality (p < 0.001). (Table 15) 81 level II-2

HE
AL
TH
TE
CH
NO
LO
GY
AS
SE
SS
ME
NT
RE
PO
RT
HE
AL
TH
TE
CH
NO
LO
GY
AS
SE
SS
ME
NT
SE
CT
ION
(M
aH
TA
S)
ME
DIC
AL
DE
VE
LO
PM
EN
T D
IVIS
ION
, M
INIS
TR
Y O
F H
EA
LT
H
48
NA
TIO
NA
L E
AR
LY
WA
RN
ING
SC
OR
E (
NE
WS
)
Table 15: AUROC, Sensitivity and Specificity values for prediction of the need for admission and in-hospital mortality.
ScoreAdmission to ward or ICU In-hospital mortality
AUROC (95%CI) Sensitivity Specificity AUROC (95%CI) Sensitivity Specificity
Pre-hospital
pNEWSpMEWS
0.559 (0.536–0.583)0.547 (0.525–0.572)
54%54.9%
54,8%50.6%
0.678 (0.633–0.720)0.652 (0.609–0.695)
65.4%57.5%
59.7%64.5%
Emergency Department
eNEWSeMEWS
0.628 (0.605–0.652)0.591 (0.569–0.616)
55.3%41.2%
63.1%75.7%
0.789 (0.747–0.829)0.720 (0.671–0.765)
78.7%69.3%
64.0%67.6%
The analysis of data of 1713 pre-hospital patients in a retrospective cohort study by Silcock DJ et al. (2018) aimed to compare the ability of NEWS and qSOFA to predict adverse outcomes in a prehospital population with suspected infection.82 level II-2 The study revealed that among unselected pre-hospital patients, an elevated qSOFA much like NEWS, was associated with increased levels of adverse outcomes, namely, ICU admission within 48 hours of presentation and/ or 30-day mortality. The aggregated total NEWS score was, however, significantly superior to qSOFA at identifying patients at combined risk of either ICU admission within 48 hours of presentation and/or 30-day mortality. The relative discriminatory value of NEWS and qSOFA for the combined outcomes of ICU admission within 48 hours of presentation and/or 30-day mortality were AUROC 0.740 (95%CI 0.685, 0.795) and AUROC 0.679 (95%CI 0.624, 0.733); p=0.011. Comparison of the AUROC curves between NEWS and qSOFA showed no statistically significant difference between NEWS and qSOFA at predicting ICU admission within 48 hours [AUROC NEWS 0.798 (95%CI 0.693, 0.902); AUROC qSOFA 0.689 (95%CI 0.571, 0.808), p=0.057] and at predicting 30-day mortality [AUROC NEWS 0.731 (95%CI 0.671, 0.791); AUROC qSOFA 0.682 (95%CI 0.623, 0.740), p=0.647]. Therefore, the authors suggested that rather than qSOFA, a NEWS of medium or high clinical risk be used to fulfil the requirement of the Sepsis-3 UK definitions namely ‘to prompt clinicians to further investigate for organ dysfunction, to initiate or escalate therapy as appropriate, and to consider referral to critical care or increase the frequency of monitoring’. 82 level II-2
Weighted pooled result for mortality outcomes
In pre-hospital setting, the pooled AUROC values for NEWS in predicting short term (24 hours) and long term (30 days) mortality outcomes were 0.84 (95%CI 0.82, 0.86) and 0.79 (95%CI 0.72, 0.85), respectively. (Figure 27)
Test for overall effect Z=51.87, p<0.001
Figure 27: The pooled estimate of AUROC values for 24-hour mortality and 30-day mortality for patients in pre-hospital setting

49
HE
AL
TH
TE
CH
NO
LO
GY
AS
SE
SS
ME
NT
RE
PO
RT
HE
AL
TH
TE
CH
NO
LO
GY
AS
SE
SS
ME
NT
SE
CT
ION
(MaH
TA
S)
ME
DIC
AL
DE
VE
LO
PM
EN
T D
IVIS
ION
, MIN
IST
RY
OF
HE
AL
TH
NA
TIO
NA
L E
AR
LY
WA
RN
ING
SC
OR
E (N
EW
S)
NEWS2
Pimentel MAF et al. (2019) undertook a multicenter retrospective cohort study to compare the ability of the NEWS and NEWS2 to predict in-hospital mortality, unanticipated ICU admission and cardiac arrest within 24 hours of a vital sign observation in three risk groups: those with documented type 2 respiratory failure (T2RF), those at risk of T2RF and patients in neither of these groups.83 level II-2 For the in-hospital mortality within 24 hours of an observation, NEWS2 demonstrated no improvement in discrimination over NEWS for patients with documented T2RF, but at the suggested Royal College of Physicians of London (RCPL) cut-offs of 5 and 7 points, the positive predictive values (PPV) were higher for NEWS2 than NEWS [AUROC NEWS 0.862 (95%CI 0.848, 0.875); NEWS2 0.841 (95%CI 0.827, 0.855); PPV NEWS 2.5%; NEWS2 3.0%]. However, for patients at risk of T2RF, NEWS had superior discrimination and higher PPV compared to NEWS2 [AUROC NEWS 0.881 (95%CI 0.878, 0.884); NEWS2 0.860 (95%CI 0.857, 0.864); PPV NEWS 3.2%; NEWS2 2.7%]. When applied to patients not at risk of T2RF (to simulate the impact of using NEWS2 in error in such patients) NEWS2 discriminated less well than NEWS and had lower PPV. NEWS2 did not improve discrimination for unanticipated ICU admission, cardiac arrest or combined outcomes compared to NEWS (Table 16). The efficiency curves comparing the efficiency of NEWS and NEWS2 demonstrated that, for the few patients with documented T2RF, the use of NEWS2 at the suggested RCPL cut-offs of 5 and 7 points reduced absolute staff workload by approximately 11% and 5% respectively, but at the expense of reduced sensitivity of approximately 10% and 14%, respectively. For patients at risk of T2RF, the use of NEWS2 at the suggested RCPL cut-offs of 5 and 7 points did not significantly decrease staff workload, but reduces sensitivity by 5–6%. Finally, if used in error for patients not at risk of T2RF at the suggested RCPL cut-offs, NEWS2 was slightly more sensitive than NEWS but, to achieve this, risks doubling the workload.83 level II-2
Table 16: Performance metrics of the two scoring systems (NEWS and NEWS2) for predicting unanticipated ICU admission, cardiac arrest and combined outcome in the three risk groups: AUROC, with 95% confidence interval (CI). NEWS– NEWS2 indicates the mean difference (95% CI) between the AUROCs of NEWS and NEWS2.
Documented T2RF At risk T2RF Not at risk T2RF
Unanticipated ICU admissionNEWSNEWS2NEWS – NEWS2
0.806 (0.786 - 0.826)a 0.816 (0.796 - 0.836)a -0.010 (-0.023 - 0.003)a
0.814 (0.808 - 0.821) 0.815 (0.808 - 0.821) 0.000 (-0.004 - 0.004)
0.841 (0.837 - 0.845) 0.833 (0.829 - 0.837) 0.008 (0.007 - 0.010) ∝
Cardiac arrest NEWSNEWS2NEWS – NEWS2
0.701 (0.654 - 0.749)a 0.706 (0.658 - 0.753)a -0.004 (-0.046 - 0.037)a
0.756 (0.744 - 0.769) 0.741 (0.728 - 0.754) 0.015 (0.008 - 0.022)∝
0.785 (0.776 - 0.794) 0.768 (0.760 - 0.777) 0.016 (0.012 - 0.020) ∝
Combined outcome NEWSNEWS2NEWS – NEWS2
0.835 (0.824 - 0.847) 0.830 (0.818 - 0.841) 0.006 (-0.003 - 0.014)
0.858 (0.855 - 0.861) 0.843 (0.840 - 0.847) 0.015 (0.013 - 0.016) ∝
0.881 (0.879 - 0.884) 0.867 (0.864 - 0.869) 0.015 (0.014 - 0.016) ∝
a Where number of adverse outcomes is under 100. ∝ Denotes significant difference in AUROC (p < 0.05).
A study by Hodgson LE et al. (2018) using retrospective cohort design, aimed to assess the performance of NEWS and NEWS2 in acute exacerbation of chronic obstructive pulmonary disease (AECOPD) cohort.84 level II-2 The study reported that among the non-survivors, median NEWS was 7 (IQR 3–9) compared to 4 (IQR 2–8) using NEWS2 (p<0.001). Of patients who died, 50% had an admission NEWS ≥7 points; rescoring using NEWS2 SpO2 parameters, 44% of these patients would have been placed in a lower call-out threshold, reducing sensitivity. Of cases with NEWS>7 who survived (false positives for mortality) 66% (n=291/440) would have been similarly placed in a lower threshold, increasing specificity. The NEWS2 at admission did not outperform the original NEWS. 84 level II-2

HE
AL
TH
TE
CH
NO
LO
GY
AS
SE
SS
ME
NT
RE
PO
RT
HE
AL
TH
TE
CH
NO
LO
GY
AS
SE
SS
ME
NT
SE
CT
ION
(M
aH
TA
S)
ME
DIC
AL
DE
VE
LO
PM
EN
T D
IVIS
ION
, M
INIS
TR
Y O
F H
EA
LT
H
50
NA
TIO
NA
L E
AR
LY
WA
RN
ING
SC
OR
E (
NE
WS
)
Another study by Echevarria C et al. (2019) using prospective cohort design also aimed to compare prognostic performance of NEWS and NEWS2 for in-hospital mortality and the impact on alert frequency in patients with COPD.85 level II-2 Findings revealed that NEWS2 showed superior discrimination for mortality to NEWS, but only reclassified 3.1% as not requiring a review, based on an alert trigger of 5 or more. NEWS2
All COPD, adopting target saturations of 88%–92% and scale 2 of the NEWS2
tool for all patients, led to an absolute reduction in alert frequency of 12.6%. The performance of NEWS2
All COPD was similar to NEWS2, with no increased risk of death
in the low-risk group. NEWS2All COPD
was a stronger mortality predictor than NEWS (AUROC NEWS2
All COPD=0.72, 95%CI 0.68, 0.76, versus NEWS=0.65, 95%CI 0.61, 0.68;
p<0.001). NEWS2 All COPD
showed a trend towards superiority compared with NEWS2 (AUROC NEWS2
All COPD=0.72, 95%CI 0.68, 0.76 versus NEWS2=0.70, 95%CI 0.67,
0.74; p=0.090). The percentage of patients classified as requiring an urgent review (score of 5 or more) for NEWS2
All COPD, NEWS2 and NEWS was 62.1%, 71.6% and 74.7%
NEWS2All COPD
resulted in a shift of total scores towards the lower risk range compared with NEWS2. NEWS2
All COPD identified fewer patients requiring medical review relative
to NEWS2 (9.5% absolute reduction), but the risk of death in the low-risk group was similar (3.5% and 3.1%, p=0.686).(Figure 28)85 level II-2
Figure 28: Frequency of alerts for NEWS2All COPD, NEWS2 and NEWS. Figure shows the percentage of patients in each risk category, grouped together by early warning score
Fernando SM et al. (2019) through retrospective cohort study, sought to evaluate the prognostic accuracy of NEWS2 among hospitalized patients with acute deterioration, requiring Rapid Response Team (RRT) assessment.86 level II-2 The authors found that NEWS2 accurately predicted in-hospital mortality particularly among patients with suspected infection. For the entire RRT cohort, the AUROC was 0.72 (95%CI 0.71, 0.74) and for patients with suspected infection only, NEWS2 had an AUROC of 0.75 (95%CI 0.73, 0.78). At the critical threshold (≥ 5), the NEWS2 had sensitivity of 84.5% (95%CI 82.8, 86.2) and specificity of 49.0% (95%CI 47.4, 50.7). The number needed to examine (NNE) was 2.20 (95%CI 2.16, 2.25). For prediction of ICU admission, sensitivity of NEWS2 was 83.4% ((95%CI 81.4, 85.3) and specificity 64.5% (95%CI 62.7, 66.2). The study did not report AUROC value of NEWS2 for ICU admission.86 level II-2
Mellhammar L et al. (2019) conducted a retrospective cohort study to compare the prognostic accuracy of qSOFA and NEWS2 for a composite outcome of sepsis with organ dysfunction, infection-related mortality within 72 hours or intensive care due to an infection.87 level II-2 Retrospective analysis of data was done for two ED patient cohorts. Cohort A consisted of 526 patients with a diagnosed infection, 288 with the composite outcome. Cohort B consisted of 645 patients, of whom 269 had a diagnosed infection and 191 experienced the composite outcome. In Cohort A and B,

51
HE
AL
TH
TE
CH
NO
LO
GY
AS
SE
SS
ME
NT
RE
PO
RT
HE
AL
TH
TE
CH
NO
LO
GY
AS
SE
SS
ME
NT
SE
CT
ION
(MaH
TA
S)
ME
DIC
AL
DE
VE
LO
PM
EN
T D
IVIS
ION
, MIN
IST
RY
OF
HE
AL
TH
NA
TIO
NA
L E
AR
LY
WA
RN
ING
SC
OR
E (N
EW
S)
NEWS2 had significantly higher AUROC , 0.80 (95%CI 0.75, 0.83) and 0.70 (95%CI 0.65, 0.74), than qSOFA, AUROC 0.70 (95%CI 0.66, 0.75) and 0.62 (95%CI 0.57–0.67) p < 0.01 and, p = 0.02, respectively for the composite outcome. NEWS2 was superior to qSOFA for screening for sepsis with organ dysfunction, infection-related mortality or intensive care due to an infection both among infected patients and among undifferentiated patients at emergency departments.87 level II-2
A multi centre prospective cohort study by Martin-Rodriguez F et al. (2019a) aimed to evaluate the ability of the prehospital NEWS2 to predict early mortality (within 48 hours) after the index event based on the triage priority assigned for any cause in the emergency department.88 level II-2 A total of 1054 patients were included in the study and early mortality within the first 48 hours after the index event affected 55 patients (5.2%), of which 23 cases (41.8%) had causes of cardiovascular origin. Mortality at 7 days from the index event increased to 81 cases (7.7%) and up to 119 cases (11.3%) at 30 days. The predictive power of the NEWS2 scale to discriminate mortality at 2, 7, and 30 days was evidenced by an AUROC of 0.88 (95%CI 0.82, 0.94), 0.86 (95%CI 0.81, 0.91) and 0.82 (95%CI 0.77, 0.87), verifying how its capacity to assess mortality fell by 6% between the AUC at 2 days and the AUC at 30 days. Early mortality according to the assigned Spanish Triage System priority in the ED, in level I (resuscitation) the mortality rate was 24.4%, in level II (emergency) 5.5%, and in level III (urgency) 0.9%. The combined use of the NEWS2 and hospital triage can help to identify patients with a high risk of early death, including those that a priori were not emergencies or resuscitation cases. When stratified by triage levels, the AUCs of the NEWS2 obtained for short-term mortality varied between 0.77 (95%CI 0.65, 0.89) for level I and 0.94 (95%CI 0.79, 1) for level III. (Figure 29) A NEWS2 score greater than or equal to 7 among patients with priority III had a sensitivity of 100% (95%CI 56.6, 100) and a specificity of 78.7% (95%CI 75.1, 81.9) with a PPV of 4.1% (95%CI 1.8, 9.3) and a NPV of 100% (95%CI 99.1, 100). Meanwhile, in patients with priorities I and II, the cutoff point with better sensitivity and joint specificity rose to 9 points in both cases, with associated NPV of 92.5% (95%CI 82.1, 97.0) for level I and 98.4% (95%CI 96.2, 99.3) for level II. 88 level II-2
Figure 29: Diagnostic performance curves and areas under the curve with 95%CI for NEWS and Spanish triage system. Mortality less than 2 days.

HE
AL
TH
TE
CH
NO
LO
GY
AS
SE
SS
ME
NT
RE
PO
RT
HE
AL
TH
TE
CH
NO
LO
GY
AS
SE
SS
ME
NT
SE
CT
ION
(M
aH
TA
S)
ME
DIC
AL
DE
VE
LO
PM
EN
T D
IVIS
ION
, M
INIS
TR
Y O
F H
EA
LT
H
52
NA
TIO
NA
L E
AR
LY
WA
RN
ING
SC
OR
E (
NE
WS
)
Another prospective cohort study was conducted by Martin-Rodriguez F et al. (2019b) in adult patients who were treated by the advanced life support unit and transferred to the emergency department in order to evaluate six different EWS [Early Warning Score (EWS), National Early Warning Score 2 (NEWS 2), Modified Early Warning Score (MEWS), Vital- PAC Early Warning Score (ViEWS), Hamilton Early Warning Score (HEWS), Scottish Early Warning Score (SEWS)] that can be used in the pre-hospital setting to predict mortality in the first 48 hours.89 level II-2 NEWS2 and the ViEWS had the best prognostic performance with an AUROC of 0.896 (95%CI 0.82, 0.95) and 0.894 (95%CI 0.82, 0.96), respectively. When comparing both scales, no statistically significant differences are observed (p = 0.919). The MEWS scale obtained the lowest AUROC of 0.848 (95%CI 0.76, 0.93). The NEWS2 and the ViEWS presented the same sensitivity and specificity for scores of more than 8 and a positive likelihood ratio of 3.36 (95%CI 2.69, 4.22) and 3.29 (95%CI 2.63, 4.11) respectively. For scores greater than or equal to 10, the specificity increased to 0.88 (95% CI 0.84–0.91) in the NEWS2 and 0.87 (95% CI 0.83–0.90) in the ViEWS with a probability ratio of 7.09 and 6.85, respectively. (Figure 30) 89 level II-2
Figure 30: Diagnostic performance curves and areas under the curve with 95% confidence intervals for six EWS. Analysis of early mortality. EWS Early Warning Score, MEWS Modified Early Warning Score, HEWS Hamilton Early Warning Score, ViEWS VitalPAC Early Warning Score, SEWS Scottish Early Warning Score, NEWS2 National Early Warning Score-2.
6.1.2 Impact on clinical outcomes
Haegdorens F et al. (2019) conducted a post-hoc data analysis of a stepped wedge cluster randomized controlled trial in six Belgian hospitals to study the impact of NEWS implementation on cardiac arrest event, unexpected death rate and unplanned ICU admission.90 level II-1 The intervention comprised of an observation protocol using NEWS combined with a pragmatic medical response strategy implemented in two medical wards and two surgical wards for each participated hospitals. The control group standard care was provided where nurses observed patients according to local protocols or standard practice. The cardiac arrest rate was 1.0 per 1000 admissions versus 1.3 per 1000 admissions (control), the unexpected death rate was 0.6 per 1000 admissions versus 1.5 per admissions (control) and the unplanned ICU admission was 10.7 per 1000 admissions versus 6.5 per 1000 admissions (control). However, the differences between control and intervention groups were not seen to be statistically

53
HE
AL
TH
TE
CH
NO
LO
GY
AS
SE
SS
ME
NT
RE
PO
RT
HE
AL
TH
TE
CH
NO
LO
GY
AS
SE
SS
ME
NT
SE
CT
ION
(MaH
TA
S)
ME
DIC
AL
DE
VE
LO
PM
EN
T D
IVIS
ION
, MIN
IST
RY
OF
HE
AL
TH
NA
TIO
NA
L E
AR
LY
WA
RN
ING
SC
OR
E (N
EW
S)
significant. Based on analysis of aggregrated ward level data, compliance to NEWS protocol was negatively associated with patient mortality adjusted for comorbidity and age (correlation coefficients, r = -0.452, p=0.027).90, 91 level II-1
The pre-post intervention study conducted by Farenden S et al. (2017) in a tertiary UK hospital did not observed any change in mortality at different time points six months following the introduction of NEWS.92 level II-2 However, the finding of this study reinforced the fact that there was a positive correlation (r2=0.854) between higher NEWS scores and hospital mortality.92 level II-2
In another pre-post intervention study, Sutherasan Y et al. (2018) sought to evaluate the impact of NEWS protocol six months post implementation, in response to patient deterioration in general medical wards.93 level II-2 The NEWS was compared with traditional hierarchy of stepwise approach of assessment (4-hourly observation) and management. The study found that higher NEWS on admission was associated with increased in-hospital mortality and ICU transfer rates. Implementing NEWS did not change overall patient outcomes [in-hospital mortality; 2.6% (pre-NEWS) versus 2.0% (NEWS group), p=0.47 and ICU admission; 5.7% (pre-NEWS) versus 3.9% (NEWS group), p=0.16].93 level II-2
An evaluation of the impact of a NEWS or NEWS-based track and trigger system (TTS) on the rate of in-patient cardiac arrests (IHCAs) and patients’ survival in 106 UK hospitals was carried out by Hogan H et al. (2019).94 level III Based on cross-sectional interrupted time-series and difference-in-difference analyses of 13 millions hospital admissions data with 34 202 identified cardiac arrest events between 2009 and 2015, there was a downward trend in the rate of IHCAs attended by the resuscitation team and improvement in the survival of IHCA patients. The use of a NEWS or NEWS-based TTS, when compared with a non-NEWS TTS, was associated with an additional reduction above pre-existing trends of 8.4% in the rate of IHCAs [Incidence rate ratio, IRR 0.925 (95%CI 0.890, 0.961;p<0.001)]. A conversion from paper to electronic TTS use was associated with an additional 7.6% decrease in the rate of IHCAs [IRR 0.923 (95%CI 0.873, 0.976;p=0.005)]. Restricting IHCAs to ward-based arrests increased the reduction to 9.9% for NEWS [IRR 0.901 (95%CI 0.858, 0.944; p < 0.001)] or NEWS-based TTSs and to 13.1% for electronic TTSs [IRR 0.869 (95%CI 0.809, 0.933; p<0.001)]. There was no evidence of an association between the type of TTS and survival of all hospital admissions, or on any of the measures of survival of patients who had an IHCA. 94 level III
6.2 Safety
A prospective cohort study of 370 medical patients conducted by Kolic I et al. (2015) revealed a high rate of NEWS score calculated incorrectly (18.9%) which adversely affected clinical response (25.9% of inappropriate response); a trend towards increased mortality for patients who received an incorrect response to a NEWS score was observed.95 level II-2 The authors highlighted an important patient safety concern whereby accuracy of NEWS scoring decreased significantly with increasing score or worsening physiological derangement. (Table 17). Inappropriate or inadequate response was associated with increasing NEWS (Table 18) and day of admission. Patients admitted at the weekend had a worse clinical response [adjusted OR 4.15 (95%CI 2.24, 7.69), p<0.0001]. Clinically there was a significant difference in mortality between patients who has an adequate response to the score (6%) compared to patients who had an inadequate clinical response (8.5%), but the results did not reach statistical significance (p=0.573).95 level II-2

HE
AL
TH
TE
CH
NO
LO
GY
AS
SE
SS
ME
NT
RE
PO
RT
HE
AL
TH
TE
CH
NO
LO
GY
AS
SE
SS
ME
NT
SE
CT
ION
(M
aH
TA
S)
ME
DIC
AL
DE
VE
LO
PM
EN
T D
IVIS
ION
, M
INIS
TR
Y O
F H
EA
LT
H
54
NA
TIO
NA
L E
AR
LY
WA
RN
ING
SC
OR
E (
NE
WS
)
Table 17: Univariate analysis of factors associated with a NEWS scoring error
Factor Correct score Incorrect scoreUnivariate analysis
Crude OR (95%CI) p value
Age 77 (18–102) 77 (23–97) 1.01 (0.99–1.02) 0.160
Time of day
Day(9am-9pm)Night(9pm-9am)
149 (79.7) 151 (82.5)
38 (20.3) 32 (17.5)
0.83 (0.49–1.40) 0.487
Day of weekWeekdayWeekend
237 (80.3) 63 (84.0)
58 (19.7) 12 (16.0)
0.78 (0.39–1.54) 0.471
NEW score
NEWS 0 NEWS 1–4 NEWS 5–6 NEWS 7
131 (87.9) 156 (78.0) 9 (69.2) 4 (50.0)
18 (12.1) 44 (22.0) 4 (30.8) 4 (50.0)
1.02.05 (1.13–3.72)
3.24 (0.90–11.60) 7.28 (1.67–31.68)
0.0180.0720.008
Data is presented as median (range) or number (percent).OR, Odds Ratio; CI, Confidence Interval; NEW score, National Early Warning Score. Binary logistic regression analysis with score error as the indicator dependent variable.
Table 18: Univariate and multivariate analysis of factors affecting the adequacy of the clinical response to NEWS score
Factor Adequate response
Inadequate response
Univariate analysis Multivariate analysis
Crude OR (95%CI)
p value Adjusted OR (95% CI)
p value
Age 78 (18–102) 75 (21–97) 1.01 (0.99–1.02) 0.358
Time of day
Day(9am-9pm)Night(9pm-9am)
142 (75.9) 132 (72.1)
45 (24.1)51 (27.9) 1.22 (0.77–1.94) 0.404
Day of week
WeekdayWeekend
234 (79.3) 40 (53.3)
61 (20.7)35 (46.7) 3.36 (1.97–5.73) <0.0001 4.15 (2.24–7.69) <0.0001
NEW score
NEWS 0 NEWS 1–4 NEWS 5–6 NEWS 7
137 (92.0) 135 (67.5) 0a
2 (25.0)
12 (8.0) 65 (32.5)13 (100.0)6 (75.0)
1.05.50 (2.84-10.64) 297 (16.64-5302)34.25 (6.22-188.6)
<0.0001<0.0001<0.0001
1.06.13 (3.08-12.16)177 (20.72–1510)40.64 (7.04–234.7)
<0.0001<0.0001<0.0001
Data is presented as median (range) or number (percent).OR, Odds Ratio; CI, Confidence Interval; NEW score, National Early Warning Score.Binary logistic regression analysis with adequate response as the indicator dependent variable.a A contingency factor of 0.5 was used to enable logistic regression calculations.
Petersen JA et al. (2014) utilising a prospective cohort study design, aimed to investigate the occurrence of serious adverse events (unexpected death, cardiac arrest and unanticipated ICU admission) and the attributable NEWS related factors to this incidents.96 level II-2 The authors found a concerning number of serious adverse events (144 events) whereby in 92% of the events, non-adherence to the escalation protocol occurred at one or several levels. Patients were monitored at least twice daily in 88% of the cases, but in only 19% the minimal observation interval according to the escalation protocol was followed and patients with higher NEWS were less likely to be monitored adequately. Patients were monitored according to the escalation protocol only in 13% of unanticipated ICU admission, 31% of cardiac arrest and 13% unexpected death. Nurses escalated care and contacted physicians in 64% and 60% of events of unanticipated ICU admission and the corresponding proportions for combined were 58% and 55%. On call physicians provided adequate care (defined as attended the patient immediately and implemented an appropriate treatment) in only 49% of cases of unanticipated ICU admission and 29% of cases of the combined outcome. Out of 106 events with EWS ≥ 6 of which 58% were not treated by the attending physician, 27 of these, there was no documentation that the attending physician had been alerted by nursing staff. Senior staff (specialists) was involved according to protocol (with

55
HE
AL
TH
TE
CH
NO
LO
GY
AS
SE
SS
ME
NT
RE
PO
RT
HE
AL
TH
TE
CH
NO
LO
GY
AS
SE
SS
ME
NT
SE
CT
ION
(MaH
TA
S)
ME
DIC
AL
DE
VE
LO
PM
EN
T D
IVIS
ION
, MIN
IST
RY
OF
HE
AL
TH
NA
TIO
NA
L E
AR
LY
WA
RN
ING
SC
OR
E (N
EW
S)
NEWS ≥ 9), only in 53% and 36% of cases of unanticipated ICU admission and cardiac arrest, respectively. The authors identified poor compliance with the escalation protocol was commonly found when serious adverse events occurred, however level of care provided by physicians was also a problem in a hospital with implemented early warning system.96 level II-2
A HTA on the use of information technology for early warning system found that no adverse events or negative effects on patient safety were reported as a result of the introduction of electronic early warning systems. 29 level I Adverse event reporting was minimal. One study documented a technical problems with the device prevented complete recording for the whole monitoring period for 33 of 257 monitored patients. In 30 of these episodes, motion artifact gave a spurious abnormal reading. 29 level I
6.3 Economic Evaluation
The economic evidence from the literature on NEWS was limited. The search of the economic literature did not produce any full economic evaluation. There were one health technology assessment (HTA) (HIQA, 2015) and two budget impact analyses (BIA) (NCEC, 2013 and NCEC, 2014) included in this review. These studies were Irish studies previously commissioned by the Department of Health. The HTA described the electronic implementation of NEWS, whilst one BIA was for original guideline on NEWS (NCEC, 2013) and another BIA on the additional cost implications from the implementation of the Sepsis Management Guideline (NCEC, 2014).
The HTA conducted by Irish Health Information and Quality Authority (HIQA) (2015) estimated resources gains and the investment required to implement an electronic early warning system into a representative Irish teaching hospital (530 bed occupancy).29 level I Benefits were estimated using extrapolated results from the systematic review and measured as resource gains. Using Irish average LOS data and evidence from Jones et al. (2011) estimated potential reductions in general average LOS was 28.9% and ICU average LOS was 40.3%. It was estimated that these reductions in LOS translated into just over 802,000 bed days per annum in general wards and 30,628 ICU bed days per annum. However, this was considered as an efficiency rather than a monetary saving. Other potential benefits presented were efficiencies owing to a reduction in vital sign recording time (up to 1.6 times faster than the paper system). 29 level I
In terms of the investment required to move from paper based to an electronic EWS, a core model without continuous monitoring was included in the analysis. Resources considered over a five-year period were classified as technology based (software, hardware and integration fees) and implementation (project management staff, staff education and clinical leadership). Note that two different licensing agreements were considered in the analysis. Type 1 involved a fee for a definitive time period plus additional hardware and maintenance costs per annum. Whereas, type 2 required a one-off license payment, but maintenance and hardware costs were on-going. Prices were estimated using indicative costs from suppliers and hospitals in the UK. Total cost for type 1 (including implementation costs) over five years was €1.0 million and type 2 was €1.3 million per site. The authors highlighted that this amounted to a national cost of €40.1 million for type 1 and €51.4 million for type 2 over five years. 29 level I
The Irish National Clinical Guideline for NEWS (NCEC, 2013) included a BIA to assess the economic impact of introducing NEWS and the COMPASS education programme.97 In assessing the budget impact of employing NEWS and COMPASS two cost categories were considered, those that applied to the initial implementation phase and the on-going intervention costs. Initial costs, included staff costs (trainers and trainees), which amounted to €7.47million and non-staff costs of €18,000 for materials. On-going intervention costs, which included staff and non-staff costs, were estimated to be €425,000 per annum. The report acknowledged that additional resources were likely due to the expected increase in the response rate to triggers; however an estimate for this was not provided. In addition, efficiency savings were

HE
AL
TH
TE
CH
NO
LO
GY
AS
SE
SS
ME
NT
RE
PO
RT
HE
AL
TH
TE
CH
NO
LO
GY
AS
SE
SS
ME
NT
SE
CT
ION
(M
aH
TA
S)
ME
DIC
AL
DE
VE
LO
PM
EN
T D
IVIS
ION
, M
INIS
TR
Y O
F H
EA
LT
H
56
NA
TIO
NA
L E
AR
LY
WA
RN
ING
SC
OR
E (
NE
WS
)
likely owing to reduced ICU days (estimated at €4.2 million using Irish ICU LOS data and cost per diem and assumptions regarding reduction in ICU admissions informed by Mitchell et al. 2010). Other efficiency savings were gained from replacing the previously used ALERT system with COMPASS, realising a saving of approximately €6,000 in annual licence fees per annum, also disability treatments avoided due to the reduction in cardiac arrest were expected but the potential value attributed to this saving was not given.97
The Sepsis Management Guideline of the National Clinical Effectiveness Committee (NCEC), published by the Department of Health in 2014 highlighted the significance of the timely recognition of sepsis and incorporated the NEWS system as part of a suite of guidelines to detect the acutely deteriorating in-patient in the correct management of sepsis.98 The report included evidence from a UK study, conducted by the Sepsis Trust, who found that compliance with the sepsis protocol reduced the relative risk of sepsis by 46.6% (Richards, 2013). The study also showed that patients in receipt of the protocol reduced their LOS by an average of two days in critical care with a total reduction of 3.4 hospital days, which equated to a cost saving of €4,500 per patient (Richards, 2013). The NCEC (2014) also conducted a BIA which considered the additional cost implications that could arise further to implementation of the guideline. They outlined the costs involved in introducing point of care lactate testing, and, in their BIA considered the costs of the device, education and staff. The BIA showed an estimated cost of €1.9 million (€1.4 million incurred in the initial set-up and on-going annual costs of €0.5 million) leading to a saving of €12 million per annum.98
Local costing analysisBased on cost analysis of local costing data, there is a potential long-term cost saving in NEWS implementation if NEWS is integrated into existing electronic medical record (EMR) system. (Table 19)
Table 19: Cost comparison between local paper- and electronic-based EWS
Source of costing data from Medical Department, Hospital Sg Buloh and Faculty of Medicine,University Malaya

57
HE
AL
TH
TE
CH
NO
LO
GY
AS
SE
SS
ME
NT
RE
PO
RT
HE
AL
TH
TE
CH
NO
LO
GY
AS
SE
SS
ME
NT
SE
CT
ION
(MaH
TA
S)
ME
DIC
AL
DE
VE
LO
PM
EN
T D
IVIS
ION
, MIN
IST
RY
OF
HE
AL
TH
NA
TIO
NA
L E
AR
LY
WA
RN
ING
SC
OR
E (N
EW
S)
6.4 Organisational implications
6.4.1 Impact on resources
a) Length of hospital stay
A systematic review by Smith ME et al. (2014) (n=21) reported four studies evaluated length of hospital stay before and after EWS implementation and found mixed results.17 level 1 In a good-quality trial and a pre–post observational study, no differences in length of hospital stay were detected 1–2 years after EWS implementation. A study with a shorter observation period (47 days before and 38 days after EWS implementation) found a significantly reduced length of stay (median [IQR] 9.7 days [4.70-19.8] vs. 6.9 days [3.3–13.9]; p=0.001). An increase in length of hospital stay from 4.0 (1.8–8.3) days to 4.8 (2.2–9.8) days was observed in a fourth study comparing data four months before with those four months after EWS implementation. Variation in study populations (patients with an unplanned ICU admission or medical emergency vs all ward patients) and follow-up time make it difficult to assess the overall effect of EWS on length of stay across studies. 17 level 1
Alam N et al. (2015) in a cohort study evaluating the NEWS performance in emergency department found that LOS was significantly correlated with NEWS, at all measured time points (p<0.05). Median LOS more than doubled for a NEWS score >7 compared with a score of 0–4. 40 level II-2
b) Admission to the intensive care
Smith ME et al. (2014) also reported mixed results on the impact of the EWS on ICU utilization also reported mixed results.17 level 1 Two studies found a significant increase in the number of ICU admissions after implementing EWS and accounting for differences in overall hospital admission rates, whereas a third study found no difference in the proportion of patients transferred from the general medicine wards to the ICUs. One study involving two hospitals found increases of 24.5% and 14% in the annual ICU admission rates, but a significant decrease in the proportion of patients admitted to the ICU after having undergone cardiopulmonary resuscitation (pre-EWS 3% vs. post-EWS 2%, p=0.004; and pre-EWS 6.65% vs. post-EWS 2.63%, p= 0.001). One study found the proportion of clinically unstable patients who were on the ward for six hours or longer had decreased from 41.2% to 24.5% after implementing EWS. 17 level 1
c) Use of rapid response or code team
Smith ME et al. (2014) found at least a 50% increase in the number of RRT or ICU liaison team calls in all studies assessing the impact of EWS on RRTs and code teams. Code blue calls decreased by 6–33% in three studies. 17 level 1 One study found that the number of code blue calls for a patient still breathing and with a pulse increased from 47.9% to 64.4%, suggesting that response teams were activated before the patient’s condition deteriorated to the point of cardiac or respiratory arrest. 17 level 1
6.4.2 Impact on work process a) Workload
Jarvis S et al. (2015a) revealed that escalation of care to a doctor when any component of NEWS scores 3 compared to when aggregate NEWS values ≥5, would have increased doctors workload by 40% with only a small increase in the number of detected adverse outcomes from 2.99 to 3.08 per day (a 3% improvement in detection).55 level II-2

HE
AL
TH
TE
CH
NO
LO
GY
AS
SE
SS
ME
NT
RE
PO
RT
HE
AL
TH
TE
CH
NO
LO
GY
AS
SE
SS
ME
NT
SE
CT
ION
(M
aH
TA
S)
ME
DIC
AL
DE
VE
LO
PM
EN
T D
IVIS
ION
, M
INIS
TR
Y O
F H
EA
LT
H
58
NA
TIO
NA
L E
AR
LY
WA
RN
ING
SC
OR
E (
NE
WS
)
In a study by Kovacs C et al. (2016) involving surgical and medical patients, the analysis of NEWS efficiency curve showed that using a NEWS threshold of 5 generates different workload and detection rates for the two patient groups (medical: workload 12⋅3%, detection 70⋅2%; surgical: workload 6⋅1%, detection 60⋅6%); and similarly for a NEWS value of 7 (medical: workload 4⋅4%, detection 48⋅7%; surgical: workload 1⋅8%, detection 36⋅9%).56 level II-2
A result from study by Forster S et al. (2018) in COPD population showed that NEWS would have generated an eightfold increase in mandatory workload due to a lower specificity in this population.64 level II-2
b) Level of adherence (documentation/clinical response)
Documentation
Pedersen NE et al. (2017) in a cross-sectional study performed assessment on NEWS data recorded manually and stored electronically over 12 months period in an inpatient hospital service.99 Of 2,835,333 NEWS records from 168 496 patients, 10% were incomplete with one or more variable missing and 0.2% of records containing implausible values. Body temperature was the most frequently missing single NEWS variable, missing in 66% (n=79,991) of incomplete records. Artefacts or extreme value were detected in 0.2% (n=5,361) of records indicating that entry of wrong values and entry of values in wrong fields were sources of error. The most common extreme value was 0. Digit preferences were identified for respiratory rate, supplementation oxygen flow, pulse rate, and systolic blood pressure. Respiratory rate and pulse rate showed a digit preference for even numbers. The distribution indicated an overrepresentation of values for respiratory rates divisible by 4 (16, 20, 24 and 28). A preference for numbers divisible by 10 was seen in both pulse rate and systolic blood pressure records. A distributional anomaly was found as an accumulation was seen of records of pulse rate just below 91 beats per minute. Among complete NEWS records, 64% had NEWS≥1; 29% had NEWS≥3; and 8% had NEWS≥6. Staff practice influenced the recorded values in a system where data were manually entered into the EMR.99
Utilising cross-sectional study design, Clifton DA et al. (2015) sought to investigate factors associated with errors using an established paper-based early warning score (EWS) system.100 Based on analysis of 6 795 observation sets, from 200 postsurgical patients, 34.5% of all observation sets were incomplete. Temperature was the most commonly missing vital sign, being absent in 11.4% of observation sets. An incomplete observation sets were more likely to contain observations which should have led to an alert than complete observation sets (15.1% vs 7.6%, p<0.001), but less likely to have an alerting score correctly calculated (38.8% vs 30.0%, p<0.001). In a complete observation sets, type of error that occurred were errors in the assignment of weights to vital sign measurements (16.2%), error in the aggregate score(15.9%) and composite error in the assignment of weights and the aggregate score (16.9%). Mis-scoring was much more common when leaving a sequence of three or more consecutive observation sets with aggregate scores of 0 (55.3%) than within the sequence (3.0%, p<0.001). Observation sets that ‘incorrectly’ alerted were more frequently followed by a correctly alerting observation set than error-free non- alerting observation sets (14.7% vs 4.2%, p<0.001). Observation sets that ‘incorrectly’ did not alert were more frequently followed by an observation set that did not alert than error-free alerting observation sets (73.2% vs 45.8%, p<0.001).The authors concluded that missed alerts were particularly common in incomplete observation sets and when a patient first became unstable. Observation sets that ‘incorrectly’ alert or ‘incorrectly’ do not alert were highly predictive of the next observation set, suggesting that clinical staff detect both deterioration and improvement in advance of the EWS system by using information not currently encoded within it. 100

59
HE
AL
TH
TE
CH
NO
LO
GY
AS
SE
SS
ME
NT
RE
PO
RT
HE
AL
TH
TE
CH
NO
LO
GY
AS
SE
SS
ME
NT
SE
CT
ION
(MaH
TA
S)
ME
DIC
AL
DE
VE
LO
PM
EN
T D
IVIS
ION
, MIN
IST
RY
OF
HE
AL
TH
NA
TIO
NA
L E
AR
LY
WA
RN
ING
SC
OR
E (N
EW
S)
Clinical response
Poor compliance with the NEWS protocol and level of care was observed when faced with a deteriorating patient as described by Petersen JA et al. (2014). 96 level II-2
Based on the finding reported by Kolic I et al. (2015), clinical response to NEWS scores was significantly worse at weekends compared to weekdays, which has implications for standards of care for patients out of hours. 95 level II-2
In a mixed method study by Lydon S et al. (2015) revealed many of the barriers to the implementation of NEWS were related to sociocultural aspects of introducing a new system into current practice.101 It was highlighted that these sociocultural issues may affect non-compliance and must be addressed in order to improve detection of the clinical deterioration of patients.101
6.4.3 Education and training
Liaw SY et al. in a randomised control trial sought to evaluated the effect of an educational programme on improving the nurses’ knowledge and performances in recognising and responding to clinical deterioration.102, 103 level II-1 The interactive web-based educational programme addressed three areas: (1) early detection of changes in vital signs; (2) performance of nursing assessment and interventions using airway, breathing, circulation, disability and expose/examine and (3) reporting clinical deterioration using identity, situation, background, assessment and recommendation (ISBAR) communication tool. The experimental group underwent a 3 hours programme while the control group received no intervention. Pretests and post-tests, a mannequin-based assessment and a multiple-choice knowledge questionnaire were conducted. The authors evaluated the participants’ performances in assessing, managing and reporting the deterioration of a patient using a validated performance tool. A significantly higher number of nurses from the experimental group than the control group monitored respiratory rates (48.2% vs 25%, p<0.05) and pulse rates (74.3% vs 37.5%, p<0.01) in the simulated environment, after the intervention. The post-test mean scores of the experimental group was significantly higher than the control group for knowledge (21.29 vs 18.28, p<0.001), performance in assessing and managing clinical deterioration (25.83 vs 19.50, p<0.001) and reporting clinical deterioration (12.83 vs 10.97, p<0.001). There was a significant increase in knowledge and performance in assessing, managing and reporting clinical deterioration following participation in a web-based educational programme developed for hospital nurses one week post-intervention. 102, 103 level II-1
A before and after study was undertaken by Merriel A et al. (2015) to establish whether a short multidisciplinary training intervention can improve recognition of the deteriorating patient using an aggregated physiological parameter scoring system EWS.104 level II-2 Nursing, medical, and allied nursing staff participated in an hour-long training session, using real-life scenarios with simple tools and structured debriefing. After training, staff were more likely to calculate EWS scores correctly [68.02% vs 55.12%; risk ratio (RR) = 1.24 (95%CI 1.07, 1.44], and observations were more likely to be performed at the correct frequency [78.57% vs 68.09%; RR = 1.20 (95% CI 1.09,1.32)]. Multidisciplinary training, according to core principles, can lead to more accurate identification of deteriorating patients, up to 6 months post-intervention, with implications for subsequent care and outcome. 104 level II-2
6.4.4 EWS Implementation
a) Observation Tool : The impact of chart design
Using eye-tracking technology to study search efficiency and cognitive workload, Cornish L et al. (2019) demonstrated that a chart that incorporated both graphically
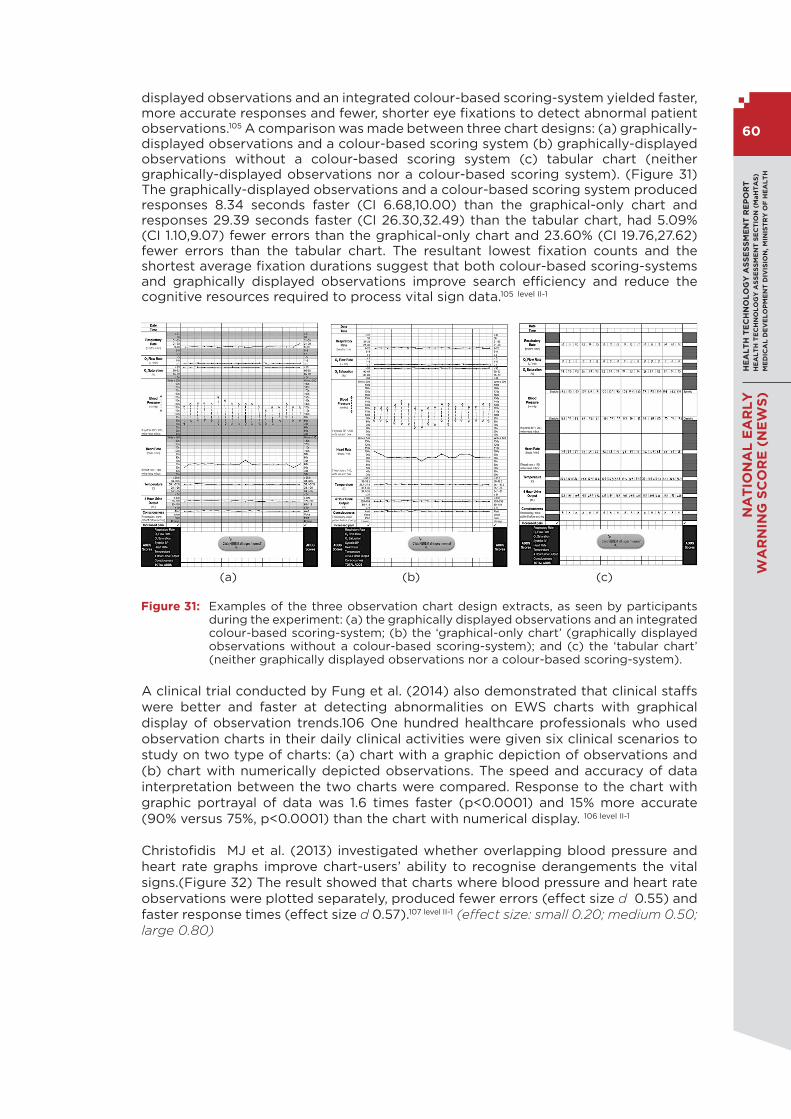
HE
AL
TH
TE
CH
NO
LO
GY
AS
SE
SS
ME
NT
RE
PO
RT
HE
AL
TH
TE
CH
NO
LO
GY
AS
SE
SS
ME
NT
SE
CT
ION
(M
aH
TA
S)
ME
DIC
AL
DE
VE
LO
PM
EN
T D
IVIS
ION
, M
INIS
TR
Y O
F H
EA
LT
H
60
NA
TIO
NA
L E
AR
LY
WA
RN
ING
SC
OR
E (
NE
WS
)
displayed observations and an integrated colour-based scoring-system yielded faster, more accurate responses and fewer, shorter eye fixations to detect abnormal patient observations.105 A comparison was made between three chart designs: (a) graphically-displayed observations and a colour-based scoring system (b) graphically-displayed observations without a colour-based scoring system (c) tabular chart (neither graphically-displayed observations nor a colour-based scoring system). (Figure 31) The graphically-displayed observations and a colour-based scoring system produced responses 8.34 seconds faster (CI 6.68,10.00) than the graphical-only chart and responses 29.39 seconds faster (CI 26.30,32.49) than the tabular chart, had 5.09% (CI 1.10,9.07) fewer errors than the graphical-only chart and 23.60% (CI 19.76,27.62) fewer errors than the tabular chart. The resultant lowest fixation counts and the shortest average fixation durations suggest that both colour-based scoring-systems and graphically displayed observations improve search efficiency and reduce the cognitive resources required to process vital sign data.105 level II-1
(a) (b) (c)
Figure 31: Examples of the three observation chart design extracts, as seen by participants during the experiment: (a) the graphically displayed observations and an integrated colour-based scoring-system; (b) the ‘graphical-only chart’ (graphically displayed observations without a colour-based scoring-system); and (c) the ‘tabular chart’ (neither graphically displayed observations nor a colour-based scoring-system).
A clinical trial conducted by Fung et al. (2014) also demonstrated that clinical staffs were better and faster at detecting abnormalities on EWS charts with graphical display of observation trends.106 One hundred healthcare professionals who used observation charts in their daily clinical activities were given six clinical scenarios to study on two type of charts: (a) chart with a graphic depiction of observations and (b) chart with numerically depicted observations. The speed and accuracy of data interpretation between the two charts were compared. Response to the chart with graphic portrayal of data was 1.6 times faster (p<0.0001) and 15% more accurate (90% versus 75%, p<0.0001) than the chart with numerical display. 106 level II-1
Christofidis MJ et al. (2013) investigated whether overlapping blood pressure and heart rate graphs improve chart-users’ ability to recognise derangements the vital signs.(Figure 32) The result showed that charts where blood pressure and heart rate observations were plotted separately, produced fewer errors (effect size d 0.55) and faster response times (effect size d 0.57).107 level II-1 (effect size: small 0.20; medium 0.50; large 0.80)

61
HE
AL
TH
TE
CH
NO
LO
GY
AS
SE
SS
ME
NT
RE
PO
RT
HE
AL
TH
TE
CH
NO
LO
GY
AS
SE
SS
ME
NT
SE
CT
ION
(MaH
TA
S)
ME
DIC
AL
DE
VE
LO
PM
EN
T D
IVIS
ION
, MIN
IST
RY
OF
HE
AL
TH
NA
TIO
NA
L E
AR
LY
WA
RN
ING
SC
OR
E (N
EW
S)
(a) Overlapping blood pressure and heart rate graph with colour based scoring EWS
(b) Separate blood pressure and heart rate graph with colour based scoring EWS
Figure 32: Chart design extracts used in the study
Christofidis MJ et al. (2015) sought to evaluate the effect of chart design on the speed and accuracy of scoring.108 Forty-seven novice chart-users were presented with three different observation chart designs for EWS. They varied according to their placement of individual vital sign scoring-rows: (a) grouped row (b) separate rows, with each row presented immediately below the corresponding vital sign row (c) no rows (excluded altogether). (Figure 33) The response time (the mean number of seconds to record an EWS) was 6.35 seconds faster when there was no row for scoring than when there were separate rows and 7.69 seconds faster when no row was compared to grouped rows. Participants responded 1.34 seconds faster with separated rows compared to grouped rows. Error rates (the number of incorrect EWS as a percentage) were 2.48% and 2.76% less with no row compared to separate rows and grouped rows respectively. There was no significant difference between the separated and grouped rows conditions. Data for patient in the worse state was associated with prolonged response time and higher chance of error.108 level II-1

HE
AL
TH
TE
CH
NO
LO
GY
AS
SE
SS
ME
NT
RE
PO
RT
HE
AL
TH
TE
CH
NO
LO
GY
AS
SE
SS
ME
NT
SE
CT
ION
(M
aH
TA
S)
ME
DIC
AL
DE
VE
LO
PM
EN
T D
IVIS
ION
, M
INIS
TR
Y O
F H
EA
LT
H
62
NA
TIO
NA
L E
AR
LY
WA
RN
ING
SC
OR
E (
NE
WS
)
(a) Grouped row (b) Separated rows (c) No row
Figure 33: The three chart designs which varied according to placement of scoring rows. Red numerals indicate the potential order in which a chart user typically attend to vital sign observation rows and scoring-rows when determining scores.
Another study by Christofidis MJ et al. (2016) further evaluated the impact of chart design on chart-users’ detection of patient deterioration by examining different design features.109 The evaluation was done using a 2 x 2 x 2 x 2 mixed factorial design by random assignment. The following design features were assessed as shown in Figure 34;
i. data-recording format (drawn dots vs. written numbers)ii. scoring-system integration (integrated colour-based system vs. non-integrated
tabular system) iii. scoring-row placement (grouped vs. separate) varied within-participantsiv. scores (present vs. absent) varied between-participants

63
HE
AL
TH
TE
CH
NO
LO
GY
AS
SE
SS
ME
NT
RE
PO
RT
HE
AL
TH
TE
CH
NO
LO
GY
AS
SE
SS
ME
NT
SE
CT
ION
(MaH
TA
S)
ME
DIC
AL
DE
VE
LO
PM
EN
T D
IVIS
ION
, MIN
IST
RY
OF
HE
AL
TH
NA
TIO
NA
L E
AR
LY
WA
RN
ING
SC
OR
E (N
EW
S)
(a) (b)
(c) (d)
Figure 34: Examples of chart design used with EWS (a) an integrated colour-based scoring- system and grouped scoring rows (b) an integrated colour-based scoring-system and separate scoring-rows (c) a non-integrated tabular scoring-system and separate scoring-rows (d) a non-integrated tabular scoring-system and grouped scoring-rows. The remaining four designs were identical, except that each used the alternative data-recording format option.
Based on the responses of 205 novice chart-users for the given eight clinical scenarios (four containing abnormal observations) on each of eight designs (64 cases of genuine de-identified patient data), chart-users detected patient deterioration faster and more accurately using designs with a drawn-dot data-recording format (as opposed to written numbers) [2.24 seconds faster (CI 1.76,2.72) and 2.57% fewer errors (CI 1.19,3.94)] and an integrated colour-based scoring-system (rather than a non-integrated tabular one) [3.94 seconds faster (CI 3.40,4.48) and 2.24% fewer errors (CI 0.75,3.73)]. Charts were manipulated to whether or not EWS scores available to participants, to give a broader range of real-world clinical situations. There was a main effect of scores, indicating that participants for whom scores were present (versus absent) responded faster overall, F(1, 186) = 194.80, p < 0.001, effect size η2 = 0.52. Again, fewer errors was made overall by the participants for whom scores were present (versus absent), F(1, 186) = 51.99, p < 0.001, effect size η2 = 0.22. The optimal arrangement of scoring-rows may depend on the clinical context and compliance culture. Participants were faster at determining and recording early-warning scores when the scoring-rows were separate, rather than grouped if scores were present.109
level II-1

HE
AL
TH
TE
CH
NO
LO
GY
AS
SE
SS
ME
NT
RE
PO
RT
HE
AL
TH
TE
CH
NO
LO
GY
AS
SE
SS
ME
NT
SE
CT
ION
(M
aH
TA
S)
ME
DIC
AL
DE
VE
LO
PM
EN
T D
IVIS
ION
, M
INIS
TR
Y O
F H
EA
LT
H
64
NA
TIO
NA
L E
AR
LY
WA
RN
ING
SC
OR
E (
NE
WS
)
b) Electronic Tool: Opportunity For Automation
The HTA conducted by Irish Health Information and Quality Authority (HIQA) (2015) identified eight studies ( one RCTs, two randomised controlled cross-over studies, one controlled before and after study, four before and after studies) that investigate the role of automation in improving detection of deteriorating patients with early warning scores. 29 level I The early warning systems that were examined in this HTA included the review of a move from a paper-based to electronic early warning systems, the comparison of a new electronic alerting system to no alerts and continuous monitoring systems either with or without the integration of an automated electronic early warning. The results indicated that there were evidences that the implementation of electronic early warning systems has contributed to reduced mortality rates. The change in general and intensive care unit (ICU) length of stay (LOS) varied from a minimal reduction up to 29% and 40% reductions, respectively. Improved efficiency and accuracy of recording vital sign parameters and compliance with escalation protocols were also reported. However, the authors noted the limitation to generalise the results as the quality of studies of effectiveness was variable and the interventions performed in a number of healthcare jurisdictions with a range of outcomes measured. 29 level I The summary of the studies included in the review and the outcome reported, grouped according to type of comparison is shown below in Table 20. 29 level I
Table 20: Summary of the included studies and the outcome reported according to type of comparison
Type of comparison Study Outcome reported
Manual versus electronic data input
Prytherch 2006, UK (Randomised Crossover Study, classroom setting.)
[Handheld personal digital assistant, VitalPAC versus paper-based generic early warning score]
1. Fewer errors in computer-based systems2. Recording efficiency gains
v Incorrect entries/omissions decreased from 29% to 10% using the VitalPAC method.
v Fewer incorrect clinical actions were indicated (14% to 5%) and mean time taken for participants to calculate and chart the early warning score was 1.6-times faster with VitalPAC
Mohammed 2009, UK(Before and after study)
[Handheld personal digital assistant, VitalPAC versus paper-based generic early warning score]
v Accuracy: Paper based 58% vs. electronic classroom 96% CI 95% 31-44% (P<0.0001), Phase 3: Electronic classroom 96% vs. Electronic Ward 88% p=0.006
v Efficiency: Paper based 37.9s vs. Electronic classroom 35.1s (p=0.016) vs. Electronic Ward 24.0s (p<0.0001)
Electronic alerts versus no electronic alerts
Kollef 2014, US (RCT)
[Realtime alert]
Length of stay (LOS) v Reduction in LOS in general ward [9.4 days
(control) v. 8.4 days (intervention) p=0.038]
Unplanned ICU admission/transfer v No difference in ICU admission/transfer
between intervention and control groups.
Bailey 2013, US(Cross- over study)
Mortality outcome v Patients with alerts were at 8.9-fold greater risk
of death than those without alerts (244 of 2353 [10.4%] vs. 206 of 17678 [1.2%]).
v Among patients identified by the early warning system, there were no differences in the proportion of patients who died in the intervention group as compared with the control group. Alerts occurred a median of 8 hours prior to death (interquartile range, 4.09-15.66).
Length of stay v No difference in LOS between intervention and
control group (specific data not reported)

65
HE
AL
TH
TE
CH
NO
LO
GY
AS
SE
SS
ME
NT
RE
PO
RT
HE
AL
TH
TE
CH
NO
LO
GY
AS
SE
SS
ME
NT
SE
CT
ION
(MaH
TA
S)
ME
DIC
AL
DE
VE
LO
PM
EN
T D
IVIS
ION
, MIN
IST
RY
OF
HE
AL
TH
NA
TIO
NA
L E
AR
LY
WA
RN
ING
SC
OR
E (N
EW
S)
Type of comparison Study Outcome reported
Continuous monitoring versus no continuous monitoring
Bellomo 2012, Multi US, UK, Sweden, Australia(Controlled before and after study)
[Automated advisory vital signs monitors]
v The intervention was associated with an increased proportion of calls secondary to abnormal respiratory vital signs (from 21% to 31%).
v Survival immediately after rapid response team treatment, to hospital discharge or 90 days increased from 86% to 92%.
v Median length of stay and time to record observations were also significantly reduced.
v The time required to complete and record a set of vital signs decreased from 4.1 ± 1.3 mins to 2.5 ± 0.5 mins (difference [95% CI] 1.6 [1.4–1.8]; p < 0.0001)
v Significant reduction in LOS 4(before) [2– 6.7] and 3[2–6] (after) p<0.0001, Hospital length of stay (days)
Paper versus Electronic Early Warning System
Schmidt 2014, UK(Controlled before and after study)
[VitalPAC]
Mortality outcome v Crude mortality reduction in the 5 year study
period Hospital 1: 7.75% to 6.42% (p<0.001) (estimated 397 fewer deaths) Hospital 2: 7.57% to 6.15% (p<0.001) (estimated 372 fewer deaths).
v Seasonally-adjusted mortality was predominantly above the 7- year mean [Hospital 1, 30/47 (63.8%) months; Hospital 2, 45/57 (78.9%)], whereas afterward introduction, it was seldom so [Hospital 1, 4/37 (10.8%) months; Hospital 2, 2/27 (7.4%)]
Dawes 2014(Before and after study)
VitalPAC system linked with EWS
Mortality outcome v Reduction of observed mortality rate; 8.3% to
5.2% over 5 years (p=0.29 post adjustment for disease severity)
Length of stay v No significant reduction in length of stay post
adjustment for patient severity on admission.
Jones 2011, UK(Before and after study)
Patientrack
Mortality outcome v Deaths in study population [baseline 67 (9.5%)
vs. alert 59 (7.6%) p=0.19]
Length of stay v statistically significant decrease in LOS post
intervention by 2.8 days v statistically significant reduction in ICU LOS
during the study periods: (pre-intervention) 14 patients (51 critical care bed-days) and (post intervention) 5 patients (26 critical care bed-days) (p=0.04)
Unplanned ICU admission/transfer v Reduced critical care bed days 14 admissions to
5 admissions p=0.04
Cardiopulmonary arrest v Reduced Cardio-Pulm arrest 3 (0.4%) to 0,
p=0.21)
Changes in work process v Accuracy of recording improved 81% to 100%, v Clinical attendance improved (EWS 3, 4, and
5) 29% to 79%; EWS level >5 from 67% to 96% (p<0.001). Complete compliance with the early warning score protocol for EWS 3, 4 or 5 (i.e., recheck EWS within 1 hour and if still EWS 3, 4 or 5 then clinical response within the next hour) could not be determined in the baseline group due to poor documentation of attendance times in the medical record.

HE
AL
TH
TE
CH
NO
LO
GY
AS
SE
SS
ME
NT
RE
PO
RT
HE
AL
TH
TE
CH
NO
LO
GY
AS
SE
SS
ME
NT
SE
CT
ION
(M
aH
TA
S)
ME
DIC
AL
DE
VE
LO
PM
EN
T D
IVIS
ION
, M
INIS
TR
Y O
F H
EA
LT
H
66
NA
TIO
NA
L E
AR
LY
WA
RN
ING
SC
OR
E (
NE
WS
)
A before and after study by Mestrom E et al. (2019) compared non-automated with automated EWS, evaluating operational outcomes (number of recorded assessments, number of complete EWS assessment, adherence rate to related EWS protocol) and clinical outcomes ( hospital length of stay, mortality, ICU readmission rate) for surgical high dependency unit patients.110 level II-2 The automated EWS comprised of electronic device that automatically measured the physiological parameters, calculate the EWS values and showed them on the screen of the device as well as on a monitor at the central nurse station. A short advice was displayed on the screen for further monitoring such as the recommended time until the next assessment, or recommended actions, such as alerting a physician or the RRT. The adherence to EWS hospital protocol improved from 1.1% to 25.4% and the number of complete EWS recorded improved significantly by 43%. However, there were no significant differences in clinical outcomes. 110 level II-2
6.4.5 Clinical Guidelines Published Internationally
a) NICE Guideline: Acutely ill adults in hospital: Recognising and Responding To Deterioration111
The National Institute for Health and Care Excellence (NICE) UK (2007) in their clinical guidance requires that, hospitals must have (i) a clear written monitoring plan specifying which vital signs should be recorded (and at what frequency for all adult hospitalised patients), (ii) a physiological EWS for documenting vital signs and (iii) a graded response strategy. The graded response strategy according to NICE for patients identified as being at risk of clinical deterioration should be agreed and delivered locally (low score group -increased observations, charge nurse alerted; medium score group- urgent call to team with primary medical responsibility for the patient and simultaneous call to personnel with core competencies for the management of acute illness which can be delivered by a variety of means; high-score group- emergency call with immediate response to team with critical care competencies and diagnostic skills). The updated version of the guideline 2019 included details of the NEWS2 tool.111
b) NCEC National Clinical Guideline No. 1: National Early Warning Score112
In December 2013, the first National Clinical Guideline of National Early Warning Score was published by the Irish National Clinical Effectiveness Committee (NCEC). The NEWS guideline is part of a suite of National Clinical Guidelines on Clinical Deterioration for Irish health system. It was updated in August 2014 to ensure alignment with National Clinical Guideline No. 6 Sepsis Management. The guideline focuses on ensuring that a ‘track and trigger’ system is in place for adult patients whose condition is deteriorating, and outlines the clinical processes and organisational supports required to implement the guideline. It describes the essential features of the systems of care required to implement the NEWS System, (using the VitalPACTM Early Warning Score (ViEWS) Parameters) and the NEWS escalation protocol, to recognise and respond to clinical deterioration.112
c) SIGN 139 Guideline: Care of Deteriorating Patients113
The Scottish Intercollegiate Guideline Network (SIGN) (2014) developed consensus recommendations to underpin a national approach to the care of adult deteriorating patients. Similarly, the SIGN system makes reference to patients with high NEWS score requiring immediate action from staff with an emergency call to the team with critical care competencies and diagnostic skills. SIGN noted that as a first step in implementing any new recommendation an understanding of current clinical practice is required. In addition, acute hospitals should consider the introduction of electronic track, trigger and alert systems.113

67
HE
AL
TH
TE
CH
NO
LO
GY
AS
SE
SS
ME
NT
RE
PO
RT
HE
AL
TH
TE
CH
NO
LO
GY
AS
SE
SS
ME
NT
SE
CT
ION
(MaH
TA
S)
ME
DIC
AL
DE
VE
LO
PM
EN
T D
IVIS
ION
, MIN
IST
RY
OF
HE
AL
TH
NA
TIO
NA
L E
AR
LY
WA
RN
ING
SC
OR
E (N
EW
S)
d) AUSTRALIAN COMMISSION ON SAFETY AND QUALITY IN HEALTH CARE. 2017. National Consensus Statement: Essential Elements for Recognising and Responding to Clinical Deterioration.114
AUSTRALIAN COMMISSION ON SAFETY AND QUALITY IN HEALTH CARE. 2012. Safety and Quality Improvement Guide Standard 9: Recognising and Responding to Clinical Deterioration in Acute Health Care.115
In 2010 the National Consensus Statement relating to the “Recognising and Responding to Clinical Deterioration” was endorsed by Health Ministers as the national approach for recognition and response systems in Australian acute care facilities. The purpose of the Consensus Statement is to describe the elements that are essential for prompt and reliable recognition of, and response to, physiological deterioration of patients in acute healthcare facilities in Australia. The evidence base regarding recognition and response systems for clinical deterioration has matured since the Consensus Statement was originally released in 2010. This revision reflects the agreed views of experts in the field and the Australian Commission on Safety and Quality in Health Care, and the findings of a rapid review of the literature from 2010-2016. The current version of the document includes eight essential elements. Four relate to clinical processes that need to be locally delivered (measurement and documentation of observations, escalation of care, rapid response system and clinical communication), and are based on the circumstances of the health service in which care is provided. Four relate to the structural and organisational prerequisites that are essential for recognition and response systems to operate effectively (leadership and governance, education and training, evaluation and audit, support system for high quality care).114 An Australian guidance document was particularly concerned regarding implementation strategies and noted that governance arrangements need to be in place “to support the development, implementation, and maintenance of organisation-wide recognition and response systems” (Standard 9.1).115 Such a governance system includes: the identification of a suitable individual, group or committee to take responsibility for governance; development and implementation of processes for collecting, analysing and reporting feedback from the workforce; identification of system failures through data collection systems which review deaths and cardiopulmonary arrest; routine and timely provision of relevant data about recognition and response systems to the clinical workforce; utilisation of the data from evaluation of recognition and response systems to inform quality improvement activities.115
6.5 Ethical and legal issues
Risk prediction models and algorithms have long been utilized in healthcare to support decision-making. There are well-established frameworks that provide guidance to the development and utilization of these algorithms and models. A well-known framework is the one proposed jointly by the International Society for Pharmacoeconomics and Outcomes Research (ISPOR) and the Society for Medical Decision Making (SMDM) through their ISPOR-SMDM modeling good research practices task force.116, 117 The implementation of electronic health care predictive analytic (e-HPA) applications such as electronic NEWS on a wide scale to aid in real-time, point-of-care decision-making brings a new set of challenges and opportunities that are not covered by earlier frameworks. As a result of rapid development, many ethical, legal, regulatory, methodological and technical challenges are emerging; consequently, the existing frameworks in these areas are not well equipped to provide sufficient guidance for addressing these new challenges. Seventeen international experts with diverse expertise including methodology, ethics, legal, regulation and health care delivery systems were assembled to identify emerging opportunities and challenges of e-HPA and to propose a framework to guide the development and application of e-HPA.118

HE
AL
TH
TE
CH
NO
LO
GY
AS
SE
SS
ME
NT
RE
PO
RT
HE
AL
TH
TE
CH
NO
LO
GY
AS
SE
SS
ME
NT
SE
CT
ION
(M
aH
TA
S)
ME
DIC
AL
DE
VE
LO
PM
EN
T D
IVIS
ION
, M
INIS
TR
Y O
F H
EA
LT
H
68
NA
TIO
NA
L E
AR
LY
WA
RN
ING
SC
OR
E (
NE
WS
)
The framework proposed by the panel includes three key domains where e-HPA differs qualitatively from earlier generations of models and algorithms (Data Barriers, Transparency, and Ethics) and areas where current frameworks are insufficient to address the emerging opportunities and challenges of e-HPA (Regulation and Certification; and Education and Training). The following list of recommendations summarizes the key points of the framework:118
1. Data Barriers: Establish mechanisms within the scientific community to support data sharing for predictive model development and testing.
2. Transparency: Set standards around e-HPA validation based on principles of scientific transparency and reproducibility.
3. Ethics: Develop both individual-centered and society-centered risk-benefit approaches to evaluate e-HPA.
4. Regulation and Certification: Construct a self-regulation and certification framework within e-HPA.
5. Education and Training: Make significant changes to medical, nursing, and paraprofessional curricula by including training for understanding, evaluating, and utilizing predictive models.
A systematic review of applied analytics and qualitative/conceptual papers (n=117) on healthcare analytics identified four papers that highlighted healthcare privacy and fraud detection of major concern.119 The traditional technique of security for healthcare information system which uses de-identification or anonymization technique leaves healthcare data vulnerable to re-identification. One paper analyzed the major policy, ethical, and legal challenges of performing predictive analytics on health care big data. The proposed recommendations for overcoming challenges raised in the four-phase life cycle of a predictive analytics model (i.e., data acquisition, model formulation and validation, testing in real-world setting and implementation and use in broader scale) included developing a governance structure at the earliest phase of model development to guide patients and participating stakeholders across the process (from data acquisition to model implementation). It was also recommended that model developers strictly comply with the federal laws and regulations in concert with human subject research and patients information privacy when using patients’ data.119
According to Cohen IG et al., among legal and ethical concerns that could arise from using predictive analytics are the the liability issue whereby clinicians who are early users of predictive analytics models may face increased risks of liability or at least litigation.120
Potential liabilities are;
1. Failure to properly study patient’s medical record from existing electronic health record
v The case law on electronic health records establishes that “physicians can be held liable for harm that could have been averted had they more carefully studied their patients’ medical records.” 121 Use of the predictive models could cause clinicians to reduce the time they spend with those medical records and thus increase their liability.
2. Overriding an alert or recommendation v Plaintiffs might use evidence that a doctor overrode an alert or recommendation
from the model as proof that he or she was negligent. It is clinically appropriate to override many computerized alerts in the practice of medicine. However, there is a significant risk that “a doctor who is accustomed to overriding alerts may become desensitized to them and occasionally ignore a critical one,” and evidence of a doctor’s overriding alerts may prove damaging in litigation.121

69
HE
AL
TH
TE
CH
NO
LO
GY
AS
SE
SS
ME
NT
RE
PO
RT
HE
AL
TH
TE
CH
NO
LO
GY
AS
SE
SS
ME
NT
SE
CT
ION
(MaH
TA
S)
ME
DIC
AL
DE
VE
LO
PM
EN
T D
IVIS
ION
, MIN
IST
RY
OF
HE
AL
TH
NA
TIO
NA
L E
AR
LY
WA
RN
ING
SC
OR
E (N
EW
S)
3. Following the recommendations of faulty predictive analytic model v Doctors may also face liability if they follow the recommendations of a predictive
analytics model that contains an error. In the case of computer decision support software more generally, some legal scholars suggest that courts are likely to fault a physician for failing to question bad advice given by the software—even if the error was in the software—because courts would assume that physicians would ultimately rely on their own judgment and professional knowledge.122
The ethical challenge of predictive analytics is its potential impact on the role of the physician. Predictions of adverse clinical events by the models can promise greater accuracy than prognostication by clinicians.120 Hence, physicians’ clinical expertise and self-esteem may be called into question. Physicians will need to master new skills, including how to communicate effectively with patients or their families about the trade-offs involved in different clinical outcomes. The role of the physician in the delivery of care across inpatient and outpatient settings may need to be reconfigured. The separation of hospitalists from ambulatory care providers, the frequent handoffs of responsibility for inpatients from one physician to another, and the rarity of long-term primary care relationships all mean that when a predictive analytics model identifies a patient as being at risk, the treating physician might not know the patient or his or her values and preferences. A model’s predictions also raise novel questions about the doctor-patient relationship. Conventionally, a physician provided care to an individual patient based on the patient’s best interests, as guided by his or her preferences and values. In the era of predictive analytics and team-based care, clinical decision making may be heavily influenced by default rules set by the health care organization. These rules may be driven by financial and administrative incentives and by a desire to maximize population-based health. It would appear to patients that the treating physician is no longer exercising clinical judgment and acting in their best interests.120
6.6 Social implications
Wood C et al. (2019) conducted a mixed method systematic review (n=23) to explore medical and surgical ward nurses’ attitudes, perception and intention towards the use of early warning scoring systems.123 Three themes emerged from this review; barriers to following early warning score algorithms, inconsistent activation of the rapid response team and overreliance on scores. (Table 21) The review identified nurses aimed to use early warning score systems to detect deterioration and ensure patient safety, however cultures, confidence and past experiences impact on rates of afferent limb failure globally. The nurses had difficulty adhering to the easy to follow algorithms used in track and trigger charts due to heavy workloads and challenges in getting medical officers to review within recommended time frames. Nurses relied heavily on the scores generated by early warning score systems but unable to follow algorithms and undertake holistic physical assessments to detect deterioration earlier.123

HE
AL
TH
TE
CH
NO
LO
GY
AS
SE
SS
ME
NT
RE
PO
RT
HE
AL
TH
TE
CH
NO
LO
GY
AS
SE
SS
ME
NT
SE
CT
ION
(M
aH
TA
S)
ME
DIC
AL
DE
VE
LO
PM
EN
T D
IVIS
ION
, M
INIS
TR
Y O
F H
EA
LT
H
70
NA
TIO
NA
L E
AR
LY
WA
RN
ING
SC
OR
E (
NE
WS
)
Table 21: Thematic synthesis
Theme Subtheme Note on key findings
Barrier to following early warning score algorithms and rapid response team activation
Previous experiences with the rapid response team
v nurses confidence level - nurses had a fear of criticism and retribution for inappropriate referrals which directly contributed to afferent limb failure.
v ardous collaboration with the RRT- found RRT to be problematic when called if the patient wasn’t critically unwell
Workload v a delay between a trigger being identified and a repeat set of observations or a review being undertaken
v adherence to monitoring frequency would be neglected during busy periods
v collaboration and communication with doctors about patients with elevated early warning scores was deemed to be unrealistic due to the high number of patients with elevated scores
v The incidence of falsely elevated scores was further compounded by nurses who miscalculated scores when undertaking observations, leading to both over and under reporting of vital sign changes, further increasing the workloads of both nurses and doctors
Lack of knowledge /inadequate training
v doctors need more training in the tool as they had a lack of understanding and therefore poor response times when called to review patients with elevated scores.
v continuous disagreement on the scores for nurses - identified that patients often have elevated scores due to treating teams neglecting to chart modifications on the track and trigger charts for chronic diseases such as chronic obstructive pulmonary disease
Inconsistent activation of the rapid response team
Culture v some nurses called the RRT when they were unhappy with the treating team plan
v others didn’t call the RRT when patients met criteria but didn’t look unwell
Confidence in inter-professional collegiality
v some nurses prefer to call treating teams before activating the rapid response team whilst others called the rapid response team if the treating team are not responding appropriately
v nurses didn’t often feel confident enough to activate the rapid response team but felt more confident in calling the intensive care outreach nurse.
v as familiarity and agreement with rapid response team activation criteria increased, clinicians were more likely to activate the rapid response team than those who were unfamiliar or believed the criteria to be incorrect.
v nurses and junior doctors feared calling the rapid response team in case the patient was not found to be critically unwell.
v RRT was activated when criteria were met or when communication between professionals broke down such as when nurses could not reach doctors through normal lines of communication or when there were interprofessional disagreements surrounding decisions that affect patient care
Overreliance on scores
Privileging early warning score over own clinical assessments
v score generated by the early warning system was the most important indicator of referral to the rapid response team
v nurses often lack the knowledge and skills to recognise and respond to deterioration in patients
v nurses identified track and trigger scores were often miscalculated leading to delays in recognising deterioration and therefore, afferent limb failure.
Lack of experience in identifying signs of early deterioration
v when assessing patients’ nurses often neglected to consider their medical history which led them to call the rapid response team with little information, despite having an awareness that the rapid response team need background history when called to review deteriorating patients
v education programmes could improve nurses’ knowledge and skills when performing a holistic assessment and handover of a deteriorating patient
Increased sensitivity of detection with the computational equipment
v increased incidence of activation of RRT with the use computer aided technology

71
HE
AL
TH
TE
CH
NO
LO
GY
AS
SE
SS
ME
NT
RE
PO
RT
HE
AL
TH
TE
CH
NO
LO
GY
AS
SE
SS
ME
NT
SE
CT
ION
(MaH
TA
S)
ME
DIC
AL
DE
VE
LO
PM
EN
T D
IVIS
ION
, MIN
IST
RY
OF
HE
AL
TH
NA
TIO
NA
L E
AR
LY
WA
RN
ING
SC
OR
E (N
EW
S)
A qualitative study conducted by Hogan H et al. (2019) to explore staff perspectives on key factors that had been important in the effectiveness of the implementation of track and trigger systems (TTSs) and education initiatives, utilizing thematic analysis of semi-structure in depth interview with 60 healthcare staff from 13 NHS hospitals.124 The interviews principally assessed service configurations for the NEWS, education provision and any contextual factors such organizational culture, staff engagement and communication. Within the two domains of the thematic framework, the authors identified and mapped themes and subthemes as shown in Table 22. The NEWS had been well received and was seen as straightforward to use and the standard tool was helpful in an environment where staff turnover is high. The utility of the NEWS across the whole spectrum of patients was questioned, both from the point of view of the scope of the physiological measures included and its under/oversensitivity in particular groups. Many clinicians viewed it as a basic building block and had added additional measures when they felt that the additions added value. These alterations of a validated tool may threaten its reliability. Electronic versions of the NEWS, were viewed as important mechanisms in improvement of care around deteriorating patients. Benefits cited included removing barriers to escalation and decreasing the possibility of ‘human error’, as calculation of scores and triggering a response were done automatically. Issues highlighted for electronic NEWSs including issues of sensitivity and additional issues, such as the need to help staff get over their fears of new technology, as well as the requirement to update and maintain hardware and software systems. Education and training were perceived to have a role in empowering nurses to speak to clinicians and helping to overcome challenges of communication across different disciplines and seniorities. Staff shortages and high staff turnover were felt to be detrimental to maintaining a suitably trained workforce. 124
Table 22: Themes and subthemes from data analysis organised by thematic framework domains
Domain 1: Service configuration for NEWS
Theme Subthemes Note on key findings
Benefits of NEWS
User friendly v simple design, easy to use v require minimal training and supervision
Standardisation v standardisation enabled a familiarity with a single tool and decreased the length of time required to train new or bank staff when they began working in a new ward or hospital
Empowerment v feeling empower to call a doctor if concerned about a patient by providing evidence that something was wrong
Limitations of NEWS
Miscalculation and missed escalation
v concern about adding up the score incorrectly even with the aid of colour coding; incomplete observations; possible missed escalation
v inexperience and skill deficit staffs making decision about escalation without consider individual patient’s context as well.
Lengthy implementation
v changeover to NEWS not an easy process, taken up 2 years for many NHS hospitals involving negotiations with different wards, trial periods and significant training for staff.
‘Deskilling’ workforce v perception of NEWS ‘deskilling’ NHS workforce: more ‘less skilled’ staff in patient caring roles than previously_ seeing the introduction of a’one-size-fits-all’ TTS only solve patient caring issue but not really address the skill deficit issue
Lack generalizability v the score was too generic for use in certain specialties or in particular patients.
Lack reliability as stand alone clinical decision tool
v the need to combine calculation of the NEWS with assessment of the patient’s clinical context by an experienced health-care professional; differing perceptions _lack of sensitivity for detecting early deterioration and deterioration in certain patient groups vs oversensitive & resulted in unnecessary escalation.

HE
AL
TH
TE
CH
NO
LO
GY
AS
SE
SS
ME
NT
RE
PO
RT
HE
AL
TH
TE
CH
NO
LO
GY
AS
SE
SS
ME
NT
SE
CT
ION
(M
aH
TA
S)
ME
DIC
AL
DE
VE
LO
PM
EN
T D
IVIS
ION
, M
INIS
TR
Y O
F H
EA
LT
H
72
NA
TIO
NA
L E
AR
LY
WA
RN
ING
SC
OR
E (
NE
WS
)
Domain 2: Electronic system
Themes Subthemes Note on key findings
Benefits Barrier removal v viewed as important mechanisms in improvement of care around deteriorating patients ; removing barriers to escalation
Minimising error v removing barriers to escalation and decreasing the possibility of ‘human error’; calculation of scores & triggering a response done automatically
Increase compliance v omissions of certain observations were decreased as the electronic systems forced staff to enter a full set of observations.
Limitations Technophobia v the need to get over fears of new technology
System maintenance v the requirement to update and maintain hardware and software system
Suggestion: further digitisation, such as electronic patient records or Wi-Fi access throughout the hospital to enable tablets to be used to collect observations, would make jobs easier and free up time for patient care.
Domain 3: Education and Training Programmes
Themes Subthemes Notes on key findings
Benefits Knowledge enhancement
v valued bedside teaching, especially when provided by outreach teams, as a way of improving their knowledge in identifying and responding to deteriorating patients
Courage to speak up v role that education and training can have in empowering nurses to speak to clinicians
Bridging communication
v helped overcome challenges of communication across different disciplines and seniorities.
Barriers Sceptism v sceptical of the value of formal courses
Lack of sustainability due to trainer shortage
v staff shortages and high staff turnover were felt to be detrimental to maintaining a suitably trained workforce
Time constraint for educator
v the difficulty of maintaining the role of educator while at the same time being increasingly called on to fill other roles, such as providing overnight cover in place of junior doctors
v prioritisation of risk assessments and paperwork that they could not spend as much time as they wanted on teaching at the bedside.
Jensen JK et al. (2019) using a qualitative approach, explored hospital nurses’ perceptions and reactions to the NEWS during an introduction programme. In total, nine seminars with 79 nurses and 23 simulation sessions with 52 nurses were included.125 The findings revealed four tensions related to the working context: (a) tension between using a standardized tool and relying on clinical judgement (the tool could be either an aid or a barrier to patient assessment); (b) tension in the community of practice (the tool could be beneficial or increase stress and anxiety); (c) tension related to rules and compliance (the tool could be perceived as optional or compulsory); and (d) tension related to the division of labour (nurses feared more work). The nurses underlined the particular utility value of NEWS for new and inexperienced nurses and described it as a tool that could enable them to more readily identify deteriorating patients. However, it is interesting to note the contradictory feelings that the nurses displayed towards NEWS. On the one hand, they welcomed the tool as a helpful aid in the assessment of patients and as a reminder of the importance of vital signs in clinical practice. On the other hand, they seemed concerned that using a standardized tool like NEWS would affect and somehow hamper their ability to rely on and use their professional competence in the assessment of patients. The nurses seemed to perceive the situation in a somewhat less harmonious light. It seems that some nurses’ experiences with other tools, such

73
HE
AL
TH
TE
CH
NO
LO
GY
AS
SE
SS
ME
NT
RE
PO
RT
HE
AL
TH
TE
CH
NO
LO
GY
AS
SE
SS
ME
NT
SE
CT
ION
(MaH
TA
S)
ME
DIC
AL
DE
VE
LO
PM
EN
T D
IVIS
ION
, MIN
IST
RY
OF
HE
AL
TH
NA
TIO
NA
L E
AR
LY
WA
RN
ING
SC
OR
E (N
EW
S)
as SOFA, influenced their ambivalence towards using standardized tools in general and their reaction to the implementation of NEWS in particular. Their reactions were partly linked to the possibility that nurses might somehow become too dependent on numeric tool scores and hence undervalue their own clinical judgement of a situation. The nurses also said that they feared that doctors would emphasize measurements at the expense of nurses’ observations and clinical judgements.125
Another qualitative study conducted by Jensen JK et al. (2019) applying a hermeneutic design aimed to explore general hospital ward nurses’ experiences with the NEWS and to determine its impacts on their professionalism.126 It consisted of semi-structured, in-depth interviews with 14 hospital nurses. Four themes were identified: (a) the National Early Warning Score and clinical judgement in patient assessment, (b) responding to the National Early Warning Score standard, (c) involving the professional community and (d) adjusting the tool. Nurses were aware of the importance of incorporating all of their professional competence, comprising clinical judgement, discretion and accountability, with the NEWS to accurately assess patients’ conditions. Findings indicated that the NEWS was beneficial to nurses’ professional practice; however, accountability to this standard alone does not ensure quality care and patient safety.126
Brangan E et al. (2019) in a qualitative study sought to explore staff experiences of using NEWS outside acute hospital setting (primary care, ambulance, referral management/acute interface, community, mental health services and service commissioning).127 Thematic analysis of qualitative semi-structured interviews with 25 healthcare staff was conducted. Four themes were highlighted; (1) NEWS and communication, (2) NEWS in prioritization of care, (3) NEWS and clinical judgement (4) integrating NEWS into clinical practice. Participants reported that NEWS could support clinical decision-making around escalation of care, and provide a clear means of communicating clinical acuity between clinicians and across different healthcare organisations. Challenges with implementing NEWS varied—in primary care, clinicians had to select patients for NEWS and adopt different methods of clinical assessment, whereas for paramedics it fitted well with usual clinical practice and was used for all patients. In community services and mental health, modifications were ‘needed’ to make the tool relevant to some patient populations.127
McClelland G et al. (2016) sought to explore the thoughts and opinions of North East Ambulance Service NHS Foundation Trust (NEAS) paramedics about the NEWS system, and to explore the presence of barriers and/or facilitators to the use of NEWS in the pre-hospital setting. Three overarching themes emerged from the data: applying NEWS, decision making and external influences. (Table 23) 128
Table 23: Themes and subthemes that emerged from paramedics’ interview
Themes Subthemes Notes on key findings
Applying NEWS
To support discharge decision
vv Discharging patients from their care without transporting them to hospitalvv a NEWS of 0 was a good support for their
decision
Sepsis screeningvv A high NEWS did not always lead to
checking for sepsis but a patient with sepsis was thought to often have a high NEWS
More use to non-paramedic roles in terms of being used to trigger decisions such as summoning paramedic backup.
vv Some comments about non-paramedics not seeing it as part of their role or not being aware that they can use tools like NEWS
Decision making
To support or check decisions that had already been made rather than perceived as a threat to paramedic autonomy
vv NEWS was used at the end of decision making processvv To guide non-paramedics in decision making
process
External influences
The influence of other health care professionals (HCPs) and institutions.
vv Negative reception at hospital, or lack of perceived value to handing over NEWS, acted as a disincentive to continued use by the paramedics

HE
AL
TH
TE
CH
NO
LO
GY
AS
SE
SS
ME
NT
RE
PO
RT
HE
AL
TH
TE
CH
NO
LO
GY
AS
SE
SS
ME
NT
SE
CT
ION
(M
aH
TA
S)
ME
DIC
AL
DE
VE
LO
PM
EN
T D
IVIS
ION
, M
INIS
TR
Y O
F H
EA
LT
H
74
NA
TIO
NA
L E
AR
LY
WA
RN
ING
SC
OR
E (
NE
WS
)
A mixed method study was conducted by Brimblecombe N et al. (2019) to assess the attitudes and views of staff and patients on the use of electronic NEWS. A total of 82 staff and 26 patients participated in the study.129 Two themes emerged from the patients focus group discussion; security of the digital system and concern about personal information, increased physical observations and delayed leave. In a staff focus group discussion, three particular themes were highlighted namely risks associated with using handheld devices, the impact of digital recording of observation on staff time as well as workload and concern about system reliability and fit with existing information technology systems. Patients expressed concerns about data confidentiality. Most staff were neutral or positive about moving NEWS to the electronic platform, but raised possible safety risks and the risk of electronic recording being misinterpreted by patients.129
6.7 An overview of NEWS: the Malaysian Context
Early warning score has not been widely used in hospitals in Malaysia. However, there are public and private healthcare facilities through their individual initiative for quality improvement of care to their patients, have implemented early warning score in their settings. An organisational survey was conducted during the process of this review to determine the distribution and use of EWS in hospitals under Ministry of Health (MOH) as well as the presence of variation in EWS application among these hospitals. The survey was sent to 135 hospitals within Ministry of Health and 110 (81.5%) responded. Out of 110 hospitals, 12 hospitals responded to the use of EWS in one or more locations within their facilities.The implementation of EWS happened as early as 2012. The most commonest location for the use of EWS was general medical ward (67% of the hospitals), followed by emergency department (33%) and surgical ward (33%). Other locations were paediatric ward, labour room, obstetric and gynaecological ward and outpatient clinic (mental health service). (Figure 35) The majority of Ministry of Health hospitals operated a paper-based EWS system (91.7%). There were a variety of different EWS used across Ministry of Health hospitals including the NEWS, Modified Early Warning score (MEWS), Paediatric Early Warning Score (PEWS) and a hospital’s own scoring systems. The most popular choice of EWS was MEWS (used by 7 hospitals) followed by NEWS (by two hospitals). (Table 24) The findings on the individual characteristics of different type of EWS used revealed that all EWS had included heart rate, respiratory rate, blood pressure and temperature as a measured parameters in their scoring system. Only six EWS included measurement of oxygen saturation in their scoring model and 3 EWS had assigned separate aggregate score for use of supplemental oxygen. Other physiological parameters used in the system score were level of consciousness/mental status and urine output. (Table 25) The survey had shown that the use of EWS is limited among Ministry of Health hospitals. Variation of EWS practice could be seen between hospitals that utilised EWS from the choice of EWS used to the implementation process.

75
HE
AL
TH
TE
CH
NO
LO
GY
AS
SE
SS
ME
NT
RE
PO
RT
HE
AL
TH
TE
CH
NO
LO
GY
AS
SE
SS
ME
NT
SE
CT
ION
(MaH
TA
S)
ME
DIC
AL
DE
VE
LO
PM
EN
T D
IVIS
ION
, MIN
IST
RY
OF
HE
AL
TH
NA
TIO
NA
L E
AR
LY
WA
RN
ING
SC
OR
E (N
EW
S)
Table 24: List of MOH hospitals, type of EWS used and their implementation characteristic
NameType of
EWSYear of
implementationSetting
Type of implementation
tool
1. Hospital Sg Buloh MEWS 2014 vv General medical ward Paper-based
2. Hospital Taiping & the cluster hospitals
MEWS 2019 vv General medical ward Paper-based
3. Hospital Sarikei MEWS 2011 vv General medical ward Paper-based
4. Hospital Kuala Kangsar
NEWS 2019vv General medical wardvv Emergency
departmentPaper-based
5. Hospital Yan MEWS 2017vv General medical wardvv Emergency
departmentPaper-based
6. Hospital Selama MEWS 2016vv General medical wardvv Emergency
departmentPaper-based
7. Hospital Kuala Krai NEWS 2017vv Surgical wardvv Orthopaedic ward
Paper-based
8. Hospital Umum Sarawak
MEWS
2016
2017
vv Surgical wardvv Orthopaedic wardvv Labour roomvv Gynaecology ward
Paper-based
9. Hospital Labuan MEWS 2017vv General medical wardvv Surgical wardvv Gynaecology ward
Paper-based
10.Hospital Sultan Hj Ahmad Shah, Temerloh
Tem OBGYN PaWS
2017vv Labour room, O+G
wardsElectronic-
based
11. Hospital KapitPEWS and
KEWS2012
vv General medical ward
vv Surgical wardvv Emergency
departmentvv Paediatric ward
Paper-based
12. Hospital Mesra Bukit Padang
EWS -vv Outpatient clinic
(mental health service)Paper-based
Tem OBGYN PaWS =Temerloh OBYSGYN Patient Warning System ; KEWS= Kapit Early Warning Score
Figure 35: The percentage of EWS usage according to type of setting
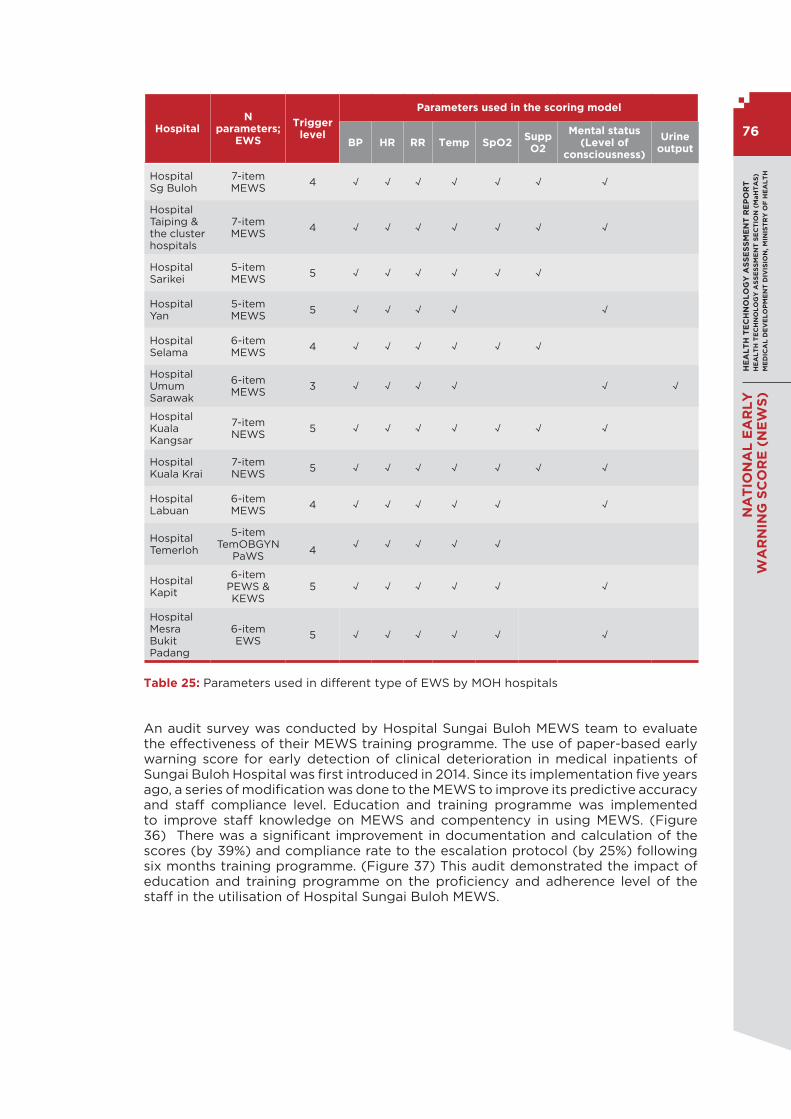
HE
AL
TH
TE
CH
NO
LO
GY
AS
SE
SS
ME
NT
RE
PO
RT
HE
AL
TH
TE
CH
NO
LO
GY
AS
SE
SS
ME
NT
SE
CT
ION
(M
aH
TA
S)
ME
DIC
AL
DE
VE
LO
PM
EN
T D
IVIS
ION
, M
INIS
TR
Y O
F H
EA
LT
H
76
NA
TIO
NA
L E
AR
LY
WA
RN
ING
SC
OR
E (
NE
WS
)
HospitalN
parameters; EWS
Triggerlevel
Parameters used in the scoring model
BP HR RR Temp SpO2
Supp O2
Mental status (Level of
consciousness)
Urine output
Hospital Sg Buloh
7-item MEWS
4 √ √ √ √ √ √ √
Hospital Taiping & the cluster hospitals
7-itemMEWS
4 √ √ √ √ √ √ √
Hospital Sarikei
5-itemMEWS
5 √ √ √ √ √ √
Hospital Yan
5-itemMEWS
5 √ √ √ √ √
Hospital Selama
6-itemMEWS
4 √ √ √ √ √ √
Hospital Umum Sarawak
6-itemMEWS
3 √ √ √ √ √ √
Hospital Kuala Kangsar
7-itemNEWS
5 √ √ √ √ √ √ √
Hospital Kuala Krai
7-item NEWS
5 √ √ √ √ √ √ √
Hospital Labuan
6-itemMEWS
4 √ √ √ √ √ √
Hospital Temerloh
5-itemTemOBGYN
PaWS4
√ √ √ √ √
Hospital Kapit
6-itemPEWS & KEWS
5 √ √ √ √ √ √
Hospital Mesra Bukit Padang
6-itemEWS
5 √ √ √ √ √ √
Table 25: Parameters used in different type of EWS by MOH hospitals
An audit survey was conducted by Hospital Sungai Buloh MEWS team to evaluate the effectiveness of their MEWS training programme. The use of paper-based early warning score for early detection of clinical deterioration in medical inpatients of Sungai Buloh Hospital was first introduced in 2014. Since its implementation five years ago, a series of modification was done to the MEWS to improve its predictive accuracy and staff compliance level. Education and training programme was implemented to improve staff knowledge on MEWS and compentency in using MEWS. (Figure 36) There was a significant improvement in documentation and calculation of the scores (by 39%) and compliance rate to the escalation protocol (by 25%) following six months training programme. (Figure 37) This audit demonstrated the impact of education and training programme on the proficiency and adherence level of the staff in the utilisation of Hospital Sungai Buloh MEWS.

77
HE
AL
TH
TE
CH
NO
LO
GY
AS
SE
SS
ME
NT
RE
PO
RT
HE
AL
TH
TE
CH
NO
LO
GY
AS
SE
SS
ME
NT
SE
CT
ION
(MaH
TA
S)
ME
DIC
AL
DE
VE
LO
PM
EN
T D
IVIS
ION
, MIN
IST
RY
OF
HE
AL
TH
NA
TIO
NA
L E
AR
LY
WA
RN
ING
SC
OR
E (N
EW
S)
Figure 36: The flow chart of MEWS training programme for nursing staff and doctors in Hospital Sungai Buloh medical department

HE
AL
TH
TE
CH
NO
LO
GY
AS
SE
SS
ME
NT
RE
PO
RT
HE
AL
TH
TE
CH
NO
LO
GY
AS
SE
SS
ME
NT
SE
CT
ION
(M
aH
TA
S)
ME
DIC
AL
DE
VE
LO
PM
EN
T D
IVIS
ION
, M
INIS
TR
Y O
F H
EA
LT
H
78
NA
TIO
NA
L E
AR
LY
WA
RN
ING
SC
OR
E (
NE
WS
)
Figure 37: The percentage of documented MEWS parameters, correct calculation and monitoring compliance among nursing staff in 4D medical ward Hospital Sg Buloh before and after training programme.
In November 2017, University Malaya Medical Centre (UMMC) implemented NEWS system that has been fully integrated into its electronic patient management system. The process of planning and implementation was done over a six-month period by the UMMC quality department and the UMMC NEWS committee. Permission was obtained for unrestricted using of the original NEWS from the Royal College of Physicians, UK. The warning system is used by all the wards in the hospital except the intensive care unit, cardiac care unit, obstetric and gynaecology, paediatric and emergency departments. Three warning levels recommended by the original NEWS was adopted as the level of responses suitable for use locally. The first level of warning will trigger a response from the nursing team leader for the shift, while the second level will require the nurse to contact a medical officer, bypassing the houseman on call. The highest level of warning will prompt the nurse to call a specialist immediately. NEWS training workshops were provided for nurses which include introduction of NEWS, hands on training (how to use NEWS in EMR) with case scenarios and discussions. In addition, a roadshow was also conducted during which the NEWS committee training doctors in individual departments on the use of NEWS. Audits were conducted pre and post implementation of NEWS in a UMMC general medical ward to assess the impact of NEWS implementation. There was 63% reduction in the rate of patients with acute deterioration post-NEWS. Consequently, the number of unexpected deaths decreased with the relative risk reduction of 60%. The mean response time by nurse was found to be reduced from 3.56 hours to less than one hour (0.4167) indicating that improvement on nurses’ response. (Figure 38) In addition, there was a slight decrease in a patient’s average of length of hospital stay post NEWs implementation. (Figure 39)

79
HE
AL
TH
TE
CH
NO
LO
GY
AS
SE
SS
ME
NT
RE
PO
RT
HE
AL
TH
TE
CH
NO
LO
GY
AS
SE
SS
ME
NT
SE
CT
ION
(MaH
TA
S)
ME
DIC
AL
DE
VE
LO
PM
EN
T D
IVIS
ION
, MIN
IST
RY
OF
HE
AL
TH
NA
TIO
NA
L E
AR
LY
WA
RN
ING
SC
OR
E (N
EW
S)
Source: Faculty of Medicine, University Malaya
Figure 38: The mean of response time by nurse in pre and post NEWs system Implementation
Source: Faculty of Medicine, University Malaya
Figure 39: The mean of length of hospital stay

HE
AL
TH
TE
CH
NO
LO
GY
AS
SE
SS
ME
NT
RE
PO
RT
HE
AL
TH
TE
CH
NO
LO
GY
AS
SE
SS
ME
NT
SE
CT
ION
(M
aH
TA
S)
ME
DIC
AL
DE
VE
LO
PM
EN
T D
IVIS
ION
, M
INIS
TR
Y O
F H
EA
LT
H
80
NA
TIO
NA
L E
AR
LY
WA
RN
ING
SC
OR
E (
NE
WS
)
The following are published research on EWS in the Malaysian context:
Jusoh A et al. (2019) in a prospective cohort study sought to determine the best in patient trigger level for NEWS in predicting occurrence of serious adverse events (death and unanticipated ICU admission).130 level II-2 A total of 226 in-patients from surgical and orthopaedic wards of Hospital Kuala Krai, Kelantan was enrolled in the study. The study revealed that there was an increased of serious adverse events with increasing NEWS scoring. National early warning score was able to independently predict death or unanticipated ICU admission with an excellent prognostic performance (AUROC 0.905, p<0.001). A score of 5 or more had the optimal sensitivity 87% and specificity (91.3) with PPV of 26.9% to predict serious adverse events in general ward (OR 2.828; 95%CI 1.632, 4.902). The number needed to screen at this threshold was 3.6.130 level II-2
Peng LS et al. (2018) conducted a prognostic accuracy study involving 259 patients from emergency department of Hospital Tuanku Ja’afar, Seremban to evaluate the ability of MEWS to risk stratify critically ill patients.131 The MEWS in this study composed of five physiological parameters namely blood pressure, heart rate, respiratory rate, temperature and mental status (AVPU) for scoring. Modified early warning score with cut-off value of 4 was found to be most effective in detecting patients who require lifesaving intervention in the emergency department with the AUROC value of 0.959 (95% CI: 0.91–1.00, p<0.001), sensitivity 95% and specificity of 81%.131 level III
7.0 DISCUSSION
This review was undertaken in order to assess the effectiveness of NEWS in early detection of deteriorating patients from the available evidence and to identify key determinants to support effective robust implementation of NEWS in Malaysia. The evidence to support the introduction of NEWS is of variable quality with certain methodological limitations. There are 47 studies included in this review that focus on evaluating the performance of NEWS as a predictor of mortality, unanticipated ICU admission and cardiopulmonary arrest as well as its role in risk stratification of patients (prognosis prediction and disease progression evaluation). Most of the studies employed either retrospective or prospective cohort design. When using studies with historical controls, there is the risk of unmeasured confounding variables and temporal bias. For example, it is very likely that vital signs are not recorded at random but are instead measured after or because of a clinical change in the patient. Thus, all these studies likely suffer from a confounding by indication bias. Furthermore, these studies likely are limited by immortal time bias since patients without adverse events have more time available for vital sign measurement. Additionally, advances in medical care or other changes in practice cannot be ruled out as the cause of the outcomes. For example, adoption of a highly successful sepsis campaign might influence the outcome of mortality, independent of NEWS. There are numerous systematic review published on Early Warning Score (EWS). However, we decided not to include majority of them in this review as the findings were reported to represent the effectiveness and impact of EWS as a whole. Hence the findings might not be representative of true performance and impact of NEWS. We concluded it was best to report the individual NEWS studies. No formal comprehensive systematic review focussing solely on NEWS has ever been published to date.
National Early Warning Score has become prominent with the detection of the deteriorating patient. This review confirms that NEWS has good predictive value and has been found to influence patient outcomes in different healthcare settings [pre-hospital setting (ambulance service), general ward and emergency department]. All studies that included AUROC for one or more outcome measures found AUROCs which were far greater than 0.5, which is the cut-off for correlation that is reached by chance alone. The majority of the studies that objectified the performance of NEWS with either hazard ratio (HR), odd ratio (OR), risk ratio (RR) or p value found a strong significant correlation with their outcome variables. A higher ED-NEWS was associated with in-hospital mortality (OR 1.26, 95%CI 1.11,1.42; AUROC 0.75, 95%CI 0.64,0.86, p<0.001) and 30-day mortality (OR 1.27, 95%1.17,1.39; AUROC 0.78, 95%0.71,0.84, p<0.001) irrespective of age and comorbidity.36

81
HE
AL
TH
TE
CH
NO
LO
GY
AS
SE
SS
ME
NT
RE
PO
RT
HE
AL
TH
TE
CH
NO
LO
GY
AS
SE
SS
ME
NT
SE
CT
ION
(MaH
TA
S)
ME
DIC
AL
DE
VE
LO
PM
EN
T D
IVIS
ION
, MIN
IST
RY
OF
HE
AL
TH
NA
TIO
NA
L E
AR
LY
WA
RN
ING
SC
OR
E (N
EW
S)
For general ward patients, NEWS score ≥ 5 or if the weighted score for any individual vital sign was 3 was associated with an increased odds of mortality at 30 and 60 day: NEWS score ≥5 30-day mortality: OR 11.8 (95%CI 4.26, 32.6); NEWS score ≥7 30-day mortality: OR 11.4 (95%CI 4.40, 29.6); NEWS score ≥5 60-day mortality OR 5.55 (95%CI 2.91–10.6). Similarly in pre-hospital setting, the high risk NEWS group (NEWS≥7 ) had significant increases in 48 hours mortality [RR 35.32 (95%CI 10.08, 123.7)], 30 day mortality [RR 6.7 (95%CI 3.79, 11.88)] and ICU admission [RR 5.43 (2.29–12.89)].73 Mortality was the most prevalent prognostic outcome, followed by ICU admission and the composite outcome of mortality and ICU admission. Most studies reported outcomes at multiple time points up to 30 days. Studies comparing NEWS with other EWS or single parameter system revealed that NEWS performance was comparable if not superior than the rest. While NEWS scores do have the ability to identify patients at risk of clinical deterioration, there is limited data on the impact of their implementation on patient outcomes. Similarly, NEWS may be predictive of important outcomes but their impact on clinically important outcomes such as mortality has not been established. Although some evidence on the impact of implementation on mortality and cardiac arrest were found, there was no evidence on additional outcomes such as other cardiac events, acute coronary syndrome, use of vasopressors, number of ventilator days, respiratory failure, or quality of life at discharge.
Patient population and time to follow-up greatly influenced the performance of NEWS, with some scores reaching good to excellent AUROC in some populations such liver disease patients, but only poor AUROC in others. However, it is important to recognize that they are more effective in certain patient groups, and care must be taken in the elderly and palliative populations. NEWS works with different prediction ability for various diseases. Liu et al. considered that NEWS enjoyed a relatively strong prediction ability on prognosis of respiratory diseases, with an area under ROC curve of 0.885; while the prediction ability on cardiovascular disease was weaker, with an area under ROC curve of 0.798. However, another study has obtained contrary results. It considered that NEWS should be weak in predicting chronic hypoxic respiratory diseases. The patient may be stable even at the warning threshold of NEWS. Because the patient has adapted to long-term hypoxia and the oxygen saturation has been in a low state, the uplifted NEWS score would not be fully correlated with the patient’s condition. In December 2017, the RCPL published an update to NEWS - the National Early Warning Score 2 (NEWS2) - which includes several modifications to the NEWS vital sign weightings. To account for concerns about NEWS and type 2 respiratory failure (T2RF), NEWS2 includes a new SpO2 scoring scale for patients with/at risk of T2RF. Despite having slightly better performance if not similar to NEWS, Echevarria C et al. reported NEWS2 led to an absolute reduction in alert frequency of 12.6%.82
Whilst some papers report that the universal language of early warning scores improves communication between healthcare professionals, this is not always reflected in the reaction to the escalation. Concerns revolve around the resources needed to implement NEWS. Studies that compared nurses trained to those untrained in NEWS for recognizing signs of a simulated deteriorating patient and responses to their assessments, found that trained nurses were better able to identify and react but still missed multiple elements of the NEWS, failed to calculate the aggregate score and failed to take action informing the physician, which was part of their trained protocol. Other studies also revealed that accuracy and compliance of scoring decreased significantly with increasing score or worsening physiological derangement. Calculation errors are common and although improved with an electronic system, responses to the triggering score remain variable.
Training may improve staff engagement and the response to poor scores. Two interventions could improve the success of early warning scores to the benefit of patients. Firstly, the introduction of automated early warning score systems can minimize the risk of user error. Using a handheld computer device to document vital signs can highlight erroneous data, improve accuracy of calculations and prompt escalation. Scores can also be accessed remotely, which aids communication between healthcare professionals. Successful implementation of NEWS in the hospital however must go hand in hand with proper education of staff and increasing awareness of the necessity of structural patient monitoring. This will eventually lead to a change in the mindset of healthcare providers to collaborate as a team thereby leading to a better organization of patient care.

HE
AL
TH
TE
CH
NO
LO
GY
AS
SE
SS
ME
NT
RE
PO
RT
HE
AL
TH
TE
CH
NO
LO
GY
AS
SE
SS
ME
NT
SE
CT
ION
(M
aH
TA
S)
ME
DIC
AL
DE
VE
LO
PM
EN
T D
IVIS
ION
, M
INIS
TR
Y O
F H
EA
LT
H
82
NA
TIO
NA
L E
AR
LY
WA
RN
ING
SC
OR
E (
NE
WS
)
In local Malaysian context, there is a growing trend of utilising EWS both in private and public hospitals. A total of 12 hospitals within Ministry of Health has been using EWS. However, one drawback is that the approach is not standardized, as many hospitals use their own modified version of the EWS scorings system. This variation in methodology and approach can result in a lack of familiarity with local systems when staff move between clinical areas and hospitals, the various EWS systems are not necessarily equivalent or interchangeable. This diversity requires much effort to be put for standardisation of scoring system between hospitals.
8.0 CONCLUSION
Effectiveness
1. Discriminative Ability and Predictive Validity
NEWS
There was a substantial fair level of evidence to suggest;
Emergency department
vv The NEWS was an effective assessment tool to identify and triage the patient for the most appropriate acute care assessments and interventions.
vv The NEWS was a good predictor for serious adverse events (mortality and unanticipated ICU admission) in adult patients of varying severity of illness presenting to emergency department. It was able to rapidly predict prognosis and evaluate disease progression of critical patients in resuscitation room.
vv The performance of NEWS was superior than quick Sequential Organ Failure Assessment (qSOFA), Systemic Inflammatory Response Sydrome criteria (SIRS) and Modified Early Warning score (MEWS), in risk-stratifying patients with suspected infection or sepsis and predicting death and unanticipated ICU admission in this subpopulation. Table-based aggregate weighted systems, such as NEWS, were more predictive and robust compared with tally-based single parameter scores such as qSOFA and SIRS.
vv However, NEWS may not be the optimum scoring system for all patient subgroups. The NEWS showed moderate predictive ability for patient with community acquired pneumonia and low accuracy for in-hospital mortality in critically ill geriatric patients.
General wards
vv The NEWS assessed on ward admission was able to risk stratify clinical deterioration and a good predictor of in-hospital serious adverse outcomes.
vv NEWS discriminates high risk patients in a heterogenic general ward population independently of multiple confounding factors (age, gender, cumulative comorbidity, admission characteristic).
vv The NEWS outperformed 33 other widely used Early Warning Scores (EWSs) for combined outcome of death, cardiac arrest and unanticipated ICU admission within 24 hours in the general population of patients.
vv Between non-elective surgical patients and non-elective medical patients, NEWS had almost equal discriminative ability for prediction of serious adverse events.
vv The NEWS accurately discriminates patients at risk of death, admission to the intensive care unit, or cardiac arrest within a 24-hour period for a range of liver-related diagnoses.
vv A local study showed that NEWS was able to independently predict death or unanticipated ICU admission with an excellent prognostic performance (AUROC 0.905, p<0.001) in general surgical and orthopaedic wards. A score of 5 or more
83
HE
AL
TH
TE
CH
NO
LO
GY
AS
SE
SS
ME
NT
RE
PO
RT
HE
AL
TH
TE
CH
NO
LO
GY
AS
SE
SS
ME
NT
SE
CT
ION
(MaH
TA
S)
ME
DIC
AL
DE
VE
LO
PM
EN
T D
IVIS
ION
, MIN
IST
RY
OF
HE
AL
TH
NA
TIO
NA
L E
AR
LY
WA
RN
ING
SC
OR
E (N
EW
S)
had the optimal sensitivity (87%) and specificity (91.3%) with PPV of 26.9% to predict serious adverse events in general ward (OR 2.828; 95%CI 1.632, 4.902). The number needed to screen at this threshold was 3.6.
vv National Early Warning Score was identified as independent predictor of early clinical deterioration 24 hours after ICU discharge and readmission to ICU or High Dependency Unit (HDU). A NEWSdc > 7 showed the best sensitivity (93.6%) and specificity (82.2%) to detect early clinical deterioration 24 hours after ICU discharge.
vv The NEWS also had reasonable discrimination for any ICU patient’s discharge location within 24 hours of admission to any ICU specialty. Hence, it could potentially be applied within a universal discharge planning tool for ICU, improving patient safety at the point of discharge (reduce the likelihood of both premature discharge and discharge delay by allowing care providers adequate time to plan accordingly).
vv However, the NEWS system, whilst beneficial, lacks sensitivity and specificity in subpopulations of older adult patients (with/without comorbidity, high frailty index), patients with chronic obstructive pulmonary diseases (COPD) and oncology patients at risk of deterioration.
Pre-hospital setting
vv In pre-hospital setting whereby NEWS was calculated using parameters recorded on the scene or prior ambulance transfer, NEWS showed good discriminative performance for both short term and long term mortality, and ICU admission from ED.
vv A threshold level of 7 was associated with increased risk for the combined outcome of death or critical care unit escalation within 48 hours of hospital admission.
vv Pre-hospital NEWS had better diagnostic accuracy in cases where the initial dispatch code was specified as trauma.
vv Pre-hospital NEWS had poor prognostic performance for in-hospital mortality in elderly patients.
vv Among pre-hospital patients with suspected infection, an elevated NEWS, was associated with increased levels of adverse outcomes (ICU admission within 48 hours of presentation and/ or 30-day mortality). The aggregated total NEWS score was, significantly superior to qSOFA at identifying patients at combined risk. A NEWS of medium or high clinical risk could be used according to sepsis guideline to prompt clinicians to further investigate for organ dysfunction, to initiate or escalate therapy as appropriate, and to consider referral to critical care or increase the frequency of monitoring.
NEWS2
vv In predicting 24 hours mortality among patients with documented or at risk of type 2 respiratory failure, NEWS2 did not show superior performance to original NEWS. The NEWS2 did not improve discrimination for unanticipated ICU admission, cardiac arrest or combined outcomes compared to NEWS either.
vv In acute exacerbation of chronic obstructive pulmonary disease (AECOPD) cohort, NEWS2 at admission did not outperform the original NEWS.
vv In pre-hospital setting, NEWS2 had the best prognostic performance [AUROC of 0.896 (95%CI 0.82, 0.95)], in comparison with other EWS namely EWS [Early Warning Score (EWS), Modified Early Warning Score (MEWS), Vital-PAC Early Warning Score (ViEWS), Hamilton Early Warning Score (HEWS) and Scottish Early Warning Score (SEWS).
vv The NEWS2 accurately predicted in-hospital mortality particularly among patients with suspected infection. At the critical threshold (≥ 5), the NEWS2 had sensitivity of 84.5% (95%CI 82.8, 86.2) and specificity of 49.0% (95%CI 47.4, 50.7). The number needed to examine (NNE) was 2.20 (95%CI 2.16, 2.25). NEWS2 was

HE
AL
TH
TE
CH
NO
LO
GY
AS
SE
SS
ME
NT
RE
PO
RT
HE
AL
TH
TE
CH
NO
LO
GY
AS
SE
SS
ME
NT
SE
CT
ION
(M
aH
TA
S)
ME
DIC
AL
DE
VE
LO
PM
EN
T D
IVIS
ION
, M
INIS
TR
Y O
F H
EA
LT
H
84
NA
TIO
NA
L E
AR
LY
WA
RN
ING
SC
OR
E (
NE
WS
)
superior to qSOFA for screening for sepsis with organ dysfunction, infection-related mortality or intensive care due to an infection both among infected patients and among undifferentiated patients at emergency departments.
2. Impact on clinical outcome (NEWS and NEWS2)v
vv Despite having good prognostic performance of death and ICU admission, the implementation of NEWS has not yet been reported to have any change in overall
patient outcomes (survival rate, serious adverse events rate, ICU mortality rate).
Safety
There was fair level of evidence to suggest;
vv Accuracy of NEWS scoring decreased significantly with increasing score or worsening physiological derangement and it had become a safety concern.
vv The NEWS that were calculated incorrectly had implications for trigger actions and associated clinical care. Increased mortality trend was observed among patients who received an incorrect response.
vv Patients admitted at the weekend had a worse clinical response [adjusted OR 4.15 (95%CI 2.24, 7.69), p<0.001].
vv Non-adherence to NEWS escalation protocol at one or several levels was
associated with the occurrence of serious adverse events.
Economic evaluation
There was no retrievable evidence on cost-effectiveness. However, there were one cost analysis and two budget impact analysis conducted on implementation of NEWS. They suggested that the NEWS leads to cost and/or efficiency savings. If this trend is continuous and savings can be realised, it could be hypothesized that NEWS may indeed be cost effective.
Organisational implication There was fair level of evidence to suggest:
vv Length of stay (LOS) was found to be significantly correlated with NEWS, where median LOS was more than doubled for a NEWS score >7 compared with a score of 0–4.
vv Level of workload was inversely associated with NEWS scoring or threshold level. A NEWS score of 3 as a trigger would have increased doctors workload by 40% with only a small increase in the number of detected adverse outcomes per day (a 3% improvement in detection) whereas NEWS threshold of 5 would generate lower workload and higher detection rates (medical: workload 12⋅3%, detection 70⋅2%; surgical: workload 6⋅1%, detection 60⋅6%).
vv Reduced sensitivity of the triggering system and the overall effectiveness of the NEWS were likely to be caused by poor recording of vital signs, incorrect calculations and non-adherence to the escalation protocol.
vv Chart design affected the speed and accuracy of documentation. The use of graphical display and avoiding visual clutter, and the use of overlapping graphical displays of data helped to improve adherence.
vv Interdisciplinary, multimodal and follow-up educational programmes were most effective in improving adherence rate.
vv Improved efficiency and accuracy of recording vital sign parameters and compliance with escalation protocols were seen with automation of EWS.

85
HE
AL
TH
TE
CH
NO
LO
GY
AS
SE
SS
ME
NT
RE
PO
RT
HE
AL
TH
TE
CH
NO
LO
GY
AS
SE
SS
ME
NT
SE
CT
ION
(MaH
TA
S)
ME
DIC
AL
DE
VE
LO
PM
EN
T D
IVIS
ION
, MIN
IST
RY
OF
HE
AL
TH
NA
TIO
NA
L E
AR
LY
WA
RN
ING
SC
OR
E (N
EW
S)
Ethical and legal issues
There was evidence to suggest that in overcoming ethical and legal challenges of performing predictive analytics on healthcare, developing a governance structure at the earliest phase of model development is recommended in order to guide patients and participating stakeholders across the process. Liability issues such as failure to obtain crucial knowledge of patient’s medical history due to dependency on predictive model to make clinical decision which lead to harm, overriding an alert or recommendation or following the recommendations of faulty predictive analytic model should be anticipated and preventive measures should be put in place. Ethical issue surrounding doctor-patient relationship whereby the treatment approach could be shifted from catering to individual patient’s best interest to the interest of healthcare organization in maximizing population based health should be foreseen.
Social implication
There was evidence to suggest that understanding the organisational culture, systems, practices, barriers and facilitators and the stakeholders’ perceptions and interactions with the NEWS pre-implementation is important. The success of NEWS intervention depends on human interaction with the system and understanding the variable organisational practices; this involved understanding how the nursing staff incorporate the EWS system into their daily work routines and how they feel the system works for them. Organisations also need to address power hierarchy between medial teams to reduce delays in response to deteriorating patients. A ‘whole system’ approach incorporating a EWS, well designed chart, communication tool, decision aides, evidence based care bundles, Rapid Response Team (RRT), bedside evaluation, education, reinforcement and audit is most effective at identifying and responding to deteriorating patients. A poor-quality implementation likely to worsen patient care.
9.0 RECOMMENDATIONS
Based on the findings of this review, NEWS may have a role in the early identification of deteriorating patient and can be used for adult non-obstetric patients within the hospital system to improve safety and efficiency of patient care through standardisation of early warning score application. The following considerations should be taken into account in the development of national approach of early warning score in order to ensure its effective implementation;
vv A requirement for systems approach supported by appropriate governance as NEWS is a system-level complex intervention. The emphasis should be given on regular reinforcement and auditing to promote high levels adherence to NEWS to ensure effectiveness.
vv For effective escalation of care, the appropriate trigger levels should be set and a mechanism should be in place to ensure that the appropriate individuals with higher NEW scores are reviewed promptly by health care professionals with critical care competencies and diagnostic skills.
vv Ensuring regular training and continuous education of all health care providers using NEWS; such training and education should include: interdisciplinary in person simulations/case-reviews; be multimodal, and inclusion of regular reinforcement.
vv In healthcare settings where automated healthcare service is available, the potential use of electronic data capture, EWS triggering, notification and tracking of outcomes should be carefully considered. The implementation of electronic NEWS should be initiated as a pilot programme before expansion to other hospitals.
vv In settings that still utilize manual system in delivering services to patients, a structured manual approach (paper-based NEWS) would be a more suited choice.

HE
AL
TH
TE
CH
NO
LO
GY
AS
SE
SS
ME
NT
RE
PO
RT
HE
AL
TH
TE
CH
NO
LO
GY
AS
SE
SS
ME
NT
SE
CT
ION
(M
aH
TA
S)
ME
DIC
AL
DE
VE
LO
PM
EN
T D
IVIS
ION
, M
INIS
TR
Y O
F H
EA
LT
H
86
NA
TIO
NA
L E
AR
LY
WA
RN
ING
SC
OR
E (
NE
WS
)
10.0 REFERENCES
1. Statistics OoN. Avoidable mortality in the UK 2016 (Available from: https://www.ons.gov.uk/peoplepopulationandcommunity/healthandsocialcare/causesofdeath/bulletins/avoidablemortalityinenglandandwales/2016. Accessed on 15.02.2019.
2. Hogan H, Healey F, Neale G et al. Preventable deaths due to problems in care in English acute hospitals: a retrospective case record review study. BMJ Qual Saf. 2012;21(9):737-745.
3. Amenable and preventable deaths statistics. Eurostat Statistic Explained. (Updated June 2018) (Available from: https://ec.europa.eu/eurostat/statistics-explained/index.php/Amenable_and_preventable_deaths_statistics#571_000_deaths_from_potentially_avoidable_causes. Accessed on 15.02.2019.
4. Alkire BC, Peters AW, Shrime MG et al. The Economic Consequences Of Mortality Amenable To High-Quality Health Care In Low- And Middle-Income Countries. Health Aff (Millwood). 2018;37(6):988-996.
5. Hodgetts TJ, Kenward G, Vlackonikolis I et al. Incidence, location and reasons for avoidable in-hospital cardiac arrest in a district general hospital. Resuscitation. 2002;54(2):115-123.
6. Goldhil DR. Intensive and high-dependency care for the high-risk surgical patient Original Research Article Best Practice & Research Clinical Anaesthesiology. 1999;13(3):427-436.
7. Goldhill DR, McNarry AF. Physiological abnormalities in early warning scores are related to mortality in adult inpatients. Br J Anaesth. 2004;92(6):882-884.
8. McQuillan P, Pilkington S, Allan A et al. Confidential inquiry into quality of care before admission to intensive care. BMJ. 1998;316(7148):1853-1858.
9. Akre M, Finkelstein M, Erickson M et al. Sensitivity of the pediatric early warning score to identify patient deterioration. Pediatrics. 2010;125(4):e763-769.
10. Stenhouse C, Coates S, Tivey M et al. Prospective evaluation of a modified Early Warning Score to aid earlier detection of patients developing critical illness on a general surgical ward. BJA: British Journal of Anaesthesia. 2000;84(5):663.
11. McGaughey J, Alderdice F, Fowler R et al. Outreach and Early Warning Systems (EWS) for the prevention of intensive care admission and death of critically ill adult patients on general hospital wards. Cochrane Database Syst Rev. 2007(3):Cd005529.
12. Agency NPS. Recognising and Responding Appropriately to Early Signs of Deterioration in Hospitalised Patients.: NHS; 2007. Available from: https://www.patientsafetyoxford.org/wp-content/uploads/2018/03/NPSA-DeteriorPatients.pdf.
13. James J, Butler-Williams C, Hunt J et al. Vital signs for vital people: an exploratory study into the role of the Healthcare Assistant in recognising, recording and responding to the acutely ill patient in the general ward setting. J Nurs Manag. 2010;18(5):548-555.
14. Wheatley I. The nursing practice of taking level 1 patient observations. Intensive Crit Care Nurs. 2006;22(2):115-121.
15. Buist M, Bernard S, Nguyen TV et al. Association between clinically abnormal observations and subsequent in-hospital mortality: a prospective study. Resuscitation. 2004;62(2):137-141.
16. Nolan JP, Deakin CD, Soar J et al. European Resuscitation Council guidelines for resuscitation 2005. Section 4. Adult advanced life support. Resuscitation. 2005;67 Suppl 1:S39-86.
17. Smith ME, Chiovaro JC, O’Neil M et al. Early warning system scores for clinical deterioration in hospitalized patients: a systematic review. Ann Am Thorac Soc. 2014;11(9):1454-1465.
18. Preston R, Flynn D. Observations in acute care: evidence-based approach to patient safety. Br J Nurs. 2010;19(7):442-447.
19. Quirke S, Coombs M, McEldowney R. Suboptimal care of the acutely unwell ward patient: a concept analysis. J Adv Nurs. 2011;67(8):1834-1845.
20. Planning Division, Ministry of Health Malaysia. Health Facts 2018 (Available from: http://www.moh.gov.my/resources/index/Penerbitan/Penerbitan%20Utama/Fakta%20kesihatan/KKM_HEALTH_FACTS_2018_new.pdf.
21. Jarrar M, Abdul Rahman H, Don MS. Optimizing Quality of Care and Patient Safety in Malaysia: The Current Global Initiatives, Gaps and Suggested Solutions. Glob J Health Sci. 2015;8(6):44132.

87
HE
AL
TH
TE
CH
NO
LO
GY
AS
SE
SS
ME
NT
RE
PO
RT
HE
AL
TH
TE
CH
NO
LO
GY
AS
SE
SS
ME
NT
SE
CT
ION
(MaH
TA
S)
ME
DIC
AL
DE
VE
LO
PM
EN
T D
IVIS
ION
, MIN
IST
RY
OF
HE
AL
TH
NA
TIO
NA
L E
AR
LY
WA
RN
ING
SC
OR
E (N
EW
S)
22. Malaysia Health System Research Volume 1. Contextual Analysis of the Malaysian Health System. Ministry of Health Malaysia; 2016.
23. Ngu DJ. UMMC implements automated warning system to improve patient safety. 2017 (Available from: https://specialty.mims.com/topic/ummc-implements-automated-warning-system-to-improve-patient-safety?topic-grouper=news. Accessed on 01.03.2019.
24. Metro NEWS. Better medical response with fully automated warning system. (Available from: https://www.thestar.com.my/metro/metro-news/2018/10/26/better-medical-response-with-fully-automated-warning-system. Accessed on 15.02.2019.
25. Linkedin. Elevating patient care and outcomes with Malaysia’s Bagan Specialist Centre. (Available from: https://www.linkedin.com/pulse/elevating-patient-care-outcomes-malaysias-bagan-specialist-zeven. Accessed on 15.02.2019.
26. Royal College of Physicians. National Early Warning Score (NEWS) 2: Standardising the assessment of acute-illness severity in the NHS. Updated report of a working party. London: RCP, 2017. Available from: https://www.rcplondon.ac.uk/projects/outputs/national-early-warning-score-news-2.
27. Mitchell IA, McKay H, Van Leuvan C et al. A prospective controlled trial of the effect of a multi-faceted intervention on early recognition and intervention in deteriorating hospital patients. Resuscitation. 2010;81(6):658-666.
28. Shiloh AL, Lominadze G, Gong MN et al. Early Warning/Track-and-Trigger Systems to Detect Deterioration and Improve Outcomes in Hospitalized Patients. Semin Respir Crit Care Med. 2016;37(1):88-95.
29. HIQA. Health Technology Assessment of The Use of Information Technology for Early Warning and Clinical Handover Systems. Ireland, Health Information and Quality Authority. 2015:60-68.
30. Critical Appraisal Skills Programme (CASP); making sense of evidence. Available from: http://www.casp-uk.net/casp-tools-checklists.
31. Higgins JPT GS. Cochrane Handbook for Systematic Reviews of Interventions Version 6 (updated July 2019): The Cochrane Collaboration 2011. Available from www.handbook.cochrane.org
32. Tufanaru C MZ, Aromataris E, Campbell J, Hopp L. Chapter 3: Systematic reviews of effectiveness. In: Aromataris E, Munn Z (Editors). Joanna Briggs Institute Reviewer’s Manual. The Joanna Briggs Institute, 2017. Available from https://reviewersmanual.joannabriggs.org/.
33. National Institutes of Health (NIH). Quality Assessment Tool for Before-After (Pre-Post) Studies With No Control Group. 2014. Available from https://www.nhlbi.nih.gov/health-pro/guidelines/in-develop/cardiovascular-risk-reduction/tools/before-after.
34. Harris RP, Helfand M, Woolf SH et al. Current methods of the US Preventive Services Task Force: a review of the process. Am J Prev Med. 2001;20(3 Suppl):21-35.
35. Iezzoni LI, Ed. Risk adjustment for measuring health care outcomes. 3rd ed. . Chicago, IL: Health Administration Press.2003.
36. Abbott TEF, Torrance HDT, Cron N et al. A single-centre cohort study of National Early Warning Score (NEWS) and near patient testing in acute medical admissions. Eur J Intern Med. 2016;35:78-82.
37. Ohman EM, Granger CB, Harrington RA et al. Risk stratification and therapeutic decision making in acute coronary syndromes. JAMA. 2000;284(7):876-878.
38. Higgins JP TS, Deeks JJ, Altman DG. Measuring inconsistency in meta-analyses. BMJ. 2003(327):557-560.
39. Kivipuro M, Tirkkonen J, Kontula T et al. National early warning score (NEWS) in a Finnish multidisciplinary emergency department and direct vs. late admission to intensive care. Resuscitation. 2018;128:164-169.
40. Alam N, Vegting IL, Houben E et al. Exploring the performance of the National Early Warning Score (NEWS) in a European emergency department. Resuscitation. 2015;90:111-115.
41. Liu F, Qin J, Wang R et al. A Prospective Validation of National Early Warning Score in Emergency Intensive Care Unit Patients at Beijing. Hong Kong J Emerg Me. 2015;22(3):137-144.

HE
AL
TH
TE
CH
NO
LO
GY
AS
SE
SS
ME
NT
RE
PO
RT
HE
AL
TH
TE
CH
NO
LO
GY
AS
SE
SS
ME
NT
SE
CT
ION
(M
aH
TA
S)
ME
DIC
AL
DE
VE
LO
PM
EN
T D
IVIS
ION
, M
INIS
TR
Y O
F H
EA
LT
H
88
NA
TIO
NA
L E
AR
LY
WA
RN
ING
SC
OR
E (
NE
WS
)
42. Bilben B, Grandal L, Sovik S. National Early Warning Score (NEWS) as an emergency department predictor of disease severity and 90-day survival in the acutely dyspneic patient - a prospective observational study. Scand J Trauma Resusc Emerg Med. 2016;24:80.
43. Sbiti-Rohr D, Kutz A, Christ-Crain M et al. The National Early Warning Score (NEWS) for outcome prediction in emergency department patients with community-acquired pneumonia: results from a 6-year prospective cohort study. BMJ Open. 2016;6(9):e011021.
44. Dundar ZD, Kocak S, Girisgin AS. Lactate and NEWS-L are fair predictors of mortality in critically ill geriatric emergency department patients. Am J Emerg Med [Epub ahead of print]. 2019.
45. Wuytack F, Meskell P, Conway A et al. The effectiveness of physiologically based early warning or track and trigger systems after triage in adult patients presenting to emergency departments: a systematic review. BMC Emerg Med. 2017;17(1):38-38.
46. Yuan WC, Tao C, Dan ZD et al. The significance of National Early Warning Score for predicting prognosis and evaluating conditions of patients in resuscitation room. Hong Kong J Emerg Me. 2018;25(6):324-330.
47. Lee SB, Kim DH, Kim T et al. Triage in Emergency Department Early Warning Score (TREWS) is predicting in-hospital mortality in the emergency department. Am J Emerg Med. 2019.
48. Keep JW, Messmer AS, Sladden R et al. National early warning score at Emergency Department triage may allow earlier identification of patients with severe sepsis and septic shock: a retrospective observational study. Emerg Med J. 2016;33(1):37-41.
49. Corfield AR, Lees F, Zealley I et al. Utility of a single early warning score in patients with sepsis in the emergency department. Emerg Med J. 2014;31(6):482-487.
50. Usman OA, Usman AA, Ward MA. Comparison of SIRS, qSOFA, and NEWS for the early identification of sepsis in the Emergency Department. Am J Emerg Med. 2019;37(8):1490-1497.
51. Brink A, Alsma J, Verdonschot R et al. Predicting mortality in patients with suspected sepsis at the Emergency Department; A retrospective cohort study comparing qSOFA, SIRS and National Early Warning Score. PLoS One. 2019;14(1):e0211133.
52. Churpek MM, Snyder A, Han X et al. Quick Sepsis-related Organ Failure Assessment, Systemic Inflammatory Response Syndrome, and Early Warning Scores for Detecting Clinical Deterioration in Infected Patients outside the Intensive Care Unit. Am J Respir Crit Care Med. 2017;195(7):906-911.
53. Smith GB, Prytherch DR, Meredith P et al. The ability of the National Early Warning Score (NEWS) to discriminate patients at risk of early cardiac arrest, unanticipated intensive care unit admission, and death. Resuscitation. 2013;84(4):465-470.
54. Badriyah T, Briggs JS, Meredith P et al. Decision-tree early warning score (DTEWS) validates the design of the National Early Warning Score (NEWS). Resuscitation. 2014;85(3):418-423.
55. Jarvis S, Kovacs C, Briggs J et al. Aggregate National Early Warning Score (NEWS) values are more important than high scores for a single vital signs parameter for discriminating the risk of adverse outcomes. Resuscitation. 2015a;87:75-80.
56. Kovacs C, Jarvis SW, Prytherch DR et al. Comparison of the National Early Warning Score in non-elective medical and surgical patients. Br J Surg. 2016;103(10):1385-1393.
57. Spangfors M, Bunkenborg G, Molt M et al. The National Early Warning Score predicts mortality in hospital ward patients with deviating vital signs: A retrospective medical record review study. J Clin Nurs. 2019;28(7-8):1216-1222.
58. Spagnolli W, Rigoni M, Torri E et al. Application of the National Early Warning Score (NEWS) as a stratification tool on admission in an Italian acute medical ward: A perspective study. Int J Clin Pract. 2017;71(3-4).
59. Lee YS, Choi JW, Park YH et al. Evaluation of the efficacy of the National Early Warning Score in predicting in-hospital mortality via the risk stratification. J Crit Care. 2018;47:222-226.
60. Roberts D, Djarv T. Preceding national early warnings scores among in-hospital cardiac arrests and their impact on survival. Am J Emerg Med. 2017;35(11):1601-1606.

89
HE
AL
TH
TE
CH
NO
LO
GY
AS
SE
SS
ME
NT
RE
PO
RT
HE
AL
TH
TE
CH
NO
LO
GY
AS
SE
SS
ME
NT
SE
CT
ION
(MaH
TA
S)
ME
DIC
AL
DE
VE
LO
PM
EN
T D
IVIS
ION
, MIN
IST
RY
OF
HE
AL
TH
NA
TIO
NA
L E
AR
LY
WA
RN
ING
SC
OR
E (N
EW
S)
61. Tirkkonen J, Olkkola KT, Huhtala H et al. Medical emergency team activation: performance of conventional dichotomised criteria versus national early warning score. Acta Anaesthesiol Scand. 2014;58(4):411-419.
62. Eccles SR, Subbe C, Hancock D et al. CREWS: improving specificity whilst maintaining sensitivity of the National Early Warning Score in patients with chronic hypoxaemia. Resuscitation. 2014;85(1):109-111.
63. Hodgson LE, Dimitrov BD, Congleton J et al. A validation of the National Early Warning Score to predict outcome in patients with COPD exacerbation. Thorax. 2017;72(1):23-30.
64. Forster S, Housley G, McKeever TM et al. Investigating the discriminative value of Early Warning Scores in patients with respiratory disease using a retrospective cohort analysis of admissions to Nottingham University Hospitals Trust over a 2-year period. BMJ Open. 2018;8(7):e020269.
65. Grudzinska FS, Aldridge K, Hughes S et al. Early identification of severe community-acquired pneumonia: a retrospective observational study. BMJ Open Respir Res. 2019;6(1):e000438.
66. Hydes TJ, Meredith P, Schmidt PE et al. National Early Warning Score Accurately Discriminates the Risk of Serious Adverse Events in Patients With Liver Disease. Clin Gastroenterol Hepatol. 2018;16(10):1657-1666.e1610.
67. Cooksley T, Kitlowski E, Haji-Michael P. Effectiveness of Modified Early Warning Score in predicting outcomes in oncology patients. QJM. 2012;105(11):1083-1088.
68. Uppanisakorn S, Bhurayanontachai R, Boonyarat J et al. National Early Warning Score (NEWS) at ICU discharge can predict early clinical deterioration after ICU transfer. J Crit Care. 2018;43:225-229.
69. Klepstad PK, Nordseth T, Sikora N et al. Use of National Early Warning Score for observation for increased risk for clinical deterioration during post-ICU care at a surgical ward. Ther Clin Risk Manag. 2019;15:315-322.
70. Chen YC, Yu WK, Ko HK et al. Post-intensive care unit respiratory failure in older patients liberated from intensive care unit and ventilator: The predictive value of the National Early Warning Score on intensive care unit discharge. Geriatr Gerontol Int. 2019;19(4):317-322.
71. Zaidi H, Bader-El-Den M, McNicholas J. Using the National Early Warning Score (NEWS/NEWS 2) in different Intensive Care Units (ICUs) to predict the discharge location of patients. BMC Public Health. 2019;19(1):1231.
72. Jarvis SW, Kovacs C, Briggs J et al. Are observation selection methods important when comparing early warning score performance? Resuscitation. 2015b;90:1-6.
73. Abbott TE, Vaid N, Ip D et al. A single-centre observational cohort study of admission National Early Warning Score (NEWS). Resuscitation. 2015;92:89-93.
74. Yu S, Leung S, Heo M et al. Comparison of risk prediction scoring systems for ward patients: a retrospective nested case-control study. Crit Care. 2014;18(3):R132.
75. Khwannimit B, Bhurayanontachai R, Vattanavanit V. Comparison of the accuracy of three early warning scores with SOFA score for predicting mortality in adult sepsis and septic shock patients admitted to intensive care unit. Heart Lung. 2019;48(3):240-244.
76. Silcock DJ, Corfield AR, Gowens PA et al. Validation of the National Early Warning Score in the prehospital setting. Resuscitation. 2015;89:31-35.
77. Abbott TEF, Cron N, Vaid N et al. Pre-hospital National Early Warning Score (NEWS) is associated with in-hospital mortality and critical care unit admission: A cohort study. Ann Med Surg (Lond). 2018;27:17-21.
78. Pirneskoski J, Kuisma M, Olkkola KT et al. Prehospital National Early Warning Score predicts early mortality. Acta Anaesthesiol Scand. 2019;63(5):676-683.
79. Hoikka M, Silfvast T, Ala-Kokko TI. Does the prehospital National Early Warning Score predict the short-term mortality of unselected emergency patients? Scand J Trauma Resusc Emerg Med. 2018;26(1):48.
80. Shaw J, Fothergill RT, Clark S et al. Can the prehospital National Early Warning Score identify patients most at risk from subsequent deterioration? Emerg Med J. 2017;34(8):533-537.

HE
AL
TH
TE
CH
NO
LO
GY
AS
SE
SS
ME
NT
RE
PO
RT
HE
AL
TH
TE
CH
NO
LO
GY
AS
SE
SS
ME
NT
SE
CT
ION
(M
aH
TA
S)
ME
DIC
AL
DE
VE
LO
PM
EN
T D
IVIS
ION
, M
INIS
TR
Y O
F H
EA
LT
H
90
NA
TIO
NA
L E
AR
LY
WA
RN
ING
SC
OR
E (
NE
WS
)
81. Mitsunaga T, Hasegawa I, Uzura M et al. Comparison of the National Early Warning Score (NEWS) and the Modified Early Warning Score (MEWS) for predicting admission and in-hospital mortality in elderly patients in the pre-hospital setting and in the emergency department. PeerJ. 2019;7:e6947.
82. Silcock DJ, Corfield AR, Rooney KD et al. Superior performance of National Early Warning Score compared with quick Sepsis-related Organ Failure Assessment Score in predicting adverse outcomes: a retrospective observational study of patients in the prehospital setting. Eur J Emerg Med. 2018.
83. Pimentel MAF, Redfern OC, Gerry S et al. A comparison of the ability of the National Early Warning Score and the National Early Warning Score 2 to identify patients at risk of in-hospital mortality: A multi-centre database study. Resuscitation. 2019;134:147-156.
84. Hodgson LE, Congleton J, Venn R et al. NEWS 2 - too little evidence to implement? Clin Med (Lond). 2018;18(5):371-373.
85. Echevarria C, Steer J, Bourke SC. Comparison of early warning scores in patients with COPD exacerbation: DECAF and NEWS score. Thorax. 2019;74(10):941-946.
86. Fernando SM, Fox-Robichaud AE, Rochwerg B et al. Prognostic accuracy of the Hamilton Early Warning Score (HEWS) and the National Early Warning Score 2 (NEWS2) among hospitalized patients assessed by a rapid response team. Crit Care. 2019;23(1):60.
87. Mellhammar L, Linder A, Tverring J et al. NEWS2 is Superior to qSOFA in Detecting Sepsis with Organ Dysfunction in the Emergency Department. J Clin Med. 2019;8(8).
88. Martin-Rodriguez F, Lopez-Izquierdo R, Del Pozo Vegas C et al. A Multicenter Observational Prospective Cohort Study of Association of the Prehospital National Early Warning Score 2 and Hospital Triage with Early Mortality. Emerg Med Int. 2019a;2019:5147808.
89. Martin-Rodriguez F, Castro-Villamor MA, Del Pozo Vegas C et al. Analysis of the early warning score to detect critical or high-risk patients in the prehospital setting. Intern Emerg Med. 2019b;14(4):581-589.
90. Haegdorens F, Monsieurs KG, De Meester K et al. An intervention including the national early warning score improves patient monitoring practice and reduces mortality: A cluster randomized controlled trial. J Adv Nurs. 2019;75(9):1996-2005.
91. Haegdorens F, Van Bogaert P, Roelant E et al. The introduction of a rapid response system in acute hospitals: A pragmatic stepped wedge cluster randomised controlled trial. Resuscitation. 2018;129:127-134.
92. Farenden S, Gamble D, Welch J. Impact of implementation of the National Early Warning Score on patients and staff. Br J Hosp Med (Lond). 2017;78(3):132-136.
93. Sutherasan Y, Theerawit P, Suporn A et al. The impact of introducing the early warning scoring system and protocol on clinical outcomes in tertiary referral university hospital. Ther Clin Risk Manag. 2018;14:2089-2095.
94. Hogan H, Hutchings A, Wulff J et al. Health Services and Delivery Research. Interventions to reduce mortality from in-hospital cardiac arrest: a mixed-methods study. Southampton (UK): NIHR Journals Library. Copyright (c) Queen’s Printer and Controller of HMSO 2019.
95. Kolic I, Crane S, McCartney S et al. Factors affecting response to national early warning score (NEWS). Resuscitation. 2015;90:85-90.
96. Petersen JA, Mackel R, Antonsen K et al. Serious adverse events in a hospital using early warning score - what went wrong? Resuscitation. 2014;85(12):1699-1703.
97. NCEC. National Early Warning Score. Ireland [Economic Impact Report for the National Early Warning Score (NEWS) and COMPASS© Programme], Department of Health. 2013:120-126.
98. NCEC. Sepsis Management. National Clinical Guideline No.6., Department of Health, Ireland. 2014.
99. Pedersen NE, Rasmussen LS, Petersen JA et al. A critical assessment of early warning score records in 168,000 patients. J Clin Monit Comput. 2018;32(1):109-116.
100. Clifton DA, Clifton L, Sandu DM et al. ‘Errors’ and omissions in paper-based early warning scores: the association with changes in vital signs--a database analysis. BMJ Open. 2015;5(7):e007376.

91
HE
AL
TH
TE
CH
NO
LO
GY
AS
SE
SS
ME
NT
RE
PO
RT
HE
AL
TH
TE
CH
NO
LO
GY
AS
SE
SS
ME
NT
SE
CT
ION
(MaH
TA
S)
ME
DIC
AL
DE
VE
LO
PM
EN
T D
IVIS
ION
, MIN
IST
RY
OF
HE
AL
TH
NA
TIO
NA
L E
AR
LY
WA
RN
ING
SC
OR
E (N
EW
S)
101. Lydon S, Byrne D, Offiah G et al. A mixed-methods investigation of health professionals’ perceptions of a physiological track and trigger system. BMJ Qual Saf. 2016;25(9):688-695.
102. Liaw SY, Wong LF, Ang SB et al. Strengthening the afferent limb of rapid response systems: an educational intervention using web-based learning for early recognition and responding to deteriorating patients. BMJ Qual Saf. 2016;25(6):448-456.
103. Liaw SY, Wong LF, Chan SW et al. Designing and evaluating an interactive multimedia Web-based simulation for developing nurses’ competencies in acute nursing care: randomized controlled trial. J Med Internet Res. 2015;17(1):e5.
104. Merriel A, van der Nelson H, Merriel S et al. Identifying Deteriorating Patients Through Multidisciplinary Team Training. Am J Med Qual. 2016;31(6):589-595.
105. Cornish L, Hill A, Horswill MS et al. Eye-tracking reveals how observation chart design features affect the detection of patient deterioration: An experimental study. Appl Ergon. 2019;75:230-242.
106. Fung K, Khan F, Dawson J. The introduction of an integrated early warning score observation chart-a picture paints a thousand words. J Patient Saf. 2014;10(1):13-19.
107. Christofidis MJ, Hill A, Horswill MS et al. Observation charts with overlapping blood pressure and heart rate graphs do not yield the performance advantage that health professionals assume: an experimental study. J Adv Nurs. 2014;70(3):610-624.
108. Christofidis MJ, Hill A, Horswill MS et al. Less is more: the design of early-warning scoring systems affects the speed and accuracy of scoring. J Adv Nurs. 2015;71(7):1573-1586.
109. Christofidis MJ, Hill A, Horswill MS et al. Observation chart design features affect the detection of patient deterioration: a systematic experimental evaluation. J Adv Nurs. 2016;72(1):158-172.
110. Mestrom E, De Bie A, Steeg MV et al. Implementation of an automated early warning scoring system in a surgical ward: Practical use and effects on patient outcomes. PLoS One. 2019;14(5):e0213402.
111. NICE. Acutely ill adults in hospital: recognising and responding to deterioration. National Institute for Health and Care Excellence; Updated 2019. Contract No.: ISBN: 978-1-4731-3420-1. Available from: https://www.nice.org.uk/guidance/cg50. Accessed on 15.08.2019.
112. NCEC National Clinical Guideline No. 1: National Early Warning Score. Clinical Effectiveness Unit, Department of Health, Ireland; Updated 2014. Available from: https://health.gov.ie/wp-content/uploads/2015/01/NEWSFull-ReportAugust2014.pdf.
113. SIGN. Guideline 139: Care of Deteriorating Patients. Scottish Intercollegiate Guideline Network; 2014. Available from: https://www.sign.ac.uk/assets/sign139.pdf.
114. Australian Commission on Safety and Quality in Health Care. National consensus statement: essential elements for recognising and responding to acute physiological deterioration ACSQHC; 2017. Available from: https://www.safetyandquality.gov.au/sites/default/files/migrated/National-Consensus-Statement-clinical-deterioration_2017.pdf.
115. Australian Commission on Safety and Quality in Health Care. Safety and Quality Improvement Guide Standard 9: Recognising and Responding to Clinical Deterioration in Acute Health Care. ACSQHC; 2012. Available from: https://www.safetyandquality.gov.au/sites/default/files/migrated/Standard9_Oct_2012_WEB.pdf.
116. Roberts M, Russell LB, Paltiel AD et al. Conceptualizing a model: a report of the ISPOR-SMDM Modeling Good Research Practices Task Force--2. Value Health. 2012;15(6):804-811.
117. Caro JJ, Briggs AH, Siebert U et al. Modeling good research practices--overview: a report of the ISPOR-SMDM Modeling Good Research Practices Task Force--1. Value Health. 2012;15(6):796-803.
118. Amarasingham R, Audet A-MJ, Bates DW et al. Consensus Statement on Electronic Health Predictive Analytics: A Guiding Framework to Address Challenges. EGEMS (Wash DC). 2016;4(1):1163-1163.
119. Islam MS, Hasan MM, Wang X et al. A Systematic Review on Healthcare Analytics: Application and Theoretical Perspective of Data Mining. Healthcare (Basel). 2018;6(2):54.

HE
AL
TH
TE
CH
NO
LO
GY
AS
SE
SS
ME
NT
RE
PO
RT
HE
AL
TH
TE
CH
NO
LO
GY
AS
SE
SS
ME
NT
SE
CT
ION
(M
aH
TA
S)
ME
DIC
AL
DE
VE
LO
PM
EN
T D
IVIS
ION
, M
INIS
TR
Y O
F H
EA
LT
H
92
NA
TIO
NA
L E
AR
LY
WA
RN
ING
SC
OR
E (
NE
WS
)
120. Cohen IG, Amarasingham R, Shah A et al. The legal and ethical concerns that arise from using complex predictive analytics in health care. Health Aff (Millwood). 2014;33(7):1139-1147.
121. Hoffman S PA. E-health hazards: provider liability and electronic health record systems. Berkeley Technol Law J. 2009;24(4):1523-1581.
122. Ridgely MS GM. Too many alerts, too much liability: sorting through the malpractice implications of drug-drug interaction clinical decision support. St Louis U J Health L Poly. 2012;5:257-295.
123. Wood C, Chaboyer W, Carr P. How do nurses use early warning scoring systems to detect and act on patient deterioration to ensure patient safety? A scoping review. Int J Nurs Stud. 2019;94:166-178.
124. Hogan H, Hutchings A, Wulff J et al. Health Services and Delivery Research. Interventions to reduce mortality from in-hospital cardiac arrest: a mixed-methods study Chapter 3: A qualitative study of staff perspectives on measures to prevent patient deterioration. Southampton (UK): NIHR Journals Library Copyright (c) Queen’s Printer and Controller of HMSO 2019. p. 29-41.
125. Jensen JK, Skar R, Tveit B. Introducing the National Early Warning Score - A qualitative study of hospital nurses’ perceptions and reactions. Nurs Open. 2019a;6(3):1067-1075.
126. Jensen JK, Skar R, Tveit B. Hospital nurses’ professional accountability while using the National Early Warning Score: A qualitative study with a hermeneutic design. J Clin Nurs. 2019b.
127. Brangan E, Banks J, Brant H et al. Using the National Early Warning Score (NEWS) outside acute hospital settings: a qualitative study of staff experiences in the West of England. BMJ Open. 2018;8(10):e022528.
128. McClelland G, Haworth D. A Qualitative Investigation Into Paramedics; Thoughts About The Introduction Of National Early Warning Scores. Emergency Medicine Journal. 2016;33(9):e2.
129. Brimblecombe N, Quist H, Nolan F. A mixed-methods survey to explore views of staff and patients from mental health wards prior to introduction of a digital early warning system for physical deterioration. J Psychiatr Ment Health Nurs. 2019;26(3-4):65-76.
130. Jusoh A, Shafei S, Zakaria N et al. National Early Warning Score (NEWS) independently predicts death or unexpected ICU admission in general surgical or orthopedic patient. Worldwide Medicine. 2019;1(5):144-151.
131. Peng LS, Hassan A, Bustam A et al. Using modified early warning score to predict need of lifesaving intervention in adult non-trauma patients in a tertiary state hospital. Hong Kong J Emerg Me. 2018;25(3):146-151.
11.0 APPENDICES
Appendix 1
HIERARCHY OF EVIDENCE FOR EFFECTIVENESS STUDIES DESIGNATION OF LEVELS OF EVIDENCE
I Evidence obtained from at least one properly designed randomized controlled trial. II-I Evidence obtained from well-designed controlled trials without randomization. II-2 Evidence obtained from well-designed cohort or case-control analytic studies,
preferably from more than one centre or research group. II-3 Evidence obtained from multiple time series with or without the intervention.
Dramatic results in uncontrolled experiments (such as the results of the introduction of penicillin treatment in the 1940s) could also be regarded as this type of evidence.
III Opinions or respected authorities, based on clinical experience; descriptive studies and case reports; or reports of expert committees.
SOURCE: US/CANADIAN PREVENTIVE SERVICES TASK FORCE (Harris 2001)

93
HE
AL
TH
TE
CH
NO
LO
GY
AS
SE
SS
ME
NT
RE
PO
RT
HE
AL
TH
TE
CH
NO
LO
GY
AS
SE
SS
ME
NT
SE
CT
ION
(MaH
TA
S)
ME
DIC
AL
DE
VE
LO
PM
EN
T D
IVIS
ION
, MIN
IST
RY
OF
HE
AL
TH
NA
TIO
NA
L E
AR
LY
WA
RN
ING
SC
OR
E (N
EW
S)
Appendix 2
PTK-FM-02 Pin.1/2016
HEALTH TECHNOLOGY ASSESSMENT (HTA) PROTOCOL NATIONAL EARLY WARNING SCORE
1.0 BACKGROUND
Reduction in the incidence of hospital adverse events and the number of preventable deaths in hospital has been the major focus of many quality improvement initiatives worldwide. It is a reflection on the capacity of the healthcare service in delivering high quality care to the patients. In 2016, approximately 24% of all deaths in the UK were considered preventable (141,101 deaths out of 597,206).1 About one-third of potentially preventable deaths in the UK relate to poor clinical monitoring.2 The total number of deaths in EU that could have potentially been prevented through effective medical interventions was just over 1.2 million in 2015.3 According to a newly published analysis led by Harvard Medical School, eight million largely preventable deaths from lack of high quality medical care cost $6 trillion in lost economic welfare in low- and middle-income countries. If current conditions persist, low- and middle-income countries could lose collectively $11 trillion in gross domestic product (GDP) by 2030.4
‘Catastrophic’ medical or sentinel events which include in-hospital cardiopulmonary arrests and deterioration in the patient’s clinical condition are often preceded by a steady accumulation of small clinical clues or a period of abnormal physiological status of the patient. In numerous studies, this abnormality was reflected on recorded patient’s vital signs (blood pressure, heart rate, respiratory rate and temperature) suggesting that potential serious complications or adverse events in patient outcomes can be avoided if they were anticipated early.5-10 Research suggests that patients suffering from a cardiac and/or respiratory arrest usually display physiological deviations (changes in vital signs and/or mental status) at least eight hours prior to their need for more intensive care.10 A study reported that 86% of code blue events or rapid response team (RRT) activation could have been predicted beforehand, with a median advanced warning time of 11.5 hours.9
Recording patient’s physiological observations is considered part of daily routine management in hospital either in acute hospital setting like in emergency department or in general ward setting. It is currently based mostly on intermittent measurements of basic parameters; blood pressure, heart rate, temperature and oxygen saturation by nursing staffs. Several hours can pass between such measurements and patient deterioration can go unnoticed especially on busy wards or during the night.11 Analysis of 576 deaths reported to the UK National Patient Safety Agency’s (NPSA) National Reporting and Learning System (NRLS) over a one year period identified that 11% were as a result of deterioration not recognised or acted upon.12 According to the report produced by the UK NPSA, contributing factors for failure to recognise and respond to patient’s clinical deterioration were observations not being taken or poorly documented, observations causing concern not being reported, early signs of deterioration not being recognised or misinterpreted and not responding appropriately.12 These were often due to demanding workloads, poor staffing level, time limitation and communication failure between teams.13, 14 Studies revealed that this failure had led to delays in diagnosis, treatment or referral, resulting in increased patient morbidity, mortality and admission to intensive care units or cardiac arrests, which were preventable.15-19
In order to address these challenges, hospitals require robust escalation of care processes to ensure that worsening conditions in patients are recognised and treated. A high quality response is essential to stop the potential transition from an initial serious complication to a progressive cascade of adverse occurrences that can lead to preventable patient harm and death, or ‘failure to rescue’. Current nursing practise (routine vital signs observation) in hospitals is not sensitive enough to detect a deteriorating or critically ill patient at an early stage. Providing clinical staffs with the tools they need, to be aware of those patients who are deteriorating fast will be a significant step forward. Early warning scores (EWS) are clinical bedside decision support tools used by care teams to potentially predict a patient’s risk of deterioration and facilitate changes in management. Currently, it has been implemented across a variety of specialties and international settings.
1.1 Local Background and Context
In Malaysia, Ministry of Health is the major provider of healthcare services in public sector and consists of 144 hospitals (including special medical institutions namely Rehabilitation Hospital, Women & Children Hospital, National Leprosy Control Centre, Institute of Respiratory Medicine, National Cancer Institute and Pyschiatric Institutions) with a total inpatient bed capacity of 42 302.20 A total of 57 831 doctors and 106 289 nurses are currently working in public and private healthcare facilities, delivering services for patients, with a doctor and nurse to population ratio of 1:554 and 1:302, respectively.20 There are challenges in sustaining the quality and patient safety in Malaysia. As the population increases, demand for healthcare increases as well.21

HE
AL
TH
TE
CH
NO
LO
GY
AS
SE
SS
ME
NT
RE
PO
RT
HE
AL
TH
TE
CH
NO
LO
GY
AS
SE
SS
ME
NT
SE
CT
ION
(M
aH
TA
S)
ME
DIC
AL
DE
VE
LO
PM
EN
T D
IVIS
ION
, M
INIS
TR
Y O
F H
EA
LT
H
94
NA
TIO
NA
L E
AR
LY
WA
RN
ING
SC
OR
E (
NE
WS
)
PTK-FM-02 Pin.1/2016
The highly subsidised government healthcare services with inequitable distribution of resources, changing in pattern of diseases and rising costs have resulted in heavy workload and long waiting time for patients to receive treatment.21 Nowdays, patients are better informed and have an expectation that the care they receive is evidence based, effective, safe and of high quality. Advances in medical technology are constantly pushing the healthcare providers for better services but at great cost. According to Malaysia Health Systems Research Key Findings 2016, 219 deaths for every 100 000 population in Malaysia can be prevented with better healthcare.22
In order to elevate patient care and outcomes, a number of Ministry of Health hospitals as well as private hospitals have introduced EWS into their routine nursing practice for monitoring patient’s clinical parameters as one of the strategic steps to strengthen its ability to better serve patients while easing the tasks of the hospital’s personnel and management team. Early warning score is used mostly in general adult medical and surgical wards. In recent years, some of these hospitals mainly private hospitals started transitioning their EWS from paper observation charts to electronic platforms. University Malaya Medical Centre (UMMC) has become the first public hospital in the country to implement a warning score system that is fully integrated into its electronic patient management system.23 Penang Adventist Hospital and Bagan Specialist Centre in Penang are two examples of private hospitals that have adopted fully automated early warning scoring system.24, 25
At present, there has not been a formal adoption of single standardised EWS at national level that can be used across Malaysian healthcare system. While the few have adopted EWS either in its original version or adapted versions, tailored to their personalised hospital needs, majority of local hospitals are still using a conventional observation chart with routine four basic vital signs monitoring. The staff use their clinical judgement regarding the frequency of observations and adjust where necessary. Consistent use of a single nationally agreed EWS system as a tool for detection and response to clinical deterioration in adult patients will ensure that all patients are objectively assessed in the same way, regardless of the clinical expertise of the clinician or where the patient is assessed. This will ensure that the severity of illness and the rate of deterioration can be explicitly stated and understood throughout the entire Malaysian healthcare system. Hence, this Health Technology Assessment (HTA) was requested by Head of Department and Senior Consultant of General Surgery from Kuala Krai Hospital, Kelantan, to assess the effectiveness, safety, economic and organisational impacts of National Early Warning Score (NEWS) as standardised approach for the detection of and response to clinical deterioration in patients with acute illness.
2.0 TECHNICAL FEATURES
2.1 Early Warning Scores/Systems (EWS) 26-28
Early Warning Scores/Systems, also referred to as ‘Track and Trigger Systems’, are simple scoring systems for bedside monitoring, to serve as clinical support tools using routinely collected vital sign data. The scoring tools have been established in acute clinical care settings to facilitate early detection of deterioration by categorising a patient’s severity of illness and prompting nursing staff to request a medical review at specific trigger points utilising a structured communication tool while following a definitive escalation plan. They were developed initially as paper based approach then later moved to electronic platform.
In its simplest form, Early Warning/Track and Trigger Systems require an efficient data collection mechanism to ‘track’ physiological signs or changes followed by a data analysis algorithm to generate an early ‘trigger’ to intervene and escalate care. Overall, these systems focus on combating the problem of “failure to rescue”; they are then broken down into issues of “failure to identify” (afferent limb) and “failure to escalate” (efferent limb). The afferent limb of the system is meant to identify patient deterioration and trigger a response indicating the need for a higher level of care. The efferent limb is the response to the trigger—delivered through higher levels of monitoring and care or a rapid response/medical emergency team. (Figure 1) Numerous EW/TTS are used internationally to detect patients at risk of deteriorating. They are broadly divided into single parameter, multiple parameter and aggregate weighted systems, which are shown in the Table 1.

95
HE
AL
TH
TE
CH
NO
LO
GY
AS
SE
SS
ME
NT
RE
PO
RT
HE
AL
TH
TE
CH
NO
LO
GY
AS
SE
SS
ME
NT
SE
CT
ION
(MaH
TA
S)
ME
DIC
AL
DE
VE
LO
PM
EN
T D
IVIS
ION
, MIN
IST
RY
OF
HE
AL
TH
NA
TIO
NA
L E
AR
LY
WA
RN
ING
SC
OR
E (N
EW
S)
PTK-FM-02 Pin.1/2016
Data
Vital Signs
Physical Exam
NeurologicalStatus
LaboratoryValues
Test Results
Action
IncreasedMonitoring
ClinicalEscalation
ProviderNotification
Rapid ResponseTeam
EFFER
EN
T LIM
BAFF
ER
EN
T L
IM
B
EARLYWARNING
SCORE TRACKAND SYSTEM
WARDPATIENT
PAPER BASED DATA ENTRYAND SCORE CALCULATIOM
ELECTRONIC MEDICALRECORD WITH AUTOMATEDSCORING SYSTEMS
DIGITAL DATA ENTRYAND SCORE CALCULATION
Figure 1: A schematic representation of early warning/track-and-trigger systems demonstrating the afferent and efferent limbs of the system.28
Table 1: Types of Early Warning System
System Characteristics
Single parameter system Periodic observation of selected vital signs or laboratory values that are compared with a simple set of criteria with predefined thresholds, with a response algorithm being activated when any single criterion is met.vv Thresholds for classifying the values as
abnormal are not uniform among hospitals and scoring systems are chosen somewhat arbitrarily based on local preferences and expertise.
vv Examples: qSOFA, SIRS
Multiple parameter system Response algorithm requires more than one criterion to be met or differs according to the number of criteria met.vv Example: shock index (SI)—heart rate divided
by systolic blood pressure
Aggregate scoring system Weighted scores are assigned to physiological values and compared with predefined trigger thresholds.vv Examples: NEWS, MEWS, ViEWS
2.2 Electronic early warning systems29
While commercial electronic early warning systems may comprise a wide range of features, there are four core elements that are common to all systems.
a) Electronic reporting (information capture) of vital sign parameters at the bedside using a mobile, user-friendly platform
b) Computer learning systems that calculate the early warning scorec) Escalation of care when appropriated) Communication of the actions to be taken/or have been taken to address deteriorating vital
sign and patient parameters.
When an electronic early warning system is introduced into a setting, the threshold parameters are usually set in line with national or local guidelines for early warning scores and escalation protocols.
2.3 National Early Warning Score (NEWS)26
National Early Warning Score was developed in 2012, through collaborative work of Royal College of Physicians (RCP) and National Health Service (NHS) Trusts in UK on the basis of there should be a national system for recognising very sick patients whose condition is deteriorating and who need more intensive medical or nursing care. It is a pragmatic approach, with a key emphasis on system-wide standardisation and the use of physiological parameters that are already routinely measured in hospitals and in prehospital care, recorded on a standardised clinical chart. The NEWS is an adjunct to decision making, used in combination with clinical judgement and communicated across the care pathway. NEWS does not replace disease-specific validated scoring systems but highly recommended to be used alongside these validated scoring systems as dictated by patient need. It offers the following features;
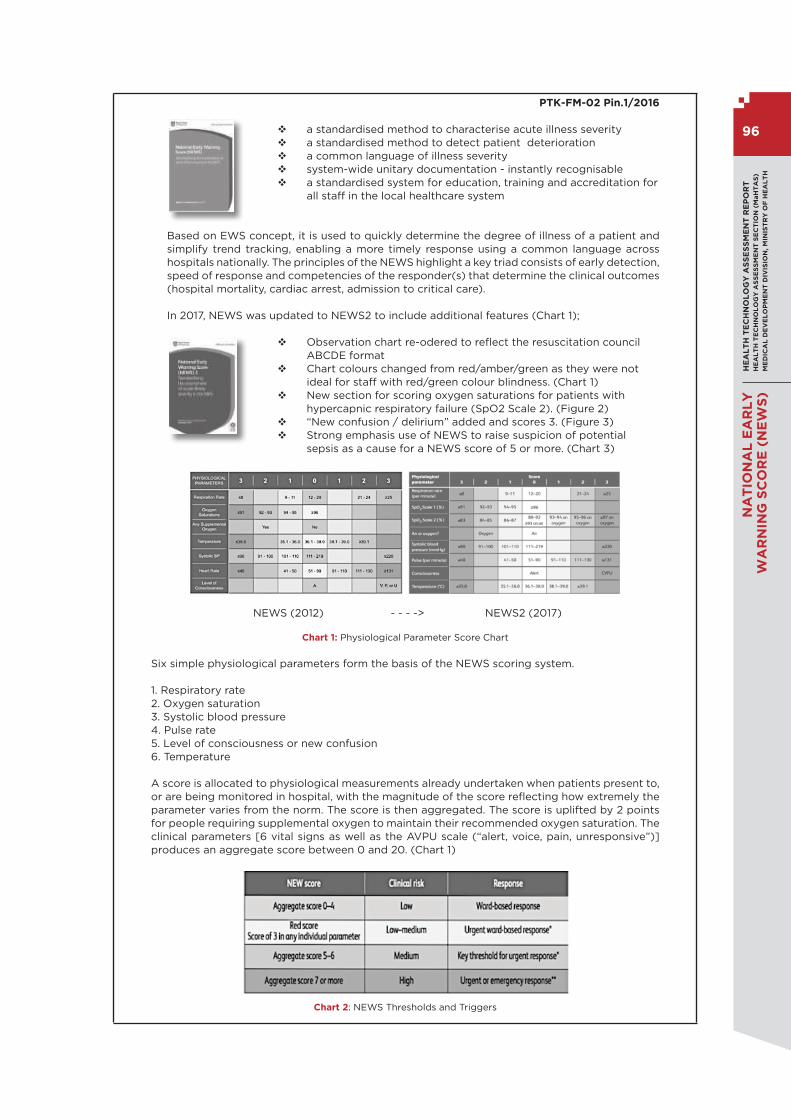
HE
AL
TH
TE
CH
NO
LO
GY
AS
SE
SS
ME
NT
RE
PO
RT
HE
AL
TH
TE
CH
NO
LO
GY
AS
SE
SS
ME
NT
SE
CT
ION
(M
aH
TA
S)
ME
DIC
AL
DE
VE
LO
PM
EN
T D
IVIS
ION
, M
INIS
TR
Y O
F H
EA
LT
H
96
NA
TIO
NA
L E
AR
LY
WA
RN
ING
SC
OR
E (
NE
WS
)
PTK-FM-02 Pin.1/2016
v a standardised method to characterise acute illness severity v a standardised method to detect patient deterioration v a common language of illness severity v system-wide unitary documentation - instantly recognisable v a standardised system for education, training and accreditation for
all staff in the local healthcare system
Based on EWS concept, it is used to quickly determine the degree of illness of a patient and simplify trend tracking, enabling a more timely response using a common language across hospitals nationally. The principles of the NEWS highlight a key triad consists of early detection, speed of response and competencies of the responder(s) that determine the clinical outcomes (hospital mortality, cardiac arrest, admission to critical care).
In 2017, NEWS was updated to NEWS2 to include additional features (Chart 1);
v Observation chart re-odered to reflect the resuscitation council ABCDE format
v Chart colours changed from red/amber/green as they were not ideal for staff with red/green colour blindness. (Chart 1)
v New section for scoring oxygen saturations for patients with hypercapnic respiratory failure (SpO2 Scale 2). (Figure 2)
v “New confusion / delirium” added and scores 3. (Figure 3) v Strong emphasis use of NEWS to raise suspicion of potential
sepsis as a cause for a NEWS score of 5 or more. (Chart 3)
NEWS (2012) - - - -> NEWS2 (2017)
Chart 1: Physiological Parameter Score Chart
Six simple physiological parameters form the basis of the NEWS scoring system.
1. Respiratory rate2. Oxygen saturation3. Systolic blood pressure4. Pulse rate5. Level of consciousness or new confusion 6. Temperature
A score is allocated to physiological measurements already undertaken when patients present to, or are being monitored in hospital, with the magnitude of the score reflecting how extremely the parameter varies from the norm. The score is then aggregated. The score is uplifted by 2 points for people requiring supplemental oxygen to maintain their recommended oxygen saturation. The clinical parameters [6 vital signs as well as the AVPU scale (“alert, voice, pain, unresponsive”)] produces an aggregate score between 0 and 20. (Chart 1)
Chart 2: NEWS Thresholds and Triggers

97
HE
AL
TH
TE
CH
NO
LO
GY
AS
SE
SS
ME
NT
RE
PO
RT
HE
AL
TH
TE
CH
NO
LO
GY
AS
SE
SS
ME
NT
SE
CT
ION
(MaH
TA
S)
ME
DIC
AL
DE
VE
LO
PM
EN
T D
IVIS
ION
, MIN
IST
RY
OF
HE
AL
TH
NA
TIO
NA
L E
AR
LY
WA
RN
ING
SC
OR
E (N
EW
S)
NEWS recommends four trigger levels for a clinical alert requiring clinician assessment based on the NEWS (Chart 2) :
v LOW score: an aggregate NEW score of 1–4 v A single red score: an extreme variation in an individual physiological parameter (a score of 3 in any one parameter, which is colour-coded red on the NEWS chart)
v MEDIUM score: an aggregate NEW score of 5 or 6. A NEW score of 5 or more is a key threshold and is indicative of potential serious acute clinical deterioration and the need for an urgent clinical response
v HIGH score: an aggregate NEW score of 7 or more.
NEWS recommends that these triggers should determine the urgency of the clinical response and the clinical competency of the responder(s). (Chart 3)
Chart 3: Clinical response to the NEWS trigger threshold
NEWS recommends the use of the standardised NEWS observation chart for the routine recording of clinical observations, across the hospitals. The NEWS chart is colour-coded to provide both visual and numeric prompts to aid identification of abnormal clinical parameters. It is recognised that the rest of the chart area will be customised to reflect other key parameters not incorporated in the NEWS, eg urine output and pain scores, according to the clinical environment. (Chart 4)
Chart 4: NEWS Observation Chart

HE
AL
TH
TE
CH
NO
LO
GY
AS
SE
SS
ME
NT
RE
PO
RT
HE
AL
TH
TE
CH
NO
LO
GY
AS
SE
SS
ME
NT
SE
CT
ION
(M
aH
TA
S)
ME
DIC
AL
DE
VE
LO
PM
EN
T D
IVIS
ION
, M
INIS
TR
Y O
F H
EA
LT
H
98
NA
TIO
NA
L E
AR
LY
WA
RN
ING
SC
OR
E (
NE
WS
)
PTK-FM-02 Pin.1/2016
3.0 POLICY QUESTION
Should National Early Warning Score (NEWS) be implemented in Ministry of Health (MOH) hospitals to improve safety, efficiency and standardisation of patient care?
4.0 OBJECTIVE
4.1 To assess the effectiveness and safety of NEWS in timely detection of patient’s clinical deterioration by evaluating its predictive ability and impact on patient’s clinical outcomes
4.2 To determine the economic implications of a nationally implemented Early Warning Score system
4.3 To evaluate the organisational, ethical, legal and social implications of NEWS implementation
Research Questions
i. How effective and safe is NEWS as clinical decision support tools, in predicting patient’s clinical deterioration?
ii. What is the economic impacts of NEWS implementation in minimizing occurrence of adverse events and preventable hospital mortality?
iii. What are the organisational, ethical, legal and social issues related to NEWS implementation?
5.0 METHODS
5.1. Search Strategy Electronic database will be searched for published literatures pertaining to NEWS.
5.1.1. Databases as follows; MEDLINE, EMBASE, PubMed, CINAHL, EBM Reviews-Cochrane Database of Systematic Review, EBM-Reviews-Cochrane Central Register of Controlled Trials, EBM Reviews-Health Technology Assessment, EBM Reviews-Cochrane Methodology Register, EBM Reviews-NHS Economic Evaluation Database, Database of Abstracts of Reviews of Effects (DARE), Horizon Scanning, INAHTA Database, HTA database and FDA database will be searched.
5.1.2. Additional literatures will be identified from the references of the retrieved articles.
5.1.3 General search engine will be used to get additional web-based information if there is no retrievable evidence from the scientific databases.
5.1.4 There will be no limitation applied in the search such as year and language.
5.1.5 The search strategy will be included in the appendix.
5.2 Inclusion and Exclusion Criteria
5.2.1 Inclusion Criteria
a) Populationi. All adult patients (aged 16 years old and above) in pre-hospital and hospital
settingsii. Heathcare staffs who are involved in delivering the intervention
b) InterventionNational Early Warning Score (NEWS) [paper based or digitised approach ie VitalPAC Early Warning Score (ViEWS)]
c) Comparators
i. Other established scoring system designed to identify deteriorating patients [ie Patient at Risk (PAR) score, Physiological Scoring Systems (PSS), Vital
Sign Score (VSS), BioSign]ii. Standard/Usual care (Standard Observation Charts)iii. No comparator

99
HE
AL
TH
TE
CH
NO
LO
GY
AS
SE
SS
ME
NT
RE
PO
RT
HE
AL
TH
TE
CH
NO
LO
GY
AS
SE
SS
ME
NT
SE
CT
ION
(MaH
TA
S)
ME
DIC
AL
DE
VE
LO
PM
EN
T D
IVIS
ION
, MIN
IST
RY
OF
HE
AL
TH
NA
TIO
NA
L E
AR
LY
WA
RN
ING
SC
OR
E (N
EW
S)
PTK-FM-02 Pin.1/2016
d) Outcomes
i. Effectivenessvv Predictive ability to detect clinical deterioration
- model discrimination for outcomes of mortality, cardiopulmonary arrest, serious adverse events and ICU admission within 48 hours of measurement.
vv Patient’s clinical outcomes- in-hospital mortality - cardiovascular (CV) events (cardiac arrest, acute
coronary syndrome, cardiogenic shock)
ii. Safetyvv Adverse events
[Adoption issues ie. inconsistency in NEWS application among staffs and across medical specialties, the inaccuracies and miscalculations related to manual data collection leading to inappropriate clinical response or misalerts.]
iii. Economic impactsvv Cost effectiveness analysisvv Cost utility analysisvv Cost benefit analysisvv Cost analysisvv Any other measure of economic outcomes
iv. Organisational issuesvv Resource utilisation
- length of hospital stay- admissions to ICU- use of Rapid Response or Code Team- nursing staffs – staffing demand, level of workload,
compliance ratevv Training requirementvv Efficiency in work processvv NEWS application adaptability
- in resource limited settings- cross specialty application
vv Opportunity for automation (electronic charting and scoring system for NEWS)
v. Ethical and legal issuesvv Ethical challenge of predictive analytics
- impact on the role of the physician- clinical decision making vv Liability or litigation risk as a predictive modelling
user for either overriding alerts or for following the recommendation of a predictive analytics model that contains an error (especially for electronic version) against using professional judgement and knowledgevv Liability of healthcare system for defective equipment
(electronic system)
vi. Social implications(Nursing staffs and doctors)v Acceptancev Attitudev Work satisfactionv Experience
e) Study Designs
HTA reports, systematic review with meta- analysis, systematic review, randomised controlled trial (RCT), cohort, case-control, cross-sectional, qualitative studies and economic evaluation studies.
f) English full text articles

HE
AL
TH
TE
CH
NO
LO
GY
AS
SE
SS
ME
NT
RE
PO
RT
HE
AL
TH
TE
CH
NO
LO
GY
AS
SE
SS
ME
NT
SE
CT
ION
(M
aH
TA
S)
ME
DIC
AL
DE
VE
LO
PM
EN
T D
IVIS
ION
, M
INIS
TR
Y O
F H
EA
LT
H
100
NA
TIO
NA
L E
AR
LY
WA
RN
ING
SC
OR
E (
NE
WS
)
PTK-FM-02 Pin.1/2016
5.2.2. Exclusion Criteria
a) Studies that involved subgroup populations: obstetric and paediatric patientsb) Study design : Animal study, laboratory study, narrative review c) Non English full text articles
Based on the above inclusion and exclusion criteria, study selection will be carried out independently by two reviewers. Disagreement will be resolved by discussion.
5.3 Critical Appraisal of Literature
The risk of bias of all retrieved literatures will be assessed using the relevant checklist of Critical Appraisal Skill Programme (CASP) and The Cochrane Collaboration’s tool for RCT.
5.4 Analysis and Synthesis of Evidence
5.4.1. Data extraction strategy
The following data will be extracted:
i. Details of methods and study population characteristics ii. Detail of intervention and comparators iii. Details of individual outcomes specified
Data will be extracted from selected studies by a reviewer using a pre- designed data extraction form and checked by another reviewer. Disagreements will be resolved by discussion.
5.4.2 Methods of data synthesis
Data on the outcome measures will be presented in tabulated format with narrative summaries. Meta-analysis may be conducted for this Health Technology Assessment.
6.0 REPORT WRITING
7.0 REFERENCES
1. Statistics OoN. Avoidable mortality in the UK. 2016. Available from: https://www.ons.gov.uk/peoplepopulationandcommunity/healthandsocialcare/causesofdeath/bulletins/avoidablemortalityinenglandandwales/2016
2. Hogan H HF, Neale G et al. . Preventable deaths due to problems in care in English acute hospitals: a retrospective case record review study. . BMJ Qual Saf 2012;21:737-745.
3. Amenable and preventable deaths statistics. Eurostat Statistic Explained. (Updated June 2018). Available from: https://ec.europa.eu/eurostat/statistics-explained/index.php/Amenable_and_preventable_deaths_statistics#571_000 _deaths_from_potentially_avoidable_causes. Accessed on 15.02.2019.
4. Alkire BC, Peters AW, Shrime MG, et al. The Economic Consequences Of Mortality Amenable To High-Quality Health Care In Low- And Middle-Income Countries. Health Aff (Millwood). 2018;37(6):988-996.
5. Hodgetts TJ, Kenward G, Vlackonikolis I, et al. Incidence, location and reasons for avoidable in-hospital cardiac arrest in a district general hospital. Resuscitation. 2002;54(2):115-123.
6. Goldhill DR. Intensive and high-dependency care for the high-risk surgical patient Original Research Article Best Practice & Research Clinical Anaesthesiology. 1999;13(3):427-436.
7. Goldhill DR, McNarry AF. Physiological abnormalities in early warning scores are related to mortality in adult inpatients. Br J Anaesth. 2004;92(6):882-884.
8. McQuillan P, Pilkington S, Allan A, et al. Confidential inquiry into quality of care before admission to intensive care. BMJ. 1998;316(7148):1853-1858.
9. Akre M, Finkelstein M, Erickson M, et al. Sensitivity of the pediatric early warning score to identify patient deterioration. Pediatrics. 2010;125(4):e763- 769.
10. Stenhouse C, Tivey M, Allsop P, et al. Prospective evaluation of a modified Early Warning Score to aid earlier detection of patients developing critical illness on a general surgical ward. BJA: British Journal of Anaesthesia. 2000;84(5):663-663.
11. McGaughey J, Alderdice F, Fowler R, et al. Outreach and Early Warning Systems (EWS) for the prevention of intensive care admission and death of critically ill adult patients on general hospital wards. Cochrane Database Syst Rev. 2007(3):Cd005529.

101
HE
AL
TH
TE
CH
NO
LO
GY
AS
SE
SS
ME
NT
RE
PO
RT
HE
AL
TH
TE
CH
NO
LO
GY
AS
SE
SS
ME
NT
SE
CT
ION
(MaH
TA
S)
ME
DIC
AL
DE
VE
LO
PM
EN
T D
IVIS
ION
, MIN
IST
RY
OF
HE
AL
TH
NA
TIO
NA
L E
AR
LY
WA
RN
ING
SC
OR
E (N
EW
S)
PTK-FM-02 Pin.1/2016
12. Agency NPS. Recognising and Responding Appropriately to Early Signs of Deterioration in Hos-pitalised Patients.: NHS; 2007. Report No.: 978-0- 9556340-8-6. Available from: https://www.patientsafetyoxford.org/wp- content/uploads/2018/03/NPSA-DeteriorPatients.pdf.
13. James J, Butler-Williams C, Hunt J, et al. Vital signs for vital people: an exploratory study into the role of the Healthcare Assistant in recognising, recording and responding to the acutely ill patient in the general ward setting. J Nurs Manag. 2010;18(5):548-555.
14. Wheatley I. The nursing practice of taking level 1 patient observations. Intensive Crit Care Nurs. 2006;22(2):115-121.
15. Buist M, Bernard S, Nguyen TV, et al. Association between clinically abnormal observations and subsequent in-hospital mortality: a prospective study. Resuscitation. 2004;62(2):137-141.
16. Nolan JP, Deakin CD, Soar J, et al. European Resuscitation Council guidelines for resuscitation 2005. Section 4. Adult advanced life support. Resuscitation. 2005;67 Suppl 1:S39-86.
17. Smith ME, Chiovaro JC, O’Neil M, et al. Early warning system scores for clinical deterioration in hos-pitalized patients: a systematic review. Annals of the American Thoracic Society. 2014;11(9):1454-1465.
18. Preston R, Flynn D. Observations in acute care: evidence-based approach to patient safety. Br J Nurs. 2010;19(7):442-447.
19. Quirke S, Coombs M, McEldowney R. Suboptimal care of the acutely unwell ward patient: a con-cept analysis. J Adv Nurs. 2011;67(8):1834-1845.
20. Planning Division, Ministry of Health Malaysia. Health Facts 2018. Available from: http://www.moh.gov.my/resources/index/Penerbitan/Penerbitan%20Utama/Fa kta%20kesihatan/KKM_HEALTH_FACTS_2018_new.pdf.
21. Jarrar Mt, Abdul Rahman H, Don MS. Optimizing Quality of Care and Patient Safety in Malaysia: The Current Global Initiatives, Gaps and Suggested Solutions. Glob J Health Sci. 2015;8(6):44132-44132.
22. Malaysia Health System Research Volume 1. Contextual Analysis of the Malaysian Health System. Ministry of Health Malaysia; 2016. Available from: http://www.moh.gov.my/penerbitan/Laporan/Vol%201_MHSR%20Contextual %20Analysis_2016.pdf.
23. Ngu DJ. UMMC implements automated warning system to improve patient safety. 2017. (Updated. Available from: https://specialty.mims.com/topic/ummc-implements-automated-warning-sys-tem-to-improve-patient-safety?topic-grouper=news. Accessed on 01.03.19.
24. News M. Better medical response with fully automated warning system. (Updated. Available from: https://www.thestar.com.my/metro/metro-news/2018/10/26/better-medical-response-with-ful-ly-automated-warning- system/. Accessed on 15.02.19.
25. Linkedin. Elevating patient care and outcomes with Malaysia’s Bagan Specialist Centre. (Updated. Available from: https://www.linkedin.com/pulse/elevating- patient-care-outcomes-malaysias-ba-gan-specialist-zeven. Accessed on 15.02.19.
26. Royal College of Physicians. National Early Warning Score (NEWS) 2: Standardising the assess-ment of acute-illness severity in the NHS. Updated report of a working party. London: RCP, 2017.Available from: https://www.rcplondon.ac.uk/projects/outputs/national-early-warning-score- news-2.
27. Mitchell IA, McKay H, Van Leuvan C, et al. A prospective controlled trial of the effect of a multi-fac-eted intervention on early recognition and intervention in deteriorating hospital patients. Resus-citation. 2010;81(6):658-666.
28. HIQA. Health technology assessment of the use of information technology for early warning and clinical handover systems. Health Information and Quality Authority (HIQA); 2015.Available from: https://www.hiqa.ie/sites/default/files/2017-01/HTA-of-use-of-information-technology-for-ear-ly-warning-and-clinical-handover-systems.pdf.

HE
AL
TH
TE
CH
NO
LO
GY
AS
SE
SS
ME
NT
RE
PO
RT
HE
AL
TH
TE
CH
NO
LO
GY
AS
SE
SS
ME
NT
SE
CT
ION
(M
aH
TA
S)
ME
DIC
AL
DE
VE
LO
PM
EN
T D
IVIS
ION
, M
INIS
TR
Y O
F H
EA
LT
H
102
NA
TIO
NA
L E
AR
LY
WA
RN
ING
SC
OR
E (
NE
WS
)
Appendix 3
SEARCH STRATEGY
OVID MEDLINE searched 3.04.2019, 13.08.2019 and 9.09.2019
Database: Ovid MEDLINE(R) and Epub Ahead of Print, In-Process & Other Non- Indexed Citations and Daily <2015 to September 5, 2019>-----------------------------------------------------------------------------------
1 ACUTE DISEASE/ (55200) 2 (acute adj1 disease$1).tw. (2029) 3 CRITICAL ILLNESS/ (10520) 4 (critical* adj1 illnesse$1).tw. (225) 5 adult patient.tw. (2753) 6 1 or 2 or 3 or 4 or 5 (70079) 7 SEVERITY OF ILLNESS INDEX/ (72216) 8 severity of illness index.tw. (32) 9 MONITORING, PHYSIOLOGIC/ (16167) 10 ((physiologic* or patient) adj1 monitoring).tw. (1901) 11 RISK ASSESSMENT/ (79591) 12 (health risk adj1 assessment$1).tw. (1967) 13 (risk assessment$1 adj health).tw. (10) 14 (risk adj1 assessment$1).tw. (28181) 15 (benefits adj2 risks).tw. (8424)16 ((risk benefit or benefit risk) adj1 assessment$1).tw. (559) 17 EARLY DIAGNOSIS/ (8224) 18 (early adj1 diagnosis).tw. (31097) 19 (early detection adj2 disease).tw. (367) 20 detection of deterioration.tw. (28) 21 identification of deterioration.tw. (4) 22 track.mp. and trigger system.tw. [mp=title, abstract, original title, name of substance word, subject
heading word, floating sub-heading word, keyword heading word, organism supplementary concept word, protocol supplementary concept word, rare disease supplementary concept word, unique identifier, synonyms] (13)
23 (warning system$ or early warning).tw. (3317) 24 physiological scoring system.tw. (12) 25 7 or 8 or 9 or 10 or 11 or 12 or 13 or 14 or 15 or 16 or 17 or 18 or 19 or 20 or 21 or 22 or 23 or 24 (224381) 26 HOSPITAL MORTALITY/ (14921) 27 (hospital adj2 mortalit*).tw. (17451) 28 (in house adj2 mortalit*).tw. (29) 29 HEART ARREST/ (9521) 30. ((heart or cardiac or cardiopulmonary) adj1 arrest).tw. (15894) 31 SENSITIVITY.mp. and SPECIFICITY/ [mp=title, abstract, original title, name of substance word, subject
heading word, floating sub-heading word, keyword heading word, organism supplementary concept word, protocol supplementary concept word, rare disease supplementary concept word, unique identifier, synonyms] (95452)
32 sensitivity.tw. (348178) 33 specificity.tw. (193988) 34 (sensitivity adj2 specificity).tw. (58266) 35 PREDICTIVE VALUE OF TESTS/ (66388) 36 predictive value of tests.tw. (23) 37 INTENSIVE CARE UNITS/ (18275) 38 (intensive adj2 care).tw. (59279) 39 HOSPITALIZATION/ (36900) 40 hospitali#ation$1.tw. (67408) 41 TREATMENT OUTCOME/ (311839) 42 ((clinical or treatment) adj1 eff*).tw. (87577) 43 ((patient relevant or rehabilitation or treatment) adj1 outcome$1).tw. (23920) 44 ((patient relevant or rehabilitation or treatment) adj1 outcome$1).tw. (23920) 45 HEALTH KNOWLEDGE, ATTITUDES, PRACTICE/ (33125) 46 health knowledge, attitudes, practice.tw. (1) 47 knowledge, attitudes, practice.tw. (16) 48 HEALTH CARE COSTS/ (11570) 49 ((health care or medical care) adj1 cost$1).tw. (6014) 50 ((health or treatment) adj1 cost$1).tw. (4581) 51 COST OF ILLNESS/ (8194) 52 ((disease or sickness or illness) adj2 cost$1).tw. (1611)

103
HE
AL
TH
TE
CH
NO
LO
GY
AS
SE
SS
ME
NT
RE
PO
RT
HE
AL
TH
TE
CH
NO
LO
GY
AS
SE
SS
ME
NT
SE
CT
ION
(MaH
TA
S)
ME
DIC
AL
DE
VE
LO
PM
EN
T D
IVIS
ION
, MIN
IST
RY
OF
HE
AL
TH
NA
TIO
NA
L E
AR
LY
WA
RN
ING
SC
OR
E (N
EW
S)
53 (economic burden adj2 disease).tw. (97) 54 (illness adj2 burden$1).tw. (884) 55 COSTS.mp. and COST ANALYSIS/ [mp=title, abstract, original title, name of substance word, subject
heading word, floating sub-heading word, keyword heading word, organism supplementary concept word, protocol supplementary concept word, rare disease supplementary concept word, unique identifier, synonyms] (11533)
56 (cost adj1 analys#s).tw. (3146) 57 (cost minimi#ation adj1 analys#s).tw. (293) 58 (cost adj1 comparison$1).tw. (491) 59 (cost analys#s adj2 cost$1).tw. (3003) 60 (cost adj1 measure$1).tw. (296) 61 COST BENEFIT ANALYSIS/ (23292) 62 ((cost benefit or cost utility or marginal or cost effectiveness) adj1 analys#s).tw. (7894) 63 (cost benefit adj1 data).tw. (6) 64 (cost adj1 effectiveness).tw. (26068) 65 (economic adj1 evaluation$1).tw. (5100) 66 26 or 27 or 28 or 29 or 30 or 31 or 32 or 33 or 34 or 35 or 36 or 37 or 38 or 39 or 40 or 41 or 42 or 43 or
44 or 45 or 46 or 47 or 48 or 49 or 50 or 51 or 52 or 53 or 54 or 55 or 56 or 57 or 58 or 59 or 60 or 61 or 62 or 63 or 64 or 65 (1154363)
67 6 and 25 and 66 (2876)
PUBMED searched 3.04.2019, 13.08.2019 and 9.09.2019
((track and trigger [Title/Abstract])) OR (((((((“Hospital Information Systems”[Mesh]) OR Risk Assessment/ methods [Mesh]) OR Point-of-Care Systems [Mesh]) OR Monitoring, Physiologic/methods[Mesh])) OR ((clinical deterioration[Title/Abstract]) OR risk assessment report[Title/Abstract])) OR (((early warning[Title/ Abstract]) OR warning system*[Title/Abstract]) OR warning scoring[Title/Abstract])) AND ((((((physiological scoring system[Title/Abstract])) OR ((vital sign[Title/Abstract]) AND score[Title/Abstract])) OR (vitalpac[Title/ Abstract])) OR (sbar[Title/Abstract])) OR (situation background assessment recommendation[Title/Abstract])) AND ((((((((((((C statistic*[Title/Abstract])) OR (Likelihood ratio[Title/Abstract])) OR (expected to observed[Title/ Abstract])) OR (calibration[Title/Abstract])) OR (Calibration[Mesh])) OR (area under curve[Title/ Abstract])) OR (Area Under Curve[Mesh])) OR ((((PPV[Title/Abstract]) OR positive predictive value[Title/Abstract]) OR NPV[Title/Abstract]) OR negative predictive value[Title/Abstract])) OR (Predictive Value of Tests[Mesh])) OR (((Receiver Operating[Title/ Abstract]) OR Receiver Operator[Title/Abstract]) OR ROC[Title/Abstract])) OR (ROC Curve[Mesh])) OR (discriminative function[Title/Abstract]) AND ((mortality[Title/Abstract])) OR (Hospital Mortality[Mesh]) AND ((length of stay[Title/Abstract])) OR (Length of Stay[Mesh]) AND (((((cardiac arrest[Title/Abstract]) OR cardiogenic shock[Title/Abstract]) OR ACS[Title/Abstract]) OR acute coronary syndrome[Title/Abstract])) OR ((Shock, Cardiogenic[Mesh]) OR Acute Coronary Syndrome[Mesh]) AND ((Respiratory Insufficiency[Mesh])) OR (respiratory failure[Title/Abstract]) AND (((Sepsis[Mesh]) OR Shock, Septic[Mesh])) OR ((sepsis[Title/Abstract]) OR septic[Title/Abstract]) AND (((((ICU[Title/Abstract]) OR intensive care unit[Title/ Abstract])) AND ((admission[Title/Abstract]) OR admissions[Title/Abstract]))) OR ((Patient Transfer[Mesh]) OR Intensive Care Units/ utilization[Mesh])
CINAHL searched 21.05.2019 and 9.09.2019
(MH “Hospital Information Systems”) OR (MH “Risk Assessment/MT”) OR “point of care systems” OR (MH “Monitoring, Physiologic/MT”) OR “track and trigger” OR “clinical deterioration” OR “risk assessment report” OR “early warning” OR “warning system*” OR “warning scoring” AND (TI vital sign AND TI score) OR TI physiological scoring system OR TI worthing OR TI vialpac OR TI sbar OR TI situation background assessment recommendation AND (M H “Calibration”) OR (MH “ROC Curve”) OR (MH “Predictive Value of Tests”) OR TI C statistic* OR TI likelihood ratio OR TI expected to observed OR TI calibration OR TI area under curve OR TI ppv OR TI positive predictive value OR TI NPV OR TI negative predictive value OR TI receiver operating OR TI receiver operator OR TI ROC OR TI discriminative function AND (MH “Hospital Mortality”) OR TI mortality AND (MH “Length of Stay”) OR “length of stay” AND (MH “Shock, Cardiogenic”) OR “cardiogenic shock” OR “acute coronary syndrome” OR (MH “Acute Coronary Syndrome”) OR “cardiac arrest” OR TI ACS AND (MH “Length of Stay”) OR “length of stay” AND (M H “Shock, Cardiogenic”) OR “cardiogenic shock” OR “acute coronary syndrome” OR (MH “Acute Coronary Syndrome”) OR “cardiac arrest” OR TI ACS AND (M H “Respiratory Failure”) OR “respiratory failure AND (M H “Respiratory Failure”) OR “respiratory failure AND ((TI ICU OR TI Intensive care unit ) AND (TI Admission OR TI Admission)) OR “patient transfer” OR (MH “Intensive Care Units/UT”)
Appendix 4
Evidence table can be downloaded from:
v MOH website : http://www.moh.gov.my/index.php/pages/view/1749 v MaHTAS apps: HTA: National Early Warning Score (NEWS)


105
HE
AL
TH
TE
CH
NO
LO
GY
AS
SE
SS
ME
NT
RE
PO
RT
HE
AL
TH
TE
CH
NO
LO
GY
AS
SE
SS
ME
NT
SE
CT
ION
(MaH
TA
S)
ME
DIC
AL
DE
VE
LO
PM
EN
T D
IVIS
ION
, MIN
IST
RY
OF
HE
AL
TH
NA
TIO
NA
L E
AR
LY
WA
RN
ING
SC
OR
E (N
EW
S)
K E M E N T E R I A N K E S I H A T A N M A L A Y S I A
Malaysian Health Technology Assessment Section (MaHTAS) Medical Development Division, Ministry of Health Malaysia,
Level 4, Block E1, Complex E, Precint 1,Federal Government Administrative Centre
62590, Putrajaya, Malaysia
Tel: 03-88831229Fax: 03-8883 1230
9 7 8 9 6 7 2 1 7 3 9 8 4
Copyright © 2022 FDOKUMEN