Magnitude-dependence of equivalent comfort contours for fore-and-aft, lateral and vertical...
18
JOURNAL OF SOUND AND VIBRATION Journal of Sound and Vibration 298 (2006) 755–772 Magnitude-dependence of equivalent comfort contours for fore-and-aft, lateral and vertical whole-body vibration Miyuki Morioka , Michael J. Griffin Human Factors Research Unit, Institute of Sound and Vibration Research, University of Southampton, Southampton SO17 1BJ, England Received 3 May 2006; received in revised form 10 May 2006; accepted 8 June 2006 Available online 8 August 2006 Abstract It is currently assumed that the same frequency weightings, derived from studies of vibration discomfort, can be used to evaluate the severity of vibration at all vibration magnitudes from the threshold of vibration perception to the vibration magnitudes associated with risks to health. This experimental study determined equivalent comfort contours for the whole- body vibration of seated subjects over the frequency range 2–315 Hz in each of the three orthogonal axes (fore-and-aft, lateral and vertical). The contours were determined at vibration magnitudes from the threshold of perception to levels associated with severe discomfort and risks to health. At frequencies greater than 10 Hz, thresholds for the perception of vertical vibration were lower than thresholds for fore- and-aft and lateral vibration. At frequencies less than 4 Hz, thresholds for vertical vibration were higher than thresholds for fore-and-aft and lateral vibration. The rate of growth of sensation with increasing vibration magnitude was highly dependent on the frequency and axis of vibration. Consequently, the shapes of the equivalent comfort contours depended on vibration magnitude. At medium and high vibration magnitudes, the equivalent comfort contours were reasonably consistent with the frequency weightings for vibration discomfort in current standards (i.e. W b and W d ). At low vibration magnitudes, the contours indicate that relative to lower frequencies the standards underestimate sensitivity at frequencies greater than about 30 Hz. The results imply that no single linear frequency weighting can provide accurate predictions of discomfort caused by a wide range of magnitudes of whole-body vibration. r 2006 Elsevier Ltd. All rights reserved. 1. Introduction The EU Physical Agents Directive [1] requires the minimisation of risks from exposure to whole-body vibration. The Directive defines ‘exposure action values’ and ‘exposure limit values’ for fore-and-aft, lateral, and vertical vibration evaluated using frequency weightings defined in current standards. Dose–response relationships between whole-body vibration and injury have not been established, so it is optimistic to assume that the risk of injury can be estimated using any currently defined measure of vibration [2]. However, increases in vibration magnitude increase vibration discomfort and pain and can be assumed to increase the risks to health. In the absence of information to the contrary, the strength of sensation has been assumed to ARTICLE IN PRESS www.elsevier.com/locate/jsvi 0022-460X/$ - see front matter r 2006 Elsevier Ltd. All rights reserved. doi:10.1016/j.jsv.2006.06.011 Corresponding author. Tel.: +44 23 80 592277; fax: +44 23 80 592927. E-mail address: [email protected] (M. Morioka).
-
Upload
independent -
Category
Documents
-
view
0 -
download
0
Transcript of Magnitude-dependence of equivalent comfort contours for fore-and-aft, lateral and vertical...
ARTICLE IN PRESS
JOURNAL OFSOUND ANDVIBRATION
0022-460X/$ - s
doi:10.1016/j.js
�CorrespondE-mail addr
Journal of Sound and Vibration 298 (2006) 755–772
www.elsevier.com/locate/jsvi
Magnitude-dependence of equivalent comfort contours forfore-and-aft, lateral and vertical whole-body vibration
Miyuki Morioka�, Michael J. Griffin
Human Factors Research Unit, Institute of Sound and Vibration Research, University of Southampton, Southampton SO17 1BJ, England
Received 3 May 2006; received in revised form 10 May 2006; accepted 8 June 2006
Available online 8 August 2006
Abstract
It is currently assumed that the same frequency weightings, derived from studies of vibration discomfort, can be used to
evaluate the severity of vibration at all vibration magnitudes from the threshold of vibration perception to the vibration
magnitudes associated with risks to health. This experimental study determined equivalent comfort contours for the whole-
body vibration of seated subjects over the frequency range 2–315Hz in each of the three orthogonal axes (fore-and-aft,
lateral and vertical). The contours were determined at vibration magnitudes from the threshold of perception to levels
associated with severe discomfort and risks to health.
At frequencies greater than 10Hz, thresholds for the perception of vertical vibration were lower than thresholds for fore-
and-aft and lateral vibration. At frequencies less than 4Hz, thresholds for vertical vibration were higher than thresholds
for fore-and-aft and lateral vibration. The rate of growth of sensation with increasing vibration magnitude was highly
dependent on the frequency and axis of vibration. Consequently, the shapes of the equivalent comfort contours depended
on vibration magnitude. At medium and high vibration magnitudes, the equivalent comfort contours were reasonably
consistent with the frequency weightings for vibration discomfort in current standards (i.e. Wb and Wd). At low vibration
magnitudes, the contours indicate that relative to lower frequencies the standards underestimate sensitivity at frequencies
greater than about 30Hz. The results imply that no single linear frequency weighting can provide accurate predictions of
discomfort caused by a wide range of magnitudes of whole-body vibration.
r 2006 Elsevier Ltd. All rights reserved.
1. Introduction
The EU Physical Agents Directive [1] requires the minimisation of risks from exposure to whole-bodyvibration. The Directive defines ‘exposure action values’ and ‘exposure limit values’ for fore-and-aft, lateral,and vertical vibration evaluated using frequency weightings defined in current standards. Dose–responserelationships between whole-body vibration and injury have not been established, so it is optimistic to assumethat the risk of injury can be estimated using any currently defined measure of vibration [2]. However,increases in vibration magnitude increase vibration discomfort and pain and can be assumed to increase therisks to health. In the absence of information to the contrary, the strength of sensation has been assumed to
ee front matter r 2006 Elsevier Ltd. All rights reserved.
v.2006.06.011
ing author. Tel.: +4423 80 592277; fax: +4423 80 592927.
ess: [email protected] (M. Morioka).
ARTICLE IN PRESSM. Morioka, M.J. Griffin / Journal of Sound and Vibration 298 (2006) 755–772756
reflect health risks, and knowledge of the relation between vibration and discomfort has greatly influenced thefrequency weightings used to estimate risks, and the minimisation of the risks, from exposures to whole-bodyvibration.
The discomfort produced by whole-body vibration is dependent on several factors, including the frequencyand the magnitude of the vibration [3]. The effect of the frequency of vibration on discomfort caused bywhole-body vibration has been investigated by determining equivalent comfort contours for seated persons[4–12]. There is some consistency between these studies (e.g. the overall shape of equivalent comfort contours),but also inconsistencies that may partially be explained by the use of different experimental methods, differentsitting postures, etc.
Previous studies have determined equivalent comfort contours over a range of vibration magnitudes, butthey have not systematically explored whether vibration magnitude affects the frequency-dependence of thecontours. Some of the differences between the contours obtained in the different studies may therefore arisefrom the different magnitudes of vibration that have been investigated. A magnitude-dependence in equivalentcomfort contours for hand-transmitted vibration has been partly explained by mediation via differentpsychophysical channels at different vibration magnitudes [13]. The perception of whole-body vibration ismore complex, involving several sensory systems (e.g., visual, vestibular, acoustic and somatosensory senses),and the mechanisms involved in the perception of whole-body vibration are less well understood than thoseinvolved in the perception of vibration applied to parts of the body.
The relation between physical stimuli and sensations is often expressed by Stevens’ power law [14], in whichthe ‘objective magnitude’, j, of the stimulus and the ‘subjective magnitude’, c, of the response are assumed tobe related by a power function:
c ¼ kjn. (1)
The value of the exponent, n, is assumed to be constant for each type of stimulus. For typical magnitudes ofvertical whole-body vibration, values of the exponent have been obtained at frequencies over frequency range2–80Hz [6,11,15–17]. Miwa [15] determined exponents for 5, 20 and 60Hz and reported a reduction in theexponent with an increase in vibration magnitude, suggesting an exponent of 0.6 for vibration greater than1.0ms�2 rms and 0.46 for vibration less than 1.0ms�2 rms. Jones and Saunders [16] found a mean exponentranging from 0.88 to 0.99, but suggested that an exponent of 0.93 may be used to describe the response towhole-body vertical vibration from 5 to 80Hz. Shoenberger and Harris [6] determined exponents forfrequencies from 3.5 to 20Hz and found that the exponent at 5Hz was significantly greater than at 7, 15 and20Hz. Howarth and Griffin [11] investigated exponents for low magnitude (i.e., 0.04–0.4ms�2 rms) verticaland lateral whole-body vibration over the frequency range 4–63Hz and found no frequency dependence withvertical vibration but an increase with increasing frequency from 4 to 16Hz with horizontal vibration.
A frequency-dependence in the exponent indicates that the rate of growth of sensation varies withfrequency, and implies that the shapes of equivalent comfort contours depend on vibration magnitude. Thecurrently available results are insufficient to define any such magnitude-dependence, partly due to the limitedinvestigation of the rate of growth of sensation over the range of magnitudes from perception thresholds tomagnitudes associated with severe discomfort and risks to health.
The power law is sometimes written with an additive constant, j0, representing the threshold of perception[18], assuming no sensation below the perception threshold:
c ¼ kðj� j0Þn. (2)
The power law with the additive constant has proved useful in describing sensations caused by hand-transmitted vibration [13].
This paper reports an investigation of the effect of vibration magnitude (from the threshold of perception tomagnitudes associated with discomfort and risks to health) on equivalent comfort contours over the frequencyrange 2–315Hz for seated persons exposed to fore-and-aft, lateral and vertical whole-body vibration. It washypothesised that, within each of the three axes, the frequency-dependence of vibration discomfort would varywith vibration magnitude.
The study comprised two experiments. The first experiment determined absolute threshold contours in eachof the three translational axes (fore-and-aft, lateral and vertical). The second experiment determined the
ARTICLE IN PRESSM. Morioka, M.J. Griffin / Journal of Sound and Vibration 298 (2006) 755–772 757
strength of sensation caused by whole-body vibration in each of the three axes and allowed the calculation ofequivalent comfort contours.
2. Experiment 1: Perception thresholds
2.1. Method
2.1.1. Subjects
Three groups of male subjects participated in the study, with one group for each axis of vibration. Thesubjects in each group attended two experiments in which perception thresholds (Experiment 1) andjudgements of the strength of sensation (Experiment 2) were determined in either the fore-and-aft, lateral, orvertical direction. All subjects were students or office workers with no history of occupational exposure towhole-body vibration. The three groups of 12 males (total of 36 subjects) were aged between 21 and 29 yearswith a mean age of 24.8 years (standard deviation, SD ¼ 2.2), a mean stature of 177.3 cm (SD ¼ 7.2) and amean weight of 73.6 kg (SD ¼ 9.6) participated. The characteristics of the subjects in each group are shown inTable 1. There were no significant differences in age, weight or body stature between the three groups (Mann-Whitney, p40:1) (Table 2).
During the tests, subjects were exposed to white noise at 75 dB(A) via a pair of headphones to prevent themhearing the vibration and to assist their concentration on the vibration by masking any distracting sounds.
Both experiments were approved by the Human Experimentation Safety and Ethics Committee of theISVR, University of Southampton. Informed consent to participate in the experiments was given by allsubjects.
2.1.2. Apparatus
A Derritron VP180LS vibrator was employed to generate vertical vibration at the seat. A Derritron VP 85vibrator (coupled with a slip table, Kinball Industries, Inc.) was employed to generate fore-and-aft and lateralvibration at the seat.
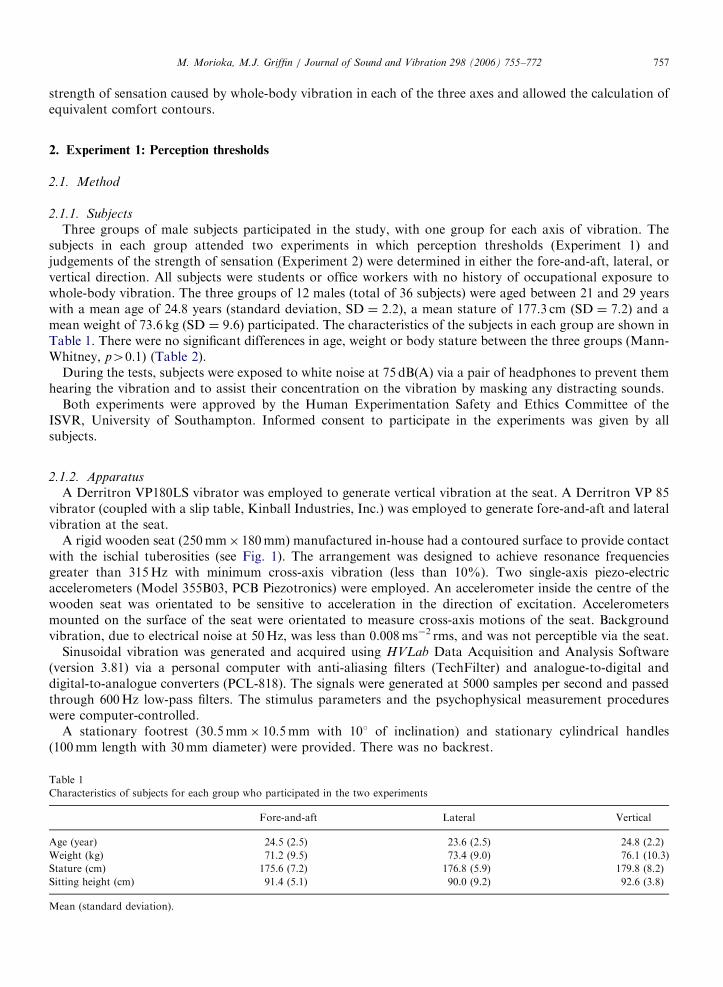
A rigid wooden seat (250mm� 180mm) manufactured in-house had a contoured surface to provide contactwith the ischial tuberosities (see Fig. 1). The arrangement was designed to achieve resonance frequenciesgreater than 315Hz with minimum cross-axis vibration (less than 10%). Two single-axis piezo-electricaccelerometers (Model 355B03, PCB Piezotronics) were employed. An accelerometer inside the centre of thewooden seat was orientated to be sensitive to acceleration in the direction of excitation. Accelerometersmounted on the surface of the seat were orientated to measure cross-axis motions of the seat. Backgroundvibration, due to electrical noise at 50Hz, was less than 0.008ms�2 rms, and was not perceptible via the seat.
Sinusoidal vibration was generated and acquired using HVLab Data Acquisition and Analysis Software(version 3.81) via a personal computer with anti-aliasing filters (TechFilter) and analogue-to-digital anddigital-to-analogue converters (PCL-818). The signals were generated at 5000 samples per second and passedthrough 600Hz low-pass filters. The stimulus parameters and the psychophysical measurement procedureswere computer-controlled.
A stationary footrest (30.5mm� 10.5mm with 101 of inclination) and stationary cylindrical handles(100mm length with 30mm diameter) were provided. There was no backrest.
Table 1
Characteristics of subjects for each group who participated in the two experiments
Fore-and-aft Lateral Vertical
Age (year) 24.5 (2.5) 23.6 (2.5) 24.8 (2.2)
Weight (kg) 71.2 (9.5) 73.4 (9.0) 76.1 (10.3)
Stature (cm) 175.6 (7.2) 176.8 (5.9) 179.8 (8.2)
Sitting height (cm) 91.4 (5.1) 90.0 (9.2) 92.6 (3.8)
Mean (standard deviation).
ARTICLE IN PRESS
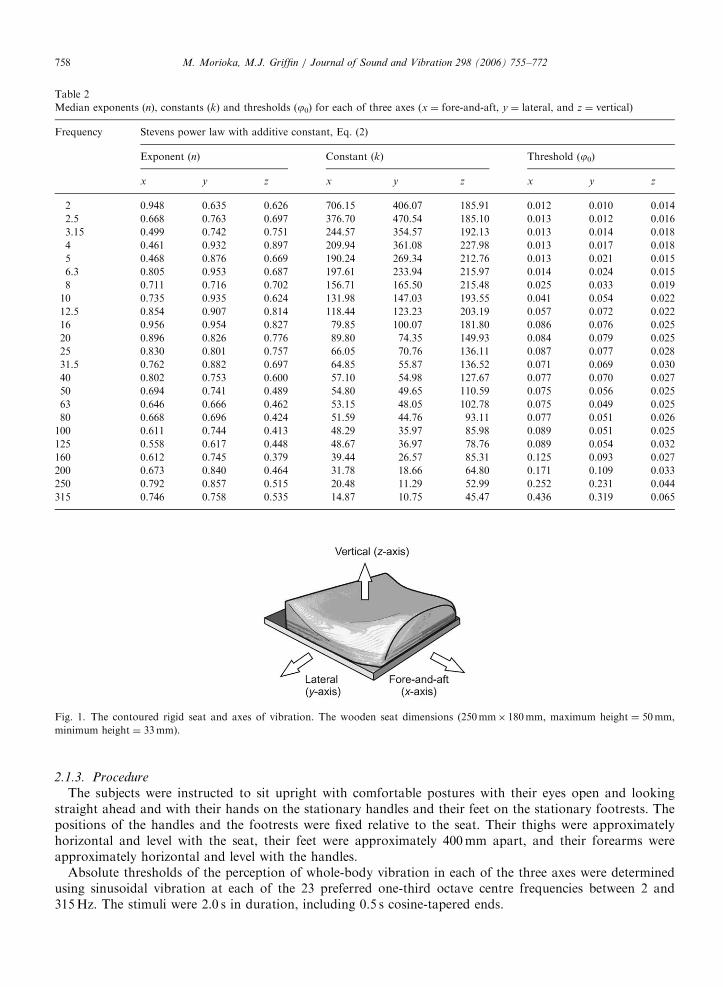
Table 2
Median exponents (n), constants (k) and thresholds (j0) for each of three axes (x ¼ fore-and-aft, y ¼ lateral, and z ¼ vertical)
Frequency Stevens power law with additive constant, Eq. (2)
Exponent (n) Constant (k) Threshold (j0)
x y z x y z x y z
2 0.948 0.635 0.626 706.15 406.07 185.91 0.012 0.010 0.014
2.5 0.668 0.763 0.697 376.70 470.54 185.10 0.013 0.012 0.016
3.15 0.499 0.742 0.751 244.57 354.57 192.13 0.013 0.014 0.018
4 0.461 0.932 0.897 209.94 361.08 227.98 0.013 0.017 0.018
5 0.468 0.876 0.669 190.24 269.34 212.76 0.013 0.021 0.015
6.3 0.805 0.953 0.687 197.61 233.94 215.97 0.014 0.024 0.015
8 0.711 0.716 0.702 156.71 165.50 215.48 0.025 0.033 0.019
10 0.735 0.935 0.624 131.98 147.03 193.55 0.041 0.054 0.022
12.5 0.854 0.907 0.814 118.44 123.23 203.19 0.057 0.072 0.022
16 0.956 0.954 0.827 79.85 100.07 181.80 0.086 0.076 0.025
20 0.896 0.826 0.776 89.80 74.35 149.93 0.084 0.079 0.025
25 0.830 0.801 0.757 66.05 70.76 136.11 0.087 0.077 0.028
31.5 0.762 0.882 0.697 64.85 55.87 136.52 0.071 0.069 0.030
40 0.802 0.753 0.600 57.10 54.98 127.67 0.077 0.070 0.027
50 0.694 0.741 0.489 54.80 49.65 110.59 0.075 0.056 0.025
63 0.646 0.666 0.462 53.15 48.05 102.78 0.075 0.049 0.025
80 0.668 0.696 0.424 51.59 44.76 93.11 0.077 0.051 0.026
100 0.611 0.744 0.413 48.29 35.97 85.98 0.089 0.051 0.025
125 0.558 0.617 0.448 48.67 36.97 78.76 0.089 0.054 0.032
160 0.612 0.745 0.379 39.44 26.57 85.31 0.125 0.093 0.027
200 0.673 0.840 0.464 31.78 18.66 64.80 0.171 0.109 0.033
250 0.792 0.857 0.515 20.48 11.29 52.99 0.252 0.231 0.044
315 0.746 0.758 0.535 14.87 10.75 45.47 0.436 0.319 0.065
Fig. 1. The contoured rigid seat and axes of vibration. The wooden seat dimensions (250mm� 180mm, maximum height ¼ 50mm,
minimum height ¼ 33mm).
M. Morioka, M.J. Griffin / Journal of Sound and Vibration 298 (2006) 755–772758
2.1.3. Procedure
The subjects were instructed to sit upright with comfortable postures with their eyes open and lookingstraight ahead and with their hands on the stationary handles and their feet on the stationary footrests. Thepositions of the handles and the footrests were fixed relative to the seat. Their thighs were approximatelyhorizontal and level with the seat, their feet were approximately 400mm apart, and their forearms wereapproximately horizontal and level with the handles.
Absolute thresholds of the perception of whole-body vibration in each of the three axes were determinedusing sinusoidal vibration at each of the 23 preferred one-third octave centre frequencies between 2 and315Hz. The stimuli were 2.0 s in duration, including 0.5 s cosine-tapered ends.
ARTICLE IN PRESSM. Morioka, M.J. Griffin / Journal of Sound and Vibration 298 (2006) 755–772 759
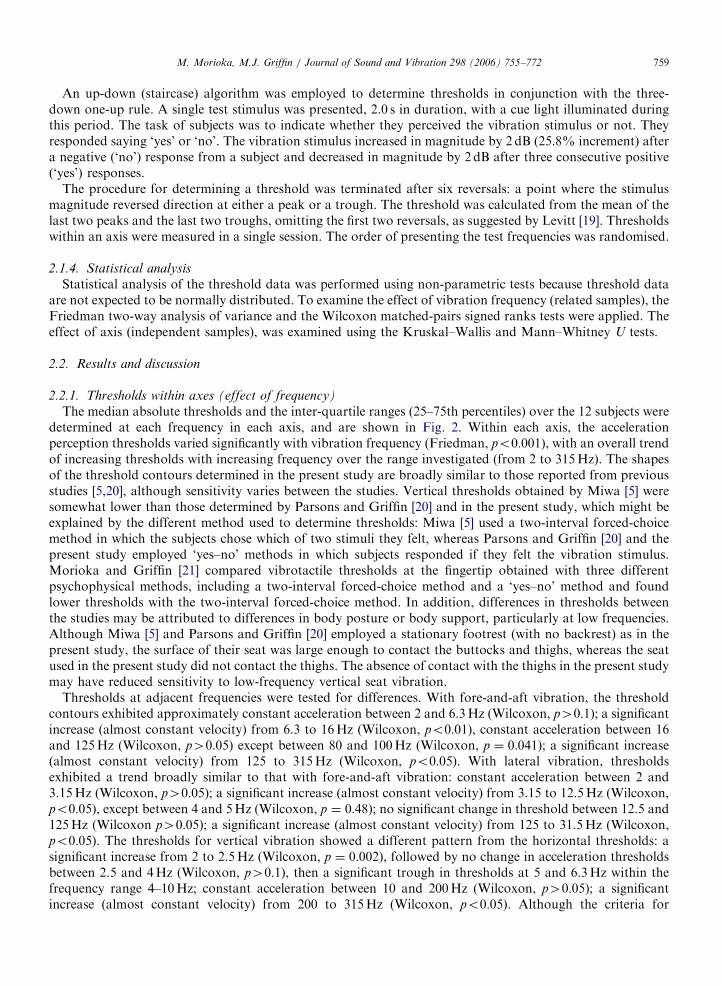
An up-down (staircase) algorithm was employed to determine thresholds in conjunction with the three-down one-up rule. A single test stimulus was presented, 2.0 s in duration, with a cue light illuminated duringthis period. The task of subjects was to indicate whether they perceived the vibration stimulus or not. Theyresponded saying ‘yes’ or ‘no’. The vibration stimulus increased in magnitude by 2 dB (25.8% increment) aftera negative (‘no’) response from a subject and decreased in magnitude by 2 dB after three consecutive positive(‘yes’) responses.
The procedure for determining a threshold was terminated after six reversals: a point where the stimulusmagnitude reversed direction at either a peak or a trough. The threshold was calculated from the mean of thelast two peaks and the last two troughs, omitting the first two reversals, as suggested by Levitt [19]. Thresholdswithin an axis were measured in a single session. The order of presenting the test frequencies was randomised.
2.1.4. Statistical analysis
Statistical analysis of the threshold data was performed using non-parametric tests because threshold dataare not expected to be normally distributed. To examine the effect of vibration frequency (related samples), theFriedman two-way analysis of variance and the Wilcoxon matched-pairs signed ranks tests were applied. Theeffect of axis (independent samples), was examined using the Kruskal–Wallis and Mann–Whitney U tests.
2.2. Results and discussion
2.2.1. Thresholds within axes (effect of frequency)
The median absolute thresholds and the inter-quartile ranges (25–75th percentiles) over the 12 subjects weredetermined at each frequency in each axis, and are shown in Fig. 2. Within each axis, the accelerationperception thresholds varied significantly with vibration frequency (Friedman, po0:001), with an overall trendof increasing thresholds with increasing frequency over the range investigated (from 2 to 315Hz). The shapesof the threshold contours determined in the present study are broadly similar to those reported from previousstudies [5,20], although sensitivity varies between the studies. Vertical thresholds obtained by Miwa [5] weresomewhat lower than those determined by Parsons and Griffin [20] and in the present study, which might beexplained by the different method used to determine thresholds: Miwa [5] used a two-interval forced-choicemethod in which the subjects chose which of two stimuli they felt, whereas Parsons and Griffin [20] and thepresent study employed ‘yes–no’ methods in which subjects responded if they felt the vibration stimulus.Morioka and Griffin [21] compared vibrotactile thresholds at the fingertip obtained with three differentpsychophysical methods, including a two-interval forced-choice method and a ‘yes–no’ method and foundlower thresholds with the two-interval forced-choice method. In addition, differences in thresholds betweenthe studies may be attributed to differences in body posture or body support, particularly at low frequencies.Although Miwa [5] and Parsons and Griffin [20] employed a stationary footrest (with no backrest) as in thepresent study, the surface of their seat was large enough to contact the buttocks and thighs, whereas the seatused in the present study did not contact the thighs. The absence of contact with the thighs in the present studymay have reduced sensitivity to low-frequency vertical seat vibration.
Thresholds at adjacent frequencies were tested for differences. With fore-and-aft vibration, the thresholdcontours exhibited approximately constant acceleration between 2 and 6.3Hz (Wilcoxon, p40:1); a significantincrease (almost constant velocity) from 6.3 to 16Hz (Wilcoxon, po0:01), constant acceleration between 16and 125Hz (Wilcoxon, p40:05) except between 80 and 100Hz (Wilcoxon, p ¼ 0:041); a significant increase(almost constant velocity) from 125 to 315Hz (Wilcoxon, po0:05). With lateral vibration, thresholdsexhibited a trend broadly similar to that with fore-and-aft vibration: constant acceleration between 2 and3.15Hz (Wilcoxon, p40:05); a significant increase (almost constant velocity) from 3.15 to 12.5Hz (Wilcoxon,po0:05), except between 4 and 5Hz (Wilcoxon, p ¼ 0:48); no significant change in threshold between 12.5 and125Hz (Wilcoxon p40:05); a significant increase (almost constant velocity) from 125 to 31.5Hz (Wilcoxon,po0:05). The thresholds for vertical vibration showed a different pattern from the horizontal thresholds: asignificant increase from 2 to 2.5Hz (Wilcoxon, p ¼ 0:002), followed by no change in acceleration thresholdsbetween 2.5 and 4Hz (Wilcoxon, p40:1), then a significant trough in thresholds at 5 and 6.3Hz within thefrequency range 4–10Hz; constant acceleration between 10 and 200Hz (Wilcoxon, p40:05); a significantincrease (almost constant velocity) from 200 to 315Hz (Wilcoxon, po0:05). Although the criteria for
ARTICLE IN PRESS
0.01
0.1
1
0.1
Acc
eler
atio
n (m
s-2 r.
m.s
.)
0.01
0.1
0.001
1 10 100 1000
Frequency (Hz)
0.01
0.001
0.001
(a)
(b)
(c)
Fig. 2. Median absolute perception thresholds between 2 and 315Hz: (a) fore-and-aft, (b) lateral, (c) vertical. Error bars represent inter-
quartile range.
M. Morioka, M.J. Griffin / Journal of Sound and Vibration 298 (2006) 755–772760
significance in the above p-values were not adjusted for pair-wise multiple comparisons for repeated measures,it may be speculated from the trends in the results that changes in sensitivity to vibration reflected changes inthe sensory systems responsible for detecting vibration, such as visual, vestibular, acoustic, and somatosensorysenses. Griffin [3] suggested that the high-frequency thresholds arose from various end organs in the muscles,on the bones and near the surface of the body, whereas the low-frequency thresholds were likely to beassociated with vision, the vestibular system, and other cues to movement such as relative motion between theseat and footrest.
There was a tendency for negative correlations between thresholds and body stature (i.e. standing height),with the correlations significant with lateral vibration at 2Hz (Spearman, p ¼ 0:013) and with verticalvibration at 2 and 2.5Hz (Spearman, po0:05). This trend was consistent with the finding by Corbridge and
ARTICLE IN PRESS
1
Acc
eler
atio
n (m
s-2
r.m
.s.)
0.01
0.1
1 10 100 1000
Frequency (Hz)
LateralVertical
Fore-and-aft
0.001
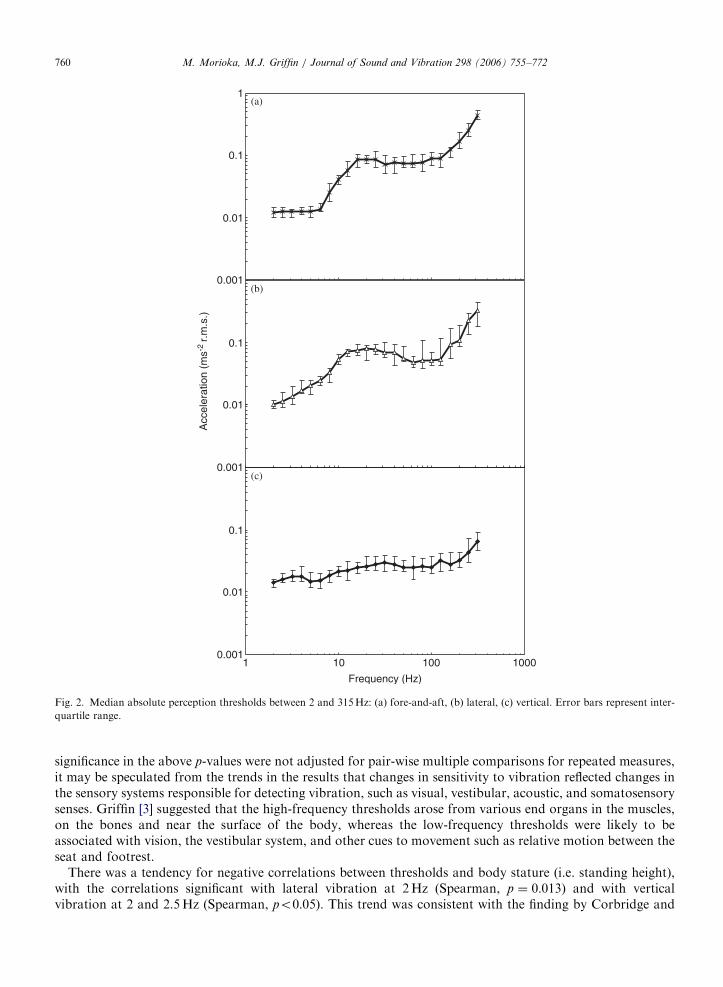
Fig. 3. Median perception threshold contours for the three axes. � : fore-and-aft, W: lateral, and ~: vertical.
M. Morioka, M.J. Griffin / Journal of Sound and Vibration 298 (2006) 755–772 761
Griffin [8], in which taller male subjects with longer legs were more sensitive to low-frequency verticalvibration at frequencies less than 2Hz.
2.2.2. Thresholds between axes (effect of axis)
The median absolute thresholds in the three axes (i.e. fore-and-aft, lateral, and vertical) are compared inFig. 3. The thresholds differed significantly between the three axes at all frequencies (Kruskal–Wallis, po0:05)except at the lowest frequency of 2Hz (Kruskal–Wallis, p ¼ 0:067).
To allow for multiple-comparisons between the three axes, the significance criterion for two independentsamples (Mann–Whitney tests) reported below were adjusted to p ¼ 0:05=3 (0.017). At frequencies greaterthan 10Hz, the body was most sensitive to vertical vibration: vertical thresholds were significantly lower thanfore-and-aft thresholds and lateral thresholds at all frequencies between 10 and 315Hz (Mann–Whitney,po0:017). In contrast, at frequencies less than 3.15Hz, sensitivity to vertical vibration was less than sensitivityto fore-and-aft vibration (Mann–Whitney, po0:017). The greater sensitivity to vertical vibration thanhorizontal vibration at high frequencies may be explained, at least partially, by greater transmission of high-frequency vertical vibration to the head [22,23].
Thresholds for fore-and-aft and lateral vibration were similar across the frequency range, except between 4and 6.3Hz where fore-and-aft thresholds were lower than lateral thresholds (Mann–Whitney, po0:017).Similar thresholds for fore-and-aft and lateral vibration of seated subjects across the range 2–100Hz (apartfrom 16Hz) have also been reported by Parsons and Griffin [20].
3. Experiment 2: Equivalent comfort contours
3.1. Method
3.1.1. Subjects
Three groups of male subjects participated in the study, with one group for each axis of vibration (i.e. fore-and-aft, lateral or vertical axis). The subjects who participated in Experiment 1 also took part in Experiment 2.The characteristics of the subjects in each group are shown in Table 1.
3.1.2. Apparatus
All apparatus, including the signal generation and signal acquisition, were the same as employed inExperiment 1.
ARTICLE IN PRESSM. Morioka, M.J. Griffin / Journal of Sound and Vibration 298 (2006) 755–772762
3.1.3. Procedure
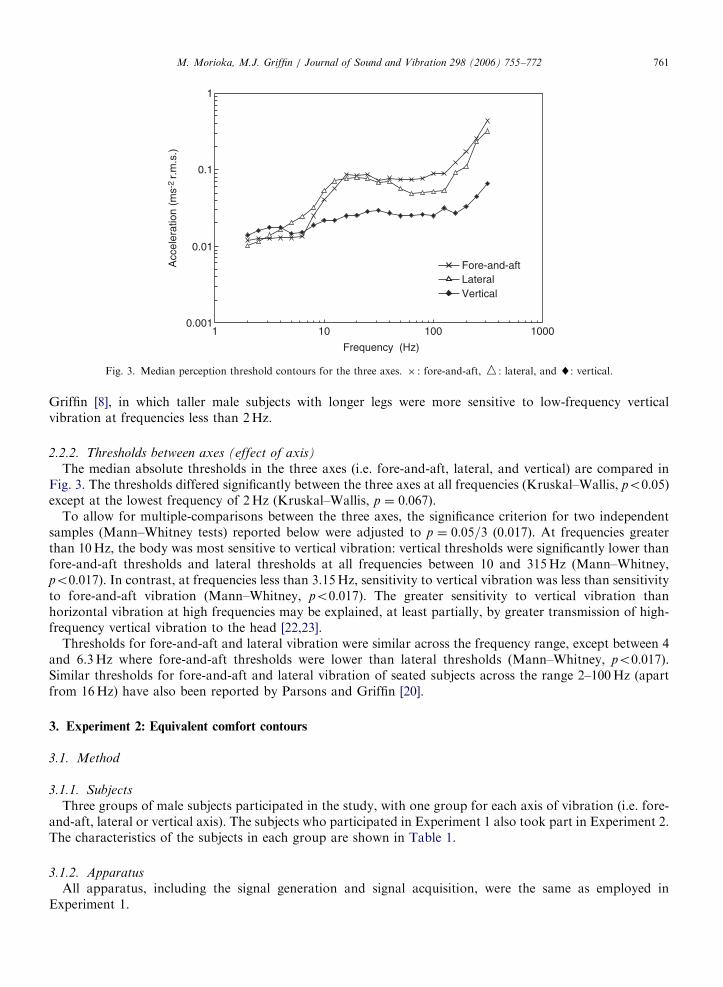
Subjects adopted the same sitting posture as specified in Experiment 1. The subjects judged the discomfortcaused by sinusoidal whole-body vibration in each of the three axes (fore-and-aft, lateral and vertical) at the 23preferred one-third octave centre frequencies between 2 and 315Hz. The stimuli lasted 2.0 s, including 0.5 scosine-tapered ends. The motions varied in velocity from 0.02 to 1.25ms�1 rms in 3 dB steps. The range ofstimulus magnitudes varied between the axes, so as to ensure that the stimuli were above the absoluteperception thresholds but not likely to be considered excessively unpleasant. The acceleration ranges of thetest stimuli are shown in Fig. 4.
The method of magnitude estimation [14] was employed to determine judgements of discomfort caused bythe vibration. Pairs of motions, a 2 s reference motion and a 2 s test motion, were presented with a 1.0 sinterval. The reference motion was fixed with a frequency of 20Hz and a magnitude of 0.5ms�2 rms forvertical (z-axis) vibration, and a frequency of 20Hz and a magnitude of 1.0ms�2 rms for horizontal vibration(in the x- and y-axis). The subjects were asked to assign a number representing the discomfort of the testmotion relative to the discomfort of the reference motion, assuming the discomfort of the reference motioncorresponded to ‘100’. The order of presenting the magnitudes and frequencies of the test motions wascompletely random. Subjects were able to ask for a pair of stimuli to be repeated if they were unsure of theirjudgment. They were instructed to indicate ‘no sensation’ if the test stimulus was not perceived. A small cuelight was illuminated during the presentation of the reference and the test stimuli.
Prior to commencing the experiment, subjects practiced magnitude estimation by judging the lengths of linesdrawn on paper and by judging a few selected vibration stimuli. This provided an opportunity to check thatthey understood the procedure and also familiarised them with the type of vibration stimuli. Each subjectreceived all the vibration stimuli in one axis of excitation in a single session, with short breaks every 35 pairs.
There were a few stimuli at low magnitudes that were not perceived by all subjects. The stimuli not felt by asubject were not included in the analysis of the subject’s judgements.
3.1.4. Statistical analysis
Statistical analysis of the rate of growth of sensation was performed using the same non-parametric tests asdescribed for Experiment 1.
0.01
0.1
1
10
100
1 10 100 1000
Frequency (Hz)
Acc
eler
atio
n (m
s-2 r.
m.s
.)
Fig. 4. Range of vibration magnitudes used for the method of magnitude estimation in Experiment 2. : horizontal axis upper limit,
: vertical axis upper limit, : horizontal axis lower limit, and : vertical axis lower limit.
ARTICLE IN PRESSM. Morioka, M.J. Griffin / Journal of Sound and Vibration 298 (2006) 755–772 763
3.2. Results and discussion
3.2.1. Growth of sensation
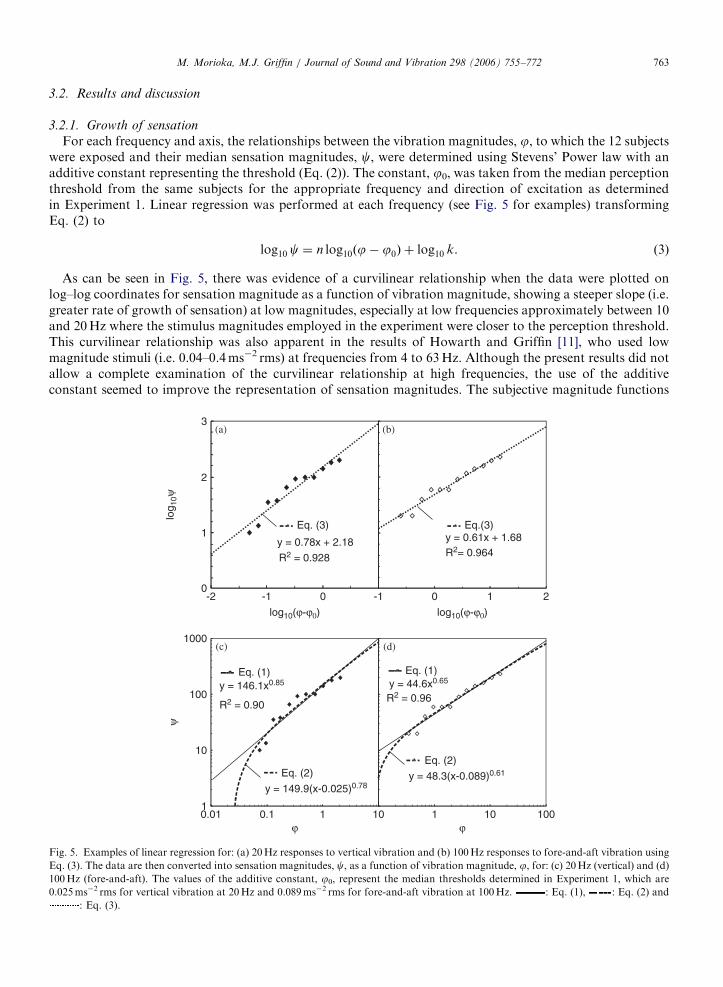
For each frequency and axis, the relationships between the vibration magnitudes, j, to which the 12 subjectswere exposed and their median sensation magnitudes, c, were determined using Stevens’ Power law with anadditive constant representing the threshold (Eq. (2)). The constant, j0, was taken from the median perceptionthreshold from the same subjects for the appropriate frequency and direction of excitation as determinedin Experiment 1. Linear regression was performed at each frequency (see Fig. 5 for examples) transformingEq. (2) to
log10 c ¼ n log10ðj� j0Þ þ log10 k. (3)
As can be seen in Fig. 5, there was evidence of a curvilinear relationship when the data were plotted onlog–log coordinates for sensation magnitude as a function of vibration magnitude, showing a steeper slope (i.e.greater rate of growth of sensation) at low magnitudes, especially at low frequencies approximately between 10and 20Hz where the stimulus magnitudes employed in the experiment were closer to the perception threshold.This curvilinear relationship was also apparent in the results of Howarth and Griffin [11], who used lowmagnitude stimuli (i.e. 0.04–0.4ms�2 rms) at frequencies from 4 to 63Hz. Although the present results did notallow a complete examination of the curvilinear relationship at high frequencies, the use of the additiveconstant seemed to improve the representation of sensation magnitudes. The subjective magnitude functions
1
10
100
1000
0.1 1
0
1
2
3
-2 -1 0
log 1
0ψψ
ϕ0.01
log10(ϕ-ϕ0)
y = 0.78x + 2.18
1
-1 20
ϕ100
(a) (b)
y = 0.61x + 1.68
R2 = 0.928 R2= 0.964
1010
Eq. (3) Eq.(3)
Eq. (1)
(c)
y = 146.1x0.85
R2 = 0.90
y = 149.9(x-0.025)0.78
Eq. (2)Eq. (2)
y = 48.3(x-0.089)0.61
Eq. (1)
(d)
y = 44.6x0.65
R2 = 0.96
1
log10(ϕ-ϕ0)
Fig. 5. Examples of linear regression for: (a) 20Hz responses to vertical vibration and (b) 100Hz responses to fore-and-aft vibration using
Eq. (3). The data are then converted into sensation magnitudes, c, as a function of vibration magnitude, j, for: (c) 20Hz (vertical) and (d)
100Hz (fore-and-aft). The values of the additive constant, j0, represent the median thresholds determined in Experiment 1, which are
0.025ms�2 rms for vertical vibration at 20Hz and 0.089ms�2 rms for fore-and-aft vibration at 100Hz. : Eq. (1), : Eq. (2) and
: Eq. (3).
ARTICLE IN PRESSM. Morioka, M.J. Griffin / Journal of Sound and Vibration 298 (2006) 755–772764
had lower slopes when using an additive constant than when using Stevens’ power law without the additiveconstant. Moreover, the coefficients of determination, R2, determined using the power law with the additiveconstant are mostly higher (20 out of 23 frequencies) than those determined with Stevens’ power law withoutthe additive constant. A similar trend was found by Morioka and Griffin [13] with hand-transmitted vibration.
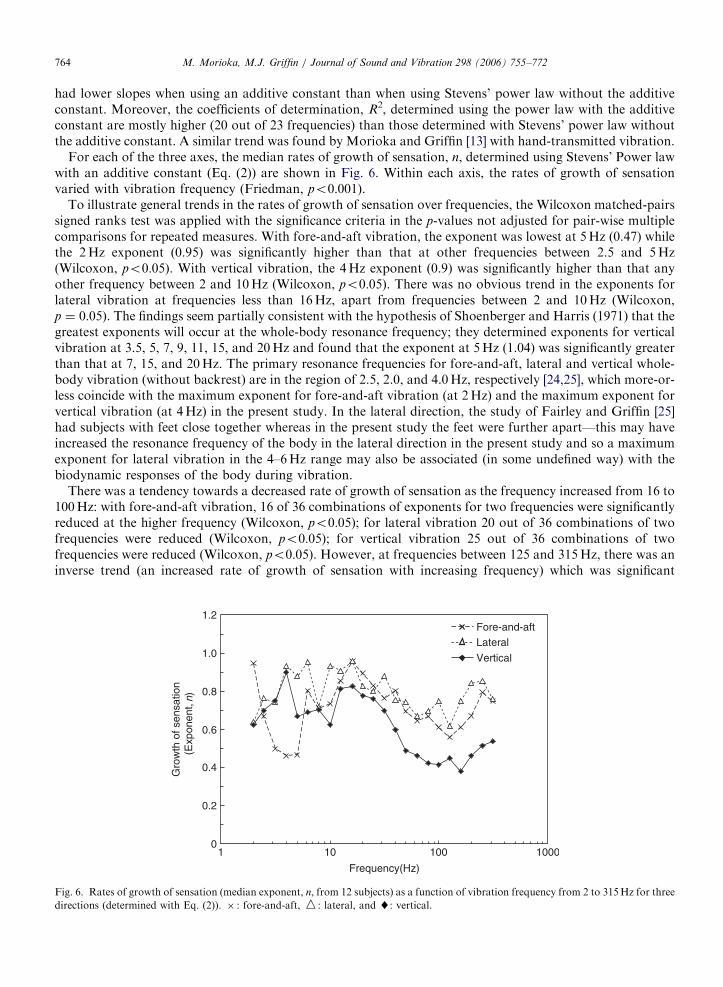
For each of the three axes, the median rates of growth of sensation, n, determined using Stevens’ Power lawwith an additive constant (Eq. (2)) are shown in Fig. 6. Within each axis, the rates of growth of sensationvaried with vibration frequency (Friedman, po0:001).
To illustrate general trends in the rates of growth of sensation over frequencies, the Wilcoxon matched-pairssigned ranks test was applied with the significance criteria in the p-values not adjusted for pair-wise multiplecomparisons for repeated measures. With fore-and-aft vibration, the exponent was lowest at 5Hz (0.47) whilethe 2Hz exponent (0.95) was significantly higher than that at other frequencies between 2.5 and 5Hz(Wilcoxon, po0:05). With vertical vibration, the 4Hz exponent (0.9) was significantly higher than that anyother frequency between 2 and 10Hz (Wilcoxon, po0:05). There was no obvious trend in the exponents forlateral vibration at frequencies less than 16Hz, apart from frequencies between 2 and 10Hz (Wilcoxon,p ¼ 0:05). The findings seem partially consistent with the hypothesis of Shoenberger and Harris (1971) that thegreatest exponents will occur at the whole-body resonance frequency; they determined exponents for verticalvibration at 3.5, 5, 7, 9, 11, 15, and 20Hz and found that the exponent at 5Hz (1.04) was significantly greaterthan that at 7, 15, and 20Hz. The primary resonance frequencies for fore-and-aft, lateral and vertical whole-body vibration (without backrest) are in the region of 2.5, 2.0, and 4.0Hz, respectively [24,25], which more-or-less coincide with the maximum exponent for fore-and-aft vibration (at 2Hz) and the maximum exponent forvertical vibration (at 4Hz) in the present study. In the lateral direction, the study of Fairley and Griffin [25]had subjects with feet close together whereas in the present study the feet were further apart—this may haveincreased the resonance frequency of the body in the lateral direction in the present study and so a maximumexponent for lateral vibration in the 4–6Hz range may also be associated (in some undefined way) with thebiodynamic responses of the body during vibration.
There was a tendency towards a decreased rate of growth of sensation as the frequency increased from 16 to100Hz: with fore-and-aft vibration, 16 of 36 combinations of exponents for two frequencies were significantlyreduced at the higher frequency (Wilcoxon, po0:05); for lateral vibration 20 out of 36 combinations of twofrequencies were reduced (Wilcoxon, po0:05); for vertical vibration 25 out of 36 combinations of twofrequencies were reduced (Wilcoxon, po0:05). However, at frequencies between 125 and 315Hz, there was aninverse trend (an increased rate of growth of sensation with increasing frequency) which was significant
1.2
Gro
wth
of s
ensa
tion
(Exp
onen
t,
1 10 100 1000
Frequency(Hz)
0.2
0.4
0.6
0.8
1.0
0
Lateral
Vertical
Fore-and-aft
n)
Fig. 6. Rates of growth of sensation (median exponent, n, from 12 subjects) as a function of vibration frequency from 2 to 315Hz for three
directions (determined with Eq. (2)). � : fore-and-aft, W: lateral, and ~: vertical.
ARTICLE IN PRESSM. Morioka, M.J. Griffin / Journal of Sound and Vibration 298 (2006) 755–772 765
between 125 and 160Hz for fore-and-aft vibration (Wilcoxon, p ¼ 0:019), significant between 125 and 200Hzfor lateral vibration (Wilcoxon, p ¼ 0:006), and significant between 160 and 250Hz and 160 and 315Hz forvertical vibration (Wilcoxon, po0:05). There was no significant difference in the rate of growth between 250and 315Hz in any of the three axes. No combinations of exponents for two frequencies showed a significantincrease in the rate of growth with increasing frequency. Other studies have found little evidence of afrequency-dependence in the exponent within the frequency range from 16 to 80Hz, but no study hasinvestigated exponents for whole-body vibration at frequencies greater than 80Hz. Miwa [15] determined theexponent for vertical and horizontal vibration at 5, 20, and 60Hz and found no difference between thefrequencies. Jones and Saunders [16] also found no significant difference in the exponent for vertical vibrationin the frequency range 5–80Hz, although the mean exponents showed a slight decrease with increasingfrequency from 10Hz (slope of 0.96) to 80Hz (slope of 0.9). Howarth and Griffin [11] found relatively highexponent values and no frequency-dependence for either vertical or lateral vibration at frequencies between 16and 63Hz, but for lateral vibration there was a tendency for the exponent to increase (from 0.68 to 1.99) withincreasing frequency from 4 to 16Hz. They explained the increase in the slope with frequency as an effect ofmagnitude rather than frequency: greater slopes may have arisen from lower subjective magnitudes that fell onthe steeper section of the curve. The magnitude range employed by Jones and Saunders [16](0.35–1.41ms�2 rms from 5 to 80Hz) and Howarth and Griffin [11] (0.04–0.4ms�2 rms from 4 to 63Hz)show little overlap, whereas the present study almost covered both magnitude ranges. The comfort contoursdetermined from the present study were derived from curvilinear regression (Stevens’ power law with anadditive constant for the threshold), whereas others have employed linear regression (Stevens’ power lawwithout a constant representing the threshold). The subjective magnitudes determined by Howarth and Griffin[11] probably fell into the lower section of the curve (where the slope is greater) while the subjectivemagnitudes determined by Jones and Saunders [16] probably fell into the higher section of the curve (where theslope is reduced). This is consistent with Jones and Saunders finding lower exponents than Howarth andGriffin. A greater mean exponent found by Howarth and Griffin for lateral vibration than vertical vibration atfrequencies from 16 to 63Hz is consistent with the difference between axes found in the present study.
With hand-transmitted vibration, similar to the present study, a progressive decrease in the exponent hasbeen found as the frequency increases from 20Hz in each of the three axes [13]. At frequencies greater thanabout 16Hz, subject judgements of whole-body vibration are unlikely to have been influenced by visual orvestibular stimulation, so it may be speculated that their judgements arose from stimulation of thesomatosensory system, which is also responsible for the perception of hand-transmitted vibration. Althoughdifferent channels of the somatosensory system may be involved in the perception of whole-body vibrationand hand-transmitted vibration, the similar trends in the exponents (apart from frequencies greater than125Hz) suggests some similarities. An understanding of the frequency-dependence and axis-dependence of theexponent awaits further study.
3.2.2. Equivalent comfort contours
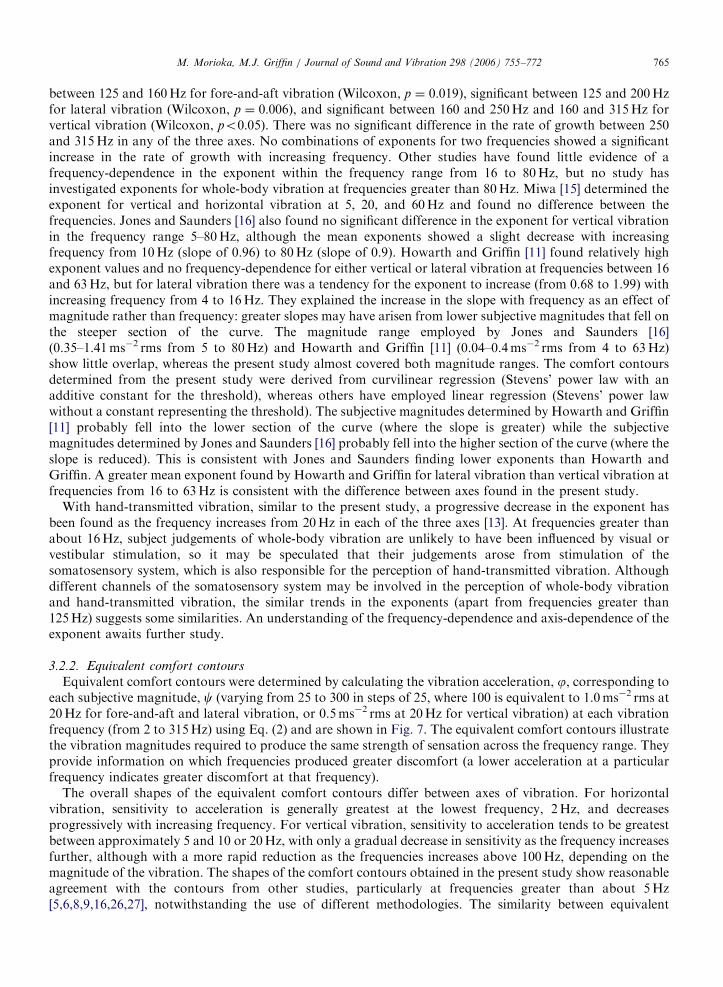
Equivalent comfort contours were determined by calculating the vibration acceleration, j, corresponding toeach subjective magnitude, c (varying from 25 to 300 in steps of 25, where 100 is equivalent to 1.0ms�2 rms at20Hz for fore-and-aft and lateral vibration, or 0.5ms�2 rms at 20Hz for vertical vibration) at each vibrationfrequency (from 2 to 315Hz) using Eq. (2) and are shown in Fig. 7. The equivalent comfort contours illustratethe vibration magnitudes required to produce the same strength of sensation across the frequency range. Theyprovide information on which frequencies produced greater discomfort (a lower acceleration at a particularfrequency indicates greater discomfort at that frequency).
The overall shapes of the equivalent comfort contours differ between axes of vibration. For horizontalvibration, sensitivity to acceleration is generally greatest at the lowest frequency, 2Hz, and decreasesprogressively with increasing frequency. For vertical vibration, sensitivity to acceleration tends to be greatestbetween approximately 5 and 10 or 20Hz, with only a gradual decrease in sensitivity as the frequency increasesfurther, although with a more rapid reduction as the frequencies increases above 100Hz, depending on themagnitude of the vibration. The shapes of the comfort contours obtained in the present study show reasonableagreement with the contours from other studies, particularly at frequencies greater than about 5Hz[5,6,8,9,16,26,27], notwithstanding the use of different methodologies. The similarity between equivalent
ARTICLE IN PRESS
0.01
0.1
0.1
Acc
eler
atio
n (m
s-2 r.
m.s
.)
0.01
0.1
0.01
1 10 100 1000
Frequency (Hz)
1
10
100
1
10
1
10
25
50
100
200300
Perceptionthreshold
(c)
(b)
(a)
Fig. 7. Equivalent comfort contours for sensation magnitudes from 25 to 300 relative to a vibration magnitude of 1.0ms�2 rms (fore-and-
aft and lateral vibration) or 0.5ms�2 rms (vertical vibration) at 20Hz from Eq. (2): (a) fore-and-aft, (b) lateral, (c) vertical. Median
absolute perception threshold contours for each axis as determined in Experiment 1 are also shown (solid line with symbols). Dotted lines
indicate the range of stimuli investigated in this study (equivalent comfort contours beyond these lines were determined by extrapolation of
the regression lines).
M. Morioka, M.J. Griffin / Journal of Sound and Vibration 298 (2006) 755–772766
comfort contours in the fore-and-aft and lateral directions in the present study is consistent with the results ofMiwa [5] and Griffin et al. [9]. At frequencies less than about 4Hz, some studies have produced contours withapproximately constant acceleration for horizontal vibration, but contours with increased acceleration (i.e.decreased sensitivity) with decreasing frequency for vertical vibration [5,8,9,26,28]. This differs somewhatfrom the present findings but may be explained by differences in the seating arrangements between studies.The stationary footrests and stationary handles employed in the present study are likely to have increased
ARTICLE IN PRESSM. Morioka, M.J. Griffin / Journal of Sound and Vibration 298 (2006) 755–772 767
sensitivity at low frequency due to producing relative movement between the seat and feet and between theseat and hands. Jang and Griffin [29] investigated discomfort caused by phase differences between the seat andthe feet in the vertical vibration. It was found that discomfort increased when the phase differences at the seatand the feet increased at frequencies less than about 4Hz. The effect was greatest at low magnitudes andreflected in greater exponents when the relative motion (caused by phase differences between the seat and thefeet) was greatest. The absence of thigh contact with the seat in the present study (due to the small size of theseat) may also have altered sensitivity to low-frequency vibration. Miwa [5] and Griffin et al. [9] employedstationary footrests, while Dupuis et al. [28], Donati et al. [26] and Corbridge and Griffin [8] employedfootrests that moved with the seat. None of these studies employed stationary handles, except Dupuis et al.[28] who provided a stationary guide wheel (steering wheel) to support the hands and arms of the subjects.
As a result of the change in the exponent with frequency, the shapes of the equivalent comfort contoursdepend on vibration magnitude. With increasing sensation magnitude, the comfort contours approximatecontours corresponding to constant velocity (i.e. acceleration increasing in proportion to frequency) within thefrequency range 2–315Hz for horizontal vibration and within the frequency range 16–315Hz for verticalvibration. With decreasing sensation magnitudes, the contours become similar to the absolute perceptionthresholds. This is particularly notable at frequencies greater than about 20Hz where the frequency-dependence of sensitivity to vibration changes from approximately constant velocity at high magnitudes to,very roughly, constant acceleration at low magnitudes. This magnitude-dependence changes the relativediscomfort produced by stimuli. For example, 4ms�2 rms fore-and-aft vibration produced more than doubleof strength of sensation at 20Hz than at 100Hz, whereas 0.4ms�2 rms, fore-and-aft vibration produced asimilar strength of sensation at 20 and 100Hz. The magnitude-dependence of the contours is less pronouncedwith lateral vibration than with the other two axes of vibration.
Few studies have determined equivalent comfort contours for low magnitudes of vibration. Howarth andGriffin [11] determined contours from power functions for vertical and lateral vibration at magnitudesbetween 0.04 and 0.4ms�2 rms within the frequency range 4–63Hz and Bellmann et al. [12] determinedequivalent comfort contours for vertical vibration of magnitudes between 0.03 to 0.32ms�2 rms within thefrequency range 12.5–63Hz. The comfort contours determined by Howarth and Griffin [11] and Bellmannet al. [12] are similar to those in the present study at similar magnitudes, and confirm the ‘flattening’ ofcomfort contours at low magnitudes of whole-body vibration.
4. General discussion
In each of the three axes, the perception threshold contours and the equivalent comfort contours indicatethat sensitivity to whole-body vibration is highly dependent on vibration frequency. This confirms the need forsome means of taking account of changes in sensitivity with frequency (e.g., a frequency weighting). BritishStandard 6841 [30] advocates the use of frequency weighting Wd for the evaluation of x- and y-axis whole-body vibration and frequency weighting Wb for the evaluation of z-axis whole-body vibration. The Wd
frequency weighting for horizontal acceleration is independent of frequency (a slope of 0 dB per octave)between 0.5 and 2Hz, and inversely proportional to frequency (i.e., �6 dB per octave) between 2 and 80Hz,indicating greatest sensitivity to acceleration at frequencies between 0.5 and 2Hz [30]. The Wb frequencyweighting for vertical acceleration is independent of frequency (0 dB per octave) between 0.5 and 2Hz,increases in proportion to frequency (+6dB per octave) between 2 and 5Hz, independent of frequency (0 dBper octave) between 5 and 16Hz, and decreases inversely proportional to frequency (�6 dB per octave)between 16 and 80Hz, indicating greatest sensitivity to acceleration at frequencies between 5 and 16Hz [30].The Wd and Wb frequency weightings were derived from equivalent comfort contours determined by Griffinet al. [10] over the frequency range 1–100Hz and by Corbridge and Griffin [8] over the range 0.5–5Hz.
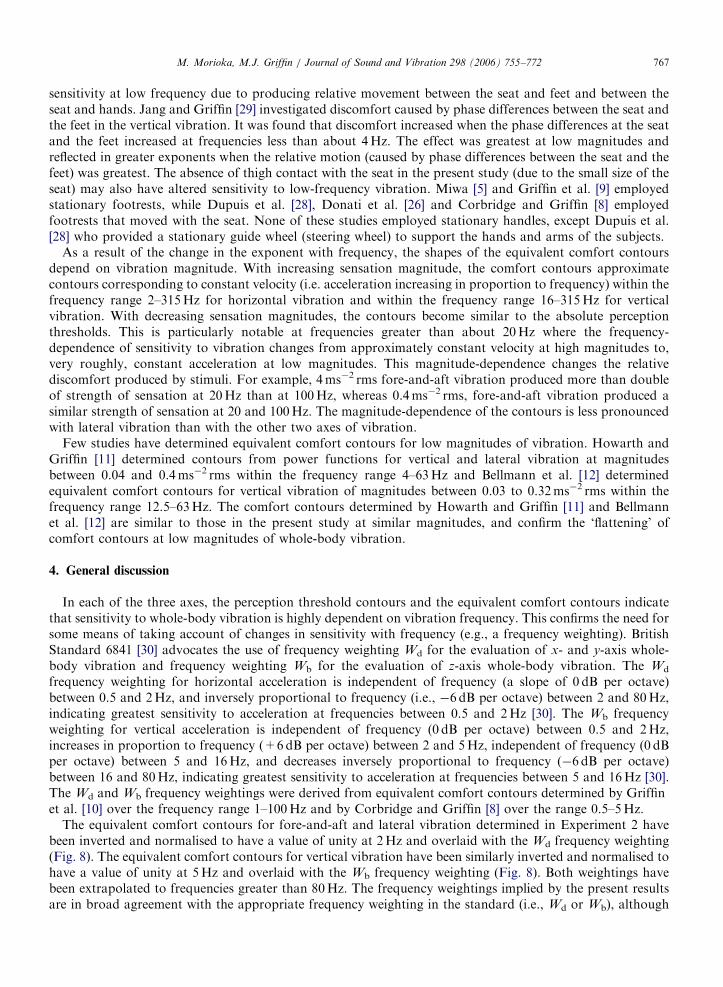
The equivalent comfort contours for fore-and-aft and lateral vibration determined in Experiment 2 havebeen inverted and normalised to have a value of unity at 2Hz and overlaid with the Wd frequency weighting(Fig. 8). The equivalent comfort contours for vertical vibration have been similarly inverted and normalised tohave a value of unity at 5Hz and overlaid with the Wb frequency weighting (Fig. 8). Both weightings havebeen extrapolated to frequencies greater than 80Hz. The frequency weightings implied by the present resultsare in broad agreement with the appropriate frequency weighting in the standard (i.e., Wd or Wb), although
ARTICLE IN PRESS
0.01
0.1
0.1
Fre
quen
cy w
eigh
ting
0.01
0.1
0.01
0.1 10 100 1000
Frequency (Hz)
1
1
1
10
(c)
(b)
(a)
50100150200250300
Wd
0.001
0.001
0.0011
Wb
Wd
Threshold
ψ
Fig. 8. Effect of vibration magnitude on frequency weightings (inverted equivalent comfort contours normalised at 2Hz for fore-and-aft
and lateral vibration and normalised at 5Hz for vertical vibration): (a) fore-and-aft, (b) lateral, (c) vertical. A sensation magnitude of 100
is equivalent to the discomfort produced by 1.0ms�2 rms (fore-and-aft and lateral vibration) or 0.5ms�2 rms (vertical vibration) at 20Hz.
The results are compared with the frequency weightings from BS 6841 [30]. : 50, : 100, : 150, : 200, : 250,
: 300, : threshold.
M. Morioka, M.J. Griffin / Journal of Sound and Vibration 298 (2006) 755–772768
there is a tendency for the standardised frequency weightings to underestimate discomfort at frequenciesgreater than about 30Hz (or, conversely, the frequency weightings Wd or Wb overestimate the sensationscaused by the lower frequencies).
International Standard 2631 [31] uses frequency weighting Wk for the evaluation of some types of verticalvibration—weighting Wk was based on the preference of some committee members rather than experimentalevidence. If frequency weighting Wk were used for evaluating vertical vibration at the seat, the underestimateof human sensitivity at higher frequencies is greater than when using frequency weighting Wb—consistent withthe widespread use of Wb for predicting comfort in the automotive and rail industries (e.g. ISO 2631-4 [32]).
ARTICLE IN PRESSM. Morioka, M.J. Griffin / Journal of Sound and Vibration 298 (2006) 755–772 769
Moreover, the underestimate of human sensitivity to high-frequency vibration is greater at lower sensationmagnitudes (i.e. vibration magnitudes closer to perception thresholds). For vertical vibration at frequenciesless than 5Hz, the present results differ from the Wb frequency weighting, but this may be explained by therelative movement between the seat and the feet arising from the use of a stationary footrest: decreasedsensitivity to vertical vibration is expected if the relative movement between the seat and feet was reduced bythe seat and the feet having the same vertical movement.
For assessing the health effects of whole-body vibration, the current EU Physical Agents Directive [1] forvibration defines an ‘exposure limit value’ and ‘exposure action value’, corresponding to 0.5 and 1.15ms�2 rmsfor 8 h daily exposures expressed as root-mean-square (rms) or vibration dose value (VDV). With bothmethods (i.e. rms and VDV), the exposure limit value and exposure action value increase with reductions inthe daily exposure duration. For 10min exposures, the rms exposure action value and the rms limit value are3.5 and 8.0ms�2 rms, respectively, whereas the VDV exposure action value and exposure limit value are 1.3and 3.1ms�2 rms, respectively. There are only a few studies of equivalent comfort contours at such highvibration magnitudes. Magid et al. [33] determined contours for human tolerance (for a short time, 2 and3min) of vertical vibration at frequencies from 3 to 20Hz. They found greatest sensitivity at frequenciesbetween 4 and 8Hz corresponding to about 5, 10 and 20ms�2 rms for 3 and 2minute and short timeexposures, respectively. Their contours suggest a relatively high sensitivity to frequencies in the 4–8Hz range(roughly as in ISO 2631, 1974), compared with the present and other studies with lower magnitudes (about 0.5and 2.0ms�2 rms) where greatest sensitivity is at frequencies over a broader range of frequencies betweenabout 5 and 16Hz. The Magid et al. [33] studies suggest that the magnitude-dependence of equivalent comfortcontours may occur at magnitudes greater than those studied here.
The magnitude-dependence of the equivalent comfort contours demonstrated in the present results implythat no single linear frequency weighting can provide an accurate prediction of subjective judgements ofdiscomfort caused by whole-body vibration over a range of vibration frequencies and magnitudes fromthreshold to levels associated discomfort and injury.
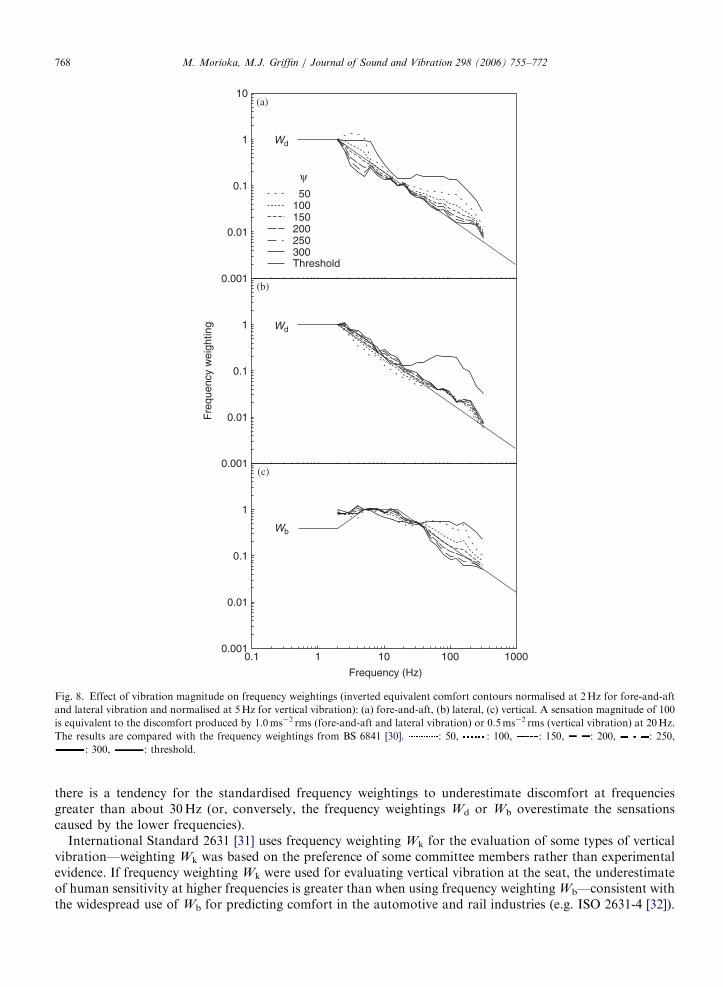
The frequency weightings calculated for the three axes of vibration are compared in Fig. 9 for low, medium,and high vibration magnitudes (equivalent to subjective magnitudes of 50, 100, 200, and 300), assuming aunity weighting at 2Hz for horizontal vibration and a unity weighting at 5Hz for vertical vibration (as in BSI6841 [30]). Experiment 2 did not directly investigate the equivalence of vibration discomfort between the threeaxes, but the weightings as drawn are consistent with equal sensitivity to whole-body horizontal and verticalvibration at 3.15Hz [30,31]. At any sensation magnitude, vertical vibration will have the greatest weightingamong the three axes at frequencies greater than about 4Hz. There was a similar, although not identical,pattern with perception thresholds for the three axes: at frequencies greater than 10Hz thresholds determinedin Experiment 1 were lower for vertical vibration (Fig. 3).
It seems likely that the variations in subjective judgements with vibration frequency, axis, and magnitudewill have been influenced by body dynamics, with greater discomfort arising when there was greatertransmission of vibration to the body. Griffin et al. [9] found strong correlations between equivalent comfortcontours and seat-to-head transmissibilities for vertical vibration at preferred one-third octave centrefrequencies from 1 to 100Hz. However, the equivalent comfort contours are not a simple reflection of thetransmissibility of the body: there was greater discomfort with high frequencies (greater than 10Hz) thanpredicted from the reciprocal of the seat-to-head transmissibility.
Increased transmission of vibration to the body is reflected in the apparent mass of the body. When seatedon a rigid flat surface with no backrest, the apparent mass of the body shows a first major resonance withvertical excitation at about 5Hz and a second resonance in the region of 10Hz [24]. In the fore-and-aft andlateral directions there are resonances at about 1.5 and 3Hz [25]. The present results show greatest subjectiveresponse to vertical vibration around 5–10Hz and greatest sensitivity to horizontal vibration around 2Hz,suggesting that the increased discomfort around these frequencies was associated with resonance of the body.
Non linearity in biodynamic responses to vertical vibration have been demonstrated in various studies (e.g.Refs. [24,34,35]), with greater vibration magnitudes producing reductions in the principal resonance frequencyof the apparent mass. This non linear biodynamic response may explain the magnitude-dependence of thecomfort contours at low frequencies in the present results. Matsumoto and Griffin [36] examined the effect ofvibration magnitude on both subjective and biodynamic responses to continuous and transient whole-body
ARTICLE IN PRESS
0.001
0.1
1
10
0.01
0.1
1
Fre
quen
cy w
eigh
ting
Fre
quen
cy w
eigh
ting
0.1 10 100
Frequency (Hz)
1 10 100 1000
Frequency (Hz)
WdWb
(a) (b)
(c) (d)
Fore-and-aftLateralVertical
WdWb
WdWb
WdWb
0.01
0.0011 0.1
Fig. 9. Effect of axis of vibration excitation on frequency weightings (inverted equivalent of comfort contours normalised at 2Hz for fore-
and-aft and lateral vibration and at 5Hz for vertical vibration) for sensation magnitudes of: (a) 50, (b) 100, (c) 200 and (d) 300. A sensation
magnitude of 100 is the equivalent discomfort produced by 1.0ms�2 rms (fore-and-aft and lateral vibration) or 0.5ms�2 rms (vertical
vibration) at 20Hz. The results are compared with the frequency weightings from BS 6841 [30]. : fore-and-aft, : lateral, :
vertical.
M. Morioka, M.J. Griffin / Journal of Sound and Vibration 298 (2006) 755–772770
vertical vibration in the frequency range 3.15–8.0Hz at three magnitudes (0.5, 1.0 and 2.0ms�2 rms). Withincreasing vibration magnitude, they found significant increases in discomfort at 3.15 and 4.0Hz relative to areference vibration at 5.0Hz, with the increases correlated with changes in the mechanical impedance of thebody at these frequencies, suggesting the nonlinearities in discomfort were partly caused by the nonlineardynamic response of the body. The magnitude-dependence of comfort contours at high frequencies (greaterthan about 30Hz) cannot currently be explained by this phenomenon.
5. Conclusions
When seated on a rigid surface with no backrest, thresholds for the perception of whole-body vibration ineach of the three axes (i.e. fore-and-aft, lateral and vertical) were highly dependent on vibration frequency, butwith an overall trend of increasing acceleration thresholds with increasing frequency from 2 to 315Hz. Atfrequencies greater than 10Hz, thresholds for vertical vibration were lower than those for horizontalvibration, whereas at frequencies less than 4Hz, thresholds for vertical vibration were higher than those forhorizontal vibration. Thresholds for fore-and-aft and lateral vibration were similar over the frequency rangeinvestigated.
The rates of growth of sensation within each of three axes of vibration (i.e. the exponent in Stevens’ Powerlaw when using an additive constant), were also dependent on vibration frequency. With low frequencies offore-and-aft and vertical vibration, the greatest exponent was obtained around the principal resonancefrequency of the body, whereas with high frequencies (16–315Hz) the dependence of the rate of growth ofsensation on vibration frequency was similar to that for hand-transmitted vibration.
Over the frequency range 2–315Hz, the equivalent comfort contours showed maximum sensitivity toacceleration between 5 and 10Hz for vertical vibration, and at 2Hz for both fore-and-aft and lateral vibration.Where comparison is possible, the present contours are consistent with contours obtained in previous studies.However, the present results show a magnitude-dependence in the equivalent comfort contours, particularlywith fore-and-aft and vertical vibration. At low vibration magnitudes, the equivalent comfort contours have asimilar frequency-dependence to perception thresholds. With increasing vibration magnitude, the equivalentcomfort contours approximate to contours of constant velocity within the frequency range 2–315Hz for
ARTICLE IN PRESSM. Morioka, M.J. Griffin / Journal of Sound and Vibration 298 (2006) 755–772 771
horizontal vibration and within the frequency range 16–315Hz for vertical vibration. The results areconsistent with knowledge of biodynamic responses to whole-body vibration.
The frequency weightings derived from the equivalent comfort contours are reasonably consistent with thefrequency weightings in current standards (Wb and Wd as in BS6841 [30]), while suggesting more sensitivity atfrequencies greater than about 30Hz. However, the magnitude-dependence in the equivalent comfort contoursmeans that no single linear frequency weighting can provide accurate predictions of subjective judgements ofdiscomfort caused by whole-body vibration.
References
[1] The European Parliament and the Council of the European Union, On the minimum health and safety requirements regarding the
exposure of workers to the risks arising from physical agents (vibration), Directive 2002/44/EC; Official Journal of the European
Communities, 6 July 2002; L177/13-19, 2002.
[2] M.J. Griffin, Minimum health and safety requirements for workers exposed to hand-transmitted vibration and whole-body vibration
in the European Union; a review, Occupational and Environmental Medicine 61 (2004) 387–397.
[3] M.J. Griffin, Handbook of Human Vibration, Academic Press, New York, 1990.
[4] H. Reiher, F.J. Meister, The sensitiveness of the human body to vibrations (Die Empfindlichkeit des Menschen gegen
Erschutterungen), Forschung (VDI), 2 (1931) 381–386. Translation, Report No. F-TS-616-RE (1946). Headquarters Air Material
Command, Writ Field, Dayton, Ohio.
[5] T. Miwa, Evaluation methods for vibration effect. I. Measurements of threshold and equal sensation contours of whole-body for
vertical and horizontal vibrations, Industrial Health 5 (1967) 183–205.
[6] R.W. Shoenberger, C.S. Harris, Psychophysical assessment of whole-body vibration, Human Factors 13 (1971) 41–50.
[7] D.J. Oborne, The stability of equal sensation contours for whole-body vibration, Ergonomics 21 (1978) 651–658.
[8] C. Corbridge, M.J. Griffin, Vibration and comfort: vertical and lateral motion in the range 0.5–5.0Hz, Ergonomics 29 (1986) 249–272.
[9] M.J. Griffin, E.M. Whitham, K.C. Parsons, Vibration and comfort I. Translational seat vibration, Ergonomics 25 (1982) 603–630.
[10] M.J. Griffin, K.C. Parsons, E.M. Whitham, Vibration and comfort IV. Application of experimental results, Ergonomics 25 (1982)
721–739.
[11] H.V.C. Howarth, M.J. Griffin, The frequency dependence of subjective reaction to vertical and horizontal whole-body vibration at
low magnitudes, Journal of the Acoustical Society of America 83 (1988) 1406–1413.
[12] M.A. Bellmann, V. Mellert, H. Remmers and R. Weber, Experiments on the perception of whole-body vibration, in: Proceedings of
the 35th UK Group Meeting on Human Response to Vibration, 13–15 September 2000, University of Southampton, 2000,
pp. 355–364.
[13] M. Morioka, M.J. Griffin, Magnitude-dependence of equivalent comfort contours for hand-transmitted vibration in three axes,
Journal of Sound and Vibration 295 (2006) 633–648.
[14] S.S. Stevens, Psychophysics, Introduction to its Perceptual, Neural and Social Prospects, Wiley, New York, 1975.
[15] T. Miwa, Evaluation methods for vibration effect—part 4. Measurements of vibration greatness for whole-body and hand in vertical
and horizontal vibrations, Industrial Health 6 (1968) 1–10.
[16] A.J. Jones, D.J. Saunders, A scale of human reaction to whole body, vertical, sinusoidal vibration, Journal of Sound and Vibration 35
(1974) 503–520.
[17] L.C. Fothergill, M.J. Griffin, The subjective magnitude of whole-body vibration, Ergonomics 20 (1977) 521–533.
[18] G. Ekman, A simple method for fitting psychophysical power functions, The Journal of Psychology 51 (1961) 343–350.
[19] H. Levitt, Transformed up-down methods in psychoacoustics, Journal of the Acoustical Society of America 49 (1971) 467–477.
[20] K.C. Parsons, M.J. Griffin, Whole-body vibration perception thresholds, Journal of Sound and Vibration 121 (1988) 237–258.
[21] M. Morioka, M.J. Griffin, Dependence of vibrotactile thresholds on the psychophysical measurement method, International Archives
of Occupational and Environmental Health 75 (2002) 78–84.
[22] G.S. Paddan, M.J. Griffin, The transmission of translational seat vibration to the head-I. Vertical seat vibration, Journal of
Biomechanics 21 (1988) 191–197.
[23] G.S. Paddan, M.J. Griffin, The transmission of translational seat vibration to the head-II. Horizontal seat vibration, Journal of
Biomechanics 21 (1988) 199–206.
[24] T.E. Fairley, M.J. Griffin, The apparent mass of the seated human body in the: vertical vibration, Journal of Biomechanics 22 (1989)
81–94.
[25] T.E. Fairley, M.J. Griffin, The apparent mass of the seated human body in the fore-and-aft and lateral directions, Journal of Sound
and Vibration 139 (1990) 299–306.
[26] P. Donati, A. Grosjean, P. Mistrot, L. Roure, The subjective equivalence of sinusoidal and random whole-body vibration in the
sitting position (an experimental study using the ‘floating reference vibration’ method), Ergonomics 26 (1983) 251–273.
[27] B. Griefahn, P. Brode, Comfort contours: inter-axis equivalence, Journal of Sound and Vibration 204 (1997) 85–97.
[28] H. Dupuis, E. Hartung, L. Louda, The effect of random vibrations of a limited frequency band compared with sinusoidal vibrations,
on human beings. R.A.E. Library translation 1603, 1972 (of Report from Max-Planck Institute for Agricultural Work and
Techniques, Bad Kreuznach).
ARTICLE IN PRESSM. Morioka, M.J. Griffin / Journal of Sound and Vibration 298 (2006) 755–772772
[29] H.-K. Jang, M.J. Griffin, Effect of phase, frequency, magnitude and posture on discomfort associated with differential vertical
vibration at the seat and feet, Journal of Sound and Vibration 229 (2000) 273–286.
[30] British Standards Institution BS 6841, Measurement and evaluation of human exposure to whole-body mechanical vibration and
repeated shock, 1987.
[31] International Organization for Standardization ISO 2631-1, Mechanical vibration and shock-evaluation of human exposure to whole-
body vibration—part 1: general requirements, 1997.
[32] International Organization for Standardization ISO 2631-4, Mechanical vibration and shock-evaluation of human exposure to whole-
body vibration—part 4: guidelines for the evaluation of the effects of vibration and rotational motion on passenger and crew comfort
in fixed guideway transport systems, 2001.
[33] E.B. Magid, R.R. Coermann, G.H. ZIegenruecker, Human tolerance to whole-body sinusoidal vibration, short-time, one-minute and
three-minute studies, Aerospace Medicine 31 (1960) 915–924.
[34] Y. Matsumoto, M.J. Griffin, Effect of muscle tension on non-linearities in the apparent masses of seated subjects exposed to vertical
whole-body vibration, Journal of Sound and Vibration 253 (2002) 77–92.
[35] N. Nawayseh, M.J. Griffin, Non-linear dual axis biodynamic response to vertical whole-body vibration, Journal of Sound and
Vibration 268 (2003) 503–523.
[36] Y. Matsumoto, M.J. Griffin, Nonlinear subjective and biodynamic responses to continuous and transient whole-body vibration in the
vertical direction, Journal of Sound and Vibration (2005).