Magnetic and fluorescent core-shell nanoparticles for ratiometric pH sensing
11
Magnetic and fluorescent core–shell nanoparticles for ratiometric pH sensing This article has been downloaded from IOPscience. Please scroll down to see the full text article. 2011 Nanotechnology 22 415501 (http://iopscience.iop.org/0957-4484/22/41/415501) Download details: IP Address: 94.134.192.89 The article was downloaded on 20/09/2011 at 09:10 Please note that terms and conditions apply. View the table of contents for this issue, or go to the journal homepage for more Home Search Collections Journals About Contact us My IOPscience
Transcript of Magnetic and fluorescent core-shell nanoparticles for ratiometric pH sensing

Magnetic and fluorescent core–shell nanoparticles for ratiometric pH sensing
This article has been downloaded from IOPscience. Please scroll down to see the full text article.
2011 Nanotechnology 22 415501
(http://iopscience.iop.org/0957-4484/22/41/415501)
Download details:
IP Address: 94.134.192.89
The article was downloaded on 20/09/2011 at 09:10
Please note that terms and conditions apply.
View the table of contents for this issue, or go to the journal homepage for more
Home Search Collections Journals About Contact us My IOPscience

IOP PUBLISHING NANOTECHNOLOGY
Nanotechnology 22 (2011) 415501 (10pp) doi:10.1088/0957-4484/22/41/415501
Magnetic and fluorescent core–shellnanoparticles for ratiometric pH sensingAlejandro Lapresta-Fernandez1,2, Tristan Doussineau1,3,Silvio Dutz4, Frank Steiniger5, Artur J Moro1,6
and Gerhard J Mohr7
1 Institute of Physical Chemistry, Friedrich-Schiller-University Jena, Lessingstrasse 10,07743 Jena, Germany2 Instituto de Ciencia de Materiales de Sevilla, centro mixto CSIC-Universidade Sevilla,Avenida Americo Vespucio 49, 41092, Sevilla, Spain3 Universite Lyon 1, CNRS, UMR 5579, LASIM, F-69622 Villeurbanne, France4 Institute of Photonic Technology, Department of Nano-Biophotonics, Jena, Germany5 Centre for Electron Microscopy of the Medical Faculty, Jena, Germany6 REQUIMTE, Departamento de Quımica, Faculdade de Ciencias e Tecnologia, UniversidadeNova de Lisboa, 2829-516 Caparica, Portugal7 Fraunhofer Research Institution for Modular Solid State Technologies, Department ofPolytronic Systems, Workgroup Sensor Materials, Josef-Engert-Straße 9, D-93053Regensburg, Germany
E-mail: [email protected]
Received 13 July 2011, in final form 23 August 2011Published 16 September 2011Online at stacks.iop.org/Nano/22/415501
AbstractThis paper describes the preparation of nanoparticles composed of a magnetic core surroundedby two successive silica shells embedding two fluorophores, showing uniform nanoparticle size(50–60 nm in diameter) and shape, which allow ratiometric pH measurements in the pH range5–8. Uncoated iron oxide magnetic nanoparticles (∼10 nm in diameter) were formed by thecoprecipitation reaction of ferrous and ferric salts. Then, they were added to a water-in-oilmicroemulsion where the hydrophilic silica shells were obtained through hydrolysis andcondensation of tetraethoxyorthosilicate together with the corresponding silylated dyederivatives—a sulforhodamine was embedded in the inner silica shell and used as the referencedye while a pH-sensitive fluorescein was incorporated in the outer shell as the pH indicator. Themagnetic nanoparticles were characterized using vibrating sample magnetometry, dynamic lightscattering, transmission electron microscopy, x-ray diffraction and Fourier transform infraredspectroscopy. The relationship between the analytical parameter, that is, the ratio offluorescence between the sensing and reference dyes versus the pH was adjusted to a sigmoidalfit using a Boltzmann type equation giving an apparent pKa value of 6.8. The fluorescenceintensity of the reference dye did not change significantly (∼3.0%) on modifying the pH of thenanoparticle dispersion. Finally, the proposed method was statistically validated against areference procedure using samples of water and physiological buffer with 2% of horse serum,indicating that there are no significant statistical differences at a 95% confidence level.
(Some figures in this article are in colour only in the electronic version)
1. Introduction
The development of core–shell nanostructures that combinethe magnetic properties of the core along with luminescentbehaviour was reported recently [1–6]. In a typicallyprocedure, metal nanoparticles are coated with a shell of silica
and doped with a suitable fluorophore [7–16]. This is a way toobtain bright systems based on luminescent silica NPs [17, 18]which was recently applied to biosensors [19], ATP [20], metaldetection [21] and pH [22] with a wide variety of fluorescentpH indicators [23]. The magnetic and fluorescent nanoparticlescan be used for analytical purposes [9], e.g. detection of
0957-4484/11/415501+10$33.00 © 2011 IOP Publishing Ltd Printed in the UK & the USA1
Nanotechnology 22 (2011) 415501 A Lapresta-Fernandez et al
cancer cells [24] and in diagnosis of infectious pathogens [25].In addition, they are expected to find broad applications inhigh-throughput multiplexed biomolecular assays [26], givingmultifunctionality at the nanoscale range. For all of theseapplications, the magnetic core enables targeting specific sitesof interest (in vivo or in reactors [27]) by means of theapplication of an external magnetic field. For the magneticguidance of the particles to their point of destination, a highmagnetic moment of the particles is advantageous. Beside thevolume of the particle, the magnetic moment is also dependenton the magnetization of the particle. Because the saturationmagnetization of magnetite is higher (Ms = 80–85 A m2 kg−1)than for maghemite (Ms = 60–70 A m2 kg−1) it seemsfavourable to use cores consisting of magnetite. Particles ofpure magnetite can be prepared only when oxygen is excludedfrom the reaction vessel. But due to the high specific surfacearea of nanoparticles, magnetite particles can be oxidized byatmospheric oxygen to maghemite—the thermodynamicallypreferred modification of the magnetic iron oxides.
In a parallel development, the core–shell approachhas been used to design ratiometric nanosensors [28–33],being explored as powerful tools for monitoring biologicalparameters which play a crucial role in medical sciences.The ratiometric measurement stems from two differentsignals, one from the reference dye, which gives the stablereference signal and the second one from the sensingfluorophore, signalling analyte binding. This ratiometricapproach improves the reliability in analyte detection whencompared to nanosensors based on indicator dyes only.The shells also protect the fluorophores against collisionalquenching, photodegradation and, in the case of silicashells, give a platform of amorphous material for furtherfunctionalization, providing a defined environment for easyconjugation to target biomolecules. Furthermore, the silicashell minimizes aggregation [34] involving discrete andmonodisperse particles smaller than 100 nm and decreases theisoelectric point of magnetite from pH 7 to pH 3, increasingthe nanoparticle stability in the neutral pH region [1, 35, 36].Recently, magnetic nanocrystals have been coated with silicashells in order to enhance their biocompatibility, whicheventually led to applications of these nanoparticles inbiosamples [37, 38], monitoring different aspects of cellularphysiology [39], as contrast agents in magnetic resonanceimaging (MRI) [40, 41] and as nanovehicles for drugs [42–45]or anticancer agents [46]. Furthermore, luminescent silicashells composed of different kinds of fluorophores [47, 48]have been developed, and combined with magnetic coresin order to obtain bifunctional nanosensors [49, 50]. Thefabrication of these nanosensors typically comprised varioussynthetic steps. First of all, magnetic iron oxide nanocrystalswere prepared by different approaches such as coprecipitatingferrous and ferric ions in aqueous solution or by thermaldecomposition of organometallic compounds, microemulsionsor under hydrothermal synthesis [51]. Then, the silicashell coating of these magnetic nanocrystals involved aseries of additional steps, which required long processsynthesis [52] and often tedious separation and purificationcycles. These cycles not only reduced the final material yield,
but also seriously impeded eventual industrial upscaling ofthe nanomaterials [40]. Therefore, after adding a magneticcore into the architecture of fluorescent NPs, it is possibleto magnetically move them to the place where the studyis desired, for sensing in the local environment. Amongthe numerous possibilities within this field, we exploredratiometric pH measurements [28, 29, 31, 33, 48].
Thus, this study describes the preparation and character-ization of new multilayer core–shell magnetic nanoparticles.In a first step, we synthesized iron oxide nanocrystalsin aqueous solution stabilized with citric acid (CA) by acoprecipitation method. Then, we used a one-pot water-in-oil reversed microemulsion method, controlling the additionof tetraethoxyorthosilicate (TEOS) to a dispersion of Fe3O4
nanocrystals. This dispersion is thereby homogeneouslyincorporated as cores into monodisperse silica nanoparticles.The microemulsion is a clear isotropic and thermodynamicallystable ternary system (water, oil, and a surfactant). Waternanodroplets formed in the bulk oil phase act as a reactionmedium for the formation of discrete nanoparticles. In the laststep, to enable ratiometric measurements, the two silica shellswere doped consecutively with two different fluorophores,without applying intermediate purification cycles. In the innershell there was embedded a silylated sulforhodamine, used as areference dye (necessary for ratiometric measurements), whilea silylated pH-sensitive fluorescein was incorporated in theouter shell as a pH indicator. Both dyes were covalently boundto silica shells to ensure reliable measurements of pH. Theprocedure was applied in the determination of pH in differentkinds of water and in physiological buffer adding 2% of horseserum. The results were statistically validated against the pHglass electrode as the reference.
2. Results and discussion
The chemical process used to fabricate the magnetic core–shell–shell luminescent nanoparticles is described in detail insection 4 and outlined in scheme 1.
For providing a stable dispersion in aqueous media,magnetic cores (nanocrystals) were coated with citric acid(CA), as it can be seen in section 2.4. CA was usedto prevent the aggregation of the particles because of thechemical adsorption of CA onto the iron oxide surface [53, 54].This allowed an electrostatic stabilization, decreasing theagglomeration tendency of the magnetic particles due to thestrong mutual electrostatic repulsion [55] in water. However,some large aggregates (120 nm) of particle clusters stillremained within the ferrofluid according to the TEM imageanalysis (figure 1(a)). The iron oxide nanocrystals werepurified via cycles of magnetic decantation followed bycentrifugation and ultrasonic redispersion in water. Thecollected material was a black macroscopically homogeneouspowder that readily followed a magnet as figure 1(b1) shows.Structural and magnetic measurements revealed a particle sizeof around 10 nm. According to x-ray diffraction studies (seesection 2.2), the synthesized iron oxide nanocrystals had ahigh concordance degree with the magnetite pattern peaks [56].After characterization of the magnetic nanocrystals, twodifferent amounts of them (1 and 10 mg) were added in
2
Nanotechnology 22 (2011) 415501 A Lapresta-Fernandez et al
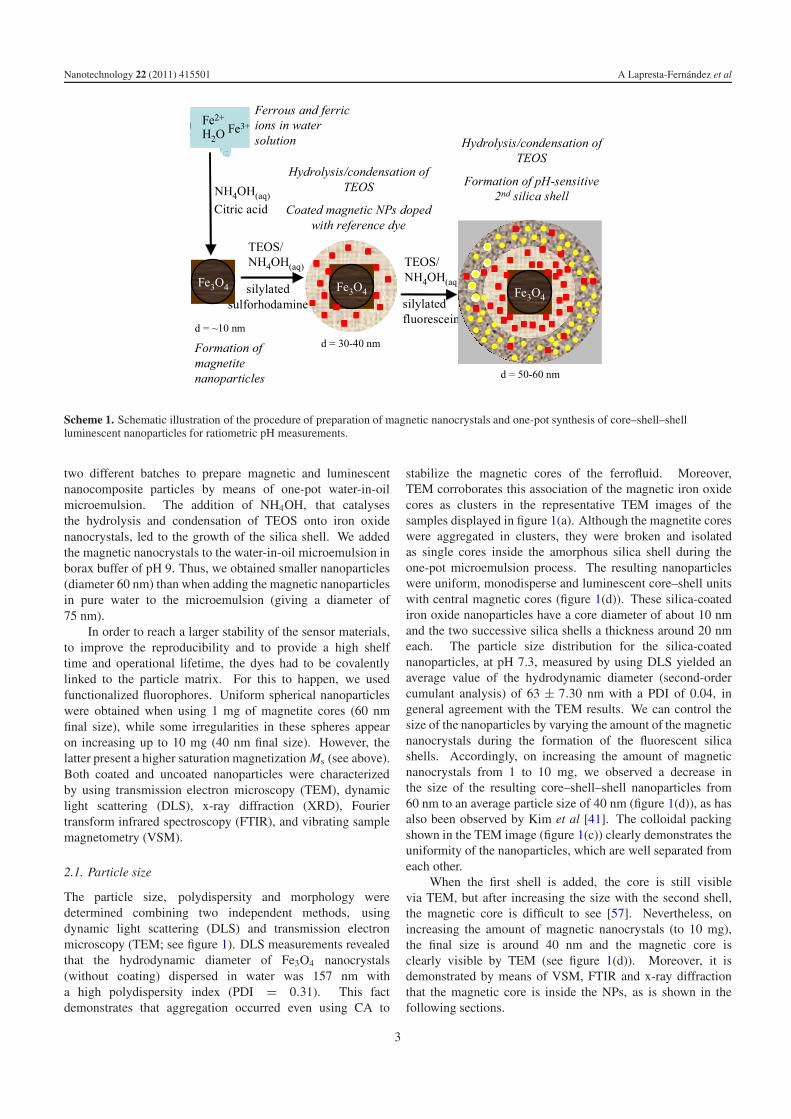
Scheme 1. Schematic illustration of the procedure of preparation of magnetic nanocrystals and one-pot synthesis of core–shell–shellluminescent nanoparticles for ratiometric pH measurements.
two different batches to prepare magnetic and luminescentnanocomposite particles by means of one-pot water-in-oilmicroemulsion. The addition of NH4OH, that catalysesthe hydrolysis and condensation of TEOS onto iron oxidenanocrystals, led to the growth of the silica shell. We addedthe magnetic nanocrystals to the water-in-oil microemulsion inborax buffer of pH 9. Thus, we obtained smaller nanoparticles(diameter 60 nm) than when adding the magnetic nanoparticlesin pure water to the microemulsion (giving a diameter of75 nm).
In order to reach a larger stability of the sensor materials,to improve the reproducibility and to provide a high shelftime and operational lifetime, the dyes had to be covalentlylinked to the particle matrix. For this to happen, we usedfunctionalized fluorophores. Uniform spherical nanoparticleswere obtained when using 1 mg of magnetite cores (60 nmfinal size), while some irregularities in these spheres appearon increasing up to 10 mg (40 nm final size). However, thelatter present a higher saturation magnetization Ms (see above).Both coated and uncoated nanoparticles were characterizedby using transmission electron microscopy (TEM), dynamiclight scattering (DLS), x-ray diffraction (XRD), Fouriertransform infrared spectroscopy (FTIR), and vibrating samplemagnetometry (VSM).
2.1. Particle size
The particle size, polydispersity and morphology weredetermined combining two independent methods, usingdynamic light scattering (DLS) and transmission electronmicroscopy (TEM; see figure 1). DLS measurements revealedthat the hydrodynamic diameter of Fe3O4 nanocrystals(without coating) dispersed in water was 157 nm witha high polydispersity index (PDI = 0.31). This factdemonstrates that aggregation occurred even using CA to
stabilize the magnetic cores of the ferrofluid. Moreover,TEM corroborates this association of the magnetic iron oxidecores as clusters in the representative TEM images of thesamples displayed in figure 1(a). Although the magnetite coreswere aggregated in clusters, they were broken and isolatedas single cores inside the amorphous silica shell during theone-pot microemulsion process. The resulting nanoparticleswere uniform, monodisperse and luminescent core–shell unitswith central magnetic cores (figure 1(d)). These silica-coatediron oxide nanoparticles have a core diameter of about 10 nmand the two successive silica shells a thickness around 20 nmeach. The particle size distribution for the silica-coatednanoparticles, at pH 7.3, measured by using DLS yielded anaverage value of the hydrodynamic diameter (second-ordercumulant analysis) of 63 ± 7.30 nm with a PDI of 0.04, ingeneral agreement with the TEM results. We can control thesize of the nanoparticles by varying the amount of the magneticnanocrystals during the formation of the fluorescent silicashells. Accordingly, on increasing the amount of magneticnanocrystals from 1 to 10 mg, we observed a decrease inthe size of the resulting core–shell–shell nanoparticles from60 nm to an average particle size of 40 nm (figure 1(d)), as hasalso been observed by Kim et al [41]. The colloidal packingshown in the TEM image (figure 1(c)) clearly demonstrates theuniformity of the nanoparticles, which are well separated fromeach other.
When the first shell is added, the core is still visiblevia TEM, but after increasing the size with the second shell,the magnetic core is difficult to see [57]. Nevertheless, onincreasing the amount of magnetic nanocrystals (to 10 mg),the final size is around 40 nm and the magnetic core isclearly visible by TEM (see figure 1(d)). Moreover, it isdemonstrated by means of VSM, FTIR and x-ray diffractionthat the magnetic core is inside the NPs, as is shown in thefollowing sections.
3
Nanotechnology 22 (2011) 415501 A Lapresta-Fernandez et al
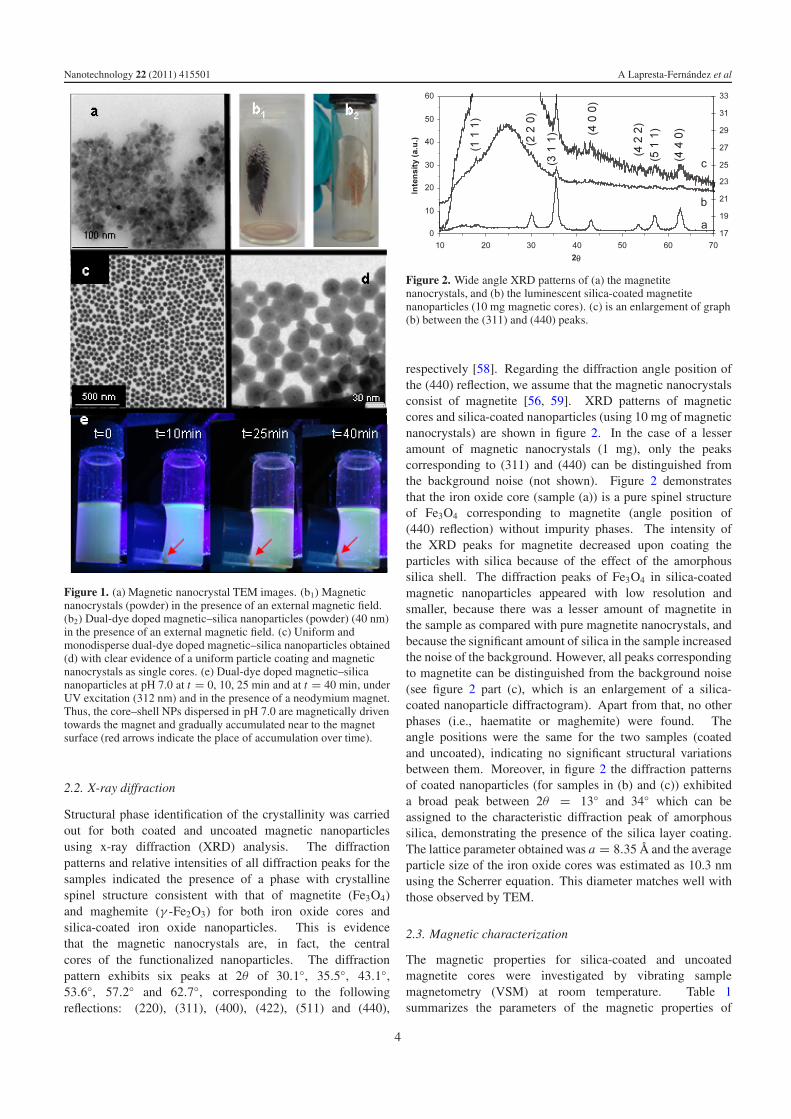
Figure 1. (a) Magnetic nanocrystal TEM images. (b1) Magneticnanocrystals (powder) in the presence of an external magnetic field.(b2) Dual-dye doped magnetic–silica nanoparticles (powder) (40 nm)in the presence of an external magnetic field. (c) Uniform andmonodisperse dual-dye doped magnetic–silica nanoparticles obtained(d) with clear evidence of a uniform particle coating and magneticnanocrystals as single cores. (e) Dual-dye doped magnetic–silicananoparticles at pH 7.0 at t = 0, 10, 25 min and at t = 40 min, underUV excitation (312 nm) and in the presence of a neodymium magnet.Thus, the core–shell NPs dispersed in pH 7.0 are magnetically driventowards the magnet and gradually accumulated near to the magnetsurface (red arrows indicate the place of accumulation over time).
2.2. X-ray diffraction
Structural phase identification of the crystallinity was carriedout for both coated and uncoated magnetic nanoparticlesusing x-ray diffraction (XRD) analysis. The diffractionpatterns and relative intensities of all diffraction peaks for thesamples indicated the presence of a phase with crystallinespinel structure consistent with that of magnetite (Fe3O4)and maghemite (γ -Fe2O3) for both iron oxide cores andsilica-coated iron oxide nanoparticles. This is evidencethat the magnetic nanocrystals are, in fact, the centralcores of the functionalized nanoparticles. The diffractionpattern exhibits six peaks at 2θ of 30.1◦, 35.5◦, 43.1◦,53.6◦, 57.2◦ and 62.7◦, corresponding to the followingreflections: (220), (311), (400), (422), (511) and (440),
Figure 2. Wide angle XRD patterns of (a) the magnetitenanocrystals, and (b) the luminescent silica-coated magnetitenanoparticles (10 mg magnetic cores). (c) is an enlargement of graph(b) between the (311) and (440) peaks.
respectively [58]. Regarding the diffraction angle position ofthe (440) reflection, we assume that the magnetic nanocrystalsconsist of magnetite [56, 59]. XRD patterns of magneticcores and silica-coated nanoparticles (using 10 mg of magneticnanocrystals) are shown in figure 2. In the case of a lesseramount of magnetic nanocrystals (1 mg), only the peakscorresponding to (311) and (440) can be distinguished fromthe background noise (not shown). Figure 2 demonstratesthat the iron oxide core (sample (a)) is a pure spinel structureof Fe3O4 corresponding to magnetite (angle position of(440) reflection) without impurity phases. The intensity ofthe XRD peaks for magnetite decreased upon coating theparticles with silica because of the effect of the amorphoussilica shell. The diffraction peaks of Fe3O4 in silica-coatedmagnetic nanoparticles appeared with low resolution andsmaller, because there was a lesser amount of magnetite inthe sample as compared with pure magnetite nanocrystals, andbecause the significant amount of silica in the sample increasedthe noise of the background. However, all peaks correspondingto magnetite can be distinguished from the background noise(see figure 2 part (c), which is an enlargement of a silica-coated nanoparticle diffractogram). Apart from that, no otherphases (i.e., haematite or maghemite) were found. Theangle positions were the same for the two samples (coatedand uncoated), indicating no significant structural variationsbetween them. Moreover, in figure 2 the diffraction patternsof coated nanoparticles (for samples in (b) and (c)) exhibiteda broad peak between 2θ = 13◦ and 34◦ which can beassigned to the characteristic diffraction peak of amorphoussilica, demonstrating the presence of the silica layer coating.The lattice parameter obtained was a = 8.35 A and the averageparticle size of the iron oxide cores was estimated as 10.3 nmusing the Scherrer equation. This diameter matches well withthose observed by TEM.
2.3. Magnetic characterization
The magnetic properties for silica-coated and uncoatedmagnetite cores were investigated by vibrating samplemagnetometry (VSM) at room temperature. Table 1summarizes the parameters of the magnetic properties of
4
Nanotechnology 22 (2011) 415501 A Lapresta-Fernandez et al
Table 1. VSM measurements of the saturation magnetization Ms,coercivity Hc, relative remanence Mr/Ms, and mean diameter D forcoated and uncoated magnetic nanoparticles. (Note: n.m.: notmeasured, since this method can only be used to measure diametersof uncoated particles.)
SampleMs
(A m2 kg−1) Mr/Ms
Hc
(kA m−1) D (nm)
Magnetic cores 50.900 0.0059 0.266 8.7Silica coated, 1 mg 0.346 0.0734 1.439 n.mSilica coated, 10 mg 0.897 0.0176 0.492 n.m
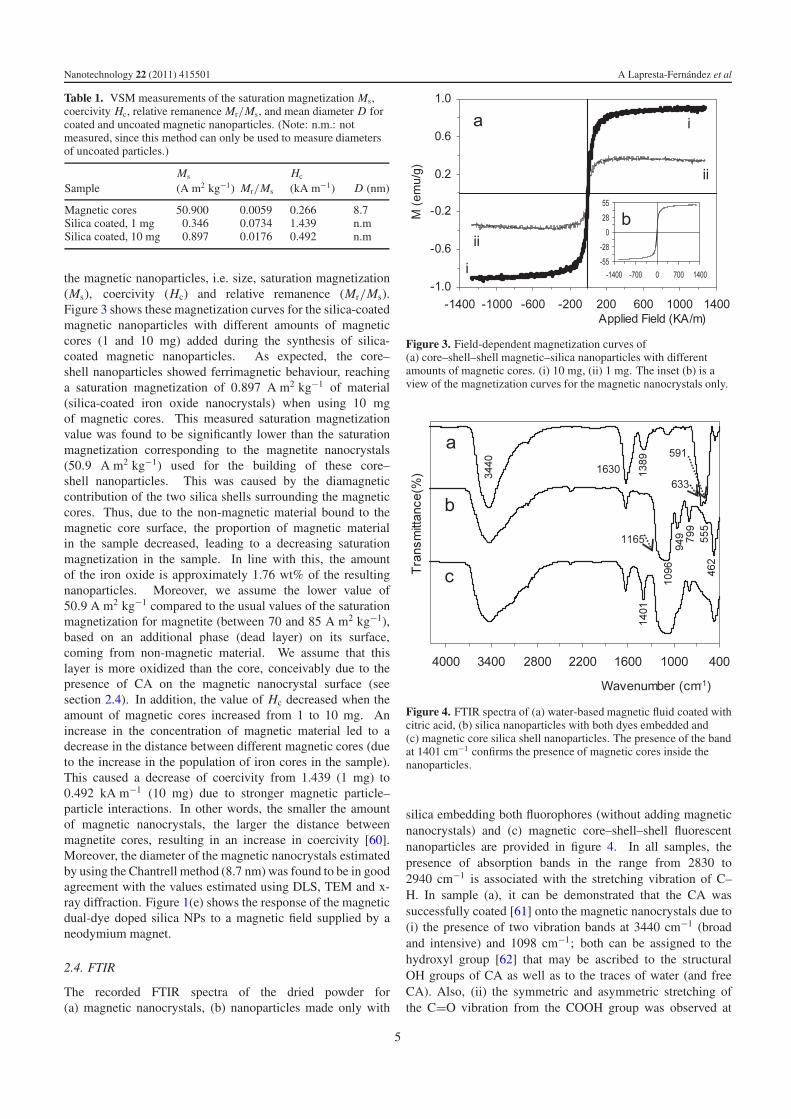
the magnetic nanoparticles, i.e. size, saturation magnetization(Ms), coercivity (Hc) and relative remanence (Mr/Ms).Figure 3 shows these magnetization curves for the silica-coatedmagnetic nanoparticles with different amounts of magneticcores (1 and 10 mg) added during the synthesis of silica-coated magnetic nanoparticles. As expected, the core–shell nanoparticles showed ferrimagnetic behaviour, reachinga saturation magnetization of 0.897 A m2 kg−1 of material(silica-coated iron oxide nanocrystals) when using 10 mgof magnetic cores. This measured saturation magnetizationvalue was found to be significantly lower than the saturationmagnetization corresponding to the magnetite nanocrystals(50.9 A m2 kg−1) used for the building of these core–shell nanoparticles. This was caused by the diamagneticcontribution of the two silica shells surrounding the magneticcores. Thus, due to the non-magnetic material bound to themagnetic core surface, the proportion of magnetic materialin the sample decreased, leading to a decreasing saturationmagnetization in the sample. In line with this, the amountof the iron oxide is approximately 1.76 wt% of the resultingnanoparticles. Moreover, we assume the lower value of50.9 A m2 kg−1 compared to the usual values of the saturationmagnetization for magnetite (between 70 and 85 A m2 kg−1),based on an additional phase (dead layer) on its surface,coming from non-magnetic material. We assume that thislayer is more oxidized than the core, conceivably due to thepresence of CA on the magnetic nanocrystal surface (seesection 2.4). In addition, the value of Hc decreased when theamount of magnetic cores increased from 1 to 10 mg. Anincrease in the concentration of magnetic material led to adecrease in the distance between different magnetic cores (dueto the increase in the population of iron cores in the sample).This caused a decrease of coercivity from 1.439 (1 mg) to0.492 kA m−1 (10 mg) due to stronger magnetic particle–particle interactions. In other words, the smaller the amountof magnetic nanocrystals, the larger the distance betweenmagnetite cores, resulting in an increase in coercivity [60].Moreover, the diameter of the magnetic nanocrystals estimatedby using the Chantrell method (8.7 nm) was found to be in goodagreement with the values estimated using DLS, TEM and x-ray diffraction. Figure 1(e) shows the response of the magneticdual-dye doped silica NPs to a magnetic field supplied by aneodymium magnet.
2.4. FTIR
The recorded FTIR spectra of the dried powder for(a) magnetic nanocrystals, (b) nanoparticles made only with
Figure 3. Field-dependent magnetization curves of(a) core–shell–shell magnetic–silica nanoparticles with differentamounts of magnetic cores. (i) 10 mg, (ii) 1 mg. The inset (b) is aview of the magnetization curves for the magnetic nanocrystals only.
Figure 4. FTIR spectra of (a) water-based magnetic fluid coated withcitric acid, (b) silica nanoparticles with both dyes embedded and(c) magnetic core silica shell nanoparticles. The presence of the bandat 1401 cm−1 confirms the presence of magnetic cores inside thenanoparticles.
silica embedding both fluorophores (without adding magneticnanocrystals) and (c) magnetic core–shell–shell fluorescentnanoparticles are provided in figure 4. In all samples, thepresence of absorption bands in the range from 2830 to2940 cm−1 is associated with the stretching vibration of C–H. In sample (a), it can be demonstrated that the CA wassuccessfully coated [61] onto the magnetic nanocrystals due to(i) the presence of two vibration bands at 3440 cm−1 (broadand intensive) and 1098 cm−1; both can be assigned to thehydroxyl group [62] that may be ascribed to the structuralOH groups of CA as well as to the traces of water (and freeCA). Also, (ii) the symmetric and asymmetric stretching ofthe C=O vibration from the COOH group was observed at
5
Nanotechnology 22 (2011) 415501 A Lapresta-Fernandez et al
1389 and 1630 cm−1, the latter being expected at 1700 cm−1;this shift reveals the binding of a CA radical on the magnetitesurface [63]. Moreover, the difference between the asymmetricand symmetric stretching of the C=O vibration from theCOOH group (�υa−s = 241 cm−1) is the result of a bidentatecomplexation of CA with the magnetite surface; meanwhilelarger differences would involve unidentate coordination [64]between −COO− groups and metal cations. In connection withthis, it is suggested that the carboxylate group was connected,via acid–base reaction, to the magnetite surface (Fe–OH)through two oxygen atoms. Therefore, the presence of CAcoating is confirmed.
The bands between 400 and 650 cm−1 can be attributedto stretching and torsional vibration modes of magnetite. TheFTIR spectrum of magnetite has a characteristic absorptionband for the Fe–O bond [65, 66] of bulk Fe3O4 at around570 cm−1. Nevertheless, when the size of Fe3O4 particleswas reduced to nanoscale dimensions [58, 63] a blue-shift wasobserved from the band of Fe–O bonds towards 591 cm−1.Moreover, the Fe–O vibration was split into two peaks at 633and 591 cm−1, both peaks being assigned to the stretchingmodes of the Fe–O bond at the tetrahedral sites and onthe surface of the nanoparticles [64]. This assignment isin accordance with a previous report [67]. Therefore, it isconfirmed that the main phase of iron oxide in the nanocrystalsof the samples was magnetite.
For sample (b) the main characteristic bands of silicaare shown [68]. We observe the peaks at 3415 and1632 cm−1, which are characteristic of OH vibrations fromwater molecules. Peaks at 1200 cm−1 (shoulder) and1090 cm−1 can be assigned to the bands of asymmetricvibrations of (Si–O–Si). In addition to these peaks, thecharacteristic symmetric vibration of Si–OH and asymmetricvibrations of Si–O–Si were observed at 949 and 799 cm−1,respectively. The peak at 555 cm−1 can be associatedwith a specific vibration (through the presence) of cyclictetramers [69]. Finally, the peak at 462 cm−1 is attributed tothe bending vibration of O–Si–O.
For sample (c) the peaks corresponding to Fe–O vibration(between 400 and 650 cm−1) cannot be found because they areoverlapped by those assigned to the silica shell. However, thepresence of magnetic cores, stabilized with CA, is confirmedby the peak at 1401 cm−1, which is associated with thesymmetry stretching of C=O vibrations from CA (in goodagreement with the case for sample (a)). Thus, the presenceof this peak provides evidence of successful silica coatingon magnetic nanocrystals. In other words, the magneticnanocrystals, surrounded by silica, are forming part of thesemultifunctional nanoparticles due to the presence of the peakat 1401 cm−1.
2.5. Luminescent properties of the nanosensors
Luminescent silica nanoparticles were synthesized by incor-porating two organic dyes into a silica matrix that surroundsmagnetite cores (using tetraethylorthosilicate) as the silicaprecursor in the (water-in-oil microemulsion). Both dyeswere covalently bound into the amorphous silica shells.
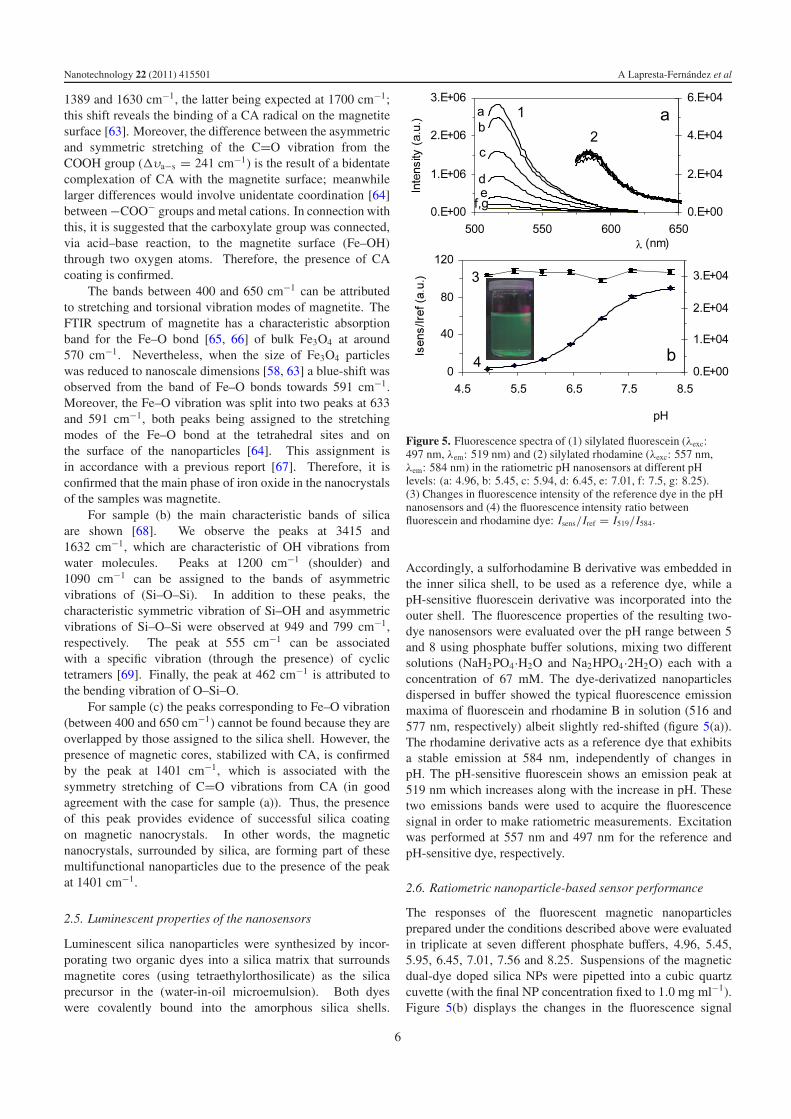
Figure 5. Fluorescence spectra of (1) silylated fluorescein (λexc:497 nm, λem: 519 nm) and (2) silylated rhodamine (λexc: 557 nm,λem: 584 nm) in the ratiometric pH nanosensors at different pHlevels: (a: 4.96, b: 5.45, c: 5.94, d: 6.45, e: 7.01, f: 7.5, g: 8.25).(3) Changes in fluorescence intensity of the reference dye in the pHnanosensors and (4) the fluorescence intensity ratio betweenfluorescein and rhodamine dye: Isens/Iref = I519/I584.
Accordingly, a sulforhodamine B derivative was embedded inthe inner silica shell, to be used as a reference dye, while apH-sensitive fluorescein derivative was incorporated into theouter shell. The fluorescence properties of the resulting two-dye nanosensors were evaluated over the pH range between 5and 8 using phosphate buffer solutions, mixing two differentsolutions (NaH2PO4·H2O and Na2HPO4·2H2O) each with aconcentration of 67 mM. The dye-derivatized nanoparticlesdispersed in buffer showed the typical fluorescence emissionmaxima of fluorescein and rhodamine B in solution (516 and577 nm, respectively) albeit slightly red-shifted (figure 5(a)).The rhodamine derivative acts as a reference dye that exhibitsa stable emission at 584 nm, independently of changes inpH. The pH-sensitive fluorescein shows an emission peak at519 nm which increases along with the increase in pH. Thesetwo emissions bands were used to acquire the fluorescencesignal in order to make ratiometric measurements. Excitationwas performed at 557 nm and 497 nm for the reference andpH-sensitive dye, respectively.
2.6. Ratiometric nanoparticle-based sensor performance
The responses of the fluorescent magnetic nanoparticlesprepared under the conditions described above were evaluatedin triplicate at seven different phosphate buffers, 4.96, 5.45,5.95, 6.45, 7.01, 7.56 and 8.25. Suspensions of the magneticdual-dye doped silica NPs were pipetted into a cubic quartzcuvette (with the final NP concentration fixed to 1.0 mg ml−1).Figure 5(b) displays the changes in the fluorescence signal
6

Nanotechnology 22 (2011) 415501 A Lapresta-Fernandez et al
Table 2. Statistical parameters from the Boltzmann fit andperformance characteristics. (Note: S: standard error.)
Parameter Value; S
a1 2.809; 0.5903a2 92.915; 0.8450a0 6.812; 0.0139a3 0.432; 0.0134r 2 0.9991Reduced χ2 1.0767Analytical range 4.96–8.25Apparent pKa 6.8RSD(%)
pH 5.45 1.0pH 7.01 1.9pH 8.25 1.3
of the sensor nanoparticles, showing that the fluorescenceintensity of the reference dye did not change significantly(∼3.0%) on modifying the pH of the nanoparticle dispersionin the pH range 5–8 (figure 5(b)(3)). Changes in fluorescenceintensity of the pH indicator in the buffer solutions withdifferent pH levels were observed within a few secondsindicating an easy accessibility of the embedded dye to protonsthrough the pores of the silica shell. The relationship betweenthe analytical parameter, that is, the ratio of fluorescencebetween the sensing and reference dyes versus the pH wasadjusted to a sigmoidal fit using a Boltzmann type equation (1)(figure 5(b)(4)) giving an apparent pKa value of 6.8:
Isens/Iref = a2 + a2 − a1
1 + exp((pH−a0)
a3)
(1)
where a0 to a3 are adjusting coefficients. The precision,expressed as a relative standard deviation (RSD), was evaluatedat three pH levels, 5.45, 7.01 and 8.25, using four differentreplicates for each. The precision data, the function obtained(which shows an excellent fit (r 2 = 0.9991)), and the statisticalparameters calculated from this fit function are presented intable 2.
Typically, a linear relationship from the calibration curvecan be obtained by fitting the central part of the sigmoidalfunction to a linear relationship, validated by means of a lack-of-fit test and another in the zone of lowest pH. From theintercept of the two functions, we obtained the lower limitof the measuring range, which was 5.96. We used as theupper limit of the measuring range the highest value testedthat fitted the linear range, which was 7.56. Nevertheless,the interpolation of the experimental analytical parameter intothe sigmoidal function produces a wider measurement range,namely from 4.96 to 8.25.
2.7. Stability and lifetime
The stability of the magnetic dual-dye doped fluorescent silicaNPs was evaluated in terms of short and long term storage,i.e. after 15 min and 1 month, respectively. After 15 min of NPequilibration in pH 7.01, the fluorescence emission intensitiesfor the sensing and for the reference fluorophores showedsignal differences of 1.6 and 0.4% respectively, whereas the
ratio of fluorescence intensity was 1.3%. The ratiometric pHnanosensor showed a satisfactory stability for one month, witha signal variation of 3.5%, in good agreement with the RSDcorresponding to a few seconds of reaction time. Therefore,these NPs offer an adequate sensitivity for analytical purposes.
2.8. Validation and application
Samples of water coming with different provenances, aswell as a physiological buffer containing 2% of horse serumwere measured. The composition of the physiological buffersolution was 2 mM CaCl2, 137 mM NaCl, 1 mM MgCl2,2.7 mM KCl, 8 mM Na2HPO4, 1.5 mM KH2PO4, and alsoadding 2% of horse serum. The pH of this solution wasadjusted to 7.4. The representative measurements using thesensor NPs are outlined in table 3 and were compared to theresults for the pH glass electrode. With these results, we wereable to assess the usefulness of the proposed methodology,showing that there are no significant statistical differences at aconfidence level of 95% as the probability value (Pval) showed.
Consequently, it can be concluded that both changesin ionic strength [70] and the addition of proteins to thenanoparticle suspension do not significantly affect, at a 95%of confidence level, the overall fluorescence of our NPs.
3. Conclusions
The design and characterization of fluorescent core–shellmagnetic nanoparticles is described. We obtained luminescentsilica-coated magnetite nanoparticles with a narrow particlesize distribution (40–60 nm) and without the need for a particlesize separation step. The nanoparticles were made of a singleFe3O4 nanocrystal core and covered by two amorphous silicashells incorporating two different dyes. The luminescentfunctionalization of the nanoparticles was carried out in water-in-oil microemulsion, obtaining spherical, discrete and highlymonodisperse amorphous silica nanoparticles, as can be seenby TEM. A silylated sulforhodamine was embedded in theinner silica shell and used as the reference dye while a silylatedpH-sensitive fluorescein was incorporated in the outer shell asthe pH indicator. Both dyes were covalently bound in the silicashells which ensured the reliability of the pH measurements.The size of the fluorescent silica-coated magnetic nanoparticleswas about 40–60 nm. Phase identification using XRDand the observed IR absorption bands demonstrated that theparticles consisted of magnetite coated with silica. Thesaturation magnetization decreased on covering the magneticnanocrystals with both silica shells, as shown by VSM. Theprocedure presented is facile, cost-effective and promisingfor functionalization of nanoparticles, the embedding offluorophores and even the engineering of their surfaces. Themagnetic nanosensors offer adequate sensitivity and responsetime for real-time pH monitoring that can render them suitablefor pH measurements in bioreactors and for the design ofmicrofluidic sensing devices. Therefore, this architectureallows one to move the NPs, by applying an external magneticfield, to the specific region where the analysis will takeplace, decreasing the effects of the surrounding media and
7
Nanotechnology 22 (2011) 415501 A Lapresta-Fernandez et al
Table 3. Determination of pH in different real samples using the sensor nanoparticles. (Note: s(1): standard deviation from three replicateseach.)
Sensor-based NPs Glass electrode
Sample pH s(1) pH s(1) Pval (%)
Tap water (Granada) 7.8 0.30 7.84 4.16 × 10⁻² 69.0Tap water (Seville) 7.9 0.17 7.83 6.03 × 10⁻² 21.3PBS + 2% Horse serum 7.6 0.23 7.45 5.29 × 10⁻² 25.1
the source of light intensity by a ratiometric approach. Dueto the intrinsic features of the silicate-based nanosensors, i.e.,biocompatibility, ease of functionalization, and nanometricsize, they appear suitable for pH monitoring of relevantbiological materials, and in combination with their magneticproperties, they may be used for targeting specific locations ofcells, tissues, and microorganisms in vivo and even for MRIimaging.
4. Experimental details
Materials. All chemicals used were of analytical-reagentgrade and all aqueous solutions were prepared using deionizeddouble-distilled water produced by Seralpur PRO 90 CNsystem (Seral, Ransbach-Baumbach, Germany). The citricacid monohydrate, disodium hydrogen phosphate dihydrateand sodium dihydrogen phosphate monohydrate, tetraethoxy-orthosilicate (TEOS), ammonium hydroxide (NH4OH, 25%w/w in water), Triton X-100 (TX-100), 1-hexanol and cyclo-hexane were obtained from Fluka; the ferrous (FeCl2·4H2O)and ferric ion solutions (FeCl3·6H2O) were purchased fromSigma-Aldrich. The ethanol (99.8%) was used as suppliedwithout further purification (Roth).
Instrumentation. The ratiometric nanoparticle-based pHsensors were characterized by using DLS, TEM, XRD, FTIR,and VSM. The DLS experiments were conducted on anALVNIBS/high-performance particle sizer coupled to an ALV-5000/EPP correlator (ALVLaser). The morphology of the ironoxide and silica shell magnetic nanoparticles was collectedby TEM using a Hitachi H8100 microscope operating at200 kV. To identify the crystallographic phases of the ironoxide nanocrystals and magnetic nanospheres, XRD patternswere recorded with a Siemens D5000 diffractometer equippedwith a monochromator to avoid the fluorescence of ironcores and a Cu Kα1 radiation source. For refinement of thepowder patterns, Eva Software was used. FTIR spectra wererecorded using a Bruker IFS 66 FTIR spectrophotometer. Themagnetization of the coated and uncoated nanoparticles wasmeasured by VSM using a magnetometer MICROMAG3900from Princeton Measurements. The luminescence spectra ofthe nanosensor suspensions were measured using a FluoroLog-3 spectrofluorometer (Horiba) with a cuvette holder whosetemperature was maintained at 22 ± 0.2 ◦C. The pH wascontrolled with a digital pH meter from Hanna Instruments andcalibrated at 25 ± 1 ◦C with standard buffers, pH 4.00 and pH7.00 (Merck).
Synthesis of both silylated fluorescent dyes. Silylated pH-sensitive dye based on a fluorescein derivative [28] (i) and a
sulforhodamine derivative as the reference dye [29] (ii) weresynthesized according to [28, 29], respectively. (i) Briefly,to 10 mg of fluorescein isothiocyanate (FITC; 25.6 mmol)dissolved in 2 ml of anhydrous EtOH we added 60 μlof 3-aminopropyltriethoxysilane (APTEOS; 256 mmol, 10equivalent). The reaction was allowed to proceed for 12 hat room temperature under an inert atmosphere. The productwas used without further purification. (ii) Sulforhodamine acidchloride (0.1 g; 0.17 mmol) was first dissolved in anhydrousCH2Cl2 (3 ml) and cooled in an ice bath. Then, dry pyridine(20 μl), a catalytic amount of dry dimethylformamide andAPTEOS (50 μl) were successively added. The mixture wasstirred under an inert atmosphere for 24 h. The product wasused as-synthesized without purification.
Synthesis of magnetite nanocrystals modified with citricacid. In a typical synthesis, magnetic nanocrystals wereprepared by a chemical coprecipitation method [71–73]. Acomplete precipitation of Fe3O4 was achieved under alkalineconditions, by preparing a reaction mixture of Fe2+ andFe3+ = 1:2 in aqueous ammonia. Typically, to obtain1 g of Fe3O4 nanoparticles, 0.86 g of FeCl2·4H2O and2.36 g of FeCl3·6H2O were dissolved under an argonatmosphere in 40 ml of deoxygenated and double-distilledwater with vigorous stirring, the solution being heated to 80 ◦C.Subsequently, 5 ml of ammonium hydroxide was added intothe flask causing a black precipitate to appear immediately.After 30 min of stirring to allow the growth of nanocrystals,1 g of citric acid in 2 ml of water was added dropwise.The mixture was stirred continuously for another 90 minin an argon atmosphere. After the solution was cooled toroom temperature, the resulting magnetic nanoparticles, whichappeared as a black precipitate, were collected and subjectedto a magnetic decantation to remove all soluble substances;this was followed by cycles of centrifugation (9000 rpm for15 min) and ultrasonic redispersion in water. The finalmagnetic nanocrystals remained dispersed in water before andafter exposure to an external magnetic field, indicating that astable magnetic fluid had formed.
Synthesis of iron oxide/silica core–shell fluorescent nanopar-ticles. Silica nanoparticles containing a magnetic core andtwo fluorescent dyes were prepared by a water-in-oil reversemicroemulsion [48, 74–76] in a one-pot synthesis procedure.Specifically, 10 mg of the synthesized magnetite nanocrystals,dispersed in 480 μl of a 0.1 M buffer solution of borax pH 9.0,were added to a stirred (10 min), clear and homogeneous water-in-oil microemulsion, previously prepared by mixing 1.77 mlof TX-100 and 1.8 ml of n-hexanol in 7.5 ml of cyclohexane.After 40 min of vigorous stirring, 0.1 ml of TEOS was added
8
Nanotechnology 22 (2011) 415501 A Lapresta-Fernandez et al
as a precursor for silica shell formation, followed after 10 minby the addition of 70 μl of NH4OH (25% in water) to catalysethe hydrolysis and condensation process. The solution was leftfor 2 h, under continuous stirring. In a next step, we added1 μl of silylated rhodamine solution (19.0 mM), resulting ina slightly red microemulsion. The hydrolysis/condensationreaction was allowed to proceed for 8 h at room temperature.This reaction corresponds to the growth of the inner silica shelldoped with the reference dye. Next, 0.1 ml of TEOS was addedand after 10 min, 70 μl of NH4OH (25% in water). Two hourslater, 3.2 μl of silylated fluorescein derivative from a 14.2 mMsolution was added. The final molar ratio of TEOS/dye isabout 10 000, assuming that the synthesis of the silylatedderivatives dye (rhodamine and fluorescein) is stoichiometric.Finally, after 12 h of stirring at room temperature, the resultingsuspension was washed to remove any surfactant moleculesusing cycles of centrifugation and ultrasonic redispersion inEtOH until no fluorescent signal, either from reference dyeor from pH-sensitive dye, was detected in the supernatantsolution.
Acknowledgments
We gratefully acknowledge the financial support from theEU projects ‘Sensor nanoparticles for ions and biomolecules’(MTKD-CT-2005-029554) and ‘Development of robust andquantitative biosensors based on near-infrared two-dyedsilicate nanoparticles’ (PIEF-GA-2008-220775) as well asfrom the projects MO 1062/6-1 and MO 1062/5-2 of DeutscheForschungsgemeinschaft. This work was also supported bythe Bayerische Staatsministerium fur Wirtschaft, Infrastruktur,Verkehr und Technologie within project AZ-Nr.: 20.10-3410-2 (Projekt Sensormaterialien). Finally the authors would liketo thank Mrs Ludwig for the FTIR measurements, Dr MMuller for wide angle x-ray diffraction measurements and Dr CCranfield for his help.
References
[1] Corr S A, Rakovich Y P and Gun’ko Y K 2008 Nanoscale Res.Lett. 3 87
[2] Lessard-Viger M, Rioux M, Rainville L and Boudreau D 2009Nano Lett. 9 3066
[3] Ren C, Li J, Liu Q, Ren J, Chen X, Hu Z and Xue D 2008Nanoscale Res. Lett. 3 496
[4] Heitsch A T, Smith D K, Patel R N, Ress D and Korgel B A2008 J. Solid State Chem. 181 1590
[5] Liu H M et al 2008 small 4 619[6] Makovec D, Campelj S, Bele M, Maver U, Zorko M,
Drofenik M, Jamnik J and Gaberscek M 2009 Colloids Surf.A 334 74
[7] Bergey E J, Levy L, Wang X, Krebs L J, Lal M, Kim K S,Pakatchi S, Liebow C and Prasad P N 2002 Biomed.Microdevices 4 293
[8] Lu Y, Yin Y, Mayers B T and Xia Y 2002 Nano Lett. 2 183[9] Yoon T J, Kim J S, Kim B G, Yu K N, Cho M H and Lee I K
2005 Angew. Chem. Int. Edn 44 1068[10] Tovmachenko O G, Graf C, van den Heuvel D J, van
Blaaderen A and Gerritsen H C 2006 Adv. Mater. 18 91[11] Ma D, Guan J, Normandin F, Denomee S, Enright G,
Veres T and Simard B 2006 Chem. Mater. 18 1920
[12] Lu C W et al 2006 Nano Lett. 7 149[13] Yoon T J, Yu K, Kim E, Kim J, Kim B, Yun S H, Sohn B H,
Cho M H, Lee J K and Park S 2006 small 2 209[14] Ren C, Li J, Chen X, Hu Z and Xue D 2007 Nanotechnology
18 345604[15] Lee J H, Jun Y, Yeon S I, Shin J S and Cheon J 2006 Angew.
Chem. Int. Edn 45 8160[16] Slowing I I, Trewyn B G, Giri S and Lin V S Y 2007 Adv.
Funct. Mater. 17 1236[17] Bonacchi S, Genovese D, Juris R, Montalti M, Prodi L,
Rampazzo E and Zaccheroni N 2011 Angew. Chem. Int. Edn50 4056
[18] Bonacchi S, Genovese D, Juris R, Montalti M, Prodi L,Rampazzo E, Sgarzi M and Zaccheroni N 2011 LuminescentChemosensors Based on Silica Nanoparticles LuminescenceApplied in Sensor Science ed L Prodi, M Montalti andN Zaccheroni (Berlin: Springer) pp 93–138
[19] Lee K G, Wi R, Park T J, Yoon S H, Lee J, Lee S J andKim D H 2010 Chem. Commun. 46 6374
[20] Moro A J, Schmidt J, Doussineau T, Lapresta-Fernandez A,Wegener J and Mohr G J 2011 Chem. Commun. 47 6066
[21] Zong C, Ai K, Zhang G, Li H and Lu L 2011 Anal. Chem.83 3126
[22] Xie C J, Yin D G, Li J, Zhang L, Liu B H and Wu M H 2010Chin. J. Anal. Chem. 38 488
[23] Han J and Burgess K 2010 Chem. Rev. 110 2709[24] Yang J, Lim E K, Lee H J, Park J, Lee S C, Lee K, Yoon H G,
Suh J S, Huh Y M and Haam S 2008 Biomaterials 29 2548[25] Tallury P, Malhotra A, Byrne L M and Santra S 2010 Adv.
Drug Deliv. Rev. 62 424[26] Sathe T R, Agrawal A and Nie S 2006 Anal. Chem. 78 5627[27] Mistlberger G, Borisov S M and Klimant I 2009 Sensors
Actuators B 139 174[28] Doussineau T, Smaıhi M and Mohr G J 2009 Adv. Funct.
Mater. 19 117[29] Doussineau T, Trupp S and Mohr G J 2009 J. Colloid Interface
Sci. 339 266[30] Allard E and Larpent C 2008 J. Polym. Sci. A 46 6206[31] Hornig S, Biskup C, Grafe A, Wotschadlo J, Liebert T,
Mohr G J and Heinze T 2008 Soft Matter 4 1169[32] Mohr G J (ed) 2008 Fibre-optic and nanoparticle-based
fluorescence sensing using indicator dyes: pitfalls, self-referencing, application, and future trends Standarizationand Quality Assurance in Fluorescence Measurements I(Berlin: Springer) pp 347–372
[33] Doussineau T, Schulz A, Lapresta-Fernandez A, Moro A,Karsten S, Trupp S and Mohr G 2010 Chem.—Eur. J.16 10290
[34] Fowler C E, Khushalani D, Lebeau B and Mann S 2001 Adv.Mater. 13 649
[35] Zhao X, Shi Y, Wang T, Cai Y and Jiang G 2008J. Chromatogr. A 1188 140
[36] Guo J, Yang W, Deng Y, Wang C and Fu S 2005 small 1 737[37] Xu C and Sun S 2007 Polym. Int. 56 821[38] Torchilin V P 2005 Nature Rev. Drug Discov. 4 145[39] Shaw S Y, Westly E C, Pittet M J, Subramanian A,
Schreiber S L and Weissleder R 2008 Proc. Natl Acad. Sci.USA 105 7387
[40] Taboada E, Solanas R, Rodrıguez E, Weissleder R andRoig A 2009 Adv. Funct. Mater. 19 2319
[41] Kim J, Kim H S, Lee N, Kim T, Kim H, Yu T, Song I C,Moon W K and Hyeon T 2008 Angew. Chem. Int. Edn47 8438
[42] Peer D, Karp J M, Hong S, Farokhzad O C, Margalit R andLanger R 2007 Nature Nano 2 751
[43] Dobson J 2006 Drug Dev. Res. 67 55[44] Jie L, Monty L, Jeffrey I Z and Fuyuhiko T 2007 small 3 1346[45] Barbe C, Bartlett J, Kong L, Finnie K, Lin H Q, Larkin M,
Calleja S, Bush A and Calleja G 2004 Adv. Mater. 16 1959
9
Nanotechnology 22 (2011) 415501 A Lapresta-Fernandez et al
[46] Duncan R 2006 Nature Rev. Cancer 6 688[47] Aslan K, Wu M, Lakowicz J R and Geddes C D 2007 J. Am.
Chem. Soc. 129 1524[48] Gao F, Tang L, Dai L and Wang L 2007 Spectrochim. Acta A
67 517[49] He R, You X, Shao J, Gao F, Pan B and Cui D 2007
Nanotechnology 18 315601[50] Wu J, Ye Z, Wang G and Yuan J 2007 Talanta 72 1693[51] Lu A-H, Salabas E L and Schuth F 2007 Angew. Chem. Int. Edn
46 1222[52] Huh S, Wiench J W, Yoo J C, Pruski M and Lin V S Y 2003
Chem. Mater. 15 4247[53] Racuciu M, Creanga D and Airinei A 2006 Eur. Phys. J. E
21 117[54] Kallay N and Matijevic E 1985 Langmuir 1 195[55] Wang X, Zhou L, Ma Y, Li X and Gu H 2009 Nano Res. 2 365[56] Maity D and Agrawal D C 2007 J. Magn. Magn. Mater. 308 46[57] Hu X and Gao X 2010 ACS Nano 4 6080[58] Khan A 2007 Mater. Lett. 62 898[59] Dutz S, Hergt R, Murbe J, Topfer J, Muller R, Zeisberger M,
Andra W and Bellemann E 2006 Z. Phys. Chem. 220 145[60] Dutz S 2008 Dissertation Hamburg[61] Frimpong R A, Dou J, Pechan M and Hilt J Z 2010 J. Magn.
Magn. Mater. 322 326[62] Lattuada M and Hatton T A 2006 Langmuir 23 2158
[63] Tie S L, Lee H C, Bae Y S, Kim M B, Lee K and Lee C H 2007Colloids Surf. A 293 278
[64] Tie S L, Lin Y Q, Lee H C, Bae Y S and Lee C H 2006Colloids Surf. A 273 75
[65] Namduri H and Nasrazadani S 2008 Corros. Sci. 50 2493[66] Ishii M, Nakahira M and Yamanaka T 1972 Solid State
Commun. 11 209[67] Waldron R D 1955 Phys. Rev. 99 1727[68] Bertoluzza A, Fagnano C, Morelli M A, Gottardi V and
Guglielmi M 1982 J. Non-Cryst. Solids 48 117[69] Yoshino H, Kamiya K and Nasu H 1990 J. Non-Cryst. Solids
126 68[70] Weidgans B M, Krause C, Klimant I and Wolfbeis O S 2004
Analyst 129 645[71] Sahoo Y, Goodarzi A, Swihart M T, Ohulchanskyy T Y,
Kaur N, Furlani E P and Prasad P N 2005 J. Phys. Chem. B109 3879
[72] Ma Z, Dosev D, Nichkova M, Dumas R K, Gee S J,Hammock B D, Liu K and Kennedy I M 2009 J. Magn.Magn. Mater. 321 1368
[73] Sahoo Y, Pizem H, Fried T, Golodnitsky D, Burstein L,Sukenik C N and Markovich G 2001 Langmuir 17 7907
[74] Santra S, Bagwe R P, Dutta D, Stanley J T, Walter A G, Tan W,Moudgil B M and Mericle R A 2005 Adv. Mater. 17 2165
[75] Wang L and Tan W 2005 Nano Lett. 6 84[76] Rieter J W, Kim J S, Taylor M L K, An H, Lin W, Lin W and
Lin W 2007 Angew. Chem. Int. Edn 46 3680
10