
MAAZZPUBLICATIONS SCHOLARS WORLD InternationallRefereed MultidisciplinaryyJournal...
202
MAAZ PUBLICATIONS SCHOLARS W ORLD International Refereed Multidisciplinary Journal of Contemporary Research Volume II Issue II April 2014 PRINT ISSN:2319-5789, ONLINE ISSN:2320-3145 INDEXING Directory Of Open Access Journals, Sweden Ulrich’s Web-global Series Directory, USA Directory of Research Journals Indexing, India Open J-Gate, India Pub-Res- (International Research Library) IRMJCR IMPACT FACTORS Universal Impact Factor = 1.2242 International Impact Factor Services = 0.654
Transcript of MAAZZPUBLICATIONS SCHOLARS WORLD InternationallRefereed MultidisciplinaryyJournal...

MAAZ PUBLICATIONS
SCHOLARSWORLD
International RefereedMultidisciplinary Journalof Contemporary Research
Volume II Issue II April 2014
PRINT ISSN:2319-5789, ONLINE ISSN:2320-3145
INDEXING
Directory Of Open Access Journals, Sweden
Ulrich’s Web-global Series Directory, USA
Directory of Research Journals Indexing, India
Open J-Gate, India
Pub-Res- (International Research Library)
IR
MJC
R
IMPACT FACTORS
Universal Impact Factor = 1.2242
International Impact Factor Services = 0.654
SCHOLARS WORLD-IRMJCR EISSN 2320-3145, ISSN 2319-5789
Website: www.scholarsworld.net E-mail: [email protected]
Editor in Chief,
DR. MOHAMMED YAHYA SABA
Kirori Mal College- Delhi ( India)
Editor,
DR. MANOJ KAMAT
VVM’S SHREE DAMODAR COLLEGE (GOA UNIVERSITY) (India)
Associate Editor,
DR. R.S.DEORE,
VICE PRINCIPAL
MSG COLLEGE- MALEGAON (CAMP)-INDIA
DR HAJJAH JARIAH MOHD JAN,
DEPUTY DEAN
UNIVERSITY OF MALAYA, MALAYSIA
PROFESSOR NAWAB ALI KHAN,
AL- KHARJ SALMAN BIN ABDULAZIZ
UNIVERSITY (KINGDOM OF SAUDI ARABIA)
BHANU SHRESTHA,
ASSISTANT PROFESSOR
KWANGWOON UNIVERSITY, SEOUL, KOREA
RAMEL D. TOMAQUIN, Ph.D., DPA,
DEAN, CAS SURIGAO DEL SUR STATE UNIVERSITY
TANDAG CITY SURIGAO DEL SUR, PHILIPPINES
Managing Editor
ISHTIYAQUE AHMED (INDIA)
Disclaimer:
The views articulated in the journal are those of author(s) and not the
publisher or the Editorial Board. The readers are informed, authors, editors or the
publisher do not owe any responsibility for any damage or loss to any person for the
result of any action taken on the basis of the work. © The articles/papers published
in the journal are subject to copyright of the publisher. No part of the publication
can be copied or reproduced without the permission of the publisher.
Published By:
MAAZ PUBLICATIONS,
H.No.117, S.No.170, Zaitoon Pura, Malegaon Nasik, Maharashtra, India, 423203
SCHOLARS WORLD-IRMJCR Online: ISSN 2320-3145, Print: ISSN 2319-5789
www.scholarsworld.net [email protected] Volume. II, Issue. II, April 2014
CONTENTS
1.
Electronics Engineering
COMPARATIVE ANALYSIS OF MICROSTRIP BANDSTOP RESONATOR FILTERS USING
SPURLINE CONFIGURATIONS
BHANU SHRESTHA,NAM-YOUNG KIM, (Korea)
01-06
2.
Literature
BOKO HARAM: THE NATION AS TERRORIST
LEKAN BALOGUN, (New Zealand) 07-17
3.
English Literature
CHILDREN ACQUIRE THEIR MOTHER TONGUE THROUGH VARIOUS STAGES
DR. ANJALI HANS, (Kingdom of Saudi Arabia) 18-23
4.
Biotechnology
SCREENING AND OPTIMIZATION OF PHYSICOCHEMICAL CONDITIONS FOR
PROTEASE PRODUCTION
SUSHMA DUBEY, KAVITA SHARMA, ASHISH SARAF, (India)
24-30
5.
English Literature
THE ROLE OF METACOGNITIVE AWARENESS-RAISING IN DEVELOPING LEARNERS’
READING PROFICIENCY AND STRATEGY USE: CASE OF FIRST YEAR LMD STUDENTS
AT ABOU BEKR BELKAID UNIVERSITY OF TLEMCEN
MRS YASSAMINA HAICHA – ABDAT (Algeria)
31-45
6.
Human Resource Management
EFFECT OF RAINFALL ON WORKER PARTICIPATION IN MGNREGA: EVIDENCE FROM
UTTAR PRADESH
MALVIKA TYAGI, (India)
46-51
7.
Economics
DOES INVESTOR ATTENTION MATTER’S?
RASHID AMIN,HABIB AHMAD, (Pakistan)
52-64
8.
Education
STUDENT INTEREST IN CHEMISTRY FROM UPPER PRIMARY TO HIGHER SECONDARY
SCHOOLS IN KERALA
DR. K. ABDUL GAFOOR, SHILNA V, (India)
65-71
9.
Management
DISTRIBUTION MANAGEMENT PARADIGM AND CHANNEL BEHAVIOR DIMENSION OF
RURAL RETAILERS: AN EMPIRICAL STUDY IN RURAL ASSAM
DR. ABHIGYAN BHATTACHARJEE, (India)
72-82
10
Management
EFFECT OF BRAND TRUST, BRAND IMAGE ON CUSTOMER BRAND LOYALTY IN FMCG
SECTOR AT GWALIOR REGION
DR. NISCHAY K. UPAMANNYU, PROF. CHANDA GULATI, DR. GARIMA MATHUR, (India)
83-93
11.
Management
ROLE OF COMMUNICATION IN SUPPLY CHAIN MANAGEMENT: AN OVERVIEW
DR. S. K. WADEKAR, (India) 94-103
12.
Education
CONTINUOUS AND COMPRENHENSIVE EVALUATION AND QUALITY EDUCATION
R.MALLIKA, (Algeria) 104-109
SCHOLARS WORLD-IRMJCR Online: ISSN 2320-3145, Print: ISSN 2319-5789
www.scholarsworld.net [email protected] Volume. II, Issue. II, April 2014
13.
Management
CONTRIBUTION OF MANAGEMENT EDUCATION IN INCULCATING EMPLOYABILITY
SKILLS IN THE STUDENTS
DR. NIDHI GUPTA,MS. POOJA KALRA, (India)
110-116
14.
Education
REFINING SCIENCE EDUCATION IN TIBETAN BUDDHIST SETTLEMENT IN INDIA
Dr. BAIJU K. NATH, LISHA APPUKUTTAN, (India) 117-123
15.
Business Technology
APPLICATION OF XBRL IN FINANCIAL REPORTING
DR. MEGHNA CHOTALIYA, (India) 124-130
16.
Commerce
MEDICAL TOURISM IN ASIA - AN OVERVIEW
S.S.ROSE MARY, (India) 131-136
17.
Education
MORAL EDUCATION AS A MEANS FOR SOCIAL DEVELOPMENT
MS. V. MRUNALINI, (India)
137-140
18.
Geography
URBAN LAND VALUE-A CASE STUDY OF COCHIN CITY
DR. LANCELET T.S, (India)
141-144
19.
Management
QUALITY OF WORK LIFE: A COMPARATIVE STUDY OF SELECTED FOOD UNITS OF
CHATTRAL AND CHAROTAR REGION OF GUJARAT
DR.YOGESH JAIN,RENIL THOMAS, (India)
145-152
20.
Economics
DIGITAL ECONOMY
DR. K. V. RAMACHANDRAN,(India) 153-157
21.
Philosophy
THE PHILOSOPHY OF MAYA AND TAGORE’S HUNGRY STONES: A CRITICAL STUDY
KOUSIK ADHIKARI, (India) 158-162
22.
Management
STRESS MANAGEMENT PROGRAMMES (A STUDY ON THE PERCEPTIONS OF THE
EMPLOYEES IN BHEL TIRUCHIRAPALLI UNIT)
DR. S. VASANTHI, (India)
163-173
23.
Management
BORROWING AND CREDIT: THE CHOICE OF URBAN POPULATION OF INDIA
RUCHI BHATIA, DR. JAYENDER VERMA, (India) 174-183
24.
Education
ACTIVATING STUDENTS CREATIVITY: THE EFFECT OF READER RESPONSE
APPROACH ON CREATIVE WRITING IN AN ELT CLASSROOM
Dr. K. P. MEERA, RINCY MOL SEBASTIAN, (India)
184-189
25.
Marketing
RETAIL MARKETING
NARESH KANWAR, (India) 190-197
SCHOLARS WORLD-IRMJCR Online: ISSN 2320-3145, Print: ISSN 2319-5789
www.scholarsworld.net [email protected] Volume. II, Issue II, April 2014
EDITORIAL BOARD
EDITOR IN CHIEF
DR. MOHAMMED YAHYA SABA, KIRORI MAL COLLEGE- DELHI (INDIA)
EDITOR
DR. MANOJ KAMAT, SR. FACULTY AT VVM'S SHREE DAMODAR COLLEGE
(GOA UNIVERSITY)-INDIA
MANAGING EDITOR
ISHTIYAQUE AHMED-(India)
ASSOCIATE EDITORS:
DR. R.S.DEORE VICE PRINCIPAL
M.S.G COLLEGE- MALEGAON (CAMP)-INDIA
DR HAJJAH JARIAH MOHD JAN DEPUTY DEAN
UNIVERSITY OF MALAYA, MALAYSIA
PROFESSOR NAWAB ALI KHAN AL- KHARJ SALMAN BIN ABDULAZIZ UNIVERSITY
(KINGDOM OF SAUDI ARABIA)
BHANU SHRESTHA ASSISTANT PROFESSOR
KWANGWOON UNIVERSITY, SEOUL, KOREA
RAMEL D. TOMAQUIN, Ph.D., DPA, DEAN, CAS SURIGAO DEL SUR STATE UNIVERSITY
TANDAG CITY SURIGAO DEL SUR, PHILIPPINES
MEMBERS OF EDITORIAL BOARD
DR. LOO FUNG YING
Malaysia
DR. R.DHANAPAL
India
DR. LOO FUNG CHIAT
Malaysia
JOHN KAISER S. CALAUTIT,
UK
DR.N.SAKTHIVEL
India
DR. RUCHI TREHAN
India
DR. RAKESH KUMAR PANDEY
India
Dr. SHIBU.N.S
India
DR. BEERAN MOIDIN B M
India
DR. NAGENDRA S.
India
DR. NARASIMHA MURTHY M.S.
India
DR. SAURABH MITTAL
India
DR.SANTOSH SINGH BAIS
India
DR. K. PRABHAKAR
India
BENSAFI ABD-EL-HAMID
Algeria
DR. LOKESH JINDAL
India
RÉAGAN (EDITH) LORRAINE LAVORATA,
France
DR. SUMA PARAHAKARAN
Malaysia
DR RAKHI GUPTA
India
DR. RAVI PRAKASH TEKCHANDANI
India
DR.V. DARLING SELVI
India
DR.ABHIK MUKHOPADHYAY
India
DR. SUBHASH NIKAM
India
Dr. KAMATAM SRINIVAS
India
DR. REEMA CHAUDHURY
India
Dr. A.SELVARAJ
India
DR DIVYA GUPTA CHOWDHRY
India
DR. NEETU MITTAL
India
Dr. A.VIJAYA KUMAR
India
KAMAKSHAIAH MUSUNURU
India
DR. SUNIL KUMAR MISHRA
India
DR. AMIT KUMAR SINGH
India
Dr. M. JAYA
India
AKMAL SHAHZAD
Pakistan
DR. PREETI SINGH
India
DR. PARUL MISHRA
India
Dr. ARTEE AGGRAWAL
India
Dr. K. SENTHILKUMAR
India
AZIZUR RAHMAN FALAHI
Malaysia
DR. SYED ABUZAR
India
PROFESSOR DEBASHRI BANERJEE
India
Dr. VIJAY HEMATLAL PITHADIA
India
DR. R. SHASHI KUMAR
India
DR. SANDEEP KUMAR
India
PROF. RAJENDRE TRIBHUVAN
India
DR. C.M. NIKAM
India
PROF. RAJENDER TRIBHUVAN
India
DR. S. K. WADEKAR,
(India)
DR. ANJALI HANS
Dammam
DR. MD. ZIA-UR-REHMAN
Pakistan
MR. SHAFEEQUE AHMED
Saudi Arabia

SCHOLARS WORLD-IRMJCR Online: ISSN 2320-3145, Print: ISSN 2319-5789
www.scholarsworld.net [email protected] Volume. II, Issue II, April 2014 [1]
COMPARATIVE ANALYSIS OF MICROSTRIP BANDSTOP
RESONATOR FILTERS USING SPURLINE CONFIGURATIONS
BHANU SHRESTHA,
Department of Electronic Engineering,
Kwangwoon University, 447-1 Wolgye-dong,
Nowon-ku, Seoul, Korea
NAM-YOUNG KIM,
Department of Electronic Engineering,
Kwangwoon University, 447-1 Wolgye-dong,
Nowon-ku, Seoul, Korea
ABSTRACT
In this paper, three types of spurline resonator filters were designed, fabricated and characterized
for X-band applications. These resonators have a bandstop characteristic with higher insertion
loss. The operating resonance frequencies of the bandstop filters are at 9 GHz with insertion loss
of less than -28 dB and return losses re below -1 dB. The miniaturized resonator filters consist of
an L-type spurline, a meander spurline, and symmetric meander spurline with inductive and
capacitive characteristics. The capacitively loaded spurline resonator filters provides a band
rejection frequency response. The simulation and measurement results are compared separately in
the form of graph and their results are tabulated. The quality factor (Q) of those resonators filters
are good for implementing in microwave oscillators. Implementation of such resonator filters in
MMIC technology is also possible due to their inherent capability to integrate into small sizes.
Keywords: Spurline Resonator, Microstrip Resonator, Symmetric Spurline, Resonator, Spurline

SCHOLARS WORLD-IRMJCR
www.scholarsworld.net [email protected]
1. INTRODUCTION:
Microstrip resonator bandstop filters (BSFs) are very important component in communication systems in which
all the desired frequencies are rejected since these filters exhibit bandstop characterics. The BSFs are required
to have higher return loss, lower insertion loss for good impedance matching with interconnecting components,
and high frequency rejection to prevent interference. The higher frequency selectively rejection can determine
the guard band between each channel to specify the higher rate of fre
mechanical performance, these BSFs are required to have small volume and good temperature stability [1
The BSFs which are used in wireless communication system have been demanding tighter requirement in terms
of electrical specifications as well as drastic reduction of manufacturing cost and development times. Therefore,
the area of microwave filters, especially for X
theoretical, technological, and performa
design process was utilizing spurline configurations. The spurline configuration can overcome the problem of
miniaturization, Q-factor, easy fabrication and low cost material as compared
resonators like hairpin resonator, dielectric resonator and so on.
A spurline is a simple embedded internal defected line structure; it can be fabricated by a simple etching
process and the defected meander spurline also exhibi
resonators are also easy to integrate into circuits due to their inherent compact size. These resonator filters are
widely used in various communication systems due to their bandstop characteristics,
and bandgap characteristics. The spurline and meander spurline resonators were used to build bandstop filters
and circuit modeling due to their significant results [3
2. DESIGN AND SIMULATION:
Spurline Resonator Filters Design:
The microstrip spurline resonators were simulated using the SONNET Lite 3D planar analysis EM simulator.
The L-type, meander spurline and symmetric spurline resonators were designed, fabricated and characterized.
The resonators were fabricated using a Teflon substrate with the thickness and the dielectric constant of 0.54
mm and 2.54, respectively [5]. The schematic of the L
symmetric meander spurline are depicted in Fig. 1 (a), (b), and (c) resp
of the L-type spurline is a slot width s of 0.15 mm, a slot length l of 5.6 mm and a slot height h of 1.1 mm. The
meander spurline has a slot width w of 0.15 mm, a slot length l of 3.2 mm and a slot height h of 1.35
the symmetric meander spurline structure has a slot width w of 0.15 mm, a slot length l of 5.1 mm and a slot
height h of 1.35 mm. In the design process, all spurline slot width was made the same to compare their
capacitive and inductive effect on th
inductive and capacitive values came to 5.08 nH and 0.058 pF respectively for the L
the overall inductive and capacitive values came to 6.04 nH and 0.05 p
For the asymmetric meander spurline resonator, overall inductive and capacitive values came to 7.08
0.048 pF. Thus, the effective permittivity of the dielectric substrate increases as the effective inductanc
capacitance of the microstrip line is improved by spurlines [5]. As mentioned above, the effective inductance
and capacitive effect of the spurline is greatly improved in the Q value.
(A) L-TYPE SPURLINE
Online: ISSN 2320-3145, Print: ISSN 2319
[email protected] Volume. II, Issue II, April 2014
Microstrip resonator bandstop filters (BSFs) are very important component in communication systems in which
all the desired frequencies are rejected since these filters exhibit bandstop characterics. The BSFs are required
insertion loss for good impedance matching with interconnecting components,
and high frequency rejection to prevent interference. The higher frequency selectively rejection can determine
the guard band between each channel to specify the higher rate of frequency efficiency. In the view of
mechanical performance, these BSFs are required to have small volume and good temperature stability [1
The BSFs which are used in wireless communication system have been demanding tighter requirement in terms
ical specifications as well as drastic reduction of manufacturing cost and development times. Therefore,
the area of microwave filters, especially for X-band applications, has experienced significant improvements in
theoretical, technological, and performance subjects. One of the significant improvements in resonator filter
design process was utilizing spurline configurations. The spurline configuration can overcome the problem of
factor, easy fabrication and low cost material as compared to another various types of
resonators like hairpin resonator, dielectric resonator and so on.
A spurline is a simple embedded internal defected line structure; it can be fabricated by a simple etching
process and the defected meander spurline also exhibits inductive characteristics. These defected microstrip
resonators are also easy to integrate into circuits due to their inherent compact size. These resonator filters are
widely used in various communication systems due to their bandstop characteristics,
and bandgap characteristics. The spurline and meander spurline resonators were used to build bandstop filters
and circuit modeling due to their significant results [3-4].
:
microstrip spurline resonators were simulated using the SONNET Lite 3D planar analysis EM simulator.
type, meander spurline and symmetric spurline resonators were designed, fabricated and characterized.
using a Teflon substrate with the thickness and the dielectric constant of 0.54
mm and 2.54, respectively [5]. The schematic of the L-type spurline, the meander spurline resonator and
symmetric meander spurline are depicted in Fig. 1 (a), (b), and (c) respectively. The final optimized dimension
type spurline is a slot width s of 0.15 mm, a slot length l of 5.6 mm and a slot height h of 1.1 mm. The
meander spurline has a slot width w of 0.15 mm, a slot length l of 3.2 mm and a slot height h of 1.35
the symmetric meander spurline structure has a slot width w of 0.15 mm, a slot length l of 5.1 mm and a slot
height h of 1.35 mm. In the design process, all spurline slot width was made the same to compare their
capacitive and inductive effect on the frequency responses. When simulating the resonator filters, the overall
inductive and capacitive values came to 5.08 nH and 0.058 pF respectively for the L-type spurline resonator and
the overall inductive and capacitive values came to 6.04 nH and 0.05 pF respectively for the meander spurline.
For the asymmetric meander spurline resonator, overall inductive and capacitive values came to 7.08
0.048 pF. Thus, the effective permittivity of the dielectric substrate increases as the effective inductanc
capacitance of the microstrip line is improved by spurlines [5]. As mentioned above, the effective inductance
and capacitive effect of the spurline is greatly improved in the Q value.
TYPE SPURLINE (B) MEANDER SPURLINE
3145, Print: ISSN 2319-5789
Volume. II, Issue II, April 2014 [2]
Microstrip resonator bandstop filters (BSFs) are very important component in communication systems in which
all the desired frequencies are rejected since these filters exhibit bandstop characterics. The BSFs are required
insertion loss for good impedance matching with interconnecting components,
and high frequency rejection to prevent interference. The higher frequency selectively rejection can determine
quency efficiency. In the view of
mechanical performance, these BSFs are required to have small volume and good temperature stability [1-2].
The BSFs which are used in wireless communication system have been demanding tighter requirement in terms
ical specifications as well as drastic reduction of manufacturing cost and development times. Therefore,
band applications, has experienced significant improvements in
nce subjects. One of the significant improvements in resonator filter
design process was utilizing spurline configurations. The spurline configuration can overcome the problem of
to another various types of
A spurline is a simple embedded internal defected line structure; it can be fabricated by a simple etching
ts inductive characteristics. These defected microstrip
resonators are also easy to integrate into circuits due to their inherent compact size. These resonator filters are
widely used in various communication systems due to their bandstop characteristics, inherently compact size,
and bandgap characteristics. The spurline and meander spurline resonators were used to build bandstop filters
microstrip spurline resonators were simulated using the SONNET Lite 3D planar analysis EM simulator.
type, meander spurline and symmetric spurline resonators were designed, fabricated and characterized.
using a Teflon substrate with the thickness and the dielectric constant of 0.54
type spurline, the meander spurline resonator and
ectively. The final optimized dimension
type spurline is a slot width s of 0.15 mm, a slot length l of 5.6 mm and a slot height h of 1.1 mm. The
meander spurline has a slot width w of 0.15 mm, a slot length l of 3.2 mm and a slot height h of 1.35 mm and
the symmetric meander spurline structure has a slot width w of 0.15 mm, a slot length l of 5.1 mm and a slot
height h of 1.35 mm. In the design process, all spurline slot width was made the same to compare their
e frequency responses. When simulating the resonator filters, the overall
type spurline resonator and
F respectively for the meander spurline.
For the asymmetric meander spurline resonator, overall inductive and capacitive values came to 7.08 nH and
0.048 pF. Thus, the effective permittivity of the dielectric substrate increases as the effective inductance and
capacitance of the microstrip line is improved by spurlines [5]. As mentioned above, the effective inductance
(B) MEANDER SPURLINE

SCHOLARS WORLD-IRMJCR
www.scholarsworld.net [email protected]
(C) SYMMETRIC MEANDER SPURLINE
Figure 1 the schematic of three types of spurline resonator filters.
Therefore, it has potential to achieve a low phase noise when implemented in a microwave oscillator [6
Theoretically, the loaded Q can be found using the 3 dB bandwidth of the insertion loss which is given by
QL=ω0/∆ω. The spurline resonators were etched on a 50
obvious bandgap at the resonant frequency of 9 G
insertion loss and a narrow bandwidth. Basically, in order to obtain a deeper rejection and a wider bandstop of
the open-stub filter, more open stubs should be employed. However, it would also incre
the insertion loss [9]. On the other hand, spurline filters are suitable only for moderate rejection bandwidth
applications. The three types of resonator filters were designed with the center frequency of 9 GHz. The wave
length, L=(λg /4) in microstrip spurline is given by
λ
Where L is the length of the spurline; C is the light speed (3×10
rejected frequency) frequency and ε
calculated from the equation (2).
Where is the phase, β, the phase constant, and
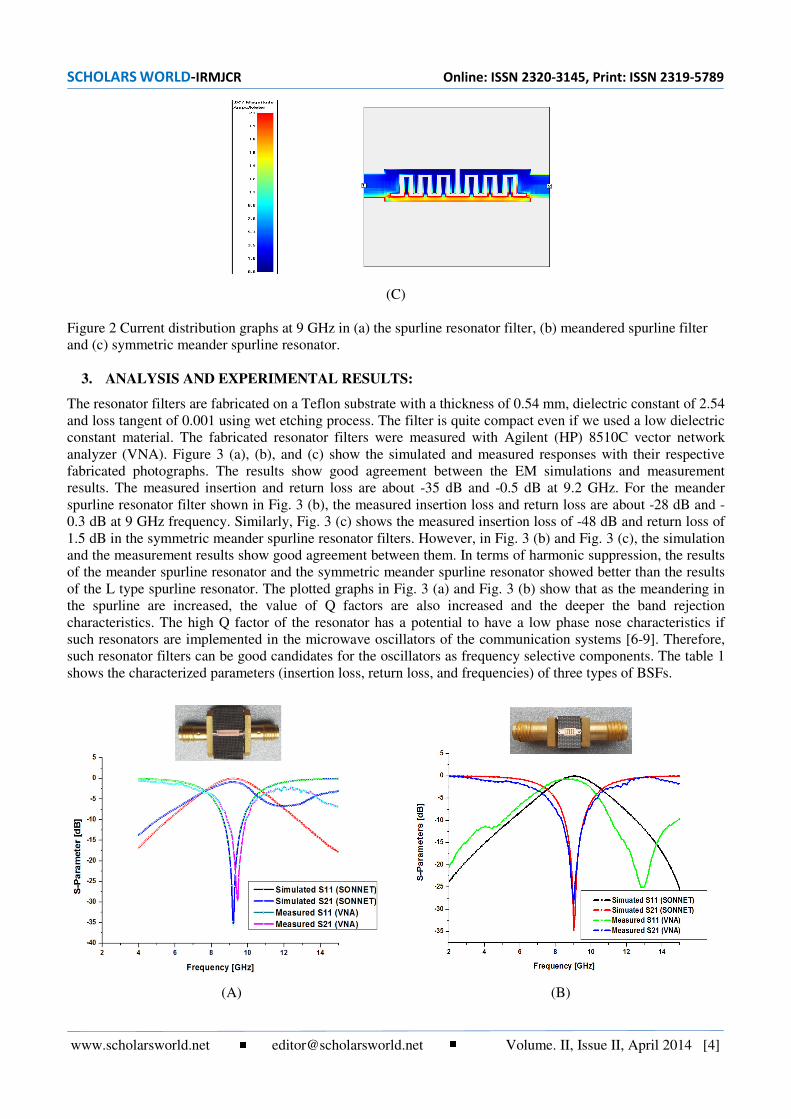
Current Distribution:
The The electromagnetic simulation is performed to analyze the behavior of the resonator filters. Therefore, the
current distribution simulation results of the spurline resonator filter, the meandered spurline filter and the
symmetric meander spurline resonator are observed at the resonance frequency of 9 GHz in the stopband which
are illustrated in Fig. 2. The bar in the left side represents the surface current density in (A/m) which is the
magnitude of coupling between spurlines and feed lin
current distribution is the lowest at 9 GHz frequency in Figure 2 (a), (b) and (c) which means the frequencies are
rejected at 9 GHz in three types of resonator filters, since these filters have b
seen the Fig. 2, the electric field is highly concentrated in the gap that gives capacitive effect. In the same way, the
electric field nearly vanishes in the outside of the gap that shows magnetic field and gives inducti
(A)
Online: ISSN 2320-3145, Print: ISSN 2319
[email protected] Volume. II, Issue II, April 2014
(C) SYMMETRIC MEANDER SPURLINE
schematic of three types of spurline resonator filters.
herefore, it has potential to achieve a low phase noise when implemented in a microwave oscillator [6
Theoretically, the loaded Q can be found using the 3 dB bandwidth of the insertion loss which is given by
. The spurline resonators were etched on a 50 Ω microstrip line 1.49 mm wide (w). There is an
obvious bandgap at the resonant frequency of 9 GHz. In addition, the spurline resonator provides a higher
insertion loss and a narrow bandwidth. Basically, in order to obtain a deeper rejection and a wider bandstop of
stub filter, more open stubs should be employed. However, it would also incre
the insertion loss [9]. On the other hand, spurline filters are suitable only for moderate rejection bandwidth
applications. The three types of resonator filters were designed with the center frequency of 9 GHz. The wave
g /4) in microstrip spurline is given by;
effbseffg f
cεε
λλ == (1)
here L is the length of the spurline; C is the light speed (3×10⁸
m/s), fbs , the bandstop and (i. e. the desired
rejected frequency) frequency and εeff, the substrate effective permittivity [5]. The electrical length can be
llg.2.
λ
πβφ == (2)
, the phase constant, and l, the equivalent electrical length of the spurline
The The electromagnetic simulation is performed to analyze the behavior of the resonator filters. Therefore, the
current distribution simulation results of the spurline resonator filter, the meandered spurline filter and the
spurline resonator are observed at the resonance frequency of 9 GHz in the stopband which
are illustrated in Fig. 2. The bar in the left side represents the surface current density in (A/m) which is the
magnitude of coupling between spurlines and feed lines. As a result of randaom current density simulations, the
current distribution is the lowest at 9 GHz frequency in Figure 2 (a), (b) and (c) which means the frequencies are
rejected at 9 GHz in three types of resonator filters, since these filters have bandstop characteristics.
seen the Fig. 2, the electric field is highly concentrated in the gap that gives capacitive effect. In the same way, the
electric field nearly vanishes in the outside of the gap that shows magnetic field and gives inducti
(B)
3145, Print: ISSN 2319-5789
Volume. II, Issue II, April 2014 [3]
herefore, it has potential to achieve a low phase noise when implemented in a microwave oscillator [6-8].
Theoretically, the loaded Q can be found using the 3 dB bandwidth of the insertion loss which is given by
microstrip line 1.49 mm wide (w). There is an
Hz. In addition, the spurline resonator provides a higher
insertion loss and a narrow bandwidth. Basically, in order to obtain a deeper rejection and a wider bandstop of
stub filter, more open stubs should be employed. However, it would also increase the circuit size and
the insertion loss [9]. On the other hand, spurline filters are suitable only for moderate rejection bandwidth
applications. The three types of resonator filters were designed with the center frequency of 9 GHz. The wave
, the bandstop and (i. e. the desired
effective permittivity [5]. The electrical length can be
, the equivalent electrical length of the spurline.
The The electromagnetic simulation is performed to analyze the behavior of the resonator filters. Therefore, the
current distribution simulation results of the spurline resonator filter, the meandered spurline filter and the
spurline resonator are observed at the resonance frequency of 9 GHz in the stopband which
are illustrated in Fig. 2. The bar in the left side represents the surface current density in (A/m) which is the
es. As a result of randaom current density simulations, the
current distribution is the lowest at 9 GHz frequency in Figure 2 (a), (b) and (c) which means the frequencies are
andstop characteristics. As can be
seen the Fig. 2, the electric field is highly concentrated in the gap that gives capacitive effect. In the same way, the
electric field nearly vanishes in the outside of the gap that shows magnetic field and gives inductive effect.
(B)
SCHOLARS WORLD-IRMJCR Online: ISSN 2320-3145, Print: ISSN 2319-5789
www.scholarsworld.net [email protected] Volume. II, Issue II, April 2014 [4]
(C)
Figure 2 Current distribution graphs at 9 GHz in (a) the spurline resonator filter, (b) meandered spurline filter
and (c) symmetric meander spurline resonator.
3. ANALYSIS AND EXPERIMENTAL RESULTS:
The resonator filters are fabricated on a Teflon substrate with a thickness of 0.54 mm, dielectric constant of 2.54
and loss tangent of 0.001 using wet etching process. The filter is quite compact even if we used a low dielectric
constant material. The fabricated resonator filters were measured with Agilent (HP) 8510C vector network
analyzer (VNA). Figure 3 (a), (b), and (c) show the simulated and measured responses with their respective
fabricated photographs. The results show good agreement between the EM simulations and measurement
results. The measured insertion and return loss are about -35 dB and -0.5 dB at 9.2 GHz. For the meander
spurline resonator filter shown in Fig. 3 (b), the measured insertion loss and return loss are about -28 dB and -
0.3 dB at 9 GHz frequency. Similarly, Fig. 3 (c) shows the measured insertion loss of -48 dB and return loss of
1.5 dB in the symmetric meander spurline resonator filters. However, in Fig. 3 (b) and Fig. 3 (c), the simulation
and the measurement results show good agreement between them. In terms of harmonic suppression, the results
of the meander spurline resonator and the symmetric meander spurline resonator showed better than the results
of the L type spurline resonator. The plotted graphs in Fig. 3 (a) and Fig. 3 (b) show that as the meandering in
the spurline are increased, the value of Q factors are also increased and the deeper the band rejection
characteristics. The high Q factor of the resonator has a potential to have a low phase nose characteristics if
such resonators are implemented in the microwave oscillators of the communication systems [6-9]. Therefore,
such resonator filters can be good candidates for the oscillators as frequency selective components. The table 1
shows the characterized parameters (insertion loss, return loss, and frequencies) of three types of BSFs.
(A) (B)

SCHOLARS WORLD-IRMJCR Online: ISSN 2320-3145, Print: ISSN 2319-5789
www.scholarsworld.net [email protected] Volume. II, Issue II, April 2014 [5]
(C)
Figure 3 the simulated and measured results of insertion loss and return loss (a) L-type spurline BPF, (b)
Meander spurline BPF, and (c) Symmetric meander spurline BPF.
TABLE I. THE SUMMARY OF THE SIMULATED AND MEASURED
RESULTS OF THREE TYPES OF SPURLINE RESONATOR BSFS
Resonator Filter
Configurations
Operating Frequency
[GHz]
Return Loss (S11)
[dB]
Insertion Loss (S21)
[dB]
Simulated Measured Simulated Measured Simulated Measured
L-Type spurline 9 9.1 0.1 0.5 -30 -35
Meander spurline 9 9 0.1 0.3 -34 -28
Symmetric
meander spurline 9 9 0.3 1.5 -48 -48
4. CONCLUSION:
Compact microstrip resonator filters were designed, fabricated and characterized at 9 GHz utilizing bandstop
characteristics of spurlines and compared each other. The simulation and measurement results showed good
agreement between them in terms of insertion loss and return loss in three different spurline configurations.
However, in the case of L-type spurline resonator filter, the center frequency is upshifted. Because of the defected
nature of the spurline, these filters have further integration potential and Q factor of the meandering spurline
resonator filters are better than that of the L-type spurline resonator at the given frequency so that these resonator
filters can be good candidates as a frequency determining network for the microwave oscillator design.
ACKNOWLEDGEMENT:
This research was supported by the National Research Foundation of Korea (NRF) and a grant from the Korea
government (MEST) (No.2012-0009224) and (No. 2012R1A1A2004366). This work was also supported by a
Research Grant of Kwangwoon University in 2014.
5. REFERENCES:
1. Wang Y. Z., and Her M. L. (2006), “Compact microstrip bandstop filters using stepped impedance
resonator and spur-line sections”, IEE Proc. Microw. Ant. Propag, Vol. 153, pp. 435-440.
2. Hong J. S. and M. J Lancaster, “Microstrip Filters for RF / Microwave Applications,” Wily, USA, 2001.
3. Liu H., Knoechel R. H, and Schuenemann K. (2007), “Miniaturized Bandstop Filter Using Meander
Spurline and Capacitively Loaded Stubs”, ETRI Journal, Vol. 29, pp. 614-618.
4. Kumar A. and Verma A. K. (2011), “Control of Stop Band Using Spur Line Resonators of DGS Based
Low Pass Filter”, IEEE Students’ Technology. Symposium, 61-64.

SCHOLARS WORLD-IRMJCR Online: ISSN 2320-3145, Print: ISSN 2319-5789
www.scholarsworld.net [email protected] Volume. II, Issue II, April 2014 [6]
5. Angkawisittapn N.(2012), “Harmonic suppression of microstrip ring resonator using double spurlines”,
Int’l J. of the phy. Sci. Vol.7, pp. 31-36.
6. Shrestha B., and Kim N. Y.(2011), “Low phase noise microwave oscillator using meander spurline
resonator for X-band application”, Ind. J. of Eng. & Mat. Sci.,Vol. 18, pp. 381-384.
7. Shrestha B.,and Kim N. Y.(2010), “Design of Low Phase Noise InGaP/GaAs HBT Based Differential
Colpitts VCOs for Interference Cancellation System”, Ind. J. of Eng. & Mat. Sci. Vol. 17, pp.34-38.
8. Shrestha B., and Kim N. Y.(2012), “Spurline Resonators Design and Its Implementation to Microwave
Oscillators”, Microw. and Opt. Tech. Lett. Vol. 154, pp.171-176.Tu W. H., and Chan K. (2005),
“Compact Microstrip Bandstop Filter Using Open Stub and Spurline”, IEEE Microw. and Wireless
Compo. Lett., vol. 15, pp.268-270.
----
SCHOLARS WORLD-IRMJCR Online: ISSN 2320-3145, Print: ISSN 2319-5789
www.scholarsworld.net [email protected] Volume. II, Issue II, April 2014 [7]
BOKO HARAM: THE NATION AS TERRORIST
LEKAN BALOGUN,
Theatre Programme
Victoria University of Wellington
New Zealand
ABSTRACT
Political violence has become a significant “way of life” in the entire world today. In most cases,
groups have emerged challenging perceived and actual wrongs and systems they considered
unfriendly to their demands and aspiration in one form or the other. Violence and, in some
extreme cases, wars have been fought as a way of “fighting back” and “correcting” such wrongs.
In Nigeria for example, there are historical accounts of agitations against colonial subjugation and
imperialism, as much as those of minority/tribal/ethnic/religious skirmishes that left in their wake
tales of woes and loss recorded since independence. Series of bloody ethnic outbursts, especially
in the northern parts of the county which led to the Nigerian Civil War of 1967-1970 are
examples. The “Jama’atu Ahlus-Sunnah Lidda’ Awati Wal Jihad”, known to the world as Boko
Haram, a new group out of many of such, draws attention to the history of northern Nigeria,
particularly noted for such violent extremism, in relation to resistance and clamour for certain
ideals and goals. Through historical and dramatic exploration, this paper focuses on the north’s
history of resistance struggle, and recent violent acts by the Boko Haram group against the
backdrop of the nation’s shaky political and economic situation. This paper argues that Boko
Haram is neither affiliated to Algeria’s al-Qaeda nor Somalia’s al Shaabab terrorists groups; that
the activities of the groups are not religiously motivated, but political factors far outweigh other
considerations responsible for such acts of extremism by the group.
Keywords: Boko Haram, Caliphate, Colonialism, Heroism, Politics, Religion, Slavery
SCHOLARS WORLD-IRMJCR Online: ISSN 2320-3145, Print: ISSN 2319-5789
www.scholarsworld.net [email protected] Volume. II, Issue II, April 2014 [8]
INTRODUCTION:
Political violence has become a major characteristic of most nations in the world today. Groups claiming to
challenge wrongs and systems considered unsympathetic to their demands and “national” aspiration have
emerged and resorted to violence and, in some extreme cases, wars in order to enforce their demands. Such
extreme acts have not only succeeded in aggravating the fear people have about global politics, it has also
drawn attention to the tragic reality of the imbalance resulting from the relationship between affluent nations
and others groping in debt and squalor; between the privileged class and the embittered masses, a situation
which often promotes mistrust, tension and unbridled vices. Foreign nations’ meddling in the affairs of
developing countries and the insincerity of the governments of most of these nations are among other factors
discovered to be promoting such brutal occurrences with attendant loss of lives and displacement of several in
countries where there had been such eruptions.
In Nigeria for example, there are historical accounts of agitations against colonial subjugation and imperialism,
as much as pockets of minority/tribal/ethnic/religious skirmishes that left in their wake tales of woes and loss.
Boko Haram, as an emergent group clamoring for “justice and equity”, has given the extremity associated with
such demands a new kind of name, and dimension not known before now. It has also “finally” succeeded in
“(re)branding” the northern part of the country, where its activities are mostly concentrated, and further, if not
finally battering its’ image and existing notoriety for religious agitation and violent extremism. The situation
has equally succeeded in further denting the image of Islam, as a religion founded on truth and peace, under
whose banner some of these fanatical and heretical groups supposedly perpetrate the dastardly acts, in the
country and the world over, even though significant evidence has shown how local and foreign media, funded
by political alliances and groups promoting these skirmishes albeit, as some forms of hegemonic control and
assertion of specific agenda, play up the entire perception. Rather than toe this same line of thought, this paper
looks at how and why Boko Haram as a group, out of many, pursues its aims, outside of the established Islamic
tenets, which stand apart from the insanity that such groups, no matter the genuineness of their claims and
demands, truly represent.
For those who truly read their history very well, northern Nigeria is not all about religious extremism; agitations
for decency, good governance, fundamental rights etc are not always for the wrong reasons. There have been
heroic displays by some inspired northern individuals and the collective, against actual wrongs and violent
conducts directed at the people, their faith and way of life by some elements. The concern of this paper is to
draw attention to, on one aspect, the heroic steps taken by the people in order to assert their “selfhood”, against
movements and acts which undermined them. Second, to examine such heroism in relation to the history of
violence in northern Nigeria especially with regards to Boko Haram associated violence, side-by-side with
unbiased view of the sociopolitical administrative arrangement and power structure of the country which fuel
such extremism, as tellingly argued by some informed sources.
NORTHERN NIGERIA BEFORE COLONIALISM:
Basil Davidson (1968) writes that “History, in other words, is not a calculating machine. It unfolds in the mind
and the imagination, and it takes body in the multifarious responses of a people’s culture, itself the infinitely
subtle mediation of material realities, of underpinning economic fact, of gritty objective”. Perhaps Davidson
meant to write about the historical and political reality of the northern part of Nigeria. He must also have meant
to disagree with Nietzsche (1961)’s pessimism that “what we know of history is transposition of illusion” and
agree with Yerima (2009) that it is best to “pay attention to [the] dialectic content”, of history.
Historians and scholars notably Johnston (1967); Brenner (1993);Loimeier (1997); Kani and
Gandi(1990);Falola and Heaton(2008) and Bunza (2004) among other several impressive scholars have written
and variously chronicled the history of Northern Nigeria, especially its emergence as a formidable hegemony in
the history of nationhood in the continent and among Black people. These scholars all agree that it is home to
numerous ethnic groups and religious communities. These include historically important urban centres like
Kano, Sokoto, Zaria, Maiduguri and Kaduna despite their rural landscape. These cities have been famous
centres of learning in the Islamic world for centuries, with predominant groups such as the Hausa, Fulani and
Kanuri among other roughly 160 smaller groups; the larger majority being Muslims, as well as a smaller
number of Christians and animists. Since the British colonization in the early 1900s, these groups have
crystallized into both the “majority groups” and the “minorities”, of which the Sokoto Caliphate is the capital
and most prominent.

SCHOLARS WORLD-IRMJCR Online: ISSN 2320-3145, Print: ISSN 2319-5789
www.scholarsworld.net [email protected] Volume. II, Issue II, April 2014 [9]
The Sokoto Caliphate traces its preeminence to the efforts of Shehu Uthman Dan Fodio whose jihad, aimed at
purifying Islamic practice in the region, ultimately led to the installation of a new righteous leadership. Under
his leadership, the capitals and emirates witnessed the flourishing of trade, secured transport routes and the
attainment of considerable wealth [1]. The Caliphate, according to Shehu Shagari, encompassed “the vast
territories of the United Islamic States of West Africa which extended from Goa on the River Niger in the west
to Garoua near the source of River Benue in the East and from the fringes of the Rainforest south”(Shagari, qtd
in Yerima,1998:10).This was the background while colonial penetration of the hinterland was underway thereby
providing a ready and juicy target for Imperialist manipulation and subsequent attack due to its resistance.
In the late nineteenth century, the British government established its control of Southern Nigeria as a
protectorate with Lagos as a colony. In 1900, it began extending its control northward proclaiming that region
also a protectorate. Frederick Lugard, the High Commissioner of Northern Nigeria gradually negotiated and
actually forced and manipulated some of the emirs to accept colonial rule. Some agreed as their kingdoms were
already weakened by the internal crises resulting from the end of the once lucrative Atlantic slave trade. But
those who resisted were defeated from Bida in 1901 to Sokoto in 1903[2]. However, Sultan Attahiru’s
confrontation with colonial forces has remained a significant watershed in the history of the region. Though
defeated like Ovonramwen Nogbaisi of Benin, Jaja of Opoboland and Nana of Itsekiri, his bold resistance
continues to be celebrated by the people, who find in such history of heroism a strategic rallying point to
campaign for the need to forge a common front in spite of varying degrees of challenge they face.
Also, in the history of the Igala people, an originally predominantly Muslim community of people in present-
day Kogi state in the Lokoja region, Ameh Oboni’s ‘tragic encounter’ with British brutalizing colonial machine
equally adds to the picture of the North as a society whose history holds a lot of promise for national cohesion,
integration and survival if the lessons leading up to that historic encounter are revisited, thought over and the
gains harnessed. One specific drama text, Attahiru (1998) by Ahmed Yerima explores with vividness the
violence and crisis ever since created by the displacement of that existing sociopolitical structure, replaced by
foreign hegemony through methods that were once deceptive and overwhelming in their impact, resulting in
“disruptive and cataclysmic consequences” (Fanon 1983), on the lives of the people, and especially “the
structures and values of their societies”(Olorunleke 1999).
COLONIALISM: IMPERIALISM AND THE AGENDA OF DIVISION:
In Africa as in much of the rest of the Third World, the colonial enterprise not only undermined the
sociopolitical reality of the people, but also truncated their cultural and religious values. In their words, Ilyin
and Motylev (1986) argue that “for nearly a century in Africa, two centuries in Asia, and three to four centuries
in Latin America, the colonial countries were plundered of all their wealth, their most fertile lands were used to
produce a single type of crop for the colonialists, and the obtained products were exported to the imperialists
states”. Fanon (1983) also writes that “colonialism [was] not a thinking machine, not a body endowed with
reasoning faculties [but] it is violence in its natural state”.
Colonial attitude towards African natives was nothing but abhorrence of their ways, intellect and beliefs---
attitude carried over even where foreign values are concerned and, by some natives themselves, many years
after colonialism [3]. Rather, the wealth of the colonies was sought with greed and annoying audacity and
eternal fracture of social cohesion, has been created in countries that once enjoyed relative peaceful co-
existence despite their minimal levels of development at the time [4]. Conflicts arising from the encounter
continue to plague the societies. Colonialists, such as Lugard actually tried to justify the “need” for colonialism,
by an argument that reeks of arrogance and self-righteousness. Lugard (1923) writes “The tropics are the
heritage of mankind, and neither on the one hand has the suzerain power a right to their exclusive exploitation
nor on the other have the races which inhabit them a right to deny their bounties to those who need them”. The
tension arising from this kind of attitude has remained perpetual. The creation of the colonial state, as a direct
result of the introduction and imposition of Indirect Rule by Lord Frederick Lugard, brought about disharmony
in pre-colonial Nigerian polities that were, according to Olorunleke, once “heterogenous societies with their
respective endocentric engines of growth coupled with corresponding politico-cultural institutions”
(Olorunleke,1999:126), and, in the case of Northern Nigeria, a very well-established religious structure under
the leadership of the emirs and the Caliph in Sokoto all governed by Islamic tenets. If anything, the policy of
“Divide and Rule” as a strategy which ensured that an effective form of disunity was created among the people
through which colonial authorities were able to plunder their resources also, unfortunately, served to sow seeds
SCHOLARS WORLD-IRMJCR Online: ISSN 2320-3145, Print: ISSN 2319-5789
www.scholarsworld.net [email protected] Volume. II, Issue II, April 2014 [10]
of discord among the people. Isichei’s remark that Nigeria’s “confrontation with an alien culture, its conquest,
and the experience of an alien rule, created crises”(Isichei,1973:180), captures the reality of the colonial agenda.
Northern Nigeria appears to be the worst hit by this historic encounter considering the spate of contemporary
tribal and religious conflicts recorded in that region, thus resonating with the fact of the tragic reality Cesaire
(1972) paints that “wherever there are colonizers and the colonized face to face, I see force, brutality, cruelty,
sadism, conflict”. Such divisions among the people that was so successfully created ensured that a gulf existed
between the once law-abiding northern citizens and their rulers whose authority, derived essentially from the
Holy Qur’an and Hadith as well as other guiding principles from Islam was opposed. Ward writes that “the
three years’ campaign which Lugard fought over the great spaces of the north against the Fulani emirs, who
were not supported by their Hausa speaking subjects, was part of the old humanitarian tradition that runs
through from Gransville Sharp through Wilberforce and Livingstone”(Ward,1965:389). Lother Bucher also
expresses such colonialist’s sentiment, which can be construed to be a summation of the 1884/85 Berlin
Conference agenda. He says; “Colonies are the best means of developing manufactured export and import trade,
and finally a respectable Navy” (Bucher, qtd in Ake, 1981:9).
ATTAHIRU: MARTYRDOM TO PROTECT THE CALIPHATE:
When playwrights use history, according to Yerima (2013), “a new type of signification is given to the
incidences of the past, a form of refreshing and a relook at the past within a new framework” [emphasis mine].
The use to which such materials are put not only stands as an embodiment of a certain specific and germane
reality that the society can draw knowledge from, but also as he further argues, it becomes “a blend of aesthetics
with history [that] gives it new importance and expands the old meaning with new sensibilities”. Yerima’s
penetrating opinion is further highlighted by Paul Hamilton who argues that
The new significance of the redeemed event revises present modes of understanding, empowering them to make
still historical discoveries. And so the dialectical historicity of the past and present generates its own momentum
(Hamilton, 1996:207)
This attempt, a “redemptive” exercise as Yerima explains it, taking his own idea from Hamilton’s, often finds
expression in a kind of “an alternative universe which is refract(ed) from the historical reality” (Yeima,2013:63)
in order to offer new opinion and provide fresh insights into an existing one. He does this well with the
historical play, Attahiru, which focuses on the Sokoto Caliphate’s historic encounter with colonial penetration
of the northern part of Nigeria. Recalling such history, at a time like this, bothers on the need to show example
of what it means to fight a good cause and how well such stories of heroism can help inspire a new generation
of people toward edifying acts rather than irresponsible violence. It also bothers on the question of responsible
leadership as shown by Sultan Attahiru in his confrontation with the colonial penetrating machine led by Lord
Lugard on a British Empire’s mission of expansion and assertive control.
Sultan Attahiru’s ascension to the Caliphate in November, 1902 as the twelfth Caliph of Sokoto and Sarkin
Musulumi was according to Yerima, overshadowed by a major development in the history of Nigeria, notably
the British military penetration of the hinterland in the North with its Imperial might already felt by the defeat
of indigenous resistance movements in Ijebuland (1892), Brass (1895), Ilorin and Bida (1897), Benin (1897),
Arochukwu (1901-2) among others. Sultan Attahiru was not unaware of this development---a fact he expresses
at his coronation amidst the euphoria of celebration and hope for prosperity from the people
CALIPH: I am becoming the Caliph at a time when the history of our lives is at a
delicate balance. At a time when the Whiteman is determined to upset the peace
of our lives. But it is too early to dare enemies, or to look for one. I shall await
their moves. But let us pray to Allah’s hand in the matter. Let us pray for peace.
Let us pray for our children. Let us pray for the growth of our lives and position
in the Islamic world. Thank you all (21).
The play opens in front of a mosque against the background of Muslim call to prayer—another fact which
establishes the very pervading presence of Islam as the state religion and highlighting the level of the people’s
devotion to their spiritual tenet. The conversation between Yakubu, the seller of Islamic books and other
religious items and Abbas, a blind beggar is illuminating in providing useful hints regarding the Caliphate’s
impending clash with Imperial forces led by Lugard. Kano’s war with the invaders had already claimed many
lives, with same situation recorded in Kontagora, Bida and Yola, with Sokoto which had just been bereaved of
Caliph Abdulrahman, appearing to be the next target of invasion.

SCHOLARS WORLD-IRMJCR Online: ISSN 2320-3145, Print: ISSN 2319-5789
www.scholarsworld.net [email protected] Volume. II, Issue II, April 2014 [11]
While the populace awaits the decision of the governing council regarding the choice of caliph between
Mohammad Attahiru Ahmadu and Muhammad al-Tahir Aliyu, the statement by Abbas captures the fear which
overshadows the celebration. He fears “the fast shooting gun of the Whiteman (which) spits bullets of death”
(17). The sense of trepidation is understandable knowing that the “poisonous arrows of our soldiers waddle
when you compare them to the bullets of the Whiteman’s guns”(18). Attahiru eventually emerges caliph ending
speculations and he soon gets busy with state affairs. However, while Sultan Attahiru, with the support of his
council, engages in resolving domestic dispute over market control and authority such as the one involving
Sarkin Zango and Sarkin Fatake and their members who are mostly peasants and traders, the enormity of the
task ahead is not lost on him. He draws attention to the need to “like good Muslim brothers find common
ground for peace”, because the times are not suited for “land and well problems” (25).
The news of the removal of his representatives, the emirs of Bida and Kontagora by Lugard who accuses them of
highhandedness is not as shocking as the undermining of the Caliph’s person and authority by Lugard, who sends the
message to the Sultan to nominate new emirs whose choices can only be confirmed through colonial ratification. He
ridicules the Islamic religion by referring to the deposed emirs as scoundrels and infidels. As Waziri laments; “the
greatest irony is that the selector of these good Muslims, is himself a Whiteman, an infidel. A kafir!”(28). But giving
the colonialist a name is not enough to quench his insatiable quest for Sokoto as part of his already conquered
territories in what Rodney (1982:223) describes as its “incorporation into the economic structure of world
capitalism”, which in the long run is intended to “usurp the colonized people’s historical process and equally
disarticulate the economic, political and cultural structure in the dominated society”(Olorunleke,1999:123). What is
needed is expedient action in order to forestall his every move, particularly as Abbas informs us that “the whitemen
are marching towards Argungu and Gwandu already”(17), a piece of news which resonates with the tragic tale of a
heavy loss his family and several others had suffered after the defeat of Kano.
Lugard’s victory in Bida and Kontagora opens bitter wounds and painful recollection bothering on strained
relationship between the people of Sokoto and their neighbours. Anger and bitterness allow for council
members to openly express their concern and fear. Ubandoma sees the “crack in the walls” as a factor. He
explains to the Council.
UBANDOMA: Sokoto and Zaria have not been our friends. They were even
ready to forget that the Zaria people are our Muslim brothers. They felt that as
long as Ibrahim the former Emir of Kontagora attacked Zaria in order to feed his
men, it was a Zaria problem. When the Emir of Zazzau sent to us for help it was
in this very Palace that we decided not to interfere. The Emir of Zazzau was
forced to call the Whiteman, who helped him chase away Ibrahim, a fellow
Muslim, and now the Whiteman have refused to leave. They have become like
the egrets, who help the cows to pick out bad worms and flies, but also peck at
the wounds of the cows which sometimes kill the cows (31-32).
Madawaki equally makes one of the most memorable statements in the play. His anger is rightly directed, not at
the colonial Imperialist, but at the people who have failed to see the need for unity in their conduct. He paints a
global picture of disharmony when he retorts bitterly; “the black race makes me want to cry. The white men are
only a handful, then how come he is such a big bad bully, that we all shiver? Because we all are to blame. We
all created the big bad bully”(30-31). While the whole Caliphate trembles at the thought of likely brutal
confrontation, Sultan Attahiru is himself undaunted by the looming shadow of Imperialism. He talks tough
sending a decisive message, stating in unequivocal terms the position of Sokoto under his authority as a true
Muslim and leader of the Faithful.
However, the seriousness of the tone of the letter is not lost on Lugard who meets with his lieutenants, Colonel
Morland and Willcocks to strategize. Despite his readiness to match the Caliph strength for strength, he
expresses his disdain for the way events are turning and would rather “be a peaceful infidel ruler than a
sleepless conqueror” (35). One could be tempted to view his actions in good light, judging from such remark.
But further discussion clearly reveals that his real agenda and the underlying motive of transgression on African
soil, is no doubt selfish interests of European powers. British incursion and frenzied desire to control the colony,
by any means necessary is threatened by the presence of another colonialist adventurer, the French, which
clearly shows how colonizers struggle among themselves in order to penetrate and plunder the resources of the
colonies at the detriment of the natives. This conversation between the trio is most illuminating
WILLCOCKS: My major worry is the French. They are moving closer to Sokoto
through the north of Katsina.

SCHOLARS WORLD-IRMJCR Online: ISSN 2320-3145, Print: ISSN 2319-5789
www.scholarsworld.net [email protected] Volume. II, Issue II, April 2014 [12]
LUGARD: I have studied the situation myself. It means that we either fight and
take Sokoto now, or the French would cross the Niger and join Sokoto and
thereby cutting us off totally. This must never be allowed
MORLAND: Details Sir, I am hoping that if we have to take Sokoto, it will be
swift and quick. We can’t allow a long war or defeat
LUGARD: Defeat? Never! Right now the morale of our men is high. With the spoils
of Zaria and Kano, they will fight even their fathers for the glory of Britain (35).
But, with the drums of war sounding at the background, faith and devotion to the great cause of Islam find their
way in. Sultan Attahiru’s meeting with his son Mai Wurno and the spiritual teacher Mallam is revealing. With
perspective of spirituality, owing to a prophecy that would end the over a century reign of the Caliphate
established by Shehu Uthman Dan Fodio notwithstanding, Sultan Attahiru’s composure reveals a character of
immense grace and poise. After series of revealing nightmares, which portend danger, he finds recourse in
doing the bidding of Allah, by standing up to challenge desecration of valued Islamic tenets by an unrelenting
foe who “raises dust on all fronts around Sokoto”(38) and has succeeded in breaking up the unity of the
Caliphate built by his (Attahiru)’s ancestors by installing his own loyalists who openly question the Sultan’s
rulings. Naturally one would expect the diversity of opinion such as those from Warafa who asks that “if reason
can prevail on an issue, why rush to spill blood?”(44). But the “colonial machine” as Fanon describes
Imperialism, is not one given to reasons, however genuine in so far as it does not serve its interest.
With the fall of flag bearers under the Caliph, notably Yola, Zaria, Kano, Kontagora and Ilorin, resigning to fate
is neither a luxury Sultan Attahiru can afford, nor the fear he chooses not to entertain. Rather, controlling the
same fate becomes a duty, mixed with the determination to succeed like Atiku, Muazu, Umoru and Abdul-
Rahman; all caliphs before his time. As the Imperialist’s final onslaught begins and Katsina surrenders, Sokoto
under Sultan Attahiru continues to be steadfast and determined, who insists that “if Sokoto must fall, it will fall
fighting, not with the Caliph and his people unwrapping their Rawanis for the Whiteman to see their bald
heads” (47). After the bloody confrontation at Bebeji noted for heavy loss of lives, Burmi soon becomes the
fiercest battle ground and the place history will meet with resilience, faith with duty, honour with fate as the
troop led by Sultan Attahiru clashes with Lugard’s well-equipped and trained soldiers unlike Hausa/Fulani
peasants the Caliph has taken to the battle front.
Prior to this decisive clash, the colonial Imperialists’ have hurried enthroned Prince Muhammad al-Tahir Aliyu
as the new Sultan (a move to divide the Caliphate into conflicting interest groups and finally destroy the last
whiff of authority Sultan Attahiru wields) Muslim Faithfuls and loyalists still rally round in support of truth
symbolized by Sultan Attahiru who prophetically notes that “it is not how long, but what you did while on the
throne that people will remember”(61). Defeated by the superior forces of Lugard all right, Sultan Attahiru’s
heroism is marked by the symbolism of the flag that was never allowed to fall, as each falling Muslims
defended it with his life and indeed “say no to colonial oppression at the cost of their lives”(61). Such was the
fate of the region as Attahiru goes down clutching onto glory. Sokoto crumbles in the face of a more organized
power, but heroism on the part of the defeated stands out very tall.
Sultan Attahiru’s courage and rare devotion is considered worthy of celebration. His stability of character in
fighting a noble cause is reminiscent of Omar Mukhtar’s effort as the leader of the Bedoin Arabs in Libya
during the Fascist government of Mussolini, the same way Algerian resistance movement is seen, as well as the
Nelson Mandela led African National Congress (ANC) struggle against the Apartheid system in South Africa.
Struggles against colonial penetration were in every way some noble endeavour; just and decidedly marked
attempts to rescue a whole populace and nation from both territorial and politico-economic strangulation by
foreign powers, which had little or no respect for the humanity of the natives [5]. From the literary/dramatic
perspective as reflected in the play, such glorious effort can be seen in the light of Yerima’s opinion that “the
concept of tragedy heavily influenced by religion takes the protagonist to the position of a spiritually ordained
victim whose downfall becomes an inspiration raising him to the position of spiritual envy and respect, with the
willingness on his part making him become a martyr” (38).
NORTHERN NIGERIA AFTER:
Wilson (2005) asks certain fundamental questions in his attempt to explain the connection of tragedy to human
society. Tragedy, he argues, has the unique ability to ask “basic questions about human existence”. He then sets
out to ask;“Why are people sometimes cruel to one another? Why is the world unjust? Why are men and women
SCHOLARS WORLD-IRMJCR Online: ISSN 2320-3145, Print: ISSN 2319-5789
www.scholarsworld.net [email protected] Volume. II, Issue II, April 2014 [13]
called on to endure suffering? What are the limits of human achievement? To what heights of courage, strength,
generosity, and integrity can human beings rise?”(Wilson, 2005:236). While Sultan Attahiru’s heroism is
earned through a resilient hold onto truth, fight for true dignity of the human person as symbolized by the
people under his rule; faith in true Islam, which propagates brotherhood and common good for all against an
opposition that rises to undermine all of these (the colonial imperialist venture that encourages division,
employs callous method of penetration and brutal destruction of a/the people’s religious and political structure)
certain facts stand out; namely, honesty and the sincere commitment to serve the people and submit to the will
of the higher power represented by the Supreme. Also, some other factors come to the fore, namely, that
colonial imperialism and subjugation have not been without some attendant sociopolitical tribulation as
witnessed in the North and the entire country till date.
In the first instance, the history of distrust between the North and South as well as the East, which was the
stimulating factor for the crisis and violence leading to the Nigerian Civil War (1967-1970) can be traced to the
bitterness of the North against other regions, which were blamed for providing the needed troop by the colonial
authority in the successful suppression of Northern resistance during that colonial period [6]. Also, the rise of
religious conflicts in the North had its antecedent in the colonial presence which caused division and conflict
between the two major Sufi brotherhoods, namely the Qadiriyya which had established its presence as the
official and dominant order of the Caliphate since the fifteenth century and the Tijaniyya with its strong base
derived from the newly rich traders and bureaucratic class that formed its membership.
This is similar to what Ameh Oboni regards as double-standard in the treatment of religious adherents in the
North. According to him, “the White men trust the core Hausas. We in the middle belt are a problem of
Geography” (26). The allegations of collaboration with colonial authority often levied against the Qadiriyya by
the Tijaniyya gradually degenerated into brutal clashes in the 1940s. It also had direct and catastrophic effects
on the political situation, especially those involving the two major political parties in the region of that era,
Northern Elements Progressive Union (NEPU) and the Northern People’s Congress (NPC)[7]. Also the
resistance posed by the Madhi group, which had the reputation of being feared by the colonial authority, is also
remarkably relevant in understanding colonial midwife of religious crisis in the northern region [8].
BOKO HARAM AND THE NIGERIAN NATION:
The African, nay Nigerian inheritors of power from colonial masters have not done well to justify the sacrifice put
into achieving independence. Persistent political turbulence and outright outbreak of war, stemming from
differences not in the interest of the populace, but of a few group constituting the political class have left several
impoverished, wealth of the nation plundered and ethnic, tribal and religious misunderstandings played up beyond
control. Most importantly, insincerity in government offices has left several people disillusioned and so many
others have lost total confidence in the ruling class who, unfortunately, continue to recycle the same set of people,
and ideas that have practically failed to move the country forward and thus give birth to a group like Boko Haram.
According to Walker Andrew (2012) in the publication Special Report, by the United States Institute of Peace;
“Boko Haram has grown at a time when there are many national issues that draw anger and feed the group”.
Government’s insincerity and failure to honestly stand up to national need and crises except those that appear set
to ruffle the nest of the ruling can be regarded as a major factor in the emergence of Boko Haram and its threat to
peace in the country. The fact that “the group [has] constructed a “state within a state”, with a cabinet, its own
religious police, and a large farm […] attracted more and more people under its roof by offering welfare handouts,
food, and shelter. Many of the people the group attracted were refugees from the wars over the borders in Chad
and jobless Nigerian youths”(Walker,2012:3) clearly buttress these points. This fact also stresses the point that the
group is a local breed that feeds on the inadequacies of the government and shows its intent to take advantage of
institutional weakness in order to negotiate both religious and political reforms in the country [9].
Aside this obvious weakness of the government, the fact that religion is always held up as a “scapegoat”
whenever crises involving the north and south of the country erupt, has served to blur the line between the
actual reason(s) for most crises that are outright politically motivated and those ethnically and/or religiously
promoted. According to Walker, when “viewed from outside, it can appear that these conflicts boil down to
religious differences, tensions between blocs of Muslim and Christian inhabitants [but] when one looks deeper,
one finds that politics---more precisely, control of government patronage---is the primary cause of many of
these conflicts”. The revelation that Boko Haram has within its rank children of influential politicians and that
the group enjoys such patronage, with significant example being its ability to produce chemical weapons and
explosives such as bombs, procure and use sophisticated ammunitions of military grades, also serve to buttress

SCHOLARS WORLD-IRMJCR Online: ISSN 2320-3145, Print: ISSN 2319-5789
www.scholarsworld.net [email protected] Volume. II, Issue II, April 2014 [14]
the speculation of heavy financial support that an ordinary angry and radical group, nurtured and living in
deserted mosques, as it has initially been portrayed to the Nigerian people to be, can possibly afford and/or have
access to. There is also the possibility of viewing Boko Haram as a reactionary group against certain actions by
the government or its functionaries. Every political movement or action might not be unconnected to some
relationship between government and the people, especially the minorities, or even those who feel marginalized
in some ways. For example, the Ogoni crisis of the oil-rich Niger-Delta region of the country was left to
snowball into a national “terrorist” act of hostage-taking, kidnapping and extra-judicial killings before what
appears to be a meaningful step to control and possibly stem its tide was taken. There is a sense in drawing
attention to this fact, for according to Walker, part of the likely reasons for the emergence of a group like Boko
Haram seems to be directly related to the fact that it believes like “many other groups in northern Nigeria
believe [that] some governors are responsible for a campaign of “ethnic cleansing” against Hausa and Fulani
people”. This fact might be cited as the reason for series of violent clashes and the senseless killing of innocent
people, especially in Jos, Plateau state.
Minority and ethnic reaction and clamour of this nature in the Nigerian polity is as old as the nation itself. But
the tragic reality is the not too encouraging attitude of successive governments in stemming the tide. For some
that as much as tried in the past, bureaucratic procedures, insincerity and pseudo-communique which are run
into the ditch by elements within the same government remain the only sign of feeble attempt and their kind of
commitment, noticeable in such areas as “badly managed, foreign-dominated economy, an oppressive, philistine
political regime, an ossified colonial bureaucracy” (Osundare 2007:38). In a situation where the populace
grapples with “irregular power supply, dry water taps, and an utterly poor communication system”, a dastard
group like Boko Haram can as well lay claim to some fickle and utterly imaginary authority and power to
negotiate “good governance” for the same people it massacres, or even ridiculously attempt to draw the line
between sanity and absolute madness, fragile peace and over-fed lawlessness, particularly in a country that
prides herself as the giant of the continent. In his prophetic work, Anthills of the Savannah, Achebe draws a
palpable picture of the nation’s everyday life. He observes that “the failure of this government [like every other
ones before it] can’t be the massive corruption though its scale and pervasiveness are truly intolerable; it isn’t
the subservience to foreign manipulation, degrading as it is; it isn’t the second-class hand-me-down capitalism,
ludicrous and doomed […] It is the failure of our rulers to re-establish vital inner links with the poor and the
dispossessed of this country, with the bruised heart that throbs painfully at the core of the nation’s everyday
life”. For instance, that the government has not denied nor openly challenge the allegation of genocide against
the North (which replays the events leading to the Nigerian Civil war); the claims that children of influential
citizens’ are involved in Boko Haram activities, or that the group itself is fully sponsored by top politicians and
government functionaries, and the view that the entire violent charade boils down to the North’s refusal to
accept the legitimacy of the incumbent presidency aside government’s inability to address burning national
issues among other related failures, suggest that the root cause of the terrible state of fear the nation has been
pushed in the last three years or so, is actually politically motivated, rather than religious as the people have
always been made to believe.
Having people swayed towards this line of thought has helped to sustain the grip of a certain hegemony that
favours only a privileged few fortunate enough to parade the corridors of political power. Not just political
power as it were, but every sphere of control over a throng already emotionally emasculated and
psychologically saturated with emptiness of failed promises and dashed hopes that has become so familiar at
every stages of their lives to the point of almost getting used to it. Hegemony in this particularly case does not
however follow in the line of Thwaites and Males (1994:128) opinion that “it is a social process of consensus in
which power relations follow the cultural leadership of a dominant group”; for, in this case, a dominant group
such as the Northern region in Nigeria is itself under siege by a powerful “minority” acting on behalf of a
powerless, rudderless and disoriented majority. Further, the situation establishes a connection with Gramsci’s
who engaged this kind of hegemony we are interested in from the perspective of “principal constituent elements
[that work through] consent and persuasion” (Fontana 1993:14); just as Berry explains it “[as a process]
achieved by a combination of coercion and persuasion, not force; hegemonic discourse, not dictatorial rhetoric;
construction of ideological and political consent, not voting; self and civil organization more so than state
organized; and finally, active consent, not passive apprehension” (2000:111)[emphasis mine].This is extremely
obvious in the case of northern Nigeria. The Special Report has it, “tactics employed by government security
[…] have been consistently brutal and counterproductive”(1). The idea of “persuasive consent” works perfectly
for the “powerful” minority who uses religion to control the rudderless but angry majority, especially in the face
SCHOLARS WORLD-IRMJCR Online: ISSN 2320-3145, Print: ISSN 2319-5789
www.scholarsworld.net [email protected] Volume. II, Issue II, April 2014 [15]
of apparent institutional weakness to contain such insurgence and, in the opinion of the Special Report, by a
government which uses “standard maneuver to blame problems on political enemies” (7) or even religion,
which has always been a “willing” scapegoat in this country. The fact that “Boko Haram is an Islamic sect that
believes politics in northern Nigeria has been seized by a group of corrupt, false Muslims” that it wants to deal
with, might also fit properly into Williams and Williams idea of “conscious[ly] interventionist thought” (1993;
152) even though as it happens, it is not as pressing as the danger it poses for the entire nation despite being
dangerous enough. Yet, the strategy of squashing the group and possibly bringing the members to justice might
appear rather difficult if not impossible, at least for now, considering the fact that the government’s “reliance on
extrajudicial execution as a tactic in “dealing” with any problem in Nigeria not only created Boko Haram and
other less-popular insurgent groups across the country as known today, but also sustains and gives [them] fuel
to expand” (Walker, 2012:1). Essentially as it appears, combating Boko Haram is obviously not as important as
addressing the situation which gave birth to Boko Haram and other related groups in the first place.
Besides these points, major political crises including several others in the past, such as the El-Zakzaky led
Muslim Brotherhood of the 1980s, the Maitatsine sect of the 2000s and the very recent Boko Haram attacks can
be linked to the gradual, calculated and treacherous imbalance in the distribution of wealth and opportunities for
the citizenry. This point alone speaks volume of a domineering power which has little, if any respect, for the
right of its people as well as the need to provide equal opportunity for all, which is a priority condition that is
not determined by tribal, religious or ethnic consideration. Most especially, the fact that the conflicts continue to
draw attention to the need to give more than passing attention to the needs and aspiration of the various groups,
which form the polity, continues to foreground the necessity for the entire political arrangement in the country
to be honestly addressed (not in any way in the way and manner of organized Constitutional Conference and
other charades by the Obasanjo administration and the present government of Goodluck Jonathan) in the
interest of the nation’s and people’s survival as one united hegemony. Significant points stressed by the Special
Report could become very important at this crucial stage. First, there is this summation that
Northern Nigeria as a whole has very deep development problems, perhaps deeper than the rest of the country.
It has some of the worst maternal and infant mortality rates in the world. The level of poverty and deprivation is
higher than the rest of the country, while active participation in politics, beyond fealty to a thin band of political
and religious godfathers who hold power, is low. The only way to remove the threat of the group in the long
term is widespread reform of northern Nigeria that improves the livelihoods of northern Nigerians, and gives
them a bigger stake in their politics [emphasis mine]
Second, there is the urgent need to pay attention to the fact argued by Walker that “a weakness in the
institutions of politics and the security services has created a political situation where such threats to stability
are not dealt with until violence is a certainty”(Walker,2012:2). This point stresses the urgent need to change
the perception often promoted by the media, which is equally culpable in the sordid reality of national life by
the unnecessary heaping of the blame of government’s failure to live up to its billing on religious fanaticism and
unbridled fundamentalism. It did not work to alleviate conditions in the past neither is it working now, except to
throw fear and more confusion in an already messy affair.
CONCLUSION:
Against the widespread speculation about the real identity, true intentions and clear clamour or demands of the
group as well as government’s double-standard cum call on the outside world for help in combating the whole
bloody and troubling scenario, “extreme caution must be advised, as what might appear to be a little “local
difficulty” might hide a growing rift between both north and south”(Walker,2012:3).This very important
submission by the Special Report also sums up the crucial need for government and those involved to take a
decisive step towards addressing the situation, else the nation might have a repeat of the civil war. The signs are
everywhere.
REFERENCES:
1. Achebe, Chinua (1987) Anthills of the Savannah. London: Heinemann.
2. Ade Ajayi, J.F & Espie, Ian (1965) A Thousand Years of West African History. Ibadan: University Press & Nelson.
3. Afigbo, A.E (1965) “The Colonial Phase in British West Africa: A Reassessment of the Historiography of
the Period” A Thousand Years of West African History. Ade Ajayi, J.F & Espie, Ian (eds). Ibadan:
University Press & Nelson.419-430.
SCHOLARS WORLD-IRMJCR Online: ISSN 2320-3145, Print: ISSN 2319-5789
www.scholarsworld.net [email protected] Volume. II, Issue II, April 2014 [16]
4. Ake, Claude.A (1981) Political Economy of Africa. London: Longman.
5. Akinjogbin, I.A and Osoba, S.O (1980) Topics on Nigerian Economic and Social History. Ile Ife:
University of Ife Press.
6. Berry, Kathleen, S (2000) The Dramatic Arts and Cultural Studies.Against the Grain. New York and
London: Farmer Press.
7. Brenner, Loius (1993) Muslim Identity and Social Change in Sub-Saharan Africa. Indiana.
8. Bunza, Muktar Umar (2004) “The Sokoto Caliphate after 200 years: A Reflection”, Conference paper,
Usman Dan Fodio University, Sokoto.
9. Cabral, Amilcar (1982) “Weapon of Theory” Unity and Struggle. London: Heinemann.
10. Cesaire, Aime (1972) Discourse on Colonialism Trans John Pinkham. New York and London: Monthly
Review Press.
11. Daniel, John (1981) “The Culture of Dependency and Political Education in Africa” Political Economy of
Africa: Selected Readings Cohen, D and Daniel (eds) London: Longman.
12. Davidson, Basil (1968) Africa in History London: Penguin Books.
13. Fafunwa, A. Babs (1974) History of Education in Nigeria. London: George, Allen & Unwin.
14. Falola, Toyin and Heaton, Mathew (2008)A History of Nigeria. Cambridge: Cambridge University Press.
15. Fanon, Frantz (1983) The Wretched of the Earth. London: Pelican Books.
16. Fontana, B (1993) Hegemony and Power—On a Relation between Gramsci and Machiavelli.
Minneapolis: University of Minnesota Press.
17. Gellner, Smith (1983) Nations and Nationalism. 2nd
edition. Oxford: Blackwell.
18. Gramsci, A (1973) Letters from Prison. New York: Harper and Row.
19. Hamilton, Paul (1996) Historicism. London: Routledge.
20. Ilyin, S and Motylev, A. Sdobnikora (1986) What is Political Economy? Trans. Galina Moscow:
Progress Publishers.
21. International Crisis Group (2010) “Northern Nigeria: Background to Conflict” Africa Report No 168, 20
December.
22. Isichei, Elizabeth (1973) The Ibo People and the Europeans. New York: St. Martin’s Press.
23. Johnston, H.A.S (1967) The Fulani Empire of Sokoto. London.
24. Kani, A.M and Gandi, K.A (1990) State and Society in the Sokoto Caliphate. Sokoto.
25. Loimeier, Roman (1997) Islamic Reform and Political Change in Nigeria. Evanston.
26. Lovejoy, Paul .E & Hogendorn, J.S (1990) “Revolutionary Madhism and Resistance to Colonial Rule in
the Sokoto Caliphate,1905-1906”Journal of African History,vol.31,no.2.217-224.
27. Nietzsche, Friederich (1961) Thus Spake Zarathusra. London: Penguin.
28. Ogot, B (1966) “The Development of African Politics in the Rural Societies of East Africa” Africa in the
Nineteenth and Twentieth Century. Anene, J.C and Brown, G (eds). Ibadan: Ibadan University Press.492-
493.
29. Olorunleke, Ojo (1999) “Images of the Colonial State in African Literature: A Prolegomenon” New
Perspectives in Linguistics and Literature. Olorunleke, Ojo and Ladele, Lola (eds) Lagos: Ilu Project
Associates.
30. Osundare, Niyi (2007) The Writer as Righter. The African Literature Artist and His Social Obligation.
Ibadan, Nigeria: Hope Publications.
31. Paden, John. N (1973) Religion and Political Culture in Kano. Berkeley.
32. Rodney, Walter (1982) How Europe Underdeveloped Africa. Enugu: Ikenga Publishers.
33. Shagari, Shehu (1998) “Foreword” Attahiru. Yerima, Ahmed. Ibadan: Kraft Books Limited.
34. Smith, A.D (1971) Theories of Nationalism. London: Duckworth.
35. Walker, Andrew (2012) Special Report: The United States Institute of Peace. Washington DC.
36. Ward, W.E.F (1965) “The Colonial Phase in British West Africa: Political Developments” A Thousand
Years of West African History. Ade Ajayi, J.F & Espie, Ian (eds). Ibadan: University Press & Nelson.
37. Williams, P and Williams, L (1993) Colonial Discourse and Post-Colonial Theory: A Reader. New York:
Harvester,Wheatsheaf.
38. Wilson, Edwin (2005) Theater Experience. Boston: McGraw Hill.
39. Yerima, Ahmed (2005) Ameh Oboni: the Great. Ibadan: Kraft Books Limited.
40. ……. (1998) Attahiru. Ibadan: Kraft Books Limited.
41. .…… (2009) Discourse on Tragedy. Minna, Gurara Publishing.

SCHOLARS WORLD-IRMJCR Online: ISSN 2320-3145, Print: ISSN 2319-5789
www.scholarsworld.net [email protected] Volume. II, Issue II, April 2014 [17]
42. ……. (2013) “Refracted Universe, Alternative Realities: The Artist as god”.Inaugural Lecture,
Redeemer’s University, Mowe, Ogun State, Nigeria.
ENDNOTES:
1. See “Northern Nigeria: Background to Conflict”, in International Crisis Group: Africa Report No 168,
20 December, 2010.
2. See Afigbo, A.E (1965) “The Colonial Phase in British West Africa: A Reassessment of the
Historiography of the Period” A Thousand Years of West African History. Ade Ajayi, J.F & Espie, Ian
(eds). Ibadan: University Press & Nelson.419-430
3. Colonial attitude towards African natives readily subscribes to the theory of Ernest Gellner who focuses
on education as a means of subjugating people to a cultural hegemony, leading to their domination. See
Gellner, Smith (1983) Nations and Nationalism. Oxford: Blackwell, 2nd
edtn; Oxford, 2006; Smith, A.D
(1971) Theories of Nationalism. London: Duckworth; Fafunwa, A. Babs (1974) History of Education in
Nigeria. London: George, Allen & Unwin; Daniel, John (1981) “The Culture of Dependency and Political
Education in Africa” Political Economy of Africa: Selected Readings Cohen, D and Daniel (eds) London:
Longman.
4. See Ake, Claude. A (1981) Political Economy of Africa. London: Longman; Ward, W.E.F (1965) “The
Colonial Phase in British West Africa: Political Developments” A Thousand Years of West African
History .Ade Ajayi, J.F & Espie, Ian (eds). Ibadan: University Press & Nelson, p. 389; Rodney, Walter
(1982) How Europe Underdeveloped Africa. Enugu: Ikenga Publishers; Akinjogbin, I.A and Osoba, S.O
(1980) Topics on Nigerian Economic and Social History. Ile Ife: University of Ife Press.
5. See Ogot, B (1966) “The Development of African Politics in the Rural Societies of East Africa” Africa in
the Nineteenth and Twentieth Century. Anene, J.C and Brown, G (eds). Ibadan: Ibadan University
Press.492-493; Ake, Claude (1981) A Political Economy of Africa. London: Longman.9.
6. See Loimeier, Roman (1973) Islamic Reform and Political Change in Nigeria. Evanston, 1997; Paden,
John. N (1973) Religion and Political Culture in Kano. Berkeley.
7. See Lovejoy, Paul .E & Hogendorn, J.S (1990) “Revolutionary Madhism and Resistance to Colonial Rule
in the Sokoto Caliphate, 1905-1906”Journal of African History, vol.31, no.2.217-224.
8. See Lovejoy, Paul .E & Hogendorn, J.S (1990) “Revolutionary Madhism and Resistance to Colonial Rule
in the Sokoto Caliphate, 1905-1906”Journal of African History, vol. 31, no.2.217-224.
9. Several conflicting reports have emerged, from the press circle and, most especially from the Federal
Government. These reports have been debunked in many ways. Special Report has it that “Following the
failed rescue of hostages Chris McManus and Franco Lamolinara in north-eastern Nigeria in March 2011,
President Goodluck Jonathan played up the connections between the group and international terrorism”,
but that “Boko Haram is not in the same global jihadist bracket as Algeria’s al-Qaeda in the Islamic
Maghreb, or Somalia’s al Shaabab. Despite its successful attack on the UN compound Abuja in August
2011. Boko Haram is not bent on attacking Western interests. There have been no further attacks on
international interests since that time” (1).
----

SCHOLARS WORLD-IRMJCR Online: ISSN 2320-3145, Print: ISSN 2319-5789
www.scholarsworld.net [email protected] Volume. II, Issue II, April 2014 [18]
CHILDREN ACQUIRE THEIR MOTHER
TONGUE THROUGH VARIOUS STAGES
DR. ANJALI HANS,
(Lecturer in English)
University of Dammam
Kingdom of Saudi Arabia
ABSTRACT
Mother-tongue is the language that a child learns in his mother's lap. It is the language which the
child learns almost without any conscious effort on his part. It is a language which the child
acquires while living in his own social group.A first language (also native language, mother
tongue, arterial language, or L1) is the language(s) a person has learned from birth or within the
critical period, or that a person speaks the best and so is often the basis for sociolinguistic
identity. The word “mother” means the prime care giver (female or male) of a child. “Tongue” in
this sense means the language that is primarily spoken by this caregiver. Therefore, when the
words “mother and tongue” are analyzed, the question is asking for the process by which a child
learns or develops his primary/first language.
Keywords: Mother-tongue, native language, mother tongue, arterial language, or L1

SCHOLARS WORLD-IRMJCR Online: ISSN 2320-3145, Print: ISSN 2319-5789
www.scholarsworld.net [email protected] Volume. II, Issue II, April 2014 [19]
INTRODUCTION:
The first language of a child is part of their personal, social and cultural identity. Another impact of the first
language is that it brings about the reflection and learning of successful social patterns of acting and speaking. It
is basically responsible for differentiating the linguistic competence of acting. While some argue that there is no
such thing as "native speaker" or a "mother tongue", it is important to understand these key terms as well as
understand what it means to be a "non-native" speaker and the implications that can have on one's life. Research
suggest that while a non-native speaker may develop fluency in a targeted language after about two years of
immersion, it can actually take between five to seven years for that child to be on the same working level as
their native speaking counterparts. This has implications on the education of non- native speakers. Language is
a shared system of symbols that has structure, rules and meaning. If someone says “pencil my give please me”.
We instantly know that is not how we speak. Instead we say, “Give me my pencil please”. Children learn the
correct structure of a language by listening to persons around them or their caregiver while they speak.
Languages are shared with, and understand by those who are familiar with the systems of symbols. A baby
begins to communicate at birth through non-verbal communication such as, facial expressions, cries and other
sounds and body movement.
From approximately 0 to 4 months of age, child sounds are mainly limited to reflexive crying. They are not yet
using sounds to manipulate, but simply expressing their feelings in the only way they have. This is their first
production of what scholars call vegetative sounds. Some theorize that later in this stage they are deliberately
exploring their own prosody. At this time they may start making cooing or laughing sounds, though they may be
hard to recognize as such early on.
Perception of speech sounds, however, develops even before birth. Researchers have discovered that unborn
babies’ heart rates will decrease at the sound of their mother’s voice. Further study has indicated that new
sounds directed at the womb through a loudspeaker can also cause the heart rate to decrease, and as the sound is
repeated, the heart rate will eventually increase again. When tried with stories and poems, the heart rate would
also decrease with the new sounds, and decrease with repetition. It seems that babies can learn to recognize
speech patterns and voices before birth.
By roughly 4 to 6 months of age babies start to make many more sounds. Before speaking words, babies go
through a period of babbling, in which they are practicing the sounds, intonations and rhythms of language.
They learn to replicate sounds they hear and how moving their tongue and lips change the sounds they are
making. They learn to modulate their voice, to yell and whisper. They start to babble in reaction to stimuli, and
eventually use it to manipulate others by expressing needs and wants. By 9-12 months the child’s babbling
becomes more melodic.
Intonation starts to sound more like adult patterns. At first the sounds will be mainly drawn out vowel
sounds and soon after they tend to add consonant sounds and repetitive sounds, like “da” or “dada.” They may
combine these first sounds with gestures. A squeal and point may be the child’s way of telling you he wants
something over in that general direction.
Babies between four and eight months show preference to speech patterns that are typical of their own language,
according to rebased on the “Head-turn procedure,” and they also show preference to their own name over other
names, including those with the same stress patterns. In this stage the infant is learning the phonology of his
particular language. For example, there are many sounds in other languages that are not present in English. The
child learns to distinguish between the phonemes of his or her language and other languages. Indeed, by 10 to 12
months babies become desensitized to sound differences in other languages that don’t exist in the language (or
languages) they are exposed to. This is also the stage in which children learn to recognize words and even begin to
understand their meaning. This is quite a feat considering how most people speak. Through normal adult
conversation children must learn to pick out sound patterns that are repeated and attach meaning to them.
Likely through a combination of child-directed speech, repetitive observation and innate ability, by the end of
the first year babies may have a vocabulary of 50 or more words. You can ask a 10 month old where his blue
car is and chances are he’ll look around or point to it, maybe even crawl over to it. They are unable, at this
point to say the words, however. It takes time and practice to open their mouths and produce a specific sound
on purpose. They are storing these words and meanings and slowly learning to make sounds. Eventually they
will put them together and learn to speak words.
A child’s first words are produced by approximately 14 to 20 months of age. This is a general guideline and not
all children will speak when the scientists say they should. They begin with content words. These would
include “mama” or “dada” or “book” or “car.” It is common at this early stage to leave off consonants or

SCHOLARS WORLD-IRMJCR Online: ISSN 2320-3145, Print: ISSN 2319-5789
www.scholarsworld.net [email protected] Volume. II, Issue II, April 2014 [20]
consonant clusters from the beginning or end of a word. Sometimes a single word may represent an entire
thought. “Boo” may mean “read me a book.” If a baby wants a bottle and is just beginning to learn to use
language to manipulate, he may point to his bottle, say (or scream) “ba” or “baba,” which obviously means,
“give me my bottle, now!” Of course this becomes problematic when a child yells “BA!” and the parent do not
know whether he wants a bottle or a ball or a book, or if he just feels like yelling.
Soon, between 18 and 24 months or so, spoken vocabulary starts to catch up. This is the vocabulary spurt and it
goes from a new word every few days or so, to as many as several new words a day. On average, 22 to 37 new
word a month. This of course varies from child to child. It is at this stage that children begin to learn words by
imitating. This is when adults begin to hear words they’d rather not hear and wish they hadn’t said.
From approximately 2 years of age, or when they have a vocabulary of about 50 words, children begin to string
two content words together to indicate location, “daddy gone;” possession, “doggie mine;” or action, “mommy
juice.” This is also called telegraphic speech. It is quite an accomplishment because it shows an understanding
of language semantics; not only words, but context, and the difference between action words and objects.
Multi-word sentences begin sometime between ages 2 and 3. At first they mostly use content words, often strung
together in no sensible grammatical order. “Mommy juice drink” probably means “Mommy get me some juice to
drink.” “Daddy grandma phone talk” means that daddy was talking to grandma on the phone (or maybe grandma
was talking to daddy on the phone). We know that at this point they understand word order and context, and soon
they will be able to verbalize them. Gradually, through practice, they begin to master the morphology of language
and start adding affixes, like “ing.” “Mommy walk” becomes “Mommy walking.” Soon they start using function
words like “the” and “is,” and string together grammatically correct sentences, like “Mommy is walking.”
Eventually, they master syntax, so that “Daddy grandma phone talk” becomes “Daddy is talking to Grandma on
the phone.” By this stage a child is certainly able to communicate and will spend the rest of their childhood, and
indeed their adulthood, expanding their vocabulary and knowledge of language.
STAGES OF MOTHER TONGUE ACQUISITION IN CHILD:
Sounds From birth, infants make and respond to sounds. First there is crying and gurgling. The next stage is
cooing. This sound is commonly heard when the baby is in a pleasant mood. As early as a month, infants make
these sounds in response to the attention they get. This is called the pre-verbal speech or the development
of expressive language.
BABBLING–6 TO 9 MONTHS:
Sounds like da-da-da-da, ma-ma-ma-ma are the sounds babies make at this age. These sounds do not have a
specific meaning as most parents believe, but because parents mimic these sounds, the child eventually calls the
parent by those sounds. Studies have shown that in most languages, children use ma-ma da-da, or similar
sounds as names for their caregivers.
HOLOPHRASES--12 TO 18 MONTHS:
At this stage, the child learns a number of single words. Each word represents a phrase or a sentence that is
called a holophrase. Words like pen, cat, dog and double syllable words like “daddy”, “water”, and “grandma”
become “taa-aa”, “ta-ta”, or any such utterances. A vocabulary of holophrases allows a child to communicate
with his or her caregiver. Banging and touching often help these non-verbal children to communicate when their
holophrases cannot be interpreted. Studies have shown that young children understand much more of what is
said to them than what they say. For example, if a caregiver tells a child “Go bring Mommy’s shoes” the child
often responds correctly through actions.
TWO-WORD SENTENCES–18 TO 20 MONTHS: These two-words are used to express ideas concerning relationships. For example, “Mommy shoe”, and
“Daddy car” are used for sentences. Two-words are also used to describe actions, such as “Grandma eat”, “dog
come” and “want water”. It is also proven that if a child lives in an environment where the mother/caregiver
repeats the sentences correctly, that child will develop speech patterns much earlier than a child who is not
spoken to, or just mimicked. A child who is brought up in a nurturing environment will have at 24 months or
there about, a vocabulary of about 300 words.
TELEGRAPHIC SENTENCES–24 TO 27 MONTHS: The child attempts to make sentences consisting of two or more words into a phrase. These are
called telegraphic sentences and may contain nouns, verbs, prepositions or pronouns. Pronouns however usually

SCHOLARS WORLD-IRMJCR
www.scholarsworld.net [email protected]
come much later. For example, “Daddy drive car”, “want orange juice”, all has the function words such as
“the”, and “this” missing. These sentences are supplemented with gestures.
JOINED SENTENCES---30 TO 33 MONTHS
At nearly three years, the child is ready for pre
pronouns, and joined sentence (four-five words) are now being used. Many things that they say at this age are
still unlike that of what an adult would say.
LANGUAGE AND THE PRE-SCHOOL CHILDPre-school children use language in a symbolic way. For example, the word
They use words to represent things. At first, words are used in an egocentric way through the use of mon
in which the child talks aloud during play, but not to anyone. At this stage, they usually have a vocabulary of
about 1000 words or more. When the child moves from parallel or solitary play, to associative play, one child
speaks for a long while, but the others do not listen.
because they ask many questions. They ask
interesting. It is a known fact that between 2 and 6 years, children learn
the answers given by their caregivers or other adults. It is of great importance that as caregivers and teachers
that we answer children in a correct manner and never say things to them like “shut up! You ask too man
questions!” It doing so they even acquire negative language and words that their caregiver really would not
want them to acquire, for example slangs and so
Stages Typical age
Babbling 6
One-word stage
(better one-morpheme
or one-unit)
or holophrastic stage
9
Two-word stage 18
Telegraphic stage
or early multiword stage
(better multi-morpheme)
24
Later multiword stage 30+ months
At birth, the infant vocal tract is in some ways more like that of an ape than that of an adult human. Compare the
diagram of the infant vocal tract shown on the left to
velum reaches or overlaps with the tip of the epiglottis. As the infant grows, the tract gradually reshapes itself in
the adult pattern. During the first two months of life, infant vocalizations are mainly expressions of discomf
(crying and fussing), along with sounds produced as a by
coughing, sucking, swallowing and burping. There are some no reflexive, no distress sounds produced with a
lowered velum and a closed or nearly closed mouth, giving the impression of a syllabic nasal or a nasalized vowel.
During the period from about 2-4 months, infants begin making "comfort sounds", typically in response to
pleasurable interaction with a caregiver. The earliest
being more vowel-like "coos". The vocal tract is held in a
Online: ISSN 2320-3145, Print: ISSN 2319
[email protected] Volume. II, Issue II, April 2014
come much later. For example, “Daddy drive car”, “want orange juice”, all has the function words such as
“the”, and “this” missing. These sentences are supplemented with gestures.
30 TO 33 MONTHS:
years, the child is ready for pre-school and he/she is saying many words, function words;
five words) are now being used. Many things that they say at this age are
still unlike that of what an adult would say.
SCHOOL CHILD–36 TO 39 MONTHS: school children use language in a symbolic way. For example, the word leaf might be associated to an
They use words to represent things. At first, words are used in an egocentric way through the use of mon
in which the child talks aloud during play, but not to anyone. At this stage, they usually have a vocabulary of
about 1000 words or more. When the child moves from parallel or solitary play, to associative play, one child
ut the others do not listen. The vocabulary of pre-school children grows rapidly
because they ask many questions. They ask how, why, what and where about everything that they find
interesting. It is a known fact that between 2 and 6 years, children learn about 600 words a year, chiefly through
the answers given by their caregivers or other adults. It is of great importance that as caregivers and teachers
that we answer children in a correct manner and never say things to them like “shut up! You ask too man
questions!” It doing so they even acquire negative language and words that their caregiver really would not
want them to acquire, for example slangs and so-called “bad words”.
Typical age Description
6-8 months Repetitive CV patterns
9-18 months Single open-class words or word stems
18-24 months "mini-sentences" with simple semantic relations
24-30 months "Telegraphic" sentence structures of
lexical rather than
grammatical morphemes
30+ months Grammatical or functional structures emerge
is in some ways more like that of an ape than that of an adult human. Compare the
diagram of the infant vocal tract shown on the left to diagrams of adult human and ape.
velum reaches or overlaps with the tip of the epiglottis. As the infant grows, the tract gradually reshapes itself in
During the first two months of life, infant vocalizations are mainly expressions of discomf
(crying and fussing), along with sounds produced as a by-product of reflexive or vegetative actions such as
coughing, sucking, swallowing and burping. There are some no reflexive, no distress sounds produced with a
closed mouth, giving the impression of a syllabic nasal or a nasalized vowel.
4 months, infants begin making "comfort sounds", typically in response to
pleasurable interaction with a caregiver. The earliest comfort sounds may be grunts or sighs, with later versions
like "coos". The vocal tract is held in a fixed position. Initially comfort sounds are brief and
3145, Print: ISSN 2319-5789
Volume. II, Issue II, April 2014 [21]
come much later. For example, “Daddy drive car”, “want orange juice”, all has the function words such as
school and he/she is saying many words, function words;
five words) are now being used. Many things that they say at this age are
might be associated to an ant.
They use words to represent things. At first, words are used in an egocentric way through the use of monologue,
in which the child talks aloud during play, but not to anyone. At this stage, they usually have a vocabulary of
about 1000 words or more. When the child moves from parallel or solitary play, to associative play, one child
school children grows rapidly
about everything that they find
about 600 words a year, chiefly through
the answers given by their caregivers or other adults. It is of great importance that as caregivers and teachers
that we answer children in a correct manner and never say things to them like “shut up! You ask too many
questions!” It doing so they even acquire negative language and words that their caregiver really would not
class words or word stems
sentences" with simple semantic relations
"Telegraphic" sentence structures of
rather than functional or
structures emerge
is in some ways more like that of an ape than that of an adult human. Compare the
In particular, the tip of the
velum reaches or overlaps with the tip of the epiglottis. As the infant grows, the tract gradually reshapes itself in
During the first two months of life, infant vocalizations are mainly expressions of discomfort
product of reflexive or vegetative actions such as
coughing, sucking, swallowing and burping. There are some no reflexive, no distress sounds produced with a
closed mouth, giving the impression of a syllabic nasal or a nasalized vowel.
4 months, infants begin making "comfort sounds", typically in response to
comfort sounds may be grunts or sighs, with later versions
. Initially comfort sounds are brief and

SCHOLARS WORLD-IRMJCR Online: ISSN 2320-3145, Print: ISSN 2319-5789
www.scholarsworld.net [email protected] Volume. II, Issue II, April 2014 [22]
produced in isolation, but later appear in series separated by glottal stops. Laughter appears around 4 months.
During the period from 4-7 months, infants typically engage in "vocal play", manipulating pitch (to produce
"squeals" and "growls"), loudness (producing "yells"), and also manipulating tract closures to produce friction
noises, nasal murmurs, "raspberries" and "snorts".
At about seven months, "canonical babbling" appears: infants start to make extended sounds that are chopped
up rhythmically by oral articulations into syllable-like sequences, opening and closing their jaws, lips and
tongue. The ranges of sounds produced are heard as stop-like and glide-like. Fricatives, affricates and liquids
are more rarely heard, and clusters are even rarer. Vowels tend to be low and open, at least in the beginning.
Repeated sequences are often produced, such as [bababa] or [nanana], as well as "variegated" sequences in
which the characteristics of the consonant-like articulations are varied. The variegated sequences are initially
rare and become more common later on.
Both vocal play and babbling are produced more often in interactions with caregivers, but infants will also
produce them when they are alone.
No other animal does anything like babbling. It has often been hypothesized that vocal play and babbling have
the function of "practicing" speech-like gestures, helping the infant to gain control of the motor systems
involved, and to learn the acoustical consequences of different gestures.
RATE OF VOCABULARY DEVELOPMENT:
In the beginning, infants add active vocabulary somewhat gradually. Here are measures of active vocabulary development
in two studies. The Nelson study was based on diaries kept by mothers of all of their children's utterances, while the Fenson
study is based on asking mothers to check words on a list to indicate which they think their child produces.
Milestone Nelson 1973
(18 children) Fenson 1993 (1,789 children)
10 words 15 months
(range 13-19)
13 months
(range 8-16)
50 words 20 months
(range 14-24)
17 months
(range 10-24)
Vocabulary at 24 months 186 words
(range 28-436)
310 words
(range 41-668)
There is often a spurt of vocabulary acquisition during the second year. Early words are acquired at a rate of 1-3 per
week (as measured by production diaries); in many cases the rate may suddenly increase to 8-10 new words per
week, after 40 or so words have been learned. However, some children show a steadier rate of acquisition during
these early stages. The rate of vocabulary acquisition definitely does accelerate in the third year and beyond: a
plausible estimate would be an average of 10 words a day during pre-school and elementary school years.
IMPORTANCE OF MOTHER TONGUE IN SOCIETY AND EDUCATION:
In today's society, our traditional cultural values and identity are at risk. We have to make a conscious effort to
ensure that, we do not lose touch with our cultural heritage/culture. One of the important features of a cultural
identity is the ability to speak one's mother tongue. One's mother tongue would be the language spoken by
members of the same race, same location or place.
There may be some who may argue that it would be better, if everyone spoke the same language, so as to
promote communication and closer ties between the different peoples of the world. It is very easy to speak or
express our thought/idea in our own mother tongue, rather in different language. A mother tongue spoken helps
to bind a people together and promote the positive values of a culture. If we are well grounded and know where
we come from and what kinds of behaviour are deemed and acceptable in our community we would be
equipped to resist external negative influences that may otherwise sway us. Also having a cultural identity of
our own would help us to understand better how other people value their own language and traditions. We
would not be so quick to fear what is unfamiliar to us but instead try to understand it.
In this changing world, which is drawing closer together through technology in communication, English is
generally the language adopted for ease of communication in sectors such as trade and education. However, this

SCHOLARS WORLD-IRMJCR Online: ISSN 2320-3145, Print: ISSN 2319-5789
www.scholarsworld.net [email protected] Volume. II, Issue II, April 2014 [23]
does not mean that we should neglect our own mother tongue. It is always suggested to learn different
languages so that it will help or communicate with people of different locations/places.
Mother-tongue plays a tremendously useful role in the education of a child. It has a great importance in the field of
education. Therefore, mother tongue must be given an important and prominent place in the school curriculum.
Specifically, the importance of mother tongue is due to the following reasons:
1. Medium of Expression and Communication: Mother tongue is the best medium for the expression of one's ideas and feelings. Thus, it is the most
potent agent for mutual communication and exchange of ideas.
2. Formation of a Social Group: It is through language, and especially through the mother-tongue, that individuals form themselves into a
social organisation.
3. Easy to Learn:
Of all the languages, the mother-tongue is most easy to learn. Full proficiency or mastery can be achieved
in one's own mother tongue.
4. Best Medium for Acquiring Knowledge: Thinking is an instrument of acquiring knowledge, and thinking is impossible without language. "And
training in the use of mother-tongue-the tongue in which a child thinks and dreams-becomes the first
essential of shoaling and the finest instrument of human culture." (P. B. Ballard.) It is therefore of the
greatest importance for our pupils to get a firm grounding in their mother-tongue.
5. It brings about Intellectual Development: Intellectual development is impossible without language. Reading, expressing oneself, acquisition of
knowledge and reasoning are the instruments for bringing about intellectual development; and all of these
are possible only through language, or the mother-tongue of the child.
6. Instrument of Creative Self-Expression:
We may be able to communicate in any language, but creative self-expression is possible only in one's
own mother tongue. This is clear from the fact that all great writers could produce great literature only in
their own language.
7. Instrument of Emotional Development: Mother-tongue is the most important instrument for bringing about emotional development of the
individual. The emotional effect of literature and poetry is something which is of vital importance in the
development and refinement of emotions.
8. Instrument of Growth of the Pupils: The teaching of the mother tongue is important because on it depend the growth of our pupils. Growth in
their intellectual life ; growth in knowledge ; growth in ability to express themselves; growth in creative
and productive ability-all stem from the mother-tongue.
9. Source of Original Ideas:
Original ideas are the product of one's own mother tongue. On account of the facility of thought and
expression, new and original ideas take birth and get shape only in one's own mother tongue.
CONCLUSION:
The child must pass through various stages to acquire mother tongue. He cannot proceed to the next stage until
the previous stage is learned. It is claimed by someone that if any of these points in development are missed, the
child is never able to go back and learn in the same way. Once the age of puberty is reached, the ability to
acquire language rapidly deteriorates. Language seems parallel to other developments like motor and
intellectual. Mother-tongue is the language that a child learns in his mother's lap. It is the language which the
child learns almost without any conscious effort on his part. Mother tongue has tremendous importance in
education and in the curriculum.
WORK CITED:
1. Aspects of Language by Bolinger Dwight
2. Approaches and Methods in Teaching by Richard & Rodgers
3. Early Language by De Villier
4. The child’s Acquisition of Language by Derrick J
----
SCHOLARS WORLD-IRMJCR Online: ISSN 2320-3145, Print: ISSN 2319-5789
www.scholarsworld.net [email protected] Volume. II, Issue II, April 2014 [24]
SCREENING AND OPTIMIZATION OF PHYSICOCHEMICAL
CONDITIONS FOR PROTEASE PRODUCTION
SUSHMA DUBEY,
Research Scholar,
MATS University,
Raipur, (Chhattisgarh) India
KAVITA SHARMA,
Head, Department Of Botany,
Arts and Commerce Girls College,
Raipur, (Chhattisgarh) India
ASHISH SARAF,
Faculty MATS University, Raipur, (Chhattisgarh) India
ABSTRACT
Proteases are one of the most important classes of industrial enzymes. They execute a large
variety of functions and have important biotechnological applications. Proteases represent one of
the three largest groups of industrial enzymes and find application in detergents, leather industry,
food industry, pharmaceutical industry and bioremediation processes and accounts for about 60%
of commercial enzymes in the world. These enzymes are found in a wide diversity of sources
such as plants, animals and microorganisms but they are mainly produced by bacteria and fungi.
Fungi elaborate a wide variety of proteolytic enzymes than bacteria. Under this study, isolation of
fungal species from deteriorating wall paintings of caves and rocks of Sarguja district, Ambikapur
(Chhattisgarh, India) was done followed by its identification. Preliminary screening for protease
production was done by incorporating 1% casein/ gelatin in Asthana and Hawker’s medium and
A. fumigatus gave positive result. Highest protease production by A. fumigatus was recorded at
pH 5.5 followed by pH 6.0, but gradually declined beyond these values and increase in final pH
was observed. Enzyme production by test fungi varies significantly with increase and decrease in
temperature and maximum yield was observed at temperature 32 ± 2ºC. Carbon sources such as
maltose, cellulose, sorbitol and mannitol enhanced the growth of enzyme whereas addition of
inorganic nitrogen sources suppressed enzyme production except urea and sodium nitrate which
stimulate extracellular protease liberation in the medium at lower concentration while at higher
concentration enzyme production declined significantly.
Keywords: Aspergillus Fumigatus, Protease, Metabolic Activities, Enzyme

SCHOLARS WORLD-IRMJCR Online: ISSN 2320-3145, Print: ISSN 2319-5789
www.scholarsworld.net [email protected] Volume. II, Issue II, April 2014 [25]
INTRODUCTION:
Microorganisms have been endowed with vast potentials of new biocatalysts (enzymes). They produce an array
of enzymes, which have been exploited commercially over the years. In recent years, the potentials of using
microorganisms as biotechnological sources of industrially relevant enzymes has stimulated interest in the
exploration of extracellular enzymatic activity in several microorganisms (Jayani et al., 2005; Alva et al.,
2007). Proteases constitute one of the most important groups of industrial enzymes accounting for about 60% of
the total industrial market (Rao et al., 1998). Proteases catalyze hydrolytic reactions in which protein molecules
are degraded to peptides and amino acids. They have diverse applications in a wide variety of industries, such
as in detergent, food, and pharmaceutical, leather, silk and for recovery of silver from used X-ray films (Ward,
1983; Gupta et al., 2002). The industrial demand for highly active preparations of proteolytic enzymes with
appropriate specificity and stability to extreme pH and temperature continues to stimulate the search for new
enzyme sources. Although the majority commercial proteases originated from bacteria belonging to the genus
Bacillus, fungi exhibit a wider variety of proteases than bacteria. In addition, fungi are normally GRAS
(generally regarded as safe) strains and they produce extracellular enzymes, which can be recovered easily from
the fermentation broth. Certain genera such as Aspergillus, Penicillium and Fusarium have been reported to
produce neutral proteases. Few examples for organism producing acidic and alkaline proteases having
commercial values are Aspergillus sp., Penicillium sp. and Mucor sp. (Sandhya et al., 2005). Each organism
has its own individual growth condition as well as enzymes production.
Among the various groups of microorganisms filamentous fungi are most widely exploited because of their
ability to grow on complex solid substrates and production of wide range of extracellular enzymes (Lekha et al.,
1994). ). The present investigation has been focused with isolation of mycoflora having potential protease
producing ability from deteriorating wall paintings of caves and rocks. Effect of various physico-chemical
parameters on protease production has also been carried out.
MATERIAL AND METHODS:
Collection and Isolation of samples: Samples were collected from deteriorating wall paintings of caves and rocks of sarguja dist. The samples were
collected in sterile containers and transported to the Department of Biotechnology, MATS University Raipur
for immediate laboratory investigations. All the samples were processed within 2-3 hours of collection to
minimize saprophytic growth followed by soil dilution method (Deshmukh, 1997).
Identification of fungal samples: Samples were dilute in 10 ml sterile distillated water and shake mechanically for 10 minutes. This suspension
were use to make microbial concentration (10-1
-10-5
). 1 ml of microbial suspension of each concentration was
added to sterile petridishes (triplicate of each dilution) containing 15 ml of sterile PDA media. The plates were
incubated at 27±1°C. All the cultures were grown in 7 days. As soon as fungal colonies appeared they were
individually transferred to freshly prepared PDA slants. Macroscopic and microscopic characteristics of the
obtained isolates were examined for identification; slide culture technique was followed as per (Agrawal and
Hasija, 1980; Weber 2000). Identification of fungi was based on the macroscopic features of colonies grows on
agar plates, papers were consulted for correct identification further; experts were also consulted for
identification of some fungus.
Screening of protease producing fungi:
To select a hyper protease producer strain preliminary screening was carried out by incorporating 1% casein in
Asthana and Hawker’s medium (Vermalho et al., 1996). The molten sterilized medium was poured in sterile glass
petridish aseptically. After solidification of the medium, the plates were seeded with 2mm disc separated from 7
days old culture on PDA medium. These plates were then incubated at 26 ± 1ºC for 5-6 days. For detection of
proteolytic activity, gelatin or casein/ gelatin containing agar plates were flooded with developer reagent i.e. HgCl2
solution (Macfaddin, 1980). Plates were allowed to stand for 10 min and later decanted off to visualize the zone of
proteolysis around the colony. The zone diameter was measured with the help of meter scale.
Effect of pH and Temperature on Enzyme Activity and Stability:
The optimum pH of the enzyme preparation was studied over a pH range of 5.0–9.5 at 30±10C using casein 1%
(w/v). For studying pH stability, the crude enzyme was incubated in buffers of different pH values in the range
of pH 5.0–9.5 for 1 h at 30C. Residual proteolytic activity was then determined under standard assay
conditions. The following buffer systems were used: 100mM sodium acetate buffer for pH 5.0–6.0, 100mM

SCHOLARS WORLD-IRMJCR Online: ISSN 2320-3145, Print: ISSN 2319-5789
www.scholarsworld.net [email protected] Volume. II, Issue II, April 2014 [26]
potassium phosphate buffer for pH 7.0, 100mM Tris-HCl buffer for pH 8.0, and 100mM glycine-NaOH buffer
for pH 9.0. To investigate the effect of temperature, proteolytic activity was tested at different temperatures
using casein as a substrate for 5 min at pH 5.0. Thermal stability was examined by incubating the enzyme for
60min at 20 to 50 0C. Aliquots were withdrawn at desired time intervals to test the remaining activity at
optimum conditions of pH and temperature. The no heated enzyme was considered as the 100% control.
Effect of Carbon Sources on Protease Secretion: To determine the effect of carbon sources on enzyme production the test organism was grown on substrate
supplemented with each of 8 carbon sources (Malathi and Chakraborthy, 1991; Ellaiah et al., 2003). Amount of
carbon present in dextrose was taken as standard which was replaced by rest of sources, so that final
concentration reached to 0.2, 0.8, and 1.0% residual carbon per 10 g of substrate. Polysaccharides were also
added in above concentration. The carbon sources used were dextrose, fructose, galactose, mannose, mannitol,
sorbitol, sucrose and lactose.
Effect of Nitrogen Sources in Protease Secretion: The effect of nitrogen source on enzyme production was determined by incorporating different inorganic and organic
nitrogenous compounds to the substrate (Malathi and Chakraborthy, 1991). The final concentration of organic and
inorganic sources used was 1% w/w per 10 g of substrate. Amount of nitrogen present in KNO3 was replaced by
same amount present in various sources. The organic sources used were casein, BSA, corn flour, and soy flour.
While the inorganic sources were ammonium sulfate, potassium nitrate, urea, ammonium chloride. Heat labile
sources were filtered, sterilized and imparted to the medium in the desired concentration before fermentation.
RESULT AND DISCUSSION:
Survey and Collection of Samples: The surveys of various caves have been made for collection of fungal samples from detoriated painting
specifically from sarguja area. A good number of strains were obtained which served as excellent sites for
survival of proteolytic fungi due to availability of protein rich material. But could not harbor more than 20%
fungal strains showing prominent protease activity during present investigations belong to the fungal genera
Aspergillus, Penicillium, Alternaria, Curvularia, Microsporum, Fusarium, and Trichoderma. Several reports
suggesting prevalence of proteolytic fungi inhabiting various oil paintings (Inoue and Koyano, 1991). Hanzi et
al. (1993) reported wide spread occurrence of Aspergillus spp. in protein rich areas.
Effect of pH and Incubation Temperature:
As the metabolic activities of enzyme are very much sensitive towards pH change (Tunga et al., 1998). The data
depicted in table-1 clearly shows that enzyme production greatly varied with initial pH values. Highest protease
production by A. fumigatus was recorded at 5.5 followed by pH 6.0 activity was gradually declined beyond
these values and increase in final pH was observed. Similar variations in enzyme activities due to vaired pH
have also been recorded by many workers. Chakraborty et al., (1995) reported maximum acid protease
production at pH 6.0 by A. niger. Similarly Tunga et al. (1998) achieved maximum protease activity by R.
oligosporous at pH 5.5-6.0.
TABLE: 1. EFFECT OF INITIAL PH ON PROTEASE PRODUCTION BY A. FUMIGATES
S.N. pH Relative Enzyme activity U/g
DMS Total Protein (mg/ml)
1 5 282.70 ± 1.43 1.08±3.86
2 5.5 302.70 ± 2.08 1.4±4.33
3 6 296.00 ± 2.00 2±2.25
4 6.5 286.00 ± 4.36 2.1±1.55
5 7 279.70 ± 3.03 2.33±4.25
6 7.5 269.00 ± 4.36 2.49±3.61
7 8 263.30 ± 2.13 2.68±2.25
8 8.5 263.00 ± 1.24 2.25±5.00
9 9 233.00 ± 5.72 2±1.95
10 9.5 207.30 ± 1.72 1.67±3.57
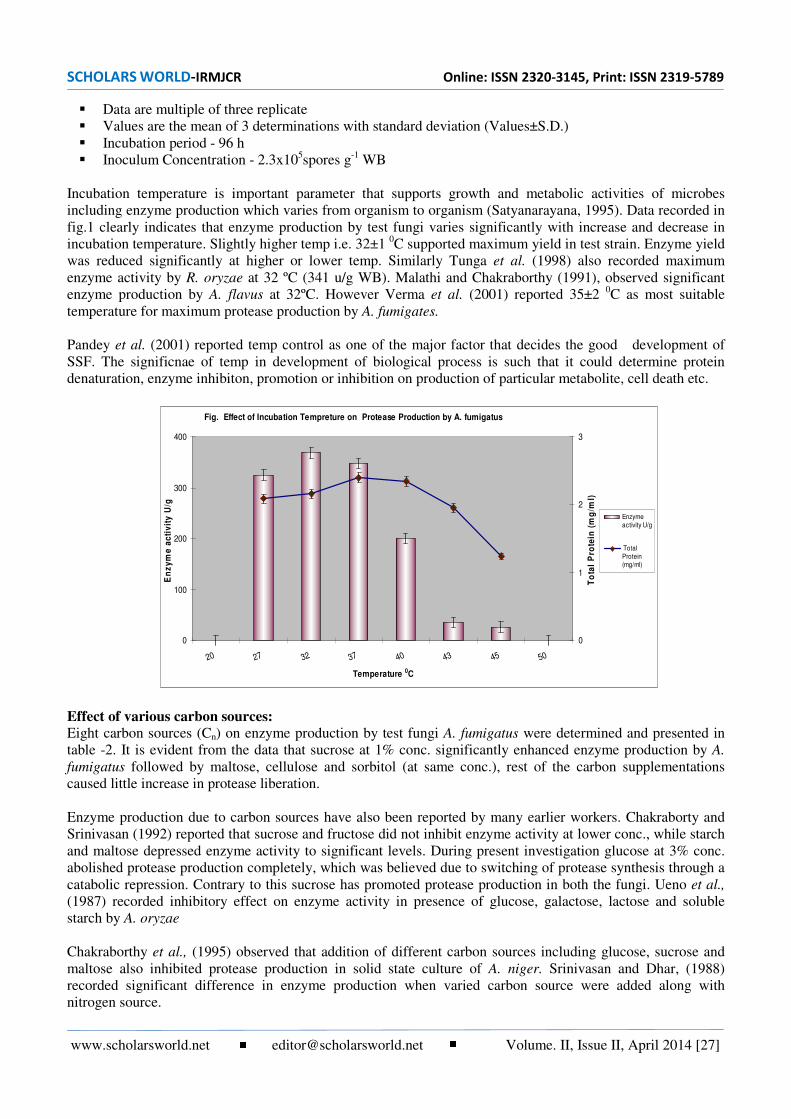
SCHOLARS WORLD-IRMJCR Online: ISSN 2320-3145, Print: ISSN 2319-5789
www.scholarsworld.net [email protected] Volume. II, Issue II, April 2014 [27]
Data are multiple of three replicate
Values are the mean of 3 determinations with standard deviation (Values±S.D.)
Incubation period - 96 h
Inoculum Concentration - 2.3x10⁵spores g
-1 WB
Incubation temperature is important parameter that supports growth and metabolic activities of microbes
including enzyme production which varies from organism to organism (Satyanarayana, 1995). Data recorded in
fig.1 clearly indicates that enzyme production by test fungi varies significantly with increase and decrease in
incubation temperature. Slightly higher temp i.e. 32±1 0C supported maximum yield in test strain. Enzyme yield
was reduced significantly at higher or lower temp. Similarly Tunga et al. (1998) also recorded maximum
enzyme activity by R. oryzae at 32 ºC (341 u/g WB). Malathi and Chakraborthy (1991), observed significant
enzyme production by A. flavus at 32ºC. However Verma et al. (2001) reported 35±2 0C as most suitable
temperature for maximum protease production by A. fumigates.
Pandey et al. (2001) reported temp control as one of the major factor that decides the good development of
SSF. The significnae of temp in development of biological process is such that it could determine protein
denaturation, enzyme inhibiton, promotion or inhibition on production of particular metabolite, cell death etc.
Effect of various carbon sources:
Eight carbon sources (Cn) on enzyme production by test fungi A. fumigatus were determined and presented in
table -2. It is evident from the data that sucrose at 1% conc. significantly enhanced enzyme production by A.
fumigatus followed by maltose, cellulose and sorbitol (at same conc.), rest of the carbon supplementations
caused little increase in protease liberation.
Enzyme production due to carbon sources have also been reported by many earlier workers. Chakraborty and
Srinivasan (1992) reported that sucrose and fructose did not inhibit enzyme activity at lower conc., while starch
and maltose depressed enzyme activity to significant levels. During present investigation glucose at 3% conc.
abolished protease production completely, which was believed due to switching of protease synthesis through a
catabolic repression. Contrary to this sucrose has promoted protease production in both the fungi. Ueno et al.,
(1987) recorded inhibitory effect on enzyme activity in presence of glucose, galactose, lactose and soluble
starch by A. oryzae
Chakraborthy et al., (1995) observed that addition of different carbon sources including glucose, sucrose and
maltose also inhibited protease production in solid state culture of A. niger. Srinivasan and Dhar, (1988)
recorded significant difference in enzyme production when varied carbon source were added along with
nitrogen source.
Fig. Effect of Incubation Tempreture on Protease Production by A. fumigatus
0
100
200
300
400
20 27 32 37 40 43 45 50
Temperature 0C
En
zy
me
ac
tiv
ity
U/g
0
1
2
3
To
tal
Pro
tein
(m
g/m
l)
Enzyme
activity U/g
Total
Protein(mg/ml)
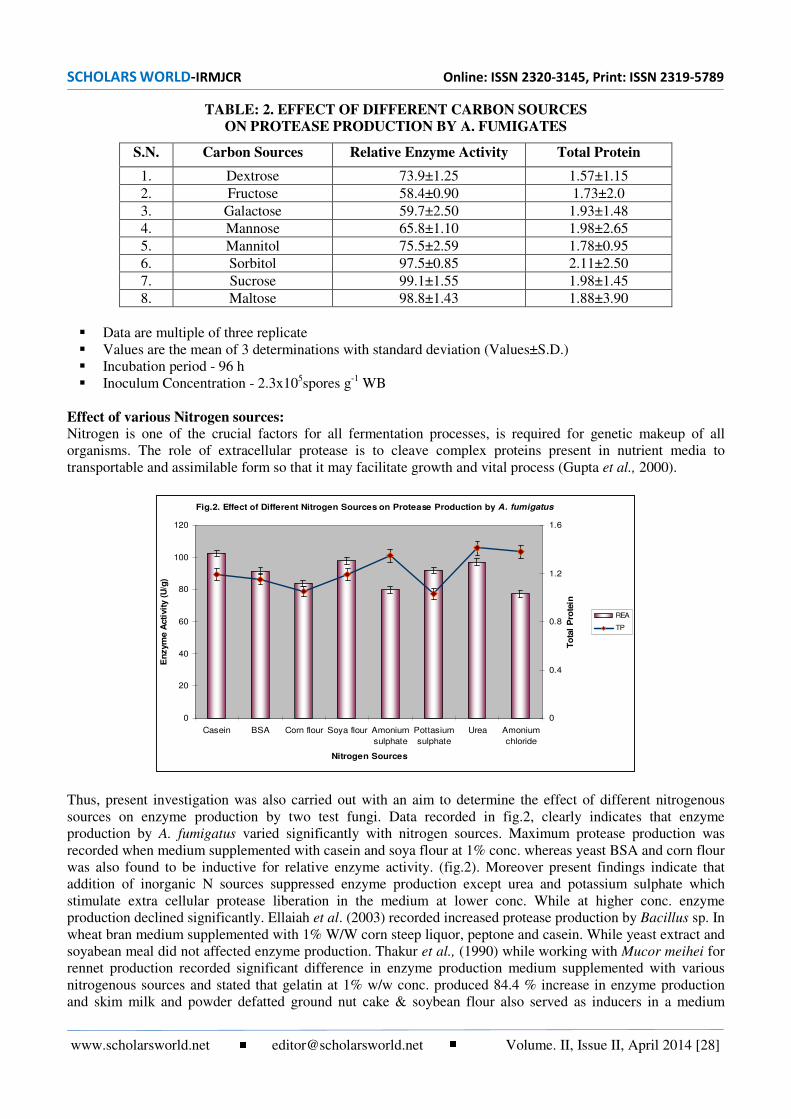
SCHOLARS WORLD-IRMJCR Online: ISSN 2320-3145, Print: ISSN 2319-5789
www.scholarsworld.net [email protected] Volume. II, Issue II, April 2014 [28]
TABLE: 2. EFFECT OF DIFFERENT CARBON SOURCES
ON PROTEASE PRODUCTION BY A. FUMIGATES
S.N. Carbon Sources Relative Enzyme Activity Total Protein
1. Dextrose 73.9±1.25 1.57±1.15
2. Fructose 58.4±0.90 1.73±2.0
3. Galactose 59.7±2.50 1.93±1.48
4. Mannose 65.8±1.10 1.98±2.65
5. Mannitol 75.5±2.59 1.78±0.95
6. Sorbitol 97.5±0.85 2.11±2.50
7. Sucrose 99.1±1.55 1.98±1.45
8. Maltose 98.8±1.43 1.88±3.90
Data are multiple of three replicate
Values are the mean of 3 determinations with standard deviation (Values±S.D.)
Incubation period - 96 h
Inoculum Concentration - 2.3x10⁵spores g
-1 WB
Effect of various Nitrogen sources:
Nitrogen is one of the crucial factors for all fermentation processes, is required for genetic makeup of all
organisms. The role of extracellular protease is to cleave complex proteins present in nutrient media to
transportable and assimilable form so that it may facilitate growth and vital process (Gupta et al., 2000).
Thus, present investigation was also carried out with an aim to determine the effect of different nitrogenous
sources on enzyme production by two test fungi. Data recorded in fig.2, clearly indicates that enzyme
production by A. fumigatus varied significantly with nitrogen sources. Maximum protease production was
recorded when medium supplemented with casein and soya flour at 1% conc. whereas yeast BSA and corn flour
was also found to be inductive for relative enzyme activity. (fig.2). Moreover present findings indicate that
addition of inorganic N sources suppressed enzyme production except urea and potassium sulphate which
stimulate extra cellular protease liberation in the medium at lower conc. While at higher conc. enzyme
production declined significantly. Ellaiah et al. (2003) recorded increased protease production by Bacillus sp. In
wheat bran medium supplemented with 1% W/W corn steep liquor, peptone and casein. While yeast extract and
soyabean meal did not affected enzyme production. Thakur et al., (1990) while working with Mucor meihei for
rennet production recorded significant difference in enzyme production medium supplemented with various
nitrogenous sources and stated that gelatin at 1% w/w conc. produced 84.4 % increase in enzyme production
and skim milk and powder defatted ground nut cake & soybean flour also served as inducers in a medium
Fig.2. Effect of Different Nitrogen Sources on Protease Production by A. fumigatus
0
20
40
60
80
100
120
Casein BSA Corn flour Soya flour Amonium
sulphate
Pottasium
sulphate
Urea Amonium
chloride
Nitrogen Sources
En
zym
e A
cti
vit
y (
U/g
)
0
0.4
0.8
1.2
1.6
To
tal
Pro
tein
REA
TP

SCHOLARS WORLD-IRMJCR Online: ISSN 2320-3145, Print: ISSN 2319-5789
www.scholarsworld.net [email protected] Volume. II, Issue II, April 2014 [29]
comprising of WB and wheat flour (90:10). Gelation and skim milk powder declined enzyme activities at
higher concentrations. Dixit and Verma (1993) concluded that 0.8% yeast extract in soy cake medium was best
nutrient combination for alkaline protease production by Penicillium gresiofulvin. Moreover, protein sources
supplied exogenously may exert a cumulative positive influence on enzyme production. Thus, it can be
concluded that enzyme production was greatly influenced by changing in the physico-chemical parameters
which responsible for increase and decrease enzyme production.
ACKNOWLEDGEMENT:
Authors are thankful to Head of the MATS University and Faculty of Life Science for providing central
laboratory facilities.
REFERENCES:
1. Agrawal, G. P. and S. K. Hasija (1980). Microorganisms in the laboratory: A loaboratory guide for
mycology, microbiology, plant pathology. Ravi printers, Jabalpur (M.P). India.
2. Alva, S., Anupama, J., Savla, J., Chiu, Y.Y. and P. Vyshali et al. (2007). Production and characterization of
fungal amylase enzyme isolated from Aspergillus sp. JGI 12 in solid state culture. Afr. J. Biotechnol. 6: 576-581.
3. Chakraborty, R. and M. Srinivasan (1992). Production and regulation of a thermostable protease by
Pseudomonas sp. B45. Acta Microbiol Hung. 39(2): 181-91
4. Chakraborty, R., Srinivasan, M., Sarkar, S. K. and K. V. Raghavan (1995). J. Microbial. Biotech. 10: 17-30.
5. Deshmukh, A. M. (1997). Handbook of media stains and reagents in Microbiology. PAMA Publications,
Maharashtra. Pp. 297.
6. Dixit, G. and S. C. Verma (1993). Production of alkaline proteases by Penecillium griseofulvum. Ind. J.
Micro. 33(4): 257-260.
7. Ellaiah, P., adinarayana, K., Rajyalakshmi, P. and B. Srinivasalu (2003). Optimization of process
parameters for alkaline protease production under solid substrate fermentation by alkalophilic Bacillus
spp. Asian J. Microb. 41: 99-104.
8. Gupta, R., Beg Q. K. and P. Lorenz (2000). Bacterial alkaline proteases: molecular approaches and
industrial applications. Appl. Microb. Biotechnol. 59: 5-12.
9. Gupta, R., Beg, Q.K. and P. Lorenz (2002). Bacterial alkaline proteases: molecular approaches and
industrial applications. Appl. Microbiol. Biotechnol. 59: 15-32.
10. Inoue, M., and M. Koyano (1991). Fungal contamination of oil paintings in Japan. Int. Biodeterior. 28: 23–35.
11. Jayani, R.S., Saxena, S. and R. Gupta (2005). “Microbial Pectinolytic Enzymes: A review.” Process
Biochem. 40 (9): 2931-2944.
12. Lekha, P.K. and B.K. Lonsane (1994). Comparative titers, location and properties of tannin acyl
hydrolase produced by Aspergillus niger PKL104 in solid state, liquid surface and submerged
fermentation. Process Biochem. 29: 497–503.
13. Macfaddin, J. F. (1980). Biochemical tests for identification of medical bacteria. 2nd
edition. Williams and
Willkins Baltimore, USA, 128: 137.
14. Malathi, S. and R. Chakraborthy (1991). Production of alkaline protease by a new Aspergillus flavus
isolate under solid state fermentation conditions for use as a depilation agent. Appl. Environ. Microbio.
57(3): 712-716.
15. Pandey, A. C. R. Soccol J. A. Rodrigue, Z. Leon and P. Nigam (2001). Solid state fermentation in
Biotechonology Fundamentals and Applications 1st edition Asiatech publishers Inc. New Delhi, India.
16. Rao, M.B., Tanksale, A.M., Ghatge, M.S. and V.V. Deshpande, (1998). Molecular and biotechnological
aspects of microbial proteases. Microbiol. Mol. Biol. Rev. 62: 597-635.
17. Sandhya, C., Sumantha, A., Szakacs, G. and A. Pandey (2005). Comparative evaluation of neutral protease
production by Aspergillus oryzae in submerged and solid state fermentation. Process Biochem. 40: 2689–94.
18. Satyanarayana, T. (1994). Production of bacterial extracellular enzymes by solid state fermentation. In
solid state fermentation (A. Pandey. ed). Wiley Eastern Limited, New Delhi.
19. Srinivasan, M. and S. C. Dhar (1988). Effect of carbon and nitrogen on exoprotease synthesis in batch
cultures of Bacillus lencheniformis NCIM 2042. Ind. J. Exp. Biol. 26: 22-24.
20. Thakur, M. S.. N. G. Karanth and K. Nand (1990). Production of fungal rennet by Mucor meihei using
solid state fermentation. Appl. Micro. Biotech. 32: 409-413.

SCHOLARS WORLD-IRMJCR Online: ISSN 2320-3145, Print: ISSN 2319-5789
www.scholarsworld.net [email protected] Volume. II, Issue II, April 2014 [30]
21. Tunga, R., R. Banerjee and B. C. Bhattacharya (1998). Optimizing some factors affecting protease
production under solid substrate fermentation. Bio. Proc. Engg. 19: 187-190.
22. Ueno, S. M. Miyama, Y. Ohashi, M. Izumiya and I.Kusaka (1987). Excretory enzyme production and
condition of Aspergillus oyrzae in submerged liquid culture. Appl. Micro. Biotech. 26: 273-276.
23. Verma, R., Sil K., Pandey, A.K. and Rajak, R.C. (2001). Soilid state fermentation to produce alkaline
protease by Aspergillus fumigatus (B149). Ind. J. Microbio. 41: 111-114.
24. Vermelho, A. B., Meirelles, M.N.L., Lopes, A., Gonçalves Petinate, S.D., Chaia, A. and M.H.
Branquinha (1996). Detection of Extracellular Proteases from Microorganisms on Agar Plates. Mem Inst
Oswaldo Cruz, Rio de Janeiro. 91(6): 755-760,
25. Ward, O.P. (1983). Proteinases. In Microbiol Enzymes and Biotechnology Fogarty, WM. (Ed.): Applied
Science Publishers. New York. 251-305.
26. Weber, R. W. S. and D. Pitt (2000). Teaching techniques for mycology : II Ridel’s slide cultures.
Mycologists. 14(3): 118-120.
----
SCHOLARS WORLD-IRMJCR Online: ISSN 2320-3145, Print: ISSN 2319-5789
www.scholarsworld.net [email protected] Volume. II, Issue II, April 2014 [31]
THE ROLE OF METACOGNITIVE AWARENESS-RAISING IN
DEVELOPING LEARNERS’ READING PROFICIENCY AND
STRATEGY USE: CASE OF FIRST- YEAR LMD STUDENTS
AT ABOU BEKR BELKAID UNIVERSITY OF TLEMCEN
MRS YASSAMINA HAICHA – ABDAT
English Department
Tlemcen University, Algeria
ABSTRACT
Within the field of education, one of the most important responsibilities that each teacher needs to
assume consists in equipping the learners with all the necessary tools to cope with the demands of
an ever-changing world. With no doubt, for a more successful fulfillement of such a prominent
responsibility, the learners need to be consciously aware of the true nature of the learning process
as well as the crucial role of acquiring skills and strategies that would certainly engender an
effective learning process. These two concerns have led to a plethora of research on how to help
the individuals become successful learners, and what teachers can do to assist their learning.
Bearing all this in mind, the present exploratory research endeavors to elucidate the major effect
of an explicit and integrated instruction of metacognitive reading strategies on learners’ EFL
reading proficiency and strategy use. The researcher has thus chosen ten Algerian speaking
students by random selection studying at the Department of English in Abou Bakr Belkaid
University of Tlemcen. Data were collected by means of three essential data-gathering tools,
namely questionnaire, proficiency tests and think-aloud protocol (TAP). The researcher
confirmed that metacognitive reading strategy instruction had a positive effect on the learners’
reading proficiency and strategy use which was empirically verified during the implementation of
the think aloud protocol.
Keywords: Meta cognitive Awareness, Reading Strategies, Explicit Teaching. EFL Learners,
TAP (Think Aloud Protocol)
SCHOLARS WORLD-IRMJCR Online: ISSN 2320-3145, Print: ISSN 2319-5789
www.scholarsworld.net [email protected] Volume. II, Issue II, April 2014 [32]
INTRODUCTION:
It would be with no exaggeration to note that English functions as a universal language due to its pervasive
importance in this changing time of globalization, and has consequently become the language widely adopted
for political, technological, social and educational development. Similarly, it has witnessed such development in
its role in the Algerian educational context since 1962, and more importantly after the advent of globalization
process in the early 1990s.
Yet, within the field of education, more specifically in EFL process a significant number of oriented studies has
clearly shown that learners still encounter some serious issues throughout their studies that are in some part due
to the unsuccessful equal consideration of four fundamental linguistic skills: listening, speaking, reading and
writing. Despite all the efforts and much time consumed by EFL teachers, the results seem strikingly
unsatisfactory, and the learners still display low achievement in English language use. Perhaps inspired by this
thought, the present article endeavours to review theoretically the significance of the teaching / learning of
reading skill at university level paying due attention to elucidating and unearthing to what extent the explicit
and integrated metacognitive reading strategy instruction at awareness-raising level may affect positively the
learners reading proficiency and strategy use.
THEORETICAL BACKGROUND:
1. READING COMPREHENSION:
Over the last few decades, a set of considerable investigations in FL reading have been conducted that have
provided numerous insights for FL reading theories and reading instruction. The basic rationale of such research
was to seek for the most suitable definition of reading. It has led to the argument that reading can be defined
from two standpoints: common knowledge, and scientific view.
For the popular literature, reading is the ability of processing one’s aptitude or capability to recognize the shape
of a finite number of letters and alphabetical symbols that are connected to form an infinite number of
meaningful items, clauses and sentences respecting the punctuation and division of paragraphs. In this respect,
the process of reading follows a common sense description of three related dimensions:
As an opening stage, the learner recognizes the written characters he meets in print, which are organized in
particular spatial order; (from the left to the right when speaking about all Indo-European languages, while it is
completely the reverse for Hamito- Semitic ones); and masters their pronunciation.
In the subsequent phase, he combines them into meaningful conventional items and sentences respecting the
rules of syntax that may not resemble those of his native language. Additionally, the mastery of the printed
words can be done successfully through a consistent vocabulary and syntax activities, which should not be
underestimated for they contribute well in enhancing learners’ comprehension of reading.
Once the recognized written symbols are combined into meaningful items and sentences, the learner controls
then the third stage that of interpretation.
In such a case, the three related dimensions discussed above are then closely related to three linguistic skills i.e.
recognition with phonology (how to pronounce sounds in various combinations), structuring with syntax (rules
that govern word order), and interpretation with semantics (when the learner assigns the accurate meaning of
the printed symbols, then comprehension takes place).
However, from the scientific perspective, numerous neurological researchers notice that reading is not merely a
product-oriented approach that constitutes language form, but also an intricate process actively involving both
hemispheres of the brain that endeavours to negotiate understanding between the learner and the writer of the
text. Furthermore, it is an inside-the head factor that plays a crucial role in comprehension. Here, reading is
merely regarded as an end product or a process-oriented approach that deals with language content.
Urquart and Weir have endeavoured to summarize the complexity of this process as follows: Reading is the
process of receiving and interpreting information encoded in language form via the medium of print. (1988, p. 22).
2. READING AS A LANGUAGE SKILL:
It is pertinent to note that reading strives not only to teach the learner how to establish components necessary for
reading process, but attempts also to model this process by specifying these components, and reveal correlations
between them. According to Hoover (1990): “reading consists of only two components; one that allows language
to be recognized through graphic representation and another that allows language to be comprehended”.(p.01)

SCHOLARS WORLD-IRMJCR Online: ISSN 2320-3145, Print: ISSN 2319-5789
www.scholarsworld.net [email protected] Volume. II, Issue II, April 2014 [33]
For the sake of communication to take place, there should be, however, a direct association and interaction between
the interlocutors, i.e. the learner being ‘the reader’ of the text, and the writer. In this respect, the learner necessitates
both ability, and proficiency to understand the message conveyed by the writer of the text. In the same line of
thought, Davies (1995) assumes that: Reading is private. It is a mental, or a cognitive process which involves a
reader in trying to follow and respond to a message from the writer who is distant in place and time. (p.01)
However, it is unrealistic to believe that reading can be acquired without special effort i.e. as a passive skill, as
it requires learner’s mental and experimental input than is suggested by the mere decoding of symbols. In this
context, Goodman (1973) maintains that, the learner:
As a user of a language interacts with the graphic input as he seeks to reconstruct a message encoded by the
writer. He concentrates his total prior experience and concepts he has attained, as well as the language
competence he has achieved. (p.162)
3. THE SURVEY OF READING STRATEGIES (SORS):
Before classifying reading strategies, it would seem undeniably wiser to consider the question: what is meant by
the term strategy? And what makes it different from a skill?
The term ‘strategy’ can be operationalized as learning techniques or behaviours that help learners iron out the
frequent difficulties encountered whenever learning is taking place, and enable them to effectively and
efficiently interact with the written passages. This concept has been defined differently by numerous specialists
in this field of research. Anderson, on deliberate cognitive steps that readers can take to assist in acquiring,
storing, and retrieving new information’ (1991, p.460).
Therefore, it can be obviously stated that reading strategies are paramount for they enable readers to better
tackle different reading tasks, and construct meaning from the written passages as competently as possible.
These strategies may involve a wide range of cognitive mental activities which can be summarized as follows:
The strategies may involve skimming, scanning, guessing, recognizing cognates and word families, reading for
meaning, predicting, activating general knowledge, making inferences, and separating main ideas from
supporting ideas. (Phan 2006, p. 01) Furthermore, there are other more recently recognized text-processing strategies such as activating prior
knowledge, and recognizing textual organization, which have been added to the list of strategic behaviours.
These strategies discussed above have been later grouped by Carrell (1989) as ‘local’ bottom-up decoding types
of reading strategies and ‘global’, top-down types of reading strategies. As the former, it concerns sound-to
letter correspondence (phonetics-based approach), the latter has to do with readers’ activated background
knowledge (readers-driven types of information processing) and recognizing text structure.
Reading researchers generally typify reading strategies into two main categories: cognitive and metacognitive
reading strategies. Cognitive strategies serve as primordial learning techniques that assist learners in
constructing meaning from the text, which are made up of bottom-up and top-down strategies. In the case of
using bottom-up reading strategies, the learners’ minds,
Repeatedly engage in a variety of processes ... Readers start by processing information at the sentence level. In
other words, they focus on the identification of the meaning and grammatical category of a word, sentence,
syntax, text detail and so forth. (Salataci, 2002, p.02)
Whereas top-down strategies consist of integrating one’s background knowledge to the reading process to
construct meaning from a text rather than passively identifying words in the text, predicting and getting the gist
of text or skimming. In this sense, ‘reading is asking questions of printed text, and reading with comprehension
becomes a matter of getting your questions answered’ (Smith, 1975, p.105).
Metacognitive reading strategies, on the other side, function as a valuable means to monitor and regulate
cognitive strategies which include “ checking the outcome of any attempt to solve a problem, planning one’s
next move, monitoring the effectiveness of any attempted action, testing, revising and evaluating one’s
strategies for learning. .(Brown et al, 1984, p. 354)
Reading researchers, later could obtain through other several case studies some strategies that successful readers
generally employ to enhance reading comprehension and overcome comprehension failure. These strategies will
be shown in the following list.
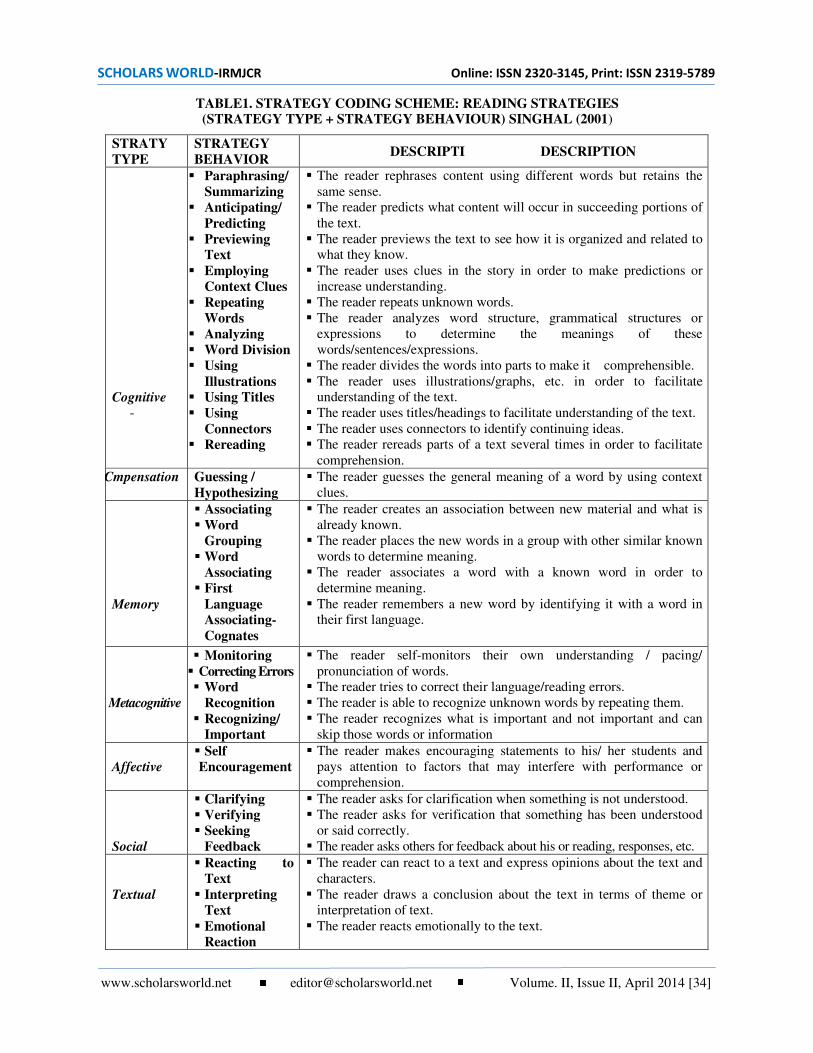
SCHOLARS WORLD-IRMJCR Online: ISSN 2320-3145, Print: ISSN 2319-5789
www.scholarsworld.net [email protected] Volume. II, Issue II, April 2014 [34]
TABLE1. STRATEGY CODING SCHEME: READING STRATEGIES (STRATEGY TYPE + STRATEGY BEHAVIOUR) SINGHAL (2001)
STRATY TYPE
STRATEGY BEHAVIOR
DESCRIPTI DESCRIPTION
Cognitive -
Paraphrasing/ Summarizing
Anticipating/
Predicting Previewing
Text
Employing Context Clues
Repeating Words
Analyzing Word Division Using
Illustrations Using Titles Using
Connectors Rereading
The reader rephrases content using different words but retains the
same sense.
The reader predicts what content will occur in succeeding portions of
the text.
The reader previews the text to see how it is organized and related to
what they know.
The reader uses clues in the story in order to make predictions or
increase understanding.
The reader repeats unknown words.
The reader analyzes word structure, grammatical structures or
expressions to determine the meanings of these
words/sentences/expressions.
The reader divides the words into parts to make it comprehensible.
The reader uses illustrations/graphs, etc. in order to facilitate
understanding of the text.
The reader uses titles/headings to facilitate understanding of the text.
The reader uses connectors to identify continuing ideas.
The reader rereads parts of a text several times in order to facilitate
comprehension.
Cmpensation Guessing /
Hypothesizing
The reader guesses the general meaning of a word by using context
clues.
Memory
Associating Word
Grouping Word
Associating First
Language Associating-
Cognates
The reader creates an association between new material and what is
already known.
The reader places the new words in a group with other similar known
words to determine meaning.
The reader associates a word with a known word in order to
determine meaning.
The reader remembers a new word by identifying it with a word in
their first language.
Metacognitive
Monitoring
Correcting Errors Word
Recognition
Recognizing/ Important
The reader self-monitors their own understanding / pacing/
pronunciation of words.
The reader tries to correct their language/reading errors.
The reader is able to recognize unknown words by repeating them.
The reader recognizes what is important and not important and can
skip those words or information
Affective
Self Encouragement
The reader makes encouraging statements to his/ her students and
pays attention to factors that may interfere with performance or
comprehension.
Social
Clarifying Verifying Seeking
Feedback
The reader asks for clarification when something is not understood.
The reader asks for verification that something has been understood
or said correctly.
The reader asks others for feedback about his or reading, responses, etc.
Textual
Reacting to Text
Interpreting Text
Emotional Reaction
The reader can react to a text and express opinions about the text and
characters.
The reader draws a conclusion about the text in terms of theme or
interpretation of text.
The reader reacts emotionally to the text.
SCHOLARS WORLD-IRMJCR Online: ISSN 2320-3145, Print: ISSN 2319-5789
www.scholarsworld.net [email protected] Volume. II, Issue II, April 2014 [35]
The importance accorded to these strategies can be shown in numerous empirical case studies which have been
conducted by SL/FL researchers seeking to understand why some learners are likely to be more successful
readers than others. In a qualitative study, Hosenfeld attempted to identify the direct relation between certain
types of reading strategies and successful or less successful learners. The results obtained have clearly
demonstrated that the differences lie in the fact those successful learners:
Kept the meaning of the passage in mind during reading.
Read in broad phrases.
Skipped words viewed as unimportant to total phrase meaning.
Had positive concept of themselves as readers ( Hosenfeld, 1977,p. 110).
The unsuccessful learners, on the other hand, tend to be; in contrast those; who:
Lost the meaning of sentences as soon as they were decoded.
Read in short phrases.
Seldom skipped words as unimportant and viewed words as equal in their contribution to total phrase
meaning.
Had a negative self-concept as a reader ( Carrell, 1989, p. 03)
4. METACOGNITIVE AWARENESS AND READING COMPREHENSION:
Although studies on SL / FL reading strategies are a major trend of second foreign language research, recent research
interest has focused on language learners’ metacognitive knowledge or awareness of strategies, and the primordial
role it plays during reading process. Yet, before tackling this effect, it would be indeed helpful to provide at first
definitions-based on the concept of metacognition, and have a brief and synchronized look at its history.
The term metacognition has been variously defined as ‘cognition of cognition’ (Carrell, et al, 1989, p 647), ‘the
conscious awareness of cognitive processes’ (Bernhardt 1991:52), and ‘knowledge about learning’ (Wenden,
1998,p 516). In the context of learning reading comprehension, ‘metacognition is the knowledge that takes as its
object or regulates any aspect of any cognitive endeavour’ (Flavell, 1979,p 08).
Historically speaking, metacognition has its root in research conducted prior to 1976 during which Flavell’s
pioneering work greatly helped in giving form of this concept and provided an impetus for its study. During this
period, research occurred in the field of developmental and educational psychology whereby to offer more
sophisticated methodologies for asserting metacognition (Nelson, 1988). The studies based on metacognition
were grouped into four categories, the former category incorporates studies of cognition monitoring whose
purpose consisted in examining people’s knowledge of their knowledge and thought processes, and how
accurately they can monitor the current state their knowledge and processes, the second category stresses on
‘regulation of one’s own thinking processes in order to cope with changing situational demands. The third
category of metacognitive research has examined how people regulate their choice of strategies and recently, the
fourth category stressed on the ways in which metacognitive theory can be applied in the educational settings.
In the context of teaching / learning of reading, metacognition can be divided into five primary interrelated
components of which none of them can function in isolation. These components concern:
Preparing and planning for reading.
Deciding when to use particular reading strategies.
Knowing how to monitor strategy use.
Learning how to orchestrate various strategies.
Evaluating reading strategy use. (Anderson, 2001).
Those processes were and are still considered to be part of metacognitive skills which play a great role in self-
regulated monitoring that takes place during reading comprehension. By practising and applying these
components, learners will unquestionably become good readers capable of handling any text across a curriculum.
As explained in Flavell’s study, metacognitive knowledge can be categorized into two components namely
knowledge about cognition and regulation of cognition (1978, p.08). Knowledge of cognition includes three
related components that are involved within any learning task. They have been labelled: ‘declarative’,
‘procedural’, and ‘conditional’ components.
Declarative knowledge: refers to ‘knowing what’ strategy to use in specific learning task e.g. one may
know what is skimming or scanning.
Procedural knowledge: refers to ‘knowing how’ to perform various activities or putting the knowledge
into action e.g. how to sum up a text, how to skim (to get the gist of the selected passage) or how to scan
(to spot the information required by the learner)… and so forth.
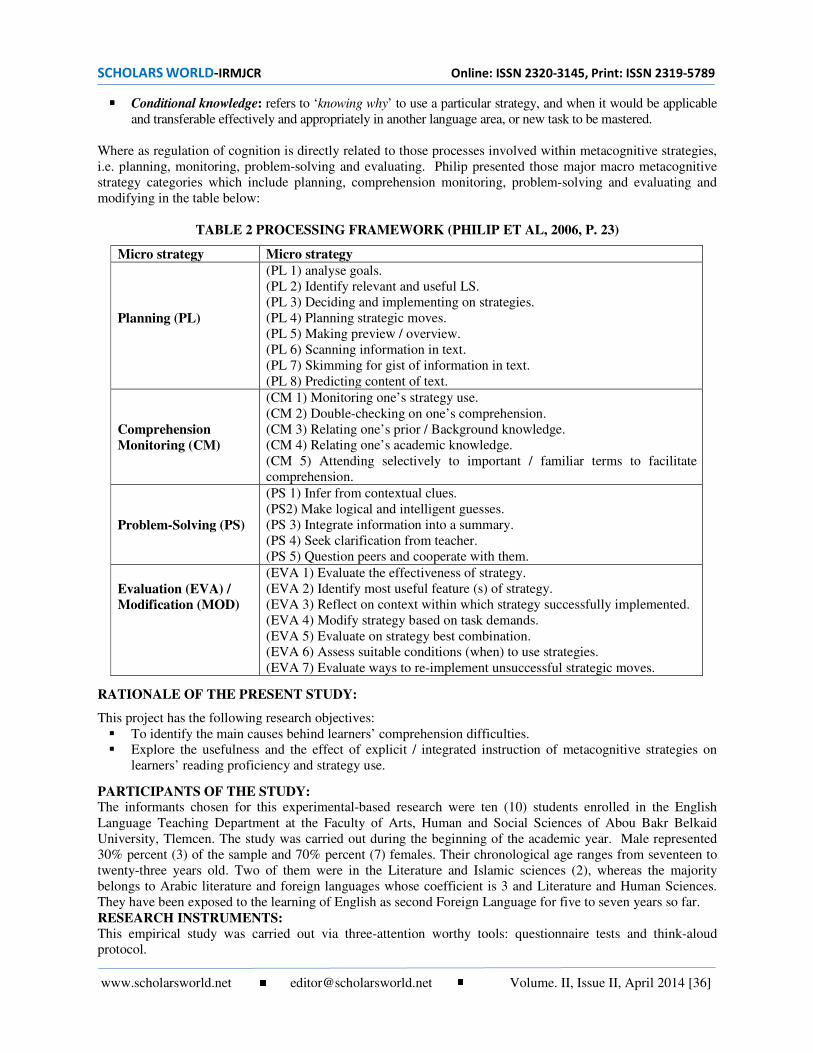
SCHOLARS WORLD-IRMJCR Online: ISSN 2320-3145, Print: ISSN 2319-5789
www.scholarsworld.net [email protected] Volume. II, Issue II, April 2014 [36]
Conditional knowledge: refers to ‘knowing why’ to use a particular strategy, and when it would be applicable
and transferable effectively and appropriately in another language area, or new task to be mastered.
Where as regulation of cognition is directly related to those processes involved within metacognitive strategies,
i.e. planning, monitoring, problem-solving and evaluating. Philip presented those major macro metacognitive
strategy categories which include planning, comprehension monitoring, problem-solving and evaluating and
modifying in the table below:
TABLE 2 PROCESSING FRAMEWORK (PHILIP ET AL, 2006, P. 23)
Micro strategy Micro strategy
Planning (PL)
(PL 1) analyse goals.
(PL 2) Identify relevant and useful LS.
(PL 3) Deciding and implementing on strategies.
(PL 4) Planning strategic moves.
(PL 5) Making preview / overview.
(PL 6) Scanning information in text.
(PL 7) Skimming for gist of information in text.
(PL 8) Predicting content of text.
Comprehension Monitoring (CM)
(CM 1) Monitoring one’s strategy use.
(CM 2) Double-checking on one’s comprehension.
(CM 3) Relating one’s prior / Background knowledge.
(CM 4) Relating one’s academic knowledge.
(CM 5) Attending selectively to important / familiar terms to facilitate
comprehension.
Problem-Solving (PS)
(PS 1) Infer from contextual clues.
(PS2) Make logical and intelligent guesses.
(PS 3) Integrate information into a summary.
(PS 4) Seek clarification from teacher.
(PS 5) Question peers and cooperate with them.
Evaluation (EVA) / Modification (MOD)
(EVA 1) Evaluate the effectiveness of strategy.
(EVA 2) Identify most useful feature (s) of strategy.
(EVA 3) Reflect on context within which strategy successfully implemented.
(EVA 4) Modify strategy based on task demands.
(EVA 5) Evaluate on strategy best combination.
(EVA 6) Assess suitable conditions (when) to use strategies.
(EVA 7) Evaluate ways to re-implement unsuccessful strategic moves. RATIONALE OF THE PRESENT STUDY:
This project has the following research objectives:
To identify the main causes behind learners’ comprehension difficulties.
Explore the usefulness and the effect of explicit / integrated instruction of metacognitive strategies on
learners’ reading proficiency and strategy use. PARTICIPANTS OF THE STUDY: The informants chosen for this experimental-based research were ten (10) students enrolled in the English
Language Teaching Department at the Faculty of Arts, Human and Social Sciences of Abou Bakr Belkaid
University, Tlemcen. The study was carried out during the beginning of the academic year. Male represented
30% percent (3) of the sample and 70% percent (7) females. Their chronological age ranges from seventeen to
twenty-three years old. Two of them were in the Literature and Islamic sciences (2), whereas the majority
belongs to Arabic literature and foreign languages whose coefficient is 3 and Literature and Human Sciences.
They have been exposed to the learning of English as second Foreign Language for five to seven years so far.
RESEARCH INSTRUMENTS: This empirical study was carried out via three-attention worthy tools: questionnaire tests and think-aloud
protocol.
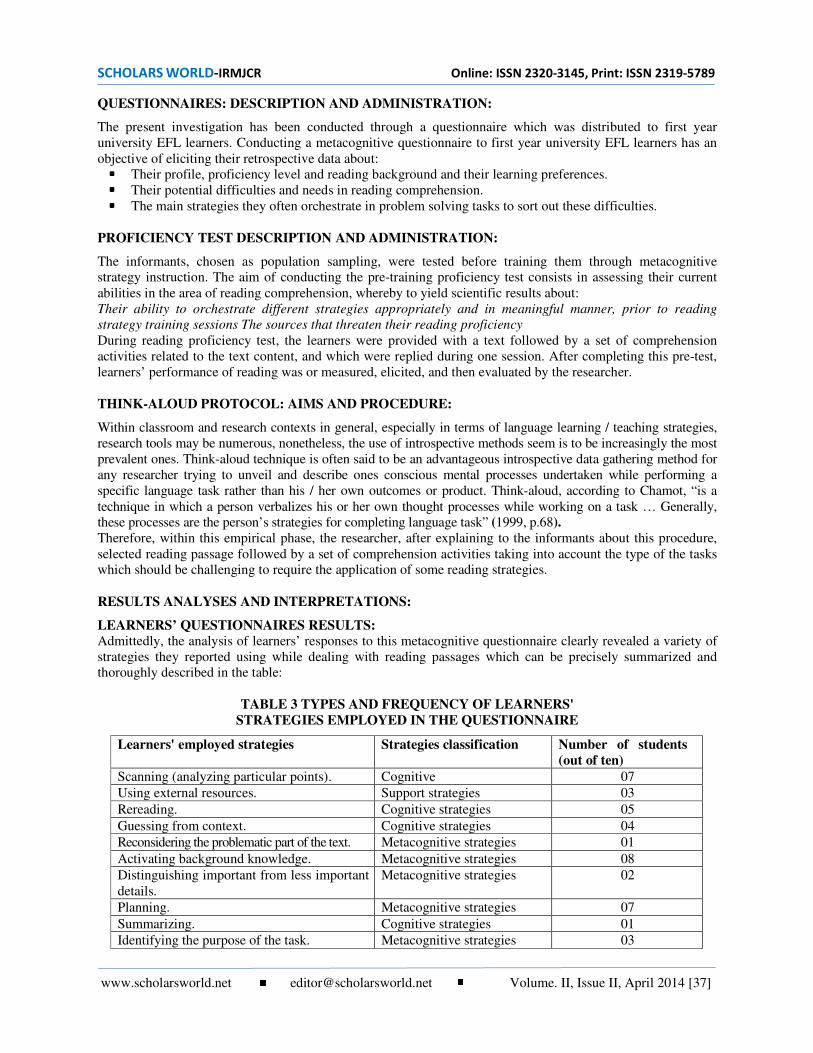
SCHOLARS WORLD-IRMJCR Online: ISSN 2320-3145, Print: ISSN 2319-5789
www.scholarsworld.net [email protected] Volume. II, Issue II, April 2014 [37]
QUESTIONNAIRES: DESCRIPTION AND ADMINISTRATION:
The present investigation has been conducted through a questionnaire which was distributed to first year
university EFL learners. Conducting a metacognitive questionnaire to first year university EFL learners has an
objective of eliciting their retrospective data about:
Their profile, proficiency level and reading background and their learning preferences.
Their potential difficulties and needs in reading comprehension.
The main strategies they often orchestrate in problem solving tasks to sort out these difficulties.
PROFICIENCY TEST DESCRIPTION AND ADMINISTRATION:
The informants, chosen as population sampling, were tested before training them through metacognitive
strategy instruction. The aim of conducting the pre-training proficiency test consists in assessing their current
abilities in the area of reading comprehension, whereby to yield scientific results about:
Their ability to orchestrate different strategies appropriately and in meaningful manner, prior to reading
strategy training sessions The sources that threaten their reading proficiency
During reading proficiency test, the learners were provided with a text followed by a set of comprehension
activities related to the text content, and which were replied during one session. After completing this pre-test,
learners’ performance of reading was or measured, elicited, and then evaluated by the researcher.
THINK-ALOUD PROTOCOL: AIMS AND PROCEDURE:
Within classroom and research contexts in general, especially in terms of language learning / teaching strategies,
research tools may be numerous, nonetheless, the use of introspective methods seem is to be increasingly the most
prevalent ones. Think-aloud technique is often said to be an advantageous introspective data gathering method for
any researcher trying to unveil and describe ones conscious mental processes undertaken while performing a
specific language task rather than his / her own outcomes or product. Think-aloud, according to Chamot, “is a
technique in which a person verbalizes his or her own thought processes while working on a task … Generally,
these processes are the person’s strategies for completing language task” (1999, p.68). Therefore, within this empirical phase, the researcher, after explaining to the informants about this procedure,
selected reading passage followed by a set of comprehension activities taking into account the type of the tasks
which should be challenging to require the application of some reading strategies.
RESULTS ANALYSES AND INTERPRETATIONS:
LEARNERS’ QUESTIONNAIRES RESULTS: Admittedly, the analysis of learners’ responses to this metacognitive questionnaire clearly revealed a variety of
strategies they reported using while dealing with reading passages which can be precisely summarized and
thoroughly described in the table:
TABLE 3 TYPES AND FREQUENCY OF LEARNERS'
STRATEGIES EMPLOYED IN THE QUESTIONNAIRE
Learners' employed strategies Strategies classification Number of students (out of ten)
Scanning (analyzing particular points). Cognitive 07
Using external resources. Support strategies 03
Rereading. Cognitive strategies 05
Guessing from context. Cognitive strategies 04
Reconsidering the problematic part of the text. Metacognitive strategies 01
Activating background knowledge. Metacognitive strategies 08
Distinguishing important from less important
details.
Metacognitive strategies 02
Planning. Metacognitive strategies 07
Summarizing. Cognitive strategies 01
Identifying the purpose of the task. Metacognitive strategies 03
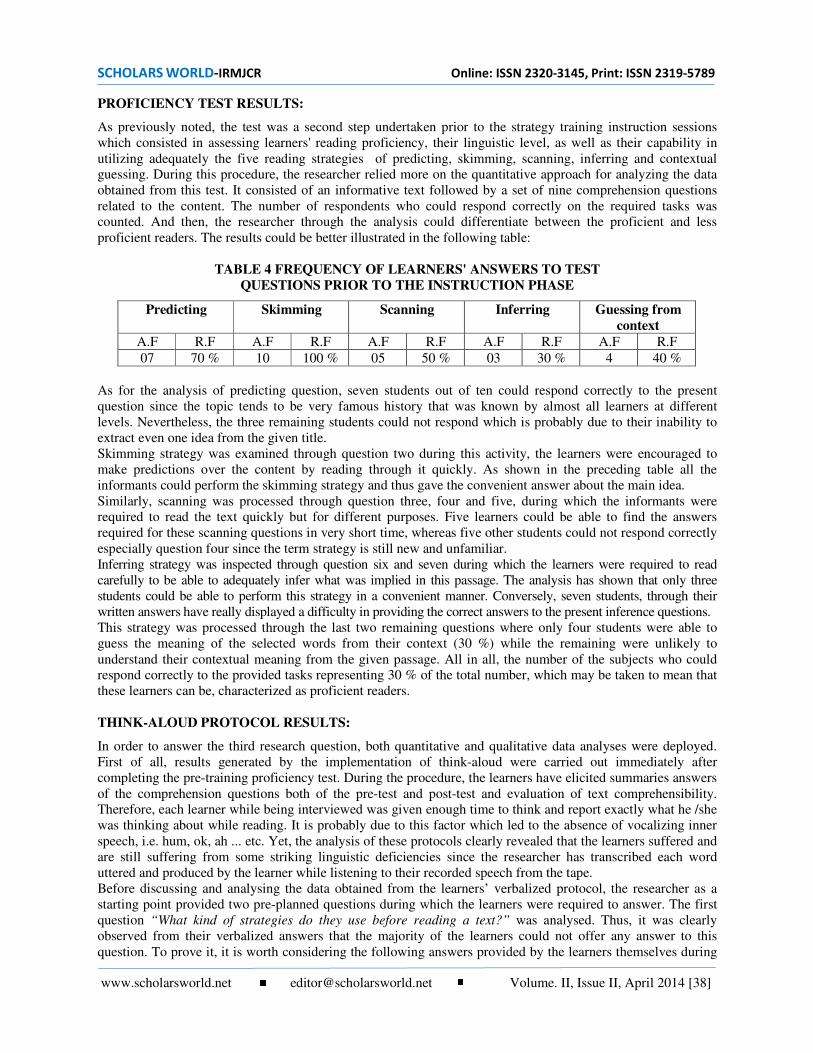
SCHOLARS WORLD-IRMJCR Online: ISSN 2320-3145, Print: ISSN 2319-5789
www.scholarsworld.net [email protected] Volume. II, Issue II, April 2014 [38]
PROFICIENCY TEST RESULTS:
As previously noted, the test was a second step undertaken prior to the strategy training instruction sessions
which consisted in assessing learners' reading proficiency, their linguistic level, as well as their capability in
utilizing adequately the five reading strategies of predicting, skimming, scanning, inferring and contextual
guessing. During this procedure, the researcher relied more on the quantitative approach for analyzing the data
obtained from this test. It consisted of an informative text followed by a set of nine comprehension questions
related to the content. The number of respondents who could respond correctly on the required tasks was
counted. And then, the researcher through the analysis could differentiate between the proficient and less
proficient readers. The results could be better illustrated in the following table:
TABLE 4 FREQUENCY OF LEARNERS' ANSWERS TO TEST
QUESTIONS PRIOR TO THE INSTRUCTION PHASE
Predicting Skimming Scanning Inferring Guessing from
context
A.F R.F A.F R.F A.F R.F A.F R.F A.F R.F
07 70 % 10 100 % 05 50 % 03 30 % 4 40 %
As for the analysis of predicting question, seven students out of ten could respond correctly to the present
question since the topic tends to be very famous history that was known by almost all learners at different
levels. Nevertheless, the three remaining students could not respond which is probably due to their inability to
extract even one idea from the given title.
Skimming strategy was examined through question two during this activity, the learners were encouraged to
make predictions over the content by reading through it quickly. As shown in the preceding table all the
informants could perform the skimming strategy and thus gave the convenient answer about the main idea.
Similarly, scanning was processed through question three, four and five, during which the informants were
required to read the text quickly but for different purposes. Five learners could be able to find the answers
required for these scanning questions in very short time, whereas five other students could not respond correctly
especially question four since the term strategy is still new and unfamiliar.
Inferring strategy was inspected through question six and seven during which the learners were required to read
carefully to be able to adequately infer what was implied in this passage. The analysis has shown that only three
students could be able to perform this strategy in a convenient manner. Conversely, seven students, through their
written answers have really displayed a difficulty in providing the correct answers to the present inference questions.
This strategy was processed through the last two remaining questions where only four students were able to
guess the meaning of the selected words from their context (30 %) while the remaining were unlikely to
understand their contextual meaning from the given passage. All in all, the number of the subjects who could
respond correctly to the provided tasks representing 30 % of the total number, which may be taken to mean that
these learners can be, characterized as proficient readers.
THINK-ALOUD PROTOCOL RESULTS:
In order to answer the third research question, both quantitative and qualitative data analyses were deployed.
First of all, results generated by the implementation of think-aloud were carried out immediately after
completing the pre-training proficiency test. During the procedure, the learners have elicited summaries answers
of the comprehension questions both of the pre-test and post-test and evaluation of text comprehensibility.
Therefore, each learner while being interviewed was given enough time to think and report exactly what he /she
was thinking about while reading. It is probably due to this factor which led to the absence of vocalizing inner
speech, i.e. hum, ok, ah ... etc. Yet, the analysis of these protocols clearly revealed that the learners suffered and
are still suffering from some striking linguistic deficiencies since the researcher has transcribed each word
uttered and produced by the learner while listening to their recorded speech from the tape.
Before discussing and analysing the data obtained from the learners’ verbalized protocol, the researcher as a
starting point provided two pre-planned questions during which the learners were required to answer. The first
question “What kind of strategies do they use before reading a text?” was analysed. Thus, it was clearly
observed from their verbalized answers that the majority of the learners could not offer any answer to this
question. To prove it, it is worth considering the following answers provided by the learners themselves during

SCHOLARS WORLD-IRMJCR Online: ISSN 2320-3145, Print: ISSN 2319-5789
www.scholarsworld.net [email protected] Volume. II, Issue II, April 2014 [39]
which they relied heavily on mixing code approach (using Arabic, French, English and even dialectal Arabic)
from time to time so that to purposefully make the invisible processes of reading visible.
ك ف ل –آش - ؟ paragraphe ! "#$ و #ود ف آ دا ا*(ع دام . planا*-ع آ ,
What..ahh, what to do . I couldn’t understand, maybe I am going to check how many paragraphs it
contains, then I’ll try to check the type of the provided passage, yet since I still have not the text, so no
plan is utilized (The present question therefore was misunderstood for they have been told to elicit the
steps undertaken before distributing the text).
Aucune idée about the text no idea about the text so no particular plan is used (student B).
Je réfléchis, imagine about the type of the text, then ... hum. no plan, آ
I try to think about the text, type. Above all, no plan is used).
These answers may be taken to mean that the non-strategic readers tend to read without setting a purpose, thus
no self-planning strategy was utilized. On the reverse, three out of ten students responded as follows;
Ah ... bon, ... imagine about the type
I try to get the meaning from the title and think ,(Student F, appendix G) .Or وا
ة، أول , 1 7م ه5 #"1 ا*#(ان و ذ*2 *#"1 ,ل ور ا*-ع، - :و :# ول A B ا@"?ر *5 =:< =اءة ا*(; C17 و أD*5 ا"# …!(ي
-
I see the key words of the title.)
Before reading a text, the first step I should normally go through is to read the title, I try to simultaneously
activate my content schemata about the topic the text discusses; in addition, I will circle or underline the key
words of the title.
These learners may be classified among the strategic readers since they could notice the crucial importance of
self-planning strategy as a primordial metacognitive process that each learner should go though prior to reading
activity for enhancing better reading performance.
As for the frequency of strategies mentioned under the question “What do you normally do when you don’t
understand a part of reading text?” Almost able reported using some comprehension monitoring strategies like
rereading, willing the key works, and guessing their contextual meaning by reading the section around them to
figure out their meaning which was evidenced several times. Yet, only one student assumed that using either
social strategies or support strategies may be the most convenient solution for solving the problem under
consideration. Thus, they responded as follows:
I try to understand the whole text.
I underline the key words.
I read the text several times or
ا**1 ول F ا*?ة أو ا*? 1 *5 #ه و *5 =: G1 "5 ه:#H 1 آ B 5$ء =اء)Iا، و أJ ;)*7أ ا )!. KL*1 أ"#أم ول #ا F واN7$ FO # أن ا=أ ا*B< ا*Bورة *، و 5D7D M وا, ا@H=ء *5 ...!( =اءة ا*(; و !م
1 fort >#D 1 Oو P dictionaries! "5 ا*F، أو ا@Oذ و
I.e. while reading, I come across an unfamiliar word, in this way I try to read the section around it to
figure out its meaning. If I still unclear, I ask the help from one of my peers, or my teacher and as a last
solution, I check its meaning in the dictionary. (Student G).
As for the analysis of the answers obtained from the five cognitive strategies (predicting, skimming, scanning,
inferring and contextual guessing), the rationale of examining these answers during think-aloud procedure consists
in providing insights on the metacognitive strategy used by the selected participants during their actual reading
process. Because of the fact that the strategy changes for different purposes, frequencies and percentages are
determined for each strategy type used by the participants which are presented in the following table;

SCHOLARS WORLD-IRMJCR Online: ISSN 2320-3145, Print: ISSN 2319-5789
www.scholarsworld.net [email protected] Volume. II, Issue II, April 2014 [40]
TABLE 4 TYPES AND FREQUENCY OF STRATEGIES EMPLOYED IN THINK-ALOUD (PRE-TRAINING PHASE
Strategy unveiled Strategy classification R.F A.F
Predicting
Activating background
knowledge
Metacognitive strategy 09 90 %
Translation. Cognitive strategy 01 10 %
Re-reading. Cognitive strategy 01 10 %
Self-management. Metacognitive strategy 02 20 %
Underlying key words of the title. Cognitive strategy 01 10 %
Advance organizing. Metacognitive strategy 01 10 %
From the above table, it might be obvious and well observed that on the whole, the respondents made use of
more types of cognitive strategies than metacognitive ones, while performing predicting strategy. The examples
of cognitive and metacognitive strategies the learners reported using them prior to the strategy training
instruction can be well explained through the following answers:
ة، ل F * QJ$ ،دةR 17، و زD*5 ا"# Q"! ... 1N*ا ،Dآ $)! ، J 5*Titanicا " 5O $?ت ... م "Aذه 1!O "FV! نW )# .(Student A) .و
1R BX FJ Q 1 و#* F *ا Y ت ا@,اث?$
Concerning skimming strategy, the learners made use of set of strategies that can be categorized into cognitive
and metacognitive strategies which are exposed in the table below:
TABLE 5 TYPES AND FREQUENCY OF STRATEGIES EMPLOYED IN SKIMMING STRATEGY
Strategy employed Strategy classification R.F A.F
Skimming
Finding key words. Cognitive strategy 06 60 %
Re-reading. Cognitive strategy 03 30 %
Using background knowledge Metacognitive strategy 03 30 %
Directed attention. Metacognitive strategy 02 20 %
Self-management. Metacognitive strategy 03 30 %
Ignoring unnecessary details. Metacognitive strategy 02 20 %
Reading with a purpose. Metacognitive strategy 01 10 %
Linking sounds with imagery Cognitive strategy 01 10 %
Selective attention. Metacognitive strategy 01 10 %
As shown in the above table, when the frequency with which these students used such strategies was analysed, it
was seen that the most frequently employed strategy when performing skimming was ‘identifying the key
words’ (cognitive strategy) which was employed by seven students, whereas the use of metacognitive reading
strategies which was clearly employed once the learners were interviewed during the think-aloud was
‘integrating one’s background knowledge’ which was employed by three students as far as the second question
of the pre-test was concerned. To prove it, one may consider the following answers as exactly recorded on the
tape:
Q= text deux fois ، و puisque ;)*5 ا" # .$2 ه5 ا*? 1 ا*,Q" ،1 ! ا@"?ر *5 !(ه !=1
I.e. I have read the text twice, and since the word ‘Titanic’ represents the key word, I went straightforward
to highlight the main ideas that are related to ‘Titanic’. (Student A)
ة ل = ...F *ا و را5 !د !ء*1 ! .
I have read the text several times ... and I still remember the events of this story.
Concerning scanning, the respondents rely on a set of cognitive and metacognitive strategies which are clearly
identified and thoroughly explained in the following table:

SCHOLARS WORLD-IRMJCR Online: ISSN 2320-3145, Print: ISSN 2319-5789
www.scholarsworld.net [email protected] Volume. II, Issue II, April 2014 [41]
TABLE 6 TYPES AND FREQUENCY OF STRATEGIES EMPLOYED IN SCANNING ACTIVITY
Strategy employed Strategy classification R.F A.F
Scanning
Rereading. Cognitive strategy. 06 60 %
Selective attention. Metacognitive strategy. 07 70 %
Linking sound with imagery. Cognitive strategy. 01 10 %
Highlighting main ideas. Metacognitive strategy. 02 20 %
Finding key words. Cognitive strategy. 03 30 %
Therefore, to prove the idea that the already elicited strategies explained above were put into practice during think-
aloud, it might be worthwhile to consider their answers which were of course provided using mixing code approach.
]Nت sort-outو les details رآRت ! M و Y\=ا@"?ر *5 " ا!اد، أ,اث و !. I focus on the main ideas (especially those impressing numbers, events and characters). (Student B).
As regard the use of cognitive and metacognitive reading strategies when performing inferring activity, which
were unveiled during think-aloud by the participants, it is clearly felt by the researcher that most of them neither
reply the question of the pre-test that required the utilization of this strategy nor unveil any particular strategy to
help them solve such problem, claiming that the lack of vocabulary was more influential than the effect of
background knowledge. Through the story of ‘Titanic’ was well known by almost the majority of people, it was
hard for some to understand the entire content of the text because of several unfamiliar words. In addition, it
was even difficult and complex for them to infer the meaning implicitly stated in the text. The results are to be
shown in the table:
TABLE 7 TYPES AND FREQUENCY OF STRATEGIES EMPLOYED IN INFERRING ACTIVITY
Strategy employed Strategy classification R.F A.F
Inferring
Self-management. Metacognitive strategy. 02 20 %
Circling the key words. Cognitive strategy. 01 10 %
Rereading. Cognitive strategy. 01 10 %
As obviously shown in the present table, only two students out of ten respondents tended to use self-
management metacognitive strategy. However, the least frequent of all the cognitive strategies observed in the
TAP1 circling the key words and re-reading strategies, which were employed more than one time. Thus, one
may consider what was exactly uttered by the learners themselves while performing ‘inferring’ strategy during
the think-aloud procedure.
5 F$ 1 كN7*ا normalement 2هذl’alarme 1 لJ Qآ captaine repetition ش (her / she Yو ز ا*?$P Aر
It was clearly understood that the alarm had been given to the captain (1st question).
In addition, the writer preferred to use ‘she’ and ‘her’ just in the case to avoid repetition. (2nd
question Student B)
Concerning the last activity, which concerns the performance of guessing strategy, some of learners still encounter some
difficulties, while the others utilize some cognitive and metacognitive strategies as shown in the following table:
TABLE.8 TYPE AND FREQUENCY OF STRATEGIES EMPLOYED IN GUESSING ACTIVITY
Strategy employed Strategy classification R.F A.F
Contextual
Guessing
Self-management. Metacognitive strategy. 02 20 %
Using words around them. Cognitive strategy. 01 10 %
Integrating one’s background
knowledge.
Metacognitive strategy. 02 20 %
Translation / knowledge
transfer
Cognitive strategy. 01 10 %
Rereading. Cognitive strategy. 01 10 %
As shown in the above table, concerning the use of metacognitive strategies with the ten students in think-aloud,
the most frequent strategies were trying to integrate one’s background knowledge (employed twice), and self-
management strategy (also employed two times). However, the least frequent strategies, which were both
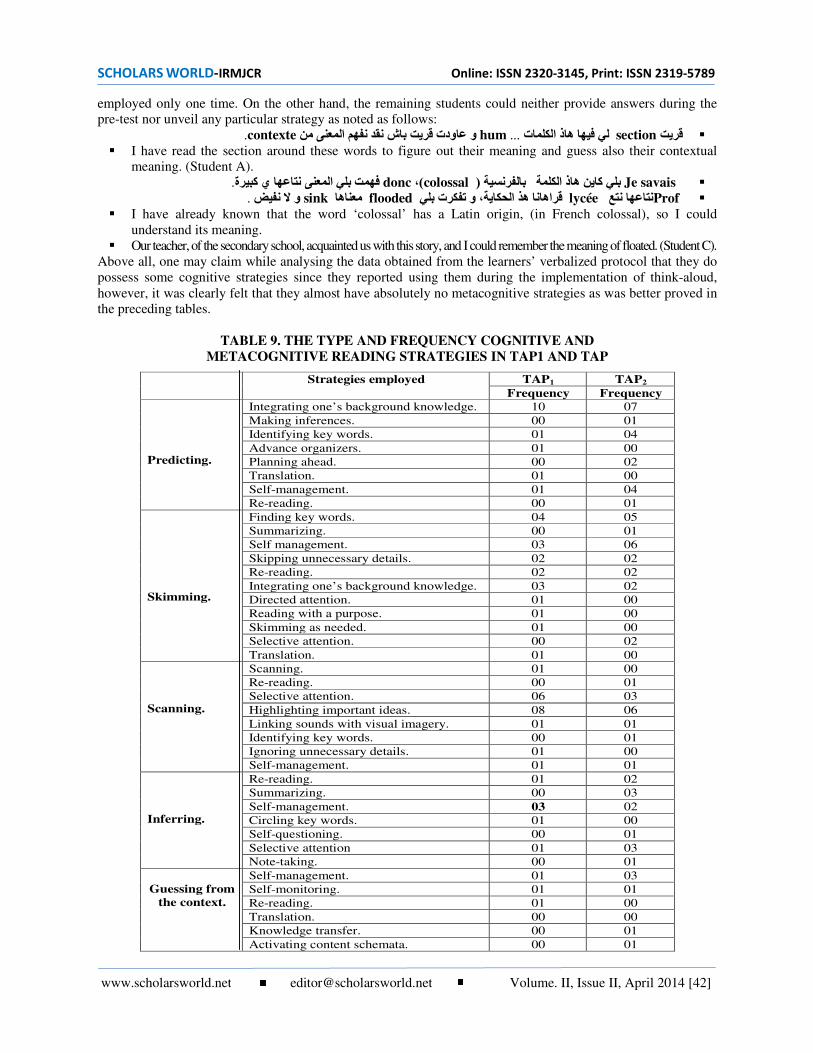
SCHOLARS WORLD-IRMJCR Online: ISSN 2320-3145, Print: ISSN 2319-5789
www.scholarsworld.net [email protected] Volume. II, Issue II, April 2014 [42]
employed only one time. On the other hand, the remaining students could neither provide answers during the
pre-test nor unveil any particular strategy as noted as follows:
Q=section 5 " هذ ا*? ت* ... hum Q= و !ودت .contexte ش F 7 ا*#( I have read the section around these words to figure out their meaning and guess also their contextual
meaning. (Student A).
Je savais 5 1 آD* 1 ?*هذ ا )colossal ( ،donc ي آ:ة ! )#*5 ا Q". Prof Y ! lycée 1?*ا Gو $?ت 5 ، =اه هflooded ه)# sinkو _ M .
I have already known that the word ‘colossal’ has a Latin origin, (in French colossal), so I could
understand its meaning.
Our teacher, of the secondary school, acquainted us with this story, and I could remember the meaning of floated. (Student C).
Above all, one may claim while analysing the data obtained from the learners’ verbalized protocol that they do
possess some cognitive strategies since they reported using them during the implementation of think-aloud,
however, it was clearly felt that they almost have absolutely no metacognitive strategies as was better proved in
the preceding tables.
TABLE 9. THE TYPE AND FREQUENCY COGNITIVE AND METACOGNITIVE READING STRATEGIES IN TAP1 AND TAP
Strategies employed TAP1 TAP2
Frequency Frequency
Predicting.
Integrating one’s background knowledge. 10 07
Making inferences. 00 01
Identifying key words. 01 04
Advance organizers. 01 00
Planning ahead. 00 02
Translation. 01 00
Self-management. 01 04
Re-reading. 00 01
Skimming.
Finding key words. 04 05
Summarizing. 00 01
Self management. 03 06
Skipping unnecessary details. 02 02
Re-reading. 02 02
Integrating one’s background knowledge. 03 02
Directed attention. 01 00
Reading with a purpose. 01 00
Skimming as needed. 01 00
Selective attention. 00 02
Translation. 01 00
Scanning.
Scanning. 01 00
Re-reading. 00 01
Selective attention. 06 03
Highlighting important ideas. 08 06
Linking sounds with visual imagery. 01 01
Identifying key words. 00 01
Ignoring unnecessary details. 01 00
Self-management. 01 01
Inferring.
Re-reading. 01 02
Summarizing. 00 03
Self-management. 03 02
Circling key words. 01 00
Self-questioning. 00 01
Selective attention 01 03
Note-taking. 00 01
Guessing from
the context.
Self-management. 01 03
Self-monitoring. 01 01
Re-reading. 01 00
Translation. 00 00
Knowledge transfer. 00 01
Activating content schemata. 00 01
SCHOLARS WORLD-IRMJCR Online: ISSN 2320-3145, Print: ISSN 2319-5789
www.scholarsworld.net [email protected] Volume. II, Issue II, April 2014 [43]
DISCUSSION OF THE RESULTS:
In an attempt to consider the results obtained from think-aloud in the pre-training and post-training phases, one
may notice that the most frequency used metacognitive strategy was integrating one’s background knowledge;
which was employed ten times during the first and seven times during the think-aloud protocols; while the least
frequent metacognitive self-management, directed attention, and self-monitoring strategies which were all
evidenced not more than three times as far as the strategies unveiled while performing the five reading strategies
of predicting, skimming, scanning, inferring and guessing.
Apart from the most frequent and least frequent metacognitive strategies explained previously, it was obviously
noticed during the learners’ protocols that they did rely on a set of cognitive strategies (as already shown in the
table above) among which the most frequent strategy was re-read (employed six times), and circling and
identifying key words (employed four times). However, the least frequent of all the cognitive strategies
observed in think-aloud TAP1and TAP2 were skimming and scanning as needed (employed solely in the think-
aloud two times), summarizing, and linking sounds with imagery (employed one time), knowledge transfer,
translation and note-taking strategies as well.
All in all and to put it in a nutshell, it might be worthwhile to note down the following points:
First of all, the qualitative and quantitative analysis obtained from think-aloud data has proved the fact
that some participants, if not all, have already possessed some strategies which can be categorized into
cognitive and metacognitive strategies, which socio-affective ones could not be unveiled during their
verbal protocol.
Secondly, some strategies; which are clearly identified and objectively explained from the inventory
compiled from the works of Barker et al ( 1984 ), Wilson(1981), Hosenfeld (1977,1979) as well as the
inventory which comprises a set of learning strategies categorized into metacognitive, cognitive and
socio-affective strategies, which are themselves made up of some sub-categories have not been employed
by the learners when being interviewed individually during think-aloud procedure.
Finally, the results which were discussed and interpreted in a step-by-step process during this assessment
verify the validity of the fourth hypothesis which states that the explicit / integrated strategy instruction
can have to some extent positive effect on learners’ reading proficiency in EFL setting though results
obtained in the present study have not shown statistically significant and remarkable difference in terms
of the types and frequency of strategies employed which is probably due to the fact that the learners may
have already learnt or possessed effective strategies before coming to the university.
CONCLUSION:
The present article at hand has endeavoured to deal with the results and has offered interpretations for the
various findings. It was designed under four research questions that the study has set out to answer. Thus, in the
first part the results obtained from learners’ questionnaire have helped in answering objectively the first
research question which sought to unveil the real causes behind learners’ comprehension deficiencies. Then the
results, that helped to yield information about what the second research question aimed at revealing, have been
considered through analysing the learners’ scores of the pre training proficiency test as far as the five reading
strategies were concerned .While the third research question which has sought to assess whether the learners are
metacognitively aware of the usefulness of reading strategies could be empirically answered once
implementing think aloud prior to the strategy training instruction . The last research question, on the other
hand, which was set out to unveil the possible effect of an integrated and direct instruction of metacognitive
strategies in reading at awareness raising level on the learners’ reading proficiency at EFL setting was answered
though a post test and another think aloud making use of course both quantitative and qualitative data whereby
to analyse the type and frequency of strategies deployed as well as comparing the result obtained before
receiving explicitly strategy training instruction with those obtained once strategy instruction was completed .
Thus, in an attempt to offer convincing answer to the first question, and at the same time confirm the validity of
the first stated hypothesis; one may notice that the real causes behind learners’ comprehension weaknesses can
be either due to:
Their incapability to utilize adequately and effectively some cognitive reading strategies and how to
transfer them in newly provided situations that condition their application.
SCHOLARS WORLD-IRMJCR Online: ISSN 2320-3145, Print: ISSN 2319-5789
www.scholarsworld.net [email protected] Volume. II, Issue II, April 2014 [44]
A dilemma which faced the learners particularly when employing the embedded approach which was
evidenced by numerous researchers whose findings have clearly proved that such approach generally
leads to little use and transfer of strategies to other tasks.
As for the second research question which sought to assess whether the learners already possess some reading
strategies or not, the analysis of the pre-test clearly proved that some learners are unable to utilize some reading
strategies in the required activities, while others could utilize them in the most convenient way whenever necessary.
As regards the third research question which sought to find out whether the learners are metacognitively aware of the
usefulness of the strategies employed during the pre-test, the answers could be empirically and objectively provided
once the first think-aloud protocol was conducted. Their verbalized data have proved that not all the learners were
consciously aware of the strategies employed, while the others were not. This difference can be regarded as a factor
that helps characterize the difference between strategic learners and non strategic ones.
As for the fourth research question, the researcher confirmed the validity of the last hypothesis which states that
metacognitive reading strategy instruction at awareness-raising level had to some extent an effect on the
learners’ reading proficiency and strategy use which was empirically verified during the implementation of the
second think aloud protocol.
REFERENCES:
1. Anderson, N. J. (1991). Individual Differences in Strategy Use in Second Language Reading and
Testing. In Modern Language Journal. 75, 460 – 472.
2. Brown, H D. (1994). Principles of Language Learning and Teaching. Englewood Cliffs: Prentice Hall.
3. Carrell, P. L., Pharis B.G., & Liberto, J. (1989). Metacognitive Strategy Training for ESL Reading.
TESOL Quarterly, 23, 647-678.
4. Carrell, P. L. (1998). Can Reading Strategies Be Successfully Taught? The Japan Association for
Language Teaching Journal.
5. Chamot, A. U., El Dinary. P.B., & Robbins, J. (1999). The Learning Strategies Handbook. White Plains,
NY: Addition Wesley Longman.
6. Davies, F. (1995). Introducing Reading. Penguin Group.
7. Flavell, J. H. (1978). Metacognitive Development . In Scandura, J. M., & Brainerd, C .J. (Eds) Structural /
Process Theories of Complex Human Behaviour. (213-245).
8. The Netherlands:Sijthoff and Wordhoff
9. Goodman, K. (1973). Analysis of Reading Miscues. In Smith, F. Psycholinguistics and Reading. New
York: Rinhart and Winson.
10. Hoover, W. A., & Tunner, W. E. (1993). The Comonents of Reading in Thompson, G. B, & Nichlson, T.
(Eds) Reading Acquisition Processes. (1-19), Cleverton, UK: Multilingual Matters.
11. Hosenfeld, C. (1977). A Preliminary Investigation of the Reading Strategies of Successful and Non-
successful Second Language Learners. System. (5, 110-123).
12. Phan, N. (2006). Effective Reading. Teachers Article. (11, 1- 4).
13. Philip, B., & Hua, K. (2006). Metacognitive Strategy Instruction (MSI) For Reading: Co-Regulation of
Cognition. Unpublished PhD Thesis, University Kebangsaan Malaysia.
14. Salataci, R& Akyel,A. (2002). Possible Effects of Strategy Instruction on L1 and L2 Reading. Reading
in Foreign Language Journal.14,1.
15. Singhal, M. (2001) Reading Proficiency, Reading Strategies, Metacognitive Awareness and L2 Readers.
In Reading Matrix (1, 01-09).
16. Smith, F. (1978). Reading, Cambridge: Cambridge University Press.
17. Urquhart, S., & Weir, C. (1998). Reading in Second Language: Process, Product and Practice. London: Longman.
APPENDIX A: LEARNERS’ QUESTIONNAIRE DEAR STUDENTS,
The following questionnaire submitted to you attempts systematically to collect information about your
current difficulties you commonly encounter when reading an English text, and assess the strategies you may
incorporate to face up these frequent issues.
Therefore, you are kindly requested to answer the following questions by checking on the answer you
think it is more appropriate, and make comments when necessary.

SCHOLARS WORLD-IRMJCR Online: ISSN 2320-3145, Print: ISSN 2319-5789
www.scholarsworld.net [email protected] Volume. II, Issue II, April 2014 [45]
1- Age…….
2- gender: male female
3- Stream of secondary school studies.....................................
4- Do you enjoy the Reading Comprehension Module?
Yes
No
Write why …………………………………………………………………………..
5- During reading sessions, what kind of materials do you find yourself much more motivated in?
General
Algerian
Culturally based
• British
Others Specify …………………………….
6- What do you do if you encounter a word you do not understand?
Use other words around it to figure out its meaning
Use other reference materials such as dictionaries and textbook indices
Pinpoint my problem by sounding it out
Ignore it temporally, and wait for clarification
7- What do you do if you come across an entire sentence which you cannot understand?
Keep on reading, and hope for further clarification
Spot the unfamiliar words and look for their contextual meaning
Disregard it completely
Read the problematic part of the text
8- When reading an English text, what do you do to remember specific information?
Relate it to your prior experience and knowledge
Ignore the secondary details
Realize I need to remember one point rather than another
9- Before you start to read, what kind of plan do you make to help you understand better?
No specific plan is needed
Think about what I already know about the topic
Think about why I am reading
10- Why would you go back and read the entire passage over again?
I cannot understand the overall meaning of the text
To clarify a particular idea
To summarize the passage
11- According to you, which sentences seem not important in reading passage?
Almost all sentences, otherwise they would not be mentioned at all
The sentences that contain details or facts
The topic sentences that have close relation with the main idea
12- The best reader, according to you, is the one who is capable of ….
Recognizing words
Using dictionary
Integrating the information in the text with what you know already
Differentiate between the supporting details and the unnecessary ones
13- According to you, what are the most important strategies thaÿÿhelp learnÿÿs who have difficulties with
reading better understand the text and therefore complete the tasks in appropriate ways?
----

SCHOLARS WORLD-IRMJCR Online: ISSN 2320-3145, Print: ISSN 2319-5789
www.scholarsworld.net [email protected] Volume. II, Issue II, April 2014 [46]
EFFECT OF RAINFALL ON WORKER PARTICIPATION IN
MGNREGA: EVIDENCE FROM UTTAR PRADESH
MALVIKA TYAGI,
Research Scholar,
Department of Humanities and Social Sciences,
IIT Delhi, Delhi- India
ABSTRACT
Environmental factors like rainfall, temperature, soil quality etc. have most important role to play
in agriculture. Favourable environmental conditions lead to good output while as if the
environmental conditions are not favourable, output will be less and so will the income of the
farmers who are dependent on agriculture. This becomes more important in case of India where a
large share of population (55%) is employed in agriculture. The income of farming class depends
upon agricultural output which keeps fluctuating depending upon the environmental factors.
Since under the scheme workers are guaranteed employment, this acts as an alternative source of
income in the rural areas. In case the availability of job in rural labour market is lesser, especially
if there is a bad monsoon, the rural workers undertake what is called as ‘Distress migration’.
MGNREGA is said to have brought it down. One of the ways to test that claim will be to check
whether more people participate in the scheme in case the rainfall is deficient from its LPA.
The research focuses on the effect of deficit in rainfall on participation in MGNREGA
(Dependent variable), and finds a negative relationship between the amount of deficit in amount
of rainfall and MGNREGA participation. It can hence be concluded that MGNREGA has been
used by the farmers for income smoothing. The policy implication of this study is that regions
which suffer rainfall deficits must be provided with more number of work days than the present
fixed number of 100.
Keywords: Environmental factors, rainfall, temperature, soil quality, NREGA, MGNREGA
SCHOLARS WORLD-IRMJCR Online: ISSN 2320-3145, Print: ISSN 2319-5789
www.scholarsworld.net [email protected] Volume. II, Issue II, April 2014 [47]
INTRODUCTION:
National Rural Employment Guarantee Act (NREGA), now renamed as Mahatma Gandhi National Rural
Employment Guarantee Act (MGNREGA), was passed in year 2005 and implemented in 2006 as National Rural
Employment Guarantee scheme (NREGS) in 200 most backward districts of India. The Act came into force on
February 2, 2006 and was implemented in a phased manner in the whole country. In Phase I it was introduced in
200 most backward districts, it was implemented in additional 130 districts in Phase II (2007-2008). The
remaining 285 rural districts of India were covered in 2008-09. Maharashtra Employment Guarantee Scheme
(MEGS), the largest state sponsored public works program to alleviate poverty acted as a prelude to National
Rural Employment Guarantee Scheme. MGNREGA is different from the earlier public employment programs
since it is a right based program. Workers can rightfully demand work from the Government and the Government
is liable to provide them employment. In case Government fails to provide employment to desirous workers, it is
liable to pay them unemployment allowances. Under the provisions of the Act, each rural household is entitled to
at least 100 days of employment in a year. It is a social security measure for the rural households which cannot
find employment in the local labor market and at the same time helps in asset creation. Since the scheme is
implemented through the Panchayati Raj Institutions, it infuses strength in them apart from making these local
units of governance accountable and transparent. As MGNREGA document [Source: The National Rural
Employment Guarantee Act (NREGA): Design, Process & Impact: UNDP: Chapter 1, p.9] puts it: “The primary
objective of the Act is augmenting wage employment. Its auxiliary objective is strengthening natural resource
management through works address causes of chronic poverty, like drought, deforestation, and soil erosion and so
encourage sustainable development. The process outcomes include strengthening grass-root processes of
democracy and infusing transparency and accountability in governance”.
The rural areas could not benefit either directly or indirectly from the economic growth that India has registered
in the last decade given the poverty levels and deprivation that still persists in them. MGNREGA transfers
funds directly to these left out regions. Assets created will form the basis of future growth in rural areas and act
as a source of long term employment for rural people once the scheme is called off. The scheme is a way to
transfer money to rural people; to target it effectively, people are required to do manual unskilled labour.
Employment generation is important provision of the scheme, 60 per cent of all expenditure is to be made on
wage payments, capital and heavy machinery cannot be employed at the work site, the projects are not to be
executed by the contractors etc. These provisions make sure that maximum employment is generated by the
scheme. There is less scope of corruption in this scheme. Wage payment is not made in cash but is transferred
to the workers through their bank accounts. This ensures that there are no intermediaries involved like earlier
employment programs to siphon off the funds meant for poor.
The problem with employment programs which were operational before MGNREGA was that there were no
specified clauses for wage material ratio, no restriction on employment of contractors, and no reservation for
females. MGNREGA tries to do away with most of these short comings. Under provisions of MGNREGA, the
share of females in total employment should be at least one-third. To incentivise workers to participate,
especially females, the scheme provides various worksite facilities which includes crèche, clean drinking water,
toilet facility, place for shade, first aid facility etc.
LITERATURE REVIEW:
Underdeveloped countries have a characteristic feature that a large share of population is poor and is engaged
directly or indirectly in agriculture. Given that agriculture is the mainstay of population, fluctuations in
agricultural output lead to fluctuations in income and consumption of a large share of population. In case of
India, these fluctuations are more frequent since rainfall is the main source of irrigation which in turn depends
upon uncertain Monsoon winds. Fluctuations in income are exacerbated by lack of employment opportunities in
case of bad agricultural output or during lean season. Income shocks as a result of droughts and other
productivity shocks have serious effects on the socio economic aspects of the rural poor like malnutrition,
children dropout of the school and farmers sell off their assets and hence reducing their income earning capacity
in future years (see, e.g.,Rosenzweig and Wolpin 1993; Dreze 1995). To deal with these adverse situations,
either weather insurance is provided to famers which insures them against risks related to output as a result of
fluctuations in weather or Government sponsored workfare programs (like Mahatma Gandhi National Rural
Employment Guarantee Act, MGNREGA) are started which provide employment on demand. Developing
country like India where both demand and supply of weather based agricultural insurance is low; workfare

SCHOLARS WORLD-IRMJCR Online: ISSN 2320-3145, Print: ISSN 2319-5789
www.scholarsworld.net [email protected] Volume. II, Issue II, April 2014 [48]
programs become important in dealing with income fluctuations. Workfare programs have two effects on rural
workers they help transfer income to the rural workers, transfer effect and stabilize their income and hence
consumption pattern, stabilization effect (Ravallion, 1991). Transfer benefits can be both direct, i.e. benefits
accrued as a result of participating in the scheme less any participation costs, as well as indirect i.e. benefits
from assets created under the scheme. Stabilisation benefits accrue through the reduced risk of fluctuations in
income and hence workers receiving a steady stream of income payments. These stabilization benefits become
important in an agricultural setting dependent upon monsoons. Rural employment generation programs have to
a large extent successfully dealt with the seasonal fluctuations in agricultural income, fluctuations due to
famines and droughts (see Lieberman 1985; Dreze 1988; Dreze and Sen 1989). Walker and others (1986)
estimated a 50% less variation in income stream of landless agricultural households in two villages where
employment guarantee scheme (EGS) was in operation compared to third village where no such scheme
operated. Besides employment under EGS was found to follow a periodicity in terms of participation going up
in dry season (march-June) and declining rapidly afterwards. Also previous year monsoon exerted its effect on
participation which varied according to the status of previous year monsoon.
In underdeveloped/developing countries, workfare programs become more important as there are many other
sources apart from weather which cause fluctuations in output like pest attack, lack of proper knowledge about
cultivation of crops, lack of timely availability of irrigation etc. all these factors make weather based insurance
less attractive from farmers’ point of view. If the supply of labour is less elastic because farmers are living close
to subsistence, less able to migrate, and are credit constrained, the productivity shocks tend to become more
severe. Income and productivity shocks through income and substitution effects affect the decision of the
worker regarding labour he is going to supply. For underdeveloped economies, income effect more than
compensates the substitution effect (which works in opposite direction) in case of reduction in wage rate and
hence workers increase their supply of labor to keep purchasing power constant. Migration can help the workers
to mitigate the effect of reduced wages by making labor supply more elastic but that is mostly not the case. This
inelastic supply of labor leads to further reduction in wages and hence making the shock more severe for
workers (Jayachandran, 2006). Uninsured weather risk plays important role in rural areas with respect to
decisions about the crops to be cultivated. Farmers prefer lesser but certain output to higher but uncertain
output. They will cultivate the crops which they are sure will grow even if total output is lower compared to
probabilistic high output. This leads to lower efficiency and lower average income in rural areas. The
availability of rainfall insurance would both raise overall profits in high risk areas and decrease earning
inequality within those areas. Although there are apparent gains from weather insurance, both private and
social, still the market for weather insurance seems to be absent. Given that the moral hazard problem is dealt
with in case of rainfall insurance as opposed to yield insurance, the demand for rainfall insurance is very weak.
This may be because first, a substantial proportion of profit risk is idiosyncratic, and evidently well diffused.
Second, demand for weather insurance would come primarily, if not exclusively, from poor farmers. Wealthy
farmers are evidently unwilling to pay a premium, via reduced averaged profits, to reduce their exposure to ex
ante weather risks (Rosenzweig and Binswanger, 1993).
Workfare programs like MGNREGA are a suitable substitute for weather based insurance as employment is
available on demand at any time of the year. If the Government fails to provide employment on demand,
workers are entitled to unemployment allowances. Besides, targeting of scheme to poor and needy is guaranteed
through the inbuilt mechanism of screening and deterrent effects that workfare programs have (Besley and
Coate, 1992). Implementation costs are reduced as a result of self-selecting nature of the workfare programs.
The success of employment guarantee programs as alternative to weather insurance scheme depends upon the
government budgets, eligiblity criteria and wage rates. Ravallion (1991) saya that there should be “as few
restrictions on eligibility as feasible, and wage schedules and the rights of participants should be well defined,
well known, and non-discriminatory. Ideally all who want work at the going wage rate should be able to get it.”
Inclusiveness is the key as households should be reassured that they will have a place to turn when they fall on
hard times (Mudroch, 1999).
Doug Johnson (2009) in his study for Andhra Pradesh found that the hypothesis agricultural season rainfall does
not affect lean season log NREGA wages is convincingly rejected (PValue<.00005). In his model two
coefficients come out to be significant at 1% level which are days by which monsoon has been delayed (Days)

SCHOLARS WORLD-IRMJCR Online: ISSN 2320-3145, Print: ISSN 2319-5789
www.scholarsworld.net [email protected] Volume. II, Issue II, April 2014 [49]
and deficit in monsoon in millimetres of rainfall (deficit). The coefficients for these variables indicate that each
millimetre in deficit rainfall suffered by a sub-district results in nearly 20 Rs in additional NREGA wages per
working age person while each extra day of rain decreases NREGA wages per working age person by slightly
over 7 Rs. These results strongly confirm that MGNREGA is indeed responsive to rainfall induced variation in
income. This rights based employment guarantee program seems to be an alternative to the weather based
agricultural insurance in its present form and can better serve the purpose if some adequate changes are made.
The number of person days of work available to each household can be made dependent upon the rainfall in the
state with the lower limit remaining the same, which is presently 100 days. Evidence from two of the poorest
Indian states (UP and Bihar) can further strengthen the case for reforms in MGNREGA to make it more suitable
as an alternative to weather based insurance index. In this paper I will try to explore this analysis further by
using the current data, data used by Douglas (2009) was up to 2009 when the scheme was still in its initial
stage. I hope to extend this analysis to the whole country so as to get a better picture of changes in MGNREGA
participation and weather (rainfall). Also, person days worked under the scheme can better serve as an indicator
of participation than wage earned (as used by Douglas, 2009). Sometimes wage revision within a year can
increase the wage earned by household while as the person days worked under the scheme remaining the same.
EMPIRICAL STUDY AND RESULTS:
The effect of rainfall on participation in MGNREGA; (See Appendix, Table 1)
Rainfall is an important determinant of agricultural activity in India as Indian agriculture is still referred to as ‘The
Gamble of Monsoons’. Therefore considerable amount of agricultural activity is associated with how the monsoon
turns out to be. In case of rural areas, the employment options for the workers are limited. If the agricultural
activity is lesser, it affects the demand for workers. MGNREGA provides an alternative employment opportunity
to these workers who may not find employment elsewhere in a bad agricultural season. Therefore it is highly
likely that workers will participate more in MGNREGA work in a bad monsoon year. This is what the paper tries
to find out by looking at the data of participation in MGNREGA by households and deficit in rainfall. The
hypothesis is that if the deficit in rainfall is higher from the LPA, the participation in MGNREGA should be
higher given that not many employment options are available to rural workers.
The study includes eight districts from UP of both east and west regions as classified by Indian Meteorological
department (IMD). The data has been collected for four years starting from 2009 to 2012. Similarly the data for
rainfall deficit was collected for the same years. Then a panel data regression was run with log of number of
days worked under MGNREGA as dependent variable and rainfall deficit as independent variable. The
regression gave us a positive sign for the deficit in rainfall, the variable of interest, which means that there is a
positive relationship between rainfall deficit and the number of workdays by a household and therefore we
cannot reject the null.
Starting with the hypothesis that whether rainfall deficit affects MGNREGA participation, the hypothesis that it
does is accepted given that all value statistics are significant. The equation of the model is Yi,t = C + β1 t +β2
ID+β3 Ri,t + εi,t, which is a panel data fixed effects regression model Where, y is the number of workdays by each
household in a district in a year, C is the constant term, t is the year, R is the deficit in rain fall, ID is the district.
The relationship between deficit in rainfall and participation in the scheme as measured by number of work
days by each household is positive which means that any deficit in rainfall from LPA will lead to an increase in
the number of workdays that each household will work under MGNREGA. The results show that for in a
district ‘i’ at time period ‘t’, 1 mm deficit in rainfall from LPA, the number of workdays worked by households
in a district increases by 0.05 %, this may seem a small number but consider a district in which 10 lakh
households participate in the scheme and the deficit in rainfall is 10 mm.
CONCLUSION:
This result can have very important implications from the policy making perspective. Under MGNREGA, a
household has limited number of days of employment available in a year i.e. 100 days, Since our result shows that
in case of deficient rainfall in a district, people tend to participate more in MGNREGA, the number of days of
work available to household can be made dependent on rainfall deficit with the lower band of 100 days. The
regions which suffer more deficits in rainfall should be compensated with more number of workdays. This helps
them to mitigate the adverse effects of deficient rainfall and hence reduces the distress migration. This study can
also be useful to highlight the success of MGNREGA. It is highly likely that the increase in employment of the

SCHOLARS WORLD-IRMJCR Online: ISSN 2320-3145, Print: ISSN 2319-5789
www.scholarsworld.net [email protected] Volume. II, Issue II, April 2014 [50]
households will lead to increase in income of those households. Therefore, MGNREGA plays the role of income
smoothing as well. This aspect is very important in the rural and agricultural context of India and given that still
more than 50% of population is engaged in agriculture. Any fluctuation in the agricultural output directly or
indirectly affects these people.
REFERENCES:
1. Besley, Timothy and Stephen Coate, “Workfare versus Welfare: Incentive Arguments for Work
Requirements in Poverty-Alleviation Programs” The American Economic Review, Vol. 82, No. 1 (Mar.,
1992), pp. 249-261
2. Dreze, Jean. 1995. “Famine Prevention in India.” In The Political Economy of Hunger: Selected Essays,
edited by Jean Dreze, Amartya Sen, and Athar Hussain. Oxford: Clarendon.
3. Dreze, Jean. 1988. "Social Insecurity in India: A Case Study." Paper prepared for the Workshop on Social
Security in Developing Countries, London School of Economics.
4. Dreze, Jean, and Amartya Sen. 1989. Hunger and Public Action. Oxford: Oxford University Press.
5. Jayachandran, Seema. “Selling Labor Low: Wage Responses to Productivity Shocks in Developing
Countries”, Journal of Political Economy, Vol. 114, No. 3 (June 2006), pp. 538-57
6. Johnson, doug, “Can Workfare Serve as a Substitute for Weather Insurance? The Case of NREGA in
Andhra Pradesh”, Institute of Microfinance working paper series, no 32, institute of financial
management and research
7. Lieberman, S. S. 1985. "Field-Level Perspectives on Maharashtra's Employment Guarantee Scheme."
Public Administration and Development 5: 109-27.
8. Mudroch, Jonathan, “Between the State and the Market: Can Informal Insurance Patch the Safety Net?”
The World Bank Research Observer, Vol. 14, No. 2 (Aug., 1999), pp. 187-207
9. Ravallion, Martin. “Reaching the Rural Poor through Public Employment: Arguments, Evidence, and
Lessons from South Asia, The World Bank Research Observer, Vol. 6, No. 2 (Jul., 1991), pp. 153-175
10. Rosenzweig, Mark R., and Kenneth I. Wolpin. 1993. “Credit Market Constraints, Consumption
Smoothing, and the Accumulation of Durable Production Assets in Low-Income Countries: investment in
Bullocks in India.” Journal of political economy 101 (April): 223–44
11. Walker, Thomas S., R. P. Singh, and M. Asokan. 1986. "Risk Benefits, Crop Insurance, and Dryland
Agriculture." Economic and Political Weekly 21 (June): A81-A88.
----

SCHOLARS WORLD-IRMJCR Online: ISSN 2320-3145, Print: ISSN 2319-5789
www.scholarsworld.net [email protected] Volume. II, Issue II, April 2014 [51]
APPENDIX:
TABLE-1
Estimation Command:
==================
LS P C ID YEAR R
Estimation Equation:
==================
P = C (1) + C (2)*ID + C (3)*YEAR + C (4)*R
Substituted Coefficients:
==================
P = -373.766424257 - 0.00298707915023*ID + 0.189074157414*YEAR + 0.000542423296448*R
Dependent Variable: P
Method: Panel Least Squares
Date: 11/18/13 Time: 23:21
Sample: 2009 2012
Periods included: 4
Cross-sections included: 8
Total panel (balanced) observations: 32
Variable Coefficient Std. Error t-Statistic Prob.
C -373.7664 150.5805 -2.482171 0.0193
ID -0.002987 0.036785 -0.081204 0.9359
YEAR 0.189074 0.074887 2.524789 0.0175
R 0.000542 0.000352 1.542458 0.1342
R-squared 0.281840 Mean dependent var 6.271598
Adjusted R-squared 0.204894 S.D. dependent var 0.519041
S.E. of regression 0.462822 Akaike info criterion 1.413520
Sum squared resid 5.997714 Schwarz criterion 1.596737
Log likelihood -18.61631 Hannan-Quinn criter. 1.474251
F-statistic 3.662844 Durbin-Watson stat 1.965737
Prob(F-statistic) 0.024106
Where, Yi,t = C + β1 t +β2 ID+β3 Ri,t + εi,t
is the number of workdays by each household in a district in a year.
C is the constant term
T is the year
R is the deficit in rain fall
ID is the district.
----

SCHOLARS WORLD-IRMJCR Online: ISSN 2320-3145, Print: ISSN 2319-5789
www.scholarsworld.net [email protected] Volume. II, Issue II, April 2014 [52]
DOES INVESTOR ATTENTION MATTER’S?
RASHID AMIN,
Department of Finance and Economics,
Foundation University Rawalpindi,
Pakistan
HABIB AHMAD,
Department of Finance and Economics,
Foundation University Rawalpindi,
Pakistan
ABSTRACT
The purpose of the study is to examine the effect of investor attention on profitability,
liquidity and volatility of a firm. Forty two firms listed on Karachi Stock Exchange are
investigated. Data with monthly frequency from November 2009 to October 2013 is
analyzed to inspect the relationship. It is found that the investor attention partially affect
profitability, liquidity and volatility. Liquidity of a firm is more affected by investor
attention as compared to profitability and volatility.
Keywords: Google search volume, Investor Attention, liquidity, profitability; volatility.
SCHOLARS WORLD-IRMJCR Online: ISSN 2320-3145, Print: ISSN 2319-5789
www.scholarsworld.net [email protected] Volume. II, Issue II, April 2014 [53]
INTRODUCTION:
It is often said that investors have infinite cognitive resources with high attentiontoward the stock market
activities. On the other hand investors have in realitylimitedcognitive capabilities (Kaheman, 1973).Previous
studies show that there are limitsto the essential cognitive processing capability of the human brain.Sometime
huge amount of information is available but investor collect specific information for their decision purpose, and
alsoshows that attention have vital role in investors learning and trading behavior.
In the advancement of information technology the world is going in the digital era and internet is becoming an
essential research tool. It provide us the easiest way to access information from different sources and people are
more dependent on search engines to get their desired results from the internet, with respect to other search
engine Google become the most frequently using search engine as worldwide and now in Pakistan, if someone
do search on Google so he is paying attention to it (Da, Engelberg, & Gao, In Search of Attention, 2011),and
without any biasness Google trend is the most reliable source of measuring Pakistani investors’ attention so
irrelevant and noisy information is ignorable or negligible.
Our research contributes andsomehow relates to the stream of literature that analyze the “investor attention
hypothesis” (e.g., (Fang & Peress, 2009), (Grullon, Kanatas, & Weston, 2004) and (Tetlock, 2010). Investor
frequently gather information on stocks that are traded in market, they pay high attention toward every piece of
information which is related to the specific stock, because as we discuss before human brain has a limited
central cognitive processing capability. Sometimes incomplete or asymmetric information becomes a problem
for investors and it could be risky for them to make decisions. When investor pay a high level of attention
toward the stock by searching actively on search engine, so they receive specific information on the stock which
decreases level of asymmetric and incomplete information problems. It result, the stocks with more investor
attention have a high rate of liquidity.
This paper is divided in to following steps. First, we examined the case of Pakistani stock market while
previous studies emphasize on the US and French stock markets (Ding & Hou, 2011) (Vlastakis & Markellos,
2012) and (Aouadi, Arouri, & Teulon, 2013). Second, the paper analyzes empirically that does investor
attention matters? And we follow Google search volume as a proxy on monthly basis for knows in investors’
attention for stock sin KES 100-index.
And third, we considered Investor Attention as independent variable and profitability, liquidity and volatility as
dependent variable.
Our results may help for stakeholders of institutions like financial markets (e.g. stock brokers and liquidity
traders) from this they can efficiently learn investors trading behaviors. Finally, our findings may also benefit to
search engine firms to develop a business model and standardize the search data on individuals searching
behavior in terms of accuracy and timeliness, and then they are able to sell this information to concerned
participants those who need such information.
The rest of the paper is arranged as follows. Section 2 demonstrates relevant literature review. Section 3
describes data and methodology. Section 3 presents empirical results, interpretation and relevant discussion.
Section 4 will draw conclusion.
LITERATURE REVIEW:
The concept “recognition of investor” was initially introduced by (Merton, 1987) and suggests that investor
attention may be relevant to the stock market activities. Human brain is bounded in its information processing
capability, attention plays a vital role in learning, selecting, decision making, and also effects trading behavior
of investors (Hou, Xiong, & Peng, 2009).Asset pricing model speculate that investor attention is an essential
part of stock price to fully integrate the public information, as an investor has to be conscious about information
before he can observe and respond to this specific stock information. (Peng, Xiong, & Bollerslev, 2007)They
find out that investors shift their limited attention to process market level information, an increase in market
wide uncertainty and then subsequently divert their attention back to asset specific information.
According to Merton the firm should be well recognized or front line investors should be aware to the firm
before investments, this shows investor attention is obligatory condition for a company to be recognized, also
stated that increment in search volume increases the trading activities like stock prices, liquidity and temporary
returns (Merton, 1987).
(Barber, Odean, & Zhu, 2006) Investors only focus on those stocks which are more familiar in the stock market
and that information may not enough to determine attraction of investors. This study indirectly indicates that
SCHOLARS WORLD-IRMJCR Online: ISSN 2320-3145, Print: ISSN 2319-5789
www.scholarsworld.net [email protected] Volume. II, Issue II, April 2014 [54]
limited attention toward direct determination is so effected because it is very difficult to measure human
attention especially in stock market, For directly measures researchers have to go back in that particular time
period which is very hard to do.(Barber & Odean, 2008) Individual investors locates the information about the
firm’s environment, product, history and strategies and they are more conscious to search for information when
they are buying since they have to choose from a large set of available alternatives.(Fehle, Tsyplakov,
&Zdorovtsov, 2005)Examine that most of the firms create and then increase investor attention through
advertising techniques.(DellaVigna & Pollet, 2009)They find out that volume and two day stock price reaction
to Friday news released media is relatively weaker than the other days of week. (Huberman & Regev,
2001)They find that newspaper can affect the stock prices even contents don’t have genuine information thus
prove the important role exercised by investor attention.(DellaVigna & Pollet, 2009)They find out that volume
and two day stock price reaction to Friday news released media is relatively weaker than the other days of
week. Mostly investor’s intentions toward buying of stocks or grabbing stocks, high intention toward specific
stock is due to its familiar reputation like headlines news, extreme or high returns and high abnormal trading
volume. The result of attention is not restricted to the retail investors; High attention increases the level of
unaccepted trading and uninformed investors (Yuan, 2008). (Chemmanur & Yan, 2009)Find that an increase in
the level of investor intension is related with a higher cotemporary stock return and a lower future return. Stock
market related news cause the investor’s ignorant or attentive behavior towards frequently switching process
(Andrei & Hasler, 2011).In good law enforcement countries investors pay more attention to firm’s specific
information which leads to higher momentum returns (Gavrailov, 2013).(Da, Engelberg, & Gao, The sum of all
fears: investor sentiment and asset prices, 2010)Show that investor attention is correlated with the high first-day
return and the long-run underperformance of IPO stocks. We emphasize from these studies that investor
attention is almost depended on the way investor react on specific information and they are restricted to limited
stocks and there information. Attention to stock market rises in times of high market activities, Moreover an
increase in investor attention is followed by high volatility (Dimpfl & Jank, 2011).There are lots of tools and
techniques through investor attention can be measured, like in previous studies researchers uses different
indirect methods to measure investor attention. Such as business cycle activities (Kita & Wang, 2012), media
coverage (Fang & Peress, 2009), abnormal trading volume (Hou, Xiong, & Peng, 2009) and advertising
expense (Lou, 2009), extreme or high returns (Barber & Odean, 2008).(Grullon, Kanatas, & Weston,
2004)Examine that advertising expense is positively related to the number of investors and stock market
liquidity. (DellaVigna & Pollet, 2009)Find that news can be the sources through stock prices reacts. (Fang &
Peress, 2009) Report that there is a negative relationship between stock returns and media coverage.
Internet search volume proxies can be the most reliable sources because researcher can get highly relevant
results. According to (Ding & Hou, 2011) when people pay more attention to trading activities by actively
searching on the internet they receive relevant information on stocks and may eventually become investors of it,
and this enable the firm stocks and name to be better recognized as a result stocks with increased investor
attention become more liquid.GSV first introduce by (Mondria, Wu, & Zhang, 2010)and (Da, Engelberg, &
Gao, In Search of Attention, 2011) in their financial literatures as a direct measure of investor attention and
show that it is more efficient than the previous measure of investor attention. (Aouadi, Arouri, & Teulon,
2013)Successfully measure the attention through Google search volume proxy, (Now onward Google search
volume is called GSV) inspired by them and especially for avoiding any biasness GSV has been used in this
paper. Most frequently used search engine Google, online search volume data was released on 2008 but search
data is available from 2004 and onward. GSV captures information demand among investor and most of the
searches have been performed during the period of earning announcement (Drake, Jennings, Roulstone, &
Thornock, 2012).Higher GSV leads to increase greater stock liquidity, trading activities and greater the future
returns in short term period (Bank, Larch, & Peter, 2011), (Da, Engelberg, & Gao, In Search of Attention,
2011), (Vlastakis & Markellos, 2012), (Dimpfl & Jank, 2011), and (Kita & Wang, 2012)These researcher use
GSV on firms tickers, names and other related terms to determine investor attention as the information is
available publicly, all these articles suggest that investor’s online behavior is strongly time varying and larger in
times of high volatility. Moreover (Vlastakis & Markellos, 2012) define that GSV explain about 50% of the
variability in the Market Volatility Index.
Facts and figures suggest that GSV is the most reliable proxy source for measuring Pakistan’s investor’s
attention. Useful and reliable information is perceived more valuable in Pakistan’s financial markets, use of
search engines is increasing rapidly day by day, and most of the investors and brokers are aware of it. All credit
SCHOLARS WORLD-IRMJCR Online: ISSN 2320-3145, Print: ISSN 2319-5789
www.scholarsworld.net [email protected] Volume. II, Issue II, April 2014 [55]
goes to information technology and then internet system because it decreases the cost of data gathering and
increases the flow of information, still most of people are not the regular users of internet but in recent decades
they are showing high interest towards it. Regarding GSV previous researches show positive results for
different empirical studies in stock market activities. As we discuss below, the empirical question (Does
investor attention matters?) can be examined.
DATA AND METHODOLOGY:
Companies listed on KSE 100 index are used to measure the effect of investor attention on liquidity,
profitability and volatility. 42 companies are filtered out of 100 stock firms based on the availability of data.
Time duration for the analysis range from November 2009 to October 2013 with monthly frequency, stock
firms are listed in the KSE 100 index which is chosen for our sample period and reason for selection of stocks
from KSE 100 index is that they are the upfront representatives of Karachi Stock Exchange. To measure the
investor attention we use Google Search volume and it considered as a proxy Index because it better as compare
to other proxies of measure used in the previous literatures e.g. Advertisement expenditure , media coverage
(Grullon, Kanatas, & Weston, 2004), (DellaVigna & Pollet, 2009).To measure the profitability of stock we
convert individual stock price into return by using this equation r
1.We follow the(Ascioglu,
Comerton-Forde, & McInish, 2007)(Chae, 2005) (Barnea & Logue, 1975)to measure the monthly volatility in
the returns of a firm is calculated with the help of standard deviation of the daily returns. Turnover is used as a
proxy of measure for liquidity of a firm by following (Fong, Holden, & Trzcinka, 2011)as representative of
liquidity; a high ratio indicates a more liquid stock (low price impact of trades).
Table 1 show the queries used in the analysis. The combination of words in any search query is of very much
importance. In Pakistan mostly the firms are searched by their names rather than the tickers as it is easy to
remember the names. Also symbols of tickers may be used in different meaning than required.
To investigates the effect of investor attention on Turnover, profitability and volatility all the series are tested
for stationary. The returns and volatility are found to be stationary at level for all the 42 firms. But for some
companies it is observe that the series of turnover and Investor attention showed a unit root at level that’s why
ARDL is applied for that series. The results of Augmented Dickey Fuller test are shown in table 2 while Table 3
reports descriptive statistics for Turnover, profitability and volatility.
EMPIRICAL RESULTS:
The results of regression are shown in table 4 estimates of ARDL are marked as italic whereas estimates of
ordinary least square are non-italic. From the table we observe that turnover of 26% firms are significantly
affected by investor attention, the results also indicates that 17% firms and volatility of 9% firms are also affected
by investor attention at 5% Confidence Interval. At 1% Confidence Interval 19% firms in case of turnover, 12%
firms in case of returns and 5% firms in case of volatility are found to be affected by investor attention.
Similar when 10% confidence interval is considered that 36% firms in case of turnover, 19% in case of returns
and 14% firms in case of volatility are found to be affected by investor attention.
From these results it is observed that liquidity is most affected variable by investor attention and volatility is the
least variable in our observation.
CONCLUSION:
The research conclude that Investor Attention that investor attention partially affected liquidity, volatility and
returns but the effect of Investor Attention is more in the case of liquidity it means that when a stock receive
more investor attention investors tend to trade the stock with accelerating frequency. Returns and volatility are
effected by investor attention, it suggest that when investor pay more attention to particular stock it doesn’t
means that the attention is due to its profitability or volatility.
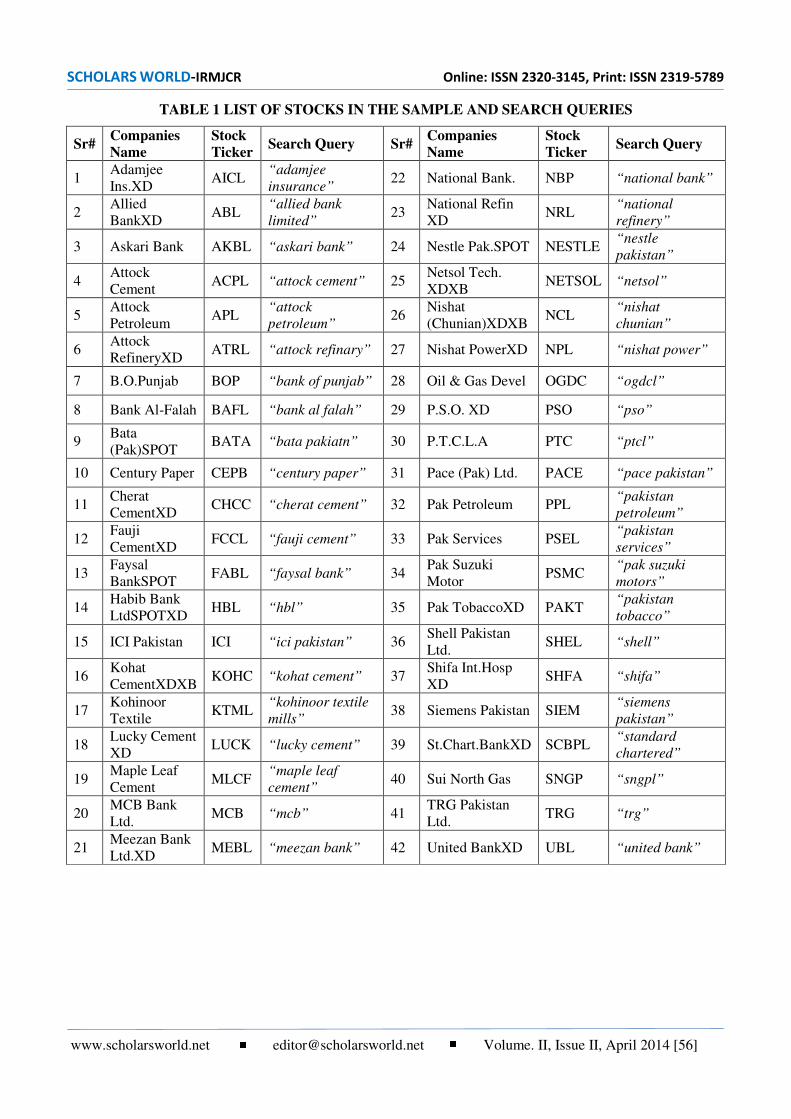
SCHOLARS WORLD-IRMJCR Online: ISSN 2320-3145, Print: ISSN 2319-5789
www.scholarsworld.net [email protected] Volume. II, Issue II, April 2014 [56]
TABLE 1 LIST OF STOCKS IN THE SAMPLE AND SEARCH QUERIES
Sr# Companies
Name
Stock
Ticker Search Query Sr#
Companies
Name
Stock
Ticker Search Query
1 Adamjee
Ins.XD AICL
“adamjee
insurance” 22 National Bank. NBP “national bank”
2 Allied
BankXD ABL
“allied bank
limited” 23
National Refin
XD NRL
“national
refinery”
3 Askari Bank AKBL “askari bank” 24 Nestle Pak.SPOT NESTLE “nestle
pakistan”
4 Attock
Cement ACPL “attock cement” 25
Netsol Tech.
XDXB NETSOL “netsol”
5 Attock
Petroleum APL
“attock
petroleum” 26
Nishat
(Chunian)XDXB NCL
“nishat
chunian”
6 Attock
RefineryXD ATRL “attock refinary” 27 Nishat PowerXD NPL “nishat power”
7 B.O.Punjab BOP “bank of punjab” 28 Oil & Gas Devel OGDC “ogdcl”
8 Bank Al-Falah BAFL “bank al falah” 29 P.S.O. XD PSO “pso”
9 Bata
(Pak)SPOT BATA “bata pakiatn” 30 P.T.C.L.A PTC “ptcl”
10 Century Paper CEPB “century paper” 31 Pace (Pak) Ltd. PACE “pace pakistan”
11 Cherat
CementXD CHCC “cherat cement” 32 Pak Petroleum PPL
“pakistan
petroleum”
12 Fauji
CementXD FCCL “fauji cement” 33 Pak Services PSEL
“pakistan
services”
13 Faysal
BankSPOT FABL “faysal bank” 34
Pak Suzuki
Motor PSMC
“pak suzuki
motors”
14 Habib Bank
LtdSPOTXD HBL “hbl” 35 Pak TobaccoXD PAKT
“pakistan
tobacco”
15 ICI Pakistan ICI “ici pakistan” 36 Shell Pakistan
Ltd. SHEL “shell”
16 Kohat
CementXDXB KOHC “kohat cement” 37
Shifa Int.Hosp
XD SHFA “shifa”
17 Kohinoor
Textile KTML
“kohinoor textile
mills” 38 Siemens Pakistan SIEM
“siemens
pakistan”
18 Lucky Cement
XD LUCK “lucky cement” 39 St.Chart.BankXD SCBPL
“standard
chartered”
19 Maple Leaf
Cement MLCF
“maple leaf
cement” 40 Sui North Gas SNGP “sngpl”
20 MCB Bank
Ltd. MCB “mcb” 41
TRG Pakistan
Ltd. TRG “trg”
21 Meezan Bank
Ltd.XD MEBL “meezan bank” 42 United BankXD UBL “united bank”
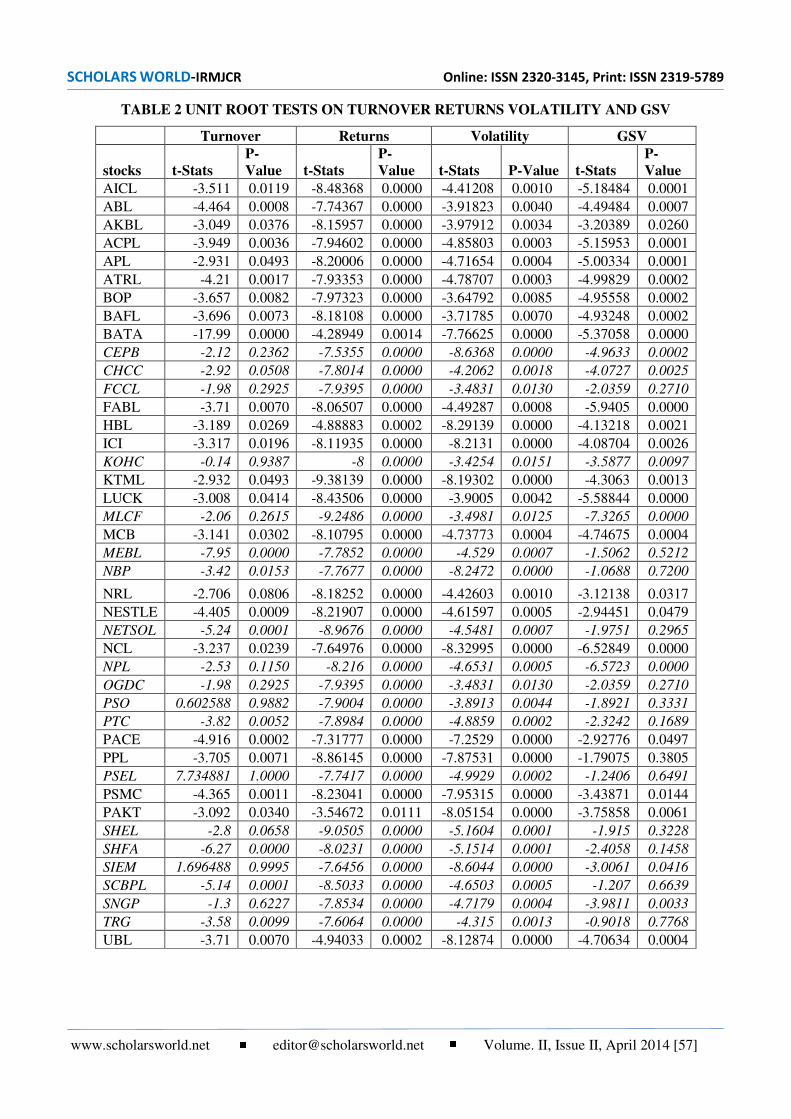
SCHOLARS WORLD-IRMJCR Online: ISSN 2320-3145, Print: ISSN 2319-5789
www.scholarsworld.net [email protected] Volume. II, Issue II, April 2014 [57]
TABLE 2 UNIT ROOT TESTS ON TURNOVER RETURNS VOLATILITY AND GSV
Turnover Returns Volatility GSV
stocks t-Stats
P-
Value t-Stats
P-
Value t-Stats P-Value t-Stats
P-
Value
AICL -3.511 0.0119 -8.48368 0.0000 -4.41208 0.0010 -5.18484 0.0001
ABL -4.464 0.0008 -7.74367 0.0000 -3.91823 0.0040 -4.49484 0.0007
AKBL -3.049 0.0376 -8.15957 0.0000 -3.97912 0.0034 -3.20389 0.0260
ACPL -3.949 0.0036 -7.94602 0.0000 -4.85803 0.0003 -5.15953 0.0001
APL -2.931 0.0493 -8.20006 0.0000 -4.71654 0.0004 -5.00334 0.0001
ATRL -4.21 0.0017 -7.93353 0.0000 -4.78707 0.0003 -4.99829 0.0002
BOP -3.657 0.0082 -7.97323 0.0000 -3.64792 0.0085 -4.95558 0.0002
BAFL -3.696 0.0073 -8.18108 0.0000 -3.71785 0.0070 -4.93248 0.0002
BATA -17.99 0.0000 -4.28949 0.0014 -7.76625 0.0000 -5.37058 0.0000
CEPB -2.12 0.2362 -7.5355 0.0000 -8.6368 0.0000 -4.9633 0.0002
CHCC -2.92 0.0508 -7.8014 0.0000 -4.2062 0.0018 -4.0727 0.0025
FCCL -1.98 0.2925 -7.9395 0.0000 -3.4831 0.0130 -2.0359 0.2710
FABL -3.71 0.0070 -8.06507 0.0000 -4.49287 0.0008 -5.9405 0.0000
HBL -3.189 0.0269 -4.88883 0.0002 -8.29139 0.0000 -4.13218 0.0021
ICI -3.317 0.0196 -8.11935 0.0000 -8.2131 0.0000 -4.08704 0.0026
KOHC -0.14 0.9387 -8 0.0000 -3.4254 0.0151 -3.5877 0.0097
KTML -2.932 0.0493 -9.38139 0.0000 -8.19302 0.0000 -4.3063 0.0013
LUCK -3.008 0.0414 -8.43506 0.0000 -3.9005 0.0042 -5.58844 0.0000
MLCF -2.06 0.2615 -9.2486 0.0000 -3.4981 0.0125 -7.3265 0.0000
MCB -3.141 0.0302 -8.10795 0.0000 -4.73773 0.0004 -4.74675 0.0004
MEBL -7.95 0.0000 -7.7852 0.0000 -4.529 0.0007 -1.5062 0.5212
NBP -3.42 0.0153 -7.7677 0.0000 -8.2472 0.0000 -1.0688 0.7200
NRL -2.706 0.0806 -8.18252 0.0000 -4.42603 0.0010 -3.12138 0.0317
NESTLE -4.405 0.0009 -8.21907 0.0000 -4.61597 0.0005 -2.94451 0.0479
NETSOL -5.24 0.0001 -8.9676 0.0000 -4.5481 0.0007 -1.9751 0.2965
NCL -3.237 0.0239 -7.64976 0.0000 -8.32995 0.0000 -6.52849 0.0000
NPL -2.53 0.1150 -8.216 0.0000 -4.6531 0.0005 -6.5723 0.0000
OGDC -1.98 0.2925 -7.9395 0.0000 -3.4831 0.0130 -2.0359 0.2710
PSO 0.602588 0.9882 -7.9004 0.0000 -3.8913 0.0044 -1.8921 0.3331
PTC -3.82 0.0052 -7.8984 0.0000 -4.8859 0.0002 -2.3242 0.1689
PACE -4.916 0.0002 -7.31777 0.0000 -7.2529 0.0000 -2.92776 0.0497
PPL -3.705 0.0071 -8.86145 0.0000 -7.87531 0.0000 -1.79075 0.3805
PSEL 7.734881 1.0000 -7.7417 0.0000 -4.9929 0.0002 -1.2406 0.6491
PSMC -4.365 0.0011 -8.23041 0.0000 -7.95315 0.0000 -3.43871 0.0144
PAKT -3.092 0.0340 -3.54672 0.0111 -8.05154 0.0000 -3.75858 0.0061
SHEL -2.8 0.0658 -9.0505 0.0000 -5.1604 0.0001 -1.915 0.3228
SHFA -6.27 0.0000 -8.0231 0.0000 -5.1514 0.0001 -2.4058 0.1458
SIEM 1.696488 0.9995 -7.6456 0.0000 -8.6044 0.0000 -3.0061 0.0416
SCBPL -5.14 0.0001 -8.5033 0.0000 -4.6503 0.0005 -1.207 0.6639
SNGP -1.3 0.6227 -7.8534 0.0000 -4.7179 0.0004 -3.9811 0.0033
TRG -3.58 0.0099 -7.6064 0.0000 -4.315 0.0013 -0.9018 0.7768
UBL -3.71 0.0070 -4.94033 0.0002 -8.12874 0.0000 -4.70634 0.0004
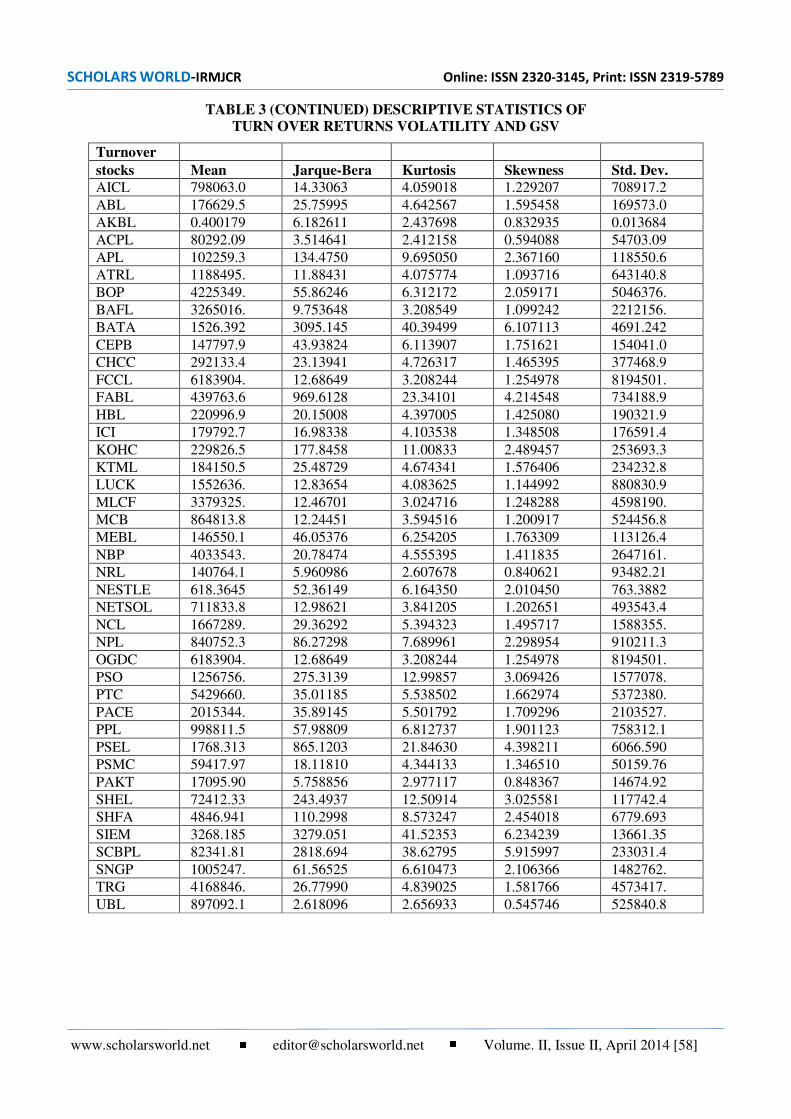
SCHOLARS WORLD-IRMJCR Online: ISSN 2320-3145, Print: ISSN 2319-5789
www.scholarsworld.net [email protected] Volume. II, Issue II, April 2014 [58]
TABLE 3 (CONTINUED) DESCRIPTIVE STATISTICS OF
TURN OVER RETURNS VOLATILITY AND GSV
Turnover
stocks Mean Jarque-Bera Kurtosis Skewness Std. Dev.
AICL 798063.0 14.33063 4.059018 1.229207 708917.2
ABL 176629.5 25.75995 4.642567 1.595458 169573.0
AKBL 0.400179 6.182611 2.437698 0.832935 0.013684
ACPL 80292.09 3.514641 2.412158 0.594088 54703.09
APL 102259.3 134.4750 9.695050 2.367160 118550.6
ATRL 1188495. 11.88431 4.075774 1.093716 643140.8
BOP 4225349. 55.86246 6.312172 2.059171 5046376.
BAFL 3265016. 9.753648 3.208549 1.099242 2212156.
BATA 1526.392 3095.145 40.39499 6.107113 4691.242
CEPB 147797.9 43.93824 6.113907 1.751621 154041.0
CHCC 292133.4 23.13941 4.726317 1.465395 377468.9
FCCL 6183904. 12.68649 3.208244 1.254978 8194501.
FABL 439763.6 969.6128 23.34101 4.214548 734188.9
HBL 220996.9 20.15008 4.397005 1.425080 190321.9
ICI 179792.7 16.98338 4.103538 1.348508 176591.4
KOHC 229826.5 177.8458 11.00833 2.489457 253693.3
KTML 184150.5 25.48729 4.674341 1.576406 234232.8
LUCK 1552636. 12.83654 4.083625 1.144992 880830.9
MLCF 3379325. 12.46701 3.024716 1.248288 4598190.
MCB 864813.8 12.24451 3.594516 1.200917 524456.8
MEBL 146550.1 46.05376 6.254205 1.763309 113126.4
NBP 4033543. 20.78474 4.555395 1.411835 2647161.
NRL 140764.1 5.960986 2.607678 0.840621 93482.21
NESTLE 618.3645 52.36149 6.164350 2.010450 763.3882
NETSOL 711833.8 12.98621 3.841205 1.202651 493543.4
NCL 1667289. 29.36292 5.394323 1.495717 1588355.
NPL 840752.3 86.27298 7.689961 2.298954 910211.3
OGDC 6183904. 12.68649 3.208244 1.254978 8194501.
PSO 1256756. 275.3139 12.99857 3.069426 1577078.
PTC 5429660. 35.01185 5.538502 1.662974 5372380.
PACE 2015344. 35.89145 5.501792 1.709296 2103527.
PPL 998811.5 57.98809 6.812737 1.901123 758312.1
PSEL 1768.313 865.1203 21.84630 4.398211 6066.590
PSMC 59417.97 18.11810 4.344133 1.346510 50159.76
PAKT 17095.90 5.758856 2.977117 0.848367 14674.92
SHEL 72412.33 243.4937 12.50914 3.025581 117742.4
SHFA 4846.941 110.2998 8.573247 2.454018 6779.693
SIEM 3268.185 3279.051 41.52353 6.234239 13661.35
SCBPL 82341.81 2818.694 38.62795 5.915997 233031.4
SNGP 1005247. 61.56525 6.610473 2.106366 1482762.
TRG 4168846. 26.77990 4.839025 1.581766 4573417.
UBL 897092.1 2.618096 2.656933 0.545746 525840.8
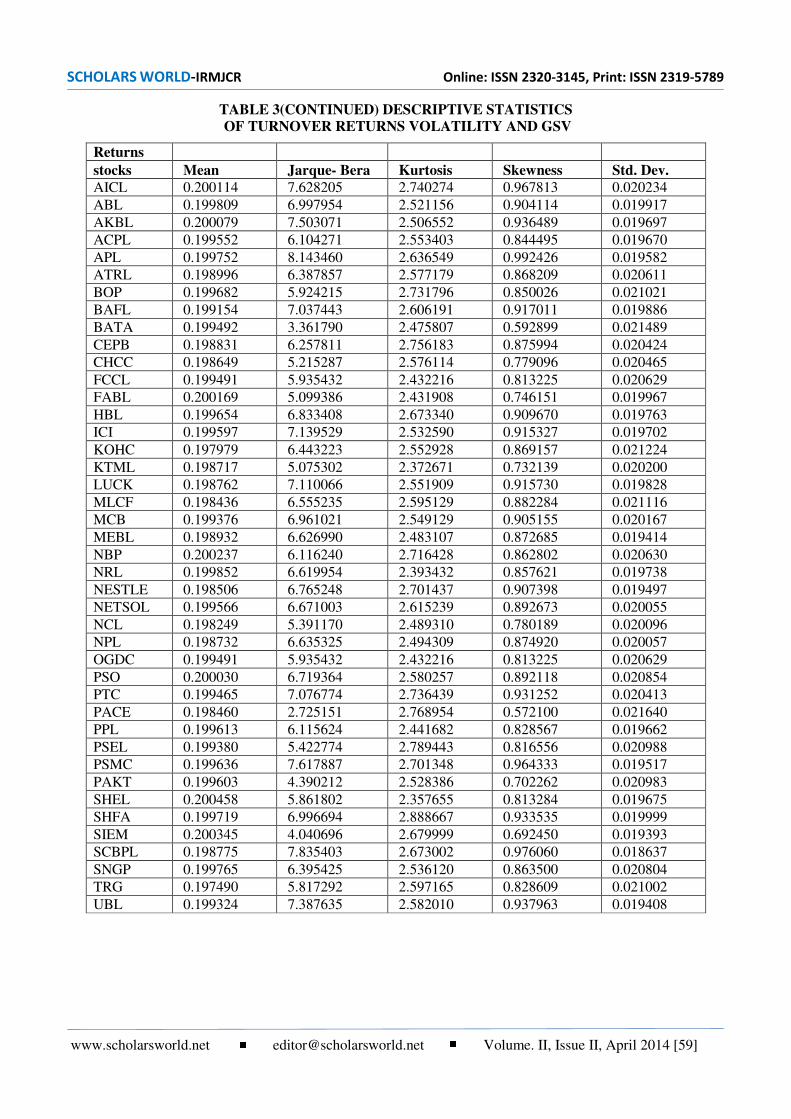
SCHOLARS WORLD-IRMJCR Online: ISSN 2320-3145, Print: ISSN 2319-5789
www.scholarsworld.net [email protected] Volume. II, Issue II, April 2014 [59]
TABLE 3(CONTINUED) DESCRIPTIVE STATISTICS
OF TURNOVER RETURNS VOLATILITY AND GSV
Returns
stocks Mean Jarque- Bera Kurtosis Skewness Std. Dev.
AICL 0.200114 7.628205 2.740274 0.967813 0.020234
ABL 0.199809 6.997954 2.521156 0.904114 0.019917
AKBL 0.200079 7.503071 2.506552 0.936489 0.019697
ACPL 0.199552 6.104271 2.553403 0.844495 0.019670
APL 0.199752 8.143460 2.636549 0.992426 0.019582
ATRL 0.198996 6.387857 2.577179 0.868209 0.020611
BOP 0.199682 5.924215 2.731796 0.850026 0.021021
BAFL 0.199154 7.037443 2.606191 0.917011 0.019886
BATA 0.199492 3.361790 2.475807 0.592899 0.021489
CEPB 0.198831 6.257811 2.756183 0.875994 0.020424
CHCC 0.198649 5.215287 2.576114 0.779096 0.020465
FCCL 0.199491 5.935432 2.432216 0.813225 0.020629
FABL 0.200169 5.099386 2.431908 0.746151 0.019967
HBL 0.199654 6.833408 2.673340 0.909670 0.019763
ICI 0.199597 7.139529 2.532590 0.915327 0.019702
KOHC 0.197979 6.443223 2.552928 0.869157 0.021224
KTML 0.198717 5.075302 2.372671 0.732139 0.020200
LUCK 0.198762 7.110066 2.551909 0.915730 0.019828
MLCF 0.198436 6.555235 2.595129 0.882284 0.021116
MCB 0.199376 6.961021 2.549129 0.905155 0.020167
MEBL 0.198932 6.626990 2.483107 0.872685 0.019414
NBP 0.200237 6.116240 2.716428 0.862802 0.020630
NRL 0.199852 6.619954 2.393432 0.857621 0.019738
NESTLE 0.198506 6.765248 2.701437 0.907398 0.019497
NETSOL 0.199566 6.671003 2.615239 0.892673 0.020055
NCL 0.198249 5.391170 2.489310 0.780189 0.020096
NPL 0.198732 6.635325 2.494309 0.874920 0.020057
OGDC 0.199491 5.935432 2.432216 0.813225 0.020629
PSO 0.200030 6.719364 2.580257 0.892118 0.020854
PTC 0.199465 7.076774 2.736439 0.931252 0.020413
PACE 0.198460 2.725151 2.768954 0.572100 0.021640
PPL 0.199613 6.115624 2.441682 0.828567 0.019662
PSEL 0.199380 5.422774 2.789443 0.816556 0.020988
PSMC 0.199636 7.617887 2.701348 0.964333 0.019517
PAKT 0.199603 4.390212 2.528386 0.702262 0.020983
SHEL 0.200458 5.861802 2.357655 0.813284 0.019675
SHFA 0.199719 6.996694 2.888667 0.933535 0.019999
SIEM 0.200345 4.040696 2.679999 0.692450 0.019393
SCBPL 0.198775 7.835403 2.673002 0.976060 0.018637
SNGP 0.199765 6.395425 2.536120 0.863500 0.020804
TRG 0.197490 5.817292 2.597165 0.828609 0.021002
UBL 0.199324 7.387635 2.582010 0.937963 0.019408
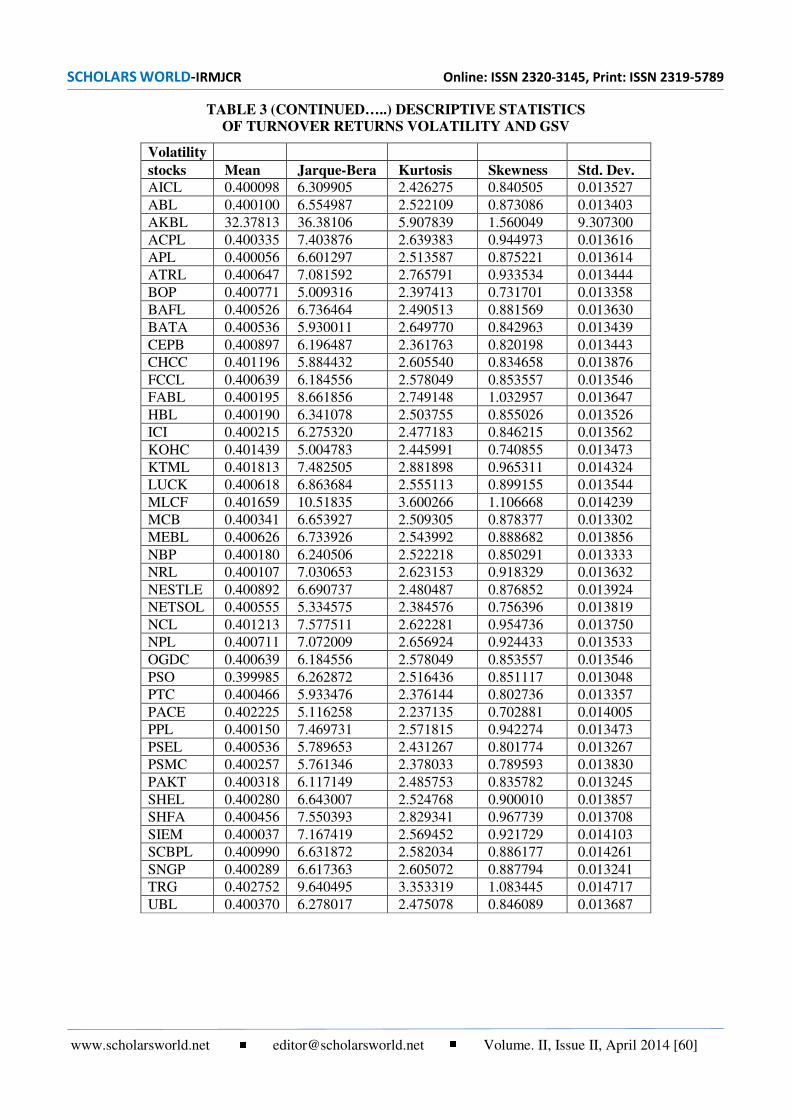
SCHOLARS WORLD-IRMJCR Online: ISSN 2320-3145, Print: ISSN 2319-5789
www.scholarsworld.net [email protected] Volume. II, Issue II, April 2014 [60]
TABLE 3 (CONTINUED…..) DESCRIPTIVE STATISTICS
OF TURNOVER RETURNS VOLATILITY AND GSV
Volatility
stocks Mean Jarque-Bera Kurtosis Skewness Std. Dev.
AICL 0.400098 6.309905 2.426275 0.840505 0.013527
ABL 0.400100 6.554987 2.522109 0.873086 0.013403
AKBL 32.37813 36.38106 5.907839 1.560049 9.307300
ACPL 0.400335 7.403876 2.639383 0.944973 0.013616
APL 0.400056 6.601297 2.513587 0.875221 0.013614
ATRL 0.400647 7.081592 2.765791 0.933534 0.013444
BOP 0.400771 5.009316 2.397413 0.731701 0.013358
BAFL 0.400526 6.736464 2.490513 0.881569 0.013630
BATA 0.400536 5.930011 2.649770 0.842963 0.013439
CEPB 0.400897 6.196487 2.361763 0.820198 0.013443
CHCC 0.401196 5.884432 2.605540 0.834658 0.013876
FCCL 0.400639 6.184556 2.578049 0.853557 0.013546
FABL 0.400195 8.661856 2.749148 1.032957 0.013647
HBL 0.400190 6.341078 2.503755 0.855026 0.013526
ICI 0.400215 6.275320 2.477183 0.846215 0.013562
KOHC 0.401439 5.004783 2.445991 0.740855 0.013473
KTML 0.401813 7.482505 2.881898 0.965311 0.014324
LUCK 0.400618 6.863684 2.555113 0.899155 0.013544
MLCF 0.401659 10.51835 3.600266 1.106668 0.014239
MCB 0.400341 6.653927 2.509305 0.878377 0.013302
MEBL 0.400626 6.733926 2.543992 0.888682 0.013856
NBP 0.400180 6.240506 2.522218 0.850291 0.013333
NRL 0.400107 7.030653 2.623153 0.918329 0.013632
NESTLE 0.400892 6.690737 2.480487 0.876852 0.013924
NETSOL 0.400555 5.334575 2.384576 0.756396 0.013819
NCL 0.401213 7.577511 2.622281 0.954736 0.013750
NPL 0.400711 7.072009 2.656924 0.924433 0.013533
OGDC 0.400639 6.184556 2.578049 0.853557 0.013546
PSO 0.399985 6.262872 2.516436 0.851117 0.013048
PTC 0.400466 5.933476 2.376144 0.802736 0.013357
PACE 0.402225 5.116258 2.237135 0.702881 0.014005
PPL 0.400150 7.469731 2.571815 0.942274 0.013473
PSEL 0.400536 5.789653 2.431267 0.801774 0.013267
PSMC 0.400257 5.761346 2.378033 0.789593 0.013830
PAKT 0.400318 6.117149 2.485753 0.835782 0.013245
SHEL 0.400280 6.643007 2.524768 0.900010 0.013857
SHFA 0.400456 7.550393 2.829341 0.967739 0.013708
SIEM 0.400037 7.167419 2.569452 0.921729 0.014103
SCBPL 0.400990 6.631872 2.582034 0.886177 0.014261
SNGP 0.400289 6.617363 2.605072 0.887794 0.013241
TRG 0.402752 9.640495 3.353319 1.083445 0.014717
UBL 0.400370 6.278017 2.475078 0.846089 0.013687
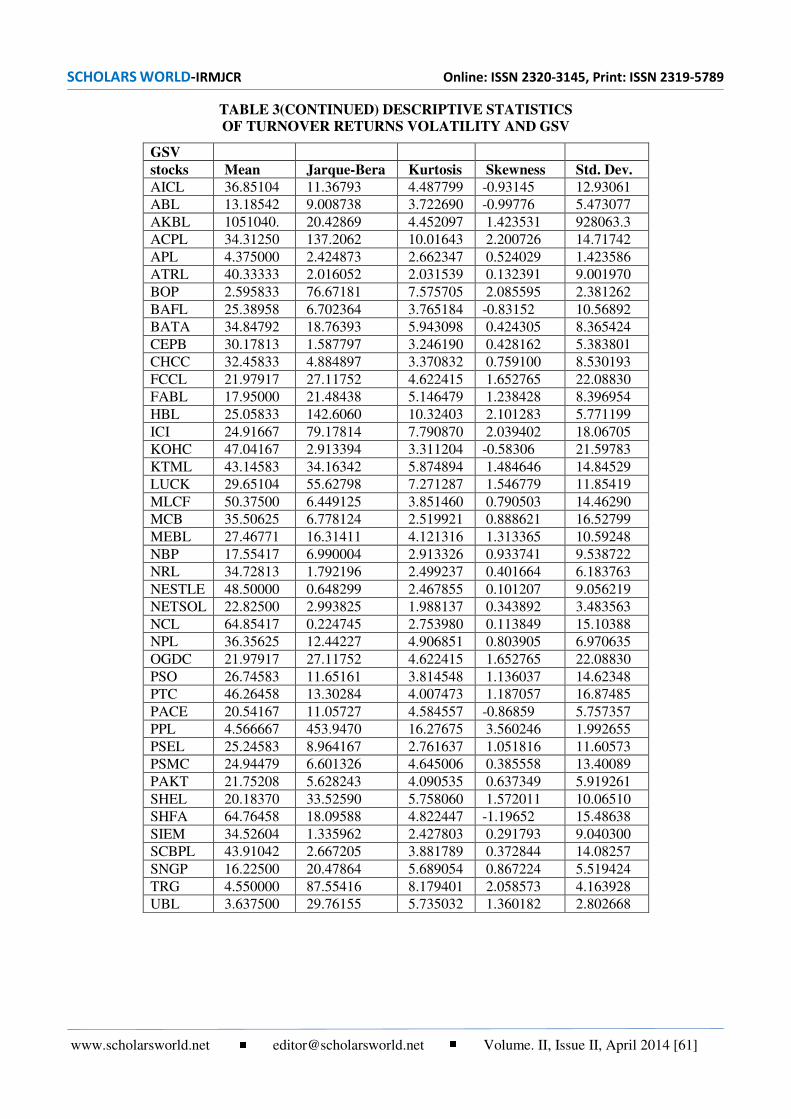
SCHOLARS WORLD-IRMJCR Online: ISSN 2320-3145, Print: ISSN 2319-5789
www.scholarsworld.net [email protected] Volume. II, Issue II, April 2014 [61]
TABLE 3(CONTINUED) DESCRIPTIVE STATISTICS
OF TURNOVER RETURNS VOLATILITY AND GSV
GSV
stocks Mean Jarque-Bera Kurtosis Skewness Std. Dev.
AICL 36.85104 11.36793 4.487799 -0.93145 12.93061
ABL 13.18542 9.008738 3.722690 -0.99776 5.473077
AKBL 1051040. 20.42869 4.452097 1.423531 928063.3
ACPL 34.31250 137.2062 10.01643 2.200726 14.71742
APL 4.375000 2.424873 2.662347 0.524029 1.423586
ATRL 40.33333 2.016052 2.031539 0.132391 9.001970
BOP 2.595833 76.67181 7.575705 2.085595 2.381262
BAFL 25.38958 6.702364 3.765184 -0.83152 10.56892
BATA 34.84792 18.76393 5.943098 0.424305 8.365424
CEPB 30.17813 1.587797 3.246190 0.428162 5.383801
CHCC 32.45833 4.884897 3.370832 0.759100 8.530193
FCCL 21.97917 27.11752 4.622415 1.652765 22.08830
FABL 17.95000 21.48438 5.146479 1.238428 8.396954
HBL 25.05833 142.6060 10.32403 2.101283 5.771199
ICI 24.91667 79.17814 7.790870 2.039402 18.06705
KOHC 47.04167 2.913394 3.311204 -0.58306 21.59783
KTML 43.14583 34.16342 5.874894 1.484646 14.84529
LUCK 29.65104 55.62798 7.271287 1.546779 11.85419
MLCF 50.37500 6.449125 3.851460 0.790503 14.46290
MCB 35.50625 6.778124 2.519921 0.888621 16.52799
MEBL 27.46771 16.31411 4.121316 1.313365 10.59248
NBP 17.55417 6.990004 2.913326 0.933741 9.538722
NRL 34.72813 1.792196 2.499237 0.401664 6.183763
NESTLE 48.50000 0.648299 2.467855 0.101207 9.056219
NETSOL 22.82500 2.993825 1.988137 0.343892 3.483563
NCL 64.85417 0.224745 2.753980 0.113849 15.10388
NPL 36.35625 12.44227 4.906851 0.803905 6.970635
OGDC 21.97917 27.11752 4.622415 1.652765 22.08830
PSO 26.74583 11.65161 3.814548 1.136037 14.62348
PTC 46.26458 13.30284 4.007473 1.187057 16.87485
PACE 20.54167 11.05727 4.584557 -0.86859 5.757357
PPL 4.566667 453.9470 16.27675 3.560246 1.992655
PSEL 25.24583 8.964167 2.761637 1.051816 11.60573
PSMC 24.94479 6.601326 4.645006 0.385558 13.40089
PAKT 21.75208 5.628243 4.090535 0.637349 5.919261
SHEL 20.18370 33.52590 5.758060 1.572011 10.06510
SHFA 64.76458 18.09588 4.822447 -1.19652 15.48638
SIEM 34.52604 1.335962 2.427803 0.291793 9.040300
SCBPL 43.91042 2.667205 3.881789 0.372844 14.08257
SNGP 16.22500 20.47864 5.689054 0.867224 5.519424
TRG 4.550000 87.55416 8.179401 2.058573 4.163928
UBL 3.637500 29.76155 5.735032 1.360182 2.802668

SCHOLARS WORLD-IRMJCR Online: ISSN 2320-3145, Print: ISSN 2319-5789
www.scholarsworld.net [email protected] Volume. II, Issue II, April 2014 [62]
TABLE 4 LEAST SQUARE REGRESSIONS ON TURNOVER, RETURNS VOLATILITY AND GSV
Turnover Returns
stocks
Co-
efficient
Std.
Error
t-
Statistic Prob.
Co
efficient
Std.
Error
t-
Statistic Prob.
AICL -11575.3 7901.242 -1.46499 0.1497 5.93E-05 0.000231 0.257391 0.798
ABL -13672.7 4099.338 -3.33535 0.0017*** 0.00022 0.000536 0.411152 0.6829
AKBL 18617.73 14443.41 1.289012 0.2038 0.000135 0.000311 0.432633 0.6673
ACPL 967.1147 529.1501 1.827676 0.0741* -5.8E-05 0.000197 -0.29218 0.7715
APL 11610 12158.47 0.95489 0.3446 0.001525 0.002016 0.756377 0.4533
ATRL 8370.735 10461.36 0.800158 0.4277 -0.00034 0.000334 -1.00527 0.32
BOP -196722 311110.2 -0.63232 0.5303 0.001868 0.001272 1.468254 0.1488
BAFL -1.5E-05 0.000277 -0.05261 0.9583 -1.5E-05 0.000277 -0.05261 0.9583
BATA -180.037 78.30704 -2.29911 0.0261** -0.00071 0.000364 -1.95713 0.0564*
CEPB 5101.7 1417.1 3.6 0.001*** -0.00049 0.000555 -0.88308 0.3818
CHCC 8331.7 4316.8 1.9301 0.06 0.000464 0.000347 1.338283 0.1874
FCCL 83666.4 133637.7 0.62607 0.534 0.005925 0.003567 1.6611 0.104
FABL -9696.2 12812.09 -0.7568 0.453 0.000445 0.000344 1.292561 0.2026
HBL -1415.87 4857.841 -0.29146 0.772 8.16E-05 0.000505 0.161679 0.8723
ICI 3692.251 1334.351 2.767075 0.0081*** 1.62E-06 0.000161 0.010079 0.992
KOHC 4733.6 1035.8 4.5699 0*** 5.74E-05 0.000145 0.397187 0.6931
KTML -6.4E-05 0.0002 -0.31824 0.7517 -1047.37 2321.247 -0.45121 0.654
LUCK 12542.34 10798.54 1.161484 0.2514 -1.3E-05 0.000247 -0.05147 0.9592
MLCF 59464 51490.1 1.1549 0.254 -0.00026 0.000212 -1.22613 0.2264
MCB 18157 3836.912 4.732192 0*** 0.000102 0.000179 0.568786 0.5723
MEBL 7296.3 12000.5 0.608 0.546 0.006053 0.002358 2.5665 0.014*
NBP 149538.7 60982.9 2.4521 0.018** 0.005405 0.009985 0.54129 0.591
NRL -390.525 2228.19 -0.17527 0.8616 -0.00025 0.000469 -0.53254 0.5969
NESTLE -3.56318 12.41742 -0.28695 0.7754 0.000288 0.000315 0.914697 0.3651
NETSOL 27850.3 2886.2 9.6496 0*** 0.007798 0.001595 4.8898 0***
NCL 22531.7 15145.23 1.48771 0.1437 8.38E-05 0.000196 0.428194 0.6705
NPL 24714.7 9071.6 2.7244 0.009*** -9.2E-05 0.000424 -0.21649 0.8296
OGDC 19442.6 8177 2.3777 0.022 0.005272 0.000815 6.4687 0***
PSO 46329.8 41542 1.1153 0.271 0.00492 0.003808 1.2921 0.203
PTC -49.5399 120.5612 -0.41091 0.683 0.003971 0.000717 5.5417 0***
PACE 6080.984 53862.43 0.112898 0.9106 -0.00025 0.000553 -0.44981 0.655
PPL -88659.8 54565.58 -1.62483 0.111 -0.00098 0.001448 -0.67811 0.5011
PSEL -49.5399 120.5612 -0.41091 0.683 0.006197 0.002525 2.4544 0.018**
PSMC 913.6336 535.1849 1.707136 0.0945* 0.000315 0.00021 1.504234 0.1394
PAKT -87.4755 365.3076 -0.23946 0.8118 -5.4E-05 0.000523 -0.10287 0.9185
SHEL 3001.9 2325.9 1.2906 0.204 -9.4E-05 0.000168 -0.55576 0.5811
SHFA 74.4628 11.5945 6.4222 0*** 0.002932 0.000232 12.6265 0***
SIEM 72.775 55.1685 1.3191 0.194 0.000289 0.000313 0.921657 0.3615
SCBPL 52723.7 26606.6 1.9816 0.054* 0.004063 0.000806 5.0403 0***
SNGP 1077.5 1000 1.0774 0.287 -0.0002 0.000555 -0.36696 0.7153
TRG 420759.8 416898.9 1.0093 0.318 0.024499 0.02134 1.1481 0.257
UBL -35524.2 27162.9 -1.30782 0.1974 0.000505 0.001018 0.496258 0.6221
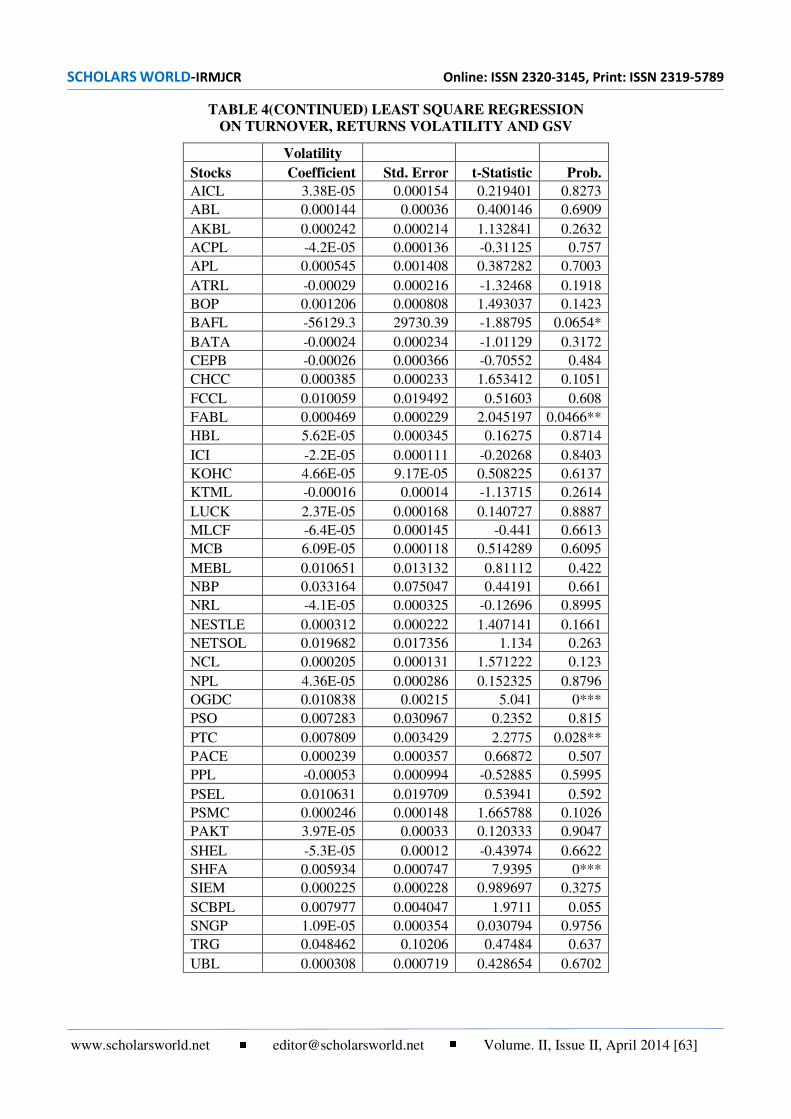
SCHOLARS WORLD-IRMJCR Online: ISSN 2320-3145, Print: ISSN 2319-5789
www.scholarsworld.net [email protected] Volume. II, Issue II, April 2014 [63]
TABLE 4(CONTINUED) LEAST SQUARE REGRESSION
ON TURNOVER, RETURNS VOLATILITY AND GSV
Volatility
Stocks Coefficient Std. Error t-Statistic Prob.
AICL 3.38E-05 0.000154 0.219401 0.8273
ABL 0.000144 0.00036 0.400146 0.6909
AKBL 0.000242 0.000214 1.132841 0.2632
ACPL -4.2E-05 0.000136 -0.31125 0.757
APL 0.000545 0.001408 0.387282 0.7003
ATRL -0.00029 0.000216 -1.32468 0.1918
BOP 0.001206 0.000808 1.493037 0.1423
BAFL -56129.3 29730.39 -1.88795 0.0654*
BATA -0.00024 0.000234 -1.01129 0.3172
CEPB -0.00026 0.000366 -0.70552 0.484
CHCC 0.000385 0.000233 1.653412 0.1051
FCCL 0.010059 0.019492 0.51603 0.608
FABL 0.000469 0.000229 2.045197 0.0466**
HBL 5.62E-05 0.000345 0.16275 0.8714
ICI -2.2E-05 0.000111 -0.20268 0.8403
KOHC 4.66E-05 9.17E-05 0.508225 0.6137
KTML -0.00016 0.00014 -1.13715 0.2614
LUCK 2.37E-05 0.000168 0.140727 0.8887
MLCF -6.4E-05 0.000145 -0.441 0.6613
MCB 6.09E-05 0.000118 0.514289 0.6095
MEBL 0.010651 0.013132 0.81112 0.422
NBP 0.033164 0.075047 0.44191 0.661
NRL -4.1E-05 0.000325 -0.12696 0.8995
NESTLE 0.000312 0.000222 1.407141 0.1661
NETSOL 0.019682 0.017356 1.134 0.263
NCL 0.000205 0.000131 1.571222 0.123
NPL 4.36E-05 0.000286 0.152325 0.8796
OGDC 0.010838 0.00215 5.041 0***
PSO 0.007283 0.030967 0.2352 0.815
PTC 0.007809 0.003429 2.2775 0.028**
PACE 0.000239 0.000357 0.66872 0.507
PPL -0.00053 0.000994 -0.52885 0.5995
PSEL 0.010631 0.019709 0.53941 0.592
PSMC 0.000246 0.000148 1.665788 0.1026
PAKT 3.97E-05 0.00033 0.120333 0.9047
SHEL -5.3E-05 0.00012 -0.43974 0.6622
SHFA 0.005934 0.000747 7.9395 0***
SIEM 0.000225 0.000228 0.989697 0.3275
SCBPL 0.007977 0.004047 1.9711 0.055
SNGP 1.09E-05 0.000354 0.030794 0.9756
TRG 0.048462 0.10206 0.47484 0.637
UBL 0.000308 0.000719 0.428654 0.6702

SCHOLARS WORLD-IRMJCR Online: ISSN 2320-3145, Print: ISSN 2319-5789
www.scholarsworld.net [email protected] Volume. II, Issue II, April 2014 [64]
REFERENCES:
1. Andrei, Daniel and Michael Hasler. "Investor's Attention and Stock Market Volatility." Available at
SSRN 1761421 (2011).
2. Aouadi, Amal, Mohamed Arouri and Fr\'ed\'eric Teulon. "Investor attention and stock market
activity: Evidence from France." Economic Modelling 35 (2013): 674-681.
3. Ascioglu, A, Carole Comerton-Forde and Thomas H McInish. "Price clustering on the Tokyo stock
exchange." Financial Review 42.2 (2007): 289-301.
4. Bank, Matthias, Martin Larch and Georg Peter. "Google search volume and its influence on liquidity and
returns of German stocks." Financial markets and portfolio management 25.3 (2011): 239-264.
5. Barber, Brad M and Terrance Odean. "All that glitters: The effect of attention and news on the buying
behavior of individual and institutional investors." Review of Financial Studies 21 (2008): 785-818.
6. Barber, Brad, Terrance Odean and Ning Zhu. "Do noise traders move markets?" EFA 2006 Zurich Meetings Paper (2006).
7. Barnea, Amir and Dennis E Logue. "The effect of risk on the market maker's spread." Financial Analysts
Journal (1975): 45-49.
8. Chae, Joon. "Trading volume, information asymmetry, and timing information." The Journal of Finance 60.1 (2005): 413-442.
9. Chemmanur, Thomas and An Yan. "Product market advertising and new equity issues." Journal of
Financial Economics 92 (2009): 40-65.
10. Da, Zhi, Joseph Engelberg and pengjie Gao. "In Search of Attention." The Journal of Finance Volume 66
Issue 5 (2011): 1461–1499.
11. Da, Zhi, Joseph Engelberg and Pengjie Gao. "The sum of all fears: investor sentiment and asset prices." SSRN
eLibrary (2010)."The sum of all fears: Investor sentiment, noise trading and aggregate volatility." (2009).
12. DellaVigna, Stefano and Joshua M Pollet. "Investor inattention and Friday earnings announcements." The
Journal of Finance 64 (2009): 709-749.
13. Dimpfl, Thomas and Stephan Jank. "Can internet search queries help to predict stock market volatility?"
CFR working paper (2011).
14. Ding, Rong and Wenxuan Hou. "Retail investor attention and stock liquidity." Available at SSRN 1786762 (2011).
15. Drake, Michael, et al. "The Mechanisms of Information Transfer." Available at SSRN 2157727 (2012).
16. Fang, Lily and Joel Peress. "Media Coverage and the Cross-section of Stock Returns." The Journal of
Finance 64 (2009): 2023-2052.
17. Fehle, Frank, Sergey Tsyplakov and Vladimir Zdorovtsov. "Can companies influence investor behaviour through
advertising? Super bowl commercials and stock returns." European Financial Management 11 (2005): 625-647.
18. Fong, Kingsley, Craig Holden and Charles Trzcinka. "What are the best liquidity proxies for global
research?" Available at SSRN 1558447 (2011).
19. Gavrailov, AH. "Investor Attention, Momentum, and the World Financial Crisis." (2013).
20. Grullon, Gustavo, George Kanatas and James P Weston. "Advertising, breadth of ownership, and
liquidity." Review of Financial Studies 17.2 (2004): 439-461.
21. Hou, Kewei, Wei Xiong and Lin Peng. "A tale of two anomalies: The implications of investor attention
for price and earnings momentum." Available at SSRN 976394 (2009).
22. Huberman, Gur and Tomer Regev. "Contagious speculation and a cure for cancer: A nonevent that made
stock prices soar." The Journal of Finance 56 (2001): 387-396.
23. Kaheman, Daniel. "Attention and Effort." PRENTICE-HALL INC., Englewood Cliffs, New Jersey (1973).
24. Kita, Arben and Qingwei Wang. "Investor attention and FX market volatility." Bangor Business School 3 (2012): 33.
25. Lou, Dong. "Attracting investor attention through advertising." Financial Markets Group (2009).
26. Merton, Robert C. "A simple model of capital market equilibrium with incomplete information." The
Journal of Finance 42.3 (1987): 483-510.
27. Mondria, Jordi, Thomas Wu and Yi Zhang. "The determinants of international investment and attention
allocation: Using internet search query data." Journal of International Economics 82.1 (2010): 85--95.
28. Peng, Lin, Wei Xiong and Tim Bollerslev. "Investor Attention and Time-varying Comovements."
European Financial Management (2007): 394–422.
29. Tetlock, Paul C. "Does public financial news resolve asymmetric information?" Review of Financial Studies 23.9 (2010).
30. Vlastakis, Nikolaos and Raphael N Markellos. "Information demand and stock market volatility." Journal
of Banking \& Finance 36.6 (2012): 1808-1821.
31. Yuan, Yu. "Attention and trading." Unpublished Working Paper. University of Pennsylvania (2008).
----

SCHOLARS WORLD-IRMJCR Online: ISSN 2320-3145, Print: ISSN 2319-5789
www.scholarsworld.net [email protected] Volume. II, Issue II, April 2014 [65]
STUDENT INTEREST IN CHEMISTRY FROM UPPER
PRIMARY TO HIGHER SECONDARY SCHOOLS IN KERALA
DR. K. ABDUL GAFOOR,
Associate Professor,
Department of Education,
University of Calicut, Kerala, India
SHILNA V,
Junior Research Fellow
Department of Education,
University of Calicut, Kerala, India
ABSTRACT
In view of the increasing significance of science in students’ life, this paper investigates interest
in chemistry topics among school students in Kerala and the differences there in by level of
schooling and gender. This study made use of secondary data from three cross sectional studies.
Interest in chemistry topics is highest at the upper primary stage, for both boys and girls. Post-
primary decline in interest, of both boys and girls, is sharper in chemistry, than in science in
general. At upper primary level, boys had higher interest in chemistry than girls; by higher
secondary level girls are significantly higher on it than boys. Students’ interest in chemistry falls
by ¼, from upper primary to high school. For boys, interest in chemistry falls by 1/3, from upper
primary to higher secondary school, while it is ¼ for girls. Thus, Student’s preference for
chemistry differs significantly with gender, with girls being better on it at the end of schooling.
The reason for lack of interest in chemistry is attributed to many factors. The use of modern
instructional strategies can develop interest among students and hence overcome this situation.
Keywords: Interest in Chemistry, Gender, Upper Primary, Secondary Student, Higher
Secondary, Chemistry Topics

SCHOLARS WORLD-IRMJCR Online: ISSN 2320-3145, Print: ISSN 2319-5789
www.scholarsworld.net [email protected] Volume. II, Issue II, April 2014 [66]
INTRODUCTION:
One of the most important aims of science education is to provide developments in affective domain for
students. Learning in the affective domain includes changing of individuals’ values, beliefs and attitudes. Many
science educators attribute great importance to the affective domain (Baker and Doran, 1975; Gardner, 1985,
1998; Oh and Yager, 2004; Schibeci, 1984; Sjoberg, 2002). Shulman and Tamir (1973) argued that the affective
outcomes of science instruction are at least as important as their cognitive counterparts. The affective domain is
characterized by a variety of constructs such as attitudes, preferences, and interests. Different researchers’
definitions of these constructs vary and consequently may be confusing.
NEED AND SIGNIFICANCE OF THE STUDY:
Students’ initial positive attitudes toward science subjects change markedly in the upper grades, especially in
chemistry and physics (Graber, 1993). Generally, a negative attitude towards a given subject leads to lack of
interest and, when subjects can be selected, as in senior high school, to avoiding the subject or course.
Furthermore, a positive attitude toward science “leads to a positive commitment to science that influences
lifelong interest and learning in science” (Simpson & Oliver, 1990, p. 14). Studies have identified a number of
factors affecting students’ attitudes towards science in general. These can be largely categorized as gender,
personality traits, structural variables, and curriculum variables. Of these, the most significant is gender. “Sex is
probably the most important variable related to pupils’ attitudes to science,” (Gardner1975, p. 22). Studies
(Francis & Greer, 1999; Jones et al., 2000; Menis, 1983; Sjoberg, 1983, 2000a, b; Weinburgh, 1995) have
reported that males have more positive attitudes toward science than females. Yet, there is no consensus in this
regard, as there are studies that found no statistically significant gender differences (Selim&Shrigley, 1983).
There is distinction in gender differences, between attitudes towards physical and biological sciences
(Ormerod& Duckworth, 1975).Gardner (1974), stated that there are “clear differences in the nature of ‘boys’
and ‘girls’ scientific interests, boys expressing relatively greater interest in physical science activities, while
girls are more interested in biological and social science topics” (p. 243). More recently, Osborne et al. (2003)
showed “that there is still a bias against physical sciences held by girls, suggesting that at an individual level the
overwhelming majority of girls still choose not to do physical science as soon as they can” (p. 1064).
Specifically, interest in physics is declining as students move from upper primary to secondary and higher
secondary levels, among girls than boys (Gafoor, 2013). However, gender difference in interest in chemistry
separately is not yet explored.
According to Gardner and Tamir (1989a), ‘interest’ refers to preference to engage in some types of activities
rather than others. An interest can be regarded as a highly specific type of attitude. When interested in a
particular phenomenon or activity, one is favorably inclined to attend and give time to it.The combination of
factors determining interest in science subjects varies from one student to another.For the question “is chemistry
really interesting?”, the answer is “yes” only to a limited number of chemists but not to the public. There are
many reasons for the lack of interest. This study deals with the students’ preferences towards chemistry in
relation to their interest in science.
OBJECTIVES OF THE STUDY:
This study investigates interest in chemistry topics among school students in Kerala and the differences there in
by level of schooling and gender. This study has the following specific objectives, viz,
1. To estimate the extent of interest in chemistry among upper primary, high school and higher secondary
school students of Kerala, and to contrast it against extent of interest in science of these students.
2. To depict the changes in extent of interest in chemistry as the students go from upper through high school
to higher secondary levels.
3. To reveal the extent of changes in interest in chemistry by gender and level of schooling.
SAMPLEL:
This study used three sets of data pertaining to upper primary, high school and higher secondary school students
were derived respectively from Gafoor and Smitha (2010), Gafoor and Jaithra (2011), and Deepak (2010)
collected by the sources for obtaining aggregate score of interest in science. All the three sources have used

SCHOLARS WORLD-IRMJCR Online: ISSN 2320-3145, Print: ISSN 2319-5789
www.scholarsworld.net [email protected] Volume. II, Issue II, April 2014 [67]
stratified random procedures for drawing their samples from Kozhikode revenue district of Kerala and gives
evidence of ensuring representativeness to the population of school students ( of their respective stage) in
Kerala. It is significant to note that higher secondary school students sampled are all science students, and hence
possibly represents students with highest science related interest in that stage.
TABLE 1 SIZE AND ATTRIBUTES OF THE SAMPLES USED AS SOURCE OF DATA FOR THIS STUDY
UPPER
PRIMARY
HIGH
SCHOOL
HIGHER
SECONDARY
Grade V VI VII VIII IX XII
Boys 216 229 208 272 231 353
Girls 243 279 286 259 238 422
Total 459 508 494 531 469 775
For this study, data was obtained from secondary sources. Sets of data pertaining to upper primary, high school
and higher secondary school students were derived respectively from Gafoor and Smitha (2010), Gafoor and
Jaithra (2011), and Deepak (2010) collected by the sources for obtaining aggregate score of interest in science
as the sum of preference scores on a large set of topics. These measures are used because they are more
valuable than the interest measures obtained from frequently used likert type interest scales. Further, these
measures are more realistic and present oriented as they are derived from the students preference for topics they
at their level of schooling are studying, rather than a desirable state, which the students wish to. There were 42,
30, and 20 chemistry topics in the original measures meant for interest in science among upper primary, high
school and higher secondary school students. The source data sets provided respondents’ preferences for the
respective topics on a 3-point likert scale. Scores on select topics were averaged, and then converted to a
derived score with range, 0 to 1.
PROCEDURE:
This study has done a four-step analysis of the data obtained on interest in chemistry.
1. The mean interest in chemistry of students was found out (by dividing the total interest score with number
of topics in the respective tools).
2. The mean score of interest in chemistry at each stage of schooling (for the total sample and gender-wise
samples) were plotted in a line graph to reveal the trend as the students move from lower to higher stages
of schooling; and interest in science of the respective samples is plotted as a reference point.
3. The trend line of the girls and boys were plotted together to reveal gender difference in chemistry interest
as students move from upper primary to higher secondary stage.
4. Doughnuts of interest in chemistry were prepared to demonstrate the percentage of decline in interest of
students as the move up from upper primary to higher secondary school.
RESULTS:
Extent of interest in chemistry of students at school: The scores on interest in chemistry, which can range between 0 and 1 were derived for students at the three
levels of schooling in total and by students’ gender (table2).
TABLE 2 DERIVED MEAN SCORE OF INTEREST IN CHEMISTRY AND INTEREST
IN SCIENCE AMONG STUDENTS AT THREE LEVELS OF SCHOOLING
Interest in Chemistry Interest in Science
UPa HS
b HSS
c UP* HS** HSS***
Total 0.74 0.57 0.52 0.76 0.61 0.57
Boys 0.76 0.56 0.5 0.77 0.61 0.57
Girls 0.73 0.58 0.54 0.76 0.61 0.58 *, ** ,& ***based on Gafoor and Smitha (2010), Gafoor and Jaithra (2011), and Deepak (2010)respectively
a, b, c denotes SD=0.18, SD=0.21, and SD=0.20 respectively
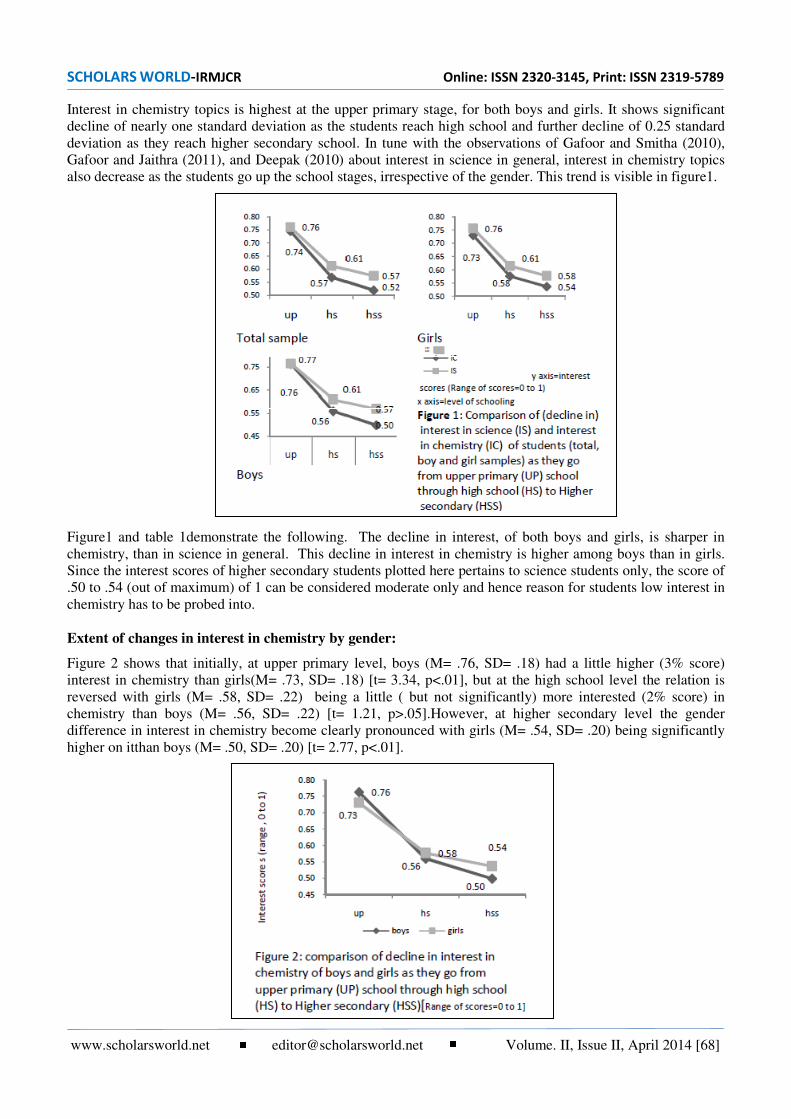
SCHOLARS WORLD-IRMJCR Online: ISSN 2320-3145, Print: ISSN 2319-5789
www.scholarsworld.net [email protected] Volume. II, Issue II, April 2014 [68]
Interest in chemistry topics is highest at the upper primary stage, for both boys and girls. It shows significant
decline of nearly one standard deviation as the students reach high school and further decline of 0.25 standard
deviation as they reach higher secondary school. In tune with the observations of Gafoor and Smitha (2010),
Gafoor and Jaithra (2011), and Deepak (2010) about interest in science in general, interest in chemistry topics
also decrease as the students go up the school stages, irrespective of the gender. This trend is visible in figure1.
Figure1 and table 1demonstrate the following. The decline in interest, of both boys and girls, is sharper in
chemistry, than in science in general. This decline in interest in chemistry is higher among boys than in girls.
Since the interest scores of higher secondary students plotted here pertains to science students only, the score of
.50 to .54 (out of maximum) of 1 can be considered moderate only and hence reason for students low interest in
chemistry has to be probed into.
Extent of changes in interest in chemistry by gender:
Figure 2 shows that initially, at upper primary level, boys (M= .76, SD= .18) had a little higher (3% score)
interest in chemistry than girls(M= .73, SD= .18) [t= 3.34, p<.01], but at the high school level the relation is
reversed with girls (M= .58, SD= .22) being a little ( but not significantly) more interested (2% score) in
chemistry than boys (M= .56, SD= .22) [t= 1.21, p>.05].However, at higher secondary level the gender
difference in interest in chemistry become clearly pronounced with girls (M= .54, SD= .20) being significantly
higher on itthan boys (M= .50, SD= .20) [t= 2.77, p<.01].

SCHOLARS WORLD-IRMJCR Online: ISSN 2320-3145, Print: ISSN 2319-5789
www.scholarsworld.net [email protected] Volume. II, Issue II, April 2014 [69]
Extent of changes in interest in chemistry by students’ level of schooling:
In order to quantify the extent of decline in interest in chemistry by the level of school, the interest in chemistry
of the students at upper primary level were considered maximum (100%) and the interest scores of the latter
stages were proportionally amplified by multiplying them also with the same ratio. Then, the percentage decline
in interest in chemistry by high school and higher secondary school were computed by subtracting the letter
values from 100. Figure 3 shows the decline of interest in chemistry of the samples.
Figure 3 shows that in percentage terms, in total sample, there is 24% decline in interest in chemistry of high
school students, in comparison to the interest in chemistry of upper primary school students. Higher secondary
school students’ interest in chemistry is 7% further lower than that of high school students (31% less than the
interest in chemistry of upper primary students). In higher secondary boy samples, thus, there is 35% less
interest in chemistry than what the boys at upper primary level have; of this 27% of interest is lost by high
school stage, and 8% interest is lost by the higher secondary stage. In comparison to this, decline in interest in
chemistry of girls is lesser; there is 26% less interest in chemistry than what the girls at upper primary level
have; a reduction of 21% by high school stage and a further 5% interest is lost by the higher secondary stage.
CONCLUSION:
As students move from upper-primary classes to high school and then to higher secondary classes the interest
towards chemistry is declining. Some kids practice for hours in their spare time creating arts, playing
instruments, or perfecting their skills in sports simply because they are interested in those practices. Thus,
chemistry instructors may also improve students’ learning by inspiring students’ interest. Chemistry teachers
must make much effort to create an ideal environment for teaching and learning by employing different
teaching techniques. The use of innovative instructional strategies including technological tools in the
classroom may reduce the dislike of students towards chemistry.
According to Keeves and Morgenstern, (1992), students’ anxiety towards the learning of chemistry makes them
to lose interest in the sciences. Major challenge in chemistry education is the gap between the high demands
that learning requires and the low efforts that students make partially due to cognitive load. Chemistry contains
abundant amount of abstract concepts, which necessitates significant time and effort commitments from the
students. The contrast between low inputs and high demands results in unsatisfactory performance on the
students' side and frustration on the instructors' side. Learning is actually an interaction between the existing
knowledge and new knowledge. The use of appropriate teaching strategies can relate the novel abstract
chemistry concepts with the concrete existing chemistry knowledge. Thus, the strategies can inculcate interest
among students towards the subject chemistry.
For the past decade, chemistry scholars and researchers have been trying to explain how students should be
helped to understand chemistry better. Researchers have been arguing the necessity of learning at macroscopic,
microscopic and symbolic levels (Gabel 1998; Johnstone 1993).Literature presents many alternatives to remedy
the difficulties in chemistry. Analogies have been an important part of chemistry education for many years.
Especially, analogies have been used to teach abstract concepts like chemical equilibrium, nature of matter and
chemical bonding. Studies into analogy texts done by Glynn and Takahashi (1998) and by Paris and Glynn
(2004) showed that the analogy-enhanced text had a positive effect on students' science knowledge.
The use of concept mapping can help students begin to understand interrelationships among concepts. This
method can arrange concepts through interacting systems, in this system, all relationships between concepts are

SCHOLARS WORLD-IRMJCR Online: ISSN 2320-3145, Print: ISSN 2319-5789
www.scholarsworld.net [email protected] Volume. II, Issue II, April 2014 [70]
made clear. Words are used to label the links in order to depict the relationships more explicitly (Anderson-
Inman & Zeitz 1994). Concept maps can serve as a key plan for a teacher in working out the best way to teach a
topic. Students, in more informal atmosphere produced by playing games, are less self conscious and, therefore
more apt to experiment and participate freely in class. In addition, games automatically stimulate student
interest; a properly introduced game can be a very good motivating technique.
REFERENCES:
1. Anderson-Inman, L. &Zeitz, L. (1994) Beyond notecards: Synthesizing information with electronic study
tools. The Computing Teacher, 21(8), 21-25.
2. Baker, M., & Doran, R. (1975). From an awareness of scientific data to concerns of mankind: Strategies
for affective instruction in science. Science Education 59: 539–558.
3. Deepak, R. (2010). Effect of gender, learning style and out of school science experiences on interest in
science.Masters’ dissertation. University of Calicut
4. Francis, L., &Greer, J. (1999).Measuring attitudes towards science among secondary school students: The
affective domain.Journal of Research in Science Teaching 35: 877–896.
5. Gabel, D. (1998) The complexity of chemistry and implications for teaching, in: B.J.FRASER & K.G.
TOBIN (Eds) International Handbook of Science Education (Dordrecht, Kluwer).
6. Gafoor, K.A. (2013). Differences in students’ interest in physics by gender and stage of schooling in
Kerala, Journal of Indian Education, (August issue, in press).
7. Gafoor, K.A&SmithaNarayan(2010). Out-of-school Science Experiences and interest in Science of Upper
Primary School Pupils of Kerala, Journal of Indian Education, XXXVI(1), 29-38
8. Gafoor, K.A. &Jaithra, V.S. (2011).Influence of Out-of-School Experiences on Interest in Science of
Secondary School Students in Kerala. Indian Educational Review,50(1),7-25
9. Gardner, P. (1998). The development of males’ and females’ interestsin science and technology. In
Hoffman, L., Krapp, A.,Renninger, K., and Baumert, J. (Eds.), Interest and Learning,Proceedings of the
Second Conference on Interest and Gender,Kiel, IPN, pp. 41–57.
10. Gardner, P. L. (1975) Attitude to science - A review.Studies in Science Education 2, 1-41.
11. Gardner, P., &Tamir, P. (1989a). Interest in Biology. Part I:A multidimensional construct. Journal of
Research in ScienceTeaching 26: 409–423.
12. Gardner, P., &Tamir, P. (1989b). Interest in Biology. Part II:Relationship with the enrollment intentions
of Israeli seniorhigh school biology students. Journal of Research in ScienceTeaching 26: 425–433
13. Glynn, S.M. & Takahashi, T. (1998). Learning from analogy-enhanced science text. Journal of Research
in Science Teaching, 35, 1129-1149.
14. Graber, W. (1993).Pupils’ interest in chemistry and chemistrylessons.In Proceedings of the International
Conference ScienceEducation in Developing Countries: From Theory toPractice, Jerusalem, Israel, p.
201.
15. Johnstone, A. H. (1993). The development of chemistry teaching: A changing response to changing
demand. Journal of Chemical Education, 70, 701-704.
16. Jones, G., Howe, A., &Rua, M. (2000). Gender differences instudents’ experiences, interests, and
attitudes towards scienceand scientists. Science Education 84: 180–192.
17. Keeves JP, &Morgenstern C (1992).Attitudes toward science: measures and effects. In J.P. Keeves (Ed.)
The IEA Study of Science III:Changes in science Education and Achievement:1970-1984. (pp 122-140).
New York: Pergamon.
18. Kelly, A. (1988) The customer is always right….Girls’ and boys’ reaction to science lessons. School
Science Review 69,249.
19. Menis, J. (1983). Attitudes towards chemistry as compared withthose towards mathematics among tenth
grade pupils (aged15) in high level secondary schools in Israel. Research in Scienceand Technological
Education 1: 185–191.
20. Oh, P.S., &Yager, R. (2004).Development of constructivistscience classrooms and changes in student
attitudes towardsciencelearning.Science Education International 15:
105-113.
21. Ormerod, M., & Duckworth, D. (1975).Pupils’ Attitudes to Science,Slough, National Foundation for
Educational Research.

SCHOLARS WORLD-IRMJCR Online: ISSN 2320-3145, Print: ISSN 2319-5789
www.scholarsworld.net [email protected] Volume. II, Issue II, April 2014 [71]
22. Osborne et al(2003). Attitudes towards science: a review of the literature and itsimplications,
International Journal of Science Education, 25: 9, 1049 – 1079
23. Paris, N. A., & Glynn, S. M. (2004). Elaborate analogies in science text: Tools for enhancing preservice
teachers’ knowledge and attitudes. Contemporary Educational Psychology, 29, 230-247.
24. Schibeci, R. (1984).Attitudes to science: An update.Studies in ScienceEducation 11: 26–59.
25. Selim, M., &Shrigley, R. (1983). The group-dynamics approach:A socio-psychological approach for
testing the effect of discoveryand expository teaching on the science achievementand attitude of young
Egyptian students. Journal of Researchin Science Teaching 20: 213–224.
26. Shulman, R., &Tamir, P. (1973).Research on teaching in thenational science. In Travers, R. (Ed.), Second
Handbook ofResearch on Teaching, Rand McNally, Chicago.
27. Simpson, R., & Oliver, J. (1990). A summary of major influenceson attitude toward and achievement in
science among adolescentstudents.Science Education 74: 1–18.
28. Sjoberg, S. (2002).Science for the children?Department ofTeacher Education and School Department,
University of Oslo.
29. Weinburgh, M. (1995).Gender differences in student attitudestoward science: A meta-analysis of the
literature from 1970to 1991.Journal of Research in Science Teaching 32: 387–398.
----
SCHOLARS WORLD-IRMJCR Online: ISSN 2320-3145, Print: ISSN 2319-5789
www.scholarsworld.net [email protected] Volume. II, Issue II, April 2014 [72]
DISTRIBUTION MANAGEMENT PARADIGM AND CHANNEL
BEHAVIOR DIMENSION OF RURAL RETAILERS:
AN EMPIRICAL STUDY IN RURAL ASSAM
DR. ABHIGYAN BHATTACHARJEE,
Associate Professor,
Department Of Management
North Eastern Hill University, Tura Campus, Meghalaya India
ABSTRACT
Proper distribution coverage is a powerful tool to stimulate the demand which not only helps in
retaining the present customers but can also attract additional customers by offering better
services. The paper opted for an exploratory study using the interview technique to solicit
information from the target retail outlets. The data were complemented by other information from
Consumer Behavior and Rural Marketing literatures. Publications of government and private
agencies, reports, magazines and from the related web site via internet are also availed. An
empirical insight about the distribution mechanisms and channel behavior dimension of the rural
retailers is provided. Understanding channel behavior has a critical influence on channel
decisions. Identifying the manner in which the retailer performs his business, would help
streamline the ability and influence the retailer by stocking and promoting his products in a better
way. The study was restricted within the periphery of a limited region. Therefore, further research
is encouraged to test the proposed propositions further.
The paper includes implications for understanding distribution management and channel behavior
which are critical for the rural retailers so that they may have ample opportunity and scope to
cater the growing demand of the rural customers. The paper also explores to identify the
criticality of products positioning specific to the rural areas for Fast Moving Consumer Goods
(FMCGs). The study shall prove beneficial to the marketers in understanding the various nuances
in the distribution and channel behavior dimension pertaining to rural areas.
Article Type: Research paper
Keywords: Distribution Mechanism, Channel Behavior, Rural Retailers, Fast Moving Consumer
Goods, Rural Consumers.
SCHOLARS WORLD-IRMJCR Online: ISSN 2320-3145, Print: ISSN 2319-5789
www.scholarsworld.net [email protected] Volume. II, Issue II, April 2014 [73]
INTRODUCTION:
Proper distribution coverage is a powerful tool to stimulate the demand which not only helps in retaining the
present customers but can also attract additional customers by offering better services. The right distribution
objective is to get the right goods to the right places at the right time for the least cost.
In the state of Assam, there are 125 towns and 25124 villages as per 2011 census. (Statistical Handbook
Assam,2012). In Kamrup district there are 9 towns and 1393 villages in the same period. Due to saturation and
cut throat competition in urban India including Assam, many Fast Moving Consumer Goods (FMCG)
companies are devising strategies for targeting rural consumers in a big way.
For a long time, a small trickle of goods has over-flowed from the towns into the small rural shops, but the
products have been flowing erratically, without proper stock control, merchandising and they are priced high.
Barring very few exceptions, there has been a total lack of marketing efforts on the part of Indian companies to
organize an effective distribution of their products in widely scattered village markets in the country and Assam
is no exception to this. There have been a large number of factors, responsible for this lack of efforts, viz.,
diversity and dispersion of the market, under-developed communication and transportation systems, dearth of
well-developed distribution companies at local and regional levels and paucity of resources on the part of
companies to devote to setting up direct distributions systems.
The starting point for designing an effective distribution system for rural markets in the State is provided by the
buying habits of the ruralites themselves. Rural consumers, located in thousands of villages, scattered
throughout the length and breadth of the State, purchase their requirements from retail shops in their village and
retail outlets in nearby towns. Another mode which rural consumers adopt to shop for their goods is through
attending some fairs or visiting periodic moving markets. Independent hawkers also visit many of these villages
with their wares and rural consumers purchase some of their requirements from them.
REVIEW OF LITERATURE:
Many FMCG companies are focusing on increasing their distribution network to penetrate the rural area with a
step by step plan. This is the reason that FMCG urban market size has dropped from 50% to 29% in last 5 years.
The FMCG market size for semi-urban and rural segment was 19% and 52% respectively for the year 2006-07. As
per FICCI, the FMCG market size for urban, semi-urban and rural for year 2007-08 was expected to be 57%, 21%
and 22%, which clearly shows that rural market is the growth engine for FMCG growth. (Kochhar 2008a)
Though the urban markets are growing too, the incremental addition in consumer’s households is much more in
rural space as compared to urban markets. The planned development of roads, ports, railways and airports, will
increase FMCG penetration in the long term. 180 million rural and semi-urban people’s attention has already
been diverted towards FMCG products, according to latest estimates released by industry chamber, Assocham
in 2008. The estimated number of households using FMCG products in rural India has grown from 131 million
in 2004 to 140 million in 2007, according to market research company IMRB. Over 70% sale of FMCG
products is made to middle class households and over 50% of middle class is in rural India. (Kochhar 2008b)
Accessing rural markets presents challenges to the marketer as these markets are geographically spread out with
a large number of retail outlets. The rural retail system is, therefore, the predominant mechanism to reach and
service the rural consumers.
Accessing the rural market through the rural distribution network is important as it significantly increases the
rural penetration of brands. The higher dealer penetration results in higher reach among consumers and
therefore a higher market share. This is examined by comparing the percentage dealer penetration and market
share. (Velayudhan 2007)
Distribution means to spread out or disseminate. In the field of marketing, channels of distribution indicates
routes or pathways through which goods and services flow or move from producers to consumers. Distribution
management is the area which requires substantial attention. Peter Drucker calls it as the economy’s Dark
Continent. According to Drucker “both the market and the distribution channel are often more crucial than the
product. They are primary, the product is secondary. They deserve a good deal of attention and study much
more than they usually receive.”(Bhattacharjee 2012a, p.106)
SCHOLARS WORLD-IRMJCR Online: ISSN 2320-3145, Print: ISSN 2319-5789
www.scholarsworld.net [email protected] Volume. II, Issue II, April 2014 [74]
In India a traditional distribution system spread over the whole of the country down to the village level has been
serving both industry and consumers. Dr. A.S. Ganguly, in his speech as Chairman, HLL highlights the problem
of rural distribution in these words: “The low density of population and inaccessibility make the problem of
servicing these villages individually difficult and often uneconomical. Direct delivery of goods to even the top
one per cent of villages’ costs twice as much as servicing urban markets. Therefore in the initial stage it may be
better to concentrate only on the larger villages, mandi towns and towns with large agricultural hinterlands that
act as foci for distribution. The semi- wholesalers and retailers servicing smaller villages can obtain stocks from
these places or the villagers themselves can buy the necessary items.” (Bhattacharjee 2012b, p.106)
One of the cheapest distribution systems for the opening up of large rural markets is the satellite marketing
system. It assists in the deepest penetration of consumer products with no additional costs to the manufacturers.
In general, companies already cover wholesalers and retailers in district towns. These wholesalers and retailers
in district towns always have personal contacts and trade links with various other retailers and large dealers in
other nearby towns and village markets (the satellite markets around them). So, companies can persuade and
encourage such wholesalers in district towns, to send smaller consignments to large dealers and retailers in the
satellite markets around them. These large dealers may also visit nearby towns (mandis) once a fortnight for a
month for other purchases, so they may easily be persuaded to pack a few more products of the company in
trucks or bullock carts or smaller vans without additional freight charges.(Dogra 2004a)
These large dealers in such markets are a sort of semi-wholesalers, with whom the wholesalers share their
commission for the quantity of the goods bought. These semi-wholesalers perform the same functions in the
small market as the wholesalers perform in the large market, i.e., financing of goods, warehousing, and their
distribution to retailers. These semi-wholesalers, in turn, send out goods to still smaller satellite towns around
them. This way, the entire exercise can be repeated till the rural market in the country is covered. But, marketers
need to ensure that additional costs out of such operations are kept to the bare minimum so that the ruralites do
not find prices high. (Dogra 2004b)
NEED AND SIGNIFICANCE OF THE STUDY:
Research in distribution channels has predominantly been embedded in the urban context and very few studies
have been done in the rural areas where the population density is low and spread out, and with low purchasing
capacities. Distribution Management is generally said to be influenced by three broad set of issues, viz,
i) Related to the rural infrastructure facilities,
ii) The rural distribution management and
iii) The rural retailers.
The interaction of these three elements – the rural infrastructure facilities, the rural distribution management
and rural retailer leads to the formation of distribution structure. This emergence of structure happens over a
period of time, but because the current study is cross-sectional in nature it doesn’t look into the evolutionary
issue in channel structure formation. In the present study, the issue of distribution management has been
conceptualized as being influenced by the presence of retailers with reference to FMCG products.
RETAILING - AN OVERVIEW:
Retailing is defined as ‘the activities involved in the sale of goods and services to the consumers for their
personal, family and household use’. An expanded definition of retailing is ‘marketing activities designed to
provide satisfaction to the final consumer and profitably maintain these customers through a program of
continuous quality improvement’. The scope of retailing, is therefore, defined as activities aimed at satisfying
the final consumer profitably. (Venugopal 2007a)
Retailing is the final phase of the distribution channel. It is availability and distribution that drives growth in
rural markets. Hence retailing is significant and will undergo greater organization and maturity as is being
witnessed in the urban markets. Study on buying behavior of rural consumer indicates that the rural retailer
influences 35% of purchase decisions. The rural areas of Assam offers a huge, sustainable and growing rural
SCHOLARS WORLD-IRMJCR Online: ISSN 2320-3145, Print: ISSN 2319-5789
www.scholarsworld.net [email protected] Volume. II, Issue II, April 2014 [75]
market which can be tapped effectively through innovative distribution channels with retailing being the most
critical element of this strategy as it is the final and the actual touch point with the customer which can be the
most critical influencer in the buying process.
COMPOSITION OF RURAL RETAIL OUTLETS:
It is estimated that there are about 20 lakh private retail outlets in rural areas in India. This is in addition to
cooperative outlets. Nearly 5 per cent of the outlets are fair price shops functioning under the public distribution
system for supply of essential commodities like sugar, edible oils, food grains etc. The above figures boil down
to the fact that on an average there are about 4 to 5 shops per village. In other words, there is a rural retail outlet
for every 350 to 400 persons. (Gopalaswamy 2006)
The rural retail universe has a larger proportion of grocers. Grocers still comprise the largest block, with 32 per
cent share at an all-India level. Paan/bidi stores have emerged as the second largest block accounting for about
15 per cent. General stores and food shops (restaurants, soft drinks outlets, ice cream outlets, etc.) are the two
other major outlet types. Chemists, technically the retail outlets for pharmaceuticals (ethical/ over the counter)
products, have emerged as major FMCG outlets, especially for premium products. (Venugopal, 2007b)
OBJECTIVES OF THE STUUDY:
The given study has the following objectives;
1. To know the different segments of rural retailers in rural Assam and their corresponding distribution
management for FMCG products.
2. To analyze the channel behavior dimensions adopted by the rural retailers for FMCG products.
RESEARCH METHODOLOGY:
Sample Design: The study is conducted with the sampling design of three stage stratified purposive sampling with the
Development Blocks as the first stage, the village and the target retail outlet as the second and third stages
respectively.
In the first stage, out of total 11 blocks of Guwahati Sub-division, only three blocks from Guwahati Sub-
division, viz., Boko Development block, Chaygaon Development block, Hajo Development block and Rani
Development Block are selected. Similarly, out of 4 blocks in Rangia Sub-division, only one block, viz.,
Rangiya Development Block has been selected.
In the second stage, the choice of four villages has been done on random basis, where one village each from the
selected blocks of Guwahati Sub-division, viz., Jalukbari, Kukurmara and Ketekibari respectively were
selected. Whereas, Bangaon village forms the only village from Rangiya Development Block.
In the third and final stage, from each village fifteen retail outlets were selected. A total of sixty (60) retail
outlets spread over four villages in the two sub-divisions is being selected for the purpose of the study.
Data Source: In order to achieve the objectives and to test the research question the present study is mainly based on primary
sources of information. For collecting primary data the personal interview of 60 retail outlet owners were done.
Besides secondary data have been collected from various issues of ‘Statistical Handbook of Assam’ and
‘Economic Survey Assam’, Directorate of Economics and Statistics, as well as from the office and library of
State Institute for Rural Development, Guwahati, National Institute for Rural Development, Guwahati, Indian
Institute of Entrepreneurship, Guwahati among others and from various issues of journals relating to Consumer
Behavior and Rural Marketing. Various publications of government and private agencies, reports, magazines
and from the related web site via internet are also availed.
RESULTS AND DISCUSSION:
In the present study, among the 60 rural retail outlets surveyed in four villages in Kamrup district (rural), the
proportion of grocers were 36, i.e. 60 per cent. Paan/ bidi store along with General stores stood at 7, i.e. 12 per
cent each. While chemists and fair price shops surveyed were 5 accounting 8 per cent each (See Table 1).

SCHOLARS WORLD-IRMJCR Online: ISSN 2320-3145, Print: ISSN 2319-5789
www.scholarsworld.net [email protected] Volume. II, Issue II, April 2014 [76]
TABLE: 1 TYPES OF RETAIL OUTLETS
Retail Outlet Type Number %
Grocers 36 60
Paan/ bidi 7 12
General Stores 7 12
Chemists 5 8
Fair Price shops 5 8
Total 60 100
Source: Field Study
Retail Premises:
The size distribution of the retail shops indicates that most of them, i.e., 48% of the retail shop were of size within
the range of 100 -200 sq feet big. 20% of the stores were above 200 sq feet, whereas nearly 32% of the stores were
only within 100 sq feet range. Almost all the shops in the villages were located on their owned premises and are
proprietary in nature except the fair price shops and few of General stores and grocers. Refer Table 2.
TABLE 2 SIZE DISTRIBUTIONS OF THE RURAL RETAILERS
Retail Store
Shop Area Number Store (%)
Above 200 sq feet 12 20
100-200 sq feet 29 48
Up to 100 sq feet 19 32
Total 60 100
Source: Field Study
It is worth noting that most of the retail shops make use of electricity, as the villages have access to electricity
connectivity. This indicates long business hours where majority of the shops continued shopping hours during
the night up to 10PM while starting the day from 7.AM onwards. The average shopping hours were found to be
for almost 10 to 12 hours in a day. Although frequent load shedding do take place in the villages, the retailers
construe that such power failure does not much affect the shopping hours, as electricity is replaced easily with
candles, lantern or menthol stoves.
RETAIL SHELF:
In a study by Industrial Credit and Investment Corporation of India (1979) it was found that over two-fifths of
the retail outlets stocked eight to nine standard product categories and three-fourths of the outlets which stocked
eight to nine product categories kept four items or less in each category while one-fourths had five to six items
in each category.
In another study, it was found that on an average, the number of product categories stocked by a rural store is 19
while in an urban store it is 27 (Munshi 2005)
A large number of retailers are spread in the rural areas of the State. A typical rural retailer keeps all sorts of
convenience goods and to satisfy the wide ranging needs of rural people. Making available the brand choice is
not seriously considered by the retailers.
In the present study, out of 60 rural retailers, surveyed, it revealed that almost 12 per cent of the shops stocked
more than 25 different product categories of the fast moving consumer goods including toiletries, personal care
and other packaged food stuffs. Only 20 per cent opined that they stock product categories up to 20-25 and only
23 per cent of the outlets stocked products in the range 15-20. Approximately 17 per cent of the outlets stocked
10-15 product categories. A top 28 per cent of the outlets including paan/bidi shops, chemists and fair price
shops stocked items within a range of 5-10.(See Table 3)
This indicates that the rural retailers have ample opportunity and scope to cater the growing demand of the rural
customers. But the scarcity of products available on the retail shelf in the villages suggests that the suppliers of
these products need to deliver more products to these outlets. It is an eye opener to the present and potential
marketers to channelize their products for the growing rural demand and make significant presence in rural
markets.

SCHOLARS WORLD-IRMJCR Online: ISSN 2320-3145, Print: ISSN 2319-5789
www.scholarsworld.net [email protected] Volume. II, Issue II, April 2014 [77]
TABLE 3 DISTRIBUTIONS OF RURAL RETAIL STORES
BY NUMBER OF PRODUCTCATEGORIES STOCKED
Number of Product
Categories Stocked Retail Outlets Retail outlet type
5-10 17(28.3) Paan/bidi, chemist, Fair price
shops 10-15 10(16.6) Grocers, General Stores
15-20 14(23.3) Grocers, General Stores
20-25 12(20.0) Grocers, General Stores
>25 7(11.6)
Grocers, General Stores
Total 60(100)
Note: Figures in bracket indicate percentages Source: Field Survey
Though the survey found that the retail outlets stocked different product categories, but it was observed that that
the outlets stocked a few standard product categories, and carried very few items within a category. The survey
revealed that very few outlets had retail shelf space for standard category products. This is shown in Table 4
Table 4 Opinion of the Retailers whether they maintain shelf space for displaying FMCG products
Opinion of the Retailers
Yes No
34% 66%
Source: Field Survey
Of the 34% outlets which maintained shelf space include Grocers, General Stores and Chemists. They opined
that company representatives pursue them to provide for shelf space. Among the companies, HUL is the
forerunner followed by ITC. The companies have contract with the retailers through the company
representatives who visit the outlets and pursue for displaying products in shelf space. It was observed that the
period for display ranges from 1 month to 45 days and is subject to extension/ renewal of contract by the
company distributor.
During the field survey, a few observations were also made wherein products of some leading FMCG majors
were found having shelf space for ‘special display’ in some of the village retail outlets. They are put as under:
Soaps:
(Lux, Lifebuoy, Lifebuoy hand wash, Fiama) of HUL and Dettol of Reckitt Benckiser (India) Ltd
Shampoo & sachet:
(Clinic plus, clinic all clear, head& shoulders) of HUL and Vivel of ITC
Personal care:
(Pepsodent, Vaseline total moisture, Ponds body lotion, Ponds moisturizing cold cream, Fair& Lovely)
Packaged foodstuffs:
(Nestle Nido, Sun feast bscuit of ITC, Maggi cuppa mania and Maggi Rich Tomato Hot & Sweet Sauce,
Nescafe).
Household care:
(Vim drop dish wash).
The above mentioned products are found to be on ‘special display’ by the retail outlets in the rural areas when
the survey was conducted.
Thus, it may be observed that there is a place available for the marketers to store and exhibit their stocks
keeping view the vast potential rural customer base.
SALES AND STOCK TURNOVER:
The sales turnover of the rural retailer is low with approximately 75 per cent of the rural retailers having sales
of less than Rs 10,000 a month. See Table 5 below:

SCHOLARS WORLD-IRMJCR Online: ISSN 2320-3145, Print: ISSN 2319-5789
www.scholarsworld.net [email protected] Volume. II, Issue II, April 2014 [78]
TABLE 5 DISTRIBUTIONS OF RURAL RETAILERS BY MONTHLY SALES
Retail Stores
Monthly Sales Number %
Above Rs 10000 15 25
Rs 5000 to Rs 10000 28 47
Up to Rs 5000 17 28
Total 60 100
Source: Field Survey
An ICICI study indicates the monthly off-take for packaged products was only slightly more in feeder villages
compared to interior villages. The variation is in the composition with a larger off-take of packaged foodstuffs
and tobacco compared to other products in the interior villages; while, in feeder villages, toiletries had a higher
off-take compared to other product categories.
The low off-take, low stocks and lower stock turnover ratio reinforces the observation made in the study that the
number of products and items stocked is low in the villages of Kamrup district. This locks up the retail shelf space
by the existing products and brands leaving no room for new products and brands. The marketer has to ensure that
his product and brand is on the shelf as otherwise the competitors’ brand will occupy the shelf instead. This would
require a combination of margin, credit and servicing that is superior to that of the competitor.
BEHAVIOUR OF THE CHANNEL:
Understanding channel behavior has a critical influence on channel decisions. The ability to influence the
retailer to stock and promote requires identifying the manner in which the retailer performs his business.
Channel behavior dimensions in the study include:
Purchase source for the retailer
Mode of Product Purchase by Retailer
Promotion by the retailer
Channel promotion
Information source and influence on the retailer
Mode of Product Sale to customers
Pricing by the channel
Reason for stocking a product/brand
PURCHASE SOURCE FOR THE RETAILER:
A study of retailers in Uttar Pradesh indicated that retailers in interior areas are not visited by agents of distributors.
Therefore, they go to town or feeder village once or twice a month to buy their stock. Retailers in feeder villages
purchase items like cosmetics, toiletries, detergents and packaged foodstuffs from agents of distributors who visit
their shop at regular intervals and deliver these items. (Kilaru cited in Velayudhan 2007, p 177).
The present study of retailers in Kamrup district also reveals the source of purchase of products by the rural
retailers. The following table depicts the number of retailers along with their corresponding purchase source.
TABLE 6 OPINIONS OF RETAILERS ABOUT THEIR PURCHASE SOURCE
Purchase Source for the Retailer Daily Weekly Bi-weekly Monthly
Nearby town by self - 7(12) 22(37) 43(72)
From within the village - 9(15) 14(23) 14(23)
Replenished by Company / Distributor /
Wholesale agent
- 19(32) 33(55) 33(55)
Figure(s) in the bracket indicate percentages. Source: Field Survey
From Table: 6 it could be figured out that 72% of the retailers go to town once a month or more to buy their stock.
Out of the 72% retailers, 37% of them also purchase bi-weekly and 12% on weekly basis. This is due to the fact
that small retailers have limited capacity to lift goods on large quantity at a time; therefore they cannot wait for
one long month for replenishment of stocks. However most of the retailers indicated that they stock their products

SCHOLARS WORLD-IRMJCR Online: ISSN 2320-3145, Print: ISSN 2319-5789
www.scholarsworld.net [email protected] Volume. II, Issue II, April 2014 [79]
from multiple sources as well, as evident from the table above. In case a company representative does not visit
their shop on a regular basis, they resort to self visit from nearby town for purchase of stocks. Out of the surveyed
outlets, most of the retailers opined that adequate products are not available within the village and most of the time
company representatives or distributor agents fail to turn up in their outlets to replenish the stocks.
This implies that it is necessary for marketers of FMCG to ensure that the products are delivered at right time
especially (toiletries, detergents and packaged foodstuffs) to the feeder villages, as these are the items that are
also stocked in the shops in interior villages.
MODE OF PRODUCTS PURCHASE BY RETAILERS:
Small retailers and retailers in interior villages make their purchases in cash while larger retailers in feeder
markets buy on credit (Kilaru cited in Velayudhan 2007, p178).
In the study it was found that 68% of the village retailers buy goods on cash basis. While the rest 32% retailers’
avail credit for purchasing their stocks. The retailers who buy goods in cash are relatively small in size with low
turnover and mostly belong to interior villages, while those who purchase on credit are relatively bigger in size
with higher turnover of sales. (See Table 7)
TABLE 7
Mode of Purchase of products by Retailers
Cash Credit
68% 32%
Source: Field Survey
The opinion of the retailers was that it is more convenient to do business on credit than on cash basis. Cash
purchase compels especially the smaller retailers to stock limited category of products of the fast moving
brands. However, the rural consumer is aware and has the urge for purchasing variety products, courtesy the
availability of TV and knowledge of the products through the advertisement. Here the companies need to ensure
that it moulds a policy to include the smaller retailers to avail credit facility to facilitate more products to reach
the interior villages where there is unsaturated demand.
PROMOTION BY THE RETAILER:
When retailers in rural markets promote products to the consumers, the rural consumer expects the retailer to
provide information and suggestions about the product. This is partly supported by studies on consumer
behavior. (Velayudhan, 2007, p 178)
The opinion of the retailers surveyed in the study indicates that 43% of the retailers promote/ recommend
company brand to the consumers. They opined that the company provides them commission and credit facility
for promoting its products. Company representatives who visit the outlets ask the retailers to display a particular
brand of company product separately from other ordinary or branded company’s products. The study reveals
that commission and credit facility received from the company or the wholesalers are the important factors
inducing the retailers to promote and recommend products of the concerned company. Out of the affirmative
43% retailers, a marginal 10% of the retailers also opined that apart from commission and credit facility, they
also recommend a brand out of personal choice. A majority 57% of the retailers opined that they do not
promote/recommend any product (Table 8).
TABLE 8 OPINION OF THE RETAILERS WHETHER THEY PROMOTE/
RECOMMEND PRODUCTS TO THE CONSUMER
Yes No
43% 57%
Source: Field Survey
The implication is that the marketers should provide attractive commission and credit facility to motivate the
retailer to promote the brand.
CHANNEL PROMOTION: The present study on the rural retailers shows the following picture:

SCHOLARS WORLD-IRMJCR Online: ISSN 2320-3145, Print: ISSN 2319-5789
www.scholarsworld.net [email protected] Volume. II, Issue II, April 2014 [80]
TABLE 9 OPINIONS OF THE RETAILERS WHETHER THEY AVAIL ANY
DISCOUNT SCHEMES FROM DISTRIBUTOR/WHOLESALER
Yes No
23% 77%
Source: Field Survey
This is worth noting that the 23% retailers whose opinion was in the affirmative belong to feeder villages. The
implication leads to the fact that they availed the discount schemes on sheer merit for lifting large quantity of
goods from the wholesalers/distributors at a time. The rest 77% of the retailers opined that due to lack of
capacity and less lifting of products at a time, they could not avail discount schemes. Discounts for retailers in
feeder markets are relevant as the additional stocks carried out by outlets in the feeder markets meet the needs
of not only the consumers but also the retailer in the interior villages, thereby having dual advantage of
providing products to the consumers at a low price than the marked price in one hand and also letting the
retailers of the interior villages to fetch a higher margin of profit.
INFORMATION SOURCE AND INFLUENCE ON THE RETAILERS:
The marketer would do well to motivate the wholesaler to get the retailer in the rural market to stock its
products, more so for newer products. This is the approach followed in the case of Nirma. Ghosh and
Krishnaswamy (cited in Velayudhan, 2007, p 177)
In the present study, the opinion of 32% of them was that they usually depend on self availed information on
the products in the market, which include information availed from television and knowledge about new
products on their visit to the town nearby. Whereas up to 75% of the retailers opined that it is the wholesaler/
distributor who act as an important information source for the retailer about product in the market (Table 6.12).
This observation is similar with another study covering 25 retailers in seven villages of Deoria district of Uttar
Pradesh which brought out the importance of the wholesaler. According to the study, the wholesaler is the most
important source of information for the retailer. The wholesaler has also the most important influence on the
retailer (Kilaru cited in Velayudhan 2007, p 177).
TABLE 10 INFORMATION ON PRODUCTS IN THE MARKET
Information Source Percentage Response of Retailers
Rely on self availed information 32%
By wholesalers/distributors 75%
By sales personnel/ company
representatives
57%
Source: Field Survey
MODE OF PRODUCT SALE TO CONSUMERS:
In a village environment, there is a feeling of brother hood and almost all the people residing in a locality live in
a harmonious way. There is all community involvement for even a simple function taking place at someone’s
residence. As such every individual come in contact with each other and the relation almost become close,
casual and friendly. Village retailer also being a part of the same common society enjoys equal unanimity as
others. Hence, the consumers are no any strangers but the known people of the same locality to which the
retailer himself belongs to. Due to this growing casual relation with the people in general most of the village
folks when make products purchases from the village shop, prefer to make it on credit. At this point it may be
noted that the retailer though prefers to sell his products in cash but sometimes cannot object to the consumers’
demand if they insist for credit purchase. As pointed out by the retailer, he usually maintains a ‘khata’ (sales
day book) where all the credit transactions are being noted against the consumers’ name. The amount accrued
thereon is generally paid at the month end.
In a study by ICICI, it was observed that the extension of credit facilities to consumers is practically non-
existent in towns but in interior villages it is common (ICICI, 1979). In another study, variations were also
observed according to the products. Credit facility is given on essential commodities like rice, oil etc., but not
for packaged goods (Kilaru cited in Velayudhan 2007, p 175).

SCHOLARS WORLD-IRMJCR Online: ISSN 2320-3145, Print: ISSN 2319-5789
www.scholarsworld.net [email protected] Volume. II, Issue II, April 2014 [81]
In the present study, a total of 60 retailers surveyed had the following opinion about the items sold on credit
(See Table 11)
TABLE 11 ITEMS SOLD ON CREDIT BY THE RURAL RETAILERS
Items sold on Credit Retailers(%)
Both essential commodities and packaged goods 47%
Only essential commodities 53%
Only packaged goods -
Neither essential nor packaged goods -
Source: Field Survey
From the above table, it may be observed that 47% of the retailers sell their goods on credit on both essential
commodities and packaged goods. Whereas 53% of the retailers indicated that they allow credit facility on only
essential commodities, like rice, pulses, sugar, oil etc. The retailers opined that they do not allow any credit
facility if only packaged goods is purchased. Again, the retailers also opined that they neither allow credit on
essential nor packaged goods’. The above figures imply that no retailer sell their goods purely on cash. Every
retailer big or small makes sale mostly on credit basis and less on cash basis.
PRICING BY THE CHANNEL:
An attempt was made to know whether the retailers in the villages charge more than the maximum retail price.
A survey found that no retailers charge more than the maximum retail price of a product. However, the study is
not prejudiced to the same as different observation may be found out in other parts of villages in the rural
market of different areas.
Kilaru (cited in Velayudhan 2007, p 178) observed that some retailers in interior villages charge more than the
maximum retail price. They justify overcharging by pointing out that they spend time and money to fetch the
products from wholesalers. This in turn suggests that higher margins are sought by channel members in rural
markets. This inference is supported as it is observed that festival discounts given by the manufacturers to
wholesalers or retailer normally contribute to increasing stock levels in the shops. These concessions are almost
never passed on to consumers.
To understand more on the pricing by the retailer the present study found some striking facts which are quite
contrary to the observation made as above.
The following table indicates the response of the retailers on whether they offer goods below the maximum
retail price of a product (Table 12).
TABLE 12 OPINIONS OF RETAILERS WHETHER THEY OFFER PRODUCTS BELOW MRP
Products offered below MRP Response (%)
On all branded and local products -
On some branded and local products 35%
Only on local products 47%
Neither branded nor local products 18%
Source: Field Survey Table 12 brings to light that the retailers offer products below MRP of a product. No retailers indicated whether
they offer products below MRP on all branded and local products. However, 35% of them opined that they offer
products below MRP on some branded and local products. A majority of the retailers, ie, 47% opined that they
offer below MRP only on local products. This is possible on the ground that the retailer avails more retail margin
on local products than the premium branded products in the same category of products. Some of the retailers
figuring 18% opined that they do not offer below maximum retail price on either branded or local products.
REASON FOR STOCKING A PRODUCT/ BRAND:
Rural retailers stock a particular item usually because consumers request it and to a lesser extent because of
wholesaler’s push or because a competitor stocks the item. The following table bring to fore the reason for
stocking products/brand by a retailer, (Table 13)

SCHOLARS WORLD-IRMJCR Online: ISSN 2320-3145, Print: ISSN 2319-5789
www.scholarsworld.net [email protected] Volume. II, Issue II, April 2014 [82]
TABLE 13 OPINIONS OF RETAILERS FOR REASON FOR STOCKING THE PRODUCTS/ BRAND
Reason for Stocking Products/Brand Response (%)
Cash Discount on products availed from
company/dealer 24%
Delivery of goods on time 20%
Credit availed from dealers/ wholesalers -
Request from the Consumers 38%
Competitors stocking the item 18%
Source: Field Survey
The Table 13 indicates that 24% of the retailers, stock a product/brand due to the cash discount availed therein
from the company or the dealer. 20% of the retailers opined that they stock products due to the timely delivery
of the concerned goods. However, none of the retailers indicated that the credit availed from dealers/
wholesalers as one of the reason for stocking goods. A majority 38% of the retailers said that it is because of
request from the consumers for which they stock products/brand for a category. A marginal 18% of the retailers
were of the opinion that it is because of other retail outlet stocking similar product/ brand for which they also
stock similar category of item. The implication is that the marketer has to direct his effort in promoting the
brand both to the consumer and to the wholesaler.
CONCLUSION:
The study revealed that the rural market comprises of small dispersed village settlements, infrequent retail
outlets and low off- take per retailer. The high distribution cost due to inadequate communication facilities and
the low volumes result in a barrier to entry in the rural market.
The low volumes and high cost of distribution, or the ‘Distribution Cost-volume Cycle’ requires a substantial
marketing effort to reach the retail shelf.
Thus, entry into rural markets requires a long term perspective rather than short term gain. Keeping this in
mind, there is a need:
To have a low-cost system of distribution. This suggests the use of a longer channel with the retailer at
the tail-end servicing the customer.
To efficiently service the channels in an intensive effort to build volumes.
REFERENCES:
1. Balram S. Dogra, 2004 Marketing Management and Rural Marketing, Common Wealth Publishers, New
Delhi-110002
2. Bhattacharjee Abhigyan, 2012, Transformation of Rural Market in Assam: Issues and Challenges, Global
Publishing House, Visakhapatnam, AP (India)
3. Das Munshi, Sujit2005.’Breaking Rural Marketing Barriers’, Business Today, 30 January.
4. Gopalaswamy TP 2006, Rural Marketing, Environment, Problems and Strategies, second edition, Vikas
Publishing House Pvt. Ltd.
5. ICICI, 1979, Rural Marketing: A Pilot Study. Mumbai: Industrial credit and Investment Corporation of India.
6. Navya Chaudhary, Rural Retailing, viewed 27 April 2012, http://EzineArticles.com
7. Nitin, Kochhar 2008, FMCG Marketers; destination for FMCG Marketing, Indian FMCG Sector Growth
Drivers and Category Trends: 2008-09, viewed wed 30 July 2012, <http://www.fmcgmarketers.com/>
8. Pingali Venugopal 2007, Marketing Channel Management, A Customer- Centric Approach, Response
Books, New Delhi.
9. Statistical Handbook Assam, 2007, Directorate of Economics and Statistics, Assam.
10. Velayudhan Sanal Kumar 2007, Rural Marketing, Targeting the Non-Urban Consumer, second edition,
Response Business Books, Sage, New Delhi, p173-178.
----
SCHOLARS WORLD-IRMJCR Online: ISSN 2320-3145, Print: ISSN 2319-5789
www.scholarsworld.net [email protected] Volume. II, Issue II, April 2014 [83]
EFFECT OF BRAND TRUST, BRAND IMAGE ON CUSTOMER
BRAND LOYALTY IN FMCG SECTOR AT GWALIOR REGION
DR. NISCHAY K. UPAMANNYU,
Assistant Professor
Prestige Institute of Management,
Airport Road, Gwalior, India
PROF. CHANDA GULATI,
Assistant Professor
Prestige Institute of Management,
Airport Road, Gwalior, India
DR. GARIMA MATHUR,
Associate Professor
Prestige Institute of Management, Air port Road, Gwalior, India
ABSTRACT
In this research article we have examined the Effect of Brand Trust, Brand image on
Customer brand loyalty and also cause and effect relationship has been established
between customer brand loyalty and brand trust & brand image in context of the FMCG
sector. The data was collected from 300 customers of FMCG sector at Gwalior City of
Central India. Results are analyzed through Multivariate analysis (MANCOVA). Linear
regression was also applied between independent variable and dependent variable.
Keywords: Brand Trust, Brand Image and Brand Loyalty

SCHOLARS WORLD-IRMJCR Online: ISSN 2320-3145, Print: ISSN 2319-5789
www.scholarsworld.net [email protected] Volume. II, Issue II, April 2014 [84]
1. INTRODUCTION:
Customer loyalty has become widely accepted as an important issue for all organizations, it is used as a
marketing benchmark for the company performance (Bennett & Rundle -Thiele, 2004). On the other hand we
can say that brand image, Brand Trust and customer loyalty are all important. This is also to be said that if the
customer is loyal so he will be interesting to buy another extension product of the same brand. In the current
study, this conception about customers will be evaluated through using all the important variable such as Brand
trust, Brand Image, Customer loyalty. Current study would be very much useful for the retail industry because a
Maggi Brand has been chosen for conducting a customer study.
1.1. THEORETICAL BACKGORUND:
1.1.1. Brand Trust: it is Feeling of security held by the consumer in his/her interaction with the brand, that it is
based on the perceptions that the brand is reliable and responsible for the interests and welfare of the consumer.
The variability dimension of brand trust has a technical nature because it concerns the perception that the brand
can fulfill or satisfy consumers’ needs. It is related to the individual’s belief that the brand accomplishes its
value promise. McAllister (1995) defined as “the degree to which an individual is confident and eager to act on
the basis of the words, actions and results of others”.
1.1.2. Brand Image: Brand image is the current view of the customers about a brand. It can be defined as a unique
bundle of associations within the minds of target customers. It signifies what the brand presently stands for. It is a set
of beliefs held about a specific brand. In short, it is nothing but the consumers’ perception about the product.
1.1.3. Customer brand loyalty: Brand loyalty can be defined as the relative possibility of customer shifting to
another brand in case there is a change in product’s features, price or quality. As brand loyalty increases, customers
will respond less to competitive moves and actions. Brand loyal customers remain committed to the brand, are
willing to pay a higher price for that brand, and will promote their brand always. A company having brand loyal
customers will have greater sales, less marketing and advertising costs, and best pricing. This is because the brand
loyal customers are less reluctant to shift to other brands, respond less to price changes and self- promote the brand as
they perceive that their brand have unique value which is not provided by other competitive brands.
1.2. REVIEW OF LITERATURE:
1.2.1. Brand trust – Arjun & Morris (2001) narrated that the brand trust is a consumer would like to trust in
his/her own initiative, and trust the product that brand provides. Trust can reduce the consumer's uncertainty,
because the consumer not only knows that brand can be worth trusting, but also thinks that dependable, safe and
honest consumption scenario is the important link of the brand trusts.
Hiscock (2001) explored the “The ultimate goal of marketing is to generate an intense bond between the
consumer and the brand, and the main ingredient of this bond is trust”, but trust is an elusive concept. The
ultimate goal of marketing is to generate an intense bond between the consumer and the brand, and the main
ingredient of this bond is trust. Blackston (1992) defined that trust is one component of consumer relationships
with brands.
Rotter (1980) explored that trust is an important variable affecting human relationships at all levels. Deutsch
(1973) explained that Trust is also a confidence that makes one brand preferred another. Urban et al. (1996)
found that Brand trust is undoubtedly one of the most strongest tools of making the relationships with the
customers on the internet.
1.2.2. Brand Image - Keller, (1993) defined brand image as a summation of brand associations in the
memory of the consumer which leads him towards brand perception and brand association including brand
attributes, brand benefits and brand attitude. Hsieh, Pan, & Setiono (2004) argued, brand image helps consumer
in recognizing their needs and satisfaction regarding the brand, it also distinguishes the brand from other rivals
motivating customers to buy the brand. Kotler (2001) defined image as the attitude, thought and feelings of a
person for a particular thing or object. Roth, (1995) defined that The essential part of the company’s marketing
program is to sustain the brand image and strategy of the brand (Keller, 1993; Aaker, 1991). Aaker (1991)
found the Image can create importance and it helps consumers with gathering information, distinguish the
brand, creates a reason to purchase, and also creates constructive feelings and provides the basis for brand
extension.
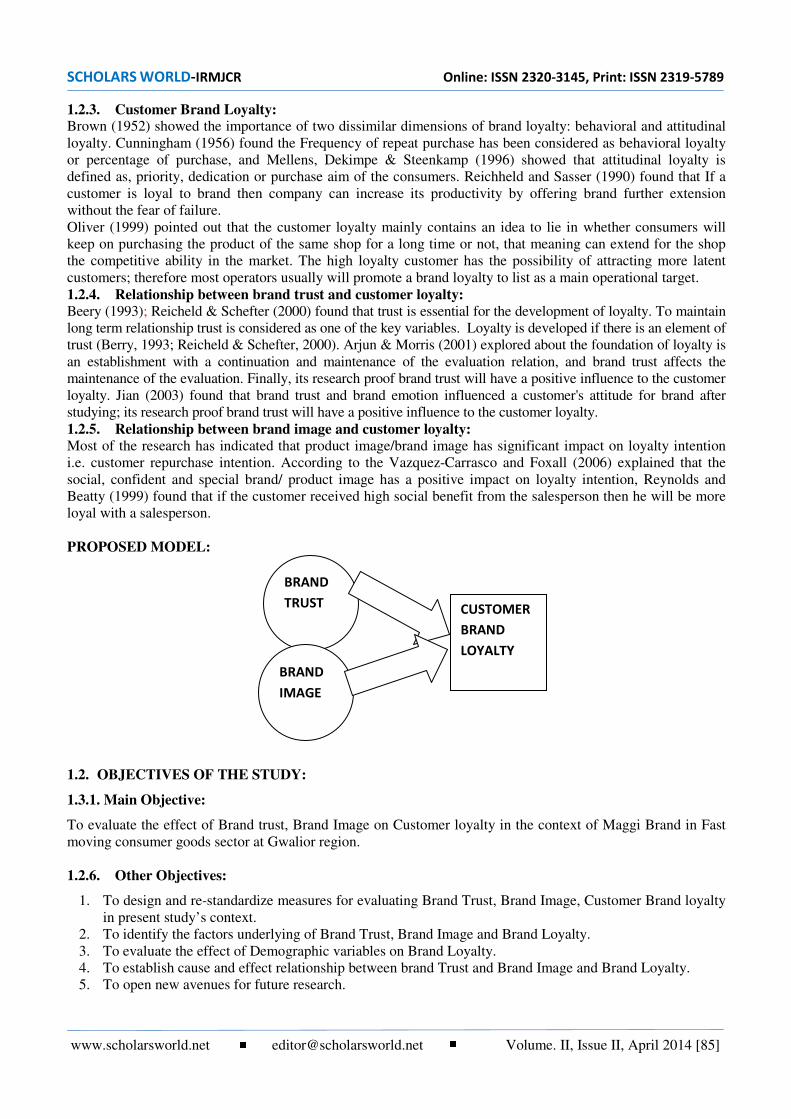
SCHOLARS WORLD-IRMJCR Online: ISSN 2320-3145, Print: ISSN 2319-5789
www.scholarsworld.net [email protected] Volume. II, Issue II, April 2014 [85]
1.2.3. Customer Brand Loyalty: Brown (1952) showed the importance of two dissimilar dimensions of brand loyalty: behavioral and attitudinal
loyalty. Cunningham (1956) found the Frequency of repeat purchase has been considered as behavioral loyalty
or percentage of purchase, and Mellens, Dekimpe & Steenkamp (1996) showed that attitudinal loyalty is
defined as, priority, dedication or purchase aim of the consumers. Reichheld and Sasser (1990) found that If a
customer is loyal to brand then company can increase its productivity by offering brand further extension
without the fear of failure.
Oliver (1999) pointed out that the customer loyalty mainly contains an idea to lie in whether consumers will
keep on purchasing the product of the same shop for a long time or not, that meaning can extend for the shop
the competitive ability in the market. The high loyalty customer has the possibility of attracting more latent
customers; therefore most operators usually will promote a brand loyalty to list as a main operational target.
1.2.4. Relationship between brand trust and customer loyalty:
Beery (1993); Reicheld & Schefter (2000) found that trust is essential for the development of loyalty. To maintain
long term relationship trust is considered as one of the key variables. Loyalty is developed if there is an element of
trust (Berry, 1993; Reicheld & Schefter, 2000). Arjun & Morris (2001) explored about the foundation of loyalty is
an establishment with a continuation and maintenance of the evaluation relation, and brand trust affects the
maintenance of the evaluation. Finally, its research proof brand trust will have a positive influence to the customer
loyalty. Jian (2003) found that brand trust and brand emotion influenced a customer's attitude for brand after
studying; its research proof brand trust will have a positive influence to the customer loyalty.
1.2.5. Relationship between brand image and customer loyalty:
Most of the research has indicated that product image/brand image has significant impact on loyalty intention
i.e. customer repurchase intention. According to the Vazquez-Carrasco and Foxall (2006) explained that the
social, confident and special brand/ product image has a positive impact on loyalty intention, Reynolds and
Beatty (1999) found that if the customer received high social benefit from the salesperson then he will be more
loyal with a salesperson.
PROPOSED MODEL:
1.2. OBJECTIVES OF THE STUDY:
1.3.1. Main Objective:
To evaluate the effect of Brand trust, Brand Image on Customer loyalty in the context of Maggi Brand in Fast
moving consumer goods sector at Gwalior region.
1.2.6. Other Objectives:
1. To design and re-standardize measures for evaluating Brand Trust, Brand Image, Customer Brand loyalty
in present study’s context.
2. To identify the factors underlying of Brand Trust, Brand Image and Brand Loyalty.
3. To evaluate the effect of Demographic variables on Brand Loyalty.
4. To establish cause and effect relationship between brand Trust and Brand Image and Brand Loyalty.
5. To open new avenues for future research.
BRAND
TRUST
BRAND
IMAGE
CUSTOMER
BRAND
LOYALTY

SCHOLARS WORLD-IRMJCR Online: ISSN 2320-3145, Print: ISSN 2319-5789
www.scholarsworld.net [email protected] Volume. II, Issue II, April 2014 [86]
1.4. HYPOTHESIS OF THE STUDY:
H01: There is no effect of Brand Trust on Customer Brand loyalty.
H02: There is no effect of Brand Image on Customer Brand Loyalty
H03: There is no effect of Gender on Customer Brand loyalty
H04: There is no effect of Qualification on Customer Brand loyalty
H05: There is no effect of Age on Customer Brand Loyalty
H06: There is no effect of Income on Customer Brand Loyalty
H07: There is no cause and effect relationship between Brand Trust, Brand Image and Customer Brand loyalty
2. RESEARCH METHODOLOGY:
The study was Casual in nature and the survey method was used for data collection. Sample design consists of
the size of population, sample element, sampling size and sampling techniques. Population of the current study
was all the customers in FMCG Sector in Gwalior region for this study.
2.1 Sample
Individual customers in the age range of 18 to 60 years old Were selected for the study. Most of them 68
percent were females and the rest were males. An individual customer was treated as element of study. In all
400 questionnaires were distributed and out of them 332 were received. Finally 300 questionnaires were
selected as 32 were not filled properly.
2.2. Measures
The responses were collected on a Likert type scale of 1 to 5 for all the variables. The measures were tested for
reliability and validity. Content validity of measures was established through a panel of judges before using the
measure for collecting data for the study.
Brand trust was assessed through the five item scale of adopted from the research of Amber Abraheem Shlash
Mohammad (2012). Cronbach’s alpha for the scale was reported as 0.811 in the previous research and for the
current study it was reported as 0.863 (see table 1). The five items were taken from the work of (Matzler et al.,
2008; Morgan & Hunt , 1994; Ballester and Munuera , 2005; laser et al ., 1995; chandhuri and Holbrook, 2001;
Hsteh and Hiang 2004; Caceres and Paparoidamis 007; Ballester and Aleman-Munuera 2001; Dixon, Bridson,
Evans and Morrison 2005). The items were: “I trust this brand,” “I rely on this brand,” “This is an honest
brand,” “This brand meets my expectations,” and “This brand is safe.”
Brand Loyalty was assessed the twelve item scale of adopted from the research of Anber Abraheem Shlash
Mohammad (2012). The cronbach’s Alpha for the scale was reported as 0.797 in the previous research and for
the current study it was reported as 0.828 (see table no 1). The twelve items were taken from the work of The
brand loyalty measures were adapted from previous studies, twelve items were adopted from (Chaudhuri and
Holbrook, 2001; Grace and O’Cass 2005; Algesheimer, et.al 2005; Fullerton, 2005; Heithman, et.al 2007; Hess
and Story, 2005; Johnson, et.al 2006; Sierra and McQuity, 2005; Zeithaml, et.al 1996). I intend to buy this
brand in near future, I intend to buy other product of this brand, I consider this brand as my first choice in this
category, The next time i need that product, i will buy the same brand, I will continue to be loyal customer for
this brand, I am willing to pay a price premium over competing product to be able to purchase this brand again,
I would only consider purchasing this brand again, if it would be substantially cheaper, I say positive things
about this brand to other people, I recommend this brand to someone who seeks my advice, I intend to
recommend this brand to other people and I consider this brand my first choice in next few year.
Brand Image was assessed the twelve item scale which was self made based on requirement of the current
study. The croanbach’s alpha of the current study in context of brand image was found 0.821. the construct of
brand image was constituted using attitude, association and brand personality ; Brand aggressive, Brand having
simplicity, Relationship with brands, This brands is sentimental, Used in store decoration, Stability in quality,
Freshness in raw material, Relationship with the brand, Like flavor, Serve what I want, Brand having
responsiveness and Complete knowledge about the brand.
RESULTS AND DISCUSSION:
3.1. Reliability Test of Brand Trust, Brand Image, and Customer brand loyalty: Nunnally (1978) recommended that instruments used in basic research have reliability of about 0.70 or better.
The reliability was computed by using PASW 18 software. The Croanbach’s Alpha reliability test was applied
to compute reliability coefficients for all the items in the questionnaire.

SCHOLARS WORLD-IRMJCR Online: ISSN 2320-3145, Print: ISSN 2319-5789
www.scholarsworld.net [email protected] Volume. II, Issue II, April 2014 [87]
No. of
variable
Name of Variable Croanbach Alpha No. of Items
Variable 1 Brand Trust 0.863 5
Variable 2 Brand Loyalty 0.828 10
Variable 3 Brand Image 0.821 12
It is considered that the reliability value more than 0.7 is considered good enough. The Cronbach’s Alpha reliability
value of Brand Trust, Brand Loyalty, Brand extension attitude, Brand affect and Brand Image were found to be
0.863, 0.828, and 0.821 which values are higher than the standard value 0.7. therefore, the Questionnaire can be
treated as reliable for the study excepting only one measure that was Brand extension attitude but the Cronbach’s
Alpha reliability value is near to 0.7 therefore it was treated as good measure for the current study.
2.2. FACTOR ANALYSIS:
3.2.1. KMO Bartlett’s Test of Brand Trust:
A Kaiser Meyer Olkin measure of sampling adequately indicated KMO value of 0.730 which indicated that the
sample size was good enough to for the current study. KMO values above 0.5 are considered to be good enough
to consider the data as normally distributed and therefore suitable for exploratory Factor analysis.
KMO AND BARTLETT'S TEST
Kaiser-Meyer-Olkin Measure of Sampling Adequacy. .730
Bartlett's Test of Sphericity Approx. Chi-Square 427.997
Df 3
Sig. .000
Bartlett’s test sphericity which tested the null hypothesis that the item to correlation matrix based on the
responses received from respondents for Brand Trust was an identity matrix. The Bartlett’s test was evaluated
through chi-square test having Chi-Square value 427.997 which is significant at 0.000 level of significance,
indicating that null hypothesis is rejected. Therefore it is clear that the item to item correlation matrix not an
identity matrix and the data were normally distributed and data were suitable for factor analysis.
2.2.2. Principal of component analysis:
The Principal Component Analysis (PCA) was applied on the Brand Trust data collected on Maggi brand to
identify the latent factors of Brand Trust. The PCA with Kaiser Normalization and Varimax Rotation converged
in one factor after four iterations. The factors were named as Confidence. The entire emerged factor was
displayed in the table below.
Variable Eigen
Value
Total Variance Statement Loading
value
Confidence 2.360 2.360 78.677 I can trust completely
I can rely
I feel secure
.905
.888
.868
2.2.3. KMO Bartlett’s test of Brand Loyalty:
Kaiser Meyer Olkin measure of sampling adequately indicated KMO value of 0.884 which indicated that the
sample size was good enough to for current study. KMO values above 0.5 are considered to be good enough to
consider the data as normally distributed and therefore suitable for exploratory Factor analysis.
KMO AND BARTLETT'S TEST
Kaiser-Meyer-Olkin Measure of Sampling Adequacy. .884
Bartlett's Test of Sphericity Approx. Chi-Square 753.638
Df 45
Sig. .000

SCHOLARS WORLD-IRMJCR Online: ISSN 2320-3145, Print: ISSN 2319-5789
www.scholarsworld.net [email protected] Volume. II, Issue II, April 2014 [88]
Bartlett’s test sphericity which tested the null hypothesis that the item to correlation matrix based on the
responses received from respondents for Brand Loyalty was an identity matrix. The Bartlett’s test was
evaluated through chi-square test having Chi-Square value 753.638 which is significant at 0.000 level of
significant, indicating that null hypothesis is rejected. Therefore it is clear that the item to item correlation
matrix not an identity matrix and the data were normally distributed and data were suitable for factor analysis.
2.2.4. Principal of component analysis of Brand loyalty:
The Principal Component Analysis (PCA) was applied on the Brand Loyalty data collected on Maggi brand to
identify the latent factors of Brand Loyalty. The PCA with Kaiser Normalization and Varimax Rotation
converged on two factors after three iterations. The factors were named as Attitudinal and Behavioral Intent.
The entire emerged factor was displayed in the table below.
Variable Eigen
Value
Total Variance Statement Loading
value
Attitudinal 3.965 2.942 29.422 Recommend to this brand
Someone who seek my
Intend to buy product of
another brand
Say positive things about you
Intend to buy when it
substantially cheaper
Consider this brand as my
first choice
0.737
0.711
0.670
0.661
0.651
0.521
.868
Behavioral
Intent
1.117 2.140 21.398 Continue to be loyal
Willing to pay price premium
First choice
When I need, I will buy same
0.767
0.728
0.584
0.509
1.2.2. KMO Bartlett’s Test of Brand Image:
Kaiser Meyer Olkin measure of sampling adequately indicated KMO value of 0.868 which indicated that the
sample size was good enough to for current study. KMO values above 0.5 are considered to be good enough to
consider the data as normally distributed and therefore suitable for exploratory Factor analysis.
KMO AND BARTLETT'S TEST
Kaiser-Meyer-Olkin Measure of Sampling Adequacy. .868
Bartlett's Test of Sphericity Approx. Chi-Square 796.955
Df 66
Sig. .000
Bartlett’s test sphericity which tested the null hypothesis that the item to correlation matrix based on the
responses received from respondents for Brand Image was an identity matrix. The Bartlett’s test was evaluated
through chi-square test having Chi-Square value 796.955 which is significant at 0.000 level of significant,
indicating that null hypothesis is rejected. Therefore it is clear that the item to item correlation matrix not an
identity matrix and the data were normally distributed and data were suitable for factor analysis.
1.2.3. Principal component analysis of Brand Image:
The Principal Component Analysis (PCA) was applied on the Brand Image data collected on Maggi brand to
identify the latent factors of Brand Trust. The PCA with Kaiser Normalization and Varimax Rotation converged
on four factors after four iterations. The factors were named as Cheerful Personality and Accountability. The
entire emerged factor was displayed in the table below.

SCHOLARS WORLD-IRMJCR Online: ISSN 2320-3145, Print: ISSN 2319-5789
www.scholarsworld.net [email protected] Volume. II, Issue II, April 2014 [89]
Variable Eigen
Value
Total Variance Statement Loading value
Cheerful
personality
4.105 3.066 25.549 Brand agressive
Brand having simplicity
Relationship with brands
This brands is sentimental
Used in store decoration
Stability in quality
Freshness in raw material
Relationship with the brand
0.657
0.650
0.633
0.622
0.607
0.575
0.519
0.492
Accountability 1.112 2.151 17.925 Like flavor
Serve what I want
Brand having responsivness
Complete knowledge about
the brand
0.700
0.672
0.637
0.630
UNIVARIATE ANCOVA:
Univariate Analysis (Two ways ANOVA) was applied to evaluate the effect of Demographics variable (Gender,
Qualification, Income & Age) on Brand Loyalty. Categorical variable were used as fixed variable and Brand
Loyalty was treated as the dependent variable.
LEVENE'S TEST OF EQUALITY OF ERROR VARIANCESA
Dependent Variable:BRANDLOYALTY
F df1 df2 Sig.
4.099 48 250 .047
Tests the null hypothesis that the error variance of the dependent variable is equal across
groups.
a. Design: Intercept + GENDER + QUALIFICATION + INCOME + AGE +
BRANDIMAGE + BRANDTRUST
To select appropriate Post Hoc test Levene’s test of equality of error variances was applied. The null hypothesis
that the error variance of the dependent variable (Brand Loyalty) is equal across the groups was tested using ‘F’
test. The value of ‘F’ was found to be 4.099 which is significant at the 4.7% level of significance, indicating that
Null hypothesis is rejected at the 5% level of significance. Since the no. of groups for the dependent variable are
very large (2*4*4*4*), the error variance of the dependent variable was in any case likely to be unequal and
post hoc tests that available and suitable for equal variances among across the group were used.
Tests of Between-Subjects Effects
Dependent Variable: BRAND LOYALTY
Source Type III Sum of
Squares df Mean Square F Sig.
Corrected Model 5930.718a
12 494.227 23.582 .000
Intercept 30.410 1 30.410 1.451 .229
GENDER 19.430 2 9.715 7.464 .030
QUALIFICATION 7.754 2 3.877 .185 .831
INCOME 70.220 3 23.407 12.117 .003
AGE 95.087 3 31.696 10.512 .011
Error 5994.011 286 20.958
Total 442997.000 299
Corrected Total 11924.729 298
a. R Squared = .497 (Adjusted R Squared = .476)
The Univariate Analysis (ANOVA) model fit indicated by Adjusted R2 which has the value of the dependent variable
(Brand Loyalty) is 0.476. Corrected model of (Brand Loyalty) has been tested for best fit using ‘F’ test having a

SCHOLARS WORLD-IRMJCR Online: ISSN 2320-3145, Print: ISSN 2319-5789
www.scholarsworld.net [email protected] Volume. II, Issue II, April 2014 [90]
value of 23.582 which is significant at the 0.000% level of significance that indicating the model with demographics
variable (Gender, Qualification, Income and Age ) as fixed factors and Brand Loyalty has a good fit.
H01: There is no effect of Gender on Brand Loyalty. The effect of ‘Gender’ as a demographic variable on Brand Loyalty was tested through F-test. The value of F
was found to be 7.464, which is significant at the 3% level of significance. Therefore, the null hypothesis is
rejected at the 5% level of significance, indicating that there is a significant effect of Gender as a demographic
variable on ‘Brand Loyalty’.
H02: There is no effect of Qualification on Brand Loyalty. The effect of ‘Qualification’ as a demographic variable on Brand Loyalty was tested through F-test. The value
of F was found to be 0.185, which is significant at the 83.1% level of significance. Therefore, the null
hypothesis is not rejected at the 5% level of significance, indicating that there is no effect of Qualification as a
demographic variable on ‘Brand Loyalty’.
H03: There is no effect of Income on Brand Loyalty. The effect of ‘Income’ as demographics variable on Brand Loyalty was tested through F-test. The value of F-
test was found to be 12.117, which is significant at the 0.3% level of significance. Therefore, the null hypothesis
is rejected at the 5% level of significance, indicating that there is a significant effect of Income as
Demographics variable on Brand Loyalty.
H04: There is no effect of Age on Brand Loyalty. The effect of ‘Income’ as demographics variable on Brand Loyalty was tested through F-test. The value of F-
test was found to be 12.117, which is significant at the 0.3% level of significance. Therefore, the null hypothesis
is rejected at the 5% level of significance, indicating that there is a significant effect of Income as
Demographics variable on Brand Loyalty.
MULTIPLE REGRESSION ANALYSIS:
H05: There is no cause and effect relationship between Independent variable and dependent variable. The linear regression analysis was applied to establish cause and effect relationship between Brand Image,
Brand Trust and Customer Brand loyalty through PASW 18 software. Here in this regression equation,
customer Brand Image, Brand Trust were taken as independent variable and Customer Brand Loyalty was
treated as dependent variable.
MODEL SUMMARY
Model R R Square Adjusted R Square Std. Error of the
Estimate
dimension0 1 .690a .476 .472 4.59459
a. Predictors: (Constant), BRANDTRUST, BRANDIMAGE
Multiple Linear regression analysis was used to establish the cause and effect relationship between Brand
Image, Brand Trust and customer Brand loyalty. Here, In the regression equations, Brand Image and Brand
Trust were taken as independent variable and Customer Brand loyalty was taken as independent variable was
treated as the dependent variable and the Result of Model summary indicated through Adjusted R2 value which
was found to be 0.472, indicating that Brand Image & Brand Trust having 47.2% on Customer Brand loyalty.
ANOVAb
Model Sum of Squares df Mean Square F Sig.
1 Regression 5676.085 2 2838.043 134.439 .000a
Residual 6248.644 296 21.110
Total 11924.729 298
a. Predictors: (Constant), BRANDTRUST, BRANDIMAGE
b. Dependent Variable: BRANDLOYALTY
The goodness fit of the model was tested using ANOVA and the F-value was found to be 134.439 which is
significant at the 0.000% level of significance, indicating that the model is showing good faith.
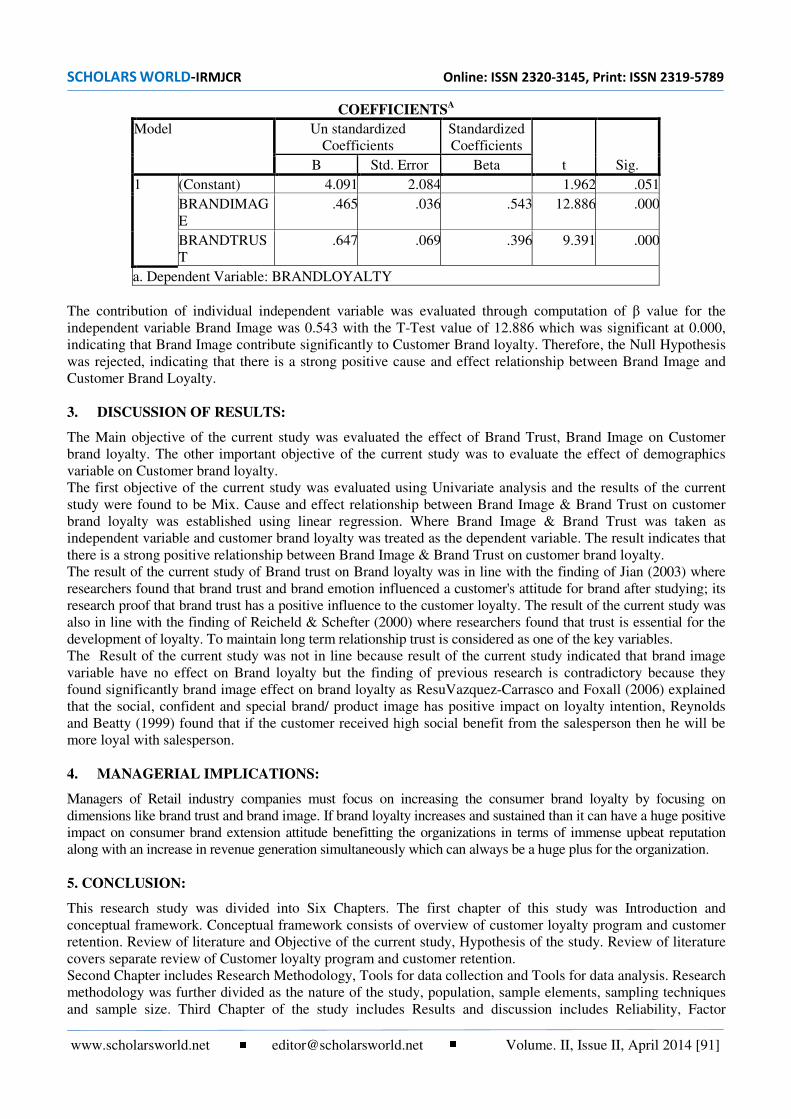
SCHOLARS WORLD-IRMJCR Online: ISSN 2320-3145, Print: ISSN 2319-5789
www.scholarsworld.net [email protected] Volume. II, Issue II, April 2014 [91]
COEFFICIENTSA
Model Un standardized
Coefficients
Standardized
Coefficients
t Sig. B Std. Error Beta
1 (Constant) 4.091 2.084 1.962 .051
BRANDIMAG
E
.465 .036 .543 12.886 .000
BRANDTRUS
T
.647 .069 .396 9.391 .000
a. Dependent Variable: BRANDLOYALTY
The contribution of individual independent variable was evaluated through computation of β value for the
independent variable Brand Image was 0.543 with the T-Test value of 12.886 which was significant at 0.000,
indicating that Brand Image contribute significantly to Customer Brand loyalty. Therefore, the Null Hypothesis
was rejected, indicating that there is a strong positive cause and effect relationship between Brand Image and
Customer Brand Loyalty.
3. DISCUSSION OF RESULTS:
The Main objective of the current study was evaluated the effect of Brand Trust, Brand Image on Customer
brand loyalty. The other important objective of the current study was to evaluate the effect of demographics
variable on Customer brand loyalty.
The first objective of the current study was evaluated using Univariate analysis and the results of the current
study were found to be Mix. Cause and effect relationship between Brand Image & Brand Trust on customer
brand loyalty was established using linear regression. Where Brand Image & Brand Trust was taken as
independent variable and customer brand loyalty was treated as the dependent variable. The result indicates that
there is a strong positive relationship between Brand Image & Brand Trust on customer brand loyalty.
The result of the current study of Brand trust on Brand loyalty was in line with the finding of Jian (2003) where
researchers found that brand trust and brand emotion influenced a customer's attitude for brand after studying; its
research proof that brand trust has a positive influence to the customer loyalty. The result of the current study was
also in line with the finding of Reicheld & Schefter (2000) where researchers found that trust is essential for the
development of loyalty. To maintain long term relationship trust is considered as one of the key variables.
The Result of the current study was not in line because result of the current study indicated that brand image
variable have no effect on Brand loyalty but the finding of previous research is contradictory because they
found significantly brand image effect on brand loyalty as ResuVazquez-Carrasco and Foxall (2006) explained
that the social, confident and special brand/ product image has positive impact on loyalty intention, Reynolds
and Beatty (1999) found that if the customer received high social benefit from the salesperson then he will be
more loyal with salesperson.
4. MANAGERIAL IMPLICATIONS:
Managers of Retail industry companies must focus on increasing the consumer brand loyalty by focusing on
dimensions like brand trust and brand image. If brand loyalty increases and sustained than it can have a huge positive
impact on consumer brand extension attitude benefitting the organizations in terms of immense upbeat reputation
along with an increase in revenue generation simultaneously which can always be a huge plus for the organization.
5. CONCLUSION:
This research study was divided into Six Chapters. The first chapter of this study was Introduction and
conceptual framework. Conceptual framework consists of overview of customer loyalty program and customer
retention. Review of literature and Objective of the current study, Hypothesis of the study. Review of literature
covers separate review of Customer loyalty program and customer retention.
Second Chapter includes Research Methodology, Tools for data collection and Tools for data analysis. Research
methodology was further divided as the nature of the study, population, sample elements, sampling techniques
and sample size. Third Chapter of the study includes Results and discussion includes Reliability, Factor
SCHOLARS WORLD-IRMJCR Online: ISSN 2320-3145, Print: ISSN 2319-5789
www.scholarsworld.net [email protected] Volume. II, Issue II, April 2014 [92]
analysis, Univariate Two way ANOVA test and linear regression analysis. The Fourth chapter of the study
includes Discussion of Results of the study and Managerial Implication and Fifth chapter includes Limitation
and Conclusion and seven chapters of this study consist of Reference and Annexure.
The conclusion of the current study indicates that there is a significant positive relationship between brand trust,
brand Image and Customer brand Loyalty. Following conclusions can be derived from the study.
Brand trust and brand image have a positive impact on brand loyalty.
All the demographics variable Gender, Income, and Age have a positive and significant effect on
Customer brand loyalty.
REFERENCES:
1. Aaker, D. A. (1991), Managing Brand Equity, New York: The Free Press.
2. Aaker, D.A.; Keller, K.L. (1990) Consumer Evaluations of Brand Extensions, Journal of Marketing, Vol.
54, No. 1, pp. 27-41.
3. Aaker, D.A.; Keller, K.L. (1990) Consumer Evaluations of Brand Extensions, Journal of Marketing, Vol.
54, No. 1, pp. 27-41.
4. Berry, L. L. (1993), “Playing Fair in Retailing”, Arthur Anderson Retailing Issues Newsletter (March), 5, 2
5. Berry, L. L. and. Parasuraman, A.A. (1991), “Marketing Services: Competing Through Quality”. New
York, NY: Free Press.
6. Blackston, Max (1992), “A Brand with an Attitude: A Suitable Case for the Treatment”, Journal of the
Market Research Society, 34 (3), 231-241.
7. Bottomley, P.A.; Doyle, J.R. (1996) The Formation of Attitudes Towards Brand Extensions: Testing and
Generalising Aaker and Keller’s Model, International Journal of Research in Marketing, Vol. 13, No. 4,
pp. 365-377.
8. Brown, G. H. (1952), “Brand loyalty-fact or fiction”, Advertising Age, 23, 53–54
9. Brozniarczyk, S.M.; Alba, J.W. (1994), “The Importance of the Brand in Brand Extensions”, Journal of
Marketing Research, Vol. 31, pp. 214-228.
10. Chaudhari, Arjun and Holbrook, Morris B. ;( 2002), ‘How Brand Reputation Affects the Advertising-
Brand Equity Link,’ Journal of Advertising Research, 42 (3), 33
11. Chaudhuri A. Holbrook M.B (2001), “The chain of effects from brand trust and brand affect to brand
performance: The role of brand loyalty”. Journal of Marketing 2001; 65 (April): 81-93.
12. Chaudhuri Arjun & Holbrook Morris (2001), “The Chain of Effects from Brand Trust and Brand Affect
to Brand Performance: The Role of Brand Loyalty.” Journal of Marketing, 65(2), 81-93
13. Chen, A. C, (2001), “Using free association to examine the relationship between ,The characteristics of
brand associations and brand equity”, Journal of product and brand management, 10(7), 439-451.
14. Cunningham, R.M. (1956), “Brand loyalty-what, where, how much”, Harvard Business Review, Vol.39,
November-December, pp. 116-38
15. Deutsch, M. (1973), “The Resolution of Conflict: Constructive and Destructive Processes”, New Haven
CN: Yale University Press
16. Fazio, R. H., & Zanna, M. P (1978), “Attitudinal qualities relating to the strength of the attitude-behavior
relationship”, Journal of Social Experimental Psychology, 14, 398–408
17. Fazio, R. H.,&Zanna, M. P (1981), “Direct experience and attitude-behavior consistency”, In L. Berkowitz
(Ed.), Advances in experimental social psychology (Vol. 14, pp. 161–202). New York: Academic.
18. Hiscock, J. (2001), ‘Most trusted brands’, Marketing, March, 32–33.
19. Hsieh, M.H., Pan, S.L. and Setiono, R. (2004), “Product-, corporate-, and country-image dimensions and
purchase behavior: a multicountry analysis”, Journal of the Academy of Marketing Science, Vol. 32 No.
3, pp. 251-70.
20. Jian, Y.X.(2004). Research on the product vaule, brand trust, brand emotion and the brand loyalty,
Journal of Management, 61,29-50.
21. Keller, K. L. (1993), “Conceptualizing, Measuring, and Managing Customer-Based Brand Equity”,
Journal of Marketing Research, 29: 1-22.
22. Kotler, P. (2001), “A framework for marketing management”, Upper Saddle River, NJ: Prentice-Hall.
23. Mc Allister, Daniel J (1995), “Affect and Cognition-based trust as foundation for interpersonal
Cooperation in Organization”, Academy of management Journal, 38 (1), 24-59
SCHOLARS WORLD-IRMJCR Online: ISSN 2320-3145, Print: ISSN 2319-5789
www.scholarsworld.net [email protected] Volume. II, Issue II, April 2014 [93]
24. Mellens, M, Dekimpe, M G & Steenkamp, J B E M (1996), “A review of brand loyalty measures in
marketing”. Tijdschrift voor Economie en Management, Vol.41, pp.507–533
25. Moorman, Christine, Rohit Deshpande, and Gerald Zaltman (1993), “Factors affecting trust in market
research relationships.” Journal of Marketing 57(21 Jan): 81-102.
26. Morgan, Robert M. and Shelby D. Hunt (1994), “The Commitment-Trust Theory of Relationship
Marketing”, Journal of Marketing, 58 (July), 20-38.
27. Morgan, Robert M. and Shelby D. Hunt (1994), “The Commitment-Trust Theory of Relationship
Marketing”, Journal of Marketing, 58 (July), 20-38.
28. Nijssen, E.J.; Hartman, D. (1994) Consumer Evaluations of Brand Extensions: An Integration of Previous
Research, in Bloemer, J., Lemmick, J. and Kasper, H. (eds.), Proceedings of 23rd European Marketing
Academy Conference, Maasticht: European Marketing Academy Conference, pp. 673-683.
29. Oliver (1999), “whence consumer loyalty’?, Journal of Marketing, 63(4), 33–44.
30. Park, C.W.; Milberg, S.; Lawson, R. (1991) Evaluation of Brand Extensions: The Role of Product Feature
Similarity and Brand Concept Consistency, Journal of Consumer Research, Vol. 18, September, pp. 185-193.
31. Reichheld, F.F. & Sasser, Jr., W.E. (1990), “Zero defections Quality comes to services”, Harvard
Business Review, 68(5), 105-111.
32. Reichheld,F.F., & Schefter,P. (2000), “E-loyalty: Your secret weapon on the Web. Harvard Business
Review, 78, 105–113.
33. Reynolds, K. E., & Beatty, S. E. (1999), “Customer benefits and company consequences of customer-
salesperson relationships in retailing”, Journal of Retailing, 75(1), 11–32
34. Ringberg, T. and S. F. Gupta (2003), “The importance of understanding the symbolic world of customers
in asymmetric business-to-business relationships”, The Journal of Business & Industrial Marketing,
18(6/7), pp.607-626
35. Roth, M. S. (1995), “Effects of global market conditions on brand image customization and brand
performance”, Journal of Advertising, 24(4), 55–72
36. Rotter, J. B. (1980), “Interpersonal trust, trustworthiness, and gullibility”, American Psychologist, 35(1), 1-7
37. Roux. E. (1995) Consumer Evaluation of Luxury Brand Extensions, in Proceedings of the European
Marketing Academy, ESSEC: Cergy-Pontoise, France, pp. 1971-1980.
38. Sheinin, Daniel A. (1998), “Positioning Brand Extensions: Implications for Beliefs and Attitudes,”
Journal of Product; Brand Management, Vol. 7, N 2, 137-149.
39. Sunde, L.; Brodie, R.J. (1993) Consumer Evaluations of Brand Extensions: Further Empirical Results,
International Journal of Research in Marketing, Vol. 10, No. 1, pp. 47-53.
40. Thiele, R. S., & Macky, M. M. (2001), “Assessing the performance of brand loyalty measures”, Journal
of Service Marketing, 15(7), 529-546.
41. Urban, G.L., Sultan, F., Qualls, W.J (2000), “Placing trust at the center of your Internet strategy”, Sloan
Management Review 42 (1), 39–48
42. Vazquez-Carrasco, R., & Foxall, G. R. (2006), “Influence of personality traits on satisfaction, perception
of relational benefits, and loyalty in a personal services context”, Journal of Retailing and Consumer
Services, 13(3), 205–219.
----

SCHOLARS WORLD-IRMJCR Online: ISSN 2320-3145, Print: ISSN 2319-5789
www.scholarsworld.net [email protected] Volume. II, Issue II, April 2014 [94]
ROLE OF COMMUNICATION IN SUPPLY
CHAIN MANAGEMENT: AN OVERVIEW
DR. S. K. WADEKAR, M.Com. M.Phil, M.B.A, Ph.D
Associate Professor & HOD in Insurance & Transport,
Department of Commerce, M.S.G. College,
Malegaon Camp. Maharashtra India
ABSTRACT
Supply chain management (SCM) is the 21st century global operations strategy for achieving
organizational competitiveness. Companies are attempting to find ways to improve their
flexibility and responsiveness and in turn competitiveness by changing their operations strategy,
methods and technologies that include the implementation of SCM paradigm and information
technology (IT). However, a thorough and critical review of literature is yet to be carried out with
the objective of bringing out pertinent factors and useful insights into the role and implications of
IT in SCM. In this paper, the literature available on IT in SCM have been classified using suitable
criteria and then critically reviewed to develop a framework for studying the applications of IT in
SCM. Based on this review and analysis, recommendations have been made regarding the
application of IT in SCM and some future research directions are indicated.
Keywords: Information Technology; Supply Chain Management; Literature Review; Framework
SCHOLARS WORLD-IRMJCR Online: ISSN 2320-3145, Print: ISSN 2319-5789
www.scholarsworld.net [email protected] Volume. II, Issue II, April 2014 [95]
1. INTRODUCTION:
Nowadays, companies are in the race for improving their organizational competitiveness in order to compete in
the 21st century global market. This market is electronically connected and dynamic in nature. Therefore,
companies are trying to improve their agility level with the objective of being flexible and responsive to meet
the changing market requirements. In an effort to achieve this, many companies have decentralized their value-
adding activities by outsourcing and developing virtual enterprise (VE). All these highlight the importance of
information technology (IT) in integrating suppliers/partnering firms in virtual enterprise and supply chain.
Supply chain management (SCM) is an approach that has evolved out of the integration of these considerations.
SCM is defined as the integration of key business processes from end user through original suppliers that
provides products, services, and information and hence adds value for customers and other stakeholders (Ding
2011) (Forslund 2007).
SCM is an increasingly applied operations paradigm for enhancing overall organizational competitiveness. A
recent survey of more than 300 supply chain-related executives found that 92% of those surveyed were
planning to implement one or more supply chain initiatives in 1999 Savistskie et.al (2007)SCM is based on the
integration of all activities that add value to customers starting from product design to delivery.
According to Sanchez et.al(2010)SCM is a set of approaches utilized to effectively integrate suppliers,
manufacturers, warehouses, and stores, so that merchandise is produced and distributed at the right quantities,
to the right locations, and at the right time, in order to minimize system wide cost while satisfying service level
requirements(Sanchez et al 2010).
There are numerous articles on the strategies, techniques and technologies for the design and development of
SCM. Also, several literature- survey papers which include taxonomy of SCM, and modelling and analysis of
SCM Kearney et.al (2004) However, there is a very few literature survey article that deals with IT in SCM.
However, it is impossible to achieve an effective supply chain without IT. Since suppliers are located all over
the world, it is essential to integrate the activities both inside and outside of an organization. This requires an
integrated information system (IS) for sharing information on various value-adding activities along the supply
chain. IT is like a nerve system for SCM. There are many articles on IT in supply chain. Most of the literature
discusses only the implications of one or two aspects of supply chain, for example, strategies, tools and
techniques, but not in an entirety.
However, a comprehensive survey of IT in SCM will be useful to identify the critical success factors of IT for
an integrated supply chain. Unfortunately, design and implementation of IT system for an effective SCM have
not received adequate attention from both researchers and practitioners, in particular, business to business
(B2B) e-commerce (EC) and SCM. There are lots of debates around the applications of IT in SCM concerning
business to business e-commerce model, matching to business model, etc. Considering the importance of IT in
achieving effective SCM, an attempt has been made in this paper to review the literature on IT in SCM based on
suitable criteria. The main objective here is to identify the major issues surrounding the application of IT in
SCM, using suitable classification scheme and develop a framework for IT applications in SCM. Also, some
future research directions are indicated for developing IT embedded SCM system.
The organization of the paper follows as Section 2 objective of review. The details of the research methodology
are presented in Section 3. Section 4 presents brief review of the literature is presented in Section 5. In Section
6, a framework for future direction, Section 7 will be managerial implications. Next section will be
bibliography will focus on research papers used in same process.
However A study (Closs.2000) has explained use of information technologies in supply chain management. and
also produced details of different type of IT system These are as follows this review focuses on impact of
communication technologies on supply chain performance so more attention has been given to the those
elements which comes under communication technology.

SCHOLARS WORLD-IRMJCR Online: ISSN 2320-3145, Print: ISSN 2319-5789
www.scholarsworld.net [email protected] Volume. II, Issue II, April 2014 [96]
TABLE 1: VARIOUS INFORMATION TECHNOLOGIES & THEIR APPLICATIONS
1 Backbone of logistic
information system
1.Enterprise resource planning
2. Legacy system.
2 Communication system 1.EDI
2.EPC
3. Bar-coding& scanning.
4.RFID
5.Internet
6. Satellite.
3 Execution system 1. Warehouse management system.
2. Transport management system.
3. Customaries selection with ERP.
2. OBJECTIVES OF REVIEW:
1. To analyze impact of communication technologies on supply chain performance.
2. Implementation and adoption of new technology always causes financial bourdon on the organization.
Few studies have mentioned that implementation of connective technologies not show quick result in
supply chain performance. The important objective of review is to understand, do the benefits outweigh
the cost of implementation of communication technology?
3. As big firm like Wal-Mart can manage to adopt new technology in shorter time and also enforced supplier to
adopt it. This review is an attempt to understand size of firm and its role in adoption of new technology.
4. External environment (political, economical, infrastructure etc.)play an important role in adoption and
implementation of new technology.(Lin 2011) (Voronnaeu 2009)Various studies has been done in context
of developed countries like USA, Germany.
5. Role of employee is important, as effective implementation could be possible with co-ordination and co-
operation from employee. Also point to be noted that technology causes operation deployment which is
directly related with decreasing labor cost. Focus has been made to understand acceptance from employee
for connective technology.
6. Integration of customer is essential to understand his demand fluctuation. Focus is required to understand
whether technology implementation make positive impact on buying process.
7. This study will try to produce justification for supply chain traceability will improve supply chain
performance and if yes, this enhanced performance can convert into competitive advantage.
3. RESEARCH METHODOLOGY:
The aim of this study is to analyze impact of traceability impact on supply chain performance. To accomplish
the study aims, this research is based on the examination of various journals, all of which are directly related to
Information Technology and its application. As we believe that journals are the recourses that are most
commonly used to acquire information and release new findings, conference papers, Master Theses, doctoral
dissertations, text books, news reports, and unpublished working papers are excluded. Due to the youth and
diversity of this area of research, journals, and thus a literature search was conducted using the following
electronic databases.
1. ABI/INFORM.
2. Academic Search Premier.
3. Emerald Fulltext.
4. Science Direct.
5. IEEE/IEE Electronics Library.
Every article that was retrieved through the search process was carefully reviewed before making a decision
regarding its inclusion in the survey. WE classified each article using a single category for each diversity
characteristic.

SCHOLARS WORLD-IRMJCR Online: ISSN 2320-3145, Print: ISSN 2319-5789
www.scholarsworld.net [email protected] Volume. II, Issue II, April 2014 [97]
4. REVIEW OF LITERATURE:
1. Qu.W.G(2011):This study suggests that migration to open IOS from prior generations of IOS such as
EDI involves a paradox. On the one hand, the adoption of open IOS can be facilitated by firm experience
in EDI. On the other hand, when many firms adopt EDI, it becomes very difficult for a firm to migrate to
open IOS because open IOS is usually not compatible with EDI, and firms cannot gain network effects
from the adoption of open IOS. Although the experience in EDI may increase a firm's absorptive capacity
for open IOS, it may eventually inhibit firms from adopting open IOS due to the network effects of EDI.
In other words, while a high level of absorptive capacity enables firms to adopt open IOS, firms may still
refuse to adopt open IOS due to the low network effects of open IOS. Managers should notice this
paradox when they make decisions on EDI adoption. The experience in proprietary IOS has a similar
story. While firm experience in proprietary IOS facilitates the adoption of open IOS, industry experience
in proprietary IOS hampers the diffusion of open IOS. But the negative impact of industry experience in
proprietary IOS on open IOS adoption is probably due to institutional forces, not network effects.
2. Hasan.M.(2011): The research finds that the planned and actual use of ERP systems is pervasive in the
Australian manufacturing sector, with both small and large companies implementing or planning to
implement an ERP system. It was also revealed that ERP system implementation benefits are
concentrated more in quickly providing high-quality information within firm. Future research may be
carried out to investigate the impact of ERP in small companies. Another limitation of this research is its
small sample size, albeit similar studies on ERP have similar sample size as discussed in previous
discussion. Although the response rate is acceptable, small sample size restricts the authors to apply more
sophisticated statistical analysis.
3. Sanchez, A., (2010): This research analyses the impact of EDI on inter-organizational co-operation along
with co-ordination in the supply chain for Spanish automotive supplier. The use of EDI is greater among
supplier that perceive more strategic benefits, fewer cost and organizational difficulties. The pro-active
management, are less dependence on suppliers, operational &strategic benefits, mainly are of technology,
organizational, external pressure, pro-active management, supplier dependence mutual understanding,
coordination with customer & supplier, company size ties, experience in use & EDI. Study indicates that
adopters have operational benefits reduced difficulties and high degree of co-operation & co-ordination
over non-adopters study should carried out to focus performance improvement of logistic function with
the help of EDI in automobile supplier industry where higher co-ordination, co-operation is required.
4. White, A., (2008): This study focused on use of EDI with the potential to improvise the performance in
supply chain with the study of early adopters in Europe. This study consists of two key elements namely
factors that determine the outcomes of RFID adoption and outcomes themselves. First variable is divided
into four variables as customer mandate, industry sector, perceived organization innovativeness and level
of integration, embedded vs. slap & ship. The second component covers anticipated benefits, anticipated
ROI and operational deployment. The results state that use of RFID yields faster sales cycle, competitive
advantage and cost reductions for organizations. It could be concluded from above study that tracked data
if share with supplier in faster change result in performance of supply chain.
5. Hellsorm 2009: This research makes important contribution to understand cost and process of
implementation of RFID process. Researcher has focused six important issues for the implementation
process Initiation, Adoption, Adaption, Acceptance, Reutilization and infusion also cost for
implementation is considered to be an important issue with implementation process study also reveals
focus on co-operation, co-ordination and contribution from all levels of organization, study also point out
mind set of employee to resist the change. Also study discusses cost benefit analysis of RFID process
and come to the conclusion than span of Implementation of RFID is short and could be cover in less than
24 months.
6. Che-yu Lin 2009: This research focus on the influence of organization factors on adoption of RFID for
logistic organizations. The study reveals that few organizations had experience of adoption of RFID, still
there is big potential of remaining Taiwanian logistical organization to adopt and experience the impact
of RFID. In same context researcher comes out with various parameter, which are important while doing
empirical study of organizational determination of RFID adoption in logistic industry. These parameters
are mainly organization support for innovation, quality of human capital, organizational knowledge
accumulation, and organization size.It is also noticed that researcher had used questionnaire as tool for
data collection which may result in possible respondent basis(as respondent are few), while current study

SCHOLARS WORLD-IRMJCR Online: ISSN 2320-3145, Print: ISSN 2319-5789
www.scholarsworld.net [email protected] Volume. II, Issue II, April 2014 [98]
not focuses on political structure, cultural and historical backgrounds, social value (External factors) and
company view (Internal Factors) which may influence those organizational factors on the adoption of
RFID technology.
7. Johansson, O., (2009): The study indicates use of Auto-ID & RFID on logistics performance on Swedish
manufacturing industries. It is a Bench-marking study which tries to investigate impact of auto-ID on the
logistics performance. Logistics performance can be defined as inventory management, service level,
reduced waste, and external co-ordination. The attributes necessary for tracking system are good
identification technology, scope of tracking and tracing system, registration timing and planning,
hierarchical level, attribute recorded, organization, accessibility and activity level. The study results that
auto-ID puts no special performance improvement than other identification technologies. But still RFID
yields better performance improvements. It could be concluded from above discussion that collected data
if share with supplier in real time can show great difference in performance of logistic operations.
8. Savitskie, K., (2007): The study investigates the internal and external logistics information technology
from an international perspective. The first focus was to categories LIT into internal and external LIT,
and the second was to determine the relationship between them. Internal LIT is used to share information
within firm. The parameters used under it are logistics information system, integrated database and access
method for sharing. External LIT is used for communication and information exchange. It includes
parameters like sharing information, facilitating e-commerce, increase the use of EDI. Overall study gives
the information about the role of LIT and investments in LIT, given the linkage between internal LIT and
external LIT. , It carries strong limitation of small sample size. Same study is expected to carry out in
different types of business domain to analyze usefulness of proposed work.
9. Park (2010):-The main focus of this study is to find out perception of RFID technology in USA
(developed countries) and South Korea (Developing countries). Same study reveals intrinsic attributes of
perceived risk and benefits and strategic importance of RFID implementation and improved business
performance verified. Study resulted in outcomes that Korean and USA firm are positive to adopt new
technology. But at same time Korean firms seek high risk in adoption of new technology. Korean firm
has not link implementation of RFID with financial benefits. This study produces scientific justification
for organization working in developed countries to improve their RFID strategies in global market by
recognizing different perception and approaches in implementation of RFID.
10. Tan.K.C (2010): The study present multi dimensional framework for considering EDI adoption in supply
chain management and its effects on relational alignment.EDI has been viewed largely as a technology to
allow firms to exchange data. However, EDI also serves as a means for alignment around shared
objectives. The results show that merely considering EDI capability to be important or aligning
information sharing will not lead to better performance. Prior literature, with few exceptions, has
emphasized direct linkages between EDI use and performance without examining the role of mediating
variables. The major contribution of this study is in demonstrating the role of supply chain information
and relational alignment as mediating variables. The study not only illustrates the importance of attitudes
towards EDI in facilitating this alignment, but it also demonstrates that the value of EDI comes in part, if
not significantly, from efforts to build inter-firm relationships and aligning information flows in the
context of these relationships. Developing elements of the "soft" infrastructure including information and
relationships is thus a key to enabling firms to work together for mutual benefit. This in turn requires that
firms carefully consider their own as well as partner EDI capabilities when managing suppliers.
11. Festus.O (2010): The results revealed that the type of IT used per se did not have a differential impact on
a company's performance in RL. However, IT operational attributes positively affected RL performance
and information sharing and collaboration are critical to RL performance. This paper examines the IT
types used in RL and their differential impact on RL performance. It looked at the operational attributes
that derive from IT use and their impact on RL performance. It also examines the importance and extent
of information sharing and collaboration in RL and their impact on RL performance.
In addition to showing the various IT types that are commonly used in RL, our results reveal that there is
no correlation between a particular IT usage and RL performance. In order words, no particular IT usage
leads itself to better RL performance. As our findings also show, IT as a necessary component provides
the potential to improve RL performance, but such performance improvement is a function of IT
attributes, rather than IT per se. Thus, our results offer one explanation to the productivity paradox of IT
in the literature.

SCHOLARS WORLD-IRMJCR Online: ISSN 2320-3145, Print: ISSN 2319-5789
www.scholarsworld.net [email protected] Volume. II, Issue II, April 2014 [99]
12. Azvedo ,(2009) : The study carried out by researcher to identify role of communication technologies in
logistic firm. Four variables like individual, organizational, technological, and environmental studied.
These four factor grouped with communication technologies .It is proposed by researcher that use of ICT
can significant impact on the performance of an organization.Tough this study cover big span it not
produce justification for following statement. Adoption and implementation always can create challenge
in front of management. Researcher has focused on only aspect of it. (i.e. after success full
implementation ICT become competitive advantage.).Some study should carried by making additional
focus on difficulties faced in internal co-ordination
13. Laif, F., (2006): This paper examines impact of information technology on 3PL of logistics firm of china.
Information technology acting as competitive tool for 3PL organization. IT shows direct proportion with
performance measurement of supply chain such as cost, time flexibility and improved quality.
competitive advantage further characterized with the help of three dimension of third party logistic
provider, 1) cost advantage which refer to relative capability to offer service at lower cost 2) service
variety advantage is defined as to offer more service products, whereas service quality refer to accurate
delivery, ordering and smooth communication and handling customer complaints Researcher come out
with strong conclusion that higher IT may help to improve delivery speed, reliability. Also IT may lead to
high cost advantage and IT may efficient achieve competitive advantage for 3PL manager. Further study
focuses on performances of 3PL by means of information technology, which is not true indicator of
overall logistic system. This study is carried out in china which differs in cultural and economical factor.
14. Kent J. (2006): This study examines co-ordination in a firm and its impact on customer value, process
efficiencies, and differential advantage. The word leverages from title stands for ability to achieve
advantage through logistic superiority. Attributes of logistic function divided into four phases in which
last phase is firm adopt and implement IT in logistic function. Following are the attributes of logistic
function evaluated time, accuracy, availability .Pre-existing formula based on three strategies.
i. Establishment of shared functional goal.
ii. Formal and informal use of inter-functional units implementing TQM.
iii. Interaction with functional areas characteristics of interaction are verbal, written communication, Top
management involvement, scheduled meetings, where as characteristics of collaborations are Inter
dependence shared goals, Top management support, shared resources Author has developed conceptual
frame work for inter-functional co-ordination between logistic and IT, also it is summarized that synergy
obtained through this co-ordination will maximize customer value and create differential advantage.
However leveraging (making strategic advantages) IT for an organization mainly depends on adoption
and implementation of information technologies at same level. Few organizations like (TATA, Wall-
mart) can force supply chain member to do so. A study should carry out to understand difficulties in
implementation of CT in manufacturing and automobile firm in India.
15. Li.et.al (2009): This study focus impact of IT implementation on supply chain performance and supply
chain integrations. Result shows that IT implementation didn’t support supply chain performance, but
strongly support supply chain integration, which ultimately result for better supply chain performances.
As supply chain performance cover cost, quality, flexibility and time which are inclusive of money.
Detailed analysis should be done to give investment priority either supply chain performance or
information technology.
16. Closs, D., (2001):- Examined Logistic IT practices for manufacturing and merchandising firms on world
class logistics firms against international benchmarking study logistic information system can be
evaluated to reveal response to three parameters i.e. capability satisfaction and resource. EDI is key IT
element to facilitate logistical integration EDI can be revealed with the help of increase use & EDI,
industry specific rather than proprietary specific standards, EDI application for increasing
competitiveness such on bar-coding and real time communication facilities The research supported that
merchandising firms have lead are manufacturing forms except some regions.
17. Brah, S.A., et.al. (2005):- Explains the relationship between total quality management, technology and
performance of the logistics companies. The main so objective of the study is to develop quality frame
work which tells us the relationship between above topics. Technology is the key factor for development
of TQM and with the help of TQM and technology, internal and external integration can be obtained
which is the main ability of logistics companies. Thus both TQM and technology is necessary for the

SCHOLARS WORLD-IRMJCR Online: ISSN 2320-3145, Print: ISSN 2319-5789
www.scholarsworld.net [email protected] Volume. II, Issue II, April 2014 [100]
different firms to perform better and better. Researcher has developed frame work of quality based on
following points. Though study produces support for all hypothesis mentioned.
1. Top management leadership.
2. Strategic planning.
3. Process management.
4. Information system analysis.
5. Human resource management.
6. Quality and customer focus.
This study find greater performance level integration, technology performance, quality in TQM logistic firms,
hence the relevance and importance of TQM to service industries, perhaps logistic firms look for better way to
improve their process and management. They need to seek continuous improvement in quality.
18. Germine, R., (2001): This study proposer connection between EDI technology adoption and just-m-time
(JIT) strategy in theoretical framework content refers to organizational immediate operating environment
that is uncontrollable by management in short-run, size described by physical scale & operation and
environment uncertainty refers to unpredictability in external including technologies customer competitor
& market involved in manufacturing and operation based on review of literature concepts are taking into
existence are size and JIT strategy, environmental uncertainty and JIT strategy, production complexity
and JIT strategy adoption, production complexity and environmental uncertainty, effect of form size on
EDI adoption. The result depicts that EDI adoption depends primarily on extent of JIT strategy
implementation and secondarily on organizational context. This result output of research of few
manufacturing firm. Same model should applied for small and medium scale organization.
19. Larson, P., (2007):- Focuses on the performance improvement programs and its impact on logistics
people as well as performance. The two most popular programs are EDI and outsourcing. Performance
improvement programs are classified under three groups:
A. Technological program – improve logistics performance not relations.
B. Relational program – improves both logistics performance and relations.
C. Analytical program – improves logistics performance not relationships.
D. The survey studied the impact of programs on co-operative relations and customer service and total costs.
The programs included benchmarking, TQM, ILM, carrier reduction, bar-coding, EDI, JIT and
outsourcing. The research unable to produce justification for following points,
E. Does the communication level between people makes positive impact on logistic performance?
F. Change in result, if applied in developing country like India
20. Smith, A., (2005):- The purpose of this paper is to understand impact of reverse logistic to accommodate
return item by customer In return item by customer though web based technologies with the help of
RFID. In return management researcher has focused following parameters of supply chain they are
capability, customer return centers, compatibility customer return centers, Distribution centers of reverse
logistics, strategic sources web-based Auto identification and data capture (AIDC),RFID system observed
as great tool for collecting data for return product The reverse logistic strategy having following steps
involved. 1) Assessing the role of reverse logistics 2) Information supports 3) Relationship commitment.
Study also focuses on cost and non-glamorous part of reverse logistics, but as reverse logistic related with
customer relationship management, organization can seek greater advantage by adopting reverse logistics
as part of strategic supply chain, increased Brand image and shows responsiveness to society.
This study linked with RFID and its application for returnable goods through web based technology.
Though this study covered important aspect of reverse logistic still it uncover following points, to
improve online purchase experience whether managing good return is more important than fast, effective
service, and user-friendly solutions.
21. Trainor.k.j.et.al (2011): This research focuses on performance implication and information technologies
with marketing capabilities. Model was derived having eight measure paremeters.These are market
orientation, technological orientation, competitive environment-marketing capabilities, market
turbulence, competitive intensity, customer performance, organizational performance. Industry should
pay special attention to complementary resource that is needed to be successfully implemented. IT
enabled marketing initiative and emphasis on technology is not sufficient. However this study lacks to
produce justification for some firm which realizes more gain from e-marketing initiative than other firm.
A study should carry out to investigate it.

SCHOLARS WORLD-IRMJCR Online: ISSN 2320-3145, Print: ISSN 2319-5789
www.scholarsworld.net [email protected] Volume. II, Issue II, April 2014 [101]
5. CONCLUSION:
Technology also plays an important role in the success of supply chain management. Even though the supply
chain concept pre-dates the Internet, only through the use of web-based software and communication can it
truly reach its full potential? Before the Internet, companies were limited because they were not able to receive
or to send updates, feedback, or other important information in a timely fashion. Additionally, companies were
limited in their ability to work with global partners because of language barriers and time differences. Using the
Internet to handle most of the elements involved in supply change management, including procurement and
communication, makes the exchange of data and the running of the supply chain faster.
One of the biggest benefits technology has given to the supply chain concept is the ability for companies to
collaborate. These collaborations are designed for the mutual benefit of all parties. For example, a supplier of
consumer goods may be linked up via the Internet to one of its distributors so that when the supply gets too low
an order for more of those goods can be placed automatically. In this way, the distributor never has to worry
about running out of a product and disappointing customers and the supplier doesn't have to worry about
maintaining a large inventory in expectation of demand. Similar systems have also been constructed to send out
multiple requests to vendors when an order is placed. Collaborating this way makes better use of existing
resources and paves the way for a larger profit margin on all sides of the equation.
While the benefits of supply chain management are many, using technology to achieve those benefits does have
two main drawbacks: one is resistance from vendors and the other is resistance from employees. Suppliers of
goods are often hesitant to jump onboard because of the initial costs involved in setting up their own end of
supply chain management system and because most vendors do not have a trusting relationship with their
buyers. To overcome this obstacle, the strong relationship must be present and the seller needs to be able to see
the profit potential on their end of the arrangement. Likewise, many employees have learned to develop a hate-
hate relationship with new technology. After all, it costs them their jobs and often makes them feel that their
work is more tedious or more complicated. Plus, software mistakes, which are inevitable at the beginning, may
cause other employees to lose faith in the system altogether. Employees need to trust the system, the company,
and their ability to use the program if they are going to adopt the supply chain management software.
6. FUTURE RESEARCH DIRECTION:
It has been demonstrated that IT is an essential ingredient for business survival and improves the
competitiveness of firms. As a result of the literature review, we can see that IT has a tremendous influence on
achieving an effective SCM. Integrating the supply chain activities is driven by the need to streamline
operations to achieve quality service to customers. There are many research articles on IT in SCM, but there is a
lack of critical review of the literature with the objective of brings out the pertinent factors that would influence
the successful application of IT in SCM. In this paper, an attempt has been made to review the literature on IT
in SCM and to develop a framework for the development and implementation of IT in SCM.
The literature available on IT in SCM has been reviewed based on the major components of IT- enabled SCM.
Although the literature survey is not exhaustive, it serves as a comprehensive base for an understanding of IT in
SCM. This classification has the objective of bringing out pertinent factors that would support practitioners in
their efforts to successfully achieving an IT-enabled SCM. As a result of the literature survey, the major
components of IT-enabled SCM comprises of six major areas: (i) strategic planning, (ii) virtual enterprise, (iii)
e-commerce, (iv) infrastructure, (v) knowledge and IT management and (vi) implementation. The foundations
of a well-developed IT-enabled SCM lie in the preparation of the ground factors of strategic planning and infra-
structure from which all development emanates. IT in supply chain strategy needs to be determined by the
senior executives in strategic plan. Senior managers and planners should understand that the importance of IT in
supply chain and realize that without support of IT systems, it is difficult to provides information for making
the best supply chain decisions.
Besides, the following are comments that derived from the literature survey on IT in SCM:
The strategic information systems should include the strategic objectives of SCM.
Information systems architecture needs to be designed for SCM that could be different from that of
traditional organizations.
Successful strategic information systems are not easy to implement in SCM. They require major changes
in how a business operates internally and with external partner.

SCHOLARS WORLD-IRMJCR Online: ISSN 2320-3145, Print: ISSN 2319-5789
www.scholarsworld.net [email protected] Volume. II, Issue II, April 2014 [102]
Commercial enterprise information systems require flexibility in order to accommodate individual
organizational characteristics.
Performance measures and metrics need to be established for measuring the performance and suitability
of IT in SCM.
There is a need for developing standards and legal frameworks for the application of IT in SCM.
The alignment between information model and supply chain model or objectives needs further
investigation.
7. MANAGERIAL IMPLICATION:
This research supports the posited relationships that there exist significantly different patterns of behavior in
logistics IT implementation, across different regions of the world and business types. Overall, the merchandising
firms are perceived to have a lead over the manufacturing firms for the nine IT issues probed, although such a lead
is sometimes marginal or reversed in some regions. However, merchandising firms across the several regions
(including WCL) attach higher competitive importance to EDI, bar-coding, and real time communications than the
manufacturing firms in their respective regions. While there are a number of possible explanations for this
observation, two interpretations are that merchandisers are more sensitive to logistics breakdowns than
manufacturers due to their proximity to final consumers, and that merchandisers are more geographically diverse,
thus desiring more real time communication.
Among the baseline firms from three developed regions of the world, the European firms seemingly
outperformed the North American and Pacific Rim firms in the five-year improvement in LIS capability, LIS
resource share increase, and the adequacy of LIS in meeting the firm's requirements. However, in the rest of the
nine IT issues related to EDI, barcode, and real time communications, North American firms tend to show a
significant lead over the European and the Pacific Rim. Pacific Rim firms, given the same technology
availability and similar industrial development, still seem to lag behind in these issues. However, these entire
baseline firms probably have to look up to the WCL firms for excellence in Major IT practice, as these WCL
firms tend to dominate in all nine issues over their counterparts of the same business types. These gaps are
usually statistically significant among groups, but especially so between the baseline groups and a WCL group.
This indicates that there is a substantial difference between world class firms and their more average
counterparts in all these dimensions of logistics IT strategy and capability.
This analysis provides an excellent opportunity for any firm wishing to benchmark on logistics IT practices. If a
logistics manager takes the initiative to examine its IT practice and determine the firm's scores related to the
nine issues presented here, he/she can readily pinpoint the strengths and weaknesses of their logistics IT by
comparing with those logistically elite firms in their business types (and regions).
The essence of these analyses also provides strong statistical evidence that the capabilities and supporting
practices of world class logistics are fundamentally the same throughout industrially developed nations, and that
being world class does make a difference (GLR, 1995). In terms of logistics IT capabilities, the WCL firms,
manufacturing or merchandising, show consistently less within-group difference (variation) than the between-
group difference (between the WCL firms and North American firms, for instance), and have a much higher
score in each of the nine IT issues on average.
8. FUTURE SCOPE:
The fast-paced evolution of information technology continues to offer new tools for firms to apply in logistics
planning and operations. In particular, the development of enterprise resource planning (ERP), Internet-based e-
commerce and e-business applications, collaborative planning, forecasting and replenishment (CPFR), and
advanced planning and scheduling (APS) certainly offer significant potential to enhance logistics performance.
However, the new developments in ERP, Internet, CPFR, and APS still build on the empirical observations
developed in this paper. New technologies employ the infrastructure developed using EDI, real-time
communications, and bar-coding. The current level of these new technologies still focus on the transaction-
oriented planning and operating applications that share substantial common ground with the "traditional"
technology such as EDI, bar-coding and satellite communications. This leads us to believe that much of our
findings related to "traditional" LIT would also be applicable to this new LIT technique to a certain extent.
While this research has focused on the development leaders and trends for LIT, there is certainly a need for
comparable research investigating the application of these newer technologies.

SCHOLARS WORLD-IRMJCR Online: ISSN 2320-3145, Print: ISSN 2319-5789
www.scholarsworld.net [email protected] Volume. II, Issue II, April 2014 [103]
9. REFERENCES:
1. Angeles,R.,et al.,“An empirical investigation of the level of electronic data interchange (EDI) implementation
and its ability to predict EDI system success measurement and EDI implementation factor”, International
Journal of Physical Distribution and Logistics Management, Vol. 28 No.12,2000 , pp. 773-793.
2. Angeles.R. “Anticipated IT infrastructure and supply chain integration capabilities for RFID and their associated
deployment outcomes.”International Journals of Information Management.Vol.29 2009 pp 219 -231.
3. Ballou, R., “Revenue estimation for logistics customer service offerings”, The International Journal of
Logistics Management, Vol. 17 No. 1, 2006, pp. 21-37.
4. Bazaras.D. et al; “Comparable analysis of information and communication in Lithuania and
Finland.”Information and Communication Technologies.Vol.1.No.25. 2010 pp 98 -123.
5. Brah, S., and Lim, H., “The effect of technology and TQM on the performance of logistics companies”,
International Journal of Physical Distribution & Logistics Management, Vol. 36 No. 3, 2006, pp. 192-209.
6. Byrd.T.et.al.”Examination of path model relating technology infrastructure with firm
performance.”Journals of Business Logistics. Vol.29, No.2 .2009.pp161-187.
7. Chieh-Yu Lin., et al. “An empirical study on organizational determinants of RFID adoption in logistic
industry.”Journals of Technology management and Innovation.vol.1.No.4 2009.pp 11-18.
8. Cho, J., et al. “Logistics capability, logistics outsourcing and firm performance in an e-commerce market”,
International Journal of Physical Distribution & Logistics Management, Vol. 38 No. 5, 2008, pp. 336-359.
9. Closs.D., “Logistics information technology practice in manufacturing and merchandising firms – an
international benchmarking study versus world class logistics firms”, International Journal of Physical
Distribution & Logistics Management, Vol. 30 No. 10, 2000, pp. 869-886.
10. Connolly, C., et al.” “Sensor trends in the processing and packaging of foods and pharmaceuticals”,
Sensor Review, Vol. 27 No. 2, 2007, pp. 103-108.
----
SCHOLARS WORLD-IRMJCR Online: ISSN 2320-3145, Print: ISSN 2319-5789
www.scholarsworld.net [email protected] Volume. II, Issue II, April 2014 [104]
CONTINUOUS AND COMPRENHENSIVE
EVALUATION AND QUALITY EDUCATION
R. MALLIKA,
Assistant Professor,
Avinashilingam University for Women, Ayya Avinashilingam
Nagar, Varappalayam, Coimbatore, Tamil Nadu- India
ABSTRACT
Evaluation must relate not only to the academic achievements of the students, but also aim at
assessing the all round development of the children. Comprehensive and Continuous Evaluation
is emphasized by explaining why, what, who, how, where and when of evaluation and a need for
a total scheme of evaluation. Importance of evaluating all round development, objectives of
assessment, and assessment as a means of improving school effectiveness are discussed in this
paper. Certain simple strategies that can be supported with traditional systems of evaluation such
as assessment through play story- telling and story completion, incomplete sentence technique,
original drawings and paintings are explained with suitable examples. Situations where projective
techniques can be used and the advantages of projective techniques have been briefed.
Keywords: Quality Education, Educational Evaluation, comprehensive evaluation, continuous
evaluation, innovations in evaluation, patterns of evaluation

SCHOLARS WORLD-IRMJCR Online: ISSN 2320-3145, Print: ISSN 2319-5789
www.scholarsworld.net [email protected] Volume. II, Issue II, April 2014 [105]
INTRODUCTION:
Provision of universal elementary education has been a-salient feature of our national policies and programmes.
A lot of plans and projects have been and being implemented in our country with all hopes and aspirations
which have not brought us to our expected destination. The quantitative expansion still far from our reach and
quality improvement is our desired dream.
The aim can be reached through proper evaluation of the system and integration the feedback into the system.
Comprehensive evaluation based on the continuous periodic assessment allows and encourages frequent
interaction between students and teachers, which helps the teacher to know the strengths and weakness of the
students. The remedial help provided by the teachers to the needy students using one - to - one communication
motivates students to attend the schools regularly and punctually. In the long run it reduces the dropout and
stagnation among school going children and increases their retention and quality of learning.
COMPREHENSIVE AND CONTINUOUS EVALUATION:
For making teaching learning effective, a teacher needs to evaluate the efficacy of instructional strategies
relative to the curriculum content and its transaction. He needs to modify the strategies as per the needs of
students. Continuous evaluation will be helpful to teachers in providing information on achievement of
particular levels of skills, understanding, and knowledge rather than mere achievement of numerical marks or
grades in one or two aspects of school curriculum programme.
Comprehensive and continuous evaluation is always with reference to the objectives of education and is not
done in a vacuum. It has to be comprehensive in a system which aims at the many sided development of the
personality of a child. Evaluation therefore, must relate not only to the academic achievements of the students,
but also aim at assessing the all round development of the children.
Why, what, who, how, where and when of Evaluation:
1. How - Diagnostic Testing - Reports, Oral Interview, Survey,
- Questionnaire
- Examination - Built in procedure, Criterion reference.
- Quality Control
2. Where - Place and action.
3. Why - To provide feedback – Improve Designs, Guidance
- Achievements of Objectives
- Efficiency and effectiveness of Teaching – Materials and action taken
4. What - Performance – Quantity - Number
Quality -Content, Methodology, Strategy
Competences, Materials
Procedure
Criteria
Objectives
5. When - End
- Interim - Random, Systematic
6. Who - Evaluator – Teacher, Self, Observers, Management, Peers, Parents
IMPORTANCE OF EVALUATING ALL ROUND DEVELOPMENT:
The primary task of education is the all-round development – cognitive, affective and psychomotor domain of
the learner. The role of the teacher is to check to what extent an objective fixed has been fulfilled and how far
the learning experiences provided have been appropriate and useful. But the traditional examination system
measure mostly scholastic areas neglecting other objectives. This type of traditional procedures and practices
use for testing pupil’s progress and for overall assessment do more harm than good to the students. More over
the traditional system has given scope to unfair means in the examination hall as well as wrote memory. Further
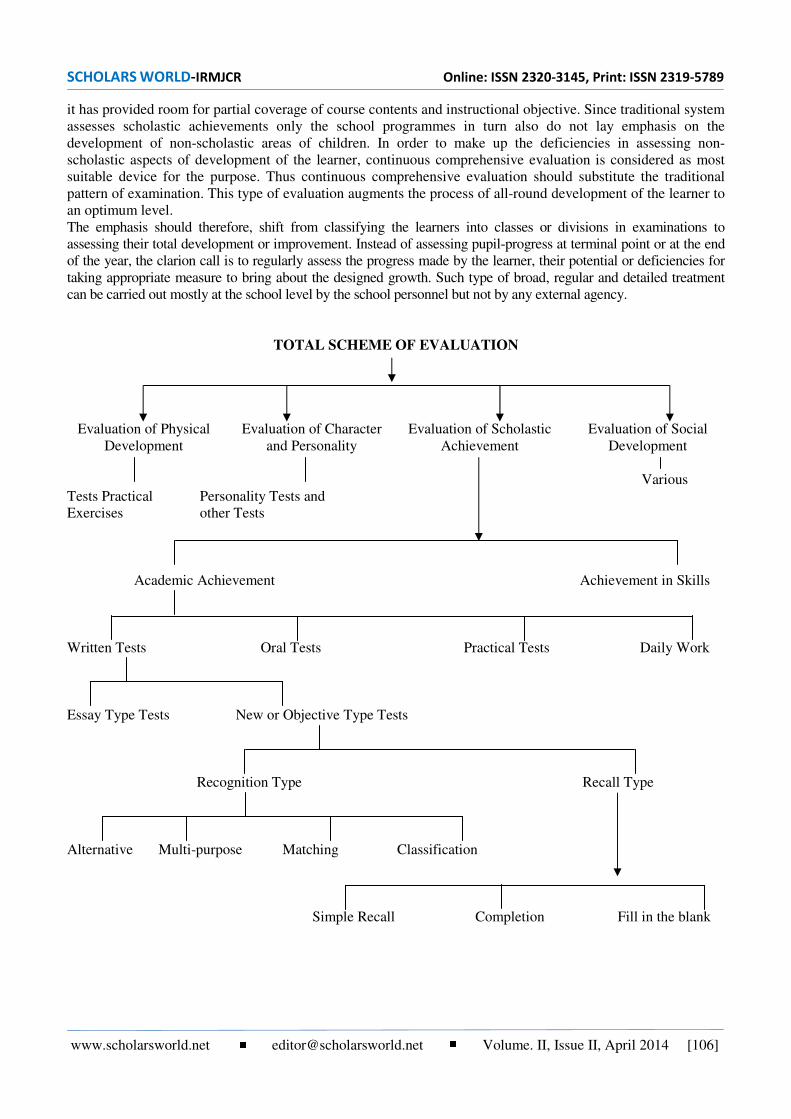
SCHOLARS WORLD-IRMJCR Online: ISSN 2320-3145, Print: ISSN 2319-5789
www.scholarsworld.net [email protected] Volume. II, Issue II, April 2014 [106]
it has provided room for partial coverage of course contents and instructional objective. Since traditional system
assesses scholastic achievements only the school programmes in turn also do not lay emphasis on the
development of non-scholastic areas of children. In order to make up the deficiencies in assessing non-
scholastic aspects of development of the learner, continuous comprehensive evaluation is considered as most
suitable device for the purpose. Thus continuous comprehensive evaluation should substitute the traditional
pattern of examination. This type of evaluation augments the process of all-round development of the learner to
an optimum level.
The emphasis should therefore, shift from classifying the learners into classes or divisions in examinations to
assessing their total development or improvement. Instead of assessing pupil-progress at terminal point or at the end
of the year, the clarion call is to regularly assess the progress made by the learner, their potential or deficiencies for
taking appropriate measure to bring about the designed growth. Such type of broad, regular and detailed treatment
can be carried out mostly at the school level by the school personnel but not by any external agency.
TOTAL SCHEME OF EVALUATION
Evaluation of Physical
Development
Evaluation of Character
and Personality
Evaluation of Scholastic
Achievement
Evaluation of Social
Development
Various
Tests Practical
Exercises
Personality Tests and
other Tests
Academic Achievement Achievement in Skills
Written Tests Oral Tests Practical Tests Daily Work
Essay Type Tests New or Objective Type Tests
Recognition Type Recall Type
Alternative Multi-purpose Matching Classification
Simple Recall Completion Fill in the blank

SCHOLARS WORLD-IRMJCR Online: ISSN 2320-3145, Print: ISSN 2319-5789
www.scholarsworld.net [email protected] Volume. II, Issue II, April 2014 [107]
OBJECTIVES OF ASSESSMENT ARE:
1. To assess the learning outcomes in selected competencies in various subjects, of study prescribed to those
classes by using universally accepted scientific approaches.
2. To enable the stakeholders to appreciate the need for assessment of quality and analyse the ensuring
outcomes so that they are better equipped to strive for educational progress.
3. To make available the reports of assessment to educational administrators, thinkers and common men at
large, so that the formulation of educational plans and schemes are done on sound scientific lines
ASSESSMENT AS A MEANS OF IMPROVING SCHOOL EFFECTIVENESS:
In India enrolment figures appeared to be impressive but the retention rates is much below the expectations.
Still difficult to explain is the situation when a child attends schooling and does not seem to demonstrate
enhanced scholastic achievements and other qualities. This refers to the quality of output of schooling, which
has a large number of antecedently variables. The assessment of pupil achievement and the circumstances from
pupils becomes absolutely necessary to dig out the truth behind less than optimal outcomes of educational
venture. The assessment may vary in nature, clientele, purpose and its use. However, weak accomplishments,
certainly has to be of poorer quality of education. Assessment figures need to point out what has been teaching
or how well pupils have learnt. Needless to mention that this realization will be directly proportional to the
quality of tools employed for making such an assessment. More important would be the capacity of the teachers
and other personnel to analyse the assessment results and related to the inputs and process which may in turn
helped develop insight into the cause of these outcomes. This feed back, when utilised to undertake appropriate,
well-thought corrective measures, is likely to improve the quality of elementary education, in general, and that
of pupil achievement in particular. The feedback would also be utilized to analyse the effect of various input
variables and identify areas of weaknesses.
Action to remove the weaknesses will again contribute towards higher quality of output. In fact, assessment has
to be against certain goals liable to be achieved commensurate with the inputs and processes. Assessment based
on quantitative data alone is not sufficient. Such quantifications are not possible for all input variables,
especially the process values.
The interest in quality dimensions is, relatively, a newer concept and a challenge of modern times. Obviously, it
is not only the collection of a variety of concepts, which may
automatically ensure quality of elementary education. Indeed, it is the quality of individual inputs that matters.
Further, important is the process that takes place in a congenial environment, which may determine the quality of
output. It implies that assessment should focus on ascertaining the adequacy, appropriateness and quality of each
input, besides ensuring the quality of the processes undertaken. There are no commonly used procedures to meet
this challenge. It poses threat to the ingenuity of persons interested in developing assessment tools for monitoring,
quality dimensions of elementary education in a reasonable seriousness. The following projective techniques shall
be of great use in bringing out the unrevealed sides of assessment to lay strong foundation to the child in preparing
him to meet the various demands of his future life with courage and confidence. The emotional maturity shall be
expected from those children whose feelings are properly assessed, guided and nurtured.
Assessment through Play:
Situation should be such as to give a free play to his ideas at the unconscious level. Controlled play techniques
shall be used. A great variety of material may be used in play situations. An example is briefed hereunder.
Many dolls are given to the child to play with and observation is made of his reactions. These dolls represent a
father, a mother, a boy and a girl. These dolls provide a medium the medium through which the child might act
out or reveal his thoughts, impulses and feelings about himself and others.
In a free play, a boy who happens to be jealous of his sister might assign the role of the sister to the baby and
cause it punished by the father doll or mother doll, or shunt the baby doll to a far corner of the room. This will
indicate that the girl is preferred to him in the family.
Assessment through Story- telling and Story Completion:
An incomplete story may be told to the child and he may be asked to complete it. While completing the story,
the child may reveal something about his feelings and desires. He may be asked to let his imagination go to

SCHOLARS WORLD-IRMJCR Online: ISSN 2320-3145, Print: ISSN 2319-5789
www.scholarsworld.net [email protected] Volume. II, Issue II, April 2014 [108]
show how imaginative he is. The situation selected should be such as touches the emotional life of the child
whose personality traits we wish to assess. For instance, the child is asked to relate a story about an innocent
child who was beaten by his father. The child is likely to depict his innermost feelings, wishes and thoughts
while he narrates the story. Take another case when a child is told about the beginning of a story. Father is
ready to take the children to the exhibition. All of a sudden a guest comes. The child may be asked to complete
the story. As the child finishes the story, the teacher comes to know the personality traits of the child.
Assessment through Incomplete Sentence Technique:
The method is very simple. Some incomplete sentences are presented to the child, which he completes in any
way he likes. By reading the individual’s response, the counselor records observations that indicate unhealthy
or conflicting, positive or healthy attitudes, etc. Stimulus in the form of the following words may be presented
to the child:
(a) A baby ……………….
(b) The world ……………
(c) My home ……………..
(d) My father ……………..
(e) Money …………………
(f) My best friend …………
For example, the child may complete these sentences in the following manner:
(a) A baby is very lovely.
(b) The world is full of cruel people.
(c) My home is not a good place to live in.
(d) My father is very cruel.
(e) Money is everything in life.
(f) My best friend is very poor.
The teacher, by going through these sentences, shall get some clue of the repressed wishes of the child.
Assessment through Original Drawings and Paintings:
Original drawings and paintings of the children give an idea of the personality of the child. The theme or
subject he chooses the color he uses, the masses and the open spaces that the paintings contain, the length,
direction, curvature of the lines –all these give an indication of the various traits of the personality of the child.
Situations where Projective Techniques can be used:
Some of the most favorable situations for the use of projective techniques are given below:
1. To diagnose the behavioral problems of students.
2. To study the personality of children who are not able or not willing to discuss their problems directly.
3. To verify the patterns of personality emerging out of subjective or objective techniques.
4. To study the home and school adjustment of adolescents.
5. To study the personality or adjustment patterns of more sensitive persons or of those who tend to give
biased responses on tests.
6. To use for clinical work.
7. To test illiterate persons of different language backgrounds.
8. To identify the subject’s real concerns, his conception of himself and the way he views his human environment.
Advantages of Projective Techniques:
1. An individual reveals himself in various situations and sometimes he is not aware of this fact. Thus we
get reliable information.
SCHOLARS WORLD-IRMJCR Online: ISSN 2320-3145, Print: ISSN 2319-5789
www.scholarsworld.net [email protected] Volume. II, Issue II, April 2014 [109]
2. The connection between diagnosis and the situations is very close.
3. It is not possible for the individual to give readymade, habitual or conventional responses, as the tasks
presented are novel and unstructured.
4. These encourage spontaneous responses.
5. These enable us to have a total view of the personality of an individual, rather than in piece-meal.
CONCLUSION:
On the whole, effective steps have been taken by Government of India and other agencies in the field of
Elementary Education. But universalisation of Primary Education and up-gradation of the quality of
Elementary Education has still far away from achievement. All kinds of projects and experiments are to be
taken to improve the Elementary Education up to our expectation. On account of the deficiency and failure of
Elementary Education, eradication of illiteracy would be a great task. Government has been duplicating a
number of institutions and multiplying the schemes over these years. Co-ordination cooperation and
commitment on the part of the people in charge of implementation shall reduce a lot of wastage and duplication
of efforts. Adequate evaluation and monitoring of the achievements of the children in terms of their
requirements are necessary. We are getting so much of funds from different sources both internal and external
and sometimes we are incurring loans from the World Bank and other Agencies, but the very purpose of
improving the quality and quantity of elementary education shall be ensured if and only if our systems prepare
the citizens to meet the challenges of their lives. The all round development and evaluation of the same and
proper usage of feedbacks from the evaluation are the key words to success
REFERENCES:
1. Agarwal.A.C., (2003) Basic Ideas in Educational Psychologyhipra Publications`
2. RaviKrishna,M., Rao, D.B., (2004), Examination Systems, Discovery Publishing House
3. Mohanthy,J., (2002)Primary and Elementary Education, Deep & DeepPublications.
4. Sivarajan, K., (2004), Trends and Developments in Modern Educational Practice, Calicut University.
5. Rajagopal, K.R.,(2006), Evaluation, Elements of Statistics and Research in Education, Shantha
Publications, Chennai.
6. Vashist, S.R. (2006), Practice of Educational Evaluation, Anmol Publications Pvt Ltd., New Delhi.
7. Ramchandani, S. (2008), Modern Methods and Techniques of Teaching, Dominant Publishers and
Distributors, New Delhi.
8. Mangal,S.K. (2011),Advanced Educational Psychology, Tandon Publishers, Ludhiana.
9. www.edtech.vt.edu/edtech/id/wbi/indexhtml
----

SCHOLARS WORLD-IRMJCR Online: ISSN 2320-3145, Print: ISSN 2319-5789
www.scholarsworld.net [email protected] Volume. II, Issue II, April 2014 [110]
CONTRIBUTION OF MANAGEMENT EDUCATION IN
INCULCATING EMPLOYABILITY SKILLS IN THE STUDENTS
DR. NIDHI GUPTA,
Professor
Rukmini Devi Institute Of advanced Studies,
Madhuban Chowk, Outer Ring Road,
Rohini Delhi- India
MS. POOJA KALRA,
Assistant professor
Rukmini Devi Institute Of advanced Studies,
Madhuban Chowk, Outer Ring Road,
Rohini Delhi- India
ABSTRACT
The quality of academia determines the prosperity of the industry and the government of a
particular country. Academia can help industry and government by sharpening the talent
resources and offering executive education. Outdated technology not catering to the needs of
industry can be resolved by involving academia. Industry’s need to constantly innovate can be
met by leveraging academia for research.
In this paper, we tried to deeply analyze the quality of management education in India and to
identify the loopholes hindering its effectiveness. According to the author, lack of clarity
regarding the expected outcome of the management education program, discipline-orientation and
ivory-tower approach of the academicians, lack of involvement by practitioners in the industry
and strong inclination towards conceptual learning are some of the reasons serving as obstacles in
the pathway of Indian management education.
If we give a glance to the statistics then we will get to know that MBA seats in India grew almost
four-fold from 95,000 in 2006-07 to 3,60,000 in 2011-12, resulting in a five-year compounded
annual growth rate of 30 per cent which shows that the stress is on just to increase the number of
higher education institution and not on enhancing the quality of education.
Though the number of education Institutes have grown manifold the job opportunities for MBA have
not grown proportionately attributing to a number of lacunas namely no quality control, placements
not commensurate with fees being charged, lack of good infrastructure & faculty & most importantly
lack of emphasis on practical skills required to survive in the everyday changing corporate
environment that offers whole new bunch of challenges to be faced everyday by the managers.
With significant changes taking place in trade, industry and economy, the Indian management
education programs are becoming less and less relevant. To cope with the increasing competition and
globalization, due to liberalization, Indian organizations are trying out newer and newer management
systems and techniques like TQM (Total Quality Management), JIT (Just-in-Time Inventory). But
management education has not been able to keep pace with the dynamism, of the practicing world.
In the design of the management education programs, there is insufficient clarity regarding the
expected outcome of the program. There appears to be no clear idea regarding the knowledge,
skills, abilities, attitudes and values required of a person, to be effective in Managerial roles. In
effect, there is no model of an ‘effective manager'. Management education programs often merely
imitate the graduate programs of American Management Schools, as developed 30 years ago,
with minor modifications.
SCHOLARS WORLD-IRMJCR Online: ISSN 2320-3145, Print: ISSN 2319-5789
www.scholarsworld.net [email protected] Volume. II, Issue II, April 2014 [111]
In addition to the discipline-orientation and lack of contact with the practicing world, the vested
interests of faculty groups seem to play an important role in curriculum design and review,
particularly in institutions where Post-Graduate Program teaching is considered prestigious. The
program curriculum often tends to be viewed as a piece of cake to be shared among the different
disciplines. The issue of "turf” seems to play an important role in curriculum design and review.
The design of the management education programs indicates a strong bias towards conceptual
learning. Development of appropriate skills, attitudes and values does not seem to be as
important. Academicians have a strong liking for conceptual learning prefer to teach what they
know best - concepts and models - rather than identifying what is required to be an effective
manager and help the students to learn that even if it is difficult to teach.
In a nutshell It can be concluded that the quality of education has deflated to such an extent that
only 10 % of the graduates are actually employable despite the robust demand for MBAs &
further the condition has been worsen as economic growth rate hit its slowest in the last nine
years and the quality of education provided by B-schools came under the radar.
Suggestions for enhancing the effectiveness of Indian management education are:
-Design of the admission criteria and curriculum need to be based on a clearer understanding of
the goals of the management education.
-Focus of the management education may need to be shifted from conceptual learning to skill
development, attitude change and value clarification.
-Acquiring a faculty having greater practical orientation and inter-disciplinary approach ought to
be made an important objective in the faculty selection and development.
-Establish greater collaboration between the management institutions and the industry with regard
to the design and conduct of management education programs and management research.
-In order to provide greater incentive to the management institutions to respond to the needs of
the practicing world, Government-financing of management institutions should be gradually
discontinued and management institutions should be encouraged to generate the funds they need
from the industry and the market.
Keywords: Quality, Industry, Academia, turf, Skills, TQM, JIT
INTRODUCTION:
In the economic perspective, according to the theory of human capital education and training are treated as an
investment process which generates a future flow of income. Investment in education is assumed to exert a
positive impact on workers’ productivity and in turn on their income (wages). Apart from these benefits,
investing in human capital also incurs costs. These costs can take the form of the expenses of studying (fees,
costs of accommodation and travel etc.), but also include opportunity cost, that is from the loss of potential
income during study – the time spent on studying cannot be devoted to a productive job that generates
production and income. It is assumed that these costs are compensated when the knowledge and competencies
accumulated in the education process (human capital) generate a sufficiently high rate of return and raise the
future flow of income to a level high enough to compensate for all costs incurred.
The theory of human capital originated in the works of Becker (1964) and rests on the assumption of a strong
relationship between productivity and wages. The model of Ben-Porath (1967) and the famous Mincer wage
equation (1974) show that education and training strongly influence wage formation during the life cycle.
Important implications of the Ben-Porath model include the following:
Persons with more schooling tend to also invest more in job training;
Persons significantly engaged in training in one period are more likely to do so again in the future;
Persons with greater ability or better schooling tend to engage in job training more than others with the
same level of schooling; and Education and training create assets in the form of knowledge and skills
which increase the productive capacity of manpower and this is referred to as human capital. Education is
considered to be a process of skill formation and in this aspect it is treated at par with the process of

SCHOLARS WORLD-IRMJCR Online: ISSN 2320-3145, Print: ISSN 2319-5789
www.scholarsworld.net [email protected] Volume. II, Issue II, April 2014 [112]
capital formation. Economists argue that as demand for educational training increases, the systems need
to meet the country’s requirement for people with high levels of skill and knowledge. But the major
stumbling block in this growth path is the inadequate skill set of the workforce. While on the one side we
have the world’s large stock of scientists, engineers and management graduates, we have been unable to
derive full economic benefit from this talent base because of the mismatch between industry needs and
university output. Skillful management of the intellectual capital could be a driver for growth and is
imperative for Indian economy. The purpose of this study is to identify the employability skills required
by young graduates and assess how there can be a value creation through effective knowledge
management in terms of pedagogy, evaluation process and feedback mechanisms.
Management education in India has gained prominence in the last one or two decades. Going by the trend, there
is mushrooming growth of institutions engaged in imparting management education to the younger generation.
But, employers are complaining that they are not finding employable candidates among the job-seekers. Many
research studies substantiate and validate the employers’ view. Such studies have reflected that only 25% of the
B-school graduates are employable. What is happening to the rest 75%? What’s wrong with them? Probably, B-
schools fail to teach young job aspirants the skills desired by employers, popularly referred to as
Employability Skills (ES) that include soft skills, technical skills, conceptual skills, life
skills and 21st century readiness skills.
Adam Smith (1776) pointed out that a “man educated at the expense of much labour and time …may be
compared to one of those expensive machines” (Smith) and other classical economists observed that
expenditure on education could be regarded as a form of investments that promised future benefits. The strength
of a nation is dependent on its intellectual and skillful citizens. It can be observed that education is an essential
tool for achieving sustainability. Only a quality future human capital can envision development of its nation to
meet the needs of the present without compromising the ability of future generations to meet their own need.
Without a quality human capital, a nation will be weak as there is no human factor that is capable to embark on
new initiatives and perspectives. A quality human capital comes from a quality education process. A carefully
designed and well planned education system is critical to developing such human capital. Thus, institutions of
higher learning play a very important role and the teaching and learning processes in institutions of higher
learning should provide such knowledge and skills to future management graduates.
If we talk about increasing number of job opportunities emerging across sectors, India is reeling under the
pressure of severe shortage of quality talent in the job market. Employability is far bigger a challenge than
unemployment. Industry leaders feel that the “skills” and “quality” of the workforce need a lot of improvement.
Plagued with problems like curriculum, lack of qualified faculty, poor quality of content, and not-so-effective
examination system, technical institutions do not provide signalling value in the job market. A disparity exists
in the types of skills taught at colleges and those that are demanded in industry.
The design of the course curriculum at b-schools does not match industry requirements. There is lack of quality
among b-schools because of propensity to commercialize. Many facilities for quality education at b-schools are
missing (except the premier ones). The students get very elementary knowledge of the subject without exposure
to good literature in important fields like FM, security analysis and portfolio management, project planning etc.
The system of education is based on offering elective subjects. Focus at most b-schools is on developing skills
like PPT preparation, conference management, dressing with precision, preparing fancy CVs and teaching the
art of handling employment interviews by circumventing the query. Placement orientation is overly focussed.
Moreover the exams of last semester are held after the placement offers; hence the institutions automatically
push students to complete the course. Such graduates carry with them a pride of an MBA degree.
The dream of getting a good salary package gets broken when the students fail to secure a good profile having a
good salary package in any reputed MNC. Because of this many students rather than taking up any institute for
doing post graduation now like to wait and appear in the entrance again and then get admitted in the college of
their choice as they say that waiting for one more year is better as compared to doing compromise and
destroying the career forever. The central and the state governments too are having grave concern over the fact
that a very meagre percentage of institutes in India are providing quality education at par. With the number of

SCHOLARS WORLD-IRMJCR Online: ISSN 2320-3145, Print: ISSN 2319-5789
www.scholarsworld.net [email protected] Volume. II, Issue II, April 2014 [113]
students sitting in entrance increasing manifolds every year the need of the hour is that majority institutes if not
all should be emphasizing on making students corporate friendly as some institutes cannot accommodate all the
deserving candidates due to the constraint of limited seats.
However, while the lower-rung management schools are being bypassed, there are still tens of thousands who
make a B-line to join an IIM. Pankaj Chandra, director of IIM-Bangalore, boasts of the lakhs of students who
sign up to take the Common Admission Test (CAT) for close to 3,000 seats that the IIMs have on offer. "It is a
great time to do an MBA. The brightest ones still want to do an MBA," he adds.
LITERATURE REVIEW:
D S Rawat, secretary general Assocham "B-schools and Engineering colleges shut down- Big Business
Struggles" by The Associated Chambers of Commerce and Industry of India (Assocham). In this he said that
there is no quality control, the placements are not commensurate with fees being charged, the faculty is not
good enough and there is no infrastructure.
"The biggest reason for the gap is the rapid mushrooming of tier-2 and tier-3 management education institutes
that has unfortunately not been matched by commensurate uplift in the quality of management education. The
most of students prefer to choose cheaper AICTE approved programs rather than B-schools", said Mr. Rawat.
A new graduate 'rich list' has revealed the universities where students are most likely to become multi-millionaires.
If we give a glance to the statistics then we will get to know that MBA seats in India grew almost
four-fold from 95,000 in 2006-07 to 3,60,000 in 2011-12 resulting in a five-year compounded annual growth
rate of 30 per cent which shows that the stress is on just to increase the number of higher education institution
and not on enhancing the quality of education.
Indore, June 8, Saturday, Indo Asian News Service (IANS) President Pranab Mukherjee.
The statement by our President Mr. Pranabh Mukerjee in IIT Indore in 2013 that not even a single Indian
Institution has not been included in the list of top 200 Universities in the world speaks the fact that where the
level of quality of education in India stands that too in the era of cut throat competition in every field
specifically corporate sector & education sector.
Aspiring Minds’ Chief Executive Himanshu Aggarwal says that a large number of India’s business schools
“underestimate” the importance of soft skills.
Aspiring Minds conducted one “employability test” on 32,000 MBA graduates from 220 business schools
across India. The test, which quizzed graduates on topics ranging from grammar to quantitative analysis, found
that only 10% of those tested had skills that recruiters typically look for while hiring management graduates.
The study found that less than half of the students tested had some knowledge of key industry terms and
concepts in their areas of specialty. For instance, one third of the surveyed students who had majored in finance,
did not know what IPO – short for initial public offering – stood for. Similarly most of the students who have
opted marketing as the major specialization were unaware of the term Green Marketing.
A third of all students tested lacked Basic English grammar skills, a prerequisite for working in the corporate
environment, particularly in client-facing roles like consulting, banking, marketing and sales.
(http://blogs.wsj.com/indiarealtime/2012/12/12/study-less-than-10-indian-mbas-employable/)
The “one-size-fits-all curriculum” doesn’t give students a chance to get an in-depth understanding of their area
of specialization, says Saurabh Mukherjee, head of the equity division at Mumbai financial services firm Ambit
Capital. Mr. Mukherjee adds that industry-specific skills and vocational training is “glaringly missing” in most
Indian business schools.
Rohit Sarin, who heads Client Associates, a Gurgaon-based private wealth management firm, agrees. Mr. Sarin
says companies like his are opting to hire individuals with a few years of work experience over fresh MBA
graduates who have little or no work experience prior to enrolling in business school in India.
To make Indian MBA graduates more employable, Mr. Sarin says business schools need to “make a conscious
effort to bridge the gap between theory and practice.”

SCHOLARS WORLD-IRMJCR Online: ISSN 2320-3145, Print: ISSN 2319-5789
www.scholarsworld.net [email protected] Volume. II, Issue II, April 2014 [114]
Making employability the buzzword, Britain's Leeds University is keen to forge ties with Indian industry to get
a sense of its needs. It is also in talks with the IITs and IISc for research projects and student exchange
programmes.
Experts say that institutes have started paying a little attention in making the students skilled workers only after
bodies like NASSCOM have stepped in and pressed the panic button that its high time and something has to be
done to nurture the students with the employability skills and to make them industry ready. NASSCOM in its
report based on the survey being conducted by them disclosed the shocking result that out of the 4,00,000 odd
students that pass out of colleges every year only 20% are capable of being employed rest are lacking the skills
required and therefore are required to go through another rigorous training to get a job. Dr. Vijay
Pandharipande, Vice Chancellor (VC), BAMU said, “From this academic year, we will have vocational courses
instead of traditional courses.”With inputs from the Marathwada Chamber of Commerce, BAMU has planned
six degree courses in the field of: Banking, Finance and Insurance Travel and Tourism Industry Automation
Information and Communication Technology Automobile Industry Pharma industry.
According to Ajay Srinivasan, Head – Industry Research, CRISIL Research, “Low occupancy rates are making
it difficult for many lower-rung colleges to sustain operations. As a result, we expect a number of colleges to
face closure or change in ownership over the next few years.”
In a nutshell It can be concluded that the quality of education has deflated to such an extent that only 10 % of
the graduates are actually employable despite the robust demand for MBAs & further the condition has been
worsen as economic growth rate hit its slowest in the last nine years and the quality of education provided by B-
schools came under the radar.
OBJECTIVES OF THE STUDY:
1. To assess the quality of education given to the students – is it at par with the industry requirement.
2. To identify the possible steps that can be taken to make the management graduates/post graduates more
corporate driven.
3. To identify where do higher education managers and academics see the biggest developmental needs?
4. To analyze do teaching modes have any impact on the successful employment and work of graduates?
5. What role do practical and international experiences play in graduates’ employability?
6. To identify do practically-oriented studies prepare graduates better for work than Scientifically-oriented
study programs?
7. To throw light on the employability skills required for technical and management graduates.
8. To discuss the initiatives taken by the state government towards skill building of technical students.
9. To explore how soft skills can be integrated with curriculum thereby grooming the professional students
for employment.
METHODOLOGY:
This study is analytical and comprises secondary data which is collected from books and periodicals, journals,
literature review and content analysis, Websites of Delhi State Government, e-articles and newspapers.
EMPLOYABILTY & MBA GRADUATES:
If we have to define employability skills we can say that “employability skills are a set of achievements,
understandings and personal attributes that make individuals more likely to gain employment and to be
successful in their chosen occupations”.
The MBA program failed to enhance students’ soft skills. Students lack good English speaking ability,
grooming, confidence, corporate orientation and attitude. It’s a myth that
MBA students automatically get dream jobs. It not only depends on the students’ ability to get trained but institution
also has an equal role in training the students. The soft skills or we can say communication skills are the area that
needs to be worked upon. Moreover a rigorous admission process needs to be followed in admitting the students in
the B schools. A very small percentage of the total B schools that are in India are following the three round process
of admission each process having its own weightage. The three round processes includes entrance test in the first
SCHOLARS WORLD-IRMJCR Online: ISSN 2320-3145, Print: ISSN 2319-5789
www.scholarsworld.net [email protected] Volume. II, Issue II, April 2014 [115]
place then those who qualify the entrance test are called for the round of Group discussion. In this round there
leadership skills, Communication skills and the content of information that they speak is rated. Those who perform
well in Group Discussion are then called for the last and the final round i.e. Interview round. Through this three
round process the institutes are able to get the candidates who can become prospective candidates for the corporate
sector after two year of rigorous training which involves moulding and shaping them to suit the ever changing needs
of corporate. By following a proper selection procedure helps the institutes can not only assess the analytical skills of
a candidate but also the communication skills. It was rightly pointed out by Mr. Aggarwal rightly quoted that if
anyone score a little less in analytical skills survival in corporate is possible but if anyone has a short hand in
communication skills that person will straight away shown the door.
Other studies also point to how difficult it is to employ MBA graduates in India. Earlier this year, Bangalore-
based education consultancy MeritTac conducted a study of 2,264 MBA students in the country and found that
only 21% of them were considered fit for employment.
Some industry experts say that these findings are evidence that India’s MBA curriculum is flawed because of its
emphasis on rote learning rather than on hands-on experience. In this paper one of the major point which stated
that B School are closing because they are not able to provide good placement for the students. This raises a
question that Why are the students not able to secure placement in MBA.
This is because of the quality of input to the colleges as student admission. Most of the colleges have to admit
to the course that ever approaches the institution.
Today the MBA joiners with passion to take management program is very low because now a days only those
who are not able to get a job or placement in UG join MBA. How can a student who has low employability skill in
UG level and not acquired additional skill or enhanced his employability skill can be placed in MBA. Youngsters
these days are more enlightened with advanced search engines available at their fingertips, they check out the sites
of prospective Institutes and before they pay for the prospectus they take a round of the Institute's premises
checking out the infrastructure and finally they never fail to have a meeting with the CRC/Placement Cell to quiz
them on the Corporates who have been to their Campus to offer Jobs and the package on Offer. The Focus it
seems is on the package......so the old theory of the Older the Wine...the better the taste is now out of the
window....it is How much ( Corporate ) tie up....and What Offer.... which holds their interests.
Another reason which is mushroom growth of colleges and increasing the intake which has increased the
demand but the supply from UG college has not increased proportionate to the demand.
CONCLUSION:
The detailed in depth analysis of the educational sector is pointing only towards one major cause that is
responsible behind low employability rate among the post graduate students and the reason is lack of Practical
experience as the course curriculum is based on outdated methodologies that stresses on imparting the
theoretical knowledge because of which the students are not able to get well versed with the real life complex
problems that they need to face every now and then once they join corporate. Majority B schools are failing to a
large extent in inculcating leadership skills among the students. Need of the hour is to focus on the overall
personality development of the students which can be achieved by adopting the strategies like Goal setting,
Conflict Management and Diversity Management. Some B schools have included Personality Development as a
part of their curriculum but the sad part is that due to poor formulation of the activities it fails to develop
Interpersonal Skills, People’s Management and handling of Cultural Diversity. Moreover there is immense lack
of Personal Mentoring and Experiential Learning process in the Course Curriculum & Imbalance in the
combination of Academic & Social Capabilities.
The solution to questions raised and problems highlighted lies in adopting multi-pronged strategy. First, b-
schools must provide in depth knowledge in the core areas, expose students to literature of repute, encourage,
guide and help them to explore and find their core subjects; focus on quality education rather than acting as
placement consultants/head hunters; and link their curriculum revision exercise to changing industry
requirements. B schools must prepare their students to become job ready by inculcating ES. In this direction,
core academic subjects for 21st Century i.e. global awareness; financial, economic, business and entrepreneurial
literacy; civil literacy must be taught which will help impart ‘TEA Skills’ (Technical skills, Employability
skills, and Academic skills). Faculty at b-schools must help aimless students to find passion and focus. Teachers
should act as facilitators and master practitioners to help students learn in context and adept their teaching to
support authentic learning.
SCHOLARS WORLD-IRMJCR Online: ISSN 2320-3145, Print: ISSN 2319-5789
www.scholarsworld.net [email protected] Volume. II, Issue II, April 2014 [116]
Secondly the employers need to communicate in clear terms to the educational institutions what all are there
specific requirements in terms of employability skills they look for in the prospective candidate. Industry-
specific, sector-wise skill sets must be chalked out and publicized at requisite forums (FICCI, CII, NSDC,
Sectoral skill councils, Management Bodies like AIMA) to enable management students to help choose skills
they want to learn in their strive for a particular career. The need of the hour is to improvise upon the standards
and raise the bar so that both the institutes and corporate can be benefitted, To Win...just as the need would be
of a Leader - a Team Player....similarly the need in Management Schools survival is in winning the confidence
of the students with improved quality enhancement.
LATEST PAPERS IN SUPPORT OF OUR STUDY:
1. Employability Skills and Attributes Framework Project –Background Paper (2011)
2. Edge/SCRE Centre (2011) Employers’ perceptions of the employability skills of new graduate.
3. Employability Skills: A Research and Policy Briefing (April 2010) –
http://www.ukces.org.uk/publications/employability-skills-research-and-policy-briefing#sthash.ED5ZH
NO p. dpuf
REFERENCES:
1. Smith Adam,(2003)“The Wealth of Nations”, 1776.
2. Bianca Kubler, Peter Forbes, (2004 ) “Student Employability Profiles Engineering. Enhancing Student
Employability”, Coordination Team (ESECT), the Higher Education Academy,
3. Hofstrand , R., [1996 71(8), 51]. “Getting all the skills employers want. Techniques: Making Education &
Career Connections”.
4. Lankard, B.A., (1990) “Employability- the fifth basic skill”, Eric Digest N0.14.Colunbus: Centeron
Education and Training for employment. the Ohio State University (ERIC No.EDO-CE-90-104)
5. "B-schools and Engineering colleges shut down- Big Business Struggles" by The Associated Chambers
of Commerce and Industry of India (Assocham).
6. Indo Asian News Service (IANS) President Pranab Mukherjee (June 8 2013), Saturday, Indore.
7. Krishan Khanna,Chairman-iWatch, www.wakeupcall.org
8. http://www.deccanherald.com/content/318782/leeds-university-looks-improving-indian.html
9. http://www.derby.ac.uk/lei/careers-and-employability/improving-student-employabilityand-career-
management –skills.
10. The Corporate Recruiters Survey by, Graduate Management Admission Council (GMAC), a global
nonprofit education organization and the owner of the Graduate Management Admission Test (GMAT).
11. Dr. Poonam, “MANAGEMENT EDUCATION – IS IT DRIVING EMPLOYABILITY?”
12. http://blogs.wsj.com/indiarealtime/2012/12/12/study-less-than-10-indian-mbas-employable/
13. Many Engineering & MBA Colleges May Shut Down – CRISIL Report
14. Hemali Chhapia, (Feb 19, 2012, 02.44 AM IST) Business dull, 65 B-schools across India to shut down, TNN.
15. O R S Rao, (03 June 2013 11:52 am) Boosting Indian Economy, , Vice Chancellor, The ICFAI
University, Jharkhand. http://www.edu-leaders.com/content/boosting-indian-
economy?utm_source=newsletter-core&utm_medium=email&utm_campaign=20130606
16. Graduate 'rich list' reveals universities that will make you a millionaire: Oxford comes top but Manchester
is also in 'super wealthy' elite http://www.dailymail.co.uk/news/article-2314550/UK-graduate-rich-list-
reveals-universities-make-millionaire-Oxford-comes-top.html#ixzz2WANnR3qi
17. Preetika Rana “Study: Less Than 10% of Indian MBA Graduates Are ‘Employable’”
18. NATIONAL EMPLOYABILITY REPORT, MBA Graduates, Annual Report 2012.
----

SCHOLARS WORLD-IRMJCR Online: ISSN 2320-3145, Print: ISSN 2319-5789
www.scholarsworld.net [email protected] Volume. II, Issue II, April 2014 [117]
REFINING SCIENCE EDUCATION IN TIBETAN
BUDDHIST SETTLEMENT IN INDIA
Dr. BAIJU K. NATH,
Assistant Professor,
Department of Education
University of Calicut, Kerala, India
LISHA APPUKUTTAN,
M. Ed Student (2012-13 Batch),
Dept. of Education, University of Calicut
Kerala, India
ABSTRACT
This paper presents an overview of Science education in the Tibetan settlement in Indian sub
continent in Bylakkuppe, Karnataka. Sera monastery is one of the great three Gelupka university
monasteries of Tibet which was built in Bylakuppe in 1969. Sera Mey and Sera Jey Monastic
Universities come under Sera monastery. These institutions are non-profitable charitable
institutions with the sole aim of preservation advancement and transferring Dharma. Both Sera
Mey and Sera Jey administers a school each, Sera Mey Thoesem School and Sera Jey Secondary
School for providing modern education for young monks along with Buddhist education.
Buddhist monasteries are concentrating on studying and teaching of Buddhist principles by
centuries. The method of teaching follows the traditional way that is oral teaching and monks
listening carefully for the knowledge given by the teacher in traditional Buddhist education, but
the method of Science teaching follows inclusion of modern technologies, use of experiments and
an exposure to the scientific facts by the trained monks. ‘Science for Monks’, ‘Science meets
Dharma’, Tenzin Gyatso Science, Scholar Program’ are the core projects which were
implemented by the Dalai Lama for educating Tibetan Buddhist Monks. The Sager Leadership
Institute, Rikon Tibetan Institute, Emory- Tibet Partnership by Emory University and Mind and
Life Summer Research Institute with the collaborating universities in the refining process.
Keywords: Buddhism, Science Teaching, Secondary Education, Science reforms

SCHOLARS WORLD-IRMJCR Online: ISSN 2320-3145, Print: ISSN 2319-5789
www.scholarsworld.net [email protected] Volume. II, Issue II, April 2014 [118]
INTRODUCTION:
Buddhism and Science have increasingly been discussed as compatible, and Buddhism has entered into the
science and religion dialogue (Yong & Amos, 2005). The case is made that the philosophic and psychological
teachings within Buddhism share commonalities with modern scientific and philosophic thought. Some popular
conceptions of Buddhism connect it to the discourse regarding evolution, quantum theory and cosmology,
though most scientists see a separation between the religious and metaphysical statements of Buddhism and
methodology of science. The present study attempts to study the reforms and the practices in science education
in the Tibetan Buddhist monastery in a practical aspect in relation to science and Buddhism.
Buddhism, in the sense of field of thought which has grown up about the Buddha’s name, was born in North India
in sixth century B.C., but within a thousand years or so it was established outside the land of birth at least ten
countries, each within a different language, and for fifteen hundred years the volume of scriptures has been
growing steadily. The Buddhist scriptures then are a vast collection of writing in a dozen of languages having the
common stem from Buddha’s enlightenment as expressed through the medium of his own or lesser minds and that
they have the same basis of teaching, the Four Noble Truths. The rest is the middle way, a way to be trodden by
each and every Buddhist as he works out his own salvation and diligence to the same Supreme Enlightenment.
INTRODUCTION OF BUDDHISM IN TIBET:
In the reign of King ThothoriNyantsen (5thB.C.), a group of Buddhist scriptures arrived at Tibet from India
written in Sanskrit, they were translated into Tibetan in the reign of King Srongtsongtsamgampo (618-649) who
was married to Chinese and Nepalese queens who were both Buddhists, later he too became interested in
Buddhism. Srongtsong tsam gampo was the first patron of Buddhism in Tibet who built many temples
throughout and encouraged the people to practice the Buddhist teachings.
In the eighth century B.C., one of the later rulers interested in the teaching of Buddha invited Shantarakshita, a
famous Buddhist scholar and Padmasambhava, a famous master of meditation from India and they together
establish the teachings of Mahayana and Vajrayana firmly in Tibet. During the time of these two great masters,
great monasteries were built, more translations of Buddhist texts were made, and by the time, India became the
primary source of Buddhist culture of the Tibetans. The eleventh century is remarked by a great increase in
contacts between Tibet and India and a corresponding growth in Buddhist activity in Tibet. Later on the entire
collection of Buddhist literature from India was translated into Tibetan and by thirteenth century when Buddhism
in India began to decline, Tibet was ready not only to preserve Buddhism, but also to transmit it to other lands.
In the middle of 20th century, when Tibet came under the rule of the People’s Republic of China, Buddhism was
repressed and Dalai Lama fled to India seeking political asylum. Followed him was an exodus of refugees.
Jawaharlal Nehru, the then prime minister of India agreed to provide assistance to the refugees, in the form of
settlements in some cooler regions of India.
Byalakuppe, in Karnataka state is one such Tibetan settlement comprised of agricultural land, small camps and
several monasteries as in all major Tibetan Buddhist traditions. Bylakuppe now holds the largest Tibetan
settlement camp in India. Bylakuupe is famous as a tourist spot in India, where the Golden Temple which
belong to Namdroling Monastery is situated. A number of monasteries, schools, camps can be seen which
belongs and highlights the Tibetan tradition.
Sera monastery is one of the great three Gelupka university monasteries of Tibet which was built in Bylakuppe
in 1969. Sera Mey and Sera Jey Monastic Universities come under Sera monastery. These institutions are non-
profitable charitable institutions with the sole aim of preservation advancement and transferring Dharma. Both
Sera Mey and Sera Jey administers a school each, Sera Mey Thoesem School and Sera Jey Secondary School
for providing modern education for young monks along with Buddhist education.
A couple of centuries ago when science and religion started to diverge and each wanted to take over the
territory of knowledge to itself both thinking that they are the supreme and everything can be explained by the
perspectives of each. Science believed everything could be explained scientifically and religions, possibly as a
kind of reaction to what the scientists are doing, believing everything could be explained in religious terms.
There was zero overlap between Religion and Science at that time (Josephson,).
SCHOLARS WORLD-IRMJCR Online: ISSN 2320-3145, Print: ISSN 2319-5789
www.scholarsworld.net [email protected] Volume. II, Issue II, April 2014 [119]
With the rise of the new millennium, the Western and Eastern religions historically coincided with the rise of
modern science and corresponding perceived decline of religious orthodoxy in the West (Verhoeven, 2001). In
the Oriental and Occidental religious and philosophic encounter, India holds a unique position in many aspects
in Science in the third millennium as explained by Richard Ernst, Nobel Laureate in Chemistry. India is the
source of some of the most profound schools of thought of mankind with the Mahabharatha and and
Bhagavatgita expressing Hindu Philosophy and the Tripitaka summarizing the Buddhist view. Both
Philosophical systems with their respect for all beings and compassion may be fruitful sources for universal
ethical system. These uniqueness attracts the western scientists in the eastern religions especially Buddhism.
The linking of science and Buddhism dates back to many years. Why science and religion and what role they
play has to be understood in separation and in cooperation. In the world in which we are living, where a true
schism exist between science and society, where society claims that science is responsible for most of the evil
on earth, having caused all the pollution including nuclear, radioactive pollution, a society that is nevertheless
thoughtlessly using and misusing all the goods of science and technology. On the other hand, the great scientists
and achievers in science believe the progress of mankind in technology is solely the contribution of science. It is
the task of science to develop strategies for sustainable development.
Religion can form the base of ethics, philosophy and can give the guidelines to solve the problems which
cannot be solved by science and technology, guidelines for our actions, guidelines for our research projects and
research goals. This can achieve progress in the direction of establishing a unified ethical system of values
which may serve as a basis for a future beneficial development of science and society on global scale.
Cabezon(2008) argues that the unsophisticated view of compatibility, or even identity, between Buddhism and
science is now being replaced by one of complementarities. Each has something to offer the other. The simplest
Buddhist formulation of the way to emancipating enlightenment outlines three trainings: the training in
morality, in meditation, and in wisdom. Buddhism and Science make an excellent contribution to discussing the
second and third in the light of modern scientific approaches, but hardly mention the first – morality. Yet the
connection between morality and scientific enterprises is a live topic in current discussions of science, with very
good reason. New scientific developments almost always have implications for human well-being beyond the
satisfaction of the curiosity of the researchers, and beyond the promise of technologies for entertainment or
labor-saving. For example, transport, agricultural (e.g. genetic modification) and power generation technologies
can have major environmental impacts. And medical technologies can involve potentially harming some beings
(including experimental animals) to fulfill the wishes of others.
The close link between intention and result, cause and effect, is central to all Buddhist philosophy. The very fabric
of modern science, lacking as it does a firm grounding in the moral sphere, would result in deleterious discoveries
and incomplete uses. It is envisaged that a through research will add to the existing knowledge about Buddhism
and science and the contributions a religion can do in the science for recognizing the real goals for the overall
good of the humanity. "I wanted to understand science because it gave me a new area to explore in my personal
quest to understand the nature of reality. I also wanted to learn about it because I recognized in it a compelling
way to communicate insights gleaned from my own spiritual tradition."( His Holiness the Dalai Lama).
The focus of this paper is on basic aspects of education and the efforts and reforms of providing science
education to the Tibetan Buddhist monks in the Indian settlement. Monastic education for centuries have been
focusing on the core subjects of Buddhism, and the initiatives for why and how the science education being
included and followed, is a topic to be explored. The major programmes and institutions collaborated in the
process also need to be explored.
METHODOLOGY:
The focus area of this research is the science education in the Sera Mahayana Monastic University (SMMU)
and Sera Mey Thoesam School (SMTS) in the Tibetan Buddhist settlement in Bylakuppe, near Kushalnagar,
Mysore District in the state of Karnataka in South west India. Sera MeyThoesem School is a monastic school
which imparts modern education and traditional education to the young monks. The Sera Mahayana monastic
university is the educational institution for Buddhist monks and the education system follows the Buddhist
traditional teaching and learning methods. We employed a Case Study to have a close relationship with the
Buddhist community to observe the peculiarities of Buddhist education practiced in real, in Sera Thoesem
SCHOLARS WORLD-IRMJCR Online: ISSN 2320-3145, Print: ISSN 2319-5789
www.scholarsworld.net [email protected] Volume. II, Issue II, April 2014 [120]
School and SeraMey Monastic University. We tried to grab the reality and thick description of participants’ life
experiences, thoughts and feelings in various situations using different data sources. The research has fixed the
boundaries of the study to the proposals and teaching method for science education for monks in the monastic
education system with principles of Buddhism as its backbone. The recent reforms in the monastic education
for the promotion of science education and the initiatives by His Holiness Dalai Lama are also analyzed.
The sample of the research includes the administrators, supporting staff, teachers and students of both SMTS
and SMMU. In SMTS, unstructured interview was done for the administrators and science teachers. The
interview with other subject teachers especially social and mathematics teachers were incidental and those
interviews added to the comprehensiveness of the study by including other dimensions of the study i.e. the
geography, the demography, history and present status of the settlement, the general characteristics of the young
monks, and experience as teachers in the monastic school.
In SMMU, interview was conducted with the administrators, especially the secretary of SMMU and science
teacher in the monastery. Questions for the monks were translated and asked by the secretary. We interviewed
the science teacher of the Sera Jey Monastery to collect information about Science Education Programs for
monks as the project set up for the Sera Monastery as whole in the initial years.
The primary data sources in this research were the interview recordings, data from our observation, ‘She- yon’
magazine published by Sera Jey Secondary School in 1998, and the data collected from the official website of
Sera Mey Monastic University.
The secondary sources include the websites of;
1. Science for monks; Science For Monks - www.scienceformonks.org,
2. Mind and Life Institute - www.mindandlife.org,
3. Tibet Rikkon Institute – www.tibetrikkoninstitute.org
4. Emory university -Tibet.emory.org
5. Website of Central Tibetan Administration (CTA) based on Dharmasala, India, which is the
administrating body of the institutions - www.sherig.org.
6. Official website of His Holiness the 14thDalai Lama Tenzin Gyatso for his talks about science and
Buddhism - www.dalailama.com.
The data was subjected to thematic analysis, on the bases of the following themes, viz., Method of Teaching,
Method of Science Teaching, Programmes for Refining Science, and Reforms in Education. The findings of the
analysis are summarized below.
EDUCATION IN THE SETTLEMENT:
Education as per the Tibetan education Policy in Exile 2005 states that, “Education is not to be recognized
merely as a means of livelihood. Instead, it is to be recognized as a means of achieving temporary as well as
long-term welfare for the self and others. In particular, it is to be recognized as a vehicle of social welfare and
service” and “Education is about recognizing the undesired suffering and abandoning its cause; and recognizing
the desired happiness and engaging in practice of its cause. It is, thus, to be recognized as a means towards
engaging in desirable actions and avoiding undesirable actions”. The education sector was given prime priority
by the His Holiness Dalai Lama with a long and sacred vision to preserve the Tibetan culture and tradition and
to provide education to the children to improve their life and cope up with the modern world. As such schools
were set up in the settlements for the giving education to the children in exile. The education sector is in two
main streams; one is the general education mainly following the CBSE pattern and the other is the monastic
studies, which resembles the Gurukula system in ancient India. The only difference is that during day time, they
have to attend the monastery schools for modern education.
During the ancient days, the tradition prevailing in Tibet was that the boy in each family must join the
monastery to learn the Buddhist philosophy as a part of enriching and preserving their culture. Nowadays, the
tradition is hardly followed. But still there is no decrease in the number of students joining the monastery.
Today the young monks joining monastery is from the families following Buddhist religion mainly from Tibet,
Nepal, Andhra Pradesh, Ladakh, Himachal Pradesh and Himalayan regions attracted mainly for free education,
accommodation and food. Also the monks are very much interested in the monastic life and dedicate themselves

SCHOLARS WORLD-IRMJCR Online: ISSN 2320-3145, Print: ISSN 2319-5789
www.scholarsworld.net [email protected] Volume. II, Issue II, April 2014 [121]
for the preservation, enrichment and transmitting the Buddhist culture and religion. The monks join monastery
in the age of usually five and the upper limit to join the school is 13. Anyone can join the monastery to study
the Buddhist philosophy but have to learn Tibetan language for a period of one year and have to practice
celibacy and must follow the life of a monk thereafter. In the modern world of culture evasion and culture
destruction the Tibetan Buddhism and the urge for its conservation holds a unique position.
Among the major monasteries in Bylakuppe, Sera monastery is the largest in the Geluk sector. Sera hold two
major monasteries Sera Jey Monastic University (SJMU) and Sera Mey Monastic University (SMMU) with
monastic schools as integral part of them. Sera Mey Thoesam School (SMMU) and Sera Jey Secondary School
(SJSS) come under the Sera Mey Monastic University and Sera Jey Monastic University respectively. These
schools are meant to provide basic education for the monks. Off the two schools, the study area selected was
Sera MeyThoesam School and Sera Mey Monastery.
The traditional Tibetan Monastic education lasts for nearly 20 years. The core curriculum includes base, path,
result and view, practice and discipline of the inner science, language, valid cognition, art and medicine
contained in the Yungdrung Bon and Buddhadharma traditions. The study of five classical texts is divided
between 14 classes.
SCIENCE EDUCATION IN THE SETTLEMENT:
The comprehensive science curriculum for the Tibetan monastic science education was developed by the
Emory- Tibet partnership which foster cross- cultural understanding. Pedagogy is based on the Problem Based
Learning, collaborative learning, active learning, and experiential learning. The science curriculum includes
many opportunities for dialogue and discussion, demonstrations, experiments, and field work and focuses on
building knowledge on the basic concepts and also advanced level concepts and discoveries of modern science.
Mathematics is also included in the science education as a part of understanding and problem solving.
The curriculum includes topics of common interest in science and Buddhism. The Philosophy of Science,
Cosmology, Life Science and Neuro-Cognitive Science are the areas of interest. Teachers as in the SMTS are of
two groups such as Scriptural teachers and Responsible teachers. The Scriptural teachers are responsible for the
education and the Responsible teachers provide overall care. The teacher appointed for science in the monastery
is a Tibetan citizen with post graduate degree and adequate teaching experience.
METHOD OF TEACHING:
The method of teaching follows the traditional way that is oral teaching and monks listening carefully for the
knowledge given by the teacher in traditional Buddhist education. The monks can approach his scriptural
teachers and also other scriptural teachers at the home or in the classes at the monastery at the time allotted for
learning Buddhist texts.
The classes are suspended during festivals and at any special occasions.
METHOD OF SCIENCE TEACHING:
Method of Science teaching in the monastery follows inclusion of modern technologies, use of experiments and
an exposure to the scientific facts by the trained monks and the lay man serving as science teachers in the
monastery. The monks have daily two hours class for science. The curriculum prescribed by Emory-Tibet
partnership is followed. The classroom teaching involves demonstration of experiments, participatory
demonstration, exhibiting videos of scientific processes and facts, student observation and active discussion
among teacher and monks and between monks.
PROGRAMMES FOR REFINING SCIENCE:
The text by Emory – Tibet partnership presents the topics both in Tibetan and English language and
classes conducted so on.
Science Education for monks is administered by the Science Department in LTWA Headed by Director
Geshe Lhakdor.
SCHOLARS WORLD-IRMJCR Online: ISSN 2320-3145, Print: ISSN 2319-5789
www.scholarsworld.net [email protected] Volume. II, Issue II, April 2014 [122]
‘Science for Monks’, ‘Science meets Dharma’, Tenzin Gyatso Science, Scholar Program’ are the core
projects which were implemented by the Dalai Lama for educating Tibetan Buddhist Monks including
Sera from 2000.
The Sager Leadership Institute, Rikon Tibetan Institute, Emory- Tibet Partnership by Emory University
and Mind and Life Summer Research Institute with the collaborating universities successfully handled the
historic undertaking of refining science successfully so far.
A comprehensive curriculum was developed by the Emory-Tibet Science Initiative (ETSI) team.
The Mind and Life Dialogues were established to pioneer collaboration between scientists, scholars, and
contemplatives, the world’s most seasoned experts in introspection and mental training.
The guiding conviction of all these collaborations was that such collaboration would be constructive for
modern science and beneficial for humanity in general from 1987.
REFORMS IN SCIENCE:
Science for Monks: The project was implemented with the mission to create science learning communities within the Tibetan
monastic in exile to engage Buddhism with science. In the initial stage of the project in 2000, Tibetan Library
set up a team of three translators to translate educational writings to Tibetan and conducted a 4-week science
course for 50 monk scholars. In 2001, the partnership of Sager Family Foundation with the Tibetan Library
brought Western scientists to India for science workshops. Between 2000 and 2007, nine 4 week intensive
science workshops were successfully implemented with the participants from the various monasteries and
teachers around the world. In 2000 the workshop was held at Sera monastery. In the initial stages the monks
from both Sera Jey and Sera Mey had common classes for science. In 2008, a group of 30 monks, the first
cohort of Sager Science Leadership Institute began training to teach science, how to implement science
education programmes and dialogues within their local monasteries. In May 2010, 30 of the monks of the first
cohort were given graduation in science and were declared as teachers and leaders of science. In April 2010, the
second cohort training was started by the Sager Leadership Institute. The second cohort was organized at the
Deer Park Institute, Bir, India for two weeks with 34 participants from various monasteries including Nepal.
The cohort focused on the topic “Perception”. The Sager Leadership Institute organized local leadership groups
with the collaborative effort of LTWA has also developed collaboration with other universities in West which
include Emory University which supported for the creation of an comprehensive curriculum for all the Tibetan
monasteries. In 2011, an interactive exhibition was organized by LTWA focusing on the topics of common
interest of both Buddhism and science. The exhibits were prepared by the monks of both Emory Science
initiative and the Sager science initiative for monks.
Science meets Dharma:
The project Science meets Dharma (SmD) from 2001-2011, is a Tibet Rikon Institute initiative, to provide
scientific education for the monks and nuns in Tibetan exile monasteries in India. In the first phase 8
monasteries from South India were selected which include Sera monasteries. During the 10 years of SmD, from
2001-2011 appropriate curricula, subject contents and dialectical forms were developed and tested in
classrooms with the active participation of the Western teachers, translators and teachers both lay men and the
monks who graduated in science. The administration of the SmD was carried out by a Swiss Manager along
with a Tibetan consultant. A Geshe serves as coordinator for the everydayneeds of the science teaching in
Bylakuppe and Mundgod. These administrators help in organizing the science classes, developing science
curriculum and provide teaching aids.In 2010, SmD organized study weeks in Mundgod and Bylakuppe on
Space and Time, Brain and Mind (2011) and Ecology (2012).
Two levels of science education/ competency of science implemented are, a novice level graduate with
conceptual level of understanding in science, and Expert level graduate with the ability to participate and
contribute to scientific experiments and discourse.
Mind and Life Institute (MLI):
The Mind and Life Dialogues were established to pioneer collaboration between scientists, scholars, and
contemplatives, the world’s most seasoned experts in introspection and mental training. The guiding conviction
was that such collaboration would be constructive for modern science and beneficial for humanity in general.
With funding from The Hershey Family Foundation, Engle and Varela were able to host 26 dialogues with the
SCHOLARS WORLD-IRMJCR Online: ISSN 2320-3145, Print: ISSN 2319-5789
www.scholarsworld.net [email protected] Volume. II, Issue II, April 2014 [123]
Dalai Lama between 1987 and 2012. From 2003, the Mind and Life Summer Research Institute coordinates the
events. The unique characteristic of MLI approach to the sciences investigating the mind is the integration of
the first and second person inquiry developed and refined by the worlds’ living contemplative traditions with
the third person inquiry developed and refined by modern science. The multidisciplinary investigation which
includes the traditional mind sciences, social sciences, contemplative scholarship and practice, philosophy and
humanities is implemented.
CONCLUSION:
From the conventional method of teaching in the Tibetan Buddhist monastery the adoption of technology in
teaching science, even though only science is a major reform in the community where still continues traditional
method of teaching followed for Buddhist texts. The monastic science classes and lab set up will reach the
standard of any modern universities soon with the heartfelt collaboration of sponsors and western universities.
Also the standard will be met in terms of facilities, teaching faculty, inventions and achievement. Beyond
technology the reforms include the organization of and participation in the science exhibitions, scientific
inquiry, science graduates among the monks and translation works of major science text to Tibetan. Tenzin
Gyatso Science Scholar Program, Science cohorts by ETSI and Sager Family Dialogues organized by MLI are
some programs for improving science education in the monasteries.
REFERENCE:
1. Cabezon, J. I. (2008), Buddhist Narratives of the Great Debates. An International Journal of Reasoning.
2. Josephson. (2004). Tibetans in India. Encyclopedia of Diaspora. Pp 1119- 1130.
3. Verhoeven, M. J. (2001). Buddhism and Science: Probing the Boundaries of Faith and Reason.Religion
East and West, vol. 1, pp77-97.
4. Yong &Amos. (2005), Buddhism and Science: Breaking New Ground (review) Buddhist-Christian
Studies vol. 25, pp176-180
WEBSITES:
1. http://www.scienceformonks.org Accessed on 1st July 2013
2. http://www.mindandlife.org Accessed on 10th July 2013
3. http://www.tibet-institut.ch/content/tir/en/about_us_only.html Accessed on 1 st July 2013
4. http://www.tibet.emory.edu Accessed on 21st July 2013
5. http://www.sherig.org. Accessed on 21st July 2013
6. http://www.dalailama.com. Accessed on 1st July 2013
----

SCHOLARS WORLD-IRMJCR Online: ISSN 2320-3145, Print: ISSN 2319-5789
www.scholarsworld.net [email protected] Volume. II, Issue II, April 2014 [124]
APPLICATION OF XBRL IN FINANCIAL REPORTING
DR. MEGHNA CHOTALIYA,
Assistant Professor,
Department of Accountancy , R. D. National College,
Linking Road, Bandra (west) Mumbai- Maharashtra- India
ABSTRACT
XBRL (e Xtensible Business Reporting Language) is a freely available, market-driven, open, and
global standard for exchanging business information. XBRL allows information modeling and the
expression of semantic meaning commonly required in business reporting. XBRL, now more than
a decade old, was developed to increase the effectiveness and efficiency of the information use.
XBRL is a language that leverages internet technologies for the communication of business
information coupled to the metadata associated with the information. This study is aimed to
understand the use of XBRL in financial reporting in India, documents and methodologies
adopted for its implementation.
Keywords: XBRL, Business Reporting, internet technologies, information.
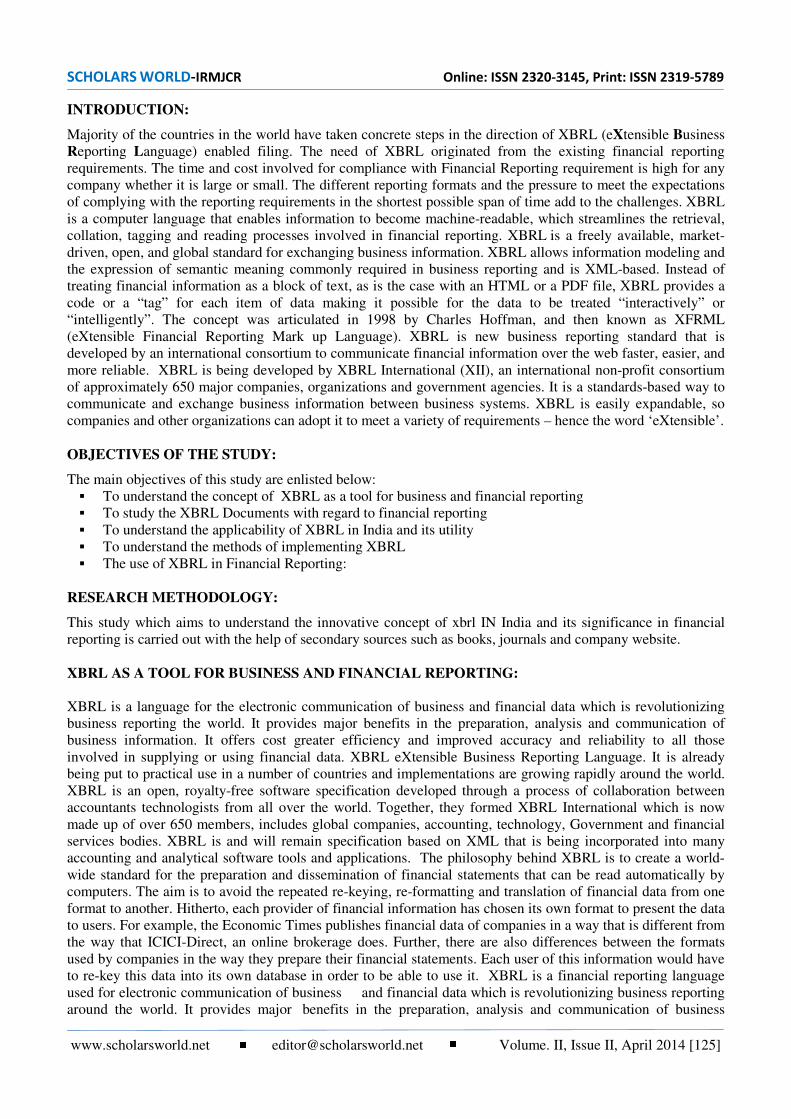
SCHOLARS WORLD-IRMJCR Online: ISSN 2320-3145, Print: ISSN 2319-5789
www.scholarsworld.net [email protected] Volume. II, Issue II, April 2014 [125]
INTRODUCTION:
Majority of the countries in the world have taken concrete steps in the direction of XBRL (eXtensible Business
Reporting Language) enabled filing. The need of XBRL originated from the existing financial reporting
requirements. The time and cost involved for compliance with Financial Reporting requirement is high for any
company whether it is large or small. The different reporting formats and the pressure to meet the expectations
of complying with the reporting requirements in the shortest possible span of time add to the challenges. XBRL
is a computer language that enables information to become machine-readable, which streamlines the retrieval,
collation, tagging and reading processes involved in financial reporting. XBRL is a freely available, market-
driven, open, and global standard for exchanging business information. XBRL allows information modeling and
the expression of semantic meaning commonly required in business reporting and is XML-based. Instead of
treating financial information as a block of text, as is the case with an HTML or a PDF file, XBRL provides a
code or a “tag” for each item of data making it possible for the data to be treated “interactively” or
“intelligently”. The concept was articulated in 1998 by Charles Hoffman, and then known as XFRML
(eXtensible Financial Reporting Mark up Language). XBRL is new business reporting standard that is
developed by an international consortium to communicate financial information over the web faster, easier, and
more reliable. XBRL is being developed by XBRL International (XII), an international non-profit consortium
of approximately 650 major companies, organizations and government agencies. It is a standards-based way to
communicate and exchange business information between business systems. XBRL is easily expandable, so
companies and other organizations can adopt it to meet a variety of requirements – hence the word ‘eXtensible’.
OBJECTIVES OF THE STUDY:
The main objectives of this study are enlisted below:
To understand the concept of XBRL as a tool for business and financial reporting
To study the XBRL Documents with regard to financial reporting
To understand the applicability of XBRL in India and its utility
To understand the methods of implementing XBRL
The use of XBRL in Financial Reporting:
RESEARCH METHODOLOGY:
This study which aims to understand the innovative concept of xbrl IN India and its significance in financial
reporting is carried out with the help of secondary sources such as books, journals and company website.
XBRL AS A TOOL FOR BUSINESS AND FINANCIAL REPORTING:
XBRL is a language for the electronic communication of business and financial data which is revolutionizing
business reporting the world. It provides major benefits in the preparation, analysis and communication of
business information. It offers cost greater efficiency and improved accuracy and reliability to all those
involved in supplying or using financial data. XBRL eXtensible Business Reporting Language. It is already
being put to practical use in a number of countries and implementations are growing rapidly around the world.
XBRL is an open, royalty-free software specification developed through a process of collaboration between
accountants technologists from all over the world. Together, they formed XBRL International which is now
made up of over 650 members, includes global companies, accounting, technology, Government and financial
services bodies. XBRL is and will remain specification based on XML that is being incorporated into many
accounting and analytical software tools and applications. The philosophy behind XBRL is to create a world-
wide standard for the preparation and dissemination of financial statements that can be read automatically by
computers. The aim is to avoid the repeated re-keying, re-formatting and translation of financial data from one
format to another. Hitherto, each provider of financial information has chosen its own format to present the data
to users. For example, the Economic Times publishes financial data of companies in a way that is different from
the way that ICICI-Direct, an online brokerage does. Further, there are also differences between the formats
used by companies in the way they prepare their financial statements. Each user of this information would have
to re-key this data into its own database in order to be able to use it. XBRL is a financial reporting language
used for electronic communication of business and financial data which is revolutionizing business reporting
around the world. It provides major benefits in the preparation, analysis and communication of business
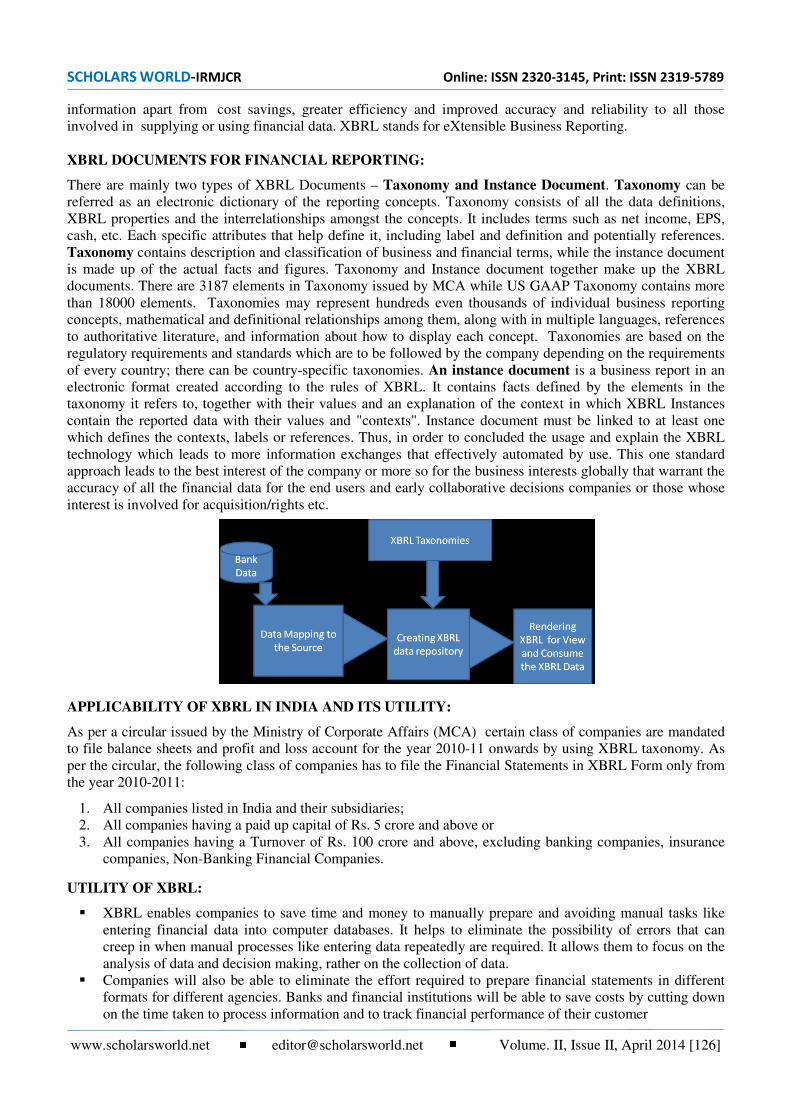
SCHOLARS WORLD-IRMJCR Online: ISSN 2320-3145, Print: ISSN 2319-5789
www.scholarsworld.net [email protected] Volume. II, Issue II, April 2014 [126]
information apart from cost savings, greater efficiency and improved accuracy and reliability to all those
involved in supplying or using financial data. XBRL stands for eXtensible Business Reporting.
XBRL DOCUMENTS FOR FINANCIAL REPORTING:
There are mainly two types of XBRL Documents – Taxonomy and Instance Document. Taxonomy can be
referred as an electronic dictionary of the reporting concepts. Taxonomy consists of all the data definitions,
XBRL properties and the interrelationships amongst the concepts. It includes terms such as net income, EPS,
cash, etc. Each specific attributes that help define it, including label and definition and potentially references.
Taxonomy contains description and classification of business and financial terms, while the instance document
is made up of the actual facts and figures. Taxonomy and Instance document together make up the XBRL
documents. There are 3187 elements in Taxonomy issued by MCA while US GAAP Taxonomy contains more
than 18000 elements. Taxonomies may represent hundreds even thousands of individual business reporting
concepts, mathematical and definitional relationships among them, along with in multiple languages, references
to authoritative literature, and information about how to display each concept. Taxonomies are based on the
regulatory requirements and standards which are to be followed by the company depending on the requirements
of every country; there can be country-specific taxonomies. An instance document is a business report in an
electronic format created according to the rules of XBRL. It contains facts defined by the elements in the
taxonomy it refers to, together with their values and an explanation of the context in which XBRL Instances
contain the reported data with their values and "contexts". Instance document must be linked to at least one
which defines the contexts, labels or references. Thus, in order to concluded the usage and explain the XBRL
technology which leads to more information exchanges that effectively automated by use. This one standard
approach leads to the best interest of the company or more so for the business interests globally that warrant the
accuracy of all the financial data for the end users and early collaborative decisions companies or those whose
interest is involved for acquisition/rights etc.
APPLICABILITY OF XBRL IN INDIA AND ITS UTILITY:
As per a circular issued by the Ministry of Corporate Affairs (MCA) certain class of companies are mandated
to file balance sheets and profit and loss account for the year 2010-11 onwards by using XBRL taxonomy. As
per the circular, the following class of companies has to file the Financial Statements in XBRL Form only from
the year 2010-2011:
1. All companies listed in India and their subsidiaries;
2. All companies having a paid up capital of Rs. 5 crore and above or
3. All companies having a Turnover of Rs. 100 crore and above, excluding banking companies, insurance
companies, Non-Banking Financial Companies.
UTILITY OF XBRL:
XBRL enables companies to save time and money to manually prepare and avoiding manual tasks like
entering financial data into computer databases. It helps to eliminate the possibility of errors that can
creep in when manual processes like entering data repeatedly are required. It allows them to focus on the
analysis of data and decision making, rather on the collection of data.
Companies will also be able to eliminate the effort required to prepare financial statements in different
formats for different agencies. Banks and financial institutions will be able to save costs by cutting down
on the time taken to process information and to track financial performance of their customer
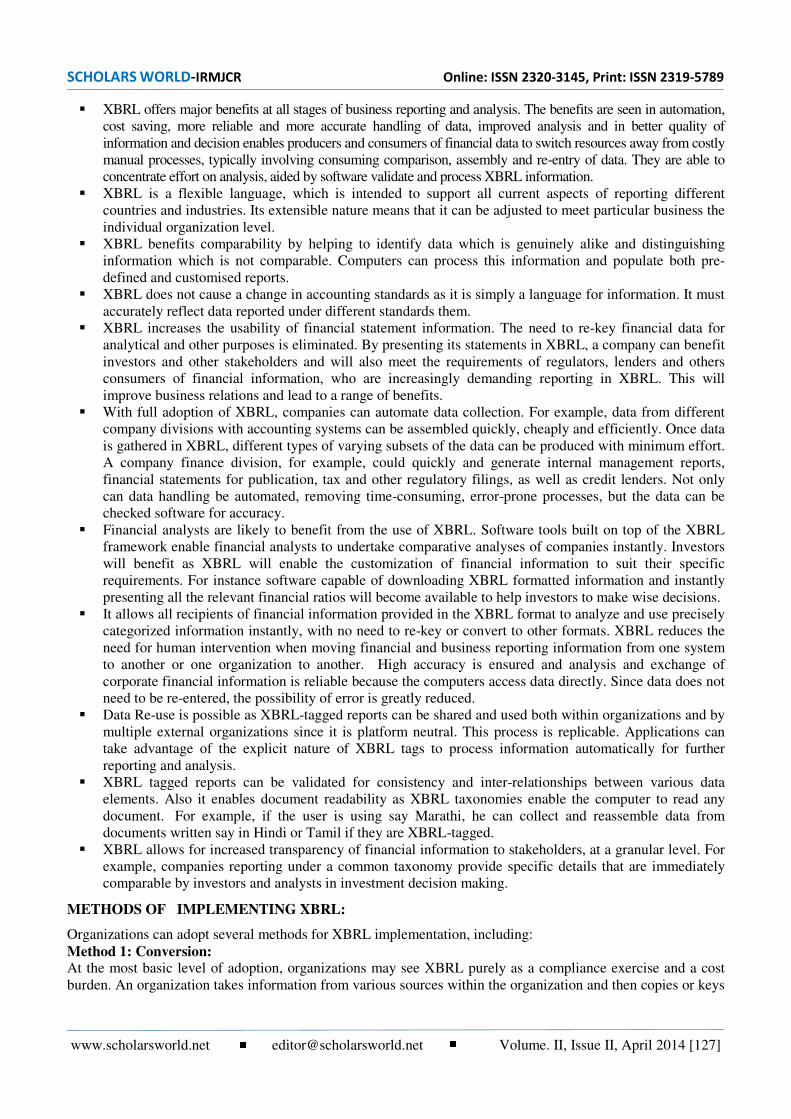
SCHOLARS WORLD-IRMJCR Online: ISSN 2320-3145, Print: ISSN 2319-5789
www.scholarsworld.net [email protected] Volume. II, Issue II, April 2014 [127]
XBRL offers major benefits at all stages of business reporting and analysis. The benefits are seen in automation,
cost saving, more reliable and more accurate handling of data, improved analysis and in better quality of
information and decision enables producers and consumers of financial data to switch resources away from costly
manual processes, typically involving consuming comparison, assembly and re-entry of data. They are able to
concentrate effort on analysis, aided by software validate and process XBRL information.
XBRL is a flexible language, which is intended to support all current aspects of reporting different
countries and industries. Its extensible nature means that it can be adjusted to meet particular business the
individual organization level.
XBRL benefits comparability by helping to identify data which is genuinely alike and distinguishing
information which is not comparable. Computers can process this information and populate both pre-
defined and customised reports.
XBRL does not cause a change in accounting standards as it is simply a language for information. It must
accurately reflect data reported under different standards them.
XBRL increases the usability of financial statement information. The need to re-key financial data for
analytical and other purposes is eliminated. By presenting its statements in XBRL, a company can benefit
investors and other stakeholders and will also meet the requirements of regulators, lenders and others
consumers of financial information, who are increasingly demanding reporting in XBRL. This will
improve business relations and lead to a range of benefits.
With full adoption of XBRL, companies can automate data collection. For example, data from different
company divisions with accounting systems can be assembled quickly, cheaply and efficiently. Once data
is gathered in XBRL, different types of varying subsets of the data can be produced with minimum effort.
A company finance division, for example, could quickly and generate internal management reports,
financial statements for publication, tax and other regulatory filings, as well as credit lenders. Not only
can data handling be automated, removing time-consuming, error-prone processes, but the data can be
checked software for accuracy.
Financial analysts are likely to benefit from the use of XBRL. Software tools built on top of the XBRL
framework enable financial analysts to undertake comparative analyses of companies instantly. Investors
will benefit as XBRL will enable the customization of financial information to suit their specific
requirements. For instance software capable of downloading XBRL formatted information and instantly
presenting all the relevant financial ratios will become available to help investors to make wise decisions.
It allows all recipients of financial information provided in the XBRL format to analyze and use precisely
categorized information instantly, with no need to re-key or convert to other formats. XBRL reduces the
need for human intervention when moving financial and business reporting information from one system
to another or one organization to another. High accuracy is ensured and analysis and exchange of
corporate financial information is reliable because the computers access data directly. Since data does not
need to be re-entered, the possibility of error is greatly reduced.
Data Re-use is possible as XBRL-tagged reports can be shared and used both within organizations and by
multiple external organizations since it is platform neutral. This process is replicable. Applications can
take advantage of the explicit nature of XBRL tags to process information automatically for further
reporting and analysis.
XBRL tagged reports can be validated for consistency and inter-relationships between various data
elements. Also it enables document readability as XBRL taxonomies enable the computer to read any
document. For example, if the user is using say Marathi, he can collect and reassemble data from
documents written say in Hindi or Tamil if they are XBRL-tagged.
XBRL allows for increased transparency of financial information to stakeholders, at a granular level. For
example, companies reporting under a common taxonomy provide specific details that are immediately
comparable by investors and analysts in investment decision making.
METHODS OF IMPLEMENTING XBRL:
Organizations can adopt several methods for XBRL implementation, including:
Method 1: Conversion: At the most basic level of adoption, organizations may see XBRL purely as a compliance exercise and a cost
burden. An organization takes information from various sources within the organization and then copies or keys

SCHOLARS WORLD-IRMJCR Online: ISSN 2320-3145, Print: ISSN 2319-5789
www.scholarsworld.net [email protected] Volume. II, Issue II, April 2014 [128]
this information into an XBRL tool. There is no process change in this approach, merely a conversion of the
results of the existing processes to a different format—including the existing inefficiencies.
Method 2: Outsourced: A second alternative is to use a third-party company to generate the XBRL by interfacing with the financials or
financial reporting tool. The organization may use the power of XBRL to layer internal metrics and definitions
within an extension to the taxonomy required by the external parties. The process must be robust and repeatable.
The mapping of internal metrics to the taxonomy is critical and should involve both management and the
outsourced provider. As a result, the risk of communicating invalid or incorrect information is minimized.
Method 3: Integrated: There are two more robust and reliable options to ensure that the information coming in to the BI warehouse
aligns with the internal taxonomy. XBRL GL may be used as the transport medium to move performance and
compliance information from the subsidiary to the head office. An alternative option, which may apply in some
cases, is to reengineer the internal processes and accounting information systems within the organization. This will
provide the greatest benefit in the longer run, but such a radical/ immediate solution may not always possible.
Internal Control and Audit trail
Regardless of which implementation strategy an organization selects, controls across three major areas are
necessary to manage risk:
Selecting, maintaining, and testing taxonomies and extension taxonomies
Accurately mapping and tagging data elements to XBRL reports
Enforcing change management procedures for XBRL processes
Selecting an appropriate taxonomy is one of the most important tasks in an XBRL implementation because the
taxonomy is the basis for tagging data in an XBRL document. Organizations must take the time to review and
understand the taxonomies. Taxonomies are updated from time to time and controls should be put in place to
ensure usage of the most appropriate version.
Accurately mapping and tagging data elements to XBRL reports creates the normal mapping control
issues. Controls should require appropriate business managers to review and approve the completeness
and accuracy of tagged data elements and watch for consistency of tagged data elements within the
selected taxonomy. Generating XBRL documents is a multistep process and changes throughout the
process must be appropriately managed.
Change management procedures are critical because of the iterative nature of producing financial
reports. Adding a tagging step adds complexity, particularly if an organization uses an outsourced
provider, because it requires several iterations of file transfer and tagging operations.
THE USE OF XBRL IN FINANCIAL REPORTING:
XBRL makes the data readable, with the help of two documents - Taxonomy and instance document. Using
the taxonomy prescribed by the regulators, companies need their reports, and generate a valid XBRL instance
document. The process of mapping means matching the concepts as reported company to the corresponding
element in the taxonomy. In addition to assigning XBRL tag from taxonomy, information like measurement,
period of data, scale of reporting etc., needs to be included in the instance document.
There are a number of ways to create financial statements in XBRL:
XBRL-aware accounting software products are becoming available which will support the export of data
in XBRL form. tools allow users to map charts of accounts and other structures to XBRL tags
Statements can be mapped into XBRL using XBRL software tools designed for this purpose
Data from accounting databases can be extracted in XBRL format. It is not strictly necessary for accounting
software to use XBRL; third party products can achieve the transformation of the data to XBRL.
Applications can transform data in particular formats into XBRL.
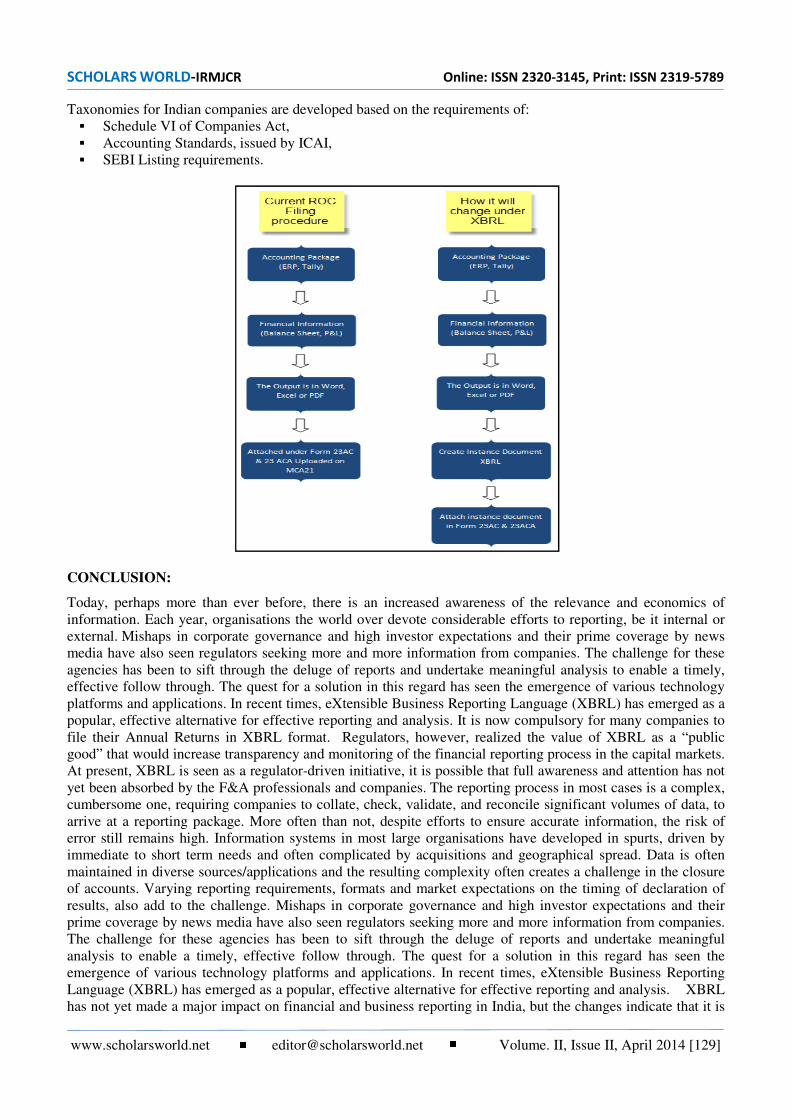
SCHOLARS WORLD-IRMJCR Online: ISSN 2320-3145, Print: ISSN 2319-5789
www.scholarsworld.net [email protected] Volume. II, Issue II, April 2014 [129]
Taxonomies for Indian companies are developed based on the requirements of:
Schedule VI of Companies Act,
Accounting Standards, issued by ICAI,
SEBI Listing requirements.
CONCLUSION:
Today, perhaps more than ever before, there is an increased awareness of the relevance and economics of
information. Each year, organisations the world over devote considerable efforts to reporting, be it internal or
external. Mishaps in corporate governance and high investor expectations and their prime coverage by news
media have also seen regulators seeking more and more information from companies. The challenge for these
agencies has been to sift through the deluge of reports and undertake meaningful analysis to enable a timely,
effective follow through. The quest for a solution in this regard has seen the emergence of various technology
platforms and applications. In recent times, eXtensible Business Reporting Language (XBRL) has emerged as a
popular, effective alternative for effective reporting and analysis. It is now compulsory for many companies to
file their Annual Returns in XBRL format. Regulators, however, realized the value of XBRL as a “public
good” that would increase transparency and monitoring of the financial reporting process in the capital markets.
At present, XBRL is seen as a regulator-driven initiative, it is possible that full awareness and attention has not
yet been absorbed by the F&A professionals and companies. The reporting process in most cases is a complex,
cumbersome one, requiring companies to collate, check, validate, and reconcile significant volumes of data, to
arrive at a reporting package. More often than not, despite efforts to ensure accurate information, the risk of
error still remains high. Information systems in most large organisations have developed in spurts, driven by
immediate to short term needs and often complicated by acquisitions and geographical spread. Data is often
maintained in diverse sources/applications and the resulting complexity often creates a challenge in the closure
of accounts. Varying reporting requirements, formats and market expectations on the timing of declaration of
results, also add to the challenge. Mishaps in corporate governance and high investor expectations and their
prime coverage by news media have also seen regulators seeking more and more information from companies.
The challenge for these agencies has been to sift through the deluge of reports and undertake meaningful
analysis to enable a timely, effective follow through. The quest for a solution in this regard has seen the
emergence of various technology platforms and applications. In recent times, eXtensible Business Reporting
Language (XBRL) has emerged as a popular, effective alternative for effective reporting and analysis. XBRL
has not yet made a major impact on financial and business reporting in India, but the changes indicate that it is

SCHOLARS WORLD-IRMJCR Online: ISSN 2320-3145, Print: ISSN 2319-5789
www.scholarsworld.net [email protected] Volume. II, Issue II, April 2014 [130]
to bring the country at par with developments in the rest of the world. The impetus for the adoption of this
technology in the country is likely to come from two sources: pressure from regulators and the need for intra-
company reporting of information. In January 2007, The Institute of Chartered Accountants of India (ICAI) said
that it would soon constitute a committee of regulators like the Reserve Bank of India, the National Stock
Exchange (NSE) and the Securities and Exchange Board of India (SEBI), to promote XBRL in India.
Satyam Computers became the first Indian participant in the XBRL International Consortium in 2005. It has
been working to help promote the technology in India and has been taking a leadership role in the area of
financial reporting. Infosys Technologies has already set a trend for Indian companies by voluntarily filing its
financial reports to the US Securities and Exchange Commission (SEC) in XBRL format. Going forward,
XBRL is likely to emerge as the global standard for reporting of financial and business information. Major
stock exchanges are likely to make it mandatory for companies to file disclosures and financial reports in XBRL
format, in order to enable the easy dissemination of such information to financial analysts and the investor
community at large.
REFERENCES:
1. ICAI Publication on XBRL – A Primer.
2. Is XBRL implementation justified in India?: http://moneybol.com/xbrl-in-india/
3. Ministry of Corporate Affairs: ·http://www.mca.gov.in/
4. The International Journal of Digital Accounting Research (2010),Vol. 10, pp. 131-147 ISSN: 1577-8517
5. “Will XBRL stay? Subramoney: http://www.subramoney.com/2011/08/will-xbrl-stay/
6. XBRL International : ·http://www.xbrl.org/
7. XBRL-US 2011. XBRL US Public Database. Available from: [email protected]
8. How Database helps in XBRL conversion: http://www.datatracks.in/xbrl-blog/
----

SCHOLARS WORLD-IRMJCR Online: ISSN 2320-3145, Print: ISSN 2319-5789
www.scholarsworld.net [email protected] Volume. II, Issue II, April 2014 [131]
MEDICAL TOURISM IN ASIA - AN OVERVIEW
S.S.ROSE MARY,
Associate Professor Department of Commerce
Periyar E.V.R. College (Autonomous) Tiruchirappalli-620 023- India
ABSTRACT
Asia is one of the first regions in the world, which promoted medical tourism and has created a branded name for it self for having affordable and high quality healthcare. Asia’s medical tourism market is expected to double in future. Thailand, Singapore and India are the three countries out of 7 in Asia is expected to control more than 80% medical tourism market share in future. Thailand has earned name of ‘Land of Smile’. Singapore occupies the sixth place among 191 countries with the best health systems in the world. India is a medical tourist destination for visitors and providing attractive health care services.
Keywords: Medical Tourism, Health care providers, Affordable, Patients, Medical Visa
SCHOLARS WORLD-IRMJCR Online: ISSN 2320-3145, Print: ISSN 2319-5789
www.scholarsworld.net [email protected] Volume. II, Issue II, April 2014 [132]
INTRODUCTION:
According to World Tourism Organization (WTO) the word, ‘Tourism’ comprises of ‘the activities of persons traveling to and staying in place outside their usual environment for leisure, business and other purposes’. Hence, when a person travel across the border and outside their usual environment to seek medical service, such person is known as ‘medical tourist’ and such travel trip is ‘medical travel’ and such activities including hospitality , cultural exposure or site seeing direct or indirect and medical services is called “Medical Tourism”1. Modern development in the treatment and provision of healthcare, the range of medical treatments and scope of cures have increased over time, with the easy international travel along with cheaper cost for medical services and treatments in some part of the world, medical tourism is becoming a growing industry for international business. Cost effective ‘private medical care in collaboration with the tourism industry for foreign patients needing specialized healthcare is facilitated by tourism industry and health care sector both private and public. The travel activity that involves medical procedures or activities that promotes the wellbeing purposes. Medical procedures include medical check-ups, health screens, dental treatments, neuro surgery, transplants and other procedures that require qualified medical intervention. Enhanced procedures also requires qualified medical personnel but it is non-disease related (unless disfigurement caused by disease) and dome mainly foe aesthetic purposes. It includes cosmetic surgery, face lifts, cosmetic dental work. The wellness segment of medical tourism develops healthier lifestyle. It includes spas, thermal and water treatment, acupuncture, aromatherapy, beauty care, facials, exercise and diet herbal beauty homeotherapy, massage, yoga and other similar procedures. Re-production tourism related to treatments related to fertility such as in ultra vie fertilizations and other similar procedures. Medical tourist travel for different reasons may be less or to avoid long waiting or facilities may not be available in their home country etc. USA medical tourist (sometimes are treating at a quarter or even 10th of the cost at their home. Canada patients are frustrated by long waiting time. In Great Britain the reason for such travel long waiting time and they can’t afford to see physician on private service and some other countries, where treatment facilities may not be available for e.g. Nepal, Bhutan etc.2 Unlike general tourists needing medical attention, medical tourists are people who cross international borders for the exclusive purpose of obtaining medical services. Medical tourism has increased in part because of rising health-care costs in developed countries, cross-border medical training and widespread air travel. The medical tourism industry has been growing worldwide. It involves about 50 countries in all continents and several Asian countries are clearly in the lead. In Asia, medical tourism is highest in India, Singapore and Thailand. These three countries, which combined comprised about 90% of the medical tourism market share in Asia in 2008,13 have invested heavily in their health-care infrastructures to meet the increased demand for accredited medical care through first-class facilities.4 ORIGIN AND PROCESS:
In ancient Greece, pilgrims and patients from all over Mediterranean visited to the sanctuary of the healing God, Asclepius at Epidaurus. In Roman Britain patients took the water at a shrine at Bath, a practice that continued for 200 years. 18th century wealthy Europeans travel to spas from Germany to Nile. In 21st century relatively low-cost jet travel has taken the industry beyond the wealthy and desperate. Countries that actively promote medical tourism include Cuba, Costa Rica, Hungary, India, Israel, Jordan, Luthuania, Malaysia and Thailand, Belgium, Poland and Singapore are now entering the field. PROCESS: A person seeking medical treatment abroad contacts a medical tourism provider. The provider usually requires the patient to provide a medical report, including the nature of ailment, local doctor’s opinion, medical history and diagnosis and may request additional information. Certified physician or consultants’ then advice on the medical treatment, the approximate expenditure, choice of hospitals and tourist destinations, and duration of stay etc is discussed. After signing consent bonds and agreements, the patient is given
1 2011,2ndInternational Conference on Business, Economics and Tourism Management, IPEDR Vol.24(2011)c(2011)IACSIT, press Singapore,p.107 2 Bernett, King, Milner, 2004, ”The health report sector in Australia; A positioning study”, Journal of Vacation Marketing,10:p 122-137 3 Bulletin of the World Health Organization, 2011;89:336-344 4 File:///D:all documents/WHO The effects of medical tourism Thailand’s experience.htm

SCHOLARS WORLD-IRMJCR Online: ISSN 2320-3145, Print: ISSN 2319-5789
www.scholarsworld.net [email protected] Volume. II, Issue II, April 2014 [133]
recommendation letter for a medical visa, to be procured from the concerned embassy. The Patient, travel to the destination country, where the medical tourism provider who takes care assigns a case executive. Once the treatment is done, the patient can remain in the tourist destination or return home. REASON:
The reasons why patients are willing to travel long distances for surgery tend to vary by region. In USA lack of health insurance can make treatment unaffordable. In UK patients get frustrated with long National Health Service waiting lists and high cost of private care. Patients from Middle East Africa are drawn to India because the technology or medical expertise is lacking in their own countries.5 Medical tourism generally involves transporting patients from developed countries to developing countries where they can get treated at lower expense. These patients do not necessarily belong to the highest social bracket in their own countries, but they (and their insurers) generally have greater purchasing power than most patients in the destination countries. FUTURE OF MEDICAL TOURISM:
Medical Tourism Industry is the one sector whose present is bright and future seems even brighter. Asia one of the first regions in the world to promote medical tourism and has created a brand name for itself for having affordable and high quality healthcare. Asia medical tourist number of arrivals is expected to cross the figure of 10 Million numbers by 2015. Asia medical tourism market is expected to double by 2015 from its current market in 2011. Out of 7 countries 3 countries Thailand, India and Singapore is expected to control more than 80% market share in 2015.Thailand is the leader in medical tourist arrivals holding more than 40% share in Asia medical tourist arrivals in 2011. Its medical tourism market is also expected to be more than double by2015 from its current market in 2011.India was one of the first countries to recognize the potential of medical tourism. From the year 2009 to 2011 the number of medical tourists in India has grown by 30%. It is estimated that by the year 2015, India will receive nearly half a Million medical tourists annually. Singapore medical facilities are considered to be the best in Asia but its treatment cost are bit costlier compared to its competitors. Singapore medical tourist arrivals are expected to be more than 1 Million by 2015.Philippines started off bit late for the medical tourism but are catching up quickly. Its medical tourism market is expected to grow with a CAGR of 9% for the period of 2012 – 2015.South Korea is a fast-growing medical tourism destination. It is forecasted that by 2015, South Korea will attract more than 300 Thousand medical tourists. Malaysia has seen an impressive growth in medical tourism industry. Malaysia medical tourism market has grown more than 8 times in 2011 compared to its market in 2003.Taiwan medical tourism has become one of the biggest attractions for mid to high income Chinese tourists. The country’s medical tourism market is expected to increase at 7% CAGR from 2012 to 20156. THAILAND:
Thailand is currently the Asian leader both in number of foreign patients and revenue. According to the Tourism Authority of Thailand (TAT) at least five million tourists come to the country annually for medical treatment. Various plastic surgery clinics could attest that the number of both Thais and foreigners undergoing dental and plastic surgeries, Lasik and other physical enhancement procedures is increasing. Apart from these, Thailand has earned its reputation as an excellent location for spa services. Each year, over a million foreigners plan their medical travel around a Thailand holiday clubbing sightseeing with medical treatments. On the tourism front, Thailand has been popular destination for decades Thailand has gained a reputation as a high quality and reliable medical tourism destination. Thailand owes it to the hospitality of the Thai people. Thailand has earned the eponym of the “Land of Smile”. The Thai treat their guests with the utmost respect and try to serve them the best way they can. On the another hand, Thailand medical has seen its popularity rise owing to the fact that it in home to many internationally accredited hospitals which offer gamut of treatments at affordable rates.7
5 www.lancet.com/journals/lancet/articles/p11s0140_67361061320/full text. lancet,vol.376,issue 9742,page 671-672,28,August,2010,cited on 7 September 2011 6. file:///D:/alldacument/SingaporeMedicalTourism IndustryOutloo2015.htm 7 &8 file://D:/all document/Medical Tourism in Thailand-Thailand Health care system_myMEDholiday.htm.

SCHOLARS WORLD-IRMJCR Online: ISSN 2320-3145, Print: ISSN 2319-5789
www.scholarsworld.net [email protected] Volume. II, Issue II, April 2014 [134]
Some procedures will cost one tenth of the price it would take for similar medical procedures in US, UK, or Australia. Hospitals have latest technology, equipped with language translators and exclusive international wings to cater foreign patients. Many doctors and physician in Thailand have medical certifications from UK, US and attend the patients with consummate professionalism and great care Health care system and quality in Thailand8. Health care in Thailand is provided by Government hospitals, private hospitals, non-governmental organizations and private practionare. Excellent medical and health care quality attract more than a million health care tourists visit to Thailand. In Thailand, medical tourism has both positive and negative effects. For the Thai economy, medical tourism generates a value added approximately equal to 0.4% of the GDP. It helps raise income for the medical services sector, the tourist sector and all related businesses, and it provides other intangible benefits. The negative effects for Thai society stem from having to provide health-care services for 420 000 to 500 000 medical tourists annually with the same number of health-care staff. In this study these negative effects are evidenced by both a shortage of physicians and by increased medical fees for self-paying Thais, which are likely to undermine their access to quality medical services. The very same problems are likely to apply to other host countries. In India, similar adverse effects have been detected9 Thailand retains top spot as world’s most visited medical tourism destination with 2.5 million international visitors in 2012. In 2008, medical tourism in Thailand generated 46 to 52 billion baht (1 United States dollar [US$] = 30 baht) of revenue from medical services plus 12 to 13 billion baht from related tourism. This makes for total revenues of 58 to 65 billion baht (Fig. 1), which translate into a value added (Fig. 2) of 31 to 35 billion baht from medical services plus 5.8 to 6.5 billion baht from tourism. This amounts to a total value added of 36.8 to 41.6 billion baht or 0.4% of the gross domestic product (GDP). Under various scenarios, the value added from medical tourism is projected to reach between 59 and 110 billion baht in 2012.10 SINGAPORE:
Singapore is one of the most developed countries in Asia. It has become a top healthcare destination. Healthcare in Singapore is one of the best in Asia. The country specializes in every major treatment available. In 2011, Singapore medical tourism attracted 30% of the people who went abroad for medical tourism.11 The health care services in Singapore extend to both private and public health care. These services are complemented by improving the standards of housing, living, medical services, education and preventive medicine. Many people club their Singapore holiday with healthcare. In 2011 alone, tourism receipts from foreigners travelling for healthcare in Singapore stood at $900 million. There are two factors which attribute the popularity of Singapore medical tourism in presence of a robust medical infrastructure and world class airport. An integrated health care system is yet another reason which attracts a huge flux of foreign medical tourists12. Singapore comes in 6th on whose list of the 191 countries with the best health systems. Even as Asia buzzing as a medical tourism destination and there is a competation amongst countries in the continent, people from across the world continue to travel to Singapore for high quality and affordable treatments. The top treatment sought in Singapore is liver transplant, kidney transplant and those associated with blood disorders. INDIA:
India’s health care industry along with its IT and tourism sectors helped it move into the economic renaissance. It is a major driver of economic growth as first world patients, driven out of their own systems by high costs and crowded conditions look for cheaper places for medical care. Many hospitals in India are now seeking accreditation by Joint Commission International (JCI) which has become a crucial stamp of approval for hospitals in developing countries seeking medical tourists. The number of JCI accredited foreign medical sites worldwide tripled from 76 in 2005 to more than 220 in 2008.13
8 ibid 9 File:///D:/all document/WHO_The effect of medical tourism Thailand/2%80%99sexperience.htm#R19 10
File:///D:/alldacuments/Thailand’s Medical Tourism Statistics Revealed on my.MEDholiday. Blog.htm. 11
&12 file://D:/all document/Medical Tourism in Singapore-Singapore Health Care
System_myMEDholiday.htm
13
www.lancet.com/Journals/lancet’articles/PIISO140-6736(10)61320-7/full text.

SCHOLARS WORLD-IRMJCR Online: ISSN 2320-3145, Print: ISSN 2319-5789
www.scholarsworld.net [email protected] Volume. II, Issue II, April 2014 [135]
Many factors which makes India a destination for visitors, seeking health care services. It includes the availability of well trained medical practioners, the medical staff with communication skills in English language, a well mix of allopathic and alternative system of medicine, the specialty centers, lab with technically advanced and diagnostic equipments and services at comparatively less cost. Good medical facilities and talented and experienced pool of professionals in the medical field, the high rate of investment in medical research in India and its history of subsidized medical tourism have created some of the most efficient medical professionals in the world. The biggest benefit for the medical tourists in India is the low cost expenses. Medical treatment in India is offered at a lower cost in the world. Their air ticket expenses and accommodation expenditure, even if they are put up in luxury hotel it will not be more than their expenses in USA or UK. Patients will be able to save at least 50% of their cost if they choose India over other developed countries. An estimated number of 1, 50,000 medical tourists travel to India every year because of the lower priced healthcare procedure available there14. Potential savings by travelling for medical health care to various countries are as follows:
India: 65-90%, Malaysia: 65-80%, Thailand: 50-70%, Turkey: 50-65%, Mexico: 40-65%, Costa Rica: 40-65%, Singapore: 30-45%, Singapore: 30-45%, Brazil: 25-40%15. Thus among these nine countries cost of the medical health care expenses in India is very low.
VISA PROCEDURE:
THAILAND: Visa on arrival is normally 15-30 days (most visitors from Western Countries receive 30 days) and visa extension can be applied if necessary. Tourists cab also apply for non – immigrant visa for medical reasons, which gives them 90 days and requires proof that they are receiving treatment from a licensed medical facility. The medical health care providers are private organization relying on non- government services of income from international patient or tourists. Therefore restriction on such tourists is minimized. Such visas are easiest and least restrictive to obtain for entry into most countries. Like other recreational tourist, medical tourist also pays for healthcare treatment. Many countries in the world support and encourage the medical tourist. SINGAPORE: For most Westerners travelling to Singapore a visa is not required. British and Irish visitors receive a 30 days stamp up on arrival, but must show proof of an onward ticket. INDIA: A medical tourist visa may be issued with the following conditions. The Indian missions/posts abroad may scrutinize the documents carefully and satisfy about the purpose for which visa is being requested. Mission must satisfy that the applicant has sought preliminary medical treatment from own country of his residence and he has been advised to go for specialized medical treatment. In case foreign national desires to go for treatment under Indian system of medicines. India is has destination of providing wellness and preventive services through Yoga, Ayurvedha, Sidha and other indigenous services. Medical visa should d be granted for seeking medical attendance only in reputed, recognized, specialized hospitals. Ophthalmic disorder, heart related, organ transplantation, congenial disorder, gene therapy, radio therapy etc. would be of primary consideration. In total, mission may satisfy about the need of the medical tourist for medical treatment or enhancement. Tourist visa is valid for one year or the period of treatment whichever is less which can be extended to a period of one year further by the state government FRROS on production of medical certificate or advice from the recognized or reputed or specialized hospital in the country. Ministry of Home affair can granted further extension on the recommendations of the State Government/FRROS supported by medical documents. This visa will be valid for maximum three entries during one year. State Government/FRROS may permit one additional entry in emergency if required. Miscellaneous visa co terminus with ‘M Visa’ of the patient shall be granted to not more than two attendants or family members who may be spouse or children or those who have blood relationship with the patient. Such visa will be called ‘M Visa’. Such foreigners are also required to get themselves registered with the local FRROS/FROS well within 14 days from the date of the arrival. Foreigners ‘M Visa’ will be available to all foreign national Bangladesh, Pakistan, China and Srilanka. Entry and departure of these foreign national will be governed as per the existing policy in respect of those nationals. 16
14 http://www.en.wikipedia.org/wiki/economy-of Chennai-Medical Tourism in India 15
The ‘myths’ of global medical tourism , 6, November,2013, Medical News Today, MNT 2003-13 cited in
www.medicalnews to day.com/articles/268387.php

SCHOLARS WORLD-IRMJCR Online: ISSN 2320-3145, Print: ISSN 2319-5789
www.scholarsworld.net [email protected] Volume. II, Issue II, April 2014 [136]
CONCLUSION:
Medical Tourism Industry is the one sector whose present is bright and future seems even brighter. Asia one of the first regions in the world to promote medical tourism and has created a brand name for itself for having affordable and high quality healthcare. Asia medical tourist number of arrivals is expected to cross the figure of 10 Million numbers by 2015. Asia medical tourism market is expected to double by 2015 from its current market in 2011. Out of 7 countries 3 countries Thailand, India and Singapore is expected to control more than 80% market share in 2015.Thailand is the leader in medical tourist arrivals holding more than 40% share in Asia medical tourist arrivals in 2011. Its medical tourism market is also expected to be more than double by2015 from its current market in 2011.India was one of the first countries to recognize the potential of medical tourism. From the year 2009 to 2011 the number of medical tourists in India has grown by 30%. It is estimated that by the year 2015, India will receive nearly half a Million medical tourists annually. Singapore medical facilities are considered to be the best in Asia but its treatment cost are bit costlier compared to its competitors. Singapore medical tourist arrivals are expected to be more than 1 Million by 2015.Philippines started off bit late for the medical tourism but are catching up quickly. Its medical tourism market is expected to grow with a CAGR of 9% for the period of 2012 – 2015.South Korea is a fast-growing medical tourism destination. It is forecasted that by 2015, South Korea will attract more than 300 Thousand medical tourists. Malaysia has seen an impressive growth in medical tourism industry. Malaysia medical tourism market has grown more than 8 times in 2011 compared to its market in 2003.Taiwan medical tourism has become one of the biggest attractions for mid to high income Chinese tourists. The country’s medical tourism market is expected to increase at 7% CAGR from 2012 to 201517.
----
16R. Kumar, Medical Tourism in India, Deep &Deep publication, Pvt. Ltd, New Delhi,P.285 17. file:///D:/alldacument/SingaporeMedicalTourism IndustryOutloo2015.htm

SCHOLARS WORLD-IRMJCR Online: ISSN 2320-3145, Print: ISSN 2319-5789
www.scholarsworld.net [email protected] Volume. II, Issue II, April 2014 [137]
MORAL EDUCATION AS A MEANS
FOR SOCIAL DEVELOPMENT
MS. V. MRUNALINI,
Asst Prof. (SS) in Special Education,
Faculty of Education, Avinahsilingam University for Women,
Coimbatore-. India
ABSTRACT
Education is basically a man building activity. Unlike other creatures, man alone is provided with
6th sense. The major role of education is to bring out the potentials in the child in a natural way
through planned activities and stimulations. If at all we are planning for an all round development
of the children, we should look at bringing in a coordination between head, heart and hand as
narrated by the Father of our Nation. When we bring in such individualistic development, we
build good societies. Especially Indian education should focus upon upholding its rich culture and
traditional values. Thus this paper looks at disseminating moral education and look at it as a
means of social development. The perception of the young minds shall be easily shaped to meet
the needs of the fast growing world. The children may not be attracted by any alien concepts that
are highly unnatural for our society. This paper explains the ways and means through which this
shall be achieved.
Keywords: Moral Education, Education as a Tool for Social Development, Development of
Ethics among Children, Moral Education Vs Social Development.

SCHOLARS WORLD-IRMJCR Online: ISSN 2320-3145, Print: ISSN 2319-5789
www.scholarsworld.net [email protected] Volume. II, Issue II, April 2014 [138]
INTRODUCTION:
India is an old country with a rich culture. This culture has shown the distinct intensity of its outlook at different
periods. The question of developing the moral and ethical values of the children through education has been
attracting the attention of teachers, parents and the country for a long time. The Government and educationists
have been thinking of doing some systematic work and have made attempts to develop a common syllabus for
the education of moral, cultural and ethical values. The concepts of moral education can be taught better only
when they are perceived and understood.
THE GOAL:
The goal of social and moral education is “The education in the spirit of socialist society moral values in
correspondence to the development of science and socialist consciousness. The socialist society demands from
its members the highest level of moral consciousness, which cannot be obtained with religious instruction.”
(Kodelja, 1995)
The goals of moral education as described by Cencic (1986) are:
1. Developing a system of values as a guide for moral behavior
2. Developing feelings and interest for moral experiences and sensitivity for the world of values;
3. Developing the motivation for congruency between behaviour and values
4. Developing the whole system of the qualities of an individual which assure one’s moral behavior.
INTERRELATIONSHIP BETWEEN SOCIAL AND MORAL DEVELOPMENT:
Moral development includes moral behaviour and moral concepts. Moral behaviour means behaviour in
conformity with the moral code of the social group. The word ‘Moral’ comes from the Latin word ‘mores’
which means manners, customs and folkways. Moral concepts are the rules of behaviour to which the members
of a culture become accustomed and which determine the expected behaviour patterns of all group members.
Moral behavior not only conforms to social standards but also it is carried out voluntarily. It is always
accompanied by a feeling of responsibility for one’s acts. It involves giving primary consideration to the
welfare of the group and considering personal gain or desires as having secondary importance. True morality is
rarely found in children; it appears during the adolescence period. This does not mean that the child is immoral,
because most of the behaviours of young children are due to ignorance of social expectations. Thus a young
child is unmoral not immoral.
STAGES OF DEVELOPMENT:
Several psychologists have discussed moral development from their own points of view. One such notable child
psychologist is Jean Piaget. For Piaget, moral development takes place along with cognitive development. Thus
from a Piagetian points of view moral development can be discussed under the same stages of cognitive
development, namely,
1. The sensorimotor period
2. The pre-operational period
3. The concrete operational period
4. The formal operational period
But Piaget’s discussion has now been replaced by Lawrence Kohlberg. In Kohlberg’s view moral development
takes place through three levels namely, the pre-conventional, conventional and post conventional.
Stage What is Right?
Pre Conventional • Obeying and avoiding punishment from a superior authority.
• Making a fair exchange, a good deal.
Conventional • Pleasing others and getting their approval
• Doing the duty and following the rules and social order.
Post Conventional • Respecting rules and laws but recognizing that they may have limits.
• Following universal ethical principles, such as justice, reciprocity,
equality and respect for human life and rights.
Kohlberg further says that there are two stages in each level of development.

SCHOLARS WORLD-IRMJCR Online: ISSN 2320-3145, Print: ISSN 2319-5789
www.scholarsworld.net [email protected] Volume. II, Issue II, April 2014 [139]
INFANCY:
During infancy the child is not capable of thinking efficiently. He has no conscience and no scale of
values. He cannot distinguish between what is good and what is bad. So no significant moral development
takes place during this stage. But he is not immoral. Rather he is unmoral or non-moral. The wrong acts
performed by the infant are not intentional. They are caused due to ignorance and his inability to
understand what is good or what is bad.
Some psychologists like Hurlock, have the opinion that since the infant has no conscience, it is no use teaching
him moral behaviour and moral concepts. Parents must, therefore, wait until the child develops his conscience
and is able to understand what the society expects.
PRE-SCHOOL YEARS AND CHILDHOOD:
Before a child can behave in a moral way, he must learn what the group regards as right and wrong. He
learns this from his relationships with parents, older siblings and through identification, imitation and
direct teaching.
Before the child enters school, he is expected to distinguish right from wrong or do’s from do not’s in simple
situations and to lay the foundation for the development of a conscience. Moral concepts during this period are
specific at first and relate to specific situations in which they were learned.
As a child approaches middle childhood, his capacity to understand relationships increases. Thus this concept of
right and wrong in different but related situations emerge. As a result he moves from specific response to a
generalized response.
Kohlberg says that during this stage conduct is determined by external factors like approval and
disapproval or rewards and punishment. Thus the child’s behaviour is oriented towards obedience and
punishment. His behaviour is hedonistic in the sense that he considers acts as right that satisfy the self and
sometimes his parents.
According to Kohlberg, morality, during this stage, is defined as performing good acts and maintaining the
conventional social order. Morality is held to be maintaining good relations and oriented towards getting
approval, and pleasing and helping others.
ADOLESCENCE:
Moral development is an important aspect of the adolescent’s development. By the time the child reaches
adolescence, his moral code is fairly well formed. During this stage, he is capable of understanding what is right
and what is wrong. Most adolescents learn to behave in a socially approved manner. When they violate the
mores of the group, they pay the penalty in the form of social rejection.
During the adolescence period morality is defined as conforming to common standards – rights or duties. The
adolescents are oriented towards existing rules and standards. They do not want to accept all that is imposed on
them and prefer democratic techniques in teaching and learning moral behaviour. Adolescents who are trained
through autocratic techniques resent those who teach them moral behaviour.
CONCLUSION:
Whether the child learns social and moral behaviour through direct teaching or through identification, parents
and teachers use discipline to shape behaviour. No one can question the utility of moral and religious education
as an instrument for character formation. In one form or the other, provision should be made for its inclusion in
a sound system of education. It should teach the children to pay respect to all the religions and men of character
irrespective of caste, colour and creed. The moral values can be inculcated in the children through short stories.
Prayer assembly, talks on morality and other programmes of co-curricular activities can also be made use of for
the moral and religious instruction.

SCHOLARS WORLD-IRMJCR Online: ISSN 2320-3145, Print: ISSN 2319-5789
www.scholarsworld.net [email protected] Volume. II, Issue II, April 2014 [140]
REFERENCE:
1. Avinashilingam, T.S., (1989), Make me a man, Sri Ramakrishna Mission Vidhyalaya, Coimbatore.
2. Joan Stephenson, Lorraine Ling, Eva Burman, Maxine Cooper, (1998), Values in Education, Hartnolls
Ltd., Bodmin, Cornwall, Great Britain.
3. Muralidhar Dash, (1998) Educational Psychology, Deep and Dee Publications, New Delhi.
4. G.K. Kaul, (1999), Values and Education in Independent India, The Associated Publishers, Ambala.
5. Douglas A. Bernstein, Peggy W.Nash, (1999), Essentials of Psychology, Houghton Miffin Company`
6. Prof. Murthy, S.K., (2002), Teacher and Education in Indian society, Prakash Brothers, Educational
publishers, Ludhiana.
7. Mani Jacob, ed., (2002), Resource for Value Education, New Delhi: Institute of Value.
8. Sidhu, H.S., Bhatia & Narang, 92002), The teaching of Social Studies, Tandon Publications, Ludhiana.
9. Sivaranjan, K., (2004), Trends and Developments in Modern Educational Practice, Calicut University.
----
SCHOLARS WORLD-IRMJCR Online: ISSN 2320-3145, Print: ISSN 2319-5789
www.scholarsworld.net [email protected] Volume. II, Issue II, April 2014 [141]
URBAN LAND VALUE-A CASE STUDY OF COCHIN CITY
DR. LANCELET T.S,
Associate Professor,
Dept. of Geography, SSUS, Kalady (India)
ABSTRACT
This paper discusses the housing land values which determine the direction of urban sprawl in
terms of the parameter of urban accessibility. The aim of the study is to determine the variables
that exist within the concept of urban accessibility and infrastructure which of these variables has
a significant relationship with the housing land values. It may be important in terms of urban
development and planning with a scientific approach. This paper highlights the human
intervention on urban land like industrialization, commercialization, transportation, reclamation,
population density etc. A large scale of construction works plays a key role in reducing the open
space and wetlands in the city of Cochin during the last decades. The rate of increase in the
population density in Cochin City is another reason for the increasing land-value. The paper
concludes with the survey result of Govt. and private agencies and land owners in the City. The
rate of change in wetland reclamation was investigated with the help of people’s participation for
resource map of Cochin 1:3960 (2004).
Keywords: Resource Map, Human Intervention, Urban Accessibility, Industrialization,
Commercialization, Transportation, Reclamation, Population Density.

SCHOLARS WORLD-IRMJCR Online: ISSN 2320-3145, Print: ISSN 2319-5789
www.scholarsworld.net [email protected] Volume. II, Issue II, April 2014 [142]
INTRODUCTION:
Cochin is located in the Western part of Ernakulam district of Kerala State. It is bounded on the west by
Lakshadweep Sea and the other three sides by Ernakulam district. The central city of Cochin extends between
90 53’ N to 10
0 05’ North latitude and 76
0 12 E’ to 76
0 23”
East longitude along South Western Coast of India
(Fig.1). The study region has an area of 275.85 sq.kms consists of Cochin Corporation, municipal towns of
Thripunithura and Kalamassery with eight adjoining census towns and two panchayaths. So the actual boundary
of the study area includes North by Nayarambalam, Ezhikkara, Kottuvally, Alangad, and Kodungalloor
Panchayats, East by Edathala, Kunnathunadu and Vadavukodu panchayat, and South by Kumbalam and
Challanam panchayats of Ernakulam district. Lakshshadweep Sea and the adjoining backwaters cover the
Western boundary of the study area. Generally the entire area showing urban and semi urban land use character.
FACTORS AFFECTING LAND VALUE HIKE IN THE STUDY AREA:
1. Lack of Dry Land For Urban Use:
Physiograghically Cochin City is divided into three well-defined zones like the ridges, the plains, and the
coastal region. Between backwaters and the sea is the long and narrow stretch of sandy seaboard densely
covered by coconut palms? The chain of lagoons or backwaters run parallel to the sea and extends as far as
Njarakkal in the North and Mattanchery in the South. These physical factors influence much on urban sprawl
towards Eastern side particularly for dry land.
Dry lands are the common word used in Kerala for showing land which can be used for settlement and
cultivation excluding paddy fields. In Malayalam it is called ‘Kara’ (Purayidam) means land which is not wet in
character. All the Land Revenue Records in Kerala mentioned the general land use pattern of each region as
‘Kara’ (Purayidam) and ‘Nilam’ (Padam). The word Nilam (Padam) is generally used for the identification of
paddy fields so one can easily identify the difference between wet and dry land respectively.
2. Increasing Population And Infrastructure Population Growth And Changing Land use Pattern:
It is noticed that there is a good relation between population growth and changing landuse pattern in Cochin
City. When the population increased, their demand for urban area also increased. Hence it causes the reduction
of wetlands through reclamation. During 1914, about 62.25 Sq.Kms of the study area were occupied with
wetlands but it became reduced as 38.99 Sq.Kms in 2004. Another notable change is the tremendous growth of
built up land during these period (0.75Sq.Kms to141.98 Sq.Kms). When the density of population increased
simultaneously the area under reclamation also increased.
POPULATION, BUILT-UP AREA AND LAND VALUE
Year Total
Population
Population
Density
person per
sq: kms
Built-up
Area
(In Sq:
Kms)
Residential Area
With mixed
crops
(sq: Kms)
Average
land value per
cents
Total
Wetlands
(In Sq:
Kms)
1914 277723 131 0.75 144 - 62.25
1968 636384 750 32.05 126 10000 57.50
1985 864831 1250 90.51 91.50 50000 44.50
2004 1017002 2150 141.98 39.27 12 lakhs 38.99
3. Location O F Industries As A Factor Of Urban Sprawl:
For urban development the location of industry is quite favorable because it brings roads, people, public, services,
houses and raw materials. Besides money, men, and material to the place which is changed to urban centers.
Industrialization brings progress and prosperity to the city (Ranapratab, 1983). The location of the industry
especially large scale can be seen in the north- eastern periphery of the study area. The areas like Kalamassery,
Eloor and Thrikkakara are together holding 70% of the total large and medium scale industries in the study area.

SCHOLARS WORLD-IRMJCR Online: ISSN 2320-3145, Print: ISSN 2319-5789
www.scholarsworld.net [email protected] Volume. II, Issue II, April 2014 [143]
4. High Population With Housing Density:
Cochin is rapidly growing commercial, industrial and trading centre of Kerala. Due to the tremendous growth of
urbanization the density of population is increasing every year. The average density of population in Cochin
City is 631 people per Sq.Kms in 1981 and it is increased as 2923 persons per Sq.Kms in 2001. The densities
are also high in the areas adjoining to CBDs and municipalities with 6277 persons per Sq.Kms. It is
considerably low in the peripheral areas with 1185 people per Sq.Kms. As a result of the advancement in
medical science, population began to multiply rapidly resulting in increased pressure on land for urban use and
increased agricultural activities and various types of constructions. This resulted, may a time in raising the land
value for assessing the capacity of the land for different kinds of development activities such as building
construction and adding of transport facilities in Cochin. This kind of urban incompatible uses took place in
locations close to existing accessible areas. Such developments based on short term benefits such as proximity
to working places or easy access to business centers is sure to create havoc in the near future as seen from the
sinking buildings and waterlogged residential areas in the City.
5. Increasing Land Value and Decreasing Open Space:
Due to the high degree of urbanization, a large amount wet lands are reclaimed for built-up area every year. As
a result of urban encroachment, the rate of open space in Cochin City also reducing day to day. The Spatio-
temporal investigation of wet land reclamation and reduction of open space in Cochin city is clearly reveals the
chance of urban heat formation. The following table shows increasing demand for urban land area and
reduction of wetlands and open space from 1914-2004.
Sl. No. Land use Class 1914 1968 1985 2004
1. Commercial 3.89 3.14 2.68 2.24
2. Industrial 6.98 7.29 7.99 8.8
3. Residential 28.80 39.98 48.12 52.01
4. Educational 1.24 1.97 2.68 3.97
5. Transportational 0.90 1.68 2.74 3.76
6. Recreational 0.82 0.97 0.99 1.03
7. Public & Semi public 0.91 1.16 1.39 1.84
8. Open space 37.64 26.03 18.15 14.20
9. Restricted Lands 0.81 0.86 0.89 0.90
10. Wet lands 18.01 16.92 14.37 11.24
Total 100 100 100 100
AREA IN Sq.Kms - Source: Ernakulam district Gazetteer – 2001

SCHOLARS WORLD-IRMJCR Online: ISSN 2320-3145, Print: ISSN 2319-5789
www.scholarsworld.net [email protected] Volume. II, Issue II, April 2014 [144]
RESULT AND DISCUSSIONS:
Land value increases with High urban sprawl.
People consider investment in the land as a strong and secure deposit on the earth with multiple returns.
Housing density and demand of dry land increase land value in Cochin
Large scale commercialization and industrialization, maritime trade- Port facilities, International Airport,
Upcoming metro city etc influence the increase in land value.
REFERENCES:
1. Chatterjee, A. B. 1976: Evolution, Land use and Social Characteristics of Culcutta conurbation, Amar –
prakashan, New Delhi.
2. Chisholm 1973: Rural settlement and Land use, Huchinson University library, London.
3. Christopher Wood 1995: Environmental impact assessment – A comparative review, Longman, New york.
4. Garner, W.F. 1974: T he origin of landscape, Oxford University – Press, London.
5. Gautam, N. G. 1978: Urban Land use studies-Aerial photo interpretation technique, pink publishing
house, Mathura.
6. Lancelet, T. S. 2004: Cochin – An Emerging industrial Center, Proceedings of the National seminar on
resource Management, University of Mysore.
7. Love Joy, Derk 1979: Land use and Land scape planning, Loonar Hill Glasgow
----

SCHOLARS WORLD-IRMJCR Online: ISSN 2320-3145, Print: ISSN 2319-5789
www.scholarsworld.net [email protected] Volume. II, Issue II, April 2014 [145]
QUALITY OF WORK LIFE: A COMPARATIVE STUDY
OF SELECTED FOOD UNITS OF CHATTRAL AND
CHAROTAR REGION OF GUJARAT
DR.YOGESH JAIN,
Assistant Professor
Pacific Institute of Management & Technology,
Pacific University, Udaipur
RENIL THOMAS,
Research Scholar
Pacific Academy of Higher Education &
Research, Udaipur- India
ABSTRACT
In this paper an attempt has been made to study the quality of work life of selected Food Units of
Chattral and Charotar Region of Gujarat. The present analytical study was conducted with an
objective to analyze the working conditions of employees in food units. This research paper has
identified some of the critical issues to be addressed as: management’s perspective and
employee’s perspective their perceptions regarding their Job, Job satisfaction, Work load,
Employee support, Physical environment, Training and development and Leadership.
Quality of Work Life has been well recognized as a multi-dimensional construct and it may not
be universal or eternal. The key concepts captured and discussed in the existing literature include
job security, better reward systems, higher pay, opportunity for growth, participative groups, and
increased organizational productivity, among others. QWL can also be defined as the favorable
conditions and environments of a workplace that support and promote employee satisfaction by
providing them with rewards, job security, and growth opportunities. In this research, researcher
has undertaken a study of four units of the similar industry namely ‘Food’ with an objective to
study the balance maintained between work and social environment by the employees within the
organization and how these environment differs from each other.
This paper is completely a analytical one whose basic information comes from primary sources
The economy of India has witnessed a marvelous growth but these reforms have significantly
reverse effects especially on quality of work life in various booming sectors in India are some of
the major findings of the study.
Keywords: Quality of work life, Job satisfaction, Food Units, Working conditions

SCHOLARS WORLD-IRMJCR Online: ISSN 2320-3145, Print: ISSN 2319-5789
www.scholarsworld.net [email protected] Volume. II, Issue II, April 2014 [146]
INTRODUCTION:
The term "quality of work life" (QWL) was first introduced in 1972 during an international labor relations
conference. QWL received more attention after United Auto Workers and General motors’ initiated a QWL
program for work reforms. Robbins in the year 1989 defined QWL as "a process by which an organization
responds to employee needs by developing mechanisms to allow them to share fully in making the decisions
that design their lives at work". QWL has been well recognized as a multi-dimensional construct and it may not
be universal or eternal. The key concepts captured and discussed in the existing literature include job security,
better reward systems, higher pay, opportunity for growth, participative groups, and increased organizational
productivity, among others. QWL can also be defined as the favorable conditions and environments of a
workplace that support and promote employee satisfaction by providing them with rewards, job security, and
growth opportunities.
The defining of quality of work life involves three major parts: occupational health care, suitable working time
and appropriate salary. The safe work environment provides the basis for the person to enjoy working. The
work should not pose a health hazard for the person. The employer and employee, aware of their risks and
rights, could achieve a lot in their mutually beneficial dialogue. There has been much concern today about
decent wages, convenient working hours , convenient working conditions etc. The term "Quality of work life"
has appeared in research journals and the press in USA only in 1970s. There is no generally acceptable
definition about this term. However, attempts were made to describe the term quality of work life (QWL). It
refers to the favorableness or unfavorableness of a job environment for people. QWL means different things to
different people. J. Richard and J. Loy define QWL as "the degree to which members of a work organisation are
able to satisfy important personnel needs through their experience in the organization." Quality of work life
improvements are defined as any activity which takes place at every level of an organization, which seeks
greater organizational effectiveness through the enhancement of human dignity and growth ... a process through
which the stockholders in the organization management, unions and employees - learn how to work together
better to determine for themselves what actions, changes and improvements are desirable and workable in order
to achieve the twin and simultaneous goals of an improved quality of life at work for all members of the
organization and greater effectiveness for both the company and the unions.
Richard E. Walton explains quality of work life in terms of eight broad conditions of employment that constitute
desirable quality of work life. He proposed the same criteria for measuring QWL. Those criteria include:
REVIEW OF LITERATURE:
The great significance of food sector to India and to the world has drawn many scholars and academicians to write
on the subject. Quality of work life has been addressed from different angles by various scholars and hence it is
rather difficult to classify the literature on quality of work life and its impact on employee of an organization.
A lot of studies were made on the performance of employees in the country but there are dearth of literature on
the critical issues of Quality of work life and its impact on job satisfaction and compensation in food sector of
the Country. Hence, this study differs from the earlier as the major thrust of the paper is upon the Quality of
work life of food sector in India especially with respect to compensation and working conditions.
Taylor (1979): more pragmatically identified the essential components of Quality of working life as; basic
extrinsic job factors of wages, hours and working conditions, and the intrinsic job notions of the nature of the
work itself. He suggested that relevant Quality of working life concepts may vary according to organization and
employee group.
Mirvis and Lawler (1984): suggested that Quality of working life was associated with satisfaction with wages,
hours and working conditions, describing the basic elements of a good quality of work life as; safe work
environment, equitable wages, equal employment opportunities and opportunities for advancement.
Baba and Jamal (1991): listed what they described as typical indicators of quality of working life, including:
job satisfaction, job involvement, work role ambiguity, work role conflict, work role overload, job stress,
organizational commitment and turn-over intentions.
Bertrand and Scott (1992) in their study: Designing Quality into Work Life found that improvements in the
quality of work life are achieved not only through external or structural modifications, but more importantly
through improved relations between supervisors and subordinates.
Datta (1999) in his study: Quality of Work Life: A Human Values Approach say that in a deeper sense, quality
of work life refers to the quality of life of individuals in their working organizations—commercial, educational,

SCHOLARS WORLD-IRMJCR Online: ISSN 2320-3145, Print: ISSN 2319-5789
www.scholarsworld.net [email protected] Volume. II, Issue II, April 2014 [147]
cultural, religious, philanthropic or whatever they are. Modern society is organizational society. Individuals spend
much of their lives in organizations. Hence, the importance of quality of work life is unquestionable.
Normala and Daud (2010): in their study ―Investigating the Relationship between Quality of Work Life and
Organizational Commitment Amongst Employees in Malaysian Firms say that the quality of work life of employees
is an important consideration for employers interested in improving employees‘job satisfaction and commitment.
SCOPE OF THE STUDY:
Work is an integral part of our everyday life, be it our livelihood or career or business. On an average we spend
around twelve hours daily in the work place, that is one third of our entire life; it does influence the overall
quality of our life. It should yield job satisfaction, give peace of mind, a fulfillment of having done a task, as it
is expected, without any flaw and having spent the time fruitfully, constructively and purposefully. Even if it is
a small step towards our lifetime goal, at the end of the day it gives satisfaction and eagerness to look forward
for the next day. A happy and a healthy employee will give better turnover, make good decisions and positively
contribute to the organizational goal. An assured good quality of work life will not only attract young and new
talent but also retain the existing experienced talent. This being the virtual fact, the current study on Quality of
Work Life among workers with special reference to selected Food Units of Chattral and Charotar Region , is
expected to prove extremely useful for the organization to improve the quality of work life among its workers
with the help of the recommendations given by the investigator.
ELEMENTS OF QUALITY OF WORK LIFE:
Adequate and Fair Compensation: There are different opinions about adequate compensation. The
committee on Fair Wages defined fair wage as" ... the wage which is above the minimum wage but below
the living age."
Safe and Healthy Working Conditions: Most of the organisations provide safe and healthy working
conditions due to humanitarian requirements and/or legal requirements. In fact, these conditions are a
matter of enlightened self interest.
Opportunity to Use and Develop Human Capacities: Contrary to the traditional assumptions, QWL is
improved ... "to the extent that the worker can exercise more control over her work, and the degree to
which the job embraces an entire meaningful task" ...but not a part of it. Further, QWL provides for
opportunities like autonomy in work and participation in planning in order to use human capabilities.
Opportunity for Career Growth: Opportunities for promotions are limited in case of all categories of
employees either due to educational barriers or due to limited openings at the higher level. QWL provides future
opportunity for continued growth and security by expanding one's capabilities knowledge and qualifications.
Social Integration in the Work Force: Social integration in the work force can be established by
creating freedom from prejudice, supporting primary work groups, a sense of community and Inter -
personnel openness, legalitarianism and upward mobility.
Constitutionalism in the Work Organisation: QWL provides constitutional protection to the employees
only to the level of desirability as it hampers workers. It happens because the management's action is
challenged in every action and bureaucratic procedures need to be followed at that level. Constitutional
protectionism provided to employees on such matters as privacy, free speech, equity and due process.
Work and Quality of Life: QWL provides for the balanced relationship among work, non-work and
family aspects of life. In other words family life and social life should not be strained by working hours
including overtime work, work during inconvenient hours, business travel, transfers, vacations etc.
Social Relevance of Work: QWL is concerned about the establishment of social relevance to work in a
socially beneficial manner. The workers' self esteem would be high if his work useful to the society and
the vice versa is also true.
RESEARCH METHODOLOGY:
Research Problem: Quality of Work Life: A Comparative Study of Selected Food Units of Chattral and Charotar Region of Gujarat.
Research Objectives: To study the relationship between compensation and job satisfaction.
To study the relationship between the qualities of work life distributed among respondents at factors.
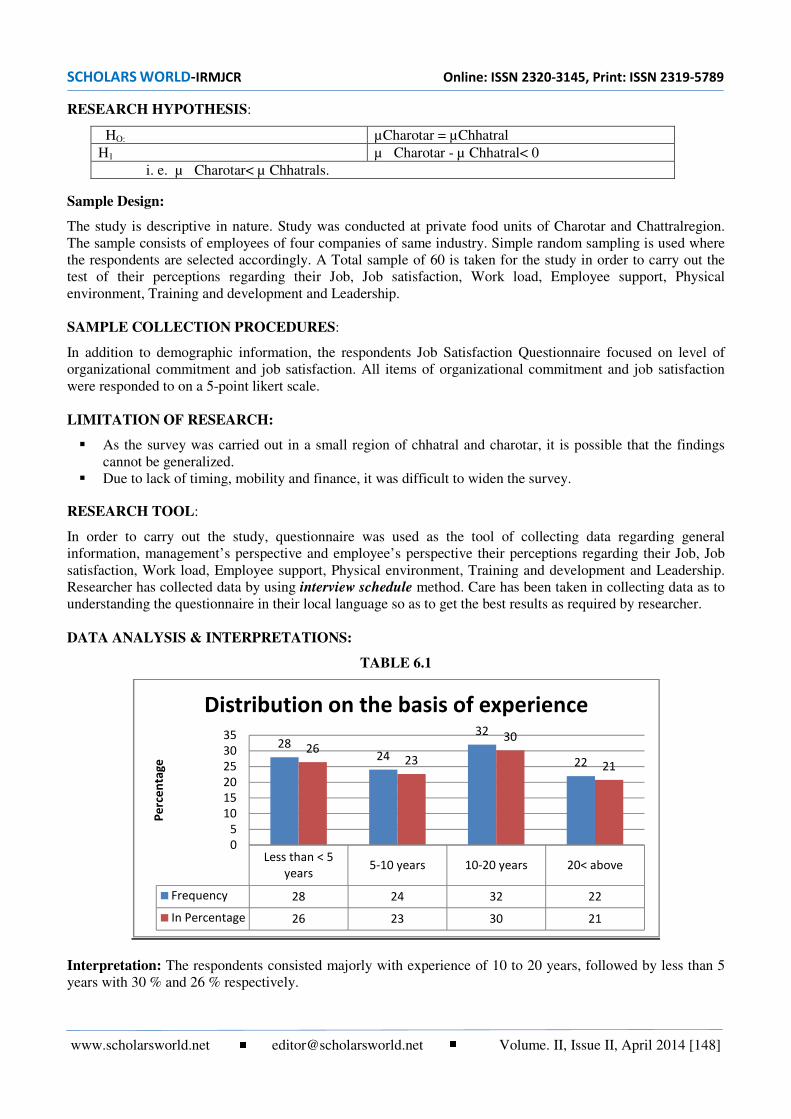
SCHOLARS WORLD-IRMJCR Online: ISSN 2320-3145, Print: ISSN 2319-5789
www.scholarsworld.net [email protected] Volume. II, Issue II, April 2014 [148]
RESEARCH HYPOTHESIS:
HO: µCharotar = µChhatral
H1 µ Charotar - µ Chhatral< 0
i. e. µ Charotar< µ Chhatrals.
Sample Design:
The study is descriptive in nature. Study was conducted at private food units of Charotar and Chattralregion.
The sample consists of employees of four companies of same industry. Simple random sampling is used where
the respondents are selected accordingly. A Total sample of 60 is taken for the study in order to carry out the
test of their perceptions regarding their Job, Job satisfaction, Work load, Employee support, Physical
environment, Training and development and Leadership.
SAMPLE COLLECTION PROCEDURES:
In addition to demographic information, the respondents Job Satisfaction Questionnaire focused on level of
organizational commitment and job satisfaction. All items of organizational commitment and job satisfaction
were responded to on a 5-point likert scale.
LIMITATION OF RESEARCH:
As the survey was carried out in a small region of chhatral and charotar, it is possible that the findings
cannot be generalized.
Due to lack of timing, mobility and finance, it was difficult to widen the survey.
RESEARCH TOOL:
In order to carry out the study, questionnaire was used as the tool of collecting data regarding general
information, management’s perspective and employee’s perspective their perceptions regarding their Job, Job
satisfaction, Work load, Employee support, Physical environment, Training and development and Leadership.
Researcher has collected data by using interview schedule method. Care has been taken in collecting data as to
understanding the questionnaire in their local language so as to get the best results as required by researcher.
DATA ANALYSIS & INTERPRETATIONS:
TABLE 6.1
Interpretation: The respondents consisted majorly with experience of 10 to 20 years, followed by less than 5
years with 30 % and 26 % respectively.
Less than < 5
years5-10 years 10-20 years 20< above
Frequency 28 24 32 22
In Percentage 26 23 30 21
2824
32
2226
23
30
21
0
5
10
15
20
25
30
35
Pe
rce
nta
ge
Distribution on the basis of experience
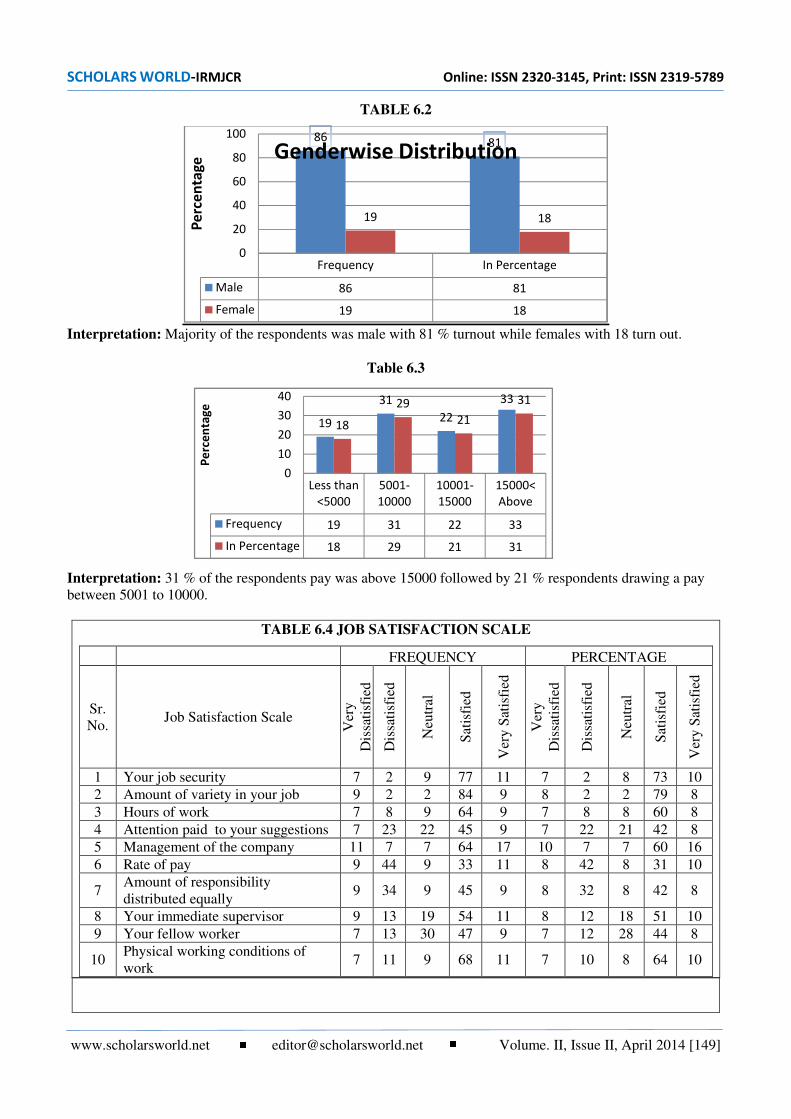
SCHOLARS WORLD-IRMJCR Online: ISSN 2320-3145, Print: ISSN 2319-5789
www.scholarsworld.net [email protected] Volume. II, Issue II, April 2014 [149]
Less than
<5000
5001-
10000
10001-
15000
15000<
Above
Frequency 19 31 22 33
In Percentage 18 29 21 31
19
31
22
33
18
29
21
31
0
10
20
30
40
Pe
rce
nta
ge
TABLE 6.2
Interpretation: Majority of the respondents was male with 81 % turnout while females with 18 turn out.
Table 6.3
Interpretation: 31 % of the respondents pay was above 15000 followed by 21 % respondents drawing a pay
between 5001 to 10000.
TABLE 6.4 JOB SATISFACTION SCALE
FREQUENCY PERCENTAGE
Sr.
No. Job Satisfaction Scale
Ver
y
Dis
sati
sfie
d
Dis
sati
sfie
d
Neu
tral
Sat
isfi
ed
Ver
y S
atis
fied
Ver
y
Dis
sati
sfie
d
Dis
sati
sfie
d
Neu
tral
Sat
isfi
ed
Ver
y S
atis
fied
1 Your job security 7 2 9 77 11 7 2 8 73 10
2 Amount of variety in your job 9 2 2 84 9 8 2 2 79 8
3 Hours of work 7 8 9 64 9 7 8 8 60 8
4 Attention paid to your suggestions 7 23 22 45 9 7 22 21 42 8
5 Management of the company 11 7 7 64 17 10 7 7 60 16
6 Rate of pay 9 44 9 33 11 8 42 8 31 10
7 Amount of responsibility
distributed equally 9 34 9 45 9 8 32 8 42 8
8 Your immediate supervisor 9 13 19 54 11 8 12 18 51 10
9 Your fellow worker 7 13 30 47 9 7 12 28 44 8
10 Physical working conditions of
work 7 11 9 68 11 7 10 8 64 10
Frequency In Percentage
Male 86 81
Female 19 18
8681
19 18
0
20
40
60
80
100
Pe
rce
nta
ge Genderwise Distribution
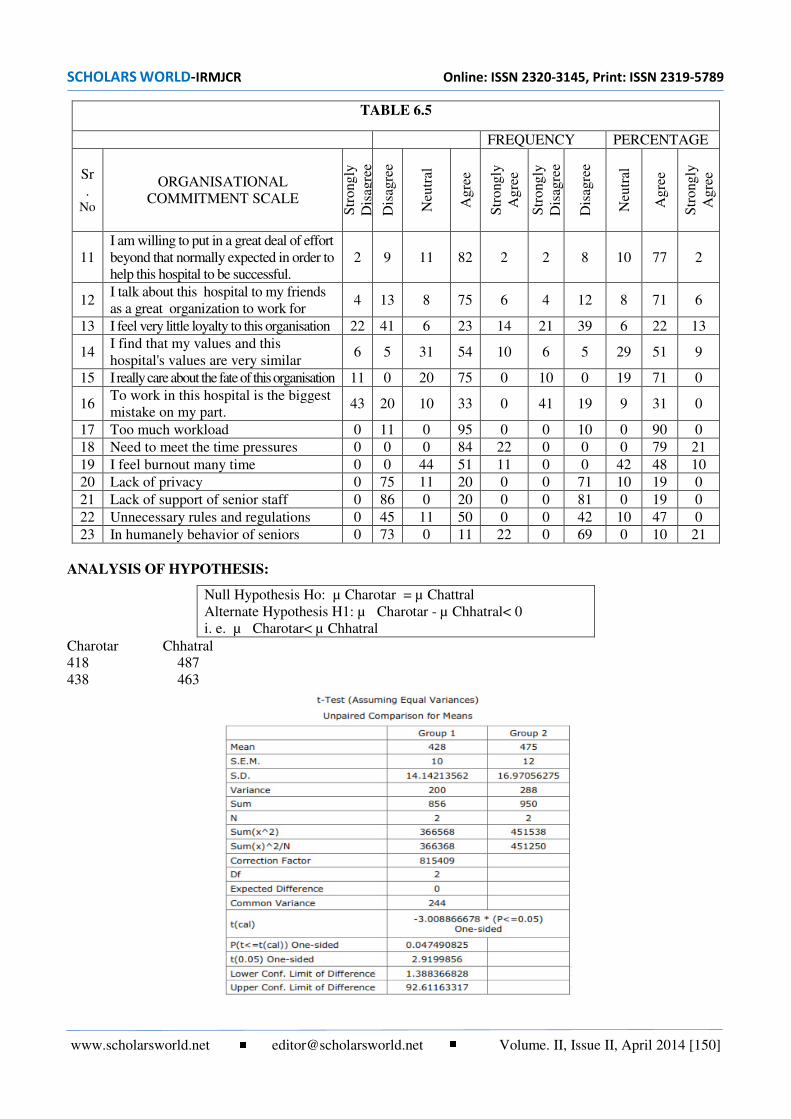
SCHOLARS WORLD-IRMJCR Online: ISSN 2320-3145, Print: ISSN 2319-5789
www.scholarsworld.net [email protected] Volume. II, Issue II, April 2014 [150]
TABLE 6.5
FREQUENCY PERCENTAGE
Sr
. No
ORGANISATIONAL
COMMITMENT SCALE
Str
ong
ly
Dis
agre
e
Dis
agre
e
Neu
tral
Ag
ree
Str
ong
ly
Ag
ree
Str
ong
ly
Dis
agre
e
Dis
agre
e
Neu
tral
Ag
ree
Str
ong
ly
Ag
ree
11
I am willing to put in a great deal of effort
beyond that normally expected in order to
help this hospital to be successful.
2 9 11 82 2 2 8 10 77 2
12 I talk about this hospital to my friends
as a great organization to work for 4 13 8 75 6 4 12 8 71 6
13 I feel very little loyalty to this organisation 22 41 6 23 14 21 39 6 22 13
14 I find that my values and this
hospital's values are very similar 6 5 31 54 10 6 5 29 51 9
15 I really care about the fate of this organisation 11 0 20 75 0 10 0 19 71 0
16 To work in this hospital is the biggest
mistake on my part. 43 20 10 33 0 41 19 9 31 0
17 Too much workload 0 11 0 95 0 0 10 0 90 0
18 Need to meet the time pressures 0 0 0 84 22 0 0 0 79 21
19 I feel burnout many time 0 0 44 51 11 0 0 42 48 10
20 Lack of privacy 0 75 11 20 0 0 71 10 19 0
21 Lack of support of senior staff 0 86 0 20 0 0 81 0 19 0
22 Unnecessary rules and regulations 0 45 11 50 0 0 42 10 47 0
23 In humanely behavior of seniors 0 73 0 11 22 0 69 0 10 21
ANALYSIS OF HYPOTHESIS:
Null Hypothesis Ho: µ Charotar = µ Chattral
Alternate Hypothesis H1: µ Charotar - µ Chhatral< 0
i. e. µ Charotar< µ Chhatral
Charotar Chhatral
418 487
438 463
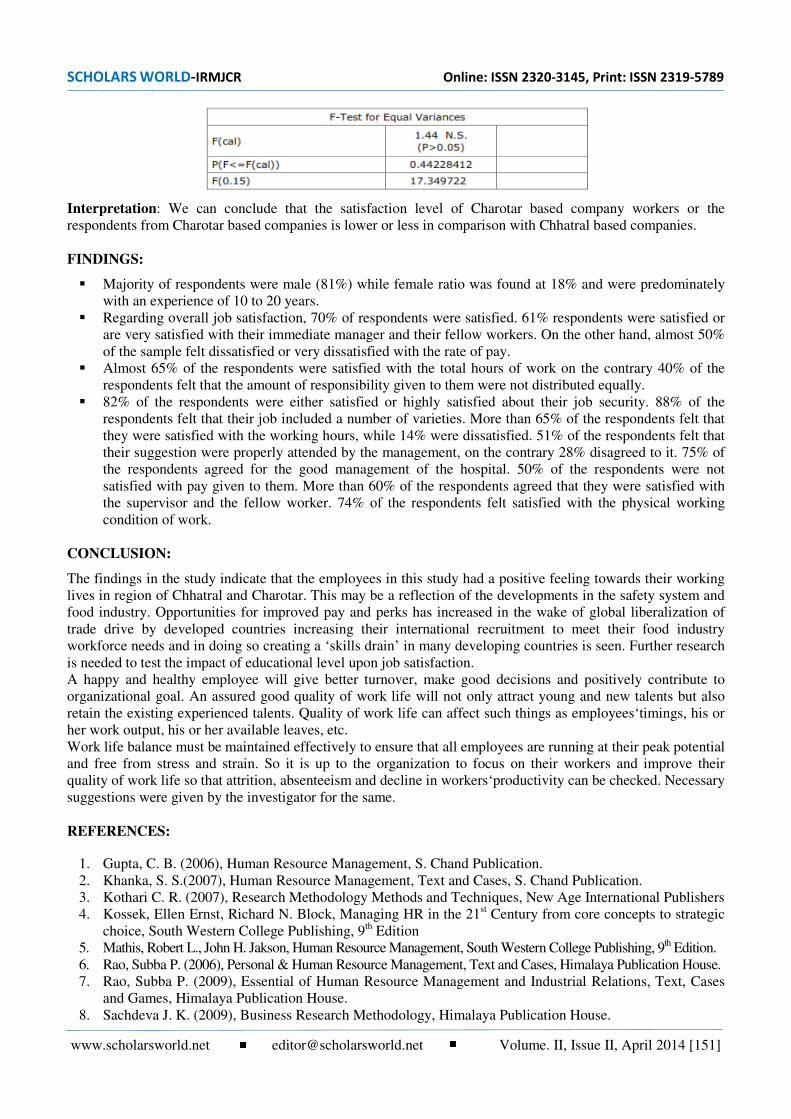
SCHOLARS WORLD-IRMJCR Online: ISSN 2320-3145, Print: ISSN 2319-5789
www.scholarsworld.net [email protected] Volume. II, Issue II, April 2014 [151]
Interpretation: We can conclude that the satisfaction level of Charotar based company workers or the
respondents from Charotar based companies is lower or less in comparison with Chhatral based companies.
FINDINGS:
Majority of respondents were male (81%) while female ratio was found at 18% and were predominately
with an experience of 10 to 20 years.
Regarding overall job satisfaction, 70% of respondents were satisfied. 61% respondents were satisfied or
are very satisfied with their immediate manager and their fellow workers. On the other hand, almost 50%
of the sample felt dissatisfied or very dissatisfied with the rate of pay.
Almost 65% of the respondents were satisfied with the total hours of work on the contrary 40% of the
respondents felt that the amount of responsibility given to them were not distributed equally.
82% of the respondents were either satisfied or highly satisfied about their job security. 88% of the
respondents felt that their job included a number of varieties. More than 65% of the respondents felt that
they were satisfied with the working hours, while 14% were dissatisfied. 51% of the respondents felt that
their suggestion were properly attended by the management, on the contrary 28% disagreed to it. 75% of
the respondents agreed for the good management of the hospital. 50% of the respondents were not
satisfied with pay given to them. More than 60% of the respondents agreed that they were satisfied with
the supervisor and the fellow worker. 74% of the respondents felt satisfied with the physical working
condition of work.
CONCLUSION:
The findings in the study indicate that the employees in this study had a positive feeling towards their working
lives in region of Chhatral and Charotar. This may be a reflection of the developments in the safety system and
food industry. Opportunities for improved pay and perks has increased in the wake of global liberalization of
trade drive by developed countries increasing their international recruitment to meet their food industry
workforce needs and in doing so creating a ‘skills drain’ in many developing countries is seen. Further research
is needed to test the impact of educational level upon job satisfaction.
A happy and healthy employee will give better turnover, make good decisions and positively contribute to
organizational goal. An assured good quality of work life will not only attract young and new talents but also
retain the existing experienced talents. Quality of work life can affect such things as employees‘timings, his or
her work output, his or her available leaves, etc.
Work life balance must be maintained effectively to ensure that all employees are running at their peak potential
and free from stress and strain. So it is up to the organization to focus on their workers and improve their
quality of work life so that attrition, absenteeism and decline in workers‘productivity can be checked. Necessary
suggestions were given by the investigator for the same.
REFERENCES:
1. Gupta, C. B. (2006), Human Resource Management, S. Chand Publication.
2. Khanka, S. S.(2007), Human Resource Management, Text and Cases, S. Chand Publication.
3. Kothari C. R. (2007), Research Methodology Methods and Techniques, New Age International Publishers
4. Kossek, Ellen Ernst, Richard N. Block, Managing HR in the 21st Century from core concepts to strategic
choice, South Western College Publishing, 9th Edition
5. Mathis, Robert L., John H. Jakson, Human Resource Management, South Western College Publishing, 9th Edition.
6. Rao, Subba P. (2006), Personal & Human Resource Management, Text and Cases, Himalaya Publication House.
7. Rao, Subba P. (2009), Essential of Human Resource Management and Industrial Relations, Text, Cases
and Games, Himalaya Publication House.
8. Sachdeva J. K. (2009), Business Research Methodology, Himalaya Publication House.

SCHOLARS WORLD-IRMJCR Online: ISSN 2320-3145, Print: ISSN 2319-5789
www.scholarsworld.net [email protected] Volume. II, Issue II, April 2014 [152]
9. Chandra Shekhar, S. F., ‘Quality of Work Experience in large hospitals’, The Icfai Journal of
Organisational Behaviour, April 2007, Vol. VI, No. 2.
10. http://www.phoenixleadership.com/downloads/qualityofworklife.pdf
11. http://www.eurofound.europa.eu/ewco/surveys/FI0410SR01/FI0410SR01.pdf
12. http://www.scipub.org/fulltext/ajas/ajas3122151-2159.pdf
13. http://www.hr.ucdavis.edu/Pubs/All/Altwork/Alternate_Work.
14. http://www.syn-dyn.com/QWL.htm
15. http://www.hr.upenn.edu/quality/worklife/flexoptions/default.aspx
16. http://www.icmrindia.org/courseware/Intro%20to%20Hrm/hrm-DS18.htm
17. http://www.evancarmichael.com/Human-Resources/840/HRM-and-the-Quality-of-Worklife.html
18. www.ohsu.cc/psychiatry/research/qol/qlq-irinterview.pdf
----
SCHOLARS WORLD-IRMJCR Online: ISSN 2320-3145, Print: ISSN 2319-5789
www.scholarsworld.net [email protected] Volume. II, Issue II, April 2014 [153]
DIGITAL ECONOMY
DR. K. V. RAMACHANDRAN,
Associate Professor,
Department of Economics, University of Calicut,
Dr. John Matthai Centre, Aranattukara, Thrissur, Kerala, South India
INTRODUCTION:
Today, we are living in an era of globalization. Everything has been globalized. Globalization has various types
as social, economical, political, cultural, and technological and as such. The digital economy is a product of
technological globalization. Digital economy is a new economy. It is an emerging economy. The information-
communication technology is only a small segment of technological globalization. The globalization made its
foot prints on information and communication too which paved the way for information- communication
technology revolution in the form of digital revolution.
So, the global economy, at present, is in the grip of digital revolution. It is a revolution due to ome persistent
and drastic changes that occurred/ have been occurring in the field of information- communication technologies
(ICTs). The very economic development/ performance/ potential power and strength of a country will be
assessed in future in terms of the total availability/ accessibility of ICTs.
The IT + CT = ICT. That means, ICT is a combined operation of both Information Technology and
Communication Technology. Merely IT/CT is not enough. But, a harmonious and simultaneous development of
IT and CT is a catalyst for the economic development of any country especially in the context of modern era.
A country may be far better in IT but may be weak in CT. That means, merely gathering of much information
and data is not a decisive index of determining growth and development. But, whatever information gathered
hold is able to easily communicate to wherever necessary without any time lag. In short, there should not be any
time gap between the flow of IT and CT because ICTs have ushered in a new era of global communications,
production, consumption, distribution, exchange, trade and investment.
The revolutionary changes in ICTs are more pronounced in developed countries than that of developing
countries like India. The rest of the world is also catching up with them fast in the digital state. The digital
economy is transforming the lives of people beyond recognition. There is a revolution in the way that things are
produced and traded before they reach the final consumers. Also, there is a revolution of rising expectations as
the world is getting transformed to global village and the access to the good things in life will no more be the
domain of the rich and influential, whether in developed or developing countries.
DIGITAL ECONOMY- DEFINITION:
Digital economy can be defined as the “pervasive use of IT (hardware, software applications and
telecommunications) in all aspects of the economy” (Atkinson and Mekay, 2007). Therefore, the digital
economy must not be confused with the Information Economy or Knowledge Economy, although all these three
have evolved rapidly and simultaneously since the end of the twentieth century. There is an economics of
digitized information whose basis fundamentally explains the features of the whole information based economy.
SCHOLARS WORLD-IRMJCR Online: ISSN 2320-3145, Print: ISSN 2319-5789
www.scholarsworld.net [email protected] Volume. II, Issue II, April 2014 [154]
In short, an economy where there is wider application of digitized information and data is called Digital
Economy. Whereas , digital economics is an economics of digitized data and information (data & information
sources, supply & demand, their cost and prices, the fields in which their applications (such as business,
marketing, trade and such).
Digitalization allows tradability and scalability of business information and changes its value as an economic
good since it can be stored, retrieved, duplicated and communicated at very low cost. Today, all information,
communication and media can now be digitized. In the digital economy no person, business or nation can
remain an island (Hellen S Runtagh, president and CEO, GE Information Services).
DIGITAL ECONOMY AND ITS INFLUENCES:
The 21st century is a knowledge based economy- a new historical era where the economy is more strongly,
deeply and directly rooted in the production, distribution, and use of knowledge and information than ever
before. The digital economy is spreading throughout the entire economies. It has direct and indirect influences
upon production, consumption, exchange, distribution, business, marketing and trading, so on. Toda, there is no
an economy without the influence of ICTs. Its scope and influences are much widening day by day.
DIGITAL ECONOMY AND ITS APPLICATIONS:
Computers and telecommunications are mainly enabling technologies which serve downstream industries in
both manufacturing like automobiles, aerospace, textiles, and electrical equipment and service sectors such as
transport and travel, finance, retail, and so on.
Even industries in the primary sector such as farming, forestry and mining largely rely now on computers,
digital apparatus, and software and advanced telecommunication services. Fishermen and farmers use radar
(radio detecting and ranging), sonar (sound navigation and ranging- used in ships) and Global positioning
system (GPS).
Farming and forestry is the main user of remote sensing and Geographic Information System (GIS – especially
used for weather detecting and forecasting).
Moreover, the digital economy has much wider applications in various fields in the form of 1.e-trading (online
trading),2.e- business,3.e-commerce,4.e-payments(escrow payments),5.e-governance, 6.e- document filing,7.e-
publication,8.e-ordering, 9.e-books, 10.e-banking(internet banking),12. e-certificates, 13.e-cash( digital
cash),14.e-trust( online-e trust by means of e- authentification, e-signature ,etc,),15.e-mone transfer(electronic
only easy money transfer), 16.e-print,17,e-camera(digital camera, web- camera ,etc),18.e-studio(digital
studio),19.e-mail, 20.e-exam(online exam),21.e-grantz,22.e-store(web- store), 23.digital cinema, 24.digital
signal processing, 25.digital album designing,26. E- District portal (by which we will be able to get more than
20 certificates by simply sitting at our home without depending Akshaya kendras. E- District portal is the
recently introduced scheme (on December, 2013) by the government of Kerala.
E-commerce or e-business is the exchange and processing of business transaction using computer connected
through a network. It allows the shop open or shopping happen 24 hours a day, 7 days in a week. It also means
that the time zones or region zones are not a problem (but, in a traditional form of business all these are a
problem). E- Commerce or e- business does not involve human interaction, and therefore, this new context
requires a new understanding of trust. Inshort, e- commerce goes beyond doing business electronically. Doing
business electronically means that conventional business processes are computerized, digitized, and are done on
the internet where product choices and prices are updated according to the customer information and
preferences in real time on web stores. The customers & producers are need not go to the market sites for
buying &selling, instead the need to visit web stores at antime, anywhere.
DIGITAL ECONOMY AND ITS PROMISES:
SCHOLARS WORLD-IRMJCR Online: ISSN 2320-3145, Print: ISSN 2319-5789
www.scholarsworld.net [email protected] Volume. II, Issue II, April 2014 [155]
The digital communication technology (DCT=ICT) will replace the easting analog media just like digital
compact discs have replaced analogy vinyl records. That is, interactive computer technology can be combined
with digital communication networks to provide interactive digital content to anyone, anywhere, and anytime
over a low cost high performance networks. For eample, the web page that we are reading. It is a digital
document which is available by pointing and clicking a mouse. Definitely, it is an interactive process. The web
page makes it “a document on demand” will be available when we just like to read it. Here, the key concept is
“interactive data transfer”.
The companies like Yahoo, MSN,etc, are digital data& information transporting or exporting companies. The
transfer of broadcast quality video, video conferencing and telepresence applications are other ways of digital
data transfer. After converging data and information, diverging them to the needy. To be more precise, those
who produce & supply digital data and information by using network connectivity are doing the convergence of
communications. Such companies are content providers (the providers of data & information). Whereas, those
companies which transport or eport digital data and information (Yahoo, MSN,etc) are actually doing the
divergence of communications.
The video conferencing &telepresence applications are other eamples of digital data transfer. The telepresence
means that one can communicate with a person at a remote location as if both were in the same room. This not
only means video conferencing but the ability to share other information as well.
The invention of fibre optic cables has fundamntally changed the technological landscape for telecoms. When
long distance communication becoame digitized, a number of long distance telephone circuits that could be
carried over a given fibre-optic cable began to double ever 18 months at constant costs. This eponential growth
now allows more than a half million simultaneous telephone coversations overa sigle fibre pair (i.e., a cable
may contain hundreds of fibre pairs). There is no longer a long distance bottleneck.
The provision of ADSL (Asymmetric Digital Subscriber Link) ervice highlights the conflicts between the
internet and telephony. If the digital part of the link is connected to the internet and charge for a flat (monthly)
rate and the telephone outlet is charged for as in the old manner one can easily see the conflict. The old
telephone link has a maximum bandwidth of 56 kpbs but the digital link has about 100 times that of bandwidth
and incurs no long distance charges. So, a customer given the choice would undoubted move as much of the
long distance communication to the internet as possible. One could easily talk directly to anyone else on the
internet using web phones or even web videos conferencing. The technology to bridge from the telephone
network to the internet is available now.
Tanscott claims that well before the end of this century, the television will be dead, replaced by an information
appliance and TV set- top boes will not prevent this. The HDTV (High Definition TV) is unlikely to get off the
ground According to Transcott “the cable companies will likel to be the big losers”because they have long
enjoyed being monopolies and have been slow to respond. Moreover, cable networks crash when there is a
storm.Given this, the importance of the internet, the silliness of HDTV, and the diversions of the set top box,
cable companies should be focussing more on how to operate with the internet and how to deliver the
interactive services to the pc.
The Digital Book and Digital Cash are the other promises due to the digital economy. However, the data
transport technology alone will not determine what happens in the digital economy. The books and journals can
be published in its full form today as what is called “Digital Book”. So, one would be able to purchase an
electronic copy of the book over the internet for substantially less than the cost of a paper back/ work- but will
this type of publications only occur after demand for hard cover/ paper back versions has subsided. The selling
of digital book brings the digital cash.
But, for publishing digital book one should set up his own website and publish the book by self. Similar issues
will arise for all of the content providers in the digital economy. The issues will be those bands who provide
music/ video/ interactive entertainment programming, etc. And issues will be to authors of non- fiction/ novel/
news/ cartoons/ magazines/ poetry/ and anything else we can think of that is currently printed or spoken. The
SCHOLARS WORLD-IRMJCR Online: ISSN 2320-3145, Print: ISSN 2319-5789
www.scholarsworld.net [email protected] Volume. II, Issue II, April 2014 [156]
issues will be also to performers, producers of just about an imaginable kind, including those of TV
programming, movies, plays and other performances, sports and entertainment promoters/ organizers, and
software providers of all kinds.
It seems that the current publishers/ broadcasters/distributors/ retailers, are doomed to live in interesting times-
as are the the plaer in the data transport industry- and ofcourse, everyone else. In a sense, the internet data
technology transfer companies are the data exporting companies.
DIGITAL ECONOMY & ITS PERILS:
There are various economic and social issues emerging out of the digital economy. Depending upon the
implementation details the digital econom ma either increase social stratification if only the “haves” can afford
access or it can be a social leveler if universal access is provided to the digital network. According to Algore
“this is not a matter of guaranteeing the right to play video games. It is a matter of guaranteeing access to
essential services. We cannot tolerate nor in the log run can this nation afford a society in which some children
become fully educated and others do not; in which some adults have access to training and lifetime education,
and others do not. A change in the flow of information, computing and communication in the recent past has
greatly influences the world economy. In the emerging digital economy the players as well as the rulers of the
game are changing fast.
Along with it has a lot of confusion and uncertainty. The digital economy may bring potential invasions of
privacy, more sophisticated and far reaching criminal activities and host of other unknown problems. There
should be a control over knowledge and information. Roldan posits that the introduction of information
technology within the context of regional globalization exacerbates the vulnerabilities of non- core workers, of
whom the women form a large part. Women are doubly vulnerable in countries such as Argentina which are
viewed by multi- national companies as peripheral sites for tapping cheap labor. It seems that within such a
context, ICTs have neither empowered women nor have they brought the desired developmental benefits to
women in poor countries.
SUGGESTIONS TO OVERCOME PERILS:
1. There should be a clear- cut strategy and that strategy need to be rested on the view that the information
highway must be developed and funded by the private sector (not allowing to be fully monopolized by
MNCs) but the government could play a decisive role in several areas.
2. Create regulatory conditions for an open competitive market place for the evolution of the information
infrastructure.
3. Use new technologies to reinvent it to cut costs and improve the delivery of the government programmes.
In doing so, government would not only deliver better and cheaper services but as a significant purchaser
place having considerable demand on the market.
4. Take steps to ensure that technology serves people by implementing policies and programmes to ensure
universal access, equity, privacy and security.
5. Act as a catalyst for new kind of partnerships that would encourage demands for networks, the growth of
applications, and the use of new technologies.
STATUTORY WARNING:
In order to assure security and privacy to network communications, the “Digital Economy Act” has been
implemented. The Digital Economy Act, 2010(C.24) is an Act of the parliament of United Kingdom, regulating
the digital media.
The Act came into force on 8th June, 2010(with the exception of certain sections that came into force on 8
th
April and certain other sections that will be brought into force by statutory instrument).
Unless such Acts are effectively brought into and strongly adhered to, the whole economies will be
engulfed by Cyber Crime, leading to utter perils. So, there is a dire need for a global pursuit aimed at in
defense of digital perils.

SCHOLARS WORLD-IRMJCR Online: ISSN 2320-3145, Print: ISSN 2319-5789
www.scholarsworld.net [email protected] Volume. II, Issue II, April 2014 [157]
CONCLUSION:
Anyhow, the digital economy is an essential reading for any business person who wishes to succeed in the
information age. The digital revolution has already started and the convergence of communication, computing
and content technologies will undoubtedly transform societies in profound and perhaps unexpected ways.
The global web of interdependence in the information age will facilitate new ways of doing business and spawn
whole new industries. These are areas where market forces (since we are living in a market driven economy)
can probably be left to determine the future landscape of the digital economy
If the digital economy is managed as socially necessary and economically viable having with better and cheer
mind then it will be good and needy for the entire globe.
REFERENCES:
1. Harbhajan Singh & Varinder.P. singh:- Digital Economy: Impacts, Influences and Challenges”
2. CeciliaNg& Swasti Mitter: Gender and the Digital Economy: Perspectives from the Developing World”-
sage publications India Private Ltd, New Delhi.
3. Don Tapscott- The Digital Economy: Promise and Peril in the age of Networked Intelligence. McGrow-
Hill (1996).
4. Edward. J. Malecki: BrunoMoriset- Digital Economy: Business Organization, Production processes,
and......
5. James W.Harrington and Peter.W. Daniels- Knowledge Based Services, Internalization and Regional
Development.
----
SCHOLARS WORLD-IRMJCR Online: ISSN 2320-3145, Print: ISSN 2319-5789
www.scholarsworld.net [email protected] Volume. II, Issue II, April 2014 [158]
THE PHILOSOPHY OF MAYA AND TAGORE’S
HUNGRY STONES: A CRITICAL STUDY
KOUSIK ADHIKARI,
PhD. Research Scholar,
Ganesh Chakraborty Vill saharda,
West Bengal (India)
ABSTRACT
The doctrine of Maya holds a special position in Indian philosophical system, dating back from
the Rig-Veda period, changed and fashioned into several manifestations in later eras evolving
through Shankar, Ramanuja, vaishnabism and shakti cults. It holds the proposition of the
unreality of the seemingly real world and points out the permanence of only atman or the
individual soul that will only be merged with the paramatman, supreme self. Tagore, who was
deeply well versed in philosophy, has used it in many of his writings. His short story Hungry
Stones is s powerful presentation of the doctrine of Maya, influencing the human beings. The
paper aims to show this philosophy of Maya shaping and influencing the story and making it a
miniature Tagorian commentary on this philosophy.
Keywords: Maya, Tagore, Hungry Stones, Philosophy.
SCHOLARS WORLD-IRMJCR Online: ISSN 2320-3145, Print: ISSN 2319-5789
www.scholarsworld.net [email protected] Volume. II, Issue II, April 2014 [159]
INTRODUCTION:
The doctrine of Maya is one of the fundamental aspects of the Indian philosophical system, dating back from the
period of Vedic scriptures. The basic proponents set by the great Sankara in the eight century AD and later
explained and verified by several others throughout ages in this field established the central teachings of Advaita
or the non-dualistic mode of Vedanta philosophy, which is regarded as the ultimate and absolute answer of the
traditional Hindu mind about the nature and proposition of being and the ultimate reality and also a theoretical
proposition of the world in which we live in. Maya stands for the illusion of world that binds us to this earth and
its associated relations and makes us think these as our own, where the reality is that the self is only the real
because the self or atman would alone be merged and united with the God or paramatman, the Supreme Being.
The vedantist thus propose a ultimate solution or answer for all the inconsistent traverses of the world.
On the other hand Maya becomes subsequently a religious tenet in vaishanav philosophy as well as in the shakti
cult. Actually this is the very difference of Hindu mind in the philosophy of maya. and western philosophy,
whereas in western philosophy, they search for the abstract truth and ultimate knowledge, Hindus have
traditionally armed philosophy only to find the religious truths because their absolute aim ceases only at the
finding of mukti or the supreme freedom or salvation from the bondage of the world that has chained us in
Rousseau’s words and this bondage is the supreme manifestation of maya. The origin of the idea of maya takes
its root in Vedic literature in sanhitas, brahmans, arayanaks, and upanishadas. In the era of epics as in The
Mahabharata, the word maya has also another meaning, which is delusion caused by magical powers. In the
great war of kurukhestra, Ghatotkach, the son of Bhima, the second pandava and his non-Aryan wife Hirimba is
said to have the power to fight a war of maya. There were also some others in the side of kauravas who has
similar powers to yield.
Sankara (AD788-850) the founder of kevaladvaita or the non-duality has his base on the Brahmansutras of the
sage Badrayana, citing the teachings of upanishadas. Ramanuj (AD1050-1157) is the founder of visishtadvaita
or non-duality with difference. His concept of maya is slightly different from Sankara. Sankara’s personal god
which is as unreal as the maya world, finds different version in Ramanuj’s treatise, where he gives an
interpretation of maya reconciling in the world of both god and the world.
In shaktivada the doctrine maya has taken a more popular shape, expounded by several proponents throughout
the mediaeval period and also especially in the British period. In one popular shymasangit of Bengal in a song
addressed to the goddess kali it is said:
“Oh! Mind just think
No one is yours,
In vain, you travel
Throughout the world,
Don’t forget Dakshinakali (one of the forms of goddess
kali)
Being imprisoned in the webs of maya” (1)
Hermann Grossmann in his empirical book Woertersuch Zum Rig-Veda finds sixty three instances, where the
word maya occurs directly and thirty nine other examples where its connotations are used. The gods are capable
of overthrowing and mastering the maya used by the demonic powers and thus they are also holder of it. The
asvins destroy the maya of wicked dasya and soma triumphs over the maya, exerted by the wicked father. In
Atharbaveda, the maya becomes chiefly attributed to the demonic powers, the asuras. Thus it could be said that
in Vedic conception the word maya is variously attributed with the concept of power, because by the use of it,
the holder of it becomes powerful over others and can conquer them or bring them under his control and further
this power is used by both the gods and asuras, the two supposed manifestations of the concept of good and
evil, thus it is differentiated as deivimaya or asuric maya. Indra, the king of gods is supposed to have the power
to change himself into various forms by his maya and thus the basic meaning of modern common concept of
maya of forms of reality and appearances takes its root veritably from Rigveda, the earliest instance of the
Hindu traditions that exists still.
In Upanishadic doctrine, the word maya is simultaneously represented as avidya or ignorance as illusion and is
devoid of reality and is a kind of ignorance. In Markendyapurana, there is a beautiful anecdote that will throw
some light on this concept of maya more simply than others where there is a story of king, Surath who was a
SCHOLARS WORLD-IRMJCR Online: ISSN 2320-3145, Print: ISSN 2319-5789
www.scholarsworld.net [email protected] Volume. II, Issue II, April 2014 [160]
powerful king and generous one but in a time he was defeated by some aggressors. Finding the king weak, the
ministers captured his treasure and kingdom. As a result to save his life he found refuge in dense forest. In his
desolate state the king was thinking of this treasure, kingdom, servants, his dear elephant etc., and soon he
found a merchant named Samadhi who was equally desolate and sad. As the king asked the reason, he
elaborates that his own wife and sons have deserted him for his wealth. But he still thinks for welfare of them
and feeling attachment for them. He rather cannot understand the reason why he is feeling so much for them
even though they have treated him so cruelly. Finding no answer they went to the ashram of the sage Medha
and ask him about the cause and the sage answers that because of the impact of Mahamaya who is also the
cause of establishment of this universe, all the beings are thrown into the whirl of pity and affection. The
Upanishads, the concluding part of vedas are called Vedanta, also deals with the ultimate knowledge of truth
and reality. Tagore in his forward to Radhakrishnan’s Philosophy of Upanishad says that they have the breadth
of a universal soil that can supply with living sap all religions which have any spiritual ideal hidden at their
core or apparent in their fruit and foliage. He also says, that It is not enough that one should know the meanings
of the words and the grammar of the Sanskrit texts in order to realize the deeper significance of the utterances
that have come to us across centuries of vast changes both of the inner as well the external conditions of life.
Once the language in which these were written was living, and therefore the words contained in them had their
full context in the life of the people to that period, who spoke them. But now divested of that vital atmosphere, a
large part of the language of these great texts offers to us merely its philological structure and life’s subtle
gesture which can express through suggesting all that is ineffable. But suggestion can neither have fixed rules of
grammar nor the rigid definitions of the lexicon so easily available to the scholar. Suggestion has its
unassailable code which finds in depths of expanding in the living hearts of the people who use it.
Tagore’s writings are thoroughly replete with philosophical undertones. Yeats has rightly observed Vedic
hymns in Gitanjali or the Songs Offerings because it was really there. On the other hand most of the western
critics and contemporary western intellectuals had misjudged Tagore because of this where they can only see
the oriental philosophy making the themes and characters abstract and make them more distant from reality as
par the European sense of the term. They cannot possibly see that for the Indian it is the reality not what the
Europeans deemed fit as reality. This very controversy of judgment between the appearance and reality and
what reality really is according to these two different and somewhat antithetical mindsets has become a critical
drawback on judging Tagore. Though perhaps Tagore’s short stories would possibly draw westerner’s attention
for their being more real according to their sense of the term but there is not any scarcity of philosophy in them.
Taogre’s Hungry Stones is an apt and profitable example to commence a discussion upon this theme.
Hungry Stones, the name itself is a kind of debate over this very theme of appearance and reality. The stone’s
becoming hungry though thoroughly impossible according to a natural point of view, for Tagore it has a
significant sense and if we pursue the whole story, we can very well see how the title became a considerate
presentation on the very theme of mayabad or the philosophy of maya. It is a beautiful exposition of all
pervading gloom of maya and how the human being, being caught into its web of intricacies from where there is
no escape. The story is presented through two narrative structures, the first one or the first narrator is the
supposed author of this tale and the second narrator is one about whom the story tells the tale. These frame
story narrative technique or one story grafted in another story is an ancient Indian narrative technique that is
used most perfectly and in several of Indian texts like Panchatantra, Betal Panchabinshati, Batris Sinhasan and
even in our two greatest epics The Ramayan and The Mahabharata. This technique played, exposed and
fashioned into two levels, expose the opposite polls of the same strings or the two faces of the seemingly same
coin –appearances, illusion, maya and reality. The narration also prepares us from the very beginning for this
simultaneous double playing as we heard from the first narrator about the second narrator whom he met in train
when he and his kinsman were returning to Calcutta from their puja trip. He says, “From his dress and bearing
we took him at first for an up-country mohamedan, but we were puzzled as we heard him talk” (3). This
bafflement is ensued because this person who is rather thought to be a ignorant country man discoursed upon all
subjects so confidently that one might think that the disposer of all things have consulted with him at the time
he did that. The first narrator’s kinsman took this mahomedan gentleman as someone inspired by some ‘occult
power’ by an ‘astral body’ which also justifies our debate on the exposition of maya as conceived in Rigvedic
period as a kind of power.

SCHOLARS WORLD-IRMJCR Online: ISSN 2320-3145, Print: ISSN 2319-5789
www.scholarsworld.net [email protected] Volume. II, Issue II, April 2014 [161]
However the person’s tale is equally enigmatic as he narrates his story about his administrative work in the
service of Nizam of Hyderabad as a collector of cotton duties of Barich. The story then goes on narrating the
second narrator’s work in Barich, the surrounding atmosphere and the solitary marble palace, where he choose
to live in. The narrator briefly touched upon the history of that solitary marble palace which was built by
emperor Mohammad Shah II, some 250 years ago, and which was built for his pleasure and luxury. The
narration very skillfully attaches the Arabian night like atmosphere, making it a Eastern tale of enchanting
romance and beauty that the westerners are always prone to attach and find with the Eastern and the narration
veritably justifies this demand, “In his days jets or rose-water spurted from its fountains, and on the cold marble
floors of its spray-cooled rooms young Persian damsels would sit, their hair disheveled before bathing, and
splashing their soft naked feet in the clear water of the reservoirs, would sing, to the tune of the guitar, the
ghazals of their vine yards” (5). The description is lively, generously sensuous and enigmatic. It’s a keatsian
world build on Tagorian earth. The super sensuousness along with the humble condition of the second narrator
makes it also quite applicable to justify the veritable structure of maya that Tagore is prone to build on.
Though the fountains play no more and the songs have ceased to tune, neither there is the snow white feet step
grace the snowy marble now, it played an enchanting effect upon the narrator and he himself admits that it may
be because of the vast and solitary quarters of the palace or may be because of his being “oppressed with
solitude and deprived of the society of women.” He settles there despite the warning of the old clerk Karim
Khan of his office and before a week scarcely passed, “the place began to exert a weird fascination upon him”
(6). The atmosphere is scented as the still air was loaded with an oppressive scent from the spicy shrubs
growing on the hills close by. When the sun sank behind the hilltops and the long curtain of night descends the
narrator heard a footfall on the steps behind. He looked back in curiosity but found none. He thought it to be an
illusion and perhaps at once to negate his opinion, he heard many footfalls as if a large number of persons
rushing down the steps. He cans sense “a bevy of joyous maidens coming down the steps to bathe in the susta in
that summer evening”(7) and he also felt the girls laughing, dashing and spattering water at each other in their
playful mode and the feet of the fair swimmers “tossed the tiny waves up in showers of pearl” (8).
The description is enchanting and also brings forth Plato’s theory of mimesis, the theory of appearance and
reality that can be very profitably compared with the Indian theory of mayabad. The narrator tossed by the
debate of appearance and reality is something becoming more and more prone to and incensed towards the
titanic structure of its enchantment and he admits,
“Call it a reality or dream, the momentary glimpse of that invisible mirage reflected from a far-off world, 250
years old, vanished in a flash. The mystic forms that brushed past me with their quick unbodied steps, and loud,
voiceless laughter, and threw themselves into the river, did not go back wringing their dripping robes as they
went. Like fragrance wafted away by the wind they were dispersed by a single breath of the spring” (9).
The point is that the narrator is nowhere sure absolutely of the actuality of the step where to stop or the no
man’s land between this underplay of appearance and reality. Sometime he thinks that perhaps it was the muse
that had taken advantage of his solitude and possessed him or it is the empty stomach that all sorts of incurable
diseases find an easy prey. The faint smell of attar, the strange tunes of guitar, the jingle of ornaments, the
distance note of nahabat, the inaccessible and unearthly visions playing around him as in a jovial mirth all
played an impact on him, binding him in an unbroken spell as if from which an escape is totally impossible. He
admits that he came under such a spell that this intangible inaccessible unearthly vision appeared to be the only
reality in the world and all else a dream. This went on till one night he feels himself following an Arabian girl.
Though he can see the girl, he can surely feel her through his mind’s eyes- her arms hard and smooth as marble,
a thin veil falling on her face and a curved dagger at her waist. She makes him feel at wending his way through
the dark narrow alleys of slumbering Baghdad and drifted into one episode of the tales of Arabian nights. In his
incensed state of being he thought that he had seen his fair guide and a glimpse of a part of room spread with a
Persian carpet and someone was sitting on the bed and he can only see the glimpse of two exquisite feet in gold-
embroidered slippers. But this night excursion suddenly ceased as he made an attempt to step across the
outstretched legs of the eunuch’s, guarding the room and the eunuch woke up and the sword fell on the marble
floor with a sharp clang.

SCHOLARS WORLD-IRMJCR Online: ISSN 2320-3145, Print: ISSN 2319-5789
www.scholarsworld.net [email protected] Volume. II, Issue II, April 2014 [162]
With a terrible scream he jumped and found himself sitting on his camp-bedstead sweating heavily. The world
is full of illusion and only one has to be inclined to it and the rest is written, it will cling to him, made him also
a part of that illusory world. The narrator’s journey towards this illusion and his ultimately breaking through the
spell of web is a miniature tale of every human being’s journey towards supreme realization, a process to
understand himself, his own being and tearing the bond that calls him back again and again to be toiled and
dusted in this earthly world. The beautiful fair guide is the caller from this illusory world, calling and gesturing
the individual being, preventing him from the ultimate realization and barring him from it. One of the curious
elements of the story is that Tagore’s use of an Arabian lady for the instance. The tradition of puritanical
mindset of women behind all the uncreation of spirituality and traditionally binding her with every kind of
earthly activities, finds a tongue in Tagore’s using the symbol. The Hindu concept of mahamaya permeating the
universe in her unbroken spell, certainly lends elements in it. On the other hand the Negro eunuch with his
sharp swords stands for the tearing of that spell and who ultimately makes it possible for the protagonist to
come to his world of reality.
In the process of this journey towards illusion he is also checked by on crazy Meher Ali who cries out as is his
daily custom “Stand back! Stand back! All is false”. He is the author’s open weapon to finalize the motive of
the story that stands veritably on the drawing of the rope between illusion and reality. As one day he could hear
a voice imploring to him, “Oh! Rescue me! Break through these doors of hard illusions, death like slumber and
fruitless dreams place me by your side. In the saddle, present to your heart, and, riding through hills and woods
and across the river, take me to the warm radiance of your sunny rooms above!” (19). This is nothing but the
call of the self after his speedy progression toward the illusion is checked by the dream like apparition of
eunuch and his sword’s sharp clang on the floor. The narrator of course could not recognize the true identity of
this call and again checked by Meher Ali’s call, “Stand back! Stand back!! All is false! All is false!!” (23).
The story ends with the supposed author or the first narrator’s comment to kinsman, “the man evidently took us
for fools and imposed upon us out of fun. The story is pure fabrication from start to finish” (25). Thus the story
veritably attests the futility of the seemingly real world and focuses on the philosophy of maya and ultimately
aims on the self consciousness that this man gained at the end of his dilemmas and debates over real and unreal.
END NOTE: 1. THE TRANSLATION IS OF THE PRESENT AUTHOR.
REFERENCES:
1. Radhakrishnan, S, Indian Philosophy, London: Longman’s Green and Company, 1923.
2. Tagore, R. Hungry Stones and Other Stories, translations, London: Macmillan, 1950.
3. Woodroffe, Sir John, Mahamaya, The World as Power: Power as Consciousness, Madras: Ganesh and
Co. 1954.
----
SCHOLARS WORLD-IRMJCR Online: ISSN 2320-3145, Print: ISSN 2319-5789
www.scholarsworld.net [email protected] Volume. II, Issue II, April 2014 [163]
STRESS MANAGEMENT PROGRAMMES
(A STUDY ON THE PERCEPTIONS OF THE
EMPLOYEES IN BHEL TIRUCHIRAPALLI UNIT)
DR. S. VASANTHI,
Associate Professor in Commerce,
PG & Research Department Of Commerce,
Holy Cross College (Autonomous), Tiruchirapalli, South India
ABSTRACT
In modern times stress has become a part of life. Stress in work atmosphere has received
considerable attention in recent years. A major source of stress is the work role or role assigned to
each employee. Work roles may create stress because they are in conflict with each other or with
the employee’s own needs, values, or abilities. Individuals have often been found complain about
what the stresses of their lives do to them: their demanding supervision gives them ulcers; their
children drive them crazy, and so forth. Stress is the general term applied to the pressures people
feel in life. The presence of stress at work is almost inevitable in many jobs. When pressure begins
to build up, it can cause adverse strain on one’s emotions, thought processes, and physical
condition. Stress is a dynamic condition in which an individual is confronted with an opportunity,
constraint, or demand related to what he or she desires and for which the outcome is perceived to be
both uncertain and important.
Stress can be seen in three main ways: as a stimulus or cause, as a response or effect, and as an
interaction between the demands made on individuals or groups and the degrees of coping
available to them. “How to manage stress” is an excellent study which describes the various
methods that can be adopted to contain and combat stress. Stress is usually regarded as
unpleasant, undesirable, unwanted, though this need not always be the case. Keeping this view in
mind the present study aims to measure the effect of stress management programmes offered by
BHEL to alleviate stress among the employees.
Keywords: Stress, Occupational Health Service, Stress Alleviation, Health, Stress Management
Programmes

SCHOLARS WORLD-IRMJCR Online: ISSN 2320-3145, Print: ISSN 2319-5789
www.scholarsworld.net [email protected] Volume. II, Issue II, April 2014 [164]
1. INTRODUCTION:
World Health Organization defines health as a state of complete physical, mental and social well being and not
merely an absence of disease or infirmity. People should be respected, recognized and motivated but not injured
by work. Work Environment should be safe and healthy. The human relationships within any organization
should be fair and equitable, with a minimum of imposed decisions from above, and unrealistic group attitudes
from below. All these things can contribute to overall mental and physical health or ill-health.
At the same time, every individual has a responsibility for his own health which he cannot pass on others. To
remain healthy, he must follow the basic rules of health which include eating properly, getting enough sleep and
exercise, no smoking, limiting the amount of alcohol taken and generally living in a way which minimizes
stress and strain and allows time for relaxation and hobbies. At work the rules for health will include ensuring
as far as possible that hazards are identified and precautions taken, both for himself and for his colleagues.
Whatever may be the technological growth, it is still ‘Man’ who makes it possible. His active involvement and
participation is essential to achieve results. Being aware of this fact, BHEL, Tiruchirapalli, spares no effort to
strengthen ‘Man’ and thus raise productivity. Man and his working environment are constantly monitored by a
specialized service - the occupational health service. This was initiated in 1976 on BHEL’s own initiative and
one has to remember that it is not just an accident prevention or rehabilitation of those who get injured. OHS is
a health promotive service with special emphasis on Man in his working environment.
Health care of the employed population should include not only medical care during sickness but also services for
promotion of health, prevention of illness, early diagnosis and rehabilitation, with special emphasis on work and
psychosocial environment inside the work place. A worker is exposed to general health risks and also to that of
ever expanding list of hazardous occupational agents. In addition, there are numerous socio-psychological factors
which operate at the place of work and which may impair the health and efficiency of workers and impede
production. As such, the worker deserves/requires greater attention compared to general population.
OCCUPATIONAL HEALTH SERVICES (OHS) OF BHEL:
The OHS Theme is:
Making sick people well
Keeping well people well
Wishing all people well
Occupational health aims at: Promotion and maintenance of the highest degree of physical, mental and social well-
being of workers in all occupations; Prevention of sickness amongst workers caused by their working conditions;
Protection of workers in their employment from risks resulting from factors adverse to health: The placing and
maintenance of the workers in an occupational environment adapted to his physiological and psychological
equipment. Adaptation of work to man and of each man to his job. It’s a psycho-physical balance.
Occupational Health Service at Plant Level aims at maintaining these various interactions between man at work
and his environment at an optimum level so that health is preserved and promoted.
The Main areas of Occupational Health Services (OHS) of BHEL in Tiruchirapalli are:
1. To identify occupational hazards;
2. To advise on the control of occupational hazards;
3. To recognize at an early stage occupational or other diseases and to screen vulnerable groups
4. To give initial treatment for injuries and illnesses of sudden onset; to treat illnesses to prevent people
from going off work;
5. To give advice about the placement of people in suitable work - on starting work following illnesses or
injury, or at other times when problems exist;
6. To undertake health education.
It is, however, important to realize now that Occupational Health Services can only be a part of a team effort to
create and maintain healthy work places with healthy people. The various activities of BHEL’s Plant Level
Occupational Health Services:
1. Pre-employment Screening,
2. Pre-placement Screening,

SCHOLARS WORLD-IRMJCR Online: ISSN 2320-3145, Print: ISSN 2319-5789
www.scholarsworld.net [email protected] Volume. II, Issue II, April 2014 [165]
3. Periodic Screening of vulnerable groups viz. Persons exposed to welding fumes, dust, radiation, noise,
food handlers etc.,
4. Healthy Screening,
5. Industrial Hygiene Monitoring of the working environment,
6. Biological Monitoring and Toxicological work,
7. Psychological Counseling and Guidance,
8. Rehabilitation of the Disabled,
9. Health Education,
10. Emergency Medical Care and
11. Maintaining Health Records.
12. Analysis and Interpretation of Health data - Health Statistics.
All the above activities are carried out by various technical persons who work in a co-ordinate manner. This
multi disciplinary approach is the basic theme in Occupational Health Service.
To highlight the importance of stress management programmes Dr. N.K. Chanarasekaran, and others of
Occupational Health Services in B.H.E.L, Tiruchirapalli have conducted many studies.
Stress can be seen in three main ways: as a stimulus or cause, as a response or effect, and as an interaction between
the demands made on individuals or groups and the degrees of coping available to them. “How to manage stress” is
an excellent study which describes the various methods that can be adopted to contain and combat stress. Stress is
usually regarded as unpleasant, undesirable, unwanted, though this need not always be the case1.
Keeping this view in mind the present study aims to measure the effect of stress management programmes
offered by BHEL to alleviate stress among the employees.
1.2 QUANTIFICATION AND MEASUREMENT OF SATISFACTION OF STRESS
ALLEVIATION MEASURES ADOPTED FOR EMPLOYEES IN BHEL:
To measure the satisfaction level of the respondents about the Stress management programme offered by
BHEL, 25 statements were prepared with the help of literature.
Rensis Likert’s summated scaling technique was adopted to measure the respondents attitude towards stress
alleviation methods in BHEL. These 25 statements were framed to facilitate the purpose of the questionnaire
and were administered. In the study the respondents were asked to indicate their response with every statement,
checking one of the following direction-intensifying descriptions (using 5 point scale). The response to various
statements were scored in such a way that a response indicative of the most favourable attitude is given the
highest score of 5 and that with the most unfavourable attitude is given the lowest score of 1. A rating of 5
indicates that the statement is STRONGLY AGREE, a rating of 4 indicates that the statement is AGREE, a
rating of 3 indicates that the statement is NO OPINION, a rating of 2 indicates that the statement is
STRONGLY DISAGREE, and a rating of 1 indicates that the statement is DISAGREE, about the stress
management programmes in BHEL. An individual’s total score has been obtained from 25 statements by
adding his scores which had been received from each separate statement. A total score for each respondent
from all the 25 statement was calculated using the above scoring procedure. The maximum score a respondent
could get from all the 25 statements would be 125 and the minimum is 25 and the average score is 75.
1.3 DISTRIBUTION OF SAMPLE EMPLOYEES BY THEIR LEVEL OF STRESS
ALLEVIATIONSATISFACTION IN BHEL:
To measure the level of stress alleviation satisfaction in BHEL, 475 workers were selected on non-random
basis. An individual’s score is the mere summation of the scores secured from the 25 statements. To collect the
required information, questionnaires printed in English and Tamil were administrated. The respondents were
grouped into three, based on the scores viz. Fair, Good, and Excellent. Those who scored below 75 were
classified as Fair, and their opinion of stress alleviation satisfaction level in BHEL is fair. Those who have
scored, between 76-100 (i.e) their opinion of stress alleviation satisfaction level in BHEL is good. Those who
have scored, between 101-125, the respondents were classified as excellent. The above scoring procedure was
adopted for officers and workers for measuring the stress alleviation satisfaction level.
1 Roy Bailey (1989) Gower Publishing, Gower house, Aldershot, Hamsphire, GUII3HR U.K. p.3

SCHOLARS WORLD-IRMJCR Online: ISSN 2320-3145, Print: ISSN 2319-5789
www.scholarsworld.net [email protected] Volume. II, Issue II, April 2014 [166]
The following table gives the distribution of the total sample respondents (both officer and workers) by their
level of satisfaction about stress alleviation programmes.
DISTRIBUTION OF WORKERS BY THEIR LEVEL OF STRESS ALLEVIATION SATISFACTION:
The following table clearly gives the distribution of the total sample respondents (workers) by their level of
stress alleviation satisfaction.
TABLE 1.3 DISTRIBUTION OF WORKERS BY THEIR
LEVEL OF STRESS ALLEVIATION SATISFACTION
Stress alleviation
satisfaction
Number of
respondents
Percentage
Fair 98 20.50
Good 145 30.50
Excellent 232 49.00
Total 475 100.00
Table 1.3 clearly indicates that out of 475 workers, 20.50 % of the respondent’s stress alleviation satisfaction
level in BHEL, was fair. The average score of 79.50% of the total respondents exceeds the score of 75. The
average score of 475 sample workers was 97.28.
1.3.1 RELATIONSHIP BETWEEN INDEPENDENT VARIABLES AND LEVEL OF STRESS
ALLEVIATION SATISFACTION IN BHEL:
Significance of the relationship of eight independent variables with the opinion of officers about stress
alleviation methods has been analyzed by applying the statistical techniques such as “Chi-square” test,
“Analysis of Variance” (“F” test), and “Z” test. To examine the relationship with the opinion of workers about
stress alleviation satisfaction level only six independent variables are considered.
1.3.2 RELATIONSHIP BETWEEN INDEPENDENT VARIABLES AND LEVEL OF STRESS
ALLEVIATION SATISFACTION OF WORKERS IN BHEL:
The sample workers comprise of (a) Artisans and (b) Unskilled and semi-skilled workers. Significance of the
relationship of the independent variables (6) with stress alleviation satisfaction level has been analyzed by
applying the statistical techniques such as ‘Chi-square’ test, ‘Analysis of Variance’ (F – test), and “Z” test.
AGE AND LEVEL OF STRESS ALLEVIATION SATISFACTION:
Age is a factor, which determines every individual to prove his eligibility to be appointed and to be retired.
Thus age is a main factor for everything in his life. Age is a great factor, which is counted for his service and is
likely to influence the stress level.
The following table gives clear information regarding the age group of sample workers and their level of stress
alleviation satisfaction. It is proposed to test the hypothesis that the workers’ opinion about stress management
in BHEL under different age groups does not differ significantly. Chi-square test was applied.
TABLE: 1.4 DISTRIBUTION OF WORKERS ON THE BASIS OF THEIR AGE
AND LEVEL OF STRESS ALLEVIATION SATISFACTION: CHI-SQUARE TEST
Age group Stress alleviation satisfaction
Total Fair Good Excellent
A (≤40 years) 40 (18%) 77 (34%) 108 (48%) 225 (100)
B (41-50 years) 47 (24%) 49 (25%) 100 (51%) 196 (100)
C (above 50 years) 11 (21%) 19 (35%) 24 (44%) 54 (100)
Total 98 (21%) 145 (30%) 232 (49%) 475 (100)
Chi-square value: 5.74.

SCHOLARS WORLD-IRMJCR Online: ISSN 2320-3145, Print: ISSN 2319-5789
www.scholarsworld.net [email protected] Volume. II, Issue II, April 2014 [167]
Table 1.4 indicates that the percentage of sample workers of category B (51%) whose opinion about stress
alleviation measures in BHEL is excellent is higher than those of the category A (48%) and category C (44%).
The Chi square test proves that there is no association between the age group of workers and their level of stress
alleviation satisfaction in BHEL.
AVERAGE SATISFACTION SCORE OF WORKERS ON THE BASIS OF THEIR AGE:
The average stress alleviation satisfaction score of the sample workers on the basis of their age are given in the
following table.
TABLE: 1.5 AVERAGE SCORE OF WORKERS ON THE BASIS OF THEIR AGE
Age group Average score Sample size
A 97.25 225
B 97.13 196
C 97.98 54
Total 97.28 475
Table 1.5 clearly indicates that the average score of sample workers of group C (97.98) is higher than group B
(97.13) and group A (97.25). It is proposed to test the hypothesis that the average score of the three groups of
sample workers on the basis of their age is the same. Variance analysis was adopted.
TABLE: 1.6 AGE AND STRESS ALLEVIATION SATISFACTION SCORE OF WORKERS: ‘F’-TEST
Source of
variation
Sum of
sequences
Degrees of
freedom
Mean square “F” Value
Between samples 31.28 2 15.64 0.04 Within samples 183855.35 472 389.52
Total 183886.63 474
The calculated value of “F” 0.04 does not exceed the table value of “F” (4.60) for 2 and 472 degrees of freedom
at 1% level of significance. Therefore the hypothesis is accepted.
EDUCATIONAL QUALIFICATION AND LEVEL OF STRESS ALLEVIATION SATISFACTION:
Educational qualification helps a person to be recruited according to his specialized knowledge ability and
skills. Thus it is decided to analyze the extent of the educational qualification of the sample workers in relation
to their stress alleviation satisfaction level.
Educational qualification of the sample workers is classified into three groups as already scheduled in the
previous HRD III chapter. It is proposed to test the hypothesis that the workers opinion/attitude about stress
alleviation management programmes under different educational qualification groups does not differ
significantly. Chi-square test was applied.
The following table gives clear information regarding the educational qualification of the sample workers and
their level of stress alleviation satisfaction in BHEL.
TABLE: 1.7 DISTRIBUTIONS OF WORKERS ON THE BASIS OF THEIR EDUCATION
AND LEVEL OF STRESS ALLEVIATION SATISFACTION: CHI-SQUARE TEST
Educational
Qualification
Stress alleviation satisfaction Total
Fair Good Excellent
A 47 (23%) 67 (32%) 95 (45%) 209 (100)
B 40 (19%) 59 (28%) 113 (53%) 212 (100)
C 11 (20%) 19 (35%) 24 (45%) 54 (100)
Total 98 (21%) 145 (30%) 232 (49%) 475 (100)
Chi-square: 3.29.

SCHOLARS WORLD-IRMJCR Online: ISSN 2320-3145, Print: ISSN 2319-5789
www.scholarsworld.net [email protected] Volume. II, Issue II, April 2014 [168]
Table 1.7 indicates that the percentage of sample workers in category B (53%) whose opinion about the stress
management in BHEL is excellent is higher than those of category A (45%) and category C (45%). The Chi-
square test proves that there is no association between the educational qualification of workers and their level of
stress alleviation satisfaction in BHEL.
AVERAGE SATISFACTION SCORE OF WORKERS ON THE BASIS OF THEIR EDUCATIONAL
QUALIFICATION:
The average stress alleviation satisfaction score of the three groups of workers on the basis of their educational
qualification is given in the following table.
TABLE: 1.8 AVERAGE SCORE OF WORKERS ON THE
BASIS OF THEIR EDUCATIONAL QUALIFICATION
Educational
Qualification
Average
score
Sample size
A 95.56 209
B 98.81 212
C 97.98 54
Total 97.28 475
Table 1.8 clearly indicates that the average score of category B (98.81) is higher than the average scores of
category a (95.56), and the category C (97.98) in BHEL. It is proposed to test the hypothesis that average score
of the three groups of workers on the basis of their educational qualification is the same. “F” test was adopted.
TABLE: 1.9 EDUCATIONAL QUALIFICATION AND WORKERS
STRESS ALLEVIATION SATISFACTION SCORE: F-TEST
Source of
variation
Sum of
sequences
Degrees of
freedom
Mean
square
“F”
Value
Between samples 1139.08 2 569.54
1.47 Within samples 182747.55 472 387.18
Total 183886.63 474
‘F’ test proves that the average stress alleviation satisfaction score of the three groups of workers is the same.
GROSS SALARY AND LEVEL OF STRESS ALLEVIATION SATISFACTION:
It includes a person’s basic pay plus all other allowances to be included for his salary. Thus gross salary of a
person shows to what extent he had earned before the committed deductions. Hence it is decided to analyze the
extent of gross salary of the sample workers in relation to their stress alleviation satisfaction.
It is proposed to test the hypothesis that the workers’ opinion/attitude about stress alleviation management
programmes under different gross salary groups does not differ significantly. Chi-square test was applied. The
following table gives clear information regarding the gross salary of the sample workers and their level of stress
alleviation satisfaction in BHEL.
TABLE: 1.10 DISTRIBUTION OF WORKERS ON THE BASIS OF THEIR GROSS
SALARY AND LEVEL OF STRESS ALLEVIATION SATISFACTION: CHI-SQUARE TEST
Gross Salary (per
month)
Stress alleviation satisfaction Total
Fair Good Excellent
A (< Rs.10,000) 54 (21%) 79 (30%) 128 (49%) 261 (100)
B (≥ Rs.10,000) 44 (21%) 66 (31%) 104 (48%) 214 (100)
Total 98 (21%) 145 (30%) 232 (49%) 475 (100)
Chi-square value: 0.0183.

SCHOLARS WORLD-IRMJCR Online: ISSN 2320-3145, Print: ISSN 2319-5789
www.scholarsworld.net [email protected] Volume. II, Issue II, April 2014 [169]
Table 1.10 clearly indicates that the percentage of sample workers in category a (49%) whose opinion about
stress management is excellent is higher than that of category B (48%). Chi-square test proves that there is no
association between the gross salary and stress alleviation satisfaction level in BHEL.
AVERAGE SATISFACTION SCORE OF WORKERS ON THE BASIS OF THEIR GROSS SALARY:
The average stress alleviation satisfaction score of the sample workers is given in the following table.
TABLE: 1.11 AVERAGE SCORE OF WORKERS ON THE BASIS OF THEIR GROSS SALARY
Gross salary Average score Sample size
A 96.98 261
B 97.65 214
Total 97.28 475
Table 1.11 clearly indicates that the average stress satisfaction score of the category B (97.65) is higher than the
average scored of category a (96.98) in BHEL. It is proposed to test the hypothesis that the average score of the
two groups of workers is the same. “Z” test was applied.
TABLE: 1.12 GROSS SALARY AND STRESS ALLEVIATION
SATISFACTION SCORE OF WORKERS: ‘Z’-TEST
Gross salary Average score Difference Standard error “Z” Value
A 96.98 0.67 1.8057 0.3710
B 97.65
‘Z’ test reveals that the average score of the two groups of workers on the basis of gross salary is the same.
FAMILY INCOME AND LEVEL OF STRESS ALLEVIATION SATISFACTION:
Family income is a vital source for the maintenance and growth of the family. Hence, it is decided to analyze
the extent of the family income of the sample workers in relation to their stress alleviation satisfaction level.
It is proposed to test the hypothesis that the workers opinion/attitude about stress alleviation management
programmes under different family income groups does not differ significantly. Chi-square test was applied.
The following table gives clear information regarding the family income of sample workers and their stress
alleviation satisfaction level.
TABLE: 1.13 DISTRIBUTION OF WORKERS ON THE BASIS OF THEIR FAMILY
INCOME AND STRESS ALLEVIATION SATISFACTION LEVEL: CHI-SQUARE TEST
Family income (per year Rs.) Stress alleviation satisfaction
Total Fair Good Excellent
A (< Rs.1, 50,000) 82 (20%) 125 (34%) 198(49%) 405 (100)
B (Rs.1,50,000 & above) 16 (23%) 20 (29%) 34(48%) 70 (100)
Total 98 (21%) 145 (30%) 232 (49%) 475 (100)
Chi-square: 0.3.
Table 1.13 clearly indicates that the percentage of sample workers in category a (49%) whose opinion about
stress satisfaction is excellent is higher than the other category B (48%). The Chi-square test proves that there
is no association between the family income and the stress alleviation satisfaction level.
AVERAGE SATISFACTION SCORE OF WORKERS ON THE BASIS OF THEIR FAMILY INCOME
The average stress alleviation satisfaction score of the sample workers on the basis of their family income is
given in the following table.

SCHOLARS WORLD-IRMJCR Online: ISSN 2320-3145, Print: ISSN 2319-5789
www.scholarsworld.net [email protected] Volume. II, Issue II, April 2014 [170]
TABLE: 1.14 AVERAGE SCORE OF WORKERS ON THE BASIS OF THEIR FAMILY INCOME
Family income Average score Sample size
A 97.41 405
B 96.53 70
Total 97.28 475
Table 1.14 clearly indicates that the average score of category a (97.4) is higher than the average score of
category B (96.53) in BHEL. It is proposed to test the hypothesis that the average score of two groups of
workers on the basis of their family income is the same. “Z” test was adopted.
TABLE: 1.15 FAMILY INCOME AND STRESS ALLEVIATION SATISFACTION SCORE: Z-TEST
Family Income Average score Difference Standard Error “Z” Value
A 97.41 0.88 2.54682 0.345
B 96.53
‘Z’ test proves that the average score of the sample workers of both the groups remains the same.
LENGTH OF SERVICE AND LEVEL OF STRESS ALLEVIATION SATISFACTION:
Here, it is decided to analyze the extent of length of service of the sample workers in relation to their stress
alleviation satisfaction level. It is proposed to test the hypothesis that the workers’ opinion/attitude about stress
alleviation management programmes under different lengths of service groups does not differ significantly.
Chi-square test was adopted. The following table gives clear information regarding the length of service of the
sample workers and their level of stress alleviation satisfaction.
TABLE: 1.16 DISTRIBUTION OF WORKERS ON THE BASIS OF THEIR LENGTH OF
SERVICE AND STRESS ALLEVIATION SATISFACTION LEVEL: CHI-SQUARE TEST
Length of
service (years)
Stress alleviation satisfaction Total
Fair Good Excellent
A (<15) 39 (18%) 79 (35%) 103 (47%) 221 (100)
B (15 -25) 41 (27%) 31 (20%) 81 (53%) 153 (100)
C (>25) 18 (18%) 35 (35%) 48 (47%) 101 (100)
Total 98 (21%) 145 (30%) 232 (49%) 475 (100)
Chi-square: 12.77.
Table 1.16 clearly indicates that the percentage of sample workers in category B (53%) whose opinion about
stress alleviation management programmes is excellent is higher than those of category A (47%) and category
C (47%). The calculated value of chi-square (12.77) exceeds the table value of chi-square (9.488) for 4 degrees
of freedom at 5% level of significance. Hence the hypothesis is not accepted. Therefore it is concluded that
there is an association between the length of service and the level of stress alleviation satisfaction in BHEL.
AVERAGE SATISFACTION SCORE OF WORKERS ON THE BASIS OF LENGTH OF SERVICE:
The average stress satisfaction score of the sample workers on the basis of length of service is given in the
following table.
TABLE: 1.17 AVERAGE SCORE OF WORKERS ON THE BASIS OF LENGTH OF SERVICE
Length of service Average score Sample size
A 96.95 221
B 97.45 153
C 97.77 101
Total 97.28 475

SCHOLARS WORLD-IRMJCR Online: ISSN 2320-3145, Print: ISSN 2319-5789
www.scholarsworld.net [email protected] Volume. II, Issue II, April 2014 [171]
Table 1.17 clearly indicates that the average score of group C (97.77) is higher than those of group A (96.95)
and group B (97.45). It is proposed to test the hypothesis that the average score of three groups of sample
workers on their length of service is the same. Analysis of variance has been adopted.
TABLE: 1.18 LENGTH OF SERVICE AND STRESS ALLEVIATION
SATISFACTION SCORE OF WORKERS: F–TEST
Sources of
variation
Sum of
squares
Degrees of
freedom
Mean
square
“F”
Value
Between samples 53.64 2 26.82
0.07 Within samples 183832.99 472 389.48
Total 183886.63 474
‘F’ test proves that there is no significant difference among the three categories of sample workers with regard
to average stress alleviation satisfaction score.
NUMBER OF DEPENDENTS AND LEVEL OF STRESS ALLEVIATION SATISFACTION:
An employee’s dependent can be a minor, aged parent’s relatives and children who have to be taken care of life
long. Hence, it is decided to analyze the extent of number of dependents of the sample workers in relation to
their stress alleviation satisfaction level. It is proposed to test the hypothesis that workers opinion/attitude about
stress alleviation management programmes under two different dependents group does not differ significantly.
Chi-square test was adopted.
TABLE: 1.19 DISTRIBUTION OF WORKERS ON THE BASIS OF THEIR NUMBER OF
DEPENDENTS AND LEVEL OF STRESS ALLEVIATION SATISFACTION: CHI-SQUARE - TEST
Number of
dependents
Stress alleviation satisfaction Total
Fair Good Excellent
A (upto 3) 55 (23%) 71(29%) 115 (48%) 241(100)
B (3 & above) 43 (18%) 74 (32%) 117 (50%) 234 (100)
Total 98 (21%) 145 (30%) 232 (49%) 475 (100)
Chi-square value: 1.45.
Table 1.19 indicates that among the two groups of workers the percentage of workers belonging to the category
B (50%) whose opinion about stress alleviation management is excellent is higher than that of category A
(48%). The Chi-square test reveals that there is no association between the number of dependants and the level
of stress alleviation satisfaction in BHEL.
AVERAGE SCORE OF WORKERS ON THE BASIS OF THEIR NUMBER OF DEPENDENTS:
The average stress alleviation satisfaction score of the sample workers on the basis of their number of
dependents is given in the following table.
TABLE: 1.20 AVERAGE SCORE OF WORKERS ON
THE BASIS OF THEIR NUMBER OF DEPENDENTS
Number of dependents Average score Sample size
A 96.56 241
B 98.03 234
Total 97.28 475
Table 1.20 clearly indicates that the average score of category B (98.03) is higher than the average score of
category A (96.56) in BHEL. It is proposed to test the hypothesis that the average score of the two groups of
workers on the basis of their number of dependents is the same. “Z” test was adopted.

SCHOLARS WORLD-IRMJCR Online: ISSN 2320-3145, Print: ISSN 2319-5789
www.scholarsworld.net [email protected] Volume. II, Issue II, April 2014 [172]
TABLE: 1.21 NUMBER OF DEPENDENTS AND STRESS
ALLEVIATION SATISFACTION SCORE OF WORKERS: Z - TEST
Number of dependents Average score Difference Standard error “Z” Value
A 96.56 2.47 1.8057 1.36
B 99.03
‘Z’ test proves that the average score of the sample workers of both the groups remains the same.
1.5 FACTOR ANALYSIS:
In this part an attempt is made to examine the ways through which the management can improve the stress
management measures to alleviate stress level of employees in BHEL Date obtained from 475
STRESS ALLEVIATION SATISFACTION LEVEL OF OFFICERS: FACTOR ANALYSIS (N=475)
FACTOR ANALYSIS:
Factor analysis is used to resolve a large set of measured variables/statements in terms of relatively new categories,
known as factors. This technique allows to group variables/statements into factors and the factors so derived may be
treated as new variables (latent variables) and their value is derived by summing the values of the original variables,
which have been grouped into the factor. Factor Analysis helps to reduce the complexity of large number of observed
variables into new (latent) variables which summaries the commonalty of all the variables.
In factor analysis literature for a loading of 0.33 to be the minimum absolute value to be interpreted. This
criterion is being used more or less by way of convention.
Data collected from 325 sample officers were subjected to principal–component factor analysis with Varimax
Rotation by using the criterion that factors with eigen value greater than 1.00 were retained. Factor analysis
yielded five factors accounting for 86.27 % of total variance.
Factor 1 consists of eleven items and explains 46.792 % of the total variance. Among the five factors, factor 1
explains the maximum variance is the most important factor which improves the level of stress alleviation
satisfaction in BHEL
Table 1.4 shows various factors, item loadings, eigen values and % of variance explained by each factor. Factor
analysis yielded five factors accounting for 86.273 % of total variance.
Factor 1 consists of twelve items and explains 46.792 % of the total variance. Among the five factors, factor 1
explains the maximum variance and is the most important factor which improves the level of stress alleviation
satisfaction in BHEL.
Factor 1 consists of eleven items and explains 46.792 % of the total variance. Among the five factors, factor 1
explains the maximum variance is the most important factor which improves the level of stress alleviation
satisfaction in BHEL. It various factors, item loadings, eigen values and % of variance explained by each
factor. Factor analysis yielded five factors accounting for 86.273 % of total variance.
Factor 1 consists of twelve items and explains 46.792 % of the total variance. Among the five factors, factor 1
explains the maximum variance and is the most important factor which improves the level of stress alleviation
satisfaction in BHEL.
In factor 1, Giving opportunities for career development, is the most important statement. Factor 2, consists of five
statements of these, Educating employees to manage time, is the most important item. Factor 3, consists four
statements of these, Providing adequate working condition, is the most important item.Factor 4, consists of three
statements of these, Recognizing and rewarding for work performance, is the most important item. Factor 5, the
only statement namely creating a smooth and cordial relationship at work place is the most important item.
SUGGESTIONS:
It is found that a high percentage of officers (24%) felt that the stress management programmes are not
adequate. It is observed that programmes such as Giving opportunities for career development, Educating to
manage time, Providing adequatre working conditions, Recognizing and rewarding for work performance,
Creating a smooth and cordial relationship at work place should be given more importance to the stress. Hence
it is suggested that the management is expected to trace out the and introduce more wellness programmes/

SCHOLARS WORLD-IRMJCR Online: ISSN 2320-3145, Print: ISSN 2319-5789
www.scholarsworld.net [email protected] Volume. II, Issue II, April 2014 [173]
Staywell programmes to educate the employees about the health risk factors to reduce risks through heal their
life styles of continuous monitoring and frequent evaluation.
CONCLUSIONS:
BHEL Tiruchirapalli is the proud winner of successive productivity awards and the “Sword of Honour” from
the British Safety Council. BHEL Tiruchy has won goodwill and sustained support for its employee welfare
schemes. BHEL- HRD department has also been awarded the presidents’ trophy as the best training established
in the country on four occasions. The HRD centre is well equipped and the facilities are being continuously
updated to the latest technology techniques. The HRD policies of BHEL are formulated centrally by the
corporate office at New Delhi, and incorporated in the Company’s personnel manual, which is updated from
time to time. The group activity and participative style of management have earned BHEL, Tiruchirapalli State
National Awards for good industrial relations. It is concluded from the various objectives of the study that the
Human Resources Relations in BHEL is excellent.
REFERENCES:
1. Benson, H. (1975). The Relaxation Response. New York: Morrow.
2. Brown, G. W., Ehrolchain, N., & Harris, T. (1975). Social class and psychiatric disturbance among
women in urban populations. Sociology, 9, 225-254.
3. Callahan, R. (1985). Five Minute Phobia Cure. Wilmington, DE: Enterprise Publishing, Inc.
4. Cohen, S., & Hoberman, H. N. (1983). Positive events and social supports as buffers of life change stress.
Journal of Applied Social Psychology, 13, 2, 99-125.
5. Davis, M., Eshelman, E.R. & McKay, M. (1996). The Relaxation and Stress Reduction Workbook.
Oakland, CA: New Harbinger Publications Inc.
6. Dean, A., Lin, N., & Ensel, W. (1981). The epidemiological significance of social support systems in depression.
Research Community and Mental Health, Vol. 2. Edited by R. G. Simons. Greenwich, CT: JAI Press. 77-109.
7. Jacobson, E. (1938). Progressive Relaxation. Chicago: University of Chicago Press.
8. Gallo, F. P. (1999) Energy Psychology: Explorations at the Interface of Energy, Cognition, Behavior and
Health. New York: CRC Press.
9. Gach, M.R. (1990). Acupressure’s Potent Points: A Guide to Self-Care for Common Ailments. New
York: Bantam Books. Greenberg, M.A. & Stone,
10. A.A. (1990). Writing about disclosed versus undisclosed traumas: Health and mood effects. Health
Psychology, 9, 114-115. House,
11. J. S. (1981). Work Stress and Social Support. Reading, MA: Addison/Wesley. Lambrou,
12. P. & Pratt, G. (2000). Acupressure for the Emotions: Instant Emotional Healing. New York: Broadway
Books. Lepore,
13. S.J., & Greenberg, M.A. (2002). Mending broken hearts: Effects of expressive writing on mood, cognitive
processing, social adjustment, and health following a relationship breakup. Psychology and Health, 17, 547-560.
14. Mind/Body Medical Institute (2004). Mind/Body basics: Relaxation response: Elicitation of the
relaxation response. Retrieved December 1, 2004, from http://www.mbmi.org/pages/mbb_rr2.asp.
15. Naparstek, B. (1994). Staying Well with Guided Imagery. New York, NY: Warner Books, Inc.
16. National Qigong Association (2004). Overview of Qigong. Retrieved December 1, 2004, from
http://www.nqa.org/qigong.html.
17. Parker, J.C. (1995). Stress management. In P.M. Nicassio & T.W. Smith (Eds). Managing Chronic
Illness: A Biopsychosocial Perspective. Washington, D.C.: American Psychological Association.
18. Pennebaker, J.W. (1997). Opening Up: The Healing Power of Expressing Emotions, revised edition. New
York: Guilford Press.
19. Seyle, H. (1956). The Stress of Life. New York: McGraw Hill.
20. Turner, R. J. (1983). Direct, indirect and moderating effects of social support upon psychological stress
and associated conditions. In Psychological Stress: Trends in Theory and Research, edited by H. B.
Kaplan. New York: New York Academic Press, 105-155.
21. National Center for Complementary and Alternative Medicine (2004). Whole medical systems: An
overview.Retrieved December 1, 2004, from http://nccam.nih.gov/health/backgrounds/wholemed.
----
SCHOLARS WORLD-IRMJCR Online: ISSN 2320-3145, Print: ISSN 2319-5789
www.scholarsworld.net [email protected] Volume. II, Issue II, April 2014 [174]
BORROWING AND CREDIT: THE CHOICE
OF URBAN POPULATION OF INDIA
RUCHI BHATIA,
Research Scholar
Manav Rachna International University
Faridabad- India
DR. JAYENDER VERMA,
Assistant Professor
Manav Rachna International University
Faridabad- India
ABSTRACT
In India, credit market is mature enough. However, there is still discrimination between the
organized and unorganized credit market. The unorganized credit market not only prevails in
rural areas but in urban areas as well. Further, credit is also being availed from sources that does
not come under any law or jurisdiction and for which no interest is also being charged viz. from
friends, neighbours, immediate family members and other relatives and also from local kirana
stores. The present paper has endeavoured to study the urban population’s perspective towards
meeting their requirements through credit/ borrowing. The study also strived to identify the most
preferred source of credit among the urban population of India. Primary data from the areas of
Delhi, NCR has been collected on the basis of convenience sampling. The data was analyzed with
respect to gender, age, income, occupation and education. Apart from this, general analysis has
also been carried out. After analyzing the collected data from a sample of 105 respondents, it was
identified that even though people borrow from their friends, neighbours, immediate family
members and relatives, but the maximum reliability has been placed on borrowings from banks.
Keywords: Credit, Borrowings, Kirana Stores, Loans, Urban Credit

SCHOLARS WORLD-IRMJCR Online: ISSN 2320-3145, Print: ISSN 2319-5789
www.scholarsworld.net [email protected] Volume. II, Issue II, April 2014 [175]
INTRODUCTION:
The history of credit dates back to the emergence of mankind. When a person requires something materialistic,
he procures it or else borrows it or even at times borrows something else in the process of procurement of the
desired substance. This nature of human beings getting indebted to the lender for fulfillment of their desire or
requirement is not new to the society and so is the case with associated defaults and their consequences thereof.
It is not even uncommon for the states and countries to borrow from others states and countries respectively in
times of need or deficit. During the epoch of past few decades many options of credit had developed in the
society and also with the advent of retail banking, debt has taken different facets in the modern era. Moreover,
credit market today has picked up a pace that is much more mature and transparent as compared to its
counterpart in the past.
Today, even the government is encouraging people to take loans for certain purposes. A tax concession on
housing loans is one of the indicators of this fact. This is so because even the government recognizes that
credit extension is an integral link in the transmission mechanism that relays changes in monetary policy to
changes in the total demand for goods and services and the rate of inflation. A change in interest rates by the
monetary authority effect the level of credit extended to households, and this would ultimately influence
aggregate demand. The availability of credit from reliable financial institutions could help channel resources
into their most productive uses and so increase economic growth and prosperity. In addition, greater access to
credit makes it easier for business enterprises to initiate new capital formation projects, augment stock levels
and expand their activities. An increase in credit also plays an effective role in enticing customers to buy
now, instead of postponing their buying for the future. Huge demand for products and services from
customers pulls supply and thereby enhances production of the business houses, which ultimately leads to
augmentation in Gross Domestic Product. Enhanced lending on several fronts contributes a lot in the
economic development of the country. GDP growth rate was at 4.30% in year 2003 rose to 8.3% in 2004 and
was recorded at 6.2% in 2005, 8.4% in 2006, 9.2% in 2007, 9% in 2008, 7.4% in 2009, 7.4% in 2010 and
8.2% in 2011. This uninterrupted expansion is assisted by markets restructuring, huge infusions of FDI,
increasing foreign exchange reserves, boom in both IT and real and estate sectors, and a thriving capital
market. Information technology, information technology enabled services, telecommunications, electronics
and hardware, automobiles, pharmaceuticals and biotechnology, consumer durables, retail, textiles,
infrastructure, construction, airlines, hospitality, power, oil and natural gas and fertilizers and chemicals are
some of the local contributors in the growth rate of GDP. Among several significant reasons for boom in
Indian economy is easy availability of loans and the reasonable rate of interests at which these loans are
available is also cited as important contributor. These days, banks are giving loan for and loan against any
and everything.
REVIEW OF LITERATURE:
Prinsloo J.W. (2002) has defined debt (including household debt) as “an obligation or liability arising from
borrowing money or taking goods or services ‘on credit’, i.e. against an obligation to pay later.” The use of
consumer debt is mainly related to consumer’s eagerness to consume now rather than later. Households
surrender future consumption because they will use the income earned at a later stage to settle debts and meet
interest commitments, if any. Consequently, they will have less money to spend at that later stage, even if they
do not further increase their commitments relative to income growth.
Cox and Jappelli (1993) found that desired debt exhibits a pronounced life-cycle pattern, increasing until the
age of the household head reaches the mid-30s, and then declining. Also, the gap between desired and actual
debt is highest for younger households, indicating that they would benefit most from the easing of liquidity
constraints. The probability of being constrained falls with age and is negatively related to permanent
earnings and net worth.
Brougham Ruby R et al. (2011), “Compulsive buying, defined as the inability to control purchasing behavior,
is higher among college-aged students than it is among the general public. In a study of 628 students revealed
that variables predictive of compulsive buying varied depending on the amount of credit card debt that the
student was personally responsible for paying.
Pamela S. Norum (2008) raised the concern regarding credit debt and its association with compulsive buying
behavior. A sample of 7342 college students was used for the study. Regression analysis revealed that
SCHOLARS WORLD-IRMJCR Online: ISSN 2320-3145, Print: ISSN 2319-5789
www.scholarsworld.net [email protected] Volume. II, Issue II, April 2014 [176]
income, rate of time preference, money attitudes, credit card usage and gender were significantly related to
compulsive buying.
Stefano Cosma and Franceso Pattarin (2012) studied the influence of attitude on consumer credit decisions.
He identified that the influence of attitude on consumer credit decisions cannot be ruled out. Attitude toward
credit appears to play an important role and is significantly related to motivations for using credit and to the
method of choice for financing consumption.
Stephan Meier, Charles Sprenger (2009), in a field study, they elicit individual time preference with
incentivized choice experiments, and matched resulting time preference measures to individual credit reports
and annual tax returns. The results indicated that present-biased individuals are more likely to have credit card
debt, controlling for disposable income, other socio-demographics and credit constraints.
“Compared with the average in America, married with children families were more likely to hold
mortgage, credit card and vehicle loans. In terms of debt burdens, married with children families had the
highest debt payment to income ratio, cohabiting couples with children and single females with children
had the highest rate of heavy debt to income ratio (over 40%) and of debt delinquency”
(Jian & Rui, 2011). McCarthy (1997) finds that a rise in debt is associated with a future rise in consumer expenditures.
Jappelli Tullio and Pagano Marco (1999) found that the breadth of credit markets is associated with
information sharing. Total bank lending to the private sector scaled by GNP is larger in countries where
information sharing is more solidly established and intense.
In the era of rising demands of individuals, it has almost become a fashion to finance the requirements.
Individuals differ in their preference of borrowing money as to their reason for borrowing, amount of
borrowing, quantum of borrowing, source of borrowing and so on. Nonetheless, a detriment faced by
individuals in enjoying the benefits of financing the personal requirements is cost which happens to be in the
nature of interest obligation required to be paid to the lender. There are bazillion different reasons to accept the
choice of becoming indebted. A loan may be borrowed to buy a home, buy a car, pay the fee for higher
education, payoff previous loan, loss of a job, personal or family illness, overspending or may be to finance a
wedding or so on.
It has always been acknowledged that money/ cash is the basic input needed to keep the life running on a
smooth basis. Households are concerned with managing of (i) cash inflows for uninterrupted applications
of money in the form of varied expenses at one end and savings and investments at the other end of the
spectrum for securing the future of self and family; (ii) cash outflows for controlled expenditures and
investments; and (iii) cash balances to be held by them at all points of time depending upon their
requirements which may vary from household to household and within households from circumstances to
circumstances. The management of cash is also important for households because it is difficult to predict
cash flows accurately, particularly the inflows, and there is no perfect coincidence between the inflows and
outflows of cash. During some periods, cash outflows will exceed cash inflows. Unexpected illness of any
of the family member, loss of job or earning opportunity as witnessed by many in times of recession, grand
function in the family, loss by theft, replacement of any of the old asset, purchase of new asset, lending of
loan to friends or relatives, a holiday trip are some of the general reasons that can be accounted for excess
of cash outflows over inflows. At other times, cash inflow will be more than cash payments. Controlled
expenses, receipt of interest or dividend, sale of an old asset, repayment of loan by friends or relatives,
winning of lottery or any other windfall gain, increment or promotion at work are some of the reasons that
contributes towards excess of cash inflows over outflows. At times of cash deficit, individuals either use
past accumulated savings, sell off their assets including gold, real estate and other precious items or else
borrow from financial institutions, friends, relatives or from other sources.
There are certain households who despite having adequate funds with them borrow from external sources
to satisfy their requirements. The reason for this can be explained in rational terms when the debt
obligation is planned prudently considering the long term benefit. For example: when an individual went to
a shopping mall and like an apparel but does not have either sufficient amount of cash to purchase it or else
does not want to spend the cash on it as he might have planned some other expense out of the available
cash or else want to hold the cash for way back to home, then he may resort to make payment for the
apparel through credit card. However, he may also make a payment through debit card or else may
withdraw more cash from the nearby ATM. A rational individual always try to hold a minimum level of
cash in the form of cash in hand, cash at bank or marketable securities to satisfy their different motives.
SCHOLARS WORLD-IRMJCR Online: ISSN 2320-3145, Print: ISSN 2319-5789
www.scholarsworld.net [email protected] Volume. II, Issue II, April 2014 [177]
Households differ in their borrowing requirements, capacity of borrowing and their attitude towards borrowing.
In India, there is no dearth of those households who never look forward towards availing credit. Such people
hold it as a principle to always try to adjust in whatever they have. On the other side, plenty of Indian
population believes borrowing to be a wonderful option. The irrational households incur unplanned expenses
and then borrow money to pay for their purchases made on credit basis. However, for these unplanned expenses
a sudden expense on medical bills does not necessarily make a person to be irrational for his expenses. The
demand for credit comes into picture because of large set of reasons that depends to a large extent on the
circumstances of an individual’s case.
OBJECTIVES:
The study is conducted with a view to fulfill the following objectives:
To study urban population’s perspective towards meeting their requirements through credit/ borrowing.
To identify the most preferred source of credit among the urban population of India.
SIGNIFICANCE OF THE STUDY:
This study aims to ascertain the view point of urban population of India regarding the availing and meeting their
requirements through borrowing/ credit and also to identify the most preferred and convenient source of credit
among Indian masses. The study has divided the sources of credit/ borrowing in to two main parts viz.
organized borrowing options and unorganized borrowing options. The organized alternatives has been restricted
only to home loans, auto or vehicle loans, gold loans, personal loans and education loans from financial
institutions. The study will contribute government in framing policies related to credit and interest. The study
will also aid the financial institutions in formulating their strategies to tap the market further and reap a higher
percentage of profits.
RESEARCH METHODOLOGY:
Research design:
This paper involves an exploratory research to a large extent and descriptive and diagnostic as well. This study
is indicated as exploratory because of the few research studies conducted related to the issue in hand and that
too with limited indicators. The study explains the attributes that are associated with the perception of urban
population of India when it comes to meeting their requirements through borrowing or seeking credit for one or
the other reason.
Duration of the study:
Since the credit industry is mature and is very nascent, no regard has been given to pre-recession and post-
recession periods and the study has been conducted during the period of two months beginning from
January 2014.
Sample size:
The universe of the study constitutes urban population of India between the age group of 18 years to 70
years. The sample selected for the study has been taken from the areas of Delhi and NCR (National Capital
Region). The sample has been selected on the basis of convenience sampling. The purposive sampling
technique was used to collect the data. Total sample size for the study is 150 out of which 105 responses
complete in all respects were received, that is the response rate was 70%. Respondents selected for the study
belonged to an educated group who have studied till the minimum level of higher secondary plus technical
qualification and were also divided on the basis of their occupation, viz. business, profession, service, homely
and student.
The demographic characteristics of respondents are given in Table 1:

SCHOLARS WORLD-IRMJCR Online: ISSN 2320-3145, Print: ISSN 2319-5789
www.scholarsworld.net [email protected] Volume. II, Issue II, April 2014 [178]
TABLE 1: BACKGROUND CHARACTERISTICS OF RESPONDENTS
BASE CATEGORIES PERCENTAGE
Gender Male
Female
60
40
Age (in years) 18-20
20-30
30-40
40-50
50-60
Above 60
06.70
20.00
29.50
20.95
15.24
07.61
Family Income (per
month in Rs.)
Up to 50,000
50,001 to 75,000
75,001 to 1,00,000
1,00,001 to 1,25,000
1,25,001 to 1,50,000
Above 1,50,000
06.70
13.33
24.75
21.90
20.94
12.38
Occupation Business
Profession
Service
Homely
Student
09.52
06.67
40.00
22.86
20.95
Education Higher Secondary + Technical
Qualification
Under Graduate
Graduate
Post Graduate
Doctorate
0.95
08.57
49.53
36.19
04.76
DATA COLLECTION:
The study made use of secondary data collected from various journals, websites, bulletins, etc. In order to meet
the objectives of the study, primary data has also been collected from the respondents by using a structured
questionnaire. The questionnaire consisted of two parts: part A consisted of well framed questions related to the
objectives of the study and part B included questions related to the demographics of the respondents. The
language of the questionnaire was set to be simple and free of technical terms. The form of the questions of the
first section and the majority of questions in the second section was closed end and the majority of questions
were multiple choice questions. In order to check the validity and reliability of the questionnaire, peer review
for the same has been carried out.
TOOLS FOR DATA INTERPRETATION:
The data was analyzed with respect to gender (male and female), age (18-20, 20-30, 30-40, 40-50, 50-60
and above 60), income (less than Rs. 50,000, Rs. 50,001 to Rs.75,000, Rs. 75,001 to Rs. 1,00,000, Rs.
1,00,001 to Rs. 1,25,000, Rs. 1,25,001 to Rs. 1,50,000 and above Rs. 1,50,,000), occupation (business,
profession, service, homely and student) and education (higher secondary + technical qualification,
under graduate, graduate, post graduate and doctorate). Apart from this segregated analysis a general
analysis of data is also performed. Frequency and other statistical tools are made use of in the process of
data analysis.
FINDINGS OF THE STUDY:
The results derived from the analysis are summed up in Table 2 given below:
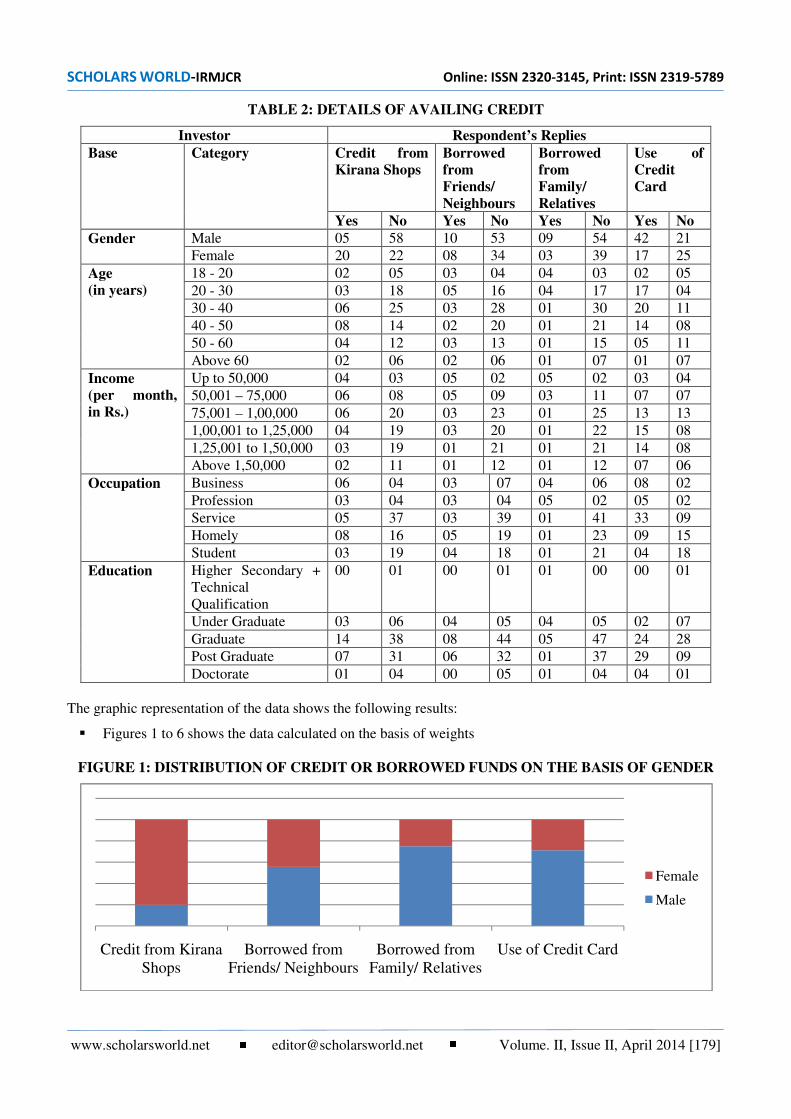
SCHOLARS WORLD-IRMJCR Online: ISSN 2320-3145, Print: ISSN 2319-5789
www.scholarsworld.net [email protected] Volume. II, Issue II, April 2014 [179]
TABLE 2: DETAILS OF AVAILING CREDIT
Investor Respondent’s Replies
Base Category Credit from
Kirana Shops
Borrowed
from
Friends/
Neighbours
Borrowed
from
Family/
Relatives
Use of
Credit
Card
Yes No Yes No Yes No Yes No
Gender Male 05 58 10 53 09 54 42 21
Female 20 22 08 34 03 39 17 25
Age
(in years)
18 - 20 02 05 03 04 04 03 02 05
20 - 30 03 18 05 16 04 17 17 04
30 - 40 06 25 03 28 01 30 20 11
40 - 50 08 14 02 20 01 21 14 08
50 - 60 04 12 03 13 01 15 05 11
Above 60 02 06 02 06 01 07 01 07
Income
(per month,
in Rs.)
Up to 50,000 04 03 05 02 05 02 03 04
50,001 – 75,000 06 08 05 09 03 11 07 07
75,001 – 1,00,000 06 20 03 23 01 25 13 13
1,00,001 to 1,25,000 04 19 03 20 01 22 15 08
1,25,001 to 1,50,000 03 19 01 21 01 21 14 08
Above 1,50,000 02 11 01 12 01 12 07 06
Occupation Business 06 04 03 07 04 06 08 02
Profession 03 04 03 04 05 02 05 02
Service 05 37 03 39 01 41 33 09
Homely 08 16 05 19 01 23 09 15
Student 03 19 04 18 01 21 04 18
Education Higher Secondary +
Technical
Qualification
00 01 00 01 01 00 00 01
Under Graduate 03 06 04 05 04 05 02 07
Graduate 14 38 08 44 05 47 24 28
Post Graduate 07 31 06 32 01 37 29 09
Doctorate 01 04 00 05 01 04 04 01
The graphic representation of the data shows the following results:
Figures 1 to 6 shows the data calculated on the basis of weights
FIGURE 1: DISTRIBUTION OF CREDIT OR BORROWED FUNDS ON THE BASIS OF GENDER
Credit from Kirana
Shops
Borrowed from
Friends/ Neighbours
Borrowed from
Family/ Relatives
Use of Credit Card
Female
Male

SCHOLARS WORLD-IRMJCR Online: ISSN 2320-3145, Print: ISSN 2319-5789
www.scholarsworld.net [email protected] Volume. II, Issue II, April 2014 [180]
The figure reflects that females avail more of credit facilities from local kirana shops as compared to their
counterparts. However, in every other case, viz. borrowing money from friends or neighbours, family or
relatives and use of credit cards, the scenario is just reverse, i.e. the males out beat the females in borrowing
from the aforementioned sources and swiping of their credit cards.
FIGURE 2: DISTRIBUTION OF CREDIT OR BORROWED FUNDS ON THE BASIS OF AGE
Figure 2 shows that the respondents between the age group of 18 to 30 relies more on borrowings from family/
relatives followed by borrowings from friends/ neighbours. Whereas, respondents between the age group of 30-
40 relies more on the use of credit cards. Credit cards however, show the least usage by respondents in the age
group of 18-20 and above 60. Credit facility by kirana shops has maximum been availed by the persons in the
age group of 40 to 50 and least by respondents in the age group of 18-20 and above 60.
FIGURE 3: DISTRIBUTION OF CREDIT OR BORROWED FUNDS
ON THE BASIS OF MONTHLY FAMILY INCOME
The overall requirement for borrowing or credit remains low for those persons whose monthly family income
exceeds Rs. 1, 50,000. The use of credit card is least for persons with monthly family income of less than Rs.
50,000. However, the same group tops the list when it comes to borrowing from family and relatives. The least
borrowings from friends and neighbours is reflected by the high income groups.
18 - 20 20 - 30 30 - 40 40 - 50 50 - 60 Above
60
Credit from Kirana Shops
Borrowed from Friends/
Neighbours
Borrowed from Family/
Relatives
Use of Credit Card
Up to
50,000
50,001 –
75,000
75,001 –
1,00,000
1,00,001
to
1,25,000
1,25,001
to
1,50,000
Above
1,50,000
Credit from Kirana Shops
Borrowed from Friends/
Neighbours
Borrowed from Family/
Relatives
Use of Credit Card

SCHOLARS WORLD-IRMJCR Online: ISSN 2320-3145, Print: ISSN 2319-5789
www.scholarsworld.net [email protected] Volume. II, Issue II, April 2014 [181]
FIGURE 4: DISTRIBUTION OF CREDIT OR BORROWED FUNDS ON THE BASIS OF OCCUPATION
The service class prefers to borrow less from the informal and unorganized sources of finance including
availing credit from kirana stores. However, the same group makes use of credit cards. The use of credit cards is
less by student and professionals wherein professionals top the list for borrowings from family and relatives
followed by business persons. Maximum credit from kirana stores has been availed by homely persons, may be
because of the reason of being responsible for purchasing from the local grocery stores.
FIGURE 5: DISTRIBUTION OF CREDIT OR BORROWED FUNDS ON THE BASIS OF EDUCATION
Graduates avail more of the credit facility offered by local kirana stores than any other category, followed by
the post graduates. The use of credit cards is not being made by the respondents who have attained higher
secondary with some technical qualification and doctorates.
FIGURE 6: LOANS THAT HAS BEEN BORROWED BY RESPONDENTS FOR NON-COMMERCIAL PURPOSES
0
0.1
0.2
0.3
0.4
0.5
0.6Credit from Kirana
Shops
Borrowed from
Friends/ Neighbours
Borrowed from
Family/ Relatives
Use of Credit Card
0
0.1
0.2
0.3
0.4
0.5
0.6Credit from
Kirana Shops
Borrowed from
Friends/
Neighbours
Borrowed from
Family/ Relatives
Use of Credit
Card
Home Loan
Auto Loan/
Vehicle Loan
Gold Loan
Personal Loan
Education Loan
Never Borrowed

SCHOLARS WORLD-IRMJCR Online: ISSN 2320-3145, Print: ISSN 2319-5789
www.scholarsworld.net [email protected] Volume. II, Issue II, April 2014 [182]
There were 7 respondents who have raised both, home loans as well as auto or vehicle loans. As per this figure,
maximum number of persons has not borrowed in last few years. Among those who have borrowed, the
maximum share of borrowing is in the form of home loan and auto loan.
FIGURE 7: THE MOST PREFERRED SOURCE OF BORROWING
IN CASE THERE ARISE THE REQUIREMENT OF FUNDS
In case of need, most of the persons prefer to borrow from banks followed by family and relatives and least
preference has been given to borrowings or advance from their offices.
FIGURE 8: RESPONDENTS WILLINGNESS FOR MORTGAGING THEIR ASSET/S FOR BORROWING MONEY
In case of need for the funds, maximum number of respondents is willing to mortgage their asset/s with the banks.
This may be because of the level of awareness among masses regarding the lending facility of banks and their norms.
SCOPE FOR FUTURE RESEARCH:
A further study can also be conducted by taking a wider range of alternatives available for availing credit, viz.
loan against PF, bonds, etc. and borrowing from unorganized credit market or moneylenders and non-financial
financial institutions. A research can also be undertaken on the issue of change in borrower’s perception – pre
and post recession period. Research can also be undertaken by collecting and interpreting responses from a
wider set of population from the all over India or on the basis of different states.
CONCLUSION:
Becoming indebted to anyone depends on the choice of the individual and their circumstances. However, even
in times of need for money, people are cautious about the source from which they are borrowing. In today’s
urban India, bank appears to be the most preferred source of finance and this is true when examples are being
viewed in the cases where people borrow from banks for home loans or for auto or vehicle loans. It is a well
known fact that shopkeepers offer credit to boost their sales. And there is no point of doubt that people
definitely purchase from the local kirana stores on credit basis. However, there can be n number of reasons for
their credit purchases – shortage of funds, ease of transaction, custom of their dealings, etc. Credit market in
urban India is still promising and lucrative despite the ups and down in the economic conditions of the country.
From Banks
From Office
From Family &
RelativesFrom Friends or
NeighboursFrom PF/ PPF/
LICWill Never
Borrow
Yes
No
Can't Say

SCHOLARS WORLD-IRMJCR Online: ISSN 2320-3145, Print: ISSN 2319-5789
www.scholarsworld.net [email protected] Volume. II, Issue II, April 2014 [183]
REFERENCES:
1. Broughman, R. R., Jacons, L. J., Hershey, D. A., & Trujillo, K. M. (2011). Who Pays Your Debt? An
Important Question for Understanding Compulsive Buying Among American College Students.
International Journal of Consumer Studies , 35 (1), 79-85.
2. Cox, D., & Jappelli, T. (1993). The Effect of Borrowing Constraints on Consumer Liabilities. Journal of
Money, Credit and Banking , 25 (2), 197-213.
3. Jappelli, T., & Pagano, M. (1999). Information Sharing, Lending and Defaults: Cross-country Evidence.
Working Paper No. 22, Centre for Studies in Economics and Finance.
4. Jian, X. J., & Rui, Y. (2011, March 1). Debt Holding and Burden by Family Structure in 1989-2007.
Retrieved November 2011, from www.papers.ssrn.com:
http://papers.ssrn.com/sol3/papers.cfm?abstract_id=1799362
5. McCarthy, J. (1997). Debt, Delinquencies, and Consumer Spending. Current Issues in Economics and
Finance, Federal Reserve Bank of New York.
6. Pamela, S. N. (2008). The Role of Time Preference and Credit Card Usage in Compulsive Buying
Behaviour. International Journal of Consumer , 32 (3).
7. Prinsloo, J. W. (2002). Household Debt, Wealth and Saving. Quarterly Bulletin .
8. Stephan, M., & Charles, S. (2009). Present-Biased Preferences and Credit Card Borrowing. Retrieved
October 10, 2013, from www.ssrn.com: http://ssrn.com/abstract=1412276
9. Stefanso, C., & Franceso, P. (2012). Psychological Determinants of Consumer Credit: The Role of
Attitudes. Review of Behavioural Finance , 4 (2), 113-129.
10. (n.d.). Retrieved June 27, 2013, from www.ficci.com: http://blog.ficci.com/q1-gdp-growth-rate-
india/1343
----

SCHOLARS WORLD-IRMJCR Online: ISSN 2320-3145, Print: ISSN 2319-5789
www.scholarsworld.net [email protected] Volume. II, Issue II, April 2014 [184]
ACTIVATING STUDENTS CREATIVITY:
THE EFFECT OF READER RESPONSE APPROACH
ON CREATIVE WRITING IN AN ELT CLASSROOM
Dr. K. P. MEERA,
Associate Professor
Department of Education
University of Calicut- Kerala-India
RINCY MOL SEBASTIAN,
Senior Research Fellow
Department of Education
University of Calicut- Kerala-India
ABSTRACT
Academicians all over the world have accepted that the vital goal of education is to help students
learn how to think more effectively. Fostering creative thinking is an asset for the overall
development of a child. The aim of the present study was to investigate the effect of Reader
Response Approach of teaching literature on creative writing in an ELT classroom. The sample of
the study consisted of 80 higher secondary students. The Experimental group was taught by using
Reader Response Approach and the Control group with the Existing method of teaching. A pre
test was administered before and a post test after the completion of the treatment. The data were
analyzed using the tests of significance of difference between means and obtained a critical ratio
is 16.97 which is much greater than the table value at 0.01 level of significance (t = 10.95, p<.
0.01). The result shows that Reader Response Approach as treatment for the students who are
learning English had a positive effect on enhancing the Creative Writing skill of higher secondary
school students.
Keywords: Reader Response Approach, transactional reader response, creativity, creative
writing, ELT classroom

SCHOLARS WORLD-IRMJCR Online: ISSN 2320-3145, Print: ISSN 2319-5789
www.scholarsworld.net [email protected] Volume. II, Issue II, April 2014 [185]
INTRODUCTION:
An important feature of English Language Teaching (ELT) is to make language learning as creative, productive
and interactive. In order to participate fully in the target language, the learner should not only acquire the
information but also utilize their creative writing skills. Our primary goal in the English curriculum is not to make
literary scholars of all our students. It is to make them reader and writers, independent and self-reliant thinkers
who employ language and literature to enrich their lives (Probst, 1994). ELT classroom is the best place to satisfy
the creative functions of language. As compared to other language skills writing has a very limited role for most
people. It is important to consider writing activities in ELT classroom not only from the instrumental perspective
of what is useful for external purpose, but also for developing student’s cognitive and affective abilities. The term
creativity is often appears daunting for teachers and students alike. Creative writing studies are an emerging field
of scholarly inquiry and research. As academic discipline, it explores and challenges the pedagogy of creative
writing (Donnelly, 2001). Creative thinking will help the students to find their own voice or style and giving them
confidence in their own ideas. It can encourage them to take risk with the language and push the boundaries of
what they know as the focus moves more to the content than to the form.
Literature plays a vital role in changing students writing from the dreariness of academic writing, to the vigor of
creative one. Exposure of literature has a vital role to enrich student’s academic, intellectual, cultural and
linguistic learning. There was a belief that if students were exposed to the best of literature, they would some
how become proficient in the language, specifically English (Brumfit, 1985). Creative writing forces the
learners to exploit the language as much as they are able to and to experiment with the language (Stulajiterova,
2010). The question is how can we promote creative writing among your students? Various pedagogical
practices might influence our teaching strategies and classroom dynamics. The use of reader response theory …
is effective in cultivating critical and creative thinking skills (Dhanapal, 2000)
The researchers wish to introduce Reader Response pedagogy as an effective method in an ELT class to
enhance the creative writing ability of the second language learners.
Reader Response Approach emphasizes the creative role of the reader and recognizes the reader as an active
agent, who imparts ‘real existence’ to the work and completes its meaning through interpretation (Rosenblatt,
1994). They argued that literature should be viewed as a performing art in which each reader creates his or her
possibly unique text related performance. Since the Transactional Reader Response approach developed by
Louis Rosenblatt assigns central role to a reader or the learner, the approach will be more useful to students in
Indian context who are taught literature as a means to facilitate them to acquire competence in the use of
English (Mishra, 2010). The student’s role according to the Reader Response approach is to be an active
participant in making lessons meaningful and filling the missing pieces of text with a variety of responses
(French, 1987; Totten, 2010; Hiravela, 1996; Carlisla, 2000).
The Reader Response Approach reinforces the natural integration of the generation of real meaning and the
creation of student’s own meaning. The pragmatic theory as Reader Response is aimed as at the audience. Terry
Eagleton says, “For literature to happen the reader is quite as vital as the author (Eagleton, 1983). Teachers and
students who would need to make significant shift from the reading strategies of literature that is prevalent in
our classroom. To effectively apply reader response approach in the creative writing classroom, students should
be more consciously determine who they want their text to address (Bizzaro, 1993). The reader response
approach asks teachers to read students work through the eyes of the reader. If the reading of a student is come
close to a reader response viewpoint, it will help the student to make his/her text more he/she planned. Cox,
1997 pointed out that, students share responsibility for their learning by making choices when responding, by
using their own voices, and by gaining control over their ideas and language. So teachers should not set
predetermined response from the students. The Reader Response Approach makes the whole classroom for
interactive process and the teacher does not take a dominant role and student take responsibility of their
learning. Students surely benefit from this approach, where there is an integration of reading, writing, speaking,
and listening because the students are using their energy to guess what the teachers want to think; instead, they
are spending energy on creating something that they have a stake in .So the teacher should strongly promote
participatory activity in the second language classroom.

SCHOLARS WORLD-IRMJCR Online: ISSN 2320-3145, Print: ISSN 2319-5789
www.scholarsworld.net [email protected] Volume. II, Issue II, April 2014 [186]
Many researchers have acknowledged the potentiality of the application of reader response theory in the ELT
classroom. Totten conducted a qualitative study by using reader response theory in high school students. The
students come to a clearer understanding and deeper appreciation of the poem through an in depth discussion with
the peers and the teachers guiding and probing questions (Totten, 1998). According to Carlisle, reader response
theory in ELT classroom stimulates foreign language learners to go beyond the first barrier of semantic
understanding and to move towards critical appreciation (Carlisle, 2000). Hiravela suggests that inclusion of
reader response theory in literature demonstrates how the inclusion of reader response theory in literature based
communicative language teaching will strengthen such situation (Hiravela, 1994). While using Reader Response
Approach the students began to trust about their responses being important and valid, they began really reading for
themselves, reading carefully and critically, and a new excitement about what literature could mean to them
(French, 1987). The investigators there for felt the need for exploring the effectiveness of Reader Response
Approach on creative writing of higher secondary students learning English as their second language.
OBJECTIVE:
To compare the mean pre test and post test scores of the Creative Writing of the Experimental and
Control group
HYPOTHESES:
1. There is significant difference in the mean pre test scores of the Creativity of the Experimental and
Control group.
2. There is significant difference in the mean post test scores of the Creative Writing of the Experimental
and Control group.
METHOD:
The present study adopted a quasi-experimental pre-test post-test nonequivalent group design.
PARTICIPANTS:
The study involved 80 students, 46 males and 34 females’ higher secondary students from Kerala for whom
English is their second language. The age of the participants ranged from 16 to 18.The participants were
assigned to the Experimental group (n=40) and Control group (n=40). The study was conducted after obtaining
prior consent from the schools.
TOOLS /INSTRUMENS:
1. Lesson transcript based on Reader Response Approach (Meera&Rincy2012):
The Reader Response lesson plan contains interactive motivational sessions: dialogue with the text, self,
peers and to the entire class, self-directed questions, creative letters to the authors and reading logs. The
materials were selected from the English course book prepared by State Council of Educational Research and
Training, Kerala. The researcher selected three prose lessons and two poems from the course book.
2. Lesson transcript based on Existing method of teaching:
The investigator prepared lesson plans for Existing method of teaching for the Control group on the basis of the
curriculum introduced to higher secondary classes in Kerala state.
3. Test of Creative Writing (Meera&Rincy2012):
Test of Creative Writing was used to measure the creativity of students who are learning English as their
second language. The test consists of 12 items and it measures the four abilities: fluency, flexibility, originality
and elaboration. Creativity measure is the sum total of the four factors. There were 100 students responded to
the questions. The investigator found out Alpha Cronbach reliability coefficient for the whole test to estimate
internal consistency. The Alpha Cronbach reliability coefficient (N=100) thus obtained Test of Creative
Writing is .563. The reliability value shows that the test is reliable. To establish face validity the items in

SCHOLARS WORLD-IRMJCR Online: ISSN 2320-3145, Print: ISSN 2319-5789
www.scholarsworld.net [email protected] Volume. II, Issue II, April 2014 [187]
the scale were subjected to expert’s evaluation. The content validity of the tool is also established. The expert
confirmed that the items were able to measure the creative writing of higher secondary students. It indicates
that the Test Creative Writing is valid and reliable test to measure the Creativity of higher secondary students.
PROCEDURE:
This quasi experimental study followed a pre-test post-test non equivalent group design with a treatment phase
lasting 12 weeks. Prior to the experiment the two classes were tested using the Test of Creative Writing for
assessing their level of creativity on the third day of the arrival to the school. The Experimental group was
taught by using Reader Response lesson plans and the Control group taught using the Existing method of
teaching. Immediately after the completion of the treatment for 12 weeks the two classes were measured their
Creativity in writing using the same tool. The data collection procedure consisted of three phases:
administration of the pre-test, treatment for 12 weeks, and administration of the post-test.
RESULT:
To examine the effectiveness of Reader Response approach to enhance the creativity writing of ELT students,
the investigator analysed the collected data using‘t’ test.
HYPOTHESIS 1:
There is significant difference in the mean pre test scores of the Creativity of the Experimental and Control group.
Comparison of pretest scores made in between the experimental and control group are discussed in this section.
DATA AND RESULT OF THE T-TEST FOR THE MEAN PRETEST
SCORES OF THE EXPERIMENTAL AND CONTROL GROUP
Experimental Group Control Group
Variable N Mean SD N Mean SD t-value
Creative
Writing 40 38.08 7.01 40 39.32 6.94 .801(ns)
The obtained t-value of pretest is .801 which is not significant. The result indicates that Experimental and
Control Group does not differ significantly in their mean pre-test score. The findings seemed to indicate the pre
experimental status of the subjects in the Experimental and Control Group, and it is found to be the same. So
the hypothesis is rejected.
COMPARISON OF POST TEST SCORE AFTER THE TREATMENT:
Hypothesis 2: There is significant difference in the mean post test scores of Experimental group and Control group.
Comparison of post test scores made in between the experimental and control group are discussed in this section.
DATA AND RESULT OF THE T-TEST FOR THE MEAN POSTTEST
SCORES OF THE EXPERIMENTAL AND CONTROL GROUP
Experimental Group Control Group
Variable N Mean SD N Mean SD t-value
Creative
Writing 40 50.40 3.97 40 40.05 4.46 10.95**
** Significant at 0.01level
SCHOLARS WORLD-IRMJCR Online: ISSN 2320-3145, Print: ISSN 2319-5789
www.scholarsworld.net [email protected] Volume. II, Issue II, April 2014 [188]
The analysis by test of significance of difference in means yielded a critical ratio of 10.95 for the mean difference
between post test scores of Experimental and Control Group. This is much greater than the t-value at 0.01 level of
significance (t = 10.95, p<. 0.01). This indicates that the mean post-test scores of creativity of Experimental and
Control Group show significant difference. This reveals that the treatment given to the experimental group has a
significant effect upon the creativity of the sample selected. So the hypothesis is accepted.
DISCUSSION:
This section gives the result in more detail and outlines the effect of Reader Response Approach on the creativity
of the second language learners. Quantitative data analysis showed that the comparison between the creativity
scores in the pre test showed low score and it is not significant but the post test score for the Experimental and
Control group showed higher score after the treatment period. It shows that as a result of the Reader Response
Approach employed in the Experimental group the Creative Writing skill has increased substantially. The
findings suggests that employing Reader Response Approach as treatment for the students who are learning
English had a positive effect on enhancing the Creative Writing skill of higher secondary school students.
CONCLUSION:
Use of Creative language is a key factor in everyday language teaching (Carter, 2000). So it is the prime
concern of the language teachers to develop the creative faculty of the learners. The role of the language
teachers can be viewed as procedural facilities who apply creative writing strategies to enable students to
retrieve, combine and synthesize experiences, information and images in novel ways (Cheung, Tse, Tsang,
2003). We often think Creative Writing can only be done by ‘expert’, that is poets, play wrights and novelists.
Interestingly however, Creative Writing can actually be cultivated through classroom writing activities. When
feelings are evoked through effective method of teaching students write above their language abilities. Teachers
need to accept different opinions and ideas put forwarded by students and recognize the student’s capacity to be
creative and should give motivation for creative thinking for their students. Reader response classroom allows
every student to share their independent view points and provides an active learner participation and
involvement. Once the students feel that what they understand and what they write is respected, they begin to
take ownership of literary perspectives (Tucker, 2000).In a reader response classroom the teacher could not
explain every details regarding a poem or a story; then the lesson has no effect on the students rather the teacher
privileges the reader in the reader response classroom (Bizzaro, 1993). To foster the creativity of students in
literature classroom teachers should develop learner’s confidence and give an open atmosphere to think and
learn. Reader Response Approach is such a learner centered approach where the students get enough room to
enrich their creative faculties.
REFERENCES:
1. Best John W. & Khan, James V. (2011). Research in Education. PHI Learning Pvt.Ltd. New Delhi
2. Bizzaro,Patrick (1993).Responding to student Poems, NCTE. Urbana.
3. Carlisle, Anthony (2000). Reading Logs: An Application of Reader Response Theory in ELT. ELT
Journal, 54, pp12-19.
4. Carter, R. (2004). Language and Creativity. The Art of Common Talk. Routledge. London.
5. Cheung, W.M; Tse, S.K; & Tsang, H.W.H. (2003). Teaching Creative Writing Skills to Primary School
Children in Hong Kong: Discordance between The views and Practices of Language Teachers. Journal of
Creative Behaviour, 37, pp 77-98.
6. Cox, C. (1997). Literature –based Teaching: A student response based classroom- in n Karolidas (Ed,)
Reader Response in Elementary Classrooms: Quest and Discovery. Mahwah,Nj: Erlbaum.
7. Dhanapal,S(2010). Cultivating Critical and Creative Thinking Skills through an Integrated Approach to
the Teaching of Literary text. University of Malaya, Malaya.
8. Donnelly, Dianne J (2009). "Establishing Creative Writing Studies as an Academic Discipline” Graduate
School Theses and Dissertations.
9. Eagleton,Terry (1983). Literary Theory: An Introduction. U of Minnesotta press. Minneapolis.
10. French, P.R. (1987). Reader Response Theory: A Practical Application. The Journal of the Midwest
Modern Language Association, 20, pp28-40.Garret, Henry.E. (2003). Statistics in Psychology and
Education, Paragon International Publishers.

SCHOLARS WORLD-IRMJCR Online: ISSN 2320-3145, Print: ISSN 2319-5789
www.scholarsworld.net [email protected] Volume. II, Issue II, April 2014 [189]
11. Hiravela, Alen (1994). Reader Response Theory and ELT. ELT Journal, 50, pp127-134.minnassotta.
12. Mishra, Prashant (2010). Reader Response and its Relevance for Communicative Language Teaching in
the context of EFL Learners. ELT Weekly, 62, pp18-25.
13. Mitchell, Dianna (1993). Reader Response Theory: Some Practical Application for the High School
English Classroom. Language Arts Journal of Michigan, 9, pp101-109.
14. Probst, E.R (1994) Reader Response Theory and English Curriculum.The English Journal, 83, pp37-44.
15. Rosenblatt, M, Louise (1994). The Reader Text and the Poem: The Transactional Theory of the Literary
Work. Southern Illinois University Press, New York.
16. Rosenblatt, M, Louise (1996). Literature as Exploration. Modern Language Association, New York.
17. Stulajiterova, Alena (2010). Using Creative Writing in Developing Language Proficiency. Humanising
Language Teaching, 12.
18. Torrance, E. Paul (1966). Torrence Test of Creative Thinking: Norms- Technical Manual. Princeton,NJ:
Personal Press.
19. Totten, Samuel (2010). Using Reader Response Theory to study Poetry about the Holocaust with High
School Students. The Social Studies, 89, pp30-34.
20. Tucker, P. Lois (2000). Liberating Students through Reader Response Pedagogy in the Introductory
Literature Course. www.csun.edu/knowlands/content. Accessed on 30.10.2013.
----

SCHOLARS WORLD-IRMJCR Online: ISSN 2320-3145, Print: ISSN 2319-5789
www.scholarsworld.net [email protected] Volume. II, Issue II, April 2014 [190]
RETAIL MARKETING
NARESH KANWAR,
Research Scholar, Barkatullah University Bhopal-India
ABSTRACT
This paper examines the importance of retailing and how retailing is a link between marketer and consumer, the various activities that retailers perform and the general activities .The paper will further examines the types of retailing stores and the various factors that affect retail marketing and where does the India stands in the world of globalization what was the retail scenario in the past and what is in the present, a comparison between the two will be presented through the paper.
Keywords: Marketer, Retailers Perform, Retail Scenario, Retail Marketing

SCHOLARS WORLD-IRMJCR Online: ISSN 2320-3145, Print: ISSN 2319-5789
www.scholarsworld.net [email protected] Volume. II, Issue II, April 2014 [191]
INTRODUCTION:
The word “Retail” is derived from French word with the prefix re and the verb tailer meaning ‘to cut again’. Evidently retail trade is one that cuts off smaller portion from a large lump of goods. It is a process through which goods are transported to final consumers. In other words retailing consists of the activities involved in selling directly to the ultimate consumer for personal non business use. Retail marketing is the range of activities undertaken by a retailer to promote awareness and sale of company’s product. This is different from other types of marketing because of the components of retail trade such as selling finished goods in small quantities to the consumers or end users, usually from a fixed location. Retail marketing makes use of the common principles of the marketing mix such as product, price, place and promotion. Retail marketing is especially useful to small retailers trying to compete against large chain stores. Retail is the sale of goods and services from individuals or businesses to the end users. Retailers are part of an integrated system called the supply chain. A retailer purchases goods or products in large quantities from manufactures directly or through a wholesale and then sells smaller quantities to the consumer for a profit. Retailing consists of the sale of goods or merchandise from a very fixed location such as a department store or by a mall in small or individual lots of direct consumption by the purchaser .Retailing may include subordinated service such as delivery. Retail marketing is the activity of selling products directly to consumers through channels such as stores , malls ,kiosks, vending machines and other fixes locations it aims at attracting customers to these channels and secondary encourages them to buy. IMPORTANCE OF RETAILING:
The retailer is an intermediary in the marketing channel because he is both marketer and customer, who sells to the last man to consume. He is a specialist who maintains contact with the consumer and the producer; and is an important connecting link in a complex mechanism of marketing. Though producers may sell directly to consumers, such method of distributing goods to ultimate users is inconvenient, expensive and time consuming as compared to the job performed by a specialist in the line. Therefore, frequently the manufacturers depend on the retailers to sell their products to the ultimate consumers. The retailer, who is able to provide appropriate amenities without an excessive advance in prices of goods, is rewarded by larger or more loyal patronage. Economic Justification for retailing all middlemen basically serve as purchasing agents for their customers and as sales specialists for their suppliers. To carry out those roles, retailers perform many activities, including anticipating customer’s wants, developing assortments of products, acquiring market information and financing. It is relatively easy to become a retailer. No large investment in production equipment is required, merchandise can often be purchased on credit and store space can be leased with no down payment or a simple website can be set up at relatively little cost. Considering these factors, perhaps it’s not surprising that there are just over a 6 million retail outlets operating across the Indian cities from north to south and from east to west. REVIEW OF LITERATURE:
According to Cathy Hart, neil Doherty, Fiona Ellis Chadwick To date, most of the commentary on the impact of the Internet on retail marketing has been anecdotal, offering exaggerated speculative forecasts of its future potential. One view contends that the Internet will become a major new retail format, replacing the traditional dominance of fixed location stores. However, little academic research exists to either disprove or support the claims of Internet penetration by retailers. Seeks to redress the balance by presenting a comprehensive and rigorous review of UK retailer Internet activities. A sampling frame of 1,099 UK retail multiples was used, and each Web site individually inspected to categorise the range of marketing functions and services offered. The findings indicated that, despite the hype, the majority of retail organisations surveyed have not yet registered a Web site address. Moreover, of those retail organisations that have developed a Web site, the vast majority are using it primarily as a communication tool to promote corporate or product information to Internet users, rather than to support direct sales. In conclusion, summarises the implications of these current levels of Internet activity for the future of retail marketing. According to Francis J. Mulhern represents the culmination of the marketing process, the contact point between consumers and manufacture products, marketing communications and customer service. This paper reviews the research on retail marketing that has appeared in the academic literature in the last several years. The review
SCHOLARS WORLD-IRMJCR Online: ISSN 2320-3145, Print: ISSN 2319-5789
www.scholarsworld.net [email protected] Volume. II, Issue II, April 2014 [192]
will address the revolutionary changes occurring in retailing today brought on by the availability of purchase transaction databases and new forms of marketing communications. The author suggests a reorientation of the role of retailers away from the prevailing focus on distribution toward an emphasis on integrated communications and the management of customer relationships. Research on many aspects of both store and non store retailing are discussed in terms of this orientation. OBJECTIVE OF THE STUDY:
1. Types of retailing stores 2. Factors affecting retail marketing 3. Comparison between present and past retail marketing
TYPES OF STORES:
Retail Stores Instore-Retaling Non-Store Retailing Franchising; 1. Department Stores 2. Direct Selling 3. Super Markets 4. Telemarketing 5. Discount Houses 6. Online Retailing 7. Chain Stores or 8. Automatic vending 9. Multiple Shops 10. Direct Marketing
Department Stores these are large scale retail stores selling less than one roof and one control a variety of goods divided into different departments, each of which specializes in an individual merchandise. Converse is of the opinion that a department store is a retail shop handling several classes of goods including fast moving consumer goods, each class being separated from others in management, accounting and location. It is viewed by Clarke as that type of retail institution which handle a wide verity of merchandise under one roof which the merchandise grouped into well-define Thus a department store is a retailing business unit that handles a wide variety of shopping and specialty goods and is organized into separate departments for purposes of sales promotion, accounting control and store operation. Recent trends are to add departments for automotive, recreational and sports equipment, as well a services such as insurance, travel advice and income-tax preparation. Department stores are distinctive in that they usually are oriented towards service. They are usually shopping centers. Classification of Department Stores These stores may be classified either according to ownership or income groups to which they appeal. a) On the basis of ownership these are: (i) The independent; (ii) The ownership group; and (iii) Chain department Stores. Independent stores are owned by a financial interest which does not own other similar stores Ownership group stores are those stores which were formerly dependent but now have been combined. Chain department stores are those stores which are centrally owned and operated. b) On the basis of income groups, these stores cater to the middle and high income groups. They usually handle good quality merchandise and offer maximum service to the customers. Other stores cater to the needs of the lower income group people. c) Sometimes there is also to be found what are called leased department stores. Although it appears to most customers that all departments in a department store are owned and operated by the store that is not always the case. The operations of certain departments are sometimes turned over to leases and such departments are called leased departments. Characteristic Features of Department Stores the chief features of these stores are: (i) these are integrated stores performing operations in addition to other retail stores such as wholesaling. (ii) Goods are divided into different classes with different locations and management within the store itself. (iii) These stores are distinguished by the nature of goods they self and not by the varieties they keep for example, drug and variety stores carry a wide variety of goods. (iv) The store is a horizontally integrated institution. It brings together under one roof a range of merchandise offerings comparable to the combined offerings of many stores specializing in single or fewer merchandise lines. Location of Department Stores The success of a department
SCHOLARS WORLD-IRMJCR Online: ISSN 2320-3145, Print: ISSN 2319-5789
www.scholarsworld.net [email protected] Volume. II, Issue II, April 2014 [193]
store depends much on its location, availability of space, the area and community to be served and ability to attract customers . FACTORS EFFECTING RETAIL MARKETING:
Various elements such as demographic, legal, social, economic and technological variables affect an organisation and its marketing efforts. It is now recognized by all that even a well concerned marketing plan may fail if adversely influenced by uncontrollable factors (demographic, legal etc.). Therefore the external macro environment must be continually monitored and its effects incorporated into Retailers marketing plans. The External Environment of Retail Marketing Demographic Social Political/Legal Environment Uncontrollable Variables Technological Environment Economic Environment. DEMOGRAPHIC ENVIRONMENT:
The first environmental fact of interest to retailers is population because people make up markets. Retailers are keenly interested in the size of the population Geographical distribution, density, mobility trends, age distribution and social ethnic and religious structure. Demographic structure is seldom static for long and changes in its composition often test the residency of a marketing firm. Further, these changes influence the behaviour of consumers which, in turn, will have a direct impact in the retailers business. The ripples of these changes will reach the organisation forcing it to alter or amend the existing marketing practices in vogue. In short, Retail firms, will have to continuously measure the changes - qualitative as well as quantitative - that are taking place in the population structure. To avoid negative consequences brought on by active consumer groups, a retailer must communicate with consumers, anticipate problems, respond to complaints and make sure that the firm operates properly. POLITICAL / LEGAL ENVIRONMENT:
Retail marketing decisions are substantially impacted by developments in the political / legal environment. This environment is composed of laws, government agencies and pressure groups that influence and constrain various organisations and individuals in society. Legislation affecting retail business has steadily increased over the years. The legislation has a number of purposes. The first is to protect from each others. So laws are passed to prevent unfair competition. The second purpose of Government regulation is to protect consumers from unfair retail practices. Some firms, if left alone, would adulterate their products, lies in their advertising, deceive through their packages and bait through their prices. Unfair consumer practices have been defined and are enforced by various agencies. The third purpose of Government Regulation is to protect the larger interest of society against unbridled business behaviour. The retail marketing executive needs a good working knowledge of the major laws protecting competition consumers and the larger interests of society. SOCIAL/ CULTURAL ENVIRONMENT:
In recent years, the concept of social responsibility has entered into the marketing literature as an alternative to the marketing concept. The implication of socially responsible marketing is that retail firms should take the lead in eliminating socially harmful products such as cigarettes and other harmful drugs etc. There are innumerable pressure groups such as consumer activists, social workers, mass media, professional groups and others who impose restrictions on marketing process and its impact may be felt by retailers in doing their business. The society that people grow up in shapes their basic beliefs, values and norms. People live in different parts of the country may have different cultural values - which has to be analysed by retail business people/firm. This will help them to reorient their strategy to fulfil the demands of their consumers. Retail marketers have a keen interest in anticipating cultural shifts in order to spot new marketing opportunities and threats. Several firms such as ORG, MARG etc. offer social / cultural forecasts in this connection. For example, marketers of foods, exercise equipment and so on will want to cater to this trend with appropriate products and communication appeals. ECONOMIC ENVIRONMENT:
Retail markets consist of purchasing power as well as people. Total purchasing power is a function of current income, prices, savings and credit availability. Marketers should be cognizant of major trends in the economic environment. The changes in economic conditions can have destructive impacts on business plans of a firm.

SCHOLARS WORLD-IRMJCR Online: ISSN 2320-3145, Print: ISSN 2319-5789
www.scholarsworld.net [email protected] Volume. II, Issue II, April 2014 [194]
Economic forecasters looking ahead through the next decade are likely to find their predictions clouded by the recurrent themes of shortages, rising costs and up and down business cycles. These changes in economic conditions provide marketers with new challenges and threats. How effectively these challenges could be converted into opportunities depend on well-thought-out marketing programmes and strategies. Further, no economy is free from the tendency of variation between boom and depression, whether it is a free economy or controlled economy. In any event, economic swings affect marketing activity, because they affect purchasing power. Retail marketing firms are susceptible to economic conditions, both directly and through the medium of market place. For example, the cost of all inputs positively responds to upward swing of economic condition - which will affect the output price and consequently affect the sales. The effect on consumers also influences the marketing through changes in consumer habits. This is an indirect influence. For example, in the event of increase in prices, consumers often curtail or postpone their expenditures. Conversely, during time of fall in prices, consumers are much less conscious of small price differences and would buy luxury and shopping products. TECHNOLOGICAL ENVIRONMENT:
The most dramatic force shaping people’s lives is technology. Advances in technology are an important factor which affects detail marketers in two ways. First, they are totally unpredictable and secondly, adoption of new technology often is prevented by constraints imposed by internal and external resources. At the same time, it should be remembered that technological progress creates new avenues of opportunity and also poses threat for individual firms. Technology has helped retailers to measure the products with modern weighing machines. Earlier, they have used balances which could not measure the merchandise correctly. With the help of weighing machine, products can be measured with the result customer satisfaction can be enhanced. In the following areas where technology have been extensively used; 1. Packing of the products 2. Printing the name of the shop on the product visibly 3. Modern refrigerators where merchandise can be used for a long time 4. Billing Technological change faces opposition from one group of people-telling that it may lead to retrenchment of employees. But in the long run, this argument may not sustain, retail marketers need to understand the changing technological environment and how new technologies can serve human needs. They need to work closely with research and development people to encourage more consumer oriented research. The retail marketers must be alert to the negative aspects of any innovation that might harm the users and create consumer distrust and opposition. COMPARISON BETWEEN PRESENT AND PAST RETAIL MARKETING:
Traditionally retailing in India can be traced to the emergence of the neighborhood kirana stores catering to the convenience of the consumers; Era of government support for rural retail: Indigenous franchise model of store chains run by Khadi &
Village Industries Commission 1980s experienced slow change as India began to open up economy. Textiles sector with companies like Bombay Dyeing, Raymond's, S Kumar's and Grasim first saw the
emergence of retail chains Later Titan successfully created an organized retailing concept and established a series of showrooms for
its premium watches The latter half of the 1990s saw a fresh wave of entrants with a shift from Manufactures to Pure Retailers. For e.g. Food World, Subhiksha and Nilgiris in food and FMCG; Planet M and Music World in music;
Crossword and Fountainhead in books. Post 1995 onwards saw an emergence of shopping centers Mainly in urban areas, with facilities like car parking Targeted to provide a complete destination experience for all segments of society Emergence of hyper and super markets trying to provide customer with Value, Variety and Volume Expanding target consumer segment: The Sachet revolution - example of reaching to the bottom of the
pyramid. At year end of 2000 the size of the Indian organized retail industry is estimated at Rs. 13,000 crore

SCHOLARS WORLD-IRMJCR Online: ISSN 2320-3145, Print: ISSN 2319-5789
www.scholarsworld.net [email protected] Volume. II, Issue II, April 2014 [195]
RECENT TRENDS:
Retailing in India is witnessing a huge revamping. India is rated the fifth most attractive emerging retail market: a potential goldmine. Estimated to be US$ 200 billion, of which organized retailing (i.e. modern trade) makes up 3 percent or
US$ 6.4 billion As per a report by KPMG the annual growth of department stores is estimated at 24% Ranked second in a Global Retail Development Index of 30 developing countries drawn up by AT Kearney. Multiple drivers leading to a consumption boom:
Favorable demographics Growth in income Increasing population of women Raising aspirations: Value added goods sales
Food and apparel retailing key drivers of growth Organized retailing in India has been largely an urban Phenomenon with affluent classes and growing number of double-income households. More successful in cities in the south and west of India. Reasons range from differences in consumer
buying behaviour to cost of real estate and taxation laws. Rural markets emerging as a huge opportunity for retailers reflected in the share of the rural market
across most categories of consumption ITC is experimenting with retailing through its e-Choupal and Choupal Sagar rural hypermarkets. HLL is using its Project Shakti initiative leveraging women self-help groups to explore the rural market. Mahamaza is leveraging technology and network marketing concepts to act as an aggregator and
serve the rural markets. IT is a tool that has been used by retailers ranging from Amazon.com to eBay to radically change buying
behaviour across the globe. E-tailing slowly making its presence felt.
Retailing is India’s largest industry, accounting for over 10% of the country’s GDP and around 8% of the nation’s employment. However, India’s retail sector appears underdeveloped not only by the standard of industrialized countries but also in comparison with several other emerging markets in Asia RESEARCH METHODOLOGY:
The Research is based on secondary data and can be understood with the help of the following;

SCHOLARS WORLD-IRMJCR Online: ISSN 2320-3145, Print: ISSN 2319-5789
www.scholarsworld.net [email protected] Volume. II, Issue II, April 2014 [196]
The first figure shows that 60% of the total retail market is taken up by food and grocery sector , 6% by apparel and another 6% is constituted by mobile and telecom sector 5% is constituted by food service, Jewellery represent 4% of the total share and cosmetic and electronic constitutes 3% and rest miscellaneous is constituted by11%. The second figure shows the organized and the unorganized market .Out of the total 92% retail marketing comes under the unorganized sector and only 8% comes under organized retail sector. The third figure shows the various big retail stores at different location in the country. ANALYSIS OF THE STUDY:
Although the present ideas and innovations are all well thought out and are giving in short term results, the Indian organized retailing is still in its e evolutionary stage. At every point all retailers are vying for there presence and the resultant picture to the consumer is all too confusing. In the maturing process, retailers need to address this primary issue of differentiating themselves and forming niches to cater to their specific market rather than make a rat race. Retailers need to understand the value of retail as a brand rather than remaining as retailers selling brands. Indian retailing is coming of age and needs to have a clear brand proposition to offer the discerning Indian retailing is coming of age and needs to have a clear brand proposition to offer the discerning Indian consumer. The emphasis here is on retail as a brand rather than retailers selling brands. The focus should be on branding the retail business itself. In their preparation to face fierce competitive pressure, Indian retailers must come to recognize the value of building their own stores as brands to reinforce their marketing positioning, to communicate quality as well as value for money. Sustainable competitive advantage will be dependent on translating core values combining products, image and reputation into a coherent retail brand strategy. There is no doubt that the retail business is gravitating from high street towards destination shopping. Brand building constitutes a way in which the main value of the retail store shifts to what has been traditionally called an intangible. However, the characteristics of the branding process, which are of interest to the retailers, are still the characteristics of the traditional product brands – they are simply extended to the intangible part of the business.

SCHOLARS WORLD-IRMJCR Online: ISSN 2320-3145, Print: ISSN 2319-5789
www.scholarsworld.net [email protected] Volume. II, Issue II, April 2014 [197]
CONCLUSION:
Retailing is a link between marketer and consumer. The retailer is an intermediately because he is both marketer and the consumer, who sells the last man to consumers. There are many retail houses and India is coming up as on of the most attractive market for retailers as in India the middleclass is the greatest scope and since the country experience a large diversity in its culture and climate therefore it provide more opportunities to retailers to invest in the country and get the benefit. WEBSITE REFERENCES:
1. www.smallbusiness.chron.com 2. www.fibre2fashion.com 3. www.rajeshthambala.blogspot.in 4. www.business.mapsof india.com 5. www.ask.com 6. www.slideshare.net 7. www.marketingdonut.co.uk 8. www.businessdictationary.com
----