Luminescence dating and associated analyses in transition landscapes of the Alto Ribatejo, Central...
37
Accepted Manuscript Luminescence dating and associated analyses in transition landscapes of the Alto Ribatejo, Central Portugal C.I. Burbidge, M.J. Trindade, M.I. Dias, L. Oosterbeek, C. Scarre, P. Rosina, A. Cruz, S. Cura, P. Cura, L. Caron, M.I. Prudêncio, G.J.O. Cardoso, D. Franco, R. Marques, H. Gomes PII: S1871-1014(13)00100-3 DOI: 10.1016/j.quageo.2013.11.002 Reference: QUAGEO 553 To appear in: Quaternary Geochronology Received Date: 9 February 2013 Revised Date: 6 November 2013 Accepted Date: 7 November 2013 Please cite this article as: Burbidge, C.I., Trindade, M.J., Dias, M.I., Oosterbeek, L., Scarre, C., Rosina, P., Cruz, A., Cura, S., Cura, P., Caron, L., Prudêncio, M.I., Cardoso, G.J.O., Franco, D., Marques, R., Gomes, H., Luminescence dating and associated analyses in transition landscapes of the Alto Ribatejo, Central Portugal, Quaternary Geochronology (2013), doi: 10.1016/j.quageo.2013.11.002. This is a PDF file of an unedited manuscript that has been accepted for publication. As a service to our customers we are providing this early version of the manuscript. The manuscript will undergo copyediting, typesetting, and review of the resulting proof before it is published in its final form. Please note that during the production process errors may be discovered which could affect the content, and all legal disclaimers that apply to the journal pertain.
Transcript of Luminescence dating and associated analyses in transition landscapes of the Alto Ribatejo, Central...

Accepted Manuscript
Luminescence dating and associated analyses in transition landscapes of the AltoRibatejo, Central Portugal
C.I. Burbidge, M.J. Trindade, M.I. Dias, L. Oosterbeek, C. Scarre, P. Rosina, A. Cruz,S. Cura, P. Cura, L. Caron, M.I. Prudêncio, G.J.O. Cardoso, D. Franco, R. Marques,H. Gomes
PII: S1871-1014(13)00100-3
DOI: 10.1016/j.quageo.2013.11.002
Reference: QUAGEO 553
To appear in: Quaternary Geochronology
Received Date: 9 February 2013
Revised Date: 6 November 2013
Accepted Date: 7 November 2013
Please cite this article as: Burbidge, C.I., Trindade, M.J., Dias, M.I., Oosterbeek, L., Scarre, C., Rosina,P., Cruz, A., Cura, S., Cura, P., Caron, L., Prudêncio, M.I., Cardoso, G.J.O., Franco, D., Marques, R.,Gomes, H., Luminescence dating and associated analyses in transition landscapes of the Alto Ribatejo,Central Portugal, Quaternary Geochronology (2013), doi: 10.1016/j.quageo.2013.11.002.
This is a PDF file of an unedited manuscript that has been accepted for publication. As a service toour customers we are providing this early version of the manuscript. The manuscript will undergocopyediting, typesetting, and review of the resulting proof before it is published in its final form. Pleasenote that during the production process errors may be discovered which could affect the content, and alllegal disclaimers that apply to the journal pertain.

MANUSCRIP
T
ACCEPTED
ACCEPTED MANUSCRIPT
1
Luminescence dating and associated analyses in transition landscapes of the Alto Ribatejo, 1
Central Portugal 2
3
C.I. Burbidgea,e*, M.J. Trindadea,e, M.I. Diasa,e, L. Oosterbeekb,d, C. Scarrec, P. Rosinab,d, A. 4
Cruzb, S. Curad, P. Curad, L. Caronb, M.I. Prudêncioa,e, G.J.O. Cardosoa, D. Francoa, R. 5
Marquesa,e, H. Gomesd 6
7 a C2TN, Campus Tecnológico e Nuclear, Instituto Superior Técnico, Universidade de Lisboa, 8
EN 10, km 139,7. 2695-066 Bobadela-LRS, Portugal. 9 b Instituto Politécnico de Tomar, Campus Tomar, Quinta do Contador - Estrada da Serra, 2300-10
313 Tomar, Portugal. 11 c Durham University, Department of Archaeology, South Road, Durham, DH1 3LE. UK. 12 d Instituto Terra e Memória, Largo Infante D. Henrique, 6120-750. Mação. Portugal. 13 e GeoBioTec, Universidade de Aveiro, Campus Universitário de Santiago, 3810-193 Aveiro, 14
Portugal. 15
16
Abstract 17
18
Artefacts and regolith (soils, sediments, colluvia, etc.) from passage tombs, pit fills, stone 19
scatter and clay structures, related to the transition to agro-pastoralism in the Alto Ribatejo, 20
were analysed by optically stimulated luminescence, neutron activation analysis, field and high-21
resolution gamma spectrometry, and X-ray diffraction. Indications of anthropogenic, autogenic, 22
and allogenic site formation and diagenetic processes, including radionuclide exchange, were 23
applied to interpret 28 date estimates from the 9th to 1st millennia BC. Results from regolith 24
samples relate to different phases of landscape activation and stability from the late 6th 25
millennium BC to the Roman conquest. However, simple archaeological questions were best 26
answered using heated materials, where present. Different chronological phases were often 27
represented by different sample types in sites with multi-phase stratigraphies, indicating the 28
importance of parallel analyses. Results from a fire pit coincide with the first indications of 29
clearance in the regional pollen record (late 9th millennium BC): these features appear promising 30
to map early Holocene human presence in the Alto Ribatejo landscape. 31
32
*Corresponding author. Email address: [email protected] 33
34
Keywords: 35
36
MANUSCRIP
T
ACCEPTED
ACCEPTED MANUSCRIPT
2
OSL; INAA; Gamma-Spectrometry; XRD; agro-pastoralism; megalithic; landscape-activation; 1
Holocene 2
3
1. Introduction 4
5
The performance and interpretation of thermally or optically stimulated luminescence (TSL, 6
OSL) dating analyses are interdependent with the archaeological, geochemical, mineralogical, 7
geomorphological, and hydrological context of the samples being analysed (Aitken, 1985). In 8
the dating of re-deposited mineral grains by OSL, the event of interest is their last exposure to 9
light during transport. Chrono-stratigraphic points of view provided by the luminescence dating 10
of heated artefacts include the direct dating of structures or typologies (e.g. Whittle and Arnaud, 11
1975), and the dating of undiagnostic sherds as geoarchaeological artefacts (e.g. Deckers et al., 12
2005). Questions of residuality, association, geometry, and alteration to be asked of the regolith 13
are different to those of the heated artefact, so their parallel measurement using the same 14
method can lend security to the dating of a context, while differences between results may be 15
effectively applied to understand complex site-formation histories. 16
17
The presence of mineral fractions, and their luminescence behaviour, depends on geological 18
source material, and the production technology of archaeological artefacts. Archaeological 19
contexts are often subject to complex formation mechanisms and diagenetic changes. These 20
may produce patterns of residuality in luminescence signals or samples (from transported grains 21
or artefacts, Barnett, 2000; Burbidge et al., 2007), complex dosimetric geometries (Aitken, 22
1985), and changes in the geometry and radioisotope contents of a sample or its surroundings 23
through time (Guibert et al., 2009; Zacharias et al., 2007). Instrumental neutron activation 24
analysis (INAA) and X-ray diffraction (XRD) provide parent element concentrations and 25
mineral concentrations, and are used to address questions of provenance, technology, use, and 26
alteration/degradation/weathering (Dias and Prudêncio, 2007). Field- and high resolution- 27
gamma spectrometry (FGS, HRGS) provide daughter radioisotope activities for different sample 28
geometries and are used to evaluate spatial and temporal variability of dose rate (e.g. Trindade 29
et al., 2013). 30
31
The Alto Ribatejo is a region of diverse geology, located on the faulting between the Central 32
Iberian Zone (CIZ) and the Ossa Morena Zone (OMZ). River valleys are deeply incised into the 33
Mesozoic Lusitanian Basin and the Lower Tejo Cenozoic Basin (Oliveira et al., 1992), through 34
a partial coverage of Mio-Pliocene fluvial clayey sands (Pais et al., 2012, Ch 5.5). The study 35
region is delimited to the South by the valley of the modern Tejo, and transition to the plains of 36
Alto Alentejo. The present and recent climate is warm-temperate with dry, warm-hot summers, 37
MANUSCRIP
T
ACCEPTED
ACCEPTED MANUSCRIPT
3
and hence highly seasonal in terms of wetness and moderately seasonal in temperature (codes 1
Csa-Csb according to Köppen-Geiger climate classification, Rubel and Kottek, 2010). Regolith 2
is commonly acidic and highly weathered. Indications from a high altitude lake core ca. 80 km 3
to the North (van der Knaap and van Leeuwen, 1995), are of a fluctuating Holocene climate 4
with phases of landscape activation and stability (Table 1), which was on average rather wetter 5
than present from ca. 9000-3000 BC and slightly wetter than present since ca. 3000 BC. 6
Charred particle analysis has highlighted palaeoclimatic/autogenic changes (Connor et al., 7
2012), but indicates potential for human impact from ca. 8000 BC. Anthropogenic (local) 8
factors came to dominate climatic (regional) in its pollen assemblages from around the onset of 9
megalithic construction in Iberia at the end of the 5th millennium BC. Substantial landscape 10
clearance is only indicated from the 3rd millennium BC onwards, when the chrono-sequence 11
may become less precisely relatable to the Alto Ribatejo, but the relationship is renewed with 12
the rapid and regional Roman conquest, indicated by Castanea Sativa pollen. 13
14
The transition from the Mesolithic to Neolithic and the earliest agriculture near the Iberian 15
Coast has been placed 5600-5400 BC, that for the interior 4900 BC; while the onset of 16
megalithic construction is placed around 4200-4000 BC (Carvalho, 2010; Rowley Conwy, 17
2011; Zapata et al., 2004). Archaeologically the Alto Ribatejo region has produced variants on 18
the paradigms of Neolithization. Important among these is a drawing away from focus on 19
coastal spread followed by inland dispersal of people (“cardial model”, Zilhão, 1997), towards 20
the possibility of overland spread along river valleys and a balance between the movement of 21
people (replacement) and that of technology/ideas (integration) (Oosterbeek, 2001). The 22
apparently lengthy Mesolithic-Neolithic co-occupation or transition in the coastal regions of 23
Portugal has led to increasing emphasis on Epipalaeolithic communities as the precursors for 24
integrative Neolithization (Carvalho, 2010; Scarre et al., 2003; Table 1), unlike other regions of 25
Atlantic Europe (Scarre, 2007). Radiocarbon and luminescence dates as early as ca. 4000 BC 26
have been reported for megaliths in the Tejo valley and various parts of Portugal (Scarre et al., 27
2003, Table 2; Scarre and Oosterbeek 2010; Cruz, 2007; Table 1). How agro-pastoralism in the 28
upper reaches of the Portuguese Tejo valley relates chronologically to evidence from on one 29
hand coastal Portugal, and on the other to central and ultimately eastern Iberia, is important to 30
distinguish between different models (Oosterbeek, 2001). However, there is a preponderance of 31
absolute dating evidence from non-megalithic littoral sites and the nature of the sites and 32
records changes with the landscape: shell middens are absent in-land and early megalithic 33
contexts in this region tend to be aceramic. Despite adverse conditions at most inland 34
archaeological sites, cases of organic preservation (e.g. Figueiredo, 2007) dominate the current 35
absolute chronological record through 14C analysis (Table 1). In addition, while megalithic 36
monuments remain an important focus of studies in this region, a range of important site types 37

MANUSCRIP
T
ACCEPTED
ACCEPTED MANUSCRIPT
4
are recognized and there is a shortage of absolute chronology for archaeological sites related to 1
agro-pastoral activities (Oosterbeek, 2001). 2
3
The present study aims to address the lack of absolute chronology for the transition to 4
agricultural societies in the Alto Ribatejo and improve understanding of formation processes in 5
different types of archaeological site in this landscape. Its objectives are firstly to generate new 6
geochronological, geochemical, and mineralogical data for different types of archaeological site 7
related to the transition to agriculture around the Alto Ribatejo, and to use these data to 8
investigate relationships between sample characteristics and their luminescence behaviours. 9
This will be used to establish the suitability of luminescence dating techniques and permit the 10
combination of measured data from heated and unheated artefacts, with field observations and 11
archaeological interpretations, to characterize the types of site encountered in the region and 12
elucidate site formation processes. Based on this analysis, materials and methodologies for 13
future programmes of analysis will be identified. 14
15
2. Sites and Samples 16
17
Four different types of feature in the archaeological landscape of the Alto Ribatejo were 18
selected for study (Figure 1): passage tombs (positive, megalithic; AL, CP), pit fills (negative; 19
QP), a structure represented by a stone scatter layer (SMC), and an in situ heated clay structure 20
(FNT). The term regolith is henceforth used generally to indicate material not from heated 21
artefacts. 22
23
Anta da Lajinha (AL) and Cabeço dos Pendentes (CP) lie on high ground (ca. 300 m asl.), 24
respectively overlooking tributary valleys of the Ribeira da Isna and Ribeira da Pracana, on 25
Cambrian schists of the Douro-Beiras super group (Oliveira et al., 1992). AL consisted of a 26
small megalithic passage tomb (Figure 1), encased in a tumulus, ca. 10 m dia., of local highly 27
weathered schist regolith (da Silva, 1939; pH 4.55, C. French, 2006. pers comm). A thin organic 28
rich topsoil (Layer A) sealed a clast rich sandy silt (Layer B, upper 25-30 cm), which overlay a 29
reddish brown clay with fewer smaller clasts (< 2 cm) and occasional charcoal (Layer C), over 30
bedrock. Six of the eight orthostats and much chamber fill had been excavated/disturbed since 31
the 1930 s (da Silva, 1939). The passage appeared free from recent disturbance but to have been 32
destroyed in antiquity. The remains of another chambered tomb, CP, lie 11.5 km South: its 33
orthostats had been removed, but appeared to have been emplaced on top of a layer of fill 34
(yellowish brown clay, clasts < 2 cm), in a circular hollow cut directly into schist bedrock 35
(Scarre et al., 2011). Undecorated ceramics from various locations at AL indicated prehistoric 36
site usage but were not diagnostic of particular periods. A decorated schist plaque and flint 37

MANUSCRIP
T
ACCEPTED
ACCEPTED MANUSCRIPT
5
arrowheads from CP indicated site usage in the Chalcolithic. However, the structural forms 1
were suggestive of the Neolithic, as part of the earliest stages of megalithic spread across the 2
Tejo. An aim of investigating the sites was to discover whether their construction pre- or post- 3
dated clearance by early farmers, if significant vegetation coverage ever existed in these areas 4
(Scarre et al. 2011). Ten regolith samples were taken from the tumulus, and the passage and 5
chamber fills at AL, and two from the remnants of fills at CP. 6
7
Five negative features and an upright menhir were encountered at Quinta do Paço II (QP), 8
Ferreira do Zêzere (Figure 1), respectively containing and surrounded by series of thin 9
compacted carbonized horizons and hearths, indicating repeated use (Caron et al., 2010). 10
Ceramics from these contexts were indicative of the late Chalcolithic / early Bronze Age, and 11
stone features associated to late Bronze Age / early Iron Age occupation were also recorded in 12
the area. QP lies in the OMZ in an area of upper Proterozoic chloritic and muscovitic schists 13
and amphibolites (Oliveira et al., 1992), with bands of tonalitic gneiss (Chaminé et al., 2003). 14
The regolith consists of dark reddish brown sandy clay and light reddish brown clayey sand 15
respectively. Four ceramic and four sediment samples recovered from the pit fills and substrate 16
(Figure 1) were analysed, to test whether construction of the pits related to either identified 17
archaeological period or to earlier activity, possibly associated with the menhir, and for 18
inherited/residual luminescence age in the ceramics/fill materials. 19
20
Povoado de Santa Margarida da Coutada (SMC) lies at 107 m asl. on gently sloping ground in a 21
presently dry valley above the south bank of the Tejo (Batista, 2004; Figure 1). Excavation 22
revealed a sub-circular stone scatter (habitation structure; Cruz, 2006), associated with a range 23
of artefact types including apparently in situ Chalcolithic ceramics (Figure 1). The modern 24
topsoil (Layer A) was developed on colluvium (Layer B), which contained the stone 25
scatter/structure (Layer B centre) and was gleyed at its base (Layer C; water table). Apart from 26
the stone scatter layer, the colluvium had a homogeneous aspect with few non-oriented clasts < 27
5 cm: below the stone scatter these included Palaeolithic artefacts. SMC lies on an Upper 28
Miocene argilo-arenitic formation, close to Quaternary Terrace 1 deposits of the Tejo, with 29
Pliocene clayey arenites and conglomerates uphill (Ribeiro et al., 1977). Two ceramic sherds 30
from the structure and two samples from the colluvium bracketing it were analysed, to delimit 31
emplacement of the stones and test the in situ nature of the artefact assemblage from them. 32
33
Povoado de Fontes (FNT) lies on a gentle slope high on the east bank of the lower Zézere, 294 34
m asl. (Figure 1; Batista, 2004), with localized outcrops of Ordovician schists with quartzite 35
bands, Miocene and Pliocene clayey arenites and conglomerates, and Middle Proterozoic 36
micaschists, gneisses and migmatites (Oliveira et al., 1992; Cruz, 2010). Loose, burnt topsoil 37

MANUSCRIP
T
ACCEPTED
ACCEPTED MANUSCRIPT
6
(Layer A) covered by quartz pebbles/grit, sealed red-brown colluvial gritty sandy clay (Layer 1
B). Below this, a thin layer of quartz pebbles sealed compact yellow-brown gritty sandy clay 2
with occasional non-oriented stones (3-10 cm) (Layer C), which overlay a very compact grey-3
brown gritty clay with many large stones (< 30 cm) (Layer D). Artefacts encountered in/on 4
Layer A included potsherds indicative of the early- to mid- Neolithic. Layers B and C yielded 5
worked flint, debitage and sherds including coarse corded ware (Neolithic-Chalcolithic 6
transition), and a concentration of quartz pebbles (post hole infill; Cruz, 2010). Founded in the 7
top of Layer D (otherwise sterile) and extending up into Layer C were sub-circular structures of 8
red-brown sandy clay, which appeared heated but otherwise unprocessed. These have been 9
interpreted as ovens or storage silos (Cruz, 2010), or fire places in huts, and may provide direct 10
evidence of early agro-pastoral activities. A regolith sample was taken from Layer C and three 11
blocks were taken from one structure, to date the activity that produced the structure, test 12
whether Layer C was cut by the structure or had accumulated around it, and evaluate how the 13
different ceramic assemblages related to the stratigraphy. 14
15
3. Methods 16
17
Twenty-eight sets of samples for dating (19 regolith and 9 ceramic/heated clay) were taken from 18
5 archaeological sites (Figure 1). Samples for ITNLUM 56 to 275 were taken in dry conditions 19
in late summer. Those for ITNLUM 438 to 453 were taken in wet conditions in winter. Regolith 20
samples were taken from previously exposed sections using stainless steel tubes (3.8 cm or 7 cm 21
dia., 15 cm l., ~0.2 or ~1 kg sample). Ceramic sherds (20 - 40 g, 0.5 - 1 cm thick, 4 - 8 cm dia.) 22
and clay-structure samples (90 - 380 g, 4 - 8 cm long, ca. 4 cm dia.) had been previously 23
excavated and were received on-site. In all cases a ca. 30 cm length, 8 cm diameter hole was 24
excavated in a location representative of the burial context of the sample (adjunct sample): Field 25
gamma spectrometry (FGS) measurement was conducted in situ for 1 hour using a 2”×2” NaI 26
probe with a Target Nanospec or HPI Rainbow MCA, calibrated relative to the Oxford and Gif-27
sur-Yvette blocks (Richter et al., 2003). For ITNLUM 56 to 275, the integral signal > 500 keV 28
was used to obtain the dose rate from gamma radiation. For ITNLUM 438 to 453, regions of 29
interest in each spectrum were used to obtain values for the concentrations of K, Th, and U. 30
Where measurements were made close to the present ground surface when the sample would 31
have been buried deeper in the past (e.g. CP, Figure 1), the solid angle of terrain detected was 32
estimated and the measured value converted to that for total enclosure. 33
34
In the laboratory, water content as a fraction of dry (50 °C) sample mass was measured as 35
received (“field”; Wf), saturated (Ws), and for ITNLUM 438 to 453 following free drainage for 1 36
hr (0 days) to 8 days (WD0-8). The time-averaged water content (W�) was constrained based on 37
MANUSCRIP
T
ACCEPTED
ACCEPTED MANUSCRIPT
7
these values, on the contextual information summarized in Table 1, and on the site descriptions. 1
For all sites except SMC, minimum constraints were assumed to be the average Wf of the 2
regolith samples taken in summer, and WD8 for ceramics. Maximum assumed constraints were 3
Wf for samples taken in winter. For ceramics these values were also applied to samples taken in 4
summer, Ws/2 was used for the regolith samples taken in summer. Since SMC was located in a 5
valley bottom close to the water table, the minimum constraint was assumed to be Wf and the 6
maximum WD8. 7
8
Sample exteriors were removed in subdued light conditions. Part of the “core” of each ceramic 9
was subsampled, dried and milled. The loose sediment adjunct to the dating samples was dried 10
(40 °C) disaggregated, sieved (2 mm), mixed and quartered, then a ca. 50 g subsample was 11
milled. The mineralogy of the milled material was analysed by XRD, using a Philips X’Pert Pro 12
diffractometer, with CuKα radiation, operating at 45 kV and 40 mA. Powder diffractograms 13
were obtained in the 4-60 º2θ range, using a 1º divergence slit scanning at 1º/min. Identification 14
of crystalline phases was performed using International Centre for Diffraction Data Powder 15
Diffraction Files (ICDD PDF). Estimation of mineral amounts was obtained by the peak areas 16
of diagnostic reflections of each mineral. Total mineral peak areas of each sample were then 17
converted to 100 % in order to obtain rough estimates of mineral percentages and enable 18
comparison between samples. 19
20
For INAA, approximately 200 mg of the milled materials was sealed in HDPE phials, which 21
were irradiated in the Portuguese Research Reactor (PRR, IST/CTN), with a thermal neutron 22
flux of 3.96×10¹² n.cm−2.s−1, Φepi/Φth = 1.03 %, Φth/Φfast = 29.77, in parallel with two 23
standards in identical geometry for each irradiation (GSS1, GSS4, GSS5, GSD9; reference 24
values from Govindaraju, 1994). The samples and standards were analysed using high-25
resolution gamma spectrometry (HRGS) (Dias and Prudêncio, 2007; Gouveia and Prudêncio, 26
2000; Prudêncio et al., 2006). The two spectrometers used were a 150 cm3 HPGe detector 27
(FWHM of 1.9 keV at 1.33 MeV) and a low energy photon detector (LEPD, FWHM of 300 eV 28
at 5.9 keV, 550 eV at 122 keV), both with Canberra 2020 amplifiers and Accuspec B MCAs. 29
Absolute and chrondrite normalized (Anders and Grevesse, 1989) concentrations of 27 elements 30
were compared with upper continental crust (UCC) and post-Archaean Australian Shale 31
(PAAS) averages (Rudnick and Gao, 2003; Taylor and McLennan, 1985) to identify 32
enrichment/depletion. Comparison of incompatible / compatible element ratios using relatively 33
insoluble and hence chemically immobile elements, sensitive to source composition, was then 34
conducted to indicate distinctions between felsic and mafic source materials (Taylor and 35
McLennan, 1985). 36
37

MANUSCRIP
T
ACCEPTED
ACCEPTED MANUSCRIPT
8
Infinite matrix dose rates (Ḋ) from alpha, beta and gamma radiation were calculated from 1
elemental concentrations of K, Rb, Th and U measured by FGS and INAA, using conversion 2
factors from Adamiec and Aitken (1998) and following correction for Wf in the case of FGS. 3
These values were corrected for W� based on Zimmermann (1971). The self-dose of the quartz 4
grains was assumed negligible (Burbidge et al., 2009). The time averaged cosmic dose rate was 5
calculated from Prescott and Stephan (1982) and Prescott and Hutton (1988), taking into 6
account the contribution from the soft component and the expected history of accumulation and 7
erosion at each site and assuming bulk density of 1.6 g.cm-3. These values were combined using 8
approximations of the geometry represented by each measurement or sample, to estimate the 9
dose rate to the HF etched cores of the quartz grains measured using OSL: Ḋ. FGS results were 10
assumed to represent an infinite matrix around the sample. INAA values for material from the 11
cylindrical holes excavated for FGS and from regolith samples taken in tubes, were assumed to 12
represent spheres of diameter = 2/(1/sample length + 1/sample diameter). Blocks of heated clay 13
were approximated in the same way, assuming a cylinder 30 cm long and 8 cm in diameter to 14
represent the portion of the structure (rather than the sampled fragment) that would have 15
contributed the majority of self-gamma dose while buried. Wide, flat ceramic sherds were 16
approximated as infinite layers of their measured thickness. The quartz grains were assumed to 17
be spheres of (90+160)/2 = 125 µm diameter, HF attack was assumed to have removed 6(±3) 18
µm from their exteriors. Bulk density was calculated where possible, but otherwise assumed to 19
be 1.6 g.cm-3 for samples and 2.65 g.cm-3 for grains. Attenuation factors, proportions of self-20
dose, and ranges, were from Adamiec and Aitken (1998), Aitken (1985), Bell (1979), Bell and 21
Zimmerman (1978), Fleming (1970), Krane (1988), Mejdahl (1979), Mejdahl (1983), Stabin 22
and da Luz (2002) and NIST ESTAR (2009). These were applied on a radioelement- and 23
radiation type- specific basis where element concentrations were available, or as radioelement 24
averaged but radiation type specific factors. 25
26
For luminescence measurements, the central, light protected part of each sample was 27
disaggregated then wet sieved (90-160 µm). To obtain quartz, the sieved fraction was treated 28
with H2O2 and HCl (both 10%, 10 min), centrifuged in sodium heteropolytungstate solution, the 29
2.62 - 2.74 g.cm-3 fraction was attacked with HF (40%, 40 min) then washed in HCl (10% 10 30
min), then re-sieved wet at 90 µm. The resultant material was checked under a binocular 31
microscope, to verify the type and form of mineral grains obtained, including the efficiency of 32
the separation procedure in isolating quartz of the desired grain-size. It was then tested using a 33
measurement sequence including optical stimulation at 830 or 880 nm (“IRSL”) and 470 nm 34
(“OSL”) and TSL (rt - 500 °C), adapted from Burbidge et al. (2007). This was designed to 35
check natural signal levels, sensitivity to dose, predose sensitization, approximate absorbed dose 36
levels and evidence for heating, in quartz and any non-quartz minerals present, and so to 37
MANUSCRIP
T
ACCEPTED
ACCEPTED MANUSCRIPT
9
indicate requirements for any further preparatory treatment and to help select and design an 1
appropriate measurement protocol. Density separation and HF attack was repeated for ITNLUM 2
443, 444, 451, 452, and 453. 3
4
For evaluation of D using OSL (470 nm), monolayers of grains ca. 5 mm diameter were fixed 5
on 12 to 24 stainless steel cups per sample using silicone oil (ca. 500-2000 grains per cup, 6
depending on quantity of quartz recovered). OSL measurements were made using a SAR 7
protocol (Murray and Wintle, 2000), with Hoya U-340 (50% Tmax 280-370 nm) detection filters 8
in Risø DA-15 and -20 TL-OSL readers, with 90Sr/90Y β irradiators giving 0.084 and 0.109 9
(±2%) Gy.s-1 to these samples. Each cup was measured using the sequence of regenerative 10
calibration doses indicated in Table 2. β was selected for each site based on initial tests, and a 11
log2 dose scale used, except for reanalysed results from samples ITNLUM 202 to 206. Signals 12
were obtained by subtracting the average count rate in the last 25 s of measurement from that in 13
the first 5 s, which included the majority of the rapidly decaying OSL (Figure 3). Signals 14
normalized to subsequent test dose (Table 2) responses were fitted with single saturating 15
exponential curves, and the absorbed dose represented by each signal N was interpolated. 16
Results were rejected where systematic effects on absorbed dose as a function of preheat 17
temperature and/or the reproducibility of the repeat point and zero-dose responses were 18
considered significant relative to statistical uncertainties. The remaining results were analysed 19
statistically in normal space using a weighted maximum likelihood estimate for a single 20
population to estimate the absorbed dose for the sample as a whole, D. In less scattered cases, 21
the analysis assumed the observed distribution to represent the sum of measured statistical 22
uncertainties and underlying scatter, with the aim of describing the “true” form of the data (e.g. 23
the CAM of Galbraith et al., 1999). This did not work well for very scattered results, but the 24
weighted mean, weighted to the inverse variance on each measurement, provided a reasonable 25
descriptor of the location of the main grouping in these datasets. 26
27
4. Results 28
29
Luminescence date estimates were produced for 28 samples (19 regolith and 9 ceramic/heated 30
clay samples) from 5 archaeological sites (Table 3; Table 4; Figure 1), from 62 sets of 31
geochemical/mineralogical/dosimetric measurements (19 FGS, Table 3; 14 XRD, Table 5; 29 32
INAA, Table 6), 29 sets of water content measurements (Table 3; Figure 4) and 28 sets of OSL 33
analyses (Table 4; Figure 2; Figure 3). 34
35
The cups of quartz grains measured by OSL exhibited strong differences in their sensitivity to 36
radiation, both within and between samples. Lowest values were obtained for the regolith from 37

MANUSCRIP
T
ACCEPTED
ACCEPTED MANUSCRIPT
10
QP; highest for the regolith from SMC (T�N = 0.3-2 and 16 kcts per Gy; Figure 2; Figure 3). 1
Ceramic samples were smaller but yielded moderate to high signals (T�N = 1-14 kcts per Gy), 2
and exhibited little scatter in absorbed dose estimates, where systematic variations with 3
measurement conditions were not evident (std. dev. accepted = 4-6%; 13% for ITNLUM 223). 4
Systematic effects on absorbed dose at high preheats were observed in some groups of samples: 5
increased scatter at FNT, high estimates at AL, and low estimates for the regolith from SMC 6
(Figure 3). Accepted results for some regolith samples and those from the clay structure also 7
exhibited little scatter (2-7%, Figure 2, ITNLUM 59r1, 202-6r1, 273, 275, 438-9, 450-3). 8
Archaeological heating of the clay structure at FNT was verified by the ratio of absorbed dose 9
estimates from OSL and TSL in the initial tests: 15:20 Gy, vs. 10:40 Gy for the unheated 10
sediment, but their radiation sensitivities were similar (Figure 2). By contrast the regolith 11
samples ITNLUM 56r1, 60r1, 272, 441 and 442 exhibited significant scatter in absorbed dose 12
(std. dev. accepted = 18-32%), and the estimates of D for these samples are considered less 13
reliable than the other results (“?” in Table 4). The luminescence signals of these samples’ 14
constituent sand grains may not have been reset at the same time; though at QP it could be a 15
consequence of low signal levels. 16
17
The field water contents of the regolith (Wf, Table 3) ranged from 0.002 to 0.33 g/g, high values 18
related to sampling in winter and vice versa. Differences in saturation level and initial drainage 19
rate related principally to stoniness, but drainage was then slow in all regolith samples, 20
reflecting the presence of fine material. Free-drainage (WD0-8) measurements indicated that the 21
regolith could retain water contents between ca. 0.18 to 0.35 for significant periods (Figure 4), 22
but the summer Wf values were consistently less than 0.02 (Table 3). This is less than air-dry 23
values for silts and clays (Rowell, 1994, Section 5.1), reflecting low humidity and strong 24
evapotranspiration. Ceramics and heated clay exhibited lower saturation (Ws) and drained more 25
rapidly. For the hilltop/slope sites the average of summer and drained values were considered to 26
slightly overestimate the present annual average, and so to be appropriate to account for long 27
term variations (Table 1). For a valley site (SMC) the average of winter and drained water 28
contents were used. Estimates of W� were on average 0.09 g/g for the regolith and 0.07 g/g for 29
ceramics and heated clays (Table 3). Uncertainties on W� were as high as 0.15 g/g for the most 30
water retentive regolith samples. In the present samples a change of 0.01 g/g inW� caused 31
differences in age of on average 1.03(±0.01)% (c.f. Aitken, 1985). 32
33
Estimated mineral abundances in selected samples from the different sites are listed in Table 5. 34
The materials studied consist mainly of quartz, alkali feldspars (K-feldspar and Na-rich 35
plagioclase) and mica, which is more abundant in samples from QP. The regolith from QP also 36
contained abundant kaolinite and traces of hematite and anatase. Traces of hematite were 37

MANUSCRIP
T
ACCEPTED
ACCEPTED MANUSCRIPT
11
observed in samples from SMC and FNT. Chlorite (clinochlore type) occurs in all samples 1
analysed from AL and CP and in one sample from FNT. The samples from SMC have the 2
highest proportion of alkali feldspars and samples from FNT are the richest in quartz. 3
4
The majority of element concentrations, as determined by INAA, in the studied materials are 5
between 0.5 and 2 times UCC (Table 6). The main exceptions are low levels of Na (0.015-0.45 6
× UCC: 0.04-2.45 ppm) and enrichment in Br (2-17 × UCC: 0.9-28 ppm). Patterns of chondrite 7
normalized rare earth element (REE) in the samples are similar to UCC and PAAS: they are all 8
light REE enriched with a negative Eu anomaly. Total REE concentrations in UCC and PAAS 9
are 130 and 160 ppm respectively but vary from 54 to 260 ppm in the studied samples: highest 10
values from the ceramic sherds, similar moderate values for regolith from AL, CP, QP and 11
SMC, and low values from FNT (Table 6). Both the regolith and structure at FNT exhibited low 12
levels of most elements except Br and As. The regolith from AL exhibited high concentrations 13
of the semi-metals As and Sb. Relatively high levels of Sb were also found at CP. The regolith 14
from SMC exhibited relatively low levels of transition metals (Fe, Sc, Co and Zn), As, Ga and 15
Br. The ceramic sherds from SMC and QP exhibited elevated levels of light rare earth elements, 16
Th, Zr and Ga, and higher levels of Na than the other studied samples. Both regolith and 17
ceramics from QP were enriched in Cs. The regolith from this site displayed the lowest 18
enrichment in Br observed at any of the sites. Some samples from SMC, and FNT exhibit La/Sc 19
and Th/Sc ratios much greater than UCC, indicating a felsic source (granites). 20
21
K, Th and U concentrations in the samples (Table 3) were on average 1.5 %, 9.0 ppm and 2.2 22
ppm for in situ FGS measurements, and 1.9 %, 12 ppm and 2.7 ppm for INAA. Regolith and 23
ceramics/heated clay yielded similar averages but the latter exhibited grater variability. 24
Measured concentrations from FGS are lower than those for INAA largely as a function of in 25
situ water (Wf) and measurement geometry (Solid Angle, Table 3), which were included in the 26
calculation of Ḋ. Cosmic dose rate estimates ranged from 0.19 to 0.28 mGy.a-1. Following 27
correction for W�, Ḋ averaged 3.3(±0.4) mGy.a-1 at AL, CP, QP and SMC, and 1.5(±0.1) mGy.a-28 1 at FNT, with contributions of Alpha, Beta, Gamma and Cosmic radiation of 2(±1)%, 58(±7)%, 29
32(±4)%, and 8(±4)%. D ranged from 10 to 22 Gy at AL, 1.6 to 15 Gy at CP, 8 to 21 Gy at QP, 30
10 to 45 Gy at SMC, and 13 to 15 Gy at FNT. These produced calendar date estimates from 31
1350 to 4900 BC at AL, 1460 AD and 2200 BC at CP, 330 to 5300 BC at QP, 800 to 9500 BC 32
at SMC, and 5700 to 8600 BC at FNT, with uncertainties from 4 to 9 % at 1σ. 33
34
5. Discussion 35
36

MANUSCRIP
T
ACCEPTED
ACCEPTED MANUSCRIPT
12
High OSL radiation sensitivity was observed in the quartz from SMC and FNT (heated and 1
unheated), signals from AL and CP were also moderate to high, whereas the sensitivity of 2
samples from QP was lower (Figure 2). The higher sensitivity samples also tended to exhibit 3
greater effects of high preheats on D evaluation (280 °C; Figure 3). Removal of compensating 4
alkali ions from Al centres in quartz can increase its radiation sensitivity (Martini et al., 1987). 5
This can be achieved through heating, or leaching during weathering and transport either 6
recently or in the geological past: low Na relative to UCC, but similar K, in the regolith at all 7
sites suggests partitioning during weathering of felsic/coarse material (White, 2008). 8
9
Most geochemical differences between sites and samples appear related to mineralogical 10
composition (Table 5). Higher levels of Cs were observed in mica-rich samples from QP. 11
Higher levels of Na were observed in ceramic sherds richer in alkali feldspars. Both regolith and 12
structure at FNT exhibit the lowest average elemental concentrations in the present study: this is 13
considered to reflect dilution by quartz and appears strongest in the structure. The local geology 14
of FNT and SMC contains Miocene and Pliocene clayey arenite units derived largely from the 15
CIZ by the palaeoTejo (Pais et al., 2012, Ch 5.5). The felsic signature of samples from these 16
sites (Table 6) may relate to their original source material including granites of the CIZ (e.g. 17
Villaseca et al., 2009). Weak Br enrichment in the regolith at SMC and particularly QP 18
indicates relatively low anthropogenic influence on their composition (Prudêncio et al., 2006; 19
Trindade et al., 2011). Enrichments in Sb at AL and CP, and As at AL and FNT, may relate to 20
mineralization associated with hydrothermal activity in the shear zone on which the study area 21
is located (Ortega et al., 1996). 22
23 5.1. Radionuclide mobility 24
25
INAA measures the concentration of the parent radionuclide while FGS measures emissions 26
from the post-222Rn part of the U decay chain, from a large volume, so concordant results can 27
indicate both that the INAA samples are geostatistically representative and that Rn escape in 28
situ was not significant. This appears to be the case for the regolith where elemental 29
concentrations were estimated from the FGS data (Table 3). Since the FGS crosscheck does not 30
apply to the ceramic/heated clay samples, sample ITNLUM 451 was tested for maximum 31
potential radon loss. 100 g of dried disaggregated material was measured by HRGS (without 32
neutron activation) shortly after sealing its container, so post-Rn isotopes did not have time to 33
equilibrate. The results were calibrated relative to sealed equilibrated samples of the standards 34
used for INAA (section 3). Apparent U concentration was 1.72(±0.04) ppm for pre-222Rn 35
emissions from 234Th and 226Ra(+235U), 1.30(±0.07) ppm from 214Pb and 214Bi, and 1.3(±0.3) 36
ppm from 210Pb. These indicate 24% radon loss and the similar value for 210Pb (t½ = 22 a) 37

MANUSCRIP
T
ACCEPTED
ACCEPTED MANUSCRIPT
13
indicates that this may be relevant to the in situ sample condition in recent decades. K and Th 1
were 0.24(±0.02) ppm and 7.2(±0.2) ppm. 2
3
The relative concentrations of period 4 transition metals in regolith and structure are variable 4
(Table 6). However, when Sc normalized data (Dias and Prudêncio, 2008) from the structure are 5
compared with the regolith of FNT and with the other sites, K and Zn appear consistently 6
depleted (1.6 to 2 times). The land surface in which the structure was formed may already have 7
been depleted in K, but if leaching of 50% occurred since the heating event being dated it would 8
imply that the original dose rate (Ḋ1) for ITNLUM 451 was 10% higher than from measured 9
INAA analyses (Ḋ2). Since the structure was covered by sediment of higher K content from ca. 10
5700 BC, it is assumed that any leaching was then inhibited and that the measured K 11
concentrations are applicable during this period (P2). The maximum effect of K loss is then 12
obtained if it occurred at the end of the preceding period (P1), so that P1 = (D – P2Ḋ2)/ Ḋ1 (c.f., 13
Zacharias et al., 2007, where the age was known a priori). 14
15
Estimates of both Ḋ (from INAA) and D, for the different samples from the clay structure are 16
within 1σ of each other (Table 4). Calculation of a single result using averaged measurements of 17
K, Th and pre-Rn U gives a date estimate of 8300(±600)BC. Based on the INAA data, modelled 18
K loss gives an average across the samples of 8000 BC, whereas weighted pre- and post-Rn U 19
contributions from the HRGS result gives 8900 BC. Comparison of radiometric, geochemical, 20
mineralogical and chrono-stratigraphic data for this sample and context indicates that effects of 21
methodological differences and radionuclide mobility lie within estimated overall uncertainties. 22
However, in other soils and clays from north-central Portugal, continual weathering and local 23
contrasts in radionuclide concentration have been found to produce differences in dose rate of 24
30% and 300%, due to K leaching and Ra uptake or Rn loss, respectively (Trindade et al., 25
2013). 26
27
Evaluation of such effects in ceramic sherds may require intensive comparative elemental 28
analyses, ideally including examples of unaltered material (Zacharias et al., 2007). The sherds 29
analysed in the present study were of plain coarse-ware. Those from QP included broader 30
thinner pieces apparently encountered in situ. The assemblage at SMC was considered in situ 31
but the dated sherds were narrower and thicker and may have been sufficiently robust to have 32
been transported and redeposited. However, K and U concentrations in the sherds from both QP 33
and SMC were on average 1.5 times those of their burial contexts, i.e. chemical gradients were 34
generally small. Th/U ratios are within 0.8 to 1.5 times UCC, with the exception of a high Th 35
content sherd from SMC (A9/195; ITNLUM 443). This yielded the older date estimate from 36
SMC: the difference from the other sherd in both age and Th/U would be consistent with an 37

MANUSCRIP
T
ACCEPTED
ACCEPTED MANUSCRIPT
14
underestimate of ca. 4.5 ppm U (i.e. 3/5), though spatial variations in Th content could also 1
cause the dose rate difference and may be more probable given the observed elevated 2
concentration. 3
4 5.2. Summary of Dating Analyses 5
6
Interpretations of the luminescence dating results listed in Table 3 illustrate that their 7
chronological meaning, and meaningfulness, differs strongly between samples and contexts 8
(Table 7). For regolith samples, interpretations differ principally according to the event that is 9
considered to be being dated. Dating results per se from the heated artefacts carry the broad 10
implication of human presence in an area at a particular time, regardless of context. 11
12
Results from sherds indicated broader and slightly different chronologies than synthetic 13
typological designations for each assemblage: the late Neolithic was represented at SMC (early 14
Chalcolithic, Cruz, 2006), and the Bronze Age and mid-late Iron Age at QP (late Chalcolithic - 15
early Bronze Age, Caron et al., 2010), though this has been reinterpreted as consistent with the 16
present results. Differences might relate to sampling: typological interpretation is necessarily 17
based on diagnostic sherds, whereas provision of non-diagnostic sherds is preferred for 18
destructive dating analysis. In the large negative features of QP the ceramics generally give 19
younger results than fills from the same feature, but come from slightly higher (Table 7; c.f. 20
Barnett, 2000). Geochemical analysis of the fills from QP indicates they have suffered little 21
anthropic influence including heating, and to be locally derived regolith. Overall the results 22
indicate activity at QP from the mid 2nd to mid/late 1st millennium BC. 23
24
A group of consistent dating results with relatively low scatter in absorbed dose, from deep in 25
the tumulus and fills at AL (ca. 4000 BC), appears to relate to resetting of the OSL signal during 26
transport or pedoturbation of surficial material prior to construction, and shortly post-dates 27
indications of minor clearance activity in the regional pollen record (Table 1; Table 7). Younger 28
than expected results from basal contexts at CP indicate that some of the material from around 29
the periphery of the chamber was exposed to light during more recent disturbance (ITNLUM 30
272), but that the fill within the chamber may have originally accumulated during a Chalcolithic 31
or Early Bronze Age phase of site use (2300 BC, ITNLUM 440). 32
33
Younger results from the vertical sequence of samples ITNLUM 202-4 at AL indicate 34
pedoturbation to ca. 30 cm from the tumulus surface since its construction, similar to the 35
findings of Bush and Feathers (2003). Similarly, some layers at QP and SMC may have 36
underlain palaeo-land-surfaces until after the dates indicated by the younger end of the broad 37
MANUSCRIP
T
ACCEPTED
ACCEPTED MANUSCRIPT
15
distributions of results from the multi-grain analyses used in the present study (ca. 150 BC, 1
3500 BC, 0 BC and 7800 BC for ITNLUM 60r1, 56r1, 441, and 442 respectively; Figure 2; 2
Table 7). 3
4
Little scatter and a younger result (5700 BC) than from the structure it sealed and surrounded 5
(8300 BC) indicates that the regolith sample from FNT represents sedimentary accumulation 6
following erosion, and also that it has not been affected by pedoturbation, so until recently it 7
was probably buried deeper than when sampled (Table 7). The structure at FNT represented a 8
context in its own right. Comparison of OSL and TSL results confirmed it was heated, and its 9
mineralogical and geochemical similarity to the more recent sediment surrounding it indicates 10
that it is the base of a fire pit cut into a lost land surface. The date estimate for the structure is 11
coincident with a broad maximum in Quercus, a local minimum in Pinus, a peak in Poaceae, 12
and the first appearance of Cerialia-type pollen in the regional record (van der Knaap and van 13
Leeuwen, 1995), and the beginning of a period of increased charred particle accumulation 14
(Connor et al., 2012). Establishment of the diachronic distribution of such structures may help 15
indicate the relative importance of anthropogenic environmental influences on this landscape in 16
the early Holocene. 17
18
6. Conclusions 19
20
The 28 regolith and ceramic samples, from passage tombs, pit fills, a stone-scatter structure, and 21
a fire pit/oven, associated with the transition to and development of agricultural societies in the 22
Alto Ribatejo, produced OSL dates from throughout Holocene prehistory. They indicate 23
occupation of the Alto Ribatejo landscape around the time of the first indications of clearance in 24
the regional pollen record (FNT; late 9th millennium BC), but no signs of landscape activation 25
(SMC) until the first indications of agriculture (FNT, erosion at AL also possibly at this time). 26
Sediment accumulation / soil formation was observed around the transition to the Neolithic 27
(FNT, AL; 5/6th millennium BC), but no direct evidence of early Neolithic occupation or 28
megalithic construction was obtained. Clearance episodes were not directly identified in present 29
samples, although a possible relationship to small scale regional indications was observed at AL 30
(late 5th millennium BC), where local data indicate that significant vegetation coverage may not 31
have existed in the time-frame of interest. Occupation at two sites began in the mid to late 32
Neolithic (AL, SMC; early 4th millennium BC) and was accompanied by variable indications of 33
landscape pressure (AL, SMC, QP). Occupation and landscape activation at four sites was 34
observed in the Chalcolithic/Early Bronze Age (AL, CP, SMC, FNT; 3rd millennium BC), 35
coincident with regional signals. The study sites contained records of occupation and variable 36
MANUSCRIP
T
ACCEPTED
ACCEPTED MANUSCRIPT
16
landscape pressure in the Bronze and Iron Ages, which ceased with the Roman conquest (SMC, 1
FNT, QP). 2
3
The present results illustrate how the combination of OSL dating of sediments and ceramics 4
with geochemical and mineralogical analysis is a powerful tool for understanding complex site 5
formation processes on a site-by-site basis. The combination of OSL, INAA, FGS, HRGS, and 6
XRD, is effective for understanding both dosimetric and luminescence behaviour, and so for 7
investigating site formation processes. This produces a rather complex matrix of information for 8
analysis, but comparison of indications and counter-indications from different sources allows a 9
more secure interpretational framework to be constructed. 10
11
With respect to sampling of regolith, analysis of samples from the geological substrate and the 12
present surface in addition to the archaeological contexts would aid the interpretation of results. 13
When dating tumuli, samples from near the bottom are most useful unless post-depositional 14
effects are of interest. For ceramic samples, analysis of diagnostic as well as undiagnostic 15
sherds is important to avoid bias and facilitate comparison with typological interpretations. 16
Overall, analysis of a variety of sample types is important to identify all relevant chronological 17
phases. Fire pits or other heated structures appear ideal to map early landscape usage in the Alto 18
Ribatejo, subject to careful radiometric and geochemical characterization. 19
20
Acknowledgements 21
22
This work was funded by the FCT project PTDC/HAH/71361/2006. Implementation of gamma 23
spectrometry and environmental dosimetry evaluation was supported by the grants 24
REEQ/590/CTE/2005 and PTDC/AAC-AMB/121375/2010. Excavations at AL and CP were 25
funded by British Academy Larger Research Grant LRG–42469 “Megalithic monuments and 26
landscapes of the Upper Tagus Valley, Portugal”. 27
28
References 29
30
Abrantes, F., Lebreiro, S., Rodrigues, T., Gil, I., Jonsdottir, H., Oliveira, P., Kissel, C., Grimalt, 31
J.O. 2005. Shallow marine sediment cores record climate variability and earthquake 32
activity off Lisbon (Portugal) for the last 2000 years. Quaternary Science Reviews 24, 33
2477-2494. 34
Adamiec, G., Aitken, M.J. 1998. Dose-rate conversion factors: update. Ancient TL 16, 37-49. 35
Aitken, M.J. 1985. Thermoluminescence dating. Academic Press, London. 36

MANUSCRIP
T
ACCEPTED
ACCEPTED MANUSCRIPT
17
Anders, E., Grevesse, N. 1989. Abundances of the elements: Meteoritic and solar. Geochemica 1
et Cosmochemica Acta 53, 197-214 2
Barnett, S.M. 2000. Sampling pottery in luminescence dating studies. Radiation Measurements 3
32, 467-472. 4
Batista, A. 2004. Carta Arqueológica do Concelho de Constância. Câmara Municipal de 5
Constância, Constância. 6
Bell, W.T. 1979. Attenuation factors for the absorbed radiation dose in quartz inclusions for 7
thermoluminescence dating. Ancient TL 8, 2-13. 8
Bell, W.T., Zimmerman, D.W. 1978. Effect of HF acid etching on morphology of quartz 9
inclusions for thermoluminescence dating. Archaeometry 20, 63-5. 10
Burbidge, C.I. 2003. Luminescence investigations and dating of anthropogenic palaeosols from 11
South Mainland Shetland. University of Wales, Aberystwyth. 396 p, Unpublished PhD 12
Thesis. 13
Burbidge, C.I., Dias, M.I., Prudêncio, M.I., Rebêlo, L.P., Cardoso, G.O., Brito, P. 2009. Internal 14
α activity: localisation, compositional associations and effects on OSL signals in quartz 15
approaching β saturation. Radiation Measurements 44, 494-500. 16
Burbidge, C.I., Sanderson, D.C.W., Housley, R.A., Allsworth Jones, P. 2007. Survey of 17
Palaeolithic sites by luminescence profiling, a case study from Eastern Europe. 18
Quaternary Geochronology 2, 296-302. 19
Bush, D.A., Feathers, J.K. 2003. Application of OSL single-aliquot and single-grain dating to 20
quartz from anthropogenic soil profiles in the SE United States. Quaternary Science 21
Reviews 22, 1153–1159. 22
Cardoso, G. Oosterbeek, L., Dias, M.I. 2012. Construção de uma base de dados de datações de 23
sítios arqueológicos da Península Ibérica: contribuição para o estudo de sequências 24
cronológicas. Estudos Arqueológicos de Oeiras 19, 305-310. 25
Caron, L., Freita, A., Oosterbeek, L. 2010. Variante à E. N. 238 entre a E. N. 110 (IC3) e 26
proximidades de Ferreira do Zêzere. In: Intervenções Arqueológicas Efectuadas pelo 27
CEIPHAR, Acompanhamento e Sondagens realizadas em contexto de obra. Estradas de 28
Portugal, S.A., 8-9. (http://www.estradasdeportugal.pt/index.php/pt/areas-de-29
actuacao/gabinete-de-ambiente/481-revista-digital-de-arqueologia) 30
Carvalho, A.F. 2010. Chronology and geography of the Mesolithic-Neolithic transition in 31
Portugal. In: Armbruester, T., Hegewisch, M. (eds.). On Pre- and Earlier History of 32

MANUSCRIP
T
ACCEPTED
ACCEPTED MANUSCRIPT
18
Iberia and Central Europe. Studies in honour of Philine Kalb, Bonn, Habelt-Verlag. 15-1
61. (url: http://ualg.academia.edu) 2
Chaminé, H.I., Gama Pereira, L.C., Fonseca, P.E., Noronha, F., Lemos de Sousa, M.J. 2003. 3
Tectonoestratigrafia da faixa de cisalhamento de Porto–Albergaria-a-Velha–Coimbra–4
Tomar, entre as Zonas Centro-Ibérica e de Ossa-Morena (Maciço Ibérico, W de 5
Portugal). Cadernos Lab. Xeolóxico de Laxe, Coruña 28, 37-78. 6
Connor, S.E., Araújo, J., van der Knaap, W.O., van Leeuwen, J.F.N. 2012. A long-term 7
perspective on biomass burning in the Serra da Estrela, Portugal. Quaternary Science 8
Reviews 55, 114-124. 9
Cruz, A. 2006. Santa Margarida da Coutada (Constância) Campanha Arqueológica – 2006. 10
Notícia Preliminar sobre a Intervenção no Povoado de Santa Margarida da Coutada. 11
Centro de Pré-História do Instituto Politécnico de Tomar. 12
(http://www.cph.ipt.pt/angulo2006/img/06-07/SMAC.pdf) 13
Cruz, A. 2007. A Pedra da Encavalada. Angulo, Serie I (2006/07), 1-16. 14
(http://www.cph.ipt.pt/angulo/index.php?option=com_jotloader§ion=files&task=do15
wnload&cid=64_6ce8c2c286d5fa98cd7e28e8d040ad9e&Itemid=14) 16
Cruz, A. 2010. Relatório da Campanha de Escavação de Fontes - 2010 (Povoado de Fontes). 17
Centro de Pré-História do Instituto Politécnico de Tomar. 18
(http://www.cph.ipt.pt/angulo/index.php?option=com_jotloader&view=categories&cid=19
13_c0bcad828bb9c3077c660d2aac7b3380&Itemid=18) 20
Deckers, K., Sanderson, D.C.W., Spencer, J.Q. 2005. Thermoluminescence screening of non- 21
diagnostic sherds from stream sediments to obtain a preliminary alluvial chronology: an 22
example from Cyprus. Geoarchaeology 20, 67-77. 23
Dias, M.I., Prudêncio, M.I. 2007. Neutron activation analysis of archaeological materials: an 24
overview of the ITN NAA laboratory, Portugal. Archaeometry 49, 383-393. 25
Dias, M.I., Prudêncio, M.I. 2008. On the importance of using scandium to normalize 26
geochemical data preceding multivariate analyses applied to archaeometric pottery 27
studies. Microchemical Journal 88, 136-141. 28
Duller, G.A.T. 2003. Distinguishing quartz and feldspar in single grain luminescence 29
measurements. Radiation Measurements 37, 161-165. 30
Figueiredo, A. 2007. Entre as Grutas e os Monumentos Megalíticos: problemáticas e 31
interrogações na Pré-História recente do Alto Ribatejo. Al-madan online. 15, 1-15. 32
Fleming, S.J. 1970. Thermoluminescence dating: refinement of the quartz inclusion method. 33
Archaeometry 12, 133-145. 34
Galbraith, R.F., Roberts, R.G., Laslett, G.M., Yoshida, H., Olley, J.M. 1999. Optical dating of 35
single and multiple grains of quartz from jinmium rock shelter, northern Australia, part 36
1, Experimental design and statistical models. Archaeometry 41, 339-364. 37

MANUSCRIP
T
ACCEPTED
ACCEPTED MANUSCRIPT
19
Gouveia, M.A., Prudêncio, M.I. 2000. New data on sixteen reference materials obtained by 1
INAA. Journal of Radioanalytical and Nuclear Chemistry 245, 105-108. 2
Govindaraju, K. 1994. Compilation of working values and sample description for 383 3
geostandards. Geostandards Newsletter 18. 4
Guibert, P., Lahaye, C., Bechtel, F. 2009. The importance of U-series disequilibrium of 5
sediments in luminescence dating: A case study at the Roc de Marsal Cave (Dordogne, 6
France). Radiation Measurements 44, 223-231. 7
van der Knaap, W.O., van Leeuwen, J.F.N. 1995. Holocene vegetation succession and 8
degradation as responses to climatic change and human activity in the Serra de Estrela, 9
Portugal. Review of Palaeobotany and Palynology 89, 153-211. 10
Krane, S.K. 1988. Introductory Nuclear Physics. Wiley. 11
Martini, M., Spinolo, G., Vedda, A. 1987. Defects dynamics in as-grown and electrodiffused 12
quartz: and interpretation of the predose effect. Journal of Applied Physics 61, 2486-13
2488. 14
Mejdahl, V. 1979. Thermoluminescence dating: Beta-dose attenuation in quartz grains. 15
Archaeometry 21, 61-72. 16
Mejdahl, V. 1983. Feldspar inclusion dating of ceramics and burnt stones. Council of Europe 17
PACT Journal 9, 351-364. 18
Murphy, P.J., Roberts, S. 1997. Evolution of a metamorphic fluid and its role in lode gold 19
mineralisation in the Central lberian Zone. Mineralium Deposita 32, 459-474. 20
Murray, A.S., Wintle, A.G. 2000. Luminescence dating of quartz using an improved single-21
aliquot regenerative-dose protocol. Radiation Measurements 32, 57-73. 22
LNEG. 2013. http://geoportal.lneg.pt/geoportal/mapas/index.html. 24/01/2013. 23
NIST ESTAR. 2009. http://physics.nist.gov/PhysRefData/Star/Text/ESTAR.html. 15/06/2009. 24
Oliveira, J.T., Pereira, E., Ramalho, M., Antunes, M.T., Monteiro, J.H. (coord.), 1992. Carta 25
Geológica de Portugal à escala 1:500000, 5ª edição, Serviços Geológicos de Portugal, 26
Lisboa. 27
Oosterbeek, L. 2001. Re-thinking the Mesolithic-Neolithic transition in the Iberian Peninsula: a 28
view from the West. Documenta Praehistorica XXVIII. Neolithic Studies 8, 75-84. 29
Ortega, L., Oyarzun, R., Gallego, M. 1996. The Mari Rosa late Hercynian Sb-Au deposit, 30
western Spain. Geology and geochemistry of the mineralizing processes. Mineralium 31
Deposita 31, 172-187. 32
Pais, J., Cunha, P., Pereira, D, Legoinha, P., Dias, R., Moura, D., Silveira, A., Kullberg, J., 33
Gonzales-Delgado, J.A. 2012. The Paleogene and Neogene of Western Iberia 34
(Portugal). Springer Briefs in Earth Sciences, Springer, Heidelberg. 35
Prescott, J.R., Hutton, J.T. 1988. Cosmic-Ray and Gamma-Ray Dosimetry For TL and Electron-36
Spin- Resonance. Nuclear Tracks and Radiation Measurements 14, 223-227. 37
MANUSCRIP
T
ACCEPTED
ACCEPTED MANUSCRIPT
20
Prescott, J.R., Stephan, L.G. 1982. The contribution of cosmic radiation to the environmental 1
dose for thermoluminescent dating. Latitude, altitude and depth dependencies. Council 2
of Europe PACT Journal 6, 17-25. 3
Prudêncio, M.I., Braga, M.A.S., Oliveira, F., Dias, M.I., Delgado, M., Martins, M. 2006. Raw 4
material sources for the roman bracarense ceramics (NW Iberian Peninsula). Clays and 5
Clay Minerals 54, 638-649. 6
Reimer, P. J., Baillie, M. G. L., Bard, E., Bayliss, A., Beck, J. W., Blackwell, P. G., Bronk 7
Ramsey, C., Buck, C. E., Burr, G., Edwards, R. L., Friedrich, M., Grootes, P. M., 8
Guilderson, T. P., Hajdas, I., Heaton, T. J., Hogg, A. G., Hughen, K. A., Kaiser, K. F., 9
Kromer, B., McCormac, F. G., Manning, S. W., Reimer, R. W., Richards, D. A., 10
Southon, J., Turney, C. S. M., van der Plicht, J., and Weyhenmeyer, C. 2009. IntCal09 11
and Marine09 radiocarbon age calibration curves, 0 - 50,000 years cal BP. Radiocarbon 12
51, 1111-1150. 13
Ribeiro, O., Teixeira, C., Gonçalves, F., Zbyszewski, G. 1977. Carta Geologica de Portugal à 14
escala 1:50000, 27-D (Abrantes). Serviços Geológicos de Portugal, Lisboa 15
Richter, D., Zink, A., Przegietka, K., Cardoso, G.O., Gouveia, M.A., Prudêncio, M.I. 2003. 16
Source calibrations and blind test results from the new Luminescence Dating 17
Laboratory at the Instituto Tecnológico e Nuclear, Sacavém, Portugal. Ancient TL 21, 18
1-7. 19
Roberts, H.M., Duller, G.A.T. 2004. Standardised growth curves for optical dating of sediment 20
using multiple grain aliquots. Radiation Measurements 38, 241-252. 21
Rowell, D.L., 1994. Soil science: methods and applications. Longman, Harlow. 22
Rubel, F., Kottek, M. 2010. Observed and projected climate shifts 1901-2100 depicted by world 23
maps of the Köppen-Geiger climate classification. Meteorologische Zeitschrift 19, 135-24
141. 25
Rudnick, R.L., Gao, S. 2003. Composition of the Continental Crust. In: Holland, H.D. & 26
Turekian, K.K. (Ed.), Treatise on Geochemistry: The Crust, Elsevier, 1-64. 27
Rowley-Conwy, P. 2011. Westward Ho! The Spread of Agriculturalism from Central Europe to 28
the Atlantic. Current Anthropology 52, S431-S451. 29
Scarre, C. 2007. Changing places: monuments and the Neolithic tradition in western France. 30
Proceedings of the British Academy 144, 243-261. 31
Scarre, C., Oosterbeek, L. 2010. The megalithic tombs of the middle Tagus basin and agro-32
pastoral origins in Western Iberia, in Beiträge zur Vor- und Frühgeschichte der 33
Iberischen Halbinsel und Mitteleuropas. Studien in honorem Philine Kalb, eds. T. 34
Armbruester & M. Hegewisch. Bonn: Habelt, 97-110. 35
Scarre, C., Arias, P., Burenhult, G., Fano, M.A., Oosterbeek, L., Schulting, R.J., Sheridan, A., 36
Whittle, A. 2003. Megalithic chronologies. In: Stones and Bones. Formal disposal of the 37

MANUSCRIP
T
ACCEPTED
ACCEPTED MANUSCRIPT
21
dead in Atlantic Europe during the Mesolithic-Neolithic interface 6000-3000 BC. 1
Archaeopress, Oxford. 65-111. 2
Scarre, C., Oosterbeek, L., French, C. 2011. Tombs, landscapes and settlement in the Tagus hill-3
country, in From the Origins: The Prehistory of the Inner Tagus Region, eds. P. Bueno 4
Ramírez, E. Cerrillo Cuenca, A. Gonzalez Cordero. Oxford: Archaeopress, 83-91. 5
van der Schriek, T. 2004. Holocene environmental change and the alluvial geoarchaeology of 6
Mesolithic settlement-subsistence in the Muge and Magos valleys, Lower Tagus Basin, 7
Portugal. Unpublished Ph.D. Thesis, University of Newcastle upon Tyne, England. 8
da Silva L.H. 1939. Monografia de Cardigos. Cucujãis: Escola Tipica das Missões. 9
Stabin, M.G., da Luz, L.C.Q.P. 2002. Decay Data for Internal and External Dose Assessment. 10
Health Physics 83, 471-475. 11
Taylor, S.R., McLennan S.M. 1985. The Continental Crust: Its Composition and Evolution. 12
Blackwell Scientific Publications, Oxford, UK. 13
Trindade, M.J., Dias, M.I., Rocha, F., Prudêncio, M.I., Coroado J. 2011. Bromine volatilization 14
during firing of calcareous and non-calcareous clays: Archaeometric implications. 15
Applied Clay Science 53, 489–499. 16
Trindade, M.J., Prudêncio, M.I., Burbidge, C.I., Dias, M.I., Cardoso, G., Marques, R., Rocha, F. 17
2013. Distribution of naturally occurring radionuclides (K, Th and U) in weathered 18
rocks of various lithological types from the uranium bearing region of Fornos de 19
Algodres, Portugal. Mediterranean Archaeology and Archaeometry 13.3. In Press. 20
Villaseca, C., Bellido. F. Perez-Soba, C., Billstrom, K. 2009. Multiple crustal sources for post-21
tectonic I-type granites in the Hercynian Iberian Belt. Mineralogy and Petrology 96, 22
197-211. 23
Vis, G.-J., Bohncke, S. J. P., Schneider, H., Kasse, C., Coenraads-Nederveen, S., Zuurbier, K., 24
Rozema, J. 2010. Holocene flooding history of the Lower Tagus Valley (Portugal). 25
Journal of Quaternary Science 25, 1222–1238. 26
White, A.F. 2008. Chapter 10, Quantitative Approaches to Characterizing Natural Chemical 27
Weathering Rates. In Brantley, S., Kubicki, J., White, A. (Eds.), Kinetics of Water-28
Rock Interaction, Ch 10. Springer Science+Business Media, LLC. 469-543. 29
Whittle, E.H., Arnaud, J.M. 1975. Thermoluminescent dating of Neolithic and Chalcolithic 30
pottery from sites in central Portugal. Archaeometry 17, 5-24. 31
Zacharias, N., Schwedt, A., Buxeda i Garrigo´s, J., Michael, C.T., Mommsen, H., Kilikoglou, 32
V. 2007. A contribution to the study of post-depositional alterations of pottery using TL 33
dating analysis. Journal of Archaeological Science 34, 1804-1809 34
Zapata, L., Peña-Chocarro, L., Pérez-Jordá, G., Stika, H-P. 2004. Early Neolithic Agriculture in 35
the Iberian Peninsula. Journal of World Prehistory 18, 283-325. 36

MANUSCRIP
T
ACCEPTED
ACCEPTED MANUSCRIPT
22
Zilhão, J. 1997. Maritime pioneer colonisation in the early Neolithic of west Mediterranean. 1
Testing the model against evidence. Poročilo o raziskovanju paleolitika, noelitika in 2
eneolitika v Sloveniji 24, 19-24. 3
Zimmerman, D.W. 1971. Thermoluminescence dating using fine grains from pottery. 4
Archaeometry 13, 29-52. 5
6

MANUSCRIP
T
ACCEPTED
ACCEPTED MANUSCRIPT
23
1
2
Captions 3
4
Table 1. Holocene environmental, climatic, and geomorphic context, summarized from van der 5
Knaap and van Leeuwen (1995), Vis et al. (2010), Abrantes et al. (2005), and van der Schriek 6
(2004). P = Palaeolithic, EP = Epipalaeolithic, M = Mesolithic, N = Neolithic, C = Chalcolithic, 7
BA = Bronze Age, IA = Iron Age, R = Roman, Med = Mediaeval, PM = Post Mediaeval. 235 8 14C, 27 TSL/OSL and 7 U-series results from ascribed contexts, plus 'Me' from otherwise 9
unascribed megalithic contexts were binned in each timeline division simply using each central 10
estimate (from the database of Cardoso et al., 2012). The area 9 to 5 °W, 39 to 40 °N, was 11
chosen to include Spanish Extremadura, the shell middens of the lower Tejo and Portuguese 12
Estremadura, and the Alto Ribatejo, Uncalibrated 14C data were converted using Reimer et al. 13
(2009), other data are as reported. Problems of method, interpretation/association, and 14
residual/intrusive materials/signals etc. produce tails in the distributions of dates for a given 15
period, and of periods for a given date. 16
17
Table 2. Calibration doses used in SAR OSL measurement sequences. (R) indicates a repeat 18
point and (IR) indicates a repeat point where the OSL response was measured following infrared 19
exposure to test for the presence of minerals other than quartz (Duller, 2003). OSL was 20
measured at 125 °C for 125 s. 21
22
Table 3. Results of water content, radiometric, and geochemical analyses used in dose rate 23
calculation. 24
25
Table 4. Samples, contexts, luminescence measurements, dosimetric calculations, and calendar 26
dates. 27
28
Table 5. Mineralogical results obtained by XRD for selected samples in Table 3. Q = Quartz, K 29
= Kaolinite, M = Mica, C = Chlorite, KF = K-feldspar, P = Plagioclase, A = Anatase, H = 30
Hematite. Sample type: R = regolith, C = ceramic, H = heated clay. 31
32
Table 6. Element concentrations and oxide % of major elements in samples of regolith (R), 33
ceramic (C), and heated clay (H) from each site determined by INAA, with upper continental 34
crust (UCC) and post-Archaean Australian Shale (PAAS) averages from Rudnick and Gao 35

MANUSCRIP
T
ACCEPTED
ACCEPTED MANUSCRIPT
24
(2003) and Taylor and McLennan (1985). INAA samples are related to luminescence results 1
(ITNLUM ) in Table 3 and Table 5. 2
3
Table 7. Summary interpretations of the luminescence dating results with respect to site 4
chronologies and formation processes, and indications of their coincidence with regional 5
archaeological and climatic patterns. 6
7
Figure 1. Site locations and general views of each site, with indications of sampling locations 8
(solid arrows), sampled contexts (dashed arrows), sampling locations in subsequently excavated 9
contexts (point on vertical reference line, AL), and locations of adjunct samples and in situ 10
measurements (solid points, QP). AL = Anta da Lajinha, CP = Cabeço dos Pendentes, QP = 11
Quinta do Paço II, SMC = Santa Margarida da Coutada, FNT = Povoado de Fontes. Ridges 12
south of AL and CP are associated with thick quartzite veins in the schists of this area. Incision 13
by the Zezêre and tributaries along faulting in the Porto-Tomar Shear zone is also apparent (and 14
see Murphy and Roberts, 1997, Fig 2.). Map from LNEG (2013). 15
16
Figure 2. Absorbed doses, D, for each aliquot of each sample, vs. the square root of the first test 17
dose response “TN”. TN1/2 is a proxy for precision based on counting statistics that is largely 18
independent of D (Burbidge, 2003). R = regolith, C = ceramic, H = heated clay. 19
20
Figure 3. Examples of contrasting OSL behaviour within the SAR protocol (ITNLUM 442, 21
SMC, and ITNLUM 60r1, QP). a. N and β OSL, and β IRSL, decay curves for aliquot 35 22
(preheat 220 °C) from each sample, b. Standardized dose responses (Roberts and Duller, 2004) 23
of all aliquots, c. D vs. preheat, d. Recycling ratio (Iβ(R)/Iβ) and IR recycling ratio (Iβ(IR)/Iβ) vs. 24
preheat, f. Zero-dose responses, Dβ(I0/Iβ) and Dβ(I0(R)/Iβ) vs. preheat. 25
26 Figure 4. Field water content (Wf), saturated overnight and subsequent free-drainage 27
characteristics, and estimates of the time-averaged water content (W�), as a fraction of dry 28
sample mass, for selected samples of regolith (R), ceramic (C) and heated clay (H). 29

MANUSCRIP
T
ACCEPTED
ACCEPTED MANUSCRIPT
25
1
Table 1. <double column portrait> 2
3
Vegetation Climate Sedimentation PeriodP EP M N Me C BA
> 10200 Forest colonization Cold dry Aeolian deposits 46 3 2 210200 - 9300 Forest development Warmer and wetter 1 19300 - 8300 Forest closure Warm and wet 4 1 18300 - 7700 Possible lowland clearance/cult ivation 1 2 17700 - 6700 Lowland anthropogenic clearance 1 6 16700 - 6500 Possible montane clearance/grazing 26500 - 5500 Agriculture in lowlands (Cerealia) 1 1 35 3 1 15500 - 4800 2 8 15 14800 - 4500 Grazing 1 5
4500 - 4000Expansion of small scale
deforestation1 14
4000 - 3600 Increased arable yields 2 123600 - 3300 Shift from cult ivation to grazing. 1 9 1 1
3300 - 2600 Deforestation, overgrazingSignificant erosion:
uplandN / C 3 2 9 10
2600 - 2300 Reforestation 2 3 8 22300 - 1900 Field cult ivation 1 2 2 3 21900 - 1500 Progressive deforestation BA 1 2 14
100BC - 350ADReduced grazing and erosional
pressureR 1 1
350 - 900Valley deforestation, upland
reforestation3
900 - 1050 Large scale deforestation: valleys Severe valley erosion1050 - 1250 Large scale deforestation: uplands 11250 - 1450 Progressive severe soil erosion1450 - 1650 Permanent erosional degradation Cold wet1650 - c.1800 Forestry plantation (Litt le Ice Age)
Severe upland erosion: alluviums
PM
1
Less wet
Med
Warm drySevere erosion:
upland and valley
1 1
Warm wet (strongly seasonal?)
Some colluviums and alluviums
C
1500 - 100Some indications of wetter climate
BA/IAContrasting phases: intensive field cult ivation/pasture/deforestation/
stability/reforestation
Timeline Extant Dating Results(BC/AD)
P
EPCycles of warm-dry / cool-wet of
c. 500 year duration, general trend to cool-wet
M/N
NDrying following
weakening of African monsoon
Alluvial accumulations
4 5
6
7
8
9

MANUSCRIP
T
ACCEPTED
ACCEPTED MANUSCRIPT
26
1
2
Table 2. <single column portrait> 3
4
Reg
ene
rativ
e D
ose
S
equ
enc
e
27
3,
274
, 2
75
,
43
8,
439
, 4
40
44
1,
442
, 4
43
, 44
4,
45
0,
451
, 4
52
, 45
3
22
1,
220
, 2
22
, 22
3,
56
r1,
57r1
, 5
9r1
, 60
r1
27
2
20
2r1
, 20
3r1
, 20
4r1
,
20
5r1
, 20
6r1
N - - - - -β 200 160 60 20 59Z 0 0 0 0 -β /4 50 40 15 5 119β /2 100 80 30 10 1782β 400 320 120 40 2384β 800 640 240 80 297
Z(R) 0 0 0 0 0β(R) 200 160 60 20 59β(IR) 200 160 60 20 -
βtest 10 10 10 10 20
Reference (ITNLUM_)
5
6
7

MANUSCRIP
T
ACCEPTED
ACCEPTED MANUSCRIPT
27
Table 3 <double column portrait>
K Th U WfK Rb Th U W� K Rb Th U W�
(%)3 (πRad) (g/g)4 Ref. (%)3 (g/g)4 Ref. (%)3 (g/g)4
Anta da Lajinha (AL)204r1 0.7 ± 0.1 4 0.01 A6/602 1.9 112 11 2.7 0.07 - - - - - -203r1 0.8 ± 0.1 4 0.01 A6/601 1.9 116 11 2.8 0.07 - - - - - -274 1.0 ± 0.1 4 0.02 A7/294 2.2 125 11 2.7 0.08 - - - - - -205r1 0.8 ± 0.1 4 0.01 A6/603 2.0 121 11 2.8 0.07 - - - - - -206r1 0.8 ± 0.1 4 0.01 A6/604 2.1 96 9 2.6 0.08 - - - - - -438 1.7 8.2 2.3 4 0.17 A9/190 2.4 130 11 2.7 0.10 - - - - - -275 1.0 ± 0.1 3.9 0.02 A7/295 2.0 120 11 2.7 0.07 - - - - - -202r1 0.8 ± 0.1 4 0.01 A6/600 2.3 134 12 3.0 0.07 - - - - - -273 1.0 ± 0.1 4 0.02 A7/293 2.3 129 12 2.9 0.07 - - - - - -439 1.7 8.2 2.2 4 0.17 A9/191 2.0 118 11 2.5 0.09 - - - - - -Cabeço dos Pendentes (CP)272 0.6 ± 0.1 3 0.02 A7/292 1.6 94 9 2.5 0.08 - - - - - -440 1.5 6.5 2.2 3 0.33 A9/192 2.3 124 10 2.8 0.17 - - - - - -Quinta do Paço II (QP)221 0.7 ± 0.1 4 0.002A6/069&72 1.7 110 11 2.2 0.07A6/734 3.3 133 11 2.8 0.0660r1 0.7 ± 0.1 4 0.002 A6/072 1.6 99 13 2.2 0.07 - - - - - -223 0.7 ± 0.1 4 0.002 A6/071 1.7 123 11 1.9 0.07A6/736 3.2 109 20 5.6 0.06222 0.7 ± 0.1 4 0.002 A6/070 1.9 107 9 2.2 0.07 A6/735 2.7 152 10 3.0 0.0657r1 0.7 ± 0.1 4 0.002 A6/069 1.8 121 10 2.2 0.07 - - - - - -59r1 0.7 ± 0.1 4 0.002 A6/071 1.7 123 11 1.9 0.07 - - - - - -220 0.5 ± 0.0 3 0.002A6/067&68 1.9 115 10 3.5 0.07A6/733 2.8 122 13 3.3 0.0656r1 0.5 ± 0.0 3 0.002 A6/068 1.7 109 10 3.3 0.07 - - - - - -Santa Margarida da Coutada (SMC)441 1.6 11 2.7 3.85 0.12 A9/193 2.1 113 15 2.9 0.14 - - - - - -444 1.7 11 2.5 3.8 0.15 A9/196 2.2 114 16 2.9 0.12A9/196 2.3 131 11 3.4 0.07443 1.7 11 2.5 3.8 0.15 A9/195 2.2 114 16 2.9 0.12A9/195 2.4 95 31 3.0 0.06442 1.8 10 2.2 3.75 0.17 A9/194 2.3 115 17 3.0 0.11 - - - - - -Povoado de Fontes (FNT)450 0.4 4.7 1.3 3.9 0.21 A9/202 0.6 43 8 2.1 0.11 - - - - - -452 0.4 4.7 1.3 3.9 0.21 A9/202 0.6 43 8 2.1 0.11A9/203 0.2 27 11 1.7 0.05451 0.4 4.7 1.3 3.9 0.21 A9/202 0.6 43 8 2.1 0.11A9/204 0.2 23 10 1.7 0.05453 0.4 4.7 1.3 3.9 0.21 A9/202 0.6 43 8 2.1 0.11A9/205 0.3 27 7 1.4 0.05
1 ITNLUM_ r1 are revised est imates of previously issued results. 2 γ ± σγ using the threshold method; K, Th, U
using the windows method; both sets as measured, i.e. not corrected for geometry or in situ water content. 3
Average uncertaint ies for K = 8% and 4%, Rb = - and 6%, Th = 13% and 4%, U = 14% and 12%; for FGS and
INAA respectively. 4 Water content as a fraction of dry sediment mass Wf = measured field water content, W� =
estimated t ime averaged water content. Average uncertainty estimated for W� was 0.06.
Heated ClayCeramic/
INAAINAASediment/Soil
(mGy a-1)
(ppm)3
γ ± σγ
Solid Angle
Ref
eren
ce
(IT
NL
UM
_)
1
FGS, In Situ 2
(ppm)3(ppm)3
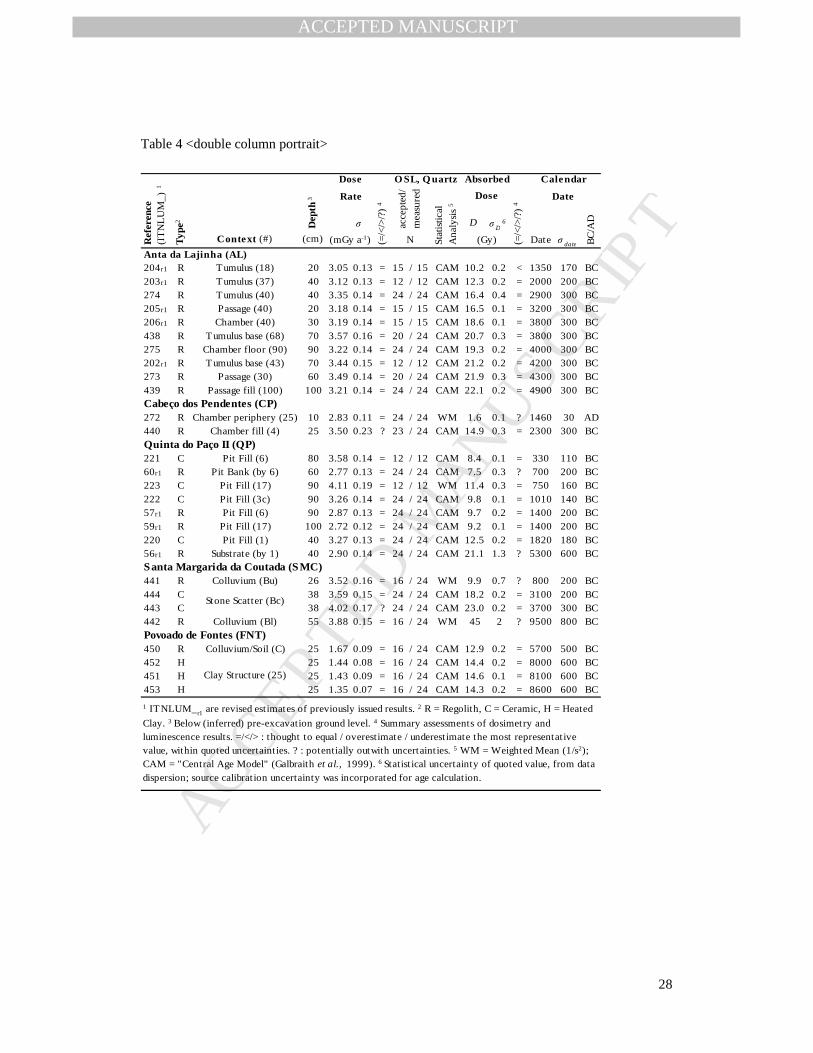
MANUSCRIP
T
ACCEPTED
ACCEPTED MANUSCRIPT
28
Table 4 <double column portrait>
� σ�
D σ D6
Context (#) (cm) Date σ date
Anta da Lajinha (AL)204r1 R Tumulus (18) 20 3.05 0.13 = 15 / 15 CAM 10.2 0.2 < 1350 170 BC203r1 R Tumulus (37) 40 3.12 0.13 = 12 / 12 CAM 12.3 0.2 = 2000 200 BC274 R Tumulus (40) 40 3.35 0.14 = 24 / 24 CAM 16.4 0.4 = 2900 300 BC205r1 R Passage (40) 20 3.18 0.14 = 15 / 15 CAM 16.5 0.1 = 3200 300 BC206r1 R Chamber (40) 30 3.19 0.14 = 15 / 15 CAM 18.6 0.1 = 3800 300 BC438 R Tumulus base (68) 70 3.57 0.16 = 20 / 24 CAM 20.7 0.3 = 3800 300 BC275 R Chamber floor (90) 90 3.22 0.14 = 24 / 24 CAM 19.3 0.2 = 4000 300 BC202r1 R Tumulus base (43) 70 3.44 0.15 = 12 / 12 CAM 21.2 0.2 = 4200 300 BC273 R Passage (30) 60 3.49 0.14 = 20 / 24 CAM 21.9 0.3 = 4300 300 BC439 R Passage fill (100) 100 3.21 0.14 = 24 / 24 CAM 22.1 0.2 = 4900 300 BCCabeço dos Pendentes (CP)272 R Chamber periphery (25) 10 2.83 0.11 = 24 / 24 WM 1.6 0.1 ? 1460 30 AD440 R Chamber fill (4) 25 3.50 0.23 ? 23 / 24 CAM 14.9 0.3 = 2300 300 BCQuinta do Paço II (QP)221 C Pit Fill (6) 80 3.58 0.14 = 12 / 12 CAM 8.4 0.1 = 330 110 BC60r1 R Pit Bank (by 6) 60 2.77 0.13 = 24 / 24 CAM 7.5 0.3 ? 700 200 BC223 C Pit Fill (17) 90 4.11 0.19 = 12 / 12 WM 11.4 0.3 = 750 160 BC222 C Pit Fill (3c) 90 3.26 0.14 = 24 / 24 CAM 9.8 0.1 = 1010 140 BC57r1 R Pit Fill (6) 90 2.87 0.13 = 24 / 24 CAM 9.7 0.2 = 1400 200 BC59r1 R Pit Fill (17) 100 2.72 0.12 = 24 / 24 CAM 9.2 0.1 = 1400 200 BC220 C Pit Fill (1) 40 3.27 0.13 = 24 / 24 CAM 12.5 0.2 = 1820 180 BC56r1 R Substrate (by 1) 40 2.90 0.14 = 24 / 24 CAM 21.1 1.3 ? 5300 600 BCSanta Margarida da Coutada (SMC)441 R Colluvium (Bu) 26 3.52 0.16 = 16 / 24 WM 9.9 0.7 ? 800 200 BC444 C 38 3.59 0.15 = 24 / 24 CAM 18.2 0.2 = 3100 200 BC443 C 38 4.02 0.17 ? 24 / 24 CAM 23.0 0.2 = 3700 300 BC442 R Colluvium (Bl) 55 3.88 0.15 = 16 / 24 WM 45 2 ? 9500 800 BCPovoado de Fontes (FNT)450 R Colluvium/Soil (C) 25 1.67 0.09 = 16 / 24 CAM 12.9 0.2 = 5700 500 BC452 H 25 1.44 0.08 = 16 / 24 CAM 14.4 0.2 = 8000 600 BC451 H 25 1.43 0.09 = 16 / 24 CAM 14.6 0.1 = 8100 600 BC453 H 25 1.35 0.07 = 16 / 24 CAM 14.3 0.2 = 8600 600 BC
Dose
(=/<
/>/?
) 4
Date
BC
/AD
(mGy a-1)
Clay Structure (25)
1 ITNLUM_ r1 are revised estimates of previously issued results. 2 R = Regolith, C = Ceramic, H = Heated
Clay. 3 Below (inferred) pre-excavation ground level. 4 Summary assessments of dosimetry and luminescence results. =/</> : thought to equal / overestimate / underest imate the most representat ive value, within quoted uncertaint ies. ? : potentially outwith uncertaint ies. 5 WM = Weighted Mean (1/s2); CAM = "Central Age Model" (Galbraith et al., 1999). 6 Statist ical uncertainty of quoted value, from data dispersion; source calibrat ion uncertainty was incorporated for age calculation.
(Gy)
Stone Scatter (Bc)
Re
fere
nce
(IT
NL
UM
_)
1
Absorbed CalendarTy
pe2 De
pth
3 Rate
(=/<
/>/?
) 4
Dose OSL, Quartz
acc
ep
ted
/
me
asu
red
Sta
tistic
al
An
aly
sis 5
N

MANUSCRIP
T
ACCEPTED
ACCEPTED MANUSCRIPT
29
Table 5<single column portrait>
Sample Type Q K M C KF P A H
A7/295 R +++ - (+) (+) (+) + - -A9/190 R +++ - (+) (+) (+) (+) - -A9/191 R +++ - (+) + (+) (+) - -
A9/192 R +++ - (+) (+) (+) (+) - -
A6/068 R +++ ++ + - (+) - + (+)A6/070 R +++ ++ ++ - (+) - - -A6/072 R +++ ++ + - (+) - - -A6/733 C +++ - (+) - + (+) (+) -A6/735 C +++ - ++ - - ++ - -
A9/193 R +++ - (+) - + (+) - (+)A9/195 C +++ - (+) - ++ (+) - (+)A9/196 C +++ - ++ - - ++ - -
A9/202 R +++ - (+) (+) (+) (+) - -A9/203 H +++ - - - - (+) - (+)
Povoado de Fontes (FNT)
Santa Margarida da Coutada (SMC)
Quinta do Paço II (QP)
Cabeço dos Pendentes (CP)
Anta da Lajinha (AL)

MANUSCRIP
T
ACCEPTED
ACCEPTED MANUSCRIPT
30
Table 6 <double column portrait>
% Concentration ppmTy
pe
K2O Sc Cr Co Zn Ga As Br Rb Zr Sb Cs Ba La Ce NdSm Eu Tb Yb Lu Hf Ta Th U
Anta da Lajinha (AL)A6/600 R 0.3 2.8 7.0 17 89 22 97 20 26 15 134 199 3.0 5.6 428 41 83 40 7.3 1.5 1.0 3.4 0.5 6.5 1.2 12 3.0A6/601 R 0.3 2.3 6.3 16 95 12 85 20 18 13 116 205 3.6 4.7 365 38 76 32 6.6 1.4 0.9 3.4 0.5 7.1 1.1 11 2.8A6/602 R 0.3 2.3 6.5 16 95 12 87 20 19 24 112 181 3.7 4.7 361 37 74 31 6.6 1.4 1.0 3.4 0.5 6.8 1.1 11 2.7A6/603 R 0.4 2.4 6.6 16 94 16 90 22 22 10 121 223 3.4 5.0 364 43 82 39 7.0 1.4 1.0 3.4 0.5 6.9 1.2 11 2.8A6/604 R 0.7 2.6 5.8 16 93 10 89 21 13 5 96 200 3.3 3.7 377 35 68 35 6.2 1.3 0.8 3.2 0.5 5.8 1.0 9 2.6A7/293 R 0.3 2.8 6.8 19 100 23 105 22 23 8 129 199 3.3 6.1 461 41 82 39 7.5 1.7 1.0 3.6 0.5 6.3 1.2 12 2.9A7/294 R 0.3 2.6 6.7 18 96 14 108 20 17 14 125 206 3.5 5.3 433 41 83 38 7.0 1.6 0.9 3.3 0.5 6.2 1.1 11 2.7A7/295 R 0.3 2.4 6.7 17 94 14 94 20 20 9 116 245 3.6 5.1 428 37 74 34 6.1 1.4 0.8 3.1 0.5 6.6 1.1 11 2.7A9/190 R 0.3 2.9 6.6 17 98 12 88 24 30 8 130 230 3.3 5.4 433 43 83 37 7.3 1.6 1.0 3.2 0.5 6.9 1.2 11 2.7A9/191 R 0.3 2.4 6.4 16 92 21 91 21 26 7 118 236 3.8 5.1 371 38 75 33 6.5 1.4 0.9 3.0 0.5 6.2 1.0 11 2.5Cabeço dos Pendentes (CP)
A7/292 R 0.2 2.0 6.4 13 75 6 41 15 13 10 94 200 1.5 4.0 262 35 71 33 5.8 1.2 0.7 2.7 0.4 6.5 0.9 9 2.5A9/192 R 0.2 2.7 5.0 15 84 6 51 21 11 22 124 200 1.5 5.1 385 36 70 33 6.7 1.3 0.9 2.8 0.5 6.1 1.0 10 2.8Quinta do Paço II (QP)
A6/067 R 0.3 2.4 9.1 23 76 10 146 16 3 3 120 225 0.4 14 724 38 75 37 7.6 1.8 1.1 3.1 0.5 6.0 1.6 11 3.8A6/068 R 0.2 2.1 12 25 122 10 140 19 25 3 109 241 0.0 16 719 43 68 41 8.1 2.0 1.1 3.1 0.5 5.7 2.1 10 3.3A6/069 R 0.1 2.2 5.9 16 32 7 78 13 20 5 121 247 0.3 12 781 54 103 72 14 3.2 1.9 5.3 0.8 6.1 1.0 10 2.2A6/070 R 0.2 2.3 5.2 14 26 7 96 12 8 2 107 225 0.2 12 682 28 66 28 6.5 1.4 0.8 2.6 0.4 6.7 0.9 9 2.2A6/071 R 0.1 2.1 6.3 18 30 7 74 12 9 2 123 224 0.2 13 701 25 51 24 5.0 1.1 0.7 2.5 0.4 6.5 0.9 11 1.9A6/072 R 0.1 1.9 5.7 16 29 5 78 10 7 1 99 188 0.2 12 667 26 89 32 6.7 1.6 0.9 3.3 0.6 5.7 0.9 13 2.2A6/733 C 0.8 3.3 5.0 15 49 8 47 18 8 4 122 217 0.3 7.8 619 63 133 73 15 3.4 2.5 6.4 0.9 5.6 1.0 13 3.3A6/734 C 1.0 4.0 6.6 16 87 9 56 23 12 15 133 176 0.6 11 714 39 70 35 6.9 1.4 1.0 3.2 0.5 4.7 1.1 11 2.8A6/735 C 2.2 3.2 5.4 15 74 7 100 23 6 2 152 188 0.1 14 735 41 85 43 8.5 2.0 1.3 3.8 0.6 4.6 1.0 10 3.0A6/736 C 0.3 3.8 6.0 28 145 30 79 43 28 28 109 481 0.8 14 531 44 89 47 11 2.6 1.4 4.9 0.8 13 2.1 20 5.6Santa Margarida da Coutada (SMC)
A9/193 R 0.4 2.5 1.3 3 88 3 28 8 3 8 113 332 0.3 4.7 233 34 69 31 5.6 0.6 0.8 3.2 0.5 10 1.0 15 2.9A9/194 R 0.3 2.8 1.1 3 17 3 24 8 3 4 115 286 0.0 4.5 237 37 75 33 6.3 0.6 0.7 2.2 0.3 8.9 1.1 17 3.0A9/195 C 1.3 2.9 6.0 13 38 11 83 26 8 21 95 476 0.3 3.7 741 98 184 77 12 1.9 1.4 3.4 0.4 12 1.7 31 3.0A9/196 C 1.7 2.8 5.9 17 100 10 78 25 8 7 131 205 0.2 8.2 491 34 67 32 5.9 1.1 0.9 2.9 0.4 5.4 1.0 11 3.4Povoado de Fontes (FNT)
A9/202 R 0.2 0.8 2.2 5 35 4 36 11 9 26 43 191 0.6 3.1 122 21 43 18 3.7 0.7 0.4 1.4 0.2 5.6 0.9 8 2.1A9/203 H 0.0 0.2 3.1 5 37 2 12 15 23 21 23 81 1.1 2.0 764 14 28 14 3.4 0.7 0.3 0.7 0.1 2.5 0.6 11 1.7A9/204 H 0.0 0.3 2.6 4 34 2 12 16 22 14 27 90 1.0 2.5 735 11 22 11 2.7 0.5 0.2 0.7 0.1 2.6 0.6 10 1.7A9/205 H 0.1 0.4 1.6 4 24 2 12 11 15 16 27 93 0.7 2.3 687 13 24 12 2.5 0.4 0.2 0.7 0.1 2.9 0.6 7 1.4
UCC 3.3 2.8 5.0 14 92 17 67 18 5 2 84 193 0.4 4.9 624 31 63 27 4.7 1.0 0.7 2.0 0.3 5.3 0.9 11 2.7PAAS 1.2 3.7 7.2 16 110 23 85 20 - - 160 210 - 15 650 38 80 32 5.6 1.1 0.8 2.8 0.4 5.0 - 15 3
Sa
mpl
e
Na 2
O
Fe 2
O3T

MANUSCRIP
T
ACCEPTED
ACCEPTED MANUSCRIPT
31
Table 7. <double column portrait>
Chron-ology Event Dated Implications Parallels
204r1, 203r1, 274, 205r1
3200 – <1400 BC
Post construction pedoturbation/redeposit ion
in surficial/peripheral locations.
Pedoturbation was effective in part ially resett ing OSL signals to c. 30 cm depth
in mound
Peak in Megalithic and early Chalcolithic dates
206r1, 438, 275, 202r1, 273
4300 – 3800 BC
Pedoturbation/accumulation shortly pre-construction. Usage/abandonment not
detected
Terminus post quem: tumulus construction most likely circa 3800 BC, slightly post-dating the onset of
Iberian Megalithic construction
Younger part of the main group of extant dates for Neolithic contexts. Increasing deforestation and arable
production, drying climate
4395200 –
4600 BCAccumulation/formation of
colluvium/subsoilPrevious erosion to bedrock or
intensive pedoturbation of thin regolithMesolithic-Neolithic transit ion, cool
wet climate
272 <1500AD
4402500 –
1900 BC
Accumulation/emplacement of regolith in chamber with
well reset OSL signals
Chalcolithic site (re-)usage (abandonment or construction not
precluded)
Oldest artefacts at CP; increasing anthropic impact; some extant dates
from Megalithic contexts
221, 223, 222
300 – 1000 BC
Phase of site usage mid-late Iron Age Pit closure probably end of the Iron Age
Fluctuating land-use intensity; followed by Romanization
2201900 –
1600 BCSite usage in the Bronze Age: pits probably constructed in this period
Most extant dates from Bronze Age contexts, progressive deforestation
57r1, 59r11600 –
1200 BC
Accumulation of regolith with well reset OSL signals from adjacent land surfaces.
Abandonment phase in the late Bronze Age: construction of pits prior to this
Follows a period of progressive deforestation
60r1>1400 – <150 BC
Mixing of well reset regolith from the late Bronze Age with material from/in/until the late Iron Age
Apparently ceased/sealed around the beginning of the Roman period
56r1>6700 –
<3500 BC
Mixing of regolith possibly reset in the early Holocene, with material from/in/until the late Neolithic
Clearance and establishment of agriculture in a drying climate
441>2500 – <0 BC
Warm, wet climate; fluctuating landscape pressure
442>13500 – <7800 BC
Climate becoming warmer and wetter. Indications of clearance
around the younger limit
443, 4443900 –
2900 BCManufacture or use if for
cooking
Human presence in the mid Neolithic and Neolithic-Chalcolithic transit ion: long/repeated use or residuality/erosion
Climate wetter and landscape pressure significantly increased
towards end of this period
4506100 –
5300 BC
Slope wash/colluvial accumulation from mixed
metamorphic and sedimentary sources
Cycles of local sedimentary erosion and redeposit ion, anthropogenic input
First main phase of agricultural activity in the region
452, 451, 453
8600 – 8000 BC
Heating of in situ material by a fire-pit/oven during site
occupation
Direct evidence for occupation in the late 9th millennium BC
Earliest indications of lowland clearance/cult ivation. Dates for Epi-
and Upper- Palaeolithic contexts
Povoado de Fontes (FNT)
Santa Margarida da Coutada (SMC)
Pedoturbation of sediments/ colluviums derived from
local Plio/Miocene clayey arenites: land surfaces with
slight anthropic input
Reference (ITNLUM_)Anta da Lajinha (AL)
Interpretation
Accumulation in the Chalcolithic and Late Glacial (or earlier), pedoturbated until the Roman and Epipalaeolithic periods (or later). Lithics in the lower layer could relate to a range of periods
Pedoturbation of regolith/subsoil below land
surfaces
Cabeço dos Pendentes (CP)Effects of redeposit ion during early 20th century excavations
Quinta do Paço II (QP)
Manufacture or use if for cooking

MANUSCRIP
T
ACCEPTED
ACCEPTED MANUSCRIPT

MANUSCRIP
T
ACCEPTED
ACCEPTED MANUSCRIPT

MANUSCRIP
T
ACCEPTED
ACCEPTED MANUSCRIPT
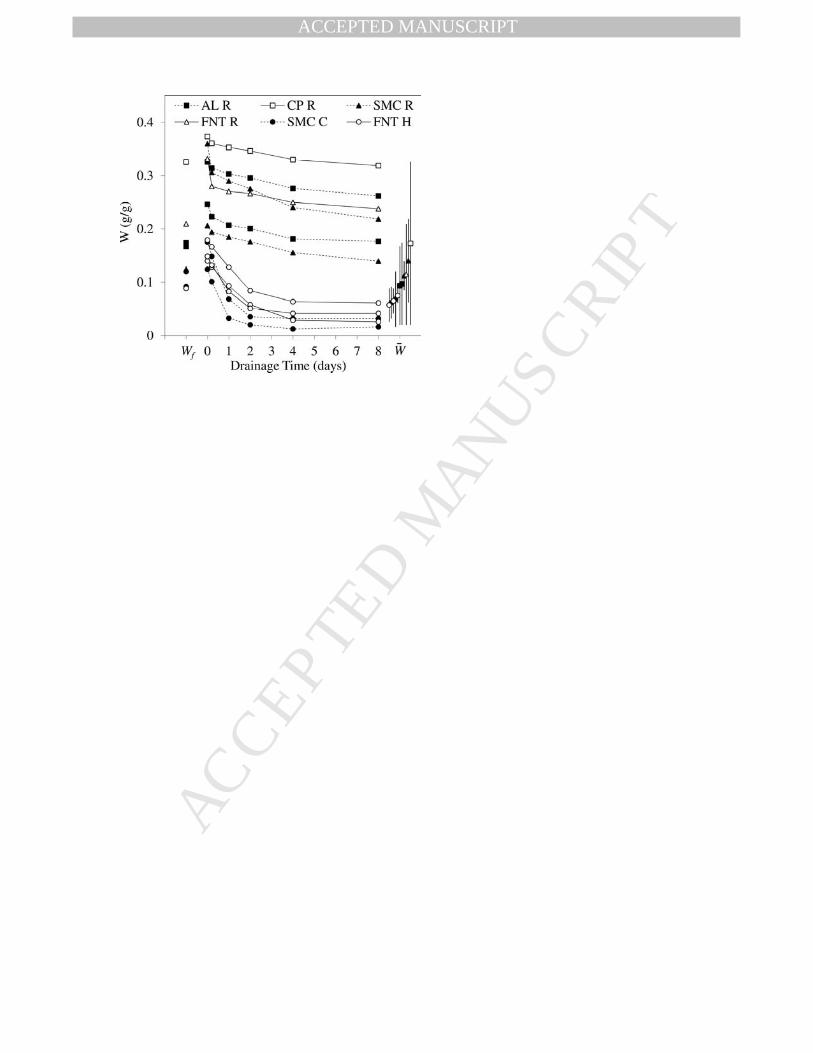
MANUSCRIP
T
ACCEPTED
ACCEPTED MANUSCRIPT
MANUSCRIP
T
ACCEPTED
ACCEPTED MANUSCRIPT
Luminescence dating and associated analyses in transition landscapes of the Alto Ribatejo,
Central Portugal
C.I. Burbidgea,e*, M.J. Trindadea,e, M.I. Diasa,e, L. Oosterbeekb,d, C. Scarrec, P. Rosinab,d, A.
Cruzb, S. Curad, P. Curad, L. Caronb, M.I. Prudêncioa,e, G.J.O. Cardosoa, D. Francoa, R.
Marquesa,e, H. Gomesd
Highlights:
- OSL is combined with geochemistry and mineralogy to investigate the transition to agro-
pastoralism in Portugal.
- INAA, field and lab' gamma spectrometry are used to evaluate spatial and temporal dosimetric
variations.
- Analysis of both heated and unheated materials is found important to identify all relevant
chronological phases.
- Analysis of diagnostic as well as undiagnostic ceramics appears important to avoid bias.
- Fire pits or other heated structures appear ideal to map early human landscape usage.