LUBS Lecture 1: The Economics of Globalization
23
Globalization and International Business: The Economics of Globalization Timothy M. Devinney University Leadership Chair in International Business Leeds University Business School
Transcript of LUBS Lecture 1: The Economics of Globalization

Globalization and International Business: The Economics of Globalization
Timothy M. Devinney University Leadership Chair in International Business Leeds University Business School
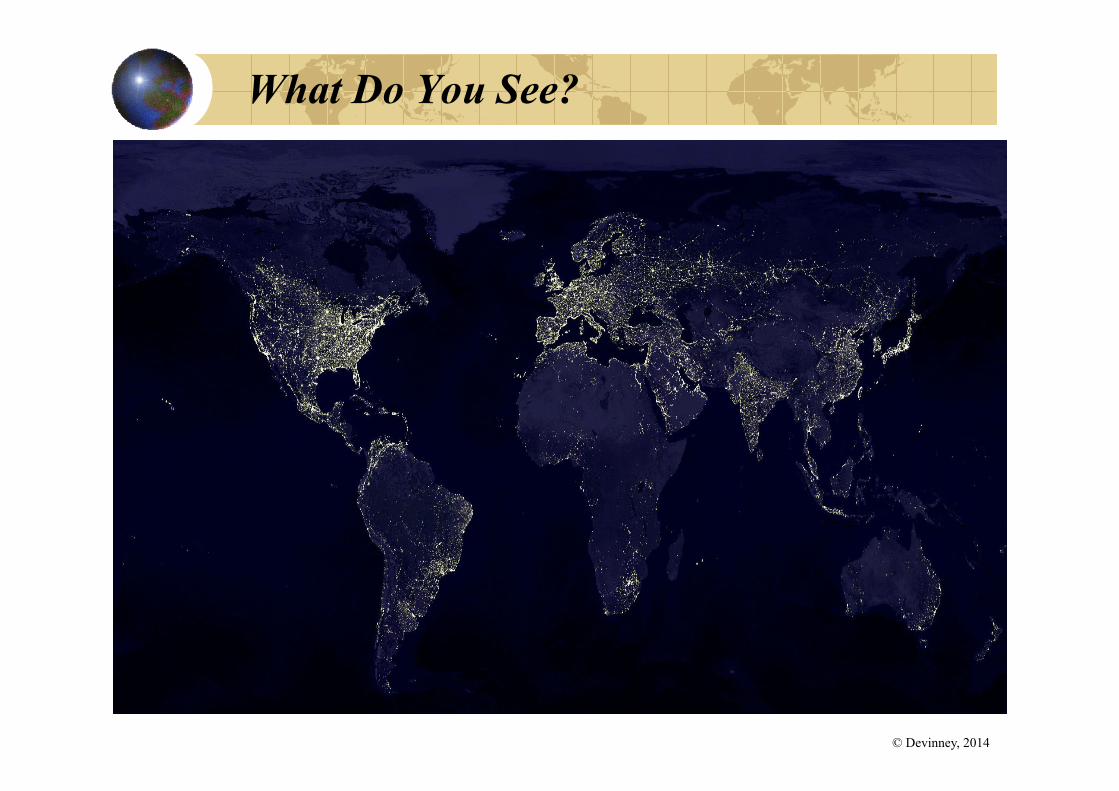
What Do You See?
© Devinney, 2014
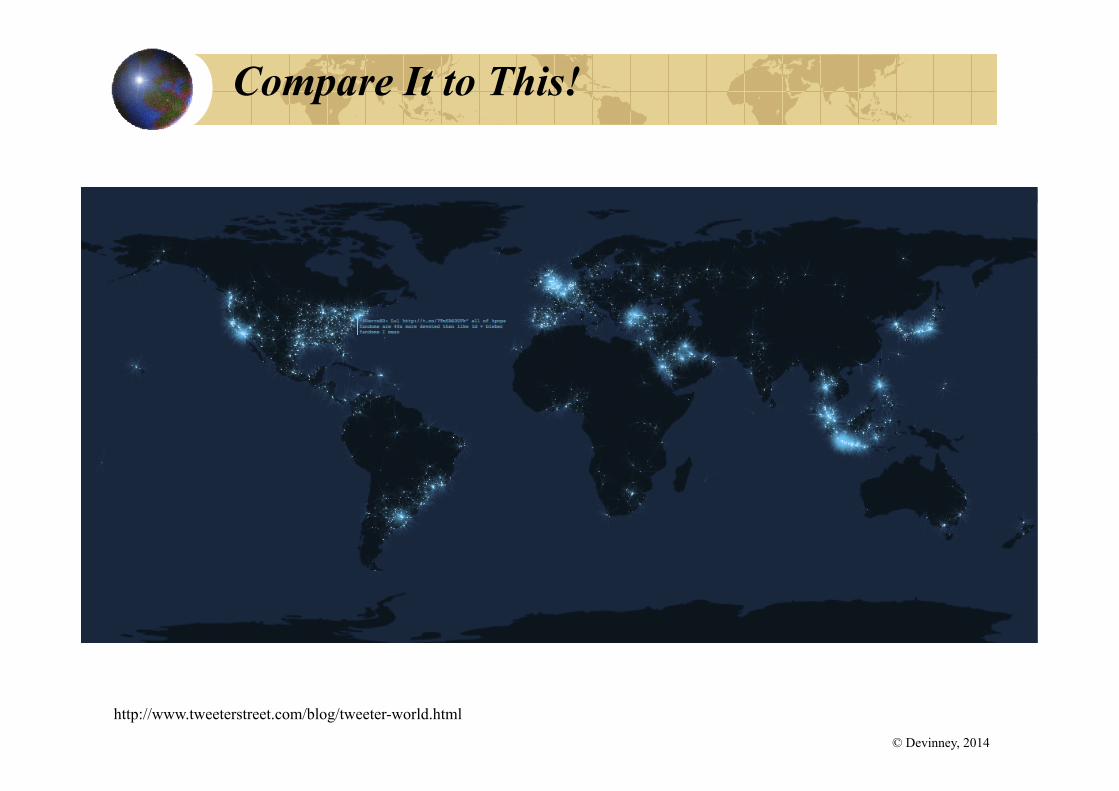
Compare It to This!
http://www.tweeterstreet.com/blog/tweeter-world.html
© Devinney, 2014
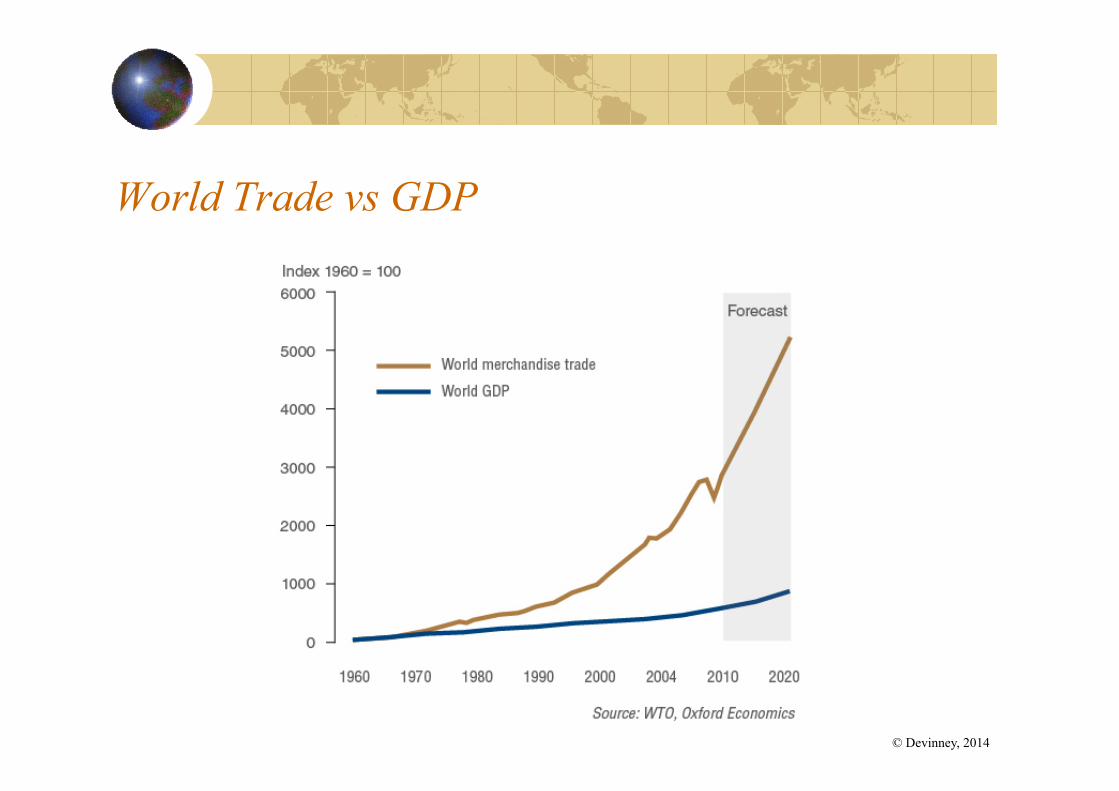
World Trade vs GDP
© Devinney, 2014
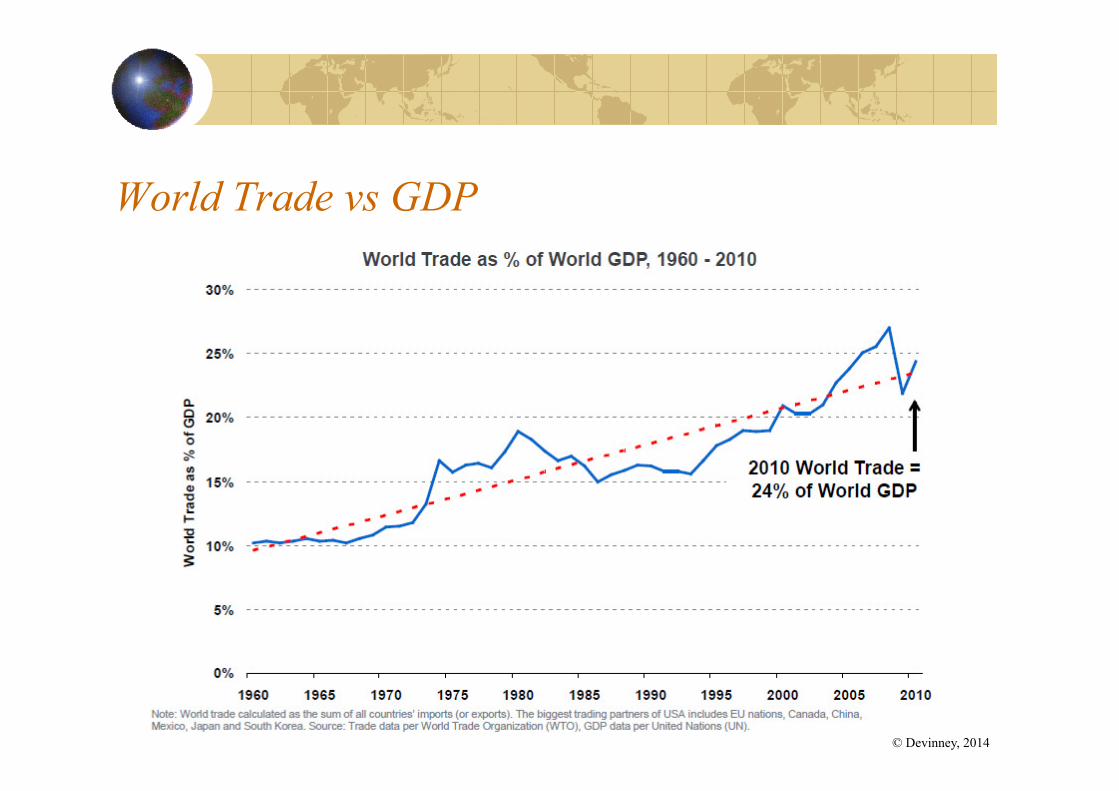
World Trade vs GDP
© Devinney, 2014

World Trade in Products and Services
© Devinney, 2014
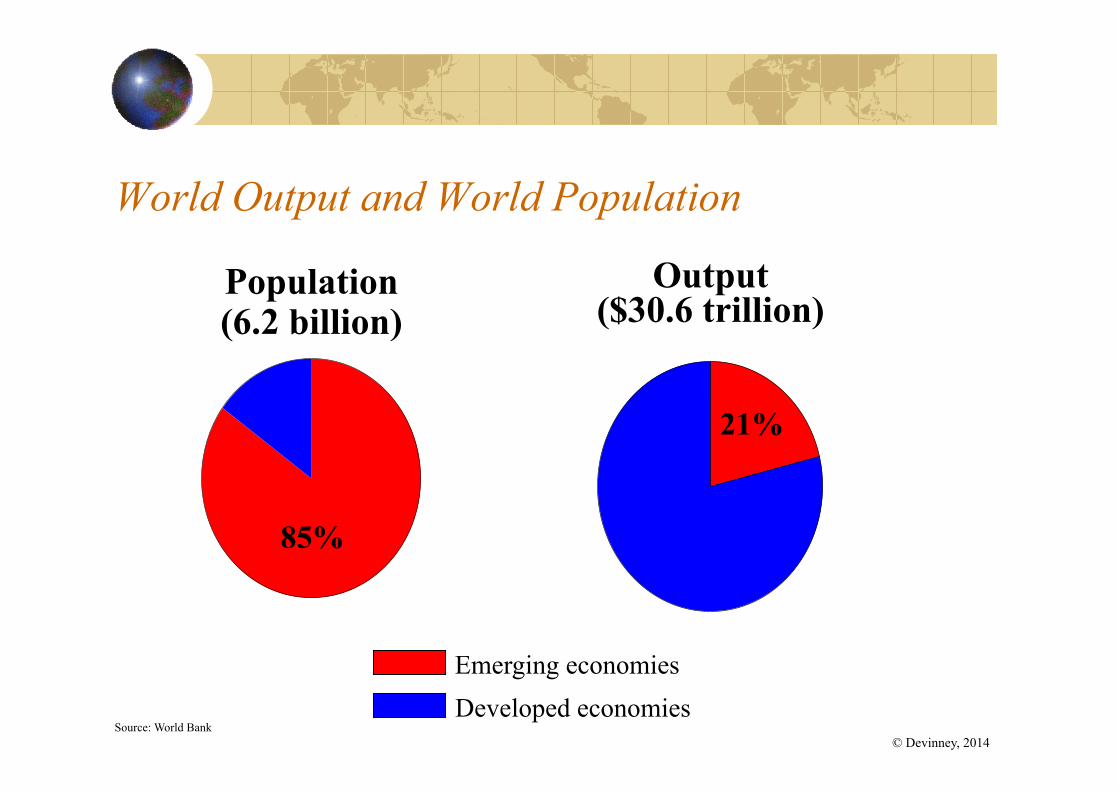
World Output and World Population
Population (6.2 billion)
Output
($30.6 trillion)
85%
21%
Emerging economies Developed economies
Source: World Bank © Devinney, 2014

Share of Global GDP
© Devinney, 2014
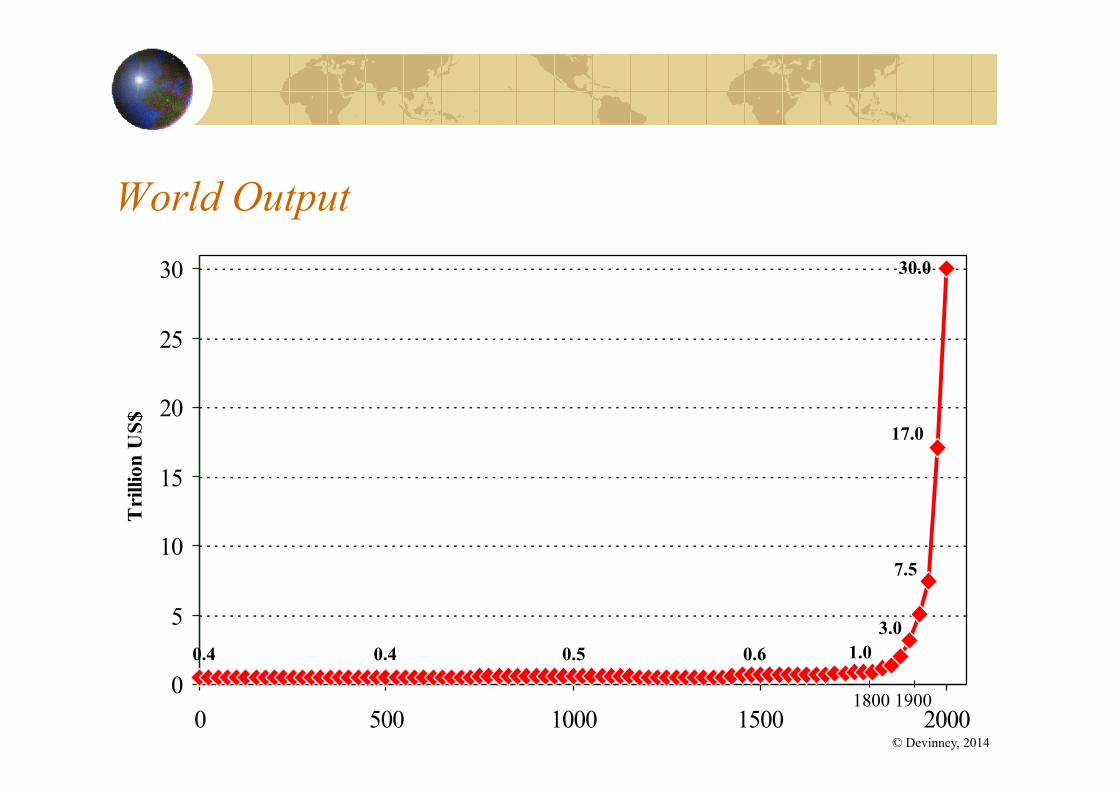
World Output
0
5
10
15
20
25
30
0 500 1000 1500 2000
Tri
llion
US$
0.4 0.4 0.5 0.6
1800 1900
1.0 3.0
7.5
17.0
30.0
© Devinney, 2014
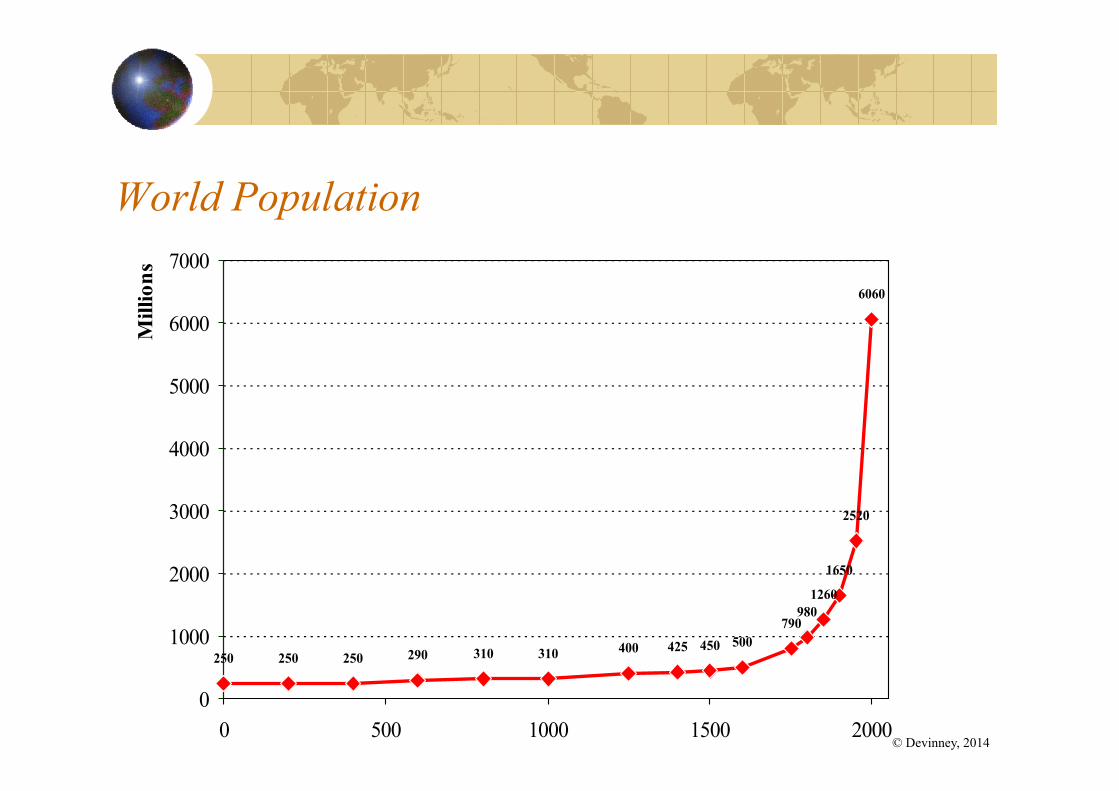
World Population
250 250 250 290 310 310 400 425 450 5007909801260
1650
2520
6060
0
1000
2000
3000
4000
5000
6000
7000
0 500 1000 1500 2000
Millions
© Devinney, 2014

Growth and Population Together
© Devinney, 2014

World Income Distribution RICHER AND POORER
(Gross National Income per head, 2000, at purchasing power parity)
$1,989
$4,582
$9,165
$27,443
$7,428
$0 $5,000 $10,000 $15,000 $20,000 $25,000 $30,000
Low income
Lower middle income
Upper middle income
High income
World
Source: World Bank
© Devinney, 2014
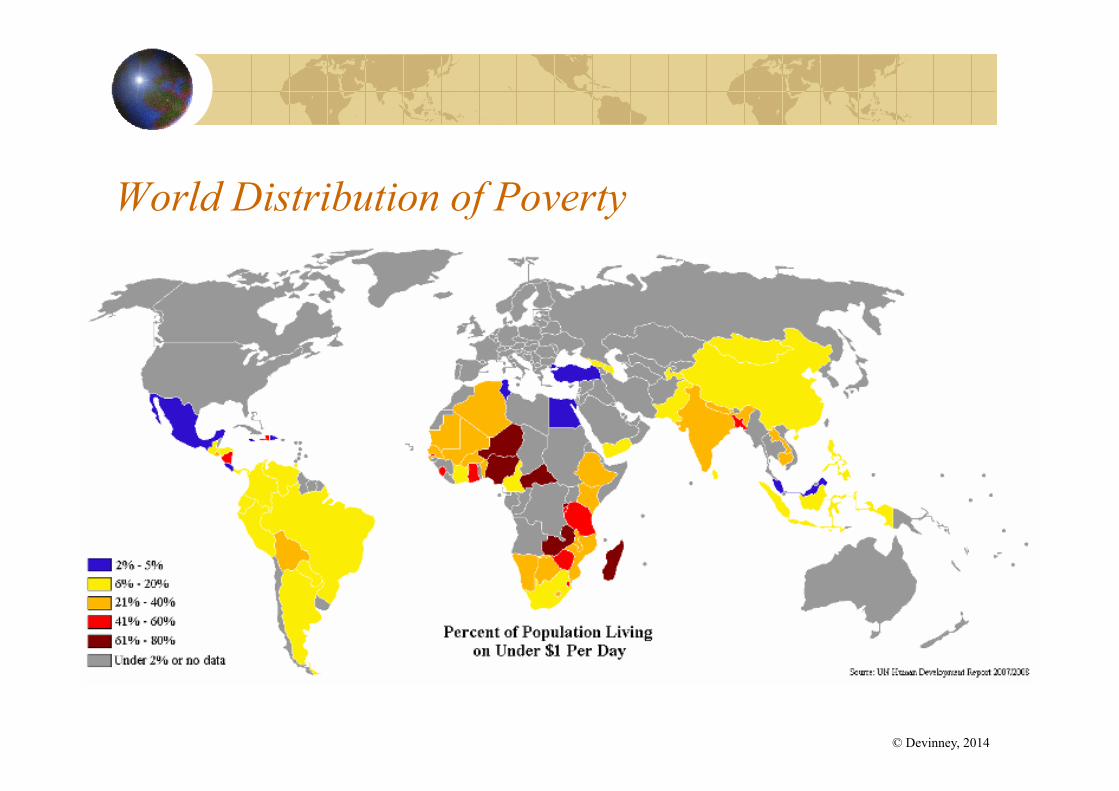
World Distribution of Poverty
© Devinney, 2014
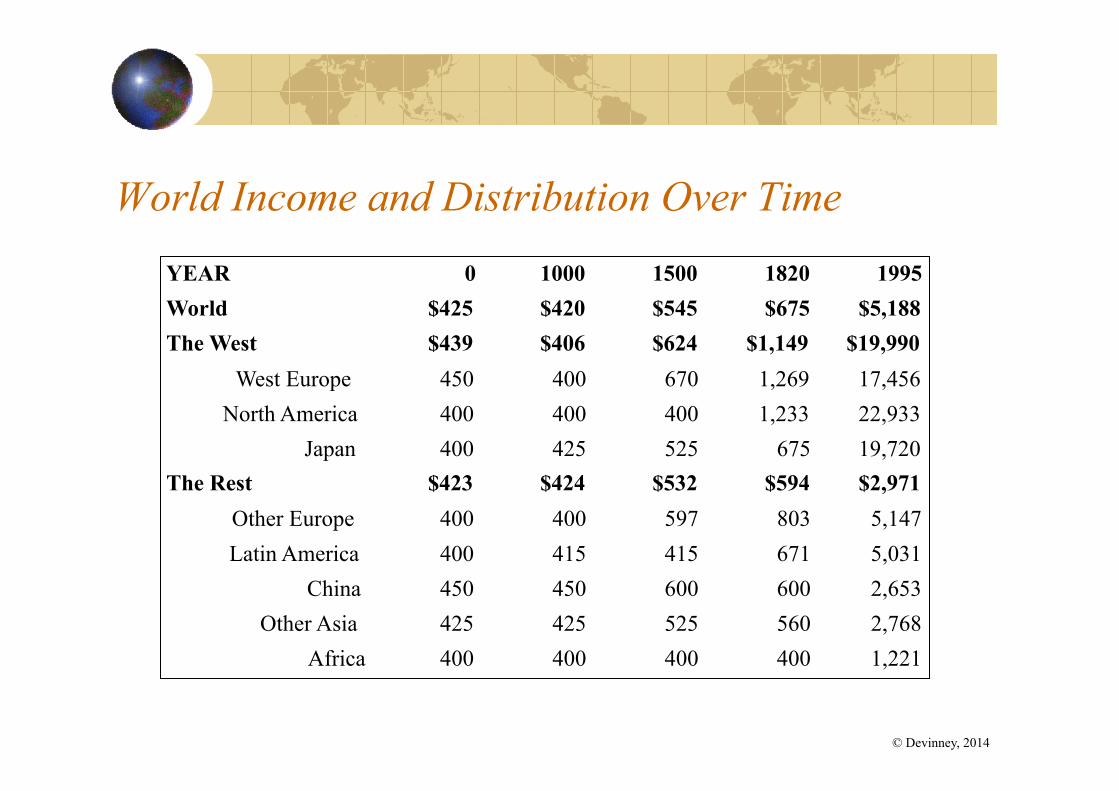
World Income and Distribution Over Time YEAR 0 1000 1500 1820 1995 World $425 $420 $545 $675 $5,188 The West $439 $406 $624 $1,149 $19,990
West Europe 450 400 670 1,269 17,456 North America 400 400 400 1,233 22,933
Japan 400 425 525 675 19,720 The Rest $423 $424 $532 $594 $2,971
Other Europe 400 400 597 803 5,147 Latin America 400 415 415 671 5,031
China 450 450 600 600 2,653 Other Asia 425 425 525 560 2,768
Africa 400 400 400 400 1,221
© Devinney, 2014
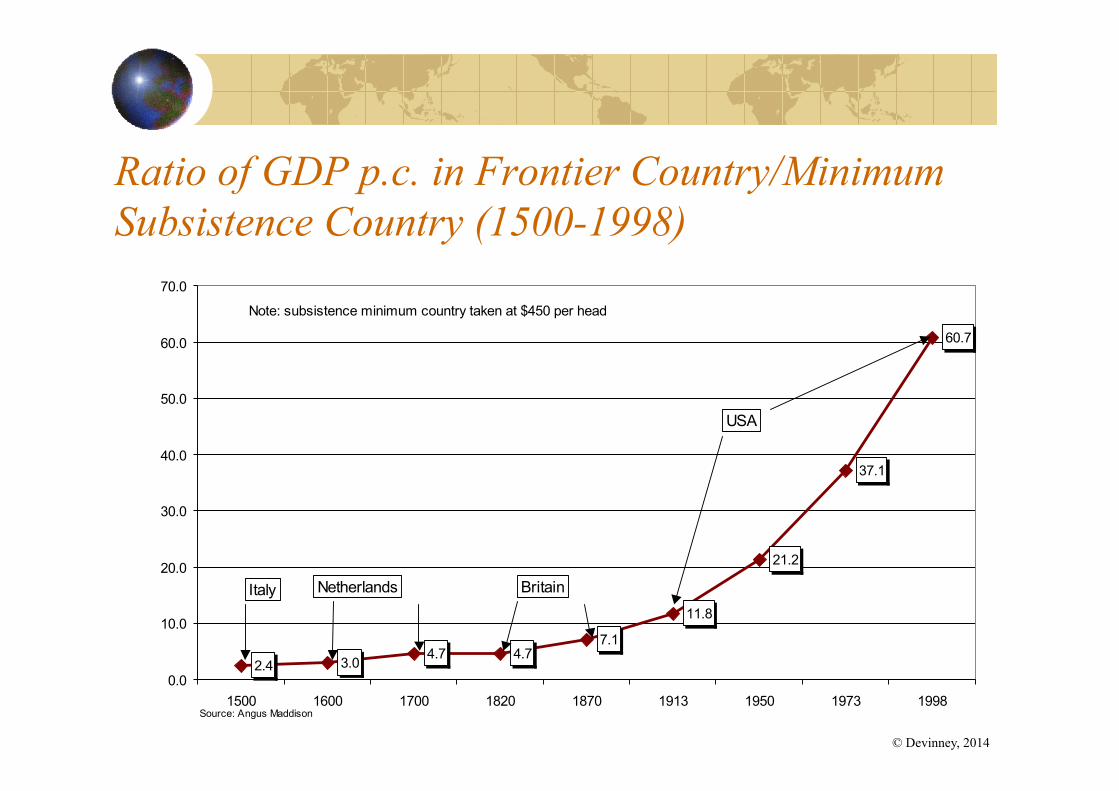
Ratio of GDP p.c. in Frontier Country/Minimum Subsistence Country (1500-1998)
2.4 3.04.7 4.7
7.1
11.8
21.2
37.1
60.7
0.0
10.0
20.0
30.0
40.0
50.0
60.0
70.0
1500 1600 1700 1820 1870 1913 1950 1973 1998Source: Angus Maddison
Italy Netherlands Britain
USA
Note: subsistence minimum country taken at $450 per head
© Devinney, 2014
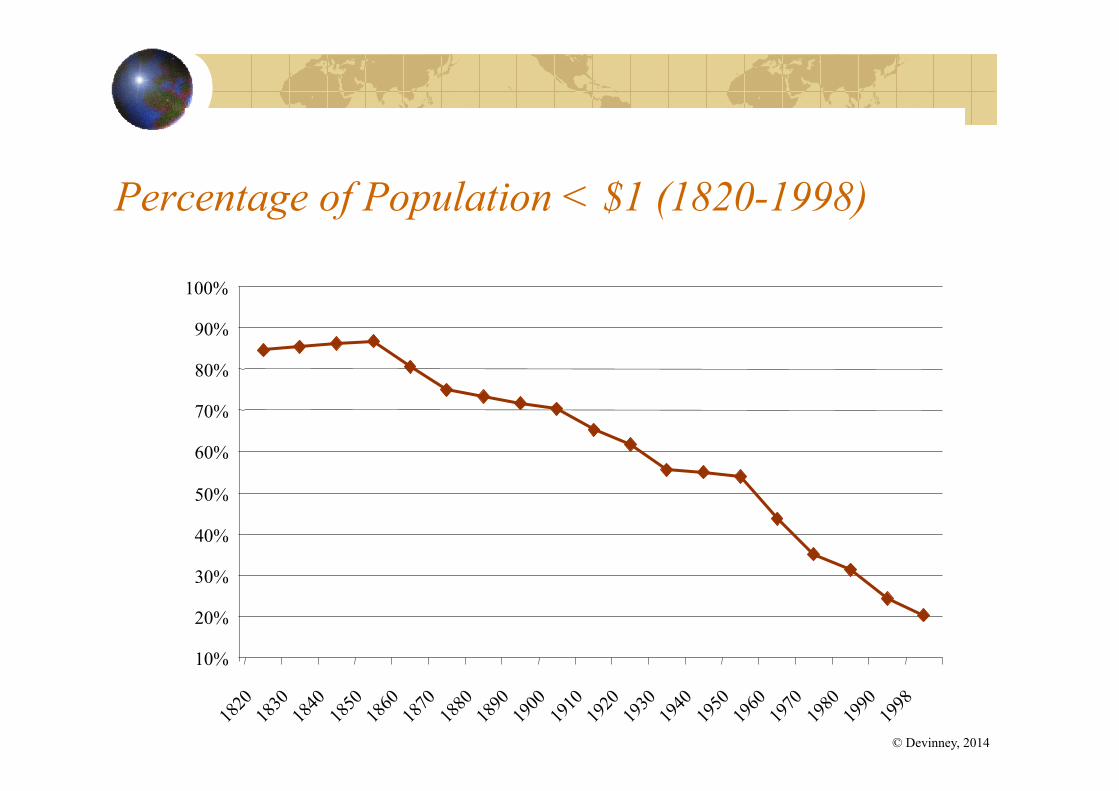
Percentage of Population < $1 (1820-1998)
10%
20%
30%
40%
50%
60%
70%
80%
90%
100%
© Devinney, 2014
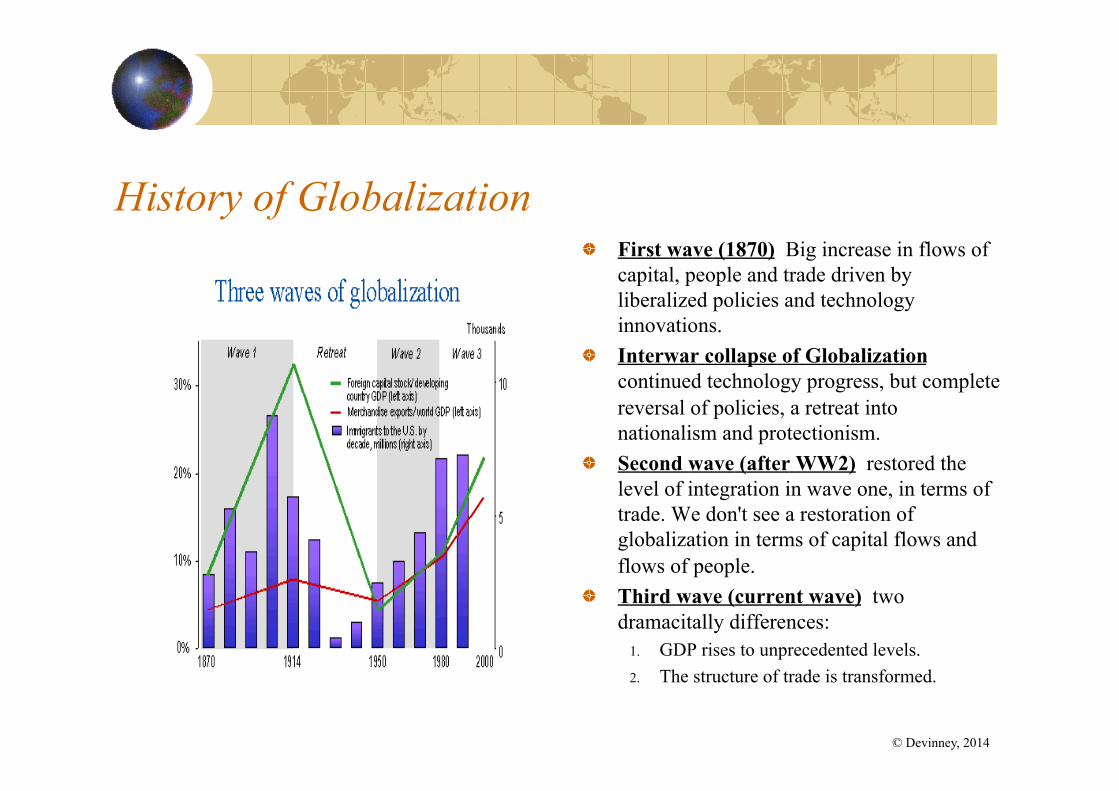
History of Globalization ! First wave (1870) Big increase in flows of
capital, people and trade driven by liberalized policies and technology innovations.
! Interwar collapse of Globalization continued technology progress, but complete reversal of policies, a retreat into nationalism and protectionism.
! Second wave (after WW2) restored the level of integration in wave one, in terms of trade. We don't see a restoration of globalization in terms of capital flows and flows of people.
! Third wave (current wave) two dramacitally differences:
1. GDP rises to unprecedented levels. 2. The structure of trade is transformed.
© Devinney, 2014
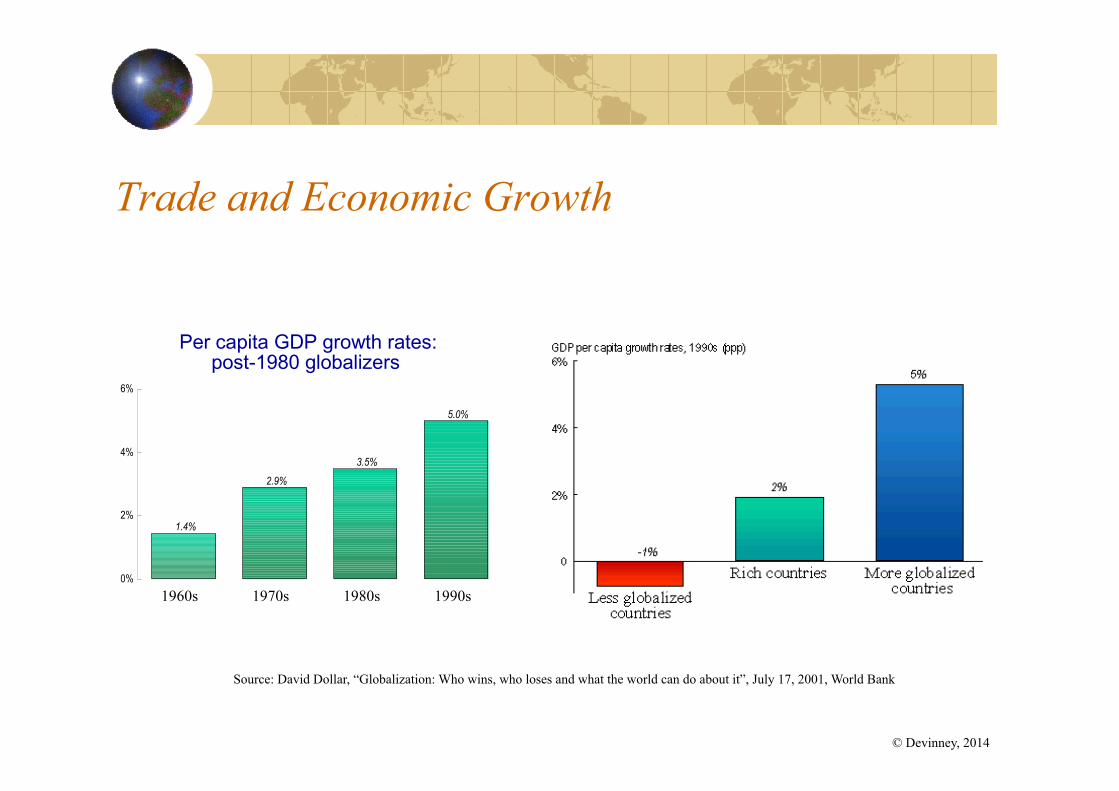
Trade and Economic Growth
Per capita GDP growth rates:post-1980 globalizers
1.4%
2.9%
3.5%
5.0%
0%
2%
4%
6%
1960s 1970s 1980s 1990s
Source: David Dollar, “Globalization: Who wins, who loses and what the world can do about it”, July 17, 2001, World Bank
© Devinney, 2014

Institutions Matter
© Devinney, 2014

Institutions Matter
© Devinney, 2014
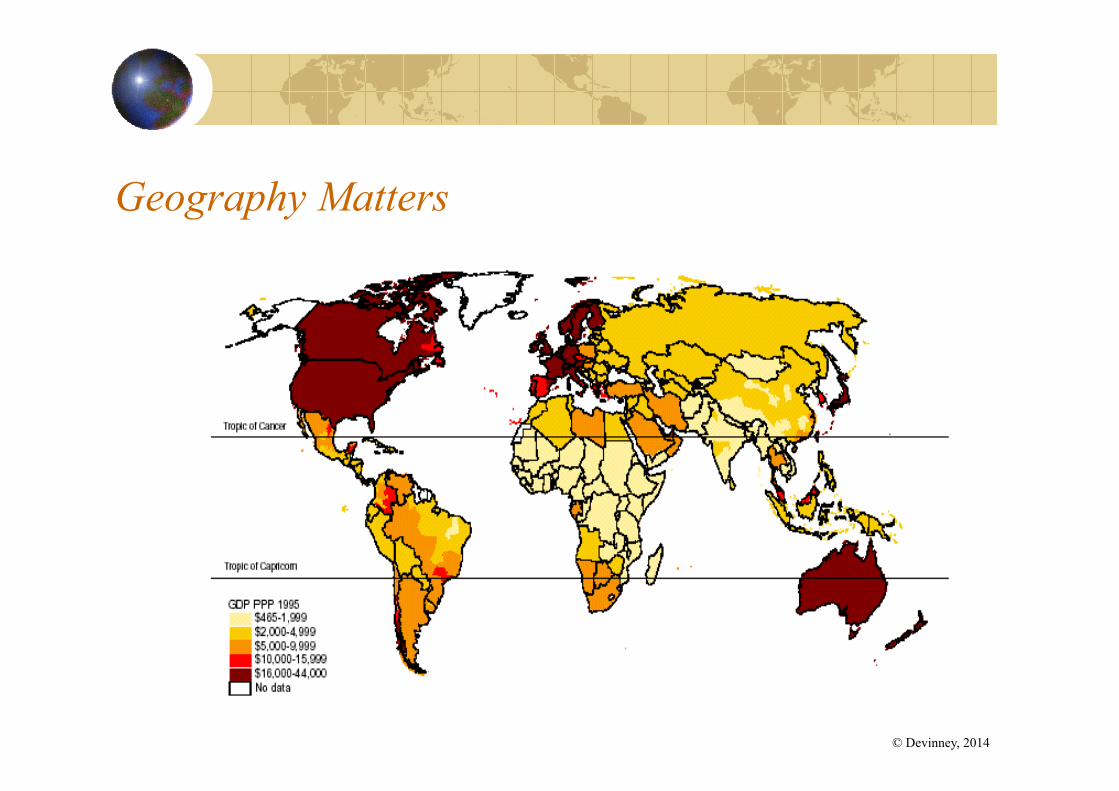
Geography Matters
© Devinney, 2014

Income by Latitude
© Devinney, 2014
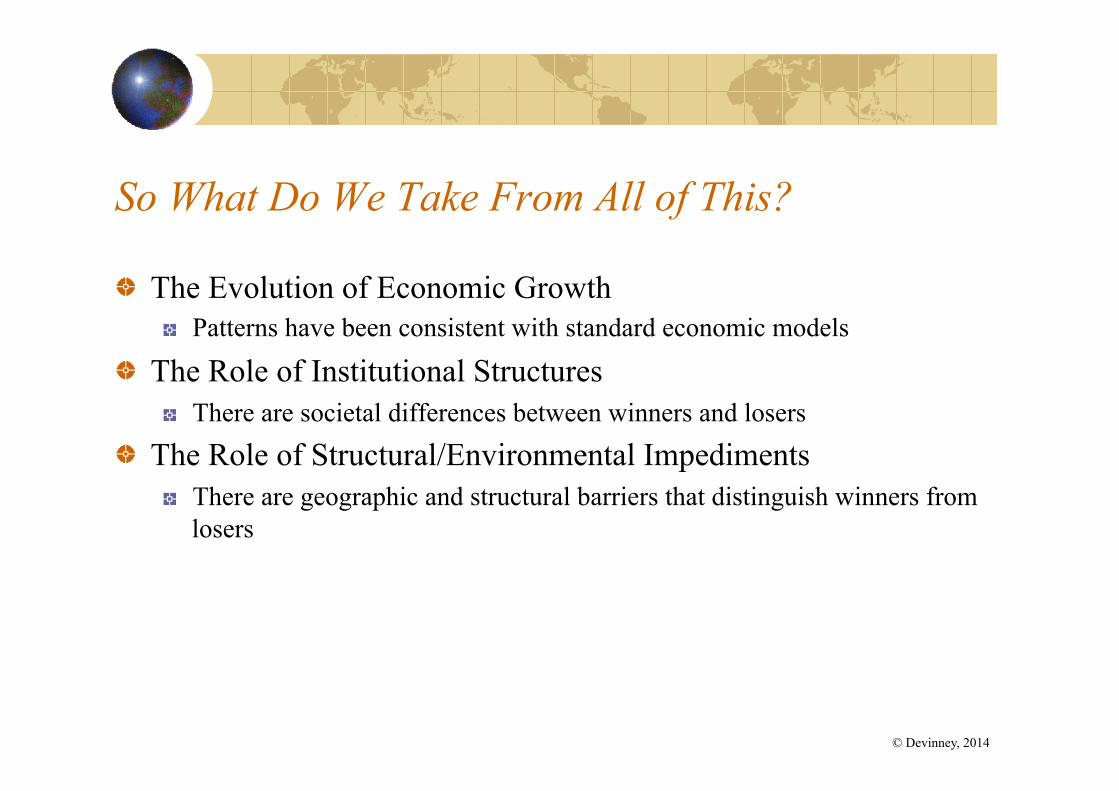
So What Do We Take From All of This?
! The Evolution of Economic Growth ! Patterns have been consistent with standard economic models
! The Role of Institutional Structures ! There are societal differences between winners and losers
! The Role of Structural/Environmental Impediments ! There are geographic and structural barriers that distinguish winners from
losers
© Devinney, 2014