L&T Infotech Ltd - Moneycontrol
11
October 18, 2021 2 Valuation Rs cr Particulars FY21 FY22E FY23E FY24E Revenue 12,369.8 15,414.6 18,188.9 21,075.4 OPM (%) 22.0 20.0 19.5 19.5 Adjusted PAT 1,881.1 2,353.5 2,697.6 3,188.4 % YoY growth 23.7 25.1 14.6 18.2 Adjusted EPS (Rs.) 110.3 134.0 153.6 181.5 P/E (x) 53.6 44.1 38.5 32.5 P/B (x) 14.3 10.8 8.4 6.7 EV/EBITDA (x) 37.9 33.5 29.1 25.2 RoNW (%) 30.5 29.0 30.3 35.8 RoCE (%) 37.2 34.6 36.4 42.2 Source: Company; Sharekhan estimates IT & ITES Sharekhan code: LTI Result Update + Positive = Neutral - Negative 3R MATRIX + = - Right Sector (RS) ü Right Quality (RQ) ü Right Valuation (RV) ü Powered by the Sharekhan 3R Research Philosophy L&T Infotech Ltd Bright Q2, set to outrun peers L&T Infotech (LTI) reported the strongest ever sequential constant currency (CC) revenue growth of 8.3%, led by strong double-digit growth in the BFS, manufacturing and other verticals. Reported USD revenue grew 8.3% q-o-q and 25.8% y-o-y to $509 million. EBIT margin improved 80bps q-o-q to 17.2%, ahead of our estimates, aided by SG&A leverage (up 70 bps) and higher offshoring, partially offset by lower utilisation and higher employee costs. The company signed large deal TCVs of $30 million in Europe in Q2FY2022. Strong demand is led by – (1) spend of transformation initiatives, (2) spends on new technologies and (3) higher automation to solve supply-side constraints. We believe LTI is well positioned to capture the market opportunities given superior digital competency, investments in sales and marketing (S&M), and solid executions. Key positives CC revenue growth of 8.3% q-o-q was ahead of our estimate Deal wins, client addition, and net staff addition remained strong. OCF to net profit improved to 91% from 19% in Q1FY22. Key negatives Attrition inched up 440 bps q-o-q to 19.6% Management commentary The management reiterated demand for IT services is one of the best in a decade. Maintained its guidance of 14-15% net profit margin for FY2022. Revenue growth in H2FY22 would be stronger versus H1FY22 given strong seasonality Revision in estimates - We revised our earnings estimates upward for FY22E/FY23E/FY24E by 1-4% Our Call Valuation – Strong growth prospects ahead: LTI is expected to deliver another strong year even after delivering nearly double-digit growth in FY2021, led by its strong capabilities in core modernisation, prudent client mining, strong sales and marketing practices and broad- based demand. Further, the management eyes a stable net profit margin going ahead despite investments in capability building and bolstering of sales team, aided by strong revenue growth, productivity enhancement, cost-optimisation measures, and hedging strategy. We estimate LTI to report USD revenue/EPS CAGR of 15%/16% over FY2022-FY2024E. At the CMP, the stock trades at 38x/33x its FY2023E/FY2024E earnings, which although expensive, is justified given its industry-leading revenue growth prospects with stable margins, strength in addressing transformation spending, and strong return ratios. Hence, we maintain our Buy rating on LTI with a revised price target (PT) of Rs. 6,850. Key Risks Rupee appreciation or/and adverse cross-currency movements and macro pressures would affect earnings. Summary Q2 numbers beat our estimates on all fronts; deal TCVs and deal pipeline were robust, client metrics healthy across categories, while offshoring and net headcount addition stayed high. OCF/net profit stayed healthy at 91%. Strong demand is led by rising spend of transformation initiatives, spend on newer technologies and increasing opportunities on automation. The management expects strong demand to sustain at least for next three years. Strong hiring, investments in sales and capabilities, right market strategies and excellent execution positions LTI for sustainable growth over FY2022-FY2024E. We expect revenue/ EPS to clock 15%/16% CAGR over FY2022-24. We maintain a Buy on LTI with a revised PT of Rs. 6,850 given its strength in addressing digital transformation spends, robust deal wins and robust demand. Stock Update Company details Market cap: Rs. 1,03,475 cr 52-week high/low: Rs. 6,498/2,828 NSE volume: (No of shares) 3.5 lakh BSE code: 540005 NSE code: LTI Free float: (No of shares) 4.5 cr Shareholding (%) Promoters 74.1 FII 13.3 DII 4.7 Others 7.9 Price performance (%) 1m 3m 6m 12m Absolute 6.5 34.8 45.5 92.2 Relative to Sensex 0.9 17.3 16.7 37.7 Sharekhan Research, Bloomberg Reco/View Change Reco: Buy CMP: Rs. 5,907 Price Target: Rs. 6,850 á á Upgrade Maintain â Downgrade Price chart What has changed in 3R MATRIX Old New RS RQ RV 2,500 3,000 3,500 4,000 4,500 5,000 5,500 6,000 6,500 Oct-20 Feb-21 Jun-21 Oct-21
-
Upload
khangminh22 -
Category
Documents
-
view
2 -
download
0
Transcript of L&T Infotech Ltd - Moneycontrol

October 18, 2021 2
Valuation Rs cr
Particulars FY21 FY22E FY23E FY24E
Revenue 12,369.8 15,414.6 18,188.9 21,075.4
OPM (%) 22.0 20.0 19.5 19.5
Adjusted PAT 1,881.1 2,353.5 2,697.6 3,188.4
% YoY growth 23.7 25.1 14.6 18.2
Adjusted EPS (Rs.) 110.3 134.0 153.6 181.5
P/E (x) 53.6 44.1 38.5 32.5
P/B (x) 14.3 10.8 8.4 6.7
EV/EBITDA (x) 37.9 33.5 29.1 25.2
RoNW (%) 30.5 29.0 30.3 35.8
RoCE (%) 37.2 34.6 36.4 42.2
Source: Company; Sharekhan estimates
IT & ITES Sharekhan code: LTI Result Update
+ Positive = Neutral - Negative
3R MATRIX + = -
Right Sector (RS) ü
Right Quality (RQ) ü
Right Valuation (RV) ü
Powered by the Sharekhan 3R Research Philosophy
L&T Infotech LtdBright Q2, set to outrun peers
L&T Infotech (LTI) reported the strongest ever sequential constant currency (CC) revenue growth of 8.3%, led by strong double-digit growth in the BFS, manufacturing and other verticals. Reported USD revenue grew 8.3% q-o-q and 25.8% y-o-y to $509 million. EBIT margin improved 80bps q-o-q to 17.2%, ahead of our estimates, aided by SG&A leverage (up 70 bps) and higher offshoring, partially offset by lower utilisation and higher employee costs. The company signed large deal TCVs of $30 million in Europe in Q2FY2022. Strong demand is led by – (1) spend of transformation initiatives, (2) spends on new technologies and (3) higher automation to solve supply-side constraints. We believe LTI is well positioned to capture the market opportunities given superior digital competency, investments in sales and marketing (S&M), and solid executions.
Key positives
� CC revenue growth of 8.3% q-o-q was ahead of our estimate
� Deal wins, client addition, and net staff addition remained strong.
� OCF to net profit improved to 91% from 19% in Q1FY22.
Key negatives
� Attrition inched up 440 bps q-o-q to 19.6%
Management commentary
� The management reiterated demand for IT services is one of the best in a decade.
� Maintained its guidance of 14-15% net profit margin for FY2022.
� Revenue growth in H2FY22 would be stronger versus H1FY22 given strong seasonality
Revision in estimates - We revised our earnings estimates upward for FY22E/FY23E/FY24E by 1-4%
Our Call
Valuation – Strong growth prospects ahead: LTI is expected to deliver another strong year even after delivering nearly double-digit growth in FY2021, led by its strong capabilities in core modernisation, prudent client mining, strong sales and marketing practices and broad-based demand. Further, the management eyes a stable net profit margin going ahead despite investments in capability building and bolstering of sales team, aided by strong revenue growth, productivity enhancement, cost-optimisation measures, and hedging strategy. We estimate LTI to report USD revenue/EPS CAGR of 15%/16% over FY2022-FY2024E. At the CMP, the stock trades at 38x/33x its FY2023E/FY2024E earnings, which although expensive, is justified given its industry-leading revenue growth prospects with stable margins, strength in addressing transformation spending, and strong return ratios. Hence, we maintain our Buy rating on LTI with a revised price target (PT) of Rs. 6,850.
Key Risks
Rupee appreciation or/and adverse cross-currency movements and macro pressures would affect earnings.
Summary
� Q2 numbers beat our estimates on all fronts; deal TCVs and deal pipeline were robust, client metrics healthy across categories, while offshoring and net headcount addition stayed high. OCF/net profit stayed healthy at 91%.
� Strong demand is led by rising spend of transformation initiatives, spend on newer technologies and increasing opportunities on automation. The management expects strong demand to sustain at least for next three years.
� Strong hiring, investments in sales and capabilities, right market strategies and excellent execution positions LTI for sustainable growth over FY2022-FY2024E. We expect revenue/EPS to clock 15%/16% CAGR over FY2022-24.
� We maintain a Buy on LTI with a revised PT of Rs. 6,850 given its strength in addressing digital transformation spends, robust deal wins and robust demand.
Sto
ck U
pd
ate
Company details
Market cap: Rs. 1,03,475 cr
52-week high/low: Rs. 6,498/2,828
NSE volume: (No of shares)
3.5 lakh
BSE code: 540005
NSE code: LTI
Free float: (No of shares)
4.5 cr
Shareholding (%)
Promoters 74.1
FII 13.3
DII 4.7
Others 7.9
Price performance
(%) 1m 3m 6m 12m
Absolute 6.5 34.8 45.5 92.2
Relative to Sensex
0.9 17.3 16.7 37.7
Sharekhan Research, Bloomberg
Reco/View Change
Reco: Buy CMP: Rs. 5,907
Price Target: Rs. 6,850 á
á Upgrade Maintain â Downgrade
Price chart
What has changed in 3R MATRIX
Old New
RS RQ RV
2,5003,0003,5004,0004,5005,0005,5006,0006,500
Oct
-20
Feb-
21
Jun-
21
Oct
-21

October 18, 2021 3
Sto
ck U
pd
ate
Powered by the Sharekhan3R Research Philosophy
Excellent quarterly performance
L&T Infotech (LTI) reported an excellent quarterly numbers in Q2FY2022, led by broad-based growth across
verticals, strong growth in top accounts and strong demand. The company reported its best-ever sequential
constant currency (CC) revenue growth of 8.3% (up 25.5% y-o-y), exceeding our estimates. Revenue growth
on q-o-q was driven by strong double-digit revenue growth in BFS (up 10.6% q-o-q), manufacturing (up 12.9%
q-o-q) and other (up 15% q-o-q) vertical. Reported USD revenue grew 8.3% q-o-q and 25.8% y-o-y to $509
million. EBIT margin improved 80bps q-o-q to 17.2%, ahead of our estimates, aided by SG&A leverage (up 70
bps) and higher offshoring, partially offset by lower utilisation and higher employee costs. We note that LTI
had advanced its wage hike cycle from July to April for FY2022, the second wage hike (the first in January
and the second in April) in a span of three months. Net profit came in at Rs. 551.7 crore (up 11.1% q-o-q and up
20.8% y-o-y) and was 1.3% ahead of our estimates, aided by beat in revenue and EBIT margin, partially offset
by lower other income. Net profit margin stood at 14.6% versus 14.3% in Q1FY2022. OCF/net profit stood at
91% in Q2FY2022 versus 19%/98% in Q1FY22/Q2FY21, respectively.
Key result highlights
� Blockbuster quarter: LTI reported the strongest-ever sequential revenue growth of 8.9% on CC basis,
led by broad-based demand across verticals, service lines, client buckets and geographies. In reported
terms, USD revenue grew by 8.3% q-o-q and 25.8% y-o-y to $509 million, led by a strong growth in
BFS, manufacturing, hi-tech and other vertical. With revenues of $509 million, the company’s quarterly
annualized revenue run-rate crossed the $2 billion mark. EBIT margin improved 80bps q-o-q to 17.2% in
Q2FY2022, beating our estimates by 30bps, led by strong revenue growth.
� Large deal in Q2: LTI announced large deal TCV of $30 million in Europe in Q2FY2022. The management
remains optimistic of reporting large deals in the coming quarters as it continues to invest in the
right capabilities. Management see multiple small sized deal given higher discretionary spends on
transformation projects.
� Demand outlook and net profit margin guidance: Management reiterated that demand for IT services
is one of the best in a decade and it is likely to sustain at least for the next three years. The strong
demand drivers are – (1) emergence of new business models, where clients are looking for technology
partners for business transformation. These spends are discretionary in nature. Management cited that
the business restructuring is comprehensive, which is leading to plethora of small-sized deals, (2) spend
on new areas as ESG and cloud security have started playing a key role in business decision and strategy.
Management believes Client’s spend on these technologies are at the initial stages, (3) supply-side issues
across industries have been creating opportunities for IT services companies as enterprises are focusing
on automation to solve such issues. We believe that LTI is well poised to capture the opportunities given
its investments in capability building, and sales & marketing practices as well, strengths in addressing
transformation spending and solid execution. LTI added 4,084 net employees in Q2FY2022, taking
total net headcount addition of 12,953 over last three quarters, to cater to the accelerated demand. The
company plans to hire around 5,500 freshers in FY2022, indicates the underlying demand. Management
indicated that the revenue growth in H2FY2022 would be stronger compared to 1HFY2022 on the back of
strong seasonality. Growth in Europe is expected to continue on the back of deal pipeline, good demand
environment and ramp-up of recent large deal wins. With healthy deal wins, sustained client mining
strategies, and broad-based demand, LTI is expected to deliver another year of strong growth even after
delivering nearly double-digit revenue growth in the pandemic-hit FY2021. The management reiterated
that the company would remain in the leaders’ quadrant of the industry in terms of revenue growth in
FY2022. The management maintained its guidance of 14-15% net profit margin for FY2022.

October 18, 2021 4
Sto
ck U
pd
ate
Powered by the Sharekhan3R Research Philosophy
� Strong growth in key verticals: During Q2FY2022, the manufacturing vertical reported strong CC revenue
growth of 12.9% q-o-q (versus -6.7% in Q1FY2022), while the BFS and other verticals reported strong
revenue growth of 10.6% q-o-q and 15.0% q-o-q respectively on a CC basis. The hi-tech, energy & utilities
and insurance verticals reported a revenue growth of 7% q-o-q, 6.9% q-o-q and 6.1% q-o-q respectively.
The company reported 2.6% q-o-q growth in CPG, retail and pharmaceutical vertical.
� Strong growth across service offerings: LTI’s management highlighted that all its service lines grew by
~20% y-o-y in Q2FY2022. Revenue from analytics, AI & cognitive and enterprise integration & mobility
reported a strong CC growth of 12.1% q-o-q (up 43.6% y-o-y) and 16.7% q-o-q (up 41.1% y-o-y) respectively.
Revenue from cloud infrastructure & security services offerings grew by 2.7% q-o-q in CC terms. Revenue
from ADM and testing and enterprise solutions grew by 9.2% q-o-q (up 19.3% y-o-y) and 8.1% q-o-q (up
23.6% y-o-y), respectively.
� Strong growth across geographies: Rest-of-the-world (RoW), North America and Europe reported strong
revenue growth, registering a CC revenue growth of 11.5% q-o-q, 9.1% q-o-q and 7.5% q-o-q. Revenue in
India grew by 6.6% q-o-q in CC terms after a decline of 19.9% q-o-q in Q1FY2022. Europe grew by 25.5%
y-o-y.
� Opportunities around cloud and data product businesses: The management highlighted that two areas
have emerged as new opportunity areas based on the conversion of market trends and its capabilities in
new-age technologies. These are - (1) cloud business – work along with hyperscalers (AWS, Azure, and
GCP) and (2) data product business with marketing platform (Mosaic and Lymbyc). The company had
carved out two separate units to focus on cloud and data products. On the cloud side, the company has
made significant progress, both in terms of setting up a dedicated organisation and in terms of market
success.
� Strong growth in the BFS and insurance vertical: The BFS vertical’s revenue grew by 10.6% q-o-q and
36% y-o-y in CC terms, led by higher spend on modernization projects and broad-based demand across
geographies. Insurance vertical’s revenue growth accelerated to 6.1% q-o-q and 10.9% y-o-y (up 5% q-o-q
on CC and 0.4% y-o-y in Q1FY2022), led by strong demand. The management expects revenue growth in
the insurance sector would continue on the back of new leaderships who would be driving opportunities
in the marketplaces and the partnership ecosystem.
� Manufacturing vertical revenue growth bounced back strongly: The manufacturing vertical’s revenue
grew by 12.9% q-o-q and 20.8% y-o-y on a CC basis. The management indicated strong deal pipeline in
this vertical given strong demand in industrial manufacturing and capital goods sector. Further, it sees
strong growth across sub-segments given higher digitalization, strong demand for data and analytics for
real-time decision making and change in operating models.
� Strong traction in utilities segment: E&U vertical’s revenue grew by 6.9% q-o-q in Q2FY2022 on CC
terms, led by strong growth in utilities space. Management highlighted that client budgets in this space
continue to remain volatile. However, the management indicated that it sees good traction in the utilities
segment.
� Growth in CPG, retail, and pharma to pick up in subsequent quarters: These verticals’ revenue grew by
2.6% q-o-q on CC terms and increased by 15.4% y-o-y in Q2FY22. Growth was driven by spend on data-
related projects as wholesaler and retailers adjust to new realities to meet customer expectations.
� Hi-tech, media and entertainment: Revenue in hi-tech, media and entertainment vertical grew by 7%
q-o-q on CC terms and 48.4% y-o-y in CC terms.
October 18, 2021 5
Sto
ck U
pd
ate
Powered by the Sharekhan3R Research Philosophy
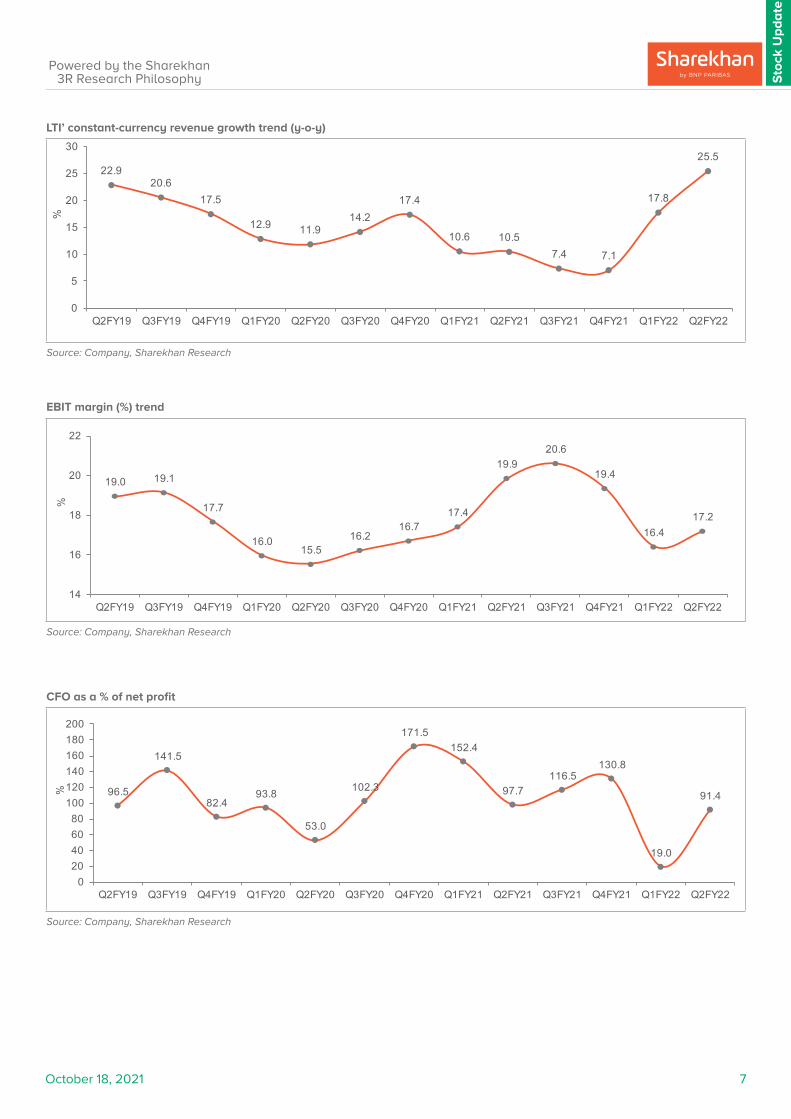
� Attrition rate to remain elevated for next 3-4 quarters: The company’s attrition rate (LTM basis) increased
440bps q-o-q to 19.6% despite taking proactive measures such as advancing wage revision by three
months from July to April for FY2022. We note that the company had provided second wage hike in a
calendar year to management the attrition in ongoing demand environment. The management stated that
most of the attrition was in the 3 to 6 years experienced bracket as there had been less freshers hire over
the last 3-4 years. Management expects it will take at-least 3-4 quarters to have some stability in attrition
rate.
� Pricing outlook: The company indicated some scope for price increase in certain pockets. However, the
company focuses on capturing growth opportunities in the marketplace.
� Revenue growth accelerated in top accounts: Revenue from top five accounts grew by 8.1% q-o-q (versus
a growth of 6.6% q-o-q in Q1FY2022). Revenue from the top 10/20 accounts grew by 6.8%/7.8% q-o-q
(versus growth of 5.9%/4.3% q-o-q in Q1FY2022). Revenue from other than top 20 accounts grew by 8.7%
q-o-q during Q2FY2022.
� Client metrics continued to improve across categories, led by strong demand: LTI added 25 clients
(versus 23 new clients in Q1FY2022) across all verticals in Q2FY2022. The number of clients under the
$100 million client buckets remained flat q-o-q, while the number of clients under the $50 million, $20
million, $10 million and $5 million increased by 1, 3,5 and 5 clients respectively, q-o-q. On a y-o-y basis,
the number of clients under the $50 million, $20 million, $10 million and $5 million category grew by 1, 5,
11 and 10, respectively.
� OCF to net profit ratio remained healthy: Operating cash flow stood at Rs. 504.1 crore (up 435% q-o-q
and 13% y-o-y). Operating cash flow to net profit remained at 91% in Q2FY2022 versus 19% in Q1FY2022.
Cash & liquid investments stood at Rs. 3,840.3 crore as compared to Rs. 4,331.4 core in Q1FY2022.
� DSO: Billed DSO increased by a day to 61 days. DSO including unbilled revenue remained flat at 98 days
on a q-o-q basis.
� Dividend: LTI declared a dividend of Rs. 15/ share versus Rs. 10/share in Q1FY2022.

October 18, 2021 6
Sto
ck U
pd
ate
Powered by the Sharekhan3R Research Philosophy
Results (Consolidated) Rs crParticulars Q2FY22 Q2FY21 Q1FY22 y-o-y (%) q-o-q (%)
Revenue ($ mn) 509.0 404.5 470.2 25.8 8.3
Revenue (Rs. cr) 3,767.0 2,998.4 3,462.5 25.6 8.8
Direct costs 2,601.1 1,953.7 2,389.8 33.1 8.8
SG&A 432.7 359.1 424.9 20.5 1.8
EBITDA 733.2 685.6 647.8 6.9 13.2
Depreciation 85.0 89.9 79.5 -5.5 6.9
EBIT 648.2 595.7 568.3 8.8 14.1
Other income (including FX) 93.8 17.4 103.9 439.1 -9.7
PBT 742.0 613.1 672.2 21.0 10.4
Tax provision 190.3 156.3 175.4 21.8 8.5
Net profit 551.7 456.8 496.8 20.8 11.1
EPS (Rs.) 31.4 26.0 28.3 21.0 11.1
Margin (%) BPS BPS
EBITDA 19.5 22.9 18.7 -340 75
EBIT 17.2 19.9 16.4 -266 79
NPM 14.6 15.2 14.3 -59 30
Tax rate 25.6 25.5 26.1 15 -45Source: Company, Sharekhan Research
Operating metrics
ParticularsRevenues Contribution $ Growth (%) CC growth (%)
($ mn) (%) q-o-q y-o-y q-o-q y-o-y
Revenue ($ million) 509 100 8.3 25.8 8.9 25.5
Geographic mix
North America 344 67.5 8.9 23.6 9.1 23.3
Europe 82 16.1 5.1 25.8 7.5 25.5
ROW 50 9.8 10.6 50.4 11.5 48.5
India 34 6.6 6.6 20.4 6.6 19.5
Industry verticals
BFS 165 32.5 9.6 36.8 10.6 36.0
Insurance 72 14.2 5.6 11.4 6.1 10.9
Manufacturing 79 15.6 12.4 20.8 12.9 20.8
Energy & Utilities 45 8.9 6.3 6.0 6.9 5.9
CPG, Retail and Pharma 51 10.1 1.9 15.3 2.6 15.4
High-Tech, Media and Enter-tainment
64 12.5 6.9 48.5 7.0 48.4
Others 32 6.2 14.2 38.4 15.0 38.4
Service offerings
ADM and Testing 174 34.2 8.7 19.5 9.2 19.3
Enterprise Solutions 155 30.4 7.2 24.3 8.1 23.6
Cloud Infrastructure & Security 71 14.0 1.9 22.7 2.7 22.7
Analytics, AI and Cognitive 62 12.1 11.9 43.7 12.1 43.6
Enterprise Integration and Mobility
47 9.3 16.2 41.3 16.7 41.1
Source: Company, Sharekhan Research
October 18, 2021 7
Sto
ck U
pd
ate
Powered by the Sharekhan3R Research Philosophy
22.920.6
17.5
12.9 11.914.2
17.4
10.6 10.57.4 7.1
17.8
25.5
0
5
10
15
20
25
30
Q2FY19 Q3FY19 Q4FY19 Q1FY20 Q2FY20 Q3FY20 Q4FY20 Q1FY21 Q2FY21 Q3FY21 Q4FY21 Q1FY22 Q2FY22
%
LTI’ constant-currency revenue growth trend (y-o-y)
Source: Company, Sharekhan Research
EBIT margin (%) trend
Source: Company, Sharekhan Research
19.0 19.1
17.7
16.0 15.5
16.2 16.7
17.4
19.9 20.6
19.4
16.4 17.2
14
16
18
20
22
Q2FY19 Q3FY19 Q4FY19 Q1FY20 Q2FY20 Q3FY20 Q4FY20 Q1FY21 Q2FY21 Q3FY21 Q4FY21 Q1FY22 Q2FY22
%
CFO as a % of net profit
Source: Company, Sharekhan Research
96.5
141.5
82.4 93.8
53.0
102.3
171.5 152.4
97.7 116.5
130.8
19.0
91.4
020406080
100120140160180200
Q2FY19 Q3FY19 Q4FY19 Q1FY20 Q2FY20 Q3FY20 Q4FY20 Q1FY21 Q2FY21 Q3FY21 Q4FY21 Q1FY22 Q2FY22
%

October 18, 2021 8
Sto
ck U
pd
ate
Powered by the Sharekhan3R Research Philosophy
DSO (including unbilled) trend
Source: Company, Sharekhan Research
Attrition rate (%)
Source: Company, Sharekhan Research
BFS CC revenue growth (y-o-y) trend
Source: Company, Sharekhan Research
114
103 103 104 105
110106
99
94 93 9498 98
80
90
100
110
120
Q2FY19 Q3FY19 Q4FY19 Q1FY20 Q2FY20 Q3FY20 Q4FY20 Q1FY21 Q2FY21 Q3FY21 Q4FY21 Q1FY22 Q2FY22
Day
s
15.3 16.5
17.5 18.3 18.4
17.7 16.5
15.2
13.5 12.4 12.3
15.2
19.6
10
12
14
16
18
20
22
Q2FY19 Q3FY19 Q4FY19 Q1FY20 Q2FY20 Q3FY20 Q4FY20 Q1FY21 Q2FY21 Q3FY21 Q4FY21 Q1FY22 Q2FY22
%
34.3
28.6
14.4
2.0 1.9
9.3
17.2
10.6
21.2 17.3 18.5
34.7 36.0
0
5
10
15
20
25
30
35
40
Q2FY19 Q3FY19 Q4FY19 Q1FY20 Q2FY20 Q3FY20 Q4FY20 Q1FY21 Q2FY21 Q3FY21 Q4FY21 Q1FY22 Q2FY22
%

October 18, 2021 9
Sto
ck U
pd
ate
Powered by the Sharekhan3R Research Philosophy
One-year forward P/E (x) band
Source: Sharekhan Research
Outlook and Valuation
n Sector view - Expect acceleration in technology spending going forward
With the outbreak of the COVID-19 pandemic, the need for business continuity, operational resilience and the switch to digital transactions has led to a strong demand for IT services. Industry analysts such as Gartner estimate that IT services spending would grow by 7-9% over CY2021-CY2024E as compared to the average of 3.6% achieved over CY2010-CY2020. Forecasts indicate higher demand for cloud infrastructure services, a potential increase in specialised software, potential investments in transformation projects by clients and increased online adoption across verticals.
n Company outlook - Superior execution likely to drive outperformance
We believe that LTI’s prudent strategies along with an efficient sales force would lead to market share gains in large accounts and new deal wins. Hence, we expect LTI to deliver industry-leading revenue growth in the long term on account of consistent large deal wins and deal pipeline, higher digital mix, prudent account mining strategies and a marquee client base. Further, LTI’s sharp focus on bringing new-age disruptive technologies along with leveraging platforms (in-house and external) would help it transform the core business of enterprises on a large scale.
n Valuation - Superior execution justifies premium valuation
LTI is expected to deliver another strong year even after delivering nearly double-digit growth in FY2021, led by its strong capabilities in core modernisation, prudent client mining, strong sales and marketing practices and broad-based demand. Further, the management eyes a stable net profit margin going ahead despite investments in capability building and bolstering of sales team, aided by strong revenue growth, productivity enhancement, cost-optimisation measures, and hedging strategy. We estimate LTI to report USD revenue/EPS CAGR of 15%/16% over FY2022-FY2024E. At the CMP, the stock trades at 38x/33x its FY2023E/FY2024E earnings, which although expensive, is justified given its industry-leading revenue growth prospects with stable margins, strength in addressing transformation spending, and strong return ratios. Hence, we maintain our Buy rating on LTI with a revised price target (PT) of Rs. 6,850.
Peer comparison
CompanyCMP (Rs / Share)
O/S Shares
(Cr)
MCAP (Rs Cr)
P/E (x) EV/EBITDA (x) P/BV (x) RoE (%)
FY22E FY23E FY22E FY23E FY22E FY23E FY22E FY23E
Persistent 4,126 8 31,534 48.6 35.9 35.1 26.0 9.9 8.5 21.7 25.4
TCS 3,647 370 13,49,192 34.4 30.0 24.5 21.3 15.2 14.8 44.5 49.9
LTI 5,907 18 1,03,475 44.1 38.5 33.5 29.1 10.8 8.4 29.0 30.3
Source: Company; Sharekhan Research
0
5
10
15
20
25
30
35
40
45
Jul-1
6
Jan-
17
Jul-1
7
Dec-
17
Jun-
18
Dec-
18
Jun-
19
Nov-
19
May
-20
Nov-
20
Apr-2
1
Oct-2
1
P/E (
x)
P/E (x) Avg. P/E (x) Peak P/E (x) Trough P/E (x)
October 18, 2021 10
Sto
ck U
pd
ate
Powered by the Sharekhan3R Research Philosophy
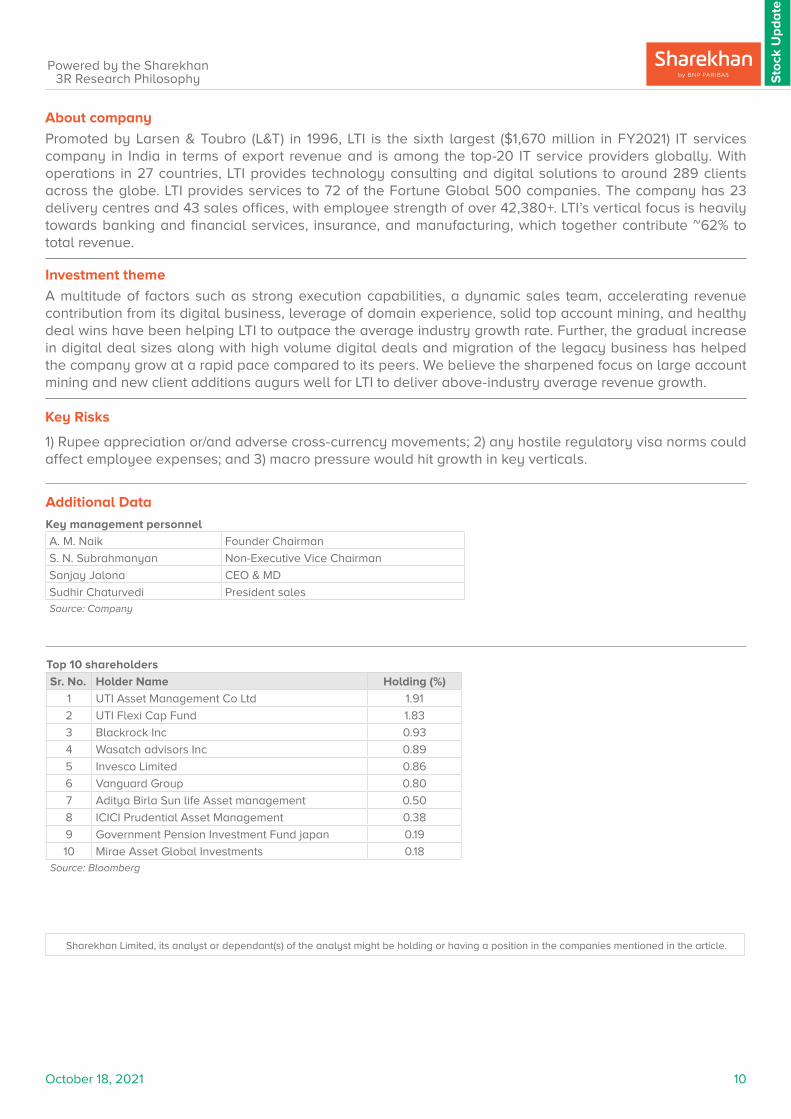
About company
Promoted by Larsen & Toubro (L&T) in 1996, LTI is the sixth largest ($1,670 million in FY2021) IT services company in India in terms of export revenue and is among the top-20 IT service providers globally. With operations in 27 countries, LTI provides technology consulting and digital solutions to around 289 clients across the globe. LTI provides services to 72 of the Fortune Global 500 companies. The company has 23 delivery centres and 43 sales offices, with employee strength of over 42,380+. LTI’s vertical focus is heavily towards banking and financial services, insurance, and manufacturing, which together contribute ~62% to total revenue.
Investment theme
A multitude of factors such as strong execution capabilities, a dynamic sales team, accelerating revenue contribution from its digital business, leverage of domain experience, solid top account mining, and healthy deal wins have been helping LTI to outpace the average industry growth rate. Further, the gradual increase in digital deal sizes along with high volume digital deals and migration of the legacy business has helped the company grow at a rapid pace compared to its peers. We believe the sharpened focus on large account mining and new client additions augurs well for LTI to deliver above-industry average revenue growth. Key Risks
1) Rupee appreciation or/and adverse cross-currency movements; 2) any hostile regulatory visa norms could affect employee expenses; and 3) macro pressure would hit growth in key verticals.
Additional Data
Key management personnel
A. M. Naik Founder Chairman
S. N. Subrahmanyan Non-Executive Vice Chairman
Sanjay Jalona CEO & MD
Sudhir Chaturvedi President salesSource: Company
Top 10 shareholders
Sr. No. Holder Name Holding (%)
1 UTI Asset Management Co Ltd 1.91
2 UTI Flexi Cap Fund 1.83
3 Blackrock Inc 0.93
4 Wasatch advisors Inc 0.89
5 Invesco Limited 0.86
6 Vanguard Group 0.80
7 Aditya Birla Sun life Asset management 0.50
8 ICICI Prudential Asset Management 0.38
9 Government Pension Investment Fund japan 0.19
10 Mirae Asset Global Investments 0.18Source: Bloomberg
Sharekhan Limited, its analyst or dependant(s) of the analyst might be holding or having a position in the companies mentioned in the article.

Understanding the Sharekhan 3R Matrix
Right Sector
Positive Strong industry fundamentals (favorable demand-supply scenario, consistent
industry growth), increasing investments, higher entry barrier, and favorable
government policies
Neutral Stagnancy in the industry growth due to macro factors and lower incremental
investments by Government/private companies
Negative Unable to recover from low in the stable economic environment, adverse
government policies affecting the business fundamentals and global challenges
(currency headwinds and unfavorable policies implemented by global industrial
institutions) and any significant increase in commodity prices affecting profitability.
Right Quality
Positive Sector leader, Strong management bandwidth, Strong financial track-record,
Healthy Balance sheet/cash flows, differentiated product/service portfolio and
Good corporate governance.
Neutral Macro slowdown affecting near term growth profile, Untoward events such as
natural calamities resulting in near term uncertainty, Company specific events
such as factory shutdown, lack of positive triggers/events in near term, raw
material price movement turning unfavourable
Negative Weakening growth trend led by led by external/internal factors, reshuffling of
key management personal, questionable corporate governance, high commodity
prices/weak realisation environment resulting in margin pressure and detoriating
balance sheet
Right Valuation
Positive Strong earnings growth expectation and improving return ratios but valuations
are trading at discount to industry leaders/historical average multiples, Expansion
in valuation multiple due to expected outperformance amongst its peers and
Industry up-cycle with conducive business environment.
Neutral Trading at par to historical valuations and having limited scope of expansion in
valuation multiples.
Negative Trading at premium valuations but earnings outlook are weak; Emergence of
roadblocks such as corporate governance issue, adverse government policies
and bleak global macro environment etc warranting for lower than historical
valuation multiple.Source: Sharekhan Research

Disclaimer: This document has been prepared by Sharekhan Ltd. (SHAREKHAN) and is intended for use only by the person or entity to which it is addressed to. This Document may contain confidential and/or privileged material and is not for any type of circulation and any review, retransmission, or any other use is strictly prohibited. This Document is subject to changes without prior notice. This document does not constitute an offer to sell or solicitation for the purchase or sale of any financial instrument or as an official confirmation of any transaction. Though disseminated to all customers who are due to receive the same, not all customers may receive this report at the same time. SHAREKHAN will not treat recipients as customers by virtue of their receiving this report.
The information contained herein is obtained from publicly available data or other sources believed to be reliable and SHAREKHAN has not independently verified the accuracy and completeness of the said data and hence it should not be relied upon as such. While we would endeavour to update the information herein on reasonable basis, SHAREKHAN, its subsidiaries and associated companies, their directors and employees (“SHAREKHAN and affiliates”) are under no obligation to update or keep the information current. Also, there may be regulatory, compliance, or other reasons that may prevent SHAREKHAN and affiliates from doing so. This document is prepared for assistance only and is not intended to be and must not alone be taken as the basis for an investment decision. Recipients of this report should also be aware that past performance is not necessarily a guide to future performance and value of investments can go down as well. The user assumes the entire risk of any use made of this information. Each recipient of this document should make such investigations as it deems necessary to arrive at an independent evaluation of an investment in the securities of companies referred to in this document (including the merits and risks involved), and should consult its own advisors to determine the merits and risks of such an investment. The investment discussed or views expressed may not be suitable for all investors. We do not undertake to advise you as to any change of our views. Affiliates of Sharekhan may have issued other reports that are inconsistent with and reach different conclusions from the information presented in this report.
This report is not directed or intended for distribution to, or use by, any person or entity who is a citizen or resident of or located in any locality, state, country or other jurisdiction, where such distribution, publication, availability or use would be contrary to law, regulation or which would subject SHAREKHAN and affiliates to any registration or licensing requirement within such jurisdiction. The securities described herein may or may not be eligible for sale in all jurisdictions or to certain category of investors. Persons in whose possession this document may come are required to inform themselves of and to observe such restriction.
The analyst certifies that the analyst has not dealt or traded directly or indirectly in securities of the company and that all of the views expressed in this document accurately reflect his or her personal views about the subject company or companies and its or their securities and do not necessarily reflect those of SHAREKHAN. The analyst and SHAREKHAN further certifies that neither he or his relatives or Sharekhan associates has any direct or indirect financial interest nor have actual or beneficial ownership of 1% or more in the securities of the company at the end of the month immediately preceding the date of publication of the research report nor have any material conflict of interest nor has served as officer, director or employee or engaged in market making activity of the company. Further, the analyst has also not been a part of the team which has managed or co-managed the public offerings of the company and no part of the analyst’s compensation was, is or will be, directly or indirectly related to specific recommendations or views expressed in this document. Sharekhan Limited or its associates or analysts have not received any compensation for investment banking, merchant banking, brokerage services or any compensation or other benefits from the subject company or from third party in the past twelve months in connection with the research report.
Either, SHAREKHAN or its affiliates or its directors or employees / representatives / clients or their relatives may have position(s), make market, act as principal or engage in transactions of purchase or sell of securities, from time to time or may be materially interested in any of the securities or related securities referred to in this report and they may have used the information set forth herein before publication. SHAREKHAN may from time to time solicit from, or perform investment banking, or other services for, any company mentioned herein. Without limiting any of the foregoing, in no event shall SHAREKHAN, any of its affiliates or any third party involved in, or related to, computing or compiling the information have any liability for any damages of any kind.
Compliance Officer: Mr. Joby John Meledan; Tel: 022-61150000; email id: [email protected];
For any queries or grievances kindly email [email protected] or contact: [email protected]
Registered Office: Sharekhan Limited, 10th Floor, Beta Building, Lodha iThink Techno Campus, Off. JVLR, Opp. Kanjurmarg Railway Station, Kanjurmarg (East), Mumbai – 400042, Maharashtra. Tel: 022 - 61150000. Sharekhan Ltd.: SEBI Regn. Nos.: BSE / NSE / MSEI (CASH / F&O / CD) / MCX - Commodity: INZ000171337; DP: NSDL/CDSL-IN-DP-365-2018; PMS: INP000005786; Mutual Fund: ARN 20669; Research Analyst: INH000006183;
Disclaimer: Client should read the Risk Disclosure Document issued by SEBI & relevant exchanges and the T&C on www.sharekhan.com; Investment in securities market are subject to market risks, read all the related documents carefully before investing.
Know more about our products and services
For Private Circulation only