“Subscribe with Caution” to Chalet Hotels Ltd. - Moneycontrol
13
“Subscribe with Caution” to Chalet Hotels Ltd. To benefit from the increased investment in rail sector
-
Upload
khangminh22 -
Category
Documents
-
view
0 -
download
0
Transcript of “Subscribe with Caution” to Chalet Hotels Ltd. - Moneycontrol

“Subscribe with Caution” to
Chalet Hotels Ltd.
To benefit from the increased investment in rail sector

Salient features of the IPO: • Chalet Hotels Ltd. (Chalet) a group company of K. Raheja Corp. is
planning to raise around Rs. 16.2-16.4bn through an IPO by offering 58.6-59.2mn shares between the price range Rs. 275 - 280 per share.
• The IPO consists of fresh issue and OFS. Net proceeds from the fresh issue would be largely utilized for the repayment/prepayment of debt availed by the company.
Key competitive strengths: • High-end branded hotels strategically located in key metro cities • Active asset management model • Well positioned to benefit from industry trends • Experienced management team • Backed by leading Indian real estate developer Risk and concerns: • Slowdown in the economy • Seasonal business • Change in consumer demand • Unexpected rise in land cost, and other operating costs • Competition Peer comparison and valuation: At the higher price band of Rs. 280 per share, Chalet’s share is valued at a cash P/E multiple of 38.7x (to its restated FY18 cash EPS of Rs. 7.2) as compared to peer average of 27.8x. Below are few key observations of the issue: (continued in next page) • Indian hotel industry is at an inflexion point. In the past, over FY07-
16, the hotel room supply growth was in excess to the demand growth, which led to lower occupancy levels and lower room rates. Since last 18-24 months there is a gradual improvement in the room demand growth. Consequently, the hotel room demand growth is exceeding supply growth, thereby increasing the occupancy levels across the industry. The management anticipates that this positive trend is likely in the foreseeable future, as slower inventory creation is expected to continue up to FY21. Improved occupancy levels are expected to improve the room rates going forward. On an average the hotel room occupancy levels are likely to improve from 65% in FY17 to 71% and 73% in FY19 and FY20, respectively, for the industry. Currently, the room rates across the segments are at a significant discount to historical peak levels, thereby indicating a significant headroom for growth.
• Chalet is an owner, developer and an active asset manager of high-end hotels in India. With 2,328 hotel rooms across five hotel properties, it had a market share of around 4.4% in the luxury-upper scale segment in FY18. Its hotel properties are managed by Marriott. In aggregate, the company shares 8-12% of the hotel revenue with Marriott. Of the total hotel rooms, 93.5% is managed by Marriott, while the rest is self managed by Chalet. Managed hotel contributed 93.9% of the hotel revenue in FY18.
• Managed hotel brands are the globally recognized i.e. JW Marriott, Westin, Marriott, Marriott Executive Apartments and Renaissance. Self managed hotel is operated under the brand name Four Points by Sheraton. The company has a long relationship with Marriott since 2001.
• The company has developed its hotels at strategic locations generally with high entry barriers and in high density business districts of metros like – Mumbai, Bangalore, Hyderabad and Navi Mumbai. As of FY18, Chalet had 64.9% of the hotel rooms in Mumbai and Navi Mumbai, characterized by high room rates in India.
28th Jan. 2019
1
Recommendation Subscribe with Caution
Price Band (Rs.) Rs. 275 - 280 per Share
Face Value (Rs.) Rs. 10
Shares for Fresh Issue (mn)
33.93 - 34.55mn Shares
Shares for OFS (mn) 24.69mn Shares
Fresh Issue Size (Rs. mn) Rs. 9,500mn
OFS Issue Size (Rs. mn) Rs. 6,788.4 - 6,911.8mn
Total Issue Size (Rs. mn) 58.61 - 59.23mn Shares (Rs. 16,288.4 - 16,411.8mn)
Bidding Date 29th Jan. - 31st Jan. 2019
MCAP at Higher Price Band
Rs. 57,407mn
Enterprise Value at Higher Price Band
Rs. 74,843mn
Book Running Lead Manager
JM Financial Ltd.; Axis Capital Ltd. and Morgan Stanley India Company Pvt. Ltd.
Registrar Karvy Fintech Pvt. Ltd.
Sector/Industry Hotels
Promoters
Ravi C. Raheja, Neel C. Raheja, K. Raheja Corp. Pvt. Ltd., K. Raheja Pvt. Ltd., Ivory Properties and Hotels Pvt. Ltd., Genext Hardware & Parks Pvt. Ltd., Touchstone Properties & Hotels Pvt. Ltd., Cape Trading LLP, Capstan Trading LLP, Casa Maria Properties LLP, Anbee Constructions LLP, Palm Shelter Estate Development LLP, Raghukool Estate Development LLP and Ivory Property Trust
Pre and post - issue shareholding pattern
Pre – Issue Post - Issue
Promoter and Promoter Group
100.00% 71.41%
Public 0.00% 28.59%
Total 100.00% 100.00%
Retail Application Money at Higher Cut-Off Price per Lot
Number of Shares per Lot 53
Application Money Rs. 14,840 per Lot
Analyst
Rajnath Yadav
Research Analyst (022 - 6707 9999; Ext: 912)
Email: [email protected]
• It generally develops hotel on large land parcels, thereby enabling it to situate a greater number of rooms, as well as provide a wide range of amenities, such as, fine dining and specialty restaurants, large banquet and outdoor spaces. All the third party managed hotel are built on self owned lands, while the Navi Mumbai hotel is on leased land. The lease period is for 60 years, and as on 30th Sept. 2018, it had a residual period of 45 years.
• Since it is backed by a leading real estate developer i.e. K. Raheja Corp., Chalet has low development cost in the industry. For instance, it has developed its luxury hotel at Sahar, Mumbai at an average development cost per room of Rs. 14mn. As of 30th Sept. 2018, the company has spent Rs. 2.1bn towards land acquisition for the hotel properties.
• The company has an efficient cost structure, thereby leading it to report a superior operating performance. Chalet has staff to room ratio of around 1.22x across the hotels as compared to an average 2x of all the hotel operating in the same category. Moreover, it is among the efficient energy user, its energy consumption per room has declined by 9% and 23% in FY18 from FY16 levels. As a result of this, the company has an EBITDA margin, which is premium to the hotel operating in the same category.

© CHOICE INSTITUTIONAL RESEARCH
Peer comparison and valuation (Contd…):
• The company follows an active asset management model for its hotels operated by third parties, pursuant to which it closely monitors and exercises regular oversight over the performance of the hotel properties. According to the company, active asset management model, premium location of hotels, large room inventory and large function spaces, together with long relationship with international hospitality brands, has allowed Chalet hotels to achieve competitive financial and operational parameters. Across, the hotel properties, the company had market leading operating metric in FY18. For instance, four of its five hotels operated at higher metric like average daily rates, occupancy levels and Rev PAR.
• The financial performance of the company is not encouraging. Despite reporting 17.6% CAGR increase in the total operating revenue over FY14-18, it has reported net loss during FY14-16. However, with the turnaround in the hotel industry, it reported net profit over FY17-18. Nevertheless, the profitability in FY17 was supported by higher other income arising from sale of investments. Through efficient operations, consolidated EBITDA increased by 32.7% over FY14-18, with margin expanding from 20.7% in FY14 to 33.7% in FY18. EBITDA margin was leading in the industry. Due to its highly leveraged balance sheet, interest cost (which formed around 32% of the top-line) increased by 11.5% CAGR. Average RoE and RoCE over the profitable period i.e. FY17-18 stood at 17.9% and 4.4%, respectively. In Hi FY19, the company reported a net loss of Rs. 436.7mn on a revenue of Rs. 4,698.7mn.
• Chalet is in the process of expanding its hotel operations by adding 588 hotel rooms by Sept. 2021, spread across three greenfield hotel properties. Of these, two hotel properties are on leased land, while one is on owned land.
• Anticipating no material room inventory addition over FY18-20, we are estimating a 10.4% and 9.2% rise in the top-line, which would be mainly backed by higher hotel room tariff and occupancy levels. EBITDA is forecasted to decline by 3.4% in FY19, whereas increase by 11.8% in FY20. EBITDA margin to contract by over 4ppts in FY19 to 29.5%. EBITDA margin is anticipated at 30.2% in FY120. Additionally, with full benefit of lower debt levels coming in FY20, the company is expected to report a net loss of Rs. 362.8mn in FY19, whereas a net profit of Rs. 504.8mn in FY20. RoE and RoCE is anticipated to decline to 3.4% and 5.7%, respectively, in FY20 as compared to 7.3% and 5.8% in FY18.
Hotel industry is asset heavy industry. As hotel assets mature over the period, its value also appreciates. Thus, we feel the better metric to evaluate the hotel industry would be the cash profit or EV/EBITDA. Over FY14-18, Chalet has reported negative cash profit in FY15 and FY16, else for the other years, it reported positive cash profit. On valuation front, at higher price band, the company is demanding a cash P/E valuation of 38.7x (to its restated cash EPS of Rs. 7.2), which is at a premium to the peer average of 27.8x. Moreover, on EV/EBITDA front, it is demanding a valuation of 25.4x as compared to peers average of 27.5x. Thus, issue seems to be fairly priced, leaving limited room for share price appreciation. However, considering the future industry outlook, relatively lower room rates as compared to historical peak, efficient operations and industry leading operating margin, we assign a “Subscribe with Caution” rating to the issue.
Note: All financials and ratio based on FY18 data; Source: Choice Broking Research
Company Name Face
Value (Rs.)
CMP (Rs.)
MCAP (Rs. mn)
EV (Rs. mn)
Stock Return (%) Total Operating Revenue (Rs. mn)
EBITDA (Rs. mn)
PAT (Rs. mn)
Cash PAT
(Rs. mn)
EBITDA Margin
(%)
PAT Margin
(%)
Cash PAT
Margin (%)
1M 3M 6M 1Y
Chalet Hotels Ltd. 10 280 57,407 74,843 8,737.8 2,944.2 365.7 1,482.0 33.7% 4.2% 17.0% EIH Ltd. 2 180 103,111 105,181 -6.0% 11.8% 12.3% -8.5% 15,984.4 2,989.4 1,792.0 2,965.4 18.7% 11.2% 18.6% Hotel Leela Venture Ltd.
2 15 9,175 40,849 -8.8% 12.0% -5.5% -36.9% 7,185.4 1,942.3 (232.2) 1,022.1 27.0% -3.2% 14.2%
The Indian Hotels Company Ltd.
1 134 159,123 176,456 -8.1% 4.3% 2.7% -10.5% 41,035.5 6,703.5 1,008.7 4,020.7 16.3% 2.5% 9.8%
Average 20.7% 3.5% 14.2%
Company Name EPS (Rs.)
Cash EPS (Rs.)
BVPS (Rs.)
DPS (Rs.)
Debt Equity Ratio
Fixed Asset Turnover
Ratio
RoE (%)
RoCE (%)
P / E (x)
Cash P / E (x)
P / B (x)
EV / Sales (x)
EV / EBITDA
(x)
MCAP / Sales (x)
Earning Yield (x)
EV / Room
(Rs. mn)
Chalet Hotels Ltd. 1.8 7.2 70.8 0.0 1.9 0.3 2.5% 4.5% 157.0 38.7 4.0 8.6 25.4 6.6 0.6% 32.1 EIH Ltd. 3.1 5.2 51.7 0.9 0.1 0.6 6.1% 5.3% 57.5 34.8 3.5 6.6 35.2 6.5 1.7% 23.1 Hotel Leela Venture Ltd.
(0.4) 1.6 6.1 0.0 8.3 0.2 -6.0% 1.9% (39.5) 9.0 2.4 5.7 21.0 1.3 -2.5%
The Indian Hotels Company Ltd.
0.8 3.4 41.7 0.3 0.5 0.5 2.0% 4.8% 157.8 39.6 3.2 4.3 26.3 3.9 0.6% 10.5
Average 3.0 0.4 0.7% 4.0% 58.6 27.8 3.0 5.5 27.5 3.9 -0.1% 16.8
Offer Opens on 29-Jan-2019
Offer Closes on 31-Jan-2019
Finalization of Basis of Allotment 05-Feb-2019
Unblocking of ASBA Account 06-Feb-2019
Credit to Demat Accounts 07-Jan-2019
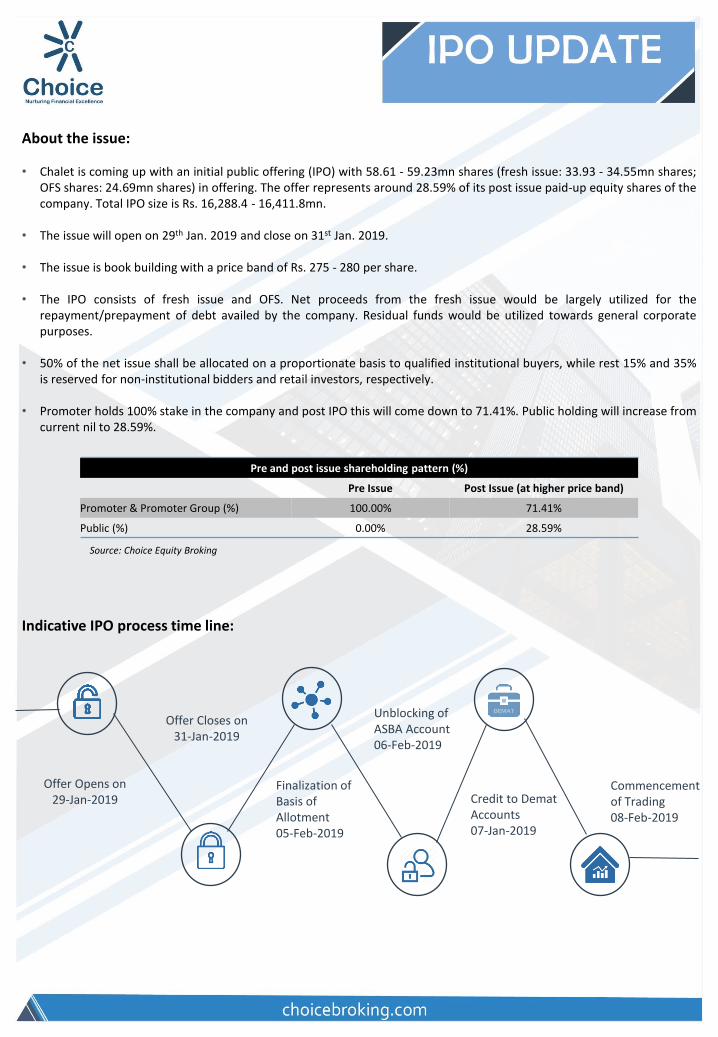
About the issue: • Chalet is coming up with an initial public offering (IPO) with 58.61 - 59.23mn shares (fresh issue: 33.93 - 34.55mn shares;
OFS shares: 24.69mn shares) in offering. The offer represents around 28.59% of its post issue paid-up equity shares of the company. Total IPO size is Rs. 16,288.4 - 16,411.8mn.
• The issue will open on 29th Jan. 2019 and close on 31st Jan. 2019.
• The issue is book building with a price band of Rs. 275 - 280 per share.
• The IPO consists of fresh issue and OFS. Net proceeds from the fresh issue would be largely utilized for the repayment/prepayment of debt availed by the company. Residual funds would be utilized towards general corporate purposes.
• 50% of the net issue shall be allocated on a proportionate basis to qualified institutional buyers, while rest 15% and 35% is reserved for non-institutional bidders and retail investors, respectively.
• Promoter holds 100% stake in the company and post IPO this will come down to 71.41%. Public holding will increase from
current nil to 28.59%.
Pre and post issue shareholding pattern (%)
Pre Issue Post Issue (at higher price band)
Promoter & Promoter Group (%) 100.00% 71.41%
Public (%) 0.00% 28.59%
Source: Choice Equity Broking
Indicative IPO process time line:
Commencement of Trading 08-Feb-2019

Company introduction: Chalet is an owner, developer and asset manager of high-end hotels in key metro cities in India. As on 30th Sept. 2018, its hotel platform comprises five operating hotels, including a hotel with a co-located serviced residence, located in the Mumbai Metropolitan Region, Hyderabad and Bengaluru, representing 2,328 keys. According to the Horwath Report, the company’s hotels are branded with globally recognized hospitality brands and are in the luxury-upper upscale and upscale hotel segments. Chalet’s hotel platform emphasizes strategic locations, efficient design & development, appropriate positioning in hotel segments together with branding and operational tie-ups with leading hospitality companies. The company uses its experience to actively manage the hotel assets to drive performance. Additionally, it has developed commercial and retail spaces, in close proximity to certain of its hotels. According to the Horwath Report, Chalet has developed its hotels at strategic locations generally with high barriers-to-entry and in high density business districts of their respective metro cities. The company generally develops its hotels on large land parcels, allowing it to situate a greater number of rooms, as well as provide a wide range of amenities, such as, fine dining and specialty restaurants, large banquet and outdoor spaces. Chalet endeavors to build its hotels to superior standards targeting the luxury-upper upscale and upscale hotel segments at an efficient gross built up area and development cost per key. Chalet seeks to brand its hotels with leading global hospitality brands, which it believes are well matched to the location, size, target customer base and intended hotel segment of its hotel properties. This allows the company to save on the time and cost required to build, develop and maintain its own hotel brand. Chalet’s hotels are currently branded with global brands such as JW Marriott, Westin, Marriott, Marriott Executive Apartments, Renaissance and Four Points by Sheraton which are held by Marriott Hotels India Pvt. Ltd. and its affiliates (collectively “Marriott”). Currently, its hotel at Vashi, Navi Mumbai, is operated by it under a license agreement with Marriott. Four of the company’s hotels, including the serviced residence, are operated pursuant to hotel operation and related agreements with Marriott. The company follows an active asset management model for its hotels operated by third parties, pursuant to which it closely monitors and exercises regular oversight over the performance of the hotel properties. Among other things, Chalet discuss and agree on budgeting, operational & financial targets, review performance reports, engage with the hotel management team at each hotel by conducting detailed monthly performance review meetings and provide regular inputs on cost saving initiatives & potential improvements. It believes that its active asset management model, the premium location of hotels, large room inventory and large function spaces, together with the relationship with international hospitality brands, has allowed its hotels to achieve competitive financial and operational parameters. For example, according to the Horwath Report, for FY18, most of Chalet’s hotels had higher average daily rates (ADR), occupancies and revenue per available room (RevPAR) compared to the average of other hotels in their respective micro-markets and hotel segments. Chalet’s operational assets:
Source: Company RHP

Company introduction (Contd…): Portfolio of high-end, globally recognized, branded hotels:
Source: Company RHP
Hotel-led complementary mixed-use commercial and retail developments:
Source: Company RHP
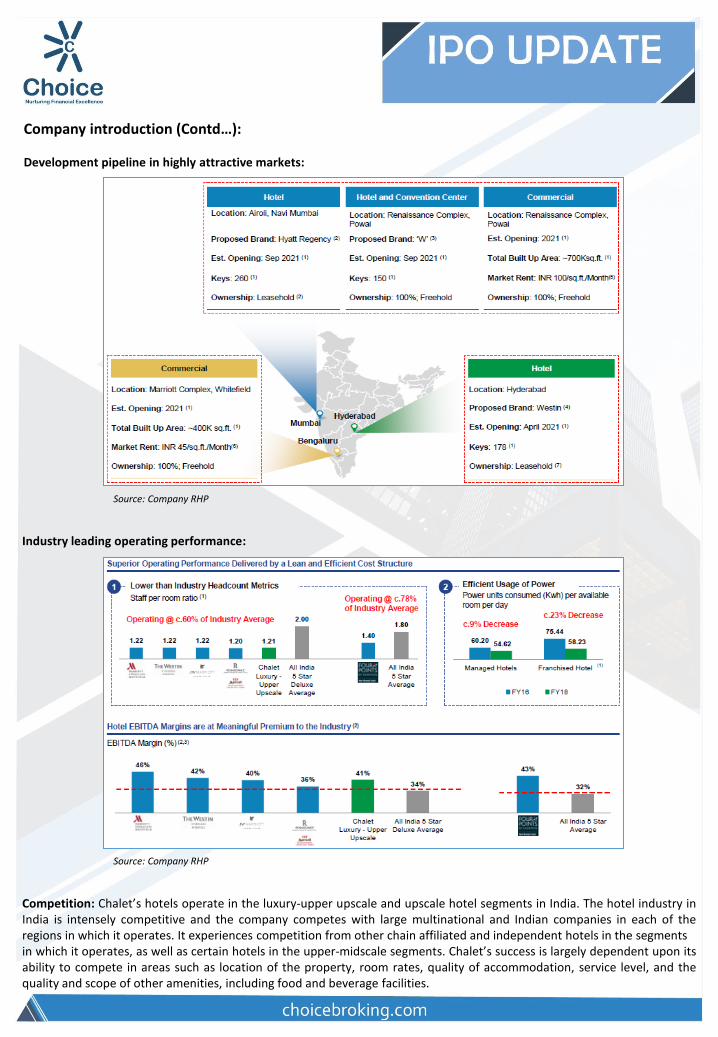
Company introduction (Contd…): Development pipeline in highly attractive markets:
Competition: Chalet’s hotels operate in the luxury-upper upscale and upscale hotel segments in India. The hotel industry in India is intensely competitive and the company competes with large multinational and Indian companies in each of the regions in which it operates. It experiences competition from other chain affiliated and independent hotels in the segments in which it operates, as well as certain hotels in the upper-midscale segments. Chalet’s success is largely dependent upon its ability to compete in areas such as location of the property, room rates, quality of accommodation, service level, and the quality and scope of other amenities, including food and beverage facilities.
Source: Company RHP
Industry leading operating performance:
Source: Company RHP

Company introduction (Contd…): Financial performance: On the back of increased rooms capacity and likely increase in the average daily rates over FY14-18, Chalet reported a 17.6% CAGR rise in consolidated operating revenue to Rs. 8,737.8mn in FY18. Business from the Hospitality segment (which contributed around an average 95% of total revenue over the period) increased by 19.3% CAGR. In H1 FY19, total revenue stood at Rs. 4,698.7mn, of which the business from the Hospitality segment stood at Rs. 4,244.2mn. Operating expenditure increased by 12.4% CAGR and stood at around an average of 75.6% of the revenue over FY16-18. Employee benefit and other expenses (which stood at 16.9% and 38.9%, respectively, of the operating revenue) increased by 17.5% each during FY14-18. As a result consolidated EBITDA increased by 32.7% CAGR to Rs. 2,944.2mn in FY18. EBITDA margin expanded from 20.7% in FY14 to 33.7% in FY18. H1 FY19 consolidated EBITDA stood at Rs. 1,067.8mn with a margin of 22.7%. Depreciation & amortization charges and finance cost increased by 17% and 11.5% CAGR, respectively, during the period. Consequently, for a period over FY14-16, the company was at a loss on pre-tax level, while in FY17 and FY18, it reported a pre-tax profit of Rs. 791.2mn and Rs. 211.9mn, respectively. Reported PAT was at loss over FY14-16, while on the back of tax credit - it stood at Rs. 1,342.2mn and Rs. 365.7mn in FY17 and FY18, respectively. Cash flow from operations was positive over FY14-18 (expect for FY15) with an average annual cash flow of Rs. 1.2-1.5bn. Average RoE over FY17-18 was around 17.9%. Average RoCE over FY14-18 was around 2.3%.
Source: Choice Equity Broking
FY14 FY15 FY16 FY17 FY18 H1 FY19 CAGR (%) Y-o-Y (%) Hospitality 4,141.4 4,293.9 5,644.3 6,806.9 8,394.9 4,244.2 19.3% 23.3% Retail & commercial: Lease Rent 7.1 7.7 114.2 166.4 119.2 45.6% Real Estate 434.8 104.6 77.4 111.4 102.1 284.6 -30.4% -8.4% Retail & Commercial 0.0 0.0 0.0 26.3 74.4 50.7 183.1% Revenue from Operations 4,576.2 4,405.6 5,729.4 7,058.8 8,737.8 4,698.7 17.6% 23.8% EBITDA 949.0 633.0 1,312.8 2,121.7 2,944.2 1,067.8 32.7% 38.8% Adjusted PAT (155.3) (1,181.3) (1,052.7) 1,342.2 365.7 (436.7)
Restated Adjusted EPS (0.8) (5.8) (5.1) 6.5 1.8 (2.1) -72.8%
Cash Flow from Operating Activities 932.8 (123.0) 793.4 2,012.2 2,489.1 1,486.9 27.8% 23.7% NOPLAT 277.6 13.8 220.0 1,298.1 1,166.8 346.5 43.2% -10.1% FCF (207.3) 75.2 4,190.1 (1,084.9) -125.9%
RoIC (%) 1.2% 0.1% 0.9% 4.8% 4.0% 1.2% 274 bps (86) bps
Revenue Growth Rate (%) -3.7% 30.0% 23.2% 23.8% EBITDA Growth Rate (%) -33.3% 107.4% 61.6% 38.8% EBITDA Margin (%) 20.7% 14.4% 22.9% 30.1% 33.7% 22.7% 1,296 bps 364 bps Adjusted PAT Growth Rate (%) 660.9% -10.9% -227.5% -72.8% Adjusted PAT Margin (%) -3.4% -26.8% -18.4% 19.0% 4.2% -9.3% 758 bps (1,483) bps
Inventories Turnover Ratio (x) 1.1 1.1 1.3 1.6 2.1 1.2 16.1% 25.9% Trade Receivable Turnover Ratio (x) 29.2 34.2 40.6 29.6 20.9 8.8 -8.0% -29.2% Accounts Payable Turnover Ratio (x) 7.8 7.4 9.2 9.4 10.2 5.8 7.2% 8.8% Fixed Asset Turnover Ratio (x) 0.2 0.2 0.2 0.2 0.3 0.2 5.7% 24.6% Total Asset Turnover Ratio (x) 0.1 0.1 0.2 0.2 0.2 0.1 11.9% 20.8%
Current Ratio (x) 1.6 1.2 1.2 0.8 1.2 1.2 -6.8% 42.9% Debt to Equity (x) 2.6 3.3 4.5 5.6 5.4 5.8 19.6% -3.0% Net Debt to EBITDA (x) 17.5 32.2 17.6 12.3 9.1 24.8 -14.9% -25.4%
RoE (%) -2.3% -18.6% -20.2% 28.5% 7.3% -9.3% 962 bps (2,121) bps RoA (%) -0.5% -3.4% -3.0% 3.6% 1.0% -1.2% 145 bps (264) bps RoCE (%) 1.5% 0.1% 1.2% 3.0% 5.8% 1.6% 433 bps 284 bps

© CHOICE INSTITUTIONAL RESEARCH
Competitive strengths: • High-end branded hotels strategically located in key metro cities of India • Active asset management model • Well positioned to benefit from industry trends • Experienced management team • Backed by leading Indian real estate developer
Business strategy:
• Focus on maximizing performance in existing portfolio through active asset management
• Disciplined development of assets in the current pipeline • Expand portfolio by way of opportunistic and accretive acquisitions • Maintain a sustainable capital structure and ensure prudent capital allocation • Opportunity for reflagging hotels or renegotiating hotel operation contracts
Risk and concerns:
• Slowdown in the economy • Adverse government regulations and policies • Seasonal business • Change in consumer demand • Inability to enter into a new contract or renew the existing hotel
operator post completion of term • Unexpected rise in land cost, and other cost related to the
operations of hotels • Competition

© CHOICE INSTITUTIONAL RESEARCH
Financial statements:
Source: Company RHP
Consolidated profit and loss statement (Rs. mn)
FY14 FY15 FY16 FY17 FY18 H1 FY19 CAGR over
FY14 - 18 (%) Annual Growth over FY17 (%)
Revenue from Operations 4,576.2 4,405.6 5,729.4 7,058.8 8,737.8 4,698.7 17.6% 23.8% Real Estate Development Costs (696.4) (350.0) (253.6) (208.0) (194.8) (316.8) -27.3% -6.3% Food and Beverages Consumed (409.0) (426.8) (603.9) (667.4) (765.7) (431.0) 17.0% 14.7% Operating Supplies Consumed (122.0) (306.0) (190.1) (218.4) (256.2) (118.5) 20.4% 17.3% Employee Benefits Expense (679.7) (861.8) (1,067.2) (1,188.3) (1,295.6) (726.9) 17.5% 9.0% Other Expenses (1,720.0) (1,828.0) (2,302.0) (2,655.1) (3,281.5) (2,037.7) 17.5% 23.6% EBITDA 949.0 633.0 1,312.8 2,121.7 2,944.2 1,067.8 32.7% 38.8% Depreciation and Amortization Expense (596.0) (617.7) (988.1) (1,269.8) (1,116.3) (569.3) 17.0% -12.1% EBIT 353.0 15.3 324.7 852.0 1,827.8 498.6 50.8% 114.5% Finance Costs (1,368.8) (1,605.7) (2,158.7) (2,179.6) (2,119.2) (1,398.7) 11.5% -2.8% Other Income 590.7 264.9 246.2 2,186.6 557.3 271.8 -1.4% -74.5% Exceptional Items (838.6) (82.6) (72.2) (67.8) (54.1) -49.6% -20.2% Share of Profit of Equity Accounted Investees (0.0) PBT (1,263.7) (1,408.1) (1,660.0) 791.2 211.9 (628.4) -73.2% Tax Expenses 269.9 144.2 535.1 483.2 99.7 191.7 -22.0% -79.4% Reported PAT (993.8) (1,263.9) (1,124.9) 1,274.4 311.6 (436.7) -75.5% Adjusted PAT (155.3) (1,181.3) (1,052.7) 1,342.2 365.7 (436.7)
Consolidated balance sheet statement (Rs. mn)
FY14 FY15 FY16 FY17 FY18 H1 FY19 CAGR over
FY14 - 18 (%) Annual Growth over FY17 (%)
Equity Share Capital 1,521.4 1,521.4 1,521.4 1,521.4 1,711.0 1,711.0 3.0% 12.5% Other Equity 5,124.9 4,840.3 3,690.7 3,190.3 3,312.7 2,963.4 -10.3% 3.8% Long Term Borrowings 16,178.0 18,907.8 20,923.2 23,111.3 25,618.9 25,698.9 12.2% 10.9% Other Financial Liabilities 15.4 26.6 53.0 119.0 151.8 115.8 77.2% 27.6% Long Term Provisions 36.8 51.2 55.7 57.6 38.1 43.0 0.9% -33.9% Deferred Tax Liabilities (Net) 1,018.2 1,201.6 1,078.7 699.2 592.2 621.1 -12.7% -15.3% Other Non Current Liabilities 21.2 28.1 33.7 32.8% Short Term Borrowings 1,414.5 1,807.7 2,583.2 3,247.5 1,634.2 1,195.1 3.7% -49.7% Trade Payables 589.4 598.7 651.9 846.7 858.8 804.7 9.9% 1.4% Other Current Financial Liabilities 422.0 781.7 418.5 432.6 294.2 358.0 -8.6% -32.0% Other Current Liabilities 3,955.1 3,493.3 3,333.9 2,984.6 3,101.8 2,860.6 -5.9% 3.9% Short Term Provisions 1,190.9 1,171.2 1,219.3 1,148.5 958.7 983.0 -5.3% -16.5% Total Liabilities 31,466.4 34,401.5 35,529.5 37,379.9 38,300.4 37,388.2 5.0% 2.5%
Property, Plant and Equipment 11,118.5 19,369.3 19,302.2 21,706.1 21,210.8 20,929.2 17.5% -2.3% Other Intangible Assets 6.3 40.9 37.9 29.8 18.5 12.4 31.2% -37.8% Capital Work-in-Progress 5,773.8 545.3 373.8 269.2 275.9 227.6 -53.2% 2.5% Investment Property 1,596.4 3,503.0 4,525.0 6,424.2 6,736.7 6,710.3 43.3% 4.9% Goodwill 36.7 36.7 36.6 226.1 226.1 226.1 57.6% 0.0% Long Term Investments 115.4 128.4 474.2 3.1 43.2 43.2 -21.8% 1301.6% Long Term Loans and Advances 156.4 110.8 117.2 105.5 114.1 101.7 -7.6% 8.1% Other Non Current Financial Assets 50.0 50.1 Deferred Tax Assets (Net) 407.4 448.6 834.2 981.8 952.3 1,174.9 23.7% -3.0% Other Non Current Assets 294.0 252.0 115.7 111.0 91.9 105.7 -25.2% -17.2% Non Current Tax Assets (Net) 81.6 165.6 213.6 339.0 463.0 458.0 54.3% 36.6% Inventories 4,021.1 4,290.5 4,330.7 4,264.0 4,189.0 3,975.0 1.0% -1.8% Trade Receivables 157.0 100.8 181.4 296.2 539.1 533.7 36.1% 82.0% Cash and Bank Balances 1,024.4 318.0 346.6 331.7 316.7 361.7 -25.4% -4.5% Short Term Loans and Advances 1,835.0 971.8 1,355.6 1,793.5 2,349.3 1,633.4 6.4% 31.0% Current Financial Assets 188.7 11.7 38.8 207.2 285.7 2.4% 434.2% Other Current Assets 307.7 344.2 414.5 460.0 516.6 559.6 13.8% 12.3% Assets Classified as Held for Sale 4,346.2 3,763.9 2,870.3 -100.0% Total Assets 31,466.4 34,401.5 35,529.5 37,379.9 38,300.4 37,388.2 5.0% 2.5%

© CHOICE INSTITUTIONAL RESEARCH
Financial statements:
Note: Ratios calculated on pre-issue data; Source: Company RHP
Consolidated cash flow statement (Rs. mn)
Particulars (Rs. mn) FY14 FY15 FY16 FY17 FY18 H1 FY19 CAGR over
FY14 - 18 (%) Annual Growth over FY17 (%)
Cash Flow Before Working Capital Changes 1,074.6 797.7 1,404.5 2,315.7 2,952.9 1,537.2 28.8% 27.5% Change in Working Capital (114.5) (835.9) (563.1) (236.3) (339.8) (55.2) 31.3% 43.8% Cash Flow from Operating Activities 932.8 (123.0) 793.4 2,012.2 2,489.1 1,486.9 27.8% 23.7% Purchase of Property , Plant & Equipment (2,905.9) (3,198.7) (1,788.9) (1,145.8) (622.1) (126.3) -32.0% -45.7% Cash Flow from Investing Activities (1,212.4) (1,896.0) (1,722.8) 3,249.4 (1,290.0) 643.2 1.6% -139.7% Cash Flow from Financing Activities (629.7) 1,490.0 530.4 (4,633.7) (1,566.8) (2,339.5) 25.6% -66.2%
Net Cash Flow (909.3) (528.9) (399.0) 627.9 (367.7) (209.3) -20.3% -158.6% Opening Balance of Cash and Bank Balances 1,310.7 381.5 (147.4) (548.5) 119.8 (138.0) -45.0% -121.8% Closing Balance of Cash and Bank Balances 381.5 (147.4) (548.5) 119.8 (138.0) (347.3) -215.2%
Consolidated financial ratios
Particulars (Rs. mn) FY14 FY15 FY16 FY17 FY18 H1 FY19
Revenue Growth Rate (%) -3.7% 30.0% 23.2% 23.8%
EBITDA Growth Rate (%) -33.3% 107.4% 61.6% 38.8%
EBITDA Margin (%) 20.7% 14.4% 22.9% 30.1% 33.7% 22.7%
EBIT Growth Rate (%) -95.7% 2017.9% 162.4% 114.5%
EBIT Margin (%) 7.7% 0.3% 5.7% 12.1% 20.9% 10.6%
Adjusted PAT Growth Rate (%) 660.9% -10.9% -227.5% -72.8%
Adjusted PAT Margin (%) -3.4% -26.8% -18.4% 19.0% 4.2% -9.3%
Liquidity ratios
Current Ratio 1.6 1.2 1.2 0.8 1.2 1.2
Debt Equity Ratio 2.6 3.3 4.5 5.6 5.4 5.8
Net Debt to EBITDA 17.5 32.2 17.6 12.3 9.1 24.8
Turnover ratios
Inventories Days 320.7 344.3 274.6 222.2 176.6
Debtor Days 12.5 10.7 9.0 12.3 17.4
Payable Days (47.0) (49.2) (39.8) (38.7) (35.6)
Cash Conversion Cycle 286.2 305.8 243.8 195.8 158.4
Fixed Asset Turnover Ratio (x) 0.2 0.2 0.2 0.2 0.3
Total Asset Turnover Ratio (x) 0.1 0.1 0.2 0.2 0.2
Return ratios
RoE (%) -2.3% -18.6% -20.2% 28.5% 7.3%
RoA (%) -0.5% -3.4% -3.0% 3.6% 1.0%
RoCE (%) 1.5% 0.1% 1.2% 3.0% 5.8%
Per share data
Restated Reported EPS (Rs.) (0.8) (5.8) (5.1) 6.5 1.8
Restated DPS (Rs.) 0.0 0.0 0.0 0.0 0.0
Restated BVPS (Rs.) 32.4 31.0 25.4 23.0 24.5
Restated Operating Cash Flow Per Share (Rs.) 4.5 (0.6) 3.9 9.8 12.1
Restated Free Cash Flow Per Share (Rs.) 0.0 (1.0) 0.4 20.4 (5.3)
Dividend Payout Ratio 0.0% 0.0% 0.0% 0.0% 0.0%

© CHOICE INSTITUTIONAL RESEARCH
Equity Research Team
Name Designation Email id Contact No.
Ajay Kejriwal President [email protected] 022 - 6707 9850
Sundar Bhagwandas Head of Research - Fundamental [email protected] 022 - 6707 9910
Sumeet Bagadia Head of Research - Technical [email protected] 022 - 6707 9830
Amit Singh VP - Institutional Sales [email protected] 022 - 6707 9530
Rajnath Yadav Research Analyst [email protected] 022 - 6707 9912
Satish Kumar Research Analyst [email protected] 022 - 6707 9913
Aman Lamba Research Associate [email protected] 022 - 6707 9917
Shrey Gandhi Research Associate [email protected] 022 - 6707 9914
Kkunal Parar Sr. Research Associate [email protected] 022 - 6707 9982
Sachin Gupta Research Associate [email protected] 022 - 6707 9978
Surendra Bhaskar Research Associate [email protected] 022 - 6707 9978
Palak Kothari Research Associate [email protected] 022 - 6707 9946
Sunand Subramaniam Sr. Research Analyst [email protected] 022 - 6707 9929
Sunil Rokade Research Analyst [email protected] 022 - 6707 9972
Harsha Sharma Research Analyst [email protected] 022 - 6707 9979
Karan Bhatt Research Advisor [email protected] 022 - 6707 9906
Diksha Mhatre Research Advisor [email protected] 022 - 6707 9933
Neeraj Dubey Research Advisor [email protected] 022 - 6707 9971
Disclaimer This is solely for information of clients of Choice Broking and does not construe to be an investment advice. It is also not intended as an offer or solicitation for the purchase and sale of any financial instruments. Any action taken by you on the basis of the information contained herein is your responsibility alone and Choice Broking its subsidiaries or its employees or associates will not be liable in any manner for the consequences of such action taken by you. We have exercised due diligence in checking the correctness and authenticity of the information contained in this recommendation, but Choice Broking or any of its subsidiaries or associates or employees shall not be in any way responsible for any loss or damage that may arise to any person from any inadvertent error in the information contained in this recommendation or any action taken on basis of this information. This report is based on the fundamental analysis with a view to forecast future price. The Research analysts for this report certifies that all of the views expressed in this report accurately reflect his or her personal views about the subject company or companies and its or their securities, and no part of his or her compensation was, is or will be, directly or indirectly related to specific recommendations or views expressed in this report. Choice Broking has based this document on information obtained from sources it believes to be reliable but which it has not independently verified; Choice Broking makes no guarantee, representation or warranty and accepts no responsibility or liability as to its accuracy or completeness. The opinions contained within the report are based upon publicly available information at the time of publication and are subject to change without notice. The information and any disclosures provided herein are in summary form and have been prepared for informational purposes. The recommendations and suggested price levels are intended purely for stock market investment purposes. The recommendations are valid for the day of the report and will remain valid till the target period. The information and any disclosures provided herein may be considered confidential. Any use, distribution, modification, copying, forwarding or disclosure by any person is strictly prohibited. The information and any disclosures provided herein do not constitute a solicitation or offer to purchase or sell any security or other financial product or instrument. The current performance may be unaudited. Past performance does not guarantee future returns. There can be no assurance that investments will achieve any targeted rates of return, and there is no guarantee against the loss of your entire investment.
POTENTIAL CONFLICT OF INTEREST DISCLOSURE (as on date of report) Disclosure of interest statement – • Analyst interest of the stock /Instrument(s): - No. • Firm interest of the stock / Instrument (s): - No.
+91-022-6707 9999 +91-022-6707 9959 www.choicebroking.in
Choice Equity Broking Pvt. Ltd. Choice House, Shree Shakambhari Corporate Park, Plot No: -156-158,
J.B. Nagar, Andheri (East), Mumbai - 400 099.


![Home] [Current Edition] [Compendium] [Forum] [Web Archive] [Email Archive] [Guestbook] [Subscribe] [Advertising Rates] Developing E-banking Capabilities in a Ghanaian Bank: Preliminary](https://static.fdokumen.com/doc/165x107/631b5b84d5372c006e03e7f7/home-current-edition-compendium-forum-web-archive-email-archive-guestbook.jpg)