Louisiana Algebra 1 Skills Workshop - Caddo Math Department
432
Louisiana Algebra 1 Skills Workshop STUDENT EDITION
-
Upload
khangminh22 -
Category
Documents
-
view
32 -
download
0
Transcript of Louisiana Algebra 1 Skills Workshop - Caddo Math Department

Louisiana Algebra 1 Skills Workshop
S T U D E N T E D I T I O N

ii
PART 1 Developing Algebra Skills
Unit 1 Getting Ready: Operations with Fractions � � � � � � � � � � � � � � � � � � � � � � � � � � � � � � � � � � � � � � � � � � � � � � � � � � 1
Getting Ready: Exponents � � � � � � � � � � � � � � � � � � � � � � � � � � � � � � � � � � � � � � � � � � � � � � � � � � � � � � � � � � � � 4
Getting Ready: Operations with Mixed Numbers � � � � � � � � � � � � � � � � � � � � � � � � � � � � � � � � � � � � � � � � � � � � � 5
Getting Ready: Integers � � � � � � � � � � � � � � � � � � � � � � � � � � � � � � � � � � � � � � � � � � � � � � � � � � � � � � � � � � � � � 7
Getting Ready: Decimals � � � � � � � � � � � � � � � � � � � � � � � � � � � � � � � � � � � � � � � � � � � � � � � � � � � � � � � � � � � � 11
Getting Ready: Solving One-Step Equations � � � � � � � � � � � � � � � � � � � � � � � � � � � � � � � � � � � � � � � � � � � � � � � 14
Getting Ready: Simplifying Expressions � � � � � � � � � � � � � � � � � � � � � � � � � � � � � � � � � � � � � � � � � � � � � � � � � � 15
Getting Ready: Venn Diagrams � � � � � � � � � � � � � � � � � � � � � � � � � � � � � � � � � � � � � � � � � � � � � � � � � � � � � � � � 16
Mini-Lesson: Solving Equations using Algebra Tiles � � � � � � � � � � � � � � � � � � � � � � � � � � � � � � � � � � � � � � � � � � 18
Mini-Lesson: Solving Equations using Flowcharts � � � � � � � � � � � � � � � � � � � � � � � � � � � � � � � � � � � � � � � � � � � 20
Mini-Lesson: Properties of Real Numbers � � � � � � � � � � � � � � � � � � � � � � � � � � � � � � � � � � � � � � � � � � � � � � � � � 22
Mini-Lesson:ConnecttoBusiness—Profit,Revenue,andCost � � � � � � � � � � � � � � � � � � � � � � � � � � � � � � � � � � � 24
Mini-Lesson: Verifying Solutions to Inequalities � � � � � � � � � � � � � � � � � � � � � � � � � � � � � � � � � � � � � � � � � � � � � 25
Mini-Lesson: Solution Set Notation � � � � � � � � � � � � � � � � � � � � � � � � � � � � � � � � � � � � � � � � � � � � � � � � � � � � � 26
Additional Unit 1 Practice � � � � � � � � � � � � � � � � � � � � � � � � � � � � � � � � � � � � � � � � � � � � � � � � � � � � � � � � � � � 27
Unit 2 Getting Ready: Patterns � � � � � � � � � � � � � � � � � � � � � � � � � � � � � � � � � � � � � � � � � � � � � � � � � � � � � � � � � � � � 38
Getting Ready: Inequalities � � � � � � � � � � � � � � � � � � � � � � � � � � � � � � � � � � � � � � � � � � � � � � � � � � � � � � � � � � 39
Getting Ready: Evaluating Expressions � � � � � � � � � � � � � � � � � � � � � � � � � � � � � � � � � � � � � � � � � � � � � � � � � � 43
Getting Ready: Coordinate Plane � � � � � � � � � � � � � � � � � � � � � � � � � � � � � � � � � � � � � � � � � � � � � � � � � � � � � � 44
Getting Ready: Representing Data with an Equation � � � � � � � � � � � � � � � � � � � � � � � � � � � � � � � � � � � � � � � � � � 49
Getting Ready: Algebraic Equations � � � � � � � � � � � � � � � � � � � � � � � � � � � � � � � � � � � � � � � � � � � � � � � � � � � � 50
Mini-Lesson: Slope-Intercept Form � � � � � � � � � � � � � � � � � � � � � � � � � � � � � � � � � � � � � � � � � � � � � � � � � � � � � 53
Mini-Lesson: Point-Slope Form � � � � � � � � � � � � � � � � � � � � � � � � � � � � � � � � � � � � � � � � � � � � � � � � � � � � � � � � 54
Mini-Lesson: Point-Slope Form Given Two Points � � � � � � � � � � � � � � � � � � � � � � � � � � � � � � � � � � � � � � � � � � � � 55
Mini-Lesson: Standard Form � � � � � � � � � � � � � � � � � � � � � � � � � � � � � � � � � � � � � � � � � � � � � � � � � � � � � � � � � 56
Additional Unit 2 Practice � � � � � � � � � � � � � � � � � � � � � � � � � � � � � � � � � � � � � � � � � � � � � � � � � � � � � � � � � � � 58
Unit 3 Getting Ready: Linear Data � � � � � � � � � � � � � � � � � � � � � � � � � � � � � � � � � � � � � � � � � � � � � � � � � � � � � � � � � � 88
Getting Ready: Writing an Equation for Data � � � � � � � � � � � � � � � � � � � � � � � � � � � � � � � � � � � � � � � � � � � � � � � 91
Getting Ready: Linear Relationships � � � � � � � � � � � � � � � � � � � � � � � � � � � � � � � � � � � � � � � � � � � � � � � � � � � � 93
Getting Ready: Graphing Linear Equations � � � � � � � � � � � � � � � � � � � � � � � � � � � � � � � � � � � � � � � � � � � � � � � � 99
Getting Ready: Solutions of Linear Inequalities in Two Variables � � � � � � � � � � � � � � � � � � � � � � � � � � � � � � � � � 104
Getting Ready: Graphing Compound Inequalities � � � � � � � � � � � � � � � � � � � � � � � � � � � � � � � � � � � � � � � � � � � 105
Table of Contents

iii
Getting Ready: Functions with a Constant Rate of Change� � � � � � � � � � � � � � � � � � � � � � � � � � � � � � � � � � � � � 106
Mini-Lesson: Using Graphing Calculators to Solve Systems of Equations � � � � � � � � � � � � � � � � � � � � � � � � � � � 109
Additional Unit 3 Practice � � � � � � � � � � � � � � � � � � � � � � � � � � � � � � � � � � � � � � � � � � � � � � � � � � � � � � � � � � 110
Unit 4 Getting Ready: Factoring � � � � � � � � � � � � � � � � � � � � � � � � � � � � � � � � � � � � � � � � � � � � � � � � � � � � � � � � � � � 126
Getting Ready: Exponential Expressions � � � � � � � � � � � � � � � � � � � � � � � � � � � � � � � � � � � � � � � � � � � � � � � � 129
Getting Ready: Distributive Property � � � � � � � � � � � � � � � � � � � � � � � � � � � � � � � � � � � � � � � � � � � � � � � � � � � 130
Getting Ready: Linear Relationships in Tables � � � � � � � � � � � � � � � � � � � � � � � � � � � � � � � � � � � � � � � � � � � � � 131
Getting Ready: Linear Equations and Their Graphs � � � � � � � � � � � � � � � � � � � � � � � � � � � � � � � � � � � � � � � � � � 132
Getting Ready: Ratio � � � � � � � � � � � � � � � � � � � � � � � � � � � � � � � � � � � � � � � � � � � � � � � � � � � � � � � � � � � � � � 136
Getting Ready: Real Numbers � � � � � � � � � � � � � � � � � � � � � � � � � � � � � � � � � � � � � � � � � � � � � � � � � � � � � � � � 140
Getting Ready: Operations with Fractions � � � � � � � � � � � � � � � � � � � � � � � � � � � � � � � � � � � � � � � � � � � � � � � � 143
Mini-Lesson: Using Prime Factorization to Simplify Square Roots � � � � � � � � � � � � � � � � � � � � � � � � � � � � � � � � 146
Mini-Lesson: Subtracting Polynomials Using Algebra Tiles � � � � � � � � � � � � � � � � � � � � � � � � � � � � � � � � � � � � 147
Mini-Lesson: Greatest Common Factor of Monomials � � � � � � � � � � � � � � � � � � � � � � � � � � � � � � � � � � � � � � � � 149
Mini-Lesson: Dividing Out Common Factors � � � � � � � � � � � � � � � � � � � � � � � � � � � � � � � � � � � � � � � � � � � � � � 151
Mini-Lesson: Least Common Multiple � � � � � � � � � � � � � � � � � � � � � � � � � � � � � � � � � � � � � � � � � � � � � � � � � � 153
Additional Unit 4 Practice � � � � � � � � � � � � � � � � � � � � � � � � � � � � � � � � � � � � � � � � � � � � � � � � � � � � � � � � � � 155
Unit 5 Getting Ready: Multiply Polynomial Expressions � � � � � � � � � � � � � � � � � � � � � � � � � � � � � � � � � � � � � � � � � � � 183
Getting Ready: Factoring Polynomial Expressions � � � � � � � � � � � � � � � � � � � � � � � � � � � � � � � � � � � � � � � � � � 185
Getting Ready: Evaluating Functions � � � � � � � � � � � � � � � � � � � � � � � � � � � � � � � � � � � � � � � � � � � � � � � � � � � 189
Getting Ready: Solving Equations � � � � � � � � � � � � � � � � � � � � � � � � � � � � � � � � � � � � � � � � � � � � � � � � � � � � � 190
Getting Ready: Solving Inequalities � � � � � � � � � � � � � � � � � � � � � � � � � � � � � � � � � � � � � � � � � � � � � � � � � � � � 191
Getting Ready: Linear Equations and Their Graphs � � � � � � � � � � � � � � � � � � � � � � � � � � � � � � � � � � � � � � � � � � 192
Getting Ready: Interpreting Graphs of Linear Functions � � � � � � � � � � � � � � � � � � � � � � � � � � � � � � � � � � � � � � 196
Mini-Lesson: Identifying Quadratic Functions � � � � � � � � � � � � � � � � � � � � � � � � � � � � � � � � � � � � � � � � � � � � � 197
Mini-Lesson: Using a Graphic Organizer to Complete the Square � � � � � � � � � � � � � � � � � � � � � � � � � � � � � � � � 198
Mini-Lesson: Simplifying Radicals � � � � � � � � � � � � � � � � � � � � � � � � � � � � � � � � � � � � � � � � � � � � � � � � � � � � � 200
Mini-Lesson: Quadratic Regression � � � � � � � � � � � � � � � � � � � � � � � � � � � � � � � � � � � � � � � � � � � � � � � � � � � � 201
Mini-Lesson: Solving a Quadratic Equation by Graphing � � � � � � � � � � � � � � � � � � � � � � � � � � � � � � � � � � � � � � 202
Additional Unit 5 Practice � � � � � � � � � � � � � � � � � � � � � � � � � � � � � � � � � � � � � � � � � � � � � � � � � � � � � � � � � � 203
Unit 6 Getting Ready: Estimating a Trend Line � � � � � � � � � � � � � � � � � � � � � � � � � � � � � � � � � � � � � � � � � � � � � � � � � 227
Getting Ready: Interpreting Slope in Context � � � � � � � � � � � � � � � � � � � � � � � � � � � � � � � � � � � � � � � � � � � � � 229
Getting Ready: Determining Missing Values in Two-Way Tables � � � � � � � � � � � � � � � � � � � � � � � � � � � � � � � � � 230
Getting Ready: Determining Row/Column Percentages in Two-Way Tables � � � � � � � � � � � � � � � � � � � � � � � � � � 232
GettingReady:Mean,Median,Mode � � � � � � � � � � � � � � � � � � � � � � � � � � � � � � � � � � � � � � � � � � � � � � � � � � � 234
Getting Ready: Constructing a Graph for Univariate Data � � � � � � � � � � � � � � � � � � � � � � � � � � � � � � � � � � � � � 237

iv
Getting Ready: The Shape of the Distribution of Data � � � � � � � � � � � � � � � � � � � � � � � � � � � � � � � � � � � � � � � � 238
Mini-Lesson: Measures of Central Tendency � � � � � � � � � � � � � � � � � � � � � � � � � � � � � � � � � � � � � � � � � � � � � � 239
Additional Unit 6 Practice � � � � � � � � � � � � � � � � � � � � � � � � � � � � � � � � � � � � � � � � � � � � � � � � � � � � � � � � � � 243
PART 2 Building Foundational Skills
Fractions, Decimals, and Percents Convert Fractions to Decimals � � � � � � � � � � � � � � � � � � � � � � � � � � � � � � � � � � � � � � � � � � � � � � � � � � � � � � � 268
Decimals and Percents � � � � � � � � � � � � � � � � � � � � � � � � � � � � � � � � � � � � � � � � � � � � � � � � � � � � � � � � � � � � 272
Determine Equivalent Fractions � � � � � � � � � � � � � � � � � � � � � � � � � � � � � � � � � � � � � � � � � � � � � � � � � � � � � � 273
Equivalent Forms of Numbers � � � � � � � � � � � � � � � � � � � � � � � � � � � � � � � � � � � � � � � � � � � � � � � � � � � � � � � 275
Equivalent Fractions � � � � � � � � � � � � � � � � � � � � � � � � � � � � � � � � � � � � � � � � � � � � � � � � � � � � � � � � � � � � � � 276
Fractions,Decimals,andPercents � � � � � � � � � � � � � � � � � � � � � � � � � � � � � � � � � � � � � � � � � � � � � � � � � � � � 279
Modeling Fractions � � � � � � � � � � � � � � � � � � � � � � � � � � � � � � � � � � � � � � � � � � � � � � � � � � � � � � � � � � � � � � 283
Multiplying with Decimals and Percents � � � � � � � � � � � � � � � � � � � � � � � � � � � � � � � � � � � � � � � � � � � � � � � � � 285
Operations with Decimals � � � � � � � � � � � � � � � � � � � � � � � � � � � � � � � � � � � � � � � � � � � � � � � � � � � � � � � � � � 287
Operations with Decimals and Percents � � � � � � � � � � � � � � � � � � � � � � � � � � � � � � � � � � � � � � � � � � � � � � � � � 290
Operations with Fractions � � � � � � � � � � � � � � � � � � � � � � � � � � � � � � � � � � � � � � � � � � � � � � � � � � � � � � � � � � 292
Representation of Fractions � � � � � � � � � � � � � � � � � � � � � � � � � � � � � � � � � � � � � � � � � � � � � � � � � � � � � � � � � 295
Operations with Numbers Absolute Value � � � � � � � � � � � � � � � � � � � � � � � � � � � � � � � � � � � � � � � � � � � � � � � � � � � � � � � � � � � � � � � � � 296
Adding and Subtracting Mixed Numbers � � � � � � � � � � � � � � � � � � � � � � � � � � � � � � � � � � � � � � � � � � � � � � � � 297
Calculations with Integers � � � � � � � � � � � � � � � � � � � � � � � � � � � � � � � � � � � � � � � � � � � � � � � � � � � � � � � � � � 298
Divisibility Rules � � � � � � � � � � � � � � � � � � � � � � � � � � � � � � � � � � � � � � � � � � � � � � � � � � � � � � � � � � � � � � � � 300
Operations with Numbers � � � � � � � � � � � � � � � � � � � � � � � � � � � � � � � � � � � � � � � � � � � � � � � � � � � � � � � � � � 301
Operations with Rational Numbers � � � � � � � � � � � � � � � � � � � � � � � � � � � � � � � � � � � � � � � � � � � � � � � � � � � � 303
Rounding � � � � � � � � � � � � � � � � � � � � � � � � � � � � � � � � � � � � � � � � � � � � � � � � � � � � � � � � � � � � � � � � � � � � � 307
Properties of Numbers Opposites� � � � � � � � � � � � � � � � � � � � � � � � � � � � � � � � � � � � � � � � � � � � � � � � � � � � � � � � � � � � � � � � � � � � � 310
Properties of Addition and Multiplication � � � � � � � � � � � � � � � � � � � � � � � � � � � � � � � � � � � � � � � � � � � � � � � � 312
Properties of Numbers � � � � � � � � � � � � � � � � � � � � � � � � � � � � � � � � � � � � � � � � � � � � � � � � � � � � � � � � � � � � 315
Properties of Whole Numbers � � � � � � � � � � � � � � � � � � � � � � � � � � � � � � � � � � � � � � � � � � � � � � � � � � � � � � � 316
Classifying and Ordering Numbers Classifying Sets of Numbers � � � � � � � � � � � � � � � � � � � � � � � � � � � � � � � � � � � � � � � � � � � � � � � � � � � � � � � � 319
Integers � � � � � � � � � � � � � � � � � � � � � � � � � � � � � � � � � � � � � � � � � � � � � � � � � � � � � � � � � � � � � � � � � � � � � � 321
Ordering Fractions and Decimals � � � � � � � � � � � � � � � � � � � � � � � � � � � � � � � � � � � � � � � � � � � � � � � � � � � � � 322
Ordering Rational Numbers � � � � � � � � � � � � � � � � � � � � � � � � � � � � � � � � � � � � � � � � � � � � � � � � � � � � � � � � � 324
Ordering Whole Numbers � � � � � � � � � � � � � � � � � � � � � � � � � � � � � � � � � � � � � � � � � � � � � � � � � � � � � � � � � � 328

v
Proportional Reasoning Conversion Factor � � � � � � � � � � � � � � � � � � � � � � � � � � � � � � � � � � � � � � � � � � � � � � � � � � � � � � � � � � � � � � � 329
Equivalent Ratios � � � � � � � � � � � � � � � � � � � � � � � � � � � � � � � � � � � � � � � � � � � � � � � � � � � � � � � � � � � � � � � � 330
Ratio and Proportion � � � � � � � � � � � � � � � � � � � � � � � � � � � � � � � � � � � � � � � � � � � � � � � � � � � � � � � � � � � � � 331
Ratios � � � � � � � � � � � � � � � � � � � � � � � � � � � � � � � � � � � � � � � � � � � � � � � � � � � � � � � � � � � � � � � � � � � � � � � 332
Ratios,Tables,andGraphs � � � � � � � � � � � � � � � � � � � � � � � � � � � � � � � � � � � � � � � � � � � � � � � � � � � � � � � � � � 333
Understanding Ratios � � � � � � � � � � � � � � � � � � � � � � � � � � � � � � � � � � � � � � � � � � � � � � � � � � � � � � � � � � � � � 335
Arithmetic and Algebraic Expressions Algebraic Expressions � � � � � � � � � � � � � � � � � � � � � � � � � � � � � � � � � � � � � � � � � � � � � � � � � � � � � � � � � � � � 336
Computations with Numbers � � � � � � � � � � � � � � � � � � � � � � � � � � � � � � � � � � � � � � � � � � � � � � � � � � � � � � � � 338
Create Visual Representations � � � � � � � � � � � � � � � � � � � � � � � � � � � � � � � � � � � � � � � � � � � � � � � � � � � � � � � 340
Evaluating Algebraic Expressions � � � � � � � � � � � � � � � � � � � � � � � � � � � � � � � � � � � � � � � � � � � � � � � � � � � � � 342
Exponential Expressions and Equations � � � � � � � � � � � � � � � � � � � � � � � � � � � � � � � � � � � � � � � � � � � � � � � � � 344
Expressions and Equations � � � � � � � � � � � � � � � � � � � � � � � � � � � � � � � � � � � � � � � � � � � � � � � � � � � � � � � � � 347
Solving Equations More Bags and Cubes to Solve Equations � � � � � � � � � � � � � � � � � � � � � � � � � � � � � � � � � � � � � � � � � � � � � � � � 349
Solving Equations � � � � � � � � � � � � � � � � � � � � � � � � � � � � � � � � � � � � � � � � � � � � � � � � � � � � � � � � � � � � � � � 351
Solving Equations using Bags and Cubes � � � � � � � � � � � � � � � � � � � � � � � � � � � � � � � � � � � � � � � � � � � � � � � � 352
Solving One-Step Equations � � � � � � � � � � � � � � � � � � � � � � � � � � � � � � � � � � � � � � � � � � � � � � � � � � � � � � � � 354
Ordered Pairs and Linear Equations Coordinate Plane � � � � � � � � � � � � � � � � � � � � � � � � � � � � � � � � � � � � � � � � � � � � � � � � � � � � � � � � � � � � � � � � 356
Finding Slope Given a Table or a Graph � � � � � � � � � � � � � � � � � � � � � � � � � � � � � � � � � � � � � � � � � � � � � � � � � 359
Linear Equations: Slope-Intercept Form � � � � � � � � � � � � � � � � � � � � � � � � � � � � � � � � � � � � � � � � � � � � � � � � � 361
Representations of Linear Relationships � � � � � � � � � � � � � � � � � � � � � � � � � � � � � � � � � � � � � � � � � � � � � � � � 363
Geometric Figures Classifying Geometric Figures � � � � � � � � � � � � � � � � � � � � � � � � � � � � � � � � � � � � � � � � � � � � � � � � � � � � � � � 367
Classifying Triangles � � � � � � � � � � � � � � � � � � � � � � � � � � � � � � � � � � � � � � � � � � � � � � � � � � � � � � � � � � � � � 372
Similar Triangles � � � � � � � � � � � � � � � � � � � � � � � � � � � � � � � � � � � � � � � � � � � � � � � � � � � � � � � � � � � � � � � � 374
Two-Dimensional Figures � � � � � � � � � � � � � � � � � � � � � � � � � � � � � � � � � � � � � � � � � � � � � � � � � � � � � � � � � � 376
Perimeter, Area, Volume, and Circumference Area of Figures � � � � � � � � � � � � � � � � � � � � � � � � � � � � � � � � � � � � � � � � � � � � � � � � � � � � � � � � � � � � � � � � � 379
Perimeter � � � � � � � � � � � � � � � � � � � � � � � � � � � � � � � � � � � � � � � � � � � � � � � � � � � � � � � � � � � � � � � � � � � � � 381
Pi: The Ratio of the Circumference of a Circle to the Diameter � � � � � � � � � � � � � � � � � � � � � � � � � � � � � � � � � � 383
Prisms,Pyramids,Cylinders,andCones � � � � � � � � � � � � � � � � � � � � � � � � � � � � � � � � � � � � � � � � � � � � � � � � � 385
Measures of Center and Spread Finding the Average � � � � � � � � � � � � � � � � � � � � � � � � � � � � � � � � � � � � � � � � � � � � � � � � � � � � � � � � � � � � � � 390
Mean Absolute Deviation � � � � � � � � � � � � � � � � � � � � � � � � � � � � � � � � � � � � � � � � � � � � � � � � � � � � � � � � � � 391
Mean and Median of Data � � � � � � � � � � � � � � � � � � � � � � � � � � � � � � � � � � � � � � � � � � � � � � � � � � � � � � � � � � 393

vi
Quartiles and IQR � � � � � � � � � � � � � � � � � � � � � � � � � � � � � � � � � � � � � � � � � � � � � � � � � � � � � � � � � � � � � � � � 395
Summary Statistics � � � � � � � � � � � � � � � � � � � � � � � � � � � � � � � � � � � � � � � � � � � � � � � � � � � � � � � � � � � � � � 397
Data Distributions Box Plots � � � � � � � � � � � � � � � � � � � � � � � � � � � � � � � � � � � � � � � � � � � � � � � � � � � � � � � � � � � � � � � � � � � � � 400
Constructing a Bar Chart � � � � � � � � � � � � � � � � � � � � � � � � � � � � � � � � � � � � � � � � � � � � � � � � � � � � � � � � � � � 402
Data Displays � � � � � � � � � � � � � � � � � � � � � � � � � � � � � � � � � � � � � � � � � � � � � � � � � � � � � � � � � � � � � � � � � � 404
Dot Plots � � � � � � � � � � � � � � � � � � � � � � � � � � � � � � � � � � � � � � � � � � � � � � � � � � � � � � � � � � � � � � � � � � � � � 408
Types of Graphs � � � � � � � � � � � � � � � � � � � � � � � � � � � � � � � � � � � � � � � � � � � � � � � � � � � � � � � � � � � � � � � � 409
PART 3 Extending the Major Work
Functions Determining Asymptotic Restrictions � � � � � � � � � � � � � � � � � � � � � � � � � � � � � � � � � � � � � � � � � � � � � � � � � � 411
Function Composition Notation � � � � � � � � � � � � � � � � � � � � � � � � � � � � � � � � � � � � � � � � � � � � � � � � � � � � � � 414
Function Operations � � � � � � � � � � � � � � � � � � � � � � � � � � � � � � � � � � � � � � � � � � � � � � � � � � � � � � � � � � � � � � 415
Transforming Functions � � � � � � � � � � � � � � � � � � � � � � � � � � � � � � � � � � � � � � � � � � � � � � � � � � � � � � � � � � � 416
Writing and Graphing Functions � � � � � � � � � � � � � � � � � � � � � � � � � � � � � � � � � � � � � � � � � � � � � � � � � � � � � � 419
Quadratic Functions and Equations Finding Zeros of Functions � � � � � � � � � � � � � � � � � � � � � � � � � � � � � � � � � � � � � � � � � � � � � � � � � � � � � � � � � 424
Interpreting Features of Functions � � � � � � � � � � � � � � � � � � � � � � � � � � � � � � � � � � � � � � � � � � � � � � � � � � � � 426
Quadratic Formula � � � � � � � � � � � � � � � � � � � � � � � � � � � � � � � � � � � � � � � � � � � � � � � � � � � � � � � � � � � � � � � 428
Rewriting a Quadratic Function by Completing the Square � � � � � � � � � � � � � � � � � � � � � � � � � � � � � � � � � � � � 430
Writing Equations for Parabolas � � � � � � � � � � � � � � � � � � � � � � � � � � � � � � � � � � � � � � � � � � � � � � � � � � � � � � 433
Exponents and Exponential Functions Compounding Periods and Finding Time � � � � � � � � � � � � � � � � � � � � � � � � � � � � � � � � � � � � � � � � � � � � � � � � 438
Exponential Expressions � � � � � � � � � � � � � � � � � � � � � � � � � � � � � � � � � � � � � � � � � � � � � � � � � � � � � � � � � � � 440
Exponential Growth and Decay � � � � � � � � � � � � � � � � � � � � � � � � � � � � � � � � � � � � � � � � � � � � � � � � � � � � � � � 441
Properties of Exponents � � � � � � � � � � � � � � � � � � � � � � � � � � � � � � � � � � � � � � � � � � � � � � � � � � � � � � � � � � � 444
Absolute Value Functions Reflectionsoverthex-axis � � � � � � � � � � � � � � � � � � � � � � � � � � � � � � � � � � � � � � � � � � � � � � � � � � � � � � � � � � 448
Transforming the Absolute Value Parent Function � � � � � � � � � � � � � � � � � � � � � � � � � � � � � � � � � � � � � � � � � � 449
Translating Linear and Absolute Value Parent Functions � � � � � � � � � � � � � � � � � � � � � � � � � � � � � � � � � � � � � � 454
Vertical Translations and Vertical Stretch/Shrink � � � � � � � � � � � � � � � � � � � � � � � � � � � � � � � � � � � � � � � � � � � 457
Polynomials Factoring Higher-Level Polynomials � � � � � � � � � � � � � � � � � � � � � � � � � � � � � � � � � � � � � � � � � � � � � � � � � � � 458
Factoring Polynomials � � � � � � � � � � � � � � � � � � � � � � � � � � � � � � � � � � � � � � � � � � � � � � � � � � � � � � � � � � � � 459
Sequences and Series Partial Sums of Geometric Series � � � � � � � � � � � � � � � � � � � � � � � � � � � � � � � � � � � � � � � � � � � � � � � � � � � � � 463
SecondDifferences � � � � � � � � � � � � � � � � � � � � � � � � � � � � � � � � � � � � � � � � � � � � � � � � � � � � � � � � � � � � � � 465

vii
Khan AcademyKhan Academy offers instructional videos, practice problems, and missions that support the study of Algebra.
SpringBoard Activity Khan Academy Links
Activity 1
Intro to dimensional analysis • Writing expressions with variables • Writing expressions with variables & parentheses • Evaluating an expression with one variable • Evaluating expressions with variables: temperature Khan Academy Practice: Introduction to algebra
Activity 2
Same thing to both sides of equations • Why we do the same thing to both sides: Variables on both sides • Representing a relationship with an equation • One-step equations intuition • One-step division equation • One-step multiplication equations • One-step subtraction equations • Simple equations: examples solving a variety of forms • Intro to two-step equations • One-step addition & subtraction equations • Dividing both sides of an equation • Two-step equations intuition • Intro to equations with variables on both sides • Equations with parentheses • Worked example: number of solutions to equations • Number of solutions to equations • Manipulating formulas: area • Solving an equation for a variable Khan Academy Practice: Solving basic equations & inequalities
Activity 3
One-step inequality word problem • One-step inequality involving addition • Inequalities using addition and subtraction • One-step inequalities examples • One-step inequalities: –5c ≤ 15 • Two-step inequality word problems: apples • Two-step inequalities • Multi-step inequalities • Compound inequalities examples Khan Academy Practice: Solving basic equations & inequalities
Activity 4
Intro to absolute value equations and graphs • Worked example: absolute value equations with no solution • Intro to absolute value inequalities Khan Academy Practice: Absolute value equations, functions, & inequalities
Activity 5
What is a function? • Relations and functions • Recognizing functions from verbal description • Domain and range of a function • What is the domain of a function? • What is the range of a function? Khan Academy Practice: Functions
Activity 6
Worked example: domain and range from graph • Recognizing functions from graph • Testing if a relationship is a function • Interpreting a graph example Khan Academy Practice: Linear equations, functions, & graphs
Activity 7Exponential function graph • Interpreting a graph example Khan Academy Practice: Linear equations, functions, & graphs
Activity 8Shifting functions • Graphing shifted functions Khan Academy Practice: Functions
Activity 9Worked example: slope from graph • Positive & negative slope • Slope (more examples) Khan Academy Practice: Linear equations, functions, & graphs
Activity 10Intro to direct & inverse variation • Direct variation word problem: space travel • Intro to inverse functions Khan Academy Practice: Linear equations, functions, & graphs
Activity 11Intro to arithmetic sequences • Sequences intro Khan Academy Practice: Sequences
Activity 12
Modeling with linear equations: gym membership and lemonade • Graph from slope-intercept equation • Converting to slope-intercept form • Slope-intercept form from a table • Slope-intercept equation from graph • Graphing using intercepts • x-intercept of a line • Intercepts from a table • Slope-intercept equation from slope & point • Slope-intercept equation from two points • Writing linear equations in all forms Khan Academy Practice: Linear equations, functions, & graphs
Activity 13
Constructing a scatter plot • Correlation and causality • Fitting a line to data • Comparing models to fit data • Estimating the line of best fit exercise • Interpreting a trend line Khan Academy Practice: Describing relationships in quantitative data
Activity 14Introduction to piecewise functions • Piecewise function graphs • Evaluate piecewise functions Khan Academy Practice: Functions
Activity 15
Modeling with linear equations: snow • Two-step equation word problem: oranges • Graphing a linear equation: y = 2x +7 • Linear graphs word problems • Linear function example: spending money Khan Academy Practice: Functions
http://www.khanacademy.org/math/algebra/linear_inequalities/inequalities/v/interpreting-inequalities
http://www.khanacademy.org/math/algebra/linear_inequalities/inequalities/v/interpreting-inequalities

viii
SpringBoard Activity Khan Academy Videos
Activity 16Intro to graphing two-variable inequalities • Solving and graphing linear inequalities Khan Academy Practice: Two-variable inequalities
Activity 17
Systems of equations with graphing • Systems of equations with graphing: y = 7/5 x 5 & 3/5 x - 1 • Systems of equations with graphing: 5x + 3y = 7 & 3x - 2y = 8 • Systems of equations with graphing: chores • Systems of equations with substitution: y = -1/4x + 100 & y = -1/4x + 120 • Systems of equations with substitution: -3x - 4y = -2 & y = 2x - 5 • Systems of equations with elimination: TV & DVD • Systems of equations with elimination: 6x - 6y= -24 & -5x - 5y= -60 • Systems of equations number of solutions: fruit prices (1 of 2) • Systems of equations number of solutions: fruit prices (2 of 2) • Forming systems of equations with different numbers of solutions • Number of solutions to a system of equations graphically • Solutions to systems of equations: consistent vs. inconsistent • Solutions to systems of equations: dependent vs. independent Khan Academy Practice: System of equations
Activity 18
Testing solutions to systems of inequalities • Intro to graphing systems of inequalities • Graphing systems of inequalities Khan Academy Practice: Two-variable inequalities
Activity 19
Exponent properties 1 • Exponent properties 2 • Thinking more about negative exponents • More negative exponent intuition • Exponent properties with parentheses Khan Academy Practice: Exponential & logarithmic functions
Activity 20
Simplifying radical expressions (subtraction) • Simplifying cube root expressions • Simplifying radical expressions: three variables Khan Academy Practice: Exponential & logarithmic functions
Activity 21 Intro to geometric sequences Khan Academy Practice: Sequences
Activity 22
Exponential function graph • Intro to exponential functions • Linear vs. exponential growth • Writing exponential functions from tables Khan Academy Practice: Exponential & logarithmic functions
Activity 23
Compound interest introduction • Exponential growth & decay word problems • Constructing exponential models • Modeling with basic exponential functions word problem Khan Academy Practice: Exponential & logarithmic functions
Activity 24
The parts of polynomial expressions • Adding polynomials • Subtracting polynomials • Subtracting polynomials: two variables • Subtracting polynomials with multiple variables Khan Academy Practice: Polynomial expressions, equations, & functions
Activity 25
Multiplying binomials by polynomials • Polynomial word problem: area of a window • Squaring binomials of the form (ax + b)² • Squaring a binomial • More examples of special products • Special products of the form (ax + b)(ax – b) Khan Academy Practice: Polynomial expressions, equations, & functions
Activity 26
Factoring with the distributive property • Factoring polynomials: common factor • Solving quadratic equations by factoring • Factoring perfect squares Khan Academy Practice: Polynomial expressions, equations, & functions
Activity 27
More examples of factoring quadratics as (x + a)(x + b) • Factoring quadratics as (x + a)(x + b) (example 2) • Factoring quadratics with common factor Khan Academy Practice: Polynomial expressions, equations, & functions
Activity 28Intro to rational expression simplification Khan Academy Practice: Rational expressions, equations, & functions
Activity 29Graphing quadratics: standard form • Graphing quadratics: vertex form Khan Academy Practice: Quadratic equations & functions
Activity 30Intro to parabola transformations • Forms & features of quadratic functions Khan Academy Practice: Quadratic equations & functions
Activity 31Vertex & axis of symmetry of a parabola Khan Academy Practice: Quadratic equations & functions
ix
SpringBoard Activity Khan Academy Videos
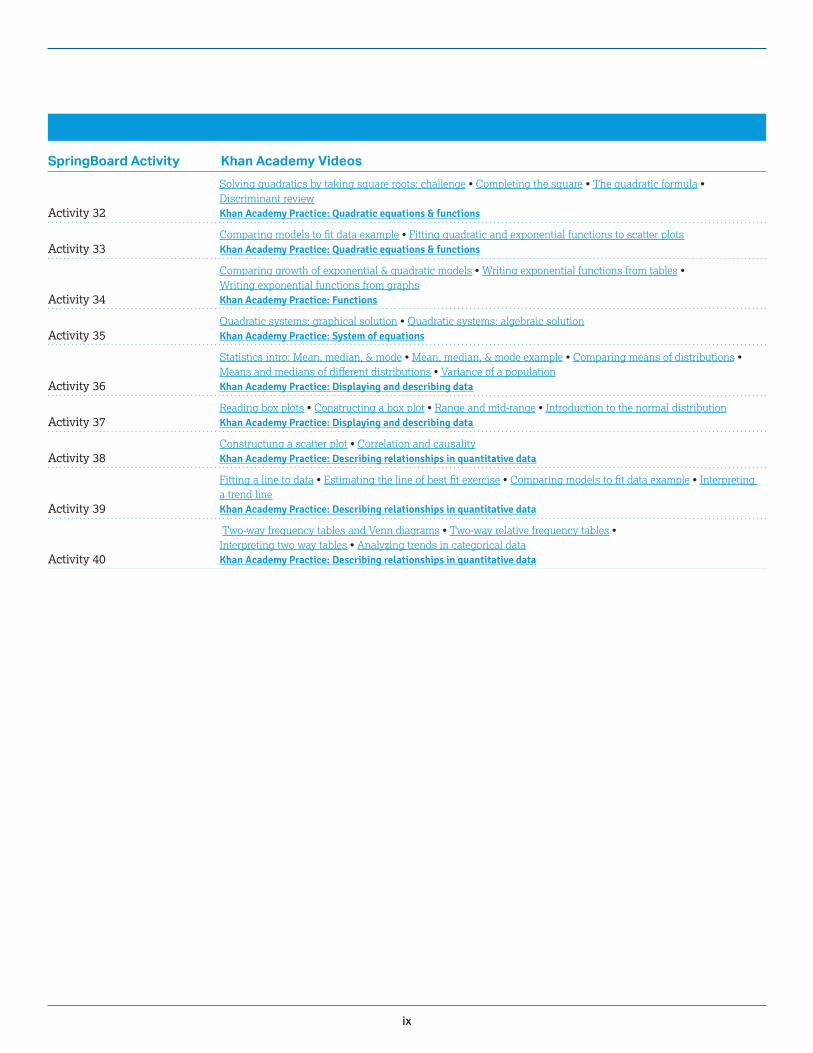
Activity 32
Solving quadratics by taking square roots: challenge • Completing the square • The quadratic formula • Discriminant review Khan Academy Practice: Quadratic equations & functions
Activity 33Comparing models to fit data example • Fitting quadratic and exponential functions to scatter plots Khan Academy Practice: Quadratic equations & functions
Activity 34
Comparing growth of exponential & quadratic models • Writing exponential functions from tables • Writing exponential functions from graphs Khan Academy Practice: Functions
Activity 35Quadratic systems: graphical solution • Quadratic systems: algebraic solution Khan Academy Practice: System of equations
Activity 36
Statistics intro: Mean, median, & mode • Mean, median, & mode example • Comparing means of distributions • Means and medians of different distributions • Variance of a population Khan Academy Practice: Displaying and describing data
Activity 37Reading box plots • Constructing a box plot • Range and mid-range • Introduction to the normal distribution Khan Academy Practice: Displaying and describing data
Activity 38Constructung a scatter plot • Correlation and causality Khan Academy Practice: Describing relationships in quantitative data
Activity 39
Fitting a line to data • Estimating the line of best fit exercise • Comparing models to fit data example • Interpreting a trend line Khan Academy Practice: Describing relationships in quantitative data
Activity 40
Two-way frequency tables and Venn diagrams • Two-way relative frequency tables • Interpreting two way tables • Analyzing trends in categorical data Khan Academy Practice: Describing relationships in quantitative data

NAME CLASS DATE
SpringBoard Louisiana Algebra 1 Skills Workshop Unit 1 • Getting Ready 1
Operations with FractionsFractions and mixed numbers are often used to make measurements. Chefs add and multiply fractions and mixed numbers to determine how much of each ingredient to use. Carpenters subtract and divide fractions and mixed numbers as they cut lumber.To add fractions and mixed numbers, the denominators must be the same. If denominators are not the same, first write equivalent fractions with like denominators. Add the numerators while keeping the denominator the same. Regroup to simplify if possible.
Melanie needs 34
cup of strawberries and 13
cup of blueberries for a smoothie
recipe. How many cups of berries does she need in all?
Step 1: Use the least common denominator (LCD) of 12 to write an
equivalent fraction for 34
and 14
.
Step 2: Rewrite the addition problem using the fractions with like denominators..
Step 3: Add the numerators and convert the improper fraction to a mixed number.
Solution: Melanie needs 1 112
cups of berries for her recipe.
34
3 34 3
912
⋅⋅
5 5
13
1 43 4
412
⋅⋅
5 5
912
412
1
912
412
9 412
1312
1 112
1 51
5 5
EXAMPLE A
Mrs. Perkins bought 5 78
pounds of apples and 412
pounds of bananas.
How many pounds of fruit did Mrs. Perkins buy altogether?
Step 1: Use the LCD to write equivalent fractions with like denominators.
Step 2: Write an equivalent mixed number for 412
using the LCD of 8.
Step 3: Add the whole-number parts of 5 78
and 4 48
.
Step 4: Add the numerators of the fractions.
Step 5: Add the sum of the whole-number parts and the sum of the fractions.
Solution: Mrs. Perkins bought 10 38
pounds of fruit.
The LCD of 78 and
12 is 8.
EXAMPLE B
4 12
4 48
5 4 978
48
118
9 118
9 88
38
10 38
5
1 5
1 5
1 5 1 1 5
4 12
4 48
5 4 978
48
118
9 118
9 88
38
10 38
5
1 5
1 5
1 5 1 1 5
4 12
4 48
5 4 978
48
118
9 118
9 88
38
10 38
5
1 5
1 5
1 5 1 1 5
4 12
4 48
5 4 978
48
118
9 118
9 88
38
10 38
5
1 5
1 5
1 5 1 1 5

Unit 1 • Getting ReadySpringBoard Louisiana Algebra 1 Skills Workshop 2
Operations with Fractions (continued)
To subtract fractions and mixed numbers, the denominators must be the same. If denominators are not the same, write equivalent fractions using the LCD. Subtract the numerators and keep the denominators the same. When subtracting mixed numbers, it may be necessary to rename more than once in order to subtract.
Allen has 423 yards of wire. He uses 2 3
4 yards of wire for a project. How many yards of wire
does he have left?
Step 1: Find the LCD of 4 23
and 2 34.
Step 2: Write equivalent mixed numbers using fractions with denominators of 12.
Step 3: There are not enough twelfths to subtract, so regroup one
whole of 4 812
as 1212
.
Step 4: Subtract the numerators of the fractions.
Step 5: Subtract the whole numbers.
Step 6: Add the differences.
Solution: Allen has 11112
yards of wire left.
The LCD of 423 and 2
34 is 12.
4 23
4 812
5 2 34
2 912
5
4 812
3 1212
812
3 2012
1 5 1 1 5
2012
912
20 912
1112
2 52
5
3 2 12 5
1 1112
11112
1 5
EXAMPLE C
To multiply with fractions and mixed numbers, first convert any mixed numbers to improper fractions. Simplify the terms, if possible. Next, multiply the numerators and then multiply the denominators. If necessary, convert the improper fraction back to a mixed number.
One batch of chocolate chip cookies calls for 23
teaspoon of salt. How many teaspoons
of salt would Monique need for 4 12 batches of cookies?
Step 1: Convert 4 12
to an improper fraction.
Step 2: Before multiplying, cancel out common factors.
Step 3: Multiply the numerators and then multiply the denominators.
Solution: Monique would need 3 teaspoons of salt for 4 12
batches of cookies.
4 12
82
12
92
1 5 1 5
23
92
1
1
3
1⋅
23
92
11
31
31
1
3
1⋅ ⋅5 5
EXAMPLE D

Unit 1 • Getting ReadySpringBoard Louisiana Algebra 1 Skills Workshop 3
Operations with Fractions (continued)
To divide with fractions and mixed numbers, first convert any mixed numbers or whole numbers to improper fractions. Then multiply the first fraction by the reciprocal of the second fraction. Simplify if possible.
Raul is cutting a board that measures 12 34
inches into pieces that are 2 18
inches
long. How many pieces will Raul have when he finishes?
Step 1: Convert both mixed numbers to improper fractions.
Step 2: Multiply the first fraction by the reciprocal of the second fraction.
The reciprocal of 178
is 817
.
Step 3: Simplify by cancelling out the common factors. Then multiply.
Solution: There will be 6 pieces after Raul is done cutting.
12 34
484
34
514
2 18
168
18
178
5 1 5
5 1 5
514
178
514
817
⋅4 5
514
817
3 21 1
61
63
1
2
1
⋅⋅
3 5 5 5
EXAMPLE E
PRACTICEFind the sum, difference, product, or quotient. Write your answers in simplest form.
1. 45
16
1
2. 58
310
2
3. 5 23
1 34
1
4. 4 14
3 35
2 5. 78
29
⋅
6. 13
38
4
7. 2 12
3 712
⋅ 8. 5 38
56
4
9. 7 49
3 18
2
10. Jerry has a length of rope that he wants to cut into 5 equal pieces.
If the rope is 2178
feet long, how long should he cut each piece? Explain your steps.
11. Paul said that ⋅315
2 38
6 340
5 . Is Paul correct? Explain your answer.
12. Hitomi, Ben, and Gayle bought 3 pumpkins that weighed 15 56
pounds altogether. Ben and
Gayle’s pumpkins each weighed the same amount.
Hitomi’s pumpkin weighed 613
pounds. How much did Gayle’s pumpkin weigh?
Explain your steps.

NAME CLASS DATE
Unit 1 • Getting ReadySpringBoard Louisiana Algebra 1 Skills Workshop 4
ExponentsAn exponent is used to indicate repeated multiplication of a number.53 means to multiply 3 factors of 5.53 5 5 3 5 3 5 5 125Many mathematical expressions contain exponents. The order of operations is used to simplify such expressions.
Find the value of each expression.
a. 32 3 10
b. 62 3 32
c. 8 1 43
d. 285 2 72
Step 1: For these expressions, evaluate the exponent first.
Step 2: Carry out any other operations.
Solution: a. 32 3 10 5 (3 3 3) 3 10 5 9 3 10 5 90
b. 62 3 32 5 36 3 9 5 324
c. 8 1 43 5 8 1 64 5 72
d. 285 2 72 5 285 2 49 5 236
EXAMPLE
PRACTICEFind value of each expression.
1. 62 3 22 2. 92 3 4 3. 52 3 2
4. 83 1 270 5. 25 2 16 6. 42 1 23
7. 103 4 10 8. 12 3 35 9. 112 3 2
10. 102 4 52 11. 33 3 8 12. 11 3 43
13. 92 1 22 14. 7 3 92 15. 104 2 5000
NAME CLASS DATE
Unit 1 • Getting ReadySpringBoard Louisiana Algebra 1 Skills Workshop 5
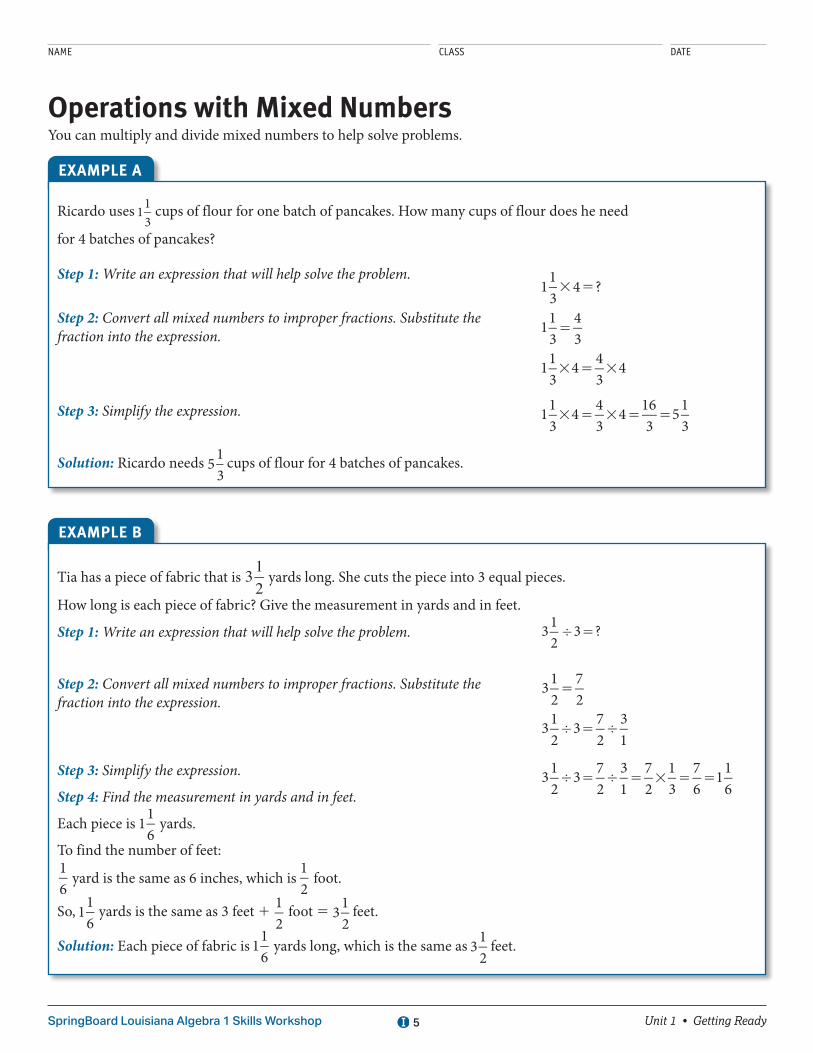
Operations with Mixed NumbersYou can multiply and divide mixed numbers to help solve problems.
Ricardo uses 113
cups of flour for one batch of pancakes. How many cups of flour does he need
for 4 batches of pancakes?
Step 1: Write an expression that will help solve the problem.
Step 2: Convert all mixed numbers to improper fractions. Substitute the fraction into the expression.
Step 3: Simplify the expression.
Solution: Ricardo needs 513 cups of flour for 4 batches of pancakes.
113
4 ?3 5
5
3 5 3
113
43
113
4 43
4
3 5 3 5 5113
4 43
4 163
513
EXAMPLE A
Tia has a piece of fabric that is 312
yards long. She cuts the piece into 3 equal pieces.
How long is each piece of fabric? Give the measurement in yards and in feet.
Step 1: Write an expression that will help solve the problem.
Step 2: Convert all mixed numbers to improper fractions. Substitute the fraction into the expression.
Step 3: Simplify the expression.
Step 4: Find the measurement in yards and in feet.
Each piece is 116
yards.
To find the number of feet:16
yard is the same as 6 inches, which is 12
foot.
So, 116
yards is the same as 3 feet 1 12
foot 5 312
feet.
Solution: Each piece of fabric is 116
yards long, which is the same as 312
feet.
4 5312
3 ?
5
4 5 4
312
72
312
3 72
31
4 5 4 5 3 5 5312
3 72
31
72
13
76
116
EXAMPLE B

Unit 1 • Getting ReadySpringBoard Louisiana Algebra 1 Skills Workshop 6
Operations with Mixed Numbers (continued)
PRACTICESolve each problem.
1. One board is 2 23
feet long. How long are 6 boards of the same length?
2. The average weight of a hardcover book of a certain size is 114
pounds. What is the average
weight of 9 books? Give the weight in pounds and in ounces.
3. Maria uses 1 34
cups of sugar for making 1 batch of muffins. How many cups of sugar does
she need for 3 batches of muffins?
4. Jenna has a piece of fabric that is 212 yards long. She cuts the piece into 5 equal pieces. How
long is each piece of fabric? Give the measurement in yards and in feet.
5. Jon has a board that is 512
feet long. He cuts the board into 3 equal pieces. How long is each
piece of fabric? Give the measurement in feet and in inches.

NAME CLASS DATE
Unit 1 • Getting ReadySpringBoard Louisiana Algebra 1 Skills Workshop 7
IntegersIntegers are the set of natural numbers, their opposites, and zero. You use integers to record scores for miniature golf or to track seasonal temperatures. Pilots use integers to determine elevation changes. In football, integers are used to show yardage gains and losses. In accounting, integers are used to show profits and losses.You can use a number line to locate integers. Integers to the left of 0 are negative and integers to the right of 0 are positive. To add a positive number on a number line, you move to the right. To add a negative number, you move to the left.
Addition of Integers with Like Signs Examples
(Positive) 1 (Positive) 5 (Positive)
54321025 24 23 22 21
2 1 3 5 5
(Negative) 1 (Negative) 5 (Negative)
54321025 24 23 22 21
22 1 (23) 5 25
A diver was at an elevation of 210 feet. She descended 5 more feet. What is the diver’s elevation now?
Step 1: Write the expression to represent the situation.
Step 2: Locate 210 on the number line.
Step 3: Move 5 units to the left.
Solution: The diver is now at 215 feet.
210 1 (25)
216 215214213212211210 29 28 27 26 25
216 215214213212211210 29 28 27 26 25
EXAMPLE A
When adding a positive integer and a negative integer, the sum could be positive or negative, depending on the addends. The number with the greater absolute value will determine the sign. Absolute value is the distance from 0 on a number line.
Addition of Integers with Unlike Signs Examples
54321025 24 23 22 21
54321025 24 23 22 21
3 1 (22) 5 1⎜3⎜ . ⎜22⎜, so the sum is positive.
54321025 24 23 22 21
54321025 24 23 22 21
23 1 (2) 5 21⎜23⎜ . ⎜2⎜, so the sum is negative.

Unit 1 • Getting ReadySpringBoard Louisiana Algebra 1 Skills Workshop 8
Integers (continued)
Bill is playing miniature golf. He shot 12, or 2 above par, in his first game and 23, or 3 below par, in his second game. What is Bill’s score after two games?
Step 1: Write the expression to represent the situation.
Step 2: Locate 2 on the number line.
Step 3: Move 3 units to the left.
Solution: Bill’s score after two games is 21, or 1 below par.
2 1 (23)
54321025 24 23 22 21
54321025 24 23 22 21
EXAMPLE B
To subtract an integer, add its opposite.
Subtraction of Integers Examples
54321025 24 23 22 21
54321025 24 23 22 21
1 2 (22) 5 1 1 2 5 3To subtract 22, add the opposite of 22.
54321025 24 23 22 21
54321025 24 23 22 21
22 2 1 5 22 1 (21) 5 23To subtract 1, add the opposite of 1.
The record high temperature for Alaska is 100°F. The record low temperature is 280°F. What is the difference between the high and low temperatures?
Step 1: Write the expression to represent the situation.
Step 2: Rewrite the expression to show adding the opposite of 280.
Step 3: Find the sum.
Solution: The difference in Alaska’s high and low temperatures is 180°F.
100 2 (280)
100 1 80
180
EXAMPLE C
When multiplying integers, multiply as you would with whole numbers. Then use the rules below to determine the sign of the product. If the signs are the same, the product is positive. If the signs are different, the product is negative.
Rules for Multiplying Integers Examples
Positive 3 Positive 5 Positive 3 3 4 5 12Negative 3 Negative 5 Positive (23) 3 (24) 5 12Positive 3 Negative 5 Negative 3 3 (24) 5 212Negative 3 Positive 5 Negative (23) 3 4 5 212

Unit 1 • Getting ReadySpringBoard Louisiana Algebra 1 Skills Workshop 9
Jamal is standing at sea level on a canyon rim. He descends into the canyon at a rate of 10 feet per second. What will be Jamal’s elevation in 60 seconds?
Step 1: Write the expression to represent the situation.
Step 2: Multiply as you would with whole numbers.
Step 3: The factors have unlike signs, so the product is negative.
Solution: Jamal’s elevation will be 2600 feet in 60 seconds.
60 3 (210)
60 3 10 5 600
2600
EXAMPLE D
As with multiplication, when dividing integers, divide as you would with whole numbers. Then use rules similar to the rules for multiplying integers to determine the sign of the quotient. If the signs are the same, the quotient is positive. If the signs are different, the quotient is negative.
The Spartans football team lost 24 yards in the last 3 plays. What was the average number of yards per play?
Step 1: Write the expression to represent the situation.
Step 2: Divide as you would with whole numbers.
Step 3: The dividend and divisor have unlike signs so the quotient is negative.
Solution: The Spartans averaged 28 yards per play.
224 4 3
24 4 3 5 8
28
EXAMPLE E
To compare and order integer expressions, find the value of each expression. Then compare the integers. You can use a number line to help.
Order expressions a, b, and c below from greatest to least. a. 22 3 3 b. 2 (22) c. 23 1 2
Step 1: Find the value of each expression.
Step 2: Locate each value on a number line.
Step 3: Order the integers from greatest to least.
Solution: The expressions ordered from greatest to least are: b, c, a
a. 22 3 3 5 26
b. 3 2 (22) 5 5
c. 23 1 2 5 21
5 6 743210
a c b
27 26 25 24 23 22 21
EXAMPLE F
Integers (continued)
5, 21, 26

Unit 1 • Getting ReadySpringBoard Louisiana Algebra 1 Skills Workshop 10
Integers (continued)
PRACTICEEvaluate each expression.
1. 5 1 (27) 2. 210 2 (26) 3. 28 3 2 4. 218 4 23 5. 29 3 23 6. 32 4 24
7. Order expressions a, b, and c from least to greatest. a. 28 1 9 b. 8 2 (29) c. 28 2 9
8. Which expression is greatest? Justify your answer. a. 4 3 25 b. 25 1 4 c. 24 2 (25)
9. On an arcade game, Connor got the 100-point bonus 5 times and the 150-point penalty 3 times. If he started with 200 points, how many points does he have now? Explain how you found your answer.
NAME CLASS DATE
Unit 1 • Getting ReadySpringBoard Louisiana Algebra 1 Skills Workshop 11
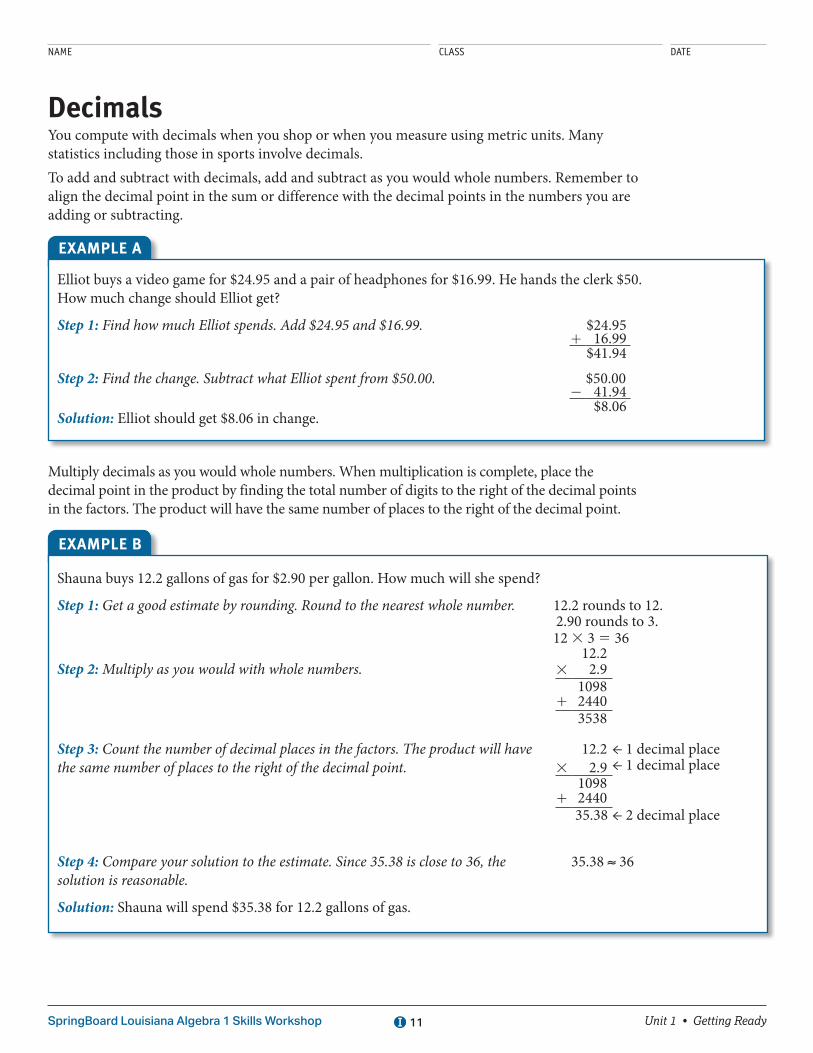
DecimalsYou compute with decimals when you shop or when you measure using metric units. Many statistics including those in sports involve decimals.To add and subtract with decimals, add and subtract as you would whole numbers. Remember to align the decimal point in the sum or difference with the decimal points in the numbers you are adding or subtracting.
Elliot buys a video game for $24.95 and a pair of headphones for $16.99. He hands the clerk $50. How much change should Elliot get?
Step 1: Find how much Elliot spends. Add $24.95 and $16.99. $24.951 16.99
$41.94
Step 2: Find the change. Subtract what Elliot spent from $50.00. $50.002 41.94
$8.06Solution: Elliot should get $8.06 in change.
EXAMPLE A
Multiply decimals as you would whole numbers. When multiplication is complete, place the decimal point in the product by finding the total number of digits to the right of the decimal points in the factors. The product will have the same number of places to the right of the decimal point.
Shauna buys 12.2 gallons of gas for $2.90 per gallon. How much will she spend?
Step 1: Get a good estimate by rounding. Round to the nearest whole number. 12.2 rounds to 12. 2.90 rounds to 3. 12 3 3 5 36
12.2Step 2: Multiply as you would with whole numbers. 3 2.9
10981 2440
3538
Step 3: Count the number of decimal places in the factors. The product will have the same number of places to the right of the decimal point. 3
12.22.9
← 1 decimal place← 1 decimal place
10981 2440 35.38 ← 2 decimal place
Step 4: Compare your solution to the estimate. Since 35.38 is close to 36, the solution is reasonable.
35.38 ≈ 36
Solution: Shauna will spend $35.38 for 12.2 gallons of gas.
EXAMPLE B

Unit 1 • Getting ReadySpringBoard Louisiana Algebra 1 Skills Workshop 12
Decimals (continued)
You can use the distributive property to multiply with decimals. The distributive property states that to multiply a sum by a number, you can multiply each addend by the number and add the products.
Multiply 10.4 3 4.8 using the distributive property.
Step 1: Break one of the decimals into a sum using addition.
Step 2: Rewrite the expression.
Step 3: Multiply inside each set of parentheses.
Step 4: Add the products.
Solution: 10.4 3 4.8 5 49.92
10.4 3 4.8 5 (10 1 0.4) 3 4.8
5 (10 3 4.8) 1 (0.4 3 4.8)
5 48 1 1.92
5 49.92
EXAMPLE C
To divide a decimal by a whole number, place the decimal point in the quotient directly above the decimal point in the dividend. Then divide as you would whole numbers.One difference in division with decimals is that you may have to write zeros in the dividend so that you have enough digits to divide.
Darby is hiking 6.8 kilometers. She will stop 8 times along her route. If her stops are equally spaced, how far will she hike before her first rest stop?
Step 1: Place the decimal point in the quotient directly above the decimal point in the dividend.
Step 2: Because 6 , 8, the quotient will be less than 1, so place a 0 before the decimal point in the quotient.
Step 3: Divide as you would with whole numbers. Add one or more zeros after the decimal point in the dividend and divide until the decimal in the quotient terminates.
Solution: Darby will hike 0.85 kilometer before her first rest stop.
EXAMPLE D
8 6.8.
8 6.80.
0
8 6.8026 4
40240
0.85

Unit 1 • Getting ReadySpringBoard Louisiana Algebra 1 Skills Workshop 13
To divide by a decimal, you must first write an equivalent expression with a whole-number divisor. To do this, multiply both the dividend and divisor by a power of 10 (10, 100, 1,000, . . .) that will make the divisor a whole number.
Jill earns $9.50 per hour for walking her neighbors’ dogs. Last week, she earned $114. For how many hours did Jill walk the dogs last week?
Step 1: The divisor has 1 decimal place. So, multiply 9.5 by 10 to make a whole-number divisor. You must also multiply the dividend by 10.
$114 4 9.5$114 3 10 9.5 3 10 1140 4 95
Step 2: Divide.
Solution: Jill walked the dogs for 12 hours last week.
EXAMPLE E
PRACTICEFind each sum, difference, product, or quotient.
1. 29.38 1 5.7 2. 3.08 1 0.72 1 0.5 3. 11.5 2 6.03 4. 0.31 2 0.009 5. 77 3 1.36 6. 0.37 3 1.2 7. 1.048 4 4 8. 75 4 0.6 9. 70.2 4 3.9
10. Kayla is going to Japan for vacation. She will exchange $300 for Japanese yen. The exchange rate is $1 5 85.74 yen. How many yen will Kayla receive?
11. When you multiply one decimal greater than 1 by one decimal less than one, how does the product compare to the factors? Illustrate with an example.
12. Mr. Alquist has 448.2 kilograms of clay. Each student needs 5.5 kilograms of clay for the art project. How many students can Mr. Alquist provide with clay?
13. Jorge bought 3 shirts and 2 pairs of pants. Each shirt cost $21.50 and each pair of pants cost $34.45. If he had $145 in his wallet, how much money will he have left after paying for his clothes? Show your work and explain your answer.
95 1140295 1902190
0
12
Decimals (continued)

NAME CLASS DATE
Unit 1 • Getting ReadySpringBoard Louisiana Algebra 1 Skills Workshop 14
Solving One-Step EquationsOne-step equations only need one step to solve them.
Solve the equation.
x 1 5 5 12Step 1: Subtract 5 from both sides.
x 1 5 5 12 25 25x 5 7Solution: x 5 7 is the solution of the equation.
EXAMPLE A
Solve the equation.
x 2 8 5 30Step 1: Add 8 to both sides.
x 2 8 5 30 18 18x 5 38Solution: x 5 38 is the solution of the equation.
EXAMPLE B
Solve the equation.
5x 5 125Step 1: Divide both sides by 5.x5
5125
55
x 5 25 Solution: x 5 25 is the solution of the equation.
EXAMPLE C
Solve the equation.
x6
35
Step 1: Multiply both sides by 6.
( )
x66
6 35
x 5 18Solution: x 5 18 is the solution of the equation.
EXAMPLE D
PRACTICESolve each equation.
1. x 1 4 5 20 2. x 1 9 5 42 3. x 1 5 5 12
4. x 2 11 5 50 5. x 2 10 5 60 6. x 2 4 5 9
7. 4x 5 24 8. 9x 5 81 9. 7x 5 105
10. x9
45 11. x2
125 12. x8
65

NAME CLASS DATE
Unit 1 • Getting ReadySpringBoard Louisiana Algebra 1 Skills Workshop 15
Simplifying ExpressionsSimplifying algebraic expressions involves combining like terms. Like terms are terms that have the same variable parts raised to the same power. For example, 3x and 27x are like terms. Numbers are like terms. Like terms can be added and subtracted so that expressions may be simplified.Combining like terms uses the Distributive Property: a(b 1 c) 5 ab 1 bc. This property is used to factor out the variable part and then to add or subtract the coefficients. Once the coefficients are combined, the expression has been simplified.
Simplify the expression: 3t 1 8t.
Step 1: Use the Distributive Property to factor out the variable t.
Step 2: Add the coefficients.
Solution: 3t 1 8t 5 11t
3t 1 8t 5 (3 1 8)t
3t 1 8t 5 (3 1 8)t 5 11t
EXAMPLE A
Simplify the expression: 23.4x 2 5.7x 1 4.
Step 1: Use the Distributive Property to factor out x.
Step 2: Subtract the coefficients of x.
Solution: 23.4x 2 5.7x 1 4 5 29.1x 1 4
23.4x 2 5.7x 1 4 5 (23.4 2 5.7)x 1 4
23.4x 2 5.7x 1 4 5 (23.4 2 5.7)x 1 4 5 29.1x 1 4
EXAMPLE B
PRACTICESimplify each expression.
1. 5y 1 7y 2. 29.2w 1 3w 3. 11x 2 2.5x
4. 6r 1 8r 5. s 2 3s 2 2 6. 12x 1 12x
7. 2 7v 2 2v 8. r 1 r 9. 8f 1 5f 1 7
10. 8 1 2y 2 6.3y 11. 27c 2 8c 12. 4k 2 8k

NAME CLASS DATE
Unit 1 • Getting ReadySpringBoard Louisiana Algebra 1 Skills Workshop 16
Venn DiagramsYou can use a Venn diagram to organize data sets and show the relationship between the sets. For example, a Venn diagram could display the number of people who have been president, vice president, or both. You may see a Venn diagram used to display data in a magazine or newspaper article. In a Venn diagram, each data set is shown as a separate circle. The circles in a Venn diagram may or may not overlap. If the circles overlap, the overlapping section shows items that belong to both sets. Items that are outside of the circles do not belong to either set.
The Venn diagram shows the students, labeled A through M, in Mr. Garcia’s class who play sports and video games. How many students in Mr. Garcia’s class play video games?
AB
E C
D
JF
IG
H
L M
K
Students whoplay sports
Students who playvideo games
Step 1: Count the number of students in the part of the “Students who play video games” circle who play only video games.
Step 2: Count the number of students in the overlapping section, which shows students who play both sports and video games.
Step 3: Add the numbers of students you counted.
Solution: There are 6 students in Mr. Garcia’s class that play video games.
Letters F, G, H, and I are in that circle. There are 4 students.
Letters J and K are in the overlapping section. There are 2 students.
4 1 2 5 6
EXAMPLE A
A Venn diagram may also show only the total number of items in each of the sets.
The Venn diagram shows the number of students from Mrs. Leahy’s class that have cell phones and digital cameras. How many students do not have cell phones? 12
3
Digitalcamera
6
CellPhone
4
Step 1: Identify the sections that represent students that do not have cell phones.
• outside both circles
• the “Digital Camera” circle minus the overlapping part
Step 2: Add the numbers in these sections. 3 1 6 5 9
Solution: There are 9 students that do not have cell phones.
EXAMPLE B

Unit 1 • Getting ReadySpringBoard Louisiana Algebra 1 Skills Workshop 17
Venn Diagrams (continued)
You can make a Venn diagram to organize data.
Make a Venn diagram to show which integers from 210 to 10 are odd numbers and which are factors of 24.
Step 1: Draw two circles and label them.
Step 2: Write the integers that are both odd and factors of 24 in the overlapping section. There are four of these: 23, 21, 1, 3.
Step 3: Write the remaining factors of 24 from 210 to 10 in the circle labeled “Factors of 24.”
Step 4: Write the remaining odd numbers in the circle labeled “Odd Numbers.”
Step 5: The remaining numbers go outside the circles.
–1–3
31
Factors of 24 Odd Numbers
Solution:
–1–2 –5
57
–7
–9
9
2
46
8
–4
–6
–8
10 –10
–331
Factors of 24 Odd Numbers
EXAMPLE C
PRACTICEThe Venn diagram shows the number of students who have visited California and Florida. Use the diagram for Items 1–8. 1. What does the number 3 represent?
2. What does the number 6 represent?
3. How many students have been to California?
4. How many students have been to Florida?
5. How many students have visited either California or Florida, but not both?
6. How many more students have visited Florida than have visited California?
7. How many more students have visited Florida than have not visited Florida?
8. How many students are represented in the Venn diagram?
9. There are 29 students in Trevor’s class. Eleven students walk to school. Twenty students ride the bus to school. Four students walk or ride the bus to school, depending on the day. Two students do not walk or ride the bus to school. Make a Venn diagram to show which of these ways the students in Trevor’s class get to school. Explain your answer.
3
6
Florida
12
California
5

NAME CLASS DATE
Unit 1 • Mini-LessonSpringBoard Louisiana Algebra 1 Skills Workshop 18
Solving Equations using Algebra TilesWhen using Algebra Tiles to solve equations, tiles represent either constants or variables. For example:
The tile for 1 1 is 11 , and the tile for 21 is 21 .
The tile for x is x .
The tile for 2x is 2x .The pairs (1 and 21; x and 2x) are the additive inverses of each other. They are called zero pairs since adding them together yields 0.
Solve 2x 2 5 5 3 using algebra tiles. Check the solution using substitution.
Step 1: Represent the equation using an algebra tiles model.
11 1111
xx 521
212121
21
Step 2: Add 5 1 1 tiles to each side of the equation and use zero pairs to isolate the x-tiles.
11 111121
212121
21
1111
1111
111111
1111
11
xx
5
Step 3: Group the tiles in rows equal to the number of x-tiles.
11 1111 1111 1111 11
x
x5
From the groupings, each x tile is equal to 4.
Step 4: Check by substituting 4 into the original equation. 2x 2 5 5 3 2(4) 2 5 5 3 8 2 5 5 3 3 5 3Solution: x 5 4
EXAMPLE

Unit 1 • Mini-LessonSpringBoard Louisiana Algebra 1 Skills Workshop 19
Solving Equations using Algebra Tiles (continued)
PRACTICESolve each equation using algebra tiles. Check using substitution.
1. 25 5 9 1 y 2. 2y 1 3 1 y 5 12
3. 2(y 1 1) 2 3 5 27 4. 4x 1 2 5 222
5. 4 1 5t 5 11 1 4t 6. 14 1 3n 5 2n

NAME CLASS DATE
Unit 1 • Mini-LessonSpringBoard Louisiana Algebra 1 Skills Workshop 20
Solving Equations using FlowchartsSolving equations using flowcharts reverses the order of operations in an equation. Equations with more than one variable term must be simplified before using flowcharts. To solve an equation using a flowchart: • Create a flowchart to show what happens to the variable.
Follow the order of operations.
• Use the arrows and work backward by doing the inverse operations.
Solve 5(x 1 30) 2 18 5 17 using a flowchart. Check the solution using substitution.
Step 1: Create a flowchart to show what happens to the variable as you “build” the equation.
X X 1 30 5 (X 1 30) 5 (X 1 30)218
17
130 35
5
218
Step 2: On the bottom line, work backward showing the inverse operations.
X X 1 30 5 (X 1 30) 5 (X 1 30)218
17
130
230 45 118
223 7 35
35
5
218
Step 3: Check by substituting 223 in the original equation. 5(x 1 30) 2 18 5 17 5(223 1 30) 2 18 5 17 5(7) 2 18 5 17 35 2 18 5 17 17 5 17Solution: x 5 223
EXAMPLE

Unit 1 • Mini-LessonSpringBoard Louisiana Algebra 1 Skills Workshop 21
Solving Equations using Algebra Tiles (continued)
PRACTICESolve each equation using a flowchart. Check using substitution.
1. 20 5 9k 1 2 2. 0.25x 2 6 5 2
3. 1
m
12
3
2 5 5 2 4. 27 5 92(t 2 3)
5. 2 1x5( 7) 28
5 4 6. x125
1 18 5 36

NAME CLASS DATE
Unit 1 • Mini-LessonSpringBoard Louisiana Algebra 1 Skills Workshop 22
Properties of Real NumbersUse your knowledge of the properties of real numbers to complete the graphic organizer below.
Property Verbal Description Algebraic model Numeric model
Commutative Property of Addition or Multiplication
If the order of the numbers being added or multiplied is changed, the result does
not change.
Addition:a 1 b 5 b 1 a
Multiplication:a • b 5 b • a
Addition:23 1 25 5 25 1 23
Multiplication:2 • 6 5 6 • 2
Associative Property of Addition or Multiplication
If the numbers being added or multiplied are
regrouped, the result does not change.
Addition:
Multiplication:(a • b) • c 5 a • (b • c)
Addition:
Multiplication:
Additive Inverse Property a 1 (2a) 5 0 3 1 (23) 5 0
Multiplicative Inverse Property
A number multiplied by its reciprocal gives a product
of 1. Reflexive Property of Equality
a 5 a
Symmetric Property of Equality
The entire expressions on each side of an equation
can be interchanged.
If 10 5 6 1 4, then 6 1 4 5 10
Transitive Property of Equality
If one quantity is equal to a second quantity and the
second quantity is equal to a third quantity, then the
first quantity is equal to the third quantity.
If a 5 b and b 5 c,then a 5 c
Distributive Property Multiplication may be “distributed” over addition
or subtraction.
a(b 1 c) 5 a(b) 1 b(c)

Unit 1 • Mini-LessonSpringBoard Louisiana Algebra 1 Skills Workshop 23
PRACTICEIdentify the property illustrated in each of the following
1. 4(x 1 3) 5 (x 1 3)4 2. 25
125
5 1
3. (4 1 x)5 5 20 1 5x 4. If y 5 11 and y 5 3x 1 2, then 11 5 3x 1 2
5. If 7 1 y 5 12, then 12 5 7 1 y 6. 5 1 (2x 1 8) 5 (5 1 2x) 1 8
Properties of Real Numbers (continued)

NAME CLASS DATE
Unit 1 • Mini-LessonSpringBoard Louisiana Algebra 1 Skills Workshop 24
Connect To Business—Profit, Revenue and, CostRevenue is the amount of money made selling a product. Profit is the amount of money earned after costs are subtracted from the revenue. The break-even point is the amount of money where the revenue 5 costs, or where the amount of money brought in is equal to the amount of money spent.
It costs a summer camp $500 per week to host each camper. This includes counselor salaries, food, lodging and activity supplies. The camp would break even if they charged each camper $500 per week to attend camp, but would have no extra money to maintain the camp facilities. Instead, the camp charges each camper $650 (revenue) per week to attend camp.
Using the formula Profit 5 Revenue 2 Cost Profit 5 $650 2 $500 Profit 5 $150
it can be determined that the camp will make $150 profit per camper per week. This $150 profit per camper can be used by the camp to maintain and upgrade the current facilities or to add new activities and experiences for campers.
EXAMPLE
PRACTICEBen’s Bicycle Helmets makes bicycle helmets at a cost of 3000 1 12x dollars per month to produce x helmets. They sell the helmets for $21 each. 1. Determine the cost to produce 500 helmets.
2. Write an expression to represent the revenue received by selling helmets.
3. Determine the revenue for selling 500 helmets.
4. Write an equation that can be used to determine the break-even point, the point where the revenue 5 costs.
5. Identify the break-even point.
6. Will Ben’s Bicycle Helmets earn a profit by selling 500 helmets a month? Justify your response.

NAME CLASS DATE
Unit 1 • Mini-LessonSpringBoard Louisiana Algebra 1 Skills Workshop 25
Verifying Solutions to InequalitiesThe solution or solutions to an equation or inequality is the value or values of the variable that make the equation or inequality true. While equations often have only one solution, inequalities frequently have multiple solutions. To verify a solution of an inequality, substitute the value into the inequality and simplify using the order of operations to determine whether the result is a true statement.
Determine whether 3 is a solution to the inequality 6x 2 4 . 3x 1 1.
6x 2 4 . 3x 1 1 6(3) 2 4 . 3(3) 1 1 18 2 4 . 9 1 1 14 . 10
Step 1: Substitute 3 for x.
Step 2: Simplify using the order of operations.
Step 3: 14 is greater than 10. 14 . 10 is a true statement. Therefore, 3 is a solution to the inequality 6x 2 4 . 3x 1 1.
EXAMPLE A
Explain why 1 is a solution to the inequality 2x 1 3 $ 5 but not to the inequality 2x 1 3 . 5.
2x 1 3 $ 5 2(1) 1 3 $ 5 2 1 3 $ 5 5 $ 5
2x 1 3 . 52(1) 1 3 . 52 1 3 . 5 5 . 5
1 is a solution to this inequality because 5 is equal to 5 and therefore meets the condition of the inequality.
1 is NOT a solution to this inequality because 5 IS NOT greater than 5 . 5 . 5 is NOT a true statement.
EXAMPLE B
PRACTICE
1. 3x 1 2 , 1; Is 3 a solution? 2. 2(x 2 4) 1 x $ 8; Is 22 a solution?
3. 6 2 5x . 2; Is 21 a solution? 4. 5 . 2 1 23x; Is 6 a solution?

NAME CLASS DATE
Unit 1 • Mini-LessonSpringBoard Louisiana Algebra 1 Skills Workshop 26
Solution Set NotationA set is a group of objects. The objects are called the elements of the set. Braces, { }, are used to indicate a set. Inside the braces, commas are used to separate the elements. An example of a set is {2, 4, 6, 8}. The numbers 2, 4, 6 and 8 are the elements of the set.A solution set is the set containing all the values of the variable for which an equation or inequality is true. If there is no solution, the empty set, Ø, may be used to represent the solution set.
Solve the inequality 2x 1 3 , 11 for all x in the set {1, 2, 3, 8}.
2x 1 3 , 11 2(1) 1 3 , 11 2 1 3 , 11 5 , 11 1 is a solution.
2x 1 3 , 112(2) 1 3 , 114 1 3 , 11 7 , 112 is a solution.
2x 1 3 , 11 2(3) 1 3 , 11 6 1 3 , 11 9 , 11 3 is a solution.
2x 1 3 , 112(8) 1 3 , 11 16 1 3 , 11 19 , 118 is NOT a solution.
The solution set is: {1, 2, 3}.
EXAMPLE A
Solve the equation |x 2 1| 5 4.
| x 2 1| 5 4 x 2 1 5 4 OR x 2 1 5 24 1 1 1 1 11 11 x 5 5 x 5 23
The solution set is: {23, 5}.
EXAMPLE B
PRACTICEDetermine the solution set for each of the following.
1. |2x 2 1| 5 7 2. What is the largest number in the solution set of 3x 2 2 , 7 if all the solutions are integers? Explain your reasoning.
3. 4 2 2(x 1 1) ,18 for all x in the domain {210, 23, 2, 0, 0.5}.

NAME CLASS DATE
Unit 1 • Additional Unit PracticeSpringBoard Louisiana Algebra 1 Skills Workshop 27
LESSON 1-1The periodic comet named Johnson has been seen at every return since its discovery in 1949, as shown in the table below.
Occurrence Year Seen
1 19492 19563 19634 1970
Use the table for Items 1–5.
1. Describe any patterns you see in the table.
2. Write the values in the second column of the table as a sequence. Identify the common difference.
3. If the pattern continues, in which of the following years will the comet be visible again?
A. 2017
B. 2018
C. 2019
D. 2020
4. About how many times would the Johnson comet be visible during a typical person’s lifetime? Explain your reasoning.
5. Reason abstractly. A man was born during a year in which the Johnson comet was visible in the sky. The next time that the comet was visible after the man’s birth year was in 2005. In what year was the man born?
LESSON 1-2Emilio is using pennies to make a pattern. He arranges his pennies as shown below.
Figure 1 Figure 2 Figure 3
Use the pattern for Items 6–11.
6. Draw the next three figures in the pattern. Make a table to show the relationship between the figure number and the number of pennies.
7. Attend to precision. Graph the pattern on a coordinate grid. Be sure to label your scales and your axes.
8. Write the numbers of pennies as a sequence. Does your sequence have a common difference? If so, identify it. If not, explain why not.
9. Emilio is using a guess and check strategy to write an expression for the number of pennies in any figure. He writes the expression n(n 1 1), where n represents the figure number.
a. Make a table to show the value of Emilio’s expression for n 5 1, 2, 3, 4, 5, and 6. How does this show that Emilio’s expression is incorrect?
b. Compare the values you found for Emilio’s expression in part a to the number of pennies in each figure. Use what you observe to modify Emilio’s expression so that it is correct. Explain your reasoning.
10. How many pennies would be required to make Figure 25?
A. 50 B. 125 C. 325 D. 650
Additional Unit 1 Practice

NAME CLASS DATE
Unit 1 • Additional Unit PracticeSpringBoard Louisiana Algebra 1 Skills Workshop 28
11. Suppose that you have 100 pennies. What is the figure number of the largest figure in Emilio’s pattern that you can make? Will you use all 100 pennies? Explain.
LESSON 2-1A cab company charges a flat rate of $2 plus an additional $0.50 for every mile traveled. Use this information for Items 12 and 13.
12. a. Write an expression that can be used to determine the total cab fare for a distance of m miles.
b. When Sara arrived at your destination, her cab fare was $7.50. Write an equation to represent this situation. How many miles did Sara travel?
13. Persevere in solving problems. The cab company runs a promotion on holidays. The flat rate and the fee per mile are the same, but there is a $1 discount off the fare when the distance traveled is greater than 10 miles.
a. How can you modify the expression you wrote in Item 12a to represent a holiday cab fare for a distance greater than 10 miles? Explain.
b. Lupe’s cab fare on a holiday was $7.50. Did Lupe travel more than 10 miles? Justify your answer.
c. How many miles did Lupe travel?
Manuel’s age is twice Gupta’s age minus 5. The sum of Manuel’s age and Gupta’s age is 31. Use this information for Items 14 and 15.
14. Let g represent Gupta’s age. You can solve the equation 2g 2 5 1 g 5 31 to find g. Which property would not be used in solving this equation?
A. Addition Property of Equality
B. Commutative Property of Addition
C. Division Property of Equality
D. Subtraction Property of Equality
15. How old is Manuel?
16. Write an equation that requires at least three steps to solve and whose solution is x 5 3.5.
LESSON 2-2 17. The solution of 3x 1 15 5 6x is shown below.
What property justifies Step 1 in the solution?
3x 1 15 5 6x Original equation3x 2 3x 1 15 5 6x 2 3x ? 15 5 3x Combine like terms. 5 5 x Division Property of
Equality
A. Addition Property of Equality
B. Subtraction Property of Equality
C. Distributive Property
D. Commutative Property of Addition
18. To solve the equation 3x 2 7 5 x 2 2, Alex says the first step is to subtract x from both sides. Danny says the first step is to add 7 to both sides.
a. Solve the equation using Alex’s method of first subtracting x from both sides.
b. Solve the equation using Danny’s method of first adding 7 to both sides.
c. Who is correct, Alex or Danny? Justify your answer.
d. Is there another correct first step for solving this equation? If so, identify another first step and use it to solve the equation. If not, explain why not.
19. Jordan has been offered two summer jobs. One job is at the mall and pays $7 per hour. The other job is with your neighbor, who will pay $50 per week plus $5 per hour. How many hours per week would Jordan have to work for both jobs to pay the same amount?
20. Construct viable arguments. Based on the information in Item 19, which job would you recommend Jordan take? Justify your choice.
NAME CLASS DATE
Unit 1 • Additional Unit PracticeSpringBoard Louisiana Algebra 1 Skills Workshop 29
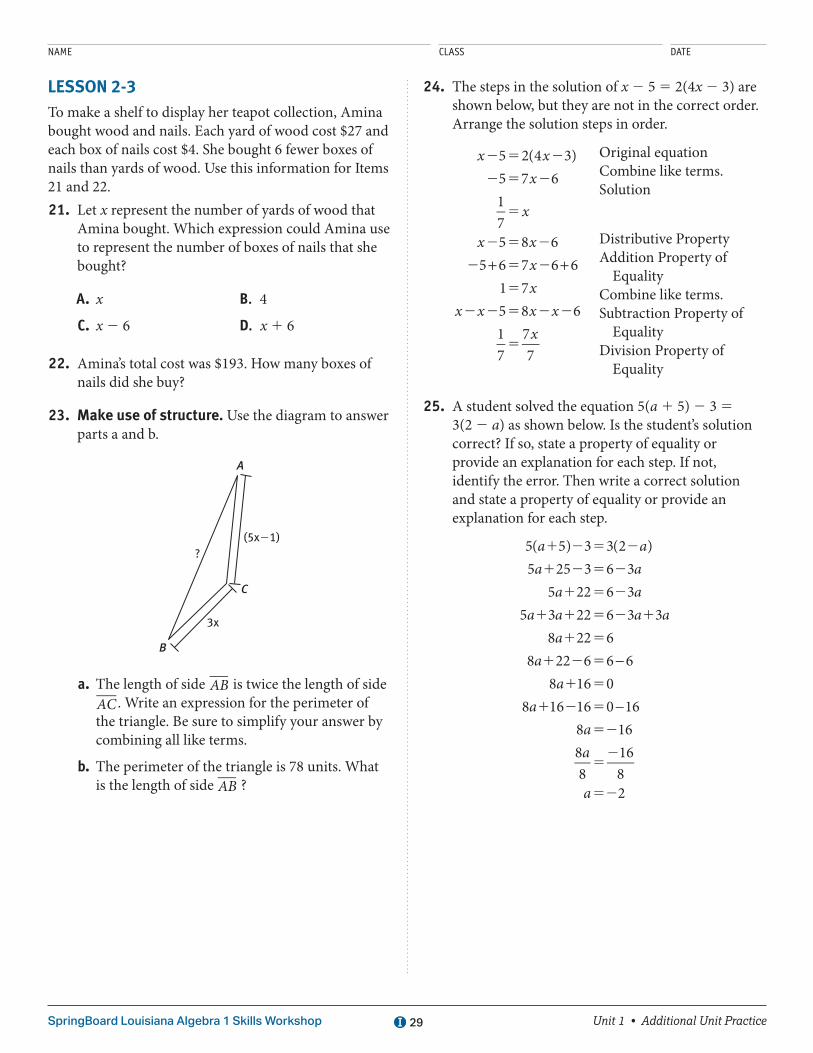
LESSON 2-3To make a shelf to display her teapot collection, Amina bought wood and nails. Each yard of wood cost $27 and each box of nails cost $4. She bought 6 fewer boxes of nails than yards of wood. Use this information for Items 21 and 22. 21. Let x represent the number of yards of wood that
Amina bought. Which expression could Amina use to represent the number of boxes of nails that she bought?
A. x B. 4
C. x 2 6 D. x 1 6
22. Amina’s total cost was $193. How many boxes of nails did she buy?
23. Make use of structure. Use the diagram to answer parts a and b.
A
(5x21)
3x
C
B
?
a. The length of side AB is twice the length of side AC . Write an expression for the perimeter of the triangle. Be sure to simplify your answer by combining all like terms.
b. The perimeter of the triangle is 78 units. What is the length of side AB ?
24. The steps in the solution of x 2 5 5 2(4x 2 3) are shown below, but they are not in the correct order. Arrange the solution steps in order.
2 5 2
2 5 2
5
2 5 2
2 5 2
5
2 2 5 2 2
5
+ +
x xx
x
x xxx
x x x xx
5 2(4 3)5 7 6175 8 6
5 6 7 6 61 75 8 617
77
Original equationCombine like terms. Solution
Distributive PropertyAddition Property of
EqualityCombine like terms.Subtraction Property of
EqualityDivision Property of
Equality
25. A student solved the equation 5(a 1 5) 2 3 5 3(2 2 a) as shown below. Is the student’s solution correct? If so, state a property of equality or provide an explanation for each step. If not, identify the error. Then write a correct solution and state a property of equality or provide an explanation for each step.
1 2 5 2
1 2 5 2
1 5 2
1 1 5 2 1
1 5
1 2 5
1 5
1 2 5
52
52
52
−
−
a aa a
a aa a a a
aa
aa
aa
a
5( 5) 3 3(2 )5 25 3 6 3
5 22 6 35 3 22 6 3 3
8 22 68 22 6 6 6
8 16 08 16 16 0 16
8 1688
1682

NAME CLASS DATE
Unit 1 • Additional Unit PracticeSpringBoard Louisiana Algebra 1 Skills Workshop 30
LESSON 2-4
26. Critique the reasoning of others. Tatiana solved the following equation. She says that because her solution results in 0 5 0, the equation has one solution, and that the solution is x 5 0. Do you agree with Tatiana? Explain.
2 52
2 52
2 5
2 5 2
5
−
xx
xx
xx
x x
12
(2 3) 2 32
32
2 32
2 32
2 2 32
2 3 2 30 0
27. Which equation has no solution?
A. 7x 2 3 5 4
B. 2 5xx1
35
5
C. 5 2x x23
5
D. 3x 2 2 5 3x 2 2
28. For what value(s) of b does the equation below have no solution? Explain.
3x 2 b 5 3x 2 2
29. Consider the rectangles below.
x112
x132x
m
a. Write an equation that states that the perimeters of the two rectangles are equal.
b. For what value(s) of m will your equation have infinitely many solutions? Explain.
c. For what value(s) of m will your equation have no solution? Explain.
d. For what value(s) of m will your equation have exactly one solution? Explain.
LESSON 2-5
30. The formula for the volume of a pyramid is
V 5 13
Bh, where B is the area of the base and h is
the height. Solve this formula for h.
The formula for converting the temperature in Fahrenheit to degrees Celsius is given by the formula
5 −C F59
( 32) , where C is the Celsius temperature and
F is the Fahrenheit temperature. Use this information for Items 31–33.
31. You have a pen pal in Canada. He starts off every letter with an update on the weather, giving the temperature in degrees Celsius. How could you rewrite the formula above so that you could use it to convert your pen pal’s given temperature to degrees Fahrenheit?
The following table gives the average temperature, in degrees Celsius, for several major cities. Use the table for Items 32 and 33.
City Average Temperature
Halifax 11° CTokyo 19° CParis 14° C
Beijing 17° C
32. Reason quantitatively. Igor the Intrepid likes it neither too hot nor too cold when he travels. His ideal average temperature range is between 55° and 60° Fahrenheit. Which of the cities in the table would you recommend he travel to? Explain.
33. Which of the cities in the table has an average temperature of 62.6° F?
A. Halifax
B. Tokyo
C. Paris
D. Beijing
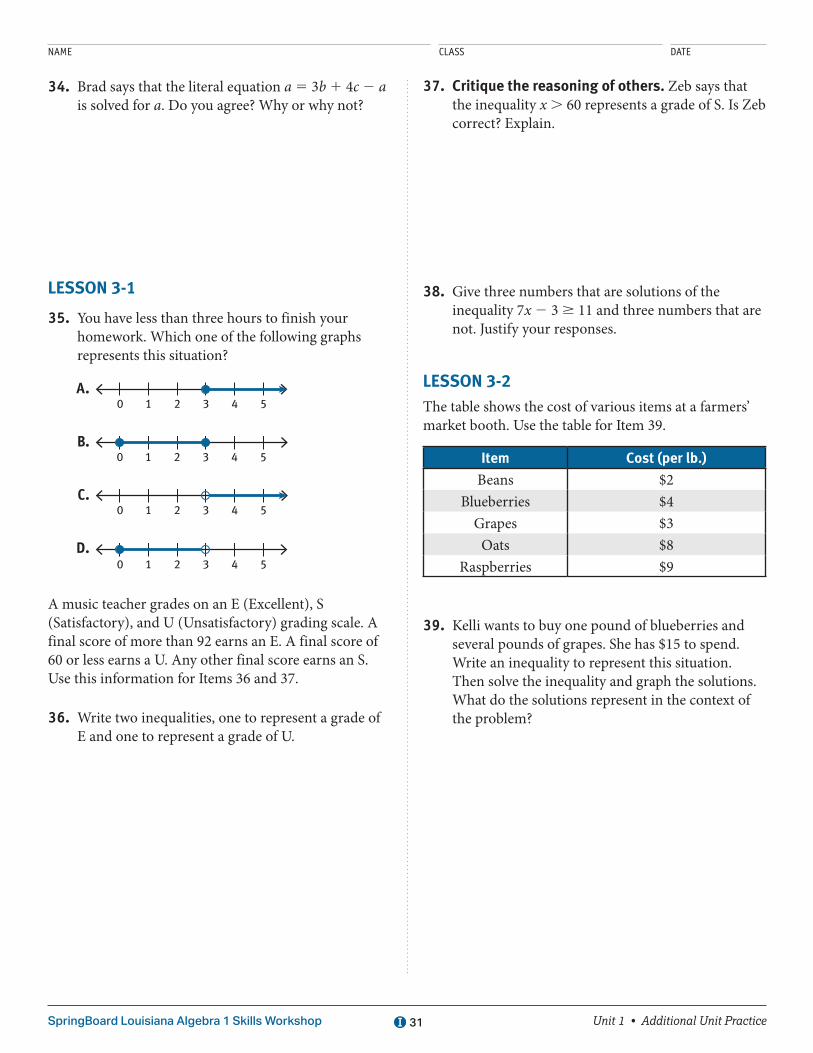
NAME CLASS DATE
Unit 1 • Additional Unit PracticeSpringBoard Louisiana Algebra 1 Skills Workshop 31
34. Brad says that the literal equation a 5 3b 1 4c 2 a is solved for a. Do you agree? Why or why not?
LESSON 3-1
35. You have less than three hours to finish your homework. Which one of the following graphs represents this situation?
A. 2 31 4 50
B. 2 31 4 50
C. 2 31 4 50
D. 2 31 4 50
A music teacher grades on an E (Excellent), S (Satisfactory), and U (Unsatisfactory) grading scale. A final score of more than 92 earns an E. A final score of 60 or less earns a U. Any other final score earns an S. Use this information for Items 36 and 37.
36. Write two inequalities, one to represent a grade of E and one to represent a grade of U.
37. Critique the reasoning of others. Zeb says that the inequality x . 60 represents a grade of S. Is Zeb correct? Explain.
38. Give three numbers that are solutions of the inequality 7x 2 3 $ 11 and three numbers that are not. Justify your responses.
LESSON 3-2The table shows the cost of various items at a farmers’ market booth. Use the table for Item 39.
Item Cost (per lb.)
Beans $2Blueberries $4
Grapes $3Oats $8
Raspberries $9
39. Kelli wants to buy one pound of blueberries and several pounds of grapes. She has $15 to spend. Write an inequality to represent this situation. Then solve the inequality and graph the solutions. What do the solutions represent in the context of the problem?

NAME CLASS DATE
Unit 1 • Additional Unit PracticeSpringBoard Louisiana Algebra 1 Skills Workshop 32
Mr. Hernandez has 41 feet of rope to enclose a pentagonal grazing area for his sheep. He makes the drawing below. Use this information and the drawing for Items 40–42.
725x
2x
523x
3x22
3x14
40. Which inequality could be used to find the possible perimeters of the grazing area?
A. 2x 1 14 , 41
B. 2x 1 14 # 41
C. 5x 1 14 , 41
D. 5x 1 14 # 41
41. Model with mathematics. Devra solved the
inequality, and she says that x 5 210 is a solution. Lavan says that a negative value of x does not make sense in the context of the problem. He says that x 5 1 is a solution. Who is correct? Explain.
42. Give an example of a positive value of x that is not a solution in the context of the problem. Why is your value of x not a solution?
LESSON 3-3
43. Write the compound inequality that is represented on the number line below.
2 31 4 52524 232221 0
44. Which number line represents the compound inequality 25 , x , 5?
A. 27262524232221 0 1 2 3 4 65 7
B. 27262524232221 0 1 2 3 4 65 7
C. 27262524232221 0 1 2 3 4 65 7
D. 27262524232221 0 1 2 3 4 65 7
The table shows the least and greatest values for several companies’ stocks over the last 52 weeks. Use the table for Items 45 and 46.
Company Low High
Dynaco $44.50 $98.20NY Corp $22.88 $44.41Century $30.14 $66.74
45. If you were to write compound inequalities to represent the value of each stock over the last 52 weeks, would the inequalities be conjunctions or disjunctions? Explain.
46. Attend to precision. To make it easier to graph on a number line, Kevin decided to round. He wrote the inequality 30 # x # 67 to represent the value of Century’s stock over the last 52 weeks. Explain why Kevin’s inequality is an inaccurate representation of the stock’s value.

NAME CLASS DATE
Unit 1 • Additional Unit PracticeSpringBoard Louisiana Algebra 1 Skills Workshop 33
LESSON 4-1
47. Draw a number line to show which two points are 3 units away from 21. Then write an absolute value equation to represent the points described.
48. If |a 1 3| 5 4, which describes all possible values of a?
a. 27 b. 1
c. 7 and 21 d. 1 and 27
49. Construct viable arguments. For two numbers x and z, is |z 2 x| always equal to |z| 2 |x|? If so, explain why. If not, give a counterexample.
The melting point of a substance is the temperature at which the substance changes from solid to liquid. The table below shows the melting points of various elements. Use the table for Item 50.
Element Melting Point
Helium 2272° CNitrogen 2210° C
Cadmium 321° CIron 1535° C
50. The melting point of cadmium is 37° C greater than 4 times the absolute value of the melting point of radon. What other information do you need to know in order to determine the melting point of radon?
LESSON 4-2The boiling point of a substance is the temperature at which the substance changes from liquid to gas. The table below shows the boiling points of various elements. Use the table for Items 51 and 52.
Element Boiling Point
Oxygen 2183° CNitrogen 2196° C
Iodine 184° CPhosphorus 280° C
51. The coldest possible temperature is absolute zero, 2273° C. The absolute value of which element’s boiling point is within 75° C of the absolute value of absolute zero?
A. Phosphorous
B. Iodine
C. Nitrogen
D. Oxygen
52. If you were to plot each element in the table on a number line according to its boiling point, which element(s) would be fewer than 200 units from 0?
53. Model with mathematics. According to the Institute of Medicine, the average adult should consume 2,300 calories each day. However, this number can vary by as much as 700 calories in either direction, depending on age, sex, and daily activity level. Write and solve an absolute value inequality to determine the range of recommended calories, c, for an adult. Graph the solutions on a number line.
54. Write an absolute value inequality whose solutions are shown in the graph below.
232221 0 1 2 3 4 65
55. Write an absolute value inequality that has no solutions. (Hint: Remember that an absolute value cannot be negative.)

NAME CLASS DATE
Unit 2 • Getting ReadySpringBoard Louisiana Algebra 1 Skills Workshop 38
PatternsTables can be used to show patterns. A pattern is given by a rule applied to numbers called inputs. After the rule is applied to an input, an output is given.
Identify the pattern rule in the table. Find the missing numbers.
Step 1: Determine how the input, x, and its output, y, are related.
The pattern is made by multiplying each input by 3 and then adding 2.
Step 2: Fill in the missing numbers using the pattern rule.
When x is 3, the output is 3(3) 1 2 5 11. To find the input corresponding to 26, work the rule backwards. Subtract 2 from 26: 24. Then divide 24 by 3 to get 8. Solution: The pattern rule can be written as y 5 3x 1 2. The output corresponding to 3 is 11. The input corresponding to 26 is 8.
x y
1 52 834 145 17
26
x y Pattern
1 5 5 5 3(1) 1 22 8 8 5 3(2) 1 23 ? ?4 14 14 5 3(4) 1 25 17 17 5 3(5) 1 2? 26 ?
EXAMPLE
PRACTICEEach table represents a pattern. Find the missing numbers.
1. x y
25 1023 6
24 4 14 8
2. x y
3 10 5 18 7 26
3814
3. x y
210 23 28 22 0 6 5
8

NAME CLASS DATE
Unit 2 • Getting ReadySpringBoard Louisiana Algebra 1 Skills Workshop 39
InequalitiesYou can use an inequality to show the limits of a real-world situation. An inequality can show the minimum amount of money a team needs to raise for new equipment. The cruising altitude of an airplane or the results of a science experiment might be represented by a compound inequality.
Inequality Sign Meaning Example Solution
, Less than x , 4 Numbers less than 4, not including 4. Greater than x . 3 Numbers greater than 3, not including 3# Less than or equal to x # 5 Numbers less than 5, including 5$ Greater than or equal to x $ 2 Numbers greater than 2, including 2
To graph an inequality on a number line, locate the number on the number line. If the inequality sign is , or ., draw an open circle at the point. If the inequality sign is # or $, draw a closed circle at the point. Draw an arrow to show the solution, which is the set of numbers that satisfy the inequality.
Graph x , 4 on the number line.
Step 1: Locate 4 on the number line.
Step 2: Use the inequality sign to determine which kind of circle to draw.
Step 3: Draw an arrow to show which numbers satisfy the inequality.
Solution:
25 24 23 22 21 0 1 2 3 4 5
The sign is ,, so draw an open circle at 4 to indicate that 4 is not included.
0 1 2 3 4 525 24 23 22 21
The variable x can be any number less than 4, so the arrow should point to the left.
25 24 23 22 21 0 1 2 3 4 5
EXAMPLE A

Unit 2 • Getting ReadySpringBoard Louisiana Algebra 1 Skills Workshop 40
Graph x $ 23 on the number line.
Step 1: Locate 23.
Step 2: Use the inequality sign to determine which kind of circle to draw.
Step 3: Draw an arrow to show which numbers satisfy the inequality.
Solution:
25 24 23 22 21 0 1 2 3 4 5
The sign is $, so draw a closed circle at −3 to show that −3 is included.
25 24 23 22 21 0 1 2 3 4 5
The variable x can be any number greater than or equal to −3, so the arrow should point to the right.
0 1 2 3 4 525 24 23 22 21
EXAMPLE B
A compound inequality gives two inequality statements that must both be true. For example, the compound inequality 24 # x , 2 means the set of all numbers, x, where x is both greater than or equal to 24 and less than 2. The solution set consists of all the numbers that are in the solution set of both simple inequalities. Graph each inequality and then draw a line to show the solution set.
Graph 24 # x , 2 and list the integers in the solution set.
Step 1: Draw the graph of the solution set of the first inequality, 24 # x which means the same as x $ 24, above the number line.
Step 2: Draw the graph of the solution set of the second inequality, x , 2, below the graph of the first inequality.
Step 3: Draw the graph of the intersection of these two sets by shading the points that belong to both.
Step 4: Identify the integers in the solution set.
Solution: The graph is shown in Step 3. Integers in the solution set: 24, 23, 22, 21, 0, 1
The first sign is #, so draw a closed circle at 24.
25 24 23 22 21 0
24 # x
1 2 3 4 5
The second sign is ,, so draw an open circle at 2.
25 24 23 22 21 0
24 # x
x , 2
1 2 3 4 5
25 24 23 22 21 0 1 2 3 4 5
The solution includes numbers that are greater than 24, including 24, and numbers less than 2, not including 2.The integers in the solution set are 24, 23, 22, 21, 0, 1.
EXAMPLE C
Inequalities (continued)

Unit 2 • Getting ReadySpringBoard Louisiana Algebra 1 Skills Workshop 41
Inequalities (continued)
A compound inequality that includes the word or, such as x , 22 or x $ 1, is true when one or both of the statements are true. The solution set is the union of the solutions sets of both inequalities.
Graph x , 22 or x $ 1 and list the integers in the solution set.
Step 1: Draw the graph of the solution set of the first inequality, x , 22 above the number line.
Step 2: Draw the graph of the solution set of the second inequality, x $ 1 below the graph of the first inequality.
Step 3: Draw the graph of the union of these two sets by shading the points that belong to the solution sets of one or both simple inequalities.
Step 4: Identify the integers in the solution set.
Solution: The graph is shown in Step 3. The solution includes integers that are less than 22, not including 22, and integers greater than 1, including 1.
25 24 23 22 21 0
x , 22
x , 221 2 3 4 5
25 24 23 22 21 0
x $ 1
1 2 3 4 5
25 24 23 22 21 0 1 2 3 4 5
The integers are −3, −4, −5, . . . and 1, 2, 3, . . . .
EXAMPLE D
To determine if an ordered pair is a solution to an inequality, substitute the x-value and y-value into the inequality. Then simplify. If the resulting inequality is a true statement, the ordered pair is a solution.
Determine if (3, 5) is a solution of y , x 1 2.
Step 1: Substitute the x- and y-values from the ordered pair into the inequality.
Step 2: Determine if the resulting statement is true.
Solution: The ordered pair (3, 5) is not a solution of y , x 1 2.
y , x 1 25 , 3 1 25 , 55 5 5, so the statement is false.
EXAMPLE E

Unit 2 • Getting ReadySpringBoard Louisiana Algebra 1 Skills Workshop 42
Inequalities (continued)
PRACTICEGraph each inequality on the number line.
1. x . 2225 24 23 22 21 0 1 2 3 4 5
2. x # 2125 24 23 22 21 0 1 2 3 4 5
3. x , 125 24 23 22 21 0 1 2 3 4 5
4. 23 , x , 425 24 23 22 21 0 1 2 3 4 5
5. 21 , x # 125 24 23 22 21 0 1 2 3 4 5
6. x , 21 or x . 325 24 23 22 21 0 1 2 3 4 5
7. x , 22 or x . 125 24 23 22 21 0 1 2 3 4 5
Tell if each ordered pair is a solution to the inequality.
8. y , x 2 5 (4, 9) 9. y $ x 2 1 (22, 23) 10. y . x 1 7 (2, 8)
11. Use graphs and words to compare and contrast the solution sets of theinequalities below. 22 # x , 2x . 2 or x # 22
25 24 23 22 21 0 1 2 3 4 5
25 24 23 22 21 0 1 2 3 4 5

NAME CLASS DATE
Unit 2 • Getting ReadySpringBoard Louisiana Algebra 1 Skills Workshop 43
Evaluating ExpressionsIn order to evaluate algebraic expressions, substitute each given value in the place of its corresponding variable. Then simplify the expression.
Evaluate 2a 1 5b for a 5 21 and b 5 3.
Step 1: Substitute the values into the expression.
2a 1 5b 52 (21) 1 5(3)Step 2: Multiply the pairs of numbers in the expression. Then simplify.
2a 1 5b 5 2 (21) 1 5(3) 5 22 1 15 5 13
Solution: After evaluating for a 5 21 and b 5 3, the expression 2a 1 5b has a value of 13.
EXAMPLE A
Evaluate 24x 2 6y for x 5 4 and y 5 22.
Step 1: Substitute the values into the expression.
24x 2 6y 5 24 (4) 2 6(22)Step 2: Multiply the pairs of numbers in the expression. Then simplify.
24x 2 6y 5 24 (4) 2 6(22)5 2 16 1 12 5 24
Solution: After evaluating for x 5 4 and y 5 22, the expression 24x 2 6y has a value of 24.
EXAMPLE B
PRACTICEEvaluate each expression for the given values.
1. 2a 2 8b for a 5 2 and b 5 22 2. a 1 8 for a 5 5
3. 3x 1 7 for x 5 28 4. 2x 1 2y for x 5 9 and y 5 24
5. 11 2 3b for b 5 8 6. x 1 3y for x 5 2 and y 5 0

NAME CLASS DATE
Unit 2 • Getting ReadySpringBoard Louisiana Algebra 1 Skills Workshop 44
Coordinate PlaneYou can use a coordinate plane to map locations and then find the travel route. For example, if you mapped out the locations of your home, your school, and the corner store on a coordinate plane, you could then determine the route you could take and the distance you will walk in all. Truck drivers, airplane pilots, and hikers all use coordinate planes, in the form of maps, to find locations and make travel plans.A coordinate plane consists of two number lines, or axes, that are perpendicular to each other. The point at which the number lines intersect is the origin. The horizontal, or x-axis, names the distance right or left from the origin. The vertical, or y-axis, names the distance up or down from the origin. The x-axis and y-axis divide the coordinate plane into four quadrants.Any point on a coordinate plane can be represented by an ordered pair of numbers written in the form (x, y).
5
4
3
2
1
1 2 3
origin
4 521
2122232425
25
24
23
22
Quadrant III Quadrant IV
y-axis
x-axis
Quadrant IQuadrant II
Which ordered pair is represented by point D?y
x
5
4
3
2AB
C
D
1
1 2 3 4 521
2122232425
25
24
23
22
Step 1: Find point D on the graph. Count the number of units to the right of the origin.
Step 2: Count the number of units below the origin.
Step 3: Write the ordered pair in the form (x, y).
Solution: Point D is located at (3, 22).
3 units to the right
2 units down
(3, 22)
EXAMPLE A

Unit 2 • Getting ReadySpringBoard Louisiana Algebra 1 Skills Workshop 45
Coordinate Plane (continued)
To graph a point on the coordinate plane, use a dot to mark where the point is located.In an ordered pair,• the first number is the x-coordinate.• the second number is the y-coordinate.
Graph (24, 23).
Step 1: Begin at the origin. Because the x-value is negative, move 4 grid units to the left.Step 2: Because the y-value is negative, move 3 grid units down.Step 3: Draw a dot and label the point (24, 23).
Solution:
y
x
5
4
3
2
1
1 2 3 4 521
212223
(24,23 )
2425
25
24
23
22
y
x
5
4
3
2
1
1 2 3 4 521
212223
(24,23 )
25
25
24
24
23
22
EXAMPLE B

Unit 2 • Getting ReadySpringBoard Louisiana Algebra 1 Skills Workshop 46
To determine if a point outside of the graphed area lies on a line, make a table of values. Extend the pattern to determine whether the point lies on the line.
Which of the following points is on this line?
A. (4, 6)
B. (24, 6)
C. (24, 26)
D. (4, 26)
Step 1: Make a table of values for the points shown on the line.
Step 2: Extend the pattern to x 5 4 and x 5 24.
Step 3: Determine which ordered pair lies on the line.
Solution: C; (24, 26) lies on this line.
x y
22 2221 00 2
x y
24 2623 2422 2221 00 21 42 63 84 10
(24, 26)
y
x
3
2
1
1 2 321
212223
23
22
EXAMPLE C
Coordinate Plane (continued)
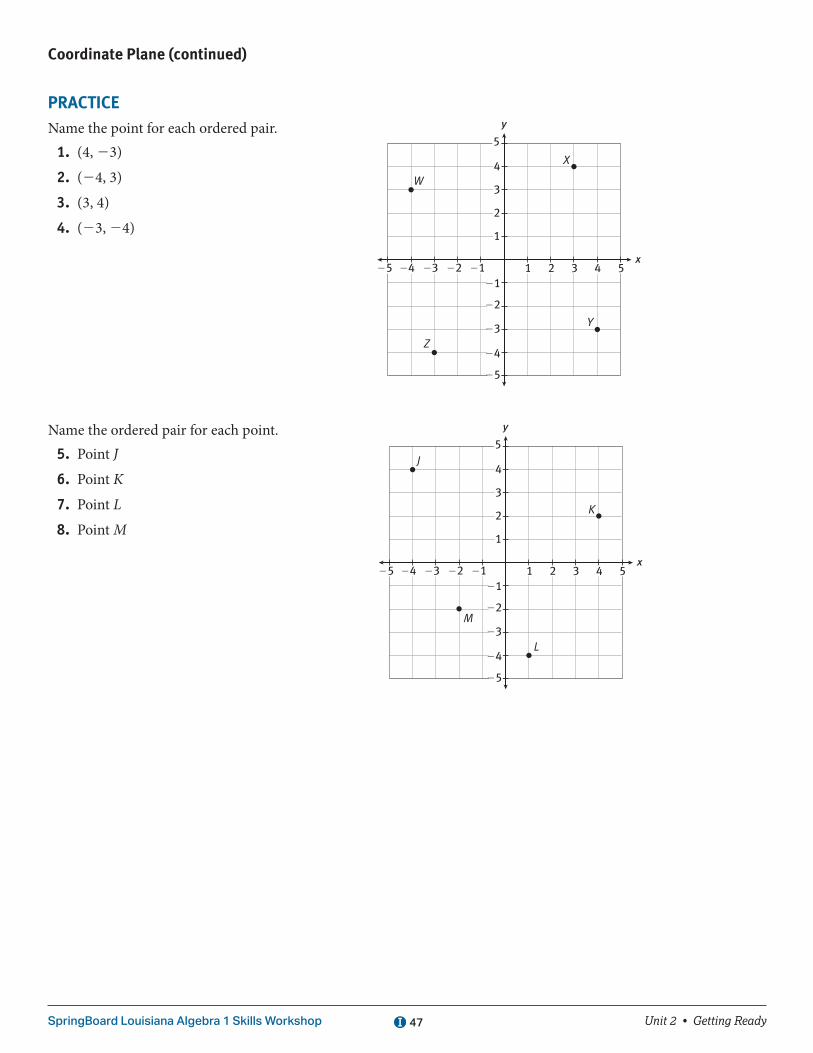
Unit 2 • Getting ReadySpringBoard Louisiana Algebra 1 Skills Workshop 47
PRACTICEName the point for each ordered pair. 1. (4, 23)
2. (24, 3)
3. (3, 4)
4. (23, 24)
Name the ordered pair for each point. 5. Point J
6. Point K
7. Point L
8. Point M
y
x
5
4
3
2
X
W
Z
Y
1
1 2 3 4 521
2122232425
25
24
23
22
y
x
5
4
3
2 K
J
M
L
1
1 2 3 4 521
2122232425
25
24
23
22
Coordinate Plane (continued)

Unit 2 • Getting ReadySpringBoard Louisiana Algebra 1 Skills Workshop 48
9. Which of the following are the coordinates of a point on this line? Show your work.
A. (4, 213)
B. (4, 13)
C. (24, 213)
D. (24, 13)
10. The coordinate plane represents the streets surrounding Janine’s house. Janine’s house is located at (2, 3), and the library is located at (23, 22). Graph and label Janine’s house and the library on the coordinate plane. If Janine can only travel along horizontal or vertical grid lines, give directions for two paths Janine can follow to go from her house to the library. Then tell how far she will travel on each path. Each unit on the grid represents 1 city block.
y
x
5
4
3
2
1
1 2 3 4 521
2122232425
25
24
23
22
y
x
5
4
3
2
1
1 2 3 4 521
2122232425
25
24
23
22
Coordinate Plane (continued)

NAME CLASS DATE
Unit 2 • Getting ReadySpringBoard Louisiana Algebra 1 Skills Workshop 49
Representing Data with an EquationYou can write an equation for data given in a table.
Which equation represents the data in the table?
A. y 5 2x 1 1
B. y 5 3x 2 1
C. y 5 3x 1 2
D. y 5 2x 2 2
Step 1: Start with equation A: y 5 2x 1 1. Substitute each pair of x and y from the table into the equation. Check that the equation holds true for that pair.
Step 2: Since the first equation is not true for (2, 8), start checking pairs into equation B: y 5 3x 2 1.
Step 3: Continue in this way with each equation until you find an equation that checks true for all pairs of data in the table.
Solution: The equation that works for all pairs in the table is equation C: y 5 3x 1 2.
y 5 2x 1 18 5 2(2) 1 18 5 5Not true
8 5 3(2) 2 18 5 5Not true
x y Check
2 8 8 5 3(2) 1 2 5 84 14 14 5 3(4) 1 2 5 146 20 20 5 3(6) 1 2 5 208 26 26 5 3(8) 1 2 5 26
x y
2 84 146 208 26
EXAMPLE
PRACTICEWhich equation represents the data of each table?
1. x y
1 213 255 297 213
2. x y
0 232 36 158 21
3. x y
1 252 244 225 21
A. y 5 2x 2 1
B. y 5 x 2 2
C. y 5 22x 1 1
D. y 5 2x 1 2
A. y 5 x 1 3
B. y 5 2 x 2 3
C. y 5 3x
D. y 5 3x 2 3
A. y 5 x 2 5
B. y 5 x 2 6
C. y 5 3x 21
D. y 5 2x 1 2

NAME CLASS DATE
Unit 2 • Getting ReadySpringBoard Louisiana Algebra 1 Skills Workshop 50
Algebraic EquationsYou can use equations to represent real-world situations. Architects, scientists, and bankers use equations. You write and solve equations to find how much you will pay for sneakers that are on sale or to find how much to save each month to buy a new bicycle.To solve an equation, you must isolate the variable. To isolate the variable, you must undo operations on the side of the equation with the variable by applying inverse operations. Every inverse operation you apply on one side of the equation.
If 4x 1 1 5 37, what is the value of x?
Step 1: First, undo the addition. Subtract 1 from both sides of the equation.
Step 2: Undo the multiplication. Divide both sides of the equation by 4.
Solution: x 5 9
xx
4 1 1 37 14 36
1 2 5 2
5
5
5
x
x
44
364
9
EXAMPLE A
Look for words and phrases in a problem that can suggest what operation or operations you need to use when writing an equation.
Brad borrowed $320 from his father to buy a digital camera. He will pay his father $20 per week until the money is paid back. He made an initial payment of $100. How many weeks will it take Brad to pay back the money he owes?
Step 1: Let w represent the number of weeks Brad will need to pay back his debt. Write an equation to represent the situation. Use words and phrases from the problem. $20 per week → 20w initial payment of $100 → 1 100
Step 2: Solve for w. First, undo the addition by subtracting 100 from both sides of the equation.
Step 3: Undo the multiplication by dividing both sides of the equation by 20.
Solution: It will take Brad 11 weeks to pay back the money he owes his father.
20w 1 100 5 320
20w 1 100 2100 5 320 2 100 20w 5 220
5
5
w
w
2020
22020
11
EXAMPLE B

Unit 2 • Getting ReadySpringBoard Louisiana Algebra 1 Skills Workshop 51
Algebraic Equations (continued)
Jill is designing a rectangular garden. She wants the length of the garden to be 3 feet more than twice the width. Write an equation that Jill could use to determine the length of the garden, l, given the width of the garden, w. Provide a table of 4 different garden dimensions, in feet.
Step 1: Write an equation for determining the length of the garden, l, in terms of the width, w. Use words and phrases from the problem. twice the width → 2w 3 feet more → 1 3
Step 2: Select 4 possible widths. Substitute each value into the equation and solve for l.
Solution: l 5 2w 1 3
w (feet) l (feet)
4 115 136 157 17
l 5 2w 1 3
l 5 2(4) 1 3 5 11l 5 2(5) 1 3 5 13l 5 2(6) 1 3 5 15l 5 2(7) 1 3 5 17
EXAMPLE C
You can write the slope-intercept form of the equation for a non-vertical line given a table of values.
Write an algebraic representation of the linear data in the table.
Step 1: Use the values of two pairs of x-y values to find the slope.
Step 2: Substitute the slope and the coordinates of one of the x-y pairs into the slope-intercept form of the equation.
Step 3: Solve for b, the y-intercept.
Step 4: Substitute the values for m and b into the slope-intercept form of the equation.
Solution: y 5 3x 2 2
Use (5, 13) and (9, 25).
m y yx x
25 139 5
124
32 1
2 15
2
25
2
25 5
y 5 mx 1 bUsing (1, 1):1 5 3(1) 1 b
1 5 3 1 bb 5 22
y 5 mx 1 by 5 3x 1 (22)y 5 3x 2 2
x 1 5 9 13y 1 13 25 37
EXAMPLE D

Unit 2 • Getting ReadySpringBoard Louisiana Algebra 1 Skills Workshop 52
PRACTICE 1. If 2b 2 5 5 43, what is the value of b?
2. If k9
1 13 5 18, what is the value of k?
3. If 26x 1 2 5 4, what is the value of x?
Write an equation in slope-intercept form for the data in each table.
4. x y
1 62 143 224 30
5. x y
2 24 36 48 5
6. x y
25 26 0 23 5 0 10 3
7. Robin is buying energy-efficient light bulbs. Each package of 4 light bulbs costs $13. She has a coupon for $5 off her total purchase.
a. Write an equation to determine the total number of light bulbs, L, for p packages. Then determine the number of light bulbs Robin will get if she buys 6 packages. Show your work.
b. Write an equation to determine the total cost, C, for buying p, the number of packages of light bulbs. Then determine how much Robin spent in all if she bought 4 packages of energy-efficient light bulbs. Show your work.
8. The entrance fee to the fair is $7 per student and $0.25 per ride ticket. Write an equation to determine the total amount spent at the fair, F, for a student who buys t ride tickets. Then determine how many tickets Keiko bought if she spent $19.50 in all. Show your work.
9. Azim is having school logo T-shirts printed to sell at football games. The printer charges a
$75 set-up fee and then $5 per T-shirt. Write an equation to determine the total cost, C, for printing t T-shirts. Then determine how many T-shirts Azim had printed if his total cost was $1325. Show your work.
10. Jonas has $95 on his cafeteria card. Every time he buys lunch, $3 is deducted from his cafeteria card. Provide a table to display the balance on his cafeteria card after each of the first 6 lunches is bought. Then write an equation to determine the balance, B, on the card after 𝓵 lunches. Show your work and explain your process.
Algebraic Equations (continued)

NAME CLASS DATE
Unit 2 • Mini-LessonSpringBoard Louisiana Algebra 1 Skills Workshop 53
Slope-Intercept FormThe slope and y-intercept of a given line can be quickly identified if the equation of the line is written in slope-intercept form.
Slope-Intercept Form: y 5 mx 1 b
m tells the slope of the line.
b helps identify the y-intercept of the line. The y-intercept of the line is (0, b).
Identify the slope and y-intercept of the line having the equation y x23
75 2 .
The slope of the line is 2
3.
The value of b is 27. Therefore, the y-intercept of the line is (0, 27).
y x23
75 2
EXAMPLE A
Write the equation, in slope-intercept form, of the line with slope 15
2 passing through the point 0, 12
.
The y-intercept is 12
0,
. Therefore, the value of b is 1
2.
y 5 mx 1 b
y 5 15
2 x 1 12
EXAMPLE B
PRACTICE 1. Write the equation, in slope-intercept form, of the line with slope 9 and y intercept (0, 213).
2. Write the equation, in slope-intercept form, of the line passing through (0, 4) with slope 38
2 .
3. Identify the slope and y-intercept of the line having equation y 5 0.25x 1 6.
4. Identify the slope and y-intercept of the line having equation y 5 28x 2 15.

NAME CLASS DATE
Unit 2 • Mini-LessonSpringBoard Louisiana Algebra 1 Skills Workshop 54
Point-Slope Form The slope and a point on a given line can be quickly identified if the equation of the line is written in point-slope form.
Point-Slope Form: y 2 y1 5 m(x 2 x1)
m tells the slope of the line.
x1 and y1 give the coordinates of a point (x1, y1) on the line.
Identify the slope and a point on the line with equation y 2 4 5 22(x 2 7).
The slope of the line is 22.
The value of x1 is 7. The value of y1 is 4. Therefore, the point (7, 4) lies on the line.
y 2 4 5 22(x 2 7)
EXAMPLE A
Write the equation, in slope-intercept form, of the line with slope 12
2 passing through the point (4, 23). y 2 y1 5 m(x 2 x1)
y 2 (23) 5 12
2 (x 2 4)
y 1 3 5 12
2 x 2 2
23 23
y 5 12
2 x 2 5
Step 1: Write the equation in point-slope form.
Step 2: Simplify.
Step 3: Solve for y.
slope-intercept form
EXAMPLE B
PRACTICE 1. Write the equation, in point-slope form, of the line with slope 2
5 and passing through the
point (28, 1).
2. Write the equation of the line with equation y 2 7 5 20.75(x 2 12) in slope-intercept form.
3. Use point-slope form to write the equation, in slope-intercept form, of the line passing through (23, 1) with slope 24.
4. Identify the slope and a point on the line having equation y x1 9 23
1 52 2
.

NAME CLASS DATE
Unit 2 • Mini-LessonSpringBoard Louisiana Algebra 1 Skills Workshop 55
Point-Slope Form Given Two PointsIn order to write the equation of a line in point-slope form, it is necessary to know the slope of the line and the coordinates of at least one point on the line.
Point-Slope Form: y 2 y1 5 m(x 2 x1)
m tells the slope of the line.
x1 and y1 give the coordinates of a point (x1, y1) on the line.
Write the equation, in point slope form, of the line passing through the points (3, 22) and (7, 24).
m
m
m
4 ( 2)7 3
2412
52 2 2
2
52
52
y y m x x
y x
y x
( )
( 2) 12
( 3)
2 12
( 3)
1 12 5 2
2 2 52 2
1 52 2
Step 1: Determine the slope of the line using the
slope formula: my yx x
2 1
2 15
2
2.
Step 2: Use point-slope form, the slope of the line and one of the points on the line, to write the equation of the line.
EXAMPLE A
PRACTICE
1. Write the equation, in point-slope form, of the line passing through the points (7, 12) and (10, 11).
2. Write the equation, in point-slope form, of the line passing through the points (22, 1) and (3, 24).
3. Use point-slope form to write the equation, in slope-intercept form, of the line passing through (23, 1) and (2, 0).

NAME CLASS DATE
Unit 2 • Mini-LessonSpringBoard Louisiana Algebra 1 Skills Workshop 56
Standard Form In order to write the equation of a line in standard form, most often it is necessary to manipulate an equation that has been written in point-slope form or slope-intercept form. In standard form, the x and y terms should be together on the same side of the equation, the leading coefficient should be positive and all fractions and/or decimals should be cleared from the equation. Standard Form: Ax 1 By 5 C
A should be positive.
C is the constant term. No variables.
A, B, and C should all be integers. No fractions or decimals.
Write the equation y x56
25 1 in standard form.
y x
y x
56
2
6( ) 6 56
2
5 1
5 1
y xx x
x y
6 5 125 5
5 6 12
5 1
2 2
2 1 5
x y1( 5 6 ) 1(12)2 2 1 52
x y5 6 122 52
Step 1: Multiply each side of the equation by 6 to eliminate the fraction.
Step 2: Subtract 5x from each side of the equation.
Step 3: Multiply each side of the equation by 21 to make the leading coefficient, 25, positive.
Standard Form
EXAMPLE A

Unit 2 • Mini-LessonSpringBoard Louisiana Algebra 1 Skills Workshop 57
Write the equation of the line passing through the points (3, 2) and (22, 21) in standard form.
m
m
m
1 22 335
35
52 2
2 2
52
2
5
y y m x x
y x
( )
2 35
( 3)
1 12 5 2
2 5 2
y x
y x
2 35
95
5( 2) 5 35
95
2 5 2
2 5 2
y xx x
x y
5 10 3 93 3
3 5 10 9
2 5 2
2 2
2 1 2 52
x yx y
10 10
3 5 11( 3 5 ) 1(1)
1 1
2 1 5
2 2 5 52
x y3 5 12 52
Step 1: Determine the slope of the line using the slope formula: m
y yx x
2 1
2 15
2
2.
Step 2: Use point-slope form, the slope of the line and one of the points on the line, to write the equation of the line.
Step 3: Distribute.
Step 4: Multiply both sides of the equation by 5 to eliminate the fractions.
Step 5: Subtract 3x from both sides of the equation.
Step 6: Add 10 to both sides of the equation.
Step 7: Multiply both sides of the equation by 21 to create a positive leading coefficient.
Standard Form
EXAMPLE B
PRACTICE
1. Write the equation, y x34
45 2 in standard form.
2. Write the equation, y 1 4 5 21(x 2 3) in standard form.
3. Use point-slope form to write the equation, in standard form, of the line passing through (23, 1) and (22, 3).
4. Write the equation, in standard form, of the line passing through (0, 28) with a slope of − 12
.
Standard Form (continued)

NAME CLASS DATE
Unit 2 • Additional Unit PracticeSpringBoard Louisiana Algebra 1 Skills Workshop 58
LESSON 5-1 1. Write the relation shown in the mapping diagram
as a set of ordered pairs.
1
3
25
0
2
2. Which set of ordered pairs represents a function?
A. {(21, 4), (2, 4), (8, 4), (10, 4)}
B. {(0, 22), (3, 7), (0, 2), (18, 2)}
C. {(21, 3), (21, 21), (21, 212), (21, 0)}
D. {(1, 2), (2, 3), (3, 4), (3, 5)}
Use the table below for Items 3 and 4.
x y
18 30 3
12 2140 29
3. Explain why the relation shown in the table is not a function. Use the words input and output in your explanation.
4. How could you change the table so that the relation is a function? Explain your reasoning.
5. Model with mathematics. Darla and Albert are playing a game. Their moves are recorded on the grid shown below. Darla’s moves are indicated by X’s and Albert’s moves are indicated by O’s. Write the letter/number combinations of Darla’s moves as a set of ordered pairs.
1 2 3 4 5 6
A O XB X XC XD O OE O
LESSON 5-2 6. Identify the domain and range of each function.
a. {(15, 2), (3, 0), (212, 0), (21, 21), (9, 2)}
b.
x
y
1
12345
2425
2322212122232425 2 3 4 50
Additional Unit 2 Practice
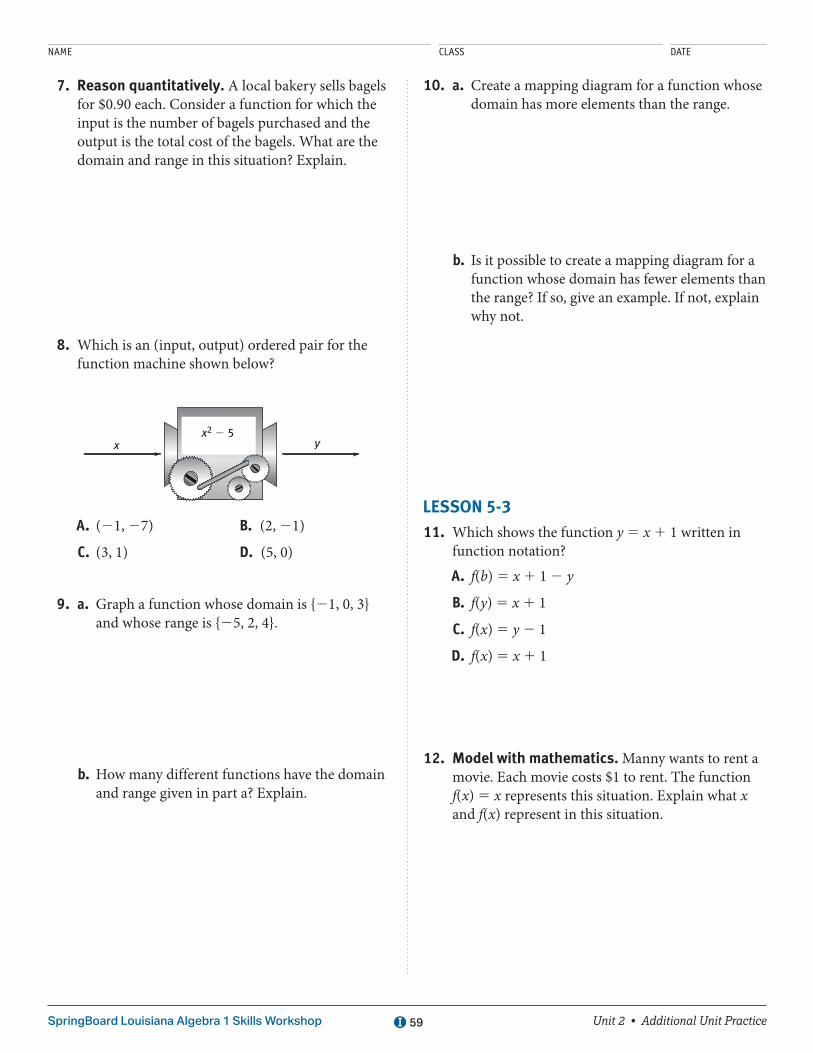
NAME CLASS DATE
Unit 2 • Additional Unit PracticeSpringBoard Louisiana Algebra 1 Skills Workshop 59
7. Reason quantitatively. A local bakery sells bagels for $0.90 each. Consider a function for which the input is the number of bagels purchased and the output is the total cost of the bagels. What are the domain and range in this situation? Explain.
8. Which is an (input, output) ordered pair for the function machine shown below?
yxx2 2 5
A. (21, 27) B. (2, 21)
C. (3, 1) D. (5, 0)
9. a. Graph a function whose domain is {21, 0, 3} and whose range is {25, 2, 4}.
b. How many different functions have the domain and range given in part a? Explain.
10. a. Create a mapping diagram for a function whose domain has more elements than the range.
b. Is it possible to create a mapping diagram for a function whose domain has fewer elements than the range? If so, give an example. If not, explain why not.
LESSON 5-3 11. Which shows the function y 5 x 1 1 written in
function notation?
A. f(b) 5 x 1 1 2 y
B. f(y) 5 x 1 1
C. f(x) 5 y 2 1
D. f(x) 5 x 1 1
12. Model with mathematics. Manny wants to rent a movie. Each movie costs $1 to rent. The function f(x) 5 x represents this situation. Explain what x and f(x) represent in this situation.

NAME CLASS DATE
Unit 2 • Additional Unit PracticeSpringBoard Louisiana Algebra 1 Skills Workshop 60
For Items 13 and 14, use the function f(x) 5 2x 1 5.
13. Evaluate the function for x 5 23, 0, 12
, and 10.
14. When asked to find the value of x for which f(x) 5 17, Hudson answered 39. What mistake did Hudson make? What is the correct answer?
15. Write a sequence for which f(3) 5 14
.
LESSON 6-1 16. Explain why the graph shown is the graph of a
continuous function.
x
y
1
12345
21212223 2 30
y 5 2x 1 4
Use the graph below for Items 17–19.
0
100
200
300
400
500
600
10 20 30 40 50 60x
y
Minutes Since Ride Began
Hei
ght
(ft)
17. Which point corresponds to the absolute maximum of the function?
A. (20, 300) B. (50, 400)
C. (60, 0) D. (0, 0)
18. a. Make sense of problems. Use set notation to write the domain and range of the function.
b. Another balloon had the same height as the second balloon for the first 50 minutes but then took 5 minutes longer to descend. How do the domain and range for the second balloon compare to the domain and range in part a?
19. a. Identify the y-intercept. What does the y-intercept represent in this situation?
b. Would it be possible for the graph of another balloon’s height to have a different y-intercept? Explain.

NAME CLASS DATE
Unit 2 • Additional Unit PracticeSpringBoard Louisiana Algebra 1 Skills Workshop 61
LESSON 6-2
20. Explain how to use the graph of a function to determine the y-intercept.
Use the graph for Items 21–23.
x
y
1
12345
232221212223 2 30
21. Which statement is true?
A. This function has no relative or absolute maxima.
B. This function has a relative maximum of 5 but no absolute maximum.
C. The point corresponding to the absolute maximum is above the y-intercept.
D. The absolute maximum is 5.
22. Identify any relative or absolute minima.
23. Explain why the domain of the function is all real numbers.
24. Construct viable arguments. Rose says that the
domain of the function f xx
( ) 14
51
is all real
numbers. Is Rose correct? If so, explain why. If not, explain why not and give the correct domain.
LESSON 6-3 25. A plumber charges $65 per hour plus a $100
inspection fee. The cost for x hours of work is given by the function f(x) 5 65x 1 100.
a. Identify the independent and dependent variables.
b. Identify the reasonable domain and range. Explain your answers.
26. James bought a plant that was 3 inches tall. Each week the plant grew 2 inches. The function h(x) 5 2x 1 3 describes the height of the plant after x weeks. Which is the reasonable domain for this function?
A. {x: x $ 2}
B. {x: x $ 3}
C. {x: x $ 0}
D. All real numbers

NAME CLASS DATE
Unit 2 • Additional Unit PracticeSpringBoard Louisiana Algebra 1 Skills Workshop 62
Use the graph below for Items 27 and 28.
x
y
1
12345
2 3 4 5 60
27. Attend to precision. Explain why {x: x $ 0} is not a reasonable domain.
28. Write a real-world situation that matches the graph.
LESSON 7-1A weight of 12 ounces stretches a spring 24 inches. A weight of 18 ounces stretches the same spring 36 inches. Use this information for Items 29–33.
29. How far does the spring stretch for each additional ounce of weight?
A. 12
inch B. 32
inches
C. 2 inches D. 20 inches
30. Model with mathematics. Write a function to describe the relationship between the distance d that the spring stretches and the weight w that is attached to the spring.
31. Identify the reasonable domain and range. Explain your answers.
32. Make a graph for this situation.
33. Kathleen says that a weight of 25 ounces will stretch the spring 45 inches. Is she correct? Describe how to check Kathleen’s answer by using the equation and by using the graph.
LESSON 7-2The height of an object in feet t seconds after it has been dropped from a height of 1200 feet can be represented by the function h(t) 5 1200 2 16t2. Use this information for Items 34–38.
34. Make a table of values for t 5 0, 1, 2, 3, 4, 5, 6, 7, 8, and 9. What information does the table tell you about when the object reaches the ground? Explain.
NAME CLASS DATE
Unit 2 • Additional Unit PracticeSpringBoard Louisiana Algebra 1 Skills Workshop 63
35. Which describes the reasonable range for the function?
A. 0 # h(t) # 16
B. 0 # h(t) # 1200
C. 16 # h(t) # 1200
D. 1200 # h(t) # 16
36. Use appropriate tools strategically. Use a graphing calculator to graph the function. Explain how to determine an appropriate viewing window. Make a sketch of the graph, including axis labels.
37. What is the y-intercept? Explain what the y-intercept means in the context of the problem.
38. Explain how to use the graph to estimate how many seconds it takes for the object to reach the ground. How can you use the equation to check your answer?
LESSON 7-3
39. Denzel bought a new computer for $540. The value of the computer decreases by 1
3 each year. Make a
table to show the value of the computer after 0, 1, 2, and 3 years.
A radioactive substance has a half-life of 2 seconds. A scientist begins with a sample of 20 grams. Use this information for Items 40–43.
40. How much of the substance remains after 8 seconds?
A. 0.625 grams B. 1.25 grams
C. 4 grams D. 10 grams
41. Reason abstractly. Explain why the amount of the substance that remains will always be greater than 0.

NAME CLASS DATE
Unit 2 • Additional Unit PracticeSpringBoard Louisiana Algebra 1 Skills Workshop 64
42. Which graph below could represent the amount of the radioactive substance over time? Justify your answer.
A.
x
y
5
10
Am
ount
(g) 15
20
2.5 5 7.5Time (seconds)
10 12.5 150
B.
x
y
25
50
Am
ount
(g) 75
100
2.5 5 7.5Time (seconds)
10 12.5 150
43. For the graph in Item 42 that could represent the amount of a decaying radioactive substance, find the amount after 2 seconds. Describe how you used the graph to find the answer.
LESSON 8-1
44. Describe the transformation from the graph of f(x) 5 x2 to the graph of g(x) 5 x2 2 4.
The graph of the function f(x) 5 2x is translated up 8 units to get the graph of g(x). Use this information for Items 45 and 46.
45. For each pair of values, tell which value is greater.
a. The y-coordinate of the y-intercept of g(x); the y-coordinate of the y-intercept of f(x)
b. f(2); g(2)
c. f(4); g(1)
46. The graph of h(x) is translated 12 units down from the graph of g(x). How is the graph of h(x) related to the graph of f(x)?
A. The graph of h(x) is translated 20 units down from the graph of f(x).
B. The graph of h(x) is translated 4 units down from the graph of f(x).
C. The graph of h(x) is translated 4 units up from the graph of f(x).
D. The graph of h(x) is translated 20 units up from the graph of f(x).

NAME CLASS DATE
Unit 2 • Additional Unit PracticeSpringBoard Louisiana Algebra 1 Skills Workshop 65
47. Critique the reasoning of others. The graph shows a transformation of the function f(x) 5 x2. Brad said the equation of the function is g(x) 5 x2 1 3. Do you agree with Brad? Explain.
x
g(x)
y
1
12345
2423222121222324 2 3 4 650
48. Bart’s Bowling Alley charges $4 for shoe rental and $5.25 for each game bowled. Alley Cat Bowling charges $5 for shoe rental and $5.25 for each game bowled.
a. Write a function b(x) that describes the total cost of bowling x games at Bart’s Bowling Alley.
b. Write a function a(x) that describes the total cost of bowling x games at Alley Cat Bowling.
c. Without graphing, describe how the graphs of b(x) and a(x) are related. Use the functions you wrote in parts b and c to justify your answer.
d. How will the graph of a(x) be transformed if Alley Cat Bowling reduces the cost for shoe rental? Explain.
LESSON 8-2
49. Describe the transformation from the graph of f(x) 5 x3 to the graph of g(x) 5 (x 1 1)3 1 12.
50. The graph of f(x) 5 x2 is translated 3 units up and 1 unit to the right to create the graph of g(x). Which is the equation of g(x)?
A. g(x) 5 (x 1 3)2 1 1
B. g(x) 5 (x 2 3)2 1 1
C. g(x) 5 (x 2 1)2 1 3
D. g(x) 5 (x 1 1)2 1 3
51. Use appropriate tools strategically. Each ordered pair below is the vertex of the graph of a function that is a transformation of the graph of f(x) 5 x2. For each vertex, write a possible function. How could you use a graph to check your answers?
a. (0, 25) b. (3, 0)
c. (6, 29) d. (22, 1)

NAME CLASS DATE
Unit 2 • Additional Unit PracticeSpringBoard Louisiana Algebra 1 Skills Workshop 66
52. The function f(x) 5 x2 1 4 is graphed below. Without graphing, identify the vertex of the graph of g(x) 5 (x 2 5)2 1 4. Explain how you found your answer.
23x
y
1
321
45678
212122 2 30
y 5 x2 1 4
53. A golf club has a driving range. Non-members of the club may use the driving range by paying an entry fee of $8.50 and $5 per bucket of balls.
a. Lenny is not a member of the golf club. He went to the driving range on Saturday and hit x buckets of balls. Write a function that gives Lenny’s total cost on Saturday.
b. On Sunday, Lenny went back to the driving range and hit 3 fewer buckets of balls. How can you modify your function from part a to describe Lenny’s total cost on Sunday?
c. Without graphing, describe the transformation from the graph of the function in part a to the graph of the function in part b. Justify your answer.
LESSON 9-1
54. Which ratio does not represent the slope of a line?
A. riserun
B. ��
xy
C. yx
change inchange in
D. vertical changehorizontal change
55. What is the slope of the line?
x
y
1
3
5
7
9
22
222426 0 2
y 5 3x12
56. A line has a slope of 2. Give the coordinates of two points that could be on this line. Show that your two points lie on a line with slope 2.
57. Reason abstractly and quantitatively. Line a passes through the points (21, 0) and (3, 28).
a. Find the slope of line a.

NAME CLASS DATE
Unit 2 • Additional Unit PracticeSpringBoard Louisiana Algebra 1 Skills Workshop 67
57. b. Line b passes through the points (21, 0) and (3, y). Find a value for y for which the slope of line b is greater than the slope of line a. Justify your answer.
LESSON 9-2 58. Look for and make use of structure. Does the
table represent data that have a constant rate of change? Justify your answer.
x y
−3 −130 −15 196 23
59. Carlos buys a phone that costs $250. He pays a monthly rate of $75.
a. Write a function f(x) for the total amount that Carlos pays for using the phone for x months.
b. Make a table of ordered pairs and graph your function. Remember to label your axes.
c. What is the rate of change?
d. Describe the relationships between the rate of change, the real-world situation, the equation of the function, and the graph.
60. For a linear function, which statement about slope and rate of change is true?
A. The slope is greater than the rate of change when the slope is positive.
B. The slope is equal to the rate of change.
C. There is no relationship between slope and rate of change.
D. Slope and rate of change are related, but more information is needed to describe the relationship.
61. Write a real-world situation for which the rate of change is 215.
LESSON 9-3 62. Each situation can be described by a linear graph.
Tell whether the slope of the graph will be positive or negative. Explain your answers.
a. Sammie earns $10 per hour.
b. Water is draining from a tank at a rate of 6 gallons per minute.
c. A car is traveling at a speed of 60 mi/h.

NAME CLASS DATE
Unit 2 • Additional Unit PracticeSpringBoard Louisiana Algebra 1 Skills Workshop 68
63. What is the slope of the line shown in the graph?
x
y
2
4
6
8
22
2224 2 40
y 5 7
A. 27 B. 0
C. 7 D. undefined
64. Construct viable arguments. Jackson says the slope of a vertical line is 0. Describe how you would explain to Jackson why he is incorrect.
65. Name a point that lies on the same line as the line containing the points (22, 0) and (4, 10). Show how you determined your answer.
66. The function in the table is linear. What is the missing y-value? Justify your answer.
x y
23 120 ?5 246 26
LESSON 10-1
67. The value of y varies directly with x, and the constant of variation is 6. What is the value of x when y 5 54?
A. 6 B. 9
C. 54 D. 324
68. The table represents a direct variation. Write the direct variation equation for the data.
x y
2 3
4 66 98 12
69. Dan bought 3 bags of potting soil and spent $3.75.
a. Does this situation represent a direct variation? If not, explain why not. If so, explain why and identify the constant of variation.
b. How much would Dan spend for 7 bags of potting soil?
70. a. Attend to precision. Write a linear equation that does not represent a direct variation.

NAME CLASS DATE
Unit 2 • Additional Unit PracticeSpringBoard Louisiana Algebra 1 Skills Workshop 69
70. b. Sketch a linear graph that does not represent a direct variation.
71. Jen says the equation 2y 2 4x 5 0 does not represent a direct variation because it is not in the form y 5 kx. How would you explain to Jen why she is incorrect?
LESSON 10-2
72. Which equation shows an indirect variation?
A. y 5 8x B. 5yx8
C. xy 5 8 D. 8y 5 x
The time needed to paint a surface varies indirectly as the number of people painting. A painting company, Color Your World, says that a team of 5 painters can paint the walls in a particular building in 8 hours. Use this information for Items 73 and 74.
73. Write and graph an indirect variation equation that relates the time to paint the building walls to the number of painters. Remember to label your axes.
74. A second painting company, Good Hues, says that they can paint the walls in the building in 6 hours with a team of 7 painters. Which painters work at a faster rate 2 the painters from Color Your World or the painters from Good Hues? Justify your answer.
75. The value of y varies indirectly with the value of x, and the constant of variation is 5. What is the value of x when y 5 10?
76. a. Express regularity in repeated reasoning. Complete the table.
x y 5 x
120 y 5
x160
y 5 x
192
1248
b. Look for patterns in the table. In an indirect variation, what happens to the value of y when the value of x is doubled?
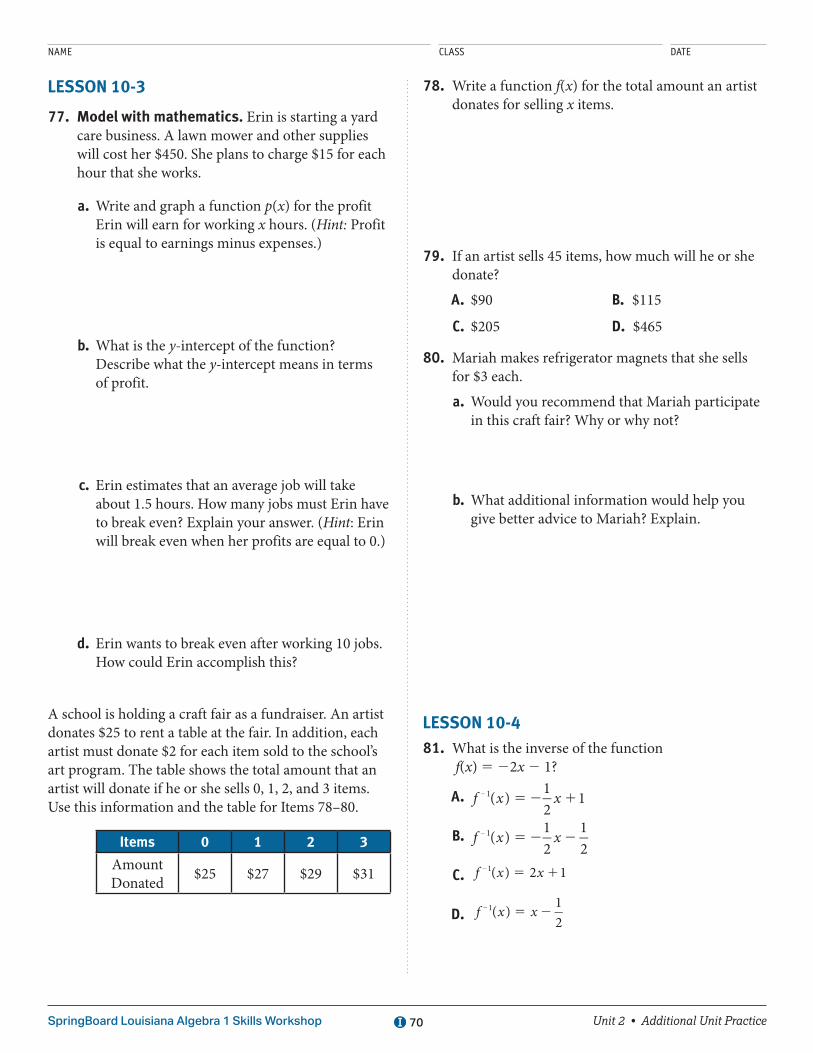
NAME CLASS DATE
Unit 2 • Additional Unit PracticeSpringBoard Louisiana Algebra 1 Skills Workshop 70
LESSON 10-3
77. Model with mathematics. Erin is starting a yard care business. A lawn mower and other supplies will cost her $450. She plans to charge $15 for each hour that she works.
a. Write and graph a function p(x) for the profit Erin will earn for working x hours. (Hint: Profit is equal to earnings minus expenses.)
b. What is the y-intercept of the function? Describe what the y-intercept means in terms of profit.
c. Erin estimates that an average job will take about 1.5 hours. How many jobs must Erin have to break even? Explain your answer. (Hint: Erin will break even when her profits are equal to 0.)
d. Erin wants to break even after working 10 jobs. How could Erin accomplish this?
A school is holding a craft fair as a fundraiser. An artist donates $25 to rent a table at the fair. In addition, each artist must donate $2 for each item sold to the school’s art program. The table shows the total amount that an artist will donate if he or she sells 0, 1, 2, and 3 items. Use this information and the table for Items 78–80.
Items 0 1 2 3
Amount Donated $25 $27 $29 $31
78. Write a function f(x) for the total amount an artist donates for selling x items.
79. If an artist sells 45 items, how much will he or she donate?
A. $90 B. $115
C. $205 D. $465
80. Mariah makes refrigerator magnets that she sells for $3 each.
a. Would you recommend that Mariah participate in this craft fair? Why or why not?
b. What additional information would help you give better advice to Mariah? Explain.
LESSON 10-4 81. What is the inverse of the function
f(x) 5 22x 2 1?
A. f x x( ) 12
11 5 2 12
B. f x x( ) 12
12
1 5 2 22
C. f x x( ) 2 11 5 12
D. f x x( ) 12
1 5 22

NAME CLASS DATE
Unit 2 • Additional Unit PracticeSpringBoard Louisiana Algebra 1 Skills Workshop 71
82. Is the function f(x) 5 4x2 a one-to-one function? Explain using the equation and the graph.
83. The function f(x) 5 9.25x gives the cost f(x) for x tickets to a baseball game.
a. What is f–1(x)?
b. What does x represent in the inverse function?
c. Tomika spent $46.25 on tickets. How many tickets did she buy?
The table shows the number of days in each month of the year (when the year is not a leap year). Use the table for Item 84.
January 31 July 31February 28 August 31March 31 September 30April 30 October 31May 31 November 30June 30 December 31
84. a. Write a set of ordered pairs in the form (month, days) to represent the function that assigns a number of days to each month.
b. Does the function you wrote in part a have an inverse function? Explain.
c. Describe a real-world situation that is an example of a one-to-one function. How do you know that the function is one-to-one?
85. Persevere in solving problems. Two functions, f(x) and g(x), are evaluated for several values of x, below. Could f(x) and g(x) be inverse functions? Justify your answer.
f(0) 5 3 g(1) 5 2
f(21) 5 12
g(0) 5 3
f(2) 5 5 g(3) 5 21
LESSON 11-1
86. Which statement about the sequence 23, 18, 13, 8, 3, …, is false?
A. The sequence is arithmetic.
B. The common difference is 5.
C. a3 5 13
D. The 8th term is 212.

NAME CLASS DATE
Unit 2 • Additional Unit PracticeSpringBoard Louisiana Algebra 1 Skills Workshop 72
87. Critique the reasoning of others. Carlotta says the sequence below is an arithmetic sequence because you multiply each term by 2 to get the next term. Is Carlotta correct? Explain.
2, 4, 8, 16, 20, …
88. Identify the common difference in each arithmetic sequence.
a. 21, 15, 9, 3, 23, …
b. 22, 232
, 21, 212
, 0, …
c. –19, –9, 1, 11, 21, …
89. Consider a sequence in which every term is the same. Is the sequence an arithmetic sequence? Explain.
LESSON 11-2Three arithmetic sequences are described below. Use the sequences for Items 90–92.
Sequence 1
22, 33, 44, 55, 66, …
Sequence 2
an 5 2.5 1 6(n 2 1)
Sequence 3
x
y
1
123456789
10111213
2 3 4 50
14
90. Which sequence has the greatest common difference?
91. Which sequence has the least value for a10?
92. Which statement is true?
A. Sequence 2 has the greatest first term.
B. The 8th term of Sequence 3 is greater than the 6th term of Sequence 2.
C. The first four terms of Sequence 3 are 1, 2, 3, and 4.
D. A graph of Sequence 1 would have a slope of 11.

NAME CLASS DATE
Unit 2 • Additional Unit PracticeSpringBoard Louisiana Algebra 1 Skills Workshop 73
93. Model with mathematics. Antonio is arranging tiles according to the pattern below.
Stage 1 Stage 2 Stage 3
Write the explicit formula for the arithmetic sequence that models Antonio’s pattern. Explain what the values of an and d represent in the context of the situation.
94. Write an arithmetic sequence for which a4 5 11 and a9 5 36. Write the explicit formula for the sequence, and graph it. Explain how you found your answer.
LESSON 11-3 95. Write a function to describe the arithmetic
sequence 23, 2, 7, 12, 19, ….
96. For the arithmetic sequence graphed below, find f(2) and f(11).
x
y
1
1
2122
234567
21 2 3 4 5 6 7 8 90
97. What ordered pair represents the nth term of the sequence shown?
14, 23, 32, 41, 50, …
A. (n, 5 1 n) B. (n, 14 1 9n)
C. (n, 5 1 9n) D. (n, 9n)
98. The 3rd term of an arithmetic sequence is 212, and the 7th term is 0. As a first step in writing a function for this sequence, Luisa found the slope of the line that contains the points (3, 212) and (7, 0).
a. Does Luisa’s first step make sense? Explain what Luisa might be thinking.
b. Write a function to model this sequence.
99. Make sense of problems. An arithmetic sequence is given by the function f(n) 5 3n 2 1.
a. What is the inverse of this function, f 21(n)?
b. What are the inputs and outputs of the inverse function?
c. Write a question that could be answered using the inverse function, and show how to use the inverse function to answer your question.

NAME CLASS DATE
Unit 2 • Additional Unit PracticeSpringBoard Louisiana Algebra 1 Skills Workshop 74
LESSON 11-4
100. An arithmetic sequence is described by the
recursive formula 5
5 12
aa a
27n n
1
1. If an21 5 1, what
is the value of an?
A. 2 B. 3
C. 7 D. 8
101. Find the recursive formula for each arithmetic sequence. Include the recursive formula in function notation.
a. 12
, 54
, 2, 114
, ...
b. an 5 2n 2 5
c. The arithmetic sequence for which a1 5 5 and a8 5 33
d.
x
y
1
2468
10
2102826242221 2 3 4 650
102. Construct viable arguments. Does the function shown represent an arithmetic sequence? Justify your answer.
5
5 2 1⋅
ff n f n(1) 1( ) 2 ( 1) 6
103. Why is it important for a recursive formula to identify the first term? For example, why isn’t an 5 an 2 1 2 3 sufficient to define a sequence?
LESSON 12-1
104. Which equation describes the line with slope 23
and y-intercept
0, 1
2 ?
A. y x12
352 1
B. y x12
352 2
C. y x3 12
52 2
D. y x3 12
52 1
105. Write the equation in slope-intercept form of the line with the same slope as the line described by 8x 1 2y 5 17 and the same y-intercept as the line described by 2x 1 y 5 1.

NAME CLASS DATE
Unit 2 • Additional Unit PracticeSpringBoard Louisiana Algebra 1 Skills Workshop 75
106. Look for and make use of structure. Write an equation of the line represented by the data in the table.
x y
−2 00 −12 −2
107. Laura opened a savings account with an initial deposit of $200. Each month she adds $50 to the account. Now she has $650.
a. Write an equation in slope-intercept form that gives the total amount Laura has in her savings account after x months.
b. How many months has Laura been putting money into the account? Explain your answer.
c. Laura’s brother also opened a savings account with $200, but his monthly deposit is not the same as Laura’s. Describe the similarities and differences between the equation and graph describing the amount of money in Laura’s account and the equation and graph describing the amount of money in her brother’s account.
108. The following problem appeared on Kris’s math quiz:
The equation of a line is y 5 mx 2 5 and (22, 3) is on the line. Find the value of m and write the equation of this line.
Kris says he cannot find the equation because he does not know the slope. Explain how Kris can find the slope. What is the equation of the line?
LESSON 12-2
109. The slope of a line is 15 and the point (3, 21) lies on the line. Write an equation of the line in point-slope form.
Use the graph for Items 110–112.
x
y
1
123
2223
21221222324 2 3
(3, 1)
(21, 21)
4 50
2x 12y521
110. Write an equation of the line in point-slope form.
111. How many different equations in point-slope form can be written for the line? Explain.

NAME CLASS DATE
Unit 2 • Additional Unit PracticeSpringBoard Louisiana Algebra 1 Skills Workshop 76
112. How many different equations in slope-intercept form can be written for the line? Explain.
113. Rosa pays a monthly membership fee at a gym. She also pays $5 for each cycling class she takes. In May, she took 4 cycling classes and her total cost for the month was $55. In June, Rosa’s total cost was equal to twice the membership fee. How many cycling classes did Rosa take in June?
A. 5 B. 6
C. 7 D. 8
114. Use appropriate tools strategically. Will says you cannot use a graphing calculator to graph a line when the equation is in point-slope form. Explain Will’s reasoning. How could you modify an equation given in point-slope form so that you could graph the line on a graphing calculator? Use the equation y 2 2 5 23(x 1 5) as an example in your explanation.
LESSON 12-3
115. Determine the x-intercept, y-intercept, and slope of the line described by 4x 1 7y 5 228.
116. Which shows the equation of the line 4y 5 3(x 2 21) written in standard form?
A. 23x 1 4y 5 263
B. 23x 1 4y 5 221
C. 3x 2 4y 5 63
D. 23x 2 4y 5 21
117. Chase says that x 5 3 is the equation in standard form for the horizontal line that passes through the point (3, 5). What mistake did Chase make? What is the correct equation in standard form for this line?
118. Several linear equations are shown below. Arrange the equations a2h in order from least slope to greatest slope.
a. y 5 12
x 1 7 b. 2x 2 5y 5 10
c. y 2 2 5 3(x 2 4) d. x 2 3y 5 6
e. y 2 2 5 2 2x12
( 1) f. y 5 2x
g. y 1 3 5 22(x 1 1) h. 3x 1 y 5 5

NAME CLASS DATE
Unit 2 • Additional Unit PracticeSpringBoard Louisiana Algebra 1 Skills Workshop 77
119. Model with mathematics. A nursery sells purple basil plants and green basil plants. Each purple plant sells for $4. Each green plant sells for $3.75. Clara has $50 to spend on basil plants. Let x represent the number of purple plants and let y represent the number of green plants. Write an equation in standard form that models this situation.
LESSON 12-4
120. Which equation describes a line that is parallel to
the graph of y x34
15 1 ?
A. 3x 1 4y 5 1
B. 4y 5 3x 2 18
C. 23y 5 4x 2 2
D. y 2 8 5 2 2x43
( 2)
121. Persevere in solving problems. For what value(s) of a are the lines described by 2x 1 3y 5 6 and ay 5 6x 1 10 perpendicular? Explain.
122. a. Write an equation of a line that is parallel to the line containing the points (0, 27) and (5, 12).
b. Is there more than one possible answer to part a? If so, explain why and give another possible answer. If not, explain why not.
123. a. Write an equation of a line that is perpendicular to the line described by y 2 2 5 2x 1 8 and that contains the point (21, 12).
b. Is there more than one possible answer to part a? If so, explain why and give another possible answer. If not, explain why not.
LESSON 13-1
124. Which equation best models the data displayed in the scatter plot?
x
y
1
123456789
222121223 2 3 4 5 6 7 802
A. y 5 2x
B. y 5 23x 1 1
C. y 5 x 1 2
D. y 5 4x
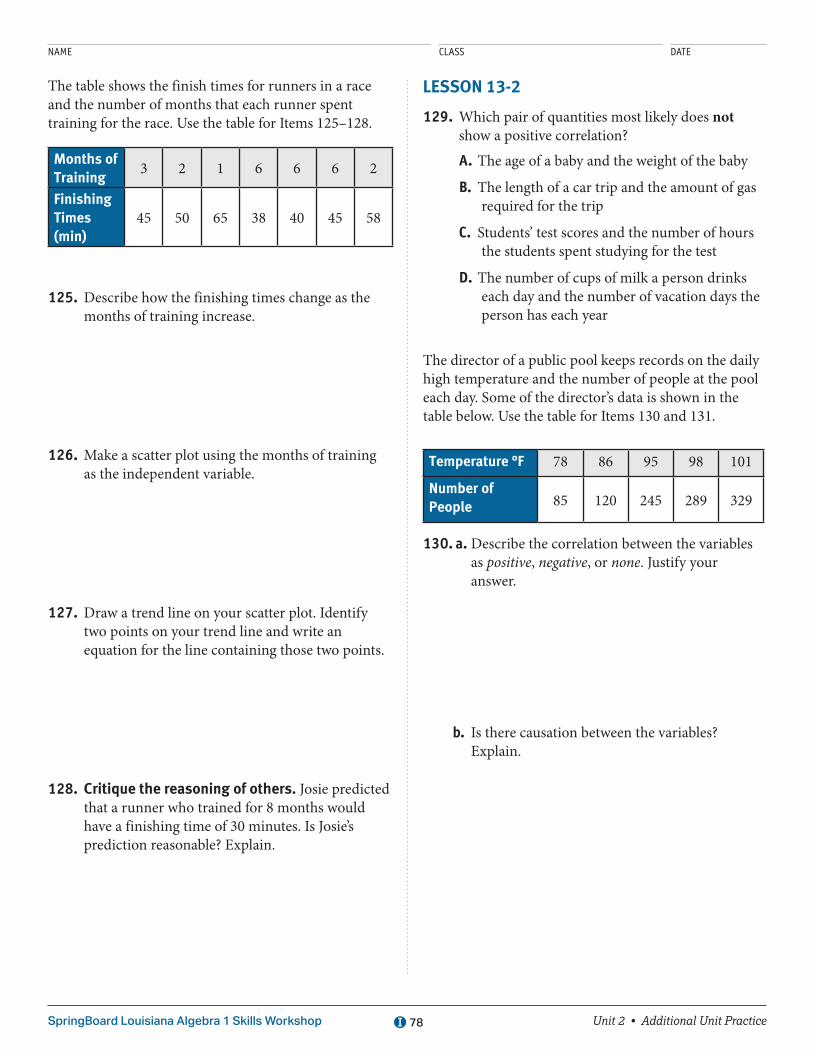
NAME CLASS DATE
Unit 2 • Additional Unit PracticeSpringBoard Louisiana Algebra 1 Skills Workshop 78
The table shows the finish times for runners in a race and the number of months that each runner spent training for the race. Use the table for Items 125–128.
Months of Training
3 2 1 6 6 6 2
Finishing Times (min)
45 50 65 38 40 45 58
125. Describe how the finishing times change as the months of training increase.
126. Make a scatter plot using the months of training as the independent variable.
127. Draw a trend line on your scatter plot. Identify two points on your trend line and write an equation for the line containing those two points.
128. Critique the reasoning of others. Josie predicted that a runner who trained for 8 months would have a finishing time of 30 minutes. Is Josie’s prediction reasonable? Explain.
LESSON 13-2
129. Which pair of quantities most likely does not show a positive correlation?
A. The age of a baby and the weight of the baby
B. The length of a car trip and the amount of gas required for the trip
C. Students’ test scores and the number of hours the students spent studying for the test
D. The number of cups of milk a person drinks each day and the number of vacation days the person has each year
The director of a public pool keeps records on the daily high temperature and the number of people at the pool each day. Some of the director’s data is shown in the table below. Use the table for Items 130 and 131.
Temperature °F 78 86 95 98 101
Number of People 85 120 245 289 329
130. a. Describe the correlation between the variables as positive, negative, or none. Justify your answer.
b. Is there causation between the variables? Explain.

NAME CLASS DATE
Unit 2 • Additional Unit PracticeSpringBoard Louisiana Algebra 1 Skills Workshop 79
131. a. Use appropriate tools strategically. Use a graphing calculator to find the equation of the line of best fit. Round values to the nearest hundredth.
b. Predict the number of people at the pool when the temperature is 75° F.
132. Give an example of two variables for which there is a correlation but no causation. Explain.
LESSON 13-3Jackson’s grandmother bought a painting 25 years ago for $675. The table shows the value of the painting through the years. Use the table for Items 133–135.
Years Since Purchase 5 10 15 20 25
Value ($) 725 800 900 975 1100
133. Which statement about the correlation between the quantities in the table is most accurate?
A. There is a negative correlation because the data do not show a constant rate of change.
B. There is a positive correlation because the painting’s value increases as time passes.
C. There is a positive correlation because negative values do not make sense for either variable.
D. There is no correlation.
134. Is there causation between the two variables? Explain.
135. a. Model with mathematics. Use a graphing calculator to find a quadratic equation that models the data. Round values to the nearest hundredth. Use the equation to predict the value of the painting after 50 years.
b. Use a graphing calculator to find an exponential equation that models the data. Round values to the nearest hundredth. Use the equation to predict the value of the painting after 50 years.
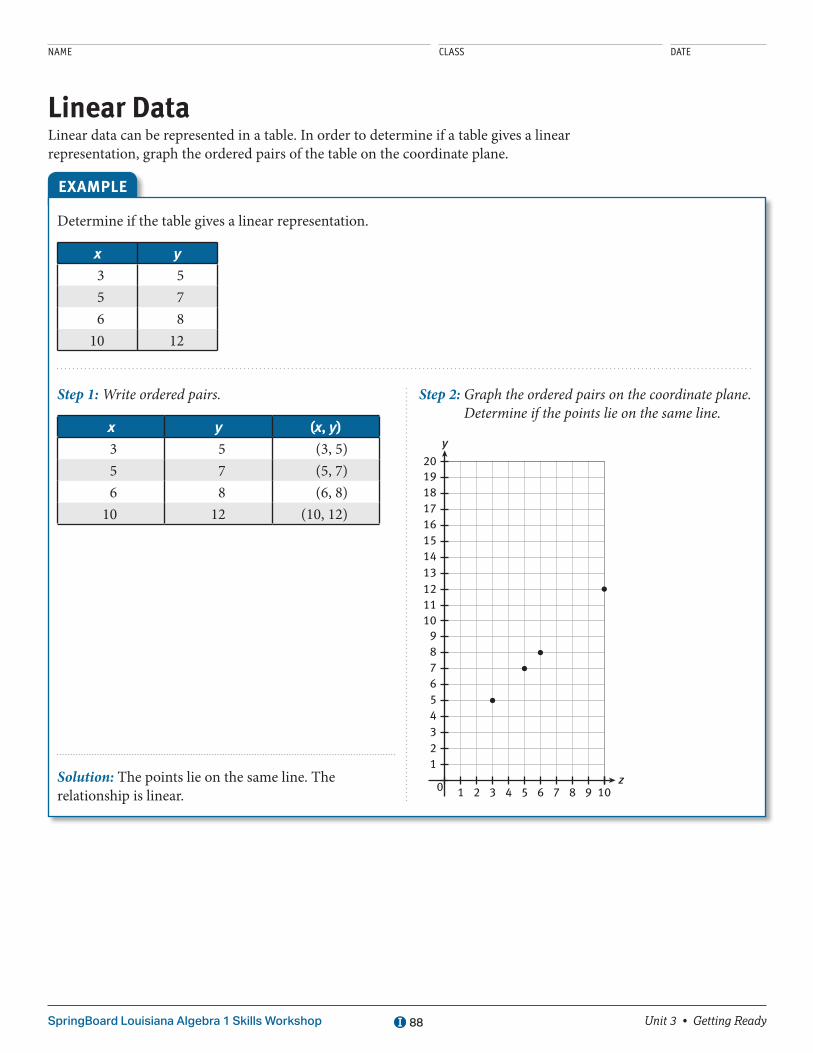
NAME CLASS DATE
Unit 3 • Getting ReadySpringBoard Louisiana Algebra 1 Skills Workshop 88
Linear DataLinear data can be represented in a table. In order to determine if a table gives a linear representation, graph the ordered pairs of the table on the coordinate plane.
Determine if the table gives a linear representation.
x y
3 55 76 8
10 12
Step 1: Write ordered pairs.
x y (x, y)
3 5 (3, 5)5 7 (5, 7)6 8 (6, 8)
10 12 (10, 12)
Solution: The points lie on the same line. The relationship is linear.
Step 2: Graph the ordered pairs on the coordinate plane. Determine if the points lie on the same line.
z
y
1
123456789
1011121314151617181920
2 3 4 5 6 7 8 9 100
EXAMPLE

Unit 3 • Getting ReadySpringBoard Louisiana Algebra 1 Skills Workshop 89
Linear Data (continued)
PRACTICEDetermine if each table represents a linear relationship. Use the coordinate grids provided as needed.
1. x y
2 124 108 4
10 1
2. x y
1 52 103 154 10
z
y
1
123456789
1011121314151617181920
2 3 4 5 6 7 8 9 100z
y
1
123456789
1011121314151617181920
2 3 4 5 6 7 8 9 100

Unit 3 • Getting ReadySpringBoard Louisiana Algebra 1 Skills Workshop 90
Linear Data (continued)
3. x y
0 182 168 109 9
4. x y
1 12 43 94 16
z
y
1
123456789
1011121314151617181920
2 3 4 5 6 7 8 9 100z
y
1
123456789
1011121314151617181920
2 3 4 5 6 7 8 9 100
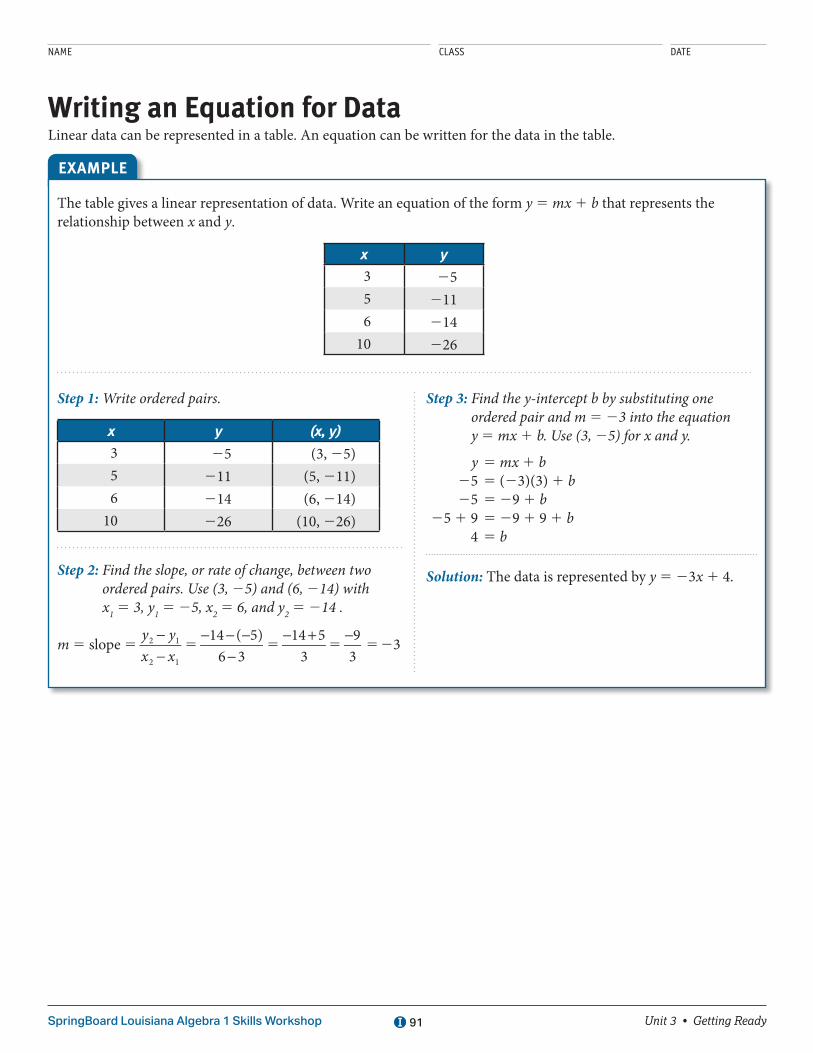
NAME CLASS DATE
Unit 3 • Getting ReadySpringBoard Louisiana Algebra 1 Skills Workshop 91
Writing an Equation for DataLinear data can be represented in a table. An equation can be written for the data in the table.
The table gives a linear representation of data. Write an equation of the form y 5 mx 1 b that represents the relationship between x and y.
x y
3 255 2116 214
10 226
Step 1: Write ordered pairs.
x y (x, y)
3 25 (3, 25)5 211 (5, 211)6 214 (6, 214)
10 226 (10, 226)
Step 2: Find the slope, or rate of change, between two ordered pairs. Use (3, 25) and (6, 214) with x1 5 3, y1 5 25, x2 5 6, and y2 5 214 .
m 5 slope 5−−
y yx x
2 1
2 1
5− − −
−14 ( 5)
6 35
− +14 53
5−93
5 23
Step 3: Find the y-intercept b by substituting one ordered pair and m 5 23 into the equation y 5 mx 1 b. Use (3, 25) for x and y.
y 5 mx 1 b 25 5 (23)(3) 1 b 25 5 29 1 b 25 1 9 5 29 1 9 1 b 4 5 b
Solution: The data is represented by y 5 23x 1 4.
EXAMPLE

Unit 3 • Getting ReadySpringBoard Louisiana Algebra 1 Skills Workshop 92
Writing an Equation for Data (continued)
PRACTICEFor each table, the relationship between x and y is linear. Determine the equation of the line that represents the relationship.
1. x y
1 82 113 144 17
2. x y
2 94 178 33
10 41
3. x y
26 21224 28
2 45 10
4. x y
3 2116 2179 223
12 229

NAME CLASS DATE
Unit 3 • Getting ReadySpringBoard Louisiana Algebra 1 Skills Workshop 93
Linear RelationshipsA linear relationship can be modeled by an equation, a table, or a graph. A table shows a linear relationship if the ratio of the change in the output values (the y-values) to the corresponding change in the input values (the x-values) is constant. A graph shows a linear relationship if it is a straight line.
Researchers and scientists might represent data in a table or graph and then analyze the data to determine if they are linear. If the data are linear, they could then write a linear equation to represent the relationship. You might use a linear equation, table, or graph to determine how much you would earn from selling different numbers of t-shirts at the soccer fundraiser.
Linear equations are often given in slope-intercept form.
Slope-Intercept Form of a Linear Equation
y 5 mx 1 b,where m 5 slope and b 5 y-intercept
Determine if the equation is linear by rewriting it in slope-intercept form.6x 5 42 2 2y
Step 1: Subtract 42 from both sides of the equation to isolate 22y on one side of the equation.
Step 2: Divide both sides of the equation by 22 to isolate y.
Step 3: Compare your equation to the slope-intercept form of a linear equation.
Solution: The equation 6x 5 42 2 2y is a linear equation.
6x 5 42 2 2y 6x 2 42 5 42 2 42 2 2y 6x 2 42 5 22y
x6 42
22
2 5
y22
2
2
x622
242
22 5
y22
2
2
23x 1 21 5 y
y 5 mx 1 by 5 23x 1 21The equation matches the slope-intercept form of a linear equation, so this is a linear equation.
EXAMPLE A

Unit 3 • Getting ReadySpringBoard Louisiana Algebra 1 Skills Workshop 94
Linear Relationships (continued)
Linear equations can also be given in the standard form.
Standard Form of a Linear Equation
Ax 1 By 5 C,where A $ 0, A and B cannot both be 0, and A, B, and C are integers whose
greatest common factor is 1.
Determine if the equation is linear by rewriting it in standard form of a linear equation.9x 1 2y 5 45 2 y 1 3x
Step 1: Add y to both sides of the equation to remove y from one side of the equation.
Step 2: Subtract 3x from both sides of the equation to remove x from one side of the equation.
Step 3: Divide both sides by the greatest common factor (GCF), 3.
Step 4: Compare your equation to the standard form of a linear equation.
9x 1 2y 5 45 2 y 1 3x 9x 1 2y 1 y = 45 − y 1 y 1 3x 9x 1 3y 5 45 1 3x 9x 2 3x 1 3y 5 45 1 3x 2 3x 6x 1 3y 5 45
x y6 3
31
5453
x63
1y3
3 5
453
2x 1 y 5 15 Ax 1 By 5 C 2x 2 y 5 15The equation matches the standard form of a linear equation, so this is a linear equation.
Solution: The equation 9x 1 2y 5 45 2 y 1 3x is a linear equation.
EXAMPLE B
A linear relationship can be represented by a table of values. If the numbers in the table show a constant rate of change, then the relationship is linear.

Unit 3 • Getting ReadySpringBoard Louisiana Algebra 1 Skills Workshop 95
Linear Relationships (continued)
Determine if the table of values represents linear data.
x y
2 34 76 118 15
Step 1: Find the differences in the numbers in the column labeled x.
Step 2: Find the corresponding differences in the numbers in the column labeled y.
Step 3: Analyze the pattern. Compute rate of change for different ordered pairs to see if they are the same.
Solution: Yes, the table of values shows a constant rate of change, so it represents linear data.
The numbers increase by 2.2 1 2 5 4, 4 1 2 5 6, 6 1 2 5 8
The corresponding numbers increase by 4.3 1 4 5 7, 7 1 4 5 11, 11 1 4 5 15
2
2
4 27 3
524
512
6 211 3
2
25
48
512
8 215 3
2
25
612
512
EXAMPLE C
Linear relationships may also be graphed. The graph of a linear relationship is astraight line with a constant rate of change.
Linear Relationship
x
y
1
123456789
10
210
242526272829
23222121222324210 2 3 4 5 6 7 8 9 102526272829 0
• Graph is a straight line• Constant rate of change• Positive slope
x
y
1
123456789
10
210
242526272829
23222121222324210 2 3 4 5 6 7 8 9 102526272829 0
• Graph is a straight line• Constant rate of change• Negative slope

Unit 3 • Getting ReadySpringBoard Louisiana Algebra 1 Skills Workshop 96
Linear Relationships (continued)
Nonlinear Relationship
x
y
1
123456789
10
210
242526272829
23222121222324210 2 3 4 5 6 7 8 9 102526272829 0
• Graph is a curve• Rate of change varies
x
y
1
123456789
10
210
242526272829
23222121222324210 2 3 4 5 6 7 8 9 102526272829 0
• Graph is a curve• Rate of change varies
Determine if the graph, taken as a whole, represents a linear relationship.
x
y
1
1234567
24252627
23222121222324 2 3 4 5 6 7252627 0
Step 1: Determine if the graph is a straight line.
Step 2: Determine if the lines together show a constant rate of change.
Solution: The graph taken as a whole does not show a constant rate of change, so it does not represent a linear relationship.
The graph shows two straight lines that intersect to form a v-shape at (21, 0).The slope of one line is positive and the slope of the other line is negative, so there is not a constant rate of change.
EXAMPLE D

Unit 3 • Getting ReadySpringBoard Louisiana Algebra 1 Skills Workshop 97
Linear Relationships (continued)
PRACTICEDetermine if each equation shows a linear relationship.
1. 2x 212
y 5 12 2. 8x 1 14 5 y 3. 24 2 x 5 y2
4. 3x2 1 4z 5 1 5. 3x 1 9 5 48 6. 5x 2 25y 5 100
Determine if each table shows a linear relationship.
7. x y
1 42 83 84 4
8. x y
2 24 86 148 20
9. x y
21 4 0 8 1 16 2 32
Determine if each graph represents a linear relationship.
10.
x
y
1
123456789
10
210
242526272829
23222121222324210 2 3 4 5 6 7 8 9 102526272829 0
11.
x
y
1
123456789
10
210
242526272829
23222121222324210 2 3 4 5 6 7 8 9 102526272829 0

Unit 3 • Getting ReadySpringBoard Louisiana Algebra 1 Skills Workshop 98
Linear Relationships (continued)
12. Evan said each representation below showed a constant rate of change. Joe said only two of the forms show a constant rate of change. Who is correct? Explain your answer.
A. 4y 2 2 5 6x B. x y
22 3 0 8 2 13 4 18
C.
x
y
1
123456789
10
210
242526272829
23222121222324210 2 3 4 5 6 7 8 9 102526272829 0

NAME CLASS DATE
Unit 3 • Getting ReadySpringBoard Louisiana Algebra 1 Skills Workshop 99
Graphing Linear EquationsLinear equations are called linear because their graphs are lines and the x-values and corresponding y-values have a constant rate of change. Two variables have a linear relationship if they can be modeled by a linear equation. For instance, the relationship between the distance traveled by an airplane flying at a constant speed and the time it has been traveling is linear, so the graph of this relationship is a line. For a gym membership that has a monthly rate plus a charge per racquetball game, the relationship between the monthly cost and the number of games played is linear, so the graph of this relationship is a set of distinct points that lie in a line.
Linear equations have several forms. One of those forms is the slope-intercept form.
Slope-Intercept Form of a Linear Equation
y 5 mx 1 b,where m 5 slope and b 5 y-intercept
The y-intercept of a line is the point at which the line intersects the y-axis. Slope represents riserun
, or steepness, of the line.
To graph a line when you are given its equation in slope-intercept form, first plot the y-intercept. Then use the slope to locate another point. Finally, draw a line through the two points.
Graph the line y 5 3x 2 2.
Step 1: Graph the y-intercept by plotting a point at (0, 22) on the y-axis.
Step 2: Use m 5riserun
to plot a second point.
m 531
= riserun
From the y-intercept, plot the next point 3 units up and 1 unit to the right.
Step 3: Draw a line through the points.
Solution: The graph is shown to the right.
x
y
1
1234567
24252627
23222121222324 2 3 4 5 6 7252627 0
y 5 3x 2 2
rise
run
EXAMPLE A

Unit 3 • Getting ReadySpringBoard Louisiana Algebra 1 Skills Workshop 100
Graphing Linear Equations (continued)
The slope can be a fraction and it can be negative.
Graph the line y 5 223
x 1 1.
Step 1: Graph the y-intercept by plotting a point at (0, 1) on the y-axis.
Step 2: Use m 5riserun
to plot a second point.
m 5223
52322
=riserun
From the y-intercept, plot the next point 2 units down and 3 units to the right.
Step 3: Draw a line through the points.
Solution:
x
y
1
1234567
24252627
23222121222324 2 3 4 5 6 7252627 0
y 5 2 x 1 123
x
y
1
12345
25242322212122232425 2 3 40 5
y-intercept
run
rise
EXAMPLE B
A line such as x 5 23 is parallel to the y-axis. The graph of x 5 23 is a vertical line 3 units to the left of the y-axis. Because division by 0 is undefined, the slope is undefined. This is true of every vertical line.

Unit 3 • Getting ReadySpringBoard Louisiana Algebra 1 Skills Workshop 101
Graph the line x 5 23.
Step 1: Identify two points on the line. Choose any two points with an x-coordinate of 23.
Step 2: Plot the points.
Step 3: Draw a line through the points.
Solution: The graph is shown to the right.
Use (23, 24) and (23, 4).
x
y
1
12345
25242322212122232425 2 3 4 50
x 5 23
EXAMPLE C
A line such as y 5 23 is parallel to the x-axis. The graph of y 5 23 is a horizontal line 3 units below the x-axis. The slope of a horizontal line is 0.
Graph the line y 5 23.
Step 1: Identify two points on the line. Choose any two points with a y-coordinate of 23.
Step 2: Plot the points.
Step 3: Draw a line through the points.
Solution: The graph is shown to the right.
Use (24, 23) and (4, 23).
x
y
1
12345
25242322212122232425 2 3 4 50
y 5 23
EXAMPLE D
Graphing Linear Equations (continued)

Unit 3 • Getting ReadySpringBoard Louisiana Algebra 1 Skills Workshop 102
Linear equations can also be written in standard form.
Standard Form of a Linear Equation
Ax 1 By 5 C, where, A $ 0, A and B cannot both be 0, and A, B, and C are integers whose greatest common factor is 1
When a linear equation is written in standard form, you can use substitution to find both the y-intercept and x-intercept. Then graph the equation by drawing a line through the two intercepts. In the following example, note that the y-intercept is a point with coordinates (0, y) and the x-intercept is a point with coordinates (x, 0).
Use the x-intercept and y-intercept to graph the equation.4x 2 5y 5 20
Step 1: To find the x-intercept, substitute y 5 0 into the equation.
Step 2: Solve for x.
Step 3: Write the x-intercept as a point.
Step 4: To find the y-intercept, substitute x = 0 into the equation.
Step 5: Solve for y.
Step 6: Write the y-intercept as a point.
Step 7: Now plot the x- and y-intercepts, and then draw a line through them.
Solution:
x
y
1
1234567
24252627
23222121222324 2 3 4 5 6 7252627 0
4x 2 5y 5 20
4x 2 5(0) 5 20 4x 2 0 5 20 4x 5 20 x 5 5
The x-intercept is (5, 0).
4(0) 2 5y 5 20 0 2 5y 5 20 25y 5 20 y 5 24
The y-intercept is (0, 24).
EXAMPLE E
Graphing Linear Equations (continued)

Unit 3 • Getting ReadySpringBoard Louisiana Algebra 1 Skills Workshop 103
PRACTICEGraph each equation.
1. y 5 2x 1 3 2. y 5 23x 2 1 3. y 5 212
x 1 1
4. 3x 2 4y 5 12 5. 2x 1 5y 5 210 6. 6x 2 3y 5 18
Describe the graph of each equation.
7. y 5 21 8. x 5 2 9. y 523
10. Gene said that two of the three equations below would have the same graph. Is Gene correct? Explain your answer using words and a graph.
y 5 2 y 5 2x 1 5 2x 1 5y 5 5
Graphing Linear Equations (continued)

NAME CLASS DATE
Unit 3 • Getting ReadySpringBoard Louisiana Algebra 1 Skills Workshop 104
Solutions of Linear Inequalities in Two VariablesA linear inequality in two variables can be written in form ax 1 by . c, where x and y are variables and a, b, and c are real numbers. An inequality can have any of the following inequality signs: ,, ., #, or $. An example of such an inequality is x , 3y 2 2.
A solution of such an inequality consists of an ordered pair, (x, y). There is one number for each variable. An ordered pair is a solution to the inequality if the inequality is true when the ordered pair is substituted into the inequality.
Determine if (2, 8) is a solution of y # x 1 5.Step 1: Substitute (2, 8) into y # x 1 5 and simplify.y # x 1 58 # 2 1 58 # 7Step 2: Determine if the simplified inequality is true or false. If it is true, the ordered pair is a solution. If it is not true,
the ordered pair is not a solution.8 # 7 is false.Solution: Because 8 # 7 is false, the ordered pair (2, 8) is not a solution of y # x 1 5.
EXAMPLE
PRACTICEDetermine if the ordered pair is a solution to the given inequality. Write yes or no.
1. 3x 2 y . 4; (2, 21) 2. 26x # y 1 2; (1, 28)
3. y 1 x $ 4; (2, 3) 4. 9 , x 2 y; (10, 2)
5. 23x 2 6y # 20; (4, 28) 6. y 1 3x # 29; (25, 22)
7. x . y 29; (0, 9) 8. 2y 2 9x . 211; (1, 3)

NAME CLASS DATE
Unit 3 • Getting ReadySpringBoard Louisiana Algebra 1 Skills Workshop 105
Graphing Compound InequalitiesA compound inequality is an inequality that consists of two inequality signs. For example, 7 # x # 15 and x , 27 or x . 7 are both compound inequalities. Their graphs can be compared and contrasted.
Compare and contrast the graphs of the two compound statements.25 , x , 10x , 25 or x . 10
Step 1: Graph both inequalities.
0 4 8 12 162428212216 0 4 8 12 162428212216
25 , x , 10 x , 25 or x . 10
Step 2: Compare the graphs by describing how they are alike.
Both graphs have open circles at 25 and 10. Step 3: Contrast the graphs by describing their differences.
The graph of 25 , x , 10 has a line segment between 25 and 10. The graph of x , 25 or x . 10 has a ray to the left of 25 and a ray to the right of 10.
Solution: Both graphs have open circles at 25 and 10. The graph of 25 , x , 10 has a line segment between 25 and 10. The graph of x , 25 or x . 10 has a ray to the left of 25 and a ray to the right of 10.
EXAMPLE
PRACTICECompare and contrast the graphs of each set of compound statements.
1. 27 , x , 11 x , 27 or x . 11
2. 3 , x , 6 x , 3 or x . 6
3. 4 , x , 22 x , 4 or x . 22
4. 215 , x , 220 x , 220 or x . 215

NAME CLASS DATE
Unit 3 • Getting ReadySpringBoard Louisiana Algebra 1 Skills Workshop 106
Functions with a Constant Rate of ChangeA function with a constant rate of change is a function with a slope that does not change. Recall that slope is the ratio of the change in y to the change in x between two points (x1, y1) and (x2, y2)on the graph of the function: m 5
2
2
y yx x
2 1
2 1
. The functions with constant rates of change are linear
functions, which are those functions whose graph is a straight line.
Determine if the function in the graph has a constant rate of change.
x
y
1
123456789
10
210
242526272829
23222121222324210 2 3 4 5 6 7 8 9 102526272829 0
Step 1: Determine if the function is linear. The graph is a straight line. The slope is 2 for any pair of points, which means that y increases 2 units for every 1 unit of increase in x.
Solution: This function has a constant rate of change.
EXAMPLE A
Determine if the function in the graph has a constant rate of change.
x
y
1
123456789
10
210
242526272829
23222121222324210 2 3 4 5 6 7 8 9 102526272829 0
Step 1: Determine if the function is linear. The graph is not a straight line. The slope can change for different pairs of points.
Solution: This function does not have a constant rate of change.
EXAMPLE B

Unit 3 • Getting ReadySpringBoard Louisiana Algebra 1 Skills Workshop 107
Functions with a Constant Rate of Change (continued)
Determine if the function represented in the table has a constant rate of change.
x y
2 64 126 188 24
Step 1: Find the slope between pairs of points. Between (2, 6) and
(4, 12), the slope is 62
531
. Between (4, 12) and (6, 18), the
slope is 62
31
5 . Between (6, 18) and (8, 24), the slope is 3.
Solution: Because the slope is the same between pairs of points, the function represented by the table has a constant rate of change.
EXAMPLE C
Determine if the function y 5 x2
2 has a constant rate of change.
Step 1: Determine if the function is linear. The function is not linear because it cannot be written in form y 5 mx 1 b.
Solution: Because the function is not linear, y 5x2
2 does not have a constant rate of change.
EXAMPLE D

Functions with a Constant Rate of Change (continued)
Unit 3 • Getting ReadySpringBoard Louisiana Algebra 1 Skills Workshop 108
PRACTICEDetermine if each function has a constant rate of change.
1.
x
y
1
123456789
10
210
242526272829
23222121222324210 2 3 4 5 6 7 8 9 102526272829 0
2.
x
y
1
123456789
10
210
242526272829
23222121222324210 2 3 4 5 6 7 8 9 102526272829 0
3. y 5x7−
4. y 5 27x 5. y 5 x327
6. x y
1 25
3 253
5 21
7 257
7. x y
210 3028 2426 1824 12

NAME CLASS DATE
Unit 3 • Mini-LessonSpringBoard Louisiana Algebra 1 Skills Workshop 109
Using Graphing Calculators to Solve Systems of EquationsGraphing calculators provide opportunities to explore systems of equations and their solutions.
Solve the system of equations x y
x y2 7
4 81 5
2 5
using a graphing calculator.
Step 1: Solve both equations for y. Equations must be solved for y in order to be entered into the calculator.
x yx x
y x
2 72 2
2 7
1 5
2 2
52 1
x yx x
y x
y x
4 8
44
84
14
2
+
2 5
2 2
2
25
2
2
5 2
Step 2: Go to the calculator’s Y= menu. Enter one equation in Y1 and the other in Y2.
Step 3: Be sure calculator is set to the standard graphing window.
Step 4: Use the calculator’s GRAPH function to graph the system of equations.
Step 5: Adjust the graphing window if necessary to see the intersection of the two graphs.
Step 6: Estimate the coordinates of the intersection point using the TRACE feature on the calculator.
Step 7: Use the INTERSECT command to determine the actual coordinates of the intersection(solution) point.
Step 8: The TABLE feature may be used to verify the solution point. In the table, the solution point will be the point where both functions have identical x and y values.
Solution: The solution point for this system of equation is (4,21)
EXAMPLE
PRACTICE
Solve each of the following systems of equations using a graphing calculator.
1. y xy x
22 7
5 1
5 1
2. x yx y
3 103 2 16
1 5
2 5
3. x yx y
2 45 3 6
1 52
1 52
4. x yx y
63 3 13
1 5
2 5

NAME CLASS DATE
Unit 3 • Additional Unit PracticeSpringBoard Louisiana Algebra 1 Skills Workshop 110
LESSON 14-1Use the table for Items 1 and 2.
Canoe Rental
Days Cost ($)
1 523 785 1047 130
1. Use function notation to write a linear function that gives the cost C in dollars of renting a canoe for t days.
2. Identify the rate of change for this linear function. What does the rate of change represent in this situation?
3. A flight from Houston to Chicago is approximately 940 miles. A plane making this flight is traveling at an average rate of 485 miles per hour. Which function represents the plane’s distance D in miles from Chicago t hours after leaving Houston?
A. D(t) 5 940 1 485t
B. D(t) 5 940 2 485t
C. D(t) 5t
4851 940
D. D(t) 5t
4852 940
4. Liam says that the value of his car over the years, shown in the table below, can be represented by a linear function. Do you agree or disagree? Justify your answer.
Liam’s Car Value
Year Value ($)
0 14,0002 10,1205 6240
5. Reason quantitatively. A chef uses the function T(w) 5 25w 1 20 to determine the time T in minutes for cooking a chicken that weighs w pounds. Interpret the rate of change of this linear function.
LESSON 14-2A nursery sells bulk garden soil using the following pricing chart. Use the table for Items 6–9.
Soil Purchased Price
less than 700 lb $3.50 for each 100 lbat least 700 lb $2.10 1 $3.20 for each 100 lb
6. Write a function to determine the cost C(w) in dollars of buying less than 700 pounds of garden soil. Identify the reasonable domain and range.
Additional Unit 3 Practice

NAME CLASS DATE
Unit 3 • Additional Unit PracticeSpringBoard Louisiana Algebra 1 Skills Workshop 111
7. Write a function to determine the cost C(w) in dollars of buying at least 700 pounds of garden soil. Identify the reasonable domain and range.
8. Teri will need 800 pounds of garden soil over the next few months. She is trying to decide how much to purchase at once. Which of the following statements is true?
A. It will cost Teri more to purchase 200 lb four times than 400 lb twice.
B. It will cost Teri less to purchase 800 lb at once than 400 lb twice.
C. It will cost Teri more to purchase 800 lb at once than 700 lb in one purchase and 100 lb in a second purchase.
D. It will cost Terri less to purchase 400 lb twice than 700 lb in one purchase and 100 lb in a second purchase.
9. Write a piecewise-defined function that can be used to determine the cost C(w) in dollars of w pounds of garden soil.
10. Model with mathematics. A baby red panda has a mass of about 100 grams at birth and gains about 13 grams per day for the first 2 weeks. From the beginning of week 3 to the end of week 4, a baby red panda gains about 22 grams per day. Write a piecewise-defined function that gives a baby red panda’s approximate mass M(a) as a function of its age a in days for the first 4 weeks of its life. By how much does the baby panda’s mass increase between the beginning of week 3 and the end of week 4?
LESSON 14-3 11. The following function gives the amount A(w) in
dollars Teresa has saved w weeks after she started saving money for a bicycle. What is A(8), and what does it represent in this situation?
A(w) 5
Use the following function for Items 12 and 13.
f(x) 5
12. What is f(4)?
A. 25 B. 1
C. 2 D. 5
13. Sketch a graph of the function.
14. Critique the reasoning of others. Alan says that f(4) 5 7 for the piecewise-defined function
f(x) 5 3x 2 5, when x , 42x 2 3, when x $ 4
. Explain the error
that Alan made, and give the correct value of f(4).
10w, when 0 , w # 520w 2 50, when 5 , w # 8
10w 1 30, when w . 8
2x 2 3, when x # 22
12
x, when 22 , x # 2
2x 2 3, when x . 2

NAME CLASS DATE
Unit 3 • Additional Unit PracticeSpringBoard Louisiana Algebra 1 Skills Workshop 112
LESSON 14-4
The function V(t) 5 10t, when 0 , t # 45t 1 20, when t . 4
gives the
cost in dollars of renting an electric bicycle at Valdez Bikes for t hours. The graph shows the function A(t), which gives the cost in dollars of renting an electric bicycle at Adam’s Bicycles for t hours. Use this information for Items 15 and 16.
80
100
60
40
20
0
A
t
Time Rented (hours)
Cost
($)
8 10
(4, 40)
62 4
Adam’s Bicycles
15. Compare the function V(t) for Valdez Bikes with the function A(t) for Adam’s Bicycles. State the similarities and differences.
16. Compare the cost of renting an electric bicycle from Valdez Bikes compared to Adam’s Bicycles. Which of the following statements is true?
A. It will always cost more to rent an electric bicycle from Adam’s Bicycles.
B. It will cost less to rent an electric bicycle from Valdez Bicycles after 3 hours.
C. It will cost more to rent an electric bicycle from Adam’s Bicycles after 4 hours.
D. For the first 5 hours, it will cost the same to rent an electric bicycle from either business.
The graph shows the piecewise-defined function f(x).Use the graph for Items 17 and 18.
x
y
2
4
6
8
22
2224 2 60 4
(1, 3)
17. Write an equation for f(x).
18. Compare f(x) to the function
g(x) 52x 1 4, when x , 1
2 12
x 1 72
, when x $ 1.
Describe the similarities and differences.
19. Look for and make use of structure. Consider the
function f(x) 52x 1 5, when x # 2
2 12
(x 2 2)1 3, when x . 2 and
the function g(x) shown in the graph below. Represent the functions in the same form, and then describe the similarities and differences between the functions.
x
y
2
4
6
22 2 60 4
22
g(x)

NAME CLASS DATE
Unit 3 • Additional Unit PracticeSpringBoard Louisiana Algebra 1 Skills Workshop 113
LESSON 15-1The graph shows how long it took Shari to run a 10K race. Use the graph for Items 20–24.
8
10
6
4
2
d
t
Time (min)
Dis
tanc
e R
emai
ning
(km
)
40 503010 20
Shari’s 10K Race
0
20. Write an equation that gives the distance d in kilometers Shari has left to run after she has been running for t minutes.
21. a. What is the slope of the line? Interpret the meaning of the slope in the context of the situation.
b. Explain why the slope is negative.
22. How long did it take Shari to finish the race? Explain how you determined your answer.
23. The graph passes through the point (20, 6). What is the meaning of this point in the context of the situation?
A. Shari ran 6 kilometers in 20 minutes.
B. After 20 minutes, Shari had 6 kilometers left to run.
C. After 6 kilometers, Shari had 20 minutes of running left.
D. In the first 20 minutes, Shari ran at a rate of 6 kilometers per minute.
24. Make sense of problems. Jody ran in the same race as Shari. The table shows information about Jody’s race.
Jody’s 10K Race
Time (min)
Distance Remaining (km)
0 10 5 8.7510 7.515 6.25
If Jody continued to run at the same pace shown in the table, by how many minutes did she beat Shari? Explain how you determined your answer.

NAME CLASS DATE
Unit 3 • Additional Unit PracticeSpringBoard Louisiana Algebra 1 Skills Workshop 114
LESSON 15-2The graph shows the predicted growth of an American elm tree that is planted under ideal conditions when it is 6 feet tall. Use the graph for Items 25–29.
16
20
12
8
4
h
t
Time (yr)
Hei
ght
(ft)
4 531 2
American Elm
0
25. At what average rate is the height of an American elm expected to change under ideal conditions? Justify your answer.
26. Under good conditions, an American elm tree that is initially 6 feet tall is predicted to grow an average of 2 feet per year. Draw a line on the graph representing growth under good conditions.
27. Reason abstractly. Write an equation for the line you graphed in Item 26. Interpret the meaning of the constant and the coefficient of t in terms of the context.
28. A 6-foot American elm was planted in better than good conditions, but less than ideal conditions. Which of the following is the most reasonable prediction for this tree’s height after 4 years?
A. 14 feet B. 16 feet
C. 18 feet D. 20 feet
29. An 18-foot American elm was planted as a 6-foot tree in better than good conditions, but less than ideal conditions. How long ago might that tree have been planted? Explain how you determined your answer.
LESSON 15-3Carly makes and sells beaded bracelets at craft fairs. She already has 8 bracelets, and each additional bracelet takes her between 2 and 3 hours to make. She is preparing for a craft fair in 2 weeks. Use this information for Items 30–34.
30. Which equation represents the number of bracelets b Carly will have if she works t hours making bracelets in the next 2 weeks and averages one bracelet every 2 hours?
A. b 5 12
t 1 8
B. b 5 12
(t 1 8)
C. b 5 2t 1 8
D. b 5 2(t 1 8)
31. Write an equation that represents the number of bracelets b Carly will have if she works t hours making bracelets in the next 2 weeks and averages one bracelet every 3 hours.
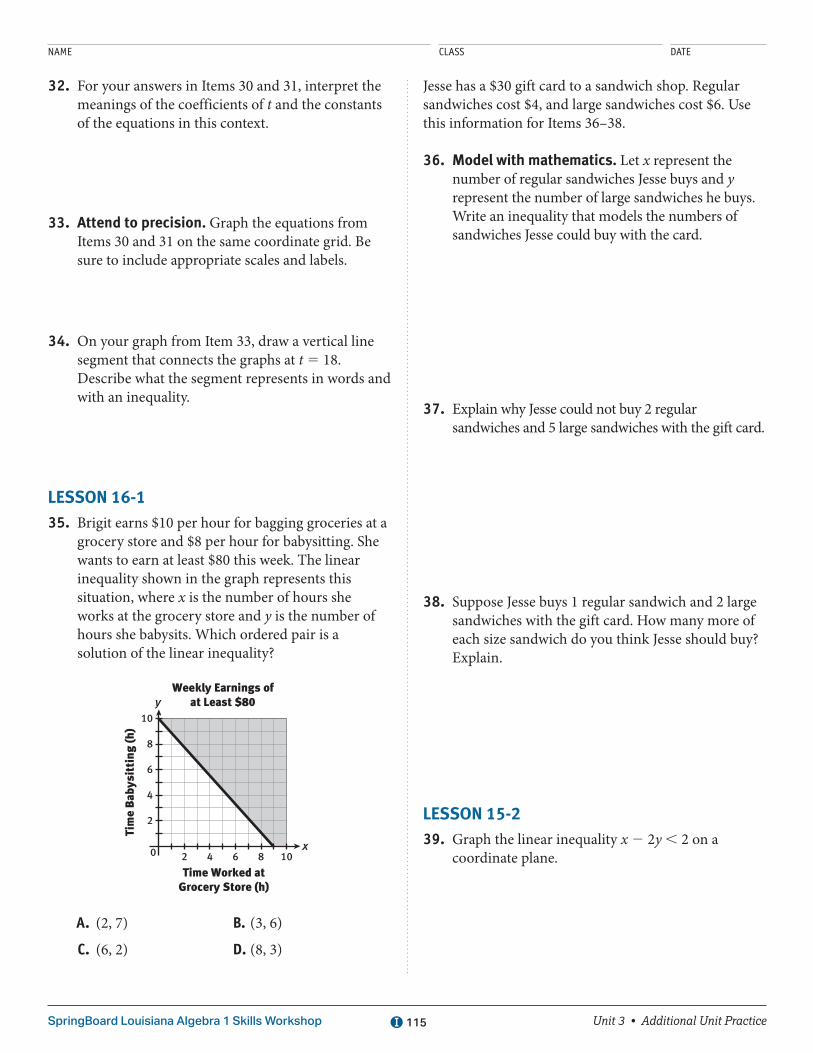
NAME CLASS DATE
Unit 3 • Additional Unit PracticeSpringBoard Louisiana Algebra 1 Skills Workshop 115
32. For your answers in Items 30 and 31, interpret the meanings of the coefficients of t and the constants of the equations in this context.
33. Attend to precision. Graph the equations from Items 30 and 31 on the same coordinate grid. Be sure to include appropriate scales and labels.
34. On your graph from Item 33, draw a vertical line segment that connects the graphs at t 5 18. Describe what the segment represents in words and with an inequality.
LESSON 16-1 35. Brigit earns $10 per hour for bagging groceries at a
grocery store and $8 per hour for babysitting. She wants to earn at least $80 this week. The linear inequality shown in the graph represents this situation, where x is the number of hours she works at the grocery store and y is the number of hours she babysits. Which ordered pair is a solution of the linear inequality?
8
10
6
4
2
y
x
Time Worked atGrocery Store (h)
Tim
e B
abys
itti
ng (h
)
8 1062 4
Weekly Earnings ofat Least $80
0
A. (2, 7) B. (3, 6)
C. (6, 2) D. (8, 3)
Jesse has a $30 gift card to a sandwich shop. Regular sandwiches cost $4, and large sandwiches cost $6. Use this information for Items 36–38.
36. Model with mathematics. Let x represent the number of regular sandwiches Jesse buys and y represent the number of large sandwiches he buys. Write an inequality that models the numbers of sandwiches Jesse could buy with the card.
37. Explain why Jesse could not buy 2 regular sandwiches and 5 large sandwiches with the gift card.
38. Suppose Jesse buys 1 regular sandwich and 2 large sandwiches with the gift card. How many more of each size sandwich do you think Jesse should buy? Explain.
LESSON 15-2 39. Graph the linear inequality x 2 2y , 2 on a
coordinate plane.

NAME CLASS DATE
Unit 3 • Additional Unit PracticeSpringBoard Louisiana Algebra 1 Skills Workshop 116
40. Which inequality is graphed below?
x
y
2
4
22 20 4
22
24
24
A. y , 232
x 1 2 B. y , 223 x 1 2
C. y #23 x 1 2 D. y #
32
x 1 2
Dale’s car gets 20 miles per gallon in the city and 25
miles per gallon on the highway. The inequality 120
x 1125
y # 5 represents the distance Dale can drive
on 5 gallons of gasoline, where x is the number of miles he drives in the city and y is the number of miles he drives on the highway. Use this information for Items 41 and 42.
41. Graph the linear inequality on a coordinate plane.
42. Identify the x-intercept and y-intercept of the boundary line of the inequality. What do they represent in this situation?
43. Look for and make use of structure. Write a series of steps explaining how to graph a linear inequality in two variables, x and y.
LESSON 17-1 44. Solve the following system of equations by
graphing.
y 5 22x 1 4
y = 13
x 2 3
45. What is the solution of the following system of equations?
2x 1 y 5 0 x 1 2y 5 3
A. (25, 4) B. (21, 2)
C. (0, 0) D. (2, 24)
46. The perimeter of a wheat field is 640 yards. The length of the field is 3 times the width. The system 2l 1 2w 5 640 and l 5 3w represents this situation, where l is the length of the field in yards and w is the width in yards. Graph the system to determine the solution. What does this solution represent?
47. Critique the reasoning of others. Regina says that the solution of the following system of equations is (4, 4). Is she correct? Explain your reasoning.
x 2 4y 5 212 2x 1 y 5 26

NAME CLASS DATE
Unit 3 • Additional Unit PracticeSpringBoard Louisiana Algebra 1 Skills Workshop 117
LESSON 17-2Use the following system of equations for Items 48 and 49.
y 5 3x 2 6y 5 22x 1 14
48. Solve the system of equations using tables of values.
49. Use appropriate tools strategically. Explain how you could use a graphing calculator to check the solution of the system of equations.
50. Solve the following system of equations.
3x 2 y 5 211 2x 1 y 5 1
Blackburn Web Hosting charges $5.69 per month plus a one-time set-up fee of $25. Randall Web Hosting charges $9.49 per month plus a one-time set-up fee of $6. Use this information for Items 51–53.
51. Let y represent the total cost in dollars of using a web hosting service for x months. Which system of equations can be used to find the number of months for which the total cost of using Blackburn Web Hosting is the same as the total cost of using Randall Web Hosting? A. y 5 5.69x 1 25
y 5 9.49x 1 6 B. y = 5.69(x 1 25)
y 5 9.49(x 1 6) C. y 1 25 5 5.69x
y 1 6 5 9.49x D. 5.69y 5 9.49x
y 1 25 5 x 1 6
52. What is the solution of the system of equations, and what does the solution of the system represent in the context of the problem?
53. What method did you use to solve the system of equations, and why did you choose this solution method?
LESSON 17-3 54. Which method could you use to eliminate one
of the variables from the following system of equations?
4x 2 6y 5 18 3x 1 4y 5 5
A. Multiply the first equation by 2 and the second equation by 3. Then add the equations.
B. Multiply the first equation by 3 and the second equation by 4. Then add the equations.
C. Multiply the first equation by 4 and the second equation by 26. Then add the equations.
D. Multiply the first equation by 5 and the second equation by 18. Then add the equations.
55. Write a scenario that could be represented by the following system of equations. Solve the system and interpret the meaning of the solution in the context of your scenario.
x 1 2y 5 9 2x 1 3y 5 14

NAME CLASS DATE
Unit 3 • Additional Unit PracticeSpringBoard Louisiana Algebra 1 Skills Workshop 118
A 4-fluid-ounce serving of orange juice contains 60 calories, and a 4-fluid-ounce serving of grapefruit juice contains 50 calories. A juice company wants to sell a mixture of orange juice and grapefruit juice. Each bottle of the mixed juice will hold 16 fluid ounces and contain 224 calories. Use this information for Items 56 and 57.
56. Write a system of equations that can be used to find the number of fluid ounces of orange juice and the number of fluid ounces of grapefruit juice in each bottle. Be sure to define the variables you use.
57. Solve the system and explain what the solution means in this context.
58. Persevere in solving problems. A chemist has two solutions of sulfuric acid, one with a concentration of 10% acid and one with a concentration of 30% acid. How many milliliters of each solution will the chemist need to mix to produce 500 milliliters of a sulfuric acid solution with a concentration of 25%? Explain how you determined your answer.
LESSON 17-4 59. The graph of a system of two linear equations
consists of two parallel lines. How many solutions does this system have?
A. none B. exactly one
C. exactly two D. infinitely many
60. Solve and graph the following system. How many solutions exist to the system of equations? Explain.
y 5 22x 1 1 4x 1 2y 5 24
61. Look for and make use of structure. Write each equation in the following system in slope-intercept form. What do the results tell you about the number of solutions the system has? Explain.
2y 2 2 5 x 1 4 3x 2 6y 5 218
62. Duke Electric charges $65 for the first hour of labor and $60 for each additional hour. Spence Electrical charges $60 per hour of labor plus a flat fee of $12. Is there a job length for which the total charge for Duke Electric is the same as the total charge for Spence Electrical (not including parts)? Use a system of linear equations to explain your answer.

NAME CLASS DATE
Unit 3 • Additional Unit PracticeSpringBoard Louisiana Algebra 1 Skills Workshop 119
63. Tanner is 120 feet to the east of Kaye on a jogging trail. Kaye begins jogging from west to east at an average speed of 8 feet per second. After 15 seconds, Tanner begins jogging in the same direction as Kaye at an average speed of 8 feet per second. Is there a time at which Kaye will pass Tanner? Use a system of equations to explain your answer.
LESSON 17-5 64. Determine the number of solutions of the
following system of equations without graphing the system. Explain how you determined your answer.
y 523 x 2 4
2x 2 3y 5 12
65. Describe the relationship between the lines of the following system of equations without graphing the system. Explain how you determined your answer.
y 512
x 2 1
x 2 2y 5 6
66. Write a system of equations that is independent and consistent. Justify your answer.
67. Which of the following systems is inconsistent?
A. x 2 3y 5 6 B. 6x 1 2y 5 3 2x 2 6y 5 12 3x 1 6y 5 9
C. x 1 y 5 3 D. 3x 1 y 5 3 3x 1 y 5 9 9x 1 3y 5 6
68. Look for and make use of structure. Write a set of rules that can be used to classify a system of two linear equations based on the slopes and y-intercepts of the lines.
LESSON 18-1 69. Solve the following system of inequalities by
graphing.
x 2 2y # 22 3x 1 y . 21
Use the system of inequalities shown in the graph for Items 70–72.
x
y
2
4
22 20 4
22
24
24
70. Which ordered pair is a solution of the system of inequalities?
A. (23, 0) B. (22, 22)
C. (21, 23) D. (1, 21)
71. Write a system of inequalities whose solution is shown by the doubly shaded region.

NAME CLASS DATE
Unit 3 • Additional Unit PracticeSpringBoard Louisiana Algebra 1 Skills Workshop 120
72. Critique the reasoning of others. Chad claims that the ordered pair (22, 23) is a solution of the system of inequalities. Is Chad’s claim correct? Explain your reasoning.
73. Name three ordered pairs that are solutions of the following system of inequalities.
y . 22x 2 3 2x 2 y . 1
LESSON 18-2 74. Graph the following system of inequalities, and
describe the solution region.
y , 223 x 1 2
2x 1 3y . 23
75. Which best describes the solutions of the following system of inequalities?
3x 1 y , 21 y , 23x 1 3
A. The solution region lies between the parallel boundary lines.
B. The solution region lies outside the parallel boundary lines.
C. The solutions are the same as the solutions of 3x 1 y , 21.
D. The solutions are the same as the solutions of y , 23x 1 3.
A 300-seat theater must make at least $3500 in ticket sales for each performance in order to make a profit. Regular tickets cost $20, and discounted tickets cost $14. A maximum of 100 discounted tickets are sold to each performance. Use this information for Items 76–78.
76. Model with mathematics. The inequality x 1 y # 300 is one of the inequalities in the system that represents this situation. Identify the meaning of each variable and write the remaining inequalities that describe the situation.
77. Sketch a graph of the system of inequalities.
78. Give an ordered pair from the solution region that makes sense in the context of the problem and an ordered pair from the solution region that does not makes sense in the context of the problem. Explain your reasoning.

NAME CLASS DATE
Unit 4 • Getting ReadySpringBoard Louisiana Algebra 1 Skills Workshop 126
FactoringA factor is any one of the numbers that, when multiplied together, form a product. Factoring means to write a number or expression as the product of its factors. Students and scientists use factoring to make complicated expressions more understandable and easier to work with.
The greatest common factor (GCF) of two whole numbers is the greatest factor that is common to both numbers. To find the GCF, list the factors of each number. Then select the greatest of the common factors.
Find the greatest common factor of 48 and 72.
Step 1: List the factors of 48 and 72.
Step 2: Find the common factors.
Step 3: Identify the greatest common factor.
Solution: The GCF of 48 and 72 is 24.
Factors of 48: 1, 2, 3, 4, 6, 8, 12, 16, 24, 48Factors of 72: 1, 2, 3, 4, 6, 8, 9, 12, 18, 24, 36, 72
1, 2, 3, 4, 6, 8, 12, 24
The GCF is 24.
EXAMPLE A
A prime number has exactly two factors: 1 and the number itself. When you find the prime factorization of a number, you show the number as a product of prime numbers only.
Give the prime factorization of 80.
Step 1: Pick two factors of 80. Try 2 and 40.
Step 2: Continue factoring the numbers until only prime numbers remain.
Step 3: Write the number as a product of prime numbers.
Solution: The prime factorization of 80 is 2 ? 2 ? 2 ? 2 ? 5.
80 5 2 ? 40
2 ? 20
2 ? 10
2 ? 5
80 5 2 ? 2 ? 2 ? 2 ? 580 5 2 ? 2 ? 2 ? 2 ? 5
EXAMPLE B
Sometimes, you may be asked to write a prime factorization using exponents. In that case, the solution to Example B above would be 24 ? 5.

Unit 4 • Getting ReadySpringBoard Louisiana Algebra 1 Skills Workshop 127
Factoring (continued)
You can write the prime factorization of an exponential expression by finding the prime factorization of the coefficient and writing the base of the exponent as repeated multiplication. The coefficient is the factor that is not raised to a power. The base is the number raised to a power, and the power (exponent) indicates how many times the base is used as a factor in the repeated multiplication.
Identify the coefficient, base, and exponent of 12x4. Then give the prime factorization.
Step 1: Identify the coefficient, base, and exponent of 12x4.
Step 2: Give the prime factorization of the coefficient.
Step 3: Write the base raised to the power in factored form.
Step 4: Write the prime factorization of the expression.
Solution: The coefficient is 12, the base is x, and the exponent is 4. The prime factorization is 2 ? 2 ? 3 ? x ? x ? x ? x.
12 is the coefficient.x is the base.4 is the exponent.
12 5 2 ? 6 5 2 ? 2 ? 3
x4 5 x ? x ? x ? x
12x4 5 2 ? 2 ? 3 ? x ? x ? x ? x
EXAMPLE C
To evaluate numerical expressions, you can use the order of operations or the distributive property.
Distributive Property of Multiplication Over Addition
For any numbers a, b, and c,a(b 1 c) 5 ab 1 ac
3(4 1 5) 5 (3 ? 4) 1 (3 ? 5)
Distributive Property of Multiplication Over Subtraction
For any numbers a, b, and c,a(b 2 c) 5 ab 2 ac
3(8 2 2) 5 (3 ? 8) 2 (3 ? 2)
Evaluate 7(28 2 5).
Using order of operations:
Step 1: Subtract inside the parentheses.
Step 2: Multiply.
Using the distributive property:
Step 1: Rewrite using the distributive property.
Step 2: Multiply inside each set of parentheses.
Step 3: Subtract.
Solution: 7(28 2 5) 5 161
7(28 2 5) 5 7(23)
5 161
7(28 2 5) 5 (7 ? 28) 2 (7 ? 5)
5 196 2 35
5 161
EXAMPLE D

Unit 4 • Getting ReadySpringBoard Louisiana Algebra 1 Skills Workshop 128
Factoring (continued)
You can use the distributive property to write the prime factorization of an expression.
Give the prime factorization of 30 ? 5 1 30 ? 25.
Step 1: Look for a factor present in both terms.
Step 2: Use the distributive property to factor out 30.
Step 3: Add inside the parentheses.
Step 4: Find the prime factorization of 30 ? 30.
Solution: The prime factorization of 30 ? 5 1 30 ? 25 is 2 ? 2 ? 3 ? 3 ? 5 ? 5.
30 ? 5 1 30 ? 25Each term has a factor of 30. 30 ? 5 1 30 ? 25 5 30(5 1 25)
5 30 ? 30
30 ? 30 5 5 ? 6 ? 5 ? 6 5 5 ? 2 ? 3 ? 5 ? 2 ? 3 5 2 ? 2 ? 3 ? 3 ? 5 ? 5
EXAMPLE E
Using exponents, the prime factorization of 30 ? 5 1 30 ? 25 in Example E above is 22 ? 32 ? 52.
PRACTICEFind the greatest common factor of each pair of numbers.
1. 12 and 90 2. 25 and 140 3. 18 and 117
Give the prime factorization of each number with and without exponents.
4. 72 5. 120 6. 500
Identify the coefficient, base, and exponent of each expression. Then give the prime factorization.
7. 2x6 8. 8y2 9. 54a3
10. Give the prime factorization of 32 ? 51 1 51 ? 19.
11. Evaluate 5(59 1 7). Explain two different ways that you could have evaluated the expression.
12. Raul says that 70 ? 25 1 70 ? 35 is equivalent to 102 ? 72. Is Raul correct? Explain how you determined your answer.

NAME CLASS DATE
Unit 4 • Getting ReadySpringBoard Louisiana Algebra 1 Skills Workshop 129
Exponential ExpressionsThere are different names for the parts of an exponential expression.
Identify the coefficient, base, and exponent of 3x7.Step 1: The coefficient is the number multiplied by the algebraic part of the exponential term. If there is no number written in the front of the term, the coefficient is understood to be 1. The coefficient of 3x7 is 3.
Step 2: The base is the part of the term that is raised to the power. The base is x.
Step 3: The power on the base is called the exponent. If there is no exponent on a base, the exponent is understood to be 1. The number 7 is the exponent of this term.
Solution: The coefficient of 3x7 is 3. The base of 3x7 is x. The exponent is of 3x7 is 7.
EXAMPLE A
Exponents can be used write equivalent forms of expressions.
Use exponents to write an equivalent expression for 49 ? 21 1 49 ? 7.Step 1: Write the expression with prime factors. 49 ? 21 1 49 ? 7 5 7 ? 7 ? 7 ? 3 1 7 ? 7 ? 7 ? 1
Step 2: Factor out the common factors. 5 7 ? 7 ? 7 (3 1 1) Step 3: Simplify inside the parentheses and use exponents for repeated factors. 5 73(4)
Step 4: If needed, write any other numbers with prime factors. 5 73(22)
If the number in parentheses is prime, then the process is complete.
Solution: 49 ? 21 1 49 ? 7 5 73 ? 22
EXAMPLE B
PRACTICEIdentify the coefficient, base, and exponent of each term.
1. 2y5 2. 2z5 3. 8r0 4. 12v
Use exponents to write an equivalent expression.
5. 64 ? 16 1 2 ? 64 6. 8 ? 4 1 24 ? 2 7. 9 ? 81 1 27 ? 6

NAME CLASS DATE
Unit 4 • Getting ReadySpringBoard Louisiana Algebra 1 Skills Workshop 130
Distributive PropertyThe Distributive Property is given as follows:a(b 1 c) 5 ab 1 bc for all real numbers a, b, and c.This property gives a method of evaluating expressions.
Evaluate 7(22 2 8) in two ways.
Method 1:Step 1: Find 22 2 8 in parentheses. The difference is 14.
Step 2: Find 7(14). The product is 98.
Solution: 7(22 2 8) 5 98
Method 2:Step 1: Use the Distributive Property. 7(22 2 8) 5 7(22) 2 7(8) 5 154 2 56
Step 2: Subtract the two products. 154 2 56 5 98.
Solution: 7(22 2 8) 5 98
EXAMPLE
PRACTICEEvaluate each expression.
1. 3(10 1 20) 2. 2(88 2 11) 3. 4(14 2 10)
4. 9(15 2 9) 5. 2(18 1 8) 6. 172(10 2 8)
7. 12(67 1 42) 8. 52(11 2 2) 9. 9(56 1 44)
10. Explain two ways to evaluate 32(16 2 6).
11. Explain two ways to evaluate 45(13 1 18).

NAME CLASS DATE
Unit 4 • Getting ReadySpringBoard Louisiana Algebra 1 Skills Workshop 131
Linear Relationships in Tables
Complete the table to create a linear relationship.
Step 1: To complete the table, find the equation of the line that represents the relationship in the table.
Write ordered pairs: (2, 13), (4, 25).
x y
2 134 2568
10
Step 2: Find the slope between the two ordered pairs.
slope m 5 y yx x
2 1
2 1
2
2 5
25 134 2
2
2 5
122
5 6
Step 3: Find the y-intercept b by substituting one ordered pair and m 5 6 into the equation y 5 mx 1 b. Use (2, 13) for x and y.
y 5 mx 1 b 13 5 (6)(2) 1 b 13 5 12 1 b 1 5 b
The data in the table is represented by y 5 6x 1 1.
Step 4: Use the equation to complete the table.
6 y 5 6(6) 1 1 5 378 y 5 6(8) 1 1 5 49
10 y 5 6(10) 1 1 5 61
Solution: The table is completed as follows.
x y
2 134 256 378 49
10 61
EXAMPLE
PRACTICEComplete each table to create a linear representation.
1. x y
1 45 207
1218
2. x y
24 522 0 1 4 219

NAME CLASS DATE
Unit 4 • Getting ReadySpringBoard Louisiana Algebra 1 Skills Workshop 132
Linear Equations and Their GraphsAn equation that models a linear relationship is called a linear equation. You might use linear equations to determine the monthly cost for renting DVDs when there is a flat monthly fee and a price-per-DVD rental. The relationship between the distance you traveled on your bike at a constant rate of speed and the time you have been biking can also be modeled by a linear equation.
Linear equations can be graphed. The graph of a linear equation is a straight line with a constant rate of change.
The following graph compares the amount of money earned by a clerk and a cashier at Grandpa’s Old World Shop. How much money do the clerk and cashier earn altogether after 4 hours?
x
140
y
120100
80604020
6
Clerk
Cashier
54321
Number of Hours
Grandpa’s Pay
Pay
($)
0
Step 1: Look at the line that represents the cashier. Find the y-value when x is equal to 4 hours.
Step 2: Look at the line that represents the clerk. Find the y-value when x is equal to 4 hours.
Step 3: Find the sum of the earnings.
Solution: The clerk and cashier earn $140 altogether after 4 hours.
The cashier earns $60 in 4 hours.
The clerk earns $80 in 4 hours.
$60 1 $80 5 $140
EXAMPLE A
Example B shows a linear equation written in standard form.
Standard Form of a Linear Equation
Ax 1 By 5 C,where A $ 0, A and B cannot both be zero, and A, B, and C are integers whose greatest common factor is 1.

Unit 4 • Getting ReadySpringBoard Louisiana Algebra 1 Skills Workshop 133
Linear Equations and Their Graphs (continued)
Evaluate the equation 3x 1 y 5 6 to find the value of y when x 5 22.
Step 1: Substitute 22 for x in the equation.
Step 2: Simplify the left side of the equation.
Step 3: Use the Addition Property of Equality. Add 6 to both sides of the equation to isolate the variable.
Solution: For the equation 3x 1 y 5 6, when x 5 22, y 5 12.
3(22) 1 y 5 6
26 1 y 5 6
26 1 6 1 y 5 6 1 6 y 5 12
EXAMPLE B
A linear equation can also be written in slope-intercept form. You can apply the properties of equality to write an equation that is in standard form as an equation in slope-intercept form.
Slope-Intercept Form of a Linear Equation
y 5 mx 1 b,where m is the slope and b is the y-intercept.
As with the standard form of a linear equation, you can substitute x-values in the slope-intercept form to find corresponding y-values.
Write the equation 3x 1 y 5 6 in slope-intercept form. Then find the range for a domain of {21, 0, 1, 2, 3}.
Step 1: Use the Subtraction Property of Equality. Subtract 3x from both sides of the equation. Then use the commutative property.
Step 2: Use the slope-intercept form of the equation to find values for y for the domain of {21, 0, 1, 2}. Make a table.
x 23x 1 6 y (x, y)
−1 23(21) 1 6 9 (21, 9) 0 23(0) 1 6 6 (0, 6) 1 23(1) 1 6 3 (1, 3) 2 23(2) 1 6 0 (2, 0) 3 23(3) 1 6 23 (3, 23)
Solution: The equation 3x 1 y 5 6 in slope-intercept form is y 5 23x 1 6. For a domain of {21, 0, 1, 2, 3}, the range is {9, 6, 3, 0, 23}.
3x 1 y 2 3x 5 6 2 3x y 5 6 2 3x y 5 23x 1 6
EXAMPLE C

Unit 4 • Getting ReadySpringBoard Louisiana Algebra 1 Skills Workshop 134
Linear Equations and Their Graphs (continued)
The slope-intercept form of an equation, y 5 mx 1 b, can be used to help you graph a linear equation. The value of b gives the point where the line crosses the y-axis. The value of m gives the number of units you need to move up or down and left or right to determine another point on the line. Then you can draw a line through the two points.
In the equation y 5 3x 1 2, the slope m is equal to 3 and the y-intercept b is equal to 2.
Graph the equation 4x 2 2y 5 12.
Step 1: Write the equation in slope-intercept form by using the properties of equality. Subtract 4x from both sides. Then divide both sides by 22.
Step 2: Identify the slope. Identify the y-intercept.
Step 3: Make the graph.
Solution:
x
8
6
4
2
26 24 22
22
24
26
28
0 42 6 8
y
28
4x 2 2y 5 12 24x 1 4x 2 2y 5 12 2 4x 22y 5 12 2 4x
y2
22
2 5
x12 42
2
2
y 5 26 1 2x y 5 2x 2 6The slope is 2.The y-intercept is 26.
Since the y-intercept is 26, plot a point at (0, 26). Then use the slope to plot another point, 2 units up and 1 unit to the right. Draw a line through the two points.
EXAMPLE D

Unit 4 • Getting ReadySpringBoard Louisiana Algebra 1 Skills Workshop 135
Linear Equations and Their Graphs (continued)
PRACTICEUse the graph to answer Items 1–5. 1. What is the speed of the car in miles per hour?
2. What is the speed of the train in miles per hour?
3. What does the ordered pair (2, 150) represent?
4. How many more miles did the train travel than the car after 4 hours? 5. Based on the graph, how many miles will the train travel in 8 hours? Explain your answer.
Evaluate each equation to find the value of y when x 5 3.
6. 2x 1 3y 5 12 7. 4x 2 3y 5 8 8. x 2 3y 5 9
Write each equation in slope-intercept form.
9. 2x 1 3y 5 12 10. 4x 2 3y 5 8 11. x 2 3y 5 9
12. In the equation 3x 2 2y 5 12, does the value of y increase or decrease as the value of x increases?
13. In the equation 2x 1 y 5 4, does the value of y increase or decrease as the value of x increases?
14. Explain how to find ordered pairs for the line of the equation 3x 2 y 5 9. Graph the line.
x
8
6
4
2
26 24 22
22
24
26
28
0 42 6 8
y
28
x
y
500400300200100
6
Train
Car
54321
Number of Hours
DistanceTraveled
Num
ber
of M
iles
0

NAME CLASS DATE
Unit 4 • Getting ReadySpringBoard Louisiana Algebra 1 Skills Workshop 136
RatioA ratio is a comparison of two quantities. Architects use ratios to determine the scale of their drawings to the size of real-life objects. Chefs use ratios to determine the amount of each ingredient to use in a recipe. School systems use ratios to describe the number of teachers to students in a school.
A ratio can compare a part to a whole, a part to a part, or a whole to a part. A ratio can be written in three ways. For example, if you have 5 coins and 32 cents, you have three dimes and two pennies. The ratio of dimes to pennies can be written as follows:
3 to 2 3:2 32
When a ratio is written as a fraction, it is not necessary to convert an improper fraction to a whole number or mixed number. As with fractions, you can write a ratio in simplest form.
A ratio can compare a whole to a part.
What is the ratio of the total number of equal parts to shaded parts in the figure below?
Step 1: Count the total number of equal parts.
Step 2: Count the number of shaded parts.
Step 3: Write the ratio of equal parts to shaded parts.
Step 4: Write the ratio in simplest form.
Solution: The ratio of equal parts to shaded parts is 87
, 8 to 7, or 8:7.
There are 16 equal parts.
There are 14 shaded parts.
The ratio is 1614
.
16 214 2
4
4 5
87
EXAMPLE A

Unit 4 • Getting ReadySpringBoard Louisiana Algebra 1 Skills Workshop 137
Ratio (continued)
A ratio can compare a part to a part.
The table shows the enrollment of students at Hamilton Middle School. What is the ratio of seventh-grade students to eighth-grade students?
Hamilton Middle School Enrollment
Grade Number of Students
6 2327 2158 248
Step 1: Write the number of seventh-grade students.
Step 2: Write the number of eighth-grade students.
Step 3: Write the ratio of seventh-grade students to eighth-grade students.
Solution: The ratio of seventh graders to eighth graders is 215 to 248.
215 seventh-grade students
248 eighth-grade students
215 to 248
EXAMPLE B
A ratio can compare a part to a whole.
Using the information in Example B, find the ratio of seventh-grade students to the total number of students at Hamilton Middle School.
Step 1: Write the number of seventh-grade students.
Step 2: Find the total number of students.
Step 3: Write the ratio of seventh graders to total students.
Step 4: Find the GCF of 215 and 695. Use prime factorization.
Step 5: Write the ratio in simplest form.
Solution: The ratio of seventh graders to total students is 43139
.
215 seventh-grade students
232 1 215 1 248 5 695
215 to 695
215 5 5 ? 43
695 5 5 ? 139
The GCF is 5.
215 5695 5
4
45
43139
EXAMPLE C

Unit 4 • Getting ReadySpringBoard Louisiana Algebra 1 Skills Workshop 138
Ratio (continued)
A ratio can model a decimal number. Use whole numbers to write the decimalas a fraction or improper fraction in simplest form.
Use whole numbers to model 6.2 as a ratio in simplest form.
Step 1: Write the ratio as a mixed number.
Step 2: Convert the mixed number to an improper fraction.
Step 3: Write the ratio in simplest form.
Solution: The ratio 315
models 6.2.
6.2 5 62
10
62
10 5
6010
1 2
10 5
6210
62 210 2
4
4 5 315
EXAMPLE D
PRACTICEWrite each ratio in simplest form.
1. shaded parts to unshaded parts 2. shaded parts to total parts 3. unshaded parts to total parts
The table shows the number of harvest fair tickets sold on one day. Write each ratio in simplest form.
Type of Ticket Child Teen Adult SeniorNumber of Tickets Sold 120 40 54 24
4. child tickets to adult tickets 5. teen tickets to child tickets 6. adult tickets to senior tickets
7. teen tickets to adult tickets 8. total tickets to teen tickets 9. senior tickets to non-senior tickets

Unit 4 • Getting ReadySpringBoard Louisiana Algebra 1 Skills Workshop 139
Ratio (continued)
Use whole numbers to model each decimal as a ratio in simplest form.
10. 0.75 11. 4.4 12. 12.5
13. Sanjay bought a pine board and an oak board of the same length. He cut the pine board into 6 equal pieces and the oak board into 8 equal pieces. He used 4 pieces of pine and 5 pieces of oak for his birdhouse design. Which board did Sanjay use more of to make the birdhouse? Explain how you found your answer.

NAME CLASS DATE
Unit 4 • Getting ReadySpringBoard Louisiana Algebra 1 Skills Workshop 140
Real NumbersMost of the numbers that you have encountered in math classes so far have been real numbers. Real numbers are the ones you use in real life, from a career in banking to reading the temperature displayed on a thermometer. The following chart shows some important sets of numbers that are subsets of the real numbers.
Subsets of Real Numbers
Natural Numbers or Counting Numbers The numbers you use to count.1, 2, 3, 4, …
Whole Numbers The natural numbers and 0.0, 1, 2, 3, 4, …
Integers Natural numbers, their opposites, and 0.… , 24, 23, 22, 21, 0, 1, 2, 3, 4, …
Rational Numbers Numbers that can be written as quotients of integers. In decimal form, their decimal parts can be written as terminating or repeating decimals.
Ex. 34
, 0.125, 1. 6 , 21 12
, 8
Irrational Numbers Numbers that cannot be written as quotients of integers. In decimal form, they do not terminate or repeat.Ex. 2 , p, 203 , 0.6573…
The diagram below can help you understand how the subsets of real numbers are related. As you can see, all real numbers are either rational or irrational, and the natural numbers are the smallest category in the diagram.
Integers
Whole Numbers
Natural Numbers Irrational Numbers
Real Numbers
Rational Numbers

Unit 4 • Getting ReadySpringBoard Louisiana Algebra 1 Skills Workshop 141
Real Numbers (continued)
Classify 1.4879 as rational or irrational and explain why. If the number is rational, identify all the subsets of rational numbers of which it is a member.
Step 1: Is 1.4879 a rational number?
Step 2: Is 1.4879 an integer?
Step 3: Is 1.4879 a whole number?
Step 4: Is 1.4879 a natural number?
Solution: 1.4879 is a rational number because it is a repeating decimal.
Yes. It is a repeating decimal.
No. Integers do not include repeating decimals.
No. Whole numbers do not include repeating decimals.
No. Natural numbers do not include repeating decimals.
EXAMPLE A
Classify 0.1234… as rational or irrational and explain why. If the number is rational, identify all the subsets of rational numbers of which it is a member.
The three dots indicate that 0.1234… is neither repeating nor terminating, so it is irrational.
Solution: 0.1234… is an irrational number because it is a non-terminating, nonrepeating decimal.
EXAMPLE B
Classify 0 as rational or irrational and explain why. If the number is rational, identify all the subsets of rational numbers of which it is a member.
Step 1: Is 0 a rational number?
Step 2: Is 0 an integer?
Step 3: Is 0 a whole number?
Step 4: Is 0 a natural number?
Solution: 0 is a rational number because it can be written as the quotient of two integers. It is also an integer and a whole number.
Yes. 0 can be written as a quotient of
integers in the form b0 , where b is an
integer and b fi 0.
Yes. The integers include 0.
Yes. The whole numbers include 0.
No. The natural numbers do not include 0.
EXAMPLE C

Unit 4 • Getting ReadySpringBoard Louisiana Algebra 1 Skills Workshop 142
Real Numbers (continued)
Classify 10 as rational or irrational and explain why. If the number is rational, identify all the subsets of rational numbers of which it is a member.
10 cannot be written as a quotient of integers, so it is irrational.
Solution: 10 is an irrational number because it cannot be written as the quotient of two integers.
EXAMPLE D
Classify 49 as rational or irrational and explain why. If the number is rational, identify all the subsets of rational numbers of which it is a member.
Step 1: Is 49 a rational number?
Step 2: Is 49 an integer?
Step 3: Is 49 a whole number?
Step 4: Is 49 a natural number?
Solution: 49 is a rational number because it equals 7, which is rational. It is also an integer, a whole number, and a natural number.
Yes. 49 5 7, which is rational.
Yes, because 7 is an integer.
Yes, because 7 is a whole number.
Yes, because 7 is a natural number.
EXAMPLE E
PRACTICEName all the ways to classify each number from among the following terms: real, irrational, rational, integer, whole, natural.
1. 64 2. 3.1879… 3. 0.4
4. p 5. 23 6. 1
7. 21.875 8. 12 9. 54
10. Garrison determined that 4p was the circumference of a circle. He said that the circumference was a rational number because 4 is a natural number. Is Garrison correct? Explain your answer.

NAME CLASS DATE
Unit 4 • Getting ReadySpringBoard Louisiana Algebra 1 Skills Workshop 143
Operations with FractionsPeople often use fractions when making measurements. You may add and multiply fractions when you follow recipes. Carpenters subtract and divide fractions as they cut apart pieces of lumber.
To add fractions with unlike denominators, first write equivalent fractions with like denominators. Add the numerators while keeping the denominator the same. Simplify if possible.
Jake bought 14
pound of sliced turkey and 12
pound of sliced ham at the market.
How much sliced meat did Jake buy altogether?
Step 1: Use the least common denominator (LCD) of 4 to
write an equivalent fraction for 12
.
Step 2: Rewrite the addition problem using the fractions with like denominators.
Step 3: Add the numerators and write the sum over the common denominator.
Solution: Jake bought 34
pound of sliced meat.
12
51 22 2
?
?5
24
14
112
14
124
14
124
51 2
41
534
EXAMPLE A
To subtract fractions that have unlike denominators, first use the LCD to write equivalent fractions with like denominators. Subtract the numerators while keeping the denominators the same. Regroup to simplify if possible.

Unit 4 • Getting ReadySpringBoard Louisiana Algebra 1 Skills Workshop 144
Operations with Fractions (continued)
What is 34
25
12? Write the answer in simplest form.
Step 1: Use the LCD of 12 to write an equivalent fraction for 34
.
Step 2: Subtract the numerators and write the difference over the common denominator.
Step 3: Simplify the result by dividing the numerator and denominator by their GCF. The GCF of 4 and 12 is 4.
Solution: 34
25
125
13
34
53 34 3
?
?5
912
912
25
125
412
412
5÷÷
4 412 4
513
EXAMPLE B
To multiply fractions, first simplify the fractions, if possible. Next, multiply the numerators and then multiply the denominators.
The distance from Tam’s house to the library is 23
mile. Tam walked from home to the library.
After walking 35
of the distance, she stopped to talk with a friend. How far had Tam walked?
Step 1: Write a multiplication expression to represent the distance.
Step 2: Simplify by cancelling out the common factors. Then multiply.
Solution: Tam had walked 25
mile.
35
?23
35
23
1
1
? 51 25 1
?
?5
25
EXAMPLE C
To divide fractions, multiply the first fraction by the reciprocal of the secondfraction. Simplify if possible.
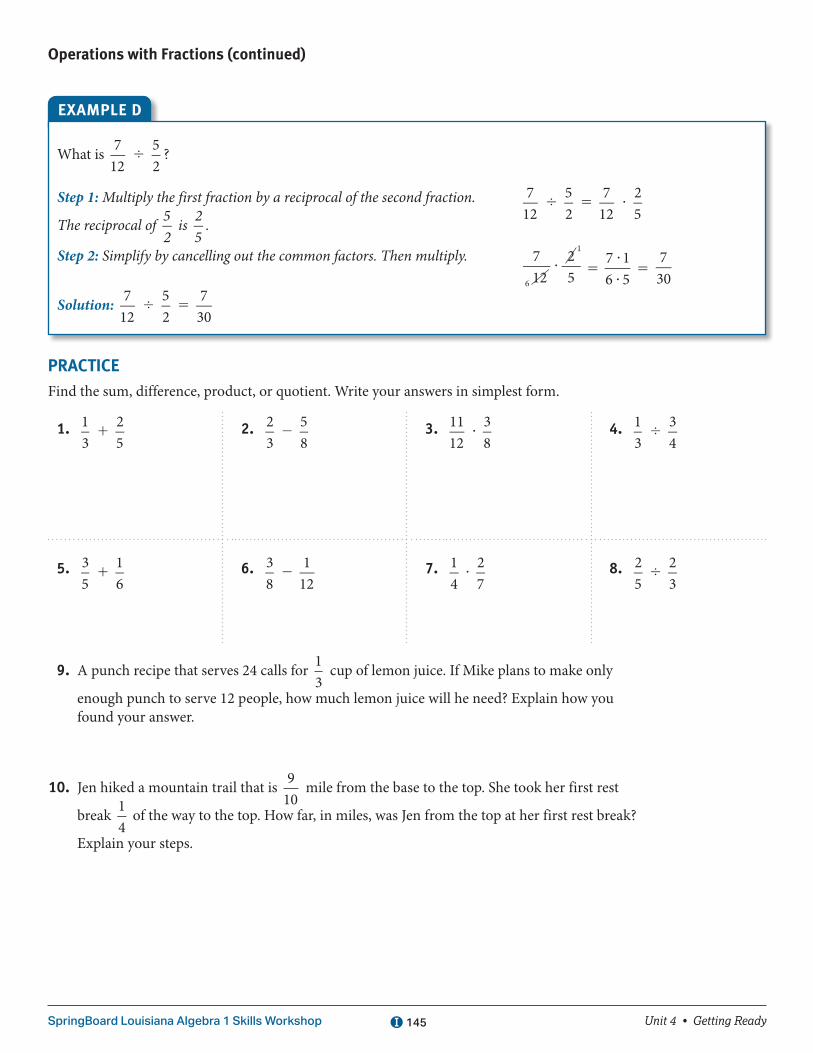
Unit 4 • Getting ReadySpringBoard Louisiana Algebra 1 Skills Workshop 145
Operations with Fractions (continued)
What is 712
4 52
?
Step 1: Multiply the first fraction by a reciprocal of the second fraction.
The reciprocal of 52
is 25
.
Step 2: Simplify by cancelling out the common factors. Then multiply.
Solution: 712
4 52
5 730
712
4 52
5 7
12 ?
25
712
256
1
? 5 7 16 5
?
? 5
730
EXAMPLE D
PRACTICEFind the sum, difference, product, or quotient. Write your answers in simplest form.
1. 13
1 25
2. 23
2 58
3. 1112
? 38
4. 13
4 34
5. 35
1 16
6. 38
2 112
7. 14
? 27
8. 25
4 23
9. A punch recipe that serves 24 calls for 13
cup of lemon juice. If Mike plans to make only
enough punch to serve 12 people, how much lemon juice will he need? Explain how you found your answer.
10. Jen hiked a mountain trail that is 910
mile from the base to the top. She took her first rest
break 14
of the way to the top. How far, in miles, was Jen from the top at her first rest break?
Explain your steps.
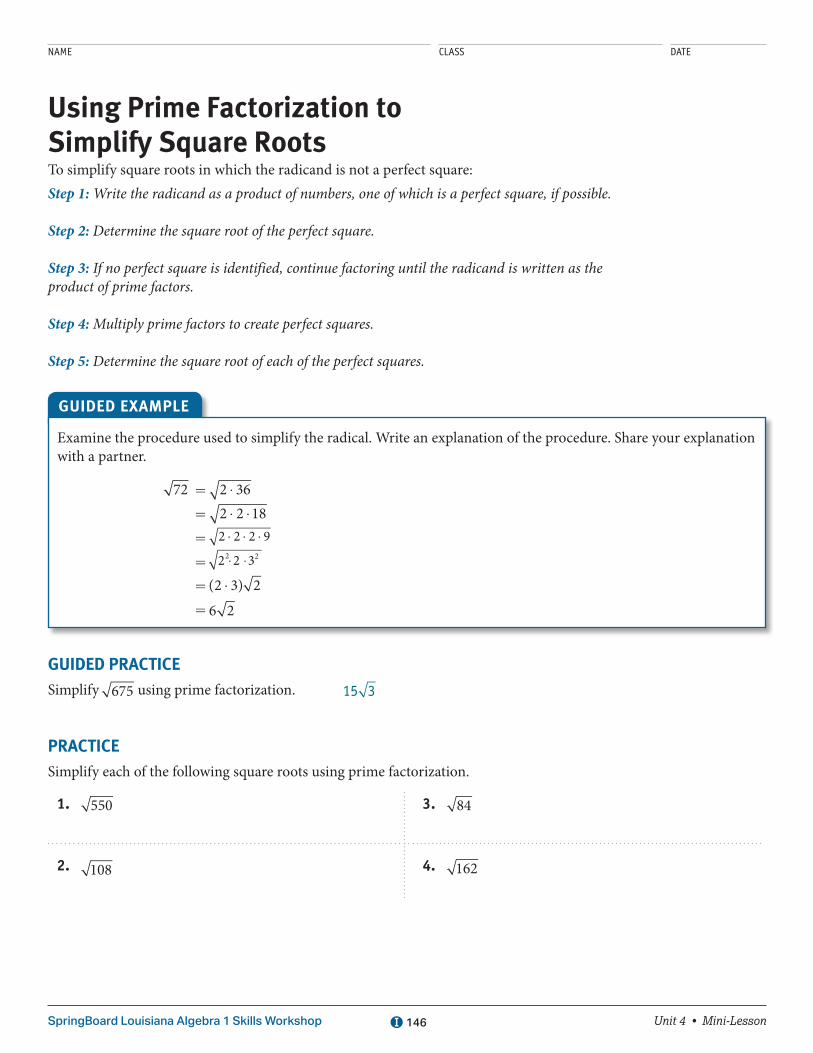
NAME CLASS DATE
Unit 4 • Mini-LessonSpringBoard Louisiana Algebra 1 Skills Workshop 146
Using Prime Factorization to Simplify Square RootsTo simplify square roots in which the radicand is not a perfect square:Step 1: Write the radicand as a product of numbers, one of which is a perfect square, if possible.
Step 2: Determine the square root of the perfect square.
Step 3: If no perfect square is identified, continue factoring until the radicand is written as the product of prime factors.
Step 4: Multiply prime factors to create perfect squares.
Step 5: Determine the square root of each of the perfect squares.
Examine the procedure used to simplify the radical. Write an explanation of the procedure. Share your explanation with a partner.
72 5 ⋅2 36 5 ⋅ ⋅2 2 18 5 ⋅ ⋅ ⋅2 2 2 9
5 ⋅ ⋅2 2 322
5 ⋅(2 3) 2 5 6 2
GUIDED EXAMPLE
GUIDED PRACTICESimplify 675 using prime factorization. 15 3
PRACTICESimplify each of the following square roots using prime factorization.
1. 550 3. 84
2. 108 4. 162

NAME CLASS DATE
Unit 4 • Mini-LessonSpringBoard Louisiana Algebra 1 Skills Workshop 147
Subtracting Polynomials Using Algebra TilesRecall that when using Algebra Tiles, individual tiles represent either constants or variables. For example:
The tile for 11 is 11 , and the tile for 21 is 21 .The tile for x is x , and the tile for 2x is 2x .
The tile for x2 is x2 .
The pairs (1 and 21; x and 2x) are the additive inverses of each other. They are called zero pairs since adding them together yields 0.
Subtracting polynomials using algebra tiles can be done by: • modeling the first polynomial
• modeling the additive inverse of the second polynomial
• identifying and removing zero pairs
• writing the resulting polynomial
Subtract (2x2 1 x 2 3) 2 (x2 1 4x 1 1) using algebra tiles.
Step 1: Model (2x2 1 x 2 3) and the additive inverse of (x2 1 4x 1 1).
2x2 2x 2x 2x 2x
21
x2 x2 x
21
21
21
Step 2: Identify and remove zero pairs.
x2 2x2 2x xx2 2x 2x 2x
2121
21
21
Step 3: Combine like tiles.
2x 2x 2xx2
2121
2121
Step 4: Write the polynomial for the model in Step 3: x2 2 3x 2 4.
Solution: (2x2 1 x 2 3) 2 (x2 1 4x 1 1) 5 x2 2 3x 2 4
EXAMPLE

Unit 4 • Mini-LessonSpringBoard Louisiana Algebra 1 Skills Workshop 148
Subtracting Polynomials Using Algebra Tiles (continued)
PRACTICESubtract the polynomials using algebra tiles. 1. (x2 1 3x 2 2) 2 (3x2 1 4x 2 1)
2. (x2 1 x 1 2) 2 (22x2 2 5x 2 7)
3. (4 1 2x 1 4x2) 2 (2x 1 4 2 3x2)

NAME CLASS DATE
Unit 4 • Mini-LessonSpringBoard Louisiana Algebra 1 Skills Workshop 149
Greatest Common Factor of MonomialsIn the polynomial 10c 110p the greatest common factor is 10. The greatest common factor (GCF) of a polynomial is the greatest monomial that divides into each term of the polynomial without a remainder.
Determine the GCF of x5, x8, x6.
The GCF of a group of terms involving variables contains the lowest power of the variable common to all the terms.
In this case, the GCF is x5.
EXAMPLE A
Determine the GCF of 2x2y3, 4x3y2, 6x4y4.
Identify the largest monomial that divides into each term without a remainder. They all have a 2, x and y so each will be in the GCF. Identify the lowest power of the common variables.
In this case, the GCF is 2x2y2.
EXAMPLE B
Factor a monomial (the GCF) from the polynomial 15t3 1 10t2 2 5t.
Identify the largest monomial that divides into each term without a remainder. They all have a 5 and t so each will be in the GCF. Identify the lowest power of the common variables and divide each coefficient by the numerical common factor. Use the distributive property to rewrite the polynomial in factored form.
In this case, the GCF is 5t, so the polynomial is written in factored form as 5t(3t2 1 2t 2 1).
A flow chart similar to the one below may be helpful when thinking about the process of determining a GCF.
Does each term contain a variable?
no
yes
Start
List the coefficients of each variable term and the constant term.
Find the GCF of the coefficients and constant.
Identify the least power of the variable.
The GCF of the terms is the GCF of the coefficients and constant.
The GCF of the terms is the GCF of the coefficients and constant multiplied by the least power of the variable.
EXAMPLE C

Unit 4 • Mini-LessonSpringBoard Louisiana Algebra 1 Skills Workshop 150
Greatest Common Factor of Monomials (continued)
PRACTICEDetermine the GCF for each of the following polynomials. Use the distributive property to write the polynomial in factored form.
1. 48x 1 16 2. 3x3 1 2x
3. 8x4 2 16x2 1 4xy 4. 3xy 1 9x2y3 2 27xy2
5. 2y4 2 8y3 1 y2

NAME CLASS DATE
Unit 4 • Mini-LessonSpringBoard Louisiana Algebra 1 Skills Workshop 151
Dividing Out Common FactorsWhen dividing fractions, write the division as multiplication by the reciprocal. If there are any common factors in both the numerators and denominators, they may be divided out before multiplying.
Divide: 54
4 2421
Step 1: Rewrite the division as multiplication by the reciprocal.
5
14 ?
2124
Step 2: Factor the numerators and denominators
?
?
5 17 2
? ?
? ? ?
7 32 2 3 2
Step 3: Divide out common factors. Pairs of common factors may be divided out of either fraction as long as one factor is in a numerator and one is in a denominator.
?
?
5 17 2
? ?
? ? ?
7 32 2 3 2
Solution: 54
4 2421
5 516
EXAMPLE A

Unit 4 • Mini-LessonSpringBoard Louisiana Algebra 1 Skills Workshop 152
Dividing Out Common Factors (continued)
Divide: 2
2
xx2 4
12 4 2
1
x xx x
23 3
2
2
Step 1: Rewrite the division as multiplication by the reciprocal.
2
2
xx2 4
12 ? 1
2
x xx x3 3
2
2
2
Step 2: Factor the numerators and denominators
x
x x2( 2)
( 1)( 1)2
2 1 ?
x xx x3 ( 1)
( 2)1
2
Step 3: Divide out common factors. Pairs of common factors may be divided out of either fraction as long as one factor is in a numerator and one is in a denominator.
x
x x2 ( 2)
( 1)( 1)2
2 1 ?
x xx x
3 ( 1)( 2)
1
2
Solution: 2
2
xx2 4
12 4 2
1
x xx x
23 3
2
2 5 x
612
EXAMPLE B
PRACTICEDivide. Leave all fractions in simplest form.
1. 54
4 1014
2. x xx
62
2 2 2
1 4 x x
x2 3 9
4 8
2 2 2
1
3. xx
11
2 2
1 4 x x
4
2 2 4. x
x6 124 20
1
2 4
xx x
3 92 152
1
2 2

NAME CLASS DATE
Unit 4 • Mini-LessonSpringBoard Louisiana Algebra 1 Skills Workshop 153
Least Common MultipleThe least common multiple (LCM) of two numbers or expressions is the smallest multiple that the numbers or expressions have in common.
One way to determine the LCM is to factor each number or expression. The LCM is the product of each factor common to the numbers or expressions as well as any non-common factors.
Determine the least common multiple of 6 and 15.Step 1: Factor each number into its prime factors.
6 5 2 ? 3 15 5 3 ? 5
Step 2: Identify any common factors.
6 and 15 have 3 as a common factor.
Step 3: Identify any non-common factors.
2 and 5 are each factors of one of the numbers, but are not common factors.
Step 4: Calculate the LCM by multiplying each factor common to the numbers as well as any non-common factors.
3 ? 2 ? 5 5 30
Solution: The LCM of 6 and 15 is 30.
EXAMPLE A
Determine the least common multiple of 12 and 28.Step 1: Factor each number into its prime factors.
12 5 2 ? 2 ? 3 28 5 2 ? 2 ? 7
Step 2: Identify any common factors.
12 and 28 have two 2’s as common factors.
Step 3: Identify any non-common factors.
3 and 7 are each factors of one of the numbers, but are not common factors.
Step 4: Calculate the LCM by multiplying each factor common to the numbers as well as any non-common factors.
2 ? 2 ? 3 ? 7 5 84
Solution: The LCM of 12 and 28 is 84.
EXAMPLE B

Unit 4 • Mini-LessonSpringBoard Louisiana Algebra 1 Skills Workshop 154
Least Common Multiple (continued)
GUIDED PRACTICEDetermine the LCM for 18x and 24.
Factor each expression: 18x 5 2 3 3 x 24 5 2 2 3 2
Common factors: 2, 3
Non-common factors: 3, x, 2, 2
LCM: 2 3 3 x 2 2 5 72x
PRACTICEDetermine the LCM for each set of numbers or expressions.
1. 15 and 18
Factor each expression: 55
Common factors:
Non-common factors:
LCM:
2. 25 and 30
Factor each expression:
Common factors:
Non-common factors:
LCM:
3. 6x and 21xy 4. x2 2 9 and 6x 1 18

NAME CLASS DATE
Unit 4 • Additional Unit PracticeSpringBoard Louisiana Algebra 1 Skills Workshop 155
Additional Unit 4 PracticeLESSON 19-1 1. The size of a text file is 35 kilobytes. The size of a
video file is 312 kilobytes. How many times greater is the size of the video file than the size of the text file?
A. 324 B. 37
C. 317 D. 360
2. Arrange the expressions in order from least to greatest.
a. 42 ? 42 b. 22
8
2
c. 77
5
3 d. 33 ? 3
3. The formula for density is D 5 MV , where D is
density, M is mass, and V is volume. The density of an object is x4 kilograms per cubic meter. Its mass is x7 kilograms. What is the volume of the object?
4. Simplify the expression x x
x
95
25
15
? .
5. Write an expression containing multiplication and division that simplifies to y4.
6. Critique the reasoning of others. Nestor says that
the value of 66
66
5
2
8
3? is 615. Is he correct? If so,
explain why. If not, identify Nestor’s error and give the correct value.
LESSON 19-2 7. Assume that x fi 0. For what value of y will 5xy
always be equal to 5? Explain your answer.
8. Simplify and write the expression a ba b
93
4 3
5 7
2
2 2 without
negative powers.
9. For what value of n is 4m2n 5 m4
5 ?
A. 25 B. 15
C. 215
D. 5
10. For what value of a is b3 ? ba 5 1? Justify your answer.
11. Reason abstractly. Determine whether the statement below is always, sometimes, or never true. Explain your reasoning.
If x is a positive integer, then the value of a2x is negative.

NAME CLASS DATE
Unit 4 • Additional Unit PracticeSpringBoard Louisiana Algebra 1 Skills Workshop 156
LESSON 19-3 12. Simplify and write each expression without
negative powers.
a. x23
18
b. x y23
16
18
c. (a3b2c22)4(abc4)(ab)
13. Which expression is not equal to
xx
4
2
12
?
A. x B. 2x
C. ( )x 212 D.
xx
2
14. Write an expression involving at least one negative exponent and a power of a product that simplifies to mn3.
15. When a quotient is raised to a negative power, Brooke claims that you can invert the quotient and write it with a positive exponent. For example,
when asked to simplify
ab3
4
2
22
, Brooke begins by
writing
ba3 2
4
2
.
a. Simplify
ab3
4
2
22
by using Brooke’s method.
Then simplify without using Brooke’s method. How do your answers compare?
b. Does Brooke’s method always work? Explain why or why not.
16. Model with mathematics. The area of a rectangle is given by the formula A 5 ℓw, where ℓ is the length and w is the width. A rectangular patio has an area of (ab)2 square feet and a length of ab2 feet. Write a simplified expression that represents the width of the patio.
LESSON 20-1 17. Kurt is cutting diagonal crossbars to stabilize a
rectangular wooden frame. If the frame has dimensions of 3 feet by 5 feet, what is the length of one crossbar? Give the exact answer using simplified radicals.
18. For each radical expression, write an equivalent expression with a fractional exponent.
a. 7
b. 193

NAME CLASS DATE
Unit 4 • Additional Unit PracticeSpringBoard Louisiana Algebra 1 Skills Workshop 157
19. a. What is the value of 2713?
b. Make use of structure. How can you use your answer to part a to help you find the value of n
for which 27n2
5 9? Find the value of n and explain your reasoning.
20. Which of the following expressions is not
equivalent to y1634( ) ?
A. y16 34 B. y8 34
C. y834 D. y16
34
34
21. a. What is 1? What is 13 ? Explain your answers.
b. Let n be a positive integer. What is the value
of 1n1
? Explain your answer.
22. A cube-shaped box has a volume of 512 cubic inches. Celia has 2.5 square feet of wrapping paper. Does she have enough paper to cover the entire surface of the box? Explain your reasoning.
LESSON 20-2 23. The perimeter of a rectangle is 8 8 feet and the
width is 4 2 feet. How many feet longer is the length of the rectangle than its width?
24. Write + +12 3 48 2 27 in simplest radical form. State whether the result is rational or irrational.
25. Find the value of a for which a5 5 3 52 5 . Explain how you found your answer.
26. Which is the sum of 2 50 and 8 ?
A. 12 2 B. 13 2
C. 13 5 D. 15 5

NAME CLASS DATE
Unit 4 • Additional Unit PracticeSpringBoard Louisiana Algebra 1 Skills Workshop 158
27. Critique the reasoning of others. Identify and correct the error in each addition or subtraction problem.
a. 7 8 5 2 2 62 5
b. 9 5 5 9 101 5
c. 8 3 3 5 3 8 5 32 1 5 1
28. Ted is fencing in an area composed of a rectangle and a right triangle as shown below.
2 27�
243�
2 12� x
He still needs to buy fencing for the side labeled x. How much fencing does Ted need to buy for this side? Express the answer in simplest radical form.
LESSON 20-3 29. Which of the following is 3 2
7 in simplest radical
form?
A. 3 2 B. 21 2
C. 3 14
7 D.
3 217
30. Jed has a rope that is 8 18 meters long. He cuts it into smaller pieces that are each 3 2 meters long. How many smaller pieces of rope does Jed now have?
31. a. Write32
1232
in simplest form. Is the
result rational or irrational?
b. What can you conclude from your answer to part a about whether the irrational numbers are closed under multiplication? Explain.
32. Lorraine solved the equation x3 24 12 6? 5 and found that x 5 4. Verify that Lorraine’s solution is correct.
33. Critique the reasoning of others. Deanna says
that 15
is in simplified form. Is she correct? If so,
explain why. If not, correct her mistake.

NAME CLASS DATE
Unit 4 • Additional Unit PracticeSpringBoard Louisiana Algebra 1 Skills Workshop 159
LESSON 21-1 34. Tell whether each sequence below is arithmetic,
geometric, or neither. If it is arithmetic, identify the common difference. If it is geometric, identify the common ratio.
a. 24, 4, 23
, 19
, …
b. 1, 4, 9, 16, 25, …
c. 3, 4.7, 6.3, 7.9, …
d. 2, 26, 18, 254, …
35. Model with mathematics. When school has been cancelled, a principal calls 4 teachers. These 4 teachers each call 4 other teachers who have not yet been called. Then those teachers each call 4 other teachers who have not yet been called, and so on.
a. The principal represents Stage 1. Make a tree diagram and a table of values to represent this situation.
b. Can this situation be represented by a geometric sequence? If so, identify the common ratio. If not, explain why not.
c. How many teachers will receive phone calls at Stage 4?
36. Consider the sequence 12, 3, x, ….
a. Find a value of x for which the sequence is arithmetic. Explain your answer.
b. Find a value of x for which the sequence is geometric. Explain your answer.
37. The terms in a geometric sequence alternate between positive and negative numbers. What must be true about this sequence?
A. The first term is negative.
B. The first term is greater than the second term.
C. The common ratio is between 0 and 1.
D. The common ratio is negative.
LESSON 21-2 38. Write the first five terms of the geometric sequence
represented by the recursive formula below.
f
f n f n
(1) 2
( ) 12
( 1)
5
5 2
39. Ernie scores 50 points in Level 1 of a video game. In each subsequent level, he scores twice as many points as he did in the previous level.
a. Write a recursive formula that represents this situation.
b. Write an explicit formula that represents this situation.
c. Use either the recursive formula or the explicit formula to find the number of points that Eddie scores in Level 10. Why did you choose the formula you did?

NAME CLASS DATE
Unit 4 • Additional Unit PracticeSpringBoard Louisiana Algebra 1 Skills Workshop 160
40. Write a geometric sequence in which every term is an odd integer. Write both the explicit and the recursive formulas for your sequence. Then identify the 9th term.
Use the geometric sequences below for Items 41 and 42.Sequence 1 Sequence 2
an 5 5 ? 2n21 aa a
25n n
1
1
5
5 2
41. Which statement is incorrect?
A. The terms in Sequence 2 increase more quickly than the terms in Sequence 1.
B. Both sequences have the same second term.
C. The explicit formula for Sequence 2 contains 2 raised to a power.
D. The common ratio for Sequence 2 is equal to the first term of Sequence 1.
42. Persevere in solving problems. How many terms in Sequence 1 are less than 500? Explain how you found your answer.
LESSON 22-1 43. Rajiv bought a rare stamp for $125. A function
that models the value of Rajiv’s after t years is v(t) 5 125 ? (1.05)t. What is the value of Rajiv’s stamp after 20 years?
A. $131.25 B. $331.66
C. $2,625.00 D. $3,316.62
44. Attend to precision. The function f(t) 5 40,000 ? (1.3)t can be used to find the value of Sally’s house between 1970 and 2010, where t is the number of decades since 1970.
a. Identify the reasonable domain and range of the function. Explain your answers.
b. Sally wants to calculate the value of her house in 1995. What number should Sally substitute for t in the function? Explain.
c. Find the value of Sally’s house in 1995.
45. The function h(t) 5 5,000 ? (2.1)t models the value of Ms. Ruiz’s house, where t represents the number of decades since 1950. In what year did the value of Ms. Ruiz’s house first exceed $25,000? Explain how you can use a table to find the answer.

NAME CLASS DATE
Unit 4 • Additional Unit PracticeSpringBoard Louisiana Algebra 1 Skills Workshop 161
46. The function h(t) 5 15,000 ? (1.5)t models the value of Sam’s house, where t represents the number of decades since 1960. The value of Kendra’s house has been doubling each decade since 1980. In 2010, the value of Sam’s house was greater than the value of Kendra’s house. Is it possible that the two houses had equal values in 1980? Explain.
LESSON 22-2 47. Identify the constant factor for the exponential
function y 513
x
. How can you use the constant
factor to tell whether the function represents exponential growth or exponential decay?
48. Mia bought a new computer for $1,500. A function that models the value of Mia’s computer after t years is v(t) 5 1,500 ? (0.68)t. How much is Mia’s computer worth after 2.5 years?
49. Jane bought a new car for $30,000. A function that models the value of Jane’s car after t years is v(t) 5 30,000 ? (0.85)t. In how many years will the car be worth less than half of what Jane paid for it?
A. 2 B. 3
C. 4 D. 5
50. Compare the graph of an exponential growth function to the graph of an exponential decay function. Describe the similarities and differences.
51. Model with mathematics. Troy bought a book with 512 pages. The next day he read half the book. On each subsequent day, he read half of the remaining pages. The exponential decay function y 5 512(0.5)x gives the number of remaining pages x days after Troy bought the book.
a. How many pages did Troy have left to read after 6 days?
b. Blake says that the value of the exponential function can never be 0, so Troy will never finish reading the book. Do you agree with Blake? Explain why or why not.
LESSON 22-3 52. Without graphing, tell which function increases
more slowly. Justify your answer.
f(x) 5 99x g(x) 5 9x

NAME CLASS DATE
Unit 4 • Additional Unit PracticeSpringBoard Louisiana Algebra 1 Skills Workshop 162
53. Use a graphing calculator to graph the function
g(x) 5 14
12
x
.
a. Identify the values of a and b (from f(x) = abx), and describe their effects on the graph.
b. Graph f(x) 512
x
on the same screen as the
graph of g(x). Describe the similarities and differences between the graphs.
54. Which function increases the fastest?
A. y 5 14x B. y 5 23 · 17x
C. y 5 120x D. y 5 2275x
55. Make sense of problems. A health club with 100 members is trying to increase its membership. Judy has a plan that will increase membership by 25 members per month, so that the number of members y after x months is given by the function y 5 100 1 25x. Desmond has a plan that will increase membership by 10% each month, so that the number of members y after x months is given by the function y 5 100 ? 1.1x.
a. Whose plan will increase club membership more quickly? Use a graph to support your answer.
b. Whose plan would you recommend? Explain.
c. To keep the club from becoming overcrowded, the maximum club membership is 500 people. Does this additional information change your recommendation from part b? Explain why or why not.
LESSON 23-1 56. On the coordinate grid below, p represents the
amount of money in Paola’s savings account, and v represents the amount in Vincent’s account. Whose account had a higher initial deposit, and how much was it? Use the graph to justify your answer.
x
y
200
400
600
800
40 800
v
p
Four students deposit money into accounts with interest that is compounded annually. The amount of money in each account after t years is given by the functions below. Use these functions for Items 57259.
Felicity: f(t) 5 500 · (1.02)t
Raisa: r(t) 5 800 · (1.01)t
Sanjay: s(t) 5 1,000 · (1.015)t
Megan: m(t) 5 200 · (1.025)t
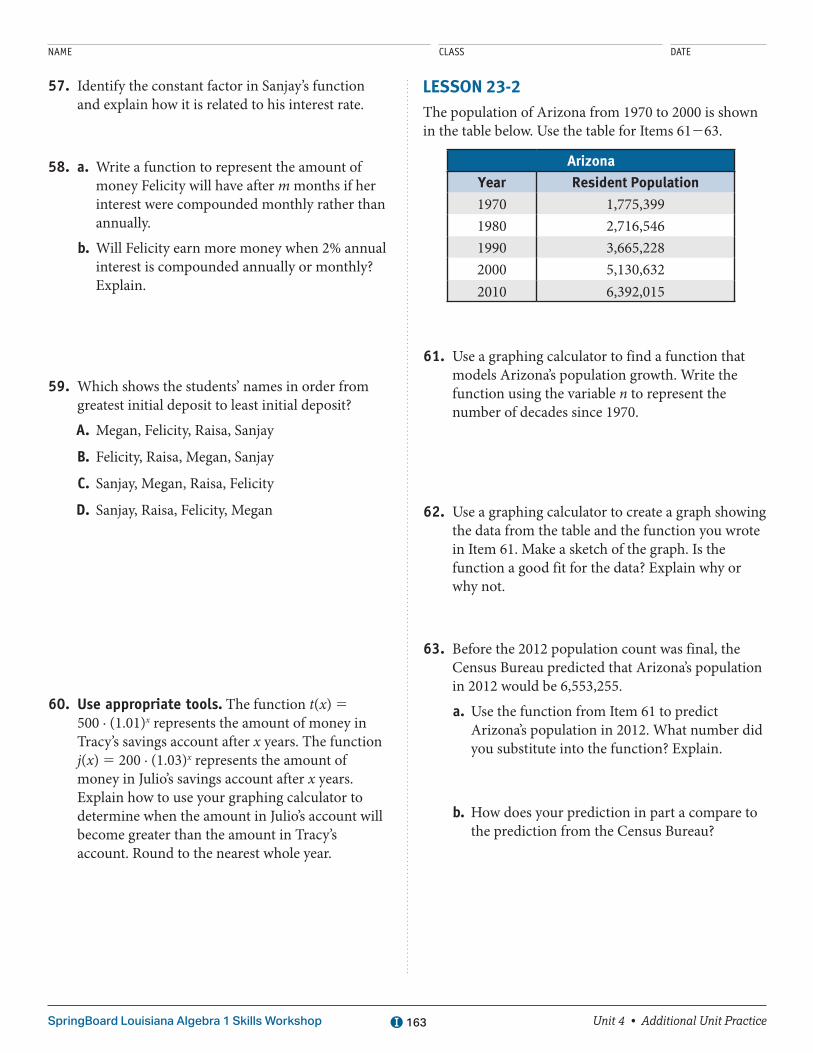
NAME CLASS DATE
Unit 4 • Additional Unit PracticeSpringBoard Louisiana Algebra 1 Skills Workshop 163
57. Identify the constant factor in Sanjay’s function and explain how it is related to his interest rate.
58. a. Write a function to represent the amount of money Felicity will have after m months if her interest were compounded monthly rather than annually.
b. Will Felicity earn more money when 2% annual interest is compounded annually or monthly? Explain.
59. Which shows the students’ names in order from greatest initial deposit to least initial deposit?
A. Megan, Felicity, Raisa, Sanjay
B. Felicity, Raisa, Megan, Sanjay
C. Sanjay, Megan, Raisa, Felicity
D. Sanjay, Raisa, Felicity, Megan
60. Use appropriate tools. The function t(x) 5 500 ∙ (1.01)x represents the amount of money in Tracy’s savings account after x years. The function j(x) 5 200 ∙ (1.03)x represents the amount of money in Julio’s savings account after x years. Explain how to use your graphing calculator to determine when the amount in Julio’s account will become greater than the amount in Tracy’s account. Round to the nearest whole year.
LESSON 23-2The population of Arizona from 1970 to 2000 is shown in the table below. Use the table for Items 61263.
Arizona
Year Resident Population
1970 1,775,3991980 2,716,5461990 3,665,2282000 5,130,6322010 6,392,015
61. Use a graphing calculator to find a function that models Arizona’s population growth. Write the function using the variable n to represent the number of decades since 1970.
62. Use a graphing calculator to create a graph showing the data from the table and the function you wrote in Item 61. Make a sketch of the graph. Is the function a good fit for the data? Explain why or why not.
63. Before the 2012 population count was final, the Census Bureau predicted that Arizona’s population in 2012 would be 6,553,255.
a. Use the function from Item 61 to predict Arizona’s population in 2012. What number did you substitute into the function? Explain.
b. How does your prediction in part a compare to the prediction from the Census Bureau?

NAME CLASS DATE
Unit 4 • Additional Unit PracticeSpringBoard Louisiana Algebra 1 Skills Workshop 164
64. Which function is the best model for the data in the table?
x y
0 151 42.52 1083 2644 688
A. y 5 16x 1 2.6 B. y 5 2.6 · 16x
C. y 5 2.6x 1 16 D. y 5 16 · 2.6x
65. Critique the reasoning of others. The function y 5 10,942(1.175)n represents the population of Nate’s hometown, where n is the number of decades since 1960. Nate wants to rewrite the function to show the growth per year. He rewrites the function as y 5 10,942(0.1175)n where n is now the number of years since 1960. Did Nate write the new function correctly? If so, explain why. If not, explain why not and write the correct function.
LESSON 24-1 66. Copy and complete the table below.
Polynomial 8x2 1 2x3 29 1 23x 2 x2 13
x5
Number of Terms
Name
Leading Coefficient
Constant Term
Degree
67. Write a polynomial in standard form that has an even number of terms and whose degree is 4.
68. Attend to precision. Which shows the polynomial 3a 1 6a2 2 16 2 2a3 written in standard form?
A. 2a3 1 6a2 2 16 1 3a
B. 22a3 1 6a2 1 3a 2 16
C. 22a3 1 6a2 2 16 1 3a
D. 22a3 1 6a2 1 3a 2 16
69. a. Is the expression 34
x2 1 x5 1 2 a polynomial?
Explain why or why not.
b. Karina says that the expression 15
x4 1 7 2 2x2 is
not a polynomial because 15
is not a whole
number. Do you agree with Karina? Explain why or why not.
LESSON 24-2 70. Add. Write your answers in standard form.
a. (2x2 1 x 1 4) 1 (6x2 1 x 2 4)
b. (5x2 1 x) 1 (7x3 2 3x 1 9)
c. (6x3 2 6x 1 1) 1 (24x3 1 x2 2 2)
d. x x x x12
6 12 34
8 92 21 2 1 2 1

NAME CLASS DATE
Unit 4 • Additional Unit PracticeSpringBoard Louisiana Algebra 1 Skills Workshop 165
71. Write the perimeter of the triangle as a polynomial in standard form.
5x 2 53x
4x 1 2
72. Devon is fencing in a square garden. The length of each side of the garden is 2x 1 3 feet.
a. Show how Devon can use addition to find an expression that represents the total number of feet of fencing he needs for all four sides of the garden. Write the sum in standard form.
b. Compare the expression for the garden’s side length, 2x 1 3, with your answer to part a. What do you notice? Does this make sense? Explain.
73. Which sum is equal to 10x2 1 7?
A. (8x2 1 3x 1 1) 1 (2x2 2 3x 2 8)
B. (8x2 1 3x 2 1) 1 (2x2 2 3x 1 8)
C. (8x2 1 3x 2 1) 1 (2x2 1 3x 1 8)
D. (8x2 2 3x 2 1) 1 (2x2 2 3x 1 8)
74. Make use of structure. Write two polynomials whose sum is:
a. 3x4 1 2x2 1 6
b. x3 2 x 2 7
c. 4.6x4 2 1.5x2
LESSON 24-3 75. Subtract. Write your answers in standard form.
a. (7x2 1 2x 1 9) 2 (5x2 1 8x 2 1)
b. (x2 2 3x 2 2) 2 (2x2 2 6x 1 2)
c.
1 2 2 2x x x x3
512
25
12
34 2 4 2
d. (23x3 1 4x2 2 7) 2 (29x2 1 10)
76. The perimeter of a rectangle is 12x 1 20 inches and the length is 4x 1 8 inches. Clark and Rachel were asked to find an expression for the width of this rectangle.
a. Clark began by writing (12x 1 20) 2 (4x 1 8). Find this difference and explain Clark’s reasoning.
b. What should Clark do next? Explain.
c. Rachel began by writing (4x 1 8) 1 (4x 1 8). Find this sum and explain Rachel’s reasoning.
d. What should Rachel do next? Explain.
e. Explain how to finish solving the problem to find an expression for the width of the rectangle.

NAME CLASS DATE
Unit 4 • Additional Unit PracticeSpringBoard Louisiana Algebra 1 Skills Workshop 166
77. Donna is planning a rectangular flower garden. The total area of the garden will be 5x2 1 7x 1 12 square feet. A square area in the garden measuring x2 1 6x 1 9 square feet will contain flowers, and the rest of the garden will contain vegetables. Write an expression for the area of the garden that will contain vegetables.
78. Which difference is equal to 3x2 1 6x 2 6?
A. (7x2 1 2x 2 3) 2 (4x2 2 8x 1 3)
B. (7x2 1 2x 2 3) 2 (4x2 2 8x 2 3)
C. (7x2 2 2x 2 3) 2 (4x2 2 8x 1 3)
D. (7x2 2 2x 2 3) 2 (4x2 2 8x 2 3)
79. Reason abstractly. Is it possible for the difference
of two polynomials to be x1
? If so, give an example
of two polynomials whose difference is x1
. If not, explain why not.
LESSON 25-1
80. Find each product. Write your answers in standard form.
a. (x 1 3)(x 2 7)
b. (2x 1 2)(x 1 9)
c. (x 2 1)(3x 1 1)
d. (x 2 5)(x 2 4)
81. Which expression represents the area of the rectangle?
5x 1 2 cm
7x 1 1 cm
A. 12x 1 3 cm2
B. 24x 1 6 cm2
C. 35x2 1 12x 1 2 cm2
D. 35x2 1 19x 1 2 cm2
82. Each product below contains an error. Explain how you can tell that the products are incorrect without multiplying. Then identify and correct each error.
a. (x 1 8)(x 1 7) 5 2x2 1 15x 1 56
b. (x 2 1)(x 2 12) 5 x2 2 13x 2 12
c. (2x 2 2)(x 1 5) 5 10x 2 10
83. Find the missing number in each product. Show that your answer is correct.
a. (x 1 5)(x 1 ) 5 x2 1 14x 1 45
b. (x 1 3)(x 2 ) 5 x2 2 3x 2 18
c. (2x 2 7)(x 1 ) 5 2x2 2 3x 2 14
d. (3x 2 1)(x 2 ) 5 3x2 2 25x 1 8
84. Make use of structure. As part of his math homework, Huong must show that (x 1 45)(x 2 80) 2 (x 2 80)(x 1 45) 5 0. Huong does not want to multiply the binomials because the numbers are large. Describe how Huong can show that the expression is equal to 0 without multiplying the binomials.

NAME CLASS DATE
Unit 4 • Additional Unit PracticeSpringBoard Louisiana Algebra 1 Skills Workshop 167
LESSON 25-2 85. Find each product. Write your answers in standard
form.
a. (x 1 5)(x 2 5)
b. (4x 1 2)(4x 2 2)
c. (x 1 7)2
d. (6x 2 5)2
86. Which product is equal to x2 2 6x 1 9?
A. (x 2 3)2 B. (3x 2 2)2
C. (x 1 3)(x 2 3) D. (3x 1 2)(3x 2 2)
87. Ginny says that the area of this quadrilateral is 9x2 1 42x 1 49 square units. What assumption is Ginny making?
3x 1 7
88. Critique the reasoning of others. Shirley says that the product (x 2 15)(x 1 15) is not a difference of two squares because the product is not in the form (a 1 b)(a 2 b). Explain to Shirley why she is incorrect.
LESSON 25-3 89. Find each product. Write your answers in standard
form.
a. 5x(3x 1 1)
b. (x2 1 3)(2x 2 5)
c. (x 2 1)(4x2 1 10x 1 6)
d. 4x2(x 1 8)(x 2 8)
e. (x 2 2)(x 1 5)(7x 2 4)
90. Which product is equal to x3 2 5x?
A. (x 2 5)3 B. x(x 2 5)
C. x(x2 2 5) D. x(x2 2 5x)
91. The formula for the area of a triangle is A 5 12
bh.
Cole and Brenda are finding a polynomial that represents the area of the triangle below. Cole plans
to multiply 12
by x 1 1 and then multiply the result
by 2x 2 6. Brenda plans to multiply 12
by 2x 2 6
and then multiply the result by x 1 1. Explain why Brenda’s solution method might be better.
2x 2 6
x 1 1

NAME CLASS DATE
Unit 4 • Additional Unit PracticeSpringBoard Louisiana Algebra 1 Skills Workshop 168
92. Express regularity in repeated reasoning. For parts a–d, find the degree of each polynomial. Then find their product and the degree of the product. Organize your results in a table.
a. Polynomial 1: 4x 2 3 Polynomial 2: x2 1 2
b. Polynomial 1: 5x4 2 2 Polynomial 2: x2 2 4x 1 6
c. Polynomial 1: 6x3
Polynomial 2: x3 1 x 2 2
d. Polynomial 1: 22x4 1 3x Polynomial 2: x 2 1
e. When two polynomials are multiplied, what is the relationship between the degree of each polynomial and the degree of their product?
LESSON 26-1 93. For which polynomial is the GCF of the terms 3x?
A. 3x2 1 3x 1 3
B. 6x2 1 12x 1 36x
C. 9x3 1 3x2 2 12x
D. 3x3 1 6x2 1 x 1 3
94. Factor each polynomial.
a. 5x 2 30
b. 6x2 2 3x 1 21
c. 24x3 1 18x2 2 36x
d. 6x6 2 9x4 1 3x2
95. Model with mathematics. Adam is planning a rectangular patio that will have an area of 16x2 1 20x square feet. The length of the patio will be x 1 5 feet. Write an expression to represent the width of the patio.
96. Give an example of a polynomial with at least three terms that cannot be factored by factoring out the GCF.
97. The length of the side of a square is represented by the expression 2x 1 4. When Carlos is asked to write an expression for the perimeter of the square with the GCF factored out, he writes 4(2x 1 4). Is Carlos correct? If so, explain why. If not, explain Carlos’s error and give the correct answer.
LESSON 26-2
98. Factor completely.
a. 4x2 2 25
b. 9x2 1 6x 1 1
c. x2 2 4x 1 4
d. 36x2 2 4
99. What factor would you need to multiply by (5x 2 1) to get 25x2 2 1?
A. 5 B. x
C. 5x 1 1 D. 5x 2 1
100. Sergio claims that x2 2 12x 2 36 is a perfect square trinomial. Explain how you can tell by examining the polynomial that Sergio is incorrect.

NAME CLASS DATE
Unit 4 • Additional Unit PracticeSpringBoard Louisiana Algebra 1 Skills Workshop 169
101. Make sense of problems. Alison has a square carpet whose area is 9x2 1 12x 1 4 square feet. Karl has a square carpet whose side length is x 1 6 feet. Find a value of x for which the areas of the carpets are equal. What is the area of each carpet for this value of x? Explain how you found your answers.
LESSON 27-1 102. Factor each trinomial. Write your answer as a
product of two binomials.
a. x2 2 x 2 20
b. x2 1 9x 1 18
c. x2 2 8x 1 12
d. x2 1 2x 2 15
103. Which trinomial cannot be factored?
A. x2 1 3x 2 4 B. x2 1 4x 1 3
C. x2 1 4x 2 3 D. x2 2 4x 1 3
104. For the trinomial x2 1 bx 2 8, give all values of b for which the trinomial can be factored. Explain how you know that you have found all possible answers.
105. Reason abstractly. Jackie says that if the factored form of a trinomial is (x 1 1)(x 1 c) for a positive number c, then c is the constant term of the trinomial and c must be a prime number because its only factors are 1 and c. Is Jackie correct? If so, explain why. If not, give a counterexample to disprove Jackie’s claim.
LESSON 27-2 106. Factor each trinomial completely.
a. 5x2 1 13x 2 6
b. 3x2 2 2x 2 8
c. 10x2 1 17x 1 3
d. 6x2 2 16x 1 10
107. An architect represents the area of a rectangular window with the expression 28x2 1 5x 2 12. Factor this trinomial to find possible expressions for the length and the width of the window.
108. The trinomial 6x2 1 bx 1 12 can be factored. Which statement is true?
A. The value of b could be an even number.
B. The value of b cannot be greater than 72.
C. The value of b must be positive.
D. The value of b must be a multiple of 2, 3, or 6.
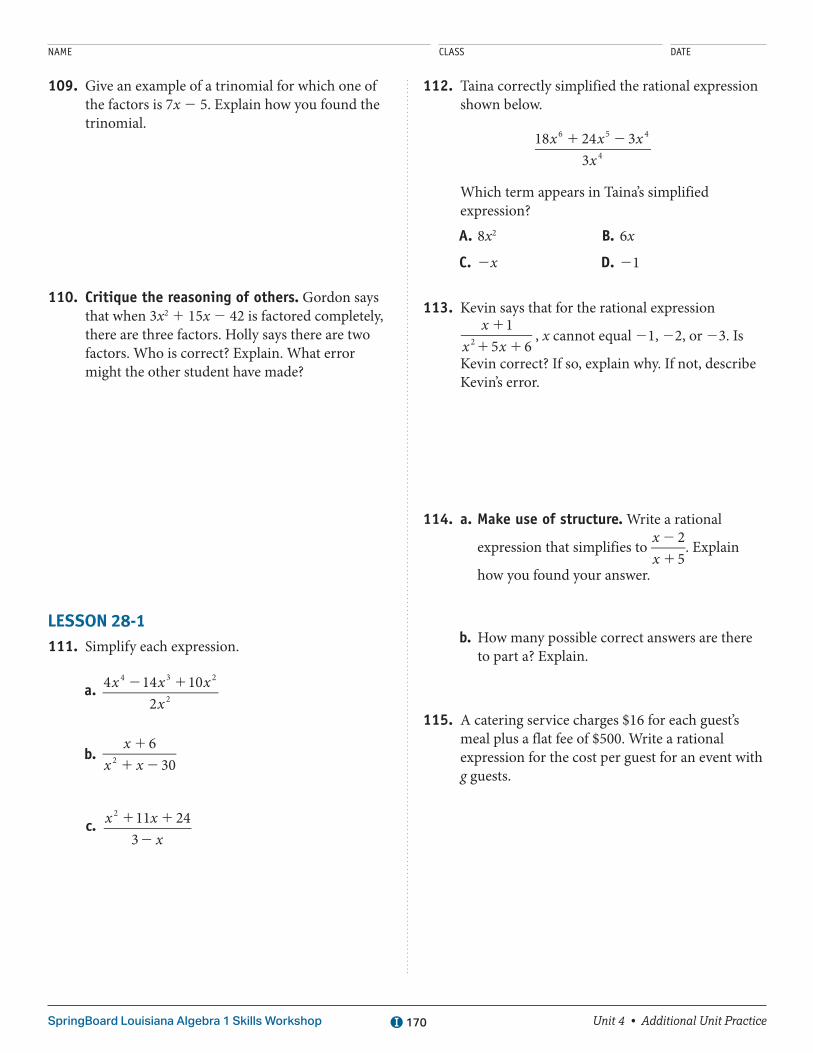
NAME CLASS DATE
Unit 4 • Additional Unit PracticeSpringBoard Louisiana Algebra 1 Skills Workshop 170
109. Give an example of a trinomial for which one of the factors is 7x 2 5. Explain how you found the trinomial.
110. Critique the reasoning of others. Gordon says that when 3x2 1 15x 2 42 is factored completely, there are three factors. Holly says there are two factors. Who is correct? Explain. What error might the other student have made?
LESSON 28-1 111. Simplify each expression.
a. x x xx
4 14 102
4 3 2
2
2 1
b. x
x x6
302
1
1 2
c. 1 1
2
x xx
11 243
2
112. Taina correctly simplified the rational expression shown below.
x x xx
18 24 33
6 5 4
4
1 2
Which term appears in Taina’s simplified expression?
A. 8x2 B. 6x
C. 2x D. 21
113. Kevin says that for the rational expression x
x x1
5 62
1
1 1, x cannot equal 21, 22, or 23. Is
Kevin correct? If so, explain why. If not, describe Kevin’s error.
114. a. Make use of structure. Write a rational
expression that simplifies to xx
25
2
1. Explain
how you found your answer.
b. How many possible correct answers are there to part a? Explain.
115. A catering service charges $16 for each guest’s meal plus a flat fee of $500. Write a rational expression for the cost per guest for an event with g guests.

NAME CLASS DATE
Unit 4 • Additional Unit PracticeSpringBoard Louisiana Algebra 1 Skills Workshop 171
LESSON 28-2 116. Simplify by using long division.
a. x xx
8 26 154 3
2 1 1
1
b. (12x2 1 18x 1 5) 4 6x
c. 2 1
1 2
x xx x
5 16 13
2
2
117. Model with mathematics. The area of a rectangular flower bed is 2x2 1 x 1 20 square feet. The length of the flower bed is x2 1 2x 1 4 feet.
a. Write an expression for the width of the flower bed.
b. What are the length, width, and area of the flower bed when x 5 2?
118. Andy was asked to simplify each expression below using long division. For which expression should he have a remainder?
A. x x6 3 9
3
2 1 1
B. x x
x4 8 6
2
2 1 1
C. x x x
x9 15 27
3
3 21 1
D. x x x
x25 10 15
5
4 3 2
2
1 1
119. Identify and correct the error in each division.
a. 2 2 1
2 1
1
12
x x x
x x
xx
1 2 2 4
2 2
0 4
2 41
3
3 2
2
b. 2 1 2
2 1
2
12
2
x x x
x x
x
xxx
5 8 15
5
13 15
13 155
2
2
LESSON 28-3 120. Multiply or divide.
a. 1
?1x
xx
x23 6
2
3
b. 2 2
1? 2
x xx
x3 10
( 2)( 4)
2
22
c. 1
1 2?
1 1
1
x xx x
x xx
2 63 4
2 7 34
2
2
2
d. 2 2
2 24
1 1
x xx x x x
2 16 5 1
16 19 3
2
2 2
121. The figure shows a rectangular prism. The area of the rectangular face ABCD is x2 1 8x 1 15. The length AB is x 1 5 and the length of BF is x 1 2. Is it possible that BCFG is a square? Explain.
A B
CD
H G
FE
2
2

NAME CLASS DATE
Unit 4 • Additional Unit PracticeSpringBoard Louisiana Algebra 1 Skills Workshop 172
122. Which product is equal to x 2 1?
A. 2 1
1 1?
1 2
1
x xx x
x xx
7 125 6
21
2
2
2
B. 1 1
1 1?
1 2
1
x xx x
x xx
7 125 6
21
2
2
2
C. 2 1
1 1?
1 2
1
x xx x
x xx
7 125 6
24
2
2
2
D. 1 1
1 1?
1 2
1
x xx x
x xx
7 125 6
24
2
2
2
123. Construct viable arguments. In the quotient a
x x( 7)3
( 7)2 214
1, a represents a real number.
Tony says that if the quotient is negative, then a must be negative. Is he correct? If so, explain why. If not, explain why not and correct Tony’s error.
LESSON 28-4 124. Which pair of expressions has a least common
multiple that is the product of the expressions?
A. x 1 4 and x 2 4
B. x 2 4 and x2 2 6x 1 8
C. x 1 4 and x2 2 16
D. x 2 4 and (x 2 4)2
125. Roy subtracted 2
1
2
xx
xx
23
43
− as shown below.
Identify and correct Roy’s error.
22
1
2
xx
xx
23
43
2 1
2
x xx
2 43
1
2
xx
43
126. Add or subtract. Simplify your answers if possible.
a. x32
1 x32
b. xx 12
2 x
112
c. x
x x6
5 62
2
1 1 2
x4
21
d. xx
21622
1 x
x2
42
127. Becky and Shannon each added x6
56
12 as shown
below. Whose solution is correct? Explain.
Becky Shannon
x6
56
12
x6
11
56
?2
21
2
x6
56
2
21
2
x 56
2 1
2
x56
2
2
x6
56
12
x6
56
11
12
?2
2
x6
56
12
x ( 5)6
1 2
x 562

NAME CLASS DATE
Unit 4 • Additional Unit PracticeSpringBoard Louisiana Algebra 1 Skills Workshop 173
128. Make sense of problems. On a hike, Rowena ran for a total of 5 miles and walked for a total of 5 miles. She ran at a rate that was twice as fast as her walking rate of r miles per hour. Write and simplify an expression for the total amount of time that Rowena walked and ran on her hike. What was the total time of her hike if she walked at a rate of 3 miles per hour?

NAME CLASS DATE
Unit 5 • Getting ReadySpringBoard Louisiana Algebra 1 Skills Workshop 183
Multiply Polynomial ExpressionsThe measures of a figure may be represented by a polynomial expression. Graphic designers and video game designers manipulate polynomial expressions in order to correctly compute all aspects of a game design.A polynomial is a single term or the sum or two or more terms. A term is a number, a variable, or the product of a number and variables. Polynomials have specific names based on how many terms they have. The chart below shows some ways to classify polynomials.
Type of Polynomial Number of Terms Examples
Monomial 1 term 22; 5xy; 4x2
Binomial 2 terms 7x 1 1; y2 1 6; c3 2 2c2
Trinomial 3 terms 3x2 2 6x 1 1; 8a 1 7b 1 3
You can multiply a polynomial by a monomial by using the distributive property.
Multiply 6x(2x 1 3).
Step 1: Use the distributive property. Multiply the monomial factor by each term in the binomial.
Step 2: Simplify each product.
Solution: 6x(2x 1 3) 5 12x2 1 18x
6x(2x 1 3)(6x)(2x) 1 (6x)(3)12x2 1 18x
EXAMPLE A
Multiply 2x(5x2 1 3x 2 6).
Step 1: Use the distributive property to multiply the monomial factor by each term in the trinomial.
Step 2: Find each product. Combine like terms if necessary.
Solution: 2x(5x2 1 3x 2 6) 5 10x3 1 6x2 2 12x
2x(5x2 1 3x 2 6)(2x ? 5x2) 1 (2x ? 3x) 1 (2x ? (26))
10x3 1 6x2 2 12x
EXAMPLE B
To multiply two binomials, use the distributive property twice to multiply each term in the first binomial by the terms in the second binomial.

Multiply Polynomial Expressions (continued)
Unit 5 • Getting ReadySpringBoard Louisiana Algebra 1 Skills Workshop 184
Multiply (x 1 4)(x 2 3).
Step 1: Use the distributive property to multiply each term in the first binomial by the terms in the second binomial.
Step 2: Use the distributive property.
Step 3: Multiply.
Step 4: Group like terms.
Step 5: Combine like terms.
Solution: (x 1 4)(x 2 3) 5 x2 1 x 2 12
(x + 4)(x − 3)(x)(x 2 3) 1 (4)(x 2 3)
(x)(x) 1 (x)(23) 1 (4)(x) 1 (4)(−3)
x2 2 3x 1 4x 2 12
x2 1 (23x 1 4x) 2 12
x2 1 x 2 12
EXAMPLE C
When multiplying two binomials and a monomial factor, multiply the two binomials first. Then distribute the monomial factor.
Multiply 3x(x 1 3)(x 2 2).
Step 1: Use the distributive property to multiply the binomials first. Find each product. Then combine like terms.
Step 2: Multiply the monomial by each term in the trinomial. Find each product. Then combine like terms if necessary.
Solution: 3x(x 1 3)(x 2 2) 5 3x3 1 3x2 2 18x
3x(x 1 3)(x 2 2)3x ? [(x)(x − 2) + 3(x − 2)]3x ? [x(x) + x(−2) + 3(x) + (3)(−2)]3x ? (x2 − 2x + 3x − 6)3x ? (x2 + x − 6)(3x ? x2) + (3x ? x) + (3x ? (−6))3x3 1 3x2 2 18x
EXAMPLE D
PRACTICEFind each product.
1. 5(3x 2 2) 2. (x 2 4)(x 1 3) 3. (x 2 6)(x 2 2)
4. 2x(x 1 5)(x 2 3) 5. 3x(2x2 2 4x 1 2) 6. 4x(x2 1 3x 2 5)
7. A square has a side that is 2x 1 3 inches long. What is the area of the square? Show your work.
8. Nick’s rectangle has a length of 3x 2 2 inches and a width of 2x 2 4 inches. Stan drew a rectangle in which each dimension was twice the corresponding dimension in Nick’s rectangle. Calculate the area of Stan’s rectangle. Explain how you found your answer.

NAME CLASS DATE
Unit 5 • Getting ReadySpringBoard Louisiana Algebra 1 Skills Workshop 185
Factoring Polynomial ExpressionsFactors are any of the numbers or symbols that when multiplied together form a product. Factoring means to write a number or expression as the product of its factors. Students and scientists use factoring to make complicated expressions more understandable and easier to work with. Factoring is an important tool for many math and science courses and for engineering applications.To factor a polynomial expression using the greatest common factor (GCF), look for a common monomial factor in the terms of the polynomial. List all the factors of each term in the polynomial. Then select the greatest of the common factors. Use the distributive property—in the reverse order from which you are used to seeing it—to factor out the GCF:
ab 1 ac 5 a(b 1 c)
Factor 4x2 1 10x.
Step 1: List the factors of each term.
Step 2: Find the factors common to both terms.
Step 3: Factor out the 2x. Make sure you divide each term inside the parentheses by 2x, since you are factoring 2x from each term.
Step 4: Write the factored expression.
Step 5: Use the distributive property to check your answer.
Solution: 4x2 1 10x 5 2x(2x 1 5)
Factors of 4x2: 2 ? 2 ? x ? xFactors of 10x: 2 ? 5 ? xThe GCF of 4x2 and 10x is 2x.
x xx
xx
2 42
102
2
1
2x(2x 1 5)
2x(2x 1 5) 5 4x2 1 10x
EXAMPLE A
When a polynomial is in the form a2 2 b2, it can be factored using the difference of two squares pattern.
Difference of Squares
a2 2 b2 5 (a 1 b)(a 2 b)

Factoring Polynomial Expressions (continued)
Unit 5 • Getting ReadySpringBoard Louisiana Algebra 1 Skills Workshop 186
Factor x2 2 64.
Step 1: Notice that this is a difference of two perfect squares, so it fits the difference of squares pattern.
Step 2: Take the square root of each term to find the values of a and b.
Step 3: Write out the binomials from the factoring pattern and substitute the values you found for a and b.
Step 4: Check your answer by using the distributive property to multiply the binomials.
Solution: x2 2 64 5 (x 1 8)(x 2 8)
x2 2 64a2 2 b2
x 2 5 x, so a 5 x64 = 8, so b 5 8
(a 1 b)(a 2 b) (x 1 8)(x 2 8)
(x 1 8)(x 2 8) 5 x2 2 8x + 8x 2 64 5 x2 2 64 The binomial factors are correct.
EXAMPLE B
To factor a trinomial, you can use patterns of products of binomials method. Trinomials in the form x2 1 bx 1 c, where b and c are integers, can be factored into two binomials in the form (x 1 d)(x 1 e), where d and e are also integers.
Factor x2 1 6x 1 8.
Step 1: Set up the two binomial factors of the trinomial. The first term in each binomial is x because x ∙ x 5 x2. To factor, you must fill in the second term in each binomial.
Step 2: List factor pairs of the third term, 8.
Step 3: Look for the factor pair that has a sum equal to the coefficient of the second term of the trinomial, 6.
Step 4: Complete the binomial factors.
Step 5: Check your answer by multiplying the binomials to see if you get the original trinomial.
Solution: x2 1 6x 1 8 5 (x 1 2)(x 1 4)
(x 1 ___)(x 1 ___)
Factors Sum
1 8 9 21 28 29 22 24 26
2 4 6
The factors 2 and 4 have a sum of 6: 2 1 4 5 6.
(x 1 2)(x 1 4)
(x 1 2)(x 1 4) 5 x2 1 4x 1 2x 1 8 5 x2 1 6x 1 8
The factors are correct.
EXAMPLE C

Factoring Polynomial Expressions (continued)
Unit 5 • Getting ReadySpringBoard Louisiana Algebra 1 Skills Workshop 187
When using the patterns of products of binomials method, if the constant in the trinomial is negative, then one of the factors of the constant is negative and the other is positive.
Factor x2 1 4x 2 12.
Step 1: Set up the two binomial factors of the trinomial.
Step 2: To complete the binomial factors, list all the factors pairs for the third term, −12. Then find the sum of each pair of factors.
Step 3: Look for the factor pair that has a sum equal to the coefficient of the second term of the trinomial, 4.
Step 4: Complete the binomial factors.
Step 5: Check your answer by multiplying the binomials to see if you get the original trinomial.
Solution: x2 1 4x 2 12 5 (x 2 2)(x 1 6)
(x 1 ___)(x 1 ___)
Factors Sum
1 212 211 21 12 11
2 26 24 22 6 4
3 24 21 23 4 1
The factors, 22 and 6, have a sum of 4: 22 1 6 5 4(x 1 (22))(x 1 6)(x 2 2)(x 1 6)(x 2 2)(x 1 6) 5 x2 1 6x 2 2x 2 12
5 x2 1 4x 2 12The factors are correct.
EXAMPLE D

Factoring Polynomial Expressions (continued)
Unit 5 • Getting ReadySpringBoard Louisiana Algebra 1 Skills Workshop 188
You can also use these special factoring patterns to factor certain trinomials.
Perfect Square Trinomials
a2 1 2ab 1 b2 5 (a 1 b)2
a2 2 2ab 1 b2 5 (a 2 b)2
If the first and third terms in a trinomial are perfect squares, check if the trinomial fits one of the perfect square trinomial factoring patterns.
Factor x2 1 18x 1 81.
Step 1: Notice that the first and third terms are perfect squares.
Step 2: Take the square roots of the first and third terms to find what the values of a and b might be.
Step 3: Test the values for a and b. Because the middle term is positive, check if the trinomial fits the pattern a2 1 2ab + b2 with a positive second term. Substitute the values for a and b to see if you get the original trinomial and then simplify.
Step 4: This matches the original trinomial, so it fits the factoring pattern. Write out the squared binomial from the factoring pattern in the table above and substitute the values you found for a and b.
Solution: x2 1 18x 1 81 5 (x 1 9)2
x2 1 18x 1 81
x 2 5 x, so a 5 x81 5 9, so b 5 9
a2 1 2ab 1 b2
x2 1 2x(9) 1 92
x2 1 18x 1 81
(a 1 b)2
(x 1 9)2
EXAMPLE E
PRACTICEFactor each polynomial.
1. 6x2 1 54x 2. 3x2 1 36x 3. 5x2 2 180
4. 3x2 2 147 5. x2 2 3x 2 18 6. x2 1 16x 1 64
7. x2 1 13x + 36 8. x2 1 2x 2 24 9. x2 2 9x 1 14
10. What is the length of a side of a square whose area is represented by the expression x2 2 22x 1 121?
11. The area of a square is represented by x2 1 28x 1 196. What is the perimeter of the square? Explain how you found your answer.

NAME CLASS DATE
Unit 5 • Getting ReadySpringBoard Louisiana Algebra 1 Skills Workshop 189
Evaluating FunctionsFunctions are used to represent a variety of situations in the real world. You can evaluate a function to determine the cost of downloading a certain number of songs. A function is a relation in which each input is paired with exactly one output. Functions are indicated by the symbol f (x), which is read as “f of x.” It represents the value in the range that corresponds to the value of x in the domain. To evaluate a function, substitute the given input value for x in the equation and solve for f (x).
If f (x) 5 2x 2 3, find f (4).
Step 1: Substitute 4 for x in the function.
Step 2: Evaluate the function by following the order of operations.
Step 3: Subtract.
Solution: f (4) 5 5
f (x) 5 2x 2 3f (4) 5 2(4) 2 3f (4) 5 8 2 3
f (4) 5 5
EXAMPLE
PRACTICEFor f (x) 5 2x 1 1, find each value.
1. f (6) 2. f (3) 3. f (−5)
For f (x) 5 23x 2 5, find each value.
4. f (0) 5. f (211) 6. f (9)
For f (x) 5 8x 2 2, find each value.
7. f (24) 8. f (22) 9. f (7)
For f (x) 5 29x 1 8, find each value.
10. f (0) 11. f (23) 12. f (26)

NAME CLASS DATE
Unit 5 • Getting ReadySpringBoard Louisiana Algebra 1 Skills Workshop 190
Solving EquationsAn equation is a mathematical statement that shows that two expressions are equal.When you solve an equation with one variable, you find the value of the variable that makes the equation true. Use the properties of equality to isolate the variable and solve the equation. Remember that to apply the properties correctly and keep an equation balanced, whatever operation you perform on one side of the equation, you must do on the other side of the equation.
Solve the equation 2x 1 4 5 18.
Step 1: Use the Subtraction Property of Equality. Subtract 4 from each side of the equation and simplify.
2x 1 4 2 4 5 18 2 42x 5 14
Step 2: Use the Division Property of Equality. Divide both sides of the equation by 2 and simplify.
5
5
x
x
22
142
7
Solution: x 5 7
EXAMPLE
PRACTICESolve each equation.
1. x 2 6 5 12 2. 3x 2 2 5 13 3. x14
6 82 5
4. 26x 1 3 5 39 5. x15
7 32 5 6. 8x 2 15 5 9
7. 2x 1 4 5 12 8. x13
10 11 5 9. x16
95
10. 28x 2 17 5 81 11. 9x 5 0 12. 25x 1 13 5 38
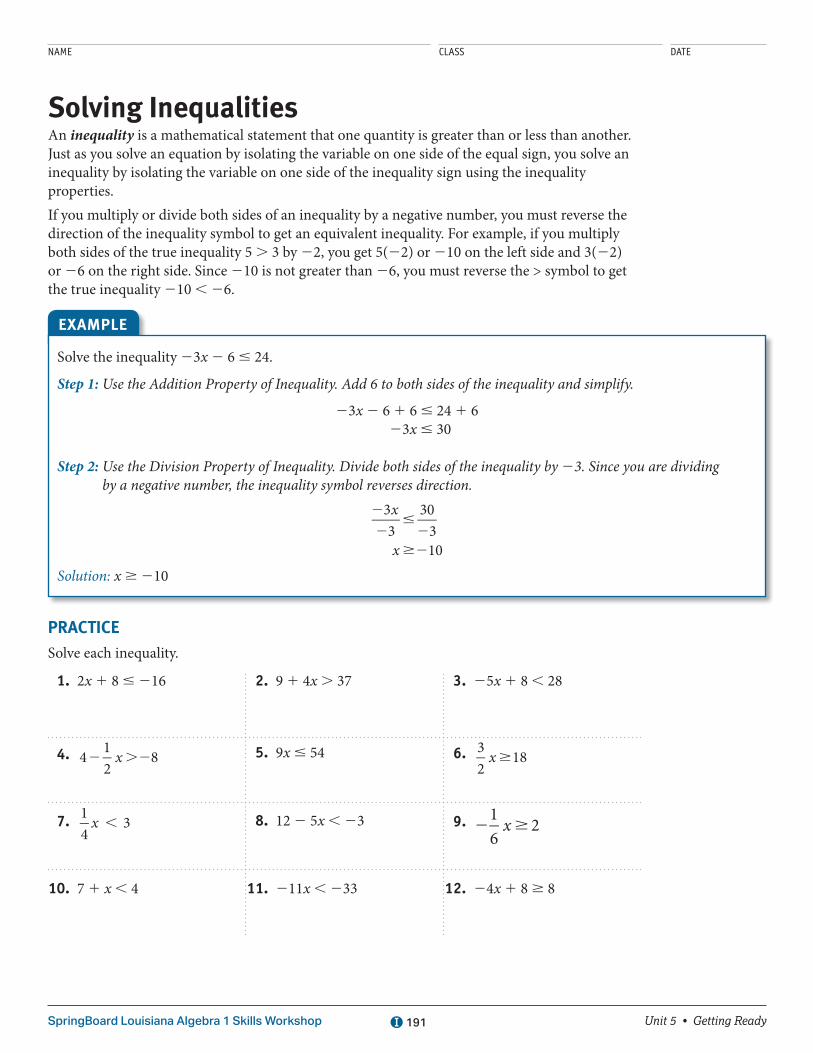
NAME CLASS DATE
Unit 5 • Getting ReadySpringBoard Louisiana Algebra 1 Skills Workshop 191
Solving InequalitiesAn inequality is a mathematical statement that one quantity is greater than or less than another. Just as you solve an equation by isolating the variable on one side of the equal sign, you solve an inequality by isolating the variable on one side of the inequality sign using the inequality properties.If you multiply or divide both sides of an inequality by a negative number, you must reverse the direction of the inequality symbol to get an equivalent inequality. For example, if you multiply both sides of the true inequality 5 . 3 by 22, you get 5(22) or 210 on the left side and 3(22) or 26 on the right side. Since 210 is not greater than 26, you must reverse the > symbol to get the true inequality 210 , 26.
Solve the inequality 23x 2 6 # 24.
Step 1: Use the Addition Property of Inequality. Add 6 to both sides of the inequality and simplify.
23x 2 6 1 6 # 24 1 623x # 30
Step 2: Use the Division Property of Inequality. Divide both sides of the inequality by 23. Since you are dividing by a negative number, the inequality symbol reverses direction.
x
x
33
30310
2
2#
2
$2
Solution: x $ 210
EXAMPLE
PRACTICESolve each inequality.
1. 2x 1 8 # 216 2. 9 1 4x . 37 3. 25x 1 8 , 28
4. x4 12
82 .2 5. 9x # 54 6. x32
18$
7. x14
3, 8. 12 2 5x , 23 9. x16
22 $
10. 7 1 x , 4 11. 211x , 233 12. 24x 1 8 $ 8

NAME CLASS DATE
Unit 5 • Getting ReadySpringBoard Louisiana Algebra 1 Skills Workshop 192
Linear Equations and Their GraphsAn equation that models a linear relationship is called a linear equation. You might use linear equations to determine the monthly cost for renting DVDs when there is a flat monthly fee and a price-per-DVD rental. The relationship between the distance you traveled on your bike at a constant rate of speed and the time you have been biking can also be modeled by a linear equation.Linear equations can be graphed. The graph of a linear equation is a straight line with a constant rate of change.
The following graph compares the amount of money earned by a clerk and a cashier at Grandpa’s Old World Shop. How much money do the clerk and cashier earn altogether after 4 hours?
x
140
y
120
100
80
60
40
20
6
Clerk
Cashier
54321
Number of Hours
Grandpa’s Pay
Pay
($)
0
Step 1: Look at the line that represents the cashier. Find the y-value when x is equal to 4 hours.
Step 2: Look at the line that represents the clerk. Find the y-value when x is equal to 4 hours.
Step 3: Find the sum of the earnings.
Solution: The clerk and cashier earn $140 altogether after 4 hours.
The cashier earns $60 in 4 hours.
The clerk earns $80 in 4 hours.
$60 1 $80 5 $140
EXAMPLE A
The next example shows a linear equation written in standard form.
Standard Form of a Linear Equation
Ax 1 By 5 C,where A $ 0, A and B cannot both be zero, and A, B, and C are integers whose greatest common factor is 1.
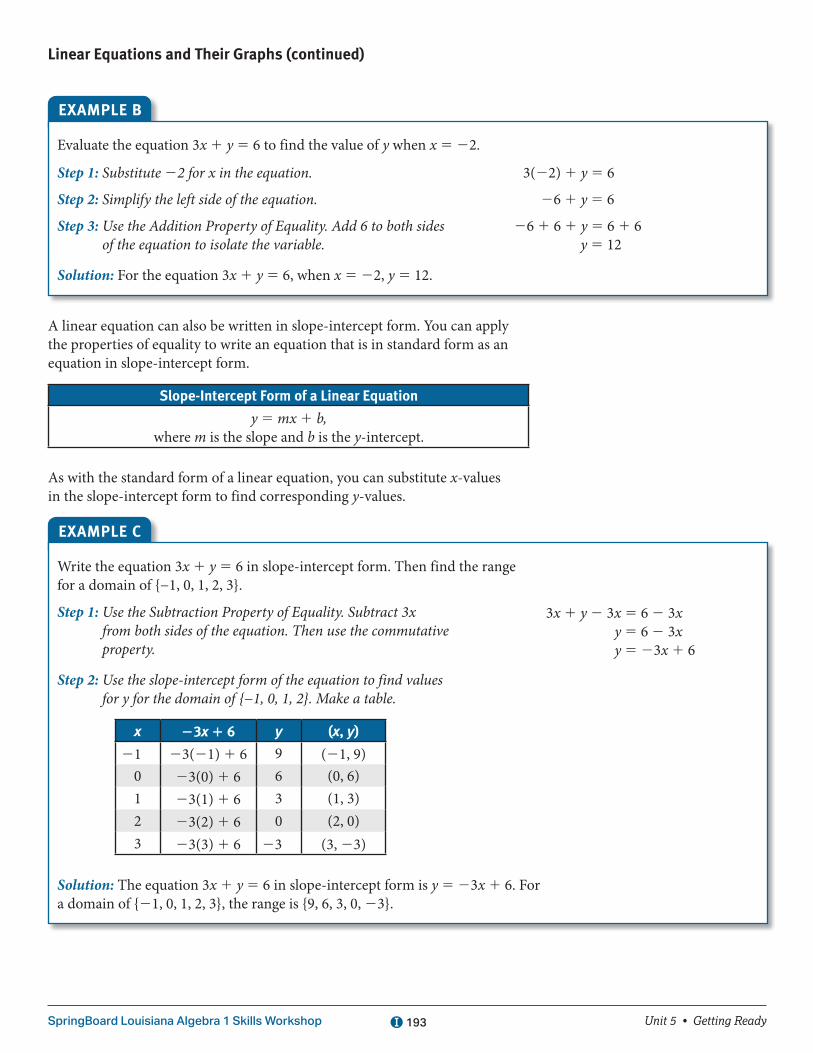
Linear Equations and Their Graphs (continued)
Unit 5 • Getting ReadySpringBoard Louisiana Algebra 1 Skills Workshop 193
Evaluate the equation 3x 1 y 5 6 to find the value of y when x 5 22.
Step 1: Substitute 22 for x in the equation.
Step 2: Simplify the left side of the equation.
Step 3: Use the Addition Property of Equality. Add 6 to both sides of the equation to isolate the variable.
Solution: For the equation 3x 1 y 5 6, when x 5 22, y 5 12.
3(22) 1 y 5 6
26 1 y 5 6
26 1 6 1 y 5 6 1 6y 5 12
EXAMPLE B
A linear equation can also be written in slope-intercept form. You can apply the properties of equality to write an equation that is in standard form as an equation in slope-intercept form.
Slope-Intercept Form of a Linear Equation
y 5 mx 1 b,where m is the slope and b is the y-intercept.
As with the standard form of a linear equation, you can substitute x-values in the slope-intercept form to find corresponding y-values.
Write the equation 3x 1 y 5 6 in slope-intercept form. Then find the range for a domain of {−1, 0, 1, 2, 3}.
Step 1: Use the Subtraction Property of Equality. Subtract 3x from both sides of the equation. Then use the commutative property.
Step 2: Use the slope-intercept form of the equation to find values for y for the domain of {−1, 0, 1, 2}. Make a table.
x 23x 1 6 y (x, y)
21 23(21) 1 6 9 (21, 9) 0 23(0) 1 6 6 (0, 6) 1 23(1) 1 6 3 (1, 3) 2 23(2) 1 6 0 (2, 0) 3 23(3) 1 6 23 (3, 23)
Solution: The equation 3x 1 y 5 6 in slope-intercept form is y 5 23x 1 6. For a domain of {21, 0, 1, 2, 3}, the range is {9, 6, 3, 0, 23}.
3x 1 y 2 3x 5 6 2 3x y 5 6 2 3xy 5 23x 1 6
EXAMPLE C

Linear Equations and Their Graphs (continued)
Unit 5 • Getting ReadySpringBoard Louisiana Algebra 1 Skills Workshop 194
The slope-intercept form of an equation, y 5 mx 1 b, can be used to help you graph a linear equation. The value of b gives the point where the line crosses the y-axis. The value of m gives the number of units you need to move up or down and left or right to determine another point on the line. Then you can draw a line through the two points.In the equation y 5 3x 1 2, the slope m is equal to 3 and the y-intercept b is equal to 2.
Graph the equation 4x 2 2y 5 12.
Step 1: Write the equation in slope-intercept form by using the properties of equality. Subtract 4x from both sides. Then divide both sides by 22.
Step 2: Identify the slope. Identify the y-intercept.
Step 3: Make the graph. Since the y-intercept is 26, plot a point at (0, −6). Then use the slope to plot another point, 2 units up and 1 unit to the right. Draw a line through the two points.
Solution:
x
y
10 5432 6 7 8
28
27
26
25
24
23
22
21
1
2
3
4
5
6
7
8
2122232425262728
4x 2 2y 5 1224x 1 4x 2 2y 5 12 2 4x
22y 5 12 2 4xy x2
212 4
22
25
2
2
y 5 26 1 2xy 5 2x 2 6
The slope is 2.The y-intercept is 26.
EXAMPLE D

Linear Equations and Their Graphs (continued)
Unit 5 • Getting ReadySpringBoard Louisiana Algebra 1 Skills Workshop 195
PRACTICE
Use the graph to answer Items 1–5.
1. What is the speed of the car in miles per hour?
2. What is the speed of the train in miles per hour?
3. What does the ordered pair (2, 150) represent?
4. How many more miles did the train travel than the car after 4 hours?
5. Based on the graph, how many miles will the train travel in 8 hours? Explain your answer.
x
y
500
400
300
200
100
6
Train
Car
54321
Number of Hours
DistanceTraveled
Num
ber
of M
iles
0
Evaluate each equation to find the value of y when x 5 3.
6. 2x 1 3y 5 12 7. 4x 2 3y 5 8 8. x 2 3y 5 9
Write each equation in slope-intercept form.
9. 2x 1 3y 5 12 10. 4x 2 3y 5 8 11. x 2 3y 5 9
12. In the equation 3x 2 2y 5 12, does the value of y increase or decrease as the value of x increases?
13. In the equation 2x 1 y 5 4, does the value of y increase or decrease as the value of x increases?
14. Explain how to find ordered pairs for the line of the equation 3x 2 y 5 9. Graph the line.
x
y
10 5432 6 7 8
28
27
26
25
24
23
22
21
1
2
3
4
5
6
7
8
2122232425262728

NAME CLASS DATE
Unit 5 • Getting ReadySpringBoard Louisiana Algebra 1 Skills Workshop 196
Interpreting Graphs of Linear FunctionsLinear equations can be graphed. The graph of a linear equation is a straight line with a constant rate of change.
The following graph compares the amount of money earned by a clerk and a cashier at Grandpa’s Old World Shop.
How much money do the clerk and cashier earn altogether after 4 hours?
Step 1: Look at the line that represents the cashier. Find the y-value when x is equal to 4 hours.
The cashier earns $60 in 4 hours.
Step 2: Look at the line that represents the clerk. Find the y-value when x is equal to 4 hours.
The clerk earns $80 in 4 hours.
Step 3: Find the sum of the earnings.
$60 1 $80 5 $140
Solution: The clerk and cashier earn $140 altogether after 4 hours.
x
140
y
120
100
80
60
40
20
6
Clerk
Cashier
54321
Number of Hours
Grandpa’s Pay
Pay
($)
0
EXAMPLE
PRACTICEUse the graph to answer Items 1–5.
x
y
500
400
300
200
100
6
Train
Car
54321
Number of Hours
DistanceTraveled
Num
ber
of M
iles
0
3. What does the ordered pair (2, 150) represent?
1. What is the speed of the car in miles per hour? 4. How many more miles did the train travel than the car after 4 hours?
2. What is the speed of the train in miles per hour? 5. Based on the graph, how many miles will the train travel in 8 hours? Explain your answer.

NAME CLASS DATE
Unit 5 • Mini-LessonSpringBoard Louisiana Algebra 1 Skills Workshop 197
Identifying Quadratic FunctionsA quadratic function is a polynomial function in one variable in which the highest degree of any term in the function is 2. A quadratic function can be written in the form f (x) 5 ax2 1 bx 1 c where a, b and c are real numbers and a fi 0.
Is f (x) 5 2x 1 4 2 3x2 a quadratic function?
Yes, f (x) 5 2x 1 4 2 3x2 is a quadratic function because it can be written in the form f (x) 5 ax2 1 bx 1 c as f (x) 5 23x2 1 2x 1 4.
EXAMPLE A
Is f xx
x( ) 4 3 225 2 1 a quadratic function?
No, f xx
x( ) 4 3 225 2 1 is not a quadratic function,
because the first term has a negative exponent. It can be rewritten as f (x) 5 4x22 2 3x 1 2.
EXAMPLE B
PRACTICEIs each function a quadratic function? Explain why or why not.
1. g (x) 5 3x22 1 2x 2 1 2. f (x) 5 42x 2 3
3. g (x) 5 5 2 2x2 4. f (x) 5 2x 2 8 1 x2
5. h x xx
( ) 3 2 225 2 1

NAME CLASS DATE
Unit 5 • Mini-LessonSpringBoard Louisiana Algebra 1 Skills Workshop 198
Using a Graphic Organizer to Complete the SquareGraphic organizers much of the same type used to multiply polynomials may be used to complete the square.
Solve x2 1 8x 2 4 5 0 by completing the square.
Step 1: Isolate the variable terms.
Add 4 to both sides.
Step 2: Use a graphic organizer to transform the left side into a perfect square trinomial.
Split the x-term in half and place the results in the top right and lower left boxes. Then square the coefficient of the halved x-term to fill in the last box and “complete the square.”
Step 3: Solve the equation.
Write the trinomial side in factored form. Use the factors from the outside of the graphic organizer.
Write the left side as a square of binomials.
Take the square root of both sides.
Solve for x.
Solution: 52 6x 4 2 5
x2 1 8x 2 4 5 0
x2 1 8x 1 __ 5 4 1 __
x 4
x x2 4x
4 4x 16
x2 1 8x 1 __ 5 4 1 __
(x 1 4)(x 1 4) 5 20
(x 1 4)2 5 20
1 5x 4 202( )1 56x 4 20
EXAMPLE

Using a Graphic Organizer to Complete the Square (continued)
Unit 5 • Mini-LessonSpringBoard Louisiana Algebra 1 Skills Workshop 199
PRACTICEUse a graphic organizer to “complete the square” for each of the following to create a perfect square trinomial.
1. x2 2 6x 1 ___ 2. x2 1 12x 1 ___
Use completing the square and a graphic organizer to solve each of the following.
3. x2 2 10x 1 5 5 0 x 25
x
25
4. x2 1 4x 2 15 5 0 x 2
x
2

NAME CLASS DATE
Unit 5 • Mini-LessonSpringBoard Louisiana Algebra 1 Skills Workshop 200
Simplifying RadicalsTo write solutions to quadratic equations in simplest radical form, simplify the radicand first and then divide out any common factors.
Simplify 4 526
6
Step 1: Simplify the radicand.
4 526
4 4 136
4 2 136
65
65
6⋅
Step 2: Factor out any common factors in the numerator.
4 2 136
2(2 13)6
65
6
Step 3: Reduce the fraction by dividing out any common factors.
2(2 13)6
2 133
65
6
EXAMPLE A
Simplify 12 482
6
Step 1: Simplify the radicand.
12 482
12 16 32
12 4 32
65
65
6⋅
Step 2: Factor out any common factors in the numerator.
12 4 32
4(3 3)2
65
6
Step 3: Reduce the fraction by dividing out any common factors.
4(3 3)
22(3 3)
65 6 or 6 3 36
EXAMPLE B
PRACTICEWrite each of the following in simplest radical form.
1. 3 186
6 2. 4 282
6
3.610 50
3 4. 66 128
2

NAME CLASS DATE
Unit 5 • Mini-LessonSpringBoard Louisiana Algebra 1 Skills Workshop 201
Quadratic RegressionGraphing calculators provide opportunities to develop quadratic functions to model data.
As part of a science experiment, a group of students launches a model rocket from a platform and collects the following data.
Time Since Launch 1 2 3 4 5Height of Rocket 68 100 100 68 4
Use a graphing calculator to write a quadratic function h(t) to model the data.
Step 1: Go to the calculator’s STAT menu and choose to EDIT the data lists.
Step 2: Enter the data in L1 (list 1) and L2 (list 2).
Step 3: Go to the STAT PLOT menu and turn on Plot 1, choosing the scatterplot option with x’s in list 1 and y’s in list 2.
Step 4: Choose the calculator’s ZOOM STAT option to graph the scatterplot of the data.
Step 5: Adjust the graphing window if necessary to see all of the points in the data set.
Step 6: Go to the calculator’s STAT menu and choose to CALCULATE the QuadReg(quadratic regression) for the data. Identify L1 as the x values and L2 as the y values. Using the VARS menu, choose FUNCTION and Y1 to write the quadratic regression equation and to enter the equation in Y1. Press ENTER.
Step 7: Choose the calculator’s ZOOM STAT option to graph the quadratic regression equation in the same viewing window as the scatterplot.
EXAMPLE
PRACTICEUse a graphing calculator to write a quadratic function f (x) to model each set of data.
1. x 1 3 5 7 9 11y 3.67 5.33 6.33 5.67 4.33 2.67
2. x 0 21 22 23 24y 21 24 25 24 21

NAME CLASS DATE
Unit 5 • Mini-LessonSpringBoard Louisiana Algebra 1 Skills Workshop 202
Solving a Quadratic Equation by GraphingAt times, approximate decimal value solutions to quadratic equations give a measure that can be more easily understood within a particular context. In these cases, a graphing calculator is an excellent tool to use to determine the solutions of a quadratic equation.
A model rocket burns for 3.5 seconds. The rocket will be 286 feet in the air when the engine burns out. After the rocket’s engine burns out, the rocket’s height is given by the function h(t) 5 286 1 190t 2 16t 2. Determine the times after the rocket is launched that it will be 450 feet in the air.
The times will be the solutions to the quadratic equation 286 1 190t 2 16t 2 5 450
Step 1: Write two functions using x and y as the variables. In this case use the functions y 5 286 1 190x 2 16x2 and y = 450.
Step 2: Go to the calculator’s Y 5 menu. Enter one equation in Y1 and the other in Y2.
Step 3: Be sure the calculator is set to the standard graphing window.
Step 4: Use the calculator’s GRAPH function to graph the two equations.
Step 5: Adjust the graphing window if necessary to see any intersections of the two graphs.
Step 6: Estimate the coordinates of one intersection point using the TRACE feature on the calculator.
Step 7: Use the INTERSECT command to determine the actual coordinates of the intersection (solution) point.
Step 8: Repeat steps 6 and 7 for the other intersection point if necessary.
Step 9: The TABLE feature may be used to verify the solution point. In the table, the solution point will be the point where both functions have identical x and y values.
Solution: The rocket will be 450 feet in the air at 4.437 seconds and 14.438 seconds.
EXAMPLE
PRACTICEUse a graphing calculator to solve each equation.
1. Determine the time at which the rocket lands on the ground.
2. 29x2 1 72x 1 297 5 320
3. x2 2 10x 1 25 5 6
4. 2x2 1 6x 1 5 5 0

NAME CLASS DATE
Unit 5 • Additional Unit PracticeSpringBoard Louisiana Algebra 1 Skills Workshop 203
LESSON 29-1 1. Model with mathematics. Kathleen has 70 feet of
fencing to make a rectangular pen for her dog.
a. Complete the table below for rectangles with the given side lengths.
Length (ft)
Width (ft)
Perimeter (ft)
Area (ft2)
5 7010 7015 7020 7025 7030 70l 70
b. Let x represent the length of the pen and let y represent the area. Make a graph using the data from the table in part a.
c. Write a function A(x) that gives the area of the pen in terms of its length. Write your function in standard form and identify the values of a, b, and c.
d. Simon is also making a rectangular pen for his dog, but he has more fencing than Kathleen. How will a graph of Simon’s situation differ from Kathleen’s graph in part b? Explain.
2. Which shows a quadratic function in standard form?
A. y 5 3 2 2x 2 3x2
B. y 5 2x3 1 3x2 2 2
C. y 5 x12
22 1 2x 2 3
D. y 5 x2
2 2 x2
1 1
3. Write f (x) 5 3 1 x2 2 2x(x 1 1) in standard form and identify the values of a, b, and c.
4. Explain why each function is not quadratic.
a. y 5 23x3 1 4x 2 1
b. y 5 x3
2 1 x13
c. y 5 x22 1 2x21 1 2
Additional Unit 5 Practice

NAME CLASS DATE
Unit 5 • Additional Unit PracticeSpringBoard Louisiana Algebra 1 Skills Workshop 204
LESSON 29-2 5. Which statement about quadratic functions is
NOT true?
A. The domain of a quadratic function describes the possible values of x and the range describes the possible values of y.
B. The graph of a quadratic function is a parabola.
C. The minimum or maximum value of a quadratic function is the y-coordinate of the graph’s vertex.
D. The y-intercepts of a parabola occur when f (x) 5 0.
6. Consider the function f (x) 5 (x 1 2)(x 2 4).
a. Create a table of values and graph the function.
b. Identify the maximum or minimum value of the function.
c. Explain how to identify the x-intercepts using the graph and using the function’s equation. What are the x-intercepts?
Use the graphs for Items 7 and 8.
x
f(x) 5 2(x 2 1)2 1 3
y
10 543221
1
2
3
4
5
6
7
8
2122232425
x
y
10 5432 6 7 82122
1
2
3
4
5
6
7
8
2122
g(x) 5 22(x 2 3)2 1 7
7. Make use of structure. Explain how to use the maximum or minimum value of each quadratic function to find the function’s range. Identify the range for each function.
8. a. For each function, identify the values of x for which the function is increasing.
b. For each function, identify the values of x for which the function is decreasing.
c. Describe the relationship between the maximum or minimum value of the function and the intervals for which the function is increasing and decreasing.

NAME CLASS DATE
Unit 5 • Additional Unit PracticeSpringBoard Louisiana Algebra 1 Skills Workshop 205
LESSON 30-1For Items 9–11, use the functions f (x) 5 x2, g (x) 5 (x 1 2)2, and h (x) 5 x2 2 4.
9. Describe the transformation from the graph of f (x) to the graph of h (x).
10. Which statement is NOT true?
A. The domain of each function is all real numbers.
B. The graph of h (x) has the same axis of symmetry as the graph of f (x).
C. The vertex of the graph of g (x) is (2, 0).
D. The range of g (x) is the same as the range of f (x).
11. What is the equation of the axis of symmetry of the graph of g (x)? Explain the relationship between the axis of symmetry and the vertex.
12. Give an example of a quadratic function whose range is y $ 3.
13. a. Attend to precision. Write the equation of a function whose graph has been translated 2 units up from the graph of y 5 x2.
b. Write the equation of a function whose graph has been translated 3 units to the left from the graph of y 5 x2.
LESSON 30-2 14. The graphs of f (x) 5 x2 and g (x) are shown below.
Which could be the equation of g (x)?
x
yf(x) 5 x2
g(x)
a. g (x) 5 x13
2 b. g (x) 5 2x2
c. g (x) 5 x2 2 3 d. g (x) 5 2(x 2 3)2

NAME CLASS DATE
Unit 5 • Additional Unit PracticeSpringBoard Louisiana Algebra 1 Skills Workshop 206
For Items 15–17, use the functions f (x) 5 x2,
g (x) 5 x13
2 , and h (x) 5 2x2.
15. Describe the transformation from the graph of f (x) to the graph of h (x).
16. Why is it true that the graphs of the three functions have the same vertex?
17. a. Write a quadratic function q (x) whose graph is wider than the graph of g (x).
b. How many different quadratic functions have graphs wider than the graph of g (x)? Explain.
18. Critique the reasoning of others. Roger says that
the graph of g (x) 5 x52
2 is a vertical shrink of the
graph of f (x) 5 x2 because 52
is a fraction. Do you
agree with Roger? Explain why or why not.
LESSON 30-3For Items 19–21, use the functions below.
g (x) 5 x13
( 2) 422 1
h (x) 5 3(x 1 1)2 2 2
k (x) 5 22(x 1 3)2 1 4
19. Which ordered pair represents the vertex of the graph of g (x)?
A. (22, 4) B. (2, 4) C. (4, 22) D. (4, 2)
20. Tell whether each statement is true or false. Explain your answers.
a. Of the three graphs, the vertex of k(x) is farthest to the left in the coordinate plane.
b. g (x) and k (x) have the same range.
c. The minimum value of h(x) is 2.
d. Of the three functions, k (x) is the only function with a maximum value.

NAME CLASS DATE
Unit 5 • Additional Unit PracticeSpringBoard Louisiana Algebra 1 Skills Workshop 207
21. Persevere in solving problems. Use the equation of g(x) to show that the graph has no x-intercepts.
22. Write the equation of the quadratic function shown in the graph in standard form.
y
x43121 0 2
LESSON 31-1 23. Solve each quadratic equation.
a. 16x2 2 24x 1 9 5 0
b. 22 5 3x2 1 7x
24. Which statement about the two roots of x2 1 10x 2 24 5 0 is NOT true?
A. One root is negative and the other is positive.
B. Both roots are integers.
C. The roots are equal to the zeros of y 5 x2 1 10x 2 24.
D. The roots can be found by solving the equation (x 2 6)(x 1 4) 5 0.
25. a. Write a quadratic equation in standard form whose roots are 23 and 12.
b. Is there more than one correct answer to part a? Justify your response.
26. Critique the reasoning of others. Carmine solved the quadratic equation x2 1 3x 2 28 5 12 as shown below. Identify Carmine’s error. What is the correct solution?
x2 1 3x 2 28 5 12 (x 1 7)(x 2 4) 5 12
x 1 7 5 12 or x 2 4 5 12x 5 5 or x 5 16
LESSON 31-2 27. Which expression can be simplified to find the axis
of symmetry of the graph of f (x) 5 2x2 2 3x 1 4?
A. 32(2)2 B. 4
2(2)2
C. ( 3)2(4)
2 2 D. ( 3)2(2)
2 2

NAME CLASS DATE
Unit 5 • Additional Unit PracticeSpringBoard Louisiana Algebra 1 Skills Workshop 208
28. For each quadratic function, identify the vertex of its graph.
a. y 5 2x2 2 4x 1 5
b. f (x) 5 5x2 1 15x 1 6
29. a. The height in feet of the water in a large fountain is given by the function
f (x) 5 x12
22 1 10x. What is the maximum
height that the water reaches?
b. The height of the water in another fountain can be
modeled by the function g (x) 5 x12
22 1 10x 1 c.
The maximum height of the water in this fountain is less than the maximum height in part a. What must be true about the value of c ? Explain.
30. Make use of structure. A quadratic function has two zeros. One zero is 6. The axis of symmetry of this function’s graph is x 5 2. What is the other zero of this function?
LESSON 31-3Use the graph for Items 31–33.
y
x84
28
y 5 x2 2 3x 2 10
31. Give the coordinates of the x-intercepts. Show how to use the x-intercepts to find the equation of the axis of symmetry.
32. Why is it difficult to give the coordinates of the vertex? What additional information would allow you to find the coordinates of the vertex? Explain.
33. Which point is the reflection of the y-intercept over the axis of symmetry?
A. (21, 26) B. (0, 210) C. (3, 210) D. (4, 26)
34. Graph each quadratic function. Label the x-intercepts, the axis of symmetry, and the vertex.
a. y 5 x2 2 6x 1 5
b. f (x) 5 x2 1 5x 1 6
c. y 5 4x2 2 8x 1 3

NAME CLASS DATE
Unit 5 • Additional Unit PracticeSpringBoard Louisiana Algebra 1 Skills Workshop 209
35. Model with mathematics. The height of an arched entry is given by the quadratic function
h(x) 5 x x14
322 1 , where x represents the distance
in feet from the left of the entryway.
a. Graph this function.
b. Find the width of the entry and the greatest height of the entry. What parts of the graph represent these characteristics?
LESSON 32-1 36. Which equation has no real solutions?
A. x2 2 25 5 0
B. x2 1 25 5 0
C. (x 2 25)2 5 0
D. (x 1 25)2 5 0
37. Solve each equation.
a. 4x2 5 25
b. 5x2 2 30 5 0
c. (x 1 4)2 5 2
d. x2 2 6x 1 9 5 5
38. Irene is designing a square garden that has a 4-foot walkway on two sides. The total area of the garden and the walkway will be 225 square feet.
4
Garden
4
a. What are the dimensions of the garden?
b. Irene decides to change the width of the walkway. She still wants the total area of the garden and the walkway to be 225 square feet. Give the dimensions of two possible square gardens and corresponding walkway widths — one in which the walkway width is less than 4 feet and one in which the walkway width is greater than 4 feet. Explain your reasoning.
39. Reason abstractly. Rita was asked to find a value of c for which the equation (x 2 1)2 5 c has no real solutions. She says that there are infinitely many possible answers.
Phil was asked to find a value of c for which the equation (x 2 1)2 5 c has exactly one solution. He also says that there are infinitely many possible answers.
Do you agree with Rita and Phil? Explain why or why not.

NAME CLASS DATE
Unit 5 • Additional Unit PracticeSpringBoard Louisiana Algebra 1 Skills Workshop 210
LESSON 32-2 40. What number should be added to both sides of the
equation x2 2 10x 5 3 to complete the square?
A. 2100 B. 225 C. 25 D. 100
41. Identify the missing values in each equation. Explain whether there is more than one possible answer.
a. x2 1 8x 1 5 (x 1 )2
b. x2 2 12x 1 5 (x 1 )2
c. x2 1 x 1 5 (x 1 )2
42. Solve by completing the square.
a. x2 2 4x 2 6 5 0
b. x2 2 14x 5 213
c. x2 5 7 2 6x
d. 2x2 1 7x 1 23 5 x2 2 5x 2 9
43. Analyze the quadratic function g (x) 5 x2 2 5x 1 4.
a. Complete the square.
b. Use your new version of the function to describe the transformation(s) from the graph of f (x) 5 x2 to the graph of g (x).
c. Describe the graph of g(x). Include in your description the vertex, the direction that the parabola opens, the axis of symmetry, and the number of x-intercepts. How do your answers to parts a and b allow you to describe the graph of g(x) without actually graphing?
d. Claudia was asked to find the y-intercept of g (x) without graphing. She substituted x 5 0 into the equation she found in part a. Is this a correct method? Is there a better way to find the y-intercept without graphing? Explain.

NAME CLASS DATE
Unit 5 • Additional Unit PracticeSpringBoard Louisiana Algebra 1 Skills Workshop 211
44. Persevere in solving problems. Andrés has 160 feet of fencing to make a play yard for his young nephew. He can model the area with the function A(w) 5 2w2 1 80w when w represents the width of the play yard. Show how to complete the square to find the maximum area Andrés can enclose as well as the length and width he would use to achieve that area.
LESSON 32-3 45. Tranh is using the quadratic formula to solve
4x2 5 2 2 3x. He uses the values a 5 4, b 5 23, and c 5 2. Is Tranh correct? If so, explain why. If not, explain why not and identify the correct values of a, b, and c.
46. Solve using the quadratic formula.
a. 2x2 2 7x 2 60 5 0
b. 12 5 6x 1 x2
c. x2 2 10x 1 23 5 0
47. Which of the following shows how to use the quadratic formula to solve 2x2 2 3x 2 8 5 0?
A. 3 ( 3) 4(2)( 8)
2(2)
22 6 2 2 2
B. −3 ( 3) 4(2)( 8)
2(2)
26 2 2
C. 3 3 4(2)( 8)2(2)
22 6 2 2 2
D. 3 3 4(2)( 8)
2(2)
26 2 2 2
48. Attend to precision. The equation h(t) 5 216t 2 1 60 gives the height in feet of a stick t seconds after it has been dropped from a 60-foot bridge.
a. Write an equation you can solve to find how long it takes the stick to fall half the distance to the ground.
b. Use the quadratic equation to solve your equation. How many solutions did you find? Do all of your solutions make sense? Explain.

NAME CLASS DATE
Unit 5 • Additional Unit PracticeSpringBoard Louisiana Algebra 1 Skills Workshop 212
LESSON 32-4 49. Make use of structure. You have learned several
ways to solve a quadratic equation: factoring, using square roots, completing the square, and using the quadratic formula. For each quadratic equation below, tell what method you would use to solve it. Explain your choices.
a. 2x2 1 3x 2 5 5 0
b. x2 5 100
c. 2x2 1 4x 5 0
d. x2 2 4x 1 1 5 0
e. x2 1 6x 2 7 5 0
f. x2 1 3x 5 5
50. What is the discriminant of 3x2 2 6x 2 4 5 0?
A. 284 B. 212
C. 12 D. 84
51. Use the discriminant to determine the number of real solutions.
a. 4x2 1 12x 1 9 5 0
b. 0 5 5x2 2 7x 2 6
c. x2 2 x 1 5 5 0
52. What will be true about the discriminant if the solutions of a quadratic equation are rational? Explain.

NAME CLASS DATE
Unit 5 • Additional Unit PracticeSpringBoard Louisiana Algebra 1 Skills Workshop 213
LESSON 32-5 53. Which expression shows 482 in simplest form?
A. i4 32 B. i2 32
C. i2 3 D. i4 3
54. Solve each equation.
a. x2 1 121 5 0
b. x2 1 4x 1 5 5 0
55. How many ways can you show that the quadratic equation x2 2 10x 1 29 5 0 has two complex solutions? Describe at least three different methods.
56. a. Express regularity in repeated reasoning. Write i 1, i 2, i 3, i 4, i 5, i 6, i 7, i 8, i 9, i 10, i 11, and i 12 in simplest form.
b. Use your results from part a to find i 57. Explain how you found your answer.
LESSON 33-1A business advisor is helping the owner of a chain of restaurants decide how to price the restaurants’ food. The advisor made the following table to show how much profit each restaurant is likely to make from sales of pancakes depending on the price of the pancakes. Use the table for Items 57–61.
Weekly Profit from Pancakes per Restaurant
Price ($) Profit ($)
4 1205 2006 2407 2408 200
57. a. Graph the data from the table. Do the data appear to be linear? Explain.
b. Describe how increasing the price of pancakes affects the profit from pancakes. Does this relationship make sense? Why or why not?
58. Use appropriate tools strategically. Use a graphing calculator to determine a quadratic function p (d ) that models the weekly profit in dollars when the pancakes are priced at d dollars.
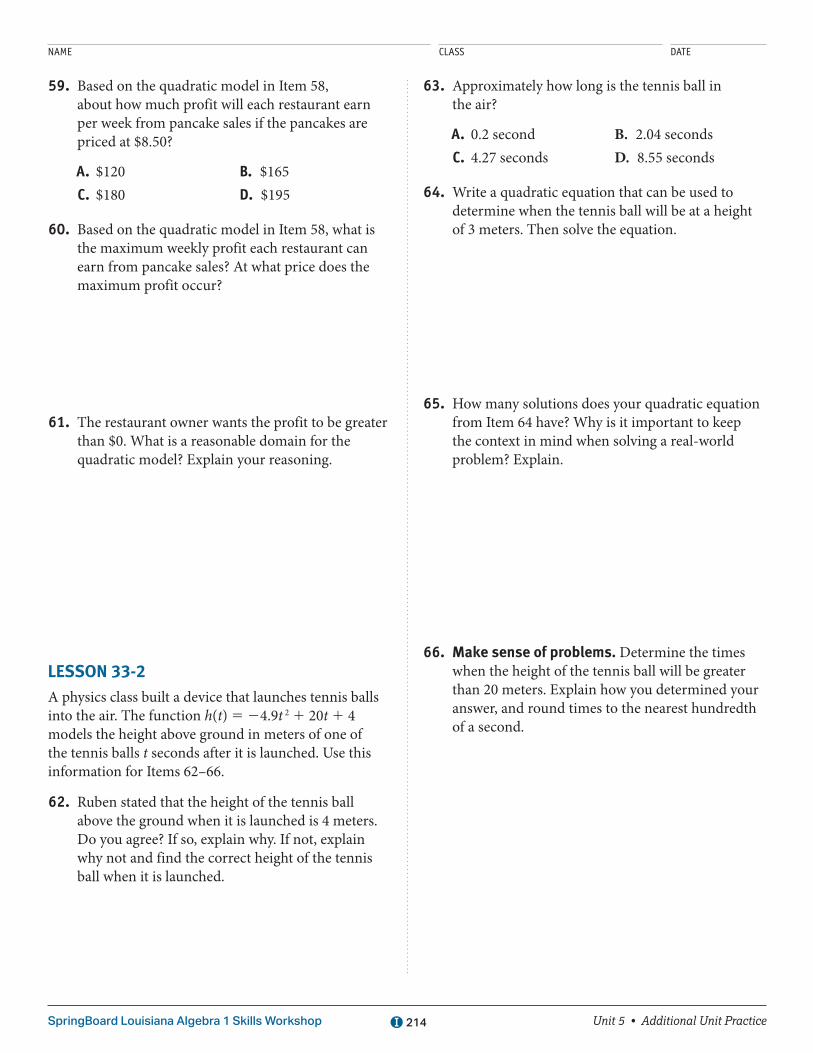
NAME CLASS DATE
Unit 5 • Additional Unit PracticeSpringBoard Louisiana Algebra 1 Skills Workshop 214
59. Based on the quadratic model in Item 58, about how much profit will each restaurant earn per week from pancake sales if the pancakes are priced at $8.50?
A. $120 B. $165 C. $180 D. $195
60. Based on the quadratic model in Item 58, what is the maximum weekly profit each restaurant can earn from pancake sales? At what price does the maximum profit occur?
61. The restaurant owner wants the profit to be greater than $0. What is a reasonable domain for the quadratic model? Explain your reasoning.
LESSON 33-2A physics class built a device that launches tennis balls into the air. The function h(t) 5 24.9t 2 1 20t 1 4 models the height above ground in meters of one of the tennis balls t seconds after it is launched. Use this information for Items 62–66.
62. Ruben stated that the height of the tennis ball above the ground when it is launched is 4 meters. Do you agree? If so, explain why. If not, explain why not and find the correct height of the tennis ball when it is launched.
63. Approximately how long is the tennis ball in the air?
A. 0.2 second B. 2.04 seconds C. 4.27 seconds D. 8.55 seconds
64. Write a quadratic equation that can be used to determine when the tennis ball will be at a height of 3 meters. Then solve the equation.
65. How many solutions does your quadratic equation from Item 64 have? Why is it important to keep the context in mind when solving a real-world problem? Explain.
66. Make sense of problems. Determine the times when the height of the tennis ball will be greater than 20 meters. Explain how you determined your answer, and round times to the nearest hundredth of a second.

NAME CLASS DATE
Unit 5 • Additional Unit PracticeSpringBoard Louisiana Algebra 1 Skills Workshop 215
LESSON 34-1Tilly posted two videos online: one of her cat jumping in and out of a box and one of her dog fetching a pickle. The table shows how many people watched each video over the past 6 weeks. Use the table for Items 67–70.
Tilly’s Videos
WeekViewers of Cat Video
Viewers of Dog Video
1 62 352 68 523 70 644 71 805 63 936 57 107
67. Examine the data in the table to determine which type of function (linear, quadratic, or exponential) best models the number of viewers for each video for the first 6 weeks. Explain how you made your choices.
68. Model with mathematics. Use the regression function of a calculator to write functions that model the number of viewers for each video for the first 6 weeks. Round coefficients and constants to the nearest thousandth.
69. Graph the functions from Item 68 on separate coordinate grids.
70. Compare and contrast the two functions. Describe the similarities and differences between the reasonable domains, maximum or minimum values (if any), and rates of change.
71. An online skateboard store has started selling a new style of skateboard. The table shows the number of skateboards in the new style sold during the first 6 weeks.
New Skateboards
Week Number Sold
1 52 93 224 405 796 162
Which function best models the number of skateboards in the new style sold in week w for the first 6 weeks?
A. n(w) 5 3.5w2
B. n(w) 5 2.4(2w)
C. n(w) 5 29w 2 49
D. n(w) 5 10w2 2 30w 1 30
LESSON 34-2 72. Make use of structure. Which function has a
maximum value?
A. f (x) 5 6(3x)
B. f (x) 5 25x 1 12
C. f (x) 5 22x2 1 4x
D. f (x) 5 (x 2 2)2 1 1
The function f (t) 5 1200 1 36t gives the amount in dollars in Fatima’s savings account after t years. The function m(t) 5 1100(1.03t) gives the amount in dollars in Mason’s savings account after t years. Use this information for Items 73 and 74.
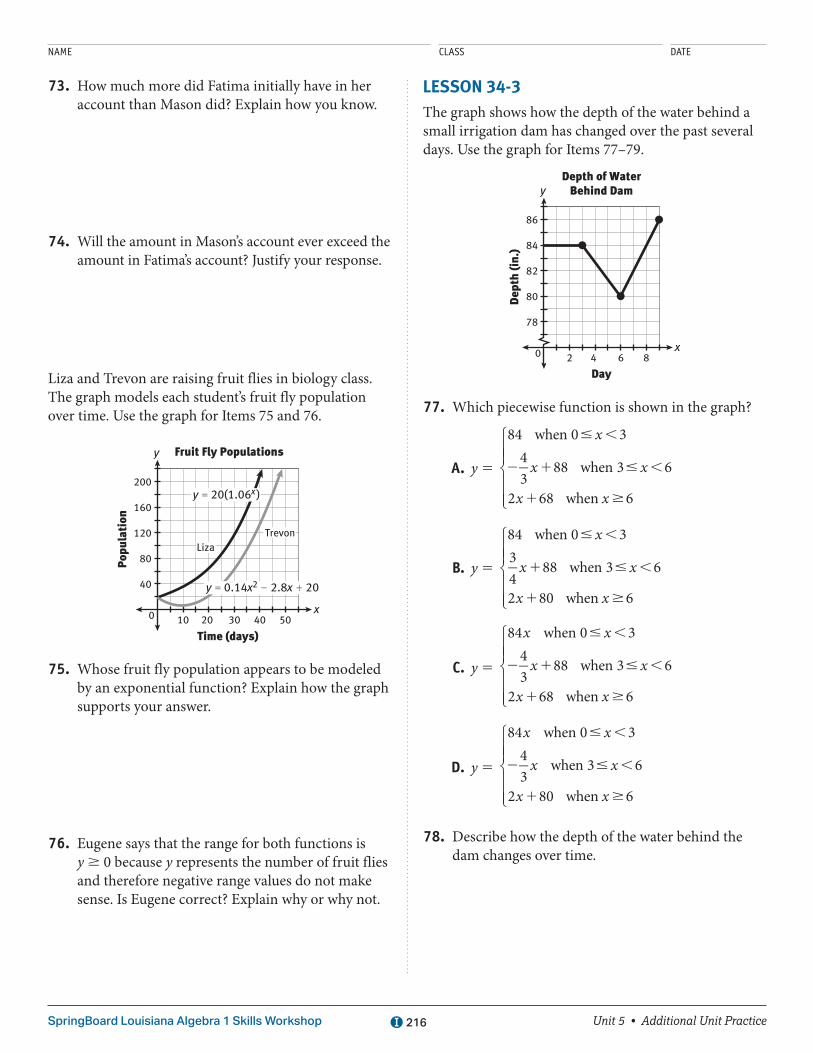
NAME CLASS DATE
Unit 5 • Additional Unit PracticeSpringBoard Louisiana Algebra 1 Skills Workshop 216
73. How much more did Fatima initially have in her account than Mason did? Explain how you know.
74. Will the amount in Mason’s account ever exceed the amount in Fatima’s account? Justify your response.
Liza and Trevon are raising fruit flies in biology class. The graph models each student’s fruit fly population over time. Use the graph for Items 75 and 76.
160
200
120
80
40
y
x
Time (days)
Popu
lati
on
504030100 20
LizaTrevon
Fruit Fly Populations
y 5 0.14x2 2 2.8x 1 20
y 5 20(1.06x )
75. Whose fruit fly population appears to be modeled by an exponential function? Explain how the graph supports your answer.
76. Eugene says that the range for both functions is y $ 0 because y represents the number of fruit flies and therefore negative range values do not make sense. Is Eugene correct? Explain why or why not.
LESSON 34-3The graph shows how the depth of the water behind a small irrigation dam has changed over the past several days. Use the graph for Items 77–79.
84
86
82
80
78
y
x
Day
Dep
th (i
n.)
862 4
Depth of WaterBehind Dam
0
77. Which piecewise function is shown in the graph?
A. y 5
x
x x
x x
84 when 0 343
88 when 3 6
2 68 when 6
# ,
2 1 # ,
1 $
B. y 5
x
x x
x x
84 when 0 334
88 when 3 6
2 80 when 6
# ,
1 # ,
1 $
C. y 5
x x
x x
x x
84 when 0 343
88 when 3 6
2 68 when 6
# ,
2 1 # ,
1 $
D. y 5
x x
x x
x x
84 when 0 343
when 3 6
2 80 when 6
# ,
2 # ,
1 $
78. Describe how the depth of the water behind the dam changes over time.

NAME CLASS DATE
Unit 5 • Additional Unit PracticeSpringBoard Louisiana Algebra 1 Skills Workshop 217
79. Critique the reasoning of others. Fay claims that after day 6, the depth of the water is increasing by a factor of 2 each day. Is Fay’s claim correct? Explain.
Teams of students are building machines. As part of Team A’s machine, a golf ball falls on a platform and the platform descends. The graph below shows the golf ball’s height over time. Use the graph for Items 80 and 81.
8
10
6
4
2
h
t
Time (s)
Hei
ght
(ft)
10.80.60.2 0.4
Team A’s Golf Ball
0
80. Describe how the height of Team A’s golf ball changes over time. Be sure to discuss the rate of change for each part of the graph, and identify the maximum and minimum heights of the ball.
81. As part of Team B’s machine, a golf ball falls into a cup. The piecewise function
h(t) 5
t tt
16 6 if 0 0.52 if 0.5
22 1 # ,
$
models the height in feet of Team B’s golf ball after t seconds. Compare and contrast any patterns you observe in the height of Team A’s ball over time and the height of Team B’s ball over time.
LESSON 35-1 82. Solve the following system of equations by
graphing. How can you check your answer?
y 5 23x 1 10 y 5 2x
83. A nonlinear system consists of one linear equation and one quadratic equation. The system has exactly one solution. Sketch a possible graph of this system.

NAME CLASS DATE
Unit 5 • Additional Unit PracticeSpringBoard Louisiana Algebra 1 Skills Workshop 218
A park has two jogging trails. On a coordinate map of the park, the park entrance is at (0, 0), and each unit represents 1 meter. One jogging trail is represented on the map by the function f (x) 5 20.02x2 1 3.2x 1 32. The second trail is represented by a linear function whose graph passes through the points (0, 122) and (170, 54). Use this information for Items 84 and 85.
84. Which function represents the second jogging trail?
A. g (x) 5 122 2 2.5x
B. g (x) 5 122 2 0.4x
C. g (x) 5 122 1 25
x
D. g (x) 5 122 1 52
x
85. Use a graph to determine the point(s) on the map where the jogging trails intersect.
86. Make sense of problems. Two invasive plants are growing on the surface of a small pond. The percent of the surface covered by Plant A doubles each month, and the percent of the surface covered by Plant B increases by 2% each month. At the beginning of April, Plant A covers 1% of the pond’s surface, and Plant B covers 10% of the pond’s surface. In what month will the percent of the surface covered by Plant A be equal to the percent of the surface covered by Plant B? Explain how you determined your answer, and use a system of equations in your explanation.
LESSON 35-2 87. Solve the following system of equations
algebraically.
y 5 2x2 1 8x 2 12 y 5 22x 1 9
A construction worker is climbing a ladder to the roof of a house at the same time as a box of nails falls from the roof. The function h(t) 5 216t 2 1 28 models the height in feet of the box t seconds after it falls. When t 5 0, the worker’s hands are 9 feet above the ground and his height above the ground is increasing at a constant rate of 3 feet per second. Use this information for Items 88–90.
88. Write an equation for w(t) to model the height in feet of the worker’s hands t seconds after the box falls.
89. The worker catches the box when it is at the same height as his hands. How long after the box falls does the worker catch it? Explain how you determined your answer.
90. At the time that the worker catches the box, which statement is true?
A. The worker has climbed 12 feet and the box has fallen 12 feet.
B. The worker has climbed 12 feet and the box has fallen 16 feet.
C. Both the box and the worker’s hands are 16 feet above the ground.
D. Both the box and the worker’s hands are 12 feet from the roof.
91. Construct viable arguments. Without graphing or solving, show that the nonlinear system x 1 y 5 5 and x2 1 y 5 3 has no real solutions.

NAME CLASS DATE
Unit 6 • Getting ReadySpringBoard Louisiana Algebra 1 Skills Workshop 227
Estimating a Trend LineData plotted on a scatter plot may have an approximate linear trend. A trend line may be found to estimate the data shown in the graph. This trend line is found in the same manner as with finding the equation of a linear function.
The scatter plot below shows a set of (x, y) coordinate pairs with an approximate linear trend.
0 1
1
2
3
4
5
6
7
8
9
10
2 3 4 5 6 7 8 9 10x
y
Estimate the trend line for the data shown.
Step 1: Select two points on the scatter plot (not necessarily data points) that could represent the linear trend. Selection will vary. For this example, use (3, 5) and (8, 9).
Step 2: Find the slope of the line that contains the two points.
52
25m
9 58 3
45
Step 3: Find the equation of the line for the two points.
y 2 5 5 45
(x 2 3)
5y 2 25 5 4(x 2 3)
5y 2 25 5 4x 2 12
5y 5 4x 1 13
y 5 45
x 1 135
This is one possible trend line for the data shown in the scatter plot.
Solution: y 5 45
x 1 135
is one possible trend line for the data in the scatter plot.
EXAMPLE

Unit 6 • Getting ReadySpringBoard Louisiana Algebra 1 Skills Workshop 228
Estimating a Trend Line (continued)
PRACTICEEach scatter plot below shows a set of (x, y) coordinate pairs with an approximate linear trend. Estimate the equation of the trend line for each graph.
1.
0
5
10
15
20
10 20 30 40 50x
y
60
2. 50
45
40
35
30
25
20
15
10
5
5 10 15 20 25
y
x0

NAME CLASS DATE
Unit 6 • Getting ReadySpringBoard Louisiana Algebra 1 Skills Workshop 229
Interpreting Slope in ContextWhen a linear function is used to model a data set (trend line), the slope can be interpreted in the context of the data. Recall that the slope of a line represents the rate of change of the line.
For the trend line below, interpret the slope of the trend line in relation to the variable quantities.
y 5 83 1 2.5x,
where x is the number of hours studied and y is the test score of the latest math test.
Step 1: Find the slope of the line.
The slope is 2.5.
Step 2: Determine if the slope is positive or negative.
The slope is positive.
Step 3: Write a sentence that interprets the slope using the meanings of the variables. A positive slope indicates an increase in y as x increases. A negative slope indicates a decrease in y as x increases.
The test score of the latest math test increases by about 2.5 points for each hour studied on average.
Solution: The test score of the latest math test increases by about 2.5 points for each hour studied on average.
EXAMPLE
PRACTICEFor each trend line below, interpret the slope of the trend line in relation to the variable quantities.
1. A bank has a withdrawal fee that varies. Let y 5 1200 2 4.50x where x is number of withdrawal fees and y is the amount of money in a savings account.
2. Let y 5 100 2 2.4x where x is the number of hours of video games played and y is the test score of last week’s English test.
3. Let y 5 18 1 3.5x where x is the number of years of post-high-school education and y is the yearly salary in thousands.
4. Let y 5 29 2 0.5x where x is the number of hours spent negotiating a price and y is the price of a new sedan in thousands.
5. Let y 5 0.5 1 2.5x where x is the number of weeks of growth of a bean plant and y is the height of the plant in inches.

NAME CLASS DATE
Unit 6 • Getting ReadySpringBoard Louisiana Algebra 1 Skills Workshop 230
Determining Missing Values in Two-Way TablesTwo-way tables are used to present information of a given situation in an organized way. Sometimes there are missing values in the tables. In order to find the missing values, use addition and subtraction.
Maria took a survey of 350 students at her school. Part of the results of the survey are shown in the two-way table below. Fill in the missing values.
Play a Musical Instrument
Do Not Play a Musical Instrument
Total
Play a Sport 134 209Do Not Play a Sport 91 40
Total 350
Step 1: Add the two values in the column ‘Play a Musical Instrument.’ This is the total number of students who play a musical instrument.
134 1 91 5 225
Step 2: Subtract the two values in the row ‘Play a Sport’ to find the missing value in the column ‘Do Not Play a Musical Instrument.’
209 2 134 5 75
Step 3: Add the value found in Step 2 and the 40 students who do not play a musical instrument and who do not play a sport. This is the total number of students who do not play a musical instrument.
75 1 40 5 125
Step 4: Add the two values in the row ‘Do Not Play a Sport’ to get the total for that row.
91 1 40 5 131
Solution: The table is completed as shown below.
Play a Musical Instrument
Do Not Play a Musical Instrument
Total
Play a Sport 134 75 209Do Not Play a Sport 91 40 131
Total 225 125 350
EXAMPLE

Unit 6 • Getting ReadySpringBoard Louisiana Algebra 1 Skills Workshop 231
Determining Missing Values in Two-Way Tables (continued)
PRACTICE 1. Ronen took a survey of students at his school. Part of the results are shown below. Fill in the
missing values of the table.
Use the Library to Study
Do Not Use the Library to Study
Total
Use the Cafeteria to Study 34 160
Do Not Use the Cafeteria to Study 88 152
Total 214 98

NAME CLASS DATE
Unit 6 • Getting ReadySpringBoard Louisiana Algebra 1 Skills Workshop 232
Determining Row/Column Percentages in Two-Way TablesTwo-way tables are used to present information of a given situation in an organized way. Many times the percentage is calculated for different parts of the table.
Student took a survey of classmates at his school. The results are shown in the table below.
Like Pizza Do Not Like Pizza Total
Like Hamburgers 110 20 130Do Not Like Hamburgers 15 75 90
Total 125 95 220
a. What percentage of the students do not like hamburgers?
Step 1: Determine the row or column for students who do not like hamburgers. Use the row “Do Not Like Hamburgers.” Find the cell that has the total for the row.
There are 90 students who do not like hamburgers.
Step 2: Find the total number of students.
There are 220 students in the survey.
Step 3: Divide the number who do not like hamburgers by the total number of students. Multiply by 100% to find the percentage.
<
90220
(100%) 41%
Solution: 41% of the students surveyed do not like hamburgers.
b. What percentage of the students like pizza?
Step 1: Determine the row or column for students who do like pizza. Use the column “Like Pizza.” Find the cell that has the total for the row.
There are 95 students who like pizza.
Step 2: Find the total number of students.
There are 220 students in the survey.
Step 3: Divide the number who like pizza by the total number of students. Multiply by 100% to find the percentage.
<
95220
(100%) 43%
Solution: 43% of the students surveyed like pizza.
EXAMPLE

Unit 6 • Getting ReadySpringBoard Louisiana Algebra 1 Skills Workshop 233
Determining Row/Column Percentages in Two-Way Tables (continued)
PRACTICEMila took a survey of students at her school. The results are shown in the table below.
Use the School Bus Do Not Use the School Bus Total
Walk to School 45 25 70Do Not Walk to School 30 80 110
Total 75 105 180
Use the two-way table to find the row or column percentage.
1. What percentage of the students use the school bus?
2. What percentage of the students do not walk to school?
3. What percentage of the students do not use the school bus?
4. What percentage of the students walk to school?

NAME CLASS DATE
Unit 6 • Getting ReadySpringBoard Louisiana Algebra 1 Skills Workshop 234
Mean, Median, ModeThe mean, median, and mode are measures of central tendency. These values can be used to analyze and interpret a set of data.
Mean Median Mode
The mean is the arithmetic average of a set of data, found by taking the sum of the data and then dividing by the total number of data items.
5Mean sum of the datatotal number of data items
The median is the middle number of a set of data in numerical order.
The mode is the data item in a set that occurs most often. A data set may have no mode, one mode, or more than one mode.
Alan had each guest at his birthday party write down his or her age as they arrived at the party. What is the mode of the ages?
15, 14, 12, 13, 16, 15, 14, 13, 14, 12, 14, 13
Step 1: Make an organized list or frequency table of the ages of the party guests.
Step 2: Identify the age that occurs the most.
Solution: The mode of the ages is 14 years.
12 13 14 15 16
| | | | | | | | | | | |
14 occurs the most often.
EXAMPLE A
The number of pages that Cassie read each day for a week is shown below. What is the mean of the number of pages that Cassie read per day?
33, 27, 43, 71, 46, 52, 15
Step 1: Find the sum of the pages that Cassie read.
Step 2: Count the number of data items.
Step 3: Divide the sum of the data by the total number of data items.
Solution: The mean of the number of pages that Cassie read per day is 41.
33 1 27 1 43 1 71 1 46 1 52 1 15 5 287
There are 7 data items.
287 4 7 5 41
EXAMPLE B

Unit 6 • Getting ReadySpringBoard Louisiana Algebra 1 Skills Workshop 235
Mean, Median, Mode (continued)
Delia wants to have a mean score of 92 on her math quizzes. Her first five quiz scores are listed below.
88, 94, 92, 100, 96
What is the minimum score that Delia can get on her next quiz to have a mean score of 92?
Step 1: Find the sum of the first five quiz scores.
Step 2: Find the minimum total sum of six quiz scores that Delia would need in order to have a mean score of 92. Multiply 6 quizzes by a mean score of 92.
Step 3: Subtract the sum of Delia’s scores so far from the minimum total score that she needs.
Solution: Delia needs a minimum score of 82 on her next quiz.
88 1 94 1 92 1 100 1 96 5 470
6(92) 5 552
The sum of Delia’s six quiz scores must be at least 552. 552 2 470 5 82
EXAMPLE C
The median is the middle number of a set of ordered data. To find the median, first write the data items in numerical order. If there is an odd number of data items, the median is the middle number. If there is an even number of data items, the median is the mean of the two middle numbers.
The amount of money that Flo earned each day babysitting is shown below.
$145, $225, $130, $85, $175, $150, $135
What is the median of the data set?
Step 1: Order the amounts of money earned from least to greatest.
Step 2: Since there is an odd number of data items, the median is the middle number. Find the middle number in the data set.
Solution: The median amount of money that Flo earned is $145.
$85, $130, $135, $145, $150, $175, $225
$145 is the middle number.
EXAMPLE D

Unit 6 • Getting ReadySpringBoard Louisiana Algebra 1 Skills Workshop 236
Mean, Median, Mode (continued)
Shira played a computer game. Her scores are shown below.
285, 329, 411, 375, 354, 425
What is the median of Shira’s scores?
Step 1: Order the scores from least to greatest.
Step 2: Since there is an even number of data items, there are two middle numbers. Find the middle numbers.
Step 3: Find the mean of the two middle numbers.
Solution: The median of Shira’s scores is 364.5.
285, 329, 354, 375, 411, 425
354 and 375
354 1 375 5 729 729 4 2 5 364.5
EXAMPLE E
PRACTICEFind the mode of each data set.
1. 38, 50, 44, 50, 38, 27, 42, 51, 38 2. 62, 71, 77, 50, 71, 50, 62, 77, 50
Find the mean of each data set.
3. 128, 142, 155, 137, 124, 142 4. 267, 428, 701, 488, 637, 532, 419
Find the median of each data set.
5. 67, 48, 53, 47, 59, 61, 72 6. 72, 96, 84, 70, 86, 87, 93, 68
7. Give two examples of three numbers whose mean is 36.
8. For a data set to have two modes, what is the least number of data that the set can have? Explain your answer.
9. Jimmy has practiced the piano a mean of 49 minutes per day the last 6 days. What will happen to the mean if he does not practice at all tomorrow? Explain how you found your answer.
10. Morris wants to have a mean bowling score of 155. His first five scores are 172, 139, 143, 154, and 129. He will bowl one more game. What is the minimum bowling score that Morris must bowl to get a mean score of 155? Explain how you found your answer.

NAME CLASS DATE
Unit 6 • Getting ReadySpringBoard Louisiana Algebra 1 Skills Workshop 237
Constructing a Graph for Univariate DataOne type of graph that shows the distribution of univariate data is a dot plot. All the values of the data are shown in the graph and the shape of the distribution can be seen.
The amount of money raised by 15 students for the animal shelter is given below.
$13, $18, $17, $17, $15, $17, $13, $22, $17, $14, $16, $19, $17, $18, $20
Construct a dot plot for the data.
Step 1: Draw a number line for the data values.
13 14 15 16 17 18 19 20 21 22
Step 2: Place a dot for each data value in the data set above the number line. If a value occurs more than once, make a column of dots above the value.
13 14 15 16 17 18 19 20 21 22
Step 3: Add a title to the dot plot.
13 14 15 16
Amount of Money Raised (dollars)17 18 19 20 21 22
Solution: The dot plot for the amount of money raised is shown in Step 3 above.
EXAMPLE
PRACTICEMake a dot plot for each set of univariate data.
1. Number of books collected by students for a book drive: 14, 16, 18, 15, 15, 18, 20, 20, 20, 18, 19, 19, 18, 17, 14
2. Number of hours spent studying for a math test: 3, 5, 2, 4, 0, 1, 1, 2, 4, 5, 4, 5, 3, 5, 2

NAME CLASS DATE
Unit 6 • Getting ReadySpringBoard Louisiana Algebra 1 Skills Workshop 238
The Shape of the Distribution of DataYou can describe the shape of the distribution of data by studying the dot plot. A graph of numerical data can be described as symmetric, skewed right, or skewed left.
This graph is symmetric. The highest part of the graph is in the middle of the graph.
0 1 2Hours Spent Writing a Paper
3 4 5
This graph is skewed left. The lowest part of the graph is to the left of the graph.
0 1 2Numbers of Hours Spent at the Library This Week
3 4 5
This graph is skewed right. The lowest part of the graph is to the right of the graph.
0 1 2Numbers of Hours Spent on the Internet Daily
3 4 5
PRACTICEDescribe the shape of the data distribution shown in each dot plot.
1.
80 81 82Weights
83 84
2.
46 47 48Ages
49 50

NAME CLASS DATE
Unit 6 • Getting ReadySpringBoard Louisiana Algebra 1 Skills Workshop 239
Use with Activity 31, Lesson 31-1
Measures of Central TendencyWhen working with large sets of data, it is often useful to find a single value to summarize the entire set. This value is called a measure of central tendency. The three primary measures of central tendency are the mean, the median, and the mode. The mean, also called the average, is found by adding the values of all the data points and dividing by the number of data points. The median is the middle value in the data set when the set is ordered from least to greatest. The mode is the value that occurs most often. It is possible for a data set to have more than one mode if different values occur the same number of times.
Find the mean of each data set.
a. 12.3, 14.2
Step 1: There are 2 data points, so add the values and divide by 2.
12.3 1 14.2 5 26.5
26.52
5 13.25
Solution: The mean is 13.25.
b. 1, 7, 11, 1, 9, 7, 11, 8, 1, 5
Step 1: There are 10 data points, so add the values and divide by 10.
1 1 7 1 11 1 1 1 9 1 7 1 11 1 8 1 1 1 5 5 61
6110
5 6.1
Solution: The mean is 6.1.
EXAMPLE A
Find the median of each data set.
a. 5, 12, 5, 10, 8
Step 1: Write the list in order from least to greatest. Since there is an odd number of data points, the median is the middle number in the list.
5, 5, 8, 10, 12
Solution: The median is 8.
EXAMPLE B

Unit 6 • Getting ReadySpringBoard Louisiana Algebra 1 Skills Workshop 240
Measures of Central Tendency (continued)
b. 12, 8, 3, 8, 5, 2
Step 1: Write the list in order from least to greatest. Since there is an even number of data points, the median is the average of the middle two numbers in the list.
Step 2: 5 and 8 are the middle two numbers in the list so add them and divide by 2.
2, 3, 5, 8, 8, 12
5 1 8 5 13
132
5 6.5
Solution: The median is 6.5.
Find the mode of each data set.
a. 2, 12, 1, 9, 6, 10, 5, 5, 2, 5
Step 1: Write the list in order from least to greatest. This will help to count the data points accurately.
Step 2: The number 5 occurs three times, which is more than any other value in the list.
1, 2, 2, 5, 5, 5, 6, 9, 10, 12
Solution: The mode is 5.
b. 1, 3, 10, 5, 3, 4, 8, 7, 7, 11
Step 1: Write the list in order from least to greatest.
Step 2: The number 3 occurs twice and the number 7 occurs twice.
1, 3, 3, 4, 5, 7, 7, 8, 10, 11
Solution: Both 3 and 7 are modes of the data set.
c. 1, 2, 5, 6, 8, 7, 12
Step 1: Each number appears the same number of times.
Solution: There is no mode.
EXAMPLE C

Unit 6 • Getting ReadySpringBoard Louisiana Algebra 1 Skills Workshop 241
Measures of Central Tendency (continued)
GUIDED PRACTICEAnswer each part of Items 1–4. 1. This data set shows the number of times a group of students accessed a homework help
website during a one-week period. Find the mean of the data set.
4, 1, 10, 7, 4, 14, 3, 15Step 1: Find the sum of the values.
Step 2: Divide the sum by the number of data points. 4 5
Solution: The mean is .
2. A gym held a pull-up competition. This data set shows the results. Find the median of the data set.
13, 12, 4, 5, 1, 11, 8, 6, 2Step 1: Write the list in order.
Step 2: Find the middle number in the data set.
Solution: The median is .
3. This data set shows the number of sea stars a marine biologist counted in ten different sampling locations. Find the median number of sea stars.
13, 7, 7, 7, 12, 9, 8, 5, 15, 14Step 1: Write the list in order.
Step 2: Find the middle number in the data set. In this case, there are two numbers in the middle.
Step 3: Find the average of the middle two numbers.
and
1 5 4 1
Solution: The median is .
4. A group of high school students recorded the age of their youngest siblings. Find the mode of the ages.
5, 8, 13, 7, 12, 6, 11, 14, 13, 2Step 1: Write the list in order.
Step 2: Find the number that occurs most often.
Solution: The mode is .
Unit 6 • Getting ReadySpringBoard Louisiana Algebra 1 Skills Workshop 242
Measures of Central Tendency (continued)
INDEPENDENT PRACTICEFind the indicated measure of central tendency for each data set. Round to the nearest thousandth.
3, 11, 8, 9, 6, 10, 5, 11, 10, 15
1. mean
2. median
3. mode
13, 8, 15, 3, 6, 4, 11, 7, 5
4. mean
5. median 6. mode
A traffic safety officer counted the number of cars that passed through an intersection at a randomly selected hour each day for ten days. This list shows the number of cars the officer counted each day.
40, 43, 79, 68, 80, 39, 88, 15, 91, 80
7. mean
8. median
9. mode
86, 17, 38, 13, 65, 46, 93, 86, 53, 47, 17
10. mean 11. median 12. mode

NAME CLASS DATE
Unit 6 • Additional Unit PracticeSpringBoard Louisiana Algebra 1 Skills Workshop 243
LESSON 36-1 1. Chloe and her friend Amanda decide to record the amount of time they exercise each day.
The result is in the table below.
Sunday Monday Tuesday Wednesday Thursday Friday Saturday
Chloe 30 min 15 min 15 min 15 min 15 min 15 min 30 minAmanda 45 min 18 min 20 min 10 min 0 min 12 min 25 min
Additional Unit 6 Practice
a. What can you tell about Chloe’s exercise routine by looking at her data? Find the mean and range of Chloe’s data.
b. What can you tell about Amanda’s exercise routine by looking at her data? Find the mean and range of Amanda’s data.
c. Reason abstractly. What can you say about each girl’s exercise routine by comparing the mean and range of the data sets?
2. Find the mean absolute deviation (MAD) of Chloe’s data set.
a. Complete the table below. Use the mean for Chloe’s data that you calculated in Item 1.
Chloe Deviation Absolute Deviation
Time Time 2 Mean Time 2 Mean
30 30 2 19151515151530
b. What is the MAD for Chloe’s data set?
3. Find the mean absolute deviation (MAD) of Amanda’s data set.
a. Complete the table below. Use the mean for Amanda’s data that you calculated in Item 1.
Amanda Deviation Absolute Deviation
Time Time 2 Mean Time 2 Mean
45 45 2 19 5 26182010 01225
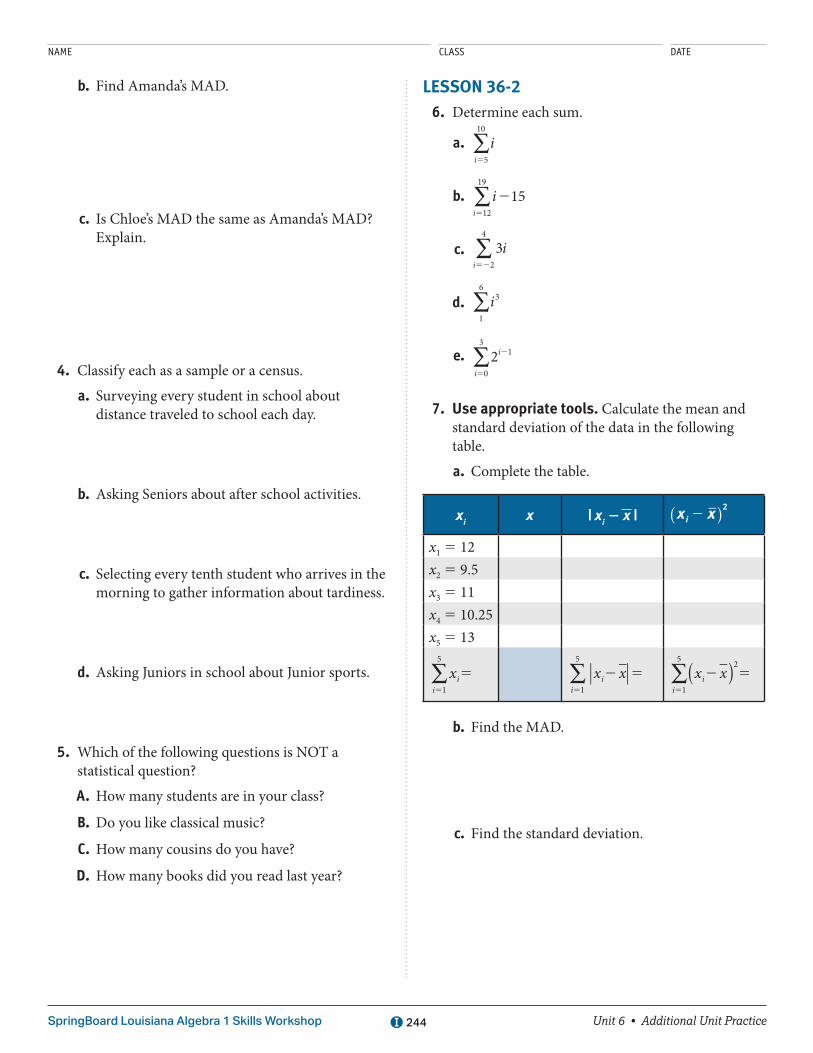
NAME CLASS DATE
Unit 6 • Additional Unit PracticeSpringBoard Louisiana Algebra 1 Skills Workshop 244
b. Find Amanda’s MAD.
c. Is Chloe’s MAD the same as Amanda’s MAD? Explain.
4. Classify each as a sample or a census.
a. Surveying every student in school about distance traveled to school each day.
b. Asking Seniors about after school activities.
c. Selecting every tenth student who arrives in the morning to gather information about tardiness.
d. Asking Juniors in school about Junior sports.
5. Which of the following questions is NOT a statistical question?
A. How many students are in your class?
B. Do you like classical music?
C. How many cousins do you have?
D. How many books did you read last year?
LESSON 36-2 6. Determine each sum.
a. ∑5
ii 5
10
b. ∑ 25
i 15i 12
19
c. ∑52
i3i 2
4
d. ∑i3
1
6
e. ∑ 2
5
2i
i
1
0
3
7. Use appropriate tools. Calculate the mean and standard deviation of the data in the following table.
a. Complete the table.
xi x | xi 2 x | ( )x xi2
2
x1 5 12x2 5 9.5x3 5 11x4 5 10.25x5 5 13
∑ 55
xii 1
5
∑ 2 55
x xii 1
5
∑( )2 55
x xii
2
1
5
b. Find the MAD.
c. Find the standard deviation.

NAME CLASS DATE
Unit 6 • Additional Unit PracticeSpringBoard Louisiana Algebra 1 Skills Workshop 245
8. Prospect Creek Camp, Alaska is one of the coldest places in the United States. The average monthly temperature in degrees Celsius is shown in the table below.
Prospect Creek Camp, Alaska
Month Jan Feb Mar Apr May Jun Jul Aug Sep Oct Nov Dec
Average low 8C 230.5 230.8 223.7 214.2 20.7 5.6 7.8 4.5 21.9 213.7 223.3 229.6
a. Organize the information in the table below. Then complete the table. Round your answers to the nearest hundredths.
xi xi | xi 2 xi | ( )x xi i2
2
∑ 55
xii 1
12
∑ 2 55
x xi ii 1
12
∑( )2 55
x xi ii
2
1
12
b. Find the MAD.
c. Find the standard deviation.
9. Arhmando did a project for homework and gathered the following statistical data: 30.8, 7.2, 31.5, 33.5. Which is the standard deviation for Arhmando’s set of data?
A. 9.275
B. 12.41947
C. 25.75
D. 37.25841
10. Reason abstractly. Find the MAD and the standard deviation of 28, 9, 15, and 210. Compare the two measures. What can you say about the data?
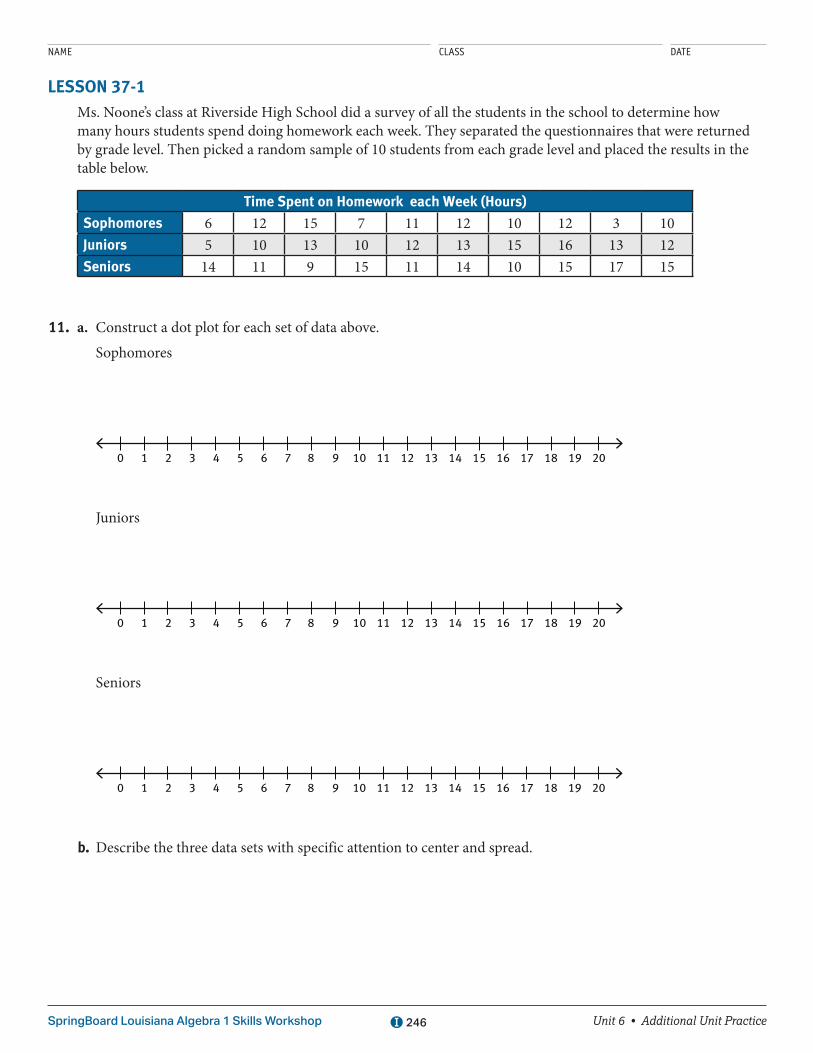
NAME CLASS DATE
Unit 6 • Additional Unit PracticeSpringBoard Louisiana Algebra 1 Skills Workshop 246
LESSON 37-1 Ms. Noone’s class at Riverside High School did a survey of all the students in the school to determine how
many hours students spend doing homework each week. They separated the questionnaires that were returned by grade level. Then picked a random sample of 10 students from each grade level and placed the results in the table below.
Time Spent on Homework each Week (Hours)
Sophomores 6 12 15 7 11 12 10 12 3 10Juniors 5 10 13 10 12 13 15 16 13 12Seniors 14 11 9 15 11 14 10 15 17 15
11. a. Construct a dot plot for each set of data above.
Sophomores
5 6 7 8 9 10 11 12 13 14 15 16 17 18 19 2043210
Juniors
5 6 7 8 9 10 11 12 13 14 15 16 17 18 19 2043210
Seniors
5 6 7 8 9 10 11 12 13 14 15 16 17 18 19 2043210
b. Describe the three data sets with specific attention to center and spread.

NAME CLASS DATE
Unit 6 • Additional Unit PracticeSpringBoard Louisiana Algebra 1 Skills Workshop 247
12. For each group, complete the five-number summaries of the data.
Sophomores Juniors Seniors
Minimum
First quartile
Median
Third quartile
Maximum
13. a. Use the summaries in Item 12 to construct box plots of the three data sets:
Sophomores
5 6 7 8 9 10 11 12 13 14 15 16 17 18 19 2043210
Juniors
5 6 7 8 9 10 11 12 13 14 15 16 17 18 19 2043210
Seniors
5 6 7 8 9 10 11 12 13 14 15 16 17 18 19 2043210
b. Which data set seems to have the least overall spread in its middle 50%?

NAME CLASS DATE
Unit 6 • Additional Unit PracticeSpringBoard Louisiana Algebra 1 Skills Workshop 248
14. Reason abstractly. Based on the data and graphs, does it appear that there is a change in the amount of time students spend on homework as they advance to a higher grade level? Explain.
15. Which type of graph makes it easier to compare centers and spreads?
A. Bar graph
B. Box plot
C. Dot plot
D. Line graph
LESSON 37-3 16. What does a z-score tell us about a data value?
17. How do you calculate a z-score?
18. The daily high mean temperature for February in Fairbanks, Alaska is shown in the table. For each data value, calculate the deviation from the mean and the z-score.
Daily High Mean Temperature in February Fairbanks, Alaska
DateTemperature
8F( x 2 x )
x xs2
1 9 2 5 3 6 4 6 5 7 6 7 7 7 8 8 9 810 911 912 1013 1014 1115 1116 1217 1218 1319 1320 1421 1422 1523 1524 1625 1626 1727 1728 18

NAME CLASS DATE
Unit 6 • Additional Unit PracticeSpringBoard Louisiana Algebra 1 Skills Workshop 249
19. Assuming the temperature highs are normally distributed, what is the probability that the high temperature will be above 10°F on a randomly selected day in February in Fairbanks, Alaska?
A. 0.35
B. 0.50
C. 0.85
D. 0.95
20. Estimate the probability that the mean high temperature will be below 7°F on a randomly selected day in February in Fairbanks, Alaska.
LESSON 38-1 21. Which of the following might show a strong
negative relationship between the two variables?
A. age and weight
B. money in a savings account and monthly withdrawals
C. number of siblings and hours of sleep
D. number of pets and annual vet bill
22. Reason quantitatively. Describe the relationship between the number of hours studying for a test and the grade on the test.
23. Model with mathematics. Describe the trend in each scatter plot. Explain what the graphs may mean about the relationship between the two variables.
a.
Test
Gra
de
Student Height
b.
Sal
es
Price
Price vs. Sales
c.
Dis
tanc
e
Time

NAME CLASS DATE
Unit 6 • Additional Unit PracticeSpringBoard Louisiana Algebra 1 Skills Workshop 250
24. a. Make a scatter plot of the data in the table.
Hours in Practice and Games Won
Hours 1 2 3 4 5 6 7 8 9 10Games Won 1 0 1 4 2 1 3 5 3 4
b. Describe the trend in the scatter plot.
c. What are some things that might affect whether or not a team wins a game?
25. What trend might you see in a scatter plot with a horizontal scale of outdoor temperature and a vertical scale of energy used for heat?
LESSON 38-2 26. What does the correlation coefficient measure?
27. A scatter plot has a correlation coefficient of 20.159. What does this suggest about the relationship between the two variables?
28. When will the correlation coefficient be 0?

NAME CLASS DATE
Unit 6 • Additional Unit PracticeSpringBoard Louisiana Algebra 1 Skills Workshop 251
29. Match the scatter plot with its correlation coefficient.
A. r 5 20.95 _____
B. r 5 0.981 _____
C. r 5 20.772 _____
D. r 5 0.043 _____
E. r 5 0.828 _____
F. r 5 20.238 _____
G. r 5 0.310 _____
x
y
710 2 3 4 5 6
5
4
3
2
1
Scatter Plot 1
x
y
710
0
0
2 3 4 5 6
5
4
3
2
1
Scatter Plot 2
x
y
81 2 3 4 5 76
6
5
4
3
2
1
Scatter Plot 3
x
y
51 2 3 4
6
5
4
3
2
1
Scatter Plot 4
51 2 3 4
x
y
71 2 3 654
71 2 3 654
71 2 3 654
87654321
Scatter Plot 5
x
y6
5
4
3
2
1
Scatter Plot 6
x
y5
4
3
2
1
Scatter Plot 7
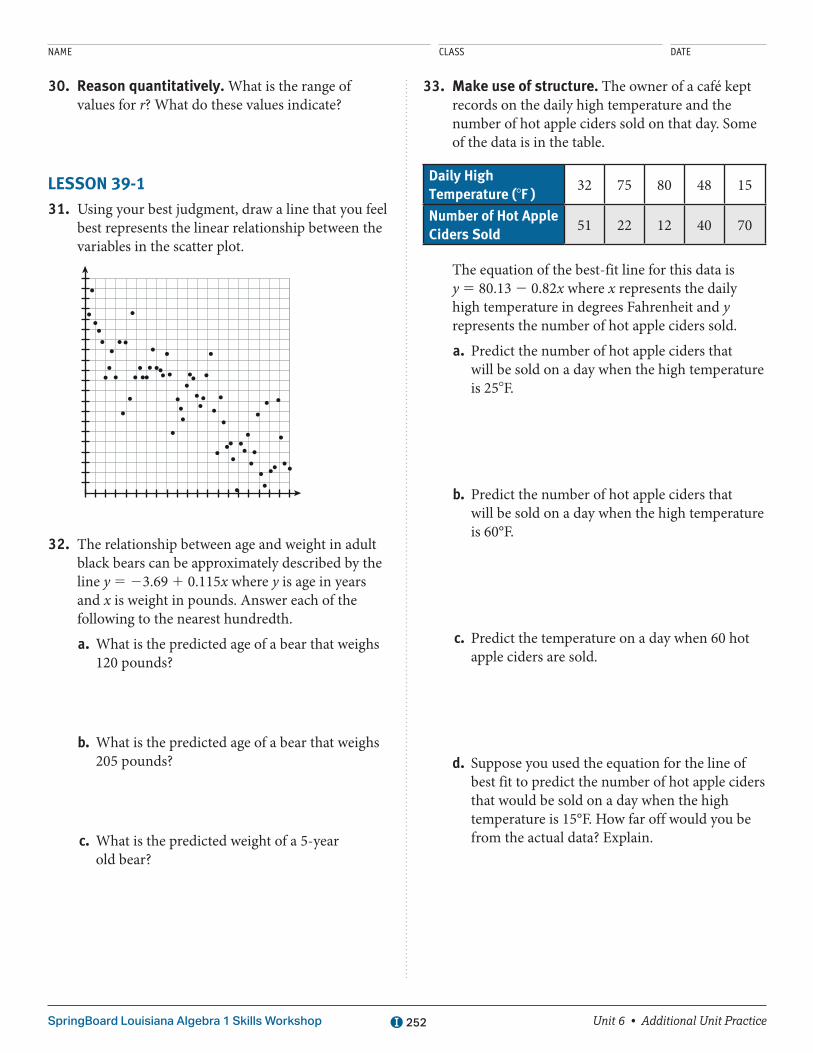
NAME CLASS DATE
Unit 6 • Additional Unit PracticeSpringBoard Louisiana Algebra 1 Skills Workshop 252
30. Reason quantitatively. What is the range of values for r? What do these values indicate?
LESSON 39-1 31. Using your best judgment, draw a line that you feel
best represents the linear relationship between the variables in the scatter plot.
32. The relationship between age and weight in adult black bears can be approximately described by the line y 5 23.69 1 0.115x where y is age in years and x is weight in pounds. Answer each of the following to the nearest hundredth.
a. What is the predicted age of a bear that weighs 120 pounds?
b. What is the predicted age of a bear that weighs 205 pounds?
c. What is the predicted weight of a 5-year old bear?
33. Make use of structure. The owner of a café kept records on the daily high temperature and the number of hot apple ciders sold on that day. Some of the data is in the table.
Daily High Temperature (8F )
32 75 80 48 15
Number of Hot Apple Ciders Sold
51 22 12 40 70
The equation of the best-fit line for this data is y 5 80.13 2 0.82x where x represents the daily high temperature in degrees Fahrenheit and y represents the number of hot apple ciders sold.
a. Predict the number of hot apple ciders that will be sold on a day when the high temperature is 258F.
b. Predict the number of hot apple ciders that will be sold on a day when the high temperature is 60°F.
c. Predict the temperature on a day when 60 hot apple ciders are sold.
d. Suppose you used the equation for the line of best fit to predict the number of hot apple ciders that would be sold on a day when the high temperature is 15°F. How far off would you be from the actual data? Explain.

NAME CLASS DATE
Unit 6 • Additional Unit PracticeSpringBoard Louisiana Algebra 1 Skills Workshop 253
34. Suppose the equation for a line of best fit is y 5 1.05x 1 1.48. For what value of x will y be 50?
A. 28
B. 32
C. 46
D. 85
35. The data points on a scatter plot do not cluster around the line of best fit. What can be said about the relationship between the bivariate data sets?
LESSON 39-2 36. Roni wanted to determine if there was a
relationship between the fuel efficiency of a car and its mass. Roni researched the fuel efficiency of 12 different models of cars. The table shows the fuel efficiency and mass of these 12 cars.
Car Fuel Efficiency
city highway combined mpg mass(kg)
1 11 17 13 1695 2 12 19 15 1560 3 16 26 19 1519 4 19 27 21 1305 5 19 27 21 1330 6 14 20 16 1635 7 22 29 25 1589 8 26 35 29 1115 9 22 28 24 130710 20 26 22 149711 21 31 25 149812 17 24 19 1950
a. Model with mathematics. Construct a scatter plot of the combined mpg and the mass of the 12 cars.
b. Based on the scatter plot, how would you describe the relationship between the combined mpg and the mass of a car?
c. Use technology to find the equation of the best-fit line.
d. Use the best-fit line to predict the combined mpg to the nearest unit of a car with a mass of 1500 kg.
37. The best-fit line for city mpg and the mass of a car is y 5 37.25 2 0.013x. To the nearest whole kilogram which is the predicted mass of a car with a fuel efficiency of 15 mg in the city.
A. 1635 kg
B. 1685 kg
C. 1712 kg
D. 1925 kg

NAME CLASS DATE
Unit 6 • Additional Unit PracticeSpringBoard Louisiana Algebra 1 Skills Workshop 254
38. Make use of structure. Car 6 has a mass of 1635 kg and an actual fuel efficiency of 20 mpg on the highway. Find the predicted highway fuel efficiency of car 6 on the line of best fit y 5 48.245 2 0.015x. Why does the predicted highway fuel efficiency of car 6 differ from the actual highway fuel efficiency?
39. What is a residual? When is a residual negative?
40. The line of best fit for the fuel efficiency on the highway of the twelve cars is y 5 48.245 2 0.015x. Complete the table by finding the predicted fuel efficiency and the residual for each car. Round your answers to the nearest whole unit.
Fuel EfficiencyCar Mass
(kg)Highway
mpgPredicted
mpgResidual
1 1695 17 2 1560 19 3 1519 26 4 1305 27 5 1330 27 6 1635 20 7 1589 29 8 1115 35 9 1307 2810 1497 2611 1498 3112 1950 24
LESSON 39-3 41. A survey of the heights of mothers and daughters
resulted in a best-fit line of y 5 69 2 0.0849x where x represents the height of the mother in inches.
a. Interpret the value of the slope in the context of this problem.
b. Make sense of problems. What other things might influence the height of the daughter besides the height of the mother?
42. Reason abstractly. When would you not use the line of best fit to make a prediction?
43. The equation of the best-fit quadratic curve for marathon data of woman is y 5 473.3 2 15.8x 1 0.203x2 where x is the age of the runner and y is the finish time in minutes. What is the predicted finish time of a 25-year-old woman?
A. 83 minutes
B. 205 minutes
C. 598 minutes
D. 995 minutes

NAME CLASS DATE
Unit 6 • Additional Unit PracticeSpringBoard Louisiana Algebra 1 Skills Workshop 255
44. The scatter plot for the age and finish time of marathon women is shown.
325Finish Time vs. Age
Fini
sh T
ime
(min
) 300
275
250
225
200
10 20 30 40Age (years)
50
y
x60 700
What does this scatter plot suggest?
45. Data of the CO2 concentration and temperature (°C) was collected for ten years. The range of the CO2 concentration was 314 to 369 parts per million. Does it make sense to predict the temperature at a CO2 concentration of 350 parts per million? Explain.
LESSON 39-4 46. The data for the CPI (Consumer Price Index)
and the cost of a subway ride in a city is shown in the table.
CPI Subway Fare ($)
Predicted Fare ($)
Residual
30.2 0.1548.3 0.35
112.20 1.00162.2 1.35191.9 1.50197.8 2.00
a. Construct a scatter plot for this data set. Describe the relationship between the variables in terms of strength, direction, and shape.
b. Find the equation of the best-fit line.
c. Compute the predicted values and the residuals to the nearest cent, and place these values in the table.
d. Construct a residual plot.
e. Does the residual plot support your description of the relationship between the two variables? Explain.

NAME CLASS DATE
Unit 6 • Additional Unit PracticeSpringBoard Louisiana Algebra 1 Skills Workshop 256
47. Make use of structure. Samantha constructed a residual plot of the data she collected. The residuals are scattered randomly above and below zero. What does this tell Samantha about the best-fit line of her data?
48. What does a strong pattern in the residual plot tell you about the use of the best-fit line to describe the relationship between the variables?
49. Suppose you graphed the best-fit line on a scatter plot. How would you know whether a point had a positive or negative residual?
50. What characteristic of the residual plot suggests that the line of best fit is a good representation of the data?
A. a strong pattern in the residual plot
B. a linear pattern in the residual plot
C. a curved pattern in the residual plot
D. a random pattern in the residual plot

NAME CLASS DATE
Unit 6 • Additional Unit PracticeSpringBoard Louisiana Algebra 1 Skills Workshop 257
LESSON 40-1 Use the table that is in the U.S. Senate report of the Loss of S.S. “Titanic” to answer Items 51–55.
Investigation into Loss of S. S. “Titanic”
CPI On Board Saved LostPercent savedWomen and
ChildrenMen Total
Women and Children
Men TotalWomen and
ChildrenMen Total
PassengersFirst ClassSecond ClassThird Class
156128224
173157486
145104105
541569
1124
119
119142417
Total passengers
. . .
Crew 23 876 20 194 3 682Total
51. a. How many second-class passengers were there?
b. How many second-class passengers were women and children?
c. How many second-class passengers were lost?
d. Reason quantitatively. Compare the number of second-class women and children lost to the number of third-class women and children lost.
52. Determine the marginal totals. Fill in the appropriate columns and rows in the table.
53. Determine the percent of passengers saved by class and percent of crew saved. Fill in the last column in the table.
54. There were 536 third-class passengers who were lost. The total number of passengers who were lost was 1324. Which is the relative frequency of the third class passengers who were lost?
A. 0.405
B. 0.536
C. 0.595
D. 0.788

NAME CLASS DATE
Unit 6 • Additional Unit PracticeSpringBoard Louisiana Algebra 1 Skills Workshop 258
55. Critique the reasoning of others. Bonnie stated that about 77% of the women and children who were lost were third-class passengers. Do you agree with that statement? Why or why not?
LESSON 40-2 56. The table shows multimedia usage in the U.S. for
three consecutive years.
United States Usage of Multimedia in Minutes Per Day
YearWeb
BrowsingMobile
ApplicationsTelevision Total
2010 70 66 1622011 72 94 1682012 70 127 168Total
a. Complete the table by filling in the totals.
b. Use the frequencies in the table to complete the Raw Percentages table. Round the percentages to the nearest tenth of a percent.
Raw Percentages U.S. Usage of Multimedia in
Minutes per Day
YearWeb
BrowsingMobile
ApplicationsTelevision Total
201020112012
c. Make a segmented bar graph to display the data in the table.
d. Reason quantitatively. Does it appear from the segmented bar graph that the distributions of multimedia usage are very similar for the three years, or are they noticeably different? How are the distributions similar or different?
57. What does a segmented bar graph represent? How is it made?
58. In a vitamin C study of 279 skiers, 31 skiers out of the 140 skiers who received a placebo caught a cold. What percentage of the skiers who took a placebo caught a cold?
A. 11%
B. 22%
C. 35%
D. 50%

NAME CLASS DATE
Unit 6 • Additional Unit PracticeSpringBoard Louisiana Algebra 1 Skills Workshop 259
59. The information in the table below was gathered from a survey by the Transportation Committee of an industrial complex to determine the mode of transportation used by employees.
Drive Alone CarpoolPublic
TransportationOther Means
Start at 8:00 64 38 10 6Start at 8:30 94 44 11 8Start at 9:00 158 45 14 8
The Transportation Committee wants to present the results of the survey in a report to the manager of the industrial complex. Describe what should be included in the report.
60. Use the information in Item 59 to describe the association between the mode of transportation and the time an employee begins work.

NAME CLASS DATE
Fractions, Decimals, and PercentsSpringBoard Louisiana Algebra 1 Skills Workshop 268
Convert Fractions to DecimalsFractions and decimals can name a part of a whole or a group. Decimals represent fractions with denominators of 10, 100, 1,000, and so on.
fraction: 310
fraction: 7100
decimal: 0.3 decimal: 0.07
in words: three tenths in words: seven hundredths
Many measurements are given as fractions and as decimals. At the supermarket, someone may ask for a half pound of turkey, but the scale that weighs the food indicates 0.5 pound. To interpret statistics, including those in sports, you may need to convert fractions to decimals.One way to convert a fraction to a decimal is to divide the numerator by the denominator.
Write 78
as a decimal. State the decimal in words.
Divide 7 by 8.
0. 8 7 58 7. 0 0 026 4
6 025 6
4 024 0
0
Solution: 78
5 0.875; eight hundred seventy-five thousandths
EXAMPLE A

Fractions, Decimals, and PercentsSpringBoard Louisiana Algebra 1 Skills Workshop 269
There is a way to convert a fraction to a decimal without dividing. If the denominator can be written as 10, 100, 1,000, or so on, you can write an equivalent fraction with that number as a denominator.
Of the students at Horace Mann Elementary School, 45 walk to school. What decimal represents the part of the
student body that walks to school?
Step 1: Determine if 5 is a factor of 10 or 100.
Step 2: Write an equivalent fraction with 10 as the denominator.
Step 3: Write the fraction as a decimal by writing the numerator as the decimal with the denominator as the number of places.
Solution: 0.8 of the students walk to school.
5 is a factor of 10 and 100.
5 0.8
EXAMPLE B
You can also write a fraction as a decimal rounded to a specific decimal place.
A football team has won 11 of its 16 games. What decimal represents the part of the games the team has won? Round the quotient to the nearest tenth.
Step 1: Write 11 out of 16 as a fraction.
Step 2: Divide the numerator by the denominator.
Step 3: To round to the tenths place, look at the digit in the hundredths place. Compare that digit to 5.
Step 4: Add 1 to the digit in the tenths place and replace the digits to the right of the tenths place with zeros. Write an equivalent decimal.
Solution: The football team won 0.6875 of its games, or about 0.7 of its games rounded to the nearest tenth.
1116
0. 6 8 7 51 6 1 1. 0 0 0 0
29 61 4 0
21 2 81 2 0
21 1 28 0
28 00
8 . 5, so round up.
0 . 6 8 7 5
0 . 7 0 0 0 5 0.7
EXAMPLE C
Convert Fractions to Decimals (continued)

Fractions, Decimals, and PercentsSpringBoard Louisiana Algebra 1 Skills Workshop 270
Some fractions convert to repeating decimals. A repeating decimal is a decimal in which one or more digits repeat without end. You can indicate a repeating decimal by drawing a bar over the digits that repeat.
Sheila has 5 hits in 18 at bats on her softball team. What is her batting average as a decimal?
Step 1: Write 5 out of 18 as a fraction.
Step 2: Divide the numerator by the denominator.
Step 3: The 7 repeats. Write a bar over the first 7.
Solution: Sheila’s batting average as a decimal is 0.27.
518
0. 2 7 71 8 5. 0 0 0
23 61 4 0
21 2 61 4 0
21 2 61 4
0.27
EXAMPLE D
In some situations, instead of writing the digits that repeat, you may want to round a repeating decimal. In baseball, batting averages are rounded to the thousandths place.
Write Sheila’s batting average as a decimal rounded to the nearest thousand.
Step 1: Write the decimal average.
Step 2: Write the decimal showing repeated 7s.
Step 3: To round to the thousandths place, write the decimal to one more decimal place after thousandths.
Step 4: Compare the digit in the ten-thousandths place to 5.
Step 5: Add 1 to the digit in the thousandths place and replace the digits to the right of the thousandths place with zeros. Write an equivalent decimal.
Solution: Rounded to the nearest thousandth, Sheila’s batting average is 0.278.
0.27
0.277777…
0.2777
7 . 5, so round up.
0 . 2 7 7 7
0 . 2 7 8 0 5 0 . 2 7 8
EXAMPLE E
Convert Fractions to Decimals (continued)

Fractions, Decimals, and PercentsSpringBoard Louisiana Algebra 1 Skills Workshop 271
Convert Fractions to Decimals (continued)
PRACTICEWrite each fraction as a decimal. Give the word form of the decimal.
1. 910
0.9; nine tenths 2. 37100
0.37; thirty-seven hundredths
3. 34
0.75; seventy-five hundredths
4. 12
0.5; five tenths 5. 38
0.375; three hundred seventy-five thousandths
6. 2125
0.84; eighty-four hundredths
Use division to find an equivalent decimal. Write a bar over any digits that repeat.
7. 13
0.3 8. 56
0.83 9. 79
0.7
Use division to find an equivalent decimal. Round each decimal to the nearest hundredth.
10. 512
0.42 11. 37
0.43 12. 811
0.73
13. Are 210
and 0.2 equivalent? Explain. No; 0.2 is equal to 29
, not 210
.
14. In Mr. Frali’s homeroom 14 of his 22 students ride the bus to school. What decimal represents the part of Mr. Frali’s homeroom students that take the bus to school? Write your decimal rounded to the nearest hundredth and if it repeats, also write it as a repeating decimal. Explain how you found your answer. 0.63 » 0.64; Explanations will vary.

NAME CLASS DATE
Fractions, Decimals, and PercentsSpringBoard Louisiana Algebra 1 Skills Workshop 272
Decimals and PercentsTo write a percent as a decimal, move the decimal point two places to the left and remove the percent sign.
Write 7.4% as a decimal.
Step 1: Move the decimal point two places to the left and remove the % sign.
Solution: 7.4% 5 0.074
7.4% 5 0.074
EXAMPLE A
To write a decimal as a percent, move the decimal point two places to the right and add a percent sign.
Write 0.042 as a percent.
Step 1: Move the decimal point two places to the right and add a percent sign.
Solution: 0.042 5 4.2%
0.042 5 4.2%
EXAMPLE B
PRACTICEWrite each percent as a decimal.
1. 65% 0.65 2. 18.6% 0.186 3. 36.6% 0.0366
4. 41.9% 0.0419 5. 3.89% 0.0389 6. 21.6% 0.216
Write each decimal as a percent.
7. 0.072 72% 8. 0.514 51.4% 9. 0.0426 4.26%
10. 0.014 1.4% 11. 0.874 87.4% 12. 0.0578 5.78%

NAME CLASS DATE
Fractions, Decimals, and PercentsSpringBoard Louisiana Algebra 1 Skills Workshop 273
Determine Equivalent FractionsEquivalent fractions are fractions that represent the same quantity even though their number representations are different.
Determine if each pair of fractions are equal.
a. 35
and 24
Step 1: Find the least common denominator for the two fractions. The least common denominator is 20.
Step 2: Find the equivalent form of each fraction with the new denominator. 35
5 1220
, 24
5 1020
Step 3: Determine if the equivalent forms are equal or not equal. Since 1220
fi 1020
, then 35
fi 24
.
Solution: The two fractions, 35
and 24
, are not equal.
b. 69
and 1827
Step 1: The least common denominator is 27.
Step 2: Find the equivalent form of each fraction with the new denominator. 69
5 1827
, 1827
5 1827
Step 3: Since 69
5 1827
, the two fractions are equal.
Solution: The two fractions, 69
and 1827
, are equal.
EXAMPLE A
Write an equivalent fraction with a denominator of 100 for 215
.
Step 1: Since 215
is a mixed fraction, write 215
as an improper fraction. 215
5 115
Step 2: Multiply the numerator and denominator by 20 to write 115
as a fraction over 100. 115
? 2020
5 220100
Solution: 215
written as a fraction with a denominator of 100 is 220100
.
EXAMPLE B

Fractions, Decimals, and PercentsSpringBoard Louisiana Algebra 1 Skills Workshop 274
Equivalent Fractions (continued)
PRACTICEDetermine if each pair of fractions is equal.
1. 18
and 6
48yes
2. 5
15 and
410
no
3. 1060
and 3
12no
4. 728
and 520
yes
5. 70
100 and
710
yes
6. 34
and 80
100no
Write an equivalent fraction with a denominator of 100.
7. 8
10
80100
8. 64 150100
9. 1250100
10. 334
375100
11. 5
50
10100
12. 1225
48100

NAME CLASS DATE
Fractions, Decimals, and PercentsSpringBoard Louisiana Algebra 1 Skills Workshop 275
Equivalent Forms of NumbersYou can convert a fraction to a decimal or a percent.
Express the fraction 58
as a percent.
Step 1: Change the fraction to a decimal by dividing the numerator by the denominator.
Step 2: To write a decimal multiply by 100% or move the decimal point two places to the right.
Solution: 58
is 62.5%
58
0.6255
0.625 5 62.5%
EXAMPLE A
Express the fraction 152200
as a percent.
Step 1: Change the fraction to a decimal by dividing the numerator by the denominator.
Step 2: To write a decimal multiply by 100% or move the decimal point two places to the right.
Solution: 152200
is 76%
152200
0.675
0.76 5 76%
EXAMPLE B
PRACTICEExpress each fraction as a percent. Round to the nearest tenth.
1. 130200 65% 2. 15
20 75% 3. 2260 36.7%
4. 44105 41.9% 5. 35
90 38.9% 6. 3672 50%
7. 2150 42% 8. 90
150 60% 9. 42130 32.3%

NAME CLASS DATE
SpringBoard Louisiana Algebra 1 Skills Workshop Fractions, Decimals, and Percents 276
Equivalent FractionsEquivalent fractions are fractions that name the same amount. Using an equivalent fraction may
make solving a problem easier. For example, 23
is much easier to understand than 1624
, yet they
have the same value. You can use a visual representation to find an equivalent fraction.
Write an equivalent fraction for the shaded part of the figure.
Step 1: Identify the fraction represented by the shaded part of the figure.
Step 2: Draw lines to cut each rectangle in half so that there are 10 smaller rectangles.
Step 3: Identify the number of shaded, smaller rectangles and write the fraction represented by the shaded part of the figure.
Solution: A fraction that is equivalent to 35
is 610
.
The part that is shaded is 35
.
The part that is shaded is 610
.
EXAMPLE A
The Property of One states that if the numerator and denominator of a fraction are multiplied or divided by the same number, your result will be an equivalent fraction. That is because multiplying or dividing the numerator and denominator by the same number is the same as multiplying or dividing the fraction by 1.
The Tigers have won 56
of their games so far this season. Write an equivalent fraction for 56
.
Step 1: Multiply the numerator and denominator by the same number. For example, use 2.
Solution: An equivalent fraction for 56
is 1012
.
3
35
5 56 2
1012
EXAMPLE B

Fractions, Decimals, and PercentsSpringBoard Louisiana Algebra 1 Skills Workshop 277
Equivalent Fractions (continued)
Another way to find an equivalent fraction is to write the fraction in simplest form. A fraction written in simplest form has a numerator and a denominator with no common factors greater than 1. You can use the Property of One and the greatest common factor (GCF) of the numerator and denominator to find the simplest form of a fraction.
Lindsey dropped a full carton of eggs. In the carton, 912
of the eggs were cracked. Write the fraction in simplest form.
Step 1: Find the GCF of 9 and 12.
Step 2: Divide the numerator and the denominator by the GCF.
Solution: In simplest form, 59
1234
.
Factors of 9: 1, 3, 9Factors of 12: 1, 2, 3, 4, 6, 12The GCF is 3.9 3
12 334
4
45
EXAMPLE C
You can use the least common denominator (LCD) to tell whether fractions are equivalent. First write the fractions with the least common multiple (LCM) of the denominators. Then compare the fractions.
Are 35
and 23
equivalent?
Step 1: Find the LCD of 35
and 23
.
Step 2: Write an equivalent fraction for 35
using 15 as the denominator.
Step 3: Write an equivalent fraction for 23
using 15 as the denominator.
Step 4: Compare the fractions.
Solution: 35
and 23
are not equivalent fractions.
Multiples of 3: 3, 6, 9, 12, 15, …Multiples of 5: 5, 10, 15, …The LCD is 15.
Because 15 4 5 5 3, multiply the numerator and denominator by 3.
Because 15 4 3 5 5,multiply the numeratorand denominator by 5.
≠9
151015
3
35
3 35 3
915
3
35
2 53 5
1015
EXAMPLE D

Fractions, Decimals, and PercentsSpringBoard Louisiana Algebra 1 Skills Workshop 278
You can easily convert a fraction with a denominator of 100 into a decimal. So when working with decimals, it is often helpful to have fractions with 100 as the denominators. You can use the Property of One to find an equivalent fraction with a denominator of 100.
Write an equivalent fraction for 920
with 100 as the denominator.
Step 1: Divide 100 by the denominator to find the factor of 100 you will use.
Step 2: Multiply the numerator and denominator by that factor, 5.
Solution: An equivalent fraction for 920
with 100 as the denominator is 45100
.
100 4 20 5 53
35
9 520 5
45100
EXAMPLE E
PRACTICEUse the Property of One to write two equivalent fractions for each fraction. Answers may vary.
1. 23
46,
1015
2. 58
1524
, 2032
3. 1220
35,
3660
Tell if each pair of fractions is equivalent.
4. 25
and 820
yes 5. 56
and 2025
no 6. 38
and 1232
yes
Use the Property of One to write an equivalent fraction with a denominator of 100 for each fraction.
7. 25
40100
8. 720
35100
9. 1625
64100
10. Three friends are saving money for a trip. They will each save the same amount. Tamika has saved 35
of the
money she needs, Alice has saved 510
of the money she needs, and Elena has saved 1020
of the money she needs.
Which two girls have saved the same amount of money so far? Explain how you found your answer.
Alice and Elena have saved the same amount of money since 510
5 1020
5 12.
Equivalent Fractions (continued)

NAME CLASS DATE
Fractions, Decimals, and PercentsSpringBoard Louisiana Algebra 1 Skills Workshop 279
Fractions, Decimals, and PercentsFractions, decimals, and percents can name a part of a whole or a group.
The denominator in a fraction tells you how many equal parts there are in the whole or group. The numerator tells how many of those parts are being
considered. Below is a model representing 23
, which is read two thirds.
23
← numerator← denominator
Decimals also name a part of a whole or a group. A decimal point (.) separates the whole number part from the decimal part.
Write: 0.1 or 1
10Read: one tenth
Write: 0.01 or 1100
Read: one hundredth
A fraction can be converted to a decimal by dividing the numerator by the denominator.
The Bulldogs football team won 58
of its games. What decimal represents the part of its games that the Bulldogs won?
Divide 5 by 8.
24 8 20 216 40 240
0
Solution: The Bulldogs won 0.625 of its games.
EXAMPLE A
0.625 8 5.000

Fractions, Decimals, and PercentsSpringBoard Louisiana Algebra 1 Skills Workshop 280
Fractions, Decimals, and Percents (continued)
There is a way to convert a fraction to a decimal without dividing. If the denominator can be written as 10, 100, 1,000, or so on, you can write an equivalent fraction with that number as a denominator.
Timmy correctly spelled 13 out of 20 spelling words on his quiz. What decimal represents the part of the words that Timmy correctly spelled?
Step 1: Write 13 out of 20 as a fraction.
Step 2: Determine if 20 is a factor of 100 or 1,000.
Step 3: Write an equivalent fraction with 100 as the denominator.
Step 4: Write the fraction as a decimal by writing the numerator as the decimal with the denominator as the number of places.
Solution: 1320 5 0.65
1320
20 is a factor of 100 and 1,000.1320 3
55 5
13 520 5
3
3 5
65100
5 0.65
EXAMPLE B
To convert a decimal to a fraction in simplest form, write the digits of the decimal as the numerator, with the least place value of the decimal as the denominator. Then write the fraction in simplest form.
Shamequa lives 0.84 kilometer from Mya. In simplest form, what fraction of a kilometer does Shamequa live from Mya?
Step 1: Write the decimal as a fraction. The least place is hundredths, so write a denominator of 100.
Step 2: Find the greatest common factor (GCF) of 84 and 100.
Step 3: Divide by the GCF.
Solution: Shamequa lives 2125
kilometer from Mya.
0.84 5 84
100
The GCF of 84 and 100 is 4.84
100 4
44 5
2125
EXAMPLE C
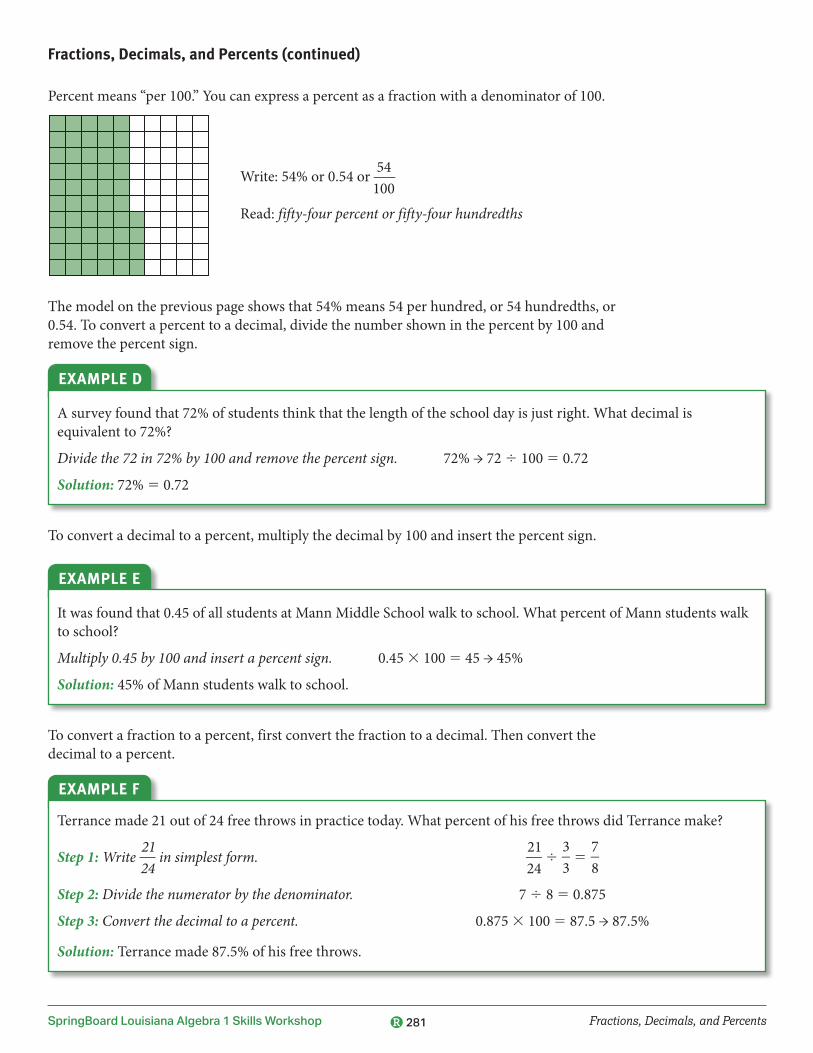
Fractions, Decimals, and PercentsSpringBoard Louisiana Algebra 1 Skills Workshop 281
Fractions, Decimals, and Percents (continued)
Percent means “per 100.” You can express a percent as a fraction with a denominator of 100.
Write: 54% or 0.54 or 54100
Read: fifty-four percent or fifty-four hundredths
The model on the previous page shows that 54% means 54 per hundred, or 54 hundredths, or 0.54. To convert a percent to a decimal, divide the number shown in the percent by 100 and remove the percent sign.
A survey found that 72% of students think that the length of the school day is just right. What decimal is equivalent to 72%?
Divide the 72 in 72% by 100 and remove the percent sign. 72% → 72 4 100 5 0.72
Solution: 72% 5 0.72
EXAMPLE D
To convert a decimal to a percent, multiply the decimal by 100 and insert the percent sign.
It was found that 0.45 of all students at Mann Middle School walk to school. What percent of Mann students walk to school?
Multiply 0.45 by 100 and insert a percent sign. 0.45 3 100 5 45 → 45%
Solution: 45% of Mann students walk to school.
EXAMPLE E
To convert a fraction to a percent, first convert the fraction to a decimal. Then convert the decimal to a percent.
Terrance made 21 out of 24 free throws in practice today. What percent of his free throws did Terrance make?
Step 1: Write 2124
in simplest form.
Step 2: Divide the numerator by the denominator.
Step 3: Convert the decimal to a percent.
Solution: Terrance made 87.5% of his free throws.
2124
4 33
5 78
7 4 8 5 0.875
0.875 3 100 5 87.5 → 87.5%
EXAMPLE F

Fractions, Decimals, and PercentsSpringBoard Louisiana Algebra 1 Skills Workshop 282
Fractions, Decimals, and Percents (continued)
To convert a percent to a fraction in simplest form, write the percent as a number per 100 in fractional form. Then simplify the fraction.
Write 75% as a fraction in simplest form.
Step 1: Write 75% as a fraction with 100 as the denominator.
Step 2: Find the greatest common factor (GCF) of 75 and 100.
Step 3: Divide the numerator and denominator by the GCF, 25.
Solution: 75% 5 34
75% 5 75
100
The GCF is 25.
75100
4 2525
4 4
4
75 25100 25
5 34
EXAMPLE G
PRACTICEWrite a fraction, decimal, and percent to describe the shaded part of each model.
1.
15, 0.2, 20%
2.
920
, 0.45, 45%
Write as a decimal.
3. 910
0.9 4. 30% 0.3 5. 38
0.375
Write as a fraction in simplest form.
6. 0.4 25
7. 85% 1720
8. 0.67 67100
Write as a percent.
9. 0.7 70% 10. 12
50% 11. 45
80%
12. Julie has saved $42 toward her goal of $75. Express the portion of her goal that she has saved as a fraction in simplest form, as a decimal, and as a percent. Explain how you found each representation.
1425
, 0.56, 56%; Explanations may vary.

NAME CLASS DATE
Fractions, Decimals, and PercentsSpringBoard Louisiana Algebra 1 Skills Workshop 283
Modeling FractionsFractions are a way to show a part of a whole or a part of a group. The denominator of a fraction tells you how many equal parts there are in the whole. The numerator tells how many of those parts are being considered.
Marcus drew the rectangle below. Write the number shown by the shaded part of the model as a fraction and as a decimal
Step 1: Count the number of equal parts.
Step 2: Count the number of shaded parts.
Step 3: Change the fraction to a decimal.
Solution: The decimal is 0.5.
There are 6 equal parts.
This is the denominator. ?6
There are 3 shaded parts.
This is the numerator. 36
EXAMPLE A
Use a model to represent the fraction 78
.
Step 1: Divide a figure into 8 equal parts.
Step 2: : Use the numerator to determine the number of parts to shade.Shade in 7 of the parts.
Solution:
EXAMPLE B
6 3.030
0
0.5

Fractions, Decimals, and PercentsSpringBoard Louisiana Algebra 1 Skills Workshop 284
PRACTICEWrite a fraction and decimal for the shaded part of each model.
1. 2. 3.
4. 5.
6.
Draw a model to represent each fraction.
7. 34
8. 610
9. 36
10. 612
11. 58
12. 24
Modeling Fractions (continued)
58; 0.625
46
; 0.6628; 0.25 5
10; 0.5
25; 0.4
810
; 0.8
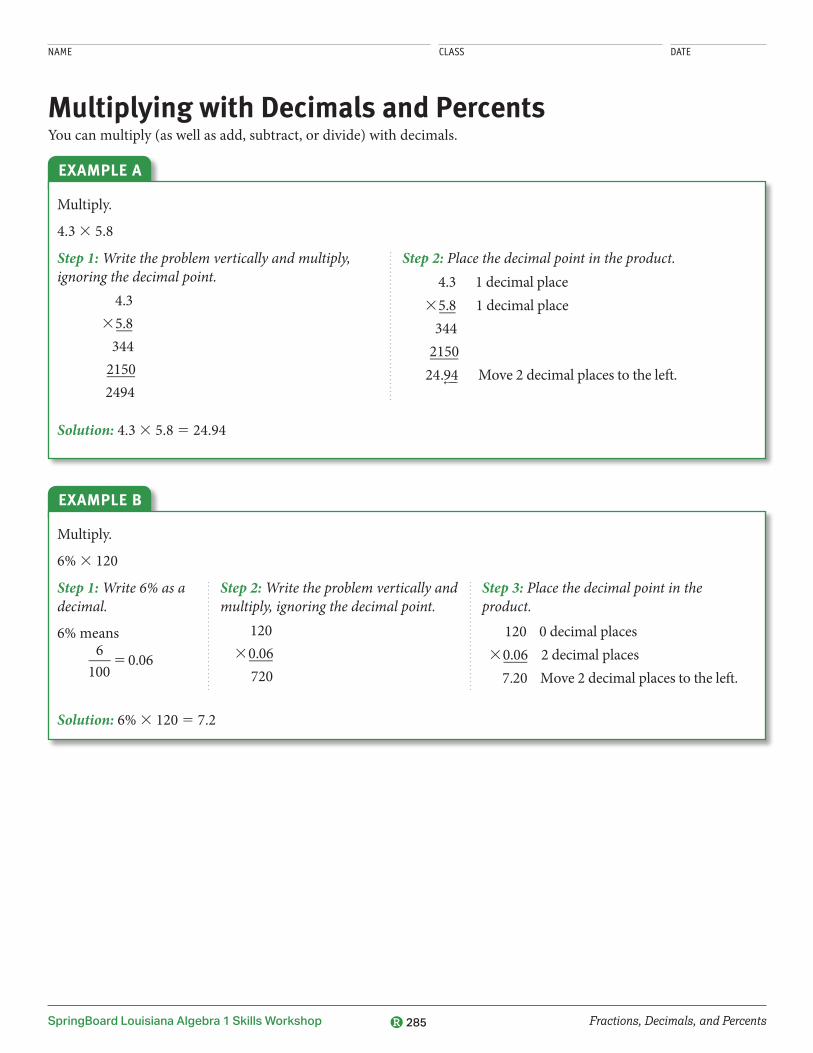
NAME CLASS DATE
Fractions, Decimals, and PercentsSpringBoard Louisiana Algebra 1 Skills Workshop 285
Multiplying with Decimals and PercentsYou can multiply (as well as add, subtract, or divide) with decimals.
Multiply.
4.3 3 5.8
Step 1: Write the problem vertically and multiply, ignoring the decimal point.
4.35.8344
21502494
3
Step 2: Place the decimal point in the product.
���
4.3 1 decimal place5.8 1 decimal place344
215024.94 Move 2 decimal places to the left.
3
Solution: 4.3 3 5.8 5 24.94
EXAMPLE A
Multiply.
6% 3 120
Step 1: Write 6% as a decimal.
6% means
6
1000.065
Step 2: Write the problem vertically and multiply, ignoring the decimal point.
1200.06720
3
Step 3: Place the decimal point in the product.
120 0 decimal places0.06 2 decimal places7.20 Move 2 decimal places to the left.
3
Solution: 6% 3 120 5 7.2
EXAMPLE B

Fractions, Decimals, and PercentsSpringBoard Louisiana Algebra 1 Skills Workshop 286
Calculations with Decimals and Percents (continued)
PRACTICEMultiply.
1. 7.2 3 1.4 10.08 2. 5.3 3 2.4 12.72
3. 9.1 3 3.8 34.58 4. 5% 3 850 42.5
5. 8% 3 190 15.2 6. 6% 3 270 16.2
7. 25 1 8% 3 150 37 8. 50 1 5% 3 842 92.1

NAME CLASS DATE
Fractions, Decimals, and PercentsSpringBoard Louisiana Algebra 1 Skills Workshop 287
Operations with DecimalsYou compute with decimals when you work with money amounts or with measurements using metric units. Many statistics including those in sports involve decimals.
You add and subtract decimals when you shop. Add and subtract as you would with whole numbers. Remember to align the decimal point in the sum or difference with the decimal points in the numbers you are adding or subtracting.
Tricia buys a granola bar for $3.75 and a fruit drink for $1.49. She pays with a $10 bill. How much change should Tricia get?
Step 1: Find how much Tricia spends. Add $3.75 and $1.49.
Step 2: Find the change. Subtract what Tricia spent from $10.00.
Solution: Tricia should get $4.76 in change.
$3.751 1.49 $5.24 $10.002 5.24 $4.76
EXAMPLE A
Multiply decimals just as you would whole numbers. When multiplication is complete, place the decimal point in the product. To place the decimal point, find the total number of digits to the right of the decimal points in the factors. The product will have this total number of places to the right of the decimal point. You can use estimation to help you decide if a product is reasonable.
Kevin rides his bicycle at a speed of 8.4 miles per hour. If he rides for 2.5 hours, how many miles will he ride?
Step 1: Estimate by rounding. Round to the nearest whole number.
Step 2: Multiply the unrounded numbers as you would with whole numbers.
Step 3: Count the number of decimal places in the factors. The product will have the same number of places to the right of the decimal point.
Step 4: Compare your solution to the estimate. Since 21 is close to 24, the solution is reasonable.
Solution: Kevin will ride 21 miles in 2.5 hours.
8.4 rounds to 8.2.5 rounds to 3.
8 3 3 5 24 8.4 3 2.5 420 1 1680 2100
8.4 ← 1 decimal place 3 2.5 ← 1 decimal place
420 1 1680
21.00 ← 2 decimal places21.00 5 21
EXAMPLE B

Fractions, Decimals, and PercentsSpringBoard Louisiana Algebra 1 Skills Workshop 288
Operations with Decimals (continued)
You can also use the distributive property to multiply with decimals. The distributive property states that to multiply a sum by a number, you can multiply each addend by the number and add the products.
Multiply 5.2 3 3.6 using the distributive property.
Step 1: Break one of the decimals into a sum using addition.
Step 2: Rewrite the expression.
Step 3: Multiply inside each set of parentheses.
Step 4: Add the products.
Solution: 5.2 3 3.6 5 18.72
5.2 3 3.6 5 (5 1 0.2) 3 3.6
5 (5 3 3.6) 1 (0.2 3 3.6)
5 18 1 0.72
5 18.72
EXAMPLE C
To divide a decimal by a whole number, place the decimal point in the quotient directly above the decimal point in the dividend. Then divide as you would whole numbers.
One difference in division with decimals is that you may have to write zeros in the dividend so that you have enough digits to divide.
Mr. Armstrong divided 5.1 liters of water equally among 6 jars for a science experiment. How much water did Mr. Armstrong put in each jar?
Step 1: Place the decimal point in the quotient directly above the decimal point in the dividend.
Step 2: Because 5 , 6, the quotient will be less than 1, so place a 0 before the decimal point in the quotient.
Step 3: Divide as you would with whole numbers. Add one or more zeros after the decimal point in the dividend and divide until the decimal in the quotient terminates.
Solution: Mr. Armstrong put 0.85 liter of water in each jar.
6 5.1.
6 5.10.
6 5.100.85
4 830300
2
2
EXAMPLE D

Fractions, Decimals, and PercentsSpringBoard Louisiana Algebra 1 Skills Workshop 289
Operations with Decimals (continued)
To divide by a decimal, you must first write an equivalent expression with a whole-number divisor. To do this, multiply both the dividend and divisor by a power of 10 that will make the divisor a whole number.
Ryan earned $52.50 for baby-sitting 3.5 hours. How much money did he earn per hour?
Step 1: The divisor has 1 decimal place. So, multiply 3.5 by 10 to make a whole-number divisor. You must also multiply the dividend by 10.
Step 2: Divide as you would with whole numbers.
Solution: Ryan earns $15 per hour.
$52.50 4 3.5 $52.50 3 10 3.5 3 10 525.0 4 35
35 52535175175
0
15
2
2
EXAMPLE E
PRACTICESolve.
1. 12.87 1 3.5 16.37 2. 2.16 1 0.43 1 0.2 2.79 3. 12.3 2 5.08 7.22
4. 0.26 2 0.008 0.252 5. 32 3 1.84 58.88 6. 0.73 3 1.4 1.022
7. 1.062 4 3 0.354 8. 83 4 0.2 415 9. 36.4 4 2.6 14
10. David is going to Mexico for vacation. He will exchange $550 for new pesos. The exchange rate is $1 5 11.85 new pesos. How many new pesos will David receive? 6517.5 pesos
11. When you multiply two decimals less than 1, how does the product compare to the factors? Illustrate with an example. The product is less than either factor. 0.8 3 0.7 5 0.56
12. A road race is 15 kilometers long. After the starting line, there are water stations every 0.3 kilometer. How many water stations are there? 50 water stations
13. A new CD costs $13.79, plus $0.97 in sales tax. How much do 3 new CDs cost? Explain how you found your answer. $44.28; 3(13.79 1 0.97)

NAME CLASS DATE
Fractions, Decimals, and PercentsSpringBoard Louisiana Algebra 1 Skills Workshop 290
Operations with Decimals and PercentsWhen adding or subtracting with decimals, add and subtract as you would with whole numbers. Remember to align the decimal point in the sum or difference with the decimal points in the numbers you are adding or subtracting.
Add or subtract.
74.4 1 13.32 65.5 2 49.33
Step 1: Line up the place values at the decimal points. Add zeros as place holders, if needed. 74.40113.32
65.50249.33
Step 2: Starting with the rightmost column, add or subtract as with whole numbers. 74.40113.32 87.72
56 15 . 45 1024 9 . 3 3
1 6 . 1 7Solution:
74.4 1 13.32 5 87.72 65.5 2 49.33 5 16.17
EXAMPLE A
Multiply decimals just as you would whole numbers. When the multiplication is complete, place the decimal point in the product. To place the decimal point, find the total number of digits to the right of the decimal points in the factors. The product will have this total number of places to the right of the decimal point.
Multiply.
120 3 0.09
Step 1: Write the problem vertically. Multiply as if the numbers are whole numbers. 12030.09
840
Step 2: Count the number of decimal places in each factor. There are 2 decimal places in one factor for a total of 2 decimal places. Move the decimal point 2 places to the left in the product. 120 0 decimal places30.09 2 decimal places
8408.40
←
Solution: 120 3 0.09 5 8.4
EXAMPLE B

Fractions, Decimals, and PercentsSpringBoard Louisiana Algebra 1 Skills Workshop 291
Operations with Decimals and Percents (continued)
When dividing decimals, the divisor must be an integer.
Divide.
798 4 0.02Step 1: Set up as long division. If there is a decimal point in the divisor, move it to the right until the divisor is an integer. Move the decimal point in the dividend the same number of places to the right. Add zeros as needed for place holders.
0.02)798. → 2)79800Step 2: Divide as with whole numbers. 399002)7980026 19218 18 218 0
Solution: 798 4 0.02 = 39,900
EXAMPLE C
You can also use the order of operations with decimals.
Simplify 0.08 3 920 1 42
Step 1: Follow the order of operations, multiply 0.08 3 920.
Step 2: Add 73.6 and 42.
0.08 3 920 1 4273.6 1 42
115.6
Solution: 0.08 3 920 1 42 5 115.6
EXAMPLE D
PRACTICEPerform the indicated operation.
1. 0.21 3 740 155.4 2. 0.07 3 960 67.20
3. 506.23 2 125.27 380.96 4. 620.50 2 70.65 2 32.45 517.40
5. 840 4 0.06 14,000 6. 960 4 0.04 24,000
7. 0.06 3 840 1 36 86.4 8. 60 1 7% 3 360 1512
9. 1200 3 0.216 1 84 343.2 10. 0.0648 3 460 1 74 1 32 135.808

NAME CLASS DATE
Fractions, Decimals, and PercentsSpringBoard Louisiana Algebra 1 Skills Workshop 292
Operations with FractionsPeople often use fractions and mixed numbers when making measurements. Chefs add and multiply fractions and mixed numbers as they mix together ingredients. Carpenters subtract and divide fractions and mixed numbers as they cut apart pieces of lumber.
To add fractions and mixed numbers with unlike denominators, first write equivalent fractions with like denominators. Add the numerators while keeping the denominator the same. Regroup to simplify if possible.
Laura walked 78
mile before school and 34
mile after school. How far did she walk altogether?
Step 1: Use the least common denominator (LCD) of 8 to write an
equivalent fraction for 34
.
Step 2: Write the addition problem using fractions with like denominators.
Step 3: Add the numerators and write the sum over the common denominator.
Step 4: Write the improper fraction as a mixed number.
Solution: Laura walked 158
miles.
34
5 3 24 2
?
? 5
68
78
1 68
78
1 68
5 7 6
81
5 138
138
5 158
EXAMPLE A
Mr. Thompson bought 312
pounds of American cheese and 238
pounds of
Cheddar cheese. How many pounds of cheese did Mr. Thompson buy in all?
Step 1: Use the LCD to write equivalent fractions with like denominators.
Step 2: Write an equivalent mixed number for 312
using the least common denominator of 8.
Step 3: Add the whole-number parts of 348
and 238
.
Step 4: Add the numerators of the fractions.
Step 5: Add the sums of the whole-number parts and the fractions.
Solution: Mr. Thompson bought 578
pounds of cheese.
The LCD of 12
and 38
is 8.
312
5 348
3 1 2 5 548
1 38
5 78
5 1 78
5 578
EXAMPLE B

Fractions, Decimals, and PercentsSpringBoard Louisiana Algebra 1 Skills Workshop 293
Operations with Fractions (continued)
To subtract fractions that have unlike denominators, first write equivalent fractions with like denominators. Subtract the numerators while keeping the denominators the same. Regroup to simplify if possible. When subtracting mixed numbers, it may be necessary to rename more than once in order to subtract.
Michael plans on running 514
miles. After running 39
10 miles, he stops to tie his shoes. How much farther does
Michael have to run?
Step 1: Find the LCD of 514
and 3910
.
Step 2: Write equivalent mixed numbers using fractions with denominators of 20.
Step 3: There are not enough twentieths to subtract, so regroup one
whole of 5520
as 2020
.
Step 4: Subtract the numerators of the fractions.
Step 5: Subtract the whole numbers.
Step 6: Write the differences.
Solution: Michael has 1720
miles left to run.
The LCD of 514
and 39
10 is 20.
514
5 5520
39
10 5 3
1820
5 1 520
5 4 1 2020
1 520
5 42520
2520
2 1820
5 25 18
202
5 720
4 2 3 5 1
1 1 720
5 1720
EXAMPLE C
To multiply with fractions and mixed numbers, first convert any mixed numbers to improper fractions. Simplify the terms, if possible. Next, multiply the numerators and then multiply the denominators. If necessary, convert the improper fraction back to a mixed number.
A stack of newspapers weighs 378
lb. How much does 23
of the stack weigh?
Step 1: Convert 378
to an improper fraction.
Step 2: Simplify. Then multiply the numerators and the denominators.
Step 3: Convert the improper fraction to a mixed number.
Solution: Two-thirds of the stack weighs 27
12 pounds.
378
5 248
1 78
5 318
3184
? 23
1
5 31 14 3
?
? 5
3112
3112
5 27
12
EXAMPLE D

Fractions, Decimals, and PercentsSpringBoard Louisiana Algebra 1 Skills Workshop 294
Operations with Fractions (continued)
To divide with fractions and mixed numbers, first convert any mixed numbers or whole numbers to improper fractions. Then multiply the first fraction by the reciprocal of the second fraction. Simplify if possible.
Carlos is cutting 4714
inches of wood into pieces that are 338
inches long. How many pieces will there be
after Carlos finishes cutting the wood?
Step 1: Convert both numbers to improper fractions.
Step 2: Multiply the first fraction by a reciprocal of the second
fraction. The reciprocal of 278
is 827
.
Step 3: Simplify the terms and multiply.
Solution: There will be 14 pieces after Carlos finishes cutting.
4714
5 189
4 and 3
38
5 278
1894
4 278
5 189
4 ?
827
1 8 94
7
1 ?
82 7
2
1 5
7 21 1
?
? 5 14
EXAMPLE E
PRACTICESolve. Write your answers in simplest form.
1. 7
1025
1
1110
2. 1112
34
2
16
3. 4 12
78
1
538
4. 2 23
1 34
2
1112
5. 56
310
?
14
6. 12
78
4
47
7. 4 13
138
?
52324
8. 14
3 12
4
17
9. 8 110
4 18
2
33940
10. A recipe that serves 4 calls for 134
cups of tomato sauce. If Jerry makes 212
times that amount,
how many cups of tomato sauce will he need? 438
11. Ms. Wilkins drives 1425
miles to work each day. Yesterday, she drove 3
10 of the way to work
before she got a flat tire. How far away was she from work when the tire went flat? Explain your steps. 10
225
miles; multiply 310
and 1425, then subtract this amount from 10
225
;
alternatively, multiply 710
and 1425

NAME CLASS DATE
Fractions, Decimals, and PercentsSpringBoard Louisiana Algebra 1 Skills Workshop 295
Representation of FractionsFractions can be represented by parts of shapes.
What fraction is represented by the part of the shape labeled A?
A
Step 1: Count the total number of parts in the square. There are 4 parts. This is the denominator of the fraction.
Step 2: Find the numerator. The numerator is 1 because only one part of the four total parts has the letter A in it.
Step 3: Write the fraction: 14
.
Solution: The fraction 14
represents the part that is labeled A.
EXAMPLE
PRACTICEWrite the fraction represented by the part of the shape labeled A.
1.
A
12
2.
A
18
3.
A
15
4.
A
13

NAME CLASS DATE
Operations with NumbersSpringBoard Louisiana Algebra 1 Skills Workshop 296
Absolute ValueThe absolute value of a number is defined as the distance between the number and zero. Absolute value is indicated by vertical bars: | |. The expression | 6 | is read as the absolute value of 6.
The number line shows the absolute values of 4 and 24.
26 25 24
|24|54
|4|54
23 22 21 0 1 2 3 4 5 6
The number line shows that |4| is the distance between 4 and 0 is 4. Thus, |4| 5 4. The number line also shows that |24| is the distance between 24 and 0 is 4. Thus, |24| 5 4. The absolute value of a positive number or zero is the number itself. The absolute value of a negative number is its opposite. The absolute value of a number is positive or zero because absolute value represents a distance.
EXAMPLE A
Find the value of the expression |3 1 6|.
Step 1: Simplify the sum inside the absolute value.
|3 1 6| 5 |9|
Step 2: Find the absolute value.
|9| 5 9 because 9 is a distance of nine units away from zero.
Solution: |3 1 6| 5 9
EXAMPLE B
PRACTICEFind the value of each expression.
1. |14| 14 2. |225| 25
3. |6 1 11| 17 4. |17 2 3| 14
5. |28| |4| 32 6. |26| |28| 48
7. |2| |9| 18 8. |7| |25| 35

NAME CLASS DATE
Operations with NumbersSpringBoard Louisiana Algebra 1 Skills Workshop 297
Adding and Subtracting Mixed NumbersAdding and subtracting mixed numbers requires determining common denominators if necessary, adding or subtracting the fractions and then the whole numbers, if any. Remember, when adding and subtracting, operate with the numerators only once common denominators have been determined. Mixed numbers may be added and subtracted either horizontally or vertically.
Add 4 45
and 7 910
.
1 5 1 1 1( )
4 4
57 9
104 7 4
59
10
5 1 1( )+
4 7 8
109
10
13 1710
5 1
13 1 710
5 1
14 710
5
Step 1: Separate whole number and fraction parts.
Step 2: Create fractions with common denominators.
Step 3: Add whole number and fractional parts.
Step 4: Change improper fractions to mixed numbers.
Step 5: Simplify.
EXAMPLE A
Subtract 3 23
and 116
.
323
5 13 23
5 3 46
1
116
2 5 116
2 2 5 116
2 2
2
36
212
1 5
EXAMPLE B PRACTICEAdd or subtract either horizontally or vertically.
1. 234
278
1 558
3. 934
35
2 93
20
2. 47
102
13
2 21130
4. 245
358
1 61740

NAME CLASS DATE
Operations with NumbersSpringBoard Louisiana Algebra 1 Skills Workshop 298
Calculations with IntegersThe numbers we use are based on the base-ten system. The table shows the place value of the digits in 567,812.034.
Hundred Thousands
Ten Thousands Thousands Hundreds Tens Ones Tenths Hundredths Thousandths
5 6 7, 8 1 2 . 0 3 4
In the table, each place value is 10 times the place to the right. You can use this to help you find products and quotients.
Knowing the patterns when multiplying and dividing by powers of 10 (1, 10, 100, 1000, 10,000, and so on) will come in handy when computing with very large numbers such as distances in outer space or very small numbers such as the length of laboratory specimens that can only be seen under a microscope.
Multiply. Look for a pattern.a. 8 3 20b. 8 3 200c. 8 3 2000
Use the fact that 8 3 2 5 16, and then add the total number of zeros at the end of each factor.
Solution:a. 8 3 20 5 160 b. 8 3 200 5 1600c. 8 3 2000 5 16,000
EXAMPLE A
Divide. Look for a pattern. a. 8000 4 10b. 8000 4 100c. 8000 4 1000
Use the fact that 8 4 1 5 8, and then delete the number of zeros from each number.
Solution:a. 8000 4 10 5 800 b. 8000 4 100 5 80c. 8000 4 1000 5 8
EXAMPLE B

Operations with NumbersSpringBoard Louisiana Algebra 1 Skills Workshop 299
Calculations with Integers (continued)
PRACTICEMultiply or divide.
1. 9 3 30 5 270 2. 5 3 4000 5 20,000
3. 4 3 8000 5 32,000 4. 3 3 70 5 210
5. 9000 4 10 5 900 6. 6000 4 100 5 60
7. 400 4 10 5 40 8. 70,000 4 1000 5 70

NAME CLASS DATE
Operations with NumbersSpringBoard Louisiana Algebra 1 Skills Workshop 300
Divisibility RulesYou can use divisibility tests to simplify fractions. One number is divisible by another if the remainder is zero.
Number Divisibility Test
2 The ones digit is 0, 2, 4, 6, or 8.3 The sum of the digits is divisible by 3.5 The ones digit is 0 or 5.6 The number is divisible by both 2 and 3.9 The sum of the digits is divisible by 9.
10 The ones digit is 0.
Determine if the number 2,145 is divisible by 2, 3, 5, 6, 9 or 10.
Step 1: Is the number divisible by 2? No, the number is NOT even, and therefore not divisible by 2.
Step 2: Is the number divisible by 3? The sum of the digits is 2 + 1 + 4 + 5 = 12. 12 is divisible by 3; so 2,145 is divisible by 3.
Step 3: Is the number divisible by 5?Yes, the last digit is a 5.
Solution: The number 2,145 is divisible by 3, 5, and 9.
Step 4: Is the number divisible by 6? No, the number is NOT divisible by both 2 and 3.
Step 5: Is the number divisible by 9? The sum of the digits is 2 + 1 + 4 + 5 = 12. 12 is NOT divisible by 9; so 2,145 is divisible by 9.
Step 6: Is the number divisible by 10? No, the last digit is not a 0.
EXAMPLE
PRACTICEDetermine whether each number is divisible by 2, 3, 5, 6, 9 or 10.
2 3 5 6 9 10
76 X124 X390 X X X X X1,024 X1,275 X X34,776 X X X X

NAME CLASS DATE
Operations with NumbersSpringBoard Louisiana Algebra 1 Skills Workshop 301
Operations with NumbersThe four operations, addition, subtraction, multiplication, and division can be performed on numbers.
Addition and Subtraction of Whole Numbers
Add or subtract.
85 1 37 725 2 128
Step 1: Line up the place values vertically.
85371
7 2 51 2 82
Step 2: Starting with the ones column, add or subtract each column.
8537
122
1
1
7 2 51 2 8
5 9 7
6 1 1
2
Solution: 85 1 37 5 122 725 2 128 5 597
EXAMPLE A
Multiplication of Whole Numbers
Multiply. 47 3 28
Step 1: Multiply the ones digit.
4728
376
5
3
Step 2: Multiply the tens digit.
4728
376940
1
3
Step 3: Add the partial products.
4728
376940
1316
1
3
1
Solution: 47 3 28 5 1316
EXAMPLE B

Operations with Numbers (continued)
Operations with NumbersSpringBoard Louisiana Algebra 1 Skills Workshop 302
Division of Whole Numbers
Divide.
185 4 14
Step 1: Set up as long division. Divide 14 into 18. Write the quotient of 1 above the 8. Multiply 14 and 1 to get 14. Subtract 14 from 18. Write the difference of 4. 114)185 214 4
Step 2: Bring down the 5 to make 45. Divide 14 into 45. Write the quotient above the 5. Multiply to get 42. Subtract 42 from 45 to get 3. Write 3 down. 1314)185 214 45 242 3
Step 3: The remainder is 3 because 14 does not divide into 3.
Solution: 185 4 14 5 13 R 3
EXAMPLE C
PRACTICEFind the value of each expression.
1. 47 1 36 83
3. 83 3 41 3403
5. 87 1 62 149
7. 33 3 23 759
9. 75 1 26 101
2. 445 2 231 214
4. 762 4 53 14 R 20
6. 742 2 273 469
8. 937 4 19 49 R 6
10. 836 2 274 562

NAME CLASS DATE
Operations with NumbersSpringBoard Louisiana Algebra 1 Skills Workshop 303
Operations with Rational NumbersThe four operations, addition, subtraction, multiplication, and division can be performed on rational numbers.
ADDITION AND SUBTRACTION OF WHOLE NUMBERS
Add or subtract.
385 1 737 481 2 228
Step 1: Line up the place values vertically.
3851 737
4812 228
Step 2: Starting with the ones column, add or subtract each column.
11385
1 7371122
4 8 12 2 2 8
1 5 3
Solution: 385 2 8737 5 1122 481 2 228 5 153
EXAMPLE A
MULTIPLICATION OF WHOLE NUMBERS
Multiply.149 3 23
Step 1: Line up the place values vertically. 1493 23
Step 2: Multiply 149 by 3. 1493 23
447
Step 3: Multiply 149 by 20. 1493 23
4472980
EXAMPLE B
173
21
1

Operations with NumbersSpringBoard Louisiana Algebra 1 Skills Workshop 304
Step 4: Add the products. 1493 23
44729803427
Solution: 149 3 23 5 3427
1
DIVISION OF WHOLE NUMBERS
Divide.285 4 12
Step 1: Set up as long division. Divide 12 into 18. Write the quotient of 2 above the 8. Multiply 12 and 2 to get 24. Subtract 24 from 18. Write the difference of 4.
Step 2: Bring down the 5 to make 45. Divide 12 into 45. Write the quotient above the 5. Multiply to get 36. Subtract 35 from 45 to get 9. Write 9 down.
Step 3: The remainder is 9 because 12 does not divide into 9.
Solution: 285 4 12 5 43 R 9.
EXAMPLE C
12 285224 4
2
12 285224
236 45
9
43
Operations with Rational Numbers (continued)

Operations with NumbersSpringBoard Louisiana Algebra 1 Skills Workshop 305
ADDITION AND SUBTRACTION OF DECIMALS
Add or subtract.
42.9 1 23.82 65.5 2 49.33
Step 1: Line up the place values at the decimal points. Add zeros as place holders, if needed.
42.901 23.82
65.502 49.33
Step 2: Starting with the rightmost column, add or subtract as with whole numbers.
42.901 23.82
76.72
6 5. 5 02 4 9. 3 3
1 3. 1 7
Solution: 42.9 1 23.82 5 76.72 65.5 2 49.33 5 13.17
EXAMPLE D
MULTIPLICATION OF DECIMALS
Multiply.2.3 3 4.8
Step 1: Write the problem vertically. Multiply as if the numbers are whole numbers.
2.33 4.8
184920
1104
Step 2: Count the number of decimal places in each factor. There is one decimal place in each factor for a total of 2 decimal places. Move the decimal point 2 places to the left in the product.
2.3 1 decimal place3 4.8 1 decimal place
184920
11.04 Move 2 decimal places to the left.
Solution: 2.3 3 4.8 5 11.04
EXAMPLE E
1 5 1 4 1
Operations with Rational Numbers (continued)

Operations with NumbersSpringBoard Louisiana Algebra 1 Skills Workshop 306
DIVISION OF WHOLE NUMBERS
Divide.7.98 4 2.1
Step 1: Set up as long division. If there is a decimal point in the divisor, move it to the right until the divisor is a whole number. Move the decimal point in the dividend the same number of places to the right. Add zeros as needed for place holders.
2.1 6.825 21 68.25
Step 2: Divide as with whole numbers.
Step 3: Place the decimal point in the quotient above the decimal point in the dividend.
Solution: 6.825 4 2.1 5 3.25
EXAMPLE F
PRACTICEFind the value of each expression.
1. 36.1 4 3.8 9.5 2. 45.9 + 23 68.9
3. 583 3 82 47,806 4. 762.32 2 425 337.32
5. 873 1 628 1,501 6. 7420 2 2731 4,689
7. 33.6 3 0.23 7.728 8. 9372 4 9 1,041 R 3
9. 753.3 1 87.26 840.56 10. 83 2 27.45 55.55
21 68.25263
242
2105
52
105
0
325
21 68.25263
242
2105
52
105
0
3.25
Operations with Rational Numbers (continued)

NAME CLASS DATE
Operations with NumbersSpringBoard Louisiana Algebra 1 Skills Workshop 307
RoundingSometimes it is not necessary to give an exact number or to compute an exact answer. In those situations, a rounded number or an estimate is all that is needed.
You might round whole numbers to discuss how many people were at a major sporting event. You may round a decimal to the nearest whole number when discussing distances.
To round a number to a specific place, first look at the digit to the right of the place to which you are rounding.
• If the digit is 5 or greater, add 1 to the digit in the place to which you are rounding.
• If the digit is less than 5, leave the digit in the place to which you are rounding as is.
In both cases, replace the digits to the right of the rounding place with zeros.
The attendance at a football stadium was 68,582. The newspaper report rounded this number to the nearest thousand. What attendance number did the newspaper report?
Step 1: Look at the digit to the right of the thousands place, the hundreds place.
Step 2: Compare the digit in the hundreds place to 5.
Step 3: Add 1 to the digit in the thousands place and replace the digits to the right of the thousands place with zeros.
Solution: The newspaper reported the attendance as 69,000, which is 68,582 rounded to the nearest thousand.
68,582
5 5 5, so round up.
68,582
69,000
EXAMPLE A
Rounding with decimals works the same way as rounding whole numbers.
A highway is 178.16 miles long. What is that number of miles rounded to the nearest mile?
Step 1: Look at the digit to the right of the ones place, the tenths place.
Step 2: Compare the digit in the tenths place to 5.
Step 3: The digit in the ones place does not change. Replace the digits to the right of the ones place with zeros.
Solution: Rounded to the nearest mile, the highway is 178 miles long.
178.16
1 , 5, so round down.
178.16
178.00
EXAMPLE B

Operations with NumbersSpringBoard Louisiana Algebra 1 Skills Workshop 308
Rounding (continued)
Rounding with money works the same way as rounding decimals.
Sarah has $24.93 in her purse. How much money does she have rounded to the nearest dollar?
Step 1: Look at the digit to the right of the ones place, the tenths place.
Step 2: Compare the digit in the tenths place to 5.
Step 3: Add 1 to the digit in the ones place and replace the digits to the right of the ones place with zeros.
Solution: To the nearest dollar, Sarah has $25.
$24.93
9 . 5, so round up.
$24.93
$25.00
EXAMPLE C
You can also round to a decimal place. The steps are the same as rounding to a whole-number place.
Krystal is the leading hitter on her softball team. Her batting average is 0.4375. Batting averages are rounded to the thousandths place. Rounded to the thousandths place, what is Krystal’s batting average?
Step 1: Identify the thousands place.
Step 2: Compare the digit in the ten-thousandths place to 5.
Step 3: Add 1 to the digit in the thousandths place and replace the digits to the right of the thousandths place with zeros.
Step 4: Write an equivalent decimal.
Solution: To the nearest thousandth, Krystal’s batting average is 0.438.
0.4375
5 5 5, so round up.
0.4375
0.4380 5 0.438
EXAMPLE D

Operations with NumbersSpringBoard Louisiana Algebra 1 Skills Workshop 309
Rounding (continued)
PRACTICERound to the underlined place.
1. 47,362 47,000 2. 51,938 50,000 3. 167,431 47,000
4. 26.38 26 5. 37.426 37.4 6. 419.474 419.47
Round to the hundreds place.
7. 3825 3800 8. 73,963 74,000 9. 802,648 802,600
10. For a parade, attendance was rounded as 10,000 to the nearest hundred. What was the greatest and least number of people that could have attended the parade? Explain your answer. greatest: 10,049; least: 9950; 10,050 would round to 10,100 and 9949 would round to 9900. All numbers in between round to 10,000.
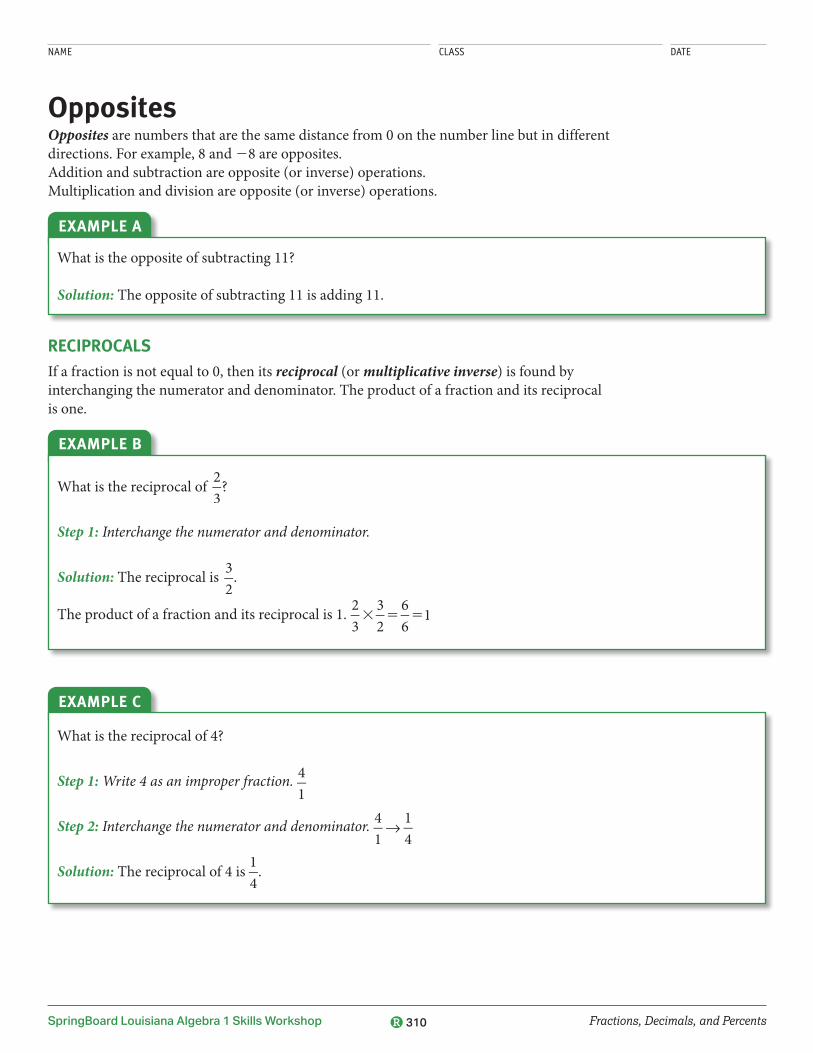
NAME CLASS DATE
Fractions, Decimals, and PercentsSpringBoard Louisiana Algebra 1 Skills Workshop 310
OppositesOpposites are numbers that are the same distance from 0 on the number line but in different directions. For example, 8 and 28 are opposites.Addition and subtraction are opposite (or inverse) operations.Multiplication and division are opposite (or inverse) operations.
What is the opposite of subtracting 11?
Solution: The opposite of subtracting 11 is adding 11.
EXAMPLE A
RECIPROCALSIf a fraction is not equal to 0, then its reciprocal (or multiplicative inverse) is found by interchanging the numerator and denominator. The product of a fraction and its reciprocal is one.
What is the reciprocal of 23
?
Step 1: Interchange the numerator and denominator.
Solution: The reciprocal is 32
.
The product of a fraction and its reciprocal is 1. 23
32
66
13 5 5
EXAMPLE B
What is the reciprocal of 4?
Step 1: Write 4 as an improper fraction. →41
14
Step 2: Interchange the numerator and denominator. →41
14
Solution: The reciprocal of 4 is 14
.
EXAMPLE C

Fractions, Decimals, and PercentsSpringBoard Louisiana Algebra 1 Skills Workshop 311
Opposites (continued)
PRACTICETell the opposite of each operation.
1. subtracting 23
adding 23
2. multiplying by 9
dividing by 9
3. dividing by 21
multiplying by 21
4. adding 45 subtracting 45
Write the reciprocal of each number.
5. 78
87
6. 89
98
7. 13
31
8. 6
16

NAME CLASS DATE
Fractions, Decimals, and PercentsSpringBoard Louisiana Algebra 1 Skills Workshop 312
Properties of Addition and MultiplicationUsing the properties of whole-number operations can make computation easier. Among the properties of addition are the commutative property and the associative property.
Commutative Property of Addition Associative Property of Addition
Changing the order of addends does not change the sum.
a 1 b 5 b 1 a3 1 4 5 4 1 3
Changing the grouping of addends does notchange the sum.
a 1 (b 1 c) 5 (a 1 b) 1 c13 1 (7 1 4) 5 (13 1 7) 1 4
You can use properties of addition when you shop. For example, if you want to buy books that cost $15, $37, and $25, you can arrange the prices in a way that you could add them mentally.
Use the properties of addition to find the value of (15 1 37) 1 25.
Step 1: Use the commutative property to reorder the addends.
Step 2: Use the associative property to group the addends.
Step 3: Add inside the parentheses.
Step 4: Add.
Solution: 15 1 37 1 25 5 77
(15 1 37) 1 25 5 25 1 (15 1 37)
5 (25 1 15) 1 37
5 40 1 37
5 77
EXAMPLE A
The commutative and associative properties can also be used for multiplication.
Commutative Property of Multiplication Associative Property of Multiplication
Changing the order of factors does not change the product.
a 3 b 5 b 3 a6 3 9 5 9 3 6
Changing the grouping of factors does not change the product.
a 3 (b 3 c) 5 (a 3 b) 3 c2 3 (5 3 13) 5 (2 3 5) 3 13
Use properties of multiplication to find the value of (4 3 9) 3 5.
Step 1: Use the commutative property to reorder the factors.
Step 2: Use the associative property to group the factors.
Step 3: Multiply inside the parentheses.
Step 4: Multiply.
Solution: 4 3 9 3 5 5 180
(4 3 9) 3 5 5 5 3 (4 3 9)
5 (5 3 4) 3 9
5 20 3 9
5 180
EXAMPLE B

Fractions, Decimals, and PercentsSpringBoard Louisiana Algebra 1 Skills Workshop 313
Properties of Addition and Multiplication (continued)
The distributive property of multiplication is used to break apart numbers to make them easier to multiply. The distributive property can be used over addition or subtraction.
Distributive Property of Multiplication over Addition
Distributive Property of Multiplicationover Subtraction
To multiply a sum by a number, you can multiply each addend by the number and add the products.
For any numbers a, b, c,a(b 1 c) 5 ab 1 ac
9 3 34 5 9(30 1 4) 5 (9 3 30) 1 (9 3 4)
To multiply a difference by a third number, you can multiply each of the two numbers by the third and then find the difference of the products.
For any numbers a, b, c,a(b 2 c) 5 ab 2 ac
34 3 9 5 34(10 2 1) 5 (34 3 10) 2 (34 3 1)
There are 57 boxes of pencils in stock at the supply store. Each box contains 8 pencils. Use the distributive property of multiplication over addition to find the total number of pencils.
Step 1: Rewrite the expression breaking 57 into 50 1 7.
Step 2: Use the distributive property.
Step 3: Multiply inside each set of parentheses.
Step 4: Add the products.
Solution: There are 456 pencils.
57 3 8 5 (50 1 7) 3 8
5 (50 3 8) 1 (7 3 8)
5 400 1 56
5 456
EXAMPLE C
There are 63 rows in a theater. Each row has 17 seats. Use the distributive property of multiplication over subtraction to find the total number of seats.
Step 1: Rewrite the expression breaking 17 into 20 2 3.
Step 2: Use the distributive property.
Step 3: Multiply inside each set of parentheses.
Step 4: Subtract the products.
Solution: There are 1,071 seats.
63 3 17 5 63(20 2 3)
5 (63 3 20) 2 (63 3 3)
5 1,260 2 189
5 1,071
EXAMPLE D

Fractions, Decimals, and PercentsSpringBoard Louisiana Algebra 1 Skills Workshop 314
Properties of Addition and Multiplication (continued)
PRACTICEIdentify the property.
1. 56 1 79 5 79 1 56
Commutative Property of Addition
2. 7 3 14 5 (7 3 20) 2 (7 3 6)
Distributive Property
3. (5 3 8) 3 7 5 5 3 (8 3 7)
Associative Property of Multiplication
4. 17 1 (23 1 38) 5 (17 1 23) 1 38
Associative Property of Addition
Write the number that makes the equation true.
5. 28 3 9 6. 42 3 38 28 3 9 5 (20 3 9) 1 ( 3 9) 42 3 38 5 (42 3 40) 2 (42 3 )
Use a property to find the value of each expression.
7. 20 3 34 3 5
3,400
8. 17 1 56 1 83
156
9. 9 3 47
423
10. 5 3 8 3 40
1,600
11. 35 3 68
2,380
12. (65 1 80) 1 20
165
13. Calista took 36 rolls of film that each took 24 photos. How can you use the distributive property of multiplication over addition to find the total number of photos that Calista took? Answers will vary.
8 2
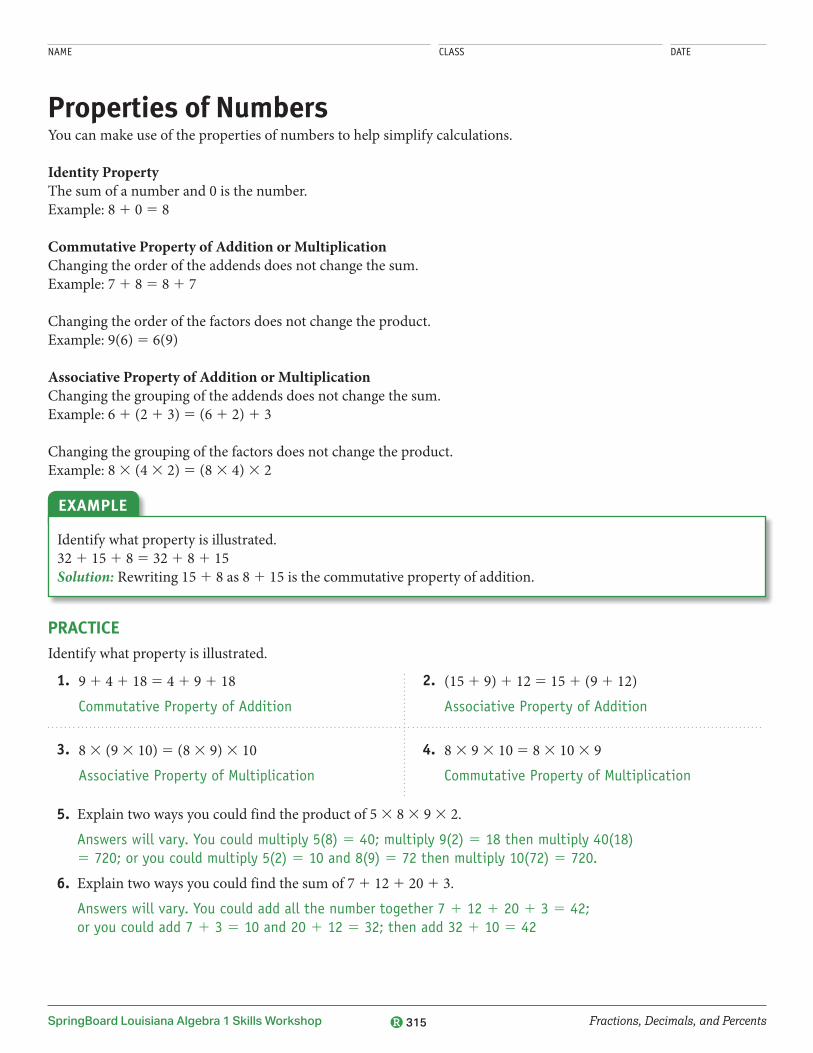
NAME CLASS DATE
Fractions, Decimals, and PercentsSpringBoard Louisiana Algebra 1 Skills Workshop 315
Properties of NumbersYou can make use of the properties of numbers to help simplify calculations.
Identity PropertyThe sum of a number and 0 is the number.Example: 8 1 0 5 8
Commutative Property of Addition or MultiplicationChanging the order of the addends does not change the sum.Example: 7 1 8 5 8 1 7
Changing the order of the factors does not change the product.Example: 9(6) 5 6(9)
Associative Property of Addition or MultiplicationChanging the grouping of the addends does not change the sum.Example: 6 1 (2 1 3) 5 (6 1 2) 1 3
Changing the grouping of the factors does not change the product.Example: 8 3 (4 3 2) 5 (8 3 4) 3 2
Identify what property is illustrated.32 1 15 1 8 5 32 1 8 1 15Solution: Rewriting 15 1 8 as 8 1 15 is the commutative property of addition.
EXAMPLE
PRACTICEIdentify what property is illustrated.
1. 9 1 4 1 18 5 4 1 9 1 18
Commutative Property of Addition
2. (15 1 9) 1 12 5 15 1 (9 1 12)
Associative Property of Addition
3. 8 3 (9 3 10) 5 (8 3 9) 3 10
Associative Property of Multiplication
4. 8 3 9 3 10 5 8 3 10 3 9
Commutative Property of Multiplication
5. Explain two ways you could find the product of 5 3 8 3 9 3 2.
Answers will vary. You could multiply 5(8) 5 40; multiply 9(2) 5 18 then multiply 40(18) 5 720; or you could multiply 5(2) 5 10 and 8(9) 5 72 then multiply 10(72) 5 720.
6. Explain two ways you could find the sum of 7 1 12 1 20 1 3.
Answers will vary. You could add all the number together 7 1 12 1 20 1 3 5 42; or you could add 7 1 3 5 10 and 20 1 12 5 32; then add 32 1 10 5 42

NAME CLASS DATE
Fractions, Decimals, and PercentsSpringBoard Louisiana Algebra 1 Skills Workshop 316
Properties of Whole NumbersUsing the properties of whole-number operations can make computations easier. Among the properties of addition and multiplication are the commutative property and the associative property.The commutative property of addition states that the order of the addends does not change the sum. The associative property of addition states that the grouping of the addends does not change the sum.
Commutative Property of Addition a 1 b 5 b 1 a 3 1 5 5 5 1 3Associative Property of Addition a 1 (b 1 c) 5 (a 1 b) 1 c 3 1 (4 1 5) 5 (3 1 4) 1 5
Properties can be used in everyday mathematics. Suppose you want to buy three items that cost $75, $68, and $25, respectively. Adding $75 1 $68 1 $25 can be difficult to do, but adding ($75 1 $25) 1 $68 is much easier because you can mentally add 75 1 25 to get 100.
Use the properties of addition to find the sum of (435 1 378) 1 265.
Step 1: Use the commutative property to reorder the addends.
Step 2: Use the associative property to group the addends.
Step 3: Add inside the parentheses.
Step 4: Add the sum of the addends inside the parentheses to the other addend.
Solution: The sum of 435 1 378 1 265 is 1,078.
(435 1 378) 1 265 5 265 1 (435 1 378)
5 (265 1 435) 1 378
5 700 1 378
5 1,078
EXAMPLE A
The commutative property of multiplication states the order of the factors does not change the product. The associative property of multiplication states that the grouping of the factors does not change the product.
Commutative Property of Multiplication a 3 b 5 b 3 a 3 3 5 5 5 3 3Associative Property of Multiplication a 3 (b 3 c) 5 (a 3 b) 3 c 3 3 (4 3 5) 5 (3 3 4) 3 5

Fractions, Decimals, and PercentsSpringBoard Louisiana Algebra 1 Skills Workshop 317
Properties of Whole Numbers (continued)
Use the properties of multiplication to find the product of (12 3 15) 3 5.
Step 1: Use the commutative property to reorder the factors.
Step 2: Use the associative property to group the factors.
Step 3: Multiply inside the parentheses.
Step 4: Multiply the product inside the parentheses by the other factor.
Solution: The product of 12 3 15 3 5 is 900.
(12 3 15) 3 5 5 5 3 (12 3 15)
5 (5 3 12) 3 15
5 60 3 15
5 900
EXAMPLE B
The distributive property of multiplication over addition states that to multiply a sum by a number, you can multiply each addend by the number and add the products. The distributive property of multiplication over subtraction states that to multiply a difference by a third number, you can multiply each of the two numbers by the third and then find the difference of the products.
Distributive Property of MultiplicationOver Addition
For any numbers a, b, and c,a(b 1 c) 5 ab 1 ac
3(4 1 5) 5 (3 3 4) 1 (3 3 5)
Distributive Property of MultiplicationOver Subtraction
For any numbers a, b, and c,a(b 2 c) 5 ab 2 ac
3(8 2 2) 5 (3 3 8) 2 (3 3 2)
Use the distributive property to find the product of 42 3 37.Using the distributive property of multiplication over addition:
Step 1: Rewrite 42 as 40 1 2.
Step 2: Rewrite using the distributive property.
Step 3: Multiply inside each set of parentheses.
Step 4: Add the products.
Using the distributive property of multiplication over subtraction:
42 3 37 5 (40 1 2) 3 37
5 (40 3 37) 1 (2 3 37)
5 (1,480) 1 (74)
5 1,480 1 74 5 1,554
Step 1: Rewrite 37 as 40 2 3.
Step 2: Rewrite using the distributive property.
Step 3: Multiply inside each set of parentheses.
Step 4: Subtract the products.
Solution: The product of 42 3 37 is 1,554.
42 3 37 5 42 3 (40 2 3)
5 (42 3 40) 2 (42 3 3)
5 (1,680) 2 (126)
5 1,680 2 126 5 1,554
EXAMPLE C

Fractions, Decimals, and PercentsSpringBoard Louisiana Algebra 1 Skills Workshop 318
Properties of Whole Numbers (continued)
The order of operations is used to evaluate expressions with multiple operations.The correct order of operations is as follows: 1. Operate inside Parentheses.
2. Multiply and Divide from left to right.
3. Add and Subtract from left to right.
Evaluate 8 1 (7 2 4) 3 12 4 2 using the order of operations.
Step 1: Operate inside parentheses.
Step 2: Multiply and divide from left to right.
Step 3: Divide.
Step 4: Add.
Solution: The expression 8 1 (7 2 4) 3 12 4 2 has a value of 26.
8 1 (7 2 4) × 12 4 25 8 1 3 3 12 4 25 8 1 36 4 25 8 1 185 26
EXAMPLE D
PRACTICEIdentify the property that is illustrated by each of the following.
1. 35 3 23 5 (35 3 20) 1 (35 3 3) Distributive Prop.
3. 62 1 38 5 38 1 62 Commutative Prop. of Add.
2. 12 3 (6 3 4) 5 (12 3 6) 3 4 Associative Prop. of Mult.
Find the sum or product and identify which property or properties you used.
4. 57 1 92 1 43 192 5. 175 1 420 1 325 1 164 1,084 6. 16 3 4 3 50 3,200 7. 82 3 42 3,444 8. 67 3 34 2,278 9. 96 3 58 5,568
Write the number that makes the equation true.
10. 58 3 36
58 3 36 5 (60 3 36) 2 ( 3 36)
11. 73 3 51
73 3 51 5 (70 3 51) 1 ( 3 51)
Evaluate using the order of operations.
12. 3 3 (6 2 2) 1 10 4 5 14 13. 9 4 3 1 (6 2 4) 3 5 13 14. 12 1 6 3 (4 4 4) 2 6 12
15. Jason earns $12 per hour for the first 35 hours that he works in a week. He earns $18 per hour for any overtime hours he works beyond 35 hours. If Jason works 50 hours in a week, how much money will he earn? The expression $12 3 35 1 $18 3 (50 2 ___ ) can be used to solve this problem. Fill in the blank to complete the expression, show your work to find the answer, and tell which properties you used to solve the problem. 35; $690
2 3

NAME CLASS DATE
Classifying and Ordering NumbersSpringBoard Louisiana Algebra 1 Skills Workshop 319
Classifying Sets of NumbersThere are many different sets of numbers.The natural numbers or counting numbers are the numbers 1, 2, 3, 4, ….The set of whole numbers consist of the natural numbers and zero: 0, 1, 2, 3…. The set of integers consist of the whole numbers and their opposites: …23, 22, 21, 0, 1, 2, 3, ….
A rational number is a number you can write as the ratio of two integers in the form ab
,
where b fi 0. Rational numbers can be represented as either repeating or terminating decimals.
Rational
Integers
Whole
0
21
92
22
2324
Natural1,2,3...
34
Identify which set of numbers the number belongs: natural, whole, integer, rational.
a. 25Solution: 25 is a integer and rational number.
b. 2 45
Solution: The number is rational because it can be written as 245
5 145
.
c. 5.8Solution: The number is rational because it can be written as 5.8 5 5
45
5 295
.
EXAMPLE

Classifying and Ordering NumbersSpringBoard Louisiana Algebra 1 Skills Workshop 320
Classifying Sets of Numbers (continued)
PRACTICEFor each number, place a check in the box of any set of which the number is a member.
Number Natural Number Whole Number Integer Rational Number
0 X X X32 X X X X4.6 X23 X X X X
241 X X
17 X X X X
2 78
X
2.8 X51 X X X X
2100 X X

NAME CLASS DATE
Classifying and Ordering NumbersSpringBoard Louisiana Algebra 1 Skills Workshop 321
IntegersIntegers can be positive, negative or 0, but do not include fractions or decimals. The set of integers consists of all natural numbers, {1, 2, 3, 4….}, their opposites, {21, 22, 23, 24….} and 0. The set of integers can be expressed as {…24, 23, 22, 21, 0, 1, 2, 3, 4…}.
Examine the following table.
Integers NOT Integers
24 9 2900 2383 1
28 0 4 1643
.3 23.8 ½ 3485
2
.275 27/5 p 27.29
1. Identify any similarities and differences in the two categories.
Student responses will vary.
2. Add each of the following numbers to the appropriate category in the table above:
28 .275 75
2 0 4 27.29 1643 p
3. Add three appropriate numbers of your choice to each category in the table above.
Student responses will vary.

NAME CLASS DATE
Classifying and Ordering NumbersSpringBoard Louisiana Algebra 1 Skills Workshop 322
Ordering Fractions and DecimalsYou can order fractions by finding the least common denominator (LCD) to write equivalent fractions. The least common denominator is the least common multiple (LCM) of the denominators. When the denominators are the same, the greater fraction has the greater numerator.
Write the fractions in order from greatest to least.12
, 34
, 58
Step 1: Find the LCD of 12, 34
, and 58
.
Step 2: Find equivalent fractions for 12
and 34
using 8 as the denominator.
Step 3: Order the fractions.
Solution: Because 68
34
5 and 12
48
5 , from greatest to least the order
is 34
, 58
, and 12
.
Because 8 is a multiple of 2 and 4, theLCD is 8.12
44
48
; 34
22
68
3 5 3 5
68
58
48
. .
EXAMPLE A
To order decimals align the decimal points. Then compare the digits from left toright, just like you would compare whole numbers.
Write these decimals in order from least to greatest.12.7, 12.58, 12.79
Step 1: Write the decimals aligned on the decimal points. Place a zero after 12.7, so each decimal has the same number of places.
Step 2: Start at the left. The tens digits are all the same. The ones digits are all the same. The tenths digits are not the same. The least digit is 5, so 12.58 is the least number.
Step 3: Look at the hundredths place. Because 0 , 9, 12.70 , 12.79.
Solution: The decimals from least to greatest are: 12.58, 12.7, and 12.79.
12.7012.5812.79
12.7012.58 ← least12.79
12.7012.58 ← least12.79 ← greatest
EXAMPLE B

Classifying and Ordering NumbersSpringBoard Louisiana Algebra 1 Skills Workshop 323
Ordering Fractions and Decimals (continued)
PRACTICEOrder from least to greatest.
1. 0.62, 0.5, 0.570.5, 0.57, 0.62
2. 38
, 45
, 23
, ,38
23
45
3. 25
, 14
, 36
, ,14
25
36
4. 13
, 12
, 18
, ,18
13
12
5. 8.7, 7.92, 8.87.92, 8.7, 8.8
6. 3.16, 3.14, 6.143.14, 3.16, 6.14

NAME CLASS DATE
Classifying and Ordering NumbersSpringBoard Louisiana Algebra 1 Skills Workshop 324
Ordering Rational NumbersYou can compare and order numbers by using the symbols below. . means is greater than , means is less than 5 means is equal to To compare whole numbers, align the numbers on the ones place.
The table shows the populations of three U.S. cities in 2008.Order the cities from greatest to least population.[Data: 2010 World Almanac]
Step 1: Align the numbers on the ones place. Compare the digits in the hundred thousands place. 5 5 5 5 5. They are all equal.
Step 2: Compare digits in the ten thousands place. 9 . 5 558,383 is the least population.
Step 3: Compare the digits in the thousands place of the two remaining numbers. 8 . 1 598,707 is the greatest population.
Solution: From greatest to least, the populations are Denver, Washington, and Las Vegas.
City Population
Denver, CO 598,707Las Vegas, NV 558,383Washington, DC 591,833
598,707558,383591,833
598,707558,383 ← least591,833
598,707 ← greatest591,833
EXAMPLE A
To compare and order decimals, align the decimal points. Then compare the digits from left to right as you would with whole numbers.

Classifying and Ordering NumbersSpringBoard Louisiana Algebra 1 Skills Workshop 325
Just Baseballs sells baseballs for $3.79 each. All-Things Sports sells them for $4.11 each, and Anson’s sells them for $3.77 each. Order the prices from least to greatest.
Step 1: Align the decimal points.
Step 2: Compare the digits in the ones place. 4 . 3 The greatest price is $4.11.
Step 3: Compare the digits in the tenths place. 7 5 7. They are equal.
Step 4: Compare the digits in the hundredths place. 9 . 7 The least price is $3.77.
Solution: From least to greatest, the prices are $3.77, $3.79, and $4.11.
3.794.113.773.794.11 ← greatest3.77
3.793.77
3.793.77 ← least
EXAMPLE B
To compare fractions with like denominators, the fraction with the greater numerator is greater.
,
24
34
To compare fractions with like numerators, the fraction with the lesser denominator is greater.
,
14
13
If the fractions have unlike denominators, use a common denominator to write equivalent fractions with like denominators. A common denominator can always be found by multiplying the denominators. The least common denominator (LCD) will give you lesser numbers that will usually be easier to compute and compare.
Ordering Rational Numbers (continued)

Classifying and Ordering NumbersSpringBoard Louisiana Algebra 1 Skills Workshop 326
Ordering Rational Numbers (continued)
Janine has completed 38
of her science fair project. Astrid has completed 25
of her science fair
project, and Rafael has completed 720
of his science fair project. Order the fractions from greatest to least.
Step 1: Find the LCD of 38
, 25
, and 720
by finding the least
common multiple of the denominators.
Step 2: Write equivalent fractions for each of the fractions using 40 as the denominator.
Step 3: Order the numerators.
Solution: Since 1640
5 25
, 1540
5 38
, and 1440
5 720
,
from greatest to least, the fractions are 25
, 38
, and 720
.
Multiples of 8: 8, 16, 24, 32, 40, . . .Multiples of 5: 5, 10, 15, 20, 25, 30, 35, 40, . . .Multiples of 20: 20, 40, . . .The LCD is 40.
38
? 55
5 1540
25
? 88
5 1640
720
? 22
5 1440
1640
. 1540
. 1440
EXAMPLE C
Sometimes you will be asked to compare and order fractions and decimals. When this happens, either convert the fractions to decimals or the decimals to fractions. It is usually easier to convert fractions to decimals.

Classifying and Ordering NumbersSpringBoard Louisiana Algebra 1 Skills Workshop 327
Order 58
, 0.62, and 1320
from greatest to least.
Step 1: Convert 58
and 1320
to decimals.
Step 2: Align the decimal points. Place zeros so the decimals have the same number of places.
Step 3: Compare the digits in the tenths place. 6 5 6 5 6. They are all the same.
Step 4: Compare the digits in the hundredths place. 2 , 5 0.65 is the greatest number.
Step 5: Compare the digits in the thousandths place. 5 . 0 0.62 is the least number.
Step 6: Order the decimals from greatest to least
Solution: Since 0.65 5 1320
, 0.625 5 58
, and 0.62 5 0.62, from
greatest to least, the numbers are 1320
, 58
, and 0.62.
58
5 0.625 and 1320
5 0.65
0.6250.6200.6500.6250.6200.650
0.6250.6200.650 ← greatest
0.6250.620 ← least
0.65, 0.625, 0.62
EXAMPLE D
PRACTICEOrder from greatest to least.
1. 0.37, 0.003, 0.326 0.37, 0.326, 0.003 2. 23
, 34, 7
10 34,
710
, 23 3. 0.48,
12
, 9
20 12, 0.48,
920
Order from least to greatest.
4. 3.4, 0.3, 4.3, 0.43 0.3, 0.43, 3.4, 4.3 5. 34
, 916
, 58
916
, 58, 34
6. 45,
1825, 0.76
1825
, 0.76, 45
7. From Los Angeles, Stockholm is 5,454 miles, Tokyo is 5,470 miles, and London is 5,439 miles. Order the cities from least to greatest distances from Los Angeles. [Data: 2010 World Almanac] London, Stockholm, Tokyo
8. Alex answered 1920
of the questions correctly on his math quiz. He answered 0.92
of the questions correctly on his spelling quiz and 910
of the questions correctly on
his social studies quiz. Order the quiz scores from greatest to least. Explain your answer. 1920
, 0.92, 910
Ordering Rational Numbers (continued)

NAME CLASS DATE
Classifying and Ordering NumbersSpringBoard Louisiana Algebra 1 Skills Workshop 328
Ordering Whole NumbersTo simplify an expression when there are more than two terms in the expression follow the order of operations. Order of Operations 1. Simplify the terms within parentheses.
2. Simplify the terms with exponents.
3. Multiply and divide from left to right.
4. Add and subtract from left to right.
Put the following expressions in order from least to greatest. a. 120 1 37 1 21 2 82 b. 2 3 15 3 42
c. 120 2 36 1 24 2 12
Step 1: Simplify each expression.
a. 120 1 37 1 21 2 82 5 22
b. 2 3 15 3 42 5 2 3 15 3 16 5 480
c. 120 2 36 1 24 2 12 5 96
Step 2: List the numbers in order from least to greatest. a. 22, c. 96, b. 120
Solution: The expressions in order from least to greatest are: a. 120 1 37 1 21 2 82, c. 120 2 36 1 24 2 12, and b. 2 3 15 3 42.
EXAMPLE
PRACTICEList the numbers in order from least to greatest.
1. a. 150 1 48 1 46 2 95
b. 3 3 31 3 4
c. 2044 4 14
d. 160 2 77 1 43 2 19
d. 107, c. 146, a. 149, b. 372
2. a. 140 1 36 2 72 1 18
b. 4 3 11 3 3
c. 792 4 9
d. 240 2 120 1 56 2 32
c. 88, a. 122, b. 132, d. 144
3. a. (9 1 4) 2 (2 3 5) 1 101
b. 4 3 52 1 15 2 2
c. 190 4 5 1 42
d. 18 1 (6 4 3) 3 9
d. 36, c. 80, a. 104, b. 113
4. a. (15 2 4) 1 (2 3 8) 1 76
b. 3 3 6 1 21 1 45
c. 420 4 5 2 52
d. 25 1 (16 4 22) 3 12
c. 32, d. 73, b. 84, a. 103

NAME CLASS DATE
Operations with NumbersSpringBoard Louisiana Algebra 1 Skills Workshop 329
Conversion FactorSome problems require one unit to be converted to another. For example, inches per second may need to be expressed as miles per hour instead. Any number or expression can be multiplied by the number one (1) without changing its value. A conversion factor is a form of the value “1” used to change from one unit to another.
A coffee maker drips coffee at a rate of 12 ounces per minute. If 1 cup 5 8 ounces, how many cups will the coffee maker drip in 1 minute?
Step 1: Use the conversion factor 1cup
8 ounces. Multiply by the original rate.
12 ounces1 minutes
1cup8 ounces
12 ounces cups8 minute ounces
3 5
Step 2: Simplify the new rate by “cancelling” the like units in the numerator and denominator.
512 ounces cups
8 minutes ounces12 cups
8 minutes
Step 3: Simplify the fraction.
The coffee maker will make 12 cups in 8 minutes.
Solution: 12 cups8 minutes
1 48
or 112
5 cups per minute
EXAMPLE
PRACTICE
1. Convert 500 feetminute
to feet per hour if 1 hour 5 60 minutes.
3000ft/hr
2. A car gets 25 miles to 1 gallon of gas. How many feet will the car travel on one gallon of gas if 5280 feet 5 1 mile?
132,000 feet
3. If 1 pound 5 16 ounces, how many pounds are there in 88 ounces?
5.5 pounds

NAME CLASS DATE
Proportional ReasoningSpringBoard Louisiana Algebra 1 Skills Workshop 330
Equivalent RatiosA ratio is a comparison between two quantities. Equivalent ratios are often helpful in solving problems. To create an equivalent ratio, multiply both terms (the numerator and the denominator) by the same factor.
A game uses a combination of red and blue marbles. A total of 28 red marbles are used. For every 3 blue marbles there are 7 red marbles. How many blue marbles are used for the game?
Step 1: Write a ratio comparing the number of blue marbles to the number of red marbles.
Step 2: Multiply the ratio times the factor needed to create an equivalent ratio with the total of 28 red marbles.
Solution: There are 12 blue marbles.
number of blue marblesnumber of red marbles
37
5
37
44
12 blue marbles28 red marbles
3 5
EXAMPLE
PRACTICE 1. In a physical education class there is a total of 15 boys. For every 3 girls in the class there are
5 boys. How many girls are in the class?
9 girls
2. In a package of candy there is a total of 24 yellow pieces. For every 5 green pieces in the package, there are 8 yellow pieces. How many green pieces of candy are in the bag?
15 green candies
3. Larry earns $68 dollars for every 8 hours he works. How many hours must he work to earn a total of $544?
8 hours

NAME CLASS DATE
Proportional ReasoningSpringBoard Louisiana Algebra 1 Skills Workshop 331
Ratio and ProportionA ratio is a comparison of two quantities. A proportion is an equation stating that two ratios are equal.
Find an equivalent ratio to 4
12.
Method 1Step 1: Multiply each term by the same number.
4 212 2
824
3
35
Solution: 4
128
245
Method 2Step 1: Divide each term by the same number.
4 212 2
26
4
45
Solution: 4
1226
5
EXAMPLE A
To find an unknown value using proportions, create a number sentence using equal ratios. Using cross products, you can determine the value of the variable that makes the proportion a true statement.
Find the value of x: x59 81
5 .
Step 1: Cross multiply. xx
5(81) 9405 9
5
5
Step 2: Divide both sides of the equation by 9. x
x
4059
99
45
5
5
Solution: The value of x is 45.
EXAMPLE B
PRACTICEFind an equivalent ratio.
1. 58
sample answer:
1016
2. 1530
sample answer:
12
3. 618
sample answer:
39
Find the value of x.
4. x
47
125
x 5 21
5. x
5635
85
x 5 5
6. x
0.5 2.56
5
x 5 1.2

NAME CLASS DATE
Proportional ReasoningSpringBoard Louisiana Algebra 1 Skills Workshop 332
RatiosThere are three ways to represent a ratio: with a semicolon, a:b; fractional notation,
ab
; and verbally, “a to b.”
In a group of 35 people, 15 are wearing white shoes and the rest are wearing black shoes.
What is the ratio of people wearing white shoes to people wearing black shoes? There are 15 people wearing white shoes, so there are 20 people wearing black shoes.
The ratio can be written as 15:20, 1520
, or 15 to 20.
What is the ratio of people wearing black shoes to people wearing white shoes?
The ratio can be written as 20:15, 2015
, or 20 to 15.
EXAMPLE
GUIDED PRACTICEThe local humane society picked up 25 stray animals one day. Ten were dogs and fifteen were cats. Express the ratio of cats to dogs three different ways.
15 to 10, 15:10 or 1510
PRACTICEWrite a ratio to represent each of the following situations. Use a different representation for each ratio. 1. Lee has found that he gets 93 miles for every 3 gallons of gas in his car. Create a ratio to show
Lee’s miles per gallon. 93:3
2. Amy gets paid $17.00 for every 2 hours she babysits. Create a ratio to show how much Amy earns per hour. 17 to 2
3. Joel has 7 tickets to the World Series. Two of the tickets were gifts from a friend and are box seats. The remaining tickets are reserved seats. What is the ratio of reserved seats to
box seats? 52

NAME CLASS DATE
Proportional ReasoningSpringBoard Louisiana Algebra 1 Skills Workshop 333
Ratios, Tables, and GraphsA ratio is a comparison of two quantities. You can represent ratios in different ways.
There are 7 boys for every 12 girls in a grade 6 classroom. Write the ratio of boys to girls in 3 different ways.
You can write a ratio of the number of boys to the number of girls with the word “to”: 7 to 12.You can write a ratio comparing the number of boys to girls with a colon: 7 : 12.You can write the number of boys to girls as a fraction. Write the number of boys on top: 7
12.
EXAMPLE A
Ratios can be shown in a table.
The table represents the ratio of boys to girls. It shows equivalent ratios for 7 boys to 12 girls.
Boys 7 14 21 28 35Girls 12
Step 1: Look at the third column with 14 boys. Find the factor by which to multiply 7 to get 14.
The factor is 2 because 7 3 2 5 14
Step 2: Multiply 12 girls by 2.
12 3 2 5 24
Step 3: Write 24 in the third column.
Continue in this way for each column of the table to fill in the table.
Solution:
Boys 7 14 21 28 35Girls 12 24 36 48 60
EXAMPLE B

Proportional ReasoningSpringBoard Louisiana Algebra 1 Skills Workshop 334
Ratios, Tables, and Graphs (continued)
A graph can be used to represent the ratio of boys to girls.
Let x represent the number of boys. Let y represent the number of girls. Graph the completed table from Example B.
Step 1: Let x represent the number of boys. Let y represent the number of girls. Write ordered pairs (x, y) for each column in the table.
(7, 12), (14, 24), (21, 36), (28, 48), (35, 60)
Step 2: Label the graph on the axes. Write a title for the graph. Plot the points.
EXAMPLE C
35
40
45
50
55
60
25
30
15
20
5
10
y
x
Number of Boys
Num
ber
of G
irls
4030 35105 20 2515
Ratio of Boys to Girls
PRACTICEWrite each ratio in three ways.
1. There are 4 cats for every 3 dogs.
4 to 3; 4:3; 43
2. There are 5 seats for each table.
5 to 1; 5:1; 51
3. Sienna can run 2 miles in 14 minutes. Complete the table.
Miles 2 4 6 8 10Minutes 14 28 52 56 70
4. Use the grid below to graph the table of miles to minutes. Label the axes and give a title to the graph.
35
40
45
50
55
80
75
70
65
60
25
30
15
20
5
10
y
x
Number of Miles
Num
ber
of M
inut
es
1242 8 106
Ratio of Miles to Minutes

NAME CLASS DATE
Proportional ReasoningSpringBoard Louisiana Algebra 1 Skills Workshop 335
Understanding RatiosA ratio is a comparison of two quantities. You can represent ratios in different ways and write equivalent ratios.
Write two equivalent ratios for 23
.
Step 1: Multiply the numerator and the denominator by the same number to make an equivalent ratio. Use the number 3.
Step 2: Multiply the numerator and the denominator of 23
by another number to make a second equivalent ratio. Use the number 5.
Solution: 69
and 1015
are equivalent ratios to 23
.
3
3
2 33 3
5 69
3
3
2 53 5 5 10
15
EXAMPLE
PRACTICEWrite three ratios equivalent to each ratio. Sample answers given.
1. 13
26
,412
,515
2. 25
410
,615
,820
3. 3
10
520
,930
,1240
4. 14
328
,12
,416
5. 38
616
,924
,1232
6. 73
146
,219
,2812
7. 126
63
,2412
,3618
8. 41
82
,123
,164
9. 26
412
,515
,824
10. 3
12
14
,624
,936
11. 72
144
,216
,288
12. 53
106
,159
,2012

NAME CLASS DATE
Arithmetic and Algebraic ExpressionsSpringBoard Louisiana Algebra 1 Skills Workshop 336
Algebraic ExpressionsAlgebraic expressions are written to represent mathematical situations. Examples of algebraic expressions include the cost to bowl a number of games with shoe rental, sharing the bill at a restaurant with friends, or finding how many objects there are in part of a group.Certain words and phrases can suggest what operation or operations you need to write an expression. This table shows some examples.
Words and Phrases Suggested Operation
plus, sum, in all, altogether, increased by, total additionminus, difference, less than, decreased by, how many more subtractiontimes, product, in all, altogether, total multiplicationquotient, per, each, split, shared equally division
It costs $6 per hour to ice skate at Madison Ice Rink. Skate rental is $4. Write an expressionto represent how much it costs to skate for any number of hours with a skate rental.
Step 1: What do you know?
Step 2: Write an expression for the cost for any number of hours. Let h represent the number of hours.Step 3: Skate rental is added to the cost.
Solution: The expression 6h 1 4 can be used to represent the cost to skate with a skate rental.
It costs $6 per hour.Skate rental is $4.6 3 h or 6h
6h 1 4
EXAMPLE A
You can evaluate an expression by substituting a number for the variable. If there is more than one operation involved, follow the order of operations.
Hot dogs come in packages of 8 and hamburgers come in packages of 6. If d represents the number of hot dog packages and h represents the number of hamburger packages, then the expression 8d 1 6h can be used to represent the total number of hot dogs and hamburgers when buying any number of packages of hot dogs and hamburgers. How many hot dogs and hamburgers did Ms. Wilson buy in all, if d 5 6 and h 5 7?
Step 1: Substitute the values for the variables in the expression.Step 2: Multiply inside each set of parentheses.Step 3: Add.
Solution: Ms. Wilson bought 90 hot dogs and hamburgers.
8d 1 6h5 (8 3 6) 1 (6 3 7)5 48 1 425 90
EXAMPLE B

Arithmetic and Algebraic ExpressionsSpringBoard Louisiana Algebra 1 Skills Workshop 337
Algebraic Expressions (continued)
You can make a table to find different values when using an expression.
Mrs. Ramirez has five grandchildren. When she visits, she gives them each an equal amount of money. Write an expression and then make a table to show how much money each grandchild would receive depending on how much money Mrs. Ramirez brings. In the table show that Mrs. Ramirez may bring multiples of $25 up to $125.
Step 1: Write an expression. Let d represent dollars.
Step 2: Make a table using the expression. Substitute 25, 50, 75, 100, and 125 for d.
d5
or d 4 5
Solution: Total AmountGiven, in dollars (d)
Amount Each GrandchildReceives, in dollars (d 4 5)
25 5 50 10 75 15100 20125 25
EXAMPLE C
PRACTICEWrite an algebraic expression for each situation. 1. 6 more than a number n 1 6 2. a number of pennies split into 4 equal groups
3. 5 fewer than 3 times a number 3n 2 5 4. 12 more than 2 times a number 2n 1 12
Evaluate each expression if x 5 8 and y 5 4. 5. 3x 1 2y 2 6 26 6. 3 3 (5x 2 6y) 48
7. Five friends went to lunch. They each ordered the same meal and at the end of lunch, they gave the waitress a $10 tip.
a. Write an algebraic expression to represent the situation. 5𝓵 1 10
b. How much was spent if each lunch cost $8? $50
8. A plumber charges $125 per hour and a $75 house-call fee.
a. Write and evaluate an algebraic expression to find how much money the plumber will charge if the job takes 3 hours. 125 3 3 1 75; $450
b. Is it less expensive to have the plumber work for 4 hours or to have her come back for two 2-hour jobs? Explain. It is less expensive to have the plumber work for 4 hours at a cost of $575 versus having her come back for two 2-hour jobs at a cost of $650.
n4

NAME CLASS DATE
Arithmetic and Algebraic ExpressionsSpringBoard Louisiana Algebra 1 Skills Workshop 338
Computations with NumbersAfter reading a word problem, ask yourself three questions before you try to solve the problem: 1) What do I know? 2) What am I trying to find? and 3) Which operation or operations do I need to use to solve the problem?Certain words and phrases can suggest what operation or operations you need to solve a problem.
Words and Phrases Suggested Operation
plus, sum, in all, altogether, increased by, total additionminus, difference, less than, decreased by, how many more subtraction
times, product, in all, altogether, total multiplicationquotient, per, each, split, shared equally division
Choosing an operation to solve a problem is part of everyday life. Add to find the total number of boys and girls in a classroom. Subtract to find how many more pages you need to read to finish a book.
Last week, Emmy received 162 text messages and sent 208 messages. Which operation should you use to find how many more messages Emmy sent than received?
Step 1: What do you know?
Step 2: What are you trying to find?
Step 3: Look for a word or phrase to suggest which operation to use.
Emmy received 162 messages. Emmy sent 208 messages.How many more messages did she send than receive?
“How many more” means to subtract. Subtract 208 2 162.
Solution: Subtract to find how many more messages Emmy sent than received.
EXAMPLE A
Chris read 132 pages on Saturday and 29 pages on Sunday. How many pages did he read altogether?
Step 1: What do you know?
Step 2: What are you trying to find?
Step 3: Look for a word or phrase to suggest which operation to use.
Step 4: Solve the problem.
Chris read 132 pages on Saturday.Chris read 29 pages on Sunday.How many pages did he read altogether?
“Altogether” can mean addition or multiplication. Here it means to add because you are finding a sum.
132 1 29 5 161
Solution: Chris read 161 pages altogether.
EXAMPLE B

Arithmetic and Algebraic ExpressionsSpringBoard Louisiana Algebra 1 Skills Workshop 339
Computations with Numbers (continued)
Multiply when you are joining equal groups. Divide when a number is separated into equal parts.
There are 8 rolls in a package. Mr. McCoy bought 6 packages of rolls. How many rolls did he buy in all?
Step 1: What do you know?
Step 2: What are you trying to find?
Step 3: Look for a word or phrase to suggest which operation to use.
Step 4: Solve the problem.
Solution: Mr. McCoy bought 48 rolls in all.
There are 8 rolls in a package.Mr. McCoy bought 6 packages of rolls.
How many rolls did he buy?
“In all” can mean addition or multiplication. Here it means to multiply because you have equal groups of rolls.
8 3 6 5 48
EXAMPLE C
PRACTICETell which operation you would use to solve each problem. 1. There are 75 balloons in a bag. What is the total number of balloons in 6 bags? 450 balloons
2. Greg’s two dogs weigh 54 pounds and 26 pounds, respectively. What is the difference in their weights? 28 pounds
3. Paul bought a 64-fluid-ounce bottle of juice. If he drinks 8 fluid ounces of juice each day, how many days will it take Paul to finish the juice? 8 days
4. A chair cost $736 and a sofa cost $3,277. What is the total cost of the two items? $4,013
Tell which operation you would use to solve each problem. Then solve the problem. Remember to include the correct units in your answer. 5. Yolanda is 15 inches taller than her sister. Her sister is 49 inches tall. How tall is Yolanda?
addition; 64 inches
6. Wayne bought 150 feet of rope. He used 88 feet of it to stake a tree. How much rope does he have left?
subtraction; 62 feet
7. A box is twice as long as it is wide. It is 16 inches wide. How long is it?
multiplication; 32 inches
8. Lisa wants a bicycle that costs $529. She has saved $312. How much more money does she need to buy the bicycle? subtraction; $217
9. Maria bought 6 packages that each contained 12 roses. She split the roses equally into 8 vases. How many roses did she put into each vase? Explain how you solved the problem. multiplication and division; 9 roses

NAME CLASS DATE
Arithmetic and Algebraic ExpressionsSpringBoard Louisiana Algebra 1 Skills Workshop 340
Create Visual RepresentationsDifferent visual representations can be created in mathematics for problem solving.
Create a visual representation to illustrate the following.The number of marbles in a box if there are 6 red marbles, 4 green marbles, and 2 blue marbles.
Step 1: This is an addition problem. Draw pictures of 6 red marbles, 4 green marbles, and 2 blue marbles, adding each group.
R R R R R R G G G G B B1 1
Step 2: Use the picture to help solve the problem. The number of marbles in the box is the number of marbles shown in the picture. There are 12 marbles in the picture.
R R
5 12 marbles
R R R R G G G G B B1 1
Solution: There are 12 marbles in the box.
EXAMPLE A
The numbers 2 and 7 are shown on the number line. Use a model to explain how to find the distance between the numbers. Then use words to explain your model.
Step 1: A number line showing the numbers 2 and 7 can be used as a model. Draw arrows one unit at a time from 2 to 7 to show the distance between the two numbers.
5 6 7 8 9 1043210
Solution:
5 6 7 8 9 1043210
Start at 2. Move along the number line one unit at a time until you get to 7. So you move from one unit from 2 to 3, one unit from 3 to 4, one unit from 4 to 5, one unit from 5 to 6, and one unit from 6 to 7. You moved a distance of 5 units.
EXAMPLE B

Arithmetic and Algebraic ExpressionsSpringBoard Louisiana Algebra 1 Skills Workshop 341
Create Visual Representations (continued)
There are 345 books in a school library. The library has 79 science books, 55 history books, and 79 fiction books. The rest of the books are geography books. Explain in words how to find the number of geography books. Then give a visual representation of how to find the number of geography books. Find the number of geography books.
Step 1: In words: You can add 79, 55, and 79 together. Then subtract the sum from 345.
Step 2: A visual representation can use math symbols: 345 2 79 2 55 2 79 or 345 2 2(79) 2 55.
Solution: Using either representation, the library has 123 geography books.
EXAMPLE C
PRACTICECreate a visual representation and solve. 1. The number of hats in a closet if there are 5 green hats, 7 yellow hats, and 9 black hats. 21 hats
2. The number of postcards if you have 9 postcards and you give 2 away. 7 postcards
3. The number of birds in a park if there were 8 birds at the beginning of the day and 2 flew away. 7 postcards
Explain in words how to solve each problem. Then create a visual representation that could solve the problem.
4. The distance between 6 and 11. 5 units
5. The distance between 20 and 27. 7 units
6. There are 427 books in a school library. The library has 134 science books, 92 poetry books, and 123 cookbooks. The rest of the books are mysteries. How many mysteries does the library have? 78 mysteries
7. There are 433 students at a school. Each student belongs to one club. The chess club has 85 members, the fencing club has 99 members, the service club has 112 members. All the other students belong to the craft club. How many students belong to the craft club? 137 students

NAME CLASS DATE
Arithmetic and Algebraic ExpressionsSpringBoard Louisiana Algebra 1 Skills Workshop 342
Evaluating Algebraic ExpressionsAn expression is a mathematical phrase that uses numbers, or variables, or both, such as 4 1 3, 8 4 2, x 1 2, or 4x. An expression with one or more variables is an algebraic expression.You can use algebraic expressions to write rules for input/output tables, to write spreadsheets on your computer, or to represent a numeric pattern in a situation.You can evaluate an expression by substituting a number for the variable. If there is more than one operation involved, follow the order of operations.
The leader of a group of students planted 4 trees. Each student in the group planted 1 tree. The expression s 1 4 can be used to represent the total number of trees planted, where s represents the number of students in the group. How many trees were planted if s 5 8?
Step 1: Substitute the value for the variable in the expression.
Step 2: Add.
Solution: A total of 12 trees were planted.
s 1 4 5 8 1 4
5 12
EXAMPLE A
In the expression 4n, the number 4 is called a coefficient. When an operational symbol does not appear between a number and a variable, it means to multiply. So, 4n means 4 3 n.
What is the value of 5n 1 3, if n 5 6?
Step 1: Substitute the value for the variable in the expression.
Step 2: Multiply.
Step 3: Add.
Solution: If n 5 6, then 5n 1 3 5 33.
5n 1 3 5 5 3 6 1 3
5 30 1 3
5 33
EXAMPLE B
A variable can be written as the numerator or the denominator of a fraction such as n4
or n6 .
To evaluate n4
, substitute the value for n and divide by 4. For n6 , divide 6 by the value of n.

Evaluating Algebraic Expressions (continued)
Arithmetic and Algebraic ExpressionsSpringBoard Louisiana Algebra 1 Skills Workshop 343
Andrea wants to put an equal number of books on three shelves. The expression b3
represents the situation
where b is the total number of books Andrea has. How many books will be on each shelf if b 5 24?
Step 1: Substitute the value for the variable in the expression.
Step 2: Divide.
Solution: Andrea will put 8 books on each shelf.
b3
5 243
5 24 4 3
5 8
EXAMPLE C
When evaluating an expression with multiple steps, use the order of operations.The order of operations is as follows:• Work inside parentheses.• Multiply and divide from left to right.• Add and subtract from left to right.
What is the value of (n 1 6) 3 9, if n 5 4?
Step 1: Substitute the value for the variable in the expression.
Step 2: Work inside the parentheses. Add 4 1 6.
Step 3: Multiply.
Solution: If n 5 4, the value of (n 1 6) 3 9 is 90.
(n 1 6) 3 9 5 (4 1 6) 3 9
5 10 3 9
5 90
EXAMPLE D
PRACTICEEvaluate each expression for n 5 6. 1. n 1 12 18 2. 2n 2 4 8 3. (n 1 4) 4 5 2
4. n
18 3 5. n2
3 6. 4(n 1 5) 44
7. The expression 3g 1 4 represents the cost of bowling, where 3 is the cost in dollars for each game, g is the number of games bowled, and 4 is the cost in dollars for renting shoes. What is the total cost for bowling 5 games? $19
8. DePalma’s Taxi Service charges $2 per mile and has a $3 pickup fee, which can be represented by the expression 2m 1 3. Rieger’s Cab Service charges $3 per mile and has a $1 pickup fee, which can be represented by 3m 1 1. Which cab company is more economical for a 5-mile ride? Explain how you found your answer. DePalma’s Taxi Service at $13 versus Rieger’s Cab Service at $16

NAME CLASS DATE
Arithmetic and Algebraic ExpressionsSpringBoard Louisiana Algebra 1 Skills Workshop 344
Exponential Expressions and EquationsScientists use expressions involving exponents to indicate the sizes of very large and very small objects and organisms. You use exponents when you determine the area, surface area, or volume of geometric figures and shapes.
In the expression 23, the exponent is 3 and the base number is 2. An exponent tells how many times the base number is used as a factor.
23 5 2 ? 2 ? 2
The expression 23 is in exponential form. A number written in exponential form uses an exponent to show the power to which the base number is raised.
Write the expression 4 ? 4 ? 4 ? 4 ? 4 ? 4 in exponential form.
Step 1: Identify the base.
Step 2: Count the number of times 4 is used as a factor. That number will be the exponent.
Solution: 4 ? 4 ? 4 ? 4 ? 4 ? 4 5 46
The base is 4.
4 is used as a factor 6 times. The exponent is 6.
EXAMPLE A
To evaluate a number written in exponential form, first write the exponential form as a repeated multiplication. Then multiply.
Evaluate 73.
Step 1: Write the expression as repeated multiplication.
Step 2: Multiply from left to right.
Solution: 73 5 343
73 5 7 ? 7 ? 7
5 49 ? 7
5 343
EXAMPLE B
When evaluating an expression with multiple steps, use the order of operations. The order of operations is as follows:
• Work inside parentheses.
• Evaluate exponents.
• Multiply and divide from left to right.
• Add and subtract from left to right.

Arithmetic and Algebraic ExpressionsSpringBoard Louisiana Algebra 1 Skills Workshop 345
Expressions and Equations (continued)
Evaluate the expression 5 1 43 2 8 4 4.
Step 1: Evaluate the exponent.
Step 2: Divide from left to right.
Step 3: Add and subtract from left to right.
Solution: 5 1 43 2 8 4 4 5 67
43 5 4 ? 4 ? 4 5 64
5 1 43 2 8 4 4 5 5 1 64 2 8 4 4 5 5 1 64 2 2 5 69 2 2 5 67
EXAMPLE C
You can use inverse operations to solve an equation. Inverse operations are operations that “undo” each other. For example, addition and subtraction are inverse operations. By using inverse operations, you can isolate the variable on one side of the equation.
Some equations involve exponents. To solve an equation with a variable to the second power, find the square root of both sides of the equation. Taking a square root of a number “undoes” the operation of squaring the number. The square root of 9 is 3 because 32 5 9.
9 5 32 5 3
Find the value of d in d 2 5 64.
Step 1: Find the square root of each side of the equation.
Step 2: Find the number that when multiplied by itself is 64.
Solution: The value of d is 8. (Note: The value of d could also be 28 since (28)2 5 (8)2 5 64.)
d 2 5 64d2 5 64|d| 5 8
EXAMPLE D
Some equations and formulas in geometry involve p (pi), which is the ratio of the circumference to the diameter of a circle. You solve equations that involve p just as you would other equations by using inverse operations to isolate the variable on one side of the equation.
Solve 2pr 5 12
(24p) for r.
Step 1: Simplify the right side of the equation.
Step 2: Divide both sides of the equation by 2p to isolate r on the left side of the equation.
Solution: r 5 6
2pr 5 12
(24p)
2pr 5 12pr2
2p
p 5
122
p
p r 5 6
EXAMPLE E

Arithmetic and Algebraic ExpressionsSpringBoard Louisiana Algebra 1 Skills Workshop 346
Expressions and Equations (continued)
PRACTICEWrite each expression in exponential form.
1. 8 ? 8 ? 8 ? 8 84 2. 2 ? 2 ? 2 ? 2 ? 2 25 3. c ? c ? c C3
Write each expression using repeated multiplication.
4. 34 3 ? 3 ? 3 ? 3 5. 53 5 ? 5 ? 5 6. a5 a ? a ? a ? a ? a
Evaluate each expression.
7. 83 512
10. 7 ? 52 175
8. 44 64
11. 2(9 ? 5 1 7 ? 4) 146
9. 105 100,000
12. 82 1 (7 2 3) ? 6 4 2 76
Solve for n.
13. n2 5 81 9 (or 29) 14. n2 5 144 12 (or 212) 15. n2 5 49 7 (or 27)
Solve for r.
16. 2pr 5 46p 23 17. 2pr 5 34
(64p) 24 18. 2pr 5 56
(42p) 1712
19. The area of a square can be found by using the formula A 5 s2. The perimeter of a square can be found using the formula A 5 4s. The area of a square picture frame is 36 square inches. What is the perimeter of the picture frame? Explain how you found your answer. 24 inches; Explanations may vary.

NAME CLASS DATE
Arithmetic and Algebraic ExpressionsSpringBoard Louisiana Algebra 1 Skills Workshop 347
Expressions and EquationsAn equation is a mathematical sentence that contains an equal (5) sign. An expression has numbers and symbols.The table below shows some of the keys words you can use in word phrases for variable expressions.
Addition Subtraction Multiplication Division
plus minus times quotientsum difference product peradd subtract in all eachsum less than multiply splittotal decreased by divide
Is 7x 1 5 and expression or an equation?
Solution: 7x 1 5 is an expression because it does not contain an equal sign.
EXAMPLE A
Write an expression to represent six more than a number.
Step 1: Look for words to tell you which operation or operations to use.
Step 2: Write an expression for “six more.”
Step 3: Write an expression for “a number.” Let n represent a number.
Solution: The expression n 1 6 can represent six more than a number.
“more than” means to add
1 6
n 1 6
EXAMPLE B
Expressions can be evaluated (not solved) by substituting values for the variables. Once the values are substituted, use the order of operations to evaluate.
What is the value of 5x 1 3y, if x 5 3.2 and y 5 5?
Step 1: Substitute the value for the variables.
Step 2: Simplify using the order of operations.
Solution: The value of the expression is 31.
5x 1 3y5(3.2) 1 3(5)5 16 1 155 31
EXAMPLE C

Arithmetic and Algebraic ExpressionsSpringBoard Louisiana Algebra 1 Skills Workshop 348
Expressions and Equations (continued)
PRACTICEIdentify each as an expression or equation.
1. 7x 1 4 1 2y expression 2. 9x 2 15 5 24 equation
3. 15 2 2x 1 7 2 x expression 4. 8x 1 2 2 x 5 9 equation
Write an expression for each word phrase.
5. a number decreased by three n 2 3 6. three-fourths of a number
7. two more than three times a number 3n 1 2 8. seven less than a number n 2 7
9. the product of a number and 8 8n 10. a number divided by 6 n 4 6
11. two less than three times a number 3n 2 2 12. seven increased by a number 7 1 n
Evaluate each expression if x 5 4.2 and y 5 2.7.
13. 2x 1 3 11.4 14. 16 2 3y 7.9
15. x 1 y 6.9 16. x 2 3 1.2
17. 8x 2 y 30.9 18. 21 1 5y 34.5
19. 3x 2 y 9.9 20. 7y 2 3x 6.3
34
n

NAME CLASS DATE
Solving EquationsSpringBoard Louisiana Algebra 1 Skills Workshop 349
More Bags and Cubes to Solve EquationsThe actions used to solve an equation using the Bags and Cubes model translate into the steps necessary to solve the equation using algebra.
If there are 7 bags and 3 cubes on one side of the scale and 2 bags and 23 cubes on the other side, how many cubes must be in each bag to maintain the balance?
Diagram ExplanationRemove 3 cubes from each side and 2 bags from each side. Divide the remaining cubes evenly among the 5 bags.
Equation and Algebraic Solution7x 1 3 5 2x 1 23
23 23 7x 5 2x 1 20 22x 22x
x5
5 5
205
x 5 4
Corresponding Explanation
Remove 3 cubes from each side.
Remove 2 bags from each side.
Divide the remaining cubes evenly among the 5 bags.
There are 4 cubes in each bag.
EXAMPLE

Solving EquationsSpringBoard Louisiana Algebra 1 Skills Workshop 350
More Bags and Cubes to Solve Equations (continued)
GUIDED PRACTICE Complete the Equation and Algebraic Solution and the Corresponding Explanation portions of the following model.
Diagram ExplanationRemove 4 bags and 5 cubes from each side. Divide the remaining cubes evenly between the 2 bags.
Equation and Algebraic Solution6x 1 5 5 4x 1 9
24x 24x 2x 1 5 5 9 25 25
x22
5 42
x 5 2
Corresponding Explanation
Remove 4 bags from each side.
Remove 5 cubes from each side.
Divide the remaining cubes evenly.
There are 2 cubes in each bag.
PRACTICEUse algebra to solve each of the following. Use bags and cubes to model if needed. 1. 4x 1 5 5 9 x 5 1
2. 5x 1 8 5 3x 1 22 x 5 7
3. 12x 1 5 5 6x 1 17 x 5 2
4. 2x 2 10 5 3(x 2 9) x 5 17

NAME CLASS DATE
Solving EquationsSpringBoard Louisiana Algebra 1 Skills Workshop 351
Solving EquationsYou can use inverse operations to solve an equation. Inverse operations are operations that “undo” each other. Multiplication and division are inverse operations. By using inverse operations, you can isolate the variable on one side of the equation.
Solve for x. 8x 5 64Step 1: The inverse of multiplication is division. Divide each side by 8. 8x 5 64
x8
8 5
648
x 5 8
Solution: The value of x is 8.
EXAMPLE A
Solve for x. 2.5x 5 18Step 1: The inverse of multiplication is division. Divide each side by 2.5. 2.5x 5 18
x2.5
2.5 5
182.5
x 5 7.2
Solution: The value of x is 7.2.
EXAMPLE B
PRACTICESolve for x.
1. 9x 5 72 x 5 8 2. 12x 5 144 x 5 12
3. 6x 5 108 x 5 18 4. 2.4x 5 36 x 5 15
5. 3.8x 5 19 x 5 5 6. 4.2x 5 80 x 5 20
7. 9x 5 153 x 5 17 8. 4.5x 5 108 x 5 24

NAME CLASS DATE
Solving EquationsSpringBoard Louisiana Algebra 1 Skills Workshop 352
Solving Equations using Bags and CubesWhen using bags and cubes to solve equations, the goal is to determine how many cubes must be contained in each bag in order to maintain the balance of the scale. In this type of model, each cup represents an x, so, for example, 3 bags represent 3x. Each cube represents a 1, so, for example, 5 cubes represent the number 5. Actual bags and centimeter cubes may be used to create models or diagrams may be drawn with paper and pencil.
If there are 3 bags and 8 cubes on one side of the scale and 7 bags and 4 cubes on the other side, how many cubes must be in each bag to maintain the balance?
Diagram ExplanationRemove 4 cubes from each side and 3 cups from each side. Divide the remaining cubes evenly among the four bags.
Equation: 3x 1 8 5 7x 1 4 Solution: x 5 1
EXAMPLE
GUIDED PRACTICEComplete the Explanation and Equation portions of the following model. If there are 3 bags and 2 cubes on one side of the scale and 14 cubes on the other, how many cubes must be in each bag to maintain the balance?
Diagram Explanation
Equation: 14 5 3x 1 2 Solution: x 5 4
Sample answer: Remove 2 cubes from each side. Divide the remaining cubes evenly among the three bags.

Solving EquationsSpringBoard Louisiana Algebra 1 Skills Workshop 353
Solving Equations using Bags and Cubes (continued)
PRACTICEUse bags and cubes to model and solve each problem below. 1. If there are 8 bags and 5 cubes on one side of the scale and 21 cubes on the other side, how
many cubes are in each bag? x 5 2
2. If there are 35 cubes on aone side of the scale and 3 bags and 14 cubes on the other side, how many cubes are in each bag? x 5 7
3. If there are 6 bags and 4 cubes on one side of the scale and 2 bags and 16 cubes on the other side, how many cubes are in each bag? x 5 3
4. If there are 7 bags and 8 cubes on one side of the scale and 3 bags and 24 cubes on the other side, how many cubes are in each bag? x 5 4

NAME CLASS DATE
Solving EquationsSpringBoard Louisiana Algebra 1 Skills Workshop 354
Solving One-Step EquationsAn equation is a number sentence that states that two expressions are equivalent. An equation has an is-equal-to sign (5) in it. Among the uses for solving equations are finding the cost of each item in a group, how items are being shared, or how many more one group is than another.
How many circles are equal to a star?
1 5
Step 1: Write an expression to represent the left side of the equation.Let s represent the number of circles that are equal to a star.
Step 2: Count the number of circles on the right side of the equation.Step 3: Use a related fact to find how many circles are equal to a star.
Solution: A star is equal to 5 circles.
3 1 s
3 1 s 5 88 2 3 5 s8 2 3 5 5
EXAMPLE A
You can use inverse operations to solve an equation. Inverse operations are operations that “undo” each other. Addition and subtraction are inverse operations. By using inverse operations, you can isolate the variable on one side of the equation.
Find the value of n in the equation n 2 12 5 19.
Step 1: Undo the subtraction. Add 12 to both sides of the equation.
Solution: The value of n is 31.
n 2 12 5 19n 2 12 1 12 5 19 1 12
n 5 31
EXAMPLE B
You can check if your solution is correct by substituting the solution into the original equation. Since 31 2 12 5 19, the solution in Example 2 is correct.
Multiplication and division are inverse operations.
Find the value of p in the equation p 4 8 5 12.
Step 1: Undo the division. Multiply each side of the equation by 8.
Solution: The value of p is 96.
p 4 8 5 12p 4 8 3 8 5 12 3 8
p 5 96
EXAMPLE C

Solving EquationsSpringBoard Louisiana Algebra 1 Skills Workshop 355
Solving One-Step Equations (continued)
One-step equations may involve negative integers.
What is the value of m in the equation below?4 1 m 5 26
Step 1: Undo the addition. Subtract 4 from both sides of the equation.
Solution: The value of m is 210.
4 1 m 5 264 2 4 1 m 5 26 2 4
m 5 210
EXAMPLE D
When multiplying and dividing with integers, remember these rules: • If the signs are the same, the product or quotient is positive.
• If the signs are different, the product or quotient is negative.
What is the value of q in the equation below?6q 5 278
Step 1: Undo the multiplication. Divide each side of the equation by 6.
Solution: The value of q is 213.
6q 5 2786q 4 6 5 278 4 6
q 5 213
EXAMPLE E
PRACTICESolve each equation. 1. 8 1 x 5 17 9 2. x 2 14 5 13 27 3. 5x 5 45 9
4. y 4 4 5 11 44 5. 16 1 y 5 45 29 6. y6
5 36 216
7. 5 1 z 5 23 28 8. z 2 4 5 22 2 9. 3z 5 221 27
10. Adam has 28 model cars and airplanes. He has 16 model cars. The rest of his models are airplanes. Write and solve an equation to find how many model airplanes Adam has.
16 1 a 5 28; a 5 12 model airplanes
11. Melissa baked 4 batches of cookies. She baked the same number of cookies in each batch. She made a total of 96 cookies.
a. Write and solve an equation to find how many cookies were in each batch.
4c 5 96; c 5 24 cookies
b. Explain how you solved the equation.
Sample explanation: I divided both sides of the equation 4c 5 96 by 4.

NAME CLASS DATE
Ordered Pairs and Linear EquationsSpringBoard Louisiana Algebra 1 Skills Workshop 356
Coordinate PlaneThe coordinate plane is formed by two perpendicular lines called axes. The horizontal axis is called the x-axis. The vertical axis is called the y-axis. The axes divide the coordinate grid into four quadrants.
You can describe the location on the plane by using an ordered pair (x, y) where x is called the x-coordinate and y is called the y-coordinate. The point where the two axes meet is called the origin, which is the point (0, 0).
x
y
0 4 5
III
III IV
2 31
22
21
24
23
25
2
4
5
1
3
22 2124 2325
What is the location of point A?
Step 1: Find the value of the x-coordinate. Count the number of units to the left of 0.
Step 2: Find the value of the y-coordinate. Count the number of units above 0.
Step 3: Write the ordered pair.
Solution: Point A is located at (23, 2).
A is located 3 units to the left of 0.The x-coordinate is 23.
A is located 2 units above 0.The y-coordinate is 2.
The ordered pair is (23, 2). x
y
A
0 4 52 31
22
21
24
23
25
2
4
5
1
3
22 2124 2325
EXAMPLE A
You can plot points on a coordinate grid using these rules. • The first coordinate tells the number of units to the left or right of 0.
• The second coordinate tells the number of units below or above 0.

Ordered Pairs and Linear EquationsSpringBoard Louisiana Algebra 1 Skills Workshop 357
Coordinate Plane (continued)
Plot and label point B at (2, 24) on a coordinate grid.
Step 1: Starting at (0, 0), move 2 units right.
Step 2: From that point, (2, 0), move 4 units down.
Step 3: Plot and label point B.
Solution: x
y
0 4 52 31
22
21
24
23
25
2
4
5
1
3
22 2124 2325
x
y
0 4 52 3
B
1
22
21
24
23
25
2
4
5
1
3
22 2124 2325
EXAMPLE B
The vertices of a figure are A(21, 4), B(5, 4), C(5, 1), D(21, 1). What is the perimeter of the figure?
Step 1: Plot the points on a coordinate plane.
Step 2: Find the distance from point A to point D.
The distance is 3 units.
Step 3: Find the distance from point A to point B.
The distance is 6 units.
Step 4: Find the perimeter of the rectangle.
P 5 2l 1 2w 5 2(6) 1 2(3) 5 12 1 6 5 8 units
Solution: The perimeter of the figure is 8 units.
x
y
0 4 62 3
D
A B
C
1
22
21
24
23
25
2
4
5
1
3
22 2126 23 52425
EXAMPLE C

Ordered Pairs and Linear EquationsSpringBoard Louisiana Algebra 1 Skills Workshop 358
PRACTICEWrite the ordered pair for each point.
1. A (28, 5) 2. B (24, 1)
3. C (29, 28) 4. D (23, 25)
5. E (2, 4) 6. F (1, 24)
7. G (8, 6) 8. H (6, 27)
Plot and label each point.
9. J (5, 7) 10. K (7, 25)
11. L (23, 4) 12. M (27, 22)
13. N (6, 2) 14. O (22, 28)
15. The vertices of a figure are A(21, 5), B(4, 5), C(4, 1), D(21, 1). What is the perimeter of the figure?
x
y
A
B
L E
F
G
HC
D
0 4 102 31
22
21
24
23
210
2
4
10
1
3
22 2124 23210
5
6
7
8
9
5 6 7 8 9
25
26
27
28
29
2526272829
J
N
K
O
M
x
y
0 4 62 31
22
21
2D
A B
C
4
6
1
3
22 21
5
5
Coordinate Plane (continued)

NAME CLASS DATE
Ordered Pairs and Linear EquationsSpringBoard Louisiana Algebra 1 Skills Workshop 359
Finding Slope Given a Table or a GraphThe slope of a line is determined by the ratio change in y
change in x between any two points that lie on the line.
The slope is the constant rate of change of a line.
Use a graph to determine the slope of a line.
Step 1: Identify two points on the line. In this case, use (0, 2) and (2, 1).
Step 2: Calculate the vertical change from one point to the next. In this case, you must count down 1 space to move from the point (0, 2) to the point (2, 1).
Step 3: Calculate the horizontal change from one point to the next. In this case, you must count right 2 spaces to move from the point (0, 2) to the point (2, 1).
Step 4: Write the ratio showing vertical changehorizontal change
in simplest form.
In this case, the slope is represented by the ratio 212
, or 212.
Solution: The slope is negative because the line falls from left to right.
y
x
2
4
6
26
24
22
22242628210 2 4 6 8 100
EXAMPLE A
GUIDED PRACTICEThe ratio of vertical change to horizontal change is the same between any two points on a line. Use two different points on the line above to show this is true.Student responses will vary depending on the points chosen. Sample response: Use points (24, 4)
and (4, 0). Vertical change: 24; Horizontal change: 8; Slope: 4
22
5 1
22
5 212
EXAMPLE B
Use a table to determine the slope of a line.
Step 1: Identify the change in each consecutive pair of y-values in the table. In this case, the changes are 5, 5 and 10.
Step 2: : Identify the change in each consecutive pair of x-values in the table. In this case, the changes are 1, 1, and 2.
Step 3: Write ratios showing the corresponding vertical changehorizontal change
in
simplest form. In this case, the ratios 51
, 51
, and 102
each simplify to 51
.
The slope of the line is 51
.
1
12
x y
1 232 23 75 17
5
510

Ordered Pairs and Linear EquationsSpringBoard Louisiana Algebra 1 Skills Workshop 360
Finding Slope Given a Table or a Graph (continued)
PRACTICEDetermine the slope for each of the following.
1. y
x
2
4
6
8
10
28
26
22
22242628210 2 4 6 8 100
210
slope 5 3
2. y
x1
123456
262524232221212223242526 2 3 4 5 60
slope 5 32
2
3. x y
5 57 39 1
11 21
slope 5 21
4. x y
2 254 67 20
11 40
slope 5 5

NAME CLASS DATE
Ordered Pairs and Linear EquationsSpringBoard Louisiana Algebra 1 Skills Workshop 361
Linear Equations: Slope-Intercept FormWhen lines are graphed in the coordinate plane, they cross the axes. The point where a line crosses the x-axis is called the x-intercept. The point where a line crosses the y-axis is called the y-intercept.
Name the y-intercept for the line graphed.
x
y
1
12345
25242322212122232425 2 3 40 5
Step 1: Write the ordered pair where the line crosses the y-axis. The y-coordinate is the y-intercept.
Solution: The y-intercept is 2.
(0, 2)
EXAMPLE A
Slope is a number indicating the steepness of a line. To find the slope of a line you can use the differences between ordered pairs.
m yx
y yx x
slope change inchange in
2 1
2 1
5 52
2.
Determine the slope of the line.Step 1: Select two points on the graph.
Step 2: Substitute into the formula.
Solution: The slope of the line is 23
.
(23, 0) and (0, 2)
52
2m
y yx x
2 1
2 1
5
2
2 2
2 00 ( 3)
5
23
x
y
1
12345
25242322212122232425 2 3 40 5
EXAMPLE B
One way to write the equation of a line is in slope-intercept form. The line with slope m and y-intercept b is given by y = mx 1 b.

Ordered Pairs and Linear EquationsSpringBoard Louisiana Algebra 1 Skills Workshop 362
Linear Equations: Slope-Intercept Form (continued)
Write the equation of the line.
Step 1: Determine the y-intercept. We found this in Example A.
Step 2: Determine the slope. We found this in Example B.
Step 3: Substitute into the slope-intercept form.
Solution: The equation of the line is 5 1y x23
2.
(0, 2)
23
y 5 mx 1 b
5 1y x23
2
1
12345
25242322212122232425 2 3 40 5
x
y
EXAMPLE C
PRACTICEWrite the equation of each line graphed below.
1.
x1
12345
25242322212122232425 2 3 40 5
y
y x34
15 2
2.
1
12345
25242322212122232425 2 3 40 5
x
y
y 5 2x 1 3
Find the slope of the line containing these three points. Then write the equation of the line.
3. x y0 222 44 10
m 5 3, y 5 3x 2 2
4. x y0 43 225 26
m 5 22, y 5 22x 1 4
5. x y0 32 44 5
m 5 12 , y x
12
35 1
6. x y0 235 1
210 211
m 5 45 , y x
45
35 2

NAME CLASS DATE
Ordered Pairs and Linear EquationsSpringBoard Louisiana Algebra 1 Skills Workshop 363
Representations of Linear RelationshipsA linear relationship is a relationship in which the two quantities being compared have a constant rate of change. Ordered pairs from a linear relationship lie in a straight line when graphed on a coordinate grid.The graph to the right is an example of a linear relationship.You may use a linear relationship when figuring out your constant monthly expenses or predicting the total amount of money you’ll have if you save the same amount each week.You can use a table to determine if a relationship is linear by determining if the rate of change is constant.
Do the ordered pairs in the table form a linear relationship? Make a graph to check your answer.
Input Output
1 222 13 44 7
Step 1: Write the ordered pairs for each pair of values in the table. The input is the x-value, and the output is the y-value. As the x-values increase by 1, the y-values increase by 3, so the rate of change is constant and the relationship is linear.
Step 2: Plot the points on a coordinate grid.
Step 3: Draw a line through the points. The line is straight.
Solution: Because the ordered pairs show a constant rate of change and the points lie in a straight line, the ordered pairs in the table form a linear relationship.
(1, 22), (2, 1), (3, 4), (4, 7)
x
y
23
1
4
8765
2223 21 2 310 4 5 6 7 8
22232425262728
2428272625 21
EXAMPLE A
x
y
23
1
4
8765
2223 21 2 310 4 5 6 7 8
22232425262728
2428272625 21
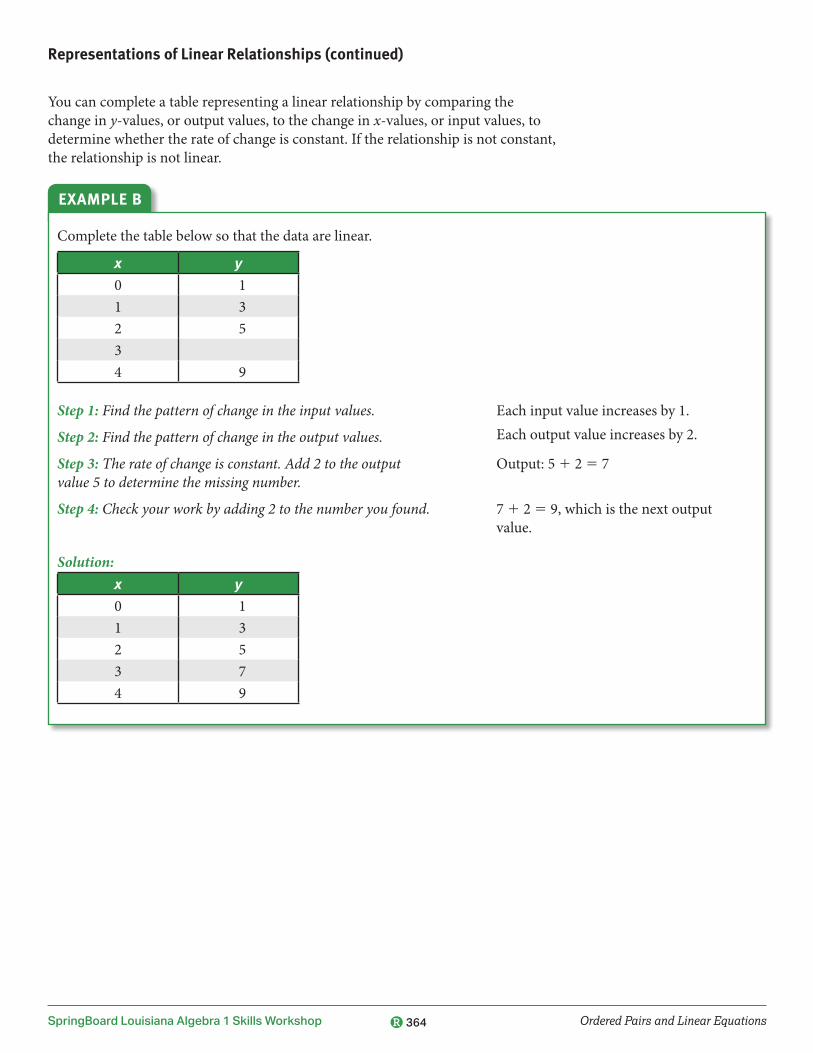
Ordered Pairs and Linear EquationsSpringBoard Louisiana Algebra 1 Skills Workshop 364
You can complete a table representing a linear relationship by comparing the change in y-values, or output values, to the change in x-values, or input values, to determine whether the rate of change is constant. If the relationship is not constant, the relationship is not linear.
Complete the table below so that the data are linear.
x y
0 11 32 534 9
Step 1: Find the pattern of change in the input values.
Step 2: Find the pattern of change in the output values.
Step 3: The rate of change is constant. Add 2 to the output value 5 to determine the missing number.
Step 4: Check your work by adding 2 to the number you found.
Solution: x y
0 11 32 53 74 9
Each input value increases by 1.Each output value increases by 2.
Output: 5 1 2 5 7
7 1 2 5 9, which is the next output value.
EXAMPLE B
Representations of Linear Relationships (continued)

Ordered Pairs and Linear EquationsSpringBoard Louisiana Algebra 1 Skills Workshop 365
The linear relationship in the table for Example B can also be described using the linear equation. y 5 2x 1 1.
Given the linear equation y 5 3x 2 2, find the ordered pairs for all integer values of x from 23 to 3.
Step 1: Substitute each integer value from −3 to 3 for x in the linear equation y 5 3x 2 2 and evaluate.
Step 2: Write the ordered pairs.
Solution: For the linear equation y 5 3x 2 2, the ordered pairs for integer values of x from 23 to 3 are (23, 211), (22, 28), (21, 25), (0, 22), (1, 1), (2, 4), and (3, 7).
y 5 3(23) 2 2 5 211y 5 3(22) 2 2 5 28y 5 3(21) 2 2 5 25y 5 3(0) 2 2 5 22y 5 3(1) 2 2 5 1y 5 3(2) 2 2 5 4y 5 3(3) 2 2 5 7
(23, 211), (22, 28), (21, 25),(0, 22), (1, 1), (2, 4), (3, 7)
EXAMPLE C
PRACTICE
1. On the grid below, draw a figure that illustrates the meaning of linear.Answers may vary. Sample graph shown.
x
y
23
1
4
8765
2223 21 2 310 4 5 6 7 8
22232425262728
2428272625 21
Representations of Linear Relationships (continued)

Ordered Pairs and Linear EquationsSpringBoard Louisiana Algebra 1 Skills Workshop 366
Name five additional ordered pairs that would be on a graph made from each table. Answers may vary.
2. Input Output
1 32 63 9
3. Input Output
4 15 26 3
4. Input Output
1 42 73 10
Complete each table so that the data are linear. 5. Input Output
1 42 63 84 10
6. Input Output
4 16 28 3
10 4
7. Input Output
1 52 83 114 14
Name three ordered pairs that satisfy each equation. Answers may vary.
8. y 5 2x 2 3 9. y 5 3x 1 5 10. y 5 5x 2 2
11. Ron was given the ordered pairs (22, 25) and (1, 1). Name the orderedpair for each integer value of x from 24 to 4 that would form a linearrelationship with Ron’s given ordered pairs.(24, 29)(23, 27)(22, 25)(21, 23)(0, 21)(1, 1)(2, 3)(3, 5)(4, 7)
Representations of Linear Relationships (continued)

NAME CLASS DATE
Geometric FiguresSpringBoard Louisiana Algebra 1 Skills Workshop 367
Classifying Geometric FiguresAngles are all around us. Your upper arm and forearm form an angle. Buildings and bridges contain many angles.An angle consists of two rays with a common endpoint called a vertex. There are four basic classifications of angles. They are listed below. Angles are usually measured in degrees (°). A square symbol at the vertex of an angle indicates that the angle is a right angle.
Acute Angle (less than 90°)
Right Angle (exactly 90°)
Obtuse Angle (greater than 90°, but less than 180°)
Straight Angle (exactly 180°)
An angle can be named using just the vertex point or using 3 points: a point on one of the sides, followed by the vertex point, followed by a point on the other side. For example, the angle at the right can be named ∠B, ∠ABC, or ∠CBA. The symbol ∠ means angle.
Classify ∠D.
D
Step 1: Compare ∠D to a right angle.
Solution: ∠D is an acute angle.
The measure of ∠D is less than that of a right angle.
EXAMPLE A
Some pairs of angles can be classified as complementary or supplementary. If the sum of the measures of two angles is equal to 90°, the angles are complementary. If the sum of the measures of two angles is equal to 180°, the angles are supplementary.
B
A
C

Geometric FiguresSpringBoard Louisiana Algebra 1 Skills Workshop 368
Classifying Geometric Figures (continued)
If ∠GEH has a measure of 25°, what is the measure of ∠FEG?
F
E
H
J
G
Step 1: Determine if ∠GEH and ∠FEG are either complementary or supplementary.
Step 2: Subtract the measure of ∠GEH from 90° to find the measure of ∠FEG.
Solution: The measure of ∠FEG is 65°.
Because ∠FEH is a right angle, ∠GEH and ∠FEG are complementary. Their measures have a sum of 90°.
90° 2 25° 5 65°
EXAMPLE B
If ∠JIK has a measure of 75°, what is the measure of ∠KIN?
J
I
L
N
M
K
Step 1: Determine if ∠JIK and ∠KIN are either complementary or supplementary.
Step 2: Subtract the measure of ∠JIK from 180° to find the measure of ∠KIN.
Solution: The measure of ∠KIN is 105°.
Because ∠JIN is a straight angle, ∠JIK and ∠KIN are supplementary. Their measures have a sum of 180°.
180° 2 75° 5 105°
EXAMPLE C

Geometric FiguresSpringBoard Louisiana Algebra 1 Skills Workshop 369
Triangles can be classified by the number of equal sides they have. A triangle can have 0 equal sides, 2 equal sides, or 3 equal sides.
Scalene Triangle (0 equal sides)
Isosceles Triangle (at least 2 equal sides)
Equilateral Triangle (3 equal sides)
Triangles can also be classified by the greatest type of angle they contain.
Right Triangle (1 right angle)
Obtuse Triangle (1 obtuse angle)
Acute Triangle (3 acute angles)
Classify triangle OPQ by the number of equal sides and by the greatest type of angle it contains.
Step 1: Identify the number of equal sides.
Step 2: Identify and classify the greatest angle.
Solution: Triangle OPQ is a scalene, obtuse triangle.
None of the sides have equal lengths. The triangle is scalene.
The triangle has 1 obtuse and 2 acuteangles. The greatest angle is ∠O, which is obtuse. The triangle is an obtuse triangle.
O
Q P
EXAMPLE D
Classifying Geometric Figures (continued)

Geometric FiguresSpringBoard Louisiana Algebra 1 Skills Workshop 370
Quadrilaterals are classified by the number of pairs of parallel sides that they have. Parallel sides never meet and remain the same distance apart.
Parallelogram (2 pairs of parallel sides)
Trapezoid (1 pair of parallel sides)
Neither a parallelogram nor a trapezoid (0 pairs of parallel sides)
Parallelograms can further be classified by the number of equal sides and by the number of right angles that they have.
Rhombus (4 equal sides)
Rectangle (4 right angles)
Square (4 equal sides and 4 right angles)
Classify the quadrilateral at right.
Step 1: Identify the number of parallel sides.
Step 2: Count the number of right angles.
Step 3: Determine if the figure has 4 equal sides.
Solution: The quadrilateral is a parallelogram.
There are two pairs of parallel sides. The quadrilateral is a parallelogram.
The parallelogram does not have any right angles. It is not a rectangle or square.
The parallelogram does not have 4 equal sides. It is not a rhombus.
EXAMPLE E
Classifying Geometric Figures (continued)

Geometric FiguresSpringBoard Louisiana Algebra 1 Skills Workshop 371
Classifying Geometric Figures (continued)
PRACTICEClassify each angle by its measure.
1. 145° obtuse 2. 90° right 3. 57° acute
Find the measure of each angle.
4. angle complementary to 36° 54° 5. angle complementary to 64° 26° 6. angle complementary to 19° 71°
Classify each triangle or quadrilateral in as many ways as you can.
7. isosceles right 8. rhombus 9. trapezoid
10. What is the least number of acute angles a triangle can have? 2
11. Can a triangle have a right angle and an obtuse angle? Explain your answer.
No; otherwise, the triangle would not exist.
12. Kaya said that a rectangle can be a rhombus. Explain whether Kaya’s statement is correct.
Kaya’s statement is correct; a rectangle that is also a rhombus is a square.
13. Andy said that a quadrilateral can have exactly 3 right angles. Explain whether Andy’s statement is correct.
Andy’s statement is incorrect; a quadrilateral can have exactly 4 right angles.

NAME CLASS DATE
Geometric FiguresSpringBoard Louisiana Algebra 1 Skills Workshop 372
Classifying TrianglesYou can classify triangles by the lengths of their sides.
Scalene Triangleno congruent sides
Isosceles Triangleat least two congruent sides
Equilateral Trianglethree congruent sides
You can also classify triangles by their angle measures.
588
828
408398
1128 298
Right Triangleone right angle
Acute Trianglethree acute angles
Obtuse Triangleone obtuse angle
Classify the triangle two ways.
Step 1: Classify the triangle by sides. All the sides are different lengths. The triangle is scalene.
Step 2: Classify the triangle by angles. There is one right angle and two acute angles.
The triangle is a right triangle.
Solution: The triangle is right and scalene.
418
498
12 cm
13 cm 5 cm
EXAMPLE

Geometric FiguresSpringBoard Louisiana Algebra 1 Skills Workshop 373
Classifying Triangles (continued)
PRACTICEClassify each triangle in two ways.
1. 608
608
608
8 m
8 m8 m
2.
678 678
46819 in. 19 in.
15 in.
3.
1308298
22832m
18m
12m
acute; equilateral acute; isosceles obtuse; scalene
4.
458
458 12.7 cm9 cm
9 cm
5. 638
838348
9 m
12 cm6 m
6.
248
18 cm
18 cm 44 cm
1338
248
right; isosceles acute; scalene obtuse; isosceles

NAME CLASS DATE
Geometric FiguresSpringBoard Louisiana Algebra 1 Skills Workshop 374
Similar TrianglesSimilar triangles have the same shape, but they do not have to be the same size.If the triangles are similar, the lengths of the corresponding sides are proportional and the measure of the corresponding angles is equal. The symbol ∼ is read “is similar to.”
Determine whether the given triangles are similar.
A
B
C
10 in
8 in
12 in
72°
37°
D
E
F5 in
4 in6 in
72°37°
Step 1: Make sure all the angles are congruent.
Step 2: Determine if the sides are in proportion.
Solution: The triangles are similar. The sides are in proportion and the corresponding angles are equal.
∠A ≅ ∠D∠B ≅ ∠E∠C ≅ ∠F
84
126
105
5 5
21
21
21
5 5
EXAMPLE

Geometric FiguresSpringBoard Louisiana Algebra 1 Skills Workshop 375
Similar Triangles (continued)
PRACTICEDetermine whether the given triangles are similar.
1. D
F
E
36 cm
40 cm
24 cmG
J
H
45 cm
30 cm
50 cm
DEF ∼ GHJ
2. A
B
C20 cm
24 cm32 cm
56°
48°
77°D
E
F16 cm
18 cm24 cm
56°
48°
77°
The triangles are not similar. The sides are not in proportion.
3. A
B
C
18 cm
21 cm
12 cm
59°
79°
42°
D
E
F
12 cm
14 cm
8 cm
59°
79°
42°
ABC ∼ DEF

NAME CLASS DATE
Geometric FiguresSpringBoard Louisiana Algebra 1 Skills Workshop 376
Two-Dimensional FiguresA plane is a flat surface that extends infinitely in all directions. A parallelogram like the one below is often used to model a plane, but remember that a plane—unlike a parallelogram—has no boundaries or sides.
A plane figure or two-dimensional figure is a figure that lies completely in one plane. When you draw, either by hand or with a computer program, you draw two-dimensional figures. Blueprints are two-dimensional models of real-life objects.
Polygons are closed, two-dimensional figures formed by three or more line segments that intersect only at their endpoints. These figures are polygons.
These figures are not polygons.
This is not a polygon because it is an open figure.
A heart is not a polygon because it is has curves.
A circle is not a polygon because it is made of a curve.
Polygons are named by the number of sides and angles they have. A polygon always has the same number of sides as angles. Listed on the next page are the most common polygons. Each of the polygons shown is a regular polygon. All the angles of a regular polygon have the same measure and all the sides are the same length.
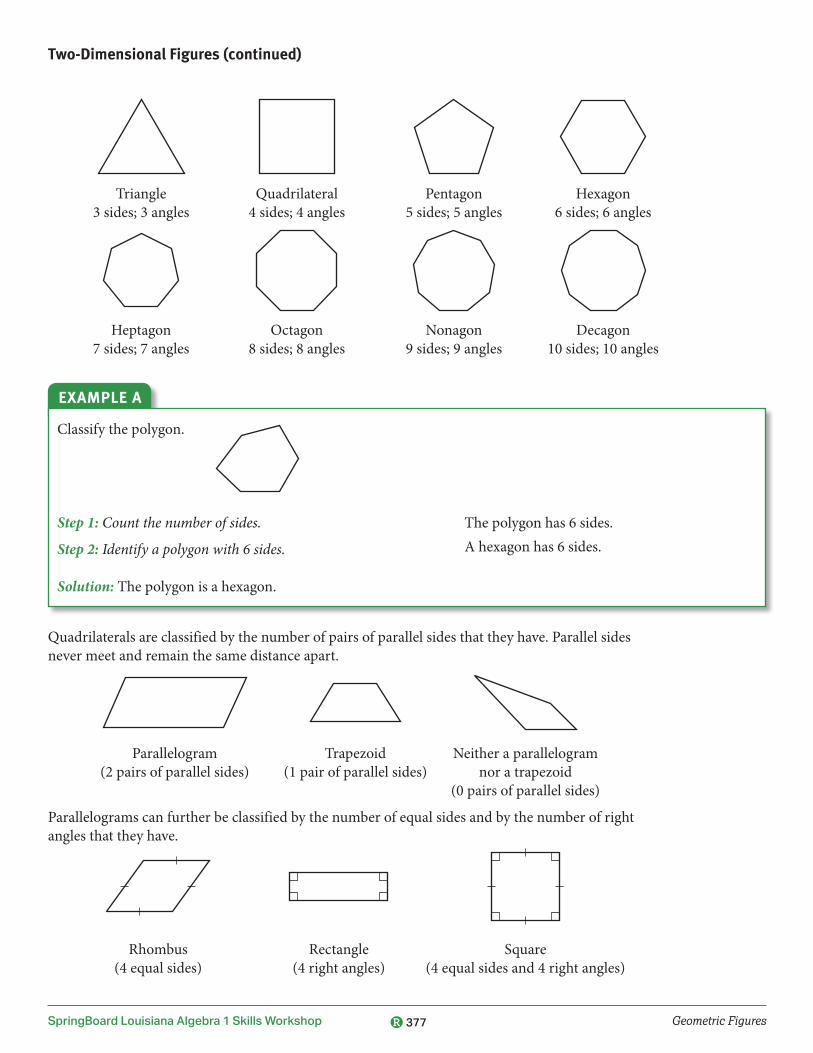
Geometric FiguresSpringBoard Louisiana Algebra 1 Skills Workshop 377
Two-Dimensional Figures (continued)
Triangle 3 sides; 3 angles
Quadrilateral 4 sides; 4 angles
Pentagon 5 sides; 5 angles
Hexagon 6 sides; 6 angles
Heptagon 7 sides; 7 angles
Octagon 8 sides; 8 angles
Nonagon 9 sides; 9 angles
Decagon 10 sides; 10 angles
Classify the polygon.
Step 1: Count the number of sides.
Step 2: Identify a polygon with 6 sides.
Solution: The polygon is a hexagon.
The polygon has 6 sides.A hexagon has 6 sides.
EXAMPLE A
Quadrilaterals are classified by the number of pairs of parallel sides that they have. Parallel sides never meet and remain the same distance apart.
Parallelogram (2 pairs of parallel sides)
Trapezoid (1 pair of parallel sides)
Neither a parallelogram nor a trapezoid
(0 pairs of parallel sides)
Parallelograms can further be classified by the number of equal sides and by the number of right angles that they have.
Rhombus (4 equal sides)
Rectangle (4 right angles)
Square (4 equal sides and 4 right angles)

Geometric FiguresSpringBoard Louisiana Algebra 1 Skills Workshop 378
Two-Dimensional Figures (continued)
Classify the quadrilateral at right in as many ways as you can.
Step 1: Determine if the quadrilateral is a parallelogram.
Step 2: Determine if the parallelogram is a rectangle.
Step 3: Determine if the rectangle is a square or rhombus.
Solution: The quadrilateral is a parallelogram and rectangle.
The figure is a parallelogram because it has two pairs of parallel sides.
It is a rectangle because it has 4 right angles.
It is neither a square nor a rhombus because it does not have 4 equal sides.
EXAMPLE B
PRACTICEDetermine if each shape is a polygon.
1. no 2. yes 3. no
Name each two-dimensional figure.
4. pentagon 5. hexagon 6. circle
Classify each quadrilateral in as many ways as you can.
7. trapezoid 8. parallelogram 9. quadrilateral
10. Adrian said that a square is always a rectangle. Curtis said a rectangle is always a square. Is either of the boys correct? Explain your answer.
Adrian is correct. A square is always a rectangle, but a rectangle is not always a square.

NAME CLASS DATE
Perimeter, Area, Volume, and CircumferenceSpringBoard Louisiana Algebra 1 Skills Workshop 379
Area of FiguresYou can find the area of different figures by using the appropriate formula.
The area A of a circle is given by A 5 pr2 where r represents the radius of the circle. Find the area of a circle with radius of 6 in. Use 3.14 for p. Round to the nearest tenth.
Step 1: Let r 5 6. Substitute r 5 6 into the formula for the area of a circle.
Step 2: Multiply 36 and 3.14. Round to the nearest tenth.
Solution: The area of the circle is 113.0 square inches, or 113 in.2
A 5 pr2
5 p(6)2
5 36p
A 5 36(3.14) 5 113.04 » 113.0
EXAMPLE A
The area A of a rectangle with length l and width w is given by A 5 l 3 w. Find the area of a rectangle with length of 9 inches and width of 8 inches.
Step 1: Substitute l 5 9 and w 5 8 into the formula for the area.
Step 2: Multiply 9 and 8.
Solution: The area of the rectangle is 72 in.2
A 5 lw 5 (9) (8)
A 5 72
EXAMPLE B
The area A of a triangle with base b and height h is given by A 5 12
bh. Find the area of a right triangle with leg lengths of 3 inches and 4 inches.
Step 1: Substitute one leg length for the base and the other for the height.
Step 2: Multiply 12
, 3, and 4.
Solution: The area of the triangle is 6 in.2
A 5 12
bh
5 12
(3) (4)
A 5 12 (12)
5 6
EXAMPLE C

Perimeter, Area, Volume, and CircumferenceSpringBoard Louisiana Algebra 1 Skills Workshop 380
Area of Figures (continued)
The area A of a trapezoid with bases b1 and b2 and height h is given by A 5 12
(b1 1 b2)h.
Find the area of a trapezoid with bases of lengths of 8 inches, 3 inches, and height of 10 inches.
Step 1: Substitute the two values for the bases and h 5 10.
Step 2: Simplify the equation.
Solution: The area of the trapezoid is 55 in.2
A 5 12
(b1 1 b2)h
5 12
(8 1 3) (10)
A 5 12 (11) (10)
5 12 (110)
5 55
EXAMPLE D
PRACTICEFind the area of each figure. Use 3.14 for p. Round to the nearest tenth, if needed. 1. right triangle with legs of length 8 inches each 32 in.2
2. circle with radius of 8 inches 201.0 in.2
3. trapezoid with bases of lengths of 6 inches, 3 inches, and height of 4 inches 18 in.2
4. rectangle with length of 11 inches and width of 4 inches 44 in.2
5. trapezoid with bases of lengths of 12 inches, 10 inches, and height of 9 inches 540 in.2
6. rectangle with length of 9 inches and width of 3 inches 27 in.2
7. right triangle with legs of length 5 inches and 12 inches 13 in.2
8. square with side length of 12 inches 144 in.2

NAME CLASS DATE
Perimeter, Area, Volume, and CircumferenceSpringBoard Louisiana Algebra 1 Skills Workshop 381
Perimeter Perimeter is the distance around a plane figure. You can measure the perimeter of a plane figure by finding the sum of the lengths of its sides. You can also use formulas to find the perimeter of plane figures.
Figure Formula
Square P 5 4sRectangle P 5 2l 1 2wTriangle P 5 a 1 b 1 c
What is the perimeter of the given figure?
18 m
15 m
Step 1: Write the formula for the given figure.
Step 2: Substitute the length and width into the formula and simplify.
Solution: The perimeter of the rectangle is 66 m.
P 5 2l 1 2w
P 5 2(18) 1 2(15) 5 36 1 30 5 66 m
EXAMPLE

Perimeter, Area, Volume, and CircumferenceSpringBoard Louisiana Algebra 1 Skills Workshop 382
Perimeter (continued)
PRACTICEFind the perimeter of each figure.
1. 9 inches
7 inches
32 feet
2. 12 inches
12 inches
48 inches
3.
15 m
12 m
32 m
59 meters
4.
18 inches
15 inches
66 inches
5.
15 feet
8 feet10 feet
24 feet
72 feet
6.
15 in.
8 in.
7 in.
10 in.
50 in.

NAME CLASS DATE
Perimeter, Area, Volume, and CircumferenceSpringBoard Louisiana Algebra 1 Skills Workshop 383
Pi: The Ratio of the Circumference of a Circle to the DiameterMaterials: string, thin black marker, rulerRecall that the circumference of a circle is the length of the edge of a circle. The diameter is the straight line that passes through the center from one point on the circle to another point on the circle.Follow the steps to estimate the ratio of the circumference of the circle below to its diameter.Step 1: Place one end of the string at the left side of the diameter of the circle below and lay down the string along the circumference, the edge of the circle. The string will meet the first end of the string. Mark the place where the strings overlap with the marker.
Step 2: Using the ruler, measure the diameter of the circle. The diameter is 2 inches long. Then measure the string from the first end to the mark. Record the measurements in the table below. For this circle, the diameter is 2 inches long. The string is approximately 6.25 inches long.
Step 3: Divide the circumference by the diameter: circumference
diameter . Round the quotient to the nearest
hundredth. For this circle, the ratio is approximately 3.13 in.
Circumference Diameter Ratio: circumference
diameter
6.25 in. 2 in. 3.13 in.
Step 4: What value is the ratio close to? The value should be close to p < 3.14159265359…. For this circle, the ratio of 3.13 in. is close to p.
Guided Practice: Use the string, marker, and ruler to find the circumference, diameter, and ratio of the given objects. Complete the table for each of the objects.
Object Circumference Diameter Ratio: circumference
diametersoup can
bottle cap
water glass
Answers will vary.

Perimeter, Area, Volume, and CircumferenceSpringBoard Louisiana Algebra 1 Skills Workshop 384
Pi: The Ratio of the Circumference of a Circle to the Diameter (continued)
PRACTICEUse the string, marker, and ruler to find the circumference, diameter, and ratio. Complete the table for each of the circles.
1. 2.
3.
Circumference Diameter Ratio: circumference
diameter1. 1 in.
2. 3 in.
3. 1.5 in.
Check students’ answers for approximate circumference and ratio.

NAME CLASS DATE
Perimeter, Area, Volume, and CircumferenceSpringBoard Louisiana Algebra 1 Skills Workshop 385
Prisms, Pyramids, Cylinders, and Cones
PRISMS AND PYRAMIDSStep 1: Use the cardstock templates and tape provided by your teacher to create a prism and a pyramid. Notice that
the base of the prism and the base of the pyramid are congruent. The prism and the pyramid also have the same height.
Step 2: Fill the pyramid with rice, sand or a similar substance. Empty the full pyramid into to the prism. Repeat until the prism is full.
Solution: The volume of the prism is ______ times more than the volume of the pyramid.
EXAMPLE A
CYLINDERS AND CONESStep 1: Use the cardstock templates and tape provided by your teacher to create a cone and a cylinder. Notice that
the base of the cone and the base of the cylinder are congruent. The cone and the cylinder also have the same height.
Step 2: Fill the cone with rice, sand or a similar substance. Empty the full cone into to the cylinder. Repeat until the cylinder is full.
Solution: The volume of the cylinder is ______ times more than the volume of the cone.
EXAMPLE B
PRACTICE 1. The volume of a cone is 13 cm3. What is the volume of a cylinder with a congruent base and
the same height? Explain your reasoning. 39 cm3
2. A prism has volume 54 in.3 What is the volume of a pyramid with a congruent base and the same height? Explain your reasoning. 18 in.3
3
3

Prisms, Pyramids, Cylinders, and Cones (continued)
Perimeter, Area, Volume, and CircumferenceSpringBoard Louisiana Algebra 1 Skills Workshop 386

Prisms, Pyramids, Cylinders, and Cones (continued)
Perimeter, Area, Volume, and CircumferenceSpringBoard Louisiana Algebra 1 Skills Workshop 387

Prisms, Pyramids, Cylinders, and Cones (continued)
Perimeter, Area, Volume, and CircumferenceSpringBoard Louisiana Algebra 1 Skills Workshop 388

Prisms, Pyramids, Cylinders, and Cones (continued)
Perimeter, Area, Volume, and CircumferenceSpringBoard Louisiana Algebra 1 Skills Workshop 389

NAME CLASS DATE
Measures of Center and SpreadSpringBoard Louisiana Algebra 1 Skills Workshop 390
Finding the Average An average is called a mean. To calculate the mean find the sum of the data divided by the number of data items.
Average sum of datanumber of data items
5
Find the average of 12, 9, 11, 8, 9, 12, 9.
Step 1: Add the numbers. 12 1 9 1 11 1 8 1 9 1 12 1 9 5 70
Step 2: Divide the sum by the number of data items. 707
105
Solution: The average of the data set is 10.
EXAMPLE A
The average will not always come out to a whole number.
Find the average of 22, 19, 31, 18, 29, 41, 18, 32.
Step 1: Add the numbers. 22 1 19 1 31 1 18 1 29 1 41 1 18 1 32 5 210
Step 2: Divide the sum by the number of data items. 210
923.35
Solution: The average of the data set is 23.3 rounded to the nearest tenth.
EXAMPLE B
PRACTICEFind the average of each data set. Round to the nearest tenth.
1. 42, 84, 78, 34, 56, 21, 90, 23 53.5
2. 8, 19, 21, 56, 23, 74, 2, 1226.9
3. 24, 48, 87, 43, 65, 12, 29, 32, 54 43.77
4. 89, 45, 76, 29, 10, 34, 56, 98, 79, 4456
5. 82, 34, 82, 65, 43, 23, 89, 33, 56, 87, 93, 4369

NAME CLASS DATE
Measures of Center and SpreadSpringBoard Louisiana Algebra 1 Skills Workshop 391
Mean Absolute Deviation
The scores on an English essay for 8 students are given below.
78, 92, 90, 80, 74, 76, 88, 90
Calculate the mean absolute deviation (MAD) for this data set. Use the table to help calculate the MAD.
Step 1: Find the mean. Round to the nearest integer.
mean 5 78 92 90 80 74 76 88 90
81 1 1 1 1 1 1
≈ 84
Step 2: Find the distance from the mean. The distance of the mean is the absolute value of the difference between each data value and the mean.
Data Value Distance from Mean of 84
78 |78 2 84| 5 |26| 5 692 |92 2 84| 5 |8| 5 890 680 474 1076 888 490 6
Step 3: Find the mean of the distances to find the MAD. Round to the nearest tenth.
MAD 5 6 8 6 4 10 8 4 6
8528
6.51 1 1 1 1 1 1
5 5
Solution: The MAD is 6.5.
EXAMPLE

Measures of Center and SpreadSpringBoard Louisiana Algebra 1 Skills Workshop 392
Mean Absolute Deviation (continued)
PRACTICEFind the mean and the mean absolute deviation of each data set. Use the table to help organize your work. Round the mean to the nearest integer. Round the MAD to the nearest tenth.
1.
Data Value Distance from Mean
32 1040 248 652 1040 244 236 640 2
mean 5 42; MAD 5 5
2.
Data Value Distance from Mean
86 499 9
100 1082 892 278 1280 10
100 10
mean 5 90; MAD 5 8.1

NAME CLASS DATE
Measures of Center and SpreadSpringBoard Louisiana Algebra 1 Skills Workshop 393
Mean and Median of Data
Eight students were asked how many hours per week he or she spent volunteering in the community. The responses are given here:
4, 6, 8, 6, 4, 5, 7, 4
a. Calculate the mean of the data set.
Step 1: Add the data values.
4 1 6 1 8 1 6 1 4 1 5 1 7 1 4 5 40
Step 2: Divide the sum by the number of data values.
mean 5 408
5 5
Solution: The mean is 5 hours.
b. Calculate the median of the data set.
Step 1: Order the data from least to greatest or greatest to least.
4, 4, 4, 5, 6, 6, 7, 8
Step 2: For an odd number of data, the median is the middle number. For an even number of data, the median is the average of the two numbers in the middle.
There are 8 data points. The two middle values are 5 and 6. The median is the mean of the two middle values: 5 6
2112
5.515 5 .
Solution: The median is 5.5 hours.
EXAMPLE A

Measures of Center and SpreadSpringBoard Louisiana Algebra 1 Skills Workshop 394
Mean and Median of Data (continued)
The number of minutes that 5 patients waited for a doctor during one day is given by:
12, 5, 24, 6, 8
a. Calculate the mean of the data set.
Step 1: Add the data values.
12 1 5 1 24 1 6 1 8 5 55
Step 2: Divide the sum by the number of data values.
mean 5 555
5 11
Solution: The mean is 11 minutes.
b. Calculate the median of the data set.
Step 1: Order the data from least to greatest or greatest to least.
24, 12, 8, 6, 8
Step 2: There are 5 data points. The middle value is 8.
Solution: The median is 8 minutes.
EXAMPLE B
PRACTICEFind the mean and median of each set of data. If necessary, round to the nearest tenth.
1. 10, 8, 3, 2, 10, 6, 12
mean 5 7.3; median 5 8
2. 12, 14, 18, 12, 18, 20
mean 5 15.7; median 5 16
3. 11, 65, 21, 48, 87
mean 5 46.4; median 5 65
4. 30, 60, 90, 40, 30, 40
mean 5 48.3; median 5 40
5. 92, 99, 94, 99, 39, 100
mean 5 87.2; median 5 96.5
6. 105, 108, 105, 108, 168
mean 5 118.8; median 5 108

NAME CLASS DATE
Measures of Center and SpreadSpringBoard Louisiana Algebra 1 Skills Workshop 395
Quartiles and IQR
A teacher recorded the test scores of her math class. The scores of the math test are listed below.
87, 92, 56, 77, 98, 78, 40
a. Calculate the first quartile of the data set.
Step 1: Find the median. Order the data from least to greatest.
40, 48, 56, 77, 78, 87, 92
Step 2: There are seven test scores. The middle value is the median.
The median is 77.Step 3: The first quartile is the median of the lower half of the data set. The lower half is made up of the values below the median. Find the lower half of the data set.
40, 48, 56
Step 4: The first quartile is the median of the lower half.Solution: The first quartile is 48.
b. Calculate the third quartile of the data set.
Step 1: The third quartile is the median of the upper half of the data set. The upper half is made up of the values above the median. Find the upper half of the data set.
78, 87, 92
Step 2: The third quartile is the median of the upper half.
Solution: The third quartile is 87.
c. Calculate the interquartile range (IQR).
The IQR is the difference between the third quartile and the first quartile.
Step 1: Subtract the first quartile from the third quartile.
87 2 48 5 39
Solution: The IQR is 39.
EXAMPLE

Measures of Center and SpreadSpringBoard Louisiana Algebra 1 Skills Workshop 396
Quartiles and IQR (continued)
PRACTICEFind the first quartile, the third quartile, and the IQR for each set of data.
1. 65, 23, 14, 9, 5, 19, 88
first quartile 5 9; third quartile 5 88 IQR 5 79
2. 345, 870, 823, 709, 104, 592
first quartile 5 592; third quartile 5 823 IQR 5 231
3. 45, 40, 49, 40, 46, 42, 42, 44
first quartile 5 41; third quartile 5 45.5 IQR 5 4.5
4. 120, 150, 130, 150, 190
first quartile 5 125; third quartile 5 170 IQR 5 45
5. 3, 10, 5, 9, 11, 4, 5, 9, 11, 0
first quartile 5 4; third quartile 5 10 IQR 5 6
6. 763, 720, 840, 250, 734, 901
first quartile 5 720 ; third quartile 5 840 IQR 5 120
7. 19, 45, 2, 71, 49, 20
first quartile 5 19; third quartile 5 49 IQR 5 30
8. 500, 700, 900, 300, 200, 100, 500, 200
first quartile 5 200; third quartile 5 600 IQR 5 400

NAME CLASS DATE
Measures of Center and SpreadSpringBoard Louisiana Algebra 1 Skills Workshop 397
Summary StatisticsStatistics can help a coach determine a batting line-up for a baseball game, or they can help a cellular phone company determine the most popular style of cell phone. The range, mean, median, and mode of a data set are statistical values that can help you understand and make predictions or conclusions about a set of data.
The range is the difference between the minimum and maximum values of a set of data.
The number of electoral votes for the winning candidates in U.S. Presidential elections from 1972 to 2008 is shown below.
[Data: 2010 World Almanac p. 567]
520, 297, 489, 525, 426, 370, 379, 271, 286, 365
What is the range of the number of electoral votes received by winning candidates?
Step 1: Identify the maximum number of votes.
Step 2: Identify the minimum number of votes.
Step 3: Subtract the minimum value from the maximum value.
525
271
525 2 271 5 254
Solution: The range of electoral votes received by winning candidates is 254.
EXAMPLE A
The mode is the value or values that occur most often in a set of data. A data set may have no mode, one mode, or more than one mode.
Janice scored the following on her social studies quizzes.
88, 84, 92, 100, 92, 88, 92, 96
What is the mode of the quiz scores?
Step 1: Make an organized list or frequency table of Janice’s quiz scores.
Step 2: Identify the score that occurs the most.
84 88 92 96 100| || ||| | |
92 occurs three times. No other score occurs that often.
Solution: The mode of the quiz scores is 92.
EXAMPLE B

Measures of Center and SpreadSpringBoard Louisiana Algebra 1 Skills Workshop 398
Summary Statistics (continued)
The mean is the arithmetic average of a set of data, found by taking the sum of the data and then dividing by the total number of data items.
Mean 5 sum of the data
total number of data items
Each month there is a town meeting at the municipal building. The number of people who attended each of the last six meetings is shown below.
128, 140, 215, 177, 164, 142
What is the mean number of people that attended the town meetings?
Step 1: Find the sum of the monthly attendance.
Step 2: Count the number of data items.
Step 3: Divide the sum of the data by the total number of data items.
128 1 140 1 215 1 177 1 164 1 142 5 966
There are 6 meetings.
966 4 6 5 161
Solution: The mean monthly attendance is 161 people.
EXAMPLE C
The median is the middle number of a set of ordered data. To find the median, first write the data items in numerical order. If there is an odd number of data items, the median is the middle number. If there is an even number of data items, the median is the mean of the two middle numbers.
The number of songs Gia downloaded each month since her birthday is shown below.
86, 12, 72, 48, 32, 16, 40
What is the median of the data?
Step 1: Order the numbers of songs from least to greatest.
Step 2: Since there is an odd number of data items, the median is the middle number. Find the middle number in the data set.
12, 16, 32, 40, 48, 72, 86
40 is the middle number.
Solution: The median is 40 songs.
EXAMPLE D

Measures of Center and SpreadSpringBoard Louisiana Algebra 1 Skills Workshop 399
Summary Statistics (continued)
Odette read six books last month. The number of pages in each of the books is shown below.
275, 340, 248, 482, 368, 502
What is the median number of pages in the books that Odette read?
Step 1: Order the numbers of pages from least to greatest.
Step 2: Since there is an even number of data items, there are two middle numbers. Find the middle numbers.
Step 3: Find the mean of the two middle numbers.
248, 275, 340, 368, 482, 502
340 and 368
15 5
340 3682
7082
354
Solution: The median number of pages in the books that Odette read is 354.
EXAMPLE E
PRACTICEFind the range of each data set.
1. 657, 438, 394, 624, 815, 572 421 2. 729, 915, 538, 649, 805, 527 377
Find the mode of each data set.
3. 57, 48, 52, 48, 52, 61, 61, 52, 57 52 4. 58, 58, 64, 76, 64, 52, 72, 58, 64 58, 64
Find the mean of each data set.
5. 86, 72, 54, 96, 74, 80 77 6. 39, 45, 41, 53, 48, 62, 55 49
Find the median of each data set.
7. 91, 64, 58, 77, 72, 86, 51 72 8. 84, 76, 92, 100, 92, 88, 70, 82 86
9. A basketball team scored 18, 24, 16, 20, and 28 points in their first five games. How will the median change if the team scores 30 points in their sixth game? It will increase from 20 to 22.
10. Bowlers with a mean score of 160 or greater can participate in the Hollywood League Tournament. Walter has bowling scores of 152, 164, 158, 147, and 168. Walter needs to bowl one more game. If he scores 165 in that game, will he qualify for the tournament? Explain how you determined your answer. No. The sum of the six scores, 954, divided by 6 is 159, which is less than 160.

NAME CLASS DATE
Data DistributionsSpringBoard Louisiana Algebra 1 Skills Workshop 400
Box Plots
Seven students were asked the number of hours they spent reading per week. Their responses are given below.
6, 12, 9, 3, 8, 10, 14
Draw a box plot for this data set.
Step 1: Find the minimum value, first quartile, median, third quartile, and the maximum value.
The minimum value is 3 and the maximum is 14.
To find the quartiles and the median, order the data set.
3, 6, 8, 9, 10, 12, 14
Minimum: 3
First quartile: 6
Median: 9
Third quartile: 12
Maximum: 14
Step 2: Draw a number line that covers the values in the data set. Mark the minimum value, first quartile, median, third quartile, and maximum value above the number line.
210 3 4 5 6 7 8 9 10 11 12 13 14 15
Step 2: Draw a box joining the first and third quartiles.
210 3 4 5 6 7 8 9 10 11 12 13 14 15
Step 3: Draw a vertical line in the box through the mark for the median.
210 3 4 5 6 7 8 9 10 11 12 13 14 15
EXAMPLE

Data DistributionsSpringBoard Louisiana Algebra 1 Skills Workshop 401
Box Plots (continued)
Step 4: Draw a horizontal line from the box to the minimum value. Do the same for the maximum value.
210 3 4 5 6 7 8 9 10 11 12 13 14 15
Step 5: Add a title under the horizontal axis, if applicable.
210 3 4 5 6 7 8 9 10 11 12 13 14 15Number of Hours Spent Reading
Solution: The box plot for the data is:
210 3 4 5 6 7 8 9 10 11 12 13 14 15Number of Hours Spent Reading
PRACTICEDraw a box plot for each set of data.
1. 8, 10, 15, 12, 0, 1
20 4 6 8 10 12 14 16 18
2. 19, 18, 22, 32, 20 22, 15
1614 18 20 22 24 26 28 30 32 383634
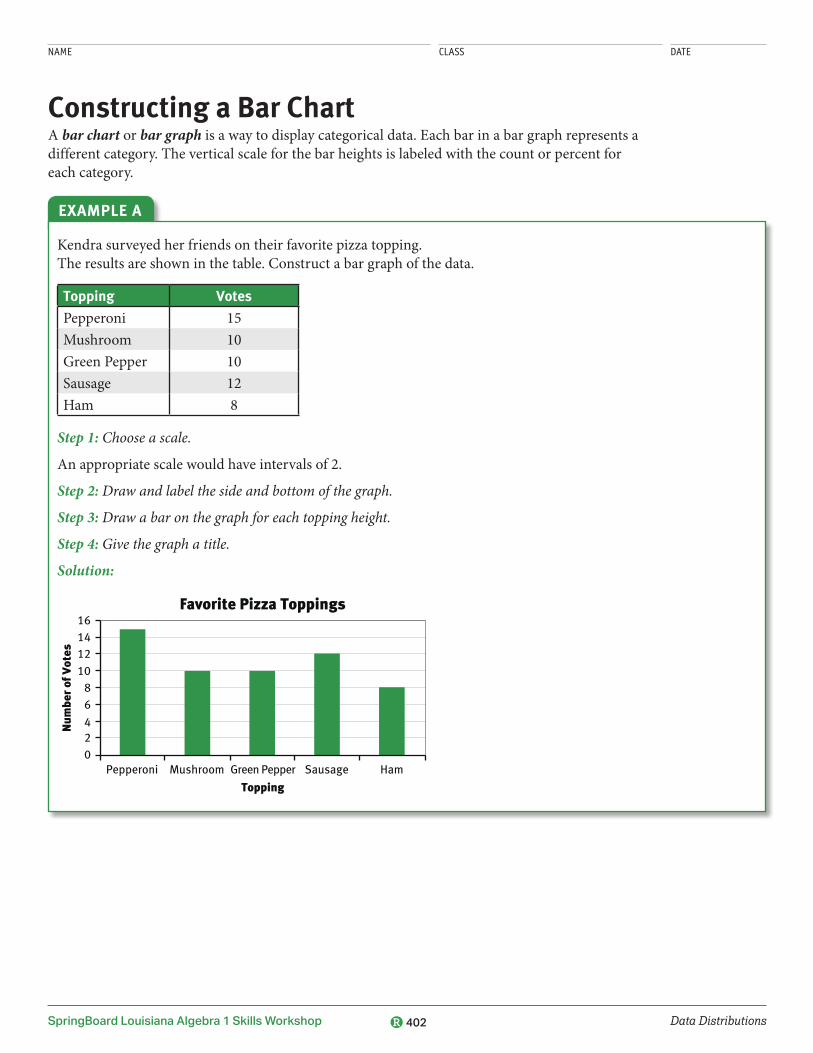
NAME CLASS DATE
Data DistributionsSpringBoard Louisiana Algebra 1 Skills Workshop 402
Constructing a Bar ChartA bar chart or bar graph is a way to display categorical data. Each bar in a bar graph represents a different category. The vertical scale for the bar heights is labeled with the count or percent for each category.
Kendra surveyed her friends on their favorite pizza topping. The results are shown in the table. Construct a bar graph of the data.
Topping Votes
Pepperoni 15Mushroom 10Green Pepper 10Sausage 12Ham 8
Step 1: Choose a scale.
An appropriate scale would have intervals of 2.
Step 2: Draw and label the side and bottom of the graph.
Step 3: Draw a bar on the graph for each topping height.
Step 4: Give the graph a title.
Solution:
16141210
86
420
Topping
Favorite Pizza Toppings
Pepperoni Mushroom Green Pepper
Num
ber
of V
otes
Sausage Ham
EXAMPLE A

Constructing a Bar Chart (continued)
Data DistributionsSpringBoard Louisiana Algebra 1 Skills Workshop 403
PRACTICE 1. The number of home runs hit by several players during the baseball season is shown in the
table. Construct a bar graph of the data.
Player Home Runs
Barry 12Juan 8Anthony 4Marcus 6Nicholas 2
141210
86
420
Barry Juan Anthony
Player
Home Runs
Num
ber
ofH
ome
Run
s
Marcus Nicholas
2. During the walk-a-thon the students kept track of how many laps they completed. Some of the data is shown in the table. Construct a bar graph of the given data.
Student Laps Completed
Jennifer 12Mia 18Brett 24Jacob 9Ruiz 18Inez 21
2124
27
181512
9
630
Jennifer Mia BrettStudent
Laps Completed
Num
ber
Com
plet
ed
Jacob InezRuiz

NAME CLASS DATE
Data DistributionsSpringBoard Louisiana Algebra 1 Skills Workshop 404
Data DisplaysData are often displayed as graphs. Advertisers use graphs to show visually how often their products are bought in order to convince other people to buy those same products.A line plot is a graph that uses symbols such as Xs or dots above numbers on a number line to show how often values occur in a set of data. You can see from a line plot how closely the data items are grouped or how spread out the data items are. Line plots are sometimes called dot plots.
The number of pets that 24 science students have is shown below.
2, 1, 0, 0, 3, 4, 2, 5, 1, 0, 2, 1,2, 3, 1, 0, 0, 2, 1, 3, 4, 5, 1, 3
Make a line plot to organize and display the data.
Step 1: Draw a number line from 0 to 5 to show the number of pets a student might have.
Step 2: Mark an X above a number to represent one student’s number of pets.
Step 3: Title the line plot.
Solution:
543210
XXXXX
XXXXXX
XXXXX
XXXX
XX
XX
Number of Pets
Pets Owned by Science Students
543210
Make sure the total number of Xs is equal to the number of data items. There are 24 students.
EXAMPLE A
Data may be numerical or categorical. The line plot above shows numerical data. Numerical data are data that are gathered through measurement, such as weights of pets or number of pages typed per minute. Categorical data are data that describe an attribute, such as a favorite subject or eye color.

Data Displays (continued)
Data DistributionsSpringBoard Louisiana Algebra 1 Skills Workshop 405
A bar graph is a way to display categorical data. Each bar in a bar graph represents a different category. The vertical scale for the bar heights is labeled with the count or percent for each category.
Students at Reynolds Middle School were asked to name their favorite school subject. The results of the survey are shown in the bar graph.
0
10
20
30
40
50
60
70
80
SocialStudies
ScienceReadingMath
Subject
Favorite Subjects
Num
ber
of S
tude
nts
How many more students chose math than social studies as their favorite subject?
Step 1: Look at the bar labeled “Math.” Read the number on the vertical axis that corresponds to the top of the bar.
Step 2: Look at the bar labeled “Social Studies.” Read the number on the vertical axis that corresponds to the top of the bar.
Step 3: Subtract the number of students that chose social studies from the number of students that chose math.
Solution: 25 more students chose math than social studies.
60 students chose math.
The top of the bar is halfway between 30 and 40. So, 35 students chose social studies.
60 2 35 5 25
EXAMPLE B

Data Displays (continued)
Data DistributionsSpringBoard Louisiana Algebra 1 Skills Workshop 406
A histogram is a graph used to show the frequencies for a set of data. The horizontal axis is divided into equal intervals. The vertical axis shows the frequency, or the number of items, in each interval.
The histogram shows the costs of items sold at the Leone’s garage sale.
0
2
4
6
8
10
12
14
16
$30–$39.99 $40–$49.99$20–$29.99$10–$19.99$0–$9.99
Price Range
Garage Sale
Num
ber
of It
ems
What fraction of the items sold at the garage sale cost less than $20?
Step 1: Find the total number of items that were sold.
Step 2: Find the number of items that cost less than $20.
Step 3: Write the ratio of items that cost less than $20 to total number of items sold. Simplify the ratio.
Solution: Of the items sold at the garage sale, 12
cost less than $20.
12 1 8 1 10 1 6 1 4 5 40
12 1 8 5 20
52040
12
EXAMPLE C
PRACTICE 1. Cleon asked students in his homeroom to name the number of movies they attended last month.
The results are shown below.
2, 3, 4, 1, 2, 3, 5, 0, 2, 1, 0, 1, 3,1, 4, 5, 2, 3, 2, 1, 0, 2, 5, 2, 1
a. Create a line plot of the data.
543210
Number of Movies Attended
b. Determine the median, mode, and range of the data. median 5 2, mode 5 2, range 5 5

Data Displays (continued)
Data DistributionsSpringBoard Louisiana Algebra 1 Skills Workshop 407
Determine if each of the following is numerical data or categorical data.
2. favorite type of music categorical 3. heights of students numerical
4. points scored in a game numerical 5. types of vegetables grown in a garden categorical
Use the bar graph to answer Items 6–8.
0
10
20
30
40
50
60
70
Thu. Fri.Wed.Tue.Mon.Day
Frank’s Study Time
Num
ber
of M
inut
es
6. How many minutes did Frank study altogether? 240 minutes
7. What is the median number of minutes that Frank studied? 50 minutes
8. What is the range of the data? 25 minutes
Use the histogram to answer Items 9–11.
0
4
8
12
16
20
24
28
32
3:00 P.M.–4:59 P.M.
5:00 P.M.–6:59 P.M.
1:00 P.M.–2:59 P.M.
11:00 A.M.–12:59 P.M.
9:00 A.M.–10:59 A.M.
Time
Library Visitors
Num
ber
of V
isit
ors
9. How many people visited the library between 11:00 a.m. and 2:59 p.m.? 44 visitors
10. How many more visitors came to the library between 3:00 p.m. and 4:59 p.m. than between 9:00 a.m. and 10:59 a.m.? 12 visitors
11. What was the mean number of library visitors per hour? Explain how you found your answer. 10 visitors; Sample answer: I found the total number of visitors between 9:00 am and 6:59 pm and divided by the total number of hours between 9:00 am and 7:00 pm.

NAME CLASS DATE
Data DistributionsSpringBoard Louisiana Algebra 1 Skills Workshop 408
Dot Plots
Ten students were asked to give the number of bracelets they made for the school fundraiser. The responses are given here:
19, 34, 25, 28, 25, 20, 28, 30, 30, 19
Step 1: Draw a number line for the data values.
19 20 21 22 23 24 25 26 27 28 29 30 31 32 33 34 35 3618
Step 2: Place a dot for each data value in the data set above the number line. If a value occurs more than once, make a column of dots above the value.
19 20 21 22 23 24 25 26 27 28 29 30 31 32 33 34 35 3618
Step 3: Add a title to the dot plot.
19 20 21 22 23 24 25 26 27Number of Bracelets Made
28 29 30 31 32 33 34 35 3618
Solution: The dot plot for the number of bracelets is shown above in Step 3.
EXAMPLE
PRACTICEMake a dot plot for each set of data.
1. Number of cans collected by students: 10, 18, 13, 12, 10, 9, 12, 16, 10, 16
9 10 11 12 13 14
Number of Cans Collected15 16 17 18 19 208
2. Number of hours spent on reading books in one week: 8, 11, 10, 8, 4, 8, 14, 12, 11, 11
9 10 11 12 13 14Hours Spent Reading during the Week
15 16 17 18 19 208

NAME CLASS DATE
Data DistributionsSpringBoard Louisiana Algebra 1 Skills Workshop 409
Types of GraphsData can be displayed in different ways. Scientists, politicians, marketers, and sports analysts use various types of data displays to help their intended audience to visualize the data. It is important to know how to read these data displays in order to correctly interpret the information.
Picture graphs, bar graphs, line graphs, and circle graphs are examples of data displays.
A picture graph or pictograph uses pictures or symbols to show data. One picture often stands for more than one item. Look for the key to understand what each picture or symbol represents.
The pictograph shows the number of CDs, by category, that a music store sold yesterday.
CDs Sold Yesterday
Classical Country Jazz
Rap Rock Key: Each = 5 CDs sold
EXAMPLE A
A bar chart or bar graph is a way to display categorical data. Each bar in a bar graph represents a different category. The vertical scale for the bar heights is labeled with the count or percent for each category.
The bar graph shows the favorite sports of sixth-grade students at Prescott Middle School.
Baseball0
5
10
15
20
25
3035
40
45
Basketball Football
Sport
Hockey Soccer
Favorite Sports
Num
ber
of S
tude
nts
EXAMPLE B

Types of Graphs (continued)
Data DistributionsSpringBoard Louisiana Algebra 1 Skills Workshop 410
A line graph uses ordered pairs to represent data that change over time. The ordered pairs are connected to show a trend over time.
The line graph shows the temperature every hour between 9:00 a.m. and 2:00 p.m. in a greenhouse.
9585
75
65
559:00 10:00 11:00 12:00 1:00 2:00
Greenhouse Temperature
Time
Tem
pera
ture
EXAMPLE C
A circle graph is a graphic representation in which sectors of a circle represent part of a whole data set or category. A circle graph is also called a pie chart.
The circle graph shows the categories that make up Mr. Brown’s monthly bills.
Rent 40%Car 25%
Food 15%
Other10%
Utilities
Mr. Brown’s Bills
10%
EXAMPLE D
PRACTICE 1. Which graph could be used to show changes over time? line
2. Which type of graph shows parts of a whole? circle
3. Which type of graph uses symbols to represent data? pictograph
4. Which of the following are three types of graphs?
A. pictograph, rectangle, circle
B. bar, line, block
C. line, bar, pictograph
D. rectangle, line, bar
C

NAME CLASS DATE
SpringBoard Louisiana Algebra 1 Skills Workshop Functions 411
Determining Asymptotic RestrictionsAsymptotes are lines that indicate values that the graph of a function may approach infinitely close to, but not reach.Asymptotes are related to the concept of limit. In mathematics, limit commonly refers to a value that cannot be quite reached. For instance, if you use a measuring tape to ensure that you are standing 10 feet from a wall, and then approach the wall by covering exactly one half of the remaining distance with each step, then in theory you should never actually touch the wall. However, no matter how long it takes, you already know you started only 10 feet away, so you cannot end up traveling more than a total of 10 feet. In this case, 10 is the limit of the distance function.You will notice limits and asymptotes as you work with rational functions because a function cannot include a division by zero. You may divide by the smallest number imaginable (resulting in an extremely large answer), but not by zero. Whenever the input value of a function results in a division by zero, that value represents a vertical asymptote. It should be identified on a graph by a vertical line where the input variable is equal to that value.
Determine the vertical asymptote of the function f (x) 5 2x5
2.
Step 1: Write a simple equation to set the entire denominator of the function equal to zero.
Step 2: Solve for x.
x 2 2 5 0
x 5 2
Solution: The function f (x) 5 2x5
2 has a vertical asymptote at x 5 2.
EXAMPLE A
Determine the vertical asymptote(s) of the function f (x) 5 1
1 1
xx x
13 22 .
Step 1: Factor the denominator of the function and simplify. 1
1 1
xx x
1( 1)( 2)
12x 1
Step 2: Solve the denominator for zero. (x 1 2) 5 0 x 5 22
Solution: The function f (x) 5 1
1 1
xx x
13 22 has a vertical asymptote at x 5 22. x 5 21 still results in a division by
zero in the original function, and is therefore an excluded value. This produces a hole in the graph of the original function at x 5 21, not an asymptote.
EXAMPLE B

SpringBoard Louisiana Algebra 1 Skills Workshop Functions 412
Determining Asymptotic Restrictions (continued)
Horizontal asymptotes are determined by the degree of the numerator and denominator in a rational function.
The degree of the numerator is
less than the degree of the denominator
The degree of the numerator is equal to the degree of the denominator
The degree of the numerator is greater than the degree of the
denominator
asymptote at y 5 0 asymptote at y 5 ab
where a is the
coefficient of the greatest power of x in the numerator and b is the similar coefficient in the denominator
no horizontal asymptote
Identify any horizontal asymptotes of f (x) 5 1 1
2 2 1
x xx x x
18 178 144 1728
2
3 2 .
Step 1: Determine the degree of the numerator and denominator.
Step 2: Compare the degree of the numerator to the degree of the denominator.
numerator greatest power of x: 2denominator greatest power of x: 3
2 , 3The degree of the numerator is less than the degree of the denominator.
Solution: There is a horizontal asymptote at y 5 0.
EXAMPLE C
Identify any horizontal asymptotes of f (x) 5 1 1
1 2 2
x x xx x x
2 49 2558 236 1008
3 2
3 2 .
Step 1: Determine the degree of the numerator and denominator.
numerator greatest power of x: 3denominator greatest power of x: 3
Step 2: Compare the degree of the numerator to the degree of the denominator.
3 5 3The degree of the numerator is equal to the degree of the denominator.
Step 3: Determine the asymptote y 5 ab
where a is 2
(the coefficient of x3 in the numerator) and b is 1 (the coefficient of x3 in the denominator).
y 5 21
Solution: There is a horizontal asymptote at y 5 2.
EXAMPLE D

SpringBoard Louisiana Algebra 1 Skills Workshop Functions 413
PRACTICEIdentify any vertical asymptotes.
1. f (x) 5 2x4
3 2. f (x) 5 2
2 1
xx x
215 562
3. f (x) 5 2
1 1
xx x
37 122 4. f (x) 5
1
1 1
xx x
3( 5)8 152
Identify any horizontal asymptotes.
5. f (x) 5 2 1
1 2
x xx x x
10 252 3
2
3 2 6. f (x) 5 2 1
2 2 1
x xx x x
14 54 12 3
4 2
3 2
7. f (x) 5 1 1
2 1
x xx x
4 48 14017 72
2
2 8. f (x) 5 1 1
2 2
x xx x x2 19 42
6 23 55
2
3 2
Determining Asymptotic Restrictions (continued)

NAME CLASS DATE
SpringBoard Louisiana Algebra 1 Skills Workshop Functions 414
Function Composition NotationComposite functions are functions that take the output of one function and use it as the input of another. A composition of two functions, f and g, is written as ( f g)(x). It is read as “f of g of x,” and means f ( g (x)). To evaluate f ( g (x)) for a given value, evaluate the innermost function for the value, and then use the output of that function as the input for the next outer function. If you evaluate a composition of more than two functions, continue this process until you reach the outermost function.
Given f (x) 5 4x and g (x) 5 3x 2 2, what is f ( g (3))?
Step 1: Identify the innermost function. In this case, the innermost function is g (x).
Step 2: Evaluate the innermost function for the given value. g (3) 5 3(3) 2 2 5 7
Step 3: Use the output of g (3) 5 7 as the input for f (x). f (7) 5 4(7) 5 28
Solution: f ( g(3)) 5 28
EXAMPLE
PRACTICEGiven f (x) 5 2x 1 3, g (x) 5 3x, and h (x) 5 4x 1 6, evaluate each composite function. 1. f ( g (22))
2. h ( g (3))
3. g (h (3))
4. ( f h)( 25)
5. ( g f h)(2)
6. ( f g h)( 21)
7. (f h g)( 21)
8. f ( g ( f (5)))

NAME CLASS DATE
SpringBoard Louisiana Algebra 1 Skills Workshop Functions 415
Function OperationsFunctions can be manipulated in the same ways as single variables by using math operators such as 1, 2, 3, and 4.
Given f (x) 5 4x 2 1 and g (x) 5 2x, perform each operation and simplify. a. ( f ? g)(x)
b. ( f 1 g)(x)
c. ( g 2 f )(x)
d. ( g 4 f )(x)
Solution: a. ( f ? g)(x) is the same as f (x) ? g (x).
( f ? g)(x) 5 f (x) ? g(x) 5 (4x 2 1)(2x) 5 8x2 2 2x 5 2x (4x 2 2)
b. ( f 1 g)(x) is the same as f (x) 1 g (x).
( f 1 g)(x) 5 f (x) 1 g (x) 5 (4x 2 1) 1 (2x) 5 6x 2 1
c. ( g 2 f )(x) is the same as g (x) 2 f (x).
( g 2 f )(x) 5 g (x) 2 f (x) 5 (2x) 2 (4x 2 1) 5 22x 1 1
d. ( g 4 f )(x) is the same as g xf x( )( )
.
( g 4 f )(x) 5 g xf x( )( )
5 2
xx2
4 1
EXAMPLE
PRACTICEGiven f (x) 5 2x 1 3, g (x) 5 3x, and h(x) 5 4x 1 6, perform each operation and simplify. 1. ( f 1 g)(x)
2. ( f 1 h)(x)
3. ( f 2 g)(x)
4. (h 2 g)(x)
5. ( g 2 h)(x)
6. ( f ? g)(x)
7. (h ? f)(x)
8. ( f 4 g)(x)
9. (h 4 f )(x)
10. ( g 1 h)(24)

NAME CLASS DATE
SpringBoard Louisiana Algebra 1 Skills Workshop Functions 416
Use with Unit 6Transforming FunctionsTransformations are the result of changing the equation that represents a function y 5 f(x) in specific ways. These changes to the equation also describe the effects to the graph of the parent function.
Translations (sliding the graph vertically or horizontally)
Head k , 0 k . 0
f (x) 1 k, a vertical translation down upf (x 1 k), a horizontal translation right left
Reflections 2f(x), a reflection across the x-axis f(2x), a reflection across the y-axis
Rotation 2f(2x), a rotation 180° about the origin
Dilations (stretching vertically or horizontally)
Head 0 , k , 1 k . 1
kf (x), a vertical translation vertical shrink vertical stretchf (kx), a horizontal translation horizontal stretch horizontal shrink
Multiple operations can be performed on a function, resulting in a more complex transformation.
Describe the transformations of the function g(x) from its parent function f(x).
f(x) 5 x2, g(x) 5 2(x 1 3)2
The function g(x) is a horizontal translation of f(x). Because the number 3 is greater than 0, it has been translated 3 units to the left. The function g(x) is also a reflection of f(x) across the x-axis.
EXAMPLE A
Describe the transformations of the function g(x) from its parent function f(x).
f(x) 5 |x|, g(x) 5 4|x| 1 5
The function g(x) is a vertical translation of f(x). Because the number 5 is greater than 0, it has been translated 5 units up. The function g(x) is also a vertical dilation of f(x) that has been stretched by a factor of 4.
EXAMPLE B

SpringBoard Louisiana Algebra 1 Skills Workshop Functions 417
Transforming Functions (continued)
Write a function g(x) that is a vertical stretch of the function f(x) 5 x2 by a factor of 3 and translated 4 units to the right.
Step 1: Identify the change that will result in a vertical stretch of the function by a factor of 3. A vertical stretch has the form kf(x) where k . 1.
g(x) 5 3(x)2
Step 2: Identify the change that will result in a translation 4 units to the right. A translation to the right has the form f(x 1 k) where k < 0.
g(x) 5 (x 2 4)2
Solution: The desired transformation is g(x) 5 3(x 2 4)2.
EXAMPLE C
GUIDED PRACTICEDescribe the transformations of the function g(x) in terms of f(x).
1. f(x), g(x) 5 f(2x) 1 2
The function f(x) has been reflected across the
and translated units to
become g(x).
2. f(x) 5 x2, g(x) 5 13
x2
The function g(x) is a
of the function f(x).
3. f(x) 5 |x|, g(x) 5 |x 2 3| 2 5
The function f(x) has been translated 3 units and 5 units to become g(x).
4. Write a function g(x) that reflects the function f(x) 5 x3 across the y-axis and stretches the function vertically by a factor of 4.
Step 1: Identify the change that will result in reflection across the y-axis. g(x) 5 2x3
Step 2: Identify the change that will result in a vertical stretch. g(x) 5 x3
Solution: The resulting function is g(x) 5 x3

SpringBoard Louisiana Algebra 1 Skills Workshop Functions 418
Transforming Functions (continued)
INDEPENDENT PRACTICEDescribe the transformation of f(x) to g(x). Do not include the scale factor for dilations.
1. f(x) 5 |x|, g(x) 5 12
|x|
2. f(x) 5 x2, g(x) 5 2(x 1 2)2
3. g(x) 5 f(2x) 2 3
4. g(x) 5 f25
x
Write a function g(x) that models the transformation.
5. vertical stretch of f(x) 5 x2 by a factor of 4
6. horizontal stretch of f(x) 5 |x| by a factor of 2
7. reflection of f(x) across the y-axis and a translation 1 unit down
8. rotation of f(x) 180° about the origin

NAME CLASS DATE
SpringBoard Louisiana Algebra 1 Skills Workshop Functions 419
Writing and Graphing FunctionsVideo game programmers, city planners, and policemen all use grid systems in their work. You use a grid system too when you graph functions.The graphs of linear functions are lines. You can graph a line by using the x- and y-intercepts. The x-intercept is where the line of an equation crosses the x-axis. The y-intercept is where the line of an equation crosses the y-axis.
Graph a line that has an x-intercept of 23 and a y-intercept of 5.
Step 1: Plot a point at the x-intercept. The x-intercept is at (23, 0).
Step 2: Plot a point at the y-intercept. The y-intercept is at (0, 5).
Step 3: Draw a line through the points.
Solution:
x
y
22242628
28
26
24
22
2
4
6
8
2 4 6 8
EXAMPLE A

Graphing Functions (continued)
SpringBoard Louisiana Algebra 1 Skills Workshop Functions 420
The slope-intercept form of a linear equation is y 5 mx 1 b, where m 5 slope and b 5 y-intercept. You can use the slope and y-intercept to graph linear equations and functions in this form.
Graph f (x) 5 13
x 1 2.
Step 1: Substitute y for f(x) in the function.
The equation is in slope-intercept form. Identify the value of m to get the slope and the value of b to get the y-intercept.
Step 2: Find the y-intercept and plot the point.
Step 3: Treat m as vertical changehorizontal change
to find and plot a second point.
Go up 1 unit and to the right 3 units from (0, 2).
Step 4: Draw a line through the points.
Solution:
x
y
22242628
28
26
24
22
2
4
6
8
2 4 6 8
5 1y x13
2
y 5 mx 1 b
m 5 slope 5 13
b 5 y-intercept 5 2
The y-intercept is at (0, 2).
The second point is (3, 3).
EXAMPLE B

Graphing Functions (continued)
SpringBoard Louisiana Algebra 1 Skills Workshop Functions 421
You have seen that the graphs of linear functions are lines. Take a look at the graph of an absolute value function y 5 |x|.The graph of y 5 |x| has the shape of a V, centered at the vertex, (0, 0). The slope of the right half of the V is 1, and the slope of the left half of the V is 21. x
y
22242628
28
26
24
22
2
4
6
8
2 4 6 8
A graph of any equation of the form y 5 |x 2 h| 1 k will have the same shape as y 5 |x|, but it will be in a different position on the coordinate plane. A change in the value of h moves the graph left or right. A change in the value of k moves the graph up or down. The vertex is always at the point (h, k).
Graph the function y 5 |x| 2 4 on the same plane as y 5 |x|.
Step 1: Write the equation in the form y 5 |x 2 h| 1 k. Set the value y 5 |x 2 h| 1 k of h equal to 0, since it does not appear in the equation. y 5 |x| 2 4 → y 5 |x 2 0| 2 4
Step 2: Determine the values of h and k. h 5 0 k 5 24
Step 3: Plot the vertex at (h, k). The vertex is at the point (0, 24).
Step 4: Draw the right half of the V up from the vertex with a slope of 1. Draw the left half of the V up from the vertex with a slope of 21.
Solution:
x
y
22242628
28
26
24
22
2
4
6
8
y 5 |x|
y 5 |x|24
2 4 6 8
EXAMPLE C

Graphing Functions (continued)
SpringBoard Louisiana Algebra 1 Skills Workshop Functions 422
Graph the function y 5 |x 2 3| on the same plane as y 5 |x|.
Step 1: Write the equation in the form y 5 |x 2 h| 1 k. Set the value of k y 5 |x 2 h| 1 k equal to 0, since it does not appear in the equation. y 5 |x 2 3| → y 5 |x 2 3| 1 0
Step 2: Determine the values of h and k. h 5 3 k 5 0
Step 3: Plot the vertex at (h, k). The vertex is at the point (3, 0).
Step 4: Draw the right half of the V up from the vertex with a slope of 1. Draw the left half of the V up from the vertex with a slope of 21.
Solution:
x
y
22242628
28
26
24
22
2
4
6
8
y 5 |x|
y 5 |x23|
2 4 6 8
EXAMPLE D
PRACTICEGraph a line with the given intercepts. Use the same grid for Items 1–3.
1. x-intercept: 4y-intercept: 22
x
y
22242628
28
26
24
22
2
4
6
8
2 4 6 8
2. x-intercept: 1y-intercept: 25
3. x-intercept: 23y-intercept: 21

Graphing Functions (continued)
SpringBoard Louisiana Algebra 1 Skills Workshop Functions 423
Graph the following functions on the same grid.
4. f (x) 5 34
x 1 1
x
f(x)
2428212216
216
212
28
24
4
8
12
16
4 8 12 16
5. f (x) 5 24x 2 2
6. f (x) 5 15
1 3
Graph the following equations on the same grid.
7. y 5 |x|
x
y
22242628
28
26
24
22
2
4
6
8
2 4 6 8
8. y 5 |x| 1 2
9. y 5 |x 1 5|
10. A game uses a coordinate grid system. In the game, a ball travels in a straight line from (7, 7) to an object at (23, 23). The ball bounces off the object at (23, 23) and travels in a straight line to the point (27, 1). Graph the path of the ball and describe it with an equation. Explain your results.
x
y
22242628
28
26
24
22
2
4
6
8
2 4 6 8

NAME CLASS DATE
SpringBoard Louisiana Algebra 1 Skills Workshop Quadratic Functions and Equations 424
Use with Unit 3Finding Zeros of FunctionsThe zeros of a function y 5 f (x) are those values of x that will make y 5 0. For example, the zeros of the function f (x) 5 x2 2 4 are 2 and 22 because 22 2 4 5 0 and (22)2 2 4 5 0. One way of finding the zeros of a function is by factoring and applying the Zero Product Property. If the product of two numbers is 0, then one (or both) of the numbers must be 0.
Find the zeros of the function f (x) 5 (x 2 3)(x 1 5).
Step 1: Set the function equal to 0.
Step 2: Set each of the binomial factors equal to 0.
Step 3: Solve for x in each equation.
Solution: x 5 25, 3
(x 2 3)(x 1 5) 5 0
x 2 3 5 0 or x 1 5 5 0
x 5 3 or x 5 25
EXAMPLE A
Find the zeros of the function f (x) 5 2x 2 1 12x 2 14
Step 1: Set the function equal to 0.
Step 2: Factor the function.
Step 3: Set each of the binomial factors equal to 0.
Step 4: Solve for x in each equation.
Solution: x 5 27, 1
2x 2 1 12x 2 14 5 0
2(x 2 1 6x 2 7) 5 0 2(x 1 7)(x 2 1) 5 0
x 1 7 5 0 or x 2 1 5 0
x 5 27 or x 5 1
EXAMPLE B

SpringBoard Louisiana Algebra 1 Skills Workshop Quadratic Functions and Equations 425
Finding Zeros of Functions (continued)
GUIDED PRACTICEComplete the steps to find the zeros of each function.
1. f (x) 5 (x 1 3)(x 2 2)
Step 1: Set the function equal to 0.
Step 2: Set each binomial factor equal to 0.
Step 3: Solve for x in each equation.
Solution:
2. f (x) 5 6x2 1 2x 2 8
Step 1: Set the function equal to 0.
Step 2: Factor the expression.
Step 3: Set each binomial factor equal to 0.
Step 3: Solve for x in each equation.
Solution:
INDEPENDENT PRACTICEFind the zeros of each function.
1. f (x) 5 (x 1 2)(x 2 8) 2. f (x) 5 3(x 2 1)(x 2 12
) 3. f (x) 5 x2 2 5x
4. f (x) 5 x2 2 9 5. f (x) 5 x2 2 6x 1 5 6. f (x) 5 3x2 2 9x 1 6

NAME CLASS DATE
SpringBoard Louisiana Algebra 1 Skills Workshop Quadratic Functions and Equations 426
Interpreting Features of FunctionsA quadratic function is a function in which the greatest exponent is 2. The general form of a quadratic function is ax2 1 bx 1 c, where a fi 0. The graph of a quadratic function is a symmetrical U-shaped curve called a parabola. Three graphs of quadratic functions are shown.
x
y
25
25
5
5
y 5 x22 4
x
y
25
25
5
5
y 522x21 2
x
y
25
25
5
5
y 52x214
The axis of symmetry is a line through the graph of a parabola that divides it into two congruent halves. The axis of symmetry intersects the parabola at a point called its vertex. The y-coordinate of the vertex is the maximum or minimum value of the function. This is the greatest or least value of the function.
Refer to the equations and graphs above for y 5 x2 2 4, y 5 22x2 1 2, and y 5 14
x2. How does the sign of the x2-term affect the parabola?Solution:
For y 5 x2 2 4, the coefficient of the x2-term is 1. It is positive. The parabola opens upward. For y 5 22x2 1 2, the coefficient of the x2-term is 22. It is negative. The parabola opens downward. For y 5
14
x2, the coefficient of the x2-term is 14
. It is positive. The parabola opens upward.
In general, if the sign of the x2-term is positive, the parabola opens upward and the vertex is the minimum point of the function. If the sign of the x2-term is negative, the parabola opens downward and the vertex is the maximum point of the function.
EXAMPLE A
Consider the function y 5 22x2 1 12x 2 6. Find each of the following. • the y-intercept
• the equation of the axis of symmetry
• the x-coordinate of the vertex
• the coordinates of the maximum or minimum point
• the domain and range
Solution:
• The y-intercept is the constant term, c, for the function in the form ax2 1 bx 1 c. The y-intercept is 26.
EXAMPLE B

SpringBoard Louisiana Algebra 1 Skills Workshop Quadratic Functions and Equations 427
Interpreting Features of Functions (continued)
PRACTICEFor each function in Items 1–4, determine whether the vertex is a maximum or minimum, and determine the y-intercept.
1. y 5 23x2 2 7 2. y 5 12
x2 1 5
3. y 5 2x2 1 3x 1 17 4. y 5 1
10 x2 2 x 2 3
For Items 5–8, find each of the following. • the equation of the axis of symmetry
• the coordinates of the vertex
• the domain and range
5. y 5 x2 1 6x 1 4 6. y 5 2x2 1 16x 2 65
7. y 5 x2 + x 2 234
8. y 5 x2 2 14x 1 49
• The equation of the axis of symmetry is x 5 2ba2
. In the function y 5 22x2 1 12x 2 6, a 5 22 and b 5 12,
so 522
522
5x 122( 2)
124
3. The axis of symmetry is x 5 3.
• The axis of symmetry intersects the parabola at its vertex. Since the equation of the axis of symmetry is x 5 3, the x-coordinate of the vertex is 3.
• The value of a in the function is 22 (a negative value), so the function opens down and has a maximum value. Since the x-coordinate of the vertex is 3, substitute x 5 3 in the function and solve for y.
y 5 22x2 1 12x 2 6 5 22(3)2 1 12(3) 2 6 5 12
The vertex is a maximum point with the coordinates (3, 12).
• The domain of a function is all the x-values allowable. The domain of this function is all real numbers. The range of a function is all the y-values. The range of this function is all real numbers less than or equal to the maximum value, or y # 12.

NAME CLASS DATE
SpringBoard Louisiana Algebra 1 Skills Workshop Quadratic Functions and Equations 428
Quadratic FormulaA quadratic equation in standard form, ax2 1 bx 1 c 5 0, can always be evaluated using the
Quadratic Formula x 5 2 6 2b b ac
a4
2
2
. Write the equation in standard form first, and then
substitute a, b, and c into the Quadratic Formula and solve for x.Depending on the value of the discriminant (the part of the formula under the radical symbol), you will get one of three outcomes. You will get zero real solutions if the discriminant is negative because the square root of a negative is not real. You will get one real solution if the discriminant is zero. You will get two real solutions if the discriminant is positive with two roots.
Use the Quadratic Formula to solve 8x2 2 22x 1 15 5 0. a. Use the discriminant to determine the number of real roots.
b. Solve the equation to identify the roots.
Step 1: Identify a, b, and c by referencing the standard form ax2 1 bx 1 c 5 0.
Step 2: Substitute a, b, and c into the Quadratic Formula
x 5 2 6 2b b ac
a4
2
2
.
Step 3: Evaluate the discriminant b2 2 4ac. Since 4 is a positive number and not 0, there are 2 real roots.
Step 4: Complete the quadratic equation, substituting the result of the discriminant for b2 2 4ac.
a 5 8, b 5 222, c 5 15
x 5 2 2 6 2 2( 22) ( 22) 4(8)(15)
2(8)
2
(222)2 2 4(8)(15) 5 4
x 5 2 2 6( 22) 4
2(8)
x 5 622 2
16
x 5 2416
532
and x 5 2016
5 54
Solution: a. The positive discriminant indicates two real roots.
b. x 5 54
, 32{ }
EXAMPLE

SpringBoard Louisiana Algebra 1 Skills Workshop Quadratic Functions and Equations 429
PRACTICESolve the quadratic equations using the Quadratic Formula.
1. 5x2 2 20x 1 15 5 0
2. 4x2 2 36x 5 272
3. 25x2 1 40x 5 325 4. x2 2 13 5 0
5. 236x 1 72 5 24x2 6. 3x2 2 18x 5 0
7. 2x2 1 10x 5 24 8. x2 2 7 1 2x 5 2x
9. 2x2 2 29 524x 10. 3x2 1 7x 5 25
Quadratic Formula (continued)

NAME CLASS DATE
SpringBoard Louisiana Algebra 1 Skills Workshop Quadratic Functions and Equations 430
Use with Activity 14, Lesson 14-1
Rewriting a Quadratic Function by Completing the SquareWriting a quadratic function in vertex form can help in graphing and solving the function. Writing the function in vertex form, from standard form , is done by completing the square . The process is similar to the one used to solve a quadratic equation: adding a value to create a perfect square polynomial, while at the same time keeping the equation balanced.
Vertex Form: y 5 a(x 2 h)2 1 k; where (h, k) is the vertex of the parabola. Standard Form: y 5 ax2 1 bx 1 c
Write the quadratic function y 5 4x2 2 24x 1 30 in vertex form by completing the square.
Step 1: Factor the leading coefficient, a, from the first two terms.
Step 2: Find 12
of b, the linear coefficient, and square it.
Step 3: Add the square of that number b2
2, inside the
parentheses. To keep the value of the expression the same, multiply that value by a and subtract that product from the c term.
Step 4: Factor the trinomial inside the parentheses.
Step 5: Write the trinomial inside the parentheses as a perfect square.
Solution: y 5 4(x 1 3)2 2 6
y 5 4x2 2 24x 1 30 y 5 4(x2 2 6x) 1 30
b 5 26 12
(26) 5 23; (23)2 5 9
y 5 4(x2 2 6x 1 9) 1 30 2 36 y 5 4(x2 2 6x 1 9) 2 6
(x2 2 6x 1 9) 5 (x 2 3)(x 2 3)
y 5 4(x 2 3)2 2 6
EXAMPLE A

SpringBoard Louisiana Algebra 1 Skills Workshop Quadratic Functions and Equations 431
Rewriting a Quadratic Function by Completing the Square (continued)
Write the quadratic function y 5 22x2 1 6x 1 4 in vertex form by completing the square.
Step 1: Factor a from the quadratic and linear terms.
Step 2: Find 12
of b, the linear coefficient, and square it.
Step 3: Add the square of that number b2
2, inside the
parentheses. To keep the value of the expression the same, multiply that value by a and subtract that product from the c term.
Step 4: Factor the trinomial inside the parentheses.
Step 5: Write the trinomial inside the parentheses as a perfect square.
Solution: y 5 22 x 1 32
2 1
172
y 5 22x2 2 6x 1 4 y 5 22(x2 1 3x) 1 4
b 5 3 12
(3) 5 32
, 32
2 5
94
y 5 22 x 2 1 3x 1 94
1 4 2 292
y 5 22 x 2 1 3x 1
94
1 172
x 2 1 3x 1 94
5 x 1 32
x 1 32
y 5 22 x 1 32
2 1
172
EXAMPLE B

SpringBoard Louisiana Algebra 1 Skills Workshop Quadratic Functions and Equations 432
Rewriting a Quadratic Function by Completing the Square (continued)
GUIDED PRACTICEComplete the steps to rewrite these quadratic functions in vertex form by completing the square.
1. y 5 x2 2 8x 2 3
Step 1: Find b2
2.
Step 2: b2
2 inside the parentheses.
y 5 (x2 2 8x 1 ) 2 3
Step 3: S ubtract the product of a and b2
2 from
the c term.
y 5 (x2 2 8x 1 ) 2 3
Step 4: .
(x2 2 8x 1 16) 5 ( )( )
Step 5: Write the trinomial inside the parentheses as a perfect square.
2. y 5 2x2 2 2x 1 5
Step 1: Factor a out of the quadratic and linear terms.
y 5 (x2 1 2x) 1 5
Step 2: Find b2
2.
Step 3: b2
2 inside the parentheses.
y 5 2(x 2 1 2x 1 ) 2 5
Step 4: Subtract the product of a and b2
2 from
the c term.
y 5 2(x2 1 2x 1 ) 2 5
Step 5: .
(x2 + 2x + 4) 5 ( )( )
Step 6: Write the trinomial inside the parentheses as a perfect square.
3. y 5 2x2 1 20x 1 17
y 5 (x2 1 2x 1 ) 1 5 1
y 5 (x 1 )2 1
4. y 5 3x2 1 3x 1 1
y 5 3(x2 1 x 1 ) 1 1 2
y 5 3(x 1 )2 1
INDEPENDENT PRACTICERewrite each quadratic function in vertex form by completing the square.
1. y 5 2x2 2 8x 1 12 2. y 5 5x2 1 30x 1 72 3. y 5 4x2 2 16x 2 8
4. y 5 12
x2 2 5x 1 3
5. y 5 23x2 2 6x 1 2
6. y 5 2x 2 1 6x 2 1

NAME CLASS DATE
SpringBoard Louisiana Algebra 1 Skills Workshop Quadratic Functions and Equations 433
Use with Unit 6Writing Equations for ParabolasThe standard form of the equation of a parabola is y 5 ax2 1 bx 1 c. Two other forms of the equation of a parabola reveal additional details about its graph. If a parabola has its vertex at the point (h, k), then the vertex form of the equation is y 5 a(x 2 h)2 1 k. If the parabola has x-intercepts, or roots, at r1 and r2, then the factored form of the equation is y 5 a(x 2 r1)(x 2 r2). The roots or the vertex can be used along with additional information to write an equation for a parabola.
Write in standard form the equation of a parabola with roots x 5 21 and x 5 3 that passes through the point (4, 10).
Step 1: Substitute the values for the roots into the factored form of the equation of a parabola.
Step 2: Substitute the x and y coordinates of the point (4, 10) for x and y in the equation, and solve for the quadratic coefficient a.
Step 3: Substitute the value of a into the factored form of the equation, and multiply to obtain the standard form.
y 5 a(x 2 r1)(x 2 r2) y 5 a(x 2 (21))(x 2 3) y 5 a(x 1 1)(x 2 3)
10 5 a(4 1 1)(4 1 3) 10 5 a(5)(1) 10 5 5a a 5 2
y 5 2(x 1 1)(x 2 3) y 5 2(x2 2 2x 2 3) y 5 2x2 2 4x 2 6
Solution: y 5 2x2 2 4x 2 6
EXAMPLE A

SpringBoard Louisiana Algebra 1 Skills Workshop Quadratic Functions and Equations 434
Writing Equations for Parabolas (continued)
Write in standard form the equation of a parabola with vertex at (2, 1) and y-intercept at 3.
Step 1: Substitute the coordinates of the vertex into the vertex form of the equation of a parabola.
Step 2: The y-intercept has coordinates (0, 3), so substitute these values for x and y and solve for a.
Step 3: Substitute the value of a into the vertex form of the equation, and rewrite in standard form.
y 5 a(x 2 h)2 1 k y 5 a(x 2 2)2 1 1
3 5 a(0 2 2)2 1 1 3 5 a(2 2)2 1 1 3 5 4a 1 1 2 5 4a
a 5 12
y 5 12
(x 2 2)2 1 1
y 5 12
(x2 2 4x 1 4) 1 1
y 5 12
x2 2 2x 1 2 1 1
y 5 12
x2 2 2x 1 3
Solution: y 5 12
x2 2 2x 1 3
EXAMPLE B
The graph of the equation y 5 3x2 1 24x 1 36 is a parabola. Write the equation in vertex form.
Step 1: Begin the process of completing the square by factoring the leading coefficient, a, from the first two terms.
Step 2: Divide the coefficient of the x-term by 2, and square the result. Add this value inside the parentheses. Subtract an equal quantity to keep the equation in balance.
Step 3: Write the expression inside the parentheses as a perfect square and simplify.
y 5 3(x2 1 8x) 1 36
y 5 3(x2 1 8x 1 16) 1 36 2 48
y 5 3(x 1 4)2 2 12
Solution: y 5 3(x 1 4)2 2 12
EXAMPLE C

SpringBoard Louisiana Algebra 1 Skills Workshop Quadratic Functions and Equations 435
Writing Equations for Parabolas (continued)
Write the equation y 5 2x2 1 6x 2 20 in factored form.
Step 1: Find and factor out any common factors from all three terms.
Step 2: Find any factors of the constant term, c, whose sum is equal to the coefficient of the first degree term, b.
Step 3: Write the polynomial expression in factored form using the values found in step 2.
y 5 2(x2 1 3x 2 10)
22 ? 5 5 210 22 1 5 5 3
y 5 2(x 2 2)(x 1 5)
Solution: y 5 2(x 2 2)(x 1 5)
EXAMPLE D
GUIDED PRACTICEWrite equations in standard form for parabolas with the given conditions.
1. Parabola with roots 3 and 5, where a 5 21.Step 1: Substitute the known values into the factored
form of the equation of a parabola.
Step 2: Multiply the factors and simplify.
Solution: y 5
y 5 a(x 2 r1)(x 2 r2) y 5 (x 2 )(x 2 )
y 5 (x2 2 x 2 x 1 ) y 5 (x2 2 x 1 ) y 5
2. Parabola with roots 25 and 2 and a y-intercept at (0, 210).Step 1: Substitute the known values in the factored form
of the equation of a parabola.
Step 2: Substitute the y-intercept coordinates into the equation and solve for a.
Step 3: Substitute the value of a into the factored form of the equation, and multiply to obtain the standard form.
Solution: y 5
y 5 a(x 2 r1)(x 2 r2) y 5 a(x 2 )(x 2 ) y 5 a( )( )
5 a( )( ) 5 a( )( ) 5 a( )( ) 5 a
a 5
y 5 ( )( ) y 5 y 5

SpringBoard Louisiana Algebra 1 Skills Workshop Quadratic Functions and Equations 436
Writing Equations for Parabolas (continued)
3. Parabola with a vertex at (21, 3) passing through point (1, 4).Step 1: Substitute the coordinates of the vertex into the
vertex form of the equation of a parabola.
Step 2: Substitute the x and y coordinates of the point (1, 4) for x and y into the equation, and solve for a.
Step 3: Substitute a into the vertex form of the equation and simplify.
Solution: y 5
y 5 a(x 2 h)2 1 k y 5 a( )2 1
4 5 a( )2 1 4 5 a 1
5 a
a 5
y 5 ( )2 1
y 5 ( ) 1
y 5
4. Parabola with a vertex at (2, 212) passing through (5, 15).Step 1: Substitute the coordinates of the vertex into the
vertex form of the equation of a parabola.
Step 2: Substitute the x and y coordinates of the given points for x and y into the equation, and solve for a.
Step 3: Substitute a into the vertex form of the equation and simplify.
Solution:
y 5
a 5
y 5
5. Write the equation y 5 5x2 2 20x 1 12 in vertex form.Step 1: Factor the leading coefficient from the first two
terms.
Step 2: Divide the coefficient of the x-term by 2, and square the result. Add this value inside the parentheses. Subtract an equal quantity to keep the equation in balance.
Step 3: Write the expression inside the parentheses as a perfect square and simplify.
Solution:
y 5 (x2 2 x) 1 12
y 5 (x2 2 x 1 ) 1 12 2
y 5 (x 2 )2 2

SpringBoard Louisiana Algebra 1 Skills Workshop Quadratic Functions and Equations 437
Writing Equations for Parabolas (continued)
6. Write the equation y 5 3x2 1 18x 1 24 in factored form.Step 1: Factor out the common factor.
Step 2: Find any factors of the constant term whose sum is equal to the coefficient of the first degree term.
Step 3: Write the polynomial expression in factored form using the values found in step 2.
Solution:
y 5 (x2 1 x 1 )
? 5 1 5
y 5 (x 1 )(x 1 )
INDEPENDENT PRACTICEWrite equations in standard form for parabolas with the given conditions.
1. Parabola with roots 22 and 4, where a 5 1
2. Parabola with roots 25 and 5, where a 5 22
3. Parabola with roots 27 and 1 passing through (3, 10)
4. Parabola with roots 3 and 8 with y-intercept at (0, 72)
5. Parabola with a vertex at (3, 22), and roots 2 and 4
6. Parabola with a vertex at (24, 25), and a y-intercept at (0, 21)
Write equations in vertex form for parabolas with the given equations.
7. y 5 x2 1 6x 1 5
8. y 5 2x2 1 20x 2 13
9. y 5 23x2 1 12x 2 5
Write equations in factored form for parabolas with the given equations.
10. y 5 x2 2 4x 2 45
11. y 5 3x2 1 33x 1 84
12. y 5 22x2 1 20x 2 32

NAME CLASS DATE
SpringBoard Louisiana Algebra 1 Skills Workshop Exponents and Exponential Functions 438
Compounding Periods and Finding TimeCompound interest is interest determined on both the initial amount (the principal) and interest previously earned. The frequency of calculating the interest is the compounding period. The total interest depends on the initial amount, the interest rate, the compounding period, and the length of the loan or investment. The compound interest formula is a common method of evaluating compound interest problems.
The compound interest formula is A 5 P 1
rn
1nt
where A 5 the total amount including
interest, P 5 the principal, r 5 the interest rate per time period as a decimal, n 5 the number of times the interest is compounded per time period, and t 5 the number of time periods. Most often, r, n, and t are expressed in years.
EXAMPLE
An investment has a starting principal of $5000 and 5% annual interest, compounded monthly.
a. Determine the interest earned in 5 years.According to the given information, P, the principal, is $5000; r, the interest rate, is 0.05 annually; n, the number of times per year the interest is compounded, is 12 (monthly); and t (time), the number of years, is 5.
A 5 5000 1
1 0.05
12
(12)(5)
A 5 5000(1 1 0.004166)(60)
A 5 5000(1.004166)(60)
A 5 5000(1.2834)A 5 $6417Since the starting principal was $5000, the interest earned was $6417 2 $5000 5 $1417.
Solution: $1417 of interest will be earned in 5 years.
b. Determine the total amount after 7 years.Substitute the information from the question into the formula just as in part a, only with t 5 7 years, instead of 5 years.
A 5 5000 1
1 0.05
12
(12)(7)
A 5 5000(1.004166)84
A 5 5000(1.418)A 5 $7090
Solution: $7090 is the total amount after 7 years.
c. If the rate is 7%, what would be the total amount after 7 years?Substitute the values from the problem as in part b, but let r 5 0.07 instead of 0.05.
A 5 5000 1
1 0.07
12
(12)(7)
A 5 5000(1.005833)84
A 5 5000(1.63)A 5 $8150
Solution: $8150 would be the total amount after 7 years.

SpringBoard Louisiana Algebra 1 Skills Workshop Exponents and Exponential Functions 439
Compounding Periods and Finding Time (continued)
PRACTICE
1. How much interest would accrue on a $3500 investment over 15 years at 3% annual interest, compounded annually?
2. How much interest would accrue on a $3500 investment over 15 years at 3% annual interest, compounded monthly?
3. How much interest would accrue on a $3500 investment over 15 years at 3% annual interest, compounded weekly?
4. How much money would you have 9 years after investing $7500 at 4% annual interest, compounded every six months (semi-annually)?
5. What was the starting principal of an investment at 6% annual interest, compounded monthly, that resulted in a total of $15,881.11 after 4 years?
6. How much money would you owe after 15 years if you borrowed $75,000 at 2.3% annual interest, compounded monthly?
7. What was the starting principal of an investment at 3.5% annual interest, compounded monthly, that resulted in a total of $142,664.36 after 30 years?
8. What was the starting principal of an investment at 6% annual interest, compounded quarterly, that resulted in a total of $5387.42 after 5 years?

NAME CLASS DATE
SpringBoard Louisiana Algebra 1 Skills Workshop Exponents and Exponential Functions 440
Exponential ExpressionsThere are different names for the parts of an exponential expression.
Identify the coefficient, base, and exponent of 3x7.Step 1: The coefficient is the number multiplied by the algebraic part of the exponential term. If there is no number written in the front of the term, the coefficient is understood to be 1. The coefficient of 3x7 is 3.
Step 2: The base is the part of the term that is raised to the power. The base is x.
Step 3: The power on the base is called the exponent. If there is no exponent on a base, the exponent is understood to be 1. The number 7 is the exponent of this term.
Solution: The coefficient of 3x7 is 3. The base of 3x7 is x. The exponent is of 3x7 is 7.
EXAMPLE A
Exponents can be used write equivalent forms of expressions.
Use exponents to write an equivalent expression for 49 ? 21 1 49 ? 7.Step 1: Write the expression with prime factors. 49 ? 21 1 49 ? 7 5 7 ? 7 ? 7 ? 3 1 7 ? 7 ? 7 ? 1
Step 2: Factor out the common factors. 5 7 ? 7 ? 7 (3 1 1) Step 3: Simplify inside the parentheses and use exponents for repeated factors. 5 73(4)
Step 4: If needed, write any other numbers with prime factors. 5 73(22)
If the number in parentheses is prime, then the process is complete.
Solution: 49 ? 21 1 49 ? 7 5 73 ? 22
EXAMPLE B
PRACTICEIdentify the coefficient, base, and exponent of each term.
1. 2y5 2. 2z5 3. 8r0 4. 12v
Use exponents to write an equivalent expression.
5. 64 ? 16 1 2 ? 64 6. 8 ? 4 1 24 ? 2 7. 9 ? 81 1 27 ? 6

NAME CLASS DATE
SpringBoard Louisiana Algebra 1 Skills Workshop Exponents and Exponential Functions 441
Use with Unit 3Exponential Growth and DecayReal-world situations in which a quantity grows or decays with time at a constant rate can be modeled by exponential growth and exponential decay functions.
The population of a town is predicted to increase by 1.5% each year. This situation can be represented by an exponential growth function, because the population is increasing by a constant rate (1.5%) each year.
The basic forms of exponential growth and decay equations are given below.
Exponential Growth Exponential Decay
y 5 a(1 1 r)x y 5 a(1 2 r)x
a: the initial amount before increasing or decreasing r: the rate of increase or decrease, using the decimal form of the percent increase x: the number of intervals y: the resulting amount after x intervals.
The population of a town is predicted to increase by 1.5% each year. The population is currently 56,000 residents. Write an equation to find the population of the town, P, after t years.
Step 1: Write the rate of increase, r, in decimal form. The population increases by 1.5% each year.
Step 2: Determine the initial population, a. The initial population is 56,000.
Step 3: Substitute the known values into the exponential growth equation.
1.5% 5 0.015 r 5 0.015
a 5 56,000
P 5 56,000(1 1 0.015)t P 5 56,000(1.015)t
EXAMPLE A
Exponential growth and decay equations can be evaluated by substituting and simplifying.
What is the predicted population of the town from Example A after 4 years, to the nearest whole number?
Step 1: Substitute 4 for t.
Step 2: Interpret the result.
P 5 56,000(1.015)4 P < 56,000(1.0614) P < 59,436
The predicted population of the town after 4 years is 59,436.
EXAMPLE B

SpringBoard Louisiana Algebra 1 Skills Workshop Exponents and Exponential Functions 442
Exponential Growth and Decay (continued)
Carlos buys a new car for $32,000. The car will lose 8% of its value each year. Write an equation to find the value of the car, V, in dollars after t years. What will the value of the car be after 6 years to the nearest dollar?
Step 1: Write the rate of decrease in decimal form. The value decreases by 8% each year.
Step 2: Determine the initial value. The initial value of the car is $32,000.
Step 3: Substitute the known values into the exponential decay equation.
Step 4: Substitute the known value for time, t, into the equation.
Step 5: Interpret the result.
8% 5 0.08 r 5 0.08
a 5 32,000
V 5 32,000(1 2 0.08)t V 5 32,000(0.92)t
V 5 32,000(0.92)6 V < 32,000(0.6064) V < 19,403
The value of the car will be $19,403 after 6 years.
EXAMPLE C
GUIDED PRACTICEFill in the missing words or values.
1. Sari’s bank account had an initial deposit of $3000 and earns 2.5% interest compounded annually. Write an equation to find the amount of money in her account, A, after t years. How much will be in Sari’s account after 5 years, to the nearest cent?
Step 1: Write the rate of increase in decimal form. The amount increases/decreases by 2.5% each year.
Step 2: Determine the initial amount deposited, a, into the account. The initial amount is $3000.
Step 3: Substitute the known values into the exponential growth/decay equation.
Step 4: Substitute the known value for time, t.
Step 5: Interpret the result.
% 5 r 5
a 5
A 5 ( )t
A 5 ( ) A < ( )
After 5 years, the amount in the account will be $3394.22.

SpringBoard Louisiana Algebra 1 Skills Workshop Exponents and Exponential Functions 443
Exponential Growth and Decay (continued)
2. Each year, there is a state high school soccer tournament. This year there are 64 teams in the tournament. During each round, half of the teams are eliminated. Fill in the steps to write an equation to find the number of soccer teams left, S, after t rounds. Then calculate how many teams will be left after 3 rounds.
Step 1: Find the rate of increase or decrease, and write it as a decimal. The number of teams increases/decreases by 50% each round.
Step 2: Find the initial number of teams, a.
Step 3: Substitute the known values into the exponential growth/decay equation.
Step 4: Substitute the known value for time.
Step 5: Interpret the result.
50% 5 r =
a 5
S 5 (1 )t S 5 ( )t
S 5 ( ) S 5
There will be teams left after rounds.
INDEPENDENT PRACTICEUse the information below to answer Items 1 and 2.A small business had an annual profit of $86,000 this year. The owner predicts that profits will increase by 4% each year. Use this information to answer Items 1 and 2.
1. Write an equation to find the predicted profit P, in dollars after t years.
2. What is the predicted annual profit in 8 years to the nearest dollar?
Use the following information to answer Items 3 and 4.In a county, the number of households that did not have internet access in 2010 was 6,200. The percent of houses that does not have internet access decreased annually by approximately 8.5%.
3. Write an equation to find the number of households, N, that did not have internet access x years after 2010.
4. To the nearest house, how many households did not have internet access in 2016 ? Show your work.
Answer items 5 and 6 with the given information.
5. Alicia is studying bacteria in a science lab. There are 8 bacteria in a petri dish. The bacteria double every hour. Write an equation to find the number of bacteria, B, after h hours. Then calculate how many bacteria will be in the petri dish after 7 hours.
6. Desmond buys a new computer for $2,800. The computer will lose 6% of its value each month. Write an equation to find the value of the computer, V, in dollars after m months. Then calculate the value of the computer in one year to the nearest dollar.

NAME CLASS DATE
SpringBoard Louisiana Algebra 1 Skills Workshop Exponents and Exponential Functions 444
Properties of ExponentsExponents are used to express very large or very small quantities and to express the powers of constants and variables in algebraic expressions. Refresh your memory of exponent properties by reviewing the chart below.
Properties of Exponents
Product of Powers (am)(an) 5 am 1 n (22)(23) 5 22 1 3 5 25 5 32
Quotient of Powersaa
am
nm n5 2 7
7
5
3 5 75 2 3 5 72 5 49
Power of a Power (am)n 5 am ? n (32)4 5 32 · 4 = 38 5 6561
Power of a Product (ab)m 5 ambm (4x)2 5 42x2 5 16x2
Power of a Quotientab
m
5
ab
m
m1011
2
5
1011
2
2 5 100121
Negative Power a 2m 5 a1m 423 5
143 5
164
Simplify y x xx
( )5 2 3 2
3.
Step 1: Apply the Product of Powers Property inside the parentheses.
Step 2: Apply the Power of a Power Property to eliminate the parentheses.
Step 3: Apply the Quotient of Powers Property to the x-terms.
Solution: y x x
x( )5 2 3 2
3 5 y5x7
y x xx
( )5 2 3 2
3 5 y xx( )5 5 2
3
5 y xx
5 10
3
5 y5x7
EXAMPLE A
Simplify xyx
( )2
32.
Step 1: Apply the Power of a Product Property.
Step 2: Apply the Negative Power Property to eliminate the fraction.
Step 3: Apply the Product of Powers Property to the x-terms.
Solution: xyx
( )2
32 5 x5y2
xyx
( )2
32 5 x yx
2 2
32
5 x3x2y2
5 x5y2
EXAMPLE B

SpringBoard Louisiana Algebra 1 Skills Workshop Exponents and Exponential Functions 445
Properties of Exponents (continued)
Scientific notation is a way to write very large and very small numbers using powers of 10, in order to use as few digits as possible.
In scientific notation, a number is written in the forma 3 10n,
where 1 # a , 10.
If a number written in scientific notation has a positive exponent in the power of 10, the number is very large.
Write 6.07 3 105 in standard form.
Step 1: Write the number before the multiplication sign.
Step 2: Move the decimal point to the right 5 places, the same number as the exponent, using zeros as placeholders.
Step 3: Rewrite the number with commas in the appropriate places.
Solution: 6.07 3 105 5 607,000
6.07
6 . 0 7 0 0 0 .
607,000
EXAMPLE C
The population of California in 2009 was about 37,000,000. Write this number in scientific notation.
Step 1: Write the number with the decimal point in the appropriate place.
Step 2: Count how many places you must move the decimal point to the left to form a number between 1 and 10.
Step 3: Rewrite the number in scientific notation, using the number greater than or equal to 1 and less than 10 as a and the number of places the decimal point moved as n.
Solution: 37,000,000 5 3.7 3 107
37,000,000.
3 . 7 0 0 0 0 0 0 .
You must move the decimal point 7 spaces to the left.
3.7 3 107
EXAMPLE D

SpringBoard Louisiana Algebra 1 Skills Workshop Exponents and Exponential Functions 446
When a number written in scientific notation has a negative exponent in the power of 10, the number is very small.
A cell in a plant is 2.5 3 1027 m wide. Write this number in standard form.
Step 1: Write the number before the multiplication sign.
Step 2: Move the decimal point to the left 7 places, using zeros as placeholders.
Step 3: Rewrite the number with the decimal point in the appropriate place.
Solution: 2.5 3 1027 m 5 0.00000025 m
2.5
0 . 0 0 0 0 0 0 2 . 5
10 is taken to the 27th power, so move the decimal point 7 spaces to the left.
0.00000025
EXAMPLE E
Write 0.00000902 in scientific notation.
Step 1: Write the number.
Step 2: Count how many places you must move the decimal point to the right to form a number between 1 and 10.
Step 3: Rewrite the number in scientific notation, using the number greater than or equal to 1 and less than 10 as a and the number of spaces the decimal point moved as n.
Solution: 0.00000902 5 9.02 × 1026
0.00000902
0 . 0 0 0 0 0 9 . 0 2
You must move the decimal point6 spaces to the right.
9.02 3 1026
EXAMPLE F
Properties of Exponents (continued)

SpringBoard Louisiana Algebra 1 Skills Workshop Exponents and Exponential Functions 447
PRACTICESimplify.
1. (4x2y)(3x3) 2. aab9
3
4
22 3. s4t t
s36
4
Write in scientific notation.
4. 43,700,000 5. 0.00068 6. 769,000,000,000
Write in standard form.
7. 3.4 3 104 8. 9.88 3 1023 9. 5.17 3 109
10. The Andromeda Galaxy is one of the farthest things you can see from Earth with the naked eye. It contains about 100,000,000,000,000 stars. An astronomer is comparing the Andromeda Galaxy to a newly discovered galaxy that has about 100,000,000,000 stars. Write the number of stars in each galaxy in scientific notation, and then calculate how many times as many stars the Andromeda Galaxy contains compared to the newly discovered galaxy. Show your work, and name any properties of exponents that you use. Write your answer in scientific and standard notation.
Properties of Exponents (continued)

NAME CLASS DATE
SpringBoard Louisiana Algebra 1 Skills Workshop Absolute Value Functions 448
Reflections over the x-axisWhen a parent function is multiplied by a negative number, the graph is reflected over the x-axis. The graph is flipped vertically.
Describe the result of each translation on the parent function f (x) 5 |x|.
a. g (x) 5 2|x|
b. g (x) 5 22|x|
c. g (x) 5 234
|x|
Solution: a. Multiplying by 21 outside of the absolute value “flips” the graph over the x-axis, resulting in a vertical
reflection.
b. Multiplying the absolute value function by a negative constant greater than 1 stretches the graph vertically, causing it to appear narrower, and also reflects it over the x-axis.
c. Multiplying the absolute value by a negative constant between 0 and 1 compresses the graph vertically, causing it to appear wider, and reflects it over the x-axis.
EXAMPLE
PRACTICEBased on the parent function f (x) 5 |x|, describe each transformation from f (x) to g (x). 1. g (x) 5 2|x| 1 1
2. g (x) 5 2|x| 2 2
3. g (x) 5 |x|
4. g (x) 5 2|x|
5. g (x) 5 12
|x| 2 2
6. g (x) 5 22|x| 1 3
7. g (x) 5 213
|x|
8. Graph the function g(x) 5 212
|x| 2 2 using transformations
of the parent function f (x) 5 |x|.
2224
22
2
2 4 626
4
24
26
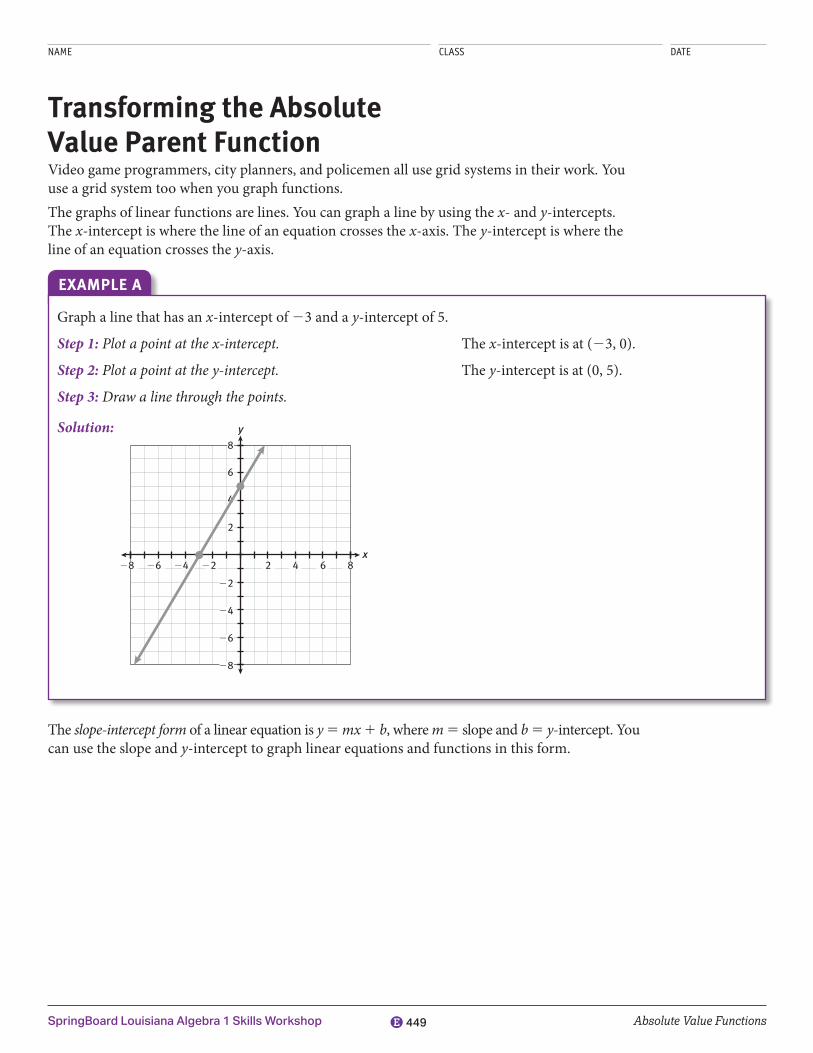
NAME CLASS DATE
SpringBoard Louisiana Algebra 1 Skills Workshop Absolute Value Functions 449
Transforming the Absolute Value Parent FunctionVideo game programmers, city planners, and policemen all use grid systems in their work. You use a grid system too when you graph functions.The graphs of linear functions are lines. You can graph a line by using the x- and y-intercepts. The x-intercept is where the line of an equation crosses the x-axis. The y-intercept is where the line of an equation crosses the y-axis.
Graph a line that has an x-intercept of 23 and a y-intercept of 5.
Step 1: Plot a point at the x-intercept. The x-intercept is at (23, 0).
Step 2: Plot a point at the y-intercept. The y-intercept is at (0, 5).
Step 3: Draw a line through the points.
Solution:
x
y
22242628
28
26
24
22
2
4
6
8
2 4 6 8
EXAMPLE A
The slope-intercept form of a linear equation is y 5 mx 1 b, where m 5 slope and b 5 y-intercept. You can use the slope and y-intercept to graph linear equations and functions in this form.

Transforming the Absolute Value Parent Function (continued)
SpringBoard Louisiana Algebra 1 Skills Workshop Absolute Value Functions 450
Graph f (x) 5 13
x 1 2.
Step 1: Substitute y for f(x) in the function.
The equation is in slope-intercept form. Identify the value of m to get the slope and the value of b to get the y-intercept.
Step 2: Find the y-intercept and plot the point.
Step 3: Treat m as vertical changehorizontal change
to find and plot a second point.
Go up 1 unit and to the right 3 units from (0, 2).
Step 4: Draw a line through the points.
Solution:
x
y
22242628
28
26
24
22
2
4
6
8
2 4 6 8
5 1y x13
2
y 5 mx 1 b
m 5 slope 5 13
b 5 y-intercept 5 2
The y-intercept is at (0, 2).
The second point is (3, 3).
EXAMPLE B

Transforming the Absolute Value Parent Function (continued)
SpringBoard Louisiana Algebra 1 Skills Workshop Absolute Value Functions 451
You have seen that the graphs of linear functions are lines. Take a look at the graph of an absolute value function y 5 |x|.The graph of y 5 |x| has the shape of a V, centered at the vertex, (0, 0). The slope of the right half of the V is 1, and the slope of the left half of the V is 21. x
y
22242628
28
26
24
22
2
4
6
8
2 4 6 8
A graph of any equation of the form y 5 |x 2 h| 1 k will have the same shape as y 5 |x|, but it will be in a different position on the coordinate plane. A change in the value of h moves the graph left or right. A change in the value of k moves the graph up or down. The vertex is always at the point (h, k).
Graph the function y 5 |x| 2 4 on the same plane as y 5 |x|.
Step 1: Write the equation in the form y 5 |x 2 h| 1 k. Set the value y 5 |x 2 h| 1 k of h equal to 0, since it does not appear in the equation. y 5 |x| 2 4 → y 5 |x 2 0| 2 4
Step 2: Determine the values of h and k. h 5 0 k 5 24
Step 3: Plot the vertex at (h, k). The vertex is at the point (0, 24).
Step 4: Draw the right half of the V up from the vertex with a slope of 1. Draw the left half of the V up from the vertex with a slope of 21.
Solution:
x
y
22242628
28
26
24
22
2
4
6
8
y 5 |x|
y 5 |x|24
2 4 6 8
EXAMPLE C

Transforming the Absolute Value Parent Function (continued)
SpringBoard Louisiana Algebra 1 Skills Workshop Absolute Value Functions 452
Graph the function y 5 |x 2 3| on the same plane as y 5 |x|.
Step 1: Write the equation in the form y 5 |x 2 h| 1 k. Set the value of k y 5 |x 2 h| 1 k equal to 0, since it does not appear in the equation. y 5 |x 2 3| → y 5 |x 2 3| 1 0
Step 2: Determine the values of h and k. h 5 3 k 5 0
Step 3: Plot the vertex at (h, k). The vertex is at the point (3, 0).
Step 4: Draw the right half of the V up from the vertex with a slope of 1. Draw the left half of the V up from the vertex with a slope of 21.
Solution:
x
y
22242628
28
26
24
22
2
4
6
8
y 5 |x|
y 5 |x23|
2 4 6 8
EXAMPLE D
PRACTICEGraph a line with the given intercepts. Use the same grid for Items 1–3.
1. x-intercept: 4y-intercept: 22
x
y
22242628
28
26
24
22
2
4
6
8
2 4 6 8
2. x-intercept: 1y-intercept: 25
3. x-intercept: 23y-intercept: 21

Transforming the Absolute Value Parent Function (continued)
SpringBoard Louisiana Algebra 1 Skills Workshop Absolute Value Functions 453
Graph the following functions on the same grid.
4. f (x) 5 34
x 1 1
x
f(x)
2428212216
216
212
28
24
4
8
12
16
4 8 12 16
5. f (x) 5 24x 2 2
6. f (x) 5 15
1 3
Graph the following equations on the same grid.
7. y 5 |x|
x
y
22242628
28
26
24
22
2
4
6
8
2 4 6 8
8. y 5 |x| 1 2
9. y 5 |x 1 5|
10. A game uses a coordinate grid system. In the game, a ball travels in a straight line from (7, 7) to an object at (23, 23). The ball bounces off the object at (23, 23) and travels in a straight line to the point (27, 1). Graph the path of the ball and describe it with an equation. Explain your results.
x
y
22242628
28
26
24
22
2
4
6
8
2 4 6 8

NAME CLASS DATE
SpringBoard Louisiana Algebra 1 Skills Workshop Absolute Value Functions 454
Use with Activity 15, Lesson 15-1
Translating Linear and Absolute Value Parent FunctionsFor a given parent function y 5 f (x), adding a constant will translate , or move, the graph of the function. The direction of the translation depends on the sign of the constant.
k < 0 k > 0
f (x) 1 k vertical translation down upf (x 1 k) horizontal translation right left
The function g (x) 5 x 2 3 is a vertical translation of the function f (x) 5 x.
–5
–4
4
5
2
–2
f(x) = x
g(x) = x – 3
The translation of the graph f (x) 5 x results in g (x) 5 x 2 3
The negative value of k means the graph moves down.
The value of k is 23, so the graph moves down 3 units.
EXAMPLE A
The vertex on the graph of an absolute value function provides an excellent reference for studying translations.
The vertex can be used to determine the translations to the absolute value graph f (x) 5 |x| to form g (x) 5 |x 2 1| 1 2.
–2
4
2
f(x) = �x�
g(x) = �x – 1� + 2
–5 5
6
The graph of the function f (x) 5 |x| is moves to the right 1 unit and up 2 units to form the graph of g (x) 5 |x 2 1| 1 2 .
EXAMPLE B

SpringBoard Louisiana Algebra 1 Skills Workshop Absolute Value Functions 455
Translating Linear and Absolute Value Parent Functions (continued)
GUIDED PRACTICE 1. Describe the transformation from the graph of f (x) 5 x to the graph of g (x) 5 x 1 10.
a. Was k added to or subtracted from the x term of the function?
b. The graph of f (x) is translated units .
2. The graph of h(x) is the graph of f (x) 5 x translated 4 units down.
a. Should k be added to or subtracted from the x term of the function?
b. Write a function to represent h(x).
h(x) 5
3. Describe the translation from the graph of f (x) 5 |x| to the graph of g (x) 5 |x 1 3|.
a. Will the graph move horizontally or vertically?
b. How do you know the direction in which the translation will occur?
c. The graph of f (x) is translated units to the .
4. The graph of f (x) 5 |x| translated 2 units to the right and 5 units up.
a. Does a horizontal translation occur inside or outside of the absolute value sign?
b. Does a vertical translation occur inside or outside of the absolute value sign?
c. Write the function to represent the graph formed by the translation.
h(x) 5 |x |

SpringBoard Louisiana Algebra 1 Skills Workshop Absolute Value Functions 456
Translating Linear and Absolute Value Parent Functions (continued)
INDEPENDENT PRACTICEDescribe the translation from f(x) to g(x).
1. f (x) 5 x
g(x) 5 x 1 5
2. f (x) 5 x
g(x) 5 x 2 9
3. f (x) 5 |x|
g(x) 5 |x| 2 2
4. f (x) 5 |x|
g(x) 5 |x 1 3|
5. f (x) 5 |x|
g(x) 5 |x 1 1| 1 8
6. f (x) 5 |x|
g(x) 5 |x 2 6| 1 4
Write the function g(x) described by the translations of the graph of f (x).
7. f (x) 5 x
1 unit up
8. f (x) 5 x
7 units down
9. f (x) 5 |x|
5 units right
10. f (x) 5 |x|
4 units down
11. f (x) 5 |x|
9 units left and 2 units down
12. f (x) 5 |x|
3 units right and 5 units down
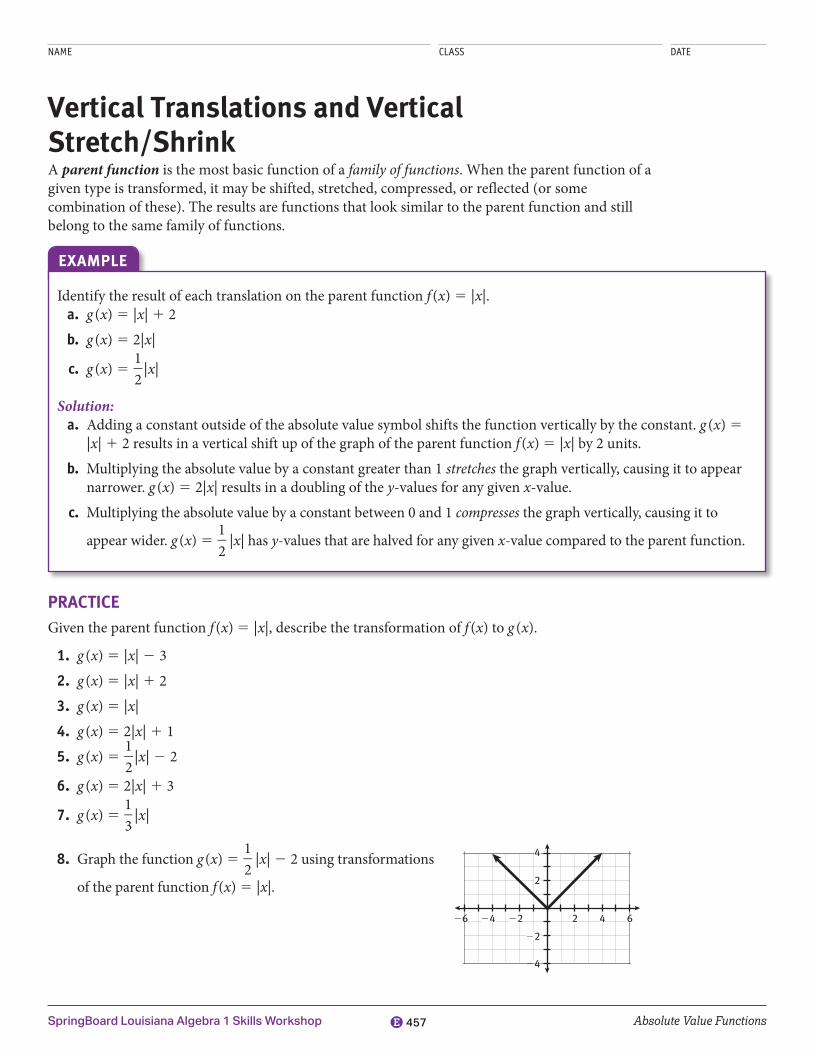
NAME CLASS DATE
SpringBoard Louisiana Algebra 1 Skills Workshop Absolute Value Functions 457
Vertical Translations and Vertical Stretch/ShrinkA parent function is the most basic function of a family of functions. When the parent function of a given type is transformed, it may be shifted, stretched, compressed, or reflected (or some combination of these). The results are functions that look similar to the parent function and still belong to the same family of functions.
Identify the result of each translation on the parent function f (x) 5 |x|. a. g (x) 5 |x| 1 2
b. g (x) 5 2|x|
c. g (x) 5 12
|x|
Solution: a. Adding a constant outside of the absolute value symbol shifts the function vertically by the constant. g (x) 5
|x| 1 2 results in a vertical shift up of the graph of the parent function f (x) 5 |x| by 2 units.
b. Multiplying the absolute value by a constant greater than 1 stretches the graph vertically, causing it to appear narrower. g (x) 5 2|x| results in a doubling of the y-values for any given x-value.
c. Multiplying the absolute value by a constant between 0 and 1 compresses the graph vertically, causing it to
appear wider. g (x) 5 12
|x| has y-values that are halved for any given x-value compared to the parent function.
EXAMPLE
PRACTICEGiven the parent function f (x) 5 |x|, describe the transformation of f (x) to g (x).
1. g (x) 5 |x| 2 3
2. g (x) 5 |x| 1 2
3. g (x) 5 |x|
4. g (x) 5 2|x| 1 1
5. g (x) 5 12
|x| 2 2
6. g (x) 5 2|x| 1 3
7. g (x) 5 13
|x|
8. Graph the function g (x) 5 12
|x| 2 2 using transformations
of the parent function f (x) 5 |x|.
2224
22
2
2 4 626
4
24

NAME CLASS DATE
SpringBoard Louisiana Algebra 1 Skills Workshop Polynomials 458
Factoring Higher-Level PolynomialsJust as there are common forms of quadratic polynomials, there are also common forms of cubic polynomials. Learning to recognize these forms can save much time and effort when you need to factor to simplify or solve cubic (third-degree) expressions.
Sum of Cubes a3 1 b3 5 (a 1 b)(a2 2 ab 1 b2)Difference of Cubes a3 2 b3 5 (a 2 b)(a2 1 ab 1 b2)
Notice that the factored form of both the sum and difference of cubes is a binomial multiplied by a trinomial, and that the relative powers of each term are the same for both sum and difference. The difference between the forms is in the signs of the terms. A “rule of thumb” for keeping track of the signs when factoring the sum and difference of cubes is S.O.P., or Same, Opposite, Positive. The terms refer to the signs in the factored form compared to the original sum or difference of cubes.
x3 2 y3 5 (x 2 y)(x2 1 xy 1 y2)
same signopposite sign
always positive sign
Factor the sum of cubes: 8x3 1 27b3.
Step 1: Determine the cube root of each term. x8 33 5 2x, b27 33 5 3b
Step 2: Use the calculated roots to populate the factored form of the sum of cubes.
(2x 1 3b) ((2x)2 2 (2x)(3b) 1 (3b)2) (2x 1 3b) (4x2 2 6xb 1 9b2)
Step 3: Verify that the signs between the terms in the factored form follow the S.O.P. rule according to the sign in the original sum of cubes, “1”.
(2x 1 3b)(4x2 2 6xb 1 9b2)
Same Opposite PositiveSolution: (2x 1 3b)(4x2 2 6xb 1 9b2)
EXAMPLE
PRACTICEFactor the sum or difference of cubes.
1. x3 2 y3 2. a3 1 8b3
3. 27x3 1 8y3 4. 64m3 2 n6
5. 5(25x3 2 25y3) 6. 3a3 1 3b3

NAME CLASS DATE
SpringBoard Louisiana Algebra 1 Skills Workshop Polynomials 459
Factoring PolynomialsFactoring is the process of writing a number or expression as the product of its factors. Factoring makes complicated expressions easier to work with. Suppose you are given the area of a square in the form x 2 1 10x 1 25. By factoring, you can find in just a few steps that the side length of the square is equal to the expression x 1 5.Expressions like the ones above are called polynomials. The terms of a polynomial are separated by plus or minus signs. Polynomials have more specific names based on how many terms they have. The chart below shows some ways to classify polynomials.
Type of Polynomial
Number of Terms Examples
Monomial 1 term 2; 7x 2; lw; 9a5b9
Binomial 2 terms x 1 5; a2 2 5b; 5z4 2 2zTrinomial 3 terms x 2 1 10x 1 25; 1 1 y 2 9x
You can simplify binomials and trinomials by factoring them.
Factor the binomial completely: 6x 2y 1 18xz.
Step 1: Look for the greatest common factor (GCF) of the coefficients in each term.
6x 2y 1 18xz6 and 18 have a GCF of 6.
Step 2: Factor out the 6. Make sure you divide each term inside the parentheses by 6, since you are factoring 6 from each.
x y xz6 66
186
2
1
6(x 2y 1 3xz)
Step 3: Look for common factors of x in the terms. x 2y and xz have a GCF of x.
Step 4: Factor out the GCF. Make sure you divide each term inside the parentheses by x, since you are factoring x from each. 1
x x yx
xzx
6 32
Step 5: Look for any other common factors. Only one term has a y and only one term has a z, so factoring is complete.
6x(xy 1 3z)
Solution: 6x(xy 1 3z)
EXAMPLE A

Factoring Polynomials (continued)
SpringBoard Louisiana Algebra 1 Skills Workshop Polynomials 460
Many trinomials in the form x 2 1 bx 1 c, where b and c are integers, canbe factored into two binomials in the form (x 1 d)(x 1 e), where d and e are also integers.
Factor the trinomial x 2 1 2x 2 8.
Step 1: Set up the two binomial factors of the trinomial. The first term in each binomial is x because x ? x 5 x 2. To factor, you must fill in the second term in each binomial.
(x 1 __ )(x 1 __ )
Step 2: List factor pairs that have a product equal to the third term, 28, and list the sum of each factor pair.
Step 3: Look for the factor pair that has a sum equal to the coefficient of the second term, 2. 22 1 4 5 2, so one of the terms is 22 and one is 4.
Factors Sum
1 28 2721 8 7
2 24 2222 4 2
(x 1 (22))(x 1 4)
Solution: x 2 1 2x 2 8 5 (x 22)(x 1 4) (x 2 2)(x 1 4)
EXAMPLE B
You can also use special factoring patterns to factor certain trinomials such as those shown below.
Perfect Square Trinomials
a2 1 2ab 1 b2 5 (a 1 b)2
a2 2 2ab 1 b2 5 (a 2 b)2
If the first and third terms in a trinomial are perfect squares, check to see if the trinomial fits one of the perfect square trinomial factoring patterns.
Factor the trinomial x 2 1 24x 1 144.
Step 1: Notice that the first and third terms are perfect squares. x 2 1 24x 1 144x 2 5 x, so a = x144 5 12, so b = 12
a2 1 2ab 1 b2
x 2 1 2x(12) 1 122
x 2 1 24x 1 144
(a 1 b)2
(x 1 12)2
Step 2: Take the square roots of the first and third terms to find the possible values of a and b.
Step 3: Test the values for a and b. Because the middle term is positive, check to see if the trinomial fits the pattern a2 1 2ab 1 b2 with a positive second term. Substitute the values for a and b to see if you get the original trinomial and then simplify.
Step 4: This matches the original trinomial, so it fits the factoring pattern. Write out the squared binomial from the factoring pattern in the table above and substitute the values you found for a and b.
Solution: x 2 1 24x 1 144 5 (x 1 12)2
EXAMPLE C

Factoring Polynomials (continued)
SpringBoard Louisiana Algebra 1 Skills Workshop Polynomials 461
Factor the trinomial x 2 2 8x 1 16.
Step 1: Notice that the first and third terms are perfect squares.
Step 2: Take the square roots of the first and third terms to find the possible values of a and b.
Step 3: Test the values for a and b. Because the middle term is negative, check if the trinomial fits the pattern a2 2 2ab 1 b2 with a negative second term. Substitute the values for a and b to see if you get the original trinomial and then simplify.
Step 4: This matches the original trinomial, so it fits the factoring pattern. Write out the squared binomial from the factoring pattern in the table on the previous page and substitute the values you found for a and b.
Solution: x 2 2 8x 1 16 5 (x 2 4)2
EXAMPLE D
The difference of squares is another factoring pattern that you can use with certain binomials.
Difference of Squares
a2 2 b2 5 (a 1 b)(a 2 b)
Factor the binomial y2 2 64.
Step 1: Notice that this is a difference of two perfect squares, y2 2 64 so it fits the Difference of Squares factoring pattern from above. a2 2 b2
Step 2: Take the square root of each term to find the y2 5 y, so a 5 y values of a and b. 64 5 8, so b 5 8
Step 3: Write out the binomials from the factoring pattern (a 1 b)(a 2 b) and substitute the values you found for a and b. (y 1 8)(y 2 8)
Solution: y2 2 64 5 (y 1 8)(y 2 8)
EXAMPLE E
x 2 2 8x 1 16
x 2 5 x, so a 5 x
16 5 4, so b 5 4a2 2 2ab 1 b2
x 2 2 2x(4) 1 42
x 2 2 8x 1 16
(a 2 b)2
(x 2 4)2

Factoring Polynomials (continued)
SpringBoard Louisiana Algebra 1 Skills Workshop Polynomials 462
PRACTICEFactor each polynomial completely.
1. 3x3y 1 12xy 2. 2m4n3 1 10m3n4 3. 21a3b 2 6a3b3c
4. y2 1 9y 1 8 5. x 2 1 5x 2 14 6. c2 1 c 2 12
7. x 2 2 14x 1 49 8. y2 2 36 9. x 2 1 18x 1 81
10. Maria tells Josie that in order to factor 3x 2y 1 60xy 1 300y she must use more than one factoring strategy. Explain what Maria means and show the completely factored form.

NAME CLASS DATE
SpringBoard Louisiana Algebra 1 Skills Workshop Sequences and Series 463
Partial Sums of Geometric SeriesA geometric series is the sum of a sequence of numbers where each number is a specific multiple of the number before it. For example, in the series 2 1 4 1 8 1 16 1 32 1 64 each term is twice the previous term. The series is geometric with a common ratio of 2. To calculate the sum of
n terms in a geometric series, you can use the formula: a1 rr
11
n
2
2, where a1 is the first term in
the series, n is the number of terms, and r is the common ratio. The sum of a finite number of terms of a sequence is a partial sum of the series.Don’t worry if the formula is somewhat daunting! It is a lot easier than it looks.
Determine the sum of the first 15 terms in the series: 2 1 4 1 8 1 16 1 32 …
Step 1: Identify the common ratio. This particular series could also be written as:
1(2)1 1 1(2)2, 1 1(2)3, 1 1(2)4 1 1(2)5 1 1(2)6 …
Written this way, you can see that the common ratio is 2 since each term is one power of 2 greater than the term before.
Step 2: Substitute the values into the formula
a rr
11
n
1
2
2.
The number of terms n is given: 15The common ratio r from Step 1: 2The first term in the series a1: 2
21 21 2
15
2
2
Step 3: Simplify 2 1 21 2
15
2
2. 2 1 2
1 2
15
2
2
2 1 32,7681
2
2
2 32,7671
2
2
2(32,767)65,534
Solution: The sum of the first 15 terms of the series is 65,534.
EXAMPLE

SpringBoard Louisiana Algebra 1 Skills Workshop Sequences and Series 464
Partial Sums of Geometric Series (continued)
PRACTICEFind the partial sums of the geometric series.
1. The first 7 terms of: 3 1 12 1 48 1 192 … 2. The first 13 terms of: 1 1 5 1 25 1 125 …
3. The first 12 terms of: 2 1 6 1 18 1 54 … 4. The first 18 terms of: 3 1 9 1 27 1 81 …
5. The first 9 terms of: 10 1 60 1 360 1 2160 … 6. The first 15 terms of: 5 1 10 1 20 1 40 1 80 …
7. The first 15 terms of: 1 1 2 1 4 1 8 1 16 … 8. The first 8 terms of: 256 1 128 1 64 1 32 …

NAME CLASS DATE
SpringBoard Louisiana Algebra 1 Skills Workshop Sequences and Series 465
Second DifferencesSecond differences can be used to determine if a particular sequence of values can be modeled by a quadratic function. Any given sequence derived from a quadratic expression such as n2 1 n 2 1 will have a second difference that is constant and equal to twice the coefficient of the n2 term.
Can the sequence 1, 8, 19, 34, 53, 76 be modeled by a quadratic function?
Step 1: Evaluate the first difference between the terms: 8 2 1 5 7, 19 2 8 5 11, 34 2 19 5 15, 53 2 34 5 19, 76 2 53 5 23
Sequence of first differences: 7, 11, 15, 19, 23
Step 2: Evaluate the second difference by evaluating the difference between the first differences: 11 2 7 5 4, 15 2 11 5 4, 19 2 15 5 4, 23 2 19 2 4
Sequence of second differences: 4, 4, 4, 4
Step 3: Note that the sequence of second differences is constant. Therefore the sequence can be modeled by a quadratic function, specifically one having an x2 coefficient of 2, since 2(2) 5 4.
Solution: The sequence can be modeled by a quadratic function.
EXAMPLE
PRACTICEDetermine if each sequence can be modeled by a quadratic function.
1. 1, 3, 5, 6, 7, 8 2. 1, 4, 9, 16, 25
3. 2, 5, 8, 11, 14, 17 4. 5, 11, 19, 29, 41
5. 0, 5, 14, 27, 44 6. 1, 4, 13, 40, 121
7. 21, 1, 3, 5, 7 8. 1, 5, 15, 31, 53