Los factores determinantes de las innovaciones relacionadas con la Administración del Conocimiento...
26
Revista Universitaria Europea Nº 21. Diciembre 2014: 133-158 ISSN: 1139 - 5796 The determinant factors of innovation related with Customer Knowledge Management Los factores determinantes de las innovaciones relacionadas con la Administración del Conocimiento del Consumidor Juan MEJÍA-TREJO Universidad de Guadalajara (México) [email protected] José SÁNCHEZ-GUTIÉRREZ Universidad de Guadalajara (México) [email protected] Recepción: Septiembre 2014 Aceptación: Noviembre 2014 ABSTRACT Innovation can be broken down in stages (INNOVS) to increase the Competitive Advantage. When the Innovation improves the Knowledge Management in the firms based on the sense of information: for, from and about the customers, is called: Customer Knowledge Management (CKM). The aim of this study is to solve: ¿Which are the determinant factors between INNOVS with CKM? A questionnaire was applied on 200 SME´s from the software developer sector in Guadalajara (SDSG), México involving Multiple Regression Analysis by Stepwise method. The results pointed out in three remarkable variables and indicators from INNOVS-CKM proposed model. Keywords: Competitive Advantage, Innovation Stages, Customer Knowledge Management. JEL Classification: M10, O32.
-
Upload
guadalajara -
Category
Documents
-
view
2 -
download
0
Transcript of Los factores determinantes de las innovaciones relacionadas con la Administración del Conocimiento...
Revista Universitaria Europea Nº 21. Diciembre 2014: 133-158
ISSN: 1139 - 5796
The determinant factors of innovation related with
Customer Knowledge Management
Los factores determinantes de las innovaciones relacionadas con
la Administración del Conocimiento del Consumidor
Juan MEJÍA-TREJO
Universidad de Guadalajara (México)
José SÁNCHEZ-GUTIÉRREZ
Universidad de Guadalajara (México)
Recepción: Septiembre 2014
Aceptación: Noviembre 2014
ABSTRACT
Innovation can be broken down in stages (INNOVS) to increase the Competitive
Advantage. When the Innovation improves the Knowledge Management in the firms
based on the sense of information: for, from and about the customers, is called:
Customer Knowledge Management (CKM). The aim of this study is to solve: ¿Which
are the determinant factors between INNOVS with CKM? A questionnaire was
applied on 200 SME´s from the software developer sector in Guadalajara (SDSG),
México involving Multiple Regression Analysis by Stepwise method. The results
pointed out in three remarkable variables and indicators from INNOVS-CKM proposed
model.
Keywords: Competitive Advantage, Innovation Stages, Customer Knowledge
Management.
JEL Classification: M10, O32.

Mejía, J; Sánchez, J.
RUE
134
RESUMEN
La innovación es dividida en etapas (INNOVS) para incrementar la ventaja competitiva.
Cuando la innovación mejora la administración del conocimiento en las Firmas, basado
en el sentido: para, desde y acerca de los consumidores es llamado: administración del
conocimiento del consumidor (CKM). El propósito de éste estudio es el determinar:
¿Cuáles son los factores determinantes que existen entre INNOVS con CKM? U n
c u e s t i o n a r i o fue aplicado a 200 PyMES del sector de desarrollo de software e n
G u a d a l a j a r a (SDSG), México aplicando análisis de regresión múltiple por etapas.
Los resultados apuntaron a detallar 3 variables relevantes con indicadores, del modelo
conceptual propuesto INNOVS-CKM.
Palabras clave: Ventaja Competitiva, Etapas de Innovación, Gestión del Conocimiento
del cliente.
Clasificación JEL: M10, O32.
The Determinant Factors of Innovation related with
Customer Knowledge Management
Revista Universitaria Europea Nº 21. Diciembre 2014: 133-158
ISSN: 1139 - 5796
135
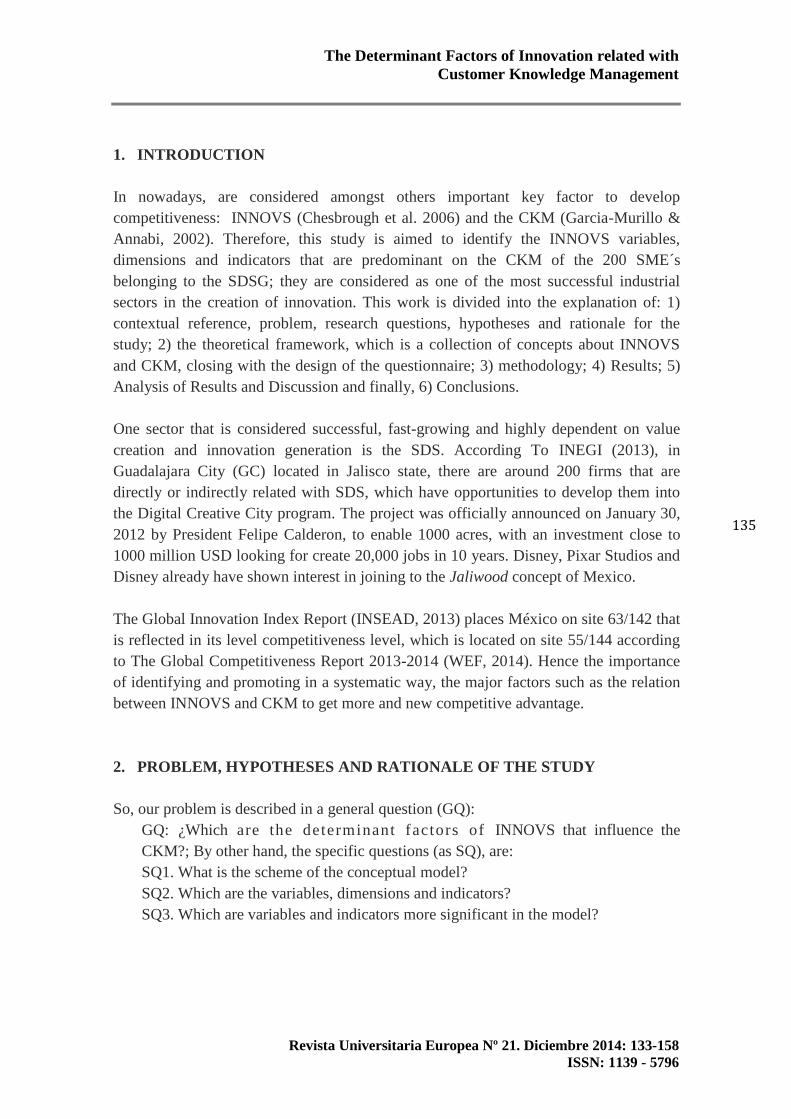
1. INTRODUCTION
In nowadays, are considered amongst others important key factor to develop
competitiveness: INNOVS (Chesbrough et al. 2006) and the CKM (Garcia-Murillo &
Annabi, 2002). Therefore, this study is aimed to identify the INNOVS variables,
dimensions and indicators that are predominant on the CKM of the 200 SME´s
belonging to the SDSG; they are considered as one of the most successful industrial
sectors in the creation of innovation. This work is divided into the explanation of: 1)
contextual reference, problem, research questions, hypotheses and rationale for the
study; 2) the theoretical framework, which is a collection of concepts about INNOVS
and CKM, closing with the design of the questionnaire; 3) methodology; 4) Results; 5)
Analysis of Results and Discussion and finally, 6) Conclusions.
One sector that is considered successful, fast-growing and highly dependent on value
creation and innovation generation is the SDS. According To INEGI (2013), in
Guadalajara City (GC) located in Jalisco state, there are around 200 firms that are
directly or indirectly related with SDS, which have opportunities to develop them into
the Digital Creative City program. The project was officially announced on January 30,
2012 by President Felipe Calderon, to enable 1000 acres, with an investment close to
1000 million USD looking for create 20,000 jobs in 10 years. Disney, Pixar Studios and
Disney already have shown interest in joining to the Jaliwood concept of Mexico.
The Global Innovation Index Report (INSEAD, 2013) places México on site 63/142 that
is reflected in its level competitiveness level, which is located on site 55/144 according
to The Global Competitiveness Report 2013-2014 (WEF, 2014). Hence the importance
of identifying and promoting in a systematic way, the major factors such as the relation
between INNOVS and CKM to get more and new competitive advantage.
2. PROBLEM, HYPOTHESES AND RATIONALE OF THE STUDY
So, our problem is described in a general question (GQ):
GQ: ¿Which are the determinant factors of INNOVS that influence the
CKM?; By other hand, the specific questions (as SQ), are:
SQ1. What is the scheme of the conceptual model?
SQ2. Which are the variables, dimensions and indicators?
SQ3. Which are variables and indicators more significant in the model?

Mejía, J; Sánchez, J.
RUE
136
Our hypotheses (H) are:
H1.-From the current knowledge and practice about INNOVS concepts and the
importance given by SDSGC firms to the CKM, different INNOVS components are
present in at least, on 50% of the variability of CKM.
H2.- The most detereminant factors of INNOVS produce, more than the 40% of the
CKM variability in the SDSGC.
3. THE IMPORTANCE OF INNOVATION AND CUSTOMER KNOWLEDEGE
MANAGEMENT RELATIONSHIP FOR COMPETITIVENESS
The competitiveness recognizes the potential of the CKM and INNOVS (Hill & Jones,
2011: 50-70; Loudon & Loudon, 2012: 100-300). Many authors have tried to identify
different senses of CKM information like: for, from, about and to co-create (Nambisan,
2002;1-10; Desouza, Awazu, Jha, Dombrowski, Papagari, & Baloh, 2007:1-12; Nicolai,
Keld & Pedersen, 2011;1-10). Even more, there are efforts to determine the Negative
side effects of Customer Integration (Gassmanna, Kausch & Enkel,2012:1-22). The
importance of how the knowledge can be supported by means of the human resources,
the exchange amongst them, the rewards (Nicolai; Keld & Pedersen, 2011;1-10; OECD,
2003:1-198; Gebert, Geib, Kolbe, & Riempp, 2013:1-10; Gloet & Samson ,2013:1-10)
and the influence of the Information and Communication Technologies (ICT) (Laudon
& Laudon ,2012:100-300) is evident to boost the innovation stages. The firm must keep
special care about the internal and external sources of information and how to extract
them for CKM process (Baker & Hart, 2007:1-10; Garcia-Murillo & Annabi, 2002:1-18;
Gebert, Geib, Kolbe, & Riempp, 2013:1-18). It´s important to remark the results around
the terms of satisfaction, experience and performance as principal indicators of the
CKM (Garcia-Murillo & Annabi, 2002:1-18).
3.1. Innovation and their Stages (INNOVS)
The competitiveness recognizes the potential of the Innovation (OCDE, 2005:1-198;
Hill & Jones, 2011:50-70, Loudon & Loudon, 2012:100-300; Chesbrough, 2006:1-200;
McKinsey, 2008: 1-20) and its different stages (Rothwell, 1994:1-5; Rogers, 1984:1-
100). According to DRAE (2014), the word innovation comes from the latin innovatio,-
ōnis and means: 1. f. Action and effect to innovate, and 2. f. Creating or modifying a
product. For the Oslo Manual (OECD, 2005: 50-56) innovation is: the introduction of a
new or significantly improved product (good / service), process, a new marketing
method, or a new organizational method in the internal business practices, the
workplace organization or external relations, so it is not just limited to the field of
technology, product or services.

The Determinant Factors of Innovation related with
Customer Knowledge Management
Revista Universitaria Europea Nº 21. Diciembre 2014: 133-158
ISSN: 1139 - 5796
137
Also, OECD (2005: 30-.37) recognize the process of creative destruction, enunciated by
Schumpeter, which raises two types of innovations: the radicals that contribute to
major changes in the world and, the incrementals, happening on an ongoing change
process. In this sense, I quote The Rogers Innovation Bell (1984:1-100), that divides
the innovation market in: a.-the innovators (they are very careful to use the latest in
technology, and very important to communicate and spread); b.- early adopters (people
considered as opinion leaders and influence their environment but are very careful to
suggest and / or use the latest innovations); c.-early majority (conservative people, but
open to technological change with some level of careful to adopt it); d.-late
majority (consumers particularly skeptical to the use of innovations until a large
number of his acquaintances, has adopted it); 5.-the laggards (very traditional people
maintaining the old forms; they hardly accept any changes and adapt to them until they
become a habit even.). Other attempt to stablish different innovation stages, is the
proposal of Rothwell (1994:1-5), determining different Innovation Models, such as: a)
First Generation: Technology-Push; b) Second Generation: Market-Pull; c) Third
Generation: Coupling Model; d) Fourth Generation: Integrated Innovation Process; e)
Fifth Generation: System Integration and Networking.
3.2. The Innovation Model
The other one additional attempt to explain and predict how the industrial sectors, such
as the Software Development Sector in Guadalajara, México is the model of
Innovation Stages (INNOVS), is proposed by Mejía-Trejo, J., Sánchez-Gutiérrez, J.&
Ortiz-Barrera, M. (2013b:1-20); briefly the conceptual model involves 6 variables:
a) Innovation Value Added (IVADD), or the real proposal of intention, where
several agents, beside the customer are in interaction, such as: the shareholder,
the Firm, the sector, the society, cost & risk of decisions (Bonel, J. I., Bonel,
F. J., & Fontaneda; 2003: 20-50). An attempt to get the relation value-price, I
consider the model created by Gale & Chapman, (1994:1-180), which is a
proper model to relate, the customer emotions and desires to identify the
attributes of products and services (Chaudhuri,.2006: 1-15; Mejía-Trejo, J. &
Sánchez-Gutiérrez, J., 2013a : 1-80).
One of the latest model, that involves clearly the value added aimed to the client, is the
Business Model Generation created by Osterwalder & Pygneur (2010: 1-180), with 9
stages to identify: customer segment; value proposition; channels; customer
relationships; revenue streams; key resources; key activities; key partnerships and cost
structure.
b) Innovation Income Items (IIIT), or the igniting process, where is
considered the early innovation, describing: opportunities, analysis, idea
generation, idea selection and the concept definition (Kausch, C., Gassmanna,

Mejía, J; Sánchez, J.
RUE
138
O., & Enkel, E. 2012: 1-20). By the hand of the facilities for innovation Shipp
(2008: 20-50) and McKinsey (2008: 1-20) define the scope of Research &
Development (R&D) staff and tangibles to support the innovation. As an
intangible assets to the process of innovation I take the efforts to use and
generate patents, create and improve databases, to improve the organizational
processes by meaning of the knowledge and skills and the decisions to increase
its availability to the risk (Canibano, 1999; Shipp, 2008: 1-10; Lev, 2001: 1-10;
Howells, 2000: 1-10). The efforts to discover new market knowledge (Popadiuk
& Wei-Choo, 2006: 1-18), is considered too.
c) Innovation Process (INPROC), or motor of the model. Take in account the
concepts around actions to improve the existing processes of Research &
Development + Innovation (Shipp, 2008: 1-10; McKinsey, 2008: 1-20; OECD,
2005: 1-198), studies about product lifecycle (Gale & Chapman, 1994: 1-180).
The design is an special issue, and includes actions to improve the existing
design (OECD, 2005: 1-1998) and the employee influence based on its own
autonomy to make opinions and decisions (Nicolai; Keld & Pedersen, 2011: 1-
20). The open innovation concepts, as a last trend are considered Chesbrough
(et. al 2006) due to the chances to discover at the same time of R&D, new
markets. The results of innovation are around on prototypes and conceptual
models that tend to improve the actual production process (OECD, 2005;
Chesbrough, 2006; McKinsey, 2008).
The diffusion of innovation (and very related with lifecycle products) is important for
marketing because the prevision of obsolete products, the changes in the market, the
early adopters, the early majority, the late majority, the laggards described all above by
mean of Rogers’s Diffusion Innovation Model (1983). The onset and end of a
technology is included as a market study that influences the innovation (Afuah, 1997;
Dussauge & Ramantsoa, 1992: 1-8).
d) Innovation Outcome Items (IOIT), or qualification of innovation stage, which
makes a revision of products and services obtained. Detects the projected level
of revenues generated by innovation (Shipp, 2008: 1-18), the projected customer
satisfaction level generated by innovation (McKinsey, 2008: 1-18), the projected
sales percentages levels generated by innovation (Lev, 2001: 1-20), the level of
the number of launches of new products/services in a period and the net
present value of its portfolio of products / services in the market generated by
the innovation (McKinsey, 2008: 1-10).
e) Innovation Performance (IPERF), or the quantification of innovation stage,
makes different ponderations about the results to determine different levels, such
as Bermúdez-García, (2010: 1-50), proposes:

The Determinant Factors of Innovation related with
Customer Knowledge Management
Revista Universitaria Europea Nº 21. Diciembre 2014: 133-158
ISSN: 1139 - 5796
139
o Cost-Benefit of Innovation = Innovation income / Investment in
Innovation;
o Opportunities Index for Collaborative Innovation = Innovation
Identified Opportunities / Total Contributors on the Process
o Generation Ideas Rate= Generated Ideas / Market Knowledge
Opportunities x Total Contributors on Process;
o Effectiveness of Idea Generation = Number of Approved Ideas / Number
of Generated Ideas;
o Implementing Effective Prototyping = Number of Correct and Timely
Prototype Terminated/ Total Prototyping Approved;
o Innovation Generation Rate= Number of Generated Innovations /
Identified Innovation Opportunities:
o Index not Successful Innovations = Number of unsuccessful innovations
implemented / Total Innovation, or other similar to quantify the final results.
And,
o Triple Helix Politics = The relationship among university- government-
industry Smith & Leydesdorff, (2010: 1-10), to develop the innovation as a
policy of innovation, is considered too.
f) Innovation Feedback Items (IFEED), or alarm set of innovation stage, makes
different analyses aimed to improve the subject versus the marginal profits. It
involves: the intellectual capital dedicated to innovation (Lev, 2001:1-5; Shipp,
2008: 1-5; Nicolai, et al., 2011: 1-8); the processes, the product/service/,
marketing, technology, organization: structure and functions, type of innovation
(radical, incremental), (OECD, 2005: 1-198), value added (Bonel, et al. 2003: 1-
10; Osterwalder & Pygneur, 2010: 1-180; Gale & Chapman, 1994: 1-180), and
type of leadership (Gloet & Samson, 2013: 1-10: Mejía-Trejo, et al.,2013b: 1-10)
3.3. The Customer Knowledge Management (CKM)
To complement our proposed model of Innovation Stages (INNOVS), we did a revision
and analysis of literature review about authors and their works about Customer
Knowledge Management (CKM). Briefly, the results are described in 4 variables:
g) CKM as a Driver of Innovation (CKMADI), or boost of Customer Knowledge
Management (CKM) where is considered the sense of information: from, about
customer (Nambisan, 2002: 1-8; Desouza , et al., 2007: 1-8; Gibbert &
Probst,2002:1-8; Garcia-Murillo & Annabi, 2002:7-10) and customer as a co-
creator (Nicolai et al., 2011:7-12; Desouza, et al., 2007: 8-12; Gibbert & Probst,
2002; 9-15) making prosumerism to get more interaction with the customer
knowledge.

Mejía, J; Sánchez, J.
RUE
140
Even more, the Negative side effects of Customer Integration such as the warning
of the firm, respect of: customer´s personality, experience, points of view, the
likelihood to choose a wrong customer, and the risk to incorporate him into the
relationship to the Firm (Kausch, et al., 2014: 10-14) takes it at all, account into the
model.
h) CKM Support (CKMS), or basis of knowledge consists in knowledge incentives,
respect of: the salary associated with the ability and willingness to share
knowledge (Nicolai et al., 2011: 8-12; OECD 2003: 10-17);It includes the
salary determined by willingness to improve skills and upgrade knowledge;
the tolerance to failure and rewards and recognition ( Gloet & Samson, 2013: 5-
9).
By other hand, we considered the fact of how the knowledge flows, through exchange
the knowledge between employees across departments, communication among
employees and management.
i) CKM other Sources of Knowledge (CKMOSK) or different sources of knowledge
is a strategic tool, in the Information and Communication Technologies (ICT)
as an infrastructure to support.
Customer Knowledge Management (CKM) (Laudon & Laudon, 2012: 100-200; Mejía-
Trejo & Sánchez- Gutierrez, ( 2013a: 1-20), that is a powerful driver to boost the
internal sources of knowledge from the environment, such as: technical services,
engineering, R&D, production, marketing and sales and purchasing and supply,
belonging to the firm´s departaments (Baker & Hart, 2007; Garcia-Murillo& Annabi,
2002: 5-15) and other employees into the same Firm (Murillo & Annabi ,2002: 5-15).
As a complement, we decided the introduction of the external sources of knowledge,
that involves: suppliers, scientists, Universities, Patents, Technology Exhibitions,
distributor agents, and Consultant(Baker & Hart, 2007; Garcia-Murillo & Annabi, 2002:
3-10) evenly the competitors.
j) CKM, Satisfaction, Experience And Performance (CKMSEP), or satisfaction
with knowledge; one important issue that I considered essential to be
determined, is the type of paradigm practiced by the Firm for Customer
Knowledge Management (CKM)(Garcia-Murillo & Annabi ,(2002: 3-10). Due
this, exist different paradigms that involve the performance on three levels to
determine Customer Retention, Satisfaction, Experience-Creativity and
Performance: Knowledge Management (KM); Customer Relationship
Management (CRM) and Customer Knowledge Management (CKM). Such
paradigms, are: If Only We Know What We Knew (KM) as a Customer
Retention, Retention is Cheaper than Acquisition (CRM) as a Customer

The Determinant Factors of Innovation related with
Customer Knowledge Management
Revista Universitaria Europea Nº 21. Diciembre 2014: 133-158
ISSN: 1139 - 5796
141
Satisfaction, If We Only Knew What Our Customer Know (CKM) as a
Customer Experience an Creativity. Finally to these variables, is proposed the
performance against financial Budget with three levels: Customer retention rate
(KM). Performance in terms of customer satisfaction and loyalty (CRM) and
performance against competitors in innovation and growth; contribution to
customer success. (CKM) (Garcia-Murillo & Annabi, 2002: 3-10). As a result
of the documentary analysis we obtained the Figure 1.
Figure 1. GENERAL CONCEPTUAL MODEL
INNOVS as Independent Variable CKM as Dependent Variable
Source: Own by Authors adaptation
4. METHODOLOGY
This is a descriptive and transversal study; it is based on documental research, to design
a conceptual model and questionnaire to obtain several groups of variables, dimensions
and indicators that involves a relationship between INNOVS and CKM. The subjects of
the study were the managers from 200 SME´s SDSG. The results were analyzed through
statistical inference tools like: Cronbach’s Alpha in pilot test and Multiple Regression
Analysis (MRA) with Stepwise method, contained in the SPSS 20 program.
5. RESULTS
To answer SQ2 we present the Scheme 1 with 10 variables, 45 dimensions and 110
indicators.
CKM
(G)CKMADI (H)CKMS
(I)CKMOSK (J)CKMSEP
(A)IVADD (B)IIIT (C)INPROC
(D)IOIT (F)IFEED (E)IPERF
INNOVS

Mejía, J; Sánchez, J.
RUE
142
Scheme 1. Final Questionnaire showing INNOVS and CKM
INNOVATION STAGES
V DIMENSION INDICATOR Q AUTHOR
A
1).-Emotions &
Desires of Customer
(VAEDC)
The innovation actions are aimed to increase the Emotions & Desire of the
Customer 1
Chaudhuri
(2006)
2).-Cost & Risk
(VACR)
The Cost is the main constraint to increase the value (VACR1) 2
Bonel (et
al.,2003)
The Risk is the main constraint to increase the value (VACR2) 3
3).-Customer
(VACUS) The innovation actions are aimed to increase the Customer value 4
4).-Shareholder
(VASHO) The Innovation actions are aimed to increase the Shareholder value 5
5).-Firm (VAFRM) The innovation actions are aimed to increase the value of the Firm 6
6).-Sector (VASEC) The innovation actions are aimed to increase the value of the Sector 7
7).-Society (VASOC) The innovation actions are aimed to increase the value to the Society 8
8).-Price Value
Relation (VAPVR)
The innovation is introduced to the market considering the relation price-
value added 9
Gale &
Chapman (1994
B
9).-Early Innovation
Phase (EIPH)
Opportunity Identification (EIPH1) 1
0
Kausch (et al.
2014)
Opportunity Analysis (EIPH2) 1
1
Idea Generation (EIPH3) 1
2
Idea Selection (EIPH4) 1
3
Concept Definition (EIPH5) 1
4
10).-Facilities for
Innovation
(Tangibles, FFI)
Provides the most sophisticated equipment to support innovation
(FFI1)
1
5 Shipp (et al.
2008);
McKinsey
(2008)
Invests in R&D+I (FFI2) 1
6
Assigns staff to R& D+I (FFI3) 1
7
11).-Efforts for
Innovation
(Intangible assets,
EFFI)
Makes efforts to use and / or generate Patents (EFFI1) 1
8
Canibano
(1999); Shipp (et
al. 2008); Lev
(2001); Howells
(2000)
Makes efforts to create and / or improve Databases (EFFI2) 1
9
Makes efforts to improve the organizational processes (EFFI3) 2
0
Makes efforts to use the most of knowledge and skills of staff (EFFI4) 2
1
Makes planned decisions to increase its availability to the risk (EFFI5) 2
2
Makes efforts to discover New Market Knowledge (EFFI6) 2
3
Popadiuk &
Wei-Choo
(2006)
Makes efforts to study the Existing Market Knowledge (EFFI7)
2
4
C
12).-Research &
Development +
Innovation (RDI)
Makes actions to improve existing processes of Research & Development
+ Innovation (RDI1)
2
5
Shipp (et
al.,2008);
McKinsey
(2008); OECD
(2005)
Makes studies about Product Lifecycle (RDI2) 2
6
Gale &
Chapman (1994)
13).- Design (DSGN)
Makes actions to improve the existing design (DSGN1) 2
7 OECD (2005)
Employees have influence on their job (DSGN2) 2
8 Nicolai (et al.,
2011) Employees engaged in teams with high degree of autonomy (DSGN3)
2
9
The strategy is based on Open Innovation concepts (DSGN4) 3
0
Chesbrough (et.
al 2006)
14).-Prototypes
(IPPFI) Makes actions to develop prototypes for improvement
3
1
Chesbrough
(2006);
McKinsey
(2008)
15).-Pre-Production
(IPPPIP) Makes improvement actions to pre-production
3
2
16).-Market Research
(MR)
Makes to investigate market needs of obsolete products (MR1) 3
3
Chesbrough (et.
al. 2006);Rogers
(1984) Makes to investigate the needs actions and / or market changes for 3

The Determinant Factors of Innovation related with
Customer Knowledge Management
Revista Universitaria Europea Nº 21. Diciembre 2014: 133-158
ISSN: 1139 - 5796
143
innovators (MR2) 4
Makes to investigate needs and / or market changes for early adopters
(MR3)
3
5
Makes to investigate needs and / or market changes for early majority
(MR4)
3
6
Makes to investigate needs and / or market changes for late majority
(MR5)
3
7
Makes to investigate needs and / or market changes for laggards (MR6) 3
8
Makes to investigate the onset of a new technology (MR7) 3
9 Afuah (1997)
Makes to investigate the term of a technology (MR8) 4
0
17).-Novelty
(NOVY)
Decides actions to improve or introduce new forms of marketing
(NOVY1)
4
1 Lev (2001)
Seeks to be new or improved in the World (Radical Innovation) (NOVY2) 4
2
OECD (2005);
Afuah (1997)
Seeks to be new or improved to the Firm (Incremental Innovation)
(NOVY3)
4
3
Seeks to be new or improved in the region (Incremental Innovation)
(NOVY4)
4
4
Seeks to be new or improved in the industry (Incremental Innovation)
(NOVY5)
4
5
18).-Training (TRAI) Makes actions to train the staff continuously (Incremental Innovation) 4
6
19).-Type of
Innovation (TOINN)
Makes actions to innovate in technology (TOINN1) 4
7
Makes actions for innovation in production processes (TOINN2) 4
8
Makes actions to improve or introduce new products forms (TOINN3) 4
9
Makes actions to improve or introduce new forms of service (TOINN4) 5
0
Makes actions to improve or introduce new organizational structures and
functions (TOINN5)
5
1
Innovation activities tend to be rather radical (TOINN6) 5
2
Innovation activities tend to be incremental (TOINN7) 5
3
D
20).-New products/
and/or services
(NPSD)
Detects the projected level of revenues generated by innovation (NPSD1) 5
4
Shipp (et al.
2008);
Detects the projected customer satisfaction level generated by innovation
(NPSD2)
5
5
McKinsey
(2008)
Detects the projected sales percentages levels generated by innovation
(NPSD3)
5
6 Lev (2001)
Detects the level of the number of launches of new products/services in a
period (NPSD4)
5
7 McKinsey
(2008) Detects the net present value of its portfolio of products / services in the
market generated by the innovation (NPSD5)
5
8
E
21).-Cost-Benefit of
Innovation (PCBOI)
Do you use an indicator like: Innovation income / (Investment in
Innovation) ?
5
9
Bermúdez-
García (2010)
22).-Opportunities
Index for
Collaborative
Innovation (POIFCI)
Do you use an indicator like: Innovation Identified Opportunities / (Total
Contributors on the Process)?
6
0
23).-Generation Ideas
Rate (PGIR)
Do you use an indicator like: Generated Ideas / (Market Knowledge
Opportunities x Total Contributors on Process)?
6
1
24).-Effectiveness of
Idea Generation
(PEOIG)
Do you use an indicator like: Number of Approved Ideas / (Number of
Generated Ideas)?
6
2
25).-Implementing
Effective Prototyping
(PIEP)
Do you use an indicator like:Number of Correct and Timely Prototype
Terminated / (Total Prototyping Approved)?
6
3
26).-Innovation
Generation Rate
(PIGR)
Do you use an indicator like: Number of Generated Innovations /
(Identified Innovation Opportunities)?
6
4
27).-Index not
Successful
Innovations (PINSI)
Do you use an indicator like: Number of unsuccessful innovations
implemented / (Total Innovation)?
6
5

Mejía, J; Sánchez, J.
RUE
144
28).-Triple Helix
Politics (PTHP)
Does exist any relationship among : university- government- industry, to
develop the innovation?
6
6
Smith &
Leydesdorff,
(2010)
F
29).-Capital (IFCAP) Based on the results identifies intellectual capital dedicated to innovation
for its improvement
6
7
Lev(2001);Shipp
(et al. 2008);
Nicolai (et al.,
2011)
30).-Product &
Process (IFPP)
Based on the results identifies the stages of new or improved process for
upgrading (IFPP1)
6
8
OECD (2005);
Chesbrough
(2006)
Based on the results identifies attributes of new or improved product /
service for its improvement (IFPP2)
6
9
31).-Innovation
(IFINN)
Based on the results identifies the stages of new or improved form of
marketing for improvement (IFINN1)
7
0
Based on the results identifies the stages of new or improved technology
for improvement (IFINN2)
7
1
Identifies the stages of the new or improved structure and functions of the
organization to its improvement (IFINN3)
7
2
Identifies the type of innovation (radical or incremental) that has given
best results (IFINN4)
7
3
32).-Value Aded
(IFV)
Based on the results identifies the new or improved value proposition
(benefits / costs) for its completion; relation value-price
7
4
Bonel (et
al.,2003)
33).-Leadership and
Innovation
(FLINNO)
The type of leadership that drives innovation is Transactional (FLINNO1) 7
5 Mejía-Trejo (et
al., 2013), Gloet
& Samson
(2013)
The type of leadership that drives innovation is Transformational
(FLINNO2)
7
6
The type of leadership that drives innovation is Passive (FLINNO3) 7
7
CUSTOMER KNOWLEDGE MANAGEMENT
G
34).-Information
from Costumer
(IFMC)
Customer is a Resource of NPD ideation; Customer Driven-Innovation
(Innovation from Customers). Mutual Innovation.
7
8
Nambisan
(2002); Desouza
(et al., 2007);
Gibbert (et. al,
2002)
35).-Information
about the Customer
(IABC)
Strategy of close collaboration with customers. Communities of creation. 7
9
Nambisan
(2002); Gibbert
(et. al, 2002)
36).-Information for
Customer (IFRC)
Customer as a User collaborates intensively in the product testing and
support. Customer Focused Innovation (Innovation for Customers)
8
0
Nambisan
(2002);
Desouza (et al.,
2007)
37).-Information as a
Customer Co-creator
(with) (IWIC)
Customer as a Co-creator helps over NPD design and development;
Customer Centered Innovation (Innovation with Customers);
Prosumerism; Team-Based-CoLearning. Joint Intellectual Property
8
1
Nicolai (et al.,
2011); Desouza
(et al., 2007);
Gibbert (et. al,
2002)
38).-Negative side
effects of Customer
Integration (NSEC)
The firm is warned about the dependence on customer´s personality
(NSEC1)
8
2
Kausch (et al.
2014)
The firm is warned about the dependence on customer´s experience
(NSEC2)
8
3
The firm is warned about the dependence on customer´s point of view
(NSEC3)
8
4
The firm is warned about to choose the wrong customer (NSEC4) 8
5
The firm is warned about the risk to integrate the customer to the
company´s side (NSEC5)
8
6
H
39).-Knowledge
Incentives (KI)
Salary associated with the ability and willingness to share knowledge
(KI1)
8
7 Nicolai (et al.,
2011); OECD
(2003) Salary determined by willingness to improve skills and
upgrade knowledge (KI2)
8
8
Tolerance of Failure (KI3) 8
9 Gloet & Samson
(2013) Rewards and Recognition (KI4)
9
0
40).-Knowledge
Fluence (KF)
Exchange the knowledge between employees across departments (KF1) 9
1 Nicolai (et al.,
2011); OECD
(2003) Communication among employees and management (KF2) 9
2
41).-Knowledge and
ICT (KICT) ICT to support and control the Customer Knowledge Management
9
3
Laudon &
Laudon (2012);
Mejía-Trejo &
Sánchez-

The Determinant Factors of Innovation related with
Customer Knowledge Management
Revista Universitaria Europea Nº 21. Diciembre 2014: 133-158
ISSN: 1139 - 5796
145
Gutierrez (2013)
I
42).-Internal Sources
of Knowledge
(ISOK)
Technical Services (IOSK1) 9
4
Baker & Hart
(2007); Garcia-
Murillo &
Annabi (2002)
Engineering Department (IOSK2) 9
5
Research and Design Development (IOSK3) 9
6
Production (IOSK4) 9
7
Marketing and Sales (IOSK5) 9
8
Purchasing and Supply (IOSK6) 9
9
Other Employees (IOSK7)
1
0
0
Murillo &
Annabi (2002)
43).-External Sources
of Knowledge
(ESOK)
Supplier (ESOK1) 1
Baker & Hart
(2007); Garcia-
Murillo &
Annabi (2002)
Scientist, Universities, Patents, Exhibitions Technological
Consultant (ESOK2) 2
Distributor Agents (ESOK3) 3
Competitor (ESOK4) 4
J
44).-Paradigm (PAR)
If Only We Know What We Knew (KM) as a Customer Retention (PAR1) 5
Garcia-Murillo
& Annabi
(2002)
Retention is Cheaper than Acquisition (CRM) as a Customer Satisfaction
(PAR2) 6
If We Only Knew What Our Customer (CKM) Know as a Customer
Experience and Creativity (PAR3) 7
45).-Performance
(PER)
Performance against budget; Customer retention rate.(KM) (PER1) 8
Performance in terms of customer satisfaction and Loyalty (PER2) 9
Performance against competitors in innovation and growth; Contribution
to customer success. (CKM) (PER3)
1
0
Notes: Variables (V); (A).-Innovation Value Added (IVADD); (B).-Innovation Income Items (IIIT); (C).-
Innovation Process (INPROC); (D) Innovation Outcome Items (IOIT); (E).- Innovation Performance
(IPERF); (F).- Innovation Feedback Items (IFEED); (G).- CKM as a Driver of Innovation (CKMADI) ;
(H).- CKM Support (CKMS); (I).- CKM other Sources of Knowledge (CKMOSK); (J).- CKM,
Satisfaction, Experience And Performance (CKMSEP).
Source: Authors by own adaptation
In the next section, we showed the results about the multivariant statistics started by:
Cronbach’s alpha (questionnaire test confidence); Multiple Regression Analysis by
Stepwise Method showing first: Pearson’s Correlations; variable entered / removed;
model summary; ANOVA Table; Coefficients Table; excluded variables table. All
above mentioned, to determine the determinant factors of INNOVS related with CKM.
The result of that, is TOINN4 (Makes actions to improve or introduce new forms of
service, see table 8) and how is compared with the rest of their other indicators.
Applying the statistical inference tools from SPSS 20 program, were obtained: the
questionnaire confidence to 20 CEOs of SDSG by Cronbach’s Alpha test =.947 (see
Table 1).

Mejía, J; Sánchez, J.
RUE
146
Table 1. Cronbach’s Alpha Test
Cronbach’s Alpha Standardized
Alpha
N of Cases N of
Variables
.947 .948 20 110
Source: SPSS 20 as a result of the research and adapted by the authors
MRA by Stepwise Method was practiced with the next results:
Table 2 shows the Correlations amongst the variables.
Table 2. Pearson’s Correlation
CK
M
IVA
DD
IIIT INPR
OC
IOI
T
IPE
RF
IFE
ED
Pearson
Correlat
ion
Coeffici
en
T
CKM 1.0
00 .140
.53
3 .655
.51
9 .564 .237
IVAD
D
.14
0 1.000
.16
4 .134
.17
0 .179 .051
IIIT .53
3 .164
1.0
00 .550
.44
8 .465 .253
INPR
OC
.65
5 .134
.55
0 1.000
.56
2 .481 .239
IOIT .51
9 .170
.44
8 .562
1.0
00 .625 .314
IPERF .56
4 .179
.46
5 .481
.62
5
1.00
0 .448
IFEE
D
.23
7 .051
.25
3 .239
.31
4 .448
1.00
0
Source: SPSS 20 as a result of the research and adapted by the authors.
Table 3 shows the set of variables entered/removed (a).
Table 3. Variables Entered/Removed
Model Variables
Entered
Variables
Removed Method Stepwise
1 INPROC Criteria: Probability of- F-to-enter<= .050,
Probability of- F-to-remove >=.100 2 IPERF
3 IIIT
(a) Dependent Variable: CKMS
Source: SPSS 20 as a result of the research and adapted by authors.
The Determinant Factors of Innovation related with
Customer Knowledge Management
Revista Universitaria Europea Nº 21. Diciembre 2014: 133-158
ISSN: 1139 - 5796
147
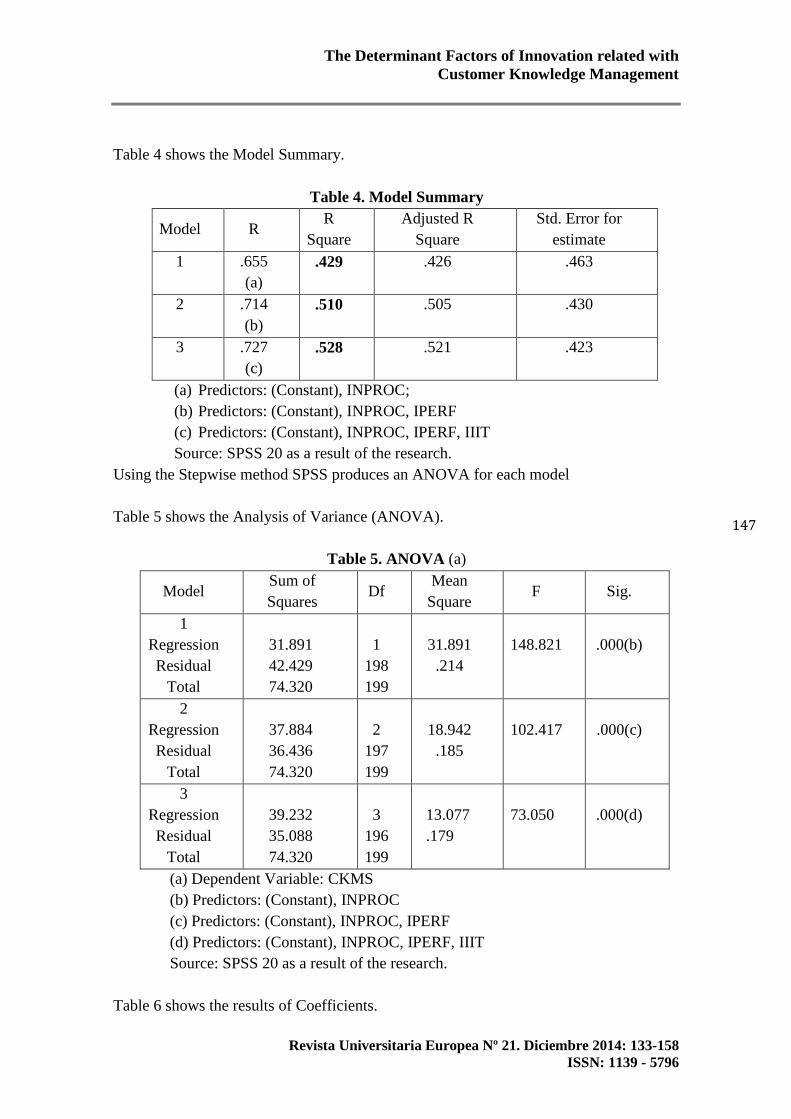
Table 4 shows the Model Summary.
Table 4. Model Summary
Model R R
Square
Adjusted R
Square
Std. Error for
estimate
1 .655
(a)
.429 .426 .463
2 .714
(b)
.510 .505 .430
3 .727
(c)
.528 .521 .423
(a) Predictors: (Constant), INPROC;
(b) Predictors: (Constant), INPROC, IPERF
(c) Predictors: (Constant), INPROC, IPERF, IIIT
Source: SPSS 20 as a result of the research.
Using the Stepwise method SPSS produces an ANOVA for each model
Table 5 shows the Analysis of Variance (ANOVA).
Table 5. ANOVA (a)
Model Sum of
Squares Df
Mean
Square F Sig.
1
Regression
Residual
Total
31.891
42.429
74.320
1
198
199
31.891
.214
148.821
.000(b)
2
Regression
Residual
Total
37.884
36.436
74.320
2
197
199
18.942
.185
102.417
.000(c)
3
Regression
Residual
Total
39.232
35.088
74.320
3
196
199
13.077
.179
73.050
.000(d)
(a) Dependent Variable: CKMS
(b) Predictors: (Constant), INPROC
(c) Predictors: (Constant), INPROC, IPERF
(d) Predictors: (Constant), INPROC, IPERF, IIIT
Source: SPSS 20 as a result of the research.
Table 6 shows the results of Coefficients.

Mejía, J; Sánchez, J.
RUE
148
Table 6. Coefficients by Stepwise Method (a)
Model
Unstandardized
Coefficients
Standardized
Coefficients t.
Si
g. B
Std.
Error Beta
1 (Constant)
INPROC
1.733
.509
.166
.042
.655
10.43
3
12.19
9
.0
0
0
.0
0
0
2
(Constant)
INPROC
IPERF
1.250
.388
.232
.176
.044
.041
.499
.324
7.093
8.770
5.693
.0
0
0
.0
0
0
.0
0
0
3
(Constant)
INPROC
IPERF
IIIT
1.010
.332
.201
.163
.194
.048
.042
.059
428
.280
.168
5.204
6.935
4.813
2.744
.0
0
0
.0
0
0
.0
0
0
.0
0
7
(a) Dependent Variable: CKM
Source: SPSS 20 as a result of the research.

The Determinant Factors of Innovation related with
Customer Knowledge Management
Revista Universitaria Europea Nº 21. Diciembre 2014: 133-158
ISSN: 1139 - 5796
149
Table 7 shows the Excluded Variables on Table 7.
Table 7. Excluded Variables (a)
Model Beta in t Sig. Partial
Correlation
Collineartity
Tolerance
1
IVADD
IIIT
IOIT
IPERF
IFEED
.054(b)
.248(b)
.221(b)
.324(b)
.085(b)
.993
4.004
3.502
5.693
1.545
.322
.000
.001
.000
.124
.071
.274
.242
.376
.109
.982
.697
.684
.768
.943
2
IVADD
IIIT
IOIT
IFEED
.016(c)
.168(c)
.070(c)
-
.035(c)
.320
2.744
1.017
-.619
.750
.007
.310
.537
.023
.192
.072
-.044
.965
.645
.521
.799
3
IVADD
IOIT
IFEED
.006(d)
.056(d)
-
.042(d)
.116
.813
-.761
.908
.417
.448
.008
.058
-.054
.959
.518
.797
(a) Dependent Variable: CKMS
(b) Predictors: (Constant), INPROC
(c) Predictors: (Constant), INPROC, IPERF
(d) Predictors: (Constant), INPROC, IPERF, IIIT
Source: SPSS 20 as a result of the research.
Doing the same MRA for the INPROC, IPERF and IIIT Indicators on CKM, we found
Table 8, about analysis of Type of Innovation (TOINN).
Table 8. Model Summary
Model R R
Square Adjusted R Square
Std. Error for
estimate
1 .672(a) .452 .449 .454
2 .739(b) .545 .541 .414
3 .763(c) .582 .576 .398
4 .779(d) .607 .599 .387
5 .789(e) .622 .612 .381
6 .796(f) .634 .623 .375
(a) Predictors: (Constant), TOINN4

Mejía, J; Sánchez, J.
RUE
150
(b) Predictors: (Constant), TOINN4,MR2
(c) Predictors: (Constant), TOINN4,MR2,MR7
(d) Predictors: (Constant), TOINN4,MR2,MR7,PEOIG
(e) Predictors: (Constant), TOINN4,MR2,MR7,PEOIG,NOVY3
(f) Predictors: (Constant), TOINN4,MR2,MR7,PEOIG,NOVY3,TOINN2
Source: SPSS 20 as a result of the research.
Multiple Regression Analysis by Stepwise Method was practiced with the next results:
Table 9 shows the Correlations amongst the variables.
Table 9. Pearson’s Correlation
CK
M
TOIN
N1
TOIN
N2
TOIN
N3
TOIN
N4
TOIN
N5
TOIN
N6
TOIN
N7 CK
M
1.0
00
.501 .560 .508 .674 .634 .654 .484 TOIN
N1
.50
1
1.00
0
.693 .583 .710 .615 .548 .500 TOIN
N2
.56
0
.693 1.00
0
.489 .717 .757 .682 .527 TOIN
N3
.50
8
.583 .489 1.00
0
.663 .605 .503 .631 TOIN
N4
.67
4
.710 .717 .663 1.00
0
.832 .802 .665 TOIN
N5
.63
4
.615 .757 .605 .832 1.00
0
.788 .594 TOIN
N6
.65
4
.548 .682 .503 .802 .788 1.00
0
.609 TOIN
N7
.48
4
.500 .527 .631 .665 .594 .609 1.00
0 Source: SPSS 20 as a result of the research and adapted by the author.
Table 10 shows the set of variables entered/removed (a).
Table 10. Variables Entered/Removed
Mo
del
Variabl
es
Entere
d
Variab
les
Remov
ed
Method Stepwise
1 TOIN
N4
Criteria: Probability of- F-to-enter<= .050, Probability
of- F- to-remove >=.100 2 TOIN
N6
(a) Dependent Variable: CKM
Source: SPSS 20 as a result of the research and adapted by author.
Table 11 shows the Model Summary.
Table 11. Model Summary
Mode
l
R R
Squar
eEe
Adjusted R
Square
Std. Error for
estimate 1 .674
(a)
.454 .451 .475 2 .700
(b)
.490 .485 .460 (a) Predictors: (Constant), TOINN4;
(b) Predictors: (Constant), TOINN4, TOINN6
Source: SPSS 20 as a result of the research.
Using the Stepwise method SPSS produces an ANOVA for each model.
Table 12 shows the Analysis of Variance (ANOVA).

The Determinant Factors of Innovation related with
Customer Knowledge Management
Revista Universitaria Europea Nº 21. Diciembre 2014: 133-158
ISSN: 1139 - 5796
151
Table 12. ANOVA(a)
Mode
l
Value Sum
of
Squa
res
Df Mean
Square
F
Sig.
1 Regression
Residual
Total
37.109
44.646
81.755
1
198
199
37.109
.225
164.5
72
.000(
b)
2 Regression
Residual
Total
40.090
41.665
81.755
2
197
199
20.045
.211
94.77
7
.000(
c)
(a) Dependent Variable: CKM
(b) Predictors: (Constant), TOINN4
(c) Predictors: (Constant), TOINN4, TOINN6
Source: SPSS 20 as a result of the research.
6. ANALYSIS OF RESULTS AND DISCUSSION
About Table 1 and according by Hinton (et al. 2004), Cronbach’s alpha corresponds :
0.90 and above shows excellent reliability; 0.70 to 0.90 shows high reliability; 0.50 to
0.70 shows moderate reliability; 0.50 and below shows low reliability. Table 2,as a
general rule, predictor variables can be correlated with each other as much as 0.8 before
there is cause for concern about multicollinearity (Hinton, et al. 2004; Hair et al., 2010).
Respect the Table 3, the Variables Entered/Removed table shows that the Stepwise
method of regression has been used. Notice that SPSS has entered into the regression
equation three variables: INPROC, IPERF and IIT that are significantly correlated with
CKM. Table 4 shows the Models: 1, 2, and 3 where the independent variables INPROC,
IPERF and IIIT accounts for 42.9 %, 51% and 52.8% respectively of the variance in the
scores of CKM dependent variable. The R value (0.655) in Model 1 is the multiple
correlation coefficients between the predictor variables and the dependent variable. As
INPROC is the only independent variable in this model we can see that the R value is
the same value as the Pearson’s correlation coefficient in our pairwise correlation
matrix.
In Model 2 the independent variables INPROC and IPERF are entered, generating a
multiple correlation coefficient, R =.714. The Adjusted R Square adjusts for a bias in R
square and is usually used. The Std. Error of the Estimate is a measure of the variability
of the multiple correlations. Table 5, indicates Model 1: F (1,198)= 148.821, p<0.01;
Model 2: F (2,197)= 102.417, p<0.01; Model 3: F (3,196)=73.050, p<0.01. Dividing the

Mejía, J; Sánchez, J.
RUE
152
Sums of Squares by the degrees of freedom (df) gives us the Mean Square or variance.
We can see that the Regression explains significantly more variance than the error or
Residual. We calculate R2 by dividing the Regression Sum of Squares by the Total Sum
of Squares. The values for Model 1 have been used as an example: 31.891/74.320=
0.4291. In Table 6 the Unstandardized Coefficients B column gives us the coefficients
of the independent variables in the regression equation for each model. Model 1: CKMS
= 1.733 + .509 INPROC; Model 2: CKMS = 1.250+ .388 INPROC+ .232 IPERF; Model
3: CKMS= 1.01+ .332 INPROC+ .201 IPERF+ .163 IIIT. The Standardized Beta
Coefficient column informs us of the contribution that an individual variable makes to
the model. The beta weight is the average amount the dependent variable increases
when the independent variable increases by one standard deviation (all other
independent variables are held constant). As these are standardized we can compare
them. The t tests are performed to test the two-tailed hypothesis that the beta value is
significantly higher or lower than zero. This also enables us to see which predictors are
significant. By observing the Sig. values in our research we can see that for Model 1 the
INPROC scores are significant (p < 0.05), and so on with Model 2 and 3. Hence, we
suggest using Model 3 because it accounts for more of the variance.
The Unstandardized Coefficients Std. Error column provides an estimate of the
variability of the coefficient. Table 7 .The Beta In value gives an estimate of the beta
weight if it was included in the model at this time. The results of t tests for each
independent variable are detailed with their probability values. From Model 1 we can
see that the t value for IPERF is significant (p < 0.05). However as we have used the
Stepwise method this variable has been excluded from the model. As IIIT has been
included in Model 2 it has been removed from this table. As the variable INPROC
scores is present in the 3 models it is not mentioned in the Excluded Variables table. The
Partial Correlation value indicates the contribution that the excluded predictor would
make if we decided to include it in our model. Collinearity Statistics Tolerance values
check for any collinearity in our data. As a general rule, a tolerance value below 0.1
indicates a serious problem (Hinton, et. al, 2004).
So far, we answered SQ3 since Table 3 that shows the most significant variables were
INPROC, IPERF and IIIT from INNOVS. Therefore, GH1 is explained because using
Table 4 Model 3, 52.8% produces the variability on the dependent variable CKM.
Table 9, as a general rule, predictor variables can be correlated with each other as
much as 0.8 before there is cause for concern about multicollinearity (Hinton, et al.
2004; Hair et al., 2010). Table 10, shows the Variables Entered/Removed table shows
that the Stepwise method of regression has been used. Notice that SPSS has entered
into the regression equation, two variables: TOINN4 and TOINN6, those are
significantly correlated with CKM.
The Determinant Factors of Innovation related with
Customer Knowledge Management
Revista Universitaria Europea Nº 21. Diciembre 2014: 133-158
ISSN: 1139 - 5796
153
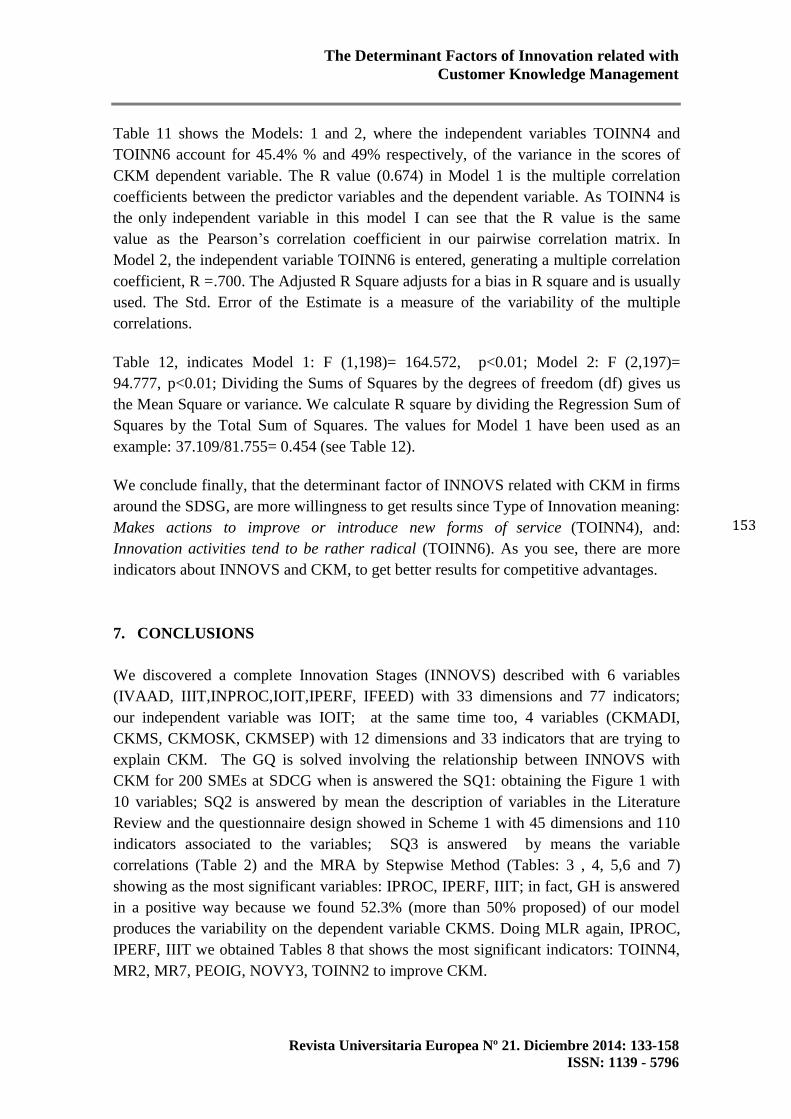
Table 11 shows the Models: 1 and 2, where the independent variables TOINN4 and
TOINN6 account for 45.4% % and 49% respectively, of the variance in the scores of
CKM dependent variable. The R value (0.674) in Model 1 is the multiple correlation
coefficients between the predictor variables and the dependent variable. As TOINN4 is
the only independent variable in this model I can see that the R value is the same
value as the Pearson’s correlation coefficient in our pairwise correlation matrix. In
Model 2, the independent variable TOINN6 is entered, generating a multiple correlation
coefficient, R =.700. The Adjusted R Square adjusts for a bias in R square and is usually
used. The Std. Error of the Estimate is a measure of the variability of the multiple
correlations.
Table 12, indicates Model 1: F (1,198)= 164.572, p<0.01; Model 2: F (2,197)=
94.777, p<0.01; Dividing the Sums of Squares by the degrees of freedom (df) gives us
the Mean Square or variance. We calculate R square by dividing the Regression Sum of
Squares by the Total Sum of Squares. The values for Model 1 have been used as an
example: 37.109/81.755= 0.454 (see Table 12).
We conclude finally, that the determinant factor of INNOVS related with CKM in firms
around the SDSG, are more willingness to get results since Type of Innovation meaning:
Makes actions to improve or introduce new forms of service (TOINN4), and:
Innovation activities tend to be rather radical (TOINN6). As you see, there are more
indicators about INNOVS and CKM, to get better results for competitive advantages.
7. CONCLUSIONS
We discovered a complete Innovation Stages (INNOVS) described with 6 variables
(IVAAD, IIIT,INPROC,IOIT,IPERF, IFEED) with 33 dimensions and 77 indicators;
our independent variable was IOIT; at the same time too, 4 variables (CKMADI,
CKMS, CKMOSK, CKMSEP) with 12 dimensions and 33 indicators that are trying to
explain CKM. The GQ is solved involving the relationship between INNOVS with
CKM for 200 SMEs at SDCG when is answered the SQ1: obtaining the Figure 1 with
10 variables; SQ2 is answered by mean the description of variables in the Literature
Review and the questionnaire design showed in Scheme 1 with 45 dimensions and 110
indicators associated to the variables; SQ3 is answered by means the variable
correlations (Table 2) and the MRA by Stepwise Method (Tables: 3 , 4, 5,6 and 7)
showing as the most significant variables: IPROC, IPERF, IIIT; in fact, GH is answered
in a positive way because we found 52.3% (more than 50% proposed) of our model
produces the variability on the dependent variable CKMS. Doing MLR again, IPROC,
IPERF, IIIT we obtained Tables 8 that shows the most significant indicators: TOINN4,
MR2, MR7, PEOIG, NOVY3, TOINN2 to improve CKM.

Mejía, J; Sánchez, J.
RUE
154
According the last results, we started the analysis about TOINN4 as a most important
determinant factor of innovation (INNOVS) related with CKM, and we answered the
SQ3 solved applying MRA between the dependent variable CKM, and the independent
variable Type of Innovation (TOINN), discovering their indicators: Makes actions to
improve or introduce new forms of service (TOINN4) and Innovation activities
tend to be rather radical (TOINN6) as the most relevant indicators into Type of
Innovation (TOINN) of Innovation Stages (INNOVS) that are related with Customer
Knowledge Customer (CKM).
Two models that might be explain and predict the behavior of CKM, by mean of the
indicators: Makes actions to improve or introduce new forms of service (TOINN4)
and Innovation activities tend to be rather radical (TOINN6):
Model 1: CKMS = 2.073 + .430 TOINN4 and
Model 2: CKMS = 1.930+ .266 TOINN4+ .201 TOINN6
About the Hypothesis1 (H1) we had:
H2: The most important factor of INNOVS, specified by mean of TOINN4
produce, more than the 40% of the Customer Knowledge Management (CKM)
variability in the Software Development Sector firms in Guadalajara, México. We
found that Makes actions to improve or introduce new forms of service (TOINN4),
Innovation activities tend to be rather radical (TOINN6) produce 49% (see Table 4)
of the Customer Knowledge Management (CKM). Therefore, the H2 is accepted.
About future studies we propose a generalized model able to predict and explain the
relationship between Innovation (INNOVS) and Customer Knowledge Management
(CKM), where are related all the 110 indicators, through the use of Structural Equations
Modelling (SEM). The aim,of thid study is to discover additionally, the underlying or
latent indicators that points out to raise the level of innovation and customer knowledge
and achieve new competitive advantages to the sector.
As we see finally, there are great opportunities to use not only the 6 indicators
mentioned above, but the rest of the 71/77 INNOVS indicators to improve CKM and get
new and pretty important competitive advantages.
BIBLIOGRAPHY
AFUAH, A. (1997): La Dinámica de la Innovación Organizacional. El Nuevo
Concepto para Lograr Ventajas Competitivas y Rentabilidad, Oxford University
Press, México.
BAKER, M., HART, S. (2007): Product Strategy and Management. Pearson, USA.

The Determinant Factors of Innovation related with
Customer Knowledge Management
Revista Universitaria Europea Nº 21. Diciembre 2014: 133-158
ISSN: 1139 - 5796
155
BERMÚDEZ-GARCÍA, J. (2010): “Cómo Medir la Innovación en las Organizaciones”,
Escuela de Postgrado de la UPC, Cuadernos de Investigación EPG(11).
BONEL, J. I., BONEL, F. J., & FONTANEDA, I. (2003): “Aplicación del nuevo
modelo estratégico de Creación de valor al análisis del éxito Empresarial del e-
business”, V Congreso de Ingeniería de Organización, pp. 11.
CANIBANO, L., GARCÍA-AYUSO, L., SÁNCHEZ, P., & OLEA, M. (1999):
“Measuring Intangibles to Understand and Improve Innovation
Management.Preliminary Results”. Paper presented at the OECD International
Symposium. Measuring and Reporting Intellectual Capital: Experience, Issues,
and Prospects. Amsterdam. 9-11 June, 1999. Amsterdam: OECD.
CHAUDHURI, A. (2006): Emotion and Reason in Consumer Behavior. Butterworth-
Heinemann (is an imprint of Elsevier).Burlington, MA. USA.
CHESBROUGH, H. W., VANHAVERBEKE, W., & WEST, J. (2006): Open
Innovation. Researching a New Paradigm. Oxford University Press, Oxford.
DESOUZA, K., AWAZU, Y., JHA, S., DOMBROWSKI, C., PAPAGARI, S., BALOH,
P. (2007): Customer-Driven Innovation. Retrieved 03 March 2014, from
http://faculty.mu.edu.sa/public/uploads/1357394142.956332024697.pdf
DUSSAUGE, P. H., & RAMANTSOA, B. (1992): Strategic Technology Management.
John Wiley. Chichester.
GALE, B., & WOOD, C. R. (1994): Managing Customer Value. Creating Quality and
Service That Customer can see. Free Press, New York.
GARCIA-MURILLO, M., & ANNABI, H. (2002): “Customer Knowledge
Management”, Journal of the Operational Research Society, 53 (8), pg. 875-884.
GASSMANNA, O., KAUSCH, C., & ENKEL, E. (2012): Integrating Customer
Knowledge in the Early Innovation Phase. Retrieved 03 March 2014, from
Integrating Customer Knowledge in the Early Innovation Phase:
http://citeseerx.ist.psu.edu/viewdoc/download?doi=10.1.1.380.2564&rep=rep1&ty
pe=pdf
GEBERT, H., GEIB, M., KOLBE, L., & RIEMPP, G. (2013): Towards Customer
Knowledge Management: Integrating Customer Relationship Management and
Knowledge Management Concepts. Retrieved 03 March 2014, from Institute of
Information Management. University of St.Gallen.St.Gallen, Switzerland:

Mejía, J; Sánchez, J.
RUE
156
file:///C:/Users/jmt/Desktop/Towards_customer_knowledge_management.pdf
GIBBERT, M. L., PROBST, G. (2002): “Five Styles of Customer Knowledge
Management, and How Smart Companies Use Them To Create Value”. European
Management Journal, 20(5), pp. 459 – 469.
GLOET, M., & SAMSON, D. (2013): “Knowledge Management to Support Systematic
Innovation Capability”, 46th Hawaii International Conference on System
Sciences, Vol. 1-1, pp. 3685-3694. Hawaii: Hawaii International Conference on
System Sciences.
HILL, C. W., JONES, G. R. (2011): Administración Estratégica un Enfoque Integral.
(9a. ed.). México, CENGAGE Learning.
HINTON, P., BROWNLOW, C., MCMURRAY, I., & COZENS, B. (2004): SPSS
Explained. USA, New,York, Routledge Taylor & Francis Group.
HOWELLS, J. (2000): The Nature of Innovation in Services. Australia: OCDE
Innovation and productivity in Services Workshop, October.
INEGI. (2014): Portal Web INEGI. Retrieved 6 Jnauary 2014, de Subportal Ciencia y
Tecnología; Innovación, Investigación y uso de TICs (Sector Privado);
Establecimientos Grandes:
http://www.inegi.org.mx/Sistemas/temasV2/Default.aspx?s=est&c=190
INSEAD. (2013): The Global Innovation Index 2013.The Local Dynamics of
Innovation. INSEAD, Geneve
LAUDON, K., LAUDON, J. (2012): Management Information Systems. Managing the
Digital Firm. USA: Prentice Hall. Lev, B. (2001). Intangibles: Management,
Measurements and Reports, Brookings Institution Press,Washington,D.C.
McKINSEY GLOBAL SURVEY RESULTS: ASSESSING INNOVATION
METRICS. (2008): McKinsey Global Survey Results: Assessing Innovation
Metrics. Retrieved 12 December 2013, from McKinsey Global Survey Results:
Assessing Innovation Metrics:
http://innovbfa.viabloga.com/files/McKinseyQuaterly
assessing_innovation_metrics_oct_2088.pdf.
MEJÍA-TREJO, J., & SÁNCHEZ-GUTIÉRREZ, J. (2013a): Patente nº
MX/a/2013/011807. Instituto Mexicano de la Propiedad Industrial (IMPI),
México.
The Determinant Factors of Innovation related with
Customer Knowledge Management
Revista Universitaria Europea Nº 21. Diciembre 2014: 133-158
ISSN: 1139 - 5796
157
MEJÍA-TREJO, J., SÁNCHEZ-GUTIÉRREZ, J.& ORTIZ-BARRERA, M. (2013b):
Leadership and Value Creation on Innovation: The Case of Software Developer
Sector in Guadalajara. Retrieved 12 Apr 2014 from portal web Social Sciences
Research Network ubicado en:
http://papers.ssrn.com/sol3/papers.cfm?abstract_id=2390787
NAMBISAN, S. (2002): “Designing Virtual Customer Environments for New Product
Development: Toward a Theory”, Academy of Management Review, Vol. 27(3),
pp. 392-413.
NICOLAI, J., KELD, L., & PEDERSEN, T. (2011): “Linking Customer Interaction and
Innovation: The Mediating Role of New Organizational Practices”. Organization
Science, 22(4), pp. 980-999.
OECD (2003). Knowledge Management. Measuring Knowledge Management in the
Business Sector. Organization for Economic Cooperation and Development
(OECD) Paris, France.
OECD (2005). Guidelines for Collecting and Interpreting Innovation Data.
Organization for Economic Cooperation and Development (OECD). Paris, France.
POPADIUK, S., WEI-CHOO, C. (2006): Innovation and knowledge creation:How are
these concepts related? International Journal of Information Management (26),
302-312.
ROGERS, E. (1983): Diffusion of Innovations. Retrieved 20 January 2014, from:
http://www.valuebasedmanagement.net/methods_rogers_innovation_adoptioncurv
e.html
SHIPP, S. S. (2008): Measuring Innovation and Intangibles: A Business Perspective.
IDA Document D-3704. Institute for Defense Analyses Science Technology
Policy Institute, USA.
SMITH, L., & LEYDESDORFF, L. (20 de FEB de 2010): The Triple Helix in the
context of global change: dynamics and challenges. Retrieved 20 February 2014
from The Triple Helix in the context of global change: dynamics and challenges:
http://www.leydesdorff.net/th11/th11.pdf
WHITE, M., BRUTON, G. (2011): The Management of Technology and Innovation.
SOUTH-WESTERN CENGAGE Learning, USA.

Mejía, J; Sánchez, J.
RUE
158
WEF (2014): The Global Competitiveness Report 2013-2014. World Economic Forum,
Geneve.