
Long-term evaluation of the needle surface wax condition of around different industries in Lithuania
9
Long-term evaluation of the needle surface wax condition of Pinus sylvestris around different industries in Lithuania Eugenija Kupcinskiene a, * , Satu Huttunen b a Department of Botany, University of Agriculture of Lithuania, Studentu 11, Akademijos mstl., LT-53361 Kauno raj, Lithuania b Department of Biology/Botany, University of Oulu, FIN-90014 Oulu, Finland Received 10 December 2004; accepted 31 January 2005 Tubular wax on the pine needle surface reflects changes/differences in industrial emissions. Abstract The aim of our study was to evaluate the annual dynamics of needle surface wax erosion and wettability in Scots pines exposed to a gradient of industrial pollutants emitted from the main factories of Lithuania: a nitrogen fertilizer factory, an oil refinery and a cement factory. Decreased emissions (in the case of the oil refinery and the cement factory) were reflected in the increased structural surface area (SSA, i.e. area covered by tubular waxes) on the needles. The nearly constant amount of emissions from the nitrogen fertilizer factory within the 1994e2000 period corresponded to negligible annual differences in SSA. Annual changes in the hydrophobicity of needles on the investigated transects were small. Despite the decreased pollution within the 7-year period, industrial emissions are still causing significantly accelerated wax erosion and increased wettability in needles sampled from the stands most heavily affected by pollutants. Ó 2005 Elsevier Ltd. All rights reserved. Keywords: Long-term monitoring; Pine needle surface; Industrial pollution; Wax structure; Wettability 1. Introduction Investigations of the effects of pollution on the wax structure and wettability of conifer needles since the early 1980s (Cape and Fowler, 1981; Huttunen et al., 1981; Huttunen and Laine, 1983) revealed that erosion of needle wax surfaces is caused by various pollutants, including SO 2 and NO x (Riding and Percy, 1985; Karhu and Huttunen, 1986; Tuomisto, 1988; Cape et al., 1995; Manninen, 1995; Staszewski et al., 1998), NH 3 (Thijse and Baas, 1990; Van der Erden et al., 1992), acidic rain (Krause and Cannon, 1991; Turunen and Huttunen, 1991, 1996; Cape and Percy, 1993; Turunen et al., 1995), acidic fog (Mengel et al., 1989; Percy et al., 1992) or acidic mist (Magel and Ziegler, 1986; Rinallo et al., 1986; Barnes and Brown, 1990), dust (Bermadinger et al., 1987; Staszewski et al., 1994) as well as ozone (Gu¨nthardt-Goerg and Keller, 1987; Barnes et al., 1988; Barnes and Brown, 1990; Kerfourn and Garrec, 1992; Percy et al., 1992, 1993; Cape et al., 1995; Vanhatalo et al., 2001). Many surveys were carried out on conifers growing in areas exposed to adverse anthropogenic influence (Cape et al., 1989; Turunen et al., 1994, 1995; Trimbacher and Weiss, 1999), but information about longer-term observations on needle wax quality is scarce. * Corresponding author. Tel.: C37 061223391; fax: C37 037752271. E-mail addresses: [email protected], [email protected] (E. Kupcinskiene). 0269-7491/$ - see front matter Ó 2005 Elsevier Ltd. All rights reserved. doi:10.1016/j.envpol.2005.01.047 Environmental Pollution 137 (2005) 610e618 www.elsevier.com/locate/envpol
Transcript of Long-term evaluation of the needle surface wax condition of around different industries in Lithuania

Environmental Pollution 137 (2005) 610e618
www.elsevier.com/locate/envpol
Long-term evaluation of the needle surfacewax condition of Pinus sylvestris around
different industries in Lithuania
Eugenija Kupcinskiene a,*, Satu Huttunen b
a Department of Botany, University of Agriculture of Lithuania, Studentu 11,
Akademijos mstl., LT-53361 Kauno raj, Lithuaniab Department of Biology/Botany, University of Oulu, FIN-90014 Oulu, Finland
Received 10 December 2004; accepted 31 January 2005
Tubular wax on the pine needle surface reflects changes/differences in industrial emissions.
Abstract
The aim of our study was to evaluate the annual dynamics of needle surface wax erosion and wettability in Scots pines exposed toa gradient of industrial pollutants emitted from the main factories of Lithuania: a nitrogen fertilizer factory, an oil refinery anda cement factory. Decreased emissions (in the case of the oil refinery and the cement factory) were reflected in the increased
structural surface area (SSA, i.e. area covered by tubular waxes) on the needles. The nearly constant amount of emissions from thenitrogen fertilizer factory within the 1994e2000 period corresponded to negligible annual differences in SSA. Annual changes in thehydrophobicity of needles on the investigated transects were small. Despite the decreased pollution within the 7-year period,industrial emissions are still causing significantly accelerated wax erosion and increased wettability in needles sampled from the
stands most heavily affected by pollutants.� 2005 Elsevier Ltd. All rights reserved.
Keywords: Long-term monitoring; Pine needle surface; Industrial pollution; Wax structure; Wettability
1. Introduction
Investigations of the effects of pollution on the waxstructure and wettability of conifer needles since theearly 1980s (Cape and Fowler, 1981; Huttunen et al.,1981; Huttunen and Laine, 1983) revealed that erosionof needle wax surfaces is caused by various pollutants,including SO2 and NOx (Riding and Percy, 1985; Karhuand Huttunen, 1986; Tuomisto, 1988; Cape et al., 1995;Manninen, 1995; Staszewski et al., 1998), NH3 (Thijseand Baas, 1990; Van der Erden et al., 1992), acidic rain
* Corresponding author. Tel.: C37 061223391; fax: C37 037752271.
E-mail addresses: [email protected], [email protected]
(E. Kupcinskiene).
0269-7491/$ - see front matter � 2005 Elsevier Ltd. All rights reserved.
doi:10.1016/j.envpol.2005.01.047
(Krause and Cannon, 1991; Turunen and Huttunen,1991, 1996; Cape and Percy, 1993; Turunen et al., 1995),acidic fog (Mengel et al., 1989; Percy et al., 1992) oracidic mist (Magel and Ziegler, 1986; Rinallo et al.,1986; Barnes and Brown, 1990), dust (Bermadingeret al., 1987; Staszewski et al., 1994) as well as ozone(Gunthardt-Goerg and Keller, 1987; Barnes et al., 1988;Barnes and Brown, 1990; Kerfourn and Garrec, 1992;Percy et al., 1992, 1993; Cape et al., 1995; Vanhataloet al., 2001).
Many surveys were carried out on conifers growingin areas exposed to adverse anthropogenic influence(Cape et al., 1989; Turunen et al., 1994, 1995;Trimbacher and Weiss, 1999), but information aboutlonger-term observations on needle wax quality is scarce.

611E. Kupcinskiene, S. Huttunen / Environmental Pollution 137 (2005) 610e618
The pollutants emitted from different factories are ofspecific quality and quantity, and the effects of theirmixtures on trees may therefore be different in every case.
The aim of our research was to evaluate the annualdynamics of needle surface quality of Scots pines exposedto industrial pollutants. The study in 1994e2000 assessedthe extent of surface wax erosion and wettability on theneedles of Scots pine stands exposed to different volumesof pollution along transects from a nitrogen fertilizerfactory, an oil refinery and a cement factory.
2. Materials and methods
2.1. Study area
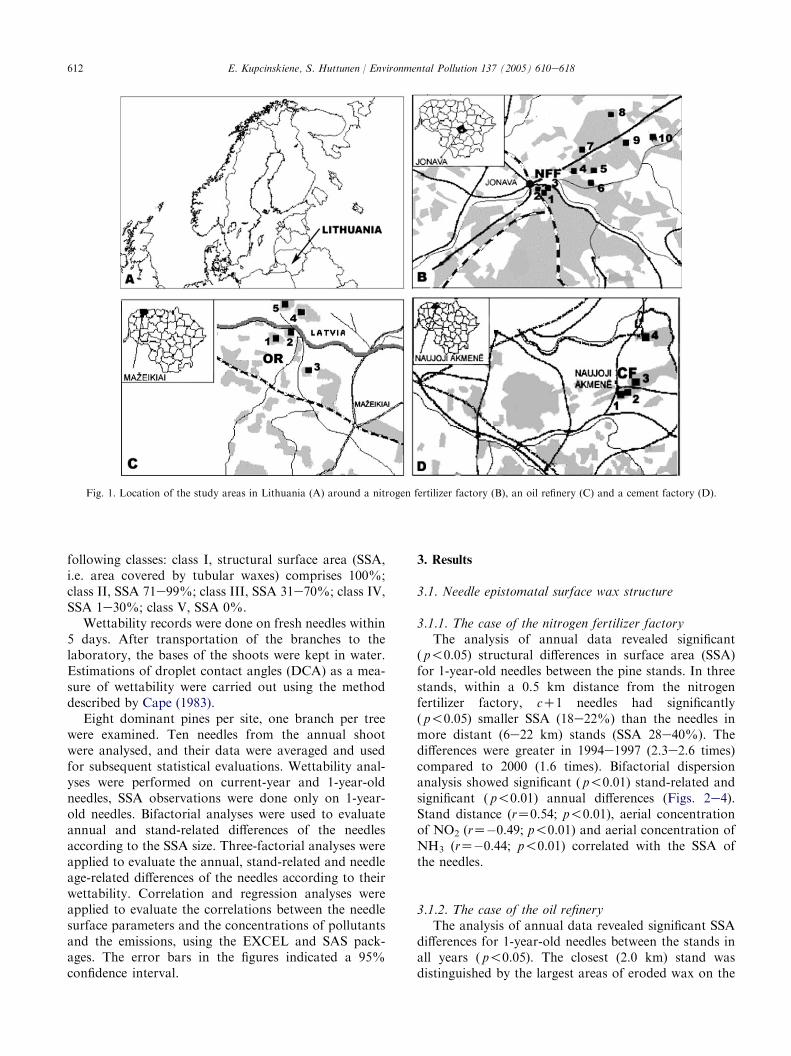
Scots pine (Pinus sylvestris L.) stands near a nitrogenfertilizer factory (NFF), an oil refinery (OR) anda cement factory (CF), i.e. the main local pollutionsources in Lithuania, were investigated. Technologicalimprovements of the factories in 1998e1999 resulted indecreased pollutant emissions (Table 1). This is whythe study of the conifer needle surface quality wasperformed in the years 1994e1997 and again in 2000.The sites along the transect next to the NFF differedup to 7.4 times in the amounts of aerial ammonia(the maximum mean monthly concentration being 26mg m�3). The sites near the OR differed in the amountsof sulphur dioxide up to 2.4 times (the maximum meanmonthly concentration being 27 mg m�3). Total de-position of calcium and magnesium ions along the CFtransect ranged between 19.1 and 2.6 kg ha�1 month�1.The sites mutually most distant from each other on thetransects showed NO2 concentrations that differed by1.5e2.3 times (the maximum mean monthly concentra-tion being 8.2 mg m�3) (Kupcinskiene et al., 1996;Armolaitis et al., 1999; Kupcinskiene, 2001).
Forests on arenosols (near NFF), luvisols (near OR)and histosols (near CF) were examined. Selection of sites
was based on the availability of stands and theprevailing wind direction from each pollution source(Fig. 1). Next to NFF, ten young (!30-year-old treesin 1994) stands of the Vaccinio-myrtillo-Pinetum type at22 km interval were chosen. Three stands at the samedistance (0.5 km) from NFF differed in location: (1)western direction; (2) northern direction; and (3) north-eastern (prevailing wind) direction. Near OR, fourmiddle-aged (O40-year-old in 1994) stands of theOxalido-Pinetum type on a 5.4 km north-easterntransect and one stand (3.6 km away from OR) in theeastern direction were examined. Related to CF, fourmiddle-aged (O40-year-old in 1994) stands belonging tothe Carico-sphagno-Pinetum (siccata) type on a 10 kmtransect were studied.
2.2. Sampling and analyses
Samplings of the trees were done at the beginning ofSeptember in 1994e1997 and 2000. At that time, thecurrent-year (c) needles were 2 months and the 1-year-old (cC1) needles 14 months of age. First-order lateralbranches were collected from the eastern side of thetrees. Branches were cut from the middle part of thecrown of young trees or from the part of the crown6e8 m aboveground from middle-aged trees.
After transportation of the branches to the labora-tory, the needles were cut and dried at room tempera-ture for scanning electron microscopy (SEM).Evaluation of the needle surface quality was done byclassifying the epistomatal waxes into five classes(Turunen and Huttunen, 1991, 1996). The needlesamples were examined with a JEOL-JXA 50A SEM(15 kV accelerating voltage). Two representative areas(the epistomatal chamber, slopes of the epistomatalchamber and the surface round the stomata) of eachneedle were analysed at magnifications of 100xe10,000x.Needle surface quality was rated according to the
Table 1
Emissions (106 kg) from the factories in 1994e2000a
Source Emission Year
1994 1995 1996 1997 1998 1999 2000
Nitrogen fertilizer factory Total 4.9 6.7 5.8 5.6 6.9 6.4 6.9
NH3 0.7 0.3 0.6 0.4 0.3 0.2 0.3
SO2 0.4 0.4 0.1 0.5 0.07 0.08 0.08
NOx 0.4 0.3 0.1 0.5 0.4 0.4 0.4
Oil refinery Total 31.4 29.0 28.9 27.7 25.5 20.9 20.0
Hydrocarbons 21.8 21.5 20.8 14.9 11.0 6.4 5.3
SO2 3.8 2.8 3.2 9.2 7.6 9.9 10.8
NOx 1.4 1.2 1.1 2.6 2.5 2.2 2.2
Cement factory Total 8.2 8.1 5.8 6.3 4.6 3.3 2.6
Dust 3.0 2.6 1.9 2.6 0.8 0.6 0.4
SO2 2.9 2.7 0.9 1.0 1.3 0.7 0.5
NOx 1.9 1.8 2.0 2.0 1.9 1.6 1.2
a Data provided by the Ministry of Environment of Lithuania.
612 E. Kupcinskiene, S. Huttunen / Environmental Pollution 137 (2005) 610e618
Fig. 1. Location of the study areas in Lithuania (A) around a nitrogen fertilizer factory (B), an oil refinery (C) and a cement factory (D).
following classes: class I, structural surface area (SSA,i.e. area covered by tubular waxes) comprises 100%;class II, SSA 71e99%; class III, SSA 31e70%; class IV,SSA 1e30%; class V, SSA 0%.
Wettability records were done on fresh needles within5 days. After transportation of the branches to thelaboratory, the bases of the shoots were kept in water.Estimations of droplet contact angles (DCA) as a mea-sure of wettability were carried out using the methoddescribed by Cape (1983).
Eight dominant pines per site, one branch per treewere examined. Ten needles from the annual shootwere analysed, and their data were averaged and usedfor subsequent statistical evaluations. Wettability anal-yses were performed on current-year and 1-year-oldneedles, SSA observations were done only on 1-year-old needles. Bifactorial analyses were used to evaluateannual and stand-related differences of the needlesaccording to the SSA size. Three-factorial analyses wereapplied to evaluate the annual, stand-related and needleage-related differences of the needles according to theirwettability. Correlation and regression analyses wereapplied to evaluate the correlations between the needlesurface parameters and the concentrations of pollutantsand the emissions, using the EXCEL and SAS pack-ages. The error bars in the figures indicated a 95%confidence interval.
3. Results
3.1. Needle epistomatal surface wax structure
3.1.1. The case of the nitrogen fertilizer factoryThe analysis of annual data revealed significant
( p!0.05) structural differences in surface area (SSA)for 1-year-old needles between the pine stands. In threestands, within a 0.5 km distance from the nitrogenfertilizer factory, cC1 needles had significantly( p!0.05) smaller SSA (18e22%) than the needles inmore distant (6e22 km) stands (SSA 28e40%). Thedifferences were greater in 1994e1997 (2.3e2.6 times)compared to 2000 (1.6 times). Bifactorial dispersionanalysis showed significant ( p!0.01) stand-related andsignificant ( p!0.01) annual differences (Figs. 2e4).Stand distance (rZ0.54; p!0.01), aerial concentrationof NO2 (rZ�0.49; p!0.01) and aerial concentration ofNH3 (rZ�0.44; p!0.01) correlated with the SSA ofthe needles.
3.1.2. The case of the oil refineryThe analysis of annual data revealed significant SSA
differences for 1-year-old needles between the stands inall years ( p!0.05). The closest (2.0 km) stand wasdistinguished by the largest areas of eroded wax on the

613E. Kupcinskiene, S. Huttunen / Environmental Pollution 137 (2005) 610e618
needles (in 1994e1997 only 8.5e11%). SSA wassignificantly ( p!0.05) smaller, showing a 2.9e3.4-foldreduction compared to the needles from the moredistant (3.6e5.4 km) stands (33e28%). In 2000, thedifferences were smaller, but still significant. Bifactorialdispersion analysis showed significant ( p!0.01) stand-related and insignificant annual differences (Figs. 2 and3). The annual needle SSA differences were significant( p!0.05) for the stand 2 km from OR (Fig. 4). Standdistance (rZ0.37, p!0.05), aerial concentration of NO2
(rZ�0.44; p!0.01) and aerial concentration of SO2
(rZ�0.61; p!0.01) correlated significantly with theSSA of the needles.
05
101520253035404550
0 25
c+1 needles from NFF transect stands,1994-1997, 2000
Distance (km)5 10 15 20
05
101520253035404550
c+1 needles from CF transect stands,1994-1997, 2000
Distance (km)0 3 6 9 12
05
101520253035404550
c+1 needles from OR transect stands,1994-1997, 2000
Distance (km)0 5 61 2 3 4
Fig. 2. Structural surface area (SSA, in %) on the cC1 needles of Scots
pines growing at different distances from the nitrogen fertilizer factory,
(NFF; 0.5 km/22 km), the oil refinery (OR; 2.0 km/5.4 km) and the
cement factory (CF; 0.5 km/10 km). The data were combined for all
years, i.e. 1994e1997 and 2000; nZ40.
3.1.3. The case of the cement factoryThe analysis of annual data revealed significant( p!0.05) SSA differences in 1-year-old needles (1.6e2.0 times) between the stands in 1994e1997 (Figs. 2 and3). The data of 1994e1997 showed that, in the standlocated within 0.5 km from the cement factory, theneedles had significantly smaller SSA (17e20%) thanthe needles from the most distant stand (10 km, 31e35%). Bifactorial dispersion analysis showed significant( p!0.01) stand-related and annual ( p!0.01) differ-ences. In 2000, no stand differences were found, and theabsolute values of SSA were higher (34e44%). Standdistance (rZ0.52, p!0.01), aerial concentration of NO2
(rZ�0.46; p!0.01) and aerial concentration of SO2
(rZ�0.33; p!0.01) correlated with the SSA of theneedles.
c+1 needles from NFF transect stands
05
101520253035404550
1994
Year1995 1996 1997 2000
1994 1995 1996 1997 2000
1994 1995 1996 1997 2000
c+1 needles from OR transect stands
05
101520253035404550
Year
c+1 needles from CF transect stands
05
101520253035404550
Year
Fig. 3. Structural surface area (SSA, in %) on the cC1 needles sampled
in different years (September, 1994e1997, 2000) from Scots pines
growing in areas exposed to industrial pollution (the data were
combined for all distances; nitrogen fertilizer factory (NFF), nZ80; oil
refinery (OR), nZ40; cement factory (CF), nZ32).

614 E. Kupcinskiene, S. Huttunen / Environmental Pollution 137 (2005) 610e618
3.2. Wettability of needle surface
3.2.1. The case of the nitrogen fertilizer factoryThe analysis of annual data revealed significant
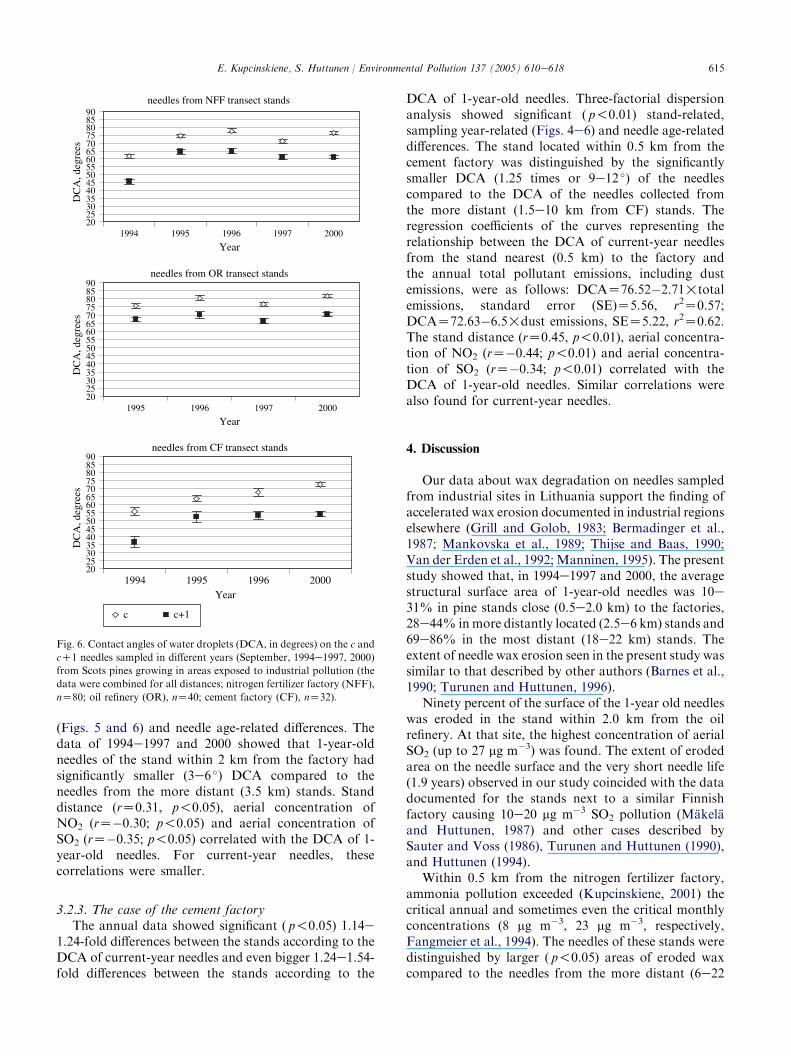
differences of 6e12 � ( p!0.05) between the stands inthe DCA of current-year needles, while differences up to12e18 � were observed between the 1-year-old needlesfrom the different stands ( p!0.01). Three-factorialdispersion analysis showed significant ( p!0.05) stand-related, annual (Figs. 5 and 6) and needle age-relateddifferences. The most marked differences in the DCAresults were observed between the needles taken fromthe stands 0.5 km away from the factory and the standsat 6 km and 18 km. The smallest DCA values weredocumented in 1994. Stand distance (rZ0.30, p!0.01),aerial concentration of NH3 (rZ�0.23; p!0.01) and
c+1 needles from the stands0.5 km distance to NFF
05
101520253035404550
Year1994 1995 1996 1997 2000
c+1 needles from the stand2 km distance to OR
05
101520253035404550
Year1994 1995 1996 1997 2000
c+1 needles from the stand0.5 km distance to CF
05
101520253035404550
Year1994 1995 1996 1997 2000
Fig. 4. Structural surface area (SSA, in %) on the cC1 needles sampled
in different years (September, 1994e1997, 2000) from the Scots pines
growing closest (0.5e2.0 km) to the factories (nitrogen fertilizer factory
(NFF), nZ24; oil refinery (OR), nZ8; cement factory (CF), nZ8).
aerial concentration of NO2 (rZ�0.24; p!0.01) corre-lated with the DCA of 1-year-old needles.
3.2.2. The case of the oil refineryThe analysis of the annual data revealed significant
( p!0.05) 1.08e1.09-fold differences between current-year needles from the different stands in 1996 and 2000,and similar 1.09e1.14-fold differences between the standswere observed for 1-year-old needles ( p!0.05, 1996,2000). Three-factorial dispersion analysis showed signif-icant ( p!0.05) stand-related, sampling year-related
needles from OR transect stands, 1994-1997, 2000
DC
A, d
egre
es
202530354045505560657075808590
0 1 2 3 4 5 6Distance (km)
needles from CF transect stands, 1994-1997, 2000
DC
A, d
egre
es
202530354045505560657075808590
0 3 6 9 12
Distance (km)
c c+1
needles from NFF transect stands, 1994-1997, 2000
202530354045505560657075808590
Distance (km)
DC
A, d
egre
es
0 5 10 15 20 25
Fig. 5. Contact angles of water droplets (DCA, in degrees) on the c and
cC1 needles of Scots pines growing at different distances from the
nitrogen fertilizer factory (NFF; 0.5 km/22 km), the oil refinery (2.0
km/5.4 km), the cement factory (0.5 km/10 km). The data were
combined for all years, i.e. 1994e1997 and 2000; nZ40.
615E. Kupcinskiene, S. Huttunen / Environmental Pollution 137 (2005) 610e618
(Figs. 5 and 6) and needle age-related differences. Thedata of 1994e1997 and 2000 showed that 1-year-oldneedles of the stand within 2 km from the factory hadsignificantly smaller (3e6 �) DCA compared to theneedles from the more distant (3.5 km) stands. Standdistance (rZ0.31, p!0.05), aerial concentration ofNO2 (rZ�0.30; p!0.05) and aerial concentration ofSO2 (rZ�0.35; p!0.05) correlated with the DCA of 1-year-old needles. For current-year needles, thesecorrelations were smaller.
3.2.3. The case of the cement factoryThe annual data showed significant ( p!0.05) 1.14e
1.24-fold differences between the stands according to theDCA of current-year needles and even bigger 1.24e1.54-fold differences between the stands according to the
needles from NFF transect stands
202530354045505560657075808590
1994
Year
DC
A, d
egre
es
1995 1996 1997 2000
DC
A, d
egre
es
needles from OR transect stands
202530354045505560657075808590
Year1995 1996 1997 2000
DC
A, d
egre
es
needles from CF transect stands
202530354045505560657075808590
Year
c c+1
1994 1995 1996 2000
Fig. 6. Contact angles of water droplets (DCA, in degrees) on the c and
cC1 needles sampled in different years (September, 1994e1997, 2000)
from Scots pines growing in areas exposed to industrial pollution (the
data were combined for all distances; nitrogen fertilizer factory (NFF),
nZ80; oil refinery (OR), nZ40; cement factory (CF), nZ32).
DCA of 1-year-old needles. Three-factorial dispersionanalysis showed significant ( p!0.01) stand-related,sampling year-related (Figs. 4e6) and needle age-relateddifferences. The stand located within 0.5 km from thecement factory was distinguished by the significantlysmaller DCA (1.25 times or 9e12 �) of the needlescompared to the DCA of the needles collected fromthe more distant (1.5e10 km from CF) stands. Theregression coefficients of the curves representing therelationship between the DCA of current-year needlesfrom the stand nearest (0.5 km) to the factory andthe annual total pollutant emissions, including dustemissions, were as follows: DCAZ76.52�2.71!totalemissions, standard error (SE)Z5.56, r2Z0.57;DCAZ72.63�6.5!dust emissions, SEZ5.22, r2Z0.62.The stand distance (rZ0.45, p!0.01), aerial concentra-tion of NO2 (rZ�0.44; p!0.01) and aerial concentra-tion of SO2 (rZ�0.34; p!0.01) correlated with theDCA of 1-year-old needles. Similar correlations werealso found for current-year needles.
4. Discussion
Our data about wax degradation on needles sampledfrom industrial sites in Lithuania support the finding ofaccelerated wax erosion documented in industrial regionselsewhere (Grill and Golob, 1983; Bermadinger et al.,1987; Mankovska et al., 1989; Thijse and Baas, 1990;Van der Erden et al., 1992; Manninen, 1995). The presentstudy showed that, in 1994e1997 and 2000, the averagestructural surface area of 1-year-old needles was 10e31% in pine stands close (0.5e2.0 km) to the factories,28e44% inmore distantly located (2.5e6 km) stands and69e86% in the most distant (18e22 km) stands. Theextent of needle wax erosion seen in the present study wassimilar to that described by other authors (Barnes et al.,1990; Turunen and Huttunen, 1996).
Ninety percent of the surface of the 1-year old needleswas eroded in the stand within 2.0 km from the oilrefinery. At that site, the highest concentration of aerialSO2 (up to 27 mg m�3) was found. The extent of erodedarea on the needle surface and the very short needle life(1.9 years) observed in our study coincided with the datadocumented for the stands next to a similar Finnishfactory causing 10e20 mg m�3 SO2 pollution (Makelaand Huttunen, 1987) and other cases described bySauter and Voss (1986), Turunen and Huttunen (1990),and Huttunen (1994).
Within 0.5 km from the nitrogen fertilizer factory,ammonia pollution exceeded (Kupcinskiene, 2001) thecritical annual and sometimes even the critical monthlyconcentrations (8 mg m�3, 23 mg m�3, respectively,Fangmeier et al., 1994). The needles of these stands weredistinguished by larger ( p!0.05) areas of eroded waxcompared to the needles from the more distant (6e22

616 E. Kupcinskiene, S. Huttunen / Environmental Pollution 137 (2005) 610e618
km) stands. In 1994e1997, the size of the needlestructural surface area along the transect from thenitrogen fertilizer factory corresponded to the findingsof a previous study (1990e1993) carried out by usinga more detailed wax structure classification (Kupcin-skiene et al., 1996; Kupcinskiene, 1999).
Nitrogen dioxide and sulphur dioxide pollution alongthe transect next to the cement factory was not as heavyas dust pollution (Armolaitis et al., 1999). Our in-vestigation showed a significant correlation between theneedle contact angle values and the chloroform-insoluble surface fraction (Nemaniute et al., 1997).The above facts seem to indicate that dust causedfaster needle surface erosion in the pines growing within0.5 km from the factory compared to the trees at a 10km distance. An increased eroded area of the needlesurfaces exposed to dust was observed in other studies(Bermadinger et al., 1987).
The small wax erosion in the most distant pine standsof the transects (6e22 km) corresponded to the ambientconcentrations of air pollutants (1.8 mg m�3 NO2; 2.7 mgm�3 SO2; Kupcinskiene et al., 1996; Kupcinskiene,2001). Compared to 1994e1997, the oil refinery totalemissions in 2000 had decreased by one-third, andhydrocarbon pollution has been cut down by threeefourtimes. These changes in pollution were reflected in thetwofold increased structural surface area on the needlessampled from the stand most seriously affected by thepollutants. Within our study period, the total emissionsof the cement factory decreased three times and dustpollution was cut down sixeseven times. These changeswere accompanied by an increased structural surfacearea on the needles and the disappearance of significantdifferences between the pine stands growing along thetransect from the cement factory. The nearly constantamounts of emissions from the nitrogen fertilizer factorywithin the study period corresponded to the negligibleannual differences in the needle structural surface area.
Along the nitrogen fertilizer factory transect thewater droplets on the needles differed by 8e12 �, andthese significant differences were smallest (4e9 �) on theoil refinery transect. On the needles collected from thetrees growing at 0.5 km from the cement factory, contactangles were 11e15 � smaller compared to the values ofthe needles sampled at 10 km. Similar findings wereobtained for pine needles near a cement factory inPoland (Staszewski et al., 1994). The changes in thehydrophobicity of the needles along the other transectswere small between the years 1994e1997 and 2000. Ananalysis of the annual dynamics of contact anglesrevealed that the needles of 1994 were distinguished bythe smallest contact angles (in July 1994 the amount ofrainfall was 7 mm). In the investigated pine stands, thecontact angles were 73e84 � on the current-year needlesand significantly smaller in 13e15 �, on the 1-year-oldneedles. These findings correspond to the results of
many other authors (Cape et al., 1989; Percy et al., 1993;Donnelly and Dowding, 1994; Turunen et al., 1995;Turunen and Huttunen, 1996; Staszewski et al., 1998).The needle age-related differences in contact angles weregreater than the stand-related or annual differences.
After a comparison of stands growing closest to thefactories on all studied transects, the stand closest to theoil refinery was distinguished by the most extensiveneedle surface erosion, while its wettability was leastincreased. Completely opposite results were obtainedfrom the stand closest to the cement factory. This couldbe explained by the differences in the hydrophobicity ofthe pollutants that precipitate on the surface of theneedles (Schreiber, 1996). After evaluation by the size ofthe contact angles of the water droplets, surfaces mayyield better or worse information than investigation ofthe wax structure by a scanning electron microscope.
Despite the decrease of pollution during the 7 yearsof study, industrial emissions are still causing signifi-cantly accelerated wax erosion and increased wettabilityof Scots pine needle surfaces. Follow-up of the in-vestigated conifer needle surface parameters may pro-vide information about the health of the assimilativeorgans of trees exposed to pollutants of varyingconcentrations due to changes in technologies and theindustrial production volumes.
5. Conclusions
The present (up to 2000) industrial pollution (withannual total emissions of 3e20!106 kg) still causessignificant impairment of the conifer needle surface intrees growing within 0.5e2.0 km from factories. Theeroded areas of the needles of Scots pines growing ata distance of 2 km from the greatest polluter (oilrefinery, range of total annual emissions 20e31!106 kg)were significantly larger than those on the needlessampled at a distance of 0.5 km from the other factories(nitrogen fertilizer factory and cement factory; range oftotal annual emissions 3e8!106 kg). The annualdecreases in the pollutant emissions from the factorieswere reflected in the increased (in 10e18%) structuralsurface areas on the needles sampled from the standsmost severely affected by the pollutants. The nearlyconstant annual emissions from the nitrogen fertilizerfactory corresponded to the negligible annual differencesin the structural surface area of the needles.
The level of industrial pollutant emissions was betterreflected in the needle surface structure than in thehydrophobicity of needles. In the stand closest to the oilrefinery, where the maximum (up to 91% of totalsurface area) needle wax erosion was observed byscanning electron microscopy, wettability was leastsignificantly increased (in 4e9 �), while a completelyopposite situation was observed in the needles of the
617E. Kupcinskiene, S. Huttunen / Environmental Pollution 137 (2005) 610e618
stand closest to the cement factory. Depending onthe nature of the pollutants, evaluation of the needlesurface condition by measuring water droplet contactangles may hide or highlight erosion compared to theassessment of the surface structure by scanning electronmicroscopy. The extent of needle surface wettabilitymight be a more sensitive parameter than the size of thestructural surface area in the case of less intense (annualemissions 0.4!106 kg) dust pollution.
Acknowledgements
The investigation was supported by grants fromCentral European University (Budapest, Hungary) andJ.S.C. Achema (Lithuania). The authors thank Dr V.Grigaliunas, Dr A. Kliucius, Dr J. Lamppu, Ms P.Huhtala and J. Nemaniute for advice and technicalassistance.
References
Armolaitis, K., Bartkevicius, E., Juknys, R., Raguotis, A.,
Sepetiene, J., 1999. Affects of pollutants from J/V ‘‘Achema’’ on
forests ecosystems. In: Ozolincius, R. (Ed.), Monitoring of Forest
Ecosystems in Lithuania. Kaunas, pp. 44e64.
Barnes, J.D., Brown, K.A., 1990. The influence of ozone and acid mist
on the amount and wettability of the surface waxes in Norway
spruce [Picea abies (L.) Karst.]. New Phytologist 114, 531e535.
Barnes, J.D., Davison, A.W., Booth, T.A., 1988. Ozone accelerates
structural degradation of epicuticular wax on Norway spruce
needles. New Phytologist 110, 309e318.
Barnes, J.D., Eamus, D., Davison, A.W., Ro-Poulsen, H.,
Mortensen, L., 1990. Persistent effects of ozone on needle water
loss and wettability in Norway spruce. Environmental Pollution 63,
345e363.Bermadinger, E., Grill, D., Golob, P., 1987. The different influence of
magnesite emissions on the surface waxes of Norway spruce and
silver fir. Canadian Journal of Botany 66, 125e129.Cape, J.N., 1983. Contact angles of water droplets on needles of Scots
pine (Pinus sylvestris) growing in polluted atmospheres. New
Phytologist 93, 293e299.
Cape, J.N., Fowler, D., 1981. Changes in epicuticular wax of Pinus
sylvestris exposed to polluted air. Silva Fennica 15, 450e458.
Cape, J.N., Paterson, I.S., Wolfenden, J., 1989. Regional variation in
surface properties of Norway spruce and Scots pine needles in
relation to forest decline. Environmental Pollution 58, 325e342.Cape, J.N., Percy, K.E., 1993. Environmental influences on the
development of spruce needle cuticles. New Phytologist 125, 787e
799.
Cape, J.N., Sheppard, L.J., Binnie, J., 1995. Leaf surface properties of
Norway spruce needles exposed to sulphur dioxide and ozone in an
open-air fumigation system at Liphook. Plant, Cell, Environment
18 (3), 285e289.Donnelly, A., Dowding, P., 1994. A comparison of epicuticular wax of
Pinus sylvestris needles from three sites in Ireland. In: Percy, K.E.,
Cape, J.N., Jagels, R., Simpson, C.J. (Eds.), Air Pollutants and the
Leaf Cuticle. NATO ASI Series, vol. G36. Springer-Verlag, Berlin,
Heidelberg, pp. 351e358.
Fangmeier, A., Hadwiger-Fangmeier, A., van der Eerden, L.,
Jager, H.J., 1994. Effects of atmospheric ammonia on vegetation
e a review. Environmental Pollution 86, 43e82.
Grill, D., Golob, P., 1983. SEM-investigations of different dust
depositions on the structure of coniferous needles and the effect on
the needle wax. Aquilo Series Botany 19, 255e261.
Gunthardt-Goerg, M.S., Keller, T., 1987. Some effects of long term
ozone fumigation on Norway spruce. II. Epicuticular wax and
stomata. Trees 1, 145e150.
Huttunen, S., 1994. Effects of air pollutants on epicuticular wax
structure. In: Percy, K.E., Cape, J.N., Jagels, R., Simpson, C.J.
(Eds.), Air Pollutants and the Leaf Cuticle. NATO ASI Series, vol.
G36. Springer-Verlag, Berlin, Heidelberg, pp. 81e96.
Huttunen, S., Havas, P., Laine, K., 1981. Effects of air pollutants on
the winter time water economy of Scots pine, Pinus sylvestris.
Holarctic Ecology 4, 94e101.
Huttunen, S., Laine, K., 1983. Effect of air-borne pollutants on the
surface wax structure of Pinus sylvestris needles. Annales Botanici
Fennici 20, 79e86.Karhu, M., Huttunen, S., 1986. Erosion effects of air pollution on
needle surfaces. Water, Air, Soil Pollution 31, 417e423.
Kerfourn, C., Garrec, J.P., 1992. Modifications in the alkane
composition of cuticular waxes from spruce needles (Picea abies)
and ivy leaves (Hedera helix) exposed to ozone fumigation and acid
fog: Comparison with needles from declining spruce trees.
Canadian Journal of Botany 70, 861e869.Krause, C.R., Cannon, W.N., 1991. Epistomatal wax injury to red
spruce needles (Picea rubens Sarg) growth in elevated levels of
ozone and acidified rain. Scanning Microscopy 5 (4), 1173e1180.
Kupcinskiene, E., 1999. Surface structures of Pinus sylvestris needles
under influence of low level emissions from nitrogen fertilizer
factory. Baltic Forestry 5, 20e31.
Kupcinskiene, E., 2001. Nitrogen fertilizer factory effects on the amino
acids and nitrogen content in the needles of Scots pine. Optimizing
Nitrogen Management in Food and Energy Production and
Environmental Protection: Proceedings of Second International
Nitrogen Conference on Science and Policy. The Scientific World
1(S2) 449e456.
Kupcinskiene, E., Huges, S., Matulionis, E., 1996. Morphophysio-
logical evaluation of Pinus sylvestris trees near local pollution
sources and in pollution conditions. Landschaftsentwicklung und
Umweltforschung 104, 101e119.
Magel, E., Ziegler, H., 1986. Einfluss von Ozon und saurem Nebel auf
die Struktur der stomataren Wachspfrophen in den Nadeln von
Picea abies (L.) Karst. Forstwissenschaftliches Centralblatt 105,
234e238.
Mankovska, B., Huttunen, S., Peura, R., 1989. The effect of air
pollution from the Krompachy and Rudnany smelteries on Picea
abies L. Karst. Ekologia (CSSR) 8 (1), 49e58.
Manninen, S., 1995. Assessing the critical level of SO2 for Scots pine
(Pinus sylvestris L.) in Northern Europe on the basis of needle
sulphur fractions, sulphur/nitrogen ratios and needle damage. Acta
Universitatis Ouluensis A 273, 47.
Mengel, K., Hogrebe, A.M.R., Esch, A., 1989. Effect of acidic fog on
needle surface and water relations of Picea abies. Physiologia
Plantarum 75, 201e207.Makela, A., Huttunen, S., 1987. Cuticular needle erosion and winter
drought in polluted environments. A model analysis. Working
paper 87.48, International Institute for Applied Systems Analysis,
Luxenburg, 25 pp.
Nemaniute, J., Kupcinskiene, E., Augustaitis, A., Kliucius, A., 1997.
Comparative characteristics of various parameters used to evaluate
Pinus sylvestris trees near oil refinery ‘Nafta’. Environmental
Engineering/Aplinkos inzinerija 1 (7), 60e68 (ISSN 1392-1622).
Percy, K.E., Jensen, K.F., McQuattie, C.J., 1992. Effects of ozone and
acidic fog on red spruce needle epicuticular wax production,
chemical composition, cuticular membrane ultrastructure and
needle wettability. New Phytologist 122, 71e80.
Percy, K.E., Jagels, R., Marden, S., McLaughlin, C.K., Carlisle, J.,
1993. Quantity, chemistry and wettability of epicuticular waxes on

618 E. Kupcinskiene, S. Huttunen / Environmental Pollution 137 (2005) 610e618
needles of red spruce along a fog-acidity gradient. Canadian
Journal of Forest Research 23, 1472e1479.
Riding, R.T., Percy, K.E., 1985. Effects of SO2 and other air pollutants
on the morphology of epicuticular waxes on needles of Pinus
strobus and Pinus Banksiana. New Phytologist 99, 555e563.
Rinallo, C., Raddi, P., diLonardo, V., 1986. Effects of simulated acid
deposition on the surface structure of Norway spruce and silver fir
needles. European Journal of Forest Pathology 16, 440e446.Sauter, J.J., Voss, U., 1986. SEM-observations on the structural
degradation of epistomatal waxes in Picea abies (L.) Karst. e and
its possible role in the ‘Fichtensterben’. European Journal of Forest
Pathology 16, 408e423.Schreiber, L., 1996. Wetting of the upper needle surface of Abies
grandis: Influence of pH, wax chemistry and epiphyllic microflora
on contact angles. Plant, Cell, Environment 19, 455e463.
Staszewski, T., Godzik, S., Poborski, P., 1994. Physico-chemical
characteristics ofpineneedle surfaces exposed todifferentair pollution
sources. In: Percy, K.E., Cape, J.N., Jagels, R., Simpson, C.J. (Eds.),
Air Pollutants and the Leaf Cuticle. NATO ASI Series, vol. G36.
Springer-Verlag, Berlin, Heidelberg, pp. 341e350.
Staszewski, T., Lukasik, W., Godzik, S., Szdzuj, J., Uzieblo, A.K.,
1998. Climatic and air pollution gradient studies on coniferous
trees health status, needles wettability and chemical characteristics.
Chemosphere 36, 901e905.
Thijse, G., Baas, P., 1990. ‘Natural’ and NH3-induced variation of
epicuticular needle wax morphology of Pseudotsuga menziessii
(Mirb.) Franco. Trees 4, 111e119.Trimbacher, K., Weiss, P., 1999. Needle surface characteristics and
element contents of Norway spruce in relation to the distance of
emission sources. Environmental Pollution 105, 111e119.
Tuomisto, H., 1988. Use of Picea abies needles as indicators of air
pollution: Epicuticular wax morphology. Annales Botanici Fenici
23, 351e364.
Turunen, M., Huttunen, S., 1990. A review of the response of
epicuticular wax of conifer needles to air pollution. Environmental
Quality 19, 35e45.
Turunen, M., Huttunen, S., 1991. The effect of simulated acid rain on
epicuticular wax of Scots pine needles in northerly conditions.
Canadian Journal of Botany 69, 412e419.
Turunen, M., Huttunen, S., 1996. Scots pine needle surfaces on radial
transects across the north boreal area of Finnish Lapland and the
Kola Peninsula of Russia. Environmental Pollution 93, 175e194.Turunen, M., Huttunen, S., Lamppu, J., Huhtala, P., 1994. Character-
istics an geographical distribution of changes in Scots pine needle
surfaces in Finnish Lapland and the Kola Peninsula. In:
Percy, K.E., Cape, J.N., Jagels, R., Simpson, C.J. (Eds.), Air
Pollutants and the Leaf Cuticle. NATO ASI Series, vol. G36.
Springer-Verlag, Berlin, Heidelberg, pp. 359e369.
Turunen, M., Huttunen, S., Back, J., Lamppu, J., 1995. Acid rain-
induced changes in cuticles and Ca distribution of Scots pine and
Norway spruce seedlings. Canadian Journal of Research 25, 1313e
1325.
Van der Erden, L.J.M., Lekkerkerk, L.J.A., Smeulders, S.M., 1992.
Effects of atmospheric ammonia and ammonium sulphate on
Douglas fir (Pseudotsuga menziesii). Environmental Pollution
76, 1e9.
Vanhatalo, M., Huttunen, S., Back, J., 2001. Effects of elevated [CO2]
and O3 on stomatal and surface wax characteristics in leaves
of pubescent birch grown under field conditions. Trees 15,
304e313.