Sustainability in project management: A literature review and impact analysis
Upload
khangminh22Category
view
3download
0
sustainability
Review
Logistics Space: A Literature Review from theSustainability Perspective
Meiling He 1,* ID , Jiaren Shen 1, Xiaohui Wu 1 and Jianqiang Luo 2
1 School of Automobile and Traffic Engineering, Jiangsu University, Zhenjiang 212013, China;[email protected] (J.S.); [email protected] (X.W.)
2 School of Management, Jiangsu University, Zhenjiang 212013, China; [email protected]* Correspondence: [email protected]
Received: 5 July 2018; Accepted: 5 August 2018; Published: 8 August 2018�����������������
Abstract: The acceleration of economic globalization and integration has led to a dramatic increase inthe flow of goods worldwide and changes in the spatial location of logistics facilities. The location oflogistics facilities affects not only the cost and efficiency of cargo transportation activities, but alsothe rational allocation of logistics resources. Recently, the two major perspectives of logistics spaceresearch—cluster (the concentration of logistics facilities and functions in geography) and sprawl(movement of facilities from the urban core to peripheral places) have received extensive attentionfrom academia and policy makers. The evolution of logistics space is influenced by land prices, trafficaccessibility, market demand, agglomeration advantages and government policies. The purpose ofthis study is to present a literature review of logistics space, including data sources, research methodsas well as research theories, and to study the impact of logistics space from the perspective ofsustainable development. The research results provide some reference for logistics space researchersand logistics facility planners, and play a role in formulating new logistics development strategiesand promoting the sustainable development of logistics.
Keywords: logistics space; sprawl; cluster; influencing factors; sustainability
1. Introduction
Under the background of economic globalization and regional economic integration, increasinglyproducts are circulating, producing, selling and consuming around the world. Logistics, as the newengine of economic growth, plays a core role in overcoming the constraints of time-space betweenproducers and the markets they serve. Logistics is the physical flow of goods from the place of supplyto the receiving place. According to actual needs, the basic functions of transportation, storage, loadingand unloading, handling, packaging, distribution processing, distribution, recycling, and informationprocessing are organically combined. Industrial space refers to the economic phenomenon in which acertain industry combines spatial distribution and industry within a country or region. Logistics spaceis a kind of industrial space, which refers to the projection of urban logistics activities (professionalmarkets, logistics companies, logistics nodes, logistics infrastructure) in the geographical space [1].In order to speed up urbanization, the government blindly planned a large number of logistics facilities.On the one hand, this has intensified the increasingly prominent contradiction of urban land use, andon the other hand caused the waste of logistics resources.
The spatial layout and evolution of urban logistics facilities is an important force driving urbaneconomic and spatial development. Data from large cargo surveys in the Tokyo metropolitan area showthat the integration of logistics facilities has increased the efficiency of logistics and transportation by4% [2]. The spatial concentration of logistics companies promotes the improvement of cooperationand value-added services between enterprises [3]. Research from the perspective of geography mainly
Sustainability 2018, 10, 2815; doi:10.3390/su10082815 www.mdpi.com/journal/sustainability
Sustainability 2018, 10, 2815 2 of 24
includes the distribution law and influencing factors of logistics space. Brown studies the distributionof storage facilities in the United States from a geographical perspective, and found that the accessibilityof air and road transport networks strongly influenced the location of storage sites [4]. Sakai analyzesthe locational dynamics of logistics facilities in the Tokyo metropolitan area, and found that logisticsfacilities moved outward by 26% in only 10 years [5]. In addition, Gothenburg, Atlanta, Zurich, andother places also showed the phenomenon of logistics sprawl [6–8]. Dablanc analyzes two importantcharacteristics of logistics industry geography: logistics sprawl and polarization logistics activities.Logistics sprawl has led to changes in the geographical location of urban cargo, increased mileage andcorresponding emissions of trucks, and affected the commuting of logistics employment [9].
Land availability and its costs, transportation infrastructure and government policies areimportant factors influencing the evolution of logistics space. Giuliano divides the factors thataffecting the spatial dynamics of the California logistics industry into economic development policies,metropolitan size, economic structure and physical geography [10]. Holl studies the impact ofaccessibility on the location of logistics companies, while Aljohani explains the reasons for the relocationof logistics facilities from land use and freight exclusion [9,11]. Kumar finds that transportationinfrastructure has a positive impact on transportation and logistics clusters [12]. By studying thetraditional disciplines of logistics, economics and transportation science have no in-depth researchon logistics space, and logistics is still relatively undeveloped from the perspective of geography [13].Logistics space as an important part of the industrial space, some scholars study the spatial aggregationand distribution of the logistics industry from the industrial space [14]. More scholars have examinedthe spatial patterns of logistics activities and related planning policy issues based on case studies [8].
The constant increase of logistics demand has put forward higher requirements for thedevelopment of modern logistics. The quantity and types of logistics facilities and enterprises haveincreased dramatically, and the quality of logistics services has being increasing, which has led todramatic changes in the spatial distribution of logistics [15]. Restructuring of logistics space leads togeographical dispersion of supply chain, increasing the distance between suppliers, manufacturers,distributors and consumers [16]. The evolution of logistics space is increasingly important forthe sustainable development of logistics in terms of environmental efficiency, social efficiency andeconomic efficiency. Therefore, grasping the spatial distribution of logistics activities, clarifying thelocation characteristics and forming mechanism of logistics space have become a realistic problemfacing logistics development.
It has been observed that although there are a large number of empirical studies on the distributionand evolution of urban logistics space, the literature review on logistics space and influencing factorshas not been resolved. In-depth study of the evolution of logistics space has importantly guidingsignificance for rational allocation of urban logistics resources and coordination of logistics andeconomic development. This paper examines academic literature, analyzes changes in spatial patternsof logistics activities, and considers possible explanations for observed spatial changes.
The structure of the paper is as follows: In order to understand the evolution of logistics spacebetter, Section 2 explains the definition, activities and influencing factors of logistics space to betterunderstand the existence and importance of logistics space. Section 3 presents the systematic literaturereview and describes search strategy as well as the outcomes of the review. The impact of logisticsspace on sustainability is discussed in Section 4 along with three dimensions of sustainability inthe paper. Section 5 provides a discussion of logistics space. The last section gives the summativeconclusions of the paper and points to potential research areas.
2. Logistics Space
2.1. Components of Logistics Space
Urban logistics is an organic system composed of logistics enterprise, logistics nodes and logisticsinfrastructure. Logistics enterprise, as the economic organization of logistics activities, undertakes
Sustainability 2018, 10, 2815 3 of 24
basic functions such as transportation, storage, loading and unloading, packaging, distributionprocessing and distribution. The logistics node is the spatial main body that undertakes the citylogistics function, including the logistics park, the logistics center, and the distribution center. Theintegrated transportation network is the basis for the operation of the entire social logistics system,such as: railways, highways, airports, ports and other infrastructure. The logistics practitioners arethe implementers of logistics activities. The spatial density distribution of logistics employees canreflect the regional scope and frequency of logistics activities. The industry generates a large amountof logistics demand and is interdependent with the logistics industry in space. Therefore, from theperspective of industry to study the spatial distribution of logistics demand, we can also analyze thechanges in logistics space. Therefore, this paper holds that logistics space is a space system composedof logistics enterprise, logistics nodes, logistics infrastructure and industry.
2.2. The Influencing Factors of the Evolution of Logistics Space
2.2.1. Land Price
Logistics is the process of strategically managing the storage and movement of materials, parts andfinished inventory [17]. Logistical activities of storage, freight transport require substantial amounts ofland. Logistics land involves distribution, logistics and warehouse (DLW), mainly includes storageland, land for external traffic and land for public facilities, of which warehousing has the greatestdemand for land [18]. From 2003 to 2013, the number of storage facilities in the United States increasedby 15% [10]. Other metropolises, such as Toronto, Zurich and Atlanta, have seen their warehousesgrow rapidly [7,8,19]. The demand for logistics land in some developing countries is also increasing.For example, the growth rate of storage area in Jiangsu Province of China is 6.1% [20]. However, Sakaifinds that the logistics facilities that are 400 m2 or smaller in floor area dropped from 43 to 29%, andthe share of the facilities that are larger than 3000 m2 increased by 12.1% [5,21]. The number of logisticsfacilities is declining, but the average size is steadily increasing [21]. It means that logistics facilitiesare developing professionally and the demand for land size is larger. Different logistics facilities havedifferent requirements for land size. The average size of parcel service terminals is 5000 square meters,while the average size of large retailers’ warehouses is as large as 100,000 square meters, which canonly be met in the suburbs [22]. The improvement of storage technology has improved the efficiencyof land utilization. To a certain extent, it has eased the demand for warehouses land (e.g., High-baywarehouses and warehouse management systems (WMS)) [23,24]. However, the overall demand forlogistics-related land is likely to increase significantly by the replacement of other logistics activities,such as inter-modal transshipment, goods handling, outdoor storage and vehicle parking [23]. Withthe competition and development, all walks of life are constantly expanding and strive for the bestinterests. Rising competition in the location has led to accelerated land consumption [21]. Logisticsland is related to the internal structure of the city, most of the research focuses on monocentric systemswith a concentric structure. According to Burgess’s theory of concentric circles, with the increaseof urban population and the expansion of urban areas, each inner zone inevitably extends outwardand invades the adjacent outer belt, thus creating a succession of land use [25]. This succession willaggravate the conflict between freight-related activities and other land uses for the same land andinterfere with each other [9]. Air pollution, noise and traffic congestion will have a negative impacton the living environment and force freight-related activities to move away from the mixed area ofresidential and industrial [26,27]. Changes in the structure of urban interior space (from industrial landto non-industrial land) and industrial land use control have contributed significantly to the growth ofland price. Land cost is an important part of operating costs of industrial enterprises, which affects theenterprise location, industrial sprawl and the industrial layout [28]. Logistics sprawl is more affectedby land prices than other industrial sprawl, and logistics enterprises will have more consideration ofland prices in the choice of location [29,30]. In general, there is a growing demand for logistics-relatedland, while fewer and fewer land is available. The conflict between demand and supply will make

Sustainability 2018, 10, 2815 4 of 24
land play increasingly important role in the location of logistics facilities and the movement of logisticsspatial. Land price makes logistics enterprises away from the city center, which increases the distanceof freight transportation. Urban planners need to develop a rational strategy for the use of sustainablecargo land to ensure the future movement of freight and logistics facilities within the urban interior [9].
2.2.2. Traffic Accessibility
Traffic accessibility refers to the size of the opportunities for interaction between nodes in a trafficnetwork, which reflects the degree of traffic convenience and location advantages of a region [31].The key determinant of transport accessibility is the capacity and structure of transport infrastructure,which stimulates the movement of goods, reduces transit times, improves market access and promoteseconomic growth [32–34]. For logistics enterprises, the transportation of goods is at the core oftheir business, so accessibility plays a major role in the location decision. Highly accessible areasattract more logistics employment and logistics enterprises [35]. As production becomes increasinglydispersed, China’s cargo turnover has increased by 110% from 2006 to 2016. The increase of shippingdistances and fuel prices has forced logistics enterprises to consider escalating shipping costs. Thenegative impact of logistics activities on the environment is expanding and there is a certain spatialaggregation effect [36]. Access to motorway, port and other transport infrastructures can increasetransport efficiency and reduce transportation costs. Verhetsel calculates the time or distance of235 logistics sites to the freeway intersection, rail terminal, inland navigation terminal and seaport,respectively as road accessibility, rail accessibility, inland navigation accessibility, and through discretechoice modeling revealed that access to port, motorway and a rail terminal play no significant rolein the location choice of logistics enterprises [30]. Bowen finds that highway accessibility is moreimportant than and sea and railway accessibility by analyzing the relationship between the location ofwarehouses and accessibility measures of several kinds of transport networks in the US [4]. Comparedto other enterprises (manufacturing, business services, and even transporters), logistics enterprisesare closer to highways and other transport infrastructure. This confirms that the logistics enterprisesare market-oriented and need to be located in or close to the consumer market [11]. Accessibility isstrongly and significantly correlated with the spatial distribution and evolution of logistics enterprises.For example, the logistics cluster in the United States is mainly located near major airports and seaports,while the logistics facilities in The Netherlands are relatively often at multimodal terminals [37,38].Land near major roads, ports and other transport infrastructure is relatively expensive compared to thesurrounding areas [2]. So, logistics enterprises need to consider the relationship between accessibilityand rent in the site selection. Accessibility is an important factor in the location of logistics enterprises,which affects transport efficiency and service quality of logistics enterprises.
2.2.3. Market Demand
Logistics as a service industry, near the market can get a lot of logistics demand. Changes in thelogistics space follow those in the market, and the expansion of logistics has always followed that of thepopulation and other commercial institutions [5,8]. In addition, the large demand for logistics in ports,airports, and industrial parks is an important factor in attracting logistics accumulation. Manufacturingindustry is the basis for logistics development. In 2016, China’s industrial product logistics accountedfor 93.16% of total social logistics. At the same time, the development of manufacturing industryshould also be supported by logistics industry, and the logistics link accounts for more than 90%of all production processes [39]. Manufacturing companies provide a lot of market demand, whilelogistics companies provide efficient logistics services. The coordinated development of the logisticsindustry and manufacturing industry is an objective requirement to reduce the cost of productionenterprises and promote the development of logistics enterprises. The balance between logisticssupply and logistics demand drives the evolution of logistics space. Therefore, it is necessary for thegovernment to use the demand forecasting model to forecast and evaluate logistics requirements whenplanning logistics nodes and corporate decision makers in deciding company site selection [40]. Some
Sustainability 2018, 10, 2815 5 of 24
logistics parks do not take into account the role of the market when planning, leaving these logisticsparks idle. Land cost and transportation accessibility affect the operating costs of logistics facilitiesor logistics enterprises, and the market determines the future development and economic benefits oflogistics enterprises.
2.2.4. Agglomeration Advantage
Enterprises in the site selection, in order to obtain a better environment for development, oftenchoose to locate in the industrial agglomeration area. Heuvel illustrates the agglomeration advantagesof logistics enterprises based on three sources of Marshall’s agglomeration economies: namely labormarket (specialized labor); inputs sharing (combining transport flows, reducing transportation costsand promoting the development of multimodal transport services) and knowledge spillovers (learningand cooperation between enterprises) [38]. Rivera divides the benefits of logistics agglomerationinto: the sharing of physical assets, the sharing of production factors and the strategic alliances ofexisting facilities and value-added services, and concludes that the logistics cluster improves theefficiency of global supply chain and reduces the cost, improve the basic transportation network [3,37].Porter’s “Diamond Model”: Industrial agglomeration is the result of competition, which is conduciveto industrial competitiveness and national competitiveness. Based on Porter’s diamond model, Chungevaluated the competitiveness of major Asian logistics clusters [41]. Transportation costs, service andother advantages attract logistics enterprises to join the cluster [42]. In addition, as a producer serviceindustry, the logistics industry needs to be the target of service around its agglomeration area. Logisticsindustry is demand-oriented, that is, the logistics industry is in spatial connection with other industries.Logistics enterprises in order to obtain a larger market share, will take the initiative to focus on theconcentration of related industries. The coordinated development of manufacturing and logisticsis an objective requirement for reducing manufacturing costs and accelerating the development oflogistics enterprises. The negative externalities of agglomeration, such as the rising prices of landand labor and the congestion of transport roads, will also reduce the agglomeration advantages andthus remove the agglomeration area [37]. For logistics enterprises, the agglomeration area providessufficient professional labor force, transportation advantages, resource sharing, value-added servicesand perfect infrastructure for logistics enterprises. In addition, the government promotes logisticsagglomeration through various financial incentives and tax incentives.
2.2.5. Government Policy
With the rising status of logistics in social and economic development, countries have begun to uselogistics as the artery and basic industry for the development of the national economy. The governmentcan inspire and guide the distribution intention of logistics enterprises and guide the relocation oflogistics enterprises through pre-launching of city plans and public government information [43].In forming a logistics space location, the government can control rent and availability by changingtraffic conditions, such as re-planning transportation routes and cargo terminal locations, and byincreasing or decreasing logistics land use [44]. Land use planning and pricing can be used by thegovernment to control the sprawl of logistics [2], and can also be used to stimulate spatial concentrationof logistics enterprises [45]. For example, China has increased its support for land and other policies,implemented and improved land-use policies that support the development of the logistics industry,and supply logistics land according to law. It also identified 29 first-level logistics park layout citiesand 70 second-level logistics park layout cities. Through the advantages of facilities and agglomerationeffects of logistics parks, logistics enterprises are guided to focus on parks, resources are shared, andlogistics organization efficiency is improved. The government can also improve the effectiveness oflogistics clusters by providing comprehensive infrastructure, effective administrative procedures, andincreased training of employees [3]. In addition, the government promotes energy conservation andemission reduction in the transportation industry by establishing a logistics information platform,formulating tax policies and fuel economy standards, and ensuring the sustainable development of
Sustainability 2018, 10, 2815 6 of 24
logistics [46]. The logistics industry has made great contributions to promoting circular economy [47].The government can rationally allocate logistics resources through macro regulation and control, andavoid the uncoordinated regional logistics and economic development. The distribution of logisticsparks and logistics centers is often guided by the government. The positioning of logistics enterprisesis also affected by local policies. In addition, some places tend to adopt preferential policies to attractforeign logistics enterprises [48].
2.3. The Activities of Logistics Space
2.3.1. Logistics Sprawl
With the suburbanization of cities and population, the logistics sprawl gradually appears in theurban development of various countries. Logistics sprawl, the spatial deconcentration of logisticsfacilities and distribution centers [49], is the trend of outward movement of logistics facilities from innerurban areas to suburban and exurban areas. “Logistics polarization” and “logistics suburbanization”are also used to describe the phenomenon of logistics facilities from the inner city to the suburbs [50].Land cost is the most important factor contributing to the location of logistics facilities [29]. Logisticsland-use spatial structure and the mechanism of its evolution have always been the key issues forlogistics land use and logistics sprawl. Numerous studies of logistics land-use spatial structure involvegeography, economics, sociology, and other fields. The next most important factor is traffic accessibility.Logistics facilities are located closer to highways and other transport infrastructure compared to othersectors. In inner urban areas, traffic is congested, and logistics facilities are also locating increasingly insuburban locations [11]. The suburbs provide cheaper industrial land and easier access to road, rail aswell as air transport for logistics facilities. Those factors have led to the movement of logistics facilitiesaway from urban centers and a large number of studies of logistics sprawl have verified the movement(e.g., Gothenburg, Atlanta, Zurich, Los Angeles, and Tokyo).
Most researches judge the logistics sprawl by the change in the average distance of logisticsfacilities from the urban center. Table 1 shows the increased distance in Gothenburg, Atlanta,Los Angeles, Tokyo, Zurich and Toronto respectively [5–8,10,19,51]. However, the increase in distancedoes not justify logistics sprawl as the entire city is expanding. So, Dablanc and Ross compared thechanges in the average distance of logistics facilities against that of business establishments (4.5 kmversus 2.1 km), they called “relative (logistics) sprawl”. Sakai also finds that the average distance of thelogistics facilities from the urban center has increased considerably more than that of the population(2.4 km versus 0.4 km). Giuliana finds logistics facilities in Los Angeles and San Francisco shift toplaces with low employment density [10]. Woudsma divides Toronto into three areas: The GreaterToronto Area (GTA), the Greater Golden Horseshoe (GGH) and Southern Ontario (S.ON). He comparesthe movement of warehouses with all businesses and finds that warehouses are not only sprawlingwithin the core urban area, but also the exurban area that includes satellite communities within theeconomic sphere of the city [19]. Comparing the sprawl patterns of warehouses with all businesses isuseful to determine whether warehouses are sprawling at the same rate as the urban area. The othermethod to determine logistics sprawl is analyzing the number or density of logistics facilities. Cidellfinds that the number of warehousing establishments grew faster in the suburban counties than that inthe central counterparts by analyzing the locations of warehousing establishments of the fifty largestmetropolitan areas in the US during 1986–2005 [52]. The warehouse as a place to store goods, which isthe largest demand for land in all logistics activities, and warehousing sprawl is more obvious thanthat of other logistics activities [7]. This is why many studies have used storage facilities as researchobjects. Heitz compares the Paris region of France with the Randstad area of Dutch and analyzes thedifferences in the distribution of logistics between monocentric region and polycentric region, andfinds that the urban structure affects the logistics sprawl [50].

Sustainability 2018, 10, 2815 7 of 24
Table 1. The increased distance of logistics sprawl.
Lead Author Location Period Increased Distance References
Heitz Gothenburg 2002–2014 Logistics facilities (+4.2 km) [6]
Giuliano Los Angeles 2003–2013 Warehousing and distribution (+5.6 km) [10]
Dablanc Atlanta 1998–2008 Warehouse (+4.2 km) [8]
Dablanc Los Angeles 1998–2009 Warehouse (+6.1 km) [51]
Sakai Tokyo 2003–2013 Logistics facilities (+6.6 km) [5]
Todesco Zurich 1995–2012 Warehouse (+9.5 km)Parcel service (+7.7 km) [7]
Woudsma Toronto 2002–2012 Warehouse (GTA: +1.3 km, GGH:+9.5 km, S.ON: +29.5 km) [19]
2.3.2. Logistics Cluster
Clustering is a common phenomenon in the process of industrial development. From manufactureto service, industrial clusters of various industries play a very important guiding and promoting rolein industrial development and economic development. For this special economic phenomenon, theresearch of scholars from Marshall, Weber, Michael Porter, Krugman and other scholars has graduallyelevated the status of industrial clusters in economic history. Rivera and Sheffi define a logisticscluster as the geographic concentration of third-party logistics (3PL-s), transport carriers, storageproviders, and freight forwarders that provide logistics services [37]. The main cause of the logisticsspace agglomeration is external scale economy, market demand and government policy guidance.The advantages of economies of scale lie in the ability to integrate resources, share infrastructure,and build a specialized labor market. Logistics cluster creates positively impacts both in termsof transportation capacity sharing and resource sharing, as well as the provision of value addedservices [3]. The most apparent benefit for logistics clusters is that it is combining transport flows,which often saves transport costs. Moreover, lower transport costs will further attract the logisticscluster of enterprises, thereby forming a virtuous circle. In addition to the transportation advantages,logistics clusters, rooted in the ability to share assets more easily, serve customers better and allowfor better adjustment to business volume [42], offer other advantages, including shared workforce,infrastructure and information. Both aldermen and public administration employees acknowledgethat spatial concentration of logistics firms in logistics concentration areas can be beneficial for societyat large [45]. Sheffi identifies a number of strengths linked to logistics clusters. For example, mostof the logistics jobs are local work, so it is not easy to be replaced by offshore work. Additionally,logistics clusters provide opportunities to train and develop skilled workforce internally. Furthermore,logistics services serve diverse industries which, as a result, are more resilient to the recessionshocks [37]. Heuvel analyzes location dynamics of logistics establishments in relation to spatialclustering and finds that logistics employment spatially concentrates in particular areas, called Absoluteand Relative Concentration areas by calculating the value of LQ [38]. Chhetri uses the four-digitAustralian and New Zealand Standard Industrial Classification, industries “explicitly” related tologistics were identified and aggregated with respect to employment. A principal component analysiswas conducted to capture the functional interdependence of inter-related industries and measures ofspatial autocorrelation were also applied to identify spatial logistics employment clusters [53]. Hongconfirms the existence of agglomeration economies in logistics activities. Foreign entrants prefer citieswith existing concentrations of logistics firms. The mechanism may be that more logistics providershelp manufactures enhance productivity, and hence increase the market demand for logistics services.The existence of agglomeration economies supports local governments’ efforts to establish logisticshubs. Cities with better logistics bases will have an advantage in attracting potential foreign logisticsinvestments, and this advantage will be self-reinforcing [48].
Sustainability 2018, 10, 2815 8 of 24
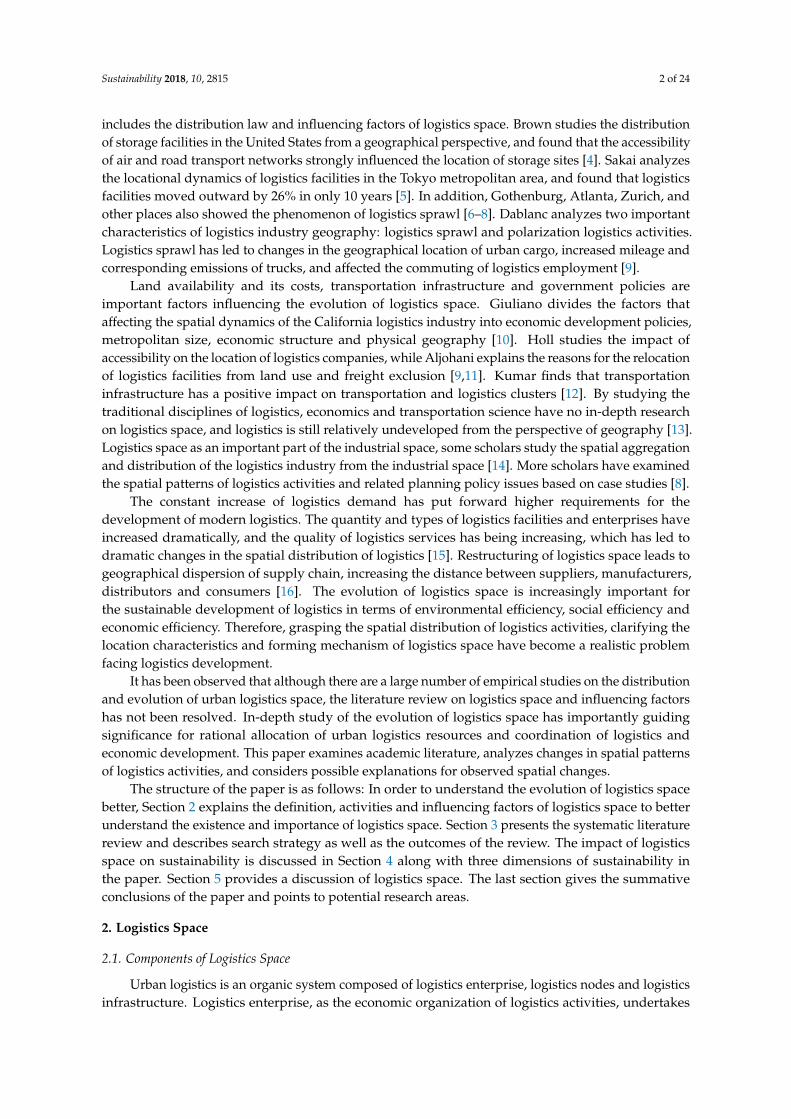
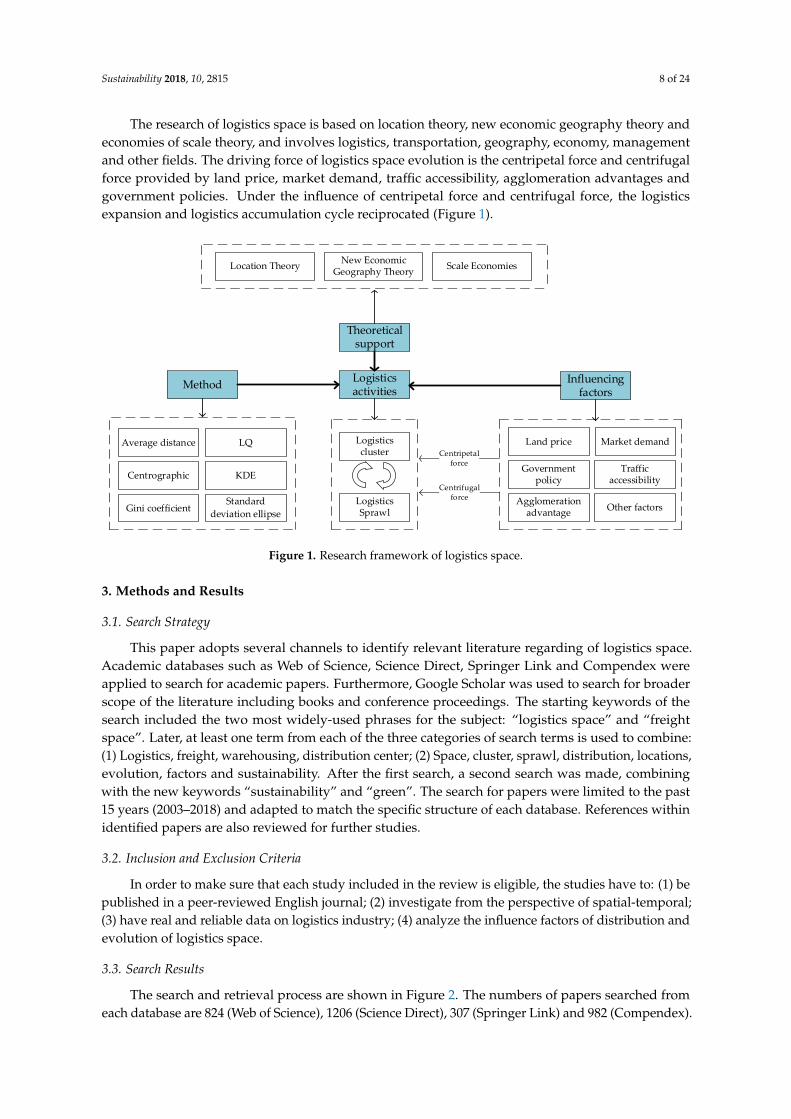
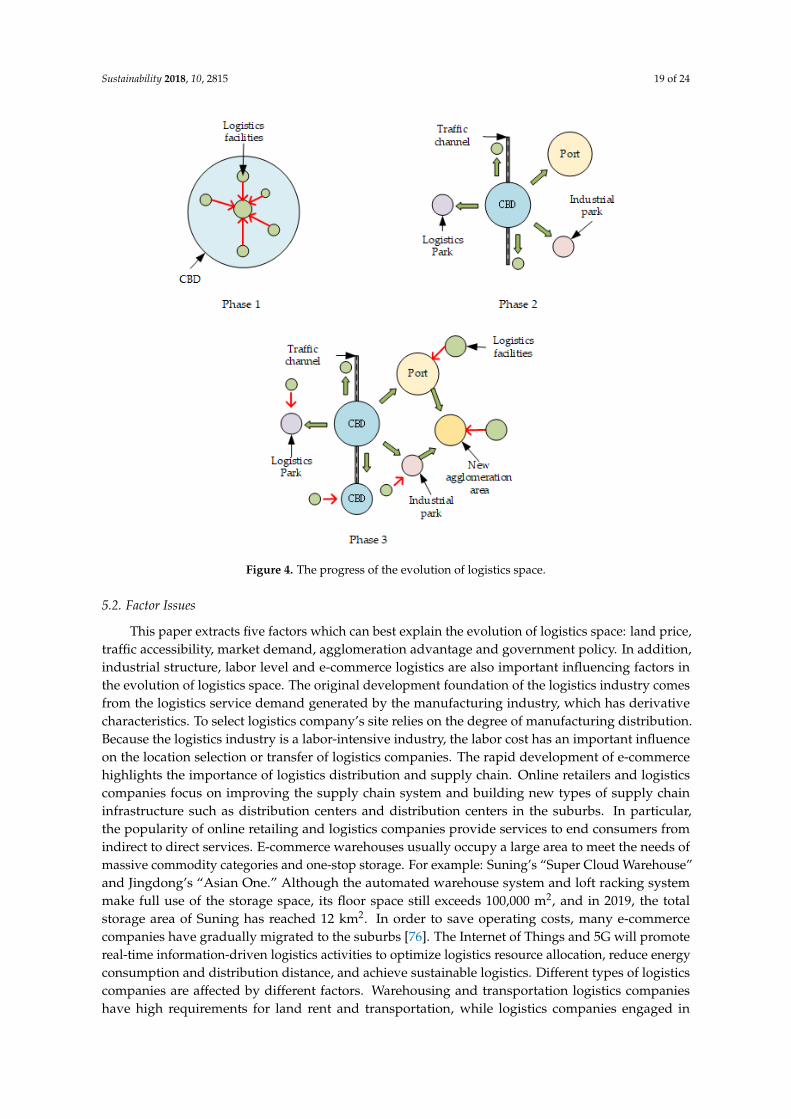
The research of logistics space is based on location theory, new economic geography theory andeconomies of scale theory, and involves logistics, transportation, geography, economy, managementand other fields. The driving force of logistics space evolution is the centripetal force and centrifugalforce provided by land price, market demand, traffic accessibility, agglomeration advantages andgovernment policies. Under the influence of centripetal force and centrifugal force, the logisticsexpansion and logistics accumulation cycle reciprocated (Figure 1).
Sustainability 2018, 10, x FOR PEER REVIEW 8 of 24
bases will have an advantage in attracting potential foreign logistics investments, and this advantage will be self-reinforcing [48].
The research of logistics space is based on location theory, new economic geography theory and economies of scale theory, and involves logistics, transportation, geography, economy, management and other fields. The driving force of logistics space evolution is the centripetal force and centrifugal force provided by land price, market demand, traffic accessibility, agglomeration advantages and government policies. Under the influence of centripetal force and centrifugal force, the logistics expansion and logistics accumulation cycle reciprocated (Figure 1).
Figure 1. Research framework of logistics space.
3. Methods and Results
3.1. Search Strategy
This paper adopts several channels to identify relevant literature regarding of logistics space. Academic databases such as Web of Science, Science Direct, Springer Link and Compendex were applied to search for academic papers. Furthermore, Google Scholar was used to search for broader scope of the literature including books and conference proceedings. The starting keywords of the search included the two most widely-used phrases for the subject: “logistics space” and “freight space”. Later, at least one term from each of the three categories of search terms is used to combine: (1) Logistics, freight, warehousing, distribution center; (2) Space, cluster, sprawl, distribution, locations, evolution, factors and sustainability. After the first search, a second search was made, combining with the new keywords “sustainability” and “green”. The search for papers were limited to the past 15 years (2003–2018) and adapted to match the specific structure of each database. References within identified papers are also reviewed for further studies.
3.2. Inclusion and Exclusion Criteria
In order to make sure that each study included in the review is eligible, the studies have to: (1) be published in a peer-reviewed English journal; (2) investigate from the perspective of spatial-temporal; (3) have real and reliable data on logistics industry; (4) analyze the influence factors of distribution and evolution of logistics space.
Theoretical support
Method
Other factors
Market demand
Government policy
Traffic accessibility
Land price
Agglomeration advantage
Influencing factors
Centripetal force
Centrifugal force
Logistics activities
Logistics cluster
LogisticsSprawl
Location Theory New Economic Geography Theory Scale Economies
Average distance
Centrographic KDE
Gini coefficient
LQ
Standard deviation ellipse
Figure 1. Research framework of logistics space.
3. Methods and Results
3.1. Search Strategy
This paper adopts several channels to identify relevant literature regarding of logistics space.Academic databases such as Web of Science, Science Direct, Springer Link and Compendex wereapplied to search for academic papers. Furthermore, Google Scholar was used to search for broaderscope of the literature including books and conference proceedings. The starting keywords of thesearch included the two most widely-used phrases for the subject: “logistics space” and “freightspace”. Later, at least one term from each of the three categories of search terms is used to combine:(1) Logistics, freight, warehousing, distribution center; (2) Space, cluster, sprawl, distribution, locations,evolution, factors and sustainability. After the first search, a second search was made, combiningwith the new keywords “sustainability” and “green”. The search for papers were limited to the past15 years (2003–2018) and adapted to match the specific structure of each database. References withinidentified papers are also reviewed for further studies.
3.2. Inclusion and Exclusion Criteria
In order to make sure that each study included in the review is eligible, the studies have to: (1) bepublished in a peer-reviewed English journal; (2) investigate from the perspective of spatial-temporal;(3) have real and reliable data on logistics industry; (4) analyze the influence factors of distribution andevolution of logistics space.
3.3. Search Results
The search and retrieval process are shown in Figure 2. The numbers of papers searched fromeach database are 824 (Web of Science), 1206 (Science Direct), 307 (Springer Link) and 982 (Compendex).

Sustainability 2018, 10, 2815 9 of 24
After removing duplicates, a total of 2813 unique records were found from four databases, of which103 were identified following the screening of titles and abstracts. There are two reasons to exclude theinvalid papers: (1) non-use data to support research; (2) research on logistics location model. After asecond search, no additional articles came up that were distinct from the ones that were found in thefirst search run. Eventually, 71 available publications were left, 28 of which satisfied the full criteriain this review, and 44 were classified as supporting research. Figure 2 shows the search process forthe papers.
Sustainability 2018, 10, x FOR PEER REVIEW 9 of 24
3.3. Search Results
The search and retrieval process are shown in Figure 2. The numbers of papers searched from each database are 824 (Web of Science), 1206 (Science Direct), 307 (Springer Link) and 982 (Compendex). After removing duplicates, a total of 2813 unique records were found from four databases, of which 103 were identified following the screening of titles and abstracts. There are two reasons to exclude the invalid papers: (1) non-use data to support research; (2) research on logistics location model. After a second search, no additional articles came up that were distinct from the ones that were found in the first search run. Eventually, 71 available publications were left, 28 of which satisfied the full criteria in this review, and 44 were classified as supporting research. Figure 2 shows the search process for the papers.
Web of Science n=824
Science Directn=1206
Springer Linkn=307
Compendexn=982
After duplicates removedn=2813
Screening titles and abstractsn=103
Full-text papers for eligibilityn=72(1) Not use data to
support research(2) Studies on location of logistics nodes
n=44Total papers included
n=28
Dissertation excludedn=34
Screening reference listsn=3
Selection and combination of search terms
Google Scholar as a supplement
Figure 2. The flowchart of review process.
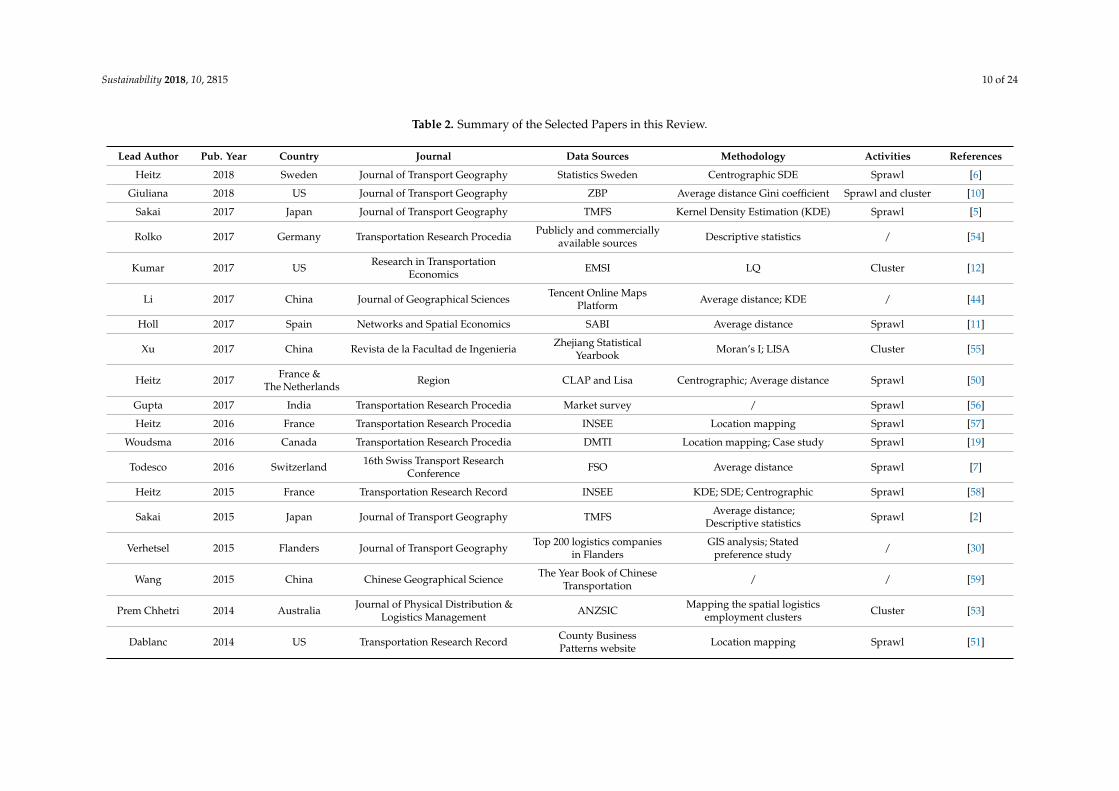
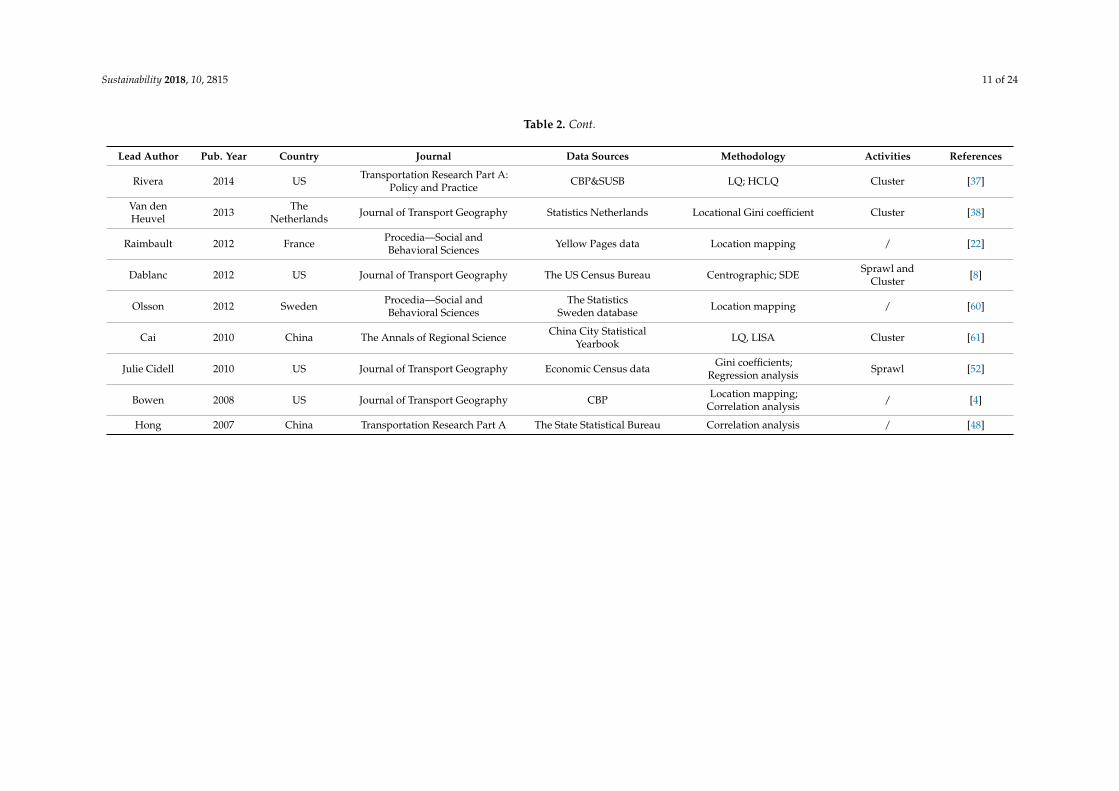
The information extracted from each of the papers mainly includes: (1) The characteristics of the papers (e.g., author, year, country and journal); (2) Data source; (3) The activities of logistics space (e.g., sprawl, cluster); (4) Research methods. The main details of 28 available papers were demonstrated as shown in Table 2.
Figure 2. The flowchart of review process.
The information extracted from each of the papers mainly includes: (1) The characteristics of thepapers (e.g., author, year, country and journal); (2) Data source; (3) The activities of logistics space(e.g., sprawl, cluster); (4) Research methods. The main details of 28 available papers were demonstratedas shown in Table 2.
Sustainability 2018, 10, 2815 10 of 24
Table 2. Summary of the Selected Papers in this Review.
Lead Author Pub. Year Country Journal Data Sources Methodology Activities References
Heitz 2018 Sweden Journal of Transport Geography Statistics Sweden Centrographic SDE Sprawl [6]
Giuliana 2018 US Journal of Transport Geography ZBP Average distance Gini coefficient Sprawl and cluster [10]
Sakai 2017 Japan Journal of Transport Geography TMFS Kernel Density Estimation (KDE) Sprawl [5]
Rolko 2017 Germany Transportation Research Procedia Publicly and commerciallyavailable sources Descriptive statistics / [54]
Kumar 2017 US Research in TransportationEconomics EMSI LQ Cluster [12]
Li 2017 China Journal of Geographical Sciences Tencent Online MapsPlatform Average distance; KDE / [44]
Holl 2017 Spain Networks and Spatial Economics SABI Average distance Sprawl [11]
Xu 2017 China Revista de la Facultad de Ingenieria Zhejiang StatisticalYearbook Moran’s I; LISA Cluster [55]
Heitz 2017 France &The Netherlands Region CLAP and Lisa Centrographic; Average distance Sprawl [50]
Gupta 2017 India Transportation Research Procedia Market survey / Sprawl [56]
Heitz 2016 France Transportation Research Procedia INSEE Location mapping Sprawl [57]
Woudsma 2016 Canada Transportation Research Procedia DMTI Location mapping; Case study Sprawl [19]
Todesco 2016 Switzerland 16th Swiss Transport ResearchConference FSO Average distance Sprawl [7]
Heitz 2015 France Transportation Research Record INSEE KDE; SDE; Centrographic Sprawl [58]
Sakai 2015 Japan Journal of Transport Geography TMFS Average distance;Descriptive statistics Sprawl [2]
Verhetsel 2015 Flanders Journal of Transport Geography Top 200 logistics companiesin Flanders
GIS analysis; Statedpreference study / [30]
Wang 2015 China Chinese Geographical Science The Year Book of ChineseTransportation / / [59]
Prem Chhetri 2014 Australia Journal of Physical Distribution &Logistics Management ANZSIC Mapping the spatial logistics
employment clusters Cluster [53]
Dablanc 2014 US Transportation Research Record County BusinessPatterns website Location mapping Sprawl [51]
Sustainability 2018, 10, 2815 11 of 24
Table 2. Cont.
Lead Author Pub. Year Country Journal Data Sources Methodology Activities References
Rivera 2014 US Transportation Research Part A:Policy and Practice CBP&SUSB LQ; HCLQ Cluster [37]
Van denHeuvel 2013 The
Netherlands Journal of Transport Geography Statistics Netherlands Locational Gini coefficient Cluster [38]
Raimbault 2012 France Procedia—Social andBehavioral Sciences Yellow Pages data Location mapping / [22]
Dablanc 2012 US Journal of Transport Geography The US Census Bureau Centrographic; SDE Sprawl andCluster [8]
Olsson 2012 Sweden Procedia—Social andBehavioral Sciences
The StatisticsSweden database Location mapping / [60]
Cai 2010 China The Annals of Regional Science China City StatisticalYearbook LQ, LISA Cluster [61]
Julie Cidell 2010 US Journal of Transport Geography Economic Census data Gini coefficients;Regression analysis Sprawl [52]
Bowen 2008 US Journal of Transport Geography CBP Location mapping;Correlation analysis / [4]
Hong 2007 China Transportation Research Part A The State Statistical Bureau Correlation analysis / [48]
Sustainability 2018, 10, 2815 12 of 24
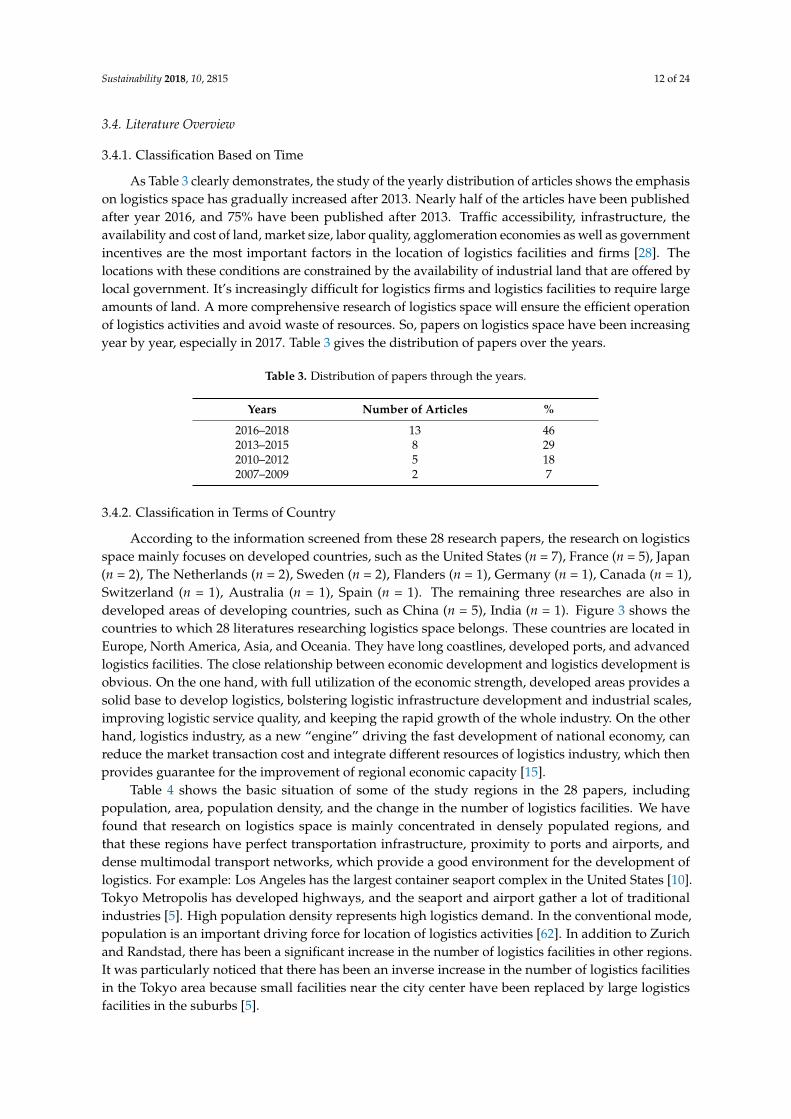
3.4. Literature Overview
3.4.1. Classification Based on Time
As Table 3 clearly demonstrates, the study of the yearly distribution of articles shows the emphasison logistics space has gradually increased after 2013. Nearly half of the articles have been publishedafter year 2016, and 75% have been published after 2013. Traffic accessibility, infrastructure, theavailability and cost of land, market size, labor quality, agglomeration economies as well as governmentincentives are the most important factors in the location of logistics facilities and firms [28]. Thelocations with these conditions are constrained by the availability of industrial land that are offered bylocal government. It’s increasingly difficult for logistics firms and logistics facilities to require largeamounts of land. A more comprehensive research of logistics space will ensure the efficient operationof logistics activities and avoid waste of resources. So, papers on logistics space have been increasingyear by year, especially in 2017. Table 3 gives the distribution of papers over the years.
Table 3. Distribution of papers through the years.
Years Number of Articles %
2016–2018 13 462013–2015 8 292010–2012 5 182007–2009 2 7
3.4.2. Classification in Terms of Country
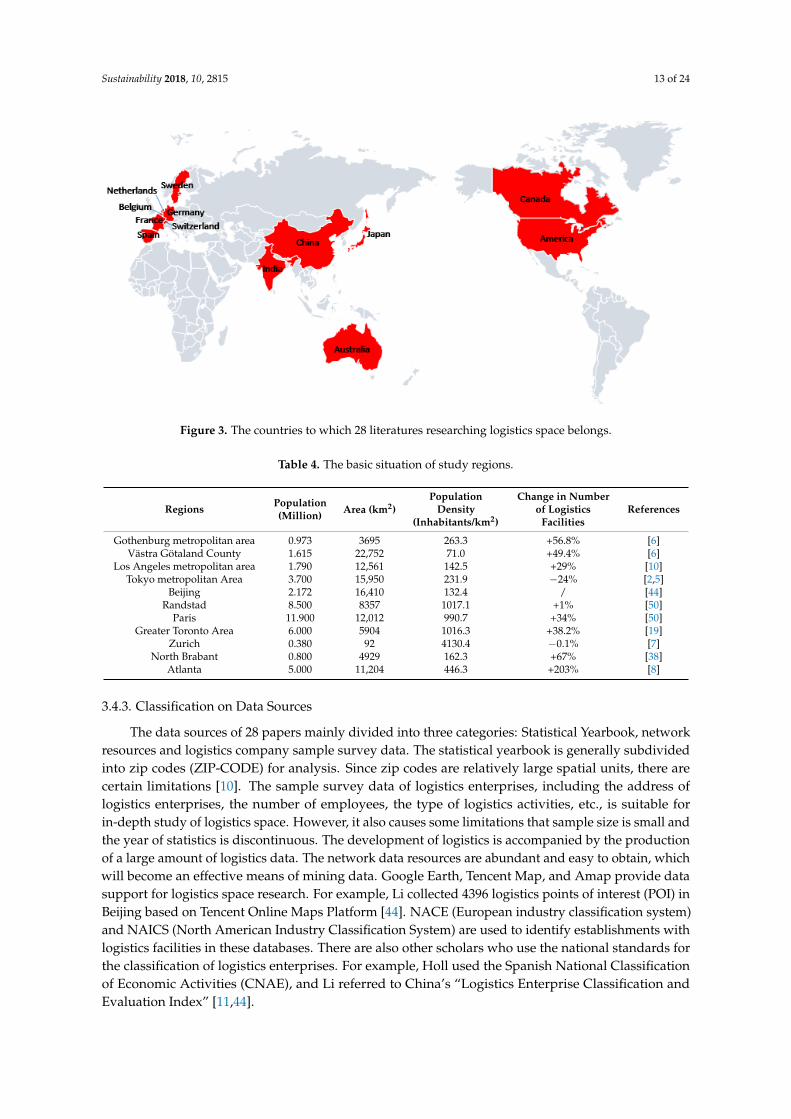
According to the information screened from these 28 research papers, the research on logisticsspace mainly focuses on developed countries, such as the United States (n = 7), France (n = 5), Japan(n = 2), The Netherlands (n = 2), Sweden (n = 2), Flanders (n = 1), Germany (n = 1), Canada (n = 1),Switzerland (n = 1), Australia (n = 1), Spain (n = 1). The remaining three researches are also indeveloped areas of developing countries, such as China (n = 5), India (n = 1). Figure 3 shows thecountries to which 28 literatures researching logistics space belongs. These countries are located inEurope, North America, Asia, and Oceania. They have long coastlines, developed ports, and advancedlogistics facilities. The close relationship between economic development and logistics development isobvious. On the one hand, with full utilization of the economic strength, developed areas provides asolid base to develop logistics, bolstering logistic infrastructure development and industrial scales,improving logistic service quality, and keeping the rapid growth of the whole industry. On the otherhand, logistics industry, as a new “engine” driving the fast development of national economy, canreduce the market transaction cost and integrate different resources of logistics industry, which thenprovides guarantee for the improvement of regional economic capacity [15].
Table 4 shows the basic situation of some of the study regions in the 28 papers, includingpopulation, area, population density, and the change in the number of logistics facilities. We havefound that research on logistics space is mainly concentrated in densely populated regions, andthat these regions have perfect transportation infrastructure, proximity to ports and airports, anddense multimodal transport networks, which provide a good environment for the development oflogistics. For example: Los Angeles has the largest container seaport complex in the United States [10].Tokyo Metropolis has developed highways, and the seaport and airport gather a lot of traditionalindustries [5]. High population density represents high logistics demand. In the conventional mode,population is an important driving force for location of logistics activities [62]. In addition to Zurichand Randstad, there has been a significant increase in the number of logistics facilities in other regions.It was particularly noticed that there has been an inverse increase in the number of logistics facilitiesin the Tokyo area because small facilities near the city center have been replaced by large logisticsfacilities in the suburbs [5].
Sustainability 2018, 10, 2815 13 of 24Sustainability 2018, 10, x FOR PEER REVIEW 13 of 24
Figure 3. The countries to which 28 literatures researching logistics space belongs.
Table 4. The basic situation of study regions.
Regions Population (Million)
Area (km2) Population Density (Inhabitants/km2)
Change in Number of Logistics Facilities
References
Gothenburg metropolitan area 0.973 3695 263.3 +56.8% [6] Västra Götaland County 1.615 22,752 71.0 +49.4% [6]
Los Angeles metropolitan area 1.790 12,561 142.5 +29% [10] Tokyo metropolitan Area 3.700 15,950 231.9 −24% [2,5]
Beijing 2.172 16,410 132.4 / [44] Randstad 8.500 8357 1017.1 +1% [50]
Paris 11.900 12,012 990.7 +34% [50] Greater Toronto Area 6.000 5904 1016.3 +38.2% [19]
Zurich 0.380 92 4130.4 −0.1% [7] North Brabant 0.800 4929 162.3 +67% [38]
Atlanta 5.000 11,204 446.3 +203% [8]
3.4.3. Classification on Data Sources
The data sources of 28 papers mainly divided into three categories: Statistical Yearbook, network resources and logistics company sample survey data. The statistical yearbook is generally subdivided into zip codes (ZIP-CODE) for analysis. Since zip codes are relatively large spatial units, there are certain limitations [10]. The sample survey data of logistics enterprises, including the address of logistics enterprises, the number of employees, the type of logistics activities, etc., is suitable for in-depth study of logistics space. However, it also causes some limitations that sample size is small and the year of statistics is discontinuous. The development of logistics is accompanied by the production of a large amount of logistics data. The network data resources are abundant and easy to obtain, which will become an effective means of mining data. Google Earth, Tencent Map, and Amap provide data support for logistics space research. For example, Li collected 4396 logistics points of interest (POI) in Beijing based on Tencent Online Maps Platform [44]. NACE (European industry classification system) and NAICS (North American Industry Classification System) are used to identify establishments with logistics facilities in these databases. There are also other scholars who use the national standards for the classification of logistics enterprises. For example, Holl used the Spanish National Classification of Economic Activities (CNAE), and Li referred to China’s “Logistics Enterprise Classification and Evaluation Index” [11,44].
Figure 3. The countries to which 28 literatures researching logistics space belongs.
Table 4. The basic situation of study regions.
Regions Population(Million) Area (km2)
PopulationDensity
(Inhabitants/km2)
Change in Numberof Logistics
FacilitiesReferences
Gothenburg metropolitan area 0.973 3695 263.3 +56.8% [6]Västra Götaland County 1.615 22,752 71.0 +49.4% [6]
Los Angeles metropolitan area 1.790 12,561 142.5 +29% [10]Tokyo metropolitan Area 3.700 15,950 231.9 −24% [2,5]
Beijing 2.172 16,410 132.4 / [44]Randstad 8.500 8357 1017.1 +1% [50]
Paris 11.900 12,012 990.7 +34% [50]Greater Toronto Area 6.000 5904 1016.3 +38.2% [19]
Zurich 0.380 92 4130.4 −0.1% [7]North Brabant 0.800 4929 162.3 +67% [38]
Atlanta 5.000 11,204 446.3 +203% [8]
3.4.3. Classification on Data Sources
The data sources of 28 papers mainly divided into three categories: Statistical Yearbook, networkresources and logistics company sample survey data. The statistical yearbook is generally subdividedinto zip codes (ZIP-CODE) for analysis. Since zip codes are relatively large spatial units, there arecertain limitations [10]. The sample survey data of logistics enterprises, including the address oflogistics enterprises, the number of employees, the type of logistics activities, etc., is suitable forin-depth study of logistics space. However, it also causes some limitations that sample size is small andthe year of statistics is discontinuous. The development of logistics is accompanied by the productionof a large amount of logistics data. The network data resources are abundant and easy to obtain, whichwill become an effective means of mining data. Google Earth, Tencent Map, and Amap provide datasupport for logistics space research. For example, Li collected 4396 logistics points of interest (POI) inBeijing based on Tencent Online Maps Platform [44]. NACE (European industry classification system)and NAICS (North American Industry Classification System) are used to identify establishments withlogistics facilities in these databases. There are also other scholars who use the national standards forthe classification of logistics enterprises. For example, Holl used the Spanish National Classificationof Economic Activities (CNAE), and Li referred to China’s “Logistics Enterprise Classification andEvaluation Index” [11,44].

Sustainability 2018, 10, 2815 14 of 24
3.4.4. Research Method of Logistics Space
We have summarized the analysis method of logistics space and divided all methods intomanagement perspective and geography perspective, as shown in Table 5. The geography perspectivemainly includes average distance method, centrographic, standard deviation ellipse and kernel densityestimation. The average distance can visually show the dispersion of logistics facilities through thechange of distance, so it is often used to determine the logistics expansion. Centrographic and standarddeviation ellipses are ideally suited to provide resources for their cartographic representations and tovisualize the scope and direction of logistics expansion. The combination of the two methods worksbetter. Kernel density estimation is suitable for the visual expression of point distribution patterns.Management perspectives include Gini coefficient, LQ, HCLQ, Moran’s I, and LISA. These methods aremainly used to measure industrial spatial concentration and industrial spatial correlation. In addition,location mapping can simply reflect the distribution of logistics space and is often used to be an analysisaid. As a computer tool that can analyze and process spatial information, GIS (Geographic InformationSystem) is used in geography research. Shen used GIS as a platform to establish a decision-makinginformation system for water resources management in the Zhenjiang section of the Yangtze Riverto analyze changes in water quality and monitor pollution sources [63]. Wei used a combinationof geostatistics and GIS to study the spatial distribution of soil organic matter and its influencingfactors [64]. Similarly, GIS plays an important role in the study of logistics space.
Table 5. Research method of logistics space.
Method Object Advantage Limitation
Geography
Average distance Activities distributed around asingle center
Quantitative calculation of thediffusion of logistics distance
Logistics activitiesaround the center arenot evenly distributed
Centrographic
Finding the weightedgeometric center, or
barycenter, of a geographicdistribution
Helping identify, quantifyspread patterns and
cartographic representations___
Standard deviationellipse
Analyzing the direction anddistribution of logistics nodes
Presenting the degree ofdiffusion and distribution of
logistics space___
KDE Spatial distribution density oflogistics node
Visual representation ofdistribution patterns Requesting point data
Management
Gini coefficient Measuring the concentrationof industrial space ___ Little spatial meaning
LQ/HCLQ/Moran’sI/LISA
Measuring the relativeconcentration and
specialization of industries
Ease of computation andlimited data requirements
The impact of externaleconomies of scale is
uncertain
4. Impact of Logistics Space: On Sustainability
The purpose of logistics is to meet the needs of social production and residents’ life. There aremany participants in logistics system, including suppliers, manufacturers, distributors, and logisticsservice providers. Around logistics activities, procurement, transportation, warehousing, loadingand unloading, handling, circulation processing, packaging and information are important functions.The freight transport is an important field for local sustainability strategies, since it causes severeenvironmental, social and economic problems in towns and regions, such as air pollution, noiseemissions, infrastructure and land use demand [65]. According to the survey data, China’s energyconsumption of tertiary industry accounts for approximately 30% of the total energy consumption.As the main forms of the logistics industry, transportation, warehousing, and postal service accountfor more than 80% of energy consumption of tertiary industry [36]. Sustainability in a broadersense is a framework that stipulates that available resources of today directly and profoundly affectthose of tomorrow [66]. It has attracted researchers as well as practitioners to study various aspectsof sustainability.
Sustainability 2018, 10, 2815 15 of 24
Combing the existing literature, we can see that most of them analyze sustainability from theperspective of logistics activities and supply chain. Logistics activities are intermediate inputs, sothat the demand for logistics services derives from the demand for final goods or services [11].The output of logistics activities has a certain impact on the environment, economy and society.According to Centobelli et al., logistics activities service is divided into four categories: transport,warehousing, logistics service and management [67]. Each service can achieve green goals andsustainable development through technological or policy means. Due to globalization, challengingmarket, demand uncertainty, and economic competitiveness, business organizations are under seriousthreat to sustain their existing supply chain. Researchers have attempted to extend the boundary ofsustainable development into the area of supply chain management (SCM), to investigate sustainablesupply chain management. Núñez-Cacho et al. propose that the design and incorporation of reverselogistics into SCM will allow the family company to close the cycle of resources, improving itsenvironmental sustainability [68]. Zhang et al. propose a hierarchical structure of sustainablesupply chain management and develops a multi-item measurement scale to reflect the specificmanagement practices of sustainable supply chain management [69]. Extend the boundary ofsustainable development into the area of SCM is particularly important.
The scope of logistics space involves a wide range, from the raw materials and production logisticsin the manufacturing industry, to the sales logistics in the trade and circulation industry, to the reverselogistics of the final waste. From a geographical point of view, the researches on logistics space mainlyfocus on the following two aspects: sprawl and cluster. Dablanc’s research on logistics activities inthe metropolitan area of Atlanta shows that at the level of metropolitan areas, the layout of logisticsfacilities and logistics distribution centers is in a spatially decentralized state, while at the regionallevel, logistics activities show a tendency toward agglomeration of metropolitan areas [8]. Chenbelieves that the industrial diffusion and agglomeration are determined by the centrifugal force andthe centripetal force of regional economic development. The centrifugal force is the operating costincrease of the enterprise, and the centripetal force mainly includes the external economy formed byindustrial agglomeration [28]. Logistics enterprises and logistics nodes exhibit the characteristic ofboth co-agglomeration and spatial separation in location [44]. Prause gives three different perspectiveson logistics sustainability: environmental efficiency (improving freight traffic sustainability), socialefficiency (improving freight traffic acceptability) and economic efficiency (improving freight trafficefficiency) [70]. The triple bottom line standard is used to evaluate logistics space, which includeseconomic, environmental and social dimensions (Table 6).
4.1. Environmental Dimension
The development of the logistics industry can promote economic growth, but it also causes anincrease in energy consumption and carbon emissions. Logistics sprawl helps to change the geographyof urban freight, increase the distance traveled by trucks and the resulting emissions, and affect thecommuting rate of logistics employment [9]. The increase in truck travel distance is the biggest impactof logistics sprawl. Between 2007 and 2015, the average haul distance of China’s road freight transportincreased by 13 km. China’s energy consumption for the logistics industry has increased by 47%,reaching 383.2 million tons of standard coal in 2015. The sustainable development of logistics isrestricted by decreasing energy. The energy efficiency has attracted the attention of scholars. It is veryimportant to create energy districts, with the main objective that they are configure as platforms forthe valorization of energy technological nutrients derived from biomass to supply energy and be moreefficient from an environmental and economic point of view [71]. In addition, energy consumptioninevitably leads to greenhouse gas emissions and air pollution. Dablanc and Rakotonarivo estimatethat the expansion of logistics resulted in an increase of 15,000 tons of CO2 emissions per year in Parisarea [49]. Although logistics sprawl can alleviate air pollution and noise pollution, it is harmful to theurban environment as a whole.
Sustainability 2018, 10, 2815 16 of 24
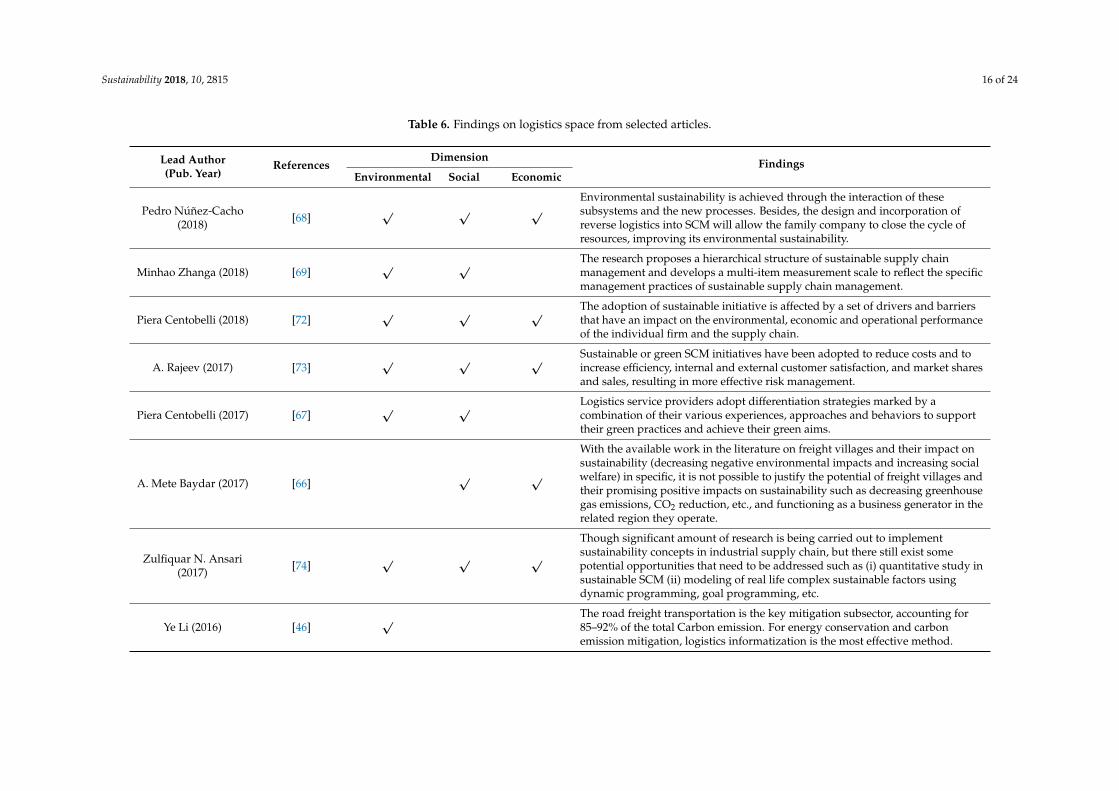
Table 6. Findings on logistics space from selected articles.
Lead Author(Pub. Year)
ReferencesDimension Findings
Environmental Social Economic
Pedro Núñez-Cacho(2018) [68]
√ √ √Environmental sustainability is achieved through the interaction of thesesubsystems and the new processes. Besides, the design and incorporation ofreverse logistics into SCM will allow the family company to close the cycle ofresources, improving its environmental sustainability.
Minhao Zhanga (2018) [69]√ √ The research proposes a hierarchical structure of sustainable supply chain
management and develops a multi-item measurement scale to reflect the specificmanagement practices of sustainable supply chain management.
Piera Centobelli (2018) [72]√ √ √ The adoption of sustainable initiative is affected by a set of drivers and barriers
that have an impact on the environmental, economic and operational performanceof the individual firm and the supply chain.
A. Rajeev (2017) [73]√ √ √ Sustainable or green SCM initiatives have been adopted to reduce costs and to
increase efficiency, internal and external customer satisfaction, and market sharesand sales, resulting in more effective risk management.
Piera Centobelli (2017) [67]√ √ Logistics service providers adopt differentiation strategies marked by a
combination of their various experiences, approaches and behaviors to supporttheir green practices and achieve their green aims.
A. Mete Baydar (2017) [66]√ √
With the available work in the literature on freight villages and their impact onsustainability (decreasing negative environmental impacts and increasing socialwelfare) in specific, it is not possible to justify the potential of freight villages andtheir promising positive impacts on sustainability such as decreasing greenhousegas emissions, CO2 reduction, etc., and functioning as a business generator in therelated region they operate.
Zulfiquar N. Ansari(2017) [74]
√ √ √Though significant amount of research is being carried out to implementsustainability concepts in industrial supply chain, but there still exist somepotential opportunities that need to be addressed such as (i) quantitative study insustainable SCM (ii) modeling of real life complex sustainable factors usingdynamic programming, goal programming, etc.
Ye Li (2016) [46]√ The road freight transportation is the key mitigation subsector, accounting for
85–92% of the total Carbon emission. For energy conservation and carbonemission mitigation, logistics informatization is the most effective method.
Sustainability 2018, 10, 2815 17 of 24
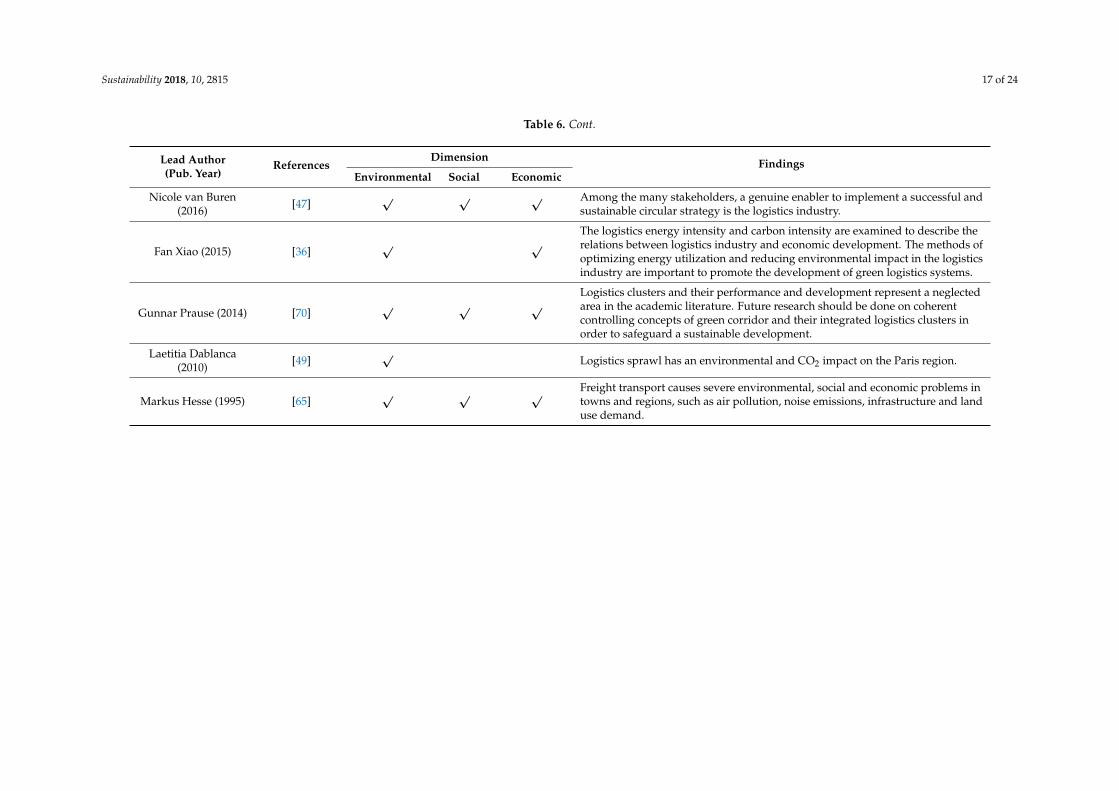
Table 6. Cont.
Lead Author(Pub. Year)
ReferencesDimension Findings
Environmental Social Economic
Nicole van Buren(2016) [47]
√ √ √ Among the many stakeholders, a genuine enabler to implement a successful andsustainable circular strategy is the logistics industry.
Fan Xiao (2015) [36]√ √
The logistics energy intensity and carbon intensity are examined to describe therelations between logistics industry and economic development. The methods ofoptimizing energy utilization and reducing environmental impact in the logisticsindustry are important to promote the development of green logistics systems.
Gunnar Prause (2014) [70]√ √ √
Logistics clusters and their performance and development represent a neglectedarea in the academic literature. Future research should be done on coherentcontrolling concepts of green corridor and their integrated logistics clusters inorder to safeguard a sustainable development.
Laetitia Dablanca(2010) [49]
√Logistics sprawl has an environmental and CO2 impact on the Paris region.
Markus Hesse (1995) [65]√ √ √ Freight transport causes severe environmental, social and economic problems in
towns and regions, such as air pollution, noise emissions, infrastructure and landuse demand.
Sustainability 2018, 10, 2815 18 of 24
4.2. Social Dimension
The development of logistics space has brought about great social effects, such as employment,urban traffic safety and urban geography. On the one hand, some municipalities favour logisticsactivities, considering that they provide industrial jobs requiring little qualifications when moretraditional manufacturing jobs have disappeared from metropolitan areas. On the other hand,many municipalities reject logistics activities, because they generate noise, truck traffic and safetyproblems [49]. They are also accused of consuming space, with a low ratio of jobs per hectare. Frequentshipments put pressure on local traffic safety and affect the normal operation of other social activities.Freight vehicles should avoid direct conflicts with other social vehicles, and its route and time isdetermined by the location of logistics facilities. In addition, heavy-duty trucks will cause wear on theroad surface, destroy road infrastructure, and bring serious security risks. Generally speaking, theincrease in freight capacity itself may very well increase the employment level. Logistics facilities needa reasonable position to ensure the sustainable development of society.
4.3. Economic Dimension
Logistics clusters and their performance and development represent an important area in theacademic literature. The scales of business activities are already promising, and for any commercial firmto enter such business cooperation with other firms, some measure of risk and/or cost minimizationmust be satisfied. Transportation costs and service advantages benefit from scale effect haveled some logistics enterprises to start gathering in specific areas. The logistics agglomerationarea will attract other enterprises to enter, thus forming a characteristic industrial park to driveeconomic growth. Cooperation and coordination among members affect economic sustainabledevelopment. The continuous development of logistics parks or cargo villages will provide moreefficient logistics activities by integrating freight and increasing efficiency, thus ensuring sustainableeconomic development [66].
5. Discussion
The purpose of this literature review is to summarize and critically assess the current paperson logistics space. To the best of our knowledge, this may be the first time to comprehensivelyevaluate the research status of logistics space from the perspectives of logistics agglomeration andlogistics diffusion.
5.1. The Process of Logistics Space Evolution
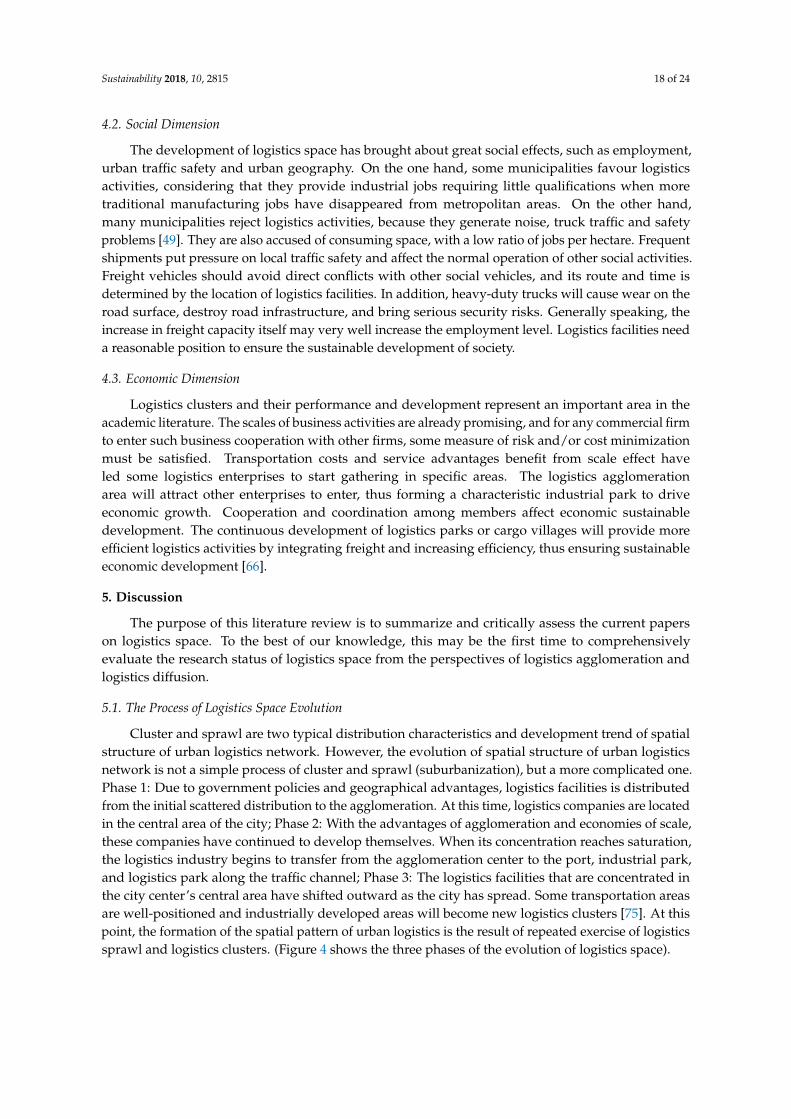
Cluster and sprawl are two typical distribution characteristics and development trend of spatialstructure of urban logistics network. However, the evolution of spatial structure of urban logisticsnetwork is not a simple process of cluster and sprawl (suburbanization), but a more complicated one.Phase 1: Due to government policies and geographical advantages, logistics facilities is distributedfrom the initial scattered distribution to the agglomeration. At this time, logistics companies are locatedin the central area of the city; Phase 2: With the advantages of agglomeration and economies of scale,these companies have continued to develop themselves. When its concentration reaches saturation,the logistics industry begins to transfer from the agglomeration center to the port, industrial park,and logistics park along the traffic channel; Phase 3: The logistics facilities that are concentrated inthe city center’s central area have shifted outward as the city has spread. Some transportation areasare well-positioned and industrially developed areas will become new logistics clusters [75]. At thispoint, the formation of the spatial pattern of urban logistics is the result of repeated exercise of logisticssprawl and logistics clusters. (Figure 4 shows the three phases of the evolution of logistics space).
Sustainability 2018, 10, 2815 19 of 24Sustainability 2018, 10, x FOR PEER REVIEW 19 of 24
Figure 4. The progress of the evolution of logistics space.
5.2. Factor Issues
This paper extracts five factors which can best explain the evolution of logistics space: land price, traffic accessibility, market demand, agglomeration advantage and government policy. In addition, industrial structure, labor level and e-commerce logistics are also important influencing factors in the evolution of logistics space. The original development foundation of the logistics industry comes from the logistics service demand generated by the manufacturing industry, which has derivative characteristics. To select logistics company’s site relies on the degree of manufacturing distribution. Because the logistics industry is a labor-intensive industry, the labor cost has an important influence on the location selection or transfer of logistics companies. The rapid development of e-commerce highlights the importance of logistics distribution and supply chain. Online retailers and logistics companies focus on improving the supply chain system and building new types of supply chain infrastructure such as distribution centers and distribution centers in the suburbs. In particular, the popularity of online retailing and logistics companies provide services to end consumers from indirect to direct services. E-commerce warehouses usually occupy a large area to meet the needs of massive commodity categories and one-stop storage. For example: Suning’s “Super Cloud Warehouse” and Jingdong’s “Asian One.” Although the automated warehouse system and loft racking system make full use of the storage space, its floor space still exceeds 100,000 m2, and in 2019, the total storage area of Suning has reached 12 km2. In order to save operating costs, many e-commerce companies have gradually migrated to the suburbs [76]. The Internet of Things and 5G will promote real-time information-driven logistics activities to optimize logistics resource allocation, reduce energy consumption and distribution distance, and achieve sustainable logistics. Different types of logistics companies are affected by different factors. Warehousing and transportation logistics companies have high requirements for land rent and transportation, while logistics companies engaged in information management tend to be densely populated. This article makes a qualitative assessment of the influencing factors of logistics space. If there is more data to support,
Figure 4. The progress of the evolution of logistics space.
5.2. Factor Issues
This paper extracts five factors which can best explain the evolution of logistics space: land price,traffic accessibility, market demand, agglomeration advantage and government policy. In addition,industrial structure, labor level and e-commerce logistics are also important influencing factors inthe evolution of logistics space. The original development foundation of the logistics industry comesfrom the logistics service demand generated by the manufacturing industry, which has derivativecharacteristics. To select logistics company’s site relies on the degree of manufacturing distribution.Because the logistics industry is a labor-intensive industry, the labor cost has an important influenceon the location selection or transfer of logistics companies. The rapid development of e-commercehighlights the importance of logistics distribution and supply chain. Online retailers and logisticscompanies focus on improving the supply chain system and building new types of supply chaininfrastructure such as distribution centers and distribution centers in the suburbs. In particular,the popularity of online retailing and logistics companies provide services to end consumers fromindirect to direct services. E-commerce warehouses usually occupy a large area to meet the needs ofmassive commodity categories and one-stop storage. For example: Suning’s “Super Cloud Warehouse”and Jingdong’s “Asian One.” Although the automated warehouse system and loft racking systemmake full use of the storage space, its floor space still exceeds 100,000 m2, and in 2019, the totalstorage area of Suning has reached 12 km2. In order to save operating costs, many e-commercecompanies have gradually migrated to the suburbs [76]. The Internet of Things and 5G will promotereal-time information-driven logistics activities to optimize logistics resource allocation, reduce energyconsumption and distribution distance, and achieve sustainable logistics. Different types of logisticscompanies are affected by different factors. Warehousing and transportation logistics companieshave high requirements for land rent and transportation, while logistics companies engaged in
Sustainability 2018, 10, 2815 20 of 24
information management tend to be densely populated. This article makes a qualitative assessmentof the influencing factors of logistics space. If there is more data to support, quantitative methodscan be used to further measure the influence degree of each factor so that to logistics space, a deepunderstanding of its evolutionary mechanism can be gained.
5.3. Recommendations for Logistics Space Planning
In order to ensure the reasonable distribution of logistics space and determine the optimal location,scale and type of logistics facility activities, a sustainable development blueprint must be planned. Firstof all, the government should formulate a strategy for the sustainable use of logistics land, make fulland reasonable use of land resources, increase land utilization, and curb the idleness and waste of land.Thus the priority is to integrate existing logistics facilities, achieve intensive use of land, and minimizeland use conflicts. What’s more, to tap the potential of land use and develop new logistics land isnecessary. Governments and enterprises should increase the construction of automated warehousesand develop underground logistics systems—a new logistics model that promotes sustainable urbandevelopment. In addition, at the required time, the production mode of the desired product is producedin the required quantity. Just-in-time production eliminates inventory, optimizes production logistics,and reduces dependence on storage land. Secondly, to improve the mobility of logistics activities is animportant way, including increasing the construction of traffic network and port intermodal transport,and improving the transit transport system. Good traffic accessibility facilitates the organizationof transportation routes for logistics activities, reduces transportation distances, and improves thelogistics efficiency of enterprises. Finally, the government should promote the joint development of thelogistics industry and the manufacturing industry. The spatial planning of the manufacturing industrycan effectively guide the transfer of the logistics industry and achieve a balance between supplyand demand in the logistics space. The joint development of the manufacturing industry and thelogistics industry is not only an important means of adjusting the industrial structure and transformingeconomic growth, but also a common requirement and an urgent need for the manufacturing andlogistics industries.
6. Conclusions and Potential Research Directions
Some studies have confirmed that with the continuous development of economic globalizationand integration, logistics geospatial space has changed. As sustainability is a new requirement forregional and urban development, logistics is becoming a new public issue for local governments.In order to limit energy consumption and greenhouse gas emissions and improve efficiency ofeconomic development, controlling the location of logistics facilities is becoming the goal of urbanspace planning. This paper examines two activities of the logistics space: sprawl and cluster. It is foundthat logistics sprawl and cluster are promoting the integration of urban logistics facilities resourcesand the division of logistics functional areas. When planning the location of logistics nodes andenterprises, urban planners and business decision makers should fully consider the impact of land rent,traffic accessibility, market demand, agglomeration advantages, and government policies. And shouldalso pay attention to the economic and social problems brought about by logistics, such as energyshortages, environmental pollution and so on. As the pace of economic activities has accelerated,the requirements for logistics efficiency have become higher and higher. It will be critical to allocatelogistics facilities in a geographical space and coordinate logistics needs and supply of logistics services.The sustainable logistics development strategy and innovative logistics operation model are urgentlyneeded to promote the rapid development of logistics. Research on logistics space has achievedpreliminary results, but in terms of a complete academic system, existing research has weaknesses inthe following areas:
(1) Theoretical research. The theoretical support of logistics space mainly comes from the theory ofindustrial agglomeration and the theory of economies of scale in economics, and the location
Sustainability 2018, 10, 2815 21 of 24
theory of geography. The breadth and depth of theoretical research is limited, and a completetheoretical system has not yet been established.
(2) Method research. The research method for logistics space is through the processing of data,calculation of industrial agglomeration index and the use of ArcGIS software to display thespatial distribution of logistics facilities on the map. Due to the use of previous data, there is atime lag in the conclusion of the study. Future research can use forecasting models to predict theevolution of logistics space based on the development trend of logistics and the government’sfuture plans.
(3) Data mining. The acceleration of the logistics information process and the continuousdevelopment of a large amount of logistics information include not only the location data oflogistics facilities but also the spatial data of freight movement. The rational use of these datato study the distribution and evolution of logistics space from the perspective of macro andmicro, abstract and concrete, has important theoretical and practical significance. Limited to thecomplexity of the logistics industry and lack of real and reliable data, it has certain deviationsfrom the distribution and evolution of logistics space. Future research should strengthen thecollection and screening of logistics data.
(4) Practical application. Due to the time lag of data, the research results can only provide experienceguidance for the evolution of logistics space. Research mainly focuses on qualitative research, andit is difficult to provide accurate guidance for government planners and business decision makers.
Author Contributions: M.H. and J.S. conceived the conception and collected documents. J.L. and X.W. screenedeligible papers carefully given reasonable opinions; J.S. wrote the manuscript. All authors have read and approvedthe final manuscript.
Funding: This research was supported by “the Natural Science Foundation of Jiangsu Province”, (GrantsNo BK20160512), “the Humanity and Social Science Youth foundation of Ministry of Education of China”,(Grants No 16YJCZH027), “the Social Science Foundation of Jiangsu Province”, (Grants No 15GLC004), “theNational Natural Science Foundation of China”, (Grant No. 71772080).
Acknowledgments: The authors thank the anonymous reviewers and members of the editorial team for theirconstructive comments.
Conflicts of Interest: The authors declare no conflict of interest.
References
1. Hu, Y.Y.; Cao, W.D. Location Characteristics and Formation Mechanism of Logistics Space in Hefei City.Reg. Res. Dev. 2016, 35, 58–63. (In Chinese)
2. Sakai, T.; Kawamura, K. Locational dynamics of logistics facilities: Evidence from Tokyo. J. Transp. Geogr.2015, 46, 10–19. [CrossRef]
3. Rivera, L.; Sheffi, Y. Logistics clusters: The impact of further agglomeration, training and firm size oncollaboration and value added services. Int. J. Prod. Econ. 2016, 179, 285–294. [CrossRef]
4. Bowen, J.T. Moving places: The geography of warehousing in the US. J. Transp. Geogr. 2008, 16, 379–387.[CrossRef]
5. Sakai, T.; Kawamura, K. Spatial reorganization of urban logistics system and its impacts: Case of Tokyo.J. Transp. Geogr. 2017, 60, 110–118. [CrossRef]
6. Heitz, A.; Dablanc, L. Spatial patterns of logistics facilities in Gothenburg, Sweden. J. Transp. Geogr. 2018.[CrossRef]
7. Todesco, P.; Weidmann, U. Logistics Sprawl in the Region Zurich. In Proceedings of the 16th Swiss TransportResearch Conference, Ascona, Switzerland, 18–20 May 2016.
8. Dablanc, L.; Ross, C. Atlanta: A mega logistics center in the Piedmont Atlantic Megaregion (PAM). J. Transp.Geogr. 2012, 24, 432–442. [CrossRef]
9. Aljohani, K.; Thompson, R.G. Impacts of logistics sprawl on the urban environment and logistics: Taxonomyand review of literature. J. Transp. Geogr. 2016, 57, 255–263. [CrossRef]
10. Giuliano, G.; Kang, S. Spatial dynamics of the logistics industry: Evidence from California. J. Transp. Geogr.2018, 66, 248–258. [CrossRef]
Sustainability 2018, 10, 2815 22 of 24
11. Holl, A.; Mariotti, I. The Geography of Logistics Firm Location: The Role of Accessibility. Netw. Spat. Econ.2017, 18, 1–25. [CrossRef]
12. Kumar, I.; Zhalnin, A. Transportation and logistics cluster competitive advantages in the U.S. regions:A cross-sectional and spatio-temporal analysis. Res. Transp. Econ. 2017, 61, 25–36. [CrossRef]
13. Hesse, M.; Rodrigue, J. The transport geography of logistics and freight distribution. J. Transp. Geogr. 2004,12, 171–184. [CrossRef]
14. He, B.; Fu, Q. Evaluation of logistics industry development and analysis of its spatial agglomeration.Rev. Fac. Ing. 2017, 32, 15–24.
15. Lan, S.; Yang, C. Data analysis for metropolitan economic and logistics development. Adv. Eng. Inform. 2017,32, 66–76. [CrossRef]
16. Rodrigue, J. The Thruport concept and transmodal rail freight distribution in North America. J. Transp. Geogr.2008, 16, 233–246. [CrossRef]
17. Christopher, M. Logistics & Supply Chain Management; FT/Prentice Hall: London, UK, 2003.18. Woudsma, C.; Jensen, J.F. Accessibility and Freight: Transportation and Land Use—Exploring Spatial-Temporal
Dimensions; Levinson, D.M., Krizek, K.J., Eds.; Emerald Group Publishing Limited: Bingley, UK, 2005;pp. 267–295.
19. Woudsma, C.; Jakubicek, P.; Dablanc, L. Logistics Sprawl in North America: Methodological Issues and aCase Study in Toronto. Transp. Res. Procedia 2016, 12, 474–488. [CrossRef]
20. Department of Urban Social and Economic Investigation, National Bureau of Statistics. Statistical Yearbook ofChina’s Urban Construction; China Planning Press: Beijing, China, 2007.
21. Hesse, M. Land for logistics: Locational dynamics, real estate markets and political regulation of regionaldistribution complexes. Tijdschr. Econ. Soc. Geogr. 2004, 95, 162–173. [CrossRef]
22. Raimbault, N.; Andriankaja, D.; Paffoni, E. Understanding the Diversity of Logistics Facilities in the ParisRegion. Procedia Soc. Behav. Sci. 2012, 39, 543–555. [CrossRef]
23. McKinnon, A. The present and future land requirements of logistical activities. Land Use Policy 2009, 26,S293–S301. [CrossRef]
24. Atieh, A.M.; Kaylani, H.; Al-abdallat, Y.; Qaderi, A.; Ghoul, L.; Jaradat, L.; Hdairis, I. PerformanceImprovement of Inventory Management System Processes by an Automated Warehouse ManagementSystem. Procedia CIRP 2016, 41, 568–572. [CrossRef]
25. Qin, L.; Liu, K. Research on Evolution Mechanism of Urban Logistics Spatial Structure. China’s Circ. Econ.2011, 30–35. (In Chinese) [CrossRef]
26. Wagner, T. Regional traffic impacts of logistics-related land use. Transp. Policy 2010, 17, 224–229. [CrossRef]27. Tian, L.; Liang, Y.; Zhang, B. Measuring residential and industrial land use mix in the peri-urban areas of
China. Land Use Policy 2017, 69, 427–438. [CrossRef]28. Chen, W.; Shen, Y.; Wang, Y.; Wu, Q. How do industrial land price variations affect industrial diffusion?
Evidence from a spatial analysis of China. Land Use Policy 2018, 71, 384–394. [CrossRef]29. Allen, J.; Browne, M.; Cherrett, T. Investigating relationships between road freight transport, facility location,
logistics management and urban form. J. Transp. Geogr. 2012, 24, 45–57. [CrossRef]30. Verhetsel, A.; Kessels, R.; Goos, P.; Zijlstra, T.; Blomme, N.; Cant, J. Location of logistics companies: A stated
preference study to disentangle the impact of accessibility. J. Transp. Geogr. 2015, 42, 110–121. [CrossRef]31. Hansen, W.G. How Accessibility Shapes Land Use. J. Am. Inst. Planners 1959, 25, 73–76. [CrossRef]32. Ng, C.P.; Law, T.H.; Wong, S.V.; Kulanthayan, S. Relative improvements in road mobility as compared to
improvements in road accessibility and economic growth: A cross-country analysis. Transp. Policy 2017, 60,24–33. [CrossRef]
33. Hong, J.; Chu, Z.; Wang, Q. Transport infrastructure and regional economic growth: Evidence from China.Transportation 2011, 38, 737–752. [CrossRef]
34. Hou, Q.; Li, S.-M. Transport infrastructure development and changing spatial accessibility in the GreaterPearl River Delta, China, 1990–2020. J. Transp. Geogr. 2011, 19, 1350–1360. [CrossRef]
35. Van den Heuvel, F.P.; Rivera, L.; van Donselaar, K.H.; de Jong, A.; Sheffi, Y.; de Langen, P.W.; Fransoo, J.C.Relationship between freight accessibility and logistics employment in US counties. Transp. Res. Part APolicy Pract. 2014, 59, 91–105. [CrossRef]
36. Xiao, F.; Hu, Z.-H.; Wang, K.-X.; Fu, P.-H. Spatial Distribution of Energy Consumption and Carbon Emissionof Regional Logistics. Sustainability 2015, 7, 9140–9159. [CrossRef]
Sustainability 2018, 10, 2815 23 of 24
37. Rivera, L.; Sheffi, Y.; Welsch, R. Logistics agglomeration in the US. Transp. Res. Part A Policy Pract. 2014, 59,222–238. [CrossRef]
38. Van den Heuvel, F.P.; de Langen, P.W.; van Donselaar, K.H.; Fransoo, J.C. Spatial concentration and locationdynamics in logistics: The case of a Dutch province. J. Transp. Geogr. 2013, 28, 39–48. [CrossRef]
39. Liu, B.Z.; Lin, T. Research on the Relationship between Logistics Outsourcing and Productivity inManufacturing Industry. Chin. Ind. Econ. 2010, 9, 67–77. (In Chinese)
40. Nuzzolo, A.; Comi, A. City Logistics Planning: Demand Modelling Requirements for Direct EffectForecasting. Procedia Soc. Behav. Sci. 2014, 125, 239–250. [CrossRef]
41. Chung, T.W. A Study on Logistics Cluster Competitiveness among Asia Main Countries using the Porter’sDiamond Model. Asian J. Ship. Logist. 2016, 32, 257–264. [CrossRef]
42. Sheffi, Y. Logistics-Intensive Clusters: Global Competitiveness and Regional Growth. In Handbook of GlobalLogistics: Transportation in International Supply Chains; Bookbinder, J.H., Ed.; Springer: New York, NY, USA,2013; pp. 463–500.
43. Qian, Q.L.; Chen, Y.B. The spatial layout characteristics of logistics enterprises in Guangzhou and itsinfluencing factors. Geogr. Res. 2011, 30, 1254–1261. (In Chinese)
44. Guoqi, L.; Fengjun, J. Location characteristics and differentiation mechanism of logistics nodes and logisticsenterprises based on points of interest (POI): A case study of Beijing. J. Geogr. Sci. 2017, 27, 879–896.[CrossRef]
45. Van den Heuvel, F.P.; de Langen, P.W.; van Donselaar, K.H.; Fransoo, J.C. Regional logistics land allocationpolicies: Stimulating spatial concentration of logistics firms. Transp. Policy 2013, 30, 275–282. [CrossRef]
46. Li, Y.; Bao, L.; Li, W.; Deng, H. Inventory and Policy Reduction Potential of Greenhouse Gas and PollutantEmissions of Road Transportation Industry in China. Sustainability 2016, 8, 1218. [CrossRef]
47. Van Buren, N.; Demmers, M.; van der Heijden, R.; Witlox, F. Towards a Circular Economy: The Role of DutchLogistics Industries and Governments. Sustainability 2016, 8, 647. [CrossRef]
48. Hong, J. Transport and the location of foreign logistics firms: The Chinese experience. Transp. Res. Part A:Policy Pract. 2007, 41, 597–609. [CrossRef]
49. Dablanc, L.; Rakotonarivo, D. The impacts of logistics sprawl: How does the location of parcel transportterminals affect the energy efficiency of goods’ movements in Paris and what can we do about it? Procedia Soc.Behav. Sci. 2010, 2, 6087–6096. [CrossRef]
50. Heitz, A.; Dablanc, L.; Tavasszy, L.A. Logistics sprawl in monocentric and polycentric metropolitan areas:The cases of Paris, France, and the Randstad, The Netherlands. Region 2017, 4, 93–107. [CrossRef]
51. Dablanc, L.; Ogilvie, S.; Goodchild, A. Logistics Sprawl: Differential Warehousing Development Patterns inLos Angeles, California, and Seattle, Washington. Transp. Res. Rec. 2014, 2410, 105–112. [CrossRef]
52. Cidell, J. Concentration and decentralization: The new geography of freight distribution in US metropolitanareas. J. Transp. Geogr. 2010, 18, 363–371. [CrossRef]
53. Chhetr, P.; Butcher, T.; Corbitt, B. Characterising Spatial Logistics Employment Clusters. Int. J. Phys. Distrib.Logist. Manag. 2014, 44, 221–241. [CrossRef]
54. Rolko, K.; Friedrich, H. Locations of Logistics Service Providers in Germany—The basis for a new freighttransport generation model. Transp. Res. Procedia 2017, 25, 1061–1074. [CrossRef]
55. Xu, Y.; Chen, S. Study on the time-spatial disparity and dynamic mechanism of logistics development ofZhejiang. Rev. Fac. Ing. 2017, 32, 775–783.
56. Gupta, S. Logistics Sprawl in Timber Markets and its Impact on Freight Distribution Patterns in MetropolitanCity of Delhi, India. Transp. Res. Procedia 2017, 25, 965–977. [CrossRef]
57. Heitz, A.; Beziat, A. The Parcel Industry in the Spatial Organization of Logistics Activities in the ParisRegion: Inherited Spatial Patterns and Innovations in Urban Logistics Systems. Transp. Res. Procedia 2016, 12,812–824. [CrossRef]
58. Heitz, A.; Dablanc, L. Logistics spatial patterns in Paris: The rise of the Paris Basin as a logistics megaregion.Transp. Res. Rec. J. Transp. Res. Board 2015, 2477, 76–84. [CrossRef]
59. Wang, C.J.; César, D. Port Integration in China: Temporal Pathways, Spatial Patterns and Dynamics.Chin. Geogr. Sci. 2015, 25, 612–628. [CrossRef]
60. Olsson, J.; Woxenius, J. Location of Freight Consolidation Centres Serving the City and Its Surroundings.Procedia Soc. Behav. Sci. 2012, 39, 293–306. [CrossRef]
Sustainability 2018, 10, 2815 24 of 24
61. Jing, N.; Cai, W. Analysis on the spatial distribution of logistics industry in the developed East Coast Area inChina. Ann. Reg. Sci. 2010, 45, 331–350. [CrossRef]
62. McKinnon, A.C. The development of warehousing in England. Geoforum 1983, 14, 389–399. [CrossRef]63. Shen, Y.J.; Zheng, M. GIS-based water resources management decision system. Drain. Irrig. Mach. 2004, 22,
34–38. (In Chinese)64. Wei, X.; Zhou, B.B. Influence of channel lining on soil organic matter and its spatial variability in the Huihui
Canal Irrigation District. J. Drain. Irrig. Mach. Eng. 2017, 35, 222–227. (In Chinese)65. Hesse, M. Urban space and logistics: On the road to sustainability? World Transp. Policy Pract. 1995, 4, 39–45.
[CrossRef]66. Baydar, A.M.; Süral, H. Freight villages: A literature review from the sustainability and societal equity
perspective. J. Clean. Prod. 2017, 167, 1208–1221. [CrossRef]67. Centobelli, P.; Cerchione, R.; Esposito, E. Developing the WH2 framework for environmental sustainability
in logistics service providers: A taxonomy of green initiatives. J. Clean. Prod. 2017, 165, 1063–1077. [CrossRef]68. Nú Ez-Cacho, P.; Molina-Moreno, V.; Corpas-Iglesias, F.A.; Cortés-García, F.J. Family Businesses Transitioning
to a Circular Economy Model: The Case of “Mercadona”. Sustainability 2018, 10, 538. [CrossRef]69. Zhang, M.; Tse, Y.K.; Doherty, B.; Li, S.; Akhtar, P. Sustainable supply chain management: Confirmation of a
higher-order model. Resour. Conserv. Recycl. 2018, 128, 206–221. [CrossRef]70. Prause, G. Sustainable development of logistics clusters in green transport corridors. J. Secur. Sustain. Issues
2014, 4, 59–68. [CrossRef]71. Molina-Moreno, V.; Utrilla, P.N.C.; Cortés-García, F.J.; Peña-García, A. The Use of Led Technology and
Biomass to Power Public Lighting in a Local Context: The Case of Baeza (Spain). Energies 2018, 11, 1783.[CrossRef]
72. Centobelli, P.; Cerchione, R. Environmental Sustainability and Energy-Efficient Supply Chain Management:A Review of Research Trends and Proposed Guidelines. Energies 2018, 11, 275. [CrossRef]
73. Rajeev, A.; Pati, R.K.; Padhi, S.S.; Govindan, K. Evolution of sustainability in supply chain management:A literature review. J. Clean. Prod. 2017, 162, 299–314. [CrossRef]
74. Ansari, Z.N.; Kant, R. A state-of-art literature review reflecting 15 years of focus on sustainable supply chainmanagement. J. Clean. Prod. 2017, 142, 2524–2543. [CrossRef]
75. Qin, L. Research on the Characteristics and Evolutionary Theory of Urban Logistics Spatial Structure; Beijing JiaotongUniversity: Beijing, China, 2012. (In Chinese)
76. Xiao, Z.P.; Wang, Y.X. How does online retail affect the spread of urban logistics space: Taking Shenzhen asan example. City Obs. 2017, 1, 62–72. (In Chinese)
© 2018 by the authors. Licensee MDPI, Basel, Switzerland. This article is an open accessarticle distributed under the terms and conditions of the Creative Commons Attribution(CC BY) license (http://creativecommons.org/licenses/by/4.0/).
Copyright © 2022 FDOKUMEN