location based services & telecartography
261
GEOWISSENSCHAFTLICHE MITTEILUNGEN Heft Nr. 74, 2005 LOCATION BASED SERVICES & TELECARTOGRAPHY Proceedings of the Symposium 2005 Edited by Georg Gartner A Publication of the Research Group Cartography within the Institute of Geoinformation and Cartography in Cooperation with the ICA Commission on Maps and the Internet with collaborative interest of ICA Commission on Ubiquitous Cartography IAG Working Group 4.1.2 ISPRS Working Group V TC2 ISSN 1811 8380 Schriftenreihe der Studienrichtung VERMESSUNGSWESEN UND GEOINFORMATION TECHNISCHE UNIVERSITÄT WIEN
-
Upload
khangminh22 -
Category
Documents
-
view
0 -
download
0
Transcript of location based services & telecartography
GEOWISSENSCHAFTLICHE MITTEILUNGENHeft Nr. 74, 2005
LOCATION BASED SERVICES &TELECARTOGRAPHY
Proceedings of the Symposium 2005
Edited byGeorg Gartner
A Publication of the Research Group Cartography within the Institute of Geoinformation and Cartography
in Cooperation with theICA Commission on Maps and the Internet
with collaborative interest ofICA Commission on Ubiquitous Cartography
IAG Working Group 4.1.2ISPRS Working Group V TC2
ISSN 1811 8380Schriftenreihe der Studienrichtung VERMESSUNGSWESEN UND GEOINFORMATION
TECHNISCHE UNIVERSITÄT WIEN

Editor:Ao. Univ. Prof. Dr. Georg GartnerResearch Group CartographyInstitute of Geoinformation and CartographyVienna University of [email protected]
Authors are fully responsible for the content of their papers.
Costs for printing were paid from donations of the Research Group Cartography,Institute of Geoinformation and Cartography, Vienna University of Technology
Prepress: Jobstmedia Präsentation Verlag, http://www.jobstmedia.atPrint: Ed. Hölzel Gesellschaft m.b.H. Nfg KG, http://www.hoelzel.at
© Copyright: Research Group Cartography, Institute of Geoinformation andCartography, Vienna University of Technology

PrefaceThe 3rd Symposium on Location Based Services and TeleCartography held in Vienna from November 28-30, 2005 continues the series of symposia at the TU Vienna (1st symposium: 2002, 2nd symposium 2004) aiming on offering a forum for research-driven ac-tivities related to the context of location and map-based services. Such activities emerged in the last years especially around issues of positioning, spatial modelling, cartographic communication as well as in the fields of ubiquitious cartography, geo-pervasive services, user-centered modelling or geo-wiki activities.
The innovative and contemporary character of the conference leads to a great variety of contributions in terms of interdisciplinar-ity. Presenters of 18 countries with backgrounds varying from academia to business, from computer science to geodesy covering an enormous number of issues with heterogenous relation to the conference´s main topic.While contemporary cartography is aiming on looking at new and efficient ways on communicating of spatial information, the development and availability of technologies like mobile networking, mobile devices or short-range sensors lead to interesting new possibilities of achieving this aim. By trying to make use of the available technologies cartography and a variety of related disciplines specifically look at user-centered and context-aware system development as well as new forms of supporting wayfind-ing and navigation systems.
Like in the forthcoming symposia the current 3rd Symposium on LBS & TeleCartography is organized by the Research Group Cartography of the Vienna University of Technology in close cooperation with the Commission on Maps and the Internet of the International Cartographic Association. This time a collaborative interest has been stated by the Commission on Ubiquitious Car-tography of the International Cartographic Association, the Working Group 4.1.2 of the International Association of Geodesy and the Working Group V TC 2 of the International Society for Photogrammetry and Remote Sensing.
The venue is again set at the Vienna University of Technology, where a number of groups are working on research projects related to the symposium´s topic. The TU Vienna is Austria´s well-known research oriented university focusing especially on natural and technical sciences, in which geodesy and cartography have been embedded since the founding of the university. Vienna, as the capi-tal of Austria, is a melting pot of a great variety of business and research activities in the context of LBS and wireless services. The mobile phone penetration in Austria is one of the highest in the world and can be seen as an indicator for the cutting-edge position Austria has reached in the field of wireless communication techniques.
Setting up an event like this during the busy “business-as-usual” program of an academic semester without any specific sponsoring or professional event organizers needs a big portion of enthusiasm and excitement. The staff of the research group Cartography of TU Vienna has again proved, that by collaboratively cooperating the organization of such an event can be succesfully handled. I therefore would like to thank especially the conference secretary DI Markus Jobst and Mrs. Violet Derman for their ambitious work, as well as for the contributions of Dr. M. Lechthaler, E. Wandl, DI V. Radoczky and DI A. Stadler.
In expectation of very useful and interesting presentations, discussions and new ideas, I wish all participants a successful meet-ing,
Georg GartnerChair of the 3rd Symposium on LBS & TeleCartographyHead of the Research Group Cartography, E127/2, TU Vienna
III

Table of Contents
Preface
From Internet to Ubiquitous Cartography1Takashi Morita Theory and Development of Research in Ubiquitious Cartography
9Michael P Peterson From Internet to Mobile Mapping: Contrasts in Development
15Carlo Ratti et alMobile Landscapes: Graz in real time
Location Based Services21Jonathan Raper Design Constraints on operational LBS
27Markus Uhlirz LBS in year 2005 - A reality check
31Bin Jiang, Xiaobai YaoLBS and GIS in perspective
Awareness33L. Tiina Sarjakoski et alKnowledge-based map adaptation for mobile map services
41Tumasch Reichenbacher The concept of relevance in mobile maps
47Barend Köbben et alWireless Campus LBS - A testbed for cartographically aware database objects
53Rainer Simon et alTowards orientation-aware Location Based Mobile Services
59Thorsten Schulz et alGIS-based Interaction for Mobile Services
61Patrick Luley et alGeo-Services and Computer Vision for object awareness in Mobile System Applications
65Rex G Cammack Syndication of Maps through the Use of Really Simple Syndication (RSS)
V

Table of Contents
Positioning73Edward Verbree et alGPS-monitored itinerary tracking: Where have you been and how did you get there?
81Günther Retscher 3D-Position Determination in a multi-storey building using a Pedestrian Navigation System
87Zvonimir Vukovic A-GPS Positioning in today‘s mobile networks
93Rudolf Pailer et alTerminal-centric location services in the IP multimedia subsystem
99Michael Thienelt et alWiKaF - A knowledge-based Kalman Filter for Pedestrian Navigation
105Andreas Eichhorn Map-independent positioning of land vehicles with causative modified motion equations
Wayfinding111Inessa Seifert “First have a plan, then make sure it is a good plan” or Dealing with underspecified spatio-temporal relations in unfamiliar large scale environments
119Mohammad Reza Malek et alA logic-based foundation for a spatial relationship in mobile GIS environments
125Steffen Volz Shortest Path Search in Multi-Representation Street Databases
131Masatoshi ArikawaGeocoding Walking Directions using Sidewalk Network Databases
Visualization137Ken Francis et alDancing without gravity. A story of Interface Design
143Julie Dillemuth Evaluating maps for mobile display^
149Birgit Elias et alConcepts for the cartographic vizualisation of landmarks
157Verena Radoczky Supporting wayfinding by multimedia cartography means
VI
Table of Contents
3D for LBS165Michael Wood et alAn experimental investigation into the effects of 2D and 3D representations on human wayfinding in mountain regions
171Jürgen Döllner et alAn approach towards semantic-based navigation in 3D city models on mobile devices
177William Cartwright Towards an understanding of the importance of landmarks to assist perceptions of a space in web-delivered 3D worlds
185Sisi Zlatanova et alThe third dimension in LBS: the steps to go
Modelling and Services191Kai-Florian Richter “Cross the River and follow the tracks”: overview information on the way to take
197Eva Grum The least risk path in 3D: the “use-case” of indoor navigation
201Natalia and Gennady Andrienko A framework for decision-centered visualisation in civil crisis managment
207Albrecht Weiser, Alexander ZipfA visual editor for generating OGC styled Layer Descriptor files for automating configuration of WMS maps
213Erich Wilmersdorf Providing an information infrastructure for map-based LBS
217David Bennett et alMoGeo: A location-based educational service
223Gerhard Navratil et alWhat makes Location-Based Services fail?
Services and Applications229Byoung-Jun Kang et alDevelopment of the Cultural Inheritance Information System using LBS technologies for tourists
233Siegfried Wiesenhofer et alMobile City Explorer - An innovative GPS and camera phone based travel assistant for city tourists
235Karl Rehrl et alCombined indoor/outdoor Smartphone navigation for public transport travellers
241Michaela Kinberger et alLWD-Infosystem Tirol: visual information about the current avalanche situation via mobile devices
VII

Table of Contents
245Chang-Yub Jeong et alInvestigation System for rock slope using mobile device
249László Zentai LBS in orienteering sport
Visions and Plans253Dieter Schmalstieg et alAugmented Reality and Ubiquitious Computing
263Rein Ahas et alApplications of the mobile positioning data in space-time behaviour studies: experiments in Estonia
Additional Papers267Brankica MalićSuggestion for the bridging of the time gap
271Rein Ahas et alSeasonal tourism spaces in Estonia: Case study with roaming data from operators network
Appendix273Alphabetical list of first authors
277Chronological list of issues
VIII
Theory and development of research in ubiquitous mapping
Takashi Morita
1 Map communicationUbiquitous Mapping refers to the use and creation of maps by users anywhere and at any time. It is strongly influenced by advances in information technology, such as the development of wireless systems, high-density data storage and broadband communication, which have acted to stimulate and facilitate dynamic and personalized mapping. However, it appears that the fundamental nature of the map has not been changed significantly from its origin. Before examining the notion of Ubiquitous Mapping, it is necessary to review the purposes for which maps have been designed.
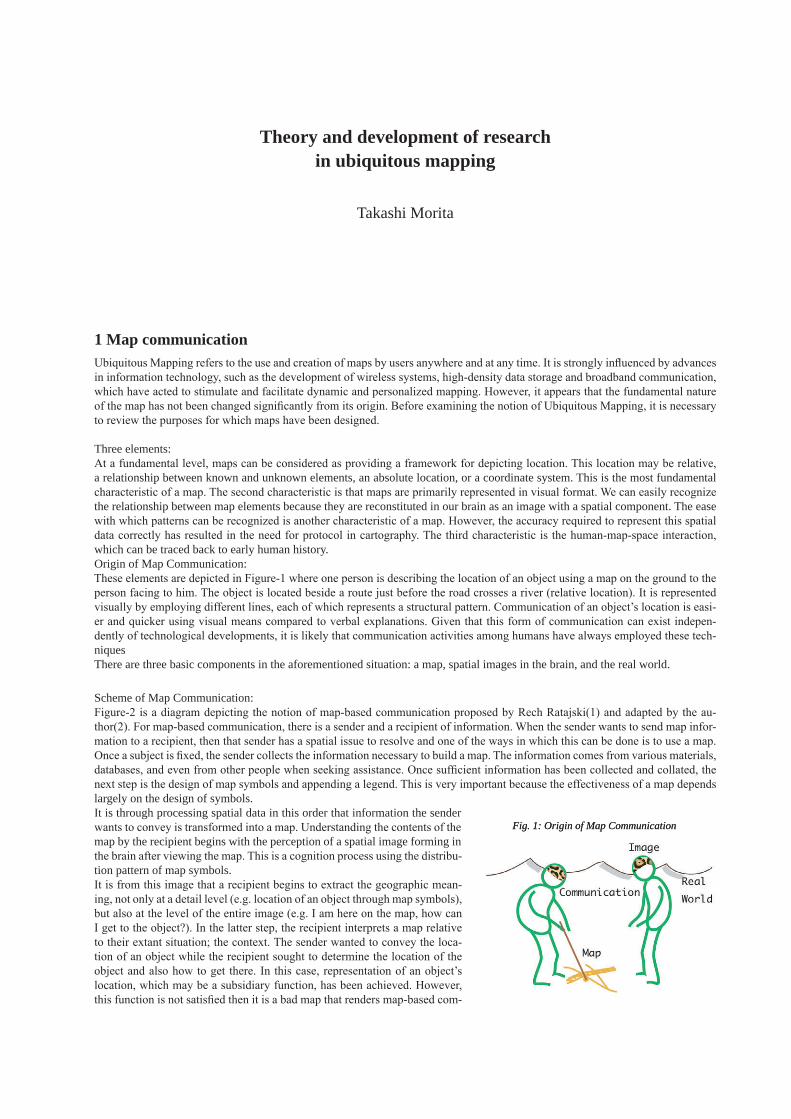
Three elements:At a fundamental level, maps can be considered as providing a framework for depicting location. This location may be relative, a relationship between known and unknown elements, an absolute location, or a coordinate system. This is the most fundamental characteristic of a map. The second characteristic is that maps are primarily represented in visual format. We can easily recognize the relationship between map elements because they are reconstituted in our brain as an image with a spatial component. The ease with which patterns can be recognized is another characteristic of a map. However, the accuracy required to represent this spatial data correctly has resulted in the need for protocol in cartography. The third characteristic is the human-map-space interaction, which can be traced back to early human history. Origin of Map Communication:These elements are depicted in Figure-1 where one person is describing the location of an object using a map on the ground to the person facing to him. The object is located beside a route just before the road crosses a river (relative location). It is represented visually by employing different lines, each of which represents a structural pattern. Communication of an object’s location is easi-er and quicker using visual means compared to verbal explanations. Given that this form of communication can exist indepen-dently of technological developments, it is likely that communication activities among humans have always employed these tech-niques There are three basic components in the aforementioned situation: a map, spatial images in the brain, and the real world.
Scheme of Map Communication:Figure-2 is a diagram depicting the notion of map-based communication proposed by Rech Ratajski(1) and adapted by the au-thor(2). For map-based communication, there is a sender and a recipient of information. When the sender wants to send map infor-mation to a recipient, then that sender has a spatial issue to resolve and one of the ways in which this can be done is to use a map. Once a subject is fixed, the sender collects the information necessary to build a map. The information comes from various materials, databases, and even from other people when seeking assistance. Once sufficient information has been collected and collated, the next step is the design of map symbols and appending a legend. This is very important because the effectiveness of a map depends largely on the design of symbols. It is through processing spatial data in this order that information the sender wants to convey is transformed into a map. Understanding the contents of the map by the recipient begins with the perception of a spatial image forming in the brain after viewing the map. This is a cognition process using the distribu-tion pattern of map symbols. It is from this image that a recipient begins to extract the geographic mean-ing, not only at a detail level (e.g. location of an object through map symbols), but also at the level of the entire image (e.g. I am here on the map, how can I get to the object?). In the latter step, the recipient interprets a map relative to their extant situation; the context. The sender wanted to convey the loca-tion of an object while the recipient sought to determine the location of the object and also how to get there. In this case, representation of an object’s location, which may be a subsidiary function, has been achieved. However, this function is not satisfied then it is a bad map that renders map-based com-
Fig. 1: Origin of Map CommunicationFig. 1: Origin of Map Communication
Takashi Morita2
munication impossible. Map-based communication between a sender and a recipient is considered effective if the object the sender intended to show was recognized by the recipient. Generally, absolute success may not be expected where a raison d’etre for cartographic study exists.
2 Mapping world Paper maps can be carried in the field. The information on the map is “fixed” on the paper and it is the user who must extract the information they require from the map. However, it is not always possible to find the necessary information because there is a limit to the surface area that can be dedicated to depict the information on the map. There are also differences between maps and reality because of the limits imposed by the frequency of maintenance of updating information. Furthermore, making map production viable demands that a large number of copies be printed within a certain time frame. Thus, there is a need for the development of a new map, one that can be produced on site. Moreover, if it is interactive and can satisfy the specific needs of the individual who requires the map, production can be referred to as on site “map-ping”.
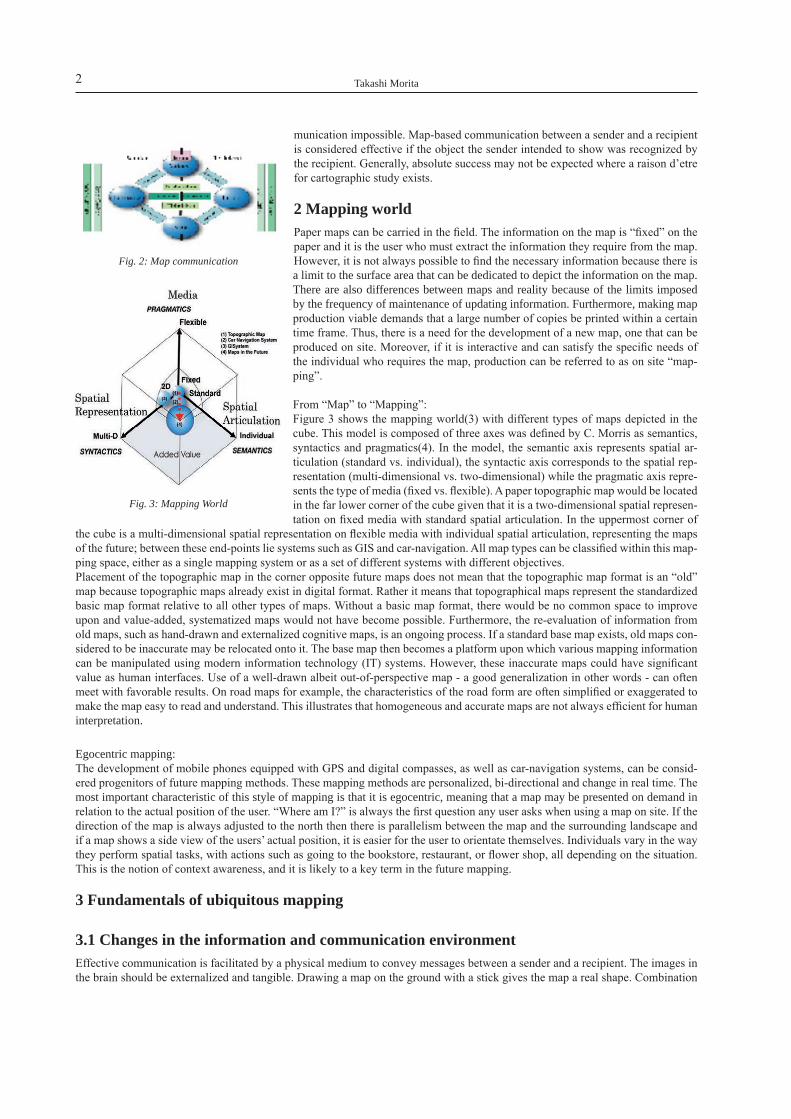
From “Map” to “Mapping”:Figure 3 shows the mapping world(3) with different types of maps depicted in the cube. This model is composed of three axes was defined by C. Morris as semantics, syntactics and pragmatics(4). In the model, the semantic axis represents spatial ar-ticulation (standard vs. individual), the syntactic axis corresponds to the spatial rep-resentation (multi-dimensional vs. two-dimensional) while the pragmatic axis repre-sents the type of media (fixed vs. flexible). A paper topographic map would be located in the far lower corner of the cube given that it is a two-dimensional spatial represen-tation on fixed media with standard spatial articulation. In the uppermost corner of
the cube is a multi-dimensional spatial representation on flexible media with individual spatial articulation, representing the maps of the future; between these end-points lie systems such as GIS and car-navigation. All map types can be classified within this map-ping space, either as a single mapping system or as a set of different systems with different objectives.Placement of the topographic map in the corner opposite future maps does not mean that the topographic map format is an “old” map because topographic maps already exist in digital format. Rather it means that topographical maps represent the standardized basic map format relative to all other types of maps. Without a basic map format, there would be no common space to improve upon and value-added, systematized maps would not have become possible. Furthermore, the re-evaluation of information from old maps, such as hand-drawn and externalized cognitive maps, is an ongoing process. If a standard base map exists, old maps con-sidered to be inaccurate may be relocated onto it. The base map then becomes a platform upon which various mapping information can be manipulated using modern information technology (IT) systems. However, these inaccurate maps could have significant value as human interfaces. Use of a well-drawn albeit out-of-perspective map - a good generalization in other words - can often meet with favorable results. On road maps for example, the characteristics of the road form are often simplified or exaggerated to make the map easy to read and understand. This illustrates that homogeneous and accurate maps are not always efficient for human interpretation.
Egocentric mapping:The development of mobile phones equipped with GPS and digital compasses, as well as car-navigation systems, can be consid-ered progenitors of future mapping methods. These mapping methods are personalized, bi-directional and change in real time. The most important characteristic of this style of mapping is that it is egocentric, meaning that a map may be presented on demand in relation to the actual position of the user. “Where am I?” is always the first question any user asks when using a map on site. If the direction of the map is always adjusted to the north then there is parallelism between the map and the surrounding landscape and if a map shows a side view of the users’ actual position, it is easier for the user to orientate themselves. Individuals vary in the way they perform spatial tasks, with actions such as going to the bookstore, restaurant, or flower shop, all depending on the situation. This is the notion of context awareness, and it is likely to a key term in the future mapping.
3 Fundamentals of ubiquitous mapping
3.1 Changes in the information and communication environmentEffective communication is facilitated by a physical medium to convey messages between a sender and a recipient. The images in the brain should be externalized and tangible. Drawing a map on the ground with a stick gives the map a real shape. Combination
Fig. 3: Mapping World
Fig. 2: Map communication

Theory and development of research in ubiquitous mapping �
of the ground surface and a stick can be viewed as the technical environment used to facilitate representation of a map, one that may either become redundant or change as new techniques become available.
Visualization of information:Tribal humans were using maps to communicate spatial concepts considerably before the invention of letters and characters. How-ever, after the development of typesetting, such as was employed to produce the Gutenberg Bible, it became easier to communicate using text than by using graphics. This development resulted in printed characters dominating books for more than five hundreds years. However, subsequent to the development of printing graphics, books came to contain more than only text. Similarly, broad-cast communication began with radio using spoken messages before evolving into TV, which incorporated the visual component in addition to sound. It is currently the same for cellular phones, personalized computers, and PDAs (personal digital assistants); portable devices that were previously incapable of sending visual information are now used to send image-rich content. As can be inferred from this convergence, communication with words and visual information are both very important, with the latter being more difficult to represent.
Ubiquitous Computing:Computers and communication networks are similar to extensions of our cerebral and nervous systems; we have come to expect to use them anywhere and at any time. This situation reflects the goal of developments in information technology. Mobile devices such as cellular phones and PDAs have become pervasive, telecommunication lines are no longer made of copper wire, but rather are made glass optical fiber for broadband - and now even to wireless. Computers are ubiquitous, and can be found in Internet cafés, airports, train stations, hotels, homes and offices, and these are just traditional applications. We already utilize ATMs (Au-tomated teller machines) at banks, ticket-vending machines, route-guiding machine, in-car navigation system, and other machines that incorporate computers for specific purposes. Small IC tags that can be attached to fixed objects such as signposts, or moving objects such as consumer goods, may become information and communication stations, connecting different computers. These are examples of the so-called “ubiquitous computing environment”. In this environment, communication between person-to-person, person-to-machine, machine-to-machine (machine communication: network, human communication: understanding) are bi-modal, interactive, and realized in real time. This is more than an information system, it is a communication system.
3.2 Ubiquitous nature of mapsThe contemporary needs for ubiquitous mapping are mentioned above. Now we will examine the potential applications of ubiqui-tous mapping and its principal characteristics.
Visual perception:Maps are generally visually perceived. Visual perception is ubiquitous because we can perceive and conceptualize an entire object through pattern recognition. At the same time however, we can observe any given part of the image. This means that we can move freely between the entire image and the partial image. The order of processing data is not predetermined as it is when we are con-fronted with reading text composed of characters. This ubiquitous nature of vision is very useful for reading maps as thematic im-ages can be superimposed in the background (figure and background) on the same plane. It is thus possible to represent alternative propositions or solutions using the same image, facilitating the rapid and simplified communication of spatial information.
Creation process:We continually refresh the spatial and temporal attributes of images in the brain and modify these images as necessary depending upon the prevailing situation. Such maps are regenerated from information contained in a database to produce one of two kinds of maps: one is the reproduction of existing map, the other is the creation of a new map in response to specific user requirements that differ in time, space, and personal attributes. This latter map-type can be created using digital systems with specific parameters ap-plied to existing maps that are modified and to which necessary information can be added. Realization of map production in this way has only been made possible through enormous advances in information technology.
Using process:A map drawn on the ground surface is a type of on demand map. A paper map can be transported and utilized by user at a different location. Such a map can be used anywhere other than its place of origin. However, in order to solve a spatial problem successfully one should attempt to acquire a suitable map. This is usually done by specialists and is difficult for members of the general public. Consequently, it is therefore highly likely that the full potential of maps has not been realized. We have mobile and wireless devices that can display maps and can receive existing maps on demand, and we can also create maps in response to the needs of a user in a particular situation. This enforcement-assistance relationship between map and user was not possible before. Maps too have become ubiquitous and can be made on demand.

Takashi Morita4
3.3 Difference between GIS and Ubiquitous MappingHow does ubiquitous mapping differ from GIS or simple geographic information? In the mapping universe these concepts fall within the same schema. However, if we attempt to distinguish between these systems, it seems that the primary differ-ence is related to the context of “information” and “communication”. As shown in Figure-4, GIS emphasizes information processing through data input, database building, data analysis, and data output of spatial information. It is used for spatial analysis using database and modeling toolbox type applications with maps simply being used as the outputs of this information processing.Conversely, communication is the principal function of ubiquitous mapping. It in-cludes not only map production, but also map use and map communication and considers the interaction between the map, the spatial image, and the real word. Instead of being a “modeling toolbox” as in GIS, there should be “IT infrastructure” for ubiquitous mapping. It is the on-site communication network system connect-ing the three elements; the map, the spatial image, and the real world. Thus, GIS is oriented toward being a spatial information system for analysis, whereas ubiquitous mapping is concerned with spatial communication; it is a human-oriented system that incorporates spatial cognition, spatial deduction and abduction, and spatial de-cision making.
4 Research in ubiquitous mappingWhat is the future direction of this domain for further studies? Since the domain is in its infancy, we have attempted to provide a working framework and provisional research agenda below. Topics such as social costs, security and cross cultural studies will also be required in the future.
4.1 Elements of context awarenessSince the purpose of Ubiquitous Mapping is to resolve spatial problems and to realize the ability, and consider the environment, of users in the creation and use of maps at any time or location, the most important and novel theme in cartography is the element of context awareness. This element is fundamental because real time mapping applications that are sensitive to context and, “any-where, any time, and anybody” require that the components of the “where, when, and who” of the users’ is known in advance. The system should therefore recognize the following elements:Three situationsAnywhere: To respond to the question of where you are, one may react using either natural language to indicate the relative posi-tion to a known landmark, place name, address, or even a geographical coordinate in an extreme case, or point to a corresponding site on a map. Any time: A users’ temporal characteristics are usually “now”, in real time and immediate. However, one may refer to a chrono-logical point in time that differs in a relative sense from the time at which the question was asked, or to a difference in the standard and/or calendar time. Time may be defined using natural language such as in an emergency, the daytime or at night, for example. Anybody: This includes the attributes of the user and corresponds directly to the objective of the mapping exercise. Characteris-tics such as gender, age, whether the user is a national of the area or a foreigner, whether they have a mental or physical disability, people in a state of haste and similar characteristics, as well as their intended activity, prescribe the function of map.Four elements
Ubiquitous Mapping consists of four basic elements: the real world, the map, the user, and the IT infrastructure with interactions between each element. The real world: Is taken as the total space required by human beings for living; it is the space consisting of the objects and the backgrounds of our activities. If the character-istics of this space were different, human behavior would also be different. The map: It is a physical map that is observable by a human sensor and is represented using map symbols. Voice may also be used to augment the data contained in the map. It may be provided on site as a guide map post or on the screen of a mobile device. Here, the notion of a “map” may be replaced with that of “mapping” as digital maps and IT infrastructure allow for real-time creation and manipulation of maps.The user: It is the subject and the actor who needs to resolve a spatial issue. Individu-als have spatial images in their brains that differ from those of other individuals. This is because personal attributes such as objectives, interpretations of spatio-temporal phenomena, personal history and spatial preference, all differ from person to person and are dynamic depending upon a given context. The IT infrastructure: This is the supporting, spatial communication system that fa-cilitates the interface between the real world, the map, and the user. It is composed
Fig. 6: Four Basic Elements of Ubiquitous Mapping
Fig. 4: GI and Ubiquitous Mapping
Fig. 5: Where-when-who

Theory and development of research in ubiquitous mapping �
of a wireless communication network, spatial communication devices, spatial information databases, mapping software, and similar attributes. Spatial com-munication devices can be divided into mobile devices and communication posts. The latter are stationary and on-site, and connect the real world, the map, and the users like a street name and house number are used as coordinates on a map.
Side view (3D view)The relative position between four elements mentioned above are also cen-tral to the context and usability of a system. When people view a townscape, the scenes are usually perceived as side or oblique views, very rarely are they viewed from a vertical angle. Since maps are normally drawn using a verti-cal projection with the element of cartographic abstraction, users are forced to interpret the side of a location into vertical view, a process that can demand considerable gymnastics of the brain. Thus, it is more convenient for a user if the map is first drawn from a side view perspective and then transformed into a vertical view. However, the characteristics of side views vary with respect to the relationship between the viewpoint and the view angle of the object scene. Consequently, it is not possible to make a side view map from vertically derived cartographic materials. However, the considerable improvements in digital cartography has resolved many of the difficulties formally associated with this prob-lem. We now have 3D urban models with which it has become possible to transform images from side views to vertical views. We have thus gradually resolved many of the problems formally associated with the cartographic abstraction required for generating side views. Photo-realistic images may not be the solution because such methods are always open to misidentification by the user. The object that constitutes “what” is a part or an element of a continuous space. A clear image of spatial elements may be given by cartographic abstrac-tion, which may then be superimposed on to a photo or real scene. This latter approach is a sort of mixed reality where symbols like arrows are directly displayed on the site or on the mobile screen.
Time representation (4D view) Time and space are intricately connected, particularly in the context awareness environment because “when” is one of three fundamental parameters referred to above. Three time vari-ables need to be represented. One is that of “real time” where the map on screen is refreshed relative to the location of the user in real time. The second type includes the representation of mobile objects or temporal phenomena that are normally omitted from traditional paper maps. Location monitoring of children using GPS and a wireless network is one such exam-ple. Temporal information can be depicted on map-enabled cellular phones and transferred to friends to notify them of a destination to which they should come. The third temporal aspect is an animation showing the movement of a phenomenon. Animated instructions to help users make a decision, such as route guidance using dynamic arrows.
Real scale map These maps have a scale that is unusual in that it has a real scale (1:1). The abstraction of spatial objects and reduction of the size of spatial phenomena are some of the basic functions of map. However, abstraction really only begins at scales of spatial cognition when we can observe an object scene and recognize the spatial characteristics of the structure. This is so called spatial articulation and is performed by everyone in their daily lives, which is the level at which spatial elements can be distinguished and classified. This process is very similar to cartographic abstraction but it is done using real scale objects and with images being retained within the brain. A map is a product of cartographic abstraction of the real world. When we utilize a map, the on site object depicted by a map must be referenced to real object to verify a position. However, such referencing is not always easy to reference abstractions
Fig. 9: Reference points of Real-Scale-Map
Fig. 7: Map and spatial cognition
Fig. 8: Mixed reality
Fig. 10: Human Navigation System using Cellular Phone
Takashi Morita�
with the real world using only the characteristics of the feature being represented. Conse-quently, we often employ signs that are located on site as well as those, like as street names, which can be described on a map. However, because this approach is not always successful, especially at local scales and it is therefore necessary to have more efficient system.The real scale map proposed here is a map drawn on the real world using well-defined ref-erence points that are visible on site and, simultaneously, as points on a map. Once this has been achieved, all cartographic elements should be defined relative these reference points. The difference between this system and the coordinate system is that the reference points on site are either visible or invisible. Consequently, reference points should be clearly visible and easy to locate. In addition, the orientation of the map should be always synchronized to the north and this could be supported by IT infrastructure.
Connection and transformation between different spatial languagesLocation may be represented using natural language, such as address, place name or as “ahead”, “turn right”. Alternately, they may be also indicated on a map, which is more con-ventionally used to represent spatial information. Thus, while natural language is easier to present, it is less precise than cartographic language. There is thus always a need to trans-form spatial information between verbal and non-verbal formats and the process of geocod-ing constitutes the connection between these two spatial languages. In the context awareness environment, both natural and cartographic languages need to be understood as the system should be able to approximate certain parameters on behalf of the user in a given context and also so that users to use both languages unconsciously.
4.2 Applications in Tokyo In-car navigation systems
A commercial system was introduced in 1981 without any digital information infrastructure. It functioned using an autonomic system that employed a dead reckoning method with gyrocompass and a paper road map. In the mid 1980’s, a beacon system that transmitted traffic information from dedicated transmitters along roads combined with digital road network data for whole country constituted the infrastructure. The use of GPS in 1990 combined with a map-matching method, as well as information on traffic congestion and accidents in real time using FM, subsequently became available. In 2005, more than 15 million in-car navigation units were sold in Japan. Their typical functions include the display of actual geographic location on digital maps in 2D and 3D with landmarks using north up/heading up, congestion/construction information in real time, route guidance (maps, diagrams and voice) to the destination using customized user profiles, queries and different display types (gas station, parking, restaurant, etc.) are also possible. The most recent systems use a hard disk, which calculates appropriate route to a given destination, even when the route is suddenly altered from the initial course.
Cellular phones“All-in-one” type high-functionality cellular phones have become more popular than PDAs (Palm and Pocket PCs) in Japan. More than 90 million units have been sold and the diffusion rate is more than 70%. Typical specifications of current cellular phones in-clude full-color LCDs, high-resolution display (240 x 320 pixels), 3D graphics engine, Java/flash/SVG compatibility, camera (3M pixels), removable memory, mail, Web, internet, voice recorder, a diary, 2D Bar (QR) Code Reader, GPS, Compass, etc., which can be applied as a human navigation system for route guidance by pedestrians. It proposes alternative routes after considering the various possible modes of transport (on foot, by taxi, by bus, by train, etc.) and provides timetable and tariff information. Once the route has been fixed, the user is provided with step-by-step directions and guided by voice with the map in the heading-up orienta-tion. The destination may be designated directly using an address or a point on a map, or through querying the system using several destination categories. One can communicate one’s actual position using the GPS and a map to the recipient without knowledge of the exact address. Another location-based service involves transmitting the location of the bearer of the equipment (children, grand-parents, etc.) to the user via an operation center. The equipment is a modified version of a cellular phone that transmits location information in response to demands sent from the operation center. The user can use the system to determine if the bearer is within a predefined safety zone or the user can request the bearer to push a button to confirm that the bearer is not in trouble. If there is no reaction a member of staff or security services will rush to the site.
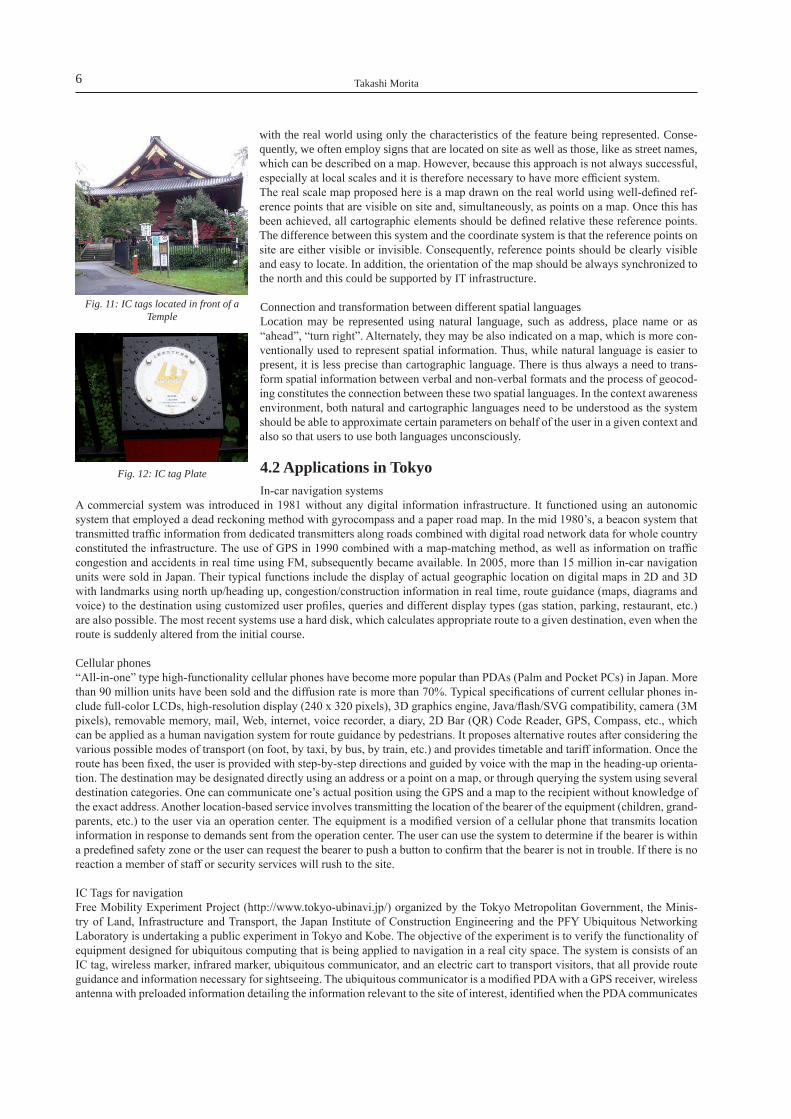
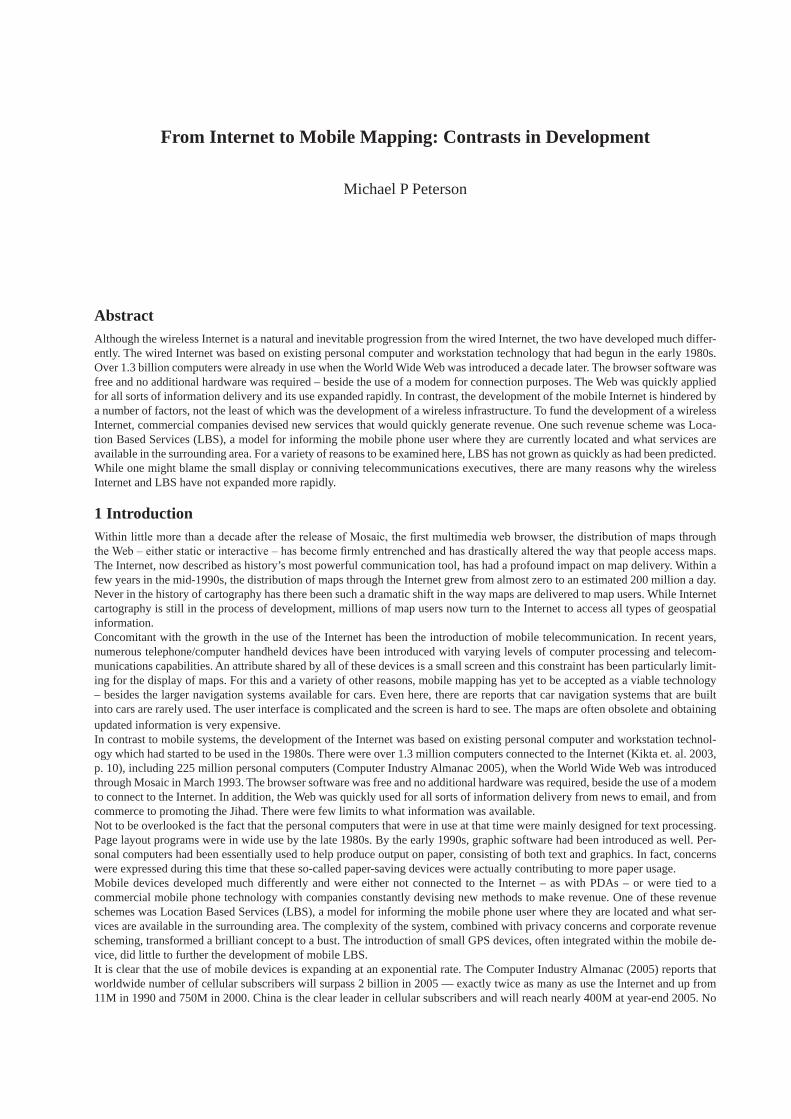
IC Tags for navigation Free Mobility Experiment Project (http://www.tokyo-ubinavi.jp/) organized by the Tokyo Metropolitan Government, the Minis-try of Land, Infrastructure and Transport, the Japan Institute of Construction Engineering and the PFY Ubiquitous Networking Laboratory is undertaking a public experiment in Tokyo and Kobe. The objective of the experiment is to verify the functionality of equipment designed for ubiquitous computing that is being applied to navigation in a real city space. The system is consists of an IC tag, wireless marker, infrared marker, ubiquitous communicator, and an electric cart to transport visitors, that all provide route guidance and information necessary for sightseeing. The ubiquitous communicator is a modified PDA with a GPS receiver, wireless antenna with preloaded information detailing the information relevant to the site of interest, identified when the PDA communicates
Fig. 11: IC tags located in front of a Temple
Fig. 12: IC tag Plate

Theory and development of research in ubiquitous mapping 7
with the IC tag (non-contact and passive) and a wireless marker (10 m active zone) at the site. The relationship between ubiquitous communicator, the IC tag and wireless marker constitute a location-based context where the real space meets with mapping space. If IC tags and wireless markers constitute a map in real space, then this relationship using various location information becomes a real scale map. A reduced map of this map with the same reference points is thus generated and a user can refer to two points on the map easily and correctly. This relationship is conducive to the creation of mixed reality.
5 ConclusionIn conclusion, ubiquitous mapping is more than a digital map distribution system in that it aims to provide technical solutions as-sociated with map creation and use. Ubiquitous mapping accelerates, facilitates, and stimulates the universal nature of map creation and use through the application of advanced information technologies. Consequently, despite being derived from the most primitive map-types, ubiquitous mapping can be considered as reprehensive of the future map type. Further studies should investigate the potential of applying new technologies and increasing our understanding of the nature of maps.
6 References(1) Ratajski, L., “The Research Structure of Theoretical Cartography, International Yearbook of Cartography”, Vol. XIII, p. 219, 1973(2) Morita, T., “Reflections on the Results of a Questionnaire on the Definitions of Map, Cartography and GIS”, The Selected Problems of Theoreti-
cal Cartography 2002, Proceedings of a seminar of the commission on Theoretical Cartography, Gdansk, Poland, July, pp. 34-44, 2002(3) Morita, T., “Ubiquitous Mapping in Tokyo”, Proceedings of the First International Joint Workshop on Ubiquitous, Pervasive and Internet Map-
ping, Tokyo Japan, September 7-9, pp. 9-13, 2004(4) Morris, C., “Foundations of the theory of signs”, International encyclopedia of unified science; Vol. 1: Foundation of the unity of science, No.
2, Univ. of Chicago Press, 59 pages, 1960(5) Proceedings of the First International Joint Workshop on Ubiquitous, Pervasive and Internet Mapping, Tokyo Japan, September 7-9, 194 pages,
2004
From Internet to Mobile Mapping: Contrasts in Development
Michael P Peterson
AbstractAlthough the wireless Internet is a natural and inevitable progression from the wired Internet, the two have developed much differ-ently. The wired Internet was based on existing personal computer and workstation technology that had begun in the early 1980s. Over 1.3 billion computers were already in use when the World Wide Web was introduced a decade later. The browser software was free and no additional hardware was required – beside the use of a modem for connection purposes. The Web was quickly applied for all sorts of information delivery and its use expanded rapidly. In contrast, the development of the mobile Internet is hindered by a number of factors, not the least of which was the development of a wireless infrastructure. To fund the development of a wireless Internet, commercial companies devised new services that would quickly generate revenue. One such revenue scheme was Loca-tion Based Services (LBS), a model for informing the mobile phone user where they are currently located and what services are available in the surrounding area. For a variety of reasons to be examined here, LBS has not grown as quickly as had been predicted. While one might blame the small display or conniving telecommunications executives, there are many reasons why the wireless Internet and LBS have not expanded more rapidly.
1 IntroductionWithin little more than a decade after the release of Mosaic, the first multimedia web browser, the distribution of maps through the Web – either static or interactive – has become firmly entrenched and has drastically altered the way that people access maps. The Internet, now described as history’s most powerful communication tool, has had a profound impact on map delivery. Within a few years in the mid-1990s, the distribution of maps through the Internet grew from almost zero to an estimated 200 million a day. Never in the history of cartography has there been such a dramatic shift in the way maps are delivered to map users. While Internet cartography is still in the process of development, millions of map users now turn to the Internet to access all types of geospatial information. Concomitant with the growth in the use of the Internet has been the introduction of mobile telecommunication. In recent years, numerous telephone/computer handheld devices have been introduced with varying levels of computer processing and telecom-munications capabilities. An attribute shared by all of these devices is a small screen and this constraint has been particularly limit-ing for the display of maps. For this and a variety of other reasons, mobile mapping has yet to be accepted as a viable technology – besides the larger navigation systems available for cars. Even here, there are reports that car navigation systems that are built into cars are rarely used. The user interface is complicated and the screen is hard to see. The maps are often obsolete and obtaining updated information is very expensive. In contrast to mobile systems, the development of the Internet was based on existing personal computer and workstation technol-ogy which had started to be used in the 1980s. There were over 1.3 million computers connected to the Internet (Kikta et. al. 2003, p. 10), including 225 million personal computers (Computer Industry Almanac 2005), when the World Wide Web was introduced through Mosaic in March 1993. The browser software was free and no additional hardware was required, beside the use of a modem to connect to the Internet. In addition, the Web was quickly used for all sorts of information delivery from news to email, and from commerce to promoting the Jihad. There were few limits to what information was available.Not to be overlooked is the fact that the personal computers that were in use at that time were mainly designed for text processing. Page layout programs were in wide use by the late 1980s. By the early 1990s, graphic software had been introduced as well. Per-sonal computers had been essentially used to help produce output on paper, consisting of both text and graphics. In fact, concerns were expressed during this time that these so-called paper-saving devices were actually contributing to more paper usage.Mobile devices developed much differently and were either not connected to the Internet – as with PDAs – or were tied to a commercial mobile phone technology with companies constantly devising new methods to make revenue. One of these revenue schemes was Location Based Services (LBS), a model for informing the mobile phone user where they are located and what ser-vices are available in the surrounding area. The complexity of the system, combined with privacy concerns and corporate revenue scheming, transformed a brilliant concept to a bust. The introduction of small GPS devices, often integrated within the mobile de-vice, did little to further the development of mobile LBS.It is clear that the use of mobile devices is expanding at an exponential rate. The Computer Industry Almanac (2005) reports that worldwide number of cellular subscribers will surpass 2 billion in 2005 — exactly twice as many as use the Internet and up from 11M in 1990 and 750M in 2000. China is the clear leader in cellular subscribers and will reach nearly 400M at year-end 2005. No
Michael P Peterson10
other country comes close. Russia has seen tremendous growth in the last few years and is projected to be in third place by year-end 2005. Rapid expansion in India will see a future climb in the rankings to a possible #2 in 2010. Worldwide cellular subscribers are forecasted to reach 3.2B by the end of 2010, approaching one-half of the world’s population.While spatial information delivery has great potential with mobile devices, it has not met the monetary expectations of telecom-munications corporate executives. A variety of reasons are examined here for why the development of the wireless Internet, and spatial information delivery in particular, has occurred differently than its wired counterpart. These differences will continue to affect how mobile mapping develops in the future. We begin by examining the differences in the development of these two forms of Internet access.
2 Contrasts in development
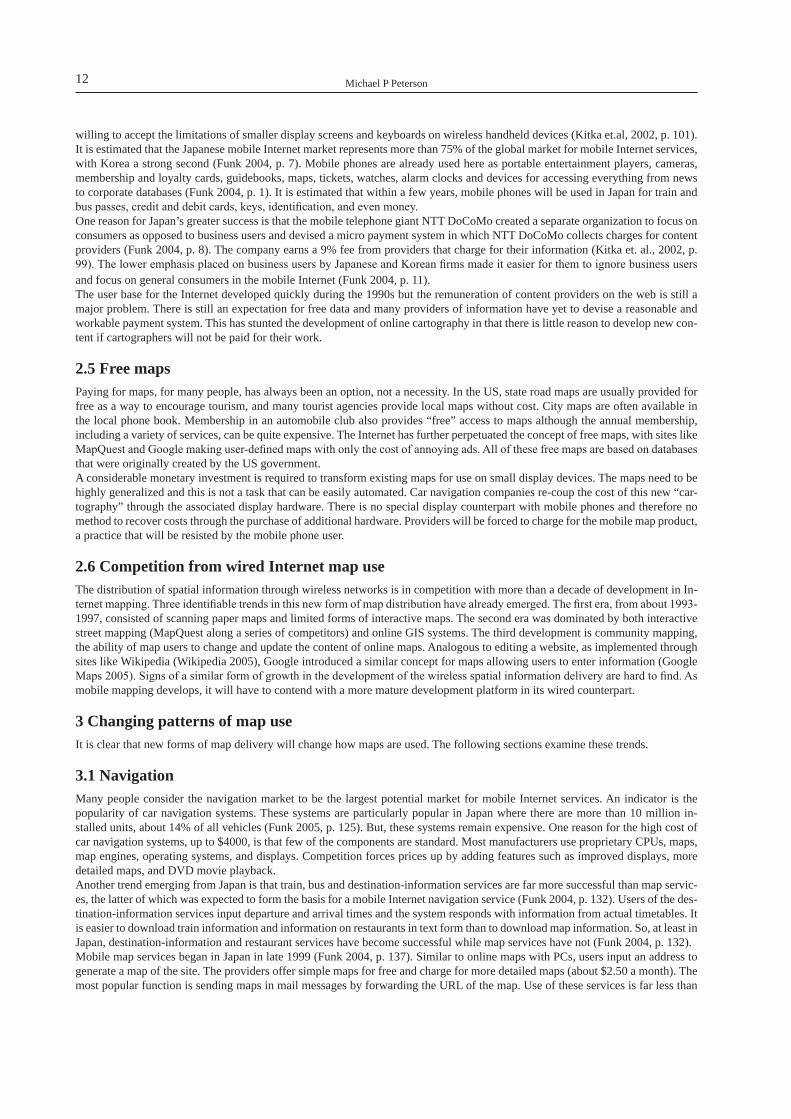
2.1 The role of governmentWith considerable investment in infrastructure, the US government played an important role in the development of the Internet. The initial impetus derived from paranoia, a fear that a nuclear attack by the Soviet Union would render communications systems in the United States inoperable. In 1969 three computers, located remotely from each other, were connected under what was then Advanced Research Projects Agency Network (ARPANET). By 1971, ARPANET computers were connected at nearly two dozen sites, including Harvard University and MIT and protocols for remote terminal access (Telnet) and file transfer (FTP) were defined. As Kitka et. al. (2002, p. 8) point out, sometime during the 1970s an interesting observation took place that ARPANET was really a government subsidized person-to-person communications service more than a system for the sharing of resources. In the 1980s, the Internet transitioned from the control of ARPANET to the US National Science Foundation. Established in 1986, NSFNET had a speed of 56 Kbps and 5000 Internet hosts. While Tim Berners-Lee posts the first computer code for the World Wide Web from Switzerland in 1991, many of the early developments of the Web during the 1990s also came from the United States. Foremost among these in the 1993 introduction of Mosaic, the first graphics-based Web browser. During the following year, traffic on the Internet expanded at a 341,634% annual growth rate. By 1996, when Microsoft Internet Explorer was introduced, there were 12.8 million Internet hosts and 500,000 WWW Sites and the number of users reaches 40 million. By 2001, the United States with less than 4.5% of the world’s population represented over 40% of its users.In contrast, the role of government, and the US government in particular, in the funding and development of mobile networks has been minimal. In Europe, governments have at least helped establish standards that allow interoperability between systems. In the United States, a more laissez-faire approach has led to many cellular systems and most are incompatible with the rest of the world. In terms of cell phone use, the US is far behind other developed, and some lesser-developed countries. It ranks 30th worldwide in cell phones per 100 population behind countries like the Czech Republic, Portugal, and Slovakia (see Table 1). Kitka et. al. (2002, p. 95) state that the most important reason that the US is behind in mobile phone use is geographic size and population density. A smaller investment in infrastructure is needed in Japan and Europe because there is less space to cover and often more people in that smaller space.While the role of government in the development of technology is not always clear, most would agree that the wired Internet could not have developed in its present form without the funding provided by the US government. In addition, as the largest economy in the world, the US has played a key role in many technological developments in the past century – both through government initiatives and private sector competition. Its lack of direction in the development of the mobile Internet, and mobile phone use in general, has been particularly noticeable.
Rank Country per 100 population Rank Country per 100
population1 Taiwan 106.45 23 Korea, South 67.952 Luxembourg 101.34 24 France 64.703 Hong Kong 92.98 25 Hungary 64.644 Italy 92.65 26 Australia 63.975 Iceland 90.28 27 Japan 62.116 Sweden 88.50 28 New Zealand 61.847 Czech Republic 84.88 29 Slovakia 54.368 Finland 84.50 30 United States 48.819 United Kingdom 84.49 31 Brunei 40.0610 Norway 84.33 32 Canada 37.7211 Greece 83.86 33 Poland 36.2612 Denmark 83.33 34 Malaysia 34.8813 Austria 82.85 35 Turkey 34.7514 Spain 82.28 36 Thailand 26.0415 Portugal 81.94 37 Mexico 25.45

From Internet to Mobile Mapping: Contrasts in Development 11
Rank Country per 100 population Rank Country per 100
population16 Singapore 79.14 38 Philippines 17.7717 Switzerland 78.75 39 China 16.0919 Belgium 78.63 40 Indonesia 5.5220 Ireland 75.53 41 Vietnam 2.3421 Netherlands 72.24 42 Cambodia 1.6622 Germany 71.67 43 Laos 1.00
44 Burma 0.03Tab. 1: Cell phones per 100 population in 2002. Source: NationalMaster.com
2.2 Content developmentIf the Internet had no content, it wouldn’t be of interest to anyone. Content makes the medium useful and interesting, and the easi-est way to add content to a new medium is to copy the old. This fact was recognized as early as 1971 when Michael Hart (1992) started the Gutenberg Project for the online distribution of classical texts – the first being the U.S. Declaration of Independence. The idea was to convert the information on paper to the computer and thereby make it available to more people. The same thought occurred in the 1990s to map librarians at the Perry-Castaňeda Library Map Collection at the University of Texas as they converted their collection of maps to be accessible through the World Wide Web (University of Texas 2005). Most of the maps scanned by the University of Texas Libraries and served from their web site, currently 5715, were produced by the US government (CIA, USGS, National Park Service) and therefore are in the public domain. No permissions are needed to distribute them. The maps are avail-able in ordinary JPEG format, and hundreds of thousands are downloaded every day. Some are even available in PDF format that can take advantage of the better resolution of printers.In contrast to the large amount of content available through the Internet, information available through mobile phones is very re-stricted. Among the many reasons for this are slower communications speeds and the need to re-format web pages for a smaller out-put size. In addition, the cost structure of mobile phone providers is such that access to web content is more expensive than ordinary phone service, either for the mobile phone itself or added charges that may be assessed according to the number of pages viewed. In short, the current mobile phone is not a good medium for information delivery for anything but the human voice, short text mes-sages and small pictures. This situation will certainly change but it will require a considerable investment of capital and time.
2.3 Compatibility with existing media Alan Kay (1977), who conceived of the Dynabook and whose design work led to the development of the graphical user interface, argues that the computer is not a tool or an instrument, but a medium. A medium is the carrier of information and is used to transmit knowledge and ideas between people. Each medium has a certain potential for communication. The computer, with the help of the Internet, is being used not only as a tool to help make maps, or search a database, but as a medium of communication. It was argued by McLuhan in the 1960s that we live in a rear-view mirror society (Theall 1971). According to McLuhan, all new forms of media take their initial content from what preceded them. Not only is the new medium based upon the old, but society dictates that the only acceptable way of approaching the new medium is by emulating the old – through the rear-view mirror.In order for a new medium to take its initial content from what precedes it, it must incorporate a delivery mechanism that can dis-play that information. The personal computer made this possible in cartography for everything but large maps – the kind of maps that only a few had access to anyway. However, to preserve the property of mobility, wireless devices cannot display most of the content of paper or the traditional computer medium because of the small display size. Making the display larger would make the devices less than mobile. Funk (2004, p. 44) estimates that doubling the display size doubles the display weight and increases the weight of the plastic housing by 50%. Similarly, a 20% increase in display area leads to a 30% increase in price. The issue, Funk goes on to point out, is whether customers will choose a heavier and more expensive phone in order to have a larger display. As Rhoton (2002, p. 117) states, it would be convenient if all the applications that been developed over the past years on comput-ers “could simply be dropped into a mobile environment and continue to work without any additional effort.” To be backward compatible, the mobile device would have to be able to perform the same function of the previous device in the process of adding new functionality. In addition to the small screen size, Rhoton (2002, p. 117) points out that mobile systems cannot be backward compatible because: 1) Many mobile platforms are closed systems, such as the Blackberry; and 2) there is a great deal of diversity in the machine interfaces of mobile devices. For these reasons and others, the mobile devices that are currently available represent a medium that is not backward compatible with either paper or the Web.
2.4 Developing a user base and paying for informationAs Rhoton (2002, p. 9) points out, a computer is not affordable for large segments of the world’s population. Even those who can afford it may not feel the value of the Internet is high enough to justify the investment. Wireless devices are smaller and more af-fordable than desktop systems and more easily deployed in constrained environments. One of the reasons why the wireless Internet has been so popular in Japan is people’s mobility and the lack of extra space in people’s living areas. If we want to see the impact that the mobile phone will likely have on our lives, we need to look no further than Japan. In 2002, only about 15% of Japanese consumers and business people were using the Internet through PCs. The remaining 85 percent were
Michael P Peterson12
willing to accept the limitations of smaller display screens and keyboards on wireless handheld devices (Kitka et.al, 2002, p. 101). It is estimated that the Japanese mobile Internet market represents more than 75% of the global market for mobile Internet services, with Korea a strong second (Funk 2004, p. 7). Mobile phones are already used here as portable entertainment players, cameras, membership and loyalty cards, guidebooks, maps, tickets, watches, alarm clocks and devices for accessing everything from news to corporate databases (Funk 2004, p. 1). It is estimated that within a few years, mobile phones will be used in Japan for train and bus passes, credit and debit cards, keys, identification, and even money.One reason for Japan’s greater success is that the mobile telephone giant NTT DoCoMo created a separate organization to focus on consumers as opposed to business users and devised a micro payment system in which NTT DoCoMo collects charges for content providers (Funk 2004, p. 8). The company earns a 9% fee from providers that charge for their information (Kitka et. al., 2002, p. 99). The lower emphasis placed on business users by Japanese and Korean firms made it easier for them to ignore business users and focus on general consumers in the mobile Internet (Funk 2004, p. 11).The user base for the Internet developed quickly during the 1990s but the remuneration of content providers on the web is still a major problem. There is still an expectation for free data and many providers of information have yet to devise a reasonable and workable payment system. This has stunted the development of online cartography in that there is little reason to develop new con-tent if cartographers will not be paid for their work.
2.5 Free mapsPaying for maps, for many people, has always been an option, not a necessity. In the US, state road maps are usually provided for free as a way to encourage tourism, and many tourist agencies provide local maps without cost. City maps are often available in the local phone book. Membership in an automobile club also provides “free” access to maps although the annual membership, including a variety of services, can be quite expensive. The Internet has further perpetuated the concept of free maps, with sites like MapQuest and Google making user-defined maps with only the cost of annoying ads. All of these free maps are based on databases that were originally created by the US government.A considerable monetary investment is required to transform existing maps for use on small display devices. The maps need to be highly generalized and this is not a task that can be easily automated. Car navigation companies re-coup the cost of this new “car-tography” through the associated display hardware. There is no special display counterpart with mobile phones and therefore no method to recover costs through the purchase of additional hardware. Providers will be forced to charge for the mobile map product, a practice that will be resisted by the mobile phone user.
2.6 Competition from wired Internet map useThe distribution of spatial information through wireless networks is in competition with more than a decade of development in In-ternet mapping. Three identifiable trends in this new form of map distribution have already emerged. The first era, from about 1993-1997, consisted of scanning paper maps and limited forms of interactive maps. The second era was dominated by both interactive street mapping (MapQuest along a series of competitors) and online GIS systems. The third development is community mapping, the ability of map users to change and update the content of online maps. Analogous to editing a website, as implemented through sites like Wikipedia (Wikipedia 2005), Google introduced a similar concept for maps allowing users to enter information (Google Maps 2005). Signs of a similar form of growth in the development of the wireless spatial information delivery are hard to find. As mobile mapping develops, it will have to contend with a more mature development platform in its wired counterpart.
3 Changing patterns of map use It is clear that new forms of map delivery will change how maps are used. The following sections examine these trends.
3.1 NavigationMany people consider the navigation market to be the largest potential market for mobile Internet services. An indicator is the popularity of car navigation systems. These systems are particularly popular in Japan where there are more than 10 million in-stalled units, about 14% of all vehicles (Funk 2005, p. 125). But, these systems remain expensive. One reason for the high cost of car navigation systems, up to $4000, is that few of the components are standard. Most manufacturers use proprietary CPUs, maps, map engines, operating systems, and displays. Competition forces prices up by adding features such as improved displays, more detailed maps, and DVD movie playback.Another trend emerging from Japan is that train, bus and destination-information services are far more successful than map servic-es, the latter of which was expected to form the basis for a mobile Internet navigation service (Funk 2004, p. 132). Users of the des-tination-information services input departure and arrival times and the system responds with information from actual timetables. It is easier to download train information and information on restaurants in text form than to download map information. So, at least in Japan, destination-information and restaurant services have become successful while map services have not (Funk 2004, p. 132). Mobile map services began in Japan in late 1999 (Funk 2004, p. 137). Similar to online maps with PCs, users input an address to generate a map of the site. The providers offer simple maps for free and charge for more detailed maps (about $2.50 a month). The most popular function is sending maps in mail messages by forwarding the URL of the map. Use of these services is far less than

From Internet to Mobile Mapping: Contrasts in Development 13
for the destination information services, probably on the order of only 1% in comparable traffic (Funk 2004, p. 137). Not only are the map services more expensive but the small screen and poor resolution make the maps hard to read. An interesting development in mobile phone mapping in Japan involves the generalization of maps. The small display forces a heavier reliance on landmarks. But, even here, the map provider had to reduce the number of landmarks on the maps because of the available screen space. This reduction in the number of landmarks was too difficult to do manually so the companies relied on an automated system to decide which landmarks could be shown at certain scales. This caused well known landmarks in some areas to be eliminated. Although improved displays will allow more landmarks to be shown, the map provider will have to update the underlying database thus incurring a further cost (Funk 2004, p. 137).
3.2 GPS integrationIt is anticipated that the combination of mobile phones and global positioning systems will be the next major development in mobile mapping. However, the power required by the GPS unit has become a major problem. In vehicle navigation systems, there is suf-ficient power from the car to power the receiver. The power consumption of GPS receiver makes the use of pure GPS with phones more difficult and thus requires some form of “assisted GPS.” In A-GPS, most of the GPS calculations are done at the server level. The receiver, being limited in processing power and normally under less than ideal conditions for position fixing, communicates with the “assistance server” that has higher processing power and access to a reference network of locations (Wikipedia 2005). A-GPS reduces power consumption but drives up communication costs. Current communication charges would mean that if a phone’s location were updated every 5 minutes over an 8 hour period, a charge of over $80 would be incurred (in 2003). A-GPS is also time-consuming, which will also slow the adoption of this technique. It takes approximately 15 seconds to download the GPS data, 15 seconds to send these data to the server and carry out the calculations, and 15 seconds to download the map (Funk 2004, p. 145).By the end of 2005, the US Federal Communications Commission (FCC) will require all cell phone carriers to provide the abil-ity to trace cell phone calls to a location within 100 meters or less. In order to comply with these FCC requirements, most carriers have decided to integrate GPS technology into cell phone handsets, rather than overhaul the tower network that could be used to triangulate the position. Most GPS enabled cell phones do not allow the user direct access to the GPS data. The location data will only be sent if an emergency call is made. As the system is being designed for emergencies, it seems unlikely that such a system will provide continuous GPS information – a requirement for effective mobile mapping.
3.3 People trackingPeople tracking involves the use of a GPS device to track the location and movements of people. Tracking the location of children, or parolees, or even pets, may provide the impetus to provide the necessary GPS and online tracking infrastructure. Several service providers advertise the capability to track a person or an object on a PC screen. Indeed, most commercial trucks are tracked in such a way. Alan Philips of uLocate.com is optimistic about the future of people tracking, saying “Cell phones are becoming multi-pur-pose devices capable of much more than simple voice communication. By leveraging the latest in satellite and wireless technology, uLocate is providing a secure, reliable, service that creates value for families, individuals, and small businesses without any addi-tional overhead, hardware or software” (Directions 2003).Monmonier (2003) examines how mapping is being used to invade privacy. He points out that: “Web cartography is especially valuable—and potentially threatening—because it not only greatly expands the audience of potential watchers (Peterson 2000) but also allows for unprecedented customization of maps that describe local crime patterns, warn of traffic congestion and inclement weather, disclose housing values, or—thanks to the Global Positioning System (GPS) and the new marketplace for “location-based services“—track wayward pets, aging parents, errant teenagers, or unreliable employees” (p. 98). He concludes that: “As society and government work through the significance of locational privacy and decide what legal limitations, if any, are appropriate and permissible, the debate will turn to possible restrictions on Internet cartography…” (p. 111).
4 Mental maps and wayfindingA mistake is often made in thinking that map use occurs at the instant that the user is examining the map. To think this way is to deny that humans have a memory and are able to process information after an object has been removed from view. It can be ar-gued that the majority of map use occurs without a map being present. Our daily movements within our surroundings, indeed, any thought about the spatial world beyond our immediate view, is based on both first-hand experience and the maps we have seen. Although the depictions of the spatial world we keep in our brains are not always accurate, they suffice to help us find our way through our immediate environment and to think about the world beyond. These mental or cognitive maps are the maps that we actually use. They are also the representations that give us the comfortable feeling that we know where we are and how to get to places. Mental maps help us feel “found” in the sense that we are aware of our spatial surroundings. In contemplating the future of Internet maps and mobile mapping, we need to examine how maps influence the internalized representations we form from them, and how they help us interact with the world.
4.1 Mental map formationWhile we don’t know exactly how mental maps form, we do know that they are based both on direct experience with the environ-ment and looking at representations of the environment in the form of maps. The internalization of maps seems to happen without

Michael P Peterson14
conscious awareness because people can recall the outlines of countries and the shapes of continents without intentionally remem-bering to do so. In addition, these shapes are remembered quite early as children can recognize outlines of countries and continents at young ages. It seems that maps have a major impact on the formation of mental maps from a very early age.
4.2 Mental map formation in wayfindingThere seems to be close relationship between the formation of mental maps and the process of wayfinding. While the primary pur-pose of wayfinding is to get to the destination with as little effort as possible, the secondary purpose is to create a mental map of the route, however primitive as first, that will aid in finding the location again without the use of a map. In other words, the purpose of the map in this function is to create a mental construct such that it will be rendered meaningless when the same task is performed again. The map succeeds by becoming useless.
4.3 Creating a permanent dependenceIn contrast, when using a mobile device for wayfinding, the user is directed to a location with minimal mental effort by the user. Because there is little coordination between the map and the environment, the quality of the resultant mental map is compromised. In addition, the depictions presented on the mobile device are too schematic to create a functional mental map of the environment. It is very likely that the user will need to get instructions from the device again for not only the return trip but a future trip to the same location. What the LBS has succeeded in doing is creating a permanent dependence on the device. The LBS device succeeds by becoming indispensable.Being told where you are bypasses the process of finding out where you are and this inhibits the formation of mental maps. Cer-tainly, the process of finding out where you are helps to form a mental map, a mental conception of where you have been and where you need to go. We need to be careful in developing wayfinding tools that we also contribute to the formation of long-term mental maps.
5 ConclusionIt seems that there are major differences in the development of the wired and wireless Internet and these differences will affect how maps and spatial information are delivered to users. The wired Internet was an outgrowth of a government initiative while the wireless Internet is almost totally a commercial enterprise. The commercial aspect of the wireless Internet permeates all aspects of its growth and development.As Kitka et. al. (2005, p. 106) state, the “wireless Internet will most certainly provide society with new experiences and freedom, and unprecedented access to information.” Funk (2004, p. 51) sees that larger “memory, faster processing capability, and greater network speeds are being used to improve the user interface, and it is possible that they can be used to significantly improve the user interface in the future.” Wiberg (2005, p. 344) adds that the “computers of yesterday were about getting things done as quickly as possible, the computer of tomorrow will help us to prolong, sustain and develop the things we care about the most, i.e., our ongo-ing interactions with others.The size of the display remains a concern for the delivery of maps. The most troubling aspect of our dependence on this new tech-nology in cartography is that it may not provide long-lasting spatial information. Rather, the systems will help guide us to a loca-tion without providing the type of long-term information that will help us find that location on our own. Further, this dependence will lead to an uneasy relationship with the world around us – and perhaps the feeling of always being lost. If we are to best use these new technologies, we need to remember that the ultimate purpose of a map is to provide a sense of connection with the world around us.
6 ReferencesComputer Industry Almanac (2005) China Tops Cellular Subscriber Top 15 Ranking. http://www.c-i-a.com/pr0905.htmDirections Magazine (2003). New Service Enables Parents To Pinpoint Kids’ Whereabouts Using Cell Phones. [http://www.directionsmag.com]Funk, Jeffrey L. (2004) Mobile Disruption. Hoboken, New Jersey: John Wiley.Google Maps (2005) [http://maps.google.com/]Hart, Michael S. (1992) History and Philosophy of Gutenberg Project. [http://www.gutenberg.org/about/history]Kay, A., and Goldberg, A. (1977) Personal Dynamic Media. Computer (USA): 31–41.Kikta, Roman, Al Fisher & Michael Courtney (2002) Wireless Internet Crash Course. New York: McGraw-Hill.Monmonier, Mark (2003) The Internet, Cartographic Surveillance, and Locational Privacy. In Peterson, Michael (ed.) Maps and the Internet. Am-
sterdam, Cambridge: Elsevier Press.Nationmaster.com (2002) Mobile Cellular per 100 population. [http://www.nationmaster.com/graph-T/med_mob_pho&int=-1]Rhoton, John ( 2002) The Wireless Internet Explained. Boston: Digital Press.Theall, Donald F. (1971) The Medium Is the Rear View Mirror: Understanding McLuhan. Montreal: McGill-Queens University Press, 1971.University of Texas (2005) Perry-Castaňeda Map Library. [http://www.lib.utexas.edu/maps/]Wikipedia (2005) Wikipedia, the Free Encylopedia. [http://en.wikipedia.org/wiki/Main_Page]
Mobile landscapes: Graz in real time
Carlo Ratti, Andres Sevtsuk, Sonya Huang
AbstractThe technology for determining the geographic location of cellphones and other hand-held devices is becoming increasingly avail-able. It is opening the way to a wide range of applications, collectively referred to as Location Based Services (LBS), that are primarily aimed at individual users. However, if deployed to retrieve aggregated data in cities, LBS could become a powerful tool for urban cartography. This paper describes preliminary results of the “Mobile Landscapes: Graz in Real Time” project, which was developed as part of the M-City exhibition (Graz Kunsthaus, 1 October 2005 – 8 January 2006, curator Marco De Michelis), in collaboration with the cellphone operator A1/Mobilkom Austria. Three types of maps of the urban area of Graz, Austria, were developed and shown in real-time on the exhibition premises: cellphone traffic intensity, traffic migration (handovers) and traces of registered users as they move through the city. Beyond their novelty and visual interest, results seem to open the way to a new paradigm in urban planning: that of the real-time city.
1 IntroductionThe mobile communications industry is booming. Cellphone subscriptions have recorded sustained growth rates in recent years and, according to EITO (2004), reached the astronomic figure of 350 million in Western Europe in 2003 (157 million in the USA). Why should the cartography and urban planning community be interested in this data? First, the widespread deployment of mobile communications, supported by personal handheld electronics, is having a significant impact on urban life. People are changing their social and working habits because of the new technology (Rheingold, 2002). Activities that once required a fixed location and con-nection can now be achieved with higher flexibility, resulting in the users’ ability to act and move more freely (for an analysis in the corporate working domain, see Duffy, 1997). As a consequence, urban dynamics are becoming more complex and require new analysis techniques. Second, and more importantly in this context, data based on the location of mobile devices could potentially become one of the most exciting new sources of information for urban analysis.Locational data are becoming increasingly available and their applications are currently a hot topic in the cellphone industry (see for instance www.lbszone.com). They are generally referred to as Location Based Services (LBS) – value-added services for in-dividuals in the form of new utilities embedded in their personal devices. Examples, both implemented and speculative, include systems providing information about one’s surroundings (nearby restaurants, museums, emergency shelters, and so on); distributed chat lines aimed at allowing people with similar profiles to encounter each other in space, via a kind of technologically augmented serendipity; and ‘digital tapestries’ that attach different types of information to physical spaces (see sections below for detailed references). And yet, surprisingly enough, aggregated locational data have not been used to describe urban systems. Research ef-forts in the area are sparse; the scientific literature mostly ignores themes such as the mapping of the cellphone activity in cities or the visualization of urban metabolism based on handset movements (a notable exceptions are the work of Ahas and Ülar, 2005 and Ratti et al., 2005). How could this be?We try to guess. The first assumption is that scholarly research has been hampered so far by the difficulty of accessing raw data and developing ad-hoc analysis software and systems in partnership with cellphone companies. The second reason could be traced back to the lack of rules for managing these data and to the increasing privacy concerns that are being raised, often resulting into a situ-ation of stall. In this study, the research team has had the opportunity to establish a partnership with the mobile network operator A1/Mobilkom Austria, which has the largest market share in its own country. Thus, a privileged insight into how aggregated data from mobile devices could reveal urban systems was gained. Furthermore, the occasion of the project was developed in the context of a public architecture and art event, the M-City exhibition (Graz Kunsthaus, 1 October 2005 – 8 January 2006, curator Marco De Michelis). Such a premise seemed ideal in order to remove suspicions of possible privacy abuse and openly engage the public in the issues related to locational data and the way they should be used.As the exhibition is in progress, only some preliminary results are presented here. Further analyses will be performed in the coming months. However, results seem to open the way to a new approach to the understanding of urban systems, which we have termed “Mobile Landscapes.” Mobile Landscapes could give new answers to long-standing questions in architecture and urban planning: how to map vehicle origins and destinations? How to understand the patterns of pedestrian movement? How to highlight critical points in the urban infrastructure? What is the relationship between urban forms and flows? And so on. More generally, information and communication technologies, which previously eluded planners with their “invisible, silent” characteristics (Graham and Mar-vin, 1996), are becoming of increasing interest. Studies on user behavior (for example Charlot and Duranton, forthcoming; Hampton

Carlo Ratti, Andres Sevtsuk, Sonya Huang 16
and Wellman, 2000; Gaspar and Glae-ser, 1996) are showing that “electronic communications” and the “metropoli-tan area […] are actually supporting each other” (Graham, 2004). The aim here is to expand upon these methods by integrating a spatial component to visualize telecommunications. Thus, the objectives of our maps are twofold: first, they enable viewers to visualize the city via an otherwise “invisible” feature; second, the maps are animated in a way that can simulate city dynam-ics in real time.In a previous paper (Ratti et al., 2005) we have shown how even simple data such as network traffic have a lot to offer to the urban designer or planner. We will describe here how some more complex types of data can be obtained
to produce real-time urban maps. In particular, three type of data are provided by the mobile network, namely cellphone traffic intensity, traffic migration (handovers) and traces of registered users as they move through the city.
2 The dataMobile communication networks are organized in cells. Each cell has an antenna that covers a certain geographical area (usually circular or pie-shaped) and offers mobile communication services to users at that particular location. In the most-common GSM networks, cell sizes vary from the diameter of about 100-300 meters in urban areas to several kilometres in rural areas. Densely inhabited areas require smaller cell sizes, as the maximum amount of data that can be transferred concurrently in one cell is limited and relates to the radio access technology of the network. Figure 1 shows the basic components of a GSM network and the data flow that was implemented for the Mobile Landscape Graz project. A Mobile Switching Center (MSC) is connected to several Base Station Controllers (BSC). The BSCs control the Base Transceiver Stations (BTS). The Base Transceiver Station houses the radio transceivers that define a cell and handles the radio-link protocols with the Mobile Equipment (ME). The movement of a mobile phone from one cell to another is called ‘handover’.Traffic in the cells of the A1/Mobilkom Austria network is constantly monitored by the Operation and Maintenance division and aggregated performance figures are logged by a Monitoring Server. For the Mobile Landscape Graz project the traffic of all cells in the city of Graz was measured periodically and traffic aggregates where reported at regular intervals to an online database set up by the MIT SENSEable City Laboratory. Traffic intensity of one cell is measured by the number of calls that originate there and by the occupancy of the cell measures in Erlang, a standard unit of measurement of traffic intensity in a telecommunications system (one Erlang is the equivalent of one caller talking for one hour on one telephone or two callers talking for 30 minutes each). Table 1 shows a sample of traffic intensity data, where BSC is the name of the Base Station Controller, FZA is an identification of the Base Transceiver Station, CI is the cell ID, TCH_ATT gives the number of traffic channel attachments including handovers, Erlang gives the occupancy of the cell and CALL_REQ gives the number of originated calls.
int_id PERIOD_START_TIME BSC FZA CI TCH_ATT ERLANG CALL_REQ792903 2005-10-08 05:30:00 Graz_4 G285-1 28516 8 0.13 4793754 2005-10-08 06:30:00 Graz_4 G285-1 28516 8 0.40 3794605 2005-10-08 07:30:00 Graz_4 G285-1 28516 38 0.89 17
Tab. 1: Traffic intensity data sample
Traffic migration is measured by the number of active calls that move from one cell to another and is reported to the SENSEable City Laboratory by giving the number of incoming and outgoing handovers between cell pairs. Table 2 shows a sample of the traffic migration data where the number of inbound and outbound handovers (HO_in, HO_out) are given for source and destination cells (Source_CI, Dest_CI).
int_id PERIOD_START_T Source_BSC Source_FZA Source_CI HO_out HO_in Dest_CI7089747 2005-10-10 10:00:00 Graz_1 G200-2 20026 3 4 582367089746 2005-10-10 10:00:00 Graz_1 G200-2 20026 2 13 431307089745 2005-10-10 10:00:00 Graz_1 G200-2 20026 10 25 43110
Tab. 2: Traffic migration sample data
Fig. 1: Data flow in the project M-City

Mobile landscapes: Graz in real time 17
Traffic intensity and traffic migration are aggregate figures that show in real time where people started their mobile phone calls, how long they talked and where they were moving while talking. The third type of data that was shown on the maps at the M-City exhibition was the movement of individual users. While the measured traffic aggregates collect only data about active phone calls, a cellular network is also able to locate passive mobiles in order to set-up calls towards them. This process is called ‘paging’ and can also be used to request the ID of the cell to which the mobile phone is attached, even if no call is being made. Based on the cell ID, geographical coordinates can be obtained, corresponding to the central point of the GSM cell where the user is attached to the network. Movement tracks can thus be generated by locating the user at regular 5-minute intervals.A note should be made, however, on the treatment of location data. On the one hand they can be of considerable value to informa-tion and communication services. On the other hand, however, they raise privacy issues; users are concerned about revealing their position data to others, especially to un-trusted third party applications. Furthermore, most countries have legal restrictions that regulate processing of personal data and the protection of privacy in electronic communications. It is of utmost importance that the users can control who gets access to their location data and that the transport in the network of such sensitive data is protected by strong security mechanisms. The Mobile Landscape Graz installation pays respect to privacy concerns by giving users full control over the location service. Only volunteers are tracked and they have to subscribe actively to the service by sending a short message (SMS), where they can also provide a pseudonym (nickname) that is shown on the map. If no pseudonym is provided, a random one is generated. The user can stop the location application at any time by simply sending a second SMS to the subscription application. Even if no second SMS is received, the application stops locating users after 24 hours. Location data is sent to the SENSEable City Laboratory via an encrypted connection and it contains only users’ pseudonyms. Table 3 shows a data sample where the geographical coordinates in latitude and longitude are given for several pseudonyms at regular intervals.
nick latitude longitude timestampSabine 47.06354 15.454447 20051009-14:32User940 47.06354 15.454447 20051009-14:32Wort 0.0 0.0 20051009-14:32Nyko 47.05407 15.462827 20051009-14:32OrangeMo 47.10022 15.397057 20051009-14:32User3346 47.09155 15.7262 20051009-14:32
Tab. 3: User movement sample data
3 The real-time mapping systemA common procedure has been developed for all data types presented above (cellphone traffic intensity, traffic migration and traces of registered users as they move through the city) in order to produce real-time maps at the exhibition premises. Records are col-lected live by A1/Mobilkom Austria and sent to an ad-hoc set up server at MIT, where they are stored in an open-source MySQL database. The data is then paired using ArcGIS with spatial information on the city of Graz, generously provided by GIS Steier-mark (www.gis.steiermark.at). Finally, the whole process is animated using Macromedia Flash. A diagram of the process is shown in Figure 2.A note should be made on the proce-dure and on the choice of using Flash. Streaming real-time animations from the MIT SENSEable City Laboratory to the exhibition venue would have been too costly in terms of bandwidth and also unreliable. Flash allowed high compat-ibility interface, running on most Inter-net browsers, and also the transfer of a limited amount of data. In the case of the Erlang map, just a maximum of 24 im-ages were transferred from SENSEable City Laboratory and then animated in Flash. In the case of the two other maps, a Flash algorithm running at the exhibi-tion venue retrieved automatically the data from the MySQL database to cre-ate the required animations, as detailed below. Options other than Flash were tested, but did not prove satisfactory. Adopt-ing ArcGIS to produce the animations
Fig. 2: Data flow from the SENSEable City Laboratory server to the final maps
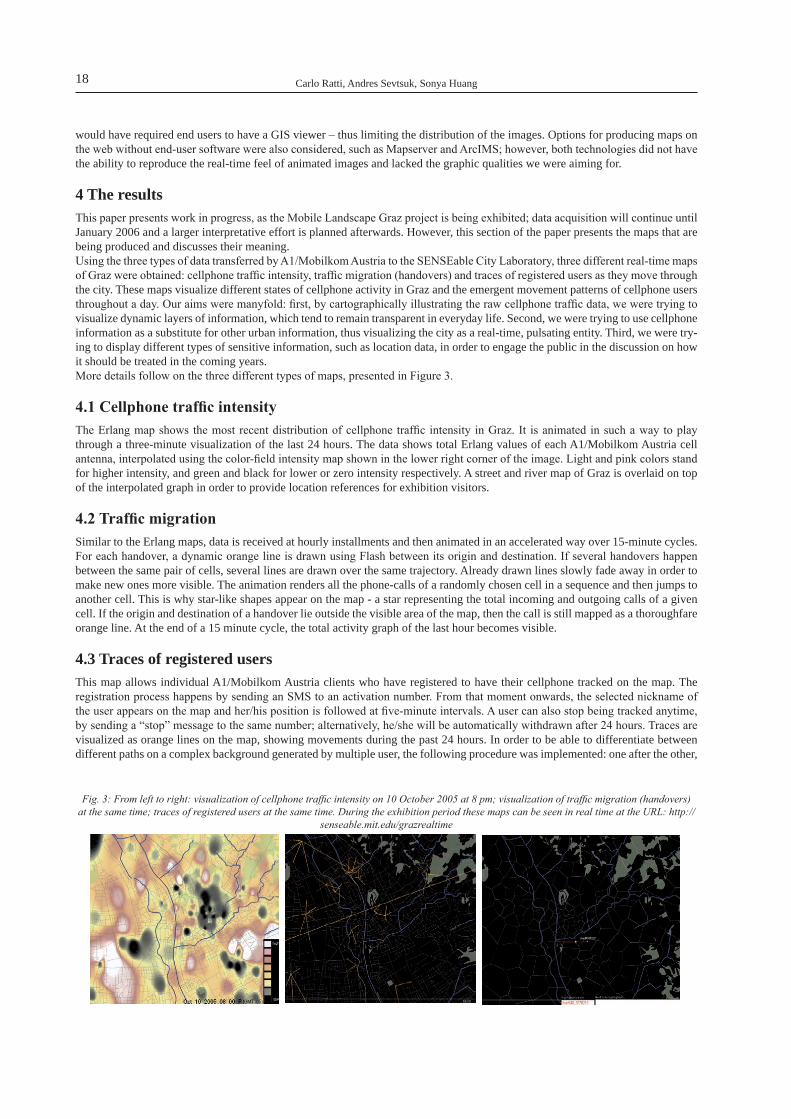
Carlo Ratti, Andres Sevtsuk, Sonya Huang 18
would have required end users to have a GIS viewer – thus limiting the distribution of the images. Options for producing maps on the web without end-user software were also considered, such as Mapserver and ArcIMS; however, both technologies did not have the ability to reproduce the real-time feel of animated images and lacked the graphic qualities we were aiming for.
4 The results This paper presents work in progress, as the Mobile Landscape Graz project is being exhibited; data acquisition will continue until January 2006 and a larger interpretative effort is planned afterwards. However, this section of the paper presents the maps that are being produced and discusses their meaning.Using the three types of data transferred by A1/Mobilkom Austria to the SENSEable City Laboratory, three different real-time maps of Graz were obtained: cellphone traffic intensity, traffic migration (handovers) and traces of registered users as they move through the city. These maps visualize different states of cellphone activity in Graz and the emergent movement patterns of cellphone users throughout a day. Our aims were manyfold: first, by cartographically illustrating the raw cellphone traffic data, we were trying to visualize dynamic layers of information, which tend to remain transparent in everyday life. Second, we were trying to use cellphone information as a substitute for other urban information, thus visualizing the city as a real-time, pulsating entity. Third, we were try-ing to display different types of sensitive information, such as location data, in order to engage the public in the discussion on how it should be treated in the coming years. More details follow on the three different types of maps, presented in Figure 3.
4.1 Cellphone traffic intensityThe Erlang map shows the most recent distribution of cellphone traffic intensity in Graz. It is animated in such a way to play through a three-minute visualization of the last 24 hours. The data shows total Erlang values of each A1/Mobilkom Austria cell antenna, interpolated using the color-field intensity map shown in the lower right corner of the image. Light and pink colors stand for higher intensity, and green and black for lower or zero intensity respectively. A street and river map of Graz is overlaid on top of the interpolated graph in order to provide location references for exhibition visitors.
4.2 Traffic migrationSimilar to the Erlang maps, data is received at hourly installments and then animated in an accelerated way over 15-minute cycles. For each handover, a dynamic orange line is drawn using Flash between its origin and destination. If several handovers happen between the same pair of cells, several lines are drawn over the same trajectory. Already drawn lines slowly fade away in order to make new ones more visible. The animation renders all the phone-calls of a randomly chosen cell in a sequence and then jumps to another cell. This is why star-like shapes appear on the map - a star representing the total incoming and outgoing calls of a given cell. If the origin and destination of a handover lie outside the visible area of the map, then the call is still mapped as a thoroughfare orange line. At the end of a 15 minute cycle, the total activity graph of the last hour becomes visible.
4.3 Traces of registered usersThis map allows individual A1/Mobilkom Austria clients who have registered to have their cellphone tracked on the map. The registration process happens by sending an SMS to an activation number. From that moment onwards, the selected nickname of the user appears on the map and her/his position is followed at five-minute intervals. A user can also stop being tracked anytime, by sending a “stop” message to the same number; alternatively, he/she will be automatically withdrawn after 24 hours. Traces are visualized as orange lines on the map, showing movements during the past 24 hours. In order to be able to differentiate between different paths on a complex background generated by multiple user, the following procedure was implemented: one after the other,
Fig. 3: From left to right: visualization of cellphone traffic intensity on 10 October 2005 at 8 pm; visualization of traffic migration (handovers) at the same time; traces of registered users at the same time. During the exhibition period these maps can be seen in real time at the URL: http://
senseable.mit.edu/grazrealtime

Mobile landscapes: Graz in real time 19
paths are highlighted in red and scanned by a white ball which replays the past 24 hours, while the nickname of the corresponding user is shown on the lower left corner of the screen.
4.4 DiscussionThe maps produced in partnership between A1/Mobilkom Austria and the SENSEable City Laboratory proved to be successful in visualizing the city of Graz in almost real time. This proof of concept seemed quite important, as no similar precedents based on cellphone mapping are found in the scientific literature. The work also managed to capture wide interest at the exhibition in the Kunsthaus Graz as well as on-line and in the press (some of the published articles and discussion can be found at the URL: http://senseable.mit.edu). Visitors in Graz seemed highly interested in seeing their home-town represented in a new, intangible way and were keen on testing the tracking system to follow their own or their friends’ traces. Many reviews on the project also confirmed both the lack and necessity of such cartography to add to our urban knowledge.The public appearance of the project also brought up many discussions about privacy concerns. Even if they were not so extreme as the ‘Geoslavery’ fears voiced by Dobson (2003), before the official opening of the exhibition ‘big brotherish’ comments appeared amongst participants and in the media. However, as privacy procedures were thoroughly respected at every step of the project and individual tracking could only happen on a voluntary basis, none of these points became detrimental. Conversely, they contributed in a certain sense to one of the aims of the project: presenting this new type of sensitive information in order to prompt a discussion on how it should be used. Practical application for the analysis of the data will be discussed once the exhibition is over. In a previous paper (Ratti et al., 2005), we have shown that even simple cellphone traffic analysis can contribute exceptionally to urban analyses. More generally, there seems to be a large gamut of interests, ranging from the enrichment of people’s understanding about urban communications to the unprecedented collection of real-time data about cities (see William Mitchell’s (2005) review of the Mobile Landscape Graz project, ‘The Real Time City’).Finally, it is worth mentioning some limitations of our process. First, as mentioned above, the accuracy of phone call and user loca-tions are estimated using the latitude and longitude coordinates of cells. This means that the larger the diameter of the cell, the less accurately we can determine the user’s exact position. Furthermore, users that are roughly equidistant between two cell antennae may have their signals picked up by either of them, sometimes even bouncing between cells. The bouncing phenomenon can be observed on our traces map: sometimes static users appear to move back and forth repeatedly between neighboring antennae. Finally, the Flash software lacks ArcGIS’s precision to convert geographical coordinates to pixel-based screen coordinates. Al-though we kept data in ArcGIS for as much of the procedure as possible, the final representation in Flash introduces some distortion in the mapping. This was acceptable in the context of the exhibition, but might require a different treatment in future quantitative analyses. A last note on the notion of ‘real time’: while data were collected instantly by the network operator, their transfer to the SENSEable City Lab server was aggregated at 5-minute to 1-hour intervals. This was done to optimize bandwith and processing power, though the same system that was set up could theoretically withstand second-long (or less) frequencies.
5 Conclusions This paper reports on the Mobile Landscape Graz project, developed by the MIT SENSEable City Laboratory in collaboration with A1/Mobilkom Austria as part of the M-City exhibition (Graz Kunsthaus, 1 October 2005 – 8 January 2006, curator Marco De Mi-chelis). The different types of data (section 2), the procedure set up to transfer them in real time (section 3) and the resulting maps (section 4) are described above and commented. While a larger interpretative effort is planned after the completion of the exhibi-tion, preliminary results suggest that the mapping of cellphone data could open unprecedented perspectives in urban cartography and lead to a new urban paradigm: that of the real time city.
6 AcknowledgementsFirst, we would like to thank all of the SENSEable Graz team: Daniel Berry, Daniel Gutierrez, David Lee, Xiongjiu Liao, Jia Lou, Andrea Mattiello, Eugenio Morello. They are the ones who made this project happen! Acknowledgements go to ‘M-City’ curator Marco de Michelis and all of the people at the Graz Kunsthaus (in particular, Peter Pakesch, Sabine Suppan and Katrin Bucher). Also, the project would not have been possible without the generous support of A1/Mobilkom Austria, who provided us with the data and worked closely with our team. Their continuing involvement, that extends till the phase of writing this paper, proves their farsighted commitment to academic discovery and policy-making. Finally, the results reported in this paper are part of a broader research effort on the use of new technologies to describe cities. We are indebted to many people at the Massachusetts Institute of Technology, Cambridge, MA, for providing an extremely stimulating research environment and for their generous feedback; amongst others: Eran Ben-Joseph, Joseph Ferreira, Dennis Frenchman, Hiroshi Ishii, Frank Levy, William Mitchell, George Stiny, and Lawrence Vale. Janet Owers, based in the ‘real’ Cambridge (UK), provided expert editorial guidance. Of course, any shortcom-ings are our sole responsibility.

Carlo Ratti, Andres Sevtsuk, Sonya Huang 20
7 ReferencesAhas R., Ülar M., 2005, “Location based services—new challenges for planning and public administration?”, Futures, 37:6 547-561Charlot S., Duranton G., 2005, “Cities and workplace communication: Some French Evidence”, Urban Studies (forthcoming)Dobson J, Fisher P, 2003, “Geoslavery”, IEEE Technology and Society 22 (1), 47-53Duffy F., 1997, The New Office, (Conran Octopus, London)EITO, 2004, Report by the European Information Technology Observatory EITO http://www.eito.com/index-eito.htmlGaspar J., Glaeser E.L., 1996, Information Technology and the Future of Cities, NBER Working Paper No. W5562 (May 1996)Graham S., 2004, “Beyond the Dazzling Light: From Dreams of Transcendence to the ‘Remediation’ of Urban Life”, New Media and Society, 6
33-42.Graham S., Marvin S., 1996, Telecommunications and the City: Electronic Spaces, Urban Places, London (Routledge)Hampton K.N., Wellman B., 2000, “Examining Community in the Digital Neighborhood: Early Results from Canada’s Wired Suburb”, Lecture
Notes in Computer Science, 1765 194-208Mitchell W., 2005, “The Real Time City”, Domus, October 2005, 885 94-99Ratti C., Pulselli R. M., Williams S., Frenchman D., 2005, “Mobile Landscapes”, Environment and Planning B – Planning and Design, forthcom-
ing.Rheingold H., 2002, Smart Mobs: The Next Social Revolution, Perseus Books Group (Cambridge, MA)Sevtsuk A., Ratti C., 2005, “iSPOT: describing the use of space on the MIT campus through the analysis of WiFi networks”, Proceedings of CU-
PUM ’05: The Ninth International Conference on Computers in Urban Planning and Urban Management, London, 29 June – 1 July 2005

Design constraints on operational LBS
Jonathan Raper
1 IntroductionDelivering fully operational location-based services (LBS) is proving to be a difficult task. Only a small number of LBS are opera-tional and revenue earning in 2005 if we define LBS as fully location-aware applications delivering services through client-server or peer to peer architectures over wireless, cellular and satellite communication networks. In one sense this is surprising given the huge interest in LBS, in another sense it seems that LBS are simply following a well worn path through the ‘hype cycle’ (Gartner 2005). In 2003-4 LBS were passing through the ‘peak of inflated expectations’, while in 2005 they are in the ‘Trough of disillu-sionment’. If LBS are to progress up the ‘Slope of enlightenment’ to the ‘Plateau of productivity’ an assessment is needed of what is needed for LBS to succeed.This paper is focussed on what the experiences of research and development into LBS have told us about the design constraints on operational LBS. This work is going on in a range of disconnected communities e.g. ubiquitous computing, mobile (geo)web ser-vices, geopositioning, telecartography, mobile HCI and personal navigation to name just a few, and few researchers have attempted a synthesis (Lopez 2004). This paper tries to assess what is now known with confidence about LBS design, in order to encourage convergence and greater cooperation between the various players in the chain of LBS relationships required to make these systems work (LBS value chain, figure 1).Finally, specifying definitions is important in a rapidly developing field. The assumption is adopted here that the following are not LBS within the richer sense defined here:
- autonomous clients with positioning, locally stored content and limited network updates (e.g. in-car navigation tool with traffic updates)
- mobile devices with low resolution geopositioning delivered by mobile telephony such as cell global identity, and simple tiled service scopes, such that the relationship between location and scope is weak (e.g. where’s my nearest functions on GPRS equipped phones)
This assumption exposes the author’s view that LBS must be able to self-customise their services, based upon high resolution physical location and semantically rich location context, and that this is the definitive core functionality of LBS. This is not to say that web and WAP delivered geographic information is not valuable in itself, merely to emphasise the distinction between Google Local directions on a mobile device and an application like workoutgps.
2 Two LBS that workLBS are a class of applications where there is a definitive design benefit from actually fully implementing the system in a real environment. Since LBS are distributed, componentised and dependent on a range of associated services such as positioning in-put, many LBS as designed would not perform acceptably in practice. There is a natural tendency of designers to expect software (re)engineering to solve these performance issues. However, in LBS the performance issues can only be solved by compromises on data models, positional update and user interfaces once the system as a whole can be evaluated in use. This means that effec-tive design requires many cycles of (sometimes comprehensive) redesign in close communication with users, preferably involving
Fig. 1 LBS value chain (courtesy of C. de la Fuente)
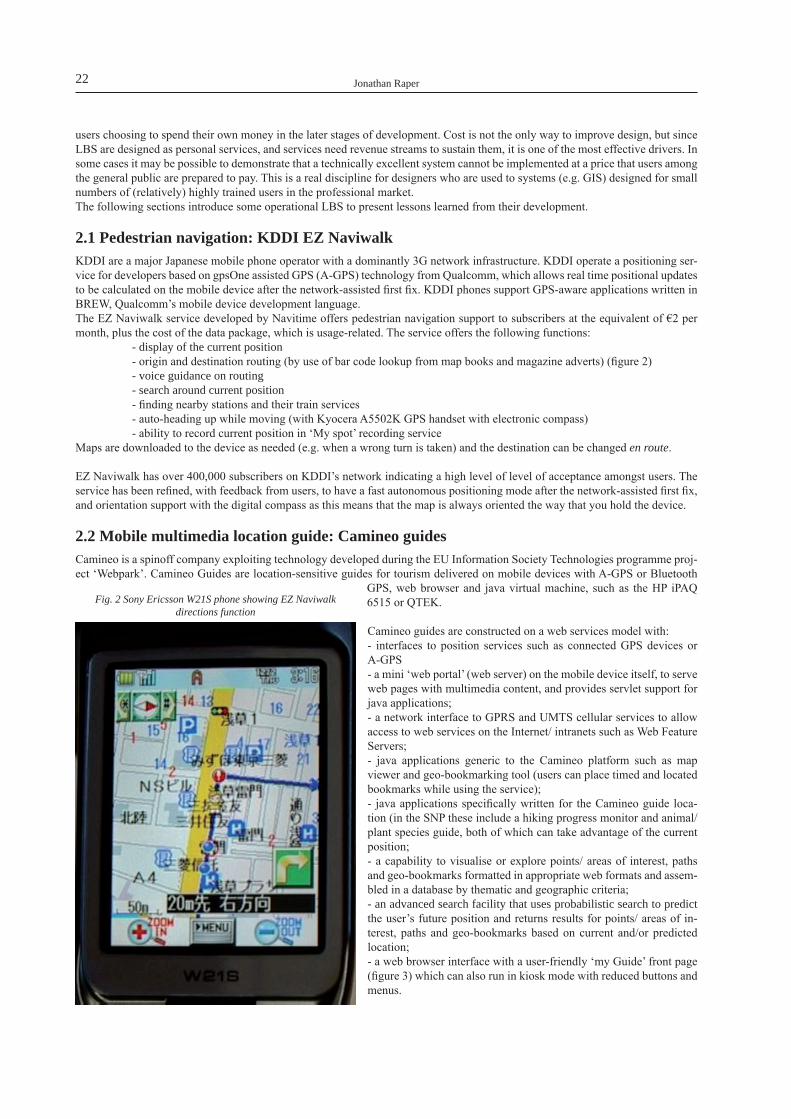
Jonathan Raper22
users choosing to spend their own money in the later stages of development. Cost is not the only way to improve design, but since LBS are designed as personal services, and services need revenue streams to sustain them, it is one of the most effective drivers. In some cases it may be possible to demonstrate that a technically excellent system cannot be implemented at a price that users among the general public are prepared to pay. This is a real discipline for designers who are used to systems (e.g. GIS) designed for small numbers of (relatively) highly trained users in the professional market.The following sections introduce some operational LBS to present lessons learned from their development.
2.1 Pedestrian navigation: KDDI EZ NaviwalkKDDI are a major Japanese mobile phone operator with a dominantly 3G network infrastructure. KDDI operate a positioning ser-vice for developers based on gpsOne assisted GPS (A-GPS) technology from Qualcomm, which allows real time positional updates to be calculated on the mobile device after the network-assisted first fix. KDDI phones support GPS-aware applications written in BREW, Qualcomm’s mobile device development language. The EZ Naviwalk service developed by Navitime offers pedestrian navigation support to subscribers at the equivalent of €2 per month, plus the cost of the data package, which is usage-related. The service offers the following functions:
- display of the current position- origin and destination routing (by use of bar code lookup from map books and magazine adverts) (figure 2)- voice guidance on routing- search around current position- finding nearby stations and their train services- auto-heading up while moving (with Kyocera A5502K GPS handset with electronic compass)- ability to record current position in ‘My spot’ recording service
Maps are downloaded to the device as needed (e.g. when a wrong turn is taken) and the destination can be changed en route.
EZ Naviwalk has over 400,000 subscribers on KDDI’s network indicating a high level of level of acceptance amongst users. The service has been refined, with feedback from users, to have a fast autonomous positioning mode after the network-assisted first fix, and orientation support with the digital compass as this means that the map is always oriented the way that you hold the device.
2.2 Mobile multimedia location guide: Camineo guidesCamineo is a spinoff company exploiting technology developed during the EU Information Society Technologies programme proj-ect ‘Webpark’. Camineo Guides are location-sensitive guides for tourism delivered on mobile devices with A-GPS or Bluetooth
GPS, web browser and java virtual machine, such as the HP iPAQ 6515 or QTEK.
Camineo guides are constructed on a web services model with:- interfaces to position services such as connected GPS devices or A-GPS- a mini ‘web portal’ (web server) on the mobile device itself, to serve web pages with multimedia content, and provides servlet support for java applications;- a network interface to GPRS and UMTS cellular services to allow access to web services on the Internet/ intranets such as Web Feature Servers;- java applications generic to the Camineo platform such as map viewer and geo-bookmarking tool (users can place timed and located bookmarks while using the service);- java applications specifically written for the Camineo guide loca-tion (in the SNP these include a hiking progress monitor and animal/ plant species guide, both of which can take advantage of the current position;- a capability to visualise or explore points/ areas of interest, paths and geo-bookmarks formatted in appropriate web formats and assem-bled in a database by thematic and geographic criteria;- an advanced search facility that uses probabilistic search to predict the user’s future position and returns results for points/ areas of in-terest, paths and geo-bookmarks based on current and/or predicted location;- a web browser interface with a user-friendly ‘my Guide’ front page (figure 3) which can also run in kiosk mode with reduced buttons and menus.
Fig. 2 Sony Ericsson W21S phone showing EZ Naviwalk directions function
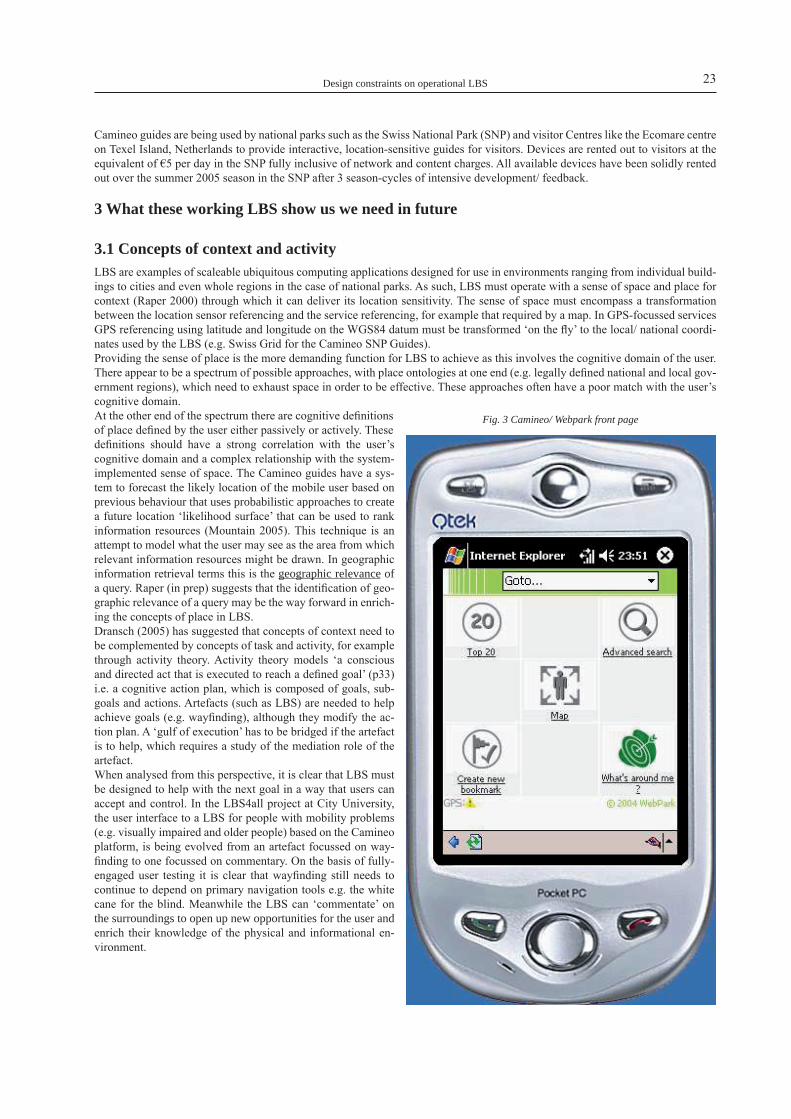
Design constraints on operational LBS 23
Camineo guides are being used by national parks such as the Swiss National Park (SNP) and visitor Centres like the Ecomare centre on Texel Island, Netherlands to provide interactive, location-sensitive guides for visitors. Devices are rented out to visitors at the equivalent of €5 per day in the SNP fully inclusive of network and content charges. All available devices have been solidly rented out over the summer 2005 season in the SNP after 3 season-cycles of intensive development/ feedback.
3 What these working LBS show us we need in future
3.1 Concepts of context and activityLBS are examples of scaleable ubiquitous computing applications designed for use in environments ranging from individual build-ings to cities and even whole regions in the case of national parks. As such, LBS must operate with a sense of space and place for context (Raper 2000) through which it can deliver its location sensitivity. The sense of space must encompass a transformation between the location sensor referencing and the service referencing, for example that required by a map. In GPS-focussed services GPS referencing using latitude and longitude on the WGS84 datum must be transformed ‘on the fly’ to the local/ national coordi-nates used by the LBS (e.g. Swiss Grid for the Camineo SNP Guides).Providing the sense of place is the more demanding function for LBS to achieve as this involves the cognitive domain of the user. There appear to be a spectrum of possible approaches, with place ontologies at one end (e.g. legally defined national and local gov-ernment regions), which need to exhaust space in order to be effective. These approaches often have a poor match with the user’s cognitive domain.At the other end of the spectrum there are cognitive definitions of place defined by the user either passively or actively. These definitions should have a strong correlation with the user’s cognitive domain and a complex relationship with the system-implemented sense of space. The Camineo guides have a sys-tem to forecast the likely location of the mobile user based on previous behaviour that uses probabilistic approaches to create a future location ‘likelihood surface’ that can be used to rank information resources (Mountain 2005). This technique is an attempt to model what the user may see as the area from which relevant information resources might be drawn. In geographic information retrieval terms this is the geographic relevance of a query. Raper (in prep) suggests that the identification of geo-graphic relevance of a query may be the way forward in enrich-ing the concepts of place in LBS.Dransch (2005) has suggested that concepts of context need to be complemented by concepts of task and activity, for example through activity theory. Activity theory models ‘a conscious and directed act that is executed to reach a defined goal’ (p33) i.e. a cognitive action plan, which is composed of goals, sub-goals and actions. Artefacts (such as LBS) are needed to help achieve goals (e.g. wayfinding), although they modify the ac-tion plan. A ‘gulf of execution’ has to be bridged if the artefact is to help, which requires a study of the mediation role of the artefact.When analysed from this perspective, it is clear that LBS must be designed to help with the next goal in a way that users can accept and control. In the LBS4all project at City University, the user interface to a LBS for people with mobility problems (e.g. visually impaired and older people) based on the Camineo platform, is being evolved from an artefact focussed on way-finding to one focussed on commentary. On the basis of fully-engaged user testing it is clear that wayfinding still needs to continue to depend on primary navigation tools e.g. the white cane for the blind. Meanwhile the LBS can ‘commentate’ on the surroundings to open up new opportunities for the user and enrich their knowledge of the physical and informational en-vironment.
Fig. 3 Camineo/ Webpark front page
Jonathan Raper24
3.2 Context architecturesConcepts of context and activity need to be operationalised for rich LBS applications. Reichenbacher (2003) has defined (comput-able) context as a function of the following functions and attributes:
- user (user profile, identity, privacy)- technology (device capabilities, network, transport protocol)- activities (the locating, navigating, searching, identifying tools)- location (mobile positioning, geocoding)- time (system time, real time)- information (sources available via WMS, WFS, gazeteers)- interface (map/ information presentation format).
This context can be defined and maintained using these functions and attributes, although as yet we know little about how to char-acterise some of them (e.g. privacy) or how they should be combined and traded off (e.g. rich services in poor network environ-ments.
José, Moreira et al. (2003) defined the AROUND context architecture to enable the discovery of LBS on the Internet through prox-imity models based on distance and service scope (where the service scope is the location context). Location contexts for service scope can be aggregated using spatial semantics, resulting in a graph structure. AROUND supports:- containment, with many to many relationship allowed between contexts.- adjacency, allowing contexts to find their neighbours, or to support pre-fetching to allow rapid context changes. The AROUND architecture is implemented as a relation between current ‘base’ context and metrically or semantically close contexts mediated by a name service to resolve global location context names into references to specific AROUND servers at which they can be accessed using CORBA protocols.
An AROUND city guide client was implemented in java for a connected mobile device, operating in push mode as the user moved through the contexts as part of the Hypergeo project (a precursor project to Webpark). The chief challenges such architectures pose are the creation, maintenance and semantic relations of contexts in a service context with no relevant standards and poor scalability and security to build on. In the development of EZ Naviwalk the context can be based on distance or service scope (e.g. railway stations), although the cognitive domain is not complex.
3.3 Positional fusion and rationalisationA wide range of sensor technologies, each with their own specific error characteristics, can provide geopositioning for LBS. Rizos (2005) divided the technologies into those that require additional installed infrastructure (such as WLAN/ UWB/ Bluetooth/ RFID technologies), those that can be delivered with existing mobile telephony infrastructures, and those ubiquitous positioning tech-nologies such as GNSS and intertial navigation / dead reckoning systems. Only the latter (specifically GPS and A-GPS) currently provide the combination of service availability and accuracy that has been sufficient to offer geopositioning to revenue earning LBS beyond the simplest ‘where’s my nearest’ services.Hightower (2002) note that ‘...each ubiquitous computing system typically treats (location) data in its own idiosyncratic manner’ (p22) and that there are lots of new location determination technologies available. This implies that location sensor (data) fusion is likely to become important. Solutions will either be:(a) rigid vendor-integrated systems for specific applications, or(b) robust software abstractions connecting multiple sensing technologies and multiple applications
To achieve the latter Hightower (2002) and Graumann (2003) proposed the ‘Location Stack’, modelled on 7-layer OSI networking model, with the following layers (from bottom up):- sensors, exporting raw data values- measurements, raw sensor data plus uncertainty related to the sensing technology- fusion, of measurements, definition of geodetic frame- arrangements, reasoning about location information produced- contextual fusion, merging location and non-location data e.g. states- activities, relating location to semantic states- intentions, cognitive desires of users
To date, most LBS have been implemented using single geopositioning solutions to avoid the need to deal with location sensor (data) fusion. The challenges of integration of GNSS and intertial navigation (IN)/ dead reckoning (DR) systems in particular pose significant problems, since there are significant non-linearities and latencies involved in fusing geopositioning derived from time (GNSS) wwith those derived from space (IN/DR) methods.
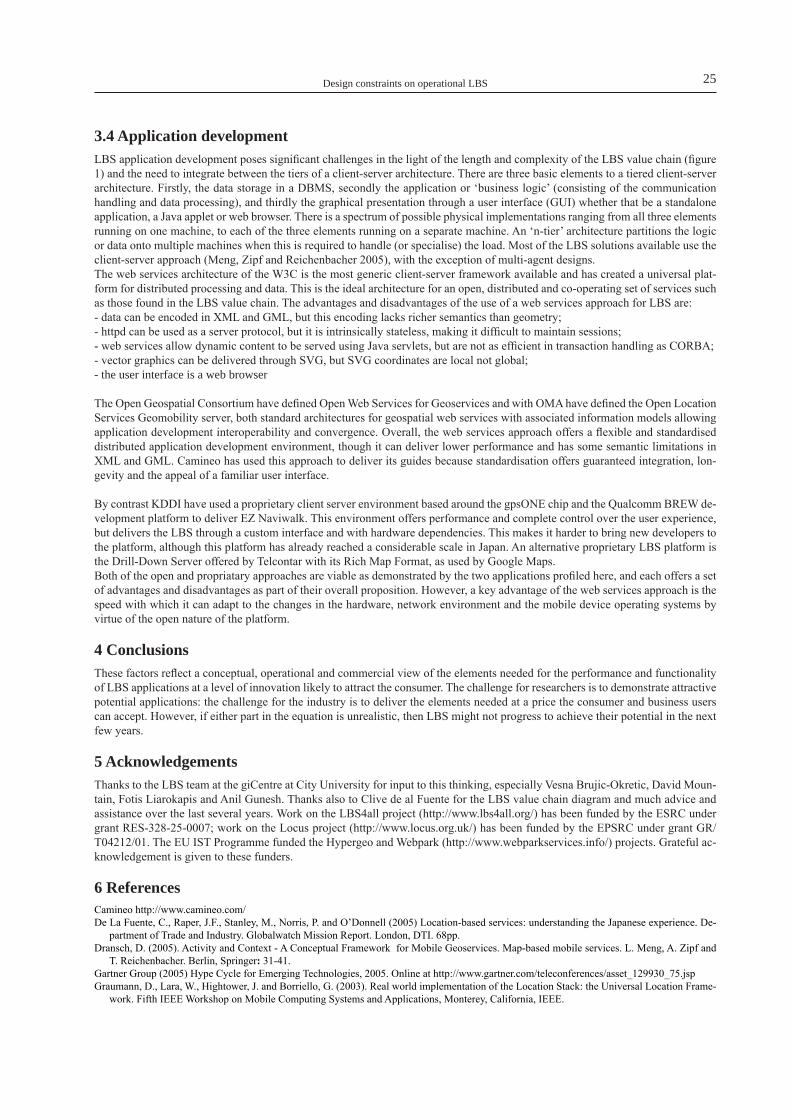
Design constraints on operational LBS 25
3.4 Application developmentLBS application development poses significant challenges in the light of the length and complexity of the LBS value chain (figure 1) and the need to integrate between the tiers of a client-server architecture. There are three basic elements to a tiered client-server architecture. Firstly, the data storage in a DBMS, secondly the application or ‘business logic’ (consisting of the communication handling and data processing), and thirdly the graphical presentation through a user interface (GUI) whether that be a standalone application, a Java applet or web browser. There is a spectrum of possible physical implementations ranging from all three elements running on one machine, to each of the three elements running on a separate machine. An ‘n-tier’ architecture partitions the logic or data onto multiple machines when this is required to handle (or specialise) the load. Most of the LBS solutions available use the client-server approach (Meng, Zipf and Reichenbacher 2005), with the exception of multi-agent designs.The web services architecture of the W3C is the most generic client-server framework available and has created a universal plat-form for distributed processing and data. This is the ideal architecture for an open, distributed and co-operating set of services such as those found in the LBS value chain. The advantages and disadvantages of the use of a web services approach for LBS are:- data can be encoded in XML and GML, but this encoding lacks richer semantics than geometry;- httpd can be used as a server protocol, but it is intrinsically stateless, making it difficult to maintain sessions;- web services allow dynamic content to be served using Java servlets, but are not as efficient in transaction handling as CORBA;- vector graphics can be delivered through SVG, but SVG coordinates are local not global;- the user interface is a web browser
The Open Geospatial Consortium have defined Open Web Services for Geoservices and with OMA have defined the Open Location Services Geomobility server, both standard architectures for geospatial web services with associated information models allowing application development interoperability and convergence. Overall, the web services approach offers a flexible and standardised distributed application development environment, though it can deliver lower performance and has some semantic limitations in XML and GML. Camineo has used this approach to deliver its guides because standardisation offers guaranteed integration, lon-gevity and the appeal of a familiar user interface.
By contrast KDDI have used a proprietary client server environment based around the gpsONE chip and the Qualcomm BREW de-velopment platform to deliver EZ Naviwalk. This environment offers performance and complete control over the user experience, but delivers the LBS through a custom interface and with hardware dependencies. This makes it harder to bring new developers to the platform, although this platform has already reached a considerable scale in Japan. An alternative proprietary LBS platform is the Drill-Down Server offered by Telcontar with its Rich Map Format, as used by Google Maps.Both of the open and propriatary approaches are viable as demonstrated by the two applications profiled here, and each offers a set of advantages and disadvantages as part of their overall proposition. However, a key advantage of the web services approach is the speed with which it can adapt to the changes in the hardware, network environment and the mobile device operating systems by virtue of the open nature of the platform.
4 ConclusionsThese factors reflect a conceptual, operational and commercial view of the elements needed for the performance and functionality of LBS applications at a level of innovation likely to attract the consumer. The challenge for researchers is to demonstrate attractive potential applications: the challenge for the industry is to deliver the elements needed at a price the consumer and business users can accept. However, if either part in the equation is unrealistic, then LBS might not progress to achieve their potential in the next few years.
5 AcknowledgementsThanks to the LBS team at the giCentre at City University for input to this thinking, especially Vesna Brujic-Okretic, David Moun-tain, Fotis Liarokapis and Anil Gunesh. Thanks also to Clive de al Fuente for the LBS value chain diagram and much advice and assistance over the last several years. Work on the LBS4all project (http://www.lbs4all.org/) has been funded by the ESRC under grant RES-328-25-0007; work on the Locus project (http://www.locus.org.uk/) has been funded by the EPSRC under grant GR/T04212/01. The EU IST Programme funded the Hypergeo and Webpark (http://www.webparkservices.info/) projects. Grateful ac-knowledgement is given to these funders.
6 ReferencesCamineo http://www.camineo.com/De La Fuente, C., Raper, J.F., Stanley, M., Norris, P. and O’Donnell (2005) Location-based services: understanding the Japanese experience. De-
partment of Trade and Industry. Globalwatch Mission Report. London, DTI. 68pp.Dransch, D. (2005). Activity and Context - A Conceptual Framework for Mobile Geoservices. Map-based mobile services. L. Meng, A. Zipf and
T. Reichenbacher. Berlin, Springer: 31-41. Gartner Group (2005) Hype Cycle for Emerging Technologies, 2005. Online at http://www.gartner.com/teleconferences/asset_129930_75.jspGraumann, D., Lara, W., Hightower, J. and Borriello, G. (2003). Real world implementation of the Location Stack: the Universal Location Frame-
work. Fifth IEEE Workshop on Mobile Computing Systems and Applications, Monterey, California, IEEE.

Jonathan Raper26
Hightower, J., Brumitt, B. and Borriello, G. (2002). The location stack: a layered model for location in ubiquitous computing. Fourth IEEE Work-shop on Mobile Computing Systems and Applications, New York, USA, IEEE.
José, R., A. Moreira, et al. (2003). “The AROUND Architecture for Dynamic Location-Based Services.” Mobile Networks and Applications 8(4): 377-387.
KDDI http://www.kddi.com/english/corporate/news_release/2003/1006/attachment.htmlLopez, X. (2004). Location-based services. Telegeoinformatics: location-based computing and services. H. Karimi and A. Hammad. Boca Raton,
FA, USA, CRC Press: 171-188.Meng, L., A. Zipf, et al. (2005). Map-based mobile services. Berlin, Springer.Mountain, D. (2005). Visualizing, querying and summarizing individual spatio-temporal behaviour. Exploring Geovisualization. J. Dykes, M.-J.
Kraak and A. MacEachren. London, Elsevier.Raper, J.F. (2000) Multidimensional geographic information science. London: Taylor and Francis.Raper, J.F. (in prep) Geographic relevance.Reichenbacher, T. (2003). Adaptive methods for mobile cartography. Proceedings of the 21st International Cartographic Conference, Durban, South
Africa, International Cartographic Association.Rizos, C. (2005). Trends in geopositioning for LBS, navigation and mapping. 4th International Symposium & Exhibition on Geoinformation 2005,
Penang, Malaysia.WorkoutGPS http://www.workoutgps.com/

LBS in year 2005 – A reality check
Markus Uhlirz
AbstractThis paper gives an overview of the market situation for commercial LBS offerings as of Year 2005. A short discussion of the nature of LBS and its competitors leads to selection criteria for suitable LBS applications, possible reasons for failure and their critical success factors.
1 IntroductionIn the absence of a universally accepted definition, the term “Location-Based Services” (LBS) shall be understood within the con-text of this paper as location-sensitive and location-aware service delivered to users by means of a public mobile telecommunica-tion system.Ever since 1997, Location-Based Services have been advertised and promoted as one of the “killer applications” for 3rd generation telecom networks. In fact, until today LBS has seen many false starts and even falser prophecies concerning its immediate future. As many other buzz-words, LBS has gone up and down the Telecom “hype curve” and has been surpassed by other hypes and buzz-words that have reached a certain level of commercial importance, however moderate it may be. In contrast, LBS has remained at marginal user acceptance for the last two years, not progressing noticeably.
2 Market trendsIn the last years, market analysts and forecasts have been overly optimistic in estimating commercial importance and user accep-tance levels of LBS. There has been a significant political pressure and the push to introduce LBS to the market in the “E-911” requirement in USA (2000/01), but industry has responded reluctantly in fulfilling these requirements. Today, E-911 is still imple-mented only partially in various degrees of completion.The supplier companies have re-focussed their attention from broad consumer market to the Corporate world, now providing spe-cialized, tailored applications to a less price-sensitive audience. This move re-positions LBS from a mass-market product to a niche solution. Here it certainly has found its place and will continue to exist for a good while.
Many of the anticipated mass-market applications envisioned in the late 90’s have not materialized or have been withdrawn from the market. Winners of this development are manufacturers of internet-based mapping (Google maps, MapQuest etc.) and portable mapping solutions, which are becoming commodity and a standard equipment also for cars in the Compact Class and medium price band (TomTom, Navigon etc.) Losers of this development are telecom carriers with own products and providers of purely telecom-
based positioning systems. The learnings of the LBS story has been late, but the message is now clearly understood: Location infor-mation is an Enabler technology, but not a sellable service in itself. Location information is only valuable (hence sellable), if bundled with a service requested and desired by the user.Location information can very well be used to filter the relevant info elements from e.g. a comprehensive response to a Google query. This will immediately add value for the user by making the search results more relevant to his current situation. This is also a sellable item.As a “Reality Check” in Year 2005, the current situa-tion shows following trends:- Do it Cheap!: Industry consensus to provide loca-tion information, but not at any costs. A cheap solu-tion seems to satisfy most of current needs and re-
Fig. 1: Hype Cycle for Telecommunications, 2005
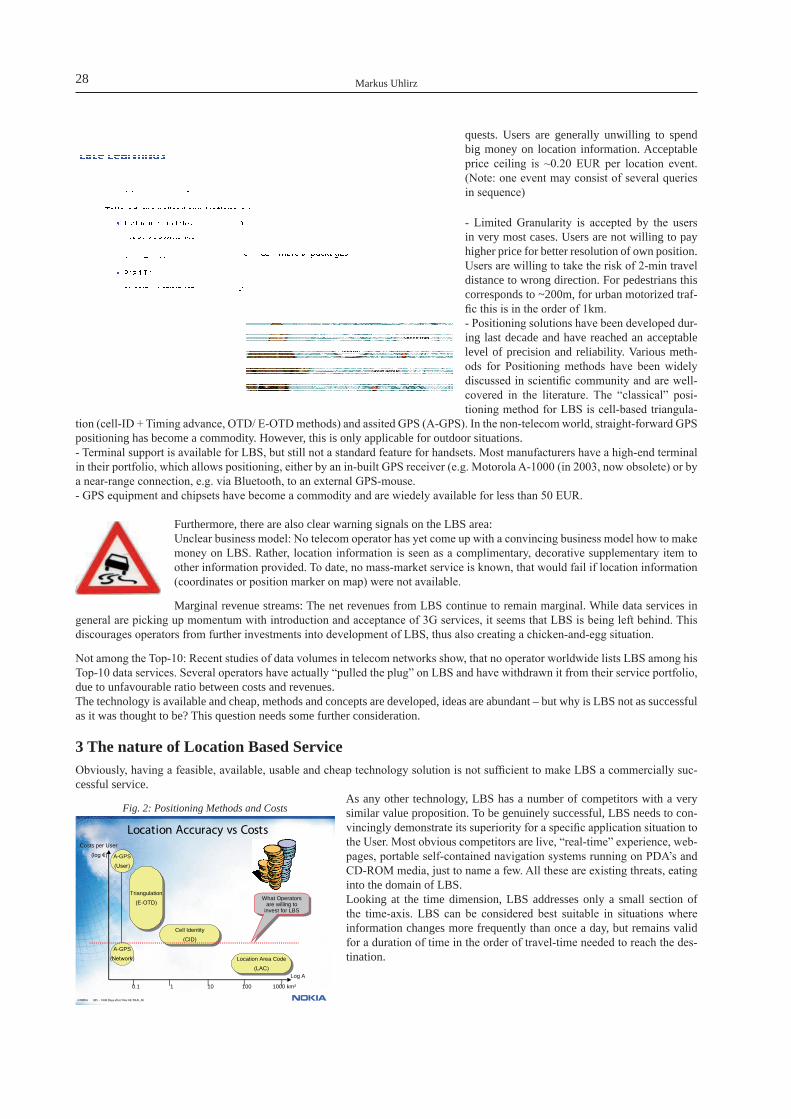
Markus Uhlirz28
quests. Users are generally unwilling to spend big money on location information. Acceptable price ceiling is ~0.20 EUR per location event. (Note: one event may consist of several queries in sequence)
- Limited Granularity is accepted by the users in very most cases. Users are not willing to pay higher price for better resolution of own position. Users are willing to take the risk of 2-min travel distance to wrong direction. For pedestrians this corresponds to ~200m, for urban motorized traf-fic this is in the order of 1km.- Positioning solutions have been developed dur-ing last decade and have reached an acceptable level of precision and reliability. Various meth-ods for Positioning methods have been widely discussed in scientific community and are well-covered in the literature. The “classical” posi-tioning method for LBS is cell-based triangula-
tion (cell-ID + Timing advance, OTD/ E-OTD methods) and assited GPS (A-GPS). In the non-telecom world, straight-forward GPS positioning has become a commodity. However, this is only applicable for outdoor situations.- Terminal support is available for LBS, but still not a standard feature for handsets. Most manufacturers have a high-end terminal in their portfolio, which allows positioning, either by an in-built GPS receiver (e.g. Motorola A-1000 (in 2003, now obsolete) or by a near-range connection, e.g. via Bluetooth, to an external GPS-mouse.- GPS equipment and chipsets have become a commodity and are wiedely available for less than 50 EUR.
Furthermore, there are also clear warning signals on the LBS area:Unclear business model: No telecom operator has yet come up with a convincing business model how to make money on LBS. Rather, location information is seen as a complimentary, decorative supplementary item to other information provided. To date, no mass-market service is known, that would fail if location information (coordinates or position marker on map) were not available.
Marginal revenue streams: The net revenues from LBS continue to remain marginal. While data services in general are picking up momentum with introduction and acceptance of 3G services, it seems that LBS is being left behind. This discourages operators from further investments into development of LBS, thus also creating a chicken-and-egg situation.
Not among the Top-10: Recent studies of data volumes in telecom networks show, that no operator worldwide lists LBS among his Top-10 data services. Several operators have actually “pulled the plug” on LBS and have withdrawn it from their service portfolio, due to unfavourable ratio between costs and revenues.The technology is available and cheap, methods and concepts are developed, ideas are abundant – but why is LBS not as successful as it was thought to be? This question needs some further consideration.
3 The nature of Location Based ServiceObviously, having a feasible, available, usable and cheap technology solution is not sufficient to make LBS a commercially suc-cessful service.
As any other technology, LBS has a number of competitors with a very similar value proposition. To be genuinely successful, LBS needs to con-vincingly demonstrate its superiority for a specific application situation to the User. Most obvious competitors are live, “real-time” experience, web-pages, portable self-contained navigation systems running on PDA’s and CD-ROM media, just to name a few. All these are existing threats, eating into the domain of LBS.Looking at the time dimension, LBS addresses only a small section of the time-axis. LBS can be considered best suitable in situations where information changes more frequently than once a day, but remains valid for a duration of time in the order of travel-time needed to reach the des-tination.
8 ©NOKIA LBS – 1000 Days after/ Nov 03/ MUh, JKi
Location Accuracy vs Costs
Log A
Costs per User
(log €)
Location Area Code
(LAC)
Location Area Code
(LAC)
Cell Identity
(CID)
Cell Identity
(CID)
0.1 1 10 100 1000 km²
Triangulation
(E-OTD)
Triangulation
(E-OTD)
A-GPS
(Network)
A-GPS
(User)
What Operators are willing to
invest for LBS
What Operators are willing to
invest for LBS
Fig. 2: Positioning Methods and Costs
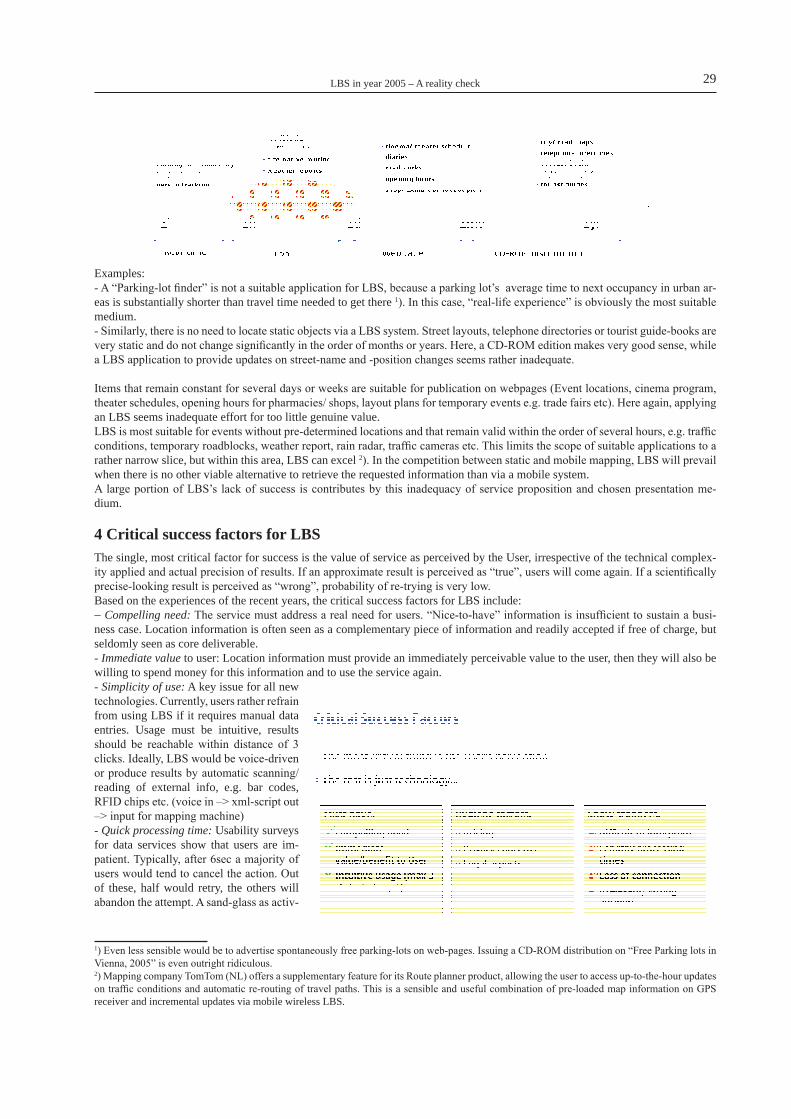
LBS in year 2005 – A reality check 29
Examples:- A “Parking-lot finder” is not a suitable application for LBS, because a parking lot’s average time to next occupancy in urban ar-eas is substantially shorter than travel time needed to get there �). In this case, “real-life experience” is obviously the most suitable medium.- Similarly, there is no need to locate static objects via a LBS system. Street layouts, telephone directories or tourist guide-books are very static and do not change significantly in the order of months or years. Here, a CD-ROM edition makes very good sense, while a LBS application to provide updates on street-name and -position changes seems rather inadequate.
Items that remain constant for several days or weeks are suitable for publication on webpages (Event locations, cinema program, theater schedules, opening hours for pharmacies/ shops, layout plans for temporary events e.g. trade fairs etc). Here again, applying an LBS seems inadequate effort for too little genuine value.LBS is most suitable for events without pre-determined locations and that remain valid within the order of several hours, e.g. traffic conditions, temporary roadblocks, weather report, rain radar, traffic cameras etc. This limits the scope of suitable applications to a rather narrow slice, but within this area, LBS can excel 2). In the competition between static and mobile mapping, LBS will prevail when there is no other viable alternative to retrieve the requested information than via a mobile system.A large portion of LBS’s lack of success is contributes by this inadequacy of service proposition and chosen presentation me-dium.
4 Critical success factors for LBSThe single, most critical factor for success is the value of service as perceived by the User, irrespective of the technical complex-ity applied and actual precision of results. If an approximate result is perceived as “true”, users will come again. If a scientifically precise-looking result is perceived as “wrong”, probability of re-trying is very low.Based on the experiences of the recent years, the critical success factors for LBS include:- Compelling need: The service must address a real need for users. “Nice-to-have” information is insufficient to sustain a busi-ness case. Location information is often seen as a complementary piece of information and readily accepted if free of charge, but seldomly seen as core deliverable.- Immediate value to user: Location information must provide an immediately perceivable value to the user, then they will also be willing to spend money for this information and to use the service again.- Simplicity of use: A key issue for all new technologies. Currently, users rather refrain from using LBS if it requires manual data entries. Usage must be intuitive, results should be reachable within distance of 3 clicks. Ideally, LBS would be voice-driven or produce results by automatic scanning/ reading of external info, e.g. bar codes, RFID chips etc. (voice in –> xml-script out –> input for mapping machine)- Quick processing time: Usability surveys for data services show that users are im-patient. Typically, after 6sec a majority of users would tend to cancel the action. Out of these, half would retry, the others will abandon the attempt. A sand-glass as activ-
�) Even less sensible would be to advertise spontaneously free parking-lots on web-pages. Issuing a CD-ROM distribution on “Free Parking lots in Vienna, 2005” is even outright ridiculous.2) Mapping company TomTom (NL) offers a supplementary feature for its Route planner product, allowing the user to access up-to-the-hour updates on traffic conditions and automatic re-routing of travel paths. This is a sensible and useful combination of pre-loaded map information on GPS receiver and incremental updates via mobile wireless LBS.
Markus Uhlirz30
ity indicator apparently is not good enough to keep the interest awake. This also is a main restriction for amount of data that can be transferred in a response to the user. 3)- Near-100% hit rate in answers: Users are unforgiving: irrelevant or wrong answers are not tolerated. Users will accept “wrong” answers typically twice, then abandon the service, disappointed.- Low or no price: Other than ringtones, wallpapers and music tracks, location information is a “non-storeable” item. It is consumed exactly once, then it is worthless. Users are price-sensitive when payment is per event. Currently, the perceived value of location information is around 0.15 .. 0.20 €/event. Location information by itself has no commercial value and needs to be bundled with other services to be a sellable item.
5 Conclusions- Industry consensus: If you do it, then do it cheap !- Limited granularity is acceptable for most cases (CID-based methods; ~500m resolution)- Marginal revenue streams from LBS --> not on Operator’s priority lists- Multiple technology threats: Mobile Mapping & Navigation. E.g. portable navi systems on PDA’s, CD’s, memory cards (Tom-Tom, NaviGon, MapQuest, ….)- LBS infrastructure exist in many networks, but not actively promoted or maintained- Weak overall business case and high maintenance costs (Opex >> Capex)- Shift in business & revenue model: move risks to LBS suppliers & 3rd Parties (“Managed LBS”)- Practical views on Legislation problems: Terminal as Network asset; trackable item, no privacy concerns
The immediate perceived value of LBS to the User is still a major issue. LBS products are difficult to communicate. A high level of information abstraction and interpretation of results is needed by the User. Usability of services is not intuitive, requires too much manual input, refinement and validation.LBS services exist today and will continue to occupy specialized niche markets. LBS is currently not positioned as a mass-market product, no viable candidates for mass-market services are in sight (yet?).
3) With current UMTS networks and the severe limitations of TCP/IP protocol over mobile radio links, this time span corresponds to a transfer volume of ca. 50kB of data. This is not a deficiency of 3G networks, but is due to the inadequacy of the protocol design for mobile usage. TCP/IP was designed 20 years ago for fixed networks and does not provide mechanisms to cope with the specifics of mobile radio links. This will change significantly with introduction of IPv6.
Location-Based Services and GIS in perspective
Bin Jiang, Xiaobai Yao
Abstract This presentation examines location-based services (LBS) from a broad perspective involving definitions, characteristics, and ap-plication prospects, in particular when compared to geographic information systems (GIS). We unpack LBS into four important components: users, locations, contexts and data, and briefly reviewed modelling efforts towards the four components. We believe that it is the diversity of users, and consistent changing locations, or contexts in more general sense, that make LBS special from ordinary GIS. Using a list of GIS research challenges as benchmarks, we cross compare LBS and GIS and highlight some research challenges that are particular unique for LBS. These challenges include, but no limited to, naïve users, massive geospatial data analysis and modelling, on-the-fly generalization and visualization, interoperability issues, and privacy and social issues. We con-clude our presentation by pointing out that (1) there is no clear-cut boundary of LBS and GIS, and (2) it is the shift of computing platforms from mainframe, to desktop, and nowadays increasing pervasive mobile computers that makes LBS and GIS research special, challenging and more exciting.
Knowledge-based map adaptation for mobile map services
L. Tiina Sarjakoski, Tommi Koivula, Tapani Sarjakoski
AbstractThe evolving map applications for different types of mobile devices present new challenges for mobile services and application providers. One of the crucial challenges faced is as how a single map service could be used to deliver and adapt mobile maps for different kinds of users in different usage situations. In order to be able to utilise and manage various map specifications for the different maps, a Map Specification Knowledge Base approach is introduced and formally described in the paper. A Map Specifi-cation Knowledge Base is a set of specification rules, properties and assignments constituting the system’s knowledge about the map to be delivered to the mobile user. Such knowledge includes rules connecting context parameters with the parameters for the level of details of the map and map generalisation, and settings for the map layout, symbols, map contents etc. The method uses an object-oriented approach to carry out the multiple-inheritance of the map specification modifiers based on the importance of the rules. To provide third-party service developers with the possibility easily creating and modifying map specifications for their own needs, a web-based editor, called Map Specification Tool was implemented. The innovative aspect of the knowledge-based map specification approach is that the service can deliver various types of maps, which match the current context parameters and user preferences in real-time. The research described in the paper has been part of an EU- project referred to as GiMoDig (Geospatial info-mobility service by real-time data-integration and generalisation). A prototype of a cartographic map service has been created to deliver geospatial data to mobile users in real-time, and is based on emerging standards, such as Extensible Mark-up Language (XML) and Open Geospatial Consortium’s (OGC) specifications.
1 IntroductionBackgroundOut of all the mobile applications, the applications that use the Global Positioning System (GPS) and display the map on a mobile device, are the most in demand at the moment. Thus, the national topographic databases play a key role in applications that need detailed geospatial information. On top of the topographic data provided by the geospatial data services third-party service develop-ers may create various end-user applications and display so called Points of Interest (PoI) data. At the same time, the developers of mobile applications face new challenges when aiming to meet the demands of the various user groups of mobile services.The research described in this paper is based on the results from an EU-funded project carried out in 2001-2004 called GiMoDig (Geospatial info-mobility service by real-time data-integration and generalisation). In the project, a prototype of a cartographic map service was created to deliver geospatial data for mobile users in real-time. As the overall objective of the GiMoDig project was to improve the accessibility and interoperability of national topographic databases, the data is delivered from the geo-databases in the participating countries’ National Mapping Agencies (NMAs) (Finland, Sweden, Denmark and Germany), and results in a vector-formatted high quality Scalable Vector Graphics (SVG) map being displayed on the user’s mobile device. The GiMoDig service is based on emerging standards, such as Extensible Mark-up Language (XML) and Open Geospatial Consortium’s (OGC) specifications.The focus of this paper is to describe a mobile map service approach that includes a knowledge base which is used when the service controls in real-time the map adaptation of mobile maps.
Previous researchToday, the ability for adaptation and context sensitiveness are regarded as essential characteristics of Location-Based Services (LBSs) (Meng et al., 2005). According to Oppermann, (1994) an adaptive system is capable of changing its own characteristics au-tomatically according to the user’s needs. For example, Baus et al. (2001) describe a system that determines the location of the user and adapts the presentation of route directions according to the characteristics of the user’s mobile device as well as to the cognitive resources of the user. Reichenbacher (2001, 2004) was among those who started to study the process of the adaptive and dynamic generation of map visualisations for mobile users in relation to cartographic principles. Nivala and Sarjakoski (2003) reported a study on the mobile contexts relevant for map adaptation.Cartographic expert systems were intensively studied at the beginning of 90s, for tasks such as cartographic design (Müller and Zeshen, 1990; Forrest, 1993), or map generalisation (Buttenfield and McMaster, 1991). However, the low success rate of such systems was claimed to be due to the lack of the necessary rules or their incompleteness. There has recently been an increasing interest in the research on cartographic expert systems (e.g., Stefanakis and Tsoulos, 2005). Techniques from areas such as the ob-
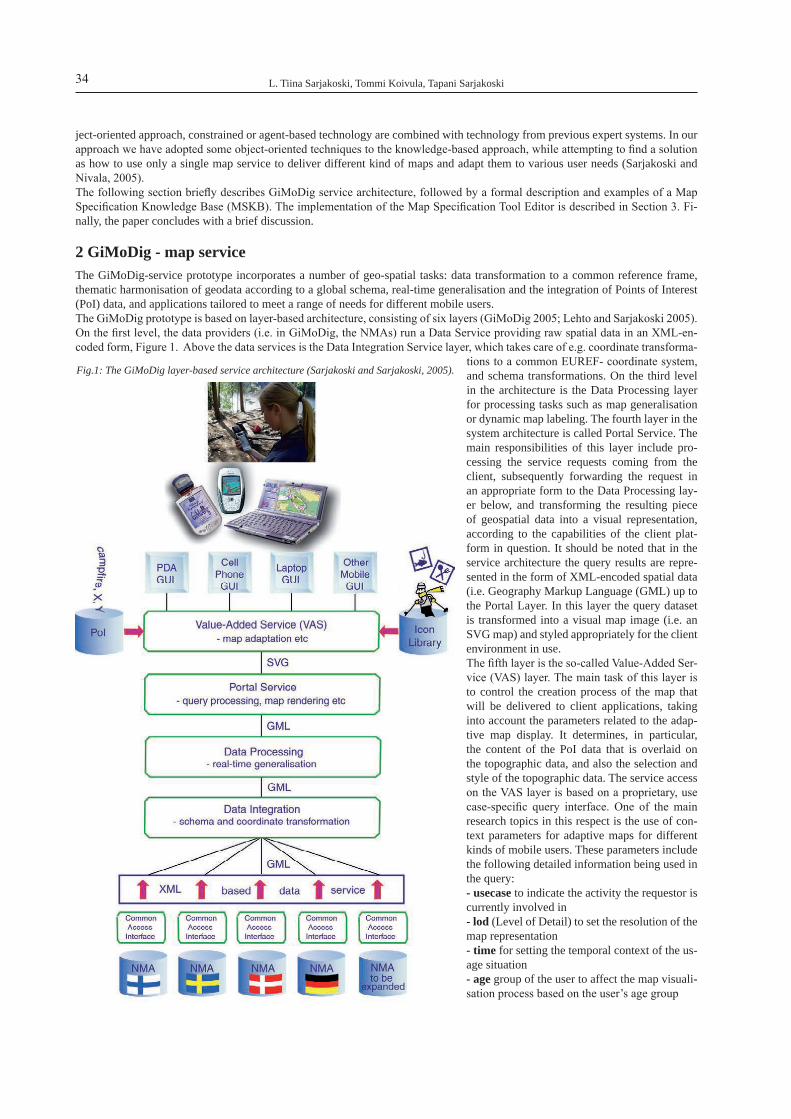
L. Tiina Sarjakoski, Tommi Koivula, Tapani Sarjakoski34
ject-oriented approach, constrained or agent-based technology are combined with technology from previous expert systems. In our approach we have adopted some object-oriented techniques to the knowledge-based approach, while attempting to find a solution as how to use only a single map service to deliver different kind of maps and adapt them to various user needs (Sarjakoski and Nivala, 2005).The following section briefly describes GiMoDig service architecture, followed by a formal description and examples of a Map Specification Knowledge Base (MSKB). The implementation of the Map Specification Tool Editor is described in Section 3. Fi-nally, the paper concludes with a brief discussion.
2 GiMoDig - map serviceThe GiMoDig-service prototype incorporates a number of geo-spatial tasks: data transformation to a common reference frame, thematic harmonisation of geodata according to a global schema, real-time generalisation and the integration of Points of Interest (PoI) data, and applications tailored to meet a range of needs for different mobile users. The GiMoDig prototype is based on layer-based architecture, consisting of six layers (GiMoDig 2005; Lehto and Sarjakoski 2005). On the first level, the data providers (i.e. in GiMoDig, the NMAs) run a Data Service providing raw spatial data in an XML-en-coded form, Figure 1. Above the data services is the Data Integration Service layer, which takes care of e.g. coordinate transforma-
tions to a common EUREF- coordinate system, and schema transformations. On the third level in the architecture is the Data Processing layer for processing tasks such as map generalisation or dynamic map labeling. The fourth layer in the system architecture is called Portal Service. The main responsibilities of this layer include pro-cessing the service requests coming from the client, subsequently forwarding the request in an appropriate form to the Data Processing lay-er below, and transforming the resulting piece of geospatial data into a visual representation, according to the capabilities of the client plat-form in question. It should be noted that in the service architecture the query results are repre-sented in the form of XML-encoded spatial data (i.e. Geography Markup Language (GML) up to the Portal Layer. In this layer the query dataset is transformed into a visual map image (i.e. an SVG map) and styled appropriately for the client environment in use.The fifth layer is the so-called Value-Added Ser-vice (VAS) layer. The main task of this layer is to control the creation process of the map that will be delivered to client applications, taking into account the parameters related to the adap-tive map display. It determines, in particular, the content of the PoI data that is overlaid on the topographic data, and also the selection and style of the topographic data. The service access on the VAS layer is based on a proprietary, use case-specific query interface. One of the main research topics in this respect is the use of con-text parameters for adaptive maps for different kinds of mobile users. These parameters include the following detailed information being used in the query:- usecase to indicate the activity the requestor is currently involved in - lod (Level of Detail) to set the resolution of the map representation - time for setting the temporal context of the us-age situation - age group of the user to affect the map visuali-sation process based on the user’s age group
Fig.1: The GiMoDig layer-based service architecture (Sarjakoski and Sarjakoski, 2005).

Knowledge-based map adaptation for mobile map services 35
- device to set the context parameters related to the physical device currently in use - center to indicate the location of the map to be requested - scale to set the display scale - position to set the user’s current position
Examples of the value sets of the parameters in a query are listed in Table 1.
Parameters Value sets vpi
pUSE_CASE {„outdoors“, „cycling“, „emergency“, „expert“, o}
pLOD {„detailed“, „basic“, „intermediate“, „overview“, „egm“, o}
pTIME {„winter“, „spring“, „summer“, „autumn“, „day“, „night“, o}
pAGE { 0-10, 11-17, 18-45, 46-, o }
pLANGUAGE {„English“, „Finnish“, „Danish“, „German“, o}
pDEVICE {„ipaq“, „pc“, o}
Tab. 1: Context parameters and their value sets selected for the GiMoDig prototype.
The Value-Added Service contains a knowledge base for different contexts and visualisations assigned to them. The VAS also uses an SVG-based icon library and a Points of Interest (PoI) database, which were developed in the GiMoDig-project. The icon library consists of icon sets in four different styles (totally 161 icons), which are selected depending on the age of the user group of the re-quested map (Sarjakoski et al., 2004; Nivala and Sarjakoski, 2005). The PoI-database contains coordinates of the PoIs (Figure 1). The client applications consisting of four use-case-based applications are on the sixth layer: A Hiker in a National Park (i.e., Out-doors use case), Cycling and Emergency use cases, and a tool for tailoring mobile maps for expert users (Sarjakoski and Sarjakoski 2004; 2005). An advantage of the layer-based architecture approach is that the results can be adapted to various client environ-ments. Three client platforms were considered for implementation: traditional web browsing on a portable PC platform, more re-stricted web access on Personal Digital Assistant (PDA) devices and a client application on mobile cell phones.
3 Map Specification Knowledge Base (MSKB)One of the research problems faced in the GiMoDig project was as how a single map service could be used to deliver and adapt mobile maps for various users in different usage situations. In order to be able to utilise and manage various map specifications for the different maps, a Map Specification Knowledge Base approach is needed. A Map Specification Knowledge Base is a set of specification rules, properties and assignments constituting the system’s knowledge about the map to be delivered to the mobile user. Such knowledge includes user preferences for the mobile context, parameters for the level of details on the map and map gen-eralisation, and settings for the map layout, symbols, map contents (i.e., displayed map feature classes and icons), etc. However, the large number of combinations of context-parameter values might make it nearly impossible to create specifications one by one. To solve this problem and to minimise the number of specification rules and properties that needs to be entered manually, a method that uses multiple-inheritance of modifiers based on the importance of the conditions is introduced in the following paragraphs. The most common properties (such as “styles of the map”) are mapped for the most important conditions (such as “a use case”) and then inherited to other less important conditions. The innovative aspect of the Map Specification Knowledge Base and the map specification approach is that the service can deliver various types of maps, which match the current context parameters and user preferences in real-time. In the following paragraphs we give a formal definition of the map specification knowledge base, and we also present an algorithm that can be used to bring this knowledge base into practice.
Context and context parametersIn general, context can be seen as a collection of information to characterise the situation of an entity. Entity is a person, place or an object that is relevant to the interaction between a user and an application, including the user and the applications themselves (Dey and Abowd, 1999). Furthermore, Dey (2001) defined a system to be a context-aware if it uses context to provide relevant in-formation and/or services to the user, where relevancy depends on the user’s task. Nivala and Sarjakoski (2003) identified in their study mobile contexts based on user tests of topographic maps in mobile devices. These included location, system, purpose of use, time, physical surroundings, navigational history, orientation, user and cultural and social elements. They proposed that embedding context awareness into the topographic maps in mobile devices could increase the usability of the map service better to support its user.First we formalise the context into a set of context parameters, which identifies the context itself. Context can be formalised by using dimensions (Tomai and Kavouras, 2005). Dimensions are specific variables when combined to give meaning to information. They describe the surroundings for all the user actions as well as the user application used. Using n dimensions, we define context C as
C=(p1,…,pn) { vp1,…,vpn | pi∈vpi }, (1)

L. Tiina Sarjakoski, Tommi Koivula, Tapani Sarjakoski36
where pi is the context parameter and vpi is a set of possible values of context parameter pi. All sets vpi also contain a value that in-dicates that the actual value of this parameter is unknown. We denote this value as ο.
The following example illustrates how contexts are used. Let say we have a context C={p1,…,p5} and the values of the context parameters can be the following: vp1={winter,summer,o}, vp2={pc,handheld,phone,o}, vp3={male,female,o}, vp4={age as integer }U{o} and vp5={lod_basic,lod_overview,o}. One possible realisation of context C could be C´ = (ο,handheld,ο,25,ο). It simply states that the user has a handheld device, his/her age is 25, and the gender and season are currently unknown.
In our approach the order of the parameters in a context C is also important. The context is evaluated so that the first parameters are considered to be more important than the last ones. For example, an age greater than 60 may indicate that the mobile map’s text fonts should be bigger, and also that when the mobile device is ‘phone’ fonts should then be smaller than usual. Suppose we have a context C1=(ο,mobile_phone,ο,65,ο). In this context the outcome would be that the text fonts are smaller than usual since the age parameter is considered to be less important than the device parameter. The purpose of these context assignments is then to control the map contents and visualisation to be delivered in the adapted map. An example of seasonal maps for teenagers on a PDA is shown in Figure 2.
Map specificationsA map specification describes all the properties of a map for a given usage situation, e.g. the parameters for the level of details of the map and map generalisation, and settings for the map layout, symbols, map contents, which of the map feature classes should be displayed, in which colour, what should be the width and style of the lines, what kind of map icons are used in the adapted map to be displayed, etc. While the context parameters describe the need for a certain type of map adaptation, a map specification is a solution for this need. A map specification can be related to many contexts, i.e. the same kind of map can be useful in various us-age situations.
In a real map specification knowledge base there can easily be dozens of different map specifications. Patterns can often be found among map specifications so that two maps can almost be similar, except for one particular map specification modifier. Therefore, in order to be able to define similar map specifications more easily, we divide them into so-called map specification modifiers. We combine these specification modifiers by using a multiple inheritance-based approach, and thus it is possible to both decrease the amount of manual work and create more generic map specifications. We denote the specification modifier as XP, defined by the context parameters:XP=(x1,…,xm), where xi are properties of the map (2)
There is no need for every map specification modifier to have all properties defined. We denote properties that are not defined as ο. For example, a map specification modifier could be X(o,handheld,o,25,o) = (x1a, o, o, x4a, o), where xia are some map properties (3)
Fig. 2: Adaptive PDA maps for different seasons for the teenager user group. In the figure, three context parameters control the map: pTIME∈{“season:winter”,”season:summer”} , pAGE =”teenager”, pDEVICE =”PDA”. The context parameter pAGE reflects to the choice of the style of the icons (for teenagers a comics style used). Depending on the context parameter value for pTIME, the delivered map has
different contents and colours defined by the map specification modifiers.
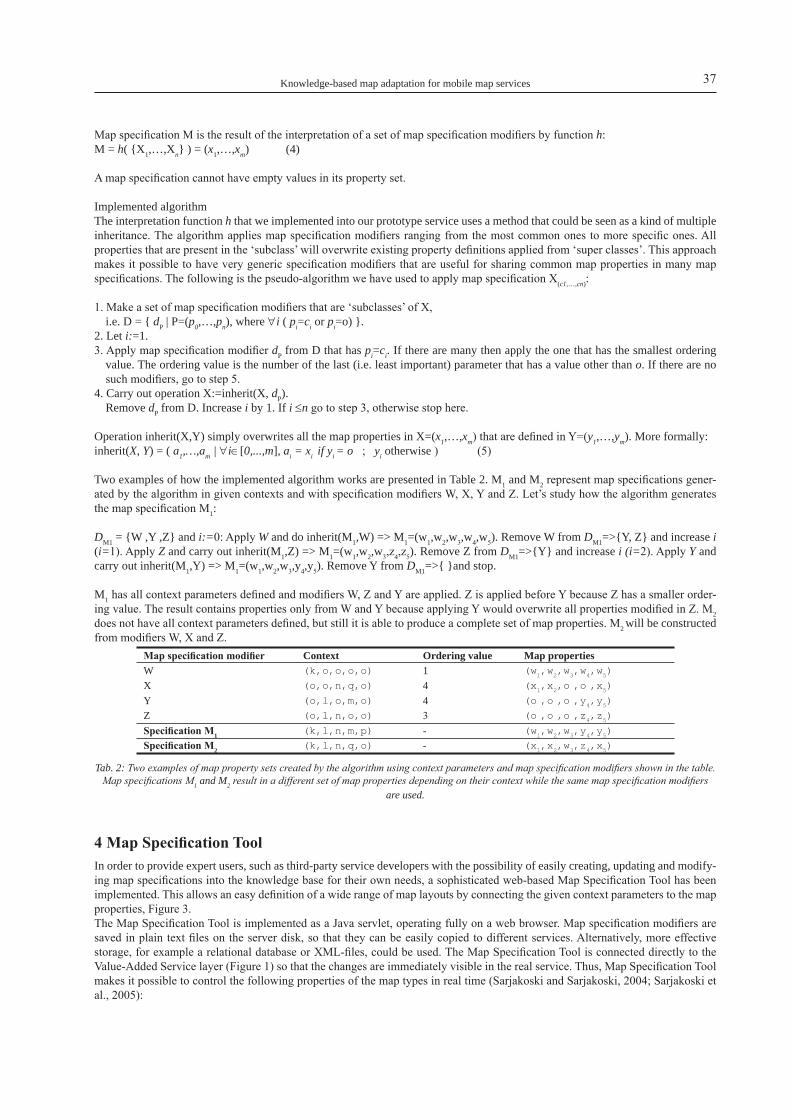
Knowledge-based map adaptation for mobile map services 37
Map specification M is the result of the interpretation of a set of map specification modifiers by function h:M = h( {X1,…,Xn} ) = (x1,…,xm) (4)
A map specification cannot have empty values in its property set.
Implemented algorithmThe interpretation function h that we implemented into our prototype service uses a method that could be seen as a kind of multiple inheritance. The algorithm applies map specification modifiers ranging from the most common ones to more specific ones. All properties that are present in the ‘subclass’ will overwrite existing property definitions applied from ‘super classes’. This approach makes it possible to have very generic specification modifiers that are useful for sharing common map properties in many map specifications. The following is the pseudo-algorithm we have used to apply map specification X(c1,…,cn):
1. Make a set of map specification modifiers that are ‘subclasses’ of X, i.e. D = { dP | P=(p0,…,pn), where ∀i ( pi=ci or pi=o) }.
2. Let i:=1.3. Apply map specification modifier dP from D that has pi=ci. If there are many then apply the one that has the smallest ordering
value. The ordering value is the number of the last (i.e. least important) parameter that has a value other than o. If there are no such modifiers, go to step 5.
4. Carry out operation X:=inherit(X, dP).Remove dP from D. Increase i by 1. If i ≤n go to step 3, otherwise stop here.
Operation inherit(X,Y) simply overwrites all the map properties in X=(x1,…,xm) that are defined in Y=(y1,…,ym). More formally:inherit(X, Y) = ( a1,…,am | ∀i∈[0,...,m], ai = xi if yi = o ; yi otherwise ) (5)
Two examples of how the implemented algorithm works are presented in Table 2. M1 and M2 represent map specifications gener-ated by the algorithm in given contexts and with specification modifiers W, X, Y and Z. Let’s study how the algorithm generates the map specification M1:
DM1 = {W ,Y ,Z} and i:=0: Apply W and do inherit(M1,W) => M1=(w1,w2,w3,w4,w5). Remove W from DM1=>{Y, Z} and increase i (i=1). Apply Z and carry out inherit(M1,Z) => M1=(w1,w2,w3,z4,z5). Remove Z from DM1=>{Y} and increase i (i=2). Apply Y and carry out inherit(M1,Y) => M1=(w1,w2,w3,y4,y5). Remove Y from DM1=>{ }and stop.
M1 has all context parameters defined and modifiers W, Z and Y are applied. Z is applied before Y because Z has a smaller order-ing value. The result contains properties only from W and Y because applying Y would overwrite all properties modified in Z. M2 does not have all context parameters defined, but still it is able to produce a complete set of map properties. M2 will be constructed from modifiers W, X and Z.
Map specification modifier Context Ordering value Map propertiesW (k,o,o,o,o) 1 (w1
,w2,w
3,w
4,w
5)
X (o,o,n,q,o) 4 (x1,x
2,o
,o
,x
5)
Y (o,l,o,m,o) 4 (o ,o
,o
,y
4,y
5)
Z (o,l,n,o,o) 3 (o ,o
,o
,z
4,z
5)
Specification M1 (k,l,n,m,p) - (w1,w
2,w
3,y
4,y
5)
Specification M2 (k,l,n,q,o) - (x1,x
2,w
3,z
4,x
5)
Tab. 2: Two examples of map property sets created by the algorithm using context parameters and map specification modifiers shown in the table. Map specifications M1 and M2 result in a different set of map properties depending on their context while the same map specification modifiers
are used.
4 Map Specification ToolIn order to provide expert users, such as third-party service developers with the possibility of easily creating, updating and modify-ing map specifications into the knowledge base for their own needs, a sophisticated web-based Map Specification Tool has been implemented. This allows an easy definition of a wide range of map layouts by connecting the given context parameters to the map properties, Figure 3.The Map Specification Tool is implemented as a Java servlet, operating fully on a web browser. Map specification modifiers are saved in plain text files on the server disk, so that they can be easily copied to different services. Alternatively, more effective storage, for example a relational database or XML-files, could be used. The Map Specification Tool is connected directly to the Value-Added Service layer (Figure 1) so that the changes are immediately visible in the real service. Thus, Map Specification Tool makes it possible to control the following properties of the map types in real time (Sarjakoski and Sarjakoski, 2004; Sarjakoski et al., 2005):

L. Tiina Sarjakoski, Tommi Koivula, Tapani Sarjakoski38
- Topographic feature classes to be shown on the map- Poits of Interest/ Areas of Interest/ Lines of Interest (POI/LOI/AOI) data to be shown on the top of the topographic data- LoD of the map and generalisation operators, and their parameters that are to be executed on the topographic features- Other visualisation operators to be executed (e.g. icon placement)- Other map layout (e.g. colours, line widths)
Once the design issues have been carefully resolved, the use of Map Specification Tool can be divided into three phases (Fig. 4):- Create a complete property set to be used as a default map specification modifier. Doing this guarantees that all the combinations of context parameter values produce a complete map.- Create all map specification modifiers by moving from the most generic to the most specific.- Verify and experiment with real contexts and fix/create new modifiers if needed.
Figure 5 shows an example of different kinds of adapted cycling maps for different types of devices. The maps in the figure have been delivered in real time from the GiMoDig service based on the varying context parameters.
Fig. 3: Screen shots of the graphical user interface for the Map Specification Tool Editor. The service administrator selects a prototype map by the context parameters (left) and then defines the specification modifiers (right). The more context parameters are left unassigned (n/a), the less specialised any given prototype map is. Any part of the specification modifier can be derived or inherited from the less specialised
prototype maps.
Fig. 4: An example of the applying process of map specification modifiers when pUSE_CASE =”cycling” and pLOD =”basic”.

Knowledge-based map adaptation for mobile map services 39
5 Concluding remarksThe paper presented a Map Specification Knowledge Base approach for using and managing different map specifications for the different user needs of mobile maps. Additionally, the web-based Map Specification Tool described in the paper was implemented to provide third-party service developers with the possibility of easily creating and modifying map specifications for their own applications. The tool provides a flexible way for application developers to elaborate in real time with the map properties and im-mediately get the response map delivered from the service. This helps the designers more effectively to find the best cartographic visualisation for the current purpose of the mobile map.
The innovative aspect of the MSKB and the map specification approach is that the service can deliver various types of maps, which match the current context parameters and user preferences in real-time. While the map specification modifiers are combined by us-ing a multiple inheritance-based approach, it is possible to both decrease the amount of manual work that needs to be done and to create more generic map specifications which makes it easy to use the approach for creating various applications. The importance of meticulous design in creation of a new map specification knowledge base cannot be overestimated. The planned structure of the knowledge base and selection of context parameters that will be used have a great impact on how easy or difficult it is to cre-ate specifications. The knowledge-based approach formally described in the paper is implemented in the GiMoDig prototype to deliver adaptive mobile maps for different types of users in different usage situations. Development of the approach will continue towards the creation of an operative system for adaptive maps. Such maps will be an essential part of the LBSs, of the not too dis-tant future.
6 AcknowledgementsThis research is part of the Geospatial Info-mobility Service by Real-time Data-integration and Generalisation (GiMoDig) project, IST-2000-30090, funded by the European Union through the Information Society Technologies (IST) programme.
7 ReferencesBaus, J., Kray, C. and Krüger, A., 2001, Visualization and route descriptions in a resource-adaptive navigation aid. Cognitive Processing, Vol., 2,
No. 2-3, pp. 323-345.Buttenfield, B.P. and McMaster R.B., (eds.), 1991, Map Generalization: Making Rules for Knowledge Representation. Longman Group, London.Dey, A. K., 2001, Understanding and Using Context. Personal and Ubiquitous Computing, Vol. 5, No. 4–7.Dey, A. and G., Abowd, 1999. Towards a Better Understanding of Context and Context-Awareness, Technical Report, GIT-GVU-99-22, Georgia
Institute of Technology, Atlanta (GA).Forrest, D., 1993, Expert systems and cartographic design, Cartographic Journal, Vol. 30, No. 2, 143-147.
Fig. 5: Different types of cycling maps delivered in real-time by the GiMoDig service. Day and night maps for a PDA and a day cycling map for a laptop PC. Observe the different styles and colours of the maps.

L. Tiina Sarjakoski, Tommi Koivula, Tapani Sarjakoski40
GiMoDig, 2005, Geospatial info-mobility service by real-time data-integration and generalisation. IST-2000-30090. Online: http://gimodig.fgi.fi/ (26/09/05).
Lehto, L. and Sarjakoski, T., 2005, XML in Service Architectures for Mobile Cartographic Applications. In: Meng, L., Zipf, A. and Reichenbacher T., (eds.), Map-based Mobile Services, Theories, Methods and Implementations, Springer Berlin Heidelberg New York, pp. 173-192.
Meng, L., Zipf, A. and Reichenbacher T., (eds.), 2005, Map-based Mobile Services, Theories, Methods and Implementations, Springer Berlin Hei-delberg New York.
Müller, J. C. and Zeshen, W.,1990. A knowledge based system for cartographic symbol design. The Cartographic Journal, Vol. 27, No.1, pp. 24-30.
Nivala, A.-M. and Sarjakoski, L. T., 2003, Need for Context-Aware Topographic Maps in Mobile Devices. In: Virrantaus, K. and Tveite H., (eds.), ScanGIS’2003, Proceedings of the 9th Scandinavian Research Conference on Geographical Information Science, June 4-6, 2003, Espoo, Fin-land, pp. 15-29.
Nivala, A-M. and L.T. Sarjakoski, 2005. Adapting Map Symbols for Mobile Users. Proc. of the International Cartographic Conference 2005: Map-ping Approaches into a Changing World, July 9-16, 2005, A Coruña, Spain, CD-ROM: Theme 12: Internet Location-Based Services, Mobile Mapping and Navigation Systems, Session 5.
Oppermann, R., (ed.), 1994, Adaptive User Support: Ergonomic Design of Manually and Automatically Adaptable Software, Computers, Cogni-tion, and Work. Hillsdale (NJ): Lawrence Erlbaum Associates.
Reichenbacher, T., 2001, The World in Your Pocket – Towards a Mobile Cartography. Proceedings of the 20th International Cartographic Confer-ence, Beijing, China, pp. 2514-2521.
Reichenbacher, T., 2004, Mobile Cartography – Adaptive Visualisation of Geographic Information on Mobile Devices. Dissertation, Department of Cartography, Technische Universität München, München: Verlag Dr. Hut.
Sarjakoski, L.T and Nivala, A.-M., 2005, Adaptation to Context – A Way to Improve the Usability of Mobile Maps, In: Meng, L., Zipf, A. and Reichenbacher T., (eds.), Map-based Mobile Services, Theories, Methods and Implementations, Springer Berlin Heidelberg New York, pp. 107-123.
Sarjakoski, L.T., Nivala, A-M. and Hämäläinen, M., 2004, Improving the Usability of Mobile Maps by Means of Adaption. In: G. Gartner (ed.), Location Based Services & TeleCartography, Proceedings of the Symposium 2004, Vienna University of Technology, January 28-29, 2004, Vienna, pp. 79-84.
Sarjakoski, L., T. and Sarjakoski, T., 2004. A Use Case Based Mobile GI Service with Embedded Map Generalisation. Papers of the ICA Work-shop on Generalisation and Multiple Representation, August 20-21, 2004, Leicester. Online: http://ica.ign.fr/Leicester/paper/Sarjakoski-v2-ICAWorkshop.pdf (26/09/05).
Sarjakoski T. and Sarjakoski, L. T., 2005. The GiMoDig public final report. GiMoDig-project, IST-2000-30090, Deliverable D1.2.31, Public EC report. Online: http://gimodig.fgi.fi/deliverables.php, (26/09/05).
Sarjakoski, T., Sester, M., Sarjakoski, L.T., Harrie, L., Hampe, M., Lehto, L. and T. Koivula, 2005. Web generalisation services in GiMoDig - to-wards a standardised service for real-time generalisation. In: Toppen, F., and M. Painho, (eds.), Conference proceedings, AGILE 2005, 8th Conference on Geographic Information Science, Estoril, Portugal, May 26-28, 2005, pp. 509-518.
Stefanakis, K. and L. Tsoulos, 2005. Structure and development of a knowledge base for cartographic composition. Proc. of the International Car-tographic Conference 2005: Mapping Approaches into a Changing World, July 9-16, 2005, A Coruña, Spain, CD-ROM: Theme 3: Map Design and Production, Session 2
Tomai, E. and M. Kavouras, 2005. Context in Geographic Knowledge Representation, Proceedings of the II International conference & exhibition on geographic information, GIS PLANET, Estoril, Portugal, May 30 - June 2, 2005, CD-ROM.

The concept of relevance in mobile maps
Tumasch Reichenbacher
AbstractMobile map based services and location-based services (LBS) are going places. Yet, they face acceptance problems for such reasons as lacking user focus and relevance. This paper looks on the concept of relevance and its potential for and application to mobile cartography. First, theoretical concepts of relevance from other disciplines are studied followed by an analysis of differ-ent approaches for the assessment of relevance. A basic model for the determination of geographic relevance is postulated and the application modes of relevance to mobile cartography are elaborated. Two applications of relevance to mobile cartography are discussed with an emphasis on visualisation techniques for the presentation of relevance in maps. Some final remarks conclude the comments on relevance in mobile maps.
1 IntroductionMobile usage of digital geographic information is becoming mainstream technology. Several types of applications and services have evolved over the last few years and are already broadly used, e.g. car navigation systems, tour guides, and, of course, Loca-tion Based Services (LBS). However, research is still sparse when it comes to developing appropriate visualisations of geographic information for small displays of mobile devices. The major challenge for mobile cartography is a separation of relevant and ir-relevant information by finding an acceptable degree of information reduction to the relevant, i.e. presenting as much information as needed and as little as required.Relevance is becoming an important feature for mobile services in general and especially for LBS and map based mobile services. Raper et al. (2002) for example claim that “… understanding the individual ‘geographical relevance’ of information will be neces-sary for location-based services to provide appropriate information …”. Geake (2000) mentions among other criteria for successful LBS the relevance of delivered information. Similarly Oinas-Kukkonen and Kurkela (2003) propose seven key design principles for highly goal-driven mobile services: (1) provide information addressing the needs of users on the move (mobility), (2) make life easier (usefulness), (3) include relevant information (relevance), (4) simple and easy to use (ease of use), (5) most important in-formation should be the easiest to locate (fluency of information), (6) focus on user’s terminology and navigational structure (user-centredness), and (7) they should be adapted to each and every user’s own needs and capabilities (personalization) or in short: “A good mobile service provides additional value for the user and is fast and natural to use”.LBS can mainly be seen as a handy supporting tool for spatial problem solving tasks like localisation (where am I?), proximity (where is the nearest X? How far is it to XY?), navigating/routing (how do I get to XY? How long will it take to XY?), neighbour-hood and other relations (do I pass X on my way to Y?), and counts and clusters (are there many N in the region R? Is there an assembly of objects?). Generally these atomic problem solving tasks are not carried out independently, but rather are embedded in higher-level activities with spatial relations that require special support.This paper describes the more fundamental concept of relevance and its application or significance to cartography in general and mobile cartography in specific. The major goal of this research is the adequate adaptation of geographic information and its presen-tation in order to reach a higher degree of relevance for the user as outlined in (Reichenbacher 2005) and to stress the significance of relevance for a successful implementation of mobile cartography in real products and services.The remainder of the paper will examine the concept of information relevance and its role in visualisation. First, theoretical con-cepts of relevance from other disciplines are examined, followed by a discussion of different dimensions of relevance and their relation to the usage context. In a further step approaches for the assessment of relevance are analysed serving as a base for a simple method for the calculation of compound geographic relevance values. Moreover, the possible applications of relevance values to mobile cartography are highlighted. Finally, the visualisation of relevance in mobile maps and possible implementations are dem-onstrated on behalf of map examples.
2 The concept of relevance in other disciplinesRelevance stems from the Latin word relevare meaning to raise up, to relieve. Although relevance is a rather fuzzy concept, as hu-mans we intuitively know what relevance is even without having a clear concept of it. In general usage we apply it synonymously for importance or pertinence. Saracevic (1996) offers a general definition of relevance derived from its general qualities: “ […] relevance involves an interactive, dynamic establishment of a relation by inference, with intentions toward a context. […] relevance

Tumasch Reichenbacher42
may be defined as a criterion reflecting the effectiveness of exchange of information between people (or between people and ob-jects potentially conveying information) in communicative relation, all within a context.” Depending on the relations established Saracevic (1996) distinguishes five manifestations of relevance (see also Fig.2): (1) the system or algorithmic, (2) the topical, (3) the cognitive, (4) the situational, and (5) the motivational relevance that form together a system of relevancies on different levels. However, the concept of relevance has some distinct notions in different scientific disciplines. A major distinction has to be made between objective (1) and subjective (2-5) relevance.The former has been the one used for years in information retrieval (IR) where the goal is to “… retrieve all the relevant documents [and] at the same retrieving as few of the non-relevant documents as possible” (van Rijsbergen 1979, p. 6). The efficiency and ef-fectiveness of this retrieval process is generally determined by the measures precision and recall (Mizzaro 2001). These measures reflect the notion of binary relevance, i.e. the document is either relevant or not. The assumption is that the success, i.e. the rel-evance of the documents, can be determined independently from the user by a system, hence the relevance is objective. However in practice, as it has been pointed out by many researchers (e.g. Saracevic 1996; Wilson and Sperber 2004; Cosijn and Ingwersen 2000), there are grades of relevance rather than a binary relevance and hence degrees of relevance need to be introduced. This is usually done by ranking the retrieved documents based on the similarity of the document and the query. All Internet search engines (e.g. Google) have an implemented ranking mechanism based on the cosine measure (the scalar product of each document vector against the query vector defining the presentation order of the retrieved documents).In linguistics, pragmatics, and communication science the objective relevance is not sufficient or useful. These disciplines focus on subjective relevance. The basic assumption is that the relevance of entities is largely determined by the user. An important con-tribution is the relevance theory of communication proposed by (Sperber and Wilson 1986; Sperber and Wilson 1995; Wilson and Sperber 2004). The theory is based on cognitive psychology understanding relevance as a judgement criterion during cognitive processes, the criteria for inputs to be relevant to an individual being effect and effort. The underlying assumption is that human cognition is directed towards maximising relevance. Sperber and Wilson (1995) define relevance as follows: “An assumption is relevant in a context if and only if it has some contextual effect in that context […] An assumption is relevant in a context to the extent that its contextual effects in this context are large […] An assumption is relevant in a context to the extent that the effort to process it in this context is small.” Some of these findings can help to grasp the concept of relevance for geographic information, although the extension to the spatial domain presents an even higher degree of complexity.
3 Relevance in mobile cartography
3.1 Relevance and ContextThe discussion of relevance in section 2 makes clear that the concept of relevance is very much dependent on context, since the context shapes the boundary between relevancy and irrelevancy. Relevance always exists in relation to a specific context and a change of context alters the relevance. Recent work in the domain of LBS, mobile cartography, and mobile web services is rich on investigations about context-awareness; see for example (Reichenbacher 2004; Nivala and Sarjakoski 2003; Dey and Abowd 1999; Schmidt et al. 1998). As pointed out by the author on other occasions more than the mere spatial relevance is required for suitable adaptation of mobile maps as well as a success of the relevance principle in mobile cartography. Apart from the spatial relation there are other factors and challenges in mobile usage situations originating from physical environmental states, temporal con-straints, mobile users’ information needs and activities, technical limitations and many more. These factors necessitate an optimal exploitation of the limited map space on mobile devices, i.e. a stringent selection of relevant objects to be displayed. The presented geographic information must be relevant to the context of use, i.e. a mobile map should satisfy the user’s contextual information needs and adequately present the respective information objects.
3.2 Relevance typesBy combining the manifestations of relevance mentioned above and the contextual factors of importance in mobile environments a set of relevance types for mobile cartographic applications and services can be derived (Fig. 1). The depicted relevance types describe the different relations between geographic information objects and context dimensions. Accordingly objective relevance types that are independent from the user and subjective relevance types related to personal aspects of the user are separated.An extension of the manifestations of relevance proposed by Saracevic (1996) is the introduction of activity relevance as a su-per-class of situational and motivational relevance (shaded in grey in Fig. 1). These relevance dimensions represent two different aspects of an activity: the motivation and the embedment in a situation. Yet, it will not always be possible to clearly separate these relevance types, since in practice they often might overlap to some extent.
4 Relevance assessment and relevance measures for mobile cartographyThe objective of relevance assessment is to formalise the relation between geospatial objects and the different dimensions shown in Fig. 1. Intuitively we might propose some general rules of thumbs for the assessment of relevance for geospatial objects that build a kind of hierarchy of relevant objects:- nearer objects are more relevant than objects further away- visible objects are more relevant than hidden or invisible objects

The concept of relevance in mobile maps 43
- audible objects are more relevant than inaudible objects- important objects, although invisible or inaudible, and most probably further away, can still be relevant due to in-trinsic characteristics- an object or an object’s attribute is relevant, if it is needed for the successful completion of an activity- objects that are linkable to users’ prevalent knowledge are more relevant- objects already well known to users are less relevant
Some of these rules can be formalised as will be discussed below. However, most formal approaches for relevance as-sessment deal mainly with non-spatial information. Never-theless, the assessment methods can be adapted for geospa-tial information.
4.1 Utility functionsUtility is an economical measure for satisfaction gained from products or services. Utility functions are a widely used tool in economics to model user preferences. A utility function RXu →: maps attributes of objects to prefer-ences by assigning scores to alternatives in the set X (http://en.wikipedia.org/wiki/Utility; accessed 13/11/2005). If x
and y are alternatives then ( ) )(yuxu > states that x is pre-ferred to y. An example of a simple function to model the utility of features dependent on their distance could look like the one depicted in Fig. 2. This function can look differently in different contexts, i.e. it can be adapted for diverse activities. In addition it can be applied to other relevance dimensions as well.
4.2 Information retrieval functionsClassic IR applies a vector space model for ranking documents according to their similar-ity to a query. IR methods relate the content of documents to the query that represents the user’s information need. Classic document retrieval uses methods of semantic distance to evaluate the match of topic. Such techniques can also be used for the selection of topi-cally relevant geospatial features based on their attributes. For a method of defining the-matic distances see (Jones et al. 2001). An alternative approach is probabilistic IR aiming at ranking documents according to the evaluated probability of relevance to the user’s information needs (Crestani et al. 1998).
4.3 Fuzzy setsFuzzy set theory proposes a way to model elements that do not belong to a set in a binary way, i.e. is or is not a member of the set. Instead different membership functions can be applied to define the degree of membership to a specific set. A membership function for a fuzzy set A looks like ( ) [ ]1,0A ∈xµ , i.e. x is assigned a value between 0 and 1. Typical membership functions are the triangle or the trapezoid function. Schmidt and Gellersen (2001) propose a model of context validity based on fuzzy set theory that can be easily altered for purposes of geographic relevance. The approach models the spatial and temporal decrease of validity of context in relation to its origin. In the same manner spatial and temporal relevancy can be modelled.
4.4 Observation-based approachesThe relevance of geospatial objects can also be derived from observation. From the knowledge about what feature types are typi-cally associated with and hence relevant for specific activities an enumerative list of typical activity-feature relations can be posted. The spatial range of the activity further defines the set of the spatially relevant objects for that activity. An alternative and more advanced approach is the logging of movement traces and feature selections that can serve as examples for machine learning al-gorithms to induce rules for feature selection or as the base for calculating a relevance score based on the observed frequency of requested features for a specific activity pattern. Attempts of modelling spatio-temporal behaviour of users for LBS are described in (Mountain and Raper 2002).
Figure 1: Relevance types for mobile cartographic applications (based on Saracevic, 1996)
Figure 2: A simple utility function for spatial distance of objects

Tumasch Reichenbacher44
4.5 Geographic information relevance assessmentApproaches to formalise relevance or importance of geospatial information are rather rare (Zipf 2003; Reichenbacher 2004; Reichenbacher 2005). The calculation of isolated relevance for the corresponding relevance types might improve the utility of services, but generally interdependencies exist between the single relevance dimensions and a concurrent determination of a com-pound relevance factor is certainly advantageous. An example of calculating such a compound relevance factor for events based on this approach is described in (Reichenbacher 2004). Individually calculated spatial, temporal, and thematic relevance values are summed up to a total relevance factor indicating the relevance of an event to the user with a specific topic interest at a certain location and time.
The spatial relevance is modelled as a function of spatial distance of the objects (O) to the current location (L): ( ) ( )OLdistfOR =Likewise temporal relevance can be modelled as a function of the temporal distance between the time of usage and a time refer-
ence of an object or event: ( ) ( )LOttdistfOR = . Thematic relevance can be modelled as a function of the distance between fea-ture attribute values and query terms organised as concepts (C) in an ontology. Then a semantic distance function could look like:
( ) ( )qOCCdistfOR = . Such methods for computing semantic similarity measures are described for instance in the SPIRIT proj-ect (Jones et al. 2001). Simplistically the general relevance R for an object Oi can be modelled as a function:
( ) ∑=
•=n
jjji rwOR
0 ;where j is the relevance type (spatial, temporal, …), rj is the value for the relevance type j, and wj is the weight for value j.The setting of weights for the considered relevance types is dependent on context. In practice not all relevance types have to or can be considered in the function. Yet, the consideration of more than one relevance type produces a more differentiated picture of object relevancies (see Reichenbacher 2005).Of course the proposed calculation is oversimplified and does so far not take into account mutual influences of the single relevance dimensions. In addition, apart from the spatial distance to the user’s position spatial relevance might become apparent as (1) an area of interest (AOI) and (2) an activity or social space. Correspondingly temporal relevance (timeliness) can express itself as (1) a time period or interval (e.g. duration, day, or month) in which a point of interest is relevant or an activity is practicable, (2) reachability (means of transport/timetable; speed; constraints) or (3) qualitatively or socially defined times (e.g. leisure time).
5 Applications of relevance in mobile cartographyThe application of relevance to mobile cartography is twofold: 1) relevance of geospatial features in relation to a specific usage situation may be used for selecting or filtering geographic information from geodatabases. 2) relevance measures can be applied to the map graphics to visually encode the differences in relevance. Both applications should improve the usability substantially by in-creasing the relevance of the presented information. It has to be stressed here that the two different applications reflect together the significant distinction between the terms relevance and saliency. The former relates to geospatial objects in the (geospatial) infor-mation space. The latter refers to map objects in the visual/symbolic map space. The main task of cartography is to select as many relevant objects as possible and portray them adequately as salient features in a map (Dent 1999). This construction of relevance for mobile usage situations is achieved through personalisation which is not equally feasible with static map products (Fig. 3).Classic static maps have to supply a greater quantity and more general kind information to meet different information needs not known a priori. Mobile, personalised maps on the other hand can be based on queries that express an information need and can be much more tailored to specific usage contexts. By that they tend to include more of the relevant and fewer of the irrelevant ob-jects.The design methodology for mobile maps follows quite tightly the thematic mapping approach. The two main parts of the map are
the base map layer and the thematic layer.General and universal information that is more or less equally relevant for all kind of mobile maps is collected in the base map layer. This layer holds the information necessary for orientation and spatial reference. However, referential information can also be selected in a hierarchical manner as distinct levels of detail.On top of the base map layer specific features relevant for the usage con-text are composed to one or several thematic layers. The content of such a layer is dependent on the spatial problem to be supported by it. For locali-sation support the user’s position in the map and visible landmarks have to be shown. For way finding support possible routes and route specific landmarks need to be included in the map. In addition features matching the user’s interests (e.g. historical sites), special needs (e.g. WC for handi-capped) or role (e.g. tourist) might be contained along the route. To support user activities the relevant features for a specific activity are portrayed in
Figure 3: Relevance enhancement through map personalisation

The concept of relevance in mobile maps 45
the layer. Features that are of general relevance to the activity can be separated from additional features that are user specific for that activity. For instance, for the activity biking the thematic layer might show bike routes depending on user specific characteristics or interests, e.g. young/old, fit/unfit. Features matching the general topic of interest to the user form thematic map layers. The thematic information is either presented as individual points of interest (POI) or areas of interests (AOI) that might be clusters of POI.The producing of mobile maps starts with filtering geographic information based on relevance. In a first step spatial filtering is ac-complished by pre-selecting those features included in an AOI for instance through the activity zone. The application of buffers is an alternative method for pre-selecting relevant objects for specific locations or along routes.The parameters for a geographical object query can be derived from the context parameter values. The OGC Filter Encoding Imple-mentation Specification (OGC 2001) offers a wide range of operators to build filter expressions for queries. Spatial operators are used for comparing the spatial relations between the query and the features (e.g. within, overlaps, intersects, contains, DWithin, BBOX, etc.). The non-spatial properties can be filtered by comparison operators such as =, ≠, <, >, etc. Both types of operators can be composed to more complex filters by applying the logical operators. Temporal relevance filtering can be based on feature in-formation, if a temporal relation is stored as an attribute of the feature. Thematically relevant objects can be filtered by comparing feature attributes with query terms. Alternatively features might be filtered based on a pre-computed normalised compound relevance measure. The selection of rel-evant objects against non-relevant would then be determined by the setting of a relevance threshold value, e.g. retrieve all objects with R > 0.75.As explained above there is a difference in relevancy and appropriateness or adequacy of the presentation. A high value of informa-tion relevance, i.e. feature filtering, alone does not necessarily lead to a high degree of relevance of visualisation where cartographic knowledge is essential. The overall relevance of a presentation of geographic information might not fully exploit its potential. Through different adaptations in the visualisation domain a higher total relevance of a mobile map service can be realised (Reichen-bacher 2004). The next chapter illustrates possible techniques of visualising differences in relevance in mobile maps.
6 Relevance visualisationsMobile map based services aim at presenting geographic information with the highest possible relevance to the user. First of all the selected or filtered objects need to be appropriately symbolised. An augmentation to the service utility is the visual presentation of the relevance of the objects that can be more efficiently processed when synoptically perceived. One way to visualise relevance in a mobile map is the direct mapping of relevance values to graphical variables, i.e. the attempt to transform relevance values to salience cues. Thereby either binary relevance, i.e. relevant and non-relevant, or degrees of relevance (relevance order, grades of relevance) can be encoded. The cartographic toolbox is rich in techniques for putting visual emphasis or focus on important features or for emphasising their relevance respectively. Some examples are listed below and also illustrated in Figure 4:- highlighting the object using luscious colours, e.g. pink or yellow (colour)- focussing the object while blurring the other objects (clarity)- decreasing the opacity of the object against the other objects (opacity)- rotating a symbol against the other symbols of the same kind (orientation)- emphasising the outline of the object (size)
Moreover dynamic variables such as duration, frequency, or order can be applied to animations of the classic graphical variables to attract the user’s attention, i.e. to show for instance the most relevant object among relevant objects. For such examples like co-lour transformations, symbol rotation or blinking symbols, or increasing and shrinking, as well as further examples of application of different graphical variables and metaphors (hotspot metaphor, fade-away metaphor) to the relevance visualisation of POI and events see (Reichenbacher 2005). The relevance of POI can intuitively be visualised as different grades of opacity values for the POI symbol (Fig. 5 left). Generally the features of the base map are symbolised in grey or in very light colours as shown in Fig. 5 left and right. However, if single feature classes or features are highly relevant for an activity or context they can be emphasised by showing them in colours commonly used. In the case of an intended ‘walk through the nature parts of the city’ the green areas and water courses and bodies are relevant and would be specially accentuated (Fig. 5 middle). A possible way to intuitively convey the relevance of different AOI is the cold-hot metaphor. Different grades of blue and red hues are picked to present the hotness or coolness of an area (Fig. 5 right).Although the usability of mobile map based services is likely to be improved by incorporating relevance, it poses at the same time new problems: so far it is not clear which graphical variables are more apt for efficiently visualising relevance. In addition, the meaning of relevance symbolisation encoded is not always obvious for the user. Colours of map symbols and relevance symbolisation might disturb each other or colours might be already taken by map symbols and may no longer be available for relevance visualisation.Technically relevance filtering and visualisation are implemented within an adaptive geovisualisation service as described by (Reichenbacher 2004). The service sends requests to a Web Feature Server (WFS) which in turn delivers features encoded in GML that can be transformed to Scalable Vector Graphics (SVG) encoded maps through Extensible Stylesheet Language Transformation (XSLT). This
Figure 4: Examples of feature emphasising
techniques usable for relevance visualisation

Tumasch Reichenbacher46
approach offers various possibilities for bringing more relevance into the service. First, filter operations can be included in the WFS request and second the XSL transformation allows for the mapping of context derived relevance values to graphical variables which are mostly easily codable as SVG elements.
7 ConclusionsThis paper aimed at unveiling the benefits of a deeper understanding of the relevance concept for mobile cartography and illus-trated that applying relevance values to mobile geovisualisation services can enhance the service usability. Further research should focus on connecting typical activities of mobile users, their embedment in contexts with fitting feature sets and the most suitable presentation forms for these activities. The general feasibility and performance efficiency of relevance computation must be proved before an application to mobile services can make sense, since time is one crucial factor in mobile services. Further enhancements should focus on interdependencies of the single relevance dimensions and a more differentiated formalisation of the relevance as-sessment. The effects of relevance filtering and visualisation within map based mobile services need to be tested in user studies with everyday tasks.
8 ReferencesCosijn, E. and Ingwersen, P. (2000): Dimensions of relevance, Information Processing and Management 36: 533-550. Crestani, F., Lalmas, M., van Rijsbergen, C. J. and Campbell, I. (1998): “Is This Document Relevant? ... Probably”: A Survey of Probabilisitic
Models in Information Retrieval, ACM Computing Surveys 30(4): 528-552. Dent, B. D. (1999): Cartography. Thematic Map Design, Dubuque (IA), Wm. C. Brown. Dey, A. K. and Abowd, G. D. (1999): Towards a Better Understanding of Context and Context- Awareness, Technical Report, GIT-GVU-99-22,
Georgia Institute of Technology, Atlanta, GA. Geake, V. (2000): Web mapping. Get mobile, it’s the place to be, GIS Europe(09/2000). http://www.geoplace.com/ge/2000/0900/0900mob.aspJones, C. B., Alani, H. and Tudhope, D. (2001): Geographical Information Retrieval with Ontologies of Place, in D. R. Montello (Ed.), Spatial In-
formation Theory: Foundations of Geographic Information Science, International Conference, COSIT 2001, Morro Bay, CA, USA, September 19-23, 2001, Proceedings. Lecture Notes in Computer Science 2205, New York, Springer, 322-335. http://eprints.ecs.soton.ac.uk/5706/01/CB-JonesCOSITrevised.pdf
Mizzaro, S. (2001): A New Measure Of Retrieval Effectiveness (Or: What’s Wrong With Precision And Recall), in T. Ojala (Ed.), International Workshop on Information Retrieval (IR’2001), Infotech Oulu, Oulu, Finland, September 19-21, 2001, 43-52.
Mountain, D. and Raper, J. (2002): Modelling human spatio-temporal behaviour: A challenge for location-based services, Proceedings AGI 2002 Nivala, A.-M. and Sarjakoski, L. T. (2003): Need for Context-Aware Topographic Maps in Mobile Devices, Proceedings 9th Scandinavian Research
Conference on Geographic Information Science ScanGIS’2003, Espoo, Finland. OGC (2001): Filter Encoding Implementation Specification, Open GIS Implementation Specification, Project Document OGC 02-059, Open GIS
Consortium. Oinas-Kukkonen, H. and Kurkela, V. (2003): Developing Successful Mobile Applications, Proceedings International Conference on Computer Sci-
ence and Technology (IASTED), Cancun, Mexico, May 19-21, 2003, 50-54. http://www.oasis.oulu.fi/publications/cst03-ho.pdfRaper, J., Dykes, J., Wood, J., Mountain, D., Krause, A. and Rhind, D. (2002): A framework for evaluating geographical information, Journal of
Information Science 28(1): 39-50. Reichenbacher, T. (2004): Mobile Cartography - Adaptive Visualisation of Geographic Information on Mobile Devices, München, Verlag Dr. Hut. Reichenbacher, T. (2005): The Importance of Being Relevant, Proceedings XXII International Cartographic Conference, A Coruna, Spain, July
9-16, 2005. Saracevic, T. (1996): Relevance reconsidered, Proceedings Second Conference on Conceptions of Library and Information Science (CoLIS 2),
Copenhagen, October 14-17, 1996, 201-218. Schmidt, A., Beigl, M. and Gellersen, H.-W. (1998): There is more to context than location, Proceedings International Workshop on Interactive Ap-
plications of Mobile Computing (IMC98), Rostock, November, 1998. Schmidt, A. and Gellersen, H.-W. (2001): Modell, Architektur und Plattform für Informationssysteme mit Kontextbezug, Informatik Forschung
und Entwicklung(16): 213-224. Sperber, D. and Wilson, D. (1986): Relevance: Communication and cognition, Cambridge (MA), Harvard University Press. Sperber, D. and Wilson, D. (1995): Relevance: Communication and cognition, Oxford, Blackwell. van Rijsbergen, C. J. (1979): Information Retrieval, London, Butterworths. Wilson, D. and Sperber, D. (2004): Relevance Theory, in L. Horn (Ed.), Handbook of Pragmatics, Oxford, Blackwell, 607-632. Zipf, A. (2003): Die Relevanz von Geoobjekten in Fokuskarten - Zur Bestimmung von Funktionen für die personen- und kontextsensitive Bew-
ertung der Bedeutung von Geoobjekten für Fokuskarten, Proceedings Symposium für Angewandte Geographische Informationstechnologie. AGIT 2003, Salzburg, Austria.
Figure 5: Relevance of POI encoded with opacity (left); colour-grey contrast (middle); hot-cold metaphor (right). (© base data: Städtisches Vermessungsamt München)
Wireless Campus LBS - A test bed for cartographically aware database objects
Barend Köbben, Kavitha Muthukrishnan, Nirvana Meratnia, Georgi Koprinkov
1 IntroductionThe Wireless Campus LBS project has been started in early 2005. It’s an informal co-operation between people at the University of Twente (UT) Computer Architecture Design and Test for Embedded Systems group (Arthur van Bunningen, Kavitha Muthukrish-nan, Nirvana Meratnia, Georgi Koprinkov), the UT department of Information Technology, Library & Education (Sander Smit, Je-roen van Ingen Schenau) and the International Institute for Geo-Information Science and Earth Observation (Barend Köbben). The initial ideas for the CampusLBS were reported earlier in the workshop report in [1], its first test phase was executed and reported on during SVG Open 2005, the 4th Annual Conference on Scalable Vector Graphics [2]. The Wireless Campus LBS is intended to serve as a test bed for research as well as to benefit from the outcomes of this research. The research mentioned goes deeper into Wireless LAN positioning techniques, into context awareness of ubiquitous data management system, and into adaptive delivery of mapping information for LBS and mobile applications by using cartographically aware database objects. This paper firstly describes the setup of the system as realised until now (September 2005) and reports on the results of the first real use case, providing the participants at SVG Open 2005 with an LBS to help them navigate the conference locations and locate fellow attendants. Secondly the paper will introduce the use of the Wireless Campus LBS as a test bed for the application of carto-graphically aware database objects.
2 The Wireless Campus at the University of TwenteIn June 2003 the “Wireless Campus” was inaugurated at the University of Twente (UT), allowing cable–free internet access to staff and students anywhere on campus. University of Twente is a young university in the Eastern part of The Netherlands. It employs 2 500 people and has over 6 000 students. On its campus, the university has 2,000 student rooms. The university campus is situated between the cities of Enschede and Hengelo, near the Dutch–German border. Spread over the 140–hectare campus 650 individual wireless network access points have been installed, making it Europe’s largest uniform wireless hotspot. Anyone with a PC, laptop, PDA or other WiFi (wireless fidelity) enabled device can access the university’s network and the internet from any building, the campus park and other facilities without cabling. University of Twente’s Wireless Campus aims at a broad range of research and applications of wireless and mobile telecommunica-tion. Furthermore, a project has just started in cooperation with Enschede Municipality to install further access points to also cover the downtown area of Enschede. Research projects investigate the technology and the applications of wireless and mobile communication in several ways, mostly in cooperation with industrial and other knowledge partners. The Wireless Campus has become a ‘test bed’ for wireless and mobile applications. The major part of this research takes place at the Centre for Telematics and Information Technology (CTIT) and the re-search institute MESA+. Both are key research institutes of the University of Twente. MESA+ is an institute that conducts research in the fields of nanotechnology, microsystems, materials science and microelectronics. CTIT is an academic ICT research institute of the University of Twente. It conducts research on the design of advanced ICT systems and their application in a variety of ap-plication domains. Its Computer Architecture Design and Test for Embedded Systems Group became interested in using the WiFi technology in the wider framework of the SmartSurroundings research program. This program is “investigating a new paradigm for bringing the flexibility of information technology to bear in every aspect of daily life. It foresees that people will be surrounded by deeply embedded and flexibly networked systems (…). This presents a paradigm shift from personal computing to ubiquitous computing, (…). Relevant knowledge areas include embedded systems, computer architecture, wireless communication, distrib-uted computing, data and knowledge modelling, application platforms, human-computer interaction, industrial design, as well as application research in different settings and sectors” [3]. An important part of such systems is establishing the position of persons, services and devices, and one of the possible strategies to achieve that is to use WiFi technology.
3 Positioning using WiFi technologyUsing WiFi technology for positioning is just one of the many wireless techniques available for positioning of mobile users. There are various reasons to choose WiFi based localization. One is the fact that it is an economical solution. Because the wireless net-

Barend Köbben, Kavitha Muthukrishnan, Nirvana Meratnia, Georgi Koprinkov48
work infrastructure already exists, localization can be done by software-only methods without adding any additional hardware. Secondly, compared to other techniques such as InfraRed, Bluetooth or RFID, the range covered by WiFi is larger. Thirdly, such as system is scalable and (re)useable in many situations, because wireless networks are currently being deployed all over the world in places like universities, airports, offices, shopping malls, etc.
3.1 MethodologyAs in most WLAN-based indoor positioning systems, our localization algorithm relies on the observed signal strength distribution as its input to determine the location. There are three basic methods of using WiFi signals for determining the location of users [4]: (a) triangulation that requires at least three distinct estimates of the distance of a mobile device with a WiFi receiver from known fixed locations, (b) using the direction or angle of arrival of at least two distinct signals from known locations and (c) employing location fingerprinting schemes. In indoor areas, the signal will almost always be reflected from various objects (such as walls and ceilings). Because of this multipath environment, techniques that use only triangulation or direction might not be very reliable. Location fingerprinting refers to techniques that match the fingerprint of some characteristic of the signal that is location depen-dent. The fingerprints of different locations are stored in a database and matched to measured fingerprints at the current location of a receiver. In WLANs, an easily available signal characteristic is the received signal strength (RSS) and this has been used in CampusLBS for fingerprinting. But the RSS is a highly variable parameter and issues related to positioning systems based on RSS fingerprinting are not under-stood very well. The big advantage of RSS-based techniques is that we can use the existing infrastructure to deploy a positioning system with minimum additional devices. It is far easier to obtain RSS information than the multipath characteristic, the time or the angle of arrival, these all require additional signal processing. The RSS information can be used to determine the distance between a transmitter and a receiver in two ways. The first approach is to map the path loss of the received signal to the distance travelled by the signal from the transmitter to the receiver. With the knowledge of the RSS from at least three transmitters, we can locate the receiver by using triangulation. The main drawback is the necessary calibration of signal strength as a function of a particular loca-tion. There is a trade-off between the amount of effort put into the calibration (it requires lots of time and work and should be per-formed repeatedly) and the accuracy obtained. Little research as of yet has addressed the issue of optimising the calibration effort. The current WiFi based component is based upon an earlier project called “FriendFinder” [5], done in 2004 for two specific build-ings on the University campus. In this project a prototype client-server architecture was built, where the client program on the mo-bile device determines its location by detecting the Access Points (APs) in range and comparing them with data about the APs that are in a server-side database. This database stores the location in XYZ of the, their BSSIDs (the unique identifier of an AP), and the strength of their antenna output (in mW).Tests have shown that the FriendFinder pilot achieved an average positioning accuracy just under 5 meters (4.6m), and only for non-moving devices. In the Wireless Campus LBS project the positioning component is part of a wider PhD research, described in [6], into a variety of positioning techniques for LBS. To achieve this, the research investigates the positioning algorithms, the filters and methods used, and also the effects of signal-reflecting obstacles on the measurements. These obstacles, such as walls and pillars, are included in the geodatabase and could therefore be accounted for in the positioning algorithm. Another area of further research will be the self-learning abilities of the system, that should theoretically make the positioning more accurate over time. One of it’s main research goals will be to have calibration-free localization preserving quality and accuracy.
3.2 Mapping the Access PointsThe WiFi based positioning algorithm is dependent on an initial mapping stage, in which the coordinates of all the access points in 3D coordinate system had to be recorded in a database. For the FriendFinder project mentioned above, only a limited number of the Access Points (APs) had been used. As no geoscientists where involved at that stage, their positioning was done in a rather impro-vised way. The height of the APs especially was a problem, it was determined only by estimate and with respect to the building’s ground floor height. In this limited project that was not a big problem, as only one building was involved, but for the larger project the elevation differences between the buildings (more than 5 meters, which is a lot for the Dutch!) had to be taken into account. The 650 individual wireless network APs that have been installed were only indicated on paper maps, one map per floor, of the in-dividual buildings of the University. The base maps are print-outs from CAD–drawings (“blue–prints”) maintained by the Facility Management Services that have a high level of detail, but they are not georeferenced and thus have a local, arbitrary, coordinate system that’s basically just ‘paper coordinates’. Furthermore, the location of the APs had been indicated on these maps haphazardly by hand-drawn symbols at the time of installation of the devices. Therefore the first task has been the digital mapping of the AP locations in a geodatabase. In order to do this, it was decided to digi-tise all locations using GIS software and digitally georeferenced versions of the CAD-drawings. The georeferencing was achieved by transformation of the CAD drawings, using control points from an overview map of the whole campus that is available in the Dutch national coordinate system “Rijks Driehoeksstelsel” (RD). It was established that it would be possible, when using simple first order transformations, to achieve Root Mean Square Errors of less than 0.1m. For all buildings a base elevation was determined in meters above NAP (the Dutch vertical datum) by combining the campus map with the Actual Height Model of the Netherlands, a detailed elevation model of the whole country made by airborne laser altimetry, which has a point density of minimal 1 point per 16 square metres and a systematic error of 5 centimetres maximum [URL1]. In order to get precise location measurements, it was deemed necessary to physically visit all APs and use a laser measurement de-

Wireless Campus LBS - A test bed for cartographically aware database objects 49
vice to determine the relative location of the AP antenna with respect to the elements of the building present in the CAD drawings (walls, floors, windows). By combining these relative measurements with the georeferenced maps a precise XYZ location has been determined and put into a geodatabase. The added bonus is that all APs have been checked and additional attributes was gathered, such as antenna type, antenna connection length (for estimating signal loss), etc.
3.3 Localization algorithmThe WiFi device inside the laptop or PDA periodically scans its environment to discover access points in the vicinity. During the access point scanning phase, the BSSID address of the access points and their Recorded Signal Strengths (RSS) are determined and stored. At any unknown location ‘n’ in the conference venue, the variation of the signal strength will be: at each n RSS varies as 0 >=RSS <=MAX.
However, the signal strengths are usually contaminated by noise. In order to have a better estimation of the actual location, an ex-ponential moving average filter is employed to smoothen the signal strength. Equation 1 shows the formula used in doing so, in which α =0.125 and SS denotes the observed signal strength:
Current RSS = α * (1 - Current RSS) + α (previous RSS) (Equation 1)
To compute the users location, the top three access points having the best signal strength are chosen. If the device gets only one or two access points in the scan, it can still estimate a position. But, as triangulation is used, the localization will be of better quality if at least three access points are used.
4 The Wireless Campus Location Based Services Their has recently been a lot of industry and research activity in the realm of “Location Based Services” (LBS). The purpose of the project described here is not the development of ‘the’ or even ‘a’ Wireless Campus LBS, but rather to investigate and set up the infrastructure necessary for LBS’s based on it. It combines input from several research projects with the practical application of new as well as established techniques to provide useful services for the UT campus population.
4.1 FLAVOUR: first tests at SVG Open 2005The first use case test of the Wireless Campus LBS was to provide the participants of a conference held at the UT grounds this summer (15–18 August 2005) with an LBS to help them navigate the conference locations and locate fellow attendants. This con-ference, SVG Open 2005, the 4th Annual Conference on Scalable Vector Graphics [URL2], was deemed to be a good test bed as it drew a crowd of some 180 people from 20 countries all over the world, from a very wide field of applications: electronic arts & media, geospatial sciences, information technologies, computer sciences, software developers, Web application designers, etc. They share an interest in Scalable Vector Graphics (SVG), the W3C open standard enabling high-quality, dynamic, interactive, styleable graphics to be delivered over the Web using XML. Most of them are technology–oriented and there is a high degree of interest in, and ownership of, mobile devices. The application built for testing by the par-ticipants has been called FLAVOUR (Friend-ly Location-aware conference Assistant with priVacy Observant architectURe). Services offered by FLAVOUR can be categorized into: - Pull services, in which location of atten-dants play an important role as the atten-dants’ request will be replied by the system on the basis of their whereabouts. Examples of pull services offered are: - Finding fellow attendants;- Locating resources available in the infra-structure such as printers, copiers, coffee ma-chines etc.- Push services, in which individual and bulk messages are sent to the attendants. This en-ables the attendants to:- Be notified about important events by con-ference organizers;
Fig. 1: FLAVOUR architecture (from [2]).
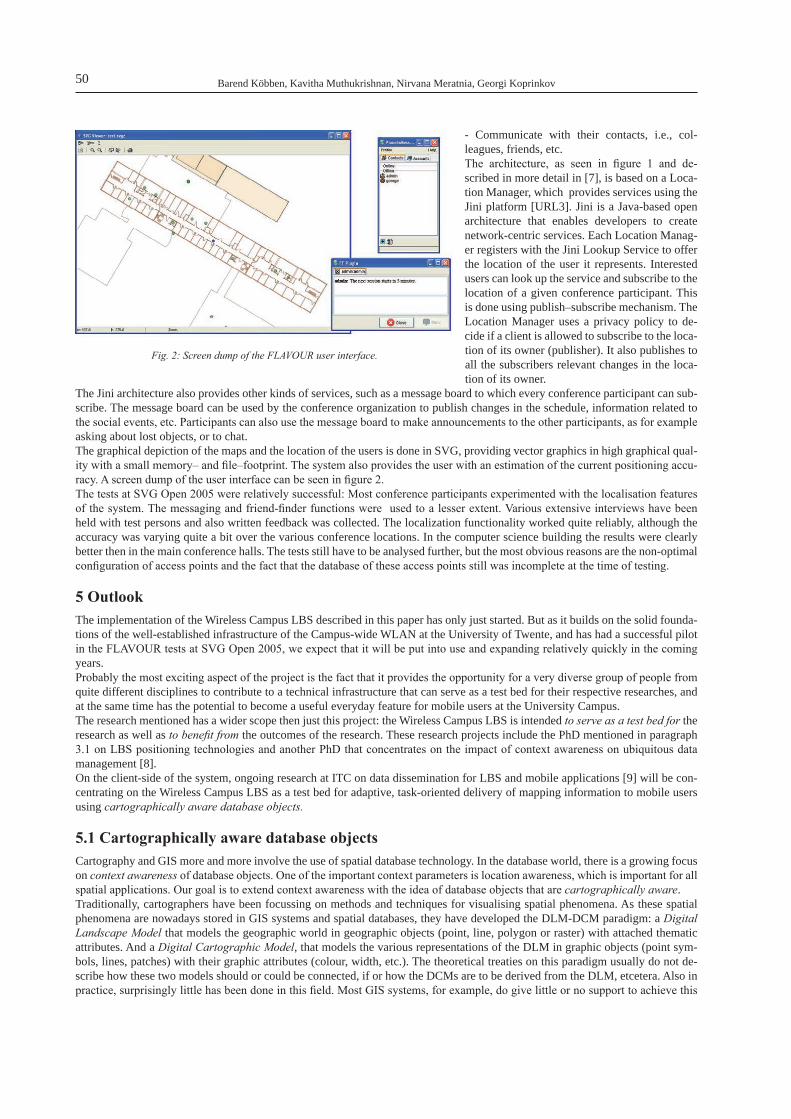
Barend Köbben, Kavitha Muthukrishnan, Nirvana Meratnia, Georgi Koprinkov50
- Communicate with their contacts, i.e., col-leagues, friends, etc.The architecture, as seen in figure 1 and de-scribed in more detail in [7], is based on a Loca-tion Manager, which provides services using the Jini platform [URL3]. Jini is a Java-based open architecture that enables developers to create network-centric services. Each Location Manag-er registers with the Jini Lookup Service to offer the location of the user it represents. Interested users can look up the service and subscribe to the location of a given conference participant. This is done using publish–subscribe mechanism. The Location Manager uses a privacy policy to de-cide if a client is allowed to subscribe to the loca-tion of its owner (publisher). It also publishes to all the subscribers relevant changes in the loca-tion of its owner.
The Jini architecture also provides other kinds of services, such as a message board to which every conference participant can sub-scribe. The message board can be used by the conference organization to publish changes in the schedule, information related to the social events, etc. Participants can also use the message board to make announcements to the other participants, as for example asking about lost objects, or to chat. The graphical depiction of the maps and the location of the users is done in SVG, providing vector graphics in high graphical qual-ity with a small memory– and file–footprint. The system also provides the user with an estimation of the current positioning accu-racy. A screen dump of the user interface can be seen in figure 2.The tests at SVG Open 2005 were relatively successful: Most conference participants experimented with the localisation features of the system. The messaging and friend-finder functions were used to a lesser extent. Various extensive interviews have been held with test persons and also written feedback was collected. The localization functionality worked quite reliably, although the accuracy was varying quite a bit over the various conference locations. In the computer science building the results were clearly better then in the main conference halls. The tests still have to be analysed further, but the most obvious reasons are the non-optimal configuration of access points and the fact that the database of these access points still was incomplete at the time of testing.
5 OutlookThe implementation of the Wireless Campus LBS described in this paper has only just started. But as it builds on the solid founda-tions of the well-established infrastructure of the Campus-wide WLAN at the University of Twente, and has had a successful pilot in the FLAVOUR tests at SVG Open 2005, we expect that it will be put into use and expanding relatively quickly in the coming years. Probably the most exciting aspect of the project is the fact that it provides the opportunity for a very diverse group of people from quite different disciplines to contribute to a technical infrastructure that can serve as a test bed for their respective researches, and at the same time has the potential to become a useful everyday feature for mobile users at the University Campus.The research mentioned has a wider scope then just this project: the Wireless Campus LBS is intended to serve as a test bed for the research as well as to benefit from the outcomes of the research. These research projects include the PhD mentioned in paragraph 3.1 on LBS positioning technologies and another PhD that concentrates on the impact of context awareness on ubiquitous data management [8]. On the client-side of the system, ongoing research at ITC on data dissemination for LBS and mobile applications [9] will be con-centrating on the Wireless Campus LBS as a test bed for adaptive, task-oriented delivery of mapping information to mobile users using cartographically aware database objects.
5.1 Cartographically aware database objectsCartography and GIS more and more involve the use of spatial database technology. In the database world, there is a growing focus on context awareness of database objects. One of the important context parameters is location awareness, which is important for all spatial applications. Our goal is to extend context awareness with the idea of database objects that are cartographically aware. Traditionally, cartographers have been focussing on methods and techniques for visualising spatial phenomena. As these spatial phenomena are nowadays stored in GIS systems and spatial databases, they have developed the DLM-DCM paradigm: a Digital Landscape Model that models the geographic world in geographic objects (point, line, polygon or raster) with attached thematic attributes. And a Digital Cartographic Model, that models the various representations of the DLM in graphic objects (point sym-bols, lines, patches) with their graphic attributes (colour, width, etc.). The theoretical treaties on this paradigm usually do not de-scribe how these two models should or could be connected, if or how the DCMs are to be derived from the DLM, etcetera. Also in practice, surprisingly little has been done in this field. Most GIS systems, for example, do give little or no support to achieve this
Fig. 2: Screen dump of the FLAVOUR user interface.
Wireless Campus LBS - A test bed for cartographically aware database objects 51
DLM–DCM model other than “by hand”, or by providing some templates and default settings. Truly ‘automated cartography’ us-ing this concept has in fact not been made possible. Connecting this problem with the context awareness research in databases might provide a way forward. Instead of treating the DLM and the DCM as separate parts, why not have single spatial database objects that represent spatial phenomena and that are cartographically aware…? One might think of an object that represents a road. The object would be spatially aware in that it has a spatial representation (eg. as a vector), and may be cartographically aware that to be represented for topographic purposes at scale 1:25 000, its should be a 2 mm wide red line with 0.1 mm black casing. While this concept on first sight might not seem to work out much different than the traditional legend tables of a GIS system, the main strength is in the fact that here the cartographic aware-ness is on an object level, not on a per layer basis, and could be subject to all kinds of (database) rules and triggers. This way, the cartographic (and other) characteristics of the objects can be influenced by other database objects and their context. As a simple example one might think of a location map in the Wireless Campus LBS where the spatial distance of the objects to the focus of the map (the users position) influences their representation: Interior walls only show themselves in buildings that the user is in, room numbers only if the user is within reading distance. But more complicated systems could be thought up, which might be especially useful for generalisation techniques that are hard to achieve in traditional layer-based systems. It is our intention to use the Wireless Campus LBS to test these concepts in practice and provide a proof of concept application.
6 WWW References[1] AHN site – http://www.ahn.nl/english.php [2] SVG Open 2005 – http://www.svgopen.org/2005/ [3] Jini platform – http://www.sun.com/jini/
7 References[1] Köbben, B., A. v. Bunningen & K. Muthukrishnan (2005): Wireless Campus LBS - Building campus-wide Location Based Services based on
WiFi technology. Proceedings of 1st International Workshop on Geographic Hypermedia, E. Stefanakis & M. Peterson (eds.). Denver (USA). pp. unpaginated CD-ROM.
[2] Muthukrishnan, K., N. Meratnia, et al. (2005): SVGOpen Conference Guide: An overview. Proceedings of SVG Open 2005, B. Köbben & J. Koolwaaij (eds.). Enschede: Stichting SVG Nederland. pp. unpaginated CD-ROM and website.
[3] Havinga, P., P. Jansen, et al. (2004): Smart Surroundings. Proceedings of 5th PROGRESS Symposium on Embedded Systems. Nieuwegein, The Netherlands: PROGRESS/STW. pp. 64-69.
[4] Kaemarungsi, K. & P. Krishnamurthy (2004): Modelling of indoor positioning systems based on location fingerprinting. Proceedings of INFO-COM 2004 - The Conference on Computer Communications: IEEE. pp. 1013-1023.
[5] Bockting, S., N. Hoogma, et al. (2004): FriendFinder Project, Localisatie met Wireless LAN. MSc. University of Twente: Enschede: 54 p.[6] Muthukrishnan, K., M. E. Lijding & P. Havinga (2005): Towards Smart Surroundings: Enabling Techniques and Technologies for Localization.
Proceedings of LOCA2005 – co-allocated with the 3rd International Conference on Pervasive Computing. Munich: Springer Verlag. pp. 11.[7] Muthukrishnan, K., N. Meratnia & M. Lijding (2005): FLAVOUR- Friendly Location- aware conference Aid with priVacy Observant architec-
tURe. CTIT Technical report TR-CTIT-05-28. University of Twente, CTIT: Enschede: 16 p.[8] Bunningen, A. H. v., L. Feng & P. M. G. Apers (2005): Context for Ubiquitous Data Management. Proceedings of Paper accepted for Interna-
tional Workshop on Ubiquitous Data Management (UDM2005). Tokyo: IEEE.[9] Köbben, B. (2004): RIMapper - a test bed for online Risk Indicator Maps using data-driven SVG visualisation. Proceedings of 2nd Sypmposium
on Location Based Services and TeleCartography, G. Gartner (ed.). Wien: Institute of Cartography and Geo-Media Techniques. pp. 189-195.
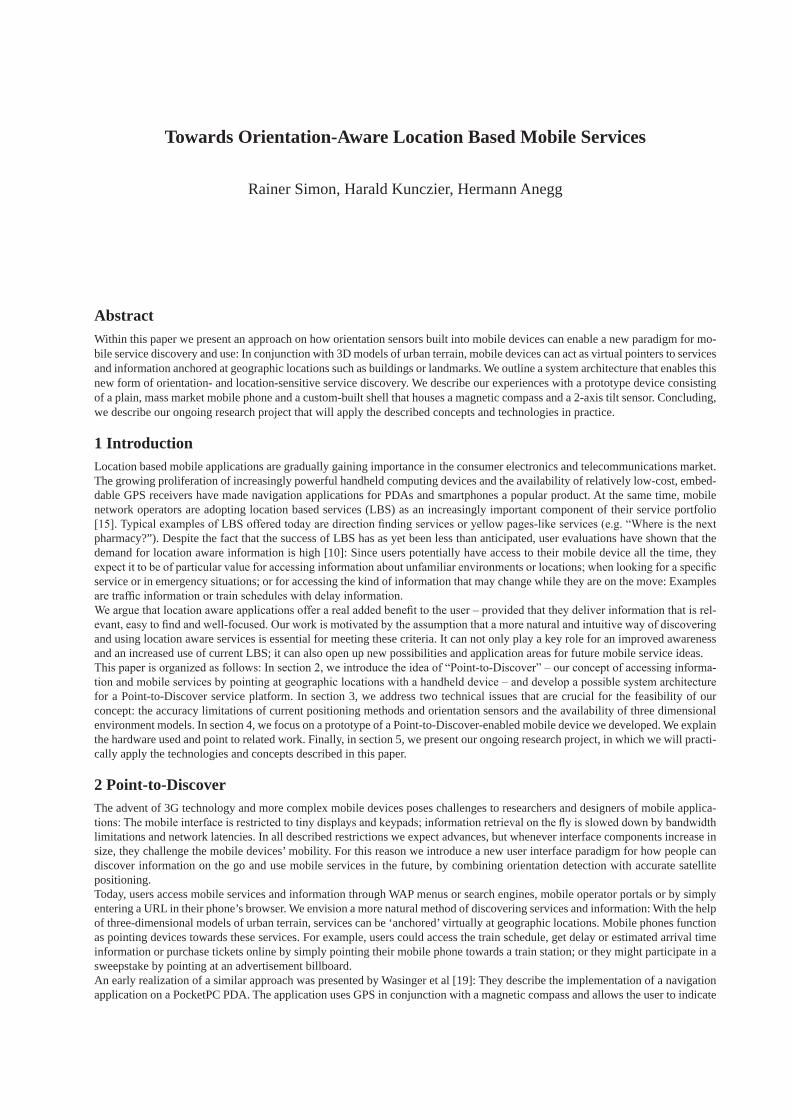
Towards Orientation-Aware Location Based Mobile Services
Rainer Simon, Harald Kunczier, Hermann Anegg
AbstractWithin this paper we present an approach on how orientation sensors built into mobile devices can enable a new paradigm for mo-bile service discovery and use: In conjunction with 3D models of urban terrain, mobile devices can act as virtual pointers to services and information anchored at geographic locations such as buildings or landmarks. We outline a system architecture that enables this new form of orientation- and location-sensitive service discovery. We describe our experiences with a prototype device consisting of a plain, mass market mobile phone and a custom-built shell that houses a magnetic compass and a 2-axis tilt sensor. Concluding, we describe our ongoing research project that will apply the described concepts and technologies in practice.
1 IntroductionLocation based mobile applications are gradually gaining importance in the consumer electronics and telecommunications market. The growing proliferation of increasingly powerful handheld computing devices and the availability of relatively low-cost, embed-dable GPS receivers have made navigation applications for PDAs and smartphones a popular product. At the same time, mobile network operators are adopting location based services (LBS) as an increasingly important component of their service portfolio [15]. Typical examples of LBS offered today are direction finding services or yellow pages-like services (e.g. “Where is the next pharmacy?”). Despite the fact that the success of LBS has as yet been less than anticipated, user evaluations have shown that the demand for location aware information is high [10]: Since users potentially have access to their mobile device all the time, they expect it to be of particular value for accessing information about unfamiliar environments or locations; when looking for a specific service or in emergency situations; or for accessing the kind of information that may change while they are on the move: Examples are traffic information or train schedules with delay information. We argue that location aware applications offer a real added benefit to the user – provided that they deliver information that is rel-evant, easy to find and well-focused. Our work is motivated by the assumption that a more natural and intuitive way of discovering and using location aware services is essential for meeting these criteria. It can not only play a key role for an improved awareness and an increased use of current LBS; it can also open up new possibilities and application areas for future mobile service ideas.This paper is organized as follows: In section 2, we introduce the idea of “Point-to-Discover” – our concept of accessing informa-tion and mobile services by pointing at geographic locations with a handheld device – and develop a possible system architecture for a Point-to-Discover service platform. In section 3, we address two technical issues that are crucial for the feasibility of our concept: the accuracy limitations of current positioning methods and orientation sensors and the availability of three dimensional environment models. In section 4, we focus on a prototype of a Point-to-Discover-enabled mobile device we developed. We explain the hardware used and point to related work. Finally, in section 5, we present our ongoing research project, in which we will practi-cally apply the technologies and concepts described in this paper.
2 Point-to-DiscoverThe advent of 3G technology and more complex mobile devices poses challenges to researchers and designers of mobile applica-tions: The mobile interface is restricted to tiny displays and keypads; information retrieval on the fly is slowed down by bandwidth limitations and network latencies. In all described restrictions we expect advances, but whenever interface components increase in size, they challenge the mobile devices’ mobility. For this reason we introduce a new user interface paradigm for how people can discover information on the go and use mobile services in the future, by combining orientation detection with accurate satellite positioning.Today, users access mobile services and information through WAP menus or search engines, mobile operator portals or by simply entering a URL in their phone’s browser. We envision a more natural method of discovering services and information: With the help of three-dimensional models of urban terrain, services can be ‘anchored’ virtually at geographic locations. Mobile phones function as pointing devices towards these services. For example, users could access the train schedule, get delay or estimated arrival time information or purchase tickets online by simply pointing their mobile phone towards a train station; or they might participate in a sweepstake by pointing at an advertisement billboard.An early realization of a similar approach was presented by Wasinger et al [19]: They describe the implementation of a navigation application on a PocketPC PDA. The application uses GPS in conjunction with a magnetic compass and allows the user to indicate
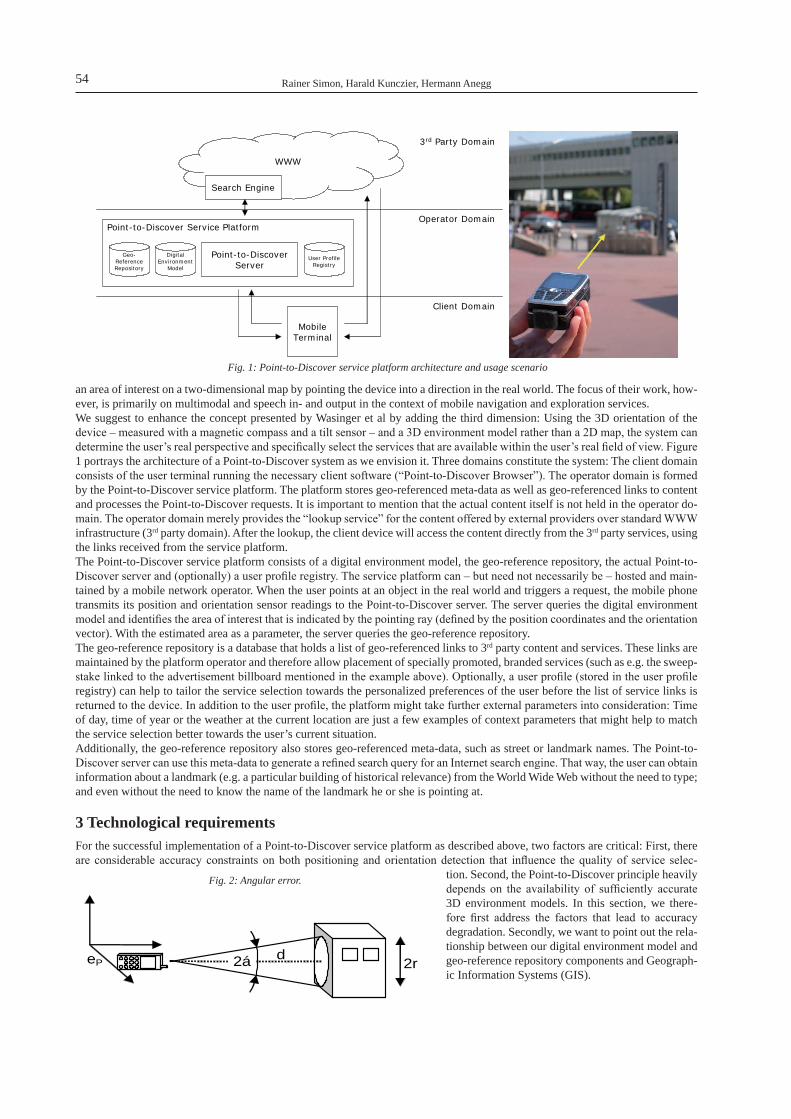
Rainer Simon, Harald Kunczier, Hermann Anegg54
an area of interest on a two-dimensional map by pointing the device into a direction in the real world. The focus of their work, how-ever, is primarily on multimodal and speech in- and output in the context of mobile navigation and exploration services.We suggest to enhance the concept presented by Wasinger et al by adding the third dimension: Using the 3D orientation of the device – measured with a magnetic compass and a tilt sensor – and a 3D environment model rather than a 2D map, the system can determine the user’s real perspective and specifically select the services that are available within the user’s real field of view. Figure 1 portrays the architecture of a Point-to-Discover system as we envision it. Three domains constitute the system: The client domain consists of the user terminal running the necessary client software (“Point-to-Discover Browser”). The operator domain is formed by the Point-to-Discover service platform. The platform stores geo-referenced meta-data as well as geo-referenced links to content and processes the Point-to-Discover requests. It is important to mention that the actual content itself is not held in the operator do-main. The operator domain merely provides the “lookup service” for the content offered by external providers over standard WWW infrastructure (3rd party domain). After the lookup, the client device will access the content directly from the 3rd party services, using the links received from the service platform.The Point-to-Discover service platform consists of a digital environment model, the geo-reference repository, the actual Point-to-Discover server and (optionally) a user profile registry. The service platform can – but need not necessarily be – hosted and main-tained by a mobile network operator. When the user points at an object in the real world and triggers a request, the mobile phone transmits its position and orientation sensor readings to the Point-to-Discover server. The server queries the digital environment model and identifies the area of interest that is indicated by the pointing ray (defined by the position coordinates and the orientation vector). With the estimated area as a parameter, the server queries the geo-reference repository.The geo-reference repository is a database that holds a list of geo-referenced links to 3rd party content and services. These links are maintained by the platform operator and therefore allow placement of specially promoted, branded services (such as e.g. the sweep-stake linked to the advertisement billboard mentioned in the example above). Optionally, a user profile (stored in the user profile registry) can help to tailor the service selection towards the personalized preferences of the user before the list of service links is returned to the device. In addition to the user profile, the platform might take further external parameters into consideration: Time of day, time of year or the weather at the current location are just a few examples of context parameters that might help to match the service selection better towards the user’s current situation.Additionally, the geo-reference repository also stores geo-referenced meta-data, such as street or landmark names. The Point-to-Discover server can use this meta-data to generate a refined search query for an Internet search engine. That way, the user can obtain information about a landmark (e.g. a particular building of historical relevance) from the World Wide Web without the need to type; and even without the need to know the name of the landmark he or she is pointing at.
3 Technological requirementsFor the successful implementation of a Point-to-Discover service platform as described above, two factors are critical: First, there are considerable accuracy constraints on both positioning and orientation detection that influence the quality of service selec-
tion. Second, the Point-to-Discover principle heavily depends on the availability of sufficiently accurate 3D environment models. In this section, we there-fore first address the factors that lead to accuracy degradation. Secondly, we want to point out the rela-tionship between our digital environment model and geo-reference repository components and Geograph-ic Information Systems (GIS).
Point-to-Discover Service Platform
User ProfileRegistry
DigitalEnvironment
Model
Geo-ReferenceRepository
Operator Domain
Client Domain
3rd Party Domain
WWW
Point-to-DiscoverServer
MobileTerminal
Search Engine
Fig. 1: Point-to-Discover service platform architecture and usage scenario
d 2á 2r eP
Fig. 2: Angular error.
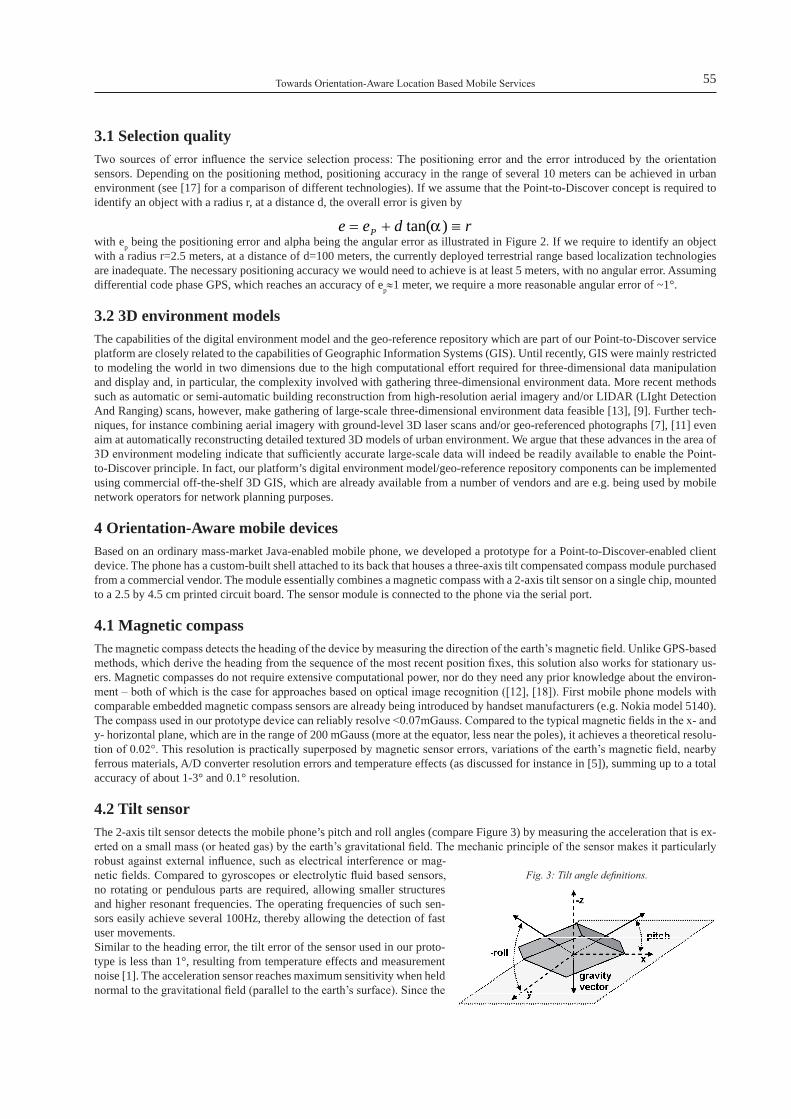
Towards Orientation-Aware Location Based Mobile Services 55
3.1 Selection qualityTwo sources of error influence the service selection process: The positioning error and the error introduced by the orientation sensors. Depending on the positioning method, positioning accuracy in the range of several 10 meters can be achieved in urban environment (see [17] for a comparison of different technologies). If we assume that the Point-to-Discover concept is required to identify an object with a radius r, at a distance d, the overall error is given by
rdee P ≡+= )tan(αwith ep being the positioning error and alpha being the angular error as illustrated in Figure 2. If we require to identify an object with a radius r=2.5 meters, at a distance of d=100 meters, the currently deployed terrestrial range based localization technologies are inadequate. The necessary positioning accuracy we would need to achieve is at least 5 meters, with no angular error. Assuming differential code phase GPS, which reaches an accuracy of ep≈1 meter, we require a more reasonable angular error of ~1°.
3.2 3D environment modelsThe capabilities of the digital environment model and the geo-reference repository which are part of our Point-to-Discover service platform are closely related to the capabilities of Geographic Information Systems (GIS). Until recently, GIS were mainly restricted to modeling the world in two dimensions due to the high computational effort required for three-dimensional data manipulation and display and, in particular, the complexity involved with gathering three-dimensional environment data. More recent methods such as automatic or semi-automatic building reconstruction from high-resolution aerial imagery and/or LIDAR (LIght Detection And Ranging) scans, however, make gathering of large-scale three-dimensional environment data feasible [13], [9]. Further tech-niques, for instance combining aerial imagery with ground-level 3D laser scans and/or geo-referenced photographs [7], [11] even aim at automatically reconstructing detailed textured 3D models of urban environment. We argue that these advances in the area of 3D environment modeling indicate that sufficiently accurate large-scale data will indeed be readily available to enable the Point-to-Discover principle. In fact, our platform’s digital environment model/geo-reference repository components can be implemented using commercial off-the-shelf 3D GIS, which are already available from a number of vendors and are e.g. being used by mobile network operators for network planning purposes.
4 Orientation-Aware mobile devicesBased on an ordinary mass-market Java-enabled mobile phone, we developed a prototype for a Point-to-Discover-enabled client device. The phone has a custom-built shell attached to its back that houses a three-axis tilt compensated compass module purchased from a commercial vendor. The module essentially combines a magnetic compass with a 2-axis tilt sensor on a single chip, mounted to a 2.5 by 4.5 cm printed circuit board. The sensor module is connected to the phone via the serial port.
4.1 Magnetic compassThe magnetic compass detects the heading of the device by measuring the direction of the earth’s magnetic field. Unlike GPS-based methods, which derive the heading from the sequence of the most recent position fixes, this solution also works for stationary us-ers. Magnetic compasses do not require extensive computational power, nor do they need any prior knowledge about the environ-ment – both of which is the case for approaches based on optical image recognition ([12], [18]). First mobile phone models with comparable embedded magnetic compass sensors are already being introduced by handset manufacturers (e.g. Nokia model 5140). The compass used in our prototype device can reliably resolve <0.07mGauss. Compared to the typical magnetic fields in the x- and y- horizontal plane, which are in the range of 200 mGauss (more at the equator, less near the poles), it achieves a theoretical resolu-tion of 0.02°. This resolution is practically superposed by magnetic sensor errors, variations of the earth’s magnetic field, nearby ferrous materials, A/D converter resolution errors and temperature effects (as discussed for instance in [5]), summing up to a total accuracy of about 1-3° and 0.1° resolution.
4.2 Tilt sensorThe 2-axis tilt sensor detects the mobile phone’s pitch and roll angles (compare Figure 3) by measuring the acceleration that is ex-erted on a small mass (or heated gas) by the earth’s gravitational field. The mechanic principle of the sensor makes it particularly robust against external influence, such as electrical interference or mag-netic fields. Compared to gyroscopes or electrolytic fluid based sensors, no rotating or pendulous parts are required, allowing smaller structures and higher resonant frequencies. The operating frequencies of such sen-sors easily achieve several 100Hz, thereby allowing the detection of fast user movements.Similar to the heading error, the tilt error of the sensor used in our proto-type is less than 1°, resulting from temperature effects and measurement noise [1]. The acceleration sensor reaches maximum sensitivity when held normal to the gravitational field (parallel to the earth’s surface). Since the
Fig. 3: Tilt angle definitions.
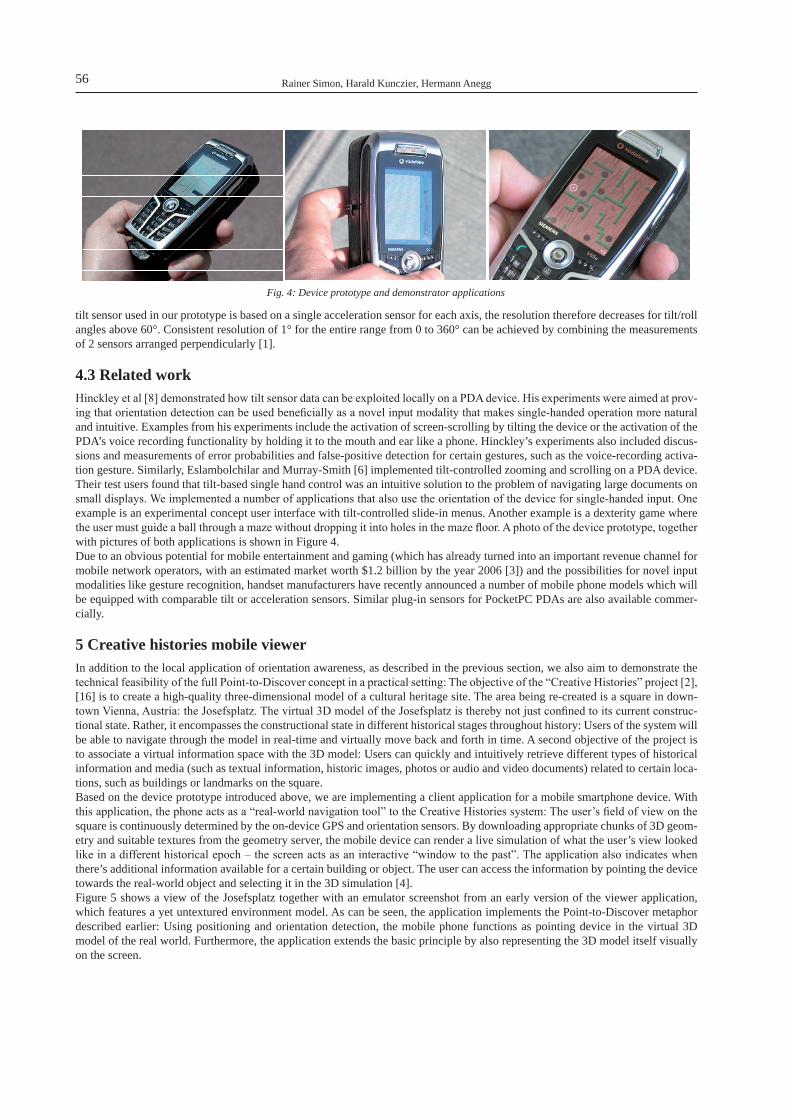
Rainer Simon, Harald Kunczier, Hermann Anegg56
tilt sensor used in our prototype is based on a single acceleration sensor for each axis, the resolution therefore decreases for tilt/roll angles above 60°. Consistent resolution of 1° for the entire range from 0 to 360° can be achieved by combining the measurements of 2 sensors arranged perpendicularly [1].
4.3 Related workHinckley et al [8] demonstrated how tilt sensor data can be exploited locally on a PDA device. His experiments were aimed at prov-ing that orientation detection can be used beneficially as a novel input modality that makes single-handed operation more natural and intuitive. Examples from his experiments include the activation of screen-scrolling by tilting the device or the activation of the PDA’s voice recording functionality by holding it to the mouth and ear like a phone. Hinckley’s experiments also included discus-sions and measurements of error probabilities and false-positive detection for certain gestures, such as the voice-recording activa-tion gesture. Similarly, Eslambolchilar and Murray-Smith [6] implemented tilt-controlled zooming and scrolling on a PDA device. Their test users found that tilt-based single hand control was an intuitive solution to the problem of navigating large documents on small displays. We implemented a number of applications that also use the orientation of the device for single-handed input. One example is an experimental concept user interface with tilt-controlled slide-in menus. Another example is a dexterity game where the user must guide a ball through a maze without dropping it into holes in the maze floor. A photo of the device prototype, together with pictures of both applications is shown in Figure 4.Due to an obvious potential for mobile entertainment and gaming (which has already turned into an important revenue channel for mobile network operators, with an estimated market worth $1.2 billion by the year 2006 [3]) and the possibilities for novel input modalities like gesture recognition, handset manufacturers have recently announced a number of mobile phone models which will be equipped with comparable tilt or acceleration sensors. Similar plug-in sensors for PocketPC PDAs are also available commer-cially.
5 Creative histories mobile viewerIn addition to the local application of orientation awareness, as described in the previous section, we also aim to demonstrate the technical feasibility of the full Point-to-Discover concept in a practical setting: The objective of the “Creative Histories” project [2], [16] is to create a high-quality three-dimensional model of a cultural heritage site. The area being re-created is a square in down-town Vienna, Austria: the Josefsplatz. The virtual 3D model of the Josefsplatz is thereby not just confined to its current construc-tional state. Rather, it encompasses the constructional state in different historical stages throughout history: Users of the system will be able to navigate through the model in real-time and virtually move back and forth in time. A second objective of the project is to associate a virtual information space with the 3D model: Users can quickly and intuitively retrieve different types of historical information and media (such as textual information, historic images, photos or audio and video documents) related to certain loca-tions, such as buildings or landmarks on the square.Based on the device prototype introduced above, we are implementing a client application for a mobile smartphone device. With this application, the phone acts as a “real-world navigation tool” to the Creative Histories system: The user’s field of view on the square is continuously determined by the on-device GPS and orientation sensors. By downloading appropriate chunks of 3D geom-etry and suitable textures from the geometry server, the mobile device can render a live simulation of what the user’s view looked like in a different historical epoch – the screen acts as an interactive “window to the past”. The application also indicates when there’s additional information available for a certain building or object. The user can access the information by pointing the device towards the real-world object and selecting it in the 3D simulation [4].Figure 5 shows a view of the Josefsplatz together with an emulator screenshot from an early version of the viewer application, which features a yet untextured environment model. As can be seen, the application implements the Point-to-Discover metaphor described earlier: Using positioning and orientation detection, the mobile phone functions as pointing device in the virtual 3D model of the real world. Furthermore, the application extends the basic principle by also representing the 3D model itself visually on the screen.
Fig. 4: Device prototype and demonstrator applications

Towards Orientation-Aware Location Based Mobile Services 57
6 AcknowledgementsProject Creative Histories is funded by the WWTF (Wiener Wissenschafts-, Forschungs- und Technologiefonds) fund-ing programme. It is a collaborative re-search project of the Austrian National Library, the Austrian Research Institute for Artificial Intelligence (OFAI), the Research Center for Virtual Reality and Visualiza-tion, Ltd. (VrVis), and the Telecommuni-cations Research Center Vienna (ftw.).
7 References[1] “Accelerometer fundamentals”, memsic application note, AN-00MX-001, http://www.memsic.com/[2] “Creative Histories – The Josefsplatz Experience” project homepage. http://www.josefsplatz.info/[3] “Sega, AT&T Wireless Push Mobile Gaming.” Wireless News Factor Press release, http://www.wirelessnewsfactor.com/perl/story/19673.html[4] Baillie, L., Kunczier, H., Anegg, H., “Rolling, Rotating and Imagining in a Virtual Mobile World.” 7th International Conference on Human Com-
puter Interaction with Mobile Devices and Services (MobileHCI 05), Salzburg, Austria, September 19-22, 2005.[5] Caruso, M., “Applications of Magnetic Sensors for Low Cost Compass Systems.” Honeywell SSEC, http://www.magneticsensors.com/[6] Eslambolchilar, P., Murray-Smith. R. “Tilt-Based Automatic Zooming and Scaling in Mobile Devices – A State-Space Implementation.” Pro-
ceedings of the Mobile HCI conference (Mobile HCI’2004), Glasgow, Scotland, September, 13-16, 2004. Springer-Verlag, Heidelberg, 2004, 120-131.
[7] Frueh, C., Zakhor, A., “Constructing 3D City Models by Merging Ground-Based and Airborne Views.” IEEE Computer Graphics and Applica-tions, Vol. 23, no. 6, pp. 52-61, November/December 2003.
[8] Hinckley, K., Pierce, J., Sinclair, M., Horvitz, E. “Sensing Techniques for Mobile Interaction”, 13th ACM Symposium on User Interface Soft-ware and Technology, San Diego, California, USA, 2000.
[9] Hu, J., You, S., Neumann, U., Park, K. K. “Building Modeling from LIDAR and Aerial Imagery.” ASPRS’04, Denver, Colorado, USA. May 23-28, 2004.
[10] Kaasinen, E., “User Needs for Location-Aware Mobile Services.” Personal and Ubiquitous Computing, Volume 7, Issue 1, May 2003.[11] Karner, K., Bauer, J., Klaus, A., Schindler, K., “MetropoGIS: a city information system.”, IEEE Conference on Image Processing (ICIP’02),
Rochester, USA, 2002[12] López de Ipiña, D., Mendonça, P. R. S., Hopper, A., “TRIP: A Low-Cost Vision-Based Location System for Ubiquitous Computing.” Personal
and Ubiquitous Computing, Vol. 6, pp 206-219, Issue 3, May, 2002.[13] Nevatia, R., Price, K., “Automatic and Interactive Modeling of Buildings in Urban Environments from Aerial Images.” IEEE Conference on
Image Processing (ICIP’02), Rochester, USA, 2002. [14] Parkinson, B. W., Spilker Jr., J. J. (ed.), “Global Positioning System: Theory and Applications”, Vol. 2, American Institute of Aeronautics and
Astronautics, Inc., 370 L’Enfant Promenade, SW, Washington, DC 20024-2518, 1996[15] Rao, B., Minakakis, L., “Evolution of Mobile Location-based Services.” Communications of the ACM. December 2003. Vol. 46, No. 12.[16] Sormann, M., Reitinger, B., Bauer, J., Klaus, A., Karner, K., “Fast and Detailed 3D Reconstruction of Cultural Heritage.” International Work-
shop on Vision Techniques applied to the Rehabilition of City Centres, 2004.[17] Syrjärinne, J., “Studies of Modern Techniques for Personal Positioning”, Doctoral Thesis, Tampere University of Technology, March 2001.[18] Ulrich, I., Nourbakhsh, I., “Appearance-Based Place Recognition for Topological Localization.” IEEE International Conference on Robotics
and Automation, San Francisco, USA, April, 2000, pp. 1023-1029.[19] Wasinger, R., Stahl, C., Krüger, A., “M3I in a Pedestrian Navigation & Exploration System”. 5th International Symposium on Human Computer
Interaction with Mobile Devices (MobileHCI 2003), Udine, Italy, September 8-11, 2003.
Fig. 5: Creative Histories mobile viewer application (untextured model)

Intuitive GIS-based Interaction for Mobile Services
Thorsten Schulz, Heiko Blechschmied
Since the introduction of graphical user interfaces the methods of user-computer interaction have mainly remained unchanged. Commonly used modalities like typing and clicking are quite appropriate for standard applications, but they are not suited for more complex tasks like access to geographical data. To improve the communication between human beings and computers in such situ-ations, the department of Graphic Information Systems of the Fraunhofer Institute for Computer Graphics (IGD) have developed a system that addresses effective information visualization by integrating domain knowledge and knowledge about human situation awareness, a well-suited representation of and interaction with multidimensional maps even on mobile devices. Mobile hardware is continuously getting smaller and lighter; and the communication bandwidth is increasing. Continuing advances in the area of communication technologies enables users to get access to information from everywhere at every time. According to getting cheaper prizes for hardware and communication more and more people are enabled to be part of the computer revolution. Today even a mobile phone is suitable to use mobile services, which may be used by everyday users. Without long training periods all the users want to get access to information they are looking for. They will use services of other provides, if this is not possible and other solutions are available. Intuitive to use user-computer interfaces are required. But com-pared to the rapid progresses in the communication technology area, the development results to user-computer interaction are clearly lagging behind. Today’s services are mostly simple text-based query and answer systems. Difficulties becomes apparent when a destination addresses have to be specified that correspond to a user’s mental image of a loca-tion. If the user doesn’t know or simply can not remember e.g. the name of a street, he has to describe the object or the surround-ing environment of interest, which he has in mind. Even if a keyboard of a mobile device is available, it’s difficult for the users to describe the corresponding query in a verbal way. Even if possible a common presentation of textual information or a fixed map is also not suitable. The understanding of results containing geographic data like the recognition of buildings is not supported. We are presenting a system, which enables efficient interaction for Location-based Services. Our solution addresses the described functional drawbacks of traditional Geographic Informationsystems (GIS) applications, when using such systems in mobile sce-narios. In particular we are presenting a solution based on ontology- and context-driven components, an alternative interaction metaphor, a mapping algorithm suitable for imprecise and ambiguity data and a suitable presentation of results. There may be other important components required to realize specific applications in the area of mobile GI-Systems, but the proposed components can provide a foundation for such systems. They may also be used in other domains like desktop solutions. In particular though, the importance of our approach can be shown in the specific area of mobile applications, where specific characteristics of the usage and the devices have to be taken into account.We propose a graph- and sketch-based interaction for mobile applications in our paper. The processing of flexible user inputs is helping to realize a more successful communication between man and computer. More directiveness (less difference between the goals of various users, their expectations, proceedings and the user interface) is supported. Applications based on our system en-able users to simply sketch objects and gestures as well as to place objects in the query area by use of icons. Spatial relationships can be described simply and effectively and can be very well obtained in a visual manner. In this way, specifications can be re-interpreted more easily. Humans and computers become better aware of the current task. Misunderstandings can be detected and avoided sooner. In our technology driven paper, we will de-scribe our concept and architecture in detail and how they can be used to build intuitive and efficient mobile systems. We will also describe possible uses of such systems in different sce-narios.
Fig. 1: Screenshots of the developed application based on the proposed system with graph- and sketch- interaction
Geo-Services and Computer Vision for Object Awareness in Mobile System Applications
Patrick Luley, Lucas Paletta, Alexander Almer, Mathias Schardt, Josef Ringert
AbstractIn recent years, location and context aware systems have been presented for the indexing and annotation of both location and user state relevant information to the user. These systems were mostly based on geo-referencing from GPS signals, and driven by changes of the system state in dependence on situations that impact the overall system performance (user pose, energy consump-tion, responsiveness, etc.). In this paper we focus attention on a completely innovative aspect of contextual indexing for mobile system applications. We claim that the application of geo-services and vision based sensing enables to determine object characteristic information that can be used for semantic indexing of information and thereby provides an innovative quality of service. Computer vision can be used to extract object information, such as, the identity of buildings (Figure 1), information signs, persons, etc., and thereby enables object based indexing which can finally be applied to extract a semantic description of the environment. Geo-services are mandatory to sup-port vision based object recognition and semantic indexing in several ways. Firstly, location based sensing provides a prior on the geo-reference of the objects in the field of view, reduces the number of possible object hypotheses and therefore can dramatically simplify the complexity of recognition. Secondly, vision provides an estimate of the user position from the geo-referenced object information. Geo-services can use this to reason more efficiently about a current object and user position.
1 IntroductionComputer vision is an emerging technology for providing reliable vision competences outdoors, dealing with the immense com-plexity of the visual input and associated degrees of freedom in image understanding. Mobile imaging as an upcoming technology will become ubiquitous such as in camera phones, vision enhanced handhelds, and wearable cameras. Mobile vision technology would make new approaches possible in scenarios of personal assistance, mobile work, assistive services and also in general loca-tion based services.Services, based on location awareness, require the knowledge about the actual location of the user, the current user context and geo-referenced information about areas and points of interest. Different technologies can be used to fulfill these requirements. Location awareness can be provided based on GPS, using wireless network technologies such as GSM and WLAN or using self-location possibilities e.g. based on street names and house numbers. Location awareness for a mobile service in urban areas can, by the use of GPS only, not be assured everywhere and anytime, because of the known weaknesses of GPS signal availability in urban areas. Mobile systems operating in urban environments must take advantage of contexts arising from the spatial and situated information at a current location of the pedestrian user. Therefore, location awareness can be realized based on the knowledge of the location of the geo-referenced objects of interest, which allows also determination of the user position.In frame of the projects MOBVIS (“Vision Technologies and Intelligent Maps for Mobile Attentive Interfaces in Urban Scenarios”, EC funded project) and “Mobile City Explorer”, which is a national funded project (Austrain Space Agency), a scenario of city ex-ploration (see Fig. 1) is proposed [LPA05], where the tourist pedestrian can send visual queries to a server based object recognition system. The goal of the system is to attain situated object awareness, i.e., to get the semantic information about the environment for object and location identification, to get semantically indexed access to knowledge data bases. This methodology has the ad-vantage that the object information is most appropriate to structure perception, and to structure the indexed search into annotation information. In the following chapters a mobile application system (see Fig. 2) will be described which offers area-wide location awareness based on a common smart-phone and image based object recognition tool in combination with a GPS module.
2 User scenarioThis section briefly describes a user scenario, in case of a city-tourist type pedestrian, focusing on the service of image based object recognition. The common way of doing city sightseeing is using a printed city map with integrated sightseeing-tours leading the tourist along a pre-defined path from one sight to the next. Brief descriptions of the sights can be found at the backside of the map.

Patrick Luley, Lucas Paletta, Alexander Almer, Mathias Schardt, Josef Ringert62
By the use of the image based object recognition service the tourist gets the freedom to explore the city without any pre-de-fined sightseeing tours. The tourist moves completely free through an unknown area and if he is interested in any object (e.g. a historical building or a statue) he just has to take a picture of it with his camera-phone, with or without GPS device connected, and pressing the “Iden-tify” button. As result he gets a detailed description of the object containing multi-media tourist information. As a second achieve-ment he also gets the position of the identified object which can be used for navigation. As the position is well known from the GPS device or the object recognition the Geo Services are able to render a map showing the surrounding area. This map is also sent to the tourist as part of the response of the object recognition and gives him an overview of the near ambience.Our user scenario and the role of image recognition in mobile tour guides was well-investigated in an usability study by Nigel Davies, Keith Cheverst, Alan Dix and Andre Hesse [DCDH05]. The result was that there is a very high acceptance for image based object recognition by tourists.
3 System architectureWe will briefly describe how a common smart-phone with built-in digital camera can be used for image based object recognition. A GPS device, built-in or connected to the phone via cable or Bluetooth can help to accelerate the recognition process consid-erably. The overall concept consists of three main phases. In the first phase, a software client is activated by a user on his personal smart phone. The software can be directly downloaded from a website to the internet enabled smart-phone and will then
be installed on the device. The software-client offers functionality to capture an image of an object the user intends to identify. Next, if available, the smart-phone reads the actual position from the GPS device. If the GPS cannot obtain a position for any reason, the cell information of the phone-network provider can be used to approximate the user location instead. The image of the object and the position of the snapshot-location are combined together into a SOAP Message and send to an image-recognition web-service, running on a dedicated server, over a common wireless internet connection like GPRS or UMTS.In the second phase, the web-service reads the request from the client (smart-phone) and extracts the image and the GPS position. The image is then analysed by a dedicated recognition algorithm to obtain representative image features like local descriptors that characterize a specific object. Next, these features are compared with reference features stored in an object-database. The database contains images of different objects, with the pre-processed features and the position of the snapshot-point. The object is then identified by matching the features of the user-picture with the features of in the database. This matching process can become, in the case of a large database with many objects, very time consuming and that is where the GPS position can help. To accelerate this process the set of objects under investigation in the database can be selected with the users GPS position. Only those database objects come into account for the matching process, which have corresponding images with a snapshot-point near the users-po-
sition. (Fig. 3) Once the object is identified the object-database is queried for some information containing text and pictures. This information is integrated into a SOAP-message and is then send to the smart-phone client as response.In the third phase the web-service response is presented to the user on the smart-phone. Addi-tional to the object quick information, contain-ing text, pictures and a location based city-map, there is an URL which can be used by the user to obtain detailed information about the object. The URL can be viewed in a common smart-phone internet browser like “Opera” or “Pocket Inter-net Explorer“. The URL contains, as a parameter, the unique identification number of the desired object and links to a dynamic website, which is generated at runtime on the server. The layout of
Fig. 1: Scenario: capturing an image about a building object of interest that is to be identified by the system.
Fig. 2: Overview of the mobile application systems concept

Geo-Services and Computer Vision for Object Awareness in Mobile System Applications 63
the website is optimized for the requesting hardware platform – because different smart-phones have different display reso-lutions. Fig. 2 illustrates the complete technical concept and its three phases.The aim of this client-server architecture is to bring the image based object recognition service to any person using a com-mon camera-phone and to gain scalability in reference of the number of objects in the database and complexity of the im-age-recognition algorithms.
4 Visual object recognition for object awarenessIn contrast to signal based approaches as proposed in most loca-tion based services, object awareness points towards semantic indexing which will enable much more flexible interpretation of the information from a local environment. Object aware-ness relies on a structural matching process of comparing the situated information extracted from the sensor streams with prototypical patterns that were developed from experience. In the case of computer vision, object recognition methods en-able to identify characteristic patterns of visual information in the field of view, such as, infrastructure objects (tourist sights, traffic signs, information boards, etc.), people, or objects of every days use (chair, lamp, mobile phone, etc.).Our proposed image based service for object awareness re-quires both, robust and fast visual object recognition of typi-cally low-quality outdoor images. We therefore applied a methodology that is highly suited for mobile vision applications, i.e., the Informative Features approach [FSPB04]. This method extracts state-of-the-art local image features, i.e., SIFT (Scale Invariant Feature Transform) descriptors [LOW04], from the greyscale image, in a first step. These texture patterns are then analysed to identify among them the most informative descriptors which are retained to establish a kind of attention filter. Responses in terms of most informative features are then matched to reference descriptors to provide a probability distribution on a pre-determined set of object hypotheses. In addition, the Informative Features approach enables to detect any object presence in the image, and back-ground vice versa [FSPB04]. We also provide a confidence value to quantify the degree of uncertainty in the final object decision, and thereby enable to define a ‘quality of service’ measure for usability analyses.
5 Geo ServicesAs already mentioned, the knowledge of the tourist position is a very important fact within the system, not only for routing and guidance purposes but also to support the matching algorithm for the object recognition. Primarily GPS is used for positioning. If GPS is not available, either the cell information of the phone-network provider, a successful accomplished object recognition, or a manual input of the street name and number can be used for position determination. In the later case the street name and number is matched against a database where all buildings are stored with their according coordinates. This is especially in urban areas a method where the user can determine the own position with minimal input an effort.The actual position is also used to present maps of the surrounding area of the tourist on the mobile device. The maps show a city map for orientation purposes, points of interest with continuative links, the GPS Track of the device and routing information. For the creation a map server application running on the server is used, cf. Fig. 2. In the current projects the map server originally developed by the University of Minnesota (UMN MapServer) is used. The map server primary function is to read data from vari-ous sources, which not necessarily need to be stored on the same computer, and pull these layers together into a graphic file. One layer may be the city map, another the points of interest, or the routing information. Each layer is overlaid or drawn on top of the others and then printed into a graphics for the tourist to see on the mobile device. Due to the fact that the map content depends on
Fig. 3: Geo-Context, e.g., from GPS based position estimates (‘M’ with blue uncertainty radius), can set priors by geographically indexing into a number of object hypotheses (‘X’s are coordinates of user positions while
capturing images about objects of interest).
Fig. 4: Sketch of the methodology used for object recognition in a robust framework. Local patterns (SIFT) are detected for an image description, filtering using only informative descriptors leads to a reduced description. This sparse description is matched towards a
reference description to determine object hypotheses.

Patrick Luley, Lucas Paletta, Alexander Almer, Mathias Schardt, Josef Ringert64
the user profile and interests, a dynamic creation of the content is nec-essary. This is done by using PHP MapScript, a dynamically loadable PHP module that makes the MapScript functions and classes of the map server available in a PHP environment.The map server application is able to easily integrate data stored in databases. For applications which bear strong relation to positions on earth the use of databases with support of geographic features is advis-able. In a lot commercial and open source databases this support can be found. In the context of the Mobile City Explorer project PostGIS is used. PostGIS adds support for geographic objects to the PostgreSQL object-relational database and follows the OpenGIS “Simple Feature Specification for SQL”. PostGIS enables the execution of spatial que-ries by offering spatial functions, such as Distance(), Intersect(), and Within(), among others, to narrow down the result of the search.Cartography on mobile devices is not comparable with traditional or digital cartography. The small display size, limited processor power of the device, and varying lightning conditions have to be taken into ac-count. The map must show only the relevant degree of details for the current task to avoid a too noisy overall impression on the small display. The dedicated use of colour and font size shall support the readability under different lightning conditions.
6 Conclusions Object awareness provides a concept for semantic indexing into huge information spaces where standard approaches suffer from the high complexity in the search processing otherwise, and provide a means to relate the mobile agent to a semantic aspect of the environment. Vi-sual object recognition using innovative and robust pattern recognition methodologies is an emerging technology to be applied in mobile com-puting services. Due to the many degrees of freedom in visual object recognition, it is highly mandatory to constrain object search by means of context based attention. In this paper we used geo-context to focus object recognition on a specific set of object hypotheses, and demon-strated that the challenging problem of identifying tourist sights in ur-ban environments can become feasible. In the projects MOBVIS and Mobile City Explorer our work will tar-get at further exploiting contextual relations in order to cut down the complexity in otherwise unconstrained visual object recognition and make mobile services feasible. This challenging research goal will be achieved by identifying and tracking spatio-temporal aspects of the user’s task context, improving the representation of geo-context by
multi-sensor information fusion, and by applying attention strategies on the visual input. In addition, future research results will be achieved in more developed demonstrators, using camera equipped phones and wearable interfaces as mobile platforms for presentation.
7 Acknowledgments This work is funded by the EU-IST project MOBVIS (FP6-511051) and the ASA via project “Mobile City Explorer” co-ordinated by Arsenal Research.
8 References [LPA05] Luley, P., Paletta, , Visual Object Detection from Mobile Phone Imagery for Context Awareness, Proc. 7th International Conference on Hu-
man Computer Interaction with Mobile Devices and Services, mobileHCI2005, Salzburg, Austria, September 19-22, 2005, pp. 385-386.[DCDH05] Davies, N., Cheverst, K., Dix, A., Hesse, A., Understanding the Role of Image Recognition in Mobile Tour Guides, Proc. 7th Interna-
tional Conference on Human Computer Interaction with Mobile Devices and Services, mobileHCI2005, Salzburg, Austria, September 19-22, 2005, pp. 191-198.
[LOW04] Lowe, D., Distinctive image features from scale-invariant keypoints, International Journal of Computer Vision 60(2), pp. 91-110, 2004. [FSPB04] Fritz, G., Seifert, C., Paletta, L., and Bischof, H., Rapid Object Recognition from Discriminative Regions of Interest, Proc. 19th National
Conference on Artificial Intelligence, AAAI 2004, San Jose, CA, July 25-29, 2004, pp. 444-449.
Fig. 5: Sample recognition of objects 15o and 18o (“Kunsthaus”, “Bärenapotheke”, out of the TSG-20 image reference database [Download at http://dib.joanneum.at/cape/
TSG-20]). Top down: (i) reference images, (ii) location of SIFT descriptors with colour coded quality of service, (iii) selection of high quality descriptors, (iv) distribution on object hypotheses with
correct decision based on maximum confidence.

Syndication of maps through the use of Really Simple Syndication (RSS)
Rex G. Cammack
1 IntroductionIn recent years the distribution of maps has changed from a single channel of distribution into a braided channel of distribution (Fig.1). One way of characterizing this change is by displaying media. Cartwright (1999) provides a detailed discussion on many of the newer multimedia technologies available to cartographers. Cartwright (1999) states that the multimedia development started in the mid-1980’s with the widespread adoptions of laserdisc and CD-ROMs. A justification for the development of multimedia cartography comes from Peterson’s (1999 p.35) view that paper maps were inadequate to “the essence of cartography – the repre-sentation and communication of the spatial and dynamic world”. As the digital age of cartography developed, cartographers used these new media types to challenge the dominance of the paper media. Along with these new media channels, a complex set of cartographic tools was developed. Currently cartographers must mix and match many of these new technology tools together to develop maps for multimedia, Internet and paper map products.
1.1 Portable mapsPeterson (1999) identifies two advantages of paper maps. The first being the portability of the paper maps while the second is the better display resolution. Coupled with these advantages the paper map clearly has several disadvantages. Peterson (1999) makes a case that the distribution o paper maps has been superseded by the distribution of Internet maps. By limiting the distribution of map information to the paper channel only, spatial knowledge and understanding is held by the upper classes and/or highly educated. This control of maps reinforces the segregation of society.Another issue to consider with making maps portable is the detachment of the cartographer from the map. Putting maps on paper and duplicating them for distribution, created a situation where the cartographer no longer accompanied the map and was allowed direct communication with the map user. This communication disconnect has long been a problem for cartography. One of the new-er trends in academics is the illustrated paper or poster session at academic conferences. The strength of this type of knowledge dis-tribution channel is that the sender and receiver are once again in direct personal contact. Cartographers could argue that this need for direct personal contact stems from the lack of clear design of the poster. And since the majority of academics are not adequately educated in visual communication they need to rely on personal communication to clarify the message. A different perspective is that cartographers still want to accompany their maps but the distribution efficiencies have made that impossible. Focusing on distribution efficiencies, Peterson (1999) suggested that the Internet has changed map use. Van Elzakker (2000) added that Internet maps have better accessibility and distribution. Gartner (2003) built on these ideas and coupled them with wireless tech-nology to suggest that Internet maps can play a key role in location-based services on wireless devices. Gartner (2003) called this fusion of ideas and technology “telecar-tography”. Along with telecartography, the term “ubiquitous mapping” (Morita, 2005) has been used to label the combi-nation of mapping technology, mobile display devices, wireless networks and location based services. In this research the term telecartography will be used. It should be noted that from the current lit-erature the two terms have many simi-larity. In the future telecartography and ubiquitous mapping may be demonstrat-ed to have a clear distinction but as yet they will be treated as the same. One could argue that the terms Internet mapping and multimedia cartography no longer have a clear distinction for the term cartography. The argument for this perspective would be that the map is a
Fig. 1: Comparison of the traditional paper map and braided map channels of information exchange.
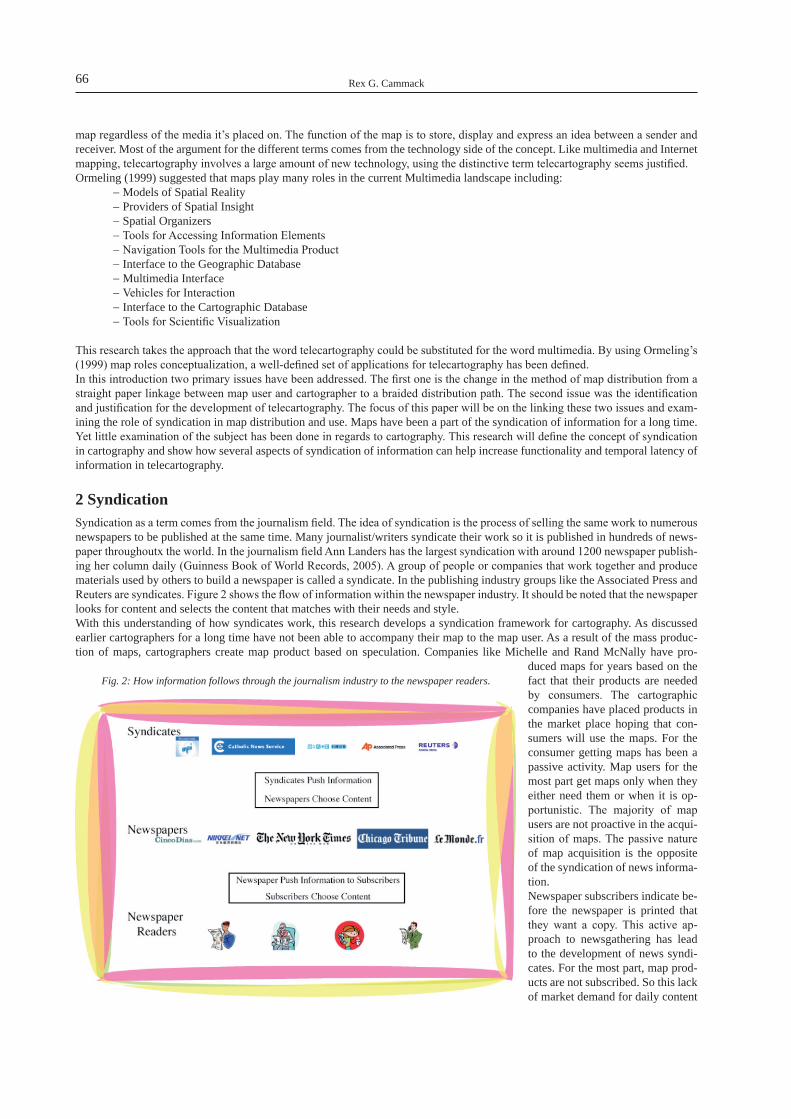
Rex G. Cammack66
map regardless of the media it’s placed on. The function of the map is to store, display and express an idea between a sender and receiver. Most of the argument for the different terms comes from the technology side of the concept. Like multimedia and Internet mapping, telecartography involves a large amount of new technology, using the distinctive term telecartography seems justified. Ormeling (1999) suggested that maps play many roles in the current Multimedia landscape including:
- Models of Spatial Reality- Providers of Spatial Insight- Spatial Organizers- Tools for Accessing Information Elements- Navigation Tools for the Multimedia Product- Interface to the Geographic Database- Multimedia Interface- Vehicles for Interaction- Interface to the Cartographic Database- Tools for Scientific Visualization
This research takes the approach that the word telecartography could be substituted for the word multimedia. By using Ormeling’s (1999) map roles conceptualization, a well-defined set of applications for telecartography has been defined. In this introduction two primary issues have been addressed. The first one is the change in the method of map distribution from a straight paper linkage between map user and cartographer to a braided distribution path. The second issue was the identification and justification for the development of telecartography. The focus of this paper will be on the linking these two issues and exam-ining the role of syndication in map distribution and use. Maps have been a part of the syndication of information for a long time. Yet little examination of the subject has been done in regards to cartography. This research will define the concept of syndication in cartography and show how several aspects of syndication of information can help increase functionality and temporal latency of information in telecartography.
2 Syndication Syndication as a term comes from the journalism field. The idea of syndication is the process of selling the same work to numerous newspapers to be published at the same time. Many journalist/writers syndicate their work so it is published in hundreds of news-paper throughoutx the world. In the journalism field Ann Landers has the largest syndication with around 1200 newspaper publish-ing her column daily (Guinness Book of World Records, 2005). A group of people or companies that work together and produce materials used by others to build a newspaper is called a syndicate. In the publishing industry groups like the Associated Press and Reuters are syndicates. Figure 2 shows the flow of information within the newspaper industry. It should be noted that the newspaper looks for content and selects the content that matches with their needs and style. With this understanding of how syndicates work, this research develops a syndication framework for cartography. As discussed earlier cartographers for a long time have not been able to accompany their map to the map user. As a result of the mass produc-tion of maps, cartographers create map product based on speculation. Companies like Michelle and Rand McNally have pro-
duced maps for years based on the fact that their products are needed by consumers. The cartographic companies have placed products in the market place hoping that con-sumers will use the maps. For the consumer getting maps has been a passive activity. Map users for the most part get maps only when they either need them or when it is op-portunistic. The majority of map users are not proactive in the acqui-sition of maps. The passive nature of map acquisition is the opposite of the syndication of news informa-tion. Newspaper subscribers indicate be-fore the newspaper is printed that they want a copy. This active ap-proach to newsgathering has lead to the development of news syndi-cates. For the most part, map prod-ucts are not subscribed. So this lack of market demand for daily content
Fig. 2: How information follows through the journalism industry to the newspaper readers.

Syndication of maps through the use of Really Simple Syndication (RSS) 67
has led to the passive map use community. It should be noted that one could argue that news information is fundamentally different from maps in the context of timeliness. News information is important for only a short period of time as compared to the informa-tion on the map that can be delivered later and used longer. A counter argument to the point is that some maps are timely and need to be delivered daily or in some cases more often. The best example of this timely need to deliver map information is weather maps. A weather map from three days ago does very few people much good while a weather map made ten second ago that shows the cur-rent conditions and projected weather over the next four hours can be used by most map users. Weather maps are already a part of most newspapers and some newspapers get their national or regional weather maps through a weather forecasting syndicate. The idea of syndicating maps is not a novel idea in cartography or geospatial science. The concept of a web mapping service can be considered a type of map syndication. In figure 2 one sees the role of syndicates and newspapers. Figure 3 shows how web mapping services fit in a syndication framework. The most important distinction between the journalism model (figure 2) and the geospatial science model (figure 3) is the concept of a subscription. In the journalism model the user subscribes to a service in the geospatial science model subscribing to a service doesn’t exist. This may stem back to the history of maps having passive users. The passiveness of the user might be from the lack of temporal urgency for the map users task. The next step in making a map syndicate is developing an expectation of temporal urgency. Gartner (2003) has suggested through telecartography an application of maps that has a temporal urgency. The integration of maps into the location based service paradigm has created an environment where maps need to be distributed to map users in a timely manner for any number of purposes. In the location based services, field map information might be available either through map brochures or public posted maps. But as Gartner (2003), Mount, et al. (2005), and Paelke, et al. (2005) show by using different wireless hand held computers, maps and mapping data can be delivered to map users based on positional information of the user. In this example a subscription relation between the map user and the information provided is still missing but they all show a pos-sible application for map subscriptions.
2.1 Syndication for TelecartographyThere are two possible types of map related telecartography subscriptions. The first type of subscription is one that delivers maps to the map user based on some set of subscription parameters. A map subscription type of relationship would deliver maps to the map user. An important point here is the concept that the delivery of the maps is active and not passive (Figure 4). A subscription to any media is an active process. The subscriber has stated their intent to receive information based on their knowledge of the media partner before the media is developed. For the media partner, having a subscriber group allows them to tailor their products to their customer base. In the telecartography paradigm a subscriber to a map navigation service would receive map data on demand based on both their current position or navigation destination. The other type of telecartography subscription is the thematic content only subscription. An example of this type of subscription would be for Automatic Teller Machines (ATMs). One could subscribe to a bank ATM location service and every time the indi-vidual was within a set mapping distance they could get the latest information about the ATM such open or closed. The next section describes the technical implementation of both subscription services based on existing Internet technologies.
2.2 Internet SyndicationThe most common form of syndication on the Internet is Really Simple Syndication (RSS). The RSS standard has been around for several years and gone through several ver-sions. Ayers and Watt (2005) give a detailed history and ex-planation of the difference be-tween the different RSS stan-dards (RSS 0.91, 0.92, 1.0 2.0, Atom 0.3 and 1.0). In recent years, the RSS standard was to be replaced by Atom be-cause of confusion regarding the different RSS versions (see Ayers and Watt 2005 for more details). Nearly all syndicates on the Internet use the RSS or Atom standard. The process of syndication on the Internet has three parts: content provider, aggregator and user. The con-
Fig. 3: How web mapping service function in a manner similar to syndicates in the journalism field.
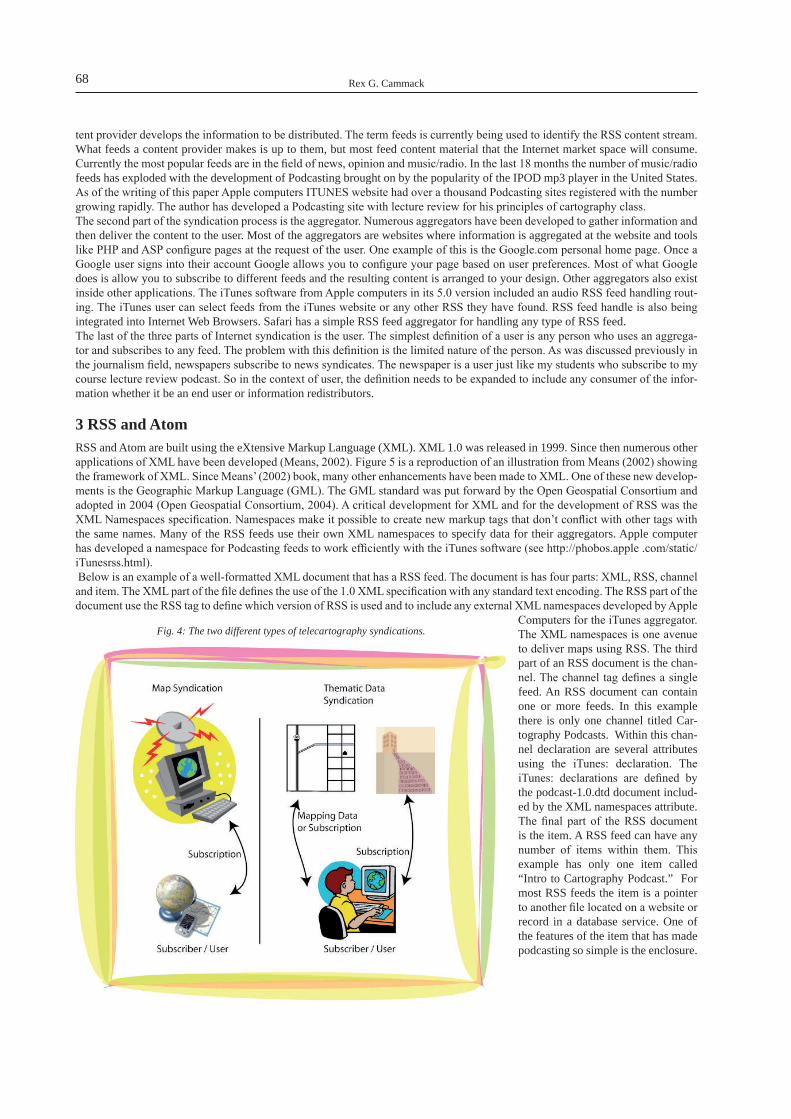
Rex G. Cammack68
tent provider develops the information to be distributed. The term feeds is currently being used to identify the RSS content stream. What feeds a content provider makes is up to them, but most feed content material that the Internet market space will consume. Currently the most popular feeds are in the field of news, opinion and music/radio. In the last 18 months the number of music/radio feeds has exploded with the development of Podcasting brought on by the popularity of the IPOD mp3 player in the United States. As of the writing of this paper Apple computers ITUNES website had over a thousand Podcasting sites registered with the number growing rapidly. The author has developed a Podcasting site with lecture review for his principles of cartography class. The second part of the syndication process is the aggregator. Numerous aggregators have been developed to gather information and then deliver the content to the user. Most of the aggregators are websites where information is aggregated at the website and tools like PHP and ASP configure pages at the request of the user. One example of this is the Google.com personal home page. Once a Google user signs into their account Google allows you to configure your page based on user preferences. Most of what Google does is allow you to subscribe to different feeds and the resulting content is arranged to your design. Other aggregators also exist inside other applications. The iTunes software from Apple computers in its 5.0 version included an audio RSS feed handling rout-ing. The iTunes user can select feeds from the iTunes website or any other RSS they have found. RSS feed handle is also being integrated into Internet Web Browsers. Safari has a simple RSS feed aggregator for handling any type of RSS feed. The last of the three parts of Internet syndication is the user. The simplest definition of a user is any person who uses an aggrega-tor and subscribes to any feed. The problem with this definition is the limited nature of the person. As was discussed previously in the journalism field, newspapers subscribe to news syndicates. The newspaper is a user just like my students who subscribe to my course lecture review podcast. So in the context of user, the definition needs to be expanded to include any consumer of the infor-mation whether it be an end user or information redistributors.
3 RSS and AtomRSS and Atom are built using the eXtensive Markup Language (XML). XML 1.0 was released in 1999. Since then numerous other applications of XML have been developed (Means, 2002). Figure 5 is a reproduction of an illustration from Means (2002) showing the framework of XML. Since Means’ (2002) book, many other enhancements have been made to XML. One of these new develop-ments is the Geographic Markup Language (GML). The GML standard was put forward by the Open Geospatial Consortium and adopted in 2004 (Open Geospatial Consortium, 2004). A critical development for XML and for the development of RSS was the XML Namespaces specification. Namespaces make it possible to create new markup tags that don’t conflict with other tags with the same names. Many of the RSS feeds use their own XML namespaces to specify data for their aggregators. Apple computer has developed a namespace for Podcasting feeds to work efficiently with the iTunes software (see http://phobos.apple .com/static/iTunesrss.html). Below is an example of a well-formatted XML document that has a RSS feed. The document is has four parts: XML, RSS, channel and item. The XML part of the file defines the use of the 1.0 XML specification with any standard text encoding. The RSS part of the document use the RSS tag to define which version of RSS is used and to include any external XML namespaces developed by Apple
Computers for the iTunes aggregator. The XML namespaces is one avenue to deliver maps using RSS. The third part of an RSS document is the chan-nel. The channel tag defines a single feed. An RSS document can contain one or more feeds. In this example there is only one channel titled Car-tography Podcasts. Within this chan-nel declaration are several attributes using the iTunes: declaration. The iTunes: declarations are defined by the podcast-1.0.dtd document includ-ed by the XML namespaces attribute. The final part of the RSS document is the item. A RSS feed can have any number of items within them. This example has only one item called “Intro to Cartography Podcast.” For most RSS feeds the item is a pointer to another file located on a website or record in a database service. One of the features of the item that has made podcasting so simple is the enclosure.
Fig. 4: The two different types of telecartography syndications.

Syndication of maps through the use of Really Simple Syndication (RSS) 69
With an enclosure you can send any data type associated with the item to the aggregator. So if the aggregator understands how to use the data type it will use it.
<?xml version=”1.0” encoding=”utf-8”?><rss xmlns:itunes=”http://www.itunes.com/DTDs/Podcast-1.0.dtd” version=”2.0”>
<channel><title>Cartography Podcasts</title><itunes:author>Dr. Rex G. Cammack</itunes:author><itunes:subtitle>A show about Mapping</itunes:subtitle><language>en-us</language><copyright>℗ & © 2005 Rex Cammack</copyright><itunes:owner>
<itunes:name>Rex G. Cammack</itunes:name><itunes:email>[email protected]</itunes:email>
</itunes:owner><link>http://maps.missouristate.edu/podcasting/cartography</link><description>Dr. Cammack Cartography Podcasts </description><itunes:category text=”Science”><itunes:category text=”Cartography”/></itunes:category><item>
<title>Intro to Cartography Podcasting</title><itunes:author>Rex G. Cammack</itunes:author><itunes:subtitle>A short introduction to Cartography Podcasting</itunes:subtitle><enclosure url=http://utah.missouristate.edu/~rexcammack/CartCasting/welcom.mp3 length=”514704” type=”audio/mpeg”/>
</item></channel>
</rss>
4 Telecartography through RSS FeedsIn the context of Location Based Services (LBS), maps via syndication could be delivered several ways. This research examines the delivery of maps as a location based service from two perspectives.
4.1 Base mapThe first perspective is the base map. For maps to be used, a base map must be available to the LBS device. It appears that there are three ways to do this currently. 1. Precompiled and stored on the device.2. Precompiled on servers and download on demand.3. Dynamically complied on servers and download on demand.
In the designing of a LBS system, the precompiled and stored on the device method is the simplest to develop and test. The major drawback to the method is the need to preinstall the base maps be-fore the user goes to the field. In most cases this approach is possible but not completely infallible. For a traveler who chooses to go to Europe with no itinerary, having the approach base map could be problematic. The second method will solve the wondering travel problem by downloading the base map based on locations when he/she needs them. This method still has the problem of pre-compilation. Cammack (2006) discusses this issue related to WMS. The synchronous development of base maps and thematic data has been an issue for cartographers for a long time. Cammack (2005) demonstrates when either thematic data or base map data are compiled and held in a static state there is a temporal disconnect between the two parts of a map and cartographic inaccuracy will result and most likely propagate. Cammack (2006)
Fig. 5: The basic framework for XML and associated technologies.

Rex G. Cammack70
suggests that the base map data and thematic data must be developed and maintained constantly and separately to improve the synchronous accuracy of maps. For both methods two and three the lack of infrastructure is a major impediment to telecartography. In areas with low population density the likelihood that public wireless networking will be developed is improbable. A historical example of this point is the Tennessee Valley Authority (TVA). In sections of the southern part of the USA electrical networks would have never been built without direct federal government intervention. With the way the publicly accessible wireless network is being created in the USA, low population areas will most likely lag behind the higher population density areas. This is not an unknown factor in LBS and some hope may rest with a space-based solution to this problem. Though this drawback exists it should not deter the development of telecartography for LBS.To deliver base maps for LBS using RSS requires several steps. The first is to develop an RSS feed similar to the example above. Instead of delivering MP3 files the feed would enclose an Internet standard MIME/TYPE that is a graphic format. The graphic for-mat would need to be consistent with the telecartography LBS application. A key aspect to developing this type of RSS feed is to create standard XML namespaces for this type of RSS feed and enclosure. Apple (2005) created XML namespaces for iTunes and a similar standard could be developed for RSS feeds for telecartography for LBS. The XML namespaces would need to create at-tributes for RSS enclosures that could be used by the LBS device to select the correct RSS enclosure to display. One must consider what triggering mechanism will be used to get a map for the LBS device. Triggering mechanisms for LBS tend to be locational which is a natural fit for telecartography for LBS. With the development of a RSS feed and a triggering mechanism, the next task is to create an aggregator that will handle the RSS feed subscription and understand the new XML namespaces and MINE/TYPE that the map is delivered in. Currently the XML namespaces and aggregator does exist but development in both areas is underway.
4.2 Thematic dataThe second aspect of telecartography for LBS using RSS is the delivery of current thematic data. Currently most LBS are fee-based service. Cost as limiting factor needs to be addressed. Some LBS charge users by either a monthly fees or per use charges. There is probably no way to create a completely free telecartography LBS so cartography must develop a means of controlling costs. One way to control cost is to make access to maps less restricted. The section on base maps shows a possible way to make an open system using RSS that would work with many telecartography providers. A second way the LBS provider makes money is by sell-ing their services to point of delivery business. A point of delivery business is a business that has a store that a customer enters and makes a financial transaction, i.e. bank, supermarket, drugstore or beer hall. The LBS provider charges fees to the LBS user and the point of delivery business. If a point of delivery business chooses not to pay this service then the user is limited by not knowing about the business. Consider this example, LBS user is in Vienna and hungry for pizza but doesn’t know where the pizza businesses are located. Being an LBS user they call up the map based navigational tool and ask for pizza stores. The LBS provider had marketed this service to all the pizza business and some have chosen to pay to advertise on this LBS service. The consumer will only be able to choose from the restricted list. Take this example one step further and the LBS user knows that they want to go to Pizza Mann but Pizza Mann has chosen not to advertise on this LBS. The LBS provider has failed to provide the user with his desired information. RSS feeds could address this problem. By making a telecartography system that is RSS savvy, user could subscribe to any geo-locational RSS feed. The system would work like this. First the point of business would create a RSS feed for store location and information. Within the RSS feed each store location would be enter attributes. What makes this a geolocational RSS feed is the inclusion of the Basic Geo vocabulary (W3C, 2003). The W3C Semantic Web Interest Group developed the Basic Geo vocabulary. The result of this effect was the creation of a basic geo RDF vocabulary for RDF documents but a second outcome was the use of GEO XML namespaces that is used with RSS feed. Yahoo! Maps (Yahoo!, 2005) used the GEO XML namespaces to interact with the Yahoo! Maps service. For the cartographer making a telecartography LBS system, making systems that arre RSS savvy and has the ability to geocode simple latitude and longitude coordinates would allow the user to subscribe to any geolocaitonal RSS service and have access to their information in a spatial format. This real-time thematic mapping would eliminate some of the limitations of some of the cur-rent LBS systems.
5 ConclusionsThis research has examined the role of syndication of maps for telecartography and LBS. The ability to syndicate maps across the Internet is a fundamental change in the information exchange process that cartographers have used for hundreds of years. The syndication process allows the cartographer to have some input from the map user before maps are actually made and distributed. A second point to the research was a detailed examination of existing technologies to see if the tools are currently available to map syndication possible for LBS. The results of the research show by using RSS feeds and developing an image MIME/TYPE aggrega-tor would make it possible to syndicate maps quickly and simply. A third finding shows that thematic data could be syndicated in a geolocational RSS feed using the GEO XML namespaces. By adding a simple geocode function to a RSS aggregator, a telecartog-raphy for LBS systems could become a more temporal accurate device.

Syndication of maps through the use of Really Simple Syndication (RSS) 71
6 ReferencesApple. (2005). How to Publish a Podcast on the iTunes Music Store. Http://phobos.apple.com/static/iTunesrss.html last modified 2005-07-07.Ayers, D. and A. Watts (2005). Beginning RSS and Atom Programming. Indianapolis USA: Wiley.Cammack, R. G. (2005). Web Mapping Services: A Tool For Thematic Internet Maps. In the Proceedings of XXII International Cartographic Con-
ference (ICC2005). A Courna, Spain.Cammack, R. G. (forthcoming Publication). Cartography Approaches to Web Mapping Services. Multimedia Cartography. 2nd ed Berlin, Germany:
Springer.Cartwright W. (1999) Development of multimedia. In Cartwright W., M. Peterson and G. Gartner (eds). Multimedia Cartography. Berlin, Germany:
Springer.Peterson, M. (1999). Elements of Multimedia Cartography. In Cartwright W., M. Peterson and G. Gartner (eds). Multimedia Cartography. Berlin,
Germany: Springer.Gartner (2003). Telecartography: Maps, Multimedia and the Mobile Internet. In M. P. Peterson (eds). Maps and the Internet. Oxford, UK: Else-
vier. Guinness World Records (2005). Guinness World Records 2006. Lincolnshire, UK: Guinness.Means, W. S. (2002). Strategic XML. Indianapolis, USA: Sams Publishing.Morita, T. (2005). A Working Conceptual Framework for Ubiquitious Mapping. In the Proceedings of XXII International Cartographic Conference
(ICC2005). A Courna, Spain.Mount J., M Armstrong, and D. Bennet (2005) Field-Based Geographic Education Using Mobile Computers. Internet-Based Cartographic Teach-
ing and Learning: Atlases, Map Use and Visual Analytics. Madrid, Spain International Cartographic Association / Association Cartographique Internationale.
Open Geospatial Consortium (2005). Geographic Markup Language (GML) Encoding specification. http://www.opengeospatial.org/specs/?page=baseline.
Ormerling, F. (1999). Map Concepts in Multimedia Products. In Cartwright W., M. Peterson and G. Gartner (eds). Multimedia Cartography. Berlin, Germany: Springer.
Paelke, V., B. Elias, and M. Hampe (2005). The CityInfo Pedestrian Information System: An Experiment with Content Creation and Presentation Techniques. In the Proceedings of XXII International Cartographic Conference (ICC2005). A Courna, Spain.
Van Elzakker, C. (2000). Users of Maps on the Web. In Kraak, M. and A. Brown (eds) WebCartography. London, UK: Taylor and Francis.W3C (2003). W3c Semantic Web Interest Group: Basic Geo (WGS84 lat/long) Vocabulary. Ed by Dan Brickley. http://www.w3.org/2003/01/
geo/#development . Yahoo! (2005). Introduction to Yahoo! Map Web Service. http://developer.yahoo.net/maps/.

GPS-monitored itinerary tracking: Where have you been and how did you get there?
Edward Verbree, Kees Maat, Wendy Bohte, Erik van Nieuwburg, Peter van Oosterom, Wilko Quak
AbstractWithin research to the objective of itineraries it is a requirement to acquire for a (large) group of respondents during a certain period for each conducted trip the location and time of depart and arrival, the route, travel mode, and also the activity purpose (i.e. travel to work, family visit, or just a walk for leisure). All trips must be reported and for each trip the requested data must be correct, complete and valid. In our research a GPS device is used to track and log the geometry and time for all trips during the research period, and a web map application is used by the respondents to specify the departure, the arrival location and the activity purpose of each trip. In that way we try to avoid errors, log gaps, and invalid entries, and we provide a mean to correct these once they are made. In conjunction existing geo-information is used to automatically interpret the traces and translate these into meaningful trips and activities.
1 IntroductionIn order to support urban and transport planners, analyzing and modeling travel patterns have since long been an important area of transportation research. Analyzing and modeling their activity and travel patterns places heavy demands on data collection. Mea-suring the exact times and locations of journeys taken by individuals is therefore an essential element of travel behavior research.To provide detailed activity and travel data, the use of activity/travel diaries has become much more widespread since the nineties. This data collection method offers in principle the advantage that the complexity of activity patterns can be recorded with much more accuracy than when respondents are asked to reconstruct from memory their past travel behavior and activities. However, it suffers from some disadvantages including the burden on the respondent, the difficulty for respondents to write down exact descriptions of the locations, and inconsistencies between trips and activities.One method for which there are great expectations in transport research is data acquisition through a Global Positioning System (GPS). This technology uses signals from satellites to determine someone’s position within a range of no more than 10 meters. Through a GIS application the travel behavior of the respondent is reproduced on a map for visual validation by the respondent and for automatically classification and justification by GIS network algorithms.Apart from its benefits, however, this state-of-the-art method has its difficulties as well, including problems with the use of the device, reception of the signal, handling of the data, etc. Worldwide experience with GPS devices for collection of travel data is poor, and mainly related to devices in cars. The planned destination and goal of the itinerary can be answered before, during or afterwards the trip. In-car route navigation is an example of the first question, as the driver will have to announce the destination to the system. But the destination will only be definitive, when that place has been reached. An interactive system can request the user during the trip to state where he is heading. Again, this will only be true, as long as the destination had been reached. A survey afterwards is the best option, as the visualiza-tion of the GPS track (positions and time) is a way to remember it. In the research of Hovgesen (2005) this kind of ‘passive GPS registration’ is called to be ‘a powerful tool for the survey of spatial behavior’. But, ‘given the present state of GPS technology, the track points that can be attained from a persons movement over a longer time span is unlikely to be continuous’. So, in the user-interactivity phase, one has to validate the GPS track, or at least the actual depart and arrival locations have to be given, before one can link the destination and the way of transport to the corrected GPS track.Following this introduction, section two gives an overview of data collection for travel behavior in general and related research with respect to the possibilities and disadvantages of GPS. Section three focuses at our approach of GPS monitored itinerary track-ing, where after section four addresses the actual GPS track log processing to meaningful activities and trips. Section five gives some conclusions and recommendation.
Edward Verbree, Kees Maat, Wendy Bohte, Erik van Nieuwburg, Peter van Oosterom, Wilko Quak74
2 Data collection for travel behavior researchAs has already been indicated in the previous section, measuring the exact times, distances and locations of journeys taken by people is an essential element of research into travel behavior. Information about travel behavior has traditionally been collected from written questionnaires or telephone interviews about aspects of travel behavior. The information gathered includes details on the frequency of commuter travel, daily and occasional shopping trips, visits to public amenities, leisure activities, social calls, and so on. Traveling times and distances are also asked about, as is the means of transport. This approach entails a number of significant disadvantages, however. The range of travel patterns depends on the variation of destinations listed in the questionnaire: destina-tions that are not included do not appear in the overall pattern. Also, such surveys reflect only the perception of the respondents as regards timings. It has been shown that this is an area subject to systematic distortions: short journeys are often forgotten about, as are those that do not involve a route either starting or ending at home. Furthermore, the various methods of transport and other relevant details are not accurately remembered, with car users underestimating their traveling times and public transport users over-estimating theirs (Ettema et al, 1996; Stopher, 1992).
2.1 Related research in itinerary trackingTo avoid these drawbacks, the use of activity and/or travel diaries has become much more widespread since the nineties (for ex-ample, see Stopher and Wilmot, 2000; Dijst, 1995; Snellen and Timmermans, 2001; Maat et al, 2004). Respondents use their travel diary for a few days to record departure and arrival times, travel movements, the destination being visited and/or activity being attended, the means of transport and any other information. Activity diaries offer in principle the advantage that the complexity of activity patterns can be recorded with much greater accuracy. However, there are disadvantages as well. First, the burden on the re-spondent is considerable, as the diary has to be (preferably) carried around on a daily basis, while detailed information about travel times, locations and activities has to be noted down for every movement. The result is that there is a strong possibility of non-re-sponse. Second, respondents will tend to postpone writing down their notes so that they ultimately put down inaccurate information about traveling times and locations, or indeed forget about entire journeys altogether. In an evaluation of different types of diary, Arentze et al (2001) reported a systematically more inaccurate and limited pattern of activity on the second day of diary entries. In order to reduce the burden, respondents are usually asked to keep the diary for only a few days (Schönfelder et al, 2002; Schlich and Axhausen, 2003). Third, it seems that giving an exact description of locations is not always easy for respondents: what is the exact location of the post office, the letterbox or the park that has been visited? Finally, paper surveys often contain many inconsistencies as a result of registration errors, such as activities that begin before the previous one has ended, journeys from locations, which were never arrived at in the first place, and unrealistic traveling times.
2.2 Possibilities of GPS in trip and activity recodingOne method for which there are great expectations in transport research is data acquisition through GPS. This technology uses signals from satellites to determine someone’s position within a range of no more than 10 meters. Cars are these days more often than not equipped with a kind of route navigation system, i.e. a portable ‘Tom Tom Go’. These systems are quite capable to direct the user to the destination by a combination of maps, pictograms, and voice. As ‘a Tom Tom’ uses a GPS receiver to determine the current position, it is thought that each general GPS device is a kind of route navigation system. It is not; basically a GPS receiver processes the code signals from the GPS satellites in ‘line-of-sight’ to a location determination in latitude, longitude and elevation according to the WGS-84 reference system. Only the combination of a GPS device, smart software, up-to-date digital maps and an intelligent user interface makes a route navigation system to what it is. To track where you have been seems however not that difficult, as you only have to store the successive GPS locations during the itinerary. By carrying a GPS receiver, the location of a respondent can be registered at any time. The places along the route taken by the respondent are linked to the times at which he was at these places and are stored in the receiver as coordinates. By entering the coordinates in a GIS application, the travel behavior of the respondent is reproduced on a map. The method has a number of important advantages. Data acquisition via GPS should mean that the research would be one of the first travel behavior studies that do not suffer from the significant shortcomings of the diary method. First, there is much less of a burden on the respondent, so that not only the numbers of non-responses are greatly reduced, but also that information can be gained from a whole week, rather than just a few days. This is an important benefit because travel behavior patterns are becoming more and more varied in time and range, partly as a result of people working part-time or further from home.Second, the degree of accuracy and completeness this method brings is way beyond anything that can be achieved through conven-tional paper surveys. Indeed, it is the case that not only the precise starting and finishing points of travel movements are recorded, including the exact times, but that the route itself can also be accurately traced. By linking the details registered in a GIS applica-tion to information on the spatial structure, it can be determined which travel mode was used (verify whether journeys were un-dertaken by road or rail) and which amenities were visited (Schönfelder et al, 2002). An important element in terms of accuracy is that inconsistencies are, to a large degree, avoided. A third advantage is that the data is immediately available in digital form, which eliminates the need for time-consuming and error-prone manual data input.

GPS-monitored itinerary tracking: Where have you been and how did you get there? 75
2.3 Disadvantages of GPS in trip and activity recording However, there are also highlighted a number of disadvantages in the literature. Firstly, the cost of the equipment is still relatively high. In addition, the method has to be explained in more detail, which means the researcher has to actually deliver the GPS and provide instructions on its use, as well as collect it again at the end of the survey period. Secondly, although the GPS registers time and location, it does not record extra details, such as the reason for the journey. This kind of information will still have to be recorded by hand, be it on paper, on-line, or a combination of the two using a Personal Digital Assistant (PDA). This option sim-ply makes the collection of the data more expensive and entails an even greater burden on the respondent. Thirdly, the presence of buildings in urban areas means that satellites are not always ‘in view’, leading to the possibility that the location of the respondent cannot always be determined.
2.4 Collaborative GPS tracking Nowadays Web Map Services (WMS) and Web Feature Services (WFS) are a mean to disseminate geo-data to literally everyone connected by Internet based on the open standards of the Open Geospatial Consortium (OGC, 2000). The providers of these ser-vices, however, also decide which data is made available. As shown, GPS devices are a mean to store your own traces. The traces are, if combined with an activity as within the project described in this paper, of interest for other people. This demand is especially an issue when these data are not made available through the regular geo-data providers. Hikes, skate routes, mountain bike trails, holiday trips, or even the location of ‘open’ wireless local area network (WLAN) hotspots, all these data are likely to be used by a dedicated group of users, most often the ones who will provide their share of the data in the first place.Some neat examples of these collaborative composed GPS track databases exist. The Geoskating project is among the finest, as it will show through a map interface where to skate, and how well the road is suitable for this kind of activity (Geoskating, URL). This example is however limited in functionality, as it is not possible to upload and download your own skate tracks. This possibil-ity is given among other initiatives, by the GPStracks and MotionBased site (GPStracks, URL; MotionBased, URL). Both initia-tives opts the possibility to map the routes by Google Earth. If you want to know which WLAN access points are freely available in your neighborhood the Wardrivemap will give you the answer by a database loaded by GPS enabled WLAN access point tracers (Wardrivemap, URL).All these examples show the possibilities of collaborative GPS track websites. It is therefore a pity to see that none of these initia-tives is yet using OGC compliant solutions for providing maps or data.
2.5 Person-based itinerary GPS trackingPerson-based itinerary GPS tracking systems are not comparable with in-car route navigation systems, although both use GPS to determine their actual position in real time. As most people do have good experiences with this kind of guiding tools, they expect the same characteristics of stand-alone, personal, GPS tracking devices. That is not the case, as in-car systems do have the charac-teristic to be part of the traffic. In contrast, person-based GPS tracking devices can be, literally, everywhere. In-car systems could work-around the fundamental issue of receiving enough GPS satellite signals – as in GPS hostile environments like tunnels and height rise buildings areas – by extra sensors like an odometer, an electronic compass and an inertial navigations system. Besides, the simple fact that cars drive at streets is used by all kinds of dead-reckoning algorithms to keep and forecast the calculated posi-tion at the up-to-date digital road network. Power supply is not an issue at all as it plugged to the battery of the car and the antenna is well positioned at the roof or at the front window. And as cars are normally at the same place as where the driver left it behind the start-up acquisition time of the GPS device is reasonable. A person is not very well designed to use a GPS device. For the best operation the GPS device should be held in the hand, as this will allow the user to operate it. A position in front of the user is also appropriate to read the display and it provides direct access to the sky for a good satellite reception, but no one wants to hold the device for 24 hours for just to be tracked. Power drain is also an issue and the GPS device should operate without extra sensors, although the combination with an electronic compass is an option.
2.6 Related research in GPS monitored itinerary trackingSeveral comparisons were made using a paper diary (see Lee-Gosselin, 2002). The use of GPS is not a new approach in person-based itinerary tracking. The last years several papers and reports on GPS enhanced household travel surveys have been published. These papers describe the possibilities on using GPS in this kind of surveys and the recording of the activity. A separate GPS for registering every journey was provided in only very few cases. (AVV, Draijer et al, 2000). A remarkable issue within the studies conducted outside Europe is the focus on the car as the only possible travel mode. This will reduce all kind of problems in power supply and GPS reception, i.e. in the study in Texas, USA (Forest, 2005) the power supply of a GeoStats GeoLogger is attached to the cigarette lighter socket in the vehicle and the antenna is mounted to the roof. Also in (Wolf, 2001) a study in Georgia, USA is described where the only travel mode under consideration is the personal vehicle. The study described in Sidney, Australia (Sto-pher, 2003) is again an in-vehicle travel-mode study with the GeoStats GeoLogger. This rugged device is quite heavy and bulky, mainly due to the battery pack to operate it over three days. For the study in London, UK (Steer, 2005) that characteristic was not a limitation to use it as a normal personal travel-tracking device. But the far better wearable Garmin Foretrex was used for the survey in Denmark (Hovgesen, 2005). Here in this European city the individuals carrying these kind of person-based GPS devices registered very accurately transportation on foot, bicycle or private motorcars. The use within public transportation, like busses and

Edward Verbree, Kees Maat, Wendy Bohte, Erik van Nieuwburg, Peter van Oosterom, Wilko Quak76
trains, posed greater challenges to GPS as a survey tool as the signal reception by the GPS antenna is much more difficult to control.
3 GPS itinerary tracking
3.1 System requirements of person-based GPS itinerary trackingTo track someone by means of a GPS device during a longer period is a quite demanding task. First and for all, the device should acquire its location during the trip, or more specific: the trip track points should be logged. Several options are possible to perform that task. One can use a GPS device equipped with internal memory to store thousands of track points at the device and download those after the survey by a serial or USB connection to a computer and upload the track logs to a central database. All commercial available ‘outdoor’ GPS devices, like the Garmin and Magal-len products, offer this possibility. They differ with respect to the track log only by the available memory for storage; most models offer 10,000 points. Another problem is the use of a proprietary communication protocol, which demands special programs to download the data. Ones downloaded the user has to choose from a bunch of file formats; although the XML based GPX format is regarded as an industry standard (Topographix, URL). A last barrier is caused by the serial connection that is still used by even the latest models like the Garmin Forerunners. The .gpx file could now be uploaded to a server. It is possible to use these kind of .gpx files, but as GPX is XML based, a XSLT transforma-tion can be applied to create the insert statements to store the track points in a geo-database like PostgreSQL/PostGIS (PostGIS, URL). Another option is to connect a basic GPS device by wire or wireless (Bluetooth) to store the track points directly at a separate logging device like a PDA, or through a mobile ‘smart phone’ that will send the tracks by GPRS or UMTS directly to a central database. Although these last options do have a lot of advantages, like real-time access to the trip-track data, and also the possibility to inquire the respondent about the trip activity right ahead, it doubles the risk on power drain. But there exist some neat examples of this kind of activity reporting, like the Amsterdam Real Time – Diary in traces project where the mobile behavior of users in the
city is visualized, see Figure 1 (Waag, URL). Another example is given by the GeoSkating project that aims to automate the cre-ation of interactive, multimedial skate maps (Geoskating, URL). The last option works very well, but we have decided to use a ‘stand-alone’ GPS device for both acquiring the track points and store them. The main reason for that approach is to make the system robust by avoiding as much as possible power-drain and depen-dences on all kinds of wireless communication between devices. A second reason is the GPS device of choice itself. The Garmin Foretrex 201(see: Figure 2) is well designed light and very wearable at the wrist, it has a running time of more than 14 hours, and it has a track log capacity of 10,000 points which will be maintained in memory even as the battery is drown. The use of a recharge-able battery has, besides the environmental advantage, the benefit to be a kind of a reminder to download the track log right ahead when the device is plugged to the AC-adapter.
3.2 Determining itineraries from GPS track logsAn itinerary is a trip from a departure to a destination. The GPS devices, however, will only start to track and store the locations as soon as the receiver has a position-fix. It is to a certain extent possible that this start of a recording is not at the actual location of departure, but somewhere along the route, because it might take some time before the first position determination takes place. If the almanac data – the course orbital parameters for all satellites – is unknown by the receiver, this information is first to be received from one of the GPS satellites. Once known, the receiver knows where to expect a certain satellite at the given time. For exact positioning however the ephemeris data – the precise orbital and clock correction data – has to be received from the GPS satellites used. As this information is only broadcasted each 30 seconds this will delay the positioning. But it not as bad as it sounds, as long as the receiver is within a range of 300 kilometers from the last use, the almanac can be used. So the receiver knows where to expect the satellites. The ephemeris data is ‘fresh’ for a certain period, thus if the receiver is powered off for only a couple of hours, the receiver knows the position of the satellites and it will restart positioning with a so-called warm-start within a couple of seconds.
Fig. 1: Amsterdam Real Time – Diary in traces
Fig. 2: Garmin Foretrex 201

GPS-monitored itinerary tracking: Where have you been and how did you get there? 77
3.3 Validation and interpretation of GPS track logsTo be sure the receiver starts logging at the departure; it is a recommendation to the respondents to examine whether or not the GPS device is powered and positioned before moving. This departure location can be marked at the receiver explicitly by user-specified waypoints. But as this action will require an extra awareness and user interaction of the respondent of the itinerary survey, this op-tion will not be regarded as an option in the test conducted. Besides, in most of the cases the respondent will depart from a location arrived at the previous trip, so this position could be derived from the history. Within the web-based itinerary survey afterwards the user has anyway the possibility to pin-point characteristic locations, like home, work, public transportation stops, etc., explicitly. This will open the possibility to ‘link’ the start and finish of a track log to these locations.During the route itself the GPS will record positions only at discrete locations, i.e. at turns. This will reduce the total storage of the track log of an itinerary undertaken considerably. The receiver has also a so-called auto stop mode, where a certain track point is marked as ‘start of this trip’ when the receiver resumes moving from a location where it has been stayed for a specified time. This ‘start of the trip’ mark is thus also given at the actual start of an itinerary. The total track log of a day will thus be separated in logi-cal parts by the GPS device itself.It is predictable that each part of the track log is undertaken with a specific travel mode. As the speed of travel is to be determined from the track log data, it is possible to validate the user’s input; it is quite unlikely to bike with a speed of 80 km/hour.How well modern GPS receivers operate these days, there will be always gaps in the recoding; either by bad satellite reception, or by misuse of the GPS receiver by the respondent. As we are not interested in a complete coverage of the trip by GPS track points, but in the itinerary itself, this omission does not have to be a problem, as long as the main characteristics of the trip itself can be recovered. One possibility to determine the route of the trip is by a shortest path analysis based on an up-to-date road network. If all track points are to be reached in time order, this network analysis will result in the most predictable route on the network. This kind of validation works however only if the travel mode is known, and the network data (road, railroad) with relation to these models (car, train) is available.
4 GPS track log processing
4.1 Conceptual model When people communicate or when systems have to be developed it is important that the involved parties do agree on the mean-ing of the used terms. That is, for a given term they associate similar concepts. This may sound trivial but in reality this is not the case, therefore attempts are made to formalize the meaning of concepts (and the associated terms). One approach is to describe the concepts in a graphical way and depict associations with others terms/concepts; such as specialization (refined more specific con-cept), aggregation (collection of other elements), etc. Within the Unified Modeling Language (UML) this is called a class diagram (Booch, Rumbaugh, and Jacobson, 1999). In addition to these associations also properties (attributes) belonging to the concepts may be specified (e.g. a person has a name and a day of birth). These properties further describe the concepts by listing the relevant attribute names and types (e.g. string and date in our example). It is also possible that certain types of operations (methods) do be-long to a class (e.g. compute the age of a person).So, when setting up an itinerary tracking system, researchers have to communicate with the persons who’s itineraries are being investigated. They have to agree on the meaning of concepts such as Trip&Activity, KnowLocation, Trace, TracePoint, Person, GeoObject, etc. The UML class diagram is given in Figure 3.In the UML class diagram the different symbols have a well-defined meaning: a concept or class is depicted by a box of three com-partments: 1. class name (e.g. Person), 2. attributes (e.g. name: String) and 3. operators. A normal association between two classes is indicated by a solid line (without arrowhead); for example the association ‘LivesAt’ between the classes Person and KnowLoca-tion. The multiplicity of the association is indicated at both sides: ‘*’ at the side of Person meaning that at a given KnowLocation n Persons may live and ‘0..1’ at the side of KnowLocation meaning that a given Person may live at 0 or 1 KnowLocations.An important object in GPS monitoring of itineraries is the Trace, which belongs to exactly one Person; this multiplicity of the association is indicated with a ‘1’, which is normally not depicted in a UML class diagram. Reversely a Person may have a Trace or not yet have a Trace (indicated with the ‘0..1’ multiplicity). A Trace has attributes such as begin and end date. More important a Trace can be seen as an aggregate of TracePoints (indicated via the solid line with a black diamond at the side of the Trace). Again the multiplicities are indicated near the ends of the solid line depicting the aggregation. In this case it is stated that a TracePoint belongs to exactly one Trace (‘1’, not depicted) and that a Trace consists of one ore more TracePoints (‘1..*’). The attributes of a trace point are the time and x, y and z coordinates of the location. Note that a TracePoint has also an association with itself: ‘next’, indicating the next TracePoint within a Trace. Operations available for the TracePoint are speed and acceleration, which can be computed based on the location and time stamps of successive TracePoints.The collection of known geographic objects (‘the map’) is modeled with the class GeoObject, which has two specializations: Geo-Location and GeoInfra. A solid line indicates the fact that something is a specialization of another class with an open arrowhead in the direction of the more generic class. KnowLocations in our model (such as houses, shops, offices, etc.) are associated with exactly one ‘map’ GeoLocation object (the reverse is not true: there is not a KnowLocation of every GeoLocation). At a Known-Location a certain type of activity can take place. The types of recognized activities are given in the enumeration type ActivityType and include: live (at home), work, recreate, shop,… (not indicated in the UML class diagram). The GeoLocation objects are point
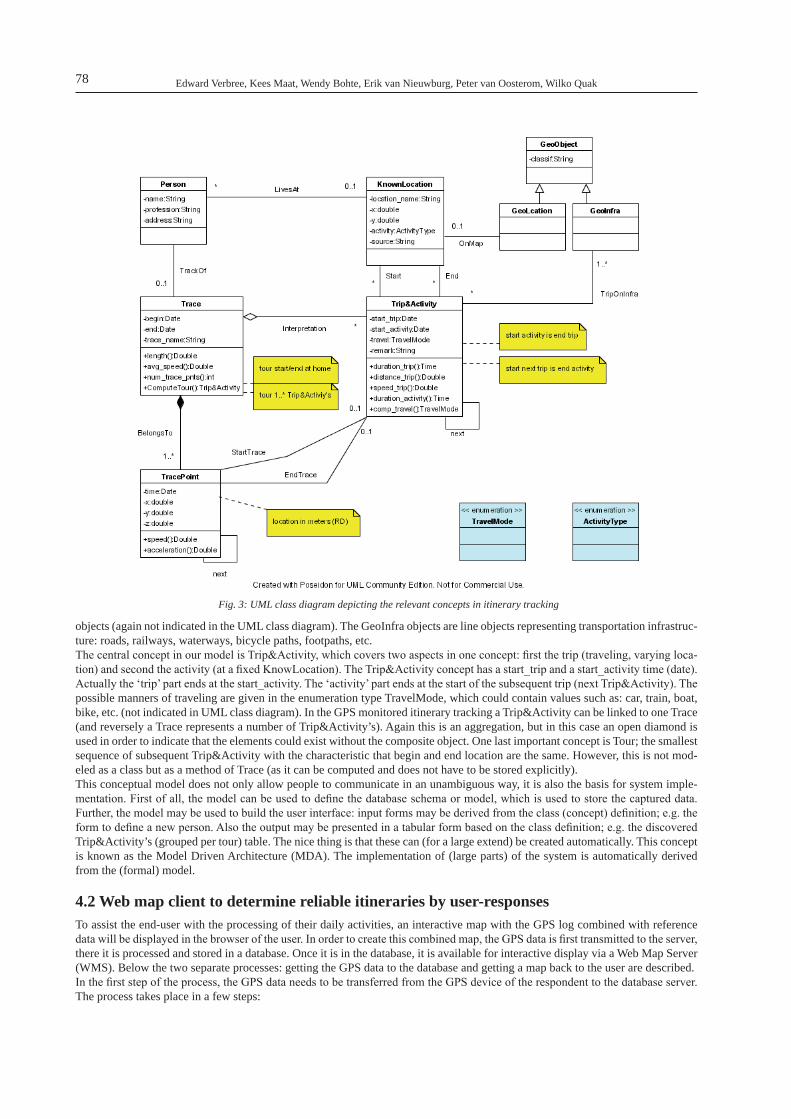
Edward Verbree, Kees Maat, Wendy Bohte, Erik van Nieuwburg, Peter van Oosterom, Wilko Quak78
objects (again not indicated in the UML class diagram). The GeoInfra objects are line objects representing transportation infrastruc-ture: roads, railways, waterways, bicycle paths, footpaths, etc.The central concept in our model is Trip&Activity, which covers two aspects in one concept: first the trip (traveling, varying loca-tion) and second the activity (at a fixed KnowLocation). The Trip&Activity concept has a start_trip and a start_activity time (date). Actually the ‘trip’ part ends at the start_activity. The ‘activity’ part ends at the start of the subsequent trip (next Trip&Activity). The possible manners of traveling are given in the enumeration type TravelMode, which could contain values such as: car, train, boat, bike, etc. (not indicated in UML class diagram). In the GPS monitored itinerary tracking a Trip&Activity can be linked to one Trace (and reversely a Trace represents a number of Trip&Activity’s). Again this is an aggregation, but in this case an open diamond is used in order to indicate that the elements could exist without the composite object. One last important concept is Tour; the smallest sequence of subsequent Trip&Activity with the characteristic that begin and end location are the same. However, this is not mod-eled as a class but as a method of Trace (as it can be computed and does not have to be stored explicitly).This conceptual model does not only allow people to communicate in an unambiguous way, it is also the basis for system imple-mentation. First of all, the model can be used to define the database schema or model, which is used to store the captured data. Further, the model may be used to build the user interface: input forms may be derived from the class (concept) definition; e.g. the form to define a new person. Also the output may be presented in a tabular form based on the class definition; e.g. the discovered Trip&Activity’s (grouped per tour) table. The nice thing is that these can (for a large extend) be created automatically. This concept is known as the Model Driven Architecture (MDA). The implementation of (large parts) of the system is automatically derived from the (formal) model.
4.2 Web map client to determine reliable itineraries by user-responsesTo assist the end-user with the processing of their daily activities, an interactive map with the GPS log combined with reference data will be displayed in the browser of the user. In order to create this combined map, the GPS data is first transmitted to the server, there it is processed and stored in a database. Once it is in the database, it is available for interactive display via a Web Map Server (WMS). Below the two separate processes: getting the GPS data to the database and getting a map back to the user are described.In the first step of the process, the GPS data needs to be transferred from the GPS device of the respondent to the database server. The process takes place in a few steps:
Fig. 3: UML class diagram depicting the relevant concepts in itinerary tracking
GPS-monitored itinerary tracking: Where have you been and how did you get there? 79
- The respondent connects the GPS to the PC and uploads the GPS data to the computer and save the track data to a GPS file- Via a web interface the GPX file is uploaded to the web server.- In the web server the GPX file is converted to the database insert statements and sent to the database server.
Now, the data is in the database and is available for analyses, but it can also be displayed on the respondent’s web interface as an image. For this MapServer is used. MapServer is an open source development environment for constructing spatially enabled In-ternet web applications (Mapserver, URL). In MapServer the GPS data of the respondent is combined with a background map and converted into an image (GIF, JPG) that can be displayed in the web browser of the respondent.At the respondents’ side, this map is very useful as a reference when the respondent is asked to completely describe their daily ac-tivities. The web map will be incorporated at the client side as a reference. It will contain four layers in total: (1) Background map; (2) KnownLocations; (3) Processed GPS points; (4) Non-processed GPS points.Every time a respondent has entered an itinerary, it will be posted to the web server and at the same time a fresh version of the web map will be requested. All of the GPS points that fall within a time-period that has already been logged as an itinerary, will be placed in the layer named “processed GPS points” and will receive other color identifications to separate them from the “non-pro-cessed GPS points”. Besides that, there will be some basic controls as zoom functionality, dragging and requesting point informa-tion (date, time).Existing geo-information (map) and derived movement information (speed, acceleration) can be used to automatically interpret the traces and translate these into more meaningful trips and activities. One thing that only the user can enter is the remark associated with a Trip&Activity; e.g. indicating motivation or purpose. When filling in the logbook in case of less (or none) automatic inter-pretation of the traces, the user is asked to enter itineraries (their movements between locations where they show a certain main activity). To enter an itinerary, one needs to specify a point of departure and a point of arrival. The choice has been made that these must be KnownLocations to ensure that a user is spared the effort of entering the same location information several times. Since every person has repetitive behavior, the use of KnownLocations will save time and energy in the end. All in all, the user must be able to add KnownLocations through the map interface.So all in all, the map and the web forms are strongly interconnected. When the form posts its data, the map adjusts its content in conjunction with the updated database. Next to that, the user is able to generate his or her personal KnownLocations to streamline their data processing.
5 Conclusions and recommendationsIt is to be expected that GPS monitored itinerary tracking will replace the use of ‘old-fashion’ paper travel diaries in the near fu-ture. However, the gathering of a complete and correct database of the itineraries of a large group of respondents by equipping this group with GPS tracking devices is not an obvious task. The disruptions in the receiving of satellite signals have to decrease, and besides that limitation, only the recording of locations during the day gives not enough information to provide a detailed overview of trips and activities. Within this research project the feedback of the respondent to validate and correct the recordings is done by a well-designed, web-based, map-oriented trip and activities processing application. Intelligent data processing algorithms will support this process. In the near future a kind of GPS logging is used by a large group of people to record a variety of activities. The processing, storage and dissemination of this special kind of spatio-temporal data will be supported by the development of collaborative GIS environ-ments. For that reason the current available geo-portals have to be extended with functionality for standardized user input, process-ing and presentation of spatio-temporal data.
6 ReferencesArentze, T., M. Dijst, E. Dugundji, J. Chang-Hyeon, L. Kapoen, S. Krygsman, K. Maat and H. Timmermans, (2001), New Activity Diary Format:
Design and Limited Empirical Evidence. Transportation Research Record, 1768, pp. 79-88.Booch, G., J. Rumbaugh, and I. Jacobson, (1999), ‘The Unified Modeling Language’. User Guide. Addison-Wesley Technology Series, Addison-
WesleyBrijs, T., (2005), personal communication.Dijst, M., (1995), Het elliptisch leven. Actieruimte als integrale maat voor bereik en mobiliteit. Utrecht/Delft: KNAG/TU Delft (Nederlandse Geo-
grafische Studies 196) (in Dutch).Draijer G., N. Kalfs en J. Perdok (2000), Global Positioning System as data collection method for travel research. Transportation Research Record
1719: 147-153.Ettema, D.F., H.J.P. Timmermans and L. van Veghel (1996), Effects of data collection methods in travel and activity research. European Institute of
Retailing and Services Studies, Eindhoven University of Technology, Eindhoven, the Netherlands.Forrest, Timothy L. and David F. Pearson, (2005) A Comparison of Trip Determination Methods in GPS-Enhanced Household Travel Surveys,
Transportation Research BoardGeoskating, URL: http://www.geoskating.comGPStracks, URL: http://www.gpstracks.nlHovgesen, H.H., T.S. Nielsen, C. Lassen and S. Godtved, (2005), The potential for the exploration of activity patterns in the urban landscape with
GPS-positioning and electronic activity diaries. International Conference for Integrating Urban Knowledge and Practice, Gothenburg, June 3, 2005.

Edward Verbree, Kees Maat, Wendy Bohte, Erik van Nieuwburg, Peter van Oosterom, Wilko Quak80
Lee-Gosselin, M. (2002), Some reflections on GPS-supported travel survey methods in an increasingly ICT-rich environment. Arlington (pre-sented).
Mapserver, URL: http://mapserver.gis.umn.eduMaat, K., H. Timmermans and E. Molin, (2004), A Model of Spatial Structure, Activity Participation and Travel Behavior. 10th World Conference
on Transport Reserach. Istanbul, 5 – 8 July 2004. MotionBased, URL: http://www.motionbased.comOGC 2000, ‘OpenGIS web map server interface implementation specification’, OpenGIS Consortium, Inc., Technical Report reversion 1.0.0 (00-
028).PostGIS, URL: http://postgis.refractions.netSchlich, R. and K.W. Axhausen (2003), Habitual travel behaviour: evidence from a six-week travel diary. Transportation 30, 13-36.Schönfelder, S., K.W. Axhausen, N. Antille and M. Bierlaire (2002), Exploring the potentials of automatically collected GPS data for travel behav-
iour analysis (ETH Zürich). Snellen, D., A. Borgers and H. Timmermans (2001), Urban form, road network type, and mode choice for frequently conducted activities: a multi-
livel analysis using quasi-experimental data. Environment and Planning A, 34, pp. 1207-1220.Steer Davies Gleave, (2003) The use of GPS to improve travel data, DTRL New Horizons Programme.Stopher, P. (1992), Use of an activity-based diary to collect household travel data. Transportation 19, 159:176.Stopher, P.R. and C.G. Wilmot (2000). Some new approaches to designing household travel surveys – time-use diaries and GPS. Paper presented at
the 79th Annual Meeting of the Transportation Research Board, Washington, D.C., January 9-13.Stopher, Peter R., Philip J. Bullock and Fredric N.F. Horst (2003), Conduction a GPS survey with a Time-Use Diary, Transportion Research Meet-
ing.Topographix, URL: http://www.topografix.comWaag, URL: http://www.waag.org/realtimeWardrivemap, URL: http://www.wardrivemap.nlWolf, Jean, Randall Guensler and William Bachman (2001), Elimination of the travel diary: an experiment to derive trip purpose from GPS travel
data, Transportation Research Board, 80th Annual Meeting.
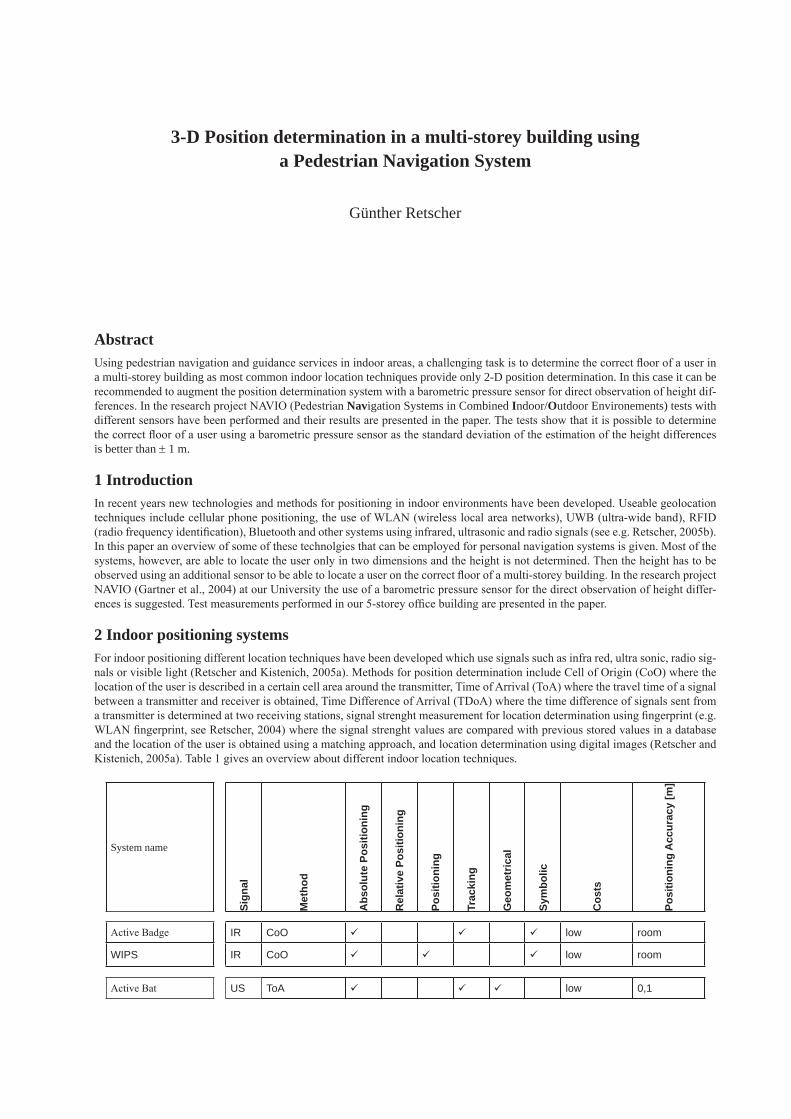
3-D Position determination in a multi-storey building using a Pedestrian Navigation System
Günther Retscher
AbstractUsing pedestrian navigation and guidance services in indoor areas, a challenging task is to determine the correct floor of a user in a multi-storey building as most common indoor location techniques provide only 2-D position determination. In this case it can be recommended to augment the position determination system with a barometric pressure sensor for direct observation of height dif-ferences. In the research project NAVIO (Pedestrian Navigation Systems in Combined Indoor/Outdoor Environements) tests with different sensors have been performed and their results are presented in the paper. The tests show that it is possible to determine the correct floor of a user using a barometric pressure sensor as the standard deviation of the estimation of the height differences is better than ± 1 m.
1 IntroductionIn recent years new technologies and methods for positioning in indoor environments have been developed. Useable geolocation techniques include cellular phone positioning, the use of WLAN (wireless local area networks), UWB (ultra-wide band), RFID (radio frequency identification), Bluetooth and other systems using infrared, ultrasonic and radio signals (see e.g. Retscher, 2005b). In this paper an overview of some of these technolgies that can be employed for personal navigation systems is given. Most of the systems, however, are able to locate the user only in two dimensions and the height is not determined. Then the height has to be observed using an additional sensor to be able to locate a user on the correct floor of a multi-storey building. In the research project NAVIO (Gartner et al., 2004) at our University the use of a barometric pressure sensor for the direct observation of height differ-ences is suggested. Test measurements performed in our 5-storey office building are presented in the paper.
2 Indoor positioning systemsFor indoor positioning different location techniques have been developed which use signals such as infra red, ultra sonic, radio sig-nals or visible light (Retscher and Kistenich, 2005a). Methods for position determination include Cell of Origin (CoO) where the location of the user is described in a certain cell area around the transmitter, Time of Arrival (ToA) where the travel time of a signal between a transmitter and receiver is obtained, Time Difference of Arrival (TDoA) where the time difference of signals sent from a transmitter is determined at two receiving stations, signal strenght measurement for location determination using fingerprint (e.g. WLAN fingerprint, see Retscher, 2004) where the signal strenght values are compared with previous stored values in a database and the location of the user is obtained using a matching approach, and location determination using digital images (Retscher and Kistenich, 2005a). Table 1 gives an overview about different indoor location techniques.
System name
Sign
al
Met
hod
Abs
olut
e Po
sitio
ning
Rel
ativ
e Po
sitio
ning
Posi
tioni
ng
Trac
king
Geo
met
rical
Sym
bolic
Cos
ts
Posi
tioni
ng A
ccur
acy
[m]
Active Badge IR CoO low room
WIPS IR CoO low room
Active Bat US ToA low 0,1

Günther Retscher82
Cricket US ToA low 1,2
GSM RS TDoA/AoA low 50-100
A-GPS RS ToA high 20-25
Locata RS ToA high 0,1-1
Radar RS SS high 3-4
IMST ipos RS SS high 1-3
Ekahau RS SS N/A N/A high 1-3
WhereNet RS SS N/A N/A N/A N/A
UWB RS ToA/TDoA high 0,2
Bluetooth RS CoO average 10
SpotON RS SS average 1 m3
RFID RS CoO low 1-20
CyberCode VL DI average variable
Ubitrack VL DI N/A N/A
EasyLiving VL DI high variable
Tab. 1: Comparison of indoor location techniques
The following abbreviations are used in Tabel 1:Signals: Postioning Methods: N/A..... not availableIR....... Infra red CoO.... Cell of Origin US...... Ultra sonic ToA.... Time of ArrivalRS...... Radio signals TDoA.. Time Difference of ArrivalVL...... Visible light AoA.... Angle of Arrival SS…... Signal strenght measurement DI…… Digital images
The systems Active Badge (Want et al., 1992) and WIPS (Roth, 2004) employ infra red signals for location determination, Ac-tive Bat (Hightower und Boriello, 2001) and Cricket (Roth, 2004) use ultra sonic signals. For the location of cellular phones ToA or TDoA measurements can be performed (Retscher, 2002). Satellite or similar signals are also employed for the location of cel-lular phones using Assisted GPS (A-GPS) or for the Australian system Locata (Barnes et al., 2003) which makes use of standard RTK positioning with GPS similar signals. For indoor positioning the use of WLAN (Wireless Local Area Networks) has become popular and the systems Radar (Bahl and Padmanabhan, 2000), IMST ipos (Imst, 2004), Ekahau (Ekahau, 2005) and WhereNet (WhereNet, 2005) are using WLAN. Apart from WLAN also Ultra Wide Band (UWB) signals and Bluetooth (Hallberg et al., 2003) can be employed. SpotON employs also radio signals and perfoms signal strenght measurements (Hightower et al., 2000). Table 1 also contains three systems using digital images for location determination, i.e., CyberCode (Rekimoto et al., 2000), Ubi-track (Newman et al., 2004) and EasyLiving (Brumitt et al., 2000). For a further description of the systems see e.g. Retscher and Kistenich (2005a).For navigation and wayfinding in smart environments the use of RFID (Radio Frequency Identification) for ubiquitous positioning is also a promissing solution. RFID is a method of remotely storing and retrieving data using devices called RFID tags. An RFID tag is a small object, such as an adhesive sticker, that can be attached to or incorporated into a product. RFID tags contain anten-nas to enable them to receive and respond to radio-frequency queries from an RFID transceiver. For location determination RFID tags can be placed on active landmarks or on known locations in the surrounding environment. If the user pases by with an RFID reader the tag ID and additional information (e.g. the 3-D coordinates of the tag) are retrieved. Thereby the range between the tag and reader in which a connection between the two devices can be established depends on the type of tag. RFID tags can be either active or passive. Passive RFID tags do not have their own power supply and the read range is less than for active tags. They have practical read ranges that vary from about 10 mm up to about 5 m. Active RFID tags, on the other hand, must have a power source, and may have longer ranges and larger memories than passive tags, as well as the ability to store additional information sent by the transceiver. At present, the smallest active tags are about the size of a coin. Many active tags have practical ranges of tens of metres, and a battery life of up to several years. The location method is Cell of Origin (CoO) and the size of the cell is defined by the range of the tags. Using active RFID tags therefore the positioning accuracy ranges between a few metres up to tens of metres
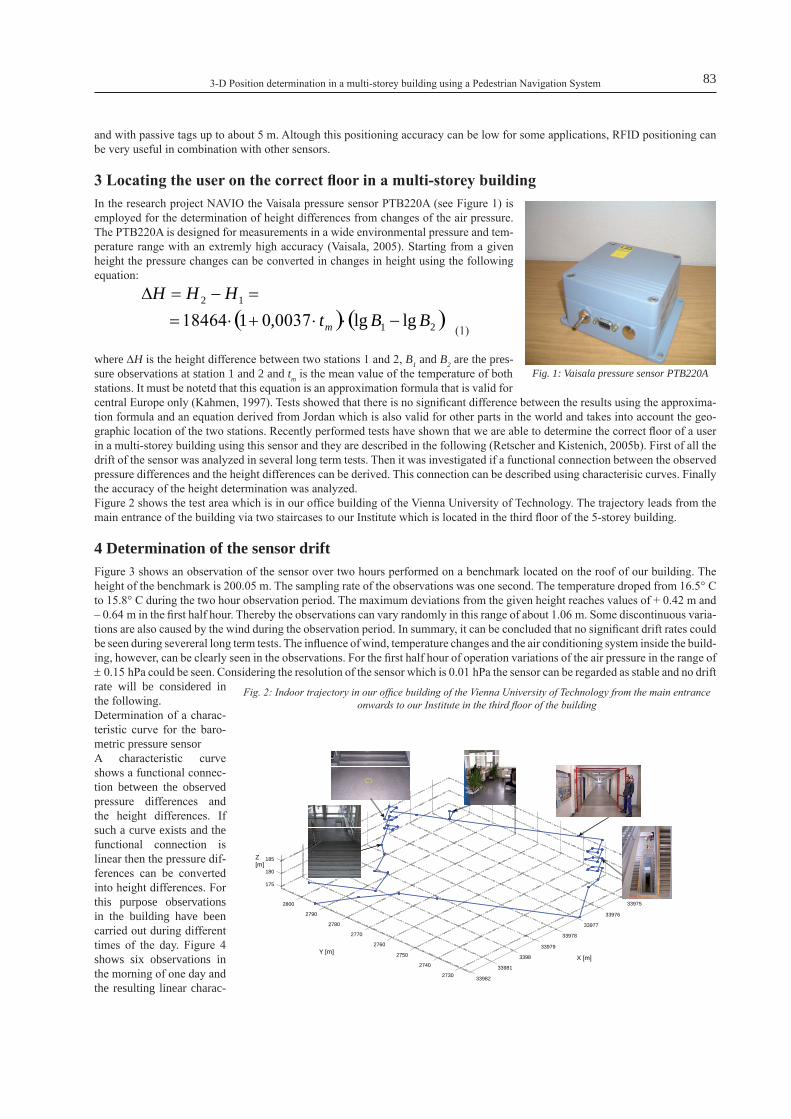
3-D Position determination in a multi-storey building using a Pedestrian Navigation System 83
X [m] Y [m]
Z [m]
2730 2740
2750 2760
2770 2780
2790 2800 33975
33976 33977
33978 33979
3398 33981
33982
175 180 185
and with passive tags up to about 5 m. Altough this positioning accuracy can be low for some applications, RFID positioning can be very useful in combination with other sensors.
3 Locating the user on the correct floor in a multi-storey buildingIn the research project NAVIO the Vaisala pressure sensor PTB220A (see Figure 1) is employed for the determination of height differences from changes of the air pressure. The PTB220A is designed for measurements in a wide environmental pressure and tem-perature range with an extremly high accuracy (Vaisala, 2005). Starting from a given height the pressure changes can be converted in changes in height using the following equation:
( ) ( )21
12
lglg0037,0118464 BBtHHH
m −⋅⋅+⋅==−=∆
(1)
where ∆H is the height difference between two stations 1 and 2, B1 and B2 are the pres-sure observations at station 1 and 2 and tm is the mean value of the temperature of both stations. It must be notetd that this equation is an approximation formula that is valid for central Europe only (Kahmen, 1997). Tests showed that there is no significant difference between the results using the approxima-tion formula and an equation derived from Jordan which is also valid for other parts in the world and takes into account the geo-graphic location of the two stations. Recently performed tests have shown that we are able to determine the correct floor of a user in a multi-storey building using this sensor and they are described in the following (Retscher and Kistenich, 2005b). First of all the drift of the sensor was analyzed in several long term tests. Then it was investigated if a functional connection between the observed pressure differences and the height differences can be derived. This connection can be described using characterisic curves. Finally the accuracy of the height determination was analyzed.Figure 2 shows the test area which is in our office building of the Vienna University of Technology. The trajectory leads from the main entrance of the building via two staircases to our Institute which is located in the third floor of the 5-storey building.
4 Determination of the sensor driftFigure 3 shows an observation of the sensor over two hours performed on a benchmark located on the roof of our building. The height of the benchmark is 200.05 m. The sampling rate of the observations was one second. The temperature droped from 16.5° C to 15.8° C during the two hour observation period. The maximum deviations from the given height reaches values of + 0.42 m and – 0.64 m in the first half hour. Thereby the observations can vary randomly in this range of about 1.06 m. Some discontinuous varia-tions are also caused by the wind during the observation period. In summary, it can be concluded that no significant drift rates could be seen during severeral long term tests. The influence of wind, temperature changes and the air conditioning system inside the build-ing, however, can be clearly seen in the observations. For the first half hour of operation variations of the air pressure in the range of ± 0.15 hPa could be seen. Considering the resolution of the sensor which is 0.01 hPa the sensor can be regarded as stable and no drift rate will be considered in the following.Determination of a charac-teristic curve for the baro-metric pressure sensor A characteristic curve shows a functional connec-tion between the observed pressure differences and the height differences. If such a curve exists and the functional connection is linear then the pressure dif-ferences can be converted into height differences. For this purpose observations in the building have been carried out during different times of the day. Figure 4 shows six observations in the morning of one day and the resulting linear charac-
Fig. 1: Vaisala pressure sensor PTB220A
Fig. 2: Indoor trajectory in our office building of the Vienna University of Technology from the main entrance onwards to our Institute in the third floor of the building

Günther Retscher84
teristic curve. The start point of three of this observa-tions was on the ground floor and for the other three on the roof of the building. The characteristic curve is given by the following equation:
ph ∆⋅=∆ 769.8where ∆h is the height difference and where ∆p is the difference in air pressure.
As can be seen from Figure 4 the measurement series show a good agreement with the resulting character-istic curve. There is also no difference if the observa-tions begin either on the ground floor or on the roof of the building. Further characteristic curves have been obtained from different measurement series and can be found in (Kistenich, 2005). As a result it can be seen that we are able to calculate a linear char-acteristic curve which describes a linear functional connection between the air pressure observations and the changes in height.
5 Determination of the height in the buidlingFigure 5 shows observations with the Vaisala pressure sensor PTB220A in our office building starting from the main entrance up to the third floor of the building where our institute is located. It can be clearly seen that the sensor is able to determine the correct floor of the user with a high precision. The standard deviation of the pressure observation is in the range of ± 0.2 hPa and the maximum deviation of the determined height is less than ± 1 m for 91 % of the observations. Thereby the deviations depend also on the time of day; higher deviations are obtained during noon where usually more people are inside the building and higher variations of the air pressure occur caused by higher air circulation due to frequent opening of doors and windows. The maximum outlier during noon reaches values of about 1.4 m. In summary, it can be concluded that the sensor is able to locate the user on the correct floor.
6 Conclusions and OutlookFor the location of persons and objects in buildings a variety of systems have been developed in recent years. In this paper an over-view about their principle of operation and their performance is given. They provide mostly only 2-D location determination of
the user and the determination of the correct floor is a very challenging task. Therefore in the research project NAVIO the use of a barometric pressure sensor for direct obser-vations of the altitude is investigated. From the presented sensor tests can be seen that a high precision and relability for the loca-tion of a pedestrian on the correct floor of a multi-storey building can be achieved if a barometric pressure sensor is employed. Then in combination with other indoor loca-tion techniques and dead reckoning sensors a continouous 3-D position determination in indoor environments is possible. The obser-vations of all sensors have to be combined and an integrated position solution has to be obtained. For the integration of all observa-tions a multi-sensor fusion model based on an extended Kalman filter which makes use of a knowledge-based preprocessing of the sensor observations shall be applied. The principle of this approach is presented in (Retscher, 2005a). The fusion model consists of two steps, i.e., a knowledge-based prepro-
End of firsthalf hour
air pressure [hPa]
time [s]
Fig. 3: Long term sensor observations with the Vaisala pressure sensor PTB220A on benchmark No. 11 on the roof of our building
Fig. 4: Linear characteristic curve of six observations in our office building between the ground floor and the roof (6th floor)

3-D Position determination in a multi-storey building using a Pedestrian Navigation System 85
cessing filter followed by a central Kalman filter for optimal estimation of the current users’s 3-D position. The knowledge-based preprocessing fil-ter represents an extension of common multi-sen-sor fusion models in a way that the data based system analysis and modeling is supplemented by a knowledge-based component and therefore not directly quantifiable information is implemented through formulation and application of rules. This rules are tested in the preprocessing step and if they are fulfilled certain actions are executed. Due to the knowledge-based analysis of the sen-sor observations gross errors and outliers can be detected and eliminated in this processing step. In addition, the preprocessing filter supplies input values for the stochastic model of the central Kal-man filter. Therefore the weightings of the sensor observations can be adjusted in the Kalman filter depending on the availability and quality of the current observations. This integration approach will be implemented and further sensor tests will be carried out to test and analyze this approach. Due to the development of new advanced sen-sors it can be expected that multi-sensor solutions which provide location capabilities in outdoor and indoor environments will be deployed in pedestrians navigation services in the near future. We believe that these services will play an important role in the field of location-based services.
7 AcknowledgmentsThe research work presented in this paper is supported by the FWF Project NAVIO of the Austrian Science Fund (Fonds zur För-derung wissenschaftlicher Forschung) (Project No. P16277-N04). The author would like to thank Mr. Michael Thienelt and Mr. Michael Kistenich for the performance of test measurements with the barometric pressure sensors and the preparation of some of the figures in this paper.
8 ReferencesBahl, P. and Padmanabhan, V. (2000) Radar: An In-Building RF-based User Location and Tracking System, Proceedings of IEEE Infocom, Tel-
Aviv, March, pp. 775-784.Barnes, J., Rizos, C. and Wang, J. (2003) Locata: A New Positioning Technology for High Precision Indoor and Outdoor Positioning, in: Papers
presented at the ION GPS/GNSS 2003 Conference, September 9-12, 2004, Portland, Oregon, USA, unpaginated CD-Rom Proceedings. Brumitt, B., Meyers, B., Krumm, J., Kern, A., and Shafer, S. (2000) EasyLiving: Technologies for Intelligent Environments, Microsoft Corpora-
tion. Ekahau (2005) Ekahau Homepage, http://www.ekahau.com, Last date accessed 07.2005.Gartner, G., Frank, A. and Retscher, G. (2004) Pedestrian Navigation System for Mixed Indoor/Outdoor Environments. in: Gartner G. (Ed.): Geow-
issenschaftliche Mitteilungen, Schriftenreihe der Studienrichtung Vermessungswesen und Geoinformation, TU Wien, Heft 66, Papers presented at the 2nd Symposium on Location Based Services and Telecartography, January 28-29, 2004, Vienna, Austria, pp. 161-167.
Hallberg, J., Nilsson, M. and Synnes, K. (2003) Bluetooth Positioning, Proceddings of the 10th International Conference on Telecommunications (ICT), Tahiti, Feb. 23 – March 1.
Hightower, J., Want, R. and Boriello, G. (2000) SpotON: An Indoor 3D Location Sensing Technology Based on RF Signal Strength. University of Washington, Department of Computer Science and Engineering.
Hightower, J. and Boriello, G. (2001) A Survey and Taxonomy of Location Systems for Ubiquitous Computing, Technical Report, University of Washington, Department of Computer Science and Engineering.
Imst (2004) Indoor Locating – Imst ipos, Project c21, Presentation, IMST GmbH, Carl-Friedrich-Gauß-Str. 2, D-47475 Kamp-Lintfort, Germany, see also http://www.centrum21.de/, Last date accessed 07.2005.
Kahmen, H. (1997) Vermessungskunde. 19. Auflage, Walter de Gruyter, Belin, New York, pp. 475-482 (German).Kistenich, M. (2005) Indoor Positioning: Vergleich von Systemen zur Positionsbestimmung und Navigation in Gebäuden, Diploma thesisi, Institute
of Geodesy and Geophysics, Vienna University of Technology. Newman, J., Wagner, M., Bauer, M., Mac Williams, A., Pintaric, T., Beyer, D., Pustka, D., Strasser, F, Schmalstieg, D. and Klinker, G. (2004)
Ubiquitous Tracking for Augmented Reality, Technical Report, Vienna University of Technology, http://www.ims.tuwien.ac.at/media/docu-ments/publications/ubitrackismar04.pdf, Last date accessed 07.2005.
Rekimoto, J. and Ayatsuka, Y. (2000) CyberCode: Designing Augmented Reality Environments with Visual Tags, Proceedings of DARE 2000, Elsinore, pp. 1-10.
time [s]
roof
height difference [m]
3rd floor
2nd floor
1st floor
ground floor
Fig. 5: Test measurements with the Vaisala pressure sensor PTB220A in our office building of the Vienna University of Technology

Günther Retscher86
Retscher, G. (2002) Diskussion der Leistungsmerkmale von Systemen zur Positions-bestimmung mit Mobiltelefonen als Basis für Location Based Services (LBS), in: Kelnhofer, F., Lechthaler, M., Brunner, K. (Eds.): Geowissenschaftliche Mitteilungen, Schriftenreihe der Studienrichtung Vermessungswesen und Geoinformation, TU Wien, Heft 58, pp. 41-58, 2002 (German).
Retscher, G. (2004) Multi-sensor Systems for Pedestrian Navigation, in: Papers presented at the ION GNSS 2004 Conference, September 21-24, 2004, Long Beach, California, USA, unpaginated CD-Rom Proceedings, 12 pgs.
Retscher, G. (2005a) A Knowledge-based Klaman Filter Approach for an Intelligent Pedestrian Navigation System, in: Papers presented at the ION GNSS 2005 Conference, September 13-16, 2005, Long Beach, California, USA, unpaginated CD-Rom Proceedings, 11 pgs.
Retscher, G. (2005b) Indoor Positioning Technologies for Personal Navigation Systems, in Grün A., H. Kahmen (Eds.): Optical 3-D Measurement Techniques VII, Papers presented at the 7th Conference on Optical 3-D Measurement Techniques, October 3-5, 2005, Vienna, Austria.
Retscher, G. and Kistenich, M. (2005a) Vergleich von Systemen zur Positionsbestimmung und Navigation in Gebäuden, Paper submitted to Zeitschrift für Geodäsie, Geoinformation und Landmanagement (ZfV) (German).
Retscher, G. and Kistenich, M. (2005b) Höhenbestimmung in einem Gebäude mit einem digitalen Barometer für die Navigation von Fußgängern. Paper submitted to the Journal Allgemeine Vermessungsnachrichten (AVN) (German).
Roth, J. (2004) Data Collection, in: Schiller, J. and Voisard A. (Eds.) (2004): Location-Based Services, Morgan Kaufmann Publishers, USA, pp. 175-205.
Vaisala (2005) PTB220 Digital Barometer, User’s guide, Vaisala, Finland, http://www.vaisala.com/businessareas/instruments/servicesupport/user-guides/barometricpressure/PTB220%20User%20Guide%20in%20English.pdf, Last date accessed: 07.2005.
Want, R., Hopper, A., Falcao, V. and Gibbson, J. (1992) The Active Badge Location System, ACM Transactions on Information Systems, 10(1), pp. 91-102.
WhereNet (2005) WhereNet Homepage, http://www.wherenet.com, Last date accessed 07.2005.

A-GPS Positioning in today‘s mobile networks
Zvonimir Vukovic
AbstractThis paper presents an innovative way for positioning subscribers of mobile networks using Assisted GPS (A-GPS) technology. A-GPS offers substantial benefits for the end user compared with both traditional network-based positioning methods and with well known GPS positioning methods. These benefits are primarily high accuracy and availability with low market introduction costs. The standardization efforts by Open Mobile Alliance (OMA) have recently been undertaken to offer a clear and unambigu-ous standard called Secure User Plane Location (SUPL). These efforts will make it possible to develop standard conformed A-GPS enabled handheld devices and application platforms offering a variety of new and innovative location based services and solutions for the world market.
1 IntroductionGenerally speaking, the location of a mobile subscriber can be obtained either by using mobile network architecture for positioning, or by using GPS positioning methods or by combining these two technologies into what we call Assisted GPS (A-GPS) positioning. Network based and GPS based positioning methods offer a number of advantages as well as disadvantages. The third way, A-GPS, combines the previously mentioned technologies into a new one by targeting the advantages of both of them.
2 ObjectivesThe objectives of this paper are following:
- to give an overview of the A-GPS technology - to compare A-GPS positioning technology with network based positioning and GPS based positioning technologies- to present the standardisation efforts undertaken to bring clear and unambiguous standards for the world market- to present development results achieved by Siemens in implementing a standardized platform for location based services
called “Location Platform 3.5”
3 Technology descriptionAs already mentioned, A-GPS technology is derived from both, network based and GPS based positioning technologies, offering superior accuracy and availability with low investments into existing mobile network infrastructure.
3.1 Network based positioning Network based positioning methods rely entirely on the capabilities of the underlying infrastructure of the mobile network and, compared with the other two technologies, do not depend on the capabilities of the handset. The subscribers’ position estimates are calculated out of the available cell information. It is possible to request a position estimate of any mobile subscriber including self positioning. Depending on the coverage and capabilities of the mobile network elements the available positioning data can be more or less appropriate for calculating a good quality position estimate, thereby delivering more or less accurate results. In urban areas it can be expected to get better quality positioning estimates since it is likely to have better coverage and more cell information; in rural areas low quality position estimates can be expected due to lower coverage and less available cell data. In general, for network based positioning attempts delivered accuracy starts with 300 m and can go far beyond that. Furthermore, location requests issued against a mobile network consume a certain amount of resources of the mobile network thereby reducing the available bandwidth for voice and data calls. This means, network operators have to invest money into network infrastructure. Also, roaming scenarios may require roaming access to foreign mobile networks and this raises further compatibility and billing problems. The reality has shown that in most cases, due to different versions of network elements and different supported standards, positioning estimates are not better than a simple translation of the serving cells’ coordinates. This is, unfortunately, not good enough for most location-based applications.

Zvonimir Vukovic88
3.2 GPSThe Global Positioning System (GPS) consists of 24 satellites, which are placed in six orbital planes at 20200 km above the Earth. From the point of view of mobile networks, pure GPS positioning does not relay on mobile network infrastructure in any way. To be positioned, a user needs to have a GPS compatible handset and a clear view to the skies to get the signal from at least three satel-lites. This makes it impossible to execute positioning within buildings or urban areas with huge skyscrapers. Furthermore, a GPS receiver needs up to several minutes from the “cold” start to be able to deliver the first position estimate (time-to-first-fix). If all the necessary circumstances are met, one can position itself with an accuracy of 10 m. GPS positioning does not raise coverage and roaming issues as in case of network based positioning.Handheld devices, such as mobile phones, can be equipped with GPS receivers and provide interfaces towards the mobile network for exchange of positioning estimates between different users and/or to report the location of a user to the appropriate authority (e.g. for emergency reasons). This opens the door for a number of commercial use cases involving the mobile network as a bearer of position estimates.From the point of view of the small handset devices, necessary calculating power and battery consumption for the full GPS chipset have a significant impact on the size and weight of such devices making them bigger and heavier.
3.3 A-GPSAssisted GPS (A-GPS) is a positioning method that is a combination of both, network and GPS based positioning, where advantag-es of both of them have been taken into consideration. In an A-GPS system outside sources, such as assistance server and reference network, are providing help for a partial GPS receiver (built into a mobile phone or similar handheld device) to perform tasks nec-essary for delivering position estimates. The partial GPS receiver is built into a mobile device; it communicates with an assistance server via mobile network. The mobile network provides an initial approximate location of the receiver using available cell data. For this a simple translation of the serving cell identification into coordinates is sufficient. This approximate position (which is in network based positioning scenarios sometimes the final result, the best one can get) is forwarded to the Assistance Server. The As-sistance Server is responsible for data exchange with the GPS reference network and for execution of complex calculations. Based on these calculations a partial GPS receiver is able to more quickly and efficiently find appropriate satellite frequencies and lock onto them. In this scenario weaker satellite signals than those required by pure GPS can be efficiently used. Reduced search space leads to shortening the time necessary to get the final position estimate from minutes to seconds. Furthermore, since assistance is obtained from the mobile network, the necessary power consumption and calculating power of the built-in receiver is lower making it more appropriate for rather small mobile devices such as mobile phones. Furthermore, indoor coverage becomes reality.
3.4 Overview of achieved accuracy using different positioning technologies The following diagram presents the accuracy that can be expected from different positioning methods nowadays available within mobile networks.
GPS Satellites GPS Receiver
GPS Signal GPS Signal
Assistance data
AGPS Server
MSC
Base stations
Fig. 1: Overview of A-GPS positioning technology

A-GPS Positioning in today‘s mobile networks 89
3.5 Strength and weaknesses of positioning technologiesThe following table presents an overview of strength and weaknesses of available positioning technologies
Positioning technology Strengths Weaknesses
Network based positioning
Availability with all mobile phones, no additional costs for the user;Quick response from the network;Mobile network offers tracking capabilities
Additional investments in mobile network infrastructure;Low accuracy
GPSNo mobile network infrastructure investments;High accuracy;High Coverage
Mobile devices with integrated GPS chipset are necessary;Increased cost and complexity; Poor indoor coverage;Long time to first fix
A-GPS
High accuracy;High availability;Indoor coverage;Short time to first fix;Low network traffic
Mobile devices with integrated partial GPS receiver are necessary;Standardization of interfaces between network and mobile phones is necessary
Tab. 1: Strengths and weaknesses of positioning methods
3.6 Standardization effortsStandardization efforts have recently been undertaken by the Open Mobile Alliance (OMA) to bring a new unambiguous standard for A-GPS positioning in mobile networks. OMA includes nearly 200 world’s leading mobile operators, device and network sup-pliers, information technology companies and content and service providers. One of the main goals of OMA is to “deliver high quality, open technical specifications based upon market requirements that drive modularity, extensibility, and consistency amongst enablers to reduce industry implementation efforts”. This ensures that any standardization effort of such kind will push all involved sides, e.g. network operators, mobile phones manufacturers and solution providers, to promptly deploy services and solutions worldwide. Siemens as one of the OMA members has provided significant contributions into developing a new standard for A-GPS positioning called Secure User Plane Location (SUPL). This standard is planned for end of June 2005 to get finalized with good quality drafts already available. It is focused on definition of all necessary interfaces and protocols used by mobile devices utilizing both, A-GPS and (full) GPS receivers, and mobile networks in the following use cases: mobile initiated positioning and network initiated posi-tioning. The standardization takes into consideration all security and authorization issues as well.
1m 3 10 30 100 300 1km 3km 10km
Availability
Accuracy
remote
rural
sub - urban
city
in - door
AGPS
Satellite positioning
GPS Cellular location services
CI
CI+ TA+Rx
1m 3 10 30 100 300 1km 3km 10km
Availability
Accuracy
remote
rural
sub - urban
city
in - door
AGPS
Satellite positioning
GPS Cellular location services
CI
CI + RTT
E-CI +
RTT
Fig. 2: Accuracy of different positioning gtechnologies

Zvonimir Vukovic90
The use case ”mobile initiated positioning” describes a situation where a user of a mobile device provides its own location to the network. Such use case is, among other cases, especially interesting for situations where a proper authority should be informed about an emergency situation.The use case ”network initiated positioning” describes a situation where a request for positioning of a certain mobile device (there-by a user of this mobile device) has been submitted to the mobile network. The mobile network initiates positioning of the requested device considering all relevant security and authorization issues and delivers the result to the requesting party.
3.7 DevelopmentsDevelopment of location based solutions has already been a topic by all major competitors in the telecommunication business for some time now. A number of different applications are already deployed worldwide. But the expected business volume has still not been met due to a number of reasons, some of them being low precision, coverage problems and lack of standardization.Siemens has developed a product called “Location Platform 3.5”. The “Location Platform 3.5” retrieves the mobile device’s po-sition and subscriber state information from the mobile network and delivers this information to interrogating applications. This future-oriented platform supports 2G, 2,5G and 3G networks. It supports cell-id based positioning based on the MAP and CAMEL standard as well as higher accuracy positioning technologies in cooperation with an SMLC according to the 3GPP standard for Location Services. Fully based on standards, LP 3.5 supports multi-vendor environments both, within a single network and in roaming scenarios. For GPS and A-GPS positioning scenarios, a brand new SUPL standard has been implemented (up to the latest standardization results at the time of writing this document, with strong intension to track all changes and updates) to support all current and future implementations of GPS and/or A-GPS devices and applications.Due to the fact that all three technologies presented here (network based positioning, GPS positioning and A-GPS positioning), and all positioning scenarios (network initiated and SET initiated) are supported, the “Location Platform 3.5” is able to perform an automatic fallback from one positioning method to another one if the initial positioning attempt fails due to any reason. The following picture gives a rough overview of the “Location Platform 3.5“ solution, showing different interfaces and supported positioning methods.
4 ResultsExisting results in development of A-GPS based positioning services have a lack of standardization due to the fact that the SUPL standard will be finalized by end of June 2005. Nevertheless, pre-standard solutions are being developed and integrated to provide complete solutions. Siemens is closely monitoring finalization of the SUPL standard and acts accordingly to provide a reference implementation.
Location Enabling
Solution
User Data
Application Domain Mobile
Network
SMLC
WAP / Push Proxy
Gateway
UMTS
GSM
GPRS
Geo Data
GeoToolBox
Location Enabling Server
SMS / WAP
SS#7
TCP/IP
User Plane Positioning (SUPL)
Control Plane Positioning (3GPP)
SMLC
Location Platform 3.5
Figure 3: Overview of Location Platform 3.5 solution

A-GPS Positioning in today‘s mobile networks 91
5 ConclusionsA-GPS is a rather new positioning technology supported by an unambiguous standard and a number of companies (either mobile network operators, mobile phones manufacturers or solution providers). It is a hybrid solution that offers superior positioning ac-curacy and coverage with low investments and cost sharing among network providers, mobile manufacturers and solution provid-ers. It has all it needs to become a bearer of standardized solutions and services on a worldwide level offering a new dimension in everyday usage of mobile phones and other mobile devices. For a common user, a mobile phone becomes not only a simple com-munication device but also a useful travel companion or context provider. Critical issues, at the time being, are the finalization of the SUPL standardization and availability of compatible mobile devices on the market. There are companies though, such as Siemens, who are already prepared for all the challenges of this technology.
6 Abbreviations2G 2nd Generation2.5G 2.5 Generation3G 3rd Generation3GPP 3rd Generation Partnership ProjectA-GPS Assisted GPSCAMEL Customized Applications for Mobile network Enhanced LogicCI Cell IdentityE-CITA Enhanced Cell Identifier Timing AdvanceGSM Global System for Mobile CommunicationGPRS General Packet Radio ServiceMAP Mobile Application PartRTT Round Trip TimeSMLC Serving Mobile Location CentreSMS Short Message ServiceUMTS Universal Mobile Telecommunications SystemWAP Wireless Application Protocol
Table 2: Abbreviations
7 References[1] Goran M. Djuknic, Robert E. Richton, “Geolocation and Assisted GPS”, February 2001[2] Jimmy LaMance, Javier DeSalas, Jani Jarvinen, “Assisted GPS. A Low-Infrastructure Approach”, GPS World, Mar 1. 2002[3] Open Mobile Alliance, http://www.openmobilealliance.org[4] TED LP 3.5 (GMLC), “Technical Description”, Siemens, issue 03, May 2004
Terminal-Centric Location Services in the IP Multimedia Subsystem
Rudolf Pailer, Florian Wegscheider, Joachim Fabini
Abstract Location-based services in 3G and beyond networks depend on high-accuracy location data. Today’s 2G and 3G access networks determine user location in a network-centric manner. The accuracy of these location mechanisms depends on the radio infrastruc-ture near the user’s geographical position and is typically limited to hundreds or thousands of meters. This precision is inadequate for typical location-based services like city maps or route planners.In this paper we present a terminal-centric location enabler that integrates seamless with the existing IP Multimedia Subsystem presence architecture and interoperates with network-centric location mechanisms. We argue that the optimal accuracy is achieved by determining the location on the user terminal, which can be equipped with location sources like Global Positioning System (GPS) receivers. In consequence, the user terminal should be used as the primary source for location information. We extend the existing and well-known concept of presence by defining location as a type of presence information that is of interest to users. Ter-minal-based triggers and filters reduce the amount of traffic on the air interface and enable a scalable location architecture.This paper describes the system architecture for a terminal-based location service enabler in the 3G IP Multimedia Subsystem (IMS).
1 IntroductionLocation Based Services (LBS) are services that require information about the physical position of a user in order to provide ‘add-ed-value’ to services in a 3rd generation (3G) network. Location data may be plain geographical coordinates, access point cell ids, civil location in form of postal addresses or more abstract definitions like ‘in the office’, ‘at home’. Example services are a map showing the user’s current location or triggering a switch of the user profile when entering a specified area.Service enablers, defined to expose network functionality to external service providers, are becoming the cornerstones of modern service architectures defined by the Parlay Group, the Open Mobile Alliance (OMA) or in the IP Multimedia Subsystem (IMS). A Location Service Enabler is a functional entity in the network enabling value-added services to query the current position of a user or to request a trigger when a specified area is entered or left.Many mobile and fixed network operators have already started to migrate their telecommunication networks towards an All-IP in-frastructure where voice loses its dominancy and becomes just one among many services. The IP Multimedia Subsystem (IMS) [1], standardized by the 3rd Generation Partnership Project (3GPP), is the most promising candidate for replacing legacy, voice-dedicat-ed mobile networks with an All-IP technology. As opposed to traditional IP-based networks, the IMS guarantees end-to-end Quality of Service (QoS) in the network. The IMS creates an infrastructure that enables the fast deployment of new IP-based services and flexible billing while still maintaining compatibility with existing applications. The 3GPP IMS location specifications [2] adopt a network-centric location mechanism based on the Gateway Mobile Location Centre (GMLC) as primary location source for LBS.The accuracy of this network-centric positioning mechanism is dynamic. Depending on the radio infrastructure near the user’s geographical location the GMLC typically positions a user within an area of several thousand square meters in urban area to sev-eral square kilometers in rural area. This accuracy is not satisfactory for many LBS. High investments are required to implement network-centric location mechanism enhancements like Network Assisted GPS (A-GPS) or Idle Period Downlink- Observed Time Difference Of Arrival (IPDL-OTDOA).We argue in this paper that the optimal source for location data is the user’s terminal. If the terminal is equipped with some generic location technology (e.g. a GPS receiver), it can deliver the most accurate positioning information to the system. We thus propose a handset-based Location Service Enabler.Many countries impose legal restrictions that regulate the processing of personal data and the protection of privacy in electronic communications. Furthermore users want to control who gets access to their location data and want to be sure that the transport in the network of such sensitive data is protected by strong security mechanisms.Our analysis of the IMS presence system shows that the requirements regarding access authorization, encryption and privacy for presence are indeed identical to those for location. The concept of presence was introduced in instant messaging systems. Presence is information about the online status of other users. A watcher can subscribe to notifications about the state of a watched user, called ‘presentity’. Classical presence information is defined as the willingness of the presentity to communicate.
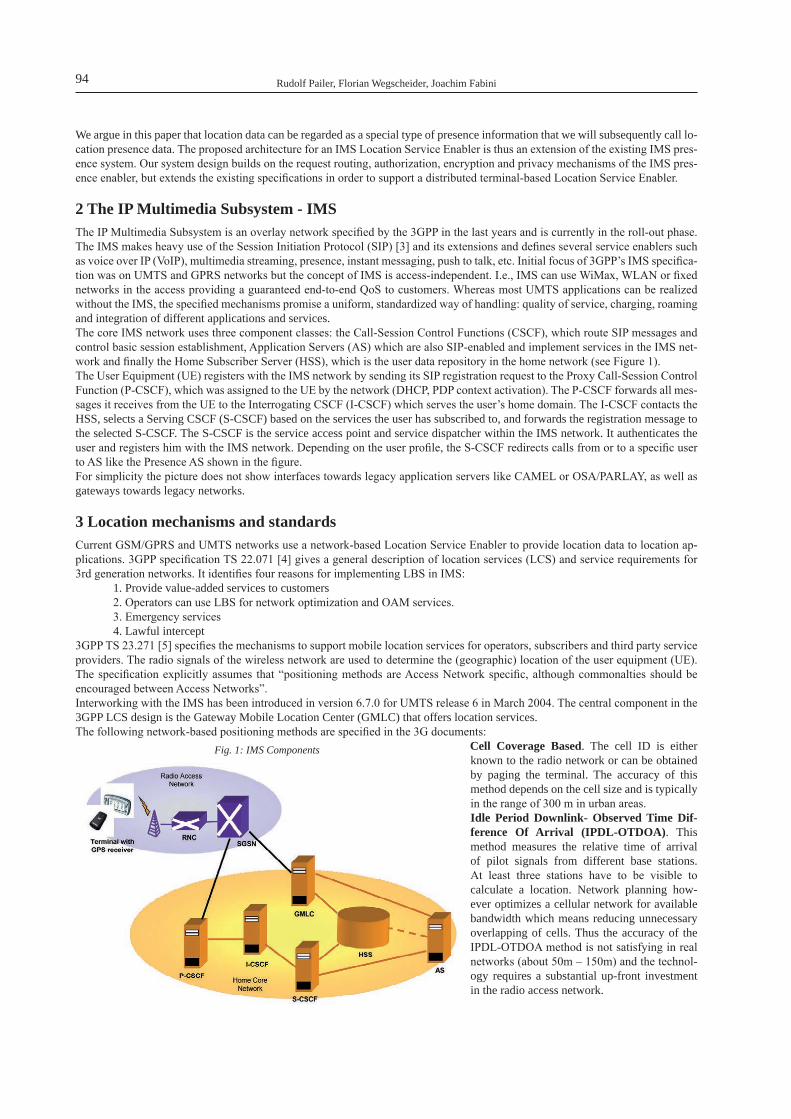
Rudolf Pailer, Florian Wegscheider, Joachim Fabini94
We argue in this paper that location data can be regarded as a special type of presence information that we will subsequently call lo-cation presence data. The proposed architecture for an IMS Location Service Enabler is thus an extension of the existing IMS pres-ence system. Our system design builds on the request routing, authorization, encryption and privacy mechanisms of the IMS pres-ence enabler, but extends the existing specifications in order to support a distributed terminal-based Location Service Enabler.
2 The IP Multimedia Subsystem - IMSThe IP Multimedia Subsystem is an overlay network specified by the 3GPP in the last years and is currently in the roll-out phase. The IMS makes heavy use of the Session Initiation Protocol (SIP) [3] and its extensions and defines several service enablers such as voice over IP (VoIP), multimedia streaming, presence, instant messaging, push to talk, etc. Initial focus of 3GPP’s IMS specifica-tion was on UMTS and GPRS networks but the concept of IMS is access-independent. I.e., IMS can use WiMax, WLAN or fixed networks in the access providing a guaranteed end-to-end QoS to customers. Whereas most UMTS applications can be realized without the IMS, the specified mechanisms promise a uniform, standardized way of handling: quality of service, charging, roaming and integration of different applications and services.The core IMS network uses three component classes: the Call-Session Control Functions (CSCF), which route SIP messages and control basic session establishment, Application Servers (AS) which are also SIP-enabled and implement services in the IMS net-work and finally the Home Subscriber Server (HSS), which is the user data repository in the home network (see Figure 1).The User Equipment (UE) registers with the IMS network by sending its SIP registration request to the Proxy Call-Session Control Function (P-CSCF), which was assigned to the UE by the network (DHCP, PDP context activation). The P-CSCF forwards all mes-sages it receives from the UE to the Interrogating CSCF (I-CSCF) which serves the user’s home domain. The I-CSCF contacts the HSS, selects a Serving CSCF (S-CSCF) based on the services the user has subscribed to, and forwards the registration message to the selected S-CSCF. The S-CSCF is the service access point and service dispatcher within the IMS network. It authenticates the user and registers him with the IMS network. Depending on the user profile, the S-CSCF redirects calls from or to a specific user to AS like the Presence AS shown in the figure.For simplicity the picture does not show interfaces towards legacy application servers like CAMEL or OSA/PARLAY, as well as gateways towards legacy networks.
3 Location mechanisms and standardsCurrent GSM/GPRS and UMTS networks use a network-based Location Service Enabler to provide location data to location ap-plications. 3GPP specification TS 22.071 [4] gives a general description of location services (LCS) and service requirements for 3rd generation networks. It identifies four reasons for implementing LBS in IMS:
1. Provide value-added services to customers2. Operators can use LBS for network optimization and OAM services.3. Emergency services4. Lawful intercept
3GPP TS 23.271 [5] specifies the mechanisms to support mobile location services for operators, subscribers and third party service providers. The radio signals of the wireless network are used to determine the (geographic) location of the user equipment (UE). The specification explicitly assumes that “positioning methods are Access Network specific, although commonalties should be encouraged between Access Networks”.Interworking with the IMS has been introduced in version 6.7.0 for UMTS release 6 in March 2004. The central component in the 3GPP LCS design is the Gateway Mobile Location Center (GMLC) that offers location services.The following network-based positioning methods are specified in the 3G documents:
Cell Coverage Based. The cell ID is either known to the radio network or can be obtained by paging the terminal. The accuracy of this method depends on the cell size and is typically in the range of 300 m in urban areas.Idle Period Downlink- Observed Time Dif-ference Of Arrival (IPDL-OTDOA). This method measures the relative time of arrival of pilot signals from different base stations. At least three stations have to be visible to calculate a location. Network planning how-ever optimizes a cellular network for available bandwidth which means reducing unnecessary overlapping of cells. Thus the accuracy of the IPDL-OTDOA method is not satisfying in real networks (about 50m – 150m) and the technol-ogy requires a substantial up-front investment in the radio access network.
Fig. 1: IMS Components
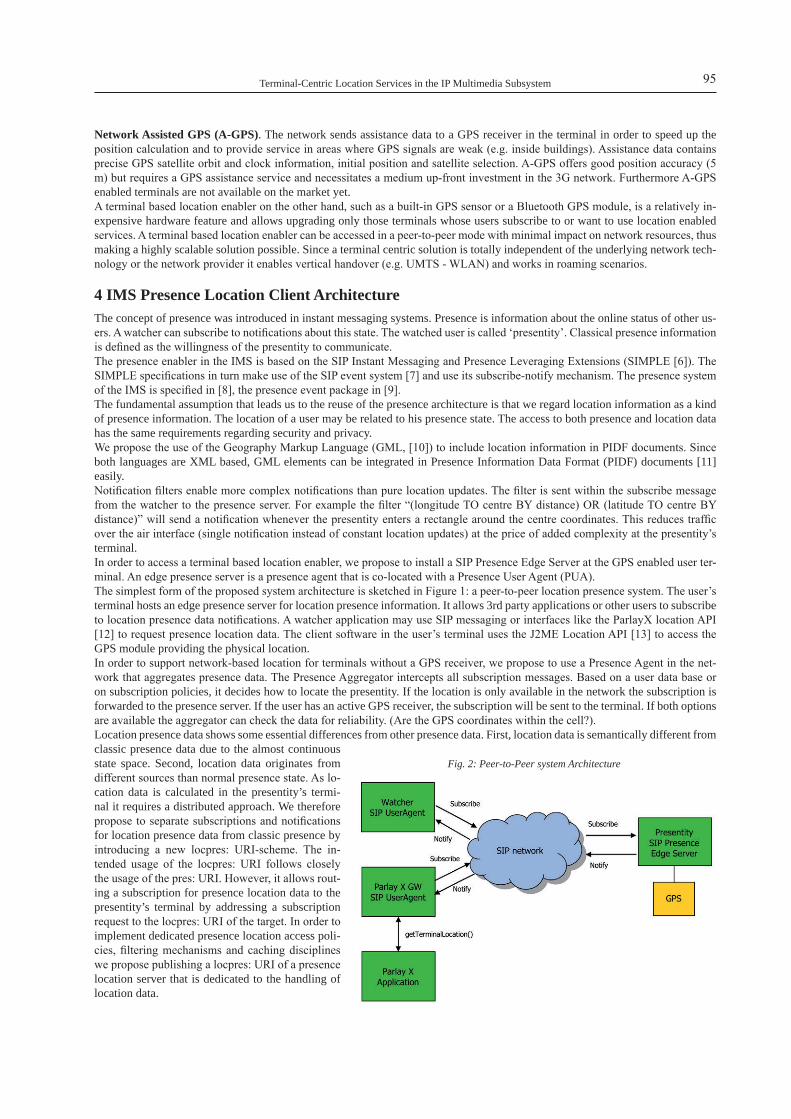
Terminal-Centric Location Services in the IP Multimedia Subsystem 95
Network Assisted GPS (A-GPS). The network sends assistance data to a GPS receiver in the terminal in order to speed up the position calculation and to provide service in areas where GPS signals are weak (e.g. inside buildings). Assistance data contains precise GPS satellite orbit and clock information, initial position and satellite selection. A-GPS offers good position accuracy (5 m) but requires a GPS assistance service and necessitates a medium up-front investment in the 3G network. Furthermore A-GPS enabled terminals are not available on the market yet.A terminal based location enabler on the other hand, such as a built-in GPS sensor or a Bluetooth GPS module, is a relatively in-expensive hardware feature and allows upgrading only those terminals whose users subscribe to or want to use location enabled services. A terminal based location enabler can be accessed in a peer-to-peer mode with minimal impact on network resources, thus making a highly scalable solution possible. Since a terminal centric solution is totally independent of the underlying network tech-nology or the network provider it enables vertical handover (e.g. UMTS - WLAN) and works in roaming scenarios.
4 IMS Presence Location Client ArchitectureThe concept of presence was introduced in instant messaging systems. Presence is information about the online status of other us-ers. A watcher can subscribe to notifications about this state. The watched user is called ‘presentity’. Classical presence information is defined as the willingness of the presentity to communicate.The presence enabler in the IMS is based on the SIP Instant Messaging and Presence Leveraging Extensions (SIMPLE [6]). The SIMPLE specifications in turn make use of the SIP event system [7] and use its subscribe-notify mechanism. The presence system of the IMS is specified in [8], the presence event package in [9].The fundamental assumption that leads us to the reuse of the presence architecture is that we regard location information as a kind of presence information. The location of a user may be related to his presence state. The access to both presence and location data has the same requirements regarding security and privacy.We propose the use of the Geography Markup Language (GML, [10]) to include location information in PIDF documents. Since both languages are XML based, GML elements can be integrated in Presence Information Data Format (PIDF) documents [11] easily.Notification filters enable more complex notifications than pure location updates. The filter is sent within the subscribe message from the watcher to the presence server. For example the filter “(longitude TO centre BY distance) OR (latitude TO centre BY distance)” will send a notification whenever the presentity enters a rectangle around the centre coordinates. This reduces traffic over the air interface (single notification instead of constant location updates) at the price of added complexity at the presentity’s terminal.In order to access a terminal based location enabler, we propose to install a SIP Presence Edge Server at the GPS enabled user ter-minal. An edge presence server is a presence agent that is co-located with a Presence User Agent (PUA).The simplest form of the proposed system architecture is sketched in Figure 1: a peer-to-peer location presence system. The user’s terminal hosts an edge presence server for location presence information. It allows 3rd party applications or other users to subscribe to location presence data notifications. A watcher application may use SIP messaging or interfaces like the ParlayX location API [12] to request presence location data. The client software in the user’s terminal uses the J2ME Location API [13] to access the GPS module providing the physical location.In order to support network-based location for terminals without a GPS receiver, we propose to use a Presence Agent in the net-work that aggregates presence data. The Presence Aggregator intercepts all subscription messages. Based on a user data base or on subscription policies, it decides how to locate the presentity. If the location is only available in the network the subscription is forwarded to the presence server. If the user has an active GPS receiver, the subscription will be sent to the terminal. If both options are available the aggregator can check the data for reliability. (Are the GPS coordinates within the cell?).Location presence data shows some essential differences from other presence data. First, location data is semantically different from classic presence data due to the almost continuous state space. Second, location data originates from different sources than normal presence state. As lo-cation data is calculated in the presentity’s termi-nal it requires a distributed approach. We therefore propose to separate subscriptions and notifications for location presence data from classic presence by introducing a new locpres: URI-scheme. The in-tended usage of the locpres: URI follows closely the usage of the pres: URI. However, it allows rout-ing a subscription for presence location data to the presentity’s terminal by addressing a subscription request to the locpres: URI of the target. In order to implement dedicated presence location access poli-cies, filtering mechanisms and caching disciplines we propose publishing a locpres: URI of a presence location server that is dedicated to the handling of location data.
Fig. 2: Peer-to-Peer system Architecture

Rudolf Pailer, Florian Wegscheider, Joachim Fabini96
The bottleneck of today’s mobile communication networks is the wireless access network – both in terms of delay and bandwidth. The communication between the mobile terminal and the location server uses the wireless access network so traffic over this inter-face must be reduced to a minimum for optimum performance.We argue that terminal-based filters can significantly reduce the amount of traffic on the air interface. The mobile terminal is not required to forward the location stream it receives from the GPS receiver to the LE.The solution that we have chosen is to provide the mobile terminal with filter information within the location presence subscribe messages. Along with the description of the location presence event these messages contain an area and the action to be taken. E.g. the subscribe message requests the mobile terminal to generate a notification on entering or leaving a rectangle area specified by centre coordinates, length and width.The sequence diagram in Figure 2 shows the message sequence for a terminal-centric location service’s operation.The figure omits the watcher who subscribed for the specific service. E.g., user Alice asks for the service “notify me if Bob is in his office”. The presence service maps the logical location information “Bob’s office” onto the corresponding geographical location data – e.g. a rectangle defined by its center coordinates, length and width. The presence service contacts the Location Enabler (LE) on behalf of the watcher Alice by sending a SIP subscribe message (1.0). Part of the subscribe message is the GML-encoded loca-tion that Alice is interested in and a description of the expected QoS: location accuracy, timing requirements, etc. The LE authorizes the subscribe request (1.1) and, if successful, forwards the subscribe message to the Edge presence Server (EPS) on Bob’s mobile device (1.3). Depending on the policy configured by Bob, the mobile device might ask interactively for Bob’s explicit permission before accepting Alice’s location request.The GPS receiver sends continuous location updates to the mobile device, which are forwarded via the JSR179 interface [13] to the terminal’s EPS (1.2, 1.4, and 1.5). The EPS detects on receipt of message 1.5 that Bob is located within the rectangle area the LE has subscribed to and that the QoS conditions are satisfied (accuracy is within limits). The EPS then sends a SIP notify message (1.7) to the LE. Depending on the QoS requested by Alice, the LE might decide to invoke a network-centric location mechanism (1.8) to do a consistency check (1.9) on Bob’s location data. E.g., Alice might be a lawful authority representative who set the location request’s QoS to the highest possible location reliability. The LE then forwards the SIP notify message to the presence service (1.9), which processes the location data and then contacts the watcher Alice.
5 IMS Presence location performanceA network-based positioning method requires request routing, access authorization and privacy control. Even if requester and target are connected to the same network, these functions are not trivial. In a roaming scenario, however, where a location request from a requesting network has to reach a location enabler in the visited network where the target terminal is actually roaming, is indeed a complex task, especially when access policies and privacy settings should be respected. The 3GPP Location Enabler architec-ture hence requires complex request routing between Requesting-, Home- and Visited network components in order to resolve the GMLC responsible for the user’s terminal.In an IMS-enabled system, however, the MSISDN based routing of a GMLC should be replaced by SIP message routing with its positive implications regarding performance, network management and security. Therefore our proposal is to send the location re-quest directly to the user’s URI using plain SIP message routing instead of introducing complex interworking functions in order to address a network-based location enabler.Furthermore, the existing network-based positioning methods are either insufficient regarding accuracy or require up-front invest-ments in the core network. Using a terminal-based GPS receiver as a source for location data is a network technology independent solution. It offers satisfactory accuracy while requiring only investments in those customers who want to use a location service.
Privacy requirements and mechanisms proposed by 3GPP standardization for Location Services are similar to those of presence systems [4] [14]. Beyond the specified functions, a real world location service system requires components that allow provisioning, user access and user control of privacy parameters. It seems reasonable to re-use the IMS presence infrastructure for subscription, authoriza-tion and privacy management of Location Based Services.Finally, a network-based positioning method is forced to implement triggered location updates through polling. In order to conserve battery power mobile termi-nals tend to be in an idle state most of the time. Hence position changes are not vis-ible to the network. We propose to imple-
Fig. 3: Terminal-centric location enabler operation
Terminal-Centric Location Services in the IP Multimedia Subsystem 97
ment trigger logic in the terminal so that necessary location updates are kept to an absolute minimum and scarce resources in the radio access network are used in the most economic way.
6 Related workThe Geographical Location and Privacy (GEOPRIV) working group of the IETF [15] has investigated a number of problems relat-ed to the distribution of geographical information on the Internet, from both a security and a policy angle. The result of this work is a generic framework for the creation and distribution of location information on the Internet that enables confidentiality and policy directives, which are abstracted from the format of the location information. Küpper and Treu propose complex location update strategies in the mobile terminal in order to realize scalable Location Based Services [16]. Shaham et al. propose to use SIP event mechanism to transport location data [17].Polk and Rosen present a framework and requirements for usage of SIP to convey user location information and consider cases where message routing by intermediaries is influenced by the location of the session initiator [18].
7 Conclusion and future workIn this paper we have presented the architecture of a terminal-centric IMS location enabler. Our solution scales better and is more accurate, efficient and cost effective than current network-based location enablers.Our group is currently working on an extension of SIP event filtering specifications and mechanisms in order to express and imple-ment complex triggering criteria in the mobile terminal. Furthermore we are in the course of implementing a prototype system in order to prove our concept in a reference implementation.Finally, we intend to contribute to the 3GPP/IMS standardization process with the aim to add the IMS location enabler to the family of basic enablers such as presence and messaging.
8 References[1] G. Camarillo, M. A. Garcia-Martin, “The 3G IP Multimedia Subsystem (IMS)”, John Wiley & Sons Ltd, 2004[2] 3rd Generation Partnership Project, “Technical Specification Group Services and System Aspects; Location Services (LCS); Service descrip-
tion; Stage 1”, 3GPP TS 22.071, version 7.1.0, 2005-01[3] J. Rosenberg, H. Schulzrinne, G. Camarillo, A. Johnston, J. Peterson, R. Sparks, M. Handley, E. Schooler, “SIP: Session Initiation Protocol”,
IETF Standards Track RFC 3261, June 2002[4] 3rd Generation Partnership Project, “Technical Specification Group Services and System Aspects; Location Services (LCS); Service descrip-
tion; Stage 1”, 3GPP TS 22.071, version 7.1.0, 2005-01[5] 3rd Generation Partnership Project, “Technical Specification Group Services and System Aspects; Functional stage 2 description of Location
Services (LCS)”, 3GPP TS 23.271, version 7.0.0, 2005-03[6] M. Day, J. Rosenberg, H. Sugano, ‘A Model for Presence and Instant Messaging’, IETF RFC 2778, February 2000[7] A. B. Roach , “Session Initiation Protocol (SIP)-Specific Event Notification”, IETF Standards Track RFC 3265, June 2002[8] 3rd Generation Partnership Project, “Presence Service; Architecture and Functional Description”, 3GPP TS 23.141, Version 6.7.0, 09/2004[9] J. Rosenberg, ‘A Presence Event Package for the Session Initiation Protocol (SIP)’, IETF Standards Track RFC 3856, August 2004[10] OpenGIS, „Open Geography Markup Language (GML) Implementation Specification“, OGC 02-023r4, January 2003, http://www.opengis.
org/techno/implementation.htm[11] H. Sugano, S. Fujimoto, G. Klyne, A. Bateman, W. Carr, J. Peterson, “Presence Information Data Format (PIDF)”, IETF Standards Track RFC
3863, August 2004[12] ETSI Standard ES 202 391-9, Open Service Access (OSA); Parlay X Web Services; Part 9: Terminal Location, V1.1.1 (2005-03)[13] Java Specification Request JSR-179, ‘Location API for the Java 2 Platform, Micro Edition (J2ME) version 1.0’, Nokia, 2003. http://jcp.org/
en/jsr/detail?id=179[14] J. Peterson, “A Presence Architecture for the Distribution of GEOPRIV Location Objects”, IETF Internet-Draft, draft-ietf-geopriv-pres-02,
September 8, 2004[15] Charter of the Geographical Location and Privacy (GEOPRIV) working group of the Internet Engineering Task Force (IETF), http://www.ietf.
org/html.charters/geopriv-charter.html[16] A. Küpper, G. Treu: From Location to Position Management: User Tracking for Location-based Services. Kommunikation in Verteilten Syste-
men (KiVS) Kurzbeiträge und Workshop 2005, pp. 81-88 [17] R. Shaham, H. Schulzrinne, W. Kellerer, S.Thakolsri, An Architecture for Location-based Service Mobility Using the SIP Event Model, Inter-
national Conference on Mobile Systems Application and Services, (Mobys 2004) Boston 2004[18] J. M. Polk, B. Rosen, “Requirements for Session Initiation Protocol Location Conveyance”, IETF Internet-Draft, draft-ietf-sipping-location-
requirements-02.txt, October 25th, 2004

WiKaF - A knowledge-based Kalman-Filter for pedestrian positioning
Michael Thienelt, Andreas Eichhorn, Alexander Reiterer
AbstractThe precise, reliable and preferably everywhere available positioning of mobile users is a substantial precondition for the provision of location and situation based information by Location Based Services. Within these applications locating of pedestrians in ‘pas-sive environments’ represents a special challenge. In this paper a new knowledge-based approach for the improvement of position quality is presented.
1 IntroductionWithin the last years there was an enormous increase of various navigation applications. Especially vehicle navigation systems made the evolution from the research labs to the user segment. Now the next logical step is to navigate the individual person. Cel-lular phone network operators already show a massive presence at the navigation market. This is motivied by the necessity to amor-tise their investments in expensive UMTS licenses introducing new profitable customer services, especially so called location based services (LBS). Many of these services offer location based information for users with mobile devices (e.g. PDA, mobile phone etc.). The service is performed dependending on the current position/situation of the user. Typical examples are “Friendfinding” or monitoring of nearest restaurants respectively shopping possibilities.The reorganization of the American army has also led to an intensified research work with LBS. One important emphasis is the positioning of pedestrians (infantry). Navigation supported by mobile devices aims at a faster and less error-prone orientation in unknown areas.Civil applications are mainly focussed on tourist navigation. The individual pedestrian shall be able to explore a city in an indepen-dent and comfortable way. Depending on his present position he gets additional information, for example of sights and shopping facilities.Depending from the type of environment the methods for positioning (locating) can be divided in two groups: (1) locating in pas-sive and (2) locating in active environments. Passive enviroments have no active sensor infrastructure. The locating of the user is realized autonomously by mobile devices with several sensors like GPS, mobile phone, digital compass or pedometer [1]. Active environments contain active landmarks. Active landmarks are single sensors or sensor networks which connect themselves with a mobile device transferring information about its present position. A successful application is realized in museums by infra-red interfaces [2]. The exhibits locate the visitor and submit relevant information (e.g. historical data) to his mobile device. Using WLAN active Landmarks can also be realized in urban areas. Current research activities try to integrate the RFID1 technology into this development.The common goal of all different positioning methods is to provide a precise, reliable and preferably everywhere available position information of the mobile users. It is a substantial precondition for the application of LBS. Especially the autonomous positioning of pedestrians in passive environments is influenced by many quality restrictions and consequently a special challenge. This contri-bution presents a new knowledge-based approach for the significant improvement of position quality: WiKaF (= ‘Wissensbasiertes Kalman-Filter’, see [3]).
2 System architectureIn Figure 1 the process chain for the positioning of pedestrians with knowledge-based Kalman-filtering is presented. A multi-sensor platform acquires absolute and relative position data of the pedestrian. In a knowledge-based preprocessing the measuring data is
1) RFID (radio frequency identification) is a method for wireless reading and storing data. The data will be stored on special RFID tags. RFID con-tains the tags, a transmission/receiver unit and the integration of this components in an existing server system [5].
Sensors Knowledge-basedFilter Kalman Filter Position
Fig. 1: Process chain of the WiKaF-System
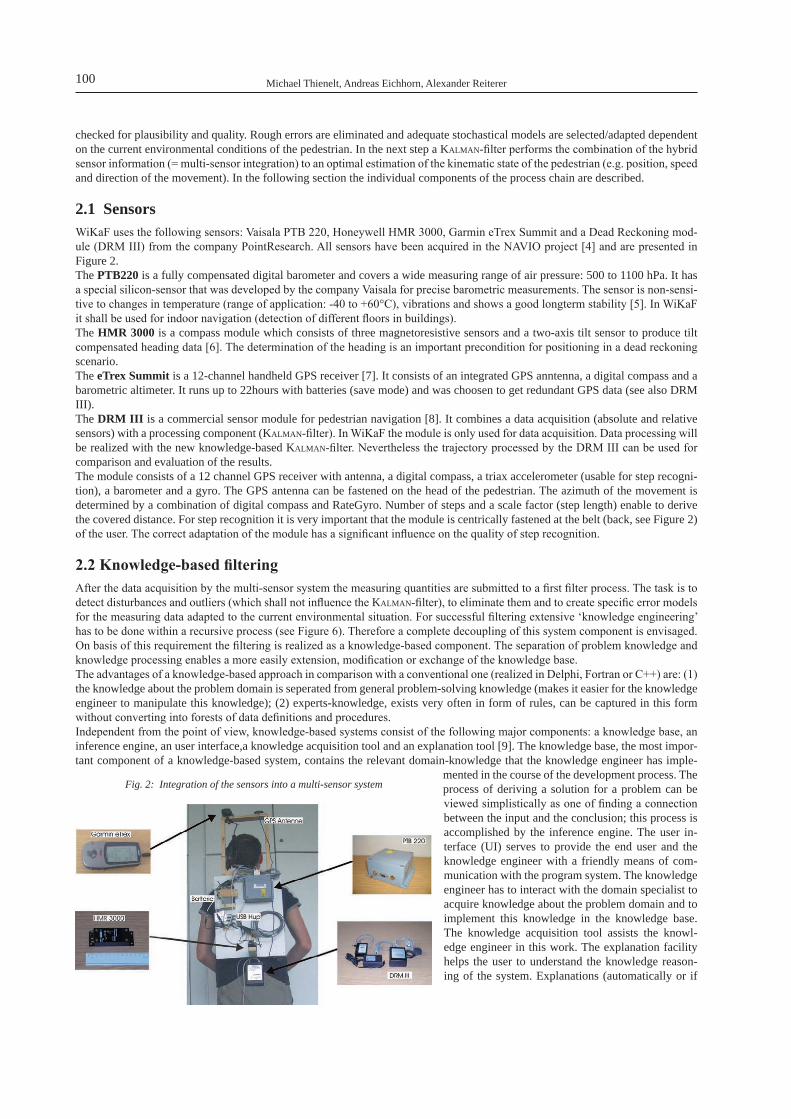
Michael Thienelt, Andreas Eichhorn, Alexander Reiterer100
checked for plausibility and quality. Rough errors are eliminated and adequate stochastical models are selected/adapted dependent on the current environmental conditions of the pedestrian. In the next step a Kalman-filter performs the combination of the hybrid sensor information (= multi-sensor integration) to an optimal estimation of the kinematic state of the pedestrian (e.g. position, speed and direction of the movement). In the following section the individual components of the process chain are described.
2.1 SensorsWiKaF uses the following sensors: Vaisala PTB 220, Honeywell HMR 3000, Garmin eTrex Summit and a Dead Reckoning mod-ule (DRM III) from the company PointResearch. All sensors have been acquired in the NAVIO project [4] and are presented in Figure 2.The PTB220 is a fully compensated digital barometer and covers a wide measuring range of air pressure: 500 to 1100 hPa. It has a special silicon-sensor that was developed by the company Vaisala for precise barometric measurements. The sensor is non-sensi-tive to changes in temperature (range of application: -40 to +60°C), vibrations and shows a good longterm stability [5]. In WiKaF it shall be used for indoor navigation (detection of different floors in buildings).The HMR 3000 is a compass module which consists of three magnetoresistive sensors and a two-axis tilt sensor to produce tilt compensated heading data [6]. The determination of the heading is an important precondition for positioning in a dead reckoning scenario.The eTrex Summit is a 12-channel handheld GPS receiver [7]. It consists of an integrated GPS anntenna, a digital compass and a barometric altimeter. It runs up to 22hours with batteries (save mode) and was choosen to get redundant GPS data (see also DRM III).The DRM III is a commercial sensor module for pedestrian navigation [8]. It combines a data acquisition (absolute and relative sensors) with a processing component (Kalman-filter). In WiKaF the module is only used for data acquisition. Data processing will be realized with the new knowledge-based Kalman-filter. Nevertheless the trajectory processed by the DRM III can be used for comparison and evaluation of the results.The module consists of a 12 channel GPS receiver with antenna, a digital compass, a triax accelerometer (usable for step recogni-tion), a barometer and a gyro. The GPS antenna can be fastened on the head of the pedestrian. The azimuth of the movement is determined by a combination of digital compass and RateGyro. Number of steps and a scale factor (step length) enable to derive the covered distance. For step recognition it is very important that the module is centrically fastened at the belt (back, see Figure 2) of the user. The correct adaptation of the module has a significant influence on the quality of step recognition.
2.2 Knowledge-based filteringAfter the data acquisition by the multi-sensor system the measuring quantities are submitted to a first filter process. The task is to detect disturbances and outliers (which shall not influence the Kalman-filter), to eliminate them and to create specific error models for the measuring data adapted to the current environmental situation. For successful filtering extensive ‘knowledge engineering’ has to be done within a recursive process (see Figure 6). Therefore a complete decoupling of this system component is envisaged. On basis of this requirement the filtering is realized as a knowledge-based component. The separation of problem knowledge and knowledge processing enables a more easily extension, modification or exchange of the knowledge base.The advantages of a knowledge-based approach in comparison with a conventional one (realized in Delphi, Fortran or C++) are: (1) the knowledge about the problem domain is seperated from general problem-solving knowledge (makes it easier for the knowledge engineer to manipulate this knowledge); (2) experts-knowledge, exists very often in form of rules, can be captured in this form without converting into forests of data definitions and procedures.Independent from the point of view, knowledge-based systems consist of the following major components: a knowledge base, an inference engine, an user interface,a knowledge acquisition tool and an explanation tool [9]. The knowledge base, the most impor-tant component of a knowledge-based system, contains the relevant domain-knowledge that the knowledge engineer has imple-
mented in the course of the development process. The process of deriving a solution for a problem can be viewed simplistically as one of finding a connection between the input and the conclusion; this process is accomplished by the inference engine. The user in-terface (UI) serves to provide the end user and the knowledge engineer with a friendly means of com-munication with the program system. The knowledge engineer has to interact with the domain specialist to acquire knowledge about the problem domain and to implement this knowledge in the knowledge base. The knowledge acquisition tool assists the knowl-edge engineer in this work. The explanation facility helps the user to understand the knowledge reason-ing of the system. Explanations (automatically or if
Fig. 2: Integration of the sensors into a multi-sensor system
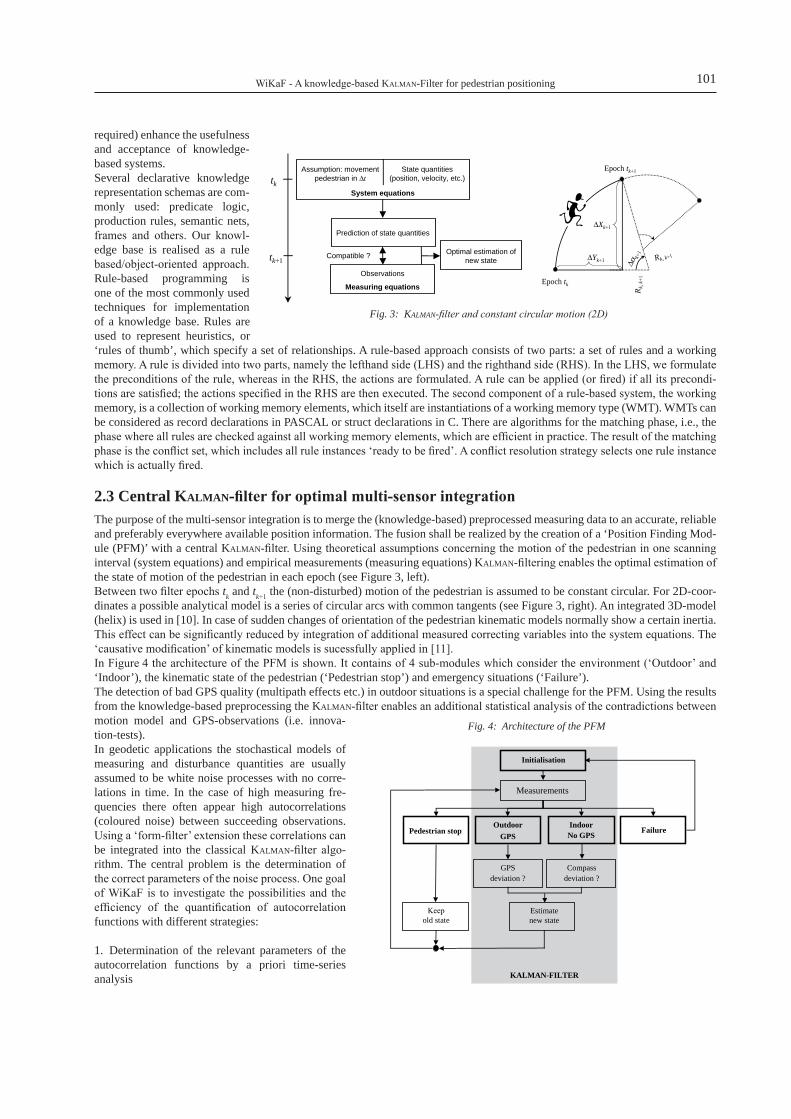
WiKaF - A knowledge-based Kalman-Filter for pedestrian positioning 101
required) enhance the usefulness and acceptance of knowledge-based systems.Several declarative knowledge representation schemas are com-monly used: predicate logic, production rules, semantic nets, frames and others. Our knowl-edge base is realised as a rule based/object-oriented approach. Rule-based programming is one of the most commonly used techniques for implementation of a knowledge base. Rules are used to represent heuristics, or ‘rules of thumb’, which specify a set of relationships. A rule-based approach consists of two parts: a set of rules and a working memory. A rule is divided into two parts, namely the lefthand side (LHS) and the righthand side (RHS). In the LHS, we formulate the preconditions of the rule, whereas in the RHS, the actions are formulated. A rule can be applied (or fired) if all its precondi-tions are satisfied; the actions specified in the RHS are then executed. The second component of a rule-based system, the working memory, is a collection of working memory elements, which itself are instantiations of a working memory type (WMT). WMTs can be considered as record declarations in PASCAL or struct declarations in C. There are algorithms for the matching phase, i.e., the phase where all rules are checked against all working memory elements, which are efficient in practice. The result of the matching phase is the conflict set, which includes all rule instances ‘ready to be fired’. A conflict resolution strategy selects one rule instance which is actually fired.
2.3 Central Kalman-filter for optimal multi-sensor integrationThe purpose of the multi-sensor integration is to merge the (knowledge-based) preprocessed measuring data to an accurate, reliable and preferably everywhere available position information. The fusion shall be realized by the creation of a ‘Position Finding Mod-ule (PFM)’ with a central Kalman-filter. Using theoretical assumptions concerning the motion of the pedestrian in one scanning interval (system equations) and empirical measurements (measuring equations) Kalman-filtering enables the optimal estimation of the state of motion of the pedestrian in each epoch (see Figure 3, left).Between two filter epochs tk and tk+1 the (non-disturbed) motion of the pedestrian is assumed to be constant circular. For 2D-coor-dinates a possible analytical model is a series of circular arcs with common tangents (see Figure 3, right). An integrated 3D-model (helix) is used in [10]. In case of sudden changes of orientation of the pedestrian kinematic models normally show a certain inertia. This effect can be significantly reduced by integration of additional measured correcting variables into the system equations. The ‘causative modification’ of kinematic models is sucessfully applied in [11].In Figure 4 the architecture of the PFM is shown. It contains of 4 sub-modules which consider the environment (‘Outdoor’ and ‘Indoor’), the kinematic state of the pedestrian (‘Pedestrian stop’) and emergency situations (‘Failure’).The detection of bad GPS quality (multipath effects etc.) in outdoor situations is a special challenge for the PFM. Using the results from the knowledge-based preprocessing the Kalman-filter enables an additional statistical analysis of the contradictions between motion model and GPS-observations (i.e. innova-tion-tests).In geodetic applications the stochastical models of measuring and disturbance quantities are usually assumed to be white noise processes with no corre-lations in time. In the case of high measuring fre-quencies there often appear high autocorrelations (coloured noise) between succeeding observations. Using a ‘form-filter’ extension these correlations can be integrated into the classical Kalman-filter algo-rithm. The central problem is the determination of the correct parameters of the noise process. One goal of WiKaF is to investigate the possibilities and the efficiency of the quantification of autocorrelation functions with different strategies:
1. Determination of the relevant parameters of the autocorrelation functions by a priori time-series analysis
tk
tk+1Optimal estimation of
new stateCompatible ?
Assumption: movementpedestrian in ∆t
State quantities(position, velocity, etc.)
System equations
Observations
Measuring equations
Prediction of state quantities
R k, k
+1Epoch tk
Epoch tk+1
∆Yk+1
∆Xk+1
∆αk+
1
Rk, k+1
Fig. 3: Kalman-filter and constant circular motion (2D)
Measurements
Initialisation
Pedestrian stopOutdoor
GPSIndoorNo GPS Failure
Keepold state
Estimatenew state
GPSdeviation ?
KALMAN-FILTER
Compassdeviation ?
Fig. 4: Architecture of the PFM

Michael Thienelt, Andreas Eichhorn, Alexander Reiterer102
2. Estimation of the parameters during the filter pro-cess using an adaptive extension (adaptive Kalman-filtering)
3 Further workflow of WiKaFHaving shown the theoretical fundamentals and the system architecture the workflow for the realization of WiKaF is pointed out. It includes the definition of suitable test-areas and the detailed planning of the individual levels of development.
3.1 Test-areasThe development and implementation of the knowl-edge-based Kalman-filter requires the definition of different types of representative test-areas. In the be-ginning of the project three scenarios were selected: two outdoor scenarios and one indoor scenario.
Test-area 1 (TA-1) is realized at the park of the castle Schoenbrunn in Vienna and offers excellent GPS-quality. Test-area 2 (TA-2) is next to the centre of the city and stretches a triangle of 140m x 200m x 250m. This area is located in an urban environment with partly poor or no GPS availability. 3D-reference trajectories are realized by tacheometry and precise levelling.In Figure 5 the 3D-reference trajectory for the indoor scenario is shown. In test-area 3 (TA-3) the trajectory is realized from the ground to the third floor of the electrotechnical building of Vienna University of Technology. At the half distance there is a little ‘side trip’ to a room which is accessible from the corridor. The endings of TA-3 are directly connected with TA-2 and enable the change from an outdoor to an indoor scenario.
3.2 Workflow of WiKaFAt the end of the conceptual description the further project steps will be briefly presented. A rough overview of the most important project phases is shown in Figure 6.The selection of the different types of sensors (see also Section 2.1) and the creation of representative reference trajectories is com-pleted. The sensor investigation and the derivation of deterministic and stochastic sensor and disturbance models is just in work. As main part of the ‘knowledge engineering’ these investigations represent one of the most important steps within the WiKaF project. The collected knowledge will be directly integrated into the two following development steps.The parallel and in most parts independent development of knowledge-based system and Kalman-filter (PFM) leads to functionally autonomous system components. It enables the establishment of a modular system and a more simple evaluation of the knowlegde-based approach against ‘classical’ Kalman-filtering by activating/deactivating of one system component.After finishing the conceptual design the complete positioning system will be realized by two different software solutions. The implementation of the knowledge-based system component will be carried out by Clips respectively WxClips. Clips is a program-ming language especially designed for the creation of rule-based expert systems (see [12]). The Kalman-filter and the PFM will be realized by Matlab. Data exchange (interfaces) between the different software modules happens by standardized ASCII-files.
4 Conclusions and perspectivesThe concept of knowledge-based Kalman-filtering (WiKaF) is an ‘intelligent’ extension of the data-based multi-sensor integra-tion. It enables the utilization of not only quantitative (measurements) but also qualitative information by the definition of rules.
X [m]Y [m]
Z [m
]
2730
2740
2750
2760
2770
2780
2790
2800 33975
33976
33977
33978
33979
3398
33981
33982
175
180
185
Fig. 5: Indoor trajectory of the test-area 3 (TA-3)
Choose of the sensors
Investigation of the sensors
System realization
Design of the KF
Design of the KBS
Tests
Fig. 6: Workflow of WiKaF

WiKaF - A knowledge-based Kalman-Filter for pedestrian positioning 103
The major goal is to support the filter in detecting and eliminating of incorrect sensor data and selecting suitable (situation related) stochastical models. In this contribution we report on the architecture and the functionality of WiKaF and its present stage of de-velopment.Using the reference trajectories described in Section 3.1 the next part of the project deals with the investigation of the single sensor systems. In this context the time series analysis of the sensor data, the sensor calibration and the evaluation and classification of topographical (disturbance) influences are important tasks and represent the basis for the design of the knowledge-based compo-nent. A special emphasis is set on the determination of auto-correlation functions as input for the form-filter (see Section 2.3).
5 AcknowledgementsThe research work presented in this paper is supported in parts by the FWF Project NAVIO of the Austrian Science Fund (Fonds zur Förderung wissenschaftlicher Forschung) (Project No. P16277-N04)
6 References[1]RetscheR,G. / thienelt,m.: NAVIO - A Navigation and Guidance Service for Pedestrians. Journal of Global Positioning Systems (Print Ver-
sion), 3 (2004),1-2; pp. 208-217[2] eyeled-Website: http://www.eyeled.de, last access: 09.2005[3] thienelt,m. / eichhoRn, A. / ReiteReR, A.: Konzept eines wissensbasierten Kalman-Filters für die Fußgängerortung (WiKaF), Österreichische
Zeitschrift für Vermessung und Geoinformation (VGI), 93. Jahrgang, Heft 2/2005, pp. 96-104[4] GaRtneR,G./FRanK,a./RetscheR,G.: Pedestrian Navigation System in Mixed Indoor/Outdoor Environment – The NAVIO Project, in: Schrenk
M. (Hrsg.): Proceedings of the CORP 2004 and Geomultimedia04 Symposium, February 24-27, 2004, Vienna, Austria, 165-171[5] Vaisala–Website: http://www.vaisala.com/businessareas/instruments/ products/barometric pressure/ptb220, last access 09.2005[6] honeyWell-Website: http://www.ssec.honeywell.com/magnetic/datasheets/ hmr3000.pdf, last access 09.2005[7] GaRmin-Website: http://www.garmin.de/Produktbeschreibungen/GPSetrex.pdf, last access 09.2005[8]PointReseaRch: http://www.pointresearch.com/drm_eval.htm, last access 09.2005[9]steFiK,m.: Introduction to Knowledge Systems. 2. Aufl., Morgan Kaufmann Verlag, San Francisco, 1998[10] aussems,t.: Positionsschätzung von Landfahrzeugen mittels Kalman-Filterung aus Satelliten- und Koppelnavigationsbeobachtungen.
Veröffentlichungen des Geodätischen Instituts der Rheinisch-Westfälischen Technischen Hochschule Aachen, Nr. 55, Aachen, 1999[11]eichhoRn,a.: Ein Beitrag zur Identifikation von dynamischen Strukturmodellen mit Methoden der adaptiven Kalman-Filterung. DGK, Reihe
C, Nr. 585, München, 2005[12] cliPs-Website: http://www.ghg.net/clips/CLIPS.html, last access: 09.2005
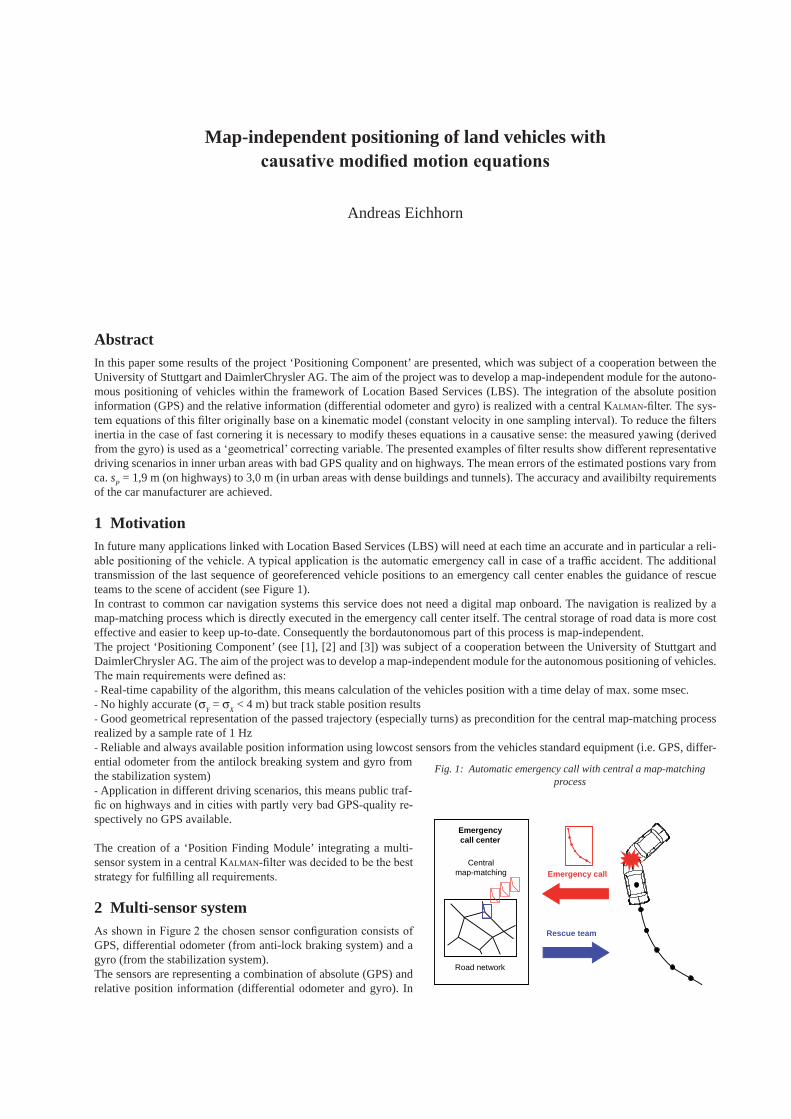
Map-independent positioning of land vehicles with causative modified motion equations
Andreas Eichhorn
AbstractIn this paper some results of the project ‘Positioning Component’ are presented, which was subject of a cooperation between the University of Stuttgart and DaimlerChrysler AG. The aim of the project was to develop a map-independent module for the autono-mous positioning of vehicles within the framework of Location Based Services (LBS). The integration of the absolute position information (GPS) and the relative information (differential odometer and gyro) is realized with a central Kalman-filter. The sys-tem equations of this filter originally base on a kinematic model (constant velocity in one sampling interval). To reduce the filters inertia in the case of fast cornering it is necessary to modify theses equations in a causative sense: the measured yawing (derived from the gyro) is used as a ‘geometrical’ correcting variable. The presented examples of filter results show different representative driving scenarios in inner urban areas with bad GPS quality and on highways. The mean errors of the estimated postions vary from ca. sP = 1,9 m (on highways) to 3,0 m (in urban areas with dense buildings and tunnels). The accuracy and availibilty requirements of the car manufacturer are achieved.
1 MotivationIn future many applications linked with Location Based Services (LBS) will need at each time an accurate and in particular a reli-able positioning of the vehicle. A typical application is the automatic emergency call in case of a traffic accident. The additional transmission of the last sequence of georeferenced vehicle positions to an emergency call center enables the guidance of rescue teams to the scene of accident (see Figure 1).In contrast to common car navigation systems this service does not need a digital map onboard. The navigation is realized by a map-matching process which is directly executed in the emergency call center itself. The central storage of road data is more cost effective and easier to keep up-to-date. Consequently the bordautonomous part of this process is map-independent.The project ‘Positioning Component’ (see [1], [2] and [3]) was subject of a cooperation between the University of Stuttgart and DaimlerChrysler AG. The aim of the project was to develop a map-independent module for the autonomous positioning of vehicles. The main requirements were defined as:- Real-time capability of the algorithm, this means calculation of the vehicles position with a time delay of max. some msec.- No highly accurate (σY = σX < 4 m) but track stable position results- Good geometrical representation of the passed trajectory (especially turns) as precondition for the central map-matching process realized by a sample rate of 1 Hz- Reliable and always available position information using lowcost sensors from the vehicles standard equipment (i.e. GPS, differ-ential odometer from the antilock breaking system and gyro from the stabilization system)- Application in different driving scenarios, this means public traf-fic on highways and in cities with partly very bad GPS-quality re-spectively no GPS available.
The creation of a ‘Position Finding Module’ integrating a multi-sensor system in a central Kalman-filter was decided to be the best strategy for fulfilling all requirements.
2 Multi-sensor systemAs shown in Figure 2 the chosen sensor configuration consists of GPS, differential odometer (from anti-lock braking system) and a gyro (from the stabilization system).The sensors are representing a combination of absolute (GPS) and relative position information (differential odometer and gyro). In
Emergency call
Rescue team
Centralmap-matching
Road network
Emergencycall center
Fig. 1: Automatic emergency call with central a map-matching process

Andreas Eichhorn106
the case of no GPS available (e.g. in tunnels) it is possible to caculate the vehicles position in dead reckoning. Redundant position information en-ables mutual control and error detection. Using this combination, reliabil-ity as well as availibility of the individual sensor is increased.During the test-drives the registration of differential odometer and gyro was realized via the vehicles CAN-bus (CAN = Controller Area Network) with a frequency of 50 Hz. Absolute GPS and differential GPS (DGPS) were separately registrated with a frequency of 1 Hz. DGPS was not used for position finding, but to derive the reference trajectories for quality con-trol of the results. The synchronization of all signals was better than 2 ms. Assuming a velocity of 200 km/h this means a position error (longitudinal deviation) of only 10 cm [4].The second step contains the derivation of geometrical quantities from the original signals. The wheel turn impulses are integrated from 50 Hz to 1 Hz and multiplied with a scale factor (from calibration) to calculate the distance covered and the change in the vehicles direction. Integration of the gyro signal although delivers the change in direction as redundant in-formation. A detailed description of the formulas can be found in [5]. The resulting position information (per s) is:
1gyro
odoodo
GPSGPS
DGPSDGPS
11)(
+
++
==
k
kk s
XY
XY
t
α∆
α∆∆LL
(1)
Sensor examination and calibration was realized by test-drives in three different scenarios: inner urban areas, highways with high velocity and winding country roads. The empirical standard deviations of the geometrical quantities (1) are shown in Table 1.
velocity [m/s]0-5 5-15 > 15
(sY , sX)GPS 1,5 ms∆s, odo per s 0,2 m 0,3 ms∆α, odo per s 2 gon 1 gons∆α, gyro per s 2 gon 1 gon
Tab. 1: Stochastical model of the multi-sensor system
3 Kalman-filter algorithm with causative motion equationsTo bring together all different sensor information under additional consideration of its individual stochastical features, a central Kalman-filter (see i.e. [6] or [7]) is used. The recurrent construction of the algorithm enables at each time tk the optimal estimation of vehicles position and other kinematic parameters (e.g. velocitiy). The Kalman-filter is a suitable tool for real-time position find-ing and error detection.
3.1 FundamentalsThe Kalman-Filter consists of two parts:1. The theoretical system equations contain geometrical and physical assumptions concerning the motion of the vehicle in one scanning interval ∆t (= 1 s).2. The measuring equations represent the empirical part containing the observations derived from the sensors.
The combination of prediction (from system equations) and measurements enables to calculate the optimal estimation of the state vector, which contains the unknown kinematic parameters: vehicles position (Y, X )k+1, orientation αk+1 and velocitiy vk+1. One im-portant feature of the algorithm is the possibility to test the compatibility of predicted and measured motion. Consequently the test provides the basic information for the detection of bad GPS-quality in inner urban areas.
3.2 Causative modified motion equationsThe geometrical and physical fundamentals of the kinematic model are based on [8]. In one scanning interval ∆t the vehicle is as-sumed to perform a constant circular motion (see Figure 3). This means constant velocity v, angular velocity α& and curvature 1/R in [tk, tk+1).
Gyro
Differential Odometer
Absolute GPS Differential GPS(Reference Trajectory)
R E G I S T R A T I O N
GPS-Position
DGPS-Position
Wheel TurnLeft / Right
Yawing
P R O C E S S I N G
∆αgyro (Y, X)DGPS(Y, X)GPS(∆s, ∆α)odo
CAN-Bus: 50 Hz Extern: 1 Hz�
Fig. 2: Sensor configuration and derivation of geometrical quantities

Map-independent positioning of land vehicles with causative modified motion equations 107
These assumptions are motivied by observations of vehicles kinematics. Possible accelerations are considered as disturbances w. The derivation of the deterministic system equations is realized in two steps. In the first step the motion is quantified in a local coor-dinate system (Figure 3) which in the second step is transformed into the global reference frame (Figure 4). The resulting recurrend non-linear system equations are shown in (2).
kk
kkk
k
k
kk
kk
k
k
k
k
k
k
vv
tvX
Y
X
Y
=
=
−
−=
+
++
+
+
++
+
+
+
1
11
1
1
11
1
)(sin
)(cos1
)(cos)(sin
)(sin)(cos
α∆αα
α∆
α∆
αα
αα
α∆∆
(2)
The state vector x consists of four elements: coordinates (Y, X), orientation (azimuth) α and velocity v of the vehicle. In difference to [8] the filter progress is realized using the change in direction ∆αk+1 as correcting variable u, derived by gyro observations (see (1)). The main advantage of this ‘causative modification’ is the reduction of the filters inertia in the case of fast cornering. Extreme small radiusses are passed without any oscillations in the estimated trajectory. Representing the non-linear equations (2) by a vecto-rial function Ψ the causative modification is illustrated in (3) and (4):
),( 1,gyro1 ++ == kkkk u α∆xx Ψ nonlinear model (3)
1,11,4
,1
1,11,4
,1
1,44,4
,1
1,4
1 kkkkkkkkkk wu ++++ ++= SBxTx
linearized model (4)
In (4) additional disturbance accelerations (w = 1 m/s2) are added. The Jacobi-matrices are indicated with T = transition matrix, B = coefficient matrix of correcting variable and S = coefficient matrix of disturbance variable.
The measuring equations are derived using the remaining position information of absolute GPS and differential odometer.
kkk
ksk
kXk
kYk
tvs
XX
YY
ααεα∆
∆ε∆
ε
ε
α∆
∆
−=−
=−
=−
=−
++
++
++
++
11,odo
11,odo
11,GPS
11,GPS
(5)
4 Creation of a ‘Position Finding Module’To accomplish the requirements defined in section 1 and as precondition for operational use the Kalman-filter is embedded in a ‘Position Finding Module’ (PFM). The architecture of the module is shown in Figure 5.The main task of the PFM is to create highly available and reliable position information which is directly linked with a stable fil-ter progress. The module consists of four submodules containing alternative strategies for position finding. The submodules ‘GPS available’ and ‘No GPS available’ represent the central elements of PFM and will be shortly characterized.
∆α
RYL
XL
Epoch tk
Epoch tk+1
YL
XL
b = v·∆
t
∆YL
∆XL
Y
X
Y L
X L
α
|| X
(Y, X)k (Y, X)k+1
(∆Y L, ∆X L)
Fig. 3: Constant circurlar motion Fig. 4: Transformation into ref. frame

Andreas Eichhorn108
In the case of GPS available (existing observation at filter in-put), several testing strategies are effected to judge its quality. The basic idea is to calculate the deviations between predicted (2) and observed vehicle position (5).
++
++
+
+
+−
−==
11,GPS
11,GPS
1,
1,
1
GPS
GPS
kk
kk
kX
kY
kXX
YY
d
dd
(6)
In inner urban areas multipath-effects and bad satellite geom-etry often cause large errors in GPS-position (> 10 m). Using the coordinate innovations (6) it’s very simple to detect single outliers. A more pretentious task is the detection of parallel shifted trajectories which show nearly no difference in inner geometry but may induce a position error of more than 20 m. In PFM the identification is realized checking the profile of succeeding coordinate innovations. In case of a parallel trajec-
tory the innovations are not randomly distributed but possess a systematic progress (see Figure 6-b). Replacing the absolute GPS-observations by GPS-differences
−
−=
+
+
+
+
kk
kk
kX
kY
XX
YY
,GPS1,GPS
,GPS1,GPS
1,
1,
GPS
GPS
∆
∆
(7)
the maintenance of inner geometry is used in dead reckoning to support differential odometer and gyro. In Figure 6-a a successful detected parallel GPS-trajectory with a length of more than 300 m and its correction in PFM are shown.In the case of no GPS available (e.g. in tunnels) the accurate position is estimated in dead reckoning using only the causative modi-fied motion equations and relative position information derived from differential odometer and gyro.
5 Results from different test-drivesShowing sections of representative test-drives some results are presented. In Figure 7 a typical scenario from inner urban area is presented. Shortly after cornering GPS-quality (square) breaks down and induces maximal position-errors of more than 20 m. Consequently PFM has to estimate (diamond) the reference-trajectory (circle) reducing GPS-weights and increasing the influence of differential odometer and gyro. Using this relative position information and the inertia reduced causative motion equations the geometry of the turn is very well represented by estimation. Transforming the filter results in a digital map it can be shown that the deviations with measured reference trajectory are caused by a systematic drift in DGPS.As part of a highway-drive PFM passes in Figure 8 a 500 m tunnel in dead reckoning, this means no GPS available for 83 s and 44 s on both ways. The filter results never lose their relationship to the road, which demonstrates the rise of availibility using PFM. At the beginning of the tunnel the cornerings again represent very well the geometry of the turns.
The quality of the results is evaluated calculating empirical accuracy-measures derived from estimated trajectory and DGPS-position (high available differential-code-solution), i.e. sabs (= standard deviation calculated with residuals from estimation DGPS representing the ab-solute accuracy of position finding). Some results derived from several test-drive scenarios are presented in Table 2.
Scenario Length [km] Filter epochs Good GPS quality [%] sabs [m]Inner urban areas 12,8 2097 76 2,85High-density area 7,1 1425 72 3,04Low-density area 5,7 672 85 2,49Highways 27,5 1402 87 1,85
Tab. 2: Quality results from test-drives
The mean absolute accuracy of PFM can be specified within a range of sabs ≈ 1,9 m (highways with good GPS quality) to sabs ≈ 3,0 m (inner urban areas with dense buildings and decreasing GPS quality). There are no significant differences between longitudinal and transverse devia-tions. Consquently the correct weighting of the different sensors can be assumed.
Measurements
Inititialization
No Motion GPS available
No GPSavailable Failure
BackwardMotion ?
Keep old State
Estimate newState
GPS Error ?
BackwardMotion ?
Fig. 5: Architecture of the PFM
850 950 1050 1150
500
600
700DGPSEstimationGPS
Y [m]
X[m
]
270 280 2900
10
20
30
tk [s]
d GPS
[m]
dGPS, krit
Fig. 6: Detection of systematic GPS-deviations

Map-independent positioning of land vehicles with causative modified motion equations 109
6 ConclusionsThe examinations have shown, that using PFM the requirements defined at the beginning could be achieved. The accuracy is significant better than the boundaries defined with σY = σX < 4 m. It is also shown that the causative modification of the motion equations reduces the filters inertia and enables a good geometrical representation of passed turns.Bad results were obtained in the case of dead reckoning with wrong initial orientation of the vehicle (e.g. some test-drives through tunnels). In this case the information derived from motion equations and remaining relative posi-tion sensors is not sufficient to detect a rotation in the estimated trajectory which at its end may induce a deviation of several hundreds of meters. This effect defines the PFM’s limits. It can only be compensated using additional absolute sensors (e.g. a compass) or information from a digital map.
7 References[1] Eichhorn, A. / Kuhlmann H. / Bettermann, R. / Czommer, R.: Entwurf eines Kalman-Filters zur kartenunabhängigen Fahrzeugortung. Final
project report, Stuttgart, 2001[2] Eichhorn, A.: Ein Beitrag zur Identifikation von dynamischen Strukturmodellen mit Methoden der adaptiven Kalman-Filterung. DGK, Reihe C,
Heft Nr. 585, München, 2005[3] Eichhorn, A.: Development of a Kalman-filter module for real-time and map-independent positioning of land vehicles based on causative mo-
tion equations. VehCom-2003: Sensors, Navigation and Communications for Vehicles Telematics, Birmingham, 2003[4] Kuhlmann, H. / Eichhorn, A.: Positionsbestimmung von PKW mit Sensoren der Serienausstattung. DGON-Symposium Posit. und Navigation,
Dresden, 2003[5] Czommer, R.: Leistungsfähigkeit fahrzeugautonomer Ortungsverfahren auf der Basis von Map-Matching-Techniken. DGK, Reihe C, Heft 535,
München, 2001[6] Brown, R.G. / Hwang, P.Y.C.: Introduction to Random Signals and Applied Kalman Filtering. John Wiley & Sons, New York, 1997[7] Gelb, A.: Applied optimal Estimation. M.I.T. Press, Cambridge, Mass., 1974[8] Aussems, T.: Positionsschätzung von Landfahrzeugen mittels Kalman-Filterung aus Satelliten- und Koppelnavigationsbeobachtungen. RWTH
Aachen, Nr. 55, 1999
2450 2500 2550 2600 2650
1020
1070
1120
1170
Y [m]
X[m
]
DGPSEstimationGPS
Fig. 7: Inner urban area: 90 degree cornering with bad GPS
11300 11500 11700 11900 12100
1400
1600
1800
2000
DGPSEstimationGPS
Tunnel
Y [m]
X [m
]
10 m
10 m
Fig. 8: Passing a 500 m tunnel to a highway in dead reckoning
“First Have a Plan then Make Sure It Is a Good Plan” or dealing with underspecified spatio-temporal relations in unfamiliar large-scale
environments
Inessa Seifert
Abstract This paper introduces an approach for dealing with underspecified spatial and temporal relations during early stage spatio-tempo-ral planning in large-scale unfamiliar environments. For that purpose a partial spatio-temporal constraint satisfaction algorithm is introduced. The algorithm operates on a qualitative as well as metric representation of the given spatio-temporal relations. In order to reduce the computational complexity structuring criteria of the problem space are introduced. The paper outlines procedures for handling of overspecified spatio-temporal relations by removing of location assignments or fixed points in time, or shortening durations of events under consideration of the corresponding priorities. The algorithm concludes with ordering procedure for events with no temporal order but specified spatial assignments. The alternative spatial locations for events with underspecified spatial as-signment are represented using a qualitative distance scheme or region-based mapping to the environment structure.
1 IntroductionSpatio-temporal planning is difficult and often annoying; especially in a large-scale unfamiliar environment which is experienced only seldom, e.g., an exhibition or a trade fair. The scientifically correct term for “difficult and annoying” is cognitively demand-ing.Imagine a situation where you have to plan a trade fair visit. Having a spatial layout of a trade fair and a list of events at hand try to answer the following questions:- Do you have enough time to follow a hint of your boss to visit some particular exhibit?- What can you do instead of listening to a scientific talk after you realized it’s been already full as you’ve arrived at the conference pavilion?The illustrated problem domain comprises different events like presentations, tasks, meetings with people or inspections of trade fair booths. Such events are interrelated with each other through a set of spatio-temporal constraints: e.g. distances between the locations of booths and feasible temporal order of visits to the booths. The main goal of a human spatio-temporal planning task is a compilation of a sequence of activities in a given environment. (cf. “…human cognition is for action”, Wilson, 2002). Ideally, such set of activities consists of a well-defined temporal order of events (e.g., e1 before e2, e2 before e3, etc.) and the corresponding locations. However, in the real world spatio-temporal events and rela-tions between them are specified only to a certain degree, e.g., qualitatively, and go through a lot of changes especially during the early stage planning. Moreover, some of the constraints are even hard to verbalize due to user’s personal preferences or even to emotions (cf. Schlieder & Hagen, 2000). Consequently, the given spatio-temporal problem domain is ill-structured, i.e., there is no “perfect” plan (i.e., optimal solution) for there is no specific definition of such optimum and the important constraint satisfaction criteria (e.g., personal moods and emotions) cannot be mechanized (cf. Simon, 1973). Consequently, spatio-temporal problem solv-ing cannot be totally outsourced to a computational constraint solver but rather requires collaboration with a human. Nevertheless, a typical spatio-temporal planning task can be outlined as follows:First, events and relations between them which describe a spatio-temporal configuration should be specified. The second step is to identify possible contradiction resulting from overspecified relations. After that the contradictions should be relaxed in order to achieve a feasible order of activities. During the relaxation process some of the relations may become underspecified. The alterna-tive arrangements caused by the underspecified relations should be compared to each other before a decision is made which of them can be taken as a result. The selected solution is a basis for accomplishing of activities in a given environment.In order to figure out how collaborative assistance can be implemented, we have to consider the following questions:
- Which kind of spatio-temporal information is relevant for a spatio-temporal planning task (i.e., dimensions to be handled) and how can reasoning about spatio-temporal constraints be shared between a human and a collaborative assistance system?
- How can contradictions be resolved and constraints be relaxed by an assistance system in order to generate feasible solutions?- How can appropriated subsets of feasible spatio-temporal solutions be selected or classified in order to reduce the cognitive
load during human mental processing of the provided alternatives?

Inessa Seifert112
In the following, I’m going to refer to the results of the exploration studies described in (Seifert, 2005) which address spatio-tem-poral planning and reasoning problems and outline the common strategies to deal with underspecified relations. Subsequently, the requirements on the representation of the dimensions and the corresponding operations will be derived from exploration studies as well as from the literature concerned with human processing of spatial and temporal information. To obtain feasible solutions for a given problem the demonstrated dimensions are represented in form of a constraint network. Subsequently, a procedure to gain partial solutions will be outlined. A partial constraint satisfaction algorithm which operates on qualitative as well as metric spatio-temporal representation of events and relations between them will be demonstrated. Finally, it will be described how one of the possible selection criteria, i.e., region-based fine-to-coarse planning heuristic introduced by (Wiener & Mallot, 2003) can be applied to the generated partial solutions. The paper ends with a discussion of further selection criteria, outlook, open questions, and plans for future work.
2 What, where and when?The exploration studies described in (Seifert, 2005) aimed at finding common human reasoning behavior during spatio-temporal planning tasks and strategies for dealing with overspecified and underspecified spatio-temporal relations. The subjects have been given a list of events with overspecified as well as underspecified spatio-temporal events with a task to find an optimal and consistent temporal order of events. The description of binary constraints consisted of events and temporal orders which should hold between them: e.g. before, after, meets, met-by. The spatial constraints were expressed by assignment of certain locations and according distances between the events. The setting of events consisted of a topic, starting point in time, location, du-ration, and priority. The events in the given spatio-temporal configurations had at least a specified topic or location, and an optional indication of a point in time or location. The protocols of the exploration studies have shown that subjects preferred to operate on qualitative rather than quantitative rela-tions between the events during spatio-temporal planning. That corresponds to common findings which can be found in the lit-erature concerned with cognitive aspects of spatial (e.g., Freksa, 1992) and temporal reasoning (e.g., Allen, 1983; Knauff et. al, 1995). Violations of temporal constraints were caused by fixed points in time and corresponding spatial constraints, i.e., too large distanc-es between some of the events. In order to achieve a feasible order of events the subjects preferred to shorten durations of events, or to change locations, and finally to relax points in time and temporal orders. Moreover, reasoning about temporal order of events was much affected by the corresponding priorities: e.g., “low”, “middle” and “high”, so it can be considered as hierarchical (cf., Qu & Beale, 1999). First, events with high priorities were considered, than with middle and after that those of the lowers priori-ties. Distances were often handled as temporal intervals to get from one location to another: e.g. a “near” distance can be reached within five minutes.In the following, the properties of an atomic spatio-temporal event and consequently the dimension of the spatio-temporal problem domain are described by topic, point in time, location, duration, and priority. An event instance is identified by its topic or location and requires a minimal duration.
3 Requirements on the representation of the spatio-temporal problem domainThe requirements on the representation of the spatio-temporal problem domain for an artificial constraint solver can be summarized as follows:
- It should allow for qualitative temporal reasoning, - Handle qualitative measures of distances and durations, - Allow for mapping of distance into temporal intervals, - And deal with hierarchical priorities.
Furthermore, it should provide precise information about spatial structure of a given environment, in order to generate feasible solutions calculating distances and handle precisely specified assignments for location or point in time. In the following, I’m going to provide a brief overview about existing techniques for dealing with such types of problems.
4 Existing approaches for spatio-temporal reasoning and partial constraint satisfaction problemsSince several decades, temporal and spatial reasoning has been in the focus of intensive research. Typically, two representation schemes, i.e., interval based (cf. Allen, 1983) and point based (cf. Vilain, Kautz, & van Beek, 1989) and various combinations (cf. Dechter, Meiri, & Pearl, 1991) are utilized for reasoning about temporal relations. Although, there are a set of temporal constraint satisfaction (TCSP) approaches, their main disadvantage is that they stop searching for a feasible solution as soon as no further valid assignments can be found. In order to solve overconstrained temporal reasoning problems another technique, called Partial Constraint Satisfaction (cf. Freuder & Wallace, 1992) stands in the focus of the investigations introduced by (Beaumont, et. al., 2001). However, the (PCS) algorithms proposed by this group operate primarily on interval-based representation of temporal con-straints, produce partial solutions by weakening of temporal constraints, don’t consider distances between the temporal intervals, and don’t allow for handling of priorities.

Dealing with underspecified spatio-temporal relations in unfamiliar large-scale environments 113
In the following, reasoning about spatial constraints can be considered as one-dimensional and eventually mapped to temporal in-tervals. However, the operations handling distance intervals should be considered differently.
5 Representation of the spatio-temporal events and relations The main goal of a common spatio-temporal problem solving task is to obtain an optimal temporal order of events which are in-terrelated through spatial and temporal constraints. Current Temporal Constraint Satisfaction algorithms aim at finding complete solution or determining one or more consistent scenarios (cf. Schwalb & Dechter, 1997). However, what we need is a set of partial solutions, where the spatial or temporal constraints can be widened or removed and allow the solution to be found (cf. Freuder & Wallace, 1992). In order to obtain a feasible solution for a given problem the constraints are represented in a constraint network (CN) which consist of a set of variables X = {X1, …., Xn}. Each of the variables is associated with a domain of discrete values: D1, …., Dn and a set of constraints, {C1, …., Cn } which is expressed as a relation defined on some subset of variables (cf. Dechter, 1992). In the given problem domain the variables are spatio-temporal events and the binary constraints which guarantee a feasible tem-poral order of events can be expressed: {before, after, meets, met-by}. Spatial constraints are expressed by corresponding distances between the events, which can be specified as temporal intervals. The domain of the variables is defined by a set of the introduced dimensions {topic, time, location, duration, priority}. For the corresponding domain values the following conditions hold:
- Each event is valid if a topic or location is specified, i.e., (topic ≠ {Ø} or location ≠ {Ø}) and duration is not zero, i.e., (duration ≠ {Ø}).
- Topic is specified by a string containing a name of the event or its description or {Ø}.- Time is defined by starting point in time of the event in the format: (hours, minutes) or {Ø}.- Location is specified by metric (x, y) coordinates on a given floor plan represented as a two dimensional matrix consisting of
raster points, or {Ø}.- Duration is specified either by precise temporal measures, e.g., in minutes and qualitatively: {short, middle, long}.- Priority is defined as {low, middle, high}.
In contrast to classical temporal reasoning problems each binary relation between pairs of events has to be obtained not only from temporal information, but also from the time required to overcome the distance between the corresponding locations of events. In the following the binary relation including distance between the corresponding locations of events is termed as spatio-temporal relation.Spatio-temporal relations between events can be defined by the thirteen qualitative relations described in (Allen, 1983) in his in-terval algebra, denoted by the labels before (b), after (bi), during (d), contains (di), overlaps (o), overlapped-by (oi), meets (m), met-by (mi), starts (s), started-by (si), finishes (f), finished-by (fi), and equals (e). In the following, I’m going to refer to a subset of the introduced relations which are relevant for identification of constraint violations consisting of 9 relations, where the 4 relations: starts (s), started by (si), finishes (f), and finished by (fi) are combined into a single during (d) relation. The following table comprises a mapping from points in time into the basic qualitative relations including distance between a pair of events denoted as t and s, where tStart is a starting point and tEnd = tStart + duration the ending point of the event t, and ac-cordingly sStart is a starting point and sEnd = sStart + duration an ending point of the event s:
Relation between t and s point-based expressionbefore (b) tEnd + distance < sStartafter (bi) tStart > sEnd + distance
equals (e)(tStart = sStart) and (tEnd = sEnd or tEnd+distance=sEnd or sEnd+distance=tEnd)
overlaps (o) (tStart < sStart) and (tEnd + distance > sStart) and (tEnd + distance < sEnd)
overlapped-by (oi) (tStart > sStart) and (tStart < sEnd + distance) and (tEnd > sEnd + distance)
meets (m) (tEnd + distance = sStart)met-by (mi) (sEnd + distance = tStart)
during (d)
((tStart > sStart) and ((tEnd = sEnd + distance) or (tEnd > sEnd + distance)) or ((tStart > sStart or tStart=sStart) and (tEnd < sEnd + distance)))
contains (di)
((tStart < sStart) and ((tEnd+ distance = sEnd) or (tEnd + distance > sEnd))) or ((tStart < sStart or tStart=sStart) and (tEnd + distance > sEnd)
Table 1. Qualitative spatio-temporal relations including distance between the events

Inessa Seifert114
In order to obtain feasible partial solutions classical backtracking algorithms and specialized variations are utilized (cf., Dechter, Schwalb & Dechter, Beaumont et. al.). Such algorithms provide an exhaustive search through the problem space consisting of all possible instantiations of the variables and corresponding relations. However, there are methods to reduce the search space: divid-ing the problem space into smaller sub-problems reduces its computational complexity. Furthermore, searching in a sorted problem space requires less backtracking (cf., Dechter, 1992) and achieves the largest, i.e., “best”, solution more quickly. Therefore, the given spatio-temporal problem space can be classified and sorted due to the specified and underspecified dimensions of the spatio-temporal events: e.g., events with no defined location but point in time, or in opposite events with defined locations and various combinations.In the following, I’m going to describe the procedure for generation of alternative partial solutions.
6 Generation of partial solutionsFirst, the set of all events, building a spatio-temporal configuration should be cut into the following subsets: Spatio-temporal events: events with both fixed point in time and an assignment of location.Temporal-only events: events with only a fixed point in time.Temporal events: events with fixed points in time, in other words a union of a set of spatio-temporal events and temporal-only events.Spatial-only events: events with an assignment of location.Other events: events with no particular assignment of either time or location.Each of the obtained subsets divides the spatio-temporal problem domain in sub spaces, which can be handled separately according to the specified dimensions of the corresponding events. The set of temporal events is used to identify overconstrained situations and generate alternative temporal orders by weakening assignments of fixed points in time or locations. The subset of spatio-temporal events derived from the resulting feasible set of temporal events builds a set of spatio-temporal reference intervals (cf. Allen, 1983). The spatio-temporal reference intervals are handled separately to obtain a feasible order of temporal-only as well as spatial-only events lying between the two corresponding edge points and locations. Consequently, the main procedure for dealing with overspecified as well as underspecified sets of events can be described as fol-lows:
1. Order the set of temporal events by time, 2. Generate partial solutions by relaxation of fixed point in time, shortening of duration to a tolerable degree or removing the as-
signment of location,3. Select the largest solutions, with the least changes. 4. Initialize the reference intervals with corresponding temporal and reachable-spatial-only events,5. Generate alternative orders of events for each of the spatio-temporal reference intervals,6. Select the largest feasible solutions,7a. Apply region-based structuring to the generated solutions,7b. Represent alternative allocations of events by qualitative distance scheme.
In subsequent sections, I’m going to describe each step of the introduced procedure in detail.
6.1 Handling overspecified eventsA partial solution consists of a set of all available events structured into the following subsets: a sorted list of temporal events, list of reference intervals, list of spatial-only events, list of temporal-only events and list of events which have duration, but neither temporal nor spatial assignment, termed other-events and a list with the resulting order of events. There are several methods that can be used to obtain a partial solution (Freuder & Wallace, 1992):
- Remove variables from the problem,- Remove constraints from the problem,- Weaken constraints in a problem,- Widen the domains of variables to include extra values.
Removing a variable from the problem is a very drastic approach to obtain a partial solution. Conversely, if we remove the binary temporal constraint which holds between each pair of events, we won’t be able to obtain a feasible order of events. Weakening the temporal constraints is equal to removing those constraints. However, weakening a spatial constraint, i.e., an assignment of some particular location to reduce the distance between the events can be taken into consideration. Subsequently, in order to keep the temporal order of events valid also the fourth method can be applied: e.g., relaxation of fixed points in time between overlapping events, and shortening duration of a corresponding event with lower priority. The procedure to deal with overspecified events can be described as follows:
1. Take an event from the list of temporal events, in the following, termed as the current event,2. If the current event is the last one, do nothing and stop searching,3. Take the next event from the list of temporal events, 4. Prove the spatio-temporal relation between the events,
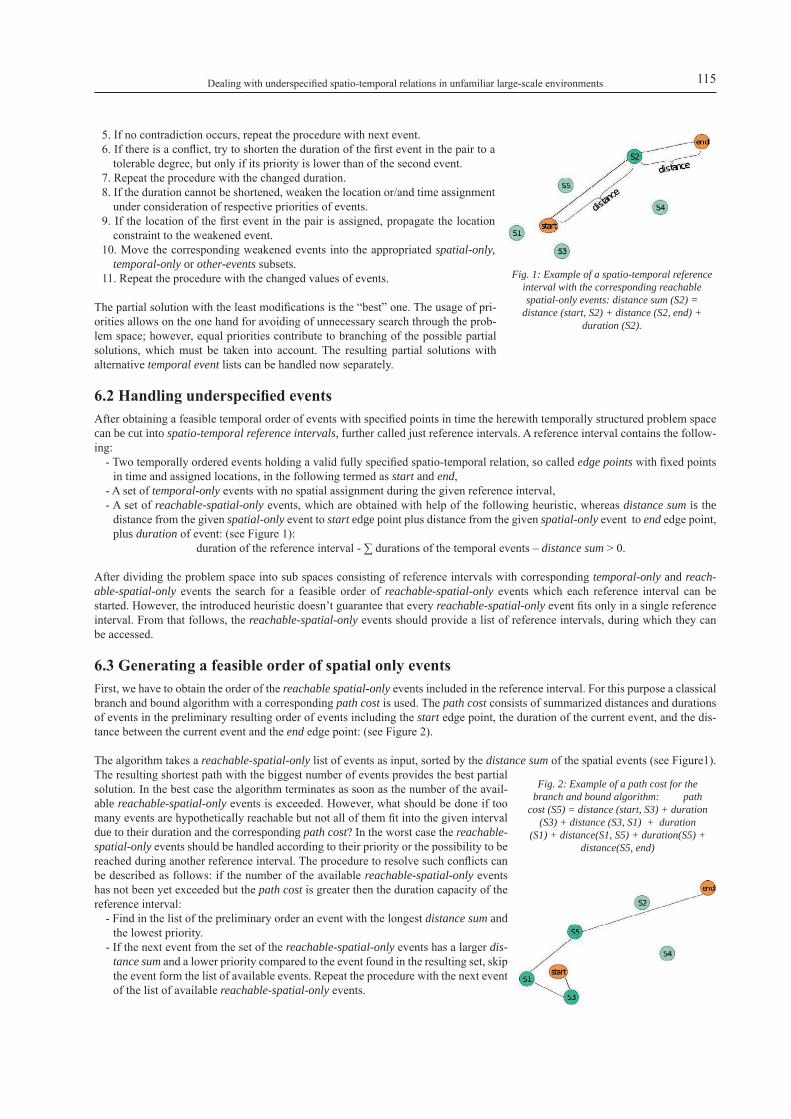
Dealing with underspecified spatio-temporal relations in unfamiliar large-scale environments 115
5. If no contradiction occurs, repeat the procedure with next event.6. If there is a conflict, try to shorten the duration of the first event in the pair to a
tolerable degree, but only if its priority is lower than of the second event. 7. Repeat the procedure with the changed duration.8. If the duration cannot be shortened, weaken the location or/and time assignment
under consideration of respective priorities of events.9. If the location of the first event in the pair is assigned, propagate the location
constraint to the weakened event. 10. Move the corresponding weakened events into the appropriated spatial-only,
temporal-only or other-events subsets. 11. Repeat the procedure with the changed values of events.
The partial solution with the least modifications is the “best” one. The usage of pri-orities allows on the one hand for avoiding of unnecessary search through the prob-lem space; however, equal priorities contribute to branching of the possible partial solutions, which must be taken into account. The resulting partial solutions with alternative temporal event lists can be handled now separately.
6.2 Handling underspecified eventsAfter obtaining a feasible temporal order of events with specified points in time the herewith temporally structured problem space can be cut into spatio-temporal reference intervals, further called just reference intervals. A reference interval contains the follow-ing:
- Two temporally ordered events holding a valid fully specified spatio-temporal relation, so called edge points with fixed points in time and assigned locations, in the following termed as start and end,
- A set of temporal-only events with no spatial assignment during the given reference interval, - A set of reachable-spatial-only events, which are obtained with help of the following heuristic, whereas distance sum is the
distance from the given spatial-only event to start edge point plus distance from the given spatial-only event to end edge point, plus duration of event: (see Figure 1):
duration of the reference interval - ∑ durations of the temporal events – distance sum > 0.
After dividing the problem space into sub spaces consisting of reference intervals with corresponding temporal-only and reach-able-spatial-only events the search for a feasible order of reachable-spatial-only events which each reference interval can be started. However, the introduced heuristic doesn’t guarantee that every reachable-spatial-only event fits only in a single reference interval. From that follows, the reachable-spatial-only events should provide a list of reference intervals, during which they can be accessed.
6.3 Generating a feasible order of spatial only events First, we have to obtain the order of the reachable spatial-only events included in the reference interval. For this purpose a classical branch and bound algorithm with a corresponding path cost is used. The path cost consists of summarized distances and durations of events in the preliminary resulting order of events including the start edge point, the duration of the current event, and the dis-tance between the current event and the end edge point: (see Figure 2).
The algorithm takes a reachable-spatial-only list of events as input, sorted by the distance sum of the spatial events (see Figure1). The resulting shortest path with the biggest number of events provides the best partial solution. In the best case the algorithm terminates as soon as the number of the avail-able reachable-spatial-only events is exceeded. However, what should be done if too many events are hypothetically reachable but not all of them fit into the given interval due to their duration and the corresponding path cost? In the worst case the reachable-spatial-only events should be handled according to their priority or the possibility to be reached during another reference interval. The procedure to resolve such conflicts can be described as follows: if the number of the available reachable-spatial-only events has not been yet exceeded but the path cost is greater then the duration capacity of the reference interval:
- Find in the list of the preliminary order an event with the longest distance sum and the lowest priority.
- If the next event from the set of the reachable-spatial-only events has a larger dis-tance sum and a lower priority compared to the event found in the resulting set, skip the event form the list of available events. Repeat the procedure with the next event of the list of available reachable-spatial-only events.
Fig. 1: Example of a spatio-temporal reference interval with the corresponding reachable spatial-only events: distance sum (S2) =
distance (start, S2) + distance (S2, end) + duration (S2).
Fig. 2: Example of a path cost for the branch and bound algorithm: path
cost (S5) = distance (start, S3) + duration (S3) + distance (S3, S1) + duration
(S1) + distance(S1, S5) + duration(S5) + distance(S5, end)
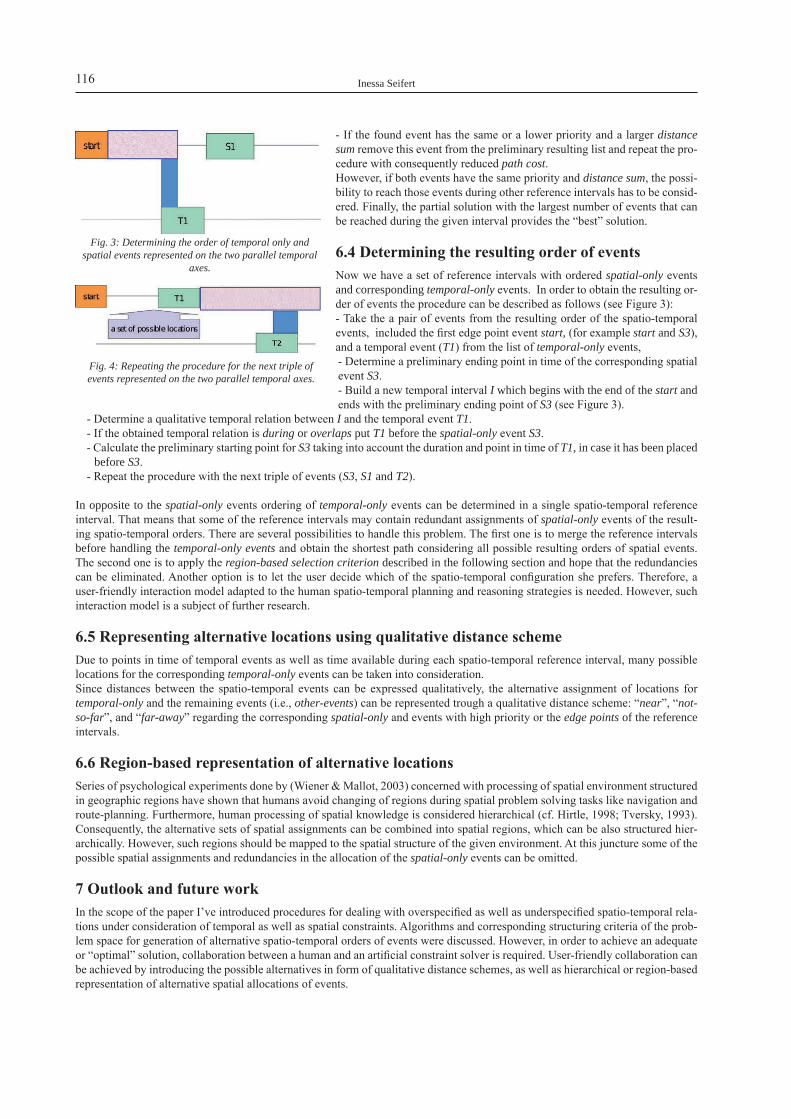
Inessa Seifert116
- If the found event has the same or a lower priority and a larger distance sum remove this event from the preliminary resulting list and repeat the pro-cedure with consequently reduced path cost.However, if both events have the same priority and distance sum, the possi-bility to reach those events during other reference intervals has to be consid-ered. Finally, the partial solution with the largest number of events that can be reached during the given interval provides the “best” solution.
6.4 Determining the resulting order of eventsNow we have a set of reference intervals with ordered spatial-only events and corresponding temporal-only events. In order to obtain the resulting or-der of events the procedure can be described as follows (see Figure 3): - Take the a pair of events from the resulting order of the spatio-temporal events, included the first edge point event start, (for example start and S3), and a temporal event (T1) from the list of temporal-only events,- Determine a preliminary ending point in time of the corresponding spatial event S3.- Build a new temporal interval I which begins with the end of the start and ends with the preliminary ending point of S3 (see Figure 3).
- Determine a qualitative temporal relation between I and the temporal event T1.- If the obtained temporal relation is during or overlaps put T1 before the spatial-only event S3. - Calculate the preliminary starting point for S3 taking into account the duration and point in time of T1, in case it has been placed
before S3.- Repeat the procedure with the next triple of events (S3, S1 and T2).
In opposite to the spatial-only events ordering of temporal-only events can be determined in a single spatio-temporal reference interval. That means that some of the reference intervals may contain redundant assignments of spatial-only events of the result-ing spatio-temporal orders. There are several possibilities to handle this problem. The first one is to merge the reference intervals before handling the temporal-only events and obtain the shortest path considering all possible resulting orders of spatial events. The second one is to apply the region-based selection criterion described in the following section and hope that the redundancies can be eliminated. Another option is to let the user decide which of the spatio-temporal configuration she prefers. Therefore, a user-friendly interaction model adapted to the human spatio-temporal planning and reasoning strategies is needed. However, such interaction model is a subject of further research.
6.5 Representing alternative locations using qualitative distance scheme Due to points in time of temporal events as well as time available during each spatio-temporal reference interval, many possible locations for the corresponding temporal-only events can be taken into consideration. Since distances between the spatio-temporal events can be expressed qualitatively, the alternative assignment of locations for temporal-only and the remaining events (i.e., other-events) can be represented trough a qualitative distance scheme: “near”, “not-so-far”, and “far-away” regarding the corresponding spatial-only and events with high priority or the edge points of the reference intervals.
6.6 Region-based representation of alternative locationsSeries of psychological experiments done by (Wiener & Mallot, 2003) concerned with processing of spatial environment structured in geographic regions have shown that humans avoid changing of regions during spatial problem solving tasks like navigation and route-planning. Furthermore, human processing of spatial knowledge is considered hierarchical (cf. Hirtle, 1998; Tversky, 1993). Consequently, the alternative sets of spatial assignments can be combined into spatial regions, which can be also structured hier-archically. However, such regions should be mapped to the spatial structure of the given environment. At this juncture some of the possible spatial assignments and redundancies in the allocation of the spatial-only events can be omitted.
7 Outlook and future workIn the scope of the paper I’ve introduced procedures for dealing with overspecified as well as underspecified spatio-temporal rela-tions under consideration of temporal as well as spatial constraints. Algorithms and corresponding structuring criteria of the prob-lem space for generation of alternative spatio-temporal orders of events were discussed. However, in order to achieve an adequate or “optimal” solution, collaboration between a human and an artificial constraint solver is required. User-friendly collaboration can be achieved by introducing the possible alternatives in form of qualitative distance schemes, as well as hierarchical or region-based representation of alternative spatial allocations of events.
Fig. 3: Determining the order of temporal only and spatial events represented on the two parallel temporal
axes.
Fig. 4: Repeating the procedure for the next triple of events represented on the two parallel temporal axes.

Dealing with underspecified spatio-temporal relations in unfamiliar large-scale environments 117
However, a suitable interaction model for collaborative spatio-temporal planning and reasoning remains a subject of further re-search.
8 AcknowledgementsI gratefully acknowledge financial support by the Deutsche Forschungsgemeinschaft (DFG) through the Transregional Collabora-tive Research Center SFB/TR 8 Spatial Cognition: Reasoning, Action, Interaction (project R1-[ImageSpace]) and valuable com-ments on the paper and discussion about my work with my colleagues Holger Schultheis, Thomas Barkowsky and Sven Bertel.
9 ReferencesAllen, J. F. (1983). Maintaining knowledge about temporal intervals. Communications of the ACM, 26 (11), 832-843.Beaumont, M., Sattar, A., Maher, M., and Thornton, J. (2001) Solving Overconstrained Temporal Reasoning Problems. In M. Brooks, D. Corbett,
and M. Stumptner (Eds.): AI 2001, LNAI 2256, pp. 37−49, 2001. Springer-Verlag Berlin Heidelberg 2001.Dechter, R., (1992) “Constraint Networks (Survey).” In Encyclopedia of Artificial Intelligence, 2nd edition, 1992, John Wiley & Sons, Inc., pp.
276-285.Dechter, R., Meiri, I., & Pearl, J.. (1991). Temporal constraint networks. Artificial Intelligence 49: 61–95.Freksa, C., (1992). Using orientation information for qualitative spatial reasoning. In A. U. Frank, I. Campari, U. Formentini (Eds.), Theories and
methods of spatio-temporal reasoning in geographic space, pp. 162–178. Springer, Berlin.Freuder, E., & Wallace, R. (1992) Partial constraint satisfaction. Artificial Intelligence, 58(1):21–70, 1992.Hirtle, S. C. (1998). The cognitive atlas: using GIS as a metaphor for memory. In M. Egenhofer & R. Golledge (Eds.), Spatial and temporal reason-
ing in geographic information systems (pp. 267-276). Oxford University Press.Knauff, M., Rauh, R., & Schlieder, C. (1995). Preferred mental models in qualitative spatial reasoning: A cognitive assessment of Allen’s calculus.
Proceedings of the Seventeenth Annual Conference of the Cognitive Science Society (pp. 200-205). Mahwah, NJ: Lawrence Erlbaum.Schlieder, C., & Hagen, C. (2000). Interactive layout generation with a diagrammatic constraint language. In C. Freksa, C. Habel, & K. F. Wender
(Eds.), Spatial cognition II - Integrating abstract theories, empirical studies, formal methods, and practical applications (pp. 198-211). Berlin: Springer.
Seifert, I. (2005). Towards cognitively adequate interaction for mental model-based spatio-temporal assistance. Proc. of 2005 AAAI Spring Sym-posium on “Reasoning with Mental and External Diagrams: Computational Modeling and Spatial Assistance”.
Simon, H.A. (1973). The Structure of Ill Structured Problems. Artificial Intelligence 4 (1973), North-Holland Publishing Company.Schwalb, E., and Dechter, R., (1997) “Processing Disjunctions in Temporal Constraint Networks.” In “Artificial Intelligence”, volume 93, pp. 29-
61, 1997.Tversky, B. (1993). Cognitive maps, cognitive collages, and spatial mental models. In A. Frank & I. Campari (Eds.), Spatial information theory
(pp. 14-24). Berlin: Springer.Vilain, M., Kautz, H., & van Beek, P. (1989). Constraint propagation algorithms for temporal reasoning: A revised report. In Daniel S. Weld and
Johan de Kleer (eds.), Readings on Qualitative Reasoning about Physical Systems. Morgan Kauffman, pages 373–381.Wiener, J.M., Mallot, H.A. (2003) ‘Fine-to-Coarse’ Route Planning and Navigation in Regionalized Environments. Spatial Cognition and Compu-
tation 3(4), pp. 331-358 Wilson, M. (2002). Six views of embodied cognition. Psychonomic Bulletin & Review, 9: 625-636Qu, Y. & S. Beale A. (1999) Constraint-Based Model for Cooperative Response Generation in Information Dialogues, (abs). Copyright AAAI. In
Proceedings of AAAI-99, Orlando, FL, July 1999.
A logic-based foundation for spatial relationships in mobile GIS environment
Mohammad Reza Malek, Mahmoud Reza Delavar
Abstract The mobile computing is a new revolutionary style of technology that enables us to access information anywhere and anytime. Mobile GIS as an integrating system of mobile computing and some GIS capabilities has fostered a great interest in the GIS field. Although the mobile computing has been increasingly grown in the past decade; there still exist some important constraints that complicate work with a mobile information system. The limited resources on the mobile computing would restrict some features that are available on the traditional computing technology. This article attempts to provide a paradigm to treat moving objects in mobile GIS environment. An idea based on space and time partitioning is suggested. A logic-based framework for representing and reasoning about qualitative spatial relations over moving objects in space and time is proposed. We provide convincing evidence of this theory, by demonstrating how it can provide a framework model of topological relations in space and time. The expressivity power of the proposed framework is shown with some new topological relationships between moving objects and describing the coaching problem in a mobile environment. The latter finds its application in RoboCup championship and battlefield, as well.
1 IntroductionMobile computing is a new revolutionary style of technology emerging of the advances in the development of portable hardware and wireless communications [23, 25]. It enables us to access information anywhere and anytime. Advances in location-based en-gines and on-board positioning sensors lead to mobile geospatial information system (GIS) [27, 31]. Mobile GIS as an integrating system of mobile computing and some GIS capabilities has fostered a great interest in the GIS field [21]. It becomes a new branch of GIS and brings the GIS into a new stage of development.Although the mobile computing has been increasingly grown in the past decade, there still exist some important constraints which complicate the design of mobile information systems. The limited resources on the mobile computing would restrict some features available on the traditional computing. The resources include computational resources (e.g., processor speed and memory), user interfaces (e.g., display and pointing device), bandwidth of mobile connectivity, and energy source [4, 16, 18, 19, 34, 36, 45]. In addition, it is assumed that in a mobile GIS environment, sensors of user side could not access all relevant information about other users (not complete data) and they are concerned to the user and its neighbors (not global data). Among of the most important characteristics of qualitative properties of spatial data and perhaps the most fundamental aspect of space are topology and topological relationships. Topological relations between spatial objects are such relationships that are in-variant with respect to specific transformations due to homeomorphism. The study of topological relationships is firmly evolving as an important area of research in the mobile GIS [34, 36]. Though in some respects, it closely resembles topological relationships in the traditional desktop GIS, the unique properties of mobile GIS environment demand its careful and separate study. Hence, it makes us to pay attention to this topic.In this paper, in order to provide a paradigm that treats with moving objects in mobile GIS environment, a logical framework is presented. In this framework the concept of spatial influenceability from relativistic physics, is combined with the partition and conquer idea from computer science. It means dividing the space and time into small parts; say space-time cell; and using influence-ability concept presented in this article, provides a theoretical framework of mobile objects in space-time. In our view, influence-ability which stands for spatial causal relations, i.e. objects must come in contact with one another; is primary an order relation. We provide convincing evidence of this theory, by demonstrating how it can provide a framework model of topological relations in space as well as in time. The expressivity power of the proposed framework is shown with some new topological relationships between moving objects and describing the coaching problem in a mobile environment. The latter finds its application in RoboCup championship and battlefield, as well. The remainder of the paper is structured as follows. Section 2 reviews related works. Section 3 shall present the fundamental con-cepts. Section 3 introduces our suggested model. In section 4 we discuss some examples of spatio-temporal relationships between two moving agents and its application in coaching. Finally, we draw some conclusions.
2 Related workDuring recent years, topological relations have been much investigated in the static environments [29, 49]. Algebraic topological model for spatial objects was introduced in [49]. Thirteen topological relations between two temporal intervals were identified by [1]. After 4-intersection model [11, 12], the famous 9-intersection approach [13, 14] was proposed for formalism of topological relations. This approach is based on point-set topological concepts. Some drawbacks of such point-based topological approach is
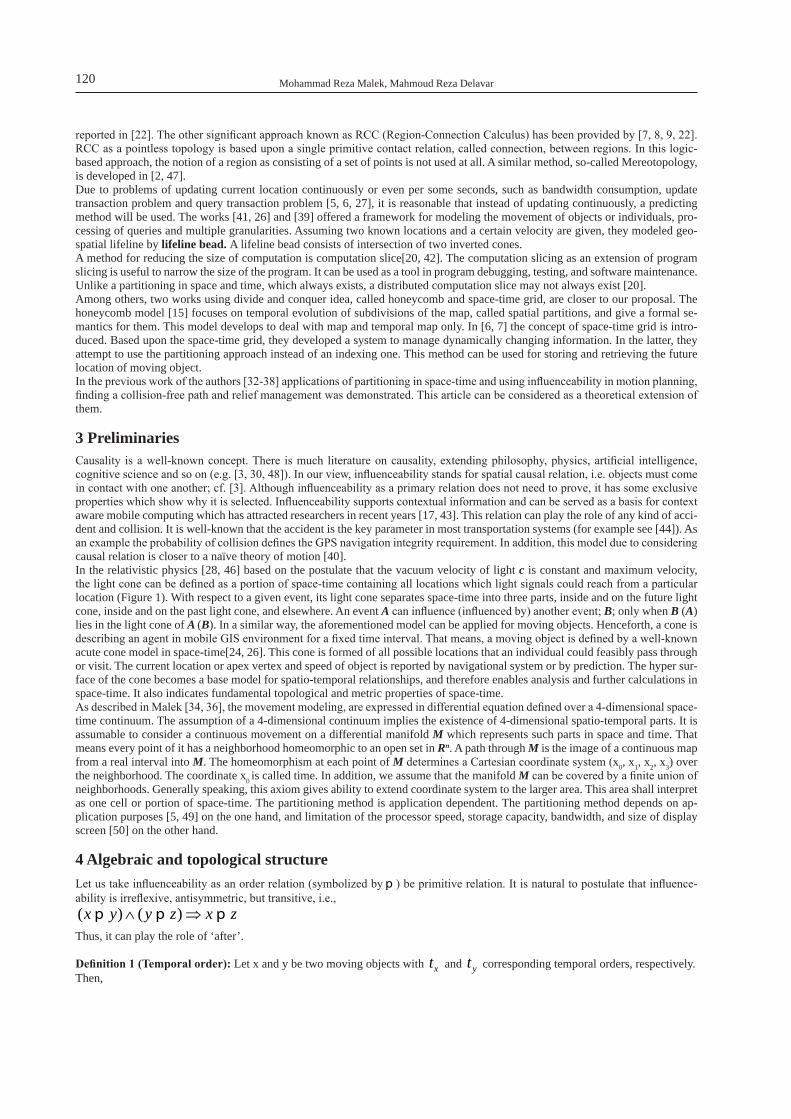
Mohammad Reza Malek, Mahmoud Reza Delavar120
reported in [22]. The other significant approach known as RCC (Region-Connection Calculus) has been provided by [7, 8, 9, 22]. RCC as a pointless topology is based upon a single primitive contact relation, called connection, between regions. In this logic-based approach, the notion of a region as consisting of a set of points is not used at all. A similar method, so-called Mereotopology, is developed in [2, 47]. Due to problems of updating current location continuously or even per some seconds, such as bandwidth consumption, update transaction problem and query transaction problem [5, 6, 27], it is reasonable that instead of updating continuously, a predicting method will be used. The works [41, 26] and [39] offered a framework for modeling the movement of objects or individuals, pro-cessing of queries and multiple granularities. Assuming two known locations and a certain velocity are given, they modeled geo-spatial lifeline by lifeline bead. A lifeline bead consists of intersection of two inverted cones.A method for reducing the size of computation is computation slice[20, 42]. The computation slicing as an extension of program slicing is useful to narrow the size of the program. It can be used as a tool in program debugging, testing, and software maintenance. Unlike a partitioning in space and time, which always exists, a distributed computation slice may not always exist [20]. Among others, two works using divide and conquer idea, called honeycomb and space-time grid, are closer to our proposal. The honeycomb model [15] focuses on temporal evolution of subdivisions of the map, called spatial partitions, and give a formal se-mantics for them. This model develops to deal with map and temporal map only. In [6, 7] the concept of space-time grid is intro-duced. Based upon the space-time grid, they developed a system to manage dynamically changing information. In the latter, they attempt to use the partitioning approach instead of an indexing one. This method can be used for storing and retrieving the future location of moving object. In the previous work of the authors [32-38] applications of partitioning in space-time and using influenceability in motion planning, finding a collision-free path and relief management was demonstrated. This article can be considered as a theoretical extension of them.
3 PreliminariesCausality is a well-known concept. There is much literature on causality, extending philosophy, physics, artificial intelligence, cognitive science and so on (e.g. [3, 30, 48]). In our view, influenceability stands for spatial causal relation, i.e. objects must come in contact with one another; cf. [3]. Although influenceability as a primary relation does not need to prove, it has some exclusive properties which show why it is selected. Influenceability supports contextual information and can be served as a basis for context aware mobile computing which has attracted researchers in recent years [17, 43]. This relation can play the role of any kind of acci-dent and collision. It is well-known that the accident is the key parameter in most transportation systems (for example see [44]). As an example the probability of collision defines the GPS navigation integrity requirement. In addition, this model due to considering causal relation is closer to a naïve theory of motion [40].In the relativistic physics [28, 46] based on the postulate that the vacuum velocity of light c is constant and maximum velocity, the light cone can be defined as a portion of space-time containing all locations which light signals could reach from a particular location (Figure 1). With respect to a given event, its light cone separates space-time into three parts, inside and on the future light cone, inside and on the past light cone, and elsewhere. An event A can influence (influenced by) another event; B; only when B (A) lies in the light cone of A (B). In a similar way, the aforementioned model can be applied for moving objects. Henceforth, a cone is describing an agent in mobile GIS environment for a fixed time interval. That means, a moving object is defined by a well-known acute cone model in space-time[24, 26]. This cone is formed of all possible locations that an individual could feasibly pass through or visit. The current location or apex vertex and speed of object is reported by navigational system or by prediction. The hyper sur-face of the cone becomes a base model for spatio-temporal relationships, and therefore enables analysis and further calculations in space-time. It also indicates fundamental topological and metric properties of space-time. As described in Malek [34, 36], the movement modeling, are expressed in differential equation defined over a 4-dimensional space-time continuum. The assumption of a 4-dimensional continuum implies the existence of 4-dimensional spatio-temporal parts. It is assumable to consider a continuous movement on a differential manifold M which represents such parts in space and time. That means every point of it has a neighborhood homeomorphic to an open set in Rn. A path through M is the image of a continuous map from a real interval into M. The homeomorphism at each point of M determines a Cartesian coordinate system (x0, x1, x2, x3) over the neighborhood. The coordinate x0 is called time. In addition, we assume that the manifold M can be covered by a finite union of neighborhoods. Generally speaking, this axiom gives ability to extend coordinate system to the larger area. This area shall interpret as one cell or portion of space-time. The partitioning method is application dependent. The partitioning method depends on ap-plication purposes [5, 49] on the one hand, and limitation of the processor speed, storage capacity, bandwidth, and size of display screen [50] on the other hand.
4 Algebraic and topological structureLet us take influenceability as an order relation (symbolized by p ) be primitive relation. It is natural to postulate that influence-ability is irreflexive, antisymmetric, but transitive, i.e.,( ) ( )x y y z x z∧ ⇒p p pThus, it can play the role of ‘after’.
Definition 1 (Temporal order): Let x and y be two moving objects with xt and yt corresponding temporal orders, respectively. Then,

A logic-based foundation for spatial relationships in mobile GIS environment 121
( ) ( )x yx y t t⇒ <p
Connection as a reflexive and symmetric relation [10]can be defined by influenceability as follows:Definition 2 (Connect relation): Two moving objects x and y are connected if the follow-ing equation holds;
( ) ( , ) : [( ) ( )] { ( )[( ) ( )]}xy C x y x y y x a x a y y a x∀ = ∨ ∧ ¬ ∃ ∨p p p p p p
Consequently, all other exhaustive and pairwise disjoint relations in region connected cal-culus (RCC), i.e., disconnection (DC), proper part (PP), externally connection (EC), iden-tity (EQ), partially overlap (PO), tangential proper part (TPP), nontangential proper part (NTPP), and the inverses of the last two; TPPi and NTPPi; can be defined.
Definition 3 (Immediately before): Let x and y be two moving objects with xt and yt corresponding temporal orders, respectively. Then, x is immediately before y (y is immediately after x) if:
: [( ) ( ( )]x y x yt t t t z x z y<< = < ∧ ¬∃ p p
The consensus task as an acceptance of the unique framework in mobile network can not be solved in a completely asynchronous system, but as indicated by Malek [34] with the help of influenceability and partitioning concept, it can be solved. Another task in mobile network is leader election. The leader, say a, can be elected by the following conditions:
{ }:x The set of moving objects a x∀ ∈ p
Furthermore, some other relations can be defined, such as which termed as speed-connection (SC) and time proper overlap (TPO) (see Figure 2):
( , ) : ( , ){[ ( , ) ( ) ( ( , ) ( ( , ) ( , ) ( , )] ( , )}SC x y EQ x y
C x y ab EC x a EC x b EC y a EC y b C a b= ¬ ∧∧ ∀ ∧ ∧ ∧ ⇒
5 Expressivity powerWhat has been shown so far is that if we regard a moving agent in mobile GIS environment as a cone then we can express certain important relations over agents purely in terms of the influenceability. In [36] we illustrated the expressive power of the theory. As an example four different relations between two objects; say A and B; can be discriminated by influenceability when A is before B and they are partial overlap. We are going to continue by some other relations and coaching problem, as well.
5.1 Qualitative geometryInfluenceability can be served as a basis of affine geometry. We are not going into detail, however, just offer collinearity conditions which are very important for building a qualitative affine geometry.Collinearity in time axis (COLT): Let x and y be two moving objects. They are collinear in time axis if
( , ) : { ( , ) [ (( ( , ) ( , )) ( ( , ) ( , ))]}COLT x y EQ x y z TPO x z TPO z y TPO y z TPO z x= ∨ ∃ ⇒ ∨ ⇒
Collinearity in space (COLS): Let x, y and z be three moving objects. They are collinear in space (Figure 3) if
( , , ) : { ( , ) ( , ) [ (( ( , ) ( , )) ( , ))]}COLS x y z EQ x z EQ y z a C x a C y a C z a= ∨ ∨ ∀ ∧ ⇒ .
Fig. 1. A cone separates space-time into 3 zones, past, future, and elsewhere.
Fig. 2. a) Speed-connection relation and b) Time-proper relation between two objects
Fig. 3. x, y and z are collinear, but x, y and w are not.
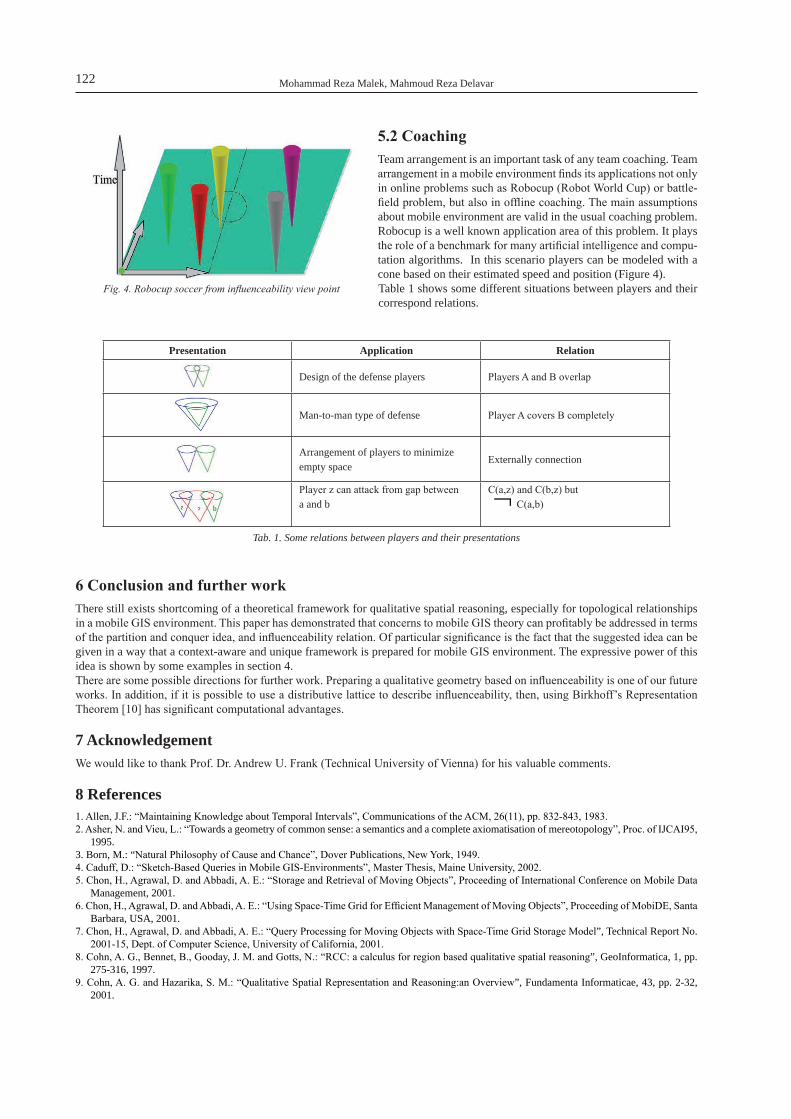
Mohammad Reza Malek, Mahmoud Reza Delavar122
5.2 CoachingTeam arrangement is an important task of any team coaching. Team arrangement in a mobile environment finds its applications not only in online problems such as Robocup (Robot World Cup) or battle-field problem, but also in offline coaching. The main assumptions about mobile environment are valid in the usual coaching problem. Robocup is a well known application area of this problem. It plays the role of a benchmark for many artificial intelligence and compu-tation algorithms. In this scenario players can be modeled with a cone based on their estimated speed and position (Figure 4). Table 1 shows some different situations between players and their correspond relations.
Presentation Application Relation
Design of the defense players Players A and B overlap
Man-to-man type of defense Player A covers B completely
Arrangement of players to minimize empty space
Externally connection
Player z can attack from gap between a and b
C(a,z) and C(b,z) but ¬ C(a,b)
Tab. 1. Some relations between players and their presentations
6 Conclusion and further workThere still exists shortcoming of a theoretical framework for qualitative spatial reasoning, especially for topological relationships in a mobile GIS environment. This paper has demonstrated that concerns to mobile GIS theory can profitably be addressed in terms of the partition and conquer idea, and influenceability relation. Of particular significance is the fact that the suggested idea can be given in a way that a context-aware and unique framework is prepared for mobile GIS environment. The expressive power of this idea is shown by some examples in section 4. There are some possible directions for further work. Preparing a qualitative geometry based on influenceability is one of our future works. In addition, if it is possible to use a distributive lattice to describe influenceability, then, using Birkhoff’s Representation Theorem [10] has significant computational advantages.
7 AcknowledgementWe would like to thank Prof. Dr. Andrew U. Frank (Technical University of Vienna) for his valuable comments.
8 References1. Allen, J.F.: “Maintaining Knowledge about Temporal Intervals”, Communications of the ACM, 26(11), pp. 832-843, 1983.2. Asher, N. and Vieu, L.: “Towards a geometry of common sense: a semantics and a complete axiomatisation of mereotopology”, Proc. of IJCAI95,
1995.3. Born, M.: “Natural Philosophy of Cause and Chance”, Dover Publications, New York, 1949.4. Caduff, D.: “Sketch-Based Queries in Mobile GIS-Environments”, Master Thesis, Maine University, 2002.5. Chon, H., Agrawal, D. and Abbadi, A. E.: “Storage and Retrieval of Moving Objects”, Proceeding of International Conference on Mobile Data
Management, 2001.6. Chon, H., Agrawal, D. and Abbadi, A. E.: “Using Space-Time Grid for Efficient Management of Moving Objects”, Proceeding of MobiDE, Santa
Barbara, USA, 2001.7. Chon, H., Agrawal, D. and Abbadi, A. E.: “Query Processing for Moving Objects with Space-Time Grid Storage Model”, Technical Report No.
2001-15, Dept. of Computer Science, University of California, 2001.8. Cohn, A. G., Bennet, B., Gooday, J. M. and Gotts, N.: “RCC: a calculus for region based qualitative spatial reasoning”, GeoInformatica, 1, pp.
275-316, 1997.9. Cohn, A. G. and Hazarika, S. M.: “Qualitative Spatial Representation and Reasoning:an Overview”, Fundamenta Informaticae, 43, pp. 2-32,
2001.
Fig. 4. Robocup soccer from influenceability view point

A logic-based foundation for spatial relationships in mobile GIS environment 123
10. Davey, B. A. and Priestly, H. A.: “Introduction to Lattices and Order”, Cambridge University Press, UK, 1990.11. Egenhofer, M.J.: “A Formal Definition of Binary Topological Relationships”, Proceeding of Third International Conference on Foundations of
Data Organization and Algorithms (FODO), Paris, France, Springer, 1989.12. Egenhofer, M. J. and Franzosa, R. D.: “Point-set topological spatial relations”, International Journal of Geographical Information Systems, 5(2),
pp. 161-174, 1991.13. Egenhofer, M. J. and Herring, J. R.: “Categorizing Binary Topological Relationships Between Regions, Lines, and Points in Geographic Data-
bases”, Department of Surveying Engineering, University of Maine, Orono, ME, 1991.14. Egenhofer, M. J.:”A Model for Detailed Binary Topological Relationships”, Geomatica, 47(3 & 4), pp. 261-273, 1993.15. Erwig, M. and Schneider M.: “The Honeycomb Model of Spatio-temporal partitions”, Proceeding of Spatio-Temporal database management,
Edinburgh, Scotland, Springer, 1999.16. Ellis, C. S.: “The case for higher-level power management”, Proc. of 7th IEEE Workshop on Hot Topics in Operating System, Rio Rico, 1999.17. Ferscha, A. and Hoertner, H. and Kotsis, G.: “Advances in Pervasive Computing”, Austrian Computer Society, 2004.18. Flinn, J. and M., S.: “Energy-aware Adaptation for Mobile Application”, Proc. of Symposium on Operating Systems Principals, 1999.19. Forman, G. H. and Zahorjan, J.: “The Challenges of Mobile Computing”, IEEE Computer, 27(4), pp. 38-47, 1994.20. Garg, V.K. and Mittal N.: “Computation Slicing: Techniques and Theory”, Proceeding of DISC 2001, Lisbon, Portugal, 2001.21. GIS-LOUNGE: “http://gislounge.com/ll/mobilegis.shtml”, Accessed time: September 2005.22. Gotts N. M. and Gooday J. M., and Cohn A.G.: “A connection based approach to common-sense topological description and reasoning”, The
Manifest, 79(1), 1995.23. Heltzel, P.: “Wireless Computing and Networking”, Techmedia, 2002.24. Hendricks, M.D. and Egenhofer M. and Hornsby K.: “Structuring a wayfinder’s Dynamic space-Time environment”, Proceeding of COSIT
2003, Kartause Ittingen, Switzerland, Springer, 2003.25. Hjelm, J.: “Creating Location Services for the Wireless Web: Professional Developer’s Guide”, John Wiley & Sons, 2002.26. Hornsby, K. and Egenhofer, M. J.: “Modeling Moving Objects over Multiple Granularities”, In: Annals of Mathematics and Artificial Intel-
ligence, 2000.27. Karimi, H. and Amin, H.: “Telegeoinformatics: Location-Based Computing and Services”, CRC Press, 2004.28. Kaufmann, W. J.: “Relativity and Cosmology”, 1966.29. Laurini, R. and D. Thompson, “Fundamentals of Spatial Information Systems”, APIC Series, Academic Press, 1992.30. Lewis, D.: “Causation”, Journal of Philosophy, 70, pp. 556-567, 1973.31. Li, L., Li, C. and Lin, Z.: “Investigation on the Concept Model of Mobile GIS”, Proceeding of Symposium on Geospatial theory, Processing
and Applications, Ottawa, 2002.32. Malek, M.R.: “Motion Modeling in GIS”, (in Persian) Proceeding of GEOMATIC 82, National Cartographic Center, Tehran, Iran, 2003.33. Malek, M. R. and Delavar, M. R.: “Motion Modeling in GIS: A Case Study in Collision-Free Space-Time”, URESCO, Modeling for Wayfind-
ing Servieces, Germany, 2003.34. Malek, M. R.: “A Logic-Based Framework for Qualitative Spatial Reasoning in Mobile GIS Environment with Applications to Navigations”,
In: Ferscha, A. and Hoertner, H. and Kotsi, G. (Ed.s):” Advances in Pervasive Computing”, Austrian Computer Society, 2004.35. Malek, M. R., Delavar, M. R. and Aliabady, S.: “The Location-Based services in a Mobile Government”, (in Persian) Proceeding of The First
Conference on IT, Software and E-city, Mashhad, 2004.36. Malek, M. R.: “A Logic-Based Framework for Qualitative Spatial Reasoning in Mobile GIS Environment”, Lecture Notes in Artificial Intel-
ligence, 3066, pp. 418-426, 2004.37. Malek, M. R. and Delavar M. R: “Mobile GIS: A Prototype for Mashhad City”, (in Persian) Surveying Magazine, 16(1), pp.10-13, 2005. 38. Malek, M.R. and Delavar M.R: “A Mobile Spatial Information System for Rescue and Relief management”, (in Persian) Proceeding of Second
Conference of Scientific & Research on Relief and Rescue Management, Tehran, Iran, 2005.39. Mark, D., Egenhofer, M., Bian, L., Hornsby, K., Rogerson, P. and Vena, J.: “Spatio-Temporal GIS Analysis for Environmental Health using
Geospatial Lifelines”, In Flahault, A., Toubiana, L. and Valleron, A.: 2nd International Workshop on Geography and Medicine: GEOMED’99, France, 1999.
40. McClosky, M.: “Naive theories of motion” In: Gentner D. and Stevens S. (Editors): “Mental Models”, Hillsdale, New Jersey, Lawrence Erl-baum, 1983.
41. Miller, H. J., “Modelling accessedibility using space-time prism concepts within geographical information systems”, International Journal of Geographical Information Systems, 5(3), pp. 287-301, 1991.
42. Mittal, N. And Garg, V.K., “Computation Slicing: Technique and theory”, Technical Report, TR-PDS-2001-002, The University of Texas at Austing, 2001.
43. Nivala, A. M. and Sarjakoski, L. T.: “Need for Context-Aware Topographic Maps in Mobile Devices”, In: Virrantaus, K. and Tveite, H.: Scan-GIS’2003, Espoo, Finland, 2003.
44. Sang, J.: “Theory and Development of GPS Integrity Monitoring System”, PhD Thesis, Queensland University of Technology, 1996.45. Satyanarayanan, M.: “Fundamental Challenges in Mobile Computing”, In:ACM Symposium on Principles of Distributed Computing, 1995.46. Sexl, R. and Sexl, H.: “Weisse Zwerge- Schwarze Locher: Einfuhrung in die reltivitische Astrophysik“, Trans. by Mansoory R., Sharif Univer-
sity, 2nd Edittion, 1370.47. Smith, B., „Mereotopology: A Theory of Parts and Boundaries”, Data and Knowledge Engineering, 20, pp. 287-303, 1996.48. Verma, T. S.: “Causal Networks: Semantics and expressiveness”, In: Sacher R. and Levitt T.S. and Kanal L.N. (ed.s):”Uncertainty in Artificial
Intelligence”, Elsevier Science, 4, 1990.49. White M. S., “A Survey of the Mathematics of Maps”, Proceeding of Auto Carto IV, 1979.50. Worboys M. F., “GIS: A Computing Perspective”, Taylor & Francis, 1995.51. Zhao, Y.: “Vehicle Location and Navigation Systems”, ITS Series, Artech House, 1997.

Shortest path search in Multi-Representation Street Databases
Steffen Volz
AbstractThe fact that mobile users of location-based services (LBS) have to be able to go anywhere on earth without changing the applica-tion brings up a major requirement: there has to be one global platform that provides a transborder and continuous access to the information necessary for this kind of information systems – and the most important information source for location-based services is geospatial data. However, the world of geospatial data is split into pieces, and the integration of those pieces is a difficult task since the data are highly heterogeneous: they have been acquired according to differing conceptual schemas (or application per-spectives), they are available in different formats and scales, with different accuracies, etc. The main problem concerning spatial data integration results from the fact that the same real world objects are stored in multiple, inconsistent representations (MRep) in different spatial databases. Thus, in order to achieve a common view on the underlying spatial data within a global information platform for location-based services, mainly the inconsistencies between multiple representations have to be considered and dealt with adequately.The problem can be depicted by means of a navigation service. Consider the task of finding the shortest car route between Stuttgart/Germany and Vienna/Austria. You will not have any problems to find a solution if you have one single, continuous street data set comprising the whole query area. However, you will encounter difficulties in case you have two or more separate, partly overlap-ping source data sets (or patches) that you have to assemble (like a mosaic) in order to form the query area. In this case your navi-gation application has to be able to merge (or conflate) the source data sets that contain multiple conflicting representations of one and the same real world (street) object in the overlapping areas to again create one consistent, single representation (SRep) street database on which the navigation algorithms can operate. The merge operation, though, is time consuming. This paper describes an approach to find an optimized solution for the navigation in MRep street networks by generating explicit relations between multiple representations and by exploiting them during shortest path search.
1 IntroductionThe Nexus project that is currently being carried out at the University of Stuttgart [7] aims at developing a global and generic plat-form for different kinds of location-based services (LBS). It is based on the idea to provide an integration schema for spatial data, the so-called Augmented World Schema (AWS), into which all the available data sources of the highly distributed spatial database servers all over the world can be converted. If the data are finally formatted according to the AWS standard and made available within the Nexus platform, the problem of multiple representations (MRep) of spatial data arises since different data providers might have captured the same real world entity. As a solution, we propose to link corresponding spatial representations existing in different data sets by explicit relations, so-called MRep Relations. These MRep Relations store, amongst others, measures to express the geometric, topological and thematic similarity (or consistence) of the representations that have been assigned to each other during a matching process. MRep Relations can on the one hand be used to support update processes within the Nexus platform and on the other hand to merge (or conflate) data sets containing multiple representations into one resulting, consistent data set that merely contains one single rep-resentation for each real world object (SRep). On such single representation data sets, conventional spatial algorithms necessary for LBS can work. Conflation, however, even of small areas, is a time-consuming process and it is illusive that a consolidated data set can be created for each client query, not to mention the efforts to produce one consistent data set for the whole world and to update it regularly. Therefore, other mechanisms have to be invented. In this paper, we suggest that MRep Relations can also be used to avoid the conflation of corresponding objects into a single rep-resentation by developing algorithms that are able to exploit the information stored in MRep Relations during the analysis process. Since navigation is one of the most important services for location-based systems, we verify our approach by means of this ap-plication and describe a shortest path algorithm that can be used in multi-representation databases (i.e. to solve scenarios like the one sketched in the abstract paragraph). For our investigation, we use street data sets from different spatial databases, namely Geo-graphic Data Files (GDF) [4] and the German Authoritative Topographic Cartographic Information System (ATKIS) [11] which have been transformed into the AWS format. GDF is an international standard that has especially been developed for car navigation applications and thus is used to describe and transfer street networks whereas ATKIS is more comprehensive and contains data of different topographic categories like settlement, vegetation, traffic, etc. Both data models capture street objects as linear features in approximately the same scale (1:25 000).
Steffen Volz126
The remainder of this paper is organized as follows: section 2 describes related work in the field of matching and conflation of multi-representation databases. Section 3 briefly introduces the Nexus project and in section 4 the idea of MRep Relations is pre-sented. Section 5 contains a detailed description of the navigation approach in multi-representation databases. Finally, section 6 summarizes this paper and gives an outlook on future issues.
2 Related workInteroperability of spatial databases is one of the main research topics in the GIS domain. Amongst others, it comprises the field of integrating multiple, potentially contradictory representations of one and the same real world object. In order to identify corresponding representations in different databases, matching techniques are developed. For example, [2] has implemented an approach for matching street network nodes of two different GDF datasets which have been acquired by different companies (NAVTEQ and TeleAtlas). The algorithm developed here is based on the idea of describing intersections of streets, i.e. nodes of a street network, by a code. This code consists of point coordinates and the number, abbreviations and names of incident streets. For each intersection, such a code is created. By comparing the codes of the intersections within the different GDF data sets and by assigning the intersections with the most similar codes to each other, references can be derived.A fundamental, line-based matching approach for street network data of ATKIS and GDF has been presented by [10]. In a first step, the algorithm finds all potential correspondences of topologically connected line elements in two source data sets by performing a buffer operation. The matching candidates are stored in a list. This list is ambiguous and typically contains a large amount of n:m matching pairs. Then, unlikely matching pairs are identified and eliminated using relational parameters like topological information and feature-based parameters like line angles. The result is a smaller but still ambiguous list with potential matching pairs. These matching pairs are evaluated with a merit function in order to compute a unique combination of matching pairs which represents the solution of the matching problem. This is a combinatorial problem which is solved with an A* algorithm.The problem of spatial data fusion or conflation is for example being tackled by [3]. The merging process is defined here as “fea-ture deconfliction”, where all parts of a matched feature pair are unified into a single “better” feature. The conflation algorithm has to decide, which properties are preserved in the resulting instance. In their approach, the authors are also taking into account the data quality information of the corresponding instances in order to derive SRep data. Also in [5] it is dealt with the fusion of multi-source vector data. The integration process is divided into a “linking” phase where homologous objects are identified and a “best map” phase that assembles the linked objects. During best map, so-called connectivity vectors are placed at the boundaries of linked objects in order to connect the geometries of corresponding representations. Similarly to our approach, a “best path” applica-tion was developed that allows finding shortest paths between low-resolution and high-resolution street data sets. However, unlike in our work, linking does not produce any information about the degree of similarity of the linked objects that could be exploited during data analysis.
3 A short introduction to NexusThe goal of the Nexus project is to provide a platform for different kinds of location-based applications. This platform is orga-nized as a federation that provides the Augmented World Schema (AWS) – a spatial integration schema, i.e. a common conceptual schema especially designed for LBS – into which the data of autonomous spatial databases (so-called context servers, CS) have to be transformed [8]. This involves the solution of semantic issues (see [9]). Just like in the WWW, anyone who wants to participate in the Nexus system can provide an own context server that merely has to be registered at the Area Service Register (ASR) com-ponent, a spatial lookup service that is utilized to find the data necessary to answer a client query. Anytime a new context server is registered, the MRep Builder is triggered to find corresponding representations in the spatial databases already available in Nexus and in the newly added one and generates MRep Relations between them. All MRep Relations are stored in special context servers, the MRep Relation Servers that also have to be registered at the ASR. If an LBS client query has to be processed, the Federation finds out via the ASR which spatial data servers and MRep Relation Servers have to be accessed to gather the query relevant data. Those services which are capable of using MRep Relations within their analysis algorithms (MRep Services) do not need any fur-ther integration steps and can create their version of a Unified Context Model. Other services, like e.g. a map service, which need to produce an SRep data set (Non-MRep Services), exploit MRep Relations in the merging process to assemble the different context models (or patches) and create another version of a Unified Context Model. Finally, the results produced by the services can be returned to the application (see Figure 1).
4 The concept of MRep relationsThe first step in integrating heterogeneous databases consists of feature matching [3], i.e. representations of the same real world ob-ject within different databases have to be identified. The matches between corresponding instances can basically be stored as simple pointers within a bidirectional list, displaying that an object OAk or an object set {OA1, …, OAk} of data set A can be assigned to an object OBn or an object set {OB1, …, OBn} of data set B (e.g. OA1↔OB1, {OA3, OA5}↔OB2, {OA6, OA9}↔{OB4, OB7}, etc.). However, dur-ing matching more information like geometric, topologic and attributive similarity measures for corresponding representations can be derived. This additional information is according to our approach represented in an own formal structure, the MRep Relation, which can be exploited for multiple purposes. One of these purposes is the shortest path search in multi-representation databases.
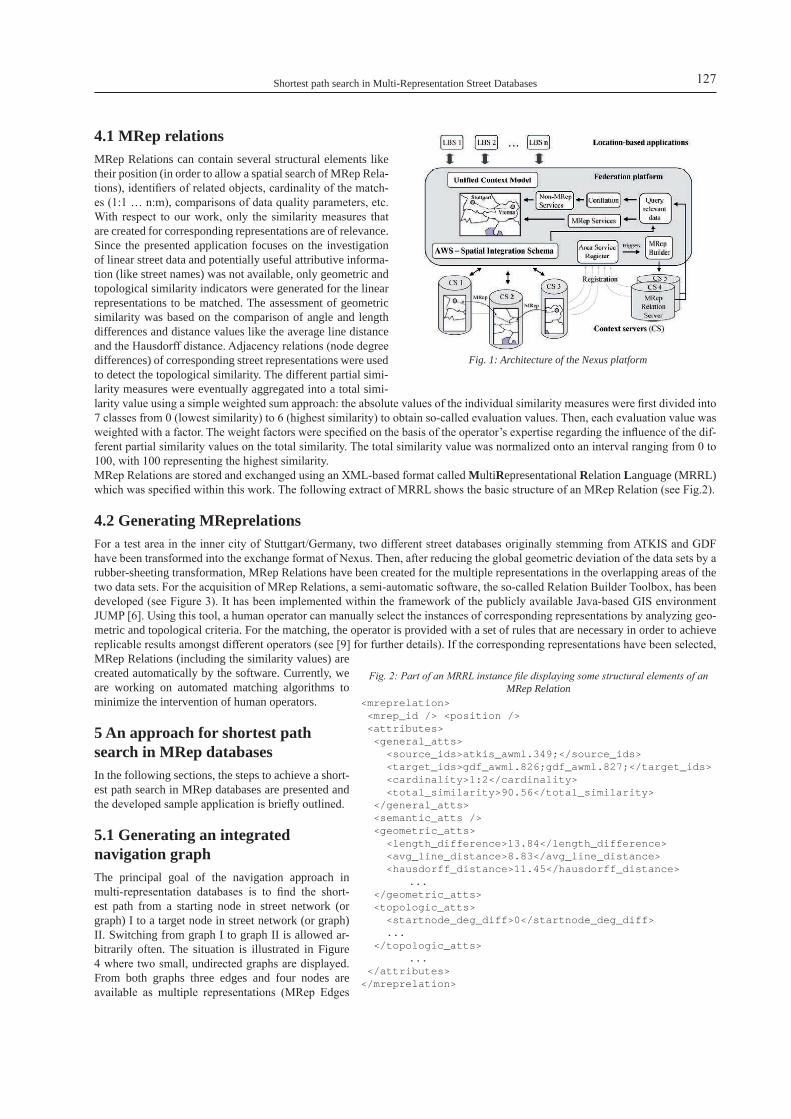
Shortest path search in Multi-Representation Street Databases 127
4.1 MRep relationsMRep Relations can contain several structural elements like their position (in order to allow a spatial search of MRep Rela-tions), identifiers of related objects, cardinality of the match-es (1:1 … n:m), comparisons of data quality parameters, etc. With respect to our work, only the similarity measures that are created for corresponding representations are of relevance. Since the presented application focuses on the investigation of linear street data and potentially useful attributive informa-tion (like street names) was not available, only geometric and topological similarity indicators were generated for the linear representations to be matched. The assessment of geometric similarity was based on the comparison of angle and length differences and distance values like the average line distance and the Hausdorff distance. Adjacency relations (node degree differences) of corresponding street representations were used to detect the topological similarity. The different partial simi-larity measures were eventually aggregated into a total simi-larity value using a simple weighted sum approach: the absolute values of the individual similarity measures were first divided into 7 classes from 0 (lowest similarity) to 6 (highest similarity) to obtain so-called evaluation values. Then, each evaluation value was weighted with a factor. The weight factors were specified on the basis of the operator’s expertise regarding the influence of the dif-ferent partial similarity values on the total similarity. The total similarity value was normalized onto an interval ranging from 0 to 100, with 100 representing the highest similarity.MRep Relations are stored and exchanged using an XML-based format called MultiRepresentational Relation Language (MRRL) which was specified within this work. The following extract of MRRL shows the basic structure of an MRep Relation (see Fig.2).
4.2 Generating MReprelationsFor a test area in the inner city of Stuttgart/Germany, two different street databases originally stemming from ATKIS and GDF have been transformed into the exchange format of Nexus. Then, after reducing the global geometric deviation of the data sets by a rubber-sheeting transformation, MRep Relations have been created for the multiple representations in the overlapping areas of the two data sets. For the acquisition of MRep Relations, a semi-automatic software, the so-called Relation Builder Toolbox, has been developed (see Figure 3). It has been implemented within the framework of the publicly available Java-based GIS environment JUMP [6]. Using this tool, a human operator can manually select the instances of corresponding representations by analyzing geo-metric and topological criteria. For the matching, the operator is provided with a set of rules that are necessary in order to achieve replicable results amongst different operators (see [9] for further details). If the corresponding representations have been selected, MRep Relations (including the similarity values) are created automatically by the software. Currently, we are working on automated matching algorithms to minimize the intervention of human operators.
5 An approach for shortest path search in MRep databasesIn the following sections, the steps to achieve a short-est path search in MRep databases are presented and the developed sample application is briefly outlined.
5.1 Generating an integrated navigation graphThe principal goal of the navigation approach in multi-representation databases is to find the short-est path from a starting node in street network (or graph) I to a target node in street network (or graph) II. Switching from graph I to graph II is allowed ar-bitrarily often. The situation is illustrated in Figure 4 where two small, undirected graphs are displayed. From both graphs three edges and four nodes are available as multiple representations (MRep Edges
Fig. 1: Architecture of the Nexus platform
<mreprelation> <mrep_id /> <position /> <attributes> <general_atts> <source_ids>atkis_awml.349;</source_ids> <target_ids>gdf_awml.826;gdf_awml.827;</target_ids> <cardinality>1:2</cardinality> <total_similarity>90.56</total_similarity> </general_atts> <semantic_atts /> <geometric_atts> <length_difference>13.84</length_difference> <avg_line_distance>8.83</avg_line_distance> <hausdorff_distance>11.45</hausdorff_distance> ... </geometric_atts> <topologic_atts> <startnode_deg_diff>0</startnode_deg_diff> ... </topologic_atts> ... </attributes></mreprelation>
Fig. 2: Part of an MRRL instance file displaying some structural elements of an MRep Relation

Steffen Volz128
and MRep Nodes). MRep Relations were only created for the edges, but not for the nodes, i.e. similarity measures are only available for the MRep Edges.In order to create one consistent naviga-tion graph from the two underlying source graphs, two options are possible: First, MRep Nodes and MRep Edges could be topologically (not geometrically) aggre-gated to derive the final navigation graph. However, using this option the information stored in the similarity measures would get lost. For this reason it was decided to re-alize the second option by introducing so-called transition edges from one graph to the other between MRep Nodes (see Fig-ure 5). Thus, it is possible to determine the uncertainty that arises when a switch-over from one graph to the other is performed. The uncertainty results from the fact that two MRep Nodes might in reality not be identical which is expressed by the similar-ity measure.
5.2 Determining possible pathsAlgorithms for shortest path search can be based on adjacency matrices like e.g. the Dikstra or Floyd algorithm. However, an adja-cency matrix can also be transformed into a tree structure where the start node is represented as the root. On tree structures, several search algorithms can operate (see [1] for an overview). We decided to apply a depth-first search to find all possible ways between a source and a target node.
5.3 Calculating the costsWhen all possible paths within the integrated navigation graph have been determined by a depth-first search, the total costs of the traversed edges (CW) can be calculated. It can be defined as the sum of the costs of all real edges (CRE) plus the sum of the costs of all transition edges (CTE).
CW = ∑ CREi + ∑ CTEk
Remember that multiple switch-overs from one graph to the other are allowed, that’s why there can be more than one transi-tion edge. For the calculation of the costs for the traversal of transition edges it has to be considered that there are only similar-ity measures available between corresponding multiple representation edges (MRep Edges), but not for their start and end nodes
(the MRep Nodes). However, to determine the cost of a transition edge, the similarity measures for the MRep Nodes have to be known. Therefore, the similarity val-ues of MRep Edges have to be converted to similarity values of the MRep Nodes and then the costs for transi-tion edges can be derived.
In those cases where MRep Nodes only have one inci-dent MRep Edge (e.g. MRep Nodes C and J in Figure 5), we can simply use the similarity measure of the in-cident MRep Edges (CE and JH = 77) as the similarity measure of the MRep Nodes. Whenever MRep Nodes do have more than one incident MRep Edge (like E and H), we chose the arithmetic mean value of the similar-ity values of all incident MRep Edges (for E,H = (77 + 89 + 93) /3 = 86,33) as an acceptable approximation for the similarity of the respective MRep Nodes.
mmnn
k=0k=0i=0i=0
Fig. 3: The MRep Relation Builder Toolbox allows a manual matching of corresponding street representations
Fig. 4: A multi-representation graph

Shortest path search in Multi-Representation Street Databases 129
The costs of each transition edge (CTE) can fi-nally be calculated by a simple cost function
CTE = (Simmax – SimTE) * ω
where Simmax is the maximum similarity val-ue between MRep Nodes (100) and SimTE is the similarity value of the investigated MRep Nodes (e.g. 86,33 for E and H), i.e. the higher the similarity of MRep Nodes (SimTE), the lower the cost for traversing the transition edge. The influence of the transitions during the shortest path calculation can be weighted by a factor ω (with ω ∈ [0..n]) and so the uncertainty which results from switching graphs can be expressed to a degree necessary for the application. The value of ω has to be chosen based on empirical observations and depends on the data sets involved. One strategy to determine a reliable result of the shortest path search could also be to neglect all paths containing transition edges with a cost above a certain threshold (e.g. above 15 for ω = 1).
5.4 Realization of the approachThe approach has been implemented as a sample application called MRep Network Analysis Tool within the JUMP environment. The user can select a start and a target node in either of the two source street networks which originally stem from GDF and ATKIS and have been translated in the AWS format. Depending on the ω value of the cost function, there can be different results for the shortest path (see Figure 6, ways A and B). Concerning way A, ω is large and so the cost function for the transition edges yields large values since the application requires a high reliability of the resulting way, i.e. the application demands that the transition has a strong influence on the length of the shortest path. Therefore, the actual transition rather takes place at those MRep Nodes that show the highest similarity (at transition A), i.e. at the place where the transition costs are minimal. As it is depicted in Figure 6, this constraint leads to a considerable detour. In the case where the transition takes place at B, the costs for the transition edges are comparably low (since ω is low), i.e. the transition has only a small influence on the length of the shortest path since the application allows a certain degree of uncertainty of the resulting path. The reason for the uncertainty in the described example results from the fact that the MRep Edge with GDF origin might be a dead-end street at transition B (although all streets directly at the boundary appear as dead-ends), whereas the corresponding ATKIS representation is connected to other roads at transition B.
Fig. 5: The costs of transition edges have to be calculated regarding the similarity values of the MRep Nodes
Fig. 6: Clipping of a boundary zone of different street networks. Between the MRep Edges, MRep Relations have been defined.
Steffen Volz130
6 Summary and outlookIn this paper we showed that explicitly linking corresponding objects in multi-representation databases through MRep Relations is an alternative to the conflation of multiple representations into a single representation (SRep) data set since GIS algorithms can be adapted to exploit MRep Relations during data analysis. We have verified our approach by means of a shortest path search in multi-representation street databases: First, we created MRep Relations between corresponding street objects (MRep Edges) within the originally separate GDF and ATKIS networks. Second, in order to connect the graph structures derived from the street networks, we introduced transition edges between MRep Nodes. The costs for traversing these transition edges depend on the similarity values stored in MRep Relations and can be further adjusted according to the reliability requirements of the applications. Third, we applied a depth-first search algorithm that allows finding the shortest path between any two nodes in the unified graph. The approach was finally implemented in a sample application.In the future, some of the processes that are part of our approach have to be extended and enhanced. Currently we are working on algorithms to automate the generation of MRep Relations as far as possible. Furthermore, issues of optimizing the tree search are being dealt with. Eventually, the creation of MRep Relations has to be adapted to other object and geometry types (e.g. buildings represented by aerial geometries) and it has to be investigated how other GIS algorithms like buffering, intersection, etc. can be extended to be able to exploit MRep Relations in the analysis process.
7 AcknowledgementsThe research presented here is supported within a Center of Excellence called “Spatial World Models for Mobile Context-Aware Applications” under grant SFB 627 by the German Research Council. The test data have kindly been provided by the NAVTEQ company and the state survey office of the federal state of Baden-Wuerttemberg.
8 References[1] Aho, A., Hopcroft, J. E., Ullman, J. D. (1987): Data Structures and Algorithms, Addison-Wesley Series in Computer Science and Information
Processing, 427 p.[2] Bofinger, J.M. (2001): Analyse und Implementierung eines Verfahrens zur Referenzierung geographischer Objekte. Diploma Thesis at the Insti-
tute for Photogrammetry, University of Stuttgart, unpublished, (2001), 76 p.[3] Cobb, M., Chung, M., Miller, V., Foley, H., Petry, F., Shaw, K. (1998): A rule-based approach for the conflation of attributed vector data, GeoIn-
formatica 2(1), pp. 7-35.[4] Comité Européen de Normalisation (CEN) (1995): Geographic Data Files Version 3.0, TC 287, GDF for Road Traffic and Transport Telemat-
ics.[5] Edwards, D., Simpson, J. (2002): Integration and Access of Multi-Source Vector Data. In: Proceedings of the Joint International Symposium on
Geospatial Theory, Processing and Applications, Ottawa, Canada, on CD-ROM.[6] Java Unified Mapping Platform JUMP, 2005: http://www.jump-project.org/[7] Nexus project homepage: http://www.nexus.uni-stuttgart.de[8] Nicklas, D., Mitschang, B., “The Nexus Augmented World Model: An Extensible Approach for Mobile, Spatially-Aware Applications”, Proc.
of the 7th Int. Conf. on Object-Oriented Information Systems, Calgary, 2001.[9] Volz, S. (2005): Data-Driven Matching of Geospatial Schemas. In: D. Mark and A. Cohn (eds.): Proceedings of the Conference on Spatial In-
formation Theory (COSIT ‘05), Ellicottville, NY, Lecture Notes in Computer Science 3693, Springer, September 2005, pp. 115-132.[10] Walter, V., Fritsch, D. (1999): Matching spatial data sets: a statistical approach. Int. J. Geographical Information Science 13(5), pp. 445–473.[11] Working Committee of the Surveying Authorities of the States of the Federal Republic of Germany (1988): Authoritative Topographic Carto-
graphic Information System (ATKIS), http://www.atkis.de

Geocoding walking directions using Sidewalk Network Databases
Masatoshi Arikawa, Kouzou Noaki
AbstractThis paper proposes an advanced method of geocoding for walking directions in documents using daily local expressions. Walking directions are usually described in casual expressions, but not in regular ones like address. Thus, it has been considered practically impossible to geocode walking directions. However, sidewalk network databases in major cities of Japan have been available for human navigation services with GPS-equipped mobile phones since 2003. The databases can be expected to enable more advanced geocoding for larger scale natural language expressions. We first introduce the core schema of sidewalk network databases. Then, we explain a structure of walking directions in Japanese, and propose FRS (Formal Route Statement) to represent and process walk-ing directions by means of a computer. Finally, prototype systems which have been developed based on our proposed framework are presented.
1 IntroductionWhen we want to have a tasty meal with our friends, we get information of restaurants from the Internet using search engines for some keywords. However, it is not easy to get exact information because there are billions of documents and the number of them is increasing. It may cause us inconvenience when we find information using computers, especially local information like restaurants. We assume that the inconvenience stems from the difference in the framework of managing information between our brains and the current computer systems. One of people’s methods of memorizing information is associated with locations. Examples of this thinking are “Mr. Suzuki who lives in Tokyo”, “a good Chinese noodle shop under the elevated rail” and “an important file in the second drawer of my desk”. In other words, locations remind people of their memories. We define these descriptions which cor-respond to the region in the real world as geo-referenced descriptions. The purpose of this research is to consider the framework to deal with information using geo-referenced descriptions as one of the important keys referring to the information.We have studied a method of converting geo-referenced descriptions like addresses and place names into their corresponding geo-graphic coordinates [1]. The process of converting descriptions into coordinates is called geocoding. In this paper, we focus on walking directions as a new type of target to geocode.
2 Sidewalk Network DatabasesSidewalk network databases store underground walks, footbridges and cross walks for pedestrians. Sidewalk network databases are simply structured as nodes and links. A node has geometric coordinates. A link is defined as a vector between two nodes. Sidewalk network databases are provided as commercial products by Shobunsha Publications Inc. [2]. The commercial sidewalk network databases presently cover major cities in Japan. Before the emergence of sidewalk network databases, there have been popular geographic network databases such as road networks for car navigations, railroads, facilities networks and so on. However, the previous geographic network databases were all designed for small scale uses, not for large scale uses such as human navigations. On the other hand, sidewalk network databases for walk-ers are getting popular for human navigation systems since 2003 in Japan. Some services and products using sidewalk network database have already been on the market. “EZnaviwalk” provided by KDDI au is one of the most popular human navigation ser-vices using cell phone, GPS, and electronic compass [3]. With sidewalk network databases, train timetables and airline timetables, EZnaviwalk finds the most direct, time-saving or money-saving route. This service has begun since October 2003. The sidewalk network database used in our research is simply structured as nodes and links. A node has not only geometric at-tributes like coordinates but non-geometrical attributes like name of spatial entity, its class and related url. A link has a distance and an angle from its start node to its end node. Users can extend the integrated database by entering additional nodes and links or inputting text data. In particular, “intersection”, “street” or “slope street” is shaped with the multiple nodes and links. For example, at least four nodes are needed to shape an intersection (Fig.1.). Figure 2 shows the core schema of sidewalk network databases. A node has attributes, that is, id (the identifier of a node), name (a spatial entity’s name which corresponds to the node), coordinates (tuples of longitude and latitude), in (a name of a street or an area both of which are constructed of multiple nodes and links), class (a class of spatial object), incoming link (id of an incoming link), outgoing link (id of an outgoing link) and poi (additional infor-mation concerning the point of interest except for name, class and url)”. A link has its id (the identifier of the link), start_node (id

Masatoshi Arikawa, Kouzou Noaki132
of the node from which the link starts), end_node (id of the node at which the link arrives), direction (of the link in degree) and distance (of the link in meter).
Sidewalk network DB : (Nodes, Links)Nodes : a set of nodeLinks : a set of linknode : (id, name, coordinates, in, class, incoming_link, outgoing_link, poi)link : (id, start_node, end_node, direction, distance)
node.id : id of the nodeNode.name : name of the node
node.coordinate : coordinates (longitude, latitude)node.in : name of group
node.class : class of spatial objectnode.incoming_link : id of the incoming linknode.outgoing_link : id of the outgoing link
node.poi : information for the point of interestlink.id : id of the link
link.start_node : id of the start nodelink.end_node : id of the end nodelink.direction : its direction in degreelink.distance : its distance in meter
Fig. 2. Core schema of the sidewalk network databases used in our research
3 Natural and formal route descriptions
3.1 Structure of walking directionsA walking direction can be divided into noun phrases and verbal phrases. For example, the description “渋谷駅ハチ公口を出て道玄坂を上り交差点を右へ曲がる (You exit from the Shibuya Hachiko Exit and go up Dogen-zaka Slope Street, and then turn right at the intersection)” is divided as follows:
渋谷駅ハチ公口を出て道玄坂を上り交差点を右へ曲がる ↓[渋谷駅ハチ公口][を出て][道玄坂][を上り][交差点][を右へ曲がる] ↓nounphrases:[渋谷駅ハチ公口],[道玄坂],[交差点]verbalphrases:[を出て],[を上り],[を右へ曲がる]
All of the above noun phrases have a place name. A place name refers to the unique place in the real world and works as a reference point for the next verbal phrase. The above verbal phrase has a preposition such as “を(at, from or through)”, a verb such as “曲がる(turn)” or “出る(exit)” and an adjunct such as “右へ(right)”, “100メートル(100meter)” or “5分(5minutes)”. It is usual for Japanese people that an agent noun for the verbal phrase is often omitted in a description. A person who is referred by an omitted agent noun is a walker who is a writer of a description or third person.
Fig. 1. Examples of nodes and links stored in sidewalk network databases. The left figure shows an intersection and the right one shows a slope street

Geocoding walking directions using Sidewalk Network Databases 133
We call a noun phrase in a walking direction spatial anchor description. Spatial anchor description includes unique noun and general noun. A general noun such as “intersection” is deduced from context of a description and situation. Spatial anchor descriptions referring those places can be used as start points, passage points and end points of routes in walking directions. These verbal phrases are the expressions of a walker’s action on the route. Walker’s actions on the walk-ing direction denote topology between places. We call a verbal phrase in a walk-ing direction spatial relationship description.
3.2 Simple model of walking directionsWe simplify walking directions, such as a list structure in Figure 3. A description of spatial anchor corresponds to an ellipse and spatial relationship description corresponds to a rectangle in Figure 3. Figure 4 illustrates the image of geocoding a walking direc-tion into spatial database. Constructing a walking direction can be compared to sticking of pins and stretching of a thread between pins on a map. Using this simple model, we define the formal statement of walking directions.
3.3 Grammar of Formal Route Statement (FRS)Formal statements are necessary for computers to indirectly deal with walking directions. On the assumption that all of walking directions can be expressed with nodes and links, we propose Formal Route Statement (FRS) to represent and process walking di-rections. FRS also works as a query language for sidewalk network databases. Using FRS, a walking direction is represented as a sub-graph of a directed graph of sidewalk networks (Figure 5). Figure 6 shows the grammar of FRS. Generalization tables are indispensable for converting various casual descriptions into regular ones, one of which is FRS (Table 1). A use case of the generalization tables is to make an instance of the spatial relationship as a value of the attribute “link.connect” in Figure 6. The attribute “link.connect” plays an important role to find a spatial object when a name referring to the next place is omitted.
FRS ::= sa_desc(0)(:sr_desc(i):sa_desc(i+1))* [i={0,...,n}];sa_desc(i) ::= node(i).node_attribute_list
node_attribute_list ::= none | node_attribute_value (&node_attribute_value)*Node_attibute_value ::= node_attribute = value
node_attribute ::= id | name | coordinate | class | statusvalue ::= numerical_value | stirng_value | url | status_values | connect_values
status_values ::= start | end | viaconnect_values::= straight | right | left
sr_desc(i) ::= link(i).link_attribute_listlink_attribute_list ::= none | link_attribute_value (&link_attribute_value)*
link_attibute_value ::= link_attribute = value link_attribute ::= id | start_node(id) | end_node(id) | direction | connect | distance
Fig. 6. Grammar of Formal Route Statement
sr_desc(0)sa_desc(0) sa_desc(1) sa_desc(2)
= Spatial Anchor Description
= Spatial Relationship Description
….sr_desc(1) sr_desc(2)
Fig. 3. Image of model for walking directions
よりexit from
JR渋谷駅東口(JR Shibuya Station
east exit)
宮益坂Miyamasu slope street
を上って約5分go up for 5 minutes
左手on your left
お店the shop
omitted
JR渋谷駅東口より,宮益坂を上って約5分,左手のお店You exit from JR Shibuya Station east exit and go up Miyamasu Slope Street for 5 minutes, and then the shop is on your left.
Fig. 4. Image of geocoding a walking direction with a spatial database through the intermediary of simple model
Fig. 5. Sub-graph G which is the result of FRS(route_desc), where route_desc is a text string
of a walking direction.
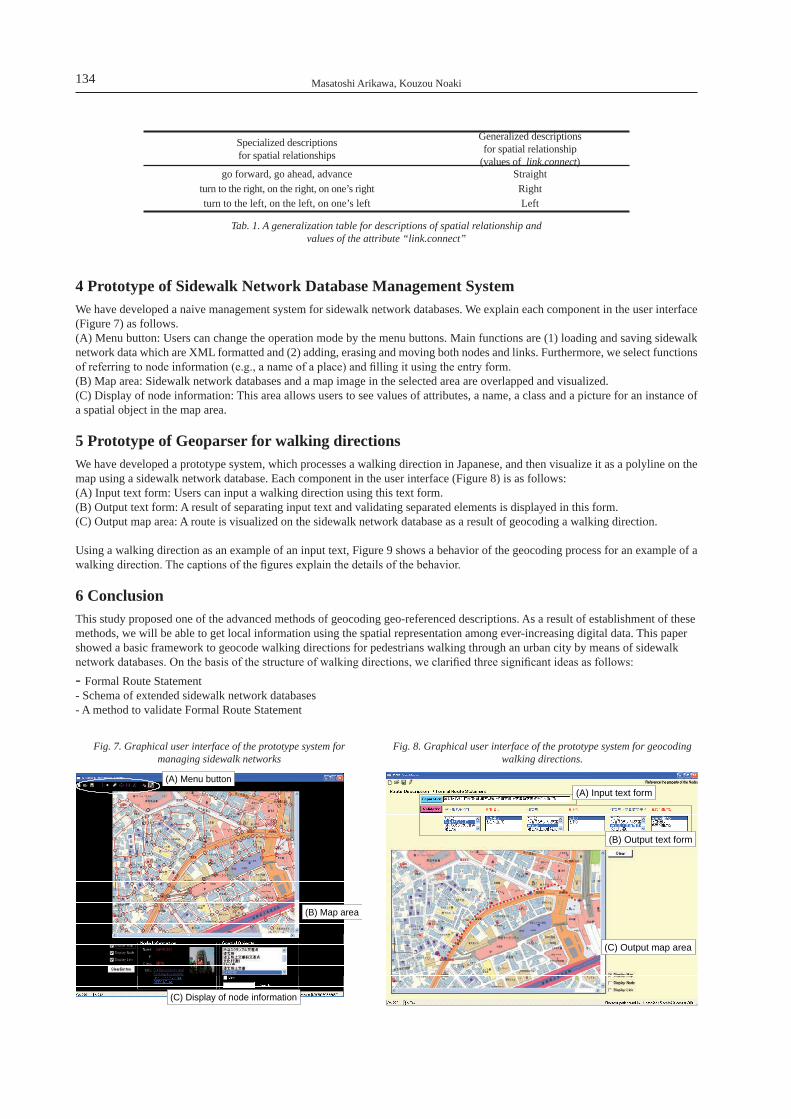
Masatoshi Arikawa, Kouzou Noaki134
Specialized descriptions for spatial relationships
Generalized descriptions for spatial relationship
(values of link.connect)go forward, go ahead, advance Straight
turn to the right, on the right, on one’s right Rightturn to the left, on the left, on one’s left Left
Tab. 1. A generalization table for descriptions of spatial relationship and values of the attribute “link.connect”
4 Prototype of Sidewalk Network Database Management System We have developed a naive management system for sidewalk network databases. We explain each component in the user interface (Figure 7) as follows.(A) Menu button: Users can change the operation mode by the menu buttons. Main functions are (1) loading and saving sidewalk network data which are XML formatted and (2) adding, erasing and moving both nodes and links. Furthermore, we select functions of referring to node information (e.g., a name of a place) and filling it using the entry form.(B) Map area: Sidewalk network databases and a map image in the selected area are overlapped and visualized. (C) Display of node information: This area allows users to see values of attributes, a name, a class and a picture for an instance of a spatial object in the map area.
5 Prototype of Geoparser for walking directionsWe have developed a prototype system, which processes a walking direction in Japanese, and then visualize it as a polyline on the map using a sidewalk network database. Each component in the user interface (Figure 8) is as follows:(A) Input text form: Users can input a walking direction using this text form.(B) Output text form: A result of separating input text and validating separated elements is displayed in this form.(C) Output map area: A route is visualized on the sidewalk network database as a result of geocoding a walking direction.
Using a walking direction as an example of an input text, Figure 9 shows a behavior of the geocoding process for an example of a walking direction. The captions of the figures explain the details of the behavior.
6 ConclusionThis study proposed one of the advanced methods of geocoding geo-referenced descriptions. As a result of establishment of these methods, we will be able to get local information using the spatial representation among ever-increasing digital data. This paper showed a basic framework to geocode walking directions for pedestrians walking through an urban city by means of sidewalk network databases. On the basis of the structure of walking directions, we clarified three significant ideas as follows: - Formal Route Statement- Schema of extended sidewalk network databases- A method to validate Formal Route Statement
(A) Menu button
(C) Display of node information
(B) Map area
Fig. 7. Graphical user interface of the prototype system for managing sidewalk networks
(A) Input text form
(B) Output text form
(C) Output map area
Fig. 8. Graphical user interface of the prototype system for geocoding walking directions.

Geocoding walking directions using Sidewalk Network Databases 135
We aim for the realization of the robust system. For example, the system corrects route descriptions when invalid route descriptions are detected. In addition, there is a problem about ambiguity of natural language. In that case, multiple solutions, which are pos-sible routes to a destination, should be ranked by some criteria of quality of the geocoding results.
7 AcknowledgementsThis research was supported in part by Grant-in-aid for Scien-tific Research on Priority Area “Informatics Studies for the Foun-dation of IT Evolution” by the Ministry of Education, Culture, Sports, Science and Technology of Japan. We would like to thank Dr. Takeshi Sagara and Mr. Hideyuki Fujita for their useful ad-vices and comments.
8 References[1] Masatoshi Arikawa, Takeshi Sagara, Koji Okamura, “Spatial Media Fusion Project,” Proceedings of 2000 Kyoto International Conference, on
Digital Libraries: Research and Practice, pp.75-82, 2000.[2] Shobunsha Publications Inc.,<http://www.mapple.co.jp/>.[3] EZnaviwalk, KDDI au, <http://www.au.kddi.com/>.[4] Annette Herskovits, “Language and Spatial Cognition,” Cambridge University Press, Melbourne, 1986.[5] Makoto Nagao, Satoshi Sato, Sadao Kurahashi, Tatsuhiko Tsunoda, “Natural Language Processing (in Japanese),” Makoto Nagao (edit), Iwa-
nami Shoten, Tokyo, 1996.[6] Japanese Morphological Analysis System ChaSen, <http://chasen.aist-nara.ac.jp/hiki/ChaSen/>.
Fig. 9(a). The prototype system searches the shortest path (the dashed line) from the node matched sa_desc(0) to the nearest one of the nodes
making up sa_desc(1). sr_desc(0) is also matched with the sidewalk network database. This figure shows the result of processing sa_desc(0)
+ sr_desc(0) + sa_desc(1).
Fig. 9(b). The system searches the shortest path to the nearest one of nodes matched with sa_desc(2). This figure shows the result of processing sa_desc(0) + sr_desc(0) + sa_desc(1) + sr_desc(1) +
sa_desc(2).
Fig. 9(c). The end node is deduced from the description of sr_desc(2) and the direction of the last matched link. This figure shows the result of processing sa_desc(0) + sr_desc(0) + sa_desc(1) + sr_desc(1) +
sa_desc(2) + sr_desc(2).
Dancing without gravity. A story of interface design
Ken Francis, Peter Williams
1 introductionAn interface must perform just one function: to serve as the mediator between the user’s wishes and the abilities of the machine. Good interface design has this goal as its beginning, but moves forward to advance the properties of ease, logic, elegance, consis-tency, wit and beauty in its form.The digital cartographic commodity as ideal map vernacular proposes an extension of the possibility of the paper map. This is only realizable if we remove the map from allegory and free it from metaphor. Interface metaphors have become redundant and clumsy, dampening the experience of “using the map”. As much as possible, the map must serve as the means by which the user explores the information. It is through this confrontation with the programmatic agenda that a rich form/content dialectic can be engendered.These are the understandings that served as the starting point for problematizing the design of interfaces used in a decision-mak-ing environment developed in the Earth Sciences Sector of Natural Resources Canada and the Canadian Geomatics industry. This paper will discuss these approaches.The Scalable Vector Graphics (SVG) format is most suitable to create dynamic web-based visualizations in the Internet environ-ment. The functionality of SVG for interface development and display of geo-spatial information is based on user selected attri-butes, from distributed, web-enabled, data services will be examined.The illustrations selected intend to explore interface design that uses Scalable Vector Graphics in an application that presents urban land use data.
2 positioning_our_workA thoughtfully crafted map offers information as a complex of understandings rather than a monologue of absolute facts. The possi-bility of the map to be an enriched field of user exploration, inquiry and intent depends entirely on thoughtful, carefully considered design that seeks to maximize the variability of possible understandings. When fully realized, the interface is an arena to hybrid-ize data, interface and information display. It invites the user to work toward a trans-figurative position, to find new contexts and ways of mixing the imagined and the hypothesized. It is dependent upon creating a space for agency rather than one of unilateral transference, upon staging the information for consideration rather than enclosing it, upon the production of variability rather than the illusory pursuit of received truth.Our work moves outward from an Activity-Centered Design approach where activities are comprised of tasks which are comprised of operations http://www.jnd.org/dn.mss/human-centered_desig.html). We relied on its focus on “work to be accomplished with the interface” and its hierarchical logic as a way to ground the way we problematized each emerging design question, rather than pin-ning our work on it as a totalizing theory. Also, working from the idea of Activity-Centered Design displaces attempts to produce a privileged user group. The interface opens up many points of access to maintain a universal and democratic position.This paper is about how we have engaged with the design questions presented to us, and the work we have produced. The solutions at which we have arrived are not singularly useful to any one application. In fact, our work has been energized by the experience of so many other designers. Little of what is here is ours alone; we have learned from the www, and an endless list of interface en-vironments both material and computational. We offer this paper as our design statement and hope our experience will be useful to other map designers and interface designers as they search for solutions to thier own design questions.
3 dancing_without_gravityDesign for the Ottawa Land Inventory Map module a grew out of a loosely expressed and often shifting list of needs. Scope of work, audience, functions, land use types to be included all were redefined throughout the life cycle of the design. This necessarily meant we had to adopt an approach that “over shot” any stated goals when formulating our design brief. Although this strategy de-manded greater design output, the output could be edited in ways that could respond to a variety of anticipated needs. Additionally, the strategy forced deeper examinations of possibilities that constitute a record of valuable design research.A constant in our mandate was that we should implement our work through Scaleable Vector Graphics (SVG). SVG is an open, vendor neutral, XML (Extensible Markup Language) based vector graphics standard for the depiction of resolution and device

Ken Francis, Peter Williams138
independent two-dimensional vector and raster data. At present SVG is a W3C recommenda-tion (w3c.org). SVG supports animation though start time, duration, and attribute values. It im-plements animation by supporting the modifica-tion of graphic objects colour values, coordinate values, and transformation values. It also per-mits motion of an object along a path.
4 our_approachTo design an interface for the Ottawa Land Use Inventory Map we found that we needed to ex-tend our consideration beyond the singular pro-gram of the map to the relationships presented in the wider interactive field. This lead to an in-vestigation of the information space as a formal typology. By problematizing the information space as a formal typology, elemental struc-tures are free to assume distinct yet co-ordi-nated roles. These roles are articulated through a precise graphic vocabulary which is directly responsive to user events.Within the interactive field, we located project-ed points of coincidence, inertia, likeness/dif-
ference, and imagined how to maximize these potentials. The strategy was one of anticipation of to-be-delivered information and insertion of interface/information programmes. We adopted a formal critique of programme intent. This allowed the graphic inter-ventions that came to define the interface/information space to respond to generally defined requirements. Parallels were recog-nized between the dialogue of use/intent and graphic response/shape, and the already established dialogue of programme insertion and orientation to site. Information display and information manipulation have been collapsed into simple graphic gestures that will accept a user’s gaze, focus and consideration. This seemlessness optimizes exploration and understanding of the information.We considered ways to create integration of various indicators—in maps, graphs, text and image—while maintaining a graphic signature for each theme. Identifying graphic signatures assures the user still can clearly read the individual themes even while in-formation from two or more sources is juxtaposed in graphing displays. The work was informed by digital form and space, merging of information and display typologies, linked action/reaction interface repetoires and a search for gestural operations.We developed the work as a cohesive, understandable product that mirrors the intentions of the user rather than that of the author. Important to achieving this is the effort to produce neutral space. Without deconstructing an already turbulent discourse, an ex-amination of the idea of spatial neutrality informed an intention that was an underpinning of how the work was art-directed. The aesthetic propensities of the art-director will surface; it would be disingenuous to suggest differently. However, the construction of the “neutral field” is used as a strategy to open up the possibilities within the information space by staging the information for consideration rather than enclosing it. This provides the best possibility for user intention to direct how the work will unfold.

Dancing without gravity. A story of interface design 139
5 the_workBasic graphic forms were explored in studies for a text menu window design, as it is the ubiquitous frame for all information in our interface design.study i — A coloured bar tops the menu window. This stabi-lizes the form and becomes user affordance for dragging and repositioning the window. Angled corners adds tension and vi-sual interest to the form.study ii — The coloured bar has been reoriented and now pre-cedes the menu items, providing a directional field for cursor movement.study iii — A textured dragger bar expresses user affordance more clearly. “Collapse” and “close” controls are introduced. Now placed vertically, the colour bar accepts user feedback/cursor tracker responsibilities, making it a focus of user inter-activity for the window.study iv — The dragger bar is given a less heavy-handed tex-ture (borrowed from Sun JAVA’s flush 3D style). The “col-lapse” and “close” controls are redrawn to reflect this new sub-tlety. A scroll bar is added, with an “expand window” control at the bottom. Cursor tracking migrates to typography, with colour delivering the feedback message. This cleans the colour bar of the visually intense tracking display. The result is a greater focus on selected items, with less visual clutter.study v — The tracking devices of the vertical colour bar have been extruded into ribbon forms ex-tending across the type field. Tracking and selection functions are signaled through colour shifts of the ribbon with a reserved out menu element reinforcing the visual cue of the selected state.
6 art_directionThe colour story has been taken out of the palette of 216 web safe colours and is maintained through-out the work. This insures cross-platform consistency, although with current monitor colour depth and resolution, that requirement is vestigial. It is an art-director imposed restraint to build a tightly composed working vocabulary. Typography is executed with Unibody-8 (underware.nl), a type fam-ily designed specifically for screen use and to maintain it’s integrity on both Mac and PC operating systems. As it contains roman, italic, bold, black, and small caps fonts, it is possible to set type for every need in the interface. These carefully applied restraints collects all interface elements in easily recognized relationships that remove former vernaculars while celebrating new graphic languages.
7 map_designA map of Canada serves as the starting point for a user’s examination of the urban land use indica-tors. An oblique orthographic projection was selected for the base map. This reduces the northern land mass as it curves over the horizon, and focuses the user’s attention on the cities in the southern portion of the country. It is a dynamic effect with a sense of depth and movement. Land mass and water bodies are rendered in an intentionally muted palette of neutral mid-tones and visual clutter is minimized by removing shore lines. In this context, boundaries are useful references but not important information, so they have become undifferentiated white lines to merge with the negative space. The base recedes allow-ing the point symbols, typography and indicator numbers to be read without competition. Great care was taken in the execution of typography for this map. A subtractive strategy was used in this design to ensure maximum clarity of type and indicator numbers.A window listing indicators and available years of Canada Land Inventory Land Use data is the entry and circulation space for user investigation. From here, indicators may be selected to be shown, on roll over, on a city map of Canada, as well as be-ing graphed as histograms. The histograms and numeric lists of indicator values, are dynamically generated SVG data views. Indicator values are organized in a cities list window which can be collapsed and closed, letting the user control a potentially visually intense display. By respecting human cognituve pro-cesses, complexity is elegantly managed through this strategy of window control while continuing to reveal the structure of how the data are orgainized.
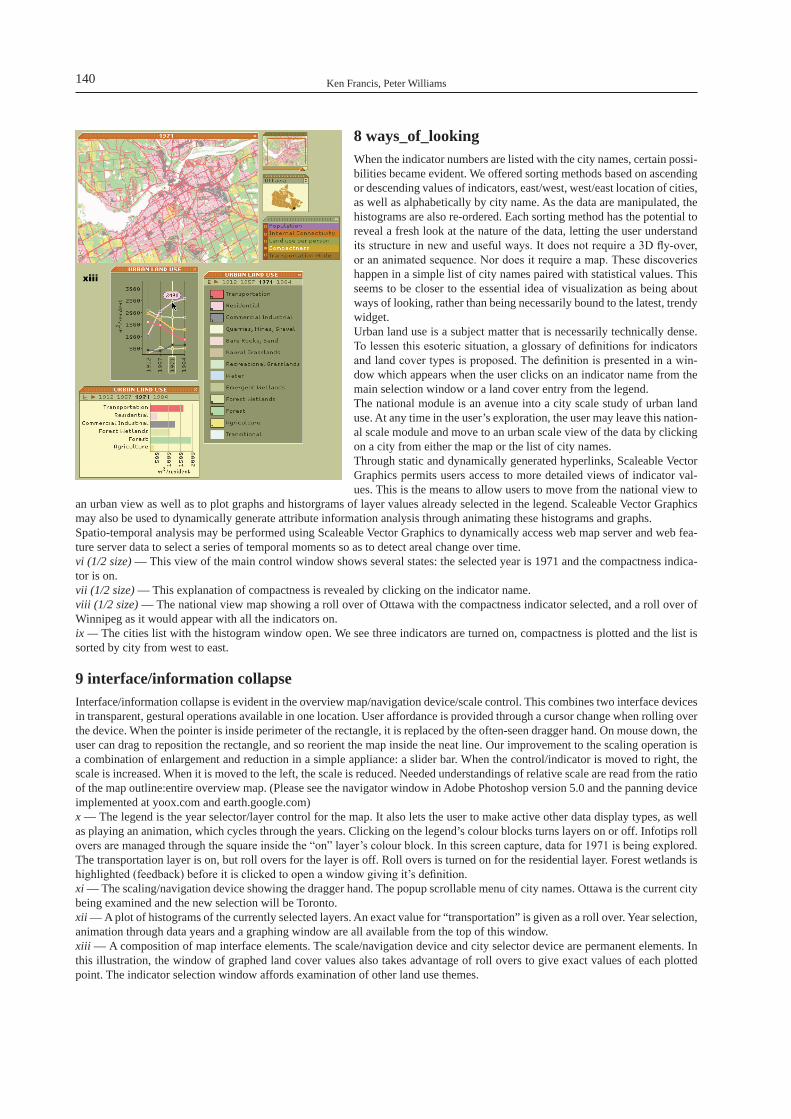
Ken Francis, Peter Williams140
8 ways_of_lookingWhen the indicator numbers are listed with the city names, certain possi-bilities became evident. We offered sorting methods based on ascending or descending values of indicators, east/west, west/east location of cities, as well as alphabetically by city name. As the data are manipulated, the histograms are also re-ordered. Each sorting method has the potential to reveal a fresh look at the nature of the data, letting the user understand its structure in new and useful ways. It does not require a 3D fly-over, or an animated sequence. Nor does it require a map. These discoveries happen in a simple list of city names paired with statistical values. This seems to be closer to the essential idea of visualization as being about ways of looking, rather than being necessarily bound to the latest, trendy widget.Urban land use is a subject matter that is necessarily technically dense. To lessen this esoteric situation, a glossary of definitions for indicators and land cover types is proposed. The definition is presented in a win-dow which appears when the user clicks on an indicator name from the main selection window or a land cover entry from the legend.The national module is an avenue into a city scale study of urban land use. At any time in the user’s exploration, the user may leave this nation-al scale module and move to an urban scale view of the data by clicking on a city from either the map or the list of city names.Through static and dynamically generated hyperlinks, Scaleable Vector Graphics permits users access to more detailed views of indicator val-ues. This is the means to allow users to move from the national view to
an urban view as well as to plot graphs and historgrams of layer values already selected in the legend. Scaleable Vector Graphics may also be used to dynamically generate attribute information analysis through animating these histograms and graphs.Spatio-temporal analysis may be performed using Scaleable Vector Graphics to dynamically access web map server and web fea-ture server data to select a series of temporal moments so as to detect areal change over time.vi (1/2 size) — This view of the main control window shows several states: the selected year is 1971 and the compactness indica-tor is on.vii (1/2 size) — This explanation of compactness is revealed by clicking on the indicator name.viii (1/2 size) — The national view map showing a roll over of Ottawa with the compactness indicator selected, and a roll over of Winnipeg as it would appear with all the indicators on.ix — The cities list with the histogram window open. We see three indicators are turned on, compactness is plotted and the list is sorted by city from west to east.
9 interface/information collapseInterface/information collapse is evident in the overview map/navigation device/scale control. This combines two interface devices in transparent, gestural operations available in one location. User affordance is provided through a cursor change when rolling over the device. When the pointer is inside perimeter of the rectangle, it is replaced by the often-seen dragger hand. On mouse down, the user can drag to reposition the rectangle, and so reorient the map inside the neat line. Our improvement to the scaling operation is a combination of enlargement and reduction in a simple appliance: a slider bar. When the control/indicator is moved to right, the scale is increased. When it is moved to the left, the scale is reduced. Needed understandings of relative scale are read from the ratio of the map outline:entire overview map. (Please see the navigator window in Adobe Photoshop version 5.0 and the panning device implemented at yoox.com and earth.google.com)x — The legend is the year selector/layer control for the map. It also lets the user to make active other data display types, as well as playing an animation, which cycles through the years. Clicking on the legend’s colour blocks turns layers on or off. Infotips roll overs are managed through the square inside the “on” layer’s colour block. In this screen capture, data for 1971 is being explored. The transportation layer is on, but roll overs for the layer is off. Roll overs is turned on for the residential layer. Forest wetlands is highlighted (feedback) before it is clicked to open a window giving it’s definition.xi — The scaling/navigation device showing the dragger hand. The popup scrollable menu of city names. Ottawa is the current city being examined and the new selection will be Toronto.xii — A plot of histograms of the currently selected layers. An exact value for “transportation” is given as a roll over. Year selection, animation through data years and a graphing window are all available from the top of this window.xiii — A composition of map interface elements. The scale/navigation device and city selector device are permanent elements. In this illustration, the window of graphed land cover values also takes advantage of roll overs to give exact values of each plotted point. The indicator selection window affords examination of other land use themes.

Dancing without gravity. A story of interface design 141
A small map of Canada is paired with a popup menu of city names. This provides a means for the user to select a new city or to return to the national view of cities and indicators.Function/information coincidence is best illustrated in the legend window. Roll over control, legend, map item on/off control are collected in one collapsible window. The window-as-interface is further developed by including “year selection” and “show histo-gram” controls at top. The legend’s essential role in traditional map design (that of typological clarifier) is taken up and advanced in our design.User intention is carried across interface/information devices. Those layers “turned on” in the legend window will be shown in the histogram and graph windows. Standard SVG roll over functions are explored in these graphing windows. An overview and general trends are available to the user from the graphs, with exact values given when the user rolls over a histogram or a graph node.
10 conclusionWhat we set out to accomplish in our work to design this interface give the user a sence of control and understanding. We wanted the user to understand the purposes of the interface and it’s responses to actions. And we want that to translate into the user’s un-derstanding of the information that is available.“Weightless” is an adjetive we kept in mind during this dance. We have placed our focus on the idea of a weightless experience that does not feel like work, but feels like an natural extention of a user’s intensions. This allowed us to substitute simplicity for com-plexity and to propose an interface design that offers ease of use, and thoughtful ways to engage the information.
Evaluating maps for mobile display
Julie Dillemuth
(Shortened version of: Dillemuth, Julie (to appear). Map Design Evaluation for Mobile Display. Cartography and Geographic In-formation Science AutoCarto 2005 Special Issue.)
AbstractDigital maps on mobile devices present new capabilities and challenges that differ from using paper maps in a mobile setting or viewing digital maps on a desktop computer. How people interact with and use such maps is not well understood, yet such knowl-edge is critical for informing cartographic design for mobile devices and contributing to a better understanding of human spatial behavior. This research investigates human-map interaction through a study that evaluated maps on a mobile device used for a field-based, pedestrian navigation task. Map representations at two levels of generalization were compared by analyzing subject perfor-mance in a route-following task, with the maps on a handheld computer used as a navigation aid. Subject time to route completion, accuracy and interaction with the map during the task were measured. Self-report data on spatial ability, familiarity with the area, and map and mobile device experience were also considered. Significant differences between the representation types carry impli-cations for map design for small, mobile displays and identify factors that affect the use of maps while moving.
1 IntroductionThe power of cartography lies in the ability to reduce a map’s complexity to represent only the information relevant to the map user. But for a digital map on a small mobile device, what is the critical amount of information? Further, with the constraints of the display size and the capability of adding or removing information for different situations, what type of information do people rely upon to orient themselves and navigate in a mobile context? Does that critical information change when the support of location based services (LBS) is incorporated? Such questions must be answered in order to determine appropriate representations of spatial information for mobile devices. This research begins to address these issues through a field-based study that tested user interaction with variations of a map representation displayed on a handheld mobile device. Using a map on a mobile device carries implications for mobile map use that are different from those for either static or online maps. A small display window limits the extent and amount of detail that can be represented in a single field of view, but zooming in or out changes those limits. Location information from the global positioning system (GPS) can be incorporated, providing direc-tional cues to the user or automatically orienting a map to the user’s cardinal direction. In addition, maps are traditionally designed to serve a specific purpose – a road map assists a driver with navigation, for example. A mobile map user, however, may be engaged in multiple activities, such as navigation and data collection, which are likely to require different types of representations. Finally, a mobile user’s attention is not fully focused on the map, but divided among a primary activity, monitoring his or her surroundings, and other factors besides interacting with the map.While mobile maps are gaining momentum due to improving technology and the benefits associated with taking the capabilities of geographic information systems (GIS) into the field (Clarke 2004), porting representations from a desktop computer to a handheld device presents challenges to users. Test implementations of mobile GIS on handheld computers in the field cite the small display as a major difficulty for viewing and working with maps (U.S. Census Bureau 2003; Tsou 2004). Images and interfaces that are effec-tive for a stationary user paying full attention to his or her desktop monitor are not appropriate for a distracted, mobile user viewing a small display (Clarke 2001). This study complements continuing research on spatial information delivery for mobile devices, and is unique in considering controlled variations of map generalization in a field-based task with a digital map. It is intended as the first part of a series of studies to systematically test carefully controlled variations of representations to determine what makes effective mobile cartography, and why.Dynamic, digital maps are key applications for mobile devices, especially for providing navigation assistance to non-expert users, or assisting scientists and others who work with spatial data in the field. Although commercial products such as in-car navigation systems are already available to consumers, cartographic research has not kept pace with the technology. There are no cartographic design guidelines yet for digital maps, for desktop viewing or otherwise, as there are for traditional paper ones (Meng 2003). There is a growing body of research investigating the variety of spatial information presentation types available for handheld and wear-able mobile devices: visual maps in 2D and 3D, text/audio descriptions, schematic diagrams, ground-view photography or video, or combinations of these (Urquhart et al. 2003 provides an overview of major projects; see Reichenbacher 2004 for a thorough summary). Many of these studies are concerned with how well a navigation system works as a whole and on a technological or usability level, such as which representation type or modality is more effective, rather than trying to determine why one representa-

Julie Dillemuth144
tion method is better in light of how users interact with the information. Map generalization research for small display is faced with the technological challenge associated with the limited screen space of mobile devices, and is driven by the need for automatic methods of creating repre-sentations that can adapt to the user’s context (Ed-wardes et al. 2003; Hampe and Elias 2004; Nivala and Sarjakoski 2003), or can change scales and levels of detail in real-time (Hampe and Sester 2002). One of the primary problems of automatic generalization is devising a way to represent only the information that is relevant to the user at a particular time (Agrawala and Stolte 2001). The question of what that relevant information is remains to be determined.
2 MethodsIn order to investigate user interaction with maps on a mobile display, an experiment was designed to have subjects use a map on a handheld computer to complete a real-world navigation task. This study sought, on one level, to test for differences between maps at two levels of generalization used for the navigation task and, on a broader level, to consider subject behavior with the maps on a mobile device: interaction with the map and the device, patterns of error, and relationship of spatial ability to performance on the task.
2.1 Participants and materialsResearch subjects were 28 students, mostly graduate students, from various departments at the University of California, Santa Bar-bara (UCSB). Fourteen males and fourteen females participated, ages ranging from 19 to 37. Representations starting at the least-generalized end of a representation spectrum were chosen for this study: a photorealistic im-age and a manually-created generalized map (Figure 1). A color aerial photograph at a scale of 1:12,000 was scanned to digital format and used as one display condition. Taken 14 months prior to the study, it portrays the actual environment in terms of detail and color, with no cartographic design applied. The generalized map is a classified and simplified version of the aerial photograph, digitized from the aerial photograph using a GIS. All readily-distinguishable landscape features on the photograph were manually traced, then the polygons were color-coded according to feature type: buildings, sidewalks, grass and other vegetation, trees, paved roads, sand and water. The objective was to evaluate two representations that were equivalent in feature information, with the only difference in the level of generalization being a reduction of detail and classification of features. The use of the aerial photograph for this study represents a baseline “map”, or even a worst-case scenario in terms of map design, since there has been no design applied. In testing the photograph against a generalized version, the differences are attributable to the level of generalization, rather than to labels or symbology that would typically be present in a map created by a cartographer. In terms of realism as a representation style, it has been argued (Bishop 1994) that the general public is more comfortable viewing realistic maps than generalized maps, since interpreting a realistic scene is more intuitive than interpreting an abstract scene, especially to an inexperienced map user. However, for use in a mobile, navigational context, the high level of detail in the aerial photograph carries the potential to overwhelm the user or make the map impossible to read on a small display. A generalized map may reduce cognitive load in terms of the user visually processing the image, but reconciling the abstract representation to the real environment may introduce another burden (Bishop 1994). From a practical-application perspective, in circumstances such as military or emergency response operations aerial photography or satellite imagery may be the best or only source of spatial information. For such time-critical situations, it is important to know how well an aerial photograph or satellite image can be used as a map. It should be noted that no location information appeared on the map. This first study was concerned with how subjects performed with just the map and the route, requiring subjects to maintain their location themselves. An important follow-up study will be to replicate the experiment with GPS location information in order to understand the effects of such assistance.
2.2 TaskThe experimental task entailed walking along a route displayed on the map on a tablet PC, using the map as a navigation aid. Subjects were instructed to complete the route as accurately as possible, walking at their normal pace. Subjects did the task with both display conditions (Figure 1), following a different route each time. Each route was the same length, 0.74 km, contained the same number of turns (19), and covered similar-sized, non-overlapping areas of the UCSB campus. Routes and map order were systematically varied among participants to avoid confounds from any differences in the two routes or from practice effects. Prior to starting the task, subjects received training with the tablet PC and completed short practice routes with each map type, to get familiar with the interface, display and task instructions. The navigation task was designed so that subjects would need to interact
(a) (b)Fig. 1: (a) generalized map display with route 1, (b) aerial photograph display
with route 2
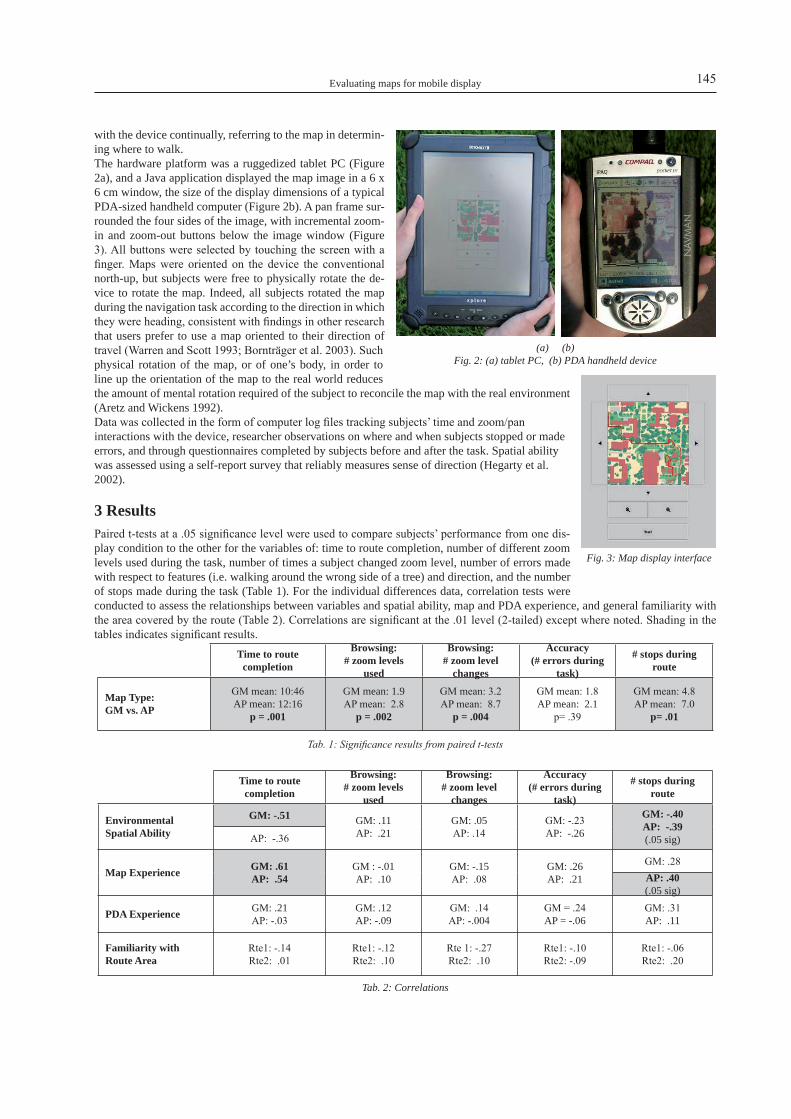
Evaluating maps for mobile display 145
with the device continually, referring to the map in determin-ing where to walk.The hardware platform was a ruggedized tablet PC (Figure 2a), and a Java application displayed the map image in a 6 x 6 cm window, the size of the display dimensions of a typical PDA-sized handheld computer (Figure 2b). A pan frame sur-rounded the four sides of the image, with incremental zoom-in and zoom-out buttons below the image window (Figure 3). All buttons were selected by touching the screen with a finger. Maps were oriented on the device the conventional north-up, but subjects were free to physically rotate the de-vice to rotate the map. Indeed, all subjects rotated the map during the navigation task according to the direction in which they were heading, consistent with findings in other research that users prefer to use a map oriented to their direction of travel (Warren and Scott 1993; Bornträger et al. 2003). Such physical rotation of the map, or of one’s body, in order to line up the orientation of the map to the real world reduces the amount of mental rotation required of the subject to reconcile the map with the real environment (Aretz and Wickens 1992). Data was collected in the form of computer log files tracking subjects’ time and zoom/pan interactions with the device, researcher observations on where and when subjects stopped or made errors, and through questionnaires completed by subjects before and after the task. Spatial ability was assessed using a self-report survey that reliably measures sense of direction (Hegarty et al. 2002).
3 ResultsPaired t-tests at a .05 significance level were used to compare subjects’ performance from one dis-play condition to the other for the variables of: time to route completion, number of different zoom levels used during the task, number of times a subject changed zoom level, number of errors made with respect to features (i.e. walking around the wrong side of a tree) and direction, and the number of stops made during the task (Table 1). For the individual differences data, correlation tests were conducted to assess the relationships between variables and spatial ability, map and PDA experience, and general familiarity with the area covered by the route (Table 2). Correlations are significant at the .01 level (2-tailed) except where noted. Shading in the tables indicates significant results.
Time to route completion
Browsing:# zoom levels
used
Browsing:# zoom level
changes
Accuracy(# errors during
task)
# stops during route
Map Type:GM vs. AP
GM mean: 10:46AP mean: 12:16
p = .001
GM mean: 1.9AP mean: 2.8
p = .002
GM mean: 3.2AP mean: 8.7
p = .004
GM mean: 1.8AP mean: 2.1
p= .39
GM mean: 4.8AP mean: 7.0
p= .01
Tab. 1: Significance results from paired t-tests
Time to route
completion
Browsing:# zoom levels
used
Browsing:# zoom level
changes
Accuracy(# errors during
task)
# stops during route
Environmental Spatial Ability
GM: -.51 GM: .11AP: .21
GM: .05AP: .14
GM: -.23AP: -.26
GM: -.40AP: -.39(.05 sig)AP: -.36
Map Experience GM: .61AP: .54
GM : -.01AP: .10
GM: -.15AP: .08
GM: .26AP: .21
GM: .28AP: .40(.05 sig)
PDA Experience GM: .21AP: -.03
GM: .12AP: -.09
GM: .14AP: -.004
GM = .24AP = -.06
GM: .31AP: .11
Familiarity with Route Area
Rte1: -.14Rte2: .01
Rte1: -.12Rte2: .10
Rte 1: -.27Rte2: .10
Rte1: -.10Rte2: -.09
Rte1: -.06Rte2: .20
Tab. 2: Correlations
(a) (b)Fig. 2: (a) tablet PC, (b) PDA handheld device
Fig. 3: Map display interface
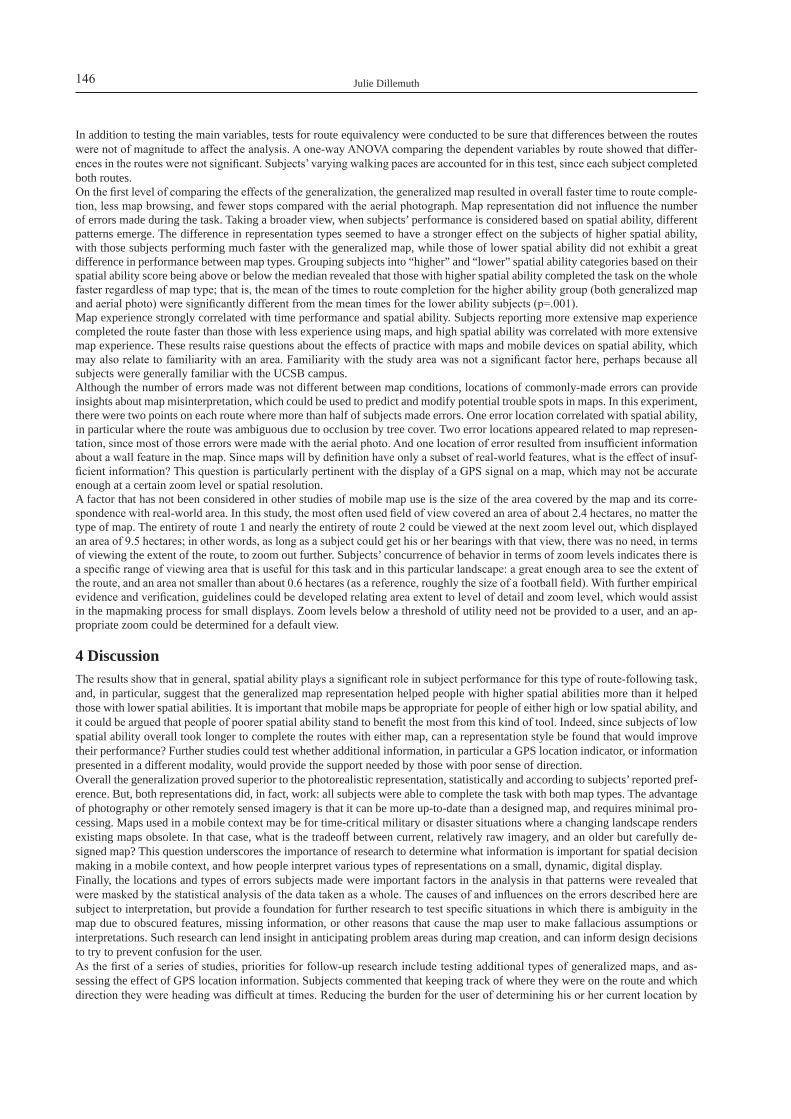
Julie Dillemuth146
In addition to testing the main variables, tests for route equivalency were conducted to be sure that differences between the routes were not of magnitude to affect the analysis. A one-way ANOVA comparing the dependent variables by route showed that differ-ences in the routes were not significant. Subjects’ varying walking paces are accounted for in this test, since each subject completed both routes. On the first level of comparing the effects of the generalization, the generalized map resulted in overall faster time to route comple-tion, less map browsing, and fewer stops compared with the aerial photograph. Map representation did not influence the number of errors made during the task. Taking a broader view, when subjects’ performance is considered based on spatial ability, different patterns emerge. The difference in representation types seemed to have a stronger effect on the subjects of higher spatial ability, with those subjects performing much faster with the generalized map, while those of lower spatial ability did not exhibit a great difference in performance between map types. Grouping subjects into “higher” and “lower” spatial ability categories based on their spatial ability score being above or below the median revealed that those with higher spatial ability completed the task on the whole faster regardless of map type; that is, the mean of the times to route completion for the higher ability group (both generalized map and aerial photo) were significantly different from the mean times for the lower ability subjects (p=.001).Map experience strongly correlated with time performance and spatial ability. Subjects reporting more extensive map experience completed the route faster than those with less experience using maps, and high spatial ability was correlated with more extensive map experience. These results raise questions about the effects of practice with maps and mobile devices on spatial ability, which may also relate to familiarity with an area. Familiarity with the study area was not a significant factor here, perhaps because all subjects were generally familiar with the UCSB campus.Although the number of errors made was not different between map conditions, locations of commonly-made errors can provide insights about map misinterpretation, which could be used to predict and modify potential trouble spots in maps. In this experiment, there were two points on each route where more than half of subjects made errors. One error location correlated with spatial ability, in particular where the route was ambiguous due to occlusion by tree cover. Two error locations appeared related to map represen-tation, since most of those errors were made with the aerial photo. And one location of error resulted from insufficient information about a wall feature in the map. Since maps will by definition have only a subset of real-world features, what is the effect of insuf-ficient information? This question is particularly pertinent with the display of a GPS signal on a map, which may not be accurate enough at a certain zoom level or spatial resolution. A factor that has not been considered in other studies of mobile map use is the size of the area covered by the map and its corre-spondence with real-world area. In this study, the most often used field of view covered an area of about 2.4 hectares, no matter the type of map. The entirety of route 1 and nearly the entirety of route 2 could be viewed at the next zoom level out, which displayed an area of 9.5 hectares; in other words, as long as a subject could get his or her bearings with that view, there was no need, in terms of viewing the extent of the route, to zoom out further. Subjects’ concurrence of behavior in terms of zoom levels indicates there is a specific range of viewing area that is useful for this task and in this particular landscape: a great enough area to see the extent of the route, and an area not smaller than about 0.6 hectares (as a reference, roughly the size of a football field). With further empirical evidence and verification, guidelines could be developed relating area extent to level of detail and zoom level, which would assist in the mapmaking process for small displays. Zoom levels below a threshold of utility need not be provided to a user, and an ap-propriate zoom could be determined for a default view.
4 DiscussionThe results show that in general, spatial ability plays a significant role in subject performance for this type of route-following task, and, in particular, suggest that the generalized map representation helped people with higher spatial abilities more than it helped those with lower spatial abilities. It is important that mobile maps be appropriate for people of either high or low spatial ability, and it could be argued that people of poorer spatial ability stand to benefit the most from this kind of tool. Indeed, since subjects of low spatial ability overall took longer to complete the routes with either map, can a representation style be found that would improve their performance? Further studies could test whether additional information, in particular a GPS location indicator, or information presented in a different modality, would provide the support needed by those with poor sense of direction.Overall the generalization proved superior to the photorealistic representation, statistically and according to subjects’ reported pref-erence. But, both representations did, in fact, work: all subjects were able to complete the task with both map types. The advantage of photography or other remotely sensed imagery is that it can be more up-to-date than a designed map, and requires minimal pro-cessing. Maps used in a mobile context may be for time-critical military or disaster situations where a changing landscape renders existing maps obsolete. In that case, what is the tradeoff between current, relatively raw imagery, and an older but carefully de-signed map? This question underscores the importance of research to determine what information is important for spatial decision making in a mobile context, and how people interpret various types of representations on a small, dynamic, digital display. Finally, the locations and types of errors subjects made were important factors in the analysis in that patterns were revealed that were masked by the statistical analysis of the data taken as a whole. The causes of and influences on the errors described here are subject to interpretation, but provide a foundation for further research to test specific situations in which there is ambiguity in the map due to obscured features, missing information, or other reasons that cause the map user to make fallacious assumptions or interpretations. Such research can lend insight in anticipating problem areas during map creation, and can inform design decisions to try to prevent confusion for the user.As the first of a series of studies, priorities for follow-up research include testing additional types of generalized maps, and as-sessing the effect of GPS location information. Subjects commented that keeping track of where they were on the route and which direction they were heading was difficult at times. Reducing the burden for the user of determining his or her current location by
Evaluating maps for mobile display 147
incorporating GPS information supports more effective movement through an environment (Suomela et al. 2003). In that case, what bearing does location information have on the map representation? Can the map then be generalized to a minimalist schematic, or do users still need a certain amount of detail for context? How much detail? The results here are specific to the type of environment of the study area and the activity of route-following, and would likely be different if the experiment were replicated in a different type of landscape, with a different sized study area, and if subjects were finding their way to a destination point rather than following a given route. Systematically considering maps in a variety of contexts is a necessary step towards a more complete understanding of how people interact with maps while mobile. This knowledge will inform generalization techniques, such as in determining just what level of detail is necessary, or to what extent features can be ag-gregated or simplified to fit in the display and still be effective.
5 ConclusionMaps for mobile devices present new and critical issues to cartographers, such as the amount of spatial information that is critical to represent on a small, dynamic display. Understanding how users interact with digital maps while moving, and how the interac-tion varies with different activities or situations is essential for effective mobile cartography. The relatively small variation in level of generalization in this study resulted in significant differences in subjects’ time performance and amount of interaction with the maps. On a broader level, individual differences of spatial ability and map experience were shown to have an influence on subject performance for this route-following activity. Such differences illustrate the need for appropriately designed map representations for mobile devices, and point to the variety of factors involved in using maps in a mobile context. An understanding of how people interact with digital maps while moving will provide insight on why one representation is better than another, and more broadly will contribute to cognitive and cartographic theory.
6 Acknowledgements Aerial photograph used with permission of Pacific Western Aerial Surveys, Santa Barbara, CA. Research supervised by Dr. Keith C. Clarke and Dr. Tobias Höllerer, and supported by the National Science Foundation IGERT Program in Interactive Digital Mul-timedia (Award #DGE-0221713) at University of California, Santa Barbara.
7 ReferencesAgrawala, M., and C. Stolte. 2001. Rendering Effective Route Maps: Improving Usability Through Generalization. In: Proc. of the 28th Conference
on Computer Graphics and Interactive Techniques, Los Angeles, California. pp. 241-249.Aretz, A. J., and C. D. Wickens. 1992. The Mental Rotation of Map Displays. Human Performance 5 (4):303-328.Bishop, I. 1994. The Role of Visual Realism in Communicating and Understanding Spatial Change and Process. In: H. M. Hearnshaw and D. J.
Unwin (eds), Visualization in Geographical Information Systems, Chichester, West Sussex, England: Wiley & Sons. pp.60-64.Bornträger, C., K. Cheverst, N. Davies, A. Dix, A. Friday, and J. Seitz. 2003. Experiments With Multi-modal Interfaces in a Context-Aware City
Guide. In: L. Chittaro (ed) Mobile HCI 2003, Lecture Notes in Computer Science, Berlin: Springer-Verlag. pp. 116-130.Clarke, K. C. 2001. Cartography in a Mobile Internet Aage. In: Proc. of the 20th International Cartographic Conference, Beijing, China. pp. 1481-
1488.Clarke, K.C. 2004. Mobile Mapping and Geographic Information Systems. Cartography and Geographic Information Science 31 (3):131-136.Edwardes, A., D. Burghardt, M. Bobzien, L. Harrie, L. Lehto, T. Reichenbacher, M. Sester, and R. Weibel. 2003. Map Generalisation Technology:
Addressing the Need for a Common Research Platform. In: Proc. of the 21st International Cartographic Conference, Durban, South Africa. pp. 170-180.
Hampe, M., and B. Elias. 2004. Integrating Topographic Information and Landmarks for Mobile Applications. In: Location Based Services and Telecartography, Proceedings of the Symposium 2004, Geowissenschaftliche Mitteilungen, Nr. 66, TU Wien, 2003. pp. 147-155.
Hampe, M., and M. Sester. 2002. Real-time Integration and Generalization of Spatial Data for Mobile Applications. In: Maps and the Internet 2002, Geowissenschaftliche Mitteilungen, Heft Nr. 60, Schriftenreihe der Studienrichtung Vermessungwesen und Geoinformation Technische: Uni-versität Wien. [http://www.ikg.uni-hannover.de/publikationen/].
Hegarty, M., A. E. Richardson, D. R. Montello, K. Lovelace, and I. Subbiah. 2002. Development of a Self-Report Measure of Environmental Spatial Ability. Intelligence 30:425-447.
Meng, L. 2003. Missing Theories and Methods in Digital Cartography. In: Proc. of the 21st International Cartographic Conference (CDROM), Durban, South Africa.
Nivala, A.-M., and L. T. Sarjakoski. 2003. Need for Context-Aware Topographic Maps in Mobile Devices. In: Proc. of the 9th Scandinavian Re-search Conference on Geographic Information Science (ScanGIS 2003), Espoo, Finland. pp. 15-19.
Reichenbacher, T. 2004. Mobile Cartography - Adaptive Visualisation of Geographic Information on Mobile Devices. PhD Dissertation, Technical University of Munich. [http://tumb1.biblio.tu-muenchen.de/publ/diss/bv/2004/reichenbacher.html], Munich, Germany.
Suomela, R., K. Roimela, and J. Lehikoinen. 2003. The Evolution of Perspective View in Walkmap. Personal and Ubiquitous Computing 7:249-262.
Tsou, M.-H. 2004. Integrated mobile GIS and wireless internet map servers for environmental monitoring and management. Cartography and Geo-graphic Information Science 31 (3): 153-165.
Urquhart, K., W. Cartwright, S. Miller, K. Mitchell, C. Quirion, and P. Benda. 2003. Ensuring Useful Cartographic Representations In Location-Based Services. In: Proc. of the 21st International Cartographic Conference, Durban, South Africa. pp. 2591-2602.
U.S. Census Bureau, A. D.. 2003. Mobile computing device map display enhancement and route navigation test final report. [http://www.census.gov/procur/www/fdca/ library.html].
Warren, D. H., and T. E. Scott. 1993. Map Alignment in Traveling Multisegment Routes. Environment and Behavior 25 (5):643-666.
Concepts for the cartographic visualization of landmarks
Birgit Elias, Volker Paelke, Sascha Kuhnt
AbstractLandmarks are an indispensable part of maps in mobile cartography applications. In this paper we propose a design concept for the visualization of building landmarks in mobile maps. We consider four categories of building landmarks: well-known shops (trade chains), shops referenced by their type, buildings with a specific name or function and buildings described by characteristic visual aspects and examine how each of these groups is most effectively visualized. Possible visualizations differ in their abstraction levels, ranging from photo realistic image presentations, over drawings, sketches and icons to abstract symbols and words. As a guideline to designers we provide a matrix representation of the design space from which possible and recommended presentation styles for each building type can be identified.
1 IntroductionMaps are a very important means to provide spatial knowledge and communicate route information (MacEachren 1995, Kray et al. 2003). Therefore, pedestrian navigation systems rely heavily on maps in addition to positioning and routing functionality to convey wayfinding information to their users. Many recent research projects have developed prototypes for mobile services like GiMoDig, NEXUS, LoL@ and NAVIO. While some have focused on the technical aspects of mobile applications, others have examined the cartographic repercussions of small displays (Radoczky and Gartner 2005, Gartner and Uhlirz 2001). The effective integration of landmarks into such maps has not been examined in detail so far. Research in the field of spatial cognition investigates the structure and elements of wayfinding instructions and provides another important foundation for the design of pedestrian navigation systems. Daniel and Denis (1998) have identified route actions (in-structions about the next movement), orientations and landmarks as the basic components of (verbal) route directions. Further ex-periments have shown that the integration of landmarks into routing instructions enhances the perceived quality of the description (Denis et al. 1999). Tversky and Lee (1999) have compared the basic elements of route maps and route directions and found that both consist of the same underlying structure and semantic content. Consequently, a good pedestrian route map should include the same elements as verbal directions. Landmarks will therefore form an indispensable part of maps in mobile cartography applications and appropriate visualization techniques for their effective pre-sentation must be provided to designers.
2 Related work
2.1 Landmarks in wayfinding instructionsLandmarks are significant physical, built, or culturally defined objects that stand out from their surroundings and therefore help lo-cating the geographic position (Golledge 1999). They are classified as local and global or on-route and off-route landmarks (directly neighboured to the route or in the far distance like a tower or mountain chain). Furthermore, on-route landmarks are positioned between nodes, at decision points (a junction where a navigation decision is to be done) or at potential decision points (where a navigation decision is possible but the route goes straight on) (Lovelace et al. 1999).Currently, landmarks are not part of commercial navigation data sets. In fact, all available route planning and guidance applications use data sets that are tailored to the requirements of car navigation. With the increasing amount of pedestrian navigation applica-tions on mobile devices, the urge to integrate important information for pedestrians rises, but is not incorporated in the databases yet. If information about landmarks were available, it could be integrated into the database and used for wayfinding descriptions.Different research approaches try to develop formal models or extract landmarks automatically from databases and focus on local landmarks at (potential) decision points (Raubal and Winter 2001, Elias 2003, Elias and Brenner 2004). While these approaches currently confine themselves to the investigating of buildings as landmark objects, other topographic objects like parks, bridges, and railroad tracks are also suitable as landmarks and can be extracted from existing databases (Elias and Sester 2002).The integration of landmarks into wayfinding descriptions requires a detailed analysis of the elements and structure of verbal way-finding instructions. Research in this direction has resulted in an ontology for the wayfinding task (Winter 2002). As an alternative,
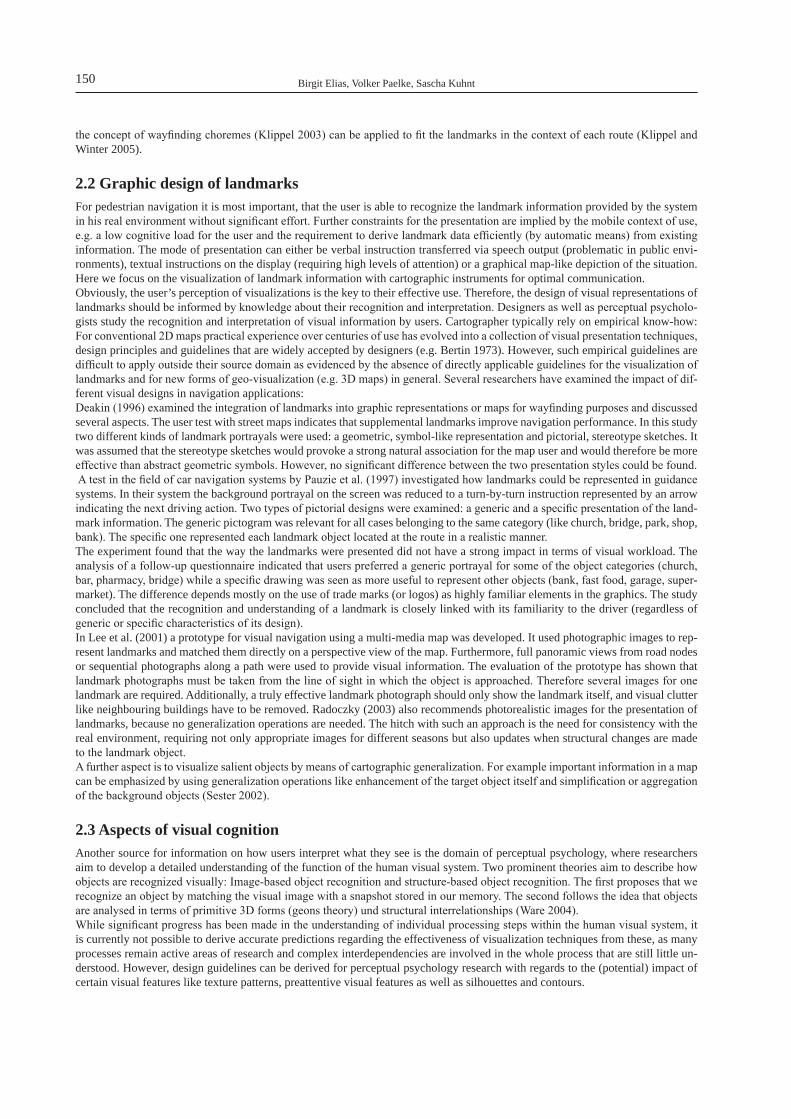
Birgit Elias, Volker Paelke, Sascha Kuhnt150
the concept of wayfinding choremes (Klippel 2003) can be applied to fit the landmarks in the context of each route (Klippel and Winter 2005).
2.2 Graphic design of landmarksFor pedestrian navigation it is most important, that the user is able to recognize the landmark information provided by the system in his real environment without significant effort. Further constraints for the presentation are implied by the mobile context of use, e.g. a low cognitive load for the user and the requirement to derive landmark data efficiently (by automatic means) from existing information. The mode of presentation can either be verbal instruction transferred via speech output (problematic in public envi-ronments), textual instructions on the display (requiring high levels of attention) or a graphical map-like depiction of the situation. Here we focus on the visualization of landmark information with cartographic instruments for optimal communication.Obviously, the user’s perception of visualizations is the key to their effective use. Therefore, the design of visual representations of landmarks should be informed by knowledge about their recognition and interpretation. Designers as well as perceptual psycholo-gists study the recognition and interpretation of visual information by users. Cartographer typically rely on empirical know-how: For conventional 2D maps practical experience over centuries of use has evolved into a collection of visual presentation techniques, design principles and guidelines that are widely accepted by designers (e.g. Bertin 1973). However, such empirical guidelines are difficult to apply outside their source domain as evidenced by the absence of directly applicable guidelines for the visualization of landmarks and for new forms of geo-visualization (e.g. 3D maps) in general. Several researchers have examined the impact of dif-ferent visual designs in navigation applications:Deakin (1996) examined the integration of landmarks into graphic representations or maps for wayfinding purposes and discussed several aspects. The user test with street maps indicates that supplemental landmarks improve navigation performance. In this study two different kinds of landmark portrayals were used: a geometric, symbol-like representation and pictorial, stereotype sketches. It was assumed that the stereotype sketches would provoke a strong natural association for the map user and would therefore be more effective than abstract geometric symbols. However, no significant difference between the two presentation styles could be found. A test in the field of car navigation systems by Pauzie et al. (1997) investigated how landmarks could be represented in guidance systems. In their system the background portrayal on the screen was reduced to a turn-by-turn instruction represented by an arrow indicating the next driving action. Two types of pictorial designs were examined: a generic and a specific presentation of the land-mark information. The generic pictogram was relevant for all cases belonging to the same category (like church, bridge, park, shop, bank). The specific one represented each landmark object located at the route in a realistic manner. The experiment found that the way the landmarks were presented did not have a strong impact in terms of visual workload. The analysis of a follow-up questionnaire indicated that users preferred a generic portrayal for some of the object categories (church, bar, pharmacy, bridge) while a specific drawing was seen as more useful to represent other objects (bank, fast food, garage, super-market). The difference depends mostly on the use of trade marks (or logos) as highly familiar elements in the graphics. The study concluded that the recognition and understanding of a landmark is closely linked with its familiarity to the driver (regardless of generic or specific characteristics of its design).In Lee et al. (2001) a prototype for visual navigation using a multi-media map was developed. It used photographic images to rep-resent landmarks and matched them directly on a perspective view of the map. Furthermore, full panoramic views from road nodes or sequential photographs along a path were used to provide visual information. The evaluation of the prototype has shown that landmark photographs must be taken from the line of sight in which the object is approached. Therefore several images for one landmark are required. Additionally, a truly effective landmark photograph should only show the landmark itself, and visual clutter like neighbouring buildings have to be removed. Radoczky (2003) also recommends photorealistic images for the presentation of landmarks, because no generalization operations are needed. The hitch with such an approach is the need for consistency with the real environment, requiring not only appropriate images for different seasons but also updates when structural changes are made to the landmark object.A further aspect is to visualize salient objects by means of cartographic generalization. For example important information in a map can be emphasized by using generalization operations like enhancement of the target object itself and simplification or aggregation of the background objects (Sester 2002).
2.3 Aspects of visual cognitionAnother source for information on how users interpret what they see is the domain of perceptual psychology, where researchers aim to develop a detailed understanding of the function of the human visual system. Two prominent theories aim to describe how objects are recognized visually: Image-based object recognition and structure-based object recognition. The first proposes that we recognize an object by matching the visual image with a snapshot stored in our memory. The second follows the idea that objects are analysed in terms of primitive 3D forms (geons theory) und structural interrelationships (Ware 2004). While significant progress has been made in the understanding of individual processing steps within the human visual system, it is currently not possible to derive accurate predictions regarding the effectiveness of visualization techniques from these, as many processes remain active areas of research and complex interdependencies are involved in the whole process that are still little un-derstood. However, design guidelines can be derived for perceptual psychology research with regards to the (potential) impact of certain visual features like texture patterns, preattentive visual features as well as silhouettes and contours.

Concepts for the cartographic visualization of landmarks 151
Silhouettes as part of the structure-based object recognition assume an important role in perceiving the structure of objects. Simpli-fied line drawings are often equal to silhouettes and many objects have particular silhouettes that are easily to recognize. One of the consequences of structural theories of perception is that certain simplified views should be easier to read. So a depiction of a hand could be perceived more rapidly in the form of a simplified line drawing than in the form of a photograph. But others studies show that time is needed to perceive details, so simplified line drawings may be most appropriate only when rapid responses are required (Ware 2004).If the necessary information is not perceivable from the silhouette itself, line drawings are the least effective mode of presentation: Ryan and Schwartz (1956) tested the speed of perception of relevant details in different presentation forms. The four principal illus-tration modes analysed were photographs of the object, shaded drawings, line drawings and cartoons (comparable to cartographic generalized depictions: the original figure is distorted to emphasize the essential spatial relationships). The time needed to perceive the detailed structure was measured and it showed that cartoons were the most quickly perceived group and line drawings were the most difficult to perceive. Photograph and shaded drawings were about equivalent and fall somewhere between the others.The adequate presentation of point information should take into account the research of ergonomic guidelines for the design of pictorial information (Bruyas et al. 1998): Basic requirements regarding recognition and understanding of symbolic information demand fast understanding with no ambiguity of graphical representations. Well designed pictorial messages enable quick visual information processing in comparison to textual messages. And because of their compactness pictograms are more efficient than textual information in case of limited surface display. The recognition performance depends on the combination of essential, neu-tral and additional elements in the pictogram: Essential elements are the typical attributes that are necessary to recognize the object at all, but too much unnecessary detail disturbs the quick understanding of a symbol. Whether confusion of the sign with similar objects occurs, depends on the familiarity of the user with the typical attributes of the object. This can be different according to the user’s population, his culture and his belonging to a generation.For the development of appropriate visual presentation techniques for landmarks and corresponding design guidelines this sug-gests an approach that builds on existing design and cartographic expertise and insights from perceptual psychology to explore the options of the design space in a systematic way. The different options for presentation techniques are systematically examined to select promising options and refine the designs that are then evaluated in user studies.
3 Types of landmarks
3.1 Classification of features typesAs part of a master thesis a user questionnaire was conducted in which 20 people were asked to describe two different pedestrian routes in the city of Hanover (Lübke 2004). One of the routes leads from the main train station to the main university building, crossing the inner city centre with shops and pedestrian areas. The other leads from a student resident building to the cafeteria of the university, crossing a residential district of the city. Both routes are about 2 kilometres long. The participants were 10 male and 10 female students of the university that have all lived in Hanover for several years. They were instructed to recall the routes from their mind and to write down the wayfinding instructions for a pedestrian unfamiliar with the area. The routes were given by nam-ing the start and end points of the route. For both routes the descriptions resulted in a number of different route choices, so not all descriptions have the same content.The route descriptions were analysed with regards to the landmarks used. All referenced objects were counted and divided into groups of object types. Here five different groups were distinguished: Buildings, monuments (statues), plazas (like market squares or big traffic junctions), references to public transport (underground stations, bus stops, tram tracks) and others (parks, bridges, pedestrian zones, stairs, cemeteries). The distribution of the objects in the route descriptions is shown in Table 1.
Object Type Route 1 (University District) Route 2 (City Centre)Buildings 20 (50 %) 32 (55 %)Monuments 1 (2,5 %) 6 (10 %)Plazas 3 (7,5 %) 5 (8 %)Public Transport 6 (15 %) 7 (12 %)Other 10 (25 %) 9 (15%)Total 40 (100 %) 59 (100 %)
Tab. 1: Distribution of object types in route descriptions
Despite the fact that the routes differ significantly in their environment (Route 2 leads through the shopping area in the pedestrian zone, Route 1 leads through a typical residential area and the university campus), in both routes about 50 % of the referenced objects are related to buildings. The proportions of the other groups stay the same. It should be kept in mind, that these are only preliminary observations, since only two different routes described by twenty people were examined so no assured statistic state-ment is possible. Based on the previous research on landmark use and backed by these findings we focus on the visualization of buildings as landmarks. Since most navigation aids are used in urban areas, an optimal representation of buildings as landmarks is a central issue.

Birgit Elias, Volker Paelke, Sascha Kuhnt152
3.2 Characteristics of landmarksBuildings can be further divided into groups depending on the function or kind of description of the building in the route instruc-tions. For the purpose of this study we distinguish four, groups (see Table 2). The first group consists of shops and restaurants refer-enced by their trade name (like H&M, Kaufhof, McDonalds), the second group of other businesses is described more general with the type of function (like hotel, pharmacy, hairdresser, butcher). A third category is formed by buildings that are referenced by their general function (library, church, university building or unique name (like Anzeigerhochhaus, Regenwaldhaus). In most cases the proper name is combined with the function (Luther church), so we combine those. The fourth category covers buildings that are specified by a description of specific visual aspects (the large yellow house, the red clinker brick building).
Building Type Route 1 (University District) Route 2 (City Centre)Shop (referenced by name) 4 (20 %) 18 (56 %)Shop (referenced by type) 3 (15 %) 8 (25 %)Function / Name 7 (35 %) 6 (19 %)Visual Aspect 6 (30 %) 0 (0 %)Total 20 (100%) 32 (100 %)
Tab. 2: Distribution of different building types in route description
If we compare the distribution of objects, it seems that the route environment determines the kind of landmark building description. In the city centre the trade names of shops are preferred, whereas in areas where no trade chains are available other building descrip-tions using the function or the visual appearance of the object are given. Consequently, it can be hypothesised that the communica-tion and recognition of trademarks is easier than the comprehension of a more complex description of individual visual aspects.
4 Designing visualizations
4.1 Developing guidelines for visualizationBecause the building landmarks separate into four categories, we propose an individual designed visualization for each group to communicate the landmark information in an ideal way. This means that the user must be able to recognize the graphics fast and identify its correspondence in the environment easily. Several approaches to the visualization of buildings have been proposed. Some of them are used especially for landmarks, others stem from the field of 3D-City Models: In Lee et al. (2001) cutouts from photographs are taken and put directly on a map to illustrate the individual facades of landmarks. In contrast to this, non-photoreal-istic rendering techniques abandon the idea of images close to reality and present 3D city models in a comic-strip like style rendered by computers (Döllner et al. 2005). This kind of design is comparable to traditional Bollmann maps and is now often used for tour-istic maps to present important tourist sights as a 3D-representation on a 2D-map (see Figure 3). A further cartographic technique is to substitute the original object with a map mark whose style may range from mimetic to arbitrary (see Figure 1). If the presentation is shrunk to a point symbol, there are different ways to compose the sign (see Figure 2): the iconicity of the symbol is very high if the sign is pictorial designed, and very low if the sign is a geometric, abstract marker (MacEachren 1995). Pictorial signs have the advantage to be recognised easily, because no sign interpretation process is necessary. It is sufficient to match the pattern of the sign to the environment. This requires that the sign is not too detailed or confusable (Bruyas et al. 1998). From this point of view logos of trademarks represent pictorial symbols and are therefore useful candidates to depict trade name shop landmarks (see Figure 4).Altogether, these kinds of depictions form a continuum of different levels of abstractions: on the one side realistic reproduction (in form of a photographic image or realistic textured 3D-model) on the other side abstracted presentation as (geometric) symbols or even as words (considering the alphabet as abstract signs) (see Figure 5). A key challenge for map designers is to select appropriate visual presentations while considering secondary design constraints (e.g. desired visual style, restricted color schemes or consis-tent visual appearance). Also aspects of cartographic generalization have to be taken into account: the image of the original object has to be scaled down to a size suited for a representation in a map. Therefore, some of the conditions under which generalization
Fig. 1: Mimetic to arbitrary continuum of map markers (taken from (MacEachren 1995), pp.259)
Fig. 2: Abstractness of point symbols (taken from (MacEachren 1995), pp. 262)
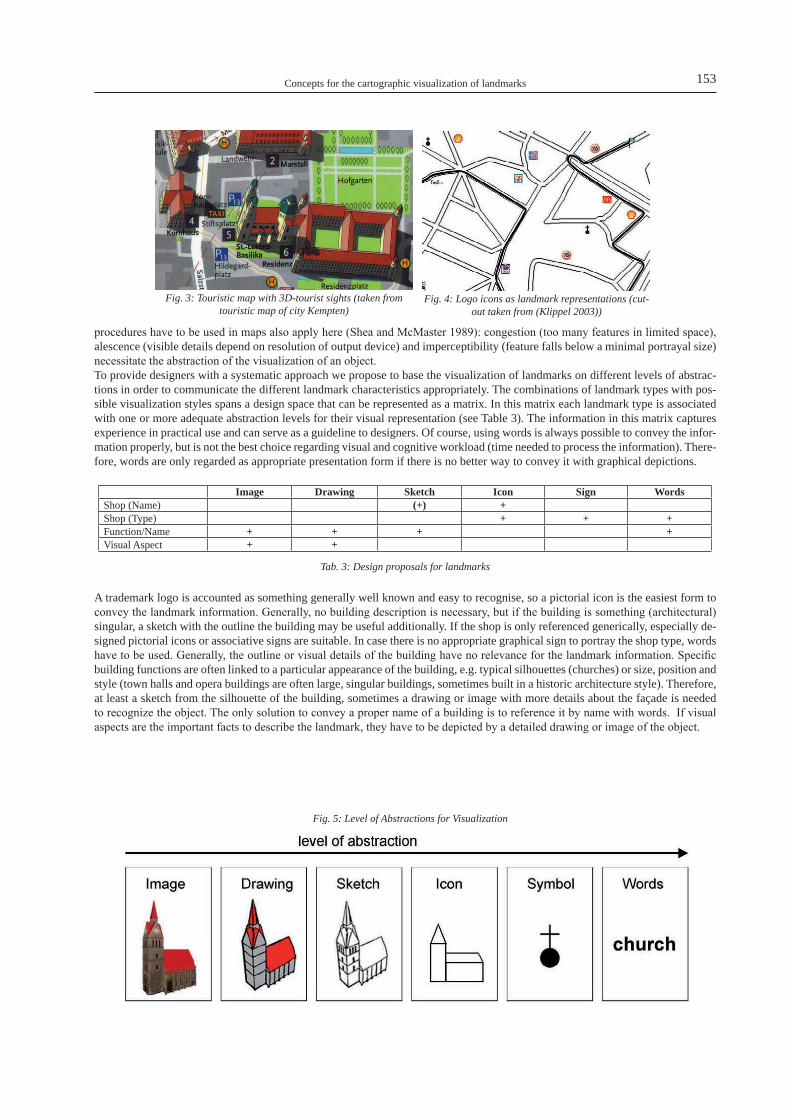
Concepts for the cartographic visualization of landmarks 153
procedures have to be used in maps also apply here (Shea and McMaster 1989): congestion (too many features in limited space), alescence (visible details depend on resolution of output device) and imperceptibility (feature falls below a minimal portrayal size) necessitate the abstraction of the visualization of an object.To provide designers with a systematic approach we propose to base the visualization of landmarks on different levels of abstrac-tions in order to communicate the different landmark characteristics appropriately. The combinations of landmark types with pos-sible visualization styles spans a design space that can be represented as a matrix. In this matrix each landmark type is associated with one or more adequate abstraction levels for their visual representation (see Table 3). The information in this matrix captures experience in practical use and can serve as a guideline to designers. Of course, using words is always possible to convey the infor-mation properly, but is not the best choice regarding visual and cognitive workload (time needed to process the information). There-fore, words are only regarded as appropriate presentation form if there is no better way to convey it with graphical depictions.
Image Drawing Sketch Icon Sign WordsShop (Name) (+) +Shop (Type) + + +Function/Name + + + +Visual Aspect + +
Tab. 3: Design proposals for landmarks
A trademark logo is accounted as something generally well known and easy to recognise, so a pictorial icon is the easiest form to convey the landmark information. Generally, no building description is necessary, but if the building is something (architectural) singular, a sketch with the outline the building may be useful additionally. If the shop is only referenced generically, especially de-signed pictorial icons or associative signs are suitable. In case there is no appropriate graphical sign to portray the shop type, words have to be used. Generally, the outline or visual details of the building have no relevance for the landmark information. Specific building functions are often linked to a particular appearance of the building, e.g. typical silhouettes (churches) or size, position and style (town halls and opera buildings are often large, singular buildings, sometimes built in a historic architecture style). Therefore, at least a sketch from the silhouette of the building, sometimes a drawing or image with more details about the façade is needed to recognize the object. The only solution to convey a proper name of a building is to reference it by name with words. If visual aspects are the important facts to describe the landmark, they have to be depicted by a detailed drawing or image of the object.
Fig. 3: Touristic map with 3D-tourist sights (taken from touristic map of city Kempten)
Fig. 4: Logo icons as landmark representations (cut-out taken from (Klippel 2003))
Fig. 5: Level of Abstractions for Visualization
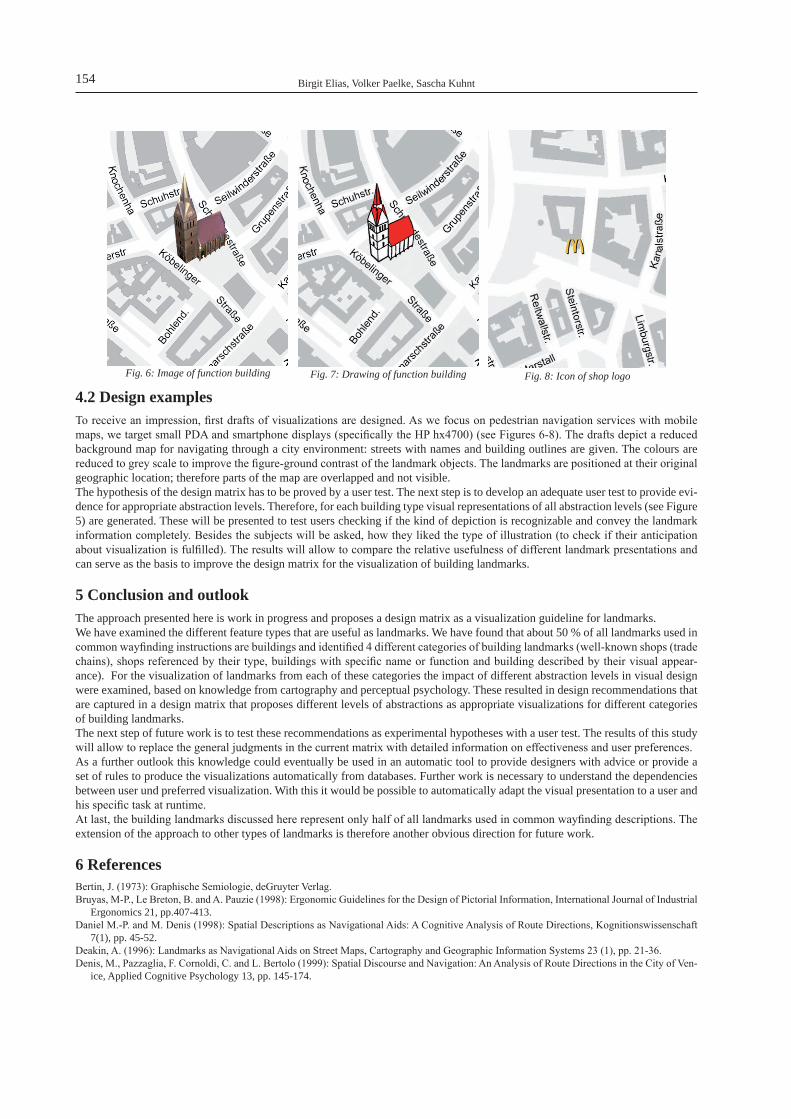
Birgit Elias, Volker Paelke, Sascha Kuhnt154
4.2 Design examplesTo receive an impression, first drafts of visualizations are designed. As we focus on pedestrian navigation services with mobile maps, we target small PDA and smartphone displays (specifically the HP hx4700) (see Figures 6-8). The drafts depict a reduced background map for navigating through a city environment: streets with names and building outlines are given. The colours are reduced to grey scale to improve the figure-ground contrast of the landmark objects. The landmarks are positioned at their original geographic location; therefore parts of the map are overlapped and not visible.The hypothesis of the design matrix has to be proved by a user test. The next step is to develop an adequate user test to provide evi-dence for appropriate abstraction levels. Therefore, for each building type visual representations of all abstraction levels (see Figure 5) are generated. These will be presented to test users checking if the kind of depiction is recognizable and convey the landmark information completely. Besides the subjects will be asked, how they liked the type of illustration (to check if their anticipation about visualization is fulfilled). The results will allow to compare the relative usefulness of different landmark presentations and can serve as the basis to improve the design matrix for the visualization of building landmarks.
5 Conclusion and outlookThe approach presented here is work in progress and proposes a design matrix as a visualization guideline for landmarks. We have examined the different feature types that are useful as landmarks. We have found that about 50 % of all landmarks used in common wayfinding instructions are buildings and identified 4 different categories of building landmarks (well-known shops (trade chains), shops referenced by their type, buildings with specific name or function and building described by their visual appear-ance). For the visualization of landmarks from each of these categories the impact of different abstraction levels in visual design were examined, based on knowledge from cartography and perceptual psychology. These resulted in design recommendations that are captured in a design matrix that proposes different levels of abstractions as appropriate visualizations for different categories of building landmarks. The next step of future work is to test these recommendations as experimental hypotheses with a user test. The results of this study will allow to replace the general judgments in the current matrix with detailed information on effectiveness and user preferences. As a further outlook this knowledge could eventually be used in an automatic tool to provide designers with advice or provide a set of rules to produce the visualizations automatically from databases. Further work is necessary to understand the dependencies between user und preferred visualization. With this it would be possible to automatically adapt the visual presentation to a user and his specific task at runtime.At last, the building landmarks discussed here represent only half of all landmarks used in common wayfinding descriptions. The extension of the approach to other types of landmarks is therefore another obvious direction for future work.
6 ReferencesBertin, J. (1973): Graphische Semiologie, deGruyter Verlag.Bruyas, M-P., Le Breton, B. and A. Pauzie (1998): Ergonomic Guidelines for the Design of Pictorial Information, International Journal of Industrial
Ergonomics 21, pp.407-413.Daniel M.-P. and M. Denis (1998): Spatial Descriptions as Navigational Aids: A Cognitive Analysis of Route Directions, Kognitionswissenschaft
7(1), pp. 45-52.Deakin, A. (1996): Landmarks as Navigational Aids on Street Maps, Cartography and Geographic Information Systems 23 (1), pp. 21-36.Denis, M., Pazzaglia, F. Cornoldi, C. and L. Bertolo (1999): Spatial Discourse and Navigation: An Analysis of Route Directions in the City of Ven-
ice, Applied Cognitive Psychology 13, pp. 145-174.
Fig. 6: Image of function building Fig. 7: Drawing of function building Fig. 8: Icon of shop logo

Concepts for the cartographic visualization of landmarks 155
Elias, B. and M. Sester (2002): Landmarks für Routenbeschreibungen, in: GI-Technologien für Verkehr und Logistik, Beiträge zu den Münsteraner GI-Tagen 20./21. Juni 2002, IfGI prints, Band 13, Institut für Geoinformatik, Münster.
Elias, B. (2003): Extracting Landmarks with Data Mining Methods, in: Kuhn, W., Worboys, M.F. and Timpf, S., (Eds.): “Spatial Information Theo-ry: Foundations of Geographic Information Science”, Vol. 2825, Lecture Notes in Computer Science, Berlin, Springer, pp. 398-412.
Elias, B. and C. Brenner (2004): Automatic Generation and Application of Landmarks in Navigation Data Sets, in: Peter Fisher (Edt.): Develop-ments in Spatial Data Handling - 11th International Symposium on Spatial Data Handling, Springer, pp. 469-480
Döllner, J., Buchholz, H., Nienhaus, M. and F. Kirsch (2005): Illustrative Visualization of 3D City Models, Proceedings of SPIE - Visualization and Data Analysis (VDA 2005), San Jose, CA, USA.
Gartner, G. and S. Uhlirz (2001): Cartographic Concepts for Realizing a Location Based UMTS Service: Vienna City Guide LoL@, Proceedings 20th International Cartographic Conference, 6.-10. August, Beijing, China.
Golledge, R. (1999): Human Wayfinding and Cognitive Maps, in: Wayfinding Behavior, John Hopkins Press, pp. 5-46.Horn, M and Köpke, J. (2005): Navigation mit Landmarken (für PDA). Seminar paper (unpublished). Institute of Cartography and Geoinformatics,
University of Hannover.Klippel, A. (2003): Wayfinding choremes. Conceptualizing wayfinding and route direction elements. Phd Thesis. University of Bremen.Klippel, A. and S. Winter (2005): Structural Salience of Landmarks for Route Directions, In: Cohn, A.G.; Mark, D.M. (Eds.), COSIT 2005. Lecture
Notes in Computer Science, 3693. Springer, Berlin, pp. 347-362.Kray, C., Laakso, K., Elting, C. and V. Coors (2003): Presenting Route Instructions on Mobile Devices, Proceedings of the Intelligent User Inter-
face, ACM, pp.117-124.Lee, Y.C., Kwong, A., Pun, L. and A. Mack (2001): Multi-Media Map for Visual Navigation, Journal of Geospatial Engineering 3(2), pp.87-96.Lovelace, K., Hegarty, M., and D. Montello (1999): Elements of Good Route Directions in Familiar and Unfamiliar Environments, in: C. Freksa
and D. Mark (Edt.): Spatial Information Theory: Cognitive and Computational Foundations of Geographic Information Science, Springer, pp.65-82.
Lübke, C. (2004): Extraktion von Landmarken aus ATKIS-Daten. Master thesis (unpublished). Institute of Cartography and Geoinformatics, Uni-versity of Hannover.
MacEachren, A. (1995): How Maps Work, The Guildford Press.Pauzie, A., Daimon, T., Bruyas, M.-P. and R. Trauchessec (1997): How to design landmarks for guidance systems?, Proceeding (CD-ROM) of the
4th World Congress on Intelligent Transport Systems (ITS), Berlin.Radoczky, V. (2003): Kartographische Unterstützungsmöglichkeiten zur Routenbeschreibung von Fußgängernavigationsystemen im In- und Out-
doorbereich, Master thesis. Vienna University of Technology.Radoczky, V. and G. Gartner (2005): Extent and Effectiveness of Map Abstraction for Communicating Routes in a LBS, in: Proceedings of 22st
International Cartographic Conference, 9. - 16. July 2005, La Coruña/Spain.Raubal, M. and S. Winter (2002): Enriching wayfinding instructions with local landmarks, in: M. Egenhofer and D. Mark (Eds.): Geographic Infor-
mation Science. Vol. 2478 of Lecture Notes in Computer Science, Springer, pp.243-259.Ryan, T. and C. Schwartz (1956): Speed of Perception as a Function of Mode of Representation, The American Journal of Psychology 69, pp.60-
69.Sester, M. (2002): Application Dependent Generalization - The Case of Pedestrian Navigation, IAPRS Vol. 34, Part 4 “Geospatial Theory, Process-
ing and Applications”, Ottawa, Canada.Shea, K. and R. McMaster (1989): Cartographic Generalization in a Digital Environment: When and How to Generalize, Proceedings Auto-Carto
9, Baltimore, Maryland, pp.56-67.Tversky, B. and P. Lee (1999): Pictorial and Verbal Tools for Conveying Routes, in: C. Freksa and D. Mark (Edt.): Spatial Information Theory:
Cognitive and Computational Foundations of Geographic Information Science, Springer, pp. 51-64.Ware, C. (2004): Information, Visualization – Perception for Design. 2nd Edition, Morgan Kaufmann.Winter, S. (2002): Ontologisches Modellieren von Routen für mobile Navigationsdienste. In: Kelnhofer, F.; Lechthaler, M. (Eds.), TeleKartogra-
phie und Location-Based Services. Schriftenreihe der Studienrichtung Vermessungswesen und Geoinformation. Technische Universität Wien, Vienna, pp. 111-124.
Supporting wayfinding by multimedia cartography means
Verena Radoczky
AbstractThe fast transfer rates via UMTS and their corresponding high-tech devices provide the opportunity to develop easily accessible Location Based Services. Mobile phones with high-resolution cameras, MP3-players and Java applications are part of our everyday life. Many drivers rely on car navigation systems that provide route information, and pedestrians also often need help in unfamiliar environments. The utilisation of multimedia presentation forms while guiding a pedestrian to a desired destination could support the wayfinding process and facilitate ongoing tasks.In this paper general considerations about multimedia presentation forms in pedestrian navigation are discussed, their applicability on modern devices is investigated and restrictions regarding their mutual use are defined.
1 IntroductionWithin the last few years car navigation systems have started to conquer the market in the Western World. Car drivers have started to trust in the guiding instructions of the system, and once they got used to it, they do not want to miss it anymore. Other than that navigation systems are not very popular until today. Pedestrians usually consult paper maps when looking for a destination. Some prototypes of portable tourist information systems (Modsching et al. 2005; Uhlirz & Lechthaler 2002; Zipf et al. 1999) are avail-able today, but user acceptance does not seem to be very high so far (Forum Mobilkommunikation 2002, Kölmel & Wirsing 2002). Beside the costs possible reasons for this might be the lack of information provided to the user. In contrast to car drivers, pedestrians do not need to be as concentrated on traffic and can therefore process a lot more information. Often a pedestrian does have a little bit of extra time and would appreciate some additional information about his current environment, which is usually not included in today’s commercial navigation software. This type of auxiliary information could be presented best in the form of multimedia-based data, which has hardly been taken into account so far. It should also be considered that the moment special stops at shops or sights are included, operating the program could become very complicated and demands a lot of patience from the user, which is why an emphasis on user interface design needs to be regarded.Moreover the range of possible paths for pedestrians is a lot higher than the street graph based routes of vehicle drivers and it gets nearly impossible to create a network that includes them all, especially when expanded with indoor paths. Indoor navigation as such is yet a very new and unexplored branch of navigation. Some museums use PDA-based navigation systems to guide visitors through an exhibition (Oppermann 2003, Chan et al. 2005) but they merely concentrate on this very specialised application area. Also wayfinding experiments within airports have been conducted by Raubal (2001) which give a deeper insight into preferred paths of travellers and route choices at public transport stations, but research on visualisation aspects of combined indoor and out-door routes is rare (Baus et al. 2002). Contrary to outdoor urban environments, where the third dimension can mostly be neglected when visualising a route, buildings require the depiction of floor levels, staircases and elevators. This demands either the switch to a 3D presentation form or a well considered design of floor plans. Since it is more likely to lose orientation within a building than outside (Hohenschuh 2004, Radoczky 2003), it is also desirable to use indoor landmarks which on their part are harder to define than outdoor landmarks.Nevertheless route guidance within large buildings like shopping centers, universities or official buildings in junction with outdoor routes would often be desirable. Users often get into the situation where they arrive at a subway station and look for the way to a specific room in a nearby public building. With the help of multimedia presentation forms this task could be assisted by a user-friendly navigation system.Additionally to navigation support it could be beneficial to supply the user with information that is adapted to the current task. For instance when visiting a shopping centre, information about bargains at favoured shops could be displayed, or when strolling around an airport or train station, information about departing planes or trains that concern the user could be provided. The technical requirements for these types of online services are mostly not achieved today, but it is imaginable that future systems will provide them in more variety.The paper is therefore organised as follows: In section 2 the term multimedia is introduced and it’s significance concerning cartog-raphy is described, in chapter 3 multimedia elements for pedestrian navigation are analysed, section 4 investigates their applicabil-itiy, chapter 5 analyses the reasonable combination of different presentation forms in a pedestrian navigation system, and finally the findings of the previous chapters are summarised in the conclusion chapter.

Verena Radoczky158
2 Multimedia in cartographic applicationsWithin the last 10 years multimedia has become an indispensable part of computer science. In 1995 multimedia was even selected by the German Language Society as the “word of the year” (GfdS, 1995). It is thus not surprising that multimedia has also entered the world of cartography. Static maps can now be extended and complemented by other presentation forms like audio, animation and video in order to provide information in a more demonstrative and user-friendly way. Interactivity can be used to reach a new level of detail and to influence the visualisation itself. Beside static depictions also dynamic presentation forms like animation and video are applicable and spatial data can be explained with the help of audio files. Typical application areas are hypermedia atlases or the very popular Google Earth (http://earth.google.com).This form of multicoding and user interaction is also a very efficient tool in pedestrian navigation systems. In the following chapter different elements which could be applied in navigation systems are described.
3 Multimedia in pedestrian navigationMany different communication forms are imaginable when supporting pedestrian wayfinding in urban environments. Each of them has advantages and disadvantages that need to be taken into account when combining them.
3.1 MapsTests have shown that maps are the most important presentation form when communicating spatial information (Reichl 2003, Radoczky 2003). They give a universally understandable overview of an area and support orientation in unfamiliar environments (Kray et al. 2003). Yet the design of a map can differ dramatically depending on the region where they come from. City maps in the USA typically show a network of street graphs whereas European maps usually depict building blocks. Sometimes users prefer a more sketchy style (Döllner & Walther, 2003) and users who are very familiar with an area could even favour a schematic map that concentrates on topology rather than on topography (Agrawala & Stolte 2000, Radoczky 2005). Therefore the design of a map needs to be adapted to the region and the purpose of use.Moreover the map should be available in different scales with different levels of detail. That way the whole route which is de-manded by the user can be shown on the display of the device as an overview map without any need to scroll or pan. The moment guidance begins, an automatic zoom can switch to a larger scale with more detail, maybe even including house numbers. During navigation it would also be advisable to automatically twist the map to an egocentric map view, in which case the north direction should always be marked on the map (Radoczky 2003, Zipf & Jöst 2004, Hohenschuh 2004). That way mistakes at crossings can be avoided because turning points can be viewed as simple left and right turns. Certainly it would be possible to twist and turn the usually small handheld device by the user himself, but that way labels and other additional information would lack readability.Another explicit advantage of maps in comparison to pure textual or oral guiding instructions is the possibility to include multime-dia features with the help of interactivity. Hot spots can act as obvious hiding places for landmark information and other additional information sources (Uhlirz 2001, Nagi 2004).
3.2 Floor plansFloor plans are the obvious presentation form when moving inside a building and so far they have also proven to be the most effec-tive ones (Radoczky 2003, Ortag 2005, Werner & Long 2003). They have similar properties as maps and are therefore rather easy to read. Yet they are not suitable for representing the switch between different floor levels when walking up/down stairs or using an elevator. An alternative would be the representation of 3D models, but most users hardly have any experience with three-dimen-sional representations and therefore often feel overstrained (Radoczky 2003), which is why a two-dimensional depiction is usually more advisable. To overcome the problem of vertical movement while using a 2D map, universally understandable pictograms that symbolise stairs, elevators or escalators can be displayed (see figures 1-3).
3.3 Route visualisationTo guarantee an efficient communication of route information, the entire route should be plotted so that the user perceives an over-view of the whole path. Preferably the trail should be visible to the user at any time and the distinction between the past and the future path should be unambiguous. One possible solution to this visualisation problem could be to make the trail such that it disap-pears over time, but this could lead to confusion, “[…] since it no longer tells the navigator that this place has been visited before, only that it hasn’t been visited lately.” (Darken & Peterson, 1999). To overcome this problem the past trail could be dyed in a very
light colour. This type of route visualisation is only reasonable though, if the user’s position is updated dynamically.
3.4 Audio guidanceVerbal guiding instructions have also shown to be a helpful tool for pedestrians. A test by Ortag (2005) indicated that test candidates who had to find part of a route with the help of a map and the other part with
Figs. 1-3: Symbols for stairs, elevators and escalators

Supporting wayfinding by multimedia cartography means 159
audio guidance did not show major performance changes after switching the presentation form. Only when being asked about the preferred mode, a slight tendency towards map presentation was observable.When being used to a personal device with earphones, oral information can be very useful in quiet environments because noise disturbance can be kept to a minimum. In noisy areas it can be difficult for the user to understand the electronic voice. Sentences should then be repeated until the information is definitely perceived by the user, which decreases the effectiveness of this method.Concerning the configuration of “good” route instructions, some guidelines should be followed (Lovelace et al. 1999, Habel 1987, Kray et al. 2003):
- Users should be prepared for upcoming decision points.- Instructions should be kept simple and clear.- Landmarks should be included in descriptions.- Street names (or corridor numbers) should be mentioned, but only, if they are usually displayed in the network of the respective
city (or building).- In case information about the segment is rare, distances can be mentioned.- The user should have the possibility to replay the last sentences.
The realisation of an audio guidance system is rather simple. Different programs convert text into voices or in case the amount of words extends a certain limit, concatentive synthesis can be applied, where real voices are divided into individual parts and can then be assembled in another sequence (Lemmetty 1999).
3.5 Textual guidanceTextual guidance is the most simple presentation form for navigation systems. They are easy to create and do not require a lot of memory. Guidelines for their configuration are very similar to audio guidance, with the advantage that sentences must not be kept to a minimum and can be written out in full. Yet the main disadvantage of written text is the problem that the user spends more time reading and might not be as attentive to his environment.
3.6 Visualisation of landmarksThe importance of landmarks for wayfinding has extensively been discussed in several publications (e.g.: Michon & Denis 2001, Foltz 1998, Lynch 1960, Golledge 1999). Undisputedly they are not only important but even necessary features in pedestrian navigation. Yet the derivation of landmarks is a very individual process that can change from one person to another (Gartner et al. 2005). Some outstanding buildings, though, can act as universal landmarks that are distinctive to almost everybody and thus should be included as orientation points in the guiding instructions. Their visualisation should be adapted to their function. A shop or a restaurant like H&M or McDonalds is represented best by its individual label, whereas historic buildings could be visualised with the help of pictograms. The user should also be able to define his own landmarks by placing labelled flag-like symbols on the map. Moreover the system itself could remember start or destination points of elapsed routes and place the flags automatically.
3.7 Textual information about landmarksLandmarks should be clearly marked and labelled on the underlying map. The best way to access additional information about the landmark is by using “on mouse-click” functions, where a little window with text pops up. The amount of text to be displayed should not be restricted by any regulations.
3.8 Audio information about landmarksAudio files could contain spoken text, significant sounds or music that help to describe and understand the landmark. An opera house, for example, could be associated with arias and a church could be represented by the sound of its bell. In case verbal infor-mation is provided, it is important to keep it short in order to be able to follow and comprehend coherences.
3.9 MusicPedestrians often carry portable radios, mp3-player or CD-player which are sometimes even integrated in their PDA or mobile phone. Many people appreciate some background music while walking around and do not want to abandon it when using a navi-gation system. In case the utilised device is equipped with an mp3-player or radio, it is advisable to abstain from audio guiding information or only interrupt the background music by very important instructions.
3.10 PhotographsAn image can be a helpful presentation form in a navigation system, even though it is not really valuable as a navigation aid (Ra-doczky 2003, Heidmann & Hermann 2003). Users need a lot of time to compare reality with the photograph which is why it is ad-visable to merely use them when describing start point, destination or landmarks. Even here it should be ensured, that the depicted building is very distinctive. To be on the safe side, photographs could be an optional choice that people, who are not familiar with the environment and who are not in a hurry, can choose to gain additional information. The same holds for panorama views. They
Verena Radoczky160
contain a lot more information than ordinary photographs and they can look very impressive and professional, but since not many users are familiar with panorama views (Radoczky 2003) they should only be scarcely used to avoid confusion.
3.11 VideosVideos have similar properties as photographs and their potential as route information aids can be rated as rather low. Objects and streets can be directly compared and identified with reality, but the quick movement often provoke the loss of orientation. In a sur-vey by Reichl (2003) subjects noted that they would not appreciate a navigation system that uses videos. Nevertheless videos can be used as optional information about landmarks and sights.
3.12 3D presentationGenerally 3D presentation forms are very effective representations of space. They can give a good overview of our environment and can contain a lot more detail than traditional maps. Especially the visualisation of buildings could be made more effective and unambiguous than floor plans. Unfortunately it is very difficult and sometimes even impossible to use them as navigation aids. One of the main disadvantages lies in the large data files and their high requirements on memory space, but since memory rates are developing very fast, it is assumed that this problem can be overcome in the near future. A more precarious problem is the demand on display size that is necessary to present the complexity of a three-dimensional file. Today users are used to mobile phones the size of a credit card and definitely do not want to carry around a device larger than a standard PDA. It is though possible, that future devices will look different, like electronic paper or glasses with installed augmented reality systems. In that case the usage of 3D visualisation will have to be reconsidered.
3.13 Online servicesEven though their availability is scarce today, online services that provide the user with additional up-to-date location based infor-mation are desirable. Similar to landmarks information could be accessed via a simple mouse click on the display where an infor-mation window pops up to inform the user about special menus of restaurants, upcoming shows in cinemas, availability and prices of tickets or opening hours of shops. This form of online advertisement could become very profitable to businesses the higher the distribution rate of location based services rises. Moreover locations of pharmacies that are open at night and timetables of public transport lines could be of use for pedestrians. Equivalent to traffic information in car navigation systems, pedestrian navigation systems could provide similar services like business disruptions of public transport or construction sites at diverse sights.
4 Applicability of multimedia presentation forms on today’s devicesMobile phones have become a necessary part of our everyday life. The Austrian Regulatory Authority for Broadcasting and Tele-communications (RTR-GmbH) announced that in the first quarter of the year 2005 the mobile phone penetration in Austria reached the level of 100%, and it is yet rising (RTR 2005). Mobile phones with an integrated camera that also function as mp3-players are not uncommon anymore and users demand more and more functions from their device that should be kept to a minimum in size. The only problem that still does not seem to be solved completely is the durability of the rechargeable battery. The more we demand from working memory, which is usually the case with multimedia applications, the sooner the device runs out of battery and there-fore strains the patience of the user. Nevertheless, mobile devices have developed rapidly in the last 10 years and probably will for another 10 years. Basically we can distinguish between three main types of mobile devices which are described in the following:
4.1 Mobile phonesThe main focus of mobile phones is the functionality of telephone calls. Yet today’s mobile phones typically contain a lot of ad-ditional features. When comparing the newest devices that enter the market in 2005 and at the beginning of 2006, we can find the following features1:
- Display size: 128x128 to 329x240 pixels- E-mail and internet access (XHTML): standard- Java applications: standard- Bluetooth: standard- USB port: standard- IrDA: standard- WLAN: only integrated in Nokia N91- GPS: only integrated in Siemens SXG75- Camera: standard, usually 2 MP- Sound: MP3 standard, radio available in some models
1 The examination considered the mobile phones Nokia 6822/N90/N91/6111/3250/6270/6280 (www.nokia.com), Samsung SGH D500/SGH Z300 (www.samsung.com), Siemens SXG75 (www.siemens.com), Sony Ericsson W550i (www.sonyericsson.com). September 2005.
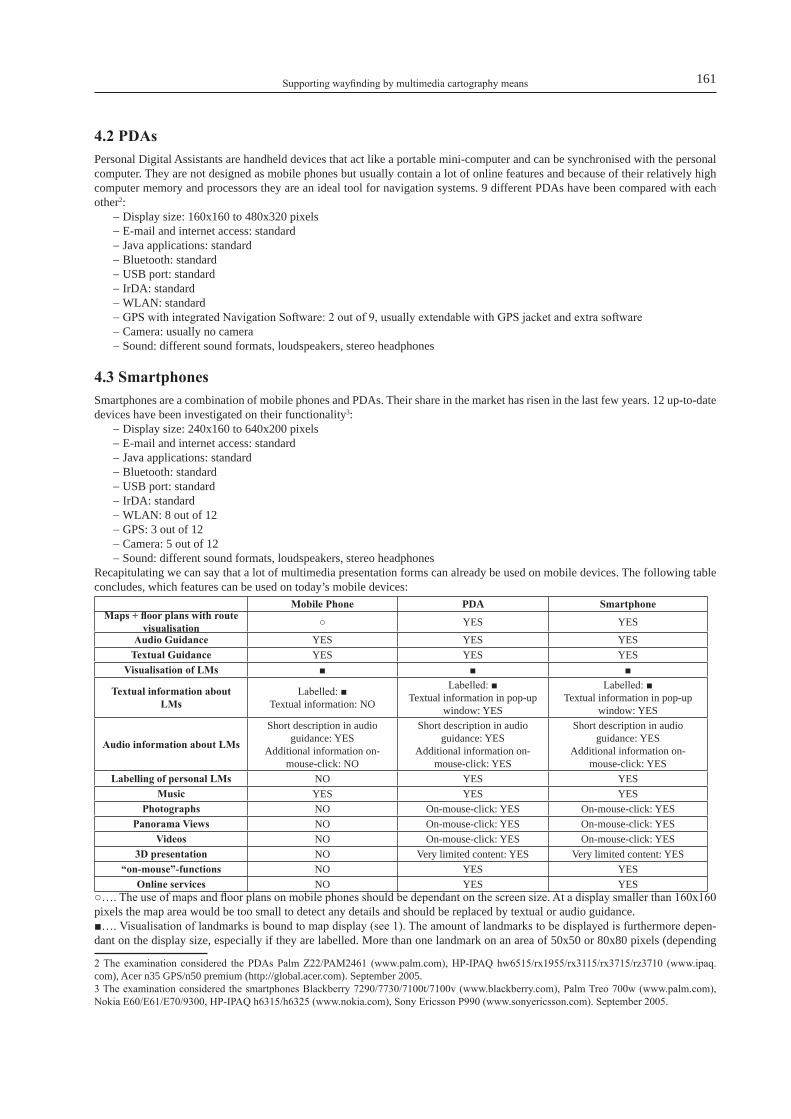
Supporting wayfinding by multimedia cartography means 161
4.2 PDAsPersonal Digital Assistants are handheld devices that act like a portable mini-computer and can be synchronised with the personal computer. They are not designed as mobile phones but usually contain a lot of online features and because of their relatively high computer memory and processors they are an ideal tool for navigation systems. 9 different PDAs have been compared with each other2:
- Display size: 160x160 to 480x320 pixels- E-mail and internet access: standard- Java applications: standard- Bluetooth: standard- USB port: standard- IrDA: standard- WLAN: standard- GPS with integrated Navigation Software: 2 out of 9, usually extendable with GPS jacket and extra software- Camera: usually no camera- Sound: different sound formats, loudspeakers, stereo headphones
4.3 SmartphonesSmartphones are a combination of mobile phones and PDAs. Their share in the market has risen in the last few years. 12 up-to-date devices have been investigated on their functionality3:
- Display size: 240x160 to 640x200 pixels- E-mail and internet access: standard- Java applications: standard- Bluetooth: standard- USB port: standard- IrDA: standard- WLAN: 8 out of 12- GPS: 3 out of 12- Camera: 5 out of 12- Sound: different sound formats, loudspeakers, stereo headphones
Recapitulating we can say that a lot of multimedia presentation forms can already be used on mobile devices. The following table concludes, which features can be used on today’s mobile devices:
Mobile Phone PDA SmartphoneMaps + floor plans with route
visualisation ○ YES YES
Audio Guidance YES YES YESTextual Guidance YES YES YES
Visualisation of LMs ■ ■ ■
Textual information about LMs
Labelled: ■Textual information: NO
Labelled: ■Textual information in pop-up
window: YES
Labelled: ■Textual information in pop-up
window: YES
Audio information about LMs
Short description in audio guidance: YES
Additional information on-mouse-click: NO
Short description in audio guidance: YES
Additional information on-mouse-click: YES
Short description in audio guidance: YES
Additional information on-mouse-click: YES
Labelling of personal LMs NO YES YESMusic YES YES YES
Photographs NO On-mouse-click: YES On-mouse-click: YESPanorama Views NO On-mouse-click: YES On-mouse-click: YES
Videos NO On-mouse-click: YES On-mouse-click: YES3D presentation NO Very limited content: YES Very limited content: YES
“on-mouse”-functions NO YES YESOnline services NO YES YES
○…. The use of maps and floor plans on mobile phones should be dependant on the screen size. At a display smaller than 160x160 pixels the map area would be too small to detect any details and should be replaced by textual or audio guidance.■…. Visualisation of landmarks is bound to map display (see 1). The amount of landmarks to be displayed is furthermore depen-dant on the display size, especially if they are labelled. More than one landmark on an area of 50x50 or 80x80 pixels (depending
2 The examination considered the PDAs Palm Z22/PAM2461 (www.palm.com), HP-IPAQ hw6515/rx1955/rx3115/rx3715/rz3710 (www.ipaq.com), Acer n35 GPS/n50 premium (http://global.acer.com). September 2005. 3 The examination considered the smartphones Blackberry 7290/7730/7100t/7100v (www.blackberry.com), Palm Treo 700w (www.palm.com), Nokia E60/E61/E70/9300, HP-IPAQ h6315/h6325 (www.nokia.com), Sony Ericsson P990 (www.sonyericsson.com). September 2005.

Verena Radoczky162
on the size of the landmark) does not seem reasonable, because map details and route visualisation could affect the readability of the map.
5 Combination of different presentation formsIn the last chapter we could see that a lot of presentation forms are applicable on today’s mobile devices. A combination of most of them is technically possible, but the question remains, if it is actually reasonable to utilise the maximum availability of multimedia contents. Singular information can cause irritation, whereas too much information can slow down decision making (Klippel, 2003). The optimum amount of multicoding is hard to define, but the following table shows which presentation forms can be combined and which are not reasonable to combine.
Map
s & F
loor
Pla
ns w
ith
rout
e vi
sual
isat
ion
3D (+
rou
te v
isua
lisat
ion)
Aud
io G
uida
nce
(+
shor
t des
crip
tion
of
LM
s)
Text
ual G
uida
nce
Vis
ualis
atio
n of
LM
s
Lab
elle
d L
Ms
Text
ual i
nfor
mat
ion
abou
t LM
s (po
p-up
w
indo
w)
Aud
io in
form
atio
n ab
out
LM
s
(o
n-m
ouse
)
Lab
ellin
g of
per
sona
l L
Ms
Mus
ic
Phot
ogra
phs
(o
n-m
ouse
)
Pano
ram
a vi
ews (
on-
mou
se)
Vid
eos
(on-
mou
se)
“on-
mou
se”-
func
tions
Onl
ine
serv
ices
either or ■ ■ ■ ■ ■ either or2 out of 3
Maps & Floor Plans with route visualisation
# + + ++ ++ + + ++ + + + + + +
3D(+route visualisation) + + ++ ++ + + ++ + + + + + +
Audio Guidance(+ short description of LMs)
+ + + # # + - # # - + +
Textual Guidance + + # # + + + + + + +
Visualisation of LMs ++ + + ++ + + + + + +
Labelled LMs + + + + + + + + +
Textual information about LMs (pop-up-window)
# + + + + + + +
Audio information about LMs(on-mouse)
+ - + + - + +
Labelling of personal LMs + + + + + +
Music + + - + +
Photographs(on-mouse) # # + +
Panorama views(on-mouse) # + +
Videos(on-mouse) + +
“on-mouse”-functions +
+… possible - not advisable ++... advisable #…not simultaneously■…. Visualisation of landmarks is bound to map display. The amount of landmarks to be displayed is furthermore dependant on the display size, especially if they are labelled. More than one landmark on an area of 50x50 or 80x80 pixels (depending on the size of the landmark) does not seem reasonable, because map details and route visualisation could affect the readability of the map.
Supporting wayfinding by multimedia cartography means 163
6 ConclusionsNavigation systems that aim on pedestrians are scarce today. In many cases car navigation systems provide the possibility to switch to a pedestrian mode, but usually this mode is not as frequently used as the car navigation service. Preconditions of pedestrians dif-fer enormously to drivers and the usage of the same data does not seem to suffice their requirements. Walking speed is a lot slower than driving speed and attention to traffic is not as important which gives the pedestrian a lot of time to concentrate on his environ-ment. Because of this added possibility to process information, the potential to add multimedia presentation forms to the system, that help the user to access more details and background information about his environment, can be utilised.This contribution indicates, which presentation forms can be valuable for pedestrians. Beside a map, where not only the route to be followed, but also landmarks and linked hot spots should be marked, verbal and textual guiding instructions and landmark informa-tion in the form of photographs, panorama views or videos can be represented in a multimedia system. Furthermore links to diverse online services are eligible that provide the user with up-to-date information about important objects and refer to special incidents and events. Yet the simultaneous application of all available media is not always reasonable and sometimes not even possible on the used device. An overload of information can provoke that the user is overstrained and does not accept the system. On this behalf restrictions are defined which should avoid this effect.
7 AcknowledgementThis work was supported by the FWF (Austrian Science Fund), project P16277.
8 ReferencesAgrawala, M., Stolte, C. (2000): A Design and Implementation for Effective Computer-Generated Route Maps. AAAI Symposium on Smart Graph-
ics, March 2000.Baus, J., Krüger, A., Wahlster, W. (2002): A Resource-Adaptive Mobile Navigation System. In: Proceedings of the 7th International Conference on
Intelligent User Interfaces IUI02, San Francisco, January 13-16, 2002. New York, ACM Press, 15-22. Chan, L.-W., Hsu, Y.-Y., Hung, Y.-P., Hsu, J. Y.-J. (2005): Orientation-Aware Handhelds for Panorama-Based Museum Guiding System. In: Smart
Environments and Their Applications to Cultural Heritage, UbiComp ’05, September 11-14, 2005, Tokyo, Japan. Darken, R. P., Peterson, B. (1999): Spatial orientation, wayfinding and representation. In: Stanney, K. M. (ed.): VE Handbook. Lawrence Erlbaum
Associates, Inc., 1999.Döllner, J., Walther, M. (2003): Real-Time Expressive Rendering of City Models. Seventh International Conference on Information Visualization,
Proceedings IEEE 2003 Information Visualization, London, July 2003, 245-250.Foltz, M. A. (1998): Designing Navigable Information Spaces. Master Thesis of Science at the Massachusetts Institute of Technology, June 1998. Forum Mobilkommunikation, FMK (2002): Location Based Services: 5.10 Näher, mein Kunde, zu Dir…. Technische Grundlagen der Mobilkom-
munikation, Weißbuch Mobilkommunikation, last updated: October 6th, 2002: http://www.fmk.at/mobilkom/detail.cfm?Textid=70&Kapitelnr=8
Gartner, G., Oakley, K., Jobst, M. (2005): Emotional Landmarks: An alternative view of way finding. Internal paper, publication in progress. GfdS, Gesellschaft für deutsche Sprache (1995): Wörter des Jahres: http://www.gfds.de/woerter.htmlGolledge, R. (1999): Human Wayfinding and Cognitive Maps. In: Golledge, R. (ed.): Wayfinding Behavior, The John Hopkins University Press,
Baltimore and London, 5 – 46. Habel, C. (1987): Prozedurale Aspekte der Wegplanung und Wegbeschreibung. In: Schnelle, H., Rickheit, G. (eds.): Kognitive und neuronale
Sprachverarbeitung. Westdeutscher Verlag, Wiesbaden. Heidmann, F., Hermann, F. (2003): Benutzerzentrierte Visualisierung raumbezogener Informationen für ultraportable mobile Systeme. In: Con-
tributios at the seminar „Visualisierung und Erschließung von Geodaten“, Hannover, February 2003. Deutsche Gesellschaft für Kartographie, Kartographische Schriften, Band 7. Bonn: Kirschbaum Verlag, 121-131.
Hohenschuh, F. (2004): Prototyping eines mobilen Navigationssystems für die Stadt Hamburg. Diploma Thesis, Faculty of Informatics, University of Hamburg.
Klippel, A. (2003): Wayfinding Choremes: Conceptualizing Wayfinding and Route Direction Elements; Doctoral Dissertation, Department of Math-ematics and Informatics, University of Bremen.
Kölmel, B., Wirsing, M. (2002): Nutzererwartungen an Location Based Services – Ergebnisse einer empirischen Analyse. In: Zipf, A., Strobl, J. (eds.): Geoinformation mobil. Heidelberg: Herbert Wichmann Verlag, 85-97.
Kray, C., Elting, C., Laakso, K., Coors, V. (2003): Presenting Route Instructions on Mobile Devices. In: Proceedings of the International Confer-ences on Intelligent User Interfaces, January 12-15, 2003, Miami, FL, USA, 117 – 124.
Lemmetty, S. (1999): Review of Speech Synthesis Technology. Master Thesis, Department of Electrical and Communications Engineering, Hel-sinki University of Technology.
Lovelace, K.L., Hegarty, M., Montello, D.R. (1999): Elements of Good Route Directions in Familiar and Unfamiliar Environments. In: Freska, C., Mark, D.M. (eds.): Spatial information theory: Cognitive and computational foundations of geographic information sciences, Proceedings of COSIT, August 25-29. Berlin: Springer-Verlag, 65-82.
Lynch, K. (1960): The image of the city. Cambridge, MA: MIT Press.Michon, P.-E., Denis, M. (2001): When and why are visual landmarks used in giving directions? In: Montello, D.R. (ed.): Spatial Information
Theory, Lecture Notes in Computer Science, vol. 2205. Springer, Berlin, 243-259. Modsching, M., Kramer, R., Ten Hagen, K. (2005): Individuelle Stadtführungen mit einem Dynamischen Tour Guide (DTG). In: Strobl, J.,
Blaschke, T., Griesebner, G. (eds.): Angewandte Geoinformatik 2005, Beiträge zum 17. AGIT-Symposium Salzburg. Wichmann Verlag, Hei-delberg, 457-466.
Nagi, R.S. (2004): Cartographic visualization for mobile applications. Thesis at the International Institute for Geo-Information Science and Earth Observation, Enschede, The Netherlands.

Verena Radoczky164
Oppermann, R. (2003): Ein Nomadischer Museumsführer aus Sicht der Benutzer. In: Szwillus, G., Ziegler, J. (eds.): Mensch & Computer 2003: Interaktion in Bewegung. Stuttgart: B. G. Teubner, 2003, 31-42.
Ortag, F. (2005): Sprachausgabe vs. Kartendarstellung in der Fußgängernavigation. Diplomarbeit am Institut für Geoinformation und Kartographie, TU-Wien.
Radoczky, V. (2003): Kartographische Unterstützungsmöglichkeiten zur Routenbeschreibung von Fußgängernavigationssystemen im In- und Out-doorbereich. Diploma Thesis, Department of Cartography and GeoMediatechniques, Vienna University of Technology.
Radoczky, V. (2005): Karten für Fußgängernavigation – kann die Bildung des mentalen Modells beeinflusst werden? In: Strobl, Blaschke, Grieseb-ner (eds.): Angewandte Geoinformatik 2005. Beiträge zum 17. AGIT-Symposium Salzburg, 568-573.
Raubal, M. (2001): Human Wayfinding in unfamiliar buildings: A simulation with a cognizing design. In: Cognitive Processing (2-3): 363-388. Reichl, B. (2003): Potential verschiedener Präsentationsformen für die Vermittlung von Routeninformation in Fußgängernavigationssystemen
(FNS). Diploma Thesis, Department of Cartography and GeoMediatechniques, Vienna University of Technology. RTR (2005): Zeitreihe Mobilfunk 1. Quartal 2005. http://www.rtr.at , last visited September 2005. Uhlirz, S. (2001): Cartographic Concepts for UMTS-Location Based Services. In: Proceedings of the 3rd Workshop on Mobile Mapping Technol-
ogy. Cairo, Egypt. Uhlirz, S., Lechthaler, M. (2002): LoL@ - City Guide. Prototyp einer kartenbasierten UMTS-Applikation. In: Geowissenschaftliche Mitteilungen,
Schriftenreihe der Studienrichtung Vermessungswesen und Geoinformation TU Wien, Heft Nr. 58, 171-182.Werner, S., Long, P. (2003): Cognition meets Le Corbusier – Cognitive principles of architectural design. In: Spatial Cognition 2003, 112-126. Zipf, A., Häußler, J., Chandrasekhara, V., Malaka,R.(1999): GIS hilft Touristen bei der Navigation - ein erster Prototyp des mobilen Deep Map Sys-
tems für das Heidelberger Schloß. In: HGG-Journal (Journal der Heidelberger Geographischen Gesellschaft) , Heft 14, 285-296.Zipf, A., Jöst, M. (2004): User Expectations and Preferences regarding Location-based Services – Results of a Survey; 2nd Symposium on LBS and
TeleCartography, Vienna 2004

Comparing the effects of 2D and 3D representations on human wayfinding
Michael Wood, David G. Pearson, Colin Calder, David Miller, Alan Tinto
AbstractThis paper reports on new research comparing the effectiveness of conventional topographic maps and computer-based geovisualisation systems as aids to navigation in wilderness mountain areas in Scotland. The programme considers both the cartographic products and the mental processes involved in their use and this paper concentrates on some fundamental issues and the results of the first experiment which trialled main procedures and concepts. In both this and the main experiment participants were asked to judge gradients and journey times for various routes presented on maps and interactive animated terrain displays. The first experiment compared only terrain models but the second included the essential comparative component of the title, the 2D map. Although work is incomplete, preliminary analysis of the second experiment indicates that one important factor likely to impact on performance is level of expertise in both map-reading and route finding in the field. This research will provide an important evidence base for future mapping system producers seeking to develop generally accessible terrain visualization tools.
1 IntroductionTangible cognitive maps, exhibiting topographically organized spatial tessellated structures anchored to external landmarks, have been associated with the region of the hippocampus of rats (Hafting, et al, 2005). Although the full relevance of this to humans is yet to emerge there is increasing recognition that the internal (cognitive) representation of spatial environmental knowledge is not only fundamental to humans but essential for spatial decision-making, especially in the context of wayfinding. Most perceptual information employed in wayfinding activities is obtained from direct environmental experience. However, since the emergence of what has been called the writing-based ‘theoretic culture’ (since c. 45 000 BP) and the associated invention of visiographics and external memory (Donald, 1991), external facilities such as maps and other related images have become increasingly common and are believed to influence the nature and content of cognitive maps and the wayfinding strategies which result.Although traditional paper maps have been valuable sources of geospatial information for travellers, complex environments lead to graphic complexity which has challenged both map makers and users. Good cartographic design and appropriate map use training have helped to accommodate such complexity, but creative application of new computer based technologies can now add signifi-cantly to knowledge acquisition and enhance decision making processes. Of course in the current period of transition, customised paper maps still exist side by side with new computer based tools such as Memory-Map (URL 1) and Anquet Maps (URL 2), which provide users with interesting alternatives. Printed topographic maps have been the tools of choice for route finding in mountains but they demand perceptual and cognitive effort for their interpretation. Understanding elevation contour patterns requires special knowledge of symbol systems, the landforms depicted and the navigation task. It has been reported that orienteers, for instance, develop a view of how parts of the terrain will appear. This “pre-experience,” impression derived from the map will later have to be attuned to the real terrain (Ottosson, 1996). Some experienced orienteers can, while running, develop and maintain a mental ‘map model’ (a form of cognitive map) of the competition area over considerable time periods and refer to it intermittently, without the need to look at the physical map. Others must keep checking back to the map to strengthen their mental image1. As the expertise required for this kind of mental modelling involves the user possibly imagining the interpreted landscape as a 3D image, this study is investigating the potential of new geovisualization techniques (compared to traditional maps) to augment these abilities. If screen based computer generated models, resembling those derived mentally from contour maps by some experts, can now be created and viewed interactively on computer screens, less experienced users may also be able to acquire some of the advantages of those with greater skill and training in traditional map reading.The programme described in this paper is comparing the value of certain new computer based cartographic products with con-ventional maps, and also seeking answers to psychological questions about the nature of the interaction between them and mental representations – largely ignored by current theories of human working memory2. Put simply, if mental representations from ex-perience of reality are many times better than those gained from reading static 2D maps, does learning from dynamic 3D models give results somewhere in between? The study is also addressing some of the ‘research challenges’ - specifically cognitive/usability issues - of geovisualization tools (MacEachren and Kraak, 2001). Separate experiments examine the relative effectiveness of in-1 The sport of orienteering permits only the basic tools of map and compass to help navigate between checkpoints along an unfamiliar course. Modern aids such as GPS and other Location-based services are illegal.2 The part of the brain that provides temporary storage and allows manipulation of the information being used in complex cognitive tasks such as learning, and reasoning.

Michael Wood, David G. Pearson, Colin Calder, David Miller, Alan Tinto166
teractive, animated 3D terrain models, and traditional contour maps, as external aids for the tasks of estimating the slope gradients of mountain paths and the time taken to complete predetermined mountain walking routes. Recognition memory for 2D and 3D representations is also being explored.
2 Some preliminary studiesAlthough pictorial maps and panoramas, often of high artistic quality, have been created during recent centuries (Wood, 2000), few would have satisfied the more rigorous characteristics of both reliable consistency and ‘visual friendliness’ required by unskilled map readers to support spatial reasoning tasks such as detailed wayfinding. By the 1980s digital terrain modelling software had been developed for the production of fixed views, but not until the 1990s was it sufficiently user friendly or could offer visually acceptable output. Pilot studies with two such earlier systems – LaserScan Horizon and ESRI’s Arc/Info - laid some of the ground-work for the present investigation. In one case 3D terrain images were created to support map reading experiments with geography undergraduates (Wood & McCrorie, 1993). Results suggested that such views could help with contour reading, but a more signifi-cant discovery was of the considerable difficulty encountered by many participants when trying to interpret contour patterns from the maps themselves, reflecting very limited map based knowledge or experience. If this condition proved widespread, the need for new and more powerful visual tools would increase. In another study (Wood & Goodwin, 1995) static 3D views were again cre-ated, this time using ESRI Arc/Info, with draped satellite images and overlaid with selected vectors (footpaths and streams). Test participants were grouped by level of knowledge and experience of map reading and mountaineering into ‘real experts’ (serious amateurs, rescue team members), ‘regular leisure walkers’, ‘occasional walkers’, and inexperienced ‘opportunists’ (such as motor tourists who reach a mountain car park in good weather and decide to take a walk!). A smaller pilot study with real experts (serious mountaineers) led to the following observations about the potential of the more limited symbolically enhanced 3D views they had experienced in 1995:
- Useful for route planning but less suited to ongoing navigation (through lack of detail).- With improved realism of surface representation such views might provide sufficient information without the support of a
map (e.g. with a full vector drape of topographic symbology).- There was modest recognition of the possibility that the ready availability of higher quality (perhaps more realistic) repre-
sentations could benefit mountain safety (although these were not available to these participants).
New generation terrain modelling software offers much greater potential for the support of external cognition, including better sur-face rendering, interactivity and animation. Output options ranging from orthographic 2D maps to 3D terrain models viewed from any angle and incorporating rotation, zooming and ‘flythro’ capability, provide the flexibility required for the proposed research programme.
3 The current project: background and experimental strategyThe increasing availability of computer based visualisation and multimedia technologies to supplement or even replace conven-tional printed maps, has been partly driven by the general assumption that dynamic 3D representations can provide more effective support than 2D maps alone. Few studies, however, have examined whether this assumption is correct (Scaife and Rogers, 1996). Most previous findings on perception and cognition in wayfinding are based on static paper maps, and much less is known about issues associated with 3D and dynamic displays (Slocum et al, 2001). It is well documented that mental representation of environ-ments stimulated by 2D maps is quantifiably different from representations produced by direct experience (e.g. Thorndyke and Hayes-Roth, 1982; Moeser, 1988). It is therefore important to investigate whether learning, using 3D terrain models (which more closely approximate reality than maps do) produces different or superior memory than learning using 2D maps of equivalent geo-spatial data. Another neglected area of research is on effects of expertise in the use of 2D and 3D representations. Users ranging from serious mountaineers to casual weekend walkers regularly visit areas such as the Scottish Cairngorm Mountains. Recent theo-ries of expert cognition in orienteering (e.g. Eccles et al., 2002) are naturally based solely on the use of 2D maps. The majority of previous studies has largely ignored direct comparison of 2D and 3D representations, and has focused on urban/manmade settings rather than wilderness environments, or on development and application of the technology for implementing such representations for prospective users (Moore et al., 1999; Morrison and Purves, 2001). The social, economic and environmental importance of mountain regions in many countries has been steadily increasing over recent years, with an associated increase in the use of such areas for recreational activities. An important aim of the current project is to help establish a source of data (based on scientifi-cally rigorous investigation) on whether or not interactive, animated 3D terrain models do provide better cognitive support than traditional static 2D maps, and to produce empirical evidence that could contribute to better evaluation of the potential impact of such geovisualisation tools for recreational use in mountain environments. The introductory phase of the programme comprised two experiments. The first, a pilot study, was primarily used to trial concepts, materials and procedures. The second focused on the interpretation of 2D and 3D geospatial data. The remainder of this paper concentrates on the first experiment, but provides an outline of the second.

Comparing the effects of 2D and 3D representations on human wayfinding 167
3.1 The stimuli used in both experimentsThree stimuli were prepared, one onscreen topographic map and two versions of a terrain model of the same area. Using ESRI Arc-GIS/ArcMap/ArcScene software, models were created of twelve separate 10 km² tiles selected from different high level mountain regions in Scotland. Ordnance Survey (OS) 1:25 000 scale digital data were used. The two versions of the models to be used in the experiments had shading from oblique illumination and one had a draped image – the raster version of the 1:50 000 OS map. The other (‘undraped’) was rendered only in a plain colour, graded using the sequence ‘the higher-the-lighter’ (Fig. 1). A walking route was clearly marked on each map/model, subdivided into five colour-coded sections and depicted by a line located 10m above the model surface to avoid visual confusion with underlying symbols. The ArcScene interface is interactive, allowing participants to manipulate the image and view it from any angle, distance or direction. The extent of zoom is limited visually by the increasing courseness of the raster elements of the OS map drape. It is also possible to ‘fly’, with some degree of control, across the landscape at any altitude and at various speeds. The flat maps were also viewed with ArcScene but fewer interactive facilities were employed. A Pentium 4 laptop computer was used to deliver the map and model images during the experimental sessions, with control through mouse and keyboard.
3.2 Experiment 1: pilot studyIn this first experiment only terrain models were used (without comparison to the 2D maps), the focus of interest being on how dif-fering levels of information on the models (the draped and undraped conditions, as described above) would affect their perception, value as an information source and ease of use.
The main hypothesis was that there would be a difference between judgements made from the two model types. This hypothesis, however, was non-directional, with two outcomes possible:
a)That the version draped with OS data might be easier to use due to the greater level of information (such as grid squares and contours) available to the user.
b)That, if the draped information is ignored (i.e. not used in calculations), estimations would inevitably end up being based on spatial perception alone. In fact in such cases the draped versions might also overload the user with unnecessary or undesired symbolism and even hinder judgement.
Twenty-four student undergraduates took part (12 female and 12 male), aged between 19 and 31. The experiment was designed with both between and within subject comparisons to avoid bias. The tasks (dependent variables) were the estimations of the slope angles/gradients of each (coloured) section of the depicted routes, and the walking time estimates for each entire route. The inde-pendent variable was the model type, draped and undraped.
3.3 ProcedureFollowing an introductory session which included familiarisation with the computer (using a training map), the participants then completed twelve trials, each with a different model. They were shown each of the twelve landscapes once, six with the ‘draped’ version and six with the undraped. However map types presented were different for different participants i.e. while half saw mod-els 1-6 draped and 7-12 undraped, the other half received the opposite combination. Also to minimise practice effects, the order in which they were presented was counter-balanced.
In each trial participants were asked to do the following:1. Observe the walking route, and for each of the colour-coded sections (A-E) were asked to
a. assign a gradient rating based on a 5-point scale (essentially flat, gentle, medium, steep, extreme)b. assign an angle estimation (from a 90º diagram with 10º steps)
Fig. 1: Model of Bruach na Frithe, Cuillin, Skye, Scotland, showing Route 6 (draped and undraped)

Michael Wood, David G. Pearson, Colin Calder, David Miller, Alan Tinto168
The angle judgement was included to allow for personal bias on slope severity (a ‘moderate’ gradient for one might be ‘steep’ for another). Specific angle estimations could also be compared later with the actual gradients, measured from the maps.
2. Consider the entire route, and estimate the time taken, in hours and minutes, to walk it.
When carrying out these tasks, participants could make full use of the interactive facilities of zooming, rotating, etc., with no time restrictions.When the experiment session ended each participant completed a short questionnaire to identify any previous experience in map reading or navigation, and also to check for their familiarity with any of the Scottish regions from which the models had been cre-ated. This was necessary to ensure that judgements had not been made from personal knowledge rather than direct observation of the models alone. They were also asked to select which of the two models they had preferred or found easier to use. Although there were no time restrictions during the trials, the overall time taken was recorded for each participant as it could be a factor influencing performance. Estimation data was also retained for later analysis.
3.4 ResultsEven after careful analysis of the data, no significant differences in walking times or gradient/angle estimations were detected be-tween the draped and undraped models.Estimations of gradient also compared well with actual gradient values (computed from the maps) and walking times (from Nai-smith’s Rule3). This would show if one model type affected accuracy judgements, but there was still no significant difference in walking time estimations between the two model types. Mean real gradients/angles also correlated well with estimations in both conditions. Times taken by participants when using their ‘preferred’ draped maps were slightly longer, but with no differences in performance. Equally, there were no significant differences in performance between those with high and low self-reported mea-sures of hill-walking frequency in either draped or undraped condition. There was also wide and variable experience/ability in map-reading among the participants, but this was not formally assessed in the first experiment.
3.5 DiscussionThe main experimental hypothesis was not supported. No differences were found between responses for the two models, draped and undraped, estimations of gradients/angles being very similar in accuracy and magnitude. However these results are striking as they might not have been anticipated! Why were there no differences in response between the model types? The OS data seemed neither to help nor hinder the estimation process. Was this extra information regarded as unnecessary or did it even lead to percep-tual or cognitive overload for the user? This is probably unlikely as if it had been a hindrance, greater success would have been recorded with the undraped model, and this was not the case. Also more than 66% of the participants preferred the draped model and so this extra information could not have been recognised as a problem. Apart from a very few who used the OS grid squares to help with distance estimation, most participants did not use the OS data, as the accuracy ratings were no better in the draped than the undraped condition. Most participants just seemed to estimate. Although the draped models did have more altitude information (contours) this was not used when estimating slope angles. Only if the task had required calculations would the contour data have been of direct use.In such studies, especially utilising flexible interactive scene manipulation, it is very difficult to control the variables, especially how participants carry out the tasks. As with walking time estimations, where a few participants did refer to grid lines, only some made more use of the visual interactive facilities than others. This information was not recorded or tested but the procedures ad-opted were intended to resemble normal experience with such facilities and so variations were inevitable. One trend noted was the tendency for participants to make some reference to estimates from previous models as reference points for the next task. Did the route look longer or shorter than the last? A few were confused by the fact that some route sections covered very rough surfaces where no obvious single gradient seemed to apply, but, as the routes were intended to be authentic, this too was regarded as an inevitable feature of the exercise.In this study expertise and experience were not formally measured and participants were not in expertise groups. This was certainly considered in the main experiment as it could affect the strategies employed. For instance someone very familiar with one type of map (such as the 1:50 000 OS scale used on the draped model) may be able to mentally visualize the models more easily. Future participant selection, therefore, would include experts such as mountain rescue team members and orienteers.
3.6 Experiment 2 – interpretation of 2D and 3D visualizationsThe content and structure of the remaining experiment was informed and enhanced by the results of the pilot project. Most signifi-cantly expertise groups were assembled and modifications were made to the recording procedures for the experimental sessions. For example the experimenter kept a record of how participants interacted with the software; i.e. number of rotations, number of zooms etc. This allowed greater insight into any expertise differences in how participants responded to the different forms of repre-sentation. Fifty four participants were tested with 18 per expertise group, namely novices (with little of no experience of mountain 3 Naismith’s Rule provides a means of estimating route times in the hills, by taking into account both the distance to be walked and height to be climbed: Time (excluding rest breaks) (mins) = 12 x the distance walked (km) + 0.1 x the height climbed (m).
Comparing the effects of 2D and 3D representations on human wayfinding 169
environments), intermediates (casual weekend walkers), and experts (with extensive orienteering-style experience). A map was added to the experimental stimuli to meet the original plan to compare the effectiveness of 2D maps with 3D interactive models. The 12 terrain models of Scotland were used once again, and other materials and procedures were as before. Each participant viewed all twelve model/regions; four through sight of the map alone, four with the undraped model, and four with the contour map drape. The experiment adopted a repeated measures counter balanced design to ensure that each of the twelve model/regions was presented an equal number of times across participants as a map, undraped model, or contour map drape. This allowed a direct comparison of participants’ performance using 2D maps and 3D models generated from the same geospatial data. The average session time was ninety minutes.Although this work is incomplete one interesting observation can be made about the preparatory stage. It proved quite difficult to identify clearly defined expertise categories. For example some who claimed to be very regular hill walkers were also members of formal clubs or informal groups and, when questioned, it became evident that they rarely took any responsibility for, or participated in wayfinding decisions. Work on the main experiment is ongoing at the time of writing and preliminary results are not yet avail-able. When completed the data will be analysed to test a number of hypotheses concerning gradient estimation in different map and model conditions. Supporting information is more explicit in the terrain model/3D imagery than in the map and it is expected that the impact of this on performance may strongly interact with expertise.
4 ConclusionAlthough some research studies have been done on the value of animated and interactive terrain modelling in support of various tasks, most have not followed a strictly experimental approach. In view of the rapidly growing popularity of leisure walking (see walkingworld.com) and growing anecdotal evidence of the attractiveness and popularity of new animated and interactive carto-graphic products (e.g. Memory-Map, Anquet Maps), the authors of this paper advise that their nature and use should be examined with some scientific rigour. Only through such methods can a suitably rich and dependable source of empirical evidence be as-sembled which can be of value to:
1. Product designers seeking to assess the degree of realism or symbolic support required from the displays2. Psychologists seeking to extend their knowledge of visuo spatial cognition and mental imagery3. Those responsible for giving advice and training to different categories of mountain visitor4. Environmental managers and planners.
This could also lead to new and valuable Internet resources and further opportunities to offer advice and pass on information about techniques for planning leisure journeys and for use with PDAs (or new-generation mobile phones!) in the field. It is also hoped that when completed these experiments will contribute to a greater understanding of geovisualization methods in general.
5 AcknowledgementsThis project was supported by funding from the British Academy.
6 ReferencesDonald, M., (1991). Origins of the Modern Mind. Cambridge, Massachusetts, Harvard University Press. Eccles, D.W., Walsh, S.E., & Ingledew, D.K. (2002), A grounded theory of expert cognition in orienteering. Journal of Sport and Exercise Psychol-
ogy, 24(1), 68-88.Hafting, T., Fyhn, M., Molden, S., Moser, M-B and Moser, E.I., (2005), Microstructure of a spatial map in the entorhinal cortex. Nature, 436, 801-
806.MacEachren, A. & Kraak, M-J. (2001), Research challenges in Geovisualisation. Cartography and Geographic Information Science, 28(1)Moeser, S., (1988), Cognitive mapping in a complex building. Environment and Behavour, 20, 21-49.Moore, K., Dykes, J. Wood, J., (1999). Using Java to interact with geo-referenced VRML within a Virtual Field Course, Computers & Geosciences,
25, 1125-1136.Morrison, K.W. & Purves, R.S., (2001). Interactive, dynamic landscape visualisation over the web: an illustration utilising Java servlets and
VRML. In D.B. Kidner and G.Higgs (Eds.) Proceedings of 9th GISRUK Annual Conference, University of Glamorgan, April 2001, 202-206.Ottosson, T, (1996). Cognition in orienteering: Theoretical perspectives and methods of study. Scientific Journal of Orienteering, 12, 66-72.Scaife, M. & Rogers, Y. (1996). External cognition: how do graphical representations work? Internatiional Journal of Human-Computer Studies,
45, 185-213. Slocum, T., et al, (2001), Cognitive and usability issues in Geovisualisation. Cartography and Geographic Information Science, 28(1).Thorndyke, P.W. & Hayes-Roth, B. (1982). Differences in spatial knowledge acquired from maps and navigation. Cognitive Psychology, 14(4),
560-589.Wood, M., (2003). The mountain panorama and its significance in the Scottish context, Cartographica 38 (1 & 2), 103-118. Wood, M. (2000). Professor Heinrich C. Berann and his Methods. Proceedings of the Seminar, Mountain Cartography 2000, M. Buchroitner (Ed.)
Dresden University, 197-205.Wood, M. & McCrorie, I. (1993), Panorama maps: an old magic on a new digital plane. Proceedings of the 16th International cartographic Confer-
ence, Koln, Germany: 103-113Wood, M. & Goodwin, A. Harvey, (1995). Digital terrain models in tourism: an investigation into the development and use of computer-generated
3Dviews for route-finding in mountain areas. Proceedings of the 17th International Conference on Cartography, Barcelona, Catalunya.

Michael Wood, David G. Pearson, Colin Calder, David Miller, Alan Tinto170
Zimmer, H.D. (2001). How to optimise human wayfinding: a cognitive science approach to a user-adaptive design. Cognitive Processing, 2-3, 309-322.
URL1: Anquet Maps, www.anquet.co.ukURL2: Memory-map, www.memory-map.co.uk
COPYRIGHTFigure 1: Image © University of Aberdeen 2005, data © Crown Copyright/database right 2005. An Ordnance Survey/EDINA Digimap supplied
service.

An approach towards semantics-based navigation in 3D City Models on mobile devices
Jürgen Döllner, Benjamin Hagedorn, Steffen Schmidt
AbstractThis paper outlines a novel approach for user navigation in complex virtual 3D city models on mobile devices. Users navigate within the virtual 3D city model by sketching navigation commands in the perspective view on the mobile client. The sketches are sent to the server, which reprojects the sketches onto the 3D scene, interprets these sketches in terms of navigation commands, and sends the resulting video-encoded image stream to the mobile client. This approach allows us to provide interactivity for complex virtual 3D city models on resource and bandwidth limited mobile clients. A high degree of usability is achieved because users can trigger complex navigation commands in a task and goal oriented way taking advantage of the navigation properties and affor-dances inherent to elements of geovirtual environments.
1 MotivationVirtual 3D city models represent urban spatial and geo-referenced data by 3D geovirtual environments (GeoVE) that include terrain models, building models, vegetation models as well as models of roads and transportation systems. In general, these models serve to present, explore, analyze, and manage these urban information spaces and, therefore, constitute a major user-interface paradigm for 3D geoinformation systems. An increasing number of applications and systems incorporate virtual 3D city models as essential system components such as for facility management, logistics, security, telecommunication, disaster management, location-based services, real estate portals as well as entertainment and education products. Consequently, a large number of potential users and usages require an efficient and effective mobile access to virtual 3D city models and their contents.We present a novel solution for accessing virtual 3D city models on mobile devices. The user controls the navigation within the vir-tual 3D city model by navigation command sketches drawn directly on the view-plane of the mobile client (Fig. 1). The sketches are sent to the server, which reprojects the sketches onto the 3D scene correlating the sketches to scene objects, interprets these sketches in terms of navigation commands, and sends the resulting video-encoded image stream to the mobile client. That is, the mobile cli-ent enables users to specify and retrieve step-by-step created video sequences that correspond to their navigation intentions.
2 Related work and challenges of Mobile 3D City ModelsMobile applications of virtual 3D city models represent a major and complex research challenge due to limited bandwidth and graphics capabilities, restricted interaction capabilities, data standardizations and distribution techniques, and digital rights issues.
Fig. 1: Sketching the navigation command “look around” (left). Sketching the navigation command “walk along the path and, finally, look at the indicated building” (right).

Jürgen Döllner, Benjamin Hagedorn, Steffen Schmidt172
2.1 Mobile 3D renderingIn 3D computer graphics, numerous rendering techniques are available to cope with complex virtual environments, including discrete and continuous multi-resolution geometry and texture representations, view-frustum culling, occlusion culling, imposter techniques, and scene-graph optimizations (Akine-Möller and Haines 2002). Virtual 3D city model visualizations require an ef-ficient management of large-scale texture data, e.g., for aerial photography and building facades (Buchholz and Döllner 2005), and level-of-detail management for large heterogeneous 3D object collections (Davis et al. 1999) and 3D terrain surfaces (Döllner et al. 2000). Although these rendering techniques enable real-time rendering of complex 3D scenes, they generally cannot be transferred directly on mobile devices due to limited computational resources and power. One principal approach to efficient mobile 3D rendering consists in the adaptive, progressive, and compressed transmission of 3D graphics data to mobile clients. For example, Royan et al. (2003) describe client-server architecture for mobile 3D virtual city visu-alizations based on a progressive and hierarchical representation for GeoVEs. The server pre-computes multi-resolution representa-tions of terrain models and building models, and progressively sends data about visible areas to the mobile clients. The clients allow users to interact with the 3D city model (e.g., virtual walk-throughs, fly-overs, etc.). However, the limited 3D graphics acceleration on today’s mobile devices makes it difficult to implement fully featured 3D rendering techniques for virtual 3D city models. Fur-thermore, the implementation is complicated due to the broad variety of hardware and software solutions for mobile 3D graphics (e.g., OpenGL ES, Mobile 3D Graphics API for J2ME).Another principle solution consists in server-side 3D rendering and the progressive, compressed transmission of image sequences. For example, Cheng et al. (2004) investigate a client-server approach for visualizing complex 3D models on thin clients applying real-time MPEG-4 streaming to compress, transmit, and visualize rendered image sequences. They identify the MPEG-4 encoding speed as bottleneck of client-server 3D rendering, and devise a fast motion estimation process for the MPEG-4 encoding process.
2.2 Mobile 3D interactionTo achieve a high degree of usability, mobile applications require goal-oriented and task-oriented interaction techniques that take into account the specific restrictions of mobile devices, e.g., no mouse, no desk, or one-handed operation. For this reason, approach-es for automating user interaction are crucial for effective mobile user interaction. Of course, these approaches are also faced with the general problems of navigating in virtual worlds (Russo et al. 2000). A critical task in applications of GeoVE represents the process of navigation, “whereby people determine where they are, where everything else is, and how to get to particular objects or places” (Jul and Furnas 1997). Navigation as the primary interaction can be distinguished into three kinds, naive search, targeted search, and exploration (Darken and Sibert 1996) and serves to explore, analyze, and gather geoinformation as well as to trigger object-specific interaction. To do this, users generally move the virtual camera or an avatar through the GeoVE. This way the user builds up a mental model of the GeoVE by forming linear maps and combining them to spatial maps (Ingram and Benford 1995). Wernert and Hanson (1999) incorporate task-based constraints on the navigation parameters (e.g., viewer position and orientation) to enable the designer of GeoVE “to provide extra assistance to keep the user’s explorational wanderings and attention focused on the task objectives”. Common navigation controls for GeoVE include world-in-hand controls, fly-over controls, and virtual trackballs. Burtnyk et al. (2002) introduce a general approach of facilitating navigation in GeoVE based on explicitly designed navigation spaces using integrated spatial and temporal controls. Buchholz et al. (2005) describe a concept of smart and physically-based navigation tech-niques, controlling the user’s movement similar to an assistance system preserving users from being disoriented or getting lost in the GeoVE. It constrains the movements to be inside the GeoVE, hinders collisions with buildings, controls the gaze direction at the terrain borders, and facilitates the switch between navigation modes. For mobile applications, semantics-based navigation control can integrate and extend these concepts.Igarashi et al. (1998) develop an intuitive approach for specifying navigation commands: The user draws the intended navigation path as a curve on the view plane. This path is mapped to the 3D scene and determines the 3D path the avatar moves along. This way, the user can specify not only the final position, but also the route and the camera direction at the goal with a single stroke. Our approach also has been motivated by the metaphor-aware 3D navigation technique (Russo et al. 2000) and specialized for virtual 3D city models.
2.3 Standardization and distributionApplications of virtual 3D city models also suffer from a lack of data standards and flexible distribution techniques. Virtual 3D city models frequently are implemented as graphical models without explicitly modeling semantic and topological relations. Therefore, they can almost only be used for visualization purposes but not as a data basis for higher-level functionality such as simulations, analysis tasks, or spatial data mining. The limited reusability and interoperability inhibits the broader use of virtual 3D city models. CityGML represents a first XML and GML-based format for storing and exchanging virtual 3D city models (Kolbe et al. 2005), which also represents semantic and thematic properties, taxonomies and aggregations. With respect to distribution, a complete delivery of city model data would result in massive data transfers. Even if only a part of a complex virtual 3D city model is required (e.g., view-dependent multiresolution selections), the costs for geometry and texture data for high-quality photorealistic models typically exceed current and future transmission capabilities.

An approach towards semantics-based navigation in 3D City Models on mobile devices 173
2.4 Digital rights managementProtecting the contents of 3D city models is one of the most critical aspects of real-world business models underlying 3D city model applications (Döllner 2005). The transmission of raw city model data or derived detailed 3D graphics data imply severe drawbacks for copyright issues and controlling usage and distribution. For this reason, we transmit only video sequences but no raw data to the mobile clients.
3 Sketch-based navigation commands
3.1 Real-time interaction vs. selective interactionCommon navigation techniques allow users to control their movement within the virtual environment in real-time. For mobile de-vices, however, real-time 3D rendering of virtual 3D city models is not practically possible due to limited computation resources and bandwidth as well as the non-stable data transmission. In contrast to the real-time user reaction that characterizes most games taking place in virtual environments, real-time 3D interaction is not crucial for many applications and systems of virtual 3D city models because exploration and analysis tasks performed by users are based on a selective, targeted access of spatial information. That is, the delay between issuing interaction commands on the mobile device and the execution of the commands is acceptable and corresponds to the expectation of the user.
3.2 Concepts of sketch-based navigation In our approach, navigation commands are graphically specified in the perspective view of the virtual 3D city model on the mobile client, e.g., drawing a line along a street, pointing to a building or the sky. The sketches are correlated with the objects of the Ge-oVE by reprojecting the sketched shapes onto the 3D scene. The sketch-based navigation commands are interpreted based on the semantics of sketch-correlated objects and their inherent navigation affordances. We distinguish between three types of information used for interpreting the commands:
- Spatial context: The spatial context refers to the virtual location to which the sketch is aligned or associated. For example, the user can draw a path along a street or mark a specific building.
- Temporal context: The temporal context refers to the order in which the user composes the sketch elements. For example, as first step the user draws a path along a street, and then marks the building.
- Sketch geometry: The elements include points, lines, and polygons drawn in the perspective view. They can be grouped and interpreted by higher-level sketch geometry such as circle-like paths or u-like paths.
The sketches can be differentiated into location-aware sketches and gestures. Location-aware sketches refer to a spatial context, whereas gestures do not. From a technical point of view, gesture recognition requires large, screen-wide drawings for correct identi-fication. For example, a circle gesture cannot be drawn close to the corners of the screen. Gestures are known from computer games, from several navigation-aware applications, or as utility programs that can be used for desktop interaction. We allow for concatenating and building up a temporal context for the navigation command sketches. For high usability and con-sistency of the user interface it must be considered that sketches might a) represent a place to go to or a path to go along, b) mean one ore more points to gaze at, or c) conclude both, place and direction of view. By combining gestures with other sketches we can introduce spatial context to gestures, too (Fig. 2).
a) b)
c)
Fig. 2: The user sketches a point on a junction and adds a circle-like gesture as secondary input (a). In the resulting animation, the camera sinks down to the marked junction (b) and then performs a turn-around (c).
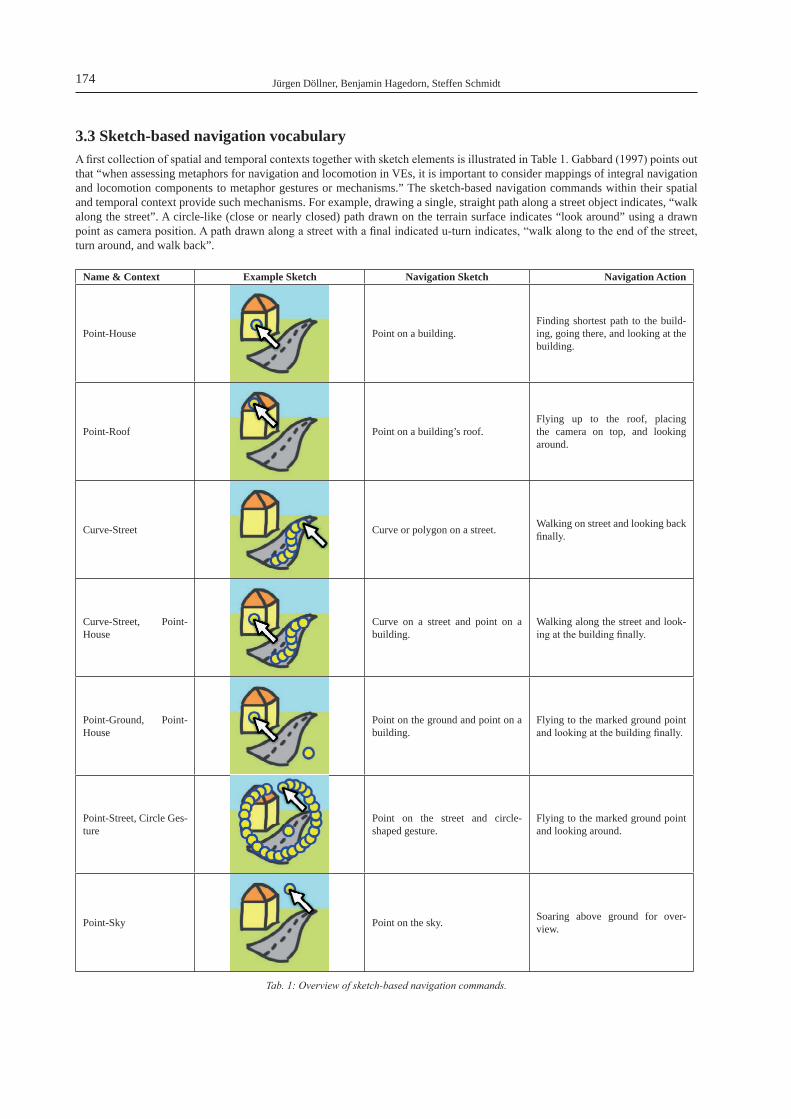
Jürgen Döllner, Benjamin Hagedorn, Steffen Schmidt174
3.3 Sketch-based navigation vocabulary A first collection of spatial and temporal contexts together with sketch elements is illustrated in Table 1. Gabbard (1997) points out that “when assessing metaphors for navigation and locomotion in VEs, it is important to consider mappings of integral navigation and locomotion components to metaphor gestures or mechanisms.” The sketch-based navigation commands within their spatial and temporal context provide such mechanisms. For example, drawing a single, straight path along a street object indicates, “walk along the street”. A circle-like (close or nearly closed) path drawn on the terrain surface indicates “look around” using a drawn point as camera position. A path drawn along a street with a final indicated u-turn indicates, “walk along to the end of the street, turn around, and walk back”.
Name & Context Example Sketch Navigation Sketch Navigation Action
Point-House Point on a building.Finding shortest path to the build-ing, going there, and looking at the building.
Point-Roof Point on a building’s roof.Flying up to the roof, placing the camera on top, and looking around.
Curve-Street Curve or polygon on a street. Walking on street and looking back finally.
Curve-Street, Point-House
Curve on a street and point on a building.
Walking along the street and look-ing at the building finally.
Point-Ground, Point-House
Point on the ground and point on a building.
Flying to the marked ground point and looking at the building finally.
Point-Street, Circle Ges-ture
Point on the street and circle-shaped gesture.
Flying to the marked ground point and looking around.
Point-Sky Point on the sky. Soaring above ground for over-view.
Tab. 1: Overview of sketch-based navigation commands.
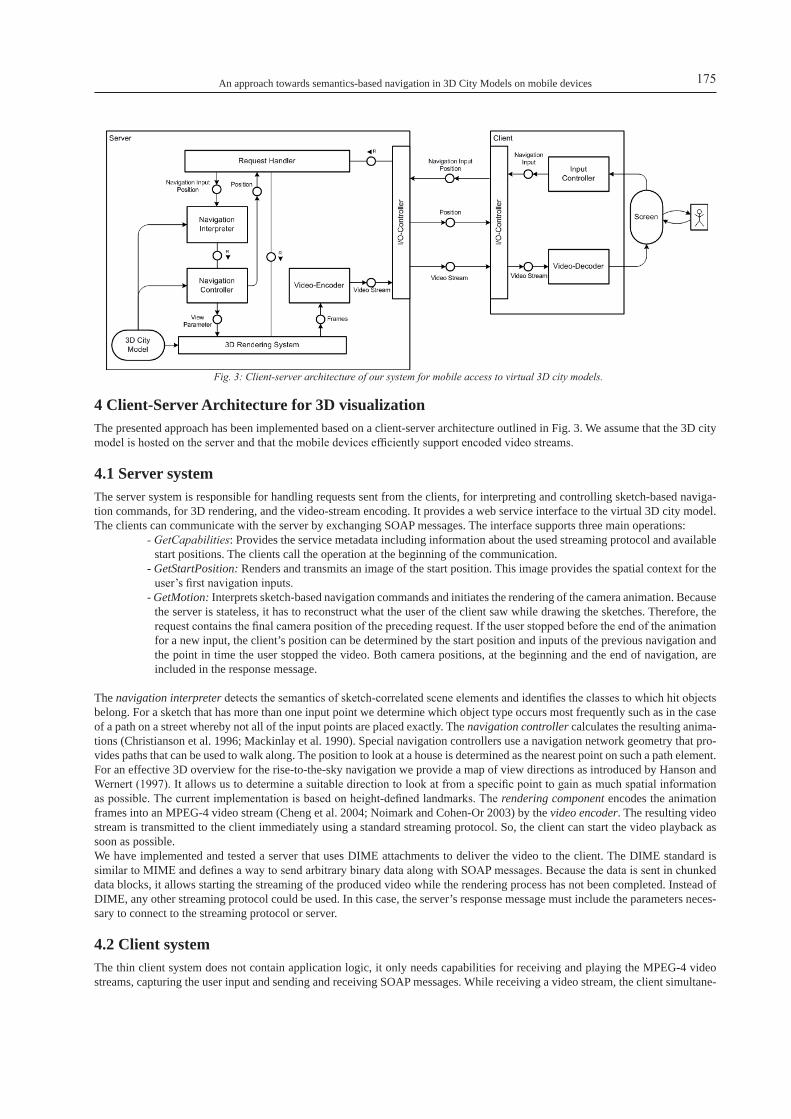
An approach towards semantics-based navigation in 3D City Models on mobile devices 175
4 Client-Server Architecture for 3D visualizationThe presented approach has been implemented based on a client-server architecture outlined in Fig. 3. We assume that the 3D city model is hosted on the server and that the mobile devices efficiently support encoded video streams.
4.1 Server system The server system is responsible for handling requests sent from the clients, for interpreting and controlling sketch-based naviga-tion commands, for 3D rendering, and the video-stream encoding. It provides a web service interface to the virtual 3D city model. The clients can communicate with the server by exchanging SOAP messages. The interface supports three main operations:
- GetCapabilities: Provides the service metadata including information about the used streaming protocol and available start positions. The clients call the operation at the beginning of the communication.
- GetStartPosition: Renders and transmits an image of the start position. This image provides the spatial context for the user’s first navigation inputs.
- GetMotion: Interprets sketch-based navigation commands and initiates the rendering of the camera animation. Because the server is stateless, it has to reconstruct what the user of the client saw while drawing the sketches. Therefore, the request contains the final camera position of the preceding request. If the user stopped before the end of the animation for a new input, the client’s position can be determined by the start position and inputs of the previous navigation and the point in time the user stopped the video. Both camera positions, at the beginning and the end of navigation, are included in the response message.
The navigation interpreter detects the semantics of sketch-correlated scene elements and identifies the classes to which hit objects belong. For a sketch that has more than one input point we determine which object type occurs most frequently such as in the case of a path on a street whereby not all of the input points are placed exactly. The navigation controller calculates the resulting anima-tions (Christianson et al. 1996; Mackinlay et al. 1990). Special navigation controllers use a navigation network geometry that pro-vides paths that can be used to walk along. The position to look at a house is determined as the nearest point on such a path element. For an effective 3D overview for the rise-to-the-sky navigation we provide a map of view directions as introduced by Hanson and Wernert (1997). It allows us to determine a suitable direction to look at from a specific point to gain as much spatial information as possible. The current implementation is based on height-defined landmarks. The rendering component encodes the animation frames into an MPEG-4 video stream (Cheng et al. 2004; Noimark and Cohen-Or 2003) by the video encoder. The resulting video stream is transmitted to the client immediately using a standard streaming protocol. So, the client can start the video playback as soon as possible.We have implemented and tested a server that uses DIME attachments to deliver the video to the client. The DIME standard is similar to MIME and defines a way to send arbitrary binary data along with SOAP messages. Because the data is sent in chunked data blocks, it allows starting the streaming of the produced video while the rendering process has not been completed. Instead of DIME, any other streaming protocol could be used. In this case, the server’s response message must include the parameters neces-sary to connect to the streaming protocol or server.
4.2 Client systemThe thin client system does not contain application logic, it only needs capabilities for receiving and playing the MPEG-4 video streams, capturing the user input and sending and receiving SOAP messages. While receiving a video stream, the client simultane-
Fig. 3: Client-server architecture of our system for mobile access to virtual 3D city models.

Jürgen Döllner, Benjamin Hagedorn, Steffen Schmidt176
ously decodes and displays the video. Most mobile devices provide built-in support for these tasks. For drawing new navigation sketches, the user can wait for the end of the video or he can stop it at any point of time.The client records the user inputs as a set of 2D points representing the screen coordinates of the navigation sketches. The temporal context of the input can be determined by the drawing order of the points and the classification of single sketches.
5 ConclusionsWe have presented an approach towards semantics-based navigation control for mobile virtual 3D city models. A high degree of usability is achieved because sketch-based navigation commands allow users to trigger effectively complex navigation intentions taking advantage of the navigation properties and affordances inherent to elements of geovirtual environments. In addition, it is per-fectly suited for the input devices and usage situation of mobile devices where generally no mouse and no desktop can be assumed. From a technical perspective, the presented approach allows mobile applications to provide users interactive access to complex 3D city models including high-resolution 3D terrain geometry, 3D building geometry, and textures exceeding several hundreds of GB of storage. In particular, the server can be optimized for processing large-scale 3D city models using high-end computer graphics hardware, whereas only multimedia capabilities are required from the mobile client.In our future work, we will address general sketch-based interaction commands and visual feedbacks about the automated naviga-tion. We also plan to include in the video stream meta-information about the scene and its objects.
6 ReferencesT. Akenine-Möller and E. Haines, “Real-Time Rendering”, 2nd Ed., A K Peters, 2002.H. Buchholz, J. Bohnet, and J. Döllner, “Smart and Physically-Based Navigation in 3D Geovirtual Environments”, IEEE Information Visualisation,
London, 2005. H. Buchholz and J. Döllner, “View-Dependent Rendering of Multiresolution Texture Atlases”, Proc. IEEE Visualization, IEEE CS Press, 2005, to
appear.N. Burtnyk, A. Khan, G. Fitzmaurice, R. Balakrishnan, and G. Kurtenbach, “StyleCam: Interactive Stylized 3D Navigation using Integrated Spatial
& Temporal Controls”, Proceedings of the ACM Symposium on User Interface Software and Technology, 2002, pp. 101-110. L. Cheng, A. Bhushan, R. Pajarola, and M. El Zarki, “Real-Time 3D Graphics Streaming using MPEG-4”, BroadWise ’04, San Jose, CA, USA,
July 2004.D.B. Christianson, S.E. Anderson, L. He, D.H. Salesin, D.S. Weld, and M.F. Cohen, “Declarative Camera Control for Automatic Cinematography”,
Proceedings of AAAI ‘96 (Portland, OR), 1996, pp. 148-155.R.P. Darken and J.L. Sibert, ”Wayfinding Strategies and Behaviors in Large Virtual Worlds”, Proceedings of ACM SIGCHI 96, 1996, pp. 142-
149.D. Davis, W. Ribarsky, T.Y. Jiang, N. Faust, and S. Ho, “Real-Time Visualization of Scalably Large Collections of Heterogeneous Objects”, Pro-
ceedings of IEEE Visualization 1999, pp. 437-440.J. Döllner, “Constraints as Means of Controlling Usage of Geovirtual Environments”, Cartography and Geographic Information Science, 2005,
32(2):69-79.J. Döllner, K. Baumann, and K. Hinrichs, “Texturing Techniques for Terrain Visualization”, Proc. IEEE Visualization 2000, IEEE CS Press, 2000,
pp. 207-234.J.L. Gabbard, “A Taxonomy of Usability Characteristics in Virtual Environments”, Technical Report, Virginia Polytechnic Institute and State Uni-
versity, 1997. A.J. Hanson and E.A. Wernert, “Constrained 3D Navigation with 2D Controllers”, IEEE, Proceedings on the Conference on Visualization, 1997,
pp. 175-183.T. Igarashi, R. Kadobayashi, K. Mase, and H. Tanaka, “Path Drawing for 3D Walkthrough”, 11th Annual Symposium on User Interface Software
and Technology, ACM UIST’98, San Francisco, November 1998, pp.173-174.R. Ingram and S. Benford, ”Legability Enhancement for Information Visualization”, Proceedings of IEEE Visualization 1995, pp. 209-216. S. Jul and G.W. Furnas, “Navigation in Electronic Worlds: A CHI 97 Workshop”, ACM SIGCHI Bulletin, Vol. 29, No. 4, October 1997, pp. 44-
49.T.H. Kolbe, G. Gröger, and L. Plümer, “CityGML - Interoperable Access to 3D City Models”, International Symposium on Geoinformation for
Disaster Management, 2005.J.D. Mackinlay, S.K. Card, and G.G. Robertson, “Rapid Controlled Movement Through a Virtual 3D Workspace”, Proceedings of SIGGRAPH ‘90,
August 1990, 24(4):171-176.Y. Noimark and D. Cohen-Or, “Streaming Scenes to MPEG-4 Video-enabled Devices”, IEEE Computer Graphics and Applications, Jan/Feb 2003,
23(1):58-64.J. Royan, C. Bouville, and P. Gioia, “PBTree - A New Progressive and Hierarchical Representation for Network-Based Navigation in Urban Envi-
ronments”, Proc. Vision Modeling Visualization (VMV 2003), pp. 299-307.C. Russo dos Santos, P. Gros, P. Abel, D. Loisel, N. Trichaud, and J.-P. Paris, “Metaphor-Aware 3D Navigation”, InfoVis’2000, IEEE Symposium
on Information Visualization, Salt Lake City, October 2000, p. 155.E.A. Wernert and A.J. Hanson, “A Framework for Assisted Exploration with Collaboration”, Proc. IEEE Visualization, 1999, pp. 241-248.
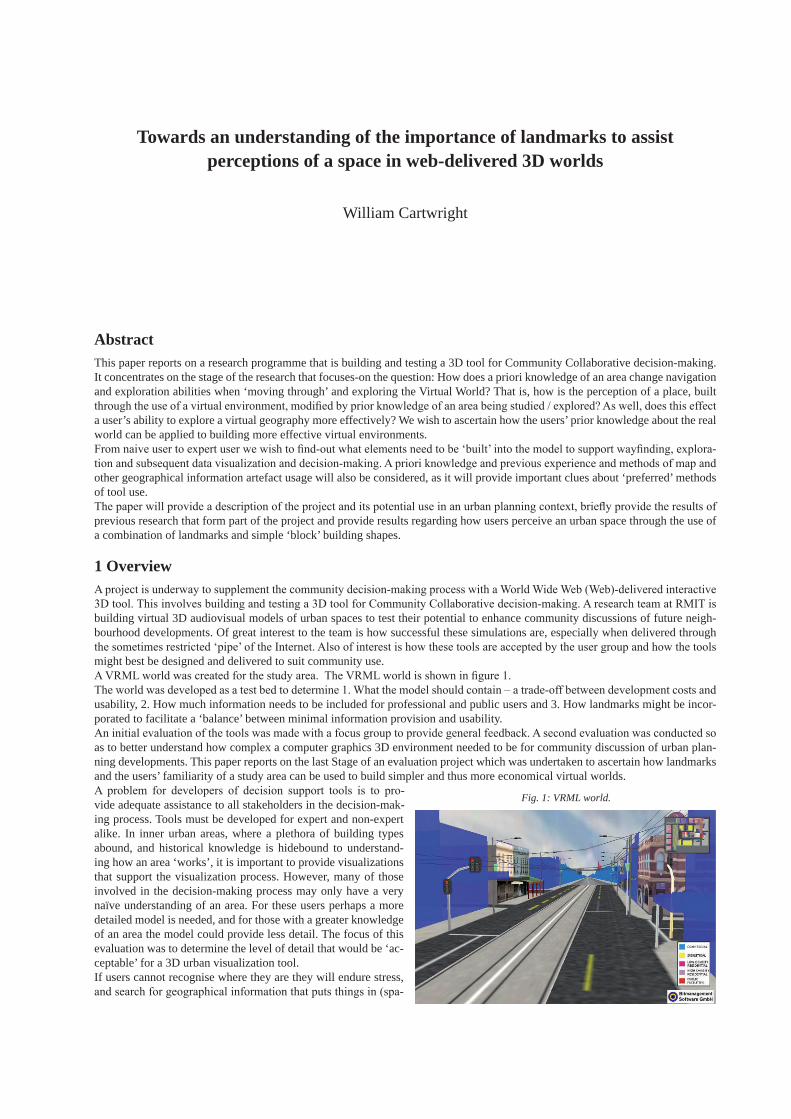
Towards an understanding of the importance of landmarks to assist perceptions of a space in web-delivered 3D worlds
William Cartwright
AbstractThis paper reports on a research programme that is building and testing a 3D tool for Community Collaborative decision-making. It concentrates on the stage of the research that focuses-on the question: How does a priori knowledge of an area change navigation and exploration abilities when ‘moving through’ and exploring the Virtual World? That is, how is the perception of a place, built through the use of a virtual environment, modified by prior knowledge of an area being studied / explored? As well, does this effect a user’s ability to explore a virtual geography more effectively? We wish to ascertain how the users’ prior knowledge about the real world can be applied to building more effective virtual environments.From naive user to expert user we wish to find-out what elements need to be ‘built’ into the model to support wayfinding, explora-tion and subsequent data visualization and decision-making. A priori knowledge and previous experience and methods of map and other geographical information artefact usage will also be considered, as it will provide important clues about ‘preferred’ methods of tool use.The paper will provide a description of the project and its potential use in an urban planning context, briefly provide the results of previous research that form part of the project and provide results regarding how users perceive an urban space through the use of a combination of landmarks and simple ‘block’ building shapes.
1 OverviewA project is underway to supplement the community decision-making process with a World Wide Web (Web)-delivered interactive 3D tool. This involves building and testing a 3D tool for Community Collaborative decision-making. A research team at RMIT is building virtual 3D audiovisual models of urban spaces to test their potential to enhance community discussions of future neigh-bourhood developments. Of great interest to the team is how successful these simulations are, especially when delivered through the sometimes restricted ‘pipe’ of the Internet. Also of interest is how these tools are accepted by the user group and how the tools might best be designed and delivered to suit community use. A VRML world was created for the study area. The VRML world is shown in figure 1.The world was developed as a test bed to determine 1. What the model should contain – a trade-off between development costs and usability, 2. How much information needs to be included for professional and public users and 3. How landmarks might be incor-porated to facilitate a ‘balance’ between minimal information provision and usability.An initial evaluation of the tools was made with a focus group to provide general feedback. A second evaluation was conducted so as to better understand how complex a computer graphics 3D environment needed to be for community discussion of urban plan-ning developments. This paper reports on the last Stage of an evaluation project which was undertaken to ascertain how landmarks and the users’ familiarity of a study area can be used to build simpler and thus more economical virtual worlds.A problem for developers of decision support tools is to pro-vide adequate assistance to all stakeholders in the decision-mak-ing process. Tools must be developed for expert and non-expert alike. In inner urban areas, where a plethora of building types abound, and historical knowledge is hidebound to understand-ing how an area ‘works’, it is important to provide visualizations that support the visualization process. However, many of those involved in the decision-making process may only have a very naïve understanding of an area. For these users perhaps a more detailed model is needed, and for those with a greater knowledge of an area the model could provide less detail. The focus of this evaluation was to determine the level of detail that would be ‘ac-ceptable’ for a 3D urban visualization tool.If users cannot recognise where they are they will endure stress, and search for geographical information that puts things in (spa-
Fig. 1: VRML world.

William Cartwright178
tial) perspective (eg finding their bearings, orientation to north etc.). According to Golledge (2000, p. 1) “We often assume there is no need to learn this type of geography because we already “know” it! And, we have not bothered to make this underlying geog-raphy explicit. Golledge thinks that naïve geography gives an implicit knowledge via environmental perception and that landmark or feature recognition and an awareness of the built environment is part of geographical understanding. He says that “People who claim they ‘can’t do’ geography can provide accurate assessments of their local area. …“Users ‘already know it” (Golledge, 2000, p. 1). For example, aspects of the geography of daily life that we “implicitly “know” but have not bothered to make the underly-ing geography explicit (ibid, p. 7). Naïve geography gives an implicit knowledge via environmental perception, through the use of landmark or feature recognition (op cit.).Navigating in the real world can be difficult for users who need to travel through unfamiliar terrain. This difficulty is enlarged when they have little local knowledge of an area as well. When users have to navigate in virtual worlds the problems can be different, but still certain ‘knowledge’ of landscapes could assist with wayfinding in this synthetic reality. So, what happens when inexperienced users are ‘plunged’ into a virtual world, and asked to explore and understand a geography they may not properly understand? And, how do they best navigate through this world? When users wayfind and explore in Virtual Worlds severe problems do exist (Darken and Sibert, 1996). Without cues users can become disoriented and may not be able to properly use a virtual environment package. According to Darken and Sibert, wayfinding strategies and behaviours are strongly influenced by environmental cues. In the type of environment that is being simulated – an inner urban environment, consisting of a diverse range of building types and differ-ent densities – the environmental cues are mainly buildings, with few other cues or landmarks to assist location determination and wayfinding (in the virtual world). Knowing about an environment prior to undertaking a study using a virtual environment can make it easier to interpret n urban simulation. Conversely, little knowledge of an area can make it very difficult to visualize a real space by using a synthesis of it. Therefore, does a done model need to be provided for a user who is knowledgeable about an area and another to someone unfamiliar with that area?What this stage of the research focusses-on is the question: How does a priori knowledge of an area change navigation and explora-tion abilities when ‘moving through’ and exploring the Virtual World? That is, how is the perception of a place, built through the use of a virtual environment, modified by prior knowledge of an area being studied / explored? As well, does this effect a user’s ability to explore a virtual geography more effectively? We wish to ascertain how the users’ prior knowledge about the real world can be applied to building more effective virtual environments.From naive user to expert user we wish to find-out what elements need to be ‘built’ into the model to support wayfinding, explora-tion and subsequent data visualization and decision-making. A priori knowledge and previous experience and methods of map and other geographical information artefact usage will also be considered, as it will provide important clues about ‘preferred’ methods of tool use.We are interested in ascertaining the users’ Spatial Knowledge (Darken and Sibert, 1996), which is based on survey knowledge – the ability to conceptualise a space as a whole, enhancing wayfinding skills (Thorndyke and Goldin, 1983, cited in Darken and Sibert, 1996). This is different from procedural knowledge (defined as the sequence of actions required to follow a particular route). It can be acquired from map use and it is also based on landmark knowledge (static information about the visual details of a specific location (Darken and Sibert, 1996).The evaluation was based on the three primary wayfinding tasks specified by Darken and Sibert (1996). These are:
- Naïve search – where the navigator has no a priori knowledge of the whereabouts of the target, requiring an exhaus-tive search;
- Primed search – where the navigator knows the location of the target, performing a non-exhaustive search; and- Exploration – where there is no target.
The naïve search, as Darken and Sibert note, is rare in the real world, but common with first-time users of a virtual space. Naive search will therefore rely on certain wayfinding aids to support their movement through the virtual world. Darken and Sibert (1996, p. 4) proposed that the basic principles of organising an environment to support wayfinding were to:
1. Divide the large-scale world into small, distinct small parts, preserving a sense of ‘place’;2. Organise the small parts under a simple organisational principle; and3. Provide frequent directional cues.
They also recommended that map design principles should be applied to the model, providing an orientation-independent repre-sentation of the environment. This entails:
- Showing all organisational elements, roads, landmarks, districts, etc.) and the organisational principle;- Indicating the observer’s position; and- Orient the model with regard to the ‘forward-up’ equivalence of map reading (ie having the ‘forward’ direction of travel
aligned with the map).
The last requirement demands interesting ‘cartographic callisthenics’, as maps are rotated this way and that, so that the map is oriented with the forward direction of travel, with the final destination being always placed furthermost from the user’s body. But, when moving / navigating through virtual worlds this is done automatically as the user is unable to rotate the screen. It is argued that this would impose a greater cognitive load.

Towards an understanding of the importance of landmarks to assist perceptions of a space in web-delivered 3D worlds 179
This stage of the evaluation process will have as its goal the determination of what users need to know or understand about SPACE (general information about the ‘area’ being studied) and PLACE (dictated / determined by location and purpose-specific elements that are unique to the particular user and their usage requirements). What needed to be resolved were
- users’ concepts of space;- their concept of place;- how they navigate through space; and- how they navigate through their personal place.
2 Evaluation29 candidates participated in the evaluation. Their age range was 18-25 and all had competent to efficient map use skills. The test candidates were split into two groups: Group 1 - identified as having a priori knowledge of the area. 12 candidates were identified as belonging to this group. Group 2 had relatively no knowledge of the area.. 17 candidates belonged to this group. Then each of these groups was further split into two sub-groups: Group 1a and 1b, Group 2a and 2b. The Candidates first completed a profile proforma to glean information about their proficiency in map and map-related tool use and also their perceived knowledge of the area.The session operated thus:
1. Groups 1a and 2a were taken on a ‘guided tour’ of the area. 2. During this time Groups 1b and 2b undertook the evaluation / feedback of the VRML model.
This took approximately 1 hour.Then this process was reversed.
3. Groups 1b and 2b were taken on a ‘guided tour’ of the area. 4. During this time Groups 1a and 2a undertook the evaluation / feedback of the VRML model.
GROUP
1. Local Knowledge 2. No Local Knowledge
1a Tour 1 1b Tour 2 2a Tour 2b Tour 2
Fig. 2: Groups
Candidates were asked to conduct two searches of the 3D model of the study area, one as a general ‘exploration’ of the area and the other a task-related search. In the task-related search they were required to find specific buildings that are typical in the study area. These searches will be 1. Naïve (the candidates had no knowledge about where they were located) and 2. Primed (they knew the area after a walking tour prior to the evaluation). Here they were asked to view two ‘virtual tours’ of the study area, one as a general ‘exploration’ of the area and the other a task-related search. In the task-related search users were asked to identify the dif-ferent building types that are typical in the study area. Here they were also asked to note the buildings that you think are the key, or landmark buildings.
Fig. 3: VRML model.
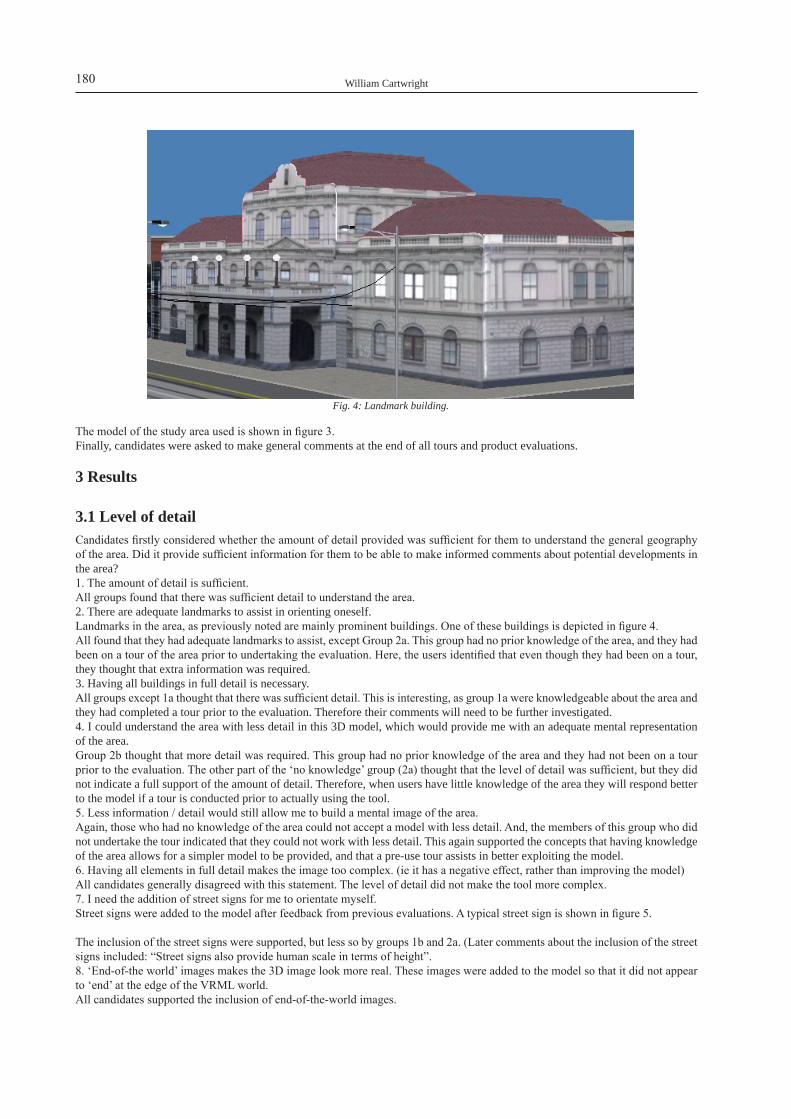
William Cartwright180
The model of the study area used is shown in figure 3.Finally, candidates were asked to make general comments at the end of all tours and product evaluations.
3 Results
3.1 Level of detailCandidates firstly considered whether the amount of detail provided was sufficient for them to understand the general geography of the area. Did it provide sufficient information for them to be able to make informed comments about potential developments in the area?1. The amount of detail is sufficient.All groups found that there was sufficient detail to understand the area. 2. There are adequate landmarks to assist in orienting oneself.Landmarks in the area, as previously noted are mainly prominent buildings. One of these buildings is depicted in figure 4.All found that they had adequate landmarks to assist, except Group 2a. This group had no prior knowledge of the area, and they had been on a tour of the area prior to undertaking the evaluation. Here, the users identified that even though they had been on a tour, they thought that extra information was required.3. Having all buildings in full detail is necessary.All groups except 1a thought that there was sufficient detail. This is interesting, as group 1a were knowledgeable about the area and they had completed a tour prior to the evaluation. Therefore their comments will need to be further investigated.4. I could understand the area with less detail in this 3D model, which would provide me with an adequate mental representation of the area.Group 2b thought that more detail was required. This group had no prior knowledge of the area and they had not been on a tour prior to the evaluation. The other part of the ‘no knowledge’ group (2a) thought that the level of detail was sufficient, but they did not indicate a full support of the amount of detail. Therefore, when users have little knowledge of the area they will respond better to the model if a tour is conducted prior to actually using the tool.5. Less information / detail would still allow me to build a mental image of the area.Again, those who had no knowledge of the area could not accept a model with less detail. And, the members of this group who did not undertake the tour indicated that they could not work with less detail. This again supported the concepts that having knowledge of the area allows for a simpler model to be provided, and that a pre-use tour assists in better exploiting the model.6. Having all elements in full detail makes the image too complex. (ie it has a negative effect, rather than improving the model)All candidates generally disagreed with this statement. The level of detail did not make the tool more complex.7. I need the addition of street signs for me to orientate myself.Street signs were added to the model after feedback from previous evaluations. A typical street sign is shown in figure 5.
The inclusion of the street signs were supported, but less so by groups 1b and 2a. (Later comments about the inclusion of the street signs included: “Street signs also provide human scale in terms of height”.8. ‘End-of-the world’ images makes the 3D image look more real. These images were added to the model so that it did not appear to ‘end’ at the edge of the VRML world.All candidates supported the inclusion of end-of-the-world images.
Fig. 4: Landmark building.
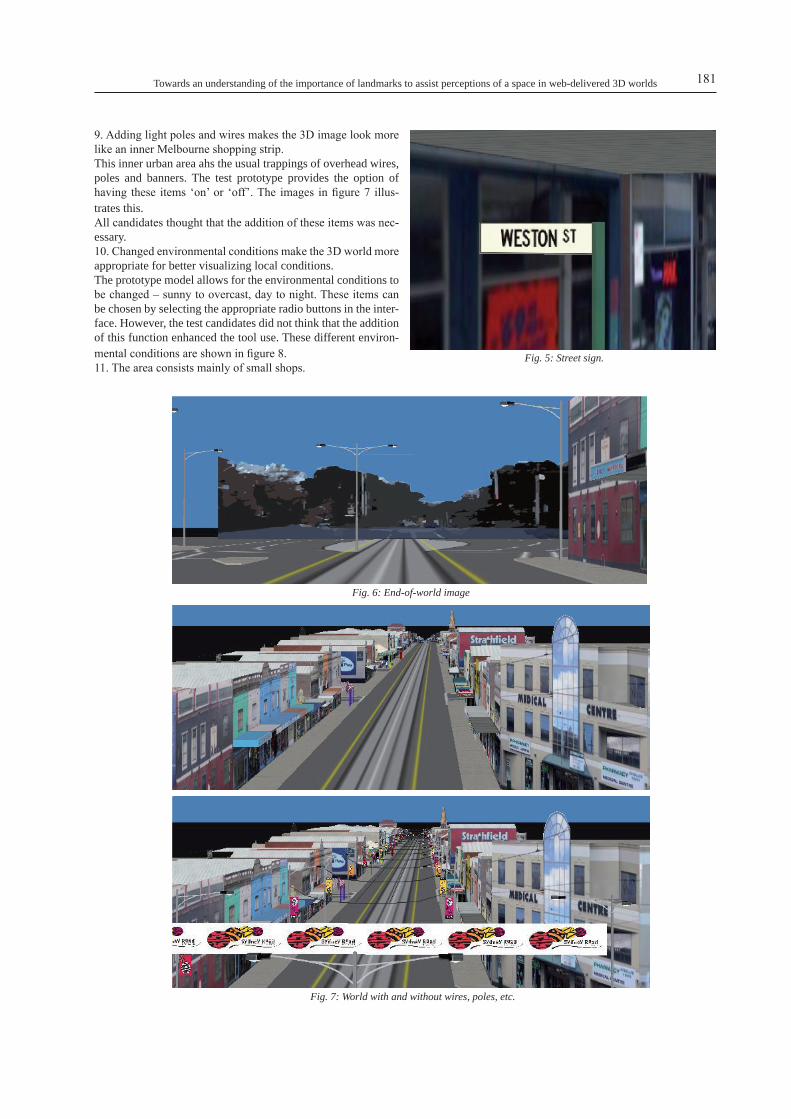
Towards an understanding of the importance of landmarks to assist perceptions of a space in web-delivered 3D worlds 181
9. Adding light poles and wires makes the 3D image look more like an inner Melbourne shopping strip.This inner urban area ahs the usual trappings of overhead wires, poles and banners. The test prototype provides the option of having these items ‘on’ or ‘off’. The images in figure 7 illus-trates this.All candidates thought that the addition of these items was nec-essary.10. Changed environmental conditions make the 3D world more appropriate for better visualizing local conditions.The prototype model allows for the environmental conditions to be changed – sunny to overcast, day to night. These items can be chosen by selecting the appropriate radio buttons in the inter-face. However, the test candidates did not think that the addition of this function enhanced the tool use. These different environ-mental conditions are shown in figure 8.11. The area consists mainly of small shops.
Fig. 5: Street sign.
Fig. 6: End-of-world image
Fig. 7: World with and without wires, poles, etc.

William Cartwright182
All candidates thought that this was the general concept of the area, both before and after the tour. Group 2a thought that the area consisted of more than ‘just shops’. This perception of the area was considered in the next question. 12. The area consists of shops and some significant buildings.All candidates agreed with this statement. Therefore, it is thought that all of these elements must be provided in the model.A summary of the results from the evaluations is provided in the following table (table 1).
Group 1 Group 2
No. Questions a b a b
1 The amount of detail is sufficient.
2 There are adequate landmarks to assist me in orienting myself.
3 Having all buildings in full detail is necessary.
4 I could understand the area with less detail in this 3D model, providing me with an adequate mental representation of the area.
5 Less information/detail would still allow me to build a mental image of the area
6 Having all elements in full detail makes the image too complex. (i.e. it has a negative effect, rather than improving the model)
7 I need the addition of street signs for me to orientate myself.
8 ‚End-of-the-world‘ images makes the 3D image look more real.
Fig. 8: From top: during the day and sunny, overcast and at night.
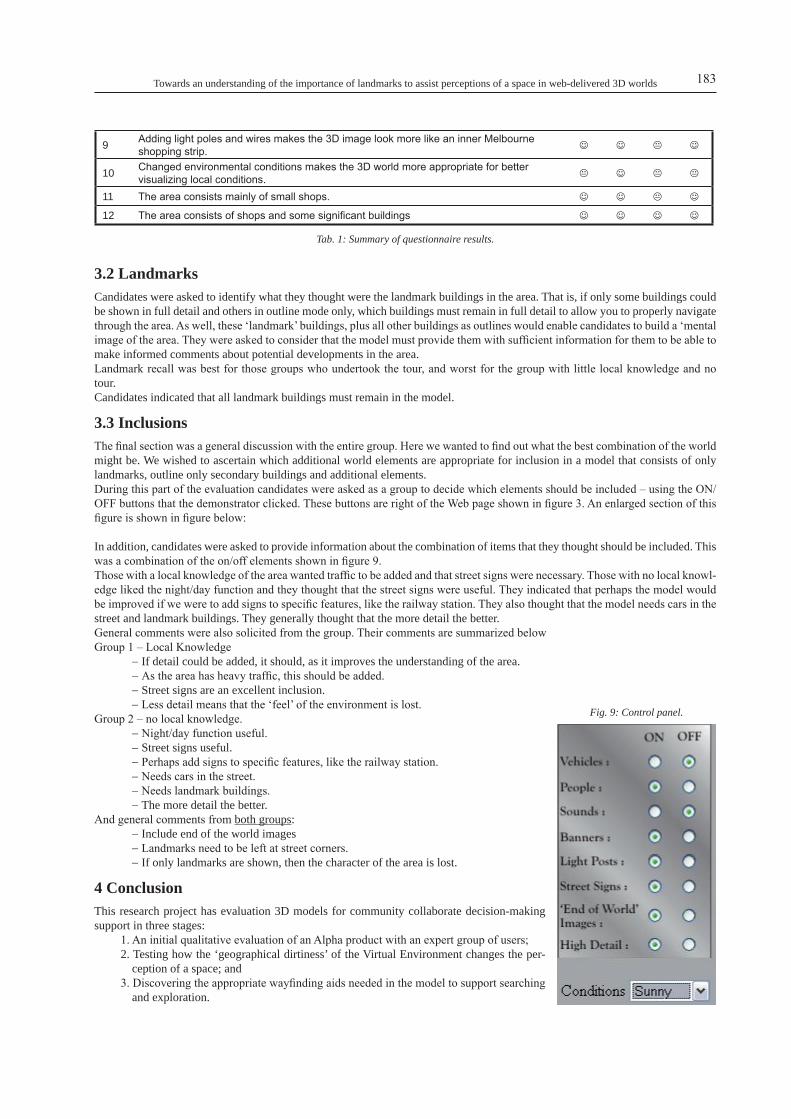
Towards an understanding of the importance of landmarks to assist perceptions of a space in web-delivered 3D worlds 183
9 Adding light poles and wires makes the 3D image look more like an inner Melbourne shopping strip.
10 Changed environmental conditions makes the 3D world more appropriate for better visualizing local conditions.
11 The area consists mainly of small shops.
12 The area consists of shops and some significant buildings
Tab. 1: Summary of questionnaire results.
3.2 LandmarksCandidates were asked to identify what they thought were the landmark buildings in the area. That is, if only some buildings could be shown in full detail and others in outline mode only, which buildings must remain in full detail to allow you to properly navigate through the area. As well, these ‘landmark’ buildings, plus all other buildings as outlines would enable candidates to build a ‘mental image of the area. They were asked to consider that the model must provide them with sufficient information for them to be able to make informed comments about potential developments in the area.Landmark recall was best for those groups who undertook the tour, and worst for the group with little local knowledge and no tour. Candidates indicated that all landmark buildings must remain in the model.
3.3 InclusionsThe final section was a general discussion with the entire group. Here we wanted to find out what the best combination of the world might be. We wished to ascertain which additional world elements are appropriate for inclusion in a model that consists of only landmarks, outline only secondary buildings and additional elements.During this part of the evaluation candidates were asked as a group to decide which elements should be included – using the ON/OFF buttons that the demonstrator clicked. These buttons are right of the Web page shown in figure 3. An enlarged section of this figure is shown in figure below:
In addition, candidates were asked to provide information about the combination of items that they thought should be included. This was a combination of the on/off elements shown in figure 9.Those with a local knowledge of the area wanted traffic to be added and that street signs were necessary. Those with no local knowl-edge liked the night/day function and they thought that the street signs were useful. They indicated that perhaps the model would be improved if we were to add signs to specific features, like the railway station. They also thought that the model needs cars in the street and landmark buildings. They generally thought that the more detail the better.General comments were also solicited from the group. Their comments are summarized belowGroup 1 – Local Knowledge
- If detail could be added, it should, as it improves the understanding of the area.- As the area has heavy traffic, this should be added.- Street signs are an excellent inclusion.- Less detail means that the ‘feel’ of the environment is lost.
Group 2 – no local knowledge.- Night/day function useful.- Street signs useful.- Perhaps add signs to specific features, like the railway station.- Needs cars in the street.- Needs landmark buildings.- The more detail the better.
And general comments from both groups:- Include end of the world images- Landmarks need to be left at street corners.- If only landmarks are shown, then the character of the area is lost.
4 ConclusionThis research project has evaluation 3D models for community collaborate decision-making support in three stages:
1. An initial qualitative evaluation of an Alpha product with an expert group of users; 2. Testing how the ‘geographical dirtiness’ of the Virtual Environment changes the per-
ception of a space; and3. Discovering the appropriate wayfinding aids needed in the model to support searching
and exploration.
Fig. 9: Control panel.

William Cartwright184
This paper has reported on the last of these stages. It focussed-on two questions: 1. What is the minimum number of landmark buildings that should be included in the model so that it provides adequate information about the area? And, how does a priori knowledge of an area change navigation and exploration abilities when ‘moving through’ and exploring the Virtual World? That is, how is the perception of a place, built through the use of a virtual environment, modified by prior knowledge of an area being studied / explored? The study was done with two evaluation groups – one with knowledge of the area and another without this knowledge. As well, tours of the area were conducted to ascertain the trade-off between time taken to tour the area and the time involved in further enhancing the model. The results reported in this paper will be used to further enhance the model and to make it more useful for community groups in-volved in ‘grassroots’ planning deliberations.
5 ReferencesCartwright, W. E., Pettit, C., Nelson, A. and Berry, M., 2004, “Building community collaborative decision-making tools based on the concepts of
naive geography”, GIScience 2004, Washington, D. C., USA: Association of American Geographers.Darken, R. P. and Sibert, J. L., 1996, “Wayfinding Strategies and Behaviours in Large Virtual Worlds, CHI96 Electronic Proceedings, http://www.acm.org/sigchi/chi96/proceedings/papers/Darken/Rpd_txt.htm, Web page accessed November 1, 2000.Golledge, R., 2000, “Geography and Everyday Life”, Directions Magazine, http://www.directionsmag.com/columns.php?column_id=37, 14pp,
Web page accessed 14 May 2004.Thorndyke, P. W. and Goldin, S. E., 1983, “Spatial Learning and Reasoning Skills”, in: Spatial Orientation: Theory, Research and Application, H.
L. Pick and L. P. Acredolo (eds.), New York: Plenum Press, pp. 195 – 217.

The third dimension in LBS: the steps to go
Sisi Zlatanova, Edward Verbree
AbstractComputer technology has evolved to a position of being able to handle large three-dimensional (3D) data sets. The third dimension is already taken for granted for visualisation on desktop machines. Nasa World Wind and Google Earth demonstrate the possibili-ties of 3D to all users of the Web. The same way, mobile computing is experiencing a similar evolution. Despite the fact that 3D mobile hardware and software technologies are currently still behind desktop 3D in terms of capabilities, the expectations are for 2-3 times faster maturing. Are the geo-specials ready to step into the third dimension?Location-based services (LBS) are among the first applications that naturally should consider the third dimension. In this paper we analyze the readiness for 3D LBS. The paper concludes on the role of the geo-specialist in this process.
1 IntroductionLocation Based Services (LBS) are often referred to as ‘location-dependent’ GIS. Starting form this point, the analogy between 3D GIS and 3D LBS is quite straightforward. LBS have two more components compared to GIS: position determination and wireless communication. The simplest, trivial way of position determination is using global navigation satellite system. The accuracy and reliability of 3D satellite positioning has improved drastically in the last several years and the GPS receivers have become cheaper and affordable for everyday use. The bandwidth of the communications also increases. In many countries UMTS is already opera-tional, which promises sufficient speed for transmissions of 3D data (often resulting in large amounts). What are then the bottle-necks for 3D LBS?Open Geospatial Consortium (OGC) has prepared Location Services (OpenLS) Implementation Specifications for core services. In these specifications, the role of ‘GeoMobility Server’ is providing requested information considering the location of the user. The minimum number of services is also defined as directory, navigation (route), location utility, gateway and presentation (see Figure 1). The five core services are considered sufficient for a variety of use cases such as proximity (find something in a given area), fencing (alert users in a given area), navigation (compute route) and tracking (‘record’ the way a user) as specified in Torg et al 2005. 3D LBS have to be able to ensure the same set of services, i.e. proximity, fencing, routing and tracking but in 3D. Example of 3D requests would be ‘show to me all the electrical switches in a building’ (proximity) (see Figure 2), ‘tell me when I am outside a dangerous section of a building ‘(fencing), ‘compute a route to a safe exit’ (routing), ‘track this visitor all the way in the shopping centre’ (tracking). In terms of core services as specified in OpenLS, 3D LBS have to provide:
- 3D location utility, i.e. 3D positioning and geo-coding - 3D navigation, i.e. route in multilevel constructions (buildings, viaducts, bridges, etc.)- 3D directory, i.e. access to 3D data for example for tracking and fencing- 3D presentation, i.e. 3D visualisation on mobile, hand-held devices and the appropriate interface for this.
Fig. 1: Request/response of GeoMobility Server as the position is provided by the communication netwrok

Sisi Zlatanova, Edward Verbree186
The following sections address these challenging aspects in detail.
2 3D positioning and geo-codingIt is also in the name: a location-based service needs to be aware of the location of the user. Position determination can be done is several ways: by coordinates, address, ZIP code, etc. In fact, coordinates are hardly used. Descriptive postcodes and addresses, and linear reference systems like mileages marks along roads, are far more common to express a location than Cartesian reference systems. However, none of the exciting LBS or GIS-packages offer a kind of a Z-coding, thus a translation of e.g. ‘at the base of this dyke’ to ‘4.73 meter above NAP’. And no LBS can tell you what floor you are when you specify your location by only a GPS-coordinate.
2.1 3D positioning with GNSSTheoretically, obtaining 3D coordinates at global scale is available. GPS-devices, and other receivers to Global Navigation Satellite Systems (GNSS) like Galileo can compute either Cartesian (X,Y,Z) or ellipsoidal (latitude, longitude, height) WGS84 coordinates. In multi-level 3D structures, the problem may come from two sides: geo-coding of the height and availability of satellites. The alti-tude is given as the distance to the WGS84 rotational ellipsoid and it is difficult to be linked to expressions used in daily (3D) life by references like ‘on/under the bridge’, ‘floor’, ‘base’, ‘ceiling’, ‘top’, etc. It is well-know that a GNSS-receiver cannot work inside or at other places with a poor satellite coverage. Many systems exists that claim to solve that problem by applying another type of measurement technique, although all these systems are bases at either a kind of distance measure, a kind of angle measurement, or a combination of both. If it is not possible to detect enough GPS satellites in line-of-sight, some close-range pseudolites transmit-ters could be also used. For example, the company Novariant offers the so-called Teralite XPS systems, a single frequency ground-based signal generator broadcasting XPS signals to mobile GPS+XPS receivers, (www.novariant.com/mining/index.cfm). For indoor use a more dedicated pseudolite-only setup could be used, like the system shown in Figure 3, (Kee, 2001). However, if the user is free to move in height, the transmitters should be arranged in a more enclosed setting to obtain a reliable 3D-position fix.It seams improbable, but television synchronization signals may be used to position a range of wireless devices that require location information. The system developed by Rosum provides according to their website: ‘accurate, reliable location indoors, outdoors and in dense urban location’ (www.rosum.com). The Rosum TV Measurement Module (RTMM) receives local TV and GPS sig-nals, measures their timing, computes the pseudoranges and sends that information to the Location Server (LS). The LS computes the position of the RTMM and sends that location back to the RTMM or to the tracking application server (see Figure 4). In addi-tion to the wide-area positioning system, Rosum also develops a limited-area, 3D positioning system. This system is used by first responders in emergency situations. Rescue personnel can be tracked from a field command center, reducing precious time spent giving location updates and eliminating blind searches in man-down situations, (see Figure 5).Assisted GPS (AGPS) combines the better of two worlds: GPS and Mobile Networks. Simple stated (www.snaptrack.com/pdf/How_aGPS_works.pdf): When a caller makes a location request, the wireless network sends the approximate location of the handset (generally the location of the closest cell site) to the location server. The location server then tells the handset which GPS satellites should be relevant for calculating its position. The handset then takes a reading of the proper GPS signals, calculates its distance from all satellites in view and sends this information back to the location server. But still, in hard conditions like inside locations, it is still difficult to impossible to ‘see’ enough satellites and thus to obtain a position fix. Moreover, inside conditions and urban canyons are known to have multi-path problems, causing unreliable pseudo-ranges and thus fault determined positions.
2.2 Sound based positionBats are known to use ultra sound for tracking themselves. This property is also used by the Norwegian Sonitor Indoor Positioning System (IPS) to track and position tagged equipment and people indoors (www.sonitor.com). The tags transmit ultrasound and ones
Fig. 2: request/response ‘important power supply’
Fig. 3: Centimeter-Accuracy Indoor Navigation Using GPS-Like Pseudolites

The third dimension in LBS: the steps to go 187
received by a set of microphones inside a room or corridor the positions and movement is calculated in real time, see. This kind of systems works only in special equipped environments, e.g. buildings.
2.3 Positioning using telecom networks Mobile communication networks, like GSM, are used for commercial LBS applications as it is quite easy to reach a group of cel-lular phone users within the area of a certain base station (Cell of Origin) and send them for example an advertisement SMS. It is however also possible to position the users within a certain sector and range of the base station by Uplink Time Difference of Arrival. If that information is monitored over time and combined with a road network, the position of the cellular phone user can be detected in a more precise manner. The company LogicaCMG has developed the so-called Mobile Traffic Service where these locations are aggregated to real-time traffic information for the Dutch province of Brabant (www.mts-live.com), (actueleverkeers-informatie.brabant.nl). Precise Mobile Network positioning requires considerable adjustments to the current GSM network setup, or the use of next gen-eration networks like UMTS. But due to the more or less planner configuration of the GSM/UMTS beacons, accurate and reliable 3D-positioning by mobile networks is not possible.
2.4 WLAN positioningEach WLAN (Wi-Fi) network can be location enabled by signal strength calibration and fingerprinting. Within a neighborhood, i.e. an office, a map is made by a site survey of the reception of the WLAN access points. That is a challenging task, as the WLAN signals appear in an irregular pattern, since the propagation of signals is heavily affected by multipath effects, dead spots, noise, and interference in an indoor environment, see Figure 6 (Xiang, 2004) (Kaemarungsi, 2005). Once known, this map is ‘turn around’, to pin-point the location by a certain signal reception. One of the premier systems using this kind of ‘fingerprinting’ is the Ekahau’s patented positioning technology (www.ekahau.com). One limitation is the calibration of the system; first of all known positions should be linked to the signal strength of the WLAN access points. This process should be repeated when a major change in the configuration of the WLAN access points is made.
2.5 RFID-UWB positioning and Sensor NetworksRadio frequency identification (RFID) is a generic term that is used to describe a system that transmits the identity (in the form of a unique serial number) of an object or person wirelessly, using radio waves. There are dif-ferent systems. Ultra Wide Band radio sys-tems can be accurate to about 6 inch (15cm) indoors because they are much less affected by multipath distortion than conventional RF systems. Ubisense uses both Time Differ-ence Of Arrival (TDOA) and Angle of Ar-rival (AOA) which greatly reduces the den-sity of sensors required to cover an area over systems that use just TDOA (www.ubisense.net).
Fig. 5: TV-GPS Plus Fireground First Responder Tracking Application
Fig. 4: Rosum TV-GPS Location Technology
Fig. 6: Layout testarea (a) and Contours (b) indicating the signal strength of Access Points

Sisi Zlatanova, Edward Verbree188
3 3D data management Once the 3D position is determined, 3D data have to be available and accessible. Currently, most of the 3D data are available as 2.5 surface data, 3D city models and 3D CAD models. Furthermore the 3D information exists but is ‘split ‘ between different orga-nizations. For example, within the Netherlands the planimetry and height are maintained by two governmental organizations. The ‘Kadaster’ is responsible for the ‘horizontal component’ and ‘Rijkswaterstaat’ manage the ‘vertical component’ through the NAP benchmarks. One consequence of that organization is the mapping of the topography, as in the Dutch 1:10.000 scale TOP10Vector, which does not take the height value into account. At the moment the relative vertical situation is only expressed at certain ‘lev-els’.Depending on the position and the requested service different types of models and spatial operations could be needed. If the user is on the street, perhaps a 3D city model will suffice. If the user is inside a building, a tunnel or a bridge, a detailed 3D interior model might be required. Furthermore, 3D outputs for LBS can be in two forms: only retrieval of data for 3D visualisation and performing spatial operations (which are needed for example for 3D route calculations, 3D proximity, etc). Currently, retrieval of 3D data can be relatively easily organized (via Open Web services) from any system. Spatial analysis (3D routing, proximity) would require spatial operations. The common problem here is a lack of 3D operations and functions. Mathematical background for such opera-tions exists but it still needs to be implemented in the systems.In this respect, last developments in Geo-DBMS are quite promising. Currently geo-DBMS can maintain different models geome-try, topology, and graph. While the geometric structure provides direct access to the coordinates of individual objects, the topologi-cal structure encapsulates information about their spatial relationships. A geometry model has been implemented in all mainstream DBMS (e.g. Oracle Spatial, Informix, Ingress, PostGIS, MySQL). Although the implemented spatial data types are 2D, 3D objects still can be stored. Topological implementation specifications are still under development, but commercial topological structures are already available (Laser-Scan Radius and Oracle Spatial 10g). A graph model is currently offered only by Oracle Spatial 10g. The combination of geometry model and graph model, i.e. the Network Data Model, can become a quite appropriate structure for 3D route calculations. While route calculations can be performed on the graph, 3D geometry can be applied for 3D navigation along the route.
4 Protocols/standards for data exchange Present specifications allow even at this moment 3D outputs. The work of the Open Geospatial Consortium (OGC) and the World Wide Web Consortium (W3C) is the most relevant to the geo-information specialists with their specification for Web services and eXtensible 3D language (X3D). The Web services define request/respond interfaces between an application (e.g. running on a hand-held) and GeoServer and X3D is the XML-based standard for 3D visualisation. The Web services are currently four (WMS, WFS, WTS and WCS). The Web service for 3D is the Web Terrain Service (WTS). WTS specification defines a standard interface for requesting 3D terrain scenes from a server capable of their generation. A WTS service supports two operations: GetCapabilities and GetView. The view is defined as a perspective image. To be able to create this view, a number of parameters have to be provided to the server: Point-of-Interest (POI), i.e. x,y,z of user focus; distance between the user and the POI; the vertical angle between the user and the POI; the horizontal angle between the north direction and the hori-zontal projection of the ‘user-POI’ line; and the Angle of View. The server returns a raster image of the 3D data. To be able to use this service for 3D navigation for example, a series of images have to be generated (at the server) by continuous round-trips to the server. The images can be further organized in a movie and send to the user. The disadvantage is that an interaction with/navigation trough data would not be possible. The Web Feature Service (WFS) is much more promising. The GetFeature request is an XML stream of vector data, i.e. Geogra-phy Markup Language (GML). GML geometry types allow for x, y and z-coordinates. Moreover GML version 3.0 introduces the ‘Solid’ geometry type, which can be used for ‘full’ 3D objects. GML 3.0 also offers the possibility to use a topological data struc-ture (a 3D object as a TopoSolid with references to Faces, Edges and Nodes). This is to say theoretically GML does not have any limitations in maintaining 3D objects (geometry and/or topology).However, the GML output of a WFS service is not a 3D scene yet. It has to be transformed into a graphic format for which visu-alization software is available. In this respect the best candidate is X3D. X3D is the XML version of the Virtual Reality Modeling Language (VRML). VRML was launched in the nineties and became an ISO standard in 1997, but never was widely used for geo-applications. The size of the VRML file could become very big (due to lack of appropriate streaming and compressing techniques), which could result easily in bad performance. X3D has improved structure (i.e. Core profile, Interactive profile, Interchange profile, and MPEG-4 interactive profile) and much more possibilities to control the size of the file and render efficiently. It is actually de-signed for implementation using a ‘low-footprint engine’ as on mobile devices. X3D was approved by ISO as International Stan-dard ISO/IEC 19775 in early 2005. To be able to visualize the 3D data, a X3D viewer has to run at the client (e.g. Cortona). De Vries and Zlatanova 2004 discuss an architecture that allows an application to request a 3D vector data. This approach can be applied for LBS as well, once accepted that the result of the request can be not only image but also other formats from the Standards Framework. The GeoMobility server then will act as a client to any GeoServer that contains 3D data.

The third dimension in LBS: the steps to go 189
5 3D presentation Presentation of 3D data is still tricky. 3D visualisation (rendering) of the 3D outputs can be done in different ways: as a static 3D image, a video and as a vector model (allowing interaction). Furthermore, the parameters of the mobile devices can vary signifi-cantly: special devices (e.g. see-through glasses), portable PC to mobile cells. The type of device has huge influence on the pos-sibilities for 3D visualization. In contrast to portable PC and tables, hand-held devices have many limitations: available memory, screen resolution and CPU. The type of operation system (Windows Mobile, SymbianOS, Smartphone, PalmOS, JV-Lite2, Linux, etc.) also varies. With these limitations even low-quality streaming video can be problematic. Currently most of the 3D visualization on mobile is provided as a streamed video (Zlatanova et al 2004). VRML browsers for 3D interaction are offered only for PocketPC by ParallelGraphics (i.e. Pocket Cortona http://www.parallelgraphics.com/products/). As discussed in the previous section interfaces between GeoMobility server and mobile devices are based on Web technologies. In this respect, several technologies might be important for 3D rendering on mobile: X3D, MPEG-4 and PDF. X3D is quite promis-ing technology not only because of the features offered but also because of the attempts of the W3C to come to an agreement with other groups developing standards. Moving Picture Experts Group (MPEG) has accepted X3D for the 3D capabilities of MPEG-4. Furthermore special mobile 3D technologies to extend X3D are also being defined for MPEG-4. Adobe Acrobat also has step into third dimension and provided interactive 3D browser inside the PDF file (http://www.adobe.com/products/acrobat/aec.html). Since PDF reader is already offered for hand-held under Windows Mobile, it could be expected that the next step will be a 3D PDF file for hand-held. The size of the PDF file (rounding to MB) and the lack of PDF streaming technology are currently the main draw-backs. In general, the use of these standards in 3D application development for low-end consumer and embedded devices is still problem-atic, mostly because of the large footprint imposed by underlying implementations and heavy utilization of hardware acceleration. The two Java technology specifications the Mobile 3D Graphics API for J2ME (JSR 184) and the Java Bindings for OpenGL ES specification (JSR 239) were expected to help significantly in accelerating this process. Nokia working in collaboration with Mo-torola, Intel, Sony Ericsson, Symbian, Cingular Wireless and France Telecom led the Mobile 3D Graphics API. The Java Bindings was led by Sun Microsystems. While successful for game industry, they did not have a lot of influence on geo-applications. As it is well-known a large amount of geo-applications are running nowadays under Windows. But, Microsoft also increases its invest-ments in mobile developments. For example Mio A701, the first GPS-enabled smart phone with Windows Mobile 5, is already on the market. The Microsoft interest in mobile computing can be a stimulator for many GIS vendors to provide browsers and appli-cations for mobile. Other non-standard solutions are also showing up. The typical polygon (triangle) rendering has a volume-based graphics, which might bring advantages also for mobile computing (http://www.ngrain.com/alliances/files/NGrain2.pdf). A very elegant way of 3D LBS might be the usage of see-through glasses based on augmented reality approaches. Augmented reality offers a lot of ad-vantages compared to traditional desktop and especially telephone cells due to: better understanding (the background view is real world) and faster retrieval and rendering (e.g. only the computed 3D route is visualised). However these systems are still unreliable and quite expensive for a daily use.
6 Conclusions This paper has discussed four critical components of LBS in the light of the third dimension: positioning, interfaces, data manage-ment and visualization. The general conclusion is that sufficient technology possibilities for 3D exist (also Zlatanova and Verbree, 2003) but they have to be appropriately combined and connected. The role of geo-specialist in 3D LBS is to provide the 3D position and find (and deliver) the requested 3D data. Regarding 3D positioning we can conclude:
- As all systems are based on the same set of observable quantities (distance and angle) many correspondences exists in techniques and methodologies. To choose with system performs best in certain conditions depend on these circum-stances. Important factors are: inside conditions, user controlled setup and maintenance of the reference beacons, active or passive targets, and the role of a GeoMobility Server.
- The integrity of the ‘space segment’ (the beacons) of all presented systems, except GNSS like GPS, is not controlled and maintained. This will lead to unreliable positioning of the targets.
- Most systems are presented as ‘stand alone’ solutions, due to commercial interests. As no system operates best under all circumstances, the reliability will be improved and ensured when the systems are more integrated.
- The OpenLS specification has to be further extended to work with Z-coordinates and provide 3D geo-coding.
Regarding the interface, we firmly believe that the communication between GeoMobility Server and the mobile client will be based on Open Web Services, which still require appropriate 3D adaptations, e.g. for exchange of parameters needed to complete WTS and WFS. Apparently, it will not be possible to organize all the 3D data needed for 3D routing and other analysis on the same server where the GeoMobilty server will operate. 3D LBS will be based on a distributed system combining GIS, CAD and geo-DBMS. This poses great challenges to geo-specialist towards improving the performance by developing better 3D data organization, indexing, generalization and compression. All issues are already addressed in literature on 3D GIS.

Sisi Zlatanova, Edward Verbree190
3D visualization on mobile is not a problem anymore, but the geo-data have to be adapted for the device and the user. 3D gener-alization, usage of textures (or not), 3D symbolization, visualization clues for attention attraction, etc. are all tasks of geo-special-ists.
7 ReferencesKaemarungsi, Kamol and Prashant Krishnamurthy, 2004, Modeling of Indoor Positioning Systems Based on Location Fingerprinting, IEEE IN-
VOCOM, 2004, 11 p.Kee, Changdon, 2001, Centimeter-Accuracy Indoor Navigation Using GPS-Like Pseudolites, GPS World, November 2001Togt,R., E. Beinat, S. Zlatanova, and H.J. Scholten, 2005, Location interoperability services for medical emergency operations during disasters, in:
PJM van Oosterom, S Zlatanova & EM Fendel (Eds.), Geo-information for disaster management, Springer Verlag, Heidelberg, pp. 1127-1141de Vries, M. and S. Zlatanova, 2004, Interoperability on the Web: the case of 3D geo-data, in: P. Isaias, P. Kommers and M. McPherson (eds.),
Proceedings of the IADIS International Conference e-Society 2004, Avila, Spain, July 16-19, pp. 667-674Xiang, Z et al , 2005 A wireless LAN based positioning system, IBM Journal Res&Dev, Vol48, Sep/Nov, 2004, pp. 617-626Zlatanova, S. and E.Verbree, 2004, User tracking as an alternative positioning technique for LBS, in Proceedings of the Symposium on Location
Based Services & Telecartography, 28-29 January, 2004, Vienna, Austria, pp.109-115Zlatanova, S., D. Holweg and V. Coors, 2004, Geometrical and topological models for real-time GIS, in: Proceedings of UDMS 2004, 27-29 Oc-
tober, Chioggia, Italy, CDROM, 10 p.Zlatanova, S. and E. Verbree, 2003, Technological Developments within 3D Location-based Services, International Symposium and Exhibition on
Geoinformation 2003 (invited paper), 13-14 October 2003, Shah Alam, Malaysia, pp. 153-160
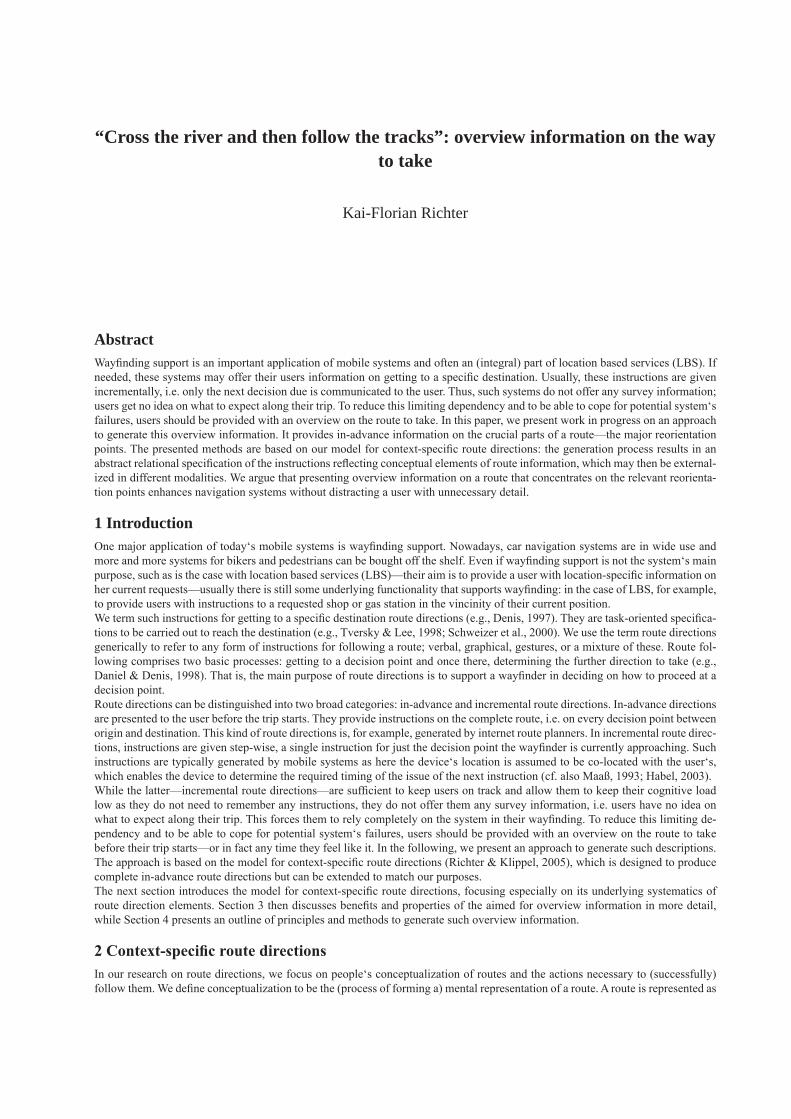
“Cross the river and then follow the tracks”: overview information on the way to take
Kai-Florian Richter
AbstractWayfinding support is an important application of mobile systems and often an (integral) part of location based services (LBS). If needed, these systems may offer their users information on getting to a specific destination. Usually, these instructions are given incrementally, i.e. only the next decision due is communicated to the user. Thus, such systems do not offer any survey information; users get no idea on what to expect along their trip. To reduce this limiting dependency and to be able to cope for potential system‘s failures, users should be provided with an overview on the route to take. In this paper, we present work in progress on an approach to generate this overview information. It provides in-advance information on the crucial parts of a route—the major reorientation points. The presented methods are based on our model for context-specific route directions: the generation process results in an abstract relational specification of the instructions reflecting conceptual elements of route information, which may then be external-ized in different modalities. We argue that presenting overview information on a route that concentrates on the relevant reorienta-tion points enhances navigation systems without distracting a user with unnecessary detail.
1 IntroductionOne major application of today‘s mobile systems is wayfinding support. Nowadays, car navigation systems are in wide use and more and more systems for bikers and pedestrians can be bought off the shelf. Even if wayfinding support is not the system‘s main purpose, such as is the case with location based services (LBS)—their aim is to provide a user with location-specific information on her current requests—usually there is still some underlying functionality that supports wayfinding: in the case of LBS, for example, to provide users with instructions to a requested shop or gas station in the vincinity of their current position.We term such instructions for getting to a specific destination route directions (e.g., Denis, 1997). They are task-oriented specifica-tions to be carried out to reach the destination (e.g., Tversky & Lee, 1998; Schweizer et al., 2000). We use the term route directions generically to refer to any form of instructions for following a route; verbal, graphical, gestures, or a mixture of these. Route fol-lowing comprises two basic processes: getting to a decision point and once there, determining the further direction to take (e.g., Daniel & Denis, 1998). That is, the main purpose of route directions is to support a wayfinder in deciding on how to proceed at a decision point.Route directions can be distinguished into two broad categories: in-advance and incremental route directions. In-advance directions are presented to the user before the trip starts. They provide instructions on the complete route, i.e. on every decision point between origin and destination. This kind of route directions is, for example, generated by internet route planners. In incremental route direc-tions, instructions are given step-wise, a single instruction for just the decision point the wayfinder is currently approaching. Such instructions are typically generated by mobile systems as here the device‘s location is assumed to be co-located with the user‘s, which enables the device to determine the required timing of the issue of the next instruction (cf. also Maaß, 1993; Habel, 2003).While the latter—incremental route directions—are sufficient to keep users on track and allow them to keep their cognitive load low as they do not need to remember any instructions, they do not offer them any survey information, i.e. users have no idea on what to expect along their trip. This forces them to rely completely on the system in their wayfinding. To reduce this limiting de-pendency and to be able to cope for potential system‘s failures, users should be provided with an overview on the route to take before their trip starts—or in fact any time they feel like it. In the following, we present an approach to generate such descriptions. The approach is based on the model for context-specific route directions (Richter & Klippel, 2005), which is designed to produce complete in-advance route directions but can be extended to match our purposes.The next section introduces the model for context-specific route directions, focusing especially on its underlying systematics of route direction elements. Section 3 then discusses benefits and properties of the aimed for overview information in more detail, while Section 4 presents an outline of principles and methods to generate such overview information.
2 Context-specific route directionsIn our research on route directions, we focus on people‘s conceptualization of routes and the actions necessary to (successfully) follow them. We define conceptualization to be the (process of forming a) mental representation of a route. A route is represented as
Kai-Florian Richter192
a sequence of decision point / action pairs (cf. also Daniel & Denis, 1998). Hence, more precisely, conceptualization is (the process of forming a) mental representation of an (expected) decision point sequence with their accompanying actions. We have developed a model that aims at creating route directions supporting this conceptualization: the generated route directions should be easy to process, i.e. they should support forming and processing a representation of the corresponding route. This also eases route follow-ing as understanding a route direction is a prerequisite for using it (cf. Dale et al., 2003).We coin the route directions generated by our model context-specific route directions. We use this term to emphasize that our model explicitly adapts the resulting route directions to the situation at hand, i.e. to the current action to take in the current surrounding environment. This reflects Dey and Abbowd‘s definition of context: “[...] any information that can be used to characterize the situ-ation of an entity” (2000, p.3). For this adaptation, we need to account for the characteristics (the structure) of the environment in which route following takes place; the structure of an environment strongly influences the kind of instruction that can be given. The following structural aspects contribute to this influence: the embedding of the path—that is induced by the route—in the spa-tial structure surrounding the path, the structure of that path itself, path annotations, and landmarks that are visible along the path. Furthermore, different reference systems provide alternatives to describe necessary actions to follow a route (cf., e.g., Tenbrink, 2005). An analysis of routes and route directions as well as the spatial knowledge required to determine and interpret them results in a systematics of elements that may be used in route directions (cf. Richter et al., 2004; Richter & Klippel, 2005). This systematics is summarized in Table 1; it is the basis for our generation process of context-specific route directions.
Global References Paths, Routes, and Landmarks
cardinal directions egocentric references
global landmarks routemarks at decision point
Environmental Structure routemarks between decision points
edges distant routemarks
districts linear routemarks
slant path annotations
Tab. 1: Systematics of Route Direction Elements
In our model, route directions are represented as abstract, relational terms. They are a conceptual representation of the action to take at a decision point. For each element of the systematics, we define corresponding relational terms, which instantiate all possibilities of referring to the elements in route directions. As an example, consider a situation where the required action at the first decision point of a route is to take the left branch, which is also marked by a sign leading to a train station. The instruction corresponding to the required action may be represented as (DP1, left)—using egocentric references; as an alternative, the same action may be represented as (DP1, follow / sign ‚station‘)—using the sign to the train station as path annotation.To generate context-specific route directions, we need to choose from all possibilities to represent an action the one that best fits our aim to ease conceptualization of the route to take. That is, for each decision point along the route we choose an abstract instruc-tion, whose externalization most likely eases its conceptualization. This choice may depend on the kind of instruction chosen for previous or following decision points. Accordingly, the generation of context-specific route directions is realized as an optimization process: initially, for each decision point all possible instructions are generated, i.e. each description that unambiguously marks the action to take. Then, in the optimization step, from each decision points‘ set of possibilities the instruction that is best according to the chosen optimization criterion is chosen (cf. Richter & Klippel, 2005, for a discussion of possible optimization criteria). In optimizing, the model exploits an important principle of conceptualizing routes and giving route directions: spatial chunking, the combination of several decision points into a single instruction as it, for example, becomes apparent in instructions like “turn left at the third intersection” (cf. Klippel et al., 2003).The model has been designed to produce complete in-advance route directions covering all decision points. But it can be extended to the generation of coarse route directions that provide an (in-advance) overview on a route; this is further elaborated in Section 4. The next section discusses properties of such overview information.
3 Overview information on the way to takeRoute directions as discussed in the introduction offer information on how to proceed for every decision point along a route—be it that the information is presented all at once (in-advance) or step-wise (incremental route directions). This information is needed to correctly execute route following, i.e. to get from origin to destination along a specified route. Such route directions are segmented at decision points. Each instruction covers one or several decision points and following an instruction a wayfinder always ends at a decision point (cf. Habel, 1988; Klippel et al., 2003).
Overview information on the way to take, on the other hand, provides only coarse route directions. Such route directions are well suited for an initial, quick overview; they allow a wayfinder to get an idea on what to expect along the route. That is, they provide a supplement to incremental route directions as offered by mobile systems. They limit a user‘s (felt) dependency on the device dur-ing wayfinding since she does not need to follow the device‘s instructions blindly anymore. To account for restrictions that play a role in developing and using such applications, like small display size of mobile devices and users‘ limited cognitive capacity (cf.

“Cross the river and then follow the tracks”: overview information on the way to take 193
also Wahlster et al., 2001), we need to take account of certain principles of generating coarse route directions: even more than in ordinary route directions (cf. Denis, 1997), coarse route directions should not distract and bother users with unnecessary detail. Therefore, we concentrate on those points along a route, which are crucial to keep the right (overall) direction. At these points, significant changes occur; they are the major reorientation points along a route. Concentrating on major reorientation points corresponds to the planning level in wayfinding as explained, for example, in Timpf et al. (1992). While the level of actions requires information on all decision points in order to take the correct turn, the planning level requires less granularity in information, i.e. less detail. On this level, coarse information is sufficient as the aim is to provide just an overview without bothering users with details on how to actually execute route following. This is, for example, reflected in the approach by Höök (1991), who generates route directions for local residents who are assumed to know the place fairly well. In this case, several roads are subsumed into a high-level instruction and details, like small roads, are omitted. Hence, conceptualization of such coarse route directions can also be just coarse and leaves many parts of the route underdetermined.Coarse route directions do not guarantee that a wayfinder strictly follows the intended route, i.e. the route determined by the com-putational system. This is because segmentation of a route is not done at decision points, but is based on major reorientation points. These points divide a route into regions. The regions comprise of the area between two reorientation points; each instruction in a coarse route direction covers one such region. Coarse route directions guide a wayfinder from one region to another without fix-ing a specific route between these regions. Consequently, if just relying on coarse directions, it is up to the wayfinder to fill these gaps with her own decisions on the exact route to take (for an overview on human region-based navigation see Wiener & Mallot, 2003). In case of combining coarse route directions with incremental route directions, the mobile device may provide information for these in-between routes.
4 Generating Overview Information: An OutlineIn order to generate overview information on a route, i.e. coarse route directions, the major reorientation points along the route at hand and their accompanying regions need to be identified and instructions providing coarse information on how to reach these points need to be generated. To that end, we make use of the elements of the systematics (Table 1) that are applicable in coarse route directions. Looking at this systematics, those elements on coarser levels of granularity, i.e. those that abstract from single decision point / action pairs to a great extend, are suited for generating overview information. This holds especially for elements of the first two levels of the systematics—the level of global references and the level of environmental structure. From the level of paths, routes, and routemarks the elements distant routemark, linear routemark, and path annotation are used, as they also strongly abstract from single decision point / action pairs. Except for cardinal directions, instructions using these elements need to include a statement announcing until which point they hold, i.e. when the corresponding action like following a linear landmark ends and a change of action occurs. We term such a state-ment end qualifier; an example for an end qualifier is “until the gas station” in an instruction like “follow the river until the gas station”. End qualifiers are required with those systematics‘ elements that allow to combine (potentially) many decision points into a single instruction (cf. Klippel et al., 2003; Richter & Klippel, 2005); they announce changes of action after a (potentially) con-siderable part of a route. Hence, end qualifiers play an important role in coarse route directions. As argued in the last section, seg-mentation of coarse route directions is done along major reorientation points, not at decision points. End qualifiers are well suited to mark these reorientation points. In the same line, confirmation information, which is used in detailed route directions to assure a wayfinder that she is still on the right track, may become “real” instructions in coarse route directions. Coarse directions are sup-posed to indicate the overall direction towards the destination. Confirmation annotations, like “cross the river”, are well suited to indicate this direction—since that is exactly what they are used for in detailed route directions.Consequently, for generating coarse route directions there are two elements of our route‘s representation that may be exploited: first, those decision points that mark the end of a chunk, i.e. at which an environment‘s feature, usually a routemark, may be ex-ploited as an end qualifier for instructions. Second, route segments along which confirmation annotations can be determined —that are based on references to edges (‚cross edge‘) or routemarks between decision points (‚pass routemark‘)—may be part of a rep-resentation of coarse route directions. These route‘s elements mark the border of a region, which a wayfinder may pass without (significant) change of action; termed region of equal directedness. This directedness is equal relative to some feature, i.e. to one of the route direction‘s elements. Examples include “follow the river” or “go in direction of the TV tower”. In the former example, a linear routemark induces the directedness—‘keep next to the river‘—in the latter, a distant routemark sets the direction—‘lessen your distance to the tower and keep it in front of you‘. Such directions typically hold for several consecutive decision points. This sub-sequence of a route‘s decision points makes up one of the regions induced by major reorientation points. Now, to fullfil the requirements of overview information discussed in Sec-tion 3, i.e. providing an initial idea on the route without distracting a user with a lot of details, the aim in generating coarse route directions should be to cover as much of the route with as few reorientation points as possible. That is, coarse route directions should comprise of a few, large regions. Like in the original model for context-specific route directions (see Section 2), generating overview information can be solved as an optimization problem. The optimization process is very similar to the original one—ac-cordingly, we can re-use the same algorithms.Determining coarse route directions then requires some heuristics. First of all, if we aim for as few reorientation points as possible, we, consequently, aim for as few chunks as possible. Put in other words, we are looking for chunks that cover as much decision points as possible: the optimization criterion is to aim for the miminal number of chunks. For optimization purposes, we need to determine the chunks using the systematics‘ elements suitable for coarse route directions; just as with context-specific route direc-

Kai-Florian Richter194
tions, we start by creating every possible chunk and use this set of chunks as basis for optimization. This way, it is guaranteed that we cover the complete route; however, this may not be desired as it may lead to more detail in the coarse directions than necessary. Therefore, we need to apply additional heuristics, which on the one hand allow leaving parts of the route unconsidered, and on the other coarsening instructions by abandoning the need to generate directions that are necessarily unambiguous.Development of these heuristics is current work. As an example, let us consider generating coarse direction information using car-dinal directions. First, to determine such directions, we need a cardinal direction model like, for example, one of those presented by Frank (1992). This allows calculating the cardinal direction to take (e.g. ‚north‘, ‚southeast‘, etc.) at each decision point; for our purposes of coarse directions we choose a four-sector model (‚north‘, ‚east‘, ‚south‘, ‚west‘) that itself already provides just coarse information (see Fig. 1a). A possible heuristic is to add decision points to the cardinal direction-chunk as long as the decision point at hand lies in the previous sector and the direction to take corresponds to the initial direction (Fig. 1b).As an open issue remains the question how we can deal with minor deviations from the overall direction? That is, we need to extend the heuristics in such a way that in determining coarse cardinal directions it ignores small route-segments that lead in dif-ferent directions. To that end, two factors may be used for a threshold: the length of the deviating route-segment and the degree of deviation, i.e. the deviating angle‘s size. Similar heuristics need to be applied for generating coarse directions employing the other systematics‘ elements.Another open issue is the externalization of coarse route directions, i.e. ways to present this information to users. Verbal presenta-tion—either written or spoken—is easily realizable by developing a parser for the abstract directions generated by our model and seems to be well suited, since verbal instructions typically are underdetermined and may leave many relations unspecified. Graphi-cal presentation, on the other hand, needs to settle for exactly one instantiation due to the representation medium‘s properties; it is, therefore, often taken to represent veridical information. Hence, suitable schematization means need to be developed to indicate that the information presented is only coarse and may not be complete (cf., e.g., Agrawala & Stolte, 2001; Klippel et al., 2005, for such approaches).
5 SummaryIn this paper, we presented ongoing work on an approach for providing overview information on the way to take. It is based on our model for context-specific route directions, which allows generating in-advance route directions that aim at being easily concep-tualizable. This model can be extended to determine coarse route directions, which concentrate on the major reorientation points along a route; we outlined how to determine these reorientation points based on an optimization process and suggested some initial heuristics for further abstractions needed to concentrate just on the crucial information.Coarse route directions provide an initial overview on the route to take, i.e. allow a wayfinder to get an idea of what to expect along a route, without bothering and distracting her with unnecessary detail. In mobile systems providing incremental route directions a user is forced to rely completely on the system in her wayfinding. Overview information relieves a user from this (felt) dependency as she does not need to follow the instructions blindly anymore. Hence, we argue that such coarse route directions ideally supple-ment incremental route directions as provided by mobile systems and should be incorporated in such systems as an option a user can choose.Future work comprises development of additional abstraction heuristics, (graphical) externalization means for coarse route direc-tions, and an evaluation of the model‘s performance.
6 AcknowledgementsThis research is carried out as part of the Transregional Collaborative Research Center SFB/TR 8 Spatial Cognition. Funding by the Deutsche Forschungsgemeinschaft (DFG) is gratefully acknowledged. I would like to thank Katharine Willis for commenting the paper and Sabine Timpf for discussing early ideas of this work.
W
S
N
E
a) b)Fig. 1: a) four-sector model of cardinal directions (cf. Frank, 1992); b) chunking decision points (the dots) of a route
(the dashed line) with equal directedness based on the four-sector model.

“Cross the river and then follow the tracks”: overview information on the way to take 195
7 ReferencesAgrawala, M. & Stolte, C. (2001). Rendering effective route maps: Improving usability through generalization. In SIGGRAPH 2001, Los Angeles,
Ca.Dale, R., Geldof, S., and Prost, J.-P. (2003). CORAL: Using natural language generation for navigational assistance. In Proceedings of the 26th
Australasian Computer Science Conference (ACSSC2003). Adelaide, Australia.Daniel, M.-P. & Denis, M. (1998). Spatial descriptions as navigational aids: A cognitive analysis of route directions. Kognitionswissenschaft,
7:45–52.Denis, M. (1997). The description of routes: A cognitive approach to the production of spatial discourse. In Cahiers Psychologie Cognitive
16(4):409-458.Dey, A.K. & Abowd, G.D. (2000). Towards a better understanding of context and context-awareness. In Proceedings of the Workshop on the What,
Who, Where, When, and How of Context-Awareness. New York.Frank, A.U. (1992). Qualitative spatial reasoning about distances and directions in geographic space. Journal of Visual Languages and Computing
3:343-371.Habel, C. (1988). Prozedurale Aspekte der Wegplanung und Wegbeschreibung. In H. Schnelle and G. Rickheit (eds.), Sprache in Mensch und
Computer: kognitive und neuronale Sprachverarbeitung (pp. 107-133). Opladen: Westdeutscher Verlag.Habel, C. (2003). Incremental generation of multimodal route instructions. In Natural Language Generation in Spoken and Written Dialogue, AAAI
Spring Symposium 2003. Palo Alto, Ca.Höök, K. (1991). An Approach to a Route Guidance Interface. Licentiate thesis, Dept. of Computer and System Sciences, Stockholm University.Klippel, A., Tappe, H., and Habel, C. (2003). Pictorial representations of routes: Chunking route segments during comprehension. In C. Freksa, W.
Brauer, C. Habel, and K.F. Wender (eds.), Spatial Cognition III. Routes and Navigation, Human Memory and Learning, Spatial Representation and Spatial Learning (pp. 11-33). Berlin: Springer.
Klippel, A., Richter, K.-F., Barkowsky, T., and Freksa, C. (2005). The cognitive reality of schematic maps. In L. Meng, A. Zipf, and T. Reichen-bacher (eds.), Map-Based Mobile Services — Theories, Methods, and Implementations (pp. 57-74). Berlin: Springer.
Maaß, W. (1993). A cognitive model for the process of multimodal, incremental route descriptions. In A.U. Frank & I. Campari (eds.), Spatial In-formation Theory: A Theoretical Basis for GIS (pp. 1-13). Berlin: Springer.
Richter, K.-F. & Klippel, A. (2005). A model for context-specific route directions. In C. Freksa, M. Knauff, B. Krieg-Brückner, & et al. (eds.), Spa-tial Cognition IV. Reasoning, Action, and Interaction: International Conference Spatial Cognition 2004, (pp. 58–78). Berlin: Springer.
Richter, K.-F., Klippel, A, and Freksa, C. (2004). Shortest, fastest, — but what next? A different approach to route directions. In M. Raubal, A. Sliwinski, and W. Kuhn (eds.), Geoinformation und Mobilität — von der Forschung zur praktischen Anwendung. Beiträge zu den Münsteraner GI-Tagen (pp. 205-217). Münster: IfGI prints.
Schweizer, K., Katz, S., and Janzen, G. (2000). Orientierung im Raum – kognitive Grundlagen und sprachliche Realisierung. Tourismus Journal 4(1):79-101.
Tenbrink, T. (2005). Semantics and application of spatial dimensional terms in English and German. Tech. Rep. No. 004-03/2005. SFB/TR 8 Spatial Cognition, Universität Bremen / Universität Freiburg.
Timpf, S., Volta, G. S., Pollock, D. W., Frank, A. U., & Egenhofer, M. J. (1992). A conceptual model of wayfinding using multiple levels of ab-straction. In A. Frank, I. Campari, & U. Formentini (eds.), Proceedings of Theories and Methods of Spatio-Temporal Reasoning in Geographic Space, (pp. 348–367). Berlin: Springer.
Tversky, B. & Lee, P.U. (1998). How space structures language. In C. Freksa, C. Habel, and K.F. Wender (eds.), Spatial Cognition. An Interdisci-plinary Approach to Representing and Processing Spatial Knowledge (pp. 157-175). Berlin: Springer.
Wahlster, W., Baus, J., Kray, C., & Krüger, A. (2001). REAL: Ein ressourcenadaptierendesmobiles Navigationssystem. Informatik Forschung und Entwicklung, 16:233–241.Wiener, J.M & Mallot, H.A. (2003). ‚Fine to coarse‘ route planning and navigation in regionalized environments. Spatial Cognition and Computa-
tion 3(4):331-358.
The least risk path in 3d: the “use case” of indoor navigation
Eva Grum
AbstractThe intention of the work in the area of pedestrian navigation is to combine the risk value of getting lost for the outdoor area and the indoor area. Previous work was the definition of the least risk path of getting lost (Grum, 2005) and the calculation of this path in the two-dimensional outdoor area. The formula for finding the least risk path must include a risk value of decision points and a cost value of street segments (Grum, 2005). For getting a formula for the indoor navigation the height must be considered.
1 IntroductionGetting lost in indoor areas is an important aspect considering the risk of getting lost. “Wayfinding in Build Enivironment” (Raubal, 2002) takes navigation in airports as an example to address this issue. Previous work shows the possibility to calculate the risk of getting lost of a path. This risk is measured in a value that is called the risk value. This risk value is defined by the costs of a path. With the result of this calculation the least risk path can be defined. “Modeling Costs of Turns in Route Planning” (Winter 2002) proposes a way to model costs of turns. What Winter in his paper calls “reaching the end of an edge” corresponds to “decision points” in our definition of the least risk path. In both cases the user has to make a decision at this point and select where to continue. The least risk path of getting lost is additionally defined by costs. These are costs of making wrong decisions added up with costs that depend on the length of the path. The result is a risk value of a whole path that can be transformed to costs. The remainder of the paper is organized as following. Chapter two defines the least risk path. In the third chapter the risk value is explained and the content of chapter four is the calculation of the risk value. This part is split in the calculation for the outdoor and the indoor area. The combination of the calculation of these two areas is done in chapter five. Conclusions are presented in the last chapter.
2 The least risk pathThe least risk path is defined by the least risk of getting lost in outdoor and indoor areas. Using this path is the optimal and securest way to the destination without getting lost. The assumption for the user is that he can follow a wrong path but he recognizes this on the next decision point and turns back to the last decision point where he was sure that he was right. Included in this path are all possibilities to make wrong decisions and to follow wrong paths. But the values of the street segments of the wrong paths are not as high as the values of the street segments on the other paths. Other paths are all possibilities to move from the starting point to the destination in a street network. The shortest path (Dijkstra) and the simplest path (Duckham) are both feasible to calculate and are also included in the terms “other paths”. The condition for the path with least risk of getting lost is, that the sum of the street segments that would be wrong, is smaller than on all other possible paths between the starting point and the destination. The length of the path with the least risk of getting lost is in the most cases higher (longer) than on the shortest path (Dijkstra) and on the simplest path (Duckham). Result of previous work was the formula to calculate the risk value of getting lost for the outdoor area. The path with the smallest risk value, i.e., with as less costs as possible is the least risk path. The calculation for this path is shown in the fourth chapter of this paper.
3 The risk valueThis value is a combination of the length of the street segments between the decision points, the values of the decision points, and the values of the street segments that would be wrong. Decision points are all crossings where the user has to make a decision, even if the instruction for the user tells one to follow the street straight ahead. The result of this calculation is the cost of the path. These costs can be transformed in risk units. The risk of getting lost is increasing the more costs accumulate on that path. For finding the path with least risk the costs of every decision point in the area must be calculated. The costs of all street segments that are consid-ered in this area must be calculated as well. Finding the least risk path means searching for the way with as little costs as possible.
4 The calculation of the risk valueFor the calculation of a path with least risk of getting lost, that includes outdoor and indoor areas, two kinds of navigation have to be combined. The navigation for the outdoor area includes two-dimensional areas whereas the indoor navigation includes three-

Eva Grum198
dimensional areas. Hence follow two different formulas and two different types of locating the user. For getting one result for an inquiry of a route for pedestrians that includes as well an outdoor as an indoor area these problems must be solved. How to calculate the risk value in the outdoor and the indoor area is shown in the next two sections.
Outdoor navigationThe calculation for the risk value of getting lost of a path for outdoor navigation includes the risk value of decision points and the value of the street segments. Each crossing where the agent can make a decision is defined as a decision point. The value of the street segments depends on their lengths. The risk value of a decision point includes the number of possibilities to walk, the number of possible choices, and two times the length of the wrong choices. With the assumption that the agent returns the same way after realizing at the next decision point that he is wrong, the length of the wrong choices have to be multiplied by two. The way the agent comes along is excluded. Possible choices are one more than wrong choices.
Fig. 1: The calculation of the risk value of a decision point
rp = risk value of the whole pathrd = risk value of a decision pointli = length of the path that is wrongn = degree of node minus 1 ls = length of the segments that are rightnd = number of decision points (nodes)
By adding the results of the calculation of the risk value of all decision points to the result of adding the values of all street segments the total risk value of the whole path can be calculated.
The test area for the formula is the area between the station Südbahnhof and the building of the University in Vienna. The following figure shows the street network of this area. The following figure shows the street network of the test area where the least risk path is marked. The numbers are the values of the street segments that depend on their length and the letters are the labels of the decision points. It is possible to see that the street segments that would be wrong have small values. This is the most important step of finding the least risk path in a street network. In the following figure the values of the decision points of the least risk path from our test area are shown. The risk values of the decision points of the other paths are higher because of the lengths of the possible wrong choices. The risk value of a path depends predominantly on the length of these wrong choices.
Indoor navigationAs base for the formula for indoor navigation the formula for outdoor naviga-tion was applied. For the indoor navigation the third dimension, the height, has to be taken into account. For the three-dimensional indoor navigation the exist-ing formula had to be transformed. Height differences in both directions, uphill and downhill, had to be included. Given that movement speed on the same level is about 5 km per hour, movement speed for uphill and downhill must be less. The standard assumption for uphill is 300 meters and for downhill 500 meters per hour. Going uphill is more exhausting than going downhill or moving on the same level. Thus the relation between the same level and uphill is 1:17 and between the same level and downhill 1:10.
A mean value of 3 meters of room height and 0,5 meters for the thickness of the ceiling is the assumption for the height difference between the floors to get an approximate valid for all buildings. This can be used to translate floor levels into height meters. In the following mathematical constraint the three different possibilities to walk are defined:
hc = height of the ceilinghr = height of the roomh = height difference between two floorsn = number of floorsls = length of the segments that are right
Fig. 2: The street network of the test area
Fig. 3: Network of the test area marked with the least risk path, the length values of the street segments, and
the label of the decision points.

The least risk path in 3d: the “use case” of indoor navigation 199
h = hc + hrf1 < f2 : costs = h * n * 17f1 = f2 : costs = lsf1 > f2 : costs = h * n * 10
f1 is the initial floor in a building and f2 is the destination floor. If f1 is 0 and f2 is 3 the client has to move from the ground floor to the third floor, i.e., he has to go uphill. The relation from moving uphill to the value of the corridor segments with the same geometrical distance on the same level is 1:17. This system should be usable for everybody and therefore it must be possible to start the path already in an indoor area. Thus, it could be that the system, first, has to calculate the least risk path for indoor navigation, then for outdoor navigation, and finally, a second time for indoor navigation. The corridor segments in the indoor area substitute the street seg-ments of the outdoor area. The values also depend on their lengths. These lengths can again be transformed to cost units. The result of the combined risk value of outdoor and indoor navigation is also a cost value. For calculating the risk value of getting lost in indoor navigation we assume that the user takes the stairs and not the elevator. The reason therefore is that every building has stairs but not every building has an elevator. This assumption has to be made to get a general formula valid for all buildings. At the indoor navigation decision points are points where the user has to make a decision. The difference to the outdoor navigation is that the user has at nearly each point also the possibility do go up or down. As with the formula for the outdoor navigation the decision points get a separate calculation for their risk value. This formula is similar to the one for the outdoor navigation. The difference is the adequate height value that will be explained afterwards in this chapter. Two times the length of the wrong choices with the adequate height value divided by the number of possible choices. The value of the corridor segments of the same level depends on their lengths. The value of the possibilities up or down has to be seen as the relation that is shown in Figure 4. The second part of the formula for the length value of the corridor segments is also similar to the formula of the outdoor area. This is the sum of the corridor segments also with the adequate height values of the right path. Moving one floor uphill gives a value of 6 because we assume 3,5 meters per floor and the relation to moving on the same level is 1:17. The result of ~ 60 is divided by 10 for easy calculation. A wrong corridor segment where the user first moves up a floor and afterwards moves down a floor is a combination of the relations of going uphill and downhill. In this example the user starts at the main entrance on the ground floor and has to move to the third floor to my office. He uses the stairs to reach the third floor, has to turn left and follow the corridor until he reaches the room with the number “CD 0336”.
Fig. 4: Network of the test area marked with the least risk path and the risk values of the decision points
Fig. 5: The relations between going uphill, downhill, and on the same level
Fig. 6: The base structure of the building of the Technical University of Vienna
Fig. 7: The base structure of the building of the Technical University of Vienna marked with the least risk path of getting lost and the risk values of the decision points from the main entrance to
my office.
Fig. 8: The building of the Technical University of Vienna with the length values of the corridor segments that are needed to
calculate the least risk path.
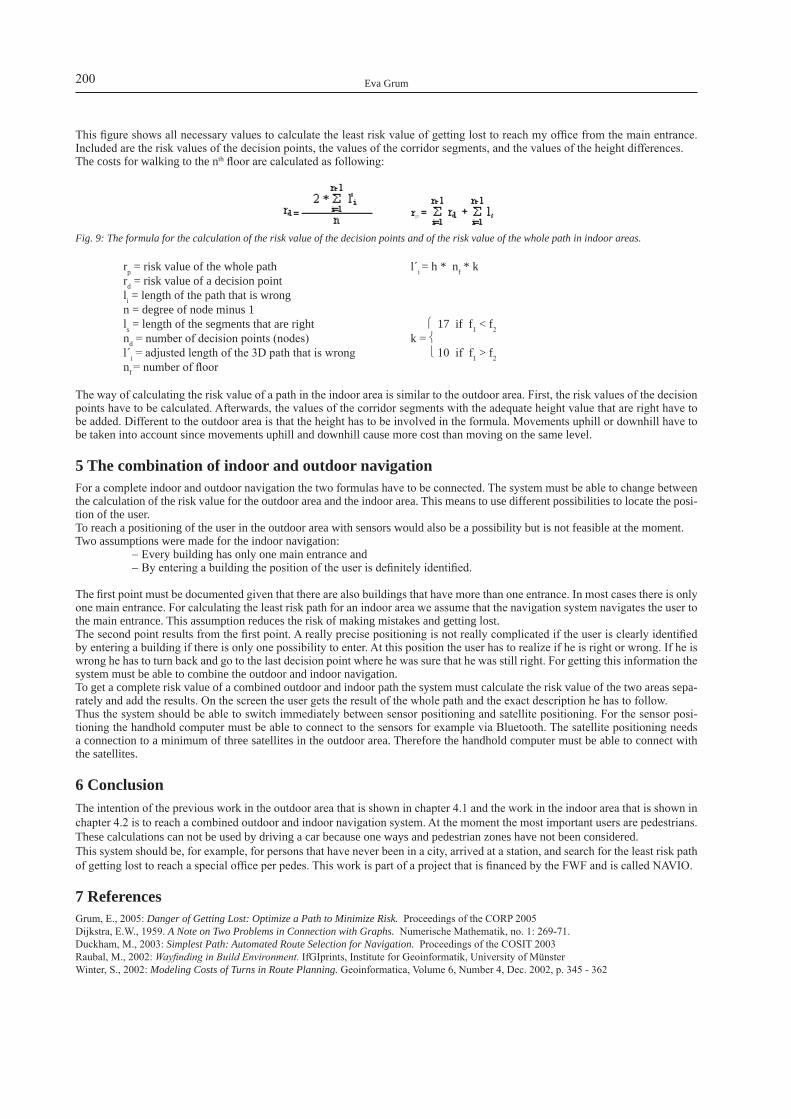
Eva Grum200
This figure shows all necessary values to calculate the least risk value of getting lost to reach my office from the main entrance. Included are the risk values of the decision points, the values of the corridor segments, and the values of the height differences. The costs for walking to the nth floor are calculated as following:
Fig. 9: The formula for the calculation of the risk value of the decision points and of the risk value of the whole path in indoor areas.
rp = risk value of the whole path l´i = h * nf * k rd = risk value of a decision point li = length of the path that is wrong n = degree of node minus 1 ls = length of the segments that are right 17 if f1 < f2 nd = number of decision points (nodes) k = l´i = adjusted length of the 3D path that is wrong 10 if f1 > f2 nf = number of floor
The way of calculating the risk value of a path in the indoor area is similar to the outdoor area. First, the risk values of the decision points have to be calculated. Afterwards, the values of the corridor segments with the adequate height value that are right have to be added. Different to the outdoor area is that the height has to be involved in the formula. Movements uphill or downhill have to be taken into account since movements uphill and downhill cause more cost than moving on the same level.
5 The combination of indoor and outdoor navigationFor a complete indoor and outdoor navigation the two formulas have to be connected. The system must be able to change between the calculation of the risk value for the outdoor area and the indoor area. This means to use different possibilities to locate the posi-tion of the user. To reach a positioning of the user in the outdoor area with sensors would also be a possibility but is not feasible at the moment. Two assumptions were made for the indoor navigation:
- Every building has only one main entrance and - By entering a building the position of the user is definitely identified.
The first point must be documented given that there are also buildings that have more than one entrance. In most cases there is only one main entrance. For calculating the least risk path for an indoor area we assume that the navigation system navigates the user to the main entrance. This assumption reduces the risk of making mistakes and getting lost.The second point results from the first point. A really precise positioning is not really complicated if the user is clearly identified by entering a building if there is only one possibility to enter. At this position the user has to realize if he is right or wrong. If he is wrong he has to turn back and go to the last decision point where he was sure that he was still right. For getting this information the system must be able to combine the outdoor and indoor navigation. To get a complete risk value of a combined outdoor and indoor path the system must calculate the risk value of the two areas sepa-rately and add the results. On the screen the user gets the result of the whole path and the exact description he has to follow. Thus the system should be able to switch immediately between sensor positioning and satellite positioning. For the sensor posi-tioning the handhold computer must be able to connect to the sensors for example via Bluetooth. The satellite positioning needs a connection to a minimum of three satellites in the outdoor area. Therefore the handhold computer must be able to connect with the satellites.
6 ConclusionThe intention of the previous work in the outdoor area that is shown in chapter 4.1 and the work in the indoor area that is shown in chapter 4.2 is to reach a combined outdoor and indoor navigation system. At the moment the most important users are pedestrians. These calculations can not be used by driving a car because one ways and pedestrian zones have not been considered.This system should be, for example, for persons that have never been in a city, arrived at a station, and search for the least risk path of getting lost to reach a special office per pedes. This work is part of a project that is financed by the FWF and is called NAVIO.
7 ReferencesGrum, E., 2005: Danger of Getting Lost: Optimize a Path to Minimize Risk. Proceedings of the CORP 2005 Dijkstra, E.W., 1959. A Note on Two Problems in Connection with Graphs. Numerische Mathematik, no. 1: 269-71.Duckham, M., 2003: Simplest Path: Automated Route Selection for Navigation. Proceedings of the COSIT 2003Raubal, M., 2002: Wayfinding in Build Environment. IfGIprints, Institute for Geoinformatik, University of Münster Winter, S., 2002: Modeling Costs of Turns in Route Planning. Geoinformatica, Volume 6, Number 4, Dec. 2002, p. 345 - 362
A framework for decision-centred visualisation in civil crisis management
Natalia Andrienko, Gennady Andrienko
1 IntroductionThis paper describes a framework for intelligent visualisation to be applied in emergency situations for supporting the crisis man-agement personnel and for informing and instructing the population. The research and development work on this topic is being done within OASIS – an Integrated Project focused on the Crisis Management part of the programme “improving risk manage-ment” of IST (IST-2003-004677, see http://www.oasis-fp6.org/). Conducted over 48 months (started in September 2004), OASIS aims at defining a generic crisis management system to support the response and rescue operations in case of large-scale disasters. The project is coordinated by EADS (France). The work on intelligent visualisation is a part of the subproject dedicated to applied research and development of innovative tools for advanced decision support in emergency situations [1].Intelligent visualisation that supports decision making in emergency situations can be viewed as an instantiation of the concept of decision-centred visualisation (DCV), which has been introduced in mid-nineties in the context of US military contracts. Essen-tially, DCV means the usage of problem-oriented domain knowledge for intelligent data search, processing, analysis, and visuali-sation in time-critical applications [2]. An ultimate goal of DCV is to optimize the overall decision-making process and improve the quality of decisions on the basis of intelligent visualisation and related scientific disciplines and technologies. DCV is usually applied in conflict domains such as military mission planning, counter-terror intelligence etc. DCV is used in these areas as a core component of modern control rooms. Public sources point to significant investments to the DCV development [3]. Within OASIS, we are going to apply, adapt, and extend the DCV concept to the tasks arising in civil protection and crisis manage-ment. In particular, intelligent visualisation is planned to be used not only for supporting decision makers in control rooms but also for alerting, informing, and instructing the on-site personnel, the population at risk, and the general public (through mass media).
2 Problem statementThe objective of intelligent visualisation may be formulated as “give everybody the right information at the right time and in the right way”. Two parts are present here:1. “Right information at the right time” means that a person or organisation should be able to get the information that is necessary for the adequate behaviour in the current situation or fulfilling this person’s or organisation’s tasks. The relevant information should be provided at the time when it is needed.2. “In the right way” means that the information should be presented in a way promoting its rapid perception, proper understand-ing, and effective use.The first part refers to the problem of the selection of the relevant information, depending on the situation and the needs, goals, and characteristics of the intended recipient. The second part refers to the problem of effective preparation, organisation, and rep-resentation of the relevant information. This, again, depends on the goals and characteristics of the intended recipient and should take into account the specific constraints of emergency situations, in particular, the time pressure and stress factor. The general requirements include:
- Reduce the information load on the recipient: not only irrelevant information should be excluded but also the relevant information should be adequately aggregated and generalised leaving out unnecessary details.
- Increase the clarity of the information presentation so that the information can be appropriately understood despite of the emotions and distractions involved in an emergency situation.
- Use such methods of representation that allow quick recognition of the meaning of the information conveyed.- Take into account the characteristics of the medium used for receiving the information.
Intelligent visualisation supposes that both the selection of the relevant information and the subsequent processing, organisation, and representation of the selected information are automated. This may be done by applying the knowledge base technology, i.e. incorporating expert knowledge in the visualisation software.
3 Actors and their information needsTo be able to select the information relevant for a specific addressee, the software must understand the needs of the addressee. The needs depend, among others, on the role of the addressee in the emergency situation. The following generic roles may be consid-ered:
Natalia Andrienko, Gennady Andrienko202
- Analyst: a person (typically in the situation control room) that needs to understand the current situation and its devel-opment, identify problems, and find proper ways of solving the problems.
- Decision maker: a person who chooses a specific action course to take in the current situation on the basis of an overall view of the situation, identified problems, and possible ways of solving them. In principle, one and the same person can play the roles of both an analyst and a decision maker.
- Planner: a person who builds a plan for realising a chosen way of solving a problem or achieving a specific goal, with assigning tasks to performers and allocating available resources to the tasks. Again, this may be the same person as the analyst and/or decision maker.
- Performer: a person, group, or organisation fulfilling a particular task or sequence of tasks. A performer may need to make various tactical decisions depending on the specifics of the situation and its changes.
- Sufferer: a person, group, or organisation that is exposed or may be exposed to some of the danger factors of the emer-gency situation.
- Observer: a person or organisation that is not directly involved in the emergency situation but is interested in receiv-ing information about it. This includes, in particular, the mass media, which distribute information about the situation among the general population.
The knowledge base of the intelligent system should specify the typical information needs for each of the roles. As an example, let us consider the needs of an analyst. An analyst deals with two sorts of information:
- Situational data characterising the current emergency situation and its progress over time.- Reference data (long-term) characterising the area where the situation occurs, the objects and population in this area,
the road and service infrastructure, etc.
An intelligent system can help the analyst by automatic retrieval of relevant reference data on the basis of situational data. For example, the system can automatically find the objects located in the danger zone and requiring particular attention as potential sources of danger (e.g. a petrol station close to a fire or a chemical factory in an area that may be flooded) or valuables that must be protected (e.g. a historical building, library, or art gallery). The system can also retrieve data about the population in the danger zone, estimate the total number and the number of persons of the most vulnerable categories such as children, elderly, and disabled. It can also find the locations of people that may need special care: hospitals, schools, kindergartens, homes for elderly, etc., taking into account the current day and time. Thus, the system can look for the data concerning schools and kindergartens only in a case when the emergency situation occurs on a weekday during the working hours. The system can also find buildings or places outside the danger zone that can be used for sheltering people or animals, and so on.Unlike an analyst, a decision maker does not need detailed information about the situation and every item requiring attention. For example, for making the decision whether to evacuate the population from the danger zone and, if yes, in what way (centralised or allowing people to evacuate on their own using the private cars), the decision maker needs to know the number of population at risk, the risk probability, the potential consequences of no action, and the time and resources required for each variant of evacu-ation. This information can be prepared by the analyst with the help of the intelligent system, and the system can present in an adequate form. A planner does not need all information concerning the current situation but only the information relevant to the particular problem the planner needs to solve at the moment. For example, the planner’s current goal may be to build a plan for the evacuation of the patients of a particular hospital. For this purpose, the planner needs the information about the location of this hospital, the number of patients and their specific needs (e.g. special equipment may be necessary for the transportation of some patients), the hospitals outside the danger zone, their profiles, and the availability of beds in them, the available roads, transportation means, etc. This in-formation can be automatically retrieved and appropriately presented to the planner.A performer needs the information relevant to the task to be performed. This includes the description of the task, the place, the time frame, and the resources and infrastructure to use. This information is prepared by the planner while the system can take care of organising and appropriately presenting it. Additionally, the system can automatically supply the performer with the information as to how to get to the place, how to protect the personnel, what sources to use for renewing consumed resources (e.g. water or fuel), what roads are destroyed or blocked, etc.A sufferer may need information on how to get out from the danger zone, how to protect himself and/or his property, what kind of help is available and how to get it. Actually, a sufferer may simultaneously be a performer when he/she is supposed to follow certain specific instructions, for example, concerning the evacuation. In this case, the sufferer needs the task-relevant information: what to do, where, when, and how. The information can be automatically retrieved and prepared individually for each sufferer/performer on the basis of the general evacuation plan. The system can take into account the location of the sufferer and his specific (dis)abilities and needs if this information is available or can be inquired from the sufferer. For example, the system can send an alarming and instructing message to sufferer’s mobile device and ask the sufferer to specify what kind of assistance is needed, if any.An observer needs general information concerning the character of the event (e.g. fire or flooding), its location, history and devel-opment forecast, number of casualties, and the measures undertaken for managing the situation. The information can be automati-cally retrieved, summarised, and suitably represented. The system can take into account the location of the observer in relation to the emergency site. Thus, if this is the same city or town, the observer is interested in the exact location of the event, which can be shown on a map of the town or city district. For an observer from another town in the same country, it is sufficient to indicate the
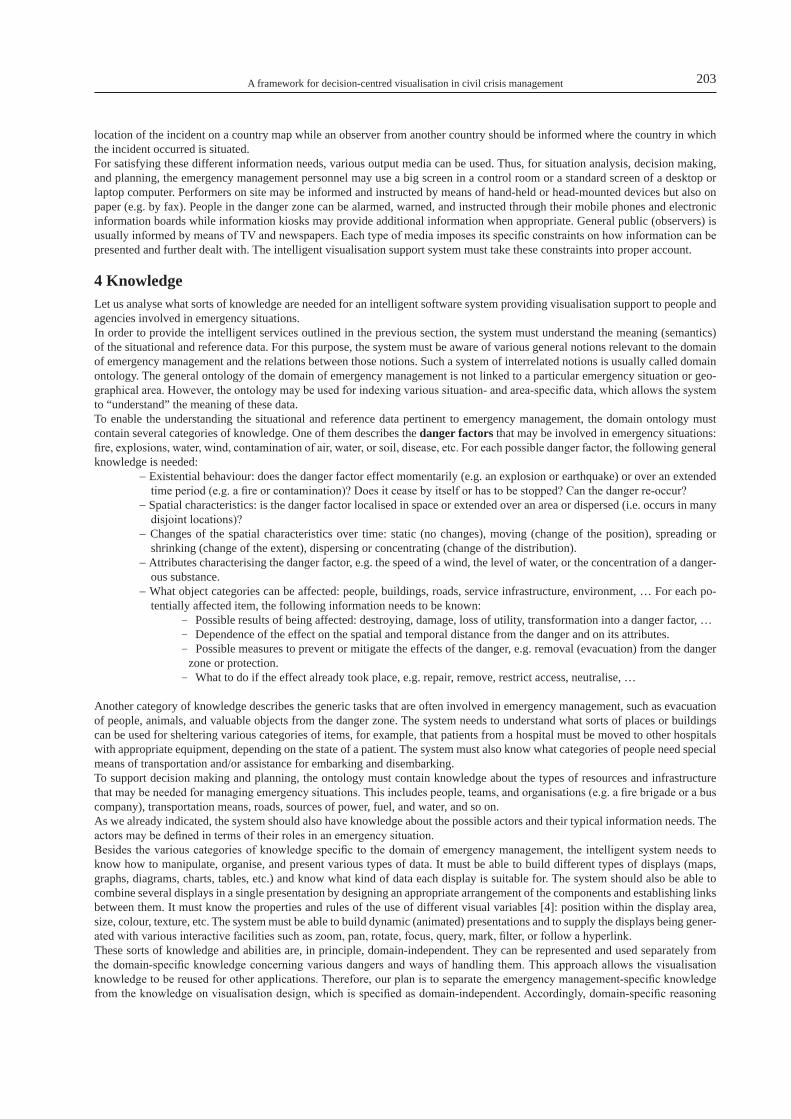
A framework for decision-centred visualisation in civil crisis management 203
location of the incident on a country map while an observer from another country should be informed where the country in which the incident occurred is situated.For satisfying these different information needs, various output media can be used. Thus, for situation analysis, decision making, and planning, the emergency management personnel may use a big screen in a control room or a standard screen of a desktop or laptop computer. Performers on site may be informed and instructed by means of hand-held or head-mounted devices but also on paper (e.g. by fax). People in the danger zone can be alarmed, warned, and instructed through their mobile phones and electronic information boards while information kiosks may provide additional information when appropriate. General public (observers) is usually informed by means of TV and newspapers. Each type of media imposes its specific constraints on how information can be presented and further dealt with. The intelligent visualisation support system must take these constraints into proper account.
4 KnowledgeLet us analyse what sorts of knowledge are needed for an intelligent software system providing visualisation support to people and agencies involved in emergency situations. In order to provide the intelligent services outlined in the previous section, the system must understand the meaning (semantics) of the situational and reference data. For this purpose, the system must be aware of various general notions relevant to the domain of emergency management and the relations between those notions. Such a system of interrelated notions is usually called domain ontology. The general ontology of the domain of emergency management is not linked to a particular emergency situation or geo-graphical area. However, the ontology may be used for indexing various situation- and area-specific data, which allows the system to “understand” the meaning of these data.To enable the understanding the situational and reference data pertinent to emergency management, the domain ontology must contain several categories of knowledge. One of them describes the danger factors that may be involved in emergency situations: fire, explosions, water, wind, contamination of air, water, or soil, disease, etc. For each possible danger factor, the following general knowledge is needed:
- Existential behaviour: does the danger factor effect momentarily (e.g. an explosion or earthquake) or over an extended time period (e.g. a fire or contamination)? Does it cease by itself or has to be stopped? Can the danger re-occur?
- Spatial characteristics: is the danger factor localised in space or extended over an area or dispersed (i.e. occurs in many disjoint locations)?
- Changes of the spatial characteristics over time: static (no changes), moving (change of the position), spreading or shrinking (change of the extent), dispersing or concentrating (change of the distribution).
- Attributes characterising the danger factor, e.g. the speed of a wind, the level of water, or the concentration of a danger-ous substance.
- What object categories can be affected: people, buildings, roads, service infrastructure, environment, … For each po-tentially affected item, the following information needs to be known:
- Possible results of being affected: destroying, damage, loss of utility, transformation into a danger factor, …- Dependence of the effect on the spatial and temporal distance from the danger and on its attributes.- Possible measures to prevent or mitigate the effects of the danger, e.g. removal (evacuation) from the danger
zone or protection.- What to do if the effect already took place, e.g. repair, remove, restrict access, neutralise, …
Another category of knowledge describes the generic tasks that are often involved in emergency management, such as evacuation of people, animals, and valuable objects from the danger zone. The system needs to understand what sorts of places or buildings can be used for sheltering various categories of items, for example, that patients from a hospital must be moved to other hospitals with appropriate equipment, depending on the state of a patient. The system must also know what categories of people need special means of transportation and/or assistance for embarking and disembarking.To support decision making and planning, the ontology must contain knowledge about the types of resources and infrastructure that may be needed for managing emergency situations. This includes people, teams, and organisations (e.g. a fire brigade or a bus company), transportation means, roads, sources of power, fuel, and water, and so on.As we already indicated, the system should also have knowledge about the possible actors and their typical information needs. The actors may be defined in terms of their roles in an emergency situation.Besides the various categories of knowledge specific to the domain of emergency management, the intelligent system needs to know how to manipulate, organise, and present various types of data. It must be able to build different types of displays (maps, graphs, diagrams, charts, tables, etc.) and know what kind of data each display is suitable for. The system should also be able to combine several displays in a single presentation by designing an appropriate arrangement of the components and establishing links between them. It must know the properties and rules of the use of different visual variables [4]: position within the display area, size, colour, texture, etc. The system must be able to build dynamic (animated) presentations and to supply the displays being gener-ated with various interactive facilities such as zoom, pan, rotate, focus, query, mark, filter, or follow a hyperlink.These sorts of knowledge and abilities are, in principle, domain-independent. They can be represented and used separately from the domain-specific knowledge concerning various dangers and ways of handling them. This approach allows the visualisation knowledge to be reused for other applications. Therefore, our plan is to separate the emergency management-specific knowledge from the knowledge on visualisation design, which is specified as domain-independent. Accordingly, domain-specific reasoning
Natalia Andrienko, Gennady Andrienko204
used for the selection of appropriate information is separated from domain-independent reasoning in the process of designing the presentation of the selected information. The entire intelligent system can be viewed as consisting of two cooperating expert subsystems, which may be called “emergency management expert” and “visualisation expert”. First, the emergency management expert selects the necessary information de-pending on the needs of the intended recipient determined by recipient’s role and the current status of the situation. Then the visu-alisation expert finds appropriate methods for transformation and presentation of the selected information.
5 Meta-informationFor appropriate processing of the selected information and designing its presentation, the visualisation expert must take into ac-count various characteristics of this information and how it is supposed to be used as well as the constraints imposed by the target output medium and some characteristics of the intended recipient. Let us use the term meta-information to refer to the factors influ-encing the ways of information processing and presentation. More specifically, meta-information includes the following items:
- Type of the entities the information refers to: movable or unmovable objects, places, processes, actions, or relations.- Structure of the data and types of the components they consist of: spatial, temporal, numeric, ordinal, or categorical.- Quality of the information: does the information result from actual measurements or observations or this is a forecast or
estimation? What is its degree of accuracy or certainty?- The goal of providing the information to the addressee:
- alert, attract attention to something unexpected like an impending threat;- inform: what, where, when, how. The information may be expected by the addressee, e.g. come in response
to a query;- suggest, e.g. some action to take or additional aspect to consider;- enable: analysis, reasoning, decision making, or action planning;- instruct: what, where, when, how to do or to avoid;- explain or justify, e.g. a decision made.
- Degree of relevance to the goal: information of primary importance, supporting information (e.g. orientation clues), irrelevant information.
- Degree of novelty to the addressee: completely unexpected, partly expected (e.g. an analyst may expect that some build-ings could collapse in result of a earthquake but not know what buildings and where), well known and expected.
- Criticality, i.e. whether an information item requires immediate attention of the addressee.- The expected level of addressee’s knowledge concerning the topic of the information and the geographical area the
information refers to.- Characteristics of the output medium to be used for presenting the information: size, resolution, available colours, pos-
sibilities for dynamic output and user interaction, memory capacity, individual or public use. According to our approach, the emergency management expert supplies the required meta-information to the visualisation expert together with the information to be presented. The meta-information concerning the character, structure, and properties of the infor-mation comes from the indexing of the information items in terms of the domain ontology. However, the emergency management expert must specify this meta-information in a domain-independent manner so that the visualisation expert could use it without having any domain knowledge. The meta-information concerning the goal for which the information is to be used comes from the user of the intelligent system. In some cases, the user is the same person as the intended recipient. Thus, an analyst or planner can directly interact with the system in the course of analysis or planning. In this case, the system presents the relevant information directly to the user. In other cases, the user employs the system for preparing and presenting information to other actors. Thus, an analyst may prepare a summary of the situation and possible ways of handling it for communicating to a decision maker. A per-former who received the task to alert and instruct the sufferers may use the system for preparing an appropriate presentation or even let the system construct a personalised message for every individual or family in the danger zone.So, the user somehow lets the system know for whom and what purpose the information is needed. Basically, the system needs to be aware of the recipient’s role in the current situation and his/her geographical location. Sometimes, this sort of meta-information is clear from the context of the system use and does not need to be explicitly specified. On the basis of the meta-information con-cerning the recipient and the stated or implied goal of information use, the emergency management expert can estimate the degree of relevance, novelty, and criticality of each information item for the recipient. For this purpose, it uses the domain knowledge concerning the actors (roles) and their typical information needs. The same knowledge allows the expert to estimate the probable level of addressee’s thematic and geographic knowledge. Thus, an analyst may be qualified as an expert in emergency management issues but the level of knowledge concerning the area of the incident may be low. In opposite, the local population to be alerted may know the area quite well but be unaware of the character of the particular threat and the possible consequences.Hence, by reasoning with the use of the domain-specific knowledge, the emergency management expert not only finds and retrieves the relevant information but also supplies it with meta-information that allows the visualisation expert to interpret, process, and present this information adequately. The meta-information is specified in a domain-independent manner so that no domain knowl-edge is needed for utilising it. Additionally to this, the visualisation expert needs to know the characteristics of the output medium. This information either comes from the context of the system use (when the information is intended directly for the system user) or the user specifies it explicitly (when the information is to be communicated to someone else).The organisation and functioning of the intelligent visualisation system can be schematically represented as is shown in Figure 1.
A framework for decision-centred visualisation in civil crisis management 205
6 Knowledge sourcesAs may be seen from the scheme, the intelligent system will use several categories of knowledge:
- Emergency management domain ontology;- Knowledge about the roles and information needs of people and organisations that may be involved in an emergency
situation;- Knowledge on visualisation design, including techniques of interactive display manipulation and mechanisms of coor-
dination of multiple displays;- Knowledge concerning techniques of data manipulation, e.g. aggregation, filtering, smoothing, interpolation, statistical
processing, etc.The first two categories of knowledge are specific to the domain of emergency management. This knowledge is currently being constructed mainly by analysing available reports describing real incidents and generalising from these cases. Some comprehensive analytical reports can be found in the literature [5, 6]. Much information concerning the management of real disasters can be found in the news reports from various news agencies available, in particular, in the Web. Thus, using the Web, we have compiled a rather detailed description of the course and management of the flood in Czech and Germany in August 2002.The second two categories of knowledge come from the extensive literature on information visualisation, geographic visualisation, data analysis, and graphics design. We have recently summarised the current state-of-the-art in these areas with the focus on tech-niques and tools supporting data exploration and analysis [7]. However, the intelligent system for decision-centred visualisation will also need the knowledge concerning effective information presentation according to the intended communication goals. The relevant literature is rather abundant and includes both theoretical studies (e.g. [8]) and descriptions of practical approaches to au-tomated presentation design (e.g. [9]). Our orientation to various types of output media necessitates the use of knowledge concern-ing the possible ways of presenting information on these media. In particular, we can use some recent research results concerning information visualisation on mobile devices [10, 11].
7 ConclusionThe realisation of the proposed framework is a very ambitious and complex task. It is hardly possible to fulfil it completely in the course of the OASIS project. Therefore, we aim at a partial realisation that would be sufficient for the demonstration of the feasi-bility of the approach and the potential benefits for the emergency management personnel and for the population. We are starting with one example scenario of managing a specific emergency situation and developing a prototype oriented to this scenario. On this stage, we shall restrict the scope of our work to only some of the roles and some types of the output media. After testing and refining the prototype, we shall extend it to further types of emergency situations and the remaining roles and media types.
Domain ontology
Conceptual index of the data
Data
Emergency management
expert
Roles and information needs
Selected data
Meta-information
Visualisation design knowledge
Visualisation expert
Recipient and goal
Output medium
User
Display
Presentation specification
Presentation renderer
Recipients
Domain-specific Domain-independent
Data manipulation knowledge
Fig. 1: A schematic representation of the structure and functioning of the intelligent visualisation system for emergency management.

Natalia Andrienko, Gennady Andrienko206
8 References1. N. Andrienko and G. Andrienko, A concept of an intelligent decision support for crisis management in the OASIS project, In P. van Oosterom.
S. Zlatanova and E.M.Fendel (Eds.) Geo-information for Disaster Management, Berlin: Springer-Verlag, 2005, pp.669-6822. J. Kohlhammer and D. Zeltzer, Towards a Visualization Architecture for Time-Critical Applications, In Proceedings IUI’04, 2004, Madeira,
Funchal, Portugal, ACM Press, pp.271-2733. M. Guzzo, “MAYA Viz lands $20 million contract from U.S. Army”, Pittsburgh Business Times, 23.7.2004, available at http://pittsburgh.biz-
journals.com/ pittburgh/stories/2004/07/26/story7.html4. J. Bertin, Semiology of Graphics. Diagrams, Networks, Maps, The University of Wisconsin Press, Madison 1983, translated from Bertin, J.:
Sémiologie graphique, Gauthier-Villars, Paris 19675. U. Rosenthal, P. Hart, and M. T. Charles (eds.) Coping with crises: the management of disasters, riots, and terrorism, Charles C Thomas,
Springfield, Illinois, USA, 19896. U. Rosenthal and B. Pijnenburg (eds.) Crisis Management and Decision Making. Simulation Oriented Scenarios, Kluwer Academic Publishers,
Dordrecht, The Netherlands, 19917. N. Andrienko and G. Andrienko, Exploratory Analysis of Spatial and Temporal Data. A Systematic Approach. Berlin, Springer-Verlag, 2005 (in
press)8. E.R. Tufte, Visual Explanations. Images and Quantities, Evidence and Narrative. Graphics Press, Cheshire, Connecticut, 19979. S.M. Casner, A Task-analytic Approach to the Automated Design of Graphic Presentations. ACM Transactions on Graphics, Vol. 10, 1991,
pp.111-15110. G. Gartner and S. Uhlirz, Cartographic Concepts for Realizing a location-based UMTS Service: Vienna City Guide Lol@, Proc. 20th Interna-
tional Cartographic Conference Beijing, August 2001, Beijing, China; vol.5, pp. 3229-323911. T. Reichenbacher, The importance of being relevant, In CD-ROM proceedings of ICC 2005 – International Cartographic Conference, A Coruna,
Spain, July 9-16, 2005

A visual editor for generating OGC Styled Layer Descriptor (SLD) files for automating configuration of Web Map Server (WMS) maps
Albrecht Weiser, Alexander Zipf
1 IntroductionThe OGC Styled Layer Descriptor (SLD) specification [28] allows to describe the design and contents of a map – in particular a map served by a SLD-WMS – in a formal way through the use of a strict XML schema. The specification is getting more and more used and supported by several implementations of Web Map Servers, but it still has some weaknesses – especially for use in LBS, see e.g. [2]. On the other hand in LBS or UbiGIS maps need to be generated dynamically taking a lot of factors into account – in particular also attributes describing the current user, the situation and general context [23, 24, 25,9]. In order to use this kind of parameter and information in an automated map service on the internet or on mobile devices we need also formal representations for this type of information – e.g. also as XML files following a specific schema. Then we need to combine the information from this context models and the base map repesented as SLD file to automatically generate adapted maps according to these parameters. The result is again an SLD file describing the adapted map, which then can be used within a request to an SLD-enabled WMS. So the first task is to generate the SLD for the base map. In order to automate the task of designing maps for Web Map Servers serving maps to the Web or the Wireless Web we will introduce a tool that we developed called ArcMap2SLD-Generator. This tool is help-ful as it allows to generate a valid SLD-file from the design of a base map within ESRI ArcMap. The resulting SLD in turn acts as a base for further modifications through user and context models in order to generate “adapted maps” [24] in a standard-conformant way. The SLD acts herby as parameter within an ordinary WMS request results.
2 Using the OGC styled layer descriptor specification for the formal representation of mapsThe OGC Styled Layer Descriptor Specification [OGC] defines a XML Schema to describe the appearance of the layers a map. The general model (simplified version) is depicted as UML class diagram in figure 1. A SLD document is a XML file that can be validated against this model. SLDs are getting more popular in Web Mapping applications with the growing availability for SLD support in WMS. But until recently these SLDs are more or less hand-made or application specific. But as SLDs provide the means to specify the look of map in a domain and vendor-neutral way it is a good choice for a formal representation of maps in general. The question is now how to go beyond these hand-made SLDs and generate these in an automated way (using Open Standards pre-dominantly). This is a technical question and can be solved using a software tool we have developed. This tool is a SLD generator for ESRI ArcMap maps. This can be used not only in WMS requests or for configuring WMSs (as in the case of the deegree WMS), but also when producing vector based maps in SVG. Merdes et al. [11] present an example of using SLD and GML from WFS re-quests with a cascade of several XSLT transformations in order to generate a SVG map from GML and SLD. We will explain and extend this approach in order to produce context adapted maps later. First we will briefly introduce our application that generates SLD files from existing maps in commercial Desktop GIS.
3 The ArcMap2SLD converterIn this section we want to explain the functionality and the benefits of ArcMap2SLD-Converter.The first question is: What is this tool designed for at all? The answer is that it was developed mainly for supporting the setup of a Web Mapping Service. One of the most exhausting works in setting up a WMS is to write the code for the symbolization prescrip-tion of the configuration file. If you want to setup a large project with various layers and many classes, by far the most effort is to code the hundreds (or even thousands) of lines of the symbolization prescription. So the question arizes how we can automate this to minimize these efforts? In the best case we could reuse the effort and work, that was already invested in setting up a project and dsigning a map with a common desktop GIS. This would allow to take the power of Desktop GIS for aiding in the symbolization process of desktop GIS also for Web-based maps. If we would be able to analyze the symbolization of a desktop GIS and transform the informations in SLD (which is the portrayal prescription of an enhanced WMS), the most time-consuming activity in setting up a WMS would be done.Therefore we developed a tool for converting the symbolization of a ArcMap project into the SLD standard format. The Arc-Map2SLD-Converter analyzes the symbolization of an ArcMap-map by stepping through each layer of the project and each class of the layer. It stores the symbol properties and further properties of the layers and the project in special data structures. This allows a
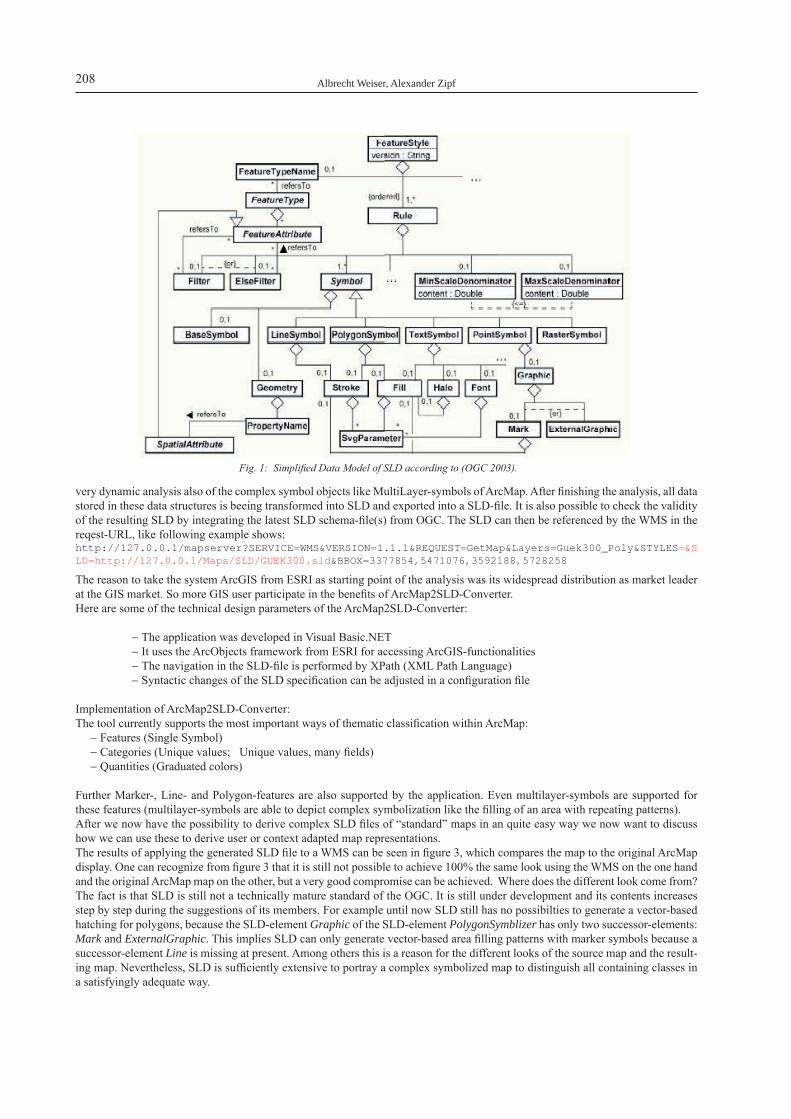
Albrecht Weiser, Alexander Zipf208
very dynamic analysis also of the complex symbol objects like MultiLayer-symbols of ArcMap. After finishing the analysis, all data stored in these data structures is beeing transformed into SLD and exported into a SLD-file. It is also possible to check the validity of the resulting SLD by integrating the latest SLD schema-file(s) from OGC. The SLD can then be referenced by the WMS in the reqest-URL, like following example shows:http://127.0.0.1/mapserver?SERVICE=WMS&VERSION=1.1.1&REQUEST=GetMap&Layers=Guek300_Poly&STYLES=&SLD=http://127.0.0.1/Maps/SLD/GUEK300.sld&BBOX=3377854,5471076,3592188,5728258
The reason to take the system ArcGIS from ESRI as starting point of the analysis was its widespread distribution as market leader at the GIS market. So more GIS user participate in the benefits of ArcMap2SLD-Converter. Here are some of the technical design parameters of the ArcMap2SLD-Converter:
- The application was developed in Visual Basic.NET- It uses the ArcObjects framework from ESRI for accessing ArcGIS-functionalities- The navigation in the SLD-file is performed by XPath (XML Path Language)- Syntactic changes of the SLD specification can be adjusted in a configuration file
Implementation of ArcMap2SLD-Converter:The tool currently supports the most important ways of thematic classification within ArcMap:
- Features (Single Symbol) - Categories (Unique values; Unique values, many fields) - Quantities (Graduated colors)
Further Marker-, Line- and Polygon-features are also supported by the application. Even multilayer-symbols are supported for these features (multilayer-symbols are able to depict complex symbolization like the filling of an area with repeating patterns).After we now have the possibility to derive complex SLD files of “standard” maps in an quite easy way we now want to discuss how we can use these to derive user or context adapted map representations.The results of applying the generated SLD file to a WMS can be seen in figure 3, which compares the map to the original ArcMap display. One can recognize from figure 3 that it is still not possible to achieve 100% the same look using the WMS on the one hand and the original ArcMap map on the other, but a very good compromise can be achieved. Where does the different look come from? The fact is that SLD is still not a technically mature standard of the OGC. It is still under development and its contents increases step by step during the suggestions of its members. For example until now SLD still has no possibilties to generate a vector-based hatching for polygons, because the SLD-element Graphic of the SLD-element PolygonSymblizer has only two successor-elements: Mark and ExternalGraphic. This implies SLD can only generate vector-based area filling patterns with marker symbols because a successor-element Line is missing at present. Among others this is a reason for the different looks of the source map and the result-ing map. Nevertheless, SLD is sufficiently extensive to portray a complex symbolized map to distinguish all containing classes in a satisfyingly adequate way.
Fig. 1: Simplified Data Model of SLD according to (OGC 2003).

A visual editor for generating OGC Styled Layer Descriptor files for automating configuration of Web Map Server maps 209
Some map server currently still offer even less support then the ones we used for all the parameters defined in SLD and therefore re-sult in maps still may look more differently. It is hopefully only a matter of time until this varying support of the SLD has reached a more stable situation and the different render engines produce very similar maps from the same SLD configuration. In order to achieve this also the SLD specification needs further extensions in order to clarify how to repre-sent a range of symbolization issues.
4 User and context modelling for adaptive GI ServicesWe propose to use this base map SLD as a fundament for further modifications accord-ing to some user and context models. Since a few years it has become more and more accepted, that the design of electronic maps – in particular mobile maps - needs to con-sider a much broader range of influences than conventional maps in order to present just the right information needed in the current situa-tion by the current user of such a map-based system (21, 22, 23). After focusing on technical limitations of mobile devices (storage, processing, interaction, display size, bandwidth etc.) the focus of research in mobile maps shifted recently to cognitive aspects (9, 21), e.g. navigation and wayfinding support [8, 11, 16]. Further examples for adaptive GI applications include e.g. the computation of routes based on context-related criteria [7] or user-aware spatial push of information [24].In order to actually apply the ideas presented there to an automated system we need to consider three different main aspects:
- What are the indicators influencing the design of a map (which attributed describing the current task, user, situation etc. – we can refer to this as the User Model and Context Model. They (are sometimes combined) and deliver the structure and possible value domains describing the situation.
- How do these attributes actually influence the design of the map? For answering this we need to components: a.) knowl-edge about cognitive aspects how to present which information the best way to the user and b.) a mathematical or com-putational framework for actually applying this within a computerized system – telling how to calculate the values for the weighting the adaptation etc. See [25] for details.
- A technical framework how to apply this in a standards-based open system.
Fig. 2: Process of designing a map in ArcMap and exporting it to a SLD document, that can be used to configure WMS servers or to issue user-specific requests to SLD Web Map
Services.
Fig. 3: Comparison of the resulting map (detail) from the dynamically generated SLD description renderend by UMN Mapserver by SLD (right side) and the original map in ArcMap (left side). Example: Geologische Übersichtskarte 1:300.000, GÜK 300,
Hessisches Landesamt für Umwelt und Geologie (HLUG) (Geological Map 1:300.000)
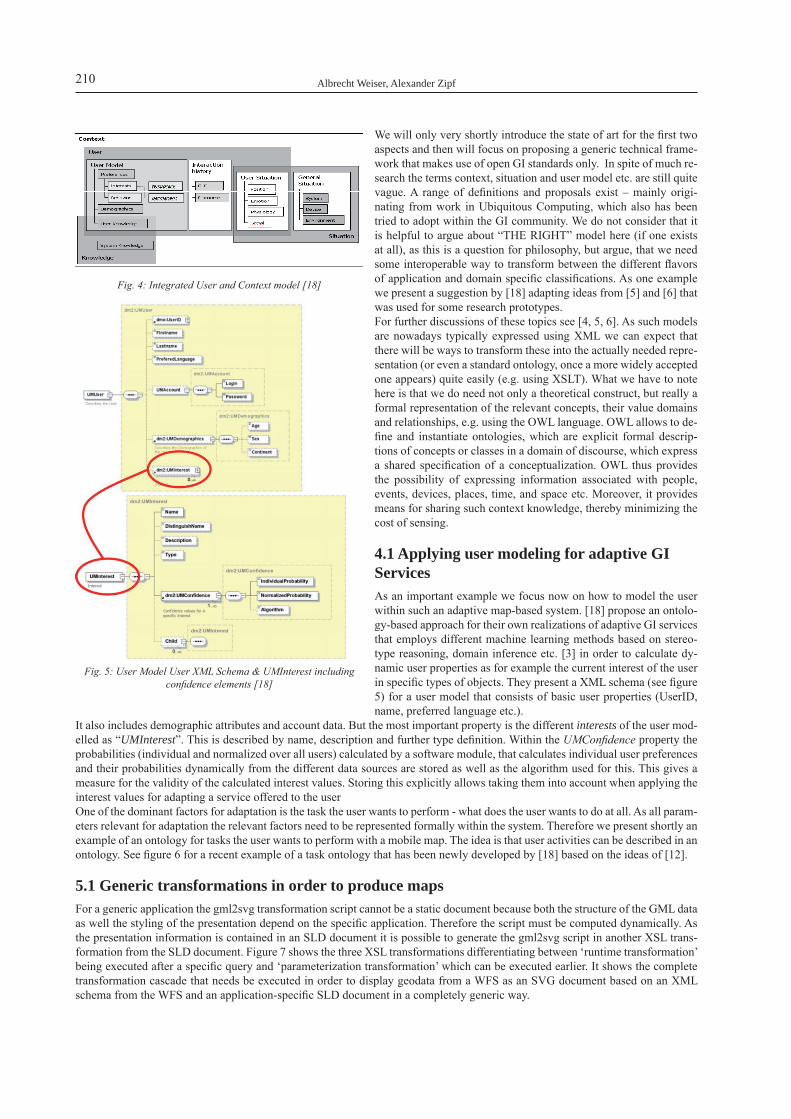
Albrecht Weiser, Alexander Zipf210
We will only very shortly introduce the state of art for the first two aspects and then will focus on proposing a generic technical frame-work that makes use of open GI standards only. In spite of much re-search the terms context, situation and user model etc. are still quite vague. A range of definitions and proposals exist – mainly origi-nating from work in Ubiquitous Computing, which also has been tried to adopt within the GI community. We do not consider that it is helpful to argue about “THE RIGHT” model here (if one exists at all), as this is a question for philosophy, but argue, that we need some interoperable way to transform between the different flavors of application and domain specific classifications. As one example we present a suggestion by [18] adapting ideas from [5] and [6] that was used for some research prototypes.For further discussions of these topics see [4, 5, 6]. As such models are nowadays typically expressed using XML we can expect that there will be ways to transform these into the actually needed repre-sentation (or even a standard ontology, once a more widely accepted one appears) quite easily (e.g. using XSLT). What we have to note here is that we do need not only a theoretical construct, but really a formal representation of the relevant concepts, their value domains and relationships, e.g. using the OWL language. OWL allows to de-fine and instantiate ontologies, which are explicit formal descrip-tions of concepts or classes in a domain of discourse, which express a shared specification of a conceptualization. OWL thus provides the possibility of expressing information associated with people, events, devices, places, time, and space etc. Moreover, it provides means for sharing such context knowledge, thereby minimizing the cost of sensing.
4.1 Applying user modeling for adaptive GI Services As an important example we focus now on how to model the user within such an adaptive map-based system. [18] propose an ontolo-gy-based approach for their own realizations of adaptive GI services that employs different machine learning methods based on stereo-type reasoning, domain inference etc. [3] in order to calculate dy-namic user properties as for example the current interest of the user in specific types of objects. They present a XML schema (see figure 5) for a user model that consists of basic user properties (UserID, name, preferred language etc.).
It also includes demographic attributes and account data. But the most important property is the different interests of the user mod-elled as “UMInterest”. This is described by name, description and further type definition. Within the UMConfidence property the probabilities (individual and normalized over all users) calculated by a software module, that calculates individual user preferences and their probabilities dynamically from the different data sources are stored as well as the algorithm used for this. This gives a measure for the validity of the calculated interest values. Storing this explicitly allows taking them into account when applying the interest values for adapting a service offered to the user One of the dominant factors for adaptation is the task the user wants to perform - what does the user wants to do at all. As all param-eters relevant for adaptation the relevant factors need to be represented formally within the system. Therefore we present shortly an example of an ontology for tasks the user wants to perform with a mobile map. The idea is that user activities can be described in an ontology. See figure 6 for a recent example of a task ontology that has been newly developed by [18] based on the ideas of [12].
5.1 Generic transformations in order to produce mapsFor a generic application the gml2svg transformation script cannot be a static document because both the structure of the GML data as well the styling of the presentation depend on the specific application. Therefore the script must be computed dynamically. As the presentation information is contained in an SLD document it is possible to generate the gml2svg script in another XSL trans-formation from the SLD document. Figure 7 shows the three XSL transformations differentiating between ‘runtime transformation’ being executed after a specific query and ‘parameterization transformation’ which can be executed earlier. It shows the complete transformation cascade that needs be executed in order to display geodata from a WFS as an SVG document based on an XML schema from the WFS and an application-specific SLD document in a completely generic way.
Fig. 4: Integrated User and Context model [18]
Fig. 5: User Model User XML Schema & UMInterest including confidence elements [18]
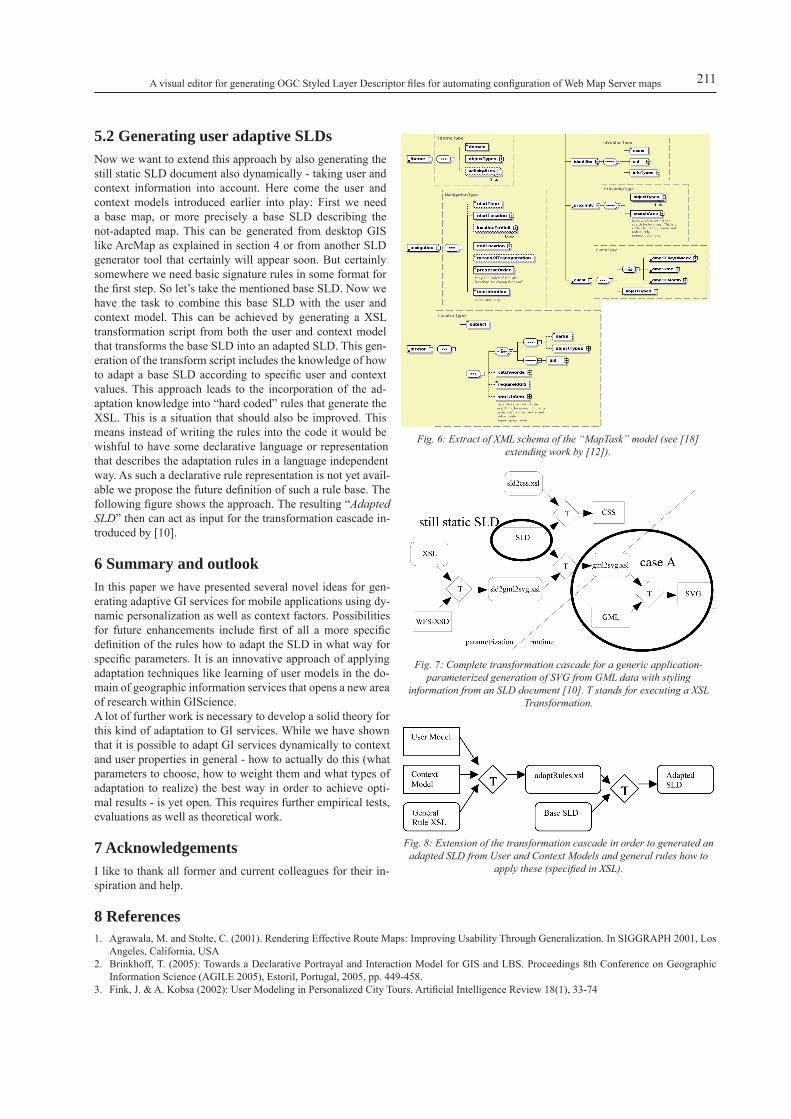
A visual editor for generating OGC Styled Layer Descriptor files for automating configuration of Web Map Server maps 211
5.2 Generating user adaptive SLDsNow we want to extend this approach by also generating the still static SLD document also dynamically - taking user and context information into account. Here come the user and context models introduced earlier into play: First we need a base map, or more precisely a base SLD describing the not-adapted map. This can be generated from desktop GIS like ArcMap as explained in section 4 or from another SLD generator tool that certainly will appear soon. But certainly somewhere we need basic signature rules in some format for the first step. So let’s take the mentioned base SLD. Now we have the task to combine this base SLD with the user and context model. This can be achieved by generating a XSL transformation script from both the user and context model that transforms the base SLD into an adapted SLD. This gen-eration of the transform script includes the knowledge of how to adapt a base SLD according to specific user and context values. This approach leads to the incorporation of the ad-aptation knowledge into “hard coded” rules that generate the XSL. This is a situation that should also be improved. This means instead of writing the rules into the code it would be wishful to have some declarative language or representation that describes the adaptation rules in a language independent way. As such a declarative rule representation is not yet avail-able we propose the future definition of such a rule base. The following figure shows the approach. The resulting “Adapted SLD” then can act as input for the transformation cascade in-troduced by [10].
6 Summary and outlookIn this paper we have presented several novel ideas for gen-erating adaptive GI services for mobile applications using dy-namic personalization as well as context factors. Possibilities for future enhancements include first of all a more specific definition of the rules how to adapt the SLD in what way for specific parameters. It is an innovative approach of applying adaptation techniques like learning of user models in the do-main of geographic information services that opens a new area of research within GIScience.A lot of further work is necessary to develop a solid theory for this kind of adaptation to GI services. While we have shown that it is possible to adapt GI services dynamically to context and user properties in general - how to actually do this (what parameters to choose, how to weight them and what types of adaptation to realize) the best way in order to achieve opti-mal results - is yet open. This requires further empirical tests, evaluations as well as theoretical work.
7 AcknowledgementsI like to thank all former and current colleagues for their in-spiration and help.
8 References1. Agrawala, M. and Stolte, C. (2001). Rendering Effective Route Maps: Improving Usability Through Generalization. In SIGGRAPH 2001, Los
Angeles, California, USA2. Brinkhoff, T. (2005): Towards a Declarative Portrayal and Interaction Model for GIS and LBS. Proceedings 8th Conference on Geographic
Information Science (AGILE 2005), Estoril, Portugal, 2005, pp. 449-458.3. Fink, J. & A. Kobsa (2002): User Modeling in Personalized City Tours. Artificial Intelligence Review 18(1), 33-74
Fig. 6: Extract of XML schema of the “MapTask” model (see [18] extending work by [12]).
Fig. 7: Complete transformation cascade for a generic application-parameterized generation of SVG from GML data with styling
information from an SLD document [10]. T stands for executing a XSL Transformation.
Fig. 8: Extension of the transformation cascade in order to generated an adapted SLD from User and Context Models and general rules how to
apply these (specified in XSL).

Albrecht Weiser, Alexander Zipf212
4. Chen, H. (2004): SOUPA - Standard Ontology for Ubiquitous and Pervasive Applications. http://pervasive.semanticweb.org/5. Dey, A.K., Abowd, G.D.: Towards a Better Understanding of Context and ContextAwareness. In CHI 2000 Workshop on the What, Who,
Where, When, and How of ContextAwareness. 6. Jameson, A. (2001): Modeling Both the Context and the User. Personal Technologies, 5, 1.7. Joest, M. and Stille, W. (2002): A User-Aware Tour Proposal Framework using a Hybrid Optimization Approach. Agnès Voisard, Shu-Ching
Chen (Eds.): ACM-GIS 2002, Proceedings of the Tenth ACM International Symposium on Advances in Geographic Information Systems, McLean, VA , USA.
8. Kray C. 2003: Situated Interaction on Spatial Topics. PhD. thesis, DISKI series vol. 274, AKA Verlag, Berlin, 2003.9. Meng, L., Zipf, A. and Reichenbacher, T. (eds.) (2004): Map-based mobile services – Theories, Methods and Implementations. Springer Geosci-
ences. Springer Verlag. Heidelberg.10. Meng, L., Zipf, A. and Reichenbacher, T. (eds.) (2004): Map-based mobile services – Theories, Methods and Implementations. Springer Geosci-
ences. Springer Verlag. Heidelberg.11. Merdes, M., J. Häußler, A. Zipf (2005): GML2GML: Generic and Interoperable Round-Trip Geodata Editing using Standards-Based Knowl-
edge Sources. AGILE 2005. 8.th AGILE Conference on GIScience. Association of Geographic Information Laboratories in Europe. Estoril. Portugal.
12. Raubal, M., Miller, H. and Bridwell, S. (forthcoming 2004): User Centered Time Geography For Location-Based Services. Geografiska Annaler B.
13. Reichenbacher, T. (2004), Mobile Cartography - Adaptive Visualisation of Geographic Information on Mobile Devices, PhD thesis, TU Mu-nich.
14. Reuter, A., Zipf, A. (2005 in print): GIScience – Where Next? In: Fotheringham S. and Wilson, J.P. (eds.): Handbook of GIS. Blackwell Publish-ers.
15. W3C: Extensible Stylesheet Language, Version 1.0, W3C Recommendation, 2001.16. W3C: Scalable Vector Graphics (SVG) 1.1 Specification, W3C Recommendation, 2003.17. Weiser, A. (2005): Diploma Thesis. University of Applied Sciences. Mainz.18. Winter, S., Raubal, M. and Nothegger, C. (2004): Focalizing Measures of Salience for Route Directions. In: A. Zipf, L. Meng and T. Reichen-
bacher (Editors). Map-based mobile services – Theories, Methods and Implementations, Springer. Berlin.19. Zipf, A. and Krüger, S. (2001): TGML - Extending GML by Temporal Constructs - A Proposal for a Spatiotemporal Framework in XML. ACM-
GIS 2001. The Ninth ACM International Symp. on Advances in Geographic Information Systems. Atlanta. USA. 20. Zipf, A and Jöst, M. (2005 accepted): Implementing Adaptive Mobile GI Services based on Ontologies - Examples for pedestrian navigation
support. In: CEUS - Computers, Environment and Urban Systems - An International Journal. Special Issue on LBS and UbiGIS. Pegamon Press, Elsevier.
21. Zipf, A. und von Hunolstein S. (2003): Task oriented map-based mobile tourist guides.International Workshop: “HCI in Mobile Guides”. at Mo-bile HCI 2003. Fifth International Symposium on Human Computer Interaction with Mobile Devices and Services. 8.-11.Sept. 2003. Undine. Itlay.
22. Zipf, A. and Richter, K.F. (2002): Using Focus Maps to Ease Map Reading. Developing Smart Applications for Mobile Devices. In: Künstliche Intelligenz (KI). Special issue: Spatial Cognition. 04/2002. 35-37.
23. Zipf, A. (2002): User-Adaptive Maps for Location-Based Services (LBS) for Tourism. In: K. Woeber, A. Frew, M. Hitz (eds.), Proc. of the 9th Int. Conf. for Information and Communication Technologies in Tourism, ENTER 2002. Innsbruck, Austria. Springer Computer Science. Hei-delberg, Berlin.
24. Zipf, A. (1998): DEEP MAP - A prototype context sensitive tourism information system for the city of Heidelberg. In: Proc. of GIS-Planet 98. Lisboa, Portugal.
25. Zipf, A. (2000): DEEP MAP / GIS - Ein verteiltes raumzeitliches Touristeninformationssystem. Phd-Dissertation. Ruprecht-Karls-Universität Heidelberg.
26. Zipf, A. and Aras, H. (2002): Proactive Exploitation of the Spatial Context in LBS - through Interoperable Integration of GIS-Services with a Multi Agent System (MAS). AGILE 2002. Int. Conf. on Geographic Information Science of the Association of Geographic Information Labo-ratories in Europe (AGILE). 04.2002. Palma. Spain.
27. Zipf, A. (2003): Zur Bestimmung von Funktionen für die personen- und kontextsensitive Bewertung der Bedeutung von Geoobjekten für Fo-kuskarten. Symposium für Angewandte Geographische Informationstechnologie. AGIT 2003. Salzburg.
28. OGC Inc.: Styled Layer Description Implementation Specification, Version 1.0.0, 2002(a).

Providing an information infrastructure for MapBased LBS
Erich Wilmersdorf
1 Introduction Densely populated regions are marked by a high density of objects but also by dynamic changes. Therefore the requirements for LBS are especially challenging, not only detailed information in respect of space but also timely aspects are in the focus. The ut-most in topicality of data with geographic reference have to be available on call to get reliable information about the kind of ser-vice asked for, which is provided by private companies or by public authorities. Urban administrations play two roles in managing space: as a producer of changes in the urban region itself and as a controlling unit, supervising the evolution of the urban area ac-cording to the legal framework of the zoning regulations defined by the masterplan. So the administrative body has the possibility to play an important role in building up a sound infrastructure for LBS, based on geo-related information. For three decades the urban administration of Vienna is collecting digital geodata in its own interest: they represent a geographic knowledge base, which alleviates decision making in internal processes with local relationship. On the other hand mapbased Web-services had been installed offering information to the public. Therefore the administration of the City of Vienna can be seen as a service providing enterprise for citizen and economy, but also in a global respect for everybody, who is interested in information about Vienna. Past experiences of the WebServices have shown the requirements for LBS. The strategic approach of the City of Vienna for mobile applications are outlined.
2 The components of Geodata-Warehouse
2.1 Data requirements of LBSLBS claim high demands on the availability of data. The need for data especially in urban regions is voluminous. In the focus are data about space:
-Geographic position-Geometry of objects-Topological connexions (e.g. network of public transport)
But also attributes of single objects and events are of importance:
-detailed classification of services,-scope of products -business hours, -recent status (vacation), -state of affairs, -time tables -etc....
2.2 Fundamental data bases for LBS In order to cope with these fundamental requirements several data bases are necessary:
2.2.1 Meta-data baseA meta-database represents a catalogue of the geodata warehouse. It covers the specifications of the data especially in geographic regard:
-data type-reference system (coordinates)-geographic extent-attributes-object class
Erich Wilmersdorf214
-data quality-maintenance information (e.g. update cycle)-responsible person
The metadatabase of Vienna is based on ISO 19 115 specifications. According to those characteristics it is possible to decide if the data are suitable and also relevant for a new LBS Service envisaged and how they can be accessed and incorporated.
2.2.2 Geographic Identifier (gazetteer)Localisation is of utmost importance in the field of LBS. There are many kinds of positional definitions applied in every day life when entering into a LBS. Apart from the self positioning by GPS or apart from the provision of the coordinates of the telecom-munication cell a large scope of user defined popular terms of locations must be supported. Besides the most frequently used house number other definitions such as object names (e.g. “Schönbrunn” as a name of a landmark) have to be stored geocoded. Not only the position but also the size of the map extent can be derived automatically from the gazetteer data base, which includes the dimen-sions of the object (see “Stadtplan mit Adressensuche”: http://www.wien.gv.at/wiengrafik). This set of local and regional identifiers alleviates the spatial analysis within LBS processing.
2.2.3 Geographic Reference SystemThe Reference System of Vienna (RBW) represents a generalized model of the urban structure furnished with a set of identifica-tion keys for blocs and street network. The postal address is geo-coded and linked twice: to the bloc and to the adjacent street seg-ment. These elements offer LBS logistic information. It is linked with the gazetteer data base too. So it forms a solid basis for the search function via an address and for the examination of networks to get a suitable route from the starting point to the target point sug-gested by LBS.
2.2.4 Topographic data baseThe City of Vienna decided to build up a digital model of high resolution in the nineteeneighties. The complete area was surveyed by techniques of tacheometry and photogrammetry, recording directly in digital mode. The data base represents a detailed descrip-tion of the geography and geometry of objects. It is an outstanding coverage because of the high resolution of the model describing the complete “urban landscape” digitally. The composing even of 3D objects (buildings) is under way. Viewed by LBS it is a powerful data base: Due to the high resolution this database offers a detailed object inventory even about small objects. So it can be seen as a collection of points of interest for different object classes. The second function is important for LBS as well. The neighbourhood can be visualised by a city map derived from this database by cartographic modelling.
2.2.5 Cartographic data basesThere are only few cartographic databases maintained periodically as in general cartographic visualisation is covered by real time processes (see 4.2: Real Time Cartography). For LBS two databases are of interest. They are used as background maps for the purpose of orientation:
City map The city map is derived automatically from the Reference System of Vienna (RBW), from the land use data base and/or from the topographic data base. It is periodically updated by automated cartographic modelling, and by rendering for different ranges of scales. For each object class the cartographic visualisation is defined by rules. The map processing is finished by a vector/raster-conversion.
OrthophotomapFor many purposes a photographic “snapshot” of the urban landscape is advantageous when background information true to nature is needed: a detailed illustration of the real world in homogenous and current manner in terms of time. Such a detailed geographic visualisation of the surface never can be provided so quickly and substantial by a map derived out of the topographic database, which represents a generalised model and is updated in a three years cycle.
3 Maintenance of Geodata Warehouse
3.1 Completion of digital geodata warehouseThe City of Vienna is already equipped additionally with voluminous databases of special fields, storing vast data about the urban area representing a detailed geocoded object inventory of the urban microcosmos e.g. a full coverage of the street network (mate-
Providing an information infrastructure for MapBased LBS 215
rial of the coverage). So the quality of the pavement can be analysed automatically (obstacles as staircases, street furniture, bottle-necks of width), in order to recommend a route for handicapped people. Additionally attribute data and other digital images of objects (photos, detailed site drawings and maps for emergency cases) are stored in a geocoded way. Due to the important role of time in LBS also short term objects are incorporated into the data ware-house, e.g. the construction sites in the road network as obstacles for routing during a predefined period.
Despite this considerable Geodata-Warehouse - already existing -, there are lacks (e.g. the network of paths and passages for pe-destrians), which represent obstacles for automated information processing especially for LBS purposes. The “GIS-Masterplan” of the City of Vienna -passed 2004- is a development scheme for the urban GIS. It envisages the penetration of the administration with GIS facilities and it focuses on the gaps in the recent ViennaGIS GeodataWarehouse to be filled until 2007/2008. On the other hand it is obvious, that the service of the public administration is only one part, the other are the many data bases of private service providing companies which must be available and updated as quickly as possible too. Detailed information about the kind of service and restriction in time must be maintained in a reliable manner, so that LBS get confidence into its services which is needed for acceptance.
3.2 Utmost efforts for quick updating To cope with the demand for utmost topicality changes in the metropolitan area have to be recorded digitally as soon as possible. Digital recording facilities are placed in those branches of the administration, where changes are observed at first (e.g. where build-ing permissions are given) or where changes are caused (e.g. public projects). Especially the integration of GIS- functionality into administrative processes is expected to contribute to these efforts: data are collected in the daily workflow. Early bird information about pending changes can be recorded automatically by tapping data flow of processes.
Update methodsMany ways of updating are applied: Electronic measuring techniques in the field, CAD input imported directly from private con-tractors, GIS workstations for sophisticated editing in house but also a WebEditor, which can be made available on a standard PC without a GIS software licence. So the urban administration is able to take charge of updating geodata on those working places, where new data occur at first. This Web-Editor offers functions for recording geo-related data on each PC in the urban telecom-munication network: simple geometric input together with object`s identification keys and attributes. Telecartography helps to improve the updating in time and in quality. A mobile version of this WebEditor is planned to support directly the collection of data in the field. It applies these methods in order to cover updating in an economic way and in the state of art. All these efforts together should guarantee that the urban administration of Vienna contributes his part to completeness and topicality of its overall Geodatawarehouse.
4 Service providing geoservices
4.1 Analytical features LBS are faced by individual requests (localisation and different points or area of interest). So a flexible combination of themes and quick response in the assembling of the adequate information package is asked for. Analysis services have to be offered as well: spatial retrieval in combination with selected attributes and object classes. Several functions for the acquirement of selected infor-mation should be provided, e.g.:
-Position of the object and its spatial extent -localisation of the route (starting point A/target B)selection of an appropriate target point B due to its spatial and attributive characteristic and the proposition of a route from A to B, taking care of barriers like stair cases or construction sites. Cor-responding to the individual demand the network for public transport, street network but also footpaths for pedestrians has to be analysed.
-extraction of objects according to the request (e.g. office of a medical practitioner)
Public authority has to offer analytical tools for those sectors which are maintained within the administration.
4.2 Real Time CartographyThe visualisation is the final stage of LBS processing, marked by adaptive adjustment of the cartographic output according to the individual demands with regard to the restrictions of mobile equipement. To provide the utmost topicality of information, the building up of the cartographic model must be possible on call, exploiting the current state of the databases. Real time processing of the map is the answer. Cartographic compilation is executed basically according to the following guideline:Cartographic modelling is generally executed in a processing stage on demand, generating cartographic objects derived from the original object data set. The objects are stored in an abstract way, to make use of them for many purposes in a flexible way. The

Erich Wilmersdorf216
cartographic compilation is executed on basis of rules for visualisation for each object class and attribute. There are many kinds of cartographic presentation, dependent on the scale, the level of detail and the set of themes. Many aspects have to be covered:
-visualisation has to be adjusted to fit the individual demand for geographic information, so to speak “maps made to measure” (e.g. scale dependent construction according to interactively defined space and content, automated text placing)
-the visualisation has to fit the requirements of the output device (size and resolution of the display) . -additional information offered in a dialogue by clicking on an object in the map to get information about the object in a separate window.
4.3 Providing Web Services
4.3.1 InfrastructureMap based WebServices claim computing power. Therefore a solid infrastructure of servers is necessary. To cope with the work-load, processing is distributed on different servers executing special tasks in parallel mode as far as possible: checking input es-pecially the local address, address localisation, calculation of the map extent, selection of the themes, constructing the map image. The services have to be available permanently, 7 x 24 hours a week. There are three levels of Webservices:
4.3.2 Map-based Internet serviceThe challenge: Individual questions have to be answered customer related.Prefabricated applications - furnished with GIS functions for identifying locally - offer information processing guided in a dia-logue. Individual navigation and geographic analysis allow the creation of flexible maps on the display e.g. the “Stadtplan mit Ad-ressensuche” for mobile equipment (PDAs) takes care of the reduced size of the display of the PDA.
All Internet services of the City of Vienna with geographic aspects are based on:-real time cartography-Standard Browser (no Plug In)-customer´s interaction-flexibility in conveying georelated information
4.3.3 WebMapServices (WMS) The municipality supports also private projects for geographic information services. Standards according to OGC are applied to support the transfer of cartographic data on call to external customers. Via a request over the client spatial ID and selection criteria defined in the parameter list are transferred to the Web Server, the spatial extent is calculated and according to the parameters the map image is constructed. The platform independent map images (raster data) can be integrated into applications of the customer and put together with his own geodata.
4.3.4 WebFeature Service (WFS) This kind of Webservice, based on OGC Standards also, allows the download of digital vector data exactly to the requirements of the user. According to the customer`s request certain object classes are selected within the defined space. Identification and selec-tion routines generate an individual package of data converted into the data exchange format and map projection asked for.
5 ConclusionMunicipalities have to build up voluminous knowledge data bases in order to manage its portfolio and to control the development of the urban region. So municipalities play a key role as an information dispensing authority. This infrastructure has to be improved, to fit the special requirements of map based LBS by:
-comprehensive data capture-quick updating-installation of platforms for tapping geographic information
Municipalities are expected to act not only as distributor of geocoded data but also as service provider of georelated information. The City of Vienna has declared it as a strategic goal to promote the installation of a framework of GIS and telecommunication, to support the effective exploitation of its Geodata-Warehouse inhouse and from outside. Information should not be available in the body of the administration only, information has to be transferred where it is needed: directly to the customer. Realisation is com-mitted to standards, which allow open services, marked by flexibility and interoperability. The infrastructure outlined aims at the ability, that LBS-requests can be answered in time, in a reliable and complete manner. Fu-ture developments are focussed on generating software on Webservices and especially on real time cartography, to improve the user interface for LBS.

MoGeo: A location-based educational service
David A. Bennett, Marc P. Armstrong, Jerry D. Mount
AbstractThe classroom is an efficient venue for conveying theories and concepts in many disciplines. In geography, however, students often have difficulty understanding spatio-temporal processes that are represented abstractly. Though field-based classes embed students in the environment they are studying, they are decoupled from supplemental information that often catalyzes learning. In this paper we present a location-based service for geographic education: the Mobile Geographic Education (MoGeo) System. MoGeo design is based on contextually-aware computing and integrates the following technologies: GPS receivers, GIS software, wireless net-works, mobile computers (PDAs or tablets), and centralized computers (e.g., servers). Using this assemblage of technologies, we integrate the important elements of the classroom and computer laboratory into a field-based learning environment by providing remote, real-time access to: 1) context-specific educational materials; 2) sophisticated spatial analyses; 3) high-end visualization and simulations; 4) feedback and evaluation; and 5) instructors and peers. The overall experience is analogous to the guided tours available at many museums, but is richer and more conducive to intellectual exploration (e.g., through simulation, visualization, and experimentation) and collaboration (e.g., through audio/visual communication and real time tracking of classmates).
1 IntroductionThe purpose of our ongoing research project is to promote geographic understanding through experiential, field-based learning opportunities supported and enhanced by location-based educational service technologies. The use of these technologies allows students to take the classroom, computer laboratory, library, and Internet with them into the field. By integrating the best elements of these more traditional learning opportunities, complex and abstract spatial concepts come alive and assume greater real-world meaning for students (Armstrong and Bennett 2005). This educational experience is referred to as Mobile Geographic Education (MoGeo). In the MoGeo framework, “where” is both paramount and, paradoxically, irrelevant. The delivery of place-specific, highly contextualized information about what students are to learn, given their current location on the landscape, is what makes MoGeo unique and powerful—the “where” matters when learning about geographic processes. On the other hand, recent advances in mobile computing technology provide access to instructors, peers, knowledge repositories, data, and computational power from almost any location—“where” no longer matters when it comes to the provision of educational materials. These characteristics of MoGeo have challenged us to rethink the way knowledge is transmitted as we disconnect educational processes from traditional classroom settings and embed them into the system under study.To understand the conceptual framework on which MoGeo is built, it is useful to make a comparison between the production of knowledge through scientific inquiry and its dissemination in higher education. First, consider how knowledge is produced (Figure 1). Reality is observed and measured. To better understand what we empirically observe we develop theories about how reality works. Experiments and models are constructed to help us examine the validity of our theories in manageable, simplified settings; experiments and models provide a bridge from theory to reality. What we learn from these experiments and models helps us rethink our theories, and what we learn about our theories can change the way we view reality. Now consider how these three elements of knowing (empirical observation, theory development, and experimentation/model building) are translated into three common teaching environments, the classroom, laboratory (here we constrain discussion to the computer laboratory), and field class. For centuries, the classroom has proven to be an efficient, if imperfect, mechanism through which theories and concepts can be conveyed. Although the classroom provides a forum for the presentation and discussion of ideas, the representation of many spa-tio-temporal phenomena of interest to geographers is restricted to highly abstract diagrams or static images of reality because of the scale of observed processes. In laboratories students get a “hands-on” feel for the interrelationships that drive dynamic spatial processes through space and time using visualization and simulation software. Furthermore, students can augment their knowledge through the review of related resources that are accessible from the Internet. While there is no consensus on whether or not internet sources improve learning, students tend to place value on multiple data sources that present information in alternative forms (Chris-man and Harvey 1998; Ritter and Lemke 2000; Jain and Getis 2003). However, two problems often constrain the learning process in computer laboratories. First, traditional laboratories are ill-suited to collaborative learning (Reed and Mitchell 2001)— too often students sit in front of their machine focused on the implementation of complicated computer instructions, taking little opportunity for the kinds of discussions that can occur in classrooms, or group problem solving activities that often occur in the field. Discus-sion and group problem solving, we maintain, assume importance when students are asked to make a cognitive connection between
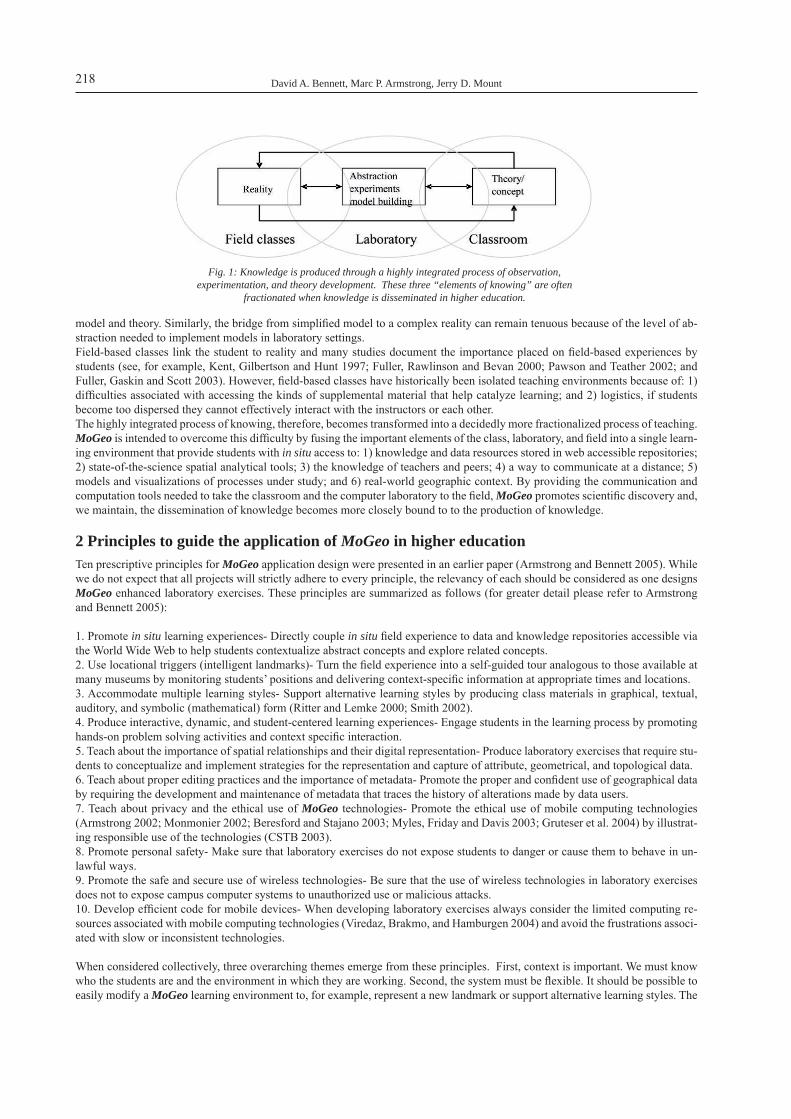
David A. Bennett, Marc P. Armstrong, Jerry D. Mount218
model and theory. Similarly, the bridge from simplified model to a complex reality can remain tenuous because of the level of ab-straction needed to implement models in laboratory settings. Field-based classes link the student to reality and many studies document the importance placed on field-based experiences by students (see, for example, Kent, Gilbertson and Hunt 1997; Fuller, Rawlinson and Bevan 2000; Pawson and Teather 2002; and Fuller, Gaskin and Scott 2003). However, field-based classes have historically been isolated teaching environments because of: 1) difficulties associated with accessing the kinds of supplemental material that help catalyze learning; and 2) logistics, if students become too dispersed they cannot effectively interact with the instructors or each other.The highly integrated process of knowing, therefore, becomes transformed into a decidedly more fractionalized process of teaching. MoGeo is intended to overcome this difficulty by fusing the important elements of the class, laboratory, and field into a single learn-ing environment that provide students with in situ access to: 1) knowledge and data resources stored in web accessible repositories; 2) state-of-the-science spatial analytical tools; 3) the knowledge of teachers and peers; 4) a way to communicate at a distance; 5) models and visualizations of processes under study; and 6) real-world geographic context. By providing the communication and computation tools needed to take the classroom and the computer laboratory to the field, MoGeo promotes scientific discovery and, we maintain, the dissemination of knowledge becomes more closely bound to to the production of knowledge.
2 Principles to guide the application of MoGeo in higher educationTen prescriptive principles for MoGeo application design were presented in an earlier paper (Armstrong and Bennett 2005). While we do not expect that all projects will strictly adhere to every principle, the relevancy of each should be considered as one designs MoGeo enhanced laboratory exercises. These principles are summarized as follows (for greater detail please refer to Armstrong and Bennett 2005):
1. Promote in situ learning experiences- Directly couple in situ field experience to data and knowledge repositories accessible via the World Wide Web to help students contextualize abstract concepts and explore related concepts. 2. Use locational triggers (intelligent landmarks)- Turn the field experience into a self-guided tour analogous to those available at many museums by monitoring students’ positions and delivering context-specific information at appropriate times and locations. 3. Accommodate multiple learning styles- Support alternative learning styles by producing class materials in graphical, textual, auditory, and symbolic (mathematical) form (Ritter and Lemke 2000; Smith 2002).4. Produce interactive, dynamic, and student-centered learning experiences- Engage students in the learning process by promoting hands-on problem solving activities and context specific interaction. 5. Teach about the importance of spatial relationships and their digital representation- Produce laboratory exercises that require stu-dents to conceptualize and implement strategies for the representation and capture of attribute, geometrical, and topological data. 6. Teach about proper editing practices and the importance of metadata- Promote the proper and confident use of geographical data by requiring the development and maintenance of metadata that traces the history of alterations made by data users.7. Teach about privacy and the ethical use of MoGeo technologies- Promote the ethical use of mobile computing technologies (Armstrong 2002; Monmonier 2002; Beresford and Stajano 2003; Myles, Friday and Davis 2003; Gruteser et al. 2004) by illustrat-ing responsible use of the technologies (CSTB 2003). 8. Promote personal safety- Make sure that laboratory exercises do not expose students to danger or cause them to behave in un-lawful ways. 9. Promote the safe and secure use of wireless technologies- Be sure that the use of wireless technologies in laboratory exercises does not to expose campus computer systems to unauthorized use or malicious attacks. 10. Develop efficient code for mobile devices- When developing laboratory exercises always consider the limited computing re-sources associated with mobile computing technologies (Viredaz, Brakmo, and Hamburgen 2004) and avoid the frustrations associ-ated with slow or inconsistent technologies.
When considered collectively, three overarching themes emerge from these principles. First, context is important. We must know who the students are and the environment in which they are working. Second, the system must be flexible. It should be possible to easily modify a MoGeo learning environment to, for example, represent a new landmark or support alternative learning styles. The
Fig. 1: Knowledge is produced through a highly integrated process of observation, experimentation, and theory development. These three “elements of knowing” are often
fractionated when knowledge is disseminated in higher education.
MoGeo: A location-based educational service 219
final theme is responsibility. The potential for abuse with mobile technologies, by both instructor and student, is clear and steps must be taken to insure that all parties understand their responsibility for the ethical use of these devices.
3 MoGeo TechnologyThe design of MoGeo is based on the concept of contextually-aware computing. The system serves educational material to a stu-dent when and where it is needed. To accomplish this coordinated push and pull of information we must know who students are and the class in which they are enrolled. We must also know the laboratory exercise particular students are attempting to complete and where they are located in the landscape. Given this information we can match the students’ context (i.e., location and labora-tory assignment) to a set of intelligent landmarks stored in the system. Each landmark is associated with a spatial feature we want students to learn about (e.g., a wetland or particular land use) or locations at which we want them to perform some task (e.g., collect data or modify a spatial database). Persistent agents, instantiated on the server, monitor student context, match student context to landmark characteristics, and, if appropriate, coordinate the push and pull of context-specific information. Using contextually trig-gered “pop quizzes”, we are able to assess how well students meet learning objectives, identify where mistakes were made (e.g., discrepancies between the students work and expected product), and take remedial actions while the student is actively engaged in the learning process. The student could, for example, be directed to recapture points that were incorrectly located, complete a step that was inadvertently skipped, search web-based resources that describe a particular concept in greater detail, or “get a call” from the instructor using VOIP. The MoGeo system consists of the following components: 1) mobile computing devices; 2) GPS receivers; 3) WiFi wireless com-munication cards; 3) GIS software; 5) a notebook or desktop-based server; 6) wireless communication access points; and 7) com-munication software. These components are deployable in two configurations. The server can be attached directly to the hardwired campus communication network and linked to the mobile devices via outdoor wireless access points installed on campus buildings. This configuration provides users with full access to network accessible knowledge repositories, but restricts the spatial range of the system to those areas covered by installed access points—an area less then 1km2 given current technology. A field-based configu-ration can also be deployed. In this situation, a wireless access point and directional antenna is attached to a notebook computer. This configuration frees the system from the campus backbone and, thus, allows it to be used at almost any location. If an Internet connection is unavailable for the notebook system, however, a knowledge repository must be developed and installed on it before going to the field. This limited connectivity, of course, reduces the total volume of information available to students. With WiMax and the proliferation of next generation cellular technologies, however, connecting to the Internet should not be a long term impedi-ment to MoGeo (at least in and around urban areas).Figure 2 illustrates the interactions among various MoGeo software and hardware components. Students log into the system, link-ing their digital identity to a class, laboratory exercise, and location stream (the stream of points produced as a student moves across the landscape). The GPS samples the students location at regular intervals (e.g., every three seconds) and software loaded on the PDA sends a “who, what, when, and where” information packet to the server through the wireless communication link. In our current system, the software used to capture, store and query data on the server side is SQL Server. Controlling logic written in XML queries these data to determine if students are within a trigger space associated with their current laboratory exercise. What happens when a trigger event occurs is, of course, dependent on the laboratory exercise. Higher level spatial analyses are sent to the server and processed using tools stored in ESRI’s ArcObject library. PDAs and tablet computers are the two most practical computing form factors available at this time for supporting MoGeo. At roughly one third the cost of a tablet, PDAs are clearly the most cost effective solution, but they have two significant limitations. First, with a display area of approximately 50cm2; these de-vices have a limited ability to present the kinds of cartographic representations that GIS users have come to expect. Second, these devices have limited computing power and, thus, cannot perform computationally intensive geographical analyses. To overcome this problem requests for such analyses can be uploaded to compute servers and the results sent back to the mobile device. The implementation of such a solution, however, has required custom software development. We have been developing MoGeo-style capabilities for about 1.5 years—supported by internal seed grants and our own curiosity about the utility of mobile technologies in the classroom. We currently deploy 20 PDAs (Compaq IPAQ model 3850, purchased in 2003) each of which runs a mobile GIS software package (ESRI ArcPad) and software developed “in house” to support commu-nication among components and the transformation of incoming data to a GIS format (Figure 3). These devices are equipped with WAAS compatible GPS units and WiFi network interface cards. The compute server is a 3.4 GHz Pentium 4 notebook computer with 1GB of RAM and a 100 GB disk. This server is equipped with a WiFi network interface card, GIS software (ESRI’s ArcMap 9.1, associated extensions and ArcObjects), and SQL Server. Persistent agents running on the server provide two main location-based services for the user. First, they collect incoming data from mobile devices and coordinate the push and pull of context spe-cific information. Second, these agents perform analytical tasks that are beyond the capability of the mobile GIS software or the PDA. These tasks are executed using calls to ArcObjects.

David A. Bennett, Marc P. Armstrong, Jerry D. Mount220
4 Teaching the four traditions of geography with MoGeoIn 1964 William Pattison established four themes that he believed captured the intellectual core of geographic enquiry (Pattison 1964). These “four traditions of geography” are: 1) spatial; 2) area studies; 3) man/land (what we now refer to as human/environ-ment); and 4) earth science. Twelve years latter, Robinson (1976) found that these traditions retained their relevance to the disci-pline. While some may debate whether additional subdisciplines should be added to this list (we can, after all, forgive Robinson and, in particular, Pattison for not foreseeing the importance of GIScience in the days of the mainframe, key punch, and line print-er), this set remains relevant today and is sufficiently diverse to illustrate the range of educational applications to which MoGeo can be applied. We are creating MoGeo enhanced laboratory exercise that teaches concepts associated with each of the four traditions of geography. The production of such exercises requires the development of spatial databases, the identification and integration of supporting resources (web links, video, articles), and the extension of existing MoGeo capabilities. We have completed a first step toward this goal by implementing a laboratory exercise in the “spatial tradition.”
This exercise is inspired by “Modelling Access with GIS in Urban Systems” (Mathews et al. 2003) that evaluated how urban infra-structure impacts the movement of individuals who use wheelchairs. Students produce spatial datasets that capture travel imped-ance using guidelines documented in Mathews et al. (2003) and the American Disabilities Act. These data are developed into a network model of wheelchair accessibility in the laboratory. Students then return to the field and, using the original and modified network datasets, produce and traverse shortest paths using GIS software. The compute server is be used to calculate alternative paths for the students in real-time based on alternative assumptions about impediments to travel.
5 Future workWe have only just begun to explore the possibilities of MoGeo and further work is needed on all aspects of this endeavor. We need, for example, to:1. rigorously evaluate the impact of MoGeo on the learning process;2. explore the utility of multiple communication channels (i.e., voice, video, data);
3. evaluate the impact of potential technological con-straints, such as bandwidth, response time, and distance, on user satisfaction;4. design, implement, and evaluate human-computer in-terfaces that facilitate the MoGeo learning process;5. design, implement, and evaluate cartographic and ge-ovisualization products well suited to the MeoGeo learn-ing process; and6. evaluate the utility of real-time feedback to students during the learning process.
6 ConclusionsLocationally enabled mobile computing is beginning to routinely affect our daily lives. As a consequence, it is important that geography students, in general, and GI-Science students, in particular, understand the strengths and weaknesses of emerging technologies by learning to
Fig. 2: Schematic of MoGeo implementation.
Fig. 3: A MoGeo device consists of a mobile computer (handheld or tablet), a global positioning system receiver, wireless access, GIS software, and
communication software.

MoGeo: A location-based educational service 221
use and apply them properly. Such understanding and hands-on experiences will give our students the knowledge needed to: 1) compete successfully in a rapidly changing technological world; and 2) use advanced geospatial and mobile technologies in an appropriate and ethical manner. We further contend that the need for such an understanding is, in fact, widespread within the acad-emy and that the activities described in this paper will have important ramifications on a wide range of disciplines, literally from Anthropology (e.g., studying the ecological context of ancient sites) to Zoology (e.g., calculating habitat suitability while conduct-ing field surveys
While an educational example is described in this paper, the concepts embedded in MoGeo are portable to LBS in general. For example, conceptual maps derived from user interaction can attach “value added” information to landmarks (e.g., individuals who found this attraction interesting, also enjoyed these attractions…), while virtual locks monitored by persistent assistants can filter out unwanted solicitations (e.g., forward only those services associated with landmarks containing historical information). The op-portunities seem endless. The trends we observe today in mobile, embedded, ubiquitous, and pervasive computing are, after all, just the metaphorical tip of a very large iceberg.
7 ReferencesArmstrong, M.P. 2002. Geographic information technologies and their potentially erosive effects on personal privacy. Studies in the Social Sci-
ences, 27 (1): 19-28.Armstrong M.P. and Bennett, D.A. 2005. A manifesto on mobile momputing in geographic education. Professional Geographer, 57(4):506-515.Beresford, A. and Stajano, F. 2003. Locational privacy in pervasive computing. Pervasive Computing, 2(1): 46-55.Chrisman N R. and Harvey, F.J. 1998. Extending the classroom: hypermedia-supported learning. Journal of Geography in Higher Education, 22(1):
11- 18.CSTB – Computer Science and Telecommunications Board Committee on Intersections Between Geospatial Information and Information Technol-
ogy. 2003. IT Roadmap to a Geospatial Future. Washington, DC: The National Academies Press.Fuller, I., Rawlinson, S., and Bevan, R. 2000. Evaluation of student learning experiences in physical geography fieldwork: paddling or pedagogy?
Journal of Geography in Higher Education, 24(2):199–215.Gruteser, M. and Xuan L. 2004. Protecting privacy in continuous location-tracking applications. IEEE Security & Privacy, 2(2): 28-35.Jain, C and Getis, A. 2003. The effectiveness of internet-based instruction: an experiment in physical geography. Journal of Geography in Higher
Education, 27(2):153–167.Kent, M., Gilbertson, D.D., Hunt, C.O. 1997. Fieldwork in geography teaching: a critical review of the literature and approaches. Journal of Ge-
ography in Higher Education, 21(3): 313- 332.Matthews, H., Beale, L., Picton, P. and Briggs, D. 2003. Modelling access with GIS in urban systems (MAGUS): capturing the experiences of
wheelchair users. Area, 35(1): 34–45.Monmonier, M. 2002. Spying With Maps. Surveillance Technologies and the Future of Privacy. Chicago, IL: University of Chicago Press Myles, G., Friday, A. and Davies, N. 2003. Preserving privacy in environments with location-based applications. Pervasive Computing, 2(1): 56-
64.Pattison, W.D. 1964. The four traditions of geography. Journal of Geography, 63(5): 211-216. Pawson, E. and Teather E.K. 2002. Geographical Expeditions: assessing the benefits of a student-driven fieldwork method. Journal of Geography
in Higher Education, 26(3): 275–289.Robinson, J.L. 1976. A new look at the four traditions of geography. Journal of Geography, 75(9): 520-530.Reed, M. and Mitchell B. 2001. Using information technologies for collaborative learning in geography: a case study from Canada. Journal of Ge-
ography in Higher Education, 25( 3):321–339.Ritter, M.E. and Lemke, K.A. 2000. Assessing the ‘seven principles for good practice in undergraduate education’ with internet enhanced education.
Journal of Geography in Higher Education, 24(1): 100-108.

What makes Location-Based Services fail?
Gerhard Navratil, Eva Grum
AbstractA lot of research projects deal with location-based services and also telephone providers started services. Some services fail to become an economic success. In this paper we investigate possible pitfalls for location-based services. The categories of pitfalls are technical possibilities, legal restrictions, and usability. Using two example services we show how to determine the possible pitfalls.
1 IntroductionDiscussions on location-based services (LBS) started in 2000 (Laurini 2000; Winter, Pontikakis et al. 2001). Since then a number of LBS was started by mobile operators. According to Berg Insight AB (2005) the revenues from LBS’s for Europe in 2004 was over 100 million Euro and they expect the number to grow by 2000% in 5 years. Not all LBS’s are economically successful. The Austrian mobile operator ONE, for example, cut the efforts on the sector of LBS in 2004.Failure of a service can be viewed from two perspectives. The user defines failure as ‘costs are higher than the benefit’. This in-cludes, for example, wrong or too expensive information. The service provider defines failure as ‘not profitable’. If the costs for the service are higher than the revenue (including indirect revenue like advertisement) the service is a failure. In this paper we discuss the problem from the view of a service provider.Services create costs for the service provider and thus the service should produce benefit for the service provider to justify the ex-penses. Pitfalls may prohibit the benefit. Thus identifying pitfalls is important for developing location-based services.Availability of data sets is influenced by three major aspects: Technical possibility, legal restrictions, usability (Navratil and Frank 2005). We assume that this structure does also apply for the success of LBS and the aspects, which let LBS fail, can be grouped into technology, legality, and usability and their interrelations.In this paper we use two examples to show how to identify possible pitfalls. The examples are LBS, which do not yet exist but could be implemented. We assume that the LBS is designed for mobile phones only since according to Rümenapp and Gutsche until 2015 98% of the population in Germany between 15 and 55 years own a mobile phone (Rüpemapp and Gutsche 2003). Other European countries will have similar numbers.We discuss the examples from the different perspectives defined above. In the first step we look at the technical status. The next step refers to limitations imposed by the Austrian law. Finally we look at the usability. In the end we discuss interrelations between these aspects. This discussion shows that the aspects are often linked together.
2 ExamplesTwo examples shall provide the framework for this paper. The first example shows how LBS can be used to improve the inter-national emergency call 122. The second example deals with pedestrian navigation in a very specific case: navigation at dealer shows.
2.1 LBS for emergency callsThe phone number 112 without any prefix is a European emergency call. 47 countries are involved in this program (European Union 2005). A call to 122 is routed to the closest emergency operator. He is connected to the emergency services in his area like police, ambulance, and fire brigade. The operator needs information about the incident - what happened and where. Depending on the incident he will react in one of two possible ways: 1. If the incident requires help on the location the operator will contact the accordant local emergency services and send them to the place of incident. The local emergency services will send one or more units to the place of incident and therefore need the address of the location or a route description. This information must be provided by the user (caller) and is forwarded by the operator. In some areas specifying a location or providing a route description is difficult, e.g. if a climber has an accident on a mountain. Route descriptions in rural areas are different than those in cities. There are no street names and house numbers, which
Gerhard Navratil, Eva Grum224
can be used to describe the route. Thus different concepts like easily recognizable trees, rock formations, or clearings have to be used to describe the route. 2. It may also be that the user needs the location for the next office of an emergency service, e.g., the police. The operator must know the position of the user and can then provide a route description to the next police office.Incidents usually require quick reactions and thus it would be helpful if the operator knew the approximate position of the user immediately. Then the operator can ask more specific questions and the system can automatically support him with additional in-formation like, e.g., a topographic map.
2.2 LBS for dealer showsDealer shows are an opportunity for companies to present their new products to potential customers. This requires a booth large enough to present the products. The corridors between the booths are kept as narrow as possible to fit the largest possible number of booths in the area available for the dealer show. The result is a situation where a large number of booths is situated in a small area and visitors gathering around booths block the corridors. Moving along the corridors is difficult.Visitors face a problem if they want to find the booth of a specific company. Walking in a crowded area makes navigation more difficult. Looking at booth maps in a crowded area may even be impossible if the map is too large. Another problem with such maps is finding the current position by matching the visible companies with companies shown in the map. This is also a drawback for companies if they cannot be found. Thus an easy to use system for navigation would benefit both visitors and companies as we learned in discussions with journalists (Fürnkranz 2005, Katz 2005).A navigation system for dealer shows can adapt results from pedestrian navigation services (Gartner, Frank et al. 2004). The user sends an SMS (short message service) to the service containing the name of the company he is looking for. The user then receives a description of the path to the booth of that company. This description may be either a unique message or a continuous stream of information. In the first case the quality of the description must be high enough to prevent errors and in the later case the service will have to track the mobile phone of the user and give directions when necessary.
3 Technical solutions and their pitfallsBoth examples comprise three steps. In the beginning the user accesses the service. Then the service processes the inquiry. Finally, the service provides information to the user. There are differences in the processing methodology of the two examples but the steps are the same.A major difference between the two services is that the emergency call must not fail. Emergency services must be accessible any-time. Since emergency calls shall save lives considerations of costs are limited. The service for dealer shows should make profit and thus price and reliability of the solution must be balanced.
3.1 Access to the serviceThe user must access the service. The access method for the emergency service is calling from a mobile phone. Depending on the rough location of the user the call is directed to an emergency response centre where a human operator receives the call.The service for a dealer show must use an automatic method. Having a response centre in addition to the information desk, which is usually available, is not useful. Since the service shall relieve the information desk, connecting the service to the information desk is not wise. Thus, the access must use a method provided by mobile phones. Possible solutions are - sending an SMS or - using a WAP-service (wireless application protocol).The user must provides the following information: - Identification of the user for locating, response and payment - Name of the company to be foundThe telephone number provides unique identification of the mobile phone. The assumption is that the momentary user of the mobile phone is also the person registered at the telephone company. Problems with the identification may occur with pre-paid telephones because there is not necessarily a name and an address connected to them and thus billing may be difficult. Special treatment of such mobile phones may be necessary.Another problem is the spelling of the company name. The service could provide a list of possible names if no perfect match is found. The user then corrects the name and again accesses the service.
3.2 Processing the inquiryA human operator is necessary to process incoming calls for the emergency call while the dealer show service requires an automatic response. The operator for the emergency call must provide help fast and efficient. The LBS can support him by supplying useful information. There is a list of questions to be asked by the operator to provide the following information: - What happened? - Where did it happen? - Who is calling?
What makes Location-Based Services fail? 225
The system can automatically provide hints for the last two questions. The system can identify the owner of the mobile phone. This information can help reduce response times assuming that in general the caller will be the owner of the mobile phone. The system can also provide a position of the mobile phone and automatically come up with a map of that area. The operator can concentrate on the first question.Maps can be provided in different ways. The easiest method would be using a web-map-service as provided by mapping agencies. Unfortunately response times depend on the workload of the web server used. A breakdown of this server could lead to a situation where the operator has no other information than the one provided by the caller. This is fatal if the operators are trained to follow a specific procedure, which depends on the availability of the map. A faster and more reliable solution would be to set up such a server within the local computer network. The agency then has full access to the server and can take precautions that backup serv-ers are available. However, this solution requires more personnel and the emergency agency must pay attention to the quality of the data used, i.e., the agency must purchase and install data updates.The operator finally has to decide if he sends an emergency unit (ambulance, police, etc.) to the location of the user or if he guides the user to a location where he can get help. Depending on the situation only one of those possibilities may be applicable. In both cases the operator must provide instructions. Emergency units require less information than the users of the service, since emergen-cy vehicles can be equipped with navigation systems. A route description for the user must consider that the user may be unfamiliar with the surroundings and thus needs detailed (and maybe even redundant) information.In case of the dealer show the system must determine the current position of the user and the path to the position of the company’s booth. The current position can be detected automatically (e.g., by the cell ID or a GPS receiver within the mobile phone or con-nected to it). The quality of the detection (Retscher and Thienelt 2004) must fit the requirements of the service. The definition of the path should be done using a suitable algorithm. A simple solution following the Dijkstra-algorithm (Dijk-stra 1959) will not be sufficient because the path may become complicated. Different additions have been proposed by Duckham (2003), Grum (2005) and others (see for example Winter 2001; Beer 2002; Winter 2002).
3.3 Transfer of instructionsThe result of the service must be transferred to the user. The transfer of the location of incident to an emergency unit can be done as usual. A map of the area as used by the operator can be sent if necessary. Sending the path description to the mobile phone of a user is more difficult. The description must use landmarks and street names to describe the path. The transfer can then be done either as in form of an SMS for short paths or as a multi-media service (MMS). The advantage of SMS is that all mobile phones can process it. Older mobile phones may not have the capabilities to process an MMS. The disadvantage of SMS is the size limitation and the restriction to text. SMS do not allow images or maps.
4 Legal restrictionsLegal restrictions for LBS originate from different parts of the law. Data is protected by copyright, programs may be subject to pat-ent law (compare the discussion on software patents), and the user himself has privacy rights. These influences dictate procedures and may result in additional costs, e.g., for licenses.The emergency call provides a more complicated case for a legal assessment than the dealer show. As said in 2.1 the emergency call works in 47 countries. Each of these countries has different laws. Some legal problems may only occur in some countries but not in others.
4.1 Access to the serviceAccessing the service is not restricted as long as there is no hidden data transfer to the service provider. An automatic download of the user’s telephone directory, for example, would be illegal. Data transfer is necessary in different cases but it must be clear for the user which data is transferred.It is also legal to charge higher rates than for normal telephone calls. However, the rates must be visible for the user. Since the emergency call is free of charge, this only applies to the dealer show example.
4.2 Processing the inquiryBoth examples include locating the mobile phone. In case of the emergency call the user must tell the operator where he is. As said in 3.2 processing of the emergency call can be accelerated by automatically detecting the location of the mobile phone. The problem with this solution is that the mobile operator is not allowed to track the mobile phone. This includes storing previous positions as well as passing the positions to third parties. The service provider needs the permission of the user to do this. In traditional solution the user must agree that his telephone is located. The agreement specifies who may receive the data and how long it is stored. The agreement can either be sent by SMS or as a signed form by mail. This is possible for the dealer show but is inappropriate for the emergency call. There are two possible solutions: - Users of the emergency call need help. The help either includes sending emergency units to the lo-cation of the user or telling the user where he has to go to find help. In both cases the user must provide his cur-rent position. Thus automatically sending the location of the mobile phone to the emergency service may be legal.

Gerhard Navratil, Eva Grum226
The fact that emergency services shall save lives and thus the processing should be as fast as possible supports this hypothesis. As described in 3.2 the automatic location of the mobile phone helps the operator to react more accurate. - Users must orally agree to locate the mobile phone. This could be done at the beginning of the call and recording the call provides proof if necessary.Processing the request requires data and software. Data are protected by copyright law. The service provider must have the right to use the data. The result of the process may be a map, which is transferred to the user or third parties (e.g. emergency units). This must be covered by the contract. The same is valid for programs. Programs written specifically for the service provider must be checked for collisions with patents. Software patents, as discussed in the European Union, may have a large influence in this area. Violations of patents or copyright laws may lead to lawsuits and, as a result, fines. Companies like Google register a large number of patents on software to avoid paying for other companies patents. They exchange their patents free of charge (Henzinger 2005). However, this is only possible if a company develops software or algorithms.
4.3 Transfer of instructionsAlso during the transfer of instructions conflicts with patents and copyright law may occur. Transfer protocols and file formats may be protected. As said above also maps are protected by copyright law and using them (e.g., as a background) requires a license.
5 UsabilityUsability has a different status in the two examples. The emergency call is free of charge. Simplicity and availability must be achieved at all costs to save lives. Finding the right way at a dealer show is convenience the user has to pay for. Problems with the speed of reaction may annoy the user but will not be as critical as in the emergency example.
5.1 Access to the serviceAccessing the emergency call should be as simple as possible. The steps of the process must be straightforward. The user should not get confused by tape instructions. A typical user of an emergency calls is nervous because he wants to report an incident and may be injured. Thus calming the caller is important. This can only be achieved by human operators who ask the user for all neces-sary data.Accessing the service for the dealer show is different. Although the user will be in a crowded area, he will be less nervous than the user of the emergency service. Here the user wants to know two things before accessing the service: - How do I access the service and how do I provide my destination? - How much does the service cost me?The user must also be capable of performing the task. The user must know how to write an SMS if this is the method to access the service. The second piece of information determines if the user accesses the service at all. The user will not use the service if the costs are higher than his benefits. This also includes the question if the costs will rise if the user misspells the name of the company. Since the benefit does not change costs should not rise.
5.2 Processing the inquiryUsability for processing emergency calls must be discussed from two perspectives: The user and the operator. The user wants to get help as fast as possible. Thus usability for the user is a measure for the response time and the capability of the service to adjust to user needs. The operator, on the other hand, defines usability in a more technical term: How much support does he get from the system?The users define the quality of the service mainly by response time. The calls from February 23rd 2005 to April 21st 2005 in the hotline of the ambulance call center of Lower Austria contained (Bachinger 2005) - 21 positive response and - 115 negative Responses.The negative responses covered, among others, the following topics directly related to response time: - Patient died due to late response (close examination showed no evidence for a connection between the call center ef-ficiency and the death of the patient) - Unnecessary questions asked - Ambulance did not find the wayEuropean emergency call will be confronted with similar complaints. Especially the problems of finding the way and asking for necessary information will occur. The complexity of the European system is higher than that of the Austrian system because more types of incidents must be handled. The operator has more possibilities to react and must ask questions to decide on one of the possibilities. The sequence of questions is important to provide help fast. Also language problems may occur if the user speaks a different language than the operator.The operators need efficient methods for data collection and decision of further actions to minimize the response time. Automatic processes can support the operator. An example is the automatic detection of the user’s position. The system then can present the correct section of a map. The system can also support the operator when transferring necessary information to the necessary emer-gency organizations like police, ambulance, or fire brigade.

What makes Location-Based Services fail? 227
Usability of the LBS for the dealer show must only consider the user’s perspective. The user has a simple definition of usability: Does the service provide all necessary information to reach the booth of the company and does the service provide this informa-tion in an acceptable time span? Usability of the instructions will be discussed in the next section. The important aspect here is the amount of time between requesting the information from the service and receiving the instructions. Users will find the system inconvenient if the delay is too long. Response times for information systems should be a few seconds when sitting in front of the system. Users of an LBS also want the answer in reasonable time. This limits the amount of time the system has to process the inquiry. The response should be faster than queuing up at the information desk. Users will be uncertain, if their request reached the system when the delay is too long and will try different methods to obtain the information.
5.3 Transfer of instructionsThe result of the service is a path description for the user or emergency vehicles. Only the emergency service may result in a path description for an emergency vehicle. A path description for the user is the result for the dealer show service but it can also occur in case of the emergency call service. The requirements for these two cases are different.Guiding emergency vehicles to a specific location requires unambiguous identification of the location. Coordinates in a standard coordinate system may provide this reference. In rare cases additional information may be necessary, for example, the floor number if the location is within a building. Problems may occur if the location of the incident is a tunnel. Then the emergency organiza-tions may be more interested in the entrance position to the tunnel and a route description within the tunnel. In general however, a single set of coordinates will be sufficient and navigation systems within the vehicles then lead the vehicle to the location of the incident.Providing route descriptions for the user cannot assume the existence of a navigation system. Maps are difficult to read on the screens of mobile phones due to the limited resolution of mobile phones. Textual descriptions (e.g., lists of instructions) may be easier to understand but it is more difficult to create them automatically. In addition they usually provide less feedback for the user because there is only limited redundant information. Redundant information is necessary to ensure the user that he is still on the correct path.All types of path descriptions should include landmarks because they deal with two problems: They allow setting the starting di-rection (‘move towards the traffic light’ is usually more helpful than ‘move south’) and they provide feedback. Raubal and Winter (2002) showed how to use landmarks in path descriptions. The selection of landmarks for route descriptions has been described in literature (Winter 2003; Nothegger, Winter et al. 2004). Logos of companies along the route provide landmarks for the dealer show example. The logos will be clearly visible since they shall attract potential customers. Since they are also distinct from each other they can be used as landmarks.
6 Combined influencesUntil now we discussed the influences independent of each other. Sometimes the influences are interrelated. The technical solution may, for example, have an influence on the usability of the service or may include some problematic legal aspects. In this section we will discuss the relations between the influences.
6.1 Technology – UsabilityA combination of technical solution and usability provides the cost balance. The technical solution determines the costs. The pro-vider of the service must pay for development of the service, acquisition of data, and running the system. The costs for each of these parts are determined by the technical solution. The users pay for the service creating income for the provider. The usability determines the number of users. If, for example, the user cannot determine the costs of the service in advance, he will not use the service. Thus the providers shall aim at technical solutions that include low costs and provide usable systems. This connection is usually discussed in a feasibility study.
6.2 Technology – LegalityNot all is legal that is technically possible. It is possible for the provider to locate a mobile phone. Locating the position of the mobile phone in relation to the network of the mobile operator is even necessary, if the provider must establish a connection (some-one is calling). It is not allowed to store the location or to transfer the location to a third party. This creates problems if the LBS is provided by a company different from the mobile operator since that company will not have data on the users position. The solu-tion must thus not only deal with the technical process of getting the location from the telephone provider, but also with getting the agreement from the owner of the telephone.Another problem is using data formats or algorithms. The technical solution may ask for specific formats or algorithms. Relying on specific technology may create legal problems with software patents. Acquisition of licenses for a patent results in additional costs that have to be considered.
Gerhard Navratil, Eva Grum228
6.3 Legality – UsabilitySometimes specific treatment may be convenient for the user. Fleet management requires information on the position of the fleet members. A simple way to determine the position is locating the mobile phones and using their position. As discussed in 4.2 the mobile operator is not allowed to transfer the position to a third party. The only way to provide this information is letting the users of the mobile phone agree to the transfer. In Austria this is even necessary if the company using the fleet management is the owner of the mobile phones.
7 Discussion and conclusionsIn this paper we showed that technical solutions, legal restrictions and usability influence the design and efficiency of LBS. Some mobile operators offered LBS but failed to get a positive financial statement from the service. The important question is why some LBS work and others do not. A reason for failure could be that one of the three influences limits the service. It may be that the technology simply does not allow locating the mobile phone accurate enough or the LBS is not accepted because it is too difficult to use. Also threats of a lawsuit for violation of patents or copyright law may stop an LBS.When designing an LBS we thus have to answer three questions: Is this technically possible to provide the information? Is it legal to provide the information? It is possible to provide the information in a usable way? If the answers to all three questions are positive we can continue with the discussion. The topic then will shift to more economic questions, e.g. “Will we have more income than costs?” However, we must first make sure, that the LBS is possible, legal, and usable. In the paper we showed with two examples how the questions can be addressed to assess the potential and possible pitfalls of the service in discussion.
8 ReferencesBachinger, G. (2005). NÖ Rettungswesen Hotline - Endbericht. St. Pölten, Austria, NÖ Patienten- und Pflegeanwaltschaft: 10.Beer, S. (2002). Wegfindung mit strukturierter Routenbeschreibung. Institute for Geoinformation. Vienna, Technical University Vienna.Berg Insight AB (2005). The Structure Of The European LBS Market 2005. Gothenburg, Sweden.Dijkstra, E. W. (1959). “A note on two problems in connection with graphs.” Numerische Mathematik(1): 269-271.Duckham, M. (2003). Simplest Path: Automated Route Selection for Navigation. COSIT 2003, Kartause Ittingen, Switzerland.European Union (2005). http://www.sos112.info/.Fürnkranz, G. (2005). Personal Communication. Businessword Magazine.Gartner, G., A. U. Frank and G. Retscher (2004). Pedestrian Navigation System in Mixed Indoor/Outdoor Environment – The NAVIO Project.
CORP 2004 & Geomultimedia04, Vienna, Austria, Selbstverlag des Institutes für EDV-gestützte Methoden in Architektur und Raumplanung.Grum, E. (2005). Danger of Getting Lost: Optimize a Path to Minimize Risk. CORP 2005 & Geomultimedia05, Vienna, Austria, Selbstverlag des
Institutes für EDV-gestützte Methoden in Architektur und Raumplanung.Henzinger, M. (2005). The Past, Present and Future of Web Information Retrieval. Vienna, Austria: Discussion after the presentation.Katz, F. (2005). Personal Communication. HAUSTEC praxis.Laurini, R. (2000). A Short Introduction to TeleGeoProcessing and TeleGeoMonitoring. TeleGeo 2000, Sophia Antipolis, France.Navratil, G. and A. U. Frank (2005). Influences Affecting Data Quality. ISSDQ, Peking, China.Nothegger, C., S. Winter and M. Raubal (2004). “Selection of Salient Features for Route Directions.” Spatial Cognition and Computation 4(2):
113-136.Raubal, M. and S. Winter (2002). Enriching Wayfinding Instructions with Local Landmarks. Geographic Information Science. M. J. Egenhofer and
D. M. Mark. Berlin, Springer. 2478: 243-259.Retscher, G. and M. Thienelt (2004). “NAVIO - A Navigation and Guidance Service for Pedestrians.” Journal of Global Positioning Systems 3(1-
2): 208-217.Rümenapp, J. and Gutsche, J.-M. Verbreitung stationärer und mobiler Zugangsgeräte zum Internet in der Bevölkerung – Status Quo und Prognose
bis 2015. ECTL Working Paper 15. Technische Universität Hamburg-Harburg.Winter, S. (2001). Weighting the Path Continuation in Route Planning. 9th ACM International Symposium on Advances in Geographic Information
Systems, Atlanta, GA, ACM Press.Winter, S. (2002). “Modeling the Costs of Turns in Route Planning.” GeoInformatica 6(4): 345-360.Winter, S. (2003). Route Adaptive Selection of Salient Features. Spatial Information Theory. W. Kuhn, M. Worboys and S. Timpf. Berlin,
Springer.Winter, S., E. Pontikakis and M. Raubal (2001). “LBS for Real-Time Navigation - A Scenario.” GeoInformatics 4: 6-9.

Development of Cultural Inheritance Information System using LBS technologies for tourists
Byoung-Jun Kang, Yosoon Choi and Hyeong-Dong Park
AbstractThe object of this study is to propose a prototype of cultural inheritance information system that provides tourists with more inter-active and dynamic information using Location-Based Service (LBS) technology. Using the Personal Digital Assistants (PDA) and Global Positioning System (GPS), tourists can acquire various information of cultural inheritance when they approach cultural in-heritance at place. Geographic Information System (GIS) database about the Deoksugung Palace, which is one of the most famous cultural inheritances in Seoul, South Korea, was constructed and dynamic functions connecting location information with cultural contents in GIS database were implemented. As a result, it is expected that the dynamic system will contribute to tourist industry by providing location-related information to tourists.
1 IntroductionLBS can integrate various mobile hardware devices, wireless communication networks, industry specific software applications with geographic information to provide users with location-related guidance. As the wireless communication and GPS technolo-gies have continuously advanced, LBS expands its application areas to military and government industries, emergency responses, and other commercial sectors (Montoya, 2003; Spinuzzi, 2003; Schiller and Voisard, 2004; Wiafe and Davenhall, 2005). Tourist industry can be also one of commercial application areas that have potential market values for LBS (Schiller and Voisard, 2004); the study on specific LBS applications in tourist industry, however, is a new challenge in academic and industrial communities. In re-cent years, various GIS-based applications have been developed in the tourist industry (e.g., Akcay and Altan, 2003). They were fo-cused on only static information without consideration of the real-time location of tourists. The real-time location of tourists is one of the critical factors for interactive and dynamic information services; the development of new LBS-based application is needed. This paper addresses a prototype of cultural inheritance information system for more interactive and dynamic tourist information services. The following section presents an example of the system on the Deoksugung Palace in Seoul, South Korea.
2 Motivation and Site InformationRecently, the number of foreign tourists visiting Korea has increased and tourist industry of Korea has expanded its market areas. Comparing from the year of 1996, there was a 56.8 % expansion of tourist industry of Korea in 2004 and a further expansion is expected this year. Despite its obvious growth, however, the quality of information services for foreign tourists has not improved. Only a few inheritances in metropolitan areas provide volunteers and tour guides who are good at foreign language. Moreover, foreign tourists can use the cultural inheritance services at the limited space and within the fixed time schedule. Tourists need more flexible services which can provide useful information about cultural inheritances any time and any where. LBS technology can be an optimal solution to improve the service quality, because it is suited to ubiquitous service framework (any time and any where). Using novel Information Technology (IT) infrastructures of Korea, successful development of LBS-based application for tourist industry can be possible. In this study, Deoksugung Palace is used for displaying example of cultural inheritance information system. Deoksugung Palace (Fig. 1) is built in 1593 and it is one of the most famous cultural inheritances in Seoul, South Korea. Deoksugung Palace is, among other things, a palace famous for its elegant stone-wall road. It is the only one that has western style buildings beside it, which adds to the uniqueness of the scenery (Kim, 1994).
3 System ArchitectureFigure 2 shows the system architecture of the cultural inheritance information system. The system consists of mobile clients run-ning on the Window CE-based Pocket PC and a GIS server running on desktop PC. Mobile clients provide the on-site inheritance information to tourists. A GPS receiver is linked to the Pocket PC through a Bluetooth connection, and is used to capture the loca-tion of tourist. Based on the location of tourists, the cultural inheritance system operates in the PDA. As a result, using the PDA and GPS, the on-site inheritance information system provides tourists various information of cultural inheritance.
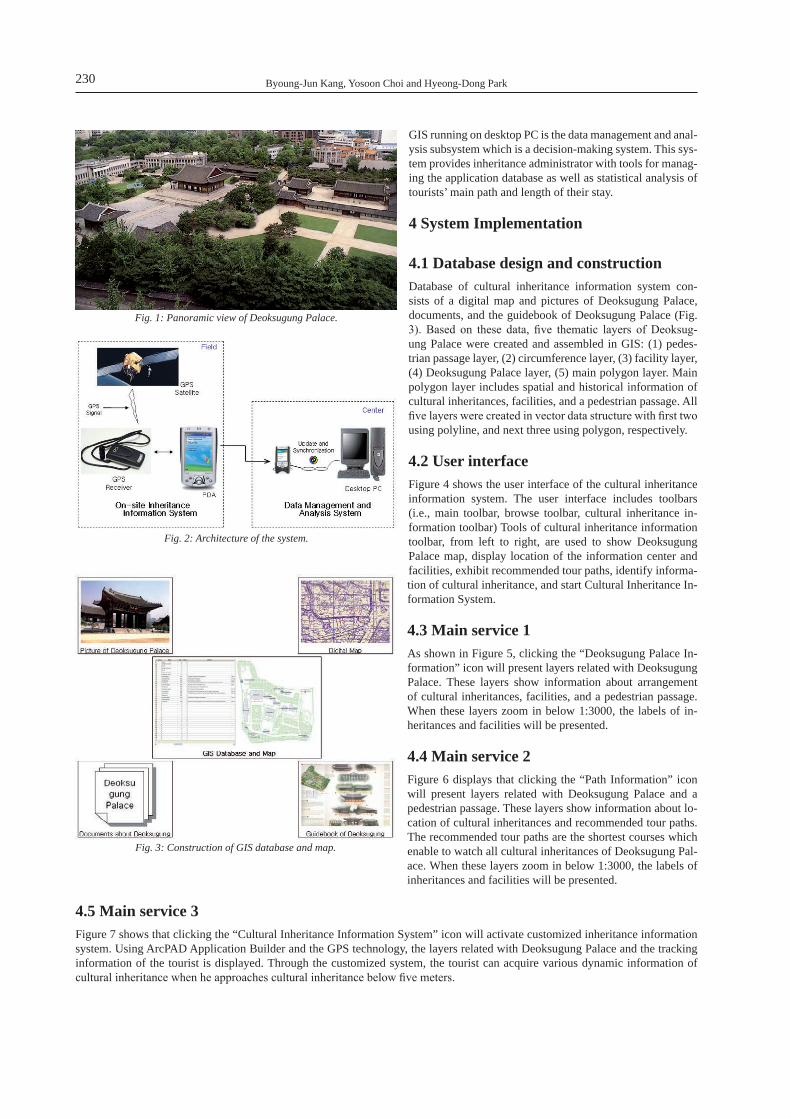
Byoung-Jun Kang, Yosoon Choi and Hyeong-Dong Park230
GIS running on desktop PC is the data management and anal-ysis subsystem which is a decision-making system. This sys-tem provides inheritance administrator with tools for manag-ing the application database as well as statistical analysis of tourists’ main path and length of their stay.
4 System Implementation
4.1 Database design and constructionDatabase of cultural inheritance information system con-sists of a digital map and pictures of Deoksugung Palace, documents, and the guidebook of Deoksugung Palace (Fig. 3). Based on these data, five thematic layers of Deoksug-ung Palace were created and assembled in GIS: (1) pedes-trian passage layer, (2) circumference layer, (3) facility layer, (4) Deoksugung Palace layer, (5) main polygon layer. Main polygon layer includes spatial and historical information of cultural inheritances, facilities, and a pedestrian passage. All five layers were created in vector data structure with first two using polyline, and next three using polygon, respectively.
4.2 User interfaceFigure 4 shows the user interface of the cultural inheritance information system. The user interface includes toolbars (i.e., main toolbar, browse toolbar, cultural inheritance in-formation toolbar) Tools of cultural inheritance information toolbar, from left to right, are used to show Deoksugung Palace map, display location of the information center and facilities, exhibit recommended tour paths, identify informa-tion of cultural inheritance, and start Cultural Inheritance In-formation System.
4.3 Main service 1As shown in Figure 5, clicking the “Deoksugung Palace In-formation” icon will present layers related with Deoksugung Palace. These layers show information about arrangement of cultural inheritances, facilities, and a pedestrian passage. When these layers zoom in below 1:3000, the labels of in-heritances and facilities will be presented.
4.4 Main service 2Figure 6 displays that clicking the “Path Information” icon will present layers related with Deoksugung Palace and a pedestrian passage. These layers show information about lo-cation of cultural inheritances and recommended tour paths. The recommended tour paths are the shortest courses which enable to watch all cultural inheritances of Deoksugung Pal-ace. When these layers zoom in below 1:3000, the labels of inheritances and facilities will be presented.
4.5 Main service 3Figure 7 shows that clicking the “Cultural Inheritance Information System” icon will activate customized inheritance information system. Using ArcPAD Application Builder and the GPS technology, the layers related with Deoksugung Palace and the tracking information of the tourist is displayed. Through the customized system, the tourist can acquire various dynamic information of cultural inheritance when he approaches cultural inheritance below five meters.
Fig. 1: Panoramic view of Deoksugung Palace.
Fig. 2: Architecture of the system.
Fig. 3: Construction of GIS database and map.
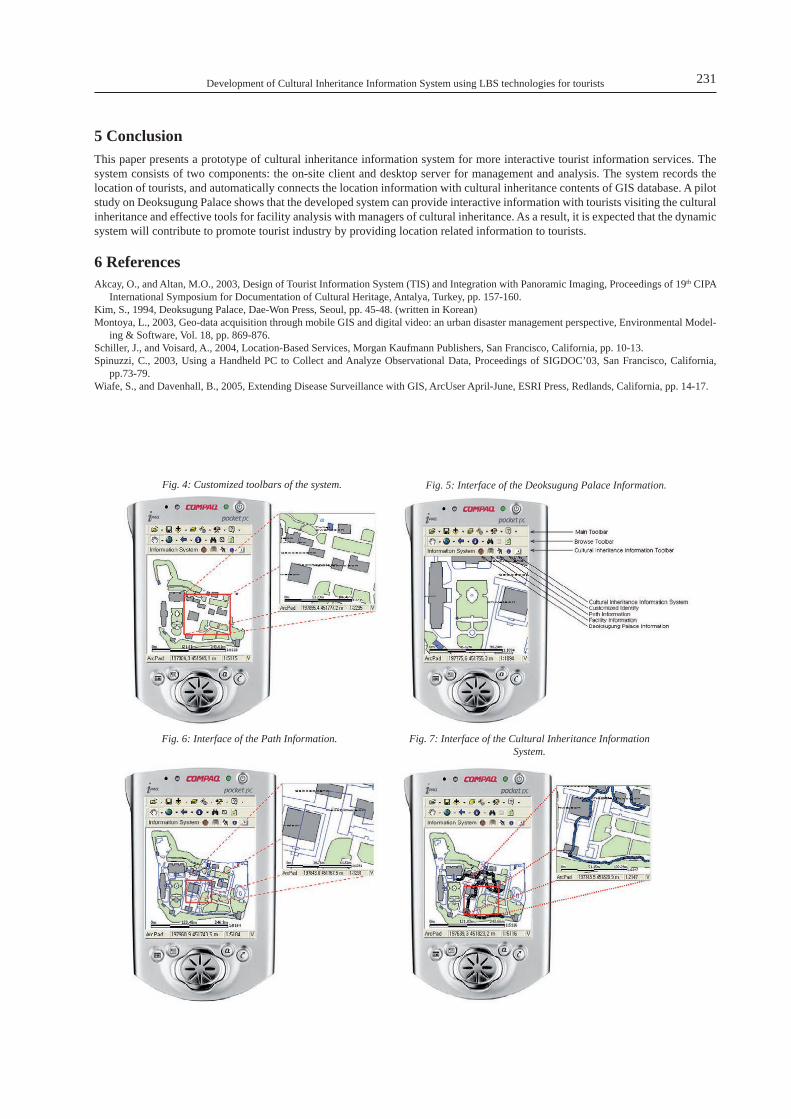
Development of Cultural Inheritance Information System using LBS technologies for tourists 231
5 ConclusionThis paper presents a prototype of cultural inheritance information system for more interactive tourist information services. The system consists of two components: the on-site client and desktop server for management and analysis. The system records the location of tourists, and automatically connects the location information with cultural inheritance contents of GIS database. A pilot study on Deoksugung Palace shows that the developed system can provide interactive information with tourists visiting the cultural inheritance and effective tools for facility analysis with managers of cultural inheritance. As a result, it is expected that the dynamic system will contribute to promote tourist industry by providing location related information to tourists.
6 ReferencesAkcay, O., and Altan, M.O., 2003, Design of Tourist Information System (TIS) and Integration with Panoramic Imaging, Proceedings of 19th CIPA
International Symposium for Documentation of Cultural Heritage, Antalya, Turkey, pp. 157-160.Kim, S., 1994, Deoksugung Palace, Dae-Won Press, Seoul, pp. 45-48. (written in Korean) Montoya, L., 2003, Geo-data acquisition through mobile GIS and digital video: an urban disaster management perspective, Environmental Model-
ing & Software, Vol. 18, pp. 869-876.Schiller, J., and Voisard, A., 2004, Location-Based Services, Morgan Kaufmann Publishers, San Francisco, California, pp. 10-13.Spinuzzi, C., 2003, Using a Handheld PC to Collect and Analyze Observational Data, Proceedings of SIGDOC’03, San Francisco, California,
pp.73-79.Wiafe, S., and Davenhall, B., 2005, Extending Disease Surveillance with GIS, ArcUser April-June, ESRI Press, Redlands, California, pp. 14-17.
Fig. 4: Customized toolbars of the system. Fig. 5: Interface of the Deoksugung Palace Information.
Fig. 6: Interface of the Path Information. Fig. 7: Interface of the Cultural Inheritance Information System.
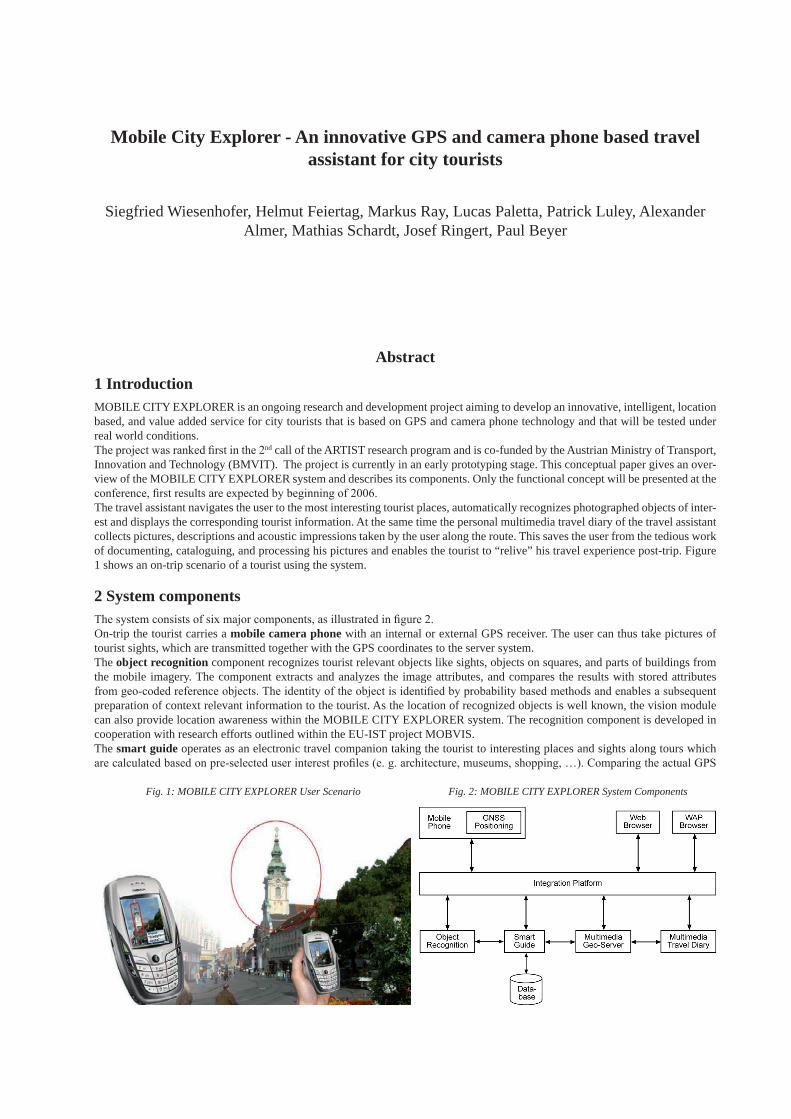
Mobile City Explorer - An innovative GPS and camera phone based travel assistant for city tourists
Siegfried Wiesenhofer, Helmut Feiertag, Markus Ray, Lucas Paletta, Patrick Luley, Alexander Almer, Mathias Schardt, Josef Ringert, Paul Beyer
Abstract
1 IntroductionMOBILE CITY EXPLORER is an ongoing research and development project aiming to develop an innovative, intelligent, location based, and value added service for city tourists that is based on GPS and camera phone technology and that will be tested under real world conditions. The project was ranked first in the 2nd call of the ARTIST research program and is co-funded by the Austrian Ministry of Transport, Innovation and Technology (BMVIT). The project is currently in an early prototyping stage. This conceptual paper gives an over-view of the MOBILE CITY EXPLORER system and describes its components. Only the functional concept will be presented at the conference, first results are expected by beginning of 2006.The travel assistant navigates the user to the most interesting tourist places, automatically recognizes photographed objects of inter-est and displays the corresponding tourist information. At the same time the personal multimedia travel diary of the travel assistant collects pictures, descriptions and acoustic impressions taken by the user along the route. This saves the user from the tedious work of documenting, cataloguing, and processing his pictures and enables the tourist to “relive” his travel experience post-trip. Figure 1 shows an on-trip scenario of a tourist using the system.
2 System componentsThe system consists of six major components, as illustrated in figure 2. On-trip the tourist carries a mobile camera phone with an internal or external GPS receiver. The user can thus take pictures of tourist sights, which are transmitted together with the GPS coordinates to the server system. The object recognition component recognizes tourist relevant objects like sights, objects on squares, and parts of buildings from the mobile imagery. The component extracts and analyzes the image attributes, and compares the results with stored attributes from geo-coded reference objects. The identity of the object is identified by probability based methods and enables a subsequent preparation of context relevant information to the tourist. As the location of recognized objects is well known, the vision module can also provide location awareness within the MOBILE CITY EXPLORER system. The recognition component is developed in cooperation with research efforts outlined within the EU-IST project MOBVIS.The smart guide operates as an electronic travel companion taking the tourist to interesting places and sights along tours which are calculated based on pre-selected user interest profiles (e. g. architecture, museums, shopping, …). Comparing the actual GPS
Fig. 1: MOBILE CITY EXPLORER User Scenario Fig. 2: MOBILE CITY EXPLORER System Components

Siegfried Wiesenhofer, Helmut Feiertag, Markus Ray, Lucas Paletta, Patrick Luley, Alexander Almer, Mathias Schardt, Josef Ringert, Paul Beyer
location of the tourist with the previously calculated route, the smart guide either guides the tourist back to the calculated route or adapts to the user behavior and recalculates a new tour of points of interest, thereby letting the user more freedom in exploring new paths.The multimedia travel diary is the interactive turntable of the travel impressions for the tourist. Pictures and audio clips taken with the camera phone are collected and are automatically assigned to visited locations by recording the user’s GPS location. The travel diary is accessible via the internet and on-trip via WAP and offers the functionality of cataloguing, editing, and sharing of the stored travel impressions. This saves the user from the tedious work of documenting his travel experiences.The multimedia geo-server provides multimedia tourist information supplemented by a cartographic representation of the sur-rounding of the tourist’s actual position. This is vital for the orientation and information of the tourist on-trip and also for the pre-sentation of the visited sites post-trip. The cartographic representation is rendered for small displays.The integration platform provides the technical infrastructure for coordinating the different components and acts as an interface to the infrastructure of mobile communication providers. It is also the interface for mobile and web presentation of tourist content.
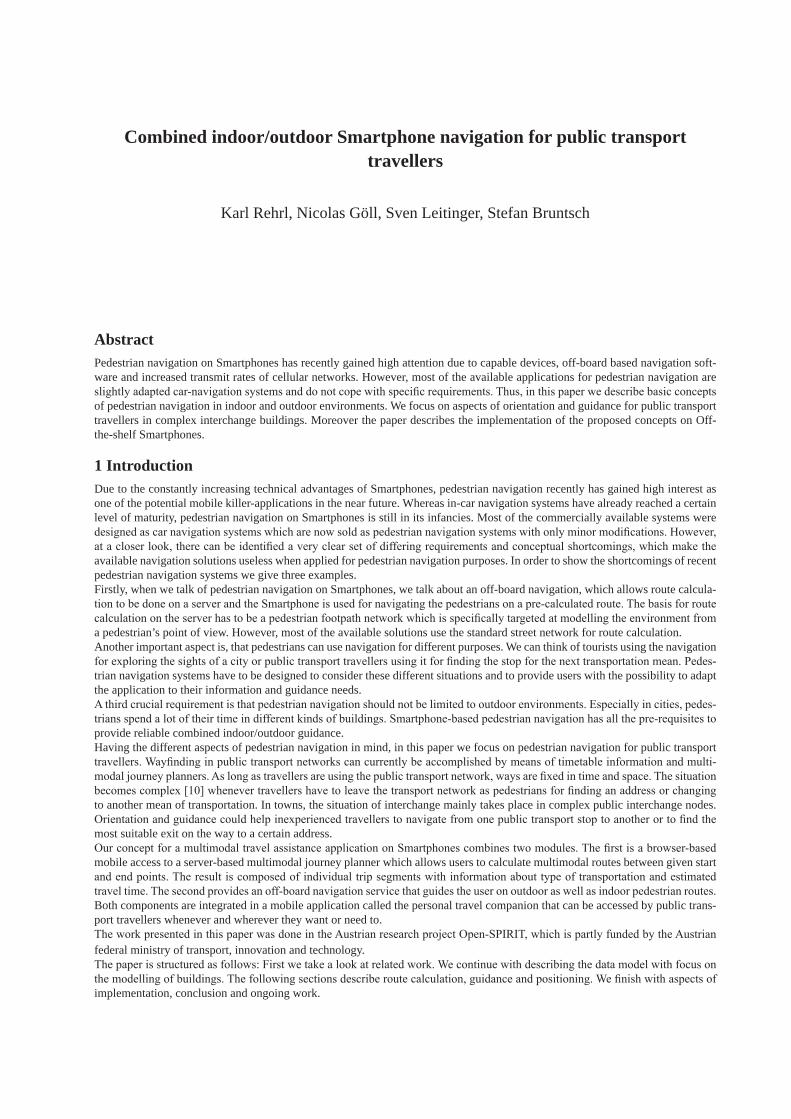
Combined indoor/outdoor Smartphone navigation for public transport travellers
Karl Rehrl, Nicolas Göll, Sven Leitinger, Stefan Bruntsch
AbstractPedestrian navigation on Smartphones has recently gained high attention due to capable devices, off-board based navigation soft-ware and increased transmit rates of cellular networks. However, most of the available applications for pedestrian navigation are slightly adapted car-navigation systems and do not cope with specific requirements. Thus, in this paper we describe basic concepts of pedestrian navigation in indoor and outdoor environments. We focus on aspects of orientation and guidance for public transport travellers in complex interchange buildings. Moreover the paper describes the implementation of the proposed concepts on Off-the-shelf Smartphones.
1 IntroductionDue to the constantly increasing technical advantages of Smartphones, pedestrian navigation recently has gained high interest as one of the potential mobile killer-applications in the near future. Whereas in-car navigation systems have already reached a certain level of maturity, pedestrian navigation on Smartphones is still in its infancies. Most of the commercially available systems were designed as car navigation systems which are now sold as pedestrian navigation systems with only minor modifications. However, at a closer look, there can be identified a very clear set of differing requirements and conceptual shortcomings, which make the available navigation solutions useless when applied for pedestrian navigation purposes. In order to show the shortcomings of recent pedestrian navigation systems we give three examples.Firstly, when we talk of pedestrian navigation on Smartphones, we talk about an off-board navigation, which allows route calcula-tion to be done on a server and the Smartphone is used for navigating the pedestrians on a pre-calculated route. The basis for route calculation on the server has to be a pedestrian footpath network which is specifically targeted at modelling the environment from a pedestrian’s point of view. However, most of the available solutions use the standard street network for route calculation.Another important aspect is, that pedestrians can use navigation for different purposes. We can think of tourists using the navigation for exploring the sights of a city or public transport travellers using it for finding the stop for the next transportation mean. Pedes-trian navigation systems have to be designed to consider these different situations and to provide users with the possibility to adapt the application to their information and guidance needs.A third crucial requirement is that pedestrian navigation should not be limited to outdoor environments. Especially in cities, pedes-trians spend a lot of their time in different kinds of buildings. Smartphone-based pedestrian navigation has all the pre-requisites to provide reliable combined indoor/outdoor guidance.Having the different aspects of pedestrian navigation in mind, in this paper we focus on pedestrian navigation for public transport travellers. Wayfinding in public transport networks can currently be accomplished by means of timetable information and multi-modal journey planners. As long as travellers are using the public transport network, ways are fixed in time and space. The situation becomes complex [10] whenever travellers have to leave the transport network as pedestrians for finding an address or changing to another mean of transportation. In towns, the situation of interchange mainly takes place in complex public interchange nodes. Orientation and guidance could help inexperienced travellers to navigate from one public transport stop to another or to find the most suitable exit on the way to a certain address.Our concept for a multimodal travel assistance application on Smartphones combines two modules. The first is a browser-based mobile access to a server-based multimodal journey planner which allows users to calculate multimodal routes between given start and end points. The result is composed of individual trip segments with information about type of transportation and estimated travel time. The second provides an off-board navigation service that guides the user on outdoor as well as indoor pedestrian routes. Both components are integrated in a mobile application called the personal travel companion that can be accessed by public trans-port travellers whenever and wherever they want or need to.The work presented in this paper was done in the Austrian research project Open-SPIRIT, which is partly funded by the Austrian federal ministry of transport, innovation and technology.The paper is structured as follows: First we take a look at related work. We continue with describing the data model with focus on the modelling of buildings. The following sections describe route calculation, guidance and positioning. We finish with aspects of implementation, conclusion and ongoing work.

Karl Rehrl, Nicolas Göll, Sven Leitinger, Stefan Bruntsch236
2 Related workWe classify related work in the following categories: pedestrian navigation pilot systems, outdoor and indoor positioning technolo-gies and conceptional models of wayfinding in public transport buildings.In the project REAL [1] a hybrid navigation system for indoor and outdoor use has been developed. The indoor navigation com-ponent has been built with infrared transmitters mounted at the ceiling of buildings, the outdoor component works with a GPS system. In addition to the different positioning technologies the REAL project deals with the presentation of route directions on different output devices. The NAVIO project [7] analyzes major aspects being important when designing a pedestrian navigation system for indoor and outdoor environments. The main parts of the project are integrated positioning technologies, multi-criteria route planning and multimedia route communication. One part of the project LoL@ [3] describes the cartographic visualisation of multimedia content on Smartphones. Retscher and Thienelt [18] discuss suitable location technologies for pedestrians. In their study they test and demonstrate different positioning technologies like satellite-positioning technologies, cellular phone positioning, dead reckoning sensors for measure-ment of heading and travelled distance as well as barometric pressure sensors for height determination. Especially for indoor po-sitioning technologies, most of the prototypes are based on Infrared, WLAN or Bluetooth ([5], [11], [13], [22]). Whereas Infrared needs line of sight, WLAN positioning needs costly calibration and can not be accessed by typical Smartphones. Bluetooth posi-tioning systems are mainly server-based and thus require a costly installation procedure.The human navigation and wayfinding process is based on concepts of human cognition ([4], [9]). Rüetschi and Timpf ([19], [20]) developed a conceptual model for describing the wayfinding process in public transport stations. They differ between the network space (the public transport network itself) and the scene space (the nodes of the public transport network, e.g. interchange facili-ties). The scene space is modelled by the schematic geometry, which is based on image schemes [12] and affordances [8]. In another study Fontaine und Denis [6] analyse the spatial human cognition in subway stations. One of the results of the study with several users is that direction signs are important elements for the navigation and wayfinding in public transport stations. The signposts are significant elements for the orientation at decision points. This result is also confirmed in a requirement study of pedestrian navigation [16].However, as far as we know, there is no existing pilot system, which focuses on guidance of public transport passengers in inter-change facilities.
3 Data modelIn this section we take a look at the data model which was designed for pedestrian navigation in general but with a special focus on indoor navigation in public interchange buildings. Following theoretical concepts of wayfinding ([19], [20]) we model buildings with a logical representation of the scene space:
- Building- Floors- Regions- Gateways- Items
Buildings can be structured in different floors. A region is a coherent space on a single floor with specific characteristics. Instances could be a room, an entrance hall together with connected corridors or an entire floor, depending on the desired granularity. Re-gions are connected through gateways that indicate possible transitions between them. Typical representations are stairs, elevators, escalators and ramps. Items are specific objects from the scene space and can be linked to regions. Items can be used to model landmarks like signs and shops. The information from the scene space is mainly used to give users a detailed virtual representation of the physical environment and to generate precise textual route descriptions.For route calculation, map generation and navigation we have connected the logical, hierarchical model of buildings with a geo-graphical model based on a coordinate system. The resulting model is a hybrid location model [14]. All the regions are modeled with non-overlapping polygons, so-called zones. Gateways have gateway areas (polygons) in the origin region and target coordi-nates in the destination region. The coordinate system was extended with a third parameter called level, which indicates the floor of the building. Gateways are used for transitions between regions and floors.The pedestrian network is built of decision and orientation points and segments connecting these points. Segments can have de-tailed attributes describing the nature of the footpath segment. Items from the scene space are linked to the directed footpath seg-ments and can thus be used for the generation of textual path descriptions. Orientation points are used as anchor points for the navi-gation. The model is suited for outdoor environments as well. Regions can either be determined automatically along the calculated footpath or regions can also be pre-defined, which is suitable for town areas.With this hybrid location model it is possible to do pedestrian route calculation, to use information from the virtual representation of the scene space for detailed textual route descriptions and map generation and to use the model for navigating users along pre-calculated pedestrian routes. Moreover, the model is the foundation for automatic positioning along the route and indoor/outdoor transitions.
4 Route calculationMultimodal route calculation is done between two points. These points may be addresses, specific points of interest or coordinates provided by an automatic positioning system.For route calculation an integrated routing network that is made up of the public transport network, the street network and the pe-destrian network is used. Transitions between the networks take place at public transport stops.
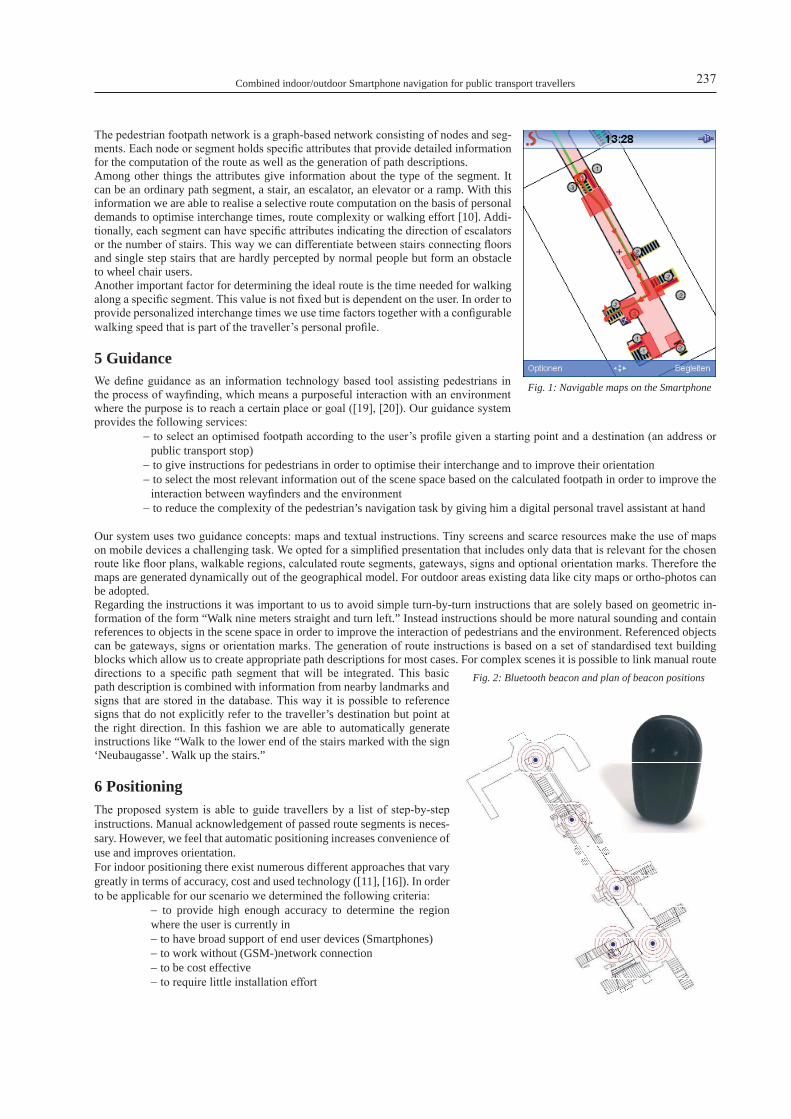
Combined indoor/outdoor Smartphone navigation for public transport travellers 237
The pedestrian footpath network is a graph-based network consisting of nodes and seg-ments. Each node or segment holds specific attributes that provide detailed information for the computation of the route as well as the generation of path descriptions.Among other things the attributes give information about the type of the segment. It can be an ordinary path segment, a stair, an escalator, an elevator or a ramp. With this information we are able to realise a selective route computation on the basis of personal demands to optimise interchange times, route complexity or walking effort [10]. Addi-tionally, each segment can have specific attributes indicating the direction of escalators or the number of stairs. This way we can differentiate between stairs connecting floors and single step stairs that are hardly percepted by normal people but form an obstacle to wheel chair users.Another important factor for determining the ideal route is the time needed for walking along a specific segment. This value is not fixed but is dependent on the user. In order to provide personalized interchange times we use time factors together with a configurable walking speed that is part of the traveller’s personal profile.
5 GuidanceWe define guidance as an information technology based tool assisting pedestrians in the process of wayfinding, which means a purposeful interaction with an environment where the purpose is to reach a certain place or goal ([19], [20]). Our guidance system provides the following services:
- to select an optimised footpath according to the user’s profile given a starting point and a destination (an address or public transport stop)
- to give instructions for pedestrians in order to optimise their interchange and to improve their orientation - to select the most relevant information out of the scene space based on the calculated footpath in order to improve the
interaction between wayfinders and the environment- to reduce the complexity of the pedestrian’s navigation task by giving him a digital personal travel assistant at hand
Our system uses two guidance concepts: maps and textual instructions. Tiny screens and scarce resources make the use of maps on mobile devices a challenging task. We opted for a simplified presentation that includes only data that is relevant for the chosen route like floor plans, walkable regions, calculated route segments, gateways, signs and optional orientation marks. Therefore the maps are generated dynamically out of the geographical model. For outdoor areas existing data like city maps or ortho-photos can be adopted.Regarding the instructions it was important to us to avoid simple turn-by-turn instructions that are solely based on geometric in-formation of the form “Walk nine meters straight and turn left.” Instead instructions should be more natural sounding and contain references to objects in the scene space in order to improve the interaction of pedestrians and the environment. Referenced objects can be gateways, signs or orientation marks. The generation of route instructions is based on a set of standardised text building blocks which allow us to create appropriate path descriptions for most cases. For complex scenes it is possible to link manual route directions to a specific path segment that will be integrated. This basic path description is combined with information from nearby landmarks and signs that are stored in the database. This way it is possible to reference signs that do not explicitly refer to the traveller’s destination but point at the right direction. In this fashion we are able to automatically generate instructions like “Walk to the lower end of the stairs marked with the sign ‘Neubaugasse’. Walk up the stairs.”
6 PositioningThe proposed system is able to guide travellers by a list of step-by-step instructions. Manual acknowledgement of passed route segments is neces-sary. However, we feel that automatic positioning increases convenience of use and improves orientation.For indoor positioning there exist numerous different approaches that vary greatly in terms of accuracy, cost and used technology ([11], [16]). In order to be applicable for our scenario we determined the following criteria:
- to provide high enough accuracy to determine the region where the user is currently in- to have broad support of end user devices (Smartphones)- to work without (GSM-)network connection- to be cost effective- to require little installation effort
Fig. 1: Navigable maps on the Smartphone
Fig. 2: Bluetooth beacon and plan of beacon positions

Karl Rehrl, Nicolas Göll, Sven Leitinger, Stefan Bruntsch238
We opted for a Bluetooth based solution, because it met our require-ments most closely. First of all a great share of the Smartphones sold today incorporate this technology and thus will support automatic positioning without additional hardware on the client side. Further-more we felt confident to reach a high enough accuracy for provid-ing orientation and useful instructions for the wayfinding process. Most of the commercially available location systems based on Blue-tooth (e.g. [23], [15], [2]) use an infrastructure of interconnected Bluetooth access points. These access points permanently execute inquiries in order to detect nearby Bluetooth devices. Once discov-ered, their location is determined on the server side and appropriate information is pushed onto the detected device. In large public trans-port stations, however, it would be very resource consuming or even impossible to install a LAN interconnecting the access points.Our approach to a cell-based positioning system makes use of a cli-
ent-side inquiry and a set of passive Bluetooth beacons. The Smartphone clients are constantly looking for beacons in the proximity that broadcast their unique ID. After receiving a beacon ID the client looks up the associated position information in a list that is part of the building description. If all the relevant data for an interchange building is cached on the device, navigation will work without any network connection. This is a crucial requirement for underground stations suffering from low cellular network coverage. The beacons utilised for this project (BlueLon Bodytags [2]) have an adjustable transmit power which makes them very flexible, because we can control the cell size. This way we are able to adapt it to the needed accuracy or to the room topology at hand (i.e. hall, room or corridor). Ideally cell sizes should be selected in a way that the covered area is not overlapping with other beacons, otherwise this would result in an ambiguous position.Due to the signals’ spherical propagation behaviour however, it is not always possible to completely separate individual cells (i.e. signals crossing floor bounds). To overcome this problem we exploit the data model’s hierarchical nature and use knowledge from the calculated path as well as information known from history. In a first step we sort out detected beacons that are outside the cur-rent region. Furthermore we can determine a sequence of beacons that will be passed when walking along the calculated route. If still more than one beacon is seen and one of them is the next expected beacon, it is assumed that the user most probably moved one step further along the way. Likewise, if the next logical beacon is not found but the one following thereafter, we consider one beacon has been skipped.Another challenging characteristic of the Bluetooth technology is the rather long delay from entering a device’s transmit range until its actual detection. This can take up to 13 seconds and imposes a lower bound to the usable cell sizes, because a user may have passed the beacon without detecting it. However, most of the time beacons are found within the first five seconds [21]. Practical tests have shown that restarting the inquiry after this duration yields higher detection probability. Together with the fault tolerant mechanism outlined above we achieved a usable cell size of down to 4 meters which is sufficient for providing useful route instruc-tions.Outdoor positioning is supported as well through the use of a GPS receiver in combination with a route matching algorithm. Au-tomatic transition from indoor to outdoor or vice versa is achieved through tagging regions with information on the positioning system. This approach works well for outdoor to indoor transitions, where the navigation application simply disconnects from the GPS receiver and starts searching for Bluetooth beacons. When leaving a building and entering an outdoor area however, we are facing the problem that currently available GPS receivers need an initialization time of about 30 seconds up to several minutes to deliver a reliable position. We try to address the problem by pretending to the user he is constantly moving along the calculated route until we are able to determine the exact location. In most of the cases this behaviour will lead to better results, because there is the chance of leaving the shadowed area during walk.
7 ImplementationIn this section we give some implementation specific details on the prototype application called the personal travel companion. The application is split up in a server side and a client side part. For the multimodal trip planning on the server-side we use the Intermodal Journey Planner [17]. This service was adopted for calculating pedestrian routes and providing maps, path descriptions and data of interchange buildings. Communication between client and server or vice versa is done via XML. Maps are delivered as geo-referenced bitmaps and can be split up in single tiles in order to improve loading times.The client running on the Smartphone is realized with J2ME. The test platform was the Off-the-Shelf Smartphone Nokia 6630. A micro browser is used for interaction with the journey planner and rendering server-generated pages containing an XML-based markup language . The markup pages may contain anchor elements for small functional modules called Smartlets that extend the browser’s functionality. This mechanism guarantees a trade-off between server-generated user interfaces where design and content is easily exchangeable and additional functionality which allows for better use of local resources.The navigation module called Navigation Smartlet is implemented to use a local data cache for accessing trip data. The cache de-cides whether trip data is locally available on the Smartphone or it has to be fetched from the server. This mechanism allows for preloading of data for a whole journey or at least parts of it. The Navigation Smartlet then gets the user’s position from the location
1
Start
1. Load beacon list for path
2. Inquiry for beacon 1
2
3. Inquiry for beacon 2
[beacon 2 found]
Pathlost
[timeout searchingfor beacon 2]
Pathmatch 4. Inquiry for beacons on path
[timeout searchingbeacons]
User decision:5. Continue navigation, try to find any known beacon6. Recalculate route from here
3
[beacon 1 found]
[beacon 1 found again]
[beacon 3 found]
Fig. 3: Schematic overview of Bluetooth inquiry
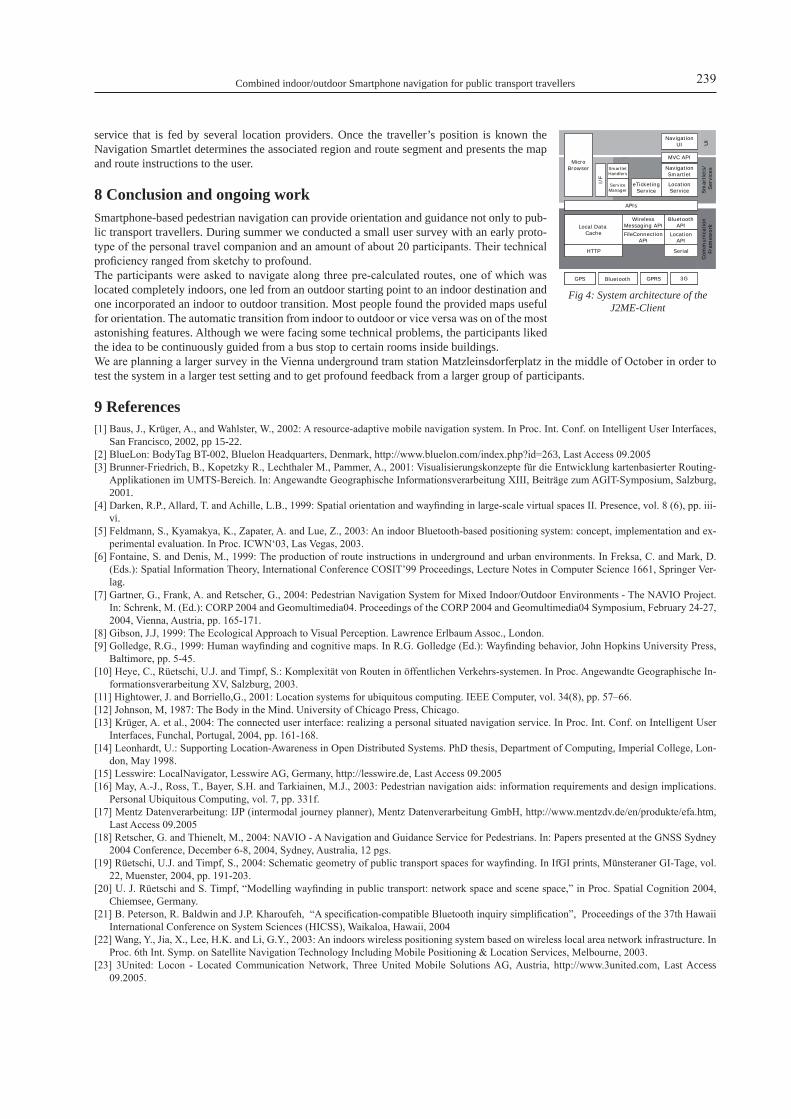
Combined indoor/outdoor Smartphone navigation for public transport travellers 239
service that is fed by several location providers. Once the traveller’s position is known the Navigation Smartlet determines the associated region and route segment and presents the map and route instructions to the user.
8 Conclusion and ongoing workSmartphone-based pedestrian navigation can provide orientation and guidance not only to pub-lic transport travellers. During summer we conducted a small user survey with an early proto-type of the personal travel companion and an amount of about 20 participants. Their technical proficiency ranged from sketchy to profound.The participants were asked to navigate along three pre-calculated routes, one of which was located completely indoors, one led from an outdoor starting point to an indoor destination and one incorporated an indoor to outdoor transition. Most people found the provided maps useful for orientation. The automatic transition from indoor to outdoor or vice versa was on of the most astonishing features. Although we were facing some technical problems, the participants liked the idea to be continuously guided from a bus stop to certain rooms inside buildings.We are planning a larger survey in the Vienna underground tram station Matzleinsdorferplatz in the middle of October in order to test the system in a larger test setting and to get profound feedback from a larger group of participants.
9 References[1] Baus, J., Krüger, A., and Wahlster, W., 2002: A resource-adaptive mobile navigation system. In Proc. Int. Conf. on Intelligent User Interfaces,
San Francisco, 2002, pp 15-22.[2] BlueLon: BodyTag BT-002, Bluelon Headquarters, Denmark, http://www.bluelon.com/index.php?id=263, Last Access 09.2005[3] Brunner-Friedrich, B., Kopetzky R., Lechthaler M., Pammer, A., 2001: Visualisierungskonzepte für die Entwicklung kartenbasierter Routing-
Applikationen im UMTS-Bereich. In: Angewandte Geographische Informationsverarbeitung XIII, Beiträge zum AGIT-Symposium, Salzburg, 2001.
[4] Darken, R.P., Allard, T. and Achille, L.B., 1999: Spatial orientation and wayfinding in large-scale virtual spaces II. Presence, vol. 8 (6), pp. iii-vi.
[5] Feldmann, S., Kyamakya, K., Zapater, A. and Lue, Z., 2003: An indoor Bluetooth-based positioning system: concept, implementation and ex-perimental evaluation. In Proc. ICWN‘03, Las Vegas, 2003.
[6] Fontaine, S. and Denis, M., 1999: The production of route instructions in underground and urban environments. In Freksa, C. and Mark, D. (Eds.): Spatial Information Theory, International Conference COSIT’99 Proceedings, Lecture Notes in Computer Science 1661, Springer Ver-lag.
[7] Gartner, G., Frank, A. and Retscher, G., 2004: Pedestrian Navigation System for Mixed Indoor/Outdoor Environments - The NAVIO Project. In: Schrenk, M. (Ed.): CORP 2004 and Geomultimedia04. Proceedings of the CORP 2004 and Geomultimedia04 Symposium, February 24-27, 2004, Vienna, Austria, pp. 165-171.
[8] Gibson, J.J, 1999: The Ecological Approach to Visual Perception. Lawrence Erlbaum Assoc., London.[9] Golledge, R.G., 1999: Human wayfinding and cognitive maps. In R.G. Golledge (Ed.): Wayfinding behavior, John Hopkins University Press,
Baltimore, pp. 5-45.[10] Heye, C., Rüetschi, U.J. and Timpf, S.: Komplexität von Routen in öffentlichen Verkehrs-systemen. In Proc. Angewandte Geographische In-
formationsverarbeitung XV, Salzburg, 2003.[11] Hightower, J. and Borriello,G., 2001: Location systems for ubiquitous computing. IEEE Computer, vol. 34(8), pp. 57–66.[12] Johnson, M, 1987: The Body in the Mind. University of Chicago Press, Chicago.[13] Krüger, A. et al., 2004: The connected user interface: realizing a personal situated navigation service. In Proc. Int. Conf. on Intelligent User
Interfaces, Funchal, Portugal, 2004, pp. 161-168.[14] Leonhardt, U.: Supporting Location-Awareness in Open Distributed Systems. PhD thesis, Department of Computing, Imperial College, Lon-
don, May 1998.[15] Lesswire: LocalNavigator, Lesswire AG, Germany, http://lesswire.de, Last Access 09.2005[16] May, A.-J., Ross, T., Bayer, S.H. and Tarkiainen, M.J., 2003: Pedestrian navigation aids: information requirements and design implications.
Personal Ubiquitous Computing, vol. 7, pp. 331f.[17] Mentz Datenverarbeitung: IJP (intermodal journey planner), Mentz Datenverarbeitung GmbH, http://www.mentzdv.de/en/produkte/efa.htm,
Last Access 09.2005[18] Retscher, G. and Thienelt, M., 2004: NAVIO - A Navigation and Guidance Service for Pedestrians. In: Papers presented at the GNSS Sydney
2004 Conference, December 6-8, 2004, Sydney, Australia, 12 pgs.[19] Rüetschi, U.J. and Timpf, S., 2004: Schematic geometry of public transport spaces for wayfinding. In IfGI prints, Münsteraner GI-Tage, vol.
22, Muenster, 2004, pp. 191-203.[20] U. J. Rüetschi and S. Timpf, “Modelling wayfinding in public transport: network space and scene space,” in Proc. Spatial Cognition 2004,
Chiemsee, Germany.[21] B. Peterson, R. Baldwin and J.P. Kharoufeh, “A specification-compatible Bluetooth inquiry simplification”, Proceedings of the 37th Hawaii
International Conference on System Sciences (HICSS), Waikaloa, Hawaii, 2004[22] Wang, Y., Jia, X., Lee, H.K. and Li, G.Y., 2003: An indoors wireless positioning system based on wireless local area network infrastructure. In
Proc. 6th Int. Symp. on Satellite Navigation Technology Including Mobile Positioning & Location Services, Melbourne, 2003.[23] 3United: Locon - Located Communication Network, Three United Mobile Solutions AG, Austria, http://www.3united.com, Last Access
09.2005.
HTTP
BluetoothGPS
MicroBrowser
Sm
artlet
s/
Ser
vice
sNavigationSmartlet
UINavigation
UI
Com
munic
atio
nFr
amew
ork
BluetoothAPI
Serial
Local DataCache
APIs
MVC API
GPRS 3G
LocationAPI
I/F
eTicketingService
WirelessMessaging API
FileConnectionAPI
LocationService
SmartletHandlers
ServiceManager
HTTP
BluetoothGPS
MicroBrowser
Sm
artlet
s/
Ser
vice
sNavigationSmartlet
UINavigation
UI
Com
munic
atio
nFr
amew
ork
BluetoothAPI
Serial
Local DataCache
APIs
MVC API
GPRS 3G
LocationAPI
I/F
eTicketingService
WirelessMessaging API
FileConnectionAPI
LocationService
SmartletHandlers
ServiceManager
Fig 4: System architecture of the J2ME-Client
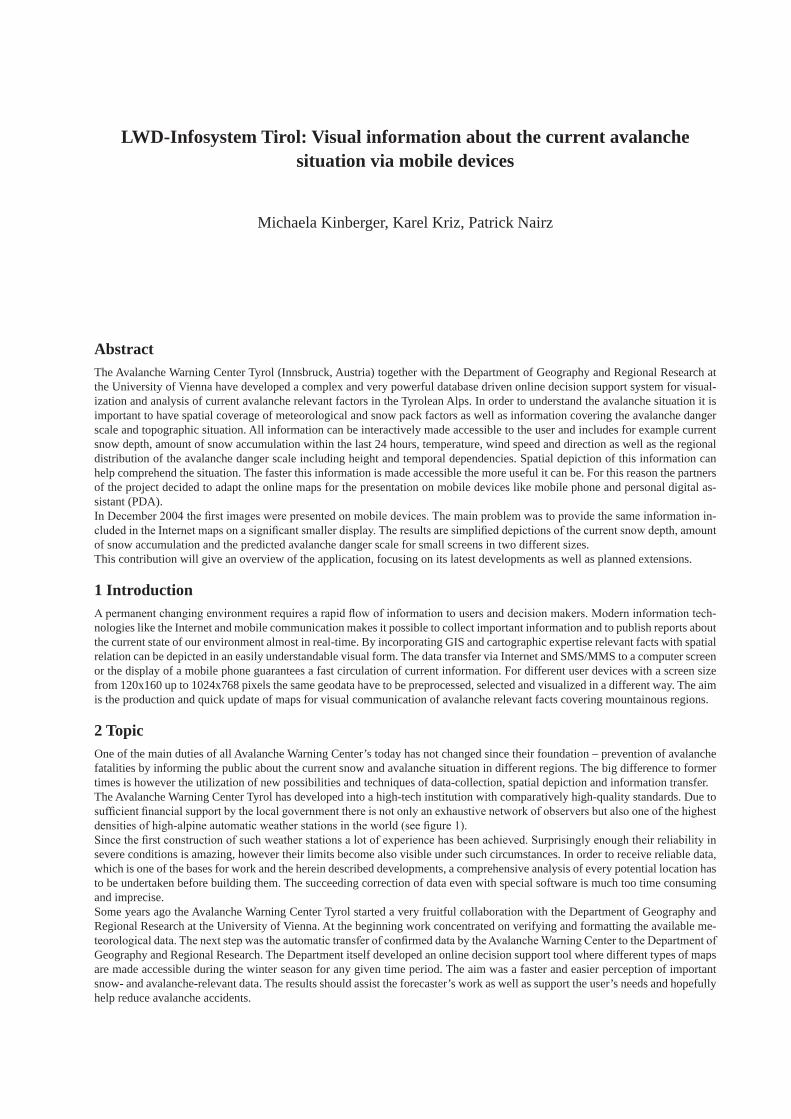
LWD-Infosystem Tirol: Visual information about the current avalanche situation via mobile devices
Michaela Kinberger, Karel Kriz, Patrick Nairz
AbstractThe Avalanche Warning Center Tyrol (Innsbruck, Austria) together with the Department of Geography and Regional Research at the University of Vienna have developed a complex and very powerful database driven online decision support system for visual-ization and analysis of current avalanche relevant factors in the Tyrolean Alps. In order to understand the avalanche situation it is important to have spatial coverage of meteorological and snow pack factors as well as information covering the avalanche danger scale and topographic situation. All information can be interactively made accessible to the user and includes for example current snow depth, amount of snow accumulation within the last 24 hours, temperature, wind speed and direction as well as the regional distribution of the avalanche danger scale including height and temporal dependencies. Spatial depiction of this information can help comprehend the situation. The faster this information is made accessible the more useful it can be. For this reason the partners of the project decided to adapt the online maps for the presentation on mobile devices like mobile phone and personal digital as-sistant (PDA).In December 2004 the first images were presented on mobile devices. The main problem was to provide the same information in-cluded in the Internet maps on a significant smaller display. The results are simplified depictions of the current snow depth, amount of snow accumulation and the predicted avalanche danger scale for small screens in two different sizes.This contribution will give an overview of the application, focusing on its latest developments as well as planned extensions.
1 IntroductionA permanent changing environment requires a rapid flow of information to users and decision makers. Modern information tech-nologies like the Internet and mobile communication makes it possible to collect important information and to publish reports about the current state of our environment almost in real-time. By incorporating GIS and cartographic expertise relevant facts with spatial relation can be depicted in an easily understandable visual form. The data transfer via Internet and SMS/MMS to a computer screen or the display of a mobile phone guarantees a fast circulation of current information. For different user devices with a screen size from 120x160 up to 1024x768 pixels the same geodata have to be preprocessed, selected and visualized in a different way. The aim is the production and quick update of maps for visual communication of avalanche relevant facts covering mountainous regions.
2 TopicOne of the main duties of all Avalanche Warning Center’s today has not changed since their foundation – prevention of avalanche fatalities by informing the public about the current snow and avalanche situation in different regions. The big difference to former times is however the utilization of new possibilities and techniques of data-collection, spatial depiction and information transfer.The Avalanche Warning Center Tyrol has developed into a high-tech institution with comparatively high-quality standards. Due to sufficient financial support by the local government there is not only an exhaustive network of observers but also one of the highest densities of high-alpine automatic weather stations in the world (see figure 1). Since the first construction of such weather stations a lot of experience has been achieved. Surprisingly enough their reliability in severe conditions is amazing, however their limits become also visible under such circumstances. In order to receive reliable data, which is one of the bases for work and the herein described developments, a comprehensive analysis of every potential location has to be undertaken before building them. The succeeding correction of data even with special software is much too time consuming and imprecise.Some years ago the Avalanche Warning Center Tyrol started a very fruitful collaboration with the Department of Geography and Regional Research at the University of Vienna. At the beginning work concentrated on verifying and formatting the available me-teorological data. The next step was the automatic transfer of confirmed data by the Avalanche Warning Center to the Department of Geography and Regional Research. The Department itself developed an online decision support tool where different types of maps are made accessible during the winter season for any given time period. The aim was a faster and easier perception of important snow- and avalanche-relevant data. The results should assist the forecaster’s work as well as support the user’s needs and hopefully help reduce avalanche accidents.
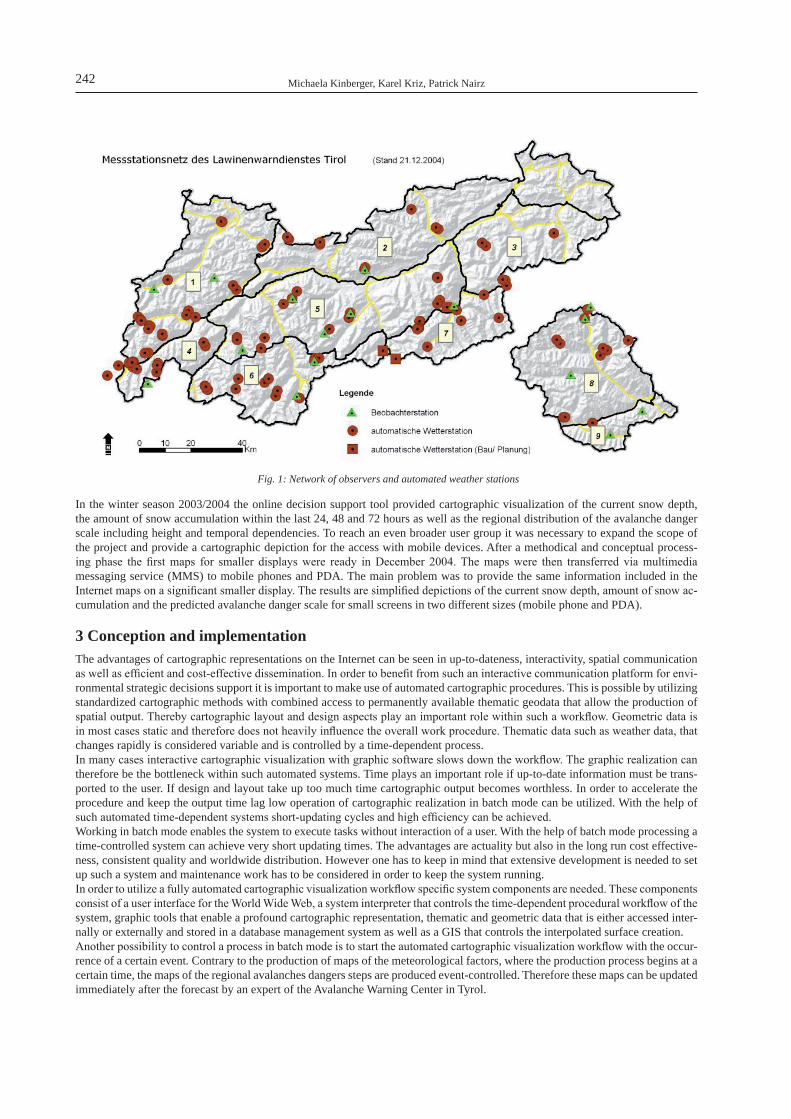
Michaela Kinberger, Karel Kriz, Patrick Nairz242
In the winter season 2003/2004 the online decision support tool provided cartographic visualization of the current snow depth, the amount of snow accumulation within the last 24, 48 and 72 hours as well as the regional distribution of the avalanche danger scale including height and temporal dependencies. To reach an even broader user group it was necessary to expand the scope of the project and provide a cartographic depiction for the access with mobile devices. After a methodical and conceptual process-ing phase the first maps for smaller displays were ready in December 2004. The maps were then transferred via multimedia messaging service (MMS) to mobile phones and PDA. The main problem was to provide the same information included in the Internet maps on a significant smaller display. The results are simplified depictions of the current snow depth, amount of snow ac-cumulation and the predicted avalanche danger scale for small screens in two different sizes (mobile phone and PDA).
3 Conception and implementationThe advantages of cartographic representations on the Internet can be seen in up-to-dateness, interactivity, spatial communication as well as efficient and cost-effective dissemination. In order to benefit from such an interactive communication platform for envi-ronmental strategic decisions support it is important to make use of automated cartographic procedures. This is possible by utilizing standardized cartographic methods with combined access to permanently available thematic geodata that allow the production of spatial output. Thereby cartographic layout and design aspects play an important role within such a workflow. Geometric data is in most cases static and therefore does not heavily influence the overall work procedure. Thematic data such as weather data, that changes rapidly is considered variable and is controlled by a time-dependent process. In many cases interactive cartographic visualization with graphic software slows down the workflow. The graphic realization can therefore be the bottleneck within such automated systems. Time plays an important role if up-to-date information must be trans-ported to the user. If design and layout take up too much time cartographic output becomes worthless. In order to accelerate the procedure and keep the output time lag low operation of cartographic realization in batch mode can be utilized. With the help of such automated time-dependent systems short-updating cycles and high efficiency can be achieved. Working in batch mode enables the system to execute tasks without interaction of a user. With the help of batch mode processing a time-controlled system can achieve very short updating times. The advantages are actuality but also in the long run cost effective-ness, consistent quality and worldwide distribution. However one has to keep in mind that extensive development is needed to set up such a system and maintenance work has to be considered in order to keep the system running.In order to utilize a fully automated cartographic visualization workflow specific system components are needed. These components consist of a user interface for the World Wide Web, a system interpreter that controls the time-dependent procedural workflow of the system, graphic tools that enable a profound cartographic representation, thematic and geometric data that is either accessed inter-nally or externally and stored in a database management system as well as a GIS that controls the interpolated surface creation. Another possibility to control a process in batch mode is to start the automated cartographic visualization workflow with the occur-rence of a certain event. Contrary to the production of maps of the meteorological factors, where the production process begins at a certain time, the maps of the regional avalanches dangers steps are produced event-controlled. Therefore these maps can be updated immediately after the forecast by an expert of the Avalanche Warning Center in Tyrol.
Fig. 1: Network of observers and automated weather stations

LWD-Infosystem Tirol: Visual information about the current avalanche situation via mobile devices 243
4 ResultsBesides Internet portals, mobile information services are important for the distribution of short living information. With the adapted In-ternet maps for mobile device access, the user is able to receive im-portant information by the means of modern, locally independent communication technology. In the following the main focus points of work during the last winter (2004/2005) will be described. More examples can be found on the homepage of the project partners (see References and Links).
4.1 Maps for mobile devicesIn the summer of the year 2004 the project team decided that users of mobile devices, such as mobile phones and PDAs, should also get access to the information provided by the “LWD-Online-Maps”. Today many mobile devices have a color display, even if it is very small. Therefore it is possible to receive and view a simplified version of the online maps on any mobile device.However, the maps available must be optimized for the small screens of mobile devices. It is absolutely necessary to reduce the content of the graphics without loosing information, so that the cartographic depiction can be represented on the substantially smaller area. The generated maps were integrated in a mobile information system. Members of the local avalanche committees receive daily updated representations of the current snow depth, amount of snow accumulation and the predicted avalanche danger scale on their mobile phone.Due to the smaller size of the display important topographic elements used in the Internet maps had to be excluded from the maps for the mobile view. In the map of the predicted avalanche danger scale the user can localize his area of interest by following the region boarders. In the maps of the current snow depth and the amount of snow accumulation within the last 24, 48 and 72 hours the selected hydrographic network makes orientation easier. Avalanche danger in particular regions is often time dependent. To show the changing avalanche danger scale over time animation is used for the Internet maps. The mobile maps are not animated, instead two single depictions are sent to the user. One picture with “AM” for the predicted avalanche danger scale in the morning and the other one with “PM” for the predicted avalanche danger scale in the afternoon. All mobile maps are depicted in two different sizes. For the smaller mobile phone display pictures with the size of 133x100 pixel are produced (see figure 2). For PDA displays images with the size of 200x150 pixel are generated.
4.2 Maps representing the current air temperature, wind speed and direction Besides the information on the current snow depth and the accumulation within the last 24 hours the automated weather stations in the Tyrolean Alps also collect values on the current air temperature, wind speed and wind direction. All these meteorological factors are transferred and stored in a centralized database. For the visualization of the current air temperature in degree Celsius the values of the single weather stations are interpolated dependent on their heights, classified and colored (see figure 3). The class limits depend on significant values of the air tempera-ture that are important for the formation of the snow pack. The class borders can still be changed at a later time by the request of experts. Current wind speed and wind direction are represented in one map. An arrow signature, pointing at the geographic po-sition of the weather station, gives infor-mation about the dominating wind direc-tion. The wind speed is depicted by the color of the arrow.
Fig. 2: Maps for mobile phones
Fig. 3: Map representing the air temperature
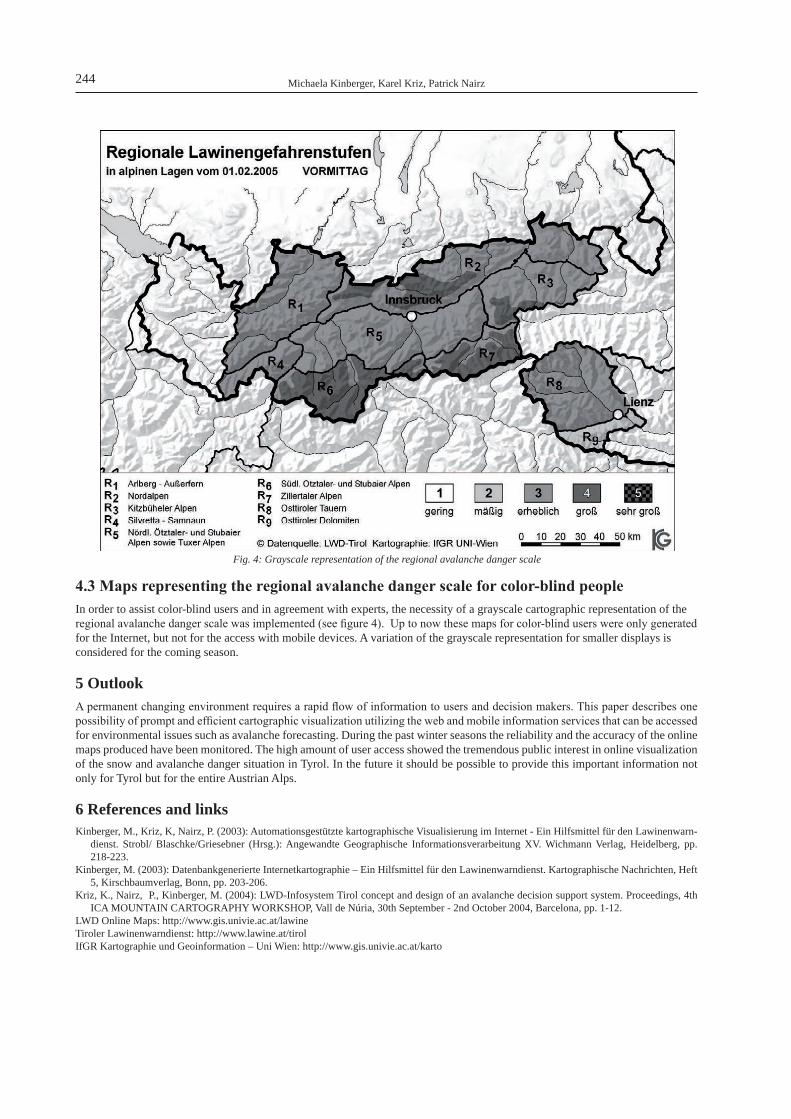
Michaela Kinberger, Karel Kriz, Patrick Nairz244
4.3 Maps representing the regional avalanche danger scale for color-blind peopleIn order to assist color-blind users and in agreement with experts, the necessity of a grayscale cartographic representation of the regional avalanche danger scale was implemented (see figure 4). Up to now these maps for color-blind users were only generated for the Internet, but not for the access with mobile devices. A variation of the grayscale representation for smaller displays is considered for the coming season.
5 OutlookA permanent changing environment requires a rapid flow of information to users and decision makers. This paper describes one possibility of prompt and efficient cartographic visualization utilizing the web and mobile information services that can be accessed for environmental issues such as avalanche forecasting. During the past winter seasons the reliability and the accuracy of the online maps produced have been monitored. The high amount of user access showed the tremendous public interest in online visualization of the snow and avalanche danger situation in Tyrol. In the future it should be possible to provide this important information not only for Tyrol but for the entire Austrian Alps.
6 References and linksKinberger, M., Kriz, K, Nairz, P. (2003): Automationsgestützte kartographische Visualisierung im Internet - Ein Hilfsmittel für den Lawinenwarn-
dienst. Strobl/ Blaschke/Griesebner (Hrsg.): Angewandte Geographische Informationsverarbeitung XV. Wichmann Verlag, Heidelberg, pp. 218-223.
Kinberger, M. (2003): Datenbankgenerierte Internetkartographie – Ein Hilfsmittel für den Lawinenwarndienst. Kartographische Nachrichten, Heft 5, Kirschbaumverlag, Bonn, pp. 203-206.
Kriz, K., Nairz, P., Kinberger, M. (2004): LWD-Infosystem Tirol concept and design of an avalanche decision support system. Proceedings, 4th ICA MOUNTAIN CARTOGRAPHY WORKSHOP, Vall de Núria, 30th September - 2nd October 2004, Barcelona, pp. 1-12.
LWD Online Maps: http://www.gis.univie.ac.at/lawineTiroler Lawinenwarndienst: http://www.lawine.at/tirolIfGR Kartographie und Geoinformation – Uni Wien: http://www.gis.univie.ac.at/karto
Fig. 4: Grayscale representation of the regional avalanche danger scale

Investigation system for rock slope using mobile device
Chang-Yub Jeong, Chang-Uk Hyun, Yo-soon Choi, Hyeong-Dong Park
AbstractLocation-based information service using mobile device, such as PDA, mobile telephone, etc, can be quite useful to geological sur-vey which be generally carried out the out-door investigation with various locations. Geologic informations collected in the field, such as geometric shape, crack, distribution of plants, rock quality, have been saved and delivered in analog format. However, it takes long time to transform information, occurs duplicate process, and causes inaccurate measurement. Therefore, it is necessary to introduce a real time digital picture acquisition and mobile system to process information, for rapid information transport and ef-ficient operation, in the field research. The objective of this research is to develop the digital information processing system which stores and analyzes real time digital picture of rock slope, other geological information, and spatial information.
1 IntroductionAn effective communication between a field surveyor and a head office is an important factor for project management in Civil Engineering. Geologic informations have collected in the field, such as geometric shape, crack, distribution of plants, rock quality, have been saved and delivered in analog format. It takes long time to transform information, occurs duplicate process, and causes inaccurate measurement. Therefore, it is necessary to introduce a real time digital picture acquisition and mobile system to process information, for rapid information transport and efficient operation, in the field research. Currently, mobile device based information systems are offered by reports such as those that have presented the PDAs and lap-tops currently available for use in wireless GIS systems and its capabilities(Casademont et al., 2004) and alternatives to PC-based resources such as personal digital assistants (PDA) or phones are needed for information access in Civil Engineering(Mora and Dwivedi, 2002) and geo-data acquisition using mobile GIS can be used for the management of geodatabase(Montoya, 2003). In this paper, attempts were made to develop the investigate system to generate the digital trace map of the rock slope and to store real time digital information; picture of rock slope, other geological information and spatial information in the database. For this, the collaborative and expansible Geographic Information System with mobile device, wireless network and CDMA are offered. It is intended to monitor field data in the office and to connect geological information digitalized in the field with wireless internet technology.
2 Investigation system for rock slope It should be developed field application of the PDA S/W suitable for the used mobile device to consider the specified I/O interface, limited memory storage, low-CPU and device platform. Table 1. shows the specifications of the programs and equipments using this research.
SpecificationOS Windows CE 4.2
SDK PocketPC 2003 SDKLanguage Visual Baseic.NETed 2003
CPU ARM
Tab. 1: Development Environment
2.1 System architecture In order to generate digital trace mapping real-time-data in field, a possible system architecture is shown in Fig. 1. It illustrates that a client-side application is composed of a field data acquisition part, a data management part and data delivery part. It is generated a digital trace mapping real-time data from a digital picture of rock slope using an image processing module in data management part. We use the the Sobel-filter for extraction of the trace map (Fig.2). Extract. It is possible to edit the extracted digital trace map on PDA and to transport it to the office server for the separated image-format.

Chang-Yub Jeong, Chang-Uk Hyun, Yo-soon Choi, Hyeong-Dong Park246
3 Experimental implementation
3.1 Target areaImage processing module on PDA is applied the target area in Figure 1. The site seems hard to be difficult of access and the test sample has the moderate trace of the slope, so it is suitable to apply this trace extraction technique using image processing on PDA
3.2 Field surveyIt is obtained Digital image of rock slope by a digital camera and spatial information by a DGPS(Fig.4). The obtained data can be stored directly to the PDA from USB-cable or memory card and it can be displayed the site using spatial information(Fig.5)
3.3 Image processingIn order to provide the real-time data in field survey, it has been developed the image processing module on PDA based on the development pipeline(Fig.6). The module operates on the mo-bile device that has the specification by Table 1. It is possible to predict the geometry of each jointed rock blocks using extracted trace map of rock slope by image processing module on PDA.
4 ConclusionsAlternatives to conventional methods to generate the trace map, it has been developed investigation system for rock slope using mobile devices (PDA) which stores and analyzes real time digital trace map of rock slope, geological information and spatial infor-mation. In this system, it could be obtained the exact position of site by DGPS and digital image of a rock slope by digital camera, and it is stored the digital trace map generated from digital image of rock slope using the image processing on PDA. The surveyor can edit the trace map in form of image file(.JPEG, .BMP etc)digital in field and, accessing the network, transport the geological data working on site to the desktop server in an office. It will be undertaken a research about open and expansible GIS (Geographic Information System) which makes it possible real time field data monitoring in office and which is connecting geological information digitalized in the field with wireless internet technology.
Fig.1: System Architecture
Fig.2: Sobel-filter
Fig.3: Image of rock face in Hongje-Dong Fig.4: Digital image and spatial data acquisition using digital camera and DGPS

Investigation system for rock slope using mobile device 247
5 ReferencesCasademont, J., Aguilera, E.L., Paradells, J., Rojas, A., Calveras, A., Barcelo, F., Cotrina, J., 2004, Wireless technology applied to GIS, Computers
& Geosciences, Vol. 30, No. 2, pp.671-682.Mora, F.P., Dwivedi, G.H., 2002, Multiple Device Collaborative and Real Time Analysis System for Project Management in Civil Engineering,
Journal of Computing in Civil Engineering, Vol. 16, No. 1, pp.23-38. Lorena Montoya, 2003, Geo-data acquisition through mobile GIS and digital video: an urban disaster management perspective , Environmental
Modelling & Software, Vol. 18, No. 10, pp.869-876.
Fig.5: Location mapping from spatial imformation using ArcPAD
in field
Fig.6: IP-module Development pipeline
Fig.7: Displayed rock slope on virtual PDA (left) and extracted trace using IP-module(right)

LBS in orienteering sport
László Zentai
AbstractNowadays every sport is going to be more media friendly. Orienteering has never been very popular in most countries (except Scandinavia) and it is not present in television: the orienteering events are hidden in the forest. The GPS receivers can help to locate the orienteers’ position, but how can we make it interesting for non-orienteers in the media? Which “telemap” can be interesting enough for the televiewers? Orienteering maps are too complicated for non-orienteers, so we have to use special, generalized maps for them. How can we use the new technologies on the main events, how can we present the excitement of sport on a television screen?On the 19th World Orienteering Championships in 2001, in Finland the competitors were equipped with small GPS receivers and their position was reported on the large screens in the finish area. The organizers had to keep the secrecy, but these new chances can effect or alter the essence of the sport. We would rather put these new technologies to show the sport for the other people - we have to show exciting maps, actions: location based services are one of the technologies that we can use.
1 Trends in sportThis paper presents a special application of location based services and telecartography. This is really an application helping to promote sport in television. Every sport is going to be media friendly. Some traditional sports even change their rules to make sport more visible, more exciting for the audience and/or for the televiewers or just to survive (biathlon, modern pentathlon, fencing). Sport is more and more a business, and to be attractive and interesting is vital for most sports: to stay in the Olympic programme or to be in the Olympics.
2 Specialities of orienteering sportOrienteering has never been very popular in most countries (except Scandinavia) and it is not present in television. The orienteering sport has some specialities, which do not make the media friendly transformation easy:
- Orienteering events mostly take place in forest areas, where to assure the infrastructure is not easy or expensive.- The competition map and course is secret. If we give an on-line broadcast we had to have extra effort to avoid unwanted
information handover to the competitors. The preparation work of the broadcast may require some outsiders to be in-cluded in the secret part of the organizing.
- Orienteering maps are very special products; they are interesting and legible only for the “experts” (competitors, fans): we have to transform the orienteering map to a media friendly, attractive screen image to make the broadcast interest-ing. This is a real telecartography task: how can we visualize the reality for the users.
- One of the key elements of orienteering sport is a route choice: the shortest way in time between to control points depends on different factors (weather, training, physical condition of the competitor). GPS can help us to follow the winner's route during the course, but there are several problems to solve.
- The competitors have to carry a GPS receiver with them and another device to report their position. These devices must be very small and they cannot effect the competitors performance.
3 Tracing the routeTechniques to track a route in real time are available. In a vehicle, tracing software can help to adjust the position to the road net-work. On an orienteering event the competitors can run everywhere, so we cannot use any software for adjusting the position. But we have additional problems to solve:How can we get GPS signals on steep slopes in the forest, where the receiver cannot see enough satellites?How can we send back the competitor’s position if there is no reliable GSM coverage in the area?
4 World Orienteering Championships 2001 (Tampere, Finland)Finland promised to have a competitor tracking system in the World Orienteering Championships (WOC) 2001 events, when Tam-pere applied to become the WOC 2001 organizer. The promise given to the International Orienteering Federation (IOF) in 1996 stated that:

László Zentai250
- The tracking system will be satellite based.- Competitor equipment will weight less than 250 g.- Accuracy of the system will be better or equal to 10 meters (comparable to the orienteering map).- Tracking data will be available real-time in TV broadcasting.
WOC 2001 needed a long period of time to look for suitable and interested partners to build the whole system. After a very large number of possible partner contacts and even demos with various partner candidates, Benefon and Novo Group were selected as the main partners.The goal of the tracking project was for the first time in orienteering sport have satellite based tracking of competitors in live TV broadcasting.
- Benefon is a Finnish mobile phone manufacturer, who has special products where the GPS receivers are integrated into a mobile phone. The responsibility of Benefon was to develop and provide the required amount of suitable devices with all the required special accessories for the event (vest, mobile device).
- Novo Group is a Finnish IT company. Their responsibility as the system integrator was to develop and operate the track-ing system.
- Sonera is a Finnish telecom operator. They were responsible for providing required network coverage and capacity for transferring the location data from orienteers to the network.
The basic operation of the system was:1. The Benefon Track GSM received signal from GPS satellites and determined the position of the competitor every sec-
ond.2. The position was sent in every 20 seconds as an SMS via special network.3. A server connected to the short message centre received the position and stored it in a special database.4. According to the instructions from the TV director, predefined parts of the map with selected competitor(s) were be
retrieved and their route drawn with special software as a still image including the competitor names.5. The image was transferred into the system to be seen by the TV director and being available for live broadcasting 15
seconds behind the real situation (nearly real-time) on the average.
The signalling load of tracking SMS traffic was monitored during the tests and it was concluded to be adequate for the WOC events. Sonera had a local base station in the event centre during the WOC 2001 events so that the GSM traffic by the audience did not give any load to the competition area.
In general, the system worked the way planned and tested and the project goal was consideredachieved.
- The amount of captured tracking routes was less than expected by the experts. The main reason for this was the GPS geometry during the competition. This had some impact on the TV visibility, since 2-3 images requested by the TV director were discarded due to incomplete or useless data. It has been concluded that nothing could have been done to improve this. In this geographical area, in a Finnish forest with constantly moving objects, the GPS geometry is the key factor that cannot be compensated within the GPS device. GPS geometry can be estimated using software and for better results the race should have taken place in another time. It is impossible to estimate the GPS geometry accurately more than 6 months in advance.
- The still image generation for TV picture in the software became slower when the amount of data increased in the sys-tems database due to a software design error. This error also caused a decrease in the TV visibility, since the timing is the key factor in a live TV broadcasting.
- The used technology led to a system that was not as much a real-time system as the TV director had wished. Using SMS technology and a relative slow update frequency is best suited to see the overall picture of route choices and mistakes, but is not suitable for providing data into a really live broadcasting that tries to capture the struggle and live action.
- The tracking system did not show any dramatic mistakes of competitors in TV. The main reason for this was not a bad working system, but rather that there were very few mistakes and different route choices made by the top runners.
For the future developers of tracking systems a few lessons can be summarized.- Good partners. The partners must have a real incentive to participate and they have to be experienced.- Co-operation with TV. TV is today the most important consumer of tracking information. TV is a very demanding
channel and requires a large amount of preparations.- GPS is tricky. Dealing with GPS requires expert knowledge of its behaviour. The theory is relatively simple, but the
real world with constantly moving satellites and weak signal impacted by various external interfering elements is hard to manage and estimate.
- Understanding project timing. WOC competitions are organized mostly by volunteers, and not by full-time employ-ers. When a company from the IT world creates a tracking system their project schedules and the way of project execu-tion are from the IT world. This may cause conflicts with rest of the organization.
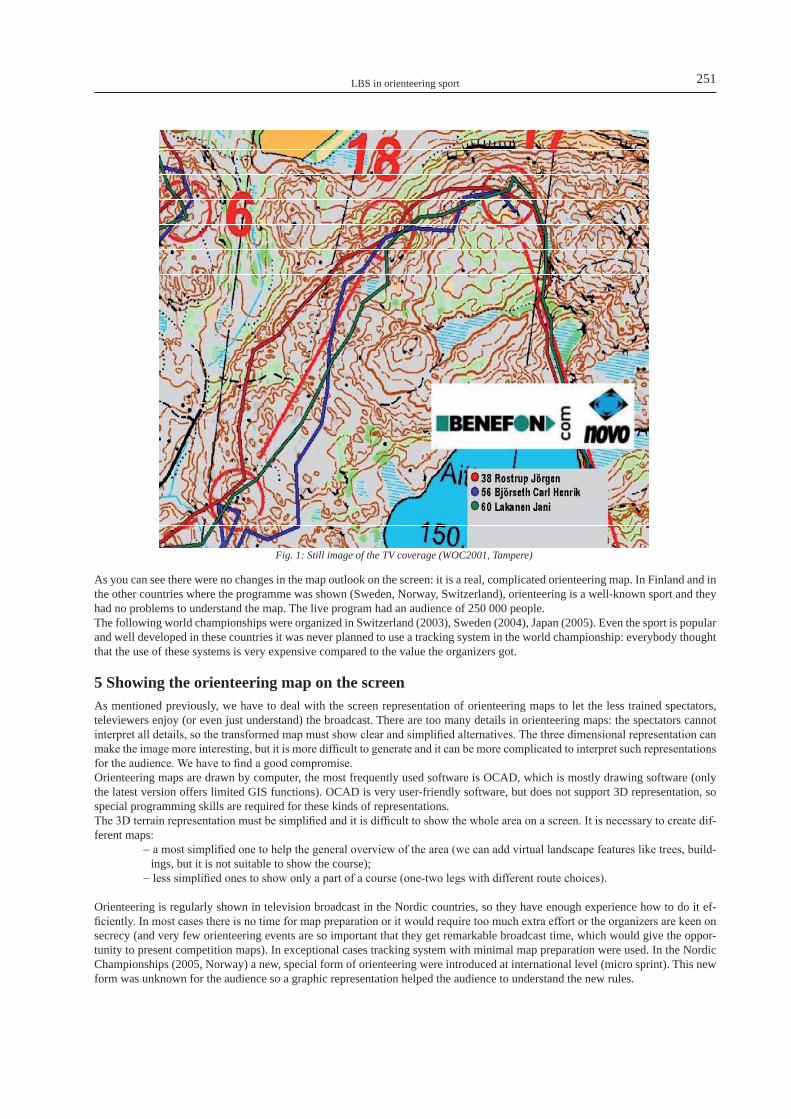
LBS in orienteering sport 251
As you can see there were no changes in the map outlook on the screen: it is a real, complicated orienteering map. In Finland and in the other countries where the programme was shown (Sweden, Norway, Switzerland), orienteering is a well-known sport and they had no problems to understand the map. The live program had an audience of 250 000 people.The following world championships were organized in Switzerland (2003), Sweden (2004), Japan (2005). Even the sport is popular and well developed in these countries it was never planned to use a tracking system in the world championship: everybody thought that the use of these systems is very expensive compared to the value the organizers got.
5 Showing the orienteering map on the screenAs mentioned previously, we have to deal with the screen representation of orienteering maps to let the less trained spectators, televiewers enjoy (or even just understand) the broadcast. There are too many details in orienteering maps: the spectators cannot interpret all details, so the transformed map must show clear and simplified alternatives. The three dimensional representation can make the image more interesting, but it is more difficult to generate and it can be more complicated to interpret such representations for the audience. We have to find a good compromise.Orienteering maps are drawn by computer, the most frequently used software is OCAD, which is mostly drawing software (only the latest version offers limited GIS functions). OCAD is very user-friendly software, but does not support 3D representation, so special programming skills are required for these kinds of representations.The 3D terrain representation must be simplified and it is difficult to show the whole area on a screen. It is necessary to create dif-ferent maps:
- a most simplified one to help the general overview of the area (we can add virtual landscape features like trees, build-ings, but it is not suitable to show the course);
- less simplified ones to show only a part of a course (one-two legs with different route choices).
Orienteering is regularly shown in television broadcast in the Nordic countries, so they have enough experience how to do it ef-ficiently. In most cases there is no time for map preparation or it would require too much extra effort or the organizers are keen on secrecy (and very few orienteering events are so important that they get remarkable broadcast time, which would give the oppor-tunity to present competition maps). In exceptional cases tracking system with minimal map preparation were used. In the Nordic Championships (2005, Norway) a new, special form of orienteering were introduced at international level (micro sprint). This new form was unknown for the audience so a graphic representation helped the audience to understand the new rules.
Fig. 1: Still image of the TV coverage (WOC2001, Tampere)
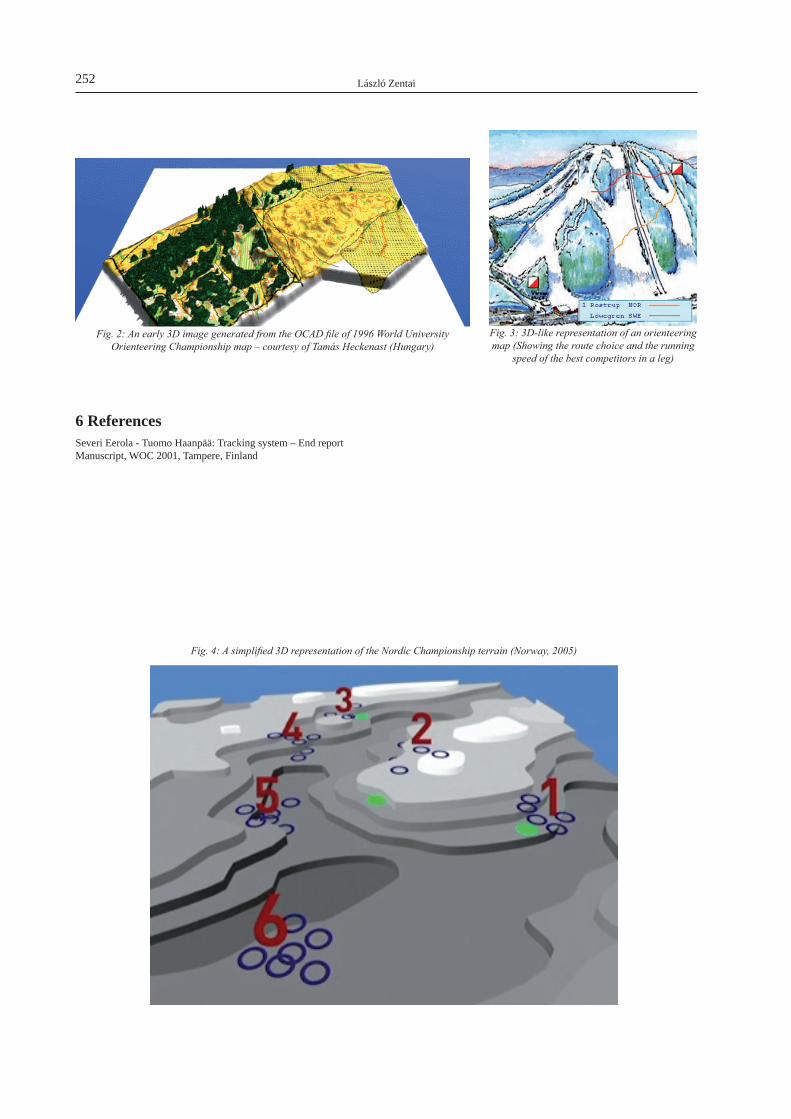
László Zentai252
6 ReferencesSeveri Eerola - Tuomo Haanpää: Tracking system – End reportManuscript, WOC 2001, Tampere, Finland
Fig. 2: An early 3D image generated from the OCAD file of 1996 World University Orienteering Championship map – courtesy of Tamás Heckenast (Hungary)
Fig. 3: 3D-like representation of an orienteering map (Showing the route choice and the running
speed of the best competitors in a leg)
Fig. 4: A simplified 3D representation of the Nordic Championship terrain (Norway, 2005)

The World as a User Interface: Augmented Reality for Ubiquitous Computing
Dieter Schmalstieg, Gerhard Reitmayr
Published in: Central European Multimedia and Virtual Reality Conference (2005), © The Eurographics Association 2005.
AbstractWe discuss the possibilities of augmented reality (AR) as a ubiquitous user interface to the real world. A mobile AR system can constantly provide guidance to its user through visual annotation of the physical environment. The first part of the paper discusses the necessary ingredients for ubiquitous AR, on which we have worked in the recent past, namely mobile AR hardware, wide area tracking, unobtrusive user interfaces, application prototypes, and geographic data models suitable for AR. The second part of the paper examines future requirements of such data models in greater detail. Based on the lessons learned in our previous work, we identify shortcoming of existing standards for geographic information systems and visualization models. Ubiquitous AR requires independence of the data model from specific applications and their implicit assumptions. A semantic network model of geo-ref-erenced data provides such a data model. We examine how such a model fits the requirements of AR applications, and how it can be implemented in practice.
1 IntroductionAugmented reality (AR) is an excellent user interface for mobile computing applications, because it allows intuitive information browsing of location-referenced information. In an AR environment, the user’s perception of the real world is enhanced by com-puter-generated entities such as 3D objects and spatialized audio [Azu97]. Interaction with these entities occurs in real-time provid-ing convincing feedback to the user and giving the impression of natural interaction. Augmented reality as a user interface becomes particularly powerful when the computer has access to location-based information so that it can seemingly merge virtual entities with real world objects in a convincing manner.Over the last years, we have created a mobile augmented reality system and a set of applications to gather experience of ubiquitous augmented reality applications. We focused on navigation and created solutions for both indoor and outdoor navigation. Both appli-cations require extensive 3D models and information which is presented to the user. Accurate and complete models of buildings and their interiors are required for rendering occlusions and highlights of buildings. Different navigation models for indoor or outdoor use were developed to fit specific requirements.The first part of this paper summarizes our work on mobile indoor and outdoor AR: presenting various hardware platforms for mobile computing and graphics; hybrid indoor/outdoor tracking solutions; user interface considerations and test applications. The second part introduces the concept of a semantic world model for AR, which directly derives from an analysis of the requirements of applying AR techniques within ubiquitous computing applications. We review recent developments in the geographic informa-tion systems (GIS) community, and how they can be used by mobile AR systems. As part of this approach, we present a conceptual design for a semantic network for AR, which can serve as a computational back end providing a new level of contextual information for AR and other types of ubiquitous computing services.
Fig. 1: The backpack system is based on a conventional notebook computer displaying stereoscopic graphics overlays in an optical see-through head mounted display.
Fig. 2: This handheld AR platform is based on a mini tablet PC that is operated as a video-see through “magic lens” device. It currently supports five different tracking technologies (3 shown) and weighs
less than 1.5kg.

Dieter Schmalstieg, Gerhard Reitmayr254
2 Mobile augmented reality platform
2.1 Hardware and softwareThe successful delivery of mobile Augmented Reality (AR) is an ongoing challenge, as interactive 3D applications must be imple-mented on constrained hardware platforms, requiring tracking over a large area of operation at high accuracy. While earlier work on mobile AR uses backpack prototypes, e.g. [FMH*97] or [TDP*98], more recently there has been a trend towards smaller, discreet, light-weight handheld setups based on PDAs and cell phones. We have assembled a series of experimental platforms of varying form factor and capability for real-world testing of the trade-offs in wearable AR.Our implementation of a classic backpack solution (Fig. 1) involved a frame equipped with a notebook computer running a standard op-
erating system (specifically a Dell Precision 8100, 2GHz P4 CPU, NVidia Quadro4Go, Windows XP). This standard platform pro-vides standard interfaces for communication (802.11 wireless LAN, GPRS) and peripherals. A differential GPS receiver (Trimble Pathfinder Pocket or Garmin GPSMouse) is used to determine the position of the system in outdoor applications. We use an optical-see-through stereoscopic color head mounted display (Sony Glasstron D100-BE) fixed to a helmet as an output device. The helmet also supports an inertial orientation tracker (InterSense InertiaCube2) and a camera (PointGrey Firefly) for indoor fiducial tracking and video see-through configurations [RS04].While the backpack system uses very powerful hardware and allows development directly on the target platform, its weight and ergonomic properties are clearly unsatisfactory. We are therefore also experimenting with smaller handheld computer platforms, which allow a “magic lens” style of video see-through augmentation. Such a handheld AR platform is inexpensive and ergonomi-cally superior to the backpack solution. Most potential users are already familiar with camcorders and consequently understand the handling (hand-eye coordination) of a handheld video-see through device. Informally we have observed that users prefer handheld AR over head mounted displays despite the lack of stereoscopic graphics and hands-free operation. The lower computational power of handhelds is partially compensated by the reduction in graphical complexity: monoscopic rather than stereoscopic; smaller screens, increased tolerance of lower resolutions and frame rates.We have developed two handheld setups. The first setup (Fig. 2) is based on a mini tablet PC (Sony Vaio U70, 1GHz Pentium-M, Windows XP). This platform combines a regular PC compatible computer with several peripherals into a very compact form factor (footprint 15x20cm, 1400g including peripherals). The second setup (Fig. 3) is based on the Pocket PC standard for personal digi-tal assistant (PDA) computers (ARM9 CPU currently attaining maximum speeds of 624MHz, Windows CE). While these devices weigh only around the 180g mark, they still feature a touch screen and a built-in camera. We have managed to implement real-time optical tracking and 3D graphics on the Pocket PC platform [WS03]. In terms of weight, size, and price these devices are almost ideally suited for our purposes, but software development for PDA operating systems is still not a straightforward task.The software framework that allows rapid prototyping of AR applications with a high degree of 3D interaction is Studierstube, a versatile environment for developing virtual reality and AR applications [SFH*02]. It is based on an object-oriented scene graph (Coin), which allows the description of 3D scenes and 3D interactions through convenient declarative scripting.
2.2 User InterfaceThe main use of a mobile AR device is as an information appliance operated in browsing mode. The system should provide con-text-sensitive cues while the user is busy performing a task or navigating through the environment. Consequently, most input to the system should be automatically derived from situational context, without requiring explicit user attention. The main method for achieving this is by tracking the user’s position in the environment, and the user’s current viewing direction. Consequently, wide area tracking is of major importance for a mobile AR system (see next section).However, applications will still require a certain amount of direct control. For example, a user may want to select a navigation target from a list of addresses or a map, or if the destination is within visible range more directly by using gaze direction. For such explicit control, we have investigated a number of interface alternatives.Touch pad and touch screen: handheld AR devices are already equipped with a touch screen, which can be conveniently used to display on-screen menus operated by stylus or a finger (Fig. 1). The same touch screen can be used for selecting objects in the video-see through display by tapping on their position on the screen, effectively a form of raypicking interaction. For configura-tions using a head-mounted display, we have relied on either a handheld touchpad peripheral that is used to control a 2D cursor in the heads-up display, or by an additional PDA which can display menus directly on its screen. Both the touchpad and the PDA can be tracked using fiducial markers observed by the helmet-mounted camera, if 3D input is desired.While the touch screen interaction clearly hints at its origins in desktop 2D and 3D user interfaces, the iOrb device (Fig. 4) was specifically designed for unified command and spatial input for mobile AR [RCK*05]. It consists of a single 3DOF inertial tracker (XSens MT9) embedded in a shell composed of two hemispheres of about 8cm diameter. By turning the sphere and then pressing the two hemispheres together, the user can issue application commands using variants of 1D and 2D pie menu techniques. Simi-
Fig. 3: The smallest fully featured AR platform to date is based on commercial PocketPC 2003 handheld computers. Using an embedded camera, these devices can perform optical marker tracking and real-time 3D graphics at ~20fps. Shown is the
“Invisible Train” multi-user game successfully demonstrated at SIGGRAPH 2004.

The World as a User Interface: Augmented Reality for Ubiquitous Computing 255
larly, spatial selections can be made using a picking ray or cone. All interactions use only relative rotational measurements and are therefore mostly insensitive to measurement inaccuracies and drifting.
2.3 Tracking infrastructureWide area tracking cannot generally be done with a single sensor, be-cause no single tracking technology can provide the range and accuracy required by a general mobile AR system. Therefore a significant body of work exists on hybrid tracking systems, combining multiple track-ing technologies through sensor fusion techniques. However, most re-search focuses on building a single, improved tracking system through sensor fusion, rather than on alternating between different sources de-pending on availability, location, and context. Notable exceptions are the systems built by Hallaway et al. [HHF*04] and by Piekarski et al. [PAT*04], which are the only systems we are aware of that are capable of alternating between indoor and outdoor operation.Several previous approaches combine multiple sensors popular for AR setups, such as fiducial tracking, inertial and GPS sensors. However, these approaches lack a general approach for management of arbitrary sensors. We have therefore developed a ubiquitous tracking framework [NWB*04], that addresses the problem of tracker integration and arbitrary sensor management. The most recent inte-grated solution that uses this approach executes on a handheld computer (U70), and combines five tracking systems: Inertial (XSens MT9), infrared vision (ARTTrack), magnetic (Flock of Birds), optical (ARToolKit), and GPS (Garmin GPS18 USB).Each tracking technology has a dedicated working volume, with the exception of the inertial orientation tracker. The inertial tracker is used to assist other tracking systems with dead reckoning information, in particular the outdoor GPS system, which does not deliver any estimates of orientation.As the core tracking software, we use OpenTracker (OT), which implements a pipes-and-filters network for connecting producers and consumers of tracking information [RS01]. The nodes of this network can execute on different hosts in a network. In particular, ARTTrack and Flock of Birds are stationary systems with a dedicated device server, each executing an instance of OT. The OT serv-er will then communicate the tracking information to another instance of OT on the handheld computer over a wireless network.Outdoor tracking: information is provided by a GPS receiver with the XSens inertial tracker providing complementary orientation estimates. Differential GPS corrections are obtained through a wireless internet connection from a local base station service or the new global correction service.ARTTrack is a commercial multi-camera system capable of tracking target bodies composed of 4-5 small retro-reflective balls. These lightweight target bodies can easily be mounted on a helmet or handheld device, which can then be tracked in an outside-in mode while in view of the cameras. The mobile device itself is completely passive and does not require batteries or tethered cables for tracking. The pose data is transmitted from a stationary tracking server that performs the online pose estimation to the mobile system using wireless networking.Flock of Birds: Since the Bird is wired, when the user with the handheld enters the effective envelope of the Bird, it is necessary to physically attach the Bird to the object of interest using velcro straps. Currently, the user triggers an event, by pressing a button, to acknowledge the presence of the Bird. Future versions will automatically determine Bird activity using correlated motion from an inertial tracker permanently mounted to the handheld device and the Bird, once it is attached to the handheld device. Similarly to the ARTTrack, the tracking data is transmitted wirelessly from a stationary server to the mobile device.ARToolKit: A significantly modified version of the popular vision tracking library ARToolKit is used for tracking indoor regions beyond the reach of the magnetic and infrared technologies. Pose estimation of the mobile camera rigidly mounted on a helmet or handheld device is performed using the 2D location of the corners of one or several square markers visible in the camera image. The identity of the markers is then decoded directly from self-correcting 2D barcodes in the marker’s interior area, which makes it pos-sible to uniquely discriminate a large number of markers dispersed throughout the indoor environment. By looking up the geomet-ric position of each observed marker in a previously surveyed model of the indoor area, the global pose of the mobile device can be computed from the camera pose estimation. The inertial tracker provides orientation dead reckoning if no markers are observed.Tracker selection: The OT configuration in the client is responsible for making the tracking “ubiquitous”, i.e., permitting online selection of the best available tracking technology. The selection mechanism is currently based on priorities: The stationary track-ing technologies ARTTrack, Flock of Birds, and ARToolKit are selected in this order if data from the corresponding sensors is avail-able. The systems attempts to fall back to GPS if none of these technologies is available, and finally reverts to a static map when there is no location data whatsoever. An improved version of the tracking framework is currently under development, which will permit fully automatic discovery of new tracking services based on a tracking service characterization.
2.4 ApplicationsOutdoor applications. The needs and requirements of a tourist are a suitable starting point for testing location-based applications. A tourist typically has little or no knowledge of the environment. However, tourists have a strong interest in their environment and
Fig. 4: The iOrb, an interaction device specifically designed for mobile AR users, unifies command input and 3D spatial
selection at a distance through raypicking.

Dieter Schmalstieg, Gerhard Reitmayr256
also want to navigate through their surroundings to visit different locations. Guided tours are also popular for tourists. Consequent-ly, we have chosen a tourist guide application for the City of Vienna as an example scenario for an AR application that integrates a large amount of data from different sources. The system provides a navigational aid that directs the user to a target location. An information browser displays location-refer-enced information icons that can be selected to present more detailed information in a variety of formats. Both functions support collaboration between multiple mobile users.In navigation mode the user selects a specific target address or a desired target location of a certain type such as a supermarket or a pharmacy. The system then computes the shortest path in a known network of possible routes. It is interactive and reacts to the us-er’s movements. It continuously re-computes the shortest path to the target if the user goes astray or decides to take another route.The information is displayed as a series of waypoints that are visualized as cylinders standing in the environment (Fig. 5). These cylinders are connected by arrows indicating the direction the user should take between waypoints. Together they become a visible line through the environment that is easy to follow. The user can enable an additional arrow that points directly from her current position to the next waypoint. Buildings can clip the displayed geometry to enable additional depth perception cues between the virtual information and the real world. Finally, the system displays simple directional information, if the user is not able to perceive the next waypoint because she is looking in the wrong direction.The information browsing mode presents the user with location-based information. Location-referenced information icons appear in view and are selected by looking at them (Fig. 6). They then present additional information associated with that location. The application conveys historical and cultural information about sights in the City of Vienna.Indoor applications. Indoors, the mobile AR system guides a user on the way through the long and winding corridors of a uni-versity building with direction and map based contextual information [RS03]. The system continuously provides the user with two modes of visual feedback: a heads-up display with directional arrows and a world in miniature model of the environment. The heads-up display shows a wire frame model of the current room superimposed on top of the real scene. The application uses a short-est path search on an adjacency graph of the building to determine the next door/portal on the way to the destination, which is then visually highlighted. In addition, an arrow shows the direction to the next door or portal turn (Fig. 7). The application also presents
Fig. 5: An outdoor navigation guide for a pedestrian visualizes the selected route as a series of waypoints. Note the correct
occlusion between the route and the archway .
Fig. 6: By gazing at a cultural artefact of interest, a user can instantly recall historic multimedia information.
Fig. 7: Indoors, a combination of directional arrows, highlighting of exit, compass (upper right) and world-in-
miniature (lower middle) is used to help a user navigate the environment.
Fig. 8: The “Augmented Library” allows a user to quickly locate the shelf on which a book of interest can be found, by
emphasizing the relevant location.
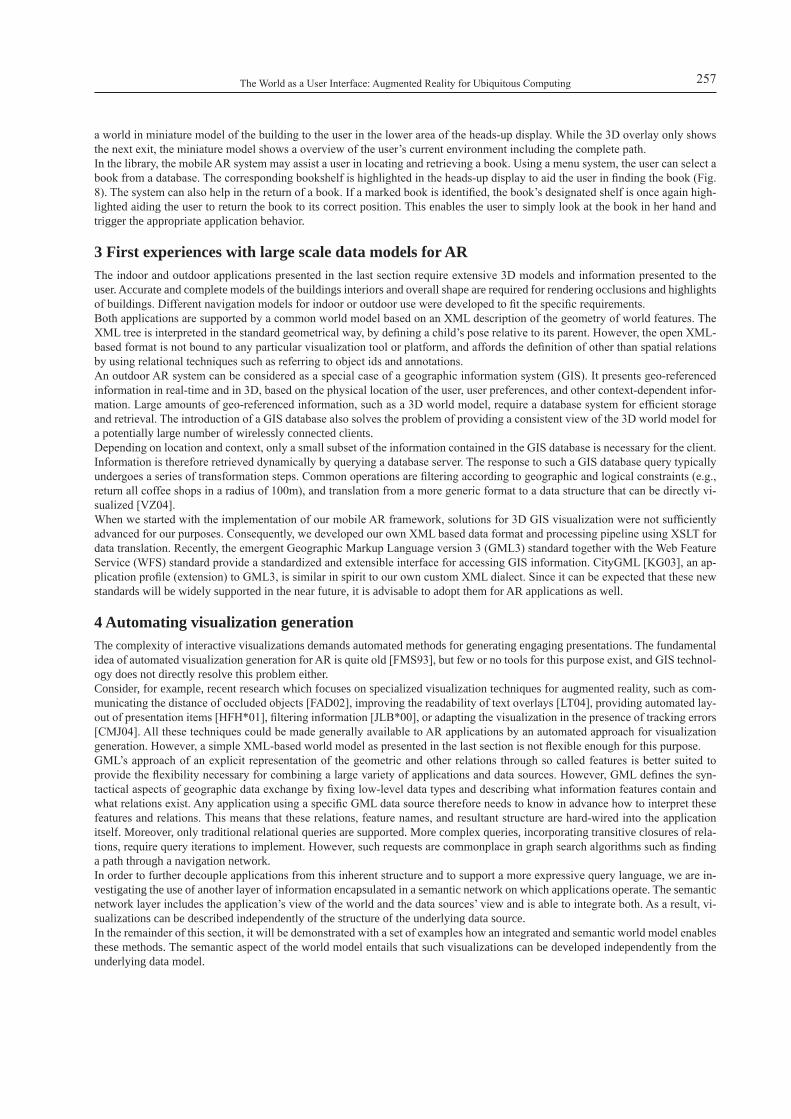
The World as a User Interface: Augmented Reality for Ubiquitous Computing 257
a world in miniature model of the building to the user in the lower area of the heads-up display. While the 3D overlay only shows the next exit, the miniature model shows a overview of the user’s current environment including the complete path.In the library, the mobile AR system may assist a user in locating and retrieving a book. Using a menu system, the user can select a book from a database. The corresponding bookshelf is highlighted in the heads-up display to aid the user in finding the book (Fig. 8). The system can also help in the return of a book. If a marked book is identified, the book’s designated shelf is once again high-lighted aiding the user to return the book to its correct position. This enables the user to simply look at the book in her hand and trigger the appropriate application behavior.
3 First experiences with large scale data models for ARThe indoor and outdoor applications presented in the last section require extensive 3D models and information presented to the user. Accurate and complete models of the buildings interiors and overall shape are required for rendering occlusions and highlights of buildings. Different navigation models for indoor or outdoor use were developed to fit the specific requirements.Both applications are supported by a common world model based on an XML description of the geometry of world features. The XML tree is interpreted in the standard geometrical way, by defining a child’s pose relative to its parent. However, the open XML-based format is not bound to any particular visualization tool or platform, and affords the definition of other than spatial relations by using relational techniques such as referring to object ids and annotations.An outdoor AR system can be considered as a special case of a geographic information system (GIS). It presents geo-referenced information in real-time and in 3D, based on the physical location of the user, user preferences, and other context-dependent infor-mation. Large amounts of geo-referenced information, such as a 3D world model, require a database system for efficient storage and retrieval. The introduction of a GIS database also solves the problem of providing a consistent view of the 3D world model for a potentially large number of wirelessly connected clients.Depending on location and context, only a small subset of the information contained in the GIS database is necessary for the client. Information is therefore retrieved dynamically by querying a database server. The response to such a GIS database query typically undergoes a series of transformation steps. Common operations are filtering according to geographic and logical constraints (e.g., return all coffee shops in a radius of 100m), and translation from a more generic format to a data structure that can be directly vi-sualized [VZ04].When we started with the implementation of our mobile AR framework, solutions for 3D GIS visualization were not sufficiently advanced for our purposes. Consequently, we developed our own XML based data format and processing pipeline using XSLT for data translation. Recently, the emergent Geographic Markup Language version 3 (GML3) standard together with the Web Feature Service (WFS) standard provide a standardized and extensible interface for accessing GIS information. CityGML [KG03], an ap-plication profile (extension) to GML3, is similar in spirit to our own custom XML dialect. Since it can be expected that these new standards will be widely supported in the near future, it is advisable to adopt them for AR applications as well.
4 Automating visualization generationThe complexity of interactive visualizations demands automated methods for generating engaging presentations. The fundamental idea of automated visualization generation for AR is quite old [FMS93], but few or no tools for this purpose exist, and GIS technol-ogy does not directly resolve this problem either.Consider, for example, recent research which focuses on specialized visualization techniques for augmented reality, such as com-municating the distance of occluded objects [FAD02], improving the readability of text overlays [LT04], providing automated lay-out of presentation items [HFH*01], filtering information [JLB*00], or adapting the visualization in the presence of tracking errors [CMJ04]. All these techniques could be made generally available to AR applications by an automated approach for visualization generation. However, a simple XML-based world model as presented in the last section is not flexible enough for this purpose. GML’s approach of an explicit representation of the geometric and other relations through so called features is better suited to provide the flexibility necessary for combining a large variety of applications and data sources. However, GML defines the syn-tactical aspects of geographic data exchange by fixing low-level data types and describing what information features contain and what relations exist. Any application using a specific GML data source therefore needs to know in advance how to interpret these features and relations. This means that these relations, feature names, and resultant structure are hard-wired into the application itself. Moreover, only traditional relational queries are supported. More complex queries, incorporating transitive closures of rela-tions, require query iterations to implement. However, such requests are commonplace in graph search algorithms such as finding a path through a navigation network. In order to further decouple applications from this inherent structure and to support a more expressive query language, we are in-vestigating the use of another layer of information encapsulated in a semantic network on which applications operate. The semantic network layer includes the application’s view of the world and the data sources’ view and is able to integrate both. As a result, vi-sualizations can be described independently of the structure of the underlying data source. In the remainder of this section, it will be demonstrated with a set of examples how an integrated and semantic world model enables these methods. The semantic aspect of the world model entails that such visualizations can be developed independently from the underlying data model.
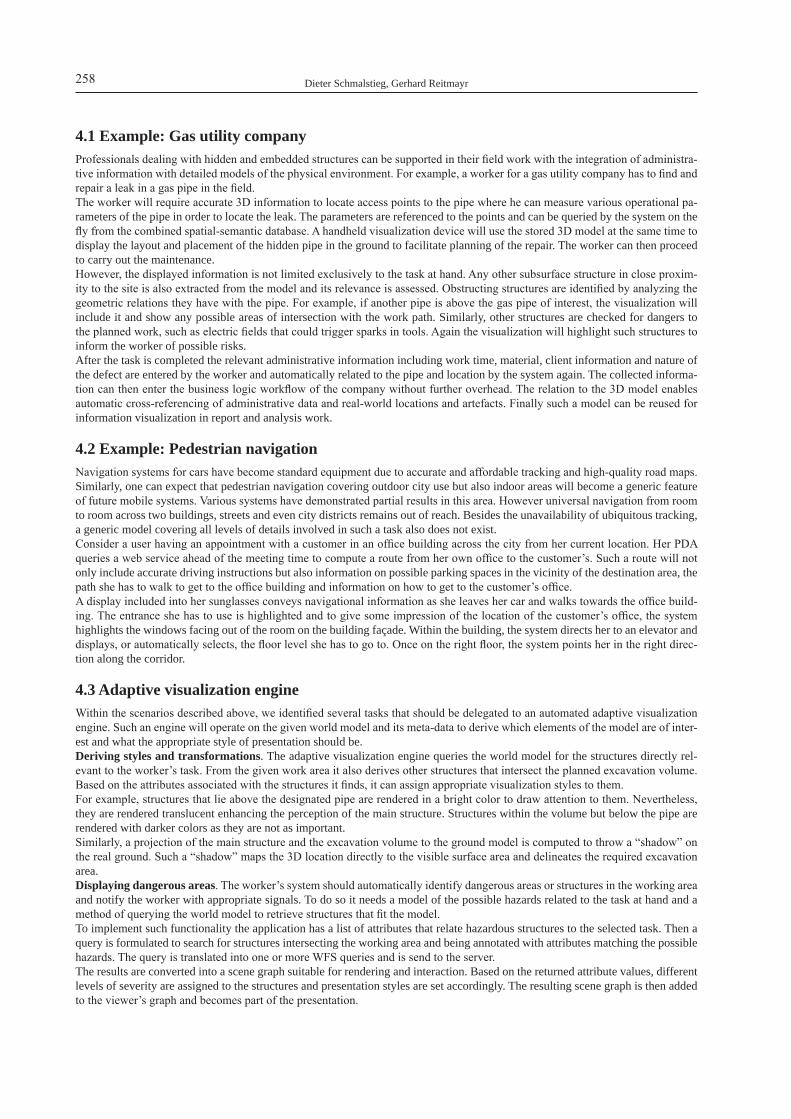
Dieter Schmalstieg, Gerhard Reitmayr258
4.1 Example: Gas utility companyProfessionals dealing with hidden and embedded structures can be supported in their field work with the integration of administra-tive information with detailed models of the physical environment. For example, a worker for a gas utility company has to find and repair a leak in a gas pipe in the field. The worker will require accurate 3D information to locate access points to the pipe where he can measure various operational pa-rameters of the pipe in order to locate the leak. The parameters are referenced to the points and can be queried by the system on the fly from the combined spatial-semantic database. A handheld visualization device will use the stored 3D model at the same time to display the layout and placement of the hidden pipe in the ground to facilitate planning of the repair. The worker can then proceed to carry out the maintenance. However, the displayed information is not limited exclusively to the task at hand. Any other subsurface structure in close proxim-ity to the site is also extracted from the model and its relevance is assessed. Obstructing structures are identified by analyzing the geometric relations they have with the pipe. For example, if another pipe is above the gas pipe of interest, the visualization will include it and show any possible areas of intersection with the work path. Similarly, other structures are checked for dangers to the planned work, such as electric fields that could trigger sparks in tools. Again the visualization will highlight such structures to inform the worker of possible risks.After the task is completed the relevant administrative information including work time, material, client information and nature of the defect are entered by the worker and automatically related to the pipe and location by the system again. The collected informa-tion can then enter the business logic workflow of the company without further overhead. The relation to the 3D model enables automatic cross-referencing of administrative data and real-world locations and artefacts. Finally such a model can be reused for information visualization in report and analysis work.
4.2 Example: Pedestrian navigationNavigation systems for cars have become standard equipment due to accurate and affordable tracking and high-quality road maps. Similarly, one can expect that pedestrian navigation covering outdoor city use but also indoor areas will become a generic feature of future mobile systems. Various systems have demonstrated partial results in this area. However universal navigation from room to room across two buildings, streets and even city districts remains out of reach. Besides the unavailability of ubiquitous tracking, a generic model covering all levels of details involved in such a task also does not exist.Consider a user having an appointment with a customer in an office building across the city from her current location. Her PDA queries a web service ahead of the meeting time to compute a route from her own office to the customer’s. Such a route will not only include accurate driving instructions but also information on possible parking spaces in the vicinity of the destination area, the path she has to walk to get to the office building and information on how to get to the customer’s office. A display included into her sunglasses conveys navigational information as she leaves her car and walks towards the office build-ing. The entrance she has to use is highlighted and to give some impression of the location of the customer’s office, the system highlights the windows facing out of the room on the building façade. Within the building, the system directs her to an elevator and displays, or automatically selects, the floor level she has to go to. Once on the right floor, the system points her in the right direc-tion along the corridor.
4.3 Adaptive visualization engineWithin the scenarios described above, we identified several tasks that should be delegated to an automated adaptive visualization engine. Such an engine will operate on the given world model and its meta-data to derive which elements of the model are of inter-est and what the appropriate style of presentation should be. Deriving styles and transformations. The adaptive visualization engine queries the world model for the structures directly rel-evant to the worker’s task. From the given work area it also derives other structures that intersect the planned excavation volume. Based on the attributes associated with the structures it finds, it can assign appropriate visualization styles to them.For example, structures that lie above the designated pipe are rendered in a bright color to draw attention to them. Nevertheless, they are rendered translucent enhancing the perception of the main structure. Structures within the volume but below the pipe are rendered with darker colors as they are not as important.Similarly, a projection of the main structure and the excavation volume to the ground model is computed to throw a “shadow” on the real ground. Such a “shadow” maps the 3D location directly to the visible surface area and delineates the required excavation area.Displaying dangerous areas. The worker’s system should automatically identify dangerous areas or structures in the working area and notify the worker with appropriate signals. To do so it needs a model of the possible hazards related to the task at hand and a method of querying the world model to retrieve structures that fit the model. To implement such functionality the application has a list of attributes that relate hazardous structures to the selected task. Then a query is formulated to search for structures intersecting the working area and being annotated with attributes matching the possible hazards. The query is translated into one or more WFS queries and is send to the server.The results are converted into a scene graph suitable for rendering and interaction. Based on the returned attribute values, different levels of severity are assigned to the structures and presentation styles are set accordingly. The resulting scene graph is then added to the viewer’s graph and becomes part of the presentation.

The World as a User Interface: Augmented Reality for Ubiquitous Computing 259
Deriving related objects of interest. For a mobile task like navigation, objects of interest are often occluded or not fully or directly visible. In such cases it is not simple for the user to interpret the visualization correctly, even if various techniques such as transpar-ency or cut-away views are employed. Therefore the adaptive visualization engine can substitute currently visible structures for the actual target structures and use these in the presentation.For example, as the user is coming close to the target building both the building entrance and a window associated with the target room are highlighted. The system emphasises the entrance in order to guide the user in the right direction, but also, it draws some attention to the window to provide some overview of the planned path. The user can therefore build a mental map of where she will go. Within the building, doorways are again used as direct navigation aids, but an outline of the intersection of the room with the ad-jacent walls can provide more information about the location and size of the target room. Such subtle additions to the presentation could help users to gain a better understanding of the structure of their environment.To implement these functions, the system will first compute a path from the current location of the user to the destination. More-over, it queries the world model for potential occluding objects in the area between the user and the destination object. If such ob-jects exist, it will further derive visible sub-structures of these objects and try to relate them to the destination room. Such relations can be topological such as windows connecting a room volume to the outside or geometrical such as proximity of walls. If such a related object is found, it can be used in the visualization instead of the destination object.
5 Semantic reasoning engineMore complex automation is achieved by incorporating knowledge-based query mechanisms into the application. Our aim is to provide a software component that reasons over the available world model to identify and select objects described by more complex propositions than simple query-based assertions.The semantic reasoning engine maintains a representation of the world and application state as a semantic network which contains information on the individual objects in the scene, the tasks of the user and the selected visualization modes. The semantic network is based on an ontological description of the properties of objects.It combines a set of formal descriptions of application knowledge:
- A basic ontology like OWL [HPH03] for defining the basic relationships between objects, such as membership of a class, subclasses, aggregation and attributes.
- An ontological description of the GML-based data in order to interpret and map the GML features to the semantic net-work representation.
- Application specific ontologies that further refine the basic ontology with the relations that hold in the application do-main.
- A description of the possible user interface representations and their relations to domain specific object attributes.- A set of mapping ontologies that translate between the GML relations and the application-specific or user interface
concepts.
Finally, a knowledge base of facts about the objects is also maintained in the network. These facts are representations of the under-lying GML feature data retrieved from the Web Feature Service back-end. An inference engine such as Racer [HM03] or FaCT [Hor98] processes queries defined by the application and returns the results with respect to the semantic network. Relations that include geometric semantics such as distance or visibility are implemented as extensions to the inference engine that operate on the geometric data itself, rather than on the representations in the semantic net-work. If further facts are required, the engine also formulates queries to the WFS back-end to replenish the knowledge base with more information. For example, a prerequisite to certain queries could be that all objects within a certain distance of the user are kept in the knowledge base. As the user moves, the engine will update the knowledge base as required.
5.1 Building visualizationsThe next step uses the knowledge encoded in the semantic network to derive convincing visualizations. Here we use the ontology describing the properties of types of visualization. For example, we could define that objects that are occluded but important for user orientation are of type I and are to be rendered with a bright yellow stippled outline, while objects that are occluded by any ob-ject of type I are themselves of type O and are rendered with a black translucent color to modify the luminance of occluded objects. The inference engine can now deduce from assertions in the knowl-edge base whether a certain object meets the criteria to be classified as either type I or O. Similarly, we could also formulate a query that returns all objects of a certain type. Note that the decision of whether an object is of type I is not solely based on geometric calculations, because it must also be important to user orientation. A formaliza-tion of this concept is in fact encoded in the domain specific applica-tion ontology.
Fig. 9: The semantic reasoning engine relies on a knowledge base interpreted according to various ontologies.

Dieter Schmalstieg, Gerhard Reitmayr260
The connection between the semantic reasoning engine and the user interface component is another crucial aspect of the system. The out-put of the engine – the results of queries to it – is transformed into scene graph representations for the rendering engine. However, due to the possible complex computations of query results, we cannot expect the reasoning engine to operate at real time in direct response to the user’s interactions. The output scene graph will rather describe the possible visualiza-tions of all objects with respect to certain changes such as visibility or distance to the user or actions by the user such as selection. The visualization will be rendered with appropriate parameters driven
by the sensor input and adapt at render time to such simple changes. Only larger movements exceeding certain thresholds or in-teractions with the application such as selecting a different mode or target will trigger a re-evaluation by the semantic reasoning engine.
5.2 System integrationThe integration of the semantic reasoning engine into the overall system is supported by the extensive use of XML-based data ex-change formats. Ontologies are expressed in RDF [MM03] and can therefore be served by web services. The knowledge base of facts in the reasoning engine is typically also expressed in RDF. Therefore XML-based transformation technologies such as XSLT can be applied to the GML query results of the Web Feature Service to extract and formulate the assertions in RDF and feed them to the reasoning engine.The output to the application is mainly entailing the creation of scene graphs for 3D rendering. Here we have already successfully employed the same techniques to generate scene graph descriptions from XML data structures. As the output of the reasoning en-gine consists of facts expressed in RDF too, we can directly apply static transformations to it and create the corresponding graph structures.
5.3 Example: Tracking target objects for navigation To demonstrate the use of the semantic reasoning engine we will describe its operation when applied to universal navigation. Here we always want to present the user with an object that is “semantically” related to the target object, even if the target is not directly visible.Within our application specific rule base, we define a set of rules that always compute a visible place-holder for the target object. A first rule is that the best place-holder is the target object itself, if visible. Another rule states that an object belongs to the type class IsInteresing, if it is visible and stands in the relation SubstituteFor with the target object. The relation SubstituteFor is defined in terms of a set of logical disjunctions and conjunctions of assertions on properties of both the target and the candidate objects. Among the assertions is the topological relation neighboursWith meaning a spatial relation that objects are adjacent to each other. The concrete implementation in terms of testable attributes or relations depends on the world model. Therefore it is either defined in the world model itself or as a set of geometric relations Touches which is part of the query language for the Web Feature Service.For example, in order to find windows that may act as substitutes for a target room, we define the relation SubstituteFor to include objects of a size not larger than the target, that stand in the relation neighboursWith to it and that are potentially visible, because the user is currently outside of the building. The semantic reasoning engine is able to map the relations to real underlying relations in the current GML data set without further interaction with the application. Therefore, the visualizations depend on high-level ab-stract descriptions of interesting objects rather than on the direct low-level expressions used to compute them.The result of the reasoning step is the set of all objects belonging to the class IsInteresting. The result set creates a scene graph representation that includes the objects’ geometry and appropriate rendering styles. Moreover, the scene graph also includes some logic to react to individual objects becoming visible or invisible as the user moves within a certain range, such that only one object is actually rendered at any point in time. When the user moves beyond this range or selects a different target, the application re-evaluates the set by updating the knowledge base accordingly and applying the reasoning again.
6 Conclusions and future workMobile AR has outgrown its infancy and is getting ready for early commercial deployment. We have presented a series of plat-forms and application prototypes developed to assess the feasibility of key technologies in mobile AR. One noteworthy aspect of our experiments is that they use probably the largest and most systematic AR model to date. From our experiences with this model and its creation process we have learned what today’s 3D modeling technologies do not provide: truly flexible interpretation of the data, which makes applications independent of assumptions concerning model structure and the relations between model entities. Semantic web technology aims to overcome this problem in the domain of online information systems.In this paper we explained why mobile AR, with its potentially large number of clients and location-based service providers, has essentially the same requirements as document-oriented semantic web applications, but in the domain of real-time 3D information. We derive a data model which allows a suitable degree of semantic reasoning for mobile AR, and describe how it can be used in practical examples. While we already have many tools in place for the implementation of such a model through our own work and
Fig. 10: XSLT is used as the general translation mechanism that interfaces the individual parts of the semantic reasoning system for AR. It can convert between geometric information (GML),
semantic information (RDF) and graphical data for visualization, such as the scene graph standard Open Inventor.
The World as a User Interface: Augmented Reality for Ubiquitous Computing 261
the resources available in the GIS and semantic web communities, the verification of the approach with real world scenarios will be the subject of future work.
7 Acknowledgements This work was sponsored by the Austrian Science Fund FWF (contract Y193). Thanks to Joseph Newman and Erick Mendez for proofreading and for useful suggestions.
8 References[Azu97] AzumA R. T.: A SuRvey of AugmenTed ReAliTy. Presence Teleoperators and Virtual Environments 6, 4 (AuguST 1997), pp. 355–385.[CmJ04] Coelho e. m., mACinTyRe B., JulieR S. J.: Osgar: A scene graph with uncertain transformations. In Proc. ISMAR 2004 (Arlington, VA,
USA, November 2–5 2004), IEEE.[fAd02] fuRmAnSki C., AzumA R., dAily m.: Augmented-reality visualizations guided by cognition: Perceptual heuristics for combining visible
and obscured information. In Proc. ISMAR 2002 (Darmstadt, Germany, September 30 – October 1 2002), IEEE and ACM, pp. 215–224.[fmh*97] feineR S., mACinTyRe B., hölleReR T., WeBSTeR A.: A touring machine: Prototyping 3D mobile augmented reality systems for exploring
the urban enviroment. In Proc. ISWC’97 (Cambridge, MA, USA, October 13–14 1997), pp. 74–81.[fmS93] feineR S., mACinTyRe B., SeligmAnn d.: Knowledge-based augmented reality. Communications of the ACM 36, 7 (July 1993), pp.
53–62.[hoR98] hoRRoCkS i. Using an expressive description logic: FaCT or fiction? In Proc. Principles of Knowledge Representation and Reasoning
KR’98 (San Francisco, CA, USA, June 1998), pp. 636-647.[hfh*01] hölleReR T., feineR S., hAllAWAy d., Bell B., lAnzAgoRTA m., BRoWn d., JulieR S., BAilloT y., RoSenBlum l.: User interface manage-
ment techniques for collaborative mobile augmented reality. Computer & Graphics 25, 25 (2001), pp. 799–810.[HHF*04] hAllAWAy d., hölleReR T., feineR S., Bridging the gaps: Hybrid tracking for adaptive mobile augmented reality. In: Applied ARTifiCiAl
inTelligenCe, SpeCiAl ediTion on ARTifiCiAl inTelligenCe in moBile SySTemS, 25, 5 (July 2004).[hm03] hAARSlev v., mölleR R., Racer: A core inference engine for the semantic web. In York Sure and Óscar Corcho, editors, Proc. EON2003,
(Sanibel Island, FL, USA, October 20 2003). [hph03] hoRRoCkS i., pATel-SChneideR p.f., vAn hARmelen f. From SHIQ and RDF to OWL: The making of a web ontology language. Journal of
Web Semantics 1, 1 (2003), pp. 7-26.[JlB*00] JulieR S., lAnzAgoRTA m., BAilloT y., RoSenBlum l.,feineR S., hölleReR T.: Information filtering for mobile augmented reality. In Proc.
ISAR 2000 (Munich, Germany, October 5–6 2000), IEEE and ACM, pp. 3–11.[kg03] kolBe T. h., gRögeR g.: Towards unified 3d city models. In Proc. of the ISPRS Comm. IV Joint Workshop on Challenges in Geospatial
Analysis, Integration and Visualization II (Stuttgart, Germany, 2003).[lT04] leykin A., TuCeRyAn m.: Automatic determination of text readability over textured backgrounds for augmented reality systems. In Proc.
ISMAR 2004 (Arlington, VA, USA, November 2–5 2004), IEEE.[mm03] mAnolA f., milleR e. Rdf Primer. W3C, http://www.w3c.org/TR/rdf-primer/, visited May 3 2003.[nWB*04] neWmAn J., WAgneR m., BAueR m., mACWilliAmS A., pinTARiC T., BeyeR d., puSTkA d., STRASSeR f., SChmAlSTieg d., klinkeR g.:
Ubiquitous tracking for augmented reality. In Proc. ISMAR 2004 (Arlington, VA, USA, November 2–5 2004), IEEE.[PAT*04] piekARSki W., AveRy B., ThomAS B. h., And mAlBezin p., Integrated Head and Hand Tracking for Indoor and Outdoor Augmented Reality
in Proc. IEEE Virtual Reality Conference, (Chicago, IL, USA, March 2004), pp. 11-276.[RCk*05] ReiTmAyR g., Chiu C., kuSTeRnig A., kuSTeRnig m., WiTzmAnn h.: iOrb - unifying command and 3d input for mobile augmented reality.
In Proc. IEEE VR Workshop on New Directions in 3D User Interfaces (Bonn, Germany, March 12 2005), IEEE, pp. 7–10.[RS01] ReiTmAyR g., SChmAlSTieg d.: openTRACkeR – An open SofTWARe ARChiTeCTuRe foR ReConfiguRABle TRACking BASed on Xml. in Proc. IEEE
Virtual Reality 2001 (yokohAmA, JApAn, mARCh 13–17 2001), pp. 285–286.[RS03] ReiTmAyR g., SChmAlSTieg d.: Location based applications for mobile augmented reality. In Proc. AUIC 2003 (Adelaide, Australia, Febru-
ary 4 – 7 2003), Biddle R., Thomas B., (Eds.), vol. 25 (3) of Australian Computer Science Communications, ACS, pp. 65–73.[RS04] ReiTmAyR g., SChmAlSTieg d.: Collaborative augmented reality for outdoor navigation and information browsing. In Proc. Symposium
Location Based Services and TeleCartography – Geowissenschaftliche Mitteilungen (Vienna, Austria, January 28–29 2004), vol. 66, Wiley, pp. 53–62.
[Sfh*02] SChmAlSTieg d., fuhRmAnn A., heSinA g., SzAlAvARi z., enCARnACAo l. m., geRvAuTz m., puRgAThofeR W.: The Studierstube augmented reality project. PRESENCE – Teleoperators and Virtual Environments 11, 1 (2002), pp. 32-54.
[TDP*98] BRuCe h. ThomAS, v.demCzuk, WAyne piekARSki, dAvid hepWoRTh, And BeRnARd gunTheR. A wearable computer system with augment-ed reality to support terrestrial navigation. In Proc. ISWC’98, (Pittsburgh, USA, October 19–20 1998), IEEE and ACM, pp. 168–171.
[VZ03] de vRieS m., zlATAnovA S., Interoperability on the Web: The Case of 3D Geo-Data. In Proc. IADIS International Conference e-Society 2004 (Avila, Spain, July 16-19), pp. 667-674.
[WS03] WAgneR d., SChmAlSTieg d.: First Steps Towards Handheld Augmented Reality. Proc. 7th International Conference on Wearable Comput-ers, (White Plains, NY, USA, October 21-23, 2003), pp. 127-135.

Applications of the mobile positioning data in space-time behaviour studies: Experiments in Estonia
Rein Ahas, Anto Aasa, Ülar Mark
1 IntroductionThe objective of the paper is to introduce the potential of the mobile phone positioning data in geography and planning. Mobile phones are widespread and their positioning has achieved such accuracy that it can be used for social and geographical research (Mountain and Raper 2001; Spinney 2003; Raubal et al 2004). The social positioning method (SPM) applies the phone location coordinates and social attributes of the phone carrier for studying the space-time behaviour of society (Ahas and Mark 2005; Ahas 2005; Ahas et al 2004). SPM differs from earlier mobile phone based tracking experiments in the sense that it includes the social attributes and other relevant information of phone owners actively in the analysis. The acquired data allows the analysis of social flows, their mobility and space-time behaviour (Timmermanns et al 2002). The key issue in using the social positioning method is guaranteeing the privacy of people, and data security (Froomkin 2000). As in any geographical survey, the people’s consent is necessary for tracking and using the acquired data.
2 SPM data collectionMovements of sample of 117 individuals were recorded by positioning their personal mobile phones in February 2004. The size of the sample and the number of positioning events was limited by the budget allocated for the experiment. The sample is based on data of the gender and age groups distribution of Tallinn’s population, based in turn on the data of the National Population Census in 2000. The experimental sample was proportionally divided into two groups: a) 91 residents of the central part of the city; b) 26 commuters eg. persons who are working every day within the city centre but living outside of Tallinn. To balance the sample the quotas of commuters were divided equally between he main commuting routes of the Tallinn region. Collection and database options of the social positioning data were conducted by the Estonian company Positium Ltd, which is currently developing SPM applications. Locations of the selected phones were registered after every 30 minutes between 7 am and 11pm during the period of 18-22 February 2004. During 5 days the motion of 117 participants was observed and altogether more than 14 000 location coordinates were registered. The location coordinates were gathered by MPS, PinPoint Mgine determined the sector of possible locations of every particular mobile phone, and the actual location of the mobile phone was calculated as the geometrical centre of this positioning sector. In addition to the mobile positioning data each individual completed a personal questionnaire registering data about their social characteristics and travel behaviour. For the positioning of the individuals, two preconditions were required: the personal consent of each participant and the required technical capability on the part of the mobile operator. In the current study the network of EMT, Estonia’s biggest operator, was used. EMT has technical and organisational capabilities for location-based services. During the ex-periment period EMT was using the MPS system of ERICSSON Ltd for mobile positioning., enhanced by PinPoint Mgine software produced by the Estonian company ReachU Ltd. PinPoint software was also used for database options during the experiment. One limiting factor of social positioning is accuracy of positioning data. Our experiments in Tallinn and Tartu conducted in 2004 revealed that SPM data allows successfully analysing the spatio-temporal behaviour of the society. The calculations of theoretical positioning error based on 180 000 positioning cases showed that the accuracy of 61 per cent of positioning remains within 1000 metres in urban areas and within 3000 metres for 53 per cent of positioning cases in rural areas in Estonia. Accuracy check con-ducted with the GPS indicated that the error is less than 1200 metres in 99 per cent of cases in urban areas. Today, some research findings are limited because of accuracy of positioning but many research areas are very promising.
2.1 Selecting time interval for mobile positioningImportant issue in SPM studies is the selection of the optimal positioning interval. Interval is dependent on research objectives and scale, transportation devices used by respondents, and available finances. We have used intervals of 4 h, 30 min, 5 min, and 1 min in experiments with different objectives. All normal end-users want to get positioning data with as short an interval as possible, but the interval is actually dependent on positioning costs. As mobile positioning is part of the services of mobile operators, the market price today is between 0,03-0,6 EUR per positioning event in networks of the Baltic Sea region. The costs of positioning
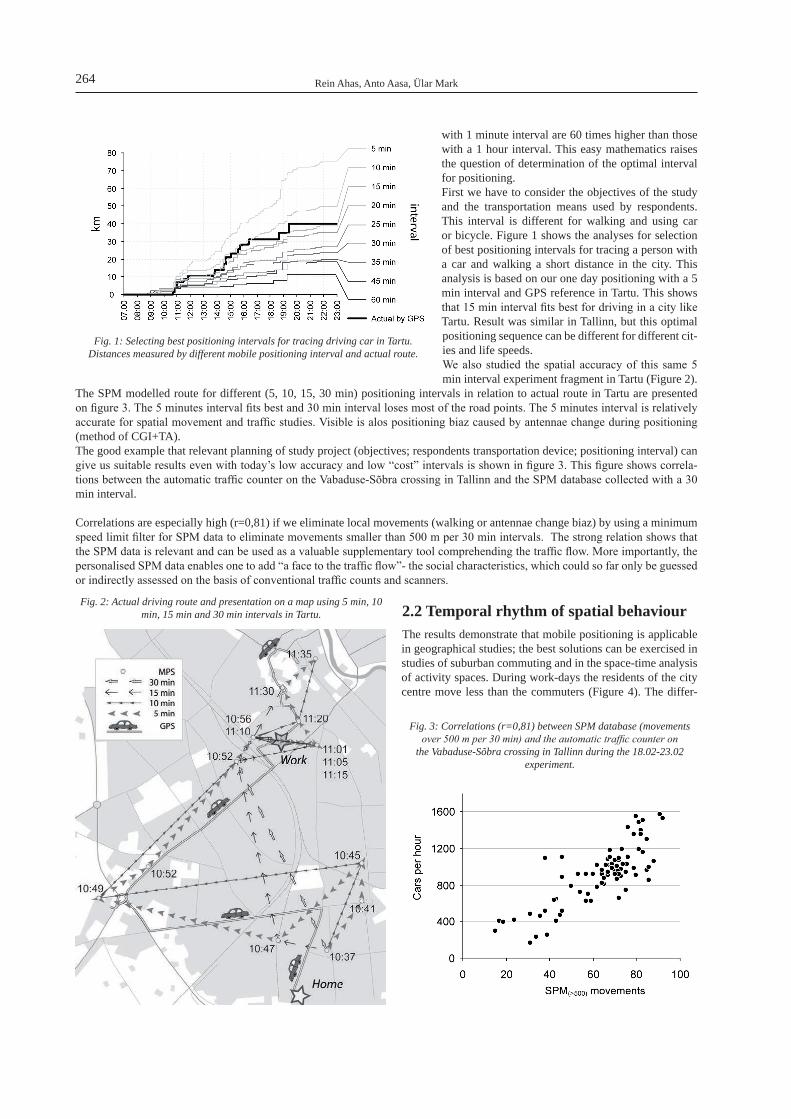
Rein Ahas, Anto Aasa, Ülar Mark264
with 1 minute interval are 60 times higher than those with a 1 hour interval. This easy mathematics raises the question of determination of the optimal interval for positioning.First we have to consider the objectives of the study and the transportation means used by respondents. This interval is different for walking and using car or bicycle. Figure 1 shows the analyses for selection of best positioning intervals for tracing a person with a car and walking a short distance in the city. This analysis is based on our one day positioning with a 5 min interval and GPS reference in Tartu. This shows that 15 min interval fits best for driving in a city like Tartu. Result was similar in Tallinn, but this optimal positioning sequence can be different for different cit-ies and life speeds.We also studied the spatial accuracy of this same 5 min interval experiment fragment in Tartu (Figure 2).
The SPM modelled route for different (5, 10, 15, 30 min) positioning intervals in relation to actual route in Tartu are presented on figure 3. The 5 minutes interval fits best and 30 min interval loses most of the road points. The 5 minutes interval is relatively accurate for spatial movement and traffic studies. Visible is alos positioning biaz caused by antennae change during positioning (method of CGI+TA).The good example that relevant planning of study project (objectives; respondents transportation device; positioning interval) can give us suitable results even with today’s low accuracy and low “cost” intervals is shown in figure 3. This figure shows correla-tions between the automatic traffic counter on the Vabaduse-Sõbra crossing in Tallinn and the SPM database collected with a 30 min interval.
Correlations are especially high (r=0,81) if we eliminate local movements (walking or antennae change biaz) by using a minimum speed limit filter for SPM data to eliminate movements smaller than 500 m per 30 min intervals. The strong relation shows that the SPM data is relevant and can be used as a valuable supplementary tool comprehending the traffic flow. More importantly, the personalised SPM data enables one to add “a face to the traffic flow”- the social characteristics, which could so far only be guessed or indirectly assessed on the basis of conventional traffic counts and scanners.
2.2 Temporal rhythm of spatial behaviour The results demonstrate that mobile positioning is applicable in geographical studies; the best solutions can be exercised in studies of suburban commuting and in the space-time analysis of activity spaces. During work-days the residents of the city centre move less than the commuters (Figure 4). The differ-
Fig. 1: Selecting best positioning intervals for tracing driving car in Tartu. Distances measured by different mobile positioning interval and actual route.
Fig. 2: Actual driving route and presentation on a map using 5 min, 10 min, 15 min and 30 min intervals in Tartu.
Fig. 3: Correlations (r=0,81) between SPM database (movements over 500 m per 30 min) and the automatic traffic counter on
the Vabaduse-Sõbra crossing in Tallinn during the 18.02-23.02 experiment.
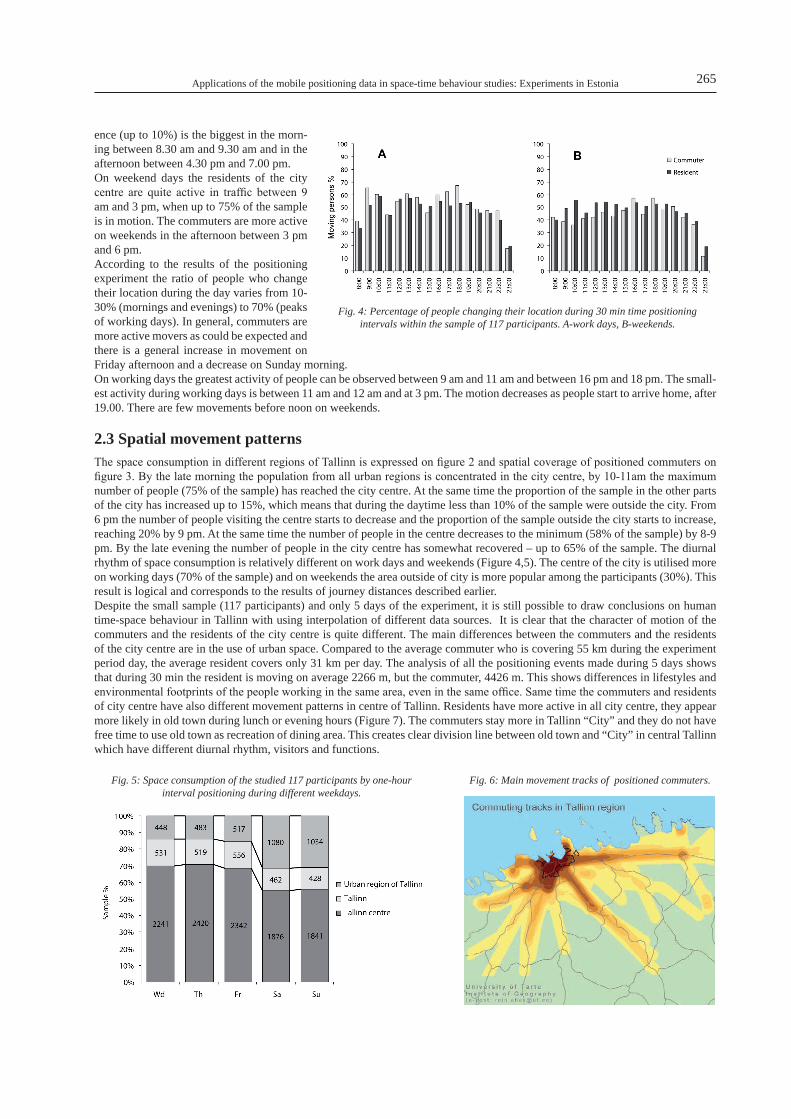
Applications of the mobile positioning data in space-time behaviour studies: Experiments in Estonia 265
ence (up to 10%) is the biggest in the morn-ing between 8.30 am and 9.30 am and in the afternoon between 4.30 pm and 7.00 pm. On weekend days the residents of the city centre are quite active in traffic between 9 am and 3 pm, when up to 75% of the sample is in motion. The commuters are more active on weekends in the afternoon between 3 pm and 6 pm. According to the results of the positioning experiment the ratio of people who change their location during the day varies from 10-30% (mornings and evenings) to 70% (peaks of working days). In general, commuters are more active movers as could be expected and there is a general increase in movement on Friday afternoon and a decrease on Sunday morning. On working days the greatest activity of people can be observed between 9 am and 11 am and between 16 pm and 18 pm. The small-est activity during working days is between 11 am and 12 am and at 3 pm. The motion decreases as people start to arrive home, after 19.00. There are few movements before noon on weekends.
2.3 Spatial movement patternsThe space consumption in different regions of Tallinn is expressed on figure 2 and spatial coverage of positioned commuters on figure 3. By the late morning the population from all urban regions is concentrated in the city centre, by 10-11am the maximum number of people (75% of the sample) has reached the city centre. At the same time the proportion of the sample in the other parts of the city has increased up to 15%, which means that during the daytime less than 10% of the sample were outside the city. From 6 pm the number of people visiting the centre starts to decrease and the proportion of the sample outside the city starts to increase, reaching 20% by 9 pm. At the same time the number of people in the centre decreases to the minimum (58% of the sample) by 8-9 pm. By the late evening the number of people in the city centre has somewhat recovered – up to 65% of the sample. The diurnal rhythm of space consumption is relatively different on work days and weekends (Figure 4,5). The centre of the city is utilised more on working days (70% of the sample) and on weekends the area outside of city is more popular among the participants (30%). This result is logical and corresponds to the results of journey distances described earlier.Despite the small sample (117 participants) and only 5 days of the experiment, it is still possible to draw conclusions on human time-space behaviour in Tallinn with using interpolation of different data sources. It is clear that the character of motion of the commuters and the residents of the city centre is quite different. The main differences between the commuters and the residents of the city centre are in the use of urban space. Compared to the average commuter who is covering 55 km during the experiment period day, the average resident covers only 31 km per day. The analysis of all the positioning events made during 5 days shows that during 30 min the resident is moving on average 2266 m, but the commuter, 4426 m. This shows differences in lifestyles and environmental footprints of the people working in the same area, even in the same office. Same time the commuters and residents of city centre have also different movement patterns in centre of Tallinn. Residents have more active in all city centre, they appear more likely in old town during lunch or evening hours (Figure 7). The commuters stay more in Tallinn “City” and they do not have free time to use old town as recreation of dining area. This creates clear division line between old town and “City” in central Tallinn which have different diurnal rhythm, visitors and functions.
Fig. 4: Percentage of people changing their location during 30 min time positioning intervals within the sample of 117 participants. A-work days, B-weekends.
Fig. 5: Space consumption of the studied 117 participants by one-hour interval positioning during different weekdays.
Fig. 6: Main movement tracks of positioned commuters.
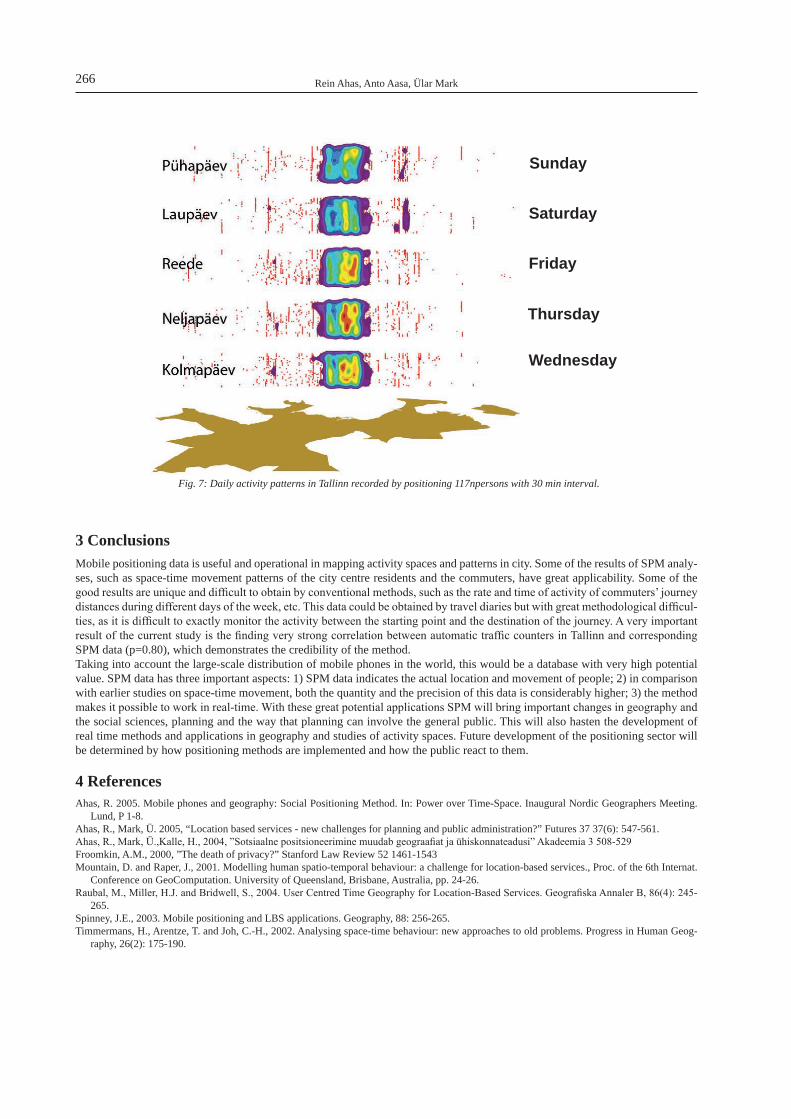
Rein Ahas, Anto Aasa, Ülar Mark266
3 ConclusionsMobile positioning data is useful and operational in mapping activity spaces and patterns in city. Some of the results of SPM analy-ses, such as space-time movement patterns of the city centre residents and the commuters, have great applicability. Some of the good results are unique and difficult to obtain by conventional methods, such as the rate and time of activity of commuters’ journey distances during different days of the week, etc. This data could be obtained by travel diaries but with great methodological difficul-ties, as it is difficult to exactly monitor the activity between the starting point and the destination of the journey. A very important result of the current study is the finding very strong correlation between automatic traffic counters in Tallinn and corresponding SPM data (p=0.80), which demonstrates the credibility of the method. Taking into account the large-scale distribution of mobile phones in the world, this would be a database with very high potential value. SPM data has three important aspects: 1) SPM data indicates the actual location and movement of people; 2) in comparison with earlier studies on space-time movement, both the quantity and the precision of this data is considerably higher; 3) the method makes it possible to work in real-time. With these great potential applications SPM will bring important changes in geography and the social sciences, planning and the way that planning can involve the general public. This will also hasten the development of real time methods and applications in geography and studies of activity spaces. Future development of the positioning sector will be determined by how positioning methods are implemented and how the public react to them.
4 ReferencesAhas, R. 2005. Mobile phones and geography: Social Positioning Method. In: Power over Time-Space. Inaugural Nordic Geographers Meeting.
Lund, P 1-8.Ahas, R., Mark, Ü. 2005, “Location based services - new challenges for planning and public administration?” Futures 37 37(6): 547-561.Ahas, R., Mark, Ü.,Kalle, H., 2004, ”Sotsiaalne positsioneerimine muudab geograafiat ja ühiskonnateadusi” Akadeemia 3 508-529Froomkin, A.M., 2000, ”The death of privacy?” Stanford Law Review 52 1461-1543Mountain, D. and Raper, J., 2001. Modelling human spatio-temporal behaviour: a challenge for location-based services., Proc. of the 6th Internat.
Conference on GeoComputation. University of Queensland, Brisbane, Australia, pp. 24-26.Raubal, M., Miller, H.J. and Bridwell, S., 2004. User Centred Time Geography for Location-Based Services. Geografiska Annaler B, 86(4): 245-
265.Spinney, J.E., 2003. Mobile positioning and LBS applications. Geography, 88: 256-265.Timmermans, H., Arentze, T. and Joh, C.-H., 2002. Analysing space-time behaviour: new approaches to old problems. Progress in Human Geog-
raphy, 26(2): 175-190.
Fig. 7: Daily activity patterns in Tallinn recorded by positioning 117npersons with 30 min interval.
Wednesday
Thursday
Friday
Saturday
Sunday

Suggestion for the bridging of the time gap
Brankica Malić
Abstract The characteristics of the map - its exactness, its content completeness and the aesthetic design of the map - should be maintained regardless of the scale. These requirements have not yet been entirely fulfilled due to the use of digital technique in the production and the design of maps. In order to come up to the expectations there is the necessity to develop more efficient computers as well as screens with the smallest pixel size possible. However, one needs to find a mid-term solution for small screens, i. e. a consistent and suitable representation, under the present circumstances until the technology has evolved. Therefore it is indispensable to do research concerning the use of the rule based systems within LBS (Location Based Services). In this way the advantages of the digital map will be superior to the conventional map.
1 The present situationCartography has been and will always be transitional. There will always be new challenges in the technological development which cartography has to face.Unfortunately, with the use of digital technology in the production of maps the content as well as the graphic and technical quality of the printed map on screens can not be preserved.Due to the screen type, the screen size and the screen resolution the numerous parameters which have been developed for the con-ventional map for map representation have been altered, for instance, the minimal dimensions (Malić 1998). However, dynamic updates, i. e. the change of the properties of the cartographic objects presented on the digital map, provide a straight-forward communication between the person and the computer.
2 The issue - TeleCartography or mobile cartographyApart from digital technology the Internet as well as modern telecommunications devices have influenced cartography (Reichen-bacher et al. 2002). By connecting computer networks with mobile computer the Internet offers a new art of map distribution and use (Gartner et al. 2003, Pammer et al. 2002). A continual positioning of mobile phones and other services of operators provide a platform for navigation and efficient usage for pedestrians and tourists with mobile city guides or national park guides as well as for car navigation systems (Retscher 2002).With location based services the method of naming is still heterogeneous, i.e. the way of visualization and the way of positioning. At present there are several co-existing equivalent systems, some have been realized as prototypes.
2.1 The name of the method Maps and map services are offered by Geo Services, which also provide positioning services, booking services, information ser-vices, settlement services, etc. Maps are indispensable for mobile services (Reichenbacher et al. 2003a). The various applications result in different names. Thus the label TeleCartography (Map based LBS) is used to put emphasis on the connection of computer networks, small computers and telephones (Pammer et al. 2002, Uhlirz 2002). The prefix „tele“ is applied in other fields such as, for instance, tele-academy, teleservices, telemedicine, etc. Mobile geoinformation services are further terms for the so-called Location Based Services (LBS) (Buziek 2002, Reichenbacher et al. 2002). The term mobile cartography aims at directing cartographic products to cartographic services. Here the focus is on the adaptation of mobile cartography, that is the dynamic adaptation of the mobile using situation (Reichenbacher et al. 2003a), rather than on the mobility of the (digital) map.
2.2 The procedure of visualization When modeling the visualization shapes which are used with maps their scale and aspects of perception on (small) screens are taken into consideration (Kelnhofer 2002, Uhlirz 2002). Under such conditions conventional map presentation for devices with small screen and for LBS is only suitable to some extent. For the screen resolution of 280 x 320 pixels a simplified graphic is required (Buziek 2002, Brunner et al. 2002).
Brankica Malić268
Mobile computers such as pocket computers (handheld-PCs), mobile phones, smart- and feature phones (Gartner et al. 2003) with small screens of 80 x 60 mm2 only allow for an enlarged and mostly simplified map graphic. Such a map graphic could consist of pictograms and cartograms using up only minimal space. For the representation of railway networks such as, for example, the local traffic, the train system and international flights, cartograms are used. Cartograms are simplified and schematic cartographic representation methods. At the same time they do not coincide with the scale although they are topologically correct. Lettering the map on the small screens can only be legible entirely by scrolling (Brunner 2002a and 2002b, Hake et al. 1994 and 2002, Meng 2002b). As the mobile map mainly serves navigation, the representation of traffic routes and landmarks are important. Here various orientation marks represent the landmarks (Elias et al. 2003, Zipf 2003). An other suggestion for visualization is adaptive zooming. By altering the scale the content and the symbol selection of the map are adapted to the target scale (Galanda et al. 2003). The adaptation of mobile cartography, i.e. the implementation of the adaptive functions, is an advantage compared to web maps (Reichenbacher et al. 2002). The focus seems to be shifted from cartographic products to cartographic services (Dransch 2000, Reichenbacher et al. 2003a). There is the need to do research on the system, which is transparent for the mobile interaction between the user and device (person-to-machine) (Meng 2002a). The project GiMoDig (Geospatial info-mobility service by real-time data integration and generalisation) has investigated and found online solutions for the availability of official geodata; there are supposed to be geodata for PDAs in the vector format. These geodata have been produced with the scales 1:5000 to 1:10000 throughout Germany and also in the borderlands of Denmark, Finland and Sweden. Seventeen out of approximately 180 feature types were represented with support of national institutions. Ev-erything is based on the FACC-Code (Feature Attribute Coding Catalogue), which has been developed as a military norm of NATO - DIGEST (Digital Geographic Information Exchange Standard) (Afflerbach 2004).In Frech et al. (2004) an offline solution with raster data is presented as a base for the map. The ReGeo-Project has assumed maps of three different scales 1:500 000, 1:100 000, 1:50 000. Furthermore satellite images as well as aerial images are in use (resolution of 30 m and 1,5 m). Rappo et al. (2004) report on the application of logarithmic projection (anamorphous) that is the fish-eye view. Herman et al. (2003) consider the ergonomic design in accordance with the ISO-standard 9241-10 and 14915-1.
2.3 The procedure of positioningPositioning is possible if a mobile computer is connected to a location system. GPS (Global Positioning System) could be em-ployed. Another method of positioning is carried out by identification of „Cell-ID“ (mobile network cell). The time is measured between the sending of the signal until detected by the receiving station (Burghardt et al. 2003, Gartner et al. 2003). Besides the po-sitioning of a mobile device is done via GPRS (General Pocket Radio Services) and UMTS (Universal Mobile Telecommunications System). An orientation procedure is supported by an electronic compass, which is installed in the mobile device (Lopau 2003).
3 The use of rule-based systemsAs mentioned in the abstract there is the need to do research on the application of rule-based systems within LBS-systems. By the application of GPS-, GPRS- and UMTS-technology the location is determined. Then the location is shown on the screen, it is put in the centre, etc. The application of rule-based systems should make it possible that the features of the digital map become sensitive. For each object the characteristic properties as well as the typical rules should be stored. After the initial information has been stored by means of client software dialogue, e.g. the client wants to visit galleries only in the closer surroundings, only these objects should be visu-alized. At the same time the selected object is supposed to recognize itself which galleries are closer to the location of the client. Such reactions of objects are controlled by programmed rules. The closer the object the more saturated the hue should be and the signature scale should be bigger. The focusing of the single selected items is the task of visualization. The entire digital map should become sensitive to the needs suggested by the client. The dynamic properties of the digital map are to be stressed. Several dynamic properties have already been mentioned here such as the changing of the scale around the location, the so-called fish-eye view.
4 ConclusionsReichenbacher et al. (2003b) discuss research issues of mobile cartography: How can effectiveness and mobility be combined best? Which expectations does the mobile user have for the map use (quality, functions, modalities of interaction, etc.)? Which function of the map is necessary for the mobile devices? How should the user interact with the map (clicking, speaking, pointing, etc.)? What are alternative representations apart from the map? How can perspective presentations and 3D-representations be used in mobile cartography? Are entirely abstract representations more suitable than (photo)realistic representations or pictures? When is what kind of option more appropriate?There is also the need to do research in the field of design and representation of cartograms as well as cartographical symbols on the screen.
5 ReferencesAfflerbach, S. (2004): Von Frankfurt nach Helsinki in einem einheitlichen Datenmodell, KN, 5, 2004, p. 199-207Brunner, K. (2002a): Topogramme für kleinformatige Displays mobiler Endgeräte, KN, 3, 2002, p. 103-106

Suggestion for the bridging of the time gap 269
Brunner, K. (2002b): Schlechte Karten – Zur Problematik kartographischer Visualisierung auf kleinformatigen Displays mobiler Endgeräte, Geo-BIT, 10, 2002, p.20-22
Brunner, K., Neudeck, S. (2002): Grafische und kartografische Aspekte der Bildanzeige, http://www.ikr.tuwien.ac.at/symposium2002/inhalt.htmlBurghardt, D., Edwardes, A., Weibel, R. (2003): WebPark – Entwicklung eines mobilen Informationssystems für Erholungs- und Naturschutzge-
biete, KN, 2, 2003, p. 58-64Buziek, G. (2002): Geoinformationen im mobilen Internet – Aspekte der Kommunikation und Wahrnehmung, http://www.ikr.tuwien.ac.at/sympo-
sium2002/inhalt.htmlDransch, D. (2000): Anforderungen an die Mensch-Computer-Interaktion in interaktiven kartographischen Visualisierungs- und Informationssyste-
men, KN, 5, 2000, p. 197-203Elias, B., Sester, M. (2003): Landmarken für Wegbeschreibungen – Identifikation, Extraktion und Visualisierung, KN, 2, 2003, p. 51-57Frech, I., Koch, B., Mosch, M., Sauter, S., Schill, Ch. (2004): Nutzung georeferenzierter Daten in multimedialen Besucherinformationssystemen
– Aspekte des ReGeo-Projekts, KN, 1, 2004, p. 10-14Galanda, M., Cecconi, A. (2003): Adaptives Zoomen in der Internetkartographie, KN, 1, 2003, p. 11-16Gartner, G., Uhlriz, S., Pammer, A., Radoczky, V. (2003): Kartographische Beiträge zur Entwicklung von LBS, KN, 1, 2003, p. 16-22Hake, G., Grünreich, D. (1994): Kartographie, 7. Auflage, Walter de Gruyter, Berlin, New YorkHake, G., Grünreich, D., Meng, L. (2002): Kartographie, Visualisierung raum-zeitlicher Informationen, 8. Auflage, Walter de Gruyter, Berlin, New
YorkKelnhofer, F. (2002): Kartographie und Tele-Kommunikation, http://ikr.tuwien.ac.at/symposium2002/inhalt.html Lopau, W. (2003): Die räumliche Orientierung von mobilen Displaygeräten, KN, 2, 2003, p. 64-67Malić, B. (1998): Physiologische und technische Aspekte kartographischer Bildschirm-Visualisierung, Doktorarbeit, Diss. Schrift der Univ. Bonn,
SIKB Heft 25Meng, L. (2002a): Zur selbsterklärenden multimedialen Präsentation für mobile Benutzer, http://www.ikr.tuwien.ac.at/symposium2002/inhalt.
htmlMeng, L. (2002b): Zur Entwicklung und Nutzung von Geodiensten, In: Am Puls von Raum und Zeit. 50 Jahre Deutche Geodätishe Kommision bei
der Bayerischen Akademie der Wissenschaften. München, Deutsche Geodätishe Kommision, 2002, p. 80-87Nexus: Umgebungsmodelle für mobile kontextbezogene Systeme, http://www.nexus.uni-stuttgart.de/de/forschung/dokumente/docs-teilprojekte/
poster-teilprojekt-c4.pdfPammer, A., Gartner, G. (2002): „Mobile Internet“ als Voraussetzung für die Telekartographie, http://www.ikr.tuwien.ac.at/symposium2002/inhalt.
htmlRappo, A., Cecconi, A., Burghardt, D. (2004): Fischaugenprojektionen für generalisierte Kartendarstellungen auf kleinen Bildschirmen, KN, 2,
2004, p. 73-79Reichenbacher, T., Angsüsser, S., Meng, L. (2002): Mobile Kartographie- eine offene Diskussion, KN, 4, 2002, p. 164-166Reichenbacher, T., Meng, L. (2003a): Mobile Kartographie – ein Annäherungsversuch an ein neues Forschungsthema; KN, 1, 2003, p. 4-6Reichenbacher, T., Meng, L. (2003b): Forschungsfragen der mobilen Kartographie, KN, 2, 2003, p. 67-70Retscher, G. (2002): Diskussion der Leistungsmerkmale von Systemen zur Positionsbestimmung mit Mobiltelefonen als Basis für Location Based
Services (LBS), http://www.ikr.tuwien.ac.at/symposium2002/inhalt.htmlUhlirz, S. (2002): Telekartographie und Location Based Services – Neue Märkte und Chancen für die Kartographie?, GeoBIT 4/2000, p. 40Zipf, A. (2003): Forschungsfragen zur benutzer- und kontextangepassten Kartengenerierung für mobile Systeme, KN, 1, 2003, p. 6-11
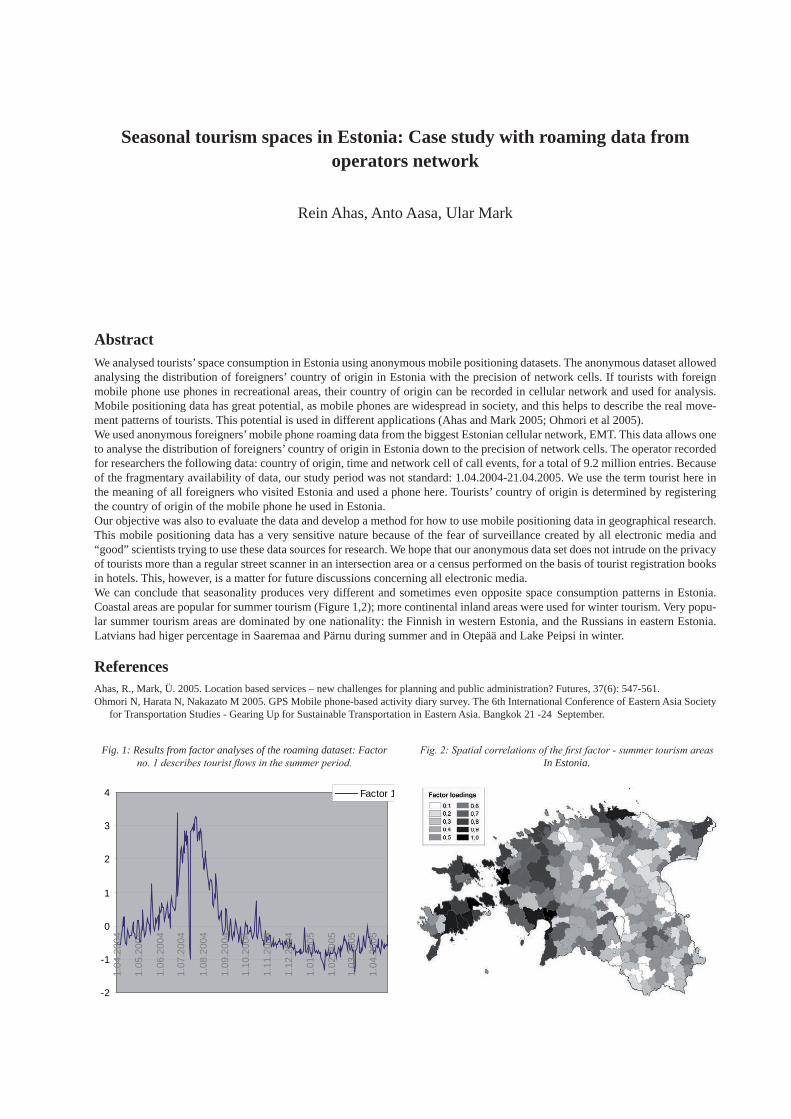
Seasonal tourism spaces in Estonia: Case study with roaming data from operators network
Rein Ahas, Anto Aasa, Ular Mark
AbstractWe analysed tourists’ space consumption in Estonia using anonymous mobile positioning datasets. The anonymous dataset allowed analysing the distribution of foreigners’ country of origin in Estonia with the precision of network cells. If tourists with foreign mobile phone use phones in recreational areas, their country of origin can be recorded in cellular network and used for analysis. Mobile positioning data has great potential, as mobile phones are widespread in society, and this helps to describe the real move-ment patterns of tourists. This potential is used in different applications (Ahas and Mark 2005; Ohmori et al 2005). We used anonymous foreigners’ mobile phone roaming data from the biggest Estonian cellular network, EMT. This data allows one to analyse the distribution of foreigners’ country of origin in Estonia down to the precision of network cells. The operator recorded for researchers the following data: country of origin, time and network cell of call events, for a total of 9.2 million entries. Because of the fragmentary availability of data, our study period was not standard: 1.04.2004-21.04.2005. We use the term tourist here in the meaning of all foreigners who visited Estonia and used a phone here. Tourists’ country of origin is determined by registering the country of origin of the mobile phone he used in Estonia.Our objective was also to evaluate the data and develop a method for how to use mobile positioning data in geographical research. This mobile positioning data has a very sensitive nature because of the fear of surveillance created by all electronic media and “good” scientists trying to use these data sources for research. We hope that our anonymous data set does not intrude on the privacy of tourists more than a regular street scanner in an intersection area or a census performed on the basis of tourist registration books in hotels. This, however, is a matter for future discussions concerning all electronic media.We can conclude that seasonality produces very different and sometimes even opposite space consumption patterns in Estonia. Coastal areas are popular for summer tourism (Figure 1,2); more continental inland areas were used for winter tourism. Very popu-lar summer tourism areas are dominated by one nationality: the Finnish in western Estonia, and the Russians in eastern Estonia. Latvians had higer percentage in Saaremaa and Pärnu during summer and in Otepää and Lake Peipsi in winter.
ReferencesAhas, R., Mark, Ü. 2005. Location based services – new challenges for planning and public administration? Futures, 37(6): 547-561.Ohmori N, Harata N, Nakazato M 2005. GPS Mobile phone-based activity diary survey. The 6th International Conference of Eastern Asia Society
for Transportation Studies - Gearing Up for Sustainable Transportation in Eastern Asia. Bangkok 21 -24 September.
-2
-1
0
1
2
3
4
1.04
.200
4
1.05
.200
4
1.06
.200
4
1.07
.200
4
1.08
.200
4
1.09
.200
4
1.10
.200
4
1.11
.200
4
1.12
.200
4
1.01
.200
5
1.02
.200
5
1.03
.200
5
1.04
.200
5
Factor 1
Fig. 1: Results from factor analyses of the roaming dataset: Factor no. 1 describes tourist flows in the summer period.
Fig. 2: Spatial correlations of the first factor - summer tourism areas In Estonia.

List of first authorsAhas ReinUniversity of Tartu, Vanemuise 46, 51014 Tartu, [email protected]
Andrienko Natalia and GennadyGerman National Research Center for Information Technology, SET.KI – Research Division Artificial Intelligence, Schloss Birling-hoven, 53754 Sankt-Augustin, [email protected]
Arikawa MasatoshiUniversity of Tokyo, 5-1-5, Kashiwa-no-ha, 277-8568 Kasahiwa, [email protected]
Bennett David A.University of Iowa, 316 Jessup Hall, 52242 Iowa City, [email protected]
Cammack Rex G.Missouri State University, 901 S National Avenue, 65897 Springfield, [email protected]
Cartwright WilliamRMIT University, 124 La Trobe Str., 3001 Melbourne, [email protected]
Dillemuth JulieUniversity of California at Santa Barbara, 1608 A Castillo Street, 93101 Santa Barbara, [email protected]
Döllner JürgenHasso-Plattner-Institut, University of Potsdam, Prof.Dr.-Hehnstr-Str. 2-3, 14482 Potsdam, [email protected]
Eichhorn AndreasDepartment of Geodesy and Geophysics, Research Group Engineering Geodesy, Vienna University of Technology, Gußhausstr. 27-29, 1040 Vienna, [email protected]
Elias BirgitInstitute of Cartography and Geoinformation, University of Hannover, Appelstr.9a, 30167 Hannover, [email protected]
Francis KenNatural Resources Canada (NRC), 615 Booth Street, Ottawa, Ontario, Canada K1A [email protected]
Gartner GeorgDepartment of Geoinformation and Cartography, Research Group Cartography, Vienna University of Technology, Gußhaustr. 30, 1040 Vienna, [email protected]
Grum EvaDepartment of Geoinformation and Cartography, Research Group Geoinformation, Vienna University of Technology, Gußhaustr. 27-29, 1040 Vienna, [email protected]
Hessing ChristianGPS GmbH, Lochhamer Schlag 5a, 82166 Gräfelfing, [email protected]

List of first authors274
Jeong Chang-YubNational University of Seoul, 38 Dong 420 Ho, 151-744 Seoul, South [email protected]
Jiang BinUniversity of Gävle, Kungsbäcksvägen 47, 801 76 Gävle, [email protected]
Jobst MarkusDepartment of Geoinformation and Cartography, Research Group Cartography, Vienna University of Technology, Gußhausstr. 30, 1040 Vienna, [email protected]
Kang Byoung-JunNational University of Seoul, 38 Dong 329 Ho, 151-744 Seoul, South [email protected]
Kinberger MichaelaUniversity of Vienna, Universitätsstr.7, 1010 Vienna, [email protected]
Klaffenböck ElisabethFFG, Österreichische Forschungsförderungsgesellschaft, Canovag. 7, 1010 Vienna, [email protected]
Köbben BarendDepartment of Geo-Information Processing, International Institute for Geo-Information Sciences and Earth Observation, PO Box 6, 7500 AA Enschede, The [email protected]
Luley Patrick MorrisJoanneum Research Forschungsgesellschaft mbH, Wastiangasse 6, 8010 Graz, [email protected]
Malek Mohammad RezaUniversity of Tehran, Azadi Square Meraj Avenue, 13185 1684 Tehran, [email protected]
Malic BrankicaUniversity of Osijek, Drinska 16a, 31000 Osijek, [email protected]
Morita TakashiUniversity of Hosei, 3-1-2, Kajinocho, Koganei-shi, 184-8584 Tokyo, [email protected]
Navratil GerhardDepartment of Geoinformation and Cartography, Research Group Geoinformation, Vienna University of Technology, Gußhaustr. 27-29, 1040 Vienna, [email protected]
Pailer RudolfMobilkom Austria, Obere Donaustr. 29, 1020 Vienna, [email protected]
Peterson Michael P.University of Nebraska at Omaha, 6001 Dodge Street, 68182 Omaha, [email protected]
Radoczky VerenaDepartment of Geoinformation and Cartography, Research Group Cartography, Vienna University of Technology, Gußhaustr. 30, 1040 Vienna, [email protected]

List of first authors 275
Raper JonathanCity University of London, 10 Northampton Square, ECIV OHB London, United [email protected]
Ratti CarloSENSEable City Laboratory, MIT, 77, Massachusetts Avenue, 02139 Cambrigde, [email protected]
Rehrl KarlSalzburg Research, Jakob-Haringerstr. 5/III, 5020 Salzburg, [email protected]
Reichenbacher TumaschDepartment of Cartography, University of Technology Munich, Arcisstr. 21, 80333 Munich, [email protected]
Retscher GüntherDepartment of Geodesy and Geophysics, Research Group Engineering Geodesy, Vienna University of Technology, Gußhausstr. 27-29, A- 1040 Vienna, [email protected]
Richter Kai-FlorianTransregional Collaborative Research Center on Spatial Cognition, University of Bremen, P.O. Box 330 440, 28334 Bremen, [email protected]
Sarjakoski L. TiinaDepartment of Geoinformatics and Cartography, Finnish Geodetic Institute, P.O. Box 15, 02431 Masala, [email protected]
Schmalstieg DieterInstitute for Computergraphics and Vision, Graz University of Technology, Inffeldg.16, 8010 Graz, [email protected]
Seifert InessaTransregional Collaborative Research Center on Spatial Cognition, University of Bremen, P.O. Box 330 440, 28334 Bremen, [email protected]
Simon RainerFTW Telecommunications Research Center, Donau-City-Str. 1, 1220 Vienna, [email protected]
Thienelt MichaelDepartment of Geodesy and Geophysics, Research Group Engineering Geodesy, Vienna University of Technology, Gußhausstr. 27-29, 1040 Vienna, [email protected]
Uhlirz MarkusNokia Austria, Nokiaweg 1, 7000 Eisenstadt, [email protected]
Verbree Edward Department of Geodesy, Delft University of Technology, Jaffalaan 9, 2628 BX, The [email protected]
Volz SteffenInstitute of Photogrammetry, University of Stuttgart, Geschwister-Scholl-Str. 24, 70174 Stuttgart, [email protected]
Vukovic ZvonimirSiemens, Heinzlova, 10000 Zagreb, [email protected]

List of first authors276
Wiesenhofer SiegfriedArsenal Research , Giefingg. 2, 1210 Vienna, [email protected]
Wilmersdorf ErichMA 14 – ADV, Rathausstr. 1, 1082 Vienna, [email protected]
Weiser AlbrechtUniversity of Applied Sciences Mainz, Holzstr. 36, 55116 Mainz, [email protected]
Wood MichaelDepartment of Geography and Environment, University of Aberdeen, Elphinstone Road, Aberdeen AB24 3UF, United [email protected]
Zentai LászlóDepartment of Geography and Geoinformatics, Eötvös Loránd University, Pázmány Péter sétány 1/a, 1117 Budapest, [email protected]
Zipf AlexanderUniversity of Applied Sciences Mainz, Holzstr. 36, 55116 Mainz, [email protected]
Zlatanova SisiDepartment of Geodesy, Delft University of Technology, Jaffalaan 9, 2628 BX Delft, The [email protected]
GEOWISSENSCHAFTLICHE MITTEILUNGEN
Bisher erschienen:Heft 1 Kolloquium der Assistenten der Studienrichtung Vermessungswesen. 1970 - 1973, Dezember 1973.Heft 2 EGGER-PERDICH-PLACH-WAGENSOMMERER, Taschenrechner HP 45 und HP 65, Programme und Anwendungen im Vermessung-
swesen. 1. Auflage, März 1974, Special Edition in English, Juli 1974, 2. verbesserte Auflage, November 1974.Heft 3 Kolloquium der Assistenten der Studienrichtung Vermessungswesen 1973 - 1974, September 1974.Heft 4 EGGER-PALFINGER-PERDICH-PLACH-WAGENSOMMERER, Tektronix-Tischrechner TEK 31, Programmbibliothek für den Einsatz
im Vermessungswesen, November 1974.Heft 5 K.LEDERSTEGER, Die horizontale Isostasie und das isostatische Geoid, Februar 1975.Heft 6 F.REINHART, Katalog von FK4 Horrebow-Paaren für Breiten von +30 bis +60, Oktober 1975.Heft 7 Arbeiten aus dem Institut für Höhere Geodäsie, Wien, Dezember 1975.Heft 8 Veröffentlichungen des Instituts für Photogrammetrie zum XIII.Internationalen Kongreß für Photogrammetrie in Helsinki 1976,
Wien, Juli 1976.Heft 9 W.PILLEWIZER, Felsdarstellung aus Orthophotos, Wien, Juni 1976. Heft 10 PERDICH-PLACH-WAGENSOMMERER, Der Einsatz des programmierbaren Taschenrechners Texas Instruments SR-52 mit Drucker
PC100 in ingenieurgeodätischen Rechentechnik, Wien, Mai 1976.Heft 11 Kolloquium der Assistenten der Studienrichtung Vermessungswesen 1974 - 1976, November 1976.Heft 12 Kartographische Vorträge der Geodätischen Informationstage 1976, Wien, Mai 1977.Heft 13 Veröffentlichung des Instituts für Photogrammetrie anläßlich des 80. Geburtstages von Prof.Dr.h.c.K.Neumaier, Wien, Januar 1978.Heft 14 L.MOLNAR, Self Checking Analytical Relative Orientation and Strip Formation, Wien, Dezember 1978.Heft 15 Veröffentlichung des Instituts für Landesvermessung anläßlich des 80. Geburtstages von Prof.Dr.Alois Bavir, Wien, Januar 1979.Heft 16 Kolloquium der Assistenten der Studienrichtung Vermessungswesen 1976 - 1978, Wien, November 1979.Heft 17 E.VOZIKIS, Die photographische Differentialumbildung gekrümmter Flächen mit Beispielen aus der Architekturbildmessung, Wien, Dezember 1979.Heft 18 Veröffentlichung des Instituts für Allgemeine Geodäsie anläßlich des 75. Geburtstages von Prof.Dipl.Ing.Dr.F.Hauer, Die Höhe des Groß-
glockners, Wien, 1981.Heft 19 H.KAGER, Bündeltriangulation mit indirekt beobachteten Kreiszentren, Wien, April 1981.Heft 20 Kartrographische Vorträge der Geodätischen Informationstage 1980, Wien, Mai 1982.Heft 21 Veröffentlichung des Instituts für Kartographie anläßlich des 70. Geburtstages von Prof.Dr.Wolfgang Pillewizer: Glaziologie und Kartog-
raphie, Wien, Dezember 1982.Heft 22 K.TEMPFLI, Genauigkeitsschätzung digitaler Höhenmodelle mittels Spektralanalyse, Wien, Mai 1982.Heft 23 E.CSAPLOVICS, Interpretation von Farbinfrarotbildern, Wien, November 1982.Heft 24 J.JANSA, Rektifizierung von Multispektral-Scanneraufnahmen - Entwicklung und Erprobung eines EDV-Programms, Wien, Mai 1983.Heft 25 Zusammenfassung der Diplomarbeiten, Dissertationen und Habilitationen an den geodätischen Instituten der TU Wien, Wien,
November 1984.Heft 26 T.WUNDERLICH, Die voraussetzungsfreie Bestimmung von Refraktionswinkeln, Wien, August 1985.Heft 27 G.GERSTBACH (Hrsg.), Geowissenschaftliche/geotechnische Daten in Landinformationssystemen - Bedarf und Möglichkeiten in Öster-
reich, Juni 1986.Heft 28 K.NOVAK, Orientierung von Amateuraufnahmen ohne Paßpunkte, Wien, August 1986.Heft 29 Veröffentlichung des Instituts für Landesvermessung und Ingenieurgeodäsie, Abt. Ingenieurgeodäsie, anläßlich des 80. Geburtstages von
Prof.Dipl.Ing.Dr.F.Hauer, Wien, Oktober 1986.Heft 30 K.-H.ROCH, Über die Bedeutung dynamisch ermittelter Parameter für die Bestimmung von Gesteins- und Gebirgseigenschaften, Wien,
Februar 1987.Heft 31 G. HE, Bildverbesserung mittels digitaler Filterung, Wien, April 1989.Heft 32 F.SCHLÖGELHOFER, Qualitäts- und Wirtschaftlichkeitsmodelle für die Ingenieurphotogrammetrie, Wien, April 1989.Heft 33 G.GERSTBACH (Hrsg.), Geowissenschaftliche/geotechnische Daten in Landinformationssystemen - Datenbestände und Datenaustausch
in Österreich, Wien, Juni 1989.Heft 34 F.HOCHSTÖGER, Ein Beitrag zur Anwendung und Visualisierung digitaler Geländemodelle, Wien, Dezember 1989.Heft 35 R.WEBER, Lokale Schwerefeldmodellierung unter Berücksichtigung spektraler Methoden zur Geländereduktion, Wien, April 1990.Heft 36 o.Prof.Dr.Hans Schmid zum 70. Geburtstag. Veröffentlichung der Abteilung für Landesvermessung, Wien, Oktober 1990.Heft 37 G.GERSTBACH, H.P.HÖLLRIEGL und R.WEBER, Geowissenschaftliche Informationsbörse - Eine Nachlese zu GeoLIS II, Wien, Oktober 1990.Heft 38 R.ECKER, Rastergraphische Visualisierungen mittels digitaler Geländemodelle, Wien, August 1991.Heft 39 Kartographische Forschungen und Anwendungsorientierte Entwicklungen, herausgegeben von W.Stams und F.Kelnhofer zum 80. Geburt-
stag von Prof.Dr.W.Pillewizer, Wien, Juli 1991.Heft 39a W.RIEGER, Hydrologische Anwendungen des digitalen Geländemodelles, Wien, Juli 1992.Heft 40 K.STEINNOCHER, Methodische Erweiterungen der Landnutzungsklassifikation und Implementierung auf einem Transputernetzwerk,
Wien, Juli 1994.Heft 41 G.FORKERT, Die Lösung photogrammetrischer Orientierungs- und Rekonstruktionsaufgaben mittels allgemeiner kurvenförmiger El-
emente, Wien, Juli 1994.Heft 42 M.SCHÖNER, W.SCHÖNER, Photogrammetrische und glaziologische Untersuchungen am Gàsbre (Ergebnisse der Spitzbergenexpedi-
tion 1991), Wien, Mai 1996.Heft 43 M.ROIC. Erfassung von nicht signalisierten 3D-Strukturen mit Videotheodoliten, Wien, April 1996.Heft 44 G.RETSCHER, 3D-Gleiserfassung mit einem Multisensorsystem und linearen Filterverfahren, Wien, April 1996.Heft 45 W.DAXINGER, Astrogravimetrische Geoidbestimmung für Ingenieurprojekte, Wien, Juli 1996.Heft 46 M.PLONER, CCD-Astrometrie von Objekten des geostationären Ringes, Wien, November 1996.

GEOWISSENSCHAFTLICHE MITTEILUNGEN278
Heft 47 Zum Gedenken an Karl Killian “Ingenieur” und “Geodät” 1903-1991, Veröffentlichung der Fachgruppe Geowissenschaften, Wien, Februar 1997.
Heft 48 A.SINDHUBER, Ergänzung und Fortführung eines digitalen Landschaftsmodelles mit multispektralen und hochauflösenden Fernerkund-ungsaufnahmen, Wien, Mai 1998.
Heft 49 W.WAGNER, Soil Moisture Retrieval from ERS Scatterometer Data, Wien, Dezember 1998. Heft 50 R.WEBER, E.FRAGNER (Editoren),Prof.Bretterbauer, Festschrift zum 70.Geburtstag, Wien, Juli 1999.Heft 51 Ch.ÖHRENEDER, A Similarity Measure for Global Image Matching Based on The Forward Modeling Principle, Wien, April 1999.Heft 52 M.LECHTHALER, G.GARTNER, Per Aspera ad Astra, Festschrift für Fritz Kelnhofer zum 60. Geburtstag, Wien, Jänner 2000.Heft 53 F.KELNHOFER, M.LECHTHALER, Interaktive Karten (Atlanten) und Multimedia – Applikationen, Wien, März 2000.Heft 54 A.MISCHKE, Entwicklung eines Videotheodlit-Meßsystems zur automatischen Richtungsmessung von nicht signalisierten Objektpunk-
ten, Wien, Mai 2000Heft 55 Veröffentlichung des I.P.F. anlässlich der Emeritierung von Prof.Dr. Peter Waldhäusl, Wien.Heft 56 F.ROTTENSTEINER, Semi-automatic Extraction of Buildings Based on Hybrid Adjustment Using 3D Surface Models and Management
of Building Data in a TIS, Wien, Juni 2001.Heft 57 D.LEGENSTEIN, Objektrekonstruktion aus perspektiven Bildern unter Einbeziehung von Umrisslinien, Wien, Mai 2001.Heft 58 F.KELNHOFER, M.LECHTHALER und K.BRUNNER (Hrsg.), Telekartographie und Location Based Services, Wien, Jänner 2002. Heft 59 K.BRETTERBAUER, Die runde Erde eben dargestellt: Abbildungslehre und sphärische Kartennetzentwürfe, Wien, 2002.Heft 60 G.GARTNER, Maps and the Internet 2002, Wien 2002.Heft 61 L.DORFFNER, Erzeugung von qualitativ hochwertigen 3D Photomodellen für Internetbasierte Anwendungen mit besonderem Augenmerk
auf Objekte der Nahbereichsphotogrammetrie, Wien, Jänner 2002.Heft 62 K. CHMELINA, Wissensbasierte Analyse von Verschiebungsdaten im Tunnelbau, Wien 2002Heft 63 A.NIESSNER, Qualitative Deformationsanalyse unter Ausnutzung der Farbinformation, Wien 2002Heft 64 K.BRETTERBAUER; R.WEBER, A Primer of Geodesy for GIS-Users, Wien im Herbst 2003Heft 65 N.PFEIFER, 3D Terain Models on the basis of a triangulation, Wien, Jänner 2002.Heft 66 G.GARTNER, (Hrsg.), Location Based Services & Telecartography, Wien, Dezember 2003Heft 67 I.KABASHI, Gleichzeitig-gegenseitige Zenitwinkelmessung über größere Entfernungen mit automatischen Zielsystemen, Wien 2004Heft 68 J.BÖHM, Troposphärische Laufzeitverzögerungen in der VLBI, Wien 2004Heft 69 R.WEBER, W.SCHLÜTER, U.SCHREIBER, O.TITOV, Evolving Space Geodesy Techniques (Papers presented at the EGS XXVII Gen-
eral Assembly, Nice, France, 2002) Wien 2004Heft 70 G.WEINWURM, Amalthea’s Gravity Field and its Impact on a Spacecraft Trajectory, Wien 2004Heft 71 Forschungsgruppe Ingenieurgeodäsie, Festschrift anlässlich des 65. Geburtstages von Herrn o.Univ.Prof.Dr.-Ing. Heribert Kahmen,
Wien 2005Heft 72 A.REITERER, A Knowledge-Based Decision System for an On-Line Video-Theodolite-Based Multisensor System, Wien 2005,Heft 73 M.HABERLER, Einsatz von Fuzzy Methoden zur Detektion konsistenter Punktbewegungen, Wien 2005