Local Transit Implementation Plan - The Town of Okotoks
138
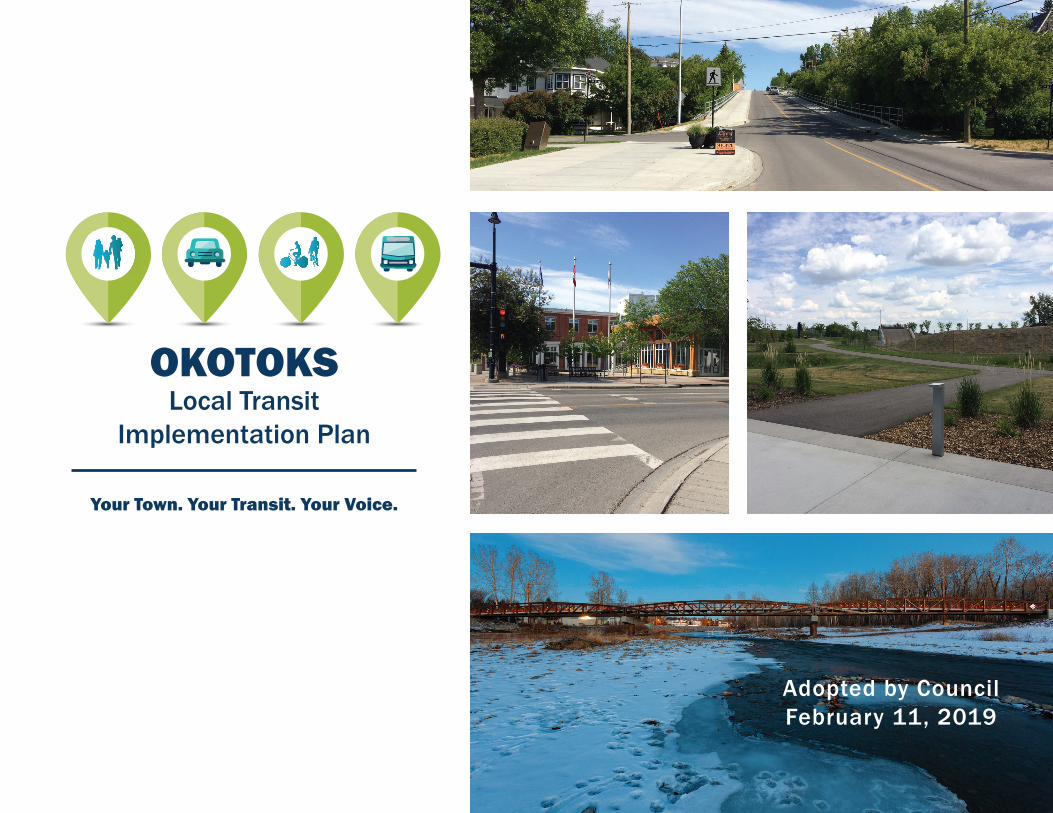
OKOTOKS Local Transit Implementation Plan Adopted by Council February 11, 2019 Your Town. Your Transit. Your Voice.
-
Upload
khangminh22 -
Category
Documents
-
view
1 -
download
0
Transcript of Local Transit Implementation Plan - The Town of Okotoks
OKOTOKSLocal Transit
Implementation Plan
Adopted by Council February 11, 2019
Your Town. Your Transit. Your Voice.

Prepared forTown of Okotoks
Prepared byStantec
TABLE OF CONTENTSChapter 1: Executive SummaryChapter 2: Okotoks ContextChapter 3: Transit Mission & PrinciplesChapter 4: Industry Innovation StrategiesChapter 5: Local Transit Strategies for OkotoksChapter 6: Okotoks Local Transit PlanChapter 7: Performance ManagementChapter 8: Moving Forward | Okotoks Transit Future Appendix A: Transit Supportive Policy ReviewAppendix B: Innovations in TechnologyAppendix C: Public Participation
412222632466066

CHAPTER 1Executive Summary
Introduction
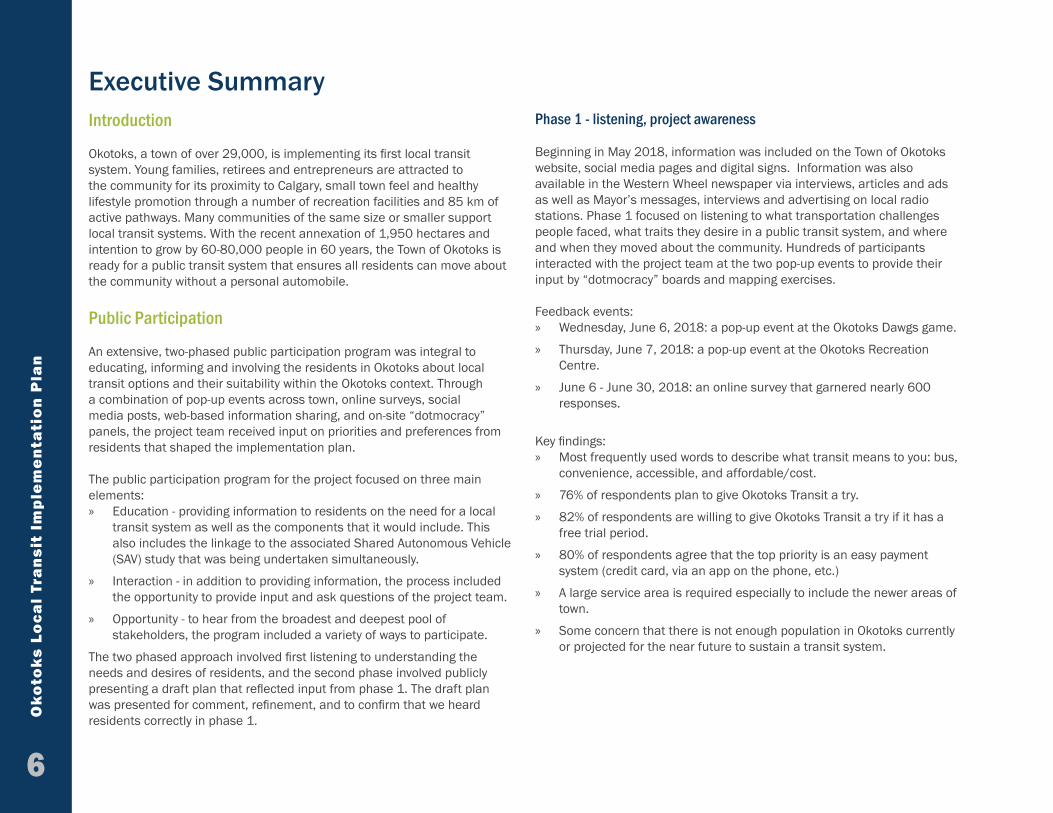
Okotoks, a town of over 29,000, is implementing its first local transit system. Young families, retirees and entrepreneurs are attracted to the community for its proximity to Calgary, small town feel and healthy lifestyle promotion through a number of recreation facilities and 85 km of active pathways. Many communities of the same size or smaller support local transit systems. With the recent annexation of 1,950 hectares and intention to grow by 60-80,000 people in 60 years, the Town of Okotoks is ready for a public transit system that ensures all residents can move about the community without a personal automobile.
Public Participation
An extensive, two-phased public participation program was integral to educating, informing and involving the residents in Okotoks about local transit options and their suitability within the Okotoks context. Through a combination of pop-up events across town, online surveys, social media posts, web-based information sharing, and on-site “dotmocracy” panels, the project team received input on priorities and preferences from residents that shaped the implementation plan.
The public participation program for the project focused on three main elements: » Education - providing information to residents on the need for a local
transit system as well as the components that it would include. This also includes the linkage to the associated Shared Autonomous Vehicle (SAV) study that was being undertaken simultaneously.
» Interaction - in addition to providing information, the process included the opportunity to provide input and ask questions of the project team.
» Opportunity - to hear from the broadest and deepest pool of stakeholders, the program included a variety of ways to participate.
The two phased approach involved first listening to understanding the needs and desires of residents, and the second phase involved publicly presenting a draft plan that reflected input from phase 1. The draft plan was presented for comment, refinement, and to confirm that we heard residents correctly in phase 1.
Phase 1 - listening, project awareness
Beginning in May 2018, information was included on the Town of Okotoks website, social media pages and digital signs. Information was also available in the Western Wheel newspaper via interviews, articles and ads as well as Mayor’s messages, interviews and advertising on local radio stations. Phase 1 focused on listening to what transportation challenges people faced, what traits they desire in a public transit system, and where and when they moved about the community. Hundreds of participants interacted with the project team at the two pop-up events to provide their input by “dotmocracy” boards and mapping exercises.
Feedback events: » Wednesday, June 6, 2018: a pop-up event at the Okotoks Dawgs game.
» Thursday, June 7, 2018: a pop-up event at the Okotoks Recreation Centre.
» June 6 - June 30, 2018: an online survey that garnered nearly 600 responses.
Key findings: » Most frequently used words to describe what transit means to you: bus,
convenience, accessible, and affordable/cost.
» 76% of respondents plan to give Okotoks Transit a try.
» 82% of respondents are willing to give Okotoks Transit a try if it has a free trial period.
» 80% of respondents agree that the top priority is an easy payment system (credit card, via an app on the phone, etc.)
» A large service area is required especially to include the newer areas of town.
» Some concern that there is not enough population in Okotoks currently or projected for the near future to sustain a transit system.
6
Oko
toks
Lo
cal
Tra
nsi
t Im
ple
me
nta
tio
n P
lan
Executive Summary
Ch
ap
ter #
| Ch
ap
ter Title
Self-Driving Shuttles
BENEFITS
USES• Urban Centers• Neighborhoods• Business Parks• Theme Parks
• Airports• Hospitals• College Campuses• Master-planned Communities
• Stadiums• Entertainment Districts
• Bidirectional - no need to turn around• Tight turning radius • Mobile app for on-demand calls• Wheelchair accessible• Redundant braking mechanisms• Emergency stop button on- board• Direct telecom connection to central
command hub for passengers
• Resolve�the�first/last�mile��� � problem
• Integral part to the future of holistic transit networks
• Improve access and mobility for all
• Use existing infrastructure• Decrease�traffic��� � � � � � � congestion
• Create�efficiency• Improve travel time
Where can we use self-driving shuttles?
Manufacturers and Shuttles
Shuttle Details
What are some benefits to using self-driving shuttles?
Easy Mile -EZ10
Local Motors -Olli
Navya -Autonom
Coast -P-1
MayMobility
20-25 km/hrtypical speed
3-10 hoursamount of time on a single battery charge
16’x7’x9’typical size
5 kmtypical maximum route length
8-16 peoplemaximum capacity
What days of the week do you
want transit service to operate?
How early in the morning
should transit service be available?
How late should transit service
operate in the evenings?
In order for you to use it daily,
what price should a one-way trip cost?
Tell Us What You Think!
Q1 Q2 Q3 Q4
Weekdays 5am under�$2.00
7pm
8pm
9pm
10pm
11pm
12am
6am $2.00-2.99
7am $3.00-3.99
8am $4.00-4.99
9am $5.00+
Saturdays
Sundays
PLACE A DOT
IN THE BOX
TO ANSWER
On-Demand Transit
The benefits of on-demand transit include...
Is this the right service area boundary?
• VALUE - Providing access to the entire community for the same or less cost than fixed�route�transit
• FLEXIBILITY - Customizable for different rider needs
• CONVENIENCE! - Go where you want, when you want
• MORE CONVENIENCE!- Simply get picked up where you are - no more walks to the bus stop
• SPEED - Shorter trip times and more direct routes
• EFFICIENCY - No empty buses since trips are only made when requested
• INFORMATION - Data collection for future fixed�route�service,�fleet�expansion,�etc.
YES
NO
PLACE A DOT
IN THE BOX
TO ANSWER
If NO, place
dots on the map
for locations
that should be
included
serves MOST of the
urbanized
area
PROPOSED SERVICE AREA
Transit Options Review
Fixed route service was not chosen as the preferred solution because…
Option 1 Option 2 Option 2
The team completed a thorough evaluation of all transit service types including fixed route, on-demand and everything in between. While on-demand service was chosen as the preferred option, the fixed route analysis is shown below for information.
• Fixed route service doesn’t serve all of the urbanized area
• Fixed route service requires a walk to the bus stop
• �Travel�time�via�fixed�route�service�is�not competitive with the private car
• Service with one-way loops means that one leg of the round-trip is lengthy and indirect
• Wait times are longer than on-demand service
• Trips are delivered according to the schedule, whether there are riders or not (empty buses running around town) or (empty bus syndrome)
• �You�must�fit�your�schedule�to�the�bus�schedule, instead of traveling when you want
• Percent of Community Served within a 5 Minute Walk: 58%
• Frequency: 20 minutes
• Percent of Community Served within a 5 Minute Walk: 76%
• Frequency: each loop at 30 minutes
• Percent of Community Served within a 5 Minute Walk: 55%
• Frequency: 30 minutes
INTERACTIVE MAPPING EXERCISEPlace stickers on your three (3) favorite destinations in Okotoks.
Where do you go in town?
LEGEND
Schools
Green Space
Municipal
Commercial
N
PLACE 3
STICKERS
ON YOUR
FAVORITE
DESTINATIONS
7
Ch
ap
ter 1
| Executive
Sum
ma
ry
Phase 2 - responding back
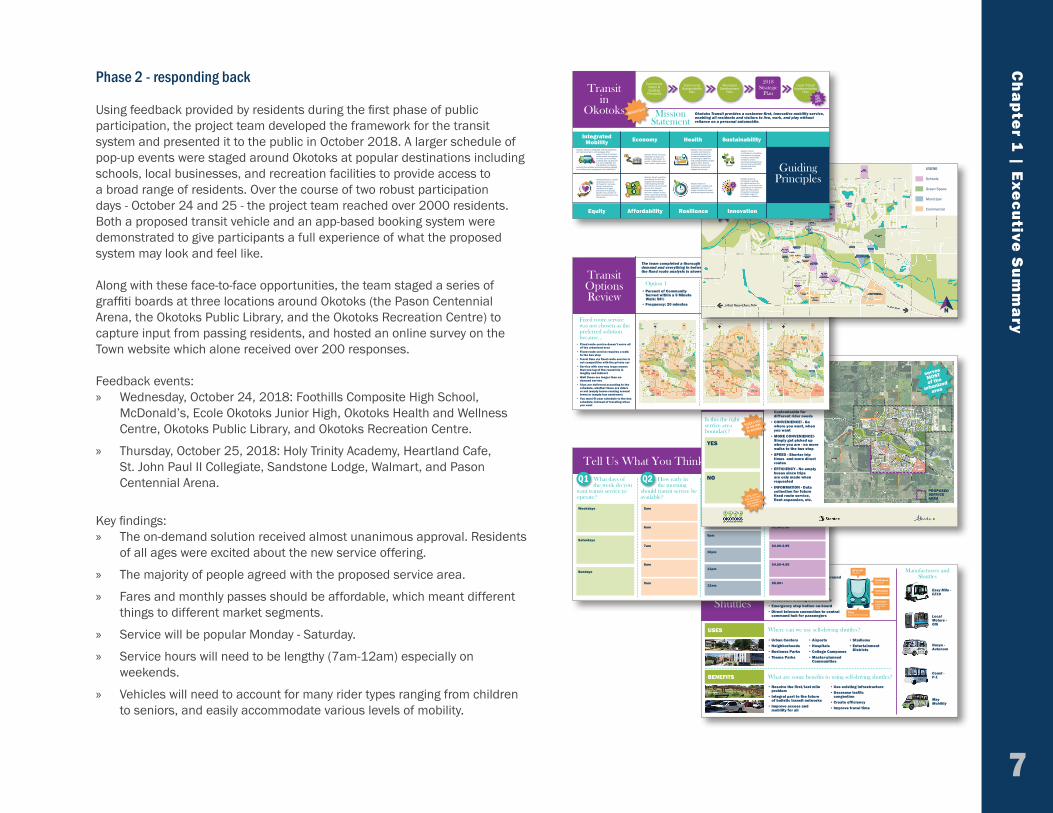
Using feedback provided by residents during the first phase of public participation, the project team developed the framework for the transit system and presented it to the public in October 2018. A larger schedule of pop-up events were staged around Okotoks at popular destinations including schools, local businesses, and recreation facilities to provide access to a broad range of residents. Over the course of two robust participation days - October 24 and 25 - the project team reached over 2000 residents. Both a proposed transit vehicle and an app-based booking system were demonstrated to give participants a full experience of what the proposed system may look and feel like.
Along with these face-to-face opportunities, the team staged a series of graffiti boards at three locations around Okotoks (the Pason Centennial Arena, the Okotoks Public Library, and the Okotoks Recreation Centre) to capture input from passing residents, and hosted an online survey on the Town website which alone received over 200 responses.
Feedback events: » Wednesday, October 24, 2018: Foothills Composite High School,
McDonald’s, Ecole Okotoks Junior High, Okotoks Health and Wellness Centre, Okotoks Public Library, and Okotoks Recreation Centre.
» Thursday, October 25, 2018: Holy Trinity Academy, Heartland Cafe, St. John Paul II Collegiate, Sandstone Lodge, Walmart, and Pason Centennial Arena.
Key findings: » The on-demand solution received almost unanimous approval. Residents
of all ages were excited about the new service offering.
» The majority of people agreed with the proposed service area.
» Fares and monthly passes should be affordable, which meant different things to different market segments.
» Service will be popular Monday - Saturday.
» Service hours will need to be lengthy (7am-12am) especially on weekends.
» Vehicles will need to account for many rider types ranging from children to seniors, and easily accommodate various levels of mobility.
MISSION AND PRINCIPLES FOR OKOTOKS TRANSITInformation about this project, including a mission statement and guiding principles
Transit in
Okotoks
Guiding Principles
Mission Statement
Integrated Mobility Economy
Equity Affordability Resilience Innovation
Health Sustainability
Okotoks Transit provides a customer-first, innovative mobility service, enabling all residents and visitors to live, work, and play without reliance on a personal automobile.
ABSOLUTELY!
Okotoks Transit is integrated with the pedestrian and cycling network, and leverages other
opportunities to connect to the system via regional services, park and rides, curbside pick-up/drop-off. It is also integrated into the aesthetic of Okotoks,
ensuring the vehicles and accompanying signage and infrastructure complement the urban form.
Okotoks Transit connects employees to jobs; and residents and visitors to events, conferences, and other tourism destinations.
Okotoks Transit is a 100% accessible service for all though it’s inclusive design, and policies that ensure all ages, socioeconomic groups, gender and cultures are able and welcomed to use the service.
Okotoks Transit prioritizes affordability for both the taxpayer and passenger, while balancing the fact that transit is a community service that requires financial support from the town. Okotoks Transit seeks unique partnerships and funding models to help balance cost.
Okotoks Transit is sustainable, scalable and adaptable over time in design, operational model, and technological solutions.
Okotoks Transit is innovative in seeking the right-fit solution for Okotoks, and is its self an embodiment of innovation which will help attract innovative businesses and foster a spirit of innovation in Okotoks.
Okotoks Transit promotes a healthy community by connecting residents to recreation opportunities, connecting to sidewalks and cycling facilities; enable aging in place beyond the driver’s license; and by fostering community onboard its vehicles.
Okotoks Transit contributes to a healthier environment by helping to reduce overall GHG emissions and by sourcing sustainable fuel sources and sustainable vehicles and other infrastructure.
Community Vision & Guiding
Principles
Community Sustainability
Plan
Municipal Development
Plan
Local Transit Implementation
PlanYOU ARE HERE
2018 Strategic
Plan

8
Oko
toks
Lo
cal
Tra
nsi
t Im
ple
me
nta
tio
n P
lan
Preferred Option | On-Demand Service Area Map. Service Hours: Monday – Saturday from 6:30am – 11:30pm.
Table showing the proposed fare breakdown with four different options: single trip, monthly pass, household pass, or a book of 10 tickets.*Children 5 and under ride for free.
Fare Type Fare
Single Trip Fare* $2.75
Monthly Pass $55.00
Household Pass $70.00
Book of 10 Tickets (get 1 free) $24.75
N
The Local Transit Solution
The preferred local transit system will utilize vans or shuttle buses that are smaller in scale to match Okotoks’ urban form and scale, have a capacity of approximately 8-22 people, and are fully accessible. The service will be on-demand, meaning that there are no routes and no schedule. During the hours of operation, riders simply request a trip through an app, website or by phone, the trip is confirmed, and then delivered. Service will initially begin with a maximum of two vehicles in service, and one additional vehicle as a spare primarily for mechanical back-up, but also for operations in the event that the demand exceeds that of two vehicles. The Town will apply its provincial GreenTRIP grant award to the purchase of these vehicles, reducing the one-time capital cost by two-thirds.
As the on-demand service is designed as a curb-to-curb solution, initially no infrastructure modifications or additions will be required. Bus stops, shelters, and other amenities will not be required because the vehicles will be able to stop anywhere in town that is a safe place to pull over. In the future, popular stops may warrant infrastructure improvements to designate the pick-up/drop-off location and to provide additional customer amenities.
As one of the foundational principles of the service is that it must be simple to understand and use, the service hours are anticipated to be consistent every service day, Monday - Saturday from 6:30 am to 11:30 pm. After the service has been operational for 12 months, the hours can be adjusted based on actual usage, however consistency and simplicity must remain as a key goal. The fare structure is also designed to be simple and easy to understand. Every trip costs $2.75 and children 5 and younger ride for free . Discounts will be offered through frequent user programs such as books of tickets and subscription passes (monthly pass and household pass).

Ch
ap
ter #
| Ch
ap
ter Title
Performance Management
Managing performance of a public transit system requires clear and realistic expectations and goals. It also means finding the delicate balance amongst revenue generation, fare pricing, and ridership. Okotoks is a low density, suburban community with ingrained routines of moving about the community without public transit. Gaining ridership means changing these routines, which takes time and considerable effort. Therefore, it should be expected that the initial year’s performance will be well below the ultimate goal when the system has reached maturity (around year three).
9
Ch
ap
ter 1
| Executive
Sum
ma
ry
Ultimate Goals(third year of service)
Annual Ridership 45,000
Rides per Hour 5
Net Cost per Capita $15.00
Cost Recovery 17%
Moving Forward
Implementing this on-demand local transit solution requires the addition of a Transit Manager to guide the implementation and ongoing operations. Procuring the vehicles, software and any other items will immediately follow. Operations, administration and maintenance staff will also need to be hired or contracted through a third-party. Creating a detailed, comprehensive and creative marketing and education plan is also a top priority. Significant effort must be made to ensure residents not only know that the service exists, but how to use it and feel comfortable and encouraged to do so.
On-Demand — How to Ride Step by Step:
1. Download app (optional).
2. Reserve/book trips via app on phone/tablet, online, or by phone.
3. Select pick-up location & time.
4. Select drop-off location.
5. The app or website will confirm trip & pick-up window.
6. Watch the transit van live on your phone or computer as it gets closer to you.
7. Pay through the app automatically (cash accommodations can be made), simply exit vehicle upon arrival.
8. Rate driver through app.
Begin by entering your destination in the
app.
Get an estimated travel time and pick
up window before confirming the trip.
Watch the transit vehicle come to you
live on the app. Never wonder whether
you’ll be picked up or not. Travel with
confidence!


CHAPTER 2Okotoks Context

Community event after a local Dawgs gameSource: okotoks_dawgs Instagram
On-It Regional Transit private busSource: onitregionaltransit.ca
Active pathways throughout the community
14
Oko
toks
Lo
cal
Tra
nsi
t Im
ple
me
nta
tio
n P
lan
Regional Collaboration and GovernanceOkotoks is located south of Calgary and is surrounded by Foothills County. The town has regional importance — over 250,000 people from surrounding municipalities (including Foothills, High River, Black Diamond, and Turner Valley) come to Okotoks for many things such as community events, recreation opportunities.1 The Town values regional governance, planning, and partnerships and has demonstrated this on numerous occasions.
Okotoks was an active member and participant in the former Calgary Regional Partnership (CRP), working together with the municipalities of the region to plan for sustainable growth. Okotoks partnered with the Towns of Black Diamond, Turner Valley, and High River as well as the City of Calgary and the CRP to pilot regional transit service (On-It Regional Transit) in the south sub-region of the Calgary region. This public transit service was discontinued alongside the disolution of the Calgary Regional Partnership in February 2018.The rights to the brand and service were purhcased by Southland Transportation Ltd. who continues to operate private shuttles to Calgary.
A legislated growth management board now exists in the Calgary region. This provides additional opportunities for Okotoks to actively participate in sustainable growth management on a regional level.
What does this mean for local transit?
The existing private regional transit, On-It Regional Transit, and the proximity to Calgary, indicates that some residents may already be accustomed to riding transit. This may make introducing a new local transit service easier to implement and gain ridership. The Town of Okotoks has the opportunity to model local transit for other municipalities in the region.
Public feedback: Many residents felt that
vehicles used for the On-It public transit system were too large for operations on
residential streets.
1 Town of Okotoks, Municipal Development Plan Update (n.d.) p. 5

Ch
ap
ter #
| Ch
ap
ter Title
15
Active Pathways LEGEND Active Pathways Open Space
Waterbodies
Roadways
Railroads
Town Boundary
85 kmof active pathways
Okotoks has a well-developed system of parks, open spaces, and pathways encompassing 495 hectares and 85 kilometres.2 A central feature of the active pathway system is the Sheep River Valley. It defines the geography and character of the town. Local transit can extend the distance of pedestrian trips by ensuring it connects to key access points in the active pathway network.
Ch
ap
ter 2
| Oko
toks C
on
text
Active Pathways Map
2 Town of Okotoks, Parks & Pathways (2018) retrieved from https://www.okotoks.ca/parks-recreation/parks-pathways

Downtown Okotoks store fronts along Elizabeth Street
The Okotoks Operations Centre
A single-family home in the Crystal Shores neighborhood
The Sandstone Lodge senior living community
16
Oko
toks
Lo
cal
Tra
nsi
t Im
ple
me
nta
tio
n P
lan
Limited Diversity in the Built EnvironmentThe Sheep River Valley defines the geography and character of the town. The built environment is comprised of discrete neighbourhoods and areas with disconnected streets; however, walkability is counterbalanced by the extensive active pathway network. Neighbourhoods are comprised mostly of owner-occupied single-family homes: 77% of homes are single-family and 84% of households own their home.3 Services and amenities are not contained within residential neighbourhoods, particularly within new residential neighbourhoods. Okotoks had a total of 1,663,749 square feet of commercial floor space in 2013 in the Olde Towne shopping district and along Northridge Drive, Southridge Drive, and Highway 7.4 Industrial development is located primarily in the Okotoks Business Park and the Southbank Business Park and there is additional undeveloped land near Highways 2 and 2A.
What does this mean for local transit?
Despite Okotoks’ extensive pathway system, the town’s isolated sections of built environment and fencing limits resident’s ability to walk to nearby arterials that are more efficient for transit operation. Fixed route transit service thrives in mixed-use corridors in well-connected streets and sidewalk grid patterns. Okotoks’ single-use, low-density development requires a flexible service in order to be accessible to a greater number of Okotokians.
Many residents noted that while the community is very walkable, the addition of another mode of transportation to and from shopping areas or evening activities would be a welcome alternative.
3 Town of Okotoks, Municipal Development Plan Update (n.d.) p. 114 Town of Okotoks, O2 Planning + Design, Coriolis Consulting Corp., Town of Okotoks Growth Study and Financial Assessment (2014) p. 43

Ch
ap
ter #
| Ch
ap
ter Title
Land Use Map
17
AgriculturalCountry ResidentialSingle Detached ResidentialMulti-Unit ResidentialMixed Use
CommercialIndustrialParks and Community FacilitiesOther
LEGEND
77%of homes are single-family
Ch
ap
ter 2
| Oko
toks C
on
text

18
A Wealthier Community of FamiliesCompared to the rest of Alberta, Okotoks has a higher proportion of families with adults aged 30–45 years old and children aged 0–19 years old, and a lower proportion of those aged 20–29 and 50+. Although these proportions are not typical of Alberta as a whole, they are in line with other suburban communities with high growth rates.5 Households in Okotoks earn a median income of $116,163 compared to $93,835 in the rest of Alberta.6 This demographic trend in Okotoks (majority young families, etc.) is expected to continue in the future.
What does this mean for local transit?
Introducing a new transit service into a community where residents are accustomed to driving personal vehicles is the single biggest hurdle for the success of transit. However, the higher percentage of families indicates the following potential transit users:
» Young commuters may not have access to a car to get to/from work.
» Junior and senior high school students can increase independence by taking transit to after-school activities, sports, and social events.
» Stay-at-home parents may find transit a fun mode of travel for their children to/from activities and events.
» Kid-friendly weekend and evening events may create transit demand.
Oko
toks
Lo
cal
Tra
nsi
t Im
ple
me
nta
tio
n P
lan
5 Town of Okotoks, O2 Planning + Design, Coriolis Consulting Corp., Town of Okotoks Growth Study and Financial Assessment (2014) p. 76 Government of Alberta Treasury Board and Finance, 2016 Census of Canada Incomes (2017)
7 Town of Okotoks, Municipal Development Plan Update (n.d.) p. 418 Town of Okotoks, Municipal Development Plan Update (n.d.) p. 179 Okotoks Economic Development, Okotoks Economic Development Strategic Plan (2015) p. 5310 Town of Okotoks, O2 Planning + Design, Coriolis Consulting Corp., Town of Okotoks Growth Study and Financial Assessment (2014) pp. 43-45
Increasing the Local Job MarketMany residents travel outside of Okotoks to work (60% of residents commute) and 87% of all working adult residents drive to work or carpool with another driver (3%) (it is assumed that those who walk, take transit, or work from home make up the remaining 10%). Three percent of residents are likely to take transit while 4% are likely to walk and less than 1% are likely to cycle. Fifty-seven percent of children walk or cycle to school.7
In 2017, 450 jobs were created and new storefronts and home-based businesses continue to increase every year.8 The major employment sectors in Okotoks are the service industry, the Town of Okotoks, and education.9
Moving forward, the Town has indicated that more commercial and industrial lands will be necessary to support the growing population. Commercial floor space is predicted to grow by about 45,000 square feet per year while industrial floor space is predicted to grow 60,000 square feet per year.10
What does this mean for local transit?
The daytime population’s mobility needs will require longer service hours to transport employees to/from service jobs with early and late hours of business. The service must also consider families with young children and trips for medical, personal business, and social occasions. The creation of a local transit option would also increase access to more employment opportunities for youth, seniors, and those without access to personal vehicles.

Ch
ap
ter #
| Ch
ap
ter Title
19
Ch
ap
ter 2
| Oko
toks C
on
text
Demographics of Okotoks
Median Income Job Growth Commercial Growth Industrial Growth
Work CommuteHighest Age Cohorts Work Commute School Commute
$116,163 470 jobs created in 2017
45,000 sq. ft./year predicted
growth
60,000 sq. ft./year predicted
growth
60% of workers commute
Young Families: Cohorts 0-19 & 30-35 years old
90% of commuters drive alone or
carpool
57% of children walk or cycle to
school

20
Oko
toks
Lo
cal
Tra
nsi
t Im
ple
me
nta
tio
n P
lan
Population Has More Than Doubled Since 2001 The population increased from 12,000 in 2001 to nearly 29,000 in 2016 and is expected to grow by around 900 people per year in the next 60 years.11 The recent annexation of 1,950 hectares in 2017, enables steady and continued growth.12 For example, the lands to the northeast and southwest of Okotoks have been identified as high priority residential development areas while commercial areas are recommended to the south of Highway 7 and to the north of Town. The areas south and southeast of Town have been recommended for industrial development.13
What does this mean for local transit?
Local transit creates increased connections between neighbourhoods and commercial hubs. It also offers alternative transportation for those working in Okotoks, as well as encouraging local shopping, increase access to medical services for those with mobility challenges or lack of personal vehicles.
The surge in Okotoks’ population has also increased parking challenges in some areas. Adding a transit option could help to alleviate this issue.
A Legacy of InnovationThe Town has embraced innovation as a way to achieve the community vision to create a thriving community that is the environmental leader in Alberta. The Town’s commitment to innovation is exemplified by projects such as the Downtown Urban Design Master Plan, Environmental Master Plan, Living Soils Filtration Project, and the Drake Landing Solar Community. In addition, the Town is also working toward diversifying the local economy by fostering an innovation sector to attract businesses and industries.
What does this mean for local transit?
Okotoks’ culture of innovation supports a local transit system that will work for residents now and into the future.
A Recognized Leader in SustainabilityOkotoks demonstrated its leadership in sustainable community development with the establishment of the Drake Landing Solar Community in 2005. The community has won several awards including the 2011 World Energy Globe Award for Sustainability. A reduction of approximately 5 tonnes greenhouse gas emissions per home occur each year in the solar community.14 In 2015 and 2018, Okotoks received a Sustainable Communities Award from the Federation of Canadian Municipalities in the water category, for its Water Conservation, Efficiency, and Productivity Programs. In the newly adopted Environmental Master Plan and the preceding Sustainability Plan, introducing transit is named as a key action item.
What does this mean for local transit?
Using local transit will reduce vehicle kilometres traveled and carbon emissions. Okotoks transit will also look to use fuels (electric and hydrogen) with a lower impact on the environment than traditional petrol fueled systems.
Residents expressed their pride in their community’s reputation, and felt that the addition of transit to Okotoks would serve as an environmentally responsible way to move around town.
11 Town of Okotoks, O2 Planning + Design, Coriolis Consulting Corp., Town of Okotoks Growth Study and Financial Assessment (2014) p. 3912 Town of Okotoks, Annexation (2018) retrieved from https://www.okotoks.ca/town-services/planning-development/planning/annexation13 Town of Okotoks, O2 Planning + Design, Coriolis Consulting Corp., Town of Okotoks Growth Study and Financial Assessment (2014) p. 58
14 Town of Okotoks, Municipal Development Plan Update (n.d.) p. 5

Ch
ap
ter #
| Ch
ap
ter Title
21
Ch
ap
ter 2
| Oko
toks C
on
text
What We Know
Primarily single family residential (77%) and siloed land use
Lower ridership expectations; difficult to serve with fixed-route transit
Employment in services, education, and civic Getting people to work will require long service hours — shift work
60% of workers leave OkotoksDaytime market: personal business, social, medical, and entertainment for young families, retirees, and those who work from home
Residents have established means of getting around Okotoks because there is no transit
Choosing transit will be a conscious choice for most (choice riders)
Lots of active paths, but neighbourhood impermeability (fences) Reduce catchment area at stops
A (R)Evolution is Upon Us While Canada began on-street testing of highly automated and connected vehicles in 2017, the United States has been testing them since 2009. The first autonomous shuttle bus (or self-driving shuttle) arrived on US soil in 2016, and the rate of adoption nationwide is growing exponentially.
What does this mean for local transit?
In the short term, the local transit system must be designed for traditional, human driven vehicles, but should take advantage of technology that makes sense: electric or hybrid engines, safety driver assist features and app-based technology to facilitate real-time customer information. Alternative uses for traditional transit vehicles should be considered in the event that highly automated vehicles are universally adopted before traditional vehicles reach the end of their operational life cycle.
Summary Innovation, sustainability, and a focus on improving the local economy are central tenants to the design of the local transit system, including how the system is delivered behind the scenes.
The character, density, and design of the community are unlikely to support a fixed-route service with a high enough frequency to be attractive to the choice rider. Instead, an alternative, innovative solution should be considered that delivers the highest quality of service, with a focus on convenience, within given budgetary constraints.
Extending the culture of environmental protection and stewardship means looking to technological advancements to secure environmentally friendly vehicles and supporting networks. Electric and hybrid vehicles are also quiet, which is less disruptive to the neighbourhoods they travel through.


CHAPTER 3Transit Mission & Principles

Okotoks Transit provides a customer-first, innovative mobility service, enabling all
residents and visitors to live, work, and play without reliance on a personal automobile.
Okotoks Vision Statement
Transit Mission Statement
The vision for Okotoks, as established by the Okotoks Community Visioning process in 2014 is:
“The Town of Okotoks is resilient, where people, businesses, ideas and sense of community thrive. Grounded by the Sheep River valley and supported by thoughtful planning and design, a strong local economy and a vibrant civic culture, Okotoks offers exceptional quality of life at every stage of life. Respect for each other and the natural environment makes Okotoks home.”
To support the overall vision of the town, Okotoks Transit has established the mission statement and supporting principles that guide all decisions made.
“Okotoks Transit provides a customer-first, innovative mobility service, enabling all residents and visitors to live, work, and play without reliance on a personal automobile.”
Customer-first is at the forefront of every decision Okotoks Transit makes. Mobility is used instead of transit to ensure resiliency of the service to expand beyond transit vehicles and into mobility as a service style in the future, if desired. “All” residents and visitors are included to showcase a 100% inclusive service, and the final portion echoes Okotoks’ Mission statement.
24
Oko
toks
Lo
cal
Tra
nsi
t Im
ple
me
nta
tio
n P
lan
Our Transit
Our Town
Our Voice

Ch
ap
ter #
| Ch
ap
ter Title
Transit Principles
25
Ch
ap
ter 3
| Tran
sit Missio
n &
Prin
ciple
s
Integrated Mobility
Okotoks Transit is integrated with the pedestrian and cycling network, and leverages other opportunities to connect to the system via regional services, park and rides, and curbside pick-up/drop-off. It is also integrated into the aesthetic of Okotoks, ensuring the vehicles and accompanying signage and infrastructure complement the urban form.
Economic
Okotoks Transit connects employees to jobs; and residents and visitors to events, conferences, and other tourism destinations.
Health
Okotoks Transit promotes a healthy community by connecting residents to recreation opportunities, sidewalks, and cycling facilities; enable aging in place beyond the driver’s license; and by fostering community onboard its vehicles.
Environment
Okotoks Transit contributes to a healthier environment by helping to reduce overall GHG emissions and by sourcing sustainable fuel sources, sustainable vehicles and other infrastructure.
Equity
Okotoks Transit is a 100% accessible service for all through it’s inclusive design, and policies that ensure all ages, socioeconomic groups, gender, and cultures are able and welcome to use the service.
Affordable
Okotoks Transit prioritizes affordability for both the taxpayer and passenger, while balancing the fact that transit is a community service that requires financial support from the Town. Okotoks Transit seeks unique partnerships and funding models to help balance cost.
Resilience
Okotoks Transit is sustainable, scalable and adaptable over time in design, operational model, and technological solutions.
Innovative
Okotoks Transit is innovative in seeking the right-fit solution for Okotoks, and is itself an embodiment of innovation which will help attract innovative businesses and foster a spirit of innovation in Okotoks.

CHAPTER 4Industry Innovative Strategies

28
Oko
toks
Lo
cal
Tra
nsi
t Im
ple
me
nta
tio
n P
lan
Industry Innovation StrategiesCommunities, businesses, and transit agencies are piloting innovative alternative service delivery strategies in lower-density neighbourhoods, often where fixed route transit is not viable. The results of these pilot projects have been encouraging as they have demonstrated improved service quality and customer experience while maintaining or reducing the cost of providing services.
By leveraging app-based technology, real-time ride-matching and optimizing software, and innovative service delivery models, organizations are experimenting with providing demand-responsive service to improve various performance metrics like: trip time, on-time performance, cost, service area and service hours. While this creativity is enabled by technology, it is also driven by an increase in customers’ expectations of service due in large part to Transportation Network Companies (TNCs), like Uber and Lyft. These TNCs offer easy-to-use, personalized service with a price point between public transit and taxis. Watching their success and realizing the opportunity, transit agencies, communities and private companies are innovating to capitalize on some of this latent demand and travel market share.
This scan of the industry for the latest innovations in transit solutions provides the Town of Okotoks with an array of tools and lessons learned from real world applications. The following case studies include both Canadian and American examples, and range in context from serving industrial parks, dense central business districts, small towns, lower density and suburban neighbourhoods. They present diverse service profiles, service delivery models, customer support and interface strategies. When available, customer survey results and financials are included.
Beginning with the foundation, this document first highlights the impact of technology on transportation and defines key terms and typical service styles. Then, nine case studies are presented with enough detail to understand the various applications, service styles, outcomes, and lessons learned. Finally, the document concludes with key take-aways and themes extracted from the research.
Transportation is TechnologyOne of the biggest drivers of change is the development of technology in the transportation and transit space. Before we dive into specific case studies, it is worth spending a moment on where and how technology continues to transform transportation.
The technological impacts are described in four areas: the customer interface, behind the scenes, the vehicles, and customer expectations.
The Customer Interface
» Customers use one central app which easily facilitates mobile fare payment and trip reservation.
» Real time visuals and information about the vehicles’ location, type and in some cases, customer satisfaction ratings of the drivers.
» Ability to customize transit to you: pick-up and drop-off locations, time of trip, and sometimes vehicle type.
Behind the Scenes
» Integrated driver app which uses powerful and self-learning algorithms and real-time traffic conditions to create the most efficient shared-passenger trips as possible.
» Real time fleet management software and app, which is often integrated with the customer interface app.
» Advanced data analytics enable quick identification of problems/opportunities to expedite quick responses for continued customer service/improvements/efficiencies.

Ch
ap
ter #
| Ch
ap
ter Title
29
Apps like Uber make reserving rides easy
Apps use tools for tipping, rating, & reporting issues
Apps provide on-demand service & dynamic routing
New Flyer Electric Bus in ManitobaSource: electrek.com
The Vehicles
» Electric buses are here. They are zero emission, quiet and substantially easier to maintain due to the fraction of moving parts in an electric engine compared to an internal combustion engine. Battery life is the primary constraint but will continually improve over time.
» In addition to traditional shuttle buses, organizations are seeking any vehicle type that meets the needs of the service, from cars, to SUVs, to converted minivans and full-sized vans.
» Connected and autonomous vehicle (CAV) technology is advancing and making its way into larger vehicles, starting with personal cars, trucks and SUVs to shuttle buses and eventually traditional 12m buses. This technology suite, sometimes referred to as automated driving systems (ADS), is designed to be safer and more efficient by removing human error, communicating with infrastructure, customers, and other vehicles.
Customer Expectations
» On-demand, dynamic routing, new mobility services (Uber and Lyft) have dramatically changed customers’ expectations.
» Access to the atomic clock via cell phones has changed the definition of ‘on time’ to a demanding one in which customers hold operators accountable to the second.
Ch
ap
ter 4
| Ind
ustry Inn
ovative
Stra
tegie
s

30
Oko
toks
Lo
cal
Tra
nsi
t Im
ple
me
nta
tio
n P
lan
Automated Connected Electric & SharedThe new mobility technologies and solutions that have emerged in the market over the last 10 years have come in four principal categories: Autonomous, Connected, Electric, and Shared (ACES). While some solutions fall in all four categories, each has potential benefits for the Town of Okotoks to consider when evaluating its overall mobility system.
Automated
Perhaps the most popular in terms of mainstream attention, autonomous vehicles are those that operate independent of the world around them and do not need a driver. Such vehicles depend on a sophisticated set of sensors and computing to construct a digital map of the world around them in real time and move accordingly. Trials and pilots of autonomous vehicles, particularly cars, have been occurring around the world for a number of years with millions of miles of successfully logged trips. Manufacturers include not just the legacy automobile manufacturers (e.g., General Motors, Ford, Volkswagen) but also include other technology-based firms including Google/Waymo, Uber, Lyft, and Apple who are developing fleets of cars, trucks, and even delivery vehicles to operate without a driver. Investment in autonomous technology has now become mainstream with billions of dollars in new investments being announced on a regular basis.
Connected
The ability for a vehicle to speak to other vehicles (Vehicle to Vehicle - V2V), the surrounding infrastructure (Vehicle to Infrastructure - V2I), and to every other potential device (Vehicle to Everything - V2X) is made possible through a series of external devices and communication protocols. Connections provide additional information to the vehicle such as the location of potential accidents ahead, ride hailing by a potential passenger, location/availability of parking spaces, and location/availability of charging stations. At its most basic level, today’s mapping applications on phones are examples of how information is communicated through a connected system that pools information from other drivers to improve the experience for everyone. The infrastructure that permits this type of communication travels across the current 4G mobile networks, across local Wi-Fi, as well as with Digital Short-Range Communications (DSRC) devices mounted in the car and along the roadside. At present only, DSRC can provide fast enough communications for a car to react in real time – such as when the vehicle in front of you suddenly stops short. In the future, 5G mobile networks are expected to deliver similar if not faster communication speeds.
A rendering from ACTIVE-AURORA, a network of on-road test beds for Connected Vehicle systems, technologies, applications and services for traffic, transit, goods movement, and active transportation. ACTIVE is based in Edmonton, Alberta, and AURORA is based in Vancouver, British Columbia.

Ch
ap
ter #
| Ch
ap
ter Title
31
Ch
ap
ter 4
| Ind
ustry Inn
ovative
Stra
tegie
s
Electric
The electric car has long been a technology that transportation planners have embraced as a way to reduce the negative impacts of air and noise pollution emanated by the internal combustion engine. To date, the limited range (under 190km per full charge) and high cost have limited their general acceptance. That has changed in the past two years as dramatic advances in battery storage have more than doubled the range potential (385-480 kilometres per charge). Further, production technologies are reducing costs such that industry experts recently estimated that the cost of delivering an automobile with an electric engine will be cheaper than a similar model with an internal combustion engine within five years (2023). The limiting factor in widespread adoption of electric vehicles will be the charging network. Tesla and some regional power companies, are leading the way with the construction of a network of super-charging stations across North America, but a more fine-grained network of local charging stations will need to be constructed.
Shared
Shared mobility has historically taken the form of public transit – buses and trains – where many people share a vehicle to travel in similar directions. The great recession gave rise to a sharing economy that leveraged the power of social networking and mapping to rent out a variety of assets including extra bedrooms (AirBNB), office space (WeWork), and available car seats (Uber/Lyft). For vehicle trips, drivers share trips with a passenger through the use of a user-friendly app that rates both driver and passenger and simplifies the payment system.
This network has now extended to the shared use of other mobility services including bicycles (both docked and dockless) and electric scooters. Additionally, manufacturers and service providers have been developing new vehicle technologies known as micro-transit or driverless shuttles to provide short distance connectivity – typically less than 5km in length – in business districts, office and college campuses, and in high tourist areas.
Electric car charging station; Source: greencarreports.com
Limebike’s dockless bikes and electric scooters; Source: businessinsider.com


CHAPTER 5Local Transit Strategies for Okotoks

34
Oko
toks
Lo
cal
Tra
nsi
t Im
ple
me
nta
tio
n P
lan
Background Evaluation of Local Transit Alternatives
Creating a service specially designed for Okotoks. There are many opportunities in Okotoks that will make transit an attractive travel mode including the extensive pathway system, desire to be the environmental leader in Alberta, interest in innovative practices, and a relatively young population who may be looking for an economical transportation option that provides independence. Despite these opportunities that point to transit as a successful mode, there are also barriers to general acceptance and use of transit in Okotoks. Since transit currently does not exist in Okotoks, the population has established alternate means of getting around, particularly through personal vehicle ownership. Residents’ dependence on cars (60% commute to Calgary for work, etc.), cultural resistance to change, low-density segregated land use, and the relatively high median income indicates that there may be limited transit use when the service first begins. Effort is required to build a transit culture within Okotoks by designing a very convenient service that is easy to use. Continued growth and development in the town may increase potential transit ridership although future planned single use land areas may further limit transit convenience and feasibility.
The Transit Principles formed the foundation from which all transit alternatives, or options, must adhere. Strategies, methods, and innovations from peer agencies influenced transit service concepts, which also leveraged the unlimited creativity that technology enables. Peer agencies across North America are piloting innovative solutions for transit and are choosing alternative service delivery strategies to replace traditional fixed-route service. With technology enabling a near limitless array of transit options, the Town must explore a variety of traditional and innovative solutions to determine which type of transit is most suitable for Okotoks. The final alternatives have been evaluated to determine which option best fulfills the mission of providing a customer-first, innovative mobility service, enabling all residents and visitors to live, work and play without reliance on a personal automobile. The five transit alternatives are described and evaluated in the following section.
The criteria used to evaluate the five alternatives include: frequency, coverage, connectivity, convenience, and route simplicity, as described in greater detail below.
Frequency
A key consideration for transit service is the balance between service frequency and service coverage. A high-frequency transit model, also referred to as a “ridership” model, prioritizes services with frequent service. A high-frequency network is typically adopted in areas with large populations and high-density land use, where riders walk or take local transit to major corridors with frequent service. Riders are typically willing to walk longer distances to reach transit if wait times are low and a higher level of service is provided. However, distances to transit that are too long to travel by foot can also create a first/last kilometre problem, where passengers cannot easily get between transit stops and their origins and destinations.
Coverage
While a high-frequency network prioritizes short headways along key corridors, the high-coverage model prioritizes providing transit access to a higher number of geographic regions and communities. High-coverage networks provide transit stops in close proximity to riders’ origins and destinations with minimal walking distances, but the wait times are longer due to meandering routes. These networks are beneficial in areas with a high population of seniors or people with mobility challenges who require short distances to access transit. High-coverage networks are also attractive to riders living in cities/regions with extreme hot or cold weather. A service with high coverage reaches lower-density neighbourhoods and provides access to a greater number of destinations along the routes.

Ch
ap
ter #
| Ch
ap
ter Title
35
Ch
ap
ter 5
| Loca
l Tran
sit Stra
tegie
s for O
koto
ks
Connectivity
Network connectivity measures can be used to determine how direct routes are between destinations. Networks can range in connectivity from low to high, where a low connectivity network, or “branching” network, produces less direct paths between destinations. In a street network, low connectivity networks are composed of cul-de-sacs and dead ends, whereas a high connectivity street network would closely mirror a grid system. This can be applied to transit by assessing the potential transit paths between destinations and subsequently the directness of travel.
Convenience
One of the most important elements for attracting riders in Okotoks is the level of convenience transit provides. It is only by providing a high level of service that transit can compete with the convenience offered by a personal vehicle. For example, services that require trip booking 24 hours in advance do not provide riders with the flexibility of traveling whenever they want. Factors such as service frequency and reliability impact travel times and wait times, subsequently impacting the amount of trip planning involved. The increase in use of technology has improved the convenience of transit by offering real-time route information and trip booking apps for on-demand services.
Route Simplicity
This measure refers to how intuitive the network is for users. When implementing a new transit service, the routes should be easy to understand to limit the amount of education and outreach that is required. Ease of use is increased by limiting the number of transfers, route diversions, one-way loops, and changes in direction that may require additional explanation. People will be less likely to test a new service if it is not easily understood. Route simplicity also impacts the route travel time, providing more direct connections between origins and destinations.
FrequencyRiders walk or take local transit to major corridors with frequent service
ConnectivityLow connectivity with cul-de-sacs and dead ends versus high connectivity with a grid system
Evaluation of Local Transit AlternativesFixed Route Options 1-4 and On-Demand Service
Route SimplicitySimple routes are direct and intuitive for users, while complex routes may include multiple transfers, route diversions, one-way loops, and changes in direction.
CoverageProvide transit stops in close proximity to riders’ origins and destinations with minimal walking distances
ConvenienceCompete with convenience of a personal vehicle through improved technology, like on-demand services
36
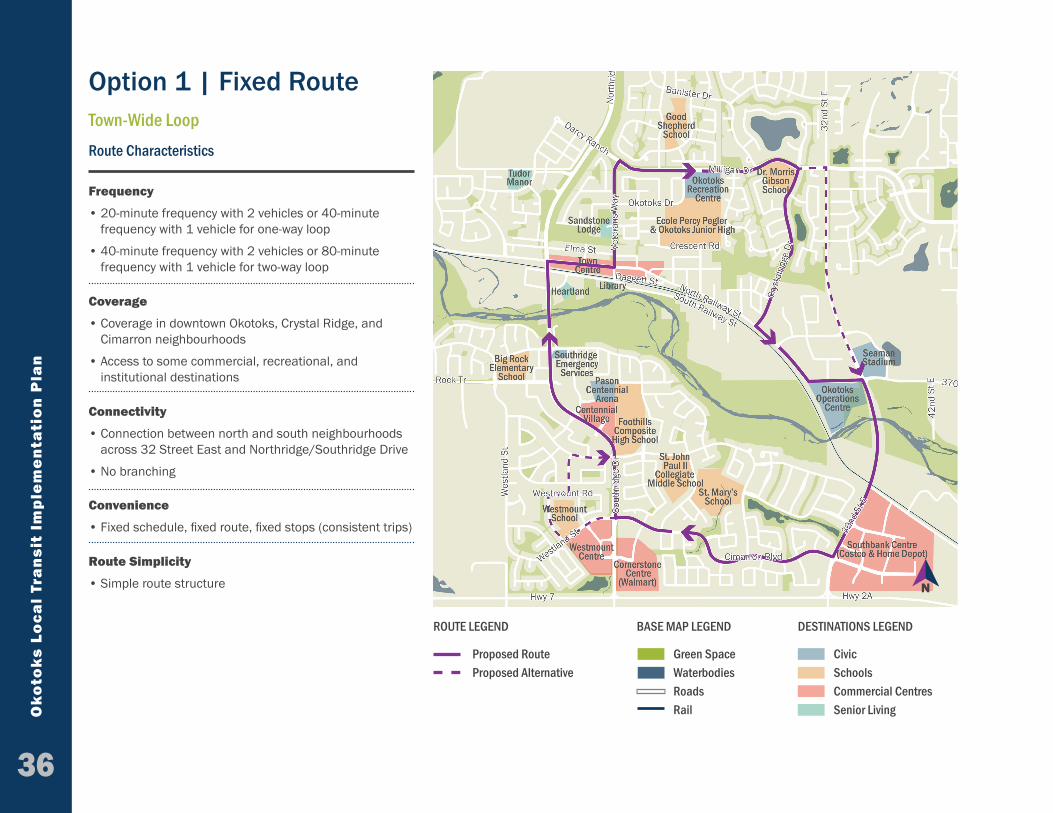
Option 1 | Fixed RouteTown-Wide LoopRoute Characteristics
N
Oko
toks
Lo
cal
Tra
nsi
t Im
ple
me
nta
tio
n P
lan
Connectivity
• Connection between north and south neighbourhoods across 32 Street East and Northridge/Southridge Drive
• No branching
Route Simplicity
• Simple route structure
Convenience
• Fixed schedule, fixed route, fixed stops (consistent trips)
Frequency
• 20-minute frequency with 2 vehicles or 40-minute frequency with 1 vehicle for one-way loop
• 40-minute frequency with 2 vehicles or 80-minute frequency with 1 vehicle for two-way loop
Coverage
• Coverage in downtown Okotoks, Crystal Ridge, and Cimarron neighbourhoods
• Access to some commercial, recreational, and institutional destinations
ROUTE LEGEND BASE MAP LEGEND DESTINATIONS LEGEND
Proposed Route Proposed Alternative
Green SpaceWaterbodiesRoadsRail
CivicSchoolsCommercial CentresSenior Living

37
Route Characteristics
N
Ch
ap
ter 5
| Loca
l Tran
sit Stra
tegie
s for O
koto
ks
Connectivity
• Connection between north and south neighbourhoods across 32 Street East and Northridge/Southridge Drive
• No branching
Route Simplicity• Complicated route structure with changes in direction
and one-way loops
• Transfer required in downtown Okotoks
Convenience
• Fixed schedule, fixed route, fixed stops (consistent trips)
Frequency
• 30-minute frequency with 2 vehicles (one for north route, one for south route)
Coverage
• Good coverage of downtown Okotoks, Crystal Ridge, Drake Landing, and Cimarron neighbourhoods
• Good access to schools and some commercial destinations, but no access to Southbank Centre
Option 2 | Fixed RouteNorth & South Loops
ROUTE LEGEND BASE MAP LEGEND DESTINATIONS LEGEND
Proposed North Route Proposed South RouteTransfer Point
Green SpaceWaterbodiesRoadsRail
CivicSchoolsCommercial CentresSenior Living

38
Oko
toks
Lo
cal
Tra
nsi
t Im
ple
me
nta
tio
n P
lan
Option 3 | Fixed RouteNorth Loop—South Route
Connectivity
• Limited connectivity within neighbourhoods
• North-south connectivity is limited to Northridge/Southridge Drive
• Branching network
Route Simplicity
• Complicated route structure with changes in direction and one-way loops
• Transfer required in downtown Okotoks
Convenience
• Fixed schedule, fixed route, fixed stops (consistent trips)
Frequency
• 30-minute frequency with 2 vehicles (one for north route, one for south route)
Coverage
• Good coverage of downtown Okotoks, Crystal Ridge, Drake Landing, and Cimarron neighbourhoods
• Good access to schools and some commercial destinations, but no access to Westmount Centre and Cornerstone Centre
Route Characteristics
N
ROUTE LEGEND BASE MAP LEGEND DESTINATIONS LEGEND
Proposed North Route Proposed South RouteTransfer Point
Green SpaceWaterbodiesRoadsRail
CivicSchoolsCommercial CentresSenior Living

39
Ch
ap
ter 5
| Loca
l Tran
sit Stra
tegie
s for O
koto
ks
Option 4 | Fixed RouteBidirectional North-South Route
Connectivity
• North-south connectivity is limited to one transfer point in downtown Okotoks
• Branching network
Route Simplicity
• Simple route structure
Convenience
• Fixed schedule, fixed route, fixed stops (consistent trips))
Frequency
• 30-minute frequency with 2 vehicles or 60-minute frequency with 1 vehicle for bidirectional route
Coverage
• Coverage in downtown Okotoks, Crystal Ridge, and Cimarron neighbourhoods
• Limited access to key destinations (Okotoks Cinema, Seaman Stadium, Off Leash Park, and Okotoks Operations Centre/ Environmental Education Centre/BMX)
Route Characteristics
N
ROUTE LEGEND BASE MAP LEGEND DESTINATIONS LEGEND
Proposed Route Green SpaceWaterbodiesRoadsRail
CivicSchoolsCommercial CentresSenior Living
40
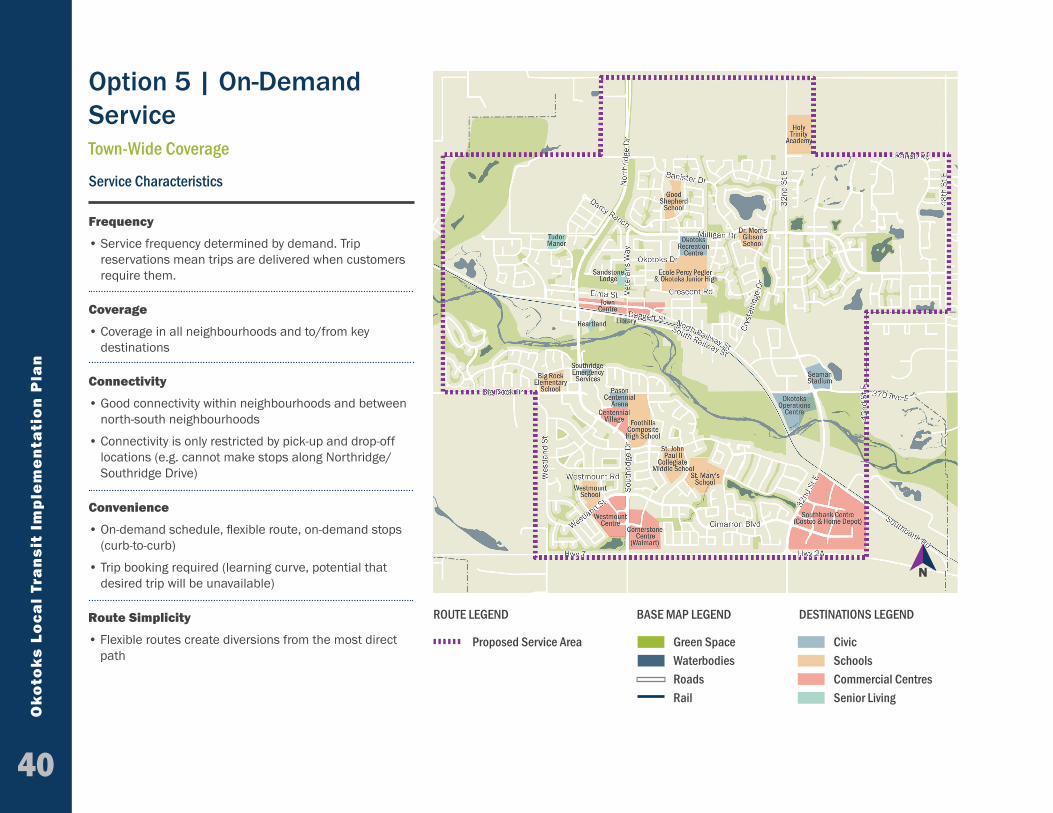
Option 5 | On-Demand Service
Oko
toks
Lo
cal
Tra
nsi
t Im
ple
me
nta
tio
n P
lan
Connectivity
• Good connectivity within neighbourhoods and between north-south neighbourhoods
• Connectivity is only restricted by pick-up and drop-off locations (e.g. cannot make stops along Northridge/Southridge Drive)
Route Simplicity
• Flexible routes create diversions from the most direct path
Convenience
• On-demand schedule, flexible route, on-demand stops (curb-to-curb)
• Trip booking required (learning curve, potential that desired trip will be unavailable)
Frequency
• Service frequency determined by demand. Trip reservations mean trips are delivered when customers require them.
Coverage
• Coverage in all neighbourhoods and to/from key destinations
Service Characteristics
N
ROUTE LEGEND BASE MAP LEGEND DESTINATIONS LEGEND
Proposed Service Area Green SpaceWaterbodiesRoadsRail
CivicSchoolsCommercial CentresSenior Living
Town-Wide Coverage

41
Ch
ap
ter 5
| Loca
l Tran
sit Stra
tegie
s for O
koto
ks
Preferred Local Transit OptionOn-Demand Service Town-WideOn-Demand Service emerged as the preferred option based on the evaluation shown in the comparative analysis to the right. By offering a flexible schedule and routing, an on-demand service provides extensive coverage across the town without sacrificing service frequency. The flexible route also allows greater north-south connectivity between neighbourhoods without requiring riders to transfer to another route or vehicle (which is required in some fixed route options). It is also the option that creates trips that most closely resembles the path taken by a private automobile, creating direct, fast trips.
The fixed route services were deemed to be less feasible for Okotoks due to the lack of connectivity, limited service coverage, and reduced frequency. All of these factors add up to a service that is not as convenient as on-demand transit.
The evaluation of local transit alternatives primarily assessed the benefits of each service type for the riders. When initiating a new service, it is important to consider what type of service will attract riders and build a strong customer base. However, the preferred on-demand alternative also offers benefits to the Town of Okotoks. An on-demand service, particularly one that is app-driven, will provide the Town with rich data on the level of transit demand in each neighbourhood, and provide insight into the major trip generators and attractors. If transit ridership in Okotoks grows to a point where fixed-route service is feasible, this data will make it possible to determine the alignment, service span, and frequency of future fixed-route services.
Comparative Analysis
Fixed Route 1
Fixed Route 2
Fixed Route 3
Fixed Route 4
On-Demand
Frequency
Coverage
Connectivity
Convenience
Route Simplicity
Results 2 4 4 3 1
LEGEND
GoodOK Great

42
Oko
toks
Lo
cal
Tra
nsi
t Im
ple
me
nta
tio
n P
lan
How is On-Demand Service Different from a Taxi Service? At first glance, on-demand transit may seem strikingly similar to taxi services, but the details clearly differentiates the two complimentary services. First of all, taxis are a private for-hire service with the ability to hail on the street. Conversely, on-demand public transit is a shared ride service whenever possible and it must be booked in advance. There are no restrictions on the number of licences granted by the Town for taxi operations. However the municipal budget limits the supply of transit vehicles, operational hours and days. Public transit is designed to be a service enabling all residents to access and move about the community.
The table below further delineates the differences between the two services.
Taxi On-Demand Transit• private service (single
person trips) • public service (open to the
public, no choice in sharing trips)
• variable rate based on distance
• fixed rate for all trips
• extensive service area • limited service area (short, local trips)
• hours of service vary • limited service days and hours
• hail on the street or book in advance
• book in advance
• no real-time tracking or app-based booking (typically)
• app-based with real-time ride tracking and information
• intuitive to use for entire population (tourists, aging population, etc.)
• intuitive for populations who are familiar with apps (younger populations)
Evaluation of Service Delivery OptionsService delivery typically defines who owns, leases or rents the vehicles, who employs the operators and other staff and who performs the maintenance. Three service delivery options were analyzed in detail for the delivery of on-demand transit, including:
» 100% in-house management and operation
» 50/50 mix between in-house and third-party management and operation
» 100% third-party management and operation
The table below gives an overview of the responsibilities of each party for each option. In the first option, the Town assumes full responsibility for the service. The second option proposes to transfer all responsibilities related to hiring and managing operators and maintenance of the vehicles to a third-party, while managing the service is the responsibility of the Town. The third option transfers nearly all of the responsibilities to a third party, leaving the Town with the management of the contract.
Service Delivery Options
Option 1: Management and Operation
In-House
Option 2: Fleet In-House
Operation by Third-Party
Option 3:Management and
Operation by Third-Party
VehiclesOwnership Maintenance Storage
OkotoksOkotoks
Third-PartyThird-Party
Third-Party
Human ResourcesDriversAdmin/MarketingMaintenance
OkotoksOkotoksOkotoks
Third-PartyOkotoks
Third-Party
Third-PartyThird-PartyThird-Party
Technology Okotoks Okotoks Third-Party
GreenTRIP Program Yes Yes No
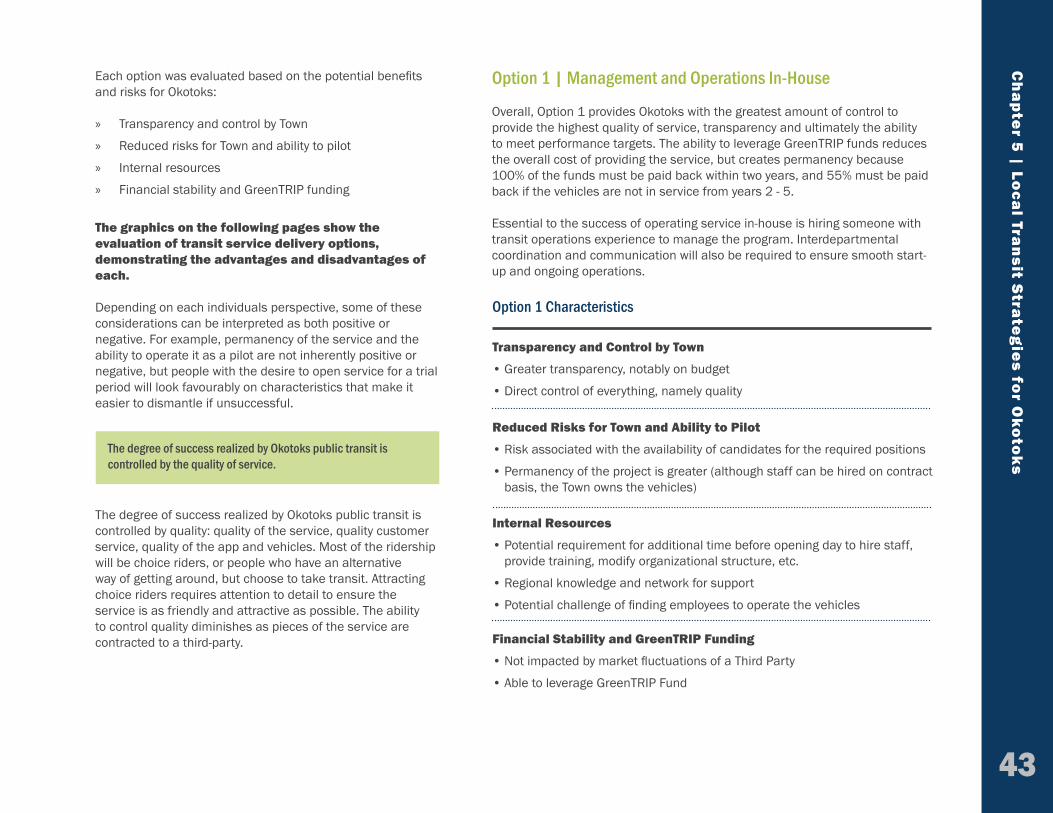
Each option was evaluated based on the potential benefits and risks for Okotoks:
» Transparency and control by Town
» Reduced risks for Town and ability to pilot
» Internal resources
» Financial stability and GreenTRIP funding
The graphics on the following pages show the evaluation of transit service delivery options, demonstrating the advantages and disadvantages of each.
Depending on each individuals perspective, some of these considerations can be interpreted as both positive or negative. For example, permanency of the service and the ability to operate it as a pilot are not inherently positive or negative, but people with the desire to open service for a trial period will look favourably on characteristics that make it easier to dismantle if unsuccessful.
The degree of success realized by Okotoks public transit is controlled by quality: quality of the service, quality customer service, quality of the app and vehicles. Most of the ridership will be choice riders, or people who have an alternative way of getting around, but choose to take transit. Attracting choice riders requires attention to detail to ensure the service is as friendly and attractive as possible. The ability to control quality diminishes as pieces of the service are contracted to a third-party.
43
Ch
ap
ter 5
| Loca
l Tran
sit Stra
tegie
s for O
koto
ks
The degree of success realized by Okotoks public transit is controlled by the quality of service.
Option 1 | Management and Operations In-House
Overall, Option 1 provides Okotoks with the greatest amount of control to provide the highest quality of service, transparency and ultimately the ability to meet performance targets. The ability to leverage GreenTRIP funds reduces the overall cost of providing the service, but creates permanency because 100% of the funds must be paid back within two years, and 55% must be paid back if the vehicles are not in service from years 2 - 5.
Essential to the success of operating service in-house is hiring someone with transit operations experience to manage the program. Interdepartmental coordination and communication will also be required to ensure smooth start-up and ongoing operations.
Internal Resources
• Potential requirement for additional time before opening day to hire staff, provide training, modify organizational structure, etc.
• Regional knowledge and network for support
• Potential challenge of finding employees to operate the vehicles
Financial Stability and GreenTRIP Funding
• Not impacted by market fluctuations of a Third Party
• Able to leverage GreenTRIP Fund
Transparency and Control by Town
• Greater transparency, notably on budget
• Direct control of everything, namely quality
Reduced Risks for Town and Ability to Pilot
• Risk associated with the availability of candidates for the required positions
• Permanency of the project is greater (although staff can be hired on contract basis, the Town owns the vehicles)
Option 1 Characteristics

44
Oko
toks
Lo
cal
Tra
nsi
t Im
ple
me
nta
tio
n P
lan
Option 2 | Fleet In-House and Operation by Third-Party
Similar to option 3, option 2 poses a greater risk that costs will fluctuate and increase at the time of contract renewal. The market for transit operations and maintenance is relatively small, which may result in bids that are greater than what it would cost to do in-house. However, the only way to know this with certainty is to go out to the market.
Okotoks’ dependence on the third party reduces the degree of control over the minutiae which have a significant impact to overall quality and customer experience. The ability to leverage GreenTRIP funds reduces the overall cost of providing the service, but creates permanency because 100% of the funds must be paid back within two years, and 55% must be paid back if the vehicles are not in service from years 2 - 5.
Option 3 | Management and Operation by Third-Party
Similar to option 2, option 3 posses greater risk that costs will fluctuate and increase at the time of contract renewal. The market for transit operations and maintenance is relatively small, which may result in bids that are greater than what it would cost to do in-house. However, the only way to know this with certainty is to go out to the market.
Okotoks’ dependence on the third party for everything reduces the degree of control over the minutiae which have grand impact to overall quality and customer experience.
The bid requirements for service must include a service guarantee for the desired service days and hours. Typically TNCs do not guarantee that service is available.
Internal Resources
• Fewer human resources required from the Town (new staff, new training, etc.)
• No need to hire operators
• Careful contract management required
Internal Resources
• Minimal internal resources required
• No need to hire operators
• Careful contract management required
Financial Stability and GreenTRIP Funding
• Cost may be higher than in-house depending on the market, for the simple inclusion of profit
• Risk of cost increase at contract renewal
• Risk of high bids due to lack of competition
• Able to leverage GreenTRIP grant
Financial Stability and GreenTRIP Funding
• Cost may be higher than in-house depending on the market, for the simple inclusion of profit
• Risk of cost increase at contract renewal
• Risk of high bids due to lack of competition
• Not able to leverage GreenTRIP grant
Transparency and Control by Town
• Less transparency
• Less direct control
Transparency and Control by Town
• Less transparency
• Least amount of control
Reduced Risks for Town and Ability to Pilot
• Okotoks shares risks with Third Party
• Project seems semi-permanent (terminate contract instead of firing staff, Town owns vehicles)
Reduced Risks for Town and Ability to Pilot
• Delegate most of the risk to Third Party
• If TNC – no guarantee of service!
• Can be operated as a temporary pilot
Option 2 Characteristics Option 3 Characteristics

Ch
ap
ter #
| Ch
ap
ter Title
45
Ch
ap
ter 5
| Loca
l Tran
sit Stra
tegie
s for O
koto
ks
Preferred Service Delivery Option
Option 1 emerged as the preferred option due to the Town’s ability to operate and control the transit system, utilize GreenTRIP funding, and realize financial stability. Customer service and overall quality of the service are paramount to the Town and to the success of the transit system. Delivering transit in-house enables the Town to establish quality control measures and integrate a positive, friendly environment into all aspects of service delivery. Unlike other municipal staff, transit operators interface with many residents daily, creating opportunity for them to be ambassadors for the Town. Happy employees make happy customers.
While it cannot be said with absolute certainty that in-house operations will be the least expensive option, it does remove profit from the equation. It also enables job sharing where appropriate to maximize internal capacity.
Option 1 | Management and Operation In-House
Transparency and Control by Town
Reduced Risks for Town and Ability to Pilot
Internal Resources Required
Financial Stability and GreenTRIP Funding
LEGEND
GoodOK Great
Comparative Analysis
In-House 50 / 50 Third
Party
Results 1 2 3

CHAPTER 6Okotoks Local Transit Plan

Service Profile
Resources
The Okotoks’ service profile is designed with the customer in mind. It is simple to use, easy to understand and has a focus on convenience and quality. The amount of service is balanced by cost considerations. In order to ensure employees can get to/from work to most service sector jobs, a broad service window is provided 6 days per week. To balance this broad operating window with cost, service is not initially offered on Sundays, and the number of vehicles is restrained to two at most and oftentimes only one vehicle. One of the biggest advantages of an app-based service is the ability to adjust vehicle availability to match demand once service is up and running. This is a clear differentiator from fixed-route services.
On opening day, Okotoks On-Demand will operate as a curb-to-curb service that is available to riders from 6:30am to 11:30pm Mondays to Saturdays. This operating window is designed to get many employees to/from work, knowing that some restaurants and bars close after 11:00pm.
48
Oko
toks
Lo
cal
Tra
nsi
t Im
ple
me
nta
tio
n P
lan
Rolling stock
Transit service will begin operation with two in-service vehicles and one spare vehicle. The vehicles must be attractive, accessible, and accommodate at least eight people and one wheelchair. Vehicle options could range from small vans to shuttle buses, and again, should prioritize the customer’s experience and comfort.
Cost Estimate
Special modifications to off the shelf vehicles for increased customer comfort, accessibility and other amenities increases the cost of the vehicle from their published off-the-shelf price. The price per vehicle is likely between $100,000 - $150,000. The GreenTRIP grant will cover 66% of the cost, lowering the Town’s portion to $33,000 - $50,000.
Potential Transit Vehicles
Option 1: mini-van
Option 2: passenger van
Option 3: shuttle bus

Ch
ap
ter #
| Ch
ap
ter Title
49
Human
Administration
A new staff person who is solely responsible for the delivery of transit service in Okotoks is required. This person will be in charge of day-to-day operations, future planning, asset management, software and data oversight, etc. Additional responsibilities that may fall under or outside of the Transit Manager’s scope include hiring and managing staff, customer service, cash and print fare product production and processing, marketing, communications and public relations.
Operators
There is an industry wide labor shortage for bus operators. King County Metro in Seattle, Washington is short 100 bus drivers, and New Jersey Transit has 200 vacancies to fill15. However, the rapid uptake in Transportation Network Company (TNC) drivers presents promise. Uber increased active US “driver-partners” (defined as delivering at least four rides in any given month) from July 2012 to January 2015 from 0 to around 160,000, and by 2017, that number exceeded 1.5M worldwide16. The transferable takeaways from the attractiveness of TNC services is namely the flexibility in schedule and the ability for people to earn a few extra dollars in their spare time. While Okotoks Transit will require that a minimum number of operators are available at any given time in order to ensure the service profile is maintained, designing flexible staff shifts around people’s busy schedules should be prioritized. In other words, create the shifts around the people who are best suited for the job, and then seek persons available to fill in the gaps. This strategy will require superior organizational skills on the administrative side, but is designed to create a working environment that is flexible and people focused, both for the customer and employee.
Ch
ap
ter 6
| Oko
toks Lo
cal Tra
nsit P
lan
The maximum number of operators required at one time is two, which aligns with the maximum number of vehicles in operations at one time. However, like traditional transit operations, the Town will want to have additional operators available in the event that someone is not able to fulfill their shift (e.g., sick, no show). The actual number of employees is dependent on the design of the shifts and the composition of full time and part time staff.
Assuming service will begin and end with one vehicle and during the majority of the day will have two vehicles operating, it is anticipated that 29.5 in-service hours will be required on weekdays and 17 on Saturdays, plus an additional hour for pre- and post-trip.
Maintenance
The vehicles will be maintained by the Town and incorporated into the existing vehicle maintenance processes. With an in-service fleet size of two, the demand on staff is not expected to be great. However, fleet consistency should be considered to reduce training and additional spare parts.
Cost Estimate
Staff time required to operate, manage and maintain transit service will range in price between $550,000 - $650,000, depending on the service delivery model chosen.
Technology
While the use of an app permits trips to be booked without advanced notice, on-demand trip booking can also act as a barrier to travel if the app is not intuitive or easy to use.
15 Bliss, Laura. There’s a Bus Driver Shortage. And No Wonder. City Lab June 28, 2018 https://www.citylab.com/transportation/2018/06/why-wont-anyone-drive-the-bus/563555/16 Hall, Jonathan. Krueger, Alan. “An Analysis of the Labor market for Uber’s Driver-Partners in the United States.” January 2015 Princeton University https://dataspace.princeton.edu/jspui/bitstream/88435/dsp010z708z67d/5/587.pdf

50
Oko
toks
Lo
cal
Tra
nsi
t Im
ple
me
nta
tio
n P
lan
The following factors should be considered when sourcing software to coordinate trip booking and vehicle matching:
» The user interface must be attractive, intuitive and easy to use.
» Ideally, the app features an integrated customer-facing app with vehicle and staff management (assigning vehicles to trips, assigning staff to vehicles).
» Ability for multiple users to share one subscription and to link accounts into household groups.
» Ability to set rules in the app to achieve standards, like prioritizing shared trips.
» Ability for users to access the software via an app or the web and across platforms.
» Ability to store credit in cash or monthly subscription form, and bill directly to credit/debit cards.
» Ability to own the data and receive streamlined reports.
» Ability for users to book trips immediately, in the future, and on a subscription basis.
» Potential feature designed for families that enables the parent to track their child’s trip in real time, receive automatic text messages when the child is picked up and dropped off, and an option for the parent to approve the trip before confirming booking.
Cost Estimate
The licensing fee for the app-based software ranges from $2,000 - $4,000 / month. If the operations and maintenance of the service is put out to a contractor, this fee may be baked into the operator’s fee, or the Town may have a separate contract with the software provider.
Cost Estimate Summary
One-Time Capital Cost Low High
3 Vehicles $ 100,000 $150,000
Annual Operating Cost Low High
Human Resources & Operating Costs $ 550,000 $650,000
Technology $ 24,000 $ 48,000
Gross Operating Cost $ 574,000 $ 698,000
Cost Estimate
There will be a one-time, upfront cost to purchase the vehicles, discounted by two-thirds from the GreenTRIP grant. The annual gross operating cost is estimated to be between $574,000 - $698,000 based on the service levels described herein. The range in price is provided to account for market fluctuations in the event that some of the services are provided by a third-party. The cost estimates provided are intended to be as accurate as possible while not underestimating cost in order to inform the Town’s budgeting process. If operated by the Town, or with specific contract provisions, costs can be optimized by matching service levels to demand using real time information from the app. Additional ways in which the Town is consciously optimizing costs are discussed in the following section.
A complete discussion on performance expectations and management is reserved for Chapter 7 Performance Management.

Ch
ap
ter #
| Ch
ap
ter Title
51
Optimizing Cost
Fare Strategy
Being innovative doesn’t stop with service design, vehicle type or technology, it extends to how the service is paid for and creative solutions to reduce overall cost. For example, ensuring the GreenTRIP grant funds are maximized is a driving factor in many decisions, including the decision to purchase the vehicles, instead of leasing them. The GreenTRIP program requires that Okotoks retain the title to the assets for 10 years, otherwise a portion of the grant is to be repaid. The Town is only accountable to payback 10% of the funds received after 5 years of ownership, if the Town no longer owns them.
Also, the on-demand style of service enables the Town to have two different rates of pay: one for operators who are simply on-call, ready to deliver a trip when requested, and the other for in-service time, when the operator is driving the vehicle. Unlike a fixed-route solution, this enables the Town to realize some savings when there is no demand.
Efficiencies are also realized when integrating tasks associated with transit service into an existing employee’s responsibilities. For example, it is anticipated that most of customer service can be handled through the app and an on-line form; however, there is a need for a phone-based customer service line. Incorporating this feature into existing administrative staff’s responsibilities can be a way to add scope without adding cost. Shared staff resourcing also extends to marketing, maintenance and IT support.
Advertising on the app, the vehicle, and/or the website can create an additional revenue stream. However, the revenue potential must be balanced against other priorities, primarily the aesthetic of the service, which is particularly important for this market given that all Okotokians are accustomed to driving or being privately driven.
Fares can be used to stimulate (and manage) demand, as well as respond to financial needs by generating revenue. The interplay between fare levels, fare products, ridership, and operating costs is crucial, as agencies must strike a balance between charging an adequate fare and ensuring riders are still able to afford the service. When implementing a new transit service, setting the correct fare is particularly important to attract new riders to the service and ensure riders are happy with the value for money. As an example, an express train between Toronto Pearson Airport and Toronto’s Union Station (UP Express) cost $27.50 (or $19 with a Presto card) when it first began operating. After failing to attract riders, it was determined that the fare was too high, and the cost was reduced to $12 (or $9 with a Presto card). In the first 10 months of operation, UP Express carried 747,000 riders compared to 2.76 million in the first year after reducing the price. It is important that agencies get their cost right the first time to build ridership from the start and avoid having to backpedal.
Setting the base fare and associated fare strategy is a delicate balance between making the service attractive and attainable for residents, and generating enough revenue to meet cost recovery targets, thereby reducing the weight that taxpayers carry.
The fare strategy defines the base one-way fare, establishes any discounts, fare product types and frequent user programs. It can also advise when to raise rates and by how much.
Ch
ap
ter 6
| Oko
toks Lo
cal Tra
nsit P
lan
Finally, the next section discusses the fare strategy. It has been designed to encourage subscription-style purchases through both the discounted monthly and household passes. Like many on-line subscriptions, having a monthly automatic deduction for unlimited use will provide a more steady and predictable revenue stream.

52
Oko
toks
Lo
cal
Tra
nsi
t Im
ple
me
nta
tio
n P
lan
Based on a review of peer agencies who have implemented on-demand transit services, fares are typically comparable to local fixed-route transit. As shown in the table below, the fare for on-demand services of peer agencies ranges from approximately $1.00 to $6.00. Many transit agencies who offer traditional fixed-route services as well
as on-demand services charge the same fare for on-demand transit as fixed-route transit, typically with free transfers between services. Since Okotoks Transit does not have traditional fixed-route transit to connect to in Okotoks, fare revenue from fixed-route transit cannot be used to offset the cost of providing the on-demand service.
Peer Agency Fares for On-DemandStrategies
Service Location On-Demand Adult Fare Fare Media Inclusions/Exclusions Local Fixed-Route
Comparison
Acheson Industrial Shuttle Parkland County, AB $6.25 CAD App
(TransLoc)
• �Parkland�County�fixed-route�and�Acheson�Industrial Shuttle included in $6.25 fare (free transfers between services)
• Transfers to Edmonton Transit Service (ETS) not included
• $6.25 CAD for Parkland County Transit
• $3.25 CAD for Edmonton Transit Service adult base fare
AC�Transit�Flex Castro Valley and Newark, CA
$2.35 USD($3.15 CAD)
Cash, tickets, smart card (Clipper card)
• Same�fare�as�the�local�fixed�route�service • $2.35 USD ($3.15 CAD) for AC Transit adult base fare
Airdrie Transit On-Demand Airdrie, AB $2.25 CAD
Cash, tickets, monthly passes
• Same�fare�for�local�fixed-route�service�
• Free transfers to other local Airdrie Transit services included in $2.25 fare
• �If�connecting�to�Intercity�Express�(ICE)�service,�rider pays ICE fare ($9.00) with no additional fee for on-demand service
• $2.25 CAD for local route adult base fare
• �$9.00�CAD�Intercity�Express�(ICE) adult base fare
Go Centennial Centennial, CO $2.60 USD($3.50 CAD) App (Lyft, Via) • Same fare as the light rail line (1-2 zones) and
includes free transfers between the services
• $2.60 USD ($3.50 CAD) for RTD rail system (1-2 zones)
• $4.50 USD ($6.00 CAD) for RTD rail system (3 zones)
Peer Review
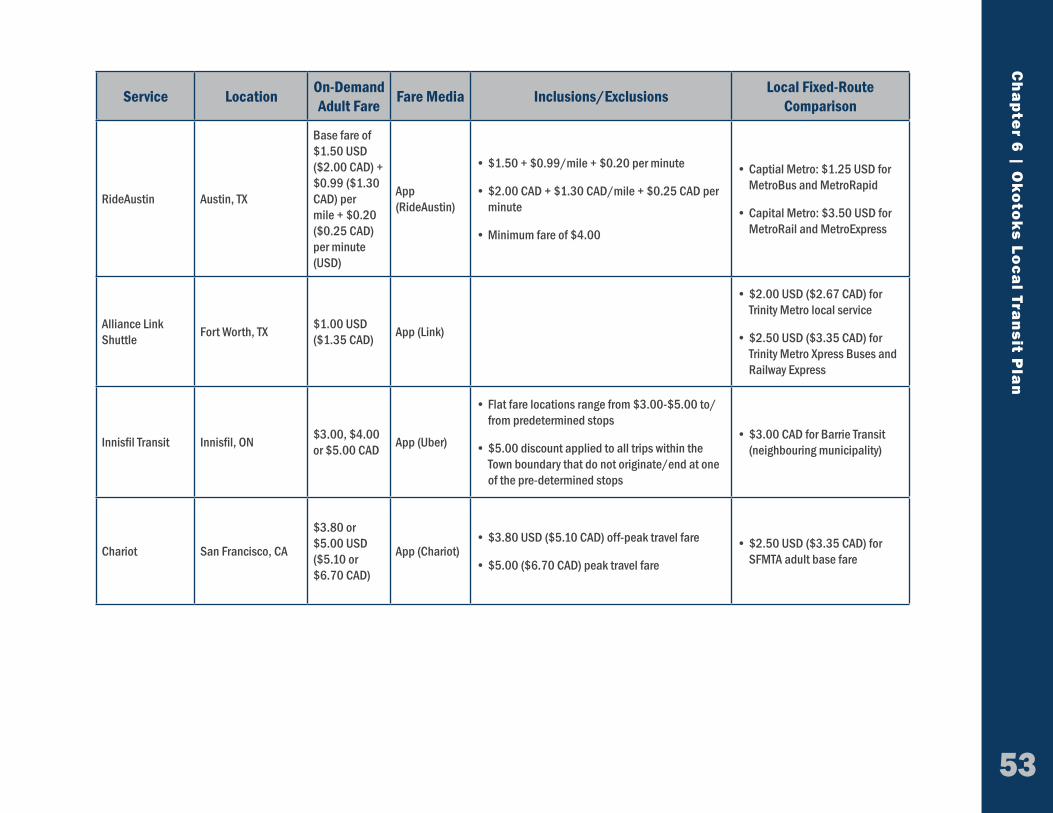
Ch
ap
ter #
| Ch
ap
ter Title
53
Ch
ap
ter 6
| Oko
toks Lo
cal Tra
nsit P
lan
Service Location On-Demand Adult Fare Fare Media Inclusions/Exclusions Local Fixed-Route
Comparison
RideAustin Austin, TX
Base fare of $1.50 USD ($2.00 CAD) + $0.99 ($1.30 CAD) per mile + $0.20 ($0.25 CAD) per minute (USD)
App (RideAustin)
• $1.50 + $0.99/mile + $0.20 per minute
• $2.00 CAD + $1.30 CAD/mile + $0.25 CAD per minute
• Minimum fare of $4.00
• Captial Metro: $1.25 USD for MetroBus and MetroRapid
• Capital Metro: $3.50 USD for MetroRail�and�MetroExpress
Alliance Link Shuttle Fort Worth, TX $1.00 USD
($1.35 CAD) App (Link)
• $2.00 USD ($2.67 CAD) for Trinity Metro local service
• $2.50 USD ($3.35 CAD) for Trinity Metro Xpress Buses and Railway�Express
Innisfil�Transit� Innisfil,�ON $3.00, $4.00 or $5.00 CAD App (Uber)
• Flat fare locations range from $3.00-$5.00 to/from predetermined stops
• $5.00 discount applied to all trips within the Town boundary that do not originate/end at one of the pre-determined stops
• $3.00 CAD for Barrie Transit (neighbouring municipality)
Chariot San Francisco, CA
$3.80 or $5.00 USD($5.10 or $6.70 CAD)
App (Chariot)• $3.80 USD ($5.10 CAD) off-peak travel fare
• $5.00 ($6.70 CAD) peak travel fare
• $2.50 USD ($3.35 CAD) for SFMTA adult base fare

54
Oko
toks
Lo
cal
Tra
nsi
t Im
ple
me
nta
tio
n P
lan
Regional Fares
Base fares in the Calgary region range from $3.30 in Calgary to $2.00 in the Bow Valley, both of which offer discounts based on age. Airdrie’s fare for on-demand service is the same as their local fixed route fare ($2.25), and the fare for their regional ICE service express to downtown is $9.00. Local fare pricing is shown to the right for Calgary, Airdrie, and ON-IT to Banff and Canmore.
What we heard from Okotokians
Price sensitivity for the base fare displayed a wide range on the interactive boards used for the open houses, while the survey response was fairly uniform. Two boards showed relatively equal distribution between less than $2.00, $2.00–$2.99, and $3.00–$3.99, while the other two boards largely favoured under $2.00. The latter two boards reflect responses from middle and high school students. In total, most participants agreed on a fare with a maximum of $2.99.
Recommendation
While there is some acceptance for fares between $3.00–$3.99, it is very limited. While popular, especially with students, setting the fare at $2.00 or below will not generate enough revenue to meet performance targets. Knowing that Airdrie’s one-way base fare for on-demand service is $2.25, and that Airdrie Transit generates most of its revenue from the regional services which help offset the cost of the local service, it is recommended to set the Okotoks transit base fare at $2.75.
It is recommended to set the base, one-way fare at $2.75.
Regional Comparison
Calgary
Okotokians wish to pay = under $2.00 to $2.99
Recommended fare = $2.75
Airdrie Banff & Canmore
Rate = $3.30Discounts offered for:• Youth = $2.30• Child (5 and under)
= Free
Rate = $2.25Discounts offered for:• Child (5 and under)
= Free
Rate = $2.00Discounts offered for:• Seniors = $1.00• Youth = $1.00• Child (under 5 or 6
years old) = Free

Ch
ap
ter #
| Ch
ap
ter Title
55
Discounts
Discounted fares are typically granted by age or income. Discounts by age makes a broad assumption about a group of people’s ability to pay based on their age, while discounts based on income more accurately reflect a person’s ability to pay. Okotoks will not offer any discounts by income initially, but will review this policy after service is up and running. Okotoks will initiate the service by extending the regional policy of children ride for free (under age 5 or 6).
Fare Media
Fare media is another way of creating discounts for frequent users.
Okotoks will offer three options:
» Tickets – a book of 10 or 12 tickets (which may be electronic and paper) purchased together. Option to provide a discount percentage or buy 10 get 1 free.
» Monthly Pass – with the purchase of this pass, the user is eligible for unlimited rides that month. The pass is exclusive to a single person.
» Household Pass – with the purchase of the household pass, anyone in the household is able to use the pass. It may only be used by one person at one time. In other words, if two members of a household were traveling together, one person can use the household pass and the other can pay the regular fare or use a ticket. The household pass can easily be disseminated electronically, acting similar to other on-line subscriptions
Children 5 and under ride for free.
like Netflix or ITunes, where a certain number of authorized users, or apps, can join a single household pass. The household pass should automatically renew every month with the ability to cancel anytime.
How to Pay
Okotoks Transit will be a cashless system meaning that no cash will be accepted on-board the vehicles. Most users will find it convenient to link their credit or debit card to the on-demand app to enable purchasing of fares. However, there will also be an option for customers to load cash onto the app, or use cash to purchase hand-held fare media at one of the designated vendor locations.
Promotion
Promotional fare products are a proven means to entice residents to try a new transit system.
Traditional options include:
» Free ticket in newspaper or mail-out flier to all residents.
» Free service for all for a brief period of time (e.g., 1 day – 1 week, or every Friday for a month).
» Financial credit once the app is downloaded and the customer registers.
Ch
ap
ter 6
| Oko
toks Lo
cal Tra
nsit P
lan
Adult Fare
One-Way Fare $2.75
Monthly Pass $55.00
Household Pass $70.00
Book of 10 Tickets (get 1 free) $24.75

56
Oko
toks
Lo
cal
Tra
nsi
t Im
ple
me
nta
tio
n P
lan
Marketing and Education StrategyInformation and PromotionTransit marketing does not need to be elaborate nor a cost-driver for the organization to be effective. For example, Fort Saskatchewan Transit (FST) made replica bus stop signs that contained user information and placed them all over the city to raise awareness for its services. The replica sign is shown at the entrance of a local Canadian Tire store. The cost of the replica signage was reportedly less than $500 and was “homemade” entirely by city employees. Educational/informational brochures or transit schedules can be included in this type of marketing to help people understand how to use the service and how Okotoks Transit benefits them and the community as a whole, covering some of the themes mentioned above.
Advertisements with a clear message and concise information can be distributed across multiple platforms at a low cost. To reach the greatest number of people, marketing strategies should involve on-line social media and traditional media campaigns.
The following platforms can help generate buzz and educate residents about the new service:
» Social media platforms such as Twitter, Facebook, and Instagram.
» The Town website.
» YouTube (Create videos that introduces the new service and instruct residents how to use it. Create link from other on-line platforms),
» The Western Wheel.
» The Town’s e-newsletter.
» Radio ads (to reach drivers and passengers while they are in their cars).
» Utility bill inserts (to reach people who may not see digital advertisements).
» Sponsored car-free events and commute challenges (e.g. Bus/Carpool to Work Week).
» Pop-up events.
Oftentimes, people are interested in trying transit but intimidated by the prospect of the “first ride”. The accompanying photo shows a community festival in Fort Saskatchewan, is a community festival where one of FST’s buses is parked and used as a free attraction for families — bus bowling. This fun and innovative approach to community engagement was well received and is believed to be directly linked to new ridership.
The top image shows transit advertising and the bottom image shows a transit attraction community event in Fort Saskatchewan.

Ch
ap
ter #
| Ch
ap
ter Title
57
Recommendation
Okotoks Transit will be present at community events, and may host a series of pop-up sessions around the community to educate residents on the new service. One of the challenges of implementing a new service is that people may not know what to expect from the new technology or vehicles used. These events will provide residents opportunities to explore the transit vehicle, will involve an app demonstration where people can try booking a ride, and will have staff on hand to help residents set up the app on their phones. These vehicle exploration and app demonstration community events will occur immediately preceding opening day, and continue to occur once service is operational.
Ongoing Advertising
Public transit offers a number of advantages for the community as well as for riders, including offering a more environmentally-friendly, sustainable, and economical way of getting around compared to owning a personal vehicle. Promotional materials for Okotoks Transit should highlight a variety of key themes related to quality of life improvements that accompany transit use.
It is recommended that Okotoks Transit will host a series of pop up sessions
around the community.
Key messaging and samples from peer agencies are provided below as inspiration for the Town of Okotoks:
» Environmental Benefits of Shared Rides: With growing congestion and GHG emissions generated from single-occupancy vehicles, transit is becoming increasingly important to towns and cities across North America to reduce the number of vehicles on city streets. It is evident from Okotoks’ guiding plans and strategies that environmental protection and stewardship is important to the Town and its residents. As a leader in sustainable community development, marketing of Okotoks’ transit system should emphasize the environmental benefits of shared rides.
» Mobility option for people without access to a personal vehicle: Based on the relatively high income of the Okotoks population, most of the population has access to at least one vehicle, but not all of the population drives. Students and young adults are less likely to have access to a car as they may not have their driver’s license, may not be financially able to purchase a car, or may choose not to drive. Instead of relying on family members or friends to drive them, Okotoks Transit will provide another option for getting around. The convenience and independence that transit provides should be used to market the service, similar to York Region Transit’s campaign that shows people using transit to get to school, work, and social activities.
“Clean. Simple. Sustainable.” campaign for MichiVan, Michigan Department of Transportation.
Ch
ap
ter 6
| Oko
toks Lo
cal Tra
nsit P
lan

58
Oko
toks
Lo
cal
Tra
nsi
t Im
ple
me
nta
tio
n P
lan
Service StandardsSpontaneous vs. Subscription
Historically, on-demand services have struggled with the balance between subscription trips and one-time requests. At certain periods of the day, subscription trips can monopolize service, prohibiting anyone else from making a spontaneous trip during that time period. With two vehicles operational at the start of the service, Okotoks may consider limiting one vehicle to delivering those subscription trips and retaining the other vehicle for spontaneous trips; or ensuring that subscription trips are still available to pick-up spontaneous trips if their trip patterns are similarly aligned.
The top images show advertisements for the “We get where you’re going” campaign for York Region Transit. The bottom image shows an advertisement for the “Ride On” campaign for the Regional Transportation Authority Chicago.
» Cost savings associated with public transit: As discussed in the fare strategy, monthly passes will be available at a fraction of the cost of insurance alone for one vehicle. To the right is an example of advertising the high cost of driving compared to transit use. While cost of parking is not an issue for Okotoks residents, this message can be adapted to emphasize the cost of gas, vehicle ownership, or maintenance.
» Okotoks Transit is “cool” and innovative: Many transit agencies have continued to provide fixed-route conventional transit services with 40-foot buses despite the fact that the way people move is constantly changing in the face of new technologies. Introducing on-demand transit using vehicles and apps that are not traditionally used for transit service shows that Okotoks is adapting service using new tools to better reflect the local demand. The app used for the local service will provide features such as real-time vehicle tracking, integrated payment, and the ability to rate the driver. The autonomous shuttle in particular should be marketed as an innovative service that not many other transit agencies are using.

Ch
ap
ter #
| Ch
ap
ter Title
59
Ch
ap
ter 6
| Oko
toks Lo
cal Tra
nsit P
lan
On-Demand — How to Ride Step by Step:
1. Download app (optional).
2. Reserve/book trips via app on phone/tablet, online, or by phone.
3. Select pick-up location & time.
4. Select drop-off location.
5. ���The�app�or�website�will�confirm�trip & pick-up window.
6. Watch the transit van live on your phone or computer as it gets closer to you.
7. Pay through the app automatically (cash accommodations can be made), simply�exit�vehicle�upon�arrival.
8. Rate driver through app.
Begin by entering your destination in the
app.
Get an estimated travel time and pick
up window before confirming�the�trip.
Watch the transit vehicle come to you
live on the app. Never wonder whether
you’ll be picked up or not. Travel with confidence!
Pick-up Window
The general tolerance to wait has decreased as technology has improved. Waiting for 30–75 seconds for a computer to dial into the internet 15 years ago was acceptable, while today if internet connection is not instantaneous, we lose our patience. Likewise, transportation features like real time vehicle tracking enables customers to precisely time their walk to the curb to be picked up without a moment wasted. While accommodating trips within 5–10 minutes of making the booking may not be a realistic expectation for this service, ensuring that trips are accommodated within a reasonable window of time should be prioritized. Having a flexible and adaptable operating model that can be responsive to demand will be essential to ensuring success.
Initially, Okotoks should strive to deliver trips within an hour of the requested time, at most. As the service is used and demand patterns emerge it will be easier to match demand and supply to minimize wait times.
Customer Service
Customer service is at the forefront of every decision Okotoks makes regarding transit. The app enables riders to rate their driver and may have the ability to implement one second surveys for periodic feedback. Hiring staff for attributes that contribute to a friendly, welcoming service, in addition to the technical ability to drive safely should be prioritized. Creating a positive work environment and upbeat culture through leadership and management will also help foster positive interactions between customers and staff.


CHAPTER 7Performance Management

62
Oko
toks
Lo
cal
Tra
nsi
t Im
ple
me
nta
tio
n P
lan
Performance ManagementMeasuring the performance of service is essential to ensure it is meeting expectations from various stakeholders including Council, tax payers, funding partners and riders. Measuring performance on a daily and weekly basis also enables management to make service adjustments to ensure that customer expectations are met. Tracking and measuring consistently year over year also enables future projections to be made, which assist with budgeting and variations in service (expansion, seasonal variation, etc.).
The accuracy and amount of data that an app-based service with live tracking of vehicles enables is astounding. While the problem a decade ago of making decisions with very little and highly inaccurate data is no longer a concern, organizations now struggle with the sheer volume of data accessible to them. Ensuring the Town knows what data could be available to them, and more importantly, knowing what questions they need answered and decisions they want to make will inform which data to access. Automating data into meaningful reports or a dashboard reduces the administrative burden and streamlines transit improvement processes.
Peer Comparison
On-demand transit is relatively new in North America, with the first Canadian system-wide application in Innisfil, Ontario in March 2017. Most of the applications of on-demand or app-based flexible routing are found in portions of transit systems which makes it very difficult to ascertain the performance of the on-demand services exclusively (reporting is by system, not by individual route). That said, there is still value in comparing the proposed Okotoks transit service with other communities even if the service style is very different. The on-demand style of service was chosen for its ability to serve customers’ needs more effectively and conveniently, but it was also chosen because it is a less expensive option than fixed route. Not to mention the fact that the entire urbanized area of Okotoks has access to on-demand transit, whereas only a portion of the Town would be able to access fixed route for the same cost.
Knowing that the service style and performance expectations are dramatically different from all British Columbian and Albertan transit systems, it is still imperative to compare measures of cost. Out of those communities sampled: » Okotoks on-demand is projected to have the lowest gross operating
cost per hour ($65.00 - $78.00).
» Okotoks’ estimated net cost per capita is substantially lower than the average for transit systems in small communities (less than 50,000 population). Estimated between $15.00 - $20.00, it is in-line with Airdrie ($18.38), and well below most other smaller systems in Alberta which have a net cost per capita between $20.00 - $77.00.
» The projected cost recovery (17%) is the lowest of all sampled, but it is also the only on-demand service. All of the others sampled are entirely or mostly fixed route systems which should be more productive services.
The table below provides select performance measures of select fixed route transit systems from the Canadian Urban Transit Association (CUTA) 2017 Transit Fact Book.
Peer Comparison
Transit System Cost per hour Net cost per capita
Cost Recovery
Chilliwack $89.85 $13.87 28%
Okotoks (projected) $65.00 $15.00 17%
Airdrie $86.46 $18.38 55%
Kootenay Boundary $124.48 $28.20 16%
Canadian population group 5 (< 50,000) $96.03 $33.32 29%
Bow Valley $85.91 $ 54.37 53%

Ch
ap
ter #
| Ch
ap
ter Title
63
Ch
ap
ter 7
| Pe
rform
an
ce M
an
age
me
nt
Two on-demand services beginning in the Calgary region 2019
Cochrane, Alberta is also planning to initiate a new transit system in fall 2019 that is on-demand. From conversations with staff and a review of Council materials, there are a few key differences and similarities. Key similarities include: » Both communities are leveraging GreenTRIP funding to
purchase transit vehicles.
» Both communities evaluated fixed-route and on-demand transit options and concluded that on-demand is the best fit and best value.
» Both services are app-based.
» One-way fare is similar in both communities. Cochrane is charging $2.50 and Okotoks is charging $2.75.
» Anticipated rides per hour are nearly the same (4.8 and 5.0).
» Cost recovery expectations are also similar, with Cochrane estimating 17%–19% and Okotoks estimating 17%.
Key differences include: » Cochrane chose a fixed stop service, while Okotoks chose a
curb-to-curb style pick-up/drop-off.
» The target transit markets to be served are different. Cochrane is focusing resources in the week-day peak (6am - 9am and 4pm - 7pm). Okotoks is focusing resources mid-day from 8am - 8pm.
» Cochrane has a shorter operating window than Okotoks, concluding service on weekdays at 8pm instead of 11:30pm and on Saturdays at 3pm instead of 11:30pm.
» Even though the service window is shorter, Cochrane is planning to have 4 vehicles operating during peak times, while Okotoks plans to have 2 peak vehicles. The difference in annual service hours is approximately 2,000, with Cochrane operating more.
» Cochrane’s net cost per capita is estimated to be greater than Okotoks’ at $20 compared to $15.
How were the performance expectations established?
The two key measurements that impact financial performance on the revenue side are rides per hour and average fare. These two metrics impact annual ridership, revenue and cost recovery estimates. To establish a realistic estimate of rides per hour, knowledge of the industry was heavily relied upon. Because averages of whole fixed route transit systems are not appropriate comparisons, portions of systems were used to ensure expectations are realistic. For example, establishing ridership expectations for Okotoks on-demand began by knowing that many flexible and on-demand routes are created in response to under performing fixed routes. While specifics vary by community, routes that serve low-density neighborhoods often have expectations of carrying 8-15 people per hour. When routes struggle to meet the minimum standards, some transit systems are testing a flexible or on-demand model to improve service quality for the same of less cost. AC Transit did just this (see Appendix B Innovations in Transit), and is averaging three rides per hour.
Knowing that Okotoks Transit wants to move people in shared trips instead of single trips, and that it is likely that a maximum of 2 - 3 trips per hour can be provided given the geography, and that on-demand services in low density areas typically capture 3–8 riders per hour, 5 rides per hour was settled on. One other important factor in this decision is the type of trips that are anticipated to be provided. Systems that move commuters typically operate more efficiently because of the predictability and repeat trips. Okotoks’ market is more likely to be diverse, catering to work, social, personal business, and shopping trips.
The average fare is established by the fare strategy that included substantial public feedback and was cross referenced with local market conditions.
Cost recovery is a factor of ridership, fare pricing and cost. Because this is designed for and anticipated to be a low productivity service, and because the fare is reasonably set, cost recovery will never be great. However, reviewing other metrics in concert with cost recovery

64
Oko
toks
Lo
cal
Tra
nsi
t Im
ple
me
nta
tio
n P
lan
provides clarity that the costs are under control. Cost recovery should be reviewed alongside net cost per capita and gross and net cost per hour, both of which are estimated to be low.
GreenTRIP Reporting
The use of GreenTRIP funds comes with a requirement to report annually for 10 years on the program’s performance that the funds support. The program is intended to support provincial public transportation initiatives through capital funding that helps to reduce congestion, realize greenhouse gas emissions savings and see an increase in public transit use.
The performance measures and targets should be reviewed with the Province to ensure they are in agreement prior to the start of the service. Many of the qualitative measurements recorded here are likely not necessary to include in the provincial report, but are essential to ensuring the system is providing excellent customer service, which impacts the sustainability performance measures like mode share and greenhouse gas emissions.
Methodology
Beyond being able to measure the desired performance metrics, consistency in methodology is essential to ensure trends and comparisons can be made. As advised by the GreenTRIP reporting guidelines, it would be wise to create a brief document that outlines:
» each of the performance metrics
» why the metric is being measured
» the measurement and specific calculations
» the data and data source required to conduct the measure
» data quality controls and cleansing of the data, if any
» the frequency of the data and reporting
» the person responsible for collecting and reporting the data
Frequency
Performance measures that enable operations staff to improve service day-to-day requires fine-grained reporting, hourly and daily. Examples include:
» hourly ridership
» excessive wait times
» unmet trips
» on-time performance
Other metrics like average fare, cost recovery and mode split provide a more global picture that will inform changes to service, policy and the fare strategy at the annual service change.
The performance management metrics are categorized by topic or question that they help to address: productivity, financial performance, quality of service and sustainability. Each of these metrics can be measured weekly, monthly and/or annually. The time horizons shown here include the first six months, the first year, and the ultimate goal. Building ridership, or changing people’s transportation habits takes time. It usually takes three years to realize a transit system’s full potential and performance. Major decisions should not be made in the first six months or year. Instead, the focus should be on service improvements and modifications to better fit supply with the demand and on continuous efforts to educate and market the service. The most common pitfall is to provide a service but not to tell anyone that it exists, or how to use it.

Ch
ap
ter #
| Ch
ap
ter Title
65
Purpose Recommended Frequency
First Six Months Goal
First Year Goal
Ultimate Goal (yearly average)
Productivity
Ridership How many people is the service carrying?
Daily, monthly, annually 7,000 18,000 45,000
Ridership per hour
(total rides/total service hours)
What is the relative performance compared to the amount of service provided?This is an industry standard metric
Daily 1.6 2 5
Percent of total trips that are shared (2+ riders)
(total number of trips made with 2+ riders/total number of trips)
How many trips are pooled and operating more efficiently than single person trips?
Monthly 20% 25% 50%
Financial Performance
Average fare
(total revenue/total passenger trips)
How are discounted fare products impacting the revenue per person?
Monthly $2.50 $2.25 $2.25
Net cost per capita
(net operating cost / population)
What is the subsidy per resident? Monthly $18.00 $17.00 $15.00
Gross cost per hour
(gross operating cost / annual service hours)
How much does the service cost compared to the amount of service provided?
Monthly $75.00 $75.00 $65.00

66
Oko
toks
Lo
cal
Tra
nsi
t Im
ple
me
nta
tio
n P
lan
Purpose Recommended Frequency
First Six Months Goal
First Year Goal
Ultimate Goal (yearly average)
Cost recovery
(total revenue/total operating costs)
What percentage of the cost to deliver service is being paid by users of the system?
Monthly 6% 7% 17%
Quality of Service
Average trip duration, compared to that of a personal car
(Sample random trips: 1- (Google maps estimated trip time of most direct route / actual trip time))** Consider creating subcategories: single rider, 2 riders, and 3+ riders
Are most trips comparable to the time it takes to drive by car? Monthly 25% 25% 25%
Wait Times
Average wait time
(actual pick-up time - requested pick-up time)
What is the transit system’s ability to deliver trips when desired?
Daily < 25 minutes < 20 minutes < 15 minutes
Ideal wait time
(number of trips delivered within 14:59 minutes of the requested time/total number of trips)
How many trips meet customer’s expectations of a responsive and readily available service?
Daily 75% 80% 95%
Excessive wait times
(number of trips delivered 25 minutes or more from the requested time/total number of trips)
What percentage of trips fall well below expectations, creating very long wait times?
Daily 25% 20% 5%

Ch
ap
ter #
| Ch
ap
ter Title
67
Purpose Recommended Frequency
First Six Months Goal
First Year Goal
Ultimate Goal (yearly average)
On-time performance
(number of trips that arrive within the designated pick-up window/total number of trips)
Is service keeping its promise of arriving when it says it will arrive?
Daily 80% 85% 100%
Unmet Trips
(number of trips delivered/number of trips requested)
Is the supply of service falling short of the demand? Daily 100% 100% 100%
Sustainability & GreenTRIP Reporting
Reduce Congestion
(number of passengers per trip in shared trips -1 (2 or more passengers) Consider only measuring during congested times of day
Is the ridership such that the transit service is reducing traffic congestion by reducing the number of vehicles on the road?
Monthly 700 1,500 10,000
Mode SplitWhat impact is public transit having on overall commuting patterns?
Annually 0.5% 0.5% 2%
Reduce Greenhouse Gas EmissionsIs public transit helping to contribute to a healthier environment?
Annually TBD TBD TBD


CHAPTER 8Moving Forward | Okotoks Transit Future

Okotoks On-DemandOne of the most attractive features of an app-based on-demand service is the ability to capture the data and use it to make informed decisions about service expansion.
First, considerations are provided for the first year of service, followed by a series of expansion packages. These expansion packages are not provided in any particular order, but are more like an a la carte menu. The expansion package that best meets the needs of ridership and responds to the performance metrics should be the one chosen for implementation.
Year One
The three most important principles for the first year of service are: » Marketing and education
» High-quality customer service
» Service consistency
Ensuring every resident knows that there is a new transit service available to them is step one. Supporting new riders through superior customer service will help ensure their first trip is as smooth and enjoyable as possible. Once customers decide to make transit a regular part of their lives, ensuring that service is consistent and dependable is essential to keeping their business.
Marketing and education
The importance of on-going education and marketing of the new transit service cannot be understated. A complete marketing and education plan should be created 4 months before service begins so it can be implemented 1-2 months prior to service starting. Technology is vital to using this service, creating space and opportunity for residents to learn how to download and use the app will be paramount.
Fine tuning performance metrics
The targets included in Chapter 7 - Performance Management are based on industry standards and real results from other jurisdictions. Towards the end of the first year, it will be important to review the data and make adjustments to these targets to reflect local conditions.
What happens if demand exceeds supply?
Good news! There is more demand for service than anticipated. In this case, it is more important to deliver service and strive to keep wait times short than it is to maintain consistent branding. Once you lose a customer, it is very difficult to get them back. Consider putting the spare vehicle into service during the most congested times. If that still does not meet the demand, consider using alternative vehicles to deliver service, like appropriate vehicles from the Town’s fleet, or potentially permitting the use of personal vehicles as a stop gap measure. If revenue isn’t enough to allow for additional service hours, consider reducing the service day if certain times of the service day are underutilized. These hours could be repurposed to add hours during congested times.
What happens if demand is not meeting performance metrics?
Ridership is not as great as was hoped. If at all possible, maintain the service promise (service hours, days, wait times and delivering all trips), and implement strategies to attract ridership. Consider a new marketing campaign targeted at key ridership markets, promotional discounts on fares, etc.
Consistency for the existing ridership base is important. If there is a desire to reduce cost, consider reducing the number of vehicles in service (from 2 to 1) during very low ridership times. If ridership and revenue continue not to meet performance metrics, a service reduction may be in order at the one year mark.
68
Oko
toks
Lo
cal
Tra
nsi
t Im
ple
me
nta
tio
n P
lan

Ch
ap
ter #
| Ch
ap
ter Title
69
Ch
ap
ter 8
| Movin
g Forw
ard
: Oko
toks Tra
nsit Future
Year Two and Beyond
Expansion package one: additional weekday capacity
Vehicles: 1 new vehicleDaily Service Hours: 8Add one vehicle to the fleet when demand necessitates to maintain a high-quality, responsive service. The specific number of hours the vehicle will be required is highly dependent on demand. Included here are 8 daily service hours for weekdays, potentially from 10am - 6pm.
Expansion package two: Sunday service
Vehicles: 0Daily Service Hours: 12Using the existing fleet, introduce service on Sundays for a shorter time period, anticipating that the demand for service will not be required in the very early morning, or the late evening. A 12 hour day is proposed.
Expansion package three: additional evening capacity
Vehicles: 0Daily Service Hours: 3.5On opening day, one vehicle is to be in service after 8pm. This expansion adds an additional vehicle in the evenings to meet demand from 8pm - 11:30pm.
Expansion package four: additional Saturday capacity
Vehicles: 0Daily Service Hours: 17One vehicle is initially planned for Saturday service in the first year. When demand necessitates it, add an additional vehicle.
Expansion package five: weekend late night service
Vehicles: 0Daily Service Hours: 2Expand service on Friday and Saturday nights beyond 11:30pm to 1:30am with one vehicle.
Expansion package six: Calgary connector
Vehicles: 3Daily Service Hours: 16Additional service to Calgary was highly requested at public engagement sessions, and is the most prominent single movement of Okotokians. This expansion package is to connect Okotoks with downtown Calgary and back. It includes a capital expenditure for 3 coach buses (2 in-service, 1 spare, unless spare fleet can be shared with other regional transit systems like Airdrie and Calgary Transit).
Expansion package seven: expand service area
Vehicles: 0Daily Service Hours: 0As development occurs beyond the initial service area boundary, Okotoks may expand the service area boundary to include these new, contiguous developments. Ensuring that the quality of service does not suffer for existing riders will be paramount in determining if another vehicle will be required for this expansion.
Expansion package eight: autonomous bus
Vehicles: 1Daily Service Hours: 0Operational Cost Savings per Hour: 30-60%When the technology is ready, and after 5 years of ownership of the existing fleet (to minimize payback to the Province of GreenTRIP funds), replace one traditional shuttle bus with an autonomous one. While an ambassador on-board may be warranted for the initial few weeks or months, the intent is for the vehicle to safely operate autonomously.


APPENDIX ATransit-Supportive Policy Review

IntroductionWhile desired transit-supportive policies may differ based on scale, transit history, and service type, there are a few overarching themes that should be considered when land use planning is aligned with transit:17
» Active transportation-supportive policy is transit-supportive policy: each transit user becomes a pedestrian or cyclist at the beginning and end of every transit trip. Land use policy that encourages pedestrian trips also encourages transit use.
» Mixed uses attract transit riders: encouraging a mix of uses (retail, commercial, residential, etc.) particularly at transit nodes and along transit corridors, helps to encourage a variety of transit trip types.
» Density increases service efficiency: increasing density increases the number of uses that can be accessed within walking distance of transit stops.
Growth in Okotoks
Commercial floor space is predicted to grow by 45,000 square feet per year while industrial floor space is predicted to grow by 60,000 square feet per year.18 The population has increased from 12,000 in 2001 to 29,000 and is expected to grow by 900 people per year in the next 60 years.19 New residential development will need to occur to accommodate
this population growth.20 The desired density of new residential development has been indicated as a minimum of eight units per gross residential acre (~20 units per gross residential hectare).21*
In the past, residential, commercial, and industrial land uses have typically been segmented into discrete areas which poses a detriment to potential transit ridership and trip distances. However, this segmentation may be reduced in policy updates anticipated in the 2019 Environmental Master Plan and Municipal Development Plan rewrite. Best practices suggest a mix of uses along transit corridors and adjacent to bus stops to promote trip generation.22
The following pages describe existing supportive and restrictive policies in the existing Okotoks Land Use Bylaw (LUB), followed by best practices for future consideration. The analysis is divided into the following four topics:
» Parking design and placement
» Mix of uses
» Street design for all users
» Focusing density at transit nodes and along corridors
72
Oko
toks
Lo
cal
Tra
nsi
t Im
ple
me
nta
tio
n P
lan
17 Ontario Ministry of Transportation, Ontario Transit-Supportive Guidelines (Queen’s Printer for Ontario, 2012)18 Town of Okotoks, O2 Planning + Design, Coriolis Consulting Corp., Town of Okotoks Growth Study and Financial Assessment (2014) p. 43-4519 Town of Okotoks, O2 Planning + Design, Coriolis Consulting Corp., Town of Okotoks Growth Study and Financial Assessment (2014) p. 39
20 Town of Okotoks, O2 Planning + Design, Coriolis Consulting Corp., Town of Okotoks Growth Study and Financial Assessment (2014), p. 4121 Town of Okotoks Community Development and Development Services, Okotoks Municipal Development Plan (1998), p. 51*Gross Residential Area: means the total developable area planned for general residential development. It is calculated by starting with gross area of land and deducting both non-developable areas and regional land uses.22 Ontario Ministry of Transportation, Ontario Transit-Supportive Guidelines (Queen’s Printer for Ontario, 2012) p. 17

Ch
ap
ter #
| Ch
ap
ter Title
Parking Design and PlacementRestrictive Policies
It is widely considered beneficial for municipalities to reduce parking requirements/provision to encourage transit use. However, these must coincide with transit nodes or corridors where transit or active transportation is sufficient to eliminate the need for additional parking spaces. While the parking requirements found within the LUB are fairly typical of automobile-oriented, suburban areas, transit-supportive parking policies should be considered in relation to the level of transit service offered.
The high parking requirements within the Residential Single-Detached (R1) district encourages automobile travel rather than transit or active modes. This particularly applies to the minimum parking requirements for single detached dwellings and studio suites which could lead to the requirement of up to five parking spaces per lot.23
Supportive Policies
The LUB has a number of parking provisions that can bolster the pedestrian and cyclist experience and can reduce parking requirements. These include requiring that parking areas are designed to minimize pedestrian disruption and provide adequate bicycle parking, and allowing developers to provide payment in lieu of required minimum parking spaces (up to 25%).24
Best Practice: An additional supportive policy could require that landowners look for shared parking opportunities. For example,a church parking lot may only be utilized in evening hours on weekdays and during the day on weekends, so it can share a parking lot with an office whose hours of operation are the opposite.
Best Practice: Require large developments to submit Transportation Demand Management (TDM) strategies as part of the site plan approval process. Include reductions in maximum and minimum parking requirements once TDM strategies are implemented.25
Best Practice: Allow reductions in parking minimums andmaximums near transit routes.26
Best Practice: Locate private driveways off the main street to break up pedestrian activity along the sidewalk.
Best Practice: Locate parking for commerical uses in rear yards for more pedestrian friendly access along potential transit nodes and corridors.
Best Practice: To ease the transition from parking in areas close to transit service, existing parking spaces can be used for temporary activities and on-street parking can be turned into parklets.
Best Practice: Encourage the design of large, surface parking lots to enable pedestrian movement in addition to vehicle movement.
Best Practice: Encourage sustainable features in large, surface parking lots such as solar panels, shade trees, permeable paving, and bio-swales.27 This aligns with Okotoks’ overall sustainability goal as well as the specific environmental transit principle.
73
Ap
pe
nd
ix A | Tra
nsit-sup
po
rtive P
olicy R
eview
23 Town of Okotoks, Land Use Bylaw (1998) p. 71 24 Town of Okotoks, Land Use Bylaw (1998) p. 33-34
25 Ontario Ministry of Transportation, Ontario Transit-Supportive Guidelines (Queen’s Printer for Ontario, 2012) p. 7926 Ontario Ministry of Transportation, Ontario Transit-Supportive Guidelines (Queen’s Printer for Ontario, 2012) p. 7927 Ontario Ministry of Transportation, Ontario Transit-Supportive Guidelines (Queen’s Printer for Ontario, 2012) p. 75

74
Oko
toks
Lo
cal
Tra
nsi
t Im
ple
me
nta
tio
n P
lan
Mix of UsesRestrictive Policies The permitted and discretionary uses within the R1 district are limited to residential uses and a small number of commercial uses. A greater variety of uses is encouraged along transit corridors and nodes to generate ridership.28
The large number of auto-oriented permitted and discretionary uses such as auto body, paint, repair, and service shops in the I1S district may not encourage transit or pedestrian usage.29
Supportive Policies The Central Business Commercial (CCB) district occupies the small area on either side of Elizabeth Street mostly contained between Northridge Drive and Poplar Avenue. It currently contains a mix of uses including government services, commercial, retail, and residential. Offering a variety of uses and options generates pedestrian and transit trips. As downtowns are usually considered a central hub in a municipality, it is likely that Okotoks’ downtown may become a transit node. This land use district is quite open-ended within the LUB, with a limited number of requirements including front yard setbacks, specific dwelling requirements, and parking requirements. This allows, but doesn’t necessarily encourage transit-supportive uses, infrastructure, and parking design.
Southridge Drive is adjacent to a number of shopping districts including the Shopping Center Commercial (CSC) district, which may support pedestrian use and trip generation.30 With careful attention, future development of these districts may support a future transit corridor or transit nodes. The LUB allows a variety of permitted and discretionary uses within the CSC district. Offering a variety of uses and options helps to attract activity at transit nodes as well as generate transit trips.31
In industrial districts such as the South Business Industrial (I1S), permitted and discretionary uses include a wide variety of employment, service, entertainment, and commercial services that may generate trips. Providing entertainment and eating establishments in close proximity to employment can encourage employees to walk on their lunch break rather than drive.32
Best Practice: Include specific language to require that internal roadways be organized to connect uses and transit from a pedestrian perspective in addition to an automobile focused one.
Best Practice: Encourage multiple modes of transportation by listing drive-in uses such as at food establishments and financial institutions as a discretionary use and not allowing these uses in or near transit nodes.33
Best Practice: Discourage low density, auto-oriented uses and encourage trip generating uses (shopping, employment, etc.) near potential transit nodes and corridors.34
28 Town of Okotoks, Land Use Bylaw (1998) p. 71-7429 Town of Okotoks, Land Use Bylaw (1998) p. 161-164 26 Town of Okotoks, Land Use Bylaw (1998) p. 131-132
30 Ontario Ministry of Transportation, Ontario Transit-Supportive Guidelines (Queen’s Printer for Ontario, 2012) p. 1931 Town of Okotoks, Land Use Bylaw (1998) p. 135-137, p.161-16432 Ontario Ministry of Transportation, Ontario Transit-Supportive Guidelines (Queen’s Printer for Ontario, 2012) p. 7533 Ontario Ministry of Transportation, Ontario Transit-Supportive Guidelines (Queen’s Printer for Ontario, 2012) p. 1534 Ontario Ministry of Transportation, Ontario Transit-Supportive Guidelines (Queen’s Printer for Ontario, 2012) p. 19-25

Ch
ap
ter #
| Ch
ap
ter Title
75
Ap
pe
nd
ix A | Tra
nsit-sup
po
rtive P
olicy R
eview
35 Town of Okotoks, Land Use Bylaw (1998) p. 71-74, 131-132, 135-13736 Town of Okotoks, Land Use Bylaw (1998) p. 43-4437 Town of Okotoks, Land Use Bylaw (1998) p. 135-13738 Town of Okotoks, Land Use Bylaw (1998) p. p. 161-164 Transportation, Ontario Transit-Supportive Guidelines (Queen’s Printer for Ontario, 2012) p. 73
39 Ontario Ministry of Transportation, Ontario Transit-Supportive Guidelines (Queen’s Printer for Ontario, 2012) p. 7340 Town of Okotoks, Land Use Bylaw (1998) p. 71-74, 131-132, 161-16441 Town of Okotoks, Land Use Bylaw (1998) p. 135-137 42 Ontario Ministry of
Street Design for All UsersRestrictive Policies
The minimum front yard setback requirements are six metres in the R1, I1S, and next to roads and residential sites in the CSC districts with a limited amount of flexibility. If transit nodes or corridors are located within or along these areas, these large setback minimums may deter pedestrian activity on the street.35
Awnings and canopies can help to improve the pedestrian environment by providing weather protection. While the LUB allows for awnings and canopies, the number of requirements that a development permit applicant must adhere to is an administrative barrier that could disincentivize their installation.36
Supportive Policies
Loading and unloading areas in the CSC district are required to be screened from view and located at the rear of buildings. This contributes to a comfortable experience for the pedestrian in the front of buildings. Requiring adjacent sites to allow connections to encourage traffic movement in this district may also indirectly support pedestrian activity.37
Requiring sidewalks connecting building entrances to the street in industrial districts such as I1S will encourage pedestrian activity and aid in connecting transit users between a transit stop and their trip origin or destination. Including minimum standards for sidewalks such as raising them above parking areas, also helps to ensure that pedestrians will feel comfortable and safe using them.38
The minimum front yard setback requirements in the CCB district are only three metres compared to larger requirements in the R1 and I1S districts. Transit-supportive policy guidelines suggest that buildings be placed close to the streetline in order to encourage pedestrian activity on the street.39 The decreased minimum setback requirements are therefore transit-supportive however, including a maximum setback requirement would further encourage street-oriented buildings.40
Maximum heights, such as 11 metres in the CSC district, will help to maintain a pedestrian scale while landscaping requirements for boulevards and sites will help to foster a pedestrian friendly environment.41
Best Practice: Parking spaces or open space/dead space closest to the street can be used for temporary activities (street festivals, bike repair, pop-up retail, food trucks, etc.) and bring activity up to the sidewalk edge. If the use inside the building is active, but the sidewalk is narrow, parklets in the street could allow activity from the building to spill out onto the sidewalk and street.
Best Practice: Loading requirements for waste pickup could be modified to require pickup to be located on side streets or rear alleys (if applicable) in all land use districts.
Best Practice: Consider including language in the special conditions of land use districts that would encourage or require the consolidation of access points of multiple developments to reduce the number of pedestrian crossings along a road. This may help to improve pedestrian safety and comfort.

Best Practice: Consider reducing setback requirements along Southridge Drive to encourage pedestrian access and activity in the street.40
Best Practice: The residential areas in Okotoks have extensive and unique systems connecting them to one another and to main streets, this could possibly be a solution within the employment/industrial districts, as well as connecting the system back to the regional system.
Best Practice: Consider increasing landscaping minimums to further establish a pedestrian oriented area.
Best Practice: Consider reducing development permit requirements for awnings and canopies to encourage their installation and use.
Focusing Density Along Transit Nodes and CorridorsRestrictive Policies
The R1 district covers a large portion of Okotoks and is reminiscent of other low-density residential neighbourhoods found throughout suburban communities in southern Alberta. As this district covers the majority of the Town, future transit routes will intersect and connect within these areas. While low-density, auto-oriented neighbourhoods can be present in transit-oriented municipalities, it is generally desired that transit corridors and nodes support higher-density and mixed uses.
The minimum area requirements of the R1 district are 390 square metres. Assuming that there is only one unit on each lot, the maximum possible density of the district would come out to roughly 26 units per hectare which is within the desired density specified in the Municipal Development Plan (studio suites are a discretionary use in this district). While the maximum allowed density is above the suggested minimum density of 22 units per hectare for areas within a five to ten-minute walk (See Table 1) of transit according to Ontario’s Transit-supportive Guidelines, this is only a maximum and there is no guarantee that any areas within the district would actually be this dense. Therefore, this requirement is more likely to restrict rather than support transit.41
While no density maximums are included in the requirements of the CCB district which may allow for higher density development, minimum density requirements would aid in reducing travel and walking distance for a greater number of transit users. This would increase the number of trip-generating uses offered within the district.42
76
Oko
toks
Lo
cal
Tra
nsi
t Im
ple
me
nta
tio
n P
lan
40 Ontario Ministry of Transportation, Ontario Transit-Supportive Guidelines (Queen’s Printer for Ontario, 2012) p. 89
41 Town of Okotoks, Land Use Bylaw (1998) p. 71-7442 Town of Okotoks, Land Use Bylaw (1998) p. 131-132

Ch
ap
ter #
| Ch
ap
ter Title
77
Ap
pe
nd
ix A | Tra
nsit-sup
po
rtive P
olicy R
eview
Transit Service Type Suggested Minimum DensityUnits/Hectare (ha)
Basic Transit Service (One bus every 20-30 minutes)
22 units per ha/50 residents & jobs combined
Frequent Transit Service (One bus every 10-15 minutes)
37 units per ha/80 residents & jobs combined
Very Frequent Transit Service (One bus every 5 minutes with potential for LRT or BRT)
45 units per ha/100 residents & jobs combined
Dedicated Rapid Transit 72 units per ha/160 residents & jobs combined
Subway 90 units per ha/200 residents & jobs combined
Supportive Policies
Increasing density in a municipality, particularly near transit stops, can help to develop the critical mass required to support transit. One way the LUB encourages this is by allowing studio suites as either a permitted or discretionary use in many residential land use districts in multiple forms (raised basement, accessory building, etc.). Increasing the number of studio suites within a neighbourhood is a helpful way of easing the transition from lower to higher density in key areas such as transit corridors and nodes in an appropriate amount of time.
The minimum Floor Area Ratio (FAR) requirements in the I1S district encourage increased density which will help to support transit especially along transit nodes and corridors. The higher FAR requirements along highways or arterial roadways (0.25 compared to 0.15) will support built-up density along potential transit corridors in the future.43
Best Practice: Consider including minimum densities for land use districts in addition to maximum densities, particularly along potential transit nodes and corridors.
Best Practice: Consider reducing increasing maximum densities along potential transit nodes and corridors.
Best Practice: Consider both residential and employment density along potential transit nodes and corridors.44
43 Town of Okotoks, Land Use Bylaw (1998) p. 161-16444 Ontario Ministry of Transportation, Ontario Transit-Supportive Guidelines (Queen’s Printer for Ontario, 2012) p. 2445 Adapted from Ontario Ministry of Transportation, Ontario Transit-Supportive Guidelines (Queen’s Printer for Ontario, 2012) p. 24
Table 1 Minimum Densities for Transit Service 45
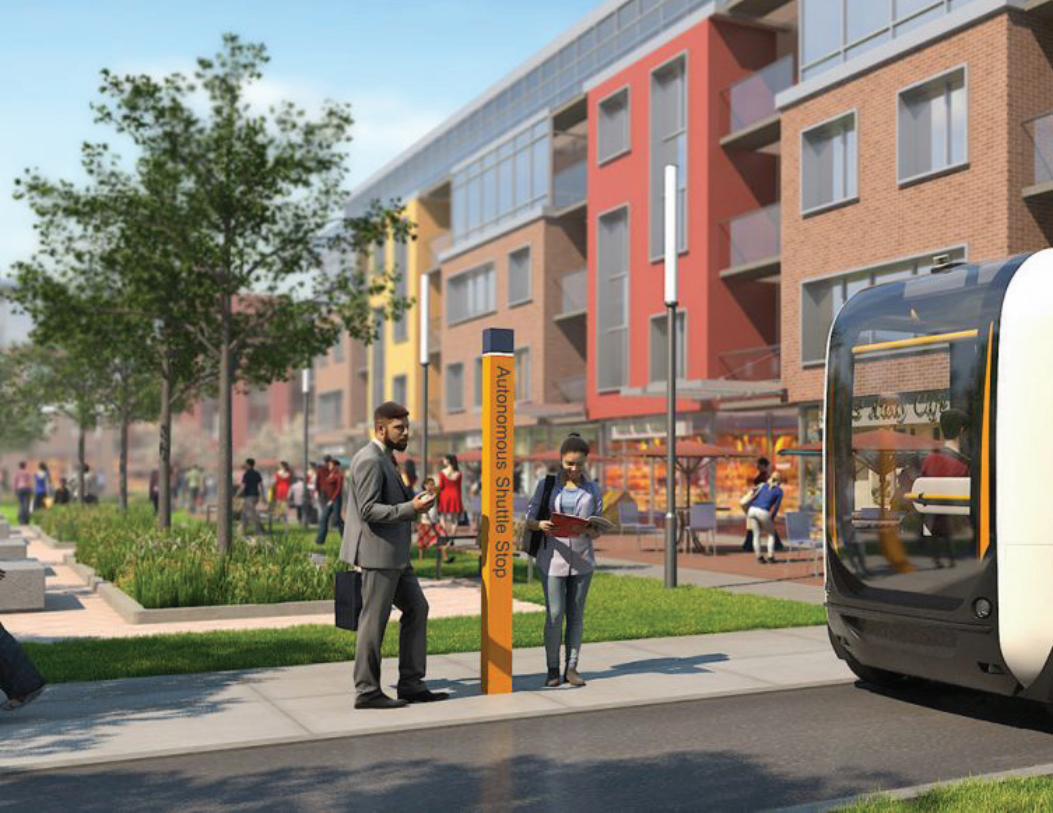

APPENDIX BInnovations in Technology

Innovations in Technology
For: The Town of Okotoks
Authored by: Stantec
Date: June 4, 2018
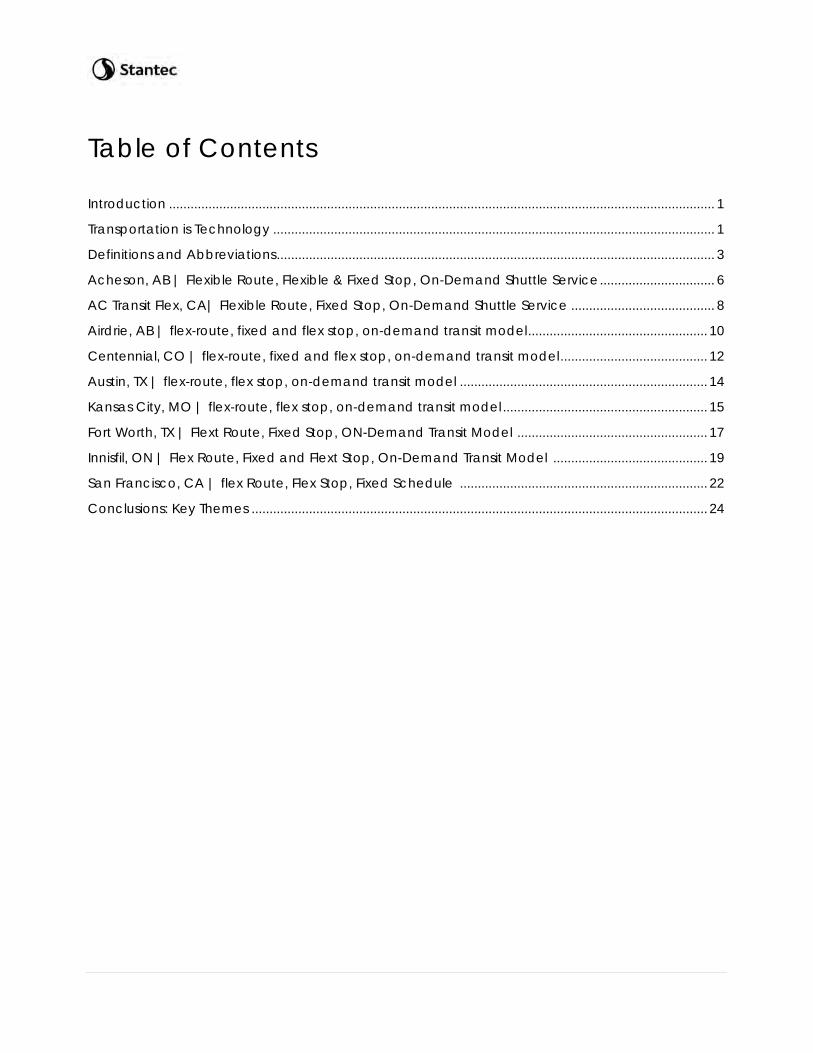
Table of Contents
Introduction ........................................................................................................................................................ 1
Transportation is Technology ........................................................................................................................... 1
Definitions and Abbreviations .......................................................................................................................... 3
Acheson, AB | Flexible Route, Flexible & Fixed Stop, On-Demand Shuttle Service ................................ 6
AC Transit Flex, CA| Flexible Route, Fixed Stop, On-Demand Shuttle Service ........................................ 8
Airdrie, AB | flex-route, fixed and flex stop, on-demand transit model .................................................. 10
Centennial, CO | flex-route, fixed and flex stop, on-demand transit model ......................................... 12
Austin, TX | flex-route, flex stop, on-demand transit model ..................................................................... 14
Kansas City, MO | flex-route, flex stop, on-demand transit model ......................................................... 15
Fort Worth, TX | Flext Route, Fixed Stop, ON-Demand Transit Model ..................................................... 17
Innisfil, ON | Flex Route, Fixed and Flext Stop, On-Demand Transit Model ........................................... 19
San Francisco, CA | flex Route, Flex Stop, Fixed Schedule ..................................................................... 22
Conclusions: Key Themes ............................................................................................................................... 24

1 | P a g e
INTRODUCTION
Communities, businesses, and transit agencies are piloting innovative alternative service delivery strategies in lower-density neighborhoods, often where fixed route productivity is poor or not available. So far, the results of these pilot projects have been encouraging as they have demonstrated improved service quality and improved customer experience while reducing the cost of providing services in these areas.
Leveraging app-based technology, real-time ride-matching and optimizing software, and innovative service delivery models, organizations are experimenting with providing demand responsive service to improve various performance metrics like: trip time, on-time performance, cost, service area and service hours. While this creativity is enabled by technology, it is also driven by an increase in customers’ expectations of service due in large part to companies like Uber and Lyft. These Transportation Network Companies (TNCs) offer easy to use, personalized service with a price point between public transit and taxis. Watching their success and realizing the opportunity, transit agencies, communities and private companies are innovating to capitalize on some of this latent demand and travel market share.
This scan of the industry for the latest innovations in transit solutions provides the Town of Okotoks with an array of tools and lessons learned from real world applications. The case studies include both Canadian and American examples, and range in context from serving industrial parks, dense central business districts, small towns, lower density and suburban neighborhoods. They present diverse service profiles, service delivery models and customer support and interface strategies. When available, customer survey results and financials are included.
Beginning with the foundation, this document first highlights the impact of technology on transportation and defines key terms and typical service styles. Then, nine case studies are presented with enough detail to understand the various applications, service styles, outcomes, and lessons learned. Finally, the document concludes with key take-aways and themes extracted from the research.
TRANSPORTATION IS TECHNOLOGY
One of the biggest drivers of change is the development of technology in the transportation and transit space. Before we dive into specific case studies, it is worth spending a moment on where and how technology continues to transform transportation. The technological impacts are described in four areas: the customer interface, behind the scenes, the vehicles, and customer expectations.
THE CUSTOMER INTERFACE
• Customers use one central app which easily facilitates mobile fare payment and trip reservation. • Real time visuals and information about the vehicles’ location, type and in some cases, customer
satisfaction ratings of the driver. • Ability to customize transit to you: pick-up and drop-off locations, time of trip, and sometimes vehicle
type.
BEHIND THE SCENES
• Integrated driver app which uses powerful and self-learning algorithms and real-time traffic conditions to create the most efficient shared passenger trips as possible.
• Real time fleet management software and app, which is often integrated with the customer interface app.
• Advanced data analytics enable quick identification of problems/opportunities to expedite quick responses for continued customer service/improvements/efficiencies.

2 | P a g e
THE VEHICLES
• Electric buses are here. They are zero emission, quiet and substantially easier to maintain due to the fraction of moving parts in an electric engine. Battery life is the primary constraint, but will continually improve over time.
• In addition to traditional shuttle buses organizations are seeking any vehicle type that meets the needs of the service, from cars, to SUVs, to converted minivans (to comply with ADA) and full-sized vans.
• Connected and autonomous vehicle (CAV) technology is advancing and making its way into larger vehicles, starting with personal cars, trucks and SUVs to shuttle buses and eventually traditional 40’ buses. This technology suite, sometimes referred to as automated driving systems (ADS), is designed to be safer and more efficient by removing human error, communicating with infrastructure, customers and other vehicles.
CUSTOMER EXPECTATIONS
• On-demand, dynamic routing, new mobility services (Uber and Lyft) have dramatically changed customers’ expectations.
• Access to the atomic clock via cell phones has changed the definition of ‘on time’ to a demanding one in which customers hold operators accountable to the second.

3 | P a g e
DEFINITIONS AND ABBREVIATIONS
There are many terms related to first and last mile transit solutions, often used with slightly different meanings. For the purposes of this document, the following definitions are provided for clarity and consistency.
Term (alternative
names)
Definition1
Carsharing A membership service providing access to a fleet of vehicles. Trips can be one-way or free-floating, which allows users to pick up a vehicle at one location and drop it off at another, or they can be round-trip, requiring users to borrow and return vehicles at the same location. Some companies offer a peer-to-peer (p2p) model which allows car owners to earn money by making their vehicle available for rental to other carshare members when it isn’t being used.
Ridesharing (carpooling, vanpooling)
Ridesharing involves adding passengers to a private trip in which driver and passenger(s) share a destination. Drivers using their personal vehicle are able to fill otherwise empty seats, enabling them to generate revenue. Riders may congregate at a common origin or be picked up at their door.
Ridesourcing Transportation Network Companies (TNC)
Ridesourcing providers such as Uber and Lyft—codified in California law as Transportation Network Companies (TNCs)—use online platforms to connect passengers with drivers and automate reservations, payments and customer feedback. Riders can choose from a variety of service classes, including drivers who use personal vehicles, traditional taxicabs dispatched via the providers’ app; and premium services with professional livery drivers and vehicles.
Co-mingled “Home to Hub”
A new innovative service model that leverages underutilized specialized transit service vehicles to provide a more flexible and low-cost means of transit service as an affordable alternative to providing fixed route conventional services in low demand, low ridership areas. Disabled and non-disabled customers are “comingled” on the same vehicles to achieve greater service productivity.
Private shuttles Traditional private shuttles include corporate, regional and local shuttles that make limited stops, often only picking up specified riders and whose routes are tailored to those riders.
Microtransit “a privately owned and operated shared transportation system that can offer fixed routes and schedules, as well as flexible routes and on-demand scheduling. The vehicles generally include vans and buses.”2 Services typically feature an app-based user interface.
On-Demand (Demand Responsive)
A transportation service which operates without a schedule and instead dynamically creates trips based on requests from passengers. Prescribed stops or door-to-door service are included. Carsharing, ridesharing, ridesourcing, private shuttles and microtransit may only offer on-demand options or may also offer scheduled service. Types of On-Demand service include: door-to-door; zone or multizone; point-to-point, or a blend of these.
1 Unless otherwise noted, definitions are direct excerpts or paraphrases from TCRP 188 Shared Mobility and the Transformation of Public Transit 2 Shaheen, Susan, Adam Cohen, and Ismail Zohdy, “Shared Mobility: Current Practices and Guiding Principles,” FHWA-HOP-16-022, U.S. Department of Transportation, Washington, DC.

4 | P a g e
Mobility as a Service (Mobility on-demand)
An integrated and connected multi-modal network of safe, affordable, and reliable transportation options that are available and accessible to all travelers. [FTA Office of Research, Demonstration and Innovation]
Self-driving or Autonomous vehicles
Vehicles which are designed to perform all safety-critical driving functions and monitor roadway conditions for the entire trip. By design, safe operation rests solely on the automated vehicle system3.
Specialized Transit
Specialized transit (also known as paratransit in some jurisdictions) are special transportation services for people with disabilities and mobility challenge, often provided as a supplement to fixed-route bus and rail systems by public transit agencies to overcome inaccessible infrastructure. Oftentimes, provincial legislation mandates these services; however, no such prevailing legislation currently exists in Alberta.
Flex-route Flexible Transit
Hybrid of conventional fixed-route and demand-responsive paratransit. Examples include route deviation and flag stop requests.
Fixed-route A system of transporting individuals (other than by aircraft), including the provision of designated public transportation service by public entities and the provision of transportation service by private entities, including, but not limited to, specified public transportation service, on which a vehicle is operated along a prescribed route according to a fixed schedule4
Zone A defined area within which a transit vehicle can pick up/drop off a passenger through a reservation.
Flag stop Time based transit service that does not have fixed pick up and drop off points but uses the closest available safe curb space to drop or pick up passengers who "flag" or wave down the bus.
The innovative transit solutions are typically a mixture of: fixed or flexible route, preset schedule or an on-demand schedule, and fixed or flexible pick-up/drop-off locations. The table below differentiates six unique types of transit service design ranging from the traditional fixed route to the newer, fully flexible and on-demand service.
3 NHTSA, “Preliminary Statement of Policy Concerning Automated Vehicles” p.5 4 Code of Federal Regulations, United States [49 CFR 37.3]

5 | P a g e
Table 1: Transit Service Style Spectrum
Fixed-Route Flex-Route On-Demand Fixed Route/ Fixed stop/
Fixed Schedule
This is traditional public transit, where the schedule is published, passengers must travel to a bus stop along the route, and the bus precisely follows the schedule.
Flexible Route /Fixed Stop /Fixed Schedule
Key timing points in the schedule are fixed, but there is flexibility in between those timing points to create a dynamic route based on requested stops. Users must choose from prescribed stops from which to travel.
Flexible Route/ Fixed Stop /On-Demand
Users request a shared trip through a tech-enabled application or by phone from a series of prescribed stops. The software creates trips based on the requests. Routes are fully dynamic and can be adjusted in real time to account for traffic and demand.
Fixed Route/ fixed Stop /on-demand schedule
While the route and stops are fixed, the service only operates if requested by a customer typically through an app or by phone. Certain stops may be skipped if they haven’t been requested.
Flexible Route / Flexible Stop /Fixed Schedule
Key timing points in the schedule are fixed, but there is flexibility in between those timing points to create a unique route based on requested stops. Passengers have flexibility in choosing pickup/dropoff locations, typically within a prescribed zone (sometimes referred to as door to door service).
Flexible Route /Flexible Stop /On-Demand
Users request a shared trip through a tech-enabled application from any location within the service area. The software creates trips based on the requests. Routes are fully dynamic and can be adjusted in real time to account for traffic and demand.
To put the table above in context, each of the case studies included in this memo are described below based on their defining characteristics of wether they have a fixed or flexible route, a fixed or flexible stop, or a fixed or flexible schedule (on-demand). In many cases, the transit solutions feature a combination of fixed and flexible stops and schedules, as will be described in further detail in the individual case studies.
Table 2: Case Study Service Styles
Case Study Route Stop Schedule
Fixed Route
Flexible Route
Fixed Stop
Flexible Stop
Fixed Schedule
On-Demand
Acheson Industrial Shuttle, AB X X X X
AC Transit Flex, CA X X X X
Airdrie On-Demand Transit, AB X X X X
GO Centennial, CO X X X X
Alliance Link, TX X X X
Innisfil Transit, ON X X X X
RideAustin, TX X X X
RideKC Freedom OnDemand, KS X X X
Chariot San Francisco, CA X X X X X
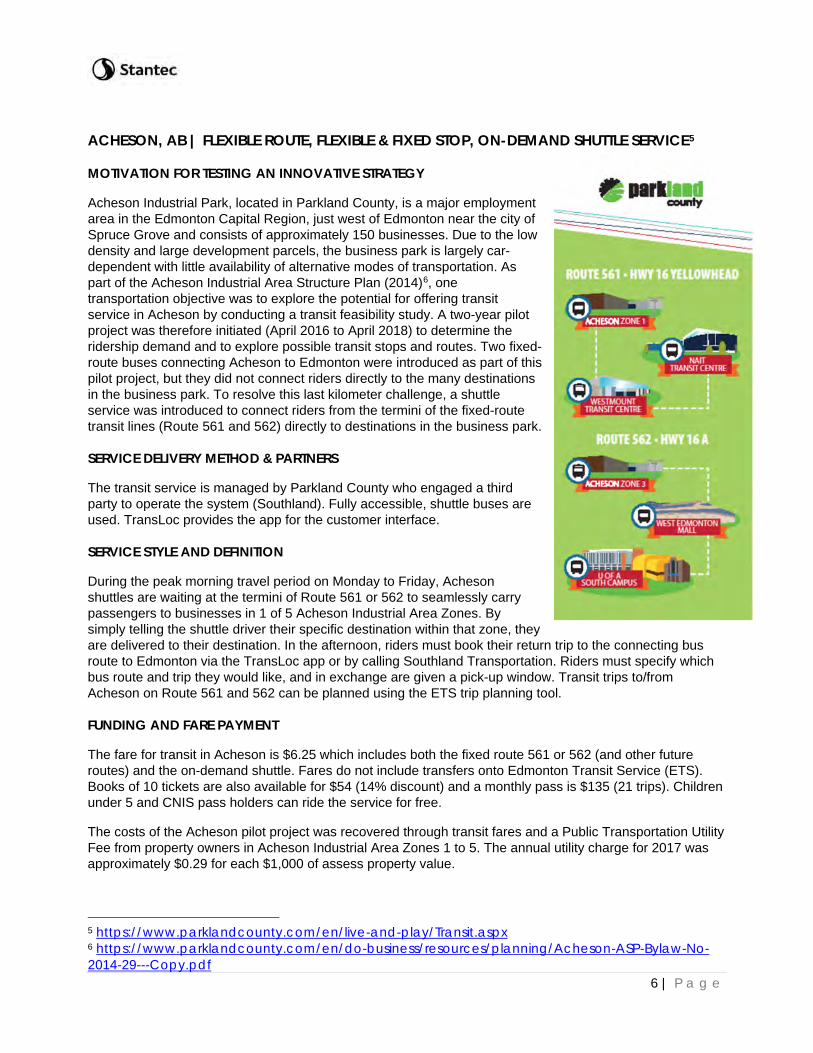
6 | P a g e
ACHESON, AB | FLEXIBLE ROUTE, FLEXIBLE & FIXED STOP, ON-DEMAND SHUTTLE SERVICE5
MOTIVATION FOR TESTING AN INNOVATIVE STRATEGY
Acheson Industrial Park, located in Parkland County, is a major employment area in the Edmonton Capital Region, just west of Edmonton near the city of Spruce Grove and consists of approximately 150 businesses. Due to the low density and large development parcels, the business park is largely car-dependent with little availability of alternative modes of transportation. As part of the Acheson Industrial Area Structure Plan (2014)6, one transportation objective was to explore the potential for offering transit service in Acheson by conducting a transit feasibility study. A two-year pilot project was therefore initiated (April 2016 to April 2018) to determine the ridership demand and to explore possible transit stops and routes. Two fixed-route buses connecting Acheson to Edmonton were introduced as part of this pilot project, but they did not connect riders directly to the many destinations in the business park. To resolve this last kilometer challenge, a shuttle service was introduced to connect riders from the termini of the fixed-route transit lines (Route 561 and 562) directly to destinations in the business park.
SERVICE DELIVERY METHOD & PARTNERS
The transit service is managed by Parkland County who engaged a third party to operate the system (Southland). Fully accessible, shuttle buses are used. TransLoc provides the app for the customer interface.
SERVICE STYLE AND DEFINITION
During the peak morning travel period on Monday to Friday, Acheson shuttles are waiting at the termini of Route 561 or 562 to seamlessly carry passengers to businesses in 1 of 5 Acheson Industrial Area Zones. By simply telling the shuttle driver their specific destination within that zone, they are delivered to their destination. In the afternoon, riders must book their return trip to the connecting bus route to Edmonton via the TransLoc app or by calling Southland Transportation. Riders must specify which bus route and trip they would like, and in exchange are given a pick-up window. Transit trips to/from Acheson on Route 561 and 562 can be planned using the ETS trip planning tool.
FUNDING AND FARE PAYMENT
The fare for transit in Acheson is $6.25 which includes both the fixed route 561 or 562 (and other future routes) and the on-demand shuttle. Fares do not include transfers onto Edmonton Transit Service (ETS). Books of 10 tickets are also available for $54 (14% discount) and a monthly pass is $135 (21 trips). Children under 5 and CNIS pass holders can ride the service for free.
The costs of the Acheson pilot project was recovered through transit fares and a Public Transportation Utility Fee from property owners in Acheson Industrial Area Zones 1 to 5. The annual utility charge for 2017 was approximately $0.29 for each $1,000 of assess property value.
5 https://www.parklandcounty.com/en/live-and-play/Transit.aspx 6 https://www.parklandcounty.com/en/do-business/resources/planning/Acheson-ASP-Bylaw-No-2014-29---Copy.pdf

7 | P a g e
The pilot project ended in April 2018, and Parkland County Council approved the pilot transit project as a permanent service in May 2018. Council also approved the expansion of Route 562 from Spruce Grove to Acheson.
In the future, 50% of the Public Transportation Utility Fee will be replaced with General Tax Revenue. Over the next four years, the Business Attraction Fund Restricted Surplus will be used to gradually phase-in the taxation. The estimated annual Transportation Utility Cost is $600,000. Table 3 shows the proposed transit funding in Parkland County.
Table 3: Parkland County Proposed Transit Funding
Source: May 22, 2018 Parkland County Council Agenda
OUTCOMES & LESSONS LEARNED
The two measures that will be used to determine the success of the project are ridership and business satisfaction. Since the pilot project ended in April 2018, detailed results of the pilot project are not yet available; however, initial findings on these measures were reported to Council in May 2018.
The ridership growth was described as “slow and steady”. Ridership was higher during the morning than the afternoon, as it was observed that the working day for many employees ended before the afternoon service began. Future afternoon peak service hours will be extended to include earlier trips and therefore better accommodate users’ working hours. The service is also planned to provide connection from Spruce Grove to Acheson Industrial Park in the future. These service changes will be implemented alongside a promotional campaign in September 2018. Using the transit agency’s marketing budget, this campaign will aim to provide employee incentives that encourage existing employees to switch to transit, build awareness about the transit improvements, attract new employees/businesses to the area, and promote transit use to Spruce Grove residents who will benefit from the service changes.
With respect to business satisfaction, business owners were found to be in support of the pilot project. However, business owners reported that the new utility fees were too high. For this reason, 50% of the transit funds will come from General Tax Revenue.

8 | P a g e
AC TRANSIT FLEX, CA| FLEXIBLE ROUTE, FIXED STOP, ON-DEMAND SHUTTLE SERVICE7
MOTIVATION FOR TESTING AN INNOVATIVE STRATEGY
AC Transit – Alameda-Contra Costa Transit District (AC Transit) has seen ridership decline in low-density service areas, in particular, the Freemont, Newark, and Castro Valley areas were home to some of the lowest performing routes in the District. To improve service for existing customers and to attract new riders, AC Transit initiated a pilot project for an on-demand transit service in these specific areas. The goals of the pilot were to:
• test an innovative delivery strategy to improve service in areas of low density and low demand; • meet the growing expectations of riders related to on-demand transportation options; and • ensure accessibility and equity.
SERVICE DELIVERY METHOD & PARTNERS
Drivers receive pick-ups and drop-offs from an onboard tablet computer that runs schedule and route-matching software developed by DemandTrans through a contract with Alameda-Contra Costa Transit District.
SERVICE STYLE AND DEFINITION
AC Transit implemented a one-year transit pilot program in March of 2017 to provide an app-based on-demand service on two existing lines – Line 275 in Newark and the northern portion of Line 48 in Castro Valley. The pilot service, AC Transit Flex, allows riders to request a pick-up from any pre-existing stop in the service area using a mobile app or telephone. The route is then customized for the passengers who requested trips, reducing the number of stops and detours made along the way. Riders can receive notifications through the app or in an email indicating that their ride is 10 minutes away.
The service is available to/from pre-existing transit stops (Figure 1), but does not follow a fixed route or schedule, except for departures from Union City BART rail station (Newark Flex) and Castro Valley BART rail station (Castro Valley Flex). At BART stations, riders do not need to book their trip in advance but can board the Flex vehicles at scheduled times and tell their destination to the driver.
Figure 1: Available stops made by reservation in Castro Valley, California Source: AC Transit – Alameda-Contra Costa Transit District
Flex service is available Monday to Friday from 6:00 a.m. to 8:00 p.m., excluding statutory holidays. The AC Transit Flex vehicles are smaller than fixed-route transit vehicles, hold 16 passengers, and are wheelchair accessible. Since the routes are flexible and more direct, Newark can provide rides from Union City BART every 30 minutes instead of every 45 minutes that the previous fixed route/schedule accomodated. During
7 http://www.actransit.org/flex/

9 | P a g e
the pilot, Line 275 was suspended and replaced by Flex Newark, while Line 48 continued to operate in Castro Valley alongside Flex Castro Valley.
FUNDING AND FARE PAYMENT
The pilot program was intended to be cost-neutral, where it traded the service hours of pre-existing fixed routes with additional hours needed to operate Flex service. The cost of the software for this pilot was taken from the money saved by operating smaller buses.
The fare for AC Transit Flex is the same as other local transit services, including discounted fares and day passes. As of July 2017, the cost is $2.25 for adults and $1.10 for youths (age 5-18), seniors (age 65+), and people with a disability.
OUTCOMES & LESSONS LEARNED
As of November 2017 (approximately 8 months into the pilot), the Newark Flex had not yet captured the previous daily ridership of Line 275. It was observed that approximately one-third of Line 275 riders switched to Newark Flex, 50% switched alternative fixed routes in the area (Lines 200 and 232), and the remaining 20% represent ridership decline on the route. Considering ridership in all South County routes declined by 22% over the same time period, it appears as though the Newark Flex has not contributed disproportionate ridership decline compared to other areas in South County.
At the end of the one-year pilot, Flex had improved on-time performance and 94% of riders indicated they preferred Flex over the fixed route. Flex service averaged 3 rides per hour, and up to 7 rides per hour during the peak travel period.
One important lesson learned from this pilot is that trip reservations can act as a barrier for riders. There were 40% more trips beginning at BART stations (where riders did not have to reserve a trip) compared to other pick-up locations. The fact that riders chose to switch to other fixed-route transit services instead of using the Flex service may also indicate that riders find trip booking inconvenient, or that it will take more time for behavior to change.
AC Transit is now planning to discontinue a number of other low-frequency transit routes and expand Flex service to more areas (Figure 3). This will allow more frequent service along major corridors, while the Flex service helps reduce the first/last kilometre challenge between origins/destinations and high-frequency transit corridors.
Figure 2: Proposed Expansion of AC Transit Flex Service Source: Flex V. Fixed: An Experiment in On-Demand Transit

10 | P a g e
AIRDRIE, AB | FLEX-ROUTE, FIXED AND FLEX STOP, ON-DEMAND TRANSIT MODEL
MOTIVATION FOR TESTING AN INNOVATIVE STRATEGY
Airdrie is primarily composed of low-density, single family dwellings plotted on a curvilinear, disconnected road network. Airdrie’s local transit network used to be composed of three fixed routes operating at 30 minute peak and 60 minute off-peak service between 6 a.m. and 6 p.m., and a Dial-a-Bus which offered local service in the evenings and on Saturdays. The local fixed routes each carried between 3 and 6 passengers per hour, when their weekday target is 10, and the Dial-a-Bus required passengers to phone dispatch to request a trip. Only one Dial-a-Bus vehicle was provided to serve Airdrie and the surrounding area, which resulted in limited availability and long travel times if many riders require a pick-up. In turn, these factors reduce its on-time performance and makes it a less attractive option. To improve efficiency and increase ridership, Airdrie implemented recommendations from their Transit Master Plan (2016): streamline the 3 fixed routes to 2 and offer a truly on-demand app-based transit solution. Airdrie Transit implemented a flex-route, fixed and flex stop, on-demand transit model.
SERVICE DELIVERY METHOD & PARTNERS
The City of Airdrie selected a third-party vendor to deliver the on-demand service: Cowboy Taxi, which is a TNC featuring their own free app. Airdrie staff perform the planning and managing of the service.
SERVICE STYLE AND DEFINITION
Airdrie Transit On-Demand provides transit service to residents who live beyond 400 metres from a local or intercity express service (ICE). The service offers flex-stop pick up locations anywhere within the service area, to a fixed-stop of 1 of 8 locations, and back. Along with the introduction of on-demand service, the previous 3 local routes (Route 1, 2, 3) were restructured into two routes (Route 1, 3). The proposed routes, transfer locations, and service area are shown in Figure 4.
Figure 3: Proposed Local Route, Bus Stops, On-Demand Transit Zones and Transfer Points Source: City of Airdrie Transit Master Plan (June 2016)

11 | P a g e
Users can book a trip through the free Cowboy Taxi app, where they can track real-time information, or they can phone customer service. The app also includes a “Wheelchair Access Required” option for riders who have mobility restrictions. Users can book a ride up to one hour in advance or can enter a future date and time. A text message is sent to the rider 3 to 5 minutes before their vehicle arrives.
FUNDING AND FARE PAYMENT
The fare structure for the on-demand service is identical to the local service, regardless of distance traveled. Since the on-demand service is an extension of fixed-route transit, there will be no additional fees to use it. Riders pay their local or ICE fare only. Cash, tickets, and monthly passes are all accepted in this service, and riders are provided with transfers to their local or ICE routes.
The 2017 budget allocated $168,270 for the On-Demand Transit Model, with $201,238 and $236,440 planned in 2018 and 2019, respectively.
OUTCOMES & LESSONS LEARNED
While specific outcomes haven’t yet been reported since the opening of the on-demand service in the fall of 2017, there are a few glaring advantages of partnering with an app-based TNC provider in a low density, low-walkability area:
• the number of vehicles available to be booked varies, but is greater than the single bus used for the prior Dial-a-Bus service.
• many customers will find the app easier to use than phoning customer service. • restricting access to the on-demand service to those beyond a 400m buffer of the local service should
help prevent fixed route users from switching to on-demand.

12 | P a g e
CENTENNIAL, CO | FLEX-ROUTE, FIXED AND FLEX STOP, ON-DEMAND TRANSIT MODEL
MOTIVATION FOR TESTING AN INNOVATIVE STRATEGY
Centennial, Colorado is a suburb located approximately 15 miles southeast of downtown Denver, home to over 109,000 residents. The commute between Denver and Centennial during peak hours is currently plagued by traffic congestion. While the City is located along a light rail line that provides access to downtown Denver and Denver International Airport, access to/from transit stations is an issue.8 In effort to address this first/last kilometer challenge, the Go Centennial pilot project was initiated in August 2016 and ran until February 2017. Improving access by increase options to access the stations and increasing ridership at the Dry Creek light rail station were the primary objectives for the pilot.
SERVICE DELIVERY METHOD & PARTNERS
The Go Centennial pilot was a public-private partnership. The partners fell into four categories: funding partners (Southeast Public Improvement Metropolitan District, City of Centennial), operational partners (City of Centennial, Denver South Transportation Management Association (DSTMA)), service provision partners (Lyft, Via), and integration partners (Conduent, CH2M).
SERVICE STYLE AND DEFINITION
The model applied a demand-responsive mobile platform to provide efficient transportation connections between a local light rail station (Dry Creek LRT) and a neighboring service area.
The program itself temporarily replaced an existing ‘dial-a-ride’ service which required advanced bookings and was serviced by the transit agency’s existing paratransit fleet. Instead, riders were able to book a free ride on Lyft’s shared ride system – Lyft Line – to get between the rail station and their origin or destination. Additionally, during the pilot, ADA eligible riders were able to use an additional pilot program named ‘Go Centennial Access’ which provided service between origins and destinations within the service area other than the light rail station – this was to replace the existing paratransit service that would have normally been offered by the paratransit fleet25.
The pilot program ran from August 17,2016 to February 2017 on Monday to Friday from 5:30 a.m. to 7:00 p.m. To help encourage shared rides and reduce VMT, unrelated riders using Lyft Line for other trips, were paired with Go Centennial trips which shared similar origins and destinations.
To ensure a seamless and unified user experience, both programs were operated through the Lyft platform, meaning that both Lyft and Via drivers used the same platform.
FUNDING AND FARE PAYMENT
Go Centennial and Go Centennial Access are free for the user. The posted fare was $2.60 one-way but came with a free transfer to/from the light rail line, rendering Go Centennial free.
Go Centennial reimbursed Lyft for trips at the market rate, which ranged from $2.56 to $16.24 (average of $4.70) during the pilot.9 Via, who provided the Go Centennial Access service, invoiced the City for the number of hours served at $26.50 per hour.
8 http://www.centennialco.gov/uploads/files/Government/Iteam/Go%20Centennial%20Final%20Report_for%20web.pdf 9 http://www.centennialco.gov/uploads/files/Government/Iteam/Go%20Centennial%20Final%20Report_for%20web.pdf

13 | P a g e
At its launch, this project had $400,000 in funding for a six-month pilot, divided evenly by the City of Centennial and Southeast Public Improvement Metropolitan District (SPIMD). Additional funding was also provided by the i-team grant match fund. At the end of the pilot, $129,717 had been spent, as broken down by expense in Table 3 and Table 4.
Table 4: Go Centennial Service Provision Expenses (City + SPIMD Funding)
Source: Go Centennial Final Report (June 2017)
Table 5: Go Centennial Planning and Marketing Expenses City + SPIMD Funding)
Source: Go Centennial Final Report (June 2017)
OUTCOMES & LESSONS LEARNED
The results of the pilot were positive. Users of the system reported a 25% reduction in wait times for service and 95% of those surveyed indicated they were “satisfied” or “highly satisfied” with the service. The total costs per trip to operate the pilot (user fees + subsidies) were reduced 78% for the Go Centennial service (from $21.14 to $4.70 per trip) and 86% for the Go Centennial Access program (from $47.82 to $6.82 per trip)10.
The conclusions from this pilot offer clear insight into the benefits of replacing conventional ‘dial-a-ride’ services operated by conventional transit fleets in lower density areas with an on-demand service operated by a TNC. The feedback from riders also illustrated the benefits in customer experience this type of program offers.
10 http://www.centennialco.gov/uploads/files/Government/Iteam/Go%20Centennial%20Final%20Report_for%20web.pdf

14 | P a g e
AUSTIN, TX | FLEX-ROUTE, FLEX STOP, ON-DEMAND TRANSIT MODEL
MOTIVATION FOR TESTING AN INNOVATIVE STRATEGY
RideAustin began in June 2016 as a response to Uber and Lyft abruptly leaving the Austin market out of protest over new legislation passed by the City that required drivers to be finger printed11.
SERVICE DELIVERY METHOD & PARTNERS
RideAustin is a unique ridesharing company because it is a non-profit and provides donations to local charities through their smartphone app, which allows users to “round up” the cost of their trip and direct the extra cost to a charity of their choosing. Since launching, the service has raised more than $250,000 for charity5. RideAustin is also very open with their data, willing to release and discuss details of their operation in the hopes it can help others better offer ride sharing systems. For example, the system has acquired over $7 million dollars in donations and several in-kind service donations to get the system up and running and where it is today6.
Via is the chosen app provider, and similar to other TNCs, drivers use their personal vehicles to deliver trips.
SERVICE STYLE AND DEFINITION
RideAustin is powered by the Via app which is a ridesharing company that both runs their own systems as well as partners with other agencies to launch their own. RideAustin began as a pilot in a smaller area of the City offering rides to passengers who began and ended their trips within the pilot area. The service carried passengers from their door to their destination, sometimes picking up multiple passengers along the way heading to the same location.
FUNDING AND FARE PAYMENT
The fare for RideAustin is $0.99 per mile plus $0.20 per minute, after a base fare of $1.50 and minimum fare of $4.00. Additional fees are charged for SUVs (6 passenger vehicles), premium, luxury, and airport services.
OUTCOMES & LESSONS LEARNED
The service was well received with the community logging over 2 million trips in their first year of operation. However, when Uber and Lyft returned to the Austin market in 2017 RideAustin saw a 62% decrease in ridership compared to the week before Uber and Lyft returned12.
RideAustin demonstrates that it is possible to have a successful ‘community-first’ ridesharing option, though significant capital is required to launch a service and there is significant competition in the ride-sharing space.
11 http://money.cnn.com/2016/05/08/technology/uber-lyft-austin-vote-fingerprinting/index.html 12 https://jalopnik.com/when-it-comes-to-ride-hailing-apps-nice-guys-are-finis-1797432944

15 | P a g e
KANSAS CITY, MO | FLEX-ROUTE, FLEX STOP, ON-DEMAND TRANSIT MODEL
MOTIVATION FOR TESTING AN INNOVATIVE STRATEGY
In May 2016, the Kansas City Area Transportation Authority (KCATA) launched a one-year pilot, named RideKC Freedom On-Demand, which sought to improve KCATA’s paratransit offering by partnering with three local taxi companies to allow paratransit and senior riders the ability to hail taxis from a smartphone app. The pilot objectives also included shifting 10% of traditional paratransit (Freedom) to the on-demand service (Freedom On-Demand) in effort to reduce paratransit costs.
SERVICE DELIVERY METHOD & PARTNERS
RideKC is a partnership between KCATA and Transdev. Together they rely on MT Data’s taxi dispatch system which includes everything from apps to tracking and dispatch controls13.
SERVICE STYLE AND DEFINITION
The RideKC Freedom On-Demand service is an app-based service where the user can book and track their ride with a smartphone. Users must register their five to seven-digit paratransit number to their app account to be eligible to book trips. Booking trips without a mobile device is also possible through calling the RideKC Freedom number. It was found that only one in four trips were reserved using the Via app (26%), while over half were reserved through the call centre (59%) and the rest were reserved directly with the driver (15%).
The Freedom On-Demand service uses 10/10 Taxi, Yellow Cab Co., and zTrip vehicles with RideKC Freedom logos on the side (Figure 5). The sedans and minibuses used for RideKC Freedom (traditional paratransit) are not used for the Freedom On-Demand service.
Figure 4: RideKC Vehicles Source: http://ridekc.org/mobility-services/ridekc-freedom-ondemand
FUNDING AND FARE PAYMENT
The program offers ADA qualifying riders a subsidized rate of $3 for up to 8 miles and an additional $2/mile for any additional miles. Seniors 65 years of age or older benefit from a rate of $5 for the first 8 miles and an additional $2/mile for any additional miles. Previously, senior riders were not eligible to use KCATA’s paratransit services. Both ADA qualifying and senior riders can benefit from the subsidized rate up to a maximum of 4 times per day and all trips must be completed within one of several designated service areas14.
In May 2017, the pilot program was extended to the general public. The same subsidized rate applies to seniors and ADA qualifying riders though the general public pays the complete fare. KCATA hopes that any proceeds generated through general public fares would help finance the subsidized trips. Early results show that the cost per trip to KCATA has dropped from $27.13 to $15.8015.
13 http://austin.culturemap.com/news/innovation/06-01-17-new-ride-hailing-service-pickup-test-capital-metro/ 14 http://ridekc.org/blog/ridekc-freedom-on-demand-winning-over-riders 15 http://mtdata.us/industry/taxi/

16 | P a g e
OUTCOMES & LESSONS LEARNED
Based on a rider survey conducted three months into the pilot program, passengers indicated that knowing the fees in advance and knowing the vehicle’s arrival time were areas that were not working well. The response times and vehicle availability were varied, with some response times as long as two hours. Moving forward, efforts will be made to move more users from the call centre to the app. Establishing and formalizing performance metrics and standards for contractors will also aim to address this issue in the future.
The RideKC Freedom On-Demand pilot demonstrated a novel approach to improving paratransit service and customer service while also lowering operating costs by partnering with local taxi companies and leveraging existing ride sharing technology.

17 | P a g e
FORT WORTH, TX | FLEXT ROUTE, FIXED STOP, ON-DEMAND TRANSIT MODEL 16
MOTIVATION FOR TESTING AN INNOVATIVE STRATEGY
The purpose of creating an on-demand shuttle service between express bus routes and major destinations was to complete the trip journey between employers in Alliance, a 26,000-acre master-planned community in northern Fort Worth, Texas and potential employee pools in Denton, a community 25 miles north of Alliance. This service attempts to improve access to major employers.
SERVICE DELIVERY METHOD & PARTNERS
A partnership between Denton County Transportation Authority (DCTA) and public and private stakeholders was established to provide this on-demand service. Rides are booked through the Alliance Link app (Figure 7) by Spare Labs, creator of Spare Rides Carpooling App and DART GoPool.
SERVICE STYLE AND DEFINITION
The Alliance Link Shuttle is available by the Link app, which allows users to ride to and from work within the Alliance area. Riders can request this on-demand shared service between any of the 10 available stops (Figure 6), including the North TX Xpress service at the Heritage and Horizon stop. The ride is then shared between users who are travelling in the same direction.
Alliance Link is available during peak hours of 4:30-7:30 a.m. and 4:30-7:30 p.m. from Monday to Friday and 5:30-7:30 a.m. and 4:00-7:30 p.m. on Saturdays and Sundays.
Figure 5: Alliance Link Stops
16 https://ridealliancelink.com/

18 | P a g e
FUNDING AND FARE PAYMENT
The shuttle service costs $1.00 per ride, and can be made through all major debit cards, credit cards, and pre-paid cards. The app is free to download and payment information can then be set up within the app. Trips can be cancelled within the app, but the user will be charged for the cost of the trip.
Figure 6: Alliance Link App Screens
OUTCOMES & LESSONS LEARNED
The Alliance Link app was launched on March 21, 2018. While it is too early to determine the success of this app, it appears that Alliance Link is looking to expand the service area and is accepting suggestions about future stops.
19 | P a g e
INNISFIL, ON | FLEX ROUTE, FIXED AND FLEXT STOP, ON-DEMAND TRANSIT MODEL 1718
MOTIVATION FOR TESTING AN INNOVATIVE STRATEGY
An extremely low-density community of 37,000, the Town of Innisfil explored options to start a local transit service. The resulting transit feasibility study found that a single fixed route would require a significant capital investment for a very limited service and service area (assuming purchase of the vehicles). The high capital/operating costs, limited capital resources, large geography, and low density in the area presented challenges for operating a fixed-route transit service in the town. Instead of spending $600,000 for a fixed-route solution, council approved $100,000 in 2017 and $125,000 in 2018 for a pilot project to implement a demand-based transit solution.
SERVICE DELIVERY METHOD & PARTNERS
The service is managed by the Town and operated by two third parties: Uber and Barrie Taxi. Riders can request trips through the Uber app, or phone Barrie Taxi for accessible trip requirements.
SERVICE STYLE AND DEFINITION
As part of the Innisfil pilot, there are three types of trips. The first is that the users pay a base fee to predetermined destinations, and the Town pays the difference. The second type is that Innisfil provides a discount for Uber trips originating in the Town but not going to one of the available destinations. The third type of trip is an Accessible Vehicle Request through Barrie Taxi, which has the same fare structure as the Uber trips. Similar to how Uber operates in other jurisdictions, service is available 24 hours a day and 7 days a week, providing greater service span than would be possible on conventional transit.
All driver-partners undergo a comprehensive RCMP screening and motor vehicle record check, and all Uber vehicles must have a provincial Safety Standards Certificate. Uber driver-partners have a $2 million provincially approved ridesharing insurance policy and Innisfil Uber driver-partners are licensed by the City of Toronto’s Safety Department.
FUNDING AND FARE PAYMENT
Flat fare rides to predetermined destinations range in cost from $3.00 to $5.00, as shown in Figure 5. In March 2018, additional flat fare locations were introduced. A standard $5.00 discount is applied for all door-to-door services within the town boundary of Innisfil that do not originate/end at the pre-determined stops.
17 https://www.uber.com/en-CA/newsroom/innisfil-and-uber-ridesharing-transit-partnership/ 18 https://innisfil.civicweb.net/FileStorage/DE733BFE52FE4E6FB0138EF0CF209C8F-Innisfil%20Transit_%20Launch%20of%20Stage%202.pdf

20 | P a g e
Figure 7: Innisfil Transit Fares and Destinations
The original funding budgeted for the project was $100,000 in 2017 and $125,000 in 2018. The subsidy in the first year amounted to $149, 825 instead of the estimated $100,000. Following the pilot year, the 2018 estimate was amended to $500,000. The Town of Innisfil will be covering $350,000 of the costs, up to $93,750 will be available in 2018 from gas tax funding, and the town applied for $50,000 in funding from the County of Simcoe.
During the pilot year (2017) and subsequent year (2018), taxi licensing fees were refunded/waved ($5,150/year). During Year 2, they are recommending removal of annual medical exam from Town’s Taxi By-Law in addition to eliminating the taxi licensing fees.
OUTCOMES & LESSONS LEARNED
In 2017 (from May 15 to December 31), there were approximately 1,400 drivers, and 3,500 residents made 26,700 trips, becoming increasingly used as the pilot progress. It should also be noted that the increasingly cold weather may have impacted the increase in use as the project progressed, and that a comparison between 2017 to 2018 would provide a better metric for program growth. Interestingly, no Barrie Taxi trips were made. It is unclear whether people with disabilities were not participating in this pilot because they had alternative modes of transportation, if there were other barriers preventing their use of on-demand services, or if many were able to use the service provided by Uber.
Approximately 70% of survey respondents were strongly satisfied or satisfied with the service and the biggest complaint was unavailability of drivers. This finding shows that the demand is currently out-pacing supply, which further demonstrates the success of the pilot study. If the demand continues to outpace the supply, the data collected from Uber can be used in the future to determine potential fixed-route transit service.

21 | P a g e
Figure 8: Innisfil Transit Trips per Month (May – December 2017)
There was a 17% match rate during the pilot year, showing that this pilot facilitated shared rides and contributed to reducing single-occupancy vehicle use on the roads of Innisfil.
The top destinations included Barrie South GO and Innisfil GO bus stops along Yonge Street. The intent of this initiative was to supplement existing transit, rather than trying to replace transit.
One major lesson to be learned through this project is that there is not a one-size-fits-all solution for transit service, as it does not always make sense to provide fixed-route bus service. The demand-based transit solution in Innisfil resulted in a more cost-effective and convenient system than a conventional bus network would have provided. Other lessons learned from this project are to think differently about a problem, take the leap and accept the risks, and just try it out!
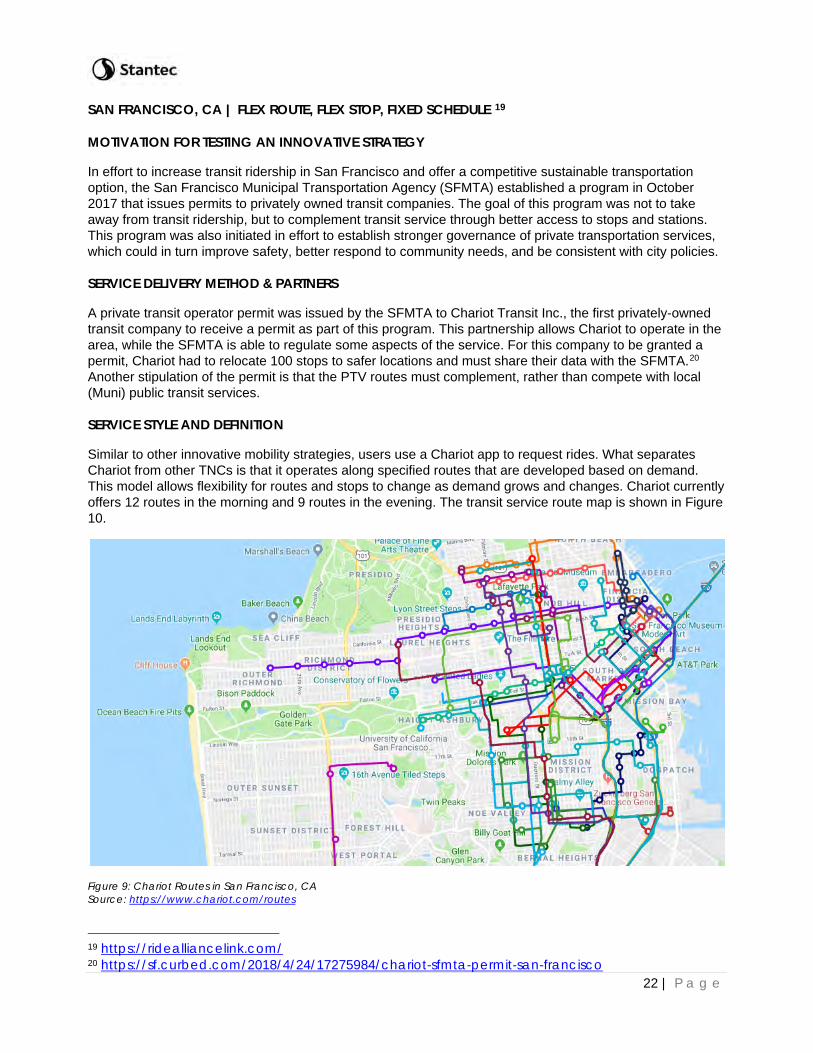
22 | P a g e
SAN FRANCISCO, CA | FLEX ROUTE, FLEX STOP, FIXED SCHEDULE 19
MOTIVATION FOR TESTING AN INNOVATIVE STRATEGY
In effort to increase transit ridership in San Francisco and offer a competitive sustainable transportation option, the San Francisco Municipal Transportation Agency (SFMTA) established a program in October 2017 that issues permits to privately owned transit companies. The goal of this program was not to take away from transit ridership, but to complement transit service through better access to stops and stations. This program was also initiated in effort to establish stronger governance of private transportation services, which could in turn improve safety, better respond to community needs, and be consistent with city policies.
SERVICE DELIVERY METHOD & PARTNERS
A private transit operator permit was issued by the SFMTA to Chariot Transit Inc., the first privately-owned transit company to receive a permit as part of this program. This partnership allows Chariot to operate in the area, while the SFMTA is able to regulate some aspects of the service. For this company to be granted a permit, Chariot had to relocate 100 stops to safer locations and must share their data with the SFMTA.20 Another stipulation of the permit is that the PTV routes must complement, rather than compete with local (Muni) public transit services.
SERVICE STYLE AND DEFINITION
Similar to other innovative mobility strategies, users use a Chariot app to request rides. What separates Chariot from other TNCs is that it operates along specified routes that are developed based on demand. This model allows flexibility for routes and stops to change as demand grows and changes. Chariot currently offers 12 routes in the morning and 9 routes in the evening. The transit service route map is shown in Figure 10.
Figure 9: Chariot Routes in San Francisco, CA Source: https://www.chariot.com/routes
19 https://ridealliancelink.com/ 20 https://sf.curbed.com/2018/4/24/17275984/chariot-sfmta-permit-san-francisco
23 | P a g e
Chariot operates during peak commuting periods, Monday to Friday from 6:30 to 10:00 a.m. and 4:00 to 8:00 p.m. Service hours for particular routes may vary slightly from these times, depending on the demand of the route.
Chariot uses 14-passenger vehicles and also has accessible vehicles available. There is an option within the app to select “Wheelchair Accessible Required” to be picked up in an accessible vehicle.
FUNDING AND FARE PAYMENT
The fee structure for Chariot varies depending on the time of day. For individual rides, the fee for peak travel is $5.00 per ride and for off-peak is $3.80 per ride. Chariot offers a peak monthly pass for $119.00 and an off-peak monthly pass for $89.00. The fee charged is dependent upon the time that the trip is booked. If a trip is booked during the off-peak but the ride arrives during the peak, the user will be charges the off-peak fee. The peak hours are from 7:00-9:15 a.m. and 4:30 to 6:15 p.m.
Annual permit fees are charged to the private transit provider to cover the City’s cost of enforcing and administering the program. Other costs associated with providing the service are the responsibility of the private company.
OUTCOMES & LESSONS LEARNED
A key goal of this program was to ensure the Chariot transit routes do not compete with Muni transit services, but instead complement existing public transit. Based on a recommendation from the SFMTA Board, the SFMTA is developing a set of criteria to determine if a private company’s routes duplicate public transit service. Since the permit requires Chariot to share GPS data with the SFMTA, this data will be a useful tool for measuring how well the public and private transit networks are working together.
If Chariot’s transit routes do in fact supplement Muni routes rather than provide additional competition for public transit, this could be a useful strategy for providing transit service in areas where providing traditional fixed-route services is not feasible.

24 | P a g e
CONCLUSIONS: KEY THEMES
The case studies demonstrate that there is not a perfect solution, but rather they prove that the additional tools that technology has enabled can be customized to fit the specific context and demand. Given the diversity of travel needs in Okotoks, each case study may have applicable lessons learned depending on the target market. Several of these key themes are provided below followed by lessons learned from a few specific case studies:
General themes:
• Don’t be dazzled by the fancy technology, leaving good planning principles by the wayside. Instead, ensure all decisions are customer-first and driven by project principles.
• Good practice with potential technological solutions is to first determine the problem or the opportunity, set specific goals and use that as a guide to deciding which technological solution is best. Then, engage tech vendors to help personalize the tech to the specific need, instead of trying to mold workflow to fit the tech.
• Performance metrics (tied directly to project goals), should extend beyond ridership and cost, and include things like improved access to transit, increased service hours, increased safety and improved customer service.
• Establish realistic performance metrics especially regarding productivity and ridership. The analysis shows that on-demand and flexible transit tends to average 2-5 persons per trip or 3-8 rides /hour.
Lessons learned from specific case studies:
• There is no one-size-fits all model to alternative delivery strategies and public officials, private operators, and the community should work together to develop a pilot project that best meets the needs of the population. (Innisfil Transit)
• To ensure a seamless and unified user experience, two separate services are funneled through one platform (Lyft), meaning that both Lyft and Via drivers use the same platform, and most importantly, customers, regardless of ability use the same mobile app. (Go Centennial and Go Centennial Access)
• The most effective solutions will complement existing mobility options rather than compete with them. GO transit stops (Innisfil Transit) and BART stations (AC Transit) were major destinations for on-demand pilot users. (Chariot San Francisco & Innisfil Transit & AC Transit)
• While technology can connect users to more transportation options, it can also act as a barrier to uptake if the technology is difficult to use. (RideKC)
• Changing the service strategy by time of day to match demand can be successful. Using a zone on-demand service to collect people and take them to a transit route in the morning, and then having vehicles waiting at the station/stop ready to take passengers home was successful for larger commuter movements. (Innisfil Transit & AC Transit)
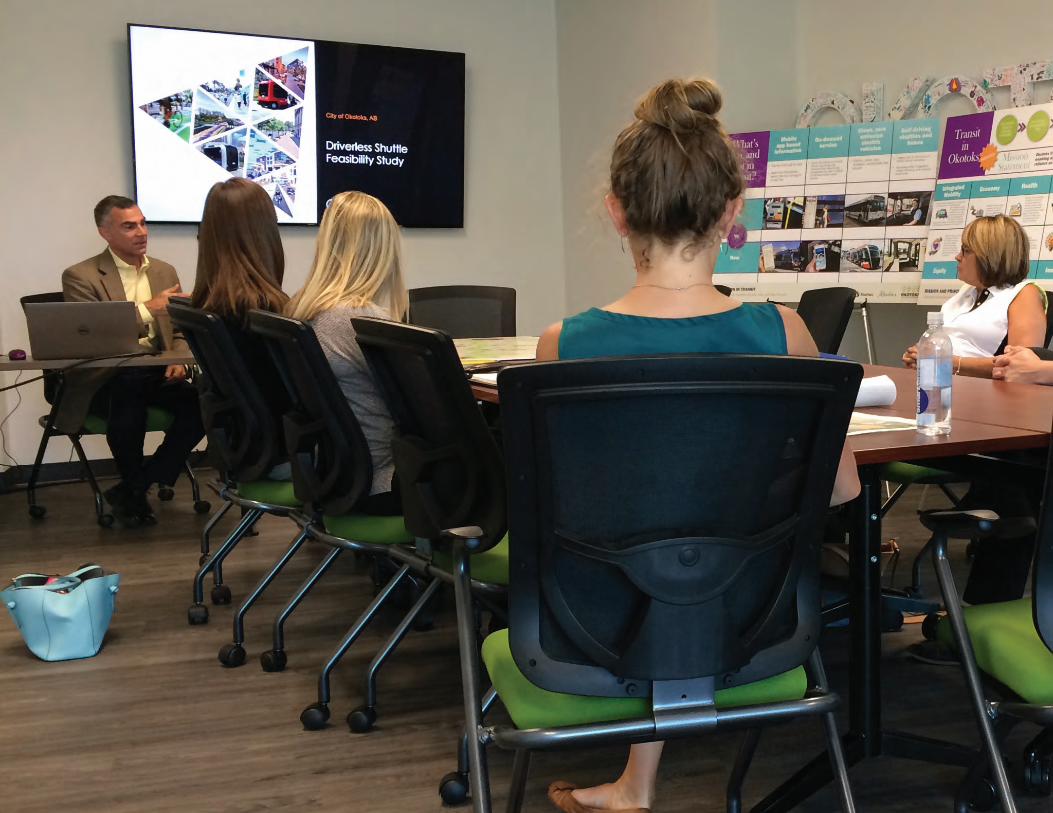

APPENDIX CPublic Participation

Town of Okotoks Local Transit Implementation Plan Phase 1 Public Participation Summary
February 7, 2019
Prepared for: Town of Okotoks Prepared by: Stantec Consulting Ltd.

PHASE 1 PUBLIC PARTICIPATION SUMMARY
Table of Contents
EXECUTIVE SUMMARY ............................................................................................................... I
1.0 ABOUT THE PROJECT ................................................................................................ 1.1
2.0 WHO WE TALKED TO ..................................................................................................... 1 2.1 POP-UP EVENT – OKOTOKS DAWGS GAME................................................................ 1 2.2 POP-UP EVENT – OKOTOKS RECREATION CENTRE ................................................. 1 2.3 ONLINE OPINIONS SURVEY .......................................................................................... 1
3.0 WHAT WE HEARD ........................................................................................................... 5

PHASE 1 PUBLIC PARTICIPATION SUMMARY
i
Executive Summary
The Town of Okotoks is exploring the creation of a viable, efficient local transit system that provides a transportation option for residents to move around within the Town. To support this project, phase one of the public participation program was completed that included both face-to-face and online interactions with the project’s stakeholders. Feedback was gathered at:
• A pop-up event at the Okotoks Dawgs game on June 6, 2018
• A pop-up event at the Okotoks Recreation Centre on June 7, 2018
• An online survey that ran from June 6 to June 30, 2018
The public participation program gathered input from hundreds of interested participants. A typical respondent to the online survey:
• Lives in one of the newer areas of the Town, away from most of the services and amenities
• Has lived in the Town for 5 years or more
• Is part of the working population of the Town (aged 15-64)
Most respondents are interested in trying out the proposed transit system, which will need to be convenient, accessible, and offer simple payment options.

PHASE 1 PUBLIC PARTICIPATION SUMMARY
1.1
1.0 ABOUT THE PROJECT
The Town of Okotoks (“the Town”) has grown significantly over the past several decades, and our future looks very bright. With this growth, the demand for more transportation choices has increased and future transit options are continuously evolving with technology and innovation. These future transit options may include ride-sharing services, self-driving vehicles, the use of apps and real-time ride matching software, and increased integration of “active modes” of transportation like cycling and walking.
One piece of the transportation puzzle is still missing from Okotoks: public transit. We have heard from our residents that local transit is a top priority. The Town is working through a planning process that will evaluate several types of transit solutions that can be quickly implemented over the next year while staying flexible enough to adapt to future transit trends.
The plan will evaluate several styles of transit and choose the best solution for Okotoks both now and for years to come. It will include some key pieces, such as:
• Potential routes and service hours
• Fare structure
• Types of vehicles
• Service delivery method – Town owned/managed, partnership, etc.
The plan will focus on local transit service – moving people around Okotoks in their daily lives – but will consider how the service could be expanded outward and link other systems in the future.
The planning process involves a two-phased public participation approach. Phase 1 – Listen, is focused on hearing from residents about their preferences. Where do you go most often in Okotoks? Which of your daily or weekly trips might be possible or more convenient via transit and why? Which incentives would entice you to try transit?
From the feedback we gather in phase one, combined with data analysis and an innovative approach to creating a truly Okotokian transit solution, a draft local transit service plan will be created and presented to the public in Phase 2 of the public participation program. The goal is to use this feedback to create a final service plan, which would put the local transit system into operation in early 2019.

PHASE 1 PUBLIC PARTICIPATION SUMMARY
1
2.0 WHO WE TALKED TO
Creating a local transit plan is not something that can be done from behind a desk. If the residents don’t see the system as a true option and a good reason to not use their personal vehicles, the system will not be well-used and will be hard to keep running as intended. To combat this, the project team created several opportunities for the citizens and businesses of Okotoks to provide input to help shape the draft transit plan. This included:
• Hosting a project information booth at the Okotoks Dawgs game
• Hosting a project information booth at the Okotoks Recreation Centre
• Launching and promoting an online opinions survey
2.1 POP-UP EVENT – OKOTOKS DAWGS GAME
The project team hosted an information booth on the main concourse at Seaman Stadium on Wednesday, June 6, 2018. The project and the information booth were promoted to the attendees at the previous game (June 2, 2018) as well as several times that evening. With attendance at 3,694 at the game, the team had the opportunity to talk to a multitude of attendees of varying ages, backgrounds and interest levels. Participants were given reminder cards with information a brief description of the project and a link to the project webpage and the online survey.
2.2 POP-UP EVENT – OKOTOKS RECREATION CENTRE
The project team hosted an information booth in the main lobby of the recreation centre on Thursday, June 7, 2018. With numerous lessons and activities planned for that evening, a constant flow of residents was briefed on the project and provided with survey reminder cards.
2.3 ONLINE OPINIONS SURVEY
The Phase 1 survey was linked through the main project webpage on the Town of Okotoks website and ran from June 6 to 30, 2018. A total of 601 responses to the survey were received, with a 100% completion rate of the 12 questions that it contained. A summary of the demographic type questions is included on the following pages. A summary of the raw responses from the entire survey is included in Appendix B.

PHASE 1 PUBLIC PARTICIPATION SUMMARY
2
More than ¾ of respondents (about 77%) have lived in Okotoks for at least 5 years. This is valuable information, as it shows that the responses in the other areas of the survey represent individuals who have experience with living in Okotoks and therefore have had time to reflect on the transportation challenges and opportunities in the community.
The responses to this question of the survey align almost exactly with the demographics of Okotoks, which means that the overall results should provide a fairly representative sample of the opinions of the residents. Unsurprisingly, the population of the Town is skewed heavily toward the working population age groups (ages 15-64), especially those within the years that align with raising families, which is supported by the next graph.
131165
303
Less than 5 years 5-10 years More than 10 years0
50
100
150
200
250
300
350
Years of residency
11
99
237
178
74
Under 18 18 to 31 32 to 45 46 to 60 61 or older0
50
100
150
200
250
Age of Respondents

PHASE 1 PUBLIC PARTICIPATION SUMMARY
3
More than half of the respondents lived in four newer neighbourhoods – Cimarron (southeast portion of Town), Crystal Shores/Crystal Green (northeast), Drake Landing (east), and Crystalridge/Downey Ridge (north central). Apart from Cimarron, the other neighbourhoods represent areas with little commercial or retail development, meaning that they essentially no walkable access to services and will require some other form of transportation.
46
152
109
171
115
It’s just me! Myself and oneother person
Myself and twoother people
Myself and threeother people
Myself and four ormore people
0
20
40
60
80
100
120
140
160
180
Household density, including children
16
5776
12
132
25
58
3346 45
28 2818 13 13
020406080
100120140
What part of town do you live in?

PHASE 1 PUBLIC PARTICIPATION SUMMARY
4
Much like the results on age of respondents, the income of the respondents aligns very closely with the previously reported survey results, indicating that the responses to the other areas of the survey likely represent a good sample of the population of the Town.
48
27
49
79
98
118
100
56
Less than$25,000
$25,000 to$34,999
$35,000 to$49,999
$50,000 to$74,999
$75,000 to$99,999
$100,000to
$149,999
$150,000to
$199,999
$200,000or more
0
20
40
60
80
100
120
140
Total household income before taxes during the past 12 months

PHASE 1 PUBLIC PARTICIPATION SUMMARY
5
3.0 WHAT WE HEARD
The survey contained seven questions that directly related to the transit implementation plan, each of which was created to test resident preferences and receive input on the opportunities and challenges that may face the system.
When asked to describe a word that they felt best describes “transit”, a very large proportion responded with “bus” or “buses”, as shown in the word cloud above. Word clouds give relative size to words in a grouping that are repeated – the larger the word in the image, the more times it was mentioned. As is shown, bus/buses were the most frequently used words, but several other prominent mentions include:
• Convenience/Convenient • Finally • Accessible/Accessibility • Needed • Several themes relating to cost – Affordable, Expensive, Cost, Taxes
While it appears that there is support for the creation of the transit system, it is apparent that there is also some caution within the residents who want to make sure that the system does not become a tax burden and improves the convenience and accessibility of moving around the Town without using a personal vehicle.

PHASE 1 PUBLIC PARTICIPATION SUMMARY
6
The results of this question point to several potential routes, as the options used in the question use the main routes within the Town – Southridge Drive, 32 Street E, the historic downtown core along Elizabeth Street, and the recreation centre. Any route that combines access to these key areas with some frequency will likely have good support. Most of the “other” responses were clarifications of one or more of the options, with several noting that the No Frills grocery store was also a frequent destination.
142
243303
391
542 526
351
251 234
66
0
100
200
300
400
500
600
Where do you travel frequently in Okotoks? Please select all that apply.

PHASE 1 PUBLIC PARTICIPATION SUMMARY
7
Respondents clearly indicated that making it easy to board and pay for a fare will be a critical factor in ridership of the transit system, along with comfortable seating and accessibility of the vehicles used. When probed deeper regarding the types of fare options, the respondents showed a clear preference for electronic/cashless methods of payment.
215
349
255
162 183
482
83
free Wifi comfortableseating
accessibility(kneeling
buses, etc.)
bike rack stroller space easy paysystem
Other (pleasespecify)
0
100
200
300
400
500
600
Which features on the bus would be important to you? (Circle all that apply)
3.65 3.85 4.02
3.17 3.173.55
pay through yourphone
(connected to acredit or interact
card)
by tapping acredit card upon
entering thevehicle
by tapping orswiping a transit
card
one-time usetickets
cash somecombination ofthese options
00.5
11.5
22.5
33.5
44.5
Average preference rank for transit payment method
(1=most preferred, 6=least preferred)

PHASE 1 PUBLIC PARTICIPATION SUMMARY
8
Respondents were then asked if they plan to try out the transit system when it is implemented in 2019. While a very large proportion of them responded that they would, it is interesting to note that there would be little additional gain in ridership if the service were offered for free during a trial period, as shown in the graphs below.
452
140
Yes No0
50
100
150
200
250
300
350
400
450
500
Do you plan to give Okotoks Transit a try?
484
107
Yes No0
100
200
300
400
500
600
If transit were free for a limited time, would you give transit a try?
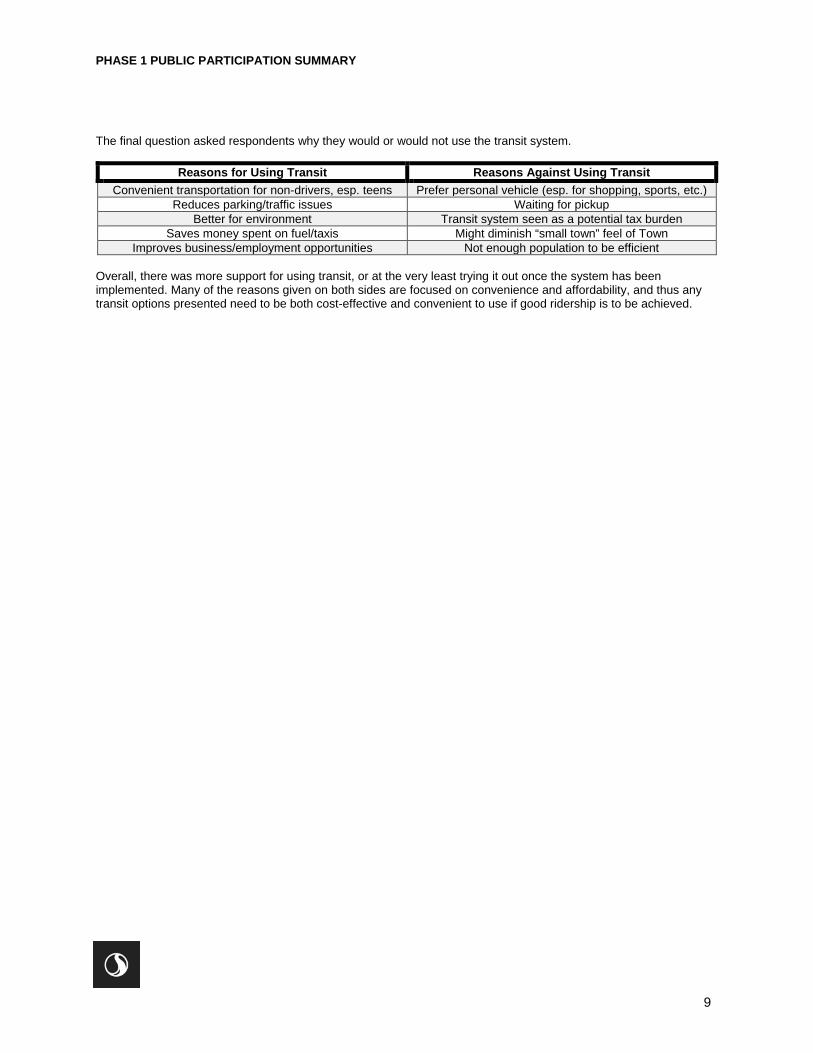
PHASE 1 PUBLIC PARTICIPATION SUMMARY
9
The final question asked respondents why they would or would not use the transit system.
Reasons for Using Transit Reasons Against Using Transit Convenient transportation for non-drivers, esp. teens Prefer personal vehicle (esp. for shopping, sports, etc.)
Reduces parking/traffic issues Waiting for pickup Better for environment Transit system seen as a potential tax burden
Saves money spent on fuel/taxis Might diminish “small town” feel of Town Improves business/employment opportunities Not enough population to be efficient
Overall, there was more support for using transit, or at the very least trying it out once the system has been implemented. Many of the reasons given on both sides are focused on convenience and affordability, and thus any transit options presented need to be both cost-effective and convenient to use if good ridership is to be achieved.

Town of Okotoks Local Transit Implementation Plan Phase 2 Public Participation Summary
February 1, 2019
Prepared for: Town of Okotoks Prepared by: Stantec Consulting Ltd.

PHASE 2 PUBLIC PARTICIPATION SUMMARY
Table of Contents
EXECUTIVE SUMMARY .............................................................................................................. 1
1.0 ABOUT THE PROJECT ................................................................................................... 2
2.0 WHO WE TALKED TO ..................................................................................................... 3 2.1 POP-UP EVENTS ............................................................................................................. 3 2.2 ONLINE FEEDBACK SURVEY ......................................................................................... 4
3.0 WHAT WE HEARD ........................................................................................................... 9

PHASE 2 PUBLIC PARTICIPATION SUMMARY
1
Executive Summary
The Town of Okotoks is exploring the creation and implementation of a viable, efficient local transit system that provides a transportation option for residents to move around within the town. To support this project, a second phase of public participation was completed and included both face-to-face and online interactions with the project’s stakeholders. Feedback was gathered via:
• A series of pop-up events at venues across Okotoks on October 24 and 25, 2018
• A series of graffiti boards located at the Okotoks Recreation Centre, the Pason Centennial Arena, and the Okotoks Town Office
• An online survey that ran from October 24 to November 9, 2018
The public participation gathered input from thousands of interested participants. The demographics of survey respondents aligned very closely with both the actual demographic profile of the Town of Okotoks and the results from the Phase 1 survey, providing confidence that the overall results are a reflection of a good section of residents. Key results indicate that:
• The proposed service area is largely acceptable
• Service hours will need to fairly long (7 AM to 12 AM on weekdays, 9 AM to 12 AM on weekends)
• Schedules and number of vehicles will need to consider both weekday and weekend user levels
• Initial single use fares should be $3 or less to attract frequent use
• Consideration should be given for a fare structure that provides discounts for students/youth, seniors and low-income households

PHASE 2 PUBLIC PARTICIPATION SUMMARY
2
1.0 ABOUT THE PROJECT
The Town of Okotoks (“the Town”) has grown significantly over the past several decades, and our future looks very bright. With this growth, the demand for more transportation choices has increased and future transit options are continuously evolving with technology and innovation. These future transit options may include ride-sharing services, self-driving vehicles, the use of apps and real-time ride matching software, as well as increased integration of “active modes” of transportation like cycling and walking.
One piece of the transportation puzzle is still missing from Okotoks: public transit. We have heard from our residents that local transit is a top priority. The Town is working through a planning process that will evaluate several types of transit solutions that can be quickly implemented over the next year while staying flexible enough to adapt to future transit trends.
The plan will evaluate several styles of transit and from that, the best solution for Okotoks, both now and for years to come, will be chosen. It will include some key pieces, such as:
• Potential routes and service hours
• Fare structure
• Types of vehicles
• Service delivery method – Town owned/managed, partnership, etc.
The plan will focus on local transit service – moving people around Okotoks in their daily lives – but will also consider how the service could be expanded outward and link other systems in the future.
The planning process involves a two-phased public participation approach. Phase 1, which occurred in May and June 2018, focused on hearing from residents about their preferences. Using the feedback gathered from the community, analysis of other local data, and best practices from similar programs in other locales across North America, a draft local transit service plan was created and presented to the public in Phase 2 of the public participation program in October and November 2018. The feedback from this second phase will be used to further refine the final service plan, which would put the local transit system into operation in early 2019.

PHASE 2 PUBLIC PARTICIPATION SUMMARY
3
2.0 WHO WE TALKED TO
Much like the previous phase of the project, the goal of the second phase of public participation was to create multiple opportunities for residents to participate in this project and to provide their feedback on the draft local transit service plan. To accomplish this, the project team conducted an extensive outreach program consisting of two days of pop-up events at locations across Okotoks coupled with a second online feedback survey. The schedule of events is included in Table 1 below.
Table 1 - Phase 2 Participation Event Schedule
Wed, Oct 24 Thurs, Oct 25 7:45am-8:30am
Foothills Composite High School 222 Woodhaven Drive
7:45am-8:30am
Holy Trinity Academy 338072 32 Street
8:45am-9:45am
McDonald’s by Home Depot 105 Southbank Boulevard
10am-11am Heartland Café 46 McRae Street
12pm-1pm Ecole Okotoks Junior High 1 Pacific Avenue
12pm-1pm St. John Paul II Collegiate 53 Cimarron Drive
2pm-3pm Okotoks Health and Wellness Centre 11 Cimarron Common
3pm-4pm Sandstone Lodge 101 Centre Court
4pm-5pm Okotoks Public Library 7 Riverside Drive
4:30pm-5:30pm Walmart 201 Southridge Drive
6pm-8pm Okotoks Recreation Centre 99 Okotoks Drive
6pm-7pm Pason Centennial Arena 204 Community Way
2.1 POP-UP EVENTS
The project team hosted a series of 12 events over two days (October 24 and 25, 2018) at popular locations around Okotoks. Each event site was chosen to target specific demographics within the town, including parents, students and seniors. Sites were also selected to get input from residents at locations that would typically be associated with routine travel around town such as shopping, doctor’s appointments and trips to the local municipal recreation facilities. The project team met with over 2000 residents over the course of the two days of events.
Each event followed a consistent format and included two main elements: information relating to the draft plan, including a chance to sit in a typical vehicle used in this type of transportation model and try out a potential trip booking via smartphones; and an opportunity to provide feedback to the team via a series of on-site “graffiti boards”. A set of each of the boards was left at the final location on each day (Okotoks Recreation Centre on Day 1, Pason Centennial Arena on Day 2) as well as at the Town Office, for the duration of the survey period. As the boards were filled with feedback, they were removed and replaced with new boards so that additional residents would have a chance to participate. An example of one of the

PHASE 2 PUBLIC PARTICIPATION SUMMARY
4
graffiti boards is included below in Figure 1. Participants were also given reminder cards with information, a brief description of the project and a link to the project webpage and the online survey.
Figure 1 - Sample of Feedback Received Via Phase 2 Graffiti Boards
2.2 ONLINE FEEDBACK SURVEY
The Phase 2 survey was linked through the main project webpage on the Town of Okotoks website and ran from October 24 to November 9, 2018. A total of 207 responses to the survey were received, with a 93% completion rate of the 16 questions that it contained. A summary of the survey questions is included on the following pages. A summary of the raw responses from the entire survey is included in this document as Appendix B. Note that the wording, topics and response categories of the demographic questions used in this survey were identical to the ones used in the previous phase, allowing for direct comparison of the data received.

PHASE 2 PUBLIC PARTICIPATION SUMMARY
5
More than 80% of respondents have lived in Okotoks for at least 5 years. This is consistent with the results from the Phase 1 survey and provides valuable information, as it shows that the responses in the other areas of the survey represent individuals who have experience with living in Okotoks and therefore have had time to reflect on the transportation challenges and opportunities in the community.
Much like in the previous survey, the responses to this question align almost exactly with the demographics of Okotoks - meaning that the overall results should provide a fairly representative sample
19%
31%
50%
Less than 5 years 5-10 years More than 10 years0%
10%
20%
30%
40%
50%
60%
Length of residency in Okotoks
3%
9%
41%
30%
17%
Under 18 18 to 31 32 to 45 46 to 60 61 or older0%
5%
10%
15%
20%
25%
30%
35%
40%
45%
Age of respondents

PHASE 2 PUBLIC PARTICIPATION SUMMARY
6
of the opinions of the residents. Unsurprisingly, the population of the Town is skewed heavily toward the working population age groups (ages 15-64), especially those within the years that align with raising families, which is supported by the next graph. The results from this question show the same relative breakdown of respondent groups.
8%
26%
18%
30%
19%
It’s just me! Myself and oneother person
Myself and twoother people
Myself and threeother people
Myself and four ormore people
0%
5%
10%
15%
20%
25%
30%
35%
Household density, including children

PHASE 2 PUBLIC PARTICIPATION SUMMARY
7
More than half of the respondents lived in four newer neighbourhoods – Cimarron (southeast portion of Town), Crystal Shores/Crystal Green (northeast), Drake Landing (east), and Crystalridge/Downey Ridge (north central). Apart from Cimarron, the other neighbourhoods represent areas with little commercial or retail development, meaning that they essentially have no walkable access to services and will require some other form of transportation. The data trend in the responses to this question is remarkably similar to the responses from the first survey, with the exception that there were significantly fewer responses from those living in the annexed lands in this survey. Note that an additional area – D’Arcy – has been included as a response option in this second survey, although no responses were generated.
5%
9%
15%
2%
22%
0%
4%
12%
3%
7% 8%
4%3% 3%
1%
4%
0%
5%
10%
15%
20%
25%
What part of town do you live in?

PHASE 2 PUBLIC PARTICIPATION SUMMARY
8
Much like the results on age of respondents, the income of the respondents aligns very closely with the actual demographics of the town and shows a consistent division with what was received in the first survey. This provides additional confidence that the responses in the other areas of the survey likely represent a good sample of the population of the Town.
3% 4% 5%7%
15%18%
14%
10%
26%
Less than$25,000
$25,000to
$34,999
$35,000to
$49,999
$50,000to
$74,999
$75,000to
$99,999
$100,000to
$149,999
$150,000to
$199,999
$200,000or more
Prefer notto answer
0%
5%
10%
15%
20%
25%
30%
Total household income before taxes during the past 12 months

PHASE 2 PUBLIC PARTICIPATION SUMMARY
9
3.0 WHAT WE HEARD
The survey contained eleven questions that directly related to providing feedback on the draft transit implementation plan, each of which was created to further refine the elements within the plan to make it more likely to represent a “made for Okotoks” solution.
A large majority of respondents felt that the proposed service area had been set correctly, with some minor requests for the addition of service to:
• Areas further north along Highway 2A • Areas further northeast to include St. James Church and Holy Trinity Academy • Areas further east along Highway 2A
There were also several requests for service to be expanded to include connections to Calgary Transit stations. The intent of the transit implementation plan is to provide service within Okotoks; however, connections to destinations outside of town may be contemplated in the future once the service has become established.

PHASE 2 PUBLIC PARTICIPATION SUMMARY
10
The remaining questions of the survey were related to two distinct and important topics – the proposed fares for the transit system, and the time that the service would be available to residents.
Additional suggestions for fare options include:
• the creation of discounted fares for students/youth, seniors and low-income households • single use tickets • packages of non-expiring tickets
47%
22%
31%27%
Discounted family pass- anyone in the
household can use it
Discounted monthlypass - only you can use
it
Frequent user program(i.e. take 9 trips, getthe 10th free, etc.)
Other (please specify)0%
5%
10%
15%
20%
25%
30%
35%
40%
45%
50%
Potential fare option preferences

PHASE 2 PUBLIC PARTICIPATION SUMMARY
11
As part of the planned rollout of the transit system, awareness and early ridership will go a long way in setting up the new system for long term success. Respondents were asked to provide their preference for some potential transit ideas that were based on feedback received in Phase 1. As shown in the graph, respondents are leaning toward ideas that provide an opportunity for riders to have a longer trial period and get used to the system.
559 558
482
421
Free rides every Friday $20 credit for you touse transit
Free transit for 2weeks
One free trip0
100
200
300
400
500
600
Weighted preference for potential transit promotion ideas
28%
16%
12%
9% 9% 9%8%
10%
$40-49 $50-59 $60-69 $70-79 $80-89 $90-99 $100+ Other(pleasespecify)
0%
5%
10%
15%
20%
25%
30%
Respondent preference for unlimited monthly user pass price

PHASE 2 PUBLIC PARTICIPATION SUMMARY
12
Unsurprisingly, the acceptable price point for a monthly transit pass is heavily skewed toward the lower options presented. This is aligned with the strong sentiment heard in the previous phase of public participation that the transit system will need to be affordable to give it an opportunity gain larger ridership, especially early in its rollout. It also aligns with the results from other questions in both surveys that indicate that a large portion of the riders will be those that will need affordable access, including seniors, youth and low-income households.
One of several questions that was replicated in both the survey and the graffiti boards, respondents were asked what the price point would need to be for them to use the transit system daily (outside of a monthly pass or other option, etc.). Affordability was again a high priority, with 74% indicating that a fare under $3 would entice them to ride daily.
6480
3612 8
11956
40
6 9
under $2.00 $2.00-2.99 $3.00-3.99 $4.00-4.99 $5.00+0
20
40
60
80
100
120
140
160
180
200
Preferred one-way trip cost to drive daily usage of transit system
Board Responses
Survey Responses

PHASE 2 PUBLIC PARTICIPATION SUMMARY
13
Much like the responses from the previous phase of public participation, it appears that ridership will be likely be in higher demand during the work week and on Saturday than during other times. This aligns with other information provided that shows that ridership will likely be dominated by students, local employees, and trips for routine tasks like shopping, attending doctor’s appointments, etc. Note that the options for responses for statutory holidays or never/not applicable were not included on the graffiti boards but likely would not have generated significant responses in any case based on the data trend from the survey.
139102 85
41 33
123
110
63
Weekdays Saturday Sunday StatutoryHolidays
Never/notapplicable
0
50
100
150
200
250
300
Preference for days of the week for on-demand transit service
Board Responses
Survey Responses

PHASE 2 PUBLIC PARTICIPATION SUMMARY
14
As noted above, most ridership during weekdays will be students and local employees, which aligns with the preference for early service start times and late end times. The later end time at midnight also captures the usual later socializing on Friday nights.
729
51 4331 28
34
72
57
1514
5 AM 6 AM 7 AM 8 AM 9 AM Other(pleasespecify)
0
20
40
60
80
100
120
Preferred weekday morning service start times
Board Responses
Survey Responses
227
3346
2540
17
10
9
12
3757
75
7 PM 8 PM 9 PM 10 PM 11 PM 12 AM Other(pleasespecify)
0
20
40
60
80
100
120
140
Preferred weekday evening service end times
Board Responses
Survey Responses

PHASE 2 PUBLIC PARTICIPATION SUMMARY
15
Unsurprisingly, weekend start times can likely start slightly later as riders will more likely be using the transit service for transportation to activities as opposed to work, school or appointments. Likewise, the preference for a later end time is likely due to the later social events on Saturdays.
37
26
44
76
32
5 AM 6 AM 7 AM 8 AM 9 AM Other (pleasespecify)
0
10
20
30
40
50
60
70
80
Preferred weekend morning service start times
124
15
3236
68
20
7 PM 8 PM 9 PM 10 PM 11 PM 12 AM Other (pleasespecify)
0
10
20
30
40
50
60
70
80
Preferred weekend evening service end times

PHASE 2 PUBLIC PARTICIPATION SUMMARY
16
Additional comments provided by survey respondents and attendees at the pop-up events included: • Transit should be on-demand and user-friendly • Consider an app-based payment system • On-demand is particularly useful for persons with disabilities • Transit should be child-friendly and senior-friendly • Consider discounts or free service for children, seniors, students, and low-income
households • Concerns expressed about scheduling, routes, and practical connections to existing
regional transit systems • Encouragement to use environmentally-friendly vehicles • Plan transit stops as pick-up/drop-off loops to avoid disruptions to flow of traffic • Participants expressed interest in using service to go out to restaurants, professional
services (e.g. doctor, dentist), and shopping • Consider special routes for game days or other public events • Concerns that Okotoks is too small to necessitate public transit, and that an increase in
taxes should not be used to pay for public transit