Assessment of climate variations in temperature and precipitation extreme events over Iran
Upload
khangminh22Category
view
0download
0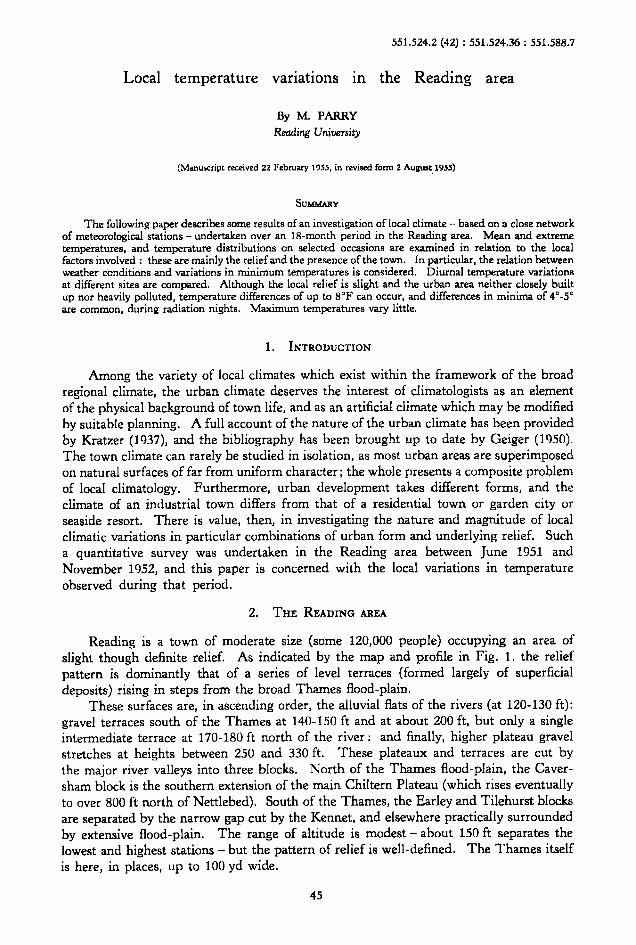
551.524.2 (42) : 551.524.36 : 551.588.7
Local temperature variations in the Reading area
By M. PARRY Reading University
(Manuscript received 22 February 1955, in revised form 2 August-1955)
SUMMARY
The following paper describes some results of an investigation of local climate - based on a close network of meteorological stations - undertaken over an 18-month period in the Reading area. Mean and extreme temperatures, and temperature distributions on selected occasions are examined in relation to the local factors involved : these are mainly the relief and the presence of the town. In particular, the relation between weather conditions and variations in minimum temperatures is considered. Diurnal temperature variations at different sites are compared. Although the local relief is slight and the urban area neither closely built up nor heavily polluted, temperature differences of up to 8°F can occur, and differences in minima of 4"-5" are common, during radiation nights. Maximum temperatures vary little.
1. INTRODUCTION
Among the variety of local climates which exist within the framework of the broad regional climate, the urban climate deserves the interest of climatologists as an element of the physical background of town life, and as an artificial climate which may be modified by suitable planning. A full account of the nature of the urban climate has been provided by Kratzer (1937), and the bibliography has been brought up to date by Geiger (1950). The town climate can rarely be studied in isolation, as most urban areas are superimposed on natural surfaces of far from uniform character ; the whole presents a composite problem of local climatology. Furthermore, urban development takes different forms, and the climate of an industrial town differs from that of a residential town or garden city or seaside resort. There is value, then, in investigating the nature and magnitude of local climatic variations in particular combinations of urban form and underlying relief. Such a quantitative survey was undertaken in the Reading area between June 1951 and November 1952, and this paper is concerned with the local variations in temperature observed during that period.
2. THE READING AREA
Reading is a town of moderate size (some 120,000 people) occupying an area of slight though definite relief. As indicated by the map and profile in Fig. 1. the relief pattern is dominantly that of a series of level terraces (formed largely of superficial deposits) rising in steps from the broad Thames flood-plain.
These surfaces are, in ascending order, the alluvial flats of the rivers (at 120-130 ft): gravel terraces south of the Thames at 140-150 ft and at about 200 ft, but only a single intermediate terrace at 170-180 ft north of the river : and finally, higher plateau gravel stretches at heights between 250 and 330 ft. These plateaux and terraces are cut by the major river valleys into three blocks. North of the Thames flood-plain, the Caver- sham block is the southern extension of the main Chiltern Plateau (which rises eventually to over 800 ft north of Nettlebed). South of the Thames, the Earley and Tilehurst blocks are separated by the narrow gap cut by the Kennet, and elsewhere practically surrounded by extensive flood-plain. The range of altitude is modest - about 150 ft separates the lowest and highest stations - but the pattern of relief is well-defined. The Thames itself is here, in places, up to 100 yd wide.
45

46 M. PARRY
NORTH SOUTH
C A V E R S X A M E A R L E Y x I I D 5 I P 1 7 I1 4
, Y &F,tdo
:t. I ; I ' R. ' R . ; ; m+ .;_ -.,I. - --a jKcnnctjTharnes ;
2 0 0 mi-rU11. h4- ..nnl.@' 100
I 7 3 4 ; ~ i l ~ ~ nc+----- Milcs . 0
P R O F I L E ALONG L I N E X Y .
Fig. 1 shows also that the main extension of the built-up area is on the lower gravel terraces. The higher parts are distinctly suburban in character and, generally, away from the relatively small heavily built-up nucleus, the urban pattern is fairly open and the propoltion of green space to total area is high. There are few blocks of flats, industry is mainly light, and there is little of what may be called industrial wasteland. Atmospheric pollution is not a serious problem. The urban factor cannot therefore be as strongly marked as in the larger, more closely built-up and more heavily polluted towns.
;.;.:.::. . . . . Bul l t -up A r c a . .:..... C e n t r a l A r c a . .... ....
Y I 4 % a - Mi lcs
Contours at50ft.intcrvo + S t a t i o n
3. THE FORM OF THE INVESTIGATION The investigation was based on data derived from a close network of orthodox
meteorological stations. The results are therefore comparable with those of similar studies in the Nottingham area (Tinn 1938), the Manchester area (Manley 1944), and the Bath area (Balchin and Pye 1947, 1949-50). They are less strictly comparable, however, with most North American work in this field (the urban stations, there, being nearly always on roof-top sites), or with the results of much Continental work based on mobile surveys with portable equipment. The use of meteorological stations in a local study has many advantages-the problem is discussed by Balchin and Pye (1947) and by Sundborg (1951) -but it is an essential requirement of this method that the siting of the stations should be as truly representative as possible of the different facets of the area.
Figure 1. The Reading area : relief, extent of built-up area, and location of meteorological stations. Numbers refer to stations listed in Table 1.
LOCAL TEMPERATURE VARIATIONS 47
Twelve stations were used in the Reading survey (three being permanent auxiliary climatological stations), and their distribution is shown on Fig. 1. The station numbers correspond with those of Table 1, to which reference should be made for details of heights of stations and types of exposure. Nine of the stations were situated on or very near the north-south profile shown on Fig. 1, a line that traverses all the major terraces and the different types of urban pattern. At all stations but one, conditions of exposure, while varying with the nature of the station, conformed with the requirements laid down by the Meteorological Office. The exception was station 9, which was somewhat over- sheltered by buildings and trees, an exaggerated urban exposure not inappropriate for the town centre. The other urban stations were sited on small lawns surrounded by buildings, the suburban stations on larger lawns more freely exposed, and the remainder on sites as open as possible.
At each station, observations were made once daily at 09 GMT (09 hr clock time at station 9), and the procedure in general corresponded to that at an auxiliary climatological station. The thermometers used were either certified or standardized against certified thermometers. Records of daily temperatures were maintained continuously at ten stations : stations 11 and 12 operated for most of the period.
4. MEAN AND EXTREME DAILY TEMPERATURES
For each station that operated continuously, averages were obtained of daily maximum, minimum and mean temperatures for each month. In Table 1 these mean values (all readings are in Fahrenheit) are averaged for the whole period and for each season (the usual climatological definition of the seasons being adopted), and are expressed as differences
TABLE 1. &AN DAILY TEMPERANRES (OF), JULY 1951-NOVEMBER 1952 (expressed as differences from values at station 1)
Station No. 1 2 3 4 5 6 7 8 9 10 11. 12.
Elevation (ft) 152 200 141 274 230 141 125 120 143 248 178 124
Exposure Urban Open Open OpenSuburban Open Urban Open Urban Open Suburban Open
(a) Daily mean temperatures All months 52.1 - 0.9 - 0.6 - 1.0 - 0.9 - 0.7 - 0.3 - 0.5 + 0.7 - 1.2 Summer 62.4 - 1.0 - 0 6 - 1.1 - 1.0 - 0.8 - 0.3 - 0.5 + 0.7 - 1.3 Autumn 50.0 - 0.8 - 0.6 - 0.8 - 1.0 - 0.8 - 0.2 - 0.3 + 0.6 - 1.1 Winter 40.1 - 0.9 - 0.3 - 1.0 - 0.6 - 0 7 - 0.4 - 0.5 + 0.6 - 1.1 Spring 51.5 - 1.1 - 0.8 - 1.0 - 0.9 - 0.6 - 0.3 - 0.9 + 0.9 - 1.4
(b) Daily maximum temperatures All months 59.3 - 0.5 - 0.1 - 0.7 - 0 6 - 0.4 + 0.1 0.0 + 0 8 - 1.0 Summer 70.9 - 0 5 - 0.4 - 0.8 - 1.0 - 0.5 - 0.1 0.0 C 1.3 - 1.1 Autumn 56.5 - 0.3 - 0.2 - 0.6 - 0.6 - 0.6 + 0.1 + 0.4 + 0.5 - 1.0 Winter 45.4 - 0.5 + 0.3 - 0.8 - 0.1 0.0 + 0.1 - 0.2 C 0.3 - 0.7
Spring 59.3 - 0.6 - 0.2 - 0.5 - 0 5 0.0 + 0.2 - 0.1 + 1.1 - 1.1
(c) Daily minimum temperatures All months 45.0 - 1.4 - 1.1 - 1.3 - 1.2 - 1.2 - 0.7 - 1.1 + 0.7 - 1.4 Summer 53.8 - 1.6 - 1.1 - 1.5 - 1.3 - 1.3 - 0.8 - 1.0 4- 0.5 - 1.6
Autumn 43.4 - 1.2 - 1.1 - 1.0 - 1.2 - 1.0 - 0.6 .- 0.9 + 0.8 - 1.1 Winter 34.9 - 1.3 - 0.8 - 1.2 - 1.0 - 1.2 - 0.7 - 0.7 + 1.0 - 1.5
Spring 43.8 - 1.7 - 1.5 - 1.6 - 1.3 - 1.5 - 0.9 - 1.6 + 0.6 - 1.8
Rccorda not mntinuou

48 M. PARRY
from the values recorded at the urban station 1 (University). The variations in daily mean temperatures are small but not without significance. The largest differences (about - 1"F, for all months) are shown by the highest stations having open or rural exposures (except for station 5 which is suburban). Both the difference in altitude and the difference in exposure seem to be involved here. Stations of open exposure but at heights similar to that of station 1 are about )"F colder on average. This *", then, repre- sents broadly the contrast between urban and rural exposures, and the remaining go represents the contrast in altitude : this corresponds broadly with the normal lapse rate of 1°F in 300 fi. The greatest differences between stations occur in spring and summer.
If mean daily maximum temperatures are considered in the same way, the differences are seen to be very small, but the plateau stations again have the lowest values and the urban stations (especially 9) the highest. The greatest local differences occur at night. The plateau stations record, on average, minima nearly 1~5°F below the values at station 1 (all months considered), while ' rural ' stations at roughly the same height as station 1 have minima about 1" lower : here the urban factor operates alone. Station 9, repre- senting the closely built-up town centre, is always the warmest station at night : of the three urban stations, 7, situated on the valley floor, is always the coldest.
When extreme temperatures were examined, it was soon evident that the extreme maxima at the various stations Mered only slightly from each other, and from the corresponding mean maxima. Among the extreme minima, however, departures of - 4°F from the station 1 values were common, especially in the summer months. The urban stations nearly always registered the highest extreme minima. The lowest values were recorded not always by the plateau stations, but often by the valley-floor and low terrace stations with open exposures : here is an indication, not apparent in the mean values, of the significance of temperature inversions in the local climatology.
Figure 2. Maximum temperatures, 29 June 1952.

LOCAL TEMPERATURE VARIATIONS 49
5. SELECTED TEMPERATURE DISTRIBUTIONS
In Figs. 2-5 is presented a selection of characteristic distributions of maximum and minimum temperatures on days of widely varying weather conditions : on each map, the values are plotted against a background of the relief and the built-up area, and the inset map shows the accompanying synoptic situation.
(a) Maximum temperatures
Fig. 2 shows the distribution of maximum temperature on a fine summer day with little cloud and wind. Even under these conditions, which most favour the development of local contrasts, the differences between stations are small, the range of values being 3". The plateau stations are a degree or two cooler than the valley stations, and there is a slight urban effect. Station 11 evidently benefits from a favourable aspect on a south-facing terrace.
Under cloudy, windy conditions, the urban influence vanishes and the differences generally amount to no more than a degree. Winter day-time temperature inversions did not occur during the period. All the evidence, in fact, indicates that the local influences are rarely strong enough to assert themselves against the turbulence which normally reaches its peak in the afternoon and thus tends to impose ;general uniformity of maximum temperature throughout the area.
(b) Minimum temperatures
On the other hand, the distributions of minimum temperature show two contrasted patterns, associated with cloudy, turbulent conditions and with anticyclonic conditions respectively (though intermediate types are well represented). O n nights with much cloud and wind, differences between minima remain small. Fig. 3 shows a pattern that
Figure 3. Minimum temperatures, 8 July 1952.
so M. PARRY
occurred under conditions of increasing frontal cloud and winds of Force 3 to 4 : the only significant local factor is relief, the plateau stations being a degree cooler than sites in the valley. This difference corresponds broadly with the dry adiabatic lapse rate (1°F in 180 ft) which must in fact be established in the lower air layers under such turbulent conditions.
Considerable temperature contrasts may develop, however, on the clear calm nights often associated with anticyclonic situations. The example illustrated in Fig. 4 is quite typical of such radiation nights in spring, summer and autumn : the winter distributions are similar but the range of differences is generally less. Both the relief and the urban factor are significant in this example, The temperature inversion is well developed, the low-lying stations away from the town being up to 4°F colder than the plateau stations. In the town centre, the urban warmth is sufficient to destroy the surface inversion, though station 7, with a valley-floor site in the less densely built-up Lower Caversham area, while warmer than valley stations away from the town, is nevertheless colder than the plateau station 4 : the urban influence is here weaker than that of relief.
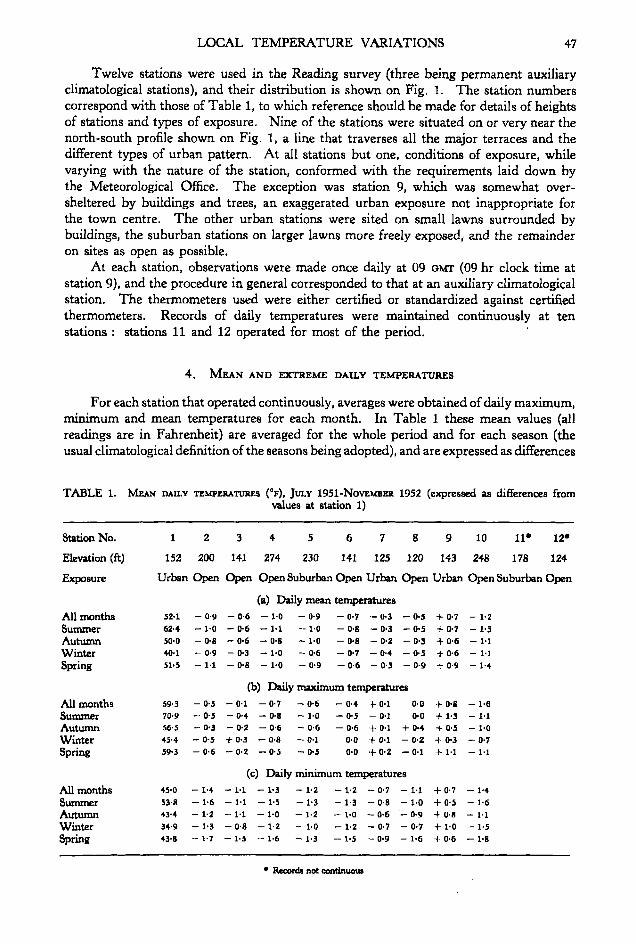
On a few occasions a complete inversion occurred, undisturbed by the urban warmth. Such a pattern was recorded on an October night (Fig. S), part of a spell of bright cloudless weather with radiation fog developing at night. Not only did this example provide the most marked inversion observed during the period-the plateau station 4 recording a minimum 8°F above that of the valley station 12 - but the urban stations 1 and 9, normally the warmest, recorded minima 2°F below that of station 4. This is an instance of a very complete domination of the urban factor by that of relief.
These examples show that the most marked temperature contrasts occur under conditions of strong outgoing radiation, and illustrate the typical operation of the local factors involved : these are plainly the relief and the urban influence (which is usually, though not invariably, the dominant of the two). On a number of radiation nights, no
Figure 4. Minimum temperatures, 4 June 1952.
LOCAL TEMPERATURE VARIATIONS 51
inversion was apparent, plateau stations being as cold as vailey stations, although the urban effect was well marked. These were probably cases of deep inversions, undetected because of the lack of stations higher up on the Chiltern Plateau. The small range of altitude in the Reading area, and its general setting near the western end of the London Basin, must not be forgotten. On such occasions - similarly when a deep radiation fog submerges the whole of the Reading area - the local climate is overpowered by the regional climate, i.e., the accumulation of cold air in the London Basin as a whole. It is also of interest that stations with open exposure situated within or near the built-up area (6 and 8) behave like more distant rural stations in recording low minima on radiation nights. This testifies to the comparative cleanliness of the Reading atmosphere : a typical smoke pall would reduce nocturnal radiation from these sites and maintain higher minima.
6. MINIMUM TEMPERATURES AND NOCTURNAL WEATHER CONDITIONS
Since the weather at the time is clearly a significant permissive factor in the develop- ment of local variations, special attention has been paid in this work to the problem of relating patterns of minimum temperatures to the prevailing conditions of cloudiness and wind. In the absence of any observations made at night at the Reading stations, use was made of the Daily Weather Report observations for the station nearest Reading, which is London Airport (21 mi distant), assuming conditions there to be reasonably representative of those in the Reading area. On this basis, each night was classified according to state of sky, using the categories ‘ b,’ ‘ bc,’ c,’ and ‘ o ’ (where b and bc have their standard meanings, c signifies 6-7/8ths of cloud, and o completely overcast), and also according to wind force, using the Beaufort Scale. The minimum temperatures for each night, at each station, were expressed as departures from the corresponding values at station 1 (University), and these departures placed in the category of state of sky and wind force
Figure 5. Minimum temperatures, 10 October 1951.
52 M. PARRY
TABLE 2. MEAN DIFFERENCES IN MINIMUM TEMPERATURES BETWEEN UNIVERSITY AND OTHER STATIONS (SUMMER PERIOD)
Kings Meadow (120 ft, open exposure)
Wind 0 1 2 3 4 5 + Sky b - 3.0 - 3.2 - 1.7 + 1.0 0
8 13 10 3 1
bc - 2.0 - 1.7 - 0.8 - 0.5 - 0.5 0 4 21 32 13 4 3
C - 3.0 - 0.2 - 0.7 - 0.1 0 1 5 7 1 6 4
0 - 1.7 - 0.3 - 0.3 + 0.1 3 7 7 6
Caversham Park (274 ft, open exposure)
Wind 0 1 2 3 4 5 + Sky b - 1.7 - 2.8 - 1.8 - 1.0 - 1.0
8 13 10 3 1
bc - 2.5 - 2.0 - 1.6 - 1.3 - 1.0 o 4 21 32 13 4 3
C - 2.0 - 0.8 - 1.0 - 1.2 - 0.3
0 - 1.3 - 1.0 - 1.3 - 1.0
1 5 7 1 6 4
3 7 7 6
Lower Caversham Forbury Gardens
Wind 0 1 2 3 4 5 + Wind 0 1 2 3 4 5 + (125 ft, urban exposure) (143 ft, urban exposure)
Sky b + 1.0 + 0.5 + 0.5 + 0.3 + 1.0
%Y b - 1.5 - 2.1 - 1.2 - 0.5 O
8 13 10 2 1 8 13 10 3 1
bc - 1.3 - 1.2 - 0.8 - 0.3 - 0.7 + 0.3 bc 4- 1.0 t 0.8 + 0-4 + 0.5 0 4- 0.7 4 21 32 13 4 3 4 21 32 13 4 3
C - 1.0 0 0 - 0.1 - 0.3 1 5 7 1 6 4
0 - 1.0 - 0.4 - 0.4 - 0.1 3 7 7 6
C 4- 1.0 + 1.0 + 0.6 + 0.8 + 0.3 1 5 7 1 6 4
0 + 1.0 - 0.3 + 0.1 - 0.5 3 7 7 6
appropriate to that particular night. Finally, all such figures in each category were averaged, the result being a series of tables as in Table 2, in which, for each station, mean differences in minimum temperature were shown for various conditions of sky and wind. The data were analyzed on a seasonal basis, so that four tables were constructed for each station.
Table 2 gives four examples, all for the summer period (chosen because it combines two summer seasons), for selected stations of contrasted heights and exposures : for comparison, it should be remembered that the university station is at 152ft and has an urban exposure. Since the reliability of the averages depends on the number of occurrences within each category, the number is given below each average.
In general the greatest departures occur in the top left-hand comer of the tables, i.e., on radiation nights, and the differences become more or less progressively reduced away from that corner. At Kings Meadow (station 8), the freely exposed valley-floor station, minima are about 3°F lower than the University averages on clear calm nights. This is mainly the difference between urban and rural exposures. Under cloudy and - especially -windy conditions, the differences on average are small : with wind Force 4 and above, they are negligible, which implies that at such wind speeds the urban effect is practically eliminated. In the case of Caversham Park (4) on the open plateau, the largest differences again occur towards the top left-hand corner of the table, though not in the bO category, owing perhaps to the frequency of inversions on such nights. Under windy turbulent conditions, there is a difference of about 1°F from the University, repre- senting the difference in elevation (122 ft) between the two stations. At Lower Caversham (7), the low-lying urban station, conditions differ from those at Kings Meadow in the smaller departures on radiation nights. Finally, Forbury Gardens (9), the over-sheltered town centre station, is slightly warmer than the University under practically all con- ditions.

LOCAL TEMPERATURE VARIATIONS 53
This method is clearly not here used to the best advantage, owing to insufficient occurrences and uncertainties involved in the use of the London Airport observations. Nevertheless it demonstrates sufficiently the operation of the local factors under various weather conditions. Tables for the other seasons show similar though less well defined features.
The relationships between minimum temperatures and nocturnal conditions may be considered also in terms of the most frequently occurring departures between the University and other stations. Frequency distribution graphs were drawn for all stations : Figs. 6
K I N G S M E A D O W C A V E R S H A M P A R K
1 2 0 T t . O p e n E x p o s u r e
I---\ \ : 2 0 I
a U U
0 ) 5 L
0
: 10
I n
2 5
0 +3 +2 + I 0 -I -2 -3 - 4 - 5
I 2 5
c I
5 2 0 U U
0 I5 -
0
: 10 n E a
2 5
0 * F
274 f t . O p e n E x p o s u r e .
D l T f e r e n c r i In M i n i m u m T r m p i r o t u r e i
S T A T E O F S K Y - b __-- b c .-.-.- c .-........ 0
L O W E R C A V E R S H A M
1 2 5 f t . U r b a n E x p o i u r e .
' \
U
: 2 0
O 15
: 10
a U U
c 0
n E a z 5
0
I \ \ I
I \
+ I 0 - 1 - 2 - 3 -4 *F
F O R B U R Y G A R D E N S
1 4 3 (1. U r b a n E x p o s u r e . ,- - -1
30 r I
C ji5/ : 2 0
I I
I I
I I
I
I I I I \ I \
if I I + 3 + 2 + I 0 - I - 2 -3
D i f f e r a n c i s i n M i n i m u m T m m p c r o l u r c s .
Figure 6. Freqwncy distributions of differences in minimum temperatures between University and other stations, in relation to state of sky. (Summer period).
54 M. PARRY
and 7 provide examples for the four stations previously selected, again for the summer period. The horizontal axis of each graph represents the difference in minima from the University values, and the vertical axis the number of occurrences of these differences.
In Fig. 6, frequency curves have been plotted for occurrences within each of the categories of state of sky. The Kings Meadow curves show that on clear nights this station is most frequently 4°F colder than the University, but with increasingly clouded skies the peak shifts to 0°F. This clearly demonstrates the suppression of the urban influence on cloudy nights when outgoing radiation is at its least. Caversham Park shows a similar displacement of the peak, which however stops at - 1"F, even under overcast conditions, i.e., the effect of exposure is overcome but that of relief remains. On clear nights, the Caversham Park minima are most frequently 2°F lower than those of the University, compared with 4°F for Kings Meadow : this again demonstrates the inversion effect. In the curves for Lower Caversham and Forbury Gardens the movement of the peak is slight.
K I N G S MEADOW C A V E R S H A M P A R K
120 f t O p e n E s p o r u r e . 274 I t . O p i n E x p o s u r e . r
O F .
U c : I 5
D l f f e r r n c i n i n M i n i m u m T e m p e r a l u r e s
W I N D F O R C E B i a u f o r t S c a l e
0 I 2 3 4
---- . . . . . . . . . . . . .
LOWER C A V E R S H A M F O R B U R Y G A R D E N S
1 1 5 1 l . U r b o n E x p o s u r e . 1 4 3 f l . U r b a n E x p o s u r i
; I 5 - . 2 5 /.
- :
- * U C
I U .', ;',
' \ . ' . I . : I. \
. .
a c z 2 0 . ..
+ I 0 - 1 -2 -3 -4 O F , + 3 + 2 + I 0 - I -2 -3 OF D i f l i r i n c i r i n M i n l m u m T i m p i r a t u r r s .
Figure 7. Frequency distributions of differences in minimum temperatures between University and other stations, in relation to wind force. (Summer period).

LOCAL TEMPERATURE VARIATIONS 55
Figure 8. (a)-(f) Superimposed thermograph traces for University (solid line), Kings Meadow (dashed line) and Caversham Park (dotted line), for selected periods.

56 M. PARRY
In these graphs the factor of wind force has been ignored, and consequently there are apparent anomalies : for example, the secondary peak at 0 in the b curve for Kings Meadow. Similar graphs relating to five categories of wind force on the Beaufort Scale complete the general picture (Fig. 7). These curves also show the movement of the peak frequency from large to small differences, this time as the wind force increases. The evidence of the Kings Meadow curves reinforces the already stated view that with a Force 4 wind (and sometimes with a Force 3) the urban warmth is entirely eliminated. In the case of Caversham Park, the shift of the peak stops at - 1"F, and this is clearly related to the difference in elevation between the plateau station and the University, and to the lapse rate under turbulent conditions.
7. CONTINUOUS TEMPERATURE RECORDS
Thermographs were maintained at three stations, Kings Meadow and Caversham Park (representing respectively open conditions on the flood-plain and on the plateau), and the University (at an intermediate elevation and representative of most of the urban area). Some changing temperature relationships between the three stations over selected 24-hr periods are illustrated by the superimposed thermograph traces of Fig. 8.
The first example (a) illustrates conditions on a cloudy, rather windy, summer morning, followed by a somewhat sunnier afternoon : the morning traces show a general uniformity, with, however, the Caversham Park temperature steadily a degree below the others (the relief effect), while in the afternoon the urban warmth becomes apparent. The remaining examples are of anticyclonic conditions, characterized by a considerable diurnal range of temperature generally, and marked differences in the individual traces which reflect clearly the local influences. There is in each case a well marked nocturnal inversion : on most occasions, this is overcome by the urban warmth, but included is the example, already referred to, of the complete inversion (f).
The diurnal range of temperature is smallest at the town station, owing mainly to the higher minima, and largest at Kings Meadow. The daily march of temperature within the town differs from that outside. The morning rise of temperature at the urban station proceeds more slowly than at rural stations more exposed to the low morning sun : on the other hand, the evening temperature fall is delayed in the town - owing to the retention of heat in brickwork, pavements, etc. - with the result that the largest temperature difference between town and country occurs in the evening (e.g. , 8°F between University and Kings Meadow at about 21 hr in example (e)). It is again characteristic of radiation nights that the time at which minimum temperature occurs is later at the town station than at the other two (examples (b) to (f)).
8. CONCLUSIONS
The evidence presented shows that substantial local temperature variations may occur within aq area in which the range of altitude is modest and the urban pattern relatively open. There seems no need to look to local factors other than the relief and the presence of the town in order to explain these temperature relationships. There is no evidence that the rivers are significant on a local - as opposed to a micro - scale. The flood-plain station Kings Meadow (situated 200 yd from the Thames) frequently recorded the lowest minima in the whole area, though records from a station on the river bank would perhaps have reflected the influence of the river. It was not possible to place every station on the same type of subsoil : apart from the flood-plain stations 7 and 8, all were sited on gravel, with the exception of 5 and 10, which were on clay. This too, seems to have no significance in the records.
LOCAL TEMPERATURE VARIATIONS 57
The general control exerted by the prevailing weather over local temperature variations has been demonstrated. The analyses reveal that, for Reading, the thermal effect of the town is eliminated by a wind of Force 3-4 (say between 10 and 15rni/hr). In com- parison, Mey (quoted by Kratzer 1937) has put the significant wind speed for the larger town of Bremen at 8 m/sec (about 19 mi/hr, between Force 4 and 5) . Finally, it is evident that the town of Reading exhibits a modified type of urban climate -that of a predominantly residential town - characterized less by the urban smoke pall (here weakly developed) than by the distinctive thermal properties of the urban surfaces and structures.
ACKNOWLEDGMENTS
The author's thanks are due to the Director of the Meteorological Office for authorizing the loan of equipment, and to the Research Board of the University of Reading for the financial support, that together made this investigation possible. He must also express his gratitude to the many volunteer observers who co-operated enthusiastically in the maintenance of the records.
REFERENCES
Balchin, W. G. V. and Pye, N.
Geiger, R. Kratzer, A. 1937 Das Stadtkfima, Braunschweig (Viewed. Manley, G. 1944 Geogr. J., 103, p. 241. Sundborg, A. 1951 'Climatological studies in Uppsala,' Pap. Geogr. Inst.,
Tm, A. B.
1947 Quart. J . R. Met. Soc., 73, p. 297. 1949-50 J . Manchester Geogr. Soc., 55, p. 1. 1950 7% climate near the ground, Harvard University Press.
Uppsala Unio., No. 22. Quart. J . R. Met. Soc., 64, p. 391. 1938
Copyright © 2022 FDOKUMEN