Local scaling and multifractal spectrum analyses of DNA sequences – GenBank data analysis
17
This article appeared in a journal published by Elsevier. The attached copy is furnished to the author for internal non-commercial research and education use, including for instruction at the authors institution and sharing with colleagues. Other uses, including reproduction and distribution, or selling or licensing copies, or posting to personal, institutional or third party websites are prohibited. In most cases authors are permitted to post their version of the article (e.g. in Word or Tex form) to their personal website or institutional repository. Authors requiring further information regarding Elsevier’s archiving and manuscript policies are encouraged to visit: http://www.elsevier.com/copyright
Transcript of Local scaling and multifractal spectrum analyses of DNA sequences – GenBank data analysis
This article appeared in a journal published by Elsevier. The attachedcopy is furnished to the author for internal non-commercial researchand education use, including for instruction at the authors institution
and sharing with colleagues.
Other uses, including reproduction and distribution, or selling orlicensing copies, or posting to personal, institutional or third party
websites are prohibited.
In most cases authors are permitted to post their version of thearticle (e.g. in Word or Tex form) to their personal website orinstitutional repository. Authors requiring further information
regarding Elsevier’s archiving and manuscript policies areencouraged to visit:
http://www.elsevier.com/copyright
Author's personal copy
Local scaling and multifractal spectrum analyses of DNAsequences – GenBank data analysis
Zhi-Yuan Su a,*, Tzuyin Wu b, Shu-Yin Wang c
a Department of Information Management, Chia Nan University of Pharmacy and Science, Tainan 717, Taiwan, ROCb Department of Mechanical Engineering, National Taiwan University, Taipei 106, Taiwan, ROC
c Department of Animal Science, Chinese Culture University, Taipei 111, Taiwan, ROC
Accepted 17 September 2007
Abstract
Base sequences of deoxyribonucleic acid (DNA) in an organism carry all the instructions regarding its growthand development. On the surface, such sequences seem irregular; yet in reality, they are symbolic sequences with anorganized structure. This study investigates the characteristics of base arrangement and distribution in DNAsequences from the fractal theory viewpoint. In addition to multifractal features demonstrated by the DNAsequence, this study also compares the multifractal spectra derived from a particular family of gene among severaldifferent species. The results reveal that a considerable correlation exists between base distribution and evolutionaryorder. Furthermore, local scaling exponent (Holder exponent) differences between coding segments (exon) and non-coding segments (intron) are also examined. It is suggested that such differences in the local distribution of basescan be applied to find coding segments within the DNA sequence that is to be translated into protein. This localscaling analysis is feasible and has the potential to become an effective tool for rapid location of possible codingsites in DNA sequences. The authors hope that future studies using more complicated bioinformatics methods foranalyzing DNA sequences can benefit from this study.� 2007 Elsevier Ltd. All rights reserved.
1. Introduction
Complex DNA base sequence studies began twenty years ago. In the 1980s, Gates started to map bases in a DNAsequence onto a two-dimensional space [1]. In the 1990s, Peng et al. [2] published a paper in the Nature journal. It wasthe first time that DNA base sequences transformed into a one-dimensional irregular walk, named ‘‘DNA walk.’’ One-dimensional DNA walk can be defined as: if pyrimidine is located in the ith position along the DNA chain, then thewalker steps up (u(i) = +1); if purine is found, then the walker steps down (u(i) = �1). Calculate the sum of u(i) afterl steps and a curve y(l) for DNA walk can be obtained. DNA walk not only provides a simple and intuitional repre-sentation of each DNA sequence but also assists in analyzing correlations among DNA base sequences through calcu-lating root mean square fluctuation F(l) of average displacement. F(l) can be used to distinguish three types of
0960-0779/$ - see front matter � 2007 Elsevier Ltd. All rights reserved.doi:10.1016/j.chaos.2007.09.078
* Corresponding author. Tel.: +886 6 2664911x5305; fax: +886 6 3660607.E-mail address: [email protected] (Z.-Y. Su).
Available online at www.sciencedirect.com
Chaos, Solitons and Fractals 40 (2009) 1750–1765
www.elsevier.com/locate/chaos
Author's personal copy
behaviors: (1) if nucleotide sequence is random, then F(l) � l1/2; (2) if local correlation can be found within a certaincharacteristic range (such as Markov chain) with asymptotic behavior to a purely random sequence, then, eventuallyF(l) � l1/2 for large l; (3) if characteristic length does not exist, then the relation between fluctuation F(l) and l ispower-law, F(l) � ld, with d 5 1/2, indicating that DNA walk features self-similarity, or fractal property [3]. Penget al. [2] analysed nucleotide sequences of genes and discovered a long-range correlation among genes abundant withintron, counting up to thousands of bases. On the contrary, for cDNA and genes with scarce intron, d � 1/2; in otherwords, long-range correlation is not observed. A major obstacle to overcome in long-range correlation analysis is thatthe DNA sequence’s mosaic structure causes the four bases A (adenine), G (guanine), T (thymine), C (cytosine) strandbiases and ‘‘trend’’ presence in a DNA walk [4–6]. Peng [2] proposed a min–max method to overcome this problem,which unfortunately required determination on the number of local maximum and minimum in a DNA walk curve,suffering from practical application difficulties. Therefore, Peng et al. [7] later proposed the bridge method and detrend-ed fluctuation analysis, or DFA. In 1993, Buldyrev et al. [8] used DFA to investigate genes in the myosin heavy chainfamily to examine the relation of base sequence fractal complexity to evolution. The use of single gene family can avoidpotential bias caused by different evolutionary pressures and various base compositions among irrelevant gene families.Their analytical results reveal that, for species from eukaryotes to invertebrates to vertebrates, the correlation coefficientfeatures monotonic increase. After that, Ossadnik et al. [9] proposed the coding sequence finder algorithm (CSF), basedon DFA. First, a certain ‘‘window size’’ is selected. Then the DNA sequence is divided into several regions, which arerespectively measured for individual DFA exponents. The results reveal that the local value of the DFA exponent typ-ically displays minima where genes are suspected. Reviews about DFA’s applications can be referred to in the bibliog-raphy [10].
DNA walk is very intuitional, but for the nucleotide sequences, it involves introducing artificial correlations intoDNA walks of less than four dimensions. To avoid introducing artificial correlation, Voss [11] proposed a simplemethod that separates a DNA base sequence into four sub-sequences of A, G, T, and C, each of which stands for baselocation in the original DNA sequence. For example, sub-sequence A is a numeric sequence obtained by replacing Awith 1 and replacing the other three bases with 0 in the original DNA nucleotide sequence, resulting in a time sequencexA(n) that oscillates with position coordinate n. In this manner, time sequences for other bases can be defined as xG(n),xT(n), and xC(n). Through Fourier transform, time sequences of these bases can be illustrated into a power spectra Sk(f),showing that basically they share similar tendency. In cases of larger f, Sk(f) is mostly white noise. Under low-frequency,Sk(f) demonstrates a power-law Sk(f) � 1/fb. In many cases, 1/fb noise is assumed independent of high-frequency whitenoise, so that high-frequency white noise can be deducted from Sk(f), making the long-range correlation within a low-frequency area more obvious. The Voss approach is special in that the original DNA base sequence’s correlation func-tion can be regarded as the sum of correlation functions of the four sub-sequences, xA(n), xG(n), xT(n), and xC(n). Thisconclusion also applies to spectral density. Thus, by figuring out the spectral densities of all sub-sequences, the spectraldensity of original DNA sequence can be obtained without assuming any correlation among the four bases.
Besides aforementioned approaches, other DNA sequence analyses include general entropy function calculation [12],the Zipf linguistics method [13,14], Hurst exponent analysis [15,16], Hao’s geometric representations [17–19], two-dimensional DNA walk [20], nonlinear prediction method [21], cluster-size distribution [22–24] and so on. However,most of research methods focus on the overall properties of DNA sequences. The power spectra, for example, depictthe average distribution of energy under each oscillation frequency contained in the sequence. Therefore, local energyvariations in the oscillation frequency of the sequence cannot be obtained. An average component energy distributionfor oscillations presented in natural phenomena is very rare, and this is true for DNA sequences. From a geometricpoint of view, the sequence of a particular base in a DNA strand can be viewed as a distribution of a set of points alonga line. Naturally evolving systems are seldom characterized by a single scaling ratio; different parts of a system may bescaling differently. That is, the clustering pattern is not uniform over the whole system. Such a system is better charac-terized as a ‘‘multifractal’’ system [3,25]. This study applies that notion in the same way to the study of DNA sequences.Since the production of a polypeptide chain (protein) only depends on the linear order of bases along the DNA strand,spatial distribution patterns of bases are scrutinized using multifractal formalism.
2. Local scaling and multifractal analyses
2.1. Multifractal formalism
Basically, the multifractal formalism is introduced to characterize non-uniformity of a fractal distribution. Let l bethe size of the covering boxes and Pi(l) be the fraction of points (mass, density or probability measure) in the ith box.Then, in the limit l! 0, an exponent (singularity strength, or Holder exponent) a can be defined by
Z.-Y. Su et al. / Chaos, Solitons and Fractals 40 (2009) 1750–1765 1751
Author's personal copy
P iðlÞ / la ð1Þ
In general, a is not uniformly distributed and can therefore serve as the crowding index of a local cluster. If the num-ber of boxes N(a) where the probability measure Pi has a singularity strength between a and a + da is counted, then f(a)can be loosely defined as the fractal dimension of the set of boxes with singularity strength a by [25]
NðaÞ / l�f ðaÞ ð2Þ
This formalism thus describes a multifractal measure in terms of interwoven sets of different singularity strengths a,where each set is characterized by its own fractal dimension f(a). Another useful multifractal formalism is the so-calledgeneralized dimension, defined as [26,27]
Dq ¼ liml!0
1
q� 1
logP
iPqi ðlÞ
log l; ð3Þ
where the probability Pi is raised to the power of q. Thus, different values of q emphasize distribution with differingdegrees of clustering vicinities. In a point distribution set, Dq with the limit q! +1 is associated with the fractaldimension of the most densely occupied regions in the set, while Dq with q!�1 is associated with the fractal dimen-sion of the least populated regions. This formalism quantifies the non-uniformity of a distribution based on the statis-tical moments of its probability measure.
As the generalized dimension Dq is computed, the multifractal spectrum f(a) is usually evaluated from Dq via aLegendre transformation [25]:
sðqÞ ¼ ðq� 1ÞDq
f ¼ qa� s
a ¼ ds=dq
ð4Þ
However, as other studies indicate [28,29], the validity of the Legendre transformation relies on the smoothness offunctions f(a) and Dq. In the attempt to obtain Dq by scaling the probability measures P q
i with box sizes l, naturallyevolving and experimentally observed data often produce a log–log plot featuring oscillations and scattering rather thanperfect linear behavior, especially when the value of q is large. This then produces a Dq curve with large uncertainties.Applying the Legendre transformation to such a curve may generate false results and make error estimation in the f � a.Previous studies propose a direct determination of f(a) to circumvent this pitfall. This method first involves constructinga one-parameter family of normalized measures l(q) at each box i from probabilities Pi(l)
liðq; lÞ ¼½P iðlÞ�qP
j½P jðlÞ�qð5Þ
Then, f(a) is simply the Hausdorff dimension of the measure-theoretic support of l(q), which is given by
f ðqÞ ¼ liml 0
Piliðq; lÞ log liðq; lÞ
log l: ð6Þ
The value of the singularity strength a, averaged with respect to l(q), can be computed from the following equation:
aðqÞ ¼ liml 0
Piliðq; lÞ log P iðlÞ
log lð7Þ
Eqs. (6) and (7) provide an alternative definition of the multifractal spectrum, which can be used to obtain f(a) directlyfrom real-world data without using the Legendre transformation. Subsequent calculation in make use of this method.
2.2. Calculations of Holder exponent a for DNA sequences
Featuring DNA’s structure by the variation of local scaling exponent curve (or Holder exponent a) according to thelocation of base in DNA chain is the idea of this study. Since exon and intron in the DNA sequences differ notably inHolder exponent distribution, it can be applied to find coding DNA sequences. The definition of a is as follows:
a ¼ liml!0
log P iðlÞlog l
ð8Þ
in which Pi(l) = Ni(l)/N refers to the proportion of designated bases (depending on the rule applied) fall into sub-coverscentered at the ith base position with radius of l/2 against the total number of bases. a = 1 refers to an evenly distributed
1752 Z.-Y. Su et al. / Chaos, Solitons and Fractals 40 (2009) 1750–1765
Author's personal copy
structure of base pairs, while a < 1 and a > 1 stand for ‘‘a densely occupied region surrounded by sparse vicinity’’ and‘‘a less populated region surrounded by dense vicinity’’ structures respectively.
2.3. Calculations of multifractal spectrum for DNA sequences
In addition to the Holder exponent, our analysis on DNA sequence also included multifractal spectrum analysis.Calculation of multifractal spectrum f(a) comprises several steps. First, the DNA sequence is considered point distri-bution by different rules. These points are then covered by boxes of size l. If the proportion of designated bases (depend-ing on the rule applied) that fall into the ith box is Pi(l), then li(q, l) can be calculate through Eq. (5). From Eqs. (6),(7),the equations for f(q) and a(q), values of
Piliðq; lÞ log liðq; lÞ and
Piliðq; lÞ log P iðlÞ when covered with boxes of size l
can be calculated first. Further, the value of l is changed to find out each corresponding value ofP
iliðq; lÞ log liðq; lÞand
Piliðq; lÞ log P iðlÞ. The results are respectively illustrated in the diagrams for
Piliðq; lÞ log liðq; lÞ � log l andP
iliðq; lÞ log P iðlÞ � log l. Areas of scaling region in the diagram are found and then fitted by the least square methodto calculate the slope, which is the value of f(q) and a(q). In accordance with various q, the values of f(q) and a(q) arerespectively calculated and then plotted into the coordinate system. The curve is the f(a) spectra.
3. GenBank analysis and discussion
3.1. Local scaling analyses
Detailed spatial organization of nucleotide sequences can be analysed by inspecting the distribution of the Holderexponent a. The Holder exponent compares the invariant scaling nature of the population density of bases in a smallregion centered at position i with that in the vicinities of increasing sizes. Variations in a values with base position i
signify changes in the local clustering pattern of bases along the DNA strand.Various rules for forming point distribution are possible; for example, a point distribution of each different base A,
T, C, G can be formed separately (the single base rule); a point distribution can contain A and G only (the purine–pyrimidine rule), and a point distribution can contain G and C only (the hydrogen bond rule), etc. [30–32]. The pur-ine–pyrimidine rule is related to the strand chemical bias. Further, since A can hydrogen bond specifically only with Tand G can bond specifically only with C, the hydrogen bond rule is related to the strand separation energy balance.
Adopting the purine–pyrimidine rule means that, reading from the beginning of a DNA sequence and down alongthe strand, each base position encountered is filled by either a black point for a purine (A or G) or a white point for apyrimidine (C or T). The resulting purine bases are treated as a distribution of a set of points in a one-dimensional line.With each point (black or white), various range l applied, count the black point number N(l) in the range considered.Dividing N(l) by the total number of black points N reveals the proportion value under different l, P(l). The results arethen illustrated onto log l � logP(l), where the slope obtained from least square fitting the data points can be regardedas the Holder exponent of this base location. The error in a is estimated from the standard deviation of fitted data fromthe linear slope. A similar approach can be applied to each base location to produce a Holder exponent curve. When thebase selected is too close to either end and the range l is too large, the sub-cover will exceed the DNA sequence, causingan edge effect. Hence, this study does not analyse a from the very beginning of the sequence, nor near the end of thesequence. Instead, it analyses DNA sequences within the 1/10–9/10 sections of the sequence.
The myosin heavy chain gene family represents one of the few gene families whose complete sequences are well doc-umented in the GenBank for a phylogenetically diverse group of organisms. This documentation provides a goodopportunity to look into the fractal property changes of their components spatial organization with evolution. Thus,the type II myosin heavy chain gene family was selected as the subject of this research and was first investigated byexamining the Holder exponent. In general, the purine–pyrimidine rule provides the most robust results, probablydue to it reflects chemical structure similarities and preserves the most common point mutations, from purine to purineand from pyrimidine to pyrimidine, in the original genes [33]. Hence, listing the results of purine–pyrimidine rule first,as in other rules, is also feasible.
Fig. 1 shows a typical log–log plot of purine base populations Pi(l) vs. sizes of boxes and fitting lines centered at thebase position i = 12,458 of the human cardiac-myosin heavy chain gene. The smallest box has a width of just a few basepairs, while the largest box can extend to a length of a few thousand base pairs. To avoid an edge effect, the largest boxsize is limited to 1/5 of the total base pairs in the chain, in this case, about 5600 bps. As Fig. 1 indicates, most points fallon the fitting line very well. The slope of the line is 1.2987, which means the Holder exponent a is 1.2987.
Fig. 2 shows the variation of a along the entire strand of the human myosin heavy chain gene as calculated by thepurine–pyrimidine rule for DNA sequence in the human myosin heavy chain gene. An irregular fluctuation of the curve
Z.-Y. Su et al. / Chaos, Solitons and Fractals 40 (2009) 1750–1765 1753

Author's personal copy
101 102 103 10410-4
10-3
10-2
10-1
100
a = 1.2987 ± 0.028
log l
log
Pi (
l)
i = 12458
Fig. 1. Scaling of Pi(l) with box size l.
2000 4000 6000 80000.8
1.2
1.6
Holder exponent (A+G)
HUMBMYH7( Homo sapiens beta-myosin heavy chain (MYH7) gene )
Exon
8000 10000 12000 140000.8
1.2
1.6
Holder exponent (A+G)
HUMBMYH7( Homo sapiens beta-myosin heavy chain (MYH7) gene )
Exon
14 000 16000 18000 200000.8
1.2
1.6
Holder exponent (A+G)
HUMBMYH7( Homo sapiens beta-myosin heavy chain (MYH7) gene )
Exon
20 000 22000 24000 260000.8
1.2
1.6
Holder exponent (A+G)
HUMBMYH7( Homo sapiens beta-myosin heavy chain (MYH7) gene )
Exon
αα
αα
base position i
base position i
base position i
base position i
Fig. 2. Comparison in exon segments and Holder exponent curve of purine distribution in human cardiac b-myosin heavy chain gene.
1754 Z.-Y. Su et al. / Chaos, Solitons and Fractals 40 (2009) 1750–1765

Author's personal copy
is apparent, suggesting non-uniformity in base distributions. The a value calculated by the purine–pyrimidine rule fellbetween 0.8 and 1.5, similar to the range in most other rules. The diagram shows that, to avoid the aforementioned edgeeffect, the curve is not calculated from the first to the last base. Overlaying the known positions of exon segments(extracted from the GenBank) on the a curve calculated from the human myosin heavy chain gene reveals the surprisingfeature that most exons appear to be at the regions where the Holder exponent a is less than one (see Fig. 2, border linesin Fig. 2 represent exons while thinner lines represent the Holder exponent oscillation curve). If a ‘‘matching ratio’’ isthe percentage of exons that falls in the region with a < 1, then computation reveals that the matching ratio reachedð86:8þ3:2
�4:1Þ%. The ± errors are estimated from uncertainties in the a values. Uncertainties are inevitable for least squarefitting similar to that in Fig. 1, which then lead to an upward or downward shifting of the a curve and hence change thematching ratio.
The biological explanation of this phenomenon is currently not well established. However, the present results lendsupport to the findings of [34–36], which analyse the cluster-size distributions in coding and non-coding DNAsequences. Notice that in Fig. 2, large peaks in the a curve are normally found between exon segments, indicatingthe existence of large clusters (either pyrimidine or purine) in the non-coding regions. This is consistent with the claimsmade in [34–36] that the power-law behavior of the base sequence is associated with the tendency of large pyrimidineand purine cluster formation in the non-coding regions. Moreover, Raghavan et al. [37] also observed that polypurinespreferentially occur in genome coding regions, whereas such a bias does not occur in non-coding regions. Most exonsegments observed would therefore be located in sections where the Holder exponent curve of the purine distributionis less than one.
The results of myosin heavy chain gene family including Baker’s Yeast, Caenorhabditis elegans, Brugia malayi, fruitfly, chicken, rat, and human are summarized in Table 1. The fourth column of Table 1 shows that the number of exonsegments in the myosin heavy chain gene family increases with the evolutionary order. The fifth column in Table 1 indi-cates that, except for the fruit fly with a total exon length of 8024 base pairs, most species have a length of around 6000base pairs. The total exon length does not vary drastically with evolution, yet the total DNA sequence length increases.Therefore, the proportion of exon in a DNA sequence decreases from 100% to about 21%. Further, the seventh columnin Table 1 shows that the matching ratio tends to increase (from 50% in yeast to 87% in human genes), indicating thatexon segments of higher species are more likely to coincide with sections where A and G bases cluster. To assesswhether such a trend could result from a possible a value bias (e.g., there are probably more places with a < 1 inthe genetic sequence of higher species), the sixth column of Table 1 lists the percentage of length in the sequence witha < 1. All species have roughly the same percentage value; the maximum difference is only about 4%. Yet the matchingratio is 50% in yeast and 87% in human. Obviously, this result is not fortuitous. The eighth column in Table 1 indicatesthat, in human myosin heavy chain genes, a total of 39 exon segments fall within the range analysed (number in paren-theses). This total contains 33 exon segments with a 70% length that fall within the sections where a < 1. The proportionis about 84.6%, which also increases with the evolutionary order.
In addition to the myosin heavy chain gene family, this study analyses another 335 DNA sequences, including 74 C.
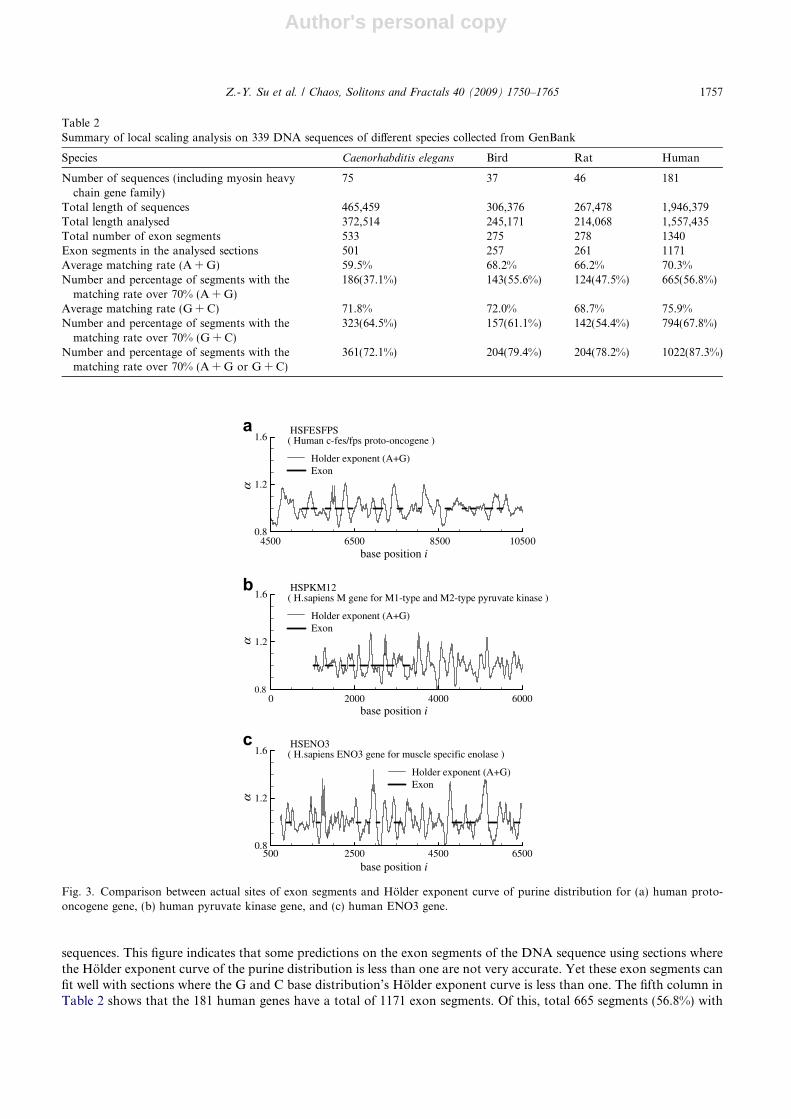
elegans genes, 36 bird genes, 45 rat genes, and 180 human genes. Including the myosin heavy chain gene, the total num-ber of DNA sequences analysed is 342. Table 2 summarizes the analysis results. The seventh row in Table 2 indicatesthat the average matching rates for C. elegans, birds, rats, and human are 59.5%, 68.2%, 66.2% and 70.3%, respectively,as calculated from the purine base distribution (purine–pyrimidine rule). The eighth row in Table 2 shows that the pro-portion of exon segments with 70% length that fall within sections of the curve where a < 1 to total exon segments in theanalysed sections are 37.1%, 55.6%, 47.5% and 56.8%, respectively. Fig. 3 shows calculation results for the human geneDNA sequences, according to purine distribution.
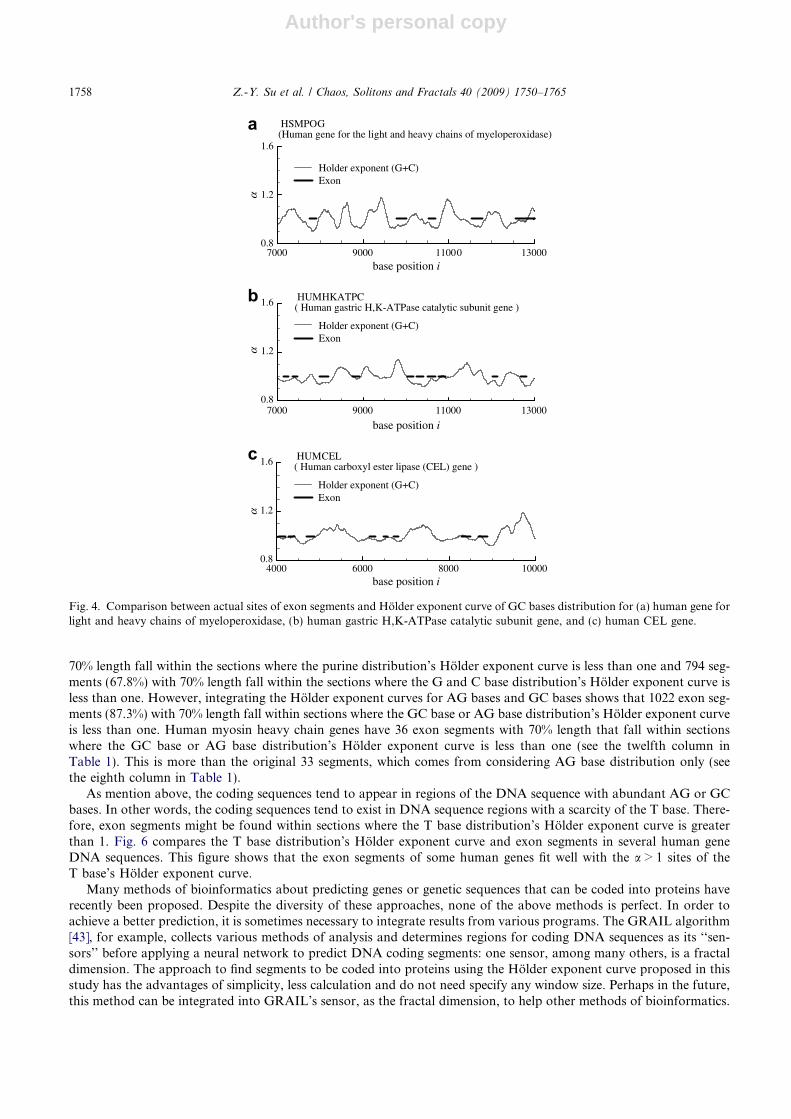
Sometimes consideration of the Holder exponent curve calculated by purine distribution only cannot produce thebest results. Therefore, it is necessary to search other common characteristics of protein-coding segments to increasethe accuracy. Some studies suggest that coding sequences in genes tend to contain more G and C bases than non-codingsequences, and that is particularly obvious in the DNA sequences of warm-blooded vertebrates [38–41]. This means thatthe DNA sequence coding segments could also fall within sections where the Holder exponent of the G and C basedistribution is less than one. For this reason, this study also calculates the Holder exponent curves for G and C basedistribution for all DNA sequences. Fig. 4 shows some of these results. The ninth to eleventh columns of Table 1 sum-marize in detail the data for the myosin heavy chain gene family, and the ninth to tenth rows of Table 2 summarize all339 DNA sequences. The exon segments fit well with the Holder exponent curve of G and C base distribution where theHolder exponent is less than one.
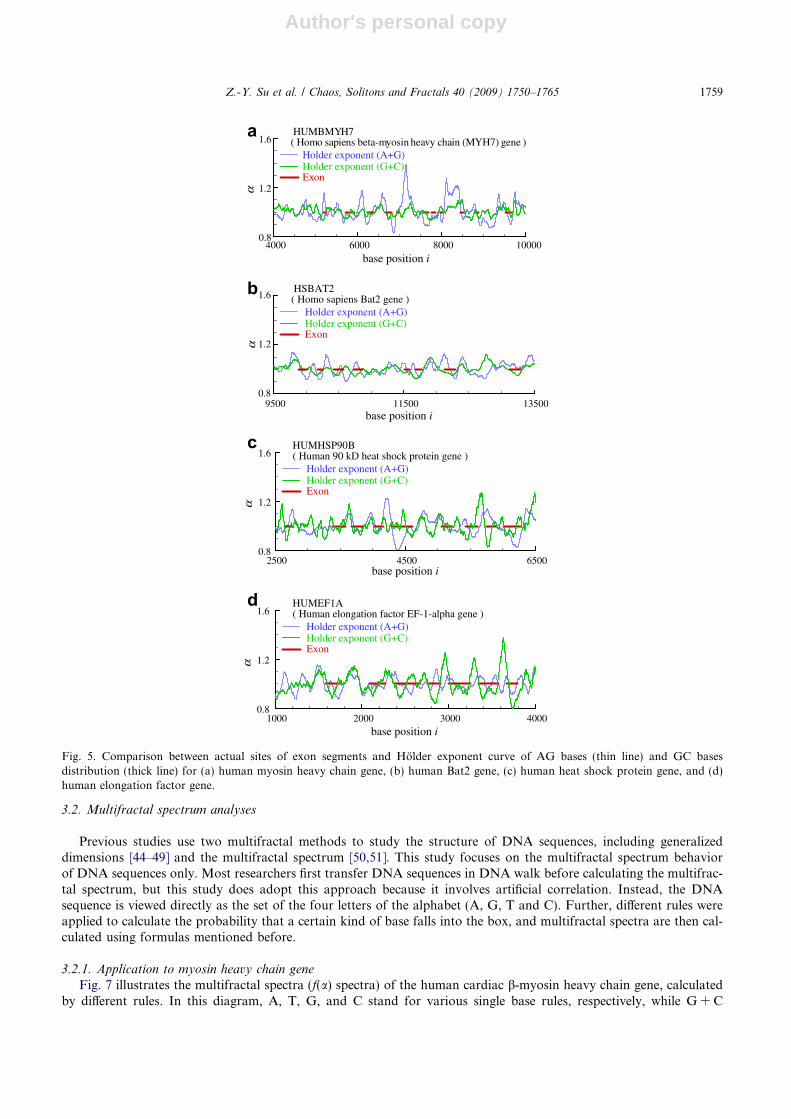
Because different species or different genes differ dramatically in base arrangement, it is sometimes not enough toconsider the Holder exponent curve based on only one rule. Integrating different rules may be a good idea [42]. There-fore, two rules mentioned previously can perhaps be combined to obtain more accurate results. Fig. 5 compares exonsegments, Holder exponent curves for AG base distribution, and GC base distribution of several human DNA
Z.-Y. Su et al. / Chaos, Solitons and Fractals 40 (2009) 1750–1765 1755

Author's personal copy
Table 1Summary of local scaling analysis on myosin heavy chain genes family
Familyorganism
GenBankaccession #(locus)
Lengthanalysed(bp)(total length)
# of exonsegments
Totalexonlength(bp)(% exonlength)
%a < 1 inanalysis(A + G)
%a < 1 inexon(A + G)
# of exonsegmentswhose %a < 1 aregreater than 70(# of exonsegments inanalysed region)(A + G)
%a < 1 inanalysis(G + C)
%a < 1 inexon(G + C)
# of exonsegmentswhose %a < 1 aregreater than 70(# of exonsegments inanalysed region)(G + C)
# of exonsegmentswhose %a< 1 aregreaterthan 70(# of exonsegmentsin analysedregion)(A + G orG + C)
Saccharomyces
cerevisiae
(yeast)
X53947 4889 1 6108 50.0 50.0+5.8 0 49.1 49.1+6.4 0 0(SCMYO1G) (6108) (100) �5.7 (1) �4.8 (1) (1)
Caenorhabditis
elegans #3(worm)
X08067 9285 7 5911 51.6 53.0+6.7 4 49.1 54.6+6.8 5 5(CEMYO3) (11,604) (50.9) �7.8 (7) �6.6 (7) (7)
Brugia malayi
(worm)M74000 9415 13 5598 52.3 64.8+5.6 6 51.7 69.3+5.1 6 7(BRPMYOHEA) (11,766) (47.6) �6.1 (11) �5.4 (11) (11)
Drosophila
melanogaster
(fruit fly)
M61229 18,132 30 8024 52.2 67.7+5.6 12 52.2 85.8+2.6 21 23(DROMHC) (22,663) (35.4) �6.2 (27) �3.7 (27) (27)
Gallus gallus
(chicken)J02714 24,890 38 5823 50.9 75.8+4.5 28 49.2 90.8+2.1 31 36(CHKMYHE) (31,111) (18.7) �5.2 (38) �2.9 (38) (38)
Rattus
norvegicus
(rat)
X04267 20,606 41 6015 50.1 72.8+2.6 21 54.4 80.8+3.8 24 31(RNMHCG) (25,755) (23.4) �4.3 (34) �5.1 (34) (34)
Homo sapiens
(human)M57965 22,752 40 6008 54.3 86.8+3.2 33 55.2 79.4+4.3 25 36(HUMBMYH7) (28,438) (21.1) �4.1 (39) �4.9 (39) (39)
1756Z
.-Y.
Su
etal.
/C
haos,
Solito
ns
and
Fra
ctals
40
(2009)
1750–1765
Author's personal copy
sequences. This figure indicates that some predictions on the exon segments of the DNA sequence using sections wherethe Holder exponent curve of the purine distribution is less than one are not very accurate. Yet these exon segments canfit well with sections where the G and C base distribution’s Holder exponent curve is less than one. The fifth column inTable 2 shows that the 181 human genes have a total of 1171 exon segments. Of this, total 665 segments (56.8%) with
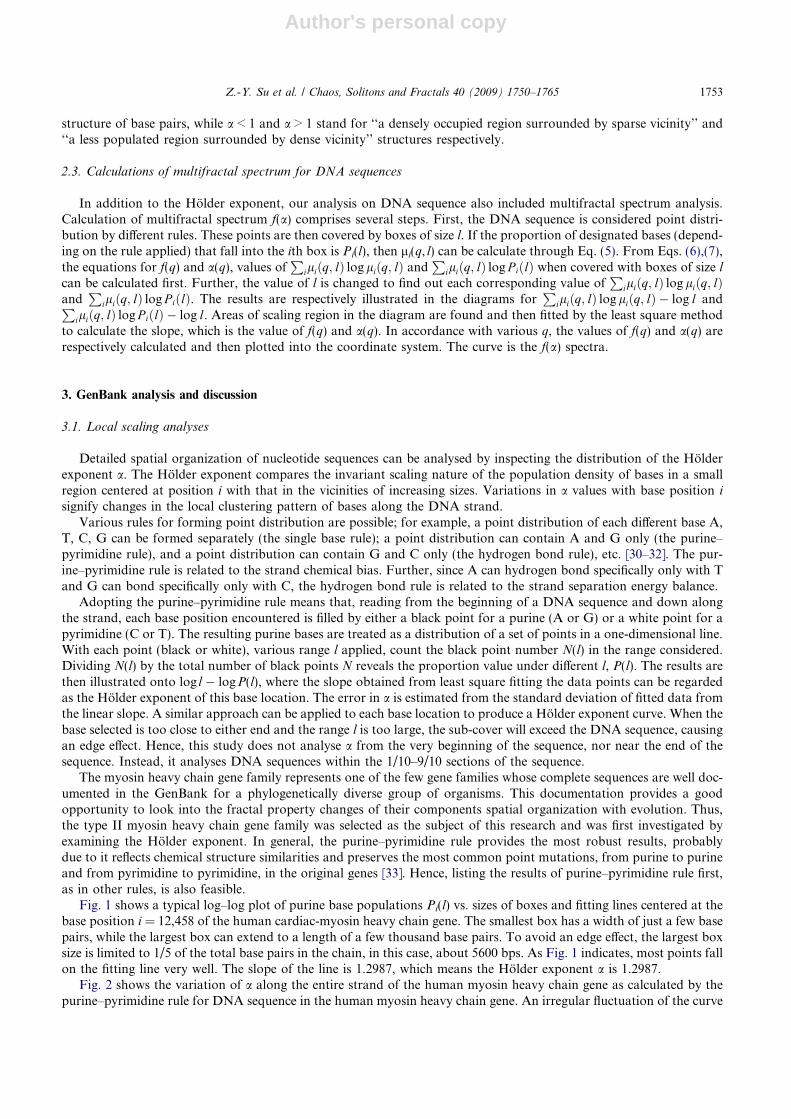
Table 2Summary of local scaling analysis on 339 DNA sequences of different species collected from GenBank
Species Caenorhabditis elegans Bird Rat Human
Number of sequences (including myosin heavychain gene family)
75 37 46 181
Total length of sequences 465,459 306,376 267,478 1,946,379Total length analysed 372,514 245,171 214,068 1,557,435Total number of exon segments 533 275 278 1340Exon segments in the analysed sections 501 257 261 1171Average matching rate (A + G) 59.5% 68.2% 66.2% 70.3%Number and percentage of segments with the
matching rate over 70% (A + G)186(37.1%) 143(55.6%) 124(47.5%) 665(56.8%)
Average matching rate (G + C) 71.8% 72.0% 68.7% 75.9%Number and percentage of segments with the
matching rate over 70% (G + C)323(64.5%) 157(61.1%) 142(54.4%) 794(67.8%)
Number and percentage of segments with thematching rate over 70% (A + G or G + C)
361(72.1%) 204(79.4%) 204(78.2%) 1022(87.3%)
4500 6500 8500 105000.8
1.2
1.6
Holder exponent (A+G)
HSFESFPS( Human c-fes/fps proto-oncogene )
Exon
0 2000 4000 60000.8
1.2
1.6
Holder exponent (A+G)
HSPKM12( H.sapiens M gene for M1-type and M2-type pyruvate kinase )
Exon
500 2500 4500 65000.8
1.2
1.6
Holder exponent (A+G)
HSENO3( H.sapiens ENO3 gene for muscle specific enolase )
Exon
base position i
base position i
base position i
αα
α
a
b
c
Fig. 3. Comparison between actual sites of exon segments and Holder exponent curve of purine distribution for (a) human proto-oncogene gene, (b) human pyruvate kinase gene, and (c) human ENO3 gene.
Z.-Y. Su et al. / Chaos, Solitons and Fractals 40 (2009) 1750–1765 1757
Author's personal copy
70% length fall within the sections where the purine distribution’s Holder exponent curve is less than one and 794 seg-ments (67.8%) with 70% length fall within the sections where the G and C base distribution’s Holder exponent curve isless than one. However, integrating the Holder exponent curves for AG bases and GC bases shows that 1022 exon seg-ments (87.3%) with 70% length fall within sections where the GC base or AG base distribution’s Holder exponent curveis less than one. Human myosin heavy chain genes have 36 exon segments with 70% length that fall within sectionswhere the GC base or AG base distribution’s Holder exponent curve is less than one (see the twelfth column inTable 1). This is more than the original 33 segments, which comes from considering AG base distribution only (seethe eighth column in Table 1).
As mention above, the coding sequences tend to appear in regions of the DNA sequence with abundant AG or GCbases. In other words, the coding sequences tend to exist in DNA sequence regions with a scarcity of the T base. There-fore, exon segments might be found within sections where the T base distribution’s Holder exponent curve is greaterthan 1. Fig. 6 compares the T base distribution’s Holder exponent curve and exon segments in several human geneDNA sequences. This figure shows that the exon segments of some human genes fit well with the a > 1 sites of theT base’s Holder exponent curve.
Many methods of bioinformatics about predicting genes or genetic sequences that can be coded into proteins haverecently been proposed. Despite the diversity of these approaches, none of the above methods is perfect. In order toachieve a better prediction, it is sometimes necessary to integrate results from various programs. The GRAIL algorithm[43], for example, collects various methods of analysis and determines regions for coding DNA sequences as its ‘‘sen-sors’’ before applying a neural network to predict DNA coding segments: one sensor, among many others, is a fractaldimension. The approach to find segments to be coded into proteins using the Holder exponent curve proposed in thisstudy has the advantages of simplicity, less calculation and do not need specify any window size. Perhaps in the future,this method can be integrated into GRAIL’s sensor, as the fractal dimension, to help other methods of bioinformatics.
7000 9000 11000 130000.8
1.2
1.6
Holder exponent (G+C)
HSMPOG(Human gene for the light and heavy chains of myeloperoxidase)
Exon
base position iα
αα
7000 9000 11000 130000.8
1.2
1.6
Holder exponent (G+C)
HUMHKATPC( Human gastric H,K-ATPase catalytic subunit gene )
Exon
base position i
4000 6000 8000 100000.8
1.2
1.6
Holder exponent (G+C)
HUMCEL( Human carboxyl ester lipase (CEL) gene )
Exon
base position i
a
b
c
Fig. 4. Comparison between actual sites of exon segments and Holder exponent curve of GC bases distribution for (a) human gene forlight and heavy chains of myeloperoxidase, (b) human gastric H,K-ATPase catalytic subunit gene, and (c) human CEL gene.
1758 Z.-Y. Su et al. / Chaos, Solitons and Fractals 40 (2009) 1750–1765
Author's personal copy
3.2. Multifractal spectrum analyses
Previous studies use two multifractal methods to study the structure of DNA sequences, including generalizeddimensions [44–49] and the multifractal spectrum [50,51]. This study focuses on the multifractal spectrum behaviorof DNA sequences only. Most researchers first transfer DNA sequences in DNA walk before calculating the multifrac-tal spectrum, but this study does adopt this approach because it involves artificial correlation. Instead, the DNAsequence is viewed directly as the set of the four letters of the alphabet (A, G, T and C). Further, different rules wereapplied to calculate the probability that a certain kind of base falls into the box, and multifractal spectra are then cal-culated using formulas mentioned before.
3.2.1. Application to myosin heavy chain gene
Fig. 7 illustrates the multifractal spectra (f(a) spectra) of the human cardiac b-myosin heavy chain gene, calculatedby different rules. In this diagram, A, T, G, and C stand for various single base rules, respectively, while G + C
4000 6000 8000 100000.8
1.2
1.6
Holder exponent (A+G)
HUMBMYH7( Homo sapiens beta-myosin heavy chain (MYH7) gene )
ExonHolder exponent (G+C)
base position iα
αα
α
9500 11500 135000.8
1.2
1.6
Holder exponent (A+G)
HSBAT2( Homo sapiens Bat2 gene )
Holder exponent (G+C)Exon
base position i
2500 4500 65000.8
1.2
1.6
Holder exponent (A+G)
HUMHSP90B( Human 90 kD heat shock protein gene )
ExonHolder exponent (G+C)
base position i
1000 2000 3000 40000.8
1.2
1.6
Holder exponent (A+G)
HUMEF1A( Human elongation factor EF-1-alpha gene )
ExonHolder exponent (G+C)
base position i
a
b
c
d
Fig. 5. Comparison between actual sites of exon segments and Holder exponent curve of AG bases (thin line) and GC basesdistribution (thick line) for (a) human myosin heavy chain gene, (b) human Bat2 gene, (c) human heat shock protein gene, and (d)human elongation factor gene.
Z.-Y. Su et al. / Chaos, Solitons and Fractals 40 (2009) 1750–1765 1759

Author's personal copy
represents the hydrogen bond rule and A + G represents the purine–pyrimidine rule. All the f(a) curves have an invertedand downward-opening parabolic shape; that is, the DNA sequence features a multifractal structure, but the opening ofthe f(a) curve varies with different rules. For example, the a value of the purine distribution (A + G) is between approx-imately 0.8 and 1.4.
To confirm this heterogeneity in base distribution, the positions of these bases are scrambled by a random scheme(base pair numbers, A, G, T, and C, remain the same as those in the original sequence). Fig. 8 plots the resulting f(a)spectra of the purine distribution and the result of original DNA sequences in the same figure. The crosses on the
20000 22000 24000 260000.8
1.2
1.6
Holder exponent (T)
HUMBMYH7( Homo sapiens beta-myosin heavy chain (MYH7) gene )
Exon
base position i
2000 4000 6000 80000.8
1.2
1.6
Holder exponent (T)
HUMDKERB( Human cytokeratin 8 (CK8) gene)
Exon
1.6 n
base position i
3000 5000 7000 90000.8
1.2
1.6
Holder exponent (T)
HUMNUCLEO( Human nucleolin gene )
Exon
base position i
αα
α
Fig. 6. Comparison between actual sites of exon segments and Holder exponent curve of T distribution for (a) human myosin heavychain gene, (b) human cytokeratin 8 gene, and (c) human nucleolin gene.
A
GA+ GG+ C
T
0.7 0.9 1.1 1.3 1.5 1.70
0.2
0.4
0.6
0.8
1
C
α
f ( ) α
Fig. 7. Multifractal spectra of human cardiac b-myosin heavy chain genes under different rules.
1760 Z.-Y. Su et al. / Chaos, Solitons and Fractals 40 (2009) 1750–1765

Author's personal copy
symbols in the diagram stand for uncertainties in the values of a and f(a) arising from the least square fitting procedurein Eqs. (6) and (7). A wider opening of the parabola in the diagram indicates that purine bases of original DNAsequences before scrambling are not uniformly distributed along the human myosin heavy chain gene; rather, they tendto form clusters of different sizes. After scrambling, a much smaller opening curve occurs, indicating that the basesequence has a more uniform distribution. This implies that the DNA sequence base arrangement in the human myosinheavy chain gene is far more complicated than any random sequence and carries considerable messages. The remainingslight opening (a � 0.94 � 1.08) of the curve is perhaps due to the so-called ‘‘strand bias’’ (there are slightly more pur-ines than pyrimidines in the myosin heavy chain gene) normally observed in genomes.
All introns are deleted, and the remaining exon segments of the human’s myosin heavy chain gene are stitchedtogether to form a shorter sequence containing protein-coding regions only. Fig. 9 gives the corresponding f(a) spectraof purine distribution. Compared with the spectra of original DNA sequence in Fig. 8, a much narrower f(a) isobserved. Scrambling this shorter sequence produces little difference in f(a) (see Fig. 9), implying that the protein-codingsequence has a more uniform and random-like base distribution than the original intron-rich sequence. This observa-tion is consistent with previous findings based on the random-walk model, which state that long-range correlation isassociated with intron parts of DNA sequence.
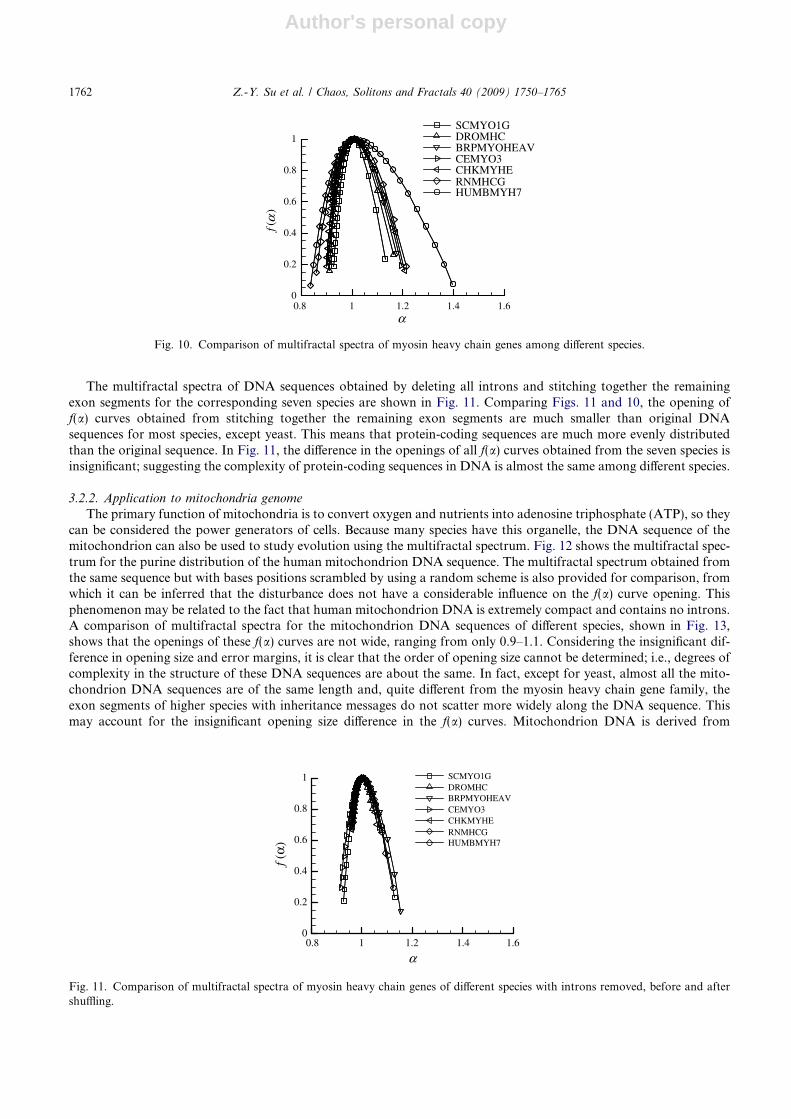
Next, this study calculates the f(a) spectra of seven species DNA sequences in the myosin heavy chain gene family,ranging from yeast to human (Homo sapiens). Fig. 10 shows the result of purine distribution in DNA sequence. Com-paring the f(a) spectra obtained from the seven species in Fig. 10, the gradual opening of the f(a) curve indicates that thepurine distribution of DNA sequences of higher species is more uneven, irregular, and has more local clusters. Thesevariations suggest an increasing complexity in the structures of DNA sequences. Again, the degree of complexity fol-lows the evolutionary order from fungus, invertebrates, vertebrates, to human. This result agrees with Table 1, whichreveals that higher species have more fragmented coding regions in their DNA sequences.
HUMBMYH7HUMBMYH7(Scrambled)
0.8 1 1.2 1.4 1.60
0.2
0.4
0.6
0.8
1
α
f ( ) α
Fig. 8. Multifractal spectra for the purine distributions of human cardiac b-myosin heavy chain gene nucleotide sequence before andafter shuffling.
HUMBMYH7HUMBMYH7(Scrambled)
0.8 1 1.2 1.4 1.60
0.2
0.4
0.6
0.8
1
α
f ( ) α
Fig. 9. Multifractal spectra of human cardiac b-myosin heavy chain gene with introns removed, before and after shuffling.
Z.-Y. Su et al. / Chaos, Solitons and Fractals 40 (2009) 1750–1765 1761
Author's personal copy
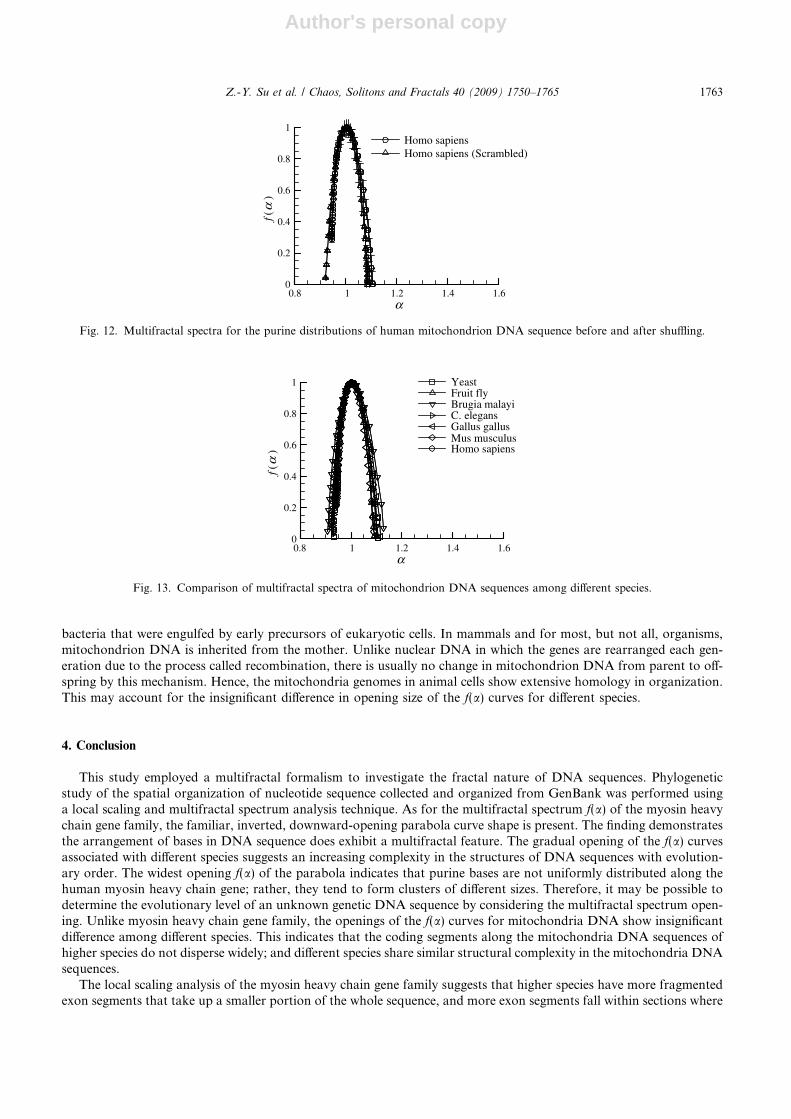
The multifractal spectra of DNA sequences obtained by deleting all introns and stitching together the remainingexon segments for the corresponding seven species are shown in Fig. 11. Comparing Figs. 11 and 10, the opening off(a) curves obtained from stitching together the remaining exon segments are much smaller than original DNAsequences for most species, except yeast. This means that protein-coding sequences are much more evenly distributedthan the original sequence. In Fig. 11, the difference in the openings of all f(a) curves obtained from the seven species isinsignificant; suggesting the complexity of protein-coding sequences in DNA is almost the same among different species.
3.2.2. Application to mitochondria genome
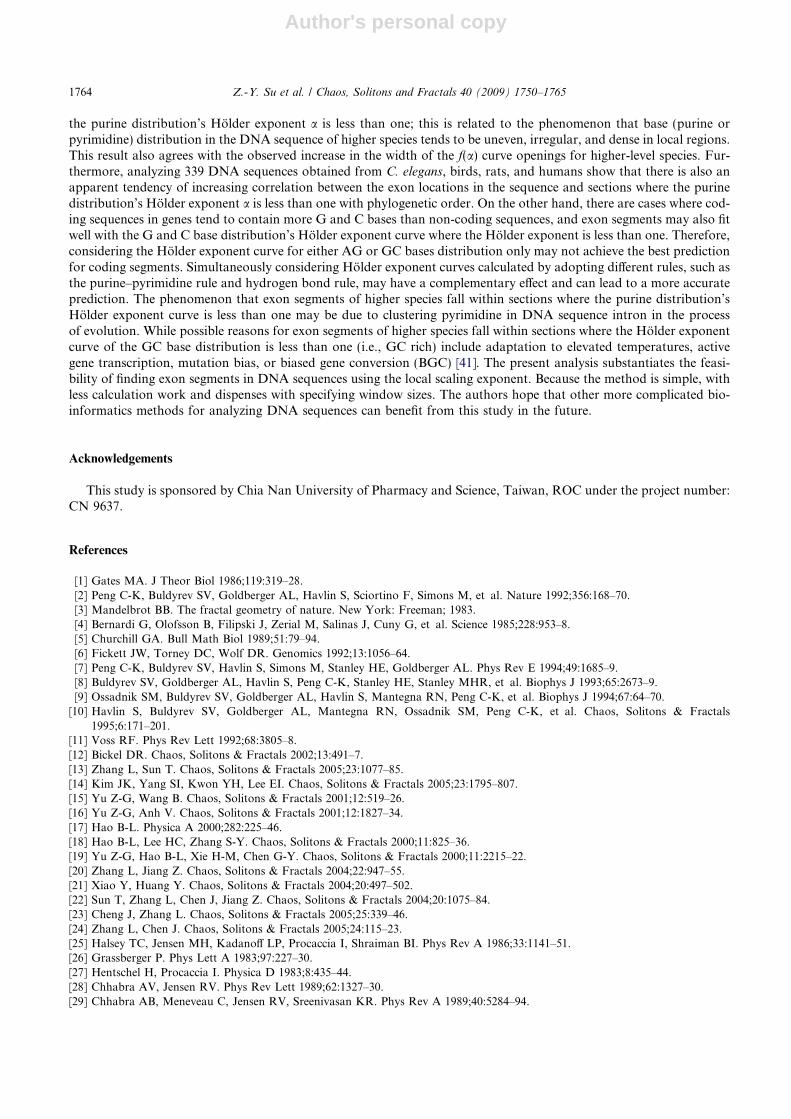
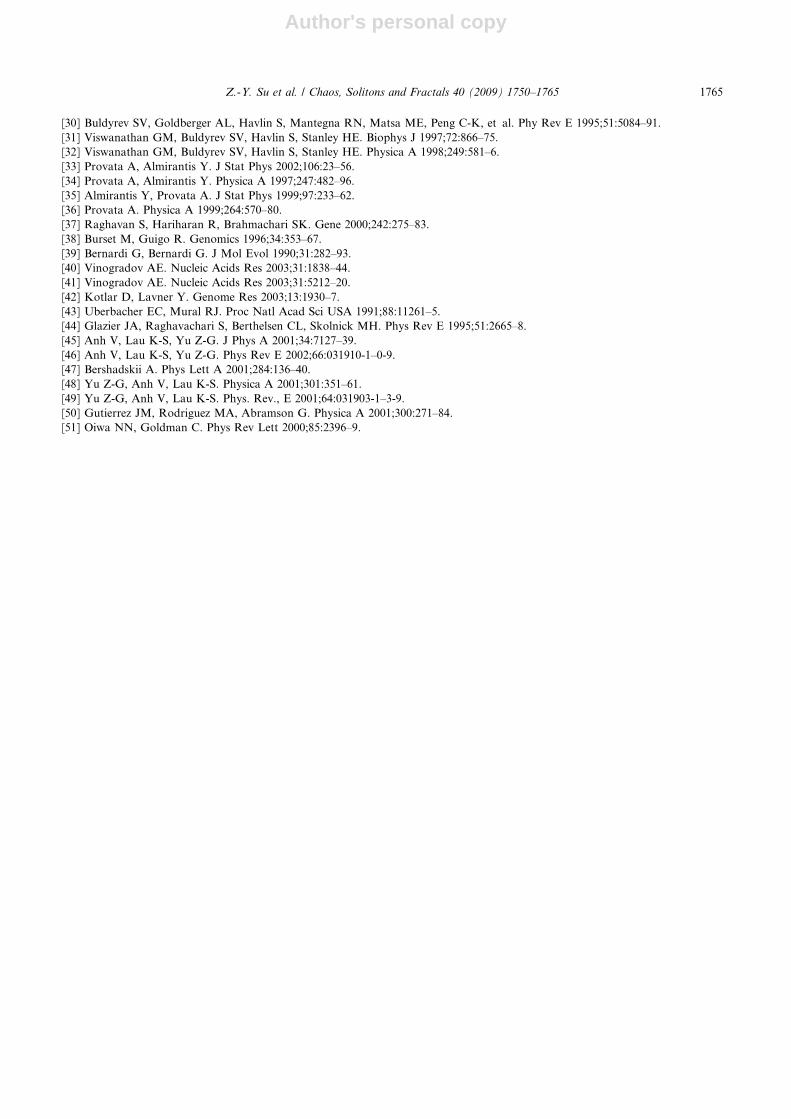
The primary function of mitochondria is to convert oxygen and nutrients into adenosine triphosphate (ATP), so theycan be considered the power generators of cells. Because many species have this organelle, the DNA sequence of themitochondrion can also be used to study evolution using the multifractal spectrum. Fig. 12 shows the multifractal spec-trum for the purine distribution of the human mitochondrion DNA sequence. The multifractal spectrum obtained fromthe same sequence but with bases positions scrambled by using a random scheme is also provided for comparison, fromwhich it can be inferred that the disturbance does not have a considerable influence on the f(a) curve opening. Thisphenomenon may be related to the fact that human mitochondrion DNA is extremely compact and contains no introns.A comparison of multifractal spectra for the mitochondrion DNA sequences of different species, shown in Fig. 13,shows that the openings of these f(a) curves are not wide, ranging from only 0.9–1.1. Considering the insignificant dif-ference in opening size and error margins, it is clear that the order of opening size cannot be determined; i.e., degrees ofcomplexity in the structure of these DNA sequences are about the same. In fact, except for yeast, almost all the mito-chondrion DNA sequences are of the same length and, quite different from the myosin heavy chain gene family, theexon segments of higher species with inheritance messages do not scatter more widely along the DNA sequence. Thismay account for the insignificant opening size difference in the f(a) curves. Mitochondrion DNA is derived from
DROMHCSCMYO1G
BRPMYOHEAV
HUMBMYH7
CEMYO3CHKMYHE
0.8 1 1.2 1.4 1.6
RNMHCG
0
0.2
0.4
0.6
0.8
1
α
αf(
)
Fig. 10. Comparison of multifractal spectra of myosin heavy chain genes among different species.
DROMHCSCMYO1G
BRPMYOHEAV
HUMBMYH7
CEMYO3CHKMYHE
0.8 1 1.2 1.4 1.60
0.2
0.4
0.6
0.8
1
RNMHCG
α
f (α)
Fig. 11. Comparison of multifractal spectra of myosin heavy chain genes of different species with introns removed, before and aftershuffling.
1762 Z.-Y. Su et al. / Chaos, Solitons and Fractals 40 (2009) 1750–1765
Author's personal copy
bacteria that were engulfed by early precursors of eukaryotic cells. In mammals and for most, but not all, organisms,mitochondrion DNA is inherited from the mother. Unlike nuclear DNA in which the genes are rearranged each gen-eration due to the process called recombination, there is usually no change in mitochondrion DNA from parent to off-spring by this mechanism. Hence, the mitochondria genomes in animal cells show extensive homology in organization.This may account for the insignificant difference in opening size of the f(a) curves for different species.
4. Conclusion
This study employed a multifractal formalism to investigate the fractal nature of DNA sequences. Phylogeneticstudy of the spatial organization of nucleotide sequence collected and organized from GenBank was performed usinga local scaling and multifractal spectrum analysis technique. As for the multifractal spectrum f(a) of the myosin heavychain gene family, the familiar, inverted, downward-opening parabola curve shape is present. The finding demonstratesthe arrangement of bases in DNA sequence does exhibit a multifractal feature. The gradual opening of the f(a) curvesassociated with different species suggests an increasing complexity in the structures of DNA sequences with evolution-ary order. The widest opening f(a) of the parabola indicates that purine bases are not uniformly distributed along thehuman myosin heavy chain gene; rather, they tend to form clusters of different sizes. Therefore, it may be possible todetermine the evolutionary level of an unknown genetic DNA sequence by considering the multifractal spectrum open-ing. Unlike myosin heavy chain gene family, the openings of the f(a) curves for mitochondria DNA show insignificantdifference among different species. This indicates that the coding segments along the mitochondria DNA sequences ofhigher species do not disperse widely; and different species share similar structural complexity in the mitochondria DNAsequences.
The local scaling analysis of the myosin heavy chain gene family suggests that higher species have more fragmentedexon segments that take up a smaller portion of the whole sequence, and more exon segments fall within sections where
0.8 1 1.2 1.4 1.6
Homo sapiensHomo sapiens (Scrambled)
α
0
0.2
0.4
0.6
0.8
1
αf(
)
Fig. 12. Multifractal spectra for the purine distributions of human mitochondrion DNA sequence before and after shuffling.
Fruit flyYeast
Brugia malayi
Homo sapiens
C. elegansGallus gallusMus musculus
0.8 1 1.2 1.4 1.6α
0
0.2
0.4
0.6
0.8
1
αf(
)
Fig. 13. Comparison of multifractal spectra of mitochondrion DNA sequences among different species.
Z.-Y. Su et al. / Chaos, Solitons and Fractals 40 (2009) 1750–1765 1763
Author's personal copy
the purine distribution’s Holder exponent a is less than one; this is related to the phenomenon that base (purine orpyrimidine) distribution in the DNA sequence of higher species tends to be uneven, irregular, and dense in local regions.This result also agrees with the observed increase in the width of the f(a) curve openings for higher-level species. Fur-thermore, analyzing 339 DNA sequences obtained from C. elegans, birds, rats, and humans show that there is also anapparent tendency of increasing correlation between the exon locations in the sequence and sections where the purinedistribution’s Holder exponent a is less than one with phylogenetic order. On the other hand, there are cases where cod-ing sequences in genes tend to contain more G and C bases than non-coding sequences, and exon segments may also fitwell with the G and C base distribution’s Holder exponent curve where the Holder exponent is less than one. Therefore,considering the Holder exponent curve for either AG or GC bases distribution only may not achieve the best predictionfor coding segments. Simultaneously considering Holder exponent curves calculated by adopting different rules, such asthe purine–pyrimidine rule and hydrogen bond rule, may have a complementary effect and can lead to a more accurateprediction. The phenomenon that exon segments of higher species fall within sections where the purine distribution’sHolder exponent curve is less than one may be due to clustering pyrimidine in DNA sequence intron in the processof evolution. While possible reasons for exon segments of higher species fall within sections where the Holder exponentcurve of the GC base distribution is less than one (i.e., GC rich) include adaptation to elevated temperatures, activegene transcription, mutation bias, or biased gene conversion (BGC) [41]. The present analysis substantiates the feasi-bility of finding exon segments in DNA sequences using the local scaling exponent. Because the method is simple, withless calculation work and dispenses with specifying window sizes. The authors hope that other more complicated bio-informatics methods for analyzing DNA sequences can benefit from this study in the future.
Acknowledgements
This study is sponsored by Chia Nan University of Pharmacy and Science, Taiwan, ROC under the project number:CN 9637.
References
[1] Gates MA. J Theor Biol 1986;119:319–28.[2] Peng C-K, Buldyrev SV, Goldberger AL, Havlin S, Sciortino F, Simons M, et al. Nature 1992;356:168–70.[3] Mandelbrot BB. The fractal geometry of nature. New York: Freeman; 1983.[4] Bernardi G, Olofsson B, Filipski J, Zerial M, Salinas J, Cuny G, et al. Science 1985;228:953–8.[5] Churchill GA. Bull Math Biol 1989;51:79–94.[6] Fickett JW, Torney DC, Wolf DR. Genomics 1992;13:1056–64.[7] Peng C-K, Buldyrev SV, Havlin S, Simons M, Stanley HE, Goldberger AL. Phys Rev E 1994;49:1685–9.[8] Buldyrev SV, Goldberger AL, Havlin S, Peng C-K, Stanley HE, Stanley MHR, et al. Biophys J 1993;65:2673–9.[9] Ossadnik SM, Buldyrev SV, Goldberger AL, Havlin S, Mantegna RN, Peng C-K, et al. Biophys J 1994;67:64–70.
[10] Havlin S, Buldyrev SV, Goldberger AL, Mantegna RN, Ossadnik SM, Peng C-K, et al. Chaos, Solitons & Fractals1995;6:171–201.
[11] Voss RF. Phys Rev Lett 1992;68:3805–8.[12] Bickel DR. Chaos, Solitons & Fractals 2002;13:491–7.[13] Zhang L, Sun T. Chaos, Solitons & Fractals 2005;23:1077–85.[14] Kim JK, Yang SI, Kwon YH, Lee EI. Chaos, Solitons & Fractals 2005;23:1795–807.[15] Yu Z-G, Wang B. Chaos, Solitons & Fractals 2001;12:519–26.[16] Yu Z-G, Anh V. Chaos, Solitons & Fractals 2001;12:1827–34.[17] Hao B-L. Physica A 2000;282:225–46.[18] Hao B-L, Lee HC, Zhang S-Y. Chaos, Solitons & Fractals 2000;11:825–36.[19] Yu Z-G, Hao B-L, Xie H-M, Chen G-Y. Chaos, Solitons & Fractals 2000;11:2215–22.[20] Zhang L, Jiang Z. Chaos, Solitons & Fractals 2004;22:947–55.[21] Xiao Y, Huang Y. Chaos, Solitons & Fractals 2004;20:497–502.[22] Sun T, Zhang L, Chen J, Jiang Z. Chaos, Solitons & Fractals 2004;20:1075–84.[23] Cheng J, Zhang L. Chaos, Solitons & Fractals 2005;25:339–46.[24] Zhang L, Chen J. Chaos, Solitons & Fractals 2005;24:115–23.[25] Halsey TC, Jensen MH, Kadanoff LP, Procaccia I, Shraiman BI. Phys Rev A 1986;33:1141–51.[26] Grassberger P. Phys Lett A 1983;97:227–30.[27] Hentschel H, Procaccia I. Physica D 1983;8:435–44.[28] Chhabra AV, Jensen RV. Phys Rev Lett 1989;62:1327–30.[29] Chhabra AB, Meneveau C, Jensen RV, Sreenivasan KR. Phys Rev A 1989;40:5284–94.
1764 Z.-Y. Su et al. / Chaos, Solitons and Fractals 40 (2009) 1750–1765
Author's personal copy
[30] Buldyrev SV, Goldberger AL, Havlin S, Mantegna RN, Matsa ME, Peng C-K, et al. Phy Rev E 1995;51:5084–91.[31] Viswanathan GM, Buldyrev SV, Havlin S, Stanley HE. Biophys J 1997;72:866–75.[32] Viswanathan GM, Buldyrev SV, Havlin S, Stanley HE. Physica A 1998;249:581–6.[33] Provata A, Almirantis Y. J Stat Phys 2002;106:23–56.[34] Provata A, Almirantis Y. Physica A 1997;247:482–96.[35] Almirantis Y, Provata A. J Stat Phys 1999;97:233–62.[36] Provata A. Physica A 1999;264:570–80.[37] Raghavan S, Hariharan R, Brahmachari SK. Gene 2000;242:275–83.[38] Burset M, Guigo R. Genomics 1996;34:353–67.[39] Bernardi G, Bernardi G. J Mol Evol 1990;31:282–93.[40] Vinogradov AE. Nucleic Acids Res 2003;31:1838–44.[41] Vinogradov AE. Nucleic Acids Res 2003;31:5212–20.[42] Kotlar D, Lavner Y. Genome Res 2003;13:1930–7.[43] Uberbacher EC, Mural RJ. Proc Natl Acad Sci USA 1991;88:11261–5.[44] Glazier JA, Raghavachari S, Berthelsen CL, Skolnick MH. Phys Rev E 1995;51:2665–8.[45] Anh V, Lau K-S, Yu Z-G. J Phys A 2001;34:7127–39.[46] Anh V, Lau K-S, Yu Z-G. Phys Rev E 2002;66:031910-1–0-9.[47] Bershadskii A. Phys Lett A 2001;284:136–40.[48] Yu Z-G, Anh V, Lau K-S. Physica A 2001;301:351–61.[49] Yu Z-G, Anh V, Lau K-S. Phys. Rev., E 2001;64:031903-1–3-9.[50] Gutierrez JM, Rodriguez MA, Abramson G. Physica A 2001;300:271–84.[51] Oiwa NN, Goldman C. Phys Rev Lett 2000;85:2396–9.
Z.-Y. Su et al. / Chaos, Solitons and Fractals 40 (2009) 1750–1765 1765