Living in the Light- The Bangladesh Solar Home System Story
144
ANIL CABRAAL WILLIAM A. WARD V. SUSAN BOGACH AMIT JAIN LIVING IN THE LIGHT: THE BANGLADESH SOLAR HOME SYSTEMS STORY Public Disclosure Authorized Public Disclosure Authorized Public Disclosure Authorized Public Disclosure Authorized
-
Upload
khangminh22 -
Category
Documents
-
view
0 -
download
0
Transcript of Living in the Light- The Bangladesh Solar Home System Story
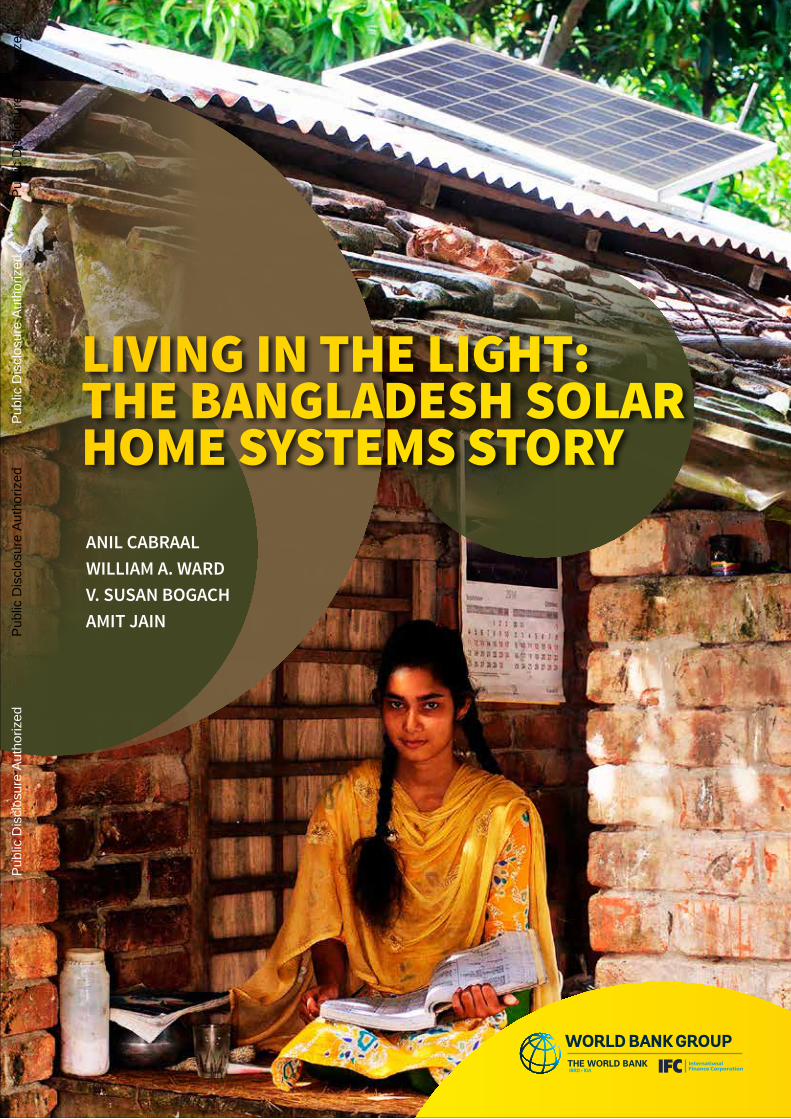
ANIL CABRAAL WILLIAM A. WARD V. SUSAN BOGACHAMIT JAIN
LIVING IN THE LIGHT: THE BANGLADESH SOLAR HOME SYSTEMS STORY
Pub
lic D
iscl
osur
e A
utho
rized
Pub
lic D
iscl
osur
e A
utho
rized
Pub
lic D
iscl
osur
e A
utho
rized
Pub
lic D
iscl
osur
e A
utho
rized
© 2021 International Bank for Reconstruction and Development / The World Bank
The World Bank1818 H Street, NW Washington, DC 20433USATel: 1-202-473-1000Fax: 1-207-477-6391www.worldbank.org
This work is a product of the staff of The World Bank with external contributions. The findings, interpretations, and conclusions expressed in this work do not necessarily reflect the views of The World Bank, its Board of Executive Directors, or the governments they represent.
The World Bank does not guarantee the accuracy, completeness, or currency of the data included in this work and does not assume responsibility for any errors, omissions, or discrepancies in the information, or liability with respect to the use of or failure to use the information, methods, processes, or conclusions set forth. The boundaries, colors, denominations, and other information shown on any map in this work do not imply any judgment on the part of The World Bank concerning the legal status of any territory or the endorsement or acceptance of such boundaries.
Nothing herein shall constitute or be construed or considered to be a limitation upon or waiver of the privileges and immunities of The World Bank, all of which are specifically reserved.
Rights and PermissionsThe material in this work is subject to copyright. Because The World Bank encourages dissemination of its knowledge, this work may be reproduced, in whole or in part, for noncommercial purposes as long as full attribution to this work is given.
AttributionPlease cite the work as follows: Cabraal, Anil, William A. Ward, V. Susan Bogach and Amit Jain. 2021. Living in the Light: The Bangladesh Solar Home Systems Story. A World Bank Study. Washington, DC: World Bank.
TranslationsIf you create a translation of this work, please add the following disclaimer along with the attribution: This translation was not created by The World Bank and should not be considered an official World Bank translation. The World Bank shall not be liable for any content or error in this translation.
AdaptationsIf you create an adaptation of this work, please add the following disclaimer along with the attribution: This is an adaptation of an original work by The World Bank. Views and opinions expressed in the adaptation are the sole responsibility of the author or authors of the adaptation and are not endorsed by The World Bank.
Third-party contentThe World Bank does not necessarily own each component of the content contained within the work. The World Bank therefore does not warrant that the use of any third-party-owned individual component or part contained in the work will not infringe on the rights of those third parties. The risk of claims resulting from such infringement rests solely with you. If you wish to reuse a component of this work, it is your responsibility to determine whether permission is needed for that reuse and to obtain permission from the copyright owner. Examples of components can include, but not are limited to tables, figures, or images.
Any queries on rights and licenses, including subsidiary rights, should be addressed to World Bank Publications, The World Bank Group, 1818 H Street NW, Washington, DC 20433, USA; fax: 1-202-522-2625; e-mail: [email protected].
Photo credit: IDCOL (Front cover photo, and page no. vii, xi, xvii, 26, 27, 78, 79, 105) David Waldorf/The World Bank (page no. 3, 7, 12. 30, 37, 44)Arne Hoel/The World Bank (page no. 65, 71)
Graphic design and Illustration by M. Inamul Shahriar
World Bank Office DhakaPlot- E-32, Agargaon, Sher-e-Bangla Nagar, Dhaka-1207BangladeshTel: 880-2-5566-7777Fax: 880-2-5566-7778www.worldbank.org/bangladesh
LIVING IN THE LIGHT: THE BANGLADESH SOLAR HOME SYSTEMS STORY
Anil CabraalWilliam A. WardV. Susan BogachAmit Jain
A World Bank Study
FOREWORD – GOVERNMENT OF BANGLADESH viii
FOREWORD – THE WORLD BANK ix
FOREWORD – INTERNATIONAL SOLAR ALLIANCE x
ACKNOWLEDGMENTS xii
AUTHORS xiv
ACRONYMS AND ABBREVIATIONS xv
ECONOMIC INDEXES xvi
EXECUTIVE SUMMARY xviii
TABLE OF CONTENT
INTRODUCTION 1
THE SOLAR HOME SYSTEMS PROGRAM 9
ADAPTING TO REALITY 29
IMPACT OF DECLINING SHS SALES AND MITIGATION ACTIONS TAKEN 39
ECONOMIC AND FINANCIAL ANALYSIS 51
MAIN CONCLUSIONS AND LESSONS LEARNED 67
REFERENCES 73
APPENDIX 81
123456
LIST OF FIGURES
LIST OF TABLES
Figure 1. Organizational Structure of the SHS Program and Functional Roles (IDCOL) xix
Figure 2. SHS Installation Progress xx
Figure 3. Schematic of an SHS 2
Figure 4. Trends in Rural Electricity Access 1995–2018 4
Figure 5. SHS Program Functional Relationships and Roles 13
Figure 6. SHS Program Organization at IDCOL 14
Figure 7. Development Partner Financing for the SHS Program (US$, millions) 19
Figure 8. Annual and Cumulative SHS Installations 22
Figure 9. Number of SHS Installed from 2003 to 2018 by Size 22
Figure 10. Households with SHS as Percentage of Rural and Total Households 22
Figure 11. SHS Sales (by Color) and Market Penetration (% of Total Households) at the District Level 23
Figure 12. Timeline of Promotion and Outreach Activities 31
Figure 13. Trend in Weighted Average Size of SHS 33
Figure 14. Trend in Market Share of SHS by Capacity 33
Figure 15. Reduction of SHS Unit Cost with Cumulative SHS Installations 34
Figure 16. Trend in Unelectrified Rural Households and SHS Installations 40
Figure 17. BREB Grid Connection Rate Increased Rapidly after 2014 42
Figure 18. Sales of SHS and TR/KABITA Larger Public Service PV Systems 43
Figure 19. SHS Sales per PO under the SHS Program 44
Figure 20. Global Solar PV Module Cost Trend 45
Figure 21. Cumulative Stakeholder Benefits from the SHS Program, 2003–2042 62
Figure 22. ODA Loan Withdrawals and Repayments by GOB 2003–2054 62
Figure 23. Net GOB Loan Receipts by IDCOL Minus IDCOL Repayments 2003-2042 63
Figure 24. GOB Net on ODA Pass-Through to IDCOL 2003-2054 63
Figure 25. GOB Treasury Net Flows from SHS Program 2003 to 2054 64
Table 1. Sources and Amounts of Financing to December 2017 for the SHS Program 18
Table 2. Lending Terms to POs 19
Table 3. Sources and Amounts of Grants for SHS per Agreement 20
Table 4. Actual Amount of Grants Provided for SHS 21
Table 5. Market Penetration of SHS in Bangladesh 2003–2018 24
Table 6. Total SHS Sales as % of Divisional Households (2003–2018) 25
Table 7. Trends in Unit Cost of SHS 2003–2017 34
Table 8. Debt Collection Efficiency of POs from SHS Customers, 2009 to 2019 42
Table 9. Example of Comparative SHS Costs in 2013 and 2016 45
Table 10. Strengthening Security Requirements for Loans to POs 46
Table 11. PO Loan Status 2009–2018 47
LIST OF BOXESBox 1. Solar Home System 2
Box 2. Bangladesh Solar Home Systems Program - World Bank Support 11
Box 3. Microfinance in Bangladesh and Its Role in SHS 15
Box 4. Case Studies - Improving Quality of Life 26
Box 5. Findings and Recommendations for Debt Problem Resolution 48
Box 6. Methodology Used to Compute Kerosene Cost 95
Table 12. Economic Analysis of the SHS Program 2003–2029 (Constant 2018 US$, millions) 54
Table 13. Financial Analysis of the SHS Program from the Household Stakeholder Group Perspective (Constant 2018 US$, millions) 57
Table 14. Stakeholder Indicative Net Financial Benefits from the SHS Program 2003–2042 (Constant 2018 US$, millions) 59
Table 15. Summation of Distribution of Estimated Net Financial Benefits to Indicated Stakeholders 2003–2042 61
Table D.1. Expected Useful Life of SHS Component Parts 94
Table D.2. Kerosene Cost Estimation: Landed Cost at Chittagong 2003–2018 (constant 2018 US$/liter) 96
Table D.3. Kerosene Cost Estimation: From Landed Cost at Chittagong to Official versus Actual Retail Prices per Liter, 2003–2018 (constant 2018 US$/liter) 96
Table D.4. Summary Survey Data (Grameen SHS CDM Project 2012) 97
Table D.5. Grameen Shakti Kerosene Avoided in CDM Application 97
Table D.6. Kerosene Offset (liters per year), Based on Grameen Shakti Survey Data 98
Table D.7. Calculation of Total Liters of Kerosene Use Avoided during 2003–2022 by SHS Program Installations 2003–2018 99
Table D.8. Kerosene Saved by the Bangladesh SHS Program, 2003 to 2022: Value at the Household Level, Aggregated SHS Households 99
Table D.9. Estimation of Kerosene Subsidy Saved by the GOB as a Result of SHS Program Electricity Output (constant 2018 US$) 100
Table D.10. Kerosene Distributor Profit Losses from SHS-Related Reductions in Kerosene Use 100
Table D.11. Financial and Economic Value of Grid Electricity Offset by SHS from 2022 to 2029 101
Table D.12. SHS Installation Data 101
Table D.13. SHS Program Costs by Year 102
Table D.14. Tax and Duty Information 102
Table D.15. Imputed SHS Approximate Conversion Factors by Year or Year Groups 103
Table D.16. Calculation of Tax Component of GOB Stakeholder Impact (constant 2018 US$) 103
Table D.17. Estimated Partner Organization Profits on SHS Sales and Installations 104
Table E.1. IDCOL Net Financial Benefit from Management of SHS Program, 2003–2042 106
Table F.1. ODA Lending Terms 108
Table F.2. ODA Loan Withdrawals and Repayments by Bangladesh Government 2003–2055 109
Table F.3. IDCOL ODA Loan Withdrawals and Repayments, 2003–2042 110
Table F.4. Comparison of Treasury versus IDCOL Stakeholder Impacts of Financial Structuring of ODA Pass-Through Funding of the SHS Program, 2003–2054 111
Table F.5. Net Impact on GOB of SHS Program in Present Value Terms 2003–2054 113
vi
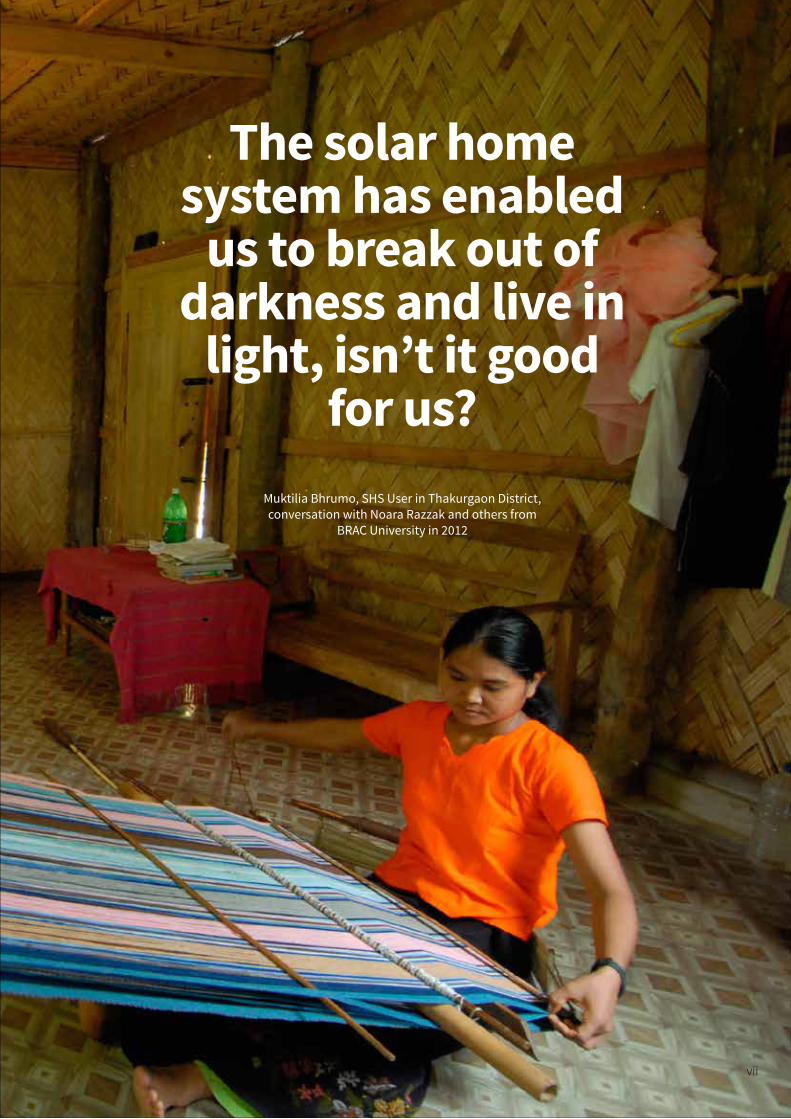
The solar home system has enabled
us to break out of darkness and live in
light, isn’t it good for us?
Muktilia Bhrumo, SHS User in Thakurgaon District,conversation with Noara Razzak and others from
BRAC University in 2012
vii
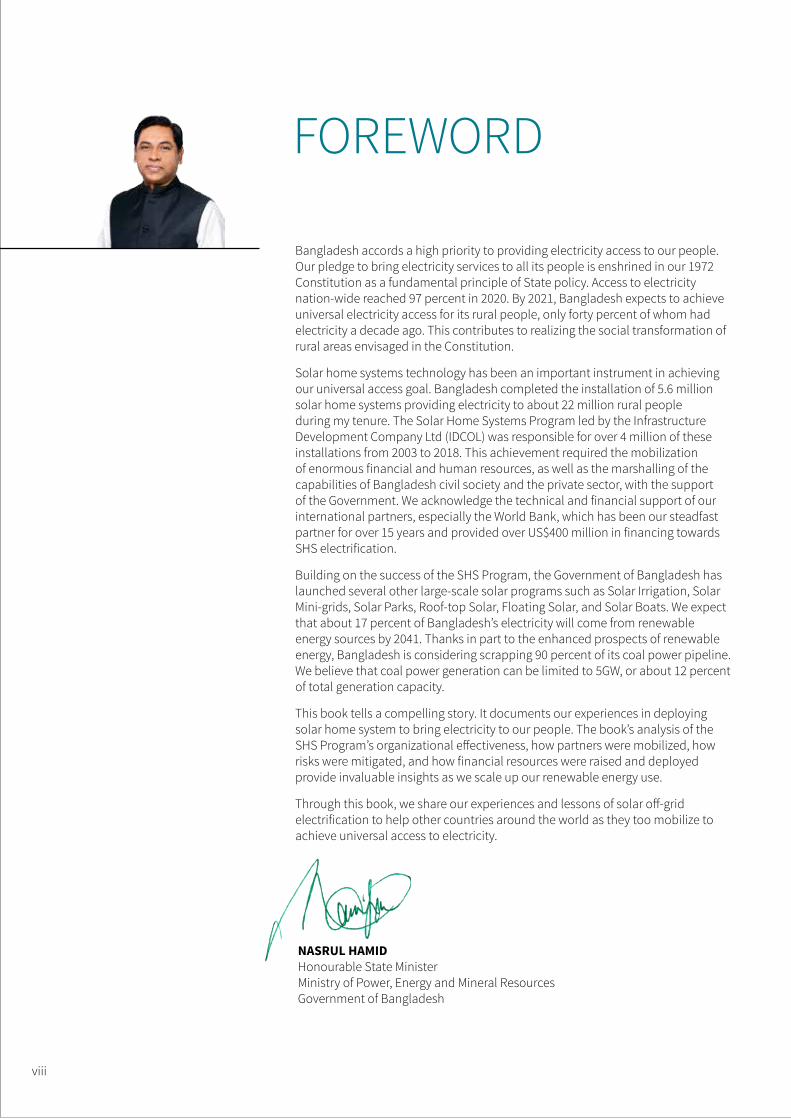
FOREWORD
Bangladesh accords a high priority to providing electricity access to our people. Our pledge to bring electricity services to all its people is enshrined in our 1972 Constitution as a fundamental principle of State policy. Access to electricity nation-wide reached 97 percent in 2020. By 2021, Bangladesh expects to achieve universal electricity access for its rural people, only forty percent of whom had electricity a decade ago. This contributes to realizing the social transformation of rural areas envisaged in the Constitution.
Solar home systems technology has been an important instrument in achieving our universal access goal. Bangladesh completed the installation of 5.6 million solar home systems providing electricity to about 22 million rural people during my tenure. The Solar Home Systems Program led by the Infrastructure Development Company Ltd (IDCOL) was responsible for over 4 million of these installations from 2003 to 2018. This achievement required the mobilization of enormous financial and human resources, as well as the marshalling of the capabilities of Bangladesh civil society and the private sector, with the support of the Government. We acknowledge the technical and financial support of our international partners, especially the World Bank, which has been our steadfast partner for over 15 years and provided over US$400 million in financing towards SHS electrification.
Building on the success of the SHS Program, the Government of Bangladesh has launched several other large-scale solar programs such as Solar Irrigation, Solar Mini-grids, Solar Parks, Roof-top Solar, Floating Solar, and Solar Boats. We expect that about 17 percent of Bangladesh’s electricity will come from renewable energy sources by 2041. Thanks in part to the enhanced prospects of renewable energy, Bangladesh is considering scrapping 90 percent of its coal power pipeline. We believe that coal power generation can be limited to 5GW, or about 12 percent of total generation capacity.
This book tells a compelling story. It documents our experiences in deploying solar home system to bring electricity to our people. The book’s analysis of the SHS Program’s organizational effectiveness, how partners were mobilized, how risks were mitigated, and how financial resources were raised and deployed provide invaluable insights as we scale up our renewable energy use.
Through this book, we share our experiences and lessons of solar off-grid electrification to help other countries around the world as they too mobilize to achieve universal access to electricity.
NASRUL HAMIDHonourable State MinisterMinistry of Power, Energy and Mineral ResourcesGovernment of Bangladesh
viii
FOREWORD
We are proud to partner with the Government of Bangladesh to increase access to clean electricity through solar power. Today, thanks to our joint efforts, along with other development partners, civil society and the private sector, Bangladesh has one of the world’s largest domestic off-grid solar power programs bringing modern electricity services to its rural population.
The Bangladesh Solar Home Systems (SHS) Program supported by the Government of Bangladesh and the World Bank began in 2003 at a time, when only 27 percent of rural Bangladesh households had access to grid electricity. The 50,000 household pilot was implemented under the capable leadership of the Infrastructure Development Company Ltd (IDCOL). Thinking outside the box, IDCOL combined its expertise in infrastructure financing with Bangladesh’s pioneering work in micro-finance and early attempts at solar electrification by companies to build an off-grid electrification business model that ultimately brought electricity services to about 14 percent of Bangladesh population.
Over the course of 15 years US$1 billion in financing was mobilized from international and domestic sources for SHS electrification. The SHS Program has demonstrated that hundreds of millions of dollars mobilized at the international level can flow efficiently down to the remotest corners of Bangladesh to offer loans in amounts of one hundred dollars or less that permitted a rural household to purchase a solar home system.
The Bangladesh SHS electrification experience, as told in this book, convincingly demonstrates that off-grid electrification can be a mainstream provider of electricity to a large segment of the population. Isolated communities no longer need to wait years or decades until the grid reaches their communities to reap the benefits of electricity.
Building on its success in using solar energy to provide electricity in rural areas, the World Bank is now extending considerable financial and technical support to Bangladesh to scale up other clean renewable energy options including solar irrigation, solar mini-grids, roof-top solar, and solar farms.
The book offers practical lessons to other countries that are embarking on accelerated off-grid electrification programs. It is a steppingstone to achieving a clean energy future to benefit all humankind. The World Bank will use the insights in this book to help countries implement economically smart and tailored approaches that best suit their needs, and will continue to support technological, financial and policy innovations that can help accelerate the expansion of reliable and affordable electricity services and end energy poverty.
GUANGZHE CHENRegional Director for InfrastructureSouth Asia RegionThe World Bank
MERCY MIYANG TEMBONCountry Director for Bangladesh and BhutanThe World Bank
LIVING IN THE LIGHT: THE BANGLADESH SOLAR HOME SYSTEMS STORY | ix
FOREWORD
The International Solar Alliance (ISA) has been conceived as a coalition of solar-resource-rich countries to address their special energy needs. The ISA is an action-oriented, member-driven, collaborative platform for increased solar energy technologies to enhance energy security and sustainable development and improve access to energy in developing member countries. The ISA has 72 countries have signed and ratified the ISA Framework Agreement, and another 89 countries have signed the ISA Framework Agreement.
I was deeply honoured to take over as Director-General of the International Solar Alliance at inception to lead the global effort in bringing together countries with the collective objective of achieving their energy needs through solar alternatives. With energy independence becoming a part of the new global narrative, new partnerships, and scale involvement of the private sector will be paramount for ISA’s work. The lessons from the Bangladesh Solar Home System program reflect globally replicable results.
Access to modern, clean energy is essential to give every person the opportunity for a prosperous, dignified, and healthy life. Today, as the world is battling the COVID-19 pandemic, access to modern energy is even more crucial and urgent to provide better health care access and improve peoples’ lives. With more than 800 million people still lacking electricity access, finding and deploying innovative ways to bring electricity services quickly, affordably, and sustainably to unelectrified communities is imperative.
The Bangladesh Solar Home Systems Program represents one such way for the rapid and flexible provision of electricity access to individual households. Over fifteen years, in a successful partnership between the government, the private sector, civil society and the international community, it brought modern electricity services to remote and dispersed communities in Bangladesh, far faster and at a lower cost than would have been possible by extending the national electricity grid. The SHS Program contributed significantly to Bangladesh’s likely achievement of universal access to electricity by 2021. It did so with renewable energy resources and contributed to reducing greenhouse gas emissions.
This book is a comprehensive description of the program. It documents the approach Bangladesh took, the partnerships it enabled, the challenges it faced, and the outcomes achieved. It is a useful reference to many other countries that wish to deploy off-grid renewable energy technologies to bring modern electricity services to their people.
This book offers insights and lessons to other countries that strive to achieve some of the key objectives for ISA member countries and instil the confidence that they can succeed. This book is invaluable for us at ISA, to let leaders know what is working, where, when, and why. This includes shaping messages that reflect the promise and challenges faced in achieving our objectives by making stories, approaches, and data access, allowing diverse decision-makers to act and spur results.
UPENDRA TRIPATHYDirector-GeneralInternational Solar Alliance
x
LIVING IN THE LIGHT: THE BANGLADESH SOLAR HOME SYSTEMS STORY | xi
ACKNOWLEDGMENTSBorn in 2002 when the early steps in using solar photovoltaics for off-grid electrification were being taken, the Bangladesh Solar Home Systems Program owes its success to the early visionaries and actors. They saw the promise of the technology and imagined what it would take to propagate it. Foremost among them were Dr. Masihur Rahman, Secretary, Economic Relations Division and Chairman, Infrastructure Development Company Ltd (IDCOL); Subramaniam Vijay Iyer, the World Bank Task Team Leader; and Fouzul Kabir Khan, the Chief Executive Officer (CEO) of IDCOL. Together, they conceived, launched, and guided the pilot program and began its scale-up. They were followed by the subsequent CEOs of IDCOL, up to Mahmood Malik the present CEO of IDCOL, and the World Bank Task Team Leaders who followed Vijay, including Raihan Elahi, Zubair Sadeque, and Amit Jain, and their teams who led its expansion. The success of the SHS Program is due to their drive for success and their pragmatic approach to problem solving. Crucial to the success was the building and nurturing of a public-private partnership by IDCOL.
IDCOL staff played a vital role in the program implementation. Without them there would not be a successful SHS Program. Special mention is due to S. M. Monirul Islam, Deputy CEO, and to Md. Enamul Karim Pavel, Head of Renewable Energy of IDCOL, who directed the SHS Program on a day-to-day basis. Formanul Islam played an important role in the evolution of the SHS Program while he was Deputy CEO from 2012 to 2015 and previously as Head of IDCOL’s Legal Department. We are grateful to Rashed Rahman Khan, Manager, SHS Program, and Serajul Hossain, Vice President and Unit Head, SHS Program, at IDCOL without whose assistance in gathering data and providing insights into the SHS Program this report would not be possible.
We deeply appreciate the willingness of IDCOL to openly share data and offer insights not only into what they did right but also into what could have been done better. Lessons are most valuable when they are based on open and honest discussion. Unless otherwise specified, all charts, tables, graphs, and figures are based on data provided by IDCOL.
Over the course of many years, our visits to villages to meet solar home systems users provided firsthand testimony of their experiences and aspirations. Together with IDCOL, we learnt what would work, what would not, and how electricity positively impacted their lives. These visits, along with discussions with staff from partner organizations (POs), were invaluable and informative.
Professor Rizwan Khan, Chairman of the independent Technical Standards Committee (TSC) and Vice Chancellor of United International University, played an important role from the onset to the present time in setting and enforcing quality standards for SHS. The SHS Program success owes much to the confidence consumers gained that the SHS would provide the promised services reliably over the long term.
Contributions of the POs were crucial to the success of the SHS Program. Among their leaders were Hasna Khan and Asma Haque of Prokousholi Shangsad during the project launch stage. During
xii

implementation, we acknowledge the contributions of Dipal Barua, previously Managing Director of Grameen Shakti and then Chairman of Bright Green Foundation; Ruhul Kuddus, previously Deputy General Manager, Grameen Shakti, and then Executive Director of the Rural Services Foundation; Abdul Muyeed Chy, Executive Director, Bangladesh Rural Advancement Committee (BRAC); Mohammad Ibrahim, Executive Director, Centre for Mass Education in Science (CMES); and Hosne Ara, Chairman, Thengamara Mohila Sabuj Sangha (TMSS), to name but a few of many.
World Bank Country Directors supported the SHS Program and committed the required financing and staff support. We acknowledge the valuable guidance from Demetrios Papathanasiou, Practice Manager, South Asia Energy Unit, the World Bank.
We thank the other financiers who recognized the value of building on the SHS Program modalities and co-financed the SHS Program. Their contributions permitted the SHS Program to benefit tens of millions of people and build a renewable energy industry. They include the Asian Development Bank (ADB), Global Environment Facility (GEF), Global Partnership on Output-Based Aid (GPOBA), German Agency for International Cooperation (Deutsche Gesellschaft für Internationale Zusammenarbeit, GIZ), Islamic Development Bank (IsDB), Japan International Cooperation Agency (JICA), Kreditanstalt für Wiederaufbau (KfW), UK Department for International Development (DFID), and United States Agency for International Development (USAID).
The feedback from the peer reviewers Md. Enamul Karim Pavel of IDCOL and Raihan Elahi of the World Bank, were valuable in improving the report and making it more understandable to a wider audience. Enamul Karim has had a long and deep engagement in the SHS Program and as the Head of Renewable Energy of IDCOL he was instrumental in guiding it to success. Raihan Elahi as a former Task Team Leader of the RERED Project, knew the project intimately and his suggestions are grounded in that deep knowledge.
The authors acknowledge the data analysis support from Majid Hashemi at Clemson University. We acknowledge with thanks the multifaceted support from Sreyamsa Bairiganjan; editorial support from Selvaraj Ranganathan; Inamul Shahriar for artwork, typesetting and book design; and Mehrin A. Mahbub, Communications Officer at the World Bank Dhaka Office for guidance in producing this report.
The findings, interpretations, and conclusions expressed in this work are solely those of the authors and do not necessarily reflect the views of the World Bank, its Board of Executive Directors, or the governments they represent; the Government of Bangladesh (GOB); or IDCOL. Any errors or omissions in this work are entirely the responsibility of the authors.
LIVING IN THE LIGHT: THE BANGLADESH SOLAR HOME SYSTEMS STORY | xiii
AUTHORS
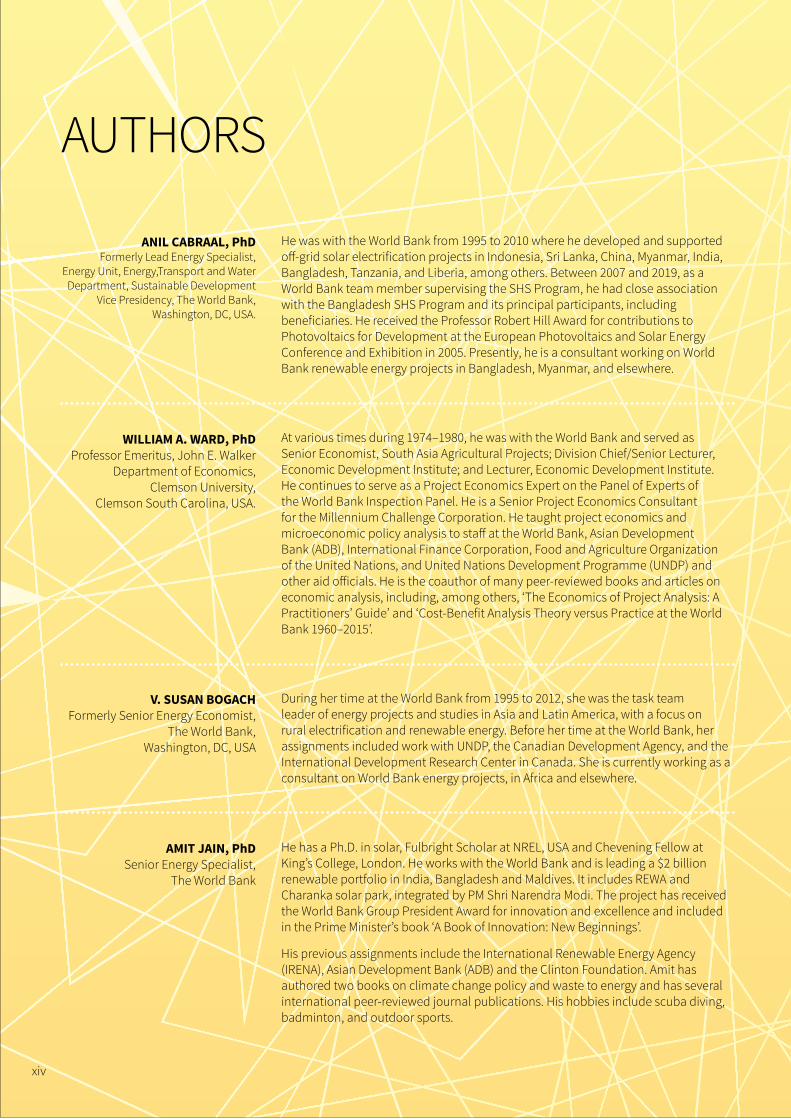
He was with the World Bank from 1995 to 2010 where he developed and supported off-grid solar electrification projects in Indonesia, Sri Lanka, China, Myanmar, India, Bangladesh, Tanzania, and Liberia, among others. Between 2007 and 2019, as a World Bank team member supervising the SHS Program, he had close association with the Bangladesh SHS Program and its principal participants, including beneficiaries. He received the Professor Robert Hill Award for contributions to Photovoltaics for Development at the European Photovoltaics and Solar Energy Conference and Exhibition in 2005. Presently, he is a consultant working on World Bank renewable energy projects in Bangladesh, Myanmar, and elsewhere.
At various times during 1974–1980, he was with the World Bank and served as Senior Economist, South Asia Agricultural Projects; Division Chief/Senior Lecturer, Economic Development Institute; and Lecturer, Economic Development Institute. He continues to serve as a Project Economics Expert on the Panel of Experts of the World Bank Inspection Panel. He is a Senior Project Economics Consultant for the Millennium Challenge Corporation. He taught project economics and microeconomic policy analysis to staff at the World Bank, Asian Development Bank (ADB), International Finance Corporation, Food and Agriculture Organization of the United Nations, and United Nations Development Programme (UNDP) and other aid officials. He is the coauthor of many peer-reviewed books and articles on economic analysis, including, among others, ‘The Economics of Project Analysis: A Practitioners’ Guide’ and ‘Cost-Benefit Analysis Theory versus Practice at the World Bank 1960–2015’.
During her time at the World Bank from 1995 to 2012, she was the task team leader of energy projects and studies in Asia and Latin America, with a focus on rural electrification and renewable energy. Before her time at the World Bank, her assignments included work with UNDP, the Canadian Development Agency, and the International Development Research Center in Canada. She is currently working as a consultant on World Bank energy projects, in Africa and elsewhere.
He has a Ph.D. in solar, Fulbright Scholar at NREL, USA and Chevening Fellow at King’s College, London. He works with the World Bank and is leading a $2 billion renewable portfolio in India, Bangladesh and Maldives. It includes REWA and Charanka solar park, integrated by PM Shri Narendra Modi. The project has received the World Bank Group President Award for innovation and excellence and included in the Prime Minister’s book ‘A Book of Innovation: New Beginnings’.
His previous assignments include the International Renewable Energy Agency (IRENA), Asian Development Bank (ADB) and the Clinton Foundation. Amit has authored two books on climate change policy and waste to energy and has several international peer-reviewed journal publications. His hobbies include scuba diving, badminton, and outdoor sports.
ANIL CABRAAL, PhDFormerly Lead Energy Specialist,
Energy Unit, Energy,Transport and Water Department, Sustainable Development
Vice Presidency, The World Bank, Washington, DC, USA.
WILLIAM A. WARD, PhDProfessor Emeritus, John E. Walker
Department of Economics,Clemson University,
Clemson South Carolina, USA.
V. SUSAN BOGACHFormerly Senior Energy Economist,
The World Bank, Washington, DC, USA
AMIT JAIN, PhD Senior Energy Specialist,
The World Bank
xiv
ACRONYMS AND ABBREVIATIONS
AC Alternating CurrentADB Asian Development BankAIT Advanced Income TaxAVT Advanced Trade VATBIDS Bangladesh Institute of Development StudiesBPC Bangladesh Petroleum CorporationBRAC Bangladesh Rural Advancement CommitteeBREB Bangladesh Rural Electrification BoardBSTI Bangladesh Standards and Testing InstitutionBUET Bangladesh University of Engineering and
TechnologyCBA Cost-Benefit AnalysisCD Customs DutyCDM Clean Development MechanismCEA Cost-Effectiveness AnalysisCEIP Collection Efficiency Improvement ProgramCEO Chief Executive OfficerCF Conversion FactorCFL Compact Fluorescent LightCIB Credit Information BureauCIF Cost, Insurance, and FreightCMES Centre for Mass Education in ScienceCUA Cost-Utility AnalysisDC Direct CurrentDCF Discounted Cash FlowDFID UK Department for International DevelopmentDSRA Debt Service Reserve AccountsEHS Environmental Health and SafetyEIRR Economic Internal Rate of ReturnERD Economic Relations DivisionERP Enterprise Resource PlanningFIRR Financial Internal Rate of ReturnFAO Food and Agriculture Organization of the United
NationsFOB Free on BoardFTL Fluorescent Tube LightGDP Gross Domestic ProductGEF Global Environment FacilityGHG Greenhouse GasGIZ German Agency for International Cooperation
(Deutsche Gesellschaft für Internationale Zusammenarbeit)
GOB Government of BangladeshGPOBA Global Partnership on Output-Based AidGTZ German Agency for Technical Cooperation
(Deutsche Gesellschaft für Technische Zusammenarbeit) (replaced by GIZ)
HHI Herfindahl–Hirschmann IndexHIES Household Income and Expenditure Survey
HS Harmonized SystemICT Information and Communication TechnologyIDCOL Infrastructure Development Company LtdIEA International Energy AgencyIEC International Electrotechnical CommissionIFC International Finance CorporationIRENA International Renewable Energy AgencyIRR Internal Rate of ReturnIsDB Islamic Development BankISO International Standards OrganizationJICA Japan International Cooperation AgencyJNNSM Jawaharlal Nehru National Solar MissionKfW Kreditanstalt für WiederaufbauLED Light-Emitting DiodeLGED Local Government Engineering DepartmentMFI Microfinance InstitutionMIS Management Information SystemMOPEMR Ministry of Power, Energy and Mineral ResourcesNGO Nongovernmental OrganizationNPV Net Present ValueOC Operations CommitteeODA Official Development AssistanceOGS Off-Grid SolarOHSAS Occupational Health & Safety Management SystemsPA Participation AgreementPAR Portfolio at RiskPAYG Pay-as-You-GoPE Private EntityPKSF Palli Karma-Sahayak FoundationPMU Program Management UnitPO Partner OrganizationPV PhotovoltaicRD Regulatory DutyRERED Rural Electrification and Renewable Energy
Development (Project)RSF Rural Services FoundationSD Supplementary DutySEforALL Sustainable Energy for AllSHS Solar Home System(s)SMA Special Mention AccountSREDA Sustainable and Renewable Energy AuthorityTMSS Thengamara Mohila Sabuj SanghaTR/KABITA National Social Safety Net Program TSC Technical Standards CommitteeUNDP United Nations Development ProgrammeUSAID United States Agency for International
DevelopmentVAT Value Added TaxWTP Willingness to Pay
LIVING IN THE LIGHT: THE BANGLADESH SOLAR HOME SYSTEMS STORY | xv

ECONOMIC INDEXES
200360.04
85.6958.15
200887.73
98.05 68.60
2014136.13
107.88 77.64
200464.60
88.04 59.51
200992.48
98.79 69.04
2015144.56
109.03 77.95
200569.15
90.88 64.33
2010100.00100.00
69.65
2016152.53
110.22 78.47
200673.83
93.67 68.93
2011111.40
102.09 74.15
2017161.23
112.32 80.44
200780.56
96.16 68.87
2013127.23
105.87 78.10
2012118.32
104.05 81.86
2018177.26
114.85 83.90
Bangladesh GDP Deflator (Index)US GDP Deflator (Index)Exchange Rate (BDT/US$)
Source: Government of Bangladesh and IDCOL Fiscal Year is from July 1 to June 30 up to 2015 and thereafter, January 1 to December 31
xvi
LIVING IN THE LIGHT: THE BANGLADESH SOLAR HOME SYSTEMS STORY | xvii

EXECUTIVE SUMMARY
The Bangladesh Solar Home Systems (SHS) Program is the largest national program in the world for off-grid electrification. Begun in 2003, SHS installations under the Program ended in 2018. It is the longest, continuously operating off-grid electrification program in the world.
The SHS Program was led and implemented by the Infrastructure Development Company Ltd (IDCOL). Over a 15-year period beginning in 2003, over 4.1 million SHS were sold and supported using a competitive business model that offered consumers a choice of quality SHS, made affordable with financing. About 14 percent of the Bangladesh population (2011 Census), about 20 million people, obtained electricity services through the SHS Program. The SHS Program enabled one-quarter of the unelectrified rural population in 2003 to obtain electricity services far sooner than would have been possible with grid electricity. SHS were mainly used in rural homes for lighting, mobile phone charging, and powering TVs and radios. They were also used in about 200,000 rural businesses and religious facilities. The program led to SHS becoming a credible electricity source in Bangladesh and, more broadly, to the acceptance of solar photovoltaics (PV) as an electricity generation technology. Building on the credibility gained, SHS distribution to the poorest households under other government programs and commercial SHS sales picked up in later years along with IDCOL-financed sales.
While the Bangladesh SHS Program will continue to 2021, this report covers the program from 2003 to 2018, describes its benefits and costs, and discusses how the program adapted to inevitable changes and risks over the 15-year period. It draws lessons that can help guide the development and implementation of other sustainable off-grid electrification programs.
IMPLEMENTATION MODELIDCOL mobilized partner organizations (POs) that were mainly nongovernmental organizations (NGOs) and microfinance institutions (MFIs) with rural networks. The POs competitively marketed, sold, financed, installed, and serviced quality-certified SHS to rural customers. Beginning with 5 POs in 2003, their number grew to 57 by 2015. The customers were mainly rural households, businesses, and religious institutions.
The government obtained SHS Program funding from development partners, beginning with IDA funds from the World Bank. IDCOL obtained these funds from the government in local currency to refinance a portion of the loans given by POs to SHS customers. The POs sold SHS to customers on credit with payments spread out over a period of up to three years at interest rates of 12 to 16 percent. Small grants, declining over time from 19 percent of the cost in 2003 to 5 percent by 2017, were given to increase the affordability of the SHS and to help the POs strengthen their institutional capability. The customers repaid the loans to the POs which repaid their loans to IDCOL. IDCOL then repaid its loans from the
xviii
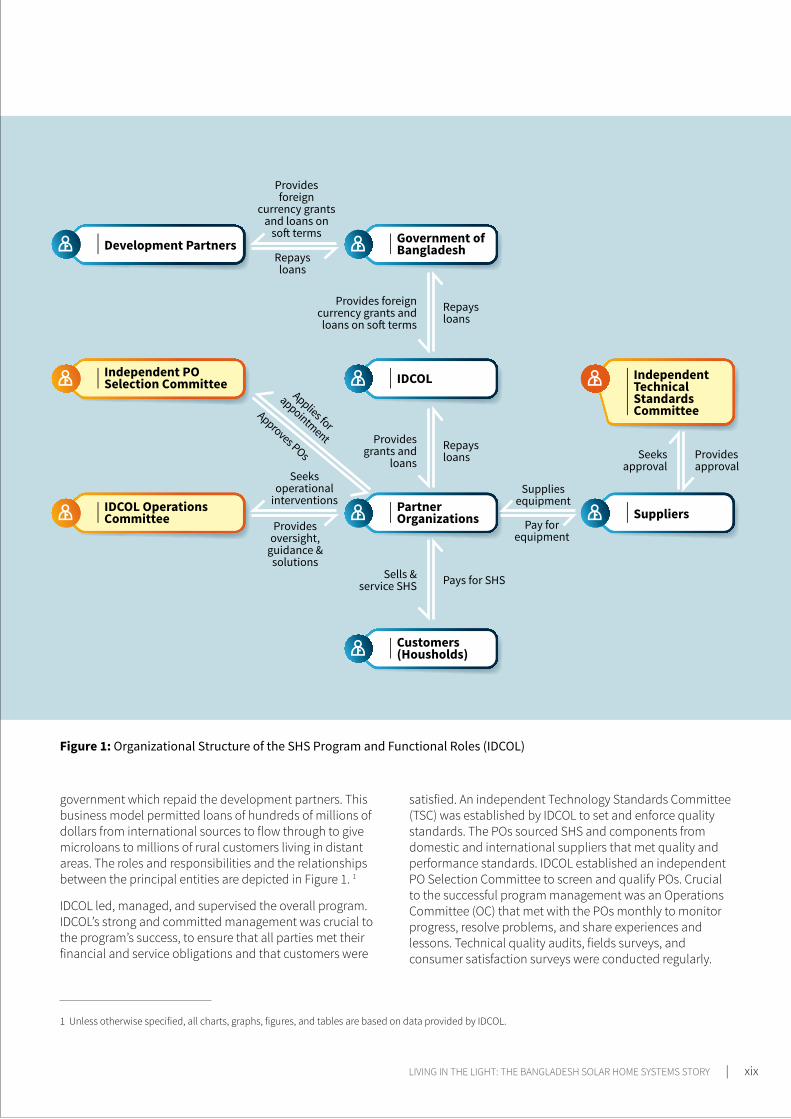
government which repaid the development partners. This business model permitted loans of hundreds of millions of dollars from international sources to flow through to give microloans to millions of rural customers living in distant areas. The roles and responsibilities and the relationships between the principal entities are depicted in Figure 1. 1
IDCOL led, managed, and supervised the overall program. IDCOL’s strong and committed management was crucial to the program’s success, to ensure that all parties met their financial and service obligations and that customers were
satisfied. An independent Technology Standards Committee (TSC) was established by IDCOL to set and enforce quality standards. The POs sourced SHS and components from domestic and international suppliers that met quality and performance standards. IDCOL established an independent PO Selection Committee to screen and qualify POs. Crucial to the successful program management was an Operations Committee (OC) that met with the POs monthly to monitor progress, resolve problems, and share experiences and lessons. Technical quality audits, fields surveys, and consumer satisfaction surveys were conducted regularly.
1 Unless otherwise specified, all charts, graphs, figures, and tables are based on data provided by IDCOL.
Figure 1: Organizational Structure of the SHS Program and Functional Roles (IDCOL)
Development Partners Government of Bangladesh
IDCOL Independent Technical Standards Committee
Independent PO Selection Committee
Partner Organizations SuppliersIDCOL Operations
Committee
Customers (Housholds)
Provides approval
Repays loans
Repays loans
Pays for SHS
Approves POs
Applies for
appointmentSeeks
approval
Provides foreign currency grants and loans on soft terms
Provides grants and
loans
Sells & service SHS
Seeks operational
interventions
Provides foreign
currency grants and loans on
soft terms
Supplies equipment
Provides oversight,
guidance & solutions
Repays loans
Pay for equipment
LIVING IN THE LIGHT: THE BANGLADESH SOLAR HOME SYSTEMS STORY | xix

ACHIEVEMENTSBeginning in 2003, SHS sales grew rapidly and peaked in 2013 with over 861,000 SHS installed that year (see Figure 2). Then the pace of installations began dropping. The decline was due mainly to rapid grid network expansion beginning in 2015 and the National Social Safety Net Program (TR/KABITA) that, beginning in 2014–2015, gave away SHS to poor households, PV systems for public services, and solar streetlights. Also, owing to the credibility of SHS created by the IDCOL SHS Program, commercial retail sales of SHS began expanding about the same time. By 2018, cumulatively, over 4.1 million SHS were sold under the SHS Program. The total solar PV capacity installed was 163 MW. Over their useful lifetime (conservatively assumed to be 12 years), SHS would supply about 2 GWh of electricity.
The share of rural households gaining access to electricity services through the SHS Program grew steadily. It peaked at 16.2 percent of rural households by 2016, or 10.5 percent of total households in Bangladesh. In comparison, the total electricity coverage of the rural population in 2016 was 66 percent. The concentration of SHS in rural areas varied—from a high of 39 percent of households in Barisal Division to 6 percent in Rajshahi Division. At a district level, SHS use was as high with every two out of three households using SHS in one district, though, not unexpectedly, in more urbanized areas such as Dhaka District, it was a low 0.2 percent.
Customers could select from several SHS sizes and functional capabilities that ranged from 10 Wp for basic lighting and mobile phone charging to as large as 300 Wp that could power TV, fans, and so on. At the beginning, SHS size averaged about 50 Wp. As more efficient and durable light-emitting diode (LED) lamps began replacing fluorescent tube and compact fluorescent lights (CFLs), the average size of SHS decreased to about 30 Wp in 2013, increasing affordability. Later, while SHS prices further declined due to a drop in PV module costs and reduction in the minimum battery size requirement from three to two days of autonomy, the average SHS size increased to 40 Wp as rural households’ income increased and they sought additional services from the SHS. The average grant amount per SHS dropped from 19 percent of the retail price in 2003 to under 5 percent in 2017. In the latter stage, the grant was to buy down the SHS cost.
Throughout this competitive, market-oriented SHS Program, unit costs of SHS were comparatively low compared to other countries. In 2003, the installed unit cost of an SHS averaged US$12 per Wp. It dropped to about US$10 per Wp in 2010 and to under US$5 per Wp by about 2017 (constant 2018 US$). What is particularly noteworthy was that the price of an SHS included free maintenance services for three years and a five-year warranty for batteries. Surveys done by IDCOL found that 90 percent of these tubular plate deep-cycle batteries were operating within specifications even after five years.
Figure 2: SHS Installation Progress
EXECUTIVE SUMMARY
xx
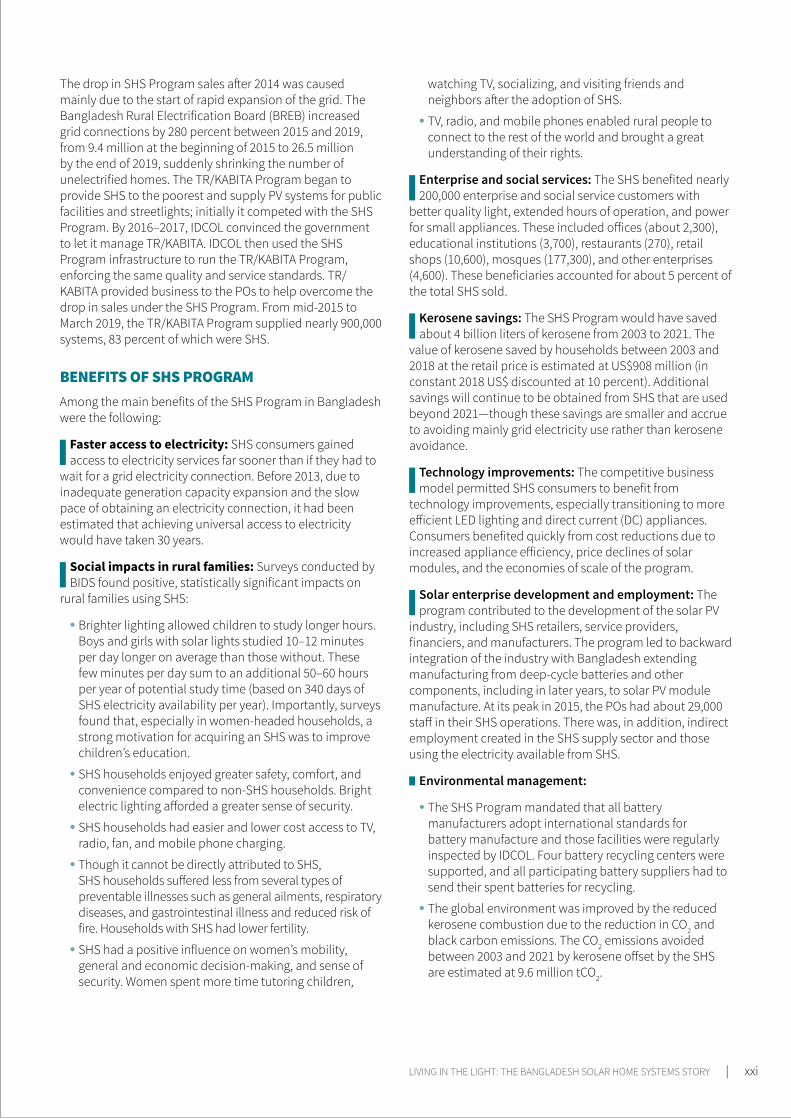
The drop in SHS Program sales after 2014 was caused mainly due to the start of rapid expansion of the grid. The Bangladesh Rural Electrification Board (BREB) increased grid connections by 280 percent between 2015 and 2019, from 9.4 million at the beginning of 2015 to 26.5 million by the end of 2019, suddenly shrinking the number of unelectrified homes. The TR/KABITA Program began to provide SHS to the poorest and supply PV systems for public facilities and streetlights; initially it competed with the SHS Program. By 2016–2017, IDCOL convinced the government to let it manage TR/KABITA. IDCOL then used the SHS Program infrastructure to run the TR/KABITA Program, enforcing the same quality and service standards. TR/KABITA provided business to the POs to help overcome the drop in sales under the SHS Program. From mid-2015 to March 2019, the TR/KABITA Program supplied nearly 900,000 systems, 83 percent of which were SHS.
BENEFITS OF SHS PROGRAMAmong the main benefits of the SHS Program in Bangladesh were the following:
Faster access to electricity: SHS consumers gained access to electricity services far sooner than if they had to
wait for a grid electricity connection. Before 2013, due to inadequate generation capacity expansion and the slow pace of obtaining an electricity connection, it had been estimated that achieving universal access to electricity would have taken 30 years.
Social impacts in rural families: Surveys conducted by BIDS found positive, statistically significant impacts on
rural families using SHS:
Brighter lighting allowed children to study longer hours. Boys and girls with solar lights studied 10–12 minutes per day longer on average than those without. These few minutes per day sum to an additional 50–60 hours per year of potential study time (based on 340 days of SHS electricity availability per year). Importantly, surveys found that, especially in women-headed households, a strong motivation for acquiring an SHS was to improve children’s education.
SHS households enjoyed greater safety, comfort, and convenience compared to non-SHS households. Bright electric lighting afforded a greater sense of security.
SHS households had easier and lower cost access to TV, radio, fan, and mobile phone charging.
Though it cannot be directly attributed to SHS, SHS households suffered less from several types of preventable illnesses such as general ailments, respiratory diseases, and gastrointestinal illness and reduced risk of fire. Households with SHS had lower fertility.
SHS had a positive influence on women’s mobility, general and economic decision-making, and sense of security. Women spent more time tutoring children,
watching TV, socializing, and visiting friends and neighbors after the adoption of SHS.
TV, radio, and mobile phones enabled rural people to connect to the rest of the world and brought a great understanding of their rights.
Enterprise and social services: The SHS benefited nearly 200,000 enterprise and social service customers with
better quality light, extended hours of operation, and power for small appliances. These included offices (about 2,300), educational institutions (3,700), restaurants (270), retail shops (10,600), mosques (177,300), and other enterprises (4,600). These beneficiaries accounted for about 5 percent of the total SHS sold.
Kerosene savings: The SHS Program would have saved about 4 billion liters of kerosene from 2003 to 2021. The
value of kerosene saved by households between 2003 and 2018 at the retail price is estimated at US$908 million (in constant 2018 US$ discounted at 10 percent). Additional savings will continue to be obtained from SHS that are used beyond 2021—though these savings are smaller and accrue to avoiding mainly grid electricity use rather than kerosene avoidance.
Technology improvements: The competitive business model permitted SHS consumers to benefit from
technology improvements, especially transitioning to more efficient LED lighting and direct current (DC) appliances. Consumers benefited quickly from cost reductions due to increased appliance efficiency, price declines of solar modules, and the economies of scale of the program.
Solar enterprise development and employment: The program contributed to the development of the solar PV
industry, including SHS retailers, service providers, financiers, and manufacturers. The program led to backward integration of the industry with Bangladesh extending manufacturing from deep-cycle batteries and other components, including in later years, to solar PV module manufacture. At its peak in 2015, the POs had about 29,000 staff in their SHS operations. There was, in addition, indirect employment created in the SHS supply sector and those using the electricity available from SHS.
Environmental management:
The SHS Program mandated that all battery manufacturers adopt international standards for battery manufacture and those facilities were regularly inspected by IDCOL. Four battery recycling centers were supported, and all participating battery suppliers had to send their spent batteries for recycling.
The global environment was improved by the reduced kerosene combustion due to the reduction in CO2 and black carbon emissions. The CO2 emissions avoided between 2003 and 2021 by kerosene offset by the SHS are estimated at 9.6 million tCO2.
LIVING IN THE LIGHT: THE BANGLADESH SOLAR HOME SYSTEMS STORY | xxi
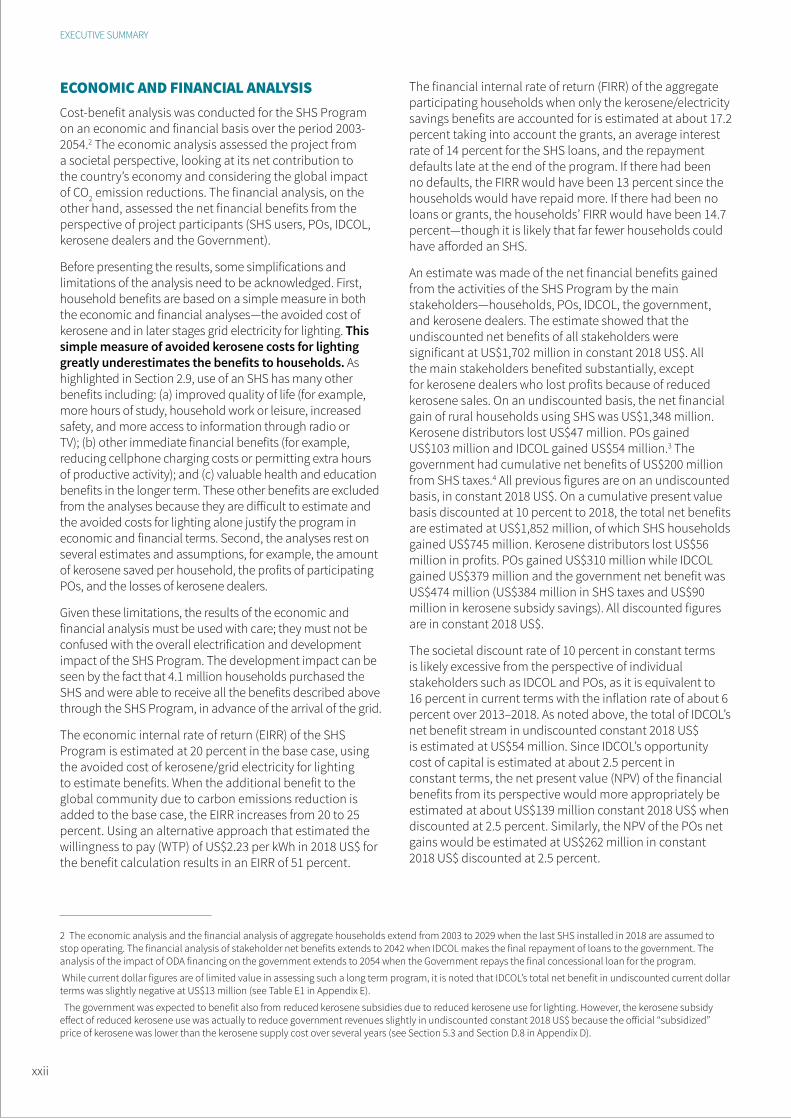
ECONOMIC AND FINANCIAL ANALYSISCost-benefit analysis was conducted for the SHS Program on an economic and financial basis over the period 2003-2054.2 The economic analysis assessed the project from a societal perspective, looking at its net contribution to the country’s economy and considering the global impact of CO2 emission reductions. The financial analysis, on the other hand, assessed the net financial benefits from the perspective of project participants (SHS users, POs, IDCOL, kerosene dealers and the Government).
Before presenting the results, some simplifications and limitations of the analysis need to be acknowledged. First, household benefits are based on a simple measure in both the economic and financial analyses—the avoided cost of kerosene and in later stages grid electricity for lighting. This simple measure of avoided kerosene costs for lighting greatly underestimates the benefits to households. As highlighted in Section 2.9, use of an SHS has many other benefits including: (a) improved quality of life (for example, more hours of study, household work or leisure, increased safety, and more access to information through radio or TV); (b) other immediate financial benefits (for example, reducing cellphone charging costs or permitting extra hours of productive activity); and (c) valuable health and education benefits in the longer term. These other benefits are excluded from the analyses because they are difficult to estimate and the avoided costs for lighting alone justify the program in economic and financial terms. Second, the analyses rest on several estimates and assumptions, for example, the amount of kerosene saved per household, the profits of participating POs, and the losses of kerosene dealers.
Given these limitations, the results of the economic and financial analysis must be used with care; they must not be confused with the overall electrification and development impact of the SHS Program. The development impact can be seen by the fact that 4.1 million households purchased the SHS and were able to receive all the benefits described above through the SHS Program, in advance of the arrival of the grid.
The economic internal rate of return (EIRR) of the SHS Program is estimated at 20 percent in the base case, using the avoided cost of kerosene/grid electricity for lighting to estimate benefits. When the additional benefit to the global community due to carbon emissions reduction is added to the base case, the EIRR increases from 20 to 25 percent. Using an alternative approach that estimated the willingness to pay (WTP) of US$2.23 per kWh in 2018 US$ for the benefit calculation results in an EIRR of 51 percent.
The financial internal rate of return (FIRR) of the aggregate participating households when only the kerosene/electricity savings benefits are accounted for is estimated at about 17.2 percent taking into account the grants, an average interest rate of 14 percent for the SHS loans, and the repayment defaults late at the end of the program. If there had been no defaults, the FIRR would have been 13 percent since the households would have repaid more. If there had been no loans or grants, the households’ FIRR would have been 14.7 percent—though it is likely that far fewer households could have afforded an SHS.
An estimate was made of the net financial benefits gained from the activities of the SHS Program by the main stakeholders—households, POs, IDCOL, the government, and kerosene dealers. The estimate showed that the undiscounted net benefits of all stakeholders were significant at US$1,702 million in constant 2018 US$. All the main stakeholders benefited substantially, except for kerosene dealers who lost profits because of reduced kerosene sales. On an undiscounted basis, the net financial gain of rural households using SHS was US$1,348 million. Kerosene distributors lost US$47 million. POs gained US$103 million and IDCOL gained US$54 million.3 The government had cumulative net benefits of US$200 million from SHS taxes.4 All previous figures are on an undiscounted basis, in constant 2018 US$. On a cumulative present value basis discounted at 10 percent to 2018, the total net benefits are estimated at US$1,852 million, of which SHS households gained US$745 million. Kerosene distributors lost US$56 million in profits. POs gained US$310 million while IDCOL gained US$379 million and the government net benefit was US$474 million (US$384 million in SHS taxes and US$90 million in kerosene subsidy savings). All discounted figures are in constant 2018 US$.
The societal discount rate of 10 percent in constant terms is likely excessive from the perspective of individual stakeholders such as IDCOL and POs, as it is equivalent to 16 percent in current terms with the inflation rate of about 6 percent over 2013–2018. As noted above, the total of IDCOL’s net benefit stream in undiscounted constant 2018 US$ is estimated at US$54 million. Since IDCOL’s opportunity cost of capital is estimated at about 2.5 percent in constant terms, the net present value (NPV) of the financial benefits from its perspective would more appropriately be estimated at about US$139 million constant 2018 US$ when discounted at 2.5 percent. Similarly, the NPV of the POs net gains would be estimated at US$262 million in constant 2018 US$ discounted at 2.5 percent.
2 The economic analysis and the financial analysis of aggregate households extend from 2003 to 2029 when the last SHS installed in 2018 are assumed to stop operating. The financial analysis of stakeholder net benefits extends to 2042 when IDCOL makes the final repayment of loans to the government. The analysis of the impact of ODA financing on the government extends to 2054 when the Government repays the final concessional loan for the program.
While current dollar figures are of limited value in assessing such a long term program, it is noted that IDCOL’s total net benefit in undiscounted current dollar terms was slightly negative at US$13 million (see Table E1 in Appendix E).
The government was expected to benefit also from reduced kerosene subsidies due to reduced kerosene use for lighting. However, the kerosene subsidy effect of reduced kerosene use was actually to reduce government revenues slightly in undiscounted constant 2018 US$ because the official “subsidized” price of kerosene was lower than the kerosene supply cost over several years (see Section 5.3 and Section D.8 in Appendix D).
EXECUTIVE SUMMARY
xxii
In addition to the net benefits gained by the program from SHS taxes and kerosene subsidy impacts, the Government benefits from on-lending concessional funds to IDCOL on less favorable terms. From 2003 through 2054, the Treasury’s forecast net gain on IDCOL payments minus ODA repayments is US$1 million in constant 2018 US$ on an undiscounted basis and US$180 million in constant 2018 US$ when discounted to 2018 at 10 percent. On a cumulative present value basis discounted at 10 percent to 2018, the Treasury’s total net gain from the SHS Program was US$655 million, made up of US$384 million from taxes on SHS, US$90 million from savings due to avoided kerosene subsidy, and US$180 million due to impact of ODA pass-through. All are in constant 2018 US.
INVESTMENTS IN AND FINANCING OF SHS PROGRAMTotal investment in the SHS Program during 2003–2018 is estimated at US$1,095 million (in current US$), to provide electricity services to about 20 million people, or about US$266 per household. Credit support came from four development partners among which the World Bank (IDA) provided US$416 million in IDA credits or 69 percent of the total international credit support of US$602 million. Other credit financiers were the Asian Development Bank (ADB), Japan International Cooperation Agency (JICA), and Islamic Development Bank (IsDB), which provided US$185.6 million. Grant funds amounting to US$80.9 million were received from the Global Environment Facility (GEF), Global Partnership on Output-Based Aid (GPOBA), United States Agency for International Development (USAID), Kreditanstalt für Wiederaufbau (KfW), German Agency for International Cooperation (Deutsche Gesellschaft für Internationale Zusammenarbeit, GIZ), and UK Department for International Development (DFID). In total, development partners provided US$683 million in loan and grant funds. The funds from the World Bank and other development partners leveraged private funding from users, POs, manufacturers, and distributors. Down payments by SHS customers, equity investments by POs, and upstream investments by manufacturers and distributors are estimated at US$412.5 million, of which user contributions for down payments for SHS are estimated at US$160 million up to December 2017.
World Bank financing leveraged 161 percent more financing from other sources. Moreover, the Rural Electrification and Renewable Energy Development (RERED) Project leveraged the capabilities of the microfinance sector that Bangladesh pioneered and the nongovernmental and private sector capabilities to manufacture, distribute, finance, and service solar and other clean energy products directly to the rural communities.
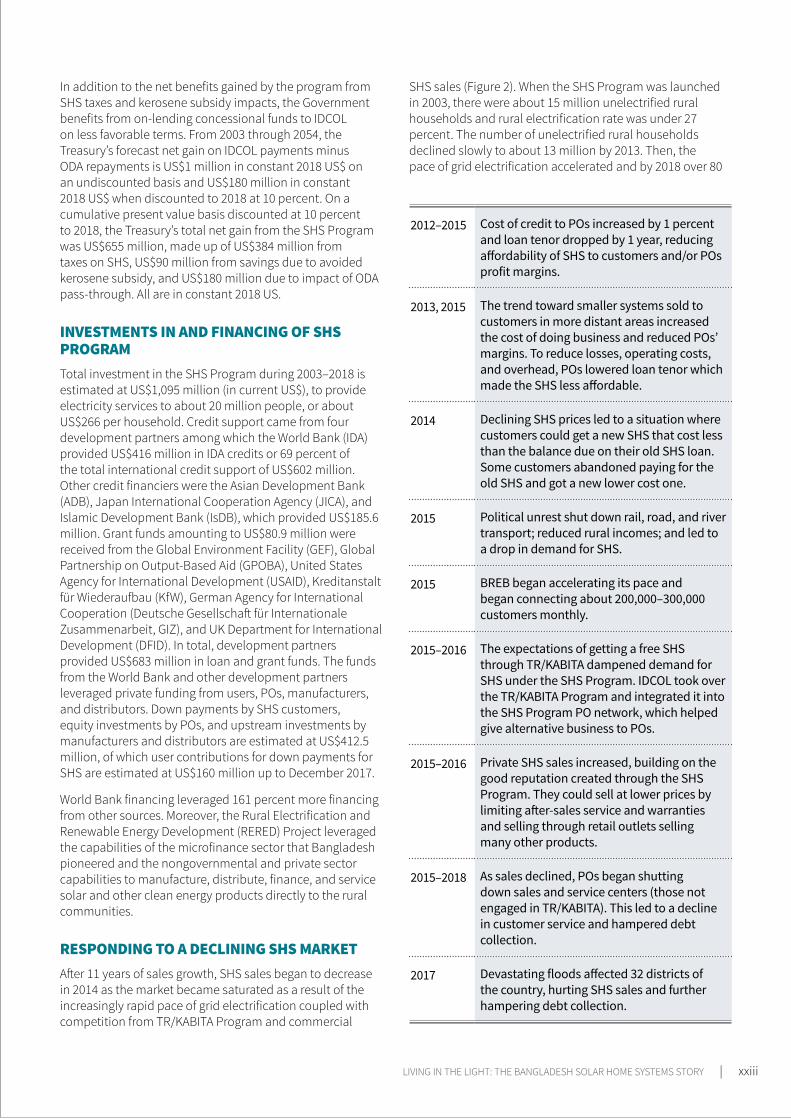
RESPONDING TO A DECLINING SHS MARKETAfter 11 years of sales growth, SHS sales began to decrease in 2014 as the market became saturated as a result of the increasingly rapid pace of grid electrification coupled with competition from TR/KABITA Program and commercial
SHS sales (Figure 2). When the SHS Program was launched in 2003, there were about 15 million unelectrified rural households and rural electrification rate was under 27 percent. The number of unelectrified rural households declined slowly to about 13 million by 2013. Then, the pace of grid electrification accelerated and by 2018 over 80
2012–2015 Cost of credit to POs increased by 1 percent and loan tenor dropped by 1 year, reducing affordability of SHS to customers and/or POs profit margins.
2013, 2015 The trend toward smaller systems sold to customers in more distant areas increased the cost of doing business and reduced POs’ margins. To reduce losses, operating costs, and overhead, POs lowered loan tenor which made the SHS less affordable.
2014 Declining SHS prices led to a situation where customers could get a new SHS that cost less than the balance due on their old SHS loan. Some customers abandoned paying for the old SHS and got a new lower cost one.
2015 Political unrest shut down rail, road, and river transport; reduced rural incomes; and led to a drop in demand for SHS.
2015 BREB began accelerating its pace and began connecting about 200,000–300,000 customers monthly.
2015–2016 The expectations of getting a free SHS through TR/KABITA dampened demand for SHS under the SHS Program. IDCOL took over the TR/KABITA Program and integrated it into the SHS Program PO network, which helped give alternative business to POs.
2015–2016 Private SHS sales increased, building on the good reputation created through the SHS Program. They could sell at lower prices by limiting after-sales service and warranties and selling through retail outlets selling many other products.
2015–2018 As sales declined, POs began shutting down sales and service centers (those not engaged in TR/KABITA). This led to a decline in customer service and hampered debt collection.
2017 Devastating floods affected 32 districts of the country, hurting SHS sales and further hampering debt collection.
LIVING IN THE LIGHT: THE BANGLADESH SOLAR HOME SYSTEMS STORY | xxiii
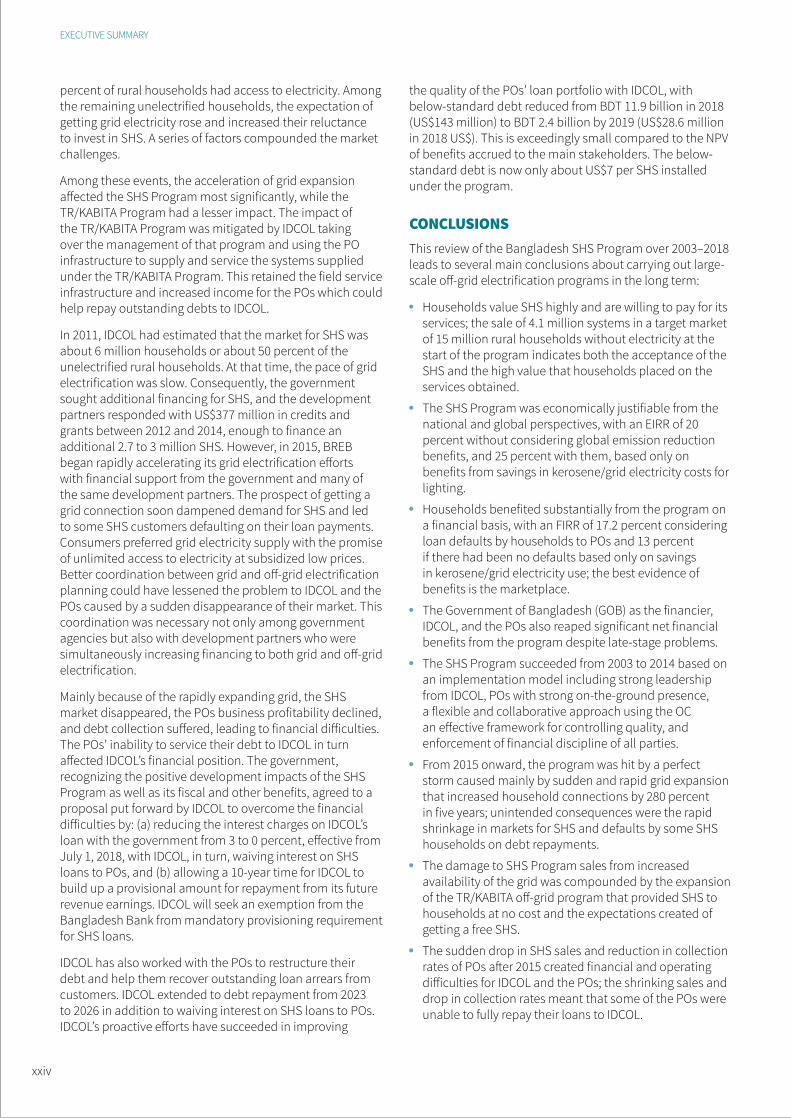
percent of rural households had access to electricity. Among the remaining unelectrified households, the expectation of getting grid electricity rose and increased their reluctance to invest in SHS. A series of factors compounded the market challenges.
Among these events, the acceleration of grid expansion affected the SHS Program most significantly, while the TR/KABITA Program had a lesser impact. The impact of the TR/KABITA Program was mitigated by IDCOL taking over the management of that program and using the PO infrastructure to supply and service the systems supplied under the TR/KABITA Program. This retained the field service infrastructure and increased income for the POs which could help repay outstanding debts to IDCOL.
In 2011, IDCOL had estimated that the market for SHS was about 6 million households or about 50 percent of the unelectrified rural households. At that time, the pace of grid electrification was slow. Consequently, the government sought additional financing for SHS, and the development partners responded with US$377 million in credits and grants between 2012 and 2014, enough to finance an additional 2.7 to 3 million SHS. However, in 2015, BREB began rapidly accelerating its grid electrification efforts with financial support from the government and many of the same development partners. The prospect of getting a grid connection soon dampened demand for SHS and led to some SHS customers defaulting on their loan payments. Consumers preferred grid electricity supply with the promise of unlimited access to electricity at subsidized low prices. Better coordination between grid and off-grid electrification planning could have lessened the problem to IDCOL and the POs caused by a sudden disappearance of their market. This coordination was necessary not only among government agencies but also with development partners who were simultaneously increasing financing to both grid and off-grid electrification.
Mainly because of the rapidly expanding grid, the SHS market disappeared, the POs business profitability declined, and debt collection suffered, leading to financial difficulties. The POs’ inability to service their debt to IDCOL in turn affected IDCOL’s financial position. The government, recognizing the positive development impacts of the SHS Program as well as its fiscal and other benefits, agreed to a proposal put forward by IDCOL to overcome the financial difficulties by: (a) reducing the interest charges on IDCOL’s loan with the government from 3 to 0 percent, effective from July 1, 2018, with IDCOL, in turn, waiving interest on SHS loans to POs, and (b) allowing a 10-year time for IDCOL to build up a provisional amount for repayment from its future revenue earnings. IDCOL will seek an exemption from the Bangladesh Bank from mandatory provisioning requirement for SHS loans.
IDCOL has also worked with the POs to restructure their debt and help them recover outstanding loan arrears from customers. IDCOL extended to debt repayment from 2023 to 2026 in addition to waiving interest on SHS loans to POs. IDCOL’s proactive efforts have succeeded in improving
the quality of the POs’ loan portfolio with IDCOL, with below-standard debt reduced from BDT 11.9 billion in 2018 (US$143 million) to BDT 2.4 billion by 2019 (US$28.6 million in 2018 US$). This is exceedingly small compared to the NPV of benefits accrued to the main stakeholders. The below-standard debt is now only about US$7 per SHS installed under the program.
CONCLUSIONSThis review of the Bangladesh SHS Program over 2003–2018 leads to several main conclusions about carrying out large-scale off-grid electrification programs in the long term:
Households value SHS highly and are willing to pay for its services; the sale of 4.1 million systems in a target market of 15 million rural households without electricity at the start of the program indicates both the acceptance of the SHS and the high value that households placed on the services obtained.
The SHS Program was economically justifiable from the national and global perspectives, with an EIRR of 20 percent without considering global emission reduction benefits, and 25 percent with them, based only on benefits from savings in kerosene/grid electricity costs for lighting.
Households benefited substantially from the program on a financial basis, with an FIRR of 17.2 percent considering loan defaults by households to POs and 13 percent if there had been no defaults based only on savings in kerosene/grid electricity use; the best evidence of benefits is the marketplace.
The Government of Bangladesh (GOB) as the financier, IDCOL, and the POs also reaped significant net financial benefits from the program despite late-stage problems.
The SHS Program succeeded from 2003 to 2014 based on an implementation model including strong leadership from IDCOL, POs with strong on-the-ground presence, a flexible and collaborative approach using the OC an effective framework for controlling quality, and enforcement of financial discipline of all parties.
From 2015 onward, the program was hit by a perfect storm caused mainly by sudden and rapid grid expansion that increased household connections by 280 percent in five years; unintended consequences were the rapid shrinkage in markets for SHS and defaults by some SHS households on debt repayments.
The damage to SHS Program sales from increased availability of the grid was compounded by the expansion of the TR/KABITA off-grid program that provided SHS to households at no cost and the expectations created of getting a free SHS.
The sudden drop in SHS sales and reduction in collection rates of POs after 2015 created financial and operating difficulties for IDCOL and the POs; the shrinking sales and drop in collection rates meant that some of the POs were unable to fully repay their loans to IDCOL.
EXECUTIVE SUMMARY
xxiv
Recognizing the contribution made by the SHS Program to the GOB’s rural electrification goals as well as the financial benefits reaped from the program, the GOB restructured its loans to IDCOL and supported IDCOL in restructuring its loans to POs in mid-2018. The GOB may need to further assist IDCOL and the POs as required to bring the program to an orderly end and ensure the long-term sustainability of these organizations as well as the SHS installed under the program.
Better planning and coordination of electrification could have avoided the late-stage difficulties in the SHS Program. The GOB was accelerating three major parallel efforts without such coordination: expanding the grid, promoting SHS under the SHS Program, and providing systems at no cost to the poorest households and public institutions under the TR/KABITA Program.
In conclusion, the SHS Program made a significant contribution to the government’s principle in the Constitution to transform rural areas by providing, among other elements, rural electrification. It provided electricity in advance of the availability of the grid to around 20 million people through the provision of 4.1 million SHS. It provided electricity service that was adopted by rural households cost-effectively and with net benefits to all participants except kerosene dealers while also reducing kerosene consumption by 4.4 billion liters and reducing greenhouse gas (GHG) emissions by 9.6 million tons.
LESSONS LEARNEDThe experience with the SHS Program in Bangladesh, one of the largest and most successful in the world despite challenges, offers lessons that may help other countries implement off-grid programs to complement grid electrification. Key lessons are summarized below.
Planning the SHS Program
Design the program in relation to a clear goal such as deepening access or reaching universal access.
Recognize that rural families value highly the electrification benefits of SHS.
Ensure coordinated planning of on-grid and off-grid electrification, at the highest levels.
Evaluate the impacts on key stakeholders as well as the overall economic returns when planning and justifying the program.
Build an off-grid service and spare part supply infrastructure that continues beyond the program.
Be flexible in implementation modalities while adhering to sound economic, technical, and business principles.
Have an exit strategy from the start, together with market monitoring, to adapt responsively and to share and manage risks as the program winds down.
Developing sustainable institutions
Have a lead agency such as IDCOL to provide close and timely supervision as well as financial discipline.
Build on the strengths of existing organizations and enterprises rather than creating new ones, where possible.
Provide responsive management taking advantage of technological and business innovation.
Ensure that participating businesses generate revenues to cover costs and provide adequate returns.
Providing quality products and services
Ensure well-designed products, quality components and installations, and support services, for sustainability.
Adopt new technologies that offer better quality and more reliable services, for example, LEDs and flat-screen TVs and improve business practices such as pay-as-you-go (PAYG) technology, mobile pay, and computerized management information systems (MISs).
Provide users with solid, practical information and training in simple maintenance and safe operating procedures.
Overcoming the first cost barrier
Do not try to compete with the grid’s promise of unlimited power at low tariffs.
Provide access to finance on affordable payment terms—this is essential—and offer credit terms that approximate household expenditure patterns.
Use grants and subsidies smartly, to build market infrastructure or reduce capital costs of SHS to users.
Rationalize duty and tax structures to level the playing field for SHS and alternatives.
Essential government and development partner support
The government needs to ensure that grid and off-grid electrification are promoted and coordinated to optimize access.
See the government and the private sector as complementary not as alternatives or competition.
Ensure that the government and development partners integrate new resources using coordinated approaches—rather than running parallel initiatives with same/similar objectives.
Seek development partners support for technology and knowledge transfer and not just as source of money.
Use development partner financing to leverage domestic financing to maximize the funds available.
As 2021 dawns and the GOB achieves its goal of bringing universal access to electricity, IDCOL and its partners can be justly proud of their contribution toward achieving this vision. It is hoped that these successes and experiences from Bangladesh will spur and guide other countries to achieve the same goal.
LIVING IN THE LIGHT: THE BANGLADESH SOLAR HOME SYSTEMS STORY | xxv
INTRODUCTION1.1 Overview 2
1.2 Evolution of Access to Electricity in Rural Bangladesh 3
1.3 View of SHS as a Rural Electrification Option 4
1.4 Benefits from Electrification 5
1.5 Early Support for Solar Home Systems in Bangladesh 5
1.6 Purpose of Report 6
1.7 Structure of the Report 6
LIVING IN THE LIGHT: THE BANGLADESH SOLAR HOME SYSTEMS STORY | 1
INTRODUCTION
1.1. OVERVIEWThe Bangladesh Solar Home Systems (SHS) Program is one of the largest national off-grid electrification programs.5 The SHS Program is a public-private partnership, led and implemented by the Infrastructure Development Company Ltd (IDCOL), with partner organizations (POs) that market, sell, finance, and service the SHS to households throughout Bangladesh. Some POs also assemble SHS from components sourced domestically and internationally. Box 1 has a brief description of a typical SHS used in Bangladesh.
BOX 1: Solar Home System
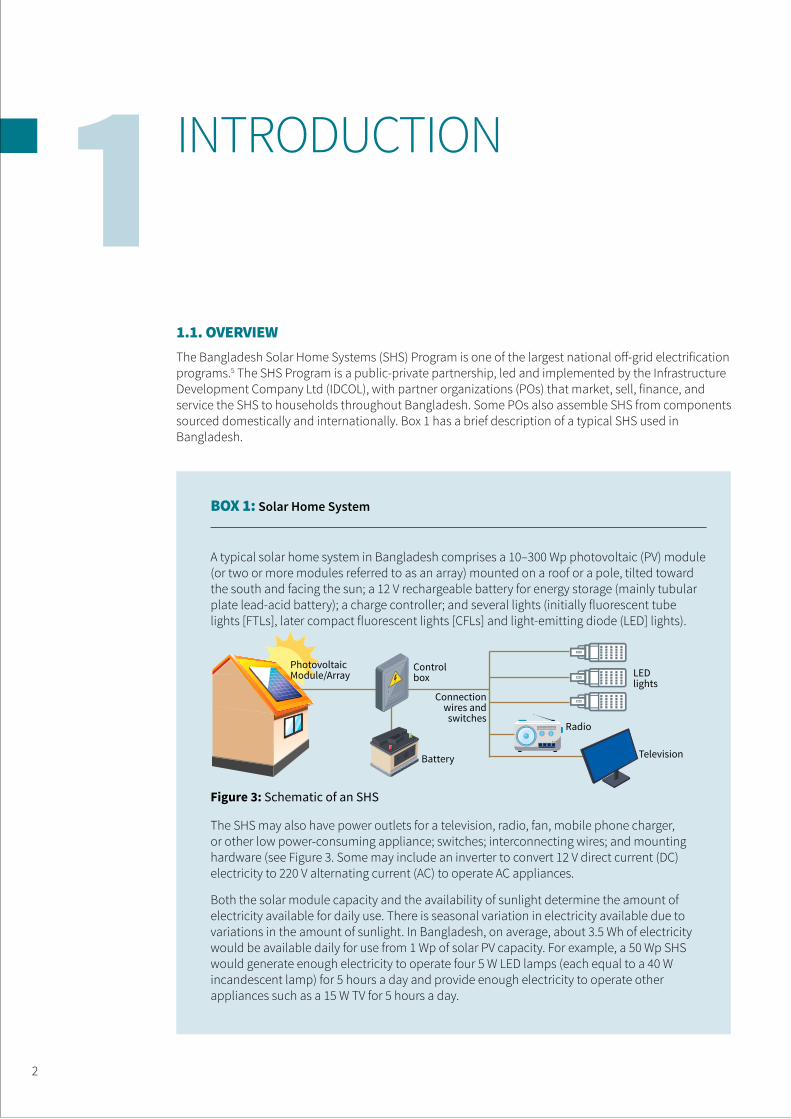
A typical solar home system in Bangladesh comprises a 10–300 Wp photovoltaic (PV) module (or two or more modules referred to as an array) mounted on a roof or a pole, tilted toward the south and facing the sun; a 12 V rechargeable battery for energy storage (mainly tubular plate lead-acid battery); a charge controller; and several lights (initially fluorescent tube lights [FTLs], later compact fluorescent lights [CFLs] and light-emitting diode (LED] lights).
The SHS may also have power outlets for a television, radio, fan, mobile phone charger, or other low power-consuming appliance; switches; interconnecting wires; and mounting hardware (see Figure 3. Some may include an inverter to convert 12 V direct current (DC) electricity to 220 V alternating current (AC) to operate AC appliances.
Both the solar module capacity and the availability of sunlight determine the amount of electricity available for daily use. There is seasonal variation in electricity available due to variations in the amount of sunlight. In Bangladesh, on average, about 3.5 Wh of electricity would be available daily for use from 1 Wp of solar PV capacity. For example, a 50 Wp SHS would generate enough electricity to operate four 5 W LED lamps (each equal to a 40 W incandescent lamp) for 5 hours a day and provide enough electricity to operate other appliances such as a 15 W TV for 5 hours a day.
Figure 3: Schematic of an SHS
LED lights
Control box
Battery
Connection wires and
switches
Photovoltaic Module/Array
Television
Radio
2
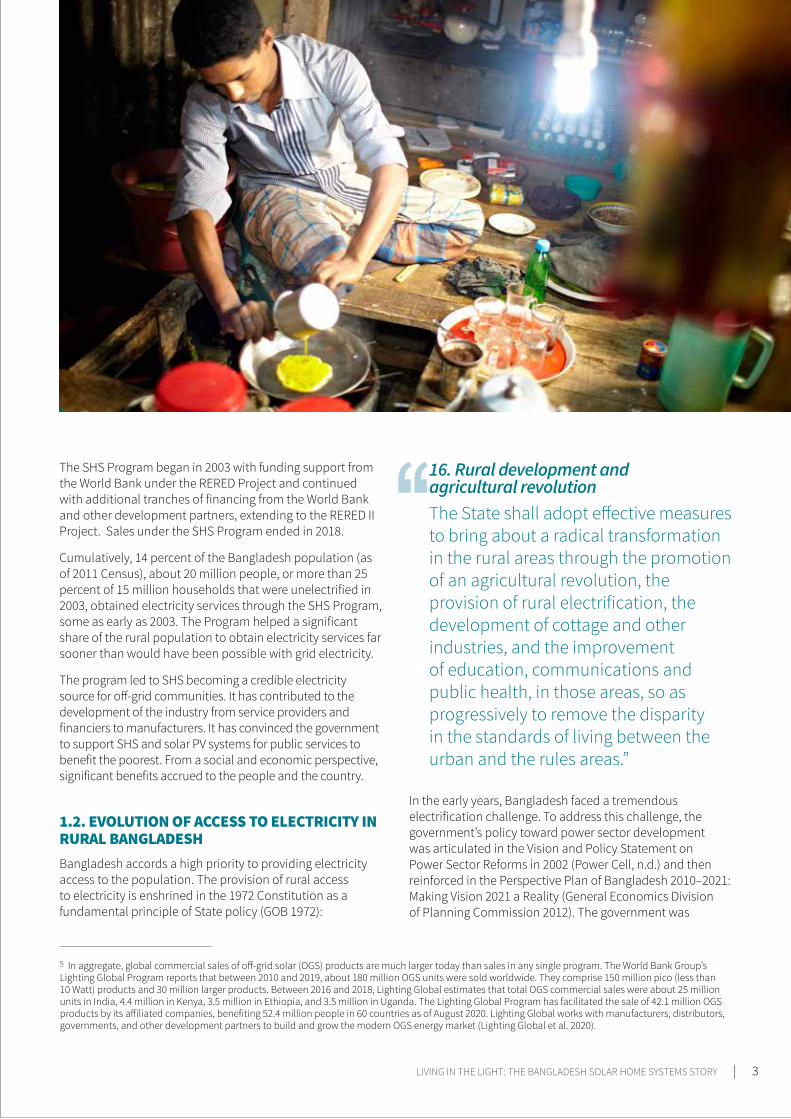
The SHS Program began in 2003 with funding support from the World Bank under the RERED Project and continued with additional tranches of financing from the World Bank and other development partners, extending to the RERED II Project. Sales under the SHS Program ended in 2018.
Cumulatively, 14 percent of the Bangladesh population (as of 2011 Census), about 20 million people, or more than 25 percent of 15 million households that were unelectrified in 2003, obtained electricity services through the SHS Program, some as early as 2003. The Program helped a significant share of the rural population to obtain electricity services far sooner than would have been possible with grid electricity.
The program led to SHS becoming a credible electricity source for off-grid communities. It has contributed to the development of the industry from service providers and financiers to manufacturers. It has convinced the government to support SHS and solar PV systems for public services to benefit the poorest. From a social and economic perspective, significant benefits accrued to the people and the country.
1.2. EVOLUTION OF ACCESS TO ELECTRICITY IN RURAL BANGLADESHBangladesh accords a high priority to providing electricity access to the population. The provision of rural access to electricity is enshrined in the 1972 Constitution as a fundamental principle of State policy (GOB 1972):
5 In aggregate, global commercial sales of off-grid solar (OGS) products are much larger today than sales in any single program. The World Bank Group’s Lighting Global Program reports that between 2010 and 2019, about 180 million OGS units were sold worldwide. They comprise 150 million pico (less than 10 Watt) products and 30 million larger products. Between 2016 and 2018, Lighting Global estimates that total OGS commercial sales were about 25 million units in India, 4.4 million in Kenya, 3.5 million in Ethiopia, and 3.5 million in Uganda. The Lighting Global Program has facilitated the sale of 42.1 million OGS products by its affiliated companies, benefiting 52.4 million people in 60 countries as of August 2020. Lighting Global works with manufacturers, distributors, governments, and other development partners to build and grow the modern OGS energy market (Lighting Global et al. 2020).
16. Rural development and agricultural revolution The State shall adopt effective measures to bring about a radical transformation in the rural areas through the promotion of an agricultural revolution, the provision of rural electrification, the development of cottage and other industries, and the improvement of education, communications and public health, in those areas, so as progressively to remove the disparity in the standards of living between the urban and the rules areas.”
In the early years, Bangladesh faced a tremendous electrification challenge. To address this challenge, the government’s policy toward power sector development was articulated in the Vision and Policy Statement on Power Sector Reforms in 2002 (Power Cell, n.d.) and then reinforced in the Perspective Plan of Bangladesh 2010–2021: Making Vision 2021 a Reality (General Economics Division of Planning Commission 2012). The government was
LIVING IN THE LIGHT: THE BANGLADESH SOLAR HOME SYSTEMS STORY | 3
committed to achieving universal access to electricity by 2021 and to making the power sector financially viable, improving sector efficiency, enhancing power system reliability, and making electricity service affordable. This led to the government’s acceleration in the pace of electrification and increased power generation as evidenced by the tenfold increase in government budget for the power sector from BDT 26.8 billion in 2009 to BDT 262.9 billion in 2018 (Economist Intelligence Unit 2018). The policy commitment backed by significant budget increases accelerated the pace of electrification, backed by generation capacity increases, beginning in about 2014–2015 and continuing today.
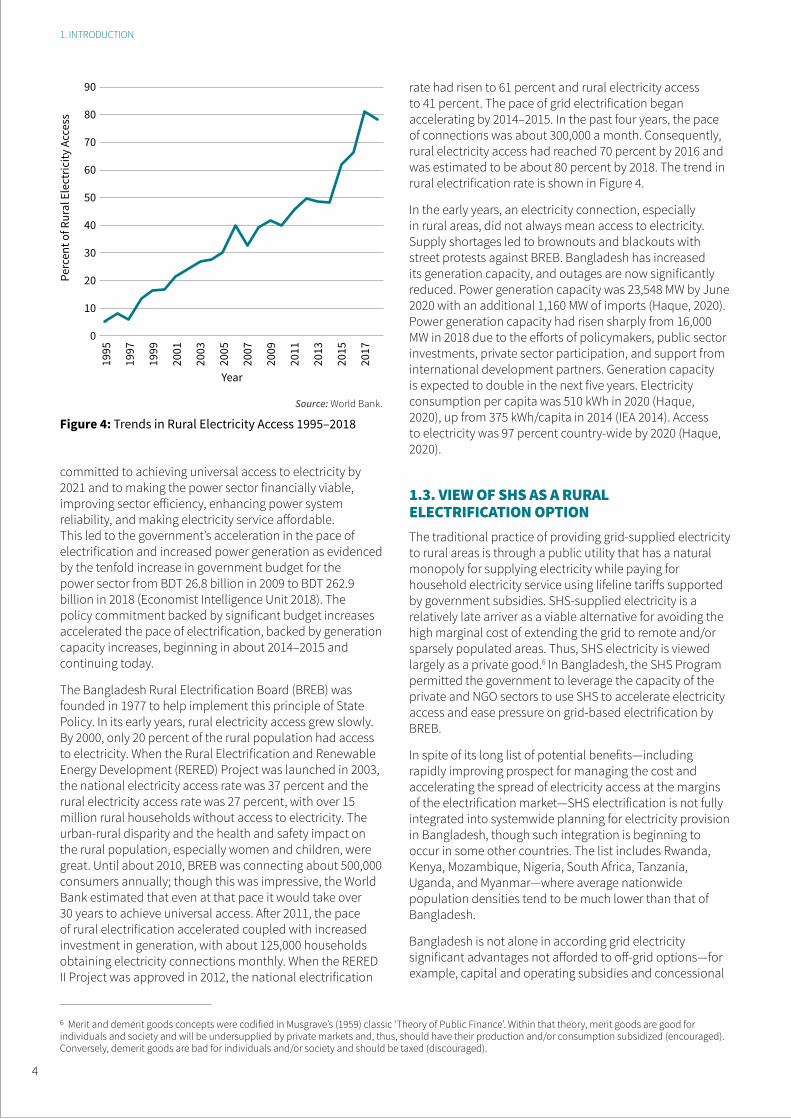
The Bangladesh Rural Electrification Board (BREB) was founded in 1977 to help implement this principle of State Policy. In its early years, rural electricity access grew slowly. By 2000, only 20 percent of the rural population had access to electricity. When the Rural Electrification and Renewable Energy Development (RERED) Project was launched in 2003, the national electricity access rate was 37 percent and the rural electricity access rate was 27 percent, with over 15 million rural households without access to electricity. The urban-rural disparity and the health and safety impact on the rural population, especially women and children, were great. Until about 2010, BREB was connecting about 500,000 consumers annually; though this was impressive, the World Bank estimated that even at that pace it would take over 30 years to achieve universal access. After 2011, the pace of rural electrification accelerated coupled with increased investment in generation, with about 125,000 households obtaining electricity connections monthly. When the RERED II Project was approved in 2012, the national electrification
rate had risen to 61 percent and rural electricity access to 41 percent. The pace of grid electrification began accelerating by 2014–2015. In the past four years, the pace of connections was about 300,000 a month. Consequently, rural electricity access had reached 70 percent by 2016 and was estimated to be about 80 percent by 2018. The trend in rural electrification rate is shown in Figure 4.
In the early years, an electricity connection, especially in rural areas, did not always mean access to electricity. Supply shortages led to brownouts and blackouts with street protests against BREB. Bangladesh has increased its generation capacity, and outages are now significantly reduced. Power generation capacity was 23,548 MW by June 2020 with an additional 1,160 MW of imports (Haque, 2020). Power generation capacity had risen sharply from 16,000 MW in 2018 due to the efforts of policymakers, public sector investments, private sector participation, and support from international development partners. Generation capacity is expected to double in the next five years. Electricity consumption per capita was 510 kWh in 2020 (Haque, 2020), up from 375 kWh/capita in 2014 (IEA 2014). Access to electricity was 97 percent country-wide by 2020 (Haque, 2020).
1.3. VIEW OF SHS AS A RURAL ELECTRIFICATION OPTIONThe traditional practice of providing grid-supplied electricity to rural areas is through a public utility that has a natural monopoly for supplying electricity while paying for household electricity service using lifeline tariffs supported by government subsidies. SHS-supplied electricity is a relatively late arriver as a viable alternative for avoiding the high marginal cost of extending the grid to remote and/or sparsely populated areas. Thus, SHS electricity is viewed largely as a private good.6 In Bangladesh, the SHS Program permitted the government to leverage the capacity of the private and NGO sectors to use SHS to accelerate electricity access and ease pressure on grid-based electrification by BREB.
In spite of its long list of potential benefits—including rapidly improving prospect for managing the cost and accelerating the spread of electricity access at the margins of the electrification market—SHS electrification is not fully integrated into systemwide planning for electricity provision in Bangladesh, though such integration is beginning to occur in some other countries. The list includes Rwanda, Kenya, Mozambique, Nigeria, South Africa, Tanzania, Uganda, and Myanmar—where average nationwide population densities tend to be much lower than that of Bangladesh.
Bangladesh is not alone in according grid electricity significant advantages not afforded to off-grid options—for example, capital and operating subsidies and concessional
1. INTRODUCTION
6 Merit and demerit goods concepts were codified in Musgrave’s (1959) classic ‘Theory of Public Finance’. Within that theory, merit goods are good for individuals and society and will be undersupplied by private markets and, thus, should have their production and/or consumption subsidized (encouraged). Conversely, demerit goods are bad for individuals and/or society and should be taxed (discouraged).
Figure 4: Trends in Rural Electricity Access 1995–2018
90
80
70
60
50
40
30
20
10
0
Perc
ent o
f Rur
al E
lect
ricity
Acc
ess
Year
1995
1997
1999
2001
2003
2007
2005
2009
2011
2013
2015
2017
Source: World Bank.
4
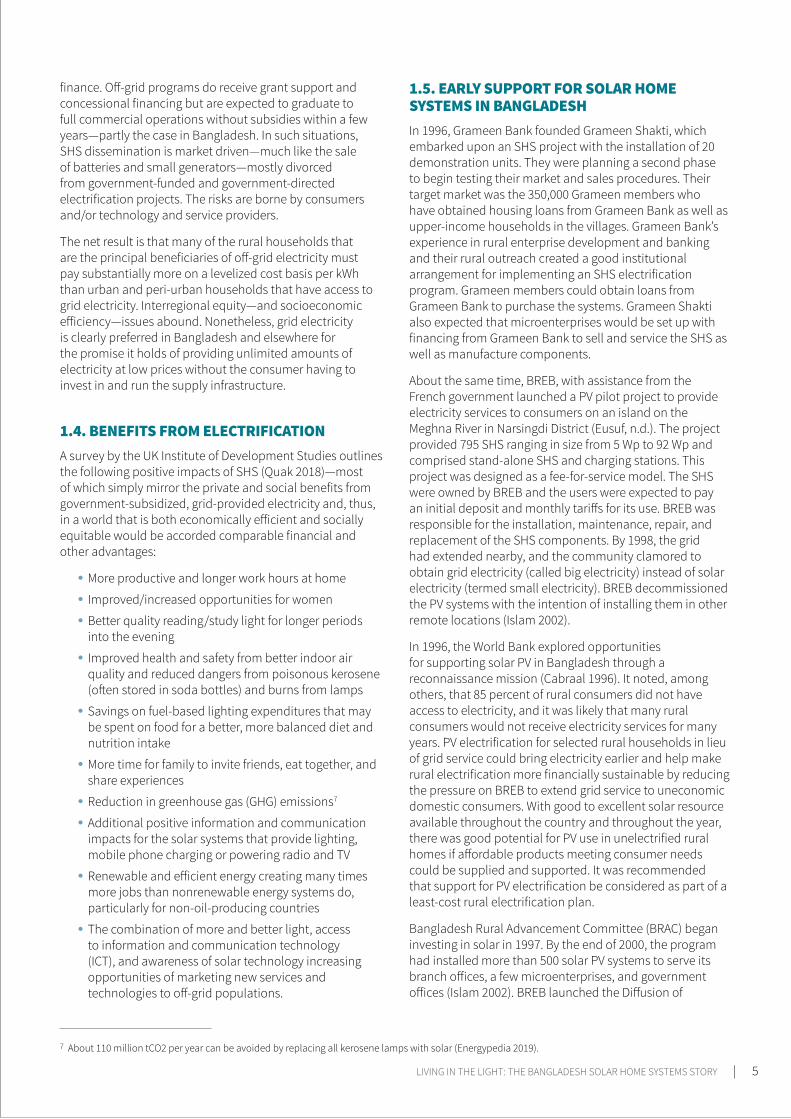
finance. Off-grid programs do receive grant support and concessional financing but are expected to graduate to full commercial operations without subsidies within a few years—partly the case in Bangladesh. In such situations, SHS dissemination is market driven—much like the sale of batteries and small generators—mostly divorced from government-funded and government-directed electrification projects. The risks are borne by consumers and/or technology and service providers.
The net result is that many of the rural households that are the principal beneficiaries of off-grid electricity must pay substantially more on a levelized cost basis per kWh than urban and peri-urban households that have access to grid electricity. Interregional equity—and socioeconomic efficiency—issues abound. Nonetheless, grid electricity is clearly preferred in Bangladesh and elsewhere for the promise it holds of providing unlimited amounts of electricity at low prices without the consumer having to invest in and run the supply infrastructure.
1.4. BENEFITS FROM ELECTRIFICATION A survey by the UK Institute of Development Studies outlines the following positive impacts of SHS (Quak 2018)—most of which simply mirror the private and social benefits from government-subsidized, grid-provided electricity and, thus, in a world that is both economically efficient and socially equitable would be accorded comparable financial and other advantages:
More productive and longer work hours at home
Improved/increased opportunities for women
Better quality reading/study light for longer periods into the evening
Improved health and safety from better indoor air quality and reduced dangers from poisonous kerosene (often stored in soda bottles) and burns from lamps
Savings on fuel-based lighting expenditures that may be spent on food for a better, more balanced diet and nutrition intake
More time for family to invite friends, eat together, and share experiences
Reduction in greenhouse gas (GHG) emissions7
Additional positive information and communication impacts for the solar systems that provide lighting, mobile phone charging or powering radio and TV
Renewable and efficient energy creating many times more jobs than nonrenewable energy systems do, particularly for non-oil-producing countries
The combination of more and better light, access to information and communication technology (ICT), and awareness of solar technology increasing opportunities of marketing new services and technologies to off-grid populations.
1.5. EARLY SUPPORT FOR SOLAR HOME SYSTEMS IN BANGLADESHIn 1996, Grameen Bank founded Grameen Shakti, which embarked upon an SHS project with the installation of 20 demonstration units. They were planning a second phase to begin testing their market and sales procedures. Their target market was the 350,000 Grameen members who have obtained housing loans from Grameen Bank as well as upper-income households in the villages. Grameen Bank’s experience in rural enterprise development and banking and their rural outreach created a good institutional arrangement for implementing an SHS electrification program. Grameen members could obtain loans from Grameen Bank to purchase the systems. Grameen Shakti also expected that microenterprises would be set up with financing from Grameen Bank to sell and service the SHS as well as manufacture components.
About the same time, BREB, with assistance from the French government launched a PV pilot project to provide electricity services to consumers on an island on the Meghna River in Narsingdi District (Eusuf, n.d.). The project provided 795 SHS ranging in size from 5 Wp to 92 Wp and comprised stand-alone SHS and charging stations. This project was designed as a fee-for-service model. The SHS were owned by BREB and the users were expected to pay an initial deposit and monthly tariffs for its use. BREB was responsible for the installation, maintenance, repair, and replacement of the SHS components. By 1998, the grid had extended nearby, and the community clamored to obtain grid electricity (called big electricity) instead of solar electricity (termed small electricity). BREB decommissioned the PV systems with the intention of installing them in other remote locations (Islam 2002).
In 1996, the World Bank explored opportunities for supporting solar PV in Bangladesh through a reconnaissance mission (Cabraal 1996). It noted, among others, that 85 percent of rural consumers did not have access to electricity, and it was likely that many rural consumers would not receive electricity services for many years. PV electrification for selected rural households in lieu of grid service could bring electricity earlier and help make rural electrification more financially sustainable by reducing the pressure on BREB to extend grid service to uneconomic domestic consumers. With good to excellent solar resource available throughout the country and throughout the year, there was good potential for PV use in unelectrified rural homes if affordable products meeting consumer needs could be supplied and supported. It was recommended that support for PV electrification be considered as part of a least-cost rural electrification plan.
Bangladesh Rural Advancement Committee (BRAC) began investing in solar in 1997. By the end of 2000, the program had installed more than 500 solar PV systems to serve its branch offices, a few microenterprises, and government offices (Islam 2002). BREB launched the Diffusion of
7 About 110 million tCO2 per year can be avoided by replacing all kerosene lamps with solar (Energypedia 2019).
LIVING IN THE LIGHT: THE BANGLADESH SOLAR HOME SYSTEMS STORY | 5
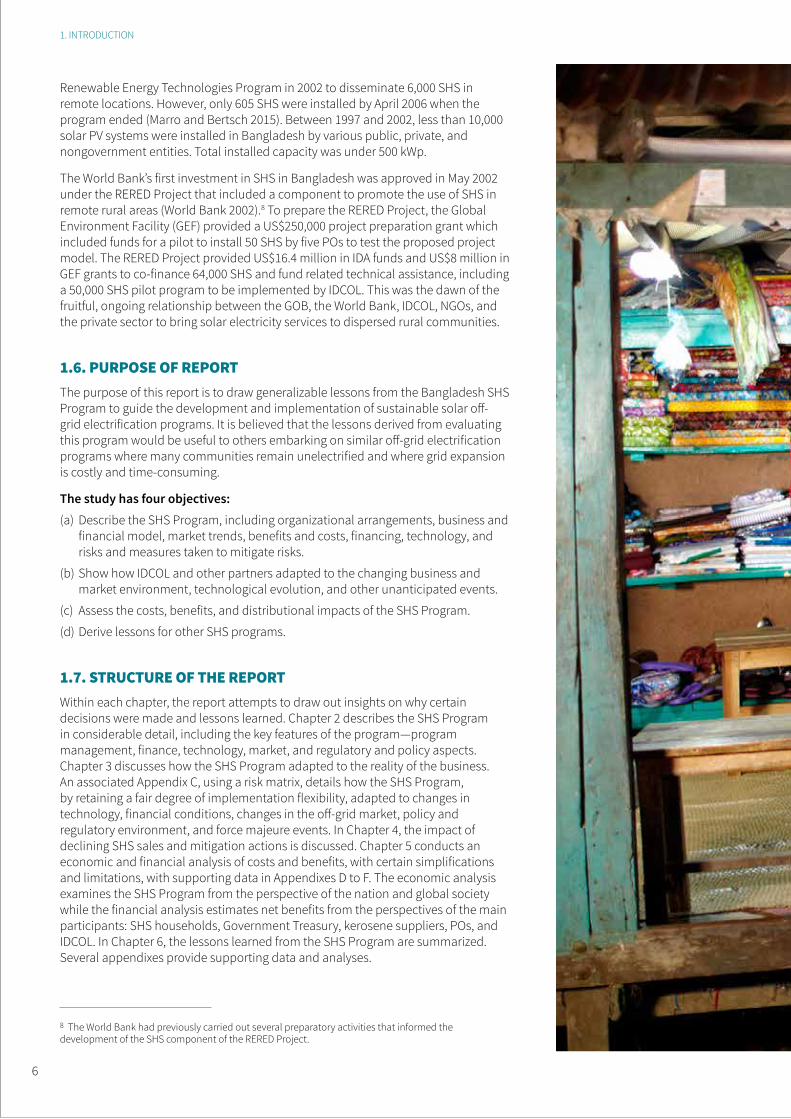
Renewable Energy Technologies Program in 2002 to disseminate 6,000 SHS in remote locations. However, only 605 SHS were installed by April 2006 when the program ended (Marro and Bertsch 2015). Between 1997 and 2002, less than 10,000 solar PV systems were installed in Bangladesh by various public, private, and nongovernment entities. Total installed capacity was under 500 kWp.
The World Bank’s first investment in SHS in Bangladesh was approved in May 2002 under the RERED Project that included a component to promote the use of SHS in remote rural areas (World Bank 2002).8 To prepare the RERED Project, the Global Environment Facility (GEF) provided a US$250,000 project preparation grant which included funds for a pilot to install 50 SHS by five POs to test the proposed project model. The RERED Project provided US$16.4 million in IDA funds and US$8 million in GEF grants to co-finance 64,000 SHS and fund related technical assistance, including a 50,000 SHS pilot program to be implemented by IDCOL. This was the dawn of the fruitful, ongoing relationship between the GOB, the World Bank, IDCOL, NGOs, and the private sector to bring solar electricity services to dispersed rural communities.
1.6. PURPOSE OF REPORTThe purpose of this report is to draw generalizable lessons from the Bangladesh SHS Program to guide the development and implementation of sustainable solar off-grid electrification programs. It is believed that the lessons derived from evaluating this program would be useful to others embarking on similar off-grid electrification programs where many communities remain unelectrified and where grid expansion is costly and time-consuming.
The study has four objectives: (a) Describe the SHS Program, including organizational arrangements, business and
financial model, market trends, benefits and costs, financing, technology, and risks and measures taken to mitigate risks.
(b) Show how IDCOL and other partners adapted to the changing business and market environment, technological evolution, and other unanticipated events.
(c) Assess the costs, benefits, and distributional impacts of the SHS Program.
(d) Derive lessons for other SHS programs.
1.7. STRUCTURE OF THE REPORTWithin each chapter, the report attempts to draw out insights on why certain decisions were made and lessons learned. Chapter 2 describes the SHS Program in considerable detail, including the key features of the program—program management, finance, technology, market, and regulatory and policy aspects. Chapter 3 discusses how the SHS Program adapted to the reality of the business. An associated Appendix C, using a risk matrix, details how the SHS Program, by retaining a fair degree of implementation flexibility, adapted to changes in technology, financial conditions, changes in the off-grid market, policy and regulatory environment, and force majeure events. In Chapter 4, the impact of declining SHS sales and mitigation actions is discussed. Chapter 5 conducts an economic and financial analysis of costs and benefits, with certain simplifications and limitations, with supporting data in Appendixes D to F. The economic analysis examines the SHS Program from the perspective of the nation and global society while the financial analysis estimates net benefits from the perspectives of the main participants: SHS households, Government Treasury, kerosene suppliers, POs, and IDCOL. In Chapter 6, the lessons learned from the SHS Program are summarized. Several appendixes provide supporting data and analyses.
1. INTRODUCTION
8 The World Bank had previously carried out several preparatory activities that informed the development of the SHS component of the RERED Project.
6
LIVING IN THE LIGHT: THE BANGLADESH SOLAR HOME SYSTEMS STORY | 7

8
2.1 Design Concept 10
2.2 Implementation Model 12
2.3 Organizations Involved in the SHS Program 13
2.4 Financing the SHS Program 17
2.5 Financing Terms from IDCOL to POs and Consumer Payment Terms 19
2.6 Loan Securitization 20
2.7 Subsidy Trends 21
2.8 SHS Program Results 21
2.9 SHS Benefits 25
THE SOLAR HOME SYSTEMS
PROGRAM
LIVING IN THE LIGHT: THE BANGLADESH SOLAR HOME SYSTEMS STORY | 9
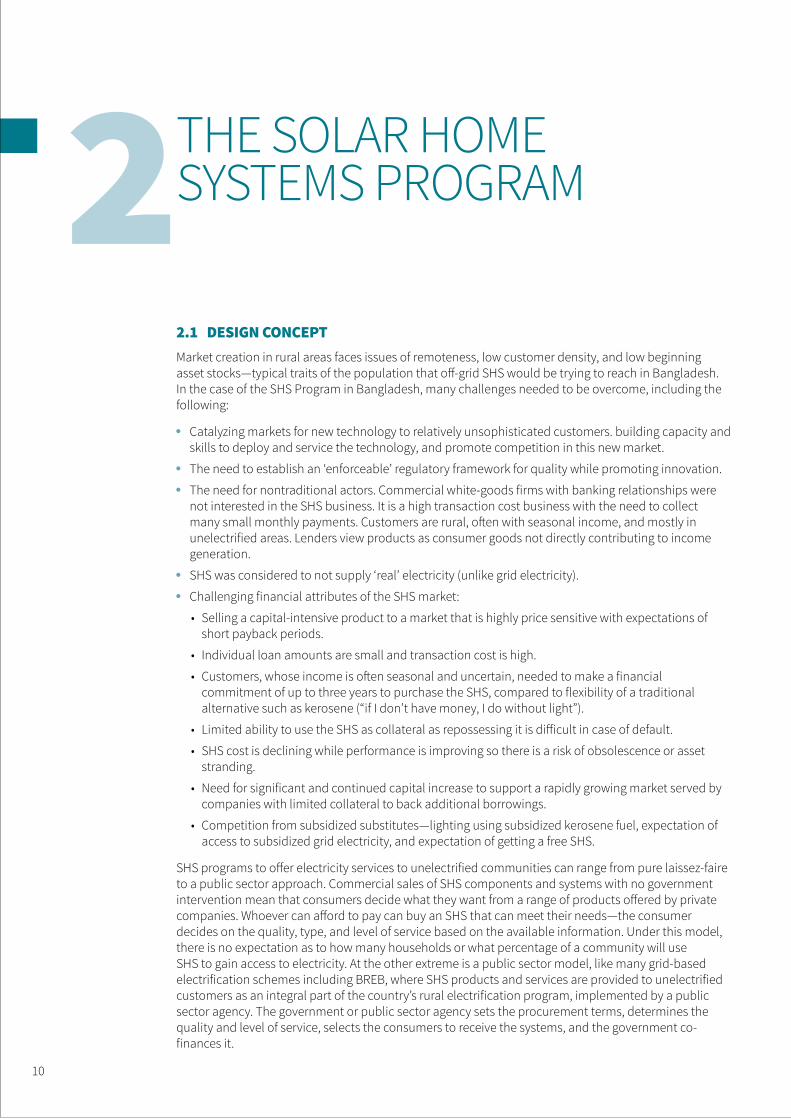
THE SOLAR HOME SYSTEMS PROGRAM
2.1 DESIGN CONCEPTMarket creation in rural areas faces issues of remoteness, low customer density, and low beginning asset stocks—typical traits of the population that off-grid SHS would be trying to reach in Bangladesh. In the case of the SHS Program in Bangladesh, many challenges needed to be overcome, including the following:
Catalyzing markets for new technology to relatively unsophisticated customers. building capacity and skills to deploy and service the technology, and promote competition in this new market.
The need to establish an ‘enforceable’ regulatory framework for quality while promoting innovation.
The need for nontraditional actors. Commercial white-goods firms with banking relationships were not interested in the SHS business. It is a high transaction cost business with the need to collect many small monthly payments. Customers are rural, often with seasonal income, and mostly in unelectrified areas. Lenders view products as consumer goods not directly contributing to income generation.
SHS was considered to not supply ‘real’ electricity (unlike grid electricity).
Challenging financial attributes of the SHS market:
• Selling a capital-intensive product to a market that is highly price sensitive with expectations of short payback periods.
• Individual loan amounts are small and transaction cost is high.
• Customers, whose income is often seasonal and uncertain, needed to make a financial commitment of up to three years to purchase the SHS, compared to flexibility of a traditional alternative such as kerosene (“if I don’t have money, I do without light”).
• Limited ability to use the SHS as collateral as repossessing it is difficult in case of default.
• SHS cost is declining while performance is improving so there is a risk of obsolescence or asset stranding.
• Need for significant and continued capital increase to support a rapidly growing market served by companies with limited collateral to back additional borrowings.
• Competition from subsidized substitutes—lighting using subsidized kerosene fuel, expectation of access to subsidized grid electricity, and expectation of getting a free SHS.
SHS programs to offer electricity services to unelectrified communities can range from pure laissez-faire to a public sector approach. Commercial sales of SHS components and systems with no government intervention mean that consumers decide what they want from a range of products offered by private companies. Whoever can afford to pay can buy an SHS that can meet their needs—the consumer decides on the quality, type, and level of service based on the available information. Under this model, there is no expectation as to how many households or what percentage of a community will use SHS to gain access to electricity. At the other extreme is a public sector model, like many grid-based electrification schemes including BREB, where SHS products and services are provided to unelectrified customers as an integral part of the country’s rural electrification program, implemented by a public sector agency. The government or public sector agency sets the procurement terms, determines the quality and level of service, selects the consumers to receive the systems, and the government co-finances it.
10
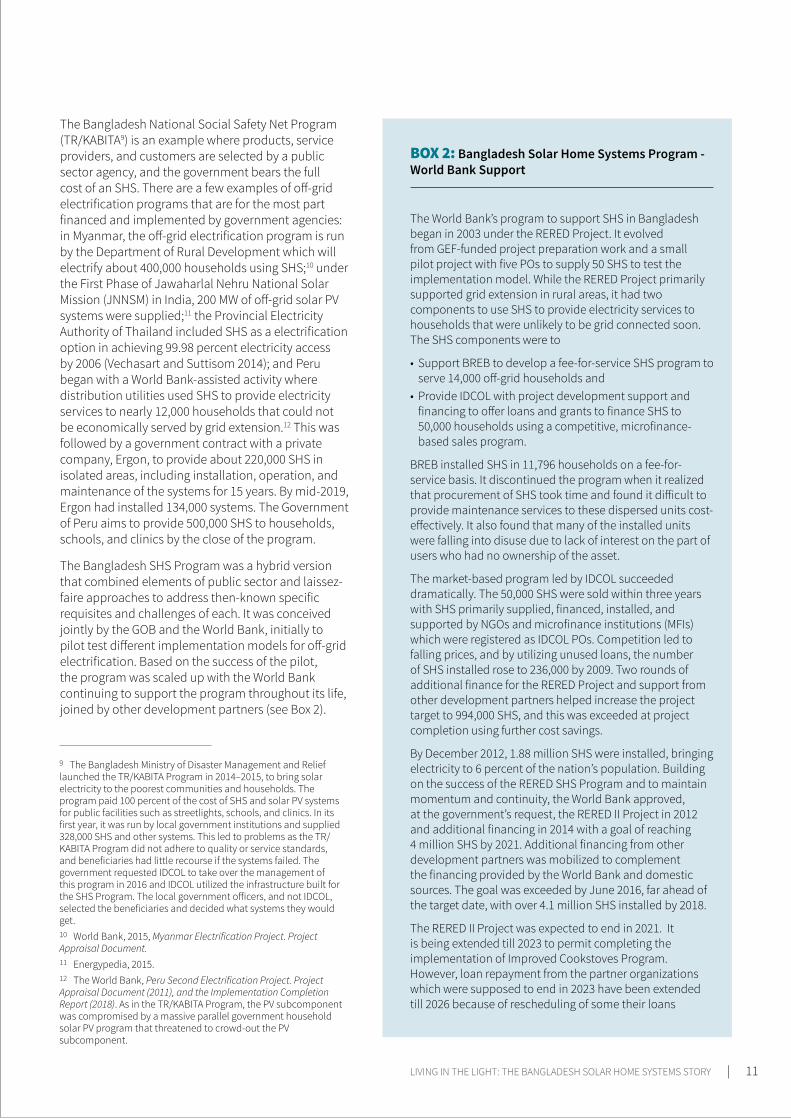
The Bangladesh National Social Safety Net Program (TR/KABITA9) is an example where products, service providers, and customers are selected by a public sector agency, and the government bears the full cost of an SHS. There are a few examples of off-grid electrification programs that are for the most part financed and implemented by government agencies: in Myanmar, the off-grid electrification program is run by the Department of Rural Development which will electrify about 400,000 households using SHS;10 under the First Phase of Jawaharlal Nehru National Solar Mission (JNNSM) in India, 200 MW of off-grid solar PV systems were supplied;11 the Provincial Electricity Authority of Thailand included SHS as a electrification option in achieving 99.98 percent electricity access by 2006 (Vechasart and Suttisom 2014); and Peru began with a World Bank-assisted activity where distribution utilities used SHS to provide electricity services to nearly 12,000 households that could not be economically served by grid extension.12 This was followed by a government contract with a private company, Ergon, to provide about 220,000 SHS in isolated areas, including installation, operation, and maintenance of the systems for 15 years. By mid-2019, Ergon had installed 134,000 systems. The Government of Peru aims to provide 500,000 SHS to households, schools, and clinics by the close of the program.
The Bangladesh SHS Program was a hybrid version that combined elements of public sector and laissez-faire approaches to address then-known specific requisites and challenges of each. It was conceived jointly by the GOB and the World Bank, initially to pilot test different implementation models for off-grid electrification. Based on the success of the pilot, the program was scaled up with the World Bank continuing to support the program throughout its life, joined by other development partners (see Box 2).
9 The Bangladesh Ministry of Disaster Management and Relief launched the TR/KABITA Program in 2014–2015, to bring solar electricity to the poorest communities and households. The program paid 100 percent of the cost of SHS and solar PV systems for public facilities such as streetlights, schools, and clinics. In its first year, it was run by local government institutions and supplied 328,000 SHS and other systems. This led to problems as the TR/KABITA Program did not adhere to quality or service standards, and beneficiaries had little recourse if the systems failed. The government requested IDCOL to take over the management of this program in 2016 and IDCOL utilized the infrastructure built for the SHS Program. The local government officers, and not IDCOL, selected the beneficiaries and decided what systems they would get. 10 World Bank, 2015, Myanmar Electrification Project. Project Appraisal Document. 11 Energypedia, 2015. 12 The World Bank, Peru Second Electrification Project. Project Appraisal Document (2011), and the Implementation Completion Report (2018). As in the TR/KABITA Program, the PV subcomponent was compromised by a massive parallel government household solar PV program that threatened to crowd-out the PV subcomponent.
BOX 2: Bangladesh Solar Home Systems Program - World Bank Support
The World Bank’s program to support SHS in Bangladesh began in 2003 under the RERED Project. It evolved from GEF-funded project preparation work and a small pilot project with five POs to supply 50 SHS to test the implementation model. While the RERED Project primarily supported grid extension in rural areas, it had two components to use SHS to provide electricity services to households that were unlikely to be grid connected soon. The SHS components were to
• Support BREB to develop a fee-for-service SHS program to serve 14,000 off-grid households and
• Provide IDCOL with project development support and financing to offer loans and grants to finance SHS to 50,000 households using a competitive, microfinance-based sales program.
BREB installed SHS in 11,796 households on a fee-for-service basis. It discontinued the program when it realized that procurement of SHS took time and found it difficult to provide maintenance services to these dispersed units cost-effectively. It also found that many of the installed units were falling into disuse due to lack of interest on the part of users who had no ownership of the asset.
The market-based program led by IDCOL succeeded dramatically. The 50,000 SHS were sold within three years with SHS primarily supplied, financed, installed, and supported by NGOs and microfinance institutions (MFIs) which were registered as IDCOL POs. Competition led to falling prices, and by utilizing unused loans, the number of SHS installed rose to 236,000 by 2009. Two rounds of additional finance for the RERED Project and support from other development partners helped increase the project target to 994,000 SHS, and this was exceeded at project completion using further cost savings.
By December 2012, 1.88 million SHS were installed, bringing electricity to 6 percent of the nation’s population. Building on the success of the RERED SHS Program and to maintain momentum and continuity, the World Bank approved, at the government’s request, the RERED II Project in 2012 and additional financing in 2014 with a goal of reaching 4 million SHS by 2021. Additional financing from other development partners was mobilized to complement the financing provided by the World Bank and domestic sources. The goal was exceeded by June 2016, far ahead of the target date, with over 4.1 million SHS installed by 2018.
The RERED II Project was expected to end in 2021. It is being extended till 2023 to permit completing the implementation of Improved Cookstoves Program. However, loan repayment from the partner organizations which were supposed to end in 2023 have been extended till 2026 because of rescheduling of some their loans
LIVING IN THE LIGHT: THE BANGLADESH SOLAR HOME SYSTEMS STORY | 11
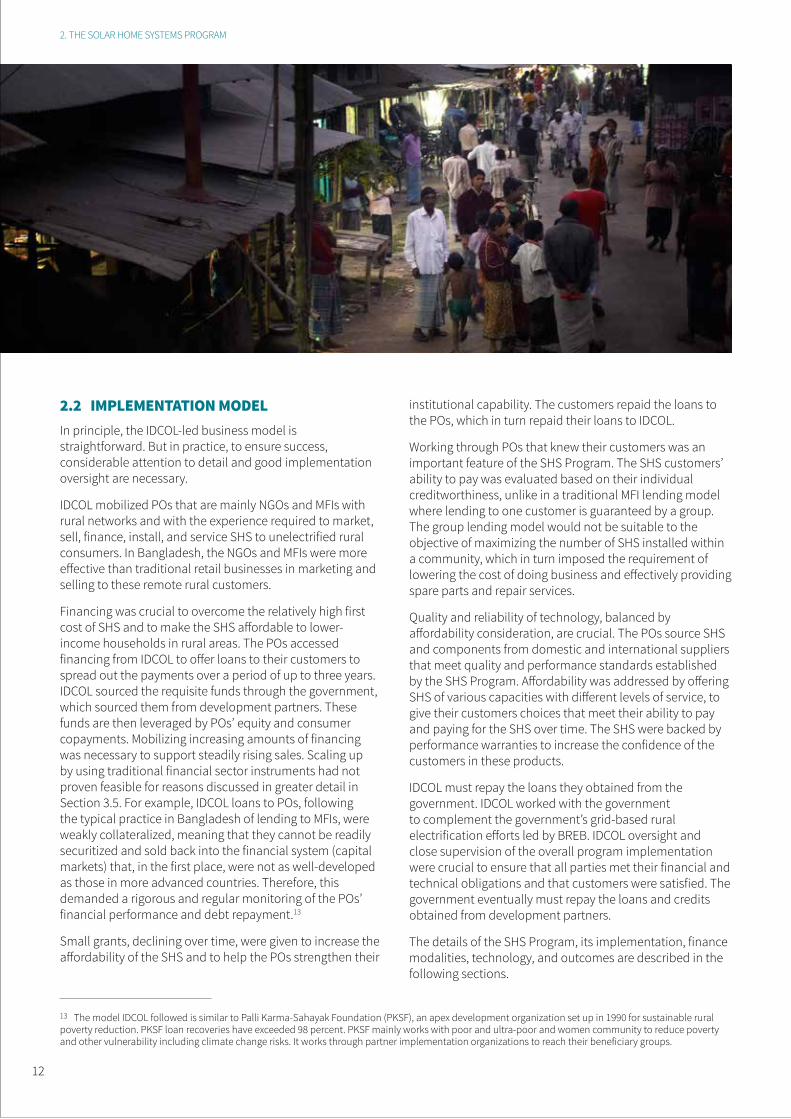
2.2 IMPLEMENTATION MODELIn principle, the IDCOL-led business model is straightforward. But in practice, to ensure success, considerable attention to detail and good implementation oversight are necessary.
IDCOL mobilized POs that are mainly NGOs and MFIs with rural networks and with the experience required to market, sell, finance, install, and service SHS to unelectrified rural consumers. In Bangladesh, the NGOs and MFIs were more effective than traditional retail businesses in marketing and selling to these remote rural customers.
Financing was crucial to overcome the relatively high first cost of SHS and to make the SHS affordable to lower-income households in rural areas. The POs accessed financing from IDCOL to offer loans to their customers to spread out the payments over a period of up to three years. IDCOL sourced the requisite funds through the government, which sourced them from development partners. These funds are then leveraged by POs’ equity and consumer copayments. Mobilizing increasing amounts of financing was necessary to support steadily rising sales. Scaling up by using traditional financial sector instruments had not proven feasible for reasons discussed in greater detail in Section 3.5. For example, IDCOL loans to POs, following the typical practice in Bangladesh of lending to MFIs, were weakly collateralized, meaning that they cannot be readily securitized and sold back into the financial system (capital markets) that, in the first place, were not as well-developed as those in more advanced countries. Therefore, this demanded a rigorous and regular monitoring of the POs’ financial performance and debt repayment.13
Small grants, declining over time, were given to increase the affordability of the SHS and to help the POs strengthen their
institutional capability. The customers repaid the loans to the POs, which in turn repaid their loans to IDCOL.
Working through POs that knew their customers was an important feature of the SHS Program. The SHS customers’ ability to pay was evaluated based on their individual creditworthiness, unlike in a traditional MFI lending model where lending to one customer is guaranteed by a group. The group lending model would not be suitable to the objective of maximizing the number of SHS installed within a community, which in turn imposed the requirement of lowering the cost of doing business and effectively providing spare parts and repair services.
Quality and reliability of technology, balanced by affordability consideration, are crucial. The POs source SHS and components from domestic and international suppliers that meet quality and performance standards established by the SHS Program. Affordability was addressed by offering SHS of various capacities with different levels of service, to give their customers choices that meet their ability to pay and paying for the SHS over time. The SHS were backed by performance warranties to increase the confidence of the customers in these products.
IDCOL must repay the loans they obtained from the government. IDCOL worked with the government to complement the government’s grid-based rural electrification efforts led by BREB. IDCOL oversight and close supervision of the overall program implementation were crucial to ensure that all parties met their financial and technical obligations and that customers were satisfied. The government eventually must repay the loans and credits obtained from development partners.
The details of the SHS Program, its implementation, finance modalities, technology, and outcomes are described in the following sections.
13 The model IDCOL followed is similar to Palli Karma-Sahayak Foundation (PKSF), an apex development organization set up in 1990 for sustainable rural poverty reduction. PKSF loan recoveries have exceeded 98 percent. PKSF mainly works with poor and ultra-poor and women community to reduce poverty and other vulnerability including climate change risks. It works through partner implementation organizations to reach their beneficiary groups.
2. THE SOLAR HOME SYSTEMS PROGRAM
12
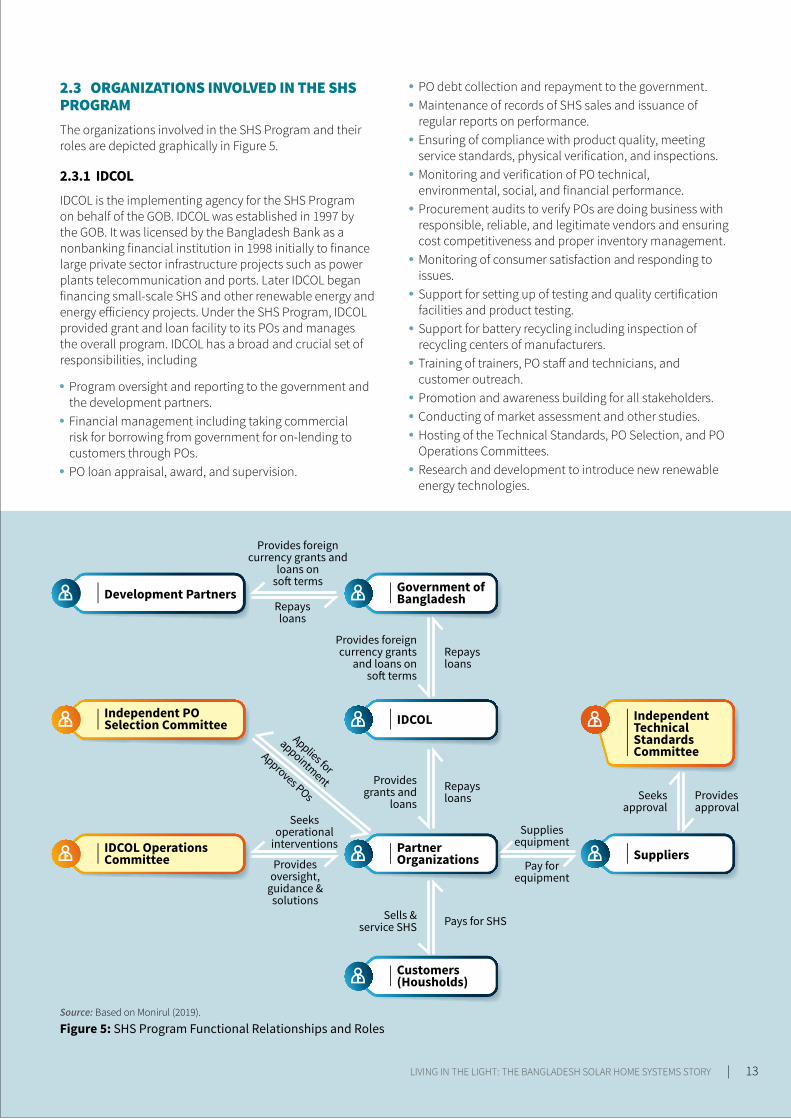
Development Partners Government of Bangladesh
IDCOL Independent Technical Standards Committee
Independent PO Selection Committee
Partner Organizations SuppliersIDCOL Operations
Committee
Customers (Housholds)
Provides approval
Repays loans
Repays loans
Pays for SHS
Approves POs
Applies for
appointmentSeeks
approval
Provides foreign currency grants
and loans on soft terms
Provides grants and
loans
Sells & service SHS
Seeks operational
interventions
Provides foreign currency grants and
loans on soft terms
Supplies equipment
Provides oversight,
guidance & solutions
Repays loans
Pay for equipment
2.3 ORGANIZATIONS INVOLVED IN THE SHS PROGRAMThe organizations involved in the SHS Program and their roles are depicted graphically in Figure 5.
2.3.1 IDCOLIDCOL is the implementing agency for the SHS Program on behalf of the GOB. IDCOL was established in 1997 by the GOB. It was licensed by the Bangladesh Bank as a nonbanking financial institution in 1998 initially to finance large private sector infrastructure projects such as power plants telecommunication and ports. Later IDCOL began financing small-scale SHS and other renewable energy and energy efficiency projects. Under the SHS Program, IDCOL provided grant and loan facility to its POs and manages the overall program. IDCOL has a broad and crucial set of responsibilities, including
Program oversight and reporting to the government and the development partners.
Financial management including taking commercial risk for borrowing from government for on-lending to customers through POs.
PO loan appraisal, award, and supervision.
PO debt collection and repayment to the government. Maintenance of records of SHS sales and issuance of regular reports on performance.
Ensuring of compliance with product quality, meeting service standards, physical verification, and inspections.
Monitoring and verification of PO technical, environmental, social, and financial performance.
Procurement audits to verify POs are doing business with responsible, reliable, and legitimate vendors and ensuring cost competitiveness and proper inventory management.
Monitoring of consumer satisfaction and responding to issues.
Support for setting up of testing and quality certification facilities and product testing.
Support for battery recycling including inspection of recycling centers of manufacturers.
Training of trainers, PO staff and technicians, and customer outreach.
Promotion and awareness building for all stakeholders. Conducting of market assessment and other studies. Hosting of the Technical Standards, PO Selection, and PO Operations Committees.
Research and development to introduce new renewable energy technologies.
Figure 5: SHS Program Functional Relationships and RolesSource: Based on Monirul (2019).
LIVING IN THE LIGHT: THE BANGLADESH SOLAR HOME SYSTEMS STORY | 13
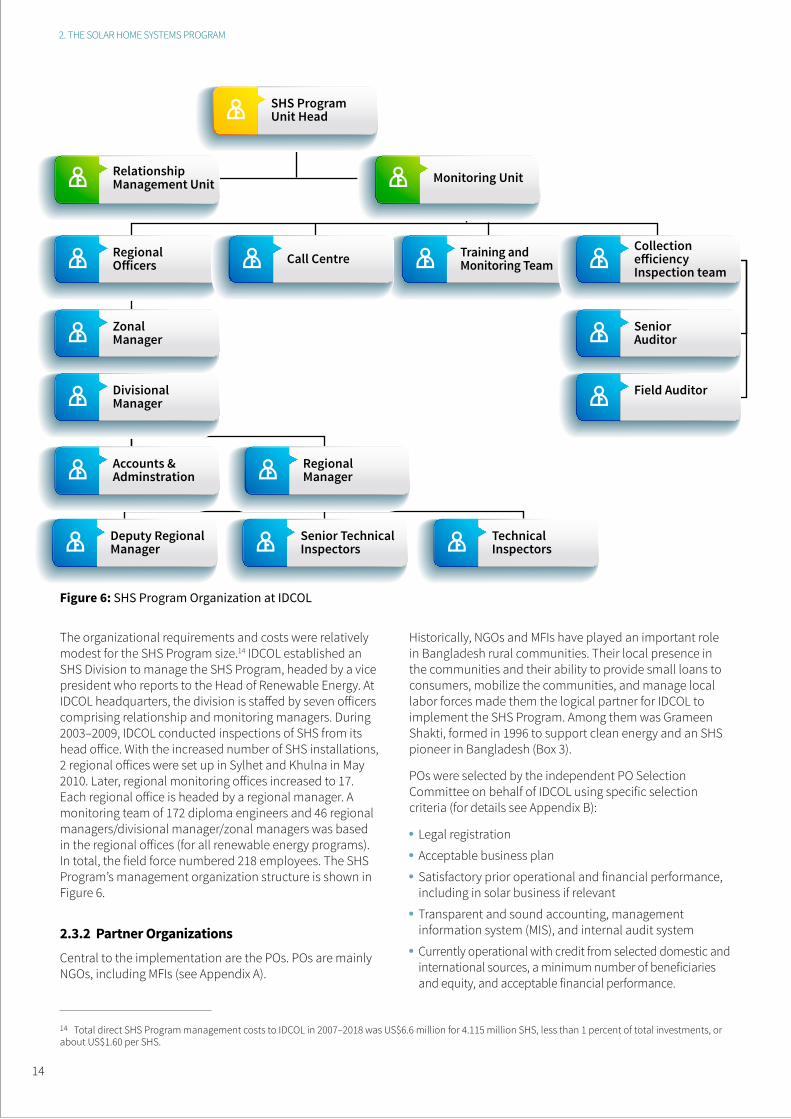
The organizational requirements and costs were relatively modest for the SHS Program size.14 IDCOL established an SHS Division to manage the SHS Program, headed by a vice president who reports to the Head of Renewable Energy. At IDCOL headquarters, the division is staffed by seven officers comprising relationship and monitoring managers. During 2003–2009, IDCOL conducted inspections of SHS from its head office. With the increased number of SHS installations, 2 regional offices were set up in Sylhet and Khulna in May 2010. Later, regional monitoring offices increased to 17. Each regional office is headed by a regional manager. A monitoring team of 172 diploma engineers and 46 regional managers/divisional manager/zonal managers was based in the regional offices (for all renewable energy programs). In total, the field force numbered 218 employees. The SHS Program’s management organization structure is shown in Figure 6.
2.3.2 Partner OrganizationsCentral to the implementation are the POs. POs are mainly NGOs, including MFIs (see Appendix A).
Historically, NGOs and MFIs have played an important role in Bangladesh rural communities. Their local presence in the communities and their ability to provide small loans to consumers, mobilize the communities, and manage local labor forces made them the logical partner for IDCOL to implement the SHS Program. Among them was Grameen Shakti, formed in 1996 to support clean energy and an SHS pioneer in Bangladesh (Box 3).
POs were selected by the independent PO Selection Committee on behalf of IDCOL using specific selection criteria (for details see Appendix B):
Legal registration
Acceptable business plan
Satisfactory prior operational and financial performance, including in solar business if relevant
Transparent and sound accounting, management information system (MIS), and internal audit system
Currently operational with credit from selected domestic and international sources, a minimum number of beneficiaries and equity, and acceptable financial performance.
14 Total direct SHS Program management costs to IDCOL in 2007–2018 was US$6.6 million for 4.115 million SHS, less than 1 percent of total investments, or about US$1.60 per SHS.
Figure 6: SHS Program Organization at IDCOL
SHS Program Unit Head
Relationship Management Unit
Regional Officers
Zonal Manager
Senior Auditor
Divisional Manager
Field Auditor
Accounts & Adminstration
Deputy Regional Manager
Regional Manager
Senior Technical Inspectors
Technical Inspectors
Training and Monitoring Team
Collection efficiency Inspection team
Call Centre
Monitoring Unit
2. THE SOLAR HOME SYSTEMS PROGRAM
14
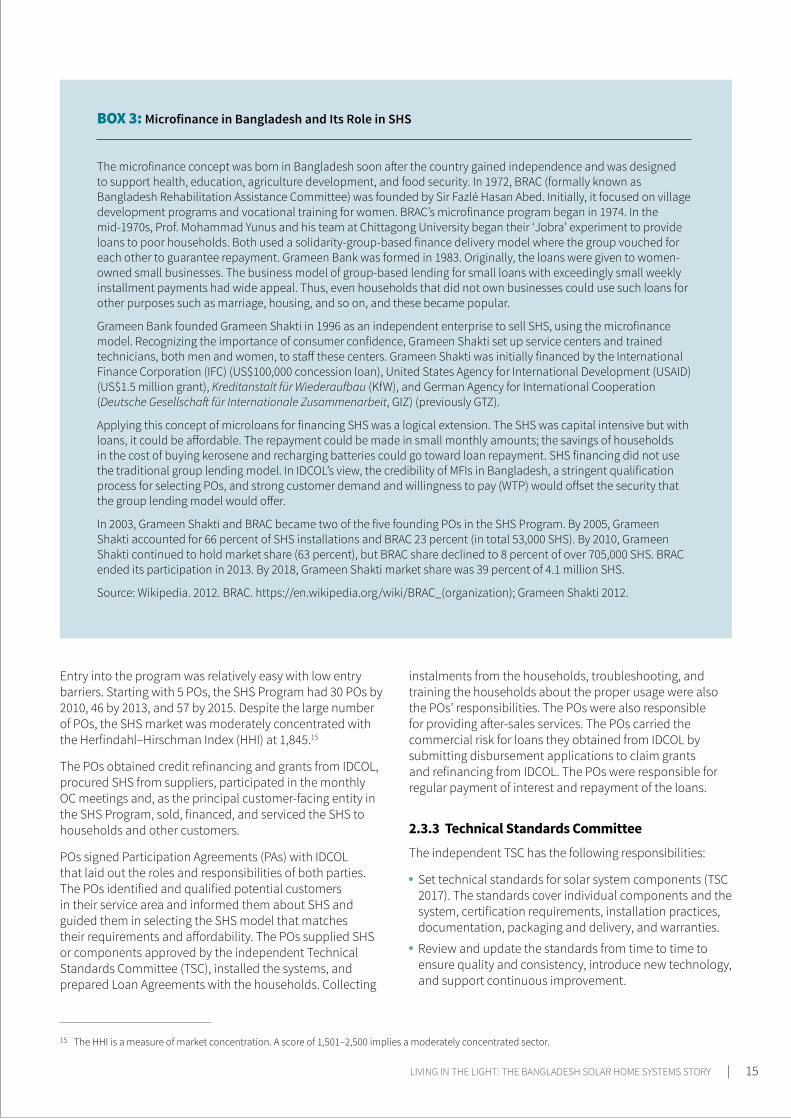
Entry into the program was relatively easy with low entry barriers. Starting with 5 POs, the SHS Program had 30 POs by 2010, 46 by 2013, and 57 by 2015. Despite the large number of POs, the SHS market was moderately concentrated with the Herfindahl–Hirschman Index (HHI) at 1,845.15
The POs obtained credit refinancing and grants from IDCOL, procured SHS from suppliers, participated in the monthly OC meetings and, as the principal customer-facing entity in the SHS Program, sold, financed, and serviced the SHS to households and other customers.
POs signed Participation Agreements (PAs) with IDCOL that laid out the roles and responsibilities of both parties. The POs identified and qualified potential customers in their service area and informed them about SHS and guided them in selecting the SHS model that matches their requirements and affordability. The POs supplied SHS or components approved by the independent Technical Standards Committee (TSC), installed the systems, and prepared Loan Agreements with the households. Collecting
instalments from the households, troubleshooting, and training the households about the proper usage were also the POs’ responsibilities. The POs were also responsible for providing after-sales services. The POs carried the commercial risk for loans they obtained from IDCOL by submitting disbursement applications to claim grants and refinancing from IDCOL. The POs were responsible for regular payment of interest and repayment of the loans.
2.3.3 Technical Standards CommitteeThe independent TSC has the following responsibilities:
Set technical standards for solar system components (TSC 2017). The standards cover individual components and the system, certification requirements, installation practices, documentation, packaging and delivery, and warranties.
Review and update the standards from time to time to ensure quality and consistency, introduce new technology, and support continuous improvement.
15 The HHI is a measure of market concentration. A score of 1,501–2,500 implies a moderately concentrated sector.
BOX 3: Microfinance in Bangladesh and Its Role in SHS
The microfinance concept was born in Bangladesh soon after the country gained independence and was designed to support health, education, agriculture development, and food security. In 1972, BRAC (formally known as Bangladesh Rehabilitation Assistance Committee) was founded by Sir Fazlé Hasan Abed. Initially, it focused on village development programs and vocational training for women. BRAC’s microfinance program began in 1974. In the mid-1970s, Prof. Mohammad Yunus and his team at Chittagong University began their ‘Jobra’ experiment to provide loans to poor households. Both used a solidarity-group-based finance delivery model where the group vouched for each other to guarantee repayment. Grameen Bank was formed in 1983. Originally, the loans were given to women-owned small businesses. The business model of group-based lending for small loans with exceedingly small weekly installment payments had wide appeal. Thus, even households that did not own businesses could use such loans for other purposes such as marriage, housing, and so on, and these became popular.
Grameen Bank founded Grameen Shakti in 1996 as an independent enterprise to sell SHS, using the microfinance model. Recognizing the importance of consumer confidence, Grameen Shakti set up service centers and trained technicians, both men and women, to staff these centers. Grameen Shakti was initially financed by the International Finance Corporation (IFC) (US$100,000 concession loan), United States Agency for International Development (USAID) (US$1.5 million grant), Kreditanstalt für Wiederaufbau (KfW), and German Agency for International Cooperation (Deutsche Gesellschaft für Internationale Zusammenarbeit, GIZ) (previously GTZ).
Applying this concept of microloans for financing SHS was a logical extension. The SHS was capital intensive but with loans, it could be affordable. The repayment could be made in small monthly amounts; the savings of households in the cost of buying kerosene and recharging batteries could go toward loan repayment. SHS financing did not use the traditional group lending model. In IDCOL’s view, the credibility of MFIs in Bangladesh, a stringent qualification process for selecting POs, and strong customer demand and willingness to pay (WTP) would offset the security that the group lending model would offer.
In 2003, Grameen Shakti and BRAC became two of the five founding POs in the SHS Program. By 2005, Grameen Shakti accounted for 66 percent of SHS installations and BRAC 23 percent (in total 53,000 SHS). By 2010, Grameen Shakti continued to hold market share (63 percent), but BRAC share declined to 8 percent of over 705,000 SHS. BRAC ended its participation in 2013. By 2018, Grameen Shakti market share was 39 percent of 4.1 million SHS.
Source: Wikipedia. 2012. BRAC. https://en.wikipedia.org/wiki/BRAC_(organization); Grameen Shakti 2012.
LIVING IN THE LIGHT: THE BANGLADESH SOLAR HOME SYSTEMS STORY | 15
Approve products from manufacturers/suppliers based on these specifications. Suppliers, both domestic and international, that wish to have their products approved for use in the SHS Program must have a type-test certificate from an accredited testing and certification organization. For local products, a certification from a TSC-authorized institution was acceptable. The approved products are posted on the IDCOL website and regularly updated (IDCOL 2020).
Periodically monitor quality.
The TSC comprises members from engineering universities and representatives from the Power Cell, BREB, and Local Government Engineering Division.
2.3.4 PO Selection CommitteeAn independent PO Selection Committee had the responsibility for selecting the POs. The committee consists of representatives from the Ministry of Finance’s Economic Relations Division (ERD), Bangladesh Institute of Development Studies (BIDS), NGO Affairs Bureau, and PKSF. PKSF is an apex NGO established to provide financial assistance and institutional development support to create productive employment opportunities for the moderately and ultra-poor, small, and marginal farmers and microentrepreneurs and to provide associated services.
2.3.5 Operations CommitteeAn organizational element of singular importance to the success of the SHS Program was the Operations Committee. It permitted IDCOL to obtain timely information from the field, get suggestions from the POs, convey consistent messages and directives to the POs, and efficiently manage the Program. It permitted the POs to learn from each other’s experiences. The OC is chaired by the Chief Executive Officer (CEO) of IDCOL and consists of representatives from all POs and IDCOL. The OC met regularly to look after the operational aspects of the SHS Program. It reviewed progress in SHS installations, implementation status of the decisions taken, collection efficiency and ‘portfolio at risk’ (PAR) reports submitted by the POs and IDCOL inspectors, technical reports submitted by POs and IDCOL technical inspectors, periodic submission of financial and other reports by the POs, and any other issues related to the implementation of the program. In addition to the requirements in the PAs, decisions made in the OC meetings were binding on the POs.
2.3.6 The SHS Customers - Rural HouseholdsHouseholds were the principal customers for SHS. The households made decisions on whether to purchase an SHS, what system to purchase, what payment terms to accept; learned about how best to take care of and use the SHS; learned its benefits and limitations; paid for the product; and contacted the POs or IDCOL in case of problems. Householders signed a Sales/Lease Agreement with a PO and paid a down payment. Then representatives from the PO installed an SHS and trained the customer in its use.
While all households that purchased an SHS did not have access to electricity, there were significant differences among the characteristics of such adopter households according to a survey completed 10 years into the SHS Program (Asaduzzaman et al. 2013). Among the SHS users, nonagricultural occupations of household heads appear to be much more prevalent than either the self-farming or worker category. SHS users had significantly higher financial and nonfinancial asset ownership and, in general, had better financial status and improved food consumption than non-adopters. These characteristics may be due to the customer selection process where customers with higher and more stable and predictable incomes may more easily obtain SHS loans from POs than nonagricultural households, and may have a greater appreciation of the SHS benefits.
A higher proportion of adopter households were female headed and often had more educated women, implying a greater role of women and especially educated women in decision-making. More than 40 percent of households had a secondary or higher level of education compared to non-adopters with only half that. Around 70 percent of households had at least one woman with primary education compared to 60 percent among non-adopters, and about 20 percent of adopter households had at least one woman with secondary education compared to 10–12 percent among non-adopters. Adopter households on average spent almost 50–80 percent more for children’s education than the non-adopter households, implying a greater appreciation of the role improved lighting (and possibly, access to better communication) can play in their children’s education.
Women played an important role in the decision to acquire an SHS. The role of women in deciding to acquire an SHS and the importance of SHS for women are illustrated by the following quotes (Razzak, Mamun-ur-Rashid, and Biswas 2012):
Halima Aktar, an assistant teacher in Gazipur, observed the greater interest among women in obtaining an SHS:
In this area, women are more upfront about installing solar home system, biogas plants or improved cooking system. They keep pressuring their husbands about availing these technologies. Moreover, in most of the households, the men live abroad, and therefore, the women have to take decisions regarding these technologies, to make their lives a bit easier. Women are the beneficiaries of these technologies and these serve their needs.”
2. THE SOLAR HOME SYSTEMS PROGRAM
16
The appreciation of the benefits of SHS by women is further reinforced by observations they made during focus group discussions.
Muktilia Bhrumo, a female adopter, observed,
In the past, my children would burn their hands on the kerosene lamps while I was cooking. Sometimes, the lamps would run out of kerosene in the middle of a meal. At other times, the children will run around and spill kerosene oil on top of the food. The food would be spoiled for the day. Now, I have no such problems. Everything is so clear under the lights (powered by solar energy). I no longer stay huddled with my children in fear of the dark. I can cook whenever I want to”. She continued, “The Solar Home System has enabled us to break out of darkness and live in light, isn’t it good for us? Now, my elder daughter can study well at school. In the past, I had to work as a domestic help in different houses so that I could contribute into the household income. Even though, at times I was not feeling well, or had a fever or a cold, I still had to go to work. My husband is a day laborer, and doesn’t earn enough for a family of five. Now, I can make mats or umbrellas at home during nighttime. I can sell my products in the market and I don’t have to work as a domestic help any longer.”
Nonetheless, the dominant role of men in deciding to get an SHS was acknowledged by a focus group discussion participant, “We all know that males are key persons, after all, there is no possibility of expansion of SHS to a single household without the consent and involvement of the male members of the family.” Accordingly, with this implicit bias, it was not surprising that marketing and advertisement drives were targeted predominantly toward men.
2.3.7 SuppliersSuppliers provide the POs, on a competitive basis, with products and components that are quality verified and approved. The POs sign contracts with equipment suppliers that specify the obligations of the equipment suppliers. The suppliers provide warranties for the equipment. These warranties are passed through by the POs to their customers. Battery suppliers are required to recycle expired batteries collected by the POs.16
2.3.8 Development PartnersDevelopment partners provided the capital required to offer consumer financing and grants. Such financing is coursed through the government to IDCOL and from IDCOL to the POs and then to consumers. World Bank IDA and GEF funds were the first to be provided for the pilot in 2003 and then for scale-up. Building on success and experience, other development partners gradually contributed both grants and loans. The development partners with IDCOL were GEF, Global Partnership on Output-Based Aid (GPOBA) (another World Bank-managed trust fund), Asian Development Bank (ADB), Japan International Cooperation Agency (JICA), USAID, KfW, GIZ, Islamic Development Bank (IsDB), and the UK Department for International Development (DFID).
An important aspect of development partner support was that they all adopted the implementation arrangements and business model established by IDCOL without attempting to launch parallel efforts with different requirements. In contrast, TR/KABITA, initially led by local administration, imposed different requirements and was considerably disruptive to the SHS business guided by IDCOL.9 Smoother implementation resulted once IDCOL took over the administration of the TR/KABITA Program and used the same POs, technical standards and warranties, and other features of the SHS Program.
2.4 FINANCING THE SHS PROGRAMTotal investment in the SHS Program is estimated at US$1,094.93 million to provide electricity services to about 20 million people or about US$266 per household. The sources and amounts of financing are shown in Table 1 (Keystone Business Support Company Limited 2018).
The original RERED Project and two rounds of additional financing as well as the follow-on RERED II Project and one more round of additional financing raised US$416.3 million for SHS from World Bank IDA resources. Other development partners, building on the positive experiences and results of the SHS Program, offered additional financing for grants and loans. Their funds were seamlessly integrated into the SHS Program using the same implementation modalities and POs. Down payments by users and equity investments by
16 POs are not permitted to sell a new battery to an SHS customer without collecting the expired ones. POs pay customers the salvage value of the battery. The battery manufacturers reimburse the salvage value to the POs. Subject to availability of funds, IDCOL pays US$5 equivalent as collection cost to POs.
LIVING IN THE LIGHT: THE BANGLADESH SOLAR HOME SYSTEMS STORY | 17
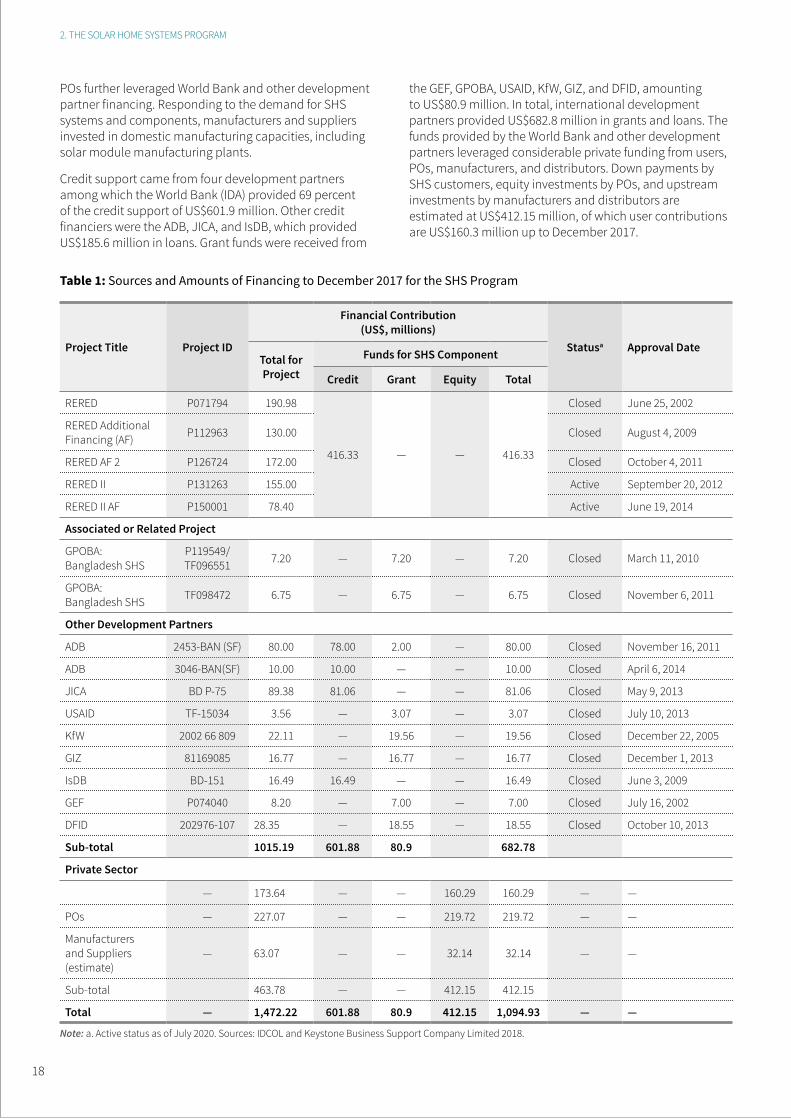
POs further leveraged World Bank and other development partner financing. Responding to the demand for SHS systems and components, manufacturers and suppliers invested in domestic manufacturing capacities, including solar module manufacturing plants.
Credit support came from four development partners among which the World Bank (IDA) provided 69 percent of the credit support of US$601.9 million. Other credit financiers were the ADB, JICA, and IsDB, which provided US$185.6 million in loans. Grant funds were received from
the GEF, GPOBA, USAID, KfW, GIZ, and DFID, amounting to US$80.9 million. In total, international development partners provided US$682.8 million in grants and loans. The funds provided by the World Bank and other development partners leveraged considerable private funding from users, POs, manufacturers, and distributors. Down payments by SHS customers, equity investments by POs, and upstream investments by manufacturers and distributors are estimated at US$412.15 million, of which user contributions are US$160.3 million up to December 2017.
Table 1: Sources and Amounts of Financing to December 2017 for the SHS Program
Project Title Project ID
Financial Contribution(US$, millions)
Statusa Approval DateTotal for Project
Funds for SHS Component
Credit Grant Equity Total
RERED P071794 190.98
416.33 — — 416.33
Closed June 25, 2002
RERED Additional Financing (AF) P112963 130.00 Closed August 4, 2009
RERED AF 2 P126724 172.00 Closed October 4, 2011
RERED II P131263 155.00 Active September 20, 2012
RERED II AF P150001 78.40 Active June 19, 2014
Associated or Related Project
GPOBA: Bangladesh SHS
P119549/ TF096551 7.20 — 7.20 — 7.20 Closed March 11, 2010
GPOBA: Bangladesh SHS TF098472 6.75 — 6.75 — 6.75 Closed November 6, 2011
Other Development Partners
ADB 2453-BAN (SF) 80.00 78.00 2.00 — 80.00 Closed November 16, 2011
ADB 3046-BAN(SF) 10.00 10.00 — — 10.00 Closed April 6, 2014
JICA BD P-75 89.38 81.06 — — 81.06 Closed May 9, 2013
USAID TF-15034 3.56 — 3.07 — 3.07 Closed July 10, 2013
KfW 2002 66 809 22.11 — 19.56 — 19.56 Closed December 22, 2005
GIZ 81169085 16.77 — 16.77 — 16.77 Closed December 1, 2013
IsDB BD-151 16.49 16.49 — — 16.49 Closed June 3, 2009
GEF P074040 8.20 — 7.00 — 7.00 Closed July 16, 2002
DFID 202976-107 28.35 — 18.55 — 18.55 Closed October 10, 2013
Sub-total 1015.19 601.88 80.9 682.78
Private Sector
— 173.64 — — 160.29 160.29 — —
POs — 227.07 — — 219.72 219.72 — —
Manufacturers and Suppliers (estimate)
— 63.07 — — 32.14 32.14 — —
Sub-total 463.78 — — 412.15 412.15
Total — 1,472.22 601.88 80.9 412.15 1,094.93 — —
Note: a. Active status as of July 2020. Sources: IDCOL and Keystone Business Support Company Limited 2018.
2. THE SOLAR HOME SYSTEMS PROGRAM
18
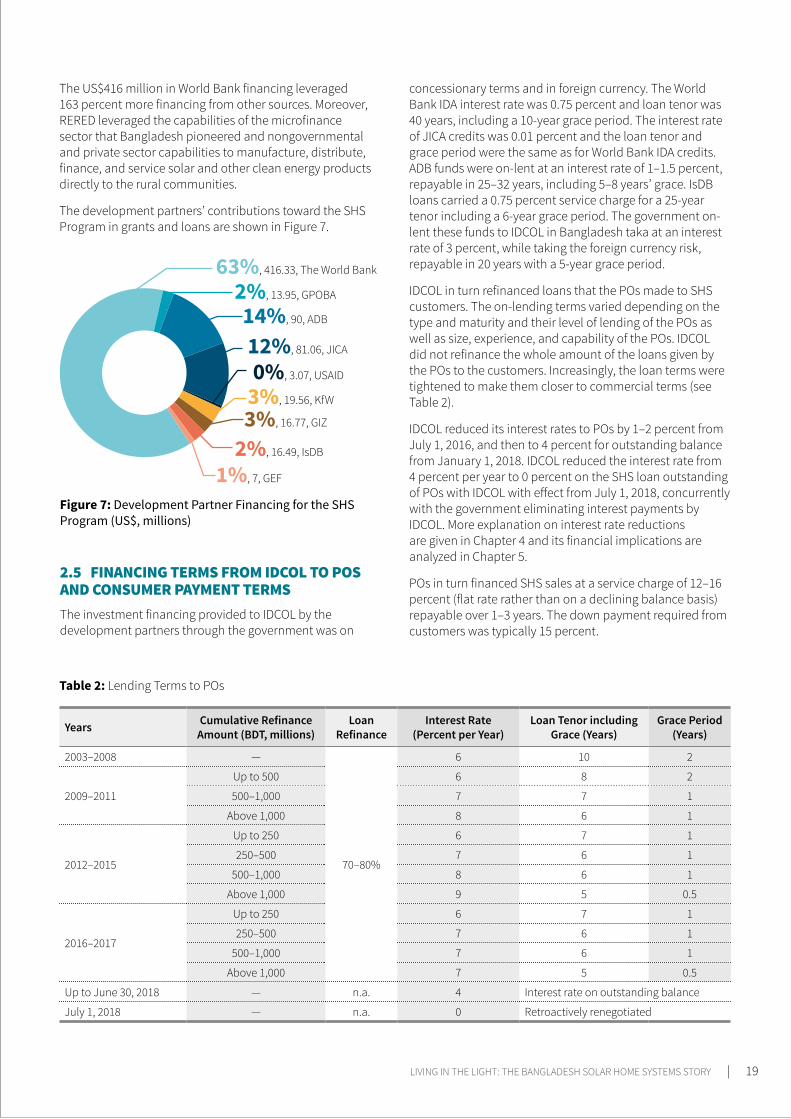
The US$416 million in World Bank financing leveraged 163 percent more financing from other sources. Moreover, RERED leveraged the capabilities of the microfinance sector that Bangladesh pioneered and nongovernmental and private sector capabilities to manufacture, distribute, finance, and service solar and other clean energy products directly to the rural communities.
The development partners’ contributions toward the SHS Program in grants and loans are shown in Figure 7.
concessionary terms and in foreign currency. The World Bank IDA interest rate was 0.75 percent and loan tenor was 40 years, including a 10-year grace period. The interest rate of JICA credits was 0.01 percent and the loan tenor and grace period were the same as for World Bank IDA credits. ADB funds were on-lent at an interest rate of 1–1.5 percent, repayable in 25–32 years, including 5–8 years’ grace. IsDB loans carried a 0.75 percent service charge for a 25-year tenor including a 6-year grace period. The government on-lent these funds to IDCOL in Bangladesh taka at an interest rate of 3 percent, while taking the foreign currency risk, repayable in 20 years with a 5-year grace period.
IDCOL in turn refinanced loans that the POs made to SHS customers. The on-lending terms varied depending on the type and maturity and their level of lending of the POs as well as size, experience, and capability of the POs. IDCOL did not refinance the whole amount of the loans given by the POs to the customers. Increasingly, the loan terms were tightened to make them closer to commercial terms (see Table 2).
IDCOL reduced its interest rates to POs by 1–2 percent from July 1, 2016, and then to 4 percent for outstanding balance from January 1, 2018. IDCOL reduced the interest rate from 4 percent per year to 0 percent on the SHS loan outstanding of POs with IDCOL with effect from July 1, 2018, concurrently with the government eliminating interest payments by IDCOL. More explanation on interest rate reductions are given in Chapter 4 and its financial implications are analyzed in Chapter 5.
POs in turn financed SHS sales at a service charge of 12–16 percent (flat rate rather than on a declining balance basis) repayable over 1–3 years. The down payment required from customers was typically 15 percent.
Table 2: Lending Terms to POs
Years Cumulative Refinance Amount (BDT, millions)
Loan Refinance
Interest Rate (Percent per Year)
Loan Tenor including Grace (Years)
Grace Period (Years)
2003–2008 —
70–80%
6 10 2
2009–2011
Up to 500 6 8 2
500–1,000 7 7 1
Above 1,000 8 6 1
2012–2015
Up to 250 6 7 1
250–500 7 6 1
500–1,000 8 6 1
Above 1,000 9 5 0.5
2016–2017
Up to 250 6 7 1
250–500 7 6 1
500–1,000 7 6 1
Above 1,000 7 5 0.5
Up to June 30, 2018 — n.a. 4 Interest rate on outstanding balance
July 1, 2018 — n.a. 0 Retroactively renegotiated
2.5 FINANCING TERMS FROM IDCOL TO POS AND CONSUMER PAYMENT TERMSThe investment financing provided to IDCOL by the development partners through the government was on
63%, 416.33, The World Bank
2%, 13.95, GPOBA
14%, 90, ADB
12%, 81.06, JICA
0%, 3.07, USAID
3%, 19.56, KfW
3%, 16.77, GIZ
2%, 16.49, IsDB
1%, 7, GEF
Figure 7: Development Partner Financing for the SHS Program (US$, millions)
LIVING IN THE LIGHT: THE BANGLADESH SOLAR HOME SYSTEMS STORY | 19

2.6 LOAN SECURITIZATIONMicrofinance organizations were used as POs for financing SHS based on their success in microcredit activities and widespread networks at the village level. Following practices by PKSF or similar funding sources, the POs were not required to provide any security under the PAs executed between IDCOL and POs except for maintaining a balance in the Debt Service Reserve Account (DSRA). This was equivalent to one semiannual installment payment that could secure less than 20 percent of the loan. Therefore, loans extended to the POs were almost collateral free.
In 2009, IDCOL executed an Amendment and Restatement Agreement to the PA with the POs that incorporated the security package for the first time. This was the time when IDCOL started to take SHS loans on its balance sheet. Therefore, IDCOL decided that some additional security should be in place to address the credit risk to IDCOL. The security package included a first charge hypothecation on all floating assets of POs, a lien on all project accounts, a demand promissory note, and a letter of continuity. However, this was not enough to significantly address the credit risk of IDCOL.
In December 2011, the IDCOL Board included some additional securities considering the increased credit exposure as well as to achieve commercialization. These included first charge hypothecation on all fixed and floating assets of POs, personal guarantee from the directors/
shareholders, corporate guarantee, mortgage of land or bank guarantee to secure 20 percent of the outstanding loan, increasing DSRA balance to be equivalent to four quarterly installment payments, and so on.
However, none of the POs provided a legal mortgage of land or bank guarantee. Also, they could not maintain the required DSRA balance but rather maintained a balance equivalent to a maximum of two quarterly installments. In addition, some POs registered as an NGO/society/foundation expressed their inability to provide personal guarantees by the members of their executive committee as they did not own the organizations.
Despite partially completed security documentation, IDCOL continued disbursement of loans to the POs to ensure smooth operation of the SHS Program. Otherwise, POs would not be able to continue installation of SHS and make debt service payments to IDCOL due to liquidity problems.
In March 2016, IDCOL made further changes to the security package approved in 2011 considering their applicability and status of the program. Mortgages of land or bank guarantees to secure 20 percent of the outstanding loan were waived. POs were now required to maintain a DSRA balance equal to two quarterly installment payments instead of four. For an NGO/MFI/society/foundation, a personal guarantee was required from one member of the executive committee instead of all members. Most of the POs complied with these lesser security requirements.
Table 3: Sources and Amounts of Grants for SHS per Agreement
No. of SHS Receiving Grant Source Number of SHS
Financed
Amount of Grant Available per SHS
Total Buy-down Grant Institutional Development Grant
First 20,000 GEF 20,000 US$90 US$70 US$20
Next 20,000 GEF 20,000 US$70 US$55 US$15
Next 35,000 GEF 35,000 US$50 US$40 US$10
Next 88,160KfW 30,000
EUR 38 EUR 30 EUR 8GIZ 58,160
Next 35,000 KfW 35,000 EUR 36 EUR 30 EUR 6
Next 238,659KfW 135,000
EUR 34 EUR 30 EUR 4GIZ 103,659
Next 161,543KfW 103,000 EUR 28 EUR 25 EUR 3
GPOBA 58,543 US$36 US$30 US$6
Next 443,520
KfW 99,018EUR 22 EUR 20 EUR 2
GIZ 24,359
GPOBA 178,103US$28 US$25 US$3
GPOBA 142,040
Next 510,960
GPOBA 70,960
US$25 US$25Nil
(US$3 will be paid to new POs only if funds remain)
ADB 80,000
IDA 360,000
Total 1,552,842
2. THE SOLAR HOME SYSTEMS PROGRAM
20
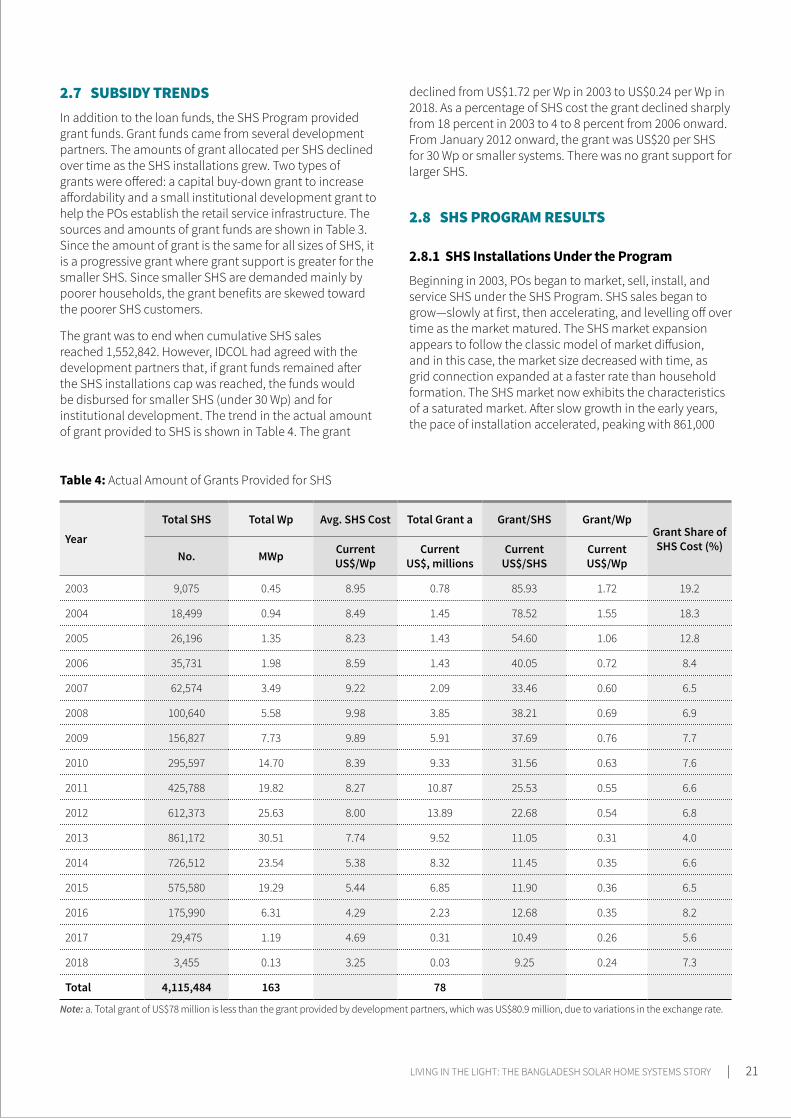
2.7 SUBSIDY TRENDSIn addition to the loan funds, the SHS Program provided grant funds. Grant funds came from several development partners. The amounts of grant allocated per SHS declined over time as the SHS installations grew. Two types of grants were offered: a capital buy-down grant to increase affordability and a small institutional development grant to help the POs establish the retail service infrastructure. The sources and amounts of grant funds are shown in Table 3. Since the amount of grant is the same for all sizes of SHS, it is a progressive grant where grant support is greater for the smaller SHS. Since smaller SHS are demanded mainly by poorer households, the grant benefits are skewed toward the poorer SHS customers.
The grant was to end when cumulative SHS sales reached 1,552,842. However, IDCOL had agreed with the development partners that, if grant funds remained after the SHS installations cap was reached, the funds would be disbursed for smaller SHS (under 30 Wp) and for institutional development. The trend in the actual amount of grant provided to SHS is shown in Table 4. The grant
declined from US$1.72 per Wp in 2003 to US$0.24 per Wp in 2018. As a percentage of SHS cost the grant declined sharply from 18 percent in 2003 to 4 to 8 percent from 2006 onward. From January 2012 onward, the grant was US$20 per SHS for 30 Wp or smaller systems. There was no grant support for larger SHS.
2.8 SHS PROGRAM RESULTS
2.8.1 SHS Installations Under the ProgramBeginning in 2003, POs began to market, sell, install, and service SHS under the SHS Program. SHS sales began to grow—slowly at first, then accelerating, and levelling off over time as the market matured. The SHS market expansion appears to follow the classic model of market diffusion, and in this case, the market size decreased with time, as grid connection expanded at a faster rate than household formation. The SHS market now exhibits the characteristics of a saturated market. After slow growth in the early years, the pace of installation accelerated, peaking with 861,000
Table 4: Actual Amount of Grants Provided for SHS
YearTotal SHS Total Wp Avg. SHS Cost Total Grant a Grant/SHS Grant/Wp
Grant Share of SHS Cost (%)
No. MWp CurrentUS$/Wp
CurrentUS$, millions
CurrentUS$/SHS
CurrentUS$/Wp
2003 9,075 0.45 8.95 0.78 85.93 1.72 19.2
2004 18,499 0.94 8.49 1.45 78.52 1.55 18.3
2005 26,196 1.35 8.23 1.43 54.60 1.06 12.8
2006 35,731 1.98 8.59 1.43 40.05 0.72 8.4
2007 62,574 3.49 9.22 2.09 33.46 0.60 6.5
2008 100,640 5.58 9.98 3.85 38.21 0.69 6.9
2009 156,827 7.73 9.89 5.91 37.69 0.76 7.7
2010 295,597 14.70 8.39 9.33 31.56 0.63 7.6
2011 425,788 19.82 8.27 10.87 25.53 0.55 6.6
2012 612,373 25.63 8.00 13.89 22.68 0.54 6.8
2013 861,172 30.51 7.74 9.52 11.05 0.31 4.0
2014 726,512 23.54 5.38 8.32 11.45 0.35 6.6
2015 575,580 19.29 5.44 6.85 11.90 0.36 6.5
2016 175,990 6.31 4.29 2.23 12.68 0.35 8.2
2017 29,475 1.19 4.69 0.31 10.49 0.26 5.6
2018 3,455 0.13 3.25 0.03 9.25 0.24 7.3
Total 4,115,484 163 78
Note: a. Total grant of US$78 million is less than the grant provided by development partners, which was US$80.9 million, due to variations in the exchange rate.
LIVING IN THE LIGHT: THE BANGLADESH SOLAR HOME SYSTEMS STORY | 21
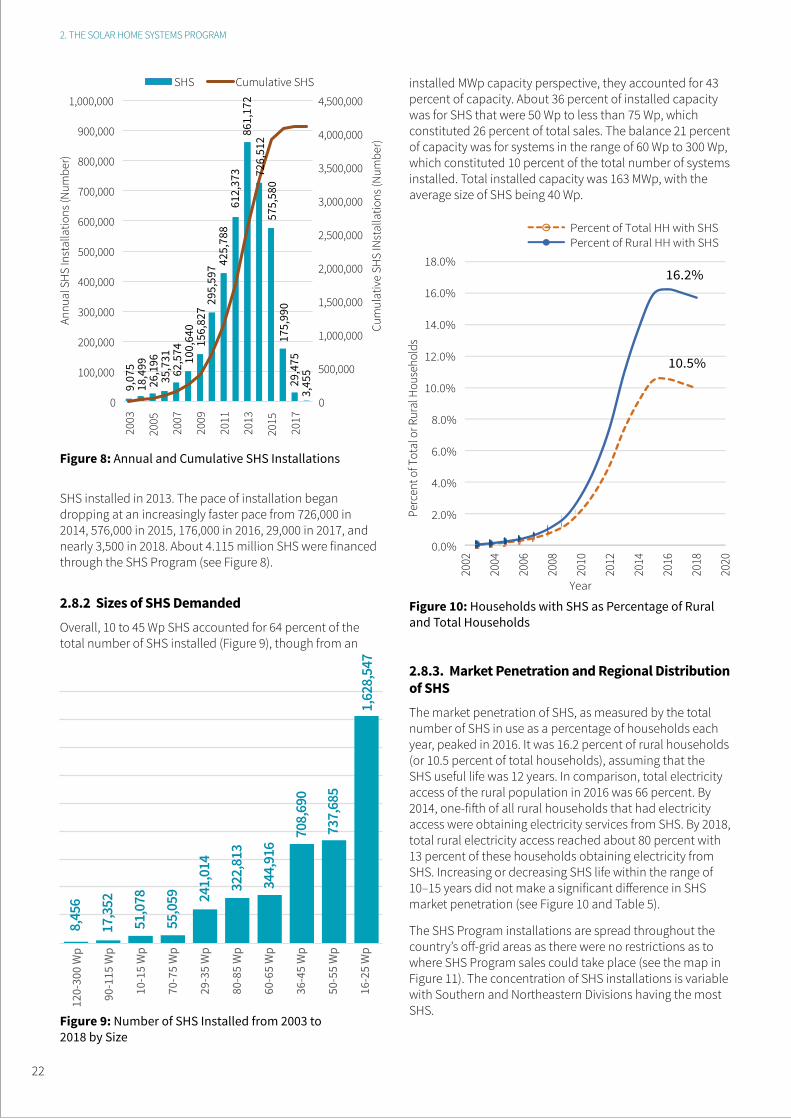
SHS installed in 2013. The pace of installation began dropping at an increasingly faster pace from 726,000 in 2014, 576,000 in 2015, 176,000 in 2016, 29,000 in 2017, and nearly 3,500 in 2018. About 4.115 million SHS were financed through the SHS Program (see Figure 8).
2.8.2 Sizes of SHS DemandedOverall, 10 to 45 Wp SHS accounted for 64 percent of the total number of SHS installed (Figure 9), though from an
2.8.3. Market Penetration and Regional Distribution of SHS The market penetration of SHS, as measured by the total number of SHS in use as a percentage of households each year, peaked in 2016. It was 16.2 percent of rural households (or 10.5 percent of total households), assuming that the SHS useful life was 12 years. In comparison, total electricity access of the rural population in 2016 was 66 percent. By 2014, one-fifth of all rural households that had electricity access were obtaining electricity services from SHS. By 2018, total rural electricity access reached about 80 percent with 13 percent of these households obtaining electricity from SHS. Increasing or decreasing SHS life within the range of 10–15 years did not make a significant difference in SHS market penetration (see Figure 10 and Table 5).
The SHS Program installations are spread throughout the country’s off-grid areas as there were no restrictions as to where SHS Program sales could take place (see the map in Figure 11). The concentration of SHS installations is variable with Southern and Northeastern Divisions having the most SHS.
Figure 8: Annual and Cumulative SHS Installations
Figure 10: Households with SHS as Percentage of Rural and Total Households
Figure 9: Number of SHS Installed from 2003 to 2018 by Size
2. THE SOLAR HOME SYSTEMS PROGRAM
installed MWp capacity perspective, they accounted for 43 percent of capacity. About 36 percent of installed capacity was for SHS that were 50 Wp to less than 75 Wp, which constituted 26 percent of total sales. The balance 21 percent of capacity was for systems in the range of 60 Wp to 300 Wp, which constituted 10 percent of the total number of systems installed. Total installed capacity was 163 MWp, with the average size of SHS being 40 Wp.
22

Figure 11: SHS Sales (by Color) and Market Penetration (% of Total Households) at the District Level
LIVING IN THE LIGHT: THE BANGLADESH SOLAR HOME SYSTEMS STORY | 23
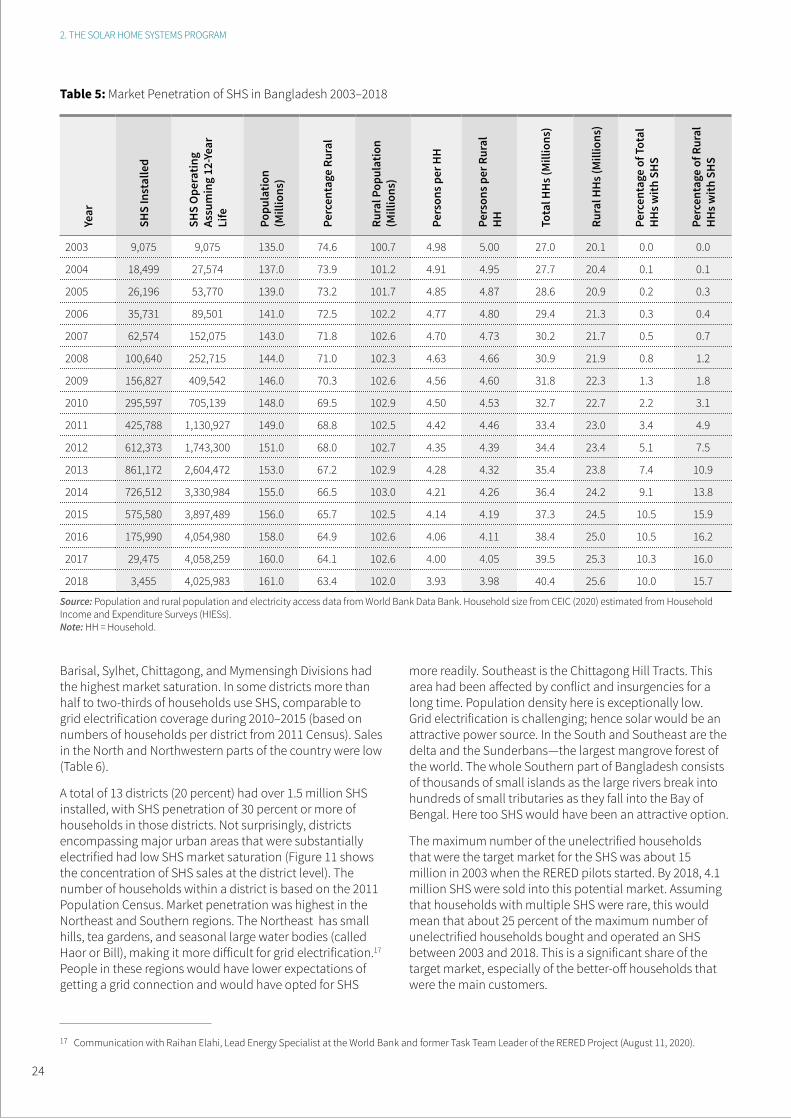
Barisal, Sylhet, Chittagong, and Mymensingh Divisions had the highest market saturation. In some districts more than half to two-thirds of households use SHS, comparable to grid electrification coverage during 2010–2015 (based on numbers of households per district from 2011 Census). Sales in the North and Northwestern parts of the country were low (Table 6).
A total of 13 districts (20 percent) had over 1.5 million SHS installed, with SHS penetration of 30 percent or more of households in those districts. Not surprisingly, districts encompassing major urban areas that were substantially electrified had low SHS market saturation (Figure 11 shows the concentration of SHS sales at the district level). The number of households within a district is based on the 2011 Population Census. Market penetration was highest in the Northeast and Southern regions. The Northeast has small hills, tea gardens, and seasonal large water bodies (called Haor or Bill), making it more difficult for grid electrification.17 People in these regions would have lower expectations of getting a grid connection and would have opted for SHS
more readily. Southeast is the Chittagong Hill Tracts. This area had been affected by conflict and insurgencies for a long time. Population density here is exceptionally low. Grid electrification is challenging; hence solar would be an attractive power source. In the South and Southeast are the delta and the Sunderbans—the largest mangrove forest of the world. The whole Southern part of Bangladesh consists of thousands of small islands as the large rivers break into hundreds of small tributaries as they fall into the Bay of Bengal. Here too SHS would have been an attractive option.
The maximum number of the unelectrified households that were the target market for the SHS was about 15 million in 2003 when the RERED pilots started. By 2018, 4.1 million SHS were sold into this potential market. Assuming that households with multiple SHS were rare, this would mean that about 25 percent of the maximum number of unelectrified households bought and operated an SHS between 2003 and 2018. This is a significant share of the target market, especially of the better-off households that were the main customers.
17 Communication with Raihan Elahi, Lead Energy Specialist at the World Bank and former Task Team Leader of the RERED Project (August 11, 2020).
Table 5: Market Penetration of SHS in Bangladesh 2003–2018Ye
ar
SHS
Inst
alle
d
SHS
Ope
ratin
g As
sum
ing
12-Y
ear
Life
Popu
latio
n (M
illio
ns)
Perc
enta
ge R
ural
Rura
l Pop
ulat
ion
(Mill
ions
)
Pers
ons p
er H
H
Pers
ons p
er R
ural
H
H
Tota
l HH
s (M
illio
ns)
Rura
l HH
s (M
illio
ns)
Perc
enta
ge o
f Tot
al
HH
s with
SH
S
Perc
enta
ge o
f Rur
al
HH
s with
SH
S
2003 9,075 9,075 135.0 74.6 100.7 4.98 5.00 27.0 20.1 0.0 0.0
2004 18,499 27,574 137.0 73.9 101.2 4.91 4.95 27.7 20.4 0.1 0.1
2005 26,196 53,770 139.0 73.2 101.7 4.85 4.87 28.6 20.9 0.2 0.3
2006 35,731 89,501 141.0 72.5 102.2 4.77 4.80 29.4 21.3 0.3 0.4
2007 62,574 152,075 143.0 71.8 102.6 4.70 4.73 30.2 21.7 0.5 0.7
2008 100,640 252,715 144.0 71.0 102.3 4.63 4.66 30.9 21.9 0.8 1.2
2009 156,827 409,542 146.0 70.3 102.6 4.56 4.60 31.8 22.3 1.3 1.8
2010 295,597 705,139 148.0 69.5 102.9 4.50 4.53 32.7 22.7 2.2 3.1
2011 425,788 1,130,927 149.0 68.8 102.5 4.42 4.46 33.4 23.0 3.4 4.9
2012 612,373 1,743,300 151.0 68.0 102.7 4.35 4.39 34.4 23.4 5.1 7.5
2013 861,172 2,604,472 153.0 67.2 102.9 4.28 4.32 35.4 23.8 7.4 10.9
2014 726,512 3,330,984 155.0 66.5 103.0 4.21 4.26 36.4 24.2 9.1 13.8
2015 575,580 3,897,489 156.0 65.7 102.5 4.14 4.19 37.3 24.5 10.5 15.9
2016 175,990 4,054,980 158.0 64.9 102.6 4.06 4.11 38.4 25.0 10.5 16.2
2017 29,475 4,058,259 160.0 64.1 102.6 4.00 4.05 39.5 25.3 10.3 16.0
2018 3,455 4,025,983 161.0 63.4 102.0 3.93 3.98 40.4 25.6 10.0 15.7
Source: Population and rural population and electricity access data from World Bank Data Bank. Household size from CEIC (2020) estimated from Household Income and Expenditure Surveys (HIESs).Note: HH = Household.
2. THE SOLAR HOME SYSTEMS PROGRAM
24
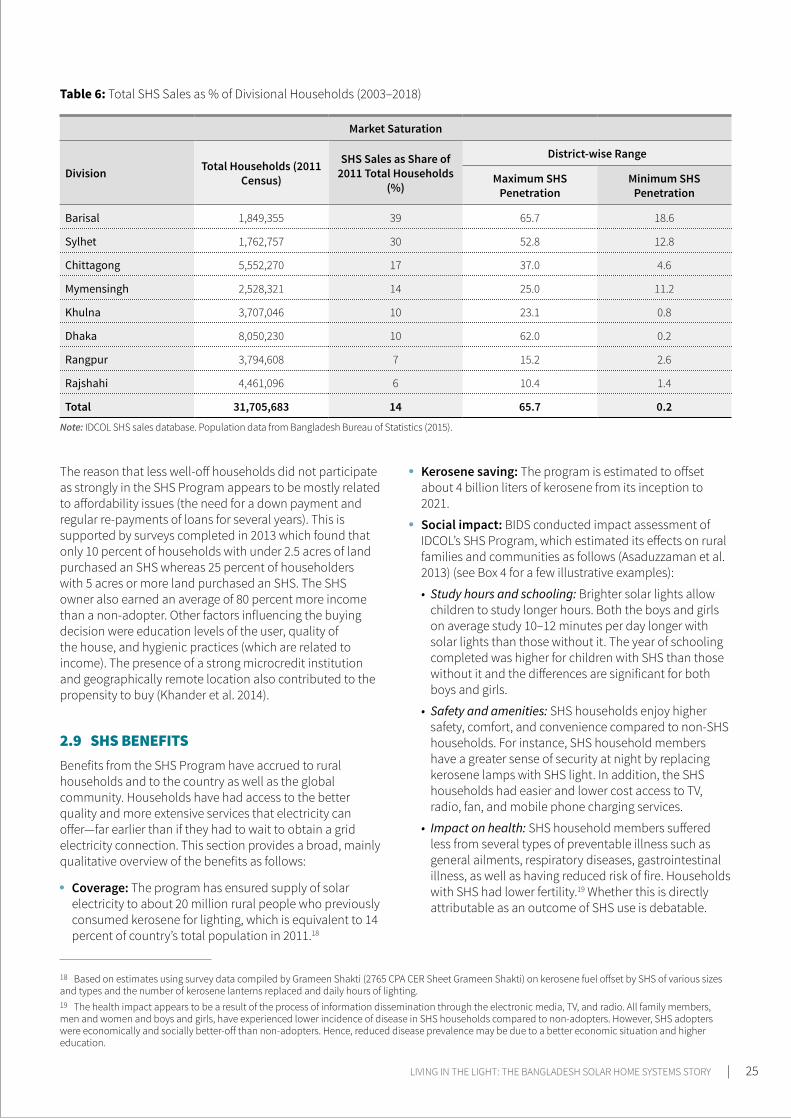
18 Based on estimates using survey data compiled by Grameen Shakti (2765 CPA CER Sheet Grameen Shakti) on kerosene fuel offset by SHS of various sizes and types and the number of kerosene lanterns replaced and daily hours of lighting. 19 The health impact appears to be a result of the process of information dissemination through the electronic media, TV, and radio. All family members, men and women and boys and girls, have experienced lower incidence of disease in SHS households compared to non-adopters. However, SHS adopters were economically and socially better-off than non-adopters. Hence, reduced disease prevalence may be due to a better economic situation and higher education.
The reason that less well-off households did not participate as strongly in the SHS Program appears to be mostly related to affordability issues (the need for a down payment and regular re-payments of loans for several years). This is supported by surveys completed in 2013 which found that only 10 percent of households with under 2.5 acres of land purchased an SHS whereas 25 percent of householders with 5 acres or more land purchased an SHS. The SHS owner also earned an average of 80 percent more income than a non-adopter. Other factors influencing the buying decision were education levels of the user, quality of the house, and hygienic practices (which are related to income). The presence of a strong microcredit institution and geographically remote location also contributed to the propensity to buy (Khander et al. 2014).
2.9 SHS BENEFITS Benefits from the SHS Program have accrued to rural households and to the country as well as the global community. Households have had access to the better quality and more extensive services that electricity can offer—far earlier than if they had to wait to obtain a grid electricity connection. This section provides a broad, mainly qualitative overview of the benefits as follows:
Coverage: The program has ensured supply of solar electricity to about 20 million rural people who previously consumed kerosene for lighting, which is equivalent to 14 percent of country’s total population in 2011.18
Kerosene saving: The program is estimated to offset about 4 billion liters of kerosene from its inception to 2021.
Social impact: BIDS conducted impact assessment of IDCOL’s SHS Program, which estimated its effects on rural families and communities as follows (Asaduzzaman et al. 2013) (see Box 4 for a few illustrative examples):
• Study hours and schooling: Brighter solar lights allow children to study longer hours. Both the boys and girls on average study 10–12 minutes per day longer with solar lights than those without it. The year of schooling completed was higher for children with SHS than those without it and the differences are significant for both boys and girls.
• Safety and amenities: SHS households enjoy higher safety, comfort, and convenience compared to non-SHS households. For instance, SHS household members have a greater sense of security at night by replacing kerosene lamps with SHS light. In addition, the SHS households had easier and lower cost access to TV, radio, fan, and mobile phone charging services.
• Impact on health: SHS household members suffered less from several types of preventable illness such as general ailments, respiratory diseases, gastrointestinal illness, as well as having reduced risk of fire. Households with SHS had lower fertility.19 Whether this is directly attributable as an outcome of SHS use is debatable.
Table 6: Total SHS Sales as % of Divisional Households (2003–2018)
Market Saturation
Division Total Households (2011 Census)
SHS Sales as Share of 2011 Total Households
(%)
District-wise Range
Maximum SHS Penetration
Minimum SHS Penetration
Barisal 1,849,355 39 65.7 18.6
Sylhet 1,762,757 30 52.8 12.8
Chittagong 5,552,270 17 37.0 4.6
Mymensingh 2,528,321 14 25.0 11.2
Khulna 3,707,046 10 23.1 0.8
Dhaka 8,050,230 10 62.0 0.2
Rangpur 3,794,608 7 15.2 2.6
Rajshahi 4,461,096 6 10.4 1.4
Total 31,705,683 14 65.7 0.2
Note: IDCOL SHS sales database. Population data from Bangladesh Bureau of Statistics (2015).
LIVING IN THE LIGHT: THE BANGLADESH SOLAR HOME SYSTEMS STORY | 25
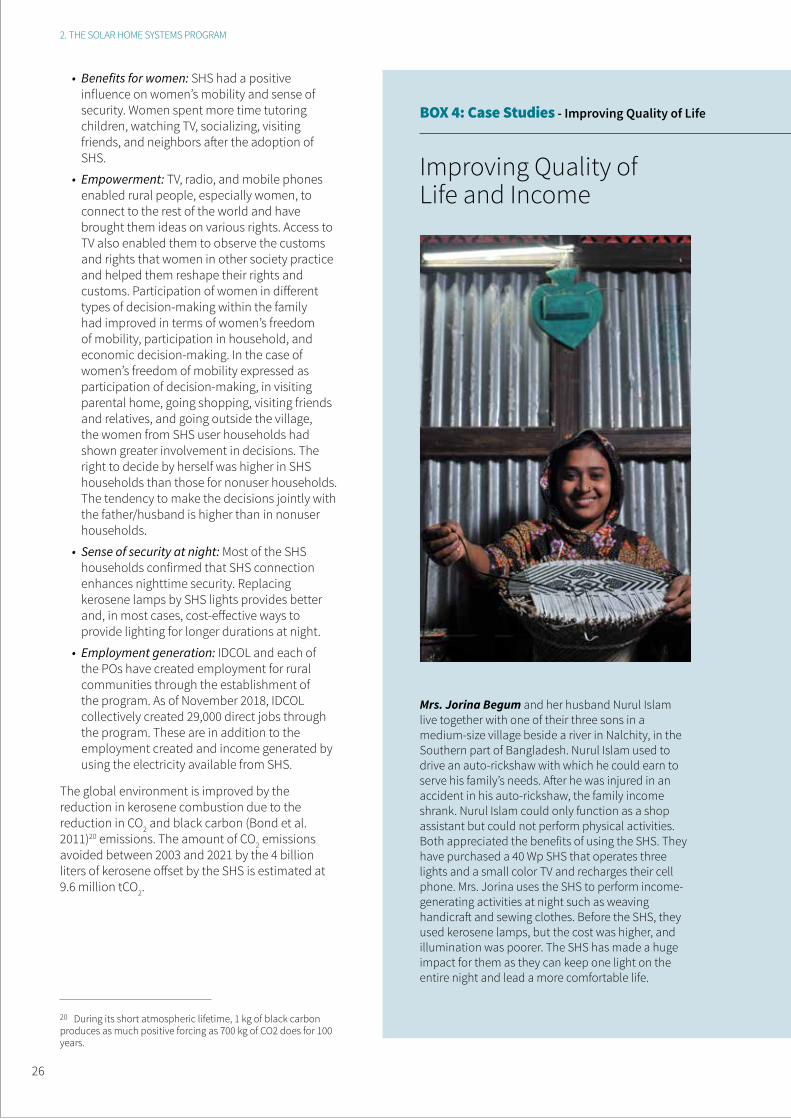
• Benefits for women: SHS had a positive influence on women’s mobility and sense of security. Women spent more time tutoring children, watching TV, socializing, visiting friends, and neighbors after the adoption of SHS.
• Empowerment: TV, radio, and mobile phones enabled rural people, especially women, to connect to the rest of the world and have brought them ideas on various rights. Access to TV also enabled them to observe the customs and rights that women in other society practice and helped them reshape their rights and customs. Participation of women in different types of decision-making within the family had improved in terms of women’s freedom of mobility, participation in household, and economic decision-making. In the case of women’s freedom of mobility expressed as participation of decision-making, in visiting parental home, going shopping, visiting friends and relatives, and going outside the village, the women from SHS user households had shown greater involvement in decisions. The right to decide by herself was higher in SHS households than those for nonuser households. The tendency to make the decisions jointly with the father/husband is higher than in nonuser households.
• Sense of security at night: Most of the SHS households confirmed that SHS connection enhances nighttime security. Replacing kerosene lamps by SHS lights provides better and, in most cases, cost-effective ways to provide lighting for longer durations at night.
• Employment generation: IDCOL and each of the POs have created employment for rural communities through the establishment of the program. As of November 2018, IDCOL collectively created 29,000 direct jobs through the program. These are in addition to the employment created and income generated by using the electricity available from SHS.
The global environment is improved by the reduction in kerosene combustion due to the reduction in CO2 and black carbon (Bond et al. 2011)20 emissions. The amount of CO2 emissions avoided between 2003 and 2021 by the 4 billion liters of kerosene offset by the SHS is estimated at 9.6 million tCO2.
20 During its short atmospheric lifetime, 1 kg of black carbon produces as much positive forcing as 700 kg of CO2 does for 100 years.
BOX 4: Case Studies - Improving Quality of Life
Mrs. Jorina Begum and her husband Nurul Islam live together with one of their three sons in a medium-size village beside a river in Nalchity, in the Southern part of Bangladesh. Nurul Islam used to drive an auto-rickshaw with which he could earn to serve his family’s needs. After he was injured in an accident in his auto-rickshaw, the family income shrank. Nurul Islam could only function as a shop assistant but could not perform physical activities. Both appreciated the benefits of using the SHS. They have purchased a 40 Wp SHS that operates three lights and a small color TV and recharges their cell phone. Mrs. Jorina uses the SHS to perform income-generating activities at night such as weaving handicraft and sewing clothes. Before the SHS, they used kerosene lamps, but the cost was higher, and illumination was poorer. The SHS has made a huge impact for them as they can keep one light on the entire night and lead a more comfortable life.
Improving Quality of Life and Income
2. THE SOLAR HOME SYSTEMS PROGRAM
26
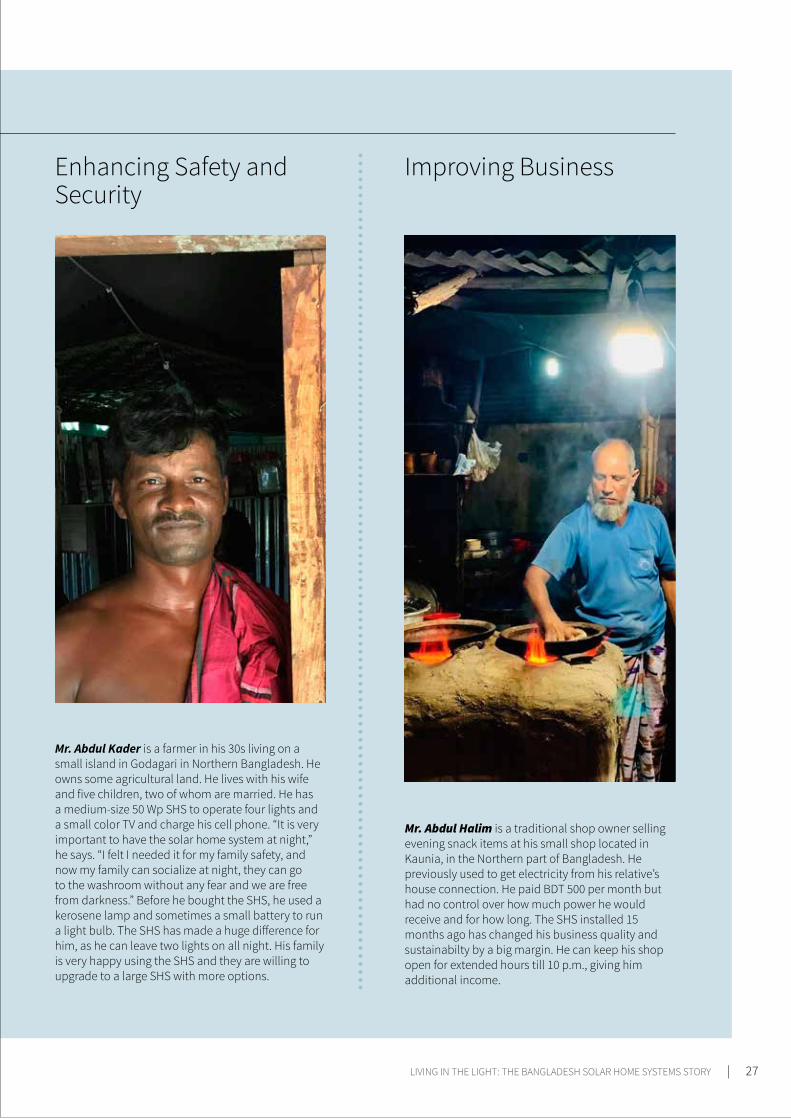
BOX 4: Case Studies - Improving Quality of Life
Mr. Abdul Kader is a farmer in his 30s living on a small island in Godagari in Northern Bangladesh. He owns some agricultural land. He lives with his wife and five children, two of whom are married. He has a medium-size 50 Wp SHS to operate four lights and a small color TV and charge his cell phone. “It is very important to have the solar home system at night,” he says. “I felt I needed it for my family safety, and now my family can socialize at night, they can go to the washroom without any fear and we are free from darkness.” Before he bought the SHS, he used a kerosene lamp and sometimes a small battery to run a light bulb. The SHS has made a huge difference for him, as he can leave two lights on all night. His family is very happy using the SHS and they are willing to upgrade to a large SHS with more options.
Mr. Abdul Halim is a traditional shop owner selling evening snack items at his small shop located in Kaunia, in the Northern part of Bangladesh. He previously used to get electricity from his relative’s house connection. He paid BDT 500 per month but had no control over how much power he would receive and for how long. The SHS installed 15 months ago has changed his business quality and sustainabilty by a big margin. He can keep his shop open for extended hours till 10 p.m., giving him additional income.
Enhancing Safety and Security
Improving Business
LIVING IN THE LIGHT: THE BANGLADESH SOLAR HOME SYSTEMS STORY | 27
28
3.1 Continuous Adaptation of the Program to Changing Circumstances 30
3.2 Obtaining Timely Information/Data 30
3.3 Responding to SHS Technology Change and Consumer Choice 32
3.4 Responding to Environmental Management Needs 34
3.5 Attempts to Access Commercial Financing 35
3.6 Assuring Long-term Sustainability of SHS 35
3.7 Solar Industry Development in Bangladesh 36
ADAPTING TO REALITY
LIVING IN THE LIGHT: THE BANGLADESH SOLAR HOME SYSTEMS STORY | 29

ADAPTING TO REALITY
3.1 CONTINUOUS ADAPTATION OF THE PROGRAM TO CHANGING CIRCUMSTANCESA key feature of the SHS Program was retaining flexibility to adjust to changing technology, changes in consumer demands and affordability, and market conditions. To successfully adapt, IDCOL required timely information, quick decisions, and rapid implementation of changes. It also needed feedback to ensure that the changes were effective and, if not, to modify. In the SHS Program, a process of continuous adaptation naturally evolved during implementation, owing to the openness of management. This adaptation process as implemented by IDCOL was innovative and successful to a significant extent, but there is always room for improvement, as discussed in the following sections.
The continuous adaptation of the SHS Program is illustrated using a detailed risk matrix to describe how IDCOL mitigated various risks over time (see Appendix C). The matrix demonstrates how the implementation features were modified based on feedback from the POs and suppliers, consumer surveys, inspections and monitoring, changing technology, changing costs and market conditions, and force majeure events.
3.2 OBTAINING TIMELY INFORMATION/DATAA crucially important aspect of the continuous adaptation process of the program was communication—between IDCOL and POs and suppliers, POs and their customers, and IDCOL and SHS users. Communication played several essential roles—ensuring POs complied with project requirements, carrying feedback from POs to help improve project implementation and address quality concerns as well as market development issues, providing consumer feedback, and enabling IDCOL and the POs to respond to their concerns. The OC payed an exceedingly important organizational role in such communication.
30
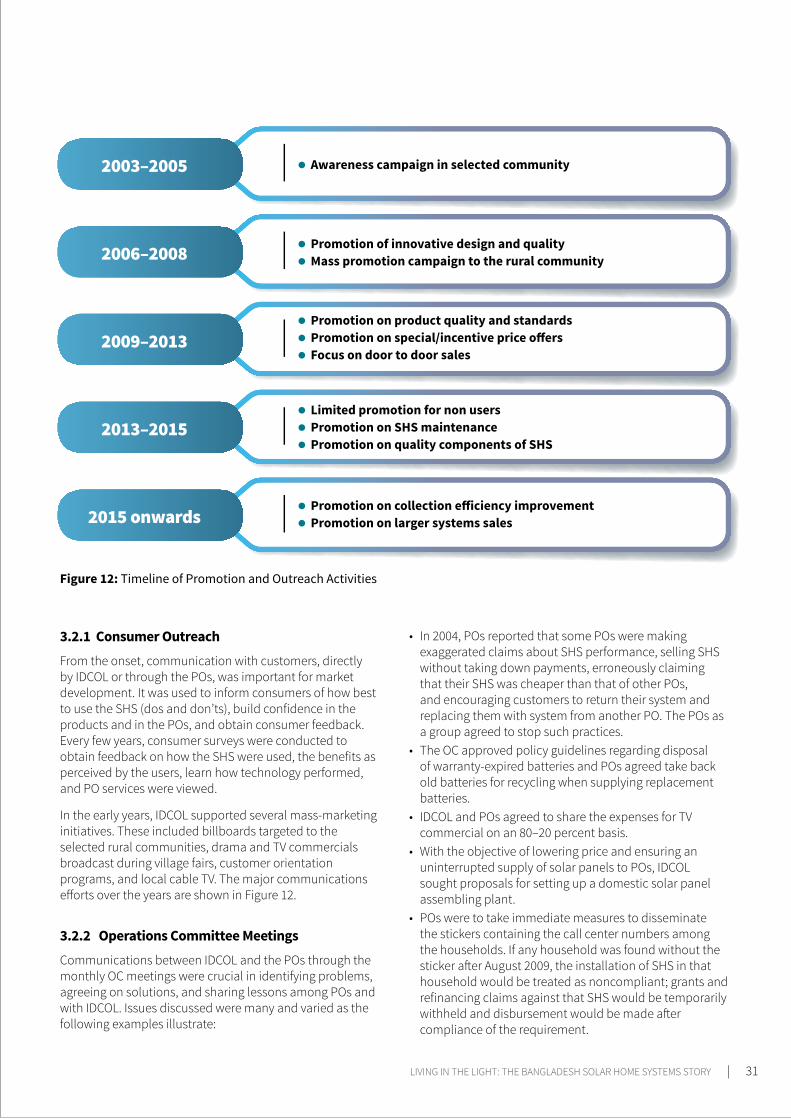
3.2.1 Consumer OutreachFrom the onset, communication with customers, directly by IDCOL or through the POs, was important for market development. It was used to inform consumers of how best to use the SHS (dos and don’ts), build confidence in the products and in the POs, and obtain consumer feedback. Every few years, consumer surveys were conducted to obtain feedback on how the SHS were used, the benefits as perceived by the users, learn how technology performed, and PO services were viewed.
In the early years, IDCOL supported several mass-marketing initiatives. These included billboards targeted to the selected rural communities, drama and TV commercials broadcast during village fairs, customer orientation programs, and local cable TV. The major communications efforts over the years are shown in Figure 12.
3.2.2 Operations Committee MeetingsCommunications between IDCOL and the POs through the monthly OC meetings were crucial in identifying problems, agreeing on solutions, and sharing lessons among POs and with IDCOL. Issues discussed were many and varied as the following examples illustrate:
Awareness campaign in selected community
Promotion of innovative design and quality Mass promotion campaign to the rural community
Promotion on product quality and standards Promotion on special/incentive price offers Focus on door to door sales
Limited promotion for non users Promotion on SHS maintenance Promotion on quality components of SHS
Promotion on collection efficiency improvement Promotion on larger systems sales
2003–2005
2006–2008
2009–2013
2013–2015
2015 onwards
Figure 12: Timeline of Promotion and Outreach Activities
• In 2004, POs reported that some POs were making exaggerated claims about SHS performance, selling SHS without taking down payments, erroneously claiming that their SHS was cheaper than that of other POs, and encouraging customers to return their system and replacing them with system from another PO. The POs as a group agreed to stop such practices.
• The OC approved policy guidelines regarding disposal of warranty-expired batteries and POs agreed take back old batteries for recycling when supplying replacement batteries.
• IDCOL and POs agreed to share the expenses for TV commercial on an 80–20 percent basis.
• With the objective of lowering price and ensuring an uninterrupted supply of solar panels to POs, IDCOL sought proposals for setting up a domestic solar panel assembling plant.
• POs were to take immediate measures to disseminate the stickers containing the call center numbers among the households. If any household was found without the sticker after August 2009, the installation of SHS in that household would be treated as noncompliant; grants and refinancing claims against that SHS would be temporarily withheld and disbursement would be made after compliance of the requirement.
LIVING IN THE LIGHT: THE BANGLADESH SOLAR HOME SYSTEMS STORY | 31
• To respond to increasing numbers of complaints, POs agreed to train all customers using IDCOL’s user training guidelines.
• POs were advised on the Collection Efficiency Improvement Program (CEIP) and proposed new models to improve the collection performance.
3.2.3 Call CenterIn 2007, IDCOL set up a call center, open every day except Fridays and government holidays, for customers to report technical problems and seek after-sales service. IDCOL has since been receiving calls directly from customers regarding the problems not addressed by the POs for rectification.
The complaints received by the call center were addressed in two ways. The customer was given the contact details of the PO’s regional office to connect the two parties directly. The concerned PO was also informed by the call center about the complaint and was advised to take necessary actions. The record of the complaint was kept in a database. A follow-up call was made by the call center to the customer to ensure the problem was resolved by the concerned PO within a reasonable time.
3.2.4. Verification of Operational PerformanceIDCOL teams visited and inspected a sample of SHS installations. Release of grant funds and loan refinancing was contingent on the installations passing the inspections. The quality inspectors visited customer households to ensure the following:
• SHS are installed within off-grid areas.
• The systems meet technical and financial requirements as set by IDCOL.
• Approved SHS components (solar panel, battery, controller, and so on) are used.
• After-sales maintenance and warranty support are provided to customers.
• Customers are satisfied with the service.
• Technical problems with SHS are identified for rectification by the POs.
IDCOL prepared technical reports for each PO and provided them to the PO unit offices for immediate action. IDCOL also followed up on the status of the problems with POs and customers on a regular basis. Before 2013, IDCOL did not penalize POs for technical discrepancy of SHS as the percentage of noncompliance was low. However, when sales were at their peak, IDCOL observed that the share of noncompliant SHS installations began increasing, which implied that POs were focusing more on installing SHS rapidly than doing so properly. To reverse this, IDCOL started to deduct the noncompliant SHS from the monthly claim request of POs. Such corrective measures made POs more attentive in resolving problems, and gradual improvements were observed in PO performance.
3.2.5. Technical AuditsIDCOL conducted third-party technical audits to ensure accountability of suppliers and POs in terms of quality and after-sales services. The technical audits were conducted randomly to verify quality of the main SHS components, that is, solar module, battery, charge controller, and CFL/LED bulb, to ensure that suppliers were providing quality products.
The audit also verified the POs’ performance in terms of installation, warranty, and after-sales support. Based on the findings of the technical audit, necessary corrective measures were taken including penalizing suppliers/manufacturers for poor quality products. The TSC also made changes to the technical standards based on the feedback of the technical audit.
Independent technical audits showed that most of the equipment supplied by manufacturers under the SHS Program was performing well. The audit identified problems in some equipment in which case equipment approval was suspended or manufacturers were penalized for the equipment not meeting technical standards of the TSC.
3.2.6. Random Sample TestingAs a part of regular monitoring for quality assurance, the SHS Program randomly collected samples from suppliers’ warehouses and installation sites and tested them at the Bangladesh University of Engineering and Technology (BUET), at a testing facility that had been set up with the support of the SHS Program. The test reports were submitted to the TSC for review. If there were deviations from the technical standards, the TSC recommended temporary suspension of the specific model. If retests were unsatisfactory, the TSC could delist the product.
3.3 RESPONDING TO SHS TECHNOLOGY CHANGE AND CONSUMER CHOICEConsumer choice was an important feature of the SHS Program. Recognizing that consumers had differing abilities to pay and different priorities for electricity use, the SHS Program sold SHS of various capacities (10–300 Wp), though all had to meet quality standards. Though this increased the cost of business, it was crucial to SHS acceptance.
Initially, SHS of 30 Wp to 100 Wp solar module capacities were sold during the early years when the grant available for SHS was higher than in later years. Later, as more efficient CFLs and then even more efficient LED lamps became available, smaller SHS, including pico-SHS of 10 Wp capacity, were offered. As rural consumers became wealthier and their electricity needs increased, larger systems were demanded. Most importantly, beginning in 2008, the lighting value of SHS electricity increased significantly with the introduction of far more efficient LED lamps. As the amount of electricity needed for lighting declined, consumers preferring lower cost of service purchased smaller-size SHS, and the average size of SHS sold declined.
3. ADAPTING TO REALITY
32
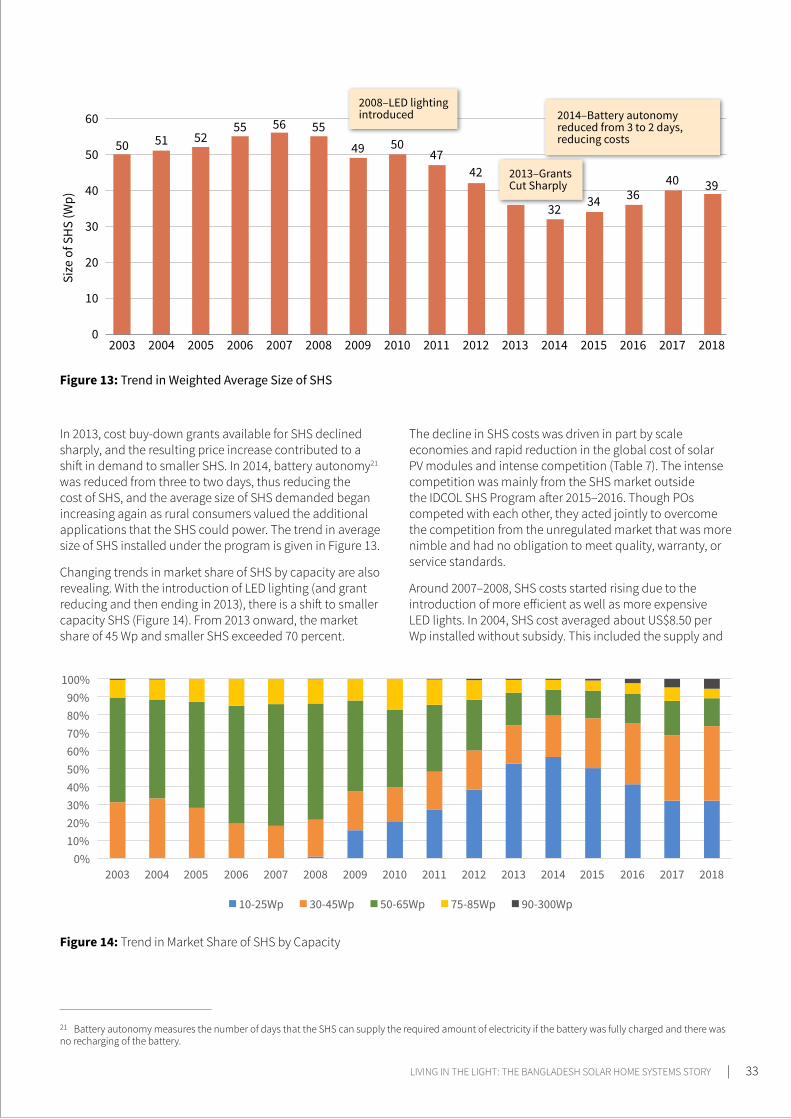
In 2013, cost buy-down grants available for SHS declined sharply, and the resulting price increase contributed to a shift in demand to smaller SHS. In 2014, battery autonomy21 was reduced from three to two days, thus reducing the cost of SHS, and the average size of SHS demanded began increasing again as rural consumers valued the additional applications that the SHS could power. The trend in average size of SHS installed under the program is given in Figure 13.
Changing trends in market share of SHS by capacity are also revealing. With the introduction of LED lighting (and grant reducing and then ending in 2013), there is a shift to smaller capacity SHS (Figure 14). From 2013 onward, the market share of 45 Wp and smaller SHS exceeded 70 percent.
21 Battery autonomy measures the number of days that the SHS can supply the required amount of electricity if the battery was fully charged and there was no recharging of the battery.
Figure 13: Trend in Weighted Average Size of SHS
Figure 14: Trend in Market Share of SHS by Capacity
2003
Size
of S
HS
(Wp)
50
60
50
40
30
20
10
02004
51
2005
52
2006
55
2007
56
2008
55
2009
49
2010
50
2011
47
2012
42
2013
36
2014
32
2015
34
2016
36
2017
40
2018
39
The decline in SHS costs was driven in part by scale economies and rapid reduction in the global cost of solar PV modules and intense competition (Table 7). The intense competition was mainly from the SHS market outside the IDCOL SHS Program after 2015–2016. Though POs competed with each other, they acted jointly to overcome the competition from the unregulated market that was more nimble and had no obligation to meet quality, warranty, or service standards.
Around 2007–2008, SHS costs started rising due to the introduction of more efficient as well as more expensive LED lights. In 2004, SHS cost averaged about US$8.50 per Wp installed without subsidy. This included the supply and
2008‒LED lighting introduced 2014‒Battery autonomy
reduced from 3 to 2 days, reducing costs
2013‒Grants Cut Sharply
LIVING IN THE LIGHT: THE BANGLADESH SOLAR HOME SYSTEMS STORY | 33

installation of the SHS and the warranties (20 years for solar module, 5 years for batteries, 1 year for controller and lights, and 3 years of free maintenance). In 2014, there was a sharp reduction in unit costs as shown in Table 7, due to reducing the size of the battery from three to two days of autonomy.
The cost reductions appear to have experienced curve effects like that observed in ‘Swanson’s Law’22 for PV cost reduction, though applied in this case to SHS system-wide cost (see Figure 15). The average cost of an SHS (in constant 2018 dollars) dropped by about 21 percent for every doubling of cumulative number of SHS sold or for every doubling of cumulative MW of sales.
3.4 RESPONDING TO ENVIRONMENTAL MANAGEMENT NEEDSIDCOL realized as early as 2007 that the accelerating demand for SHS meant that there would be many used batteries that would need replacement every five years. While the number of such batteries would always be far less than batteries used in the transport sector, it would be important to ensure batteries are properly recycled.
Table 7: Trends in Unit Cost of SHS 2003–2017
Total WpMWp
SHS Cost without Subsidy a (Current US$/Wp) SHS Cost without Subsidy a (Constant 2018 US$/Wp)
20 Wp 30 Wp 40 Wp 50 Wp 75 Wp 120 Wp 20 Wp 30 Wp 40 Wp 50 Wp 75 Wp 120 Wp
2004 — — 8.49 8.66 8.50 7.56 — — 11.07 11.30 11.09 9.86
2005 — — 8.23 8.66 8.10 6.95 — — 10.39 10.95 10.23 8.78
2006 11.73 — 8.59 8.60 7.69 6.95 14.39 — 10.53 10.55 9.43 8.52
2007 13.06 — 9.22 9.11 8.11 8.02 15.59 — 11.02 10.88 9.68 9.58
2008 12.12 — 9.98 9.91 8.55 8.81 14.19 — 11.68 11.60 10.02 10.32
2009 11.41 — 9.89 9.83 8.50 8.77 13.27 — 11.50 11.43 9.88 10.19
2010 9.99 — 8.39 8.41 7.54 7.82 11.47 — 9.64 9.66 8.66 8.98
2011 9.81 — 8.27 8.30 7.48 7.82 11.04 — 9.30 9.34 8.42 8.79
2012 9.81 — 8.00 8.04 7.14 6.79 10.83 — 8.83 8.87 7.88 7.50
2013 9.80 7.59 7.74 7.77 6.80 5.77 10.63 8.23 8.40 8.43 7.38 6.26
2014 7.66 6.04 5.38 5.14 4.74 3.83 8.16 6.43 5.73 5.47 5.05 4.08
2015 6.88 5.33 5.44 4.99 4.44 3.89 7.25 5.61 5.73 5.26 4.68 4.10
2016 6.14 5.23 4.29 4.27 3.50 3.18 6.40 5.45 4.47 4.45 3.65 3.31
2017 5.93 4.60 4.69 4.31 3.90 3.35 6.06 4.70 4.79 4.40 3.99 3.43
Note: a. Includes 3 years free maintenance plus 5-year battery warranty and 20-year module warranty.
22 Swanson predicted that cost of solar modules would drop 20 percent for every doubling of cumulative solar PV module shipment (The Economist 2012).
Figure 15: Reduction of SHS Unit Cost with Cumulative SHS Installations
3. ADAPTING TO REALITY
34
23 ISO = International Organization for Standardization.24 OHSAS = Occupational Health and Safety Management Systems.
As agreed by covenant with the RERED Project, IDCOL made it mandatory for all battery manufacturers to adopt ISO23 14001-2004 (Environmental Management Standard) and OHSAS24 18001:1999 by June 2012. After 2012, IDCOL did not accept any battery manufacturer in the SHS Program without having these certifications.
Uniquely among SHS programs, IDCOL and RERED supported and required that POs collect used batteries and deliver them to approved battery recycling centers. By 2018, there were 16 battery suppliers of which 15 were local and the remaining one, Japan Solar Tech, sold imported batteries. Four battery manufacturers (Rahimafrooz, Panna Battery, RIMSO, and HAMKO) set up independent recycling facilities which were ISO 14001:2004/2005 and OHSAS 18001:2007 compliant. They have agreements with other battery suppliers to accept their old batteries for recycling.
IDCOL inspectors regularly visit these recyclers, every three months. IDCOL inspectors also visit the manufacturing plants to ensure that the manufacturing process follows environmental and safety standards and to verify that air and effluent treatment comply with standards.
3.5 ATTEMPTS TO ACCESS COMMERCIAL FINANCINGThe intention of the SHS Program was to eventually make SHS financing fully commercial with the POs borrowing funds at market terms from commercial sources by the end of the implementation. However, a commercialization study commissioned by IDCOL found that commercial banks were not interested in lending to this sector, either directly to consumers or to refinance POs (Alam 2013). The main factors hindering commercial lending in SHS financing cited in the draft report were as follows:
• Although the investment improves living conditions and generates indirect savings by avoiding alternate energy expenditures, lenders do not recognize that it yields direct income and hence it fails the basic criteria of commercial financing.
• The target market is well outside the typical network of a commercial bank and makes direct administration impossible.
• Opposing business/financial dynamics: Typically, from risk management and evaluation perspectives, these kinds of small loans are considered high risk as there is no recourse to any asset of compensating economic value such as a property or business. By the same logic, the consumer or retail banking costs are higher. For example, while a good standing corporate lending rate can be around 12–14 percent, consumer lending rate
would be around 16–19 percent. In case of a consumer loan, recourse is to the acquired asset and income of the borrower. In this scenario, financing SHS would not be viable at all.
• Investment in SHS is essentially rural financing. Commercial banks and financial institutions do not have much understanding of the related socioeconomic aspects of these customers.
The report concluded that the best choices for handling and reaching out to the target population in the rural areas are the NGOs/MFIs. Significant development and improvement of rural livelihood improvement have been achieved through these institutions and the SHS Program is no exception.
3.6 ASSURING LONG-TERM SUSTAINABILITY OF SHSWith module warranties extending 20 years and batteries 5 years, SHS users expect that their SHS will provide useful service for a long time. However, as with any electrical equipment, failures can occur and customers will need access to spare parts and repair services, even after the warranty period ends.
Ensuring SHS customers had convenient access to repair services and spare parts is crucial. Such services were provided through the unit offices that the POs were required to establish to provide spares and services. In 2013, during the peak time of SHS installations, POs had about 5,700 unit offices throughout the country with over 29,000 staff employed in 2015 (staff declined to 6,000 by 2018). By 2014, a commercial SHS market had also evolved. Then, rapid grid expansion and commercial market development led to declining SHS sales under the SHS Program. The POs were forced to close or consolidate some of their unit offices due to lack of sales business.
IDCOL taking over the management of the TR/KABITA Program and using the same POs to supply and service SHS and public PV systems took up some of the slack caused by the decline in SHS Program sales. This permitted unit offices to remain functional and support both SHS Program and TR/KABITA SHS. As there is at least one PO nominated in each upazila (subunit of a district) under TR/KABITA, the customers who purchased SHS under the SHS Program can get their spare parts and repair services from these unit offices even if the warranty period expires. This arrangement was effective. IDCOL call center records show that 89 percent of the 10,338 complaints received between November 2018 and April 2019 were successfully resolved within one month of receiving the complaint.
LIVING IN THE LIGHT: THE BANGLADESH SOLAR HOME SYSTEMS STORY | 35
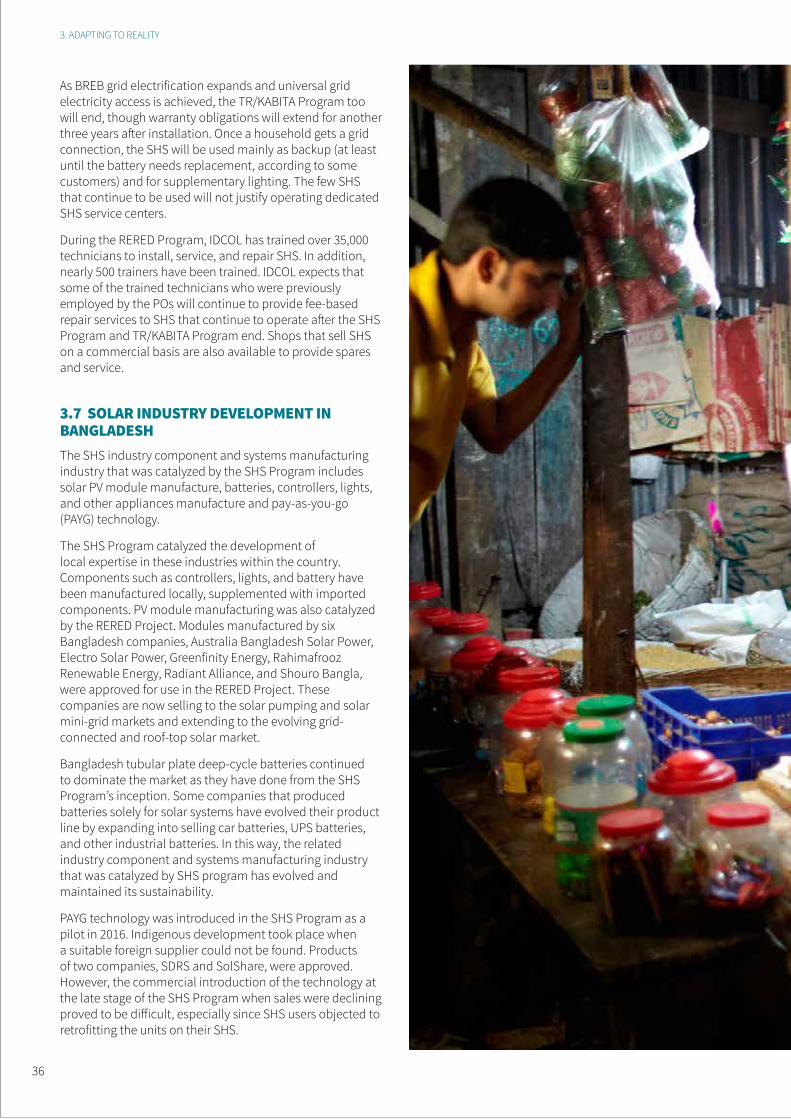
As BREB grid electrification expands and universal grid electricity access is achieved, the TR/KABITA Program too will end, though warranty obligations will extend for another three years after installation. Once a household gets a grid connection, the SHS will be used mainly as backup (at least until the battery needs replacement, according to some customers) and for supplementary lighting. The few SHS that continue to be used will not justify operating dedicated SHS service centers.
During the RERED Program, IDCOL has trained over 35,000 technicians to install, service, and repair SHS. In addition, nearly 500 trainers have been trained. IDCOL expects that some of the trained technicians who were previously employed by the POs will continue to provide fee-based repair services to SHS that continue to operate after the SHS Program and TR/KABITA Program end. Shops that sell SHS on a commercial basis are also available to provide spares and service.
3.7 SOLAR INDUSTRY DEVELOPMENT IN BANGLADESHThe SHS industry component and systems manufacturing industry that was catalyzed by the SHS Program includes solar PV module manufacture, batteries, controllers, lights, and other appliances manufacture and pay-as-you-go (PAYG) technology.
The SHS Program catalyzed the development of local expertise in these industries within the country. Components such as controllers, lights, and battery have been manufactured locally, supplemented with imported components. PV module manufacturing was also catalyzed by the RERED Project. Modules manufactured by six Bangladesh companies, Australia Bangladesh Solar Power, Electro Solar Power, Greenfinity Energy, Rahimafrooz Renewable Energy, Radiant Alliance, and Shouro Bangla, were approved for use in the RERED Project. These companies are now selling to the solar pumping and solar mini-grid markets and extending to the evolving grid-connected and roof-top solar market.
Bangladesh tubular plate deep-cycle batteries continued to dominate the market as they have done from the SHS Program’s inception. Some companies that produced batteries solely for solar systems have evolved their product line by expanding into selling car batteries, UPS batteries, and other industrial batteries. In this way, the related industry component and systems manufacturing industry that was catalyzed by SHS program has evolved and maintained its sustainability.
PAYG technology was introduced in the SHS Program as a pilot in 2016. Indigenous development took place when a suitable foreign supplier could not be found. Products of two companies, SDRS and SolShare, were approved. However, the commercial introduction of the technology at the late stage of the SHS Program when sales were declining proved to be difficult, especially since SHS users objected to retrofitting the units on their SHS.
3. ADAPTING TO REALITY
36
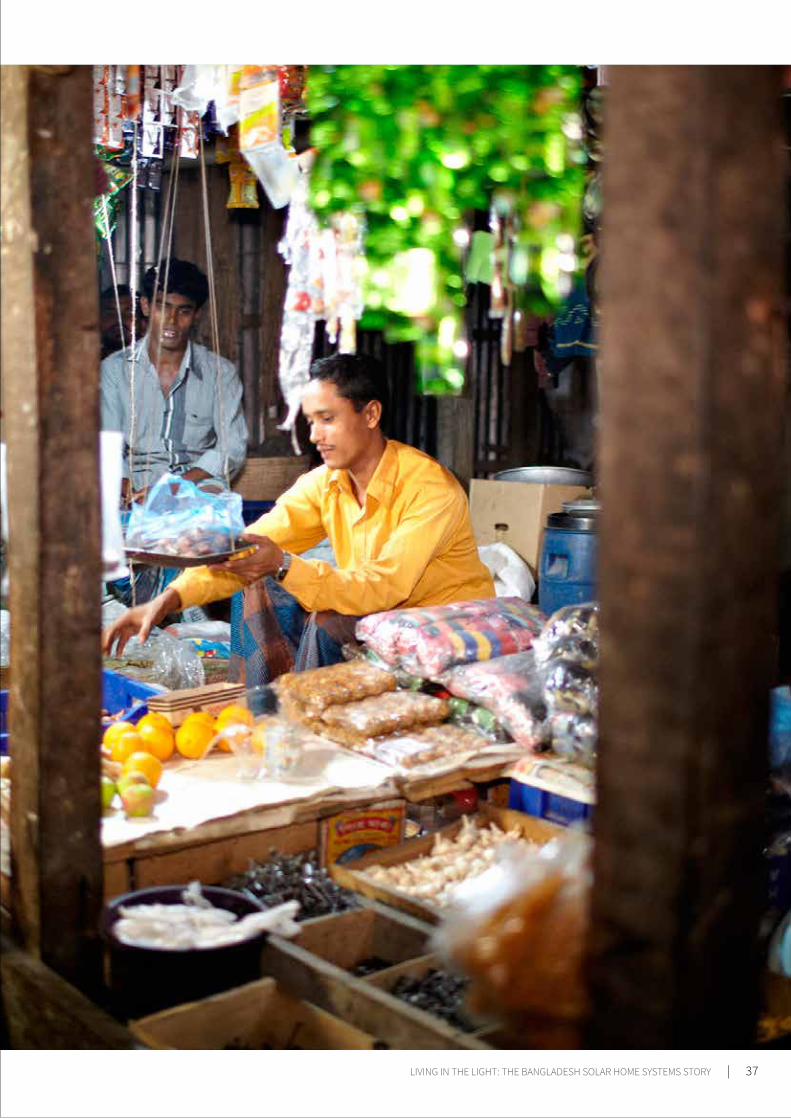
LIVING IN THE LIGHT: THE BANGLADESH SOLAR HOME SYSTEMS STORY | 37

38
4.1 Anatomy of a Market Decline 41
4.2 Impact of Competition on SHS Sales 42
4.3 Impact of Declining Markets on PO Operations 45
4.4 Strengthening Security Requirements for Loans to POs 46
4.5 Efforts to Overcome the Loan Default Challenges 46
4.6 IDCOL’s PO Loan Portfolio Quality and Measures to Improve It 47
4.7 Plan for IDCOL Soft Exit from the Program 48
4.8 Key Takeaways on SHS Market Decline 49
IMPACT OF DECLINING
SHS SALES AND MITIGATION
ACTIONS TAKEN
LIVING IN THE LIGHT: THE BANGLADESH SOLAR HOME SYSTEMS STORY | 39
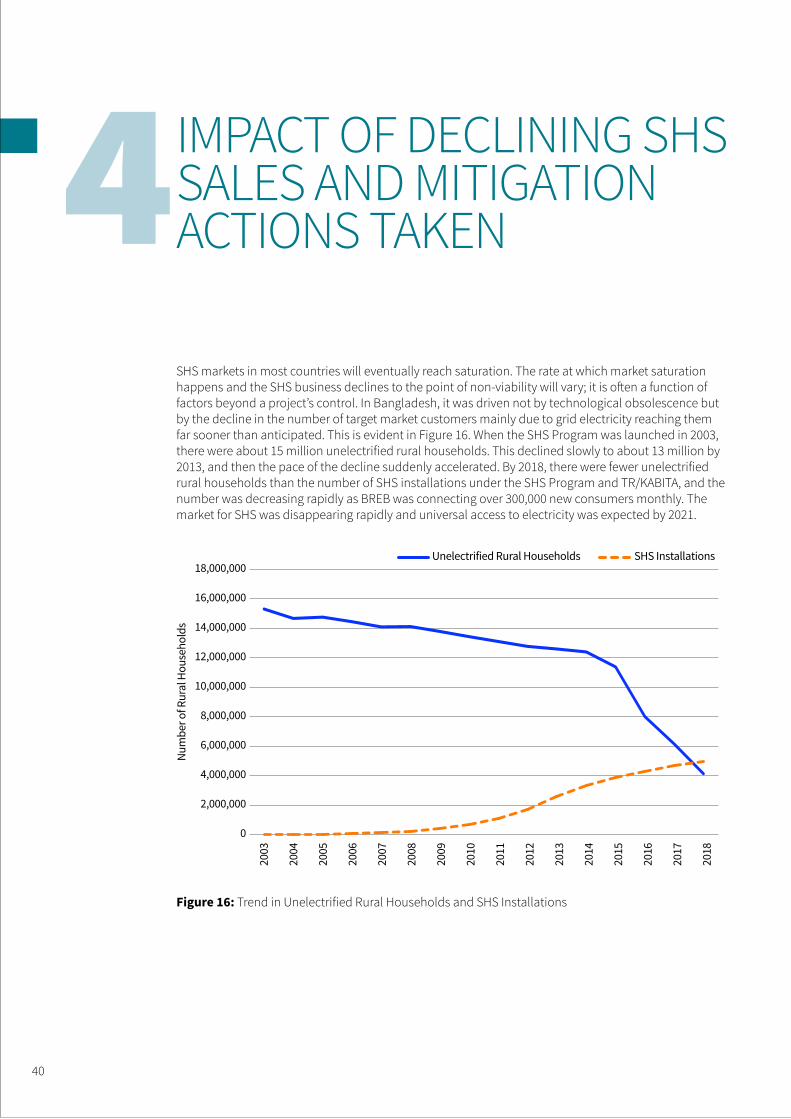
IMPACT OF DECLINING SHS SALES AND MITIGATION ACTIONS TAKEN
SHS markets in most countries will eventually reach saturation. The rate at which market saturation happens and the SHS business declines to the point of non-viability will vary; it is often a function of factors beyond a project’s control. In Bangladesh, it was driven not by technological obsolescence but by the decline in the number of target market customers mainly due to grid electricity reaching them far sooner than anticipated. This is evident in Figure 16. When the SHS Program was launched in 2003, there were about 15 million unelectrified rural households. This declined slowly to about 13 million by 2013, and then the pace of the decline suddenly accelerated. By 2018, there were fewer unelectrified rural households than the number of SHS installations under the SHS Program and TR/KABITA, and the number was decreasing rapidly as BREB was connecting over 300,000 new consumers monthly. The market for SHS was disappearing rapidly and universal access to electricity was expected by 2021.
18,000,000
16,000,000
14,000,000
12,000,000
10,000,000
8,000,000
6,000,000
4,000,000
2,000,000
0
2003
2004
2005
2006
2007
2008
2009
2010
2011
2012
2013
2014
2015
2016
2017
2018
Num
ber o
f Rur
al H
ouse
hold
s
Unelectrified Rural Households SHS Installations
Figure 16: Trend in Unelectrified Rural Households and SHS Installations
40
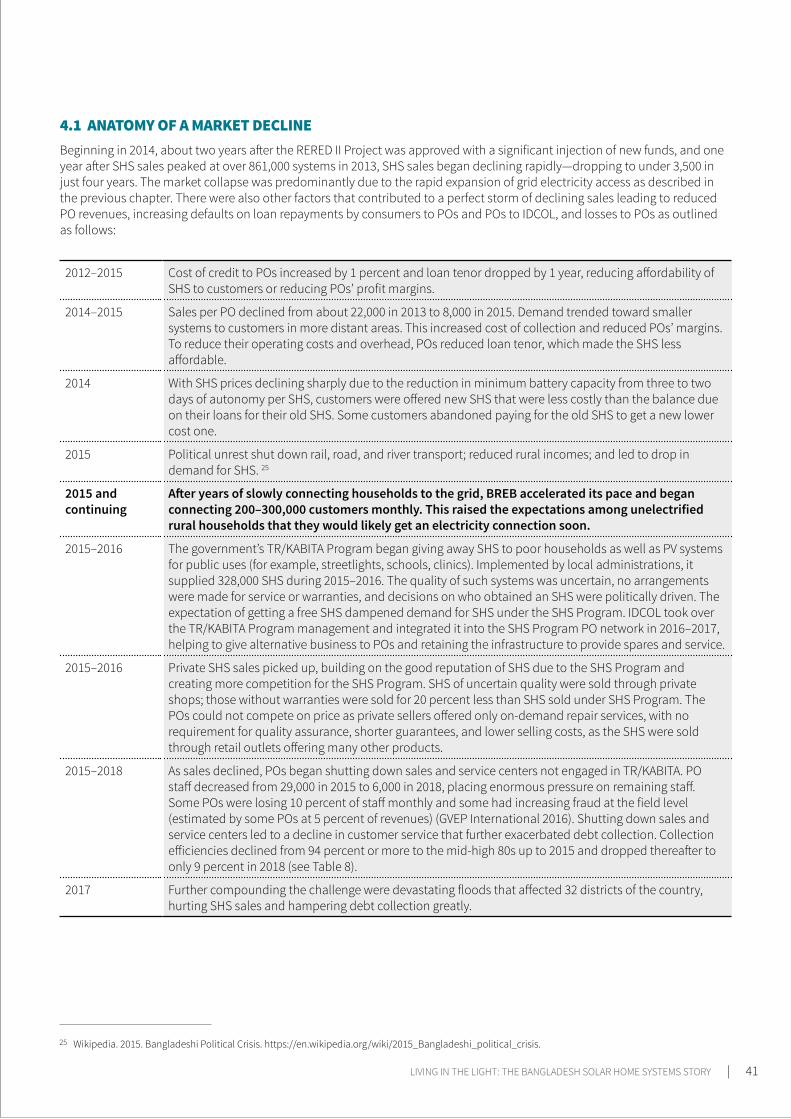
4.1 ANATOMY OF A MARKET DECLINEBeginning in 2014, about two years after the RERED II Project was approved with a significant injection of new funds, and one year after SHS sales peaked at over 861,000 systems in 2013, SHS sales began declining rapidly—dropping to under 3,500 in just four years. The market collapse was predominantly due to the rapid expansion of grid electricity access as described in the previous chapter. There were also other factors that contributed to a perfect storm of declining sales leading to reduced PO revenues, increasing defaults on loan repayments by consumers to POs and POs to IDCOL, and losses to POs as outlined as follows:
2012–2015 Cost of credit to POs increased by 1 percent and loan tenor dropped by 1 year, reducing affordability of SHS to customers or reducing POs’ profit margins.
2014–2015 Sales per PO declined from about 22,000 in 2013 to 8,000 in 2015. Demand trended toward smaller systems to customers in more distant areas. This increased cost of collection and reduced POs’ margins. To reduce their operating costs and overhead, POs reduced loan tenor, which made the SHS less affordable.
2014 With SHS prices declining sharply due to the reduction in minimum battery capacity from three to two days of autonomy per SHS, customers were offered new SHS that were less costly than the balance due on their loans for their old SHS. Some customers abandoned paying for the old SHS to get a new lower cost one.
2015 Political unrest shut down rail, road, and river transport; reduced rural incomes; and led to drop in demand for SHS. 25
2015 and continuing
After years of slowly connecting households to the grid, BREB accelerated its pace and began connecting 200–300,000 customers monthly. This raised the expectations among unelectrified rural households that they would likely get an electricity connection soon.
2015–2016 The government’s TR/KABITA Program began giving away SHS to poor households as well as PV systems for public uses (for example, streetlights, schools, clinics). Implemented by local administrations, it supplied 328,000 SHS during 2015–2016. The quality of such systems was uncertain, no arrangements were made for service or warranties, and decisions on who obtained an SHS were politically driven. The expectation of getting a free SHS dampened demand for SHS under the SHS Program. IDCOL took over the TR/KABITA Program management and integrated it into the SHS Program PO network in 2016–2017, helping to give alternative business to POs and retaining the infrastructure to provide spares and service.
2015–2016 Private SHS sales picked up, building on the good reputation of SHS due to the SHS Program and creating more competition for the SHS Program. SHS of uncertain quality were sold through private shops; those without warranties were sold for 20 percent less than SHS sold under SHS Program. The POs could not compete on price as private sellers offered only on-demand repair services, with no requirement for quality assurance, shorter guarantees, and lower selling costs, as the SHS were sold through retail outlets offering many other products.
2015–2018 As sales declined, POs began shutting down sales and service centers not engaged in TR/KABITA. PO staff decreased from 29,000 in 2015 to 6,000 in 2018, placing enormous pressure on remaining staff. Some POs were losing 10 percent of staff monthly and some had increasing fraud at the field level (estimated by some POs at 5 percent of revenues) (GVEP International 2016). Shutting down sales and service centers led to a decline in customer service that further exacerbated debt collection. Collection efficiencies declined from 94 percent or more to the mid-high 80s up to 2015 and dropped thereafter to only 9 percent in 2018 (see Table 8).
2017 Further compounding the challenge were devastating floods that affected 32 districts of the country, hurting SHS sales and hampering debt collection greatly.
25 Wikipedia. 2015. Bangladeshi Political Crisis. https://en.wikipedia.org/wiki/2015_Bangladeshi_political_crisis.
LIVING IN THE LIGHT: THE BANGLADESH SOLAR HOME SYSTEMS STORY | 41
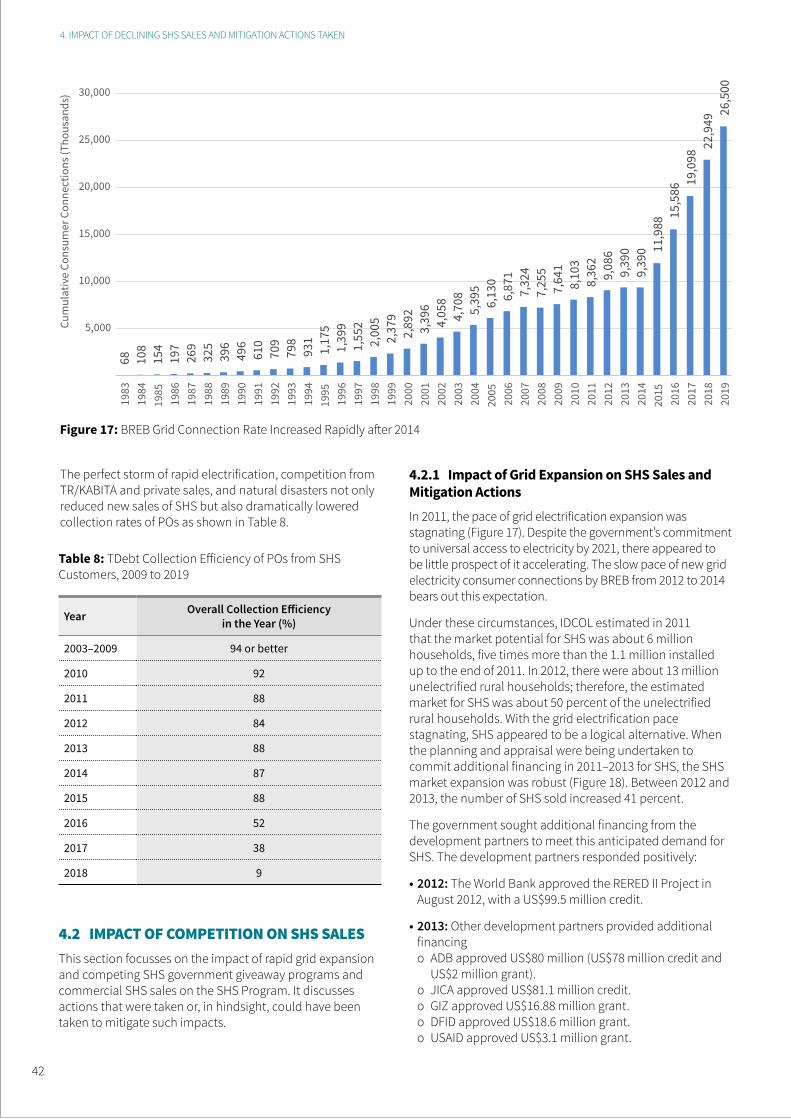
4.2 IMPACT OF COMPETITION ON SHS SALES This section focusses on the impact of rapid grid expansion and competing SHS government giveaway programs and commercial SHS sales on the SHS Program. It discusses actions that were taken or, in hindsight, could have been taken to mitigate such impacts.
Figure 17: BREB Grid Connection Rate Increased Rapidly after 2014
4.2.1 Impact of Grid Expansion on SHS Sales and Mitigation Actions In 2011, the pace of grid electrification expansion was stagnating (Figure 17). Despite the government’s commitment to universal access to electricity by 2021, there appeared to be little prospect of it accelerating. The slow pace of new grid electricity consumer connections by BREB from 2012 to 2014 bears out this expectation.
Under these circumstances, IDCOL estimated in 2011 that the market potential for SHS was about 6 million households, five times more than the 1.1 million installed up to the end of 2011. In 2012, there were about 13 million unelectrified rural households; therefore, the estimated market for SHS was about 50 percent of the unelectrified rural households. With the grid electrification pace stagnating, SHS appeared to be a logical alternative. When the planning and appraisal were being undertaken to commit additional financing in 2011–2013 for SHS, the SHS market expansion was robust (Figure 18). Between 2012 and 2013, the number of SHS sold increased 41 percent.
The government sought additional financing from the development partners to meet this anticipated demand for SHS. The development partners responded positively:
• 2012: The World Bank approved the RERED II Project in August 2012, with a US$99.5 million credit.
• 2013: Other development partners provided additional financingo ADB approved US$80 million (US$78 million credit and
US$2 million grant).o JICA approved US$81.1 million credit.o GIZ approved US$16.88 million grant.o DFID approved US$18.6 million grant.o USAID approved US$3.1 million grant.
4. IMPACT OF DECLINING SHS SALES AND MITIGATION ACTIONS TAKEN
The perfect storm of rapid electrification, competition from TR/KABITA and private sales, and natural disasters not only reduced new sales of SHS but also dramatically lowered collection rates of POs as shown in Table 8.
Table 8: TDebt Collection Efficiency of POs from SHS Customers, 2009 to 2019
Year Overall Collection Efficiency in the Year (%)
2003–2009 94 or better
2010 92
2011 88
2012 84
2013 88
2014 87
2015 88
2016 52
2017 38
2018 9
42
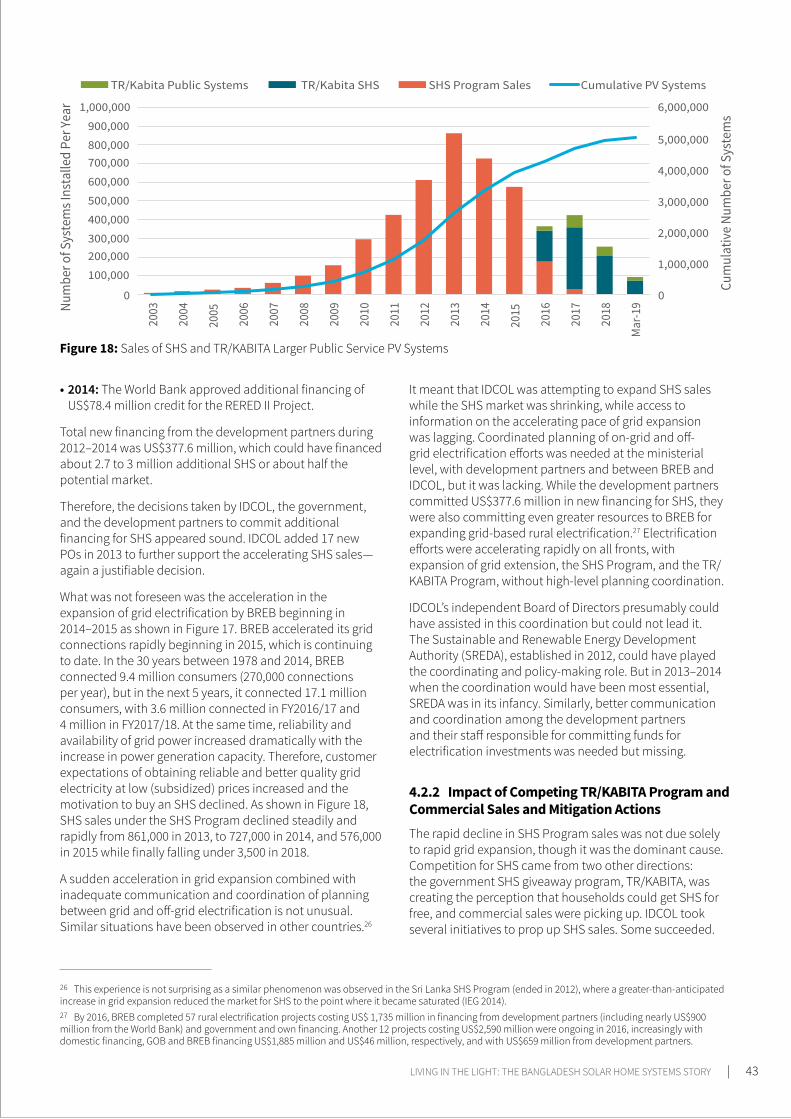
Figure 18: Sales of SHS and TR/KABITA Larger Public Service PV Systems
• 2014: The World Bank approved additional financing of US$78.4 million credit for the RERED II Project.
Total new financing from the development partners during 2012–2014 was US$377.6 million, which could have financed about 2.7 to 3 million additional SHS or about half the potential market.
Therefore, the decisions taken by IDCOL, the government, and the development partners to commit additional financing for SHS appeared sound. IDCOL added 17 new POs in 2013 to further support the accelerating SHS sales—again a justifiable decision.
What was not foreseen was the acceleration in the expansion of grid electrification by BREB beginning in 2014–2015 as shown in Figure 17. BREB accelerated its grid connections rapidly beginning in 2015, which is continuing to date. In the 30 years between 1978 and 2014, BREB connected 9.4 million consumers (270,000 connections per year), but in the next 5 years, it connected 17.1 million consumers, with 3.6 million connected in FY2016/17 and 4 million in FY2017/18. At the same time, reliability and availability of grid power increased dramatically with the increase in power generation capacity. Therefore, customer expectations of obtaining reliable and better quality grid electricity at low (subsidized) prices increased and the motivation to buy an SHS declined. As shown in Figure 18, SHS sales under the SHS Program declined steadily and rapidly from 861,000 in 2013, to 727,000 in 2014, and 576,000 in 2015 while finally falling under 3,500 in 2018.
A sudden acceleration in grid expansion combined with inadequate communication and coordination of planning between grid and off-grid electrification is not unusual. Similar situations have been observed in other countries.26
It meant that IDCOL was attempting to expand SHS sales while the SHS market was shrinking, while access to information on the accelerating pace of grid expansion was lagging. Coordinated planning of on-grid and off-grid electrification efforts was needed at the ministerial level, with development partners and between BREB and IDCOL, but it was lacking. While the development partners committed US$377.6 million in new financing for SHS, they were also committing even greater resources to BREB for expanding grid-based rural electrification.27 Electrification efforts were accelerating rapidly on all fronts, with expansion of grid extension, the SHS Program, and the TR/KABITA Program, without high-level planning coordination.
IDCOL’s independent Board of Directors presumably could have assisted in this coordination but could not lead it. The Sustainable and Renewable Energy Development Authority (SREDA), established in 2012, could have played the coordinating and policy-making role. But in 2013–2014 when the coordination would have been most essential, SREDA was in its infancy. Similarly, better communication and coordination among the development partners and their staff responsible for committing funds for electrification investments was needed but missing.
4.2.2 Impact of Competing TR/KABITA Program and Commercial Sales and Mitigation Actions The rapid decline in SHS Program sales was not due solely to rapid grid expansion, though it was the dominant cause. Competition for SHS came from two other directions: the government SHS giveaway program, TR/KABITA, was creating the perception that households could get SHS for free, and commercial sales were picking up. IDCOL took several initiatives to prop up SHS sales. Some succeeded.
26 This experience is not surprising as a similar phenomenon was observed in the Sri Lanka SHS Program (ended in 2012), where a greater-than-anticipated increase in grid expansion reduced the market for SHS to the point where it became saturated (IEG 2014). 27 By 2016, BREB completed 57 rural electrification projects costing US$ 1,735 million in financing from development partners (including nearly US$900 million from the World Bank) and government and own financing. Another 12 projects costing US$2,590 million were ongoing in 2016, increasingly with domestic financing, GOB and BREB financing US$1,885 million and US$46 million, respectively, and with US$659 million from development partners.
LIVING IN THE LIGHT: THE BANGLADESH SOLAR HOME SYSTEMS STORY | 43
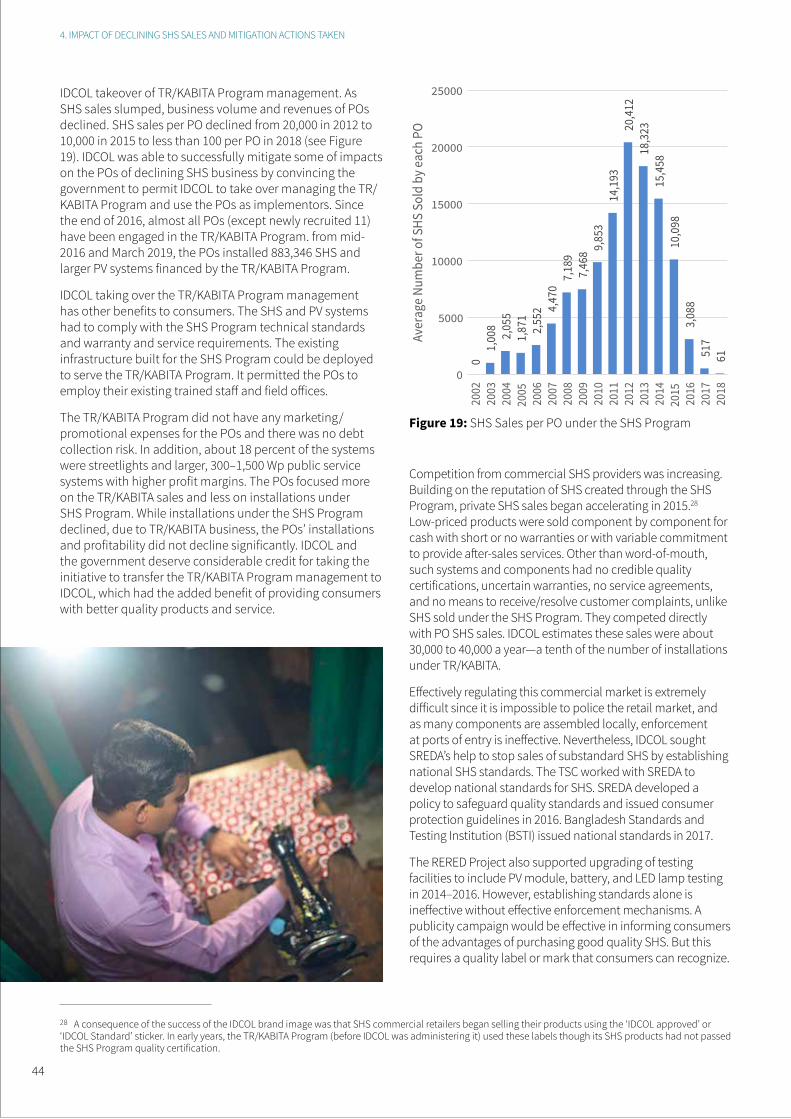
IDCOL takeover of TR/KABITA Program management. As SHS sales slumped, business volume and revenues of POs declined. SHS sales per PO declined from 20,000 in 2012 to 10,000 in 2015 to less than 100 per PO in 2018 (see Figure 19). IDCOL was able to successfully mitigate some of impacts on the POs of declining SHS business by convincing the government to permit IDCOL to take over managing the TR/KABITA Program and use the POs as implementors. Since the end of 2016, almost all POs (except newly recruited 11) have been engaged in the TR/KABITA Program. from mid-2016 and March 2019, the POs installed 883,346 SHS and larger PV systems financed by the TR/KABITA Program.
IDCOL taking over the TR/KABITA Program management has other benefits to consumers. The SHS and PV systems had to comply with the SHS Program technical standards and warranty and service requirements. The existing infrastructure built for the SHS Program could be deployed to serve the TR/KABITA Program. It permitted the POs to employ their existing trained staff and field offices.
The TR/KABITA Program did not have any marketing/promotional expenses for the POs and there was no debt collection risk. In addition, about 18 percent of the systems were streetlights and larger, 300–1,500 Wp public service systems with higher profit margins. The POs focused more on the TR/KABITA sales and less on installations under SHS Program. While installations under the SHS Program declined, due to TR/KABITA business, the POs’ installations and profitability did not decline significantly. IDCOL and the government deserve considerable credit for taking the initiative to transfer the TR/KABITA Program management to IDCOL, which had the added benefit of providing consumers with better quality products and service.
Competition from commercial SHS providers was increasing. Building on the reputation of SHS created through the SHS Program, private SHS sales began accelerating in 2015.28 Low-priced products were sold component by component for cash with short or no warranties or with variable commitment to provide after-sales services. Other than word-of-mouth, such systems and components had no credible quality certifications, uncertain warranties, no service agreements, and no means to receive/resolve customer complaints, unlike SHS sold under the SHS Program. They competed directly with PO SHS sales. IDCOL estimates these sales were about 30,000 to 40,000 a year—a tenth of the number of installations under TR/KABITA.
Effectively regulating this commercial market is extremely difficult since it is impossible to police the retail market, and as many components are assembled locally, enforcement at ports of entry is ineffective. Nevertheless, IDCOL sought SREDA’s help to stop sales of substandard SHS by establishing national SHS standards. The TSC worked with SREDA to develop national standards for SHS. SREDA developed a policy to safeguard quality standards and issued consumer protection guidelines in 2016. Bangladesh Standards and Testing Institution (BSTI) issued national standards in 2017.
The RERED Project also supported upgrading of testing facilities to include PV module, battery, and LED lamp testing in 2014–2016. However, establishing standards alone is ineffective without effective enforcement mechanisms. A publicity campaign would be effective in informing consumers of the advantages of purchasing good quality SHS. But this requires a quality label or mark that consumers can recognize.
28 A consequence of the success of the IDCOL brand image was that SHS commercial retailers began selling their products using the ‘IDCOL approved’ or ‘IDCOL Standard’ sticker. In early years, the TR/KABITA Program (before IDCOL was administering it) used these labels though its SHS products had not passed the SHS Program quality certification.
4. IMPACT OF DECLINING SHS SALES AND MITIGATION ACTIONS TAKEN
Figure 19: SHS Sales per PO under the SHS Program
44
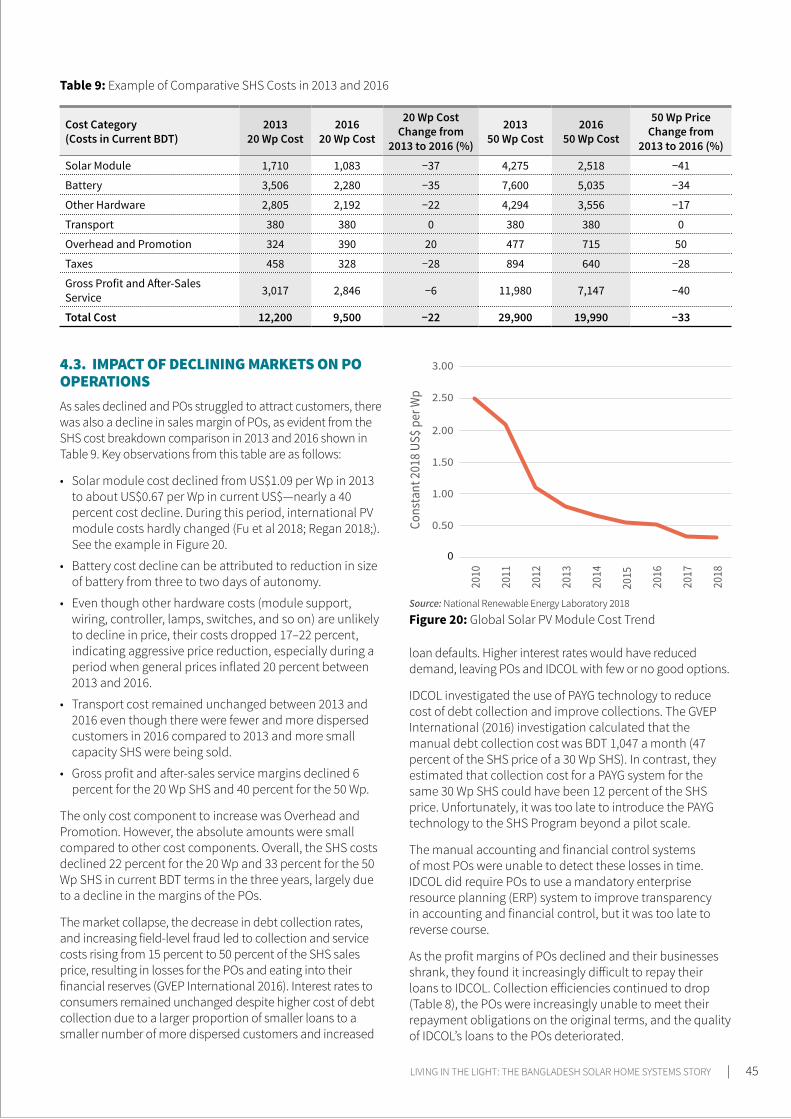
Figure 20: Global Solar PV Module Cost TrendSource: National Renewable Energy Laboratory 2018
Table 9: Example of Comparative SHS Costs in 2013 and 2016
Cost Category(Costs in Current BDT)
201320 Wp Cost
2016 20 Wp Cost
20 Wp Cost Change from
2013 to 2016 (%)
2013 50 Wp Cost
2016 50 Wp Cost
50 Wp Price Change from
2013 to 2016 (%)Solar Module 1,710 1,083 −37 4,275 2,518 −41
Battery 3,506 2,280 −35 7,600 5,035 −34
Other Hardware 2,805 2,192 −22 4,294 3,556 −17
Transport 380 380 0 380 380 0
Overhead and Promotion 324 390 20 477 715 50
Taxes 458 328 −28 894 640 −28
Gross Profit and After-Sales Service 3,017 2,846 −6 11,980 7,147 −40
Total Cost 12,200 9,500 −22 29,900 19,990 −33
4.3. IMPACT OF DECLINING MARKETS ON PO OPERATIONS As sales declined and POs struggled to attract customers, there was also a decline in sales margin of POs, as evident from the SHS cost breakdown comparison in 2013 and 2016 shown in Table 9. Key observations from this table are as follows:
• Solar module cost declined from US$1.09 per Wp in 2013 to about US$0.67 per Wp in current US$—nearly a 40 percent cost decline. During this period, international PV module costs hardly changed (Fu et al 2018; Regan 2018;). See the example in Figure 20.
• Battery cost decline can be attributed to reduction in size of battery from three to two days of autonomy.
• Even though other hardware costs (module support, wiring, controller, lamps, switches, and so on) are unlikely to decline in price, their costs dropped 17–22 percent, indicating aggressive price reduction, especially during a period when general prices inflated 20 percent between 2013 and 2016.
• Transport cost remained unchanged between 2013 and 2016 even though there were fewer and more dispersed customers in 2016 compared to 2013 and more small capacity SHS were being sold.
• Gross profit and after-sales service margins declined 6 percent for the 20 Wp SHS and 40 percent for the 50 Wp.
The only cost component to increase was Overhead and Promotion. However, the absolute amounts were small compared to other cost components. Overall, the SHS costs declined 22 percent for the 20 Wp and 33 percent for the 50 Wp SHS in current BDT terms in the three years, largely due to a decline in the margins of the POs.
The market collapse, the decrease in debt collection rates, and increasing field-level fraud led to collection and service costs rising from 15 percent to 50 percent of the SHS sales price, resulting in losses for the POs and eating into their financial reserves (GVEP International 2016). Interest rates to consumers remained unchanged despite higher cost of debt collection due to a larger proportion of smaller loans to a smaller number of more dispersed customers and increased
loan defaults. Higher interest rates would have reduced demand, leaving POs and IDCOL with few or no good options.
IDCOL investigated the use of PAYG technology to reduce cost of debt collection and improve collections. The GVEP International (2016) investigation calculated that the manual debt collection cost was BDT 1,047 a month (47 percent of the SHS price of a 30 Wp SHS). In contrast, they estimated that collection cost for a PAYG system for the same 30 Wp SHS could have been 12 percent of the SHS price. Unfortunately, it was too late to introduce the PAYG technology to the SHS Program beyond a pilot scale.
The manual accounting and financial control systems of most POs were unable to detect these losses in time. IDCOL did require POs to use a mandatory enterprise resource planning (ERP) system to improve transparency in accounting and financial control, but it was too late to reverse course.
As the profit margins of POs declined and their businesses shrank, they found it increasingly difficult to repay their loans to IDCOL. Collection efficiencies continued to drop (Table 8), the POs were increasingly unable to meet their repayment obligations on the original terms, and the quality of IDCOL’s loans to the POs deteriorated.
LIVING IN THE LIGHT: THE BANGLADESH SOLAR HOME SYSTEMS STORY | 45
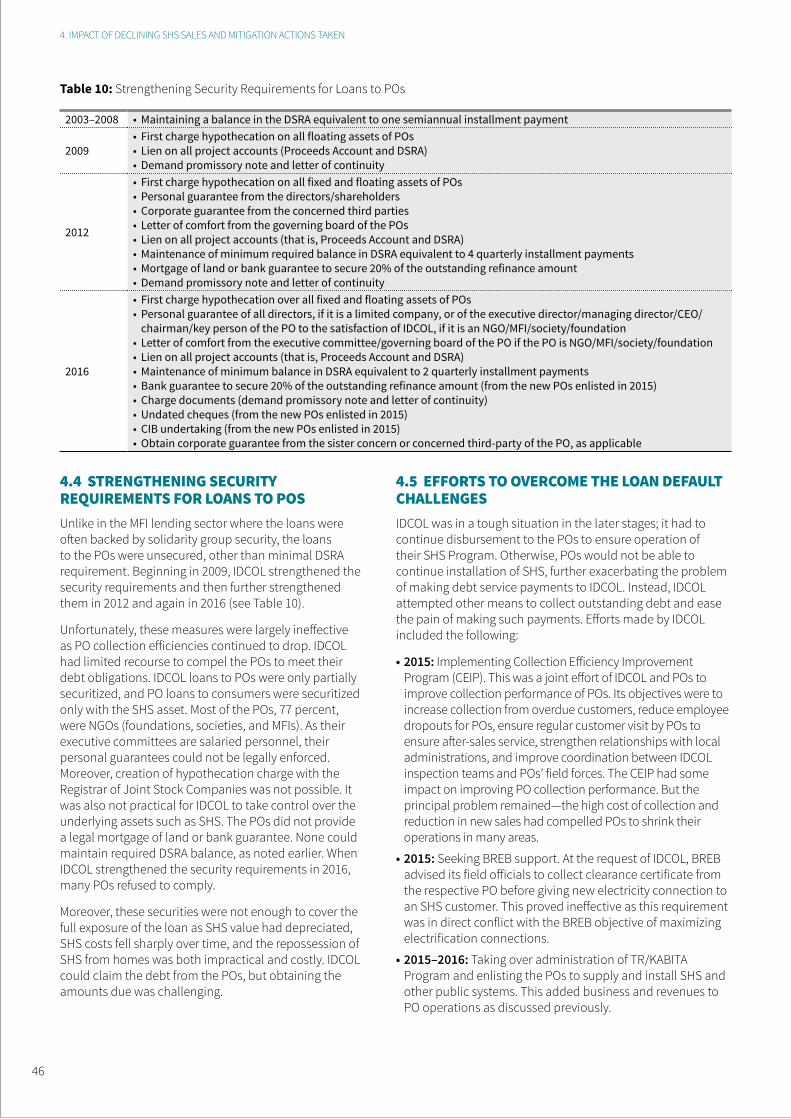
4.4 STRENGTHENING SECURITY REQUIREMENTS FOR LOANS TO POS Unlike in the MFI lending sector where the loans were often backed by solidarity group security, the loans to the POs were unsecured, other than minimal DSRA requirement. Beginning in 2009, IDCOL strengthened the security requirements and then further strengthened them in 2012 and again in 2016 (see Table 10).
Unfortunately, these measures were largely ineffective as PO collection efficiencies continued to drop. IDCOL had limited recourse to compel the POs to meet their debt obligations. IDCOL loans to POs were only partially securitized, and PO loans to consumers were securitized only with the SHS asset. Most of the POs, 77 percent, were NGOs (foundations, societies, and MFIs). As their executive committees are salaried personnel, their personal guarantees could not be legally enforced. Moreover, creation of hypothecation charge with the Registrar of Joint Stock Companies was not possible. It was also not practical for IDCOL to take control over the underlying assets such as SHS. The POs did not provide a legal mortgage of land or bank guarantee. None could maintain required DSRA balance, as noted earlier. When IDCOL strengthened the security requirements in 2016, many POs refused to comply.
Moreover, these securities were not enough to cover the full exposure of the loan as SHS value had depreciated, SHS costs fell sharply over time, and the repossession of SHS from homes was both impractical and costly. IDCOL could claim the debt from the POs, but obtaining the amounts due was challenging.
4.5 EFFORTS TO OVERCOME THE LOAN DEFAULT CHALLENGESIDCOL was in a tough situation in the later stages; it had to continue disbursement to the POs to ensure operation of their SHS Program. Otherwise, POs would not be able to continue installation of SHS, further exacerbating the problem of making debt service payments to IDCOL. Instead, IDCOL attempted other means to collect outstanding debt and ease the pain of making such payments. Efforts made by IDCOL included the following:
• 2015: Implementing Collection Efficiency Improvement Program (CEIP). This was a joint effort of IDCOL and POs to improve collection performance of POs. Its objectives were to increase collection from overdue customers, reduce employee dropouts for POs, ensure regular customer visit by POs to ensure after-sales service, strengthen relationships with local administrations, and improve coordination between IDCOL inspection teams and POs’ field forces. The CEIP had some impact on improving PO collection performance. But the principal problem remained—the high cost of collection and reduction in new sales had compelled POs to shrink their operations in many areas.
• 2015: Seeking BREB support. At the request of IDCOL, BREB advised its field officials to collect clearance certificate from the respective PO before giving new electricity connection to an SHS customer. This proved ineffective as this requirement was in direct conflict with the BREB objective of maximizing electrification connections.
• 2015–2016: Taking over administration of TR/KABITA Program and enlisting the POs to supply and install SHS and other public systems. This added business and revenues to PO operations as discussed previously.
4. IMPACT OF DECLINING SHS SALES AND MITIGATION ACTIONS TAKEN
Table 10: Strengthening Security Requirements for Loans to POs
2003–2008 • Maintaining a balance in the DSRA equivalent to one semiannual installment payment
2009• First charge hypothecation on all floating assets of POs• Lien on all project accounts (Proceeds Account and DSRA)• Demand promissory note and letter of continuity
2012
• First charge hypothecation on all fixed and floating assets of POs• Personal guarantee from the directors/shareholders• Corporate guarantee from the concerned third parties• Letter of comfort from the governing board of the POs• Lien on all project accounts (that is, Proceeds Account and DSRA)• Maintenance of minimum required balance in DSRA equivalent to 4 quarterly installment payments• Mortgage of land or bank guarantee to secure 20% of the outstanding refinance amount• Demand promissory note and letter of continuity
2016
• First charge hypothecation over all fixed and floating assets of POs• Personal guarantee of all directors, if it is a limited company, or of the executive director/managing director/CEO/
chairman/key person of the PO to the satisfaction of IDCOL, if it is an NGO/MFI/society/foundation• Letter of comfort from the executive committee/governing board of the PO if the PO is NGO/MFI/society/foundation • Lien on all project accounts (that is, Proceeds Account and DSRA)• Maintenance of minimum balance in DSRA equivalent to 2 quarterly installment payments• Bank guarantee to secure 20% of the outstanding refinance amount (from the new POs enlisted in 2015)• Charge documents (demand promissory note and letter of continuity)• Undated cheques (from the new POs enlisted in 2015)• CIB undertaking (from the new POs enlisted in 2015)• Obtain corporate guarantee from the sister concern or concerned third-party of the PO, as applicable
46
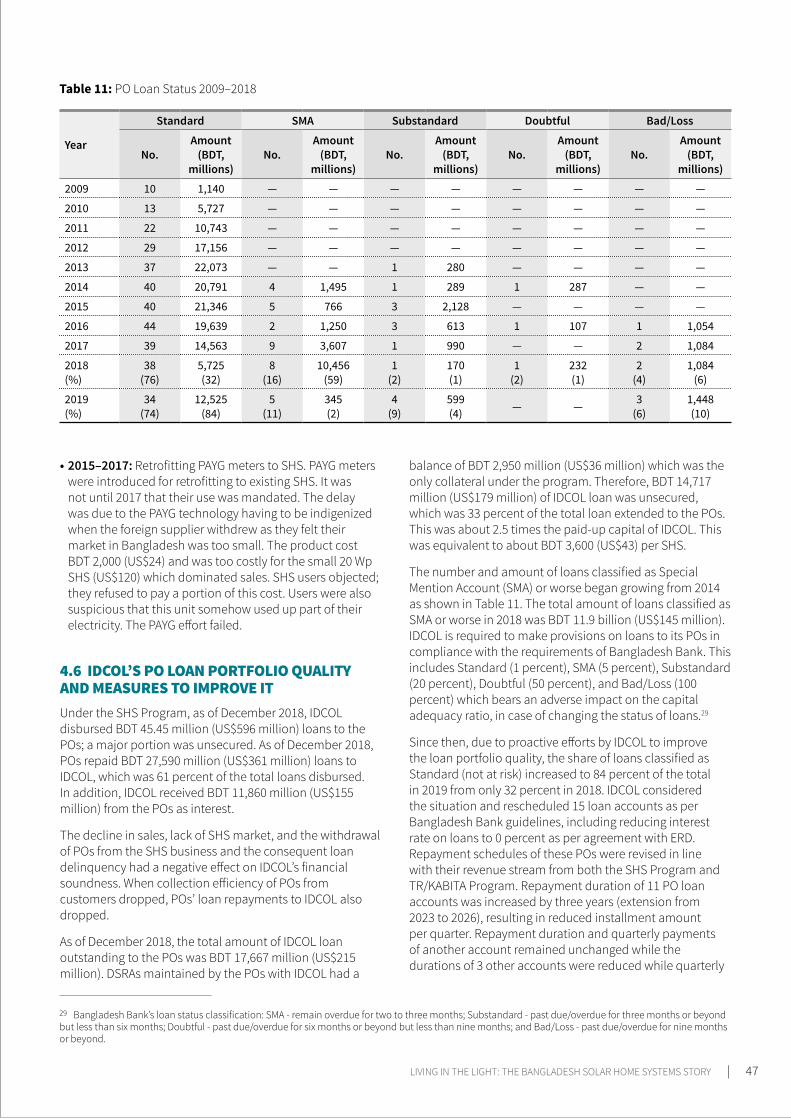
• 2015–2017: Retrofitting PAYG meters to SHS. PAYG meters were introduced for retrofitting to existing SHS. It was not until 2017 that their use was mandated. The delay was due to the PAYG technology having to be indigenized when the foreign supplier withdrew as they felt their market in Bangladesh was too small. The product cost BDT 2,000 (US$24) and was too costly for the small 20 Wp SHS (US$120) which dominated sales. SHS users objected; they refused to pay a portion of this cost. Users were also suspicious that this unit somehow used up part of their electricity. The PAYG effort failed.
4.6 IDCOL’S PO LOAN PORTFOLIO QUALITY AND MEASURES TO IMPROVE IT Under the SHS Program, as of December 2018, IDCOL disbursed BDT 45.45 million (US$596 million) loans to the POs; a major portion was unsecured. As of December 2018, POs repaid BDT 27,590 million (US$361 million) loans to IDCOL, which was 61 percent of the total loans disbursed. In addition, IDCOL received BDT 11,860 million (US$155 million) from the POs as interest.
The decline in sales, lack of SHS market, and the withdrawal of POs from the SHS business and the consequent loan delinquency had a negative effect on IDCOL’s financial soundness. When collection efficiency of POs from customers dropped, POs’ loan repayments to IDCOL also dropped.
As of December 2018, the total amount of IDCOL loan outstanding to the POs was BDT 17,667 million (US$215 million). DSRAs maintained by the POs with IDCOL had a
balance of BDT 2,950 million (US$36 million) which was the only collateral under the program. Therefore, BDT 14,717 million (US$179 million) of IDCOL loan was unsecured, which was 33 percent of the total loan extended to the POs. This was about 2.5 times the paid-up capital of IDCOL. This was equivalent to about BDT 3,600 (US$43) per SHS.
The number and amount of loans classified as Special Mention Account (SMA) or worse began growing from 2014 as shown in Table 11. The total amount of loans classified as SMA or worse in 2018 was BDT 11.9 billion (US$145 million). IDCOL is required to make provisions on loans to its POs in compliance with the requirements of Bangladesh Bank. This includes Standard (1 percent), SMA (5 percent), Substandard (20 percent), Doubtful (50 percent), and Bad/Loss (100 percent) which bears an adverse impact on the capital adequacy ratio, in case of changing the status of loans.29
Since then, due to proactive efforts by IDCOL to improve the loan portfolio quality, the share of loans classified as Standard (not at risk) increased to 84 percent of the total in 2019 from only 32 percent in 2018. IDCOL considered the situation and rescheduled 15 loan accounts as per Bangladesh Bank guidelines, including reducing interest rate on loans to 0 percent as per agreement with ERD. Repayment schedules of these POs were revised in line with their revenue stream from both the SHS Program and TR/KABITA Program. Repayment duration of 11 PO loan accounts was increased by three years (extension from 2023 to 2026), resulting in reduced installment amount per quarter. Repayment duration and quarterly payments of another account remained unchanged while the durations of 3 other accounts were reduced while quarterly
29 Bangladesh Bank’s loan status classification: SMA - remain overdue for two to three months; Substandard - past due/overdue for three months or beyond but less than six months; Doubtful - past due/overdue for six months or beyond but less than nine months; and Bad/Loss - past due/overdue for nine months or beyond.
Table 11: PO Loan Status 2009–2018
Year
Standard SMA Substandard Doubtful Bad/Loss
No.Amount
(BDT, millions)
No.Amount
(BDT, millions)
No.Amount
(BDT, millions)
No.Amount
(BDT, millions)
No.Amount
(BDT, millions)
2009 10 1,140 — — — — — — — —
2010 13 5,727 — — — — — — — —
2011 22 10,743 — — — — — — — —
2012 29 17,156 — — — — — — — —
2013 37 22,073 — — 1 280 — — — —
2014 40 20,791 4 1,495 1 289 1 287 — —
2015 40 21,346 5 766 3 2,128 — — — —
2016 44 19,639 2 1,250 3 613 1 107 1 1,054
2017 39 14,563 9 3,607 1 990 — — 2 1,084
2018(%)
38(76)
5,725(32)
8(16)
10,456(59)
1(2)
170(1)
1(2)
232(1)
2(4)
1,084(6)
2019(%)
34(74)
12,525(84)
5(11)
345(2)
4(9)
599(4) — — 3
(6)1,448(10)
LIVING IN THE LIGHT: THE BANGLADESH SOLAR HOME SYSTEMS STORY | 47
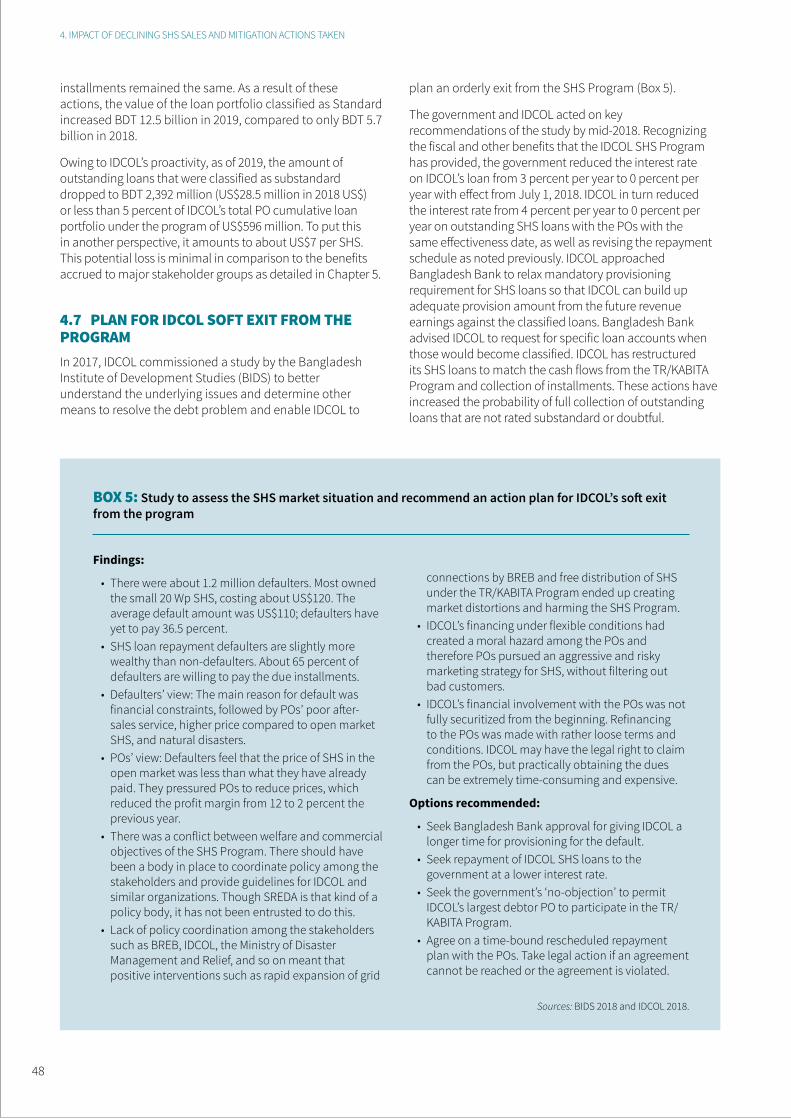
installments remained the same. As a result of these actions, the value of the loan portfolio classified as Standard increased BDT 12.5 billion in 2019, compared to only BDT 5.7 billion in 2018.
Owing to IDCOL’s proactivity, as of 2019, the amount of outstanding loans that were classified as substandard dropped to BDT 2,392 million (US$28.5 million in 2018 US$) or less than 5 percent of IDCOL’s total PO cumulative loan portfolio under the program of US$596 million. To put this in another perspective, it amounts to about US$7 per SHS. This potential loss is minimal in comparison to the benefits accrued to major stakeholder groups as detailed in Chapter 5.
4.7 PLAN FOR IDCOL SOFT EXIT FROM THE PROGRAM In 2017, IDCOL commissioned a study by the Bangladesh Institute of Development Studies (BIDS) to better understand the underlying issues and determine other means to resolve the debt problem and enable IDCOL to
4. IMPACT OF DECLINING SHS SALES AND MITIGATION ACTIONS TAKEN
plan an orderly exit from the SHS Program (Box 5).
The government and IDCOL acted on key recommendations of the study by mid-2018. Recognizing the fiscal and other benefits that the IDCOL SHS Program has provided, the government reduced the interest rate on IDCOL’s loan from 3 percent per year to 0 percent per year with effect from July 1, 2018. IDCOL in turn reduced the interest rate from 4 percent per year to 0 percent per year on outstanding SHS loans with the POs with the same effectiveness date, as well as revising the repayment schedule as noted previously. IDCOL approached Bangladesh Bank to relax mandatory provisioning requirement for SHS loans so that IDCOL can build up adequate provision amount from the future revenue earnings against the classified loans. Bangladesh Bank advised IDCOL to request for specific loan accounts when those would become classified. IDCOL has restructured its SHS loans to match the cash flows from the TR/KABITA Program and collection of installments. These actions have increased the probability of full collection of outstanding loans that are not rated substandard or doubtful.
BOX 5: Study to assess the SHS market situation and recommend an action plan for IDCOL’s soft exit from the program
Findings:
• There were about 1.2 million defaulters. Most owned the small 20 Wp SHS, costing about US$120. The average default amount was US$110; defaulters have yet to pay 36.5 percent.
• SHS loan repayment defaulters are slightly more wealthy than non-defaulters. About 65 percent of defaulters are willing to pay the due installments.
• Defaulters’ view: The main reason for default was financial constraints, followed by POs’ poor after-sales service, higher price compared to open market SHS, and natural disasters.
• POs’ view: Defaulters feel that the price of SHS in the open market was less than what they have already paid. They pressured POs to reduce prices, which reduced the profit margin from 12 to 2 percent the previous year.
• There was a conflict between welfare and commercial objectives of the SHS Program. There should have been a body in place to coordinate policy among the stakeholders and provide guidelines for IDCOL and similar organizations. Though SREDA is that kind of a policy body, it has not been entrusted to do this.
• Lack of policy coordination among the stakeholders such as BREB, IDCOL, the Ministry of Disaster Management and Relief, and so on meant that positive interventions such as rapid expansion of grid
connections by BREB and free distribution of SHS under the TR/KABITA Program ended up creating market distortions and harming the SHS Program.
• IDCOL’s financing under flexible conditions had created a moral hazard among the POs and therefore POs pursued an aggressive and risky marketing strategy for SHS, without filtering out bad customers.
• IDCOL’s financial involvement with the POs was not fully securitized from the beginning. Refinancing to the POs was made with rather loose terms and conditions. IDCOL may have the legal right to claim from the POs, but practically obtaining the dues can be extremely time-consuming and expensive.
Options recommended:
• Seek Bangladesh Bank approval for giving IDCOL a longer time for provisioning for the default.
• Seek repayment of IDCOL SHS loans to the government at a lower interest rate.
• Seek the government’s ‘no-objection’ to permit IDCOL’s largest debtor PO to participate in the TR/KABITA Program.
• Agree on a time-bound rescheduled repayment plan with the POs. Take legal action if an agreement cannot be reached or the agreement is violated.
Sources: BIDS 2018 and IDCOL 2018.
48
30 See Lighting Global (2020.
4.8 KEY TAKEAWAYS ON SHS MARKET DECLINEThe SHS market could not sustain the multipronged competitive pressure, especially unexpectedly rapid grid expansion from 2015. The PO sales and collection performance significantly worsened. Installment collection alone was not enough to sustain branch offices which had to close, further affecting ability of POs to market and sell SHS. Moreover, due to debt collection difficulties, IDCOL stopped providing new credit support in 2017. While the program continues to operate, it is in its final stages with the focus being on loan repayments of customers to POs and from POs to IDCOL. It is expected to close in 2021. After 2021, operation and maintenance support of SHS installed under the program will be supplied by any POs that still offer such services outside of the program or by commercial system suppliers.
Key takeaways from the period of market decline post 2013 are as follows:
• A high-level oversight body within the government is needed to take responsibility for planning and policy development of parallel on-grid and off-grid electrification programs to ensure that they complement each other to achieve overall access goals, rather than competing. From 2013 to 2018, the GOB was rapidly expanding three parallel electrification programs without such coordination: (a) BREB was accelerating grid extension, (b) the TR/KABITA Program was increasing provision of PV systems at no cost for public use and SHS for poor households; and (c) the SHS Program was expanding sales of SHS to customers on near commercial terms through the POs. All three programs were successful, but the first two programs resulted in the disappearance of the market for the SHS Program after 2015. While this can be seen clearly in hindsight, the absence of high-level planning and coordination meant that it was not seen in 2013–2014 when major new resources were being committed to the SHS Program. Two types of coordination are needed:
o Close coordination with and careful monitoring of grid expansion progress is necessary to adjust SHS sales expectations and plans to remaining market potential. In the extreme situation in Bangladesh, the market disappearance was so sudden that little could be done by the time it happened. Had grid expansion been more gradual, POs could have been incentivized to market in districts where grid expansion would be delayed or where existing POs are not operating.
o Close coordination and joint planning of competing off-grid electrification programs are also necessary. The various development partners agreeing to adopt the same modalities of the SHS Program was of great benefit. On the other hand, the TR/KABITA Program was initially run independently of the SHS Program. While the SHS Program eventually took over management of the TR/
KABITA Program, earlier and better coordination to ensure the use of common standards and prevent overlap could have resulted in better outcomes and more efficient use of resources.
• It is important to have a clear goal for any SHS program and to foresee its eventual end, in relation to this goal. With the Bangladesh SHS Program, the goal was to provide electricity to households in advance of the coming of the grid through a program that sold SHS on affordable but near commercial terms with credit. Coordinated planning by a rural electrification authority could have recognized that the market would be saturated and the SHS Program would need to be brought to an orderly close while ensuring that the SHS installed under the program would continue to receive after-sales service. This transition, while now under way, could have been foreseen with less pain to IDCOL and the POs in the process.
• If the intent of an SHS program is to deepen access to electricity within communities, then a purely market-based program alone is not suitable as sales will be to those with ability to pay. This was evident from Figure 11 which showed that SHS market penetration in some districts was above 50 percent, but in some predominantly unelectrified districts, it was barely 10 percent. Even if smaller SHS with more limited service were offered, poorer households may have other priorities (for example, food), may not be willing to risk making a long-term financial commitment to buy on credit, or may not qualify for a loan. Incentives such as those offered for grid electrification may be needed to make SHS affordable to poorer consumers—similar in principle to lifeline tariffs offered for grid electricity. The TR/KABITA Program is clearly one option to make SHS affordable to poorer households, but it is subject to ‘leakage’ and SHS may not reach the intended poorer consumers because of the inadequate selection process of recipients.
• POs diversifying to related business areas helped them remain in business and meet their obligations to customers and IDCOL. IDCOL achieved this by convincing the government to permit POs to also undertake TR/KABITA installations with implementation supervision by IDCOL.
• Broader consumer awareness is needed even in a mature market to convince customers. A key success of the IDCOL SHS Program was establishing its brand image in rural communities. Off-grid consumers were aware of the quality of products approved by IDCOL. In other countries, in the absence of any form of quality recognition (such as Lighting Global),30 such broad information dissemination as undertaken by IDCOL is necessary to sensitize customers.
LIVING IN THE LIGHT: THE BANGLADESH SOLAR HOME SYSTEMS STORY | 49

50
5.1 EIRR: SHS Program Rate of Return to Society as a Whole 53
5.2 Financial Analysis of the Net Benefits of the SHS Program 56
5.3 Summary of Distribution of Net Financial Benefits Among Stakeholders 61
5.4 Analysis of ODA Flows for the SHS Program on the GOB 62
ECONOMIC AND FINANCIAL
ANALYSIS
LIVING IN THE LIGHT: THE BANGLADESH SOLAR HOME SYSTEMS STORY | 51
ECONOMIC AND FINANCIAL ANALYSIS
This chapter uses financial and economic analysis of the SHS Program to estimate the indicative gains and losses to various stakeholders—society, consumers, service and technology providers, IDCOL, the government, and global society—over the half century from the start of the program in 2003 until the final concessional loan repayment is made by the Government in 2054.31
The chapter addresses three related questions:
(a) Are the total economic benefits of the SHS Program enough to pay its total economic costs at the societal level? In other words, is the SHS Program desirable overall?
(b) On a financial basis, did the households benefit sufficiently from the program to justify their costs?
(c) What were the net financial benefits or costs to other key program participants and those affected by it—the government, IDCOL, the POs, and kerosene distributors?
The first question is readily answered through a traditional World Bank economic internal rate of return (EIRR) calculation for the SHS Program. The second question is answered by financial analysis at the aggregate household level. The third question is answered by analyzing the program’s net financial impacts on the other program participants, some gaining and some losing. Methodological issues and assumptions and data are provided in Appendixes D through F.
It is important to acknowledge from the outset that the economic and financial analyses of the SHS Program presented here are highly simplified and have important limitations. First, household benefits are based on a simple measure in both the economic and financial analyses—the avoided cost of kerosene and in later stages grid electricity for lighting. This simple measure of avoided kerosene/grid electricity costs for lighting greatly underestimates the benefits to households. As highlighted in Section 2.9, use of an SHS has many other benefits including, among others, (a) improving quality of life (for example, more hours of study, household work or leisure, increased safety, and more access to information through radio or TV); (b) providing other immediate financial benefits (for example, reducing cellphone charging costs or permitting extra hours of productive activity); and (c) providing valuable health and education benefits in the longer term. These other benefits are excluded from the analysis in this chapter because they are difficult to estimate and the avoided kerosene costs alone justify the program in economic and financial terms. A second limitation is that the analyses rest on several estimates and assumptions, for example, the amount of kerosene saved per household, the profits of participating POs, and the losses of kerosene dealers.
Given the underestimation of benefits to households, the results of the economic and financial analysis must be used with care. The estimates of net economic and financial benefits must not be confused with the overall development impact of the SHS Program. The other benefits identified above are significantly more important to the households and the government than the kerosene savings obtained from the program. Chapters 1 and 2 show that the SHS Program fully met the government’s development objective of bringing many of the benefits of electrification to a significant share of rural households in advance of the availability of the grid.
31 Together, the grace periods and repayment periods for official development assistance (ODA) loans and credits stretch out the overall net cash flow for the nation to 2054.
52
32 This compares to estimates of WTP for lighting in other countries ranging from US$0.47 to US$3.37 (IEG 2008, 41).
Section 5.1 presents the overall economic analysis of the SHS Program. Section 5.2 contains financial analysis of the impact of the SHS Program, first presenting a detailed financial cost-benefit analysis for households (Section 5.2.1) and then estimating the net financial benefits for all stakeholders (Section 5.2.2). Section 5,3 analyzes the impact of ODA flows for the SHS Program on the government.
5.1 EIRR: SHS PROGRAM RATE OF RETURN TO SOCIETY AS A WHOLEThe benefit to society as a whole is estimated using an economic cost-benefit analysis similar to that used by the World Bank for conventional rural electrification projects. The economic benefits and costs of the Bangladesh SHS Program are estimated for 2003–2029 for all participating households. The economic analysis is done from society’s point of view; it excludes transfer payments such as grants, taxes, and subsidies and uses international or border prices for traded goods and ‘shadow prices’ for non-traded goods (see Appendix D for details).
The economic analysis considers as costs the stream of costs of the initial SHS cost to the households as well as the replacement costs of components over the life of the system. It assumes a 12-year life for the solar modules and replacement of shorter-lived assets at regular intervals (see Appendix D for details on component lives). Thus, the 2018 tranche of SHS units can remain in service until 2029.
The benefits in the base case are conservatively estimated until 2022 as the avoided cost of kerosene for lighting to the households. That is, the benefits are estimated as the value of the kerosene saved for lighting. From 2022 onward, the grid is assumed to be universally available and the avoided cost is based on the electricity from the grid for lighting that is saved by using the SHS. As the avoided cost of grid electricity for lighting is much lower than kerosene, benefits drop from 2022 to 2029. It should be noted that the savings from the use of the SHS are estimated only for lighting.
Two variations of benefit estimates are made from the base case. The first variation adds to the avoided cost of kerosene/grid electricity, the global benefits of the GHGs avoided by not burning kerosene for lighting until 2022 and from avoided grid electricity generation after 2022. The second variation estimates benefits based on an estimate of the WTP of households for lighting that includes the avoided cost of kerosene and an estimate of the consumer surplus that is gained by the user through the improved quantity of light with the SHS (IEG 2008). Since this considers that the SHS provides more light, the benefit estimate based on WTP is higher than in the base case.
The base case economic analysis in table 12, with benefits based only on the kerosene/grid electricity saved for lighting, shows that the SHS Program benefits Bangladesh society substantially with an EIRR of 20 percent. When global benefits due to GHG mitigation are added to the value of kerosene/grid electricity savings, the EIRR increases to 25 percent. When the alternative benefit estimate uses the WTP for lighting of US$2.23 in 2018 US$ per kWh in Bangladesh rural areas (see table 12 note), the EIRR is higher at 51 percent, recognizing the improved quantity and quality of light.32
The EIRR of the SHS Program is robust. Switching value analysis for the most conservative case where benefits are measured as savings in kerosene/grid electricity shows that kerosene offset can be reduced by 25 percent before the EIRR drops to 10 percent (that is, average kerosene offset during 2003–2018 reduced to 0.23 liters per day per SHS from 0.31 liters per day per SHS).
The EIRR analysis clearly indicates that the total benefits easily pay for the costs of the SHS Program, even when the benefits are underestimated by valuing only benefits from avoided kerosene/grid electricity costs of SHS households for lighting and excluding the other important benefits identified in Section 2.9.
LIVING IN THE LIGHT: THE BANGLADESH SOLAR HOME SYSTEMS STORY | 53
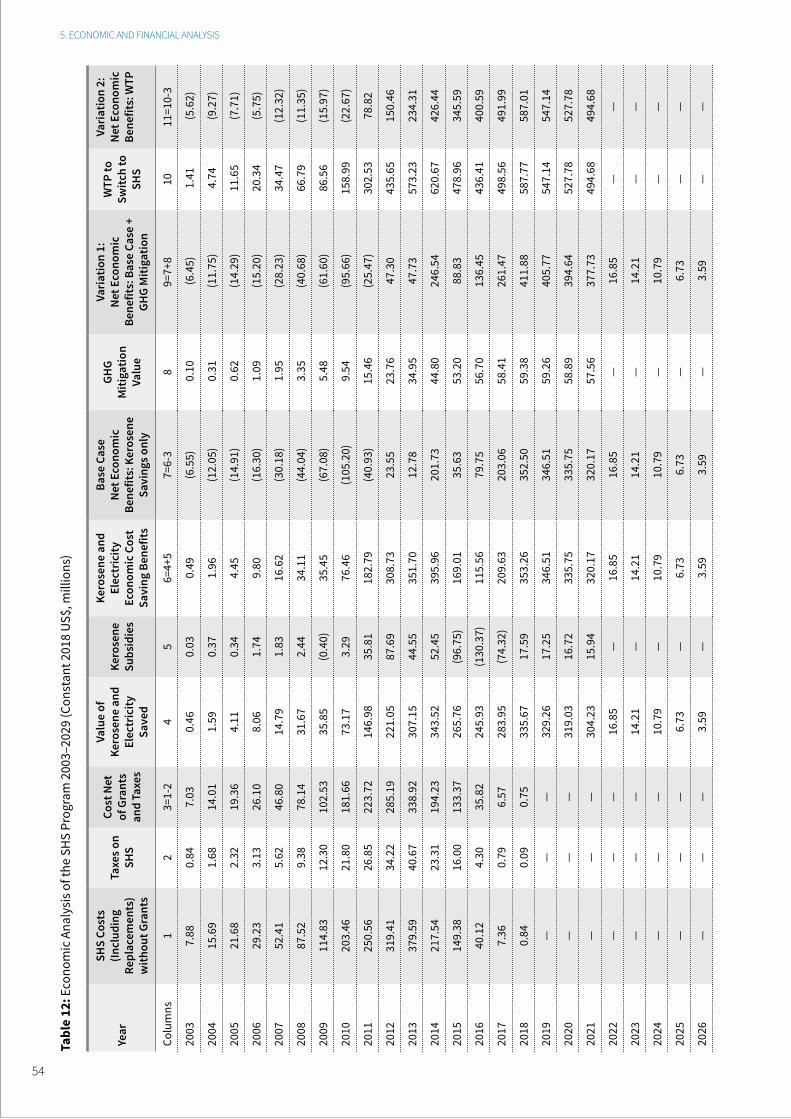
5. ECONOMIC AND FINANCIAL ANALYSIS
Tabl
e 12
: Eco
nom
ic A
naly
sis o
f the
SH
S Pr
ogra
m 2
003–
2029
(Con
stan
t 201
8 US
$, m
illio
ns)
Year
SHS
Cost
s (In
clud
ing
Repl
acem
ents
) w
ithou
t Gra
nts
Taxe
s on
SHS
Cost
Net
of
Gra
nts
and
Taxe
s
Valu
e of
Ke
rose
ne a
nd
Elec
tric
ity
Save
d
Kero
sene
Su
bsid
ies
Kero
sene
and
El
ectr
icity
Ec
onom
ic C
ost
Savi
ng B
enef
its
Base
Cas
eNe
t Eco
nom
ic
Bene
fits:
Ker
osen
e Sa
ving
s onl
y
GHG
Miti
gatio
n Va
lue
Varia
tion
1:Ne
t Eco
nom
ic
Bene
fits:
Bas
e Ca
se +
GH
G M
itiga
tion
WTP
to
Switc
h to
SH
S
Varia
tion
2:Ne
t Eco
nom
ic
Bene
fits:
WTP
Colu
mns
12
3=1-
24
56=
4+5
7=6-
38
9=7+
810
11=1
0-3
2003
7.88
0.84
7.03
0.46
0.03
0.49
(6.5
5) 0
.10
(6.4
5) 1
.41
(5.6
2)
2004
15.6
91.
6814
.01
1.59
0.37
1.96
(12.
05)
0.3
1 (1
1.75
) 4
.74
(9.2
7)
2005
21.6
82.
3219
.36
4.11
0.34
4.45
(14.
91)
0.6
2 (1
4.29
) 1
1.65
(7
.71)
2006
29.2
33.
1326
.10
8.06
1.74
9.80
(16.
30)
1.0
9 (1
5.20
) 2
0.34
(5
.75)
2007
52.4
15.
6246
.80
14.7
91.
8316
.62
(30.
18)
1.9
5 (2
8.23
) 3
4.47
(1
2.32
)
2008
87.5
29.
3878
.14
31.6
72.
4434
.11
(44.
04)
3.3
5 (4
0.68
) 6
6.79
(1
1.35
)
2009
114.
8312
.30
102.
5335
.85
(0.4
0)35
.45
(67.
08)
5.4
8 (6
1.60
) 8
6.56
(1
5.97
)
2010
203.
4621
.80
181.
6673
.17
3.29
76.4
6(1
05.2
0) 9
.54
(95.
66)
158
.99
(22.
67)
2011
250.
5626
.85
223.
7214
6.98
35.8
118
2.79
(40.
93)
15.
46
(25.
47)
302
.53
78.
82
2012
319.
4134
.22
285.
1922
1.05
87.6
930
8.73
23.5
5 2
3.76
4
7.30
4
35.6
5 1
50.4
6
2013
379.
5940
.67
338.
9230
7.15
44.5
535
1.70
12.7
8 3
4.95
4
7.73
5
73.2
3 2
34.3
1
2014
217.
5423
.31
194.
2334
3.52
52.4
539
5.96
201.
73 4
4.80
2
46.5
4 6
20.6
7 4
26.4
4
2015
149.
3816
.00
133.
3726
5.76
(96.
75)
169.
0135
.63
53.
20
88.
83
478
.96
345
.59
2016
40.1
24.
3035
.82
245.
93(1
30.3
7)11
5.56
79.7
5 5
6.70
1
36.4
5 4
36.4
1 4
00.5
9
2017
7.36
0.79
6.57
283.
95(7
4.32
)20
9.63
203.
06 5
8.41
2
61.4
7 4
98.5
6 4
91.9
9
2018
0.84
0.09
0.75
335.
6717
.59
353.
2635
2.50
59.
38
411
.88
587
.77
587
.01
2019
——
—32
9.26
17.2
534
6.51
346.
51 5
9.26
4
05.7
7 5
47.1
4 5
47.1
4
2020
——
—31
9.03
16.7
233
5.75
335.
75 5
8.89
3
94.6
4 5
27.7
8 5
27.7
8
2021
——
—30
4.23
15.9
432
0.17
320.
17 5
7.56
3
77.7
3 4
94.6
8 4
94.6
8
2022
——
—16
.85
—16
.85
16.8
5—
16.
85
——
2023
——
—14
.21
—14
.21
14.2
1—
14.
21
——
2024
——
—10
.79
—10
.79
10.7
9—
10.
79
——
2025
——
—6.
73—
6.73
6.73
— 6
.73
——
2026
——
—3.
59—
3.59
3.59
— 3
.59
——
54
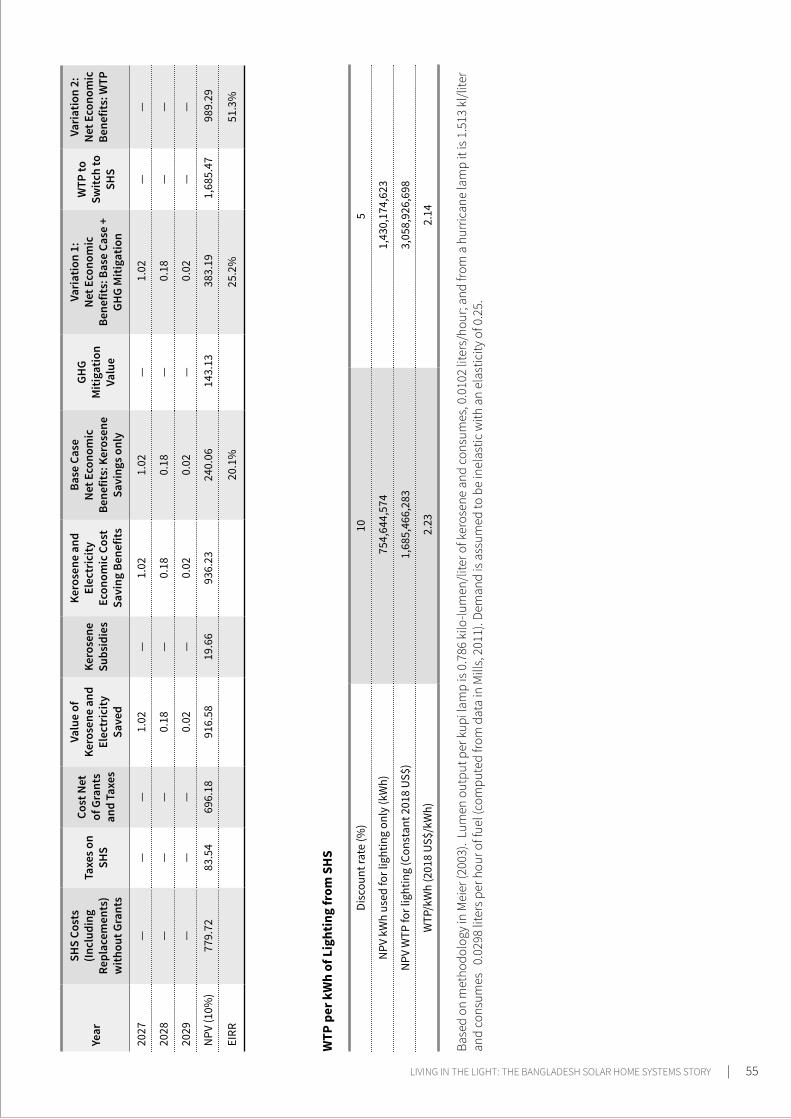
WTP
per
kW
h of
Lig
htin
g fr
om S
HS
Disc
ount
rate
(%)
105
NPV
kW
h us
ed fo
r lig
htin
g on
ly (k
Wh)
754
,644
,574
1
,430
,174
,623
NPV
WTP
for l
ight
ing
(Con
stan
t 201
8 US
$) 1
,685
,466
,283
3
,058
,926
,698
WTP
/kW
h (2
018
US$/
kWh)
2.2
3 2
.14
Base
d on
met
hodo
logy
in M
eier
(200
3).
Lum
en o
utpu
t per
kup
i lam
p is
0.7
86 k
ilo-lu
men
/lite
r of k
eros
ene
and
cons
umes
, 0.0
102
liter
s/ho
ur; a
nd fr
om a
hur
rican
e la
mp
it is
1.5
13 k
l/lite
r an
d co
nsum
es 0
.029
8 lit
ers p
er h
our o
f fue
l (co
mpu
ted
from
dat
a in
Mill
s, 2
011)
. Dem
and
is a
ssum
ed to
be
inel
astic
with
an
elas
ticity
of 0
.25.
Year
SHS
Cost
s (In
clud
ing
Repl
acem
ents
) w
ithou
t Gra
nts
Taxe
s on
SHS
Cost
Net
of
Gra
nts
and
Taxe
s
Valu
e of
Ke
rose
ne a
nd
Elec
tric
ity
Save
d
Kero
sene
Su
bsid
ies
Kero
sene
and
El
ectr
icity
Ec
onom
ic C
ost
Savi
ng B
enef
its
Base
Cas
eNe
t Eco
nom
ic
Bene
fits:
Ker
osen
e Sa
ving
s onl
y
GHG
Miti
gatio
n Va
lue
Varia
tion
1:Ne
t Eco
nom
ic
Bene
fits:
Bas
e Ca
se +
GH
G M
itiga
tion
WTP
to
Switc
h to
SH
S
Varia
tion
2:Ne
t Eco
nom
ic
Bene
fits:
WTP
2027
——
—1.
02—
1.02
1.02
— 1
.02
——
2028
——
—0.
18—
0.18
0.18
— 0
.18
——
2029
——
—0.
02—
0.02
0.02
— 0
.02
——
NPV
(10%
)77
9.72
83.5
469
6.18
916.
5819
.66
936.
2324
0.06
143
.13
383
.19
1,6
85.4
7 9
89.2
9
EIRR
20.1
%25
.2%
51.3
%
LIVING IN THE LIGHT: THE BANGLADESH SOLAR HOME SYSTEMS STORY | 55
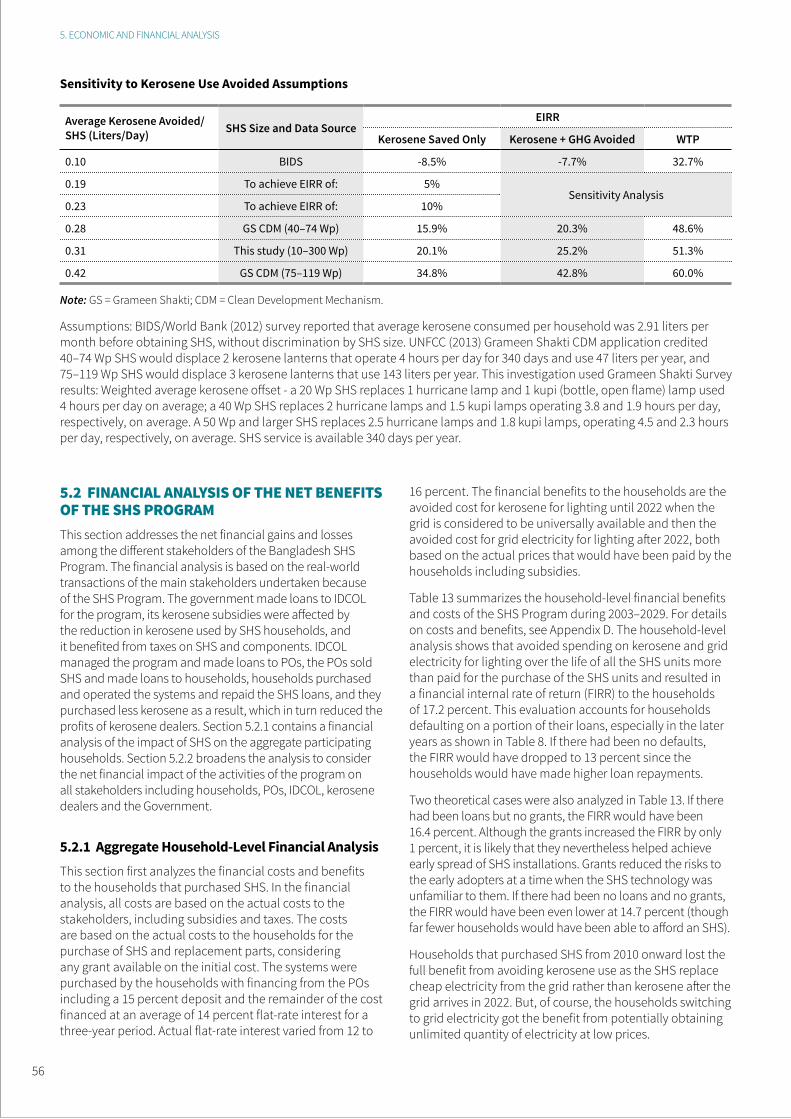
5. ECONOMIC AND FINANCIAL ANALYSIS
Sensitivity to Kerosene Use Avoided Assumptions
Average Kerosene Avoided/SHS (Liters/Day) SHS Size and Data Source
EIRR
Kerosene Saved Only Kerosene + GHG Avoided WTP
0.10 BIDS -8.5% -7.7% 32.7%
0.19 To achieve EIRR of: 5%Sensitivity Analysis
0.23 To achieve EIRR of: 10%
0.28 GS CDM (40–74 Wp) 15.9% 20.3% 48.6%
0.31 This study (10–300 Wp) 20.1% 25.2% 51.3%
0.42 GS CDM (75–119 Wp) 34.8% 42.8% 60.0%
Note: GS = Grameen Shakti; CDM = Clean Development Mechanism.
Assumptions: BIDS/World Bank (2012) survey reported that average kerosene consumed per household was 2.91 liters per month before obtaining SHS, without discrimination by SHS size. UNFCC (2013) Grameen Shakti CDM application credited 40–74 Wp SHS would displace 2 kerosene lanterns that operate 4 hours per day for 340 days and use 47 liters per year, and 75–119 Wp SHS would displace 3 kerosene lanterns that use 143 liters per year. This investigation used Grameen Shakti Survey results: Weighted average kerosene offset - a 20 Wp SHS replaces 1 hurricane lamp and 1 kupi (bottle, open flame) lamp used 4 hours per day on average; a 40 Wp SHS replaces 2 hurricane lamps and 1.5 kupi lamps operating 3.8 and 1.9 hours per day, respectively, on average. A 50 Wp and larger SHS replaces 2.5 hurricane lamps and 1.8 kupi lamps, operating 4.5 and 2.3 hours per day, respectively, on average. SHS service is available 340 days per year.
5.2 FINANCIAL ANALYSIS OF THE NET BENEFITS OF THE SHS PROGRAM This section addresses the net financial gains and losses among the different stakeholders of the Bangladesh SHS Program. The financial analysis is based on the real-world transactions of the main stakeholders undertaken because of the SHS Program. The government made loans to IDCOL for the program, its kerosene subsidies were affected by the reduction in kerosene used by SHS households, and it benefited from taxes on SHS and components. IDCOL managed the program and made loans to POs, the POs sold SHS and made loans to households, households purchased and operated the systems and repaid the SHS loans, and they purchased less kerosene as a result, which in turn reduced the profits of kerosene dealers. Section 5.2.1 contains a financial analysis of the impact of SHS on the aggregate participating households. Section 5.2.2 broadens the analysis to consider the net financial impact of the activities of the program on all stakeholders including households, POs, IDCOL, kerosene dealers and the Government.
5.2.1 Aggregate Household-Level Financial AnalysisThis section first analyzes the financial costs and benefits to the households that purchased SHS. In the financial analysis, all costs are based on the actual costs to the stakeholders, including subsidies and taxes. The costs are based on the actual costs to the households for the purchase of SHS and replacement parts, considering any grant available on the initial cost. The systems were purchased by the households with financing from the POs including a 15 percent deposit and the remainder of the cost financed at an average of 14 percent flat-rate interest for a three-year period. Actual flat-rate interest varied from 12 to
16 percent. The financial benefits to the households are the avoided cost for kerosene for lighting until 2022 when the grid is considered to be universally available and then the avoided cost for grid electricity for lighting after 2022, both based on the actual prices that would have been paid by the households including subsidies.
Table 13 summarizes the household-level financial benefits and costs of the SHS Program during 2003–2029. For details on costs and benefits, see Appendix D. The household-level analysis shows that avoided spending on kerosene and grid electricity for lighting over the life of all the SHS units more than paid for the purchase of the SHS units and resulted in a financial internal rate of return (FIRR) to the households of 17.2 percent. This evaluation accounts for households defaulting on a portion of their loans, especially in the later years as shown in Table 8. If there had been no defaults, the FIRR would have dropped to 13 percent since the households would have made higher loan repayments.
Two theoretical cases were also analyzed in Table 13. If there had been loans but no grants, the FIRR would have been 16.4 percent. Although the grants increased the FIRR by only 1 percent, it is likely that they nevertheless helped achieve early spread of SHS installations. Grants reduced the risks to the early adopters at a time when the SHS technology was unfamiliar to them. If there had been no loans and no grants, the FIRR would have been even lower at 14.7 percent (though far fewer households would have been able to afford an SHS).
Households that purchased SHS from 2010 onward lost the full benefit from avoiding kerosene use as the SHS replace cheap electricity from the grid rather than kerosene after the grid arrives in 2022. But, of course, the households switching to grid electricity got the benefit from potentially obtaining unlimited quantity of electricity at low prices.
56
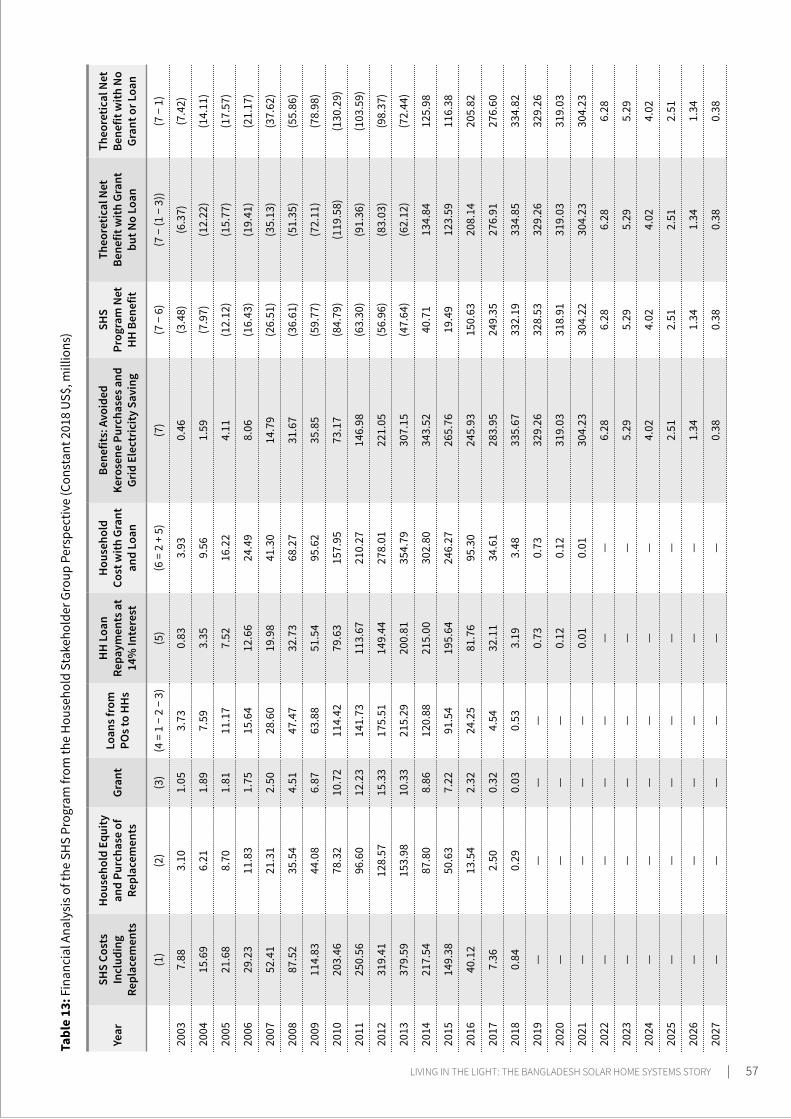
Tabl
e 13
: Fin
anci
al A
naly
sis o
f the
SH
S Pr
ogra
m fr
om th
e H
ouse
hold
Sta
keho
lder
Gro
up P
ersp
ectiv
e (C
onst
ant 2
018
US$,
mill
ions
)
Year
SHS
Cost
s In
clud
ing
Repl
acem
ents
Hou
seho
ld E
quity
an
d Pu
rcha
se o
f Re
plac
emen
tsGr
ant
Loan
s fro
m
POs t
o H
Hs
HH
Loa
n Re
paym
ents
at
14%
Inte
rest
Hou
seho
ld
Cost
with
Gra
nt
and
Loan
Bene
fits:
Avo
ided
Ke
rose
ne P
urch
ases
and
Gr
id E
lect
ricity
Sav
ing
SHS
Prog
ram
Net
H
H B
enef
it
Theo
retic
al N
et
Bene
fit w
ith G
rant
bu
t No
Loan
Theo
retic
al N
et
Bene
fit w
ith N
o Gr
ant o
r Loa
n
(1)
(2)
(3)
(4 =
1 −
2 −
3)
(5)
(6 =
2 +
5)
(7)
(7 −
6)
(7 −
(1 −
3))
(7 −
1)
2003
7.88
3.10
1.05
3.73
0.83
3.93
0.46
(3.4
8)(6
.37)
(7.4
2)
2004
15.6
96.
211.
897.
593.
359.
561.
59(7
.97)
(12.
22)
(14.
11)
2005
21.6
88.
701.
8111
.17
7.52
16.2
24.
11(1
2.12
)(1
5.77
)(1
7.57
)
2006
29.2
311
.83
1.75
15.6
412
.66
24.4
98.
06(1
6.43
)(1
9.41
)(2
1.17
)
2007
52.4
121
.31
2.50
28.6
019
.98
41.3
014
.79
(26.
51)
(35.
13)
(37.
62)
2008
87.5
235
.54
4.51
47.4
732
.73
68.2
731
.67
(36.
61)
(51.
35)
(55.
86)
2009
114.
8344
.08
6.87
63.8
851
.54
95.6
235
.85
(59.
77)
(72.
11)
(78.
98)
2010
203.
4678
.32
10.7
211
4.42
79.6
315
7.95
73.1
7(8
4.79
)(1
19.5
8)(1
30.2
9)
2011
250.
5696
.60
12.2
314
1.73
113.
6721
0.27
146.
98(6
3.30
)(9
1.36
)(1
03.5
9)
2012
319.
4112
8.57
15.3
317
5.51
149.
4427
8.01
221.
05(5
6.96
)(8
3.03
)(9
8.37
)
2013
379.
5915
3.98
10.3
321
5.29
200.
8135
4.79
307.
15(4
7.64
)(6
2.12
)(7
2.44
)
2014
217.
5487
.80
8.86
120.
8821
5.00
302.
8034
3.52
40.7
113
4.84
125.
98
2015
149.
3850
.63
7.22
91.5
419
5.64
246.
2726
5.76
19.4
912
3.59
116.
38
2016
40.1
213
.54
2.32
24.2
581
.76
95.3
024
5.93
150.
6320
8.14
205.
82
2017
7.36
2.50
0.32
4.54
32.1
134
.61
283.
9524
9.35
276.
9127
6.60
2018
0.84
0.29
0.03
0.53
3.19
3.48
335.
6733
2.19
334.
8533
4.82
2019
——
——
0.73
0.73
329.
2632
8.53
329.
2632
9.26
2020
——
——
0.12
0.12
319.
0331
8.91
319.
0331
9.03
2021
——
——
0.01
0.01
304.
2330
4.22
304.
2330
4.23
2022
——
——
——
6.28
6.28
6.28
6.28
2023
——
——
——
5.29
5.29
5.29
5.29
2024
——
——
——
4.02
4.02
4.02
4.02
2025
——
——
——
2.51
2.51
2.51
2.51
2026
——
——
——
1.34
1.34
1.34
1.34
2027
——
——
——
0.38
0.38
0.38
0.38
LIVING IN THE LIGHT: THE BANGLADESH SOLAR HOME SYSTEMS STORY | 57
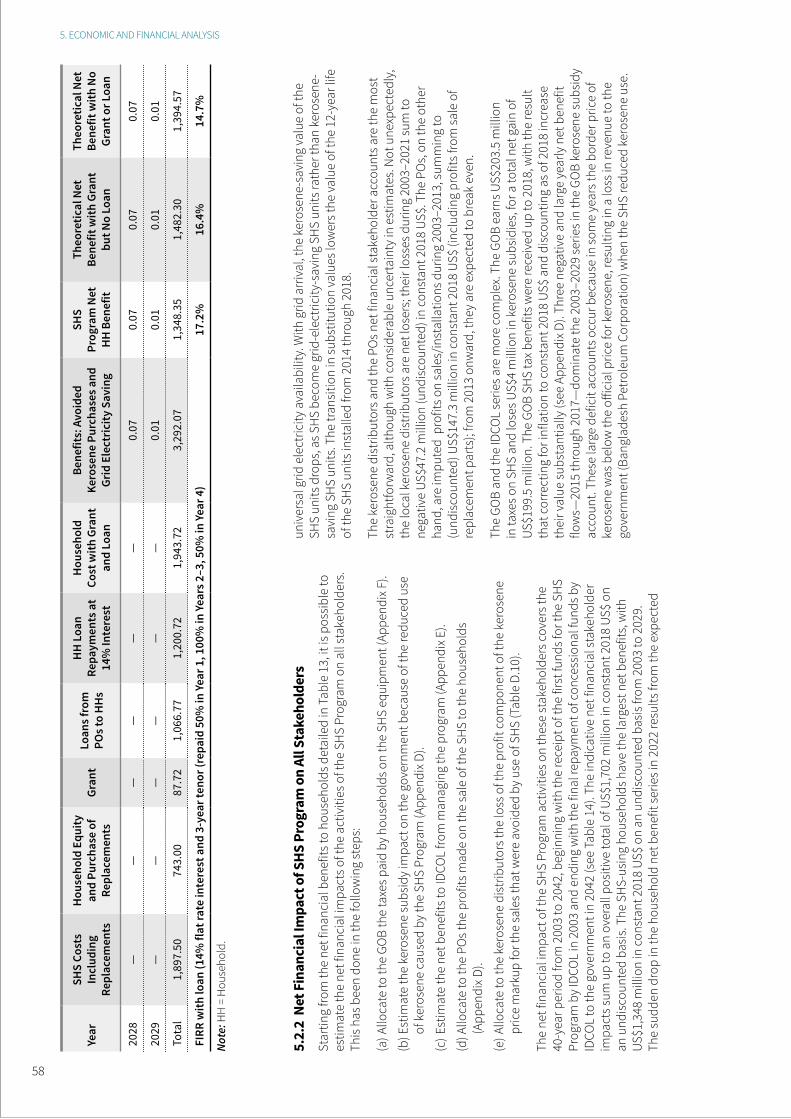
5. ECONOMIC AND FINANCIAL ANALYSIS
Year
SHS
Cost
s In
clud
ing
Repl
acem
ents
Hou
seho
ld E
quity
an
d Pu
rcha
se o
f Re
plac
emen
tsGr
ant
Loan
s fro
m
POs t
o H
Hs
HH
Loa
n Re
paym
ents
at
14%
Inte
rest
Hou
seho
ld
Cost
with
Gra
nt
and
Loan
Bene
fits:
Avo
ided
Ke
rose
ne P
urch
ases
and
Gr
id E
lect
ricity
Sav
ing
SHS
Prog
ram
Net
H
H B
enef
it
Theo
retic
al N
et
Bene
fit w
ith G
rant
bu
t No
Loan
Theo
retic
al N
et
Bene
fit w
ith N
o Gr
ant o
r Loa
n
2028
——
——
——
0.07
0.07
0.07
0.07
2029
——
——
——
0.01
0.01
0.01
0.01
Tota
l1,
897.
5074
3.00
87.7
21,
066.
771,
200.
721,
943.
723,
292.
071,
348.
351,
482.
301,
394.
57
FIRR
with
loan
(14%
flat
rate
inte
rest
and
3-y
ear t
enor
(rep
aid
50%
in Ye
ar 1
, 100
% in
Year
s 2–3
, 50%
in Ye
ar 4
)17
.2%
16.4
%14
.7%
Not
e: H
H =
Hou
seho
ld.
5.2.
2 N
et F
inan
cial
Impa
ct o
f SHS
Pro
gram
on
All S
take
hold
ers
Star
ting
from
the
net f
inan
cial
ben
efits
to h
ouse
hold
s det
aile
d in
Tab
le 1
3, it
is p
ossi
ble
to
estim
ate
the
net f
inan
cial
impa
cts o
f the
act
iviti
es o
f the
SH
S Pr
ogra
m o
n al
l sta
keho
lder
s.
This
has
bee
n do
ne in
the
follo
win
g st
eps:
(a) A
lloca
te to
the
GOB
the
taxe
s pai
d by
hou
seho
lds o
n th
e SH
S eq
uipm
ent (
Appe
ndix
F).
(b) E
stim
ate
the
kero
sene
subs
idy
impa
ct o
n th
e go
vern
men
t bec
ause
of t
he re
duce
d us
e of
ker
osen
e ca
used
by
the
SHS
Prog
ram
(App
endi
x D).
(c) E
stim
ate
the
net b
enef
its to
IDCO
L fro
m m
anag
ing
the
prog
ram
(App
endi
x E).
(d) A
lloca
te to
the
POs t
he p
rofit
s mad
e on
the
sale
of t
he S
HS
to th
e ho
useh
olds
(A
ppen
dix D
).
(e) A
lloca
te to
the
kero
sene
dis
trib
utor
s the
loss
of t
he p
rofit
com
pone
nt o
f the
ker
osen
e pr
ice
mar
kup
for t
he sa
les t
hat w
ere
avoi
ded
by u
se o
f SH
S (T
able
D.1
0).
The
net f
inan
cial
impa
ct o
f the
SH
S Pr
ogra
m a
ctiv
ities
on
thes
e st
akeh
olde
rs c
over
s the
40
-yea
r per
iod
from
200
3 to
204
2, b
egin
ning
with
the
rece
ipt o
f the
firs
t fun
ds fo
r the
SH
S Pr
ogra
m b
y ID
COL
in 2
003
and
endi
ng w
ith th
e fin
al re
paym
ent o
f con
cess
iona
l fun
ds b
y ID
COL
to th
e go
vern
men
t in
2042
(see
Tab
le 1
4). T
he in
dica
tive
net f
inan
cial
stak
ehol
der
impa
cts s
um u
p to
an
over
all p
ositi
ve to
tal o
f US$
1,70
2 m
illio
n in
con
stan
t 201
8 U
S$ o
n an
und
isco
unte
d ba
sis.
The
SH
S-us
ing
hous
ehol
ds h
ave
the
larg
est n
et b
enef
its, w
ith
US$
1,34
8 m
illio
n in
con
stan
t 201
8 U
S$ o
n an
und
isco
unte
d ba
sis f
rom
200
3 to
202
9.
The
sudd
en d
rop
in th
e ho
useh
old
net b
enef
it se
ries i
n 20
22 re
sults
from
the
expe
cted
univ
ersa
l grid
ele
ctric
ity a
vaila
bilit
y. W
ith g
rid a
rriv
al, t
he k
eros
ene-
savi
ng v
alue
of t
he
SHS
units
dro
ps, a
s SH
S be
com
e gr
id-e
lect
ricity
-sav
ing
SHS
units
rath
er th
an k
eros
ene-
savi
ng S
HS
units
. The
tran
sitio
n in
subs
titut
ion
valu
es lo
wer
s the
valu
e of
the
12-y
ear l
ife
of th
e SH
S un
its in
stal
led
from
201
4 th
roug
h 20
18.
The
kero
sene
dis
trib
utor
s and
the
POs n
et fi
nanc
ial s
take
hold
er a
ccou
nts a
re th
e m
ost
stra
ight
forw
ard,
alth
ough
with
con
side
rabl
e un
certa
inty
in e
stim
ates
. Not
une
xpec
tedl
y,
the
loca
l ker
osen
e di
strib
utor
s are
net
lose
rs; t
heir
loss
es d
urin
g 20
03–2
021
sum
to
nega
tive
US$
47.2
mill
ion
(und
isco
unte
d) in
con
stan
t 201
8 U
S$. T
he P
Os,
on
the
othe
r ha
nd, a
re im
pute
d p
rofit
s on
sale
s/in
stal
latio
ns d
urin
g 20
03–2
013,
sum
min
g to
(u
ndis
coun
ted)
US$
147.
3 m
illio
n in
con
stan
t 201
8 U
S$ (i
nclu
ding
pro
fits f
rom
sale
of
repl
acem
ent p
arts
); fro
m 2
013
onw
ard,
they
are
exp
ecte
d to
bre
ak e
ven.
The
GOB
and
the
IDCO
L se
ries a
re m
ore
com
plex
. The
GO
B ea
rns U
S$20
3.5
mill
ion
in ta
xes o
n SH
S an
d lo
ses U
S$4
mill
ion
in k
eros
ene
subs
idie
s, fo
r a to
tal n
et g
ain
of
US$
199.
5 m
illio
n. T
he G
OB
SHS
tax b
enef
its w
ere
rece
ived
up
to 2
018,
with
the
resu
lt th
at c
orre
ctin
g fo
r inf
latio
n to
con
stan
t 201
8 U
S$ a
nd d
isco
untin
g as
of 2
018
incr
ease
th
eir v
alue
subs
tant
ially
(see
App
endi
x D).
Thre
e ne
gativ
e an
d la
rge
year
ly n
et b
enef
it flo
ws—
2015
thro
ugh
2017
—do
min
ate
the
2003
–202
9 se
ries i
n th
e GO
B ke
rose
ne su
bsid
y ac
coun
t. Th
ese
larg
e de
ficit
acco
unts
occ
ur b
ecau
se in
som
e ye
ars t
he b
orde
r pric
e of
ke
rose
ne w
as b
elow
the
offic
ial p
rice
for k
eros
ene,
resu
lting
in a
loss
in re
venu
e to
the
gove
rnm
ent (
Bang
lade
sh P
etro
leum
Cor
pora
tion)
whe
n th
e SH
S re
duce
d ke
rose
ne u
se.
58

Tabl
e 14
: Sta
keho
lder
Indi
cativ
e N
et F
inan
cial
Ben
efits
from
the
SHS
Prog
ram
200
3–20
42 (C
onst
ant 2
018
US$,
mill
ions
)
Year
Hou
seho
ld N
et
Bene
fits w
ith
Gran
ts a
nd L
oans
GOB
Net B
enef
itsID
COL
Net
Fina
ncia
l Be
nefit
s a
PO P
rofit
s on
SH
S In
stal
latio
ns
Kero
sene
Di
strib
utor
Fo
rego
ne P
rofit
s
Tota
l Net
Sta
keho
lder
Be
nefit
sTa
xes C
olle
cted
on
SH
SSa
ving
s on
Kero
sene
Su
bsid
ies
Tota
l GO
B Re
al T
rans
actio
n Ac
coun
t
(1)
(2)
(3)
(4 =
2 +
3)
(5)
(6)
(7)
(8 =
1 +
4 +
5 +
6 +
7)
2003
(3.4
8) 0
.84
0.0
3 0
.88
(0.0
3) 0
.95
(0.0
1) (1
.69)
2004
(7.9
7) 1
.68
0.3
7 2
.06
(0.1
2) 1
.88
(0.0
2) (4
.17)
2005
(12.
12)
2.3
2 0
.34
2.6
6 0
.57
2.6
0 (0
.04)
(6.3
3)
2006
(16.
43)
3.1
3 1
.74
4.8
7 1
.72
3.5
1 (0
.07)
(6.4
1)
2007
(26.
51)
5.6
2 1
.83
7.4
5 4
.62
6.2
9 (0
.14)
(8.2
9)
2008
(36.
61)
9.3
8 2
.44
11.
82
9.2
8 1
0.50
(0
.24)
(5.2
5)
2009
(59.
77)
12.
30
(0.4
0) 1
1.90
1
5.16
1
3.78
(0
.40)
(19.
32)
2010
(84.
79)
21.
80
3.2
9 2
5.09
2
3.58
2
4.42
(0
.72)
(12.
42)
2011
(63.
30)
26.
85
35.
81
62.
65
27.
30
30.
07
(1.2
3) 5
5.49
2012
(56.
96)
34.
22
87.
69
121
.91
30.
09
38.
33
(1.9
1) 1
31.4
5
2013
(47.
64)
40.
67
44.
55
85.
22
34.
35
7.5
9 (2
.88)
76.
64
2014
40.
71
23.
31
52.
45
75.
75
37.
24
4.3
5 (3
.78)
154
.28
2015
19.
49
16.
00
(96.
75)
(80.
74)
34.
17
2.9
9 (4
.58)
(28.
67)
2016
150
.63
4.3
0 (1
30.3
7) (1
26.0
7) 3
5.50
—
(4.9
7) 5
5.09
2017
249
.35
0.7
9 (7
4.32
) (7
3.54
) 2
4.30
—
(5.1
5) 1
94.9
6
2018
332
.19
0.0
9 1
7.59
1
7.68
2
2.95
—
(5.4
8) 3
67.3
4
2019
328
.53
— 1
7.25
1
7.25
(2
.72)
— (5
.38)
337
.68
2020
318
.91
— 1
6.72
1
6.72
(4
.30)
— (5
.21)
326
.12
2021
304
.22
— 1
5.94
1
5.94
(4
.30)
— (4
.97)
310
.89
2022
6.2
8 —
——
(3.2
4)—
— 3
.04
2023
5.2
9 —
——
(3.8
0)—
— 1
.49
2024
4.0
2 —
——
(29.
76)
——
(25.
74)
2025
2.5
1 —
——
(29.
25)
——
(26.
74)
2026
1.3
4 —
——
(28.
79)
——
(27.
45)
2027
0.3
8 —
——
(28.
37)
——
(27.
99)
LIVING IN THE LIGHT: THE BANGLADESH SOLAR HOME SYSTEMS STORY | 59
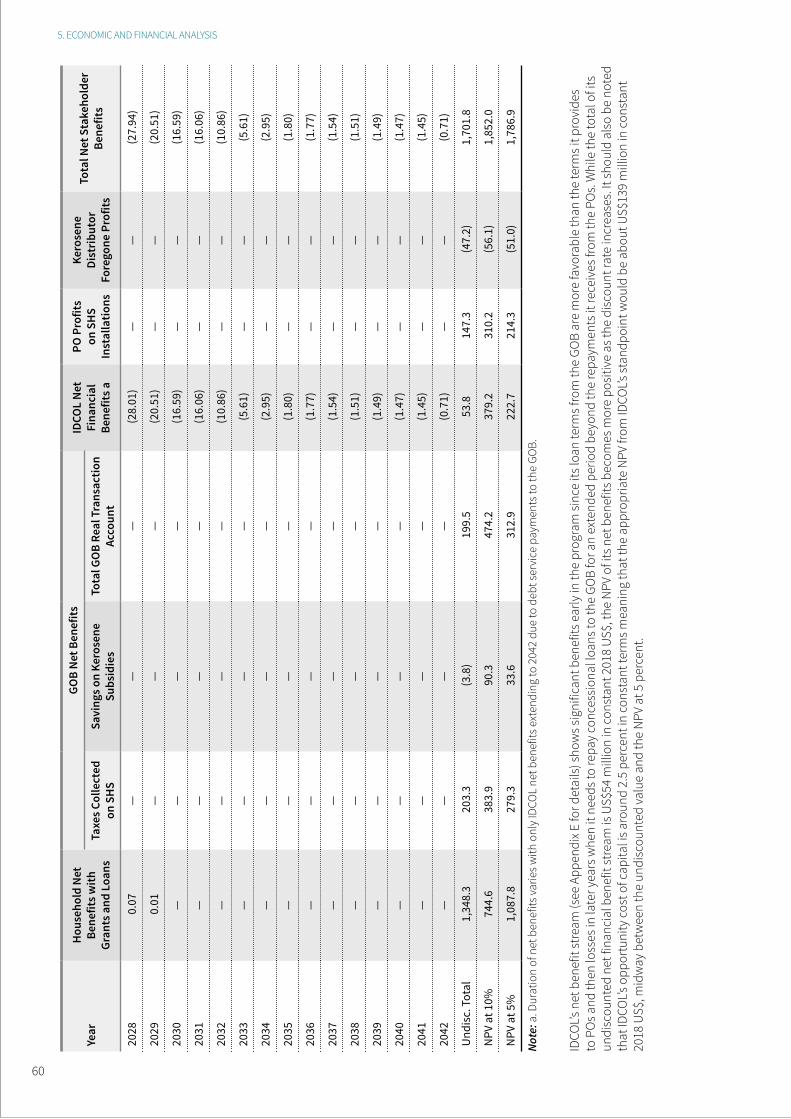
5. ECONOMIC AND FINANCIAL ANALYSIS
Year
Hou
seho
ld N
et
Bene
fits w
ith
Gran
ts a
nd L
oans
GOB
Net B
enef
itsID
COL
Net
Fina
ncia
l Be
nefit
s a
PO P
rofit
s on
SH
S In
stal
latio
ns
Kero
sene
Di
strib
utor
Fo
rego
ne P
rofit
s
Tota
l Net
Sta
keho
lder
Be
nefit
sTa
xes C
olle
cted
on
SH
SSa
ving
s on
Kero
sene
Su
bsid
ies
Tota
l GO
B Re
al T
rans
actio
n Ac
coun
t
2028
0.0
7 —
——
(28.
01)
——
(27.
94)
2029
0.0
1 —
——
(20.
51)
——
(20.
51)
2030
——
——
(16.
59)
——
(16.
59)
2031
——
——
(16.
06)
——
(16.
06)
2032
——
——
(10.
86)
——
(10.
86)
2033
——
——
(5.6
1)—
— (5
.61)
2034
——
——
(2.9
5)—
— (2
.95)
2035
——
——
(1.8
0)—
— (1
.80)
2036
——
——
(1.7
7)—
— (1
.77)
2037
——
——
(1.5
4)—
— (1
.54)
2038
——
——
(1.5
1)—
— (1
.51)
2039
——
——
(1.4
9)—
— (1
.49)
2040
——
——
(1.4
7)—
— (1
.47)
2041
——
——
(1.4
5)—
— (1
.45)
2042
——
——
(0.7
1)—
— (0
.71)
Und
isc.
Tot
al 1
,348
.3
203
.3
(3.8
) 1
99.5
5
3.8
147
.3
(47.
2) 1
,701
.8
NPV
at 1
0% 7
44.6
3
83.9
9
0.3
474
.2
379
.2
310
.2
(56.
1) 1
,852
.0
NPV
at 5
% 1
,087
.8
279
.3
33.
6 3
12.9
2
22.7
2
14.3
(5
1.0)
1,7
86.9
Not
e: a
. Dur
atio
n of
net
ben
efits
varie
s with
onl
y ID
COL
net b
enef
its e
xten
ding
to 2
042
due
to d
ebt s
ervi
ce p
aym
ents
to th
e GO
B.
IDCO
L’s n
et b
enef
it st
ream
(see
App
endi
x E fo
r det
ails
) sho
ws s
igni
fican
t ben
efits
ear
ly in
the
prog
ram
sinc
e its
loan
term
s fro
m th
e GO
B ar
e m
ore
favo
rabl
e th
an th
e te
rms i
t pro
vide
s to
PO
s and
then
loss
es in
late
r yea
rs w
hen
it ne
eds t
o re
pay
conc
essi
onal
loan
s to
the
GOB
for a
n ex
tend
ed p
erio
d be
yond
the
repa
ymen
ts it
rece
ives
from
the
POs.
Whi
le th
e to
tal o
f its
un
disc
ount
ed n
et fi
nanc
ial b
enef
it st
ream
is U
S$54
mill
ion
in c
onst
ant 2
018
US$
, the
NPV
of i
ts n
et b
enef
its b
ecom
es m
ore
posi
tive
as th
e di
scou
nt ra
te in
crea
ses.
It sh
ould
als
o be
not
ed
that
IDCO
L’s o
ppor
tuni
ty c
ost o
f cap
ital i
s aro
und
2.5
perc
ent i
n co
nsta
nt te
rms m
eani
ng th
at th
e ap
prop
riate
NPV
from
IDCO
L’s st
andp
oint
wou
ld b
e ab
out U
S$13
9 m
illio
n in
con
stan
t 20
18 U
S$, m
idw
ay b
etw
een
the
undi
scou
nted
valu
e an
d th
e N
PV a
t 5 p
erce
nt.
60
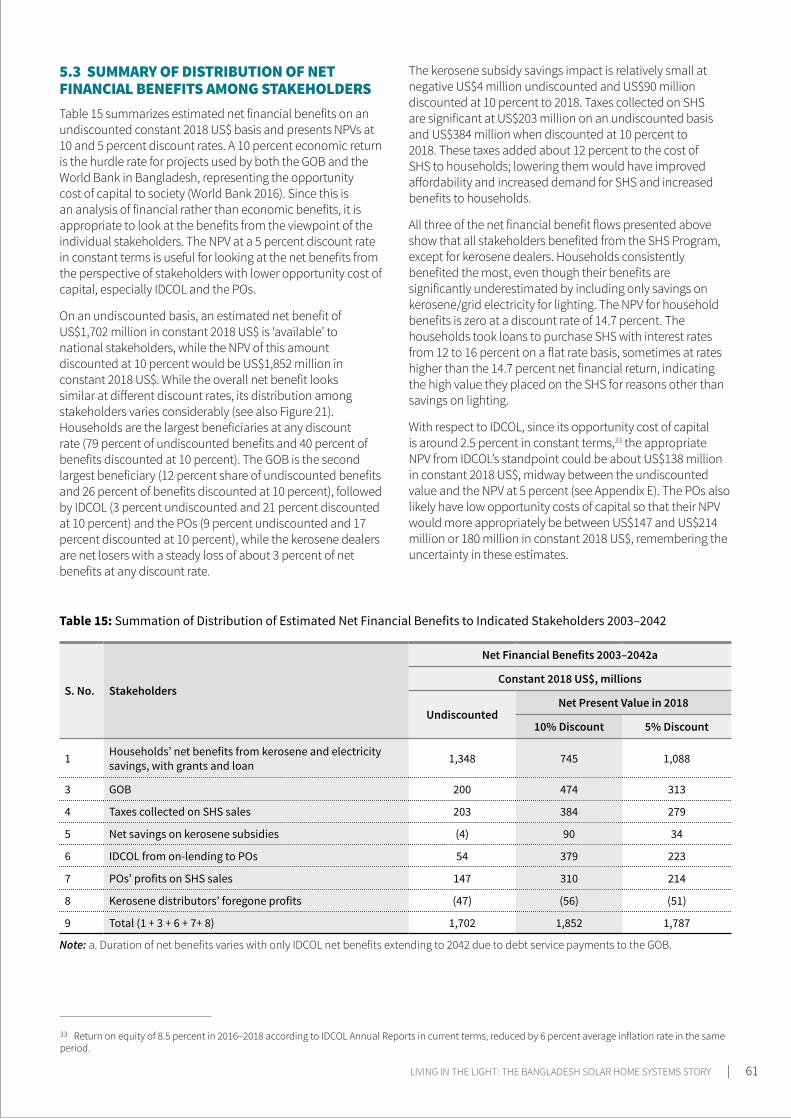
5.3 SUMMARY OF DISTRIBUTION OF NET FINANCIAL BENEFITS AMONG STAKEHOLDERS Table 15 summarizes estimated net financial benefits on an undiscounted constant 2018 US$ basis and presents NPVs at 10 and 5 percent discount rates. A 10 percent economic return is the hurdle rate for projects used by both the GOB and the World Bank in Bangladesh, representing the opportunity cost of capital to society (World Bank 2016). Since this is an analysis of financial rather than economic benefits, it is appropriate to look at the benefits from the viewpoint of the individual stakeholders. The NPV at a 5 percent discount rate in constant terms is useful for looking at the net benefits from the perspective of stakeholders with lower opportunity cost of capital, especially IDCOL and the POs.
On an undiscounted basis, an estimated net benefit of US$1,702 million in constant 2018 US$ is ‘available’ to national stakeholders, while the NPV of this amount discounted at 10 percent would be US$1,852 million in constant 2018 US$. While the overall net benefit looks similar at different discount rates, its distribution among stakeholders varies considerably (see also Figure 21). Households are the largest beneficiaries at any discount rate (79 percent of undiscounted benefits and 40 percent of benefits discounted at 10 percent). The GOB is the second largest beneficiary (12 percent share of undiscounted benefits and 26 percent of benefits discounted at 10 percent), followed by IDCOL (3 percent undiscounted and 21 percent discounted at 10 percent) and the POs (9 percent undiscounted and 17 percent discounted at 10 percent), while the kerosene dealers are net losers with a steady loss of about 3 percent of net benefits at any discount rate.
The kerosene subsidy savings impact is relatively small at negative US$4 million undiscounted and US$90 million discounted at 10 percent to 2018. Taxes collected on SHS are significant at US$203 million on an undiscounted basis and US$384 million when discounted at 10 percent to 2018. These taxes added about 12 percent to the cost of SHS to households; lowering them would have improved affordability and increased demand for SHS and increased benefits to households.
All three of the net financial benefit flows presented above show that all stakeholders benefited from the SHS Program, except for kerosene dealers. Households consistently benefited the most, even though their benefits are significantly underestimated by including only savings on kerosene/grid electricity for lighting. The NPV for household benefits is zero at a discount rate of 14.7 percent. The households took loans to purchase SHS with interest rates from 12 to 16 percent on a flat rate basis, sometimes at rates higher than the 14.7 percent net financial return, indicating the high value they placed on the SHS for reasons other than savings on lighting.
With respect to IDCOL, since its opportunity cost of capital is around 2.5 percent in constant terms,33 the appropriate NPV from IDCOL’s standpoint could be about US$138 million in constant 2018 US$, midway between the undiscounted value and the NPV at 5 percent (see Appendix E). The POs also likely have low opportunity costs of capital so that their NPV would more appropriately be between US$147 and US$214 million or 180 million in constant 2018 US$, remembering the uncertainty in these estimates.
33 Return on equity of 8.5 percent in 2016–2018 according to IDCOL Annual Reports in current terms, reduced by 6 percent average inflation rate in the same period.
Table 15: Summation of Distribution of Estimated Net Financial Benefits to Indicated Stakeholders 2003–2042
S. No. Stakeholders
Net Financial Benefits 2003–2042a
Constant 2018 US$, millions
UndiscountedNet Present Value in 2018
10% Discount 5% Discount
1 Households’ net benefits from kerosene and electricity savings, with grants and loan 1,348 745 1,088
3 GOB 200 474 313
4 Taxes collected on SHS sales 203 384 279
5 Net savings on kerosene subsidies (4) 90 34
6 IDCOL from on-lending to POs 54 379 223
7 POs’ profits on SHS sales 147 310 214
8 Kerosene distributors’ foregone profits (47) (56) (51)
9 Total (1 + 3 + 6 + 7+ 8) 1,702 1,852 1,787
Note: a. Duration of net benefits varies with only IDCOL net benefits extending to 2042 due to debt service payments to the GOB.
LIVING IN THE LIGHT: THE BANGLADESH SOLAR HOME SYSTEMS STORY | 61
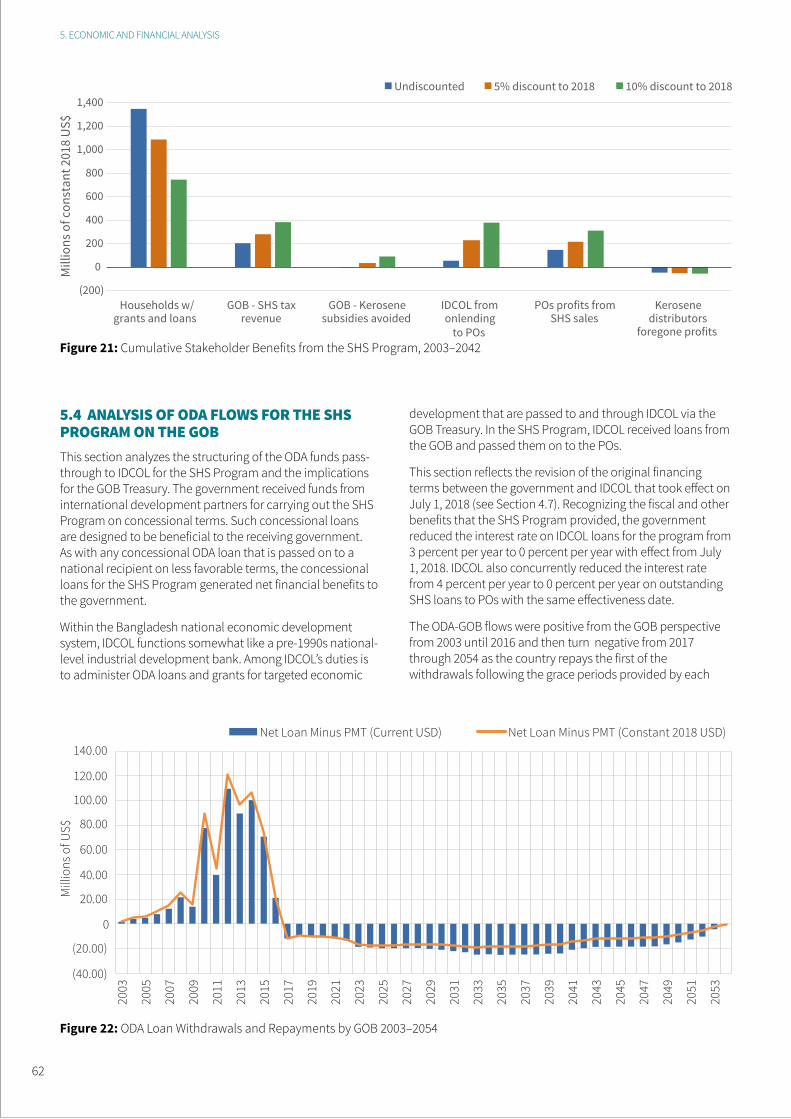
5. ECONOMIC AND FINANCIAL ANALYSIS
5.4 ANALYSIS OF ODA FLOWS FOR THE SHS PROGRAM ON THE GOB This section analyzes the structuring of the ODA funds pass-through to IDCOL for the SHS Program and the implications for the GOB Treasury. The government received funds from international development partners for carrying out the SHS Program on concessional terms. Such concessional loans are designed to be beneficial to the receiving government. As with any concessional ODA loan that is passed on to a national recipient on less favorable terms, the concessional loans for the SHS Program generated net financial benefits to the government.
Within the Bangladesh national economic development system, IDCOL functions somewhat like a pre-1990s national-level industrial development bank. Among IDCOL’s duties is to administer ODA loans and grants for targeted economic
development that are passed to and through IDCOL via the GOB Treasury. In the SHS Program, IDCOL received loans from the GOB and passed them on to the POs.
This section reflects the revision of the original financing terms between the government and IDCOL that took effect on July 1, 2018 (see Section 4.7). Recognizing the fiscal and other benefits that the SHS Program provided, the government reduced the interest rate on IDCOL loans for the program from 3 percent per year to 0 percent per year with effect from July 1, 2018. IDCOL also concurrently reduced the interest rate from 4 percent per year to 0 percent per year on outstanding SHS loans to POs with the same effectiveness date.
The ODA-GOB flows were positive from the GOB perspective from 2003 until 2016 and then turn negative from 2017 through 2054 as the country repays the first of the withdrawals following the grace periods provided by each
Figure 21: Cumulative Stakeholder Benefits from the SHS Program, 2003–2042
Figure 22: ODA Loan Withdrawals and Repayments by GOB 2003–2054
62
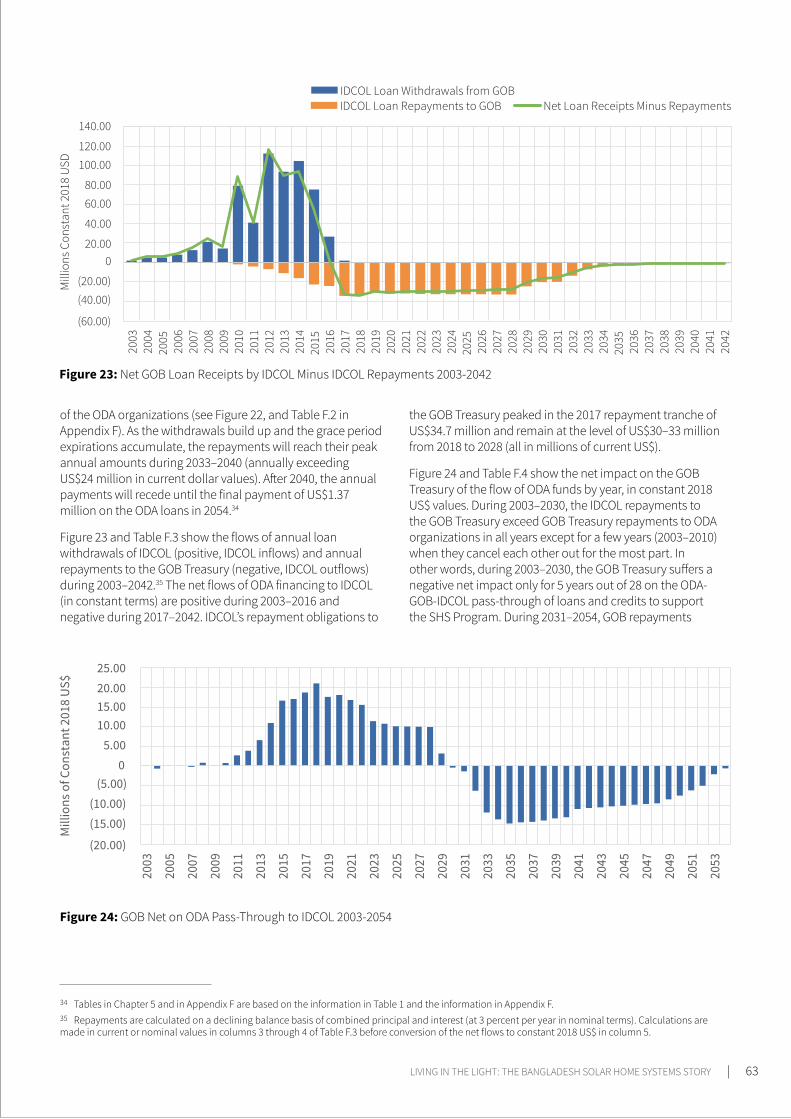
34 Tables in Chapter 5 and in Appendix F are based on the information in Table 1 and the information in Appendix F.35 Repayments are calculated on a declining balance basis of combined principal and interest (at 3 percent per year in nominal terms). Calculations are made in current or nominal values in columns 3 through 4 of Table F.3 before conversion of the net flows to constant 2018 US$ in column 5.
Figure 23: Net GOB Loan Receipts by IDCOL Minus IDCOL Repayments 2003-2042
Figure 24: GOB Net on ODA Pass-Through to IDCOL 2003-2054
of the ODA organizations (see Figure 22, and Table F.2 in Appendix F). As the withdrawals build up and the grace period expirations accumulate, the repayments will reach their peak annual amounts during 2033–2040 (annually exceeding US$24 million in current dollar values). After 2040, the annual payments will recede until the final payment of US$1.37 million on the ODA loans in 2054.34
Figure 23 and Table F.3 show the flows of annual loan withdrawals of IDCOL (positive, IDCOL inflows) and annual repayments to the GOB Treasury (negative, IDCOL outflows) during 2003–2042.35 The net flows of ODA financing to IDCOL (in constant terms) are positive during 2003–2016 and negative during 2017–2042. IDCOL’s repayment obligations to
the GOB Treasury peaked in the 2017 repayment tranche of US$34.7 million and remain at the level of US$30–33 million from 2018 to 2028 (all in millions of current US$).
Figure 24 and Table F.4 show the net impact on the GOB Treasury of the flow of ODA funds by year, in constant 2018 US$ values. During 2003–2030, the IDCOL repayments to the GOB Treasury exceed GOB Treasury repayments to ODA organizations in all years except for a few years (2003–2010) when they cancel each other out for the most part. In other words, during 2003–2030, the GOB Treasury suffers a negative net impact only for 5 years out of 28 on the ODA-GOB-IDCOL pass-through of loans and credits to support the SHS Program. During 2031–2054, GOB repayments
LIVING IN THE LIGHT: THE BANGLADESH SOLAR HOME SYSTEMS STORY | 63
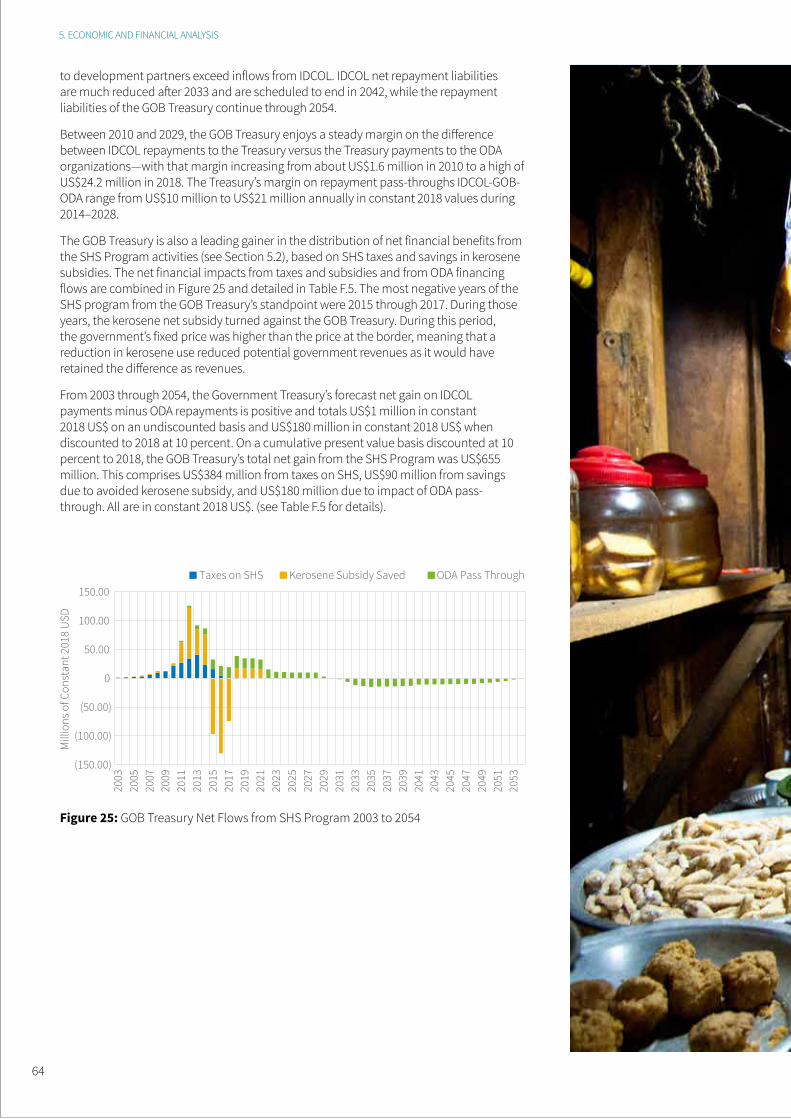
Figure 25: GOB Treasury Net Flows from SHS Program 2003 to 2054
to development partners exceed inflows from IDCOL. IDCOL net repayment liabilities are much reduced after 2033 and are scheduled to end in 2042, while the repayment liabilities of the GOB Treasury continue through 2054.
Between 2010 and 2029, the GOB Treasury enjoys a steady margin on the difference between IDCOL repayments to the Treasury versus the Treasury payments to the ODA organizations—with that margin increasing from about US$1.6 million in 2010 to a high of US$24.2 million in 2018. The Treasury’s margin on repayment pass-throughs IDCOL-GOB-ODA range from US$10 million to US$21 million annually in constant 2018 values during 2014–2028.
The GOB Treasury is also a leading gainer in the distribution of net financial benefits from the SHS Program activities (see Section 5.2), based on SHS taxes and savings in kerosene subsidies. The net financial impacts from taxes and subsidies and from ODA financing flows are combined in Figure 25 and detailed in Table F.5. The most negative years of the SHS program from the GOB Treasury’s standpoint were 2015 through 2017. During those years, the kerosene net subsidy turned against the GOB Treasury. During this period, the government’s fixed price was higher than the price at the border, meaning that a reduction in kerosene use reduced potential government revenues as it would have retained the difference as revenues.
From 2003 through 2054, the Government Treasury’s forecast net gain on IDCOL payments minus ODA repayments is positive and totals US$1 million in constant 2018 US$ on an undiscounted basis and US$180 million in constant 2018 US$ when discounted to 2018 at 10 percent. On a cumulative present value basis discounted at 10 percent to 2018, the GOB Treasury’s total net gain from the SHS Program was US$655 million. This comprises US$384 million from taxes on SHS, US$90 million from savings due to avoided kerosene subsidy, and US$180 million due to impact of ODA pass-through. All are in constant 2018 US$. (see Table F.5 for details).
5. ECONOMIC AND FINANCIAL ANALYSIS
64
LIVING IN THE LIGHT: THE BANGLADESH SOLAR HOME SYSTEMS STORY | 65
66

6.1 Conclusions 68
6.2 Lessons Learned 69
MAIN CONCLUSIONS AND LESSONS LEARNED
LIVING IN THE LIGHT: THE BANGLADESH SOLAR HOME SYSTEMS STORY | 67
MAIN CONCLUSIONS AND LESSONS LEARNED
The extensive analysis of the experience with the implementation of the Bangladesh SHS has led to several conclusions and lessons learned as described in this section.
6.1 CONCLUSIONSThis review of the Bangladesh SHS Program over 2003–2018 leads to several main conclusions about carrying out large-scale off-grid electrification programs in the long term:
• Households value SHS highly and are willing to pay for its services. The fact that 4.1 million systems were bought among a maximum of 15 million rural households without electricity at the start of the program indicates a market penetration rate well above 25 percent. This indicates both the acceptance of the SHS and the high value that households placed on the services obtained.
• The SHS Program was economically justifiable from the national and global perspectives. The EIRRs demonstrate the net overall value of the program to the nation (20 percent without GHG emission reduction benefits) as well as to global society (25 percent with GHG emission reduction benefits). These benefits are underestimated since they are based only on the avoided cost of kerosene/grid electricity and do not include important other benefits such as improved quantity and quality of light; immediate financial savings from lower costs, for example, fewer batteries and free cellphone charging; and social and lifestyle benefits, for example, access to radio and TV and improved security.
• Households benefited on a financial basis as well, with an FIRR of 17.2 percent considering loan defaults and a lower FIRR of 13 percent if there had been no such defaults. The most powerful evidence of household benefits is shown by the reality in the marketplace; the purchase of over 4 million SHS by rural households implies a strong willingness of households to pay for SHS when their ability to pay was enhanced by the availability of loans.
• The GOB as the financier, IDCOL, and the POs also reaped financial benefits from the program despite late-stage problems. The government received substantial revenue from taxes on SHS sales and reduced subsidies for kerosene. Similarly, IDCOL benefited from the difference between its loans from GOB and the loans that it made to POs as well as from administration fees from ODA partners. These covered costs and permitted IDCOL to earn a return similar to that it makes on its other lending programs. The POs were able to earn profits in early years although these were much reduced in later years.
• The SHS Program succeeded from 2003 to 2014 with the majority of SHS installed during this period (3.3 million of 4.1 million SHS). IDCOL’s strong leadership played an essential role in developing the implementation model with the following elements: implementation by POs with strong on-the-ground presence, a flexible, collaborative approach through the OC, an effective framework for controlling quality, and enforcement of financial discipline.
• The SHS Program was hit by rapid grid expansion from 2015 onward that reduced suddenly potential markets. The financial viability of SHS at the household level increased with time as SHS technological progress reduced costs and improved performance. However, after 2015, the pace of grid expansion into areas served by SHS increased sharply, reducing the potential market of unelectrified households. An unintended consequence was that households could switch to grid electricity renege on SHS loan repayments with impunity.
68
• The impact on SHS sales decline under the program with grid arrival was increased by the expansion of the TR/KABITA off-grid program that provided SHS to households at no cost. The arrival of the TR/KABITA Program could have been better planned and coordinated with IDCOL. IDCOL took over management of the TR/KABITA Program and integrated it into its PO network, providing additional business for the POs but this did not fully ameliorate the damage to the SHS Program.
• The sudden drop in SHS sales and reduction in collection rates after 2015 created financial and operating difficulties for IDCOL and the POs. The shrinking sales and drop in collection rates caused the POs to reduce operations, which in turn made it more difficult to collect payments due on systems installed. Some of the POs were unable to fully repay their loans to IDCOL.
• Coming to the financial aid of IDCOL and the POs to ensure their sustainability is the proper follow-on role of the government, given late-stage problems. Recognizing the contribution made by the SHS Program to the GOB’s rural electrification goals as well as the financial benefits reaped from the program, the GOB restructured its loans to IDCOL and supported IDCOL in restructuring its loans to POs in mid-2018. IDCOL has succeeded in renegotiating the outstanding PO debt to bring the substandard debt and bad debt down to US$28.6 million. It would also be appropriate for the GOB to further assist IDCOL and the POs, as required, to bring the program to an orderly end and ensure the long-term sustainability of these organizations as well as the SHS installed under the program.
• Better planning and coordination of on-grid and off-grid electrification could have avoided the late-stage difficulties in the SHS Program. The GOB was accelerating three major electrification efforts simultaneously without foreseeing that the impact would be to squeeze out the SHS Program. It was expanding the grid, promoting SHS under the SHS Program, and providing systems at no cost to the poorest households and public institutions under the TR/KABITA Program. SREDA, established partway into the SHS Program, is now an effective government authority to play the coordinating and policy-making role in future.
• In summary, the SHS Program made a significant contribution to the government’s efforts to meet the stated Constitutional policy principle to transform rural areas by providing, among other facilities, rural electrification. It provided electricity in advance of the availability of the grid to 20 million people through 4.1 million SHS that that were purchased by rural households cost-effectively and with net benefits to all participants except kerosene dealers, at an average cost of US$264 in constant 2018 US$ per SHS while also reducing kerosene consumption by over 4 million liters and reducing GHG emissions by an estimated 9.6 million tCO2.
6.2 LESSONS LEARNEDHow the SHS Program in Bangladesh was designed and implemented, how it adapted to changing conditions, what were the benefits and costs of SHS electrification, its successes and challenges, and how these challenges are being overcome offer lessons to help other countries with off-grid electrification to complement grid electrification efforts. Some of the main lessons learned that could be applied in other programs are summarized below.
Planning the program
• Have a clear program goal. The SHS Program in Bangladesh was a largely market-based program that aimed to provide benefits of electricity to rural households in advance of the grid. If the intent of an SHS program is to deepen access to electricity within communities, then a market-based program alone may not be suitable as sales will be to those with greatest ability to pay. Poorer households may not be served adequately unless additional incentives are offered to them. If an SHS program is used to achieve a policy goal of universal access, then a more direct public sector intervention may also be needed.
• Recognize that SHS users value the wider benefits from SHS. Customers have a strong willingness to buy SHS for the improvements observed in quality of life, access to information, safety, or other non-quantified benefits as described above, more than for savings in kerosene. Therefore, do not underestimate such attributes in determining WTP. Nevertheless, ability to pay must be enhanced by making credit available so that payments for SHS are affordable.
• Ensure high-level integrated planning of grid and off-grid electrification. Program planning must integrate planning of grid and off-grid electrification at the highest level, based on economic principles. Be open with information on electrification plans and consult and cooperate with authorities responsible for grid extension and the SHS industry. The role of the government is essential in ensuring that such high-level integrated planning takes place.
• Consider distributional impacts in planning. There is a potential risk of focusing solely on the EIRR in project appraisal as a justification, without closely examining the distribution impacts to key stakeholders. The result of ignoring the distributional impacts is that program outcomes may not be realized if some key stakeholders are disadvantaged.
• Build long-term service infrastructure. SHS can have a long service life. However, inevitably, failures do occur and some components such as lamps, controllers, and batteries must be replaced at regular intervals. SHS program lifetimes are usually short (the 15+ years of the IDCOL SHS Program is a rare exception). Therefore, it is
LIVING IN THE LIGHT: THE BANGLADESH SOLAR HOME SYSTEMS STORY | 69

6. MAIN CONCLUSIONS AND LESSONS LEARNED
essential to support building of a service and spare part supply infrastructure that continues after the program ends.
• Retain flexibility in the program. Retain flexibility in the program implementation modalities, while adhering to sound economic, technical, and business principles. This is needed to adapt to changes in policy and economic conditions, technology evolutions, technology costs, overall business environment, and even force majeure conditions. This requires good communications among the key stakeholders and ability of the main implementing agency to effectively direct actions.
• Plan an exit strategy and monitor the market. A planned and orderly exit to a government-supported SHS program needs to be foreseen from the beginning. The aim may be to continue the program until the SHS market is saturated or to transition to a commercial approach after the market is established. An exit strategy is needed together with market monitoring so that risks related to all participants in the program are properly shared and managed as the program ends. These risks include business collapse, financial losses, and customers with no recourse to repair/replacement services.
Responsive and sustainable institutional infrastructure
• Have a strong lead agency for program management. A strong lead agency such as IDCOL is needed to provide close and timely management and supervision; an uncompromising attitude toward financial discipline is essential. A successful SHS program needs well-qualified managers and trained technicians. Adequate salaries and benefits are required. Technicians must be trained and with access to spares and tools to ensure responsive repair and maintenance services. They need to be adequately compensated or they will take their newly acquired skills and move.
• Build on existing organizations. Build on the strengths of existing organizations rather than creating new ones, where possible. But make the policy changes, identifiable through the stakeholder analysis, needed for these organizations to effectively transition to the changed economy the program is designed to induce.
• Provide responsive management. Take timely advantage of technologies and business practices that can reduce cost and improve financial and business management such as PAYG technology, mobile pay, and computerized MISs for inventory, finance, and business management.
• Ensure financial sustainability. The business should generate revenues to cover costs and provide adequate returns. Avoid destructive competition where profit margins are pared to the bone to gain market share. Ensure full cost recovery, select customers with ability to pay or support rational incentives to enhance ability to pay, establish effective fee collection mechanisms, and simplify administration.
Provide quality products and services
• Ensure technical quality of SHS. Long-term sustainability demands well-designed products and quality components and installations. Lower-capacity but high-quality products should be offered to those customers with limited ability to pay. Costs should never be reduced by compromising quality or by decreasing support services. Where low-cost systems are offered, customers need to be fully aware of limitations.
• Adopt technology innovations. Adopt new technologies that offer better quality and more reliable services. Examples include LED lighting, DC appliances, flat screen DC TVs, lithium batteries, and integrated SHS ‘plug-and-play’ kits. Adopt technologies such as PAYG that can reduce cost of doing business and reduce financial risks. Prevent barriers such as a singular focus on indigenizing or high import duties from introducing imported new technology.
• Create consumer awareness. Do not oversell SHS capabilities. User education is essential for an SHS program’s success. Providing information and training on simple maintenance and safe operating procedures system is essential.
Overcome the cost barrier
• Recognize that SHS cannot compete with grid electricity. It is nearly impossible for SHS sold on a commercial basis to compete with grid electricity promising unlimited electricity at low tariffs. Even if electricity tariffs are not subsidized, the cost of SHS sold commercially at the marginal cost cannot compete with tariffs that are based on average costs to a large customer base rather than the marginal cost of new rural customers.
• Offer term credit and affordable payment schemes. Due to the high first costs of SHS, offer multi-month- or multiyear-term credit that better approximates the household expenditure patterns. Otherwise, only the better-off households will be able to participate.
• Take care with grants and subsidies. To ensure sustainable programs, such assistance should be used to build market infrastructure or limited equity to reduce the capital costs. Operating costs should not be subsidized. The analysis of stakeholder impacts will help identify groups whose transition to the SHS will be appropriately assisted by grants and subsidies.
• Remove discriminatory taxes and duties. Level the playing field—governments should rationalize duties and taxes if these discriminate among electrification options. While recognizing political issues in changing tax and duty structures, the analysis makes clear the drag that government’s failure to make appropriate and timely changes placed on the market creation objectives of the SHS Program. As noted previously, taxes on SHS systems added 12 percent to the price while kerosene subsidies are a disincentive to the poorer segment of the population to adopt SHS that offer far superior lighting services.
70
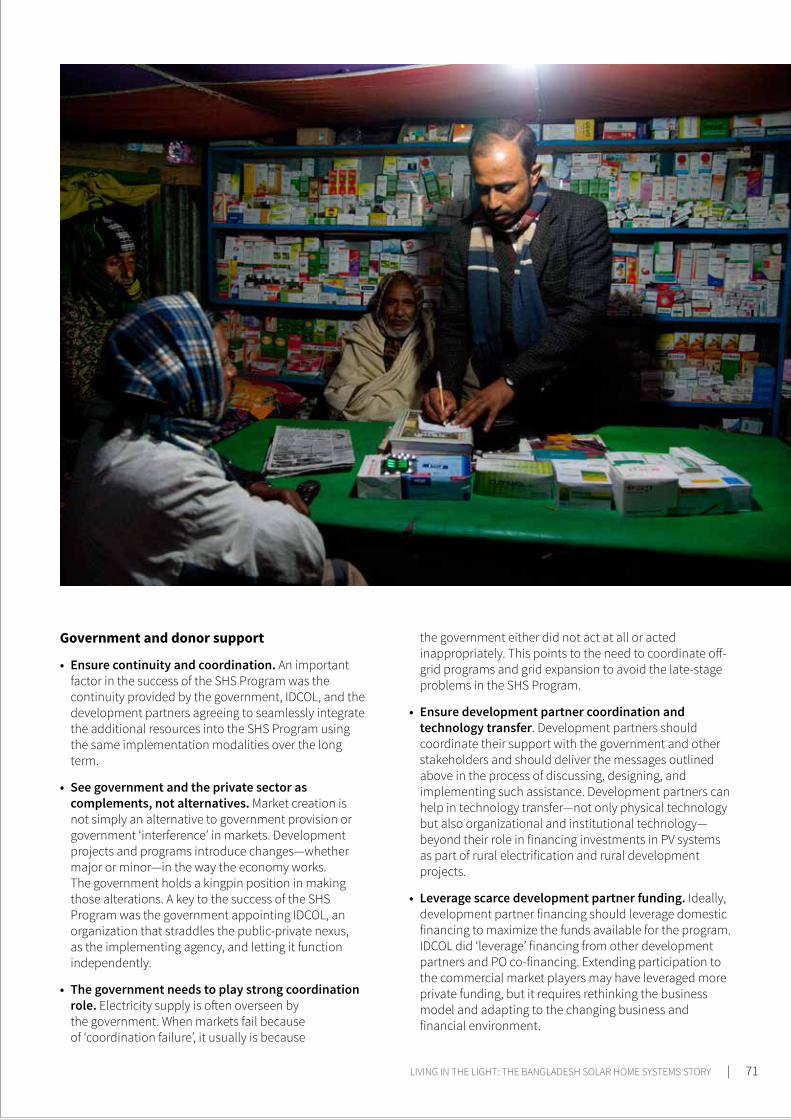
Government and donor support
• Ensure continuity and coordination. An important factor in the success of the SHS Program was the continuity provided by the government, IDCOL, and the development partners agreeing to seamlessly integrate the additional resources into the SHS Program using the same implementation modalities over the long term.
• See government and the private sector as complements, not alternatives. Market creation is not simply an alternative to government provision or government ‘interference’ in markets. Development projects and programs introduce changes—whether major or minor—in the way the economy works. The government holds a kingpin position in making those alterations. A key to the success of the SHS Program was the government appointing IDCOL, an organization that straddles the public-private nexus, as the implementing agency, and letting it function independently.
• The government needs to play strong coordination role. Electricity supply is often overseen by the government. When markets fail because of ‘coordination failure’, it usually is because
the government either did not act at all or acted inappropriately. This points to the need to coordinate off-grid programs and grid expansion to avoid the late-stage problems in the SHS Program.
• Ensure development partner coordination and technology transfer. Development partners should coordinate their support with the government and other stakeholders and should deliver the messages outlined above in the process of discussing, designing, and implementing such assistance. Development partners can help in technology transfer—not only physical technology but also organizational and institutional technology—beyond their role in financing investments in PV systems as part of rural electrification and rural development projects.
• Leverage scarce development partner funding. Ideally, development partner financing should leverage domestic financing to maximize the funds available for the program. IDCOL did ‘leverage’ financing from other development partners and PO co-financing. Extending participation to the commercial market players may have leveraged more private funding, but it requires rethinking the business model and adapting to the changing business and financial environment.
LIVING IN THE LIGHT: THE BANGLADESH SOLAR HOME SYSTEMS STORY | 71

72
REFERENCES
LIVING IN THE LIGHT: THE BANGLADESH SOLAR HOME SYSTEMS STORY | 73
REFERENCES
Alam, Mahbub. 2013. Bangladesh Solar Home Systems: Transition to Commercial Financing. Draft report. Dhaka, Bangladesh: IDCOL.
Asaduzzaman, M., M. Yunus, AKE Haque, AKM Abdul Malek Azad, S. Neelormi, and Md. A. Hossain. 2013. Power from the Sun: An Evaluation of Institutional Effectiveness and Impact of Solar Home Systems in Bangladesh. Dhaka, Bangladesh: Bangladesh Institute of Development Studies Report to the World Bank. https://www.sun-connect-news.org/fileadmin/DATEIEN/Dateien/New/Bangladesh_Idcol_Assessment.pdf.
Bangladesh Bureau of Statistics. 2015. Population and Housing Census 2011. Bangladesh Ministry of Planning, Dhaka: Bangladesh. http://bbs.dhaka.gov.bd/sites/default/files/files/bbs.dhaka.gov.bd/law_policy/6ed6b42c_2015_11e7_8f57_286ed488c766/Socio-Economic%20and%20demographic%20Report%202012.pdf
BIDS (Bangladesh Institute of Development Studies). 2012. Household Survey Data on Impact Evaluation of Solar Home Systems in Bangladesh. Report for World Bank. Washington, DC.
Bangladesh Institute of Development Studies and International Institute for Sustainable Development. 2012. A Citizens’ Guide to Energy Subsidies in Bangladesh. Winnipeg, Manitoba, Canada: IISD Global Subsidies Initiative. https://www.iisd.org/publications/citizens-guide-energy-subsidies-bangladesh
BIDS Team. 2018. “Assessing the Current Situation of Solar Home System (SHS) Program of IDCOL and Recommending Action Plan”. Principal Authors: Monzur Hossain, M. Asaduzzaman, Mohammad Yunus, Jamaluddin Ahmed, Kazi Ershadul Alam, Zabid Iqbal and Paritosh Kumar Roy. Report to Infrastructure Development Company Ltd, Dhaka, Bangladesh.
Beaubien, J. 2019. “They Pump $15 Billion A Year into Bangladesh’s Economy — But at What Cost?” NPR. https://www.npr.org/sections/goatsandsoda/2019/06/03/722085193/they-pump-15-billion-a-year-into-bangladeshs-economy-but-at-what-cost. June 3, 2019.
Bond T.C., C. Zarzycki, M. G. Flanner, D. M. Kock. 2011. “Quantifying Immediate Radiative Forcing by Black Carbon and Organic Matter with the Specific Forcing Pulse.” Atmospheric Chemistry and Physics 11:1505–1525. https://acp.copernicus.org/articles/11/1505/2011/
Cabraal, A. 1996. Bangladesh: Application of Renewable Energy. Back-to-Office Report to Per Ljung, Chief SA1EF. Washington DC, United States: World Bank.
CEIC. 2020. Bangladesh HIES: Average Household Size. New York, NY, United States. https://www.ceicdata.com/en/bangladesh/household-income-and-expenditure-survey-number-of-household-by-size/hies-average-household-size.
Dhaka Tribune. 2019. “Government to import 1.42m tons of Petroleum by June.” https://www.dhakatribune.com/business/2019/01/27/government-to-import-1-42m-tons-of-petroleum-by-june. January 27, 2019.
74
Economist Intelligence Unit. 2018. Can Bangladesh Overcome Its Energy Deficit? https://country.eiu.com/article.aspx?articleid=607103844&Country=Bangladesh&topic=Economy.
Energia. 2019. Gender and Fossil Fuel Subsidy Reform: Findings from and Recommendations for Bangladesh, India, and Nigeria. https://www.energia.org/cm2/wp-content/uploads/2019/05/RA4_Gender-and-fossil-fuel-subsidy-reform_without-Annex-2.pdf.
Energypedia. 2019. The Reduction of Kerosene Lamp Emissions through Solar Lighting. 22 January 2019. https://energypedia.info/wiki/The_Reduction_of_Kerosene_Lamp_Emissions_through_Solar_Lighting.
Eusuf, M. n.d. Dissemination of Solar PV Systems in Bangladesh: A Case Study: Narsingdi Solar PV Systems. UNDP Sustainable Development Networking Programme. http://www.sdnbd.org/pv_in_narsingdi.htm.
General Economics Division of Planning Commission. 2012. Perspective Plan of Bangladesh 2010–2021: Making Vision 2021 a Reality. Dhaka, Bangladesh: GOB. https://policy.asiapacificenergy.org/sites/default/files/Perspective%20Plan_Final.pdf.
GOB (Government of Bangladesh). 1972. Constitution of the Peoples’ Republic of Bangladesh: Part II Fundamental Principles of State Policy. Dhaka, Bangladesh: Government of Bangladesh. http://www.commonlii.org/bd/legis/const/2004/part2.html
GOB. 2012. Sustainable and Renewable Energy Development Authority Act No. 48 of 2012. https://www.dpp.gov.bd/upload_file/gazettes/10720_39500.pdf
Grameen Shakti. 2012. Renewable Energy Solutions in Bangladesh. https://static1.squarespace.com/static/51bef39fe4b010d205f84a92/t/576936cfff7c5085d0a35c14/1466513104098/4_Grameen+Shakti.pdf.
GVEP International and Insensus. 2016. PAYG Technology Introduction for IDCOL Market in Bangladesh. Report to IDCOL. London, United Kingdom: Global Village Energy Partnership (now Energy for Impact).
Haque, M. A. 2020. Bangladesh Power Sector: An appraisal from a multi-dimensional perspective (part-1). Dhaka, Bangladesh: EBL Securities. https://www.arx.cfa/-/media/regional/arx/post-pdf/2020/09/03/bangladesh-power-sector-an-appraisal-from-a-multi-dimensional-perspective.ashx?la=en&hash=0FA01602944BF9832225FFD52BAEE5B241C47861
IDCOL. 2006-2018. “Annual Reports”. Reports issued to shareholders, Dhaka, Bangladesh. http://www.idcol.org/home/an_report.
IDCOL. 2018. IDCOL Solar Home Systems Program: Present Status and Way Forward. Report to IDCOL Board, Dhaka, Bangladesh.
IDCOL. October 2020. “SHS Program Updated Suppliers List”. Version as of October 1, 2020. https://idcol.org/home/downloads/solar.
IEG. 2014. ICR Review: Sri Lanka Renewable Energy for Rural Economic Development. Washington, DC: World Bank. http://documents.worldbank.org/curated/en/830571474939221498/pdf/000180307-20141120032100.pdf.
IEG (Independent Evaluation Group). 2008. The Welfare Impact of Rural Electrification: A Reassessment of the Costs and Benefits. Washington, DC: World Bank. https://openknowledge.worldbank.org/bitstream/handle/10986/6519/454000PUB0978011PUBLIC10Mar06102008.pdf?sequence=1&isAllowed=y.
Energypedia. 2015. Jawaharlal Nehru National Solar Mission. July 10, 2015. https://energypedia.info/wiki/Jawaharlal_Nehru_National_Solar_Mission.
IEA (International Energy Agency). 2014. IEA Statistics. https://www.iea.org/countries/Bangladesh/.
Islam, M. 2002. “Utilization of Renewable Energies in Bangladesh”. In Shakti: Energy Website of Bangladesh. https://citeseerx.ist.psu.edu/viewdoc/download?doi=10.1.1.197.5569&rep=rep1&type=pdf.
Islam, S. M. Monirul. 2019. “IDCOL Solar Home System Program.” Presentation at Pattaya, Thailand, revised by IDCOL and authors.
LIVING IN THE LIGHT: THE BANGLADESH SOLAR HOME SYSTEMS STORY | 75
REFERENCES
Kaldor, Nicholas, “Capital Accumulation and Economic Growth,” in F.A. Lutz and D.C. Hague, eds., The Theory of Capital, St. Martin’s Press, 1961, pp. 177–222.
Keystone Business Support Company Limited. 2018. Bangladesh Rural Electrification and Renewable Energy Development- MFD Analysis Report and Annex. Report to the World Bank. Dhaka, Bangladesh.
Khander, S. R., H.A. Samad, Z.K.M. Sadeque, M. Asaduzzaman, M. Yunus and A. K. E. Haque. 2014. “Surge in Solar-Powered Homes: Experience in Off-grid Bangladesh,” In Directions in Development, Energy and Mining, Chapter 4. Washington, DC: World Bank. http://documents.worldbank.org/curated/en/871301468201262369/pdf/Surge-in-solar-powered-homes-experience-in-off-grid-rural-Bangladesh.pdf.
Lighting Global, GOGLA, and ESMAP, in collaboration with Vivid Economics and Open Capital Advisors. 2020. Off-grid Solar Market Trends Report 2020. Produced by Lighting Global, GOGLA, and ESMAP in collaboration with Vivid Economics and Open Capital Advisors. Washington, DC. https://www.lightingglobal.org/wp-content/uploads/2020/03/VIVID%20OCA_2020_Off_Grid_Solar_Market_Trends_Report_Full_High.pdf.
Marro, Peter, and Natalie Bertsch. 2015. “Making Renewable Energy a Success in Bangladesh: Getting the Business Model Right.” ADB South Asia Working Paper Series No. 41, Manila, The Philippines. https://sun-connect-news.org/fileadmin/DATEIEN/Dateien/New/ADB-making-renewable-energy-success.pdf.
Meier, Peter. 2003. Economic Analysis of Solar Home Systems: A Case Study for the Philippines. In Chapter 3 of Report to World Bank Asia Alternative Energy Unit, Washington DC. http://documents1.worldbank.org/curated/en/820381468234277260/pdf/345410PH0Economic1Solar1Home.pdf
Mills, Evan. 2003. Technical and Economic Performance Analysis of Kerosene Lamps and Alternative Approaches to Illumination in Developing Countries. Berkeley, CA, United States: Lawrence Berkeley National Laboratory, University of California. http://large.stanford.edu/courses/2011/ph240/machala1/docs/offgrid-lighting.pdf.
Moazzem, K. G. and Mohammad Ali. 2019. “The Power and Energy Sector of Bangladesh: Challenges of Moving beyond the Transition Stage.” Paper presented at “Power and Energy Sector: Immediate Issues and Challenges,” Dhaka, Bangladesh: Centre for Policy Dialogue (CPD). https://cpd.org.bd/wp-content/uploads/2019/03/The-Power-and-Energy-Sector-of-Bangladesh.pdf.
Musgrave, Richard A. 1959. The Theory of Public Finance: A Study in Public Economy. New York, New York: McGraw-Hill Book Company.
National Renewable Energy Laboratory. 2018. U.S. Solar Photovoltaic System Cost: Benchmark: Q1 2018. Technical Report NREL/TP-6A20-72399, Golden, CO, United States. https://www.nrel.gov/docs/fy19osti/72399.pdf.
Power Cell. n.d. Vision Statement. Ministry of Power, Energy and Mineral Resources, Government of Bangladesh, Dhaka, Bangladesh. https://powerdivision.portal.gov.bd/sites/default/files/files/powerdivision.portal.gov.bd/page/f6d0e100_e2d8_47e7_b7cd_e292ea6395d3/4.%20VSPSPSectorReform.pdf.
Quak, E. 2018. The Costs and Benefits of Lighting and Electricity Services for Off-grid Populations in Sub-Sahara Africa. K4D Helpdesk Report. Brighton, United Kingdom: Institute of Development Studies. https://assets.publishing.service.gov.uk/media/5af96657ed915d0df4e8cdea/Costs_Benefits_Off-Grid_Electricity_Lighting_Systems.pdf.
Razzak, N., Md. Mamun-ur-Rashid, and Niloy R Biswas. 2012. Gender Responsive Social Assessment for Bangladesh Rural Electrification and Renewable Energy Development II Project. Dhaka, Bangladesh: BRAC University.
Renewable Energy World. 2017. “As Pay-as-you-go Solar Proliferates, Here Are 7 Lessons for Business Success.” December 12, 2017. https://www.renewableenergyworld.com/ugc/articles/2017/12/01/bolstering-payg-agent-networks-7-lessons-learned-from-other-industries.html.
Risad, M. 2017. Power Tariff to Hike Again from December 1st. Dhaka, Bangladesh: Energy Bangla. https://energybangla.com/power-prices-hiked-again/.
Regan, Ryan. 2018. “Innovations Spur Era of Rapidly Declining Solar Costs.” Solar Tribune, April 11, 2018. https://solartribune.com/residential-solar-cost-trends/.
76
Samad, Hussain A., Shahidur R. Khandker, M. Asaduzzaman, and Mohammad Yunus. 2013. “The Benefits of Solar Home Systems: An Analysis from Bangladesh.” Policy Research Working Paper 6724, World Bank, Washington, DC. http://documents.worldbank.org/curated/en/656991467998808205/pdf/WPS6724.pdf.
Susrut. 2019. “What Is the Cost of Shipping Oil by Tanker.” Cost Finder. January 26, 2019. http://cost-finder.com/what-is-the-cost-of-shipping-oil-by-tanker/.
TSC (Technical Standards Committee). 2017. Technical Specifications for Solar Home System. Dhaka, Bangladesh: IDCOL. http://idcol.org/download/08da7f64cdb13269790a514f5a0cdd34.pdf.
The Economist. 2012. “The Rise of Solar Energy.” December 20, 2012. https://www.economist.com/graphic-detail/2012/12/28/pricing-sunshine.
U.S. Environmental Protection Agency. 2014. “Emission Factors for Greenhouse Gas Inventories.” April 4, 2014. Washington, DC: EPA. https://www.epa.gov/sites/production/files/2015-07/documents/emission-factors_2014.pdf.
UNFCC. 2013. “Grameen Shakti SHS Project CDM application.” 2765 CPA CER Sheet. https://cdm.unfccc.int/UserManagement/FileStorage/MG04Y2DKQ7CXSZ9RTW6LENOJFAV3H8.
Vechasart, R. and S. Suttisom. 2014. Rural Electrification in Thailand: Policy and Implementation. https://www.iitk.ac.in/ime/anoops/for14/PPTs/Day%20-%205%20Bangkok/RE%20in%20Thailand%20-Policy%20and%20Implementation%20-%20Mr.%20Reungvith%20Vechasart.pdf.
Ward, William A. 2019. “Cost-Benefit Analysis Theory versus Practice at the World Bank, 1960–2015.” Journal of Benefit Cost Analysis 10 (1): 124–144. https://www.cambridge.org/core/journals/journal-of-benefit-cost-analysis/article/costbenefit-analysis-theory-versus-practice-at-the-world-bank-1960-to-2015/C0F1838DEFCD0D44C6FCFDBB1BFD3072.
Ward, William A., and Mehdi Al Bazzaz. 1986 Rev. Ed. “Containers Corporation of the Caribbean: Project Economic and Policy Analysis Case Study.” IE-5234P and IE-5234-S, EDI Case Studies and Exercise Series. Washington, DC: Economic Development Institute, World Bank.
Wilson, Margaret, John Besant Jones, and Pierre Audinet. 2010. A New Slant on Slopes Measuring the Benefits of Increased Electricity Access in Developing Countries. ESMAP Report No. 53963-GLB. Washington, DC: World Bank. http://documents.worldbank.org/curated/en/603961468152701050/pdf/539630ESW0Gray10Disclosed0414120111.pdf.
World Bank. 2002. Bangladesh Rural Electrification and Renewable Energy Development Project. Project Appraisal Document. Washington DC: World Bank. http://documents.worldbank.org/curated/en/226581468741678811/pdf/multi0page.pdf.
World Bank. 2011. Peru Second Electrification Project. Project Appraisal Document. Washington, DC: World Bank. http://documents.worldbank.org/curated/en/550011468325218624/pdf/601540PAD0P1171OFFICIAL0USE0ONLY191.pdf.
World Bank. 2015. Myanmar Electrification Project. Project Appraisal Document. Washington, DC: World Bank. http://documents.worldbank.org/curated/en/149061468191334165/pdf/PAD1410-CORRIGENDUM-IDA-R2015-0237-2-Box393200B-OUO-9.pdf.
World Bank. 2016. Technical Note on Discounting Costs and Benefits in Economic Analysis of World Bank Projects. OPSPQ. Washington, DC: World Bank.
World Bank. 2017. Guidance Note on the Shadow Price of Carbon. Washington, DC: World Bank. http://documents.worldbank.org/curated/en/621721519940107694/pdf/2017-Shadow-Price-of-Carbon-Guidance-Note.pdf.
World Bank. 2018. Peru Second Electrification Project Implementation Completion Report. Washington, DC: World Bank. http://documents.worldbank.org/curated/en/427001520273463728/pdf/ICR00004397-03012018.pdf.
LIVING IN THE LIGHT: THE BANGLADESH SOLAR HOME SYSTEMS STORY | 77
78
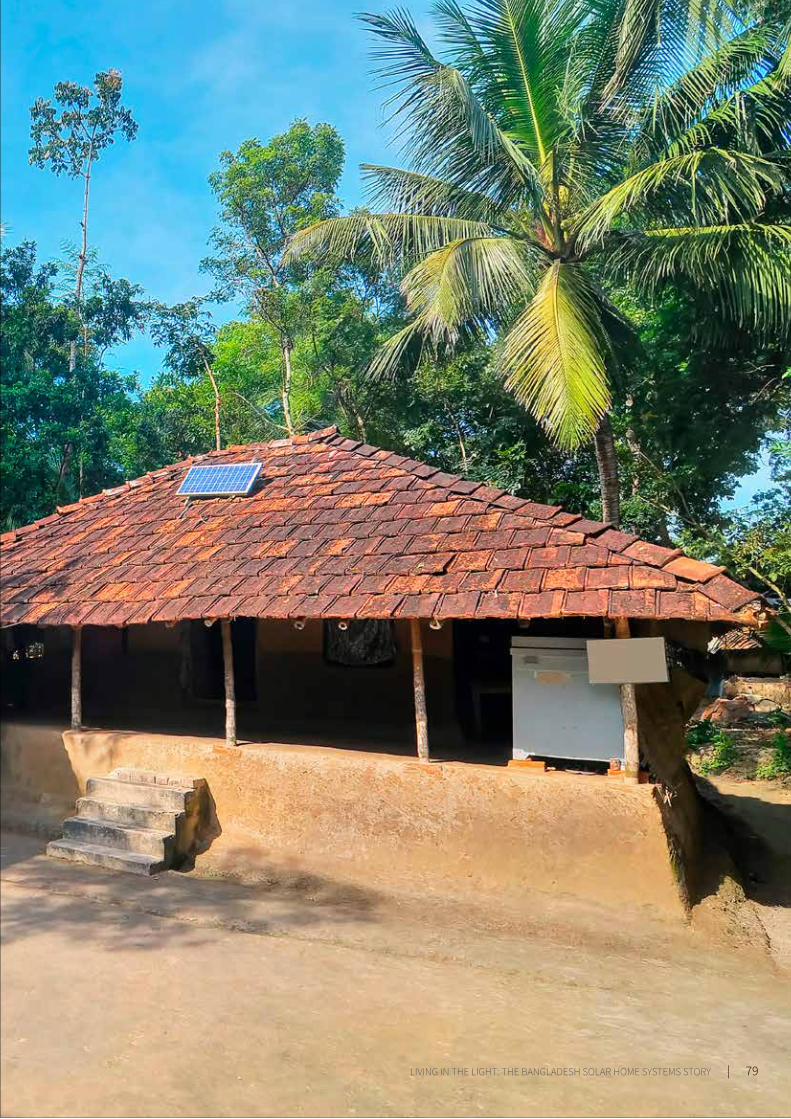
LIVING IN THE LIGHT: THE BANGLADESH SOLAR HOME SYSTEMS STORY | 79
80
APPENDIX
APPENDIX A: Partner Organizations and Year of Appointment 80
APPENDIX B: PO Selection Criteria 81
APPENDIX C: Risks and Risk Mitigation in the SHS Program 82
APPENDIX D: Methodological Issues and Assumptions in Economic and Financial Analysis 94
APPENDIX E: Estimate of Indicative Net Financial Benefits to IDCOL from SHS Program Management 105
APPENDIX F: Impact on GOB Treasury from SHS Program Loan Transactions 108
LIVING IN THE LIGHT: THE BANGLADESH SOLAR HOME SYSTEMS STORY | 81
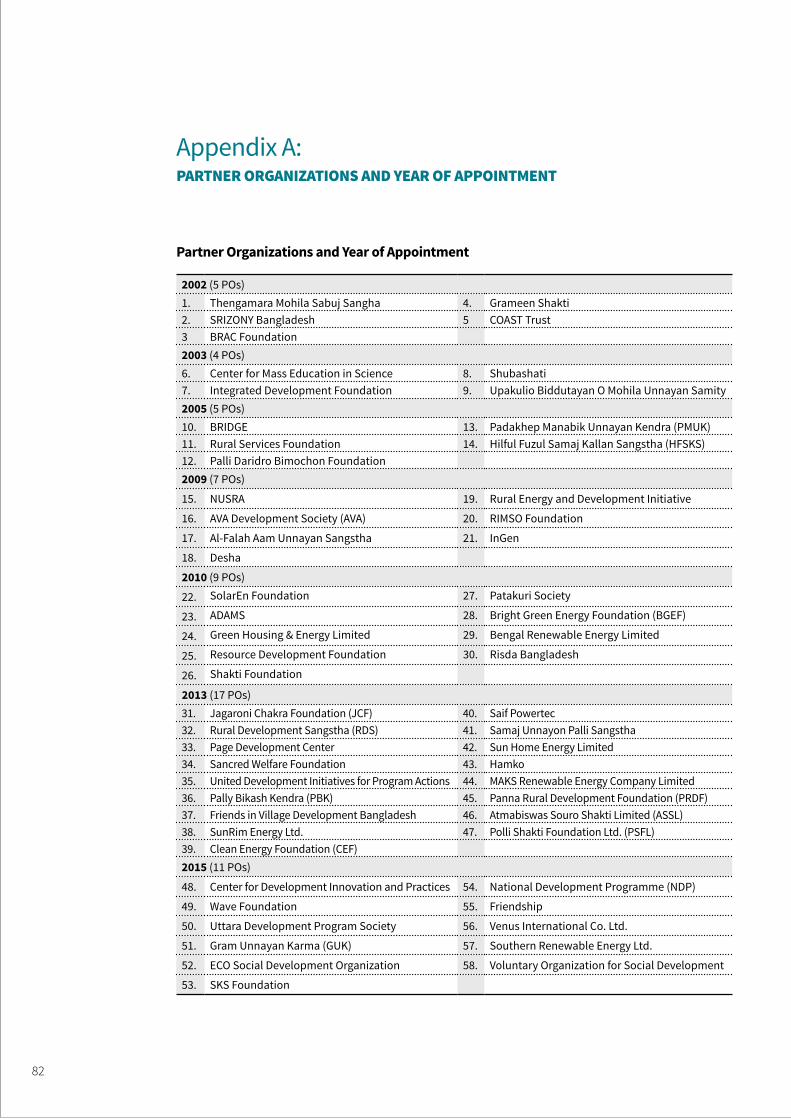
Appendix A: PARTNER ORGANIZATIONS AND YEAR OF APPOINTMENT
Partner Organizations and Year of Appointment
2002 (5 POs)1. Thengamara Mohila Sabuj Sangha 4. Grameen Shakti2. SRIZONY Bangladesh 5 COAST Trust3 BRAC Foundation2003 (4 POs)6. Center for Mass Education in Science 8. Shubashati7. Integrated Development Foundation 9. Upakulio Biddutayan O Mohila Unnayan Samity2005 (5 POs)10. BRIDGE 13. Padakhep Manabik Unnayan Kendra (PMUK)11. Rural Services Foundation 14. Hilful Fuzul Samaj Kallan Sangstha (HFSKS)12. Palli Daridro Bimochon Foundation2009 (7 POs)
15. NUSRA 19. Rural Energy and Development Initiative
16. AVA Development Society (AVA) 20. RIMSO Foundation
17. Al-Falah Aam Unnayan Sangstha 21. InGen
18. Desha
2010 (9 POs)
22. SolarEn Foundation 27. Patakuri Society
23. ADAMS 28. Bright Green Energy Foundation (BGEF)
24. Green Housing & Energy Limited 29. Bengal Renewable Energy Limited
25. Resource Development Foundation 30. Risda Bangladesh
26. Shakti Foundation
2013 (17 POs)31. Jagaroni Chakra Foundation (JCF) 40. Saif Powertec32. Rural Development Sangstha (RDS) 41. Samaj Unnayon Palli Sangstha33. Page Development Center 42. Sun Home Energy Limited 34. Sancred Welfare Foundation 43. Hamko35. United Development Initiatives for Program Actions 44. MAKS Renewable Energy Company Limited36. Pally Bikash Kendra (PBK) 45. Panna Rural Development Foundation (PRDF)37. Friends in Village Development Bangladesh 46. Atmabiswas Souro Shakti Limited (ASSL)38. SunRim Energy Ltd. 47. Polli Shakti Foundation Ltd. (PSFL)39. Clean Energy Foundation (CEF)2015 (11 POs)
48. Center for Development Innovation and Practices 54. National Development Programme (NDP)
49. Wave Foundation 55. Friendship
50. Uttara Development Program Society 56. Venus International Co. Ltd.
51. Gram Unnayan Karma (GUK) 57. Southern Renewable Energy Ltd.
52. ECO Social Development Organization 58. Voluntary Organization for Social Development
53. SKS Foundation
82
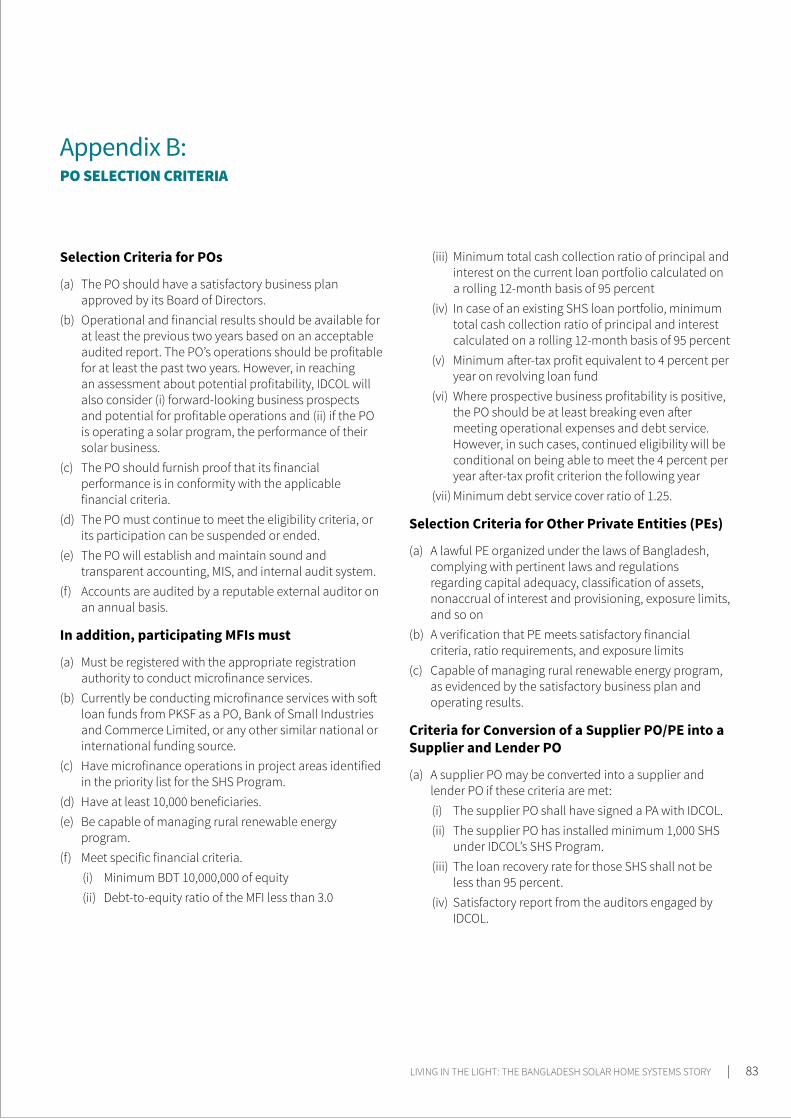
Appendix B: PO SELECTION CRITERIA
Selection Criteria for POs
(a) The PO should have a satisfactory business plan approved by its Board of Directors.
(b) Operational and financial results should be available for at least the previous two years based on an acceptable audited report. The PO’s operations should be profitable for at least the past two years. However, in reaching an assessment about potential profitability, IDCOL will also consider (i) forward-looking business prospects and potential for profitable operations and (ii) if the PO is operating a solar program, the performance of their solar business.
(c) The PO should furnish proof that its financial performance is in conformity with the applicable financial criteria.
(d) The PO must continue to meet the eligibility criteria, or its participation can be suspended or ended.
(e) The PO will establish and maintain sound and transparent accounting, MIS, and internal audit system.
(f) Accounts are audited by a reputable external auditor on an annual basis.
In addition, participating MFIs must
(a) Must be registered with the appropriate registration authority to conduct microfinance services.
(b) Currently be conducting microfinance services with soft loan funds from PKSF as a PO, Bank of Small Industries and Commerce Limited, or any other similar national or international funding source.
(c) Have microfinance operations in project areas identified in the priority list for the SHS Program.
(d) Have at least 10,000 beneficiaries.(e) Be capable of managing rural renewable energy
program.(f) Meet specific financial criteria.
(i) Minimum BDT 10,000,000 of equity(ii) Debt-to-equity ratio of the MFI less than 3.0
(iii) Minimum total cash collection ratio of principal and interest on the current loan portfolio calculated on a rolling 12-month basis of 95 percent
(iv) In case of an existing SHS loan portfolio, minimum total cash collection ratio of principal and interest calculated on a rolling 12-month basis of 95 percent
(v) Minimum after-tax profit equivalent to 4 percent per year on revolving loan fund
(vi) Where prospective business profitability is positive, the PO should be at least breaking even after meeting operational expenses and debt service. However, in such cases, continued eligibility will be conditional on being able to meet the 4 percent per year after-tax profit criterion the following year
(vii) Minimum debt service cover ratio of 1.25.
Selection Criteria for Other Private Entities (PEs)
(a) A lawful PE organized under the laws of Bangladesh, complying with pertinent laws and regulations regarding capital adequacy, classification of assets, nonaccrual of interest and provisioning, exposure limits, and so on
(b) A verification that PE meets satisfactory financial criteria, ratio requirements, and exposure limits
(c) Capable of managing rural renewable energy program, as evidenced by the satisfactory business plan and operating results.
Criteria for Conversion of a Supplier PO/PE into a Supplier and Lender PO
(a) A supplier PO may be converted into a supplier and lender PO if these criteria are met:(i) The supplier PO shall have signed a PA with IDCOL.(ii) The supplier PO has installed minimum 1,000 SHS
under IDCOL’s SHS Program.(iii) The loan recovery rate for those SHS shall not be
less than 95 percent.(iv) Satisfactory report from the auditors engaged by
IDCOL.
LIVING IN THE LIGHT: THE BANGLADESH SOLAR HOME SYSTEMS STORY | 83
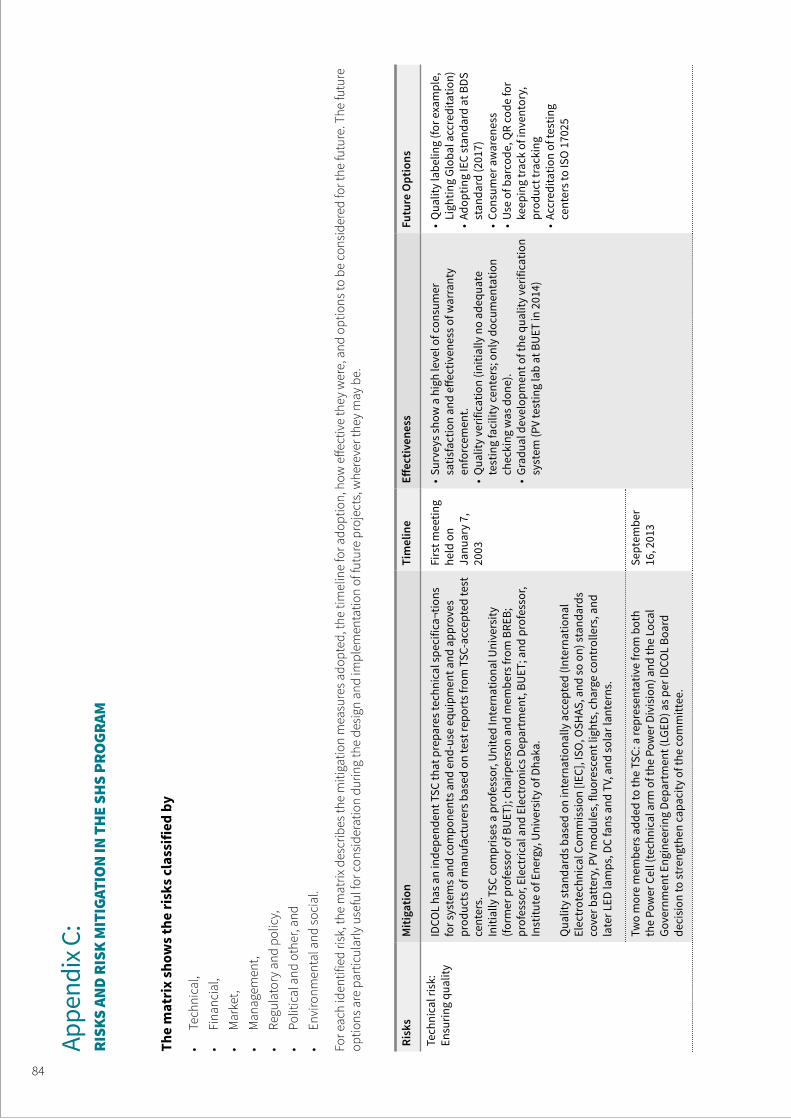
Appe
ndix
C:
RISK
S AN
D RI
SK M
ITIG
ATIO
N IN
TH
E SH
S PR
OGR
AM
The
mat
rix
show
s the
risk
s cla
ssifi
ed b
y
• Te
chni
cal,
• Fi
nanc
ial,
• M
arke
t,•
Man
agem
ent,
• Re
gula
tory
and
pol
icy,
• Po
litic
al a
nd o
ther
, and
• En
viro
nmen
tal a
nd so
cial
.
For e
ach
iden
tifie
d ris
k, th
e m
atrix
des
crib
es th
e m
itiga
tion
mea
sure
s ado
pted
, the
tim
elin
e fo
r ado
ptio
n, h
ow e
ffect
ive
they
wer
e, a
nd o
ptio
ns to
be
cons
ider
ed fo
r the
futu
re. T
he fu
ture
op
tions
are
par
ticul
arly
use
ful f
or c
onsi
dera
tion
durin
g th
e de
sign
and
impl
emen
tatio
n of
futu
re p
roje
cts,
whe
reve
r the
y m
ay b
e.
Risk
sM
itiga
tion
Tim
elin
eEff
ectiv
enes
sFu
ture
Opt
ions
Tech
nica
l ris
k:
Ensu
ring
qual
ityID
COL
has a
n in
depe
nden
t TSC
that
pre
pare
s tec
hnic
al sp
ecifi
ca¬t
ions
fo
r sys
tem
s and
com
pone
nts a
nd e
nd-u
se e
quip
men
t and
app
rove
s pr
oduc
ts o
f man
ufac
ture
rs b
ased
on
test
repo
rts f
rom
TSC
-acc
epte
d te
st
cent
ers.
In
itial
ly T
SC co
mpr
ises
a p
rofe
ssor
, Uni
ted
Inte
rnat
iona
l Uni
vers
ity
(form
er p
rofe
ssor
of B
UET
); ch
airp
erso
n an
d m
embe
rs fr
om B
REB;
pr
ofes
sor,
Elec
tric
al a
nd E
lect
roni
cs D
epar
tmen
t, BU
ET; a
nd p
rofe
ssor
, In
stitu
te o
f Ene
rgy,
Uni
vers
ity o
f Dha
ka.
Qua
lity
stan
dard
s bas
ed o
n in
tern
atio
nally
acc
epte
d (In
tern
atio
nal
Elec
trot
echn
ical
Com
mis
sion
[IEC
], IS
O, O
SHAS
, and
so o
n) st
anda
rds
cove
r bat
tery
, PV
mod
ules
, flu
ores
cent
ligh
ts, c
harg
e co
ntro
llers
, and
la
ter L
ED la
mps
, DC
fans
and
TV,
and
sola
r lan
tern
s.
Firs
t mee
ting
held
on
Janu
ary
7,
2003
• Su
rvey
s sho
w a
hig
h le
vel o
f con
sum
er
satis
fact
ion
and
effec
tiven
ess o
f war
rant
y en
forc
emen
t.•
Qua
lity
verif
icat
ion
(initi
ally
no
adeq
uate
te
stin
g fa
cilit
y ce
nter
s; o
nly
docu
men
tatio
n ch
ecki
ng w
as d
one)
. •
Grad
ual d
evel
opm
ent o
f the
qua
lity
verif
icat
ion
syst
em (P
V te
stin
g la
b at
BU
ET in
201
4)
• Q
ualit
y la
belin
g (fo
r exa
mpl
e,
Ligh
ting
Glob
al a
ccre
dita
tion)
• Ad
optin
g IE
C st
anda
rd a
t BDS
st
anda
rd (2
017)
• Co
nsum
er a
war
enes
s•
Use
of b
arco
de, Q
R co
de fo
r ke
epin
g tr
ack
of in
vent
ory,
pr
oduc
t tra
ckin
g•
Accr
edita
tion
of te
stin
g ce
nter
s to
ISO
170
25
Two
mor
e m
embe
rs a
dded
to th
e TS
C: a
repr
esen
tativ
e fro
m b
oth
the
Pow
er C
ell (
tech
nica
l arm
of t
he P
ower
Div
isio
n) a
nd th
e Lo
cal
Gove
rnm
ent E
ngin
eerin
g De
part
men
t (LG
ED) a
s per
IDCO
L Bo
ard
deci
sion
to st
reng
then
cap
acity
of t
he co
mm
ittee
.
Sept
embe
r 16
, 201
3
84
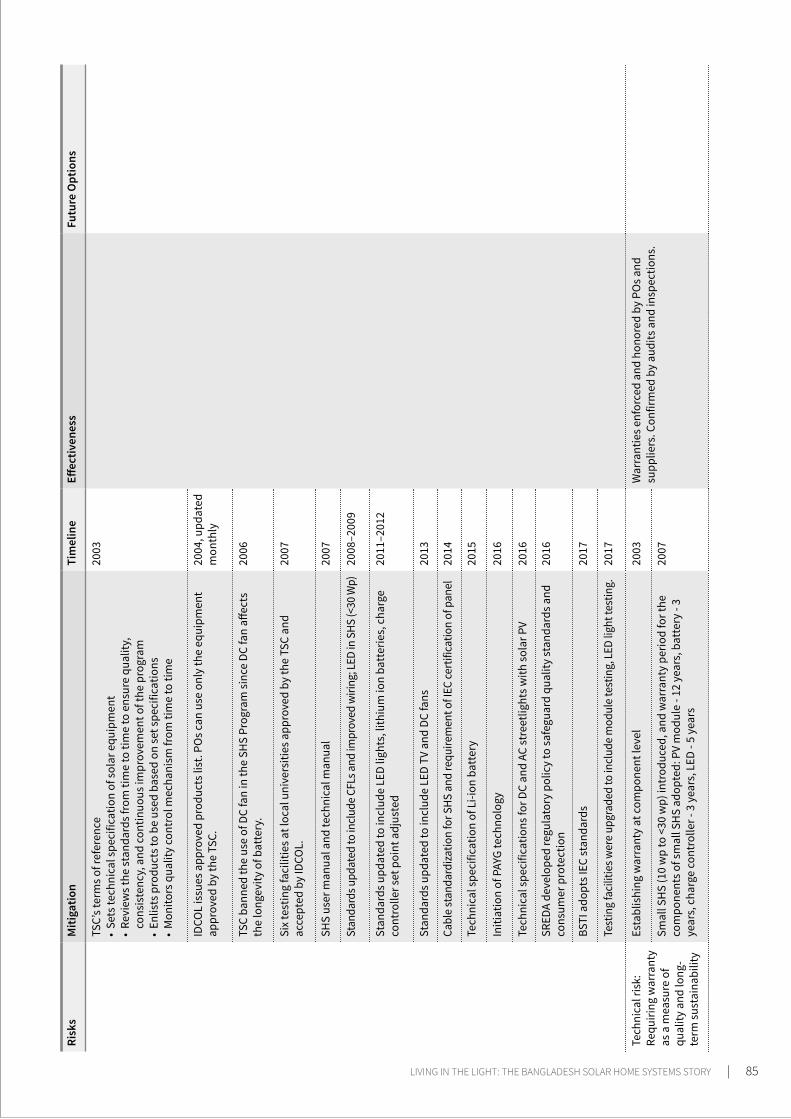
Risk
sM
itiga
tion
Tim
elin
eEff
ectiv
enes
sFu
ture
Opt
ions
TSC’
s ter
ms o
f ref
eren
ce•
Sets
tech
nica
l spe
cific
atio
n of
sola
r equ
ipm
ent
• Re
view
s the
stan
dard
s fro
m ti
me
to ti
me
to e
nsur
e qu
ality
, co
nsis
tenc
y, a
nd co
ntin
uous
impr
ovem
ent o
f the
pro
gram
• En
lists
pro
duct
s to
be u
sed
base
d on
set s
peci
ficat
ions
• M
onito
rs q
ualit
y co
ntro
l mec
hani
sm fr
om ti
me
to ti
me
2003
IDCO
L is
sues
app
rove
d pr
oduc
ts li
st. P
Os c
an u
se o
nly
the
equi
pmen
t ap
prov
ed b
y th
e TS
C.
2004
, upd
ated
m
onth
ly
TSC
bann
ed th
e us
e of
DC
fan
in th
e SH
S Pr
ogra
m si
nce
DC fa
n aff
ects
th
e lo
ngev
ity o
f bat
tery
.20
06
Six
test
ing
faci
litie
s at l
ocal
uni
vers
ities
app
rove
d by
the
TSC
and
acce
pted
by
IDCO
L.20
07
SHS
user
man
ual a
nd te
chni
cal m
anua
l20
07
Stan
dard
s upd
ated
to in
clud
e CF
Ls a
nd im
prov
ed w
iring
; LED
in S
HS (<
30 W
p)20
08–2
009
Stan
dard
s upd
ated
to in
clud
e LE
D lig
hts,
lith
ium
ion
batt
erie
s, c
harg
e co
ntro
ller s
et p
oint
adj
uste
d20
11–2
012
Stan
dard
s upd
ated
to in
clud
e LE
D TV
and
DC
fans
2013
Cabl
e st
anda
rdiza
tion
for S
HS a
nd re
quire
men
t of I
EC ce
rtifi
catio
n of
pan
el20
14
Tech
nica
l spe
cific
atio
n of
Li-i
on b
atte
ry20
15
Initi
atio
n of
PAY
G te
chno
logy
2016
Tech
nica
l spe
cific
atio
ns fo
r DC
and
AC st
reet
light
s with
sola
r PV
2016
SRED
A de
velo
ped
regu
lato
ry p
olic
y to
safe
guar
d qu
ality
stan
dard
s and
co
nsum
er p
rote
ctio
n20
16
BSTI
ado
pts I
EC st
anda
rds
2017
Test
ing
faci
litie
s wer
e up
grad
ed to
incl
ude
mod
ule
test
ing,
LED
ligh
t tes
ting.
2017
Tech
nica
l ris
k:
Requ
iring
war
rant
y as
a m
easu
re o
f qu
ality
and
long
-te
rm su
stai
nabi
lity
Esta
blis
hing
war
rant
y at
com
pone
nt le
vel
2003
War
rant
ies e
nfor
ced
and
hono
red
by P
Os a
nd
supp
liers
. Con
firm
ed b
y au
dits
and
insp
ectio
ns.
Smal
l SH
S (1
0 w
p to
<30
wp)
intr
oduc
ed, a
nd w
arra
nty
perio
d fo
r the
co
mpo
nent
s of s
mal
l SH
S ad
opte
d: P
V m
odul
e - 1
2 ye
ars,
bat
tery
- 3
year
s, c
harg
e co
ntro
ller -
3 y
ears
, LED
- 5
year
s
2007
LIVING IN THE LIGHT: THE BANGLADESH SOLAR HOME SYSTEMS STORY | 85

Risk
sM
itiga
tion
Tim
elin
eEff
ectiv
enes
sFu
ture
Opt
ions
Tech
nica
l ris
k:
Insp
ectio
n an
d ve
rific
atio
n to
en
sure
qua
lity
of
inst
alla
tion
IDCO
L w
eb-b
ased
dat
abas
e is
acc
essi
ble
onlin
e an
d al
low
s IDC
OL
regi
onal
offi
ces a
nd P
Os t
o ac
cess
the
data
base
rem
otel
y. A
fter
inst
alla
tion
of th
e sy
stem
s, th
e PO
s inp
ut d
ata
of th
e sy
stem
s. T
he
softw
are
cond
ucts
initi
al sc
reen
ing
of th
e PO
s’ e
ntry
such
as d
uplic
ate
syst
ems,
una
ppro
ved
com
pone
nts,
and
so o
n.
2010
The
data
base
has
giv
en m
uch
mor
e fle
xibi
lity
to
IDCO
L in
man
agin
g th
e pr
ogra
m a
nd a
llow
s for
tim
ely
corr
ectiv
e ac
tions
to b
e ta
ken.
Bar c
odes
on
SHS
and
use
of m
obile
app
can
impr
ove
accu
racy
and
eas
e da
ta e
ntry
.
Regi
onal
mon
itorin
g off
ices
: 17
regi
onal
mon
itorin
g off
ices
with
142
te
chni
cal i
nspe
ctor
s. S
taffi
ng: R
egio
nal m
anag
er w
ith 8
–9 te
chni
cal
insp
ecto
rs to
phy
sica
lly v
erify
the
syst
ems t
hrou
ghou
t the
yea
r to
ensu
re
prop
er in
stal
latio
n an
d aft
er-s
ales
serv
ices
.•
Insp
ecto
rs c
heck
if sy
stem
s wer
e pr
ofes
sion
ally
inst
alle
d an
d TS
C-ap
prov
ed e
quip
men
t are
use
d, id
entif
y te
chni
cal p
robl
ems,
and
ver
ify
after
-sal
es se
rvic
e.
• Re
insp
ectio
n of
the
syst
ems:
rand
om re
insp
ectio
n co
nduc
ted
to
subs
tant
iate
find
ings
of i
nitia
l ins
pect
ion.
Pro
cess
hel
ped
mon
itor
qual
ity a
nd th
orou
ghne
ss o
f ini
tial i
nspe
ctio
ns.
Offi
ces s
etup
2010
- 2
2011
- 6
2014
- 12
2018
- 17
If pr
oble
ms f
ound
, PO
s are
info
rmed
. PO
solv
es
prob
lem
upd
ates
dat
abas
e fo
r fol
low
-up.
Typ
ical
is
sues
unc
over
ed a
nd th
en re
solv
ed b
y PO
s: lo
ng
cabl
es, m
odul
e sh
adin
g, b
atte
ry ce
ll da
mag
ed,
batt
ery
leak
age,
faul
ty c
harg
e co
ntro
ller,
cont
rolle
r byp
ass,
or n
o co
ntro
ller.
At th
e be
ginn
ing,
mon
itorin
g of
SH
S w
as co
nduc
ted
from
th
e he
ad o
ffice
. Lat
er re
gion
al
offic
es w
ere
open
ed a
t diff
eren
t tim
es b
ased
on
conc
entr
atio
n of
SH
S to
max
imiz
e in
spec
tion
num
bers
as w
ell a
s to
redu
ce
mon
itorin
g co
st.
• Es
tabl
ishe
d fo
r con
sum
er fe
edba
ck a
nd co
mpl
aint
s, th
e Ca
ll ce
nter
op
erat
es fr
om 9
a.m
. to
9 p.
m. e
xcep
t Frid
ays a
nd o
ther
gov
ernm
ent
holid
ays t
o en
sure
cus
tom
er se
rvic
e re
gard
ing
any
tech
nica
l pro
blem
an
d aft
er-s
ales
serv
ice.
•
Resu
lts d
iscu
ssed
at O
C m
eetin
gs.
2007
The
com
plai
nts r
ecei
ved
by th
e ca
ll ce
nter
are
ad
dres
sed
in tw
o w
ays.
The
cus
tom
er is
giv
en
the
cont
act d
etai
ls o
f the
PO
’s re
gion
al o
ffice
to
conn
ect t
he tw
o pa
rtie
s dire
ctly
. The
conc
erne
d PO
is a
lso
info
rmed
by
the
call
cent
er o
f the
co
mpl
aint
and
is a
dvis
ed to
take
nec
essa
ry
mea
sure
. The
reco
rd o
f the
com
plai
nt is
kep
t in
a da
taba
se. A
follo
w-u
p ca
ll is
don
e by
the
call
cent
er to
the
cust
omer
to e
nsur
e th
e pr
oble
m is
re
solv
ed b
y th
e co
ncer
ned
PO. T
he re
sults
hav
e be
en fo
und
to b
e eff
ectiv
e to
som
e ex
tent
.
• De
dica
ted
shor
t cod
e ha
s be
en ta
ken
rece
ntly
for t
he
call
cent
er (1
6653
). •
TR/K
ABIT
A cu
stom
ers r
ecei
ve
a vo
ice
call
or a
text
mes
sage
ev
ery
alte
rnat
e m
onth
.•
An in
tegr
ated
softw
are
is
bein
g de
velo
ped
thro
ugh
whi
ch n
umbe
r of c
ompl
aint
s re
solv
ed a
nd co
mpl
aint
re
solu
tion
lead
tim
e ca
n be
tr
acke
d on
line.
• In
depe
nden
t tec
hnic
al a
udit
by th
ird-p
arty
firm
to e
nsur
e ac
coun
tabi
lity
of su
pplie
rs a
nd P
Os f
or q
ualit
y an
d aft
er-s
ales
serv
ices
•
Verif
ies q
ualit
y of
mai
n sy
stem
com
pone
nts a
nd v
erifi
es P
Os
inst
alla
tion,
war
rant
y, a
nd a
fter-s
ales
mai
nten
ance
supp
ort
• Co
rrec
tive
mea
sure
s tak
en in
clud
ed p
enal
izin
g su
pplie
rs/
man
ufac
ture
rs a
nd re
visi
ons t
o te
chni
cal s
tand
ards
Audi
ts
cond
ucte
d in
20
03, 2
009,
20
12, 2
014,
an
d 20
15
Base
d on
the
findi
ngs o
f the
tech
nica
l aud
its,
subs
eque
nt a
ctio
ns w
ere
take
n. T
here
are
in
stan
ces o
f str
ict m
easu
res t
aken
by
IDCO
L w
hich
incl
ude
pena
lizat
ion
of th
e su
pplie
rs a
nd
susp
ensi
on o
f the
app
rove
d m
odel
s in
case
s of
the
unsa
tisfa
ctor
y re
port
s of t
he te
chni
cal a
udits
re
gard
ing
the
batt
ery,
cha
rge
cont
rolle
r, so
lar
pane
ls, a
nd L
ED la
mps
. It s
eeSa
me
appr
oach
ado
pted
for q
ualit
y ve
rific
atio
n of
TR/
KABI
TA
inst
alla
tions
. BU
ET co
ntra
cted
to e
valu
ate
the
qual
ity, e
ffect
iven
ess,
and
se
rvic
e of
the
inst
alle
d sy
stem
s und
er T
R/KA
BITA
.
2019
86
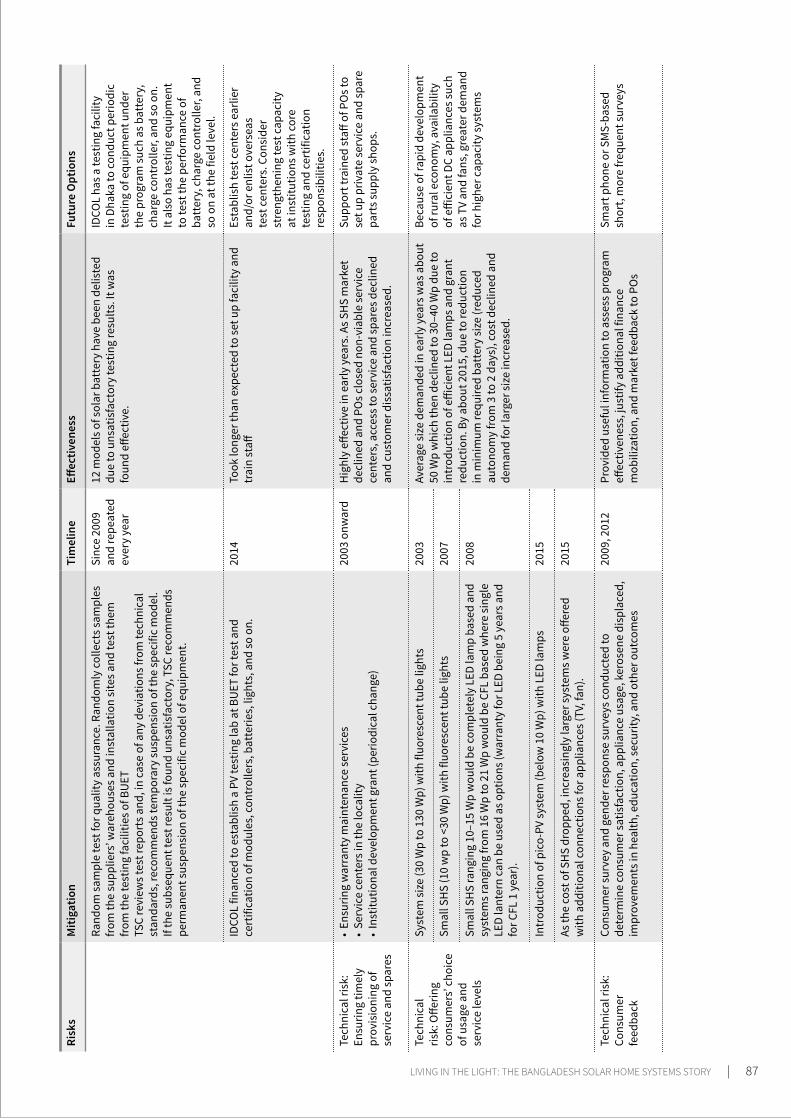
Risk
sM
itiga
tion
Tim
elin
eEff
ectiv
enes
sFu
ture
Opt
ions
Rand
om sa
mpl
e te
st fo
r qua
lity
assu
ranc
e. R
ando
mly
colle
cts s
ampl
es
from
the
supp
liers
’ war
ehou
ses a
nd in
stal
latio
n si
tes a
nd te
st th
em
from
the
test
ing
faci
litie
s of B
UET
TS
C re
view
s tes
t rep
orts
and
, in
case
of a
ny d
evia
tions
from
tech
nica
l st
anda
rds,
reco
mm
ends
tem
pora
ry su
spen
sion
of t
he sp
ecifi
c m
odel
. If
the
subs
eque
nt te
st re
sult
is fo
und
unsa
tisfa
ctor
y, T
SC re
com
men
ds
perm
anen
t sus
pens
ion
of th
e sp
ecifi
c m
odel
of e
quip
men
t.
Sinc
e 20
09
and
repe
ated
ev
ery
year
12 m
odel
s of s
olar
bat
tery
hav
e be
en d
elis
ted
due
to u
nsat
isfa
ctor
y te
stin
g re
sults
. It w
as
foun
d eff
ectiv
e.
IDCO
L ha
s a te
stin
g fa
cilit
y in
Dha
ka to
cond
uct p
erio
dic
test
ing
of e
quip
men
t und
er
the
prog
ram
such
as b
atte
ry,
char
ge co
ntro
ller,
and
so o
n.
It al
so h
as te
stin
g eq
uipm
ent
to te
st th
e pe
rform
ance
of
batt
ery,
cha
rge
cont
rolle
r, an
d so
on
at th
e fie
ld le
vel.
IDCO
L fin
ance
d to
est
ablis
h a
PV te
stin
g la
b at
BU
ET fo
r tes
t and
ce
rtifi
catio
n of
mod
ules
, con
trol
lers
, bat
terie
s, li
ghts
, and
so o
n.20
14To
ok lo
nger
than
exp
ecte
d to
set u
p fa
cilit
y an
d tr
ain
staff
Esta
blis
h te
st ce
nter
s ear
lier
and/
or e
nlis
t ove
rsea
s te
st ce
nter
s. C
onsi
der
stre
ngth
enin
g te
st c
apac
ity
at in
stitu
tions
with
core
te
stin
g an
d ce
rtifi
catio
n re
spon
sibi
litie
s.
Tech
nica
l ris
k:
Ensu
ring
timel
y pr
ovis
ioni
ng o
f se
rvic
e an
d sp
ares
• En
surin
g w
arra
nty
mai
nten
ance
serv
ices
• Se
rvic
e ce
nter
s in
the
loca
lity
• In
stitu
tiona
l dev
elop
men
t gra
nt (p
erio
dica
l cha
nge)
2003
onw
ard
Hig
hly
effec
tive
in e
arly
yea
rs. A
s SH
S m
arke
t de
clin
ed a
nd P
Os c
lose
d no
n-vi
able
serv
ice
cent
ers,
acc
ess t
o se
rvic
e an
d sp
ares
dec
lined
an
d cu
stom
er d
issa
tisfa
ctio
n in
crea
sed.
Supp
ort t
rain
ed st
aff o
f PO
s to
set u
p pr
ivat
e se
rvic
e an
d sp
are
part
s sup
ply
shop
s.
Tech
nica
l ris
k: O
fferin
g co
nsum
ers’
cho
ice
of u
sage
and
se
rvic
e le
vels
Syst
em si
ze (3
0 W
p to
130
Wp)
with
fluo
resc
ent t
ube
light
s20
03Av
erag
e si
ze d
eman
ded
in e
arly
yea
rs w
as a
bout
50
Wp
whi
ch th
en d
eclin
ed to
30–
40 W
p du
e to
in
trod
uctio
n of
effi
cien
t LED
lam
ps a
nd g
rant
re
duct
ion.
By
abou
t 201
5, d
ue to
redu
ctio
n in
min
imum
requ
ired
batt
ery
size
(red
uced
au
tono
my
from
3 to
2 d
ays)
, cos
t dec
lined
and
de
man
d fo
r lar
ger s
ize
incr
ease
d.
Beca
use
of ra
pid
deve
lopm
ent
of ru
ral e
cono
my,
ava
ilabi
lity
of e
ffici
ent D
C ap
plia
nces
such
as
TV
and
fans
, gre
ater
dem
and
for h
ighe
r cap
acity
syst
ems
Smal
l SH
S (1
0 w
p to
<30
Wp)
with
fluo
resc
ent t
ube
light
s20
07
Smal
l SH
S ra
ngin
g 10
–15
Wp
wou
ld b
e co
mpl
etel
y LE
D la
mp
base
d an
d sy
stem
s ran
ging
from
16
Wp
to 2
1 W
p w
ould
be
CFL
base
d w
here
sing
le
LED
lant
ern
can
be u
sed
as o
ptio
ns (w
arra
nty
for L
ED b
eing
5 y
ears
and
fo
r CFL
1 y
ear)
.
2008
Intr
oduc
tion
of p
ico-
PV sy
stem
(bel
ow 1
0 W
p) w
ith L
ED la
mps
2015
As th
e co
st o
f SH
S dr
oppe
d, in
crea
sing
ly la
rger
syst
ems w
ere
offer
ed
with
add
ition
al co
nnec
tions
for a
pplia
nces
(TV,
fan)
. 20
15
Tech
nica
l ris
k:
Cons
umer
fe
edba
ck
Cons
umer
surv
ey a
nd g
ende
r res
pons
e su
rvey
s con
duct
ed to
de
term
ine
cons
umer
satis
fact
ion,
app
lianc
e us
age,
ker
osen
e di
spla
ced,
im
prov
emen
ts in
hea
lth, e
duca
tion,
secu
rity,
and
oth
er o
utco
mes
2009
, 201
2Pr
ovid
ed u
sefu
l inf
orm
atio
n to
ass
ess p
rogr
am
effec
tiven
ess,
just
ify a
dditi
onal
fina
nce
mob
iliza
tion,
and
mar
ket f
eedb
ack
to P
Os
Smar
t pho
ne o
r SM
S-ba
sed
shor
t, m
ore
frequ
ent s
urve
ys
LIVING IN THE LIGHT: THE BANGLADESH SOLAR HOME SYSTEMS STORY | 87
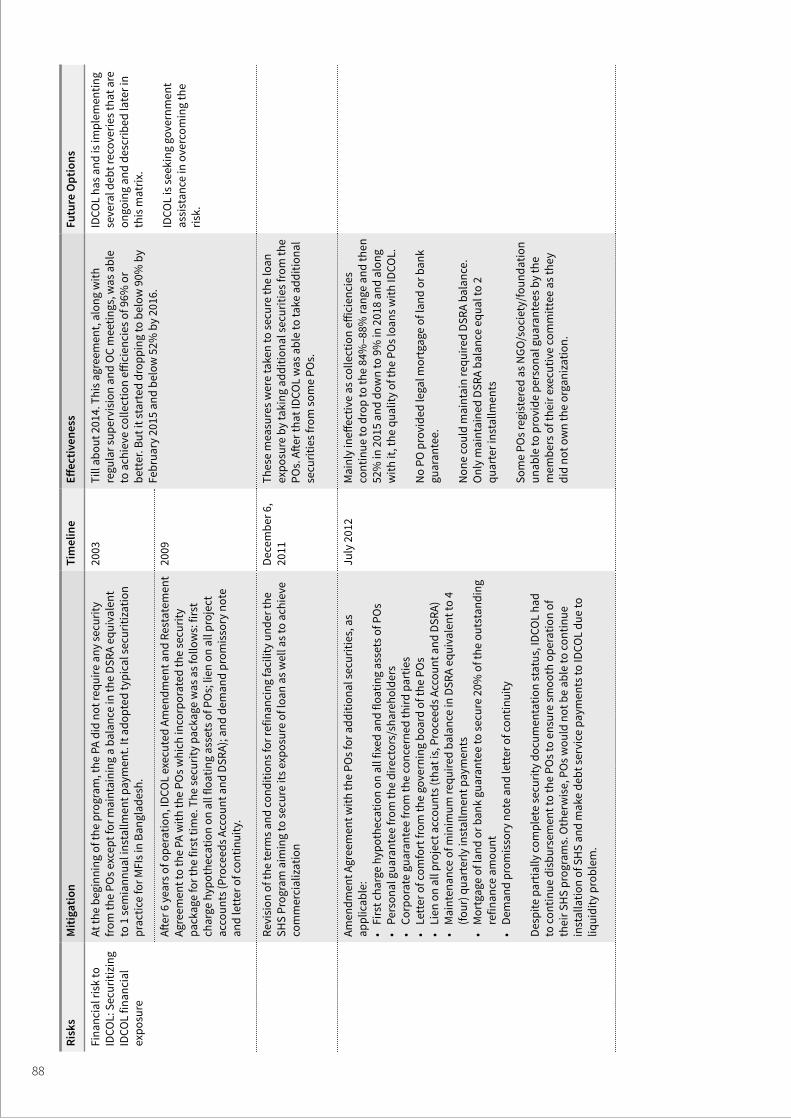
Risk
sM
itiga
tion
Tim
elin
eEff
ectiv
enes
sFu
ture
Opt
ions
Fina
ncia
l ris
k to
ID
COL:
Sec
uriti
zing
ID
COL
finan
cial
ex
posu
re
At th
e be
ginn
ing
of th
e pr
ogra
m, t
he P
A di
d no
t req
uire
any
secu
rity
from
the
POs e
xcep
t for
mai
ntai
ning
a b
alan
ce in
the
DSRA
equ
ival
ent
to 1
sem
iann
ual i
nsta
llmen
t pay
men
t. It
adop
ted
typi
cal s
ecur
itiza
tion
prac
tice
for M
FIs i
n Ba
ngla
desh
.
2003
Till
abou
t 201
4. T
his a
gree
men
t, al
ong
with
re
gula
r sup
ervi
sion
and
OC
mee
tings
, was
abl
e to
ach
ieve
colle
ctio
n eff
icie
ncie
s of 9
6% o
r be
tter
. But
it st
arte
d dr
oppi
ng to
bel
ow 9
0% b
y Fe
brua
ry 2
015
and
belo
w 5
2% b
y 20
16.
IDCO
L ha
s and
is im
plem
entin
g se
vera
l deb
t rec
over
ies t
hat a
re
ongo
ing
and
desc
ribed
late
r in
this
mat
rix.
IDCO
L is
seek
ing
gove
rnm
ent
assi
stan
ce in
ove
rcom
ing
the
risk.
After
6 y
ears
of o
pera
tion,
IDCO
L ex
ecut
ed A
men
dmen
t and
Res
tate
men
t Ag
reem
ent t
o th
e PA
with
the
POs w
hich
inco
rpor
ated
the
secu
rity
pack
age
for t
he fi
rst t
ime.
The
secu
rity
pack
age
was
as f
ollo
ws:
firs
t ch
arge
hyp
othe
catio
n on
all
float
ing
asse
ts o
f PO
s; li
en o
n al
l pro
ject
ac
coun
ts (P
roce
eds A
ccou
nt a
nd D
SRA)
; and
dem
and
prom
isso
ry n
ote
and
lett
er o
f con
tinui
ty.
2009
Revi
sion
of t
he te
rms a
nd co
nditi
ons f
or re
finan
cing
faci
lity
unde
r the
SH
S Pr
ogra
m a
imin
g to
secu
re it
s exp
osur
e of
loan
as w
ell a
s to
achi
eve
com
mer
cial
izat
ion
Dece
mbe
r 6,
2011
Thes
e m
easu
res w
ere
take
n to
secu
re th
e lo
an
expo
sure
by
taki
ng a
dditi
onal
secu
ritie
s fro
m th
e PO
s. A
fter t
hat I
DCO
L w
as a
ble
to ta
ke a
dditi
onal
se
curit
ies f
rom
som
e PO
s.
Amen
dmen
t Agr
eem
ent w
ith th
e PO
s for
add
ition
al se
curit
ies,
as
appl
icab
le:
• Fi
rst c
harg
e hy
poth
ecat
ion
on a
ll fix
ed a
nd fl
oatin
g as
sets
of P
Os
• Pe
rson
al g
uara
ntee
from
the
dire
ctor
s/sh
areh
olde
rs•
Corp
orat
e gu
aran
tee
from
the
conc
erne
d th
ird p
artie
s•
Lett
er o
f com
fort
from
the
gove
rnin
g bo
ard
of th
e PO
s•
Lien
on
all p
roje
ct a
ccou
nts (
that
is, P
roce
eds A
ccou
nt a
nd D
SRA)
• M
aint
enan
ce o
f min
imum
requ
ired
bala
nce
in D
SRA
equi
vale
nt to
4
(four
) qua
rter
ly in
stal
lmen
t pay
men
ts•
Mor
tgag
e of
land
or b
ank
guar
ante
e to
secu
re 2
0% o
f the
out
stan
ding
re
finan
ce a
mou
nt•
Dem
and
prom
isso
ry n
ote
and
lett
er o
f con
tinui
ty
Desp
ite p
artia
lly co
mpl
ete
secu
rity
docu
men
tatio
n st
atus
, IDC
OL
had
to co
ntin
ue d
isbu
rsem
ent t
o th
e PO
s to
ensu
re sm
ooth
ope
ratio
n of
th
eir S
HS
prog
ram
s. O
ther
wis
e, P
Os w
ould
not
be
able
to co
ntin
ue
inst
alla
tion
of S
HS
and
mak
e de
bt se
rvic
e pa
ymen
ts to
IDCO
L du
e to
liq
uidi
ty p
robl
em.
July
201
2M
ainl
y in
effec
tive
as co
llect
ion
effic
ienc
ies
cont
inue
to d
rop
to th
e 84
%–8
8% ra
nge
and
then
52
% in
201
5 an
d do
wn
to 9
% in
201
8 an
d al
ong
with
it, t
he q
ualit
y of
the
POs l
oans
with
IDCO
L.
No
PO p
rovi
ded
lega
l mor
tgag
e of
land
or b
ank
guar
ante
e.
Non
e co
uld
mai
ntai
n re
quire
d DS
RA b
alan
ce.
Onl
y m
aint
aine
d DS
RA b
alan
ce e
qual
to 2
qu
arte
r ins
tallm
ents
Som
e PO
s reg
iste
red
as N
GO/s
ocie
ty/fo
unda
tion
unab
le to
pro
vide
per
sona
l gua
rant
ees b
y th
e m
embe
rs o
f the
ir ex
ecut
ive
com
mitt
ee a
s the
y di
d no
t ow
n th
e or
gani
zatio
n.
88
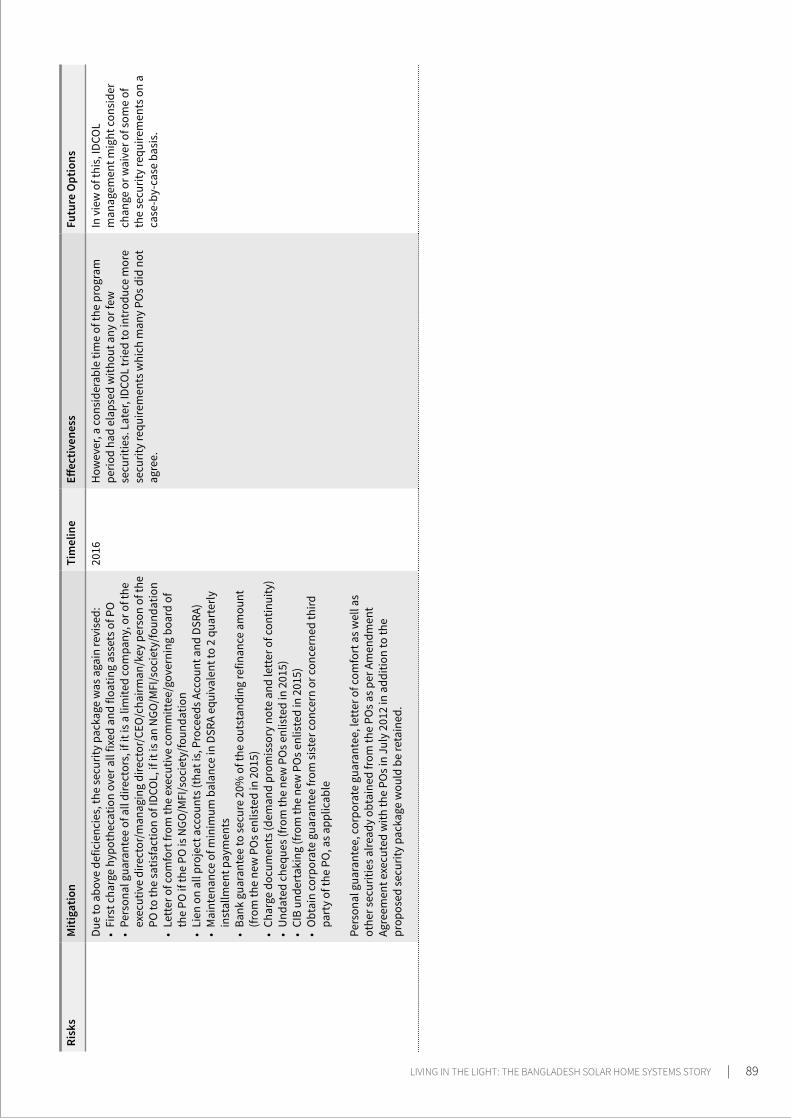
Risk
sM
itiga
tion
Tim
elin
eEff
ectiv
enes
sFu
ture
Opt
ions
Due
to a
bove
def
icie
ncie
s, th
e se
curit
y pa
ckag
e w
as a
gain
revi
sed:
• Fi
rst c
harg
e hy
poth
ecat
ion
over
all
fixed
and
floa
ting
asse
ts o
f PO
• Pe
rson
al g
uara
ntee
of a
ll di
rect
ors,
if it
is a
lim
ited
com
pany
, or o
f the
ex
ecut
ive
dire
ctor
/man
agin
g di
rect
or/C
EO/c
hairm
an/k
ey p
erso
n of
the
PO to
the
satis
fact
ion
of ID
COL,
if it
is a
n N
GO/M
FI/s
ocie
ty/fo
unda
tion
• Le
tter
of c
omfo
rt fr
om th
e ex
ecut
ive
com
mitt
ee/g
over
ning
boa
rd o
f th
e PO
if th
e PO
is N
GO/M
FI/s
ocie
ty/fo
unda
tion
• Li
en o
n al
l pro
ject
acc
ount
s (th
at is
, Pro
ceed
s Acc
ount
and
DSR
A)•
Mai
nten
ance
of m
inim
um b
alan
ce in
DSR
A eq
uiva
lent
to 2
qua
rter
ly
inst
allm
ent p
aym
ents
• Ba
nk g
uara
ntee
to se
cure
20%
of t
he o
utst
andi
ng re
finan
ce a
mou
nt
(from
the
new
PO
s enl
iste
d in
201
5)•
Char
ge d
ocum
ents
(dem
and
prom
isso
ry n
ote
and
lett
er o
f con
tinui
ty)
• U
ndat
ed c
hequ
es (f
rom
the
new
PO
s enl
iste
d in
201
5)•
CIB
unde
rtak
ing
(from
the
new
PO
s enl
iste
d in
201
5)•
Obt
ain
corp
orat
e gu
aran
tee
from
sist
er co
ncer
n or
conc
erne
d th
ird
part
y of
the
PO, a
s app
licab
le
Pers
onal
gua
rant
ee, c
orpo
rate
gua
rant
ee, l
ette
r of c
omfo
rt a
s wel
l as
othe
r sec
uriti
es a
lread
y ob
tain
ed fr
om th
e PO
s as p
er A
men
dmen
t Ag
reem
ent e
xecu
ted
with
the
POs i
n Ju
ly 2
012
in a
dditi
on to
the
prop
osed
secu
rity
pack
age
wou
ld b
e re
tain
ed.
2016
How
ever
, a co
nsid
erab
le ti
me
of th
e pr
ogra
m
perio
d ha
d el
apse
d w
ithou
t any
or f
ew
secu
ritie
s. L
ater
, IDC
OL
trie
d to
intr
oduc
e m
ore
secu
rity
requ
irem
ents
whi
ch m
any
POs d
id n
ot
agre
e.
In v
iew
of t
his,
IDCO
L m
anag
emen
t mig
ht co
nsid
er
chan
ge o
r wai
ver o
f som
e of
th
e se
curit
y re
quire
men
ts o
n a
case
-by-
case
bas
is.
LIVING IN THE LIGHT: THE BANGLADESH SOLAR HOME SYSTEMS STORY | 89
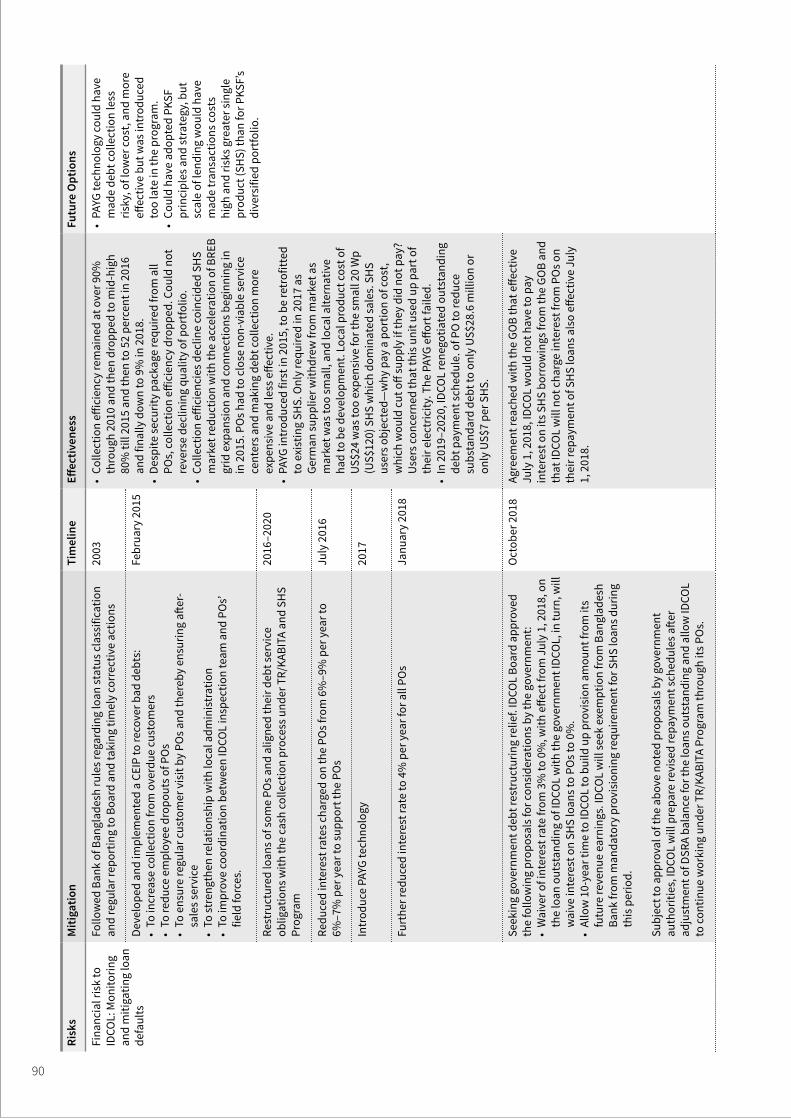
Risk
sM
itiga
tion
Tim
elin
eEff
ectiv
enes
sFu
ture
Opt
ions
Fina
ncia
l ris
k to
ID
COL:
Mon
itorin
g an
d m
itiga
ting
loan
de
faul
ts
Follo
wed
Ban
k of
Ban
glad
esh
rule
s reg
ardi
ng lo
an st
atus
cla
ssifi
catio
n an
d re
gula
r rep
ortin
g to
Boa
rd a
nd ta
king
tim
ely
corr
ectiv
e ac
tions
2003
• Co
llect
ion
effic
ienc
y re
mai
ned
at o
ver 9
0%
thro
ugh
2010
and
then
dro
pped
to m
id-h
igh
80%
till
2015
and
then
to 5
2 pe
rcen
t in
2016
an
d fin
ally
dow
n to
9%
in 2
018.
• De
spite
secu
rity
pack
age
requ
ired
from
all
POs,
colle
ctio
n eff
icie
ncy
drop
ped.
Cou
ld n
ot
reve
rse
decl
inin
g qu
ality
of p
ortfo
lio.
• Co
llect
ion
effic
ienc
ies d
eclin
e co
inci
ded
SHS
mar
ket r
educ
tion
with
the
acce
lera
tion
of B
REB
grid
exp
ansi
on a
nd co
nnec
tions
beg
inni
ng in
in
201
5. P
Os h
ad to
clo
se n
on-v
iabl
e se
rvic
e ce
nter
s and
mak
ing
debt
colle
ctio
n m
ore
expe
nsiv
e an
d le
ss e
ffect
ive.
• PA
YG in
trod
uced
firs
t in
2015
, to
be re
trof
itted
to
exi
stin
g SH
S. O
nly
requ
ired
in 2
017
as
Germ
an su
pplie
r with
drew
from
mar
ket a
s m
arke
t was
too
smal
l, an
d lo
cal a
ltern
ativ
e ha
d to
be
deve
lopm
ent.
Loca
l pro
duct
cost
of
US$2
4 w
as to
o ex
pens
ive
for t
he sm
all 2
0 W
p (U
S$12
0) S
HS
whi
ch d
omin
ated
sale
s. S
HS
user
s obj
ecte
d—w
hy p
ay a
por
tion
of co
st,
whi
ch w
ould
cut
off
supp
ly if
they
did
not
pay
? Us
ers c
once
rned
that
this
uni
t use
d up
par
t of
thei
r ele
ctric
ity. T
he P
AYG
effor
t fai
led.
•
In 2
019–
2020
, IDC
OL
rene
gotia
ted
outs
tand
ing
debt
pay
men
t sch
edul
e. o
f PO
to re
duce
su
bsta
ndar
d de
bt to
onl
y US
$28.
6 m
illio
n or
on
ly U
S$7
per S
HS.
• PA
YG te
chno
logy
coul
d ha
ve
mad
e de
bt co
llect
ion
less
ris
ky, o
f low
er co
st, a
nd m
ore
effec
tive
but w
as in
trod
uced
to
o la
te in
the
prog
ram
. •
Coul
d ha
ve a
dopt
ed P
KSF
prin
cipl
es a
nd st
rate
gy, b
ut
scal
e of
lend
ing
wou
ld h
ave
mad
e tr
ansa
ctio
ns co
sts
high
and
risk
s gre
ater
sing
le
prod
uct (
SHS)
than
for P
KSF’
s di
vers
ified
por
tfolio
.
Deve
lope
d an
d im
plem
ente
d a
CEIP
to re
cove
r bad
deb
ts:
• To
incr
ease
colle
ctio
n fro
m o
verd
ue c
usto
mer
s•
To re
duce
em
ploy
ee d
ropo
uts o
f PO
s•
To e
nsur
e re
gula
r cus
tom
er v
isit
by P
Os a
nd th
ereb
y en
surin
g aft
er-
sale
s ser
vice
• To
stre
ngth
en re
latio
nshi
p w
ith lo
cal a
dmin
istr
atio
n •
To im
prov
e co
ordi
natio
n be
twee
n ID
COL
insp
ectio
n te
am a
nd P
Os’
fie
ld fo
rces
.
Febr
uary
201
5
Rest
ruct
ured
loan
s of s
ome
POs a
nd a
ligne
d th
eir d
ebt s
ervi
ce
oblig
atio
ns w
ith th
e ca
sh co
llect
ion
proc
ess u
nder
TR/
KABI
TA a
nd S
HS
Prog
ram
2016
–202
0
Redu
ced
inte
rest
rate
s cha
rged
on
the
POs f
rom
6%
–9%
per
yea
r to
6%–7
% p
er y
ear t
o su
ppor
t the
PO
sJu
ly 2
016
Intr
oduc
e PA
YG te
chno
logy
20
17
Furt
her r
educ
ed in
tere
st ra
te to
4%
per
yea
r for
all
POs
Janu
ary
2018
Seek
ing
gove
rnm
ent d
ebt r
estr
uctu
ring
relie
f. ID
COL
Boar
d ap
prov
ed
the
follo
win
g pr
opos
als f
or co
nsid
erat
ions
by
the
gove
rnm
ent:
• W
aive
r of i
nter
est r
ate
from
3%
to 0
%, w
ith e
ffect
from
Jul
y 1,
201
8, o
n th
e lo
an o
utst
andi
ng o
f IDC
OL
with
the
gove
rnm
ent I
DCO
L, in
turn
, will
w
aive
inte
rest
on
SHS
loan
s to
POs t
o 0%
. •
Allo
w 1
0-ye
ar ti
me
to ID
COL
to b
uild
up
prov
isio
n am
ount
from
its
futu
re re
venu
e ea
rnin
gs. I
DCO
L w
ill se
ek e
xem
ptio
n fro
m B
angl
ades
h Ba
nk fr
om m
anda
tory
pro
visi
onin
g re
quire
men
t for
SH
S lo
ans d
urin
g th
is p
erio
d.
Subj
ect t
o ap
prov
al o
f the
abo
ve n
oted
pro
posa
ls b
y go
vern
men
t au
thor
ities
, IDC
OL
will
pre
pare
revi
sed
repa
ymen
t sch
edul
es a
fter
adju
stm
ent o
f DSR
A ba
lanc
e fo
r the
loan
s out
stan
ding
and
allo
w ID
COL
to co
ntin
ue w
orki
ng u
nder
TR/
KABI
TA P
rogr
am th
roug
h its
PO
s.
Oct
ober
201
8Ag
reem
ent r
each
ed w
ith th
e GO
B th
at e
ffect
ive
July
1, 2
018,
IDCO
L w
ould
not
hav
e to
pay
in
tere
st o
n its
SH
S bo
rrow
ings
from
the
GOB
and
that
IDCO
L w
ill n
ot c
harg
e in
tere
st fr
om P
Os o
n th
eir r
epay
men
t of S
HS
loan
s als
o eff
ectiv
e Ju
ly
1, 2
018.
90

Risk
sM
itiga
tion
Tim
elin
eEff
ectiv
enes
sFu
ture
Opt
ions
Fina
ncia
l ris
k to
PO
s: E
nhan
cing
aff
orda
bilit
y w
hile
en
surin
g fin
anci
al
reco
verie
s
POs u
sed
to g
ive
loan
s to
hous
ehol
ds fo
r up
to 3
yea
rs b
efor
e 20
15 w
hen
debt
colle
ctio
ns st
arte
d to
dro
p.20
03–2
015
Debt
repa
ymen
t col
lect
ions
beg
an d
ropp
ing
by
abou
t 201
5.Re
duce
loan
teno
r
Onl
y on
e-ye
ar lo
ans o
ffere
d to
cus
tom
ers
2015
Hig
her m
onth
ly p
aym
ents
mad
e lo
ans l
ess
affor
dabl
e to
man
y of
cus
tom
ers
• Ad
optio
n of
PAY
G te
chno
logy
• Ca
sh sa
les o
nly
2016
Curr
ently
virt
ually
all
sale
s are
cas
h sa
les.
PA
YG in
trod
uced
too
late
in th
e pr
ogra
m to
be
effec
tive.
Earli
er a
dopt
ion
of P
AYG
tech
nolo
gy. B
ut m
ake
sure
SH
S se
rvic
e le
vels
mat
ch c
usto
mer
re
quire
men
ts.
Seek
BRE
B su
ppor
t to
requ
ire S
HS
cust
omer
s who
wis
h to
obt
ain
a gr
id
conn
ectio
n to
cert
ify th
ey a
re c
urre
nt o
n SH
S lo
an re
paym
ent.
2017
Ineff
ectiv
e as
it m
ade
the
BREB
obj
ectiv
e of
in
crea
sing
conn
ectio
ns m
ore
diffi
cult
Sust
aina
ble
mar
ket
risk:
Sus
tain
ing
sale
s and
serv
ice
in a
mar
ket
that
is c
apac
ity
cons
trai
ned
IDCO
L ap
prov
ed 1
7 ne
w P
Os i
n 20
13 (n
early
60%
incr
ease
) and
then
11
mor
e in
201
5 (a
noth
er 2
3% in
crea
se) t
o se
rve
divi
sion
s and
dis
tric
ts
whe
re S
HS
sale
s wer
e ex
trem
ely
low
. An
IDCO
L/W
orld
Ban
k st
udy
in
2014
est
imat
ed th
e m
arke
t wou
ld b
e 6
mill
ion
SHS
com
pare
d to
und
er 2
m
illio
n in
stal
led
at th
at ti
me.
The
opt
imis
m w
as fu
eled
by
the
follo
win
g:•
The
pace
of S
HS
inst
alla
tions
risi
ng to
ove
r 860
,000
in 2
013
• Go
od co
llect
ion
effic
ienc
ies a
nd g
ood
cust
omer
loan
reco
verie
s•
Rapi
d dr
op in
SH
S pr
ices
• Go
vern
men
t’s p
aral
lel T
R/KA
BITA
giv
ing
away
larg
e nu
mbe
rs o
f SH
S w
ithou
t coo
rdin
atio
n w
ith ID
COL
until
201
5–20
16•
BREB
inab
ility
to e
xpan
d gr
id co
nnec
tions
fast
and
inad
equa
te
gene
ratio
n ca
paci
ty
• U
nive
rsal
ele
ctric
ity a
cces
s est
imat
ed to
take
30
year
s.
Cum
ulat
ive
SHS
inst
alla
tions
are
now
abo
ut 5
mill
ion
and
mar
ket s
how
s cl
assi
c si
gns o
f sat
urat
ion.
2013
and
201
5BR
EB a
ccel
erat
ed it
s grid
conn
ectio
ns ra
pidl
y be
ginn
ing
in 2
014
and
cont
inui
ng to
dat
e. T
his
rais
ed e
xpec
tatio
ns o
f get
ting
a gr
id co
nnec
tion
soon
. It c
onvi
nced
pot
entia
l cus
tom
ers t
o st
op
buyi
ng S
HS
and
exis
ting
cust
omer
s to
retu
rn S
HS
or d
efau
lt on
loan
pay
men
tsDe
clin
ing
dem
and
for S
HS
led
to
• In
crea
sed
com
petit
ion
and
pric
e cu
ttin
g.•
Redu
ced
gros
s mar
gins
and
reve
nues
to P
Os.
• Cl
osin
g se
rvic
e ce
nter
s.•
Poac
hing
eac
h ot
her’s
staff
.•
With
SH
S pr
ice
defla
tiona
ry p
ress
ures
, som
e PO
s offe
ring
to se
ll ne
w S
HS
to c
usto
mer
s at
low
er co
st th
an re
payi
ng o
ld lo
ans a
nd a
dded
to
def
aults
.
• Ta
rget
new
ent
rant
s to
area
s whe
re m
arke
ts a
re
not s
atur
ated
. Too
muc
h co
mpe
titio
n is
as b
ad a
s too
lit
tle.
• Cl
oser
pla
nnin
g co
ordi
natio
n w
ith g
rid-b
ased
el
ectr
ifica
tion.
• SR
EDA
to a
ssis
t in
clea
rer
polic
y co
ordi
natio
n.•
Reco
gniz
e th
at in
den
sely
po
pula
ted
coun
trie
s lik
e Ba
ngla
desh
, SH
S is
like
ly
to b
e co
nsid
ered
a p
re-
elec
trifi
catio
n op
tion.
Seek
SRE
DA su
ppor
t to
stop
sale
s of s
ubst
anda
rd S
HS
by e
stab
lishi
ng
natio
nal S
HS
stan
dard
s.20
17St
anda
rds a
lone
are
ineff
ectiv
e w
ithou
t en
forc
emen
t or m
ajor
pub
licity
cam
paig
n.Co
nsid
er a
dopt
ing
qual
ity
labe
ling
such
as L
ight
ing
Glob
al.
To e
nsur
e co
ntin
ued
serv
ice
and
prov
isio
n of
spar
es to
cus
tom
ers,
ac
cess
to su
ch se
rvic
es a
nd sp
ares
is n
eede
d in
cus
tom
ers l
ocal
ities
.20
19In
201
5, P
Os h
ad o
ver 2
9,00
0 em
ploy
ees w
hich
dr
oppe
d to
16,
000
in 2
017
and
to 6
,000
by
2018
. Th
eref
ore,
ther
e ar
e m
any
expe
rienc
ed a
nd
trai
ned
tech
nici
ans,
som
e of
who
m m
ay w
ish
to
esta
blis
h th
eir o
wn
busi
ness
that
incl
udes
sale
s an
d se
rvic
e of
SH
S. S
ome
exis
ting
POs m
ay w
ish
to u
nder
take
the
sam
e, e
spec
ially
if th
ey a
re
also
invo
lved
in re
late
d bu
sine
ss su
ch a
s sol
ar
irrig
atio
n or
sola
r min
i-grid
s.
IDCO
L co
uld
asse
ss th
e in
tere
st
of su
ch e
mpl
oyee
s or P
Os a
nd
iden
tify
thei
r req
uire
men
ts to
se
t up
such
ent
erpr
ises
. Eith
er
thro
ugh
IDCO
L or
thro
ugh
MFI
s or
ban
ks, I
DCO
L co
uld
faci
litat
e th
eir e
ntre
pren
eurs
to e
stab
lish
such
bus
ines
ses.
LIVING IN THE LIGHT: THE BANGLADESH SOLAR HOME SYSTEMS STORY | 91
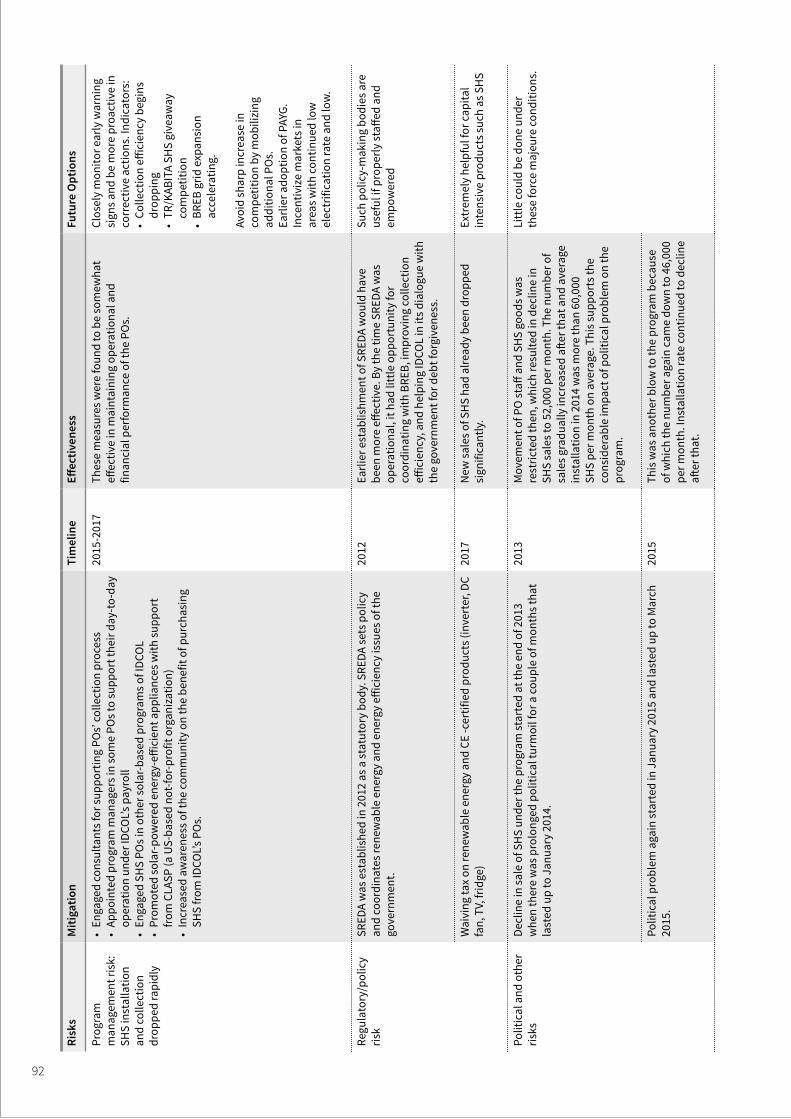
Risk
sM
itiga
tion
Tim
elin
eEff
ectiv
enes
sFu
ture
Opt
ions
Prog
ram
m
anag
emen
t ris
k:
SHS
inst
alla
tion
and
colle
ctio
n dr
oppe
d ra
pidl
y
• En
gage
d co
nsul
tant
s for
supp
ortin
g PO
s’ co
llect
ion
proc
ess
• Ap
poin
ted
prog
ram
man
ager
s in
som
e PO
s to
supp
ort t
heir
day-
to-d
ay
oper
atio
n un
der I
DCO
L’s p
ayro
ll•
Enga
ged
SHS
POs i
n ot
her s
olar
-bas
ed p
rogr
ams o
f IDC
OL
• Pr
omot
ed so
lar-p
ower
ed e
nerg
y-eff
icie
nt a
pplia
nces
with
supp
ort
from
CLA
SP (a
US-
base
d no
t-for
-pro
fit o
rgan
izat
ion)
• In
crea
sed
awar
enes
s of t
he co
mm
unity
on
the
bene
fit o
f pur
chas
ing
SHS
from
IDCO
L’s P
Os.
2015
-201
7Th
ese
mea
sure
s wer
e fo
und
to b
e so
mew
hat
effec
tive
in m
aint
aini
ng o
pera
tiona
l and
fin
anci
al p
erfo
rman
ce o
f the
PO
s.
Clos
ely
mon
itor e
arly
war
ning
si
gns a
nd b
e m
ore
proa
ctiv
e in
co
rrec
tive
actio
ns. I
ndic
ator
s:•
Colle
ctio
n eff
icie
ncy
begi
ns
drop
ping
• TR
/KAB
ITA
SHS
give
away
co
mpe
titio
n•
BREB
grid
exp
ansi
on
acce
lera
ting.
Avoi
d sh
arp
incr
ease
in
com
petit
ion
by m
obili
zing
ad
ditio
nal P
Os.
Earli
er a
dopt
ion
of P
AYG.
Ince
ntiv
ize
mar
kets
in
area
s with
cont
inue
d lo
w
elec
trifi
catio
n ra
te a
nd lo
w.
Regu
lato
ry/p
olic
y ris
kSR
EDA
was
est
ablis
hed
in 2
012
as a
stat
utor
y bo
dy. S
REDA
sets
pol
icy
and
coor
dina
tes r
enew
able
ene
rgy
and
ener
gy e
ffici
ency
issu
es o
f the
go
vern
men
t.
2012
Earli
er e
stab
lishm
ent o
f SRE
DA w
ould
hav
e be
en m
ore
effec
tive.
By
the
time
SRED
A w
as
oper
atio
nal,
it ha
d lit
tle o
ppor
tuni
ty fo
r co
ordi
natin
g w
ith B
REB,
impr
ovin
g co
llect
ion
effic
ienc
y, a
nd h
elpi
ng ID
COL
in it
s dia
logu
e w
ith
the
gove
rnm
ent f
or d
ebt f
orgi
vene
ss.
Such
pol
icy-
mak
ing
bodi
es a
re
usef
ul if
pro
perly
staff
ed a
nd
empo
wer
ed
Wai
ving
tax
on re
new
able
ene
rgy
and
CE -c
ertif
ied
prod
ucts
(inv
erte
r, DC
fa
n, T
V, fr
idge
)20
17N
ew sa
les o
f SH
S ha
d al
read
y be
en d
ropp
ed
sign
ifica
ntly
. Ex
trem
ely
help
ful f
or c
apita
l in
tens
ive
prod
ucts
such
as S
HS
Polit
ical
and
oth
er
risks
Decl
ine
in sa
le o
f SH
S un
der t
he p
rogr
am st
arte
d at
the
end
of 2
013
whe
n th
ere
was
pro
long
ed p
oliti
cal t
urm
oil f
or a
coup
le o
f mon
ths t
hat
last
ed u
p to
Jan
uary
201
4.
2013
Mov
emen
t of P
O st
aff a
nd S
HS
good
s was
re
stric
ted
then
, whi
ch re
sulte
d in
dec
line
in
SHS
sale
s to
52,0
00 p
er m
onth
. The
num
ber o
f sa
les g
radu
ally
incr
ease
d aft
er th
at a
nd a
vera
ge
inst
alla
tion
in 2
014
was
mor
e th
an 6
0,00
0 SH
S pe
r mon
th o
n av
erag
e. T
his s
uppo
rts t
he
cons
ider
able
impa
ct o
f pol
itica
l pro
blem
on
the
prog
ram
.
Litt
le co
uld
be d
one
unde
r th
ese
forc
e m
ajeu
re co
nditi
ons.
Polit
ical
pro
blem
aga
in st
arte
d in
Jan
uary
201
5 an
d la
sted
up
to M
arch
20
15.
2015
This
was
ano
ther
blo
w to
the
prog
ram
bec
ause
of
whi
ch th
e nu
mbe
r aga
in c
ame
dow
n to
46,
000
per m
onth
. Ins
talla
tion
rate
cont
inue
d to
dec
line
after
that
.
92
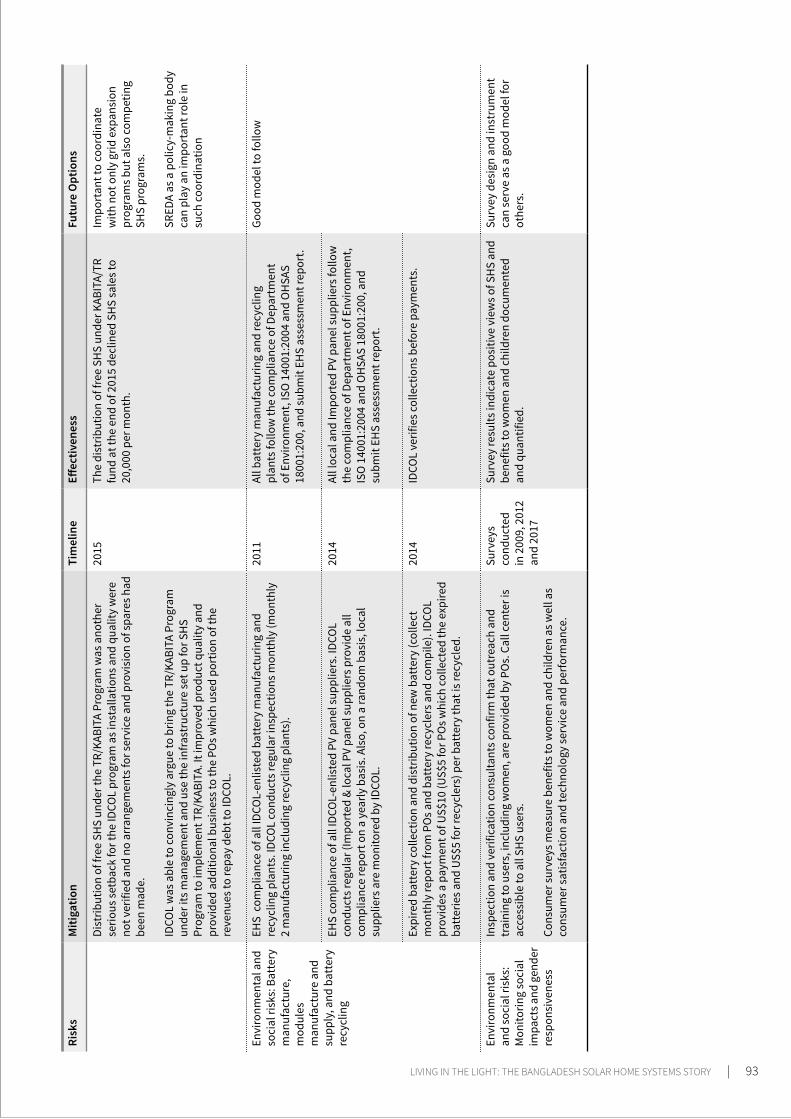
Risk
sM
itiga
tion
Tim
elin
eEff
ectiv
enes
sFu
ture
Opt
ions
Dist
ribut
ion
of fr
ee S
HS
unde
r the
TR/
KABI
TA P
rogr
am w
as a
noth
er
serio
us se
tbac
k fo
r the
IDCO
L pr
ogra
m a
s ins
talla
tions
and
qua
lity
wer
e no
t ver
ified
and
no
arra
ngem
ents
for s
ervi
ce a
nd p
rovi
sion
of s
pare
s had
be
en m
ade.
IDCO
L w
as a
ble
to co
nvin
cing
ly a
rgue
to b
ring
the
TR/K
ABIT
A Pr
ogra
m
unde
r its
man
agem
ent a
nd u
se th
e in
frast
ruct
ure
set u
p fo
r SH
S Pr
ogra
m to
impl
emen
t TR/
KABI
TA. I
t im
prov
ed p
rodu
ct q
ualit
y an
d pr
ovid
ed a
dditi
onal
bus
ines
s to
the
POs w
hich
use
d po
rtio
n of
the
reve
nues
to re
pay
debt
to ID
COL.
2015
The
dist
ribut
ion
of fr
ee S
HS
unde
r KAB
ITA/
TR
fund
at t
he e
nd o
f 201
5 de
clin
ed S
HS
sale
s to
20,0
00 p
er m
onth
.
Impo
rtan
t to
coor
dina
te
with
not
onl
y gr
id e
xpan
sion
pr
ogra
ms b
ut a
lso
com
petin
g SH
S pr
ogra
ms.
SRED
A as
a p
olic
y-m
akin
g bo
dy
can
play
an
impo
rtan
t rol
e in
su
ch co
ordi
natio
n
Envi
ronm
enta
l and
so
cial
risk
s: B
atte
ry
man
ufac
ture
, m
odul
es
man
ufac
ture
and
su
pply
, and
bat
tery
re
cycl
ing
EHS
com
plia
nce
of a
ll ID
COL-
enlis
ted
batt
ery
man
ufac
turin
g an
d re
cycl
ing
plan
ts. I
DCO
L co
nduc
ts re
gula
r ins
pect
ions
mon
thly
(mon
thly
2
man
ufac
turin
g in
clud
ing
recy
clin
g pl
ants
).
2011
All b
atte
ry m
anuf
actu
ring
and
recy
clin
g pl
ants
follo
w th
e co
mpl
ianc
e of
Dep
artm
ent
of E
nviro
nmen
t, IS
O 1
4001
:200
4 an
d O
HSA
S 18
001:
200,
and
subm
it EH
S as
sess
men
t rep
ort.
Good
mod
el to
follo
w
EHS
com
plia
nce
of a
ll ID
COL-
enlis
ted
PV p
anel
supp
liers
. IDC
OL
cond
ucts
regu
lar (
Impo
rted
& lo
cal P
V pa
nel s
uppl
iers
pro
vide
all
com
plia
nce
repo
rt o
n a
year
ly b
asis
. Als
o, o
n a
rand
om b
asis
, loc
al
supp
liers
are
mon
itore
d by
IDCO
L.
2014
All l
ocal
and
Impo
rted
PV
pane
l sup
plie
rs fo
llow
th
e co
mpl
ianc
e of
Dep
artm
ent o
f Env
ironm
ent,
ISO
140
01:2
004
and
OH
SAS
1800
1:20
0, a
nd
subm
it EH
S as
sess
men
t rep
ort.
Expi
red
batt
ery
colle
ctio
n an
d di
strib
utio
n of
new
bat
tery
(col
lect
m
onth
ly re
port
from
PO
s and
bat
tery
recy
cler
s and
com
pile
). ID
COL
prov
ides
a p
aym
ent o
f US$
10 (U
S$5
for P
Os w
hich
colle
cted
the
expi
red
batt
erie
s and
US$
5 fo
r rec
ycle
rs) p
er b
atte
ry th
at is
recy
cled
.
2014
IDCO
L ve
rifie
s col
lect
ions
bef
ore
paym
ents
.
Envi
ronm
enta
l an
d so
cial
risk
s:
Mon
itorin
g so
cial
im
pact
s and
gen
der
resp
onsi
vene
ss
Insp
ectio
n an
d ve
rific
atio
n co
nsul
tant
s con
firm
that
out
reac
h an
d tr
aini
ng to
use
rs, i
nclu
ding
wom
en, a
re p
rovi
ded
by P
Os.
Cal
l cen
ter i
s ac
cess
ible
to a
ll SH
S us
ers.
Cons
umer
surv
eys m
easu
re b
enef
its to
wom
en a
nd c
hild
ren
as w
ell a
s co
nsum
er sa
tisfa
ctio
n an
d te
chno
logy
serv
ice
and
perfo
rman
ce.
Surv
eys
cond
ucte
d in
200
9, 2
012
and
2017
Surv
ey re
sults
indi
cate
pos
itive
vie
ws o
f SH
S an
d be
nefit
s to
wom
en a
nd c
hild
ren
docu
men
ted
and
quan
tifie
d.
Surv
ey d
esig
n an
d in
stru
men
t ca
n se
rve
as a
goo
d m
odel
for
othe
rs.
LIVING IN THE LIGHT: THE BANGLADESH SOLAR HOME SYSTEMS STORY | 93

Appendix D: METHODOLOGICAL ISSUES AND ASSUMPTIONS IN ECONOMIC AND FINANCIAL ANALYSIS
D.1 Methodological Issues
Among the various revealed methods available for estimating benefit values, only the most conservative approach to estimate the avoided cost of kerosene/grid electricity for lighting is used in the base case. As a result, the immediate-term, household-level benefits presented make up only a portion of the total benefits the household members receive over time from the SHS equipment. Nevertheless, these limited avoided cost benefits are shown to pay the households’ costs for the SHS equipment—so long as the loan terms from the POs for buying the equipment are kept reasonably attractive in real terms and/or grants are used to help overcome the effect of the government’s SHS tax policies and kerosene subsidy policies.
The aggregated household-level analysis calculates the base case benefits and costs of the Bangladesh SHS Program as they accrue to participating households over 2003–2029.38
The base case for the analyses taking the Bangladesh and global perspectives uses 12 years as the economic life of
the most important asset (the solar modules) and replaces shorter-lived assets at intervals outlined in Table D.1. Thus, the 2018 tranche of SHS units is physically capable of remaining in service until 2029—though the kerosene savings benefits do not apply during the latter years of that period, thus forcing downward the expected financial and economic returns.
The impact of foregone global environment damages related to reduced kerosene usage can be added to the Bangladesh society benefits to derive the global society benefits.39 Consumer surplus benefits accruing to households is added to kerosene cost savings to assess the full value to households of switching to SHS. In this analysis, only the consumer surplus due to improved quality and quantity of lighting obtained from switching to electric lighting from kerosene was considered, though the benefits surveys noted previously elicited many other (less tangible) benefits from the switch to SHS.
In analyzing the benefits and costs over the 2003–2029 lifetime of the SHS program assets, the following counterfactuals apply (that is, the without-program alternative situation):
38 Assuming a 12-year life for the SHS equipment, the 2018 tranche of equipment will remain in service until 2029.39 The reduced GHG emissions are valued as recommended in the World Bank Guidance Note on the Shadow Price of Carbon (November 12, 2017).
Table D.1: Expected Useful Life of SHS Component Parts
Component Period Duration Warranty
Solar module (suggest 12 years as it is more likely other events such as grid arrival, some other physical damage, and so on happen before 20 years) Years 12 80% initial power output
available after 20 years
Battery (Survey shows 90% of batteries had useful capacity exceeding 80% of initial capacity after 5 years) Years 5 5-year warranty to minimum
80% of initial capacity
Controller Years 3 3-year warranty
Lights (assuming 4 hours/day of use)
Fluorescent tube lights (used 2003–2008) Hours 1,500 1-year warranty
CFLs (used 2005–2018) Hours 2,000 1-year warranty
LED (CFLs began to be replaced with LED beginning about 2008 and were nearly wholly replaced by 2014) Hours 5,000 3-year warranty
Balance of system Years 15
94
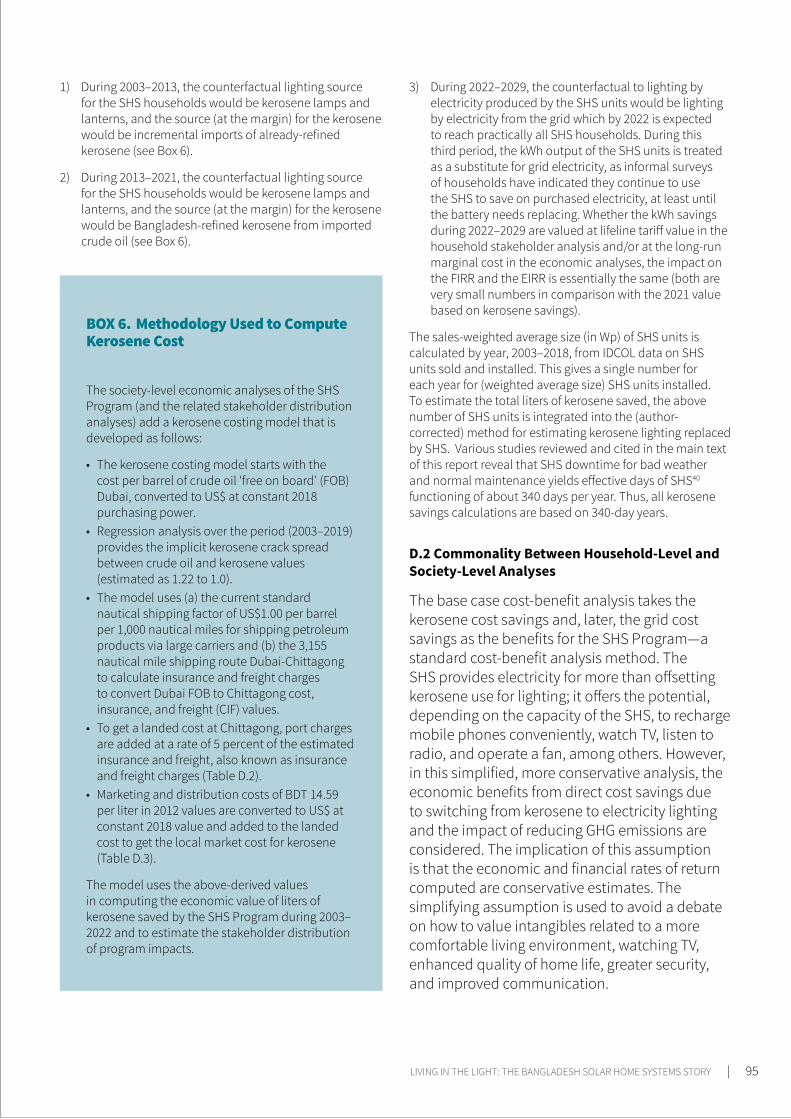
1) During 2003–2013, the counterfactual lighting source for the SHS households would be kerosene lamps and lanterns, and the source (at the margin) for the kerosene would be incremental imports of already-refined kerosene (see Box 6).
2) During 2013–2021, the counterfactual lighting source for the SHS households would be kerosene lamps and lanterns, and the source (at the margin) for the kerosene would be Bangladesh-refined kerosene from imported crude oil (see Box 6).
3) During 2022–2029, the counterfactual to lighting by electricity produced by the SHS units would be lighting by electricity from the grid which by 2022 is expected to reach practically all SHS households. During this third period, the kWh output of the SHS units is treated as a substitute for grid electricity, as informal surveys of households have indicated they continue to use the SHS to save on purchased electricity, at least until the battery needs replacing. Whether the kWh savings during 2022–2029 are valued at lifeline tariff value in the household stakeholder analysis and/or at the long-run marginal cost in the economic analyses, the impact on the FIRR and the EIRR is essentially the same (both are very small numbers in comparison with the 2021 value based on kerosene savings).
The sales-weighted average size (in Wp) of SHS units is calculated by year, 2003–2018, from IDCOL data on SHS units sold and installed. This gives a single number for each year for (weighted average size) SHS units installed. To estimate the total liters of kerosene saved, the above number of SHS units is integrated into the (author-corrected) method for estimating kerosene lighting replaced by SHS. Various studies reviewed and cited in the main text of this report reveal that SHS downtime for bad weather and normal maintenance yields effective days of SHS40
functioning of about 340 days per year. Thus, all kerosene savings calculations are based on 340-day years.
D.2 Commonality Between Household-Level and Society-Level Analyses
The base case cost-benefit analysis takes the kerosene cost savings and, later, the grid cost savings as the benefits for the SHS Program—a standard cost-benefit analysis method. The SHS provides electricity for more than offsetting kerosene use for lighting; it offers the potential, depending on the capacity of the SHS, to recharge mobile phones conveniently, watch TV, listen to radio, and operate a fan, among others. However, in this simplified, more conservative analysis, the economic benefits from direct cost savings due to switching from kerosene to electricity lighting and the impact of reducing GHG emissions are considered. The implication of this assumption is that the economic and financial rates of return computed are conservative estimates. The simplifying assumption is used to avoid a debate on how to value intangibles related to a more comfortable living environment, watching TV, enhanced quality of home life, greater security, and improved communication.
The society-level economic analyses of the SHS Program (and the related stakeholder distribution analyses) add a kerosene costing model that is developed as follows:
• The kerosene costing model starts with the cost per barrel of crude oil ‘free on board’ (FOB) Dubai, converted to US$ at constant 2018 purchasing power.
• Regression analysis over the period (2003–2019) provides the implicit kerosene crack spread between crude oil and kerosene values (estimated as 1.22 to 1.0).
• The model uses (a) the current standard nautical shipping factor of US$1.00 per barrel per 1,000 nautical miles for shipping petroleum products via large carriers and (b) the 3,155 nautical mile shipping route Dubai-Chittagong to calculate insurance and freight charges to convert Dubai FOB to Chittagong cost, insurance, and freight (CIF) values.
• To get a landed cost at Chittagong, port charges are added at a rate of 5 percent of the estimated insurance and freight, also known as insurance and freight charges (Table D.2).
• Marketing and distribution costs of BDT 14.59 per liter in 2012 values are converted to US$ at constant 2018 value and added to the landed cost to get the local market cost for kerosene (Table D.3).
The model uses the above-derived values in computing the economic value of liters of kerosene saved by the SHS Program during 2003–2022 and to estimate the stakeholder distribution of program impacts.
BOX 6. Methodology Used to Compute Kerosene Cost
LIVING IN THE LIGHT: THE BANGLADESH SOLAR HOME SYSTEMS STORY | 95
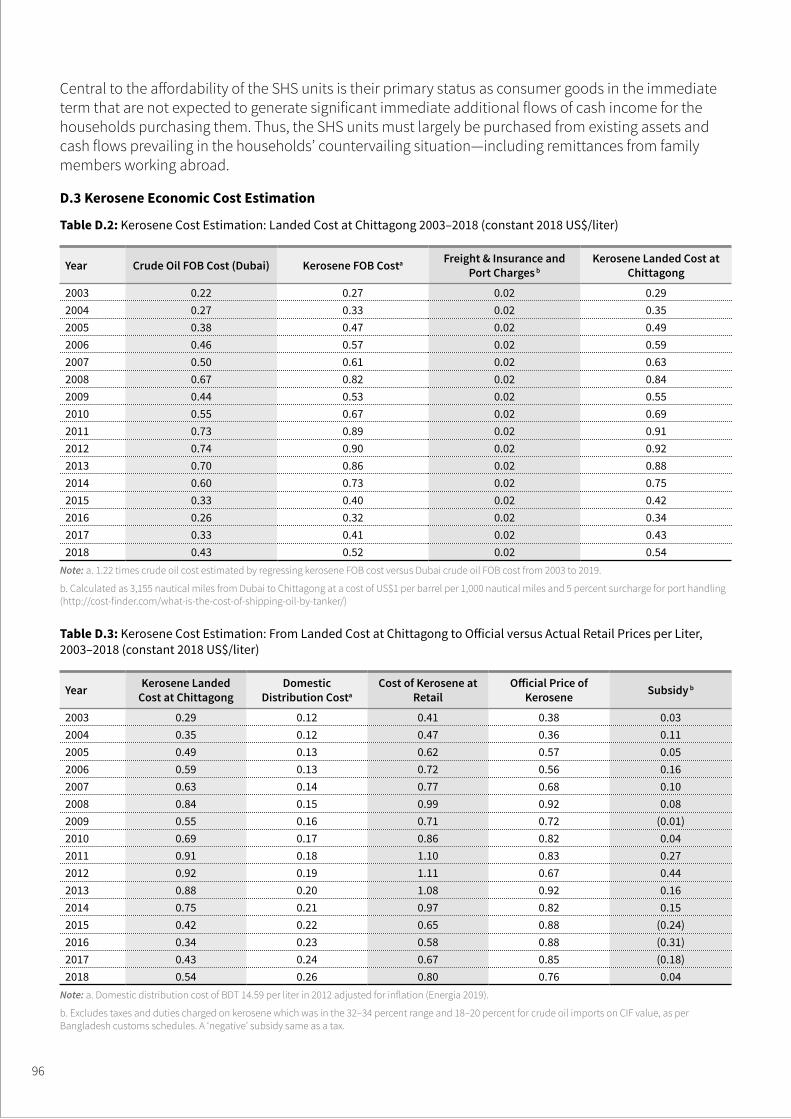
Central to the affordability of the SHS units is their primary status as consumer goods in the immediate term that are not expected to generate significant immediate additional flows of cash income for the households purchasing them. Thus, the SHS units must largely be purchased from existing assets and cash flows prevailing in the households’ countervailing situation—including remittances from family members working abroad.
D.3 Kerosene Economic Cost Estimation
Table D.2: Kerosene Cost Estimation: Landed Cost at Chittagong 2003–2018 (constant 2018 US$/liter)
Year Crude Oil FOB Cost (Dubai) Kerosene FOB Costa Freight & Insurance and Port Charges b
Kerosene Landed Cost at Chittagong
2003 0.22 0.27 0.02 0.292004 0.27 0.33 0.02 0.352005 0.38 0.47 0.02 0.492006 0.46 0.57 0.02 0.592007 0.50 0.61 0.02 0.632008 0.67 0.82 0.02 0.842009 0.44 0.53 0.02 0.552010 0.55 0.67 0.02 0.692011 0.73 0.89 0.02 0.912012 0.74 0.90 0.02 0.922013 0.70 0.86 0.02 0.882014 0.60 0.73 0.02 0.752015 0.33 0.40 0.02 0.422016 0.26 0.32 0.02 0.342017 0.33 0.41 0.02 0.432018 0.43 0.52 0.02 0.54
Note: a. 1.22 times crude oil cost estimated by regressing kerosene FOB cost versus Dubai crude oil FOB cost from 2003 to 2019.
b. Calculated as 3,155 nautical miles from Dubai to Chittagong at a cost of US$1 per barrel per 1,000 nautical miles and 5 percent surcharge for port handling (http://cost-finder.com/what-is-the-cost-of-shipping-oil-by-tanker/)
Table D.3: Kerosene Cost Estimation: From Landed Cost at Chittagong to Official versus Actual Retail Prices per Liter, 2003–2018 (constant 2018 US$/liter)
Year Kerosene Landed Cost at Chittagong
Domestic Distribution Costa
Cost of Kerosene at Retail
Official Price of Kerosene Subsidy b
2003 0.29 0.12 0.41 0.38 0.032004 0.35 0.12 0.47 0.36 0.112005 0.49 0.13 0.62 0.57 0.052006 0.59 0.13 0.72 0.56 0.162007 0.63 0.14 0.77 0.68 0.102008 0.84 0.15 0.99 0.92 0.082009 0.55 0.16 0.71 0.72 (0.01)2010 0.69 0.17 0.86 0.82 0.042011 0.91 0.18 1.10 0.83 0.272012 0.92 0.19 1.11 0.67 0.442013 0.88 0.20 1.08 0.92 0.162014 0.75 0.21 0.97 0.82 0.152015 0.42 0.22 0.65 0.88 (0.24)2016 0.34 0.23 0.58 0.88 (0.31)2017 0.43 0.24 0.67 0.85 (0.18)2018 0.54 0.26 0.80 0.76 0.04
Note: a. Domestic distribution cost of BDT 14.59 per liter in 2012 adjusted for inflation (Energia 2019).
b. Excludes taxes and duties charged on kerosene which was in the 32–34 percent range and 18–20 percent for crude oil imports on CIF value, as per Bangladesh customs schedules. A ‘negative’ subsidy same as a tax.
96
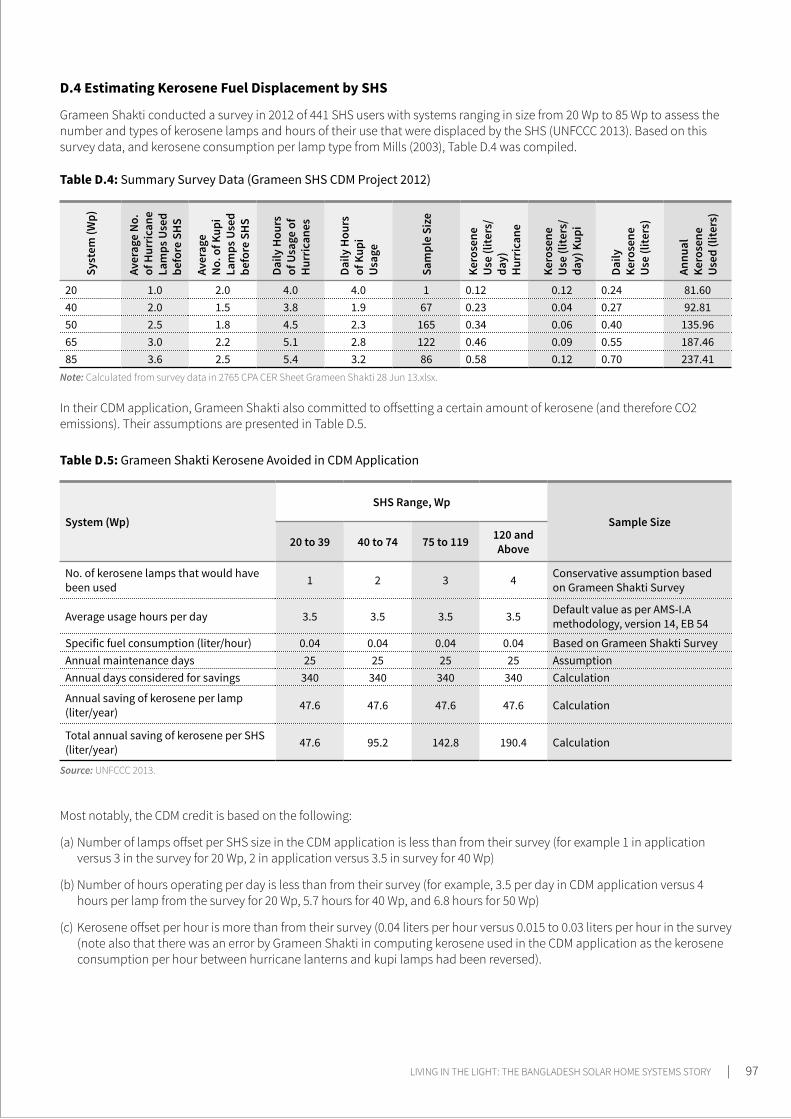
Table D.4: Summary Survey Data (Grameen SHS CDM Project 2012)
Syst
em (W
p)
Aver
age
No.
of H
urric
ane
Lam
ps U
sed
befo
re S
HS
Aver
age
No. o
f Kup
i La
mps
Use
d be
fore
SH
S
Daily
Hou
rs
of U
sage
of
Hur
rican
es
Daily
Hou
rs
of K
upi
Usag
e
Sam
ple
Size
Kero
sene
Us
e (li
ters
/da
y)H
urric
ane
Kero
sene
Us
e (li
ters
/ da
y) K
upi
Daily
Ke
rose
ne
Use
(lite
rs)
Annu
al
Kero
sene
Us
ed (l
iters
)
20 1.0 2.0 4.0 4.0 1 0.12 0.12 0.24 81.6040 2.0 1.5 3.8 1.9 67 0.23 0.04 0.27 92.8150 2.5 1.8 4.5 2.3 165 0.34 0.06 0.40 135.9665 3.0 2.2 5.1 2.8 122 0.46 0.09 0.55 187.4685 3.6 2.5 5.4 3.2 86 0.58 0.12 0.70 237.41
Note: Calculated from survey data in 2765 CPA CER Sheet Grameen Shakti 28 Jun 13.xlsx.
Table D.5: Grameen Shakti Kerosene Avoided in CDM Application
System (Wp)
SHS Range, Wp
Sample Size
20 to 39 40 to 74 75 to 119 120 and Above
No. of kerosene lamps that would have been used 1 2 3 4 Conservative assumption based
on Grameen Shakti Survey
Average usage hours per day 3.5 3.5 3.5 3.5 Default value as per AMS-I.A methodology, version 14, EB 54
Specific fuel consumption (liter/hour) 0.04 0.04 0.04 0.04 Based on Grameen Shakti SurveyAnnual maintenance days 25 25 25 25 AssumptionAnnual days considered for savings 340 340 340 340 Calculation
Annual saving of kerosene per lamp (liter/year) 47.6 47.6 47.6 47.6 Calculation
Total annual saving of kerosene per SHS (liter/year) 47.6 95.2 142.8 190.4 Calculation
Source: UNFCCC 2013.
D.4 Estimating Kerosene Fuel Displacement by SHS
Grameen Shakti conducted a survey in 2012 of 441 SHS users with systems ranging in size from 20 Wp to 85 Wp to assess the number and types of kerosene lamps and hours of their use that were displaced by the SHS (UNFCCC 2013). Based on this survey data, and kerosene consumption per lamp type from Mills (2003), Table D.4 was compiled.
Most notably, the CDM credit is based on the following:
(a) Number of lamps offset per SHS size in the CDM application is less than from their survey (for example 1 in application versus 3 in the survey for 20 Wp, 2 in application versus 3.5 in survey for 40 Wp)
(b) Number of hours operating per day is less than from their survey (for example, 3.5 per day in CDM application versus 4 hours per lamp from the survey for 20 Wp, 5.7 hours for 40 Wp, and 6.8 hours for 50 Wp)
(c) Kerosene offset per hour is more than from their survey (0.04 liters per hour versus 0.015 to 0.03 liters per hour in the survey (note also that there was an error by Grameen Shakti in computing kerosene used in the CDM application as the kerosene consumption per hour between hurricane lanterns and kupi lamps had been reversed).
In their CDM application, Grameen Shakti also committed to offsetting a certain amount of kerosene (and therefore CO2 emissions). Their assumptions are presented in Table D.5.
LIVING IN THE LIGHT: THE BANGLADESH SOLAR HOME SYSTEMS STORY | 97
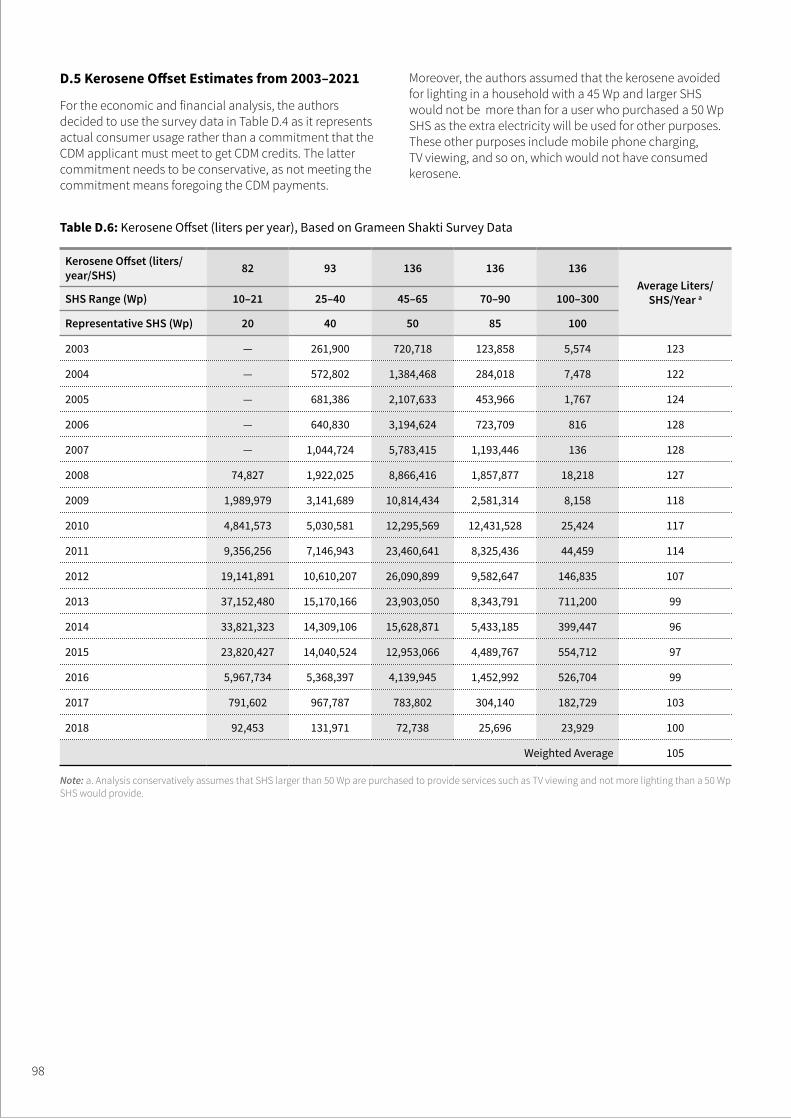
D.5 Kerosene Offset Estimates from 2003–2021
For the economic and financial analysis, the authors decided to use the survey data in Table D.4 as it represents actual consumer usage rather than a commitment that the CDM applicant must meet to get CDM credits. The latter commitment needs to be conservative, as not meeting the commitment means foregoing the CDM payments.
Moreover, the authors assumed that the kerosene avoided for lighting in a household with a 45 Wp and larger SHS would not be more than for a user who purchased a 50 Wp SHS as the extra electricity will be used for other purposes. These other purposes include mobile phone charging, TV viewing, and so on, which would not have consumed kerosene.
Table D.6: Kerosene Offset (liters per year), Based on Grameen Shakti Survey Data
Kerosene Offset (liters/year/SHS) 82 93 136 136 136
Average Liters/ SHS/Year aSHS Range (Wp) 10–21 25–40 45–65 70–90 100–300
Representative SHS (Wp) 20 40 50 85 100
2003 — 261,900 720,718 123,858 5,574 123
2004 — 572,802 1,384,468 284,018 7,478 122
2005 — 681,386 2,107,633 453,966 1,767 124
2006 — 640,830 3,194,624 723,709 816 128
2007 — 1,044,724 5,783,415 1,193,446 136 128
2008 74,827 1,922,025 8,866,416 1,857,877 18,218 127
2009 1,989,979 3,141,689 10,814,434 2,581,314 8,158 118
2010 4,841,573 5,030,581 12,295,569 12,431,528 25,424 117
2011 9,356,256 7,146,943 23,460,641 8,325,436 44,459 114
2012 19,141,891 10,610,207 26,090,899 9,582,647 146,835 107
2013 37,152,480 15,170,166 23,903,050 8,343,791 711,200 99
2014 33,821,323 14,309,106 15,628,871 5,433,185 399,447 96
2015 23,820,427 14,040,524 12,953,066 4,489,767 554,712 97
2016 5,967,734 5,368,397 4,139,945 1,452,992 526,704 99
2017 791,602 967,787 783,802 304,140 182,729 103
2018 92,453 131,971 72,738 25,696 23,929 100
Weighted Average 105
Note: a. Analysis conservatively assumes that SHS larger than 50 Wp are purchased to provide services such as TV viewing and not more lighting than a 50 Wp SHS would provide.
98

Table D.7: Calculation of Total Liters of Kerosene Use Avoided during 2003–2022 by SHS Program Installations 2003–2018
Year Average Liters/SHS/Year No. of SHS Installed by Year Total Liters of Kerosene Use Saved 2003 to 2021 by SHS Installed in that Year
2003 123 9,075 13,394,700
2004 122 18,499 27,082,536
2005 124 26,196 38,979,648
2006 128 35,731 54,882,816
2007 128 62,574 96,113,664
2008 127 100,640 153,375,360
2009 118 156,827 222,067,032
2010 117 295,597 415,018,188
2011 114 425,788 533,938,152
2012 107 612,373 655,239,110
2013 99 861,172 767,304,252
2014 96 726,512 557,961,216
2015 97 575,580 390,818,820
2016 99 175,990 104,538,060
2017 103 29,475 15,179,625
2018 100 3,455 1,382,000
Total 4,115,484 4,047,275,179
Table D.8: Kerosene Saved by the Bangladesh SHS Program, 2003 to 2022: Value at the Household Level, Aggregated SHS Households
YearKerosene Price at Retail Total Liters Saved by SHS
HouseholdsTotal Value of Kerosene Saved by
SHS Households
Constant 2018 US$ Liters of Kerosene Constant 2018 US$
2003 0.41 1,116,225 452,708
2004 0.47 3,373,103 1,591,890
2005 0.62 6,621,407 4,088,288
2006 0.72 11,194,975 8,054,024
2007 0.77 19,204,447 14,853,480
2008 0.99 31,985,727 31,808,530
2009 0.71 50,491,313 35,873,533
2010 0.86 85,076,162 73,131,236
2011 1.10 133,615,994 146,853,601
2012 1.11 199,139,905 221,417,864
2013 1.08 284,395,933 306,650,972
2014 0.97 354,141,085 341,821,510
2015 0.65 408,856,120 264,707,393
2016 0.58 424,022,252 244,498,673
2017 0.67 423,809,873 283,955,293
2018 0.80 419,581,805 335,825,674
2019 0.80 411,572,333 329,415,037
2020 0.80 398,791,053 319,185,133
2021 0.80 380,285,467 304,373,597
LIVING IN THE LIGHT: THE BANGLADESH SOLAR HOME SYSTEMS STORY | 99
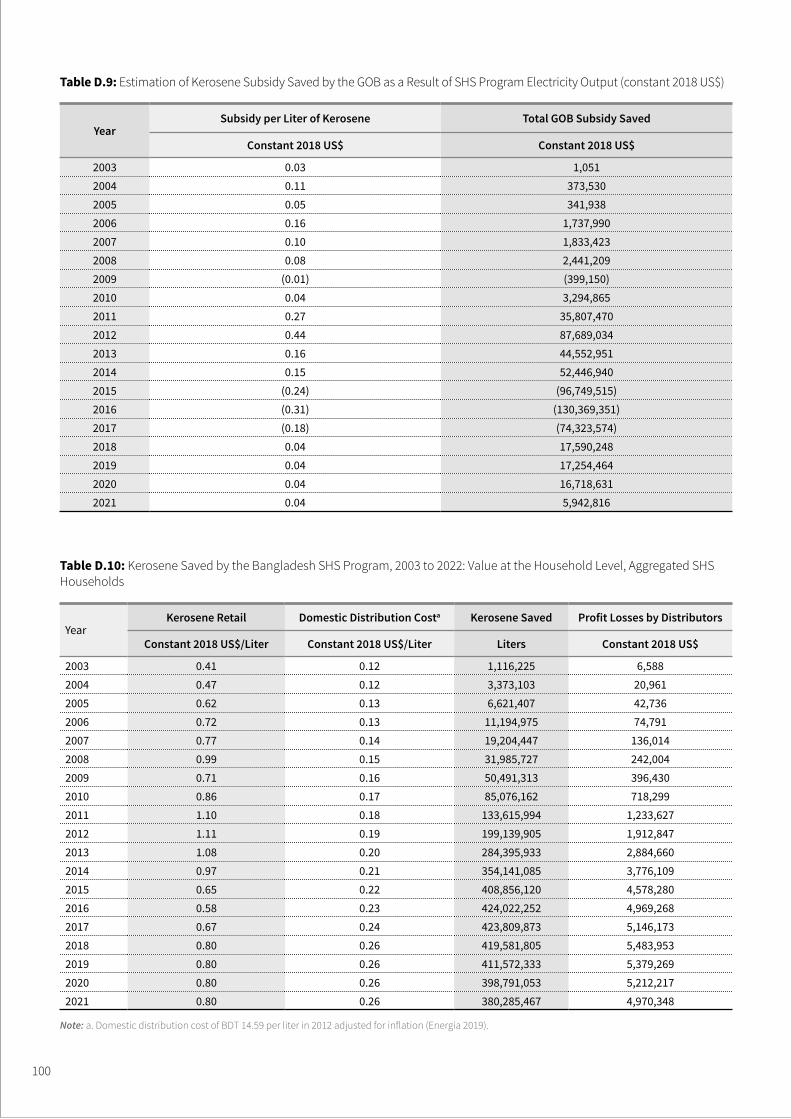
Table D.9: Estimation of Kerosene Subsidy Saved by the GOB as a Result of SHS Program Electricity Output (constant 2018 US$)
YearSubsidy per Liter of Kerosene Total GOB Subsidy Saved
Constant 2018 US$ Constant 2018 US$
2003 0.03 1,0512004 0.11 373,5302005 0.05 341,9382006 0.16 1,737,9902007 0.10 1,833,4232008 0.08 2,441,2092009 (0.01) (399,150)2010 0.04 3,294,8652011 0.27 35,807,4702012 0.44 87,689,0342013 0.16 44,552,9512014 0.15 52,446,9402015 (0.24) (96,749,515)2016 (0.31) (130,369,351)2017 (0.18) (74,323,574)2018 0.04 17,590,2482019 0.04 17,254,4642020 0.04 16,718,6312021 0.04 5,942,816
Table D.10: Kerosene Saved by the Bangladesh SHS Program, 2003 to 2022: Value at the Household Level, Aggregated SHS Households
YearKerosene Retail Domestic Distribution Costa Kerosene Saved Profit Losses by Distributors
Constant 2018 US$/Liter Constant 2018 US$/Liter Liters Constant 2018 US$
2003 0.41 0.12 1,116,225 6,5882004 0.47 0.12 3,373,103 20,9612005 0.62 0.13 6,621,407 42,7362006 0.72 0.13 11,194,975 74,7912007 0.77 0.14 19,204,447 136,0142008 0.99 0.15 31,985,727 242,0042009 0.71 0.16 50,491,313 396,4302010 0.86 0.17 85,076,162 718,2992011 1.10 0.18 133,615,994 1,233,6272012 1.11 0.19 199,139,905 1,912,8472013 1.08 0.20 284,395,933 2,884,6602014 0.97 0.21 354,141,085 3,776,1092015 0.65 0.22 408,856,120 4,578,2802016 0.58 0.23 424,022,252 4,969,2682017 0.67 0.24 423,809,873 5,146,1732018 0.80 0.26 419,581,805 5,483,9532019 0.80 0.26 411,572,333 5,379,2692020 0.80 0.26 398,791,053 5,212,2172021 0.80 0.26 380,285,467 4,970,348
Note: a. Domestic distribution cost of BDT 14.59 per liter in 2012 adjusted for inflation (Energia 2019).
100
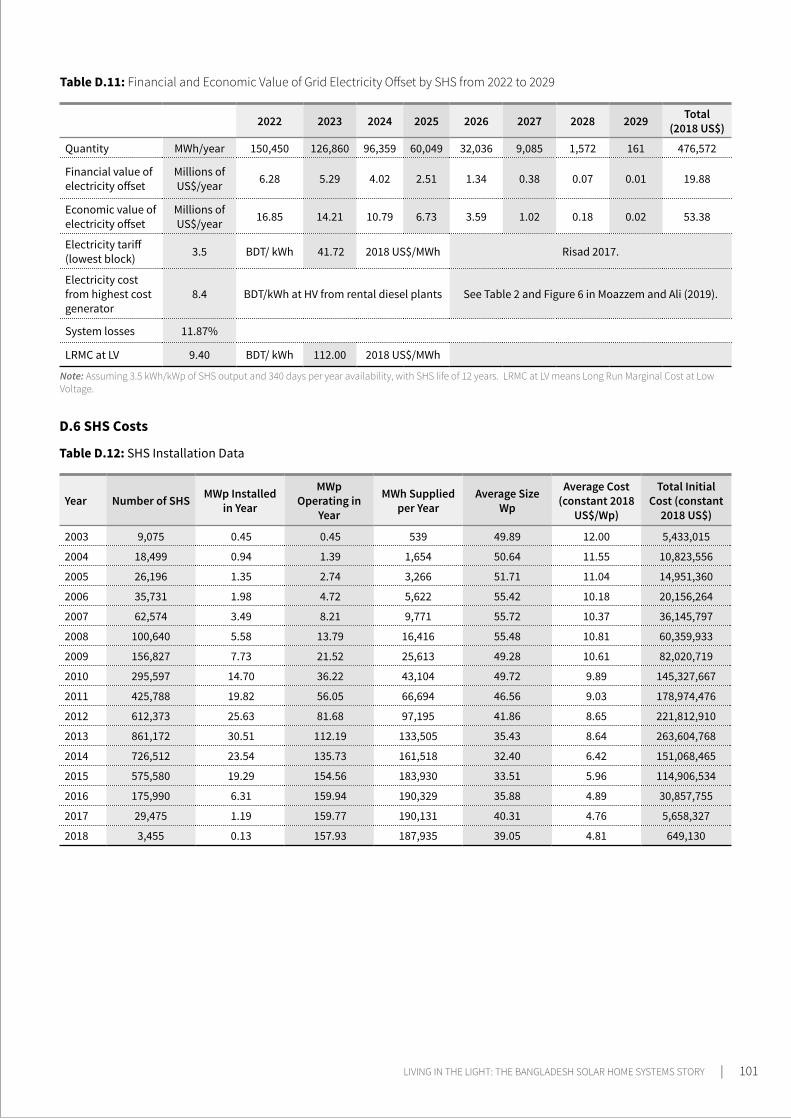
Table D.11: Financial and Economic Value of Grid Electricity Offset by SHS from 2022 to 2029
2022 2023 2024 2025 2026 2027 2028 2029 Total (2018 US$)
Quantity MWh/year 150,450 126,860 96,359 60,049 32,036 9,085 1,572 161 476,572
Financial value of electricity offset
Millions of US$/year 6.28 5.29 4.02 2.51 1.34 0.38 0.07 0.01 19.88
Economic value of electricity offset
Millions of US$/year 16.85 14.21 10.79 6.73 3.59 1.02 0.18 0.02 53.38
Electricity tariff (lowest block) 3.5 BDT/ kWh 41.72 2018 US$/MWh Risad 2017.
Electricity cost from highest cost generator
8.4 BDT/kWh at HV from rental diesel plants See Table 2 and Figure 6 in Moazzem and Ali (2019).
System losses 11.87%
LRMC at LV 9.40 BDT/ kWh 112.00 2018 US$/MWh
Note: Assuming 3.5 kWh/kWp of SHS output and 340 days per year availability, with SHS life of 12 years. LRMC at LV means Long Run Marginal Cost at Low Voltage.
D.6 SHS Costs
Table D.12: SHS Installation Data
Year Number of SHS MWp Installed in Year
MWp Operating in
Year
MWh Supplied per Year
Average Size Wp
Average Cost (constant 2018
US$/Wp)
Total Initial Cost (constant
2018 US$)
2003 9,075 0.45 0.45 539 49.89 12.00 5,433,015
2004 18,499 0.94 1.39 1,654 50.64 11.55 10,823,556
2005 26,196 1.35 2.74 3,266 51.71 11.04 14,951,360
2006 35,731 1.98 4.72 5,622 55.42 10.18 20,156,264
2007 62,574 3.49 8.21 9,771 55.72 10.37 36,145,797
2008 100,640 5.58 13.79 16,416 55.48 10.81 60,359,933
2009 156,827 7.73 21.52 25,613 49.28 10.61 82,020,719
2010 295,597 14.70 36.22 43,104 49.72 9.89 145,327,667
2011 425,788 19.82 56.05 66,694 46.56 9.03 178,974,476
2012 612,373 25.63 81.68 97,195 41.86 8.65 221,812,910
2013 861,172 30.51 112.19 133,505 35.43 8.64 263,604,768
2014 726,512 23.54 135.73 161,518 32.40 6.42 151,068,465
2015 575,580 19.29 154.56 183,930 33.51 5.96 114,906,534
2016 175,990 6.31 159.94 190,329 35.88 4.89 30,857,755
2017 29,475 1.19 159.77 190,131 40.31 4.76 5,658,327
2018 3,455 0.13 157.93 187,935 39.05 4.81 649,130
LIVING IN THE LIGHT: THE BANGLADESH SOLAR HOME SYSTEMS STORY | 101
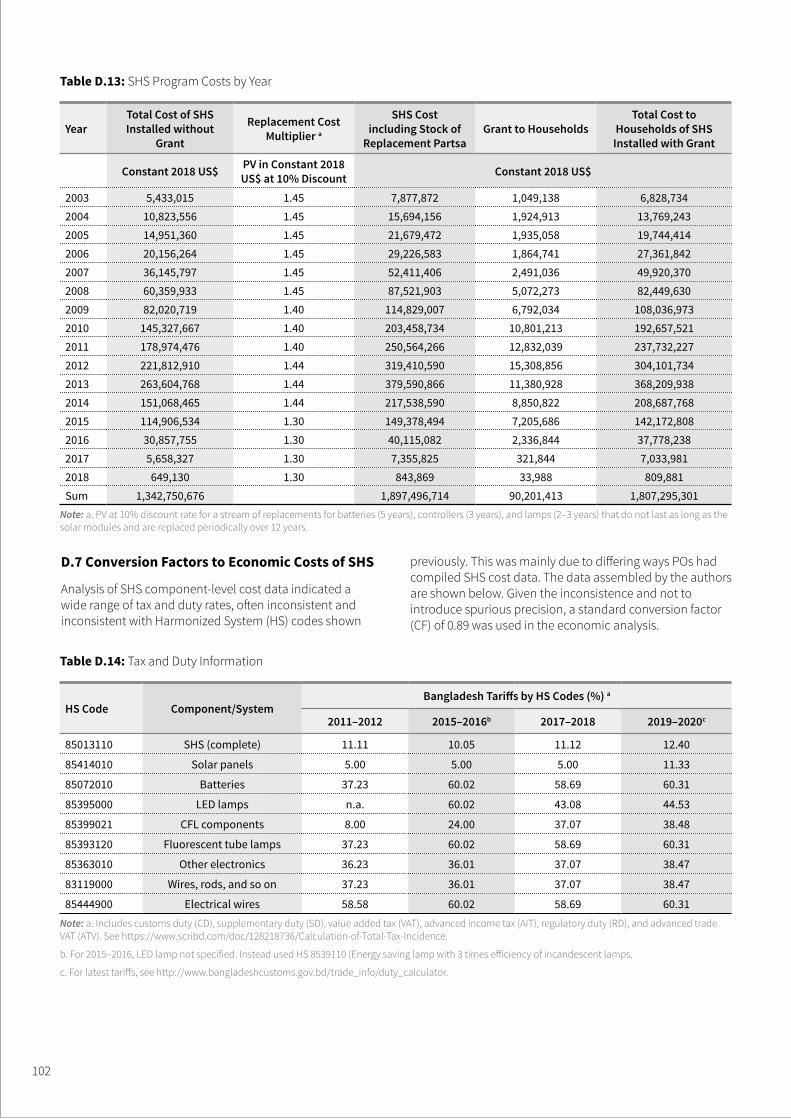
Table D.13: SHS Program Costs by Year
YearTotal Cost of SHS Installed without
Grant
Replacement Cost Multiplier a
SHS Cost including Stock of
Replacement PartsaGrant to Households
Total Cost to Households of SHS
Installed with Grant
Constant 2018 US$ PV in Constant 2018 US$ at 10% Discount Constant 2018 US$
2003 5,433,015 1.45 7,877,872 1,049,138 6,828,7342004 10,823,556 1.45 15,694,156 1,924,913 13,769,2432005 14,951,360 1.45 21,679,472 1,935,058 19,744,4142006 20,156,264 1.45 29,226,583 1,864,741 27,361,8422007 36,145,797 1.45 52,411,406 2,491,036 49,920,3702008 60,359,933 1.45 87,521,903 5,072,273 82,449,6302009 82,020,719 1.40 114,829,007 6,792,034 108,036,9732010 145,327,667 1.40 203,458,734 10,801,213 192,657,5212011 178,974,476 1.40 250,564,266 12,832,039 237,732,2272012 221,812,910 1.44 319,410,590 15,308,856 304,101,7342013 263,604,768 1.44 379,590,866 11,380,928 368,209,9382014 151,068,465 1.44 217,538,590 8,850,822 208,687,7682015 114,906,534 1.30 149,378,494 7,205,686 142,172,8082016 30,857,755 1.30 40,115,082 2,336,844 37,778,2382017 5,658,327 1.30 7,355,825 321,844 7,033,9812018 649,130 1.30 843,869 33,988 809,881Sum 1,342,750,676 1,897,496,714 90,201,413 1,807,295,301
Note: a. PV at 10% discount rate for a stream of replacements for batteries (5 years), controllers (3 years), and lamps (2–3 years) that do not last as long as the solar modules and are replaced periodically over 12 years.
Table D.14: Tax and Duty Information
HS Code Component/SystemBangladesh Tariffs by HS Codes (%) a
2011–2012 2015–2016b 2017–2018 2019–2020c
85013110 SHS (complete) 11.11 10.05 11.12 12.40
85414010 Solar panels 5.00 5.00 5.00 11.33
85072010 Batteries 37.23 60.02 58.69 60.31
85395000 LED lamps n.a. 60.02 43.08 44.53
85399021 CFL components 8.00 24.00 37.07 38.48
85393120 Fluorescent tube lamps 37.23 60.02 58.69 60.31
85363010 Other electronics 36.23 36.01 37.07 38.47
83119000 Wires, rods, and so on 37.23 36.01 37.07 38.47
85444900 Electrical wires 58.58 60.02 58.69 60.31Note: a. Includes customs duty (CD), supplementary duty (SD), value added tax (VAT), advanced income tax (AIT), regulatory duty (RD), and advanced trade VAT (ATV). See https://www.scribd.com/doc/128218736/Calculation-of-Total-Tax-Incidence.
b. For 2015–2016, LED lamp not specified. Instead used HS 8539110 (Energy saving lamp with 3 times efficiency of incandescent lamps.
c. For latest tariffs, see http://www.bangladeshcustoms.gov.bd/trade_info/duty_calculator.
D.7 Conversion Factors to Economic Costs of SHS
Analysis of SHS component-level cost data indicated a wide range of tax and duty rates, often inconsistent and inconsistent with Harmonized System (HS) codes shown
previously. This was mainly due to differing ways POs had compiled SHS cost data. The data assembled by the authors are shown below. Given the inconsistence and not to introduce spurious precision, a standard conversion factor (CF) of 0.89 was used in the economic analysis.
102
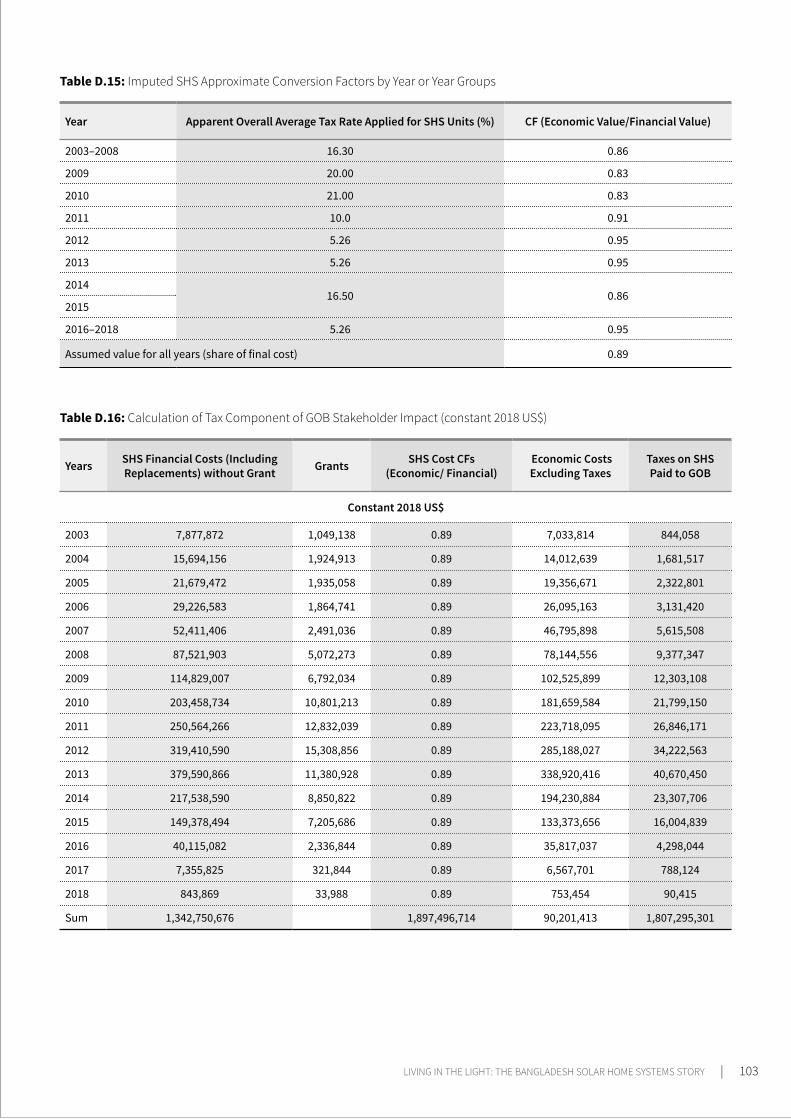
Table D.16: Calculation of Tax Component of GOB Stakeholder Impact (constant 2018 US$)
Years SHS Financial Costs (Including Replacements) without Grant Grants SHS Cost CFs
(Economic/ Financial) Economic Costs Excluding Taxes
Taxes on SHS Paid to GOB
Constant 2018 US$
2003 7,877,872 1,049,138 0.89 7,033,814 844,058
2004 15,694,156 1,924,913 0.89 14,012,639 1,681,517
2005 21,679,472 1,935,058 0.89 19,356,671 2,322,801
2006 29,226,583 1,864,741 0.89 26,095,163 3,131,420
2007 52,411,406 2,491,036 0.89 46,795,898 5,615,508
2008 87,521,903 5,072,273 0.89 78,144,556 9,377,347
2009 114,829,007 6,792,034 0.89 102,525,899 12,303,108
2010 203,458,734 10,801,213 0.89 181,659,584 21,799,150
2011 250,564,266 12,832,039 0.89 223,718,095 26,846,171
2012 319,410,590 15,308,856 0.89 285,188,027 34,222,563
2013 379,590,866 11,380,928 0.89 338,920,416 40,670,450
2014 217,538,590 8,850,822 0.89 194,230,884 23,307,706
2015 149,378,494 7,205,686 0.89 133,373,656 16,004,839
2016 40,115,082 2,336,844 0.89 35,817,037 4,298,044
2017 7,355,825 321,844 0.89 6,567,701 788,124
2018 843,869 33,988 0.89 753,454 90,415
Sum 1,342,750,676 1,897,496,714 90,201,413 1,807,295,301
Table D.15: Imputed SHS Approximate Conversion Factors by Year or Year Groups
Year Apparent Overall Average Tax Rate Applied for SHS Units (%) CF (Economic Value/Financial Value)
2003–2008 16.30 0.86
2009 20.00 0.83
2010 21.00 0.83
2011 10.0 0.91
2012 5.26 0.95
2013 5.26 0.95
201416.50 0.86
2015
2016–2018 5.26 0.95
Assumed value for all years (share of final cost) 0.89
LIVING IN THE LIGHT: THE BANGLADESH SOLAR HOME SYSTEMS STORY | 103
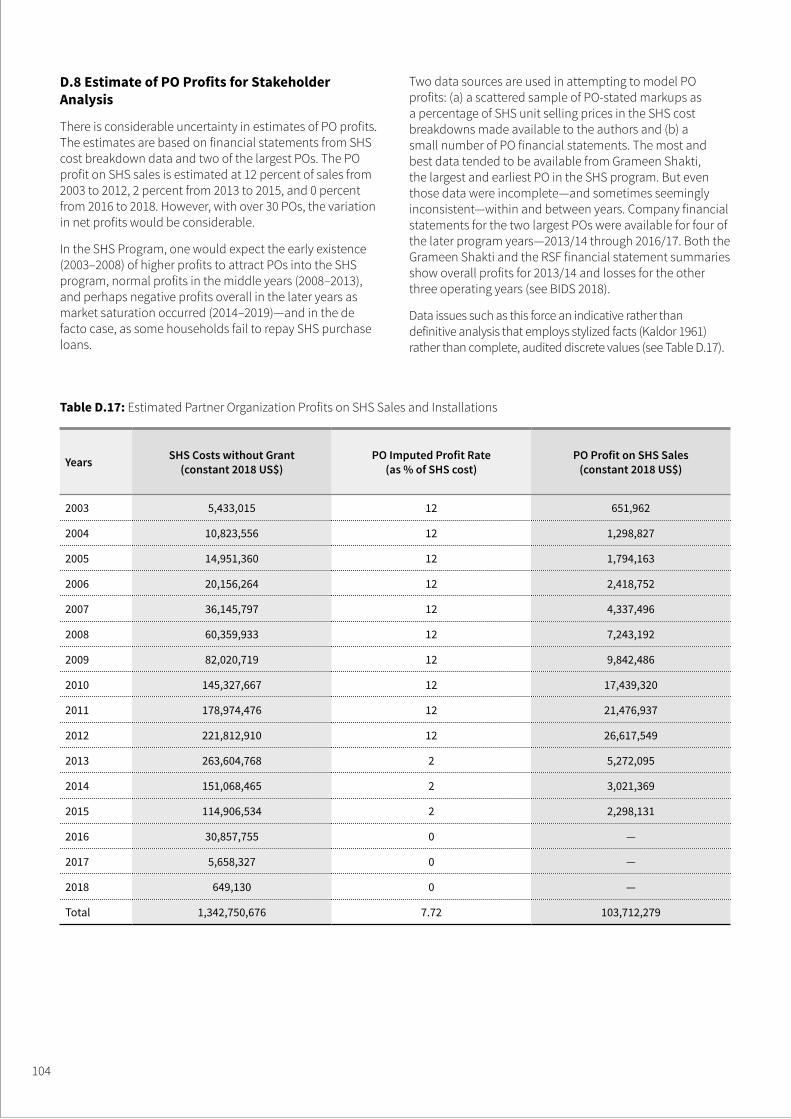
Table D.17: Estimated Partner Organization Profits on SHS Sales and Installations
Years SHS Costs without Grant(constant 2018 US$)
PO Imputed Profit Rate(as % of SHS cost)
PO Profit on SHS Sales(constant 2018 US$)
2003 5,433,015 12 651,962
2004 10,823,556 12 1,298,827
2005 14,951,360 12 1,794,163
2006 20,156,264 12 2,418,752
2007 36,145,797 12 4,337,496
2008 60,359,933 12 7,243,192
2009 82,020,719 12 9,842,486
2010 145,327,667 12 17,439,320
2011 178,974,476 12 21,476,937
2012 221,812,910 12 26,617,549
2013 263,604,768 2 5,272,095
2014 151,068,465 2 3,021,369
2015 114,906,534 2 2,298,131
2016 30,857,755 0 —
2017 5,658,327 0 —
2018 649,130 0 —
Total 1,342,750,676 7.72 103,712,279
D.8 Estimate of PO Profits for Stakeholder Analysis
There is considerable uncertainty in estimates of PO profits. The estimates are based on financial statements from SHS cost breakdown data and two of the largest POs. The PO profit on SHS sales is estimated at 12 percent of sales from 2003 to 2012, 2 percent from 2013 to 2015, and 0 percent from 2016 to 2018. However, with over 30 POs, the variation in net profits would be considerable.
In the SHS Program, one would expect the early existence (2003–2008) of higher profits to attract POs into the SHS program, normal profits in the middle years (2008–2013), and perhaps negative profits overall in the later years as market saturation occurred (2014–2019)—and in the de facto case, as some households fail to repay SHS purchase loans.
Two data sources are used in attempting to model PO profits: (a) a scattered sample of PO-stated markups as a percentage of SHS unit selling prices in the SHS cost breakdowns made available to the authors and (b) a small number of PO financial statements. The most and best data tended to be available from Grameen Shakti, the largest and earliest PO in the SHS program. But even those data were incomplete—and sometimes seemingly inconsistent—within and between years. Company financial statements for the two largest POs were available for four of the later program years—2013/14 through 2016/17. Both the Grameen Shakti and the RSF financial statement summaries show overall profits for 2013/14 and losses for the other three operating years (see BIDS 2018).
Data issues such as this force an indicative rather than definitive analysis that employs stylized facts (Kaldor 1961) rather than complete, audited discrete values (see Table D.17).
104
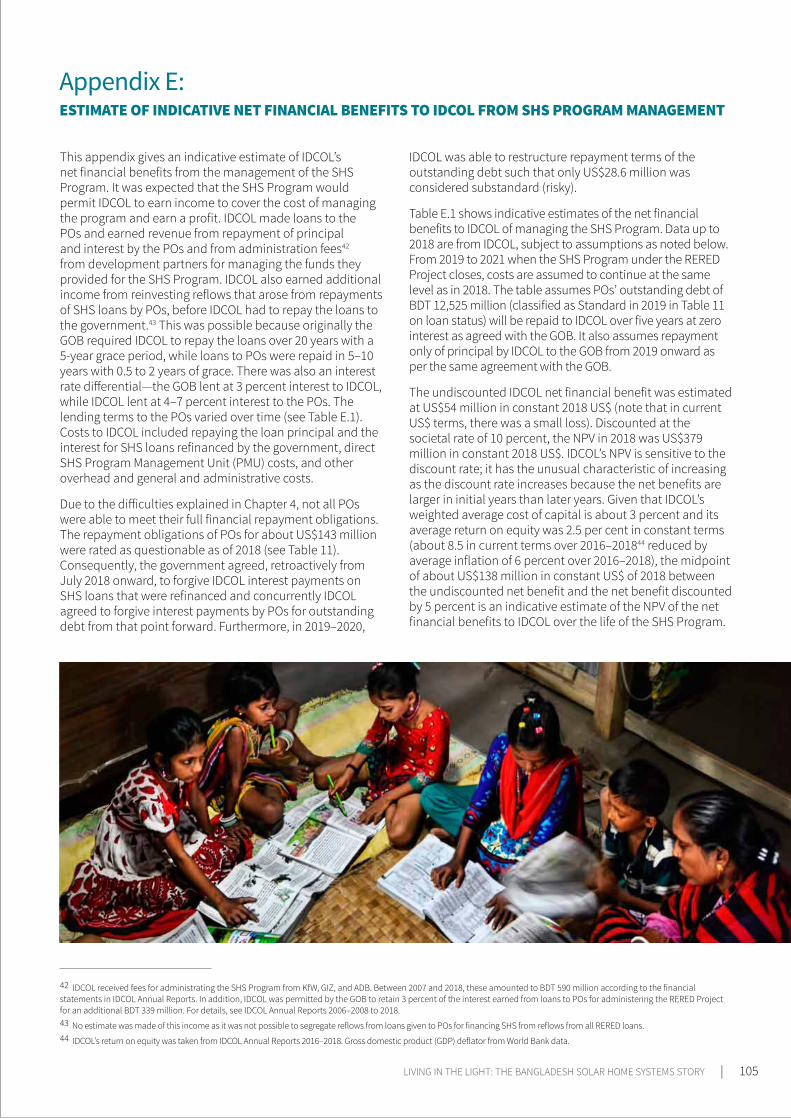
Appendix E: ESTIMATE OF INDICATIVE NET FINANCIAL BENEFITS TO IDCOL FROM SHS PROGRAM MANAGEMENT
This appendix gives an indicative estimate of IDCOL’s net financial benefits from the management of the SHS Program. It was expected that the SHS Program would permit IDCOL to earn income to cover the cost of managing the program and earn a profit. IDCOL made loans to the POs and earned revenue from repayment of principal and interest by the POs and from administration fees42 from development partners for managing the funds they provided for the SHS Program. IDCOL also earned additional income from reinvesting reflows that arose from repayments of SHS loans by POs, before IDCOL had to repay the loans to the government.43 This was possible because originally the GOB required IDCOL to repay the loans over 20 years with a 5-year grace period, while loans to POs were repaid in 5–10 years with 0.5 to 2 years of grace. There was also an interest rate differential—the GOB lent at 3 percent interest to IDCOL, while IDCOL lent at 4–7 percent interest to the POs. The lending terms to the POs varied over time (see Table E.1). Costs to IDCOL included repaying the loan principal and the interest for SHS loans refinanced by the government, direct SHS Program Management Unit (PMU) costs, and other overhead and general and administrative costs.
Due to the difficulties explained in Chapter 4, not all POs were able to meet their full financial repayment obligations. The repayment obligations of POs for about US$143 million were rated as questionable as of 2018 (see Table 11). Consequently, the government agreed, retroactively from July 2018 onward, to forgive IDCOL interest payments on SHS loans that were refinanced and concurrently IDCOL agreed to forgive interest payments by POs for outstanding debt from that point forward. Furthermore, in 2019–2020,
42 IDCOL received fees for administrating the SHS Program from KfW, GIZ, and ADB. Between 2007 and 2018, these amounted to BDT 590 million according to the financial statements in IDCOL Annual Reports. In addition, IDCOL was permitted by the GOB to retain 3 percent of the interest earned from loans to POs for administering the RERED Project for an additional BDT 339 million. For details, see IDCOL Annual Reports 2006–2008 to 2018. 43 No estimate was made of this income as it was not possible to segregate reflows from loans given to POs for financing SHS from reflows from all RERED loans. 44 IDCOL’s return on equity was taken from IDCOL Annual Reports 2016–2018. Gross domestic product (GDP) deflator from World Bank data.
IDCOL was able to restructure repayment terms of the outstanding debt such that only US$28.6 million was considered substandard (risky).
Table E.1 shows indicative estimates of the net financial benefits to IDCOL of managing the SHS Program. Data up to 2018 are from IDCOL, subject to assumptions as noted below. From 2019 to 2021 when the SHS Program under the RERED Project closes, costs are assumed to continue at the same level as in 2018. The table assumes POs’ outstanding debt of BDT 12,525 million (classified as Standard in 2019 in Table 11 on loan status) will be repaid to IDCOL over five years at zero interest as agreed with the GOB. It also assumes repayment only of principal by IDCOL to the GOB from 2019 onward as per the same agreement with the GOB.
The undiscounted IDCOL net financial benefit was estimated at US$54 million in constant 2018 US$ (note that in current US$ terms, there was a small loss). Discounted at the societal rate of 10 percent, the NPV in 2018 was US$379 million in constant 2018 US$. IDCOL’s NPV is sensitive to the discount rate; it has the unusual characteristic of increasing as the discount rate increases because the net benefits are larger in initial years than later years. Given that IDCOL’s weighted average cost of capital is about 3 percent and its average return on equity was 2.5 per cent in constant terms (about 8.5 in current terms over 2016–201844 reduced by average inflation of 6 percent over 2016–2018), the midpoint of about US$138 million in constant US$ of 2018 between the undiscounted net benefit and the net benefit discounted by 5 percent is an indicative estimate of the NPV of the net financial benefits to IDCOL over the life of the SHS Program.
LIVING IN THE LIGHT: THE BANGLADESH SOLAR HOME SYSTEMS STORY | 105
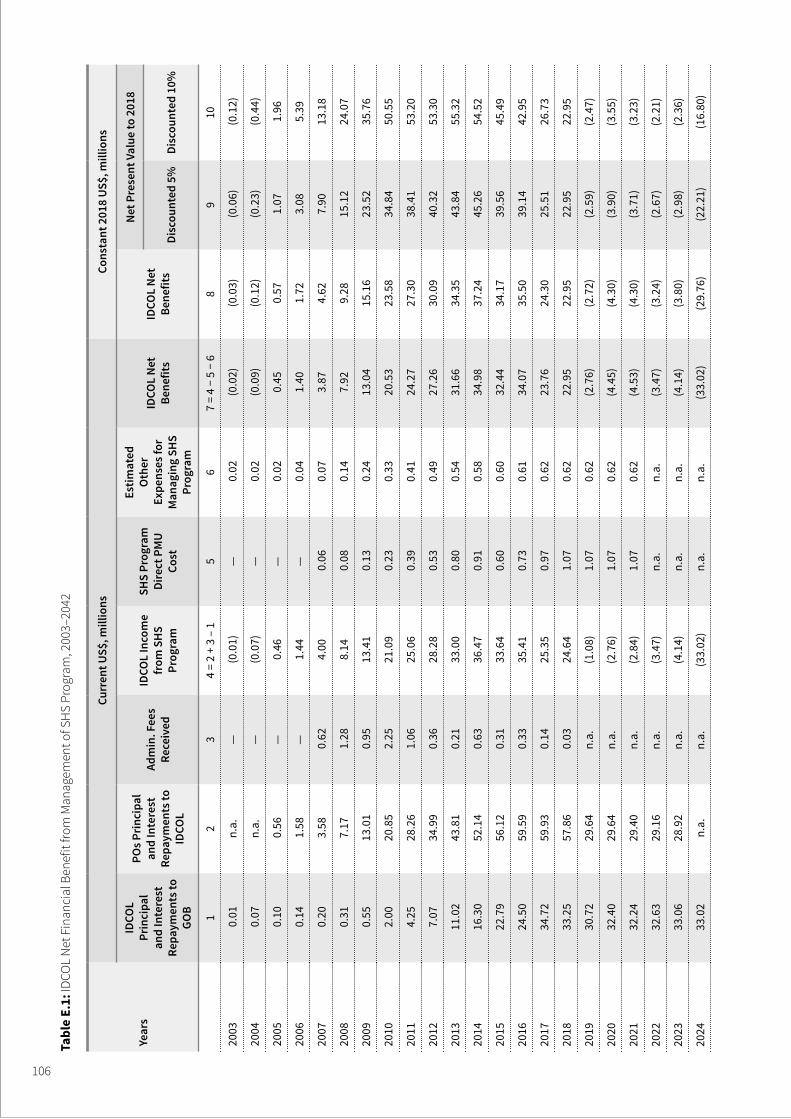
Tabl
e E.
1: ID
COL
Net
Fin
anci
al B
enef
it fro
m M
anag
emen
t of S
HS
Prog
ram
, 200
3–20
42
Year
s
Curr
ent U
S$, m
illio
nsCo
nsta
nt 2
018
US$,
mill
ions
IDCO
L Pr
inci
pal
and
Inte
rest
Re
paym
ents
to
GOB
POs P
rinci
pal
and
Inte
rest
Re
paym
ents
to
IDCO
L
Adm
in. F
ees
Rece
ived
IDCO
L In
com
e fr
om S
HS
Prog
ram
SHS
Prog
ram
Di
rect
PM
U Co
st
Estim
ated
O
ther
Ex
pens
es fo
r M
anag
ing
SHS
Prog
ram
IDCO
L Ne
t Be
nefit
sID
COL
Net
Bene
fits
Net P
rese
nt V
alue
to 2
018
Disc
ount
ed 5
%Di
scou
nted
10%
12
34
= 2
+ 3
– 1
56
7 =
4 −
5 −
68
910
2003
0.0
1 n.
a.—
(0.0
1)—
0.0
2 (0
.02)
(0.0
3) (0
.06)
(0.1
2)
2004
0.0
7 n.
a.—
(0.0
7)—
0.0
2 (0
.09)
(0.1
2) (0
.23)
(0.4
4)
2005
0.1
0 0
.56
— 0
.46
— 0
.02
0.4
5 0
.57
1.0
7 1
.96
2006
0.1
4 1
.58
— 1
.44
— 0
.04
1.4
0 1
.72
3.0
8 5
.39
2007
0.2
0 3
.58
0.6
2 4
.00
0.0
6 0
.07
3.8
7 4
.62
7.9
0 1
3.18
2008
0.3
1 7
.17
1.2
8 8
.14
0.0
8 0
.14
7.9
2 9
.28
15.
12
24.
07
2009
0.5
5 1
3.01
0
.95
13.
41
0.1
3 0
.24
13.
04
15.
16
23.
52
35.
76
2010
2.0
0 2
0.85
2
.25
21.
09
0.2
3 0
.33
20.
53
23.
58
34.
84
50.
55
2011
4.2
5 2
8.26
1
.06
25.
06
0.3
9 0
.41
24.
27
27.
30
38.
41
53.
20
2012
7.0
7 3
4.99
0
.36
28.
28
0.5
3 0
.49
27.
26
30.
09
40.
32
53.
30
2013
11.
02
43.
81
0.2
1 3
3.00
0
.80
0.5
4 3
1.66
3
4.35
4
3.84
5
5.32
2014
16.
30
52.
14
0.6
3 3
6.47
0
.91
0.5
8 3
4.98
3
7.24
4
5.26
5
4.52
2015
22.
79
56.
12
0.3
1 3
3.64
0
.60
0.6
0 3
2.44
3
4.17
3
9.56
4
5.49
2016
24.
50
59.
59
0.3
3 3
5.41
0
.73
0.6
1 3
4.07
3
5.50
3
9.14
4
2.95
2017
34.
72
59.
93
0.1
4 2
5.35
0
.97
0.6
2 2
3.76
2
4.30
2
5.51
2
6.73
2018
33.
25
57.
86
0.0
3 2
4.64
1
.07
0.6
2 2
2.95
2
2.95
2
2.95
2
2.95
2019
30.
72
29.
64
n.a.
(1.0
8) 1
.07
0.6
2 (2
.76)
(2.7
2) (2
.59)
(2.4
7)
2020
32.
40
29.
64
n.a.
(2.7
6) 1
.07
0.6
2 (4
.45)
(4.3
0) (3
.90)
(3.5
5)
2021
32.
24
29.
40
n.a.
(2.8
4) 1
.07
0.6
2 (4
.53)
(4.3
0) (3
.71)
(3.2
3)
2022
32.
63
29.
16
n.a.
(3.4
7)n.
a.n.
a. (3
.47)
(3.2
4) (2
.67)
(2.2
1)
2023
33.
06
28.
92
n.a.
(4.1
4)n.
a.n.
a. (4
.14)
(3.8
0) (2
.98)
(2.3
6)
2024
33.
02
n.a
.n.
a. (3
3.02
)n.
a.n.
a. (3
3.02
) (2
9.76
) (2
2.21
) (1
6.80
)
106
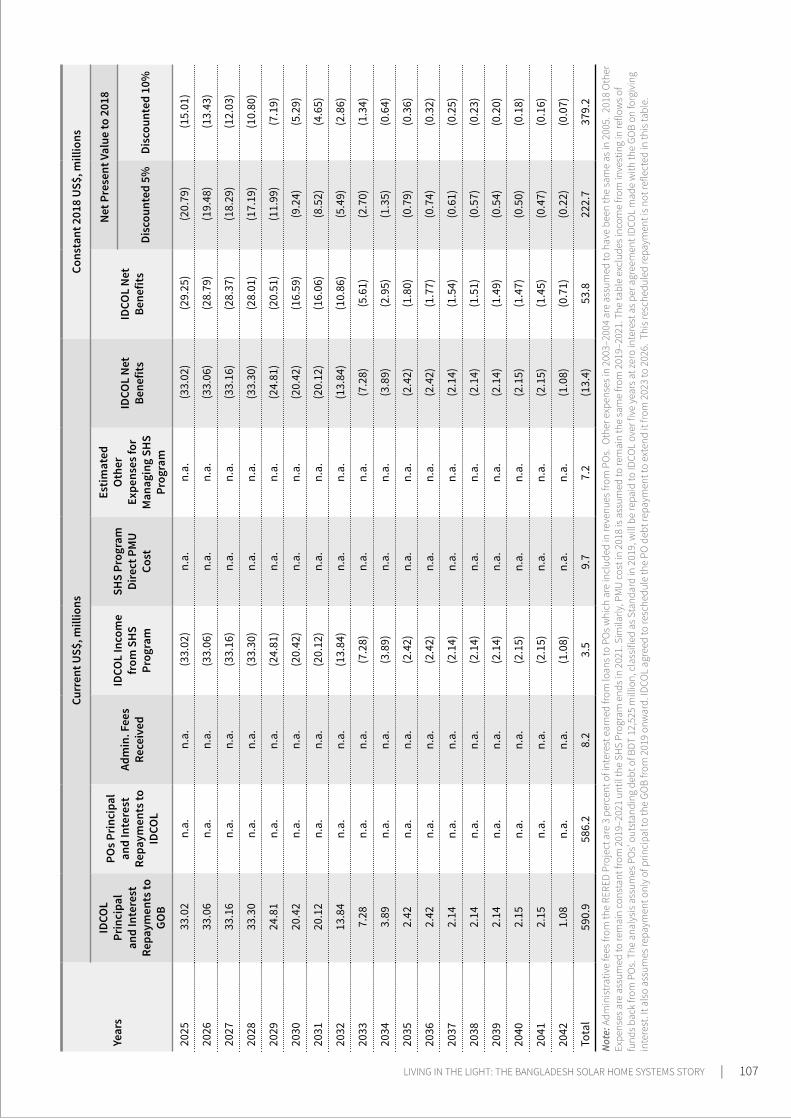
Year
s
Curr
ent U
S$, m
illio
nsCo
nsta
nt 2
018
US$,
mill
ions
IDCO
L Pr
inci
pal
and
Inte
rest
Re
paym
ents
to
GOB
POs P
rinci
pal
and
Inte
rest
Re
paym
ents
to
IDCO
L
Adm
in. F
ees
Rece
ived
IDCO
L In
com
e fr
om S
HS
Prog
ram
SHS
Prog
ram
Di
rect
PM
U Co
st
Estim
ated
O
ther
Ex
pens
es fo
r M
anag
ing
SHS
Prog
ram
IDCO
L Ne
t Be
nefit
sID
COL
Net
Bene
fits
Net P
rese
nt V
alue
to 2
018
Disc
ount
ed 5
%Di
scou
nted
10%
2025
33.
02
n.a.
n.a.
(33.
02)
n.a.
n.a.
(33.
02)
(29.
25)
(20.
79)
(15.
01)
2026
33.
06
n.a.
n.a.
(33.
06)
n.a.
n.a.
(33.
06)
(28.
79)
(19.
48)
(13.
43)
2027
33.
16
n.a.
n.a.
(33.
16)
n.a.
n.a.
(33.
16)
(28.
37)
(18.
29)
(12.
03)
2028
33.
30
n.a.
n.a.
(33.
30)
n.a.
n.a.
(33.
30)
(28.
01)
(17.
19)
(10.
80)
2029
24.
81
n.a.
n.a.
(24.
81)
n.a.
n.a.
(24.
81)
(20.
51)
(11.
99)
(7.1
9)
2030
20.
42
n.a.
n.a.
(20.
42)
n.a.
n.a.
(20.
42)
(16.
59)
(9.2
4) (5
.29)
2031
20.
12
n.a.
n.a.
(20.
12)
n.a.
n.a.
(20.
12)
(16.
06)
(8.5
2) (4
.65)
2032
13.
84
n.a.
n.a.
(13.
84)
n.a.
n.a.
(13.
84)
(10.
86)
(5.4
9) (2
.86)
2033
7.2
8 n.
a.n.
a. (7
.28)
n.a.
n.a.
(7.2
8) (5
.61)
(2.7
0) (1
.34)
2034
3.8
9 n.
a.n.
a. (3
.89)
n.a.
n.a.
(3.8
9) (2
.95)
(1.3
5) (0
.64)
2035
2.4
2 n.
a.n.
a. (2
.42)
n.a.
n.a.
(2.4
2) (1
.80)
(0.7
9) (0
.36)
2036
2.4
2 n.
a.n.
a. (2
.42)
n.a.
n.a.
(2.4
2) (1
.77)
(0.7
4) (0
.32)
2037
2.1
4 n.
a.n.
a. (2
.14)
n.a.
n.a.
(2.1
4) (1
.54)
(0.6
1) (0
.25)
2038
2.1
4 n.
a.n.
a. (2
.14)
n.a.
n.a.
(2.1
4) (1
.51)
(0.5
7) (0
.23)
2039
2.1
4 n.
a.n.
a. (2
.14)
n.a.
n.a.
(2.1
4) (1
.49)
(0.5
4) (0
.20)
2040
2.1
5 n.
a.n.
a. (2
.15)
n.a.
n.a.
(2.1
5) (1
.47)
(0.5
0) (0
.18)
2041
2.1
5 n.
a.n.
a. (2
.15)
n.a.
n.a.
(2.1
5) (1
.45)
(0.4
7) (0
.16)
2042
1.0
8 n.
a.n.
a. (1
.08)
n.a.
n.a.
(1.0
8) (0
.71)
(0.2
2) (0
.07)
Tota
l 5
90.9
58
6.2
8.2
3.5
9.
77.
2 (1
3.4)
53.
8 2
22.7
3
79.2
Not
e: A
dmin
istra
tive
fees
from
the
RERE
D Pr
ojec
t are
3 p
erce
nt o
f int
eres
t ear
ned
from
loan
s to
POs w
hich
are
incl
uded
in re
venu
es fr
om P
Os.
Oth
er e
xpen
ses i
n 20
03–2
004
are
assu
med
to h
ave
been
the
sam
e as
in 2
005.
201
8 O
ther
Ex
pens
es a
re a
ssum
ed to
rem
ain
cons
tant
from
201
9–20
21 u
ntil
the
SHS
Prog
ram
end
s in
2021
. Sim
ilarly
, PM
U c
ost i
n 20
18 is
ass
umed
to re
mai
n th
e sa
me
from
201
9–20
21. T
he ta
ble
excl
udes
inco
me
from
inve
stin
g in
reflo
ws o
f fu
nds b
ack
from
PO
s. T
he a
naly
sis a
ssum
es P
Os’
out
stan
ding
deb
t of B
DT 1
2,52
5 m
illio
n, c
lass
ified
as S
tand
ard
in 2
019,
will
be
repa
id to
IDCO
L ov
er fi
ve y
ears
at z
ero
inte
rest
as p
er a
gree
men
t IDC
OL
mad
e w
ith th
e GO
B on
forg
ivin
g in
tere
st. I
t als
o as
sum
es re
paym
ent o
nly
of p
rinci
pal t
o th
e GO
B fro
m 2
019
onw
ard.
IDCO
L ag
reed
to re
sche
dule
the
PO d
ebt r
epay
men
t to
exte
nd it
from
202
3 to
202
6. T
his r
esch
edul
ed re
paym
ent i
s not
refle
cted
in th
is ta
ble.
LIVING IN THE LIGHT: THE BANGLADESH SOLAR HOME SYSTEMS STORY | 107
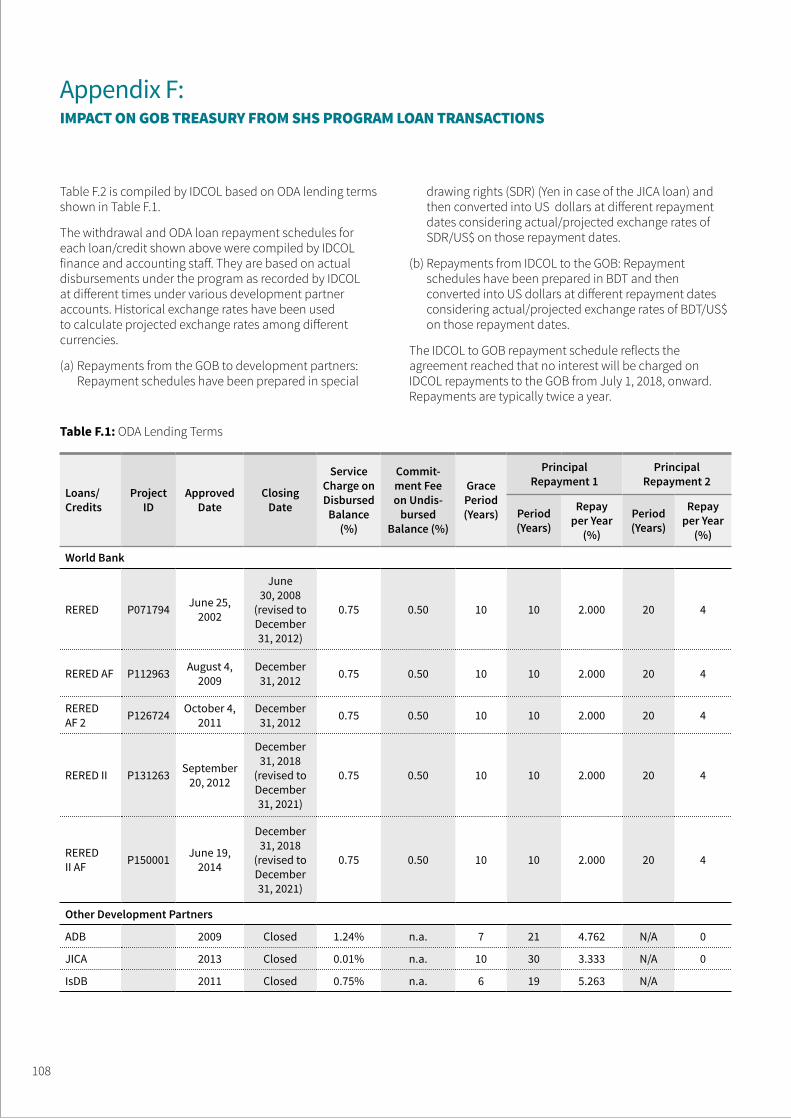
Appendix F: IMPACT ON GOB TREASURY FROM SHS PROGRAM LOAN TRANSACTIONS
Table F.2 is compiled by IDCOL based on ODA lending terms shown in Table F.1.
The withdrawal and ODA loan repayment schedules for each loan/credit shown above were compiled by IDCOL finance and accounting staff. They are based on actual disbursements under the program as recorded by IDCOL at different times under various development partner accounts. Historical exchange rates have been used to calculate projected exchange rates among different currencies.
(a) Repayments from the GOB to development partners: Repayment schedules have been prepared in special
drawing rights (SDR) (Yen in case of the JICA loan) and then converted into US dollars at different repayment dates considering actual/projected exchange rates of SDR/US$ on those repayment dates.
(b) Repayments from IDCOL to the GOB: Repayment schedules have been prepared in BDT and then converted into US dollars at different repayment dates considering actual/projected exchange rates of BDT/US$ on those repayment dates.
The IDCOL to GOB repayment schedule reflects the agreement reached that no interest will be charged on IDCOL repayments to the GOB from July 1, 2018, onward. Repayments are typically twice a year.
Table F.1: ODA Lending Terms
Loans/ Credits
Project ID
Approved Date
Closing Date
Service Charge on Disbursed
Balance (%)
Commit-ment Fee on Undis-
bursed Balance (%)
Grace Period (Years)
Principal Repayment 1
Principal Repayment 2
Period(Years)
Repay per Year
(%)
Period (Years)
Repay per Year
(%)
World Bank
RERED P071794 June 25, 2002
June 30, 2008
(revised to December 31, 2012)
0.75 0.50 10 10 2.000 20 4
RERED AF P112963 August 4, 2009
December 31, 2012 0.75 0.50 10 10 2.000 20 4
RERED AF 2 P126724 October 4,
2011December
31, 2012 0.75 0.50 10 10 2.000 20 4
RERED II P131263 September 20, 2012
December 31, 2018
(revised to December 31, 2021)
0.75 0.50 10 10 2.000 20 4
RERED II AF P150001 June 19,
2014
December 31, 2018
(revised to December 31, 2021)
0.75 0.50 10 10 2.000 20 4
Other Development Partners
ADB 2009 Closed 1.24% n.a. 7 21 4.762 N/A 0
JICA 2013 Closed 0.01% n.a. 10 30 3.333 N/A 0
IsDB 2011 Closed 0.75% n.a. 6 19 5.263 N/A
108
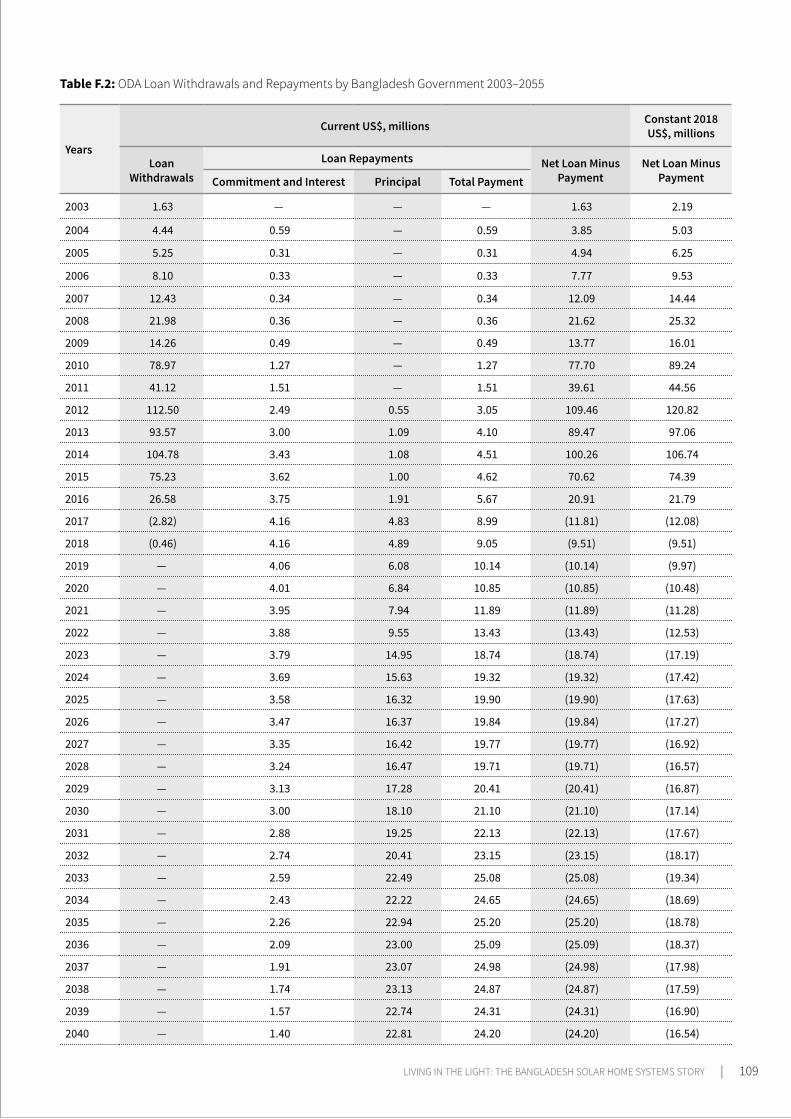
Table F.2: ODA Loan Withdrawals and Repayments by Bangladesh Government 2003–2055
Years
Current US$, millions Constant 2018 US$, millions
Loan Withdrawals
Loan Repayments Net Loan Minus Payment
Net Loan Minus PaymentCommitment and Interest Principal Total Payment
2003 1.63 — — — 1.63 2.19
2004 4.44 0.59 — 0.59 3.85 5.03
2005 5.25 0.31 — 0.31 4.94 6.25
2006 8.10 0.33 — 0.33 7.77 9.53
2007 12.43 0.34 — 0.34 12.09 14.44
2008 21.98 0.36 — 0.36 21.62 25.32
2009 14.26 0.49 — 0.49 13.77 16.01
2010 78.97 1.27 — 1.27 77.70 89.24
2011 41.12 1.51 — 1.51 39.61 44.56
2012 112.50 2.49 0.55 3.05 109.46 120.82
2013 93.57 3.00 1.09 4.10 89.47 97.06
2014 104.78 3.43 1.08 4.51 100.26 106.74
2015 75.23 3.62 1.00 4.62 70.62 74.39
2016 26.58 3.75 1.91 5.67 20.91 21.79
2017 (2.82) 4.16 4.83 8.99 (11.81) (12.08)
2018 (0.46) 4.16 4.89 9.05 (9.51) (9.51)
2019 — 4.06 6.08 10.14 (10.14) (9.97)
2020 — 4.01 6.84 10.85 (10.85) (10.48)
2021 — 3.95 7.94 11.89 (11.89) (11.28)
2022 — 3.88 9.55 13.43 (13.43) (12.53)
2023 — 3.79 14.95 18.74 (18.74) (17.19)
2024 — 3.69 15.63 19.32 (19.32) (17.42)
2025 — 3.58 16.32 19.90 (19.90) (17.63)
2026 — 3.47 16.37 19.84 (19.84) (17.27)
2027 — 3.35 16.42 19.77 (19.77) (16.92)
2028 — 3.24 16.47 19.71 (19.71) (16.57)
2029 — 3.13 17.28 20.41 (20.41) (16.87)
2030 — 3.00 18.10 21.10 (21.10) (17.14)
2031 — 2.88 19.25 22.13 (22.13) (17.67)
2032 — 2.74 20.41 23.15 (23.15) (18.17)
2033 — 2.59 22.49 25.08 (25.08) (19.34)
2034 — 2.43 22.22 24.65 (24.65) (18.69)
2035 — 2.26 22.94 25.20 (25.20) (18.78)
2036 — 2.09 23.00 25.09 (25.09) (18.37)
2037 — 1.91 23.07 24.98 (24.98) (17.98)
2038 — 1.74 23.13 24.87 (24.87) (17.59)
2039 — 1.57 22.74 24.31 (24.31) (16.90)
2040 — 1.40 22.81 24.20 (24.20) (16.54)
LIVING IN THE LIGHT: THE BANGLADESH SOLAR HOME SYSTEMS STORY | 109
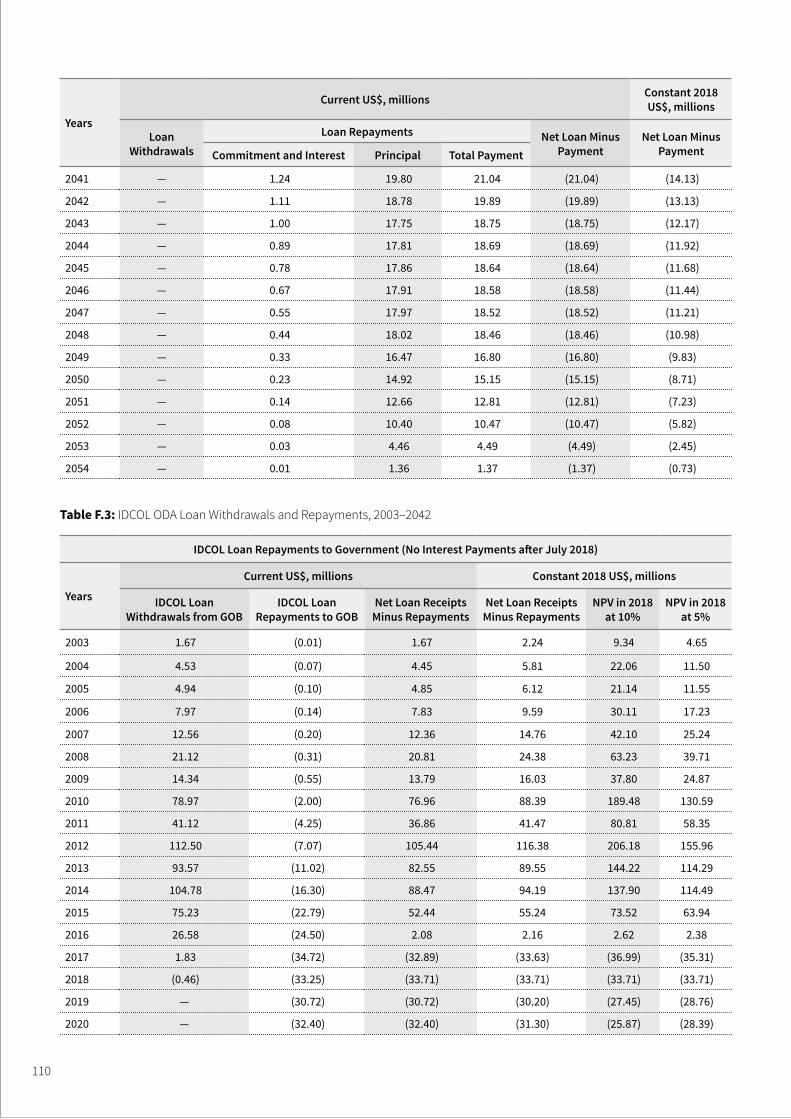
Years
Current US$, millions Constant 2018 US$, millions
Loan Withdrawals
Loan Repayments Net Loan Minus Payment
Net Loan Minus PaymentCommitment and Interest Principal Total Payment
2041 — 1.24 19.80 21.04 (21.04) (14.13)
2042 — 1.11 18.78 19.89 (19.89) (13.13)
2043 — 1.00 17.75 18.75 (18.75) (12.17)
2044 — 0.89 17.81 18.69 (18.69) (11.92)
2045 — 0.78 17.86 18.64 (18.64) (11.68)
2046 — 0.67 17.91 18.58 (18.58) (11.44)
2047 — 0.55 17.97 18.52 (18.52) (11.21)
2048 — 0.44 18.02 18.46 (18.46) (10.98)
2049 — 0.33 16.47 16.80 (16.80) (9.83)
2050 — 0.23 14.92 15.15 (15.15) (8.71)
2051 — 0.14 12.66 12.81 (12.81) (7.23)
2052 — 0.08 10.40 10.47 (10.47) (5.82)
2053 — 0.03 4.46 4.49 (4.49) (2.45)
2054 — 0.01 1.36 1.37 (1.37) (0.73)
Table F.3: IDCOL ODA Loan Withdrawals and Repayments, 2003–2042
IDCOL Loan Repayments to Government (No Interest Payments after July 2018)
Years
Current US$, millions Constant 2018 US$, millions
IDCOL Loan Withdrawals from GOB
IDCOL Loan Repayments to GOB
Net Loan Receipts Minus Repayments
Net Loan Receipts Minus Repayments
NPV in 2018 at 10%
NPV in 2018 at 5%
2003 1.67 (0.01) 1.67 2.24 9.34 4.65
2004 4.53 (0.07) 4.45 5.81 22.06 11.50
2005 4.94 (0.10) 4.85 6.12 21.14 11.55
2006 7.97 (0.14) 7.83 9.59 30.11 17.23
2007 12.56 (0.20) 12.36 14.76 42.10 25.24
2008 21.12 (0.31) 20.81 24.38 63.23 39.71
2009 14.34 (0.55) 13.79 16.03 37.80 24.87
2010 78.97 (2.00) 76.96 88.39 189.48 130.59
2011 41.12 (4.25) 36.86 41.47 80.81 58.35
2012 112.50 (7.07) 105.44 116.38 206.18 155.96
2013 93.57 (11.02) 82.55 89.55 144.22 114.29
2014 104.78 (16.30) 88.47 94.19 137.90 114.49
2015 75.23 (22.79) 52.44 55.24 73.52 63.94
2016 26.58 (24.50) 2.08 2.16 2.62 2.38
2017 1.83 (34.72) (32.89) (33.63) (36.99) (35.31)
2018 (0.46) (33.25) (33.71) (33.71) (33.71) (33.71)
2019 — (30.72) (30.72) (30.20) (27.45) (28.76)
2020 — (32.40) (32.40) (31.30) (25.87) (28.39)
110
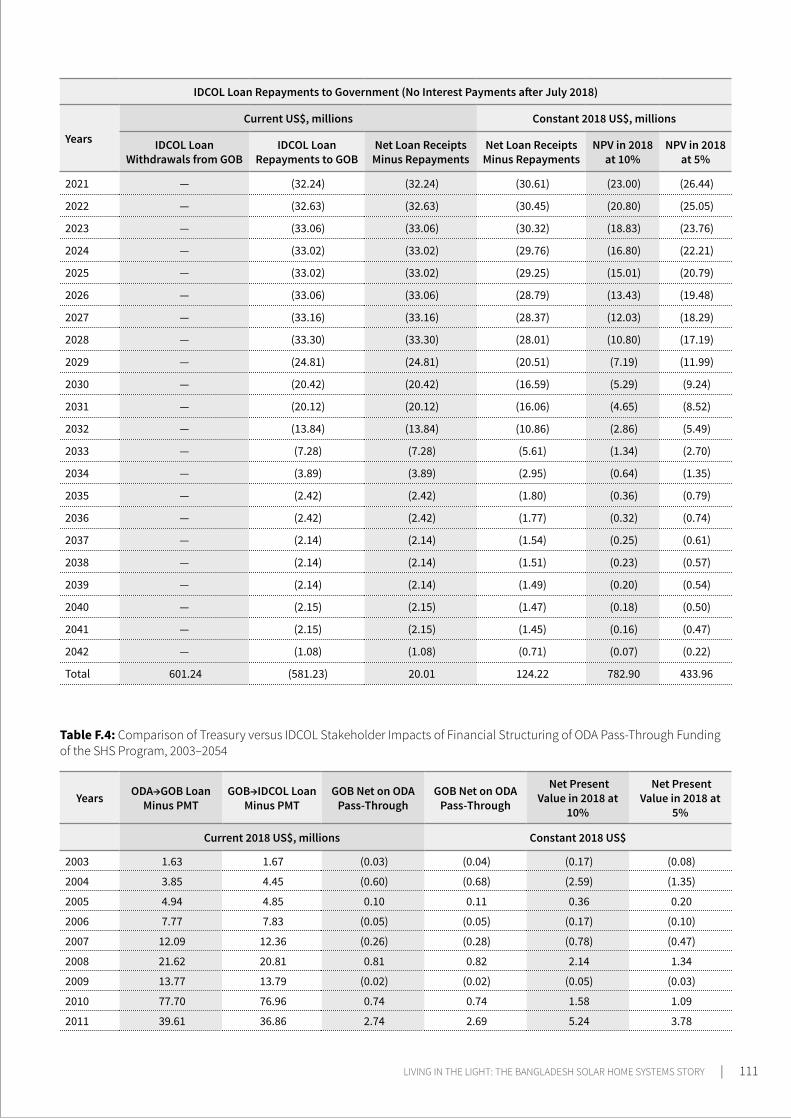
Table F.4: Comparison of Treasury versus IDCOL Stakeholder Impacts of Financial Structuring of ODA Pass-Through Funding of the SHS Program, 2003–2054
Years ODA→GOB Loan Minus PMT
GOB→IDCOL Loan Minus PMT
GOB Net on ODA Pass-Through
GOB Net on ODA Pass-Through
Net Present Value in 2018 at
10%
Net Present Value in 2018 at
5%
Current 2018 US$, millions Constant 2018 US$
2003 1.63 1.67 (0.03) (0.04) (0.17) (0.08)
2004 3.85 4.45 (0.60) (0.68) (2.59) (1.35)
2005 4.94 4.85 0.10 0.11 0.36 0.20
2006 7.77 7.83 (0.05) (0.05) (0.17) (0.10)
2007 12.09 12.36 (0.26) (0.28) (0.78) (0.47)
2008 21.62 20.81 0.81 0.82 2.14 1.34
2009 13.77 13.79 (0.02) (0.02) (0.05) (0.03)
2010 77.70 76.96 0.74 0.74 1.58 1.09
2011 39.61 36.86 2.74 2.69 5.24 3.78
IDCOL Loan Repayments to Government (No Interest Payments after July 2018)
Years
Current US$, millions Constant 2018 US$, millions
IDCOL Loan Withdrawals from GOB
IDCOL Loan Repayments to GOB
Net Loan Receipts Minus Repayments
Net Loan Receipts Minus Repayments
NPV in 2018 at 10%
NPV in 2018 at 5%
2021 — (32.24) (32.24) (30.61) (23.00) (26.44)
2022 — (32.63) (32.63) (30.45) (20.80) (25.05)
2023 — (33.06) (33.06) (30.32) (18.83) (23.76)
2024 — (33.02) (33.02) (29.76) (16.80) (22.21)
2025 — (33.02) (33.02) (29.25) (15.01) (20.79)
2026 — (33.06) (33.06) (28.79) (13.43) (19.48)
2027 — (33.16) (33.16) (28.37) (12.03) (18.29)
2028 — (33.30) (33.30) (28.01) (10.80) (17.19)
2029 — (24.81) (24.81) (20.51) (7.19) (11.99)
2030 — (20.42) (20.42) (16.59) (5.29) (9.24)
2031 — (20.12) (20.12) (16.06) (4.65) (8.52)
2032 — (13.84) (13.84) (10.86) (2.86) (5.49)
2033 — (7.28) (7.28) (5.61) (1.34) (2.70)
2034 — (3.89) (3.89) (2.95) (0.64) (1.35)
2035 — (2.42) (2.42) (1.80) (0.36) (0.79)
2036 — (2.42) (2.42) (1.77) (0.32) (0.74)
2037 — (2.14) (2.14) (1.54) (0.25) (0.61)
2038 — (2.14) (2.14) (1.51) (0.23) (0.57)
2039 — (2.14) (2.14) (1.49) (0.20) (0.54)
2040 — (2.15) (2.15) (1.47) (0.18) (0.50)
2041 — (2.15) (2.15) (1.45) (0.16) (0.47)
2042 — (1.08) (1.08) (0.71) (0.07) (0.22)
Total 601.24 (581.23) 20.01 124.22 782.90 433.96
LIVING IN THE LIGHT: THE BANGLADESH SOLAR HOME SYSTEMS STORY | 111
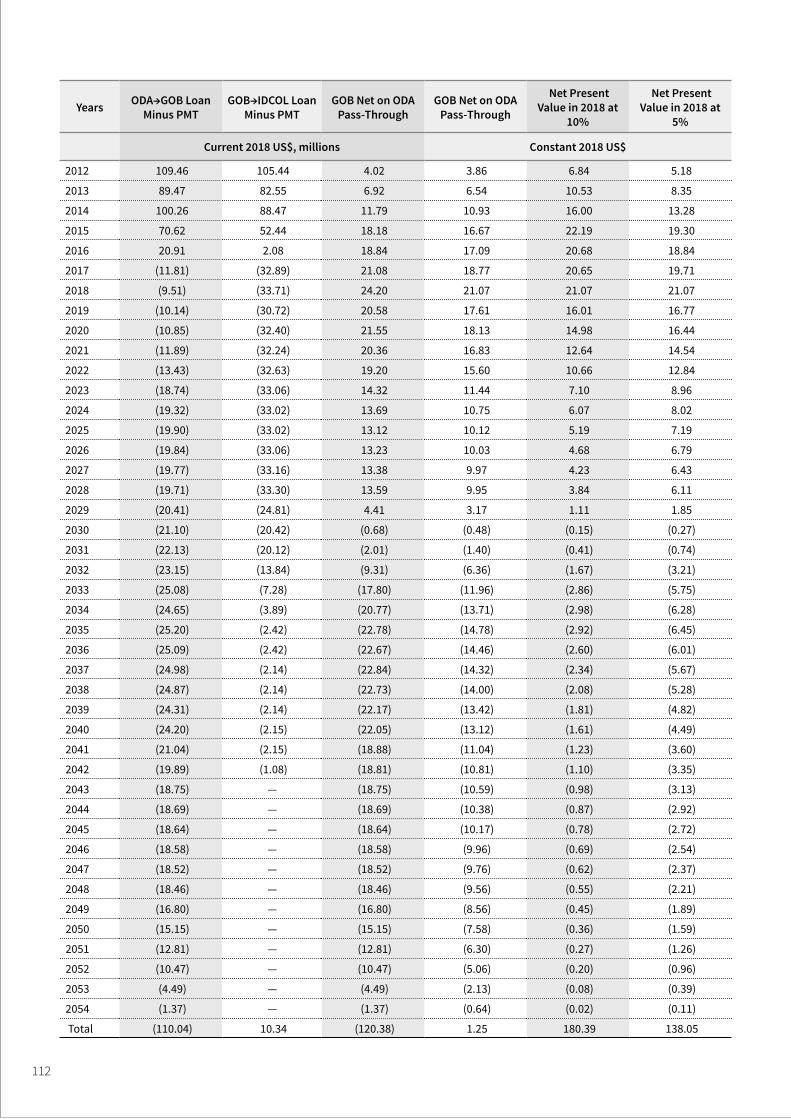
Years ODA→GOB Loan Minus PMT
GOB→IDCOL Loan Minus PMT
GOB Net on ODA Pass-Through
GOB Net on ODA Pass-Through
Net Present Value in 2018 at
10%
Net Present Value in 2018 at
5%
Current 2018 US$, millions Constant 2018 US$
2012 109.46 105.44 4.02 3.86 6.84 5.18
2013 89.47 82.55 6.92 6.54 10.53 8.35
2014 100.26 88.47 11.79 10.93 16.00 13.28
2015 70.62 52.44 18.18 16.67 22.19 19.30
2016 20.91 2.08 18.84 17.09 20.68 18.84
2017 (11.81) (32.89) 21.08 18.77 20.65 19.71
2018 (9.51) (33.71) 24.20 21.07 21.07 21.07
2019 (10.14) (30.72) 20.58 17.61 16.01 16.77
2020 (10.85) (32.40) 21.55 18.13 14.98 16.44
2021 (11.89) (32.24) 20.36 16.83 12.64 14.54
2022 (13.43) (32.63) 19.20 15.60 10.66 12.84
2023 (18.74) (33.06) 14.32 11.44 7.10 8.96
2024 (19.32) (33.02) 13.69 10.75 6.07 8.02
2025 (19.90) (33.02) 13.12 10.12 5.19 7.19
2026 (19.84) (33.06) 13.23 10.03 4.68 6.79
2027 (19.77) (33.16) 13.38 9.97 4.23 6.43
2028 (19.71) (33.30) 13.59 9.95 3.84 6.11
2029 (20.41) (24.81) 4.41 3.17 1.11 1.85
2030 (21.10) (20.42) (0.68) (0.48) (0.15) (0.27)
2031 (22.13) (20.12) (2.01) (1.40) (0.41) (0.74)
2032 (23.15) (13.84) (9.31) (6.36) (1.67) (3.21)
2033 (25.08) (7.28) (17.80) (11.96) (2.86) (5.75)
2034 (24.65) (3.89) (20.77) (13.71) (2.98) (6.28)
2035 (25.20) (2.42) (22.78) (14.78) (2.92) (6.45)
2036 (25.09) (2.42) (22.67) (14.46) (2.60) (6.01)
2037 (24.98) (2.14) (22.84) (14.32) (2.34) (5.67)
2038 (24.87) (2.14) (22.73) (14.00) (2.08) (5.28)
2039 (24.31) (2.14) (22.17) (13.42) (1.81) (4.82)
2040 (24.20) (2.15) (22.05) (13.12) (1.61) (4.49)
2041 (21.04) (2.15) (18.88) (11.04) (1.23) (3.60)
2042 (19.89) (1.08) (18.81) (10.81) (1.10) (3.35)
2043 (18.75) — (18.75) (10.59) (0.98) (3.13)
2044 (18.69) — (18.69) (10.38) (0.87) (2.92)
2045 (18.64) — (18.64) (10.17) (0.78) (2.72)
2046 (18.58) — (18.58) (9.96) (0.69) (2.54)
2047 (18.52) — (18.52) (9.76) (0.62) (2.37)
2048 (18.46) — (18.46) (9.56) (0.55) (2.21)
2049 (16.80) — (16.80) (8.56) (0.45) (1.89)
2050 (15.15) — (15.15) (7.58) (0.36) (1.59)
2051 (12.81) — (12.81) (6.30) (0.27) (1.26)
2052 (10.47) — (10.47) (5.06) (0.20) (0.96)
2053 (4.49) — (4.49) (2.13) (0.08) (0.39)
2054 (1.37) — (1.37) (0.64) (0.02) (0.11)
Total (110.04) 10.34 (120.38) 1.25 180.39 138.05
112
Tabl
e F.
5: N
et Im
pact
on
GOB
of S
HS
Prog
ram
in P
rese
nt V
alue
Ter
ms 2
003–
2054
Year
Tax
es o
n SH
S
Ker
osen
e Su
bsid
y Sa
ved
ODA
Pas
s Th
roug
h
Tot
al G
OB
Trea
sury
Net
fro
m S
HS
Prog
ram
Net
Pre
sent
Val
ue in
201
8 (1
0% D
isco
unt)
Cu
mul
ativ
e Ne
t Pre
sent
Val
ue in
201
8
GO
B Ta
xes
on S
HS
Ker
osen
e Su
bsid
y Sa
ved
ODA
Pas
s Th
roug
h
Tot
al G
OB
Trea
sury
Net
fr
om S
HS
Prog
ram
GO
B Ta
xes
on S
HS
Tot
al G
OB
Subs
idy
Save
d
Impa
ct o
f O
DA P
ass
Thro
ugh
Tot
al G
OB
Trea
sury
Net
fr
om S
HS
Prog
ram
Cons
tant
201
8 US
$, m
illio
ns
Col.
12
34
− 1
+ 2
= 3
56
78
= 5
+ 6
+ 7
910
1112
= 9
+ 1
0 +
1120
03 0
.84
0.0
3 (0
.04)
0.8
3 3
.53
0.1
3 (0
.17)
3.4
9 3
.53
0.1
3 (0
.17)
3.4
9 20
04 1
.68
0.3
7 (0
.68)
1.3
7 6
.39
1.4
2 (2
.59)
5.2
2 9
.91
1.5
5 (2
.76)
8.7
0 20
05 2
.32
0.3
4 0
.11
2.7
7 8
.02
1.1
8 0
.36
9.5
6 1
7.93
2
.73
(2.3
9) 1
8.27
20
06 3
.13
1.7
4 (0
.05)
4.8
2 9
.83
5.4
5 (0
.17)
15.
11
27.
76
8.1
8 (2
.56)
33.
38
2007
5.6
2 1
.83
(0.2
8) 7
.17
16.
02
5.2
3 (0
.78)
20.
47
43.
78
13.
41
(3.3
5) 5
3.85
20
08 9
.38
2.4
4 0
.82
12.
64
24.
32
6.3
3 2
.14
32.
79
68.
10
19.
75
(1.2
1) 8
6.64
20
09 1
2.30
(0
.40)
(0.0
2) 1
1.88
2
9.01
(0
.94)
(0.0
5) 2
8.02
9
7.11
1
8.80
(1
.26)
114
.66
2010
21.
80
3.2
9 0
.74
25.
83
46.
73
7.0
6 1
.58
55.
37
143
.84
25.
87
0.3
2 1
70.0
3 20
11 2
6.85
3
5.81
2
.69
65.
34
52.
32
69.
78
5.2
4 1
27.3
3 1
96.1
6 9
5.65
5
.55
297
.36
2012
34.
22
87.
69
3.8
6 1
25.7
7 6
0.63
1
55.3
5 6
.84
222
.82
256
.78
250
.99
12.
40
520
.17
2013
40.
67
44.
55
6.5
4 9
1.76
6
5.50
7
1.75
1
0.53
1
47.7
8 3
22.2
8 3
22.7
5 2
2.93
6
67.9
6 20
14 2
3.31
5
2.45
1
0.93
8
6.68
3
4.12
7
6.79
1
6.00
1
26.9
1 3
56.4
1 3
99.5
3 3
8.93
7
94.8
7 20
15 1
6.00
(9
6.75
) 1
6.67
(6
4.07
) 2
1.30
(1
28.7
7) 2
2.19
(8
5.28
) 3
77.7
1 2
70.7
6 6
1.12
7
09.5
9 20
16 4
.30
(130
.37)
17.
09
(108
.98)
5.2
0 (1
57.7
5) 2
0.68
(1
31.8
7) 3
82.9
1 1
13.0
1 8
1.80
5
77.7
2 20
17 0
.79
(74.
32)
18.
77
(54.
77)
0.8
7 (8
1.76
) 2
0.65
(6
0.24
) 3
83.7
8 3
1.26
1
02.4
5 5
17.4
8 20
18 0
.09
17.
59
21.
07
38.
75
0.0
9 1
7.59
2
1.07
3
8.75
3
83.8
7 4
8.85
1
23.5
2 5
56.2
4 20
19—
17.
25
17.
61
34.
87
— 1
5.69
1
6.01
3
1.70
3
83.8
7 6
4.53
1
39.5
3 5
87.9
3 20
20—
16.
72
18.
13
34.
85
— 1
3.82
1
4.98
2
8.80
3
83.8
7 7
8.35
1
54.5
1 6
16.7
3 20
21—
15.
94
16.
83
32.
77
— 1
1.98
1
2.64
2
4.62
3
83.8
7 9
0.33
1
67.1
5 6
41.3
5 20
22—
— 1
5.60
1
5.60
—
— 1
0.66
1
0.66
3
83.8
7 9
0.33
1
77.8
1 6
52.0
1 20
23—
— 1
1.44
1
1.44
—
— 7
.10
7.1
0 3
83.8
7 9
0.33
1
84.9
1 6
59.1
1 20
24—
— 1
0.75
1
0.75
—
— 6
.07
6.0
7 3
83.8
7 9
0.33
1
90.9
8 6
65.1
7 20
25—
— 1
0.12
1
0.12
—
— 5
.19
5.1
9 3
83.8
7 9
0.33
1
96.1
7 6
70.3
7 20
26—
— 1
0.03
1
0.03
—
— 4
.68
4.6
8 3
83.8
7 9
0.33
2
00.8
5 6
75.0
4 20
27—
— 9
.97
9.9
7 —
— 4
.23
4.2
3 3
83.8
7 9
0.33
2
05.0
8 6
79.2
7 20
28—
— 9
.95
9.9
5 —
— 3
.84
3.8
4 3
83.8
7 9
0.33
2
08.9
1 6
83.1
1 20
29—
— 3
.17
3.1
7 —
— 1
.11
1.1
1 3
83.8
7 9
0.33
2
10.0
3 6
84.2
2
LIVING IN THE LIGHT: THE BANGLADESH SOLAR HOME SYSTEMS STORY | 113
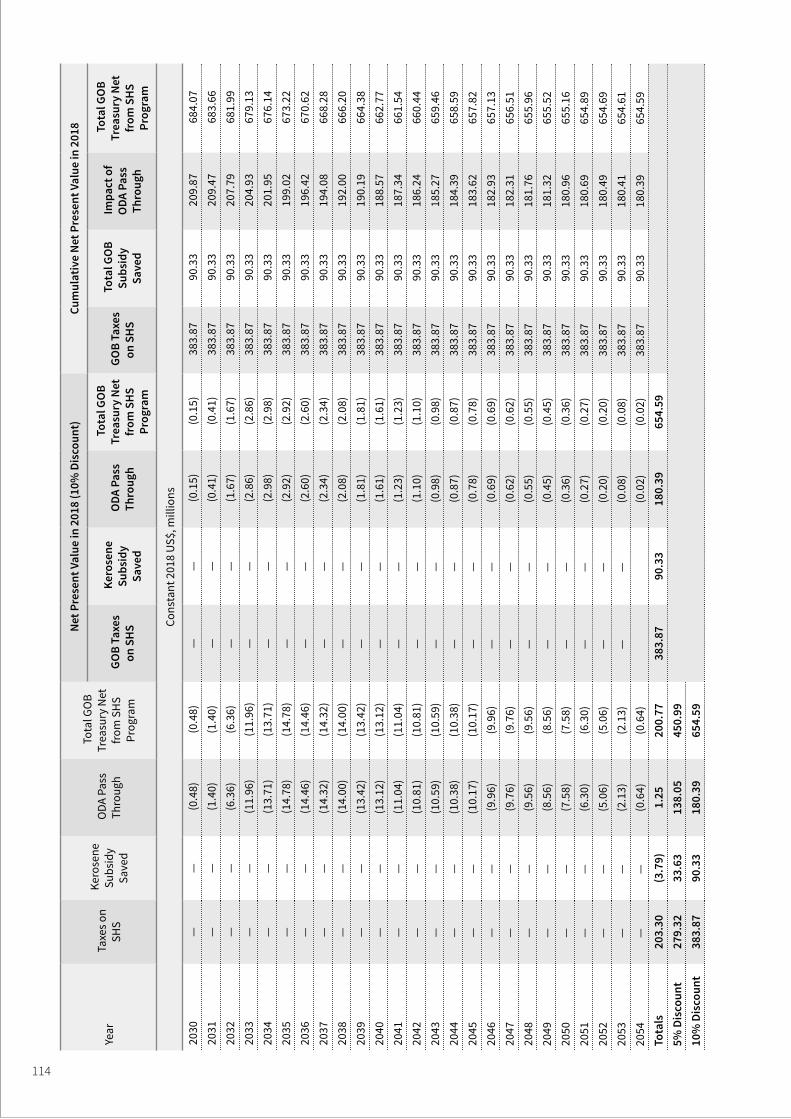
Year
Tax
es o
n SH
S
Ker
osen
e Su
bsid
y Sa
ved
ODA
Pas
s Th
roug
h
Tot
al G
OB
Trea
sury
Net
fro
m S
HS
Prog
ram
Net
Pre
sent
Val
ue in
201
8 (1
0% D
isco
unt)
Cu
mul
ativ
e Ne
t Pre
sent
Val
ue in
201
8
GO
B Ta
xes
on S
HS
Ker
osen
e Su
bsid
y Sa
ved
ODA
Pas
s Th
roug
h
Tot
al G
OB
Trea
sury
Net
fr
om S
HS
Prog
ram
GO
B Ta
xes
on S
HS
Tot
al G
OB
Subs
idy
Save
d
Impa
ct o
f O
DA P
ass
Thro
ugh
Tot
al G
OB
Trea
sury
Net
fr
om S
HS
Prog
ram
Cons
tant
201
8 US
$, m
illio
ns
2030
——
(0.4
8) (0
.48)
——
(0.1
5) (0
.15)
383
.87
90.
33
209
.87
684
.07
2031
——
(1.4
0) (1
.40)
——
(0.4
1) (0
.41)
383
.87
90.
33
209
.47
683
.66
2032
——
(6.3
6) (6
.36)
——
(1.6
7) (1
.67)
383
.87
90.
33
207
.79
681
.99
2033
——
(11.
96)
(11.
96)
——
(2.8
6) (2
.86)
383
.87
90.
33
204
.93
679
.13
2034
——
(13.
71)
(13.
71)
——
(2.9
8) (2
.98)
383
.87
90.
33
201
.95
676
.14
2035
——
(14.
78)
(14.
78)
——
(2.9
2) (2
.92)
383
.87
90.
33
199
.02
673
.22
2036
——
(14.
46)
(14.
46)
——
(2.6
0) (2
.60)
383
.87
90.
33
196
.42
670
.62
2037
——
(14.
32)
(14.
32)
——
(2.3
4) (2
.34)
383
.87
90.
33
194
.08
668
.28
2038
——
(14.
00)
(14.
00)
——
(2.0
8) (2
.08)
383
.87
90.
33
192
.00
666
.20
2039
——
(13.
42)
(13.
42)
——
(1.8
1) (1
.81)
383
.87
90.
33
190
.19
664
.38
2040
——
(13.
12)
(13.
12)
——
(1.6
1) (1
.61)
383
.87
90.
33
188
.57
662
.77
2041
——
(11.
04)
(11.
04)
——
(1.2
3) (1
.23)
383
.87
90.
33
187
.34
661
.54
2042
——
(10.
81)
(10.
81)
——
(1.1
0) (1
.10)
383
.87
90.
33
186
.24
660
.44
2043
——
(10.
59)
(10.
59)
——
(0.9
8) (0
.98)
383
.87
90.
33
185
.27
659
.46
2044
——
(10.
38)
(10.
38)
——
(0.8
7) (0
.87)
383
.87
90.
33
184
.39
658
.59
2045
——
(10.
17)
(10.
17)
——
(0.7
8) (0
.78)
383
.87
90.
33
183
.62
657
.82
2046
——
(9.9
6) (9
.96)
——
(0.6
9) (0
.69)
383
.87
90.
33
182
.93
657
.13
2047
——
(9.7
6) (9
.76)
——
(0.6
2) (0
.62)
383
.87
90.
33
182
.31
656
.51
2048
——
(9.5
6) (9
.56)
——
(0.5
5) (0
.55)
383
.87
90.
33
181
.76
655
.96
2049
——
(8.5
6) (8
.56)
——
(0.4
5) (0
.45)
383
.87
90.
33
181
.32
655
.52
2050
——
(7.5
8) (7
.58)
——
(0.3
6) (0
.36)
383
.87
90.
33
180
.96
655
.16
2051
——
(6.3
0) (6
.30)
——
(0.2
7) (0
.27)
383
.87
90.
33
180
.69
654
.89
2052
——
(5.0
6) (5
.06)
——
(0.2
0) (0
.20)
383
.87
90.
33
180
.49
654
.69
2053
——
(2.1
3) (2
.13)
——
(0.0
8) (0
.08)
383
.87
90.
33
180
.41
654
.61
2054
——
(0.6
4) (0
.64)
(0
.02)
(0.0
2) 3
83.8
7 9
0.33
1
80.3
9 6
54.5
9 To
tals
203
.30
(3.7
9) 1
.25
200
.77
383
.87
90.
33
180
.39
654
.59
5% D
isco
unt
279
.32
33.
63
138
.05
450
.99
10%
Dis
coun
t 3
83.8
7 9
0.33
1
80.3
9 6
54.5
9
114

This book is a must read for any government, business or NGO that
wants to develop a substantial solar energy market in rural areas. It brilliantly describes the business model and roles
and responsibilities of the different players, it provides a superb analysis of the financing model and the social,
economic, and environmental benefits, and describes the implications of rapid
grid expansion on the project.
Prof. Sir Robert Watson CMG FRSFormer Chairman, Intergovernmental Panel on Climate
Change, United Nations Framework Convention on Climate Change
Since 1954, the International Solar Energy Society and its members have undertaken technical research,
product development and advocacy for the growth of solar and renewable energy
technologies. With the boom in the grid connect market, solar home systems for the unelectrified is an application which
often gets overlooked. This book not only shows how Bangladesh successfully implemented a program providing solar home systems to millions of people via
a micro-credit facility the end user could afford, but is also an inspiration for others
to learn from as different countries and organisations work towards meeting
SDG7 to provide renewable electricity to communities and accelerate the
transformation with solar energy for everyone used wisely and efficient.
Prof. Dr. Klaus Vajen, PresidentInternational Solar Energy Society
The authors tell a remarkable story:
• A remarkable story where over 15 years, 20 million rural people in Bangladesh obtained access to modern electric lighting and basic electricity services using solar home systems, far sooner than they could have, had they waited for the electric grid to arrive. These families, with 10 million children, enjoyed far better quality of lighting, a cleaner and safer home environment, and access to the wider world through communications technology. Eventually, their children will gain upward mobility through improved education and health due to electricity services from SHS.
• A remarkable story of how a government, partnering with the Infrastructure Development Company Ltd, delivered over US$600 million of financing to rural families in small increments of about US$100 per transaction. The story continues— these experiences are leading IDCOL to finance investments in larger-scale roof-top and ground-mounted solar projects and solar irrigation pumping.
• A remarkable story of a partnership with Bangladesh microfinance institutions, nongovernment organizations, and private companies to deliver solar home systems and services and provide access to finance to make SHS affordable to the rural people. At its peak, more than 29,000 people were employed in this new industry.
• A remarkable story where the World Bank with other development partners, local investors, and households invested US$1,095 million, of which US$81 million was grants, and brought international best practice to this new industry.
• A remarkable story where Bangladesh avoided burning 4 billion liters of kerosene that was previously used for home lighting and avoided over 9 million tCO2 emissions. Rural people also avoided the risk of home fires as well as respiratory illnesses from breathing kerosene smoke.
• A remarkable story where costs of solar home systems dramatically dropped, and quality of products increased enormously over these 15 years and these benefits were transferred to the rural people.
This book documents the achievements, the approaches, the successes, the challenges, and the lessons. The off-grid solar technology and business have advanced greatly in these past 15 years. But the principles, lessons, and insights gained from what was then the world’s largest off-grid electrification program will endure. In this decade of Sustainable Development for All, as the global community accelerates its efforts to achieve universal access to electricity by 2030 while reducing carbon emissions, the findings of this book will be invaluable.
The insights and lessons learned in this fact-filled and deeply analytical book will be a useful reference for other countries and organizations that intend to embark on a similar journey. The main beneficiaries will be the 800 million people who are yet to experience the benefits of electricity.