Livable Cities Investment Project (Bavet)
376
Technical Assistance Consultant’s Report PUBLIC Project Number: 52064-001 March 2022 Regional: Southeast Asia Urban Services Facility Feasibility Study for Cambodia: Livable Cities Investment Project (Bavet) Vol. 15 Social Development, Poverty and Gender Prepared by: Egis For: Ministry of Public Works and Transport This consultant’s report does not necessarily reflect the views of ADB or the Government concerned, and ADB and the Government cannot be held liable for its contents. (For project preparatory technical assistance: All the views expressed herein may not be incorporated into the proposed project’s design.
-
Upload
khangminh22 -
Category
Documents
-
view
0 -
download
0
Transcript of Livable Cities Investment Project (Bavet)

Technical Assistance Consultant’s Report
PUBLIC
Project Number: 52064-001 March 2022
Regional: Southeast Asia Urban Services Facility
Feasibility Study for Cambodia: Livable Cities Investment Project (Bavet)
Vol. 15 Social Development, Poverty and Gender
Prepared by: Egis
For: Ministry of Public Works and Transport
This consultant’s report does not necessarily reflect the views of ADB or the Government concerned, and ADB and the Government cannot be held liable for its contents. (For project preparatory technical assistance: All the views expressed herein may not be incorporated into the proposed project’s design.
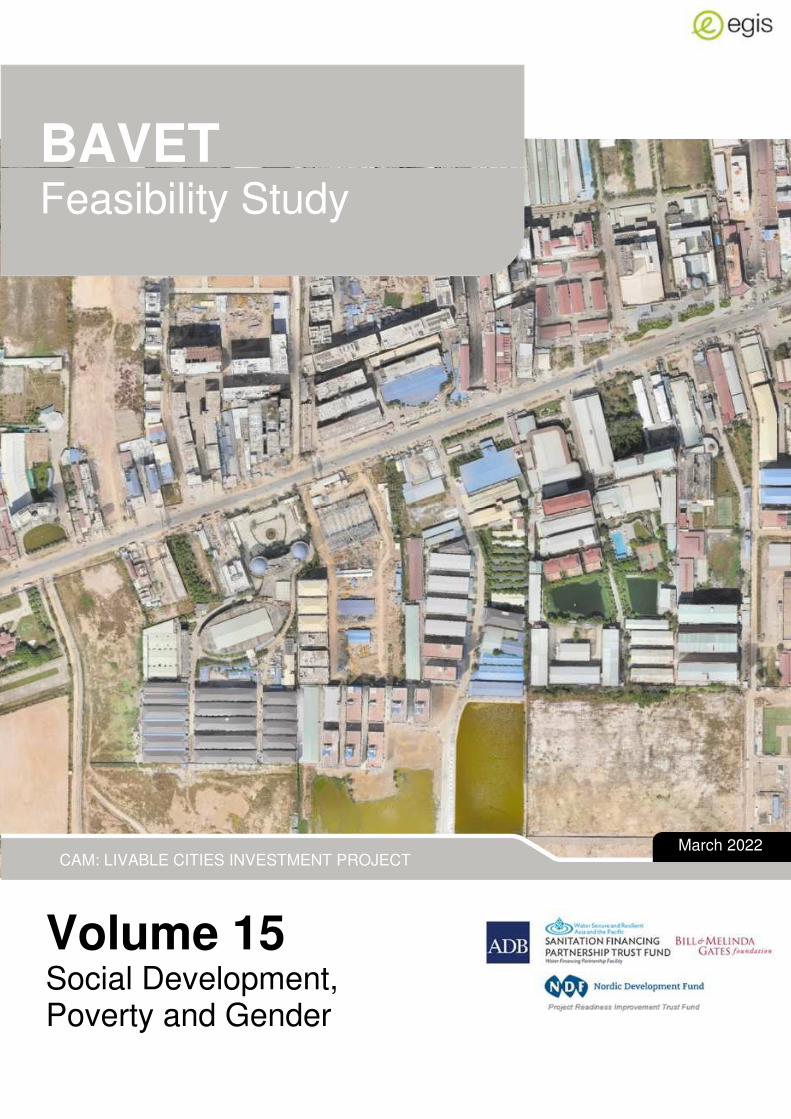
Volume 15 Social Development, Poverty and Gender Plan
BAVET
Feasibility Study
CAM: LIVABLE CITIES INVESTMENT PROJECT March 2022

REVISION HISTORY
Document Reference TA9554-CAMTO3-BAV-FST-SO-001
D 15/03/2022 Final report Jean Roussillon Sophanara
Taing Benjamin
Biscan
C 03/06/2021 Draft Final report – 3rd
Submission Diane Caroen / Ratanak Houk
Jean Roussillon
Benjamin Biscan
B 19/12/2020 Draft Final report – 2nd
Submission Diane Caroen / Ratanak Houk
- Benjamin
Biscan
A 07/11/2020 Draft Final report – 1st
Submission Diane Caroen / Ratanak Houk
- Benjamin
Biscan
Rev Date Description Written by Checked by Approved
by
This Consultant’s Report was prepared under TA 9554-REG Southeast Asia Urban Services Facility and co-financed by ADB and ADB-administered trust funds: the Project Readiness Improvement Trust Fund with funding from the Nordic Development Fund; and the Sanitation Financing Partnership Trust Fund under the Water Financing Partnership Facility. The views expressed in this report are those of the authors and do not necessarily reflect the views and policies of the funders or ADB.

ABBREVIATIONS
AAGR – Average Annual Growth Rate
ADB – Asian Development Bank
AH – Affected Households
AP – Affected Peoples
Capex – Capital expenditure
CBP – Capacity Building Program
CCS – Comprehensive City Survey
CH4 – Methane
CO2 – carbon dioxide
COD – Cut-off date
COI – Corridor Of Impact
EA – Executing Agency
EIA – Environmental Impact Assessment
EIRR – Economic Internal Rate of Return
EM – Ethnic Minorities EMP – Environmental management plan
FA – Financial analysis
FCDI – Financing Charges incurred during Implementation
FGD – Focus Group Discussions FHH – Household headed by women
FIRR – Financial Internal Rate of Return
FNPV – Financial Net Present Value
GAP – Gender Action Plan GDP – Gross domestic product
GDR – General Department of Resettlement
GRM – grievance redress mechanism
HH – Household ICT – Information and communication technology
IDF – Intensity, Duration, and Frequency
IEE – Initial Environmental Examination
IEIA – initial Environmental Impact Assessment
IOL – Inventory Of Losses
IP – Indigenous Peoples
IR – Involuntary Resettlement
KII – Key informant interviews
KR – Riel
LCIP – Livable Cities Investment Project
MEF – Ministry of Economy and Finance
MLMUPC – Ministry of Urban Planning and Construction
MP – Master plan
MPWT – Ministry of Public Works and Transport
MSW – Municipal Solid Waste
N2O – Nitrous oxide
O&M – Operation and Maintenance
OCR – ordinary capital resources loan
Opex – Operational expenditure
PA – Provincial Administration PDPWT – Provincial Department of Public Works and Transport
PIB – Public Information Brochure
PMU – Project Management Unit
PPP – Private Public Partnership
PSP – Private sector participation
PWTESPO – Public Works & Transport, Environmental, Sanitation, and Public Order Office

RGC – Royal Government of Cambodia
RSIV – Rectangular Strategy […] Phase IV
SDG – Sustainable Development Goals
SES – Socio-Economic Survey
SEZ – Special Economic Zones
SW – Stormwater
SWM – Solid waste management TRTA – Transactional Technical Assistance
UXO – Unexploded Ordnance
WACC – Weighted Average Cost of Capital
WTP – Willingness To Pay
WW – Wastewater
WWTP – Wastewater treatment plant

CONTENTS
Page
EXECUTIVE SUMMARY
I. INTRODUCTION 1
1. Rationale of the project 1
2. Project location 1
3. Description of the project 2
4. Safeguards analysis (summary) 6
II. POLICIES AND INSTITUTIONAL ARRANGEMENTS 8
1. Policies and legislative framework 8
2. Institutional arrangements 10
3. Regulation and enforcement 11
III. SOCIO-ECONOMIC PROFILE AND INDICATORS 14
1. Social development and poverty 14
2. Profile of key stakeholders 21
IV. BENEFICIARY PROFILE 32
1. Methodology 32
2. Data on the head of the household 35
3. Characteristics of beneficiary households 36
4. Livelihood, poverty, and hardship 37
5. Households and water supply 38
6. Households and sanitation 38
7. Households and stormwater drainage 40
8. Households and solid waste management 42
9. Consumer perceptions 44
10. Private sector 45
11. Civil society organizations 47
V. NEEDS, PREFERENCES, AND DEMANDS OF PROJECT STAKEHOLDERS 48
1. Informal settlement dwellers 48
2. Poor households 48
3. Female-headed households 50
4. Indigenous peoples 52
5. Youth and children 52
6. Persons with disabilities 53
7. Elderly 53
VI. SOCIAL AND POVERTY ANALYSIS 55
1. Rapid urban development but low basic service development 55
2. Addressing existing deficiencies in basic infrastructure 56
3. Impact on poverty reduction 56
4. Impact on health 62
VII. GENDER ASSESSMENT 65
1. Role and status of women 65
2. Gender characteristics in the project area 70
3. Control of resources and access to infrastructure 72
4. Health status 73
5. Gender impact analysis 74
VIII. GENDER EQUALITY AND SOCIAL INCLUSION ACTION PLAN 75
1. Social Approach 75
2. Gender Approach 80
3. Project assurances 81
IX. MONITORING AND REPORTING 83
1. Monitoring poverty and social impacts 83
2. Reporting 83
X. CONSULTATION AND PARTICIPATION 84
1. Consultations were undertaken 84
2. Results of consultations 84
3. Roles of stakeholders in planning, design, and implementation 84
4. Stakeholder participation plan 85
5. Stakeholder communication strategy 91
6. Disclosure 95
XI. CONCLUSIONS AND RECOMMENDATIONS 96
XII. APPENDICES 97
7. Key sex-disaggregated poverty and social statistics and indicators 98
8. Stakeholder consultation 105
9. Social surveys 107
10. Gender Equality and Social Inclusion Action Plan 108

LIST OF FIGURES
Figure 1: Location of main infrastructure proposed - wastewater .......................................... 3 Figure 2: Proposed Infrastructures – Average Slopes ........................................................... 5 Figure 3: Proposed landfill and composting plant location (SWM) ......................................... 6 Figure 4 Comparison between health issues encountered by adult male and adult female in Bavet .................................................................................................................................. 21 Figure 5: Map of poor household fraction identified per village ............................................ 23 Figure 6: Households headed by women per villages ......................................................... 24 Figure 7: Comparison of age pyramids 2003 and 2020, Cambodia ..................................... 28 Figure 8: Mobile data collection strategy ............................................................................. 34 Figure 9: FGD with ID poor people, social survey, Bavet September 2020 ......................... 35 Figure 10: Average monthly income per vulnerability group, 2018, CCS ............................. 38 Figure 11 Location of Households Willing to Pay a Monthly Fee for Wastewater Management ........................................................................................................................................... 40 Figure 12 Comprehensive city survey and flood-prone areas location ................................. 41 Figure 13 Collection Coverage in Bavet, Egis 2020 ............................................................ 42 Figure 14 Monthly willingness to pay - Solid waste management service, Egis 2020 .......... 44 Figure 15: Map of area showing the level of urbanization .................................................... 55
LIST OF TABLES
Table 1: Investment horizon and Design Capacity ................................................................ 3 Table 2: Key statistical information ...................................................................................... 14 Table 3: List of Civil Society Organizations identified in Bavet, 2020 ................................... 29 Table 4: Achieved Sample Size in Bavet ............................................................................. 33 Table 5: Occupation of heads of households in Bavet, 2020 ............................................... 36 Table 6: Households assets, Bavet, 2020 ........................................................................... 36 Table 7: Expenditure profile of households, 2018, Bavet ..................................................... 37 Table 8: Commerce and institutions surveyed in BAVET during the Comprehensive City Survey (CCS) ...................................................................................................................... 45 Table 9: Details of the type of commerce and institutions surveyed in Bavet during the CCS ........................................................................................................................................... 45 Table 10: Satisfaction rate for current urban infrastructure in Bavet for Commerce and Institutions, CCS. ................................................................................................................ 47 Table 11: Analysis of affordability for poor households ........................................................ 49 Table 12: Analysis of affordability for female-headed households ....................................... 51 Table 13: Analysis of affordability for elders head of households ........................................ 54 Table 14: Estimate Human resources required to operate the sewerage system ................ 59 Table 15 Sex Disaggregated data on staff at PDoPWT level, Svay Rieng. .......................... 60 Table 16: Comparison of occupation between male and female heads of households, Bavet ........................................................................................................................................... 70 Table 17: Distribution of expenses in FHHs budget, Bavet, CCS ........................................ 71 Table 18 Staff repartition per position and sexe .................................................................. 73 Table 19 Comparison between percentage of men/women per type of health condition encountered by surveyees over one year. ........................................................................... 73 Table 20: Detailed social and poverty alleviation actions ..................................................... 77 Table 21: Consultation and Participation Plan ..................................................................... 86 Table 22: Stakeholder Communication Strategy ................................................................. 93 Table 23: Disclosure plan .................................................................................................... 95 Table 24: Bavet police minorities data sheet 2020 in value and in % .................................. 98 Table 25: CCS Key disaggregated data .............................................................................. 99 Table 26: Affordability analysis .......................................................................................... 102 Table 27: Households Expenses ....................................................................................... 104 Table 28: Households Occupation .................................................................................... 104 Table 29: Households Assets ............................................................................................ 104 Table 30: List of meeting workshop FGD, and number of participants ............................... 105
LIST OF PICTURES
Picture 1: NGOs/CSOs assessment, Bavet, September 2020 47 Picture 2 Street waste collector interviewed by Egis team, Bavet, June 2020 58 Picture 3 FGD with women in Bavet, October 2020 72

EXECUTIVE SUMMARY
1. At the request of the Kingdom of Cambodia, the Asian Development Bank (ADB) is
developing the Livable Cities Investment Project (LCIP) to facilitate long-term sustainable and
economic growth. The project targets, among others, Bavet City, in Svay Rieng Province. The
assessment carried out in this project shows a lack of basic infrastructure in Bavet City to
address the current needs. The urban trend analysis: (i) City Master Plan and Projected Land
Use 2030 (MLMCP) and (ii) population projection (TRTA); reveals that a significant increase
in the needs for basic services is to be expected in the coming years, in particular in the most
urbanized Sangkat, Bavet.
2. This Poverty, Social and Gender Analysis (PSA) is part of the Safeguard Policy
Statement (SPS) and identifies the key poverty and social issue, beneficiaries, channels of
impacts, other social issues and risks, and design features. It includes a poverty reduction and
social strategy, a gender action plan to promote gender inclusion in the project activities and
monitoring system and address gender mainstreaming in the project components under
training and capacity building, a stakeholder communication strategy, and a participation plan.
3. The report is based on a literature review, secondary and primary data. several
documents served as a reference for the analysis- the Initial Poverty and Social Analysis
(IPSA), documents and reports published by the Royal Government of Cambodia, line
ministries and National Institute of Statistics and country institutions and ADB documents
available on its website1 , among others. Primary data were collected by the TRTA through a
City Comprehensive Survey (household survey) in December 2019, Key Informant Interviews
(KII) along with the project preparation and Focus Groups Discussions (FGDs) in September
and October 2020 to assess the situation of specific groups in the project area. Together with
secondary data obtained from the Municipality and ID poor program, this information was used
to draw socio-economic profiles, identify pockets of poverty and vulnerability, assess the
needs, demands, and constraints of direct beneficiaries in order for all groups to fully benefit
from the project. In total, in Bavet, 16 workshops and meetings were held with 397 participants
and 8 Focus Groups Discussions with 171 participants.
4. The project aligns with key overarching frameworks for poverty alleviation and gender
mainstreaming developed by the RGC and the ADB. The country is engaged in a progressive
decentralization and deconcentration process, which transfers additional responsibilities and
functions to the subnational levels, and more recently, to the municipalities and municipal
offices. The project will be implemented by the Provincial Department of Public Works and
Transport and will support the transfer of competences to Municipality offices.
5 Bavet city went through major changes since 2008, with the establishment of Special
Economic Zones (SEZs) and the continuous development of transborder tourism and trade.
This translates into socio-economic patterns. Main jobs are in the industry (SEZs employ
52.000 workers) and small-scale businesses (5% in service), and 14% of the population is
still engaged in agriculture. Parts of the city are urbanized, while others remain rural.
General access to urban infrastructure and services is low -except for sanitation, where 91%
of households have their own latrines2 - and is concentrated in the most urbanized Sangkat,
1 the ADB Strategy 2020, the Cambodia Partnership strategy Cam 2019-2023, Cambodia ADB Factsheet 2019, the Handbook Poverty and Social analysis and IP good practice resource book 2 Table of village data 2019

Bavet. 16% of households use water from the treater water system, 7% have a solid waste
collection service, and only 5% are connected to the drainage or sewerage system. The
average monthly income per capita is below the national average, and the city reports 7% ID
poor cardholders3.
6. Poor and vulnerable groups in Bavet are mostly made of ID poor, elderly, and female-
headed households (FHH) (12% of the population and up to 25% in some villages). There are
very few informal settlements (11 households in total). Indigenous Peoples (IPs) are
represented by 200 Vietnamese households located in the most urbanized Sangkat along the
border with Vietnam in the project target area. While having the same lifestyle as Khmer
people, since the law on nationality was amended in 2018 and some of them lose Cambodian
citizenship, they tend to participate less in community events. This needs to be addressed by
the project (SPS, SCP, IPP).
7. Vulnerable groups have the same access to the infrastructure and services, when they
are available. In general, they share the same interest as other groups to access improved
urban infrastructure and services for better health and living environment. Besides lower
education levels observed among the oldest and women, the main difference between poor
and vulnerable households and the rest of the population is income, which for the poorest is
72% lower than the average income of the population. The costs of health expenses represent
13% of the total expenses for FHHs and the poorest households when it is only 10% for other
households. The poor and vulnerable are more impacted by poor waste and sanitation, in
terms of the unhealthy living environment, higher incidence of illness due to water-borne
disease, and the weight of health expenditures in their budget.
8. Low income is a constraint to consider in ensuring the affordability and accessibility to
basic urban services. Consultations reveal that poor and vulnerable are willing to access such
services but most are unsure if they can afford it- the costs of urban infrastructure and service
would weigh in relatively more in their budget than for wealthy people, and paying for waste
management and sanitation could be at the expense of other costs (i.e., for food, education).
The results of the consultations suggest that the issue of willingness to pay and affordability
is also intricately linked to low levels of awareness and information, low degree of satisfaction/
trust in the quality of current services (e.g., solid waste collection, drainage) and lack of
incentives to change practices.
9. A comprehensive approach is proposed to ensure inclusive access to urban
infrastructure and services and to optimize the impacts of the infrastructure development,
which includes: (i) creating an enabling environment- including raising awareness and
engaging people in behavior change (knowledge and attitudes)4, (ii) using regulation to guide
people towards proper sanitation, and accelerate changes in practices, (iii) proposing
mechanisms/ prices5 allowing the poor and vulnerable to access and benefit from basic
infrastructure and services and contribute to urban sanitation and public health and (iv)
improving the quality of services delivered by the private and public operators.
3 The percentage of population living below poverty line at national level : 12.9% in 2018 4 A key output of the project will be to develop training and awareness raising on the costs and benefits of proper sanitation and disposal of waste and will promote opportunities to improve the livelihood of the residents, particularly the poor and female population, and rural people. Negative impacts of bad sanitation and hygiene are currently less a problem for population in rural area, and part of the program will be to raise awareness in anticipation of future urbanization. 5 The project incorporates practical pro-poor and social inclusion design features, such as the provision of free-of-charge stormwater drainage, free connection to the sewerage for the poorest, tailored schemes for equitable wastewater service fees , and solid waste collection to adapt to these constraint and ensure equitable and full access to basic services for the whole population..

10. While urbanization tends to modify gender roles slightly in water and sanitation (e.g.,
women/girls do not need to fetch water when there is a public water supply/type water), the
trend remains that women are primarily responsible for domestic chores, including the care of
children, elderly and sick, as well as solid waste management. They generally have a higher
risk and health exposure as the primary contributors toward household and community
sanitation tasks. Perhaps due to their low level of education, limited access to information, and
daily exposure to waste that is an accepted part of their lives, female survey participants
showed less awareness and concern about sanitation issues and their impact on the
environment and health. They are also less informed about the technical and economic
aspects of water and sanitation and are absent in decision-making and O&M related to this
subject- despite being the main users.
11. Women are under-represented in technical aspects and decision-making in the water
and sanitation sector in general. The project aims to address the role of women in decision
making and participation in the water and sanitation sector by building their knowledge and
capacity, promoting more women in technical and decision-making positions in the institutions
and engaging women in water and sanitation monitoring and O&M at the community level.
12. Social and gender indicators are proposed for integration into the DMF to ensure the
project is inclusive and provides equitable access to urban infrastructure and services, gender
equity, and contributes to social development and public health. The project also supports
participatory monitoring through regular consultation, including with women and vulnerable
groups and the establishment mixed-gender community to ensure community’s and women
engagement in behavior change and monitoring.
13. Measures are in place to mitigate or avoid potential risks associated with public works
(e.g., nuisance during construction works, potential risk of HIV communicable diseases
transmission, working conditions of construction workers). Potential loss of informal jobs due
to the reorganization of Solid Waste Management systems will be offset by the creation of
formal jobs.
14. Results of consultations with stakeholders conducted in the project preparation phase
have been incorporated into its design, and such consultation will continue throughout the
project via meetings, FGDs with specific groups (e.g., the poor and vulnerable, people living
near the landfills and water treatment plants, waste pickers/ scavengers), surveys and through
participatory monitoring, with the objective to obtain feedback from the beneficiaries, adjust
activities and increase people’s satisfaction and use of urban infrastructure and services. The
Stakeholders Participation Strategy (SPS) identifies the different approaches and depths of
participation.
15. Stakeholders involved in the project include the Provincial Department of Public
Works, key provincial departments such as the Provincial Department of Women Affairs and
the Municipality Administration, as well as local organizations, other development projects,
and the private sector (solid waste collection, civil works contractors). The participation of local
authorities and organizations (Sangkat councils, Women and Children Consultative
Committees, CSOs-NGOs) will guarantee proper dissemination of information/ awareness
messages and contribute to the smooth implementation of operation locally.
16. The Stakeholder Communication Strategy (SCS) provides comprehensive, timely, and
transparent information and targeted awareness-raising. It includes a mix of traditional and
modern communication means, direct communication, mass media, and social media, to
reach the targeted audience more effectively.
17. Urban infrastructure and services have been identified as important contributors
towards inclusive and sustainable development and the development of human capital, social
services, and public governance. The project will improve access to urban service to the
residents of the city. It will improve the attractiveness for more economic investments and
touristic development, given the basic infrastructure would be in place and provide
employment opportunities. To reach its economic, social, and environmental goals, the
development of urban infrastructure and services has to benefit all population groups and
“leave no one behind.” The project encompasses the necessary elements to reach this
objective in terms of consultation and participation of women, poor and vulnerable groups,
targeted interventions (training and awareness-raising, women’s empowerment), and
affordable services.

1
I. INTRODUCTION
1. Rationale of the project
At the request of the Kingdom of Cambodia, the Asian Development Bank (ADB) is
developing the Livable Cities Investment Project (LCIP) to facilitate long-term sustainable and
economic growth.
The project will concentrate on the secondary cities of Bavet, Poipet, and Kampot, due
to their economic potential and location in key trade and tourism zones. It will provide
interventions to improve: (i) the regulatory environment; (ii) the institution and governance
arrangements pertaining to the infrastructure sector; and (iii) the urban infrastructure (with a
focus on water supply, sanitation, solid waste management, and stormwater drainage
sectors).
The Southeast Asia Urban Services Facility (SURF), a transaction technical assistance
(TRTA) facility led by EGIS EAU, supports the project preparation and conducting technical,
financial, economic, institutional, sector policy, legal, regulatory, poverty, social, gender and
safeguard assessments.
The project will contribute to poverty reduction indirectly through developing urban
areas, improving environmental sustainability, development of human capital, and public
governance and is labeled as General Intervention for poverty targeting. The IPSA considers
that the project has no adverse impact on women and/or girls or widen gender inequality and
is categorized as Effective Gender Mainstreaming (EGM) for its potential to contribute to the
promotion of gender equity and/or empowerment of women by providing women’s access to
and use of opportunities, services, resources, assets, and participation in decision making.
2. Project location
Location. Bavet was established as a city in December 2008. It is strategically located
in the Southeast part of Cambodia at the main international border crossing with Viet Nam.
Bavet is the first town in Cambodia along the National Road 1 (NR 1) when travelling from the
border of Viet Nam and is an emerging trading and manufacturing center in the province of
Svay Rieng.
Bavet City is surrounded on the northwest side by Svay Theab District; on the
northeast side by the rural district Gò Dầu in the south of Tây Ninh Province, Southeast region,
Vietnam; in the southeast by Chan Trea District; and southwest by Kampong Rou.
Administrative Units. Bavet consists of 5 quarters (Sangkats): (i) Sangkat Bavet is
composed of 5 villages (Phum); This sangkat is the most urbanized and villages are urban,
except Chrak Leav village which is rural. Other sangkats are all rural (ii) Sangkat Prey
Angkunh - 8 villages; (iii) Sangkat Prasat - 2 villages ; (iv) Sangkat Bati - 5 villages and (v)
Sangkat Chrak Mtes - 15 villages- Prey Phdau village is mixed.
2
3. Description of the project
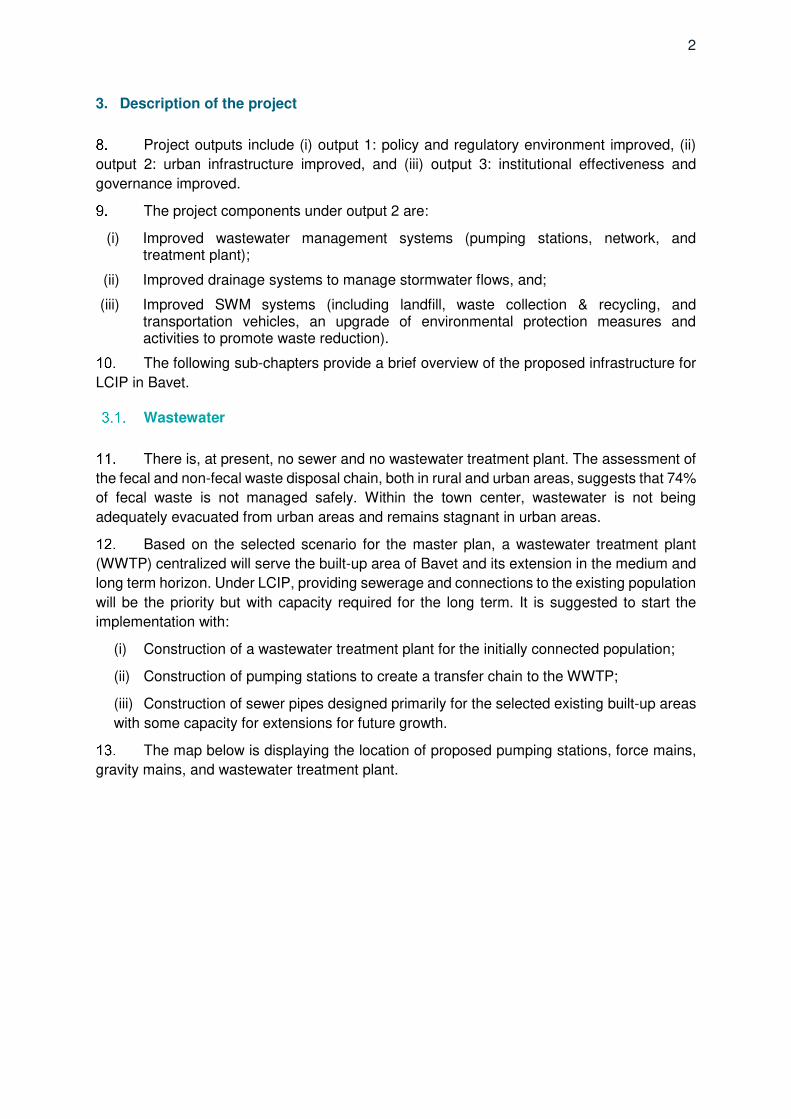
Project outputs include (i) output 1: policy and regulatory environment improved, (ii)
output 2: urban infrastructure improved, and (iii) output 3: institutional effectiveness and
governance improved.
The project components under output 2 are:
(i) Improved wastewater management systems (pumping stations, network, and treatment plant);
(ii) Improved drainage systems to manage stormwater flows, and;
(iii) Improved SWM systems (including landfill, waste collection & recycling, and transportation vehicles, an upgrade of environmental protection measures and activities to promote waste reduction).
The following sub-chapters provide a brief overview of the proposed infrastructure for
LCIP in Bavet.
Wastewater
There is, at present, no sewer and no wastewater treatment plant. The assessment of
the fecal and non-fecal waste disposal chain, both in rural and urban areas, suggests that 74%
of fecal waste is not managed safely. Within the town center, wastewater is not being
adequately evacuated from urban areas and remains stagnant in urban areas.
Based on the selected scenario for the master plan, a wastewater treatment plant
(WWTP) centralized will serve the built-up area of Bavet and its extension in the medium and
long term horizon. Under LCIP, providing sewerage and connections to the existing population
will be the priority but with capacity required for the long term. It is suggested to start the
implementation with:
(i) Construction of a wastewater treatment plant for the initially connected population;
(ii) Construction of pumping stations to create a transfer chain to the WWTP;
(iii) Construction of sewer pipes designed primarily for the selected existing built-up areas
with some capacity for extensions for future growth.
The map below is displaying the location of proposed pumping stations, force mains,
gravity mains, and wastewater treatment plant.

3
Figure 1: Location of main infrastructure proposed - wastewater
The Project focuses on the future of the sewerage system for the areas delineated by
the zoning 2025 (short term area, within budget allocation) but provides infrastructure
designed for future needs.
Table 1: Investment horizon and Design Capacity
Item LCIP – investment horizon Design Capacity
Sewer Network 2025 – short term or priority area 2040
Pumping Stations & Force mains
Equipment 2030 Civil works 2040
WWTP 2030
Stormwater drainage
Bavet has more than 20 km of the open channel network. The diameter of those
channels varies between 2 and 4 meters and depth from 1 meter to 3 meters. The open
channel network is now considered as the main drainage infrastructure. This network is the
outfall of some drainage/sewerage pipes. Except for the area covered by GMS 1, there is
currently no existing overall strategy and roadmap for the sector. The implementation of the

4
new drainage section does not seem to follow an overall strategy but a patchy logic following
the urban development.
Recurrent floods are reported by inhabitants and local authorities. Main stormwater
channels are operating properly, but their capacity is not sufficient to ensure proper drainage
of the city center.
The proposed drainage network follows the natural topography and discharges at low
points of the road. As much as possible, the few existing cross-drains will be reused to limit
the cost of road cutting and reinstatement.
Runoff rates for built-up areas are based on a 1-in-5-year storm intensity as per the
Road Design Standard (MPWT, 2003). Less intense and more frequent storms are
accommodated. More intense and less frequent storms to be expected every few years will
still cause occasional street flooding and damage to buildings and contents.
In urban areas, in order to minimize the risk of blockage by solid waste and problems
related to resettlement, an underground network (box-culvert) will be prioritized. This choice
will limit urban development constraints on the surface. The depth and width of the proposed
box culvert will allow storage and slow drainage.
In rural areas, the irrigation canal system is well developed in Bavet. It is proposed to
enlarge those existing trapezoidal earthen open-channels. This drainage solution fits with the
actual land use. In the future, and as the urban development will grow, it might be needed to
replace it with box culvert lines. The maintenance will have to be increased to clean the mud
deposit and ensure the drainages lines' capacity.
Figure below shows the types (simple or double) of infrastructure used for each section
considered.

5
Figure 2: Proposed Infrastructures – Average Slopes
Solid Waste Management
It is estimated that 85% of the solid waste generated in Bavet is unsafely managed.
The household collection coverage is only approximately 14%. A large portion of the municipal
solid waste is also left uncollected and is dumped directly in the nearby natural environment
and/or burnt. It is necessary to improve the collection of the whole city.
In terms of collection, door to door collection is preferred in the city center while
centralized collection is suggested in rural areas until these areas are sufficiently developed
to densities which make door-to-door collection cost effective. Source segregation at markets,
with a dedicated centralized collection point, would be an opportunity to increase the sorting
of bio-waste and, therefore, the potential for compost production.
In terms of treatment, a sorting plant and a composting plant have been identified as
the most appropriate technologies to reduce the amount of waste to be landfilled; to control
part of the market for recyclables; to increase revenue potential, and to contribute the climate
change mitigation. Finally, a controlled landfill is proposed as the most appropriate disposal
system for the city to avoid the harmful dumping and burning of waste.
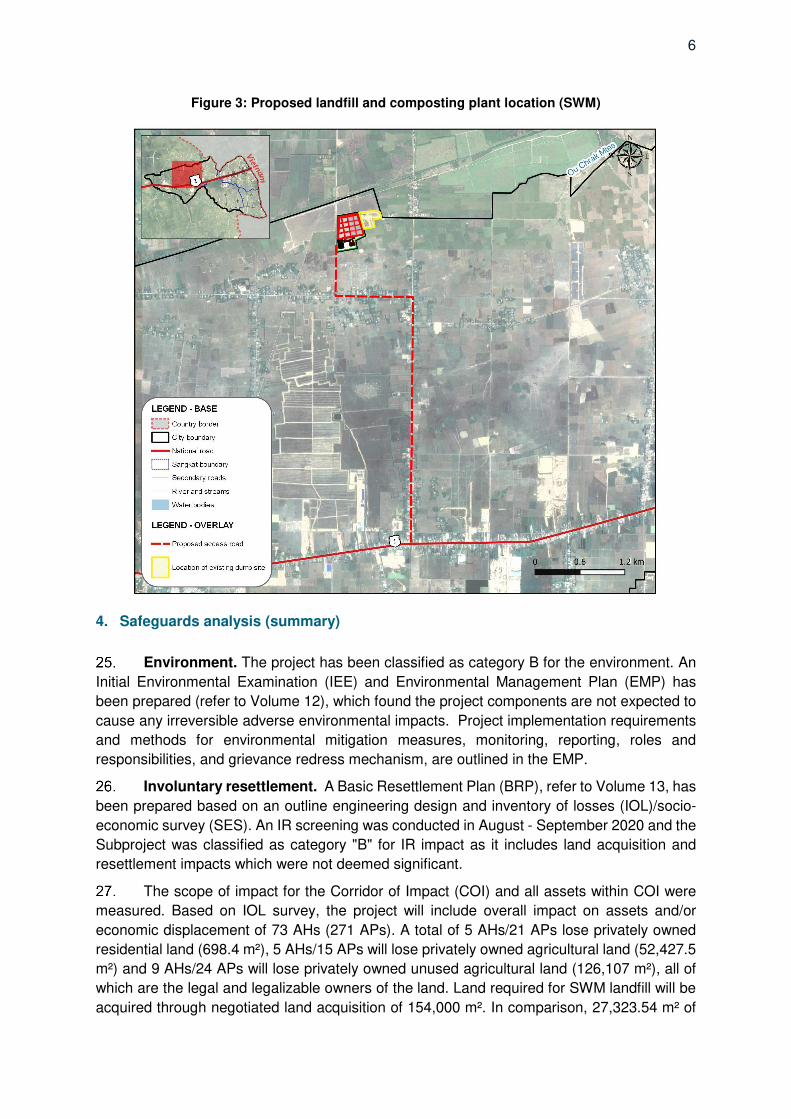
6
Figure 3: Proposed landfill and composting plant location (SWM)
4. Safeguards analysis (summary)
Environment. The project has been classified as category B for the environment. An
Initial Environmental Examination (IEE) and Environmental Management Plan (EMP) has
been prepared (refer to Volume 12), which found the project components are not expected to
cause any irreversible adverse environmental impacts. Project implementation requirements
and methods for environmental mitigation measures, monitoring, reporting, roles and
responsibilities, and grievance redress mechanism, are outlined in the EMP.
Involuntary resettlement. A Basic Resettlement Plan (BRP), refer to Volume 13, has
been prepared based on an outline engineering design and inventory of losses (IOL)/socio-
economic survey (SES). An IR screening was conducted in August - September 2020 and the
Subproject was classified as category "B" for IR impact as it includes land acquisition and
resettlement impacts which were not deemed significant.
The scope of impact for the Corridor of Impact (COI) and all assets within COI were
measured. Based on IOL survey, the project will include overall impact on assets and/or
economic displacement of 73 AHs (271 APs). A total of 5 AHs/21 APs lose privately owned
residential land (698.4 m²), 5 AHs/15 APs will lose privately owned agricultural land (52,427.5
m²) and 9 AHs/24 APs will lose privately owned unused agricultural land (126,107 m²), all of
which are the legal and legalizable owners of the land. Land required for SWM landfill will be
acquired through negotiated land acquisition of 154,000 m². In comparison, 27,323.54 m² of

7
existing public right-of-way (ROW) will be used for the Subproject components, and 200,000
m² of public state land for the wastewater treatment plant (WWTP) site. 12 AHs/39 APs will
lose access to productive agricultural land within the existing ROW (9,972 m²). One AH/3APs
will lose more than 10% of their productive agricultural land.6
Indigenous Peoples. The project was initially categorized as B for its potential impacts
on Indigenous Peoples (IP) communities but, as there no IPs are identified during project
preparation, and the ethnic groups identified in the project area IP are well integrated in the
mainstream society and will benefit from the same advantages as Khmer, it is has been
assessed as category C for the impact on IPs. Refer to Volume 14 for the Indigenous Peoples
Due Diligence Report.
6 Severity of impact will be confirmed at the DMS stage and reflected in the DRP based on the final data collected on all AHs, experiencing major impact and permanent loss of livelihood.

8
II. POLICIES AND INSTITUTIONAL ARRANGEMENTS
1. Policies and legislative framework
Key overarching Framework for poverty alleviation are the medium-term targets of the
government’s Rectangular Strategy, Phase IV (RSIV) for growth and poverty reduction, the
National Strategic Plan on Green Growth, 2013–2030; and the draft National Strategic
Development Plan, 2019–2023, which integrates Cambodia’s Sustainable Development
Goals.
The RSIV is a key government policy that aims to support the Political Platform, as
asserted by the government. It consists of four priority areas focusing on inclusive and
sustainable development to address challenges relating to urbanization and the need to
improve the capacity to respond to the impacts of climate change. The Cambodia Livable
Cities Investment Project (LCIP) aligns with the Rectangular Strategy for Growth,
Employment, Equity, and Efficiency: Building the Foundation Toward Realizing the Cambodia
Vision 2050 Phase IV (RSIV).
The National Strategic Development Plan 2019-2023 (NSDP) has been developed as
the primary tool for driving the political platform and the RSIV, outlining key measures and
actions to enable the country to reach upper-middle-income status by 2030. These collectively
seek to enable progression to Upper Middle-Income and then High-Income Country status
based on socio-economic inclusion and environmental sustainability. The imperative of
securing equitable development and leaving no one behind, and preserving Cambodia’s
natural resource endowment while also addressing the threats posed by climate change, are
fully embedded within the policy stance.
In 2003, Cambodia established the Cambodia Millennium Development Goals (MDG).
Then following the endorsement of the SDGs at the UN General Assembly in late 2015, the
RGC has worked to adapt the goals to the national context and has crafted a fully localized
framework – the Cambodian SDGs 2016-2030 (CSDGs). Among the nine targets and 14
indicators of global SDG 5 to “achieve gender equality and empower all women and girls,” the
Cambodian government has accepted seven targets and 12 indicators into the CSDG
framework (CSDG 5). In the Socio-Economic Policy Agenda (Rectangular Strategy IV) of the
current government, human resource is given the highest development priority. It includes
mainstreaming of gender equity in policy framework and national development plan which will
lessen the gender gap in education, widens women entrepreneurship initiative, reduce
domestic violence and sexual abuse against women and children and uplift social morality.7
In 2011, the RGC formulated the National Social Protection Strategy for the Poor and
Vulnerable. The strategy has four pillars: vocational and skills training; social insurance
(contributory system); social safety nets (noncontributory system); and complimentary social
welfare services. A variety of governmental and non-governmental agencies are
involved in poverty reduction, including the Ministry of Social Affairs, Veterans and Youth
Rehabilitation (MoSVY), which provides social welfare services and assistance to the
vulnerable, including disabled and elderly people, as well as the homeless.
7 SDG 5 Gender equality, Open Development Society, 11 April 2019 https://opendevelopmentcambodia.net/topics/sdg-5-gender-equality/

9
In 2017, “the National Social Protection Policy Framework 2016-2025” (SPPF) was
approved by the Council of Ministers. The goal of this policy framework is to develop a strategic
plan for the Royal Government of Cambodia to ensure income security and reduce the
economic and financial vulnerability of its citizens. It aims at increasing people’s well-being
and solidarity in society and aims at reducing poverty to a maximum extent. The policy
framework aligns, concentrates, and improves the existing social protection
programs/schemes and enhances the efficiency, equity, transparency, and consistency of the
social protection system.
Cambodia has been a member State of the ILO since 1969. It has ratified all 8 of the
core labor standards and a number of other key ILO conventions. The core labor standards
are a set of four fundamental, universal, and indivisible human rights: Freedom from forced
labor, freedom from child labor, freedom from discrimination at work, freedom to form and join
a union, and to bargain collectively. Among key conventions, Cambodia signed in 1999 the
convention on the Worst Forms of Child Labour Convention, the Equal Remuneration
Convention, and the Discrimination (Employment and Occupation) Convention.
Articles 31, and 35 of the Constitution ensure equal rights for women regardless of
race or religion, and Article 45 prohibits discrimination based on gender. A number of laws
have been adopted which protect women’s interests, such as the law on Prevention of
Domestic Violence and Protection of Victims (2005), the law on Suppression of Trafficking in
Humans and Sexual Exploitation (2008), and other measures that ensure gender equality has
been progressively and effectively integrated into the successive National Strategic
Development Plans.
The RGC ratified the Convention on the Elimination of All Forms of Discrimination
Against Women (CEDAW) in 1992 without reservation. CEDAW ensures the civil rights and
legal status of women as follows: their political participation, non-discrimination in education,
employment and in the economic and social activities and the equal rights and obligations of
women and men with regards to the choice of spouse, parenthood, individual rights, and
economic rights.
The Minimum Standards for Essential Services for Women and Girl Survivors of
Gender-Based Violence (GBV) was drafted in 2017 under the second National Action Plan to
prevent Violence Against Women 2014-2018 (NAPVAW II). NAPVAW III 2019-2023 was
officially launched 19th January 2021. The action plan, developed in line with the Rectangular
Strategy-Phase 4 of the Royal Government of Cambodia, sets out four strategies, including 1:
Primary Prevention, 2: Legal Protection and Multi-Sectoral Services, 3: Laws and Strategic
Policies, 4: Monitoring, Review, and Evaluation to prevent, respond and address the violence
against women and girls more effectively and efficiently to reduce any forms of violence
against them to promote equity and social inclusiveness.
The National Strategic Plan for Gender Equality and Women’s Empowerment, Neary
Rattanak represents the guiding policy to promote gender equality and women’s
empowerment in Cambodia. The plan is supported by the Cambodia Gender Assessment,
which provides a periodic analysis of the status of women in all sectors and the changes and
advancements made, as well as the remaining challenges. Neary Rattanak V was approved
in 2020 for the period 2019-2023. Neary Rattanak V was formulated in the framework of
drafting the first National Policy on Gender Equality, and it will become a key strategic plan to
support the implementation of this new national policy in all areas and all levels, especially in
coordination with line ministries/institutions and stakeholders. This includes the following

10
objectives, which must be considered in LCIP. (i) Strengthen the capacity of institutions and
mechanisms at the national and sub-national levels to mainstream a gender-transformative
approach through the process of formulating and implementing laws, policies, strategic plans,
national and sectoral programs at all levels with equity and inclusion. (ii) Promote the
participation of women in decision-making at all levels and the promotion of gender equality
in leadership at all levels.
The Ministry of Civil Service (MCS) issued guidelines for a 20 to 50% quota for women
in the annual recruitment of staff to work in public institutions and a target of 42% women civil
servants and 25 to 30%of women in decision-making positions by 2022.
2. Institutional arrangements
Institutional arrangements. The first major step towards democratic, decentralized
management at local levels was made in 2001, when the law on commune/Sangkat
administrative management (2001) recognized commune and Sangkat as local government
entities, with their own directly elected leadership and legislative and executive powers. In
2008, the organic law- Law on Administrative Management of the Capital, Provinces,
Municipalities, Districts, and Khans- provided the administrative basis for further
decentralization and deconcentration by formalizing the structures and roles of the provincial
level (including provinces and the capital city) as well as a district level (covering provincial
districts as well as khans).8 (Sub-Decree No. 216 ANK.BK, 2009).
In 2019, sub-decree No.182 ANK.BK redefined the functions and structure of municipal
administrations with the aim to promote the efficiency of administration management, public
service delivery, and local development at the municipality level. The ministries, institutions,
and authorities at all levels must also transfer appropriate functions to the municipal
administration. According to the sub-decree, each municipal administration shall have the
following offices and units: Administration and Finance Office; Procurement Unit; Human
Resource Management Office; Planning and Sangkat Support Office; Internal Control Office;
Council Secretary Office, Education, Youth and Sports Office; Land management, Urban
Planning, Construction, and Land Office; Legislation and Local Conflict Mediation Office;
Public Works, Transportation, Hygiene, Environment, and Public Order Office; Economy and
Community Development Office; Social Affairs and Welfare Office; and One Window Service
Office.
According to the sub-decree No.182 Art.24, the Public Works, Transportation,
Hygiene, Environment, and Public Order Office shall act as the secretariat for municipal
administration in public works, transportation, hygiene, environment, and public order tasks
and shall be responsible for the following functions, and a key stakeholder in the Cambodia
Livable Cities Investment Project (LCIP): public works and transportation, solid waste
management in urban areas, management of sewage system and wastewater treatment
system, management of smoke, sound, smell, and atmosphere pollutions, management of
natural protected area systems; tree plantation, care, and management of public gardens,
management of public lighting, management of public parking spaces, public orders, other
tasks as assigned by the municipal government.
8 http://www.localpublicsector.net/profiles/khm1112.htm
11
Gender. The Ministry of Women’s Affairs (MoWA) is in charge of coordinating,
facilitating, and advocating for gender mainstreaming within and across government and
public institutions. Gender Mainstreaming Action Groups (GMAGs) are the mechanism for
gender mainstreaming across sectors. GMAGs have been established since 2005 in all line
ministries and government agencies. Through GMAGs, all line ministries and institutions
develop Gender Mainstreaming Action Plans to guide their actions.
At the sub-national level, MoWA is represented by Provincial and District Offices of
Women’s Affairs (PDoWA and DOWA). Gender Focal Points have been designated in
provincial line departments. They work with line departments, offices, and other relevant units
under their respective jurisdictions. They are responsible for supporting, coordinating, and
conducting research to inform and provide comments to Women and Children Consultative
Committees (WCCCs) on issues concerning women, children, and youth at their own level.
Capital, Provincial, Municipal, District, and Khan Women and Children Consultative
Committees (WCCCs) are the sub-national mechanisms to promote gender equality and the
empowerment of women and children under the jurisdiction of the province and district.
WCCCs are authorized and duty-bound to provide suggestions and recommendations to the
Council, Board of Governors (Capital/Provincial/District/Khan), and other committees on
issues related to gender equity and women and children. MoWA supports PDWA and DOWA
in fulfilling their roles as permanent deputy of the committee, while the Ministry of Interior
supports capacity building and overall functions of the committee.
Commune Committees for Women and Children (CCWCs) are consultative
committees for women’s and children’s issues, such as maternal and child health, community
pre-school, hygiene/sanitation, gender equality, and child protection. The CCWC consists of
the Commune/Sangkat Chief as chair, Second Vice Chief of the Commune/Sangkat as
Deputy, and the Commune Women and Children Focal Point (CWCFP) as permanent
members.
3. Regulation and enforcement
Social. Social Assistance programs that have been implemented include: (1) the
Health Equity Fund (HEF) to provide free health care to families holding IDPoor Cards, (2) the
Food Reserve Program of the National Committee for Disaster and Food Security Programs
of the MEF to prevent food insecurity, (3) nutrition programs for pregnant women and children
to promote maternal and infant health, (4) scholarship programs for primary schools to
encourage school attendance, especially for children from poor households, (5) school feeding
programs to support students’ physical and mental development, and (6) vocational training
programs to promote vocational skills to meet labor market demands;
Social Security schemes that have been implemented include the National Social
Security Fund (NSSF), the National Social Security Fund for Civil Servants (NSSFC), the
National Fund for Veterans (NFV), and the People with Disability Fund (PWDF). These
institutions provide protection with regard to income insecurity, which might result from illness,
employment injury, disability, maternity, or old age, for the targeted groups of civil servants,
veterans, people with disabilities, workers, and employees.
12
The ID Poor Programme9, established in 2006 within the Ministry of Planning, is part
of the Royal Government of Cambodia’s ongoing efforts to reduce poverty and support socio-
economic development throughout the country. Being the RGC’s mandatory standard tool for
targeting pro-poor measures in the country, the program provides regularly updated
information on poor households to a large number of Government and non-governmental
agencies to help them target services and assistance to the poorest and most vulnerable
households. The identification of poor households in Cambodia is implemented in yearly
rounds, covering one-third of the country every year. While initially designed to identify the
rural poor, the identification process has been extended to urban areas in 2014 using an
adapted procedure and questionnaire. The IDPoor Programme’s main objectives are to
reduce duplication of effort and resources by different institutions and organizations in
identifying their target groups for various poverty reduction interventions, and to ensure that
assistance is provided to those households who most need it, and to use lists of Poor
Households that have already been approved and accepted by them in the participatory
identification process that was conducted.
Despite these achievements, it is observed that the coverage of social assistance and
social security is limited and cannot reach certain groups of citizens, like vulnerable
households not included as part of the ID Poor survey, such as newcomers/migrants for
instance. The management of the various schemes has not been concentrated/integrated,
which leads to a lack of effectiveness and efficiency, high cost and inconsistency of benefits
and allowances for various target groups; the coordination mechanism at the policy level and
the monitoring mechanism to ensure effectiveness, accountability, and transparency of the
management and operation of programs/ schemes are still limited, the investment
environment needs to be further improved, and clarification is needed on tax policies related
to the social protection system; the identification and registration of citizens, the identification
of poor and vulnerable people and the registration systems of operators are not yet linked
which might lead to double identification/registration and overlapping provision of benefits.
People have a limited understanding of social protection and its benefits as well as of their
obligations to participate in each scheme or program.10 This legal and policy framework does
not always translate into a coherent and integrated planning process, which clearly
coordinates, integrates, and prioritizes different sectoral goals and targets, with the aim of
promoting sustainable development.
Gender. In line with the strategy National Strategic Plan for Gender Equality and
Women’s Empowerment and policies and legal framework11, most ministries have developed
a Gender Mainstreaming Action Plan12. There are numerous plans and actions taken to
ensure gender equity and to address women’s specific issues across all sectors.
In recent years, progress had been made within the legislative and policy frameworks
regarding women’s rights in areas such as the justice system13, labor, health care14 , and
education15. The Government has introduced budgetary reforms to increase transparency and
9 https://www.idpoor.gov.kh/ 10 National social protection policy framework, 2016-2025, the Royal Government of Cambodia. 11 Policy Brief 1, Gender mainstreaming institutional partnership, and policy context, Cambodian Gender Assessment, 2014 12 Last update mentioned 30 out of 31 line ministries have developed a GMAP in 2018. 13 Legal Aid Policy includes specific provisions to ensure adequate, specialized legal aid forwomen. 14 The Social Assistance pillar of the National Social Protection Policy Framework 2016–2025 focuses on assisting poor and vulnerable people, including people living close to the poverty line, infants, children, pregnant women, families with food insecurity, people with disabilities and the elderly. 15 MoEYS I being implementing the Gender Mainstreaming Strategic Plan 2016-2020, which “promotes gender equality in education, particularly the increased access of women and girls in vulnerable groups to education services through awareness

13
shift towards program budgeting, which was a prerequisite for gender-responsive budgeting.
In 2019 3% of the national budget had been allocated to gender-related activities.
Observers16 mentioned that according to funding constraints, policies of Neary
Rattanak have, for the moment, focused on short-term activities rather than long-term, and
are limited in financial and geographic scope based on outside funding. While mechanisms
are in place in each ministry and in the parliament to address gender mainstreaming, there
are concerns that there are insufficient dedicated human resources and funding from the
national budget to ensure their effectiveness. Without dedicated, long-term funding out of the
national budget, the implementation of gender policies could remain inconsistent and will not
extend to all districts of all provinces in the nation. Moreover, actions at the national level are
not resulting in gender mainstreaming or gender-responsive budgeting at the local level.
Consultation conducted in October 2020 with the provincial departments and the Municipality
in Bavet confirmed this situation: the public departments do not have specific GMAP and use
their ministries’ ones (Provincial Department of Public Works and Transports, Provincial
Department of Labour and Vocational Training, Provincial Department of Social Affairs,
Provincial Department of Women Affairs) and only the Department of Women Affairs had a
budget for GAP ($1,000/year). The Municipality has a GMAP developed for the Municipality
Investment Plan, and a budget of $1,000 is allocated, but the Municipality lacks human
resources.
NGOs also note that one key challenge to measuring the success of Neary Rattanak
is the lack of publicly available sex-disaggregated data, as the Ministry is challenged by the
lack of consistency and cohesion between indicators related to CSDGs and NSDP, for
instance. Last but not least, there is no legal mechanism for enforcing the Constitution in court
and no comprehensive anti-discrimination law that would explicitly prohibit all kinds of
discrimination, including that based on sexual orientation, sex characteristics, gender identity,
and expression, sexual orientation, and religion.
raising, social accountability measures, scholarships and other financial assistance; to increase the participation of women in all areas of education service delivery and management; and promote gender responsive social attitudes”. 16 Submission by The Cambodian NGO Committee on CEDAW (NGO-CEDAW) for the 74th session (21 October to 8 November 2019) of the Committee on the Elimination of Discrimination Against Women (CEDAW) for the review of the Royal Government of Cambodia (RGC)’s Compliance with the Convention on the Elimination of All Forms of Discrimination Against Women
III. SOCIO-ECONOMIC PROFILE AND INDICATORS
1. Social development and poverty
The majority of the poverty and social indexes have significantly improved over the last
12 years in Cambodia. The RGC undertook a voluntary national review of the implementation
of the 2030 agenda. The report was issued in 201917 , and to date, progress has been
promising, with a majority of CSDG targets rated as “ahead” or “on track.” This is especially
true of the six prioritized goals (Education, Decent Work and Growth, Reduced Inequalities,
Climate Action, Peace and Institutions, and SDG Partnerships). Cambodia’s success in
achieving the MDGs and its ambitions for the CSDGs parallel the country’s development story
of rapid post-conflict recovery, dramatic poverty reduction, and its emergence as a high growth
lower middle-income country. The RGC recognizes that despite strong initial progress, much
remains to be done to realize the ambitions of the CSDGs.
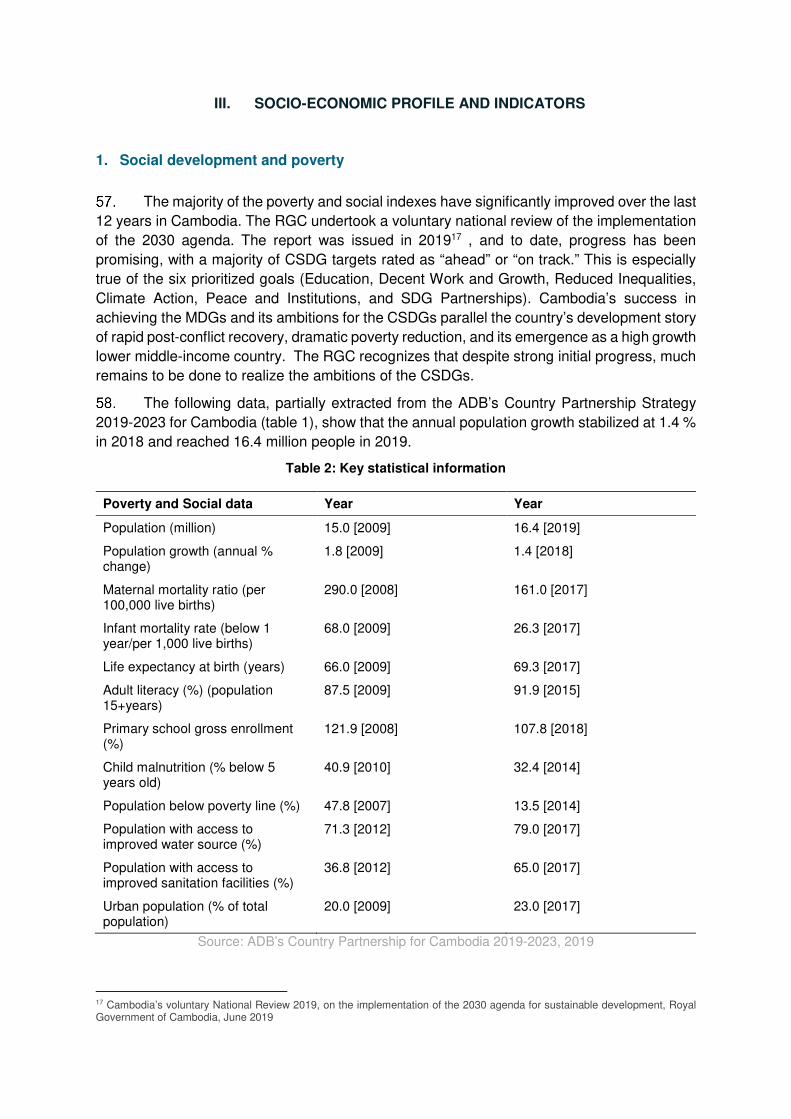
The following data, partially extracted from the ADB’s Country Partnership Strategy
2019-2023 for Cambodia (table 1), show that the annual population growth stabilized at 1.4 %
in 2018 and reached 16.4 million people in 2019.
Table 2: Key statistical information
Poverty and Social data Year Year
Population (million) 15.0 [2009] 16.4 [2019]
Population growth (annual % change)
1.8 [2009] 1.4 [2018]
Maternal mortality ratio (per 100,000 live births)
290.0 [2008] 161.0 [2017]
Infant mortality rate (below 1 year/per 1,000 live births)
68.0 [2009] 26.3 [2017]
Life expectancy at birth (years) 66.0 [2009] 69.3 [2017]
Adult literacy (%) (population 15+years)
87.5 [2009] 91.9 [2015]
Primary school gross enrollment (%)
121.9 [2008] 107.8 [2018]
Child malnutrition (% below 5 years old)
40.9 [2010] 32.4 [2014]
Population below poverty line (%) 47.8 [2007] 13.5 [2014]
Population with access to improved water source (%)
71.3 [2012] 79.0 [2017]
Population with access to improved sanitation facilities (%)
36.8 [2012] 65.0 [2017]
Urban population (% of total population)
20.0 [2009] 23.0 [2017]
Source: ADB’s Country Partnership for Cambodia 2019-2023, 2019
17 Cambodia’s voluntary National Review 2019, on the implementation of the 2030 agenda for sustainable development, Royal Government of Cambodia, June 2019
15
The last Provisional Population Totals of the 2019 Census18 taken of all ages gives a
sex ratio of 94.3. Thus the number of women is greater than the number of men, reflecting a
shorter life span for males, 22.1% of households are headed by women.
The share of the urban population has increased from 20% to 23% in 8 years (2009-
2017), though these figures differ from those of the Cambodian Socio-economic survey 2017,
which says that about 31 % of the total population now lives in the urban area compared to
less than 25% in 2008.
The percentage of the population living below the poverty line decreased from nearly
50% in 2007 to less than 15% in 2014, and according to last statistics, this figure dropped to
12.9% in 2018. This percentage is used to measure progress towards SDGs, which is based
on the purchasing power parity only and does not take into consideration other deprivation
aspects.
In 2018, the United Nations Development Program (UNDP) and the Oxford Poverty
and Human Development Initiative proposed an index, which took into consideration health,
education, and living standards – as well as income – which put Cambodia’s poverty rate at
35%. The global Multidimensional Poverty Index (MPI) is an international measure of acute
poverty covering over 100 developing countries. It complements traditional income-based
poverty measures by capturing the deprivations that each person faces at the same time with
respect to education, health, and living standards.
According to ADB’S Country Partnership Strategy 2019-2013, “Poverty has declined,
but vulnerability is widespread and social protection is limited.” Cambodia is still one of the
poorest countries in Asia. Poverty is concentrated in rural areas, with elderly women and
households headed by women being particularly vulnerable. Most Cambodians who are not
in extreme poverty are either moderately poor or economically vulnerable. i.e., people living
just above the poverty line, vulnerable to falling back into poverty when exposed to economic
and other external shocks.
In the context of the global health crisis experienced in 2020 with Covid 19, the UN19
estimates economic growth will contract from 7.1% to -4.1%; poverty will nearly double to
17.6%, and unemployment rise to 4.8%. The effects will spill outwards through lost jobs and
lower-income, hitting the most marginalized people first and worst, although also reaching
populations not traditionally regarded as vulnerable. Mounting fiscal pressures could erode
essential services and protections for poor communities, children and the elderly, and
returning migrants, among others at risk of being left out and left behind.
Income and employment
Employment: Cambodia’s labor force participation rate is high by global standards,
and unemployment is low, with 0.2% of women and 0.3% of men unemployed in 2018,
according to the ILO World Employment and Social Outlook20. In 2019, 32.3% of the
employees in Cambodia were active in the agricultural sector, 29% in industry21 , and 38.7%
18 General population census of the Kingdom of Cambodia 2019, National Institute of Statistics, Ministry of Planning, June 2019 19 UN Cambodia framework for the immediate socio-economic response to COVID-19 Source UNCT Cambodia. Posted 16 Sep 2020 Originally published 16 Sep 20 ILO (2018). World Employment and Social Outlook. Accessed at https://www.ilo.org/wesodata. 21 Cambodia’s garment and footwear factory industry employs approximately 770,000 people, 639,000 women, (83%) and 131,000 men (17%) (GMAC 2018).In the context of Covid 19, it is estimated that 130,000 garment workers have already lost their jobs. CARE Rapid Gender Analysis for COVID-19 Cambodia – July 2020
16
in the service sector. Of the 8 million jobs in Cambodia, 37 percent are wage jobs, many of
which offer higher earnings and more protections to workers. However, the other 63 % of jobs
remain more traditional. Such jobs on family farms or in household enterprises are weakly
integrated into the modern economy and offer workers lower earnings.22
Between 2000 and 2018, female laborers made up about 48% of the total labor forces
and about 80% of the total female population in Cambodia. 30% of the female labor force are
employed in the agricultural sector, 45% in service, and 25% in the industry sectors.23
Women are represented in the informal sector, with a high level of vulnerability. They
are found in the vulnerable forms of informal works, being employed in low and unstable wage
employment, casual work, and risky work environments. Poor and rural women tend to be
overrepresented in domestic work, home-based work, as street vendors, and smallholder
farmers. According to the World Bank data from 202024, 58% of total employed women are in
vulnerable employment, with a high proportion as own-account workers contributing to
domestic care and family work. Even though women own 65% of all businesses in Cambodia,
those businesses are on average smaller and less profitable than businesses run by men, with
only 1.7% registered, compared to 6.6% for male-run businesses. Women-owned businesses
are primarily concentrated at the micro-level in the wholesale and retail trade and services
sector.25
In 2018, 54.69% of the population aged 18-60 in Bavet city was employed. The
employed population increased by 14% from 2010 to 2016, but this declined from 21,387 in
2016 to 19,638 in 2018. Agriculture is an important source of income for the population (14%
of the employed persons), occupying a total of 155.39 km2 or 75.18% of Bavet’s total land
area. In 2018, about 5% of the main occupation was related to the service sector (trading,
tourism, entertainment). The main employment sector is industry due to the presence of SEZs,
which represent 81% of employment. As of 2019, 10 SEZs have been established and are in
operation in Bavet.26
Migration. In 2013, the National Institute of Statistics estimated that nearly one-quarter
of the Cambodian population (approximately 4.1 million individuals) had changed their location
of residence. Single women from rural areas are often forced by a lack of livelihood options to
migrate to Phnom Penh or larger provincial towns to find employment. In 2013, the National
Institute of Statistics estimated that nearly one-quarter of the Cambodian population
(approximately 4.1 million individuals) had changed their location of residence. Overall,
women make for 45% of migrants. 24% migrate to Thaïland or other countries and 50% to
Phnom Penh. They mostly find jobs in factories and services (restaurants/hotels). According
to a 2014 report by UN Women, many females women migrating into Phnom Penh are
engaged in informal employment where they are subjected to low or irregular income and
unstable conditions or at risk of trafficking and exploitation. As an example of their vulnerability,
in the 2009 global downturn, an estimated 30,000 mostly female garment industry jobs were
lost, with employers reportedly pressuring women to waive their benefits and severance.
22 The World Bank, Cambodia’s Future Jobs : Linking to the Economy of Tomorrow (Vol. 2) : Main Report (English), Press release, November 2019. 23 Promoting Economic Empowerment for Women in Marginalized Conditions, OXFAM, February 2020
https://cambodia.oxfam.org/latest/policy-paper/promoting-economic-empowerment-women-in-marginalized-condition 24 https://data.worldbank.org/indicator/ 25 Ibid. Promoting Economic Empowerment for Women in Marginalized Conditions, OXFAM, February 2020 26 Employment, City Socio-Economic Status report 2018
17
In Bavet, male and female heads of households’ primary activity in the CCS is a small
scale business, representing 25% of men’s and 34% of women’s jobs. 12% of females also
work as farmers, against 22% of men, and 7% of men and ?? of women are factory workers
in SEZs. 35% of FHHs are homemakers. None of the FHHs interviewed did have a job as an
employee in the government or NGO/ IOs, whereas 7% of men did. Migration abroad is a
marginal phenomenon (about 1% of households have a member abroad).
Income. Cambodia’s Household Monthly Income per Capita data was reported at KHR
464.000 in 2017. This records an increase from the previous number of KHR 415.000 for
2016.27 The disposable income per capita for female heads of household was about the same
as the disposable income per capita for male heads of households in 2017, with a ratio of
1.0.28 Disposable income per capita was slightly higher for female-headed households than
men in general and in rural areas.
While women earn substantially less than men (income versus disposable income),
the earnings gap narrows with the attainment of upper secondary and tertiary education. In
2014, only 5.3% of women in the labor force had post-secondary education, compared with
8.0% for men.29 In addition, women heading HHs are reported as less likely to be able to obtain
bank loans, making them more susceptible to higher interest rates charged by money
lenders.30
The City Comprehensive Survey collected income data per Household in Bavet, and
the average household monthly income is reported at KHR 1.992.000 in 2018. With an
average of 4.9 persons per household, the average Household income per capita is estimated
at KHR 406.500, below the national average. It is significantly lower for female-headed
households as average income per capita is reported at KHR 352.400 (average five-person
per FHHs).
Expenditure patterns and decision making
In 2017, average monthly consumption in Cambodia was 1,822,000 Riels per
household and 464,000 Riels per capita. “Food and nonalcoholic beverages” represent 43%
of the expenses, “housing, water, electricity” comes next with 19% of the total expenses.
Transportation and health represent respectively 10% and 7% of the total budget.31 Health
represents a smaller share of all expenses in an urban area compared to the rural area.
The results of Cambodia Demographic Health Survey 201432 revealed that women
who earn more than their husbands are more likely to decide how their cash earnings are used
(79 %), compared to women whose cash earnings are the same as those of their husband (69
%). Women who say they earn about the same amount as their husbands are more likely to
27 Cambodia’s Monthly Average Household Income: per Capita data remains active status in CEIC and is reported by National Institute of Statistics. The data is categorized under Global Database’s Cambodia – Table KH.H003: Monthly Household Income: per Capita 28 The ratio of disposable income per capita for household headed by a woman and household headed by a man is calculated as the average disposable income per capita for household headed by a woman dividing by the disposable income per capita for household headed by a man. If the ratio equals 1.0, it denotes a point of balance of the average disposable income between woman household head and man household head. National Institute of Statistics Cambodia, Cambodia Economic Survey 2017. 29 UN Women, 2014 30 Un Women, 2014 31 Cambodia economic survey 2017, National Institute of Statistics 32 Cambodia Demographic and Health Survey 2014 National Institute of Statistics Ministry of Planning Phnom Penh, Cambodia Directorate General for Health Ministry of Health Phnom Penh, Cambodia The DHS Program ICF International Rockville, Maryland, USA September 2015

18
make joint decisions with their husbands about how their cash earnings and those of their
husbands are used (30 % and 42 %, respectively).
Consultation with women in Bavet shows that men are the main breadwinner, women
contributing to 25%-30% of the households’ income. Women are in charge of daily expenses
such as food, energy, solid waste, clothes, healthcare, children's education, transportation,
entertainment, and social events and participate in the decisions for other expenses such as
buying land, house, motorbikes, investment for construction, equipment and loans.
The City Comprehensive survey in Bavet analyzes the average amount of expenses
(total KHR 323.000 per capita) and assesses that food consumption represents nearly one-
third of all expenses (32%), followed by social events/ ceremonies (18%) and healthcare
(10%). Energy represents 8% of expenses (for cooking, electricity, etc.). Compared to national
data, health, however, represents a higher share of all expenses in an urban area compared
to “rural area” in Bavet and weighs heavier on the poorest households and FHHs.
Education
Cambodia had 12,889 schools (including 7,144 primary schools) in 2016/2017.33
Enrollment rates for the 2016/17 school year were 93.5 % for primary, 55.7 % for lower
secondary, and 25.1 % at the upper secondary level.34 Total completion rates fall dramatically
after primary school: from 79.9 % at primary school to 42.6 % at lower secondary and 20.2 %
at upper secondary.35
Across the country, more girls are completing primary school than boys: 83.2 % vs.
76.1 %. In 2017-18, primary Gross Enrolment Rate (GER) was 97.8 % and slightly higher for
girls at 98.1 %. This gender difference also applies to lower and upper secondary
completion. For Secondary School, girls represent 52 % of all students. The gap between
female and male Lower Secondary Study Gross Completion Rate (GCR) is widening in favor
of girls, with Gender Parity Index (GPI) increasing from 0.96 in 2012-13, to 1.21 in 2017-18.36
Across ASEAN, Cambodia shows the biggest increases in the ratio of girls to boys in
primary and secondary school, from among the lowest ratio of 93 and 82 respectively in 2007,
to among the highest in 2015 with 101 and 109 respectively.
It is observed that with one teacher for every 43 students in public primary schools,
Cambodia has the poorest pupil-teacher ratio in ASEAN. 37 ADB Country report provides the
percentage of people above age 15 and over who can read and write: 86.5% for males and
75% for females. The gap between men and women tends to reduce with a higher proportion
of girls attending primary school.
In 2018, the Ministry of Education, Youth and Sport (MoEYS) has instructed all the
ministry’s units and educational institutions to institutionalize and accelerate the effort to
promote women in leadership in the education sector through key specific approaches: 1)
establish a women’s leadership program, 2) integrate female representative into promotion
33 Thach Phanarong. “Education minister: Cambodia has over 11,370 schools”. Agence Kampuchea Press, 19 March 2013. Accessed 16 February 2018. 34 The Phnom Penh Post. “Literacy target of a Sustainable Development Goal”, 11 September 2017. Accessed 25/09/2020 35 Ministry of Education, Youth and Sport. 2017. op. cit. 36 Kingdom of Cambodia Cambodia Report On the occasion of the 25th Anniversary of the Fourth World Conference on Women and the adoption of the Beijing Declaration and Platform for Action (1995) Submitted by Ministry of Women’s Affairs Royal Government of Cambodia Phnom Penh June 2019 37 Ministry of Education, Youth and Sport. 2017. “Public education statistics and indicators 2016–2017”. Accessed 25/09/2020.

19
committees, and 3) accelerate to appoint more women at the management levels. Women are
45 % of all teaching staff.
School closures since March 2020 in the context of Covid 19 have disrupted learning
for 3.2 million students.. The Ministry of Education, Youth and Sport appealed to parents of
students to provide home education in a proper environment and help them obtain more
learning materials during the COVID-19 pandemic. On March 13, 2020, the Ministry put in
motion an e-learning program where students can study free of charge on social media,
including Facebook, YouTube, and the Ministry’s website. According to the Cambodian Covid-
19 joint education needs assessment (March 2021), 70% of the students had utilized at least
one alternative distance learning method, but only 40% had a proper place for studying (table,
chair, light) and only 32% an access to internet (78% have access to a smartphone). The main
barriers for distance learning are first financial (to pay for intrenet/ phnone card), internet
connectivity issues, lack of knowledge content and time of caregivers. Supplementary
measured were utilized by the most vulnerable students to have access to distance learning
such as visiting the teacher. 76% of students who have already dropped out or reported at
high risk of dropping out have either started working or have increased contribution to
household chores compared to 70% of students who reported low or no risk of drop-out.38
In 2018, in Bavet, there were 17 state primary schools. Given 5,333 students and 149
teachers in the state primary schools, the ratio of students to teachers in state primary schools
is 36:1. There were three state secondary schools with 16 classrooms in Sangkat Bavet,
Prasat, and Bati. With 748 students and 35 teachers in the state secondary schools, the ratio
of students with teachers in state secondary schools is 22 in Bavet City. In 2 public high
schools (Bavet and Chrak Mtes sangkats) with 34 rooms, there were 84 teachers for 2,066
students. The student-teacher ratio for most of the school levels, except high school, is far
beyond the international average ratio at one teacher for 43 students.
Health
Cambodia’s healthcare system has seen significant improvements in the last two
decades. Despite this, access to quality care remains problematic, particularly for poor rural
Cambodians. Cambodia has committed to universal health coverage (UHC) and is reforming
its health financing system to align with this goal. Benefits from health spending in the public
sector are generally distributed in favor of the poor, and the distribution reflects the need for
health services.39
Health outcomes have improved substantially, with life expectancy at birth rising from
58 years in 2000 to 69.3 in 2017. Other health indicators, including maternal and infant
mortality, have markedly improved. For example, maternal mortality had declined from 472
per 100 000 live births in 2005 to 161 per 100 000 in 2017. Childhood immunization coverage
has expanded with 81% of children aged 12–23 months immunized against measles in 2016
compared with 52% in 2002. This has contributed to a steep decline in under-5 mortality rates,
dropping from 54 per 1000 live births in 2010 to 26.3 per 1000 in 2017 (ADB’s Country
Partnership for Cambodia 2019-2023).
38 Cambodia covid-19 joint education needs assessment, March 2021 39 https://doi.org/10.1093/heapol/czz011 Health Policy and Planning, Volume 34, Issue Supplement_1, October 2019, Pages i4–i13

20
Despite these achievements, health outcomes in Cambodia still rank among the
poorest in the Southeast Asian region. Malnutrition remains a challenge, with about 32% of
children under 5 (about 500 000 children) stunted and 9% severely stunted (National Institute
of Statistics et al., 2015). The country’s rate of immunization against measles—around 81%
of children aged 12–23 months in 2016—lags behind those of Myanmar (91%), Vietnam
(99%), and Thailand (99%; World Bank, 2018b). Additionally, like many low- and middle-
income countries (LMICs), Cambodia faces a double burden of infectious and non-
communicable diseases. While malaria, tuberculosis, and HIV infections are still widespread,
the growing burden of diabetes, hypertension, and hypercholesterolemia in the adult
population is putting a strain on the health system (Chhoun et al., 2017).40
Cambodia still has a high maternal mortality ratio. Women of reproductive age
experience substantial risks associated with pregnancy and childbirth. The World Bank’s data 41shows that around 167 women died from pregnancy-related causes per 100,000 live births
in 2017 in Cambodia. Women in rural areas and poor households are at greater risk. In 2012,
only 13% of births in rural areas were attended by a doctor, compared to 32% in Phnom Penh.
Cambodia’s maternal death rate remains higher than the regional average, indicating
insufficient quality and coverage of basic health care.
Cambodia is also off track for the MDG target on maternal malnutrition. Malnutrition is
considered the underlying cause in 20% of maternal deaths, accounting for nearly 300
maternal deaths annually in Cambodia.The rate of anemia among pregnant women is 53%.
About 6% of women have a height of fewer than 145 centimeters, which indicates they were
malnourished as children. These women are also likely to give birth to small children.
While there was no data on maternal mortality rate available for Bavet, the Municipality
authority estimates that almost 95% of births are attended by a doctor.
The population in Bavet has access to 2 health centers, one referral hospital, and two
private hospitals.
At the national level, access to improved and safe water (79.0 % in 2017) and
sanitation facilities (65% in 2017) remains below the average for lower-middle-income
economies. Poor access to clean water and sanitation in rural areas is a major contributor to
stunting, along with suboptimal infant feeding practices and low dietary diversity.
In Bavet in 201842, 89.40% of the total population had access to a toilet. In 2020, this
number reached 95%. 2% of the population are still practicing open defecation, and 3%
sharing a neighbor’s toilet. Regarding the situation assessment of Bavet, it is estimated that
74% of the excreta generated is unsafely managed.43 According to the Municipality database
2019, only 16% of HHs use water from the treated water system in Bavet.
Consultation done with women in Bavet in October 2020 show that they are in charge
of domestic chores (cooking, cleaning, cleaning the toilets), taking care of the family (children,
elderly and sick) while husbands are at work, and they manage solid and liquid waste. Data
from the City Comprehensive Survey shows that the percentage of females in charge of
fetching water is up to 49% (against 36% for males) when the only source of water is well.
40 https://doi.org/10.1093/heapol/czz011 Health Policy and Planning, Volume 34, Issue Supplement_1, October 2019, Pages i4–i13 41 https://data.worldbank.org/indicator/ 42 10 Department of Planning, 2018. Socio-Economic Situation Report. 43 Bavet Master Plan, CAM: Livable Cities Investment Project, June 2020
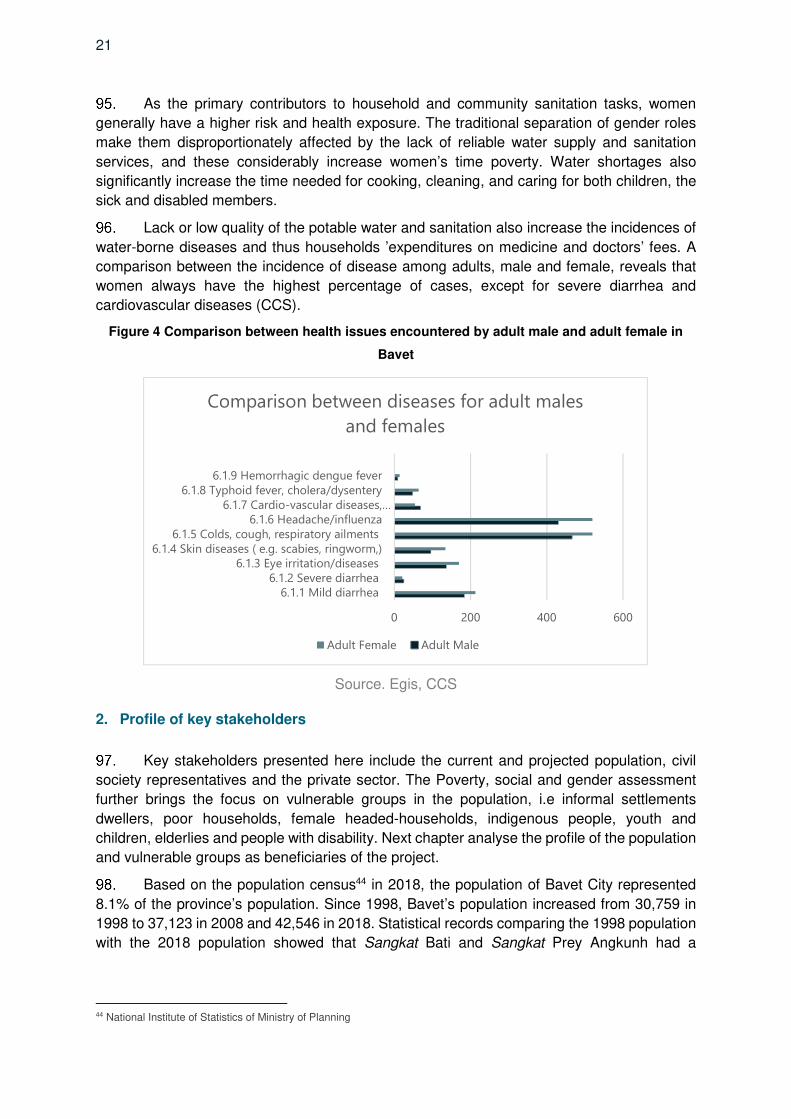
21
As the primary contributors to household and community sanitation tasks, women
generally have a higher risk and health exposure. The traditional separation of gender roles
make them disproportionately affected by the lack of reliable water supply and sanitation
services, and these considerably increase women’s time poverty. Water shortages also
significantly increase the time needed for cooking, cleaning, and caring for both children, the
sick and disabled members.
Lack or low quality of the potable water and sanitation also increase the incidences of
water-borne diseases and thus households ’expenditures on medicine and doctors’ fees. A
comparison between the incidence of disease among adults, male and female, reveals that
women always have the highest percentage of cases, except for severe diarrhea and
cardiovascular diseases (CCS).
Figure 4 Comparison between health issues encountered by adult male and adult female in
Bavet
Source. Egis, CCS
2. Profile of key stakeholders
Key stakeholders presented here include the current and projected population, civil
society representatives and the private sector. The Poverty, social and gender assessment
further brings the focus on vulnerable groups in the population, i.e informal settlements
dwellers, poor households, female headed-households, indigenous people, youth and
children, elderlies and people with disability. Next chapter analyse the profile of the population
and vulnerable groups as beneficiaries of the project.
Based on the population census44 in 2018, the population of Bavet City represented
8.1% of the province’s population. Since 1998, Bavet’s population increased from 30,759 in
1998 to 37,123 in 2008 and 42,546 in 2018. Statistical records comparing the 1998 population
with the 2018 population showed that Sangkat Bati and Sangkat Prey Angkunh had a
44 National Institute of Statistics of Ministry of Planning
0 200 400 600
6.1.1 Mild diarrhea6.1.2 Severe diarrhea
6.1.3 Eye irritation/diseases6.1.4 Skin diseases ( e.g. scabies, ringworm,)
6.1.5 Colds, cough, respiratory ailments6.1.6 Headache/influenza
6.1.7 Cardio-vascular diseases,…6.1.8 Typhoid fever, cholera/dysentery
6.1.9 Hemorrhagic dengue fever
Comparison between diseases for adult males
and females
Adult Female Adult Male

22
population increase estimated at 46% and 42%, respectively, due to the establishment of
SEZs.
According to the 2019 Municipality database, there are in total 323 vulnerable
households in Bavet, i.e., 0.7% of total households. In detail, there are 25 HHs where children
(below 18 y.o) are taken care of by parent/ guardian with a long-term illness or elderly; 11 HH
of the elderly without relatives/support, 11 people are living on public land- these are individual
cases distributed in different Sangkat. 29 HHs have a member affected by HIV/Aids, and there
are in total 239 HHs with at least one member who is disabled.
Informal settlement dwellers
The communities who live in informal urban settlements are diverse, as are their
environmental conditions. Characteristics include inadequate access to safe water and
sanitation, poor quality of housing, overcrowding, and insecure residential status. The tenure
issue is key to understanding why some people remain excluded from basic services. The
problem refers especially to those communities that are living on state land. Because they do
not own the land, they cannot formally apply for connections to services. Furthermore, they
are subject to the risk of eviction if the government decides to use that land for other purposes.
This may imply that utilities are less keen on delivering services to informal settlements, as
they can be moved at any time.
According to Municipality data 2019, only 11 families are settled on public land in Bavet
City (0.1% of the population). They are isolated cases, scattered in all sangkats. The individual
situation needs to be taken into consideration as part of the resettlement plan and at the
operational phase.
Poor households
In Cambodia, the ID Poor program45, led by the Ministry of Planning since 2006 in rural
areas, surveys the urban area since 2014. Two categories are defined: Poor level 1 (very
poor) and Poor level 2 (poor). In Bavet, the results of the last survey campaign in 2017 indicate
a total of 724 HHs or 7% of the total households for the two categories- ID Poor 1 (289 HHs)
and 2 (435 HHs).
Sangkat Bati has the highest proportion of poor (13%), and villages Chok Russei and
Prosob Leak have around 20% of the population who are poor 1 and 2. The second Sangkat
with a higher percentage of poor is Sangkat Prasat (12% of HHs are ID Poor 1 and 2). The
percentage of poor in other Sangkast is rather low (as per average for the whole area for
Chrok Mtes and Prey Angkhoun (7-8%), and 2% in Sangkat Bavet). A few villages show a
higher concentration of poor households, i.e., Phum Samaki (21%) and Phum Thnol Totueng
(16%) in Chrok Mtes.
45 The Government promulgated Sub-Decree 291 on Identification of Poor Households in December 2011

23
Figure 5: Map of poor household fraction identified per village
Female-headed households
The last Provisional Population Totals of the 2019 Census taken over all ages gives a
sex ratio of 94.3. This nationwide, the number of women is greater than the number of men,
reflecting a shorter life span for males. 22.1% of households are headed by women. Women
who are heads of households are mostly widows, and to a lesser extent, separated, divorced,
or never married.
National statistics show that FHHs have similar incomes as male-headed households,
except in urban areas. According to the CCS survey, FHHs’ average monthly income is 12%
lower than for the whole population. Statistics from 201246 also show that at the national level,
a woman head of household has an average of 55% less land than a male head of household.
While women-headed households represent 22% per of total households, only 12% of the
agricultural land of Cambodia (403,000 hectares) is owned by women-headed households.
Women-headed households have more economically inactive family members than
male-headed households; 4.96% of women-headed households have no economically active
46 National Institute of Statistics, Ministry of Planning (2012) Cambodia Socio-Economic Survey. Phnom Penh, Cambodia- extracted from Policy Brief n°9 Rights, vulnerable groups of women and girls, Cambodia Gender Assessment, Ministry of Women Affairs.

24
members, compared to 1.3% of male-headed households.47 Women-led households are also
likely to experience shocks differently than male-headed households, mainly due to social
norms and more limited economic opportunities and income.
Figure 6: Households headed by women per villages
According to Municipality data from 2019, 12% of households are headed by women
(1,247 FHHs) in Bavet municipality. This is much lower than the national average. The
percentage of FHHs is higher in Sala Tean Village in Sangkat Chrok Mtes (25% FHHs), Leab
Village in Sangkat Prey Angkounh (22%), and in Thnol Kaing village Sangkat Bati (21%
FHHs).
The results of the last ID Poor survey campaign in 2017 in Bavet shows that 28% of
FHHs are under category Poor 1 and 2: 59.9% of ID Poor 1 households are headed by women
(173 FHHs) and 42.5% of ID poor 2 Households (185 FHHs). The map below shows the
repartition of households headed by women's per villages
47Ibid.
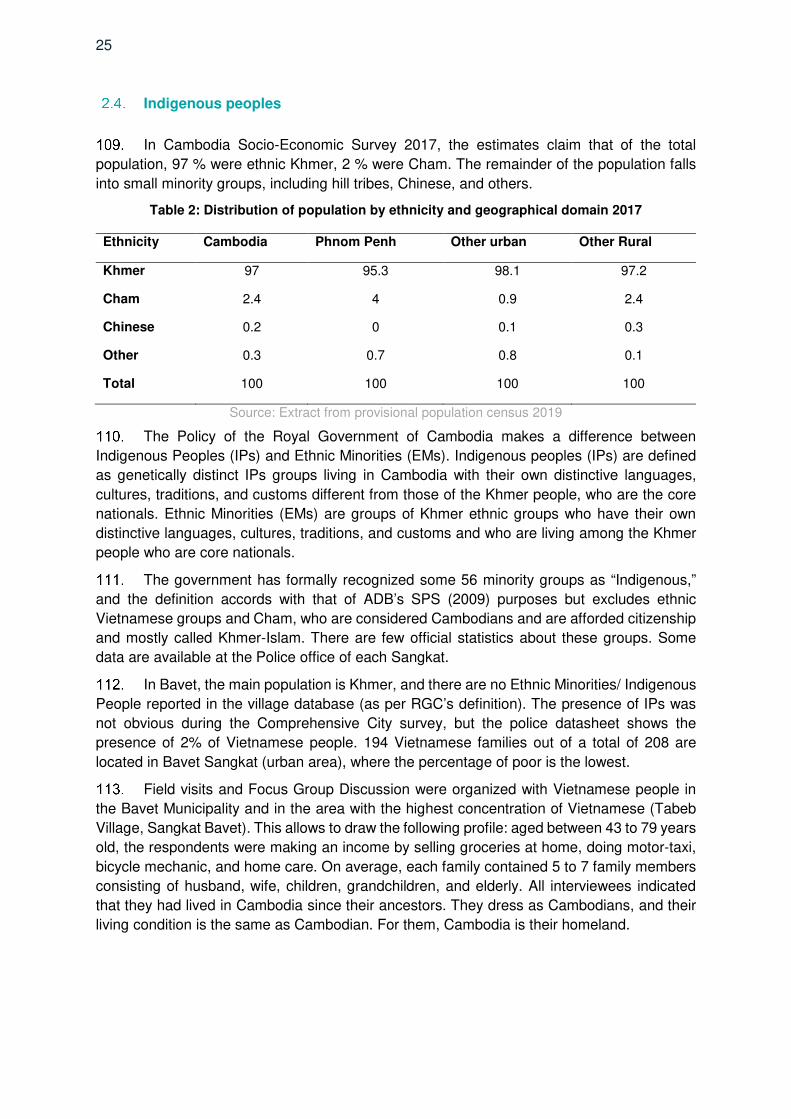
25
Indigenous peoples
In Cambodia Socio-Economic Survey 2017, the estimates claim that of the total
population, 97 % were ethnic Khmer, 2 % were Cham. The remainder of the population falls
into small minority groups, including hill tribes, Chinese, and others.
Table 2: Distribution of population by ethnicity and geographical domain 2017
Ethnicity Cambodia Phnom Penh Other urban Other Rural
Khmer 97 95.3 98.1 97.2
Cham 2.4 4 0.9 2.4
Chinese 0.2 0 0.1 0.3
Other 0.3 0.7 0.8 0.1
Total 100 100 100 100
Source: Extract from provisional population census 2019
The Policy of the Royal Government of Cambodia makes a difference between
Indigenous Peoples (IPs) and Ethnic Minorities (EMs). Indigenous peoples (IPs) are defined
as genetically distinct IPs groups living in Cambodia with their own distinctive languages,
cultures, traditions, and customs different from those of the Khmer people, who are the core
nationals. Ethnic Minorities (EMs) are groups of Khmer ethnic groups who have their own
distinctive languages, cultures, traditions, and customs and who are living among the Khmer
people who are core nationals.
The government has formally recognized some 56 minority groups as “Indigenous,”
and the definition accords with that of ADB’s SPS (2009) purposes but excludes ethnic
Vietnamese groups and Cham, who are considered Cambodians and are afforded citizenship
and mostly called Khmer-Islam. There are few official statistics about these groups. Some
data are available at the Police office of each Sangkat.
In Bavet, the main population is Khmer, and there are no Ethnic Minorities/ Indigenous
People reported in the village database (as per RGC’s definition). The presence of IPs was
not obvious during the Comprehensive City survey, but the police datasheet shows the
presence of 2% of Vietnamese people. 194 Vietnamese families out of a total of 208 are
located in Bavet Sangkat (urban area), where the percentage of poor is the lowest.
Field visits and Focus Group Discussion were organized with Vietnamese people in
the Bavet Municipality and in the area with the highest concentration of Vietnamese (Tabeb
Village, Sangkat Bavet). This allows to draw the following profile: aged between 43 to 79 years
old, the respondents were making an income by selling groceries at home, doing motor-taxi,
bicycle mechanic, and home care. On average, each family contained 5 to 7 family members
consisting of husband, wife, children, grandchildren, and elderly. All interviewees indicated
that they had lived in Cambodia since their ancestors. They dress as Cambodians, and their
living condition is the same as Cambodian. For them, Cambodia is their homeland.

26
They used to hold Cambodian citizenship and have family books, but citizenship was
withdrawn from them when the new Law on Nationality was passed in 2018,48 despite living
in Cambodia since birth. They are now living in Cambodia as an immigrant and hold
immigration cards valid for two years to stay in Cambodia. They can become Cambodian
citizens legally after holding an immigration card for seven years.
After the law passed, and as their status changed, Vietnamese ethnic are no longer
invited to participate in social events in Cambodia as before, and they can approach public
services as a migrant only, even though their children go to Cambodian (public) schools as
normal, and they feel no discrimination from the communities. They mostly speak Khmer at
home as well as at school. The younger generation speaks Khmer more than older
Vietnamese, and there is no Vietnamese school in Bavet. They obey the Buddhism religion
and attend the same Pagodas as Khmer people. They can freely conduct traditional events
like Cambodians. There is no threat to them from the local authority.
The 2018 law on Nationality makes them feel a bit distant from Cambodian society,
and it is more difficult to mobilize Vietnamese people for meetings and interviews, as observed
during the organization of FGD.
Youth and children
In Cambodia, youth (15-29 y.o) make up about one-third of the total population. This
represents a significantly young labor force. An estimated 300,000 young Cambodians enter
the labor market every year.49 According to the Youth Multi-dimensional Deprivation Indicator
(Y-MDI), one young person out of five is deprived of two or more well-being dimensions at the
same time, including health, employment, education, and civic participation, while 40% fare
poorly in at least one of these dimensions.50
In 2020, approximately 30.9% of the population in Cambodia were under 14 years of
age. In comparison, approximately 33% of the population in Cambodia were under 14 years
of age in 2011. According to the ID Poor program 2017, out of the 2.36 million people living in
households ranked ID Poor 1 and 2, one third were children. The Cambodia Socio-Economic
Survey 2014 data shows that 11% of children age 5–17 years are economically active.51
Specific demographic data on youth for Bavet is not available.
Persons with disabilities
According to the Cambodian Demographic and health survey 2014, 10% of persons
age five and over have some form of disability. Difficulties in seeing, walking, or climbing stairs,
and concentrating are the most common types of disabilities reported. Only 2% of the
household population suffers from a severe disability (a great degree of difficulty or lack of
48“2018 law on nationality, requirements for citizenship include being a “good moral citizen” with no criminal record; speak, read and write Khmer, have a good knowledge of Cambodian history and be in good health”. The law on nationality provides for foreigners to be prosecuted for illegally obtaining Cambodian identification cards or passports. The law would also punish anyone who illegally assists others to obtain Cambodian citizenship. 49 UNCT’s Common Advocacy Point, 2011 50 OECD Development Centre (2017), “Youth Well-being Policy Review of Cambodia”, EU-OECD Youth Inclusion Project, Paris. 51 UNICEF Cambodia and Division of Data, Research and Policy, UNICEF New York, A Statistical Profile of Child Protection in Cambodia, United Nations Children’s Fund, New York, March 2018.

27
ability to function at all). This indicates that most disabled people experience a moderate level
of disability.
The prevalence of disability increases with age, and women are slightly more likely to
suffer from some level of disability than their male counterparts. There is also a notable
association between disability and education, but there is little difference according to urban
or rural residence.
Living with a disability in Cambodia is associated with an increased risk of poverty.
18.2% of households living with one or more disabled members were under the Poverty line
(NIS 2014), compared to 12.8% of households without a disabled household members. The
literacy rate among the disabled is also lower than the national average (48% against 78%).
Due to their lack of skills, their chance to enter the labor force is also lower. Up to 60% of
people with disabilities could not perform any income-generating activities (NIS 2014), putting
them at risk of monetary poverty. People with disabilities are dependent on other members of
their households, which strains the household’s resources.
In Bavet, according to municipality data 2019, 0.55% of people have a disability (239
persons). They are in the majority disabled from birth or due to an accident. Sangkat Bavet
has the highest proportion of people with disabilities (0.8%), but Sangkat Chrok Mtes has the
highest number of cases (82). Detail per Sangkat and village are provided in appendices 1.1
and 1.2 Bavet village data 2019.
Elderly
The demographic scenario in Cambodia shows the decline in the population aged
under 15 in comparison with the beginning of the century. In 2003, the proportion of the
Cambodian population aged under 15 was further shrinking, making up 29% of the total
population, whereas the proportions of the working-age population and older population in the
total population were increasing, constituting 63% and 8% respectively. This is particularly
striking in the case of the aging dynamics of today's working-age population.
The proportion of older persons in the total population has been increasing at a much
higher rate (from 1998 to 2008 3% annually and from 2008 to 2013, 5 percent/year), and the
trends are projected to continue. From 2020 to 2030, the older population will be increasing
annually at a rate of around 4%, while the annual growth rate of the working-age population
will be just 1%, and the population aged under 15 will be undergoing a negative growth. Aging-
related issues that were non-existent or hardly significant have started to become challenges
to be grappled with. 25% of people interviewed in the project’s Comprehensive City Survey in
Bavet are elders- of an average age of 71.

28
Figure 7: Comparison of age pyramids 2003 and 2020, Cambodia
Source: Populationpyramid.net
There are two crucial aspects to consider: the aging of the older population and the
feminization of aging. While older persons face various issues, they face different and more
serious issues as they grow older. Similarly, older women are more vulnerable than older men.
Women constitute more than 60% of the oldest old population. Older women are more
vulnerable due to their greater discrimination in employment, financial insecurity, lower literacy
and education levels, and greater incidence of morbidity. According to our survey in Bavet, in
average FHHs are a bit older than the general population, and 46% of the FHHs were widows
An increasing proportion of the older population relative to the adult population also
results in a shrinking of the financial and care support base for older persons. Health costs
increase with the aging of the older population as the average cost per patient and financial
insecurity among older person increases with age. The data on income and health expenses
in the CCS show that elders have on average lower income than the general population ($293
versus $390, median values) but spend more in value for healthcare than the overall
population ($32 versus $24 median values).
Civil society organizations
Both local and international Non-Governmental Organizations (NGOs) are plentiful in
Cambodia and are active across the spectrum from advocacy and human rights organizations
to service delivery, humanitarian, and service organizations of many types. As of early January
2019, at least 5,523 Association of Non-Governmental Organizations (NGOs) were registered
at the Ministry of Interior and 419 foreign NGOs signed MoUs with the Ministry of Foreign
Affairs and International Cooperation52.
International and local NGOs play a major role in providing or supporting basic social
services, often in remote areas and communities, and are present in every province and major
sector in Cambodia. NGOs also bring alternative models and approaches to development—
emphasizing participation, equity, gender sensitivity, and environmental sustainability. NGOs
52 Statement from Phnom Penh governor Khoung Sreng at the Capital Hall-CSOs forum held under the theme "Responsible Partnerships”, April 2019. http://m.en.freshnewsasia.com/

29
have advocated national reforms to improve health, education, governance, human rights, the
legal system, social services, the environment, and women and children’s welfare.
In recent years, the NGO advocacy sector in Cambodia has begun to suffer from a
perception of being overly critical of the government, particularly in the area of human rights.
This is tied to what some observers identify as a decreased tolerance of political opposition.
However, in other areas, local and international Civil Society Organisations (CSOs) continue
to work closely with government policies and programs, particularly in agriculture, education,
and health sectors, and try to support the government in its attempt to increase the
participation of citizens and civil society in the development process through decentralization.
ADB recognizes CSOs, including NGOs, as significant players in the development
process and cooperates with them to improve the impact, sustainability, and quality of its
services.53
According to Bavet’s Municipality and results of FGDs, ten organizations have been
identified in Bavet, including three trade-unions, three Christian organizations, and three local
NGOs.
Table 3: List of Civil Society Organizations identified in Bavet, 2020
No. Name
Civil Society and Association
1 Youth Association of Krong Bavet
2 Sovannaphum Vongpheak Borei Association
3 Santi Sena Organisation
4 The Union of Youth Federation of Cambodia in Bavet (UYFC)
Trade Unions
5 Trade Union Workers for People Democratic (TUWFPD)
6 Khmer Youth Sound Trade Union Alliance (SSSYK)
7 Khmer Trade Union Alliance
Christian Association
8 The 4th good news
9 Association linked to the Protestant Church
10 Association linked to the Catholic Church
Private sector
The private sector in Cambodia has transformed the economy significantly over the
last two decades: as evidenced in the growth of employment, improvement in education and
skills of the labor force, and the success of Special Economic Zones at attracting investment
and diversifying the manufacturing base. However, most private sector remains very small, is
characterized by high rates of informality. While garments and tourism are two of the most
important industries, other manufacturing and service industries have emerged in recent
years.
53 ADB Civil Society Brief Cambodia,

30
The majority of businesses in Cambodia are very small (74% engage only one or two
people). In addition, most are informal (98.8% of businesses with less than ten employees are
not registered)54. According to the Prime Minister, “The Cambodian industry remains weak
as reflected by its simple structure, narrow base and low level of sophistication, while mostly
concentrated in garment, construction, and food processing industries.”55 While these
businesses form a significant part of the economy and provide work for many people, they
tend to be less productive than larger businesses. Smaller and informal businesses also are
less likely to have access to finance, pay less (or no) taxes, and typically do not provide training
for their workers or comply with labor laws and other regulations.56
The government has set targets in the industrial development policy 2015–2025 (IDP)
for increasing business formality and calls for an inclusive approach mobilizing the Public
Sector, development agencies, and the Private Sector as key partners in Cambodia’s
development.
Bavet is strategically located on the border between Cambodia and Vietnam and
benefits from a very dynamic commercial and industrial sector. Due to its strategic location,
Bavet hosts several Special Economic Zones (SEZ) for small and medium-sized
manufacturing industries. In 2019, 10 SEZs were in operation and employed approximately
52,000 workers. In 2018, about 5% of the main occupation was related to the service sector.
The opening of the cross-border trade in 1991 has enabled the growth of trade activities and
a growing influx of migrant workers into the area. The main features of Bavet city center are
large hotels, buildings, and commercial establishments that serve as casinos for gaming and
as recreational centers. Agriculture is still an important source of income for the population
(14% of the employed persons).
The Bavet water supply is managed by several operators: the Khun Development
Company, a private company with authorization license from the Ministry of Industry and
Handicraft (MIH) (from 2017 until 2022), the Sim Pheakdey Company, another private
company, and by SEZ operators for their own needs. The water supply service is financed by
a user-pay arrangement, and billings are issued and collected by private companies Khun,
Sim Pheakdey, and SEZs operators directly to end-users. The tariff guidelines are in the
contract and approved by the government MIH (≈2,000 Riel / m3 for the Khun area). Khun &
Sim Pheakdey, with its own technical and financial resources, handles construction and O&M.
In 2019, the municipality signed a contract with a private company to provide solid
waste management services, HYBRID, for a duration of 5 years. The service is financed by a
user-pay arrangement, and billings are issued and collected by HYBRID. The tariff guidelines
are in its contract and approved by the governing Ministry of Environment. HYBRID is the
owner of the Solid Waste Management assets, including the dumpsite. According to the
Comprehensive City Survey (CCS), households having a direct home collection pay a median
monthly fee of $3.9 ($6.5 on average). For recycling, there are three wholesale junkshops.
They are registered companies. They recycle waste from informal collectors, waste pickers,
and scavengers.
54 Unlocking the potential of the Cambodian private sector, March 2017, prepared by Emerging Markets Consulting for Australian Aid and Mekong Business Initiative 55 Khmer Times, August 26, 2015 56 Unlocking the potential of the Cambodian private sector, March 2017, prepared by Emerging Markets Consulting for Australian Aid and Mekong Business Initiative

31
Related to the private sector involved in sanitation, there is only one emptying services
provider in Bavet. Its main clients are the SEZs and the casinos.
The private sector is not involved in wastewater management, and there is currently
no Waste Water Treatment Plant (WWTP) in Bavet besides the two plants operated by SEZ
operators for their own needs.
The private sector is not involved at all in the stormwater drainage.

32
IV. BENEFICIARY PROFILE
1. Methodology
Secondary data
The consultant collected village data from the Municipality. The data provides updated
(2019) and relevant information at the village, Sangkat, and municipality levels on key social
indicators: population (number of households, number of female-headed households, number
of males/females), their access to basic infrastructures, and report the number of vulnerable
peoples (orphans, the elderly, people living on public land, people with disabilities). That
information is reported in Appendices 1.1 and 1.2 and integrated into the Poverty and Social
Analysis and gender assessment.
The consultants initially investigated the village data obtained from the municipalities
to identify the presence of ethnic groups. Village databases do not report on Cham and
Vietnamese population. The consultant decided to conduct a rapid additional assessment in
July 2020 and collected police minority datasheets in Bavet. These data provide information
about the Vietnamese population that is not available in the village data, the project area with
the presence of Vietnamese are identified. This information, completed with a rapid field
assessment of the situation of the IP communities in the project, FGDs as part of the social
survey, and IPs specific consultation, were used to develop the Indigenous People Plan and
related chapters in other documents. IPs population data are provided in Appendix 1.3
Third source of secondary data used is the ID Poor information obtained from the ID
poor database. It provides for each village the number of households identified under ID poor
one and ID poor two as part of the urban survey in 2017. It also gives an indication of the
gender of the head of households and the location of the household. Data are reported in
Appendix 1.4. This information crossed with municipality and IPs data allows for the
identification of poverty/vulnerability areas.
Primary data
1.2.1. Quantitative data
A Comprehensive City Survey was conducted in December 2019. The subjects to be
surveyed include household (HH) and commercial & Institutions (C&I) in the target location.
The survey report is attached to Appendix 3.1.
The objective of the Survey was to complement the secondary data and to inform the
preparation of the Due Diligence regarding People’s socio-economic status; Household
behavior/habits regarding sanitation facilities and septic tank usage and maintenance;
Wastewater and drainage, and health-related expenses; Affordability and willingness-to-pay
for sanitation improvements; General perceptions against the wastewater and drainage
services; Annual and frequent flood impacts; Solid waste management practices and identify
the exposure, sensitivity, and adaptive capacity of people (by vulnerability sub-groups) living
in the project area; provide information for the selection of appropriate sanitation and drainage
improvements, and determine mechanisms to support household adoption of centralized
systems from predominant septic tank sanitation management methods.

33
The sample size was chosen for the city allows at least a 95% confidence level with a
5% margin of error. The following formulate has been used for the sample size calculation:
With:
N = population size
e = Margin of error (percentage in decimal form)
p = estimated proportion of the population with the characteristic (0,5 if unknown)
z = number of standard deviations a given proportion is away from the mean:
For the desired confidence level of 95%, z = 1.96
For the desired confidence level of 99%, z = 2.58
Table 4: Achieved Sample Size in Bavet
Cities No. HH Survey No. C&I Survey Total
Bavet 658 75 733
Each Village, the smallest administrative boundary, has been sub-divided into ward:
(i) All ward was approximately equivalent in terms of the population living within the section (estimation); and
(ii) The size of a ward was approximately equivalent to one working day (depending on the duration of the survey, the number of surveys to be conducted, etc.) for the surveyor.
the population groups to be selected for the surveys: households that have lived for a
long time in the locality, newly arrived households, the owners, and tenants and specifically
vulnerable households (poor households, female headed households, ethnic minority
households, etc.). In each ward, households were then randomly selected.
To carry out this survey, mobile data collection was used via ArcGis Survey123
platfrom. A specific request was made to complete the questionnaires in two languages:
English / Khmer. The purpose of this translation was to facilitate the investigators'
understanding of the questions. The data collection followed the approach below.

34
Figure 8: Mobile data collection strategy
During the Survey phase, the quality control consisted in:
(i) Daily checking of the survey points. The surveys have to be located within the city boundaries.
(ii) A daily sample of the survey duration. The duration of 20% of the survey uploaded each day has to be checked.
(iii) A weekly download of the database to check the duration of each survey. The distance between the GPS point and the location point has to be below 300m.
1.2.1. Qualitative data
Based on the result of the Comprehensive Technical Options Study, an additional
social survey focusing on qualitative information was conveyed in September 2020 to (i) better
identify needs/preferences and demands of specific groups in particular: disabled people,
indigenous people, and youth/children which were not enough represented in the City
Comprehensive Survey, (ii) understand positive (perceived benefits) and negative impacts of
the project to stakeholders and assess social and institutional issues that affect participation,
ownership, acceptance, and adoption of project activities, and propose strategies to overcome
any local concerns or other issues; (iii) identify training needs, effective channels of
information, and the best approach for consultation/participation and training, with the focus
on vulnerable groups. Explore how communities including vulnerable groups can participate
in the project, (iv) assess whether NGOs/CBOs, and/or the private sector has a role in
implementing the project, (v) consult informal waste pickers/ scavengers about their current
jobs, perceived risks, and opportunities of the development of a more formal system (sorting
and composting plants), and (vi) assess the environmental situation and perceived
environmental impacts of the project to stakeholders including perceptions of climate change.
The social survey took place in early September and consisted of two consultation
meetings (105 participants), 7 FGDs with specific groups (61 persons + number of IPs) in
rural and urban areas, and meetings with two local NGOs (7 persons).
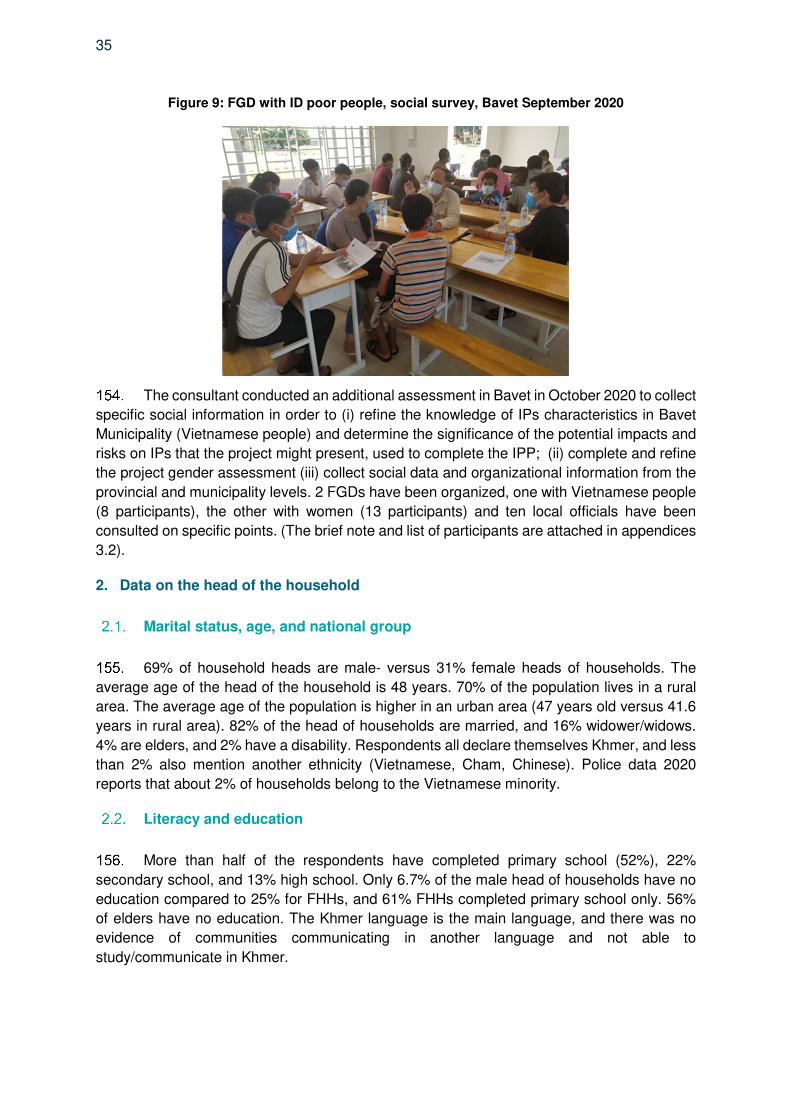
35
Figure 9: FGD with ID poor people, social survey, Bavet September 2020
The consultant conducted an additional assessment in Bavet in October 2020 to collect
specific social information in order to (i) refine the knowledge of IPs characteristics in Bavet
Municipality (Vietnamese people) and determine the significance of the potential impacts and
risks on IPs that the project might present, used to complete the IPP; (ii) complete and refine
the project gender assessment (iii) collect social data and organizational information from the
provincial and municipality levels. 2 FGDs have been organized, one with Vietnamese people
(8 participants), the other with women (13 participants) and ten local officials have been
consulted on specific points. (The brief note and list of participants are attached in appendices
3.2).
2. Data on the head of the household
Marital status, age, and national group
69% of household heads are male- versus 31% female heads of households. The
average age of the head of the household is 48 years. 70% of the population lives in a rural
area. The average age of the population is higher in an urban area (47 years old versus 41.6
years in rural area). 82% of the head of households are married, and 16% widower/widows.
4% are elders, and 2% have a disability. Respondents all declare themselves Khmer, and less
than 2% also mention another ethnicity (Vietnamese, Cham, Chinese). Police data 2020
reports that about 2% of households belong to the Vietnamese minority.
Literacy and education
More than half of the respondents have completed primary school (52%), 22%
secondary school, and 13% high school. Only 6.7% of the male head of households have no
education compared to 25% for FHHs, and 61% FHHs completed primary school only. 56%
of elders have no education. The Khmer language is the main language, and there was no
evidence of communities communicating in another language and not able to
study/communicate in Khmer.

36
Economic activity
The main economic activity in the area is small-scale business 28%s, farming 19%. It
is also noted that 12% of respondents are homemakers, and 5% are not working. People
working in SEZ (factory workers) represent 7% of respondents. Due to the human resource
demand from economic zones, migration is not common (1%).
Table 5: Occupation of heads of households in Bavet, 2020
3. Characteristics of beneficiary households
Household size and composition
More than half of the households count 4 and 5 members (average size: 4.9 HH
members as per registration book, 4.8 in practice), with an average of 1.8 women and 1.2
children per HH, 0.1 people with disability per household, and 0.2 of elders in average. In 75%
of cases, there is only one family living in the house. In 18% of cases, the building
accommodates two families.
Dwelling/housing unit and assets
In Bavet, 98% of total Households interviewed in CCS have a permanent house- 96%
own their house- and 86% live in a one-floor building. 71% of households have been living in
that place for more than 25 years (at least before 1993). The average size of the full property
is around 1,300sqm. Households are rather well equipped with a motorbike (94%) and
cellphone (93%).
Table 6: Households assets, Bavet, 2020
Type of assets All HHs Motorbike 94% Television 76% Bicycle 59% Cellphone 93% Gas cooker 90% Car 12% Washing machiner 9% Computer 7%
Occupation All HHs
Small scale business owner 28%
Housewife 12%
Farmers 19%
Construction workers 9%
Factory worker 7%
transportation services including mototaxi6%
Not working 6%
unstable jobs 4%
Other 5%

37
4. Livelihood, poverty, and hardship
According to the results of the survey and based on people’s declaration, the average
monthly income per household is estimated at $486 in 2018, with a median income per month
of $390. As observed at the national level, businesses and salaries from the private sector
generate higher incomes than agricultural activities in general. The third main source of
income is casual works.
5% of households have contracted loans- in each case, two loans- the average amount
of each loan is around $400.
Remittance from people working abroad is benefiting less than 1% of the households.
In comparison, the average amount of expenses reaches $386 (median $342) per
month. Food consumption represents nearly one-third of all expenses (32%), followed by
social events/ ceremonies (18%) and healthcare (10%). Energy represents 8% of expenses
(for cooking, electricity, etc.).
Only 22% of households do actually pay for water supply, which represents 2% of the
average monthly expenses, and 5.8% HHs pay for waste collection service. This represents
about 1.5% of the average monthly expenses.
3% of households also have rental fees, which can represent about 25% of the average
expenses budget.
Table 7: Expenditure profile of households, 2018, Bavet
Type of expenses Average value KHR % of the total 1- Food consumption 489,195 32% 2- Shopping for appliances and amenities 46,930 3% 3- Electricity for lighting/electrical appliances 90,679 6% 4- Energy/fuel for cooking 32,461 2% 5- Water consumption 7,536 0% 6- Solid waste collection 1,707 0% 7- Toilet facility 12,565 1% 8- Drainage - 0% 9- Transport including fuel 104,009 7% 10- Clothing 65,722 4% 11 Housing i.e. rental, maintenance, decoration 35,574 2% 12- Healthcare 160,059 10% 13- Education 108,614 7% 14- Communication, i.e., telephone, internet, etc. 48,418 3% 15 Entertainment/Leisure, i.e., out for a drink, cigarette, etc. 62,181 4% 16- Social event and ceremony i.e. wedding, festivals 278,979 18% 17- Other, specify (text) 0% Total average 1,544,629 100%
Based on data extracted from the Comprehensive City Survey, comparison between
different groups shows that:
(i) FHHs average monthly income reaches $430 (median income $366), average monthly expenses $395 per month, out of which 13% is for healthcare
(ii) Elders earn, on average, $389 per month (median income $293) and spend $267 per month. Health expenses represent 8% of their budget.

38
(iii) The poorest households in our sample (below $250/ month /HH) have an average income of $139 (median $146). According to their answers, expenses exceed incomes, and health expenses represent 13% of their budget.
Figure 10: Average monthly income per vulnerability group, 2018, CCS
5. Households and water supply
According to Municipality database 2019, only 16% of HHs (1,726 HHs) use water from
the treated water system. The other 84% of HHs use water from borehole-wells and combined
wells. Water treated system is available only in Sangkat Bavet. Households in Bavet rely
mainly on their own well for water supply.
Connection to piped water supply depends on the availability of pipes in the proximity
of the house. Only 10% of the surveyed households are connected to water supply. Only 25%
of households have access to pipes, out of which 34% are connected. Households mostly use
existing well (and thus do not need a connection to pipe).
For drinking water, 52% of HHs use water from their own well, and 46% buy from
vendors. Only 2 % (in the majority in an urban area) drink public water.49% of HHs treat water
before drinking. They consider the water to be of bad quality. The price of drinking water in an
urban area (bought from vendors) is an issue for 50% of the respondents
71% of the households are willing to pay to get connected to piped water supply (39%
could pay KHR 20,000 ($4.6) and 25% up to KHR 40,000 ($9.6)). (convenience, price from
water bought from vendors). Regarding price range, for a supply of 150 liters per day and per
person for 24h/7days availability, 39% of HHs would agree to pay a fee of KHR15,000 ($3.6)
to KHR 20,000 ($4.8) and 25% KHR40,000 ($9.6). 20% of HHs could accept a higher price.
No one asked for free water.
6. Households and sanitation
According to Municipality database 2019, 91% of total households (9,620HHs) have
latrines, out of which 90% are pour flush latrines. A few areas are lying behind in terms of
sanitation: only 66% of HHs have latrines in Sangkat Prasat and use in majority improper
$486
$139
$430
$281
$389
$-
$100
$200
$300
$400
$500
$600
all HHS Poor HHs FHHs IPs Elders

39
latrines (not pour-flush, or not individual), Skar village in Sangkat Chhrok Mtes (only 42% HHs
having latrines), and Thol Kaing village in Sangkat Bati, 200 out of the 280 HHs having latrines
are not pour flush latrines/ individual.
93% of interviewed HHs have toilets (all pour-flush latrines). The other 7% of HHs use
neighbor’s toilets (for free) or open fields. This matter is important to consider, given the
negative impacts on dignity, privacy, and personal safety, especially for women and girls.57
Interviewees, mostly women, had little information related about the construction of
their toilets, which suggests that sanitation issues are more commonly dealt with by men, as
it is considered a more “technical” subject.
90% of HHs have a tank, many are not proper septic tanks with a sealed tank. Half of
the interviewees have an idea about the construction cost of their septic tank. Only 2% of HHs
are connected to public sewer pipes and 3% to open drain channels. The majority don’t know
how much they paid for connection, and they do not know either if they pay a monthly fee.
According to CCS, only 5% of households are connected to sewerage. As there is no
sewerage in the city, this information has to be interpreted as a connection to the drainage
system.
The CCS showed that 2% of the surveyed population are still practicing open
defecation. This number increases in some remote village. In urban areas, the main practice
is to defecate into a plastic bag or bucket, while the paddy fields are preferred in the rural
areas.
Sharing of sanitation facilities is also an important consideration given the negative
impacts on dignity, privacy, and personal safety, especially for women and girls (JMP, 2018).
It has been estimated that 3% of the surveyed population share this facility with others who
are not members of their household in the urban areas, and 5% in the rural areas.
Among those who have no septic tank or latrines, only 33%HHs are willing to build
one. While 58% of HHs consider that they cannot afford the cost of construction, and 95%
would not consider taking a loan- even at the preferential condition- to build or renovate
sanitation facilities.
97% of interviewees in the survey responded that they do not use the service of
septage pumping trucks, and 98% do not empty septic tanks manually. Most respondents
have little or no knowledge about these sanitation aspects- frequency of desludging if needed,
costs of emptying, name of emptying company, nor where septage is transported.
62% of HHs don’t know if they are willing to pay to be connected to the sewerage pipe/
open drainage channel; they may have no idea about the benefits of being connected or are
waiting to know how much it would cost or if it could be free. 13% are ready to pay between
KHR 80,000 ($19.5) to 120,000 ($28.5) and 10% between KHR 10,000 ($2.4) and 40,000
($9.6)
Regarding monthly service fees for public sewer pipe, 62% of HHs don’t know what
they could afford, while 22%HHs are ready for a monthly fee between KHR 5,000 ($1.2) to
10,000 ($2.4), 10% between KHR 10,000 ($2.4) to 40,000 ($9.6). If a new service is proposed,
57 Progress on household drinking water, sanitation and hygiene 2000-2017. Special Focus on inequalities. New York: United
Nations Children’s Fund (UNICEF) and World Health Organization, 2019.

40
35% of households, mainly in urban areas, declare a willingness to pay a monthly fee of $2.4
on median ($4.5 on average).
Figure 11 Location of Households Willing to Pay a Monthly Fee for Wastewater Management
7. Households and stormwater drainage
Through the Comprehensive City Survey, it is estimated that 37% of the population
experiences flooding of their house at every intense rainfall event, while 64% never
experienced flooding. 68% of HHs have been warned of flooding risks (by TV/Radio and social
media). 38% of HHs observed a difference in flooding patterns compared to 10 years ago
(26% compared to 20 years ago, and 17% compared to 30 years ago).

41
Figure 12 Comprehensive city survey and flood-prone areas location
The consequences of flooding are rather well known by the interviewees, the main one
being mosquitos breeding, then in order of appearance: the proliferation of trash, stagnant
waters, wastes from septic tanks overflowing and higher prevalence of disease such as
dengue fever, typhoid, skin disease, and leptospirosis. 33% of HHs associate the experience
of skin disease by one of the HH members with flooding, as well as 29% for diarrhea. Average
spending for health in the previous year was around KHR 400,000 ($97.5) in the rural area
and up to KHR 600,000 ($146) in an urban area, which is mostly (as per people’s
understanding) related to waterborne disease.
Flooding affects people's access to health facilities for 82% HHs, and for 18%HHs
workplace or schools closed during flooding.
In Bavet, rainwater is collected in ponds by 38% of HHs and flows into the public drains
for 15%. For the locations served with public drains, 37% of HHs face no issue with the existing
system, and 20% observed the drainage is clogged with waste, and 9%HHs think it is
insufficient to manage stormwater in the area.

42
8. Households and solid waste management
According to Municipaity data 2019, only households living in Sangkat Bavet have
access to garbage collection (which represents only 7% of Bavet’s Households), and 2% of
Households in Kouk Lveang village, Sangkat Prey Angkounh.
Figure 13 Collection Coverage in Bavet, Egis 2020
53% of HHs do not directly face any environmental problem in Bavet, but 41% mention
problems with solid waste, air pollution (26%), and water pollution (17%). The percentage of
HHs acknowledging there is a problem with solid waste in their neighborhood is higher (57%
of HHs), and 62% observe waste often/ very often piling in the area with impact on air pollution
(74%), climate change/ flooding (57%) and water pollution (53%). They also quote the
following impact for their family (in descending order): discomfort because of bad smell,
diseases of the respiratory system, infection, and diseases in general, wound/scabies,
digestive systems problem. The level of awareness of the population about the negative
impacts of inadequate solid waste management is quite high. 34% of the health problems
encountered by HHs over the last year are directly attributed to waste/garbage. This figure
reaches 47% HHs in an urban area.

43
Most households produce between 1 to 3 kg of waste every day (88% domestic waste).
91% of HHs discharge waste daily and keep waste in plastic bags (83%), plastic or cardboard
containers (20%). The plastic bags are considered easy to handle, avoid odors, are clean, and
keep insects and rodents away.
In Bavet, the waste collection service is available to 11% of HHs only (in the urbanized
area mostly). 7% of HHs get their waste collected at their doorstep, while 12% dispose of
waste at a collecting point. Collection is done in the evening for 42% of HHs, for 33% in the
morning, and at irregular hours for 22% of HHs, but mostly everyday (75%) or every two days
(15%). 84% of HHs are satisfied with the service. Suggested inmprovements included: late
afternoon collection and daily collection. They also mention that a cleaner service would be
appreciated (67%). 78% of those benefiting from the waste collection service pay a monthly
fee, 27% between KHR 8,000 ($1.9) and 12,000 ($2.9) per month, and 25% between 12,001
($2.9) and 20,000KHR ($4.8). The median monthly fee for home collection amounts to $3.9
($6.5 on average), which is considered an appropriate price for 51% of HHs and expensive/
too expensive for 17%.
Waste that is not collected is widely dumped in empty land, followed by dikes/ lakes
and roadsides.
While they have a general knowledge of waste impacts, 81% of HHs never took part
in any environmental campaign apparently because of time availability. 74% of HHs sort
wastes before disposal for re-sale (cans, plastic bottles, organic wastes for animal feed
(85%)). While the proportion of HHs sorting is already high, 53% of households are ready to
sort more if required (up to 61% in an urban area).
Regarding willingness to pay for an improved waste management service, 67% of HHs
don’t know (up to 76% in the rural area), and 16% would agree to pay KHR 4,000-8,000 ($
0.9-$1.9) (below KHR 4,000 ($0.9) in a rural area). If a new or improved solid waste
management service is created, the survey shows that 30% of Households are willing to pay
a monthly fee: $1.2 median value; $3.1 on average.

44
Figure 14 Monthly willingness to pay - Solid waste management service, Egis 2020
9. Consumer perceptions
According to the CCS, it is estimated that 67% of HHs consider they are not really
affected by pollution and consider that noise, wastewaters, flooding, smells (from wastewater,
garbage) have little effect on pollution in their area. Comparatively, dust is the main nuisance,
then bad smells from the garbage.
40% of HHs are fully satisfied or satisfied with the current water supply service.
Only 8% are fully satisfied/ satisfied with wastewater management, 46% are not
satisfied at all, and 18% are not satisfied.
8% only are satisfied with drainage, while 40% are no satisfied /not satisfied at all.
Waste management is also considered as not satisfactory by the majority of HHs (56%)
in Bavet.
37% HHs consider that building more public space and playgrounds would improve
attractivness of Bavet, 22% are in favor of building houses on the outskirt of the city, and 18%
improving urban infrastructure (roads, bridge, sanitation, drainage system, solid waste
collection).
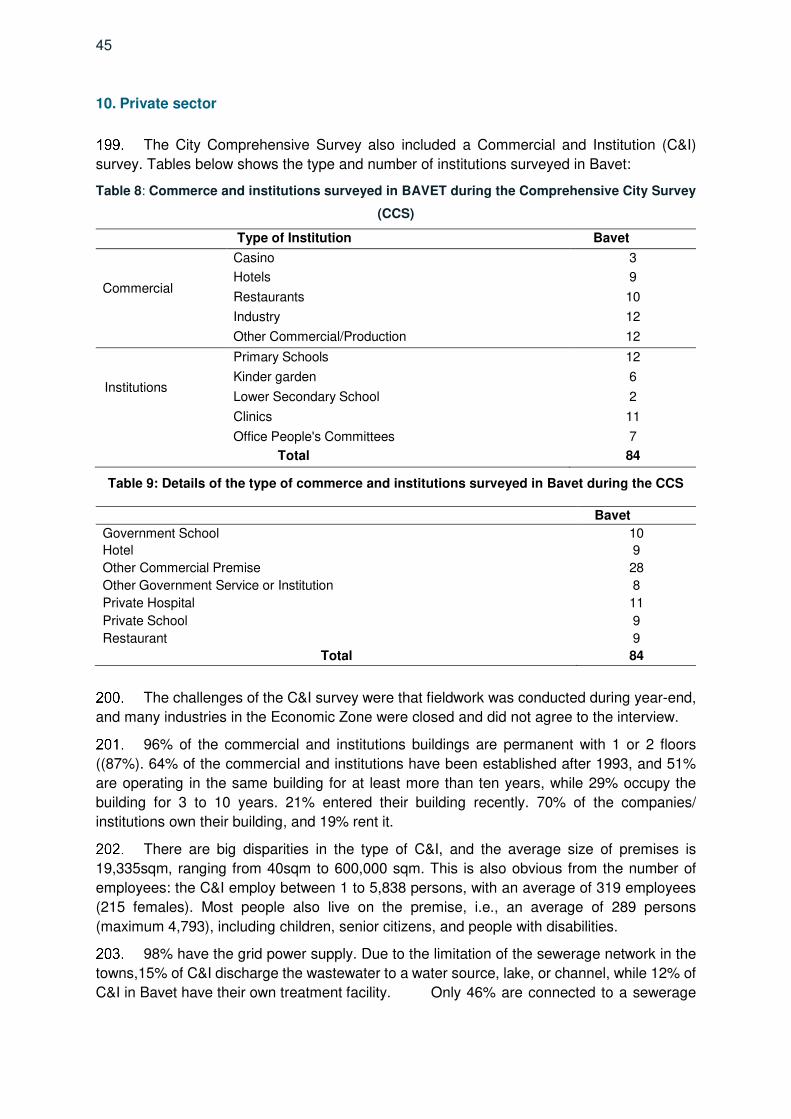
45
10. Private sector
The City Comprehensive Survey also included a Commercial and Institution (C&I)
survey. Tables below shows the type and number of institutions surveyed in Bavet:
Table 8: Commerce and institutions surveyed in BAVET during the Comprehensive City Survey
(CCS)
Type of Institution Bavet
Commercial
Casino 3
Hotels 9
Restaurants 10
Industry 12
Other Commercial/Production 12
Institutions
Primary Schools 12
Kinder garden 6
Lower Secondary School 2
Clinics 11
Office People's Committees 7
Total 84
Table 9: Details of the type of commerce and institutions surveyed in Bavet during the CCS
Bavet Government School 10 Hotel 9 Other Commercial Premise 28 Other Government Service or Institution 8 Private Hospital 11 Private School 9 Restaurant 9
Total 84
The challenges of the C&I survey were that fieldwork was conducted during year-end,
and many industries in the Economic Zone were closed and did not agree to the interview.
96% of the commercial and institutions buildings are permanent with 1 or 2 floors
((87%). 64% of the commercial and institutions have been established after 1993, and 51%
are operating in the same building for at least more than ten years, while 29% occupy the
building for 3 to 10 years. 21% entered their building recently. 70% of the companies/
institutions own their building, and 19% rent it.
There are big disparities in the type of C&I, and the average size of premises is
19,335sqm, ranging from 40sqm to 600,000 sqm. This is also obvious from the number of
employees: the C&I employ between 1 to 5,838 persons, with an average of 319 employees
(215 females). Most people also live on the premise, i.e., an average of 289 persons
(maximum 4,793), including children, senior citizens, and people with disabilities.
98% have the grid power supply. Due to the limitation of the sewerage network in the
towns,15% of C&I discharge the wastewater to a water source, lake, or channel, while 12% of
C&I in Bavet have their own treatment facility. Only 46% are connected to a sewerage

46
system and 45% to piped water supply (mostly private), 17% have a drainage system in place,
and 51% have a collection of solid waste.
In Bavet,18% of the C&I, which are mainly local commercial outlets, use their own deep
well as the main source of drinking water. Purchasing from vendors is the main source of
drinking water, while 18% of them sourced from their own deep well. There are only 36% of
C&I treat their water before drinking by using a filter (77%) or boiling (23%) daily. Those who
do not treat water because they perceive that the water is safe for drinking as they purchased
it from vendors. On average, they prefer to pay 108,200 KHR for a water supply of 150L per
day and per person 24/7 and would spend 296,300 KHR on piped water connection fees.
95% of houses/buildings are equipped with toilets (all flush toilets), and 80% are
connected to a soak pit, 11% are connected to the public drainage pipe. In Bavet, 94% of C&Is
with toilet facilities have septic tanks with an average capacity of 6.9 m3 (average construction
cost is KHR 725,500 KHR. The majority of septic tanks flow to soak pit (80%) and public
drainage pipe (11%). 21% of C&I have used pumping trucks to empty their septic tank, with a
frequency of every 1-2 years (56%) and an average fee of KHR1,459,300. If a public sewer
pipe is built, on average, they would pay 4091,100 KHR for connection and 101,800 KHR for
a monthly service fee.
50% of respondents observe problems with solid waste, air pollution (37%), and water
pollution (23%). Solid waste is a major problem due to service provision and insufficient landfill.
49% of respondents consider there is a problem with solid waste in their area: solid wastes
are scattered on the road (52%), 75% observe solid waste piling often/very often, bad smell
(45%). 70% of people consider these solid wastes can cause any adverse impacts to the
physical environment or health in the C&I, such as air pollution (78%), climate change (e.g.,
flooding), and water pollution. In terms of health, solid waste/ bad smells are associated with
diseases associated with the respiratory system (71%), infectious diseases (49%), and
wounds/scabies (41%).
Depending on their size and type of activities, C&I generates more or less solid waste:
43% between 2 to 5kg/ day and 21% generates more than 20kg/day of domestic and
production waste. 89% of discharge wastes every day, mostly in plastic bags. Only 58% of
C&I benefit from solid waste collection services from private companies (82%). 52% get the
collection at their doorstep, 6% at a collecting point, and the rest is discharged in empty lands,
ditches, lakes, on the roadside, etc.
Waste Collection is more often daily (73%) and in the morning (39%) or at the irregular
time (29%) or in the evening (27%), which is satisfying for 81% of C&Is. Only 57% pay a
collection fee. As for other types of respondents, the main improvement would be a cleaner
service (76%).
Only 42% of C&Is participated in environmental campaigns due to time limitations. Still,
70% of respondents sort cans, plastic bottles, and organic waste overall. 55% would agree to
sort more if a program was put in place.
48% of respondents experience flooding in their house when it rains heavily. 57% got
weather warnings (TV/Radio, social media). 78% are aware of the consequence of flooding
on mosquito breeding, the proliferation of trash rubbish, stagnant waters. 43% observe
problems (note specified) on their C&I members after flooding, as well as skin diseases (30%)
or diarrhea (22%). In 65% of cases flooding limit access to health facilities, but it does not
cause the closing of a school or of the business.

47
In 55% of cases, rainwater went into the public drainage. 46% observe no problem
with the drainage system, while 26% say the system is clogged or 21% that the drainage
system is incomplete and not operational.
88% are noticing changes in the weather in their areas, such as unusual season
patterns, more extreme weather conditions, and heavy rains. The main solution to mitigate
this would be planting trees (68%), raise roads, eliminate burning waste.
81% consider their area is polluted, the main nuisances being dust and bad smells.
On a scale of 1 to 5, where (1) not satisfied and (5) is fully satisfied, C&Is evaluation
of public services and infrastructures was highest for water supply and lowest for waste water
(Table 13).:
Table 10: Satisfaction rate for current urban infrastructure in Bavet for Commerce and
Institutions, CCS.
Average Bavet Water supply 3.02 Wastewater 2.06 Drainage 2.61 Solid Waste 2.11
11. Civil society organizations
Among the associations listed in Bavet, the name of 2 organizations emerged from the
discussion with the community: Santi Sena Organization and the Union of Youth Federation
of Cambodia in Bavet (UYFC). They are both associations registered at the Ministry of the
Interior. Santi Sena Organization’s scope of activities and structure make it a potential service
contractor in the project for social and environmental aspects. They have experience working
as sub-contractors in health and sanitation promotion, climate change, and biodiversity,
among others. Additional details are provided in the Social survey report.
Picture 1: NGOs/CSOs assessment, Bavet, September 2020
48
V. NEEDS, PREFERENCES, AND DEMANDS OF PROJECT STAKEHOLDERS
The socio-economic profile of households in Bavet, as well as their needs,
preferences, and demands, have been covered in the previous chapter. The focus here is on
poor and vulnerable groups.
1. Informal settlement dwellers
No informal settlement were identified as affected by the project during the Inventory
of Losses survey and as presented in the Basic Resettlement Plan volume. Therefore, no
specific demands have been listed for this stakeholder category.
2. Poor households
The definition of poor HHs can vary- and there is no specification about ID Poor in the
CCS. For the purpose of our analysis- and given the data available- we base our analysis on
the average monthly income estimated during the survey for each HH and focused on those
with less than $250/month average- i.e., 125 HHs (and approximately the poorest quintile of
the sample).Their total average income is estimated at $139, and average income per capita
per day is estimated at $0.94, near the Cambodian poverty line 2020 ($0.93)58 ID poor groups
were consulted during the social survey for additional qualitative information about needs,
preferences, and demands.
95% of those poorer HHs have a permanent house, and 92% own their house, which
is slightly below the rate in the whole group. 74% have been living in the area for more than
ten years/ forever, which is also less than in the whole group. 31% of the poorest households
are FHHs, and 16% have no education compared to 13% in the whole group. Their average
monthly income is only 28% of the average monthly income of the whole group.
44% HHs are in an area served by piped water supply, and 33% of those HHs are
connected. 52% drink water from vendors (against 46% for the whole group), 44% from their
own well (deep well) and 4% drink public water, and 59% treat water before drinking. While
36% have no issue with water supply, 42% consider water is too expensive- compared to 15%
in the whole group. 66% of HHs would pay for the connection to the public water supply pipe
(a higher percentage than for the whole group)- and 31% could pay KHR 20,000 ($4.8)and
23% KHR 40,000 ($9.6) for a monthly fee. This is comparable to affordability for the whole
group, but a willingness to be connected seems higher.
93% of HHs have toilets which is the average in the total population interviewed. 62%
don’t know how much they could afford for connection to the sewerage network, and 26%
think it could be more than KHR 40,000 ($9.6) (average: KHR 150,000 ($36.6)). 60% HHs are
also unsure of the amount they could afford for monthly fees- 24% could afford up to KHR
10,000 ($2.4)per month. The level of uncertainty is high. This is similar to affordability for other
groups. The majority of poor households (91%) would not take a loan to improve sanitation-
this is slightly below other respondents.
58 The national poverty line defines the poor as people who earn $0.93 or less per day.

49
50% of HHs face no environmental issues, but 60% are confronted with waste
management issues in their neighborhood (solid waste piling), which also affects the
environment and health (63% HHs compared to 67% in the whole group). 10% of HHs receive
a solid waste collection service. This is a bit lower than for other groups in the urban area but
much higher than for HHs in the rural area. 15% of “relatively poor” HHs find the solid waste
collection service is good and are more satisfied than the other respondents. The key point of
improvement could be a cleaner collection service. 80% never participated in an
environmental campaign. The majority of poor HHs (74%) sort their waste before disposal, as
for the rest of the interviewees. 66% of HHs don’t know how much they can afford for a monthly
collection service, and no clear amount can be drawn from the answers. This is consistent
with the whole group.
Poor households rely on the same information channels as other households for flood
warnings (TV/radio and social media).
While water supply and drainage overall satisfy the poorest HHs, they are less satisfied
with regards to wastewater management and solid waste management than other
respondents.
In Bavet, there is no major distinction between the poorer households and the rest of
the population nor in terms of preferences, needs, nor in terms of affordability. Awareness of
health and environmental problems linked to sanitation seems a bit lower and maybe
addressed through specific training and awareness campaigns.
The level of uncertainty regarding affordable costs must, however, be taken into
consideration. Participants in FGDs repeated that they may not connect to sewerage and
could not afford the service fee. They request low prices for connection and service fees. It is
noticeable that there was no request for free connection or monthly fees in the CCS.
Table 11: Analysis of affordability for poor households
Affordability data analysis Bavet (KH riels)
Poor Hhs
Cost of connection to a sewerage pipe
Free of Charge 0%
don't know 62%
<5,000 included 1%
5,000 to 8,000 included 0%
8,000 to 15,000 included 2%
20,000 to 25,000 included 4%
30000 1%
40000 3%
>40,000 26%
average >40,000
Monthly fee rate for sewerage
Free of Charge 0%
Don’t know 60%
<10,000 24%
10,000 to 20,000 included 10%

50
Affordability data analysis Bavet (KH riels)
Poor Hhs
20,000 to 40,000 included 6%
40,000 to 60,000 included 0%
80,000 to 100,000 included 0%
>100,000 1%
Monthly fee rate for the waste collection fee
Free of Charge 1%
don't know 66%
<4,000 included 9%
4,000 to 6,000 included 6%
7,000 to 8,000 included 1%
9,000 to 12,000 included 5%
12,000 to 20,000 included 5%
>20,000 7%
3. Female-headed households
199 FHHs have been surveyed during CCS. 46% of those FHHs were headed by
widows (average age of the sample 52.3 y.o, which is older than the whole sample). 98% of
FHHs live in a permanent house, and 96% own their house. 25% of heads of households have
no formal education compared to 10% of the whole population. Those households currently
benefit from the same access and services of water supply, sanitation, and waste
management than other households. We observe slight differences between FHHs and the
whole groups in terms of the level of awareness on health and sanitation and on technical
details about toilets/ sanitation.
24% of FHHs have piped water supply available in their area, and 38% of those are
connected. The others cannot afford connection and user fees. 47% treat water before
drinking, and 38% experienced no problem with the water supply. 38% consider water is,
however, too expensive, which is comparable to Poor HHs and much higher than for other
HHs. 66% of FHHs are willing to pay for connection to the water supply pipe, which is a bit
less than for other HHs. 38% of FHHs could afford connection if it is KHR 20,000 and 19% for
KHR 40,000- comparable to results obtained for the whole group. A similar price range would
be affordable for a supply of 150 liters per day and per person for 24h/7days availability. This
is like results obtained for the whole group
93% of FHHs have toilets available at their house, which is similar to the whole group.
7% of FHHs have no toilets and have to use neighbors' toilets or go to the field. Most
households had little information about the costs, construction, and maintenance of their
toilets. 67% of FHHs do not know if they will be willing to pay for connection to sewerage pipe.
17% would afford more than KHR 40,000 (average KHR 161,000). Similarly, for a monthly fee,
while 66% of FHHs have no idea about the appropriate cost, 17% could pay below KHR 10,000
per month and 10% between KHR 10,000 and 20,000. Though the highest level of uncertainty
is observed compare to other HHs, levels of affordability are similar.
52% of FHHs experience no direct problem with the environment, but 59% observe a
problem with solid waste in their neighborhoods. FHHs seems to notice less problem with solid
waste piling than other HHs, and only 56% acknowledge that solid waste mismanagement can
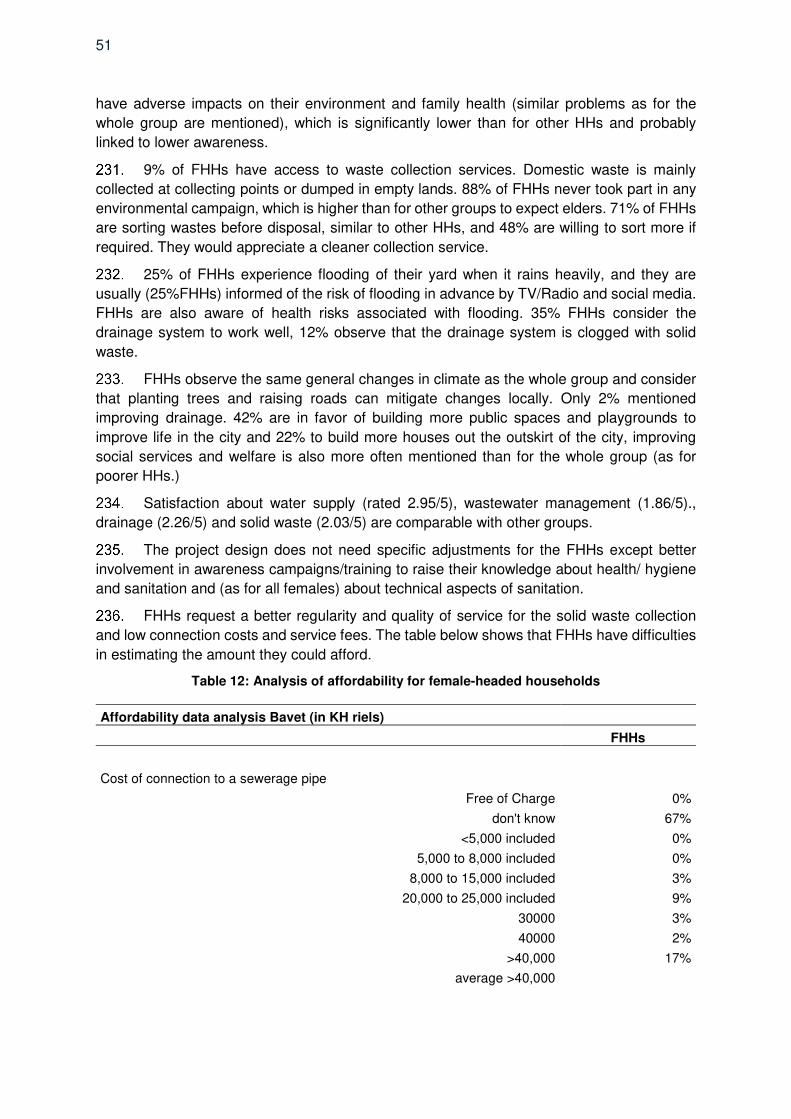
51
have adverse impacts on their environment and family health (similar problems as for the
whole group are mentioned), which is significantly lower than for other HHs and probably
linked to lower awareness.
9% of FHHs have access to waste collection services. Domestic waste is mainly
collected at collecting points or dumped in empty lands. 88% of FHHs never took part in any
environmental campaign, which is higher than for other groups to expect elders. 71% of FHHs
are sorting wastes before disposal, similar to other HHs, and 48% are willing to sort more if
required. They would appreciate a cleaner collection service.
25% of FHHs experience flooding of their yard when it rains heavily, and they are
usually (25%FHHs) informed of the risk of flooding in advance by TV/Radio and social media.
FHHs are also aware of health risks associated with flooding. 35% FHHs consider the
drainage system to work well, 12% observe that the drainage system is clogged with solid
waste.
FHHs observe the same general changes in climate as the whole group and consider
that planting trees and raising roads can mitigate changes locally. Only 2% mentioned
improving drainage. 42% are in favor of building more public spaces and playgrounds to
improve life in the city and 22% to build more houses out the outskirt of the city, improving
social services and welfare is also more often mentioned than for the whole group (as for
poorer HHs.)
Satisfaction about water supply (rated 2.95/5), wastewater management (1.86/5).,
drainage (2.26/5) and solid waste (2.03/5) are comparable with other groups.
The project design does not need specific adjustments for the FHHs except better
involvement in awareness campaigns/training to raise their knowledge about health/ hygiene
and sanitation and (as for all females) about technical aspects of sanitation.
FHHs request a better regularity and quality of service for the solid waste collection
and low connection costs and service fees. The table below shows that FHHs have difficulties
in estimating the amount they could afford.
Table 12: Analysis of affordability for female-headed households
Affordability data analysis Bavet (in KH riels)
FHHs
Cost of connection to a sewerage pipe
Free of Charge 0%
don't know 67%
<5,000 included 0%
5,000 to 8,000 included 0%
8,000 to 15,000 included 3%
20,000 to 25,000 included 9%
30000 3%
40000 2%
>40,000 17%
average >40,000

52
Affordability data analysis Bavet (in KH riels) Monthly fee rate for sewerage
Free of Charge 0%
Don’t know 66%
<10,000 17%
10,000 to 20,000 included 10%
20,000 to 40,000 included 5%
40,000 to 60,000 included 1%
80,000 to 100,000 included 2%
>100,000 1%
Monthly fee rate for the waste collection fee
Free of Charge 1%
don't know 73%
<4,000 included 7%
4,000 to 6,000 included 7%
7,000 to 8,000 included 0%
9,000 to 12,000 included 4%
12,000 to 20,000 included 6%
>20,000 3%
4. Indigenous peoples
The number of IPs surveyed in the CCS is insignificant and does not allow for specific
analysis. However, it is observed from the sample that the estimated average monthly income
reaches $281 for an estimated amount of monthly expenses of $355. The average income is
lower than the average income in the general population.
Since the new law on nationality was passed in 2018, Vietnamese people in Bavet
have lost their Khmer ID card and family book. While they confirm to have similar access to
school and public infrastructure as Cambodian families, they do participate less in social/
community events.
FGDs with IPs as part of the social survey conducted in September 2020 confirmed
that they have similar constraints and demands regarding waste collection, wastewater
management, and stormwater drainage.
These aspects are further developed in the Indigenous Peoples – Due Diligence
Report.
5. Youth and children
Youth and children were not surveyed in the CCS. Information collected from a sample
of youth from high school during FGDs, show that young people are generally involved in solid
waste management, giving a hand to their parents (collecting and disposing of trash); They
are sensitive to the problem of solid waste as it impacts their daily life (flies, smells and
associated illness). For them, the problem is caused by insufficient and irregular collection.
Solid wastes then pile everywhere, which pushes people to burn waste. None of the students
met did join any environmental campaign, and their school does not propose any specific
program. They are, however, ready to support a recycling program if needed (more sorting).

53
Young people all have access to toilets at home and school but have fewer ideas about their
O&M. They look forward to better wastewater management to improve health but are unsure
about the constraints it will cause during works and affordable prices for the community. While
they do not observe flood at home, floods can make access to school difficult. They observe
that flooding is also a consequence of improper solid waste management. Garbage clogging
the drainage systems prevent water from flowing.
6. Persons with disabilities
The number of persons with disabilities in the CCS is insignificant and does not allow
for specific analysis.
According to FGDs conducted with People with Disability (PwD) in Bavet, they share
the same needs (regular solid waste collection service, proper wastewater treatment, and
flood/ disaster risk management), constraints (costs), and opportunities (health benefits,
attractive city) as other respondents in vulnerable groups.
They request the Municipality to provide more bins and enlarge the services area. They
mention that specific prices should be proposed to PwD, which would allow them to access
the services. They are really willing to be connected, for instance, to the sewerage system but
could do it only if it is affordable. They do not specify any amount.
7. Elderly
A sample of 25 elders (average 71 y.o) has been interviewed, out of which 56% had
no formal education. 88% are long term residents of Bavet and all own their house (permanent
housing).
Elders in Bavet mostly drink water taken from their well (52%) or bought from vendors
(44%). 60% consider that the price of water is too high. Out of 40% of elders having access
to piped water systems, 30% are connected. -They mostly rely on their wells. 48% used to
treat water for drinking. A high proportion of the elders interviewed (88%) would pay to be
connected to piped water supply (for convenience, and because the price of water bought
from vendors is high), 44% could afford KHR 20,000 ($4.6) for connection, and 16% KHR
40,000 ($9.6). While the cost range is similar as for other groups, the proportion of elders
opting for the cheapest cost is higher. 44% could afford a monthly fee between KHR 15,000
($3.6) and 20,000 ($4.9).
Only 80% of elders have toilets. This is the lowest rate of all groups, but only 4% would
consider building flush toilets/ septic tank, 92% would not take a loan for sanitation
infrastructures, and 76% don’t know if they would pay to be connected to a sewerage pipe.
Proper sanitation does not seem to be a priority for those elders.
40% of elders do not face environmental problems, which are below average, and 60%
think there is a solid waste management issue, like the rest of the population. 84% of elders
consider that solid waste piling in their area affects both environment and health. 52% directly
link wastewater and garbage to disease. A high proportion of elders have never joined
environmental campaigns (92%), and they have a tendency to sort waste less than other
groups and to be less positive on sorting before disposal. 20% of elders pay for a waste
collection service, but 76% of elders don’t know if they would agree to pay for this type of
service.

54
60% of the elders interviewed were never flooded, and 32% only during heavy rains.
Their main source of warning about flooding is TV/radio. 28% observe that drainage is clogged
with solid waste.
They consider that raising roads and planting trees could help mitigate climate change
locally.
Only 20% of elders consider their area is polluted (compared to 34% for the whole
group) and are affected by dust, noise, and bad smell from the garbage.
Elders are moderately satisfied with water supply and drainage in Bavet and not
satisfied with solid waste and wastewater management.
Their main suggestion to improve life in Bavet city is to build more public spaces and
playground and build more in the outskirts of the city.
While the number of elders interviewed is limited; results show that their priority is for
piped water supply, and they seem to be more concerned by health impacts than
environmental impacts of improper waste management. They are hesitant when it comes to
paying for sanitation costs: sewerage and solid waste collection fees. Participants in FGDs
mentioned that they would agree to pay $3/month for solid waste collection service, as per
actual price, but requests the service to be improved (more regular collection and information
about service disruption) and mentioned that they would need a low price for
sewerage/drainage connection and service fees. They insisted on the need for information
and training on health/hygiene/sanitation and especially related to and during floods.
Table 13: Analysis of affordability for elders head of households
Affordability data analysis Bavet (in KH riels) Elders Cost of connection to a sewerage pipe
Free of Charge 0% don't know 76%
<5,000 included 0% 5,000 to 8,000 included 0%
8,000 to 15,000 included 0% 20,000 to 25,000 included 8%
30000 0% 40000 0%
>40,000 16% average >40,000
Monthly fee rate for sewerage Free of Charge 0%
Don’t know 76% <10,000 24%
10,000 to 20,000 included 0% 20,000 to 40,000 included 0% 40,000 to 60,000 included 0%
80,000 to 100,000 included 0% >100,000 0%
Monthly fee rate for the waste collection fee Free of Charge 0%
don't know 76% <4,000 included 12%
4,000 to 6,000 included 8% 7,000 to 8,000 included 4%
9,000 to 12,000 included 0% 12,000 to 20,000 included 0%
>20,000 0%
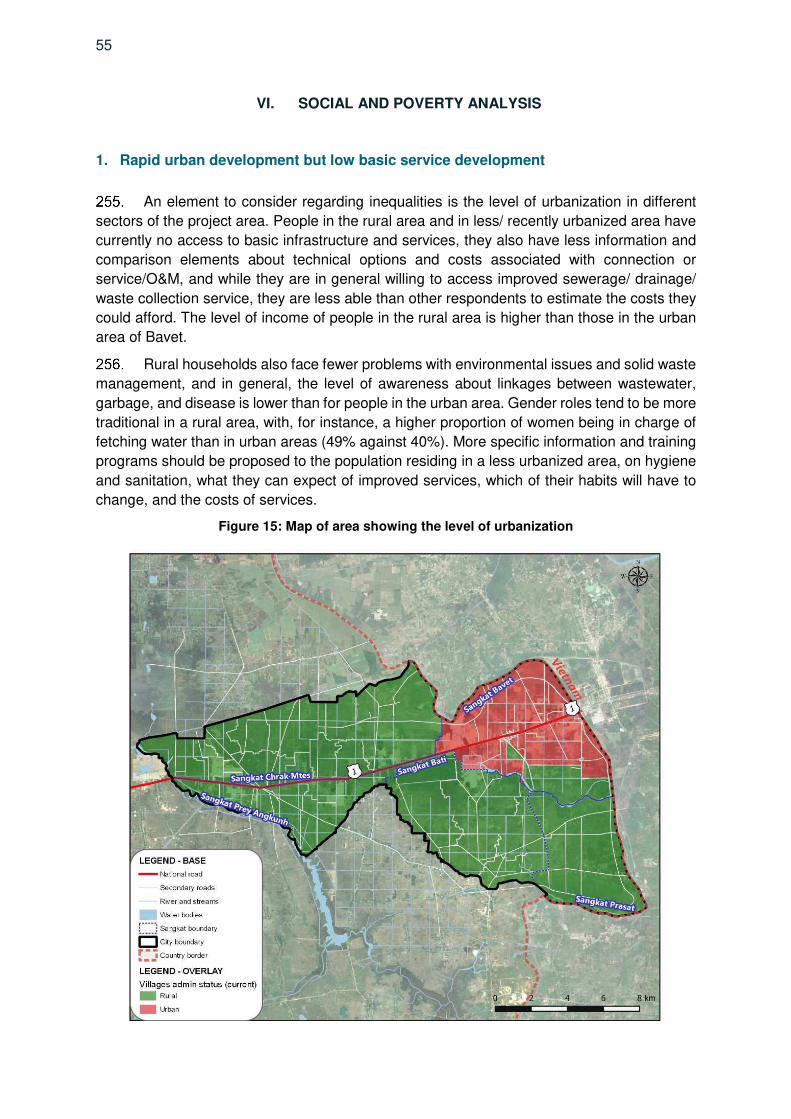
55
VI. SOCIAL AND POVERTY ANALYSIS
1. Rapid urban development but low basic service development
An element to consider regarding inequalities is the level of urbanization in different
sectors of the project area. People in the rural area and in less/ recently urbanized area have
currently no access to basic infrastructure and services, they also have less information and
comparison elements about technical options and costs associated with connection or
service/O&M, and while they are in general willing to access improved sewerage/ drainage/
waste collection service, they are less able than other respondents to estimate the costs they
could afford. The level of income of people in the rural area is higher than those in the urban
area of Bavet.
Rural households also face fewer problems with environmental issues and solid waste
management, and in general, the level of awareness about linkages between wastewater,
garbage, and disease is lower than for people in the urban area. Gender roles tend to be more
traditional in a rural area, with, for instance, a higher proportion of women being in charge of
fetching water than in urban areas (49% against 40%). More specific information and training
programs should be proposed to the population residing in a less urbanized area, on hygiene
and sanitation, what they can expect of improved services, which of their habits will have to
change, and the costs of services.
Figure 15: Map of area showing the level of urbanization

56
2. Addressing existing deficiencies in basic infrastructure
Wastewater management challenges and recommendations59:
Technical recommendation to address the challenges of poor wastewater services in
a fast urban development context (it is estimated that 74% of the excreta generated is unsafely
managed) are developed under Feasibility study Volume 3 Wastewater.
Stormwater management challenges and recommendations60
Similarly Feasibility Study, Volume 4, present some recommendation for urban and
rural areas to address the city challenges with flooding in the context of uncontrolled urban
developpement (e.g.clogging of channels) and climate change.
Solid waste management challenge and recommendations61
Solid Waste Management: Feasibility study, Volume 5 covers the challenges of service
coverage for waste collection services, collection of household hazardous waste and
operation of the dumpsite and waste recycling. It also highlight the poor working conditions of
the waste pickers in the streets and in the dumpsite and negative consequences for their
health and safety.
3. Impact on poverty reduction
Adverse social costs
As the project aims to improve the urban infrastructures, a few negative impacts are
expected:
(i) Access disruption and dust from the construction and installation of civil works associated with the sewerage system and wastewater drainage ; 62 and
(ii) Cost of access to improved infrastructures and services represent additional expenses and weights relatively more on poor/ vulnerable household budget.
(iii) Impact on informal jobs.
Special assistance for poor and vulnerable groups has been included in the Basic
Resettlement Plan.
In order to reduce the negative impacts occurring during the construction, an
Environmental Management Plan (EMP) has been prepared (refer to the Initial Environmental
Examination volume) and will need to be updated during the Detailed Engineering Design.
The project involves temporary and permanent land acquisition but no house
demolition. However, network construction works may cause temporary disruptions to vehicle
access, traffic flow, rail services, and utility services, such as water supply. Access disruption
and dust from the construction and installation of civil works could impact local businesses as
59 Feasibility study Volume 3 60 Feasibility Study, Volume 4 61 Feasibility study, Volume 5 62 Also covered in Bavet IEE report.

57
access will be momentary made more difficult, visibility reduced, or noise/dust could create
discomfort for the business owners and customers/guests. It could result in a punctual loss or
reduction of incomes.
Given the increased dust during construction, it is possible that an increase in
respiratory disorders (such as asthma, bronchitis) is observed, and these illnesses are more
likely to affect the very young and very old. People are also concerned about the risks of
accidents in the construction area (e.g., drowning of children, falling into holes). This could
impact more on women, given that they may have to assist young children in getting to school,
go to the market, and staying at home to look after sick family members. Per experience,
people are also afraid of project disruption due to funding or cash flow issues, which would let
them in the middle of a construction site for a long and uncertain time.
The construction of temporary workers camps may affect the local community and
environment. Contractors’ environmental and occupational health and safety plans will provide
mitigation measures. The recruitment of construction workers will prioritize local residents to
reduce the number of migrant workers. HIV/AIDS, communicable diseases, gender-based
volence and sexual exploitation, abuse and harassment (GBV-SEAH), COVID-19 specific
measures will also be implemented in contractors’ health and safety plans.
The cost of access to improved infrastructure and services represent additional
expenses and weighs relatively more on poor/ vulnerable household budget. For instance,
and according to the information available, the current price for solid waste collection service
in Bavet is $3.9/month (median); $6.54/month for HHs (average). While this represents barely
1% of the whole group average revenue, it is nearly 5% of the estimated average revenue of
the poorest households.
Additional costs for solid waste collection, connection to sewer pipes, and monthly
sewerage fees will impact the vulnerable group's budgets more significantly. There is a risk (i)
that poorer households cannot afford nor access improved sewerage and solid waste
management services, (ii) that poorer households have to make difficult choices between
expenses, and that better sanitation happens at the expense of nutrition, education, or health
for instance, which is not the purpose of the project.
The improvement and organization of the Solid Waste Management system, and the
closing of the existing landfill, will impact informal jobs of waste pickers and scavengers.
Street waste pickers contribute to collecting 10% of the solid waste generated each
day in Bavet. Currently, 26 waste picker households/ 115 persons (60% females) are working
at the existing landfill located on the public land, and for the majority this is a full-time job for
more than ten years.63Working conditions of waste piskers and children’s work in the dumpsite
are two major issues to address by implementing the new SWM strategy, and waste pickers
will not be authorized to informally work on the new site and will lose their main source of
income.
75% of the waste pickers consulted as part of the IOL/SES mentioned they would
continue to pick waste around markets and along the houses to make an income. Half are
interested in working in project construction work. Consulted during the social survey, groups
of informal waste pickers/ scavengers expressed that they may be interested in formal jobs.
They do not know much about vocational training options, but they are still keen on the training.
63 Draft report, Inventory of Loss and Socio-Economic-Survey October 2020, Egis
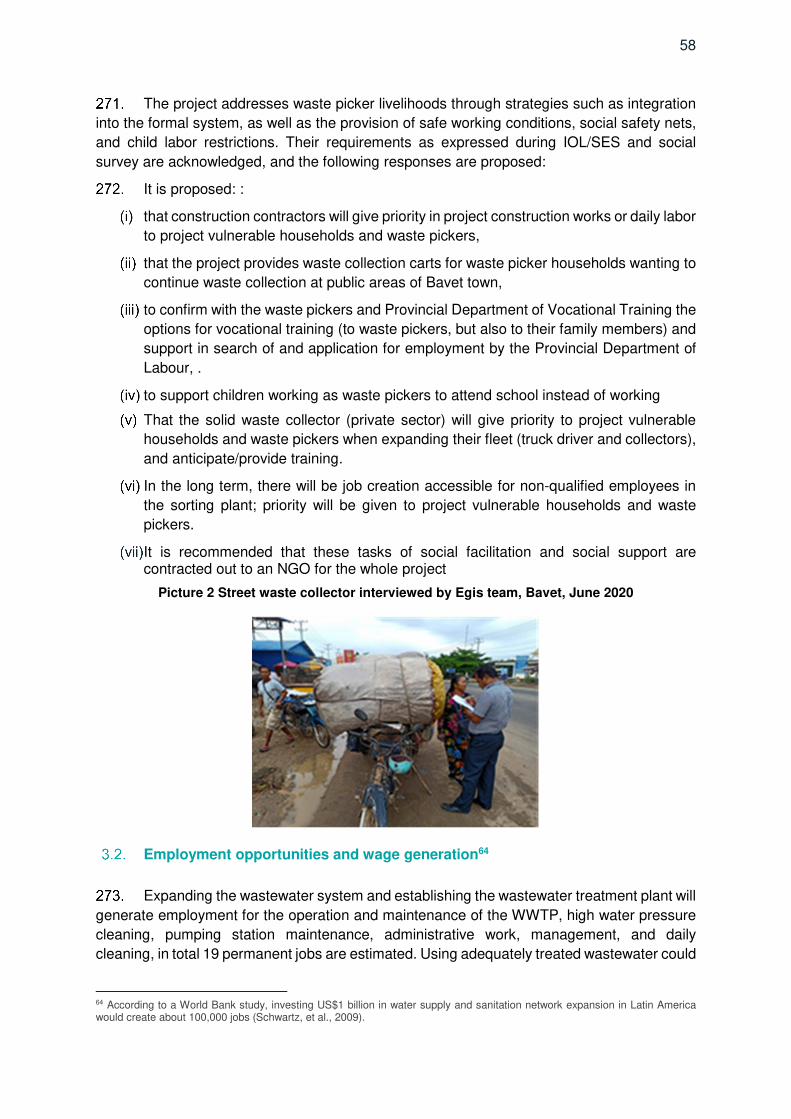
58
The project addresses waste picker livelihoods through strategies such as integration
into the formal system, as well as the provision of safe working conditions, social safety nets,
and child labor restrictions. Their requirements as expressed during IOL/SES and social
survey are acknowledged, and the following responses are proposed:
It is proposed: :
that construction contractors will give priority in project construction works or daily labor
to project vulnerable households and waste pickers,
that the project provides waste collection carts for waste picker households wanting to
continue waste collection at public areas of Bavet town,
to confirm with the waste pickers and Provincial Department of Vocational Training the
options for vocational training (to waste pickers, but also to their family members) and
support in search of and application for employment by the Provincial Department of
Labour, .
to support children working as waste pickers to attend school instead of working
That the solid waste collector (private sector) will give priority to project vulnerable
households and waste pickers when expanding their fleet (truck driver and collectors),
and anticipate/provide training.
In the long term, there will be job creation accessible for non-qualified employees in
the sorting plant; priority will be given to project vulnerable households and waste
pickers.
It is recommended that these tasks of social facilitation and social support are contracted out to an NGO for the whole project
Picture 2 Street waste collector interviewed by Egis team, Bavet, June 2020
Employment opportunities and wage generation64
Expanding the wastewater system and establishing the wastewater treatment plant will
generate employment for the operation and maintenance of the WWTP, high water pressure
cleaning, pumping station maintenance, administrative work, management, and daily
cleaning, in total 19 permanent jobs are estimated. Using adequately treated wastewater could
64 According to a World Bank study, investing US$1 billion in water supply and sanitation network expansion in Latin America would create about 100,000 jobs (Schwartz, et al., 2009).
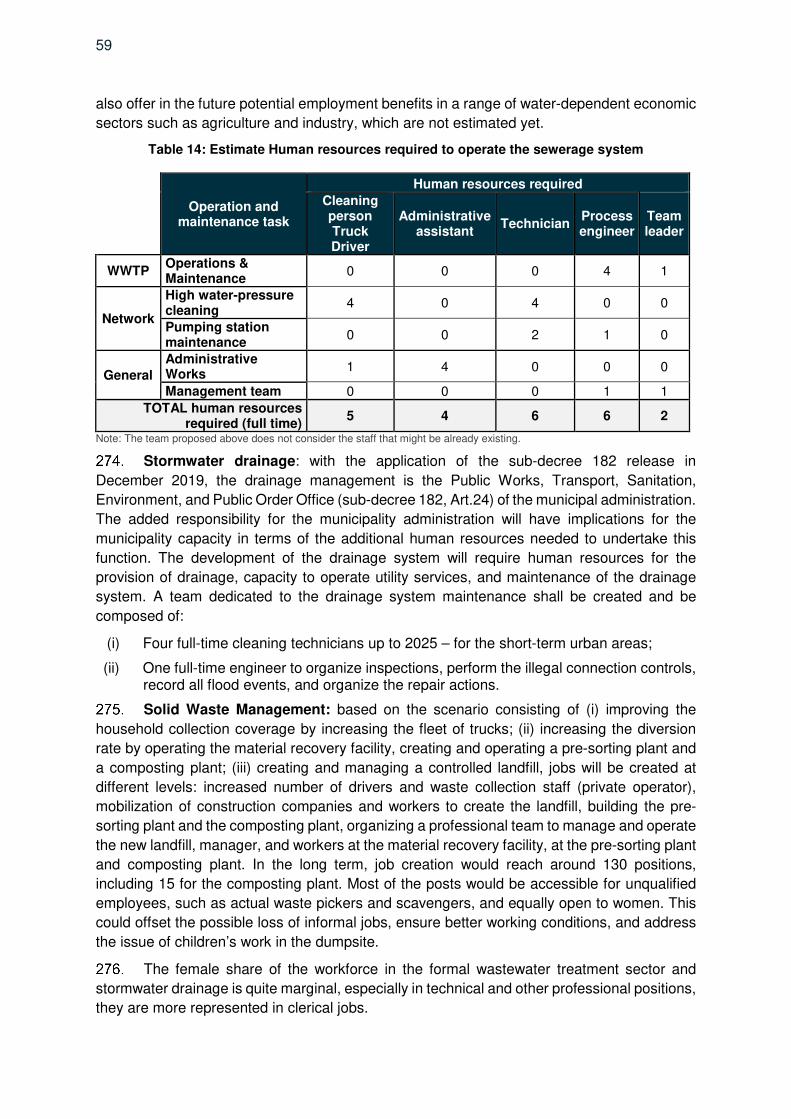
59
also offer in the future potential employment benefits in a range of water-dependent economic
sectors such as agriculture and industry, which are not estimated yet.
Table 14: Estimate Human resources required to operate the sewerage system
Operation and maintenance task
Human resources required
Cleaning person Truck Driver
Administrative assistant
Technician Process engineer
Team leader
WWTP Operations & Maintenance
0 0 0 4 1
Network
High water-pressure cleaning
4 0 4 0 0
Pumping station maintenance
0 0 2 1 0
General
Administrative Works
1 4 0 0 0
Management team 0 0 0 1 1
TOTAL human resources required (full time)
5 4 6 6 2
Note: The team proposed above does not consider the staff that might be already existing.
Stormwater drainage: with the application of the sub-decree 182 release in
December 2019, the drainage management is the Public Works, Transport, Sanitation,
Environment, and Public Order Office (sub-decree 182, Art.24) of the municipal administration.
The added responsibility for the municipality administration will have implications for the
municipality capacity in terms of the additional human resources needed to undertake this
function. The development of the drainage system will require human resources for the
provision of drainage, capacity to operate utility services, and maintenance of the drainage
system. A team dedicated to the drainage system maintenance shall be created and be
composed of:
(i) Four full-time cleaning technicians up to 2025 – for the short-term urban areas;
(ii) One full-time engineer to organize inspections, perform the illegal connection controls, record all flood events, and organize the repair actions.
Solid Waste Management: based on the scenario consisting of (i) improving the
household collection coverage by increasing the fleet of trucks; (ii) increasing the diversion
rate by operating the material recovery facility, creating and operating a pre-sorting plant and
a composting plant; (iii) creating and managing a controlled landfill, jobs will be created at
different levels: increased number of drivers and waste collection staff (private operator),
mobilization of construction companies and workers to create the landfill, building the pre-
sorting plant and the composting plant, organizing a professional team to manage and operate
the new landfill, manager, and workers at the material recovery facility, at the pre-sorting plant
and composting plant. In the long term, job creation would reach around 130 positions,
including 15 for the composting plant. Most of the posts would be accessible for unqualified
employees, such as actual waste pickers and scavengers, and equally open to women. This
could offset the possible loss of informal jobs, ensure better working conditions, and address
the issue of children’s work in the dumpsite.
The female share of the workforce in the formal wastewater treatment sector and
stormwater drainage is quite marginal, especially in technical and other professional positions,
they are more represented in clerical jobs.

60
Table 15 Sex Disaggregated data on staff at PDoPWT level, Svay Rieng.
No. Municipality / Department
Governor/ Head Dep
# of Deputy Gov/ Deputy
Dep. Chief of Office
Number of Staffing
Sex Total Female Total Female Total Female
2 PDoPWT M 3 0 10 0 56 16
Gender mainstreaming requires a better understanding of key impediments and
greater efforts to promote technical careers of young women (through scholarships, changed
recruitment procedures, , continuous training and internal promotion etc.). Professional
training needs to be complemented by adequate technical and vocational education and
training efforts.
Indirect jobs creation will result from better urban infrastructure and solid waste
management.
Better urban environment will contribute to improving the attractiveness of the city for
foreign and local tourists- with the development of tourism-related jobs in hotels, restaurants,
shops, casinos, and entertainment will become available.
Appropriately designed infrastructure and services (which anticipate future
requirements) can also make Bavet SEZs more attractive and contribute to attracting new
industries and commercial establishments. The local authorities are expecting additional
industry locators to expand the existing and develop new SEZs.
Improving the infrastructures for the poor
Investments in urban areas are key determinants of long-term sustainable growth and
the capacity of the poor to benefit from the growth process. It is recognized that infrastructural
development leads to poverty reduction, but also that through investment in infrastructure, in
general, reduces poverty, investment in social infrastructure exerts a greater effect as a
poverty reduction strategy relative to physical infrastructure investment. It is thus
recommended that physical infrastructure investment is supported by factors such as
improvement in social infrastructure (health, education) to promote rapid reductions in
poverty65. Infrastructure and social services development are a source of increased job
opportunities as well as the creation of a healthy, more productive workforce.
According to Jalilian and Weiss (2004), “On average, a 1 percent increase in
infrastructure stock per capita, holding human capital constant, is associated with a 0.35
percent reduction in the poverty ratio, when poverty is measured by US$1/day poverty
headcount, or 0.52 percent when it is measured by US$2/day poverty headcount”.66
Investments in health and education are part of other development programs
developed by the RGC with support from international donors and ADB, and coordination
between sectors and departments at municipality levels is recommended to maximize the
impact of urban infrastructure development on poverty reduction. The project will also
65 Jalilian and Weiss (2004) explore the nexus between infrastructure, growth and poverty using samples of countries from Africa, Asia and Latin America. 66 Jalilian and Weiss (2004) explore the nexus between infrastructure, growth and poverty using samples of countries from Africa, Asia and Latin America.
61
contribute to people’s education on water, hygiene and sanitation, and the environment and
improve policy and regulatory environment.
In the objective of maximizing the number of households connected to and/or using
infrastructure and services, the tariff systems have to be designed (i) to provide a price that
is affordable for all categories of households and as such will not necessarily ensure full cost
recovery, or (ii) to ensure equity, subsidize only those for whom connection or service fees
would be unbearable and not the wealthier consumers/users for whom those costs have no
significant impact on their budget. The use of the existing ID Poor P1 and P2 cardholder
system is an option that has been used for water supply in Battambang. Whereas the full water
connection fee is KHR 500,000, P1 and P2 cardholders will automatically qualify for a KHR
100,000 subsidy. This can be paid upfront, or if the HH does not have the money, it can elect
to pay by installments over a 6- or 12-month period. If a HH is poor, cannot afford the
connection fee, but does not hold a P1 or P2 card, the HH may request a letter from its
Commune Council certifying the HH’s economic status as poor and present this to the BTB
water supply agency for consideration of the subsidy or installment payments.67
Within a sustainable development framework, the need for subsidies to provide
services to the poor is widely accepted and forms part of the ADB Water Policy. During the
social survey, vulnerable groups insisted that while they are willing to be connected or to
access the services, they have limited capacity to pay, which could prevent them from
accessing the service. Local authorities are also aware of this situation and proposed to
consider equitable pricing during the social survey.
Wastewater To facilitate access to the new service, a wastewater tariff schedule will
need to be applied for residential, commercial, hotels, institutions and special economic zones.
The fees will be levied and will be slowly increased with the intention of achieving full cost
recovery from 2027, onwards. An affordability assessment was conducted which determined
that the expenditure accounts for wastewater is less than 5% of household income (deemed
affordable). The project proposes an off-site sanitation system (wastewater treatment plant
(WWTP), piped collection). However, in rural areas and urban areas where the connection
sewerage system would have been too expensive, the on-site collection is proposed. The
collected fecal sludge will be transferred by vacuum-truck to the WWTP.
The stormwater drainage is a non-revenue generating asset and will require
allocated funds from the municipal budget to cover the operative expenditure. No specific
measure is proposed. The project proposes to address the city recurrent flooding issues by
developing an underground network (box-culvert) in urban area as to minimize the risk of
blockage by solid waste and problems related to resettlement, and to deal with the low space
available (line placement under existing streets and road).
Solid Waste management:. The collection is adapted to the area (i) with the
improvement of the existing door-to-door collection system in the urban area (ii) and
improvement the global collection coverage, through centralized collection points in rural
Sangkat. The project also recommended to close the existing dumpsite where waste pickers
are working in poor conditions with negative consequences for their health and safety. It is
recommended to invest in the pre-sorting plant to reduce waste landfills and to employ waste
pickers working currently in poor conditions as sorting operators. In the final instance, a
revenue-generating service can be expected to be almost self-financing through user pay. In
67 TA8982-CAMProvincial Water Supply and Sanitation Project, Poverty, Social Impact and Gender Analysis Draft: February 2017

62
the project, a sorting plant and a composting plant are proposed. Controlling part of the
recyclables and compost economy would improve economic sustainability and reduce the
financial burden on the population. Even if the compost selling revenues do not recover the
composting plant costs in the current market condition, long term benefits should be
considered, such as lower landfill footprint and economic benefits for farmers. Composting is
also an opportunity to reduce greenhouse gas emissions
4. Impact on health
General consideration
The release of untreated or inadequately treated wastewater into the environment
remains a common practice. Livelihoods in farming, fisheries, aquaculture, and tourism suffer
as a consequence (UNEP, 2015). This practice has severe negative health impacts due to
hepatitis A infections, worm diseases, schistosomiasis, gastrointestinal infections, and
respiratory disorders (Heymann et al., 2010) and contributes to malnutrition and stunting.
Inappropriate wastewater disposal prevents or harms close to 65 million life-years annually,
which translates into reduced productivity and inability to carry out work. In Bavet, 69% of
households don’t know where wastewater from businesses/ production is handled, and 97%
don’t know where septic sludge is transported. As mentioned by participants in FGDs, in case
of flooding, soak pits overflow, and toilet wastewater mixes with rainwater, and potentially
pollutes ground water supply such as wells which is very unhealthy.
Poorly managed waste serves as a breeding ground for disease vectors spreading,
pest development and contributes to climate change through methane generation. 85% of
Households in Bavet observe bad management of solid waste in their area, and 79% are
affected by bad smells. 80% think that solid waste mismanagement affects both their
environment and their health.
The immediate health impacts of floods generally include drowning, injuries,
hypothermia, and animal bites. In the medium-term, infected wounds, complications of injury,
poisoning, poor mental health, communicable diseases, and starvation are indirect effects of
flooding. Lon term effects include chronic disease, disability, poor mental health, and poverty-
related diseases, including malnutrition68. Epidemiological evidence shows that chemical
material may contaminate homes and that in some cases, flooding may lead to the
mobilization of chemicals from storage or remobilization of chemicals already in the
environment, e.g., pesticides. Hazards may be greater when industrial or agricultural land
adjoining residential land is affected.69 Flooding can also affect the availability of health
services or access to health centers.
In Bavet, 33% of HHs associate the experience of skin disease of one of the HH
members with flooding, as well as 29% HHs associate cases of diarrhea with flooding. They
also observe the proliferation of trash, stagnant waters, overflowing wastes from septic tanks,
and a higher prevalence of diseases such as dengue fever, typhoid, skin disease, and
leptospirosis. 36% have little access to health centers during flooding.
68 Health Impacts of Floods, Paul George (a1) Published online by Cambridge University Press: 03 May 2011 69 Public health impacts of floods and chemical contamination, Euripides Euripidou, Virginia Murray, Journal of Public Health, Volume 26, Issue 4, December 2004, Pages 376–383,
63
Solid waste management is also an issue in flood risk management practice. After a
flood, the deposition of waste can block drains and be a source of toxins and breeding ground
for disease. Floods can also have an impact on waste management systems leading to the
leaching of toxins into groundwater.
Tthe better management of wastewater, solid waste, and rain/stormwater should result
in improved public health: reducing open burning, mitigating pest and disease vector
spreading, reduction in the release of untreated wastewater, lowering the impact of disasters.
Average spending for health in the previous year of survey in Bavet was around $112
($97 in a rural area and $146 in the urban area); and $103 was related to a waterborne disease
such as skin diseases, diarrhea, dysentery, typhoid fever, cholera (47.7% responses). On
average, HH members were unable to work for 5.3 days due to waterborne disease (18%
answers).
The impacts on health are described in more detail in Economic Analysis Volume.
The project can have a general impact on all the residents, the commercial sector, and
tourists through the reduction in the negative aspects.
Through improved sanitation, the population of Bavet will have access to improved
sanitary facilities, which will significantly reduce the incidence of disease related to poor
sanitation and drainage, particularly of acute intestinal infectious diseases, hepatitis, dengue
fever, malaria, etc. thereby reducing production time lost and money spent on dealing with
illnesses and impacting on the health of infants and the very young who are most susceptible
to disease related to poor sanitation.
The benefits of improved drainage are similar to the benefits of sanitation, with the
added reduction in disease and health costs associated with unsanitary sanitation, and
flooding and the contamination of floodwater with wastewater.
Risk of spread of HIV/AIDS and STIs
4.2.1. Current status of HIV/AIDS
UNAIDS data in 2019 estimate the number of adults and children living with HIV in
Cambodia at 73,000. The prevalence rate in the adult population (over 15 y.o)- is at 0.5. New
infections have been falling steadily since 1995, now reaching a steady low state of fewer than
1000 new cases per year, while the coverage of Antiretroviral therapy (ART) has been rising
to 80% of affected adults.
In Asia, HIV particularly impacts women because of gender differences. On the one
hand, men are more likely to have multiple partners, to travel for work, and to have disposable
income. On the other hand, women are physiologically more vulnerable to infection, and their
lack of social and economic power means most women are unable to negotiate safer sex.
Women generally have lower levels of education and skills and are poorer than men, so they
are less likely to access accurate information about HIV. Women are also more frequently and
severely impoverished due to HIV; often, the husband is the first in the family to get sick,
assets are sold to pay for his health care, and after his death, his widow and children are left
impoverished.
64
4.2.2. Knowledge about STIs and HIV/AIDS
In 2002, Cambodia's National Assembly passed legislation on HIV prevention and
control. The Government aim at the elimination of new HIV infections through (i) early
diagnosis of HIV infection and early access to ART as prevention and a boosted continuum of
care, (ii) boosted prevention of mother-to-child HIV transmission, (iii) boosted access to and
utilization of prevention, care and treatment services by key-affected populations, (iv)
strengthening of community-based health services, and (v) enhanced monitoring and
evaluation of impacts. The government has a multisectoral approach, and information and
awareness raising widely disseminated in the population through health and education
systems and early detection systems in place have reduced the risk of transmission.
Information and prevention go, for example, through women in the reproductive age group
(HIV and syphilis testing are proposed as part of antenatal care) and specifically target groups
at risk (drug users, entertainment and sex workers, men who have sex with men).70 Low level
of education, poverty, and living in a remote area with no or too few health centers, limit access
to information and services, which constrains behavior change and maintains social norms.
4.2.3. Risks associated with the project
Risks associated with the project infrastructures may arise during construction, and
the people most vulnerable to HIV/AIDS will be the skilled and semiskilled male workers—
including machine operators, drivers, supervisors, managers, and engineers—and young,
rural, poorly educated women who could move to the construction sites to sell sex. Local
laborers are usually less at risk because they are usually drawn from the local communities
and go back to their partners and families each night. Women who operate small
businesses/shops along the streets/roads, scavengers/ waste pickers could also be at risk of
HIV if they lose their livelihood as a result of construction works and infrastructure
development and consequently must look for other ways to gain an income such as paid
sexual transactions.71
The project aims at increasing the attractiveness of the city for tourists and businesses.
This will result in more regular and larger flows of people visiting or settling in the city (again,
more mobility coincides with a higher risk of circulation of all types of viruses including HIV)
and the development of entertainment and leisure businesses. These are favorable for the
development of the sex economy, with sex workers being at risk of contracting and spreading
HIV and STDs.
70 WHO Library Cataloguing-in-Publication Data, Joint review of the Cambodian national health sector response to HIV 2013. I. World Health Organization Regional Office for the Western Pacific 71 Intersections- Gender, HIV and infrastructure operations, lessons from selected ADB financed transport projects, August 2009, ADB.
65
VII. GENDER ASSESSMENT
1. Role and status of women
Social norms related to gender relations continue to constrain the development of
women’s potential and hinder their empowerment in economic, social, public, and political life.
Cambodian women are progressively enjoying wider freedoms and claiming their
rights through increased employment opportunities and Cambodia’s broader economic
development. Today Khmer women exercise considerable autonomy and independence.
They can own assets, land72, manage financial transactions, and contribute to household
decision making. Both men and women can inherit property, and the gender division of labor
can be complementary and flexible, with men and women performing a range of productive
and household tasks.73
However, traditional norms and low levels of education and literacy still limit girls’ and
women’s choices and options. Women are expected to follow social norms and beliefs that
allow men to enjoy their ‘gender privilege,’ while women under-value their own capacity and
potential. Women are considered to be of lower status than men, although the status is also
determined by age and other socioeconomic characteristics, especially wealth. For women,
marriage and children additionally determine status. In general, attitudes toward gender roles
continue to confine women to household and childcare duties (household manager), while at
the same time, the family’s economic status pressures them to engage in income-generating
work.74
Cambodia’s 2017 Gender Inequality Index (GII)75 value was 0.473, placing Cambodia
at 116th out of 160 countries, which was behind other ASEAN countries.
Education and health
Solid progress has been achieved in primary school enrollment from 97%%in 2012/13
to 98.4%% in 2015/16, and gender parity has been achieved at the primary level (1:1 ratio).
Overall completion rates at primary school increased to 84.1%%in 2015, with girls’ rates higher
than boys' at 86.6% %. In 2017-18, the primary gross enrolment rate (GER) was 97.8% %and
slightly higher for girls at 98.11%%. For Lower Secondary School, girls represent 52%% of all
students and 30%% of all repeaters, and women are 45%% of all teaching staff. The gap
between female and male LSS Gross Completion Rate (GCR) is widening in favor of girls,
with GPI increasing from 0.96 in 2012-13 to 1.21 in 2017-18. For Upper Secondary School,
72 In 2015, the RGC introduced the Land Policy “White Paper” in response to socio-economic development and land reform. The “White Paper” (Points 5 and 7) includes key guidelines and activities for achieving gender equality in the land sector and equity between men and women in the land registration process. 73 There are no legal restrictions for women to be recognized as the head of household, and married women are not required by law to obey their husbands. Women have the same rights and responsibilities towards their children, including being their legal guardians, during marriage (Civil Code, 2007). 74 NGO reports suggest the prevalence of customary attitudes that perceive men as the de-facto head of household, in particular when it concerns the rights to control and manage all of the family’s property (NGO CEDAW and CAMBOW, 2011). Customary law relating to the role and behavior of women, generally referred to as Chbab Srey in Khmer, is deeply rooted among many communities, in particular in rural areas where an overwhelming majority of Cambodians live. According to Chbab Srey, women should be subservient to men, and submissive and obedient to their husbands (STAR Kampuchea and ILC, 2013). 75 The Gender Inequality Index (GII) is an index for measurement of gender disparity. According to the UNDP, this index is a composite measure to quantify the loss of achievement within a country due to gender inequality. It uses three dimensions to measure opportunity cost: reproductive health, empowerment, and labor market participation.
66
girls represent 52%% of the students and 41 % of repeaters, and women are 32 % of teaching
staff and 22 % of school principals. In 2018, the Ministry of Education, Youth, and Sport
(MoEYS) instructed all the ministry’s units and educational institutions to institutionalize and
accelerate the effort to promote women in leadership in the education sector through key
specific approaches: 1) establish a women leadership program, 2) integrate female
representatives into promotion committees, and 3) accelerateappointments of more women to
management levels. Across ASEAN, Cambodia shows the biggest increases in the ratio of
girls to boys in primary and secondary schools, from among the lowest ratio of 93 and 82
respectively in 2007, to among the highest in 2015 with 101 and 109 respectively.76
In the context of Covid 19, The Ministry of Education Youth and Sport appealed to
parents of students to provide home education in a proper environment and help them obtain
more learning materials during the COVID-19 pandemic. However, this situation risks
increasing the gender gap in education. Girls may be expected, due to gender norms and
roles, to devote more time than boys to unpaid care work such as caring for younger siblings,
older populations, and those who are ill within the household rather than focusing on
education. . According to the Rapid Assessment of COVID-19 Impacts on Girls’ Education in
Northern Provinces of Cambodia conducted by Plan and Care Intrenational, COVID-19 has
magnified existing gender norms and roles particularly for women and girls in having to
manage more tasks in the household. Girls were more likely to be requested to do housework,
while boys were asked to help at the farm and paddy field with their parents.77
Women of reproductive age experience substantial risks associated with pregnancy
and childbirth. The World Bank’s data78 shows that around 167 women died from pregnancy-
related causes per 100,000 live births in 2017. Women in rural areas and poor households
are at a greater risk. In 2012, only 13% of births in rural areas were attended by a doctor,
compared to 32% in Phnom Penh. Cambodia is off track for the SDG target on maternal
malnutrition. Malnutrition is considered the underlying cause in 20% of maternal deaths,
accounting for nearly 300 maternal deaths annually in Cambodia.
The rate of anemia among pregnant women is 53%. About 6% of women have a height
of fewer than 145 centimeters, which indicates they were malnourished as children. These
women are also likely to give birth to small children.
Women generally also have a higher risk and health exposure as the primary
contributors to household and community sanitation tasks. The traditional separation of
gender roles where women are primarily responsible for domestic chores, including the care
of children, the elderly, and the sick, make them disproportionately affected by the lack of
reliable water supply and sanitation services, and these considerably increase women’s time
poverty. Women are the main users of water in households who are also primarily responsible
for solid waste, liquid waste, and wastewater management on the household level. Water
shortages also significantly increase the time needed for cooking, cleaning, and caring for both
children, the sick and disabled members. In addition, women who work in kindergarten,
schools, and hospitals bear the responsibility to fetch water and clean the toilets. Lack or low
76 Kingdom of Cambodia Cambodia Report On the occasion of the 25th Anniversary of the Fourth World Conference on Women and the adoption of the Beijing Declaration and Platform for Action (1995) Submitted by Ministry of Women’s Affairs Royal Government of Cambodia Phnom Penh June 2019 77 Rapid Assessment of COVID-19 Impacts on Girls’ Education in Northern Provinces of Cambodia, Care and Plan International August 2020, https://aseansafeschoolsinitiative.org/rapid-assessment-of-covid-19-impacts-on-girls-education-in-northern-provinces-of-cambodia/ 78 https://data.worldbank.org/indicator/

67
quality of potable water and sanitation also increase the incidences of water-borne diseases
and thus households ’expenditures on medicine and doctors’ fees.
Women and livelihood
Between 2000 and 2018, female laborers made up about 48% of the total labor force.
30% of the female labor force is employed in the agricultural sector, 45% in service, and 25%
in the industry sectors.79
Women are represented in the informal sector, with a high level of vulnerability. They
often engaged in low and unstable wage employment, casual work, and risky work
environments. Poor and rural women tend to be overrepresented in domestic work, home-
based work, and as street vendors, and smallholder farmers. According to the World Bank’s
data80, 57% of total female employment is in vulnerable employment with a high proportion as
own-account workers contributing domestic care and family work. Even though women own
65% of all businesses in Cambodia, those businesses are on average smaller and less
profitable than businesses run by men, with only 1.7% registered compared with 6.6% for
male-run businesses. Women-owned businesses are primarily concentrated at the micro-level
in the wholesale and retail trade and services sectors.81
While women earn substantially less than men, the earnings gap narrows with the
attainment of upper secondary and tertiary education. In 2014, only 5.3% of women in the
labor force had post-secondary education compared with 8.0% for men.
Women are benefiting from greater access to micro-finance: 80% of microfinance
institutions’ clients are women. However, women are less likely to access finance ( long-term
finance) because of limited collateral and low levels of formal education.
Single women from rural areas are often forced by a lack of livelihood options to
migrate to Phnom Penh or larger provincial towns to find employment, and the garment
industry is a case in point. Surveys conducted in rural areas also indicate that it is not only
men but also women who are migrating to neighboring countries to work, in particular to
Thailand, where they find employment in various occupations such as construction, domestic
help, factory work, entertainment, and hospitality. According to a 2014 report by UN Women82,
many women migrating into Phnom Penh are engaged in informal employment where they
are subject to low or irregular income and unstable conditions or at risk of trafficking and
exploitation. As an example of their vulnerability, in the 2009 global downturn, an estimated
30,000 mostly female garment industry jobs were lost, with employers reportedly pressuring
women to waive their benefits and severance payments, knowing that they may not
understand their rights or have the means to protect them. With the garment industry’s
eventual decline, women and girls in cities will be disproportionately affected.
79 Promoting Economic Empowerment for Women in Marginalized Conditions, OXFAM, February 2020 https://cambodia.oxfam.org/latest/policy-paper/promoting-economic-empowerment-women-in-marginalized-condition 80 https://data.worldbank.org/indicator/ 81 Promoting Economic Empowerment for Women in Marginalized Conditions, OXFAM, February 2020 82 Vulnerability and migration in Cambodia, World Food Programme- Cambodia Country office May 2019

68
Poverty and hardship
The traditional norms feed women’s time poverty: Women, especially women from
poorer HHs and even more from FHHs, work long hours to provide numerous services in their
homes and communities, such as buying and preparing food, cleaning, washing and taking
care of children as well as of the sick and elders, collecting water when there is no connection
to piped water, tending to kitchen gardens as well as looking after small livestock such as
poultry in rural and peri-urban areas. These very time-consuming duties are unpaid, meaning
that women are simply expected to do them, often denying them of other opportunities such
as their basic rights to education, healthcare, decent work, and leisure time, including the time
to spend with their children in the role of social mentor and teacher. Routine and non-
productive tasks also prevent them from participating in other activities and community
decision making discussions. This is often exacerbated in poorer HHs where there are higher
numbers of children due to the lack of family planning and the use of modern contraceptives.
Time poverty acts to perpetuate gender inequality.
According to the Cambodian Government’s National Social Protection Strategy for the
Poor and Vulnerable (2011-2015), the government categorized vulnerable people into 17
groups including (1) Infants and children, (2) Girls and women of reproductive age, (3)
Households vulnerable to food insecurity and unemployment, (4) Indigenous and ethnic
minorities, (5) Elderly people, (6) People with chronic illness, (7) People with disability, (8)
Orphans, (9) Youth and children at risk, (10) Victims of violence, abuse, and exploitation, (11)
Families of immigrants, (12) Homeless people, (13) Veterans, (14) Single mothers, (15)
Widows, (16) Pregnant women, and (17) Child workers. Women are overwhelmingly
represented in these categories.
Women are among those most affected by the consequences of socio-economic crisis
such as the one created by the Covid 19, like many works in more vulnerable employment,
perform a disproportionate share of unpaid care work, and may face increased risks of gender-
based violence during lockdowns. Women own 60 % of a medium, small, and
microenterprises, yet many are not formally registered and cannot obtain government support.
In addition, the already unequal division of household tasks is further exacerbated through
caring for children during school closure. In families where men and women are migrant
workers and have returned to their communities, women usually take care of the house and
family, and men will try to find work.83
Gender-based violence
According to the 2013 UNICEF (Cambodia) Annual Report, violence against children
and women pose significant developmental challenges. The majority of those studied
experienced physical violence before age 12, and 1 in 22 females (compared to 1 in 18 males)
experienced sexual abuse in childhood. Although it is difficult to obtain reliable or accurate
statistics on the incidence of domestic violence as these statistics are based upon “reported”
cases only, it can be safely assumed that the actual incidence is far higher than what is
reported. Noted that rural women were almost twice as likely to be victims of violent incidents
as urban women.
83 UN Cambodia framework for the immediate socio-economic response to COVID-19 Source UNCT Cambodia Posted 16 Sep 2020 Originally published 16 Sep

69
In a culture with unequal power relations between men and women, gender-based
violence is common, especially among vulnerable groups (e.g., migrant garment factory
workers). 21 % of ever-partnered women aged 15-64 years report experiencing intimate
partner physical and/or sexual violence at least once in their lifetime, and 4% experienced
non-partner sexual violence at least once. 19 % of women aged 20 to 24 years were first
married or in union before age 18.
Domestic violence is also a major concern: while violence against women may be
considered culturally unacceptable, domestic violence is considered justifiable.
During emergencies such as conflicts or natural disasters, the risk of violence,
exploitation, and abuse is heightened, particularly for women and girls. At the same time,
national systems and community and social support networks may weaken. In the context of
COVID-19 quarantine and isolation measures, Intimate Partner Violence (IPV) has the
potential to dramatically increase for women and girls. Restrictions on mobility also mean that
women are particularly exposed to intimate partner violence at home with limited options for
accessing support services. 84
Access to resources
Women can own assets, manage financial transactions, and contribute to household
decision making. Both men and women can inherit property. However, in general, attitudes
toward gender roles still emphasize the woman as a household manager and the man as a
provider85. According to the 2014 Cambodia Demographic and Health Survey, a large majority
of currently married women (86%) participate in three specified areas of decision making. This
includes decisions on their own health care, major household purchases, and visits to their
family or relatives.
Decision making power is strongly linked to household income contribution, women
who earn more than their husbands are more likely to decide how their cash earnings are
used, and women who are older, divorced, separated, or widowed, and those who live in urban
areas are better educated, and are paid in cash have greater financial control over the assets.
Access to the media and knowing one’s legal rights also correlate with greater economic
autonomy.86
Women have less access than men to higher-skilled occupations, public sector
employment, business associations, and networks that offer opportunities for lobbying and
agency. Occupational segregation is extensive, and women continue to be concentrated in
lower-skilled occupations.87
Obstacles to the growth of businesses run by women include a lack of access to
infrastructure (such as roads and electricity), cultural biases (which lead to discrimination and
the undervaluing of women entrepreneurs), and an inability to access finance (especially long-
term finance) because of limited collateral and low levels of formal education. Women and
especially FHHs are reported as less likely to be able to obtain bank loans, making them more
susceptible to higher interest rates charged by money lenders.
84 CARE Rapid Gender Analysis for COVID-19 Cambodia – July 2020 85 Discriminatory social norms consider women to be less competent than men with regards to family finances and decision-making, and thus they have less power than men to make decisions about their family (STAR Kampuchea and ILC, 2013). 86 USAID/Cambodia 2010 87 Cambodian Garment and Footwear Sector Bulletin 2015
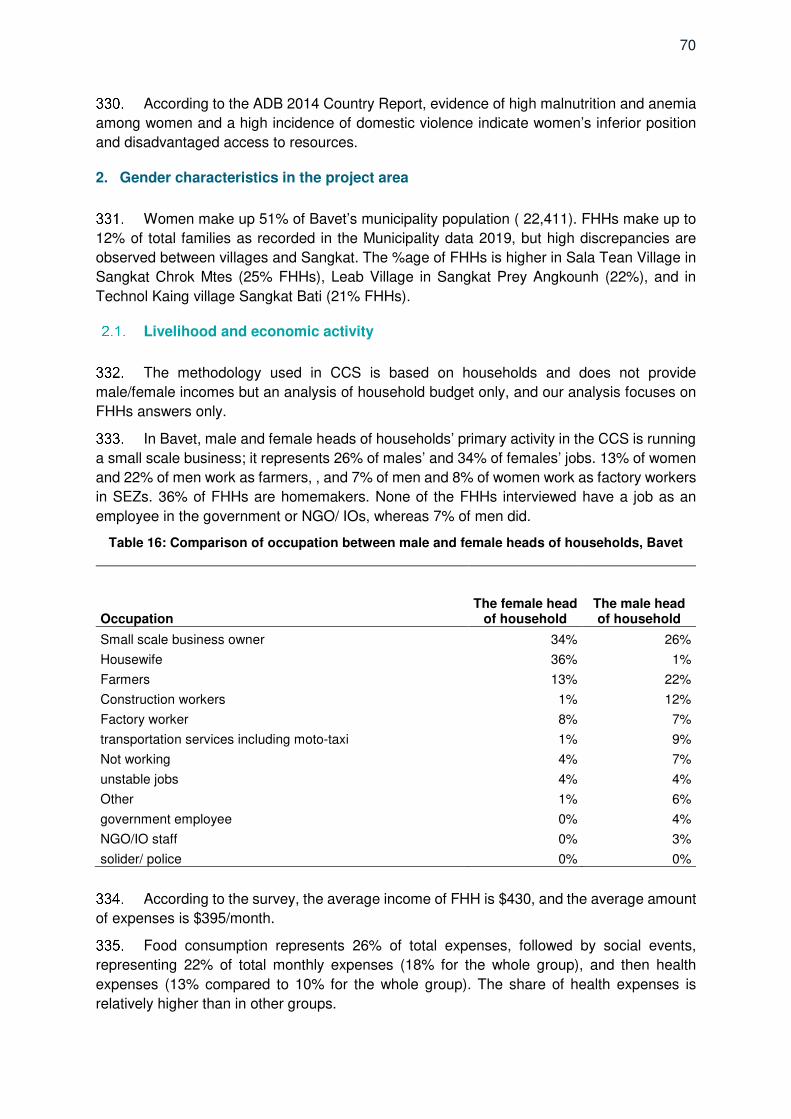
70
According to the ADB 2014 Country Report, evidence of high malnutrition and anemia
among women and a high incidence of domestic violence indicate women’s inferior position
and disadvantaged access to resources.
2. Gender characteristics in the project area
Women make up 51% of Bavet’s municipality population ( 22,411). FHHs make up to
12% of total families as recorded in the Municipality data 2019, but high discrepancies are
observed between villages and Sangkat. The %age of FHHs is higher in Sala Tean Village in
Sangkat Chrok Mtes (25% FHHs), Leab Village in Sangkat Prey Angkounh (22%), and in
Technol Kaing village Sangkat Bati (21% FHHs).
Livelihood and economic activity
The methodology used in CCS is based on households and does not provide
male/female incomes but an analysis of household budget only, and our analysis focuses on
FHHs answers only.
In Bavet, male and female heads of households’ primary activity in the CCS is running
a small scale business; it represents 26% of males’ and 34% of females’ jobs. 13% of women
and 22% of men work as farmers, , and 7% of men and 8% of women work as factory workers
in SEZs. 36% of FHHs are homemakers. None of the FHHs interviewed have a job as an
employee in the government or NGO/ IOs, whereas 7% of men did.
Table 16: Comparison of occupation between male and female heads of households, Bavet
Occupation The female head
of household The male head of household
Small scale business owner 34% 26%
Housewife 36% 1%
Farmers 13% 22%
Construction workers 1% 12%
Factory worker 8% 7%
transportation services including moto-taxi 1% 9%
Not working 4% 7%
unstable jobs 4% 4%
Other 1% 6%
government employee 0% 4%
NGO/IO staff 0% 3%
solider/ police 0% 0%
According to the survey, the average income of FHH is $430, and the average amount
of expenses is $395/month.
Food consumption represents 26% of total expenses, followed by social events,
representing 22% of total monthly expenses (18% for the whole group), and then health
expenses (13% compared to 10% for the whole group). The share of health expenses is
relatively higher than in other groups.

71
Table 17: Distribution of expenses in FHHs budget, Bavet, CCS
average value KHR % of the total
1- Food consumption 419,482 26%
2- Shopping for appliances and amenities 50,348 3%
3- Electricity for lighting/electrical appliances 103,327 6%
4- Energy/fuel for cooking 33,434 2%
5- Water consumption 5,232 0%
6- Solid waste collection 945 0%
7- Toilet facility 10,759 1%
8- Drainage - 0%
9- Transport including fuel 104,960 6%
10- Clothing 81,572 5%
11 Housing i.e. rental, maintenance, decoration 11,859 1%
12- Healthcare 212,055 13%
13- Education 79,301 5% 14- Communication, i.e., telephone, internet, etc. 54,492 3%
15 Entertainment/Leisure, i.e., out for a drink, cigarette, etc.
98,945 6%
16- Social event and ceremony i.e. wedding, festivals
350,015 22%
17- Other, specify (text) 0%
Average total 1,616,726 100%
The Comprehensive City Survey conducted by the technical assistant between
December 2019 and January 2020 (704 households interviewed – average 4.7 persons per
household) revealed that 31% of heads of households interviewed are women. 25% of FHHs
have no education, and the average age is quite high, 52.3 y.o. Many FHHs are widows.
The results of the last ID Poor survey campaign in 2017 in Bavet shows that 28% of
FHHs are under category Poor 1 and 2. 59.9% of ID Poor 1 households are headed by women
(173 FHHs) and 42.5% of ID poor 2 Households (185 FHHs).
7% of FHHs have no toilets and have to use neighbours' toilets or go to the field.
Gender-based violence
There are no statistics available at the Provincial nor at Municipality level about the
number of cases of domestic violence. The PDoWA observed that reported domestic violence
has decreased compared to the previous year (2019). There are only several cases of
domestic violence, always in the same families, which is also confirmed by the Municipality.
According to the Provincial Department of Social Affairs, 20 individuals (16 women,
two boys, and two girls) from 15 families were victims of human trafficking in 2019.
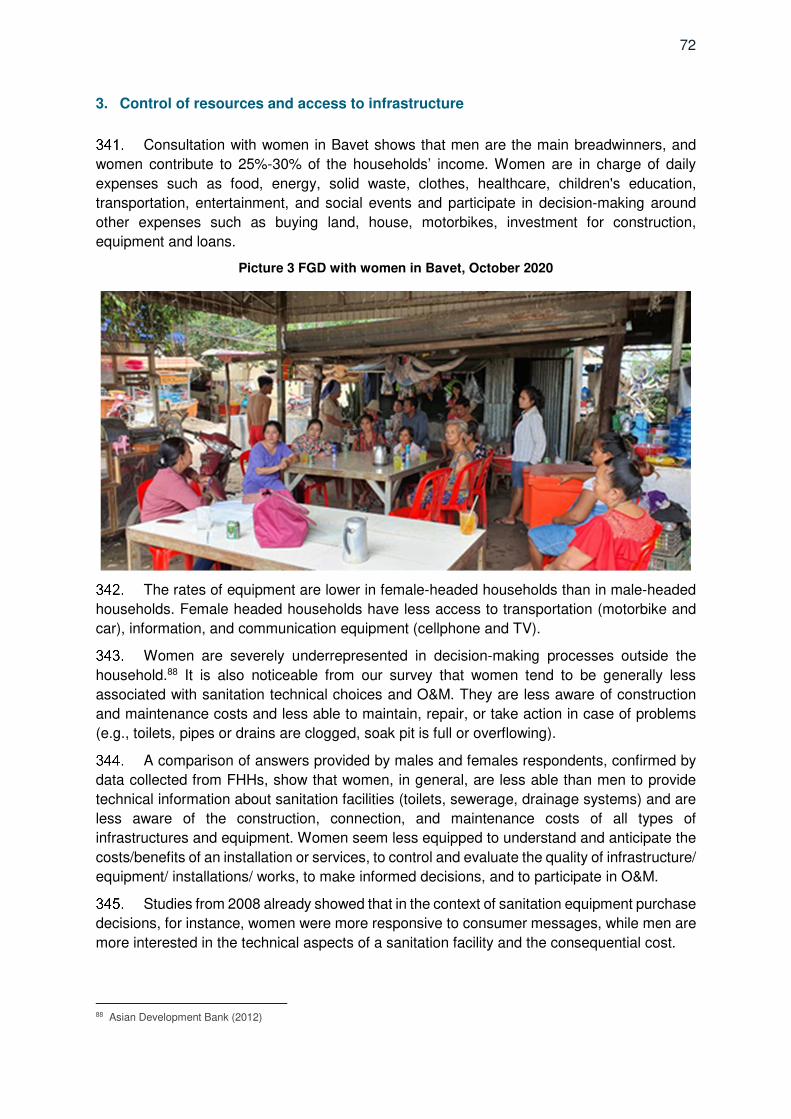
72
3. Control of resources and access to infrastructure
Consultation with women in Bavet shows that men are the main breadwinners, and
women contribute to 25%-30% of the households’ income. Women are in charge of daily
expenses such as food, energy, solid waste, clothes, healthcare, children's education,
transportation, entertainment, and social events and participate in decision-making around
other expenses such as buying land, house, motorbikes, investment for construction,
equipment and loans.
Picture 3 FGD with women in Bavet, October 2020
The rates of equipment are lower in female-headed households than in male-headed
households. Female headed households have less access to transportation (motorbike and
car), information, and communication equipment (cellphone and TV).
Women are severely underrepresented in decision-making processes outside the
household.88 It is also noticeable from our survey that women tend to be generally less
associated with sanitation technical choices and O&M. They are less aware of construction
and maintenance costs and less able to maintain, repair, or take action in case of problems
(e.g., toilets, pipes or drains are clogged, soak pit is full or overflowing).
A comparison of answers provided by males and females respondents, confirmed by
data collected from FHHs, show that women, in general, are less able than men to provide
technical information about sanitation facilities (toilets, sewerage, drainage systems) and are
less aware of the construction, connection, and maintenance costs of all types of
infrastructures and equipment. Women seem less equipped to understand and anticipate the
costs/benefits of an installation or services, to control and evaluate the quality of infrastructure/
equipment/ installations/ works, to make informed decisions, and to participate in O&M.
Studies from 2008 already showed that in the context of sanitation equipment purchase
decisions, for instance, women were more responsive to consumer messages, while men are
more interested in the technical aspects of a sanitation facility and the consequential cost.
88 Asian Development Bank (2012)
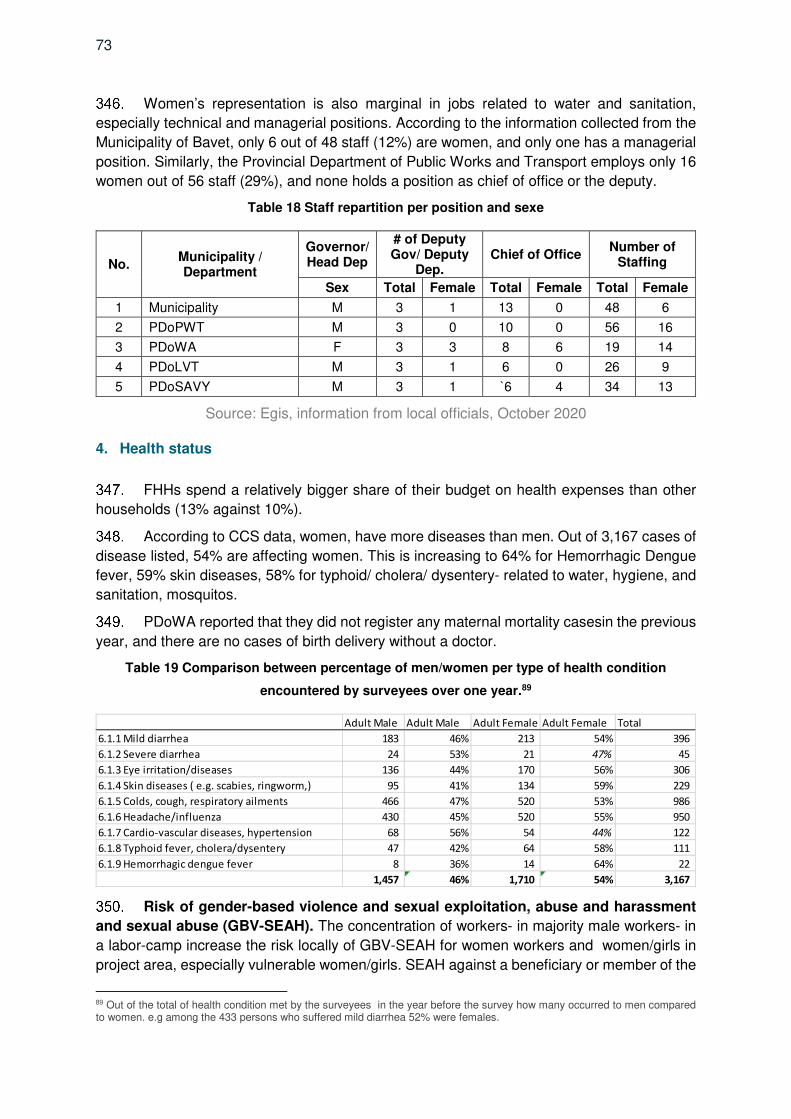
73
Women’s representation is also marginal in jobs related to water and sanitation,
especially technical and managerial positions. According to the information collected from the
Municipality of Bavet, only 6 out of 48 staff (12%) are women, and only one has a managerial
position. Similarly, the Provincial Department of Public Works and Transport employs only 16
women out of 56 staff (29%), and none holds a position as chief of office or the deputy.
Table 18 Staff repartition per position and sexe
No. Municipality / Department
Governor/ Head Dep
# of Deputy Gov/ Deputy
Dep. Chief of Office
Number of Staffing
Sex Total Female Total Female Total Female
1 Municipality M 3 1 13 0 48 6
2 PDoPWT M 3 0 10 0 56 16
3 PDoWA F 3 3 8 6 19 14
4 PDoLVT M 3 1 6 0 26 9
5 PDoSAVY M 3 1 `6 4 34 13
Source: Egis, information from local officials, October 2020
4. Health status
FHHs spend a relatively bigger share of their budget on health expenses than other
households (13% against 10%).
According to CCS data, women, have more diseases than men. Out of 3,167 cases of
disease listed, 54% are affecting women. This is increasing to 64% for Hemorrhagic Dengue
fever, 59% skin diseases, 58% for typhoid/ cholera/ dysentery- related to water, hygiene, and
sanitation, mosquitos.
PDoWA reported that they did not register any maternal mortality casesin the previous
year, and there are no cases of birth delivery without a doctor.
Table 19 Comparison between percentage of men/women per type of health condition
encountered by surveyees over one year.89
Risk of gender-based violence and sexual exploitation, abuse and harassment
and sexual abuse (GBV-SEAH). The concentration of workers- in majority male workers- in
a labor-camp increase the risk locally of GBV-SEAH for women workers and women/girls in
project area, especially vulnerable women/girls. SEAH against a beneficiary or member of the
89 Out of the total of health condition met by the surveyees in the year before the survey how many occurred to men compared to women. e.g among the 433 persons who suffered mild diarrhea 52% were females.
Adult Male Adult Male Adult Female Adult Female Total
6.1.1 Mild diarrhea 183 46% 213 54% 396
6.1.2 Severe diarrhea 24 53% 21 47% 45
6.1.3 Eye irritation/diseases 136 44% 170 56% 306
6.1.4 Skin diseases ( e.g. scabies, ringworm,) 95 41% 134 59% 229
6.1.5 Colds, cough, respiratory ailments 466 47% 520 53% 986
6.1.6 Headache/influenza 430 45% 520 55% 950
6.1.7 Cardio-vascular diseases, hypertension 68 56% 54 44% 122
6.1.8 Typhoid fever, cholera/dysentery 47 42% 64 58% 111
6.1.9 Hemorrhagic dengue fever 8 36% 14 64% 22
1,457 46% 1,710 54% 3,167

74
community, or between staff can involve any unwelcome sexual advance or unwanted verbal
or physical conduct of a sexual nature.
5. Gender impact analysis
Lack of sewage and solid waste collection system incurs social costs, and most of
these are borne by women and can be typified as (i) time and responsibility taken in dealing
with solid waste (finding a place to dispose of waste, burning, or burying wastes), dealing with
dogs and pests gravitating around piling waste, (ii) time, and responsibility for supervising
children playing near/with solid waste, near/with wastewater, in flooded area (iii) time taken to
nurse those sick from water-borne disease and or infections (iv) time taken to accompany
family members to the doctor and to buy medicine, and (v) reproductive health issues,
particularly genital and urinary tract infections, linked to improper hygiene especially during
period.
Improved hygiene and sanitation infrastructure and services help alleviate women’s
poverty of time, with reduced time and energy to dispose of waste, increased comfort and
security, especially for children, reduced need to look after those HH members sick from the
water and sanitation-related illnesses, and house cleaning, therefore allowing more time for
participating in decision making, other activities or leisure
While women are the most impacted by social costs related to lack of sewage and
solid waste collection systems, or flooding, they are also relatively less aware of their risk to
health and the environment. The project intends to target women with specific information,
awareness, and training campaigns on these topics.The behavior Change analysis and
strategy development will- as for other target groups- identify women’s specific constraints,
triggering messages for behavior change and effective communication media, which will serve
in the development of a comprehensive communication campaign to raise women’s
awareness and capacity to make informed choices and participate in O&M
The project is addressing the issue of underrepresentation of women in water and
sanitation decision-making and jobs through actions at provincial and municipality levels by
strengthening women’s leadership in the water sector and waste management (public and
private sectors) and at local levels by increasing women involvement and decision making in
water and sanitation through capacity building/ awareness raising, engagement of WCCCs,
and establishment of mixed gender Community monitoring committees.
75
VIII. GENDER EQUALITY AND SOCIAL INCLUSION ACTION PLAN
The social and poverty alleviation pan and the gender action plan are integrated in the
Gender Equality and Social Inclusion Action Plan (GESIAP) with target indicators. The
GESIAP is attached in Appendix 4.
1. Social Approach
The objectives of the infrastructure component are to maximize sewerage connections
(target: increase the safe disposal of excreta and achieve at least 70% to 85% of households
connected to a WWTP in the urban area by 2040), extend solid waste collection services
(target: 84% of all households have solid waste collection service by 2040) and make the
stormwater drainage system functional and developed in parallel to urban development.
A proactive approach is proposed to ensure inclusive access to urban infrastructure
and services and to optimize the impacts of the infrastructure development, which includes:
(i) creating an enabling environment, analyse behavior change triggers, develop and
implement targeted approach for behavior (ii) using regulation to guide people towards proper
sanitation, and accelerate changes in practices, (iii) propose mechanisms/ prices allowing the
poor and vulnerable to access and benefit from basic infrastructure and services and
contribute to urban sanitation and public health and (iv) improvement in the quality of services
delivered.
Targeted information and awareness-raising are a pre-requisite for citizen acceptance
Behavior change and public participation is key to a functional waste system. A Behavior
Change analysis will serve as basis for the behavior change strategy development and
implementation. Awareness will promote the economic, environmental, and social benefits of
better water and sanitation. The project plans for a sorting plant to sort the waste and will
develop awareness systems to motivate waste reduction, reuse, and recycling. It will inform
the population about the current wastewater system, recurrent leakages, health and
environmental issues, necessary improvement, and proposed treatment for safe wastewater
management. Regarding urban drainage, the focus is on disaster risk reduction, how to
prevent flooding and its consequences, and what possible useful local actions can be done,
such as good operations and manintenance of drainage canals, avoidance of solid waste
dumping, and keeping the drainage canal clean to avoid blockage, and let the water flow.
In parallel, the approach includes a “Give no choice” by developing and enforcing local
laws, but at the same time ensuring equity pricing systems/ schemes and quality service. This
will be developed under each sub-component as described below:
Wastewater:
(i) Push for connection to sewerage in the urban area for all HHs and businesses (per sector as per development plan) and for businesses in SEZs with a system of fines for households and businesses not connecting to the sewerage system. This is covered under the Institutional Strengthening Plan Volume
(ii) Develop and implement behavior change communication to raise willingness to be connected to the sewerage.
(iii) It is suggested that a provision to encourage households to connect to the sewer system be included directly in the cost estimate. The strategy is to subsidize

76
connection to encourage households to be connected during the construction phase. For ID Poor and vulnerable households and to achieve equity in access to service, it is proposed that the connection costs will be fully covered by the project during the construction phase. For non ID poor card holders, eligibility will be based on the identification made by local authority.
Solid Waste Management:
Forbid dumping and burning of solid waste in an urban area where a solid waste collection service is available (inform, enforce a system of fees), under Institutional Strengthening Plan Volume.
Develop and implement targeted behavior change communication to make dumping of solid waste into drainage socially unacceptable, promote social norms around using waste collection service.
Support vulnerable communities to take collective action and organize community service for collection into area/roads not accessible to the company truck and to dispose at suitable collecting point - accessible to the community collectors and the trucks of the solid waste collection contractor.
Provide appropriate solid waste containers in market areas, at collecting points, and possibly to the poorest households benefiting from door-to-door collection services. The format of containers must be agreed with the solid waste collection service to adapt to its collection system. The Municipality should supply containers in public spaces and ensure their regular emptying.
In parallel, and to make sure the more coercive measures can apply, the solid waste collection contractors must develop a culture of service. This should be part of its contractual obligation and could involve support from the project (under the Institutional Strengthening Plan Volume). It is expected that the company ensures (a) regular collection lines and schedules, (b) is responsible for cleaning collecting points and roads after collection (c) manage a page properly on social media and provides timely information in case of service disruption (d) operates a customer service for information and remediation/ hotline, (e) agree to put in place a social/equity system (tariffs) for the poor and vulnerable and (f) adhere to Core Labor and health, safety, and environmental standards, (CLS and HSE) (g) provides training to the current informal workers in solid waste management (e.g., waste pickers/ scavengers could be trained as drivers of the collecting trucks) ), safe waste handling, health risks, use of PPE, hygiene practice, and provide vaccinations and provide them with formal jobs, (h) employ women at equal conditions with men.
Key actions related to stormwater urban drainage include:
(i) Cover canals and install solid waste dumping prevention systems (protection nets or grids);
(ii) Develop and implement behavior change communication to make dumping of solid waste into drainage socially unacceptable and educate the population about the risks of waste dumping eg. blockages and flooding; pollution to waterways and impacts on bird and fish life, and amenitypollution to waterways and impacts on bird and fish life, and amentiy.
(iii) Develop a system of fines for \ dumping of solid waste into drainage and sewerage canals, develop and enforce local regulation, install proper signs near the canals (covered under Institutional Strengthening Plan Volume).
(iv) Organize supervision and O&M at the local level with the establishment of Community monitoring committees at Sangkat levels. These committees are the proposed mechanism to ensure the participation of the community in local implementation and

77
monitoring of improved urban infrastructure and services. Organized at the Sangkat level, they are made of volunteers, two men and two women selected in the community. They contribute to inform and raise awareness in the community about water and sanitation issues and verify that the infrastructure and services are working well. They report claims and problems to the Sangkat or directly to the municipality offices of private operators for intervention
(v) Organize O&M intervention teams at the public office for Public Works under the Municipality to ensure the operability of the drainage canals whenever needed.
Table 20: Detailed social and poverty alleviation actions
Key issues Proposed action
The community, and the
poor and vulnerable
households specifically,
lack the knowledge and
attitudes to adopt better
hygiene/sanitation
practices and to pay for
urban infrastructures and
service.
(i) Create an enabling environment to engage people in behavior
change (knowledge and attitudes) through targeted information and
awareness-raising sessions using social media, TV, radio, and
community events facilitated by a local organization. The focus is on the
costs/benefits of proper/improper behavior regarding health,
environment.
a. Conduct a Behavior Change analysis among different target groups on waste management and develop the Behavior Change strategy: identify triggers for behavior change for different targets, and the best approach and media for communication. The following actions will be adjusted accordingly.
b. Implement the Behavior Change Strategy in the project areas:
c. Develop awareness systems to motivate waste reduction,
reuse, separation and recycling (4R’s) in coordinated timing
with the development of related services: re-use, develop and
disseminate information, education and communication support
through social media, local radio and TV, produce short videos/
talk shows, facilitates community awareness sessions on solid
waste management.
d. Inform about current wastewater system, recurrent leakages,
health issues, necessary improvement, and proposed
treatment for safe wastewater management: formal information
meetings organized at Sangkat levels, produce short videos/
talk show for dissemination via social media/ local radio and
talkshow, Once the WWTP is operational organize study visits
for specific groups- including youth and children.
e. Regarding urban drainage, the focus is on disaster risk
reduction, how to prevent flooding and their consequences,
what are possible local action: good O&M of drainage canal,
avoid solid waste dumping, keep it clean to avoid blockage and
let the water flow.
(ii) Develop and enforce local laws to sustain behavior changes and
anchor new practices in the community.
a. Develop a local fine to encourage the connection to the
sewerage

78
Key issues Proposed action
b. Develop a local regulation and operational systems to forbid
waste dumping, especially in a specific area (drainage canals),
and impose a system of fines.
c. Develop a local regulation and operational systems to forbid
waste burning in an area served by a solid waste collection
service and impose a system of fines.
d. Inform the population about new regulations enforcement via
TV, radio, social media, local authorities, and on-site
signalization.
e. Ensure full enforcement of the new regulations with local
authorities and the community. (ref. Community Monitoring
Committees and community monitoring below)
2. The access and
adherence of poor and
vulnerable households to
urban infrastructure and
services are constrained
by their financial limitation.
(i) Ensure equitable access to urban infrastructure and service to the
poorest.
a. Provide free connection to the sewerage for ID Poor households and households that can justify of low income (similar to ID Poor cardholder, but not yet registered), as proposed by local authority
b. Subsidize the in-house linking costs to connect to the sewerage box.
c. Provide a free connection to the drainage system.
d. Propose and validate with the operators and the community social tariff with preferential conditions for the poorest regarding sewerage monthly fee and the solid waste collection fee.
e. Facilitate discussion and negotiation between communities
in areas not accessible to the trucks and the solid waste
collection operator to develop a community collection
service.
f. Find a mechanism to supply appropriate waste containers
to the poorest households.
3. People, the poor and
vulnerable especially, are
reluctant to pay for a
service whose quality has
yet to be proven.
(i) The institution and public operators develop a service that is more
qualitative and user-centered.
a. The contract between the Municipality and the contractor in
charge of solid waste collection is revised and include the
following elements to improve users satisfaction: It is
expected that the company ensures (a) regular collection
lines and schedules, (b) is responsible for cleaning
collecting points and roads after collection (c) manage a
page properly on social media and provides timely
information in case of service disruption (d) operates a
customer service for information and remediation/ hotline,
(e) agree to put in place a social/equity system (tariffs) for
the poor and vulnerable, (f) to provide proper solid waste
containers to the poorest households, (g) agree on proper

79
Key issues Proposed action
mechanisms for solid waste collection with communities
where truck access is difficult, (h) prompt response to
complaints or reports of illegal dumping, burning rubbish.
b. The project support institutional capacity building of public and
private operators (Institutional Capacity building Volume).
c. The Municipality: (a) installs additional dustbins and waste
containers in the city, especially around markets, and
arranges for regular collection (b) sets an M&O intervention
team under its office for Public Works. This team is trained
and equipped to intervene rapidly in case of problems with
the drainage and/or sewerage systems reported by the local
authorities or communities via their Community Monitoring
Committees (see below), (c) operate a webpage/ page on
social media to keep the population informed on public
works and possible disruption of systems, provide contacts
of intervention team (hotline). (Institutional Strengthening
Plan Voume).
(ii) Create the mechanism to involve the community in the
implementation and monitoring of improved urban infrastructure and
services, either through:
a. Establishment of Community Monitoring Committees at Sangkat levels. The Community Monitoring Committees are the proposed mechanism to ensure the participation of the community in the local implementation and monitoring of improved urban infrastructure and services. Organized at Sangkat level in the project area, they are made of volunteers, two men and two women selected in the community.They facilitate community monitoring using citizen scorecard or feedback systems, use photos to monitor before and after, and encourage citizen reporting via Facebook or an App (eg. of waste dumps, pollution, burning rubbish) and to local authorities directly.
b. The Community Monitoring Committees contribute to inform and raise awareness in the community about water and sanitation issues and verify that the infrastructure and services are working well. They report claims and problems to the Sangkat or directly to the municipality offices or private operators for intervention. They meet quarterly with the Sangkat councils and every six months with the office of public works at the Municipality level to evaluate the operationality of the systems and define remediation.
4. The project triggers
limited social risks. (ref.
project assurances)
(i) Minimise, mitigate potential adverse impacts
a. Include in all contracts for civil works and solid waste collection
commitments to comply with applicable labor laws and agree with
external monitoring.
b. Include in the civil works contract commitment to apply properly
measures to reduce negative impacts during works and to organize
training for workers on HIV/ communicable disease, GBV/SEAH
prevention.

80
Key issues Proposed action
c. Include in the solid waste collection/ construction contract
commitment to train and re-employ as a priority people whose
informal jobs as waste pickers are lost due to the improvement of
solid waste management systems.
d. Provide training to sanitation workers in safe waste handling,
health risks, use of PPE, hygiene practice, and provide
vaccinations.
d. Organize the dissemination information about
HIV/communicable disease and GBV/SEAH prevention among
workers at construction sites and surrounding communities.
e. Facilitate the organization of awareness sessions with civil works
contractors and local organizations.
f. Provide support to vulnerable households indirectly affected by
the project (e.g wastepickers on the dumpsite, not included in IPR)
to maintain or improve their livelihoods.
2. Gender Approach
The plan aims at addressing the following issues : (i) women are less informed about
technical and economic aspects of water, hygiene and sanitation, (ii) women are less aware
of the consequences of improper waste management on health and the environment, (iii)
women are not involved enough in water and sanitation technical monitoring in the
community, (iv) households headed by women have on average lower income and spend a
higher share of their budget on healthcare and (vi) women are not well represented in the
technical and decision-making position in the water and sanitation sector.
The objectives are to increase the proportion of qualified women employed at technical
/ engineering jobs and managerial or decision-making positions in the water and sanitation-
related institutions, to engender waste management awareness and training programs with a
view to increasing women awareness (as for other target groups) about the consequence of
wastewater and solid waste management,and increase their participation in waste
management/ drainage service.
The project intends to develop information, awareness, and training campaigns also
designed for women. The Behavior Change analysis will (as for other target groups) study
women’s specific constraints, triggering messages for behavior change in waste management
and effective communication media, which will serve in the development of a comprehensive
targeted communication campaign in a view to raise women’s awareness and capacity to
make informed choices and participate to O&M.
The project addresses the issue of the underrepresentation of women in water and
sanitation decision-making and jobs. It intends to :
(i) Work with the MPWT and PDPWT to increase the number of women in technical and decision-making positions in the institution (in the water and sanitation sector) at provincial and municipality levels by facilitating internal mobility/ promotion, proposing continuous training to women staff for them to reach higher technical and managerial position and by planning recuitement of women with higher profile.

81
(ii) Establish a partnership with a specialised training institution to promote women’s career as engineer in the water and sanitation sector among highschool students and in careers forums, show casting women engineers.
(iii) Sponsor scholarships and internships for girls in the water and sanitation sector. It is suggested to provide a general budget for girls’ scholarships at ITC linked to traineeships in MPWT/ PDPWT. The scholarship has to cover: tuition fees/ manuals etc, accommodation for girls coming from other provinces, and per diem.
Locally, the focus is to give the Women and Children Consultative Committee the
methodology, tools, and means to raise awareness in the community about wastewater/ solid
waste management/ flooding issues, introduce technical options (choices of technology,
infrastructure design, O&M requirements) and explain requirements at the household,
community, private and institutional levels for proper operation of the systems and services.
It is also proposed to establish and support in each village a water and sanitation
committee, called a “Community Monitoring Committee” consisting of 2 men and 2 women.
The committee’s functions would be: to relay to the population practical information about
works/ works progress/ new regulation implementation; to collect, report or address
households claims or questions related to sewerage/ drainage/ solid waste collection; to
encourage the citizens to monitor and report through social media or directly to the local
authority; to monitor the sewerage/ canal and solid waste status in the area; and to contact
the Municipality or service provider for intervention or remediation. Women will thus have
direct participation in water and sanitation management locally.
Sex-disaggregated data has to be collected and analyzed during and after the project
to ensure equitable benefits for men and women.
3. Project assurances
The project conforms with ADB’s social safeguard policies and seek to avoid adverse
impacts on affected people wherever possible and to minimize, mitigate, and/or compensate
for potential adverse impacts that may result from the project. Nuisances and impacts during
construction are identified and will be mitigated by proper information, physical access and
safety measures, limitation of dust and noise. The designs of the infrastructure projects are
developed to be socially inclusive, taking into account the needs of the target beneficiaries,
including vulnerable and disabled people, and to ensure access and affordability to urban
infrastructure and services for all (affordability). The project also addresses issues related to
working conditions and environmental health and safety of workers and communities.
There were no key labor issues identified. The project may, however, have direct or
indirect impacts on Core Labor Standards (CLS) as it (i) intends to create or improve
employment opportunities; (ii) can affect informal and low skilled jobs of waste pickers and
scavengers, (iii) the project will generate a contract for civil works and project contractors may
be tempted to use child labor or gender/ ethnic discrimination to reduce their costs.
The project adheres to CLS for all jobs created. The loss of informal jobs will be offset
by the creation of construction jobs and unskilled jobs at the sorting and composting plants for
which current waste pickers and scavengers qualify. Providing training is delivered by the
private sector in charge of the solid waste collection; they could also apply to jobs as truck
drivers.

82
The project will ensure arrangements to ensure compliance with CLS and related
national labor laws, including: (i) require that all civil works contracts include commitments to
comply with applicable labor laws, particularly those supporting CLS (e.g., relating to
nondiscrimination and equal pay, the prohibition of child labor, workplace safety, addressing
needs of people with disability, security at work).; (ii) organize labor-contracting societies to
represent the interests of poor and female laborers working on construction or maintenance
of project facilities and (iii) require the executing agency and project implementation
consultants to monitor and report on the performance of the civil works contractors with
respect to CLS and other relevant labor standards. Additional details are provided in the IEE
in the paragraphs related to Community and Worker Health and Safety and related to the
preparation by each project contractor of an environmental, health, and safety management
plan.
Large infrastructure projects may increase the risk of communicable diseases,
HIV/AIDS transmission, GBV/SEAH and/or human trafficking in the project area. The project
will link with ongoing HIV/AIDS and trafficking awareness and GBV prevention programs in
the project area (supported by government, other development partners, and/or
nongovernment organizations) to organize awareness and/or behavior change programs on
communicable diseases, HIV/AIDS, GBV/SEAH and trafficking risks at main construction
sites- this is to be included in the workplan fo the contractors and included in the health and
safety plans to be developed by the contractors-and in surrounding communities, with specific
attention to the special vulnerabilities of women, girls, and other marginalized groups in the
project areas. There are two well-known NGOs working in the fight against HIV/AIDS—
KHANA and PSI. Proper programs and organizations operating locally will be identified early
in project implementation.
COVID-19 Specific measures. To protect the health and safety of workers as well as
communities potentially affected by ADB-financed and/or administered projects, contractors
are required to conduct a COVID-19 risk assessment and to incorporate COVID-19 health
risks as part of their health and safety (H&S) plans, which are part of their site-specific
contractor Environmental Management Plan (CEMP).

IX. MONITORING AND REPORTING
The monitoring system should include specific indicators to follow up with the
implementation of gender and social aspects of the project.
Key social and gender indicators at project level are presented in the GESIAP in
Appendix 4.
1. Monitoring poverty and social impacts
Awareness
Participants to information, training, and consultation meetings increase their
knowledge and understanding of the issues addressed.
People's willingness to contribute to the costs of connection and services increases.
Accessibility, affordability, satisfaction
The project will keep account of the number of households connected to the sewerage
and drainage systems and served by the solid waste collection service (data from the private
operator). It also needs to earmark the status of each household (ID poor, poor without an ID
card, IP, FHH).
Monitoring employment, social risk management
The project will keep records of jobs that are created to establish and operate the
improved stormwater, wastewater, and solid waste management systems. This is done at the
municipality level and in coordination with the private operators. Additional surveys will be
needed to estimate the number of jobs lost during the reorganization, with some limitation
anticipated due to the high level of informality of jobs in the current solid waste management
system.
Monitoring Participation
It relies on systematic and reliable participation records and aims at a fair
representation of women and vulnerable groups.
2. Reporting
It is recommended that a Gender and Social Officer position be created within the
Project Management Unit (PMU) with support from the Project Management Consultant. The
officer will be responsible for the coordination and daily implementation of the GESIAP, the IP
Due Diligence Report, participation and communication plans, and contribute to quarterly and
six-months monitoring; the preparation of the quarterly safeguard reports and six-monthly
safeguards interim report.

84
X. CONSULTATION AND PARTICIPATION
1. Consultations were undertaken
As a first step in preparing the consultation and participation plan, a stakeholder
analysis was completed to identify the key actors, their interests, and strategies to maximize
their participation in the project. Information was gathered from (i) numerous government
organizations that will be involved in project implementation, (ii) civil society, (iii) public and
private actors in the water and waste management sectors, and (iv) community members living
in the project area.
In developing the project, a series of stakeholder consultations and workshops were
carried out preparatory by the technical assistance team comprising international and national
specialists with representatives at Sangkat, Municipality, Province, and Ministry levels, with
community members and with private companies. The list of workshops, meetings, and FGDs
with the number of participants is provided in appendices 2.
In total and between August 2019 and October 2020, the Key Informant Interviews
(KII), Focus Group Discussions (FGD), and workshops or meetings have involved 397 officials
and villagers in workshops and consultative meetings, and 171 persons in FGDs as part of
social surveys in Bavet.
Primary information and consultation were undertaken as part of the City
Comprehensive Survey. The survey covered all villages of the project area and consulted with
658 households, 88 commercial and institution entities, 2 SEZs.
2. Results of consultations
Consultations provided input on the design of the project. It helped determine project
priorities, socio-economic objectives, and confirm linkages with local development plans and
aspirations. The information and recommendations gathered from the various stakeholder
consultations have been incorporated into the design of the project to ensure that the
investments align with local priorities and development plans and that they will deliver
equitable socio-economic benefits to the whole population, including women, the poor, and
vulnerable.
The results of the pre-implementation consultations are also reflected in the summary
poverty reduction and social strategy, gender equality and social inclusion action plan,
resettlement plans, environmental assessments, and the simplified Indigenous People plan.
There is broad community support for the project’s approach to combine urban infrastructure
development with capacity building to improve waste and water governance and
management, improve urban sanitation, and increase city attractiveness.
3. Roles of stakeholders in planning, design, and implementation
ADB is committed to putting meaningful consultation processes into practice.
Meaningful consultation is a process that (i) begins early in the project preparation stage and
is carried out on an ongoing basis throughout the project cycle; (ii) provides timely disclosure
of relevant and adequate information that is understandable and readily accessible to affected

85
people; (iii) is undertaken in an atmosphere free of intimidation or coercion; (iv) is gender-
responsive and inclusive, and tailored to the needs of disadvantaged and vulnerable groups;
and (v) enables the incorporation of all relevant views of affected people and other
stakeholders into decision makings, such as project design, mitigation measures, the sharing
of development benefits and opportunities, and implementation issues.
ADB requires borrowers/clients to engage with communities, groups, or people
affected by proposed projects and with civil society through information disclosure,
consultation, and informed participation in a manner commensurate with the risks to and
impacts on affected communities. Enhancing stakeholder participation has also been shown
to build understanding and support among diverse groups, which can improve project design
and impacts.
Consistent with these efforts, the objectives of the consultation and participation plan
and related stakeholder communication strategy are to: (i) fully disclose information on the
proposed project, its components, and its activities with the beneficiary communities and
stakeholders, (ii) obtain information about the opinions, needs and priorities of beneficiary
communities and stakeholders; social input and feedback on the quality and affordability of
services, for example (iii) encourage the participation of beneficiary communities and
stakeholders in project activities such as the payment for connection or services, changes in
waste management practices, change in the extend and quality of services delivered,
participation to O&M, awareness-raising activities, capacity building, enforcement of local
regulations and monitoring; (iv) obtain the cooperation of beneficiary communities and
stakeholders for activities required to be undertaken as part of project planning and operation,
(v) establish clear monitoring and effective grievance redress mechanism; and (vi) ensure
transparency in all project activities.
4. Stakeholder participation plan
Broad and meaningful consultation will continue throughout the project implementation
cycle, building on the initial consultations held with various stakeholder groups during project
preparation. The various stakeholders, mechanisms for participation, entities responsible,
indicative schedules, and resources are set out in the Consultation and Participation Plan
presented in Table 21.

Table 21: Consultation and Participation Plan
Stakeholder
Group Objective of their
Involvement (Why included)
Approach to Participation
and Depth
Participation Methods Timing
Method Responsibility
MPWT Executing agency. Provide overall guidance on project scope, implementation.
Partnership (high)
Consultation: Facilitate semi-annual project steering committee and provide update on project implementation matters/key issues. Implementation: project monitoring, reporting, procurement. Monitor financial aspects of project. Participation through PMU on the key stakeholder consultations. Liaison with other line ministries as required.
PMU Throughout project implementation
Beneficiary communities, including women, ethnic minorities, poor and other vulnerable households, and households affected by involuntary resettlement
Direct beneficiaries of project Project/ subproject affected households.
Consultation (high)
Information: on project scope, technical options, design elements, tariff structures, participation, grievance redress mechanisms, and entitlements for affected persons; informed through meetings and information brochures Consultation: on willingness to pay, affordability, and level of support for the project and needs and impacts of subprojects; consultation through surveys, census and inventories, community meetings and focus group discussions Implementation: participation in project-specific grievance redress/village mediation committees to ensure they are inclusive and
PMU, PIA/PIU, DCS
Throughout project implementation

87
Stakeholder Group
Objective of their Involvement
(Why included)
Approach to Participation
and Depth
Participation Methods Timing
Method Responsibility
include representatives of disadvantaged subgroups. Agreement to pay for services; to use proper waste disposal mechanisms (to avoid burning, dumping in canals) Monitoring: communities, including ethnic minorities, women, poor, and other vulnerable groups, will be involved in the monitoring of subprojects implementation; grievance redress committees and results will be reported in the progress and safeguard reports
Waste pickers Beneficiaries of the project Improved training / livelihoods
Collaboration (medium)
Information: discussion on working arrangements (landfills) and options for social support and job opportunities Consultation: to identify waste pickers who volunteer to benefit from vocational training, business support formal jobs as construction workers in the sorting plants; discussion on the transition approach Implementation: participation in consultation / focus group meetings.
PMU, PIA, PIU At project commencement and throughout project implementation
Businesses, SEZ zone developers
Direct beneficiaries of project SEZ with access to basic services
Consultation (medium)
Information: on project scope and timing, level of service and commercial tariffs, septage services, and sanitation regulations; information provided through public meetings, announcements, public notices and leaflets, meetings with peak bodies, and through business networks Consultation: on needs and priorities for businesses through interviews and meeting, including consultation on prices, payment
PMU, PIA/PIU
Throughout project implementation
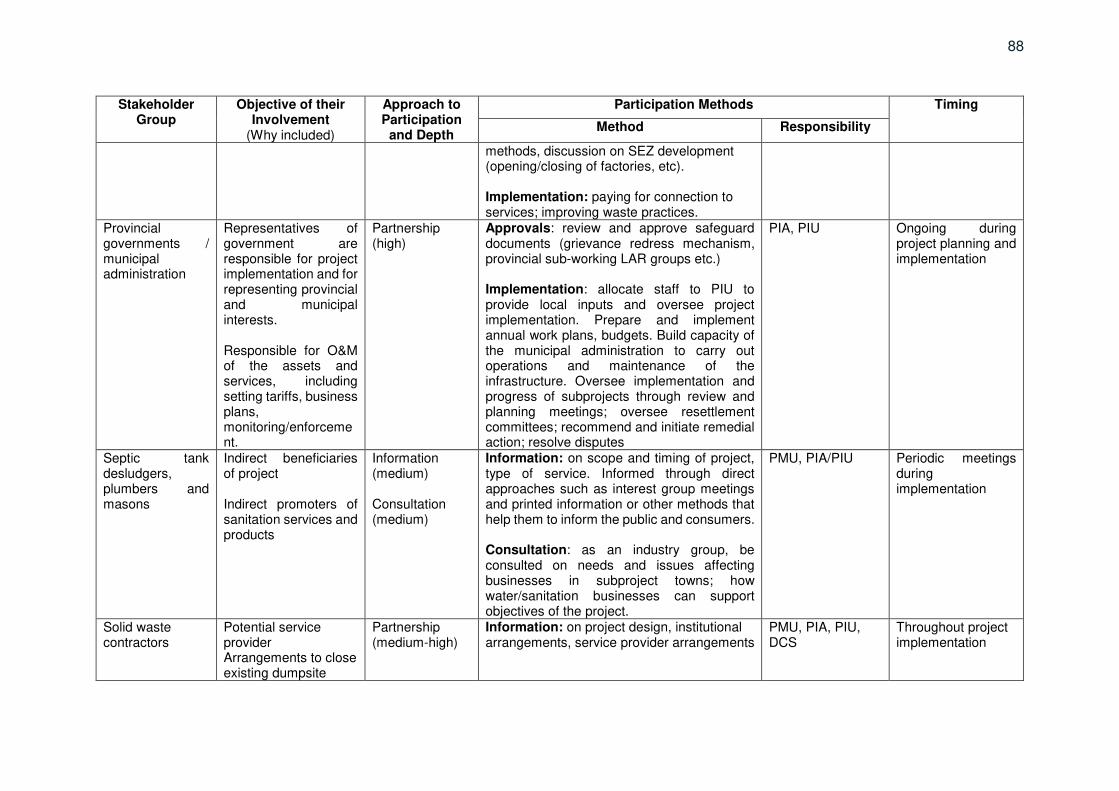
88
Stakeholder Group
Objective of their Involvement
(Why included)
Approach to Participation
and Depth
Participation Methods Timing
Method Responsibility
methods, discussion on SEZ development (opening/closing of factories, etc). Implementation: paying for connection to services; improving waste practices.
Provincial governments / municipal administration
Representatives of government are responsible for project implementation and for representing provincial and municipal interests. Responsible for O&M of the assets and services, including setting tariffs, business plans, monitoring/enforcement.
Partnership (high)
Approvals: review and approve safeguard documents (grievance redress mechanism, provincial sub-working LAR groups etc.) Implementation: allocate staff to PIU to provide local inputs and oversee project implementation. Prepare and implement annual work plans, budgets. Build capacity of the municipal administration to carry out operations and maintenance of the infrastructure. Oversee implementation and progress of subprojects through review and planning meetings; oversee resettlement committees; recommend and initiate remedial action; resolve disputes
PIA, PIU
Ongoing during project planning and implementation
Septic tank desludgers, plumbers and masons
Indirect beneficiaries of project Indirect promoters of sanitation services and products
Information (medium) Consultation (medium)
Information: on scope and timing of project, type of service. Informed through direct approaches such as interest group meetings and printed information or other methods that help them to inform the public and consumers. Consultation: as an industry group, be consulted on needs and issues affecting businesses in subproject towns; how water/sanitation businesses can support objectives of the project.
PMU, PIA/PIU Periodic meetings during implementation
Solid waste contractors
Potential service provider Arrangements to close existing dumpsite
Partnership (medium-high)
Information: on project design, institutional arrangements, service provider arrangements
PMU, PIA, PIU, DCS
Throughout project implementation

89
Stakeholder Group
Objective of their Involvement
(Why included)
Approach to Participation
and Depth
Participation Methods Timing
Method Responsibility
Consultation: participation in discussion on business opportunities, expansion of service coverage area; employment of scavengers/waste pickers; discussion with provincial government and MOE on closure of existing dumpsite
Civil society organizations
Representatives of civil society and the community
Collaboration (medium)
Consultation promotion of community participation, behavior change analysis/strategy development, raising awareness at community level, facilitate support with vulnerable groups.
PMU, PIA, PIU Early stage of project, prior to construction and during construction
Provincial Department of Women Affairs (PDoWA) /Women and Children Consultative Committees/ Commune committees for women and children
Awareness raising in the community; increase participation in planning, design, operations, maintenance and monitoring
Collaboration (medium)
Consultation: gender assessment, identification of specific needs, demands, constraints and level of satisfaction. PDoWA, with PMU and PIUs to organize participation of the consultative committees/commune committees in the implementation of the soft components for women and children (face-to-face information training, awareness raising, facilitation of consultations)
PMU, PIA, PIUs Throughout project implementation
Commune/ sangkat councils
To inform the residents of the project/project benefits
Collaboration (high)
Information: on project scope, design, institutional arrangements, roles, responsibilities, and project progress; feedback on infrastructure design. Implementation: coordinate and organize implementation in their Sangkat. Report to the municipality on key issues/concerns, facilitate implementation of O&M, monitoring and evaluation, grievance redress.
PMU, PIA, PIUS Throughout project implementation

90
Stakeholder Group
Objective of their Involvement
(Why included)
Approach to Participation
and Depth
Participation Methods Timing
Method Responsibility
Government departments
Set policy and guidelines, coordinate, and issue approvals
Collaboration (medium)
Approvals and advice: coordination, direction, and approval of technical and implementation matters; participation is through review of key documents, safeguards, and proposals, issuance of statements and directives, and project management and coordination meetings
PMU As required during project implementation

5. Stakeholder communication strategy
The Stakeholder Communication Strategy has been prepared, drawing on good
practices outlined in ADB’s Public Communication Policy. The Stakeholder Communication
Strategy is based on the principles of transparency, timeliness, meaningful participation, and
inclusion. It will ensure that women, the poor and vulnerable, are provided opportunities to
receive timely information and provide feedback during project implementation
The project will integrate institutional and social components- improving policy and
regulatory environment, enhance the provincial governments’ capacity, building community
awareness on key sustainability themes, including water usage, sanitation, and solid waste
reduction and management, promote effective gender mainstreaming activities that will
encourage and increase women participation in planning, design, operations, and
maintenance - with the infrastructure components to realize the development objective of
helping the poor in alleviating poverty and attaining socially inclusive development.
This is also a demand of the communities and local authorities, reflected during the
social survey; all groups insisted that the project would succeed - at getting the adhesion of
people to new practices and to pay for services- only if education about wastewater/ solid
waste management was improved before the start of works and if people understood the
interlinked benefits of better waste management /reduced flooding/ health. Communications
with the public who will benefit from the project will be necessary, in particular, promotional
campaigns to raise awareness on the importance of investing in sanitation, to present the
upgraded services being established, and to raise the willingness to pay for this service.
Stakeholders include: (i) the special group of waste pickers, (ii) project direct and
indirect beneficiaries with a focus on households in urban and rural areas, women and
children, poor and vulnerable groups, micro-businesses; businesses and industries in the
SEZs (ii) local authorities (Sangkat and village in levels); (iii) Civil Society Organisations; (iv)
private operators in the SWM sector and civil works (v) government agencies with a role in the
implementation and (vi) interlinked development projects. The strategy serves to inform and
support community development, enhance government capacity to deliver a positive project
outcome, and enhance project benefits while mitigating any potential negative impacts.
There are three primary objectives under the Stakeholder Communication Strategy: (i)
Ensure that all people or entities possibly affected by the project are aware of and clearly
understand the project, its impacts and compensation entitlements, and address stakeholder
concerns using transparent and inclusive approaches; (ii) Ensure that all possible
beneficiaries of the project are aware of and understand the project and its benefits, and the
details of making use of the proposed urban infrastructure and services and foster demand
and willingness to pay; (iii) Ensure that awareness about water and sanitation issues is built
into the project to enhance public health and mitigate risk.
To ensure effective communication with stakeholders during project implementation
and to enhance project outcomes, and the project will adopt a three-pronged communication
strategy:
(i) Deliver relevant project information to project-affected people, and other stakeholders possibly impacted by the project in a culturally appropriate, gender-sensitive, and timely manner, and foster a regular two-way flow of information between project

92
implementers and these stakeholders; (community meetings, information display, FGDs, participatory monitoring);
(ii) Support intensive, sustained, broad and repetitive communication, education, and advocacy about the benefits of the project to foster adhesion, participation, and positive public behavior change through official (press release, interviews, the publication of summary project reports) and non-formal/ official communication (video, talk shows, testimonies); and
(iii) Support sustained information, education, and awareness activities to raise awareness of water and sanitation behavior and best practices through community events and dissemination on Radio, TV, social media, which are the preferred information channels of the population. (women and child awareness sessions, field visits with rural groups, educational programs etc.). The stakeholder communication strategy is presented in Table 22
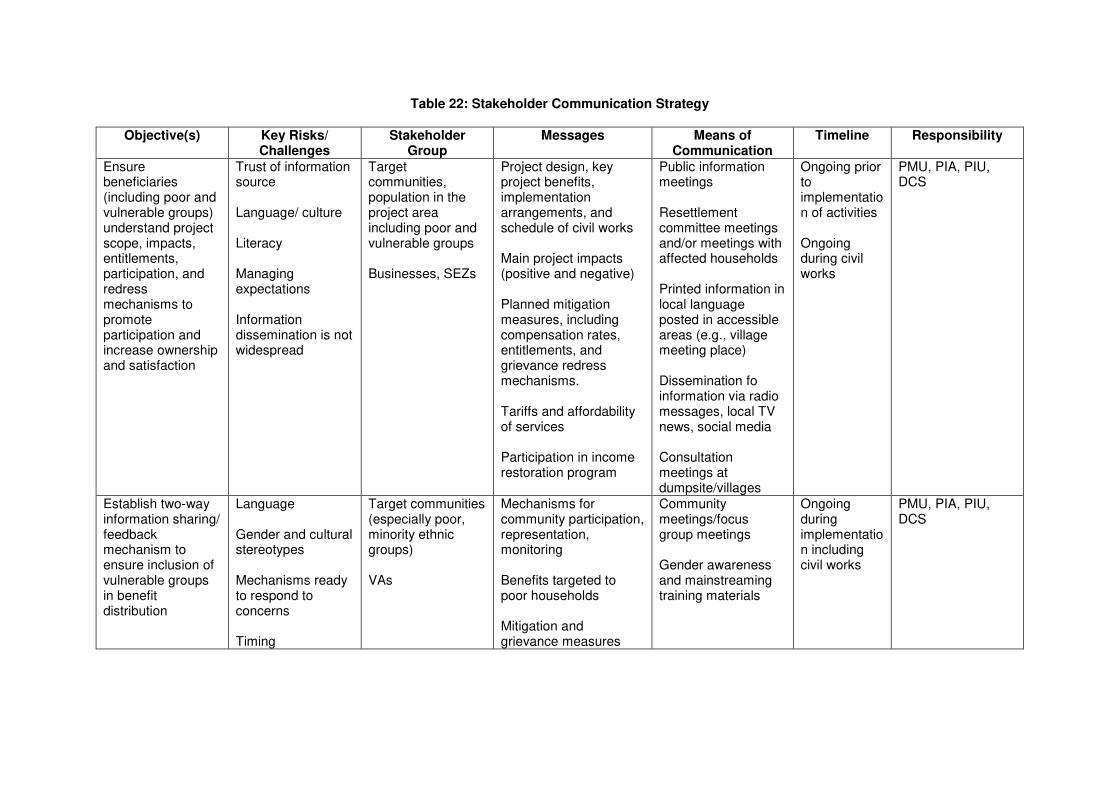
Table 22: Stakeholder Communication Strategy
Objective(s) Key Risks/ Challenges
Stakeholder Group
Messages Means of Communication
Timeline Responsibility
Ensure beneficiaries (including poor and vulnerable groups) understand project scope, impacts, entitlements, participation, and redress mechanisms to promote participation and increase ownership and satisfaction
Trust of information source Language/ culture Literacy Managing expectations Information dissemination is not widespread
Target communities, population in the project area including poor and vulnerable groups Businesses, SEZs
Project design, key project benefits, implementation arrangements, and schedule of civil works Main project impacts (positive and negative) Planned mitigation measures, including compensation rates, entitlements, and grievance redress mechanisms. Tariffs and affordability of services Participation in income restoration program
Public information meetings Resettlement committee meetings and/or meetings with affected households Printed information in local language posted in accessible areas (e.g., village meeting place) Dissemination fo information via radio messages, local TV news, social media Consultation meetings at dumpsite/villages
Ongoing prior to implementation of activities Ongoing during civil works
PMU, PIA, PIU, DCS
Establish two-way information sharing/ feedback mechanism to ensure inclusion of vulnerable groups in benefit distribution
Language Gender and cultural stereotypes Mechanisms ready to respond to concerns Timing
Target communities (especially poor, minority ethnic groups) VAs
Mechanisms for community participation, representation, monitoring Benefits targeted to poor households Mitigation and grievance measures
Community meetings/focus group meetings Gender awareness and mainstreaming training materials
Ongoing during implementation including civil works
PMU, PIA, PIU, DCS

94
Objective(s) Key Risks/ Challenges
Stakeholder Group
Messages Means of Communication
Timeline Responsibility
Ensure local authorities understand and support the project and can effectively support and inform the community
Low education Lack of experience Language Other commitments Lack of involvement/ engagement with stakeholders resulting in limited project support, obstruction of project
Sangkat authorities, Commune councils, Provincial government Municipal administration
Project design, key benefits, implementation arrangements, and schedule of civil works Participation in consultation events
Small group meetings/training Formal meeting with provincial/municipal representatives Dissemination of printed information
Ongoing from project outset
PMU, PIA, PIU, DSC
Improve community awareness of the benefits of water and sanitation to initiate behavior change, ensure willingness to pay for connection and service fees
Information is not enough to change behavior Language Cultural practices
Target communities, including mothers, school children, and ethnic minorities
Improved solid waste and wastewater for the environment, health and livability Cost of services Ways to improve sanitation and reduce flooding Solid waste management practices (reduce, reuse recycle) and proper solid waste disposal
Mass organization meetings and events School activities Local media, radio, tv Behavior change strategy / awareness campaigns Signboards
Regular events and activities after formative research and needs assessment are completed
PMU, PIA, PIU, DCS
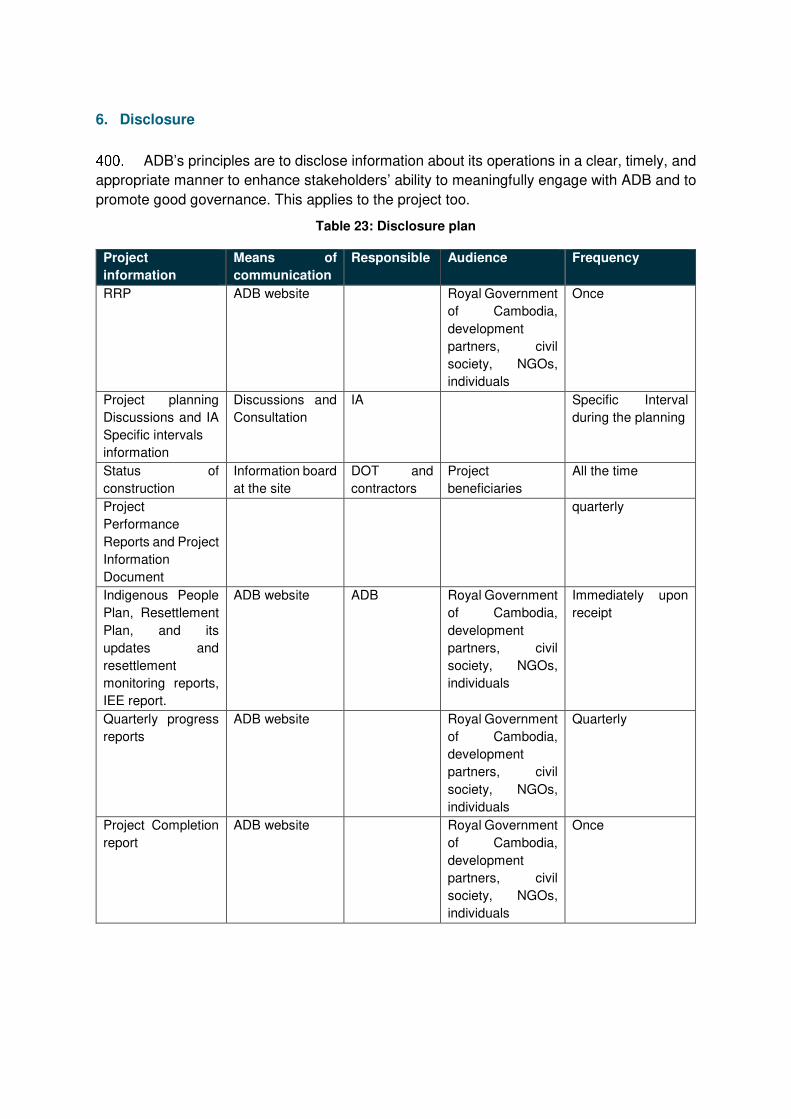
6. Disclosure
ADB’s principles are to disclose information about its operations in a clear, timely, and
appropriate manner to enhance stakeholders’ ability to meaningfully engage with ADB and to
promote good governance. This applies to the project too.
Table 23: Disclosure plan
Project
information
Means of
communication
Responsible Audience Frequency
RRP ADB website Royal Government
of Cambodia,
development
partners, civil
society, NGOs,
individuals
Once
Project planning
Discussions and IA
Specific intervals
information
Discussions and
Consultation
IA Specific Interval
during the planning
Status of
construction
Information board
at the site
DOT and
contractors
Project
beneficiaries
All the time
Project
Performance
Reports and Project
Information
Document
quarterly
Indigenous People
Plan, Resettlement
Plan, and its
updates and
resettlement
monitoring reports,
IEE report.
ADB website ADB Royal Government
of Cambodia,
development
partners, civil
society, NGOs,
individuals
Immediately upon
receipt
Quarterly progress
reports
ADB website Royal Government
of Cambodia,
development
partners, civil
society, NGOs,
individuals
Quarterly
Project Completion
report
ADB website Royal Government
of Cambodia,
development
partners, civil
society, NGOs,
individuals
Once

XI. CONCLUSIONS AND RECOMMENDATIONS
There is a general consensus that the project will improve access to urban service to
the residents of the city, contribute to inclusive and sustainable development, and the
development of human capital, social services, and public governance.
The constraints of specific poor and vulnerable groups to fully benefit from the project
facilities have been assessed and can be summarized by (i) a lack of information and
knowledge about the cost and benefits of water and sanitation management, (ii) the limited
availability and quality of facilities at the moment, and (iii) concerns about the affordability of
infrastructure and service.
The Gender Equality and Social Inclusion Action Plan, the Consultation and
Participation Plan, and Stakeholders Communication Plans incorporate all the elements
deemed necessary to maximize the social and economic impacts of the project for all. This
includes wide consultation and participation of women, poor and vulnerable groups, targeted
interventions (training and awareness-raising, women’s empowerment), better affordable
services (gratuity, social tariffs, customers centered approach), and appropriate local
regulating and monitoring mechanisms.
They also encompass a multi-stakeholder approach with the private sector, local
institutions, and civil society all mobilized to meet the specific needs of the poor, vulnerable,
and women in the target area.

97
XII. APPENDICES

7. Key sex-disaggregated poverty and social statistics and indicators
Table 24: Bavet police minorities data sheet 2020 in value and in %
Type of data Total Bavet
Municipality
Sangkat Bati Total
Sangkat Bavet Total
Ta Buem village
Ta Pov village
Bavet Loeu village
Bavet Kandal village
Sangkat
Chrok Mtes Total
Sangkat
Prasat total
Prasat village
Kandal village
Sangkat Prey Angko
unh total
Kouk Lveang village
Minority as per police datasheet- August 2020
-
Cham # of family -
-
-
-
-
-
-
-
-
-
-
-
-
Cham # of people -
-
-
-
-
-
-
-
-
-
-
-
-
Vietnamese # of family 208
-
194
55
46
24
69
-
7
1
6
7
7
Vietnamese # of people 672
-
642
182
155
77
228
-
19
3
16
11
11
Minority as %age of the population (re.village data 2019)
Cham # of family 0.0% 0.0% 0.0% 0.0% 0.0% 0.0% 0.0% 0.0% 0.0% 0.0% 0.0% 0.0% 0.0%
Cham # of people 0.0% 0.0% 0.0% 0.0% 0.0% 0.0% 0.0% 0.0% 0.0% 0.0% 0.0% 0.0% 0.0%
Vietnamese # of family 2.0% 0.0% 6.1% 6.8% 7.5% 4.1% 8.9% 0.0% 1.0% 0.5% 1.1% 0.3% 1.5%
Vietnamese # of people 1.5% 0.0% 4.7% 5.1% 6.8% 3.0% 6.3% 0.0% 0.7% 0.4% 0.8% 0.1% 0.6% Total population (village data 2019) Total Population women + men
43,377
6,353
13,788
3,581
2,295
2,531
3,648
12,466
2,659
691
1,968
8,111
1,833
Total family in village according to family book
10,504
1,505
3,186
804
610
583
772
3,016
708
184
524
2,089
471
18 ID Poor data 2017 in value and in % is available in an attached Excel sheet

99
Table 25: CCS Key disaggregated data
Analysis of key data from the City Comprehensive survey Bavet
Rural Urban Total et variations Poor HHs FHHs Elderly
70% 30% 640 20% 31% 4% average age of population 26% FHHs 32% 29% 31% 31% widows 68% IPs (not mixed Khmer +…) 0% 1% 0% 0% 0% 0% disabled 3% 1% 2% 2% 1% 0% elder 3% 6% 4% 6% 9% 0% permanent house building 99% 96% 98% 95% 98% 100% long term residents (always live there…) 88% 71% 83% 74% 85% 88% own their house 98% 93% 97% 92% 96% 100% no education (household head) 12% 15% 13% 16% 25% 56%
average monthly income $ 511
$ 430
$ 486
$ 132
$ 430
$ 389
average monthly expenses $ 361
$ 414
$ 377
$ 342
$ 395
$ 267
drink water from own well 58% 37% 52% 44% 53% 52% drink water from vendors 41% 60% 46% 52% 46% 44% drink water from public water supply 1% 5% 2% 4% 2% 4% treat water 51% 46% 49% 45% 47% 48% female in charge of fetchning water 49% 40% 46% 42% 60% 52% don't have pb with drinking water 34% 26% 31% 36% 38% 24% main pb with drinking water 0% 0% 0%
price 50% 15% 42% 38% 60% bad quality 0% 0% 15% 0%
access to piped water supply 6% 70% 25% 44% 24% 40% out of which people connected 19% 37% 34% 33% 38% 30% Willing to pay for connection 72% 68% 71% 66% 66% 88% don’t know where wastewater from business/ production is handled 69% 65% 68% 62% 65% 56% have toilet facilities 93% 95% 93% 93% 93% 80% with a septic tank (according to interviewee's response) 90% 89% 90% 89% 86% 80% don't know dimension of tank 38% 45% 40% 46% 58% 44% connected to sewer pipe 0% 5% 2% 2% 0% 4%

100
Analysis of key data from the City Comprehensive survey Bavet
Rural Urban Total et variations Poor HHs FHHs Elderly
out of which, don’t know construction cost 0% 90% 90% 0% 0% 100% out of which, don’t know monthly fee 0% 100% 100% 0% 0% 0%
connected to open channel drain 0% 0% 0% 3% 1% 0% out of which don/t know cost of connection 0% 0% 0% 25% 0% 0% willingness to build septic tank/flush latrines 2% 6% 3% 3% 4% 4% NOT willing to take a loan for sanitation 96% 93% 95% 91% 92% 92% do not need pumping servcies 0% 0% 0% 96% 0% 0% do no need to empty manually 96% 95% 96% 92% 0% 0% do NOT know wher septic sludge are transported 96% 97% 96% 95% 95% 92% do not face any environmental issues 60% 29% 51% 50% 52% 40% think there is a solid waste problem (bad smell, scattered on the road) 53% 79% 60% 60% 59% 60% observe wastes piling often/ very often 59% 85% 67% 74% 57% 64% think wastes piling can cause env. and health pbs 62% 80% 67% 63% 56% 84% have waste collection service 4% 22% 10% 15% 9% 20% collect is irregular hours 22% 23% 22% 0% 0% 0% pay for collection fees 5% 25% 11% 16% 12% 20% evaluate the state of solid waste collection in their area as good 3% 7% 4% 10% 7% 0% find state of solid waste collection is not good (1- be cleaner, 2- be more regular, 3-be cheaper) 28% 29% 28% 30% 30% 40% did not participate to environmental campaign 80% 82% 81% 80% 88% 92% sort wastes before disposal (organic wastes= animal feed in rural) 73% 74% 73% 74% 71% 68% willing to sort more 48% 61% 52% 49% 48% 40% link diseases to waste water and garbages 33% 47% 37% 40% 30% 52% link disease to drinking water 2% 5% 3% 2% 1% 0%
average annual spendings for health $ 94.63
$ 150.41
$ 84.56
$ 130.85
$ 166.86
average annual spending for water borne disease $ 103.30
$ 101.58
$ 71.18
$ 78.90
$ 63.27
never flooded (yard)/ ward 65% 57% 63% 3% 4% 60% flooded during heavy rains only 27% 38% 30% 22% 25% 32% NOt informed on risk of flooding 11% 16% 12% 15% 9% 12% source of information tv/RADIO 16% 12% 15% 10% 18% 28% social media 8% 14% 10% 9% 6% 0% MoWRAM 0% 0% 0% 0% 0% 0%

101
Analysis of key data from the City Comprehensive survey Bavet
Rural Urban Total et variations Poor HHs FHHs Elderly
no easy access to health centers when flooding 29% 36% 31% 26% 30% 32% no schools/work when flooding 29% 10% 24% 6% 7% 8% no issues with drainage system 36% 23% 32% 30% 35% 8% main issue: clogged with solid wastes 0% 0% 12% 28% main action to mitigate climate change: 0% 0% 0% 0% planting trees 35% 51% 40% 50% 31% 36% raising roads 27% 19% 25% 18% 21% 40% filling raising land/ house Improve drainage 0% 1% 3% 0% think their area area is polluted 67% 63% 66% 60% 67% 76% don;'t think their area is polluted 29% 31% 30% 34% 30% 20% main nuisances Dust 48% 42% 47% 38% 47% 68% Bad smells from garbage 30% 18% 23% 21% 32% noise 19% 24% 36% satisfaction with water supply satisfaction with wastewater satisfaction with drainage satisfaction with solid waste management How to improve the city build more public spaces and playground 35% 47% 39% 53% 42% 44% build more house in the outskirts 27% 16% 23% 16% 22% 20% rehabilitate heritage buildings 17% 6% 14% 7% 15% 8% improving urban infrastructure 12% 19% 14% 10% 9% 12% improving social welfare and services 14% 4% 14% 13% 16% know dimensions of septic tank 39% 32% 37% 26% 14% 28% agree to take pictures of toilets 65% 49% 61% 51% 57% 56% agree to take pictures of waste disposal 97% 97% 97% 93% 95% 92%

Table 26: Affordability analysis
Rural Urban Total Poor Hhs FHHs Elders Cost of connection to piped water supply % % % % % %
20000 41% 35% 39% 31% 38% 44% 40000 28% 19% 25% 23% 19% 16% 80000 6% 5% 5% 7% 7% 0%
100000 4% 6% 5% 3% 5% 0% 150000 3% 3% 3% 2% 2% 0% 200000 6% 15% 8% 14% 13% 16%
Monthly fee rate for water supply Free of Charge 0% 0% 0% 0% 0% 0%
Don’t know 9% 12% 10% 14% 13% 12% 1,000 to 10,000 included 4% 7% 5% 5% 6% 12%
10,000 to 15,000 included 0% 0% 0% 0% 0% 0% 15,000 to 20,000 included 41% 34% 39% 31% 38% 44%
40000 28% 18% 25% 23% 19% 16% 80000 6% 5% 5% 7% 7% 0%
>80,000 12% 23% 15% 19% 19% 16% Cost of connection to sewerage pipe
Free of Charge 0% 0% 0% 0% 0% 0% don't know 69% 53% 64% 62% 67% 76%
<5,000 included 0% 1% 0% 1% 0% 0% 5,000 to 8,000 included 0% 0% 0% 0% 0% 0%
8,000 to 15,000 included 1% 4% 2% 2% 3% 0% 20,000 to 25,000 included 6% 7% 6% 4% 9% 8%
30000 1% 3% 2% 1% 3% 0% 40000 3% 3% 3% 3% 2% 0%
>40,000 19% 31% 23% 26% 17% 16% average >40,000
Monthly fee rate for sewerage Free of Charge 0% 1% 0% 0% 0% 0%
Don’t know 70% 53% 65% 60% 66% 76% <10,000 17% 34% 22% 24% 17% 24%
10,000 to 20,000 included 7% 8% 7% 10% 10% 0% 20,000 to 40,000 included 3% 3% 3% 6% 5% 0% 40,000 to 60,000 included 3% 1% 2% 0% 1% 0%

103
Rural Urban Total Poor Hhs FHHs Elders Cost of connection to piped water supply % % % % % %
80,000 to 100,000 included 1% 1% 1% 0% 2% 0% >100,000 1% 1% 1% 1% 1% 0%
Monthly fee rate for waste collection fee Free of Charge 0% 1% 0% 1% 1% 0%
don't know 76% 55% 69% 66% 73% 76% <4,000 included 7% 10% 8% 9% 7% 12%
4,000 to 6,000 included 6% 17% 9% 6% 7% 8% 7,000 to 8,000 included 0% 2% 1% 1% 0% 4%
9,000 to 12,000 included 4% 7% 5% 5% 4% 0% 12,000 to 20,000 included 4% 3% 4% 5% 6% 0%
>20,000 3% 5% 3% 7% 3% 0%
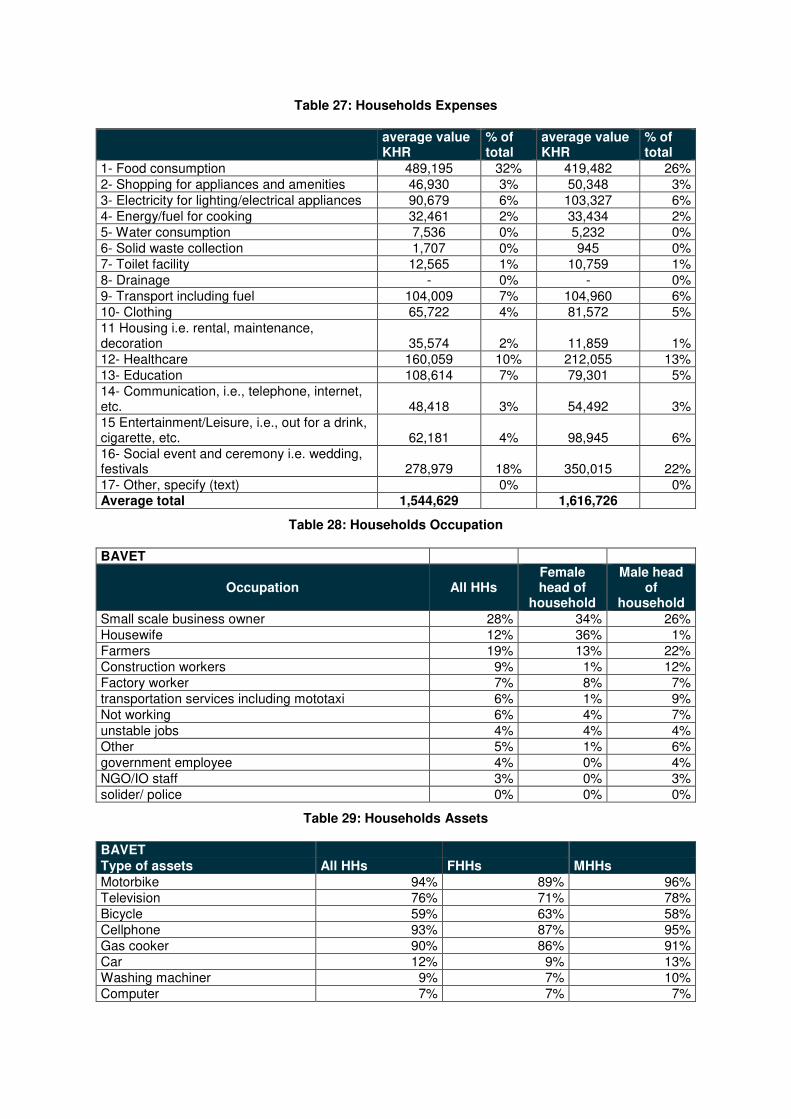
Table 27: Households Expenses
average value KHR
% of total
average value KHR
% of total
1- Food consumption 489,195 32% 419,482 26% 2- Shopping for appliances and amenities 46,930 3% 50,348 3% 3- Electricity for lighting/electrical appliances 90,679 6% 103,327 6% 4- Energy/fuel for cooking 32,461 2% 33,434 2% 5- Water consumption 7,536 0% 5,232 0% 6- Solid waste collection 1,707 0% 945 0% 7- Toilet facility 12,565 1% 10,759 1% 8- Drainage - 0% - 0% 9- Transport including fuel 104,009 7% 104,960 6% 10- Clothing 65,722 4% 81,572 5% 11 Housing i.e. rental, maintenance, decoration 35,574 2% 11,859 1% 12- Healthcare 160,059 10% 212,055 13% 13- Education 108,614 7% 79,301 5% 14- Communication, i.e., telephone, internet, etc. 48,418 3% 54,492 3% 15 Entertainment/Leisure, i.e., out for a drink, cigarette, etc. 62,181 4% 98,945 6% 16- Social event and ceremony i.e. wedding, festivals 278,979 18% 350,015 22% 17- Other, specify (text) 0% 0% Average total 1,544,629 1,616,726
Table 28: Households Occupation
BAVET
Occupation All HHs Female head of
household
Male head of
household Small scale business owner 28% 34% 26% Housewife 12% 36% 1% Farmers 19% 13% 22% Construction workers 9% 1% 12% Factory worker 7% 8% 7% transportation services including mototaxi 6% 1% 9% Not working 6% 4% 7% unstable jobs 4% 4% 4% Other 5% 1% 6% government employee 4% 0% 4% NGO/IO staff 3% 0% 3% solider/ police 0% 0% 0%
Table 29: Households Assets
BAVET Type of assets All HHs FHHs MHHs Motorbike 94% 89% 96% Television 76% 71% 78% Bicycle 59% 63% 58% Cellphone 93% 87% 95% Gas cooker 90% 86% 91% Car 12% 9% 13% Washing machiner 9% 7% 10% Computer 7% 7% 7%
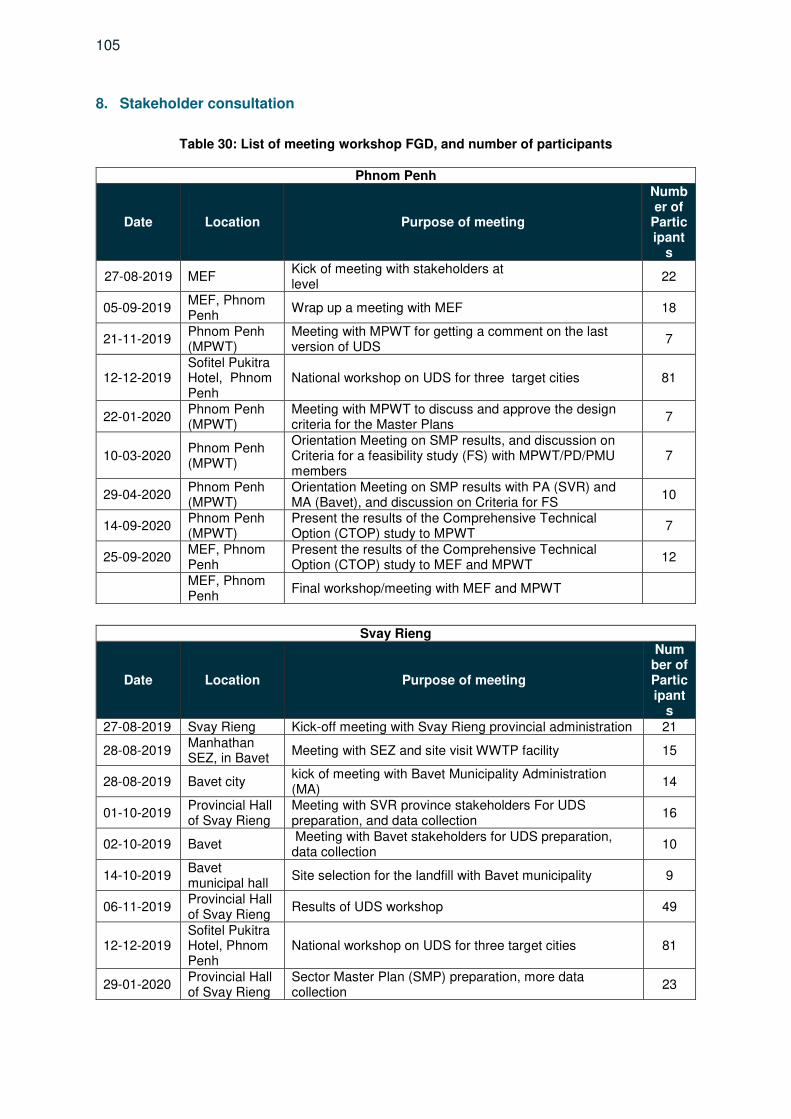
105
8. Stakeholder consultation
Table 30: List of meeting workshop FGD, and number of participants
Phnom Penh
Date Location Purpose of meeting
Number of
Participant
s
27-08-2019 MEF Kick of meeting with stakeholders at level
22
05-09-2019 MEF, Phnom Penh
Wrap up a meeting with MEF 18
21-11-2019 Phnom Penh (MPWT)
Meeting with MPWT for getting a comment on the last version of UDS
7
12-12-2019 Sofitel Pukitra Hotel, Phnom Penh
National workshop on UDS for three target cities 81
22-01-2020 Phnom Penh (MPWT)
Meeting with MPWT to discuss and approve the design criteria for the Master Plans
7
10-03-2020 Phnom Penh (MPWT)
Orientation Meeting on SMP results, and discussion on Criteria for a feasibility study (FS) with MPWT/PD/PMU members
7
29-04-2020 Phnom Penh (MPWT)
Orientation Meeting on SMP results with PA (SVR) and MA (Bavet), and discussion on Criteria for FS
10
14-09-2020 Phnom Penh (MPWT)
Present the results of the Comprehensive Technical Option (CTOP) study to MPWT
7
25-09-2020 MEF, Phnom Penh
Present the results of the Comprehensive Technical Option (CTOP) study to MEF and MPWT
12
MEF, Phnom Penh
Final workshop/meeting with MEF and MPWT
Svay Rieng
Date Location Purpose of meeting
Number of Participant
s 27-08-2019 Svay Rieng Kick-off meeting with Svay Rieng provincial administration 21
28-08-2019 Manhathan SEZ, in Bavet
Meeting with SEZ and site visit WWTP facility 15
28-08-2019 Bavet city kick of meeting with Bavet Municipality Administration (MA)
14
01-10-2019 Provincial Hall of Svay Rieng
Meeting with SVR province stakeholders For UDS preparation, and data collection
16
02-10-2019 Bavet Meeting with Bavet stakeholders for UDS preparation, data collection
10
14-10-2019 Bavet municipal hall
Site selection for the landfill with Bavet municipality 9
06-11-2019 Provincial Hall of Svay Rieng
Results of UDS workshop 49
12-12-2019 Sofitel Pukitra Hotel, Phnom Penh
National workshop on UDS for three target cities 81
29-01-2020 Provincial Hall of Svay Rieng
Sector Master Plan (SMP) preparation, more data collection
23

106
Svay Rieng
Date Location Purpose of meeting
Number of Participant
s 29-01-2020
Bavet, Svay Rieng
FGD with Chrak Leav, Prasat, Chrak Mtes villagers (CCS survey)
22
30-01-2020 Bavet, Svay Rieng
FGD with Prasab Leak villagers (CCS survey) 13
30-01-2020 Bavet, Svay Rieng
FGD with Manhattan SEZ 7
30-01-2020 Bavet, Svay Rieng
FGD with Bavet Kandal, Ta Pov, Bavet leu, Ta boeb villagers (CCS survey)
24
02-09-2020 Bavet General consultation with Local Authority (Urban) 16
02-09-2020 Bavet FGD general consultation (Urban area, ID poor, FFHs, Elders)
51
03-09-2020 Bavet General consultation with Local Authority (Rural) 27
03-09-2020 Bavet FGD with the indigenous group, high school and disable people
33
12-09-2020 Bavet Public consultation meeting for the establishment, announcement, and concurrence on the declaration of the Cut-Off-Date (COD
11-09-2020 Chrak Leav, Bavet
1st Public consultation Meeting (Social Resettlement) 23
11-09-2020 Ta Boeb, Bavet
2nd Public consultation Meeting (Social Resettlement) 32
12-09-2020 Bavet Leu, Bavet
3rd Public consultation Meeting (Social Resettlement) 23
12-09-2020 Kandal, Bavet 4th Public consultation Meeting (Social Resettlement) 25
29-09-2020 Provincial Hall of Svay Rieng
Workshop on FS results 34
20-10-2020 Bavet Kandal, Bavet
Collecting additional data on Gender (Group 1) 13
20-10-2020 Ta Boeb, Bavet
Collecting additional data on Vietnamese/ IP (Group 2) 8
107
9. Social surveys
Social survey report- Bavet, September 2020 (separate file)

10. Gender Equality and Social Inclusion Action Plan
Gender and Social Inclusion Objectives
Activities / Indicators / Targets Responsibilities Quarter/ Year
Outcome: Access to urban infrastructure and services in participating cities improved.
Inclusive access to basic infrastructure services
a. Improved sanitation facilities provided to at least 632 poor and vulnerable households, including 90 female headed households, in the project area.90 (2021 baseline:0) (OP 1.3) (DMF b)
DCS Q4/2027
Output 1: Policy and regulatory environment improved
1.1 Sector regulatory environment is gender-responsive and inclusive.
1.1.1Guidelines on financial planning, tariff setting, and reporting, that are gender responsive and inclusive, are developed for each participating city91. (2021 baseline: 0) (OP 2.3.2; OP 6.2.2) (DMF 1a)
DCS
Q4/2024
1.1.2 Operational guidelines on wastewater, stormwater drainage and municipal solid waste, that are gender responsive and inclusive, are developed for each participating city (2021 baseline: 0). (OP 2.3.2) (DMF 1b) (refer footnote 2)
DCS Q4/2024
1.1.3 At least 40% of participants in trainings and workshops on financial planning and management, project management, service delivery and O&M with the MPWT, PDPWT, and municipal administration, are women.
DCS Q3/2027
Output 2: Urban infrastructure improved
2.1 Infrastructure and services developed respond to the needs of targeted population.
2.1.2 One behavior change analysis and strategy development on wastewater and solid waste management targeting all community members, including women and vulnerable groups in the project area is completed.92
DCS Q2/2027
2.1.3 Community surveys are undertaken to track if and how the infrastructure services respond to the needs of the targeted population ensuring minimum participation of 50% women and fair representation from other vulnerable groups93 (proportional to their representation in the target area).94
DCS Q2/2027
90 Equivalent to at least 80% of eligible ID poor and vulnerable populations in the project area. 91 Guidelines and plans will consider the different factors affecting male and female clientele, and vulnerable groups. For example, guidelines on financial planning will consider
level of income and affordability. 92 Specifying key messages, information and education contents, pictures and training method targeting specific groups: men, women, vulnerable and other specific groups. 93 Vulnerable groups could include people living close to the poverty line, infants, children, pregnant women, families with food insecurity, people with disabilities and the elderly,
as defined by the legal and regulatory framework. 94 Surveys will be conducted at least at the commencement of the project (baseline) and at the end of the project (endline).
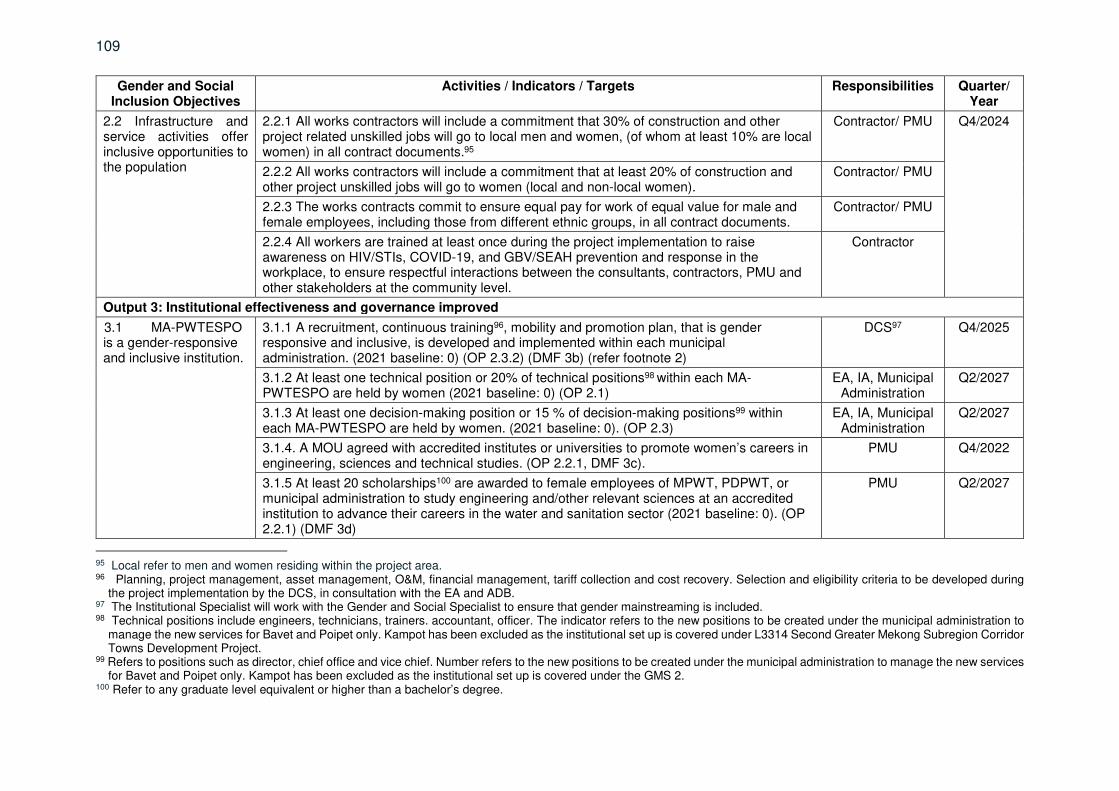
109
Gender and Social Inclusion Objectives
Activities / Indicators / Targets Responsibilities Quarter/ Year
2.2 Infrastructure and service activities offer inclusive opportunities to the population
2.2.1 All works contractors will include a commitment that 30% of construction and other project related unskilled jobs will go to local men and women, (of whom at least 10% are local women) in all contract documents.95
Contractor/ PMU Q4/2024
2.2.2 All works contractors will include a commitment that at least 20% of construction and other project unskilled jobs will go to women (local and non-local women).
Contractor/ PMU
2.2.3 The works contracts commit to ensure equal pay for work of equal value for male and female employees, including those from different ethnic groups, in all contract documents.
Contractor/ PMU
2.2.4 All workers are trained at least once during the project implementation to raise awareness on HIV/STIs, COVID-19, and GBV/SEAH prevention and response in the workplace, to ensure respectful interactions between the consultants, contractors, PMU and other stakeholders at the community level.
Contractor
Output 3: Institutional effectiveness and governance improved
3.1 MA-PWTESPO is a gender-responsive and inclusive institution.
3.1.1 A recruitment, continuous training96, mobility and promotion plan, that is gender responsive and inclusive, is developed and implemented within each municipal administration. (2021 baseline: 0) (OP 2.3.2) (DMF 3b) (refer footnote 2)
DCS97 Q4/2025
3.1.2 At least one technical position or 20% of technical positions98 within each MA-PWTESPO are held by women (2021 baseline: 0) (OP 2.1)
EA, IA, Municipal Administration
Q2/2027
3.1.3 At least one decision-making position or 15 % of decision-making positions99 within each MA-PWTESPO are held by women. (2021 baseline: 0). (OP 2.3)
EA, IA, Municipal Administration
Q2/2027
3.1.4. A MOU agreed with accredited institutes or universities to promote women’s careers in engineering, sciences and technical studies. (OP 2.2.1, DMF 3c).
PMU Q4/2022
3.1.5 At least 20 scholarships100 are awarded to female employees of MPWT, PDPWT, or municipal administration to study engineering and/other relevant sciences at an accredited institution to advance their careers in the water and sanitation sector (2021 baseline: 0). (OP 2.2.1) (DMF 3d)
PMU Q2/2027
95 Local refer to men and women residing within the project area. 96 Planning, project management, asset management, O&M, financial management, tariff collection and cost recovery. Selection and eligibility criteria to be developed during
the project implementation by the DCS, in consultation with the EA and ADB. 97 The Institutional Specialist will work with the Gender and Social Specialist to ensure that gender mainstreaming is included. 98 Technical positions include engineers, technicians, trainers. accountant, officer. The indicator refers to the new positions to be created under the municipal administration to
manage the new services for Bavet and Poipet only. Kampot has been excluded as the institutional set up is covered under L3314 Second Greater Mekong Subregion Corridor Towns Development Project.
99 Refers to positions such as director, chief office and vice chief. Number refers to the new positions to be created under the municipal administration to manage the new services for Bavet and Poipet only. Kampot has been excluded as the institutional set up is covered under the GMS 2.
100 Refer to any graduate level equivalent or higher than a bachelor’s degree.

110
Gender and Social Inclusion Objectives
Activities / Indicators / Targets Responsibilities Quarter/ Year
Project Management and Gender-Specific Activities:
4.1 A Gender and Social Specialist is engaged as part of the consulting team involved in the design (DCS) and management of the project. 4.2 At least one training session on GESIAP is given to the project teams (PDPWT and municipal administration staff) in each city. 4.3 Collection of sex-disaggregated and gender and target groups-related information relevant to the DMF and GESIAP is integrated in the overall project
performance monitoring system and reports. 4.4 A focal point(s) from the MPWT gender committee will be included in the GESIAP implementation and monitoring activities. 4.5 Regular communication about the project is provided to stakeholders.
DCS = Design and Construction Supervision Consultant; DMF = design and monitoring framework ; EA = Executing Agency; IA = Implementing Agency; MA-PWTESPO = Municipal Administration-Public Works Transport Environmental Sanitation Public Order Office; MPWT = Ministry of Public Works and Transport ; MOU = memorandum of understanding; O&M = operations and maintenance; PDPWT = Provincial Department of Public Works and Transport ; PMC: Project Management Consultant; Q = quarter.
.


Volume 15
Social Development,
Poverty and Gender Plan
CAM: LIVABLE CITIES INVESTMENT PROJECT March 2022
POIPET
Feasibility Study
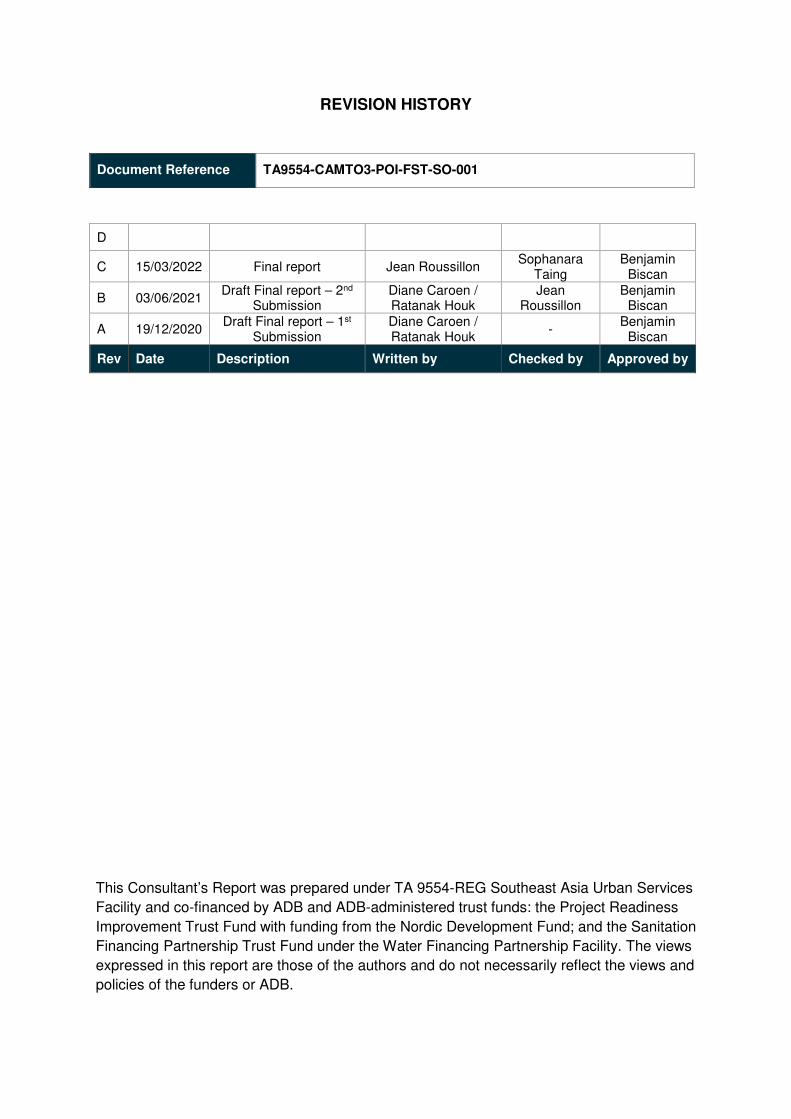
REVISION HISTORY
Document Reference TA9554-CAMTO3-POI-FST-SO-001
D
C 15/03/2022 Final report Jean Roussillon Sophanara
Taing Benjamin
Biscan
B 03/06/2021 Draft Final report – 2nd
Submission Diane Caroen / Ratanak Houk
Jean Roussillon
Benjamin Biscan
A 19/12/2020 Draft Final report – 1st
Submission Diane Caroen / Ratanak Houk
- Benjamin
Biscan
Rev Date Description Written by Checked by Approved by
This Consultant’s Report was prepared under TA 9554-REG Southeast Asia Urban Services
Facility and co-financed by ADB and ADB-administered trust funds: the Project Readiness
Improvement Trust Fund with funding from the Nordic Development Fund; and the Sanitation
Financing Partnership Trust Fund under the Water Financing Partnership Facility. The views
expressed in this report are those of the authors and do not necessarily reflect the views and
policies of the funders or ADB.

ABBREVIATIONS
AAGR – Average Annual Growth Rate
AH – Affected Households
AP – Affected People
ART – Antiretroviral therapy
C&I – Commerce and Institutions
CBO – Community Based Organisation
CCS – City Comprehensive Survey
CEDAW – Convention on the Elimination of All Forms of Discrimination Against Women
CLS – Core labor standards
CPS – Country Partnership Strategy
CSDG – Cambodian Sustainable Development Goal
CSES – Cambodia Socio-Economic Survey
CSO – Civil Society Organisation
DMC – Developing Member Country
EGM – effective gender mainstreaming
EM – Ethnic Minorities
FGD – Focus group discussion
FHH – Female Headed Household
GAP – Gender Action Plan
GBV – Gender Based Violence
GER – gross enrolment rate
GII – Gender Inequality Index
GRM – Grief redress mechanism
GRR – Gross Completion Rate
HH – Household
ICT – Information and communication technologies
IDP – Industrial development policy
IP – Indigenous People
IPSA – Initial Poverty and Social Analysis
KHR – Khmer Riels
LCIP – Livable Cities Investment Project
LSS – low secundary school
MISTI – Ministry of Industry, Science, Technology and Innovation
MoEYS – Ministry of education youth and sports
MoWA – Ministry of women affairs
MSD – Market Strategy and Development.co,ltd
NGO – Non Governemental Organisation
NIS – National Institute of Statistics
NSDP – National strategic development plan
O&M – Operations and maintenance
PDoWA – Provincial department fo women affaires
PSA – Poverty and Social Analysis
PwD – Person with disability
RGC – Royal Government of Cambodia

SDG – Sustainable Development Goal
SEZ – Special Economic Zone
SNA – Sub-national admninistration
SPPF – National Social Protection Policy Framework
SWM – Solid waste management
TRTA – Transaction technical assistance
TVET – Technical and vocational training
UNDP – United Nations Development Project
USD – American dollars
WCCCs – Women and Children Consultative Committees
WWTP – Wastewater treatment plant
CONTENTS
PAGE
EXECUTIVE SUMMARY
I. INTRODUCTION 1
1. Rationale of the Project 1
2. Project location 1
3. Description of the Project 1
4. Safeguards analysis (summary) 6
II. POLICIES AND INSTITUTIONAL ARRANGEMENTS 7
1. Policies and legislative framework 7
2. Institutional arrangements 9
3. Regulation and enforcement 10
III. SOCIO-ECONOMIC PROFILE AND INDICATORS 13
1. Social development and poverty 13
2. Profile of key stakeholders 21
IV. BENEFICIARY PROFILE 32
1. Methodology 32
2. Data on the head of the household 35
3. Characteristics of beneficiary households 36
4. Livelihood, poverty, and hardship 37
5. Households and water supply 38
6. Households and sanitation 38
7. Households and stormwater drainage 40
8. Households and solid waste management 42
9. Consumer perceptions 43
10. Private sector 43
11. Civil society organizations 46
V. NEEDS, PREFERENCES, AND DEMANDS OF PROJECT STAKEHOLDERS 47
1. Informal settlement dwellers 47
2. Poor households 47
3. Female-headed households 49
4. Indigenous peoples 51
5. Youth and children 52
6. Persons with disabilities 52
7. Elderly 53
VI. SOCIAL AND POVERTY ANALYSIS 56
1. Rapid urban development but low basic service development 56
2. Addressing existing deficiencies in basic infrastructure 57
3. Impact on poverty reduction 57
4. Impact on health 63
VII. GENDER ASSESSMENT 67
1. Role and status of women 67
2. Gender characteristics in the project area 72
3. Control of resources and access to infrastructure 74
4. Health status 75
5. Gender impact analysis 76
VIII. GENDER EQUALITY AND SOCIAL INCLUSION ACTION PLAN 78
1. Social Approach 78
2. Gender Approach 83
3. Project assurances 84
IX. MONITORING AND REPORTING 86
1. Monitoring poverty and social impacts 86
2. Reporting 86
X. CONSULTATION AND PARTICIPATION 87
1. Consultations were undertaken 87
2. Results of consultations 87
3. Roles of stakeholders in planning, design, and implementation 87
4. Stakeholder participation plan 88
5. Stakeholder communication strategy 93
6. Disclosure 97
XI. CONCLUSIONS AND RECOMMENDATIONS 98
XII. APPENDICES 99
1. Key sex-disaggregated poverty and social statistics and indicators 99
2. Stakeholders consultation 110
3. City Comprehensive Survey and Social surveys (separated files) 112
4. Gender Equality and Social Inclusion Action Plan 113

LIST OF FIGURES
Figure 1: Location of main infrastructure proposed - wastewater .......................................... 3 Figure 2: Proposed urban drainage network - overview of box-culvert types ......................... 4 Figure 3: Proposed landfill and composting plant location (SWM) ......................................... 5 Figure 4: Comparison between health issues encountered by adults male and adults female ........................................................................................................................................... 21 Figure 5: Fraction of ID Poor in the population, Poipet, ID Poor database 2018 .................. 23 Figure 6: Fraction of FHHs in the population, Municipality data ........................................... 24 Figure 7: Comparison of age pyramids 2003 and 2020, Cambodia ..................................... 28 Figure 8: Mobile data collection strategy ............................................................................. 34 Figure 9: Average monthly income per vulnerability group, 2018, CCS ............................... 38 Figure 10: Location of Households Willing to Pay a Monthly Fee for Wastewater Management, CCS .................................................................................................................................... 40 Figure 11: Flood prone areas identified from CCS .............................................................. 41 Figure 12: Location of households willing to pay for Solid Waste Collection service, CCS .. 43 Figure 13: Map of area showing the level of urbanization, Poipet ........................................ 56
LIST OF TABLES
Table 1: Summary of proposed discharge points in Poipet .................................................... 4 Table 2: Key statistical information ...................................................................................... 13 Table 3: Analysis of households expenses Poipet ............................................................... 17 Table 4: List of CSOs/NGOs, Poipet, June 2020 ................................................................. 29 Table 5: Achieved Sample Size in Poipet ............................................................................ 33 Table 6: Occupation of heads of households, Poipet, CCS ................................................. 36 Table 7: Type of assets hold by households in Poipet ......................................................... 36 Table 8: Expenditure profile of households, 2018, Poipet .................................................... 37 Table 9: Commerce and institutions surveyed in Poipet during the Comprehensive City Survey ........................................................................................................................................... 44 Table 10: Satisfaction rate for current urban infrastructure in Poipet for Commerce and Institutions, CCS. ................................................................................................................ 46 Table 11: Analysis of affordability for poor HHs ................................................................... 48 Table 12: Analysis of affordability of facilities and services for FHHs .................................. 50 Table 13: Analysis of affordability of facilities and services for elders’ head of households . 55 Table 14: Estimate Human resources required to operate the sewerage system ................ 60 Table 15: Total operators required for O&M associated with collection services and the sorting plan ..................................................................................................................................... 61 Table 16: Sex Disaggregated data on staff at PDoPWT level, Bantey Meanchey. .............. 61 Table 17: Comparison of occupation between male and female heads of households ........ 72 Table 18: Distribution of expenses in FHHs budget, Poipet, CCS ....................................... 73 Table 19: Comparison of assets between FHHs and MHHs ................................................ 74 Table 20: Staff repartition per position and sex ................................................................... 75 Table 21: Comparison between percentage of men/women per type of health condition encountered by surveyees over one year. ........................................................................... 76 Table 22: Detailed social action and poverty alleviation actions .......................................... 80 Table 23: Consultation and Participation Plan ..................................................................... 89 Table 24: Stakeholder Communication Strategy ................................................................. 95 Table 25: Disclosure plan .................................................................................................... 97 Table 26: Municipality data 2018/ sums per Sangkat .......................................................... 99 Table 27: Municipality data in % per Sangkats (details per village in soft copy only) ........ 101 Table 28: ID poor data (2018) (details per village in soft copy only) .................................. 102 Table 29: IPs Data ............................................................................................................ 103 Table 30: Key CCS data disaggregated ............................................................................ 104 Table 31: Analysis of affordability per sub-group ............................................................... 108 Table 32: Households expense ......................................................................................... 109 Table 33: Households occupation ..................................................................................... 109 Table 34: Households assets ............................................................................................ 110 Table 35: Males/fFemales diseases .................................................................................. 110 Table 36: Stakeholders Consultation ................................................................................. 110
LIST OF PICTURES
Picture 1: Focus Group Discussion with Cham women in Poipet, October 2020 ................. 26 Picture 2: Social survey, Poipet September 2020 ................................................................ 35 Picture 3: Picture of local NGO Domnok Teuk’ premises, Poipet, September 2020 ............ 46 Picture 4: FGD with youth in Poipet, social survey, September 2020 .................................. 52 Picture 5: FGD with people with disabilities in Poipet, social survey, September 2020 ........ 53 Picture 6: FGD with women in Poipet, October 2020 .......................................................... 74

EXECUTIVE SUMMARY
1. At the request of the Kingdom of Cambodia, the Asian Development Bank (ADB) is
developing the Livable Cities Investment Project (LCIP) to facilitate long-term sustainable and
economic growth. The project targets, among others, Poipet City, in Banteay Meanchey
Province. The assessment carried out in this project shows a lack of basic infrastructure in
Poipet City to address the current needs. The urban trend analysis ( (i) City Master Plan and
Projected Land Use 2030 (MLMCP) and (ii) population projection (TRTA)) reveals that a
significant increase in the needs for basic services is to be expected in the coming years in
Poipet Municipality.
2. This Poverty, Social and Gender Analysis (PSA) is part of the Safeguard Policy
Statement (SPS) and identifies the key poverty and social issue, beneficiaries, channels of
impacts, other social issues and risks and design features. It includes a poverty reduction and
social strategy, a gender action plan to promote gender inclusion in the project activities and
monitoring system and address gender mainstreaming in the project components under
training and capacity building, a stakeholder communication strategy and a participation plan.
3. The report is based on a literature review, secondary and primary data. Several
documents served as a reference for the analysis - the Initial Poverty and Social Analysis
(IPSA), documents and reports published by the Royal Government of Cambodia (RGC), line
ministries and National Institute of Statistics and country institutions and ADB documents
available on its website, among others. Primary data were collected by the TRTA through a
City Comprehensive Survey (household survey) in December 2019, Key Informant Interviews
(KII), along with the project preparation and Focus Groups Discussions (FGDs) in September
and October 2020 to assess the situation of specific groups in the project area. Together with
secondary data obtained from the Municipality and ID poor program, this information was used
to draw socio-economic profiles, identify pockets of poverty and vulnerability, assess the
needs, demands and constraints of direct beneficiaries in order for all groups to fully benefit
from the project. In total, in Poipet, 13 workshops and meetings were held with 397 participants
and 13 Focus Groups Discussions with 159 participants.
4. The project aligns with key overarching frameworks for poverty alleviation and gender
mainstreaming developed by the RGC and the ADB. The country is engaged in a progressive
decentralization and deconcentration process, which transfers additional responsibilities and
functions to the subnational levels, and more recently to the municipalities and municipal
offices. The project will be implemented by the Provincial Department of Public Works and
Transport and will support the transfer of competencies to Municipality offices.
5. Poipet city went through major changes since 2008, with the establishment of Special
Economic Zones (SEZs) and the continuous development of transborder tourism and trade.
This translates into socio-economic patterns. The service sector employs 71% of the
population, the SEZ 16%, and 13% of the population is still engaged in agriculture. Parts of
the city are urbanized while others remain rural. General access to urban infrastructure and
services is low, except for sanitation which has higher coverage (90% of households have
their own latrines1) and is concentrated in the most urbanized Sangkat. 51% of households
1 City Comprehensive Survey 2019

have access to the piped water system, 16% have a solid waste collection service in urban
areas only and only 7% are connected to the sewerage system. The average monthly income
per capita is below the national average, and the city reports 8% ID poor cardholders2.
6. Poor and vulnerable groups in Poipet are mostly made of ID poor, elderly, and female-
headed households (FHH) (13% of the population and up to 30% in some villages) and people
with disabilities. There are informal settlements (1,060 households in total). Indigenous
Peoples (IPs) are represented by 537 Cham households located mostly in Sangkat Poipet and
Sangkat Nimit.
7. Vulnerable groups have the same access to the infrastructure and services, when they
are available. In general, they share the same interest as other groups to access improved
urban infrastructure and services for better health and living environment. Besides lower
education levels observed among the oldest and women, the main difference between poor
and vulnerable households and the rest of the population is income, which, for the poorest, is
70% lower than the average income of the population. The costs of health expenses represent
16% of the total expenses for the elderly and 9% for FHHs, when it is only 7% for other
households. The poor and vulnerable are more impacted by poor waste and sanitation, in
terms of the unhealthy living environment, higher incidence of illness due to water-borne
disease and the weight of health expenditures in their budget.
8. Low income is a constraint to consider in ensuring the affordability and accessibility to
basic urban services. Consultations reveal that poor and vulnerable are willing to access such
services, but most are unsure if they can afford it- the costs of urban infrastructure and service
would weigh in relatively more in their budget than for wealthy people and paying for waste
management and sanitation could be at the expense of other costs (i.e., for food, education).
The results of the consultations suggest that the issue of willingness to pay and affordability
is also intricately linked to low levels of awareness and information, low degree of satisfaction/
trust in the quality of current services (e.g., solid waste collection, drainage) and lack of
incentives to change practices.
9. A comprehensive approach is proposed to ensure inclusive access to urban
infrastructure and services and to optimize the impacts of the infrastructure development,
which includes: (i) creating an enabling environment, including raising awareness and
engaging people in behavior change (knowledge and attitudes)3, (ii) using regulations to guide
people towards proper sanitation, and accelerate changes in practices, (iii) proposing
mechanisms/ prices4 that would allow the poor and vulnerable to access and benefit from
basic infrastructure and services and contribute to urban sanitation and public health, and (iv)
improving the quality of services delivered by the private and public operators.
10. While urbanization tends to modify gender roles slightly in water and sanitation (e.g.,
women/girls do not need to fetch water when there is a public water supply/type water), the
trend remains that women are primarily responsible for domestic chores, including the care of
2 The percentage of population living below poverty line at national level : 12.9% in 2018 3 A key output of the project will be to develop training and awareness raising on the costs and benefits of proper sanitation and disposal of waste and will promote opportunities to improve the livelihood of the residents, particularly the poor and female population, and rural people. Negative impacts of bad sanitation and hygiene are currently less a problem for population in rural area, and part of the program will be to raise awareness in anticipation of future urbanization. 4 The project incorporates practical pro-poor and social inclusion design features, such as the provision of free-of-charge stormwater drainage, free connection to the sewerage for the poorest, tailored schemes for equitable wastewater service fees , and solid waste collection to adapt to these constraint and ensure equitable and full access to basic services for the whole population..

children, elderly and sick, as well as solid waste management. They generally have a higher
risk and health exposure as the primary contributors toward household and community
sanitation tasks. Perhaps due to their low levels of education, limited access to information
and daily exposure to waste that is an accepted part of their lives, female survey participants
showed less awareness and concern about sanitation issues and their impact on the
environment and health. They are also less informed about the technical and economic
aspects of water and sanitation and are absent in decision-making and O&M related to this
subject, despite being the main users.
11. Women are under-represented in technical aspects and decision-making in the water
and sanitation sector in general. The Project aims to address the role of women in decision
making and participation in the water and sanitation sector, by building their knowledge and
capacity, promoting more women in technical and decision-making positions in the institutions,
and engaging women in water and sanitation monitoring and O&M at the community level.
12. Social and gender indicators are proposed for integration into the DMF to ensure the
project is inclusive and provides equitable access to urban infrastructure and services, gender
equity, and contributes to social development and public health. The project also supports
participatory monitoring through regular consultation including with women and vulnerable
groups and the establishment of mixed-gender Community Monitoring Committees to ensure
community’s and women engagement in behavior change and monitoring.
13 Measures are in place to mitigate or avoid potential risks associated with public works
(eg. nuisance during construction works, potential risk of HIV/ communicable diseases
transmission, working conditions of construction workers). Potential loss of informal jobs due
to the reorganization of Solid Waste Management systems will be offset by the creation of
formal jobs.
14. Results of consultations with stakeholders conducted in the project preparation phase
have been incorporated into its design and such consultations will continue throughout the
project via meetings, FGDs with specific groups (eg. the poor and vulnerable, people living
near the landfills and water treatment plants, waste pickers/ scavengers), surveys and through
participatory monitoring, with the objective to obtain feedback from the beneficiaries, adjust
activities and increase people’s satisfaction and use of urban infrastructure and services. The
Stakeholders Participation Strategy (SPS) identifies the different approaches and depths of
participation.
15. Stakeholders involved in the project include the Provincial Department of Public
Works, key provincial departments such as the Provincial Department of Women Affairs and
the Municipality Administration, as well as local organizations, other development projects and
the private sector (solid waste collection, civil works contractors). The participation of local
authorities and organizations (Sangkat councils, Women and Children Consultative
Committees, CSOs-NGOs) will guarantee proper dissemination of information/awareness
messages and contribute to the smooth implementation of operation locally.16 The
Stakeholder Communication Strategy (SCS) provides for comprehensive, timely and
transparent information, and targeted awareness-raising. It includes a mix of traditional and
modern communication means, direct communication, mass media and social media, to reach
the targeted audience more effectively.
17. Urban infrastructure and services have been identified as important contributors
towards inclusive and sustainable development, and the development of human capital, social

services, and public governance. The project will improve access to urban services to the
residents of the city. It will improve the attractiveness for more economic investments, and
tourism development, given the basic infrastructure being in place and providing employment
opportunities. To reach its economic, social and environmental goals, the development of
urban infrastructure and services has to benefit all population groups and “leave no one
behind”. The project encompasses the necessary elements to reach this objective, in terms of
consultation and participation of women, poor and vulnerable groups, targeted interventions
(training and awareness raising, women’s empowerment) and affordable services.
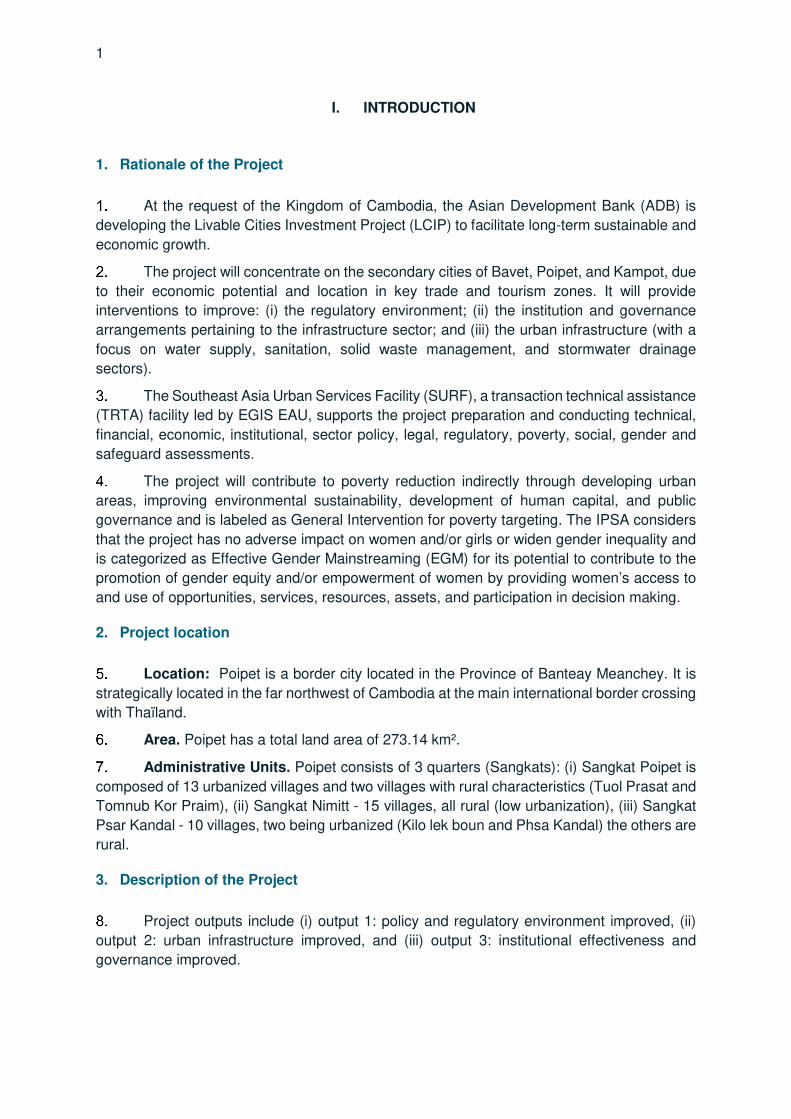
1
I. INTRODUCTION
1. Rationale of the Project
At the request of the Kingdom of Cambodia, the Asian Development Bank (ADB) is
developing the Livable Cities Investment Project (LCIP) to facilitate long-term sustainable and
economic growth.
The project will concentrate on the secondary cities of Bavet, Poipet, and Kampot, due
to their economic potential and location in key trade and tourism zones. It will provide
interventions to improve: (i) the regulatory environment; (ii) the institution and governance
arrangements pertaining to the infrastructure sector; and (iii) the urban infrastructure (with a
focus on water supply, sanitation, solid waste management, and stormwater drainage
sectors).
The Southeast Asia Urban Services Facility (SURF), a transaction technical assistance
(TRTA) facility led by EGIS EAU, supports the project preparation and conducting technical,
financial, economic, institutional, sector policy, legal, regulatory, poverty, social, gender and
safeguard assessments.
The project will contribute to poverty reduction indirectly through developing urban
areas, improving environmental sustainability, development of human capital, and public
governance and is labeled as General Intervention for poverty targeting. The IPSA considers
that the project has no adverse impact on women and/or girls or widen gender inequality and
is categorized as Effective Gender Mainstreaming (EGM) for its potential to contribute to the
promotion of gender equity and/or empowerment of women by providing women’s access to
and use of opportunities, services, resources, assets, and participation in decision making.
2. Project location
Location: Poipet is a border city located in the Province of Banteay Meanchey. It is
strategically located in the far northwest of Cambodia at the main international border crossing
with Thaïland.
Area. Poipet has a total land area of 273.14 km².
Administrative Units. Poipet consists of 3 quarters (Sangkats): (i) Sangkat Poipet is
composed of 13 urbanized villages and two villages with rural characteristics (Tuol Prasat and
Tomnub Kor Praim), (ii) Sangkat Nimitt - 15 villages, all rural (low urbanization), (iii) Sangkat
Psar Kandal - 10 villages, two being urbanized (Kilo lek boun and Phsa Kandal) the others are
rural.
3. Description of the Project
Project outputs include (i) output 1: policy and regulatory environment improved, (ii)
output 2: urban infrastructure improved, and (iii) output 3: institutional effectiveness and
governance improved.

2
The project components under output 2 are:
(i) Improved wastewater management systems (pumping stations, network, and treatment plant);
(ii) Improved drainage systems to manage stormwater flows, and;
(iii) Improved SWM systems (including landfill, waste collection & recycling, and transportation vehicles, an upgrade of environmental protection measures and activities to promote waste reduction).
The following sub-chapters provide a brief overview of the proposed infrastructure for
LCIP in Poipet.
Wastewater
Based on the selected scenario for the master plan, a centralized wastewater
treatment plant (WWTP) will serve the densest part of the built-up area of Poipet and its
extensions in the medium and long term .. LCIP targets the creation of a connection to the
wastewater network for a major part (75%) of the population located in urban areas. Long-
term capacity (up to 2040) is considered for the design of proposed infrastructure.
At the end of the master plan study stage, it was suggested to start the implementation
with:
(i) Construction of a wastewater treatment plant for the initially connected population, with
some provision for extensions for the longer term;
(ii) Construction of pumping stations to create a transfer chain to the WWTP when areas
to be serviced require, and gravity flows cannot be achieved because of distance and
topography; and
(iii) Construction of sewer pipes designed primarily for the selected existing built-up areas
with some capacity for extensions for future growth.
The map below is displaying the location of proposed pumping stations, force mains,
gravity mains, and wastewater treatment plant. To fit the budget requirement, part of the
infrastructure designed (shown in red/grey) has not been integrated into the final investment
proposed.
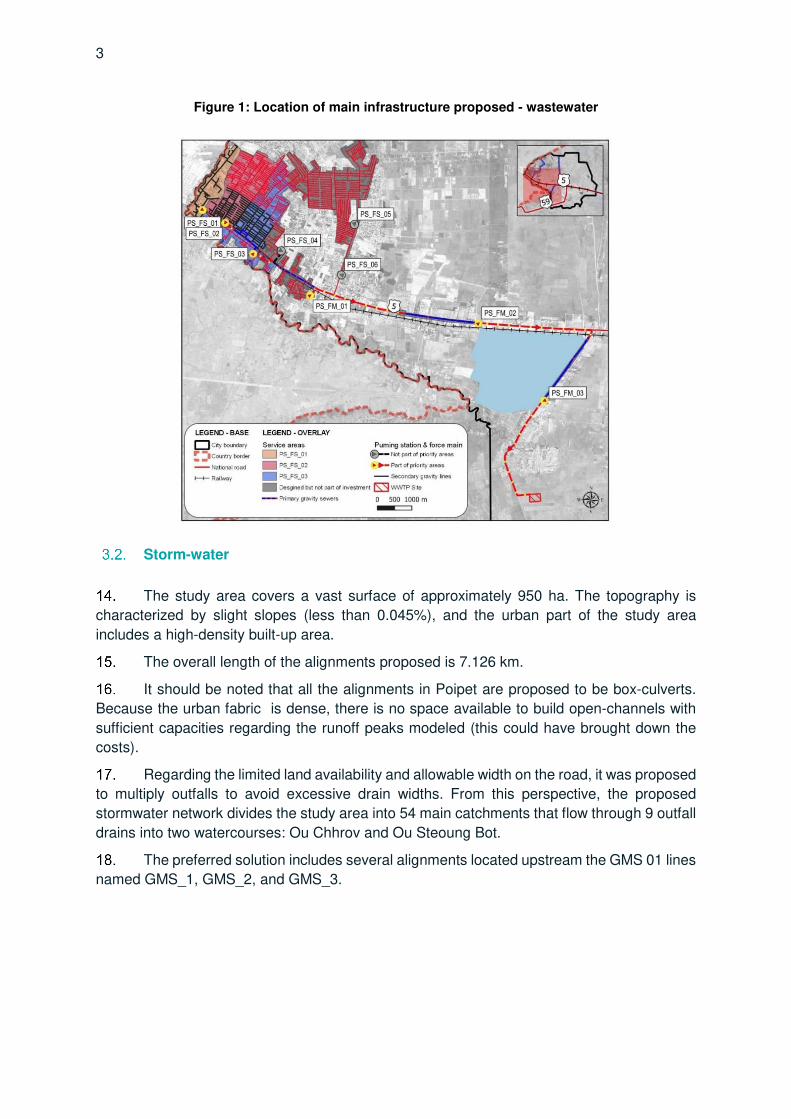
3
Figure 1: Location of main infrastructure proposed - wastewater
Storm-water
The study area covers a vast surface of approximately 950 ha. The topography is
characterized by slight slopes (less than 0.045%), and the urban part of the study area
includes a high-density built-up area.
The overall length of the alignments proposed is 7.126 km.
It should be noted that all the alignments in Poipet are proposed to be box-culverts.
Because the urban fabric is dense, there is no space available to build open-channels with
sufficient capacities regarding the runoff peaks modeled (this could have brought down the
costs).
Regarding the limited land availability and allowable width on the road, it was proposed
to multiply outfalls to avoid excessive drain widths. From this perspective, the proposed
stormwater network divides the study area into 54 main catchments that flow through 9 outfall
drains into two watercourses: Ou Chhrov and Ou Steoung Bot.
The preferred solution includes several alignments located upstream the GMS 01 lines
named GMS_1, GMS_2, and GMS_3.

4
The table below summarizes the main characteristics of the catchments and facilities
proposed:
Table 1: Summary of proposed discharge points in Poipet
Subcatchment Stormwater system
Outfall name Count Total Area 2025
Length
2025
Average
slope
Outfalls
discharge peak
flow
(ha) (m) (m/m) (m3/s)
GMS 01 11 242.4 999 0.0016 8.76
GMS 02 8 305.7 3,691 0.0012 9.24
GMS 03 11 405.8 2,437 0.0017 9.81
TOTAL 30 954 7,126 0.0045 28
Note: The hydrological parameters and initial conditions used in the PCSWMM model are detailed in Volume 4.
Figure 2 shows the types (simple or double) of box-culvert used for each section
considered.
Figure 2: Proposed urban drainage network - overview of box-culvert types

5
Out of GMS1 box-culverts under construction, it is not proposed to reuse/rehabilitate
existing lines. The existing secondary drainage network needs to be re-connected to the
proposed drainage lines to get a consistent strategy for the whole drainage network.
Secondary network connections will be studied during the detailed engineering design based
on a detailed topographical survey.
Solid waste
Regarding the situation assessment of Poipet, it is estimated that 84% of the solid
waste generated is unsafely managed. The household collection coverage is only
approximately 16%. A large portion of the municipal solid waste is also left uncollected and
dumped directly in the nearby natural environment and/or burnt. The collection for the whole
city has to be improved.
In termes of collection, a door-to-door collection is preferred in the city center while
centralized collection is suggested in rural areas until these areas are sufficiently developed
to densities which make door-to-door collection cost effective. Source segregation at markets,
with a dedicated centralized collection point, would be an opportunity to increase the sorting
of bio-waste and, therefore, the potential for compost production
In terms of treatment, a sorting plant and a composting plant have been identified as
the most appropriate technologies to reduce the amount of waste to be landfilled, to control
part of the market for recyclables, to increase revenue potential, and to contribute to climate
change mitigation. Finally, a controlled landfill is proposed as the most appropriate disposal
system for most of the city to avoid the harmful dumping and burning of waste.
Figure 3: Proposed landfill and composting plant location (SWM)

6
4. Safeguards analysis (summary)
Environment. The project has been classified as category B for the environment. An
Initial Environmental Examination (IEE) and Environmental Management Plan (EMP) has
been prepared (refer to Volume 12), which found the project components are not expected to
cause any irreversible adverse environmental impacts. Project implementation requirements
and methods for environmental mitigation measures, monitoring, reporting, roles and
responsibilities, and grievance redress mechanism, are outlined in the EMP.
Involuntary resettlement. A Basic Resettlement Plan (BRP), refer to Volume 13, has
been prepared based on an outline engineering design and inventory of losses (IOL)/socio-
economic survey (SES). An IR screening was conducted in October – November 2020 and
the Subproject was classified as category "B" for IR impact as it includes land acquisition and
resettlement impacts which were not deemed significant.
Scope of impact for the Corridor of Impact (COI) and all assets within COI were
measured. Based on IOL survey, the project will include overall impact on assets and/or
economic displacement of 102 AHs (325 APs), of which 17 AHs (60 APs) are vulnerable and
18 AHs (78 APs) major impact due to productive land loss of more than 10%. A total of 22
AHs/84 APs will lose privately owned agricultural land (328,214 m2), 3 AHs/10 APs will lose
privately owned unused agricultural land (549 m2)5, 1 AH/1 AP lose privately owned residential
land (200 m2) and 2 companies, or affected legal entity households (ALEHs) lose privately
owned commercial land (200 m2). The Subproject will acquire private land for SWM landfill
and WWTP site through negotiated land acquisition of 30 ha of private agricultural land,
whereas narrow strips of land for wastewater component are acquired through expropriation.
The storm water drainage network does not have IR impacts
Indigenous Peoples. The project was initially categorized as B for its potential impacts
on Indigenous Peoples (IP) communities but, as there no IPs are identified during project
preparation, and the ethnic groups identified in the project area IP are well integrated in the
mainstream society and will benefit from the same advantages as Khmer, it is has been
assessed as category C for the impact on IPs. Refer to Volume 14 for the Indigenous Peoples
Due Diligence Report.
5 Unused agricultural land refers to idle land which is unimproved land and hence not suitable for paddy rice based agriculture of
Cambodia without investment on land improvement.

7
II. POLICIES AND INSTITUTIONAL ARRANGEMENTS
1. Policies and legislative framework
Key overarching Framework for poverty alleviation are the medium-term targets of the
government’s Rectangular Strategy, Phase IV (RSIV) for growth and poverty reduction, the
National Strategic Plan on Green Growth, 2013–2030; and the draft National Strategic
Development Plan, 2019–2023, which integrates Cambodia’s Sustainable Development
Goals.
The RSIV is a key government policy that aims to support the Political Platform, as
asserted by the government. It consists of four priority areas focusing on inclusive and
sustainable development to address challenges relating to urbanization and the need to
improve the capacity to respond to the impacts of climate change. The Cambodia Livable
Cities Investment Project (LCIP) aligns with the Rectangular Strategy for Growth,
Employment, Equity, and Efficiency: Building the Foundation Toward Realizing the Cambodia
Vision 2050 Phase IV (RSIV).
The National Strategic Development Plan 2019-2023 (NSDP) has been developed as
the primary tool for driving the political platform and the RSIV, outlining key measures and
actions to enable the country to reach upper-middle-income status by 2030. These collectively
seek to enable progression to Upper Middle-Income and then High-Income Country status
based on socio-economic inclusion and environmental sustainability. The imperative of
securing equitable development and leaving no one behind, and preserving Cambodia’s
natural resource endowment while also addressing the threats posed by climate change, are
fully embedded within the policy stance.
In 2003, Cambodia established the Cambodia Millennium Development Goals (MDG).
Then following the endorsement of the SDGs at the UN General Assembly in late 2015, the
RGC has worked to adapt the goals to the national context and has crafted a fully localized
framework – the Cambodian SDGs 2016-2030 (CSDGs). Among the nine targets and 14
indicators of global SDG 5 to “achieve gender equality and empower all women and girls,” the
Cambodian government has accepted seven targets and 12 indicators into the CSDG
framework (CSDG 5). In the Socio-Economic Policy Agenda (Rectangular Strategy IV) of the
current government, human resource is given the highest development priority. It includes
mainstreaming of gender equity in policy framework and national development plan which will
lessen the gender gap in education, widens women entrepreneurship initiative, reduce
domestic violence and sexual abuse against women and children and uplift social morality.6
In 2011, the RGC formulated the National Social Protection Strategy for the Poor and
Vulnerable. The strategy has four pillars: vocational and skills training; social insurance
(contributory system); social safety nets (noncontributory system); and complimentary social
welfare services. A variety of governmental and non-governmental agencies are
involved in poverty reduction, including the Ministry of Social Affairs, Veterans and Youth
6 SDG 5 Gender equality, Open Development Society, 11 April 2019 https://opendevelopmentcambodia.net/topics/sdg-5-gender-equality/

8
Rehabilitation (MoSVY), which provides social welfare services and assistance to the
vulnerable, including disabled and elderly people, as well as the homeless.
In 2017, “the National Social Protection Policy Framework 2016-2025” (SPPF) was
approved by the Council of Ministers. The goal of this policy framework is to develop a strategic
plan for the Royal Government of Cambodia to ensure income security and reduce the
economic and financial vulnerability of its citizens. It aims at increasing people’s well-being
and solidarity in society and aims at reducing poverty to a maximum extent. The policy
framework aligns, concentrates, and improves the existing social protection
programs/schemes and enhances the efficiency, equity, transparency, and consistency of the
social protection system.
Cambodia has been a member State of the ILO since 1969. It has ratified all 8 of the
core labor standards and a number of other key ILO conventions. The core labor standards
are a set of four fundamental, universal, and indivisible human rights: Freedom from forced
labor, freedom from child labor, freedom from discrimination at work, freedom to form and join
a union, and to bargain collectively. Among key conventions, Cambodia signed in 1999 the
convention on the Worst Forms of Child Labour Convention, the Equal Remuneration
Convention, and the Discrimination (Employment and Occupation) Convention.
Articles 31, and 35 of the Constitution ensure equal rights for women regardless of
race or religion, and Article 45 prohibits discrimination based on gender. A number of laws
have been adopted which protect women’s interests, such as the law on Prevention of
Domestic Violence and Protection of Victims (2005), the law on Suppression of Trafficking in
Humans and Sexual Exploitation (2008), and other measures that ensure gender equality has
been progressively and effectively integrated into the successive National Strategic
Development Plans.
The RGC ratified the Convention on the Elimination of All Forms of Discrimination
Against Women (CEDAW) in 1992 without reservation. CEDAW ensures the civil rights and
legal status of women as follows: their political participation, non-discrimination in education,
employment and in the economic and social activities and the equal rights and obligations of
women and men with regards to the choice of spouse, parenthood, individual rights, and
economic rights.
The Minimum Standards for Essential Services for Women and Girl Survivors of
Gender-Based Violence (GBV) was drafted in 2017 under the second National Action Plan to
prevent Violence Against Women 2014-2018 (NAPVAW II). NAPVAW III 2019-2023 was
officially launched 19th January 2021. The action plan, developed in line with the Rectangular
Strategy-Phase 4 of the Royal Government of Cambodia, sets out four strategies, including 1:
Primary Prevention, 2: Legal Protection and Multi-Sectoral Services, 3: Laws and Strategic
Policies, 4: Monitoring, Review, and Evaluation to prevent, respond and address the violence
against women and girls more effectively and efficiently to reduce any forms of violence
against them to promote equity and social inclusiveness.
The National Strategic Plan for Gender Equality and Women’s Empowerment, Neary
Rattanak represents the guiding policy to promote gender equality and women’s
empowerment in Cambodia. The plan is supported by the Cambodia Gender Assessment,
which provides a periodic analysis of the status of women in all sectors and the changes and
advancements made, as well as the remaining challenges. Neary Rattanak V was approved
in 2020 for the period 2019-2023. Neary Rattanak V was formulated in the framework of

9
drafting the first National Policy on Gender Equality, and it will become a key strategic plan to
support the implementation of this new national policy in all areas and all levels, especially in
coordination with line ministries/institutions and stakeholders. This includes the following
objectives, which must be considered in LCIP. (i) Strengthen the capacity of institutions and
mechanisms at the national and sub-national levels to mainstream a gender-transformative
approach through the process of formulating and implementing laws, policies, strategic plans,
national and sectoral programs at all levels with equity and inclusion. (ii) Promote the
participation of women in decision-making at all levels and the promotion of gender equality
in leadership at all levels.
The Ministry of Civil Service (MCS) issued guidelines for a 20 to 50% quota for women
in the annual recruitment of staff to work in public institutions and a target of 42% women civil
servants and 25 to 30%of women in decision-making positions by 2022.
2. Institutional arrangements
Institutional arrangements. The first major step towards democratic, decentralized
management at local levels was made in 2001, when the law on commune/Sangkat
administrative management (2001) recognized commune and Sangkat as local government
entities, with their own directly elected leadership and legislative and executive powers. In
2008, the organic law- Law on Administrative Management of the Capital, Provinces,
Municipalities, Districts, and Khans- provided the administrative basis for further
decentralization and deconcentration by formalizing the structures and roles of the provincial
level (including provinces and the capital city) as well as a district level (covering provincial
districts as well as khans).7 (Sub-Decree No. 216 ANK.BK, 2009).
In 2019, sub-decree No.182 ANK.BK redefined the functions and structure of municipal
administrations with the aim to promote the efficiency of administration management, public
service delivery, and local development at the municipality level. The ministries, institutions,
and authorities at all levels must also transfer appropriate functions to the municipal
administration. According to the sub-decree, each municipal administration shall have the
following offices and units: Administration and Finance Office; Procurement Unit; Human
Resource Management Office; Planning and Sangkat Support Office; Internal Control Office;
Council Secretary Office, Education, Youth and Sports Office; Land management, Urban
Planning, Construction, and Land Office; Legislation and Local Conflict Mediation Office;
Public Works, Transportation, Hygiene, Environment, and Public Order Office; Economy and
Community Development Office; Social Affairs and Welfare Office; and One Window Service
Office.
According to the sub-decree No.182 Art.24, the Public Works, Transportation,
Hygiene, Environment, and Public Order Office shall act as the secretariat for municipal
administration in public works, transportation, hygiene, environment, and public order tasks
and shall be responsible for the following functions, and a key stakeholder in the Cambodia
Livable Cities Investment Project (LCIP): public works and transportation, solid waste
management in urban areas, management of sewage system and wastewater treatment
system, management of smoke, sound, smell, and atmosphere pollutions, management of
natural protected area systems; tree plantation, care, and management of public gardens,
7 http://www.localpublicsector.net/profiles/khm1112.htm

10
management of public lighting, management of public parking spaces, public orders, other
tasks as assigned by the municipal government.
Gender. The Ministry of Women’s Affairs (MoWA) is in charge of coordinating,
facilitating, and advocating for gender mainstreaming within and across government and
public institutions. Gender Mainstreaming Action Groups (GMAGs) are the mechanism for
gender mainstreaming across sectors. GMAGs have been established since 2005 in all line
ministries and government agencies. Through GMAGs, all line ministries and institutions
develop Gender Mainstreaming Action Plans to guide their actions.
At the sub-national level, MoWA is represented by Provincial and District Offices of
Women’s Affairs (PDoWA and DOWA). Gender Focal Points have been designated in
provincial line departments. They work with line departments, offices, and other relevant units
under their respective jurisdictions. They are responsible for supporting, coordinating, and
conducting research to inform and provide comments to Women and Children Consultative
Committees (WCCCs) on issues concerning women, children, and youth at their own level.
Capital, Provincial, Municipal, District, and Khan Women and Children Consultative
Committees (WCCCs) are the sub-national mechanisms to promote gender equality and the
empowerment of women and children under the jurisdiction of the province and district.
WCCCs are authorized and duty-bound to provide suggestions and recommendations to the
Council, Board of Governors (Capital/Provincial/District/Khan), and other committees on
issues related to gender equity and women and children. MoWA supports PDWA and DOWA
in fulfilling their roles as permanent deputy of the committee, while the Ministry of Interior
supports capacity building and overall functions of the committee.
Commune Committees for Women and Children (CCWCs) are consultative
committees for women’s and children’s issues, such as maternal and child health, community
pre-school, hygiene/sanitation, gender equality, and child protection. The CCWC consists of
the Commune/Sangkat Chief as chair, Second Vice Chief of the Commune/Sangkat as
Deputy, and the Commune Women and Children Focal Point (CWCFP) as permanent
members.
3. Regulation and enforcement
Social. Social Social Assistance programs that have been implemented include: (1)
the Health Equity Fund (HEF) to provide free health care to families holding IDPoor Cards, (2)
the Food Reserve Program of the National Committee for Disaster and Food Security
Programs of the MEF to prevent food insecurity, (3) nutrition programs for pregnant women
and children to promote maternal and infant health, (4) scholarship programs for primary
schools to encourage school attendance, especially for children from poor households, (5)
school feeding programs to support students’ physical and mental development, and (6)
vocational training programs to promote vocational skills to meet labor market demands;
Social Security schemes that have been implemented include the National Social
Security Fund (NSSF), the National Social Security Fund for Civil Servants (NSSFC), the
National Fund for Veterans (NFV), and the People with Disability Fund (PWDF). These
institutions provide protection with regard to income insecurity, which might result from illness,
employment injury, disability, maternity, or old age, for the targeted groups of civil servants,
veterans, people with disabilities, workers, and employees.
11
The ID Poor Programme8, established in 2006 within the Ministry of Planning, is part
of the Royal Government of Cambodia’s ongoing efforts to reduce poverty and support socio-
economic development throughout the country. Being the RGC’s mandatory standard tool for
targeting pro-poor measures in the country, the program provides regularly updated
information on poor households to a large number of Government and non-governmental
agencies to help them target services and assistance to the poorest and most vulnerable
households. The identification of poor households in Cambodia is implemented in yearly
rounds, covering one-third of the country every year. While initially designed to identify the
rural poor, the identification process has been extended to urban areas in 2014 using an
adapted procedure and questionnaire. The IDPoor Programme’s main objectives are to
reduce duplication of effort and resources by different institutions and organizations in
identifying their target groups for various poverty reduction interventions, and to ensure that
assistance is provided to those households who most need it, and to use lists of Poor
Households that have already been approved and accepted by them in the participatory
identification process that was conducted.
Despite these achievements, it is observed that the coverage of social assistance and
social security is limited and cannot reach certain groups of citizens, like vunerable households
not included as part of the ID Poor survey, such as newcomers/migrants for instance. The
management of the various schemes has not been concentrated/integrated, which leads to a
lack of effectiveness and efficiency, high cost and inconsistency of benefits and allowances
for various target groups; the coordination mechanism at the policy level and the monitoring
mechanism to ensure effectiveness, accountability, and transparency of the management and
operation of programs/ schemes are still limited, the investment environment needs to be
further improved, and clarification is needed on tax policies related to the social protection
system; the identification and registration of citizens, the identification of poor and vulnerable
people and the registration systems of operators are not yet linked which might lead to double
identification/registration and overlapping provision of benefits. People have a limited
understanding of social protection and its benefits as well as of their obligations to participate
in each scheme or program.9 This legal and policy framework does not always translate into a
coherent and integrated planning process, which clearly coordinates, integrates, and
prioritizes different sectoral goals and targets, with the aim of promoting sustainable
development.
Gender. In line with the strategy National Strategic Plan for Gender Equality and
Women’s Empowerment and policies and legal framework10, most ministries have developed
a Gender Mainstreaming Action Plan11. There are numerous plans and actions taken to
ensure gender equity and to address women’s specific issues across all sectors.
In recent years, progress had been made within the legislative and policy frameworks
regarding women’s rights in areas such as the justice system12, labor, health care13 , and
8 https://www.idpoor.gov.kh/ 9 National social protection policy framework, 2016-2025, the Royal Government of Cambodia. 10 Policy Brief 1, Gender mainstreaming institutional partnership, and policy context, Cambodian Gender Assessment, 2014 11 Last update mentioned 30 out of 31 line ministries have developed a GMAP in 2018. 12 Legal Aid Policy includes specific provisions to ensure adequate, specialized legal aid forwomen. 13 The Social Assistance pillar of the National Social Protection Policy Framework 2016–2025 focuses on assisting poor and vulnerable people, including people living close to the poverty line, infants, children, pregnant women, families with food insecurity, people with disabilities and the elderly.

12
education14. The Government has introduced budgetary reforms to increase transparency and
shift towards program budgeting, which was a prerequisite for gender-responsive budgeting.
In 2019 3% of the national budget had been allocated to gender-related activities.
Observers15 mentioned that according to funding constraints, policies of Neary
Rattanak have, for the moment, focused on short-term activities rather than long-term, and
are limited in financial and geographic scope based on outside funding. While mechanisms
are in place in each ministry and in the parliament to address gender mainstreaming, there
are concerns that there are insufficient dedicated human resources and funding from the
national budget to ensure their effectiveness. Without dedicated, long-term funding out of the
national budget, the implementation of gender policies could remain inconsistent and will not
extend to all districts of all provinces in the nation. Moreover, actions at the national level are
not resulting in gender mainstreaming or gender-responsive budgeting at the local level.
Consultation conducted in October 2020 with the provincial departments and the Municipality
in Bavet confirmed this situation: the public departments do not have specific GMAP and use
their ministries’ ones (Provincial Department of Public Works and Transports, Provincial
Department of Labour and Vocational Training, Provincial Department of Social Affairs,
Provincial Department of Women Affairs) and only the Department of Women Affairs had a
budget for GAP ($1,000/year). The Municipality has a GMAP developed for the Municipality
Investment Plan, and a budget of $1,000 is allocated, but the Municipality lacks human
resources.
NGOs also note that one key challenge to measuring the success of Neary Rattanak
is the lack of publicly available sex-disaggregated data, as the Ministry is challenged by the
lack of consistency and cohesion between indicators related to CSDGs and NSDP, for
instance. Last but not least, there is no legal mechanism for enforcing the Constitution in court
and no comprehensive anti-discrimination law that would explicitly prohibit all kinds of
discrimination, including that based on sexual orientation, sex characteristics, gender identity,
and expression, sexual orientation, and religion.
14 MoEYS I being implementing the Gender Mainstreaming Strategic Plan 2016-2020, which “promotes gender equality in education, particularly the increased access of women and girls in vulnerable groups to education services through awareness raising, social accountability measures, scholarships and other financial assistance; to increase the participation of women in all areas of education service delivery and management; and promote gender responsive social attitudes”. 15 Submission by The Cambodian NGO Committee on CEDAW (NGO-CEDAW) for the 74th session (21 October to 8 November 2019) of the Committee on the Elimination of Discrimination Against Women (CEDAW) for the review of the Royal Government of Cambodia (RGC)’s Compliance with the Convention on the Elimination of All Forms of Discrimination Against Women

III. SOCIO-ECONOMIC PROFILE AND INDICATORS
1. Social development and poverty
The majority of the poverty and social indexes have significantly improved over the last
12 years in Cambodia. The RGC undertook a voluntary national review of the implementation
of the 2030 agenda. The report was issued in 201916, and to date progress has been
promising, with a majority of CSDG targets rated as “ahead” or “on track”. This is especially
true of the six prioritized goals (Education, Decent Work and Growth, Reduced Inequalities,
Climate Action, Peace and Institutions, and SDG Partnerships). Cambodia’s success in
achieving the MDGs and its ambitions for the CSDGs parallel the country’s development story
of rapid post-conflict recovery, dramatic poverty reduction, and its emergence as a high growth
lower middle-income country. The RGC recognizes that despite strong initial progress, much
remains to be done to realize the ambitions of the CSDGs.
The following data, partially extracted from the ADB’s Country Partnership Strategy
2019-2023 for Cambodia (table 1), show that the annual population growth stabilized at 1.4 %
in 2018 and reached 16.4 million people in 2019.
Table 2: Key statistical information
Poverty and Social data Year Year
Population (million) 15.0 [2009] 16.4 [2019]
Population growth (annual %
change)
1.8 [2009] 1.4 [2018]
Maternal mortality ratio (per
100,000 live births)
290.0 [2008] 161.0 [2017]
Infant mortality rate (below 1
year/per 1,000 live births)
68.0 [2009] 26.3 [2017]
Life expectancy at birth (years) 66.0 [2009] 69.3 [2017]
Adult literacy (%) (population
15+years)
87.5 [2009] 91.9 [2015]
Primary school gross enrollment
(%)
121.9 [2008] 107.8 [2018]
Child malnutrition (% below 5
years old)
40.9 [2010] 32.4 [2014]
Population below poverty line (%) 47.8 [2007] 13.5 [2014]
Population with access to
improved water source (%)
71.3 [2012] 79.0 [2017]
Population with access to
improved sanitation facilities (%)
36.8 [2012] 65.0 [2017]
Urban population (% of total
population)
20.0 [2009] 23.0 [2017]
Source : ADB’s Country Partnership for Cambodia 2019-2023, 2019
16 Cambodia’s voluntary National Review 2019, on the implementation of the 2030 agenda for sustainable development, Royal Government of Cambodia, June 2019

14
The last Provisional Population Totals of the 2019 Census17 taken of all ages gives a
sex ratio of 94.3. Thus, the number of women is greater than the number of men, reflecting a
shorter life span for males. 22.1% of households are headed by women.
The share of the urban population has increased from 20% to 23% in 8 years (2009-
2017), though these figures differ from those of the Cambodian Socio-economic survey 2017,
which says that about 31 % of the total population now lives in the urban areas, compared to
less than 25% in 2008.
The percentage of the population living below the poverty line decreased from nearly
50% in 2007 to less than 15% in 2014, and according to last statistics, this figure dropped to
12.9% in 2018. This percentage is used to measure progress towards SDGs, which is based
on the purchasing power parity only and does not take into consideration other deprivation
aspects.
In 2018, the United Nations Development Program (UNDP) and the Oxford Poverty
and Human Development Initiative proposed an index, which took into consideration health,
education, and living standards – as well as income – which put Cambodia’s poverty rate at
35 %. The global Multidimensional Poverty Index (MPI) is an international measure of acute
poverty covering over 100 developing countries. It complements traditional income-based
poverty measures by capturing the deprivations that each person faces at the same time with
respect to education, health and living standards.
According to ADB’S Country Partnership Strategy 2019-2013, “Poverty has declined
but vulnerability is widespread and social protection is limited.” Cambodia is still one of the
poorest countries in Asia. Poverty is concentrated in rural areas, with elderly women and
households headed by women being particularly vulnerable. Most Cambodians who are not
in extreme poverty are either moderately poor or economically vulnerable, i.e. people living
just above the poverty line, vulnerable to falling back into poverty when exposed to economic
and other external shocks.
In the context of the global health crisis experienced in 2020 with Covid 19, the UN18
estimates economic growth will contract from 7.1% to -4.1%; poverty will nearly double to
17.6%, and unemployment rise to 4.8%. The effects will spill outwards through lost jobs and
lower income, hitting the most marginalized people first and worst, although also reaching
populations not traditionally regarded as vulnerable. Mounting fiscal pressures could erode
essential services and protections for poor communities, children and the elderly, and
returning migrants, among others at risk of being left out and left behind.
Income and employment
Employment. Cambodia’s labor force participation rate is high by global standards
and unemployment is low, with 0.2 % of women and 0.3 % of men unemployed in 2018,
according to the ILO World Employment and Social Outlook.19. In 2019, 32.3 % of the
17 General population census of the Kingdom of Cambodia 2019, National Institute of Statistics, Ministry of Planning, June 2019
18 UN Cambodia framework for the immediate socio-economic response to COVID-19 Source UNCT Cambodia. Posted 16 Sep 2020 Originally published 16 Sep 19 ILO (2018). World Employment and Social Outlook. Accessed at https://www.ilo.org/wesodata.

15
employees in Cambodia were active in the agricultural sector, 29 % in industry20 and 38.7 %
in the service sector. Of the 8 million jobs in Cambodia, 37 % are wage jobs, many of which
offer higher earnings and more protections to workers. However, the other 63 % of jobs remain
more traditional. Such jobs on family farms or in household enterprises are weakly integrated
into the modern economy and offer workers lower earnings.21
Between 2000 and 2018, female laborers made up about 48% of the total labor forces
and about 80% of the total female population in Cambodia. 30% of the female labor force are
employed in the agricultural sector, 45% in service, and 25% in the industry sectors.22
Women are represented in the informal sector, with a high level of vulnerability. They
are found in the vulnerable forms of informal works, being employed in low and unstable wage
employment, casual work, and risky work environments. Poor and rural women tend to be
overrepresented in domestic work, home-based work, as street vendors, and smallholder
farmers. According to the World Bank data from 202023, 58% of total employed women are in
vulnerable employment, with a high proportion as own-account workers contributing to
domestic care and family work. Even though women own 65% of all businesses in Cambodia,
those businesses are on average smaller and less profitable than businesses run by men, with
only 1.7% registered, compared to 6.6% for male-run businesses. Women-owned businesses
are primarily concentrated at the micro-level in the wholesale and retail trade and services
sector. In 2018, 64.10% of the population aged 18- 60 in Poipet city was employed. The
employed population of those with the main occupation increased by 20% from 2012 to 2018.
In 2018, 71% of the main occupation was related to the service sector (trading, tourism,
entertainment). The second employment sector is agriculture. It provides employment for 16%
of the population and occupies a total of 21.40 km2 or 77.40% of Poipet’s total land area. The
third employment sector is industry, due to the presence of two major SEZs, which represent
13% of employment. Poipet is benefiting from favorable conditions for further developments
and it is seen as the future industrial city of northwest Cambodia.
Migration. In 2013, the National Institute of Statistics estimated that nearly one-quarter
of the Cambodian population (approximately 4.1 million individuals) had changed their location
of residence. Single women from rural areas are often forced by a lack of livelihood options to
migrate to Phnom Penh or larger provincial towns to find employment. In 2013, the National
Institute of Statistics estimated that nearly one-quarter of the Cambodian population
(approximately 4.1 million individuals) had changed their location of residence. Overall,
women make for 45% of migrants. 24% migrate to Thaïland or other countries and 50% to
Phnom Penh. They mostly find jobs in factories and services (restaurants/hotels). According
to a 2014 report by UN Women, many females women migrating into Phnom Penh are
engaged in informal employment where they are subjected to low or irregular income and
unstable conditions or at risk of trafficking and exploitation. As an example of their vulnerability,
in the 2009 global downturn, an estimated 30,000 mostly female garment industry jobs were
lost, with employers reportedly pressuring women to waive their benefits and severance
20 Cambodia’s garment and footwear factory industry employs approximately 770,000 people, 639,000 women, (83%) and 131,000 men (17%) (GMAC 2018).In the context of Covid 19, it is estimated that 130,000 garment workers have already lost their jobs. CARE Rapid Gender Analysis for COVID-19 Cambodia – July 2020 21 The World Bank, Cambodia’s Future Jobs : Linking to the Economy of Tomorrow (Vol. 2) : Main Report (English), Press release, November 2019. 22 Promoting Economic Empowerment for Women in Marginalized Conditions, OXFAM, February 2020 https://cambodia.oxfam.org/latest/policy-paper/promoting-economic-empowerment-women-in-marginalized-condition 23 https://data.worldbank.org/indicator/
16
payments, knowing that they may not understand their rights, or have the means to protect
them.
In Poipet, males and females heads of households’ primary activity in the CCS is a
small scale business. It represents 24% of males men’s and 34% of females’ women’s
occupations. 24% of females women also work as farmers, against 14% for of men, and 4%
of males men and 2% of females women as are factory workers in SEZs. Noted that 21% of
FHHs are housewives/homemakers. None of the FHHs interviewed did have had a job as an
employee in the government or NGO/ IOs, whereas 10% of men did. Migration abroad is a
marginal phenomenon (about 1% of FHHs).
Income. Cambodia’s Household Monthly Income per capita was reported at 464.000
KHR in 2017. This records an increase from the previous number of 415,000 KHR for 2016.24
The disposable income per capita for female heads of household was about the same as the
disposable income per capita for male heads of household s in 2017, with a ratio of 1.0.25
Disposable income per capita was slightly higher for female headed households than men in
general and in the rural area.
While women earn substantially less than men (income versus disposable income),
the earnings gap narrows with the attainment of upper secondary and tertiary education. In
2014, only 5.3% of women in the labor force had post-secondary education, compared with
8.0% for men.26 In addition, women heading HHs are reported as less likely to be able to obtain
bank loans, making them more susceptible to higher interest rates charged by money
lenders.27
The City Comprehensive Survey collected income data per Household in Poipet, and
the average household monthly income is reported at KHR 1,930,000 for the year 2018. With
an average of 5 persons per household, the average household monthly income per capita is
estimated at KHR 386,500, below the national average. It is significantly lower for women-
headed households as average income per capita is reported at KHR 347,309 (average five-
person per FHHs).
Expenditure patterns and decision making
In 2017, average monthly consumption in Cambodia was 1,822,000 Riels per
household and 464,000 Riels per capita. “Food and nonalcoholic beverages” represent 43%
of the expenses, “housing, water, electricity” comes next with 19% of the total expenses.
Transportation and health represent respectively 10% and 7% of the total budget.28 Health
represents a smaller share of all expenses in an urban area compared to a rural area.
24 Cambodia’s Monthly Average Household Income: per Capita data remains active status in CEIC and is reported by National Institute of Statistics. The data is categorized under Global Database’s Cambodia – Table KH.H003: Monthly Household Income: per Capita 25 The ratio of disposable income per capita for household headed by a woman and household headed by a man is calculated as the average disposable income per capita for household headed by a woman dividing by the disposable income per capita for household headed by a man. If the ratio equals 1.0, it denotes a point of balance of the average disposable income between woman household head and man household head. National Institute of Statistics Cambodia, Cambodia Economic Survey 2017. 26 UN Women, 2014 27 Un Women, 2014 28 Cambodia economic survey 2017, National Institute of Statistics
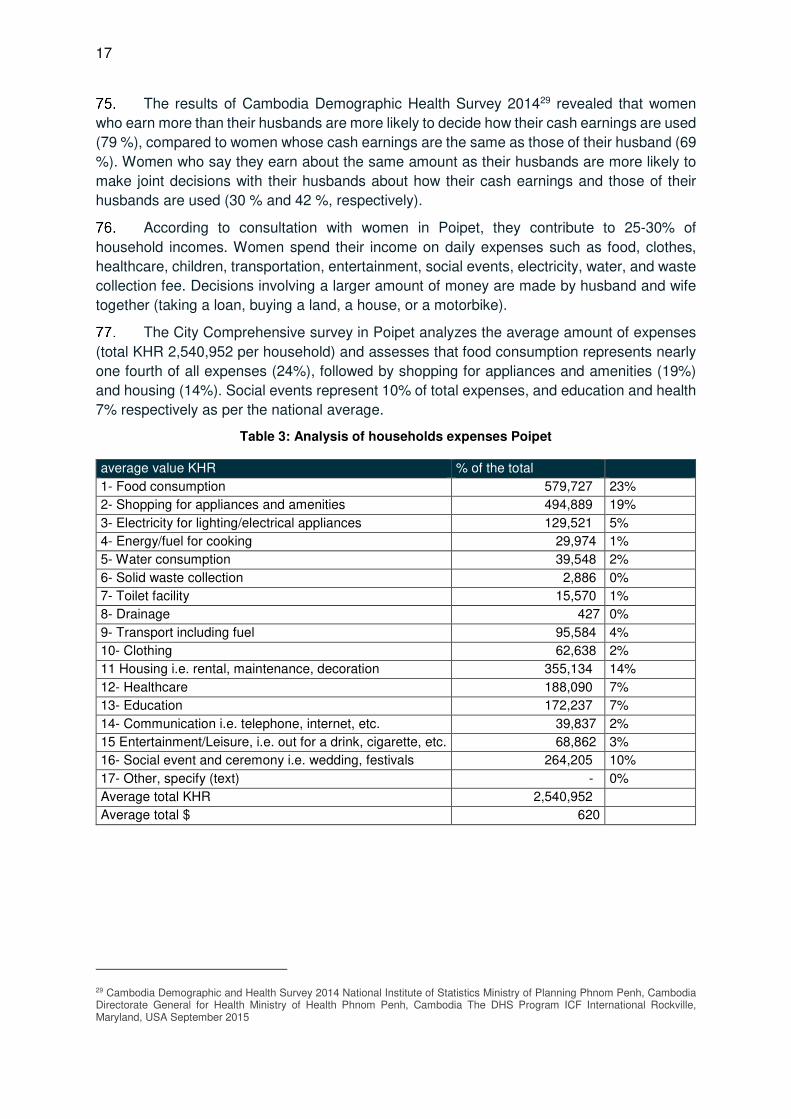
17
The results of Cambodia Demographic Health Survey 201429 revealed that women
who earn more than their husbands are more likely to decide how their cash earnings are used
(79 %), compared to women whose cash earnings are the same as those of their husband (69
%). Women who say they earn about the same amount as their husbands are more likely to
make joint decisions with their husbands about how their cash earnings and those of their
husbands are used (30 % and 42 %, respectively).
According to consultation with women in Poipet, they contribute to 25-30% of
household incomes. Women spend their income on daily expenses such as food, clothes,
healthcare, children, transportation, entertainment, social events, electricity, water, and waste
collection fee. Decisions involving a larger amount of money are made by husband and wife
together (taking a loan, buying a land, a house, or a motorbike).
The City Comprehensive survey in Poipet analyzes the average amount of expenses
(total KHR 2,540,952 per household) and assesses that food consumption represents nearly
one fourth of all expenses (24%), followed by shopping for appliances and amenities (19%)
and housing (14%). Social events represent 10% of total expenses, and education and health
7% respectively as per the national average.
Table 3: Analysis of households expenses Poipet
average value KHR % of the total
1- Food consumption 579,727 23%
2- Shopping for appliances and amenities 494,889 19%
3- Electricity for lighting/electrical appliances 129,521 5%
4- Energy/fuel for cooking 29,974 1%
5- Water consumption 39,548 2%
6- Solid waste collection 2,886 0%
7- Toilet facility 15,570 1%
8- Drainage 427 0%
9- Transport including fuel 95,584 4%
10- Clothing 62,638 2%
11 Housing i.e. rental, maintenance, decoration 355,134 14%
12- Healthcare 188,090 7%
13- Education 172,237 7%
14- Communication i.e. telephone, internet, etc. 39,837 2%
15 Entertainment/Leisure, i.e. out for a drink, cigarette, etc. 68,862 3%
16- Social event and ceremony i.e. wedding, festivals 264,205 10%
17- Other, specify (text) - 0%
Average total KHR 2,540,952
Average total $ 620
29 Cambodia Demographic and Health Survey 2014 National Institute of Statistics Ministry of Planning Phnom Penh, Cambodia Directorate General for Health Ministry of Health Phnom Penh, Cambodia The DHS Program ICF International Rockville, Maryland, USA September 2015
18
Education
Cambodia had 12,889 schools (including 7,144 primary schools) in 2016/2017.30
Enrollment rates for the 2016/17 school year were 93.5 % for primary, 55.7 % for lower
secondary, and 25.1 % at the upper secondary level.31 Total completion rates fall dramatically
after primary school: from 79.9 % at primary school to 42.6 % at lower secondary and 20.2 %
at upper secondary.32
Across the country, more girls are completing primary school than boys: 83.2 % vs.
76.1 %. In 2017-18, primary Gross Enrolment Rate (GER) was 97.8 % and slightly higher for
girls at 98.1 %. This gender difference also applies to lower and upper secondary
completion. For Secondary School, girls represent 52 % of all students. The gap between
female and male Lower Secondary Study Gross Completion Rate (GCR) is widening in favor
of girls, with Gender Parity Index (GPI) increasing from 0.96 in 2012-13, to 1.21 in 2017-18.33
Across ASEAN, Cambodia shows the biggest increases in the ratio of girls to boys in
primary and secondary school, from among the lowest ratio of 93 and 82 respectively in 2007,
to among the highest in 2015 with 101 and 109 respectively.
It is observed that with one teacher for every 43 students in public primary schools,
Cambodia has the poorest pupil-teacher ratio in ASEAN. 34 ADB Country report provides the
percentage of people above age 15 and over who can read and write: 86.5% for males and
75% for females. The gap between men and women tends to reduce with a higher proportion
of girls attending primary school.
In 2018, the Ministry of Education, Youth and Sport (MoEYS) has instructed all the
ministry’s units and educational institutions to institutionalize and accelerate the effort to
promote women in leadership in the education sector through key specific approaches: 1)
establish a women’s leadership program, 2) integrate female representative into promotion
committees, and 3) accelerate to appoint more women at the management levels. Women are
45 % of all teaching staff.18 Although public schools are nominally free for children to attend,
research from 2012 found that many students and parents say they incur costs- to cover the
whole program students have for instance to attend ”private classes” with their teachers. This
was estimated at $119 per student per year – a considerable amount for low-income families
and those with several school-age children. Cost may contribute to dropout rates. 35
School closures since March 2020 in the context of Covid 19 have disrupted learning
for 3.2 million students.. The Ministry of Education, Youth and Sport appealed to parents of
students to provide home education in a proper environment and help them obtain more
learning materials during the COVID-19 pandemic. On March 13, 2020, the Ministry put in
motion an e-learning program where students can study free of charge on social media,
including Facebook, YouTube, and the Ministry’s website. According to the Cambodian Covid-
19 joint education needs assessment (March 2021), 70% of the students had utilized at least
30 Thach Phanarong. “Education minister: Cambodia has over 11,370 schools”. Agence Kampuchea Press, 19 March 2013. Accessed 16 February 2018. 31 The Phnom Penh Post. “Literacy target of a Sustainable Development Goal”, 11 September 2017. Accessed 25/09/2020 32 Ministry of Education, Youth and Sport. 2017. op. cit. 33 Kingdom of Cambodia Cambodia Report On the occasion of the 25th Anniversary of the Fourth World Conference on Women and the adoption of the Beijing Declaration and Platform for Action (1995) Submitted by Ministry of Women’s Affairs Royal Government of Cambodia Phnom Penh June 2019 34 Ministry of Education, Youth and Sport. 2017. “Public education statistics and indicators 2016–2017”. Accessed 25/09/2020. 35 World Vision. 2017. op. cit
19
one alternative distance learning method, but only 40% had a proper place for studying (table,
chair, light) and only 32% an access to internet (78% have access to a smartphone). The main
barriers for distance learning are first financial (to pay for intrenet/ phnone card), internet
connectivity issues, lack of knowledge content and time of caregivers. Supplementary
measured were utilized by the most vulnerable students to have access to distance learning
such as visiting the teacher. 76% of students who have already dropped out or reported at
high risk of dropping out have either started working or have increased contribution to
household chores compared to 70% of students who reported low or no risk of drop-out. 36
In 2018, there were 38 state primary schools in Poipet. Given 8,802 students and 146
teachers in the state primary schools, the ratio of students to teachers in state primary schools
is 60:1. There were nine state secondary schools with 65 classrooms in Poipet. With 2,670
students and 81 teachers in the state secondary schools, the ratio of students with teachers
in state secondary schools is 32.96 in Poipet City. In 5 public high schools with 33 rooms,
there were 63 teachers for 611 students. The student-teacher ratio for most of the school
levels, except high school, is far beyond the international average ratio at one teacher for 23
students.37
Health
Cambodia’s healthcare system has seen significant improvements in the last two
decades. Despite this, access to quality care remains problematic, particularly for poor rural
Cambodians. Cambodia has committed to universal health coverage (UHC) and is reforming
its health financing system to align with this goal. Benefits from health spending in the public
sector are generally distributed in favor of the poor, and the distribution reflects the need for
health services.38
Health outcomes have improved substantially, with life expectancy at birth rising from
58 years in 2000 to 69.3 in 2017. Other health indicators, including maternal and infant
mortality, have markedly improved. For example, maternal mortality had declined from 472
per 100 000 live births in 2005 to 167 per 100 000 in 2017. Childhood immunization coverage
has expanded with 81% of children aged 12–23 months immunized against measles in 2016
compared with 52% in 2002. This has contributed to a steep decline in under-5 mortality rates,
dropping from 54 per 1000 live births in 2010 to 26.3 per 1000 in 2017 (ADB’s Country
Partnership for Cambodia 2019-2023).
Despite these achievements, health outcomes in Cambodia still rank among the
poorest in the Southeast Asian region. Malnutrition remains a challenge, with about 32% of
children under 5 (about 500 000 children) stunted and 9% severely stunted (National Institute
of Statistics et al., 2015). The country’s rate of immunization against measles—around 81%
of children aged 12–23 months in 2016—lags behind those of Myanmar (91%), Vietnam
(99%), and Thailand (99%; World Bank, 2018b). Additionally, like many low- and middle-
income countries (LMICs), Cambodia faces a double burden of infectious and non-
communicable diseases. While malaria, tuberculosis, and HIV infections are still widespread,
36 Cambodia covid-19 joint education needs assessment, March 2021 37 https://data.worldbank.org/indicator/. retrieved on 18/12/2019 for UDS. 38 https://doi.org/10.1093/heapol/czz011 Health Policy and Planning, Volume 34, Issue Supplement_1, October 2019, Pages i4–i13

20
the growing burden of diabetes, hypertension, and hypercholesterolemia in the adult
population is putting a strain on the health system (Chhoun et al., 2017).39
Cambodia still has a high maternal mortality ratio. Women of reproductive age
experience substantial risks associated with pregnancy and childbirth. The World Bank’s data
40shows that around 167 women died from pregnancy-related causes per 100,000 live births
in 2017 in Cambodia. Women in rural areas and poor households are at greater risk. In 2012,
only 13% of births in rural areas were attended by a doctor, compared to 32% in Phnom Penh.
Cambodia’s maternal death rate remains higher than the regional average, indicating
insufficient quality and coverage of basic health care.
Cambodia is also off track for the MDG target on maternal malnutrition. Malnutrition is
considered the underlying cause in 20% of maternal deaths, accounting for nearly 300
maternal deaths annually in Cambodia.The rate of anemia among pregnant women is 53%.
About 6% of women have a height of fewer than 145 centimeters, which indicates they were
malnourished as children. These women are also likely to give birth to small children.
While there are no statistics available, Poipet Municipality reports that there is no
maternal mortality rate available for Poipet, and that all births are attended by a doctor.
According to the Comprehensive City Survey, people from Poipet use mostly the
services of health centers and clinics, referral hospital, private doctors and pharmacy, and less
those of traditional healers.
At the national level, access to improved and safe water (79.0 % in 2017) and
sanitation facilities (65% in 2017) remains below the average for lower-middle-income
economies. Poor access to clean water and sanitation in rural areas is a major contributor to
stunting, along with suboptimal infant feeding practices and low dietary diversity.
According to the Comprehensive City Survey, 90% of the population surveyed had
toilet (on-site sanitation only); 2% of the population are still practicing open defecation; 6% of
the population use shared facility, and 2% public toilet. The wastewater is currently carried by
the stormwater drainage network and released to the environment without any forms of
treatment. According to the Municipality database 2018, 50% of households use water from
piped water systems in Poipet.
Consultation done with women in Poipet in October 2020 show that they are in charge
of domestic chores (cooking, cleaning, cleaning the toilets), taking care of the family (children,
elderly and sick) while husbands are at work, and they manage solid and liquid waste. Data
from the City Comprehensive Survey shows that the percentage of women in charge of
fetching water is up to 49% (against 36% for males) when the only source of water is a well.
As the primary contributors to household and community sanitation tasks, women
generally have a higher risk and health exposure. The traditional separation of gender roles
makes them disproportionately affected by the lack of reliable water supply and sanitation
services, and these considerably increase women’s time poverty. Water shortages also
significantly increase the time needed for cooking, cleaning, and caring for both children, the
39 https://doi.org/10.1093/heapol/czz011 Health Policy and Planning, Volume 34, Issue Supplement_1, October 2019, Pages i4–i13 40 https://data.worldbank.org/indicator/

21
sick and disabled members. Period poverty in Cambodia is also a threat to women’s health as
unsanitary period practices lead to infections.
Lack or low quality of the potable water and sanitation also increases the incidences
of water-borne diseases and thus households ’expenditures on medicine and doctors’ fees. A
comparison between the incidence of disease among adults, male and female reveals that
women always have the highest percentage of cases, except for severe diarrhea (CCS).
Figure 4: Comparison between health issues encountered by adults male and adults female
2. Profile of key stakeholders
Key stakeholders presented here include the current and projected population, civil
society representatives and the private sector. The Poverty, social and gender assessment
further brings the focus on vulnerable groups in the population, i.e informal settlements
dwellers, poor households, female headed-households, indigenous people, youth and
children, elderlies and people with disability. Next chapter analyse the profile of the population
and vulnerable groups as beneficiaries of the project.
Total population in Banteay Meanchey Province has 177,528 households; total
population is 859,545, 50.4% of whom are women. The average size of HHs is 4.8. Sex ratio
as provided by the provisional census 2019 gives a figure of 98.3, higher than the national
average.
Based on the population census41 in 2018, Poipet’s population increased from 43,366
in 1998 to 104,156 in 2018, making it the fourth most populous settlement in Cambodia and
larger than its provincial capital Serei Saophoan.
41 National Institute of Statistics of Ministry of Planning
- 100 200 300 400 500
6.1.1 Mild diarrhea
6.1.2 Severe diarrhea
6.1.3 Eye irritation/diseases
6.1.4 Skin diseases ( e.g. scabies, ringworm,)
6.1.5 Colds, cough, respiratory ailments
6.1.6 Headache/influenza
6.1.7 Cardio-vascular diseases, hypertension
6.1.8 Typhoid fever, cholera/dysentery
6.1.9 Hemorrhagic dengue fever
Comparison between diseases for adults male and female
Adult Female Adult Male
22
According to Municipality database 2018, there are in total 1,981 vulnerable
households in Poipet, i.e., approximately 9% of total households. In detail, there are 153 HHs
with children (below 18 y.o) taken in charge by parent/ guardian with a long-term illness or
elderly; 101 HHs of the elderly without relatives/support, and 1,060 families who live on public
land. 482 persons are disabled, and 185 HHs have a family member affected by HIV/AIDS.
Informal settlement dwellers
The communities who live in informal urban settlements are diverse, as are their
environmental conditions. Characteristics include inadequate access to safe water and
sanitation, poor quality of housing, overcrowding, and insecure residential status. The tenure
issue is key to understanding why some people remain excluded from basic services. The
problem refers especially to those communities that are living on state land. Because they do
not own the land, they cannot formally apply for connections to services. Furthermore, they
are subject to the risk of eviction if the government decides to use that land for other purposes.
This may imply that utilities are less keen on delivering services to informal settlements, as
they can be moved at any time.
According to Municipality data 2019, among the1,060 families living on public land .814
are located in Sangkat Poipet, the majority in 3 villages: Kbal Spean 1 (285 HHs), Kbal Koh
(287 HHs), and Ou Chrov Village (235 HHs), 201 other landless HHs are located in Sangkat
Kandal.
Poor households
In Cambodia, the ID Poor program42, led by the Ministry of Planning since 2006 in
rural areas, surveys the urban area since 2014. Two categories are defined: Poor level 1 (very
poor) and Poor level 2 (poor).
According to the last rounds of ID poor data collection in Banteay Meanchey (2018),
10% of Households are in the category of ID Poor Level 1 and Poor Level 2 at the Provincial
level. The percentage of Poor 1 and 2 in the Poipet project area and as per ID Poor database
is 8% (1,732) of total HHs. 3% are ID Poor 1 and 5% ID Poor 2.
Sangkat Nimitt has a relatively higher percentage of Poor (13%) than Sangkat Poipet
(6%) and Sangkat Phsa Kandal (7%). Villages with a high percentage of Poor 1 and 2 are
Village Kbal Koh in Sangkat Poipet (24% poor- and a higher number of landless people and
FHHs), Sorya village in Sangkat Nimitt (22% poor HHs), and Andong Thma Meas in Sangkat
Phsa Kandal (21% poor HHs).
42 The Government promulgated Sub-Decree 291 on Identification of Poor Households in December 2011

23
Figure 5: Fraction of ID Poor in the population, Poipet, ID Poor database 2018
Female-headed households
The last Provisional Population Totals of the 2019 Census taken over all ages gives a
sex ratio of 94.3. Thus, nationwide the number of women is greater than the number of men,
reflecting a shorter life span for males.22.1% of households are headed by women. Women
who are heads of households are mostly widows, and to a lesser extent separated, divorced
or never married.
National statistics show that FHHs have similar income as male-headed households,
except in urban areas. According to the CCS survey in Poipet, FHHs’ average monthly income
is 8% lower than for the whole population. Statistics from 201243 also show that at the national
level, a woman head of household has an average of 55 % less land than a male head of
household. While women-headed households represent 22 % of total households, only 12 %
of the agricultural land of Cambodia (403,000 hectares) is owned by women-headed
households.
43 National Institute of Statistics, Ministry of Planning (2012) Cambodia Socio-Economic Survey. Phnom Penh, Cambodia-
extracted from Policy Brief n°9 Rights, vulnerable groups of women and girls, Cambodia Gender Assessment, Ministry of Women
Affairs.

24
Women-headed households have more economically inactive family members than
male-headed households; 4.96 % of women-headed households have no economically active
members, compared to 1.3 % of male-headed households.44 Women-led households are
also likely to experience shocks differently than male-headed households, mainly due to
social norms and more limited economic opportunities and income.
Figure 6: Fraction of FHHs in the population, Municipality data
As per Municipality/ village data, 12% of households are headed by women in Poipet.
This is much lower than the national average. The percentage of FHHs is higher in Nimith 2
Village Sangkat Nimith (30% FHHs) and about one-fourth of HHs are headed by women in
Tuol Prasat Village, Kbal Koh Village, Poipet village, Palylaiy 2 village, Ou Chrov Village in
Sangkat Poipet, and Andong Thma Meas village in Sangkat Phsa Kandal. In the
Comprehensive City Survey conducted by the consultant, 27% of the households interviewed
were headed by women.
44 National Institute of Statistics, Ministry of Planning (2012) Cambodia Socio-Economic Survey. Phnom Penh, Cambodia- extracted from Policy Brief n°9 Rights, vulnerable groups of women and girls, Cambodia Gender Assessment, Ministry of Women Affairs.
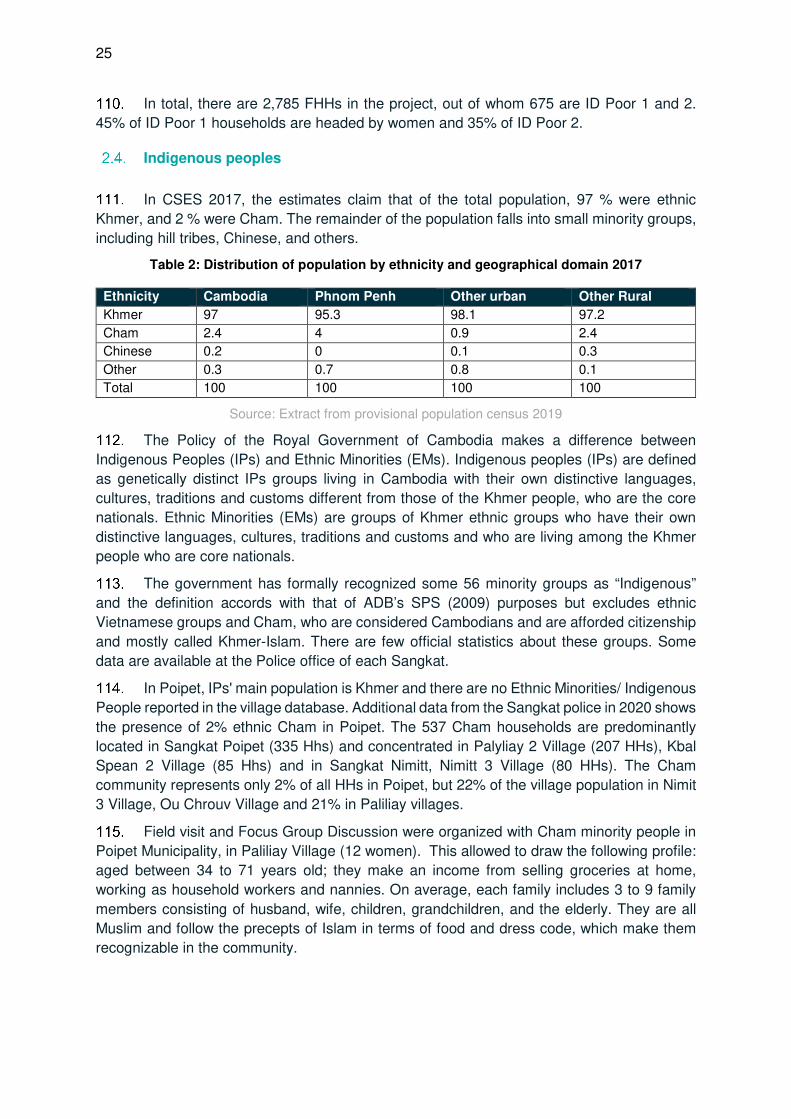
25
In total, there are 2,785 FHHs in the project, out of whom 675 are ID Poor 1 and 2.
45% of ID Poor 1 households are headed by women and 35% of ID Poor 2.
Indigenous peoples
In CSES 2017, the estimates claim that of the total population, 97 % were ethnic
Khmer, and 2 % were Cham. The remainder of the population falls into small minority groups,
including hill tribes, Chinese, and others.
Table 2: Distribution of population by ethnicity and geographical domain 2017
Ethnicity Cambodia Phnom Penh Other urban Other Rural
Khmer 97 95.3 98.1 97.2
Cham 2.4 4 0.9 2.4
Chinese 0.2 0 0.1 0.3
Other 0.3 0.7 0.8 0.1
Total 100 100 100 100
Source: Extract from provisional population census 2019
The Policy of the Royal Government of Cambodia makes a difference between
Indigenous Peoples (IPs) and Ethnic Minorities (EMs). Indigenous peoples (IPs) are defined
as genetically distinct IPs groups living in Cambodia with their own distinctive languages,
cultures, traditions and customs different from those of the Khmer people, who are the core
nationals. Ethnic Minorities (EMs) are groups of Khmer ethnic groups who have their own
distinctive languages, cultures, traditions and customs and who are living among the Khmer
people who are core nationals.
The government has formally recognized some 56 minority groups as “Indigenous”
and the definition accords with that of ADB’s SPS (2009) purposes but excludes ethnic
Vietnamese groups and Cham, who are considered Cambodians and are afforded citizenship
and mostly called Khmer-Islam. There are few official statistics about these groups. Some
data are available at the Police office of each Sangkat.
In Poipet, IPs' main population is Khmer and there are no Ethnic Minorities/ Indigenous
People reported in the village database. Additional data from the Sangkat police in 2020 shows
the presence of 2% ethnic Cham in Poipet. The 537 Cham households are predominantly
located in Sangkat Poipet (335 Hhs) and concentrated in Palyliay 2 Village (207 HHs), Kbal
Spean 2 Village (85 Hhs) and in Sangkat Nimitt, Nimitt 3 Village (80 HHs). The Cham
community represents only 2% of all HHs in Poipet, but 22% of the village population in Nimit
3 Village, Ou Chrouv Village and 21% in Paliliay villages.
Field visit and Focus Group Discussion were organized with Cham minority people in
Poipet Municipality, in Paliliay Village (12 women). This allowed to draw the following profile:
aged between 34 to 71 years old; they make an income from selling groceries at home,
working as household workers and nannies. On average, each family includes 3 to 9 family
members consisting of husband, wife, children, grandchildren, and the elderly. They are all
Muslim and follow the precepts of Islam in terms of food and dress code, which make them
recognizable in the community.

26
Picture 1: Focus Group Discussion with Cham women in Poipet, October 2020
All interviewees indicated that they had lived in Cambodia since their ancestors. For
them, Cambodia is their homeland. They have an ID card, family passbook, and birth
certificate and can access the public services like Cambodians.
They do not feel isolated or discriminated against from the society, they participate in
social events like Cambodian people, their children go to Cambodian schools. They speak
Khmer at home as well as at school. They can freely participate in traditional events. There is
no threat to them from anyone nor the local authority.
Moreover, they have their representation from the top (Parliamentarian) to sub-national
levels (local authorities: provincial, municipality, district, commune/Sangkat, and village level).
Youth and children
In Cambodia, youth (15-29 y.o) make up about one-third of the total population. This
represents a significantly young labor force. An estimated 300,000 young Cambodians enter
the labor market every year.45 According to the Youth Multi-dimensional Deprivation Indicator
(Y-MDI), one young person out of five is deprived of two or more well-being dimensions at the
same time, including health, employment, education, and civic participation, while 40% fare
poorly in at least one of these dimensions.46
In 2020, approximately 30.9 % of the population in Cambodia were under 14 years of
age. In comparison, approximately 33 % of the population in Cambodia were under 14 years
old in 2011. According to the ID Poor program 2017, out of the 2.36 million people living in
households ranked ID Poor 1 and 2, one third were children. CSES 2014 data shows that 11%
of children age 5–17 years are economically active.47
Specific demographic data on youth for Poipet is not available.
45 UNCT’s Common Advocacy Point, 2011 46 OECD Development Centre (2017), “Youth Well-being Policy Review of Cambodia”, EU-OECD Youth Inclusion Project, Paris. 47 UNICEF Cambodia and Division of Data, Research and Policy, UNICEF New York, A Statistical Profile of Child Protection in Cambodia, United Nations Children’s Fund, New York, March 2018.
27
Persons with disabilities
According to the Cambodian Demographic and health survey 2014, 10 % of persons
age five and over have some form of disability. Difficulties in seeing, walking, or climbing stairs,
and concentrating are the most common types of disabilities reported. Only 2 % of the
household population suffers from a severe disability (a great degree of difficulty or lack of
ability to function at all). This indicates that most disabled people experience a moderate level
of disability.
The prevalence of disability increases with age, and women are slightly more likely to
suffer from some level of disability than their male counterparts. There is also a notable
association between disability and education, but there is little difference according to the
urban or rural residence.
Living with a disability in Cambodia is associated with an increased risk of poverty.
18.2% of households living with one or more disabled members were under the Poverty line
(NIS 2014), compared to 12.8% of households without a disabled household member. The
literacy rate among the disabled is also lower than the national average (48% against 78%);
due to their lack of skills, their chance to enter the labor force is also lower. Up to 60% of
people with disabilities could not perform any income-generating activities (NIS 2014), putting
them at risk of monetary poverty. People with disabilities are dependent on other members of
their households, which strains the household’s resources.
In Poipet, according to municipality data 2019, 0.5% of people have a disability (482
persons). They are in the majority disabled because of war, from birth, or due to an accident.
Elderly
The demographic scenario in Cambodia shows the decline in the population aged
under 15 in comparison with the beginning of the century. In 2003, the proportion of
Cambodian population aged under 15 was further shrinking, making up 29 % of the total
population, whereas the proportions of the working-age population and older population in the
total population were increasing, constituting 63 % and 8 % respectively. This is particularly
striking in the case of the aging dynamics of today's working-age population.
The proportion of older persons in the total population has been increasing at a much
higher rate (from 1998 to 2008, 3 % annually and from 2008 to 2013, 5 %/year), and the trends
are projected to continue. From 2020 to 2030, the older population will be increasing annually
at a rate of around 4 %, while the annual growth rate of the working-age population will be just
1 %, and the population aged under 15 will be undergoing a negative growth. Aging-related
issues that were non-existent or hardly significant have started to become challenges to be
grappled with. 6% of people interviewed in the project’s Comprehensive City Survey in Poipet
are elders, of an average age of 71.

28
Figure 7: Comparison of age pyramids 2003 and 2020, Cambodia
Source: Populationpyramid.net
There are two crucial aspects to consider - the aging of the older population and the
feminization of aging. While older persons face various issues, they face different and more
serious issues as they grow older. Similarly, older women are more vulnerable than older men.
Women constitute more than 60 % of the oldest old population. Older women are more
vulnerable due to their greater discrimination in employment, financial insecurity, lower literacy
and education levels, and greater incidence of morbidity. According to our survey in Poipet, in
average FHHs are older than the general population, and 49% of the FHHs were widows.
An increasing proportion of the older population relative to the adult population also
results in a shrinking of the financial and care support base for older persons. Health costs
increase with the aging of the older population as the average cost per patient and financial
insecurity among older person increases with age. The data on income and health expenses
in the CCS show that elders in Poipet have on average lower income than the general
population ($269 versus $471) and spend more percentage of their budget for healthcare than
the overall population (16% versus 7% of health expenses).
Civil society organizations
Both local and international Non-Governmental Organizations (NGOs) are plentiful in
Cambodia and are active across the spectrum from advocacy and human rights organizations
through to service delivery, humanitarian, and service organizations of many types. As of early
January 2019, at least 5,523 Association of Non-Governmental Organizations (NGOs) were
registered at the Ministry of Interior and 419 foreign NGOs signed MoUs with the Ministry of
Foreign Affairs and International Cooperation.48
International and local NGOs play a major role in providing or supporting basic social
services, often in remote areas and communities, and are present in every province and major
sector in Cambodia. NGOs also bring alternative models and approaches to development—
emphasizing participation, equity, gender sensitivity, and environmental sustainability. NGOs
48 Statement from Phnom Penh governor Khoung Sreng at the Capital Hall-CSOs forum held under the theme "Responsible Partnerships”, April 2019. http://m.en.freshnewsasia.com/
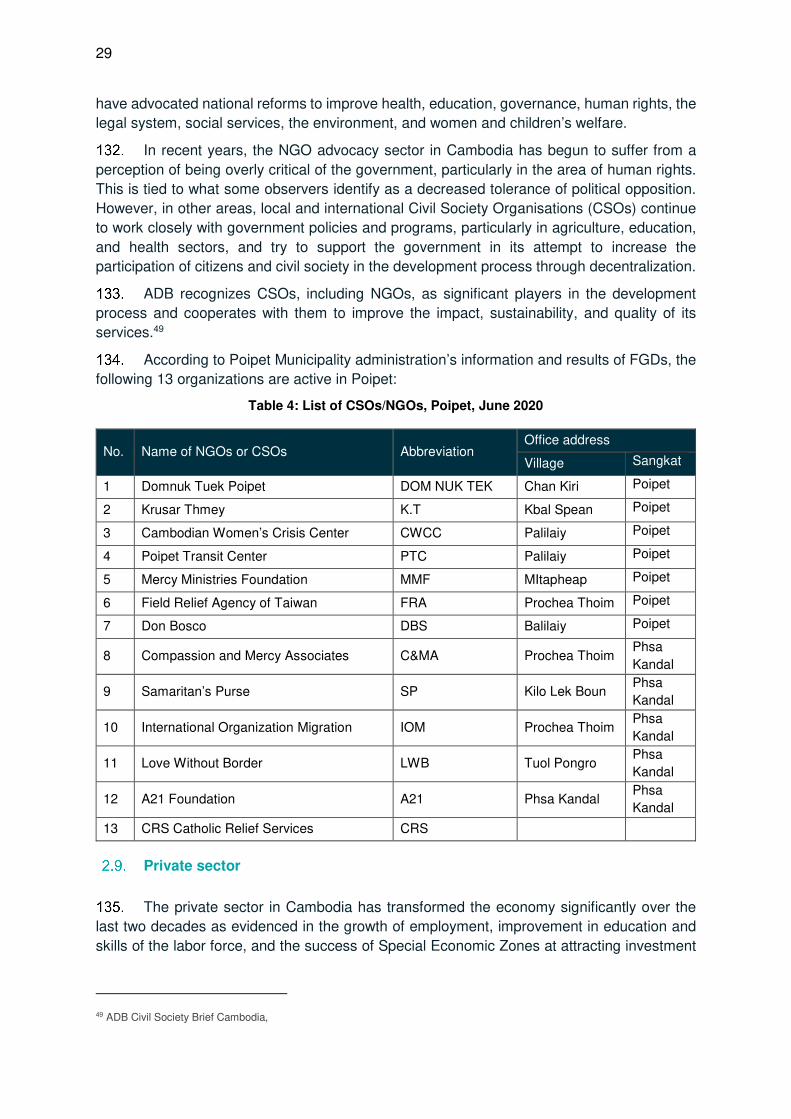
29
have advocated national reforms to improve health, education, governance, human rights, the
legal system, social services, the environment, and women and children’s welfare.
In recent years, the NGO advocacy sector in Cambodia has begun to suffer from a
perception of being overly critical of the government, particularly in the area of human rights.
This is tied to what some observers identify as a decreased tolerance of political opposition.
However, in other areas, local and international Civil Society Organisations (CSOs) continue
to work closely with government policies and programs, particularly in agriculture, education,
and health sectors, and try to support the government in its attempt to increase the
participation of citizens and civil society in the development process through decentralization.
ADB recognizes CSOs, including NGOs, as significant players in the development
process and cooperates with them to improve the impact, sustainability, and quality of its
services.49
According to Poipet Municipality administration’s information and results of FGDs, the
following 13 organizations are active in Poipet:
Table 4: List of CSOs/NGOs, Poipet, June 2020
No. Name of NGOs or CSOs Abbreviation Office address
Village Sangkat
1 Domnuk Tuek Poipet DOM NUK TEK Chan Kiri Poipet
2 Krusar Thmey K.T Kbal Spean Poipet
3 Cambodian Women’s Crisis Center CWCC Palilaiy Poipet
4 Poipet Transit Center PTC Palilaiy Poipet
5 Mercy Ministries Foundation MMF MItapheap Poipet
6 Field Relief Agency of Taiwan FRA Prochea Thoim Poipet
7 Don Bosco DBS Balilaiy Poipet
8 Compassion and Mercy Associates C&MA Prochea Thoim Phsa
Kandal
9 Samaritan’s Purse SP Kilo Lek Boun Phsa
Kandal
10 International Organization Migration IOM Prochea Thoim Phsa
Kandal
11 Love Without Border LWB Tuol Pongro Phsa
Kandal
12 A21 Foundation A21 Phsa Kandal Phsa
Kandal
13 CRS Catholic Relief Services CRS
Private sector
The private sector in Cambodia has transformed the economy significantly over the
last two decades as evidenced in the growth of employment, improvement in education and
skills of the labor force, and the success of Special Economic Zones at attracting investment
49 ADB Civil Society Brief Cambodia,
30
and diversifying the manufacturing base. However, most private sector remains very small,
and is characterized by high rates of informality. While garments and tourism are two of the
most important industries, other manufacturing and service industries have emerged in recent
years.
The majority of businesses in Cambodia are very small (74% engage only one or two
people). In addition, most are informal (98.8% of businesses with less than ten employees are
not registered). According to the Prime Minister, “The Cambodian industry remains weak as
reflected by its simple structure, narrow base and low level of sophistication, while mostly
concentrated in garment, construction, and food processing industries”.50 While these
businesses form a significant part of the economy and provide work for many people, they
tend to be less productive than larger businesses. Smaller and informal businesses also are
less likely to have access to finance, pay less (or no) taxes, and typically do not provide training
for their workers or comply with labor laws and other regulations.51
The government has set targets in the industrial development policy 2015–2025 (IDP)
for increasing business formality and calls for an inclusive approach mobilizing the Public
Sector, development agencies, and the Private Sector as key partners in Cambodia’s
development.
Poipet is strategically located on the border between Cambodia and Thaïland and
benefits from a very dynamic commercial and industrial sector, especially since the opening
of the cross-border trade in 1991. It benefited from foreign investment inflow resulting in the
construction of hotels and casinos, and commercial structures all over Sangkat Poipet.
Service-oriented activities have, therefore, expanded. Main accommodations in the city
consist of 2 hotels (Viroth Hotel and Orkiday Hotel) and three guesthouses (Long Sen, Sophai
Thavy and Phnom Pich) along with five casinos - the main form of recreation (Crown Casino,
Poipet Resort Casino, Diamond Slot Club, Grand Diamond City Casino, and Holiday Palace
Casino).
Given the competitive labor costs, the cheap and stable electricity supply from Thailand
($0.16 per kilowatt), the proximity to Bangkok, and the favorable investment policy providing
incentives, Poipet is seen as a future industrial city of the northwestern part of Cambodia. The
two major Special Economic Zones (SEZs) employ about 6500 workers (2017), about 216
employees work for small to medium industries outside the SEZs (located in Sangkat Nimitt
and Village Phsar Kandal). These areas are marked as proposed industrial areas and SEZs
in the Poipet Land Use Plan and are currently at the planning stage. 52
Water supply in the city is operated by ANCO Water Supply Company Ltd., a private
company with an authorization license from the Ministry of Industry, Science, Technology and
Innovation (MISTI) (2017-2037). ANCO is responsible for producing and providing clean and
drinkable water to Poipet City. The water supply service is financed by a user-pay
arrangement, and billings are issued and collected by ANCO from end-users. The tariff
guidelines are in its contract and approved by the MISTI (≈2,000 Riel / m3 ).
The collection and disposal of domestic solid waste is provided by a private company,
CINTRI, which owns the assets. The company has a 10-years license from January 2019 to
50 Khmer Times, August 26, 2015 51 Unlocking the potential of the Cambodian private sector, March 2017, prepared by Emerging Markets Consulting for Australian Aid and Mekong Business Initiative 52 Livable Cities Investment Project Cambodia, Poipet Urban Development Scenarios Report February 2020
31
December 2028 for the whole Poipet city administrative area. Agreements are signed directly
with the provincial governor, but the Ministry of Economy and Finance reviews and endorses
the waste collection contract before signing. The service is financed by a user-pay
arrangement, and billings are issued and collected by CINTRI. The tariff guidelines are in its
contract and approved by the government Ministry of Economy and Finance.
The MPWT has the overall responsibility for the operation and maintenance of
drainage, and wastewater treatment systems, and the private sector is not involved. at the
local level, these functions are now delegated to the municipal administration, but different
administrative entities, such as the mef and moe administrations at the provincial level, are
involved. operations and maintenance of the drainage system and wwtp system are a delegate
to sub-national levels on the municipal budget. beneficiary profile

32
IV. BENEFICIARY PROFILE
1. Methodology
Secondary data
The consultant collected village data from the Municipality. The data provides updated
(2019) and relevant information at village, Sangkats and municipality levels on key social
indicators: population (number of households, number of female-headed households, number
of males/females), their access to basic infrastructure, and reports the number of vulnerable
peoples (orphans, the elderly, people living on public land, people with disabilities). That
information is reported in Appendices 1.1 and 1.2 and integrated into the Poverty and Social
Analysis and gender assessment.
The consultants initially investigated the village data obtained from the municipalities
to identify the presence of ethnic groups. Village databases do not report on Cham and
Vietnamese population. The consultant decided to conduct a rapid additional assessment in
July 2020 and collected police minority datasheets in Poipet. These data provide information
about the Cham population that is not available in the village data, project area with the
presence of Cham are identified. This information, completed with a rapid field assessment of
the situation of the IP communities in the project, FGDs as part of the social survey, and IPs
specific consultation, were used to develop the Indigenous People Plan and related chapters
in other documents. IPs population data are provided in Appendix 1.3.
The third source of secondary data used is the ID Poor information, obtained from the
ID poor database. It provides for each village the number of households identified under ID
poor one and ID poor two as part of the urban survey in 2017. It also gives an indication of the
sex of the head of household and the location of the household. Data are reported in Appendix
1.4. This information crossed with municipality and IPs data allows for the identification of
poverty/vulnerability areas.
Primary data
1.2.1. Quantitative data
A Comprehensive City Survey was conducted in December 2019. The subjects to be
surveyed include household (HH) and commercial & Institutions (C&I) in the target location.
The survey report is attached in Appendix 3.
The objective of the Survey was to complement the secondary data and to inform the
preparation of the Due Diligence regarding People’s socio-economic status; Household
behavior/habits regarding sanitation facilities and septic tank usage and maintenance;
Wastewater and drainage, and health-related expenses; Affordability and willingness-to-pay
for sanitation improvements; General perceptions against the wastewater and drainage
services; Annual and frequent flood impacts; Solid waste management practices and identify
the exposure, sensitivity, and adaptive capacity of people (by vulnerability sub-groups) living
in the project area; provide information for the selection of appropriate sanitation and drainage

33
improvements; determine mechanisms to support household adoption of centralized systems
from predominant septic tank sanitation management methods.
The sample size was chosen for the city and allows at least a 95% confidence level
with a 5% margin of error. The following formula was used for the sample size calculation:
With:
N = population size
e = Margin of error (percentage in decimal form)
p = estimated proportion of the population with the characteristic (0,5 if unknown)
z : number of standard deviations a given proportion is away from the mean:
For a desired confidence level of 95%, z = 1.96
For the desired confidence level of 99%, z = 2.58
Table 5: Achieved Sample Size in Poipet
No. Cities No. HH Survey No. C&I Survey Total
2 Poipet 661 75 736
Each Village, the smallest administrative boundary, has been sub-divided into wards:
(i) All wards were approximately equivalent in terms of the population living within the
section (estimation); and
(ii) The size of a ward was approximately equivalent to one working day (depending on
the duration of the survey, the number of surveys to be conducted, etc.) for the
surveyor.
The Team worked with the leaders of the wards which were in the survey area to
identify the population groups to be selected for the surveys: households that have lived for a
long time in the locality, newly arrived households, the owners, and tenants and specifically
vulnerable households (poor households, female headed households, ethnic minority
households, etc.). In each ward, households were then randomly selected.
To carry out this survey, mobile data collection was used via ArcGis Survey123
platfrom. A specific request was made to complete the questionnaires in two languages:
English / Khmer. The purpose of this translation was to facilitate the investigators'
understanding of the questions. The data collection followed the approach below.

34
Figure 8: Mobile data collection strategy
During the Survey phase, the quality control consisted of:
(i) Daily checking of the survey points. The surveys have to be located within the city
boundaries.
(ii) A daily sample of the survey duration. The duration of 20% of the survey uploaded
each day has to be checked.
(iii) The weekly download of the database to check the duration of each survey. The
distance between the GPS point and the location point has to be below 300m.
1.2.2. Qualitative data
Based on the result of the Comprehensive Technical Options Study, an additional
social survey focusing on qualitative information was conveyed in September 2020 to (i) better
identify needs/preferences and demands of specific groups in particular: disabled people,
indigenous people, and youth/children which were not represented enough in the City
Comprehensive Survey , (ii) understand positive (perceived benefits) and negative impacts of
the project to stakeholders and assess social and institutional issues that affect participation,
ownership, acceptance, and adoption of project activities, and propose strategies to overcome
any local concerns or other issues; (iii) identify training needs, effective channels of
information, and the best approach for consultation/participation and training, with the focus
on vulnerable groups. Explore how communities including vulnerable groups can participate
in the project, (iv) assess whether NGOs/CBOs, and/or the private sector has a role in
implementing the project, (v) consult informal waste pickers/ scavengers about their current
jobs, perceived risks, and opportunities of the development of a more formal system (sorting
and composting plants), and (vi) assess the environmental situation and perceived
environmental impacts of the project to stakeholders including perceptions of climate change.
The social survey took place in early September and consisted of two consultation
meetings (120 participants), 8 FGDs with specific groups 570 participants- ID Poor, Female-
Headed Household, Elderly People, Indigenous People, People with disabilities, Youth 12-15
years old in High School, Workers in solid waste, NGOs/CBOs).
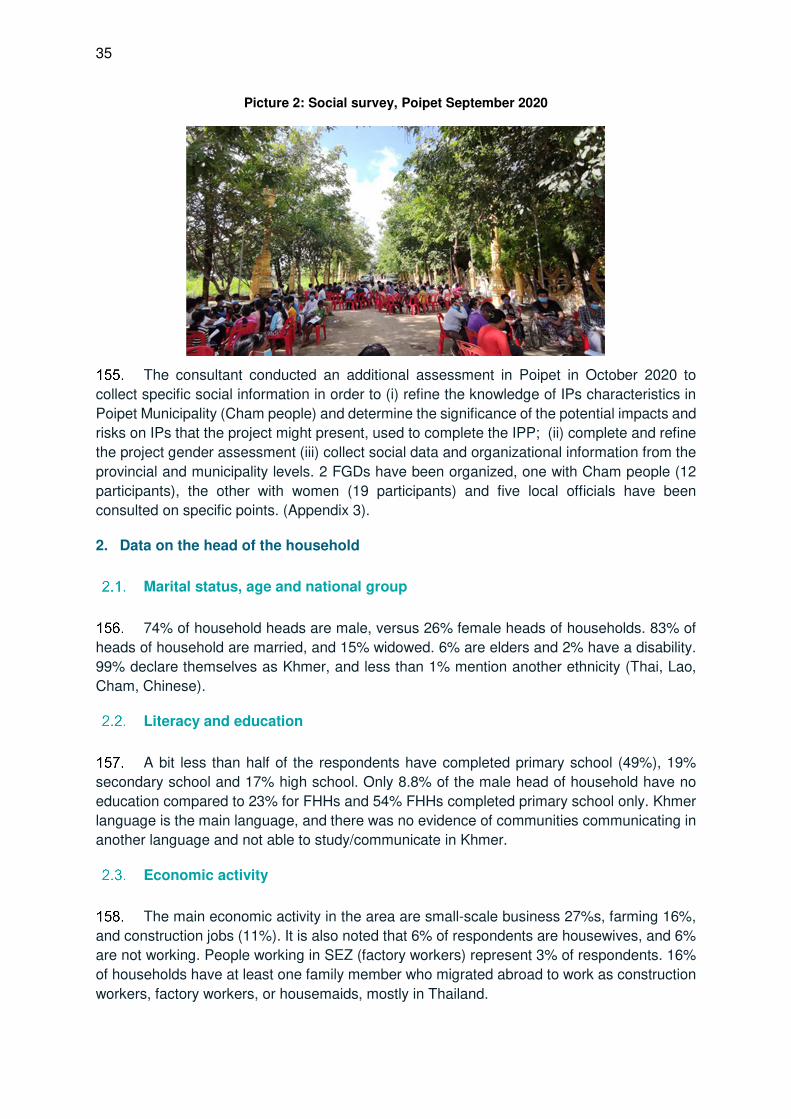
35
Picture 2: Social survey, Poipet September 2020
The consultant conducted an additional assessment in Poipet in October 2020 to
collect specific social information in order to (i) refine the knowledge of IPs characteristics in
Poipet Municipality (Cham people) and determine the significance of the potential impacts and
risks on IPs that the project might present, used to complete the IPP; (ii) complete and refine
the project gender assessment (iii) collect social data and organizational information from the
provincial and municipality levels. 2 FGDs have been organized, one with Cham people (12
participants), the other with women (19 participants) and five local officials have been
consulted on specific points. (Appendix 3).
2. Data on the head of the household
Marital status, age and national group
74% of household heads are male, versus 26% female heads of households. 83% of
heads of household are married, and 15% widowed. 6% are elders and 2% have a disability.
99% declare themselves as Khmer, and less than 1% mention another ethnicity (Thai, Lao,
Cham, Chinese).
Literacy and education
A bit less than half of the respondents have completed primary school (49%), 19%
secondary school and 17% high school. Only 8.8% of the male head of household have no
education compared to 23% for FHHs and 54% FHHs completed primary school only. Khmer
language is the main language, and there was no evidence of communities communicating in
another language and not able to study/communicate in Khmer.
Economic activity
The main economic activity in the area are small-scale business 27%s, farming 16%,
and construction jobs (11%). It is also noted that 6% of respondents are housewives, and 6%
are not working. People working in SEZ (factory workers) represent 3% of respondents. 16%
of households have at least one family member who migrated abroad to work as construction
workers, factory workers, or housemaids, mostly in Thailand.
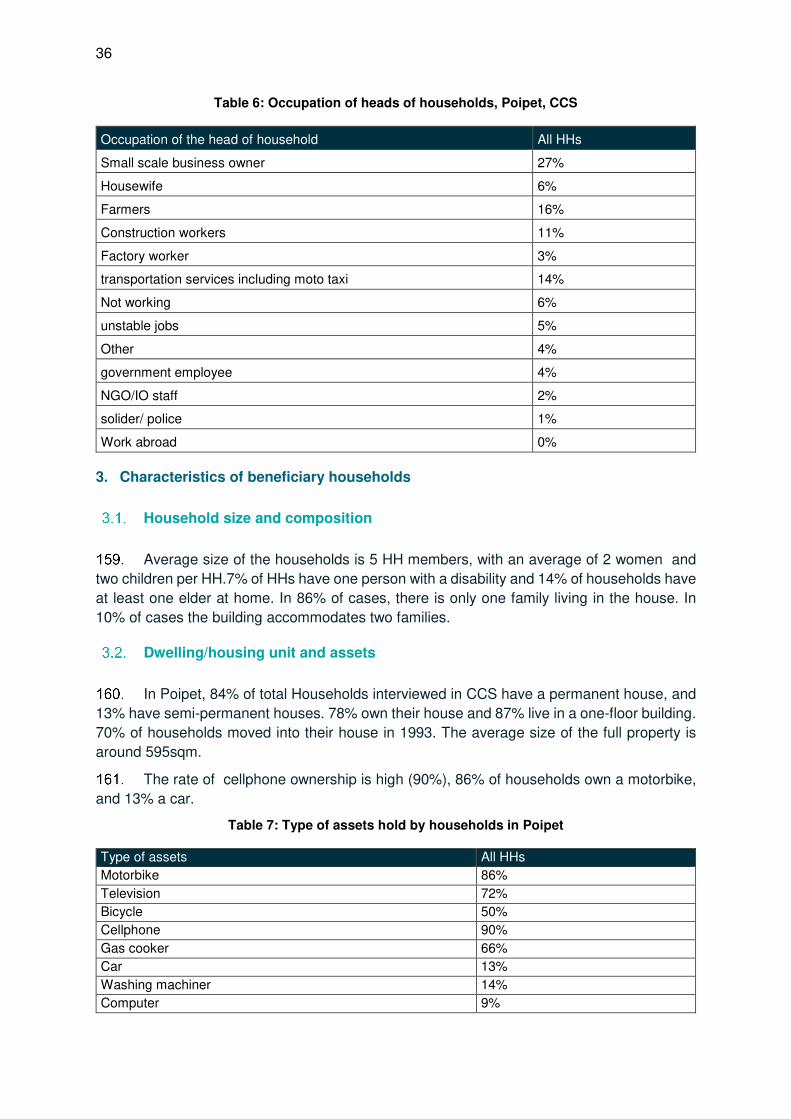
36
Table 6: Occupation of heads of households, Poipet, CCS
Occupation of the head of household All HHs
Small scale business owner 27%
Housewife 6%
Farmers 16%
Construction workers 11%
Factory worker 3%
transportation services including moto taxi 14%
Not working 6%
unstable jobs 5%
Other 4%
government employee 4%
NGO/IO staff 2%
solider/ police 1%
Work abroad 0%
3. Characteristics of beneficiary households
Household size and composition
Average size of the households is 5 HH members, with an average of 2 women and
two children per HH.7% of HHs have one person with a disability and 14% of households have
at least one elder at home. In 86% of cases, there is only one family living in the house. In
10% of cases the building accommodates two families.
Dwelling/housing unit and assets
In Poipet, 84% of total Households interviewed in CCS have a permanent house, and
13% have semi-permanent houses. 78% own their house and 87% live in a one-floor building.
70% of households moved into their house in 1993. The average size of the full property is
around 595sqm.
The rate of cellphone ownership is high (90%), 86% of households own a motorbike,
and 13% a car.
Table 7: Type of assets hold by households in Poipet
Type of assets All HHs
Motorbike 86%
Television 72%
Bicycle 50%
Cellphone 90%
Gas cooker 66%
Car 13%
Washing machiner 14%
Computer 9%
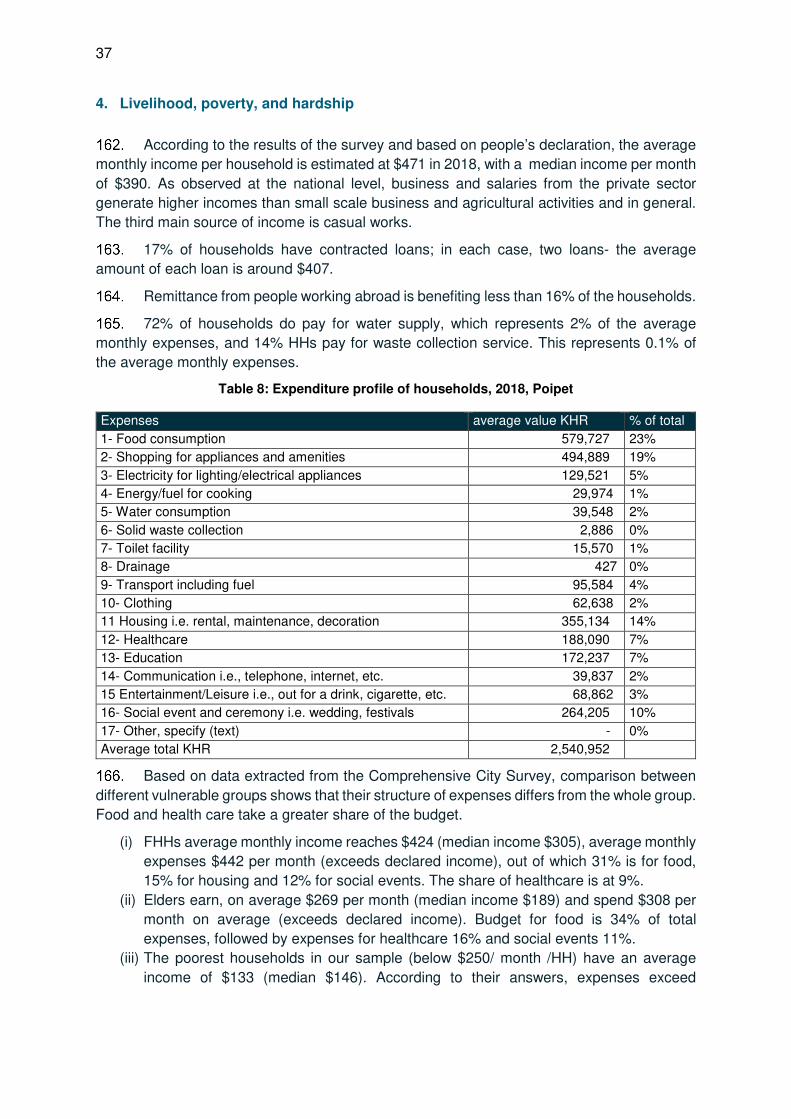
37
4. Livelihood, poverty, and hardship
According to the results of the survey and based on people’s declaration, the average
monthly income per household is estimated at $471 in 2018, with a median income per month
of $390. As observed at the national level, business and salaries from the private sector
generate higher incomes than small scale business and agricultural activities and in general.
The third main source of income is casual works.
17% of households have contracted loans; in each case, two loans- the average
amount of each loan is around $407.
Remittance from people working abroad is benefiting less than 16% of the households.
72% of households do pay for water supply, which represents 2% of the average
monthly expenses, and 14% HHs pay for waste collection service. This represents 0.1% of
the average monthly expenses.
Table 8: Expenditure profile of households, 2018, Poipet
Expenses average value KHR % of total
1- Food consumption 579,727 23%
2- Shopping for appliances and amenities 494,889 19%
3- Electricity for lighting/electrical appliances 129,521 5%
4- Energy/fuel for cooking 29,974 1%
5- Water consumption 39,548 2%
6- Solid waste collection 2,886 0%
7- Toilet facility 15,570 1%
8- Drainage 427 0%
9- Transport including fuel 95,584 4%
10- Clothing 62,638 2%
11 Housing i.e. rental, maintenance, decoration 355,134 14%
12- Healthcare 188,090 7%
13- Education 172,237 7%
14- Communication i.e., telephone, internet, etc. 39,837 2%
15 Entertainment/Leisure i.e., out for a drink, cigarette, etc. 68,862 3%
16- Social event and ceremony i.e. wedding, festivals 264,205 10%
17- Other, specify (text) - 0%
Average total KHR 2,540,952
Based on data extracted from the Comprehensive City Survey, comparison between
different vulnerable groups shows that their structure of expenses differs from the whole group.
Food and health care take a greater share of the budget.
(i) FHHs average monthly income reaches $424 (median income $305), average monthly
expenses $442 per month (exceeds declared income), out of which 31% is for food,
15% for housing and 12% for social events. The share of healthcare is at 9%.
(ii) Elders earn, on average $269 per month (median income $189) and spend $308 per
month on average (exceeds declared income). Budget for food is 34% of total
expenses, followed by expenses for healthcare 16% and social events 11%.
(iii) The poorest households in our sample (below $250/ month /HH) have an average
income of $133 (median $146). According to their answers, expenses exceed
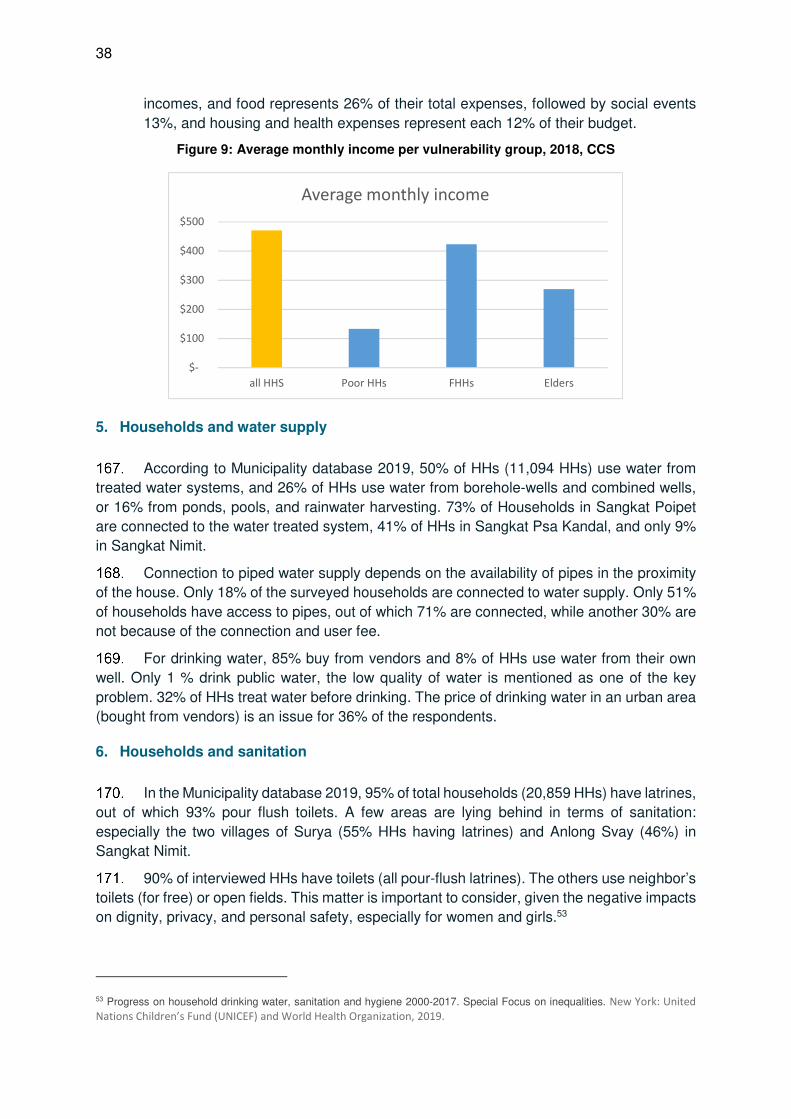
38
incomes, and food represents 26% of their total expenses, followed by social events
13%, and housing and health expenses represent each 12% of their budget.
Figure 9: Average monthly income per vulnerability group, 2018, CCS
5. Households and water supply
According to Municipality database 2019, 50% of HHs (11,094 HHs) use water from
treated water systems, and 26% of HHs use water from borehole-wells and combined wells,
or 16% from ponds, pools, and rainwater harvesting. 73% of Households in Sangkat Poipet
are connected to the water treated system, 41% of HHs in Sangkat Psa Kandal, and only 9%
in Sangkat Nimit.
Connection to piped water supply depends on the availability of pipes in the proximity
of the house. Only 18% of the surveyed households are connected to water supply. Only 51%
of households have access to pipes, out of which 71% are connected, while another 30% are
not because of the connection and user fee.
For drinking water, 85% buy from vendors and 8% of HHs use water from their own
well. Only 1 % drink public water, the low quality of water is mentioned as one of the key
problem. 32% of HHs treat water before drinking. The price of drinking water in an urban area
(bought from vendors) is an issue for 36% of the respondents.
6. Households and sanitation
In the Municipality database 2019, 95% of total households (20,859 HHs) have latrines,
out of which 93% pour flush toilets. A few areas are lying behind in terms of sanitation:
especially the two villages of Surya (55% HHs having latrines) and Anlong Svay (46%) in
Sangkat Nimit.
90% of interviewed HHs have toilets (all pour-flush latrines). The others use neighbor’s
toilets (for free) or open fields. This matter is important to consider, given the negative impacts
on dignity, privacy, and personal safety, especially for women and girls.53
53 Progress on household drinking water, sanitation and hygiene 2000-2017. Special Focus on inequalities. New York: United
Nations Children’s Fund (UNICEF) and World Health Organization, 2019.
$-
$100
$200
$300
$400
$500
all HHS Poor HHs FHHs Elders
Average monthly income

39
Interviewees, mostly women, had little information about the construction of their
toilets, which suggests that sanitation issues are more commonly dealt with by men, as it is
considered a more “technical” subject.
74% of HHs have a “kind of septic tank” -, many are not proper septic tanks with a
sealed tank. Half of the interviewees have an idea about the construction cost of their septic
tank. Only 7% of toilets are connected to public combined sewer/drainage pipes and 3% to
open drain channels. The majority don’t know how much they paid for connection, and they
do not know either if they pay a monthly fee.
Among those who have no septic tank or latrines, only 6% of HHs are willing to build
one. 94% would not consider taking a loan, even at the preferential condition, to build or
renovate sanitation facilities.
73% of interviewees in the survey responded that they do not use the service of
septage$2.4)r pumping trucks and they do not empty septic tanks manually. Most respondents
have little or no knowledge about these sanitation aspects- frequency of desludging if needed,
costs of emptying, name of emptying company, nor where septage is transported.
23% of HHs are not willing to pay to be connected to the sewerage pipe; they think it
should be provided for free, 24% don’t know how much they could afford, and 32% could pay
more than KHR 40,000 to be connected ($9.6). If the connection to sewerage is possible, 53%
of households declared a willingness to pay a connection fee of $24.4 on median ($22.3 on
average).
Regarding the monthly service fee for public sewer pipe, again, 22% of HHs would like
it for free, 23% have no idea how much they could afford, and 33% can afford less than KHR
10,000 per month ($2.4). If a sewerage service is possible, 53% of households declare a
willingness to pay a monthly fee of $2.4 on median ($5.7 on average).

40
Figure 10: Location of Households Willing to Pay a Monthly Fee for Wastewater Management,
CCS
7. Households and stormwater drainage
Through the Comprehensive City Survey, it is estimated that 48% of the population
experiences flooding of their house at every intense rainfall event, while 16% never
experienced flooding. 64% of HHs have been warned of flooding risks (by TV/Radio, social
media, and MoWRAM). 37% of HHs observed change in flooding patterns compared to 10
years ago.

41
Figure 11: Flood prone areas identified from CCS
The consequences of flooding are rather well known by the interviewees, the main one
being mosquitos breeding, then in order of appearance: stagnant waters, the proliferation of
trash, waste from septic tanks overflowing, and higher prevalence of disease such as dengue
fever, typhoid, skin disease, and leptospirosis. 58% of HHs associate the experience of skin
disease by one of the HH members with flooding, 34% with hemorrhagic dengue fever, 25%
with diarrhea. Average annual spending for health in the previous year (2018) was $142 , $74
in a rural area and up to $171 in an urban area, which is mostly (as per people’s
understanding) related to waterborne disease.
Flooding affects people's access to health facilities for 54% HHs, and for 22% HHs
workplace or schools closed during flooding.
In Poipet, rainwater is collected mostly in containers (jars) by 54% of HHs and flows
into the public drainage for 22%. For the HHs served with public drainage , 38% of HHs face
no issue with the existing system, but 58% observed the drainage is clogged with waste, 34%
that is not cleaned regularly, and in 33% of cases the system is not complete or for 23% broken
for a long time.

42
8. Households and solid waste management
As per the CCS, 13% of households have access to a solid waste collection service,
only 6% in the rural area and 40% in the urban area.
73% of HHs directly face environmental issues in Poipet. The main issue mentioned is
solid waste management (60% HHs), air pollution (56% HHs), and water pollution (45% HHs).
92% of HHs in Poipet think there is a problem with solid waste management in their area.
They notice especially bad smell (78% HHs), solid waste scattered on the roads (68% HHs),
burnt in the street or backyard (31% HHs), and that waste is not collected properly/ unsorted
(27% HHs) or is discharged in the environment (15% HHs). 84% observe solid waste piling
often or very often in their area. For 88% HHs, this can affect their physical environment (73%
air pollution, 61% water pollution, and 58% climate change/flooding) and the health of their
family members. They quote the following impact for their family (in descending order):
discomfort because of bad smell, diseases of respiratory system, wound/scabies, infection,
and diseases in general, digestive systems problems. The level of awareness and concerns
of the population about the negative impacts of inadequate solid waste management is high.
65% of the health problems encountered by HHs over the last year are directly linked to
waste/garbage.
Most households produce 1kg or less of waste every day, mostly domestic waste.
Solid waste is kept and disposed of in plastic bags (77%), plastic or cardboard containers. The
plastic bags are considered easy to handle, avoid odors, are clean, and keep insects and
rodents away.
In Poipet, the waste collection service is available to 29% of HHs only (in urbanized
areas, mostly 40% against 6% in the rural areas). 20% of all HHs get their waste collected at
their doorstep, while 10% dispose of waste at a collecting point. Collection is done in the
morning for 39% of HHs, for 34% in the evening, and at irregular hours for 22% HHs, but
mostly everyday (66%) or every two days (14%). 69% of the HHs are satisfied with this
frequency. Space for improvement could be a more regular collection (88%), a cleaner service
(62%), a cheaper fee (59%). All households benefiting from the waste collection service pay
a monthly fee. The average price is KHR 20,500 ($5), median KHR 8.000 (about $2), which is
considered as an appropriate price by 58% of HHs and expensive/ too expensive for 34%.
Waste that is not collected is widely dumped in an empty land, followed by dikes/ lakes
and roadsides.
Households have a general knowledge of waste impacts, and 60% of HHs already
took part in environmental campaigns. Only 44% of HHs sort waste before disposal for re-sale
(cans, plastic bottles, organic waste for animal feed). The proportion of HHs ready to sort more
if required is higher (61%).
Regarding willingness to pay for an improved waste management service, 19% of HHs
would like the service to be free, and 16% don’t know if they would pay. If a new or improved
solid waste management service is created, the survey shows that 22% of Households are
willing to pay a monthly fee: $2.4 median value; $3.2 on average.

43
Figure 12: Location of households willing to pay for Solid Waste Collection service, CCS
9. Consumer perceptions
According to the CCS, it is estimated that 63% of HHs think their area is polluted, the
main problems being dust, bad smells from garbage, and noise.
The satisfaction rates show that water supply service and drainage are rather
satisfactory (3.4/5 and 3/5), compared to solid waste management (2.5/5) and wastewater
management (1.6/5).
42% HHs consider that improving urban infrastructure (roads, bridge, sanitation,
drainage system, solid waste collection) would improve the city livability and attractiveness.
10. Private sector
The City Comprehensive Survey also included a Commercial and Institution (C&I)
survey. Below is the type and number of institutions surveyed in Poipet.

44
Table 9: Commerce and institutions surveyed in Poipet during the Comprehensive City Survey
Type of Institution Poipet
Commercial
Casino 7
Hotels 8
Restaurants 11
Industry 3
Other Commercial/Production 18
Institutions
Primary Schools 10
Kinder garden 9
Lower Secondary School 8
Clinics 9
Office People's Committees 5
Total 88
83% of the commercial and institutions buildings are permanent with 1 or 2 floors
(80%). 90% of the companies and institutions have been established after 1993, and 58% are
operating in the same building for more than ten years, while 28% occupy the building for 3 to
10 years. 69% of the companies/ institutions own their building and 27% rent it.
There are big disparities in the type of C&I, and the average size of premises is 66,026
sqm, ranging from 32 sqm to 4,805,000 sqm. This is also obvious from the number of
employees: the C&I employ between 1 to 8,000 persons, with an average of 162 employees
(and average 62 females employees per company). Most people also live on the premises of
the business (second floor of the family business, or factories dormitories for example), i.e.,
an average of 163 persons (maximum 4,000), including children, senior citizens and people
with disabilities.
100% have the grid power supply, 44% to piped water supply (mostly private), 27%
have a drainage system in place, and 55% have a collection of solid waste.
In Poipet, 91% of the C&I buy drinking water from vendors. 80% of C&I have accessed
to piped water, and 84% are connected. 55% of those not connected find the connection price
is too high, and 45% that the water user fee is too expensive. 43%% of C&I treat their water
before drinking. On average, they prefer to pay 105,568 KHR/ month ($25.3) for a water supply
of 150L per day and per person 24/7, and 82% would spend 521,429 KHR ($125) on piped
water connection fee.
50% of C&I don’t know where their business wastewater is discharged, 16% have their
own treatment facilities. Due to the limitation of the sewerage network in the towns,15% of C&I
discharge the wastewater discharge along with the train tracks, and 11% to lake or channel.
100% of houses/buildings are equipped with toilets (all flush toilets), and 90% are
connected to containment, 23% overflow in the public drainage system (average monthly fee
KHR 12,500 ($4.8)). 39% of C&I required to pump every 1-2 years (56%), and the average
fee of KHR 231,143 ($55.5). If a public sewer pipe is built, on average, they would pay 381,125
KHR ($91.5) for connection and 45,500 KHR ($11) for the monthly service fee.

45
60% of respondents observe problems with solid waste, air pollution (57%), and water
pollution (44%). Solid waste is a major problem due to service provision and insufficient landfill.
74% of respondents consider there is a problem with solid waste in their area: bad smells
(84%), solid waste is scattered on the road (82%), waste not collected properly/ not
segregated and burnt (38%). 89% of people think that solid waste can cause adverse impacts
to the physical environment or health in the C&I, such as air pollution (90%), climate change
(e.g., flooding) and water pollution. In terms of health, solid waste/ bad smells are associated
with diseases associated with the respiratory system (63%), infectiousdiseases (58%) and
wounds/scabies (60%).
Depending on their size and type of activities, C&I generates more or less solid waste:
22% between 2 to kg/ day and 9% generates more than 20kg/day of domestic and production
waste. 90% discharge wastes every day, mostly in plastic bags. 66% of C&I benefit from solid
waste collection services from private companies (84%). 66% get the collection at their
doorstep, 11% at a collecting point, and the rest is discharged in empty lands, ditches, lakes,
on the roadside, etc. More detail are provide in the Solid Waste Management Volume.
Waste Collection is more often daily (84%) and in the morning (36%) or at an irregular
time (26%) or in the evening (31%), which is satisfying for 55% of C&Is only. They would prefer
early morning or in the evening- outside of working hours. 69% pay a collection fee
commensurate to their waste production/ size of the C&I. The main improvement would be a
more regular collection (83%), cleaner service (78%), cheaper service (65%).
Only 56% of C&Is participated in an environmental campaign due to time limitations.
Still, 68% of respondents sort cans, plastic bottles, and organic waste overall. 80% would
agree to sort more if a program was put in place.
55% of respondents experience flooding in their building when it rains heavily. 61%
got weather warnings (TV/Radio, social media, MoWRAM). 84% are aware of the
consequence of flooding on mosquito breeding, the proliferation of trash, and stagnant waters.
37% observe problems (after flooding, such as skin diseases (30%) hemorrhagic dengue fever
(27%) or Typhoid/ cholera/dysentery (20%). In 81% of cases, flooding limit access to health
facilities and 23% experienced the closing of the workplace for an average of 7 days.
In 53% of cases, rainwater went into the public drainage. 75% observe the drainage
system is clogged.
80% are noticing changes in the weather in their areas, such as unusual season
patterns, more heavy rainfall, and more extreme weather conditions. The main solution to
mitigate this would be planting trees (86%), improve drainage (66%), eliminate burning waste
(59%).
60% consider their area is polluted, with the main nuisances being dust, noise, bad
smells from waste.
On a scale of 1 to 5, where (1) not satisfied and (5) is fully satisfied, C&Is evaluation
of public services and infrastructure was highest for water supply and lowest for wastewater
(table 16).

46
Table 10: Satisfaction rate for current urban infrastructure in Poipet for Commerce and
Institutions, CCS.
Average Poipet
Water supply 3.27
Wastewater 1.30
Drainage 2.85
Solid Waste 2.24
11. Civil society organizations
The name of organizations emerged from the discussion with the community and
authorities: Don Bosco Foundation in Cambodia, Domnok Toeuk, Imparting Smile Association
Cambodia. The other organization listed in the tbal above were not mentioned by the people.
The last three organizations have been assessed. They target priority vulnerable children and
provide non-formal/ formal education and social services. They seem to have none or only
limited experience with water, hygiene, and sanitation programs. Domnok Toeuk has more
diversified activities than the two other organizations and would fit better as a partner in the
project.
Picture 3: Picture of local NGO Domnok Teuk’ premises, Poipet, September 2020

47
V. NEEDS, PREFERENCES, AND DEMANDS OF PROJECT STAKEHOLDERS
The socio-economic profile of households in Poipet as well as their needs, preferences
and demands have been covered in the previous chapter. The focus here is on poor and
vulnerable groups.
1. Informal settlement dwellers
No informal settlement were identified as affected by the project during the Inventory
of Losses survey and as presented in the Basic Resettlement Plan volume. Therefore, no
specific demands have been listed for this stakeholder category.
2. Poor households
The definition of poor HHs can vary- and there is no specification about ID Poor in the
CCS. For the purpose of our analysis, we base on the average monthly income estimated
during the survey for each HH and focused on those with less than $250/month average- i.e.,
233 HHs.
82% of those poorer HHs have a permanent house, and 79% own their house. 63%
have been living in the area for more than ten years/ forever. 29% of the poorest households
are FHHs, and 14% have no education, which is similar to the whole group of households
surveyed. Their average monthly income is only 29% of the average monthly income of the
whole group.
39% HHs are in an area served by piped water supply, and 63% of those HHs are
connected. 76% drink water from vendors (against 85% for the whole group), 14% from their
own well (deep well) and 2% drink public water, and 55% treat water before drinking, which is
much higher than in the whole group. 29% consider water is too expensive- compared to 36%
of the whole group. 77% of HHs would pay for the connection to the public water supply pipe
(80% for the whole group). 40% could pay up to KHR 20,000 ($4.8) and 24% KHR 40,000
($9.6) for connection and similarly for a monthly fee. This is comparable to affordability for the
whole group but the willingness to be connected seems a bit lower.
87% of HHs have toilets, which are slightly below average in the total population
interviewed. 30% of poor households consider that the connection to the sewerage network
should be free. 17% don’t know how much they could afford for connection to sewerage pipe,
and 27% think it could be more than KHR 40,000 ($9.6). 26% HHs also think there should be
no fee for sewerage service, and 30% could afford less than KHR 10,000 ($2.4) per month for
sewerage. In general, the levels of affordability expressed are similar to those in the whole
group.
79% HHs face environmental issues, and 92% are confronted with waste management
problems in their neighborhood (solid waste piling), which also affects the environment and
health (86% HHs). Only 19% of poor HHs receive solid waste collection service (compared to
29% in the whole group). 11% of “relatively poor” HHs find the solid waste collection service
is good and seem less satisfied than the other respondents. The key point of improvement,
could be a cleaner collection service. 87% never participated in an environmental campaign,
which is significantly higher than for the rest of the population. Only 39% of poor HHs sort their

48
waste before disposal. 28% of poor HHs would like the solid waste collection service to be
free against 19% in the whole group, 26% could afford less than KHR 20,000 and 20% could
afford up to KHR 12,000 ($2.9). Only 12% don’t know which amount they can afford for a
monthly collection service.
Poor households rely on the same information channels as other households for flood
warnings (TV/radio and social media).
While water supply and drainage overall, and to a lesser extent solid waste
management satisfy the poorest HHs, they are less satisfied with wastewater management
than other respondents.
In Poipet, the poorer households have lower access to basic urban infrastructure and
service, they participated less in environmental campaigns, and are relatively more affected
by pollution, the main issue being solid waste. About a third of respondents request free
connection and service fees. The level of affordability for other respondents is similar to the
whole group.
Table 11: Analysis of affordability for poor HHs
Cost of connection to piped water supply %
20,000 40%
40,000 24%
80,000 8%
100,000 6%
150,000 3%
200,000 9%
Monthly fee rate for water supply Free of Charge 2%
Don’t know 0%
1,000 to 10,000 included 6%
10,000 to 15,000 included 1%
15,000 to 20,000 included 40%
40,000 24%
80,000 8%
>80,000 18%
Cost of connection to a sewerage pipe Free of Charge 30%
don't know 17%
<5,000 included 4%
5,000 to 8,000 included 0%
8,000 to 15,000 included 6%
20,000 to 25,000 included 7%
30,000 4%
40,000 3%
>40,000 27%
average >40,000 Monthly fee rate for sewerage Free of Charge 26%
Don’t know 19%
<10,000 30%

49
10,000 to 20,000 included 11%
20,000 to 40,000 included 3%
40,000 to 60,000 included 5%
80,000 to 100,000 included 3%
>100,000
2%
Monthly fee rate for waste collection fee Free of Charge 28%
don't know 12%
<4,000 included 15%
4,000 to 6,000 included 11%
7,000 to 8,000 included 0%
9,000 to 12,000 included 20%
12,000 to 20,000 included 7%
>20,000 8%
3. Female-headed households
169 FHHs have been surveyed during CCS. 49% of those FHHs were headed by
widows (average age of the sample 53 y.o, which is older than the whole sample). 80% FHHs
live in permanent houses and 75% own their house. 23% of female heads of household have
no formal education compared to 13% in the whole population. Those households currently
have slightly less access and services to water supply, sanitation and waste management
than other households. We observe a slight difference between FHHs and the whole group in
terms of participation in awareness campaigns and FHHs in higher percentage requests for
free connection and service fees.
67% FHHs have piped water supply available in their area, and 76% of those are
connected. The others cannot afford connection and user fees. 44% treat water before
drinking and 28% experienced no problem with the drinking water supply. 38% consider water
is however too expensive, which is higher than for the whole group. 76% FHHs are willing to
pay for connection to the water supply pipe, which is a bit less than for other HHs. 35% FHHs
could afford connection if it is KHR 20,000 ($4.8) and 30% for KHR 40,000 ($9.6), comparable
to results obtained for the whole group. 42% FHH could afford KHR 40,000 and 35% could
afford more than KHR 80,000 ($19.5) for a supply of 150 liters per day and per person for
24h/7days availability.
86% of FHHs have toilets available at their house,which is less than in the whole group.
14% of FHHs have no toilets and have to use neighbors' toilets or go to the field.Most
households had little information about costs, construction, and maintenance of their toilets.
24% of FHHs do not know if they will be willing to pay for connection to sewerage pipe. 35%
could afford KHR 20,000 ($4.8) and 30% KHR 40,000 ($9.6) which is very similar to the
affordability price mentioned by the whole group.
75% of FHHs experience problem of environment and 93% observe a problem with
solid waste in their neighborhoods. FHHs seem to notice a bit less problem with solid waste
piling than other HHs, but 85% acknowledge that solid waste mismanagement can have
adverse impacts on their environment and family health (similar problems as for the whole
group are mentioned). This is similar to the whole group.

50
26% of FHHs have access to waste collection service. 83% of FHHs never took part
in any environmental campaign, which is higher than for the rest of the group. 46% of FHHs
are sorting waste before disposal similarly to other HHs, and 57% are willing to sort more if
required. They would appreciate a cleaner collection service. 28% of FHHs would like the solid
waste collection service to be free against 19% in the whole group. Average affordable price
$3.7, median $1.22.
54% of FHHs experience flooding of their yard when it rains heavily, and they are
usually (59% FHHs) informed of the risk of flooding in advance by TV/Radio and social media.
FHHs are also aware of health risks associated with flooding. 31% FHHs consider the
drainage system to work well, 37% observe that the drainage system is clogged with solid
waste.
FHHs observe the same general changes in climate as the whole group and consider
that planting trees and improving drainage can mitigate changes locally. 38% are in favor of
rehabilitating heritage buildings and 28% support improving urban infrastructure to improve
the city.
Satisfaction about water supply (rated 3.7/5), wastewater management (1.5/5).,
drainage (3.21/5) and solid waste (2.68/5) is comparable with other groups.
The project will ensure the remaining gaps in access to infrastructure and service are
filled, organize for better involvement of FHHs in environmental awareness campaign/training,
and integrate their request for free connection and service fee, as part of equitable tariffs
principles.
Table 12: Analysis of affordability of facilities and services for FHHs
Cost of connection to piped water supply
20,000 35%
40,000 30%
80,000 8%
100,000 9%
150,000 4%
200,000 12%
Monthly fee rate for water supply
Free of Charge 1%
Don’t know 0%
1,000 to 10,000 included 3%
10,000 to 15,000 included 1%
15,000 to 20,000 included 8%
40,000 42%
80,000 11%
>80,000 35%
Cost of connection to sewerage pipe
Free of Charge 30%
don't know 28%
<5,000 included 3%
5,000 to 8,000 included 0%
8,000 to 15,000 included 5%
20,000 to 25,000 included 5%
30,000 4%

51
40,000 1%
>40,000 24%
average >40,000
Monthly fee rate for sewerage
Free of Charge 27%
Don’t know 26%
<10,000 30%
10,000 to 20,000 included 8%
20,000 to 40,000 included 1%
40,000 to 60,000 included 4%
80,000 to 100,000 included 2%
>100,000 2%
Monthly fee rate for waste collection fee
Free of Charge 28%
don't know 17%
<4,000 included 9%
4,000 to 6,000 included 13%
7,000 to 8,000 included 2%
9,000 to 12,000 included 15%
12,000 to 20,000 included 11%
>20,000 6%
Cost of connection to piped water supply
4. Indigenous peoples
The number of IPs in the CCS is insignificant and does not allow for specific analysis.
FGD has been undertaken with the Cham minority in Poipet. FGDs with IPs confirmed
that they have similar constraints and demands regarding waste collection, wastewater
management, and stormwater drainage. No specific issues regarding their ethnic origins were
raised.
The IPs in Poipet consider that air and surface water is polluted. They are less affected
by soil, waste, and groundwater pollution. They observed more flooding and drought in the
last ten years.
IPs in Poipet are looking forward to living in a healthier environment: reduced disease,
livable city; reduced deterioration of roads by floods, reduced flooding and cleaner city, and
more attractive to tourists, and are favorable to the project.
IPs are concerned by the price of connection and service. They recommend lowering
the prices to ensure more connection. They also raised questions about the quality of the Solid
Waste Collection service.
For IPs in Poipet proper and continuous information about the project and awareness
raising campaigns (solid waste management) are pre-requisites for the success of the project.
The Mosques can play a role in information dissemination in the Cham community.
These aspects are further developed in the Indigenous Peoples – Due Diligence
Report.
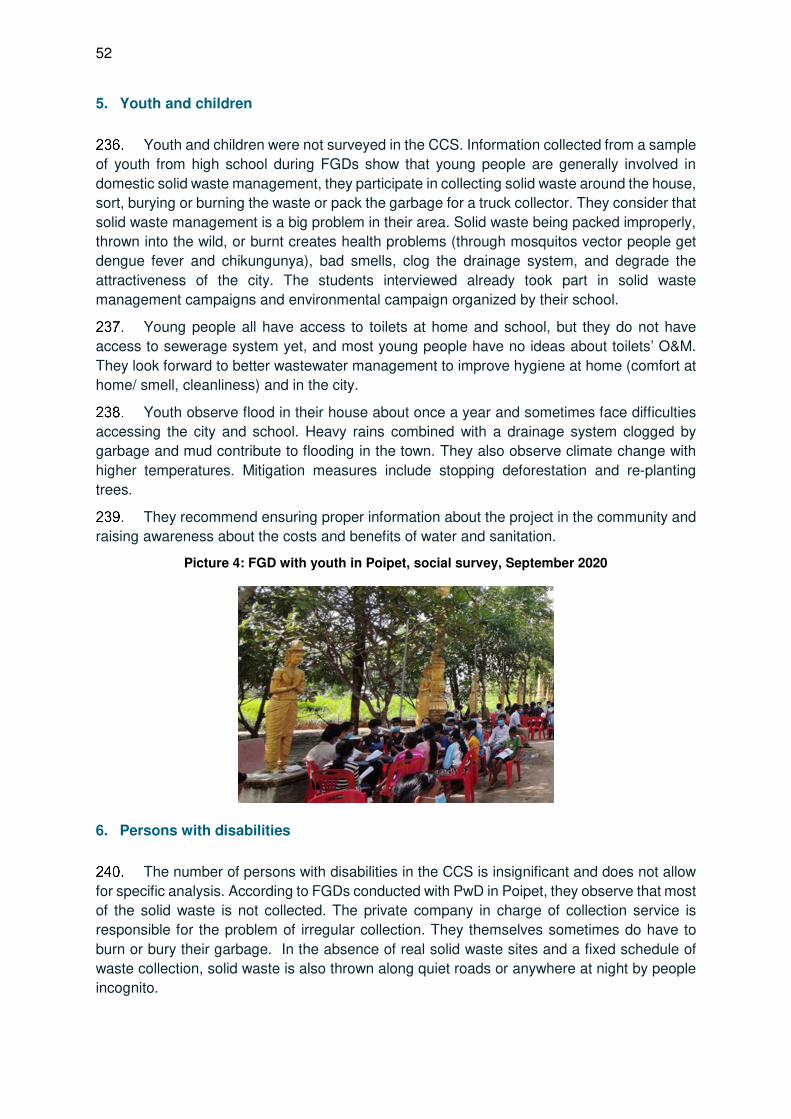
52
5. Youth and children
Youth and children were not surveyed in the CCS. Information collected from a sample
of youth from high school during FGDs show that young people are generally involved in
domestic solid waste management, they participate in collecting solid waste around the house,
sort, burying or burning the waste or pack the garbage for a truck collector. They consider that
solid waste management is a big problem in their area. Solid waste being packed improperly,
thrown into the wild, or burnt creates health problems (through mosquitos vector people get
dengue fever and chikungunya), bad smells, clog the drainage system, and degrade the
attractiveness of the city. The students interviewed already took part in solid waste
management campaigns and environmental campaign organized by their school.
Young people all have access to toilets at home and school, but they do not have
access to sewerage system yet, and most young people have no ideas about toilets’ O&M.
They look forward to better wastewater management to improve hygiene at home (comfort at
home/ smell, cleanliness) and in the city.
Youth observe flood in their house about once a year and sometimes face difficulties
accessing the city and school. Heavy rains combined with a drainage system clogged by
garbage and mud contribute to flooding in the town. They also observe climate change with
higher temperatures. Mitigation measures include stopping deforestation and re-planting
trees.
They recommend ensuring proper information about the project in the community and
raising awareness about the costs and benefits of water and sanitation.
Picture 4: FGD with youth in Poipet, social survey, September 2020
6. Persons with disabilities
The number of persons with disabilities in the CCS is insignificant and does not allow
for specific analysis. According to FGDs conducted with PwD in Poipet, they observe that most
of the solid waste is not collected. The private company in charge of collection service is
responsible for the problem of irregular collection. They themselves sometimes do have to
burn or bury their garbage. In the absence of real solid waste sites and a fixed schedule of
waste collection, solid waste is also thrown along quiet roads or anywhere at night by people
incognito.

53
The current price for waste collection service fee is 10,000 to 12,000 Riels per month
for standard households. PwD are willing to benefit from the solid waste collection service and
pay for the service fee for the project; suitable price should be less or equal to 10,000 Riels
per month. They would also like to get the address and contact phone of the collection
company and get daily collection according to the schedule. They also consider that training
on sorting/ recycling solid waste management is necessary.
PwD expect that an improved solid waste collection system will improve their living
environment and the atmosphere in the city. It will improve the hygiene and health status of
the people in the project area, attract more tourists and investors and thus increase business
and job opportunities, and improve living conditions.
PwD currently have no access to wastewater drainage system. They fall sick because
of bad sanitation and mosquito infestation in wastewater and have discomfort because of bad
smells. While they are willing to connect to the city sewerage system, they are not sure that
they would be able to pay for it and request the project to consider the appropriate price for
PwD. They also request the wastewater treatment plant to be installed far away from the city.
Thanks to improved wastewater management/ treatment, PwD expect a cleaner city
and health risks reduction. Due to the fact that wastewater is discharged and treated in a plant,
households will have less cost of pumping.
PwD consulted have no storm-water outlet drainage system in their area, and many
houses are in a low area, so during the rainy season and especially around Pchum Ben, they
are affected by storm and flood, which carts solid waste everywhere. They accept to connect
to the stormwater drainage, but the price should be low or exceptional for the poor disabled
households. They recommend organizing storm-water drainage system training in the
necessary cases.
They expect to reduce flood duration in the city and reduce damages caused by
stormwater to people's properties.
Picture 5: FGD with people with disabilities in Poipet, social survey, September 2020
7. Elderly
A sample of 36 elders (average 71 y.o) has been interviewed in CCS, out of which
56% had no formal education. 83% are long term residents of Poipet and all own their house
(86% permanent housing).
Elders in Poipet mostly buy drinking water from vendors (75%). Out of 44% of elders
having access to a piped water system, 56% are connected. 61% of those connected use to
54
treat water for drinking. A high proportion of elders interviewed (83%) would pay to be
connected to piped water supply for convenience, 33% could afford KHR 20,000 ($4.9)for
connection, and 25% KHR 40,000 ($9.6). 33% could afford a monthly fee between KHR
15,000 ($3.6) and 20,000 ($4.6), and 61% could afford more.
Only 83% of elders have toilets. This is the lowest rate of all groups, and 11% would
consider building flush toilets/ septic tank, 92% would not take a loan for sanitation
infrastructure, and 33% don’t know if they would pay to be connected to a sewerage pipe. 22%
would consider to connect if the connection to the sewerage pipe is free, and 28% are ready
to pay more than KHR 40,000 ($9.6).
39% of elders do not face environmental problems, which is higher than average for
the whole group, and 78% think there is a solid waste management issue, less than in the rest
of the population. According to FGD results, solid waste is collected irregularly, not frequently
enough, and people are not informed in case of service disruption. 75% of elders consider
that solid waste piling in their area affects both environment and health. 61% directly link the
disease to wastewater and garbage. A high proportion of elders have never joined an
environmental campaign (83%) and they sort waste less than other groups. 17% of elders
would like the solid waste collection service to be free, 11% of elders pay for waste collection
service, 22% elders don’t know if they would agree to pay for this type of service. As per
consultation during FGDs, they are willing to benefit from the waste collection system and to
pay for the service. They request a fair price, $3 per month. In addition, they would like to get
the contact of the solid waste company.
Only 3% of the elders interviewed were never flooded, and 44% are flooded only during
heavy rains. 53% have difficulties accessinghealth centers during flooding. Their main source
of warning about flooding is TV/radio. 36% observe that drainage is clogged with solid waste.
Regarding wastewater management and drainage, they also think this is necessary to treat
wastewater and reduce flooding. Again they are willing to pay for connection and service if the
prices are low enough.
58% of elders consider their area is polluted (compared to 63% for the whole group)
and are affected by dust, noise, and bad smell from the garbage.
Elders are overall satisfied by water supply and drainage in Poipet, and not satisfied
by solid waste and wastewater management.
Their main suggestion is to improve urban infrastructure and rehabilitate heritage
buildings.
They expect that improved urban infrastructure will reduce diseases, contribute to
create a cleaner and beautiful city, improve living conditions in the city, and attract more
tourists.
In order to succeed, the project needs to disclose project information, consult the
people, raise awareness about waste management, hygiene and sanitation, health risks
during flooding, implement an income restoration program and avoid conflicts during
construction.

55
Table 13: Analysis of affordability of facilities and services for elders’ head of households
Cost of connection to piped water supply
20,000 33%
40,000 25%
80,000 11%
100,000 17%
150,000 3%
200,000 6%
Monthly fee rate for water supply Free of Charge 0%
Don’t know 0%
1,000 to 10,000 included 6%
10,000 to 15,000 included 0%
15,000 to 20,000 included 33%
40,000 25%
80,000 11%
>80,000 25%
Cost of connection to sewerage pipe Free of Charge 22%
don't know 33%
<5,000 included 3%
5,000 to 8,000 included 0%
8,000 to 15,000 included 6%
20,000 to 25,000 included 8%
30,000 0%
40,000 0%
>40,000 28%
average >40,000 Monthly fee rate for sewerage Free of Charge 19%
Don’t know 36%
<10,000 31%
10,000 to 20,000 included 6%
20,000 to 40,000 included 0%
40,000 to 60,000 included 6%
80,000 to 100,000 included 0%
>100,000 3%
Monthly fee rate for waste collection fee Free of Charge 17%
don't know 22%
<4,000 included 17%
4,000 to 6,000 included 8%
7,000 to 8,000 included 3%
9,000 to 12,000 included 17%
12,000 to 20,000 included 11%
>20,000 6%

56
VI. SOCIAL AND POVERTY ANALYSIS
1. Rapid urban development but low basic service development
An element to consider regarding inequalities is the level of urbanization in different
sectors of the project area. People in the rural area and in less/ recently urbanized area have
currently no access to basic infrastructure and services, they also have less information and
comparison elements about technical options and costs associated with connection or
service/O&M, and while they are in general willing to access improved sewerage/ drainage/
waste collection service, they are less able than other respondents to estimate the costs they
could afford. The level of income of people in the rural area is higher than those in the urban
area of Poipet.
Rural households also face fewer problems with environmental issues and solid waste
management, and in general, the level of awareness about linkages between wastewater,
garbage and disease is lower than for people in an urban area. Gender roles tend to be more
traditional in a rural area, with, for instance, a higher proportion of women being in charge of
fetching water than in urban areas (49% against 40%). More specific information and training
programs should be proposed to the population residing in less urbanized areas on hygiene
and sanitation, what they can expect of improved services, which of their habits will have to
change, and the costs of services.
Figure 13: Map of area showing the level of urbanization, Poipet
57
2. Addressing existing deficiencies in basic infrastructure
Wastewater management challenges and recommendations54:
Technical recommendation to address the challenges of poor wastewater services in
a fast urban development context (91% of fecal waste is not being managed safely), stagnant
wastewater in the city center and 8% of the population having no private toilets are developed
under Feasibility study Volume 3 Wastewater.
Stormwater management challenges and recommendations55
Similarly Feasibility Study, Volume 4, present some recommendation for urban and
rural areas to address the city challenges with flooding in the context of uncontrolled urban
developpement and climate change.
Solid waste management challenge and recommendations56
Feasibility study, Volume 5 covers the challenges of service coverage for waste
collection services, collection of household hazardous waste and operation of the dumpsite
and waste recycling. It also highlight the poor working conditions of the waste pickers in the
streets and in the dumpsite and negative consequences for their health and safety.
3. Impact on poverty reduction
Adverse social costs
As the project aims to improve the urban infrastructure, a few negative impacts are
expected:
(i) Access disruption and dust from the construction and installation of civil works
associated with the sewerage system and wastewater drainage; 57 and
(ii) Cost of access to improved infrastructures and services represent additional expenses
and weights relatively more on poor/ vulnerable household budget.
(iii) Impact on informal jobs.
Special assistance for poor and vulnerable groups has been included in the Basic
Resettlement Plan.
In order to reduce the negative impacts occurring during the construction, an
Environmental Management Plan (EMP) has been prepared (refer to the Initial Environmental
Examination volume) and will need to be updated during the Detailed Engineering Design.
54 Feasibility study Volume 3
55 Feasibility Study, Volume 4
56 Feasibility study, Volume 5
57 Also covered in Poipet IEE report.

58
The project involves temporary and permanent land acquisition but no house
demolition. However, network construction works may cause temporary disruptions to vehicle
access, traffic flow, rail services, and utility services, such as water supply. Access disruption
and dust from the construction and installation of civil works could impact local businesses as
access will be momentary made more difficult, visibility reduced, or noise/dust could create
discomfort for the business owners and customers/guests. It could result in a punctual loss or
reduction of incomes.
Given the increased dust during construction, it is possible that an increase in
respiratory disorders (such as asthma, bronchitis) is observed, and these illnesses are more
likely to affect the very young and very old. People are also concerned about the risks of
accidents in the construction area (e.g. drowning of children, falling into holes). This could
impact more on women, given that they may have to assist young children in getting to school,
go to the market, and staying at home to look after sick family members. Per experience,
people are also afraid of project disruption due to funding or cash flow issues, which would let
them in the middle of a construction site for a long and uncertain time.
The construction of temporary workers camps may affect the local community and
environment. Contractors’ environmental and occupational health and safety plans will provide
mitigation measures. Recruitment of construction workers will prioritize local residents to
reduce the number of migrant workers. HIV/AIDS, communicable diseases, gender-based
violence and sexual exploitation, abuse and harassment (GBV-SEAH), COVID-19 specific
measures will also be implemented in contractors’ health and safety plans.
The cost of access to improved infrastructure and services represent additional
expenses and weighs relatively more on poor/ vulnerable household budget. For instance,
and according to the information available, the current price for solid waste collection service
in Poipet is $3.7/month (median); $5.1/month for HHs (average). While this represents barely
1% of the whole group average revenue, it is nearly 4% of the estimated average revenue of
the poorest households.
Additional costs for solid waste collection, connection to sewer pipes, and monthly
sewerage fees will impact the vulnerable group's budgets more significantly. There is a risk (i)
that poorer households cannot afford nor access improved sewerage and solid waste
management services, (ii) that poorer households have to make difficult choices between
expenses, and that better sanitation happens at the expense of nutrition, education, or health
for instance, which is not the purpose of the project.
The improvement and organization of the Solid Waste Management system, and the
recommended closure of the existing dumpsite, will impact informal jobs of waste pickers.
Closure of the dumpsite is not included in the project, although it is recommended, as the site
is full and the waste is currently burned on-site and to avoid groundwater pollution due to
rainwater infiltration through the waste mass. Its closure will also minimize the discharge of
waste into waterways and other natural habitats, thus helping to reduce air, water and soil
pollution and improve the standard of living of the population.
Street waste pickers contribute to collecting 16% of the solid waste generated each
day in Poipet. Waste pickers at dumpsite work in poor conditions, where health risk and safety
are the main issues. Children are also part of thewaste pickers, at around 10% of the following
site visit. In the dumpsite, currently, 37 waste pickers households/ 171 persons are working at
the existing landfill located on the private land and this is for the majority a full-time job for
59
more than ten years.58 Working conditions of scavengers and children’s work in the dumpsite
are two major issues and likely waste pickers will not be authorized to work on the new site
and will lose their main source of income.
The waste pickers consulted as part of the IOL/SES mentioned they would continue to
pick waste around markets and along the houses to make an income. Half are interested in
working in project construction work. Consulted during the social survey, groups of informal
waste pickers/ scavengers expressed that they may be interested formal jobs. They do not
know much about vocational training options, but they are still keen on the training.
The project addresses waste picker livelihoods through strategies such as integration
into the formal system, as well as the provision of safe working conditions, social safety nets,
and child labor restrictions. Their requirements as expressed during IOL/SES and social
survey are acknowledged and the following responses are proposed:
It is proposed: :
that construction contractors will give priority in project construction works or daily labor
to project vulnerable households and waste pickers,
that the project provides waste collection carts for waste picker households wanting to
continue waste collection at public areas of Poipet town59,
to confirm with the waste pickers and Provincial Department of Vocational Training the
options for vocational training (to waste pickers, but also to their family members) and
support in search of and application for employment by Provincial Department of Labor
to support children working as waste pickers to attend school instead of working
That the solid waste collector (private sector) will give priority to project vulnerable
households and waste pickers when expanding their fleet (truck driver and collectors),
and anticipate/provide training.
In the long term, there will be job creation accessible for non- qualified employees in
the sorting plant; priority will be given to project vulnerable households and waste
pickers.
It is recommended that these tasks of social facilitation and social support are
contracted out to an NGO for the whole project
Employment opportunities and wage generation
Expanding the wastewater system and establishing the wastewater treatment plant will
generate employment for the operation and maintenance of the WWTP, high water pressure
cleaning, pumping station maintenance, administrative work, management, and daily
cleaning, in total 20 permanent jobs are estimated. Using adequately treated wastewater could
also offer in the future potential employment benefits in a range of water-dependent economic
sectors such as agriculture and industry, which are not estimated yet.
58 Draft report, Inventory of Loss and Socio-Economic-Survey October 2020, Egis
59 included in the equipment package (output 2) “G-02 Solid waste collection equipment and vehicles”).
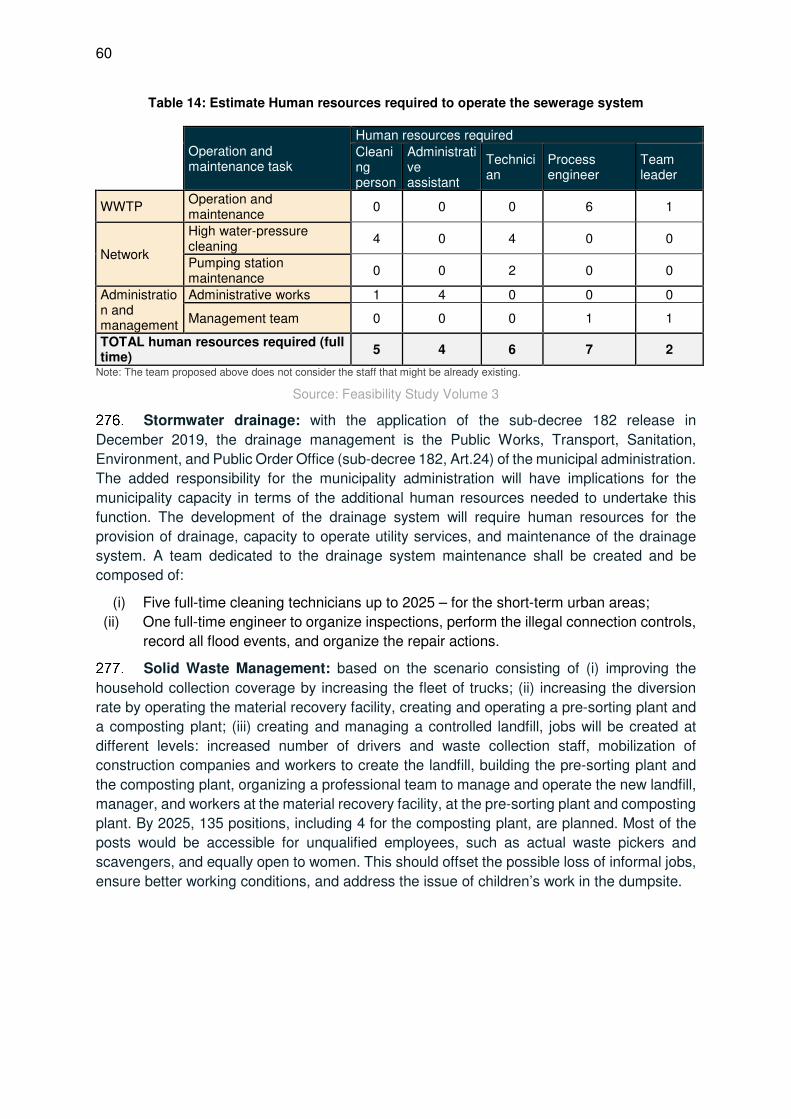
60
Table 14: Estimate Human resources required to operate the sewerage system
Operation and maintenance task
Human resources required
Cleaning person
Administrative assistant
Technician
Process engineer
Team leader
WWTP Operation and maintenance
0 0 0 6 1
Network
High water-pressure cleaning
4 0 4 0 0
Pumping station maintenance
0 0 2 0 0
Administration and management
Administrative works 1 4 0 0 0
Management team 0 0 0 1 1
TOTAL human resources required (full time)
5 4 6 7 2
Note: The team proposed above does not consider the staff that might be already existing.
Source: Feasibility Study Volume 3
Stormwater drainage: with the application of the sub-decree 182 release in
December 2019, the drainage management is the Public Works, Transport, Sanitation,
Environment, and Public Order Office (sub-decree 182, Art.24) of the municipal administration.
The added responsibility for the municipality administration will have implications for the
municipality capacity in terms of the additional human resources needed to undertake this
function. The development of the drainage system will require human resources for the
provision of drainage, capacity to operate utility services, and maintenance of the drainage
system. A team dedicated to the drainage system maintenance shall be created and be
composed of:
(i) Five full-time cleaning technicians up to 2025 – for the short-term urban areas;
(ii) One full-time engineer to organize inspections, perform the illegal connection controls,
record all flood events, and organize the repair actions.
Solid Waste Management: based on the scenario consisting of (i) improving the
household collection coverage by increasing the fleet of trucks; (ii) increasing the diversion
rate by operating the material recovery facility, creating and operating a pre-sorting plant and
a composting plant; (iii) creating and managing a controlled landfill, jobs will be created at
different levels: increased number of drivers and waste collection staff, mobilization of
construction companies and workers to create the landfill, building the pre-sorting plant and
the composting plant, organizing a professional team to manage and operate the new landfill,
manager, and workers at the material recovery facility, at the pre-sorting plant and composting
plant. By 2025, 135 positions, including 4 for the composting plant, are planned. Most of the
posts would be accessible for unqualified employees, such as actual waste pickers and
scavengers, and equally open to women. This should offset the possible loss of informal jobs,
ensure better working conditions, and address the issue of children’s work in the dumpsite.
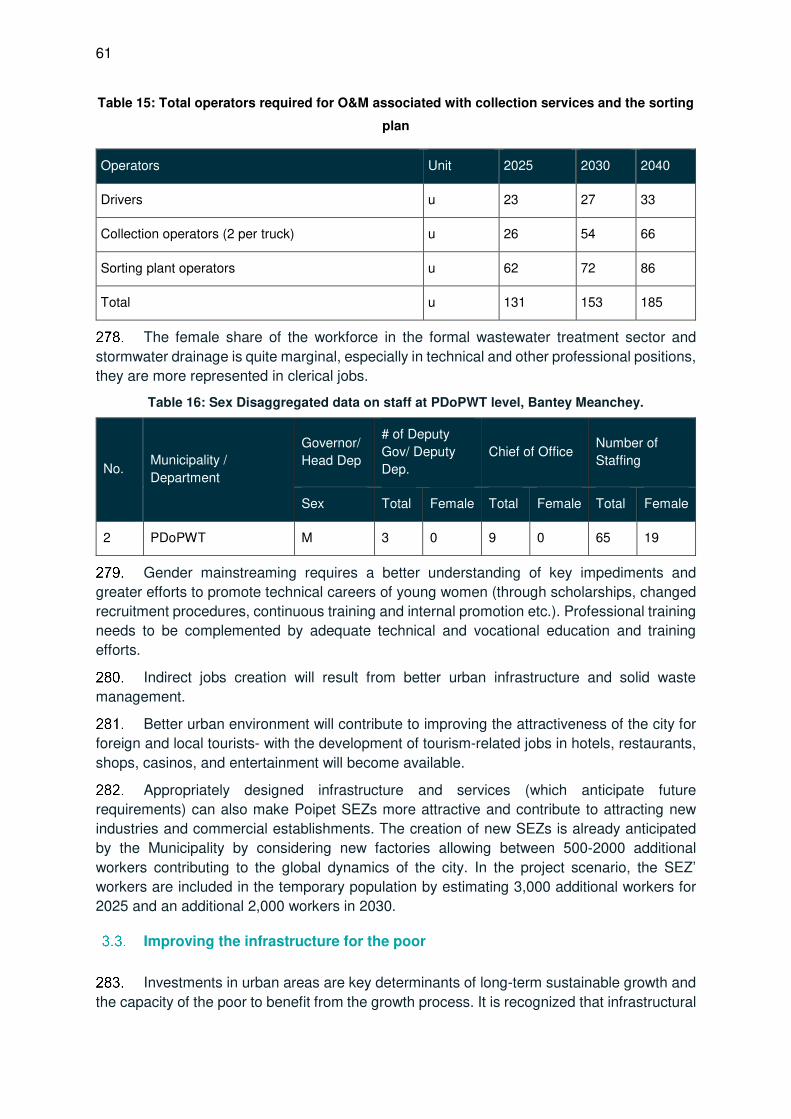
61
Table 15: Total operators required for O&M associated with collection services and the sorting
plan
Operators Unit 2025 2030 2040
Drivers u 23 27 33
Collection operators (2 per truck) u 26 54 66
Sorting plant operators u 62 72 86
Total u 131 153 185
The female share of the workforce in the formal wastewater treatment sector and
stormwater drainage is quite marginal, especially in technical and other professional positions,
they are more represented in clerical jobs.
Table 16: Sex Disaggregated data on staff at PDoPWT level, Bantey Meanchey.
No. Municipality /
Department
Governor/
Head Dep
# of Deputy
Gov/ Deputy
Dep.
Chief of Office Number of
Staffing
Sex Total Female Total Female Total Female
2 PDoPWT M 3 0 9 0 65 19
Gender mainstreaming requires a better understanding of key impediments and
greater efforts to promote technical careers of young women (through scholarships, changed
recruitment procedures, continuous training and internal promotion etc.). Professional training
needs to be complemented by adequate technical and vocational education and training
efforts.
Indirect jobs creation will result from better urban infrastructure and solid waste
management.
Better urban environment will contribute to improving the attractiveness of the city for
foreign and local tourists- with the development of tourism-related jobs in hotels, restaurants,
shops, casinos, and entertainment will become available.
Appropriately designed infrastructure and services (which anticipate future
requirements) can also make Poipet SEZs more attractive and contribute to attracting new
industries and commercial establishments. The creation of new SEZs is already anticipated
by the Municipality by considering new factories allowing between 500-2000 additional
workers contributing to the global dynamics of the city. In the project scenario, the SEZ’
workers are included in the temporary population by estimating 3,000 additional workers for
2025 and an additional 2,000 workers in 2030.
Improving the infrastructure for the poor
Investments in urban areas are key determinants of long-term sustainable growth and
the capacity of the poor to benefit from the growth process. It is recognized that infrastructural

62
development leads to poverty reduction, but also that through investment in infrastructure, in
general, reduces poverty, investment in social infrastructure exerts a greater effect as a
poverty reduction strategy relative to physical infrastructure investment. It is thus
recommended that physical infrastructure investment is supported by factors such as
improvement in social infrastructure (health, education) to promote rapid reductions in poverty
Jalilian and Weiss (2004). Infrastructure and social services development are a source of
increased job opportunities as well as the creation of a healthy, more productive workforce.
According to Jalilian and Weiss (2004), “On average, a 1 % increase in infrastructure
stock per capita, holding human capital constant, is associated with a 0.35 % reduction in the
poverty ratio, when poverty is measured by $1/day poverty headcount, or 0.52 % when it is
measured by $2/day poverty headcount”.60
Investments in health and education are part of other development programs
developed by the RGC with support from international donors and ADB, and coordination
between sectors and departments at municipality levels is recommended to maximize the
impact of urban infrastructure development on poverty reduction.
The project will: integrate soft components- improving policy and regulatory
environment, enhancing the provincial governments’ capacity, building community awareness
on key sustainability themes, including water usage, sanitation and solid waste reduction and
management, promoting effective gender mainstreaming activities that will encourage and
increase women’s participation in planning, design, operations, and maintenance - with the
hard infrastructure components to realize the development objective of alleviating poverty and
attaining socially inclusive development.
This is also a demand of the communities and local authorities, reflected during the
social survey. All groups insisted that the project would succeed to get people to adhere to
new practices and to pay for services- only if education about wastewater/ solid waste
management was improved before the start of works and if people understood the interlinked
benefits of better waste management /reduced flooding/health outcomes.
Within a sustainable development framework, the need for subsidies to provide
services to the poor is widely accepted and forms part of the ADB Water Policy. During the
social survey, vulnerable groups insisted that while they are willing to be connected or to
access the services, they have limited capacity to pay, which could prevent them from
accessing the service. Local authorities are also aware of this situation and proposed to
consider equitable pricing during the social survey.
In the objective of maximizing the number of households connected to and/or using
infrastructure and services, the tariff systems have to be designed (i) to provide a price that is
affordable for all categories of households and as such will not necessarily ensure full cost
recovery, or (ii) to ensure equity, subsidize only those for whom connection or service fees
would be unbearable and not the wealthier consumers/users for whom those costs have no
significant impact on their budget. The use of the existing ID Poor P1 and P2 cardholder
system is an option that has been used for water supply in Battambang. Whereas the full water
connection fee is KHR 500,000, P1 and P2 cardholders will automatically qualify for a KHR
100,000 subsidy. This can be paid upfront, or if the HH does not have the money, it can elect
60 Jalilian and Weiss (2004) explore the nexus between infrastructure, growth and poverty using samples of countries from Africa, Asia and Latin America.

63
to pay by installments over a 6- or 12-month period. If a HH is poor, cannot afford the
connection fee, but does not hold a P1 or P2 card, the HH may request a letter from its
Commune Council certifying the HH’s economic status as poor and present this to the BTB
water supply agency for consideration of the subsidy or installment payments.61
Within a sustainable development framework, the need for subsidies to provide
services to the poor is widely accepted and forms part of the ADB Water Policy. During the
social survey, vulnerable groups insisted that while they are willing to be connected or to
access the services, they have limited capacity to pay, which could prevent them from
accessing the service. Local authorities are also aware of this situation and proposed to
consider equitable pricing during the social survey.
Wastewater. The infrastructure proposed under the short-term horizon will be
designed to anticipate the medium and long term urban development. The project proposes
an off-site sanitation system (wastewater treatment plant (WWTP), piped collection). However,
in rural areas and urban areas where the connection sewerage system would have been too
expensive, the on-site collection is proposed. The collected fecal sludge will be transferred by
vacuum-truck to the WWTP. To facilitate access to the new service, a wastewater tariff
schedule will need to be applied for residential, commercial, hotels, institutions and special
economic zones. The fees will be levied and will be slowly increased with the intention of
achieving full cost recovery from 2027, onwards. An affordability assessment was conducted
which determined that the expenditure accounts for wastewater is less than 5% of household
income (deemed affordable).
The stormwater drainage The project proposes to address the city recurrent flooding
issues by developing an underground network (box-culvert) in urban area as to minimize the
risk of blockage by solid waste and problems related to resettlement, and to deal with the low
space available (line placement under existing streets and road).
Solid Waste Management: The collection is adapted to the area (i) with the
improvement of the existing door-to-door collection system in the urban area (ii) and
improvement the global collection coverage, through centralized collection points in rural
Sangkat. The project also recommended to close the existing dumpsite where waste pickers
are working in poor conditions with negative consequences for their health and safety. It is
recommended to invest in the pre-sorting plant to reduce waste landfills and to employ waste
pickers working currently in poor conditions as sorting operators.
4. Impact on health
General consideration
The release of untreated or inadequately treated wastewater into the environment
remains a common practice. Livelihoods in farming, fisheries, aquaculture, and tourism suffer
as a consequence (UNEP, 2015). This practice has severe negative health impacts due to
hepatitis A infections, worm diseases, schistosomiasis, gastrointestinal infections, and
respiratory disorders (Heymann et al., 2010), and contributes to malnutriton and stunting.
There is also a potential pollution of (drinking) water sources such as wells, or water sold by
61 TA8982-CAMProvincial Water Supply and Sanitation Project, Poverty, Social Impact and Gender Analysis Draft: February 2017
64
vendors (which source of water is often unknown, e.g. tanker water, cart water). Inappropriate
wastewater disposal prevents or harms close to 65 million life-years annually, which translates
into reduced productivity and inability to carry out work. In Poipet, 72% of households don’t
know where wastewater from businesses/ production is handled, and 81% don’t know where
septic sludge is transported.
Poorly managed waste serves as a breeding ground for disease vectors spreading,
pest development and contributes to climate change through methane generation. 88% of
Households in Poipet observe bad management of solid waste in their area and 85% are
affected by bad smells. 96% think that solid waste mismanagement affects both their
environment and their health.
The immediate health impacts of floods generally include drowning, injuries,
hypothermia, and animal bites. In the medium-term, infected wounds, complications of injury,
poisoning, poor mental health, communicable diseases, and starvation are indirect effects of
flooding. Long-term effects include chronic disease, disability, poor mental health, and
poverty-related diseases, including malnutrition, are the potential legacy62. Epidemiological
evidence shows that chemical material may contaminate homes and that in some cases,
flooding may lead to the mobilization of chemicals from storage or remobilization of chemicals
already in the environment, e.g., pesticides. Hazards may be greater when industrial or
agricultural land adjoining residential land is affected.63 Flooding can also affect the availability
of health services or access to health centers.
In Poipet, 58% of HHs associate the experience of skin disease of one of the HH
members with flooding, as well as 34% HHs associate cases of typhoid with flooding. They
also observe the proliferation of trash, stagnant waters, overflowing waste from septic tanks,
and a higher prevalence of diseases such as dengue fever, typhoid, skin disease, and
leptospirosis. 70% have little access to health centers during flooding.
Solid waste management is also an issue in flood risk management practice. After a
flood, the deposition of waste can block drains and be a source of toxins and breeding ground
for disease. Floods can also have an impact on waste management systems leading to the
leaching of toxins into groundwater.
The better management of wastewater, solid waste and rain/stormwater should result
in improved public health: reducing open burning, mitigating pest and disease vector
spreading, reduction in the release of untreated wastewater, lowering the impact of disasters.
Average spending for health in the previous year of survey in Poipet was around $166
($74 in the rural area and $171 in the urban area); and $138 was related to a waterborne
disease such as skin diseases, diarrhea, dysentery, typhoid fever, cholera (60% responses).
On average, HH members were unable to work for six days due to waterborne disease (28%
answers).
The impacts on health are described in more detail in Economic Analysis Volume.
The project can have a general impact on all the residents, the commercial sector, and
tourists through the reduction in the negative aspects.
62 Health Impacts of Floods, Paul George (a1) Published online by Cambridge University Press: 03 May 2011 63 Public health impacts of floods and chemical contamination, Euripides Euripidou, Virginia Murray, Journal of Public Health, Volume 26, Issue 4, December 2004, Pages 376–383,

65
Through improved sanitation, the population of Poipet will have access to improved
sanitary facilities, which will significantly reduce the incidence of disease related to poor
sanitation and drainage, particularly of acute intestinal infectious diseases, hepatitis, dengue
fever, malaria, etc. thereby reducing production time lost and money spent on dealing with
illnesses and impacting on the health of infants and the very young who are most susceptible
to disease related to poor sanitation.
The benefits of improved drainage are similar to the benefits of sanitation, with the
added reduction in disease and health costs associated with unsanitary sanitation, and
flooding and the contamination of floodwater with wastewater.
Risk of spread of HIV/AIDS and STIs
4.2.1. Current status of HIV/AIDS
UNAIDS data in 2019 estimate the number of adults and children living with HIV in
Cambodia at 73,000. The prevalence rate in the adult population (over 15 y.o)- is at 0.5. New
infections have been falling steadily since 1995, now reaching a steady low state of fewer than
1000 new cases per year, while the coverage of Antiretroviral therapy (ART) has been rising
to 80% of affected adults.
In Asia, HIV particularly impacts women because of gender differences. On the one
hand, men are more likely to have multiple partners, to travel for work, and to have disposable
income. On the other hand, women are physiologically more vulnerable to infection, and their
lack of social and economic power means most women are unable to negotiate safer sex.
Women generally have lower levels of education and skills and are poorer than men, so they
are less likely to access accurate information about HIV. Women are also more frequently and
severely impoverished due to HIV; often, the husband is the first in the family to get sick,
assets are sold to pay for his health care, and after his death, his widow and children are left
impoverished.
4.2.2. Knowledge about STIs and HIV/AIDS
In 2002, Cambodia's National Assembly passed legislation on HIV prevention and
control. The Government aim at the elimination of new HIV infections through (i) early
diagnosis of HIV infection and early access to ART (Anti Retroviral Therapy) as prevention
and a boosted continuum of care, (ii) boosted prevention of mother-to-child HIV transmission,
(iii) boosted access to and utilization of prevention, care and treatment services by key-
affected populations, (iv) strengthening of community-based health services, and (v)
enhanced monitoring and evaluation of impacts. The government has a multisectoral
approach, and information and awareness raising widely disseminated in the population
through health and education systems and early detection systems in place have reduced the
risk of transmission. Information and prevention go, for example, through women in the
reproductive age group (HIV and syphilis testing are proposed as part of antenatal care) and
specifically target groups at risk (drug users, entertainment and sex workers, men who have
sex with men).64 Low level of education, poverty and living in remote areas with no or too few
64 WHO Library Cataloguing-in-Publication Data, Joint review of the Cambodian national health sector response to HIV 2013. I. World Health Organization Regional Office for the Western Pacific
66
health centers limit access to information and services, which constraints behavior change
and maintains social norms.
4.2.3. Risks associated with the project
Risks associated with the project infrastructure may arise during construction, and the
people most vulnerable to HIV/AIDS will be the skilled and semiskilled male workers—
including machine operators, drivers, supervisors, managers, and engineers—and young,
rural, poorly educated women who could move to the construction sites to sell sex. Local
laborers are usually less at risk because they are usually drawn from the local communities
and go back to their partners and families each night. Women who operate small
businesses/shops along the streets/roads, scavengers/ waste pickers could also be at risk of
HIV if they lose their livelihood as a result of construction works and infrastructure
development and consequently must look for other ways to gain an income such as paid
sexual transactions.65
The project aims at increasing the attractiveness of the city for tourists and businesses.
This will result in more regular and larger flows of people visiting or settling in the city (again,
more mobility coincides with a higher risk of circulation of all types of viruses, including HIV)
and the development of entertainment and leisure businesses. These are favorable for the
development of the sex economy, with sex workers being at risk of contracting and spreading
HIVs and STDs.
65 Intersections- Gender, HIV and infrastructure operations, lessons from selected ADB financed transport projects, August 2009, ADB.

67
VII. GENDER ASSESSMENT
1. Role and status of women
Social norms related to gender relations continue to constrain the development of
women’s potential and hinder their empowerment in economic, social, public, and political life.
Cambodian women are progressively enjoying wider freedoms and claiming their
rights through increased employment opportunities and Cambodia’s broader economic
development. Today Khmer women exercise considerable autonomy and independence.
They can own assets, land66, manage financial transactions, and contribute to household
decision making. Both men and women can inherit property, and the gender division of labor
can be complementary and flexible, with men and women performing a range of productive
and household tasks.67
However, traditional norms and low levels of education and literacy still limit girls’ and
women’s choices and options. Women are expected to follow social norms and beliefs that
allow men to enjoy their ‘gender privilege,’ while women under-value their own capacity and
potential. Women are considered to be of lower status than men, although the status is also
determined by age and other socioeconomic characteristics, especially wealth. For women,
marriage and children additionally determine status. In general, attitudes toward gender roles
continue to confine women to household and childcare duties (household manager), while at
the same time, the family’s economic status pressures them to engage in income-generating
work.68
Cambodia’s 2017 Gender Inequality Index (GII)69 value was 0.473, placing Cambodia
at 116th out of 160 countries, which was behind other ASEAN countries.
Education and health
Solid progress has been achieved in primary school enrollment from 97 % in 2012/13
to 98.4 % in 2015/16, and gender parity has been achieved at the primary level (1:1 ratio).
Overall completion rates at primary school increased to 84.1 % in 2015, with girls’ rates higher
than boys' at 86.6 %. In 2017-18, the primary gross enrolment rate (GER) was 97.8 % and
slightly higher for girls at 98.1 %. For Lower Secondary School, girls represent 52 % of all
66 In 2015, the RGC introduced the Land Policy “White Paper” in response to socio-economic development and land reform. The “White Paper” (Points 5 and 7) includes key guidelines and activities for achieving gender equality in the land sector and equity between men and women in the land registration process. 67 There are no legal restrictions for women to be recognized as the head of household, and married women are not required by law to obey their husbands. Women have the same rights and responsibilities towards their children, including being their legal guardians, during marriage (Civil Code, 2007). 68 NGO reports suggest the prevalence of customary attitudes that perceive men as the de-facto head of household, in particular when it concerns the rights to control and manage all of the family’s property (NGO CEDAW and CAMBOW, 2011). Customary law relating to the role and behavior of women, generally referred to as Chbab Srey in Khmer, is deeply rooted among many communities, in particular in rural areas where an overwhelming majority of Cambodians live. According to Chbab Srey, women should be subservient to men, and submissive and obedient to their husbands (STAR Kampuchea and ILC, 2013). 69 The Gender Inequality Index (GII) is an index for measurement of gender disparity. According to the UNDP, this index is a composite measure to quantify the loss of achievement within a country due to gender inequality. It uses three dimensions to measure opportunity cost: reproductive health, empowerment, and labor market participation.

68
students and 30 % of all repeaters, and women are 45 % of all teaching staff. The gap between
female and male LSS Gross Completion Rate (GCR) is widening in favor of girls, with GPI
increasing from 0.96 in 2012-13 to 1.21 in 2017-18. For Upper Secondary School, girls
represent 52 % of the students and 41 % of repeaters, and women are 32 % of teaching staff
and 22 % of school principals. In 2018, the Ministry of Education, Youth, and Sport (MoEYS)
instructed all the ministry’s units and educational institutions to institutionalize and accelerate
the effort to promote women in leadership in the education sector through key specific
approaches: 1) establish a women’s leadership program, 2) integrate female representatives
into promotion committees, and 3) accelerate appointments of more women to management
levels. Across ASEAN, Cambodia shows the biggest increases in the ratio of girls to boys in
primary and secondary school, from among the lowest ratio of 93 and 82 respectively in 2007,
to among the highest in 2015 with 101 and 109 respectively.70
In the context of Covid 19, The Ministry of Education Youth and Sport appealed to
parents of students to provide home education in a proper environment and help them obtain
more learning materials during the COVID-19 pandemic. However, this situation risks
increasing the gender gap in education. Girls may be expected, due to gender norms and
roles, to devote more time than boys to unpaid care work such as caring for younger siblings,
older populations, and those who are ill within the household rather than focusing on
education. According to the Rapid Assessment of COVID-19 Impacts on Girls’ Education in
Northern Provinces of Cambodia conducted by Plan and Care Intrenational, COVID-19 has
magnified existing gender norms and roles particularly for women and girls in having to
manage more tasks in the household. Girls were more likely to be requested to do housework,
while boys were asked to help at the farm and paddy field with their parents.71
Women of reproductive age experience substantial risks associated with pregnancy
and childbirth. The World Bank’s data72 shows that around 167 women died from pregnancy-
related causes per 100,000 live births in 2017. Women in rural areas and poor households
are at a greater risk. In 2012, only 13% of births in rural areas were attended by a doctor,
compared to 32% in Phnom Penh. Cambodia is off track for the SDG target on maternal
malnutrition. Malnutrition is considered the underlying cause in 20% of maternal deaths,
accounting for nearly 300 maternal deaths annually in Cambodia.
The rate of anemia among pregnant women is 53%. About 6% of women have a height
of fewer than 145 centimeters, which indicates they were malnourished as children. These
women are also likely to give birth to small children.
Women generally also have a higher risk and health exposure as the primary
contributors toward household and community sanitation tasks. The traditional separation of
gender roles where women are primarily responsible for domestic chores, including the care
of children, the elderly and the sick, make them disproportionately affected by the lack of
reliable water supply and sanitation services, and these considerably increase women’s time
70 Kingdom of Cambodia Cambodia Report On the occasion of the 25th Anniversary of the Fourth World Conference on Women and the adoption of the Beijing Declaration and Platform for Action (1995) Submitted by Ministry of Women’s Affairs Royal Government of Cambodia Phnom Penh June 2019
71 Rapid Assessment of COVID-19 Impacts on Girls’ Education in Northern Provinces of Cambodia, Care and Plan International
August 2020, https://aseansafeschoolsinitiative.org/rapid-assessment-of-covid-19-impacts-on-girls-education-in-northern-
provinces-of-cambodia/
72 https://data.worldbank.org/indicator/

69
poverty. Women are the main users of water in the households and are also primarily
responsible for solid waste, liquid waste and wastewater management at the household level.
Water shortages also significantly increase the time needed for cooking, cleaning and caring
for both children, the sick and disabled members. In addition, women who work in
kindergarten, schools and hospitals bear the responsibility to fetch water and clean the toilets.
Lack or low quality of potable water and sanitation also increase the incidences of water-borne
diseases and thus households ’expenditures on medicine and doctors’ fees.
Women and livelihood
Between 2000 and 2018, female laborers made up about 48% of the total labor force.
30% of the female labor force are employed in the agricultural sector, 45% in service, and
25% in the industry sectors.73
Women are represented in the informal sector with a high level of vulnerability. They
are often engaged in low and unstable wage employment, casual work, and risky work
environments. Poor and rural women tend to be overrepresented in domestic work, home-
based work, and as street vendors, and smallholder farmers. According to the World Bank’s
data74, 57% of total female employment is in vulnerable employment with a high proportion as
own-account workers contributing domestic care and family work. Even though women own
65% of all businesses in Cambodia, those businesses are on average smaller and less
profitable than businesses run by men, with only 1.7% registered compared with 6.6% for
male-run businesses. Women-owned businesses are primarily concentrated at the micro-level
in the wholesale and retail trade and services sector.75
While women earn substantially less than men, the earnings gap narrows with the
attainment of upper secondary and tertiary education. In 2014, only 5.3% of women in the
labor force had post-secondary education compared with 8.0% for men.
Women are benefiting from greater access to micro-finance. 80% of microfinance
institutions’ clients are women; however, women are less likely to access finance ( long-term
finance) because of limited collateral and low levels of formal education.
Single women from rural areas are often forced by a lack of livelihood options to
migrate to Phnom Penh or larger provincial towns to find employment, and the garment
industry is a case in point. Surveys conducted in rural areas also indicate that it is not only
men but also women who are migrating to neighboring countries to work, in particular to
Thailand, where they find employment in various occupations such as construction, domestic
help, factory work, entertainment, and hospitality. According to a 2014 report by UN Women76,
many women migrating into Phnom Penh are engaged in informal employment where they
are subject to low or irregular income and unstable conditions, or at risk of trafficking and
exploitation. As an example of their vulnerability, in the 2009 global downturn, an estimated
30,000 mostly female garment industry jobs were lost, with employers reportedly pressuring
women to waive their benefits and severance payments, knowing that they may not
73 Promoting Economic Empowerment for Women in Marginalized Conditions, OXFAM, February 2020 https://cambodia.oxfam.org/latest/policy-paper/promoting-economic-empowerment-women-in-marginalized-condition 74 https://data.worldbank.org/indicator/ 75 Promoting Economic Empowerment for Women in Marginalized Conditions, OXFAM, February 2020 76 Vulnerability and migration in Cambodia, World Food Programme- Cambodia Country office May 2019
70
understand their rights, or have the means to protect them. With the garment industry’s
eventual decline, women and girls in cities will be disproportionately affected.
Poverty and hardship
19 The traditional norms feed women’s time poverty. Women, especially women
from poorer HHs and even more from FHHs, work long hours to provide numerous services
in their homes and communities, such as buying and preparing food, cleaning, washing and
taking care of children as well as of the sick and elders, collecting water when there is no
connection to piped water, tending to kitchen gardens as well as looking after small livestock
such as poultry in rural and peri-urban areas. These very time-consuming duties are unpaid,
meaning that women are simply expected to do them, often denying them other opportunities
such as their basic rights to education, healthcare, decent work, and leisure time, including
the time to spend with their children in the role of social mentor and teacher. Routine and non-
productive tasks also prevent them from participating in other activities and community
decision making discussions. This is often exacerbated in poorer HHs where there are higher
numbers of children due to the lack of family planning and use of modern contraceptives. Time
poverty acts to perpetuate gender inequality.
20 According to the Cambodian Government’s National Social Protection Strategy
for the Poor and Vulnerable (2011-2015), the government categorized vulnerable people into
17 groups including (1) Infants and children, (2) Girls and women of reproductive age, (3)
Households vulnerable to food insecurity and unemployment, (4) Indigenous and ethnic
minorities, (5) Elderly people, (6) People with chronic illness, (7) People with disability, (8)
Orphans, (9) Youth and children at risk, (10) Victims of violence, abuse and exploitation, (11)
Families of immigrants, (12) Homeless people, (13) Veterans, (14) Single mothers, (15)
Widows, (16) Pregnant women, and (17) Child workers. Women are overwhelmingly
represented in these categories.
Women are among those most affected by the consequences of socio-economic crisis
such as the one created by the Covid 19, as many work in more vulnerable employment,
perform a disproportionate share of unpaid care work, and may face increased risks of gender-
based violence during lockdowns. Women own 60 % of the medium, small, and
microenterprises, yet many are not formally registered and cannot obtain government support.
In addition, the already unequal division of household tasks is further exacerbated through
caring for children during school closure. In families where men and women are migrant
workers and have returned to their communities, women usually take care of the house and
family, and men will try to find work.77
Gender-based violence
According to the 2013 UNICEF (Cambodia) Annual Report, violence against children
and women poses significant developmental challenges. The majority of those studied
experienced physical violence before age 12, and 1 in 22 females (compared to 1 in 18 males)
experienced sexual abuse in childhood. Although it is difficult to obtain reliable or accurate
statistics on the incidence of domestic violence as these statistics are based upon reported
77 UN Cambodia framework for the immediate socio-economic response to COVID-19 Source UNCT Cambodia Posted 16 Sep 2020 Originally published 16 Sep
71
cases only, it can be safely assumed that the actual incidence is far higher than what is
reported. Noted that rural women were almost twice as likely to be victims of violent incidents
as urban women.
In a culture with unequal power relations between men and women, gender-based
violence is common, especially among vulnerable groups (e.g., migrant garment factory
workers). 21% of ever-partnered women aged 15-64 years report experiencing intimate
partner physical and/or sexual violence at least once in their lifetime, and 4% experienced
non-partner sexual violence at least once. 19% of women aged 20 to 24 years were first
married or in union before age 18.
Domestic violence is also a major concern: while violence against women may be
considered culturally unacceptable, domestic violence is considered justifiable.
During emergencies such as conflicts or natural disasters, the risk of violence,
exploitation and abuse is heightened, particularly for women and girls. At the same time,
national systems and community and social support networks may weaken. In the context of
COVID-19 quarantine and isolation measures, Intimate Partner Violence (IPV) has the
potential to dramatically increase for women and girls. Restrictions on mobility also mean that
women are particularly exposed to intimate partner violence at home with limited options for
accessing support services. 78
Access to resources
Women can own assets, manage financial transactions, and contribute to household
decision making. Both men and women can inherit property. However, in general, attitudes
toward gender roles still emphasize the woman as a household manager and the man as a
provider79. According to the 2014 Cambodia Demographic and Health Survey, a large majority
of currently married women (86%) participate in three specified areas of decision making. This
includes decisions on their own health care, major household purchases and visits to their
family or relatives.
Decision making power is strongly linked to household income contribution. Women
who earn more than their husbands are more likely to decide how their cash earnings are used
and women who are older, divorced, separated, or widowed and those who live in urban areas
are better educated, and are paid in cash have greater financial control over the assets.
Access to the media and knowing one’s legal rights also correlate with greater economic
autonomy.80
Women have less access than men to higher-skilled occupations, public sector
employment, business associations and networks which offer opportunities for lobbying and
agency. Occupational segregation is extensive, and women continue to be concentrated in
lower-skilled occupations.81
Obstacles to the growth of businesses run by women include a lack of access to
infrastructure (such as roads and electricity), cultural biases (which lead to discrimination and
78 CARE Rapid Gender Analysis for COVID-19 Cambodia – July 2020 79 Discriminatory social norms consider women to be less competent than men with regards to family finances and decision-making, and thus they have less power than men to make decisions about their family (STAR Kampuchea and ILC, 2013). 80 USAID/Cambodia 2010 81 Cambodian Garment and Footwear Sector Bulletin 2015
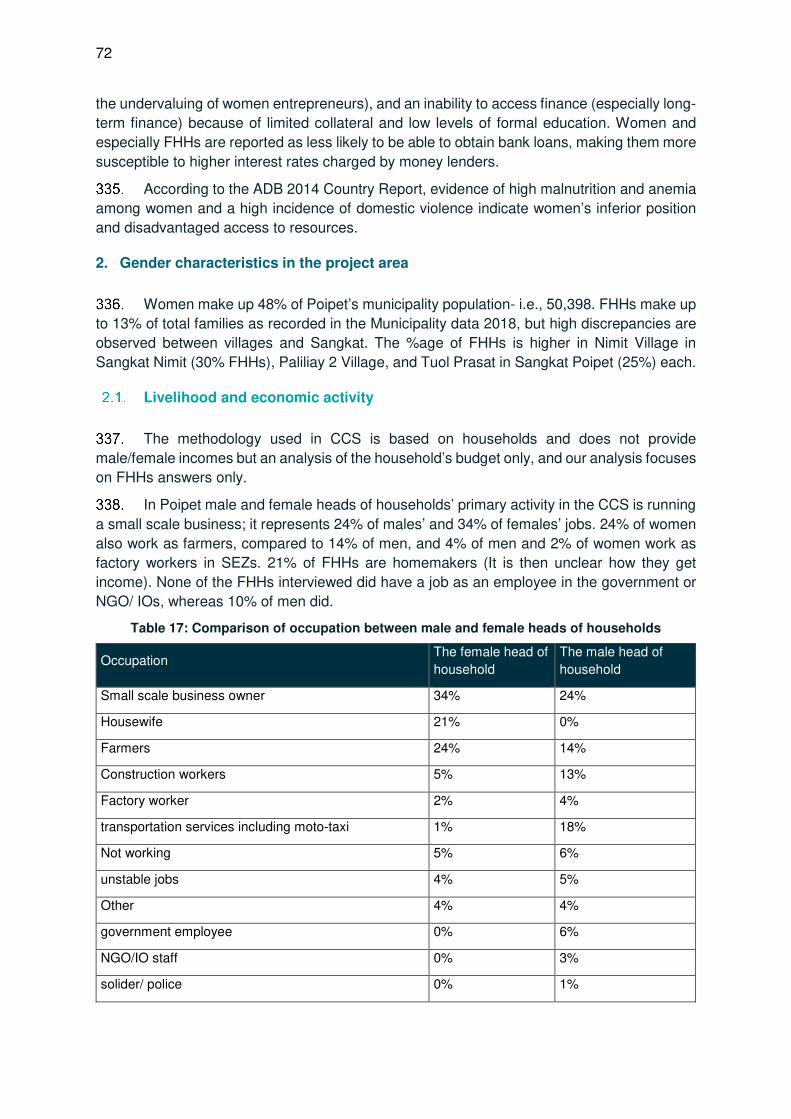
72
the undervaluing of women entrepreneurs), and an inability to access finance (especially long-
term finance) because of limited collateral and low levels of formal education. Women and
especially FHHs are reported as less likely to be able to obtain bank loans, making them more
susceptible to higher interest rates charged by money lenders.
According to the ADB 2014 Country Report, evidence of high malnutrition and anemia
among women and a high incidence of domestic violence indicate women’s inferior position
and disadvantaged access to resources.
2. Gender characteristics in the project area
Women make up 48% of Poipet’s municipality population- i.e., 50,398. FHHs make up
to 13% of total families as recorded in the Municipality data 2018, but high discrepancies are
observed between villages and Sangkat. The %age of FHHs is higher in Nimit Village in
Sangkat Nimit (30% FHHs), Paliliay 2 Village, and Tuol Prasat in Sangkat Poipet (25%) each.
Livelihood and economic activity
The methodology used in CCS is based on households and does not provide
male/female incomes but an analysis of the household’s budget only, and our analysis focuses
on FHHs answers only.
In Poipet male and female heads of households’ primary activity in the CCS is running
a small scale business; it represents 24% of males’ and 34% of females’ jobs. 24% of women
also work as farmers, compared to 14% of men, and 4% of men and 2% of women work as
factory workers in SEZs. 21% of FHHs are homemakers (It is then unclear how they get
income). None of the FHHs interviewed did have a job as an employee in the government or
NGO/ IOs, whereas 10% of men did.
Table 17: Comparison of occupation between male and female heads of households
Occupation The female head of
household
The male head of
household
Small scale business owner 34% 24%
Housewife 21% 0%
Farmers 24% 14%
Construction workers 5% 13%
Factory worker 2% 4%
transportation services including moto-taxi 1% 18%
Not working 5% 6%
unstable jobs 4% 5%
Other 4% 4%
government employee 0% 6%
NGO/IO staff 0% 3%
solider/ police 0% 1%

73
Occupation The female head of
household
The male head of
household
Work abroad 1% 0%
According to the survey, the average income of FHH is $424, and the average amount
of expenses is $442/month (exceeds income).
Food consumption represent 26% of total expenses, followed by social events,
representing 22% of total monthly expense (18% for the whole group), and then health
expenses (13%, compared to 10% for the whole group). The share of health expenses is
relatively higher than in other groups.
Table 18: Distribution of expenses in FHHs budget, Poipet, CCS
Expenses average value KHR % of the
total
1- Food consumption 569,142 31%
2- Shopping for appliances and amenities 124,308 7%
3- Electricity for lighting/electrical appliances 95,299 5%
4- Energy/fuel for cooking 28,095 2%
5- Water consumption 41,243 2%
6- Solid waste collection 2,953 0%
7- Toilet facility 14,824 1%
8- Drainage
30 0%
9- Transport including fuel 70,663 4%
10- Clothing 50,941 3%
11 Housing i.e. rental, maintenance, decoration 274,379 15%
12- Healthcare 168,615 9%
13- Education 92,604 5%
14- Communication, i.e. telephone, internet etc. 27,222 2%
15 Entertainment/Leisure, i.e. out for a drink, cigarette
etc. 41,491 2%
16- Social event and ceremony i.e. wedding, festivals 211,124 12%
17- Other, specify (text)
Average total KHR 1,812,931
The Comprehensive City Survey conducted by the technical assistant between
December 2019 and January 2020 (630) revealed that 27% of heads of households
interviewed are women. 23% of FHHs have no education and the average age is 53 y.o. Many
FHHs are widows.
The results of the last ID Poor survey campaign in 2018 in Poipet shows that 38% of
FHHs are under category Poor 1 and 2. 45% of ID Poor 1 households (312) and 35% of ID
poor 2 Households (363) are headed by women.
14% of FHHs have no toilets and have to use neighbors' toilets or go to the field.
Gender-based violence
There are no statistics available at the Provincial nor at Municipality level about the
number of cases of domestic violence. The PDoWA observed that there are only a few cases
of domestic violence reported.

74
3. Control of resources and access to infrastructure
Consultation with women in Poipet shows that men are the main breadwinners, with
women contributing to 25%-30% of the household’s income. Women are in charge of daily
expenses such as food, energy, solid waste, clothes, healthcare, children's education,
transportation, entertainment, and social events and participate in decisions about other
expenses such as buying land, house, motorbikes, investment for construction, equipment
and loans.
Picture 6: FGD with women in Poipet, October 2020
The rates of equipment are lower in female-headed households than in male-headed
households. Female headed households have less access to transportation (motorbike and
car), information, and communication equipment (cellphone and TV).
Table 19: Comparison of assets between FHHs and MHHs
Type of assets All HHs FHHs MHHs
Motorbike 86% 73% 90%
Television 72% 69% 74%
Bicycle 50% 45% 52%
Cellphone 90% 85% 92%
Gas cooker 66% 54% 70%
Car 13% 7% 15%
Washing machine 14% 9% 15%
Computer 9% 8% 9%
Women are severely underrepresented in decision-making processes outside the
household.82 It is also noticeable from our survey that women tend to be generally less
associated with sanitation technical choices and O&M. They are less aware of construction
and maintenance costs and less able to maintain, repair, or take action in case of problems
(e.g. toilets, pipes or drains are clogged, soak pit is full or overflowing).
A comparison of answers provided by male and female respondents, confirmed by
data collected from FHHs, show that women, in general, are less able than men to provide
technical information about sanitation facilities (toilets, sewerage, drainage systems) and are
less aware of the construction, connection, and maintenance costs of all types of infrastructure
82 Asian Development Bank (2012)

75
and equipment. Women seem less equipped to understand and anticipate the costs/benefits
of an installation or services, to control and evaluate the quality of infrastructure/ equipment/
installations/ works, to make informed decisions, and to participate in O&M.
Studies from 2008 already showed that in the context of sanitation equipment purchase
decisions, for instance, women were more responsive to consumer messages, while men are
more interested in the technical aspects of a sanitation facility and the consequential cost.83
Women representation is also marginal in jobs related to water and sanitation,
especially in technical and managerial positions. According to the information collected from
the Municipality of Poipet, only 18 out of 89 staff (20%) are female, and only one has a
managerial position. Similarly, the Provincial Department of Public Works and Transport
employs only 19 women out of 65 staff (34%), and none holds a position as chief of office or
the deputy.
Table 20: Staff repartition per position and sex
No. Municipality /
Department
Governor/
Head Dep
# of Deputy
Gov/ Deputy
Dep.
Chief of Office Number of
Staffing
Sex Total Female Total Female Total Female
1 Municipality M 3 1 13 0 89 18
2 PDoPWT M 3 0 9 0 65 19
4 PDoLVT M 3 1 6 3 30 17
Source: Egis, information from local officials, October 2020
4. Health status
FHHs spend a relatively bigger share of their budget on health expenses than other
households (9% against 7%).
According to CCS data, women have more diseases than men. Out of 3,167 cases of
disease listed, 53% are affecting women. This is going up to 55% skin diseases, 54% for
typhoid/ cholera/ dysentery- related to water, hygiene, and sanitation, mosquitos.
PDoWA reported that they did not register any maternal mortality casesin the previous
year, and there are no cases of birth delivery without a doctor.
83 The World Bank’s WSP released the findings of two studies conducted in Cambodia in 2008, one on the demand for latrines by consumers, and the other on the supply of latrines by the private sector. The research noted that a latrine purchase decision involves both men and women, in different ways. Whilst men and women could therefore be targeted separately, it was recognized as important to encourage household discussion between men and women on the subject of investments for latrine ownership. The study showed that women in this context were more responsive to consumer messages, while men are more interested in the technical aspects of a sanitation facility and the consequential cost

76
Table 21: Comparison between percentage of men/women per type of health condition
encountered by surveyees over one year.84
Type of diseases Adult Male Adult Female Total
6.1.1 Mild diarrhea 48% 52% 433
6.1.2 Severe diarrhea 52% 48% 227
6.1.3 Eye irritation/diseases 48% 52% 483
6.1.4 Skin diseases ( e.g. scabies, ringworm,) 45% 55% 425
6.1.5 Colds, cough, respiratory ailments 49% 51% 912
6.1.6 Headache/influenza 45% 55% 862
6.1.7 Cardio-vascular diseases, hypertension 38% 62% 391
6.1.8 Typhoid fever, cholera/dysentery 46% 54% 317
6.1.9 Hemorrhagic dengue fever 51% 49% 186
47% 53% 4236
Risk of gender-based violence and sexual exploitation, abuse and harassment
and sexual abuse (GBV-SEAH). The concentration of workers- in majority male workers- in a
labor-camp increase the risk locally of GBV-SEAH for women workers and women/girls in
project area, especially vulnerable women/girls. SEAH against a beneficiary or member of the
community, or between staff can involve any unwelcome sexual advance or unwanted verbal
or physical conduct of a sexual nature.
5. Gender impact analysis
Lack of sewage and solid waste collection system incur social costs, and most of these
are borne by women and can be typified as (i) time and responsibility taken in dealing with
solid waste (finding a place to dispose of waste, burning, or burying wastes), dealing with dogs
and pests gravitating around piling waste, (ii) time, and responsibility for supervising children
playing near/with solid waste, near/with wastewater, in flooded area (iii) time taken to nurse
those sick from water-borne disease and/or infections (iv) time taken to accompany family
members to the doctor and to buy medicine, and (v) reproductive health issues, particularly
genital and urinary tract infections, linked to improper hygiene especially during period. 14%
of FHHs have no toilets and this adds to poverty time, lack of privacy- accrued risks of
harassments, and to the difficulties to maintain proper hygiene especially during periods.
Improved hygiene and sanitation infrastructure and services help alleviate women’s
poverty of time, with reduced time and energy to dispose of waste, increased comfort and
security, especially for children, reduced need to look after those HH members sick from the
water and sanitation-related illnesses, and house cleaning, therefore allowing more time for
participating in decision making, other activities or leisure
While women are the most impacted by social costs related to lack of sewage and
solid waste collection systems, or flooding, they are also relatively less aware of their risk to
health and the environment. The project intends to to target women with specific information,
awareness, and training campaigns on these topics.The behavior Change analysis and
strategy development will- as for other target groups- identify women’s specific constraints,
84 Out of the total of health condition met by the surveyees in the year before the survey how many occurred to men compared to women. e.g among the 433 persons who suffered mild diarrhea 52% were females.

77
triggering messages for behavior change and effective communication media, which will serve
in the development of a comprehensive communication campaign to raise women’s
awareness and capacity to make informed choices and participate in O&M
The project is addressing the issue of underrepresentation of women in water and
sanitation decision-making and jobs through actions at provincial and municipality levels by
strengthening women’s leadership in the water sector and waste management (public and
private sectors) and at local levels by increasing women involvement and decision making in
water and sanitation through capacity building/ awareness raising, engagement of WCCCs,
and establishment of mixed gender Community monitoring committees.

78
VIII. GENDER EQUALITY AND SOCIAL INCLUSION ACTION PLAN
The social and poverty alleviation pan and the gender action plan are integrated in the
Gender Equality and Social Inclusion Action Plan (GESIAP) with target indicators. The
GESIAP is attached in Appendix 4.
1. Social Approach
The objectives of the infrastructure component are to maximize sewerage connection
(target: increase the safe disposal of excreta and achieve at least 42% of people connected
to the sewerage system in the urban area by 2025), extend solid waste collection service
(target: 50% of all households have solid waste collection service by 2025) and make
stormwater drainage system functional and developed in parallel to urban development (55%
households have access to the drainage network by 2025).
A proactive approach is proposed to ensure inclusive access to urban infrastructure
and services and to optimize the impacts of the infrastructure development, which includes:
(i) creating an enabling environment: analyse behaviors regarding waste management (solid
waste and wastewater), identify behavior change triggers for various groups (e.g. men/
women/vulnerable groups), develop and implement targeted approach for behavior change),
(ii) using regulation to guide people towards proper sanitation, and accelerate changes in
practices, (iii) propose mechanisms/ prices allowing the poor and vulnerable to access and
benefit from basic infrastructure and services and contribute to urban sanitation and public
health and (iv) improvement in the quality of services delivered.
Targeted information and awareness-raising are a pre-requisite for citizen adherence.
Behavior change and public participation is key to a functional waste system. The behavior
change analysis will serve as basis for the behavior change strategy development and
implementation. Awareness will promote the economic, environmental, and social benefits of
better water and sanitation. The project plans for a sorting plant to sort the waste and will
develop awareness systems to motivate waste reduction, reuse, and recycling. It will inform
the population about the current wastewater system, recurrent leakages, health and
environmental issues, necessary improvement, and proposed treatment for safe wastewater
management. Regarding urban drainage, the focus is on disaster risk reduction, how to
prevent flooding and its consequences, and what possible useful local actions can be done,
such as good operations and maintenance of drainage canals, avoidance of solid waste
dumping, and keep the drainage canal clean to avoid blockage and let the water flow.
In parallel, the approach includes a “Give no choice” by developing and enforcing local
laws, but at the same time ensuring equity pricing systems/schemes and quality service. This
will be developed under each sub-component as described below.
Wastewater:
(i) Push for connection to sewerage in an urban area for all HHs and businesses (per
sector as per development plan) and for businesses in SEZs with a system of fines
for households and businesses not connecting to the sewerage system; this is
covered under the Institutional Strengthening Plan Volume.
(ii) Develop and implement a behavior change strategy to raise willingness to be
connected to the sewerage.

79
(iii) It is suggested that a provision to encourage households to connect to the sewer
system be included directly in the cost estimate. The strategy is to subsidize
connection to encourage households to be connected during the construction phase.
For ID Poor and vulnerable households and to achieve equity in access to service, it
is proposed that the connection costs will be fully covered by the project during the
construction phase. For non ID poor card holders, eligibility will be based on the
identification made by local authority.
Solid Waste Management:
(i) Forbid dumping and burning of solid waste in an urban area where a solid waste
collection service is available (inform, enforce a system of fees),developed under the
Institutional Strengthening Plan Volume.
(ii) Develop and implement targeted behavior change communication to make dumping of
solid waste into drainage socially unacceptable, promote social norms around using
waste collection service.
(iii) Support vulnerable communities to take collective action and organize community
service for collection into area/roads not accessible to the company truck and to
dispose at suitable collecting point- accessible to the community collectors and the
trucks of the solid waste collection contractor.
(iv) Provide appropriate solid waste containers in market areas, at collecting points, and
possibly to the poorest households benefiting from door-to-door collection services.
The format of containers must be agreed with the solid waste collection service to
adapt to its collection system. The Municipality should supply containers in public
spaces and ensure their regular emptying.
(v) In parallel, and to make sure the more coercive measures can apply, the solid waste
collection contractors must develop a culture of service. This should be part of its
contractual obligation and could involve support from the project (under Institutional
Strengthening Plan Volume). It is expected that the company ensures (a) regular
collection lines and schedules, (b) is responsible for cleaning collecting points and
roads after collection (c) manage properly a page on social media and provides timely
information in case of service disruption (d) operates a customer service for information
and remediation/ hotline, (e) agree to put in place a social/equity system (tariffs) for the
poor and vulnerable and (f) adhere to Core Labor and health, safety, and
environmental standards, (CLS and HSE) (g) provide training to the current informal
workers in solid waste management (e.g., waste pickers/ scavengers could be trained
as drivers of the collecting trucks), safe waste handling, health risks, use of PPE,
hygiene practice, and provide vaccinations and provide them with formal jobs, (h)
employ women at equal conditions with men
Key actions related to stormwater urban drainage include:
(i) Cover canals and install solid waste dumping prevention systems (protection nets or
grids);
(ii) Develop and implement behavior change communication to make dumping of solid
waste into drainage socially unacceptable and educate the population about the risks
of waste dumping eg. blockages and flooding; pollution to waterways and impacts on
bird and fish life, and amenity.

80
(iii) Develop a system of fines for dumping of solid waste into drainage and sewerage
canals, develop and enforce local regulation, install proper signs near the canals
(covered under Institutional Strengthening Plan Volume ).
(iv) Organize supervision and O&M at the local level with the establishment of Community
monitoring committees at Sangkat levels. These Community Monitoring Committees
are the proposed mechanism to ensure the participation of the community in local
implementation and monitoring of improved urban infrastructure and services.
Organized at Sangkat level, they are made of volunteers, two men and two women
selected in the community. They contribute to inform and raise awareness in the
community about water and sanitation issues and verify that the infrastructure and
services are working well. They report claims and problems to the Sangkat or directly
to the municipality offices of private operators for intervention.
(v) Organize O&M intervention teams at the public office for Public Works under the
Municipality to ensure operability of the drainage canals whenever needed.
Table 22: Detailed social action and poverty alleviation actions
Key issues Proposed action
1- The community, and
the poor and
vulnerable households
specifically, lack the
knowledge and
attitudes to adopt
better
hygiene/sanitation
practices and to pay
for urban
infrastructures and
service.
(i) Create an enabling environment to engage people in behavior
change (knowledge and attitudes) through targeted information and
awareness-raising sessions using social media, TV, radio, and
community events facilitated by a local organization. The focus is on
the costs/benefits of proper/improper behavior regarding health,
environment.
a. Conduct a Behavior Change analysis among different target
groups on waste management and develop the Behavior
Change strategy: identify triggers for behavior change for
different targets, and the best approach and media for
communication. The following actions will be adjusted
accordingly.
b. Implement the Behavior Change Strategy in the project areas:
c. Develop awareness systems to motivate waste reduction,
reuse, separation and recycling (4R’s) in coordinated timing
with the development of related services: re-use, develop and
disseminate information, education and communication support
through social media, local radio and TV, produce short videos/
talk shows, facilitates community awareness sessions on solid
waste management.
d. Inform about current wastewater system, recurrent leakages,
health issues, necessary improvement, and proposed
treatment for safe wastewater management: formal information
meetings organized at Sangkat levels, produce short videos/
talk show for dissemination via social media/ local radio and
talkshow, Once the WWTP is operational organize study visits
for specific groups- including youth and children.
e. Regarding urban drainage, the focus is on disaster risk
reduction, how to prevent flooding and their consequences,
what are possible local action: good O&M of drainage canal,
avoid solid waste dumping, keep it clean to avoid blockage and
let the water flow.

81
Key issues Proposed action
(ii) Develop and enforce local laws to sustain behavior changes and
anchor new practices in the community.
a. Develop a local fine to encourage the connection to the
sewerage
b. Develop a local regulation and operational systems to forbid
waste dumping, especially in a specific area (drainage canals),
and impose a system of fines.
c. Develop a local regulation and operational systems to forbid
waste burning in an area served by a solid waste collection
service and impose a system of fines.
d. Inform the population about new regulations enforcement via
TV, radio, social media, local authorities, and on-site
signalization.
e. Ensure full enforcement of the new regulations with local
authorities and the community. (ref. Community Monitoring
Committees and community monitoring below)
2. The access and
adherence of poor and
vulnerable households to
urban infrastructure and
services are constrained
by their financial
limitation.
(i) Ensure equitable access to urban infrastructure and service to the
poorest.
a. Provide free connection to the sewerage for ID Poor
households and households that can justify of low income
(similar to ID Poor cardholder, but not yet registered), as
proposed by local authority.
b. Subsidize the in-house linking costs to connect to the
sewerage box.
c. Provide a free connection to the drainage system.
d. Propose and validate with the operators and the community
social tariff with preferential conditions for the poorest
regarding sewerage monthly fee and the solid waste
collection fee.
e. Facilitate discussion and negotiation between communities
in areas not accessible to the trucks and the solid waste
collection operator to develop a community collection
service.
f. Find a mechanism to supply appropriate waste containers
to the poorest households.
3. People, the poor and
vulnerable especially, are
reluctant to pay for a
service whose quality has
yet to be proven.
(i) The institution and public operators develop a service that is
more qualitative and user-centered.
a. The contract between the Municipality and the contractor in
charge of solid waste collection is revised and include the
following elements to improve users satisfaction: It is
expected that the company ensures (a) regular collection
lines and schedules, (b) is responsible for cleaning
collecting points and roads after collection (c) manage a
page properly on social media and provides timely
information in case of service disruption (d) operates a
customer service for information and remediation/ hotline,
(e) agree to put in place a social/equity system (tariffs) for
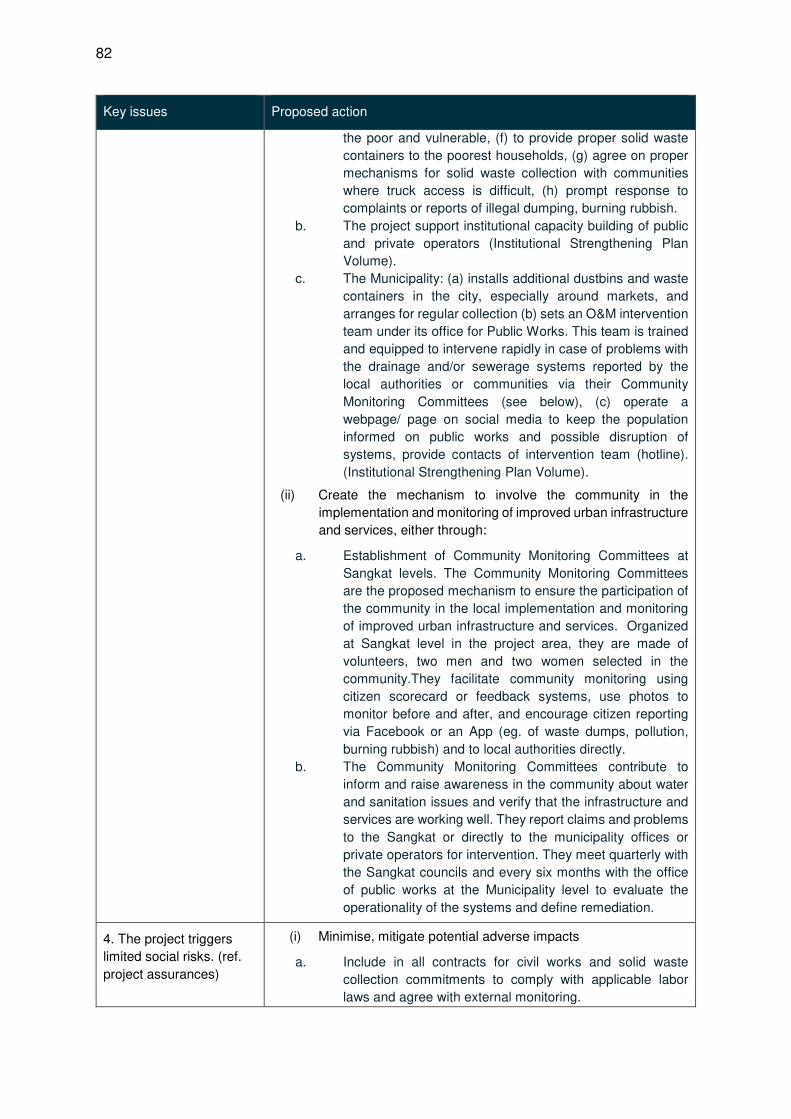
82
Key issues Proposed action
the poor and vulnerable, (f) to provide proper solid waste
containers to the poorest households, (g) agree on proper
mechanisms for solid waste collection with communities
where truck access is difficult, (h) prompt response to
complaints or reports of illegal dumping, burning rubbish.
b. The project support institutional capacity building of public
and private operators (Institutional Strengthening Plan
Volume).
c. The Municipality: (a) installs additional dustbins and waste
containers in the city, especially around markets, and
arranges for regular collection (b) sets an O&M intervention
team under its office for Public Works. This team is trained
and equipped to intervene rapidly in case of problems with
the drainage and/or sewerage systems reported by the
local authorities or communities via their Community
Monitoring Committees (see below), (c) operate a
webpage/ page on social media to keep the population
informed on public works and possible disruption of
systems, provide contacts of intervention team (hotline).
(Institutional Strengthening Plan Volume).
(ii) Create the mechanism to involve the community in the
implementation and monitoring of improved urban infrastructure
and services, either through:
a. Establishment of Community Monitoring Committees at
Sangkat levels. The Community Monitoring Committees
are the proposed mechanism to ensure the participation of
the community in the local implementation and monitoring
of improved urban infrastructure and services. Organized
at Sangkat level in the project area, they are made of
volunteers, two men and two women selected in the
community.They facilitate community monitoring using
citizen scorecard or feedback systems, use photos to
monitor before and after, and encourage citizen reporting
via Facebook or an App (eg. of waste dumps, pollution,
burning rubbish) and to local authorities directly.
b. The Community Monitoring Committees contribute to
inform and raise awareness in the community about water
and sanitation issues and verify that the infrastructure and
services are working well. They report claims and problems
to the Sangkat or directly to the municipality offices or
private operators for intervention. They meet quarterly with
the Sangkat councils and every six months with the office
of public works at the Municipality level to evaluate the
operationality of the systems and define remediation.
4. The project triggers
limited social risks. (ref.
project assurances)
(i) Minimise, mitigate potential adverse impacts
a. Include in all contracts for civil works and solid waste
collection commitments to comply with applicable labor
laws and agree with external monitoring.

83
Key issues Proposed action
b. Include in the civil works contract commitment to apply
properly measures to reduce negative impacts during
works and to organize training for workers on HIV/
communicable disease, GBV/SEAH prevention.
c. Include in the solid waste collection/ construction contract
commitment to train and re-employ as a priority people
whose informal jobs as waste pickers are lost due to the
improvement of solid waste management systems.
d. Provide training to sanitation workers in safe waste
handling, health risks, use of PPE, hygiene practice, and
provide vaccinations.
e. Organize the dissemination information about
HIV/communicable disease and GBV/SEAH prevention
among workers at construction sites and surrounding
communities.
f. Facilitate the organization of awareness sessions with civil
works contractors and local organizations.
g. Provide support to vulnerable households indirectly
affected by the project (e.g wastepickers on the dumpsite,
not included in IPR) to maintain or improve their livelihoods.
2. Gender Approach
The plan aims at addressing the following issues : (i) women are less informed about
technical and economic aspects of water, hygiene and sanitation, (ii) women are less aware
of the consequences of improper waste management on health and the environment, (iii)
women are not involved enough in water and sanitation technical monitoring in the
community, (iv) households headed by women have on average lower income and spend a
higher share of their budget on healthcare and (vi) women are not well represented in the
technical and decision-making position in the water and sanitation sector.
The objectives are to increase the proportion of qualified women employed at technical
/ engineering jobs and managerial or decision-making positions in the water and sanitation-
related institutions, to engender waste management awareness and training programs with a
view to increasing women awareness (as for other target groups) about the consequence of
wastewater and solid waste management, and increase their participation in waste
management/ drainage service.
The project intends to develop information, awareness, and training campaigns also
designed for women. The Behavior Change analysis will (as for other target groups) study
women’s specific constraints, triggering messages for behavior change in waste management
and effective communication media, which will serve in the development of a comprehensive
targeted communication campaign in a view to raise women’s awareness and capacity to
make informed choices and participate to O&M.
The project addresses the issue of the underrepresentation of women in water and
sanitation decision-making and jobs. It intends to :
(i) Work with the MPWT and PDPWT to increase the number of women in technical and
decision-making positions in the institution (in the water and sanitation sector) at

84
provincial and municipality levels by facilitating internal mobility/ promotion, proposing
continuous training to women staff for them to reach higher technical and managerial
position and by planning recuitement of women with higher profile.
(ii) Establish a partnership with a specialised training institution to promote women’s
career as engineer in the water and sanitation sector among highschool students and
in careers forums, show casting women engineers.
(iii) Sponsor scholarships and internships for girls in the water and sanitation sector. It is
suggested to provide a general budget for girls’ scholarships at ITC linked to
traineeships in MPWT: PDPWT The scholarship has to cover: tuition fees/ manuals
etc, accommodation for girls coming from other provinces, and per diem.
Locally, the focus is to give the Women and Children Consultative Committee the
methodology, tools, and means to raise awareness in the community about wastewater/ solid
waste management/ flooding issues, introduce technical options (choices of technology,
infrstructure design, O&M requirements) and explain requirements at the household,
community, private and institutional levels for proper operation of the systems and services.
It is also proposed to establish and support in each village a water and sanitation
committee, called a “Community Monitoring Committee” consisting of 2 men and 2 women.
The committee’s functions would be: to relay to the population practical information about
works/ works progress/ new regulation implementation; to collect, report or address
households claims or questions related to sewerage/ drainage/ solid waste collection; to
encourage the citizens to monitor and report through social media or directly to the local
authority; to monitor the sewerage/ canal and solid waste status in the area; and to contact
the Municipality or service provider for intervention or remediation. Women will thus have
direct participation in water and sanitation management locally.
Sex-disaggregated data has to be collected and analyzed during and after the project
to ensure equitable benefits for men and women.
3. Project assurances
The project conforms with ADB’s social safeguard policies and seeks to avoid adverse
impacts on affected people wherever possible and to minimize, mitigate, and/or compensate
for potential adverse impacts that may result from the project. Nuisances and impacts during
construction are identified and will be mitigated by proper information, physical access and
safety measures, limitation of dust, and noise. The designs of the infrastructure projects are
developed to be socially inclusive, taking into account the needs of the target beneficiaries,
including vulnerable and disabled people and to ensure access and affordability to urban
infrastructure and services for all (affordability). The project also addresses issues related to
working conditions and environmental health and safety of workers and communities.
There were no key labor issues identified. The project may however have direct or
indirect impacts on Core Labor Standards (CLS) as it (i) intends to create or improve
employment opportunities; (ii) can affect informal and low skilled jobs of waste pickers and
scavengers, (iii) the project will generate a contract for civil works and project contractors may
be tempted to use child labor or gender/ ethnic discrimination to reduce their costs.
The project adheres to CLS for all jobs created. The loss of informal jobs will be offset
by the creation of construction jobs and unskilled jobs at the sorting and composting plants
for which current waste pickers and scavengers qualify. Providing training is delivered by the
85
private sector in charge of the solid waste collection; they could also apply to jobs as truck
drivers.
The project will ensure arrangements to ensure compliance with CLS and related
national labor laws, including (i) require that all civil works contracts include commitments to
comply with applicable labor laws, particularly those supporting CLS (e.g., relating to
nondiscrimination and equal pay, the prohibition of child labor, workplace safety, addressing
needs of people with disability, security at work); (ii) organize labor-contracting societies to
represent the interests of poor and female laborers working on construction or maintenance
of project facilities, and (iii) require the executing agency and project implementation
consultants to monitor and report on the performance of the civil works contractors with
respect to CLS and other relevant labor standards. Additional details are provided in the IEE
in the paragraphs related to Community and Worker Health and Safety and related to the
preparation by each project contractor of an environmental, health and safety management
plan.
Large infrastructure projects may increase the risk of communicable diseases,
HIV/AIDS transmission, GBV/SEAH and/or human trafficking in the project area. The project
will link with ongoing HIV/AIDS and trafficking awareness and GBV prevention programs in
the project area (supported by government, other development partners, and/or
nongovernment organizations) to organize awareness and/or behavior change programs on
communicable diseases, HIV/AIDS, GBV/SEAH and trafficking risks at main construction
sites- this is to be included in the workplan fo the contractors and included in the health and
safety plans to be developed by the contractors-and in surrounding communities, with specific
attention to the special vulnerabilities of women, girls, and other marginalized groups in the
project areas. There are two well-known NGOs working in the fight against HIV/AIDS—
KHANA and PSI. Proper programs and organizations operating locally will be identified early
in project implementation.
COVID-19 Specific measures. To protect the health and safety of workers as well as
communities potentially affected by ADB-financed and/or administered projects, contractors
are required to conduct a COVID-19 risk assessment and to incorporate COVID-19 health
risks as part of their health and safety (H&S) plans, which are part of their site-specific
contractor Environmental Management Plan (CEMP).

86
IX. MONITORING AND REPORTING
The monitoring system should include specific indicators to follow up with the
implementation of gender and social aspects of the project.
Key social and gender indicators at project level are presented in the GESIAP in
Appendix 4.
1. Monitoring poverty and social impacts
Awareness
Participants to information, training, and consultation meetings increase their
knowledge and understanding of the issues addressed.
People willing to contribute to the costs of connection and services increase.
Accessibility, affordability, satisfaction
The project will keep account of the number of households connected to the sewerage
and drainage systems and served by the solid waste collection service (data from the private
operator). It also needs to earmark the status of each household (ID poor, poor without an ID
card, IP, FHH).
Monitoring employment, social risk management
The project should keep records of jobs that are created to establish and operate the
improved stormwater, wastewater, and solid waste management systems. This is done at the
municipality level and in coordination with the private operators. Additional surveys will be
needed to estimate the number of jobs lost during the reorganization, with some limitation
anticipated due to the high level of informality of jobs in the current solid waste management
system.
Monitoring Participation
It relies on systematic and reliable participation records and aims at a fair
representation of women and vulnerable groups.
2. Reporting
It is recommended that a Gender and Social Officer position be created within the
Project Management Unit (PMU) with support from the Project Manangement Consultant. The
officer will be responsible for the coordination and daily implementation of the GESIAP, the IP
Due Diligence Report, participation and communication plans, and contribute to quarterly and
six-months monitoring; the preparation of the quarterly safeguard reports and six-monthly
safeguards interim report.

X. CONSULTATION AND PARTICIPATION
1. Consultations were undertaken
As a first step in preparing the consultation and participation plan, a stakeholder
analysis was completed to identify the key actors, their interests, and strategies to maximize
their participation in the project. Information was gathered from (i) numerous government
organizations that will be involved in project implementation, (ii) civil society, (iii) public and
private actors in the water and waste management sectors, and (iv) community members living
in the project area.
In developing the project, a series of stakeholder consultations and workshops were
carried out preparatory by the technical assistance team comprising international and national
specialists with representatives at Sangkat, Municipality, Province, and Ministry levels, with
community members and with private companies. The list of workshops, meetings, and FGDs
with the number of participants is provided in appendix 2.
In total and between August 2019 and October 2020, the Key Informant Interviews
(KII), Focus Group Discussions (FGD) and workshops or meetings have involved 397 officials
and villagers in workshops and consultative meetings, and 159 persons in FGDs as part of
social surveys.
Primary information and consultation were undertaken as part of the City
Comprehensive Survey. The survey covered all villages of the project area, and consulted
with 661 households, 75 commercial and institutional entities.
2. Results of consultations
Consultations provided input on the design of the project; it helped determine project
priorities, socio-economic objectives and confirm linkages with local development plans and
aspirations. The information and recommendations gathered from the various stakeholder
consultations have been incorporated into the design of the project to ensure that the
investments align with local priorities and development plans and that they will deliver
equitable socio-economic benefits to the whole population, including women, the poor, and
vulnerable.
The results of the pre-implementation consultations are also reflected in the summary
poverty reduction and social strategy, gender equality and social inclusion action plan,
resettlement plans, environmental assessments, and the simplified Indigenous People plan.
There is broad community support for the project’s approach to combine urban infrastructure
development with capacity building to improve waste and water governance and
management, improve urban sanitation and increase the city attractiveness.
3. Roles of stakeholders in planning, design, and implementation
ADB is committed to putting meaningful consultation processes into practice.
Meaningful consultation is a process that (i) begins early in the project preparation stage and
is carried out on an ongoing basis throughout the project cycle; (ii) provides timely disclosure
of relevant and adequate information that is understandable and readily accessible to affected

88
people; (iii) is undertaken in an atmosphere free of intimidation or coercion; (iv) is gender-
responsive and inclusive, and tailored to the needs of disadvantaged and vulnerable groups;
and (v) enables the incorporation of all relevant views of affected people and other
stakeholders into decision makings, such as project design, mitigation measures, the sharing
of development benefits and opportunities, and implementation issues.
ADB requires borrowers/clients to engage with communities, groups, or people
affected by proposed projects and with civil society through information disclosure,
consultation, and informed participation in a manner commensurate with the risks to and
impacts on affected communities. Enhancing stakeholder participation has also been shown
to build understanding and support among diverse groups, which can improve project design
and impacts.
Consistent with these efforts, the objectives of the consultation and participation plan
and related stakeholder communication strategy are to: (i) fully disclose information on the
proposed project, its components, and its activities with the beneficiary communities and
stakeholders, (ii) obtain information about the opinions, needs and priorities of beneficiary
communities and stakeholders; social input and feedback on the quality and affordability of
services, for example (iii) encourage the participation of beneficiary communities and
stakeholders in project activities such as the payment for connection or services, changes in
waste management practices, change in the extend and quality of services delivered,
participation to O&M, awareness-raising activities, capacity building, enforcement of local
regulations and monitoring; (iv) obtain the cooperation of beneficiary communities and
stakeholders for activities required to be undertaken as part of project planning and operation,
(v) establish clear monitoring and effective grievance redress mechanism; and (vi) ensure
transparency in all project activities.
4. Stakeholder participation plan
Broad and meaningful consultation will continue throughout the project implementation
cycle, building on the initial consultations held with various stakeholder groups during project
preparation. The various stakeholders, mechanisms for participation, entities responsible,
indicative schedules and resources are set out in the Consultation and Participation Plan
presented in Table 23.

Table 23: Consultation and Participation Plan
Stakeholder Group
Objective of their Involvement (Why included)
Approach to Participation and Depth
Participation Methods Timing
Method Responsibility
MPWT Executing agency. Provide overall guidance on project scope, implementation.
Partnership (high)
Consultation: Facilitate semi-annual project steering committee and provide update on project implementation matters/key issues. Implementation: project monitoring, reporting, procurement. Monitor financial aspects of project. Participation through PMU on the key stakeholder consultations. Liaison with other line ministries as required.
PMU Throughout project implementation
Beneficiary communities, including women, ethnic minorities, poor and other vulnerable households, and households affected by involuntary resettlement
Direct beneficiaries of project Project/ subproject affected households.
Consultation (high)
Information: on project scope, technical options, design elements, tariff structures, participation, grievance redress mechanisms, and entitlements for affected persons; informed through meetings and information brochures Consultation: on willingness to pay, affordability, and level of support for the project and needs and impacts of subprojects; consultation through surveys, census and inventories, community meetings and focus group discussions Implementation: participation in project-specific grievance redress/village mediation committees to ensure they are inclusive and include representatives of disadvantaged subgroups. Agreement to pay for services; to use proper waste disposal mechanisms (to avoid burning, dumping in canals) Monitoring: communities, including ethnic minorities, women, poor, and other vulnerable groups, will be involved in the
PMU, PIA/PIU, DCS
Throughout project implementation
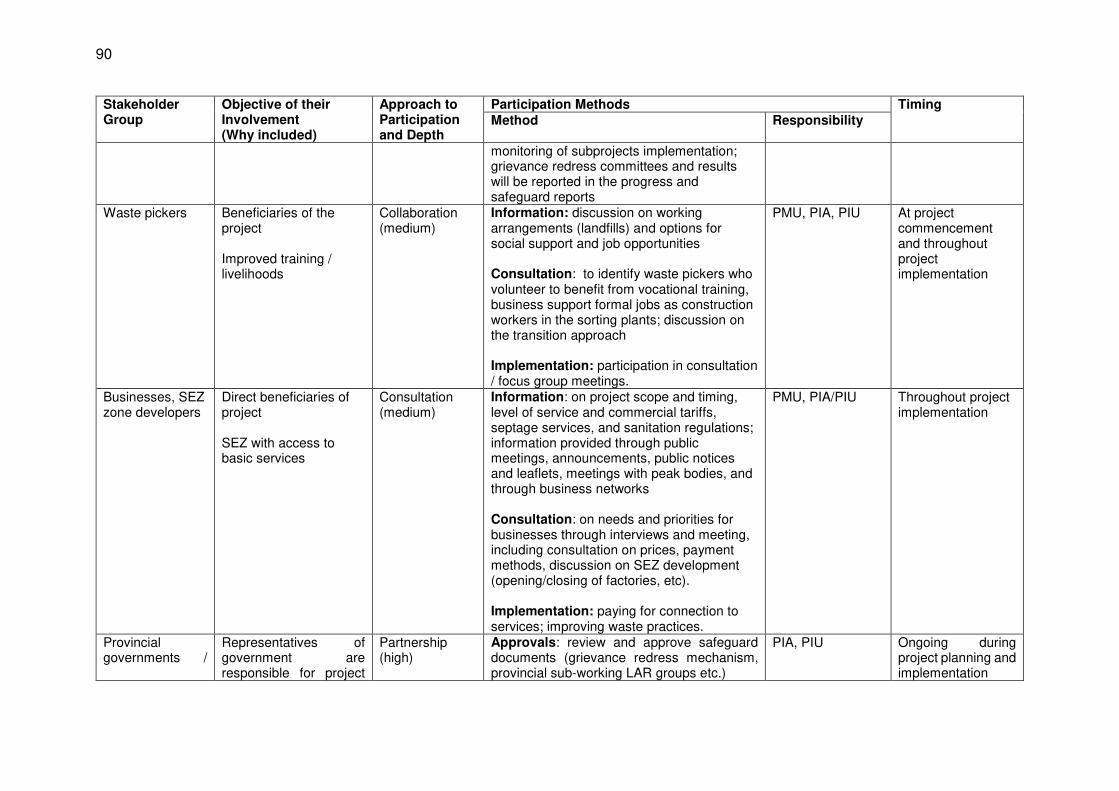
90
Stakeholder Group
Objective of their Involvement (Why included)
Approach to Participation and Depth
Participation Methods Timing
Method Responsibility
monitoring of subprojects implementation; grievance redress committees and results will be reported in the progress and safeguard reports
Waste pickers Beneficiaries of the project Improved training / livelihoods
Collaboration (medium)
Information: discussion on working arrangements (landfills) and options for social support and job opportunities Consultation: to identify waste pickers who volunteer to benefit from vocational training, business support formal jobs as construction workers in the sorting plants; discussion on the transition approach Implementation: participation in consultation / focus group meetings.
PMU, PIA, PIU At project commencement and throughout project implementation
Businesses, SEZ zone developers
Direct beneficiaries of project SEZ with access to basic services
Consultation (medium)
Information: on project scope and timing, level of service and commercial tariffs, septage services, and sanitation regulations; information provided through public meetings, announcements, public notices and leaflets, meetings with peak bodies, and through business networks Consultation: on needs and priorities for businesses through interviews and meeting, including consultation on prices, payment methods, discussion on SEZ development (opening/closing of factories, etc). Implementation: paying for connection to services; improving waste practices.
PMU, PIA/PIU
Throughout project implementation
Provincial governments /
Representatives of government are responsible for project
Partnership (high)
Approvals: review and approve safeguard documents (grievance redress mechanism, provincial sub-working LAR groups etc.)
PIA, PIU
Ongoing during project planning and implementation

91
Stakeholder Group
Objective of their Involvement (Why included)
Approach to Participation and Depth
Participation Methods Timing
Method Responsibility
municipal administration
implementation and for representing provincial and municipal interests. Responsible for O&M of the assets and services, including setting tariffs, business plans, monitoring/enforcement.
Implementation: allocate staff to PIU to provide local inputs and oversee project implementation. Prepare and implement annual work plans, budgets. Build capacity of the municipal administration to carry out operations and maintenance of the infrastructure. Oversee implementation and progress of subprojects through review and planning meetings; oversee resettlement committees; recommend and initiate remedial action; resolve disputes
Septic tank desludgers, plumbers and masons
Indirect beneficiaries of project Indirect promoters of sanitation services and products
Information (medium) Consultation (medium)
Information: on scope and timing of project, type of service. Informed through direct approaches such as interest group meetings and printed information or other methods that help them to inform the public and consumers. Consultation: as an industry group, be consulted on needs and issues affecting businesses in subproject towns; how water/sanitation businesses can support objectives of the project.
PMU, PIA/PIU Periodic meetings during implementation
Solid waste contractors
Potential service provider Arrangements to close existing dumpsite
Partnership (medium-high)
Information: on project design, institutional arrangements, service provider arrangements Consultation: participation in discussion on business opportunities, expansion of service coverage area; employment of scavengers/waste pickers; discussion with provincial government and MOE on closure of existing dumpsite
PMU, PIA, PIU, DCS
Throughout project implementation

92
Stakeholder Group
Objective of their Involvement (Why included)
Approach to Participation and Depth
Participation Methods Timing
Method Responsibility
Civil society organizations
Representatives of civil society and the community
Collaboration (medium)
Consultation promotion of community participation, behavior change analysis/strategy development, raising awareness at community level, facilitate support with vulnerable groups.
PMU, PIA, PIU Early stage of project, prior to construction and during construction
Provincial Department of Women Affairs (PDoWA) /Women and Children Consultative Committees/ Commune committees for women and children
Awareness raising in the community; increase participation in planning, design, operations, maintenance and monitoring
Collaboration (medium)
Consultation: gender assessment, identification of specific needs, demands, constraints and level of satisfaction. PDoWA, with PMU and PIUs to organize participation of the consultative committees/commune committees in the implementation of the soft components for women and children (face-to-face information training, awareness raising, facilitation of consultations)
PMU, PIA, PIUs Throughout project implementation
Commune/ sangkat councils
To inform the residents of the project/project benefits
Collaboration (high)
Information: on project scope, design, institutional arrangements, roles, responsibilities, and project progress; feedback on infrastructure design. Implementation: coordinate and organize implementation in their Sangkat. Report to the municipality on key issues/concerns, facilitate implementation of O&M, monitoring and evaluation, grievance redress.
PMU, PIA, PIUS Throughout project implementation
Government departments
Set policy and guidelines, coordinate, and issue approvals
Collaboration (medium)
Approvals and advice: coordination, direction, and approval of technical and implementation matters; participation is through review of key documents, safeguards, and proposals, issuance of statements and directives, and project management and coordination meetings
PMU As required during project implementation

5. Stakeholder communication strategy
The Stakeholder Communication Strategy (Table 24) has been prepared, drawing on
good practices outlined in ADB’s Public Communication Policy. The Stakeholder
Communication Strategy is based on the principles of transparency, timeliness, meaningful
participation, and inclusion. It will ensure that women, the poor and vulnerable, are provided
opportunities to receive timely information and provide feedback during project
implementation.
The project will integrate institutional and social components- improving policy and
regulatory environment, enhance the provincial governments’ capacity, building community
awareness on key sustainability themes, including water usage, sanitation, and solid waste
reduction and management, promote effective gender mainstreaming activities that will
encourage and increase women’s participation in planning, design, operations, and
maintenance - with the infrastructure components to realize the development objective of
helping the poor in alleviating poverty and attaining socially inclusive development.
This is also a demand of the communities and local authorities reflected during the
social survey. All groups insisted that the project would succeed - at getting the adhesion of
people to new practices and to pay for services- only if education about wastewater/ solid
waste management was improved before the start of works and if people understood the
interlinked benefits of better waste management /reduced flooding/ health. Communications
with the public who will benefit from the project will be necessary, in particular, promotional
campaigns to raise awareness on the importance of investing in sanitation, to present the
upgraded services being established and to raise the willingness to pay for this service.
Stakeholders include: (i) the special group of waste pickers, (ii) project direct and
indirect beneficiaries with a focus on households in urban and rural areas, women and
children, poor and vulnerable groups, micro-businesses; businesses and industries in the
SEZs (ii) local authorities (Sangkat and village in levels); (iii) Civil Society Organisations; (iv)
private operators in the SWM sector and civil works (v) government agencies with a role in the
implementation and (vi) interlinked development projects. The strategy serves to inform and
support community development, enhance government capacity to deliver a positive project
outcome, and enhance project benefits while mitigating any potential negative impacts.
There are three primary objectives under the Stakeholder Communication Strategy: (i)
Ensure that all people or entities possibly affected by the project are aware of and clearly
understand the project, its impacts and compensation entitlements, and address stakeholder
concerns using transparent and inclusive approaches; (ii) Ensure that all possible
beneficiaries of the project are aware of and understand the project and its benefits, and the
details of making use of the proposed urban infrastructure and services and foster demand
and willingness to pay; (iii) Ensure that awareness about water and sanitation issues is built
into the project to enhance public health and mitigate risk.
To ensure effective communication with stakeholders during project implementation
and to enhance project outcomes, and the project will adopt a three-pronged communication
strategy:
(i) Deliver relevant project information to project-affected people and other stakeholders
possibly impacted by the project in a culturally appropriate, gender-sensitive, and
timely manner, and foster a regular two-way flow of information between project

94
implementers and these stakeholders; (community meetings, information display,
FGDs, participatory monitoring);
(ii) Support intensive, sustained, broad and repetitive communication, education, and
advocacy about the benefits of the project to foster adhesion, participation, and positive
public behavior change, through official (press release, interviews, the publication of
summary project reports) and non-formal/ official communication (video, talk shows,
testimonies); and
(iii) Support sustained information, education, and awareness activities to raise awareness
of water and sanitation behavior and best practices through community events and
dissemination on Radio, TV, social media, which are the preferred information
channels of the population. (women and child awareness session, field visits with rural
groups, educational programs…). The stakeholder communication strategy is
presented in Table 24.

Table 24: Stakeholder Communication Strategy
Objective(s) Key Risks/ Challenges
Stakeholder Group Messages Means of Communication
Timeline Responsibility
Ensure beneficiaries (including poor and vulnerable groups) understand project scope, impacts, entitlements, participation, and redress mechanisms to promote participation and increase ownership and satisfaction
Trust of information source Language/ culture Literacy Managing expectations Information dissemination is not widespread
Target communities, population in the project area including poor and vulnerable groups Businesses, SEZs
Project design, key project benefits, implementation arrangements, and schedule of civil works Main project impacts (positive and negative) Planned mitigation measures, including compensation rates, entitlements, and grievance redress mechanisms. Tariffs and affordability of services Participation in income restoration program
Public information meetings Resettlement committee meetings and/or meetings with affected households Printed information in local language posted in accessible areas (e.g., village meeting place) Dissemination fo information via radio messages, local TV news, social media Consultation meetings at dumpsite/villages
Ongoing prior to implementation of activities Ongoing during civil works
PMU, PIA, PIU, DCS
Establish two-way information sharing/ feedback mechanism to ensure inclusion of vulnerable groups in benefit distribution
Language Gender and cultural stereotypes Mechanisms ready to respond to concerns Timing
Target communities (especially poor, minority ethnic groups) VAs
Mechanisms for community participation, representation, monitoring Benefits targeted to poor households Mitigation and grievance measures
Community meetings/focus group meetings Gender awareness and mainstreaming training materials
Ongoing during implementation including civil works
PMU, PIA, PIU, DCS
Ensure local authorities understand and
Low education
Sangkat authorities, Commune councils,
Project design, key benefits, implementation
Small group meetings/training
Ongoing from project outset
PMU, PIA, PIU, DSC
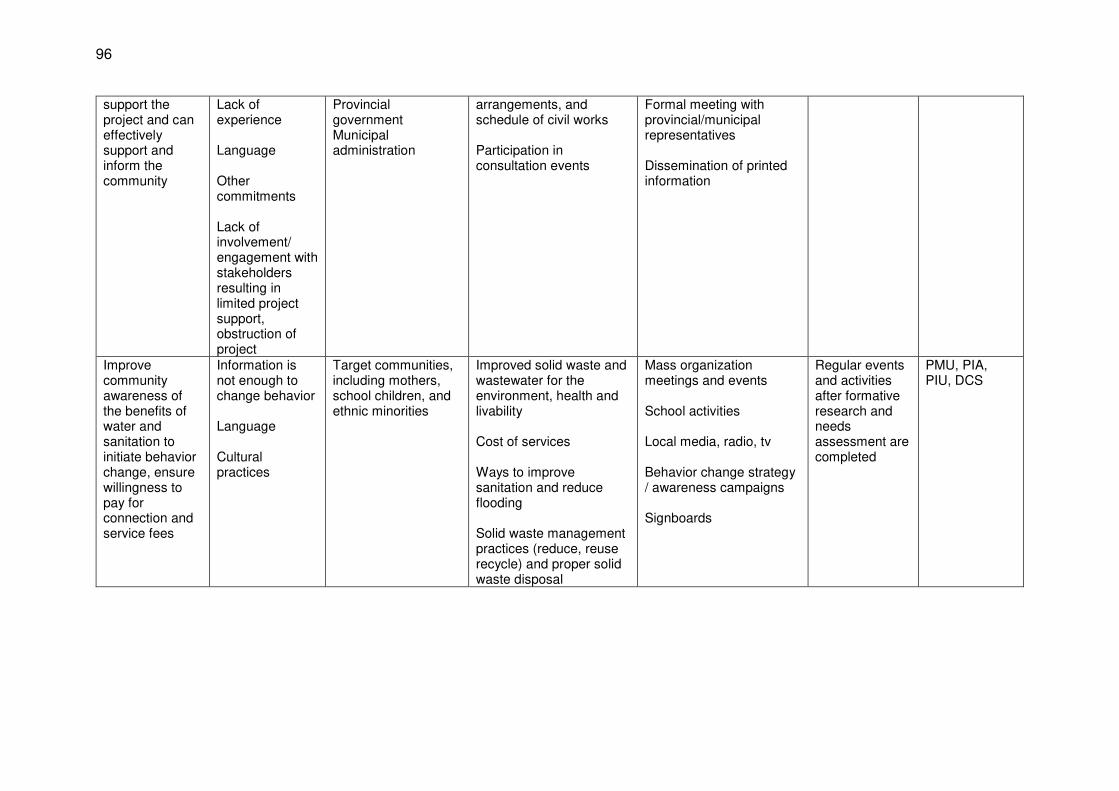
96
support the project and can effectively support and inform the community
Lack of experience Language Other commitments Lack of involvement/ engagement with stakeholders resulting in limited project support, obstruction of project
Provincial government Municipal administration
arrangements, and schedule of civil works Participation in consultation events
Formal meeting with provincial/municipal representatives Dissemination of printed information
Improve community awareness of the benefits of water and sanitation to initiate behavior change, ensure willingness to pay for connection and service fees
Information is not enough to change behavior Language Cultural practices
Target communities, including mothers, school children, and ethnic minorities
Improved solid waste and wastewater for the environment, health and livability Cost of services Ways to improve sanitation and reduce flooding Solid waste management practices (reduce, reuse recycle) and proper solid waste disposal
Mass organization meetings and events School activities Local media, radio, tv Behavior change strategy / awareness campaigns Signboards
Regular events and activities after formative research and needs assessment are completed
PMU, PIA, PIU, DCS

6. Disclosure
ADB’s principles are to disclose information about its operations in a clear, timely, and
appropriate manner to enhance stakeholders’ ability to meaningfully engage with ADB and to
promote good governance. This applies to project too.
Table 25: Disclosure plan
Project information Means of
communication Responsible Audience Frequency
RRP ADB website Royal Government of Cambodia, development partners, civil society, NGOs, individuals
Once
Project planning Discussions and IA Specific intervals information
Discussions and Consultation
IA Specific Interval during the planning
Status of construction Information board at the site
DOT and contractors
Project beneficiaries All the time
Project Performance Reports and Project Information Document
quarterly
Indigenous People Plan, Resettlement Plan and its updates and resettlement monitoring reports, IEE report.
ADB website ADB Royal Government of Cambodia, development partners, civil society, NGOs, individuals
Immediately upon receipt
Quarterly progress reports
ADB website Royal Government of Cambodia, development partners, civil society, NGOs, individuals
Quarterly
Project Completion report
ADB website Royal Government of Cambodia, development partners, civil society, NGOs, individuals
Once

98
XI. CONCLUSIONS AND RECOMMENDATIONS
There is a general consensus that the project will improve access to urban services to
the residents of the city, contribute to inclusive and sustainable development, and the
development of human capital, social services, and public governance.
The constraints of specific poor and vulnerable groups to fully benefit from the project
facilities have been assessed and can be summarized by (i) a lack of information and
knowledge about the cost and benefits of water and sanitation management, (ii) the limited
availability and quality of facilities at the moment, and (iii) concerns about the affordability of
infrastructure and service.
The Gender Equality and Social Inclusion Action Plan, the Consultation and
Participation Plan, and Stakeholders Communication Plans incorporate all the elements
deemed necessary to maximize the social and economic impacts of the project for all. This
includes wide consultation and participation of women, poor and vulnerable groups, targeted
interventions (training and awareness-raising, women’s empowerment), better affordable
services (gratuity, social tariffs, customers centered approach), and appropriate local
regulating and monitoring mechanisms.
They also encompass a multi-stakeholder approach with the private sector, local
institutions, and civil society, all mobilized to meet the specific needs of the poor, vulnerable,
and women in the target area.

XII. APPENDICES
1. Key sex-disaggregated poverty and social statistics and indicators
Table 26: Municipality data 2018/ sums per Sangkat
Total Poipet area
Sangkat Nimit
Sangkat Poipet
Sangkat Phsa Kandal
Type of data Total Total Total
Family and people 18% 52% 30%
Total number of persons (men + women) 104,156 18,278 54,141 31,737
1 Total family in village according to family book 22,046 4,395 10,755 6,896
2 Total women 50,398 9,292 26,067 15,039
3 Total men 53,758 8,986 28,074 16,698
4 Women as householde head 2,785 450 1,411 924
Using of water and sanitation
1 Number of family used water from treated water system 11,094 389 7,899 2,806
2 Number of family used water from borehole-well and combined well 5,821 1,665 1,642 2,514
5 Number of family used water from pond, pool 2,606 829 876 901
6 Number of family used water from rain water havesting 838 429 323 86
19 Total number of sanitation latrine 20,859 3,613 10,430 6,816
20 number of family have proper latrine 20,586 3,572 10,199 6,815
21 number of family have improper latrine 273 41 231 1
Vulnerable people
Number of HHs where minor are guarded by ill or elder people 47 32 57
1 number of family have childrend under 18 years take care by parend or guardian with long term ilness 75
11 20 44

100
Total Poipet area
Sangkat Nimit
Sangkat Poipet
Sangkat Phsa Kandal
Type of data Total Total Total
2 total children under 18 years take care by parend or guardian with long term ilness 91
29 37 25
3 total girl under 18 years take care by parend or guardian with long term ilness 49
18 19 12
4 number of family have orphan-childrend under 18 years take care by guardian as elder 61
36 12 13
5 total number of orphan-childrend under 18 years take care by guardian as elder 82
15 36 31
6 otal girl under 18 years take care by guardian as elder 40 5 17 18
10 homeless with mendal problem people 18 2 16 0
13 Number of elder without dependance 101 10 78 13
14 Number of family have home on the public land 1,060 45 814 201
15 number of fsamily have member got HIV/AIDS 185 36 69 80
Total number of disables 482 186 117 179
28 number of disable people since birth 110 43 38 29
29 number of women got disable since birth 51 22 14 15
30 total disable people by other accident 147 53 25 69
31 number of women got disable by other accident 48 14 9 25
32 total disable people by civil war 170 79 32 59
33 number of women got disable by civil waar 15 6 4 5
34 សរុបចំនួនជនពិ�រេ�យផ� �ះមីននិងសំណល់�តិផ� �ះសល់ពីស��� ម total disable people by mines or UXO 55 11 22 22
35 number of women disable by mines or UXO 11 2 6 3

101
Table 27: Municipality data in % per Sangkats (details per village in soft copy only)
Total Poipet area
Sangkat Nimit
Sangkat Poipet
Sangkat Phsa Kandal
Type of data Total Total Total Family and people Total number of persons (men + women) 1 Total family in village according to family book 4,395 10,755 6,896 2 Total women 48% 51% 48% 47% 3 Total men 52% 49% 52% 53% 4 Women as householde head 13% 10% 13% 13% Using of water and sanitation 1 Number of family used water from treated water system 50% 9% 73% 41% 2 Number of family used water from borehole-well and combined well 26% 38% 15% 36% 5 Number of family used water from pond, pool 12% 19% 8% 13% 6 Number of family used water from rain water havesting 4% 10% 3% 1% 19 Total number of sanitation latrine 95% 82% 97% 99% 20 number of family have proper latrine 93% 81% 95% 99% 21 number of family have improper latrine 1% 1% 2% 0% Vulnerable people Number of HHs where minor are guarded by ill or elderly people 0% 1% 0% 1%
1 number of the family have children under 18 years take care by parents or guardian with long term ilness
0% 11 20 44
2 total childrend under 18 years take care by parents or guardian with long term ilness 0% 29 37 25 3 total girl under 18 years take care by parend or guardian with long term ilness 49 18 19 12 4 number of family have orphan-children under 18 years take care by the guardian as elder 61 36 12 13 5 total number of orphan-childrend under 18 years take care by guardian as elder 82 15 36 31 6 otal girl under 18 years take care by guardian as elder 40 5 17 18 10 homeless with mendal problem people 0.0% 0% 0% 0% 13 Number of elder without dependance 0.1% 0.1% 0.1% 0.0% 14 Number of family have home on the public land 4.8% 4.2% 76.8% 19.0% 15 number of fsamily have member got HIV/AIDS 0.8% 0.8% 0.6% 1.2% Total number of disables 0.5% 1.0% 0.2% 0.6%

Table 28: ID poor data (2018) (details per village in soft copy only)
Total Poipet area
Sangkat Nimit Sangkat Poipet
Sangkat Phsa Kandal
Type of data Total Total Total ID Poor 1 Total HHs 686 195 322 169 Female headed HHs ID Poor 1 312 78 166 68 Male headed HHs ID Poor 1 374 117 156 101 ID Poor 2 Total HHs 1046 388 313 345 Female headed HHs ID Poor 2 363 137 116 110 Male headed HHs ID Poor 2 683 251 197 235
TOTAL IDPoor 1 + 2 8% 13% 6% 7% ID Poor 1 Total HHs 3% 4% 3% 2% Female headed HHs ID Poor 1 45% 40% 52% 40% Male headed HHs ID Poor 1 55% 60% 48% 60% ID Poor 2 Total HHs 5% 9% 3% 5% Female headed HHs ID Poor 2 35% 35% 37% 32% Male headed HHs ID Poor 2 65% 65% 63% 68%

Table 29: IPs Data
Type of data Total Sangkat Nimit
V. Nimit 3 V. Nimit 4 V. Ou Chrouv
Sangkat Poipet
V. Palylaiy 1
V. Kbal Spean 2
V. Chan Kiri
Sangkat Phsa Kandal
V. Prey Koub
Minority as per police datasheet- August 2020
-
Cham # of family
537
145
80
16
49
335
207
85
43
57
57
# of people
1,984
442
300
36
106
1,314
847
300
167
228
228
Minority as %age of population (re.village data 2018) Cham # of family 2% 3% 22% 5% 22% 3% 21% 7% 5% 1% 8%
# of people 2% 2% 18% 3% 11% 2% 13% 6% 4% 1% 8% Total population (village data 2018)
Total family in village according to family book
104,156
18,278
1,628
1,130
963
54,141
6,368
5,227
4,099
31,737
3,035
Total population women + men
22,046
4,395
361
301
224
10,755
998
1,249
864
6,896
759

Table 30: Key CCS data disaggregated
Analysis of key data from the City Comprehensive survey Poipet
Rural Urban Total Poor HHs FHHs Elderly
34% 66% 626 37% 27% 6%
average age of population
FHHs 30% 25% 27% 29% widows 39%
IPs (not mixed Khmer +…) 0% 1% 1% 0% 1% 0%
disabled 4% 1% 2% 3% 2% 0%
elder 5% 6% 6% 9% 8% 0%
permanent house building 91% 79% 83% 82% 80% 86%
long term residents (always live there…) 69% 56% 61% 63% 56% 83%
own their house 91% 71% 78% 79% 75% 83%
no education (household head) 13% 13% 13% 14% 23% 33%
average monthly income 383 516 471 133 424 269
average monthly expenses 778 539 620 431 442 308
drink water from own well 17% 4% 8% 14% 5% 11%
drink water from vendors 70% 92% 85% 76% 91% 75%
drink water from public water supply 1% 0% 1% 2% 0% 0%
treat water 0% 48% 32% 55% 44% 61%
female in charge of fetchning water 23% 33% 30% 27% 45% 33%
don't have pb with drinking water 50% 30% 37% 36% 28% 44%
main pb with drinking water 28% 0% 9%
price 36% 37% 36% 29% 38% 25%
bad quality 23% 27% 26% 23% 24% 19%
access to piped water supply 20% 66% 51% 39% 52% 44%
out of which people connected 47% 50% 71% 63% 67% 56%
Willing to pay for connection 77% 82% 80% 77% 76% 83%

105
Analysis of key data from the City Comprehensive survey Poipet
Rural Urban Total Poor HHs FHHs Elderly
don’t know where wastewater from business/ production is handled 75% 70% 72% 18% 78% 67%
have toilet facilities 87% 91% 90% 87% 86% 83%
with a septic tank (according to interviewee's response) 79% 72% 74% 71% 69% 67%
don't know dimension of tank 23% 43% 38% 19% 30% 29%
connected to sewer pipe 1% 10% 7% 6% 4% 3%
out of which, don’t know construction cost 33% 63% 61% 33% 50% 0%
out of which, don’t know monthly fee 33% 71% 68% 47% 33% 0%
connected to open channel drain 4% 2% 3% 4% 5% 3%
out of which don/t know cost of connection 56% 100% 75% 67% 88% 0%
willingness to build septic tank/flush latrines 4% 7% 6% 7% 11%
NOT willing to take a loan for sanitation 94% 94% 94% 94% 92% 92%
do not need pumping servcies 71% 74% 73% 0% 0% 0%
do no need to empty manually 67% 72% 70% 0% 0% 0%
do NOT know wher septic sludge are transported 77% 82% 81% 78% 83% 0%
do not face any environmental issues 28% 26% 27% 21% 25% 39%
think there is a solid waste problem (bad smell, scattered on the road) 88% 93% 92% 92% 93% 78%
observe wastes piling often/ very often 56% 83% 74% 84% 84% 61%
think wastes piling can cause env. and health pbs 89% 88% 88% 86% 85% 75%
have waste collection service 6% 40% 29% 19% 26% 39%
collect is irregular hours 18% 25% 23% 0% 0% 0%
pay for collection fees 15% 29% 24% 15% 25% 11%
evaluate the state of solid waste collection in their area as good 10% 16% 14% 11% 21% 17%
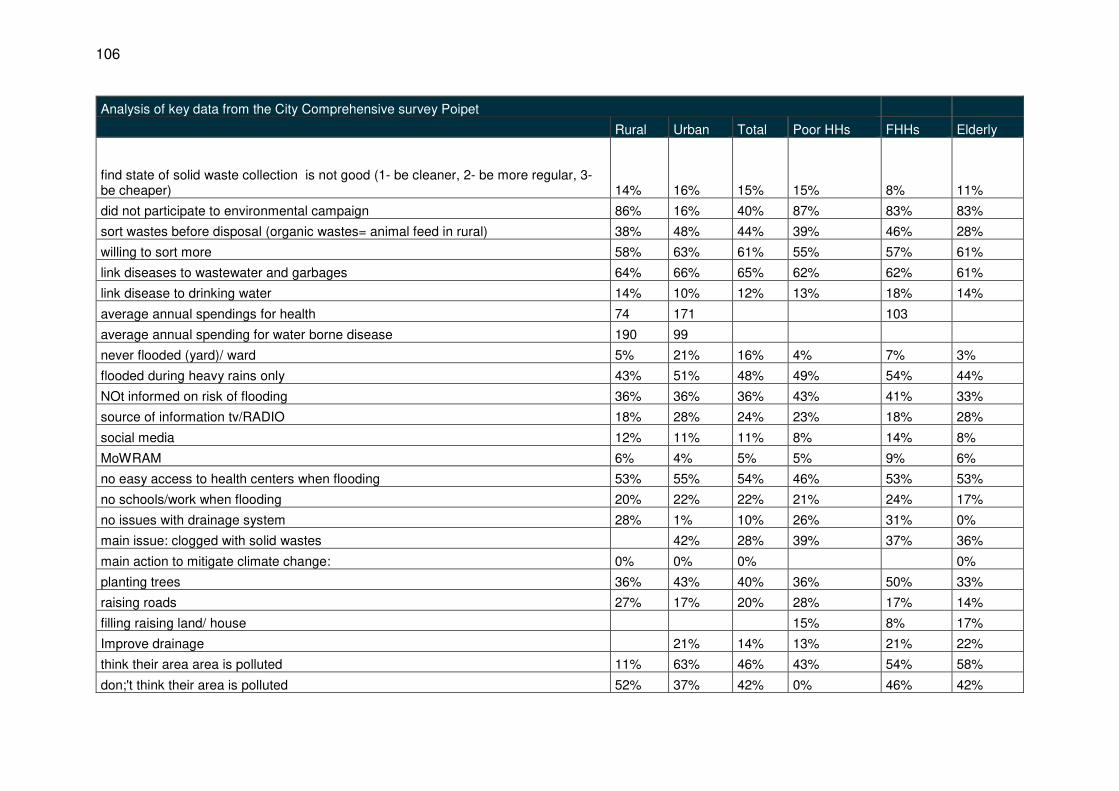
106
Analysis of key data from the City Comprehensive survey Poipet
Rural Urban Total Poor HHs FHHs Elderly
find state of solid waste collection is not good (1- be cleaner, 2- be more regular, 3-be cheaper) 14% 16% 15% 15% 8% 11%
did not participate to environmental campaign 86% 16% 40% 87% 83% 83%
sort wastes before disposal (organic wastes= animal feed in rural) 38% 48% 44% 39% 46% 28%
willing to sort more 58% 63% 61% 55% 57% 61%
link diseases to wastewater and garbages 64% 66% 65% 62% 62% 61%
link disease to drinking water 14% 10% 12% 13% 18% 14%
average annual spendings for health 74 171 103
average annual spending for water borne disease 190 99
never flooded (yard)/ ward 5% 21% 16% 4% 7% 3%
flooded during heavy rains only 43% 51% 48% 49% 54% 44%
NOt informed on risk of flooding 36% 36% 36% 43% 41% 33%
source of information tv/RADIO 18% 28% 24% 23% 18% 28%
social media 12% 11% 11% 8% 14% 8%
MoWRAM 6% 4% 5% 5% 9% 6%
no easy access to health centers when flooding 53% 55% 54% 46% 53% 53%
no schools/work when flooding 20% 22% 22% 21% 24% 17%
no issues with drainage system 28% 1% 10% 26% 31% 0%
main issue: clogged with solid wastes 42% 28% 39% 37% 36%
main action to mitigate climate change: 0% 0% 0% 0%
planting trees 36% 43% 40% 36% 50% 33%
raising roads 27% 17% 20% 28% 17% 14%
filling raising land/ house 15% 8% 17%
Improve drainage 21% 14% 13% 21% 22%
think their area area is polluted 11% 63% 46% 43% 54% 58%
don;'t think their area is polluted 52% 37% 42% 0% 46% 42%

107
Analysis of key data from the City Comprehensive survey Poipet
Rural Urban Total Poor HHs FHHs Elderly
main nuisances
Dust 44% 43% 44% 40% 43% 39%
Bad smells from garbage 23% 32% 29% 27% 31% 31%
noise 32% 21% 27% 30% 39%
satisfaction with water supply
satisfaction with wastewater
satisfaction with drainage
satisfaction with solid waste management
How to improve the city 0%
build more public spaces and playground 15% 0% 5% 9% 8% 11%
build more house in the outskirts 18% 15% 16% 24% 15% 11%
rehabilitate heritage buildings 32% 6% 15% 28% 38% 25%
improving urban infrastructure 26% 42% 37% 28% 28% 39%
improving social welfare and services 9% 8% 8% 12% 10% 14%
know dimensions of septic tank 40% 80% 66% 31% 18% 8%
agree to take pictures of toilets 58% 50% 53% 51% 51% 53%
agree to take pictures of waste disposal 93% 93% 93% 93% 93% 89%
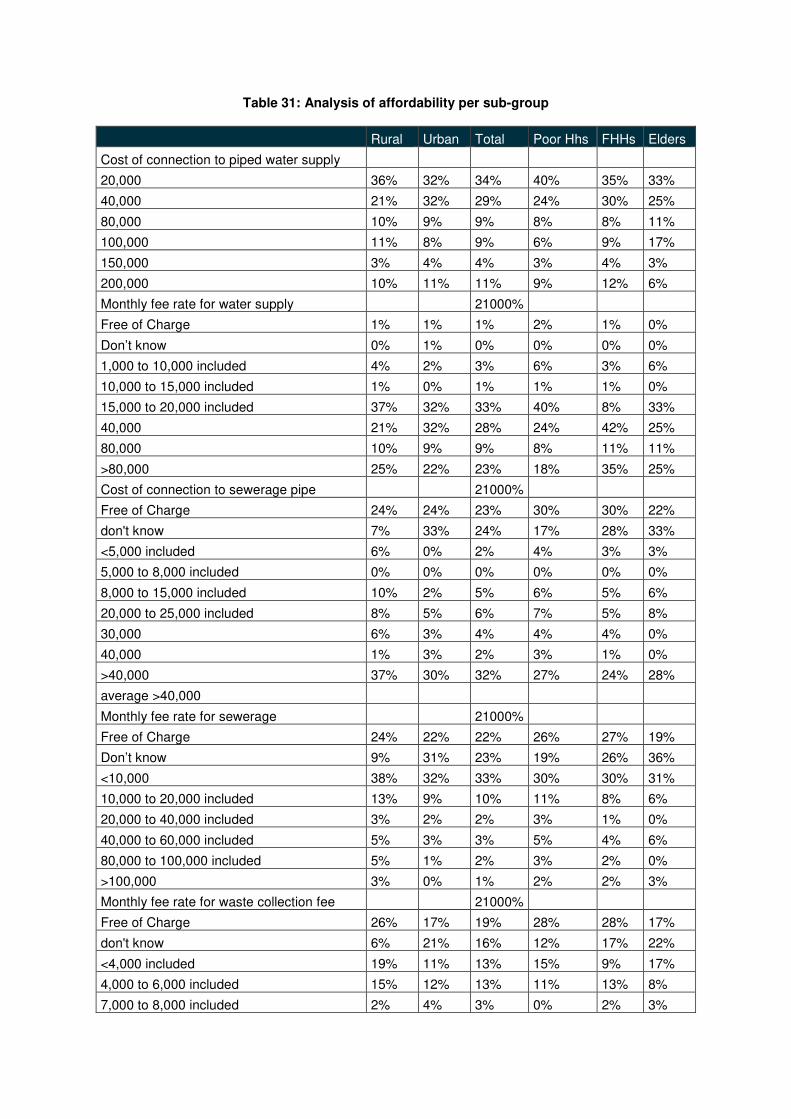
Table 31: Analysis of affordability per sub-group
Rural Urban Total Poor Hhs FHHs Elders
Cost of connection to piped water supply
20,000 36% 32% 34% 40% 35% 33%
40,000 21% 32% 29% 24% 30% 25%
80,000 10% 9% 9% 8% 8% 11%
100,000 11% 8% 9% 6% 9% 17%
150,000 3% 4% 4% 3% 4% 3%
200,000 10% 11% 11% 9% 12% 6%
Monthly fee rate for water supply 21000%
Free of Charge 1% 1% 1% 2% 1% 0%
Don’t know 0% 1% 0% 0% 0% 0%
1,000 to 10,000 included 4% 2% 3% 6% 3% 6%
10,000 to 15,000 included 1% 0% 1% 1% 1% 0%
15,000 to 20,000 included 37% 32% 33% 40% 8% 33%
40,000 21% 32% 28% 24% 42% 25%
80,000 10% 9% 9% 8% 11% 11%
>80,000 25% 22% 23% 18% 35% 25%
Cost of connection to sewerage pipe 21000%
Free of Charge 24% 24% 23% 30% 30% 22%
don't know 7% 33% 24% 17% 28% 33%
<5,000 included 6% 0% 2% 4% 3% 3%
5,000 to 8,000 included 0% 0% 0% 0% 0% 0%
8,000 to 15,000 included 10% 2% 5% 6% 5% 6%
20,000 to 25,000 included 8% 5% 6% 7% 5% 8%
30,000 6% 3% 4% 4% 4% 0%
40,000 1% 3% 2% 3% 1% 0%
>40,000 37% 30% 32% 27% 24% 28%
average >40,000
Monthly fee rate for sewerage 21000%
Free of Charge 24% 22% 22% 26% 27% 19%
Don’t know 9% 31% 23% 19% 26% 36%
<10,000 38% 32% 33% 30% 30% 31%
10,000 to 20,000 included 13% 9% 10% 11% 8% 6%
20,000 to 40,000 included 3% 2% 2% 3% 1% 0%
40,000 to 60,000 included 5% 3% 3% 5% 4% 6%
80,000 to 100,000 included 5% 1% 2% 3% 2% 0%
>100,000 3% 0% 1% 2% 2% 3%
Monthly fee rate for waste collection fee 21000%
Free of Charge 26% 17% 19% 28% 28% 17%
don't know 6% 21% 16% 12% 17% 22%
<4,000 included 19% 11% 13% 15% 9% 17%
4,000 to 6,000 included 15% 12% 13% 11% 13% 8%
7,000 to 8,000 included 2% 4% 3% 0% 2% 3%

109
Rural Urban Total Poor Hhs FHHs Elders
9,000 to 12,000 included 16% 18% 17% 20% 15% 17%
12,000 to 20,000 included 10% 11% 11% 7% 11% 11%
>20,000 7% 5% 6% 8% 6% 6%
Table 32: Households expense
source CCS All HHs FHHs ELDERS HHs
Expenses average value KHR
% of total
average value KHR
% of total
average value KHR
% of total
1- Food consumption 579,727 23%
569,142 31%
426,389 34%
2- Shopping for appliances and amenities
494,889 19%
124,308 7%
128,736 10%
3- Electricity for lighting/electrical appliances
129,521 5%
95,299 5%
109,083 9%
4- Energy/fuel for cooking 29,974 1%
28,095 2%
9,028 1%
5- Water consumption 39,548 2%
41,243 2%
25,694 2%
6- Solid waste collection 2,886 0%
2,953 0%
1,583 0%
7- Toilet facility 15,570 1%
14,824 1%
5,156 0%
8- Drainage 427 0%
30 0%
- 0%
9- Transport including fuel 95,584 4%
70,663 4%
74,363 6%
10- Clothing 62,638 2%
50,941 3%
15,917 1%
11 Housing i.e. rental, maintenance, decoration
355,134 14%
274,379 15%
1,389 0%
12- Healthcare 188,090 7%
168,615 9%
200,500 16%
13- Education 172,237 7%
92,604 5%
51,864 4%
14- Communication i.e. telephone, internet etc.
39,837 2%
27,222 2%
16,556 1%
15 Entertainment/Leisure i.e. out for drink, cigarette etc.
68,862 3%
41,491 2%
25,000 2%
16- Social event and ceremony i.e. wedding, festivals
264,205 10%
211,124 12%
142,361 11%
17- Other, specify (text) - 0%
27,778 2%
Average total KHR 2,540,952
1,812,931
1,261,396
$ 620
442
308
Table 33: Households occupation
Occupation All HHs Female head of household
Male head of household
Small scale business owner 27% 34% 24%
Housewife 6% 21% 0%
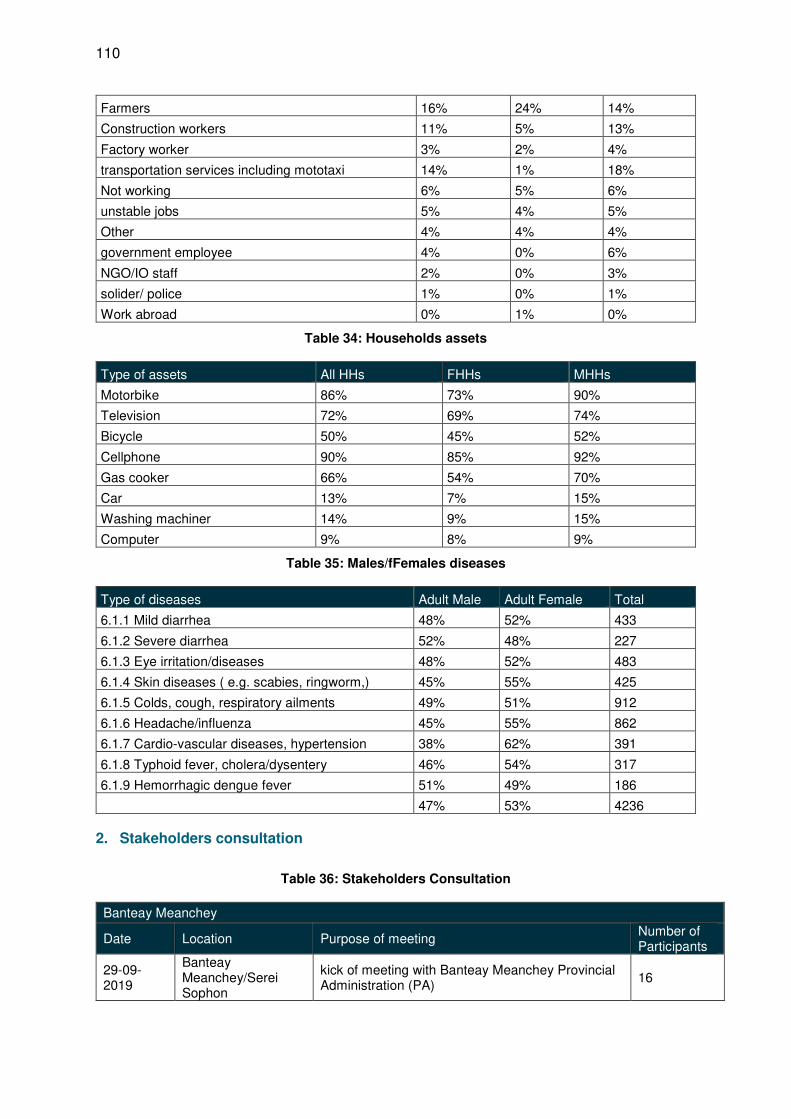
110
Farmers 16% 24% 14%
Construction workers 11% 5% 13%
Factory worker 3% 2% 4%
transportation services including mototaxi 14% 1% 18%
Not working 6% 5% 6%
unstable jobs 5% 4% 5%
Other 4% 4% 4%
government employee 4% 0% 6%
NGO/IO staff 2% 0% 3%
solider/ police 1% 0% 1%
Work abroad 0% 1% 0%
Table 34: Households assets
Type of assets All HHs FHHs MHHs
Motorbike 86% 73% 90%
Television 72% 69% 74%
Bicycle 50% 45% 52%
Cellphone 90% 85% 92%
Gas cooker 66% 54% 70%
Car 13% 7% 15%
Washing machiner 14% 9% 15%
Computer 9% 8% 9%
Table 35: Males/fFemales diseases
Type of diseases Adult Male Adult Female Total
6.1.1 Mild diarrhea 48% 52% 433
6.1.2 Severe diarrhea 52% 48% 227
6.1.3 Eye irritation/diseases 48% 52% 483
6.1.4 Skin diseases ( e.g. scabies, ringworm,) 45% 55% 425
6.1.5 Colds, cough, respiratory ailments 49% 51% 912
6.1.6 Headache/influenza 45% 55% 862
6.1.7 Cardio-vascular diseases, hypertension 38% 62% 391
6.1.8 Typhoid fever, cholera/dysentery 46% 54% 317
6.1.9 Hemorrhagic dengue fever 51% 49% 186
47% 53% 4236
2. Stakeholders consultation
Table 36: Stakeholders Consultation
Banteay Meanchey
Date Location Purpose of meeting Number of Participants
29-09-2019
Banteay Meanchey/Serei Sophon
kick of meeting with Banteay Meanchey Provincial Administration (PA)
16
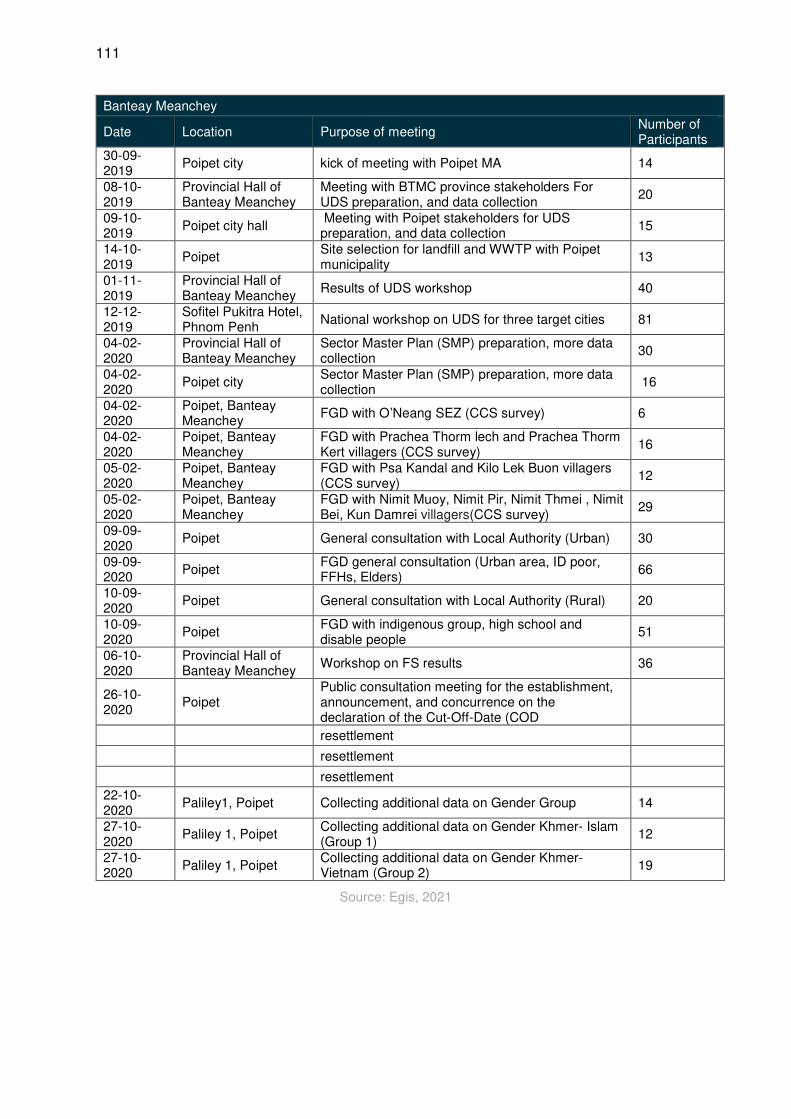
111
Banteay Meanchey
Date Location Purpose of meeting Number of Participants
30-09-2019
Poipet city kick of meeting with Poipet MA 14
08-10-2019
Provincial Hall of Banteay Meanchey
Meeting with BTMC province stakeholders For UDS preparation, and data collection
20
09-10-2019
Poipet city hall Meeting with Poipet stakeholders for UDS preparation, and data collection
15
14-10-2019
Poipet Site selection for landfill and WWTP with Poipet municipality
13
01-11-2019
Provincial Hall of Banteay Meanchey
Results of UDS workshop 40
12-12-2019
Sofitel Pukitra Hotel, Phnom Penh
National workshop on UDS for three target cities 81
04-02-2020
Provincial Hall of Banteay Meanchey
Sector Master Plan (SMP) preparation, more data collection
30
04-02-2020
Poipet city Sector Master Plan (SMP) preparation, more data collection
16
04-02-2020
Poipet, Banteay Meanchey
FGD with O’Neang SEZ (CCS survey) 6
04-02-2020
Poipet, Banteay Meanchey
FGD with Prachea Thorm lech and Prachea Thorm Kert villagers (CCS survey)
16
05-02-2020
Poipet, Banteay Meanchey
FGD with Psa Kandal and Kilo Lek Buon villagers (CCS survey)
12
05-02-2020
Poipet, Banteay Meanchey
FGD with Nimit Muoy, Nimit Pir, Nimit Thmei , Nimit Bei, Kun Damrei villagers(CCS survey)
29
09-09-2020
Poipet General consultation with Local Authority (Urban) 30
09-09-2020
Poipet FGD general consultation (Urban area, ID poor, FFHs, Elders)
66
10-09-2020
Poipet General consultation with Local Authority (Rural) 20
10-09-2020
Poipet FGD with indigenous group, high school and disable people
51
06-10-2020
Provincial Hall of Banteay Meanchey
Workshop on FS results 36
26-10-2020
Poipet Public consultation meeting for the establishment, announcement, and concurrence on the declaration of the Cut-Off-Date (COD
resettlement
resettlement
resettlement
22-10-2020
Paliley1, Poipet Collecting additional data on Gender Group 14
27-10-2020
Paliley 1, Poipet Collecting additional data on Gender Khmer- Islam (Group 1)
12
27-10-2020
Paliley 1, Poipet Collecting additional data on Gender Khmer-Vietnam (Group 2)
19
Source: Egis, 2021

112
3. City Comprehensive Survey and Social surveys (separated files)
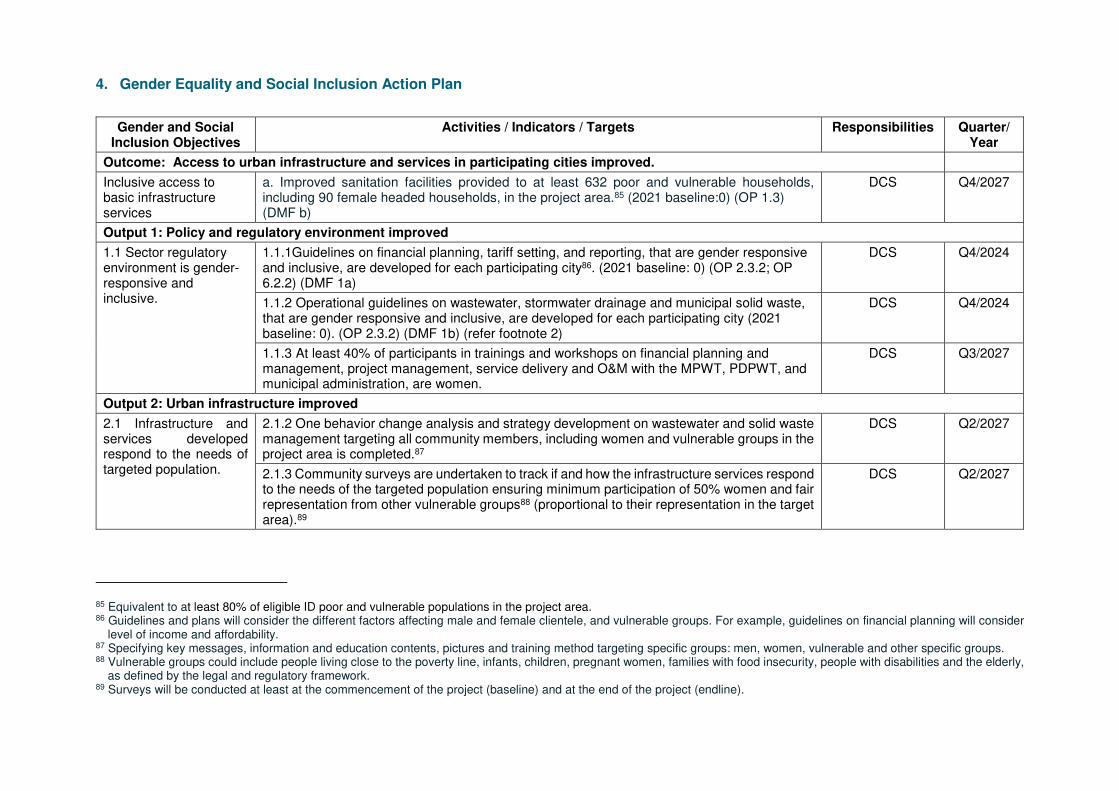
4. Gender Equality and Social Inclusion Action Plan
Gender and Social Inclusion Objectives
Activities / Indicators / Targets Responsibilities Quarter/ Year
Outcome: Access to urban infrastructure and services in participating cities improved.
Inclusive access to basic infrastructure services
a. Improved sanitation facilities provided to at least 632 poor and vulnerable households, including 90 female headed households, in the project area.85 (2021 baseline:0) (OP 1.3) (DMF b)
DCS Q4/2027
Output 1: Policy and regulatory environment improved
1.1 Sector regulatory environment is gender-responsive and inclusive.
1.1.1Guidelines on financial planning, tariff setting, and reporting, that are gender responsive and inclusive, are developed for each participating city86. (2021 baseline: 0) (OP 2.3.2; OP 6.2.2) (DMF 1a)
DCS
Q4/2024
1.1.2 Operational guidelines on wastewater, stormwater drainage and municipal solid waste, that are gender responsive and inclusive, are developed for each participating city (2021 baseline: 0). (OP 2.3.2) (DMF 1b) (refer footnote 2)
DCS Q4/2024
1.1.3 At least 40% of participants in trainings and workshops on financial planning and management, project management, service delivery and O&M with the MPWT, PDPWT, and municipal administration, are women.
DCS Q3/2027
Output 2: Urban infrastructure improved
2.1 Infrastructure and services developed respond to the needs of targeted population.
2.1.2 One behavior change analysis and strategy development on wastewater and solid waste management targeting all community members, including women and vulnerable groups in the project area is completed.87
DCS Q2/2027
2.1.3 Community surveys are undertaken to track if and how the infrastructure services respond to the needs of the targeted population ensuring minimum participation of 50% women and fair representation from other vulnerable groups88 (proportional to their representation in the target area).89
DCS Q2/2027
85 Equivalent to at least 80% of eligible ID poor and vulnerable populations in the project area. 86 Guidelines and plans will consider the different factors affecting male and female clientele, and vulnerable groups. For example, guidelines on financial planning will consider
level of income and affordability. 87 Specifying key messages, information and education contents, pictures and training method targeting specific groups: men, women, vulnerable and other specific groups. 88 Vulnerable groups could include people living close to the poverty line, infants, children, pregnant women, families with food insecurity, people with disabilities and the elderly,
as defined by the legal and regulatory framework. 89 Surveys will be conducted at least at the commencement of the project (baseline) and at the end of the project (endline).
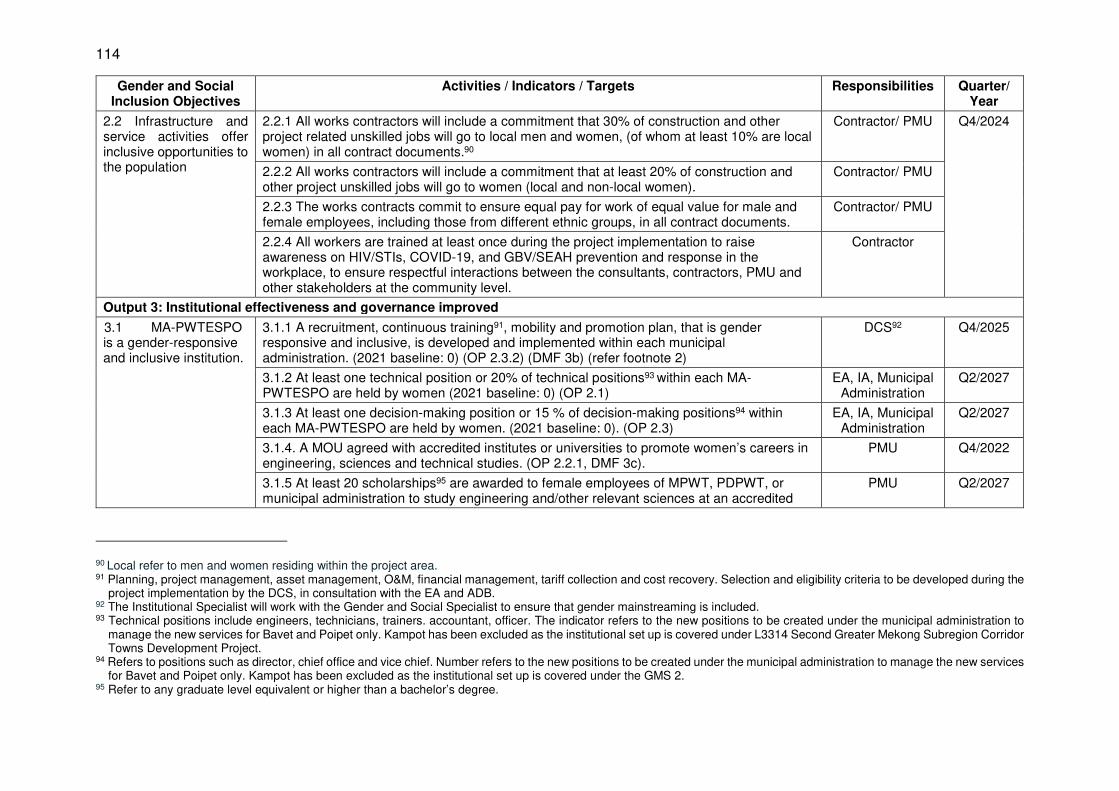
114
Gender and Social Inclusion Objectives
Activities / Indicators / Targets Responsibilities Quarter/ Year
2.2 Infrastructure and service activities offer inclusive opportunities to the population
2.2.1 All works contractors will include a commitment that 30% of construction and other project related unskilled jobs will go to local men and women, (of whom at least 10% are local women) in all contract documents.90
Contractor/ PMU Q4/2024
2.2.2 All works contractors will include a commitment that at least 20% of construction and other project unskilled jobs will go to women (local and non-local women).
Contractor/ PMU
2.2.3 The works contracts commit to ensure equal pay for work of equal value for male and female employees, including those from different ethnic groups, in all contract documents.
Contractor/ PMU
2.2.4 All workers are trained at least once during the project implementation to raise awareness on HIV/STIs, COVID-19, and GBV/SEAH prevention and response in the workplace, to ensure respectful interactions between the consultants, contractors, PMU and other stakeholders at the community level.
Contractor
Output 3: Institutional effectiveness and governance improved
3.1 MA-PWTESPO is a gender-responsive and inclusive institution.
3.1.1 A recruitment, continuous training91, mobility and promotion plan, that is gender responsive and inclusive, is developed and implemented within each municipal administration. (2021 baseline: 0) (OP 2.3.2) (DMF 3b) (refer footnote 2)
DCS92 Q4/2025
3.1.2 At least one technical position or 20% of technical positions93 within each MA-PWTESPO are held by women (2021 baseline: 0) (OP 2.1)
EA, IA, Municipal Administration
Q2/2027
3.1.3 At least one decision-making position or 15 % of decision-making positions94 within each MA-PWTESPO are held by women. (2021 baseline: 0). (OP 2.3)
EA, IA, Municipal Administration
Q2/2027
3.1.4. A MOU agreed with accredited institutes or universities to promote women’s careers in engineering, sciences and technical studies. (OP 2.2.1, DMF 3c).
PMU Q4/2022
3.1.5 At least 20 scholarships95 are awarded to female employees of MPWT, PDPWT, or municipal administration to study engineering and/other relevant sciences at an accredited
PMU Q2/2027
90 Local refer to men and women residing within the project area. 91 Planning, project management, asset management, O&M, financial management, tariff collection and cost recovery. Selection and eligibility criteria to be developed during the
project implementation by the DCS, in consultation with the EA and ADB. 92 The Institutional Specialist will work with the Gender and Social Specialist to ensure that gender mainstreaming is included. 93 Technical positions include engineers, technicians, trainers. accountant, officer. The indicator refers to the new positions to be created under the municipal administration to
manage the new services for Bavet and Poipet only. Kampot has been excluded as the institutional set up is covered under L3314 Second Greater Mekong Subregion Corridor Towns Development Project.
94 Refers to positions such as director, chief office and vice chief. Number refers to the new positions to be created under the municipal administration to manage the new services for Bavet and Poipet only. Kampot has been excluded as the institutional set up is covered under the GMS 2.
95 Refer to any graduate level equivalent or higher than a bachelor’s degree.

115
Gender and Social Inclusion Objectives
Activities / Indicators / Targets Responsibilities Quarter/ Year
institution to advance their careers in the water and sanitation sector (2021 baseline: 0). (OP 2.2.1) (DMF 3d)
Project Management and Gender-Specific Activities:
4.1 A Gender and Social Specialist is engaged as part of the consulting team involved in the design (DCS) and management of the project. 4.2 At least one training session on GESIAP is given to the project teams (PDPWT and municipal administration staff) in each city. 4.3 Collection of sex-disaggregated and gender and target groups-related information relevant to the DMF and GESIAP is integrated in the overall project
performance monitoring system and reports. 4.4 A focal point(s) from the MPWT gender committee will be included in the GESIAP implementation and monitoring activities. 4.5 Regular communication about the project is provided to stakeholders.
DCS = Design and Construction Supervision Consultant; DMF = design and monitoring framework ; EA = Executing Agency; IA = Implementing Agency; MA-
PWTESPO = Municipal Administration-Public Works Transport Environmental Sanitation Public Order Office; MPWT = Ministry of Public Works and Transport ; MOU =
memorandum of understanding; O&M = operations and maintenance; PDPWT = Provincial Department of Public Works and Transport ; PMC: Project Management Consultant;
Q = quarter.


Volume 15 Social Development, Poverty and Gender Plan
BAVET
Feasibility Study
CAM: LIVABLE CITIES INVESTMENT PROJECT March 2022

Volume 15 Social Development, Poverty and Gender Plan
BAVET Feasibility Study
CAM: LIVABLE CITIES INVESTMENT PROJECT March 2022

REVISION HISTORY
Document Reference TA9554-CAMTO3-BAV-FST-SO-001
D 15/03/2022 Final report Jean Roussillon Sophanara
Taing Benjamin
Biscan
C 03/06/2021 Draft Final report – 3rd
Submission Diane Caroen / Ratanak Houk
Jean Roussillon
Benjamin Biscan
B 19/12/2020 Draft Final report – 2nd
Submission Diane Caroen / Ratanak Houk
- Benjamin
Biscan
A 07/11/2020 Draft Final report – 1st
Submission Diane Caroen / Ratanak Houk
- Benjamin
Biscan
Rev Date Description Written by Checked by Approved
by
This Consultant’s Report was prepared under TA 9554-REG Southeast Asia Urban Services Facility and co-financed by ADB and ADB-administered trust funds: the Project Readiness Improvement Trust Fund with funding from the Nordic Development Fund; and the Sanitation Financing Partnership Trust Fund under the Water Financing Partnership Facility. The views expressed in this report are those of the authors and do not necessarily reflect the views and policies of the funders or ADB.

ABBREVIATIONS
AAGR – Average Annual Growth Rate
ADB – Asian Development Bank
AH – Affected Households
AP – Affected Peoples
Capex – Capital expenditure
CBP – Capacity Building Program
CCS – Comprehensive City Survey
CH4 – Methane
CO2 – carbon dioxide
COD – Cut-off date
COI – Corridor Of Impact
EA – Executing Agency
EIA – Environmental Impact Assessment
EIRR – Economic Internal Rate of Return
EM – Ethnic Minorities EMP – Environmental management plan
FA – Financial analysis
FCDI – Financing Charges incurred during Implementation
FGD – Focus Group Discussions FHH – Household headed by women
FIRR – Financial Internal Rate of Return
FNPV – Financial Net Present Value
GAP – Gender Action Plan GDP – Gross domestic product
GDR – General Department of Resettlement
GRM – grievance redress mechanism
HH – Household ICT – Information and communication technology
IDF – Intensity, Duration, and Frequency
IEE – Initial Environmental Examination
IEIA – initial Environmental Impact Assessment
IOL – Inventory Of Losses
IP – Indigenous Peoples
IR – Involuntary Resettlement
KII – Key informant interviews
KR – Riel
LCIP – Livable Cities Investment Project
MEF – Ministry of Economy and Finance
MLMUPC – Ministry of Urban Planning and Construction
MP – Master plan
MPWT – Ministry of Public Works and Transport
MSW – Municipal Solid Waste
N2O – Nitrous oxide
O&M – Operation and Maintenance
OCR – ordinary capital resources loan
Opex – Operational expenditure
PA – Provincial Administration PDPWT – Provincial Department of Public Works and Transport
PIB – Public Information Brochure
PMU – Project Management Unit
PPP – Private Public Partnership
PSP – Private sector participation
PWTESPO – Public Works & Transport, Environmental, Sanitation, and Public Order Office
RGC – Royal Government of Cambodia
RSIV – Rectangular Strategy […] Phase IV
SDG – Sustainable Development Goals
SES – Socio-Economic Survey
SEZ – Special Economic Zones
SW – Stormwater
SWM – Solid waste management TRTA – Transactional Technical Assistance
UXO – Unexploded Ordnance
WACC – Weighted Average Cost of Capital
WTP – Willingness To Pay
WW – Wastewater
WWTP – Wastewater treatment plant

CONTENTS
Page
EXECUTIVE SUMMARY
I. INTRODUCTION 1
1. Rationale of the project 1
2. Project location 1
3. Description of the project 2
4. Safeguards analysis (summary) 6
II. POLICIES AND INSTITUTIONAL ARRANGEMENTS 8
1. Policies and legislative framework 8
2. Institutional arrangements 10
3. Regulation and enforcement 11
III. SOCIO-ECONOMIC PROFILE AND INDICATORS 14
1. Social development and poverty 14
2. Profile of key stakeholders 21
IV. BENEFICIARY PROFILE 32
1. Methodology 32
2. Data on the head of the household 35
3. Characteristics of beneficiary households 36
4. Livelihood, poverty, and hardship 37
5. Households and water supply 38
6. Households and sanitation 38
7. Households and stormwater drainage 40
8. Households and solid waste management 42
9. Consumer perceptions 44
10. Private sector 45
11. Civil society organizations 47
V. NEEDS, PREFERENCES, AND DEMANDS OF PROJECT STAKEHOLDERS 48
1. Informal settlement dwellers 48
2. Poor households 48
3. Female-headed households 50
4. Indigenous peoples 52
5. Youth and children 52
6. Persons with disabilities 53
7. Elderly 53
VI. SOCIAL AND POVERTY ANALYSIS 55
1. Rapid urban development but low basic service development 55
2. Addressing existing deficiencies in basic infrastructure 56
3. Impact on poverty reduction 56

4. Impact on health 62
VII. GENDER ASSESSMENT 65
1. Role and status of women 65
2. Gender characteristics in the project area 70
3. Control of resources and access to infrastructure 72
4. Health status 73
5. Gender impact analysis 74
VIII. GENDER EQUALITY AND SOCIAL INCLUSION ACTION PLAN 75
1. Social Approach 75
2. Gender Approach 80
3. Project assurances 81
IX. MONITORING AND REPORTING 83
1. Monitoring poverty and social impacts 83
2. Reporting 83
X. CONSULTATION AND PARTICIPATION 84
1. Consultations were undertaken 84
2. Results of consultations 84
3. Roles of stakeholders in planning, design, and implementation 84
4. Stakeholder participation plan 85
5. Stakeholder communication strategy 91
6. Disclosure 95
XI. CONCLUSIONS AND RECOMMENDATIONS 96
XII. APPENDICES 97
7. Key sex-disaggregated poverty and social statistics and indicators 98
8. Stakeholder consultation 105
9. Social surveys 107
10. Gender Equality and Social Inclusion Action Plan 108

LIST OF FIGURES
Figure 1: Location of main infrastructure proposed - wastewater .......................................... 3 Figure 2: Proposed Infrastructures – Average Slopes ........................................................... 5 Figure 3: Proposed landfill and composting plant location (SWM) ......................................... 6 Figure 4 Comparison between health issues encountered by adult male and adult female in Bavet .................................................................................................................................. 21 Figure 5: Map of poor household fraction identified per village ............................................ 23 Figure 6: Households headed by women per villages ......................................................... 24 Figure 7: Comparison of age pyramids 2003 and 2020, Cambodia ..................................... 28 Figure 8: Mobile data collection strategy ............................................................................. 34 Figure 9: FGD with ID poor people, social survey, Bavet September 2020 ......................... 35 Figure 10: Average monthly income per vulnerability group, 2018, CCS ............................. 38 Figure 11 Location of Households Willing to Pay a Monthly Fee for Wastewater Management ........................................................................................................................................... 40 Figure 12 Comprehensive city survey and flood-prone areas location ................................. 41 Figure 13 Collection Coverage in Bavet, Egis 2020 ............................................................ 42 Figure 14 Monthly willingness to pay - Solid waste management service, Egis 2020 .......... 44 Figure 15: Map of area showing the level of urbanization .................................................... 55

LIST OF TABLES
Table 1: Investment horizon and Design Capacity ................................................................ 3 Table 2: Key statistical information ...................................................................................... 14 Table 3: List of Civil Society Organizations identified in Bavet, 2020 ................................... 29 Table 4: Achieved Sample Size in Bavet ............................................................................. 33 Table 5: Occupation of heads of households in Bavet, 2020 ............................................... 36 Table 6: Households assets, Bavet, 2020 ........................................................................... 36 Table 7: Expenditure profile of households, 2018, Bavet ..................................................... 37 Table 8: Commerce and institutions surveyed in BAVET during the Comprehensive City Survey (CCS) ...................................................................................................................... 45 Table 9: Details of the type of commerce and institutions surveyed in Bavet during the CCS ........................................................................................................................................... 45 Table 10: Satisfaction rate for current urban infrastructure in Bavet for Commerce and Institutions, CCS. ................................................................................................................ 47 Table 11: Analysis of affordability for poor households ........................................................ 49 Table 12: Analysis of affordability for female-headed households ....................................... 51 Table 13: Analysis of affordability for elders head of households ........................................ 54 Table 14: Estimate Human resources required to operate the sewerage system ................ 59 Table 15 Sex Disaggregated data on staff at PDoPWT level, Svay Rieng. .......................... 60 Table 16: Comparison of occupation between male and female heads of households, Bavet ........................................................................................................................................... 70 Table 17: Distribution of expenses in FHHs budget, Bavet, CCS ........................................ 71 Table 18 Staff repartition per position and sexe .................................................................. 73 Table 19 Comparison between percentage of men/women per type of health condition encountered by surveyees over one year. ........................................................................... 73 Table 20: Detailed social and poverty alleviation actions ..................................................... 77 Table 21: Consultation and Participation Plan ..................................................................... 86 Table 22: Stakeholder Communication Strategy ................................................................. 93 Table 23: Disclosure plan .................................................................................................... 95 Table 24: Bavet police minorities data sheet 2020 in value and in % .................................. 98 Table 25: CCS Key disaggregated data .............................................................................. 99 Table 26: Affordability analysis .......................................................................................... 102 Table 27: Households Expenses ....................................................................................... 104 Table 28: Households Occupation .................................................................................... 104 Table 29: Households Assets ............................................................................................ 104 Table 30: List of meeting workshop FGD, and number of participants ............................... 105
LIST OF PICTURES
Picture 1: NGOs/CSOs assessment, Bavet, September 2020 47 Picture 2 Street waste collector interviewed by Egis team, Bavet, June 2020 58 Picture 3 FGD with women in Bavet, October 2020 72
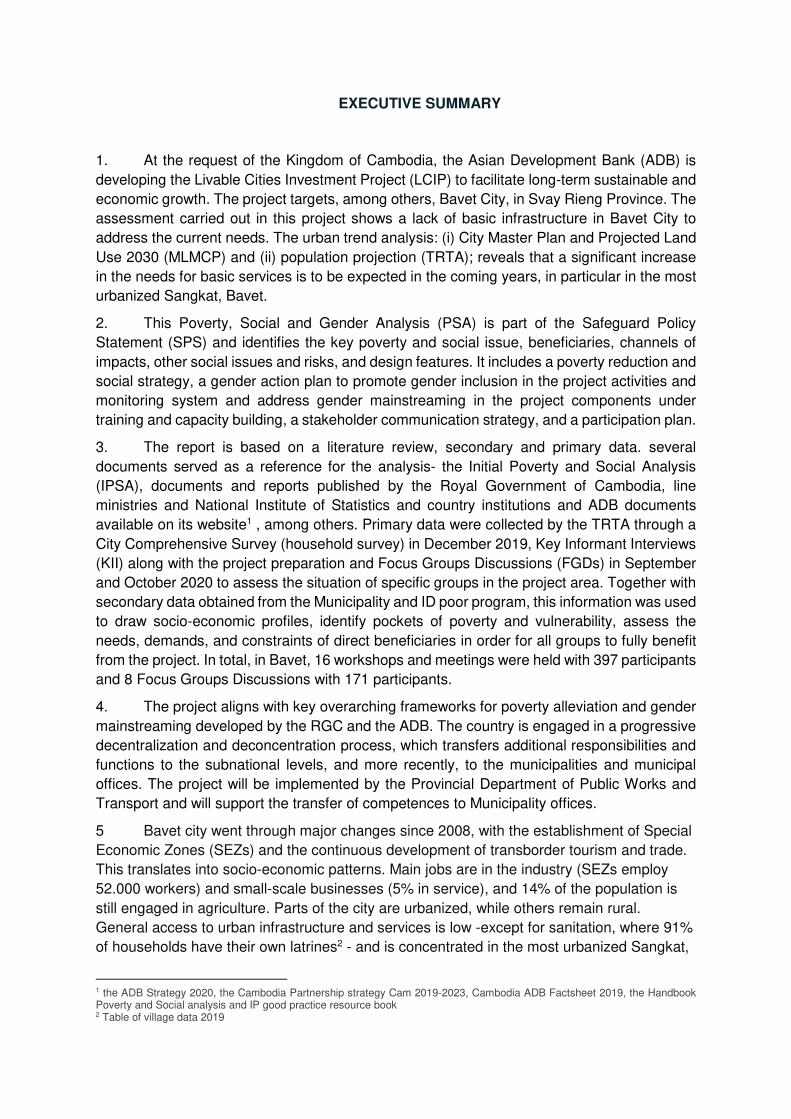
EXECUTIVE SUMMARY
1. At the request of the Kingdom of Cambodia, the Asian Development Bank (ADB) is
developing the Livable Cities Investment Project (LCIP) to facilitate long-term sustainable and
economic growth. The project targets, among others, Bavet City, in Svay Rieng Province. The
assessment carried out in this project shows a lack of basic infrastructure in Bavet City to
address the current needs. The urban trend analysis: (i) City Master Plan and Projected Land
Use 2030 (MLMCP) and (ii) population projection (TRTA); reveals that a significant increase
in the needs for basic services is to be expected in the coming years, in particular in the most
urbanized Sangkat, Bavet.
2. This Poverty, Social and Gender Analysis (PSA) is part of the Safeguard Policy
Statement (SPS) and identifies the key poverty and social issue, beneficiaries, channels of
impacts, other social issues and risks, and design features. It includes a poverty reduction and
social strategy, a gender action plan to promote gender inclusion in the project activities and
monitoring system and address gender mainstreaming in the project components under
training and capacity building, a stakeholder communication strategy, and a participation plan.
3. The report is based on a literature review, secondary and primary data. several
documents served as a reference for the analysis- the Initial Poverty and Social Analysis
(IPSA), documents and reports published by the Royal Government of Cambodia, line
ministries and National Institute of Statistics and country institutions and ADB documents
available on its website1 , among others. Primary data were collected by the TRTA through a
City Comprehensive Survey (household survey) in December 2019, Key Informant Interviews
(KII) along with the project preparation and Focus Groups Discussions (FGDs) in September
and October 2020 to assess the situation of specific groups in the project area. Together with
secondary data obtained from the Municipality and ID poor program, this information was used
to draw socio-economic profiles, identify pockets of poverty and vulnerability, assess the
needs, demands, and constraints of direct beneficiaries in order for all groups to fully benefit
from the project. In total, in Bavet, 16 workshops and meetings were held with 397 participants
and 8 Focus Groups Discussions with 171 participants.
4. The project aligns with key overarching frameworks for poverty alleviation and gender
mainstreaming developed by the RGC and the ADB. The country is engaged in a progressive
decentralization and deconcentration process, which transfers additional responsibilities and
functions to the subnational levels, and more recently, to the municipalities and municipal
offices. The project will be implemented by the Provincial Department of Public Works and
Transport and will support the transfer of competences to Municipality offices.
5 Bavet city went through major changes since 2008, with the establishment of Special
Economic Zones (SEZs) and the continuous development of transborder tourism and trade.
This translates into socio-economic patterns. Main jobs are in the industry (SEZs employ
52.000 workers) and small-scale businesses (5% in service), and 14% of the population is
still engaged in agriculture. Parts of the city are urbanized, while others remain rural.
General access to urban infrastructure and services is low -except for sanitation, where 91%
of households have their own latrines2 - and is concentrated in the most urbanized Sangkat,
1 the ADB Strategy 2020, the Cambodia Partnership strategy Cam 2019-2023, Cambodia ADB Factsheet 2019, the Handbook Poverty and Social analysis and IP good practice resource book 2 Table of village data 2019

Bavet. 16% of households use water from the treater water system, 7% have a solid waste
collection service, and only 5% are connected to the drainage or sewerage system. The
average monthly income per capita is below the national average, and the city reports 7% ID
poor cardholders3.
6. Poor and vulnerable groups in Bavet are mostly made of ID poor, elderly, and female-
headed households (FHH) (12% of the population and up to 25% in some villages). There are
very few informal settlements (11 households in total). Indigenous Peoples (IPs) are
represented by 200 Vietnamese households located in the most urbanized Sangkat along the
border with Vietnam in the project target area. While having the same lifestyle as Khmer
people, since the law on nationality was amended in 2018 and some of them lose Cambodian
citizenship, they tend to participate less in community events. This needs to be addressed by
the project (SPS, SCP, IPP).
7. Vulnerable groups have the same access to the infrastructure and services, when they
are available. In general, they share the same interest as other groups to access improved
urban infrastructure and services for better health and living environment. Besides lower
education levels observed among the oldest and women, the main difference between poor
and vulnerable households and the rest of the population is income, which for the poorest is
72% lower than the average income of the population. The costs of health expenses represent
13% of the total expenses for FHHs and the poorest households when it is only 10% for other
households. The poor and vulnerable are more impacted by poor waste and sanitation, in
terms of the unhealthy living environment, higher incidence of illness due to water-borne
disease, and the weight of health expenditures in their budget.
8. Low income is a constraint to consider in ensuring the affordability and accessibility to
basic urban services. Consultations reveal that poor and vulnerable are willing to access such
services but most are unsure if they can afford it- the costs of urban infrastructure and service
would weigh in relatively more in their budget than for wealthy people, and paying for waste
management and sanitation could be at the expense of other costs (i.e., for food, education).
The results of the consultations suggest that the issue of willingness to pay and affordability
is also intricately linked to low levels of awareness and information, low degree of satisfaction/
trust in the quality of current services (e.g., solid waste collection, drainage) and lack of
incentives to change practices.
9. A comprehensive approach is proposed to ensure inclusive access to urban
infrastructure and services and to optimize the impacts of the infrastructure development,
which includes: (i) creating an enabling environment- including raising awareness and
engaging people in behavior change (knowledge and attitudes)4, (ii) using regulation to guide
people towards proper sanitation, and accelerate changes in practices, (iii) proposing
mechanisms/ prices5 allowing the poor and vulnerable to access and benefit from basic
infrastructure and services and contribute to urban sanitation and public health and (iv)
improving the quality of services delivered by the private and public operators.
3 The percentage of population living below poverty line at national level : 12.9% in 2018 4 A key output of the project will be to develop training and awareness raising on the costs and benefits of proper sanitation and disposal of waste and will promote opportunities to improve the livelihood of the residents, particularly the poor and female population, and rural people. Negative impacts of bad sanitation and hygiene are currently less a problem for population in rural area, and part of the program will be to raise awareness in anticipation of future urbanization. 5 The project incorporates practical pro-poor and social inclusion design features, such as the provision of free-of-charge stormwater drainage, free connection to the sewerage for the poorest, tailored schemes for equitable wastewater service fees , and solid waste collection to adapt to these constraint and ensure equitable and full access to basic services for the whole population..
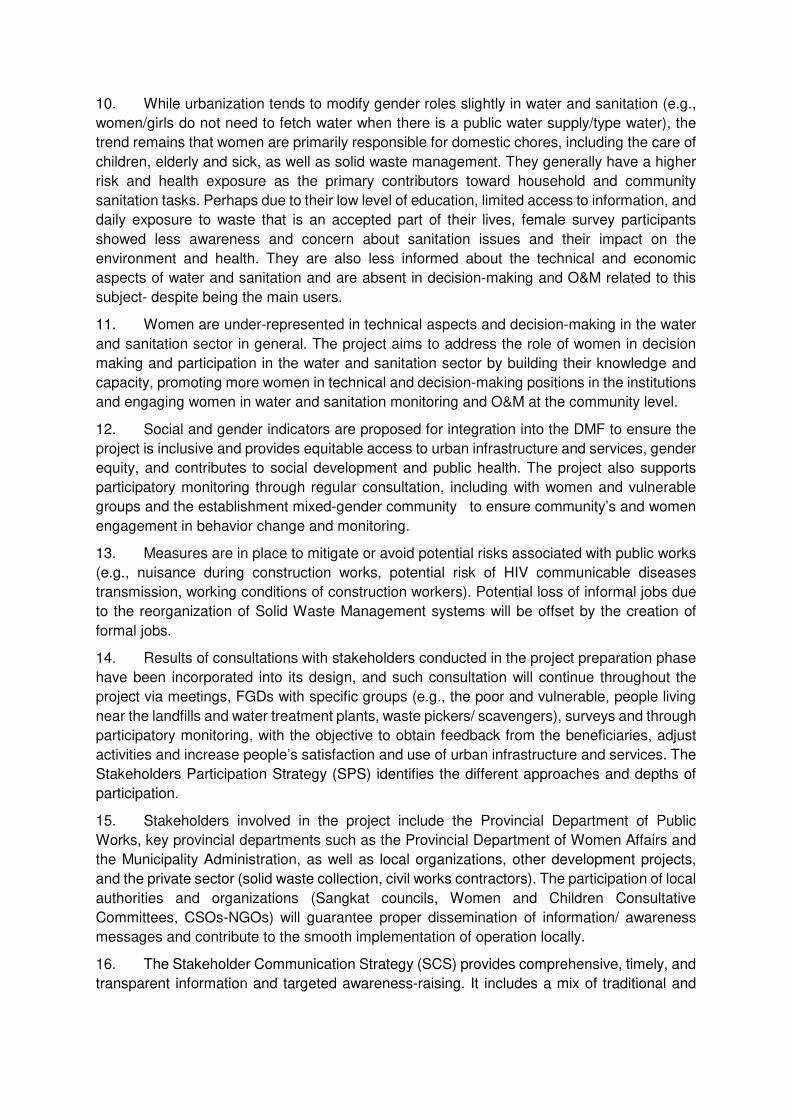
10. While urbanization tends to modify gender roles slightly in water and sanitation (e.g.,
women/girls do not need to fetch water when there is a public water supply/type water), the
trend remains that women are primarily responsible for domestic chores, including the care of
children, elderly and sick, as well as solid waste management. They generally have a higher
risk and health exposure as the primary contributors toward household and community
sanitation tasks. Perhaps due to their low level of education, limited access to information, and
daily exposure to waste that is an accepted part of their lives, female survey participants
showed less awareness and concern about sanitation issues and their impact on the
environment and health. They are also less informed about the technical and economic
aspects of water and sanitation and are absent in decision-making and O&M related to this
subject- despite being the main users.
11. Women are under-represented in technical aspects and decision-making in the water
and sanitation sector in general. The project aims to address the role of women in decision
making and participation in the water and sanitation sector by building their knowledge and
capacity, promoting more women in technical and decision-making positions in the institutions
and engaging women in water and sanitation monitoring and O&M at the community level.
12. Social and gender indicators are proposed for integration into the DMF to ensure the
project is inclusive and provides equitable access to urban infrastructure and services, gender
equity, and contributes to social development and public health. The project also supports
participatory monitoring through regular consultation, including with women and vulnerable
groups and the establishment mixed-gender community to ensure community’s and women
engagement in behavior change and monitoring.
13. Measures are in place to mitigate or avoid potential risks associated with public works
(e.g., nuisance during construction works, potential risk of HIV communicable diseases
transmission, working conditions of construction workers). Potential loss of informal jobs due
to the reorganization of Solid Waste Management systems will be offset by the creation of
formal jobs.
14. Results of consultations with stakeholders conducted in the project preparation phase
have been incorporated into its design, and such consultation will continue throughout the
project via meetings, FGDs with specific groups (e.g., the poor and vulnerable, people living
near the landfills and water treatment plants, waste pickers/ scavengers), surveys and through
participatory monitoring, with the objective to obtain feedback from the beneficiaries, adjust
activities and increase people’s satisfaction and use of urban infrastructure and services. The
Stakeholders Participation Strategy (SPS) identifies the different approaches and depths of
participation.
15. Stakeholders involved in the project include the Provincial Department of Public
Works, key provincial departments such as the Provincial Department of Women Affairs and
the Municipality Administration, as well as local organizations, other development projects,
and the private sector (solid waste collection, civil works contractors). The participation of local
authorities and organizations (Sangkat councils, Women and Children Consultative
Committees, CSOs-NGOs) will guarantee proper dissemination of information/ awareness
messages and contribute to the smooth implementation of operation locally.
16. The Stakeholder Communication Strategy (SCS) provides comprehensive, timely, and
transparent information and targeted awareness-raising. It includes a mix of traditional and

modern communication means, direct communication, mass media, and social media, to
reach the targeted audience more effectively.
17. Urban infrastructure and services have been identified as important contributors
towards inclusive and sustainable development and the development of human capital, social
services, and public governance. The project will improve access to urban service to the
residents of the city. It will improve the attractiveness for more economic investments and
touristic development, given the basic infrastructure would be in place and provide
employment opportunities. To reach its economic, social, and environmental goals, the
development of urban infrastructure and services has to benefit all population groups and
“leave no one behind.” The project encompasses the necessary elements to reach this
objective in terms of consultation and participation of women, poor and vulnerable groups,
targeted interventions (training and awareness-raising, women’s empowerment), and
affordable services.

1
I. INTRODUCTION
1. Rationale of the project
At the request of the Kingdom of Cambodia, the Asian Development Bank (ADB) is
developing the Livable Cities Investment Project (LCIP) to facilitate long-term sustainable and
economic growth.
The project will concentrate on the secondary cities of Bavet, Poipet, and Kampot, due
to their economic potential and location in key trade and tourism zones. It will provide
interventions to improve: (i) the regulatory environment; (ii) the institution and governance
arrangements pertaining to the infrastructure sector; and (iii) the urban infrastructure (with a
focus on water supply, sanitation, solid waste management, and stormwater drainage
sectors).
The Southeast Asia Urban Services Facility (SURF), a transaction technical assistance
(TRTA) facility led by EGIS EAU, supports the project preparation and conducting technical,
financial, economic, institutional, sector policy, legal, regulatory, poverty, social, gender and
safeguard assessments.
The project will contribute to poverty reduction indirectly through developing urban
areas, improving environmental sustainability, development of human capital, and public
governance and is labeled as General Intervention for poverty targeting. The IPSA considers
that the project has no adverse impact on women and/or girls or widen gender inequality and
is categorized as Effective Gender Mainstreaming (EGM) for its potential to contribute to the
promotion of gender equity and/or empowerment of women by providing women’s access to
and use of opportunities, services, resources, assets, and participation in decision making.
2. Project location
Location. Bavet was established as a city in December 2008. It is strategically located
in the Southeast part of Cambodia at the main international border crossing with Viet Nam.
Bavet is the first town in Cambodia along the National Road 1 (NR 1) when travelling from the
border of Viet Nam and is an emerging trading and manufacturing center in the province of
Svay Rieng.
Bavet City is surrounded on the northwest side by Svay Theab District; on the
northeast side by the rural district Gò Dầu in the south of Tây Ninh Province, Southeast region,
Vietnam; in the southeast by Chan Trea District; and southwest by Kampong Rou.
Administrative Units. Bavet consists of 5 quarters (Sangkats): (i) Sangkat Bavet is
composed of 5 villages (Phum); This sangkat is the most urbanized and villages are urban,
except Chrak Leav village which is rural. Other sangkats are all rural (ii) Sangkat Prey
Angkunh - 8 villages; (iii) Sangkat Prasat - 2 villages ; (iv) Sangkat Bati - 5 villages and (v)
Sangkat Chrak Mtes - 15 villages- Prey Phdau village is mixed.

2
3. Description of the project
Project outputs include (i) output 1: policy and regulatory environment improved, (ii)
output 2: urban infrastructure improved, and (iii) output 3: institutional effectiveness and
governance improved.
The project components under output 2 are:
(i) Improved wastewater management systems (pumping stations, network, and treatment plant);
(ii) Improved drainage systems to manage stormwater flows, and;
(iii) Improved SWM systems (including landfill, waste collection & recycling, and transportation vehicles, an upgrade of environmental protection measures and activities to promote waste reduction).
The following sub-chapters provide a brief overview of the proposed infrastructure for
LCIP in Bavet.
Wastewater
There is, at present, no sewer and no wastewater treatment plant. The assessment of
the fecal and non-fecal waste disposal chain, both in rural and urban areas, suggests that 74%
of fecal waste is not managed safely. Within the town center, wastewater is not being
adequately evacuated from urban areas and remains stagnant in urban areas.
Based on the selected scenario for the master plan, a wastewater treatment plant
(WWTP) centralized will serve the built-up area of Bavet and its extension in the medium and
long term horizon. Under LCIP, providing sewerage and connections to the existing population
will be the priority but with capacity required for the long term. It is suggested to start the
implementation with:
(i) Construction of a wastewater treatment plant for the initially connected population;
(ii) Construction of pumping stations to create a transfer chain to the WWTP;
(iii) Construction of sewer pipes designed primarily for the selected existing built-up areas
with some capacity for extensions for future growth.
The map below is displaying the location of proposed pumping stations, force mains,
gravity mains, and wastewater treatment plant.

3
Figure 1: Location of main infrastructure proposed - wastewater
The Project focuses on the future of the sewerage system for the areas delineated by
the zoning 2025 (short term area, within budget allocation) but provides infrastructure
designed for future needs.
Table 1: Investment horizon and Design Capacity
Item LCIP – investment horizon Design Capacity
Sewer Network 2025 – short term or priority area 2040
Pumping Stations & Force mains
Equipment 2030 Civil works 2040
WWTP 2030
Stormwater drainage
Bavet has more than 20 km of the open channel network. The diameter of those
channels varies between 2 and 4 meters and depth from 1 meter to 3 meters. The open
channel network is now considered as the main drainage infrastructure. This network is the
outfall of some drainage/sewerage pipes. Except for the area covered by GMS 1, there is
currently no existing overall strategy and roadmap for the sector. The implementation of the
4
new drainage section does not seem to follow an overall strategy but a patchy logic following
the urban development.
Recurrent floods are reported by inhabitants and local authorities. Main stormwater
channels are operating properly, but their capacity is not sufficient to ensure proper drainage
of the city center.
The proposed drainage network follows the natural topography and discharges at low
points of the road. As much as possible, the few existing cross-drains will be reused to limit
the cost of road cutting and reinstatement.
Runoff rates for built-up areas are based on a 1-in-5-year storm intensity as per the
Road Design Standard (MPWT, 2003). Less intense and more frequent storms are
accommodated. More intense and less frequent storms to be expected every few years will
still cause occasional street flooding and damage to buildings and contents.
In urban areas, in order to minimize the risk of blockage by solid waste and problems
related to resettlement, an underground network (box-culvert) will be prioritized. This choice
will limit urban development constraints on the surface. The depth and width of the proposed
box culvert will allow storage and slow drainage.
In rural areas, the irrigation canal system is well developed in Bavet. It is proposed to
enlarge those existing trapezoidal earthen open-channels. This drainage solution fits with the
actual land use. In the future, and as the urban development will grow, it might be needed to
replace it with box culvert lines. The maintenance will have to be increased to clean the mud
deposit and ensure the drainages lines' capacity.
Figure below shows the types (simple or double) of infrastructure used for each section
considered.

5
Figure 2: Proposed Infrastructures – Average Slopes
Solid Waste Management
It is estimated that 85% of the solid waste generated in Bavet is unsafely managed.
The household collection coverage is only approximately 14%. A large portion of the municipal
solid waste is also left uncollected and is dumped directly in the nearby natural environment
and/or burnt. It is necessary to improve the collection of the whole city.
In terms of collection, door to door collection is preferred in the city center while
centralized collection is suggested in rural areas until these areas are sufficiently developed
to densities which make door-to-door collection cost effective. Source segregation at markets,
with a dedicated centralized collection point, would be an opportunity to increase the sorting
of bio-waste and, therefore, the potential for compost production.
In terms of treatment, a sorting plant and a composting plant have been identified as
the most appropriate technologies to reduce the amount of waste to be landfilled; to control
part of the market for recyclables; to increase revenue potential, and to contribute the climate
change mitigation. Finally, a controlled landfill is proposed as the most appropriate disposal
system for the city to avoid the harmful dumping and burning of waste.

6
Figure 3: Proposed landfill and composting plant location (SWM)
4. Safeguards analysis (summary)
Environment. The project has been classified as category B for the environment. An
Initial Environmental Examination (IEE) and Environmental Management Plan (EMP) has
been prepared (refer to Volume 12), which found the project components are not expected to
cause any irreversible adverse environmental impacts. Project implementation requirements
and methods for environmental mitigation measures, monitoring, reporting, roles and
responsibilities, and grievance redress mechanism, are outlined in the EMP.
Involuntary resettlement. A Basic Resettlement Plan (BRP), refer to Volume 13, has
been prepared based on an outline engineering design and inventory of losses (IOL)/socio-
economic survey (SES). An IR screening was conducted in August - September 2020 and the
Subproject was classified as category "B" for IR impact as it includes land acquisition and
resettlement impacts which were not deemed significant.
The scope of impact for the Corridor of Impact (COI) and all assets within COI were
measured. Based on IOL survey, the project will include overall impact on assets and/or
economic displacement of 73 AHs (271 APs). A total of 5 AHs/21 APs lose privately owned
residential land (698.4 m²), 5 AHs/15 APs will lose privately owned agricultural land (52,427.5
m²) and 9 AHs/24 APs will lose privately owned unused agricultural land (126,107 m²), all of
which are the legal and legalizable owners of the land. Land required for SWM landfill will be
acquired through negotiated land acquisition of 154,000 m². In comparison, 27,323.54 m² of

7
existing public right-of-way (ROW) will be used for the Subproject components, and 200,000
m² of public state land for the wastewater treatment plant (WWTP) site. 12 AHs/39 APs will
lose access to productive agricultural land within the existing ROW (9,972 m²). One AH/3APs
will lose more than 10% of their productive agricultural land.6
Indigenous Peoples. The project was initially categorized as B for its potential impacts
on Indigenous Peoples (IP) communities but, as there no IPs are identified during project
preparation, and the ethnic groups identified in the project area IP are well integrated in the
mainstream society and will benefit from the same advantages as Khmer, it is has been
assessed as category C for the impact on IPs. Refer to Volume 14 for the Indigenous Peoples
Due Diligence Report.
6 Severity of impact will be confirmed at the DMS stage and reflected in the DRP based on the final data collected on all AHs, experiencing major impact and permanent loss of livelihood.
8
II. POLICIES AND INSTITUTIONAL ARRANGEMENTS
1. Policies and legislative framework
Key overarching Framework for poverty alleviation are the medium-term targets of the
government’s Rectangular Strategy, Phase IV (RSIV) for growth and poverty reduction, the
National Strategic Plan on Green Growth, 2013–2030; and the draft National Strategic
Development Plan, 2019–2023, which integrates Cambodia’s Sustainable Development
Goals.
The RSIV is a key government policy that aims to support the Political Platform, as
asserted by the government. It consists of four priority areas focusing on inclusive and
sustainable development to address challenges relating to urbanization and the need to
improve the capacity to respond to the impacts of climate change. The Cambodia Livable
Cities Investment Project (LCIP) aligns with the Rectangular Strategy for Growth,
Employment, Equity, and Efficiency: Building the Foundation Toward Realizing the Cambodia
Vision 2050 Phase IV (RSIV).
The National Strategic Development Plan 2019-2023 (NSDP) has been developed as
the primary tool for driving the political platform and the RSIV, outlining key measures and
actions to enable the country to reach upper-middle-income status by 2030. These collectively
seek to enable progression to Upper Middle-Income and then High-Income Country status
based on socio-economic inclusion and environmental sustainability. The imperative of
securing equitable development and leaving no one behind, and preserving Cambodia’s
natural resource endowment while also addressing the threats posed by climate change, are
fully embedded within the policy stance.
In 2003, Cambodia established the Cambodia Millennium Development Goals (MDG).
Then following the endorsement of the SDGs at the UN General Assembly in late 2015, the
RGC has worked to adapt the goals to the national context and has crafted a fully localized
framework – the Cambodian SDGs 2016-2030 (CSDGs). Among the nine targets and 14
indicators of global SDG 5 to “achieve gender equality and empower all women and girls,” the
Cambodian government has accepted seven targets and 12 indicators into the CSDG
framework (CSDG 5). In the Socio-Economic Policy Agenda (Rectangular Strategy IV) of the
current government, human resource is given the highest development priority. It includes
mainstreaming of gender equity in policy framework and national development plan which will
lessen the gender gap in education, widens women entrepreneurship initiative, reduce
domestic violence and sexual abuse against women and children and uplift social morality.7
In 2011, the RGC formulated the National Social Protection Strategy for the Poor and
Vulnerable. The strategy has four pillars: vocational and skills training; social insurance
(contributory system); social safety nets (noncontributory system); and complimentary social
welfare services. A variety of governmental and non-governmental agencies are
involved in poverty reduction, including the Ministry of Social Affairs, Veterans and Youth
Rehabilitation (MoSVY), which provides social welfare services and assistance to the
vulnerable, including disabled and elderly people, as well as the homeless.
7 SDG 5 Gender equality, Open Development Society, 11 April 2019 https://opendevelopmentcambodia.net/topics/sdg-5-gender-equality/

9
In 2017, “the National Social Protection Policy Framework 2016-2025” (SPPF) was
approved by the Council of Ministers. The goal of this policy framework is to develop a strategic
plan for the Royal Government of Cambodia to ensure income security and reduce the
economic and financial vulnerability of its citizens. It aims at increasing people’s well-being
and solidarity in society and aims at reducing poverty to a maximum extent. The policy
framework aligns, concentrates, and improves the existing social protection
programs/schemes and enhances the efficiency, equity, transparency, and consistency of the
social protection system.
Cambodia has been a member State of the ILO since 1969. It has ratified all 8 of the
core labor standards and a number of other key ILO conventions. The core labor standards
are a set of four fundamental, universal, and indivisible human rights: Freedom from forced
labor, freedom from child labor, freedom from discrimination at work, freedom to form and join
a union, and to bargain collectively. Among key conventions, Cambodia signed in 1999 the
convention on the Worst Forms of Child Labour Convention, the Equal Remuneration
Convention, and the Discrimination (Employment and Occupation) Convention.
Articles 31, and 35 of the Constitution ensure equal rights for women regardless of
race or religion, and Article 45 prohibits discrimination based on gender. A number of laws
have been adopted which protect women’s interests, such as the law on Prevention of
Domestic Violence and Protection of Victims (2005), the law on Suppression of Trafficking in
Humans and Sexual Exploitation (2008), and other measures that ensure gender equality has
been progressively and effectively integrated into the successive National Strategic
Development Plans.
The RGC ratified the Convention on the Elimination of All Forms of Discrimination
Against Women (CEDAW) in 1992 without reservation. CEDAW ensures the civil rights and
legal status of women as follows: their political participation, non-discrimination in education,
employment and in the economic and social activities and the equal rights and obligations of
women and men with regards to the choice of spouse, parenthood, individual rights, and
economic rights.
The Minimum Standards for Essential Services for Women and Girl Survivors of
Gender-Based Violence (GBV) was drafted in 2017 under the second National Action Plan to
prevent Violence Against Women 2014-2018 (NAPVAW II). NAPVAW III 2019-2023 was
officially launched 19th January 2021. The action plan, developed in line with the Rectangular
Strategy-Phase 4 of the Royal Government of Cambodia, sets out four strategies, including 1:
Primary Prevention, 2: Legal Protection and Multi-Sectoral Services, 3: Laws and Strategic
Policies, 4: Monitoring, Review, and Evaluation to prevent, respond and address the violence
against women and girls more effectively and efficiently to reduce any forms of violence
against them to promote equity and social inclusiveness.
The National Strategic Plan for Gender Equality and Women’s Empowerment, Neary
Rattanak represents the guiding policy to promote gender equality and women’s
empowerment in Cambodia. The plan is supported by the Cambodia Gender Assessment,
which provides a periodic analysis of the status of women in all sectors and the changes and
advancements made, as well as the remaining challenges. Neary Rattanak V was approved
in 2020 for the period 2019-2023. Neary Rattanak V was formulated in the framework of
drafting the first National Policy on Gender Equality, and it will become a key strategic plan to
support the implementation of this new national policy in all areas and all levels, especially in
coordination with line ministries/institutions and stakeholders. This includes the following

10
objectives, which must be considered in LCIP. (i) Strengthen the capacity of institutions and
mechanisms at the national and sub-national levels to mainstream a gender-transformative
approach through the process of formulating and implementing laws, policies, strategic plans,
national and sectoral programs at all levels with equity and inclusion. (ii) Promote the
participation of women in decision-making at all levels and the promotion of gender equality
in leadership at all levels.
The Ministry of Civil Service (MCS) issued guidelines for a 20 to 50% quota for women
in the annual recruitment of staff to work in public institutions and a target of 42% women civil
servants and 25 to 30%of women in decision-making positions by 2022.
2. Institutional arrangements
Institutional arrangements. The first major step towards democratic, decentralized
management at local levels was made in 2001, when the law on commune/Sangkat
administrative management (2001) recognized commune and Sangkat as local government
entities, with their own directly elected leadership and legislative and executive powers. In
2008, the organic law- Law on Administrative Management of the Capital, Provinces,
Municipalities, Districts, and Khans- provided the administrative basis for further
decentralization and deconcentration by formalizing the structures and roles of the provincial
level (including provinces and the capital city) as well as a district level (covering provincial
districts as well as khans).8 (Sub-Decree No. 216 ANK.BK, 2009).
In 2019, sub-decree No.182 ANK.BK redefined the functions and structure of municipal
administrations with the aim to promote the efficiency of administration management, public
service delivery, and local development at the municipality level. The ministries, institutions,
and authorities at all levels must also transfer appropriate functions to the municipal
administration. According to the sub-decree, each municipal administration shall have the
following offices and units: Administration and Finance Office; Procurement Unit; Human
Resource Management Office; Planning and Sangkat Support Office; Internal Control Office;
Council Secretary Office, Education, Youth and Sports Office; Land management, Urban
Planning, Construction, and Land Office; Legislation and Local Conflict Mediation Office;
Public Works, Transportation, Hygiene, Environment, and Public Order Office; Economy and
Community Development Office; Social Affairs and Welfare Office; and One Window Service
Office.
According to the sub-decree No.182 Art.24, the Public Works, Transportation,
Hygiene, Environment, and Public Order Office shall act as the secretariat for municipal
administration in public works, transportation, hygiene, environment, and public order tasks
and shall be responsible for the following functions, and a key stakeholder in the Cambodia
Livable Cities Investment Project (LCIP): public works and transportation, solid waste
management in urban areas, management of sewage system and wastewater treatment
system, management of smoke, sound, smell, and atmosphere pollutions, management of
natural protected area systems; tree plantation, care, and management of public gardens,
management of public lighting, management of public parking spaces, public orders, other
tasks as assigned by the municipal government.
8 http://www.localpublicsector.net/profiles/khm1112.htm

11
Gender. The Ministry of Women’s Affairs (MoWA) is in charge of coordinating,
facilitating, and advocating for gender mainstreaming within and across government and
public institutions. Gender Mainstreaming Action Groups (GMAGs) are the mechanism for
gender mainstreaming across sectors. GMAGs have been established since 2005 in all line
ministries and government agencies. Through GMAGs, all line ministries and institutions
develop Gender Mainstreaming Action Plans to guide their actions.
At the sub-national level, MoWA is represented by Provincial and District Offices of
Women’s Affairs (PDoWA and DOWA). Gender Focal Points have been designated in
provincial line departments. They work with line departments, offices, and other relevant units
under their respective jurisdictions. They are responsible for supporting, coordinating, and
conducting research to inform and provide comments to Women and Children Consultative
Committees (WCCCs) on issues concerning women, children, and youth at their own level.
Capital, Provincial, Municipal, District, and Khan Women and Children Consultative
Committees (WCCCs) are the sub-national mechanisms to promote gender equality and the
empowerment of women and children under the jurisdiction of the province and district.
WCCCs are authorized and duty-bound to provide suggestions and recommendations to the
Council, Board of Governors (Capital/Provincial/District/Khan), and other committees on
issues related to gender equity and women and children. MoWA supports PDWA and DOWA
in fulfilling their roles as permanent deputy of the committee, while the Ministry of Interior
supports capacity building and overall functions of the committee.
Commune Committees for Women and Children (CCWCs) are consultative
committees for women’s and children’s issues, such as maternal and child health, community
pre-school, hygiene/sanitation, gender equality, and child protection. The CCWC consists of
the Commune/Sangkat Chief as chair, Second Vice Chief of the Commune/Sangkat as
Deputy, and the Commune Women and Children Focal Point (CWCFP) as permanent
members.
3. Regulation and enforcement
Social. Social Assistance programs that have been implemented include: (1) the
Health Equity Fund (HEF) to provide free health care to families holding IDPoor Cards, (2) the
Food Reserve Program of the National Committee for Disaster and Food Security Programs
of the MEF to prevent food insecurity, (3) nutrition programs for pregnant women and children
to promote maternal and infant health, (4) scholarship programs for primary schools to
encourage school attendance, especially for children from poor households, (5) school feeding
programs to support students’ physical and mental development, and (6) vocational training
programs to promote vocational skills to meet labor market demands;
Social Security schemes that have been implemented include the National Social
Security Fund (NSSF), the National Social Security Fund for Civil Servants (NSSFC), the
National Fund for Veterans (NFV), and the People with Disability Fund (PWDF). These
institutions provide protection with regard to income insecurity, which might result from illness,
employment injury, disability, maternity, or old age, for the targeted groups of civil servants,
veterans, people with disabilities, workers, and employees.

12
The ID Poor Programme9, established in 2006 within the Ministry of Planning, is part
of the Royal Government of Cambodia’s ongoing efforts to reduce poverty and support socio-
economic development throughout the country. Being the RGC’s mandatory standard tool for
targeting pro-poor measures in the country, the program provides regularly updated
information on poor households to a large number of Government and non-governmental
agencies to help them target services and assistance to the poorest and most vulnerable
households. The identification of poor households in Cambodia is implemented in yearly
rounds, covering one-third of the country every year. While initially designed to identify the
rural poor, the identification process has been extended to urban areas in 2014 using an
adapted procedure and questionnaire. The IDPoor Programme’s main objectives are to
reduce duplication of effort and resources by different institutions and organizations in
identifying their target groups for various poverty reduction interventions, and to ensure that
assistance is provided to those households who most need it, and to use lists of Poor
Households that have already been approved and accepted by them in the participatory
identification process that was conducted.
Despite these achievements, it is observed that the coverage of social assistance and
social security is limited and cannot reach certain groups of citizens, like vulnerable
households not included as part of the ID Poor survey, such as newcomers/migrants for
instance. The management of the various schemes has not been concentrated/integrated,
which leads to a lack of effectiveness and efficiency, high cost and inconsistency of benefits
and allowances for various target groups; the coordination mechanism at the policy level and
the monitoring mechanism to ensure effectiveness, accountability, and transparency of the
management and operation of programs/ schemes are still limited, the investment
environment needs to be further improved, and clarification is needed on tax policies related
to the social protection system; the identification and registration of citizens, the identification
of poor and vulnerable people and the registration systems of operators are not yet linked
which might lead to double identification/registration and overlapping provision of benefits.
People have a limited understanding of social protection and its benefits as well as of their
obligations to participate in each scheme or program.10 This legal and policy framework does
not always translate into a coherent and integrated planning process, which clearly
coordinates, integrates, and prioritizes different sectoral goals and targets, with the aim of
promoting sustainable development.
Gender. In line with the strategy National Strategic Plan for Gender Equality and
Women’s Empowerment and policies and legal framework11, most ministries have developed
a Gender Mainstreaming Action Plan12. There are numerous plans and actions taken to
ensure gender equity and to address women’s specific issues across all sectors.
In recent years, progress had been made within the legislative and policy frameworks
regarding women’s rights in areas such as the justice system13, labor, health care14 , and
education15. The Government has introduced budgetary reforms to increase transparency and
9 https://www.idpoor.gov.kh/ 10 National social protection policy framework, 2016-2025, the Royal Government of Cambodia. 11 Policy Brief 1, Gender mainstreaming institutional partnership, and policy context, Cambodian Gender Assessment, 2014 12 Last update mentioned 30 out of 31 line ministries have developed a GMAP in 2018. 13 Legal Aid Policy includes specific provisions to ensure adequate, specialized legal aid forwomen. 14 The Social Assistance pillar of the National Social Protection Policy Framework 2016–2025 focuses on assisting poor and vulnerable people, including people living close to the poverty line, infants, children, pregnant women, families with food insecurity, people with disabilities and the elderly. 15 MoEYS I being implementing the Gender Mainstreaming Strategic Plan 2016-2020, which “promotes gender equality in education, particularly the increased access of women and girls in vulnerable groups to education services through awareness

13
shift towards program budgeting, which was a prerequisite for gender-responsive budgeting.
In 2019 3% of the national budget had been allocated to gender-related activities.
Observers16 mentioned that according to funding constraints, policies of Neary
Rattanak have, for the moment, focused on short-term activities rather than long-term, and
are limited in financial and geographic scope based on outside funding. While mechanisms
are in place in each ministry and in the parliament to address gender mainstreaming, there
are concerns that there are insufficient dedicated human resources and funding from the
national budget to ensure their effectiveness. Without dedicated, long-term funding out of the
national budget, the implementation of gender policies could remain inconsistent and will not
extend to all districts of all provinces in the nation. Moreover, actions at the national level are
not resulting in gender mainstreaming or gender-responsive budgeting at the local level.
Consultation conducted in October 2020 with the provincial departments and the Municipality
in Bavet confirmed this situation: the public departments do not have specific GMAP and use
their ministries’ ones (Provincial Department of Public Works and Transports, Provincial
Department of Labour and Vocational Training, Provincial Department of Social Affairs,
Provincial Department of Women Affairs) and only the Department of Women Affairs had a
budget for GAP ($1,000/year). The Municipality has a GMAP developed for the Municipality
Investment Plan, and a budget of $1,000 is allocated, but the Municipality lacks human
resources.
NGOs also note that one key challenge to measuring the success of Neary Rattanak
is the lack of publicly available sex-disaggregated data, as the Ministry is challenged by the
lack of consistency and cohesion between indicators related to CSDGs and NSDP, for
instance. Last but not least, there is no legal mechanism for enforcing the Constitution in court
and no comprehensive anti-discrimination law that would explicitly prohibit all kinds of
discrimination, including that based on sexual orientation, sex characteristics, gender identity,
and expression, sexual orientation, and religion.
raising, social accountability measures, scholarships and other financial assistance; to increase the participation of women in all areas of education service delivery and management; and promote gender responsive social attitudes”. 16 Submission by The Cambodian NGO Committee on CEDAW (NGO-CEDAW) for the 74th session (21 October to 8 November 2019) of the Committee on the Elimination of Discrimination Against Women (CEDAW) for the review of the Royal Government of Cambodia (RGC)’s Compliance with the Convention on the Elimination of All Forms of Discrimination Against Women

III. SOCIO-ECONOMIC PROFILE AND INDICATORS
1. Social development and poverty
The majority of the poverty and social indexes have significantly improved over the last
12 years in Cambodia. The RGC undertook a voluntary national review of the implementation
of the 2030 agenda. The report was issued in 201917 , and to date, progress has been
promising, with a majority of CSDG targets rated as “ahead” or “on track.” This is especially
true of the six prioritized goals (Education, Decent Work and Growth, Reduced Inequalities,
Climate Action, Peace and Institutions, and SDG Partnerships). Cambodia’s success in
achieving the MDGs and its ambitions for the CSDGs parallel the country’s development story
of rapid post-conflict recovery, dramatic poverty reduction, and its emergence as a high growth
lower middle-income country. The RGC recognizes that despite strong initial progress, much
remains to be done to realize the ambitions of the CSDGs.
The following data, partially extracted from the ADB’s Country Partnership Strategy
2019-2023 for Cambodia (table 1), show that the annual population growth stabilized at 1.4 %
in 2018 and reached 16.4 million people in 2019.
Table 2: Key statistical information
Poverty and Social data Year Year
Population (million) 15.0 [2009] 16.4 [2019]
Population growth (annual % change)
1.8 [2009] 1.4 [2018]
Maternal mortality ratio (per 100,000 live births)
290.0 [2008] 161.0 [2017]
Infant mortality rate (below 1 year/per 1,000 live births)
68.0 [2009] 26.3 [2017]
Life expectancy at birth (years) 66.0 [2009] 69.3 [2017]
Adult literacy (%) (population 15+years)
87.5 [2009] 91.9 [2015]
Primary school gross enrollment (%)
121.9 [2008] 107.8 [2018]
Child malnutrition (% below 5 years old)
40.9 [2010] 32.4 [2014]
Population below poverty line (%) 47.8 [2007] 13.5 [2014]
Population with access to improved water source (%)
71.3 [2012] 79.0 [2017]
Population with access to improved sanitation facilities (%)
36.8 [2012] 65.0 [2017]
Urban population (% of total population)
20.0 [2009] 23.0 [2017]
Source: ADB’s Country Partnership for Cambodia 2019-2023, 2019
17 Cambodia’s voluntary National Review 2019, on the implementation of the 2030 agenda for sustainable development, Royal Government of Cambodia, June 2019

15
The last Provisional Population Totals of the 2019 Census18 taken of all ages gives a
sex ratio of 94.3. Thus the number of women is greater than the number of men, reflecting a
shorter life span for males, 22.1% of households are headed by women.
The share of the urban population has increased from 20% to 23% in 8 years (2009-
2017), though these figures differ from those of the Cambodian Socio-economic survey 2017,
which says that about 31 % of the total population now lives in the urban area compared to
less than 25% in 2008.
The percentage of the population living below the poverty line decreased from nearly
50% in 2007 to less than 15% in 2014, and according to last statistics, this figure dropped to
12.9% in 2018. This percentage is used to measure progress towards SDGs, which is based
on the purchasing power parity only and does not take into consideration other deprivation
aspects.
In 2018, the United Nations Development Program (UNDP) and the Oxford Poverty
and Human Development Initiative proposed an index, which took into consideration health,
education, and living standards – as well as income – which put Cambodia’s poverty rate at
35%. The global Multidimensional Poverty Index (MPI) is an international measure of acute
poverty covering over 100 developing countries. It complements traditional income-based
poverty measures by capturing the deprivations that each person faces at the same time with
respect to education, health, and living standards.
According to ADB’S Country Partnership Strategy 2019-2013, “Poverty has declined,
but vulnerability is widespread and social protection is limited.” Cambodia is still one of the
poorest countries in Asia. Poverty is concentrated in rural areas, with elderly women and
households headed by women being particularly vulnerable. Most Cambodians who are not
in extreme poverty are either moderately poor or economically vulnerable. i.e., people living
just above the poverty line, vulnerable to falling back into poverty when exposed to economic
and other external shocks.
In the context of the global health crisis experienced in 2020 with Covid 19, the UN19
estimates economic growth will contract from 7.1% to -4.1%; poverty will nearly double to
17.6%, and unemployment rise to 4.8%. The effects will spill outwards through lost jobs and
lower-income, hitting the most marginalized people first and worst, although also reaching
populations not traditionally regarded as vulnerable. Mounting fiscal pressures could erode
essential services and protections for poor communities, children and the elderly, and
returning migrants, among others at risk of being left out and left behind.
Income and employment
Employment: Cambodia’s labor force participation rate is high by global standards,
and unemployment is low, with 0.2% of women and 0.3% of men unemployed in 2018,
according to the ILO World Employment and Social Outlook20. In 2019, 32.3% of the
employees in Cambodia were active in the agricultural sector, 29% in industry21 , and 38.7%
18 General population census of the Kingdom of Cambodia 2019, National Institute of Statistics, Ministry of Planning, June 2019 19 UN Cambodia framework for the immediate socio-economic response to COVID-19 Source UNCT Cambodia. Posted 16 Sep 2020 Originally published 16 Sep 20 ILO (2018). World Employment and Social Outlook. Accessed at https://www.ilo.org/wesodata. 21 Cambodia’s garment and footwear factory industry employs approximately 770,000 people, 639,000 women, (83%) and 131,000 men (17%) (GMAC 2018).In the context of Covid 19, it is estimated that 130,000 garment workers have already lost their jobs. CARE Rapid Gender Analysis for COVID-19 Cambodia – July 2020

16
in the service sector. Of the 8 million jobs in Cambodia, 37 percent are wage jobs, many of
which offer higher earnings and more protections to workers. However, the other 63 % of jobs
remain more traditional. Such jobs on family farms or in household enterprises are weakly
integrated into the modern economy and offer workers lower earnings.22
Between 2000 and 2018, female laborers made up about 48% of the total labor forces
and about 80% of the total female population in Cambodia. 30% of the female labor force are
employed in the agricultural sector, 45% in service, and 25% in the industry sectors.23
Women are represented in the informal sector, with a high level of vulnerability. They
are found in the vulnerable forms of informal works, being employed in low and unstable wage
employment, casual work, and risky work environments. Poor and rural women tend to be
overrepresented in domestic work, home-based work, as street vendors, and smallholder
farmers. According to the World Bank data from 202024, 58% of total employed women are in
vulnerable employment, with a high proportion as own-account workers contributing to
domestic care and family work. Even though women own 65% of all businesses in Cambodia,
those businesses are on average smaller and less profitable than businesses run by men, with
only 1.7% registered, compared to 6.6% for male-run businesses. Women-owned businesses
are primarily concentrated at the micro-level in the wholesale and retail trade and services
sector.25
In 2018, 54.69% of the population aged 18-60 in Bavet city was employed. The
employed population increased by 14% from 2010 to 2016, but this declined from 21,387 in
2016 to 19,638 in 2018. Agriculture is an important source of income for the population (14%
of the employed persons), occupying a total of 155.39 km2 or 75.18% of Bavet’s total land
area. In 2018, about 5% of the main occupation was related to the service sector (trading,
tourism, entertainment). The main employment sector is industry due to the presence of SEZs,
which represent 81% of employment. As of 2019, 10 SEZs have been established and are in
operation in Bavet.26
Migration. In 2013, the National Institute of Statistics estimated that nearly one-quarter
of the Cambodian population (approximately 4.1 million individuals) had changed their location
of residence. Single women from rural areas are often forced by a lack of livelihood options to
migrate to Phnom Penh or larger provincial towns to find employment. In 2013, the National
Institute of Statistics estimated that nearly one-quarter of the Cambodian population
(approximately 4.1 million individuals) had changed their location of residence. Overall,
women make for 45% of migrants. 24% migrate to Thaïland or other countries and 50% to
Phnom Penh. They mostly find jobs in factories and services (restaurants/hotels). According
to a 2014 report by UN Women, many females women migrating into Phnom Penh are
engaged in informal employment where they are subjected to low or irregular income and
unstable conditions or at risk of trafficking and exploitation. As an example of their vulnerability,
in the 2009 global downturn, an estimated 30,000 mostly female garment industry jobs were
lost, with employers reportedly pressuring women to waive their benefits and severance.
22 The World Bank, Cambodia’s Future Jobs : Linking to the Economy of Tomorrow (Vol. 2) : Main Report (English), Press release, November 2019. 23 Promoting Economic Empowerment for Women in Marginalized Conditions, OXFAM, February 2020
https://cambodia.oxfam.org/latest/policy-paper/promoting-economic-empowerment-women-in-marginalized-condition 24 https://data.worldbank.org/indicator/ 25 Ibid. Promoting Economic Empowerment for Women in Marginalized Conditions, OXFAM, February 2020 26 Employment, City Socio-Economic Status report 2018

17
In Bavet, male and female heads of households’ primary activity in the CCS is a small
scale business, representing 25% of men’s and 34% of women’s jobs. 12% of females also
work as farmers, against 22% of men, and 7% of men and ?? of women are factory workers
in SEZs. 35% of FHHs are homemakers. None of the FHHs interviewed did have a job as an
employee in the government or NGO/ IOs, whereas 7% of men did. Migration abroad is a
marginal phenomenon (about 1% of households have a member abroad).
Income. Cambodia’s Household Monthly Income per Capita data was reported at KHR
464.000 in 2017. This records an increase from the previous number of KHR 415.000 for
2016.27 The disposable income per capita for female heads of household was about the same
as the disposable income per capita for male heads of households in 2017, with a ratio of
1.0.28 Disposable income per capita was slightly higher for female-headed households than
men in general and in rural areas.
While women earn substantially less than men (income versus disposable income),
the earnings gap narrows with the attainment of upper secondary and tertiary education. In
2014, only 5.3% of women in the labor force had post-secondary education, compared with
8.0% for men.29 In addition, women heading HHs are reported as less likely to be able to obtain
bank loans, making them more susceptible to higher interest rates charged by money
lenders.30
The City Comprehensive Survey collected income data per Household in Bavet, and
the average household monthly income is reported at KHR 1.992.000 in 2018. With an
average of 4.9 persons per household, the average Household income per capita is estimated
at KHR 406.500, below the national average. It is significantly lower for female-headed
households as average income per capita is reported at KHR 352.400 (average five-person
per FHHs).
Expenditure patterns and decision making
In 2017, average monthly consumption in Cambodia was 1,822,000 Riels per
household and 464,000 Riels per capita. “Food and nonalcoholic beverages” represent 43%
of the expenses, “housing, water, electricity” comes next with 19% of the total expenses.
Transportation and health represent respectively 10% and 7% of the total budget.31 Health
represents a smaller share of all expenses in an urban area compared to the rural area.
The results of Cambodia Demographic Health Survey 201432 revealed that women
who earn more than their husbands are more likely to decide how their cash earnings are used
(79 %), compared to women whose cash earnings are the same as those of their husband (69
%). Women who say they earn about the same amount as their husbands are more likely to
27 Cambodia’s Monthly Average Household Income: per Capita data remains active status in CEIC and is reported by National Institute of Statistics. The data is categorized under Global Database’s Cambodia – Table KH.H003: Monthly Household Income: per Capita 28 The ratio of disposable income per capita for household headed by a woman and household headed by a man is calculated as the average disposable income per capita for household headed by a woman dividing by the disposable income per capita for household headed by a man. If the ratio equals 1.0, it denotes a point of balance of the average disposable income between woman household head and man household head. National Institute of Statistics Cambodia, Cambodia Economic Survey 2017. 29 UN Women, 2014 30 Un Women, 2014 31 Cambodia economic survey 2017, National Institute of Statistics 32 Cambodia Demographic and Health Survey 2014 National Institute of Statistics Ministry of Planning Phnom Penh, Cambodia Directorate General for Health Ministry of Health Phnom Penh, Cambodia The DHS Program ICF International Rockville, Maryland, USA September 2015
18
make joint decisions with their husbands about how their cash earnings and those of their
husbands are used (30 % and 42 %, respectively).
Consultation with women in Bavet shows that men are the main breadwinner, women
contributing to 25%-30% of the households’ income. Women are in charge of daily expenses
such as food, energy, solid waste, clothes, healthcare, children's education, transportation,
entertainment, and social events and participate in the decisions for other expenses such as
buying land, house, motorbikes, investment for construction, equipment and loans.
The City Comprehensive survey in Bavet analyzes the average amount of expenses
(total KHR 323.000 per capita) and assesses that food consumption represents nearly one-
third of all expenses (32%), followed by social events/ ceremonies (18%) and healthcare
(10%). Energy represents 8% of expenses (for cooking, electricity, etc.). Compared to national
data, health, however, represents a higher share of all expenses in an urban area compared
to “rural area” in Bavet and weighs heavier on the poorest households and FHHs.
Education
Cambodia had 12,889 schools (including 7,144 primary schools) in 2016/2017.33
Enrollment rates for the 2016/17 school year were 93.5 % for primary, 55.7 % for lower
secondary, and 25.1 % at the upper secondary level.34 Total completion rates fall dramatically
after primary school: from 79.9 % at primary school to 42.6 % at lower secondary and 20.2 %
at upper secondary.35
Across the country, more girls are completing primary school than boys: 83.2 % vs.
76.1 %. In 2017-18, primary Gross Enrolment Rate (GER) was 97.8 % and slightly higher for
girls at 98.1 %. This gender difference also applies to lower and upper secondary
completion. For Secondary School, girls represent 52 % of all students. The gap between
female and male Lower Secondary Study Gross Completion Rate (GCR) is widening in favor
of girls, with Gender Parity Index (GPI) increasing from 0.96 in 2012-13, to 1.21 in 2017-18.36
Across ASEAN, Cambodia shows the biggest increases in the ratio of girls to boys in
primary and secondary school, from among the lowest ratio of 93 and 82 respectively in 2007,
to among the highest in 2015 with 101 and 109 respectively.
It is observed that with one teacher for every 43 students in public primary schools,
Cambodia has the poorest pupil-teacher ratio in ASEAN. 37 ADB Country report provides the
percentage of people above age 15 and over who can read and write: 86.5% for males and
75% for females. The gap between men and women tends to reduce with a higher proportion
of girls attending primary school.
In 2018, the Ministry of Education, Youth and Sport (MoEYS) has instructed all the
ministry’s units and educational institutions to institutionalize and accelerate the effort to
promote women in leadership in the education sector through key specific approaches: 1)
establish a women’s leadership program, 2) integrate female representative into promotion
33 Thach Phanarong. “Education minister: Cambodia has over 11,370 schools”. Agence Kampuchea Press, 19 March 2013. Accessed 16 February 2018. 34 The Phnom Penh Post. “Literacy target of a Sustainable Development Goal”, 11 September 2017. Accessed 25/09/2020 35 Ministry of Education, Youth and Sport. 2017. op. cit. 36 Kingdom of Cambodia Cambodia Report On the occasion of the 25th Anniversary of the Fourth World Conference on Women and the adoption of the Beijing Declaration and Platform for Action (1995) Submitted by Ministry of Women’s Affairs Royal Government of Cambodia Phnom Penh June 2019 37 Ministry of Education, Youth and Sport. 2017. “Public education statistics and indicators 2016–2017”. Accessed 25/09/2020.
19
committees, and 3) accelerate to appoint more women at the management levels. Women are
45 % of all teaching staff.
School closures since March 2020 in the context of Covid 19 have disrupted learning
for 3.2 million students.. The Ministry of Education, Youth and Sport appealed to parents of
students to provide home education in a proper environment and help them obtain more
learning materials during the COVID-19 pandemic. On March 13, 2020, the Ministry put in
motion an e-learning program where students can study free of charge on social media,
including Facebook, YouTube, and the Ministry’s website. According to the Cambodian Covid-
19 joint education needs assessment (March 2021), 70% of the students had utilized at least
one alternative distance learning method, but only 40% had a proper place for studying (table,
chair, light) and only 32% an access to internet (78% have access to a smartphone). The main
barriers for distance learning are first financial (to pay for intrenet/ phnone card), internet
connectivity issues, lack of knowledge content and time of caregivers. Supplementary
measured were utilized by the most vulnerable students to have access to distance learning
such as visiting the teacher. 76% of students who have already dropped out or reported at
high risk of dropping out have either started working or have increased contribution to
household chores compared to 70% of students who reported low or no risk of drop-out.38
In 2018, in Bavet, there were 17 state primary schools. Given 5,333 students and 149
teachers in the state primary schools, the ratio of students to teachers in state primary schools
is 36:1. There were three state secondary schools with 16 classrooms in Sangkat Bavet,
Prasat, and Bati. With 748 students and 35 teachers in the state secondary schools, the ratio
of students with teachers in state secondary schools is 22 in Bavet City. In 2 public high
schools (Bavet and Chrak Mtes sangkats) with 34 rooms, there were 84 teachers for 2,066
students. The student-teacher ratio for most of the school levels, except high school, is far
beyond the international average ratio at one teacher for 43 students.
Health
Cambodia’s healthcare system has seen significant improvements in the last two
decades. Despite this, access to quality care remains problematic, particularly for poor rural
Cambodians. Cambodia has committed to universal health coverage (UHC) and is reforming
its health financing system to align with this goal. Benefits from health spending in the public
sector are generally distributed in favor of the poor, and the distribution reflects the need for
health services.39
Health outcomes have improved substantially, with life expectancy at birth rising from
58 years in 2000 to 69.3 in 2017. Other health indicators, including maternal and infant
mortality, have markedly improved. For example, maternal mortality had declined from 472
per 100 000 live births in 2005 to 161 per 100 000 in 2017. Childhood immunization coverage
has expanded with 81% of children aged 12–23 months immunized against measles in 2016
compared with 52% in 2002. This has contributed to a steep decline in under-5 mortality rates,
dropping from 54 per 1000 live births in 2010 to 26.3 per 1000 in 2017 (ADB’s Country
Partnership for Cambodia 2019-2023).
38 Cambodia covid-19 joint education needs assessment, March 2021 39 https://doi.org/10.1093/heapol/czz011 Health Policy and Planning, Volume 34, Issue Supplement_1, October 2019, Pages i4–i13

20
Despite these achievements, health outcomes in Cambodia still rank among the
poorest in the Southeast Asian region. Malnutrition remains a challenge, with about 32% of
children under 5 (about 500 000 children) stunted and 9% severely stunted (National Institute
of Statistics et al., 2015). The country’s rate of immunization against measles—around 81%
of children aged 12–23 months in 2016—lags behind those of Myanmar (91%), Vietnam
(99%), and Thailand (99%; World Bank, 2018b). Additionally, like many low- and middle-
income countries (LMICs), Cambodia faces a double burden of infectious and non-
communicable diseases. While malaria, tuberculosis, and HIV infections are still widespread,
the growing burden of diabetes, hypertension, and hypercholesterolemia in the adult
population is putting a strain on the health system (Chhoun et al., 2017).40
Cambodia still has a high maternal mortality ratio. Women of reproductive age
experience substantial risks associated with pregnancy and childbirth. The World Bank’s data 41shows that around 167 women died from pregnancy-related causes per 100,000 live births
in 2017 in Cambodia. Women in rural areas and poor households are at greater risk. In 2012,
only 13% of births in rural areas were attended by a doctor, compared to 32% in Phnom Penh.
Cambodia’s maternal death rate remains higher than the regional average, indicating
insufficient quality and coverage of basic health care.
Cambodia is also off track for the MDG target on maternal malnutrition. Malnutrition is
considered the underlying cause in 20% of maternal deaths, accounting for nearly 300
maternal deaths annually in Cambodia.The rate of anemia among pregnant women is 53%.
About 6% of women have a height of fewer than 145 centimeters, which indicates they were
malnourished as children. These women are also likely to give birth to small children.
While there was no data on maternal mortality rate available for Bavet, the Municipality
authority estimates that almost 95% of births are attended by a doctor.
The population in Bavet has access to 2 health centers, one referral hospital, and two
private hospitals.
At the national level, access to improved and safe water (79.0 % in 2017) and
sanitation facilities (65% in 2017) remains below the average for lower-middle-income
economies. Poor access to clean water and sanitation in rural areas is a major contributor to
stunting, along with suboptimal infant feeding practices and low dietary diversity.
In Bavet in 201842, 89.40% of the total population had access to a toilet. In 2020, this
number reached 95%. 2% of the population are still practicing open defecation, and 3%
sharing a neighbor’s toilet. Regarding the situation assessment of Bavet, it is estimated that
74% of the excreta generated is unsafely managed.43 According to the Municipality database
2019, only 16% of HHs use water from the treated water system in Bavet.
Consultation done with women in Bavet in October 2020 show that they are in charge
of domestic chores (cooking, cleaning, cleaning the toilets), taking care of the family (children,
elderly and sick) while husbands are at work, and they manage solid and liquid waste. Data
from the City Comprehensive Survey shows that the percentage of females in charge of
fetching water is up to 49% (against 36% for males) when the only source of water is well.
40 https://doi.org/10.1093/heapol/czz011 Health Policy and Planning, Volume 34, Issue Supplement_1, October 2019, Pages i4–i13 41 https://data.worldbank.org/indicator/ 42 10 Department of Planning, 2018. Socio-Economic Situation Report. 43 Bavet Master Plan, CAM: Livable Cities Investment Project, June 2020

21
As the primary contributors to household and community sanitation tasks, women
generally have a higher risk and health exposure. The traditional separation of gender roles
make them disproportionately affected by the lack of reliable water supply and sanitation
services, and these considerably increase women’s time poverty. Water shortages also
significantly increase the time needed for cooking, cleaning, and caring for both children, the
sick and disabled members.
Lack or low quality of the potable water and sanitation also increase the incidences of
water-borne diseases and thus households ’expenditures on medicine and doctors’ fees. A
comparison between the incidence of disease among adults, male and female, reveals that
women always have the highest percentage of cases, except for severe diarrhea and
cardiovascular diseases (CCS).
Figure 4 Comparison between health issues encountered by adult male and adult female in
Bavet
Source. Egis, CCS
2. Profile of key stakeholders
Key stakeholders presented here include the current and projected population, civil
society representatives and the private sector. The Poverty, social and gender assessment
further brings the focus on vulnerable groups in the population, i.e informal settlements
dwellers, poor households, female headed-households, indigenous people, youth and
children, elderlies and people with disability. Next chapter analyse the profile of the population
and vulnerable groups as beneficiaries of the project.
Based on the population census44 in 2018, the population of Bavet City represented
8.1% of the province’s population. Since 1998, Bavet’s population increased from 30,759 in
1998 to 37,123 in 2008 and 42,546 in 2018. Statistical records comparing the 1998 population
with the 2018 population showed that Sangkat Bati and Sangkat Prey Angkunh had a
44 National Institute of Statistics of Ministry of Planning
0 200 400 600
6.1.1 Mild diarrhea6.1.2 Severe diarrhea
6.1.3 Eye irritation/diseases6.1.4 Skin diseases ( e.g. scabies, ringworm,)
6.1.5 Colds, cough, respiratory ailments6.1.6 Headache/influenza
6.1.7 Cardio-vascular diseases,…6.1.8 Typhoid fever, cholera/dysentery
6.1.9 Hemorrhagic dengue fever
Comparison between diseases for adult males
and females
Adult Female Adult Male
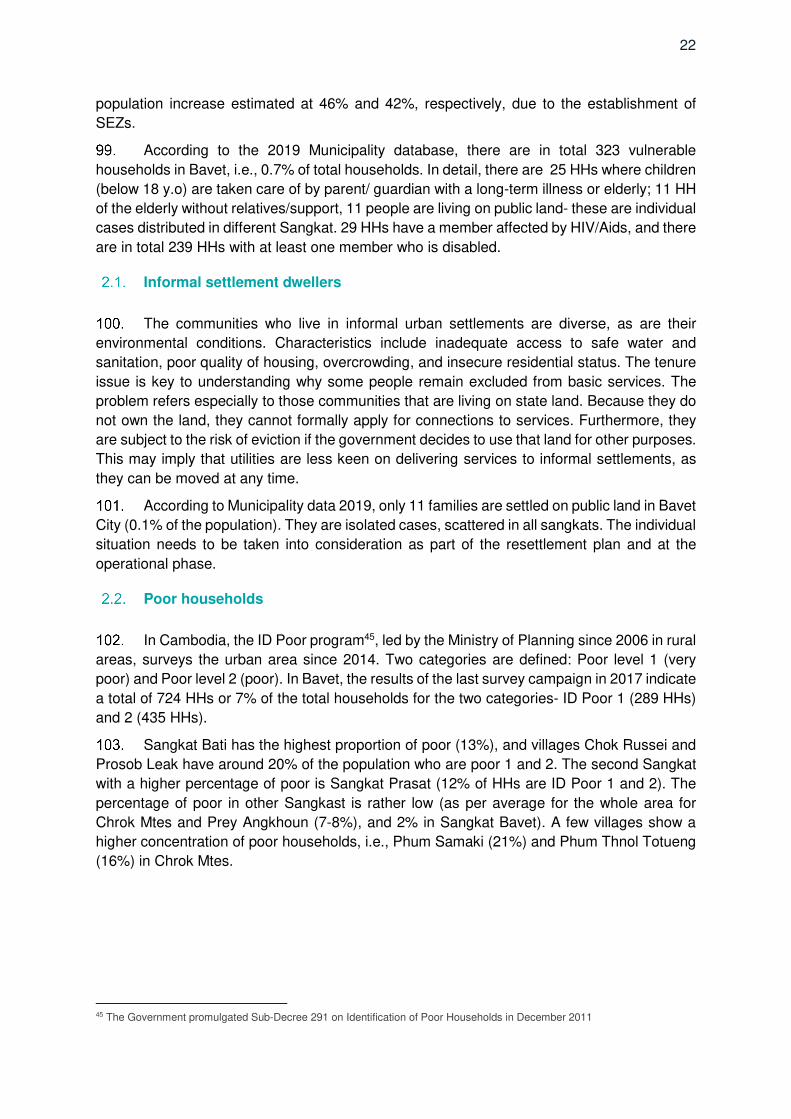
22
population increase estimated at 46% and 42%, respectively, due to the establishment of
SEZs.
According to the 2019 Municipality database, there are in total 323 vulnerable
households in Bavet, i.e., 0.7% of total households. In detail, there are 25 HHs where children
(below 18 y.o) are taken care of by parent/ guardian with a long-term illness or elderly; 11 HH
of the elderly without relatives/support, 11 people are living on public land- these are individual
cases distributed in different Sangkat. 29 HHs have a member affected by HIV/Aids, and there
are in total 239 HHs with at least one member who is disabled.
Informal settlement dwellers
The communities who live in informal urban settlements are diverse, as are their
environmental conditions. Characteristics include inadequate access to safe water and
sanitation, poor quality of housing, overcrowding, and insecure residential status. The tenure
issue is key to understanding why some people remain excluded from basic services. The
problem refers especially to those communities that are living on state land. Because they do
not own the land, they cannot formally apply for connections to services. Furthermore, they
are subject to the risk of eviction if the government decides to use that land for other purposes.
This may imply that utilities are less keen on delivering services to informal settlements, as
they can be moved at any time.
According to Municipality data 2019, only 11 families are settled on public land in Bavet
City (0.1% of the population). They are isolated cases, scattered in all sangkats. The individual
situation needs to be taken into consideration as part of the resettlement plan and at the
operational phase.
Poor households
In Cambodia, the ID Poor program45, led by the Ministry of Planning since 2006 in rural
areas, surveys the urban area since 2014. Two categories are defined: Poor level 1 (very
poor) and Poor level 2 (poor). In Bavet, the results of the last survey campaign in 2017 indicate
a total of 724 HHs or 7% of the total households for the two categories- ID Poor 1 (289 HHs)
and 2 (435 HHs).
Sangkat Bati has the highest proportion of poor (13%), and villages Chok Russei and
Prosob Leak have around 20% of the population who are poor 1 and 2. The second Sangkat
with a higher percentage of poor is Sangkat Prasat (12% of HHs are ID Poor 1 and 2). The
percentage of poor in other Sangkast is rather low (as per average for the whole area for
Chrok Mtes and Prey Angkhoun (7-8%), and 2% in Sangkat Bavet). A few villages show a
higher concentration of poor households, i.e., Phum Samaki (21%) and Phum Thnol Totueng
(16%) in Chrok Mtes.
45 The Government promulgated Sub-Decree 291 on Identification of Poor Households in December 2011

23
Figure 5: Map of poor household fraction identified per village
Female-headed households
The last Provisional Population Totals of the 2019 Census taken over all ages gives a
sex ratio of 94.3. This nationwide, the number of women is greater than the number of men,
reflecting a shorter life span for males. 22.1% of households are headed by women. Women
who are heads of households are mostly widows, and to a lesser extent, separated, divorced,
or never married.
National statistics show that FHHs have similar incomes as male-headed households,
except in urban areas. According to the CCS survey, FHHs’ average monthly income is 12%
lower than for the whole population. Statistics from 201246 also show that at the national level,
a woman head of household has an average of 55% less land than a male head of household.
While women-headed households represent 22% per of total households, only 12% of the
agricultural land of Cambodia (403,000 hectares) is owned by women-headed households.
Women-headed households have more economically inactive family members than
male-headed households; 4.96% of women-headed households have no economically active
46 National Institute of Statistics, Ministry of Planning (2012) Cambodia Socio-Economic Survey. Phnom Penh, Cambodia- extracted from Policy Brief n°9 Rights, vulnerable groups of women and girls, Cambodia Gender Assessment, Ministry of Women Affairs.
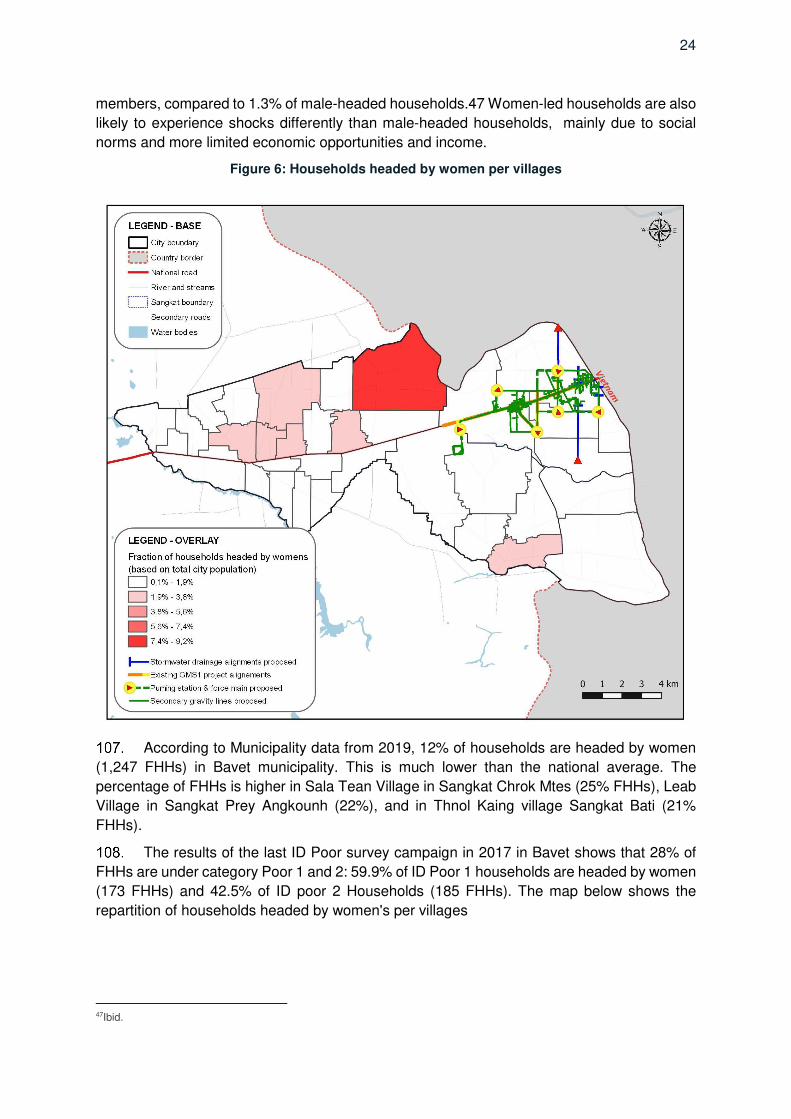
24
members, compared to 1.3% of male-headed households.47 Women-led households are also
likely to experience shocks differently than male-headed households, mainly due to social
norms and more limited economic opportunities and income.
Figure 6: Households headed by women per villages
According to Municipality data from 2019, 12% of households are headed by women
(1,247 FHHs) in Bavet municipality. This is much lower than the national average. The
percentage of FHHs is higher in Sala Tean Village in Sangkat Chrok Mtes (25% FHHs), Leab
Village in Sangkat Prey Angkounh (22%), and in Thnol Kaing village Sangkat Bati (21%
FHHs).
The results of the last ID Poor survey campaign in 2017 in Bavet shows that 28% of
FHHs are under category Poor 1 and 2: 59.9% of ID Poor 1 households are headed by women
(173 FHHs) and 42.5% of ID poor 2 Households (185 FHHs). The map below shows the
repartition of households headed by women's per villages
47Ibid.

25
Indigenous peoples
In Cambodia Socio-Economic Survey 2017, the estimates claim that of the total
population, 97 % were ethnic Khmer, 2 % were Cham. The remainder of the population falls
into small minority groups, including hill tribes, Chinese, and others.
Table 2: Distribution of population by ethnicity and geographical domain 2017
Ethnicity Cambodia Phnom Penh Other urban Other Rural
Khmer 97 95.3 98.1 97.2
Cham 2.4 4 0.9 2.4
Chinese 0.2 0 0.1 0.3
Other 0.3 0.7 0.8 0.1
Total 100 100 100 100
Source: Extract from provisional population census 2019
The Policy of the Royal Government of Cambodia makes a difference between
Indigenous Peoples (IPs) and Ethnic Minorities (EMs). Indigenous peoples (IPs) are defined
as genetically distinct IPs groups living in Cambodia with their own distinctive languages,
cultures, traditions, and customs different from those of the Khmer people, who are the core
nationals. Ethnic Minorities (EMs) are groups of Khmer ethnic groups who have their own
distinctive languages, cultures, traditions, and customs and who are living among the Khmer
people who are core nationals.
The government has formally recognized some 56 minority groups as “Indigenous,”
and the definition accords with that of ADB’s SPS (2009) purposes but excludes ethnic
Vietnamese groups and Cham, who are considered Cambodians and are afforded citizenship
and mostly called Khmer-Islam. There are few official statistics about these groups. Some
data are available at the Police office of each Sangkat.
In Bavet, the main population is Khmer, and there are no Ethnic Minorities/ Indigenous
People reported in the village database (as per RGC’s definition). The presence of IPs was
not obvious during the Comprehensive City survey, but the police datasheet shows the
presence of 2% of Vietnamese people. 194 Vietnamese families out of a total of 208 are
located in Bavet Sangkat (urban area), where the percentage of poor is the lowest.
Field visits and Focus Group Discussion were organized with Vietnamese people in
the Bavet Municipality and in the area with the highest concentration of Vietnamese (Tabeb
Village, Sangkat Bavet). This allows to draw the following profile: aged between 43 to 79 years
old, the respondents were making an income by selling groceries at home, doing motor-taxi,
bicycle mechanic, and home care. On average, each family contained 5 to 7 family members
consisting of husband, wife, children, grandchildren, and elderly. All interviewees indicated
that they had lived in Cambodia since their ancestors. They dress as Cambodians, and their
living condition is the same as Cambodian. For them, Cambodia is their homeland.

26
They used to hold Cambodian citizenship and have family books, but citizenship was
withdrawn from them when the new Law on Nationality was passed in 2018,48 despite living
in Cambodia since birth. They are now living in Cambodia as an immigrant and hold
immigration cards valid for two years to stay in Cambodia. They can become Cambodian
citizens legally after holding an immigration card for seven years.
After the law passed, and as their status changed, Vietnamese ethnic are no longer
invited to participate in social events in Cambodia as before, and they can approach public
services as a migrant only, even though their children go to Cambodian (public) schools as
normal, and they feel no discrimination from the communities. They mostly speak Khmer at
home as well as at school. The younger generation speaks Khmer more than older
Vietnamese, and there is no Vietnamese school in Bavet. They obey the Buddhism religion
and attend the same Pagodas as Khmer people. They can freely conduct traditional events
like Cambodians. There is no threat to them from the local authority.
The 2018 law on Nationality makes them feel a bit distant from Cambodian society,
and it is more difficult to mobilize Vietnamese people for meetings and interviews, as observed
during the organization of FGD.
Youth and children
In Cambodia, youth (15-29 y.o) make up about one-third of the total population. This
represents a significantly young labor force. An estimated 300,000 young Cambodians enter
the labor market every year.49 According to the Youth Multi-dimensional Deprivation Indicator
(Y-MDI), one young person out of five is deprived of two or more well-being dimensions at the
same time, including health, employment, education, and civic participation, while 40% fare
poorly in at least one of these dimensions.50
In 2020, approximately 30.9% of the population in Cambodia were under 14 years of
age. In comparison, approximately 33% of the population in Cambodia were under 14 years
of age in 2011. According to the ID Poor program 2017, out of the 2.36 million people living in
households ranked ID Poor 1 and 2, one third were children. The Cambodia Socio-Economic
Survey 2014 data shows that 11% of children age 5–17 years are economically active.51
Specific demographic data on youth for Bavet is not available.
Persons with disabilities
According to the Cambodian Demographic and health survey 2014, 10% of persons
age five and over have some form of disability. Difficulties in seeing, walking, or climbing stairs,
and concentrating are the most common types of disabilities reported. Only 2% of the
household population suffers from a severe disability (a great degree of difficulty or lack of
48“2018 law on nationality, requirements for citizenship include being a “good moral citizen” with no criminal record; speak, read and write Khmer, have a good knowledge of Cambodian history and be in good health”. The law on nationality provides for foreigners to be prosecuted for illegally obtaining Cambodian identification cards or passports. The law would also punish anyone who illegally assists others to obtain Cambodian citizenship. 49 UNCT’s Common Advocacy Point, 2011 50 OECD Development Centre (2017), “Youth Well-being Policy Review of Cambodia”, EU-OECD Youth Inclusion Project, Paris. 51 UNICEF Cambodia and Division of Data, Research and Policy, UNICEF New York, A Statistical Profile of Child Protection in Cambodia, United Nations Children’s Fund, New York, March 2018.

27
ability to function at all). This indicates that most disabled people experience a moderate level
of disability.
The prevalence of disability increases with age, and women are slightly more likely to
suffer from some level of disability than their male counterparts. There is also a notable
association between disability and education, but there is little difference according to urban
or rural residence.
Living with a disability in Cambodia is associated with an increased risk of poverty.
18.2% of households living with one or more disabled members were under the Poverty line
(NIS 2014), compared to 12.8% of households without a disabled household members. The
literacy rate among the disabled is also lower than the national average (48% against 78%).
Due to their lack of skills, their chance to enter the labor force is also lower. Up to 60% of
people with disabilities could not perform any income-generating activities (NIS 2014), putting
them at risk of monetary poverty. People with disabilities are dependent on other members of
their households, which strains the household’s resources.
In Bavet, according to municipality data 2019, 0.55% of people have a disability (239
persons). They are in the majority disabled from birth or due to an accident. Sangkat Bavet
has the highest proportion of people with disabilities (0.8%), but Sangkat Chrok Mtes has the
highest number of cases (82). Detail per Sangkat and village are provided in appendices 1.1
and 1.2 Bavet village data 2019.
Elderly
The demographic scenario in Cambodia shows the decline in the population aged
under 15 in comparison with the beginning of the century. In 2003, the proportion of the
Cambodian population aged under 15 was further shrinking, making up 29% of the total
population, whereas the proportions of the working-age population and older population in the
total population were increasing, constituting 63% and 8% respectively. This is particularly
striking in the case of the aging dynamics of today's working-age population.
The proportion of older persons in the total population has been increasing at a much
higher rate (from 1998 to 2008 3% annually and from 2008 to 2013, 5 percent/year), and the
trends are projected to continue. From 2020 to 2030, the older population will be increasing
annually at a rate of around 4%, while the annual growth rate of the working-age population
will be just 1%, and the population aged under 15 will be undergoing a negative growth. Aging-
related issues that were non-existent or hardly significant have started to become challenges
to be grappled with. 25% of people interviewed in the project’s Comprehensive City Survey in
Bavet are elders- of an average age of 71.
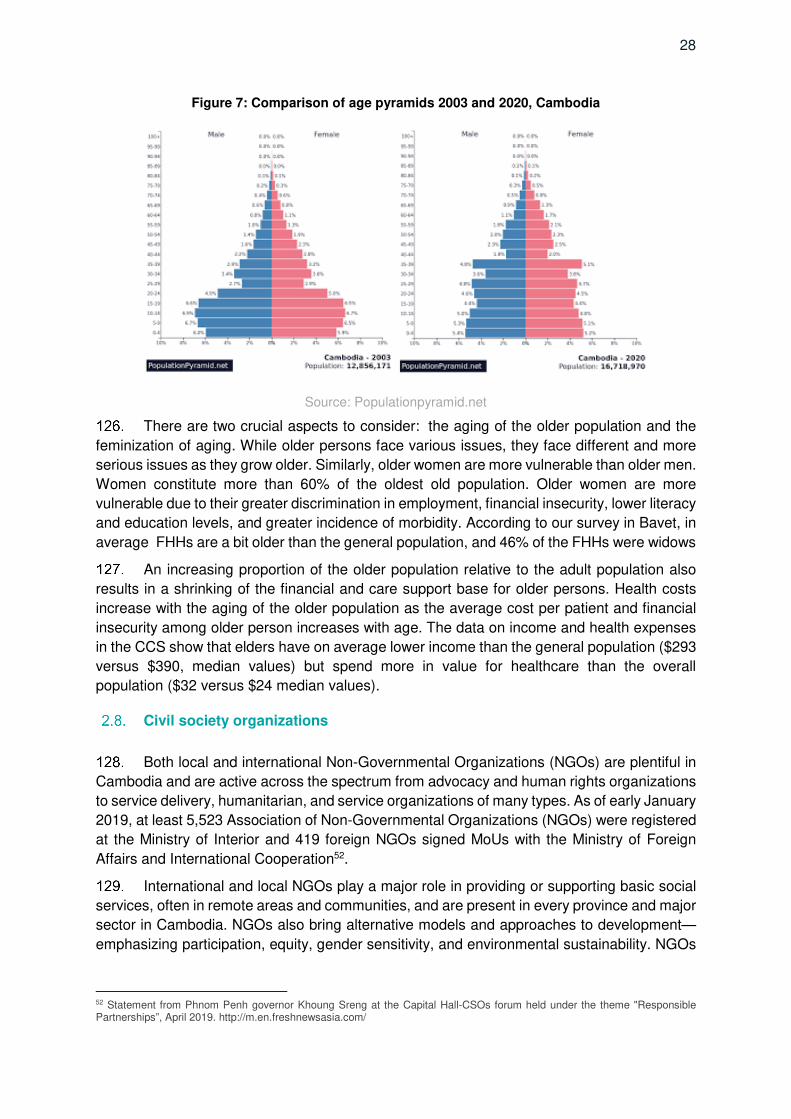
28
Figure 7: Comparison of age pyramids 2003 and 2020, Cambodia
Source: Populationpyramid.net
There are two crucial aspects to consider: the aging of the older population and the
feminization of aging. While older persons face various issues, they face different and more
serious issues as they grow older. Similarly, older women are more vulnerable than older men.
Women constitute more than 60% of the oldest old population. Older women are more
vulnerable due to their greater discrimination in employment, financial insecurity, lower literacy
and education levels, and greater incidence of morbidity. According to our survey in Bavet, in
average FHHs are a bit older than the general population, and 46% of the FHHs were widows
An increasing proportion of the older population relative to the adult population also
results in a shrinking of the financial and care support base for older persons. Health costs
increase with the aging of the older population as the average cost per patient and financial
insecurity among older person increases with age. The data on income and health expenses
in the CCS show that elders have on average lower income than the general population ($293
versus $390, median values) but spend more in value for healthcare than the overall
population ($32 versus $24 median values).
Civil society organizations
Both local and international Non-Governmental Organizations (NGOs) are plentiful in
Cambodia and are active across the spectrum from advocacy and human rights organizations
to service delivery, humanitarian, and service organizations of many types. As of early January
2019, at least 5,523 Association of Non-Governmental Organizations (NGOs) were registered
at the Ministry of Interior and 419 foreign NGOs signed MoUs with the Ministry of Foreign
Affairs and International Cooperation52.
International and local NGOs play a major role in providing or supporting basic social
services, often in remote areas and communities, and are present in every province and major
sector in Cambodia. NGOs also bring alternative models and approaches to development—
emphasizing participation, equity, gender sensitivity, and environmental sustainability. NGOs
52 Statement from Phnom Penh governor Khoung Sreng at the Capital Hall-CSOs forum held under the theme "Responsible Partnerships”, April 2019. http://m.en.freshnewsasia.com/
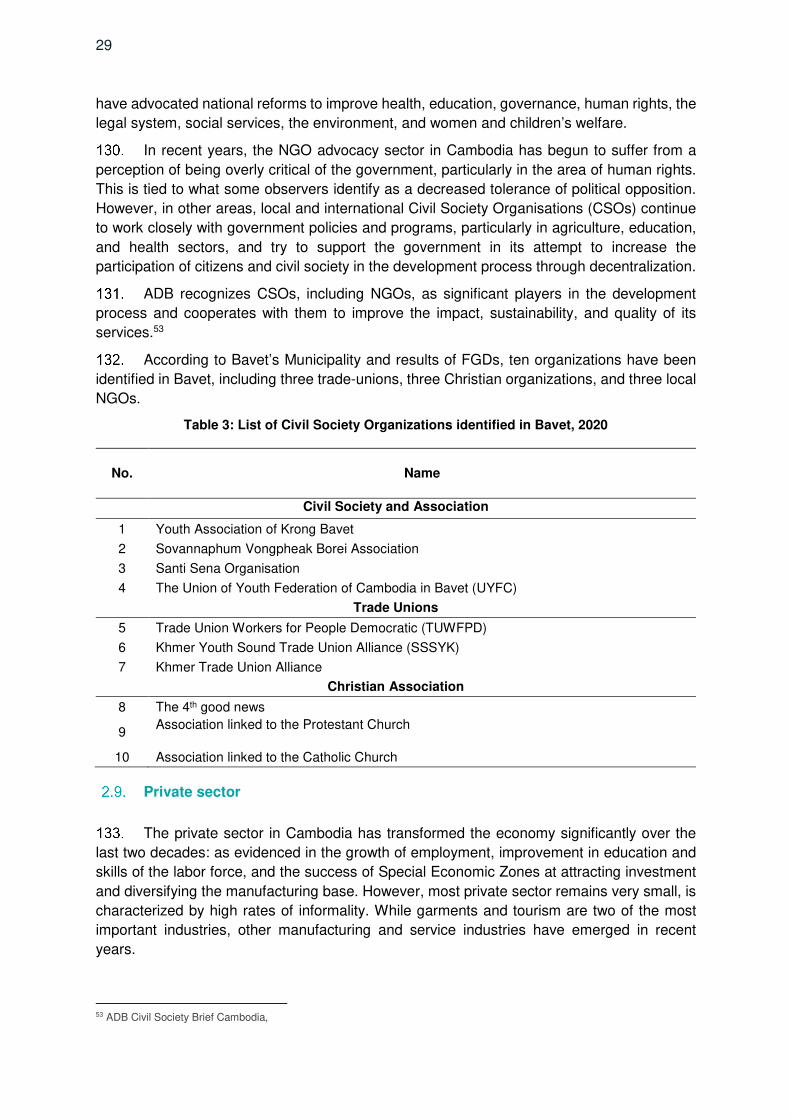
29
have advocated national reforms to improve health, education, governance, human rights, the
legal system, social services, the environment, and women and children’s welfare.
In recent years, the NGO advocacy sector in Cambodia has begun to suffer from a
perception of being overly critical of the government, particularly in the area of human rights.
This is tied to what some observers identify as a decreased tolerance of political opposition.
However, in other areas, local and international Civil Society Organisations (CSOs) continue
to work closely with government policies and programs, particularly in agriculture, education,
and health sectors, and try to support the government in its attempt to increase the
participation of citizens and civil society in the development process through decentralization.
ADB recognizes CSOs, including NGOs, as significant players in the development
process and cooperates with them to improve the impact, sustainability, and quality of its
services.53
According to Bavet’s Municipality and results of FGDs, ten organizations have been
identified in Bavet, including three trade-unions, three Christian organizations, and three local
NGOs.
Table 3: List of Civil Society Organizations identified in Bavet, 2020
No. Name
Civil Society and Association
1 Youth Association of Krong Bavet
2 Sovannaphum Vongpheak Borei Association
3 Santi Sena Organisation
4 The Union of Youth Federation of Cambodia in Bavet (UYFC)
Trade Unions
5 Trade Union Workers for People Democratic (TUWFPD)
6 Khmer Youth Sound Trade Union Alliance (SSSYK)
7 Khmer Trade Union Alliance
Christian Association
8 The 4th good news
9 Association linked to the Protestant Church
10 Association linked to the Catholic Church
Private sector
The private sector in Cambodia has transformed the economy significantly over the
last two decades: as evidenced in the growth of employment, improvement in education and
skills of the labor force, and the success of Special Economic Zones at attracting investment
and diversifying the manufacturing base. However, most private sector remains very small, is
characterized by high rates of informality. While garments and tourism are two of the most
important industries, other manufacturing and service industries have emerged in recent
years.
53 ADB Civil Society Brief Cambodia,
30
The majority of businesses in Cambodia are very small (74% engage only one or two
people). In addition, most are informal (98.8% of businesses with less than ten employees are
not registered)54. According to the Prime Minister, “The Cambodian industry remains weak
as reflected by its simple structure, narrow base and low level of sophistication, while mostly
concentrated in garment, construction, and food processing industries.”55 While these
businesses form a significant part of the economy and provide work for many people, they
tend to be less productive than larger businesses. Smaller and informal businesses also are
less likely to have access to finance, pay less (or no) taxes, and typically do not provide training
for their workers or comply with labor laws and other regulations.56
The government has set targets in the industrial development policy 2015–2025 (IDP)
for increasing business formality and calls for an inclusive approach mobilizing the Public
Sector, development agencies, and the Private Sector as key partners in Cambodia’s
development.
Bavet is strategically located on the border between Cambodia and Vietnam and
benefits from a very dynamic commercial and industrial sector. Due to its strategic location,
Bavet hosts several Special Economic Zones (SEZ) for small and medium-sized
manufacturing industries. In 2019, 10 SEZs were in operation and employed approximately
52,000 workers. In 2018, about 5% of the main occupation was related to the service sector.
The opening of the cross-border trade in 1991 has enabled the growth of trade activities and
a growing influx of migrant workers into the area. The main features of Bavet city center are
large hotels, buildings, and commercial establishments that serve as casinos for gaming and
as recreational centers. Agriculture is still an important source of income for the population
(14% of the employed persons).
The Bavet water supply is managed by several operators: the Khun Development
Company, a private company with authorization license from the Ministry of Industry and
Handicraft (MIH) (from 2017 until 2022), the Sim Pheakdey Company, another private
company, and by SEZ operators for their own needs. The water supply service is financed by
a user-pay arrangement, and billings are issued and collected by private companies Khun,
Sim Pheakdey, and SEZs operators directly to end-users. The tariff guidelines are in the
contract and approved by the government MIH (≈2,000 Riel / m3 for the Khun area). Khun &
Sim Pheakdey, with its own technical and financial resources, handles construction and O&M.
In 2019, the municipality signed a contract with a private company to provide solid
waste management services, HYBRID, for a duration of 5 years. The service is financed by a
user-pay arrangement, and billings are issued and collected by HYBRID. The tariff guidelines
are in its contract and approved by the governing Ministry of Environment. HYBRID is the
owner of the Solid Waste Management assets, including the dumpsite. According to the
Comprehensive City Survey (CCS), households having a direct home collection pay a median
monthly fee of $3.9 ($6.5 on average). For recycling, there are three wholesale junkshops.
They are registered companies. They recycle waste from informal collectors, waste pickers,
and scavengers.
54 Unlocking the potential of the Cambodian private sector, March 2017, prepared by Emerging Markets Consulting for Australian Aid and Mekong Business Initiative 55 Khmer Times, August 26, 2015 56 Unlocking the potential of the Cambodian private sector, March 2017, prepared by Emerging Markets Consulting for Australian Aid and Mekong Business Initiative
31
Related to the private sector involved in sanitation, there is only one emptying services
provider in Bavet. Its main clients are the SEZs and the casinos.
The private sector is not involved in wastewater management, and there is currently
no Waste Water Treatment Plant (WWTP) in Bavet besides the two plants operated by SEZ
operators for their own needs.
The private sector is not involved at all in the stormwater drainage.

32
IV. BENEFICIARY PROFILE
1. Methodology
Secondary data
The consultant collected village data from the Municipality. The data provides updated
(2019) and relevant information at the village, Sangkat, and municipality levels on key social
indicators: population (number of households, number of female-headed households, number
of males/females), their access to basic infrastructures, and report the number of vulnerable
peoples (orphans, the elderly, people living on public land, people with disabilities). That
information is reported in Appendices 1.1 and 1.2 and integrated into the Poverty and Social
Analysis and gender assessment.
The consultants initially investigated the village data obtained from the municipalities
to identify the presence of ethnic groups. Village databases do not report on Cham and
Vietnamese population. The consultant decided to conduct a rapid additional assessment in
July 2020 and collected police minority datasheets in Bavet. These data provide information
about the Vietnamese population that is not available in the village data, the project area with
the presence of Vietnamese are identified. This information, completed with a rapid field
assessment of the situation of the IP communities in the project, FGDs as part of the social
survey, and IPs specific consultation, were used to develop the Indigenous People Plan and
related chapters in other documents. IPs population data are provided in Appendix 1.3
Third source of secondary data used is the ID Poor information obtained from the ID
poor database. It provides for each village the number of households identified under ID poor
one and ID poor two as part of the urban survey in 2017. It also gives an indication of the
gender of the head of households and the location of the household. Data are reported in
Appendix 1.4. This information crossed with municipality and IPs data allows for the
identification of poverty/vulnerability areas.
Primary data
1.2.1. Quantitative data
A Comprehensive City Survey was conducted in December 2019. The subjects to be
surveyed include household (HH) and commercial & Institutions (C&I) in the target location.
The survey report is attached to Appendix 3.1.
The objective of the Survey was to complement the secondary data and to inform the
preparation of the Due Diligence regarding People’s socio-economic status; Household
behavior/habits regarding sanitation facilities and septic tank usage and maintenance;
Wastewater and drainage, and health-related expenses; Affordability and willingness-to-pay
for sanitation improvements; General perceptions against the wastewater and drainage
services; Annual and frequent flood impacts; Solid waste management practices and identify
the exposure, sensitivity, and adaptive capacity of people (by vulnerability sub-groups) living
in the project area; provide information for the selection of appropriate sanitation and drainage
improvements, and determine mechanisms to support household adoption of centralized
systems from predominant septic tank sanitation management methods.
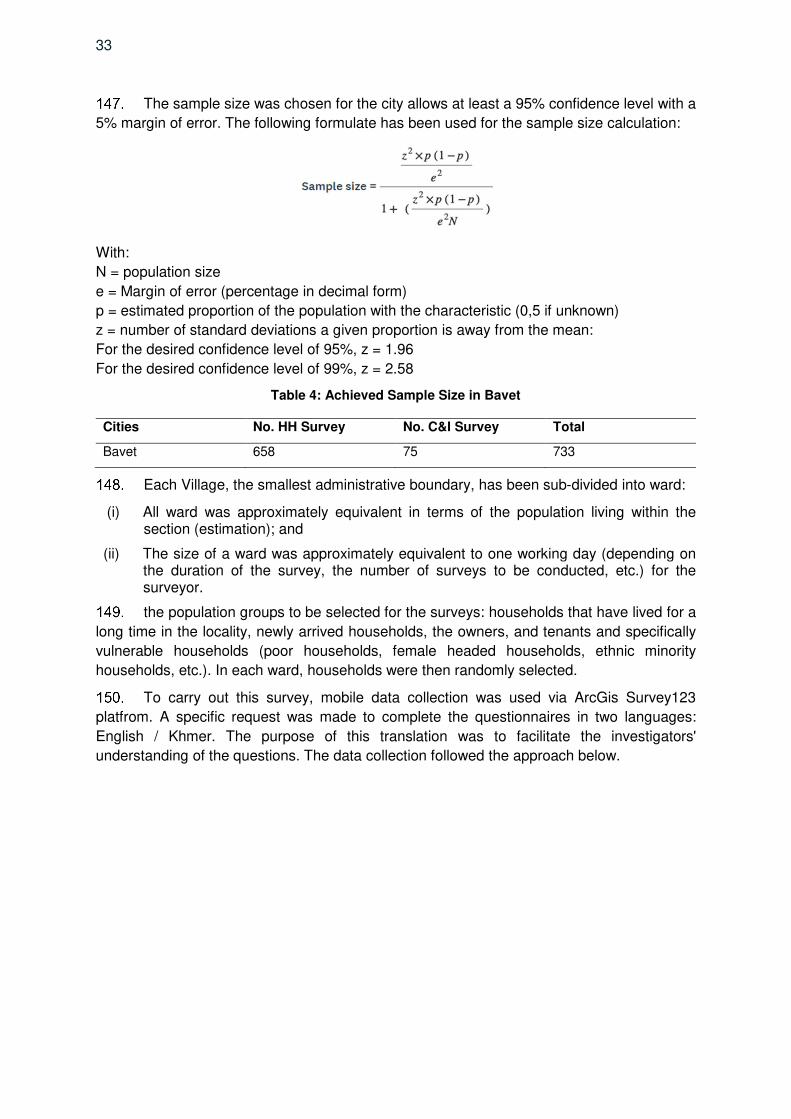
33
The sample size was chosen for the city allows at least a 95% confidence level with a
5% margin of error. The following formulate has been used for the sample size calculation:
With:
N = population size
e = Margin of error (percentage in decimal form)
p = estimated proportion of the population with the characteristic (0,5 if unknown)
z = number of standard deviations a given proportion is away from the mean:
For the desired confidence level of 95%, z = 1.96
For the desired confidence level of 99%, z = 2.58
Table 4: Achieved Sample Size in Bavet
Cities No. HH Survey No. C&I Survey Total
Bavet 658 75 733
Each Village, the smallest administrative boundary, has been sub-divided into ward:
(i) All ward was approximately equivalent in terms of the population living within the section (estimation); and
(ii) The size of a ward was approximately equivalent to one working day (depending on the duration of the survey, the number of surveys to be conducted, etc.) for the surveyor.
the population groups to be selected for the surveys: households that have lived for a
long time in the locality, newly arrived households, the owners, and tenants and specifically
vulnerable households (poor households, female headed households, ethnic minority
households, etc.). In each ward, households were then randomly selected.
To carry out this survey, mobile data collection was used via ArcGis Survey123
platfrom. A specific request was made to complete the questionnaires in two languages:
English / Khmer. The purpose of this translation was to facilitate the investigators'
understanding of the questions. The data collection followed the approach below.

34
Figure 8: Mobile data collection strategy
During the Survey phase, the quality control consisted in:
(i) Daily checking of the survey points. The surveys have to be located within the city boundaries.
(ii) A daily sample of the survey duration. The duration of 20% of the survey uploaded each day has to be checked.
(iii) A weekly download of the database to check the duration of each survey. The distance between the GPS point and the location point has to be below 300m.
1.2.1. Qualitative data
Based on the result of the Comprehensive Technical Options Study, an additional
social survey focusing on qualitative information was conveyed in September 2020 to (i) better
identify needs/preferences and demands of specific groups in particular: disabled people,
indigenous people, and youth/children which were not enough represented in the City
Comprehensive Survey, (ii) understand positive (perceived benefits) and negative impacts of
the project to stakeholders and assess social and institutional issues that affect participation,
ownership, acceptance, and adoption of project activities, and propose strategies to overcome
any local concerns or other issues; (iii) identify training needs, effective channels of
information, and the best approach for consultation/participation and training, with the focus
on vulnerable groups. Explore how communities including vulnerable groups can participate
in the project, (iv) assess whether NGOs/CBOs, and/or the private sector has a role in
implementing the project, (v) consult informal waste pickers/ scavengers about their current
jobs, perceived risks, and opportunities of the development of a more formal system (sorting
and composting plants), and (vi) assess the environmental situation and perceived
environmental impacts of the project to stakeholders including perceptions of climate change.
The social survey took place in early September and consisted of two consultation
meetings (105 participants), 7 FGDs with specific groups (61 persons + number of IPs) in
rural and urban areas, and meetings with two local NGOs (7 persons).

35
Figure 9: FGD with ID poor people, social survey, Bavet September 2020
The consultant conducted an additional assessment in Bavet in October 2020 to collect
specific social information in order to (i) refine the knowledge of IPs characteristics in Bavet
Municipality (Vietnamese people) and determine the significance of the potential impacts and
risks on IPs that the project might present, used to complete the IPP; (ii) complete and refine
the project gender assessment (iii) collect social data and organizational information from the
provincial and municipality levels. 2 FGDs have been organized, one with Vietnamese people
(8 participants), the other with women (13 participants) and ten local officials have been
consulted on specific points. (The brief note and list of participants are attached in appendices
3.2).
2. Data on the head of the household
Marital status, age, and national group
69% of household heads are male- versus 31% female heads of households. The
average age of the head of the household is 48 years. 70% of the population lives in a rural
area. The average age of the population is higher in an urban area (47 years old versus 41.6
years in rural area). 82% of the head of households are married, and 16% widower/widows.
4% are elders, and 2% have a disability. Respondents all declare themselves Khmer, and less
than 2% also mention another ethnicity (Vietnamese, Cham, Chinese). Police data 2020
reports that about 2% of households belong to the Vietnamese minority.
Literacy and education
More than half of the respondents have completed primary school (52%), 22%
secondary school, and 13% high school. Only 6.7% of the male head of households have no
education compared to 25% for FHHs, and 61% FHHs completed primary school only. 56%
of elders have no education. The Khmer language is the main language, and there was no
evidence of communities communicating in another language and not able to
study/communicate in Khmer.

36
Economic activity
The main economic activity in the area is small-scale business 28%s, farming 19%. It
is also noted that 12% of respondents are homemakers, and 5% are not working. People
working in SEZ (factory workers) represent 7% of respondents. Due to the human resource
demand from economic zones, migration is not common (1%).
Table 5: Occupation of heads of households in Bavet, 2020
3. Characteristics of beneficiary households
Household size and composition
More than half of the households count 4 and 5 members (average size: 4.9 HH
members as per registration book, 4.8 in practice), with an average of 1.8 women and 1.2
children per HH, 0.1 people with disability per household, and 0.2 of elders in average. In 75%
of cases, there is only one family living in the house. In 18% of cases, the building
accommodates two families.
Dwelling/housing unit and assets
In Bavet, 98% of total Households interviewed in CCS have a permanent house- 96%
own their house- and 86% live in a one-floor building. 71% of households have been living in
that place for more than 25 years (at least before 1993). The average size of the full property
is around 1,300sqm. Households are rather well equipped with a motorbike (94%) and
cellphone (93%).
Table 6: Households assets, Bavet, 2020
Type of assets All HHs Motorbike 94% Television 76% Bicycle 59% Cellphone 93% Gas cooker 90% Car 12% Washing machiner 9% Computer 7%
Occupation All HHs
Small scale business owner 28%
Housewife 12%
Farmers 19%
Construction workers 9%
Factory worker 7%
transportation services including mototaxi6%
Not working 6%
unstable jobs 4%
Other 5%
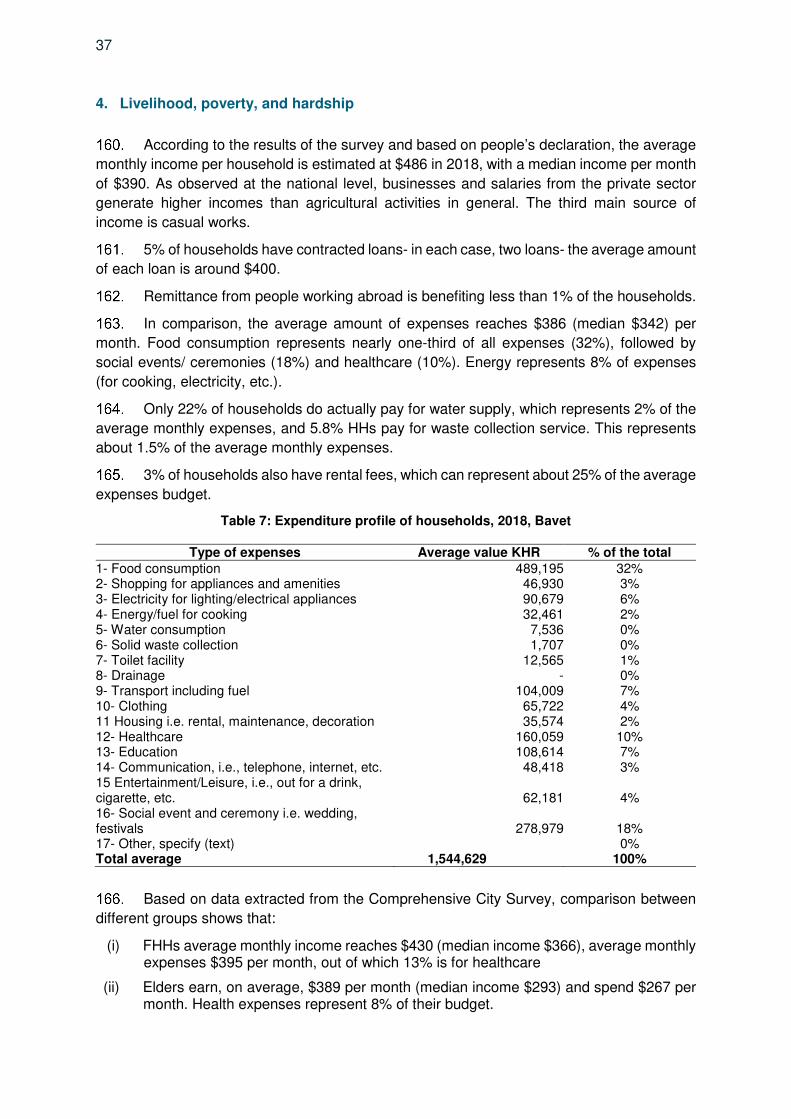
37
4. Livelihood, poverty, and hardship
According to the results of the survey and based on people’s declaration, the average
monthly income per household is estimated at $486 in 2018, with a median income per month
of $390. As observed at the national level, businesses and salaries from the private sector
generate higher incomes than agricultural activities in general. The third main source of
income is casual works.
5% of households have contracted loans- in each case, two loans- the average amount
of each loan is around $400.
Remittance from people working abroad is benefiting less than 1% of the households.
In comparison, the average amount of expenses reaches $386 (median $342) per
month. Food consumption represents nearly one-third of all expenses (32%), followed by
social events/ ceremonies (18%) and healthcare (10%). Energy represents 8% of expenses
(for cooking, electricity, etc.).
Only 22% of households do actually pay for water supply, which represents 2% of the
average monthly expenses, and 5.8% HHs pay for waste collection service. This represents
about 1.5% of the average monthly expenses.
3% of households also have rental fees, which can represent about 25% of the average
expenses budget.
Table 7: Expenditure profile of households, 2018, Bavet
Type of expenses Average value KHR % of the total 1- Food consumption 489,195 32% 2- Shopping for appliances and amenities 46,930 3% 3- Electricity for lighting/electrical appliances 90,679 6% 4- Energy/fuel for cooking 32,461 2% 5- Water consumption 7,536 0% 6- Solid waste collection 1,707 0% 7- Toilet facility 12,565 1% 8- Drainage - 0% 9- Transport including fuel 104,009 7% 10- Clothing 65,722 4% 11 Housing i.e. rental, maintenance, decoration 35,574 2% 12- Healthcare 160,059 10% 13- Education 108,614 7% 14- Communication, i.e., telephone, internet, etc. 48,418 3% 15 Entertainment/Leisure, i.e., out for a drink, cigarette, etc. 62,181 4% 16- Social event and ceremony i.e. wedding, festivals 278,979 18% 17- Other, specify (text) 0% Total average 1,544,629 100%
Based on data extracted from the Comprehensive City Survey, comparison between
different groups shows that:
(i) FHHs average monthly income reaches $430 (median income $366), average monthly expenses $395 per month, out of which 13% is for healthcare
(ii) Elders earn, on average, $389 per month (median income $293) and spend $267 per month. Health expenses represent 8% of their budget.

38
(iii) The poorest households in our sample (below $250/ month /HH) have an average income of $139 (median $146). According to their answers, expenses exceed incomes, and health expenses represent 13% of their budget.
Figure 10: Average monthly income per vulnerability group, 2018, CCS
5. Households and water supply
According to Municipality database 2019, only 16% of HHs (1,726 HHs) use water from
the treated water system. The other 84% of HHs use water from borehole-wells and combined
wells. Water treated system is available only in Sangkat Bavet. Households in Bavet rely
mainly on their own well for water supply.
Connection to piped water supply depends on the availability of pipes in the proximity
of the house. Only 10% of the surveyed households are connected to water supply. Only 25%
of households have access to pipes, out of which 34% are connected. Households mostly use
existing well (and thus do not need a connection to pipe).
For drinking water, 52% of HHs use water from their own well, and 46% buy from
vendors. Only 2 % (in the majority in an urban area) drink public water.49% of HHs treat water
before drinking. They consider the water to be of bad quality. The price of drinking water in an
urban area (bought from vendors) is an issue for 50% of the respondents
71% of the households are willing to pay to get connected to piped water supply (39%
could pay KHR 20,000 ($4.6) and 25% up to KHR 40,000 ($9.6)). (convenience, price from
water bought from vendors). Regarding price range, for a supply of 150 liters per day and per
person for 24h/7days availability, 39% of HHs would agree to pay a fee of KHR15,000 ($3.6)
to KHR 20,000 ($4.8) and 25% KHR40,000 ($9.6). 20% of HHs could accept a higher price.
No one asked for free water.
6. Households and sanitation
According to Municipality database 2019, 91% of total households (9,620HHs) have
latrines, out of which 90% are pour flush latrines. A few areas are lying behind in terms of
sanitation: only 66% of HHs have latrines in Sangkat Prasat and use in majority improper
$486
$139
$430
$281
$389
$-
$100
$200
$300
$400
$500
$600
all HHS Poor HHs FHHs IPs Elders

39
latrines (not pour-flush, or not individual), Skar village in Sangkat Chhrok Mtes (only 42% HHs
having latrines), and Thol Kaing village in Sangkat Bati, 200 out of the 280 HHs having latrines
are not pour flush latrines/ individual.
93% of interviewed HHs have toilets (all pour-flush latrines). The other 7% of HHs use
neighbor’s toilets (for free) or open fields. This matter is important to consider, given the
negative impacts on dignity, privacy, and personal safety, especially for women and girls.57
Interviewees, mostly women, had little information related about the construction of
their toilets, which suggests that sanitation issues are more commonly dealt with by men, as
it is considered a more “technical” subject.
90% of HHs have a tank, many are not proper septic tanks with a sealed tank. Half of
the interviewees have an idea about the construction cost of their septic tank. Only 2% of HHs
are connected to public sewer pipes and 3% to open drain channels. The majority don’t know
how much they paid for connection, and they do not know either if they pay a monthly fee.
According to CCS, only 5% of households are connected to sewerage. As there is no
sewerage in the city, this information has to be interpreted as a connection to the drainage
system.
The CCS showed that 2% of the surveyed population are still practicing open
defecation. This number increases in some remote village. In urban areas, the main practice
is to defecate into a plastic bag or bucket, while the paddy fields are preferred in the rural
areas.
Sharing of sanitation facilities is also an important consideration given the negative
impacts on dignity, privacy, and personal safety, especially for women and girls (JMP, 2018).
It has been estimated that 3% of the surveyed population share this facility with others who
are not members of their household in the urban areas, and 5% in the rural areas.
Among those who have no septic tank or latrines, only 33%HHs are willing to build
one. While 58% of HHs consider that they cannot afford the cost of construction, and 95%
would not consider taking a loan- even at the preferential condition- to build or renovate
sanitation facilities.
97% of interviewees in the survey responded that they do not use the service of
septage pumping trucks, and 98% do not empty septic tanks manually. Most respondents
have little or no knowledge about these sanitation aspects- frequency of desludging if needed,
costs of emptying, name of emptying company, nor where septage is transported.
62% of HHs don’t know if they are willing to pay to be connected to the sewerage pipe/
open drainage channel; they may have no idea about the benefits of being connected or are
waiting to know how much it would cost or if it could be free. 13% are ready to pay between
KHR 80,000 ($19.5) to 120,000 ($28.5) and 10% between KHR 10,000 ($2.4) and 40,000
($9.6)
Regarding monthly service fees for public sewer pipe, 62% of HHs don’t know what
they could afford, while 22%HHs are ready for a monthly fee between KHR 5,000 ($1.2) to
10,000 ($2.4), 10% between KHR 10,000 ($2.4) to 40,000 ($9.6). If a new service is proposed,
57 Progress on household drinking water, sanitation and hygiene 2000-2017. Special Focus on inequalities. New York: United
Nations Children’s Fund (UNICEF) and World Health Organization, 2019.
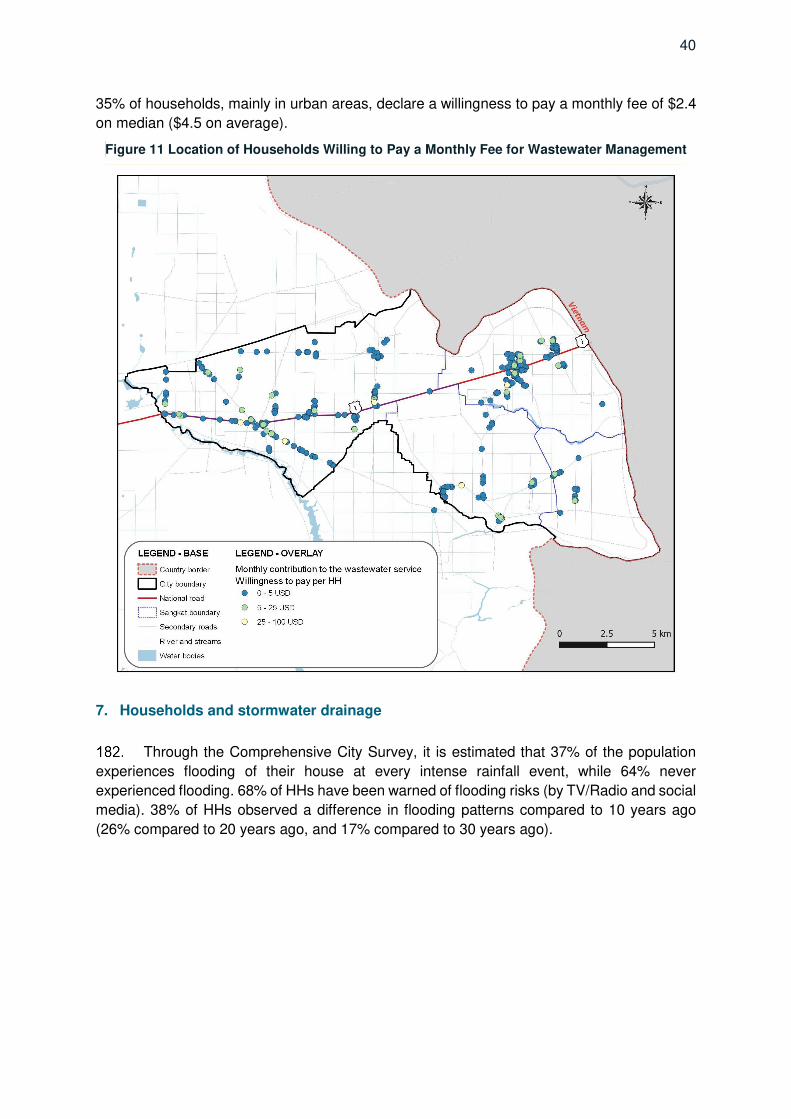
40
35% of households, mainly in urban areas, declare a willingness to pay a monthly fee of $2.4
on median ($4.5 on average).
Figure 11 Location of Households Willing to Pay a Monthly Fee for Wastewater Management
7. Households and stormwater drainage
Through the Comprehensive City Survey, it is estimated that 37% of the population
experiences flooding of their house at every intense rainfall event, while 64% never
experienced flooding. 68% of HHs have been warned of flooding risks (by TV/Radio and social
media). 38% of HHs observed a difference in flooding patterns compared to 10 years ago
(26% compared to 20 years ago, and 17% compared to 30 years ago).
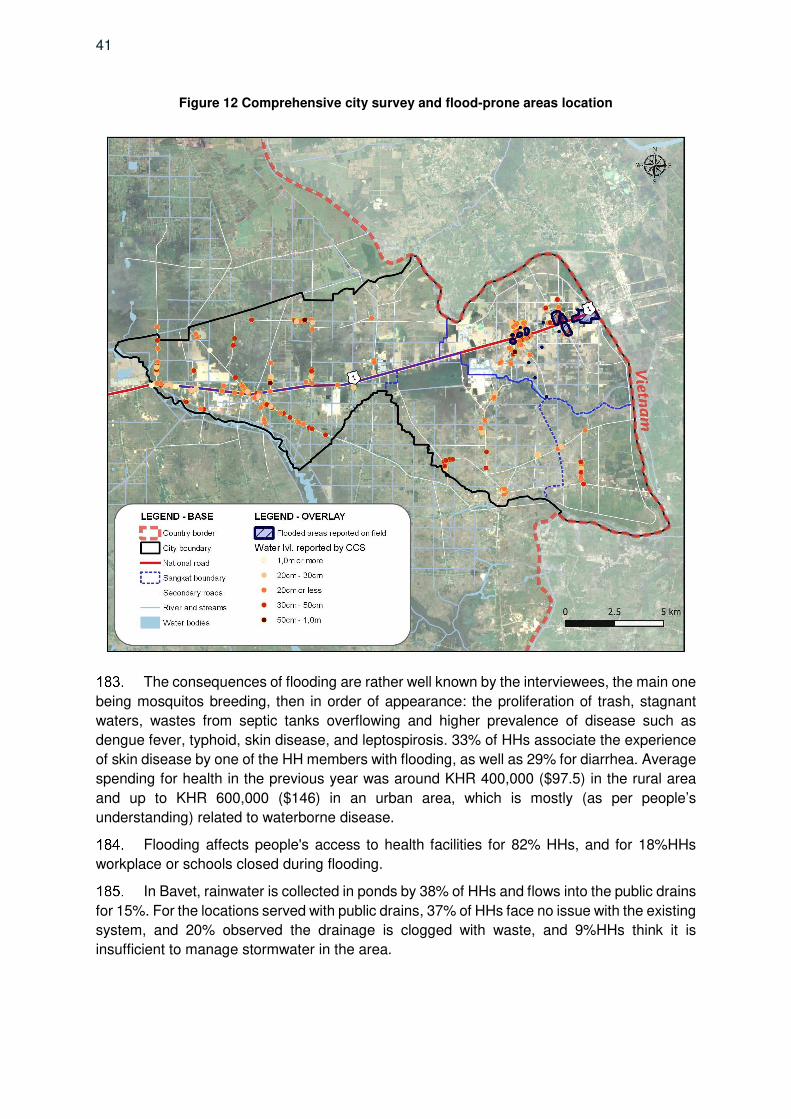
41
Figure 12 Comprehensive city survey and flood-prone areas location
The consequences of flooding are rather well known by the interviewees, the main one
being mosquitos breeding, then in order of appearance: the proliferation of trash, stagnant
waters, wastes from septic tanks overflowing and higher prevalence of disease such as
dengue fever, typhoid, skin disease, and leptospirosis. 33% of HHs associate the experience
of skin disease by one of the HH members with flooding, as well as 29% for diarrhea. Average
spending for health in the previous year was around KHR 400,000 ($97.5) in the rural area
and up to KHR 600,000 ($146) in an urban area, which is mostly (as per people’s
understanding) related to waterborne disease.
Flooding affects people's access to health facilities for 82% HHs, and for 18%HHs
workplace or schools closed during flooding.
In Bavet, rainwater is collected in ponds by 38% of HHs and flows into the public drains
for 15%. For the locations served with public drains, 37% of HHs face no issue with the existing
system, and 20% observed the drainage is clogged with waste, and 9%HHs think it is
insufficient to manage stormwater in the area.

42
8. Households and solid waste management
According to Municipaity data 2019, only households living in Sangkat Bavet have
access to garbage collection (which represents only 7% of Bavet’s Households), and 2% of
Households in Kouk Lveang village, Sangkat Prey Angkounh.
Figure 13 Collection Coverage in Bavet, Egis 2020
53% of HHs do not directly face any environmental problem in Bavet, but 41% mention
problems with solid waste, air pollution (26%), and water pollution (17%). The percentage of
HHs acknowledging there is a problem with solid waste in their neighborhood is higher (57%
of HHs), and 62% observe waste often/ very often piling in the area with impact on air pollution
(74%), climate change/ flooding (57%) and water pollution (53%). They also quote the
following impact for their family (in descending order): discomfort because of bad smell,
diseases of the respiratory system, infection, and diseases in general, wound/scabies,
digestive systems problem. The level of awareness of the population about the negative
impacts of inadequate solid waste management is quite high. 34% of the health problems
encountered by HHs over the last year are directly attributed to waste/garbage. This figure
reaches 47% HHs in an urban area.
43
Most households produce between 1 to 3 kg of waste every day (88% domestic waste).
91% of HHs discharge waste daily and keep waste in plastic bags (83%), plastic or cardboard
containers (20%). The plastic bags are considered easy to handle, avoid odors, are clean, and
keep insects and rodents away.
In Bavet, the waste collection service is available to 11% of HHs only (in the urbanized
area mostly). 7% of HHs get their waste collected at their doorstep, while 12% dispose of
waste at a collecting point. Collection is done in the evening for 42% of HHs, for 33% in the
morning, and at irregular hours for 22% of HHs, but mostly everyday (75%) or every two days
(15%). 84% of HHs are satisfied with the service. Suggested inmprovements included: late
afternoon collection and daily collection. They also mention that a cleaner service would be
appreciated (67%). 78% of those benefiting from the waste collection service pay a monthly
fee, 27% between KHR 8,000 ($1.9) and 12,000 ($2.9) per month, and 25% between 12,001
($2.9) and 20,000KHR ($4.8). The median monthly fee for home collection amounts to $3.9
($6.5 on average), which is considered an appropriate price for 51% of HHs and expensive/
too expensive for 17%.
Waste that is not collected is widely dumped in empty land, followed by dikes/ lakes
and roadsides.
While they have a general knowledge of waste impacts, 81% of HHs never took part
in any environmental campaign apparently because of time availability. 74% of HHs sort
wastes before disposal for re-sale (cans, plastic bottles, organic wastes for animal feed
(85%)). While the proportion of HHs sorting is already high, 53% of households are ready to
sort more if required (up to 61% in an urban area).
Regarding willingness to pay for an improved waste management service, 67% of HHs
don’t know (up to 76% in the rural area), and 16% would agree to pay KHR 4,000-8,000 ($
0.9-$1.9) (below KHR 4,000 ($0.9) in a rural area). If a new or improved solid waste
management service is created, the survey shows that 30% of Households are willing to pay
a monthly fee: $1.2 median value; $3.1 on average.

44
Figure 14 Monthly willingness to pay - Solid waste management service, Egis 2020
9. Consumer perceptions
According to the CCS, it is estimated that 67% of HHs consider they are not really
affected by pollution and consider that noise, wastewaters, flooding, smells (from wastewater,
garbage) have little effect on pollution in their area. Comparatively, dust is the main nuisance,
then bad smells from the garbage.
40% of HHs are fully satisfied or satisfied with the current water supply service.
Only 8% are fully satisfied/ satisfied with wastewater management, 46% are not
satisfied at all, and 18% are not satisfied.
8% only are satisfied with drainage, while 40% are no satisfied /not satisfied at all.
Waste management is also considered as not satisfactory by the majority of HHs (56%)
in Bavet.
37% HHs consider that building more public space and playgrounds would improve
attractivness of Bavet, 22% are in favor of building houses on the outskirt of the city, and 18%
improving urban infrastructure (roads, bridge, sanitation, drainage system, solid waste
collection).

45
10. Private sector
The City Comprehensive Survey also included a Commercial and Institution (C&I)
survey. Tables below shows the type and number of institutions surveyed in Bavet:
Table 8: Commerce and institutions surveyed in BAVET during the Comprehensive City Survey
(CCS)
Type of Institution Bavet
Commercial
Casino 3
Hotels 9
Restaurants 10
Industry 12
Other Commercial/Production 12
Institutions
Primary Schools 12
Kinder garden 6
Lower Secondary School 2
Clinics 11
Office People's Committees 7
Total 84
Table 9: Details of the type of commerce and institutions surveyed in Bavet during the CCS
Bavet Government School 10 Hotel 9 Other Commercial Premise 28 Other Government Service or Institution 8 Private Hospital 11 Private School 9 Restaurant 9
Total 84
The challenges of the C&I survey were that fieldwork was conducted during year-end,
and many industries in the Economic Zone were closed and did not agree to the interview.
96% of the commercial and institutions buildings are permanent with 1 or 2 floors
((87%). 64% of the commercial and institutions have been established after 1993, and 51%
are operating in the same building for at least more than ten years, while 29% occupy the
building for 3 to 10 years. 21% entered their building recently. 70% of the companies/
institutions own their building, and 19% rent it.
There are big disparities in the type of C&I, and the average size of premises is
19,335sqm, ranging from 40sqm to 600,000 sqm. This is also obvious from the number of
employees: the C&I employ between 1 to 5,838 persons, with an average of 319 employees
(215 females). Most people also live on the premise, i.e., an average of 289 persons
(maximum 4,793), including children, senior citizens, and people with disabilities.
98% have the grid power supply. Due to the limitation of the sewerage network in the
towns,15% of C&I discharge the wastewater to a water source, lake, or channel, while 12% of
C&I in Bavet have their own treatment facility. Only 46% are connected to a sewerage
46
system and 45% to piped water supply (mostly private), 17% have a drainage system in place,
and 51% have a collection of solid waste.
In Bavet,18% of the C&I, which are mainly local commercial outlets, use their own deep
well as the main source of drinking water. Purchasing from vendors is the main source of
drinking water, while 18% of them sourced from their own deep well. There are only 36% of
C&I treat their water before drinking by using a filter (77%) or boiling (23%) daily. Those who
do not treat water because they perceive that the water is safe for drinking as they purchased
it from vendors. On average, they prefer to pay 108,200 KHR for a water supply of 150L per
day and per person 24/7 and would spend 296,300 KHR on piped water connection fees.
95% of houses/buildings are equipped with toilets (all flush toilets), and 80% are
connected to a soak pit, 11% are connected to the public drainage pipe. In Bavet, 94% of C&Is
with toilet facilities have septic tanks with an average capacity of 6.9 m3 (average construction
cost is KHR 725,500 KHR. The majority of septic tanks flow to soak pit (80%) and public
drainage pipe (11%). 21% of C&I have used pumping trucks to empty their septic tank, with a
frequency of every 1-2 years (56%) and an average fee of KHR1,459,300. If a public sewer
pipe is built, on average, they would pay 4091,100 KHR for connection and 101,800 KHR for
a monthly service fee.
50% of respondents observe problems with solid waste, air pollution (37%), and water
pollution (23%). Solid waste is a major problem due to service provision and insufficient landfill.
49% of respondents consider there is a problem with solid waste in their area: solid wastes
are scattered on the road (52%), 75% observe solid waste piling often/very often, bad smell
(45%). 70% of people consider these solid wastes can cause any adverse impacts to the
physical environment or health in the C&I, such as air pollution (78%), climate change (e.g.,
flooding), and water pollution. In terms of health, solid waste/ bad smells are associated with
diseases associated with the respiratory system (71%), infectious diseases (49%), and
wounds/scabies (41%).
Depending on their size and type of activities, C&I generates more or less solid waste:
43% between 2 to 5kg/ day and 21% generates more than 20kg/day of domestic and
production waste. 89% of discharge wastes every day, mostly in plastic bags. Only 58% of
C&I benefit from solid waste collection services from private companies (82%). 52% get the
collection at their doorstep, 6% at a collecting point, and the rest is discharged in empty lands,
ditches, lakes, on the roadside, etc.
Waste Collection is more often daily (73%) and in the morning (39%) or at the irregular
time (29%) or in the evening (27%), which is satisfying for 81% of C&Is. Only 57% pay a
collection fee. As for other types of respondents, the main improvement would be a cleaner
service (76%).
Only 42% of C&Is participated in environmental campaigns due to time limitations. Still,
70% of respondents sort cans, plastic bottles, and organic waste overall. 55% would agree to
sort more if a program was put in place.
48% of respondents experience flooding in their house when it rains heavily. 57% got
weather warnings (TV/Radio, social media). 78% are aware of the consequence of flooding
on mosquito breeding, the proliferation of trash rubbish, stagnant waters. 43% observe
problems (note specified) on their C&I members after flooding, as well as skin diseases (30%)
or diarrhea (22%). In 65% of cases flooding limit access to health facilities, but it does not
cause the closing of a school or of the business.
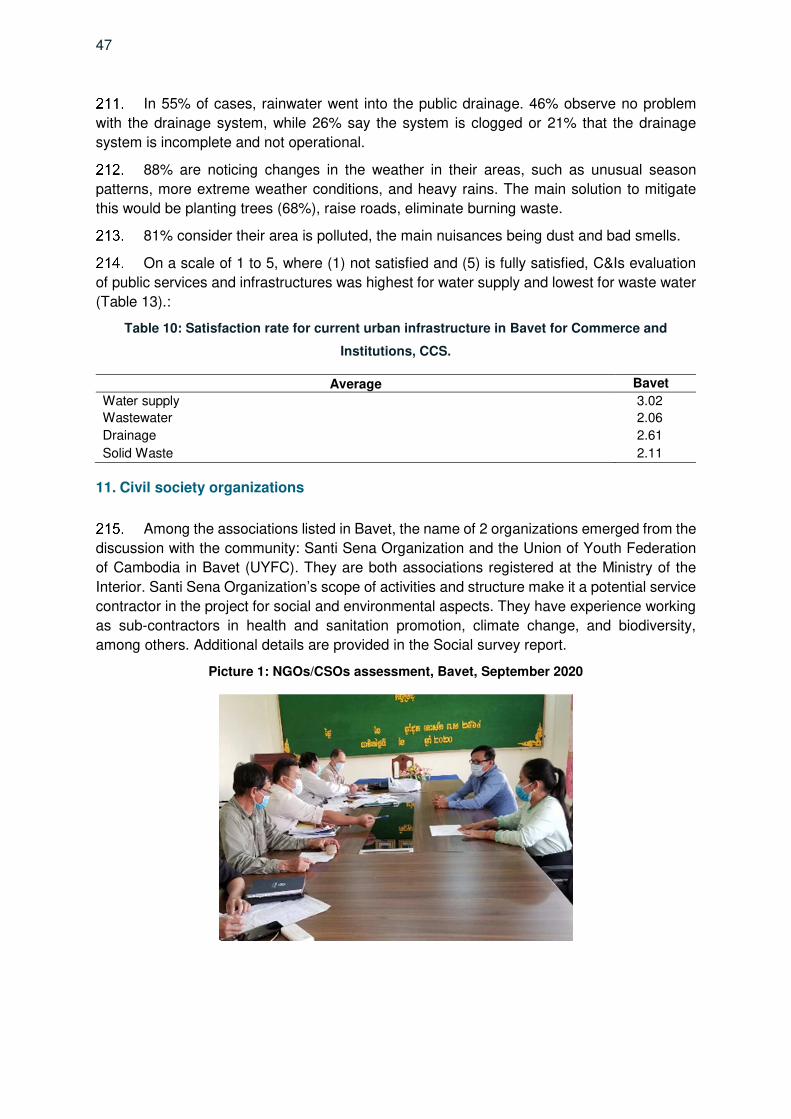
47
In 55% of cases, rainwater went into the public drainage. 46% observe no problem
with the drainage system, while 26% say the system is clogged or 21% that the drainage
system is incomplete and not operational.
88% are noticing changes in the weather in their areas, such as unusual season
patterns, more extreme weather conditions, and heavy rains. The main solution to mitigate
this would be planting trees (68%), raise roads, eliminate burning waste.
81% consider their area is polluted, the main nuisances being dust and bad smells.
On a scale of 1 to 5, where (1) not satisfied and (5) is fully satisfied, C&Is evaluation
of public services and infrastructures was highest for water supply and lowest for waste water
(Table 13).:
Table 10: Satisfaction rate for current urban infrastructure in Bavet for Commerce and
Institutions, CCS.
Average Bavet Water supply 3.02 Wastewater 2.06 Drainage 2.61 Solid Waste 2.11
11. Civil society organizations
Among the associations listed in Bavet, the name of 2 organizations emerged from the
discussion with the community: Santi Sena Organization and the Union of Youth Federation
of Cambodia in Bavet (UYFC). They are both associations registered at the Ministry of the
Interior. Santi Sena Organization’s scope of activities and structure make it a potential service
contractor in the project for social and environmental aspects. They have experience working
as sub-contractors in health and sanitation promotion, climate change, and biodiversity,
among others. Additional details are provided in the Social survey report.
Picture 1: NGOs/CSOs assessment, Bavet, September 2020

48
V. NEEDS, PREFERENCES, AND DEMANDS OF PROJECT STAKEHOLDERS
The socio-economic profile of households in Bavet, as well as their needs,
preferences, and demands, have been covered in the previous chapter. The focus here is on
poor and vulnerable groups.
1. Informal settlement dwellers
No informal settlement were identified as affected by the project during the Inventory
of Losses survey and as presented in the Basic Resettlement Plan volume. Therefore, no
specific demands have been listed for this stakeholder category.
2. Poor households
The definition of poor HHs can vary- and there is no specification about ID Poor in the
CCS. For the purpose of our analysis- and given the data available- we base our analysis on
the average monthly income estimated during the survey for each HH and focused on those
with less than $250/month average- i.e., 125 HHs (and approximately the poorest quintile of
the sample).Their total average income is estimated at $139, and average income per capita
per day is estimated at $0.94, near the Cambodian poverty line 2020 ($0.93)58 ID poor groups
were consulted during the social survey for additional qualitative information about needs,
preferences, and demands.
95% of those poorer HHs have a permanent house, and 92% own their house, which
is slightly below the rate in the whole group. 74% have been living in the area for more than
ten years/ forever, which is also less than in the whole group. 31% of the poorest households
are FHHs, and 16% have no education compared to 13% in the whole group. Their average
monthly income is only 28% of the average monthly income of the whole group.
44% HHs are in an area served by piped water supply, and 33% of those HHs are
connected. 52% drink water from vendors (against 46% for the whole group), 44% from their
own well (deep well) and 4% drink public water, and 59% treat water before drinking. While
36% have no issue with water supply, 42% consider water is too expensive- compared to 15%
in the whole group. 66% of HHs would pay for the connection to the public water supply pipe
(a higher percentage than for the whole group)- and 31% could pay KHR 20,000 ($4.8)and
23% KHR 40,000 ($9.6) for a monthly fee. This is comparable to affordability for the whole
group, but a willingness to be connected seems higher.
93% of HHs have toilets which is the average in the total population interviewed. 62%
don’t know how much they could afford for connection to the sewerage network, and 26%
think it could be more than KHR 40,000 ($9.6) (average: KHR 150,000 ($36.6)). 60% HHs are
also unsure of the amount they could afford for monthly fees- 24% could afford up to KHR
10,000 ($2.4)per month. The level of uncertainty is high. This is similar to affordability for other
groups. The majority of poor households (91%) would not take a loan to improve sanitation-
this is slightly below other respondents.
58 The national poverty line defines the poor as people who earn $0.93 or less per day.
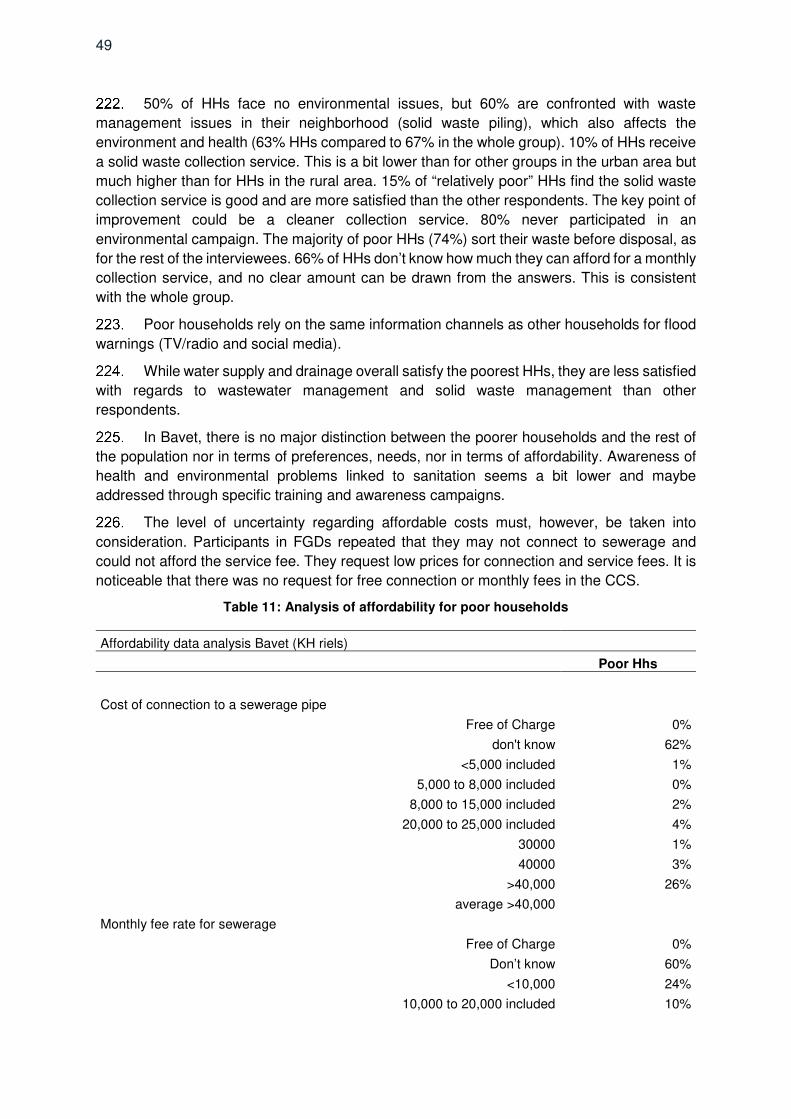
49
50% of HHs face no environmental issues, but 60% are confronted with waste
management issues in their neighborhood (solid waste piling), which also affects the
environment and health (63% HHs compared to 67% in the whole group). 10% of HHs receive
a solid waste collection service. This is a bit lower than for other groups in the urban area but
much higher than for HHs in the rural area. 15% of “relatively poor” HHs find the solid waste
collection service is good and are more satisfied than the other respondents. The key point of
improvement could be a cleaner collection service. 80% never participated in an
environmental campaign. The majority of poor HHs (74%) sort their waste before disposal, as
for the rest of the interviewees. 66% of HHs don’t know how much they can afford for a monthly
collection service, and no clear amount can be drawn from the answers. This is consistent
with the whole group.
Poor households rely on the same information channels as other households for flood
warnings (TV/radio and social media).
While water supply and drainage overall satisfy the poorest HHs, they are less satisfied
with regards to wastewater management and solid waste management than other
respondents.
In Bavet, there is no major distinction between the poorer households and the rest of
the population nor in terms of preferences, needs, nor in terms of affordability. Awareness of
health and environmental problems linked to sanitation seems a bit lower and maybe
addressed through specific training and awareness campaigns.
The level of uncertainty regarding affordable costs must, however, be taken into
consideration. Participants in FGDs repeated that they may not connect to sewerage and
could not afford the service fee. They request low prices for connection and service fees. It is
noticeable that there was no request for free connection or monthly fees in the CCS.
Table 11: Analysis of affordability for poor households
Affordability data analysis Bavet (KH riels)
Poor Hhs
Cost of connection to a sewerage pipe
Free of Charge 0%
don't know 62%
<5,000 included 1%
5,000 to 8,000 included 0%
8,000 to 15,000 included 2%
20,000 to 25,000 included 4%
30000 1%
40000 3%
>40,000 26%
average >40,000
Monthly fee rate for sewerage
Free of Charge 0%
Don’t know 60%
<10,000 24%
10,000 to 20,000 included 10%
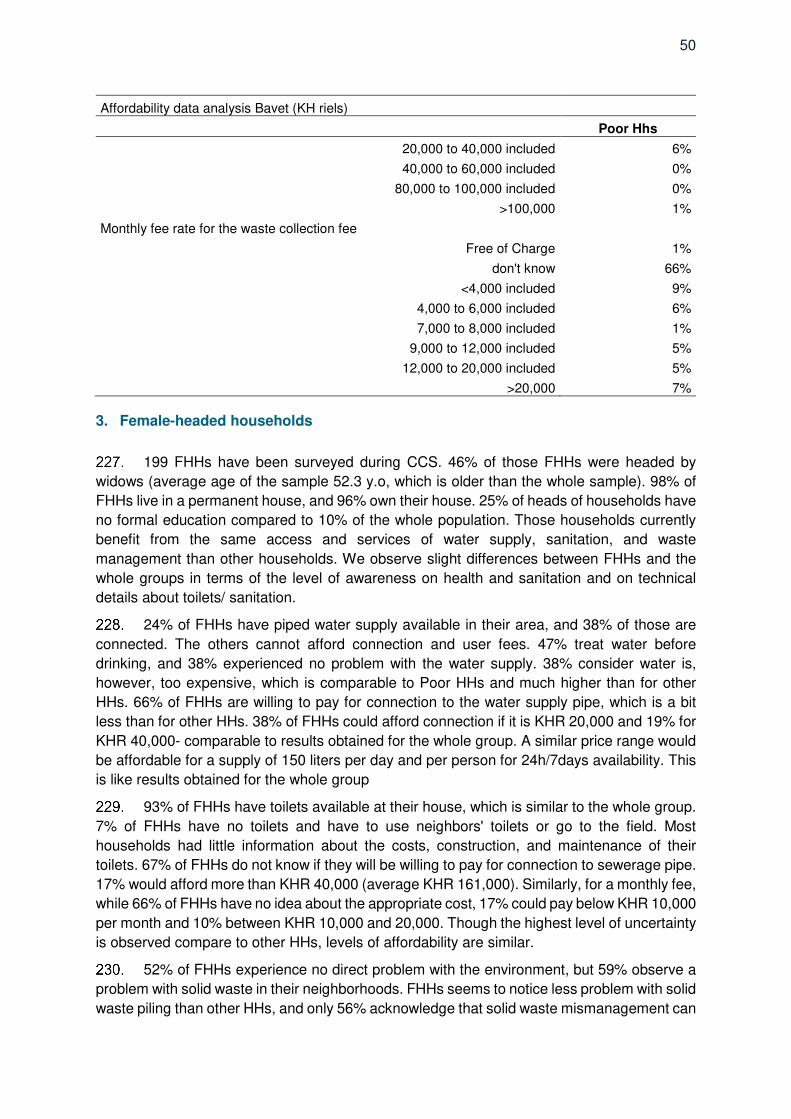
50
Affordability data analysis Bavet (KH riels)
Poor Hhs
20,000 to 40,000 included 6%
40,000 to 60,000 included 0%
80,000 to 100,000 included 0%
>100,000 1%
Monthly fee rate for the waste collection fee
Free of Charge 1%
don't know 66%
<4,000 included 9%
4,000 to 6,000 included 6%
7,000 to 8,000 included 1%
9,000 to 12,000 included 5%
12,000 to 20,000 included 5%
>20,000 7%
3. Female-headed households
199 FHHs have been surveyed during CCS. 46% of those FHHs were headed by
widows (average age of the sample 52.3 y.o, which is older than the whole sample). 98% of
FHHs live in a permanent house, and 96% own their house. 25% of heads of households have
no formal education compared to 10% of the whole population. Those households currently
benefit from the same access and services of water supply, sanitation, and waste
management than other households. We observe slight differences between FHHs and the
whole groups in terms of the level of awareness on health and sanitation and on technical
details about toilets/ sanitation.
24% of FHHs have piped water supply available in their area, and 38% of those are
connected. The others cannot afford connection and user fees. 47% treat water before
drinking, and 38% experienced no problem with the water supply. 38% consider water is,
however, too expensive, which is comparable to Poor HHs and much higher than for other
HHs. 66% of FHHs are willing to pay for connection to the water supply pipe, which is a bit
less than for other HHs. 38% of FHHs could afford connection if it is KHR 20,000 and 19% for
KHR 40,000- comparable to results obtained for the whole group. A similar price range would
be affordable for a supply of 150 liters per day and per person for 24h/7days availability. This
is like results obtained for the whole group
93% of FHHs have toilets available at their house, which is similar to the whole group.
7% of FHHs have no toilets and have to use neighbors' toilets or go to the field. Most
households had little information about the costs, construction, and maintenance of their
toilets. 67% of FHHs do not know if they will be willing to pay for connection to sewerage pipe.
17% would afford more than KHR 40,000 (average KHR 161,000). Similarly, for a monthly fee,
while 66% of FHHs have no idea about the appropriate cost, 17% could pay below KHR 10,000
per month and 10% between KHR 10,000 and 20,000. Though the highest level of uncertainty
is observed compare to other HHs, levels of affordability are similar.
52% of FHHs experience no direct problem with the environment, but 59% observe a
problem with solid waste in their neighborhoods. FHHs seems to notice less problem with solid
waste piling than other HHs, and only 56% acknowledge that solid waste mismanagement can

51
have adverse impacts on their environment and family health (similar problems as for the
whole group are mentioned), which is significantly lower than for other HHs and probably
linked to lower awareness.
9% of FHHs have access to waste collection services. Domestic waste is mainly
collected at collecting points or dumped in empty lands. 88% of FHHs never took part in any
environmental campaign, which is higher than for other groups to expect elders. 71% of FHHs
are sorting wastes before disposal, similar to other HHs, and 48% are willing to sort more if
required. They would appreciate a cleaner collection service.
25% of FHHs experience flooding of their yard when it rains heavily, and they are
usually (25%FHHs) informed of the risk of flooding in advance by TV/Radio and social media.
FHHs are also aware of health risks associated with flooding. 35% FHHs consider the
drainage system to work well, 12% observe that the drainage system is clogged with solid
waste.
FHHs observe the same general changes in climate as the whole group and consider
that planting trees and raising roads can mitigate changes locally. Only 2% mentioned
improving drainage. 42% are in favor of building more public spaces and playgrounds to
improve life in the city and 22% to build more houses out the outskirt of the city, improving
social services and welfare is also more often mentioned than for the whole group (as for
poorer HHs.)
Satisfaction about water supply (rated 2.95/5), wastewater management (1.86/5).,
drainage (2.26/5) and solid waste (2.03/5) are comparable with other groups.
The project design does not need specific adjustments for the FHHs except better
involvement in awareness campaigns/training to raise their knowledge about health/ hygiene
and sanitation and (as for all females) about technical aspects of sanitation.
FHHs request a better regularity and quality of service for the solid waste collection
and low connection costs and service fees. The table below shows that FHHs have difficulties
in estimating the amount they could afford.
Table 12: Analysis of affordability for female-headed households
Affordability data analysis Bavet (in KH riels)
FHHs
Cost of connection to a sewerage pipe
Free of Charge 0%
don't know 67%
<5,000 included 0%
5,000 to 8,000 included 0%
8,000 to 15,000 included 3%
20,000 to 25,000 included 9%
30000 3%
40000 2%
>40,000 17%
average >40,000

52
Affordability data analysis Bavet (in KH riels) Monthly fee rate for sewerage
Free of Charge 0%
Don’t know 66%
<10,000 17%
10,000 to 20,000 included 10%
20,000 to 40,000 included 5%
40,000 to 60,000 included 1%
80,000 to 100,000 included 2%
>100,000 1%
Monthly fee rate for the waste collection fee
Free of Charge 1%
don't know 73%
<4,000 included 7%
4,000 to 6,000 included 7%
7,000 to 8,000 included 0%
9,000 to 12,000 included 4%
12,000 to 20,000 included 6%
>20,000 3%
4. Indigenous peoples
The number of IPs surveyed in the CCS is insignificant and does not allow for specific
analysis. However, it is observed from the sample that the estimated average monthly income
reaches $281 for an estimated amount of monthly expenses of $355. The average income is
lower than the average income in the general population.
Since the new law on nationality was passed in 2018, Vietnamese people in Bavet
have lost their Khmer ID card and family book. While they confirm to have similar access to
school and public infrastructure as Cambodian families, they do participate less in social/
community events.
FGDs with IPs as part of the social survey conducted in September 2020 confirmed
that they have similar constraints and demands regarding waste collection, wastewater
management, and stormwater drainage.
These aspects are further developed in the Indigenous Peoples – Due Diligence
Report.
5. Youth and children
Youth and children were not surveyed in the CCS. Information collected from a sample
of youth from high school during FGDs, show that young people are generally involved in solid
waste management, giving a hand to their parents (collecting and disposing of trash); They
are sensitive to the problem of solid waste as it impacts their daily life (flies, smells and
associated illness). For them, the problem is caused by insufficient and irregular collection.
Solid wastes then pile everywhere, which pushes people to burn waste. None of the students
met did join any environmental campaign, and their school does not propose any specific
program. They are, however, ready to support a recycling program if needed (more sorting).

53
Young people all have access to toilets at home and school but have fewer ideas about their
O&M. They look forward to better wastewater management to improve health but are unsure
about the constraints it will cause during works and affordable prices for the community. While
they do not observe flood at home, floods can make access to school difficult. They observe
that flooding is also a consequence of improper solid waste management. Garbage clogging
the drainage systems prevent water from flowing.
6. Persons with disabilities
The number of persons with disabilities in the CCS is insignificant and does not allow
for specific analysis.
According to FGDs conducted with People with Disability (PwD) in Bavet, they share
the same needs (regular solid waste collection service, proper wastewater treatment, and
flood/ disaster risk management), constraints (costs), and opportunities (health benefits,
attractive city) as other respondents in vulnerable groups.
They request the Municipality to provide more bins and enlarge the services area. They
mention that specific prices should be proposed to PwD, which would allow them to access
the services. They are really willing to be connected, for instance, to the sewerage system but
could do it only if it is affordable. They do not specify any amount.
7. Elderly
A sample of 25 elders (average 71 y.o) has been interviewed, out of which 56% had
no formal education. 88% are long term residents of Bavet and all own their house (permanent
housing).
Elders in Bavet mostly drink water taken from their well (52%) or bought from vendors
(44%). 60% consider that the price of water is too high. Out of 40% of elders having access
to piped water systems, 30% are connected. -They mostly rely on their wells. 48% used to
treat water for drinking. A high proportion of the elders interviewed (88%) would pay to be
connected to piped water supply (for convenience, and because the price of water bought
from vendors is high), 44% could afford KHR 20,000 ($4.6) for connection, and 16% KHR
40,000 ($9.6). While the cost range is similar as for other groups, the proportion of elders
opting for the cheapest cost is higher. 44% could afford a monthly fee between KHR 15,000
($3.6) and 20,000 ($4.9).
Only 80% of elders have toilets. This is the lowest rate of all groups, but only 4% would
consider building flush toilets/ septic tank, 92% would not take a loan for sanitation
infrastructures, and 76% don’t know if they would pay to be connected to a sewerage pipe.
Proper sanitation does not seem to be a priority for those elders.
40% of elders do not face environmental problems, which are below average, and 60%
think there is a solid waste management issue, like the rest of the population. 84% of elders
consider that solid waste piling in their area affects both environment and health. 52% directly
link wastewater and garbage to disease. A high proportion of elders have never joined
environmental campaigns (92%), and they have a tendency to sort waste less than other
groups and to be less positive on sorting before disposal. 20% of elders pay for a waste
collection service, but 76% of elders don’t know if they would agree to pay for this type of
service.
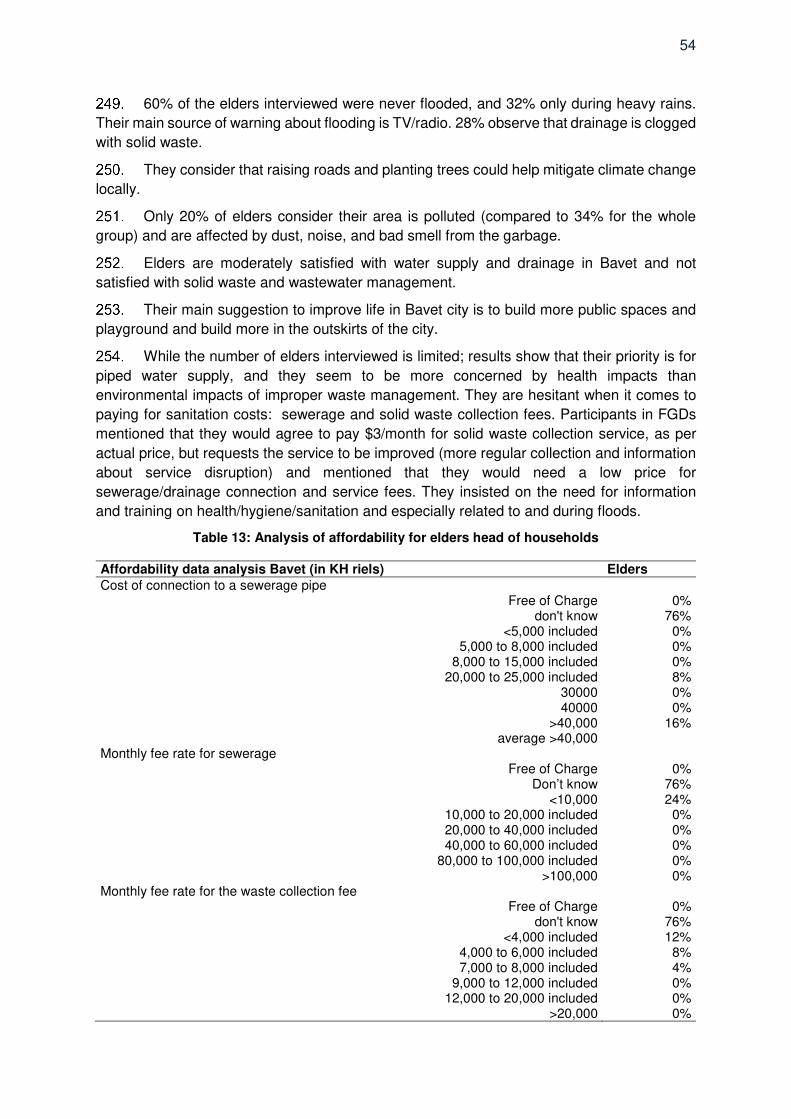
54
60% of the elders interviewed were never flooded, and 32% only during heavy rains.
Their main source of warning about flooding is TV/radio. 28% observe that drainage is clogged
with solid waste.
They consider that raising roads and planting trees could help mitigate climate change
locally.
Only 20% of elders consider their area is polluted (compared to 34% for the whole
group) and are affected by dust, noise, and bad smell from the garbage.
Elders are moderately satisfied with water supply and drainage in Bavet and not
satisfied with solid waste and wastewater management.
Their main suggestion to improve life in Bavet city is to build more public spaces and
playground and build more in the outskirts of the city.
While the number of elders interviewed is limited; results show that their priority is for
piped water supply, and they seem to be more concerned by health impacts than
environmental impacts of improper waste management. They are hesitant when it comes to
paying for sanitation costs: sewerage and solid waste collection fees. Participants in FGDs
mentioned that they would agree to pay $3/month for solid waste collection service, as per
actual price, but requests the service to be improved (more regular collection and information
about service disruption) and mentioned that they would need a low price for
sewerage/drainage connection and service fees. They insisted on the need for information
and training on health/hygiene/sanitation and especially related to and during floods.
Table 13: Analysis of affordability for elders head of households
Affordability data analysis Bavet (in KH riels) Elders Cost of connection to a sewerage pipe
Free of Charge 0% don't know 76%
<5,000 included 0% 5,000 to 8,000 included 0%
8,000 to 15,000 included 0% 20,000 to 25,000 included 8%
30000 0% 40000 0%
>40,000 16% average >40,000
Monthly fee rate for sewerage Free of Charge 0%
Don’t know 76% <10,000 24%
10,000 to 20,000 included 0% 20,000 to 40,000 included 0% 40,000 to 60,000 included 0%
80,000 to 100,000 included 0% >100,000 0%
Monthly fee rate for the waste collection fee Free of Charge 0%
don't know 76% <4,000 included 12%
4,000 to 6,000 included 8% 7,000 to 8,000 included 4%
9,000 to 12,000 included 0% 12,000 to 20,000 included 0%
>20,000 0%

55
VI. SOCIAL AND POVERTY ANALYSIS
1. Rapid urban development but low basic service development
An element to consider regarding inequalities is the level of urbanization in different
sectors of the project area. People in the rural area and in less/ recently urbanized area have
currently no access to basic infrastructure and services, they also have less information and
comparison elements about technical options and costs associated with connection or
service/O&M, and while they are in general willing to access improved sewerage/ drainage/
waste collection service, they are less able than other respondents to estimate the costs they
could afford. The level of income of people in the rural area is higher than those in the urban
area of Bavet.
Rural households also face fewer problems with environmental issues and solid waste
management, and in general, the level of awareness about linkages between wastewater,
garbage, and disease is lower than for people in the urban area. Gender roles tend to be more
traditional in a rural area, with, for instance, a higher proportion of women being in charge of
fetching water than in urban areas (49% against 40%). More specific information and training
programs should be proposed to the population residing in a less urbanized area, on hygiene
and sanitation, what they can expect of improved services, which of their habits will have to
change, and the costs of services.
Figure 15: Map of area showing the level of urbanization

56
2. Addressing existing deficiencies in basic infrastructure
Wastewater management challenges and recommendations59:
Technical recommendation to address the challenges of poor wastewater services in
a fast urban development context (it is estimated that 74% of the excreta generated is unsafely
managed) are developed under Feasibility study Volume 3 Wastewater.
Stormwater management challenges and recommendations60
Similarly Feasibility Study, Volume 4, present some recommendation for urban and
rural areas to address the city challenges with flooding in the context of uncontrolled urban
developpement (e.g.clogging of channels) and climate change.
Solid waste management challenge and recommendations61
Solid Waste Management: Feasibility study, Volume 5 covers the challenges of service
coverage for waste collection services, collection of household hazardous waste and
operation of the dumpsite and waste recycling. It also highlight the poor working conditions of
the waste pickers in the streets and in the dumpsite and negative consequences for their
health and safety.
3. Impact on poverty reduction
Adverse social costs
As the project aims to improve the urban infrastructures, a few negative impacts are
expected:
(i) Access disruption and dust from the construction and installation of civil works associated with the sewerage system and wastewater drainage ; 62 and
(ii) Cost of access to improved infrastructures and services represent additional expenses and weights relatively more on poor/ vulnerable household budget.
(iii) Impact on informal jobs.
Special assistance for poor and vulnerable groups has been included in the Basic
Resettlement Plan.
In order to reduce the negative impacts occurring during the construction, an
Environmental Management Plan (EMP) has been prepared (refer to the Initial Environmental
Examination volume) and will need to be updated during the Detailed Engineering Design.
The project involves temporary and permanent land acquisition but no house
demolition. However, network construction works may cause temporary disruptions to vehicle
access, traffic flow, rail services, and utility services, such as water supply. Access disruption
and dust from the construction and installation of civil works could impact local businesses as
59 Feasibility study Volume 3 60 Feasibility Study, Volume 4 61 Feasibility study, Volume 5 62 Also covered in Bavet IEE report.

57
access will be momentary made more difficult, visibility reduced, or noise/dust could create
discomfort for the business owners and customers/guests. It could result in a punctual loss or
reduction of incomes.
Given the increased dust during construction, it is possible that an increase in
respiratory disorders (such as asthma, bronchitis) is observed, and these illnesses are more
likely to affect the very young and very old. People are also concerned about the risks of
accidents in the construction area (e.g., drowning of children, falling into holes). This could
impact more on women, given that they may have to assist young children in getting to school,
go to the market, and staying at home to look after sick family members. Per experience,
people are also afraid of project disruption due to funding or cash flow issues, which would let
them in the middle of a construction site for a long and uncertain time.
The construction of temporary workers camps may affect the local community and
environment. Contractors’ environmental and occupational health and safety plans will provide
mitigation measures. The recruitment of construction workers will prioritize local residents to
reduce the number of migrant workers. HIV/AIDS, communicable diseases, gender-based
volence and sexual exploitation, abuse and harassment (GBV-SEAH), COVID-19 specific
measures will also be implemented in contractors’ health and safety plans.
The cost of access to improved infrastructure and services represent additional
expenses and weighs relatively more on poor/ vulnerable household budget. For instance,
and according to the information available, the current price for solid waste collection service
in Bavet is $3.9/month (median); $6.54/month for HHs (average). While this represents barely
1% of the whole group average revenue, it is nearly 5% of the estimated average revenue of
the poorest households.
Additional costs for solid waste collection, connection to sewer pipes, and monthly
sewerage fees will impact the vulnerable group's budgets more significantly. There is a risk (i)
that poorer households cannot afford nor access improved sewerage and solid waste
management services, (ii) that poorer households have to make difficult choices between
expenses, and that better sanitation happens at the expense of nutrition, education, or health
for instance, which is not the purpose of the project.
The improvement and organization of the Solid Waste Management system, and the
closing of the existing landfill, will impact informal jobs of waste pickers and scavengers.
Street waste pickers contribute to collecting 10% of the solid waste generated each
day in Bavet. Currently, 26 waste picker households/ 115 persons (60% females) are working
at the existing landfill located on the public land, and for the majority this is a full-time job for
more than ten years.63Working conditions of waste piskers and children’s work in the dumpsite
are two major issues to address by implementing the new SWM strategy, and waste pickers
will not be authorized to informally work on the new site and will lose their main source of
income.
75% of the waste pickers consulted as part of the IOL/SES mentioned they would
continue to pick waste around markets and along the houses to make an income. Half are
interested in working in project construction work. Consulted during the social survey, groups
of informal waste pickers/ scavengers expressed that they may be interested in formal jobs.
They do not know much about vocational training options, but they are still keen on the training.
63 Draft report, Inventory of Loss and Socio-Economic-Survey October 2020, Egis

58
The project addresses waste picker livelihoods through strategies such as integration
into the formal system, as well as the provision of safe working conditions, social safety nets,
and child labor restrictions. Their requirements as expressed during IOL/SES and social
survey are acknowledged, and the following responses are proposed:
It is proposed: :
that construction contractors will give priority in project construction works or daily labor
to project vulnerable households and waste pickers,
that the project provides waste collection carts for waste picker households wanting to
continue waste collection at public areas of Bavet town,
to confirm with the waste pickers and Provincial Department of Vocational Training the
options for vocational training (to waste pickers, but also to their family members) and
support in search of and application for employment by the Provincial Department of
Labour, .
to support children working as waste pickers to attend school instead of working
That the solid waste collector (private sector) will give priority to project vulnerable
households and waste pickers when expanding their fleet (truck driver and collectors),
and anticipate/provide training.
In the long term, there will be job creation accessible for non-qualified employees in
the sorting plant; priority will be given to project vulnerable households and waste
pickers.
It is recommended that these tasks of social facilitation and social support are contracted out to an NGO for the whole project
Picture 2 Street waste collector interviewed by Egis team, Bavet, June 2020
Employment opportunities and wage generation64
Expanding the wastewater system and establishing the wastewater treatment plant will
generate employment for the operation and maintenance of the WWTP, high water pressure
cleaning, pumping station maintenance, administrative work, management, and daily
cleaning, in total 19 permanent jobs are estimated. Using adequately treated wastewater could
64 According to a World Bank study, investing US$1 billion in water supply and sanitation network expansion in Latin America would create about 100,000 jobs (Schwartz, et al., 2009).

59
also offer in the future potential employment benefits in a range of water-dependent economic
sectors such as agriculture and industry, which are not estimated yet.
Table 14: Estimate Human resources required to operate the sewerage system
Operation and maintenance task
Human resources required
Cleaning person Truck Driver
Administrative assistant
Technician Process engineer
Team leader
WWTP Operations & Maintenance
0 0 0 4 1
Network
High water-pressure cleaning
4 0 4 0 0
Pumping station maintenance
0 0 2 1 0
General
Administrative Works
1 4 0 0 0
Management team 0 0 0 1 1
TOTAL human resources required (full time)
5 4 6 6 2
Note: The team proposed above does not consider the staff that might be already existing.
Stormwater drainage: with the application of the sub-decree 182 release in
December 2019, the drainage management is the Public Works, Transport, Sanitation,
Environment, and Public Order Office (sub-decree 182, Art.24) of the municipal administration.
The added responsibility for the municipality administration will have implications for the
municipality capacity in terms of the additional human resources needed to undertake this
function. The development of the drainage system will require human resources for the
provision of drainage, capacity to operate utility services, and maintenance of the drainage
system. A team dedicated to the drainage system maintenance shall be created and be
composed of:
(i) Four full-time cleaning technicians up to 2025 – for the short-term urban areas;
(ii) One full-time engineer to organize inspections, perform the illegal connection controls, record all flood events, and organize the repair actions.
Solid Waste Management: based on the scenario consisting of (i) improving the
household collection coverage by increasing the fleet of trucks; (ii) increasing the diversion
rate by operating the material recovery facility, creating and operating a pre-sorting plant and
a composting plant; (iii) creating and managing a controlled landfill, jobs will be created at
different levels: increased number of drivers and waste collection staff (private operator),
mobilization of construction companies and workers to create the landfill, building the pre-
sorting plant and the composting plant, organizing a professional team to manage and operate
the new landfill, manager, and workers at the material recovery facility, at the pre-sorting plant
and composting plant. In the long term, job creation would reach around 130 positions,
including 15 for the composting plant. Most of the posts would be accessible for unqualified
employees, such as actual waste pickers and scavengers, and equally open to women. This
could offset the possible loss of informal jobs, ensure better working conditions, and address
the issue of children’s work in the dumpsite.
The female share of the workforce in the formal wastewater treatment sector and
stormwater drainage is quite marginal, especially in technical and other professional positions,
they are more represented in clerical jobs.
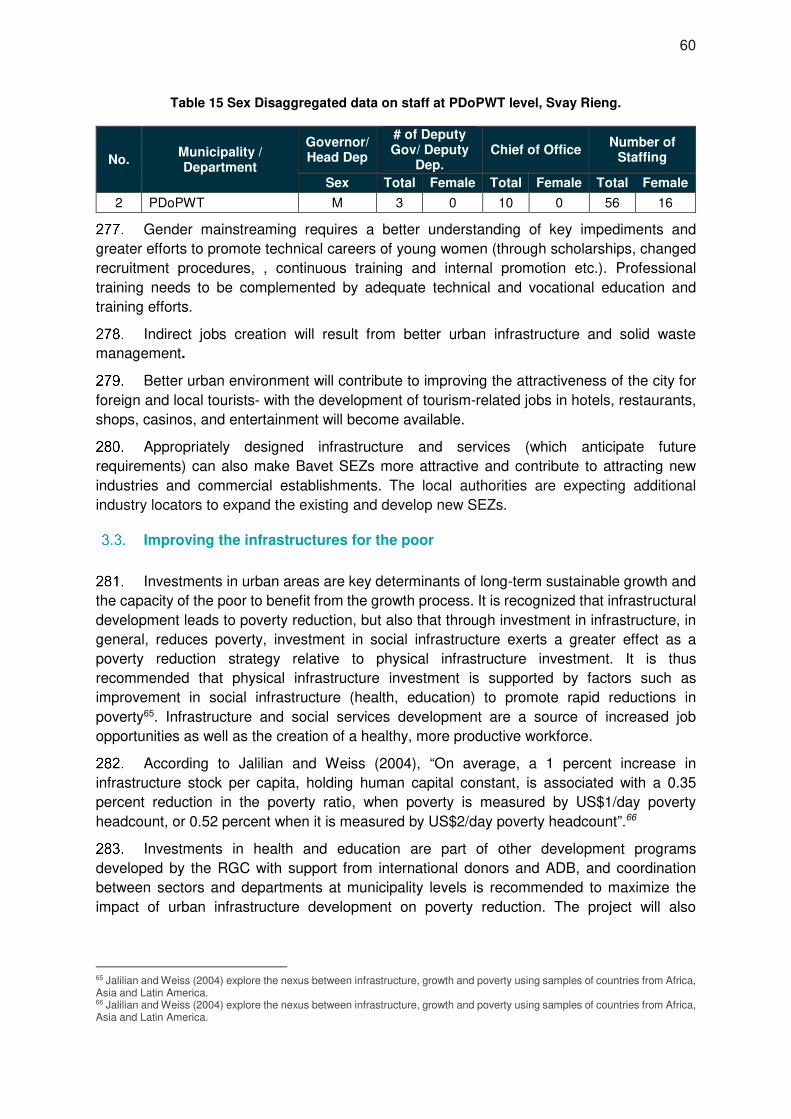
60
Table 15 Sex Disaggregated data on staff at PDoPWT level, Svay Rieng.
No. Municipality / Department
Governor/ Head Dep
# of Deputy Gov/ Deputy
Dep. Chief of Office
Number of Staffing
Sex Total Female Total Female Total Female
2 PDoPWT M 3 0 10 0 56 16
Gender mainstreaming requires a better understanding of key impediments and
greater efforts to promote technical careers of young women (through scholarships, changed
recruitment procedures, , continuous training and internal promotion etc.). Professional
training needs to be complemented by adequate technical and vocational education and
training efforts.
Indirect jobs creation will result from better urban infrastructure and solid waste
management.
Better urban environment will contribute to improving the attractiveness of the city for
foreign and local tourists- with the development of tourism-related jobs in hotels, restaurants,
shops, casinos, and entertainment will become available.
Appropriately designed infrastructure and services (which anticipate future
requirements) can also make Bavet SEZs more attractive and contribute to attracting new
industries and commercial establishments. The local authorities are expecting additional
industry locators to expand the existing and develop new SEZs.
Improving the infrastructures for the poor
Investments in urban areas are key determinants of long-term sustainable growth and
the capacity of the poor to benefit from the growth process. It is recognized that infrastructural
development leads to poverty reduction, but also that through investment in infrastructure, in
general, reduces poverty, investment in social infrastructure exerts a greater effect as a
poverty reduction strategy relative to physical infrastructure investment. It is thus
recommended that physical infrastructure investment is supported by factors such as
improvement in social infrastructure (health, education) to promote rapid reductions in
poverty65. Infrastructure and social services development are a source of increased job
opportunities as well as the creation of a healthy, more productive workforce.
According to Jalilian and Weiss (2004), “On average, a 1 percent increase in
infrastructure stock per capita, holding human capital constant, is associated with a 0.35
percent reduction in the poverty ratio, when poverty is measured by US$1/day poverty
headcount, or 0.52 percent when it is measured by US$2/day poverty headcount”.66
Investments in health and education are part of other development programs
developed by the RGC with support from international donors and ADB, and coordination
between sectors and departments at municipality levels is recommended to maximize the
impact of urban infrastructure development on poverty reduction. The project will also
65 Jalilian and Weiss (2004) explore the nexus between infrastructure, growth and poverty using samples of countries from Africa, Asia and Latin America. 66 Jalilian and Weiss (2004) explore the nexus between infrastructure, growth and poverty using samples of countries from Africa, Asia and Latin America.

61
contribute to people’s education on water, hygiene and sanitation, and the environment and
improve policy and regulatory environment.
In the objective of maximizing the number of households connected to and/or using
infrastructure and services, the tariff systems have to be designed (i) to provide a price that
is affordable for all categories of households and as such will not necessarily ensure full cost
recovery, or (ii) to ensure equity, subsidize only those for whom connection or service fees
would be unbearable and not the wealthier consumers/users for whom those costs have no
significant impact on their budget. The use of the existing ID Poor P1 and P2 cardholder
system is an option that has been used for water supply in Battambang. Whereas the full water
connection fee is KHR 500,000, P1 and P2 cardholders will automatically qualify for a KHR
100,000 subsidy. This can be paid upfront, or if the HH does not have the money, it can elect
to pay by installments over a 6- or 12-month period. If a HH is poor, cannot afford the
connection fee, but does not hold a P1 or P2 card, the HH may request a letter from its
Commune Council certifying the HH’s economic status as poor and present this to the BTB
water supply agency for consideration of the subsidy or installment payments.67
Within a sustainable development framework, the need for subsidies to provide
services to the poor is widely accepted and forms part of the ADB Water Policy. During the
social survey, vulnerable groups insisted that while they are willing to be connected or to
access the services, they have limited capacity to pay, which could prevent them from
accessing the service. Local authorities are also aware of this situation and proposed to
consider equitable pricing during the social survey.
Wastewater To facilitate access to the new service, a wastewater tariff schedule will
need to be applied for residential, commercial, hotels, institutions and special economic zones.
The fees will be levied and will be slowly increased with the intention of achieving full cost
recovery from 2027, onwards. An affordability assessment was conducted which determined
that the expenditure accounts for wastewater is less than 5% of household income (deemed
affordable). The project proposes an off-site sanitation system (wastewater treatment plant
(WWTP), piped collection). However, in rural areas and urban areas where the connection
sewerage system would have been too expensive, the on-site collection is proposed. The
collected fecal sludge will be transferred by vacuum-truck to the WWTP.
The stormwater drainage is a non-revenue generating asset and will require
allocated funds from the municipal budget to cover the operative expenditure. No specific
measure is proposed. The project proposes to address the city recurrent flooding issues by
developing an underground network (box-culvert) in urban area as to minimize the risk of
blockage by solid waste and problems related to resettlement, and to deal with the low space
available (line placement under existing streets and road).
Solid Waste management:. The collection is adapted to the area (i) with the
improvement of the existing door-to-door collection system in the urban area (ii) and
improvement the global collection coverage, through centralized collection points in rural
Sangkat. The project also recommended to close the existing dumpsite where waste pickers
are working in poor conditions with negative consequences for their health and safety. It is
recommended to invest in the pre-sorting plant to reduce waste landfills and to employ waste
pickers working currently in poor conditions as sorting operators. In the final instance, a
revenue-generating service can be expected to be almost self-financing through user pay. In
67 TA8982-CAMProvincial Water Supply and Sanitation Project, Poverty, Social Impact and Gender Analysis Draft: February 2017
62
the project, a sorting plant and a composting plant are proposed. Controlling part of the
recyclables and compost economy would improve economic sustainability and reduce the
financial burden on the population. Even if the compost selling revenues do not recover the
composting plant costs in the current market condition, long term benefits should be
considered, such as lower landfill footprint and economic benefits for farmers. Composting is
also an opportunity to reduce greenhouse gas emissions
4. Impact on health
General consideration
The release of untreated or inadequately treated wastewater into the environment
remains a common practice. Livelihoods in farming, fisheries, aquaculture, and tourism suffer
as a consequence (UNEP, 2015). This practice has severe negative health impacts due to
hepatitis A infections, worm diseases, schistosomiasis, gastrointestinal infections, and
respiratory disorders (Heymann et al., 2010) and contributes to malnutrition and stunting.
Inappropriate wastewater disposal prevents or harms close to 65 million life-years annually,
which translates into reduced productivity and inability to carry out work. In Bavet, 69% of
households don’t know where wastewater from businesses/ production is handled, and 97%
don’t know where septic sludge is transported. As mentioned by participants in FGDs, in case
of flooding, soak pits overflow, and toilet wastewater mixes with rainwater, and potentially
pollutes ground water supply such as wells which is very unhealthy.
Poorly managed waste serves as a breeding ground for disease vectors spreading,
pest development and contributes to climate change through methane generation. 85% of
Households in Bavet observe bad management of solid waste in their area, and 79% are
affected by bad smells. 80% think that solid waste mismanagement affects both their
environment and their health.
The immediate health impacts of floods generally include drowning, injuries,
hypothermia, and animal bites. In the medium-term, infected wounds, complications of injury,
poisoning, poor mental health, communicable diseases, and starvation are indirect effects of
flooding. Lon term effects include chronic disease, disability, poor mental health, and poverty-
related diseases, including malnutrition68. Epidemiological evidence shows that chemical
material may contaminate homes and that in some cases, flooding may lead to the
mobilization of chemicals from storage or remobilization of chemicals already in the
environment, e.g., pesticides. Hazards may be greater when industrial or agricultural land
adjoining residential land is affected.69 Flooding can also affect the availability of health
services or access to health centers.
In Bavet, 33% of HHs associate the experience of skin disease of one of the HH
members with flooding, as well as 29% HHs associate cases of diarrhea with flooding. They
also observe the proliferation of trash, stagnant waters, overflowing wastes from septic tanks,
and a higher prevalence of diseases such as dengue fever, typhoid, skin disease, and
leptospirosis. 36% have little access to health centers during flooding.
68 Health Impacts of Floods, Paul George (a1) Published online by Cambridge University Press: 03 May 2011 69 Public health impacts of floods and chemical contamination, Euripides Euripidou, Virginia Murray, Journal of Public Health, Volume 26, Issue 4, December 2004, Pages 376–383,

63
Solid waste management is also an issue in flood risk management practice. After a
flood, the deposition of waste can block drains and be a source of toxins and breeding ground
for disease. Floods can also have an impact on waste management systems leading to the
leaching of toxins into groundwater.
Tthe better management of wastewater, solid waste, and rain/stormwater should result
in improved public health: reducing open burning, mitigating pest and disease vector
spreading, reduction in the release of untreated wastewater, lowering the impact of disasters.
Average spending for health in the previous year of survey in Bavet was around $112
($97 in a rural area and $146 in the urban area); and $103 was related to a waterborne disease
such as skin diseases, diarrhea, dysentery, typhoid fever, cholera (47.7% responses). On
average, HH members were unable to work for 5.3 days due to waterborne disease (18%
answers).
The impacts on health are described in more detail in Economic Analysis Volume.
The project can have a general impact on all the residents, the commercial sector, and
tourists through the reduction in the negative aspects.
Through improved sanitation, the population of Bavet will have access to improved
sanitary facilities, which will significantly reduce the incidence of disease related to poor
sanitation and drainage, particularly of acute intestinal infectious diseases, hepatitis, dengue
fever, malaria, etc. thereby reducing production time lost and money spent on dealing with
illnesses and impacting on the health of infants and the very young who are most susceptible
to disease related to poor sanitation.
The benefits of improved drainage are similar to the benefits of sanitation, with the
added reduction in disease and health costs associated with unsanitary sanitation, and
flooding and the contamination of floodwater with wastewater.
Risk of spread of HIV/AIDS and STIs
4.2.1. Current status of HIV/AIDS
UNAIDS data in 2019 estimate the number of adults and children living with HIV in
Cambodia at 73,000. The prevalence rate in the adult population (over 15 y.o)- is at 0.5. New
infections have been falling steadily since 1995, now reaching a steady low state of fewer than
1000 new cases per year, while the coverage of Antiretroviral therapy (ART) has been rising
to 80% of affected adults.
In Asia, HIV particularly impacts women because of gender differences. On the one
hand, men are more likely to have multiple partners, to travel for work, and to have disposable
income. On the other hand, women are physiologically more vulnerable to infection, and their
lack of social and economic power means most women are unable to negotiate safer sex.
Women generally have lower levels of education and skills and are poorer than men, so they
are less likely to access accurate information about HIV. Women are also more frequently and
severely impoverished due to HIV; often, the husband is the first in the family to get sick,
assets are sold to pay for his health care, and after his death, his widow and children are left
impoverished.

64
4.2.2. Knowledge about STIs and HIV/AIDS
In 2002, Cambodia's National Assembly passed legislation on HIV prevention and
control. The Government aim at the elimination of new HIV infections through (i) early
diagnosis of HIV infection and early access to ART as prevention and a boosted continuum of
care, (ii) boosted prevention of mother-to-child HIV transmission, (iii) boosted access to and
utilization of prevention, care and treatment services by key-affected populations, (iv)
strengthening of community-based health services, and (v) enhanced monitoring and
evaluation of impacts. The government has a multisectoral approach, and information and
awareness raising widely disseminated in the population through health and education
systems and early detection systems in place have reduced the risk of transmission.
Information and prevention go, for example, through women in the reproductive age group
(HIV and syphilis testing are proposed as part of antenatal care) and specifically target groups
at risk (drug users, entertainment and sex workers, men who have sex with men).70 Low level
of education, poverty, and living in a remote area with no or too few health centers, limit access
to information and services, which constrains behavior change and maintains social norms.
4.2.3. Risks associated with the project
Risks associated with the project infrastructures may arise during construction, and
the people most vulnerable to HIV/AIDS will be the skilled and semiskilled male workers—
including machine operators, drivers, supervisors, managers, and engineers—and young,
rural, poorly educated women who could move to the construction sites to sell sex. Local
laborers are usually less at risk because they are usually drawn from the local communities
and go back to their partners and families each night. Women who operate small
businesses/shops along the streets/roads, scavengers/ waste pickers could also be at risk of
HIV if they lose their livelihood as a result of construction works and infrastructure
development and consequently must look for other ways to gain an income such as paid
sexual transactions.71
The project aims at increasing the attractiveness of the city for tourists and businesses.
This will result in more regular and larger flows of people visiting or settling in the city (again,
more mobility coincides with a higher risk of circulation of all types of viruses including HIV)
and the development of entertainment and leisure businesses. These are favorable for the
development of the sex economy, with sex workers being at risk of contracting and spreading
HIV and STDs.
70 WHO Library Cataloguing-in-Publication Data, Joint review of the Cambodian national health sector response to HIV 2013. I. World Health Organization Regional Office for the Western Pacific 71 Intersections- Gender, HIV and infrastructure operations, lessons from selected ADB financed transport projects, August 2009, ADB.

65
VII. GENDER ASSESSMENT
1. Role and status of women
Social norms related to gender relations continue to constrain the development of
women’s potential and hinder their empowerment in economic, social, public, and political life.
Cambodian women are progressively enjoying wider freedoms and claiming their
rights through increased employment opportunities and Cambodia’s broader economic
development. Today Khmer women exercise considerable autonomy and independence.
They can own assets, land72, manage financial transactions, and contribute to household
decision making. Both men and women can inherit property, and the gender division of labor
can be complementary and flexible, with men and women performing a range of productive
and household tasks.73
However, traditional norms and low levels of education and literacy still limit girls’ and
women’s choices and options. Women are expected to follow social norms and beliefs that
allow men to enjoy their ‘gender privilege,’ while women under-value their own capacity and
potential. Women are considered to be of lower status than men, although the status is also
determined by age and other socioeconomic characteristics, especially wealth. For women,
marriage and children additionally determine status. In general, attitudes toward gender roles
continue to confine women to household and childcare duties (household manager), while at
the same time, the family’s economic status pressures them to engage in income-generating
work.74
Cambodia’s 2017 Gender Inequality Index (GII)75 value was 0.473, placing Cambodia
at 116th out of 160 countries, which was behind other ASEAN countries.
Education and health
Solid progress has been achieved in primary school enrollment from 97%%in 2012/13
to 98.4%% in 2015/16, and gender parity has been achieved at the primary level (1:1 ratio).
Overall completion rates at primary school increased to 84.1%%in 2015, with girls’ rates higher
than boys' at 86.6% %. In 2017-18, the primary gross enrolment rate (GER) was 97.8% %and
slightly higher for girls at 98.11%%. For Lower Secondary School, girls represent 52%% of all
students and 30%% of all repeaters, and women are 45%% of all teaching staff. The gap
between female and male LSS Gross Completion Rate (GCR) is widening in favor of girls,
with GPI increasing from 0.96 in 2012-13 to 1.21 in 2017-18. For Upper Secondary School,
72 In 2015, the RGC introduced the Land Policy “White Paper” in response to socio-economic development and land reform. The “White Paper” (Points 5 and 7) includes key guidelines and activities for achieving gender equality in the land sector and equity between men and women in the land registration process. 73 There are no legal restrictions for women to be recognized as the head of household, and married women are not required by law to obey their husbands. Women have the same rights and responsibilities towards their children, including being their legal guardians, during marriage (Civil Code, 2007). 74 NGO reports suggest the prevalence of customary attitudes that perceive men as the de-facto head of household, in particular when it concerns the rights to control and manage all of the family’s property (NGO CEDAW and CAMBOW, 2011). Customary law relating to the role and behavior of women, generally referred to as Chbab Srey in Khmer, is deeply rooted among many communities, in particular in rural areas where an overwhelming majority of Cambodians live. According to Chbab Srey, women should be subservient to men, and submissive and obedient to their husbands (STAR Kampuchea and ILC, 2013). 75 The Gender Inequality Index (GII) is an index for measurement of gender disparity. According to the UNDP, this index is a composite measure to quantify the loss of achievement within a country due to gender inequality. It uses three dimensions to measure opportunity cost: reproductive health, empowerment, and labor market participation.

66
girls represent 52%% of the students and 41 % of repeaters, and women are 32 % of teaching
staff and 22 % of school principals. In 2018, the Ministry of Education, Youth, and Sport
(MoEYS) instructed all the ministry’s units and educational institutions to institutionalize and
accelerate the effort to promote women in leadership in the education sector through key
specific approaches: 1) establish a women leadership program, 2) integrate female
representatives into promotion committees, and 3) accelerateappointments of more women to
management levels. Across ASEAN, Cambodia shows the biggest increases in the ratio of
girls to boys in primary and secondary schools, from among the lowest ratio of 93 and 82
respectively in 2007, to among the highest in 2015 with 101 and 109 respectively.76
In the context of Covid 19, The Ministry of Education Youth and Sport appealed to
parents of students to provide home education in a proper environment and help them obtain
more learning materials during the COVID-19 pandemic. However, this situation risks
increasing the gender gap in education. Girls may be expected, due to gender norms and
roles, to devote more time than boys to unpaid care work such as caring for younger siblings,
older populations, and those who are ill within the household rather than focusing on
education. . According to the Rapid Assessment of COVID-19 Impacts on Girls’ Education in
Northern Provinces of Cambodia conducted by Plan and Care Intrenational, COVID-19 has
magnified existing gender norms and roles particularly for women and girls in having to
manage more tasks in the household. Girls were more likely to be requested to do housework,
while boys were asked to help at the farm and paddy field with their parents.77
Women of reproductive age experience substantial risks associated with pregnancy
and childbirth. The World Bank’s data78 shows that around 167 women died from pregnancy-
related causes per 100,000 live births in 2017. Women in rural areas and poor households
are at a greater risk. In 2012, only 13% of births in rural areas were attended by a doctor,
compared to 32% in Phnom Penh. Cambodia is off track for the SDG target on maternal
malnutrition. Malnutrition is considered the underlying cause in 20% of maternal deaths,
accounting for nearly 300 maternal deaths annually in Cambodia.
The rate of anemia among pregnant women is 53%. About 6% of women have a height
of fewer than 145 centimeters, which indicates they were malnourished as children. These
women are also likely to give birth to small children.
Women generally also have a higher risk and health exposure as the primary
contributors to household and community sanitation tasks. The traditional separation of
gender roles where women are primarily responsible for domestic chores, including the care
of children, the elderly, and the sick, make them disproportionately affected by the lack of
reliable water supply and sanitation services, and these considerably increase women’s time
poverty. Women are the main users of water in households who are also primarily responsible
for solid waste, liquid waste, and wastewater management on the household level. Water
shortages also significantly increase the time needed for cooking, cleaning, and caring for both
children, the sick and disabled members. In addition, women who work in kindergarten,
schools, and hospitals bear the responsibility to fetch water and clean the toilets. Lack or low
76 Kingdom of Cambodia Cambodia Report On the occasion of the 25th Anniversary of the Fourth World Conference on Women and the adoption of the Beijing Declaration and Platform for Action (1995) Submitted by Ministry of Women’s Affairs Royal Government of Cambodia Phnom Penh June 2019 77 Rapid Assessment of COVID-19 Impacts on Girls’ Education in Northern Provinces of Cambodia, Care and Plan International August 2020, https://aseansafeschoolsinitiative.org/rapid-assessment-of-covid-19-impacts-on-girls-education-in-northern-provinces-of-cambodia/ 78 https://data.worldbank.org/indicator/

67
quality of potable water and sanitation also increase the incidences of water-borne diseases
and thus households ’expenditures on medicine and doctors’ fees.
Women and livelihood
Between 2000 and 2018, female laborers made up about 48% of the total labor force.
30% of the female labor force is employed in the agricultural sector, 45% in service, and 25%
in the industry sectors.79
Women are represented in the informal sector, with a high level of vulnerability. They
often engaged in low and unstable wage employment, casual work, and risky work
environments. Poor and rural women tend to be overrepresented in domestic work, home-
based work, and as street vendors, and smallholder farmers. According to the World Bank’s
data80, 57% of total female employment is in vulnerable employment with a high proportion as
own-account workers contributing domestic care and family work. Even though women own
65% of all businesses in Cambodia, those businesses are on average smaller and less
profitable than businesses run by men, with only 1.7% registered compared with 6.6% for
male-run businesses. Women-owned businesses are primarily concentrated at the micro-level
in the wholesale and retail trade and services sectors.81
While women earn substantially less than men, the earnings gap narrows with the
attainment of upper secondary and tertiary education. In 2014, only 5.3% of women in the
labor force had post-secondary education compared with 8.0% for men.
Women are benefiting from greater access to micro-finance: 80% of microfinance
institutions’ clients are women. However, women are less likely to access finance ( long-term
finance) because of limited collateral and low levels of formal education.
Single women from rural areas are often forced by a lack of livelihood options to
migrate to Phnom Penh or larger provincial towns to find employment, and the garment
industry is a case in point. Surveys conducted in rural areas also indicate that it is not only
men but also women who are migrating to neighboring countries to work, in particular to
Thailand, where they find employment in various occupations such as construction, domestic
help, factory work, entertainment, and hospitality. According to a 2014 report by UN Women82,
many women migrating into Phnom Penh are engaged in informal employment where they
are subject to low or irregular income and unstable conditions or at risk of trafficking and
exploitation. As an example of their vulnerability, in the 2009 global downturn, an estimated
30,000 mostly female garment industry jobs were lost, with employers reportedly pressuring
women to waive their benefits and severance payments, knowing that they may not
understand their rights or have the means to protect them. With the garment industry’s
eventual decline, women and girls in cities will be disproportionately affected.
79 Promoting Economic Empowerment for Women in Marginalized Conditions, OXFAM, February 2020 https://cambodia.oxfam.org/latest/policy-paper/promoting-economic-empowerment-women-in-marginalized-condition 80 https://data.worldbank.org/indicator/ 81 Promoting Economic Empowerment for Women in Marginalized Conditions, OXFAM, February 2020 82 Vulnerability and migration in Cambodia, World Food Programme- Cambodia Country office May 2019

68
Poverty and hardship
The traditional norms feed women’s time poverty: Women, especially women from
poorer HHs and even more from FHHs, work long hours to provide numerous services in their
homes and communities, such as buying and preparing food, cleaning, washing and taking
care of children as well as of the sick and elders, collecting water when there is no connection
to piped water, tending to kitchen gardens as well as looking after small livestock such as
poultry in rural and peri-urban areas. These very time-consuming duties are unpaid, meaning
that women are simply expected to do them, often denying them of other opportunities such
as their basic rights to education, healthcare, decent work, and leisure time, including the time
to spend with their children in the role of social mentor and teacher. Routine and non-
productive tasks also prevent them from participating in other activities and community
decision making discussions. This is often exacerbated in poorer HHs where there are higher
numbers of children due to the lack of family planning and the use of modern contraceptives.
Time poverty acts to perpetuate gender inequality.
According to the Cambodian Government’s National Social Protection Strategy for the
Poor and Vulnerable (2011-2015), the government categorized vulnerable people into 17
groups including (1) Infants and children, (2) Girls and women of reproductive age, (3)
Households vulnerable to food insecurity and unemployment, (4) Indigenous and ethnic
minorities, (5) Elderly people, (6) People with chronic illness, (7) People with disability, (8)
Orphans, (9) Youth and children at risk, (10) Victims of violence, abuse, and exploitation, (11)
Families of immigrants, (12) Homeless people, (13) Veterans, (14) Single mothers, (15)
Widows, (16) Pregnant women, and (17) Child workers. Women are overwhelmingly
represented in these categories.
Women are among those most affected by the consequences of socio-economic crisis
such as the one created by the Covid 19, like many works in more vulnerable employment,
perform a disproportionate share of unpaid care work, and may face increased risks of gender-
based violence during lockdowns. Women own 60 % of a medium, small, and
microenterprises, yet many are not formally registered and cannot obtain government support.
In addition, the already unequal division of household tasks is further exacerbated through
caring for children during school closure. In families where men and women are migrant
workers and have returned to their communities, women usually take care of the house and
family, and men will try to find work.83
Gender-based violence
According to the 2013 UNICEF (Cambodia) Annual Report, violence against children
and women pose significant developmental challenges. The majority of those studied
experienced physical violence before age 12, and 1 in 22 females (compared to 1 in 18 males)
experienced sexual abuse in childhood. Although it is difficult to obtain reliable or accurate
statistics on the incidence of domestic violence as these statistics are based upon “reported”
cases only, it can be safely assumed that the actual incidence is far higher than what is
reported. Noted that rural women were almost twice as likely to be victims of violent incidents
as urban women.
83 UN Cambodia framework for the immediate socio-economic response to COVID-19 Source UNCT Cambodia Posted 16 Sep 2020 Originally published 16 Sep

69
In a culture with unequal power relations between men and women, gender-based
violence is common, especially among vulnerable groups (e.g., migrant garment factory
workers). 21 % of ever-partnered women aged 15-64 years report experiencing intimate
partner physical and/or sexual violence at least once in their lifetime, and 4% experienced
non-partner sexual violence at least once. 19 % of women aged 20 to 24 years were first
married or in union before age 18.
Domestic violence is also a major concern: while violence against women may be
considered culturally unacceptable, domestic violence is considered justifiable.
During emergencies such as conflicts or natural disasters, the risk of violence,
exploitation, and abuse is heightened, particularly for women and girls. At the same time,
national systems and community and social support networks may weaken. In the context of
COVID-19 quarantine and isolation measures, Intimate Partner Violence (IPV) has the
potential to dramatically increase for women and girls. Restrictions on mobility also mean that
women are particularly exposed to intimate partner violence at home with limited options for
accessing support services. 84
Access to resources
Women can own assets, manage financial transactions, and contribute to household
decision making. Both men and women can inherit property. However, in general, attitudes
toward gender roles still emphasize the woman as a household manager and the man as a
provider85. According to the 2014 Cambodia Demographic and Health Survey, a large majority
of currently married women (86%) participate in three specified areas of decision making. This
includes decisions on their own health care, major household purchases, and visits to their
family or relatives.
Decision making power is strongly linked to household income contribution, women
who earn more than their husbands are more likely to decide how their cash earnings are
used, and women who are older, divorced, separated, or widowed, and those who live in urban
areas are better educated, and are paid in cash have greater financial control over the assets.
Access to the media and knowing one’s legal rights also correlate with greater economic
autonomy.86
Women have less access than men to higher-skilled occupations, public sector
employment, business associations, and networks that offer opportunities for lobbying and
agency. Occupational segregation is extensive, and women continue to be concentrated in
lower-skilled occupations.87
Obstacles to the growth of businesses run by women include a lack of access to
infrastructure (such as roads and electricity), cultural biases (which lead to discrimination and
the undervaluing of women entrepreneurs), and an inability to access finance (especially long-
term finance) because of limited collateral and low levels of formal education. Women and
especially FHHs are reported as less likely to be able to obtain bank loans, making them more
susceptible to higher interest rates charged by money lenders.
84 CARE Rapid Gender Analysis for COVID-19 Cambodia – July 2020 85 Discriminatory social norms consider women to be less competent than men with regards to family finances and decision-making, and thus they have less power than men to make decisions about their family (STAR Kampuchea and ILC, 2013). 86 USAID/Cambodia 2010 87 Cambodian Garment and Footwear Sector Bulletin 2015

70
According to the ADB 2014 Country Report, evidence of high malnutrition and anemia
among women and a high incidence of domestic violence indicate women’s inferior position
and disadvantaged access to resources.
2. Gender characteristics in the project area
Women make up 51% of Bavet’s municipality population ( 22,411). FHHs make up to
12% of total families as recorded in the Municipality data 2019, but high discrepancies are
observed between villages and Sangkat. The %age of FHHs is higher in Sala Tean Village in
Sangkat Chrok Mtes (25% FHHs), Leab Village in Sangkat Prey Angkounh (22%), and in
Technol Kaing village Sangkat Bati (21% FHHs).
Livelihood and economic activity
The methodology used in CCS is based on households and does not provide
male/female incomes but an analysis of household budget only, and our analysis focuses on
FHHs answers only.
In Bavet, male and female heads of households’ primary activity in the CCS is running
a small scale business; it represents 26% of males’ and 34% of females’ jobs. 13% of women
and 22% of men work as farmers, , and 7% of men and 8% of women work as factory workers
in SEZs. 36% of FHHs are homemakers. None of the FHHs interviewed have a job as an
employee in the government or NGO/ IOs, whereas 7% of men did.
Table 16: Comparison of occupation between male and female heads of households, Bavet
Occupation The female head
of household The male head of household
Small scale business owner 34% 26%
Housewife 36% 1%
Farmers 13% 22%
Construction workers 1% 12%
Factory worker 8% 7%
transportation services including moto-taxi 1% 9%
Not working 4% 7%
unstable jobs 4% 4%
Other 1% 6%
government employee 0% 4%
NGO/IO staff 0% 3%
solider/ police 0% 0%
According to the survey, the average income of FHH is $430, and the average amount
of expenses is $395/month.
Food consumption represents 26% of total expenses, followed by social events,
representing 22% of total monthly expenses (18% for the whole group), and then health
expenses (13% compared to 10% for the whole group). The share of health expenses is
relatively higher than in other groups.
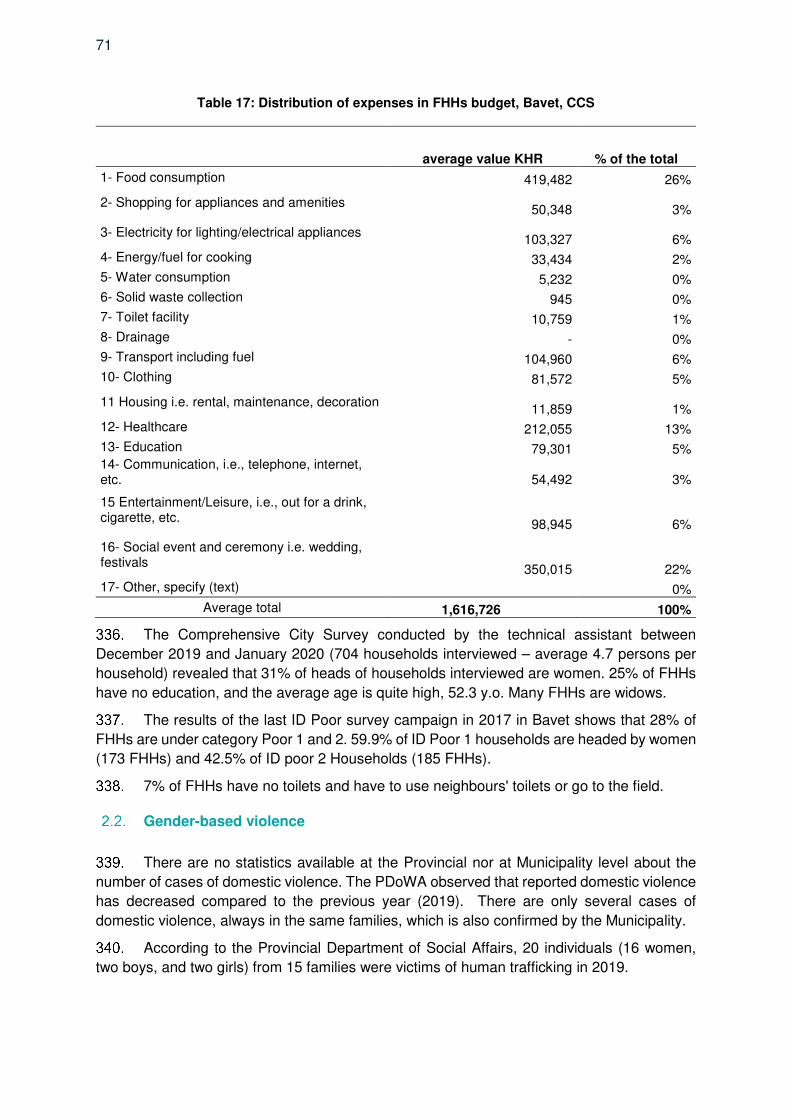
71
Table 17: Distribution of expenses in FHHs budget, Bavet, CCS
average value KHR % of the total
1- Food consumption 419,482 26%
2- Shopping for appliances and amenities 50,348 3%
3- Electricity for lighting/electrical appliances 103,327 6%
4- Energy/fuel for cooking 33,434 2%
5- Water consumption 5,232 0%
6- Solid waste collection 945 0%
7- Toilet facility 10,759 1%
8- Drainage - 0%
9- Transport including fuel 104,960 6%
10- Clothing 81,572 5%
11 Housing i.e. rental, maintenance, decoration 11,859 1%
12- Healthcare 212,055 13%
13- Education 79,301 5% 14- Communication, i.e., telephone, internet, etc. 54,492 3%
15 Entertainment/Leisure, i.e., out for a drink, cigarette, etc.
98,945 6%
16- Social event and ceremony i.e. wedding, festivals
350,015 22%
17- Other, specify (text) 0%
Average total 1,616,726 100%
The Comprehensive City Survey conducted by the technical assistant between
December 2019 and January 2020 (704 households interviewed – average 4.7 persons per
household) revealed that 31% of heads of households interviewed are women. 25% of FHHs
have no education, and the average age is quite high, 52.3 y.o. Many FHHs are widows.
The results of the last ID Poor survey campaign in 2017 in Bavet shows that 28% of
FHHs are under category Poor 1 and 2. 59.9% of ID Poor 1 households are headed by women
(173 FHHs) and 42.5% of ID poor 2 Households (185 FHHs).
7% of FHHs have no toilets and have to use neighbours' toilets or go to the field.
Gender-based violence
There are no statistics available at the Provincial nor at Municipality level about the
number of cases of domestic violence. The PDoWA observed that reported domestic violence
has decreased compared to the previous year (2019). There are only several cases of
domestic violence, always in the same families, which is also confirmed by the Municipality.
According to the Provincial Department of Social Affairs, 20 individuals (16 women,
two boys, and two girls) from 15 families were victims of human trafficking in 2019.

72
3. Control of resources and access to infrastructure
Consultation with women in Bavet shows that men are the main breadwinners, and
women contribute to 25%-30% of the households’ income. Women are in charge of daily
expenses such as food, energy, solid waste, clothes, healthcare, children's education,
transportation, entertainment, and social events and participate in decision-making around
other expenses such as buying land, house, motorbikes, investment for construction,
equipment and loans.
Picture 3 FGD with women in Bavet, October 2020
The rates of equipment are lower in female-headed households than in male-headed
households. Female headed households have less access to transportation (motorbike and
car), information, and communication equipment (cellphone and TV).
Women are severely underrepresented in decision-making processes outside the
household.88 It is also noticeable from our survey that women tend to be generally less
associated with sanitation technical choices and O&M. They are less aware of construction
and maintenance costs and less able to maintain, repair, or take action in case of problems
(e.g., toilets, pipes or drains are clogged, soak pit is full or overflowing).
A comparison of answers provided by males and females respondents, confirmed by
data collected from FHHs, show that women, in general, are less able than men to provide
technical information about sanitation facilities (toilets, sewerage, drainage systems) and are
less aware of the construction, connection, and maintenance costs of all types of
infrastructures and equipment. Women seem less equipped to understand and anticipate the
costs/benefits of an installation or services, to control and evaluate the quality of infrastructure/
equipment/ installations/ works, to make informed decisions, and to participate in O&M.
Studies from 2008 already showed that in the context of sanitation equipment purchase
decisions, for instance, women were more responsive to consumer messages, while men are
more interested in the technical aspects of a sanitation facility and the consequential cost.
88 Asian Development Bank (2012)

73
Women’s representation is also marginal in jobs related to water and sanitation,
especially technical and managerial positions. According to the information collected from the
Municipality of Bavet, only 6 out of 48 staff (12%) are women, and only one has a managerial
position. Similarly, the Provincial Department of Public Works and Transport employs only 16
women out of 56 staff (29%), and none holds a position as chief of office or the deputy.
Table 18 Staff repartition per position and sexe
No. Municipality / Department
Governor/ Head Dep
# of Deputy Gov/ Deputy
Dep. Chief of Office
Number of Staffing
Sex Total Female Total Female Total Female
1 Municipality M 3 1 13 0 48 6
2 PDoPWT M 3 0 10 0 56 16
3 PDoWA F 3 3 8 6 19 14
4 PDoLVT M 3 1 6 0 26 9
5 PDoSAVY M 3 1 `6 4 34 13
Source: Egis, information from local officials, October 2020
4. Health status
FHHs spend a relatively bigger share of their budget on health expenses than other
households (13% against 10%).
According to CCS data, women, have more diseases than men. Out of 3,167 cases of
disease listed, 54% are affecting women. This is increasing to 64% for Hemorrhagic Dengue
fever, 59% skin diseases, 58% for typhoid/ cholera/ dysentery- related to water, hygiene, and
sanitation, mosquitos.
PDoWA reported that they did not register any maternal mortality casesin the previous
year, and there are no cases of birth delivery without a doctor.
Table 19 Comparison between percentage of men/women per type of health condition
encountered by surveyees over one year.89
Risk of gender-based violence and sexual exploitation, abuse and harassment
and sexual abuse (GBV-SEAH). The concentration of workers- in majority male workers- in
a labor-camp increase the risk locally of GBV-SEAH for women workers and women/girls in
project area, especially vulnerable women/girls. SEAH against a beneficiary or member of the
89 Out of the total of health condition met by the surveyees in the year before the survey how many occurred to men compared to women. e.g among the 433 persons who suffered mild diarrhea 52% were females.
Adult Male Adult Male Adult Female Adult Female Total
6.1.1 Mild diarrhea 183 46% 213 54% 396
6.1.2 Severe diarrhea 24 53% 21 47% 45
6.1.3 Eye irritation/diseases 136 44% 170 56% 306
6.1.4 Skin diseases ( e.g. scabies, ringworm,) 95 41% 134 59% 229
6.1.5 Colds, cough, respiratory ailments 466 47% 520 53% 986
6.1.6 Headache/influenza 430 45% 520 55% 950
6.1.7 Cardio-vascular diseases, hypertension 68 56% 54 44% 122
6.1.8 Typhoid fever, cholera/dysentery 47 42% 64 58% 111
6.1.9 Hemorrhagic dengue fever 8 36% 14 64% 22
1,457 46% 1,710 54% 3,167
74
community, or between staff can involve any unwelcome sexual advance or unwanted verbal
or physical conduct of a sexual nature.
5. Gender impact analysis
Lack of sewage and solid waste collection system incurs social costs, and most of
these are borne by women and can be typified as (i) time and responsibility taken in dealing
with solid waste (finding a place to dispose of waste, burning, or burying wastes), dealing with
dogs and pests gravitating around piling waste, (ii) time, and responsibility for supervising
children playing near/with solid waste, near/with wastewater, in flooded area (iii) time taken to
nurse those sick from water-borne disease and or infections (iv) time taken to accompany
family members to the doctor and to buy medicine, and (v) reproductive health issues,
particularly genital and urinary tract infections, linked to improper hygiene especially during
period.
Improved hygiene and sanitation infrastructure and services help alleviate women’s
poverty of time, with reduced time and energy to dispose of waste, increased comfort and
security, especially for children, reduced need to look after those HH members sick from the
water and sanitation-related illnesses, and house cleaning, therefore allowing more time for
participating in decision making, other activities or leisure
While women are the most impacted by social costs related to lack of sewage and
solid waste collection systems, or flooding, they are also relatively less aware of their risk to
health and the environment. The project intends to target women with specific information,
awareness, and training campaigns on these topics.The behavior Change analysis and
strategy development will- as for other target groups- identify women’s specific constraints,
triggering messages for behavior change and effective communication media, which will serve
in the development of a comprehensive communication campaign to raise women’s
awareness and capacity to make informed choices and participate in O&M
The project is addressing the issue of underrepresentation of women in water and
sanitation decision-making and jobs through actions at provincial and municipality levels by
strengthening women’s leadership in the water sector and waste management (public and
private sectors) and at local levels by increasing women involvement and decision making in
water and sanitation through capacity building/ awareness raising, engagement of WCCCs,
and establishment of mixed gender Community monitoring committees.

75
VIII. GENDER EQUALITY AND SOCIAL INCLUSION ACTION PLAN
The social and poverty alleviation pan and the gender action plan are integrated in the
Gender Equality and Social Inclusion Action Plan (GESIAP) with target indicators. The
GESIAP is attached in Appendix 4.
1. Social Approach
The objectives of the infrastructure component are to maximize sewerage connections
(target: increase the safe disposal of excreta and achieve at least 70% to 85% of households
connected to a WWTP in the urban area by 2040), extend solid waste collection services
(target: 84% of all households have solid waste collection service by 2040) and make the
stormwater drainage system functional and developed in parallel to urban development.
A proactive approach is proposed to ensure inclusive access to urban infrastructure
and services and to optimize the impacts of the infrastructure development, which includes:
(i) creating an enabling environment, analyse behavior change triggers, develop and
implement targeted approach for behavior (ii) using regulation to guide people towards proper
sanitation, and accelerate changes in practices, (iii) propose mechanisms/ prices allowing the
poor and vulnerable to access and benefit from basic infrastructure and services and
contribute to urban sanitation and public health and (iv) improvement in the quality of services
delivered.
Targeted information and awareness-raising are a pre-requisite for citizen acceptance
Behavior change and public participation is key to a functional waste system. A Behavior
Change analysis will serve as basis for the behavior change strategy development and
implementation. Awareness will promote the economic, environmental, and social benefits of
better water and sanitation. The project plans for a sorting plant to sort the waste and will
develop awareness systems to motivate waste reduction, reuse, and recycling. It will inform
the population about the current wastewater system, recurrent leakages, health and
environmental issues, necessary improvement, and proposed treatment for safe wastewater
management. Regarding urban drainage, the focus is on disaster risk reduction, how to
prevent flooding and its consequences, and what possible useful local actions can be done,
such as good operations and manintenance of drainage canals, avoidance of solid waste
dumping, and keeping the drainage canal clean to avoid blockage, and let the water flow.
In parallel, the approach includes a “Give no choice” by developing and enforcing local
laws, but at the same time ensuring equity pricing systems/ schemes and quality service. This
will be developed under each sub-component as described below:
Wastewater:
(i) Push for connection to sewerage in the urban area for all HHs and businesses (per sector as per development plan) and for businesses in SEZs with a system of fines for households and businesses not connecting to the sewerage system. This is covered under the Institutional Strengthening Plan Volume
(ii) Develop and implement behavior change communication to raise willingness to be connected to the sewerage.
(iii) It is suggested that a provision to encourage households to connect to the sewer system be included directly in the cost estimate. The strategy is to subsidize

76
connection to encourage households to be connected during the construction phase. For ID Poor and vulnerable households and to achieve equity in access to service, it is proposed that the connection costs will be fully covered by the project during the construction phase. For non ID poor card holders, eligibility will be based on the identification made by local authority.
Solid Waste Management:
Forbid dumping and burning of solid waste in an urban area where a solid waste collection service is available (inform, enforce a system of fees), under Institutional Strengthening Plan Volume.
Develop and implement targeted behavior change communication to make dumping of solid waste into drainage socially unacceptable, promote social norms around using waste collection service.
Support vulnerable communities to take collective action and organize community service for collection into area/roads not accessible to the company truck and to dispose at suitable collecting point - accessible to the community collectors and the trucks of the solid waste collection contractor.
Provide appropriate solid waste containers in market areas, at collecting points, and possibly to the poorest households benefiting from door-to-door collection services. The format of containers must be agreed with the solid waste collection service to adapt to its collection system. The Municipality should supply containers in public spaces and ensure their regular emptying.
In parallel, and to make sure the more coercive measures can apply, the solid waste collection contractors must develop a culture of service. This should be part of its contractual obligation and could involve support from the project (under the Institutional Strengthening Plan Volume). It is expected that the company ensures (a) regular collection lines and schedules, (b) is responsible for cleaning collecting points and roads after collection (c) manage a page properly on social media and provides timely information in case of service disruption (d) operates a customer service for information and remediation/ hotline, (e) agree to put in place a social/equity system (tariffs) for the poor and vulnerable and (f) adhere to Core Labor and health, safety, and environmental standards, (CLS and HSE) (g) provides training to the current informal workers in solid waste management (e.g., waste pickers/ scavengers could be trained as drivers of the collecting trucks) ), safe waste handling, health risks, use of PPE, hygiene practice, and provide vaccinations and provide them with formal jobs, (h) employ women at equal conditions with men.
Key actions related to stormwater urban drainage include:
(i) Cover canals and install solid waste dumping prevention systems (protection nets or grids);
(ii) Develop and implement behavior change communication to make dumping of solid waste into drainage socially unacceptable and educate the population about the risks of waste dumping eg. blockages and flooding; pollution to waterways and impacts on bird and fish life, and amenitypollution to waterways and impacts on bird and fish life, and amentiy.
(iii) Develop a system of fines for \ dumping of solid waste into drainage and sewerage canals, develop and enforce local regulation, install proper signs near the canals (covered under Institutional Strengthening Plan Volume).
(iv) Organize supervision and O&M at the local level with the establishment of Community monitoring committees at Sangkat levels. These committees are the proposed mechanism to ensure the participation of the community in local implementation and

77
monitoring of improved urban infrastructure and services. Organized at the Sangkat level, they are made of volunteers, two men and two women selected in the community. They contribute to inform and raise awareness in the community about water and sanitation issues and verify that the infrastructure and services are working well. They report claims and problems to the Sangkat or directly to the municipality offices of private operators for intervention
(v) Organize O&M intervention teams at the public office for Public Works under the Municipality to ensure the operability of the drainage canals whenever needed.
Table 20: Detailed social and poverty alleviation actions
Key issues Proposed action
The community, and the
poor and vulnerable
households specifically,
lack the knowledge and
attitudes to adopt better
hygiene/sanitation
practices and to pay for
urban infrastructures and
service.
(i) Create an enabling environment to engage people in behavior
change (knowledge and attitudes) through targeted information and
awareness-raising sessions using social media, TV, radio, and
community events facilitated by a local organization. The focus is on the
costs/benefits of proper/improper behavior regarding health,
environment.
a. Conduct a Behavior Change analysis among different target groups on waste management and develop the Behavior Change strategy: identify triggers for behavior change for different targets, and the best approach and media for communication. The following actions will be adjusted accordingly.
b. Implement the Behavior Change Strategy in the project areas:
c. Develop awareness systems to motivate waste reduction,
reuse, separation and recycling (4R’s) in coordinated timing
with the development of related services: re-use, develop and
disseminate information, education and communication support
through social media, local radio and TV, produce short videos/
talk shows, facilitates community awareness sessions on solid
waste management.
d. Inform about current wastewater system, recurrent leakages,
health issues, necessary improvement, and proposed
treatment for safe wastewater management: formal information
meetings organized at Sangkat levels, produce short videos/
talk show for dissemination via social media/ local radio and
talkshow, Once the WWTP is operational organize study visits
for specific groups- including youth and children.
e. Regarding urban drainage, the focus is on disaster risk
reduction, how to prevent flooding and their consequences,
what are possible local action: good O&M of drainage canal,
avoid solid waste dumping, keep it clean to avoid blockage and
let the water flow.
(ii) Develop and enforce local laws to sustain behavior changes and
anchor new practices in the community.
a. Develop a local fine to encourage the connection to the
sewerage

78
Key issues Proposed action
b. Develop a local regulation and operational systems to forbid
waste dumping, especially in a specific area (drainage canals),
and impose a system of fines.
c. Develop a local regulation and operational systems to forbid
waste burning in an area served by a solid waste collection
service and impose a system of fines.
d. Inform the population about new regulations enforcement via
TV, radio, social media, local authorities, and on-site
signalization.
e. Ensure full enforcement of the new regulations with local
authorities and the community. (ref. Community Monitoring
Committees and community monitoring below)
2. The access and
adherence of poor and
vulnerable households to
urban infrastructure and
services are constrained
by their financial limitation.
(i) Ensure equitable access to urban infrastructure and service to the
poorest.
a. Provide free connection to the sewerage for ID Poor households and households that can justify of low income (similar to ID Poor cardholder, but not yet registered), as proposed by local authority
b. Subsidize the in-house linking costs to connect to the sewerage box.
c. Provide a free connection to the drainage system.
d. Propose and validate with the operators and the community social tariff with preferential conditions for the poorest regarding sewerage monthly fee and the solid waste collection fee.
e. Facilitate discussion and negotiation between communities
in areas not accessible to the trucks and the solid waste
collection operator to develop a community collection
service.
f. Find a mechanism to supply appropriate waste containers
to the poorest households.
3. People, the poor and
vulnerable especially, are
reluctant to pay for a
service whose quality has
yet to be proven.
(i) The institution and public operators develop a service that is more
qualitative and user-centered.
a. The contract between the Municipality and the contractor in
charge of solid waste collection is revised and include the
following elements to improve users satisfaction: It is
expected that the company ensures (a) regular collection
lines and schedules, (b) is responsible for cleaning
collecting points and roads after collection (c) manage a
page properly on social media and provides timely
information in case of service disruption (d) operates a
customer service for information and remediation/ hotline,
(e) agree to put in place a social/equity system (tariffs) for
the poor and vulnerable, (f) to provide proper solid waste
containers to the poorest households, (g) agree on proper
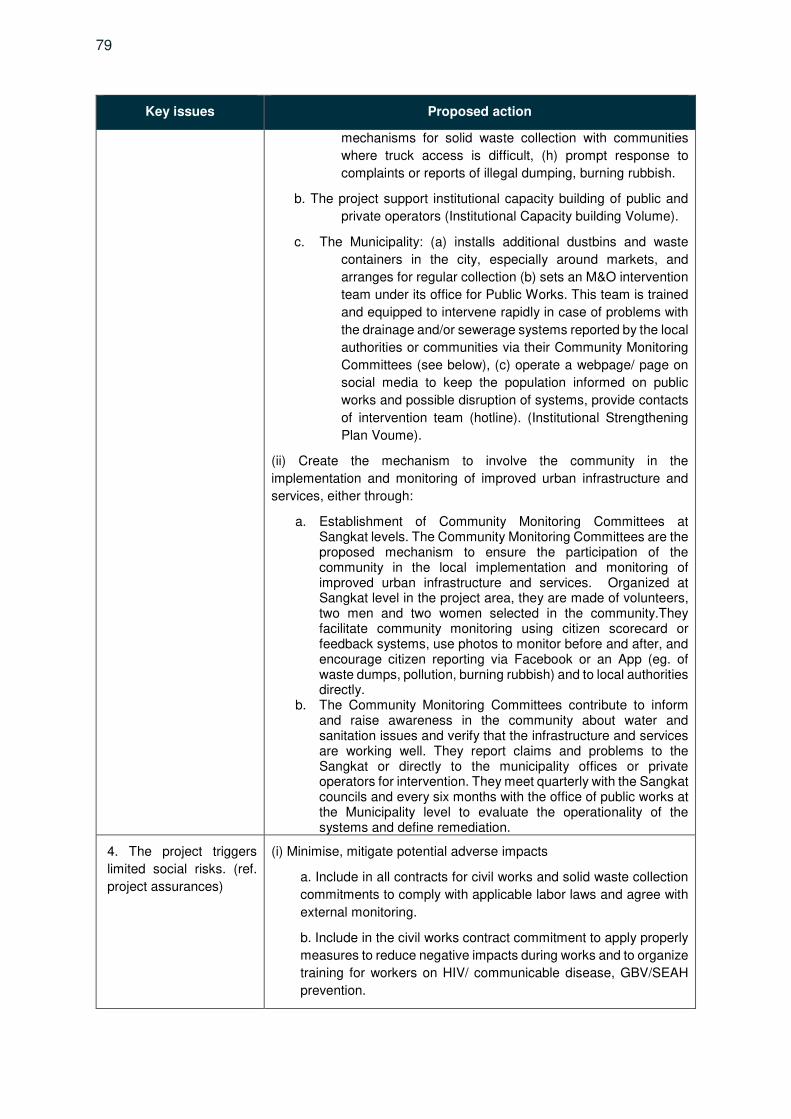
79
Key issues Proposed action
mechanisms for solid waste collection with communities
where truck access is difficult, (h) prompt response to
complaints or reports of illegal dumping, burning rubbish.
b. The project support institutional capacity building of public and
private operators (Institutional Capacity building Volume).
c. The Municipality: (a) installs additional dustbins and waste
containers in the city, especially around markets, and
arranges for regular collection (b) sets an M&O intervention
team under its office for Public Works. This team is trained
and equipped to intervene rapidly in case of problems with
the drainage and/or sewerage systems reported by the local
authorities or communities via their Community Monitoring
Committees (see below), (c) operate a webpage/ page on
social media to keep the population informed on public
works and possible disruption of systems, provide contacts
of intervention team (hotline). (Institutional Strengthening
Plan Voume).
(ii) Create the mechanism to involve the community in the
implementation and monitoring of improved urban infrastructure and
services, either through:
a. Establishment of Community Monitoring Committees at Sangkat levels. The Community Monitoring Committees are the proposed mechanism to ensure the participation of the community in the local implementation and monitoring of improved urban infrastructure and services. Organized at Sangkat level in the project area, they are made of volunteers, two men and two women selected in the community.They facilitate community monitoring using citizen scorecard or feedback systems, use photos to monitor before and after, and encourage citizen reporting via Facebook or an App (eg. of waste dumps, pollution, burning rubbish) and to local authorities directly.
b. The Community Monitoring Committees contribute to inform and raise awareness in the community about water and sanitation issues and verify that the infrastructure and services are working well. They report claims and problems to the Sangkat or directly to the municipality offices or private operators for intervention. They meet quarterly with the Sangkat councils and every six months with the office of public works at the Municipality level to evaluate the operationality of the systems and define remediation.
4. The project triggers
limited social risks. (ref.
project assurances)
(i) Minimise, mitigate potential adverse impacts
a. Include in all contracts for civil works and solid waste collection
commitments to comply with applicable labor laws and agree with
external monitoring.
b. Include in the civil works contract commitment to apply properly
measures to reduce negative impacts during works and to organize
training for workers on HIV/ communicable disease, GBV/SEAH
prevention.
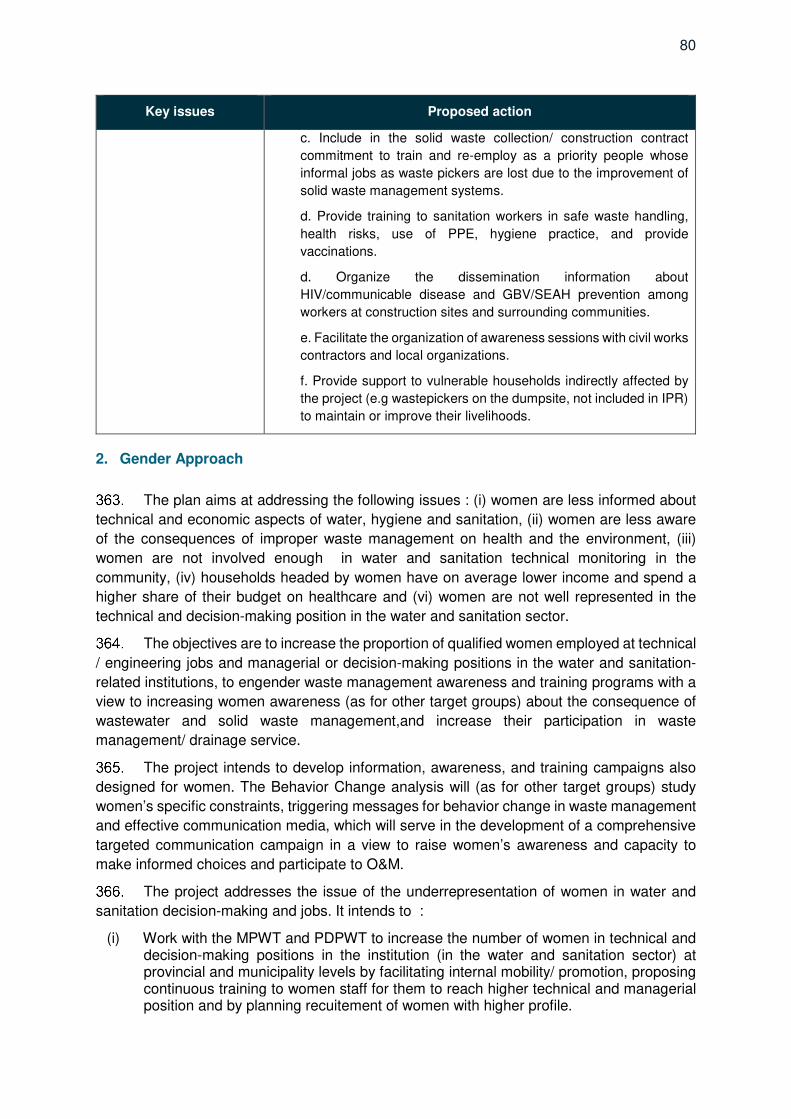
80
Key issues Proposed action
c. Include in the solid waste collection/ construction contract
commitment to train and re-employ as a priority people whose
informal jobs as waste pickers are lost due to the improvement of
solid waste management systems.
d. Provide training to sanitation workers in safe waste handling,
health risks, use of PPE, hygiene practice, and provide
vaccinations.
d. Organize the dissemination information about
HIV/communicable disease and GBV/SEAH prevention among
workers at construction sites and surrounding communities.
e. Facilitate the organization of awareness sessions with civil works
contractors and local organizations.
f. Provide support to vulnerable households indirectly affected by
the project (e.g wastepickers on the dumpsite, not included in IPR)
to maintain or improve their livelihoods.
2. Gender Approach
The plan aims at addressing the following issues : (i) women are less informed about
technical and economic aspects of water, hygiene and sanitation, (ii) women are less aware
of the consequences of improper waste management on health and the environment, (iii)
women are not involved enough in water and sanitation technical monitoring in the
community, (iv) households headed by women have on average lower income and spend a
higher share of their budget on healthcare and (vi) women are not well represented in the
technical and decision-making position in the water and sanitation sector.
The objectives are to increase the proportion of qualified women employed at technical
/ engineering jobs and managerial or decision-making positions in the water and sanitation-
related institutions, to engender waste management awareness and training programs with a
view to increasing women awareness (as for other target groups) about the consequence of
wastewater and solid waste management,and increase their participation in waste
management/ drainage service.
The project intends to develop information, awareness, and training campaigns also
designed for women. The Behavior Change analysis will (as for other target groups) study
women’s specific constraints, triggering messages for behavior change in waste management
and effective communication media, which will serve in the development of a comprehensive
targeted communication campaign in a view to raise women’s awareness and capacity to
make informed choices and participate to O&M.
The project addresses the issue of the underrepresentation of women in water and
sanitation decision-making and jobs. It intends to :
(i) Work with the MPWT and PDPWT to increase the number of women in technical and decision-making positions in the institution (in the water and sanitation sector) at provincial and municipality levels by facilitating internal mobility/ promotion, proposing continuous training to women staff for them to reach higher technical and managerial position and by planning recuitement of women with higher profile.

81
(ii) Establish a partnership with a specialised training institution to promote women’s career as engineer in the water and sanitation sector among highschool students and in careers forums, show casting women engineers.
(iii) Sponsor scholarships and internships for girls in the water and sanitation sector. It is suggested to provide a general budget for girls’ scholarships at ITC linked to traineeships in MPWT/ PDPWT. The scholarship has to cover: tuition fees/ manuals etc, accommodation for girls coming from other provinces, and per diem.
Locally, the focus is to give the Women and Children Consultative Committee the
methodology, tools, and means to raise awareness in the community about wastewater/ solid
waste management/ flooding issues, introduce technical options (choices of technology,
infrastructure design, O&M requirements) and explain requirements at the household,
community, private and institutional levels for proper operation of the systems and services.
It is also proposed to establish and support in each village a water and sanitation
committee, called a “Community Monitoring Committee” consisting of 2 men and 2 women.
The committee’s functions would be: to relay to the population practical information about
works/ works progress/ new regulation implementation; to collect, report or address
households claims or questions related to sewerage/ drainage/ solid waste collection; to
encourage the citizens to monitor and report through social media or directly to the local
authority; to monitor the sewerage/ canal and solid waste status in the area; and to contact
the Municipality or service provider for intervention or remediation. Women will thus have
direct participation in water and sanitation management locally.
Sex-disaggregated data has to be collected and analyzed during and after the project
to ensure equitable benefits for men and women.
3. Project assurances
The project conforms with ADB’s social safeguard policies and seek to avoid adverse
impacts on affected people wherever possible and to minimize, mitigate, and/or compensate
for potential adverse impacts that may result from the project. Nuisances and impacts during
construction are identified and will be mitigated by proper information, physical access and
safety measures, limitation of dust and noise. The designs of the infrastructure projects are
developed to be socially inclusive, taking into account the needs of the target beneficiaries,
including vulnerable and disabled people, and to ensure access and affordability to urban
infrastructure and services for all (affordability). The project also addresses issues related to
working conditions and environmental health and safety of workers and communities.
There were no key labor issues identified. The project may, however, have direct or
indirect impacts on Core Labor Standards (CLS) as it (i) intends to create or improve
employment opportunities; (ii) can affect informal and low skilled jobs of waste pickers and
scavengers, (iii) the project will generate a contract for civil works and project contractors may
be tempted to use child labor or gender/ ethnic discrimination to reduce their costs.
The project adheres to CLS for all jobs created. The loss of informal jobs will be offset
by the creation of construction jobs and unskilled jobs at the sorting and composting plants for
which current waste pickers and scavengers qualify. Providing training is delivered by the
private sector in charge of the solid waste collection; they could also apply to jobs as truck
drivers.

82
The project will ensure arrangements to ensure compliance with CLS and related
national labor laws, including: (i) require that all civil works contracts include commitments to
comply with applicable labor laws, particularly those supporting CLS (e.g., relating to
nondiscrimination and equal pay, the prohibition of child labor, workplace safety, addressing
needs of people with disability, security at work).; (ii) organize labor-contracting societies to
represent the interests of poor and female laborers working on construction or maintenance
of project facilities and (iii) require the executing agency and project implementation
consultants to monitor and report on the performance of the civil works contractors with
respect to CLS and other relevant labor standards. Additional details are provided in the IEE
in the paragraphs related to Community and Worker Health and Safety and related to the
preparation by each project contractor of an environmental, health, and safety management
plan.
Large infrastructure projects may increase the risk of communicable diseases,
HIV/AIDS transmission, GBV/SEAH and/or human trafficking in the project area. The project
will link with ongoing HIV/AIDS and trafficking awareness and GBV prevention programs in
the project area (supported by government, other development partners, and/or
nongovernment organizations) to organize awareness and/or behavior change programs on
communicable diseases, HIV/AIDS, GBV/SEAH and trafficking risks at main construction
sites- this is to be included in the workplan fo the contractors and included in the health and
safety plans to be developed by the contractors-and in surrounding communities, with specific
attention to the special vulnerabilities of women, girls, and other marginalized groups in the
project areas. There are two well-known NGOs working in the fight against HIV/AIDS—
KHANA and PSI. Proper programs and organizations operating locally will be identified early
in project implementation.
COVID-19 Specific measures. To protect the health and safety of workers as well as
communities potentially affected by ADB-financed and/or administered projects, contractors
are required to conduct a COVID-19 risk assessment and to incorporate COVID-19 health
risks as part of their health and safety (H&S) plans, which are part of their site-specific
contractor Environmental Management Plan (CEMP).

IX. MONITORING AND REPORTING
The monitoring system should include specific indicators to follow up with the
implementation of gender and social aspects of the project.
Key social and gender indicators at project level are presented in the GESIAP in
Appendix 4.
1. Monitoring poverty and social impacts
Awareness
Participants to information, training, and consultation meetings increase their
knowledge and understanding of the issues addressed.
People's willingness to contribute to the costs of connection and services increases.
Accessibility, affordability, satisfaction
The project will keep account of the number of households connected to the sewerage
and drainage systems and served by the solid waste collection service (data from the private
operator). It also needs to earmark the status of each household (ID poor, poor without an ID
card, IP, FHH).
Monitoring employment, social risk management
The project will keep records of jobs that are created to establish and operate the
improved stormwater, wastewater, and solid waste management systems. This is done at the
municipality level and in coordination with the private operators. Additional surveys will be
needed to estimate the number of jobs lost during the reorganization, with some limitation
anticipated due to the high level of informality of jobs in the current solid waste management
system.
Monitoring Participation
It relies on systematic and reliable participation records and aims at a fair
representation of women and vulnerable groups.
2. Reporting
It is recommended that a Gender and Social Officer position be created within the
Project Management Unit (PMU) with support from the Project Management Consultant. The
officer will be responsible for the coordination and daily implementation of the GESIAP, the IP
Due Diligence Report, participation and communication plans, and contribute to quarterly and
six-months monitoring; the preparation of the quarterly safeguard reports and six-monthly
safeguards interim report.
84
X. CONSULTATION AND PARTICIPATION
1. Consultations were undertaken
As a first step in preparing the consultation and participation plan, a stakeholder
analysis was completed to identify the key actors, their interests, and strategies to maximize
their participation in the project. Information was gathered from (i) numerous government
organizations that will be involved in project implementation, (ii) civil society, (iii) public and
private actors in the water and waste management sectors, and (iv) community members living
in the project area.
In developing the project, a series of stakeholder consultations and workshops were
carried out preparatory by the technical assistance team comprising international and national
specialists with representatives at Sangkat, Municipality, Province, and Ministry levels, with
community members and with private companies. The list of workshops, meetings, and FGDs
with the number of participants is provided in appendices 2.
In total and between August 2019 and October 2020, the Key Informant Interviews
(KII), Focus Group Discussions (FGD), and workshops or meetings have involved 397 officials
and villagers in workshops and consultative meetings, and 171 persons in FGDs as part of
social surveys in Bavet.
Primary information and consultation were undertaken as part of the City
Comprehensive Survey. The survey covered all villages of the project area and consulted with
658 households, 88 commercial and institution entities, 2 SEZs.
2. Results of consultations
Consultations provided input on the design of the project. It helped determine project
priorities, socio-economic objectives, and confirm linkages with local development plans and
aspirations. The information and recommendations gathered from the various stakeholder
consultations have been incorporated into the design of the project to ensure that the
investments align with local priorities and development plans and that they will deliver
equitable socio-economic benefits to the whole population, including women, the poor, and
vulnerable.
The results of the pre-implementation consultations are also reflected in the summary
poverty reduction and social strategy, gender equality and social inclusion action plan,
resettlement plans, environmental assessments, and the simplified Indigenous People plan.
There is broad community support for the project’s approach to combine urban infrastructure
development with capacity building to improve waste and water governance and
management, improve urban sanitation, and increase city attractiveness.
3. Roles of stakeholders in planning, design, and implementation
ADB is committed to putting meaningful consultation processes into practice.
Meaningful consultation is a process that (i) begins early in the project preparation stage and
is carried out on an ongoing basis throughout the project cycle; (ii) provides timely disclosure
of relevant and adequate information that is understandable and readily accessible to affected
85
people; (iii) is undertaken in an atmosphere free of intimidation or coercion; (iv) is gender-
responsive and inclusive, and tailored to the needs of disadvantaged and vulnerable groups;
and (v) enables the incorporation of all relevant views of affected people and other
stakeholders into decision makings, such as project design, mitigation measures, the sharing
of development benefits and opportunities, and implementation issues.
ADB requires borrowers/clients to engage with communities, groups, or people
affected by proposed projects and with civil society through information disclosure,
consultation, and informed participation in a manner commensurate with the risks to and
impacts on affected communities. Enhancing stakeholder participation has also been shown
to build understanding and support among diverse groups, which can improve project design
and impacts.
Consistent with these efforts, the objectives of the consultation and participation plan
and related stakeholder communication strategy are to: (i) fully disclose information on the
proposed project, its components, and its activities with the beneficiary communities and
stakeholders, (ii) obtain information about the opinions, needs and priorities of beneficiary
communities and stakeholders; social input and feedback on the quality and affordability of
services, for example (iii) encourage the participation of beneficiary communities and
stakeholders in project activities such as the payment for connection or services, changes in
waste management practices, change in the extend and quality of services delivered,
participation to O&M, awareness-raising activities, capacity building, enforcement of local
regulations and monitoring; (iv) obtain the cooperation of beneficiary communities and
stakeholders for activities required to be undertaken as part of project planning and operation,
(v) establish clear monitoring and effective grievance redress mechanism; and (vi) ensure
transparency in all project activities.
4. Stakeholder participation plan
Broad and meaningful consultation will continue throughout the project implementation
cycle, building on the initial consultations held with various stakeholder groups during project
preparation. The various stakeholders, mechanisms for participation, entities responsible,
indicative schedules, and resources are set out in the Consultation and Participation Plan
presented in Table 21.
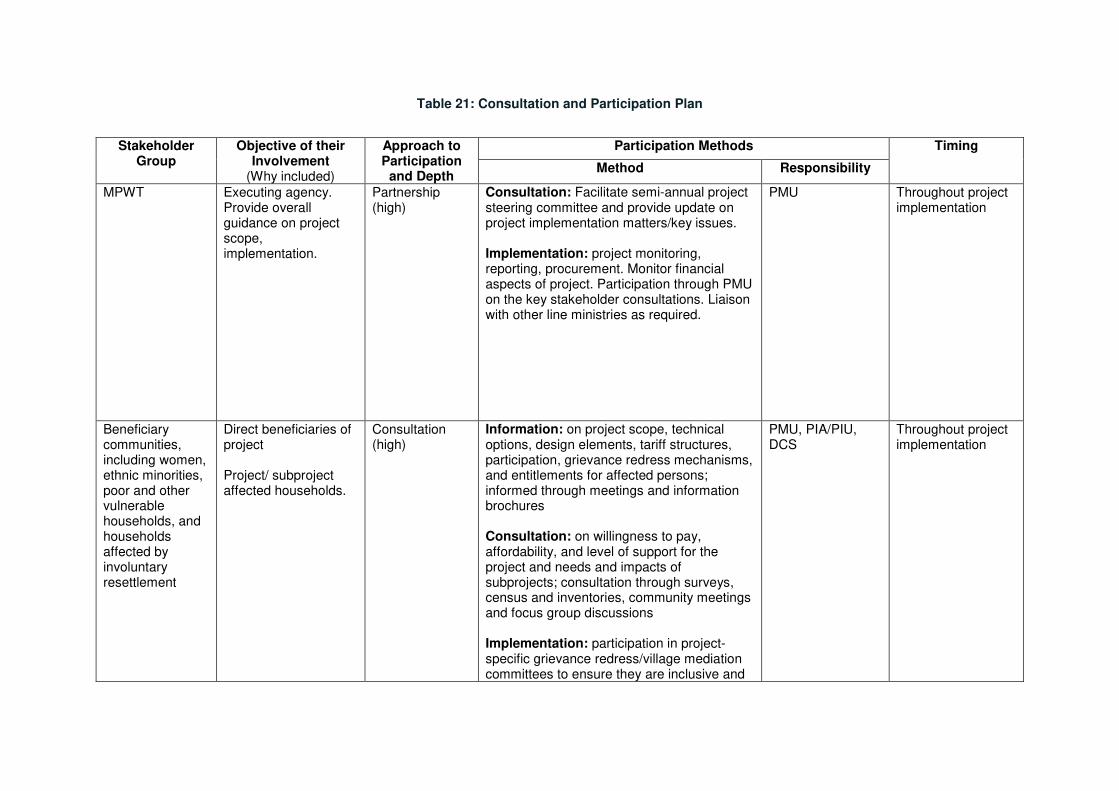
Table 21: Consultation and Participation Plan
Stakeholder
Group Objective of their
Involvement (Why included)
Approach to Participation
and Depth
Participation Methods Timing
Method Responsibility
MPWT Executing agency. Provide overall guidance on project scope, implementation.
Partnership (high)
Consultation: Facilitate semi-annual project steering committee and provide update on project implementation matters/key issues. Implementation: project monitoring, reporting, procurement. Monitor financial aspects of project. Participation through PMU on the key stakeholder consultations. Liaison with other line ministries as required.
PMU Throughout project implementation
Beneficiary communities, including women, ethnic minorities, poor and other vulnerable households, and households affected by involuntary resettlement
Direct beneficiaries of project Project/ subproject affected households.
Consultation (high)
Information: on project scope, technical options, design elements, tariff structures, participation, grievance redress mechanisms, and entitlements for affected persons; informed through meetings and information brochures Consultation: on willingness to pay, affordability, and level of support for the project and needs and impacts of subprojects; consultation through surveys, census and inventories, community meetings and focus group discussions Implementation: participation in project-specific grievance redress/village mediation committees to ensure they are inclusive and
PMU, PIA/PIU, DCS
Throughout project implementation
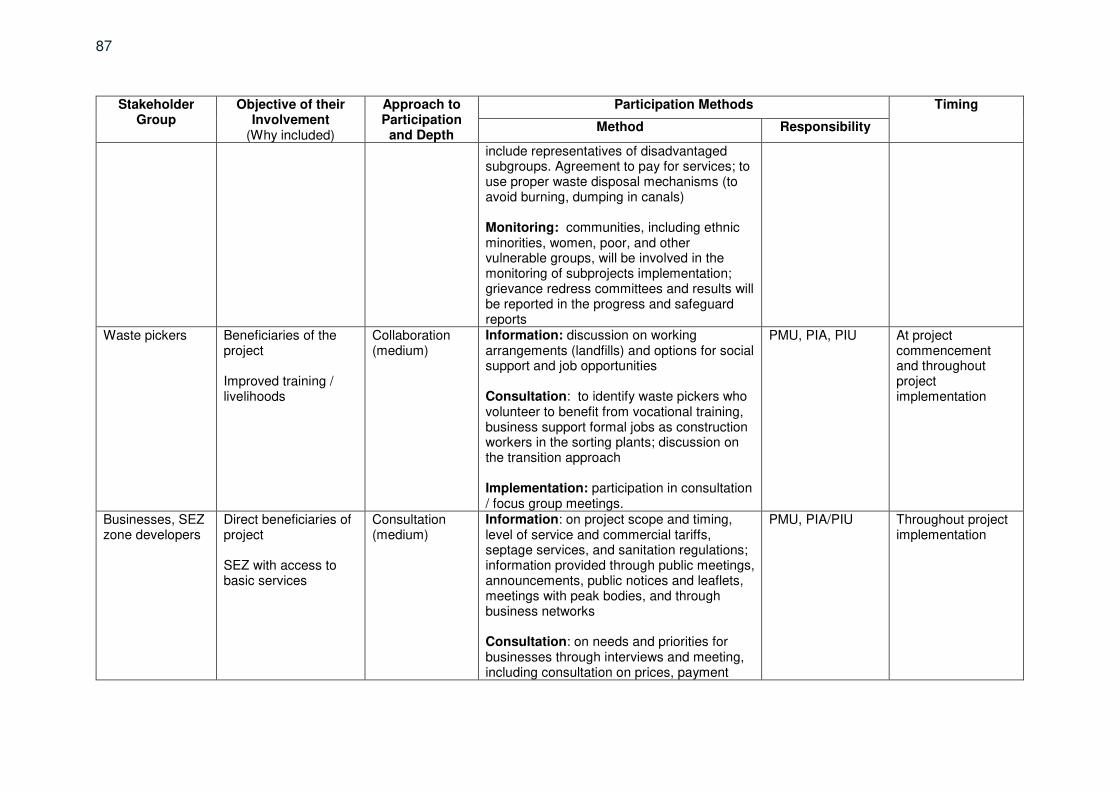
87
Stakeholder Group
Objective of their Involvement
(Why included)
Approach to Participation
and Depth
Participation Methods Timing
Method Responsibility
include representatives of disadvantaged subgroups. Agreement to pay for services; to use proper waste disposal mechanisms (to avoid burning, dumping in canals) Monitoring: communities, including ethnic minorities, women, poor, and other vulnerable groups, will be involved in the monitoring of subprojects implementation; grievance redress committees and results will be reported in the progress and safeguard reports
Waste pickers Beneficiaries of the project Improved training / livelihoods
Collaboration (medium)
Information: discussion on working arrangements (landfills) and options for social support and job opportunities Consultation: to identify waste pickers who volunteer to benefit from vocational training, business support formal jobs as construction workers in the sorting plants; discussion on the transition approach Implementation: participation in consultation / focus group meetings.
PMU, PIA, PIU At project commencement and throughout project implementation
Businesses, SEZ zone developers
Direct beneficiaries of project SEZ with access to basic services
Consultation (medium)
Information: on project scope and timing, level of service and commercial tariffs, septage services, and sanitation regulations; information provided through public meetings, announcements, public notices and leaflets, meetings with peak bodies, and through business networks Consultation: on needs and priorities for businesses through interviews and meeting, including consultation on prices, payment
PMU, PIA/PIU
Throughout project implementation

88
Stakeholder Group
Objective of their Involvement
(Why included)
Approach to Participation
and Depth
Participation Methods Timing
Method Responsibility
methods, discussion on SEZ development (opening/closing of factories, etc). Implementation: paying for connection to services; improving waste practices.
Provincial governments / municipal administration
Representatives of government are responsible for project implementation and for representing provincial and municipal interests. Responsible for O&M of the assets and services, including setting tariffs, business plans, monitoring/enforcement.
Partnership (high)
Approvals: review and approve safeguard documents (grievance redress mechanism, provincial sub-working LAR groups etc.) Implementation: allocate staff to PIU to provide local inputs and oversee project implementation. Prepare and implement annual work plans, budgets. Build capacity of the municipal administration to carry out operations and maintenance of the infrastructure. Oversee implementation and progress of subprojects through review and planning meetings; oversee resettlement committees; recommend and initiate remedial action; resolve disputes
PIA, PIU
Ongoing during project planning and implementation
Septic tank desludgers, plumbers and masons
Indirect beneficiaries of project Indirect promoters of sanitation services and products
Information (medium) Consultation (medium)
Information: on scope and timing of project, type of service. Informed through direct approaches such as interest group meetings and printed information or other methods that help them to inform the public and consumers. Consultation: as an industry group, be consulted on needs and issues affecting businesses in subproject towns; how water/sanitation businesses can support objectives of the project.
PMU, PIA/PIU Periodic meetings during implementation
Solid waste contractors
Potential service provider Arrangements to close existing dumpsite
Partnership (medium-high)
Information: on project design, institutional arrangements, service provider arrangements
PMU, PIA, PIU, DCS
Throughout project implementation

89
Stakeholder Group
Objective of their Involvement
(Why included)
Approach to Participation
and Depth
Participation Methods Timing
Method Responsibility
Consultation: participation in discussion on business opportunities, expansion of service coverage area; employment of scavengers/waste pickers; discussion with provincial government and MOE on closure of existing dumpsite
Civil society organizations
Representatives of civil society and the community
Collaboration (medium)
Consultation promotion of community participation, behavior change analysis/strategy development, raising awareness at community level, facilitate support with vulnerable groups.
PMU, PIA, PIU Early stage of project, prior to construction and during construction
Provincial Department of Women Affairs (PDoWA) /Women and Children Consultative Committees/ Commune committees for women and children
Awareness raising in the community; increase participation in planning, design, operations, maintenance and monitoring
Collaboration (medium)
Consultation: gender assessment, identification of specific needs, demands, constraints and level of satisfaction. PDoWA, with PMU and PIUs to organize participation of the consultative committees/commune committees in the implementation of the soft components for women and children (face-to-face information training, awareness raising, facilitation of consultations)
PMU, PIA, PIUs Throughout project implementation
Commune/ sangkat councils
To inform the residents of the project/project benefits
Collaboration (high)
Information: on project scope, design, institutional arrangements, roles, responsibilities, and project progress; feedback on infrastructure design. Implementation: coordinate and organize implementation in their Sangkat. Report to the municipality on key issues/concerns, facilitate implementation of O&M, monitoring and evaluation, grievance redress.
PMU, PIA, PIUS Throughout project implementation
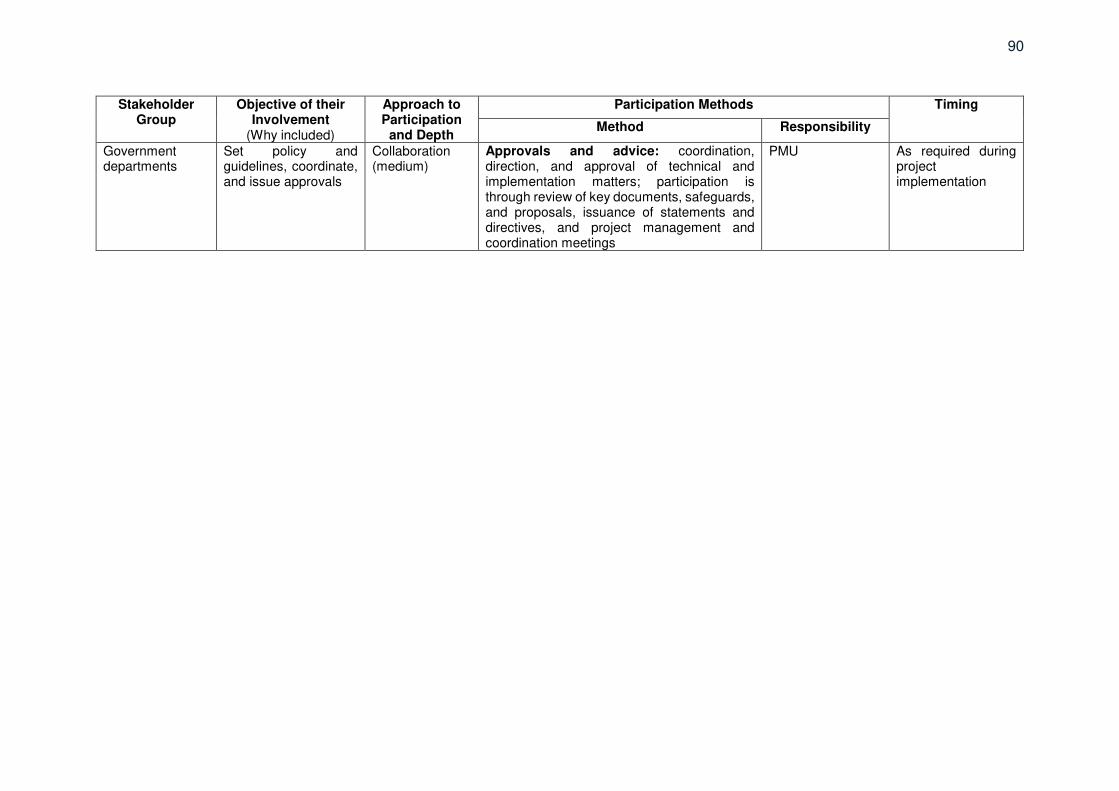
90
Stakeholder Group
Objective of their Involvement
(Why included)
Approach to Participation
and Depth
Participation Methods Timing
Method Responsibility
Government departments
Set policy and guidelines, coordinate, and issue approvals
Collaboration (medium)
Approvals and advice: coordination, direction, and approval of technical and implementation matters; participation is through review of key documents, safeguards, and proposals, issuance of statements and directives, and project management and coordination meetings
PMU As required during project implementation
5. Stakeholder communication strategy
The Stakeholder Communication Strategy has been prepared, drawing on good
practices outlined in ADB’s Public Communication Policy. The Stakeholder Communication
Strategy is based on the principles of transparency, timeliness, meaningful participation, and
inclusion. It will ensure that women, the poor and vulnerable, are provided opportunities to
receive timely information and provide feedback during project implementation
The project will integrate institutional and social components- improving policy and
regulatory environment, enhance the provincial governments’ capacity, building community
awareness on key sustainability themes, including water usage, sanitation, and solid waste
reduction and management, promote effective gender mainstreaming activities that will
encourage and increase women participation in planning, design, operations, and
maintenance - with the infrastructure components to realize the development objective of
helping the poor in alleviating poverty and attaining socially inclusive development.
This is also a demand of the communities and local authorities, reflected during the
social survey; all groups insisted that the project would succeed - at getting the adhesion of
people to new practices and to pay for services- only if education about wastewater/ solid
waste management was improved before the start of works and if people understood the
interlinked benefits of better waste management /reduced flooding/ health. Communications
with the public who will benefit from the project will be necessary, in particular, promotional
campaigns to raise awareness on the importance of investing in sanitation, to present the
upgraded services being established, and to raise the willingness to pay for this service.
Stakeholders include: (i) the special group of waste pickers, (ii) project direct and
indirect beneficiaries with a focus on households in urban and rural areas, women and
children, poor and vulnerable groups, micro-businesses; businesses and industries in the
SEZs (ii) local authorities (Sangkat and village in levels); (iii) Civil Society Organisations; (iv)
private operators in the SWM sector and civil works (v) government agencies with a role in the
implementation and (vi) interlinked development projects. The strategy serves to inform and
support community development, enhance government capacity to deliver a positive project
outcome, and enhance project benefits while mitigating any potential negative impacts.
There are three primary objectives under the Stakeholder Communication Strategy: (i)
Ensure that all people or entities possibly affected by the project are aware of and clearly
understand the project, its impacts and compensation entitlements, and address stakeholder
concerns using transparent and inclusive approaches; (ii) Ensure that all possible
beneficiaries of the project are aware of and understand the project and its benefits, and the
details of making use of the proposed urban infrastructure and services and foster demand
and willingness to pay; (iii) Ensure that awareness about water and sanitation issues is built
into the project to enhance public health and mitigate risk.
To ensure effective communication with stakeholders during project implementation
and to enhance project outcomes, and the project will adopt a three-pronged communication
strategy:
(i) Deliver relevant project information to project-affected people, and other stakeholders possibly impacted by the project in a culturally appropriate, gender-sensitive, and timely manner, and foster a regular two-way flow of information between project

92
implementers and these stakeholders; (community meetings, information display, FGDs, participatory monitoring);
(ii) Support intensive, sustained, broad and repetitive communication, education, and advocacy about the benefits of the project to foster adhesion, participation, and positive public behavior change through official (press release, interviews, the publication of summary project reports) and non-formal/ official communication (video, talk shows, testimonies); and
(iii) Support sustained information, education, and awareness activities to raise awareness of water and sanitation behavior and best practices through community events and dissemination on Radio, TV, social media, which are the preferred information channels of the population. (women and child awareness sessions, field visits with rural groups, educational programs etc.). The stakeholder communication strategy is presented in Table 22

Table 22: Stakeholder Communication Strategy
Objective(s) Key Risks/ Challenges
Stakeholder Group
Messages Means of Communication
Timeline Responsibility
Ensure beneficiaries (including poor and vulnerable groups) understand project scope, impacts, entitlements, participation, and redress mechanisms to promote participation and increase ownership and satisfaction
Trust of information source Language/ culture Literacy Managing expectations Information dissemination is not widespread
Target communities, population in the project area including poor and vulnerable groups Businesses, SEZs
Project design, key project benefits, implementation arrangements, and schedule of civil works Main project impacts (positive and negative) Planned mitigation measures, including compensation rates, entitlements, and grievance redress mechanisms. Tariffs and affordability of services Participation in income restoration program
Public information meetings Resettlement committee meetings and/or meetings with affected households Printed information in local language posted in accessible areas (e.g., village meeting place) Dissemination fo information via radio messages, local TV news, social media Consultation meetings at dumpsite/villages
Ongoing prior to implementation of activities Ongoing during civil works
PMU, PIA, PIU, DCS
Establish two-way information sharing/ feedback mechanism to ensure inclusion of vulnerable groups in benefit distribution
Language Gender and cultural stereotypes Mechanisms ready to respond to concerns Timing
Target communities (especially poor, minority ethnic groups) VAs
Mechanisms for community participation, representation, monitoring Benefits targeted to poor households Mitigation and grievance measures
Community meetings/focus group meetings Gender awareness and mainstreaming training materials
Ongoing during implementation including civil works
PMU, PIA, PIU, DCS

94
Objective(s) Key Risks/ Challenges
Stakeholder Group
Messages Means of Communication
Timeline Responsibility
Ensure local authorities understand and support the project and can effectively support and inform the community
Low education Lack of experience Language Other commitments Lack of involvement/ engagement with stakeholders resulting in limited project support, obstruction of project
Sangkat authorities, Commune councils, Provincial government Municipal administration
Project design, key benefits, implementation arrangements, and schedule of civil works Participation in consultation events
Small group meetings/training Formal meeting with provincial/municipal representatives Dissemination of printed information
Ongoing from project outset
PMU, PIA, PIU, DSC
Improve community awareness of the benefits of water and sanitation to initiate behavior change, ensure willingness to pay for connection and service fees
Information is not enough to change behavior Language Cultural practices
Target communities, including mothers, school children, and ethnic minorities
Improved solid waste and wastewater for the environment, health and livability Cost of services Ways to improve sanitation and reduce flooding Solid waste management practices (reduce, reuse recycle) and proper solid waste disposal
Mass organization meetings and events School activities Local media, radio, tv Behavior change strategy / awareness campaigns Signboards
Regular events and activities after formative research and needs assessment are completed
PMU, PIA, PIU, DCS

6. Disclosure
ADB’s principles are to disclose information about its operations in a clear, timely, and
appropriate manner to enhance stakeholders’ ability to meaningfully engage with ADB and to
promote good governance. This applies to the project too.
Table 23: Disclosure plan
Project
information
Means of
communication
Responsible Audience Frequency
RRP ADB website Royal Government
of Cambodia,
development
partners, civil
society, NGOs,
individuals
Once
Project planning
Discussions and IA
Specific intervals
information
Discussions and
Consultation
IA Specific Interval
during the planning
Status of
construction
Information board
at the site
DOT and
contractors
Project
beneficiaries
All the time
Project
Performance
Reports and Project
Information
Document
quarterly
Indigenous People
Plan, Resettlement
Plan, and its
updates and
resettlement
monitoring reports,
IEE report.
ADB website ADB Royal Government
of Cambodia,
development
partners, civil
society, NGOs,
individuals
Immediately upon
receipt
Quarterly progress
reports
ADB website Royal Government
of Cambodia,
development
partners, civil
society, NGOs,
individuals
Quarterly
Project Completion
report
ADB website Royal Government
of Cambodia,
development
partners, civil
society, NGOs,
individuals
Once
XI. CONCLUSIONS AND RECOMMENDATIONS
There is a general consensus that the project will improve access to urban service to
the residents of the city, contribute to inclusive and sustainable development, and the
development of human capital, social services, and public governance.
The constraints of specific poor and vulnerable groups to fully benefit from the project
facilities have been assessed and can be summarized by (i) a lack of information and
knowledge about the cost and benefits of water and sanitation management, (ii) the limited
availability and quality of facilities at the moment, and (iii) concerns about the affordability of
infrastructure and service.
The Gender Equality and Social Inclusion Action Plan, the Consultation and
Participation Plan, and Stakeholders Communication Plans incorporate all the elements
deemed necessary to maximize the social and economic impacts of the project for all. This
includes wide consultation and participation of women, poor and vulnerable groups, targeted
interventions (training and awareness-raising, women’s empowerment), better affordable
services (gratuity, social tariffs, customers centered approach), and appropriate local
regulating and monitoring mechanisms.
They also encompass a multi-stakeholder approach with the private sector, local
institutions, and civil society all mobilized to meet the specific needs of the poor, vulnerable,
and women in the target area.

97
XII. APPENDICES

7. Key sex-disaggregated poverty and social statistics and indicators
Table 24: Bavet police minorities data sheet 2020 in value and in %
Type of data Total Bavet
Municipality
Sangkat Bati Total
Sangkat Bavet Total
Ta Buem village
Ta Pov village
Bavet Loeu village
Bavet Kandal village
Sangkat
Chrok Mtes Total
Sangkat
Prasat total
Prasat village
Kandal village
Sangkat Prey Angko
unh total
Kouk Lveang village
Minority as per police datasheet- August 2020
-
Cham # of family -
-
-
-
-
-
-
-
-
-
-
-
-
Cham # of people -
-
-
-
-
-
-
-
-
-
-
-
-
Vietnamese # of family 208
-
194
55
46
24
69
-
7
1
6
7
7
Vietnamese # of people 672
-
642
182
155
77
228
-
19
3
16
11
11
Minority as %age of the population (re.village data 2019)
Cham # of family 0.0% 0.0% 0.0% 0.0% 0.0% 0.0% 0.0% 0.0% 0.0% 0.0% 0.0% 0.0% 0.0%
Cham # of people 0.0% 0.0% 0.0% 0.0% 0.0% 0.0% 0.0% 0.0% 0.0% 0.0% 0.0% 0.0% 0.0%
Vietnamese # of family 2.0% 0.0% 6.1% 6.8% 7.5% 4.1% 8.9% 0.0% 1.0% 0.5% 1.1% 0.3% 1.5%
Vietnamese # of people 1.5% 0.0% 4.7% 5.1% 6.8% 3.0% 6.3% 0.0% 0.7% 0.4% 0.8% 0.1% 0.6% Total population (village data 2019) Total Population women + men
43,377
6,353
13,788
3,581
2,295
2,531
3,648
12,466
2,659
691
1,968
8,111
1,833
Total family in village according to family book
10,504
1,505
3,186
804
610
583
772
3,016
708
184
524
2,089
471
18 ID Poor data 2017 in value and in % is available in an attached Excel sheet
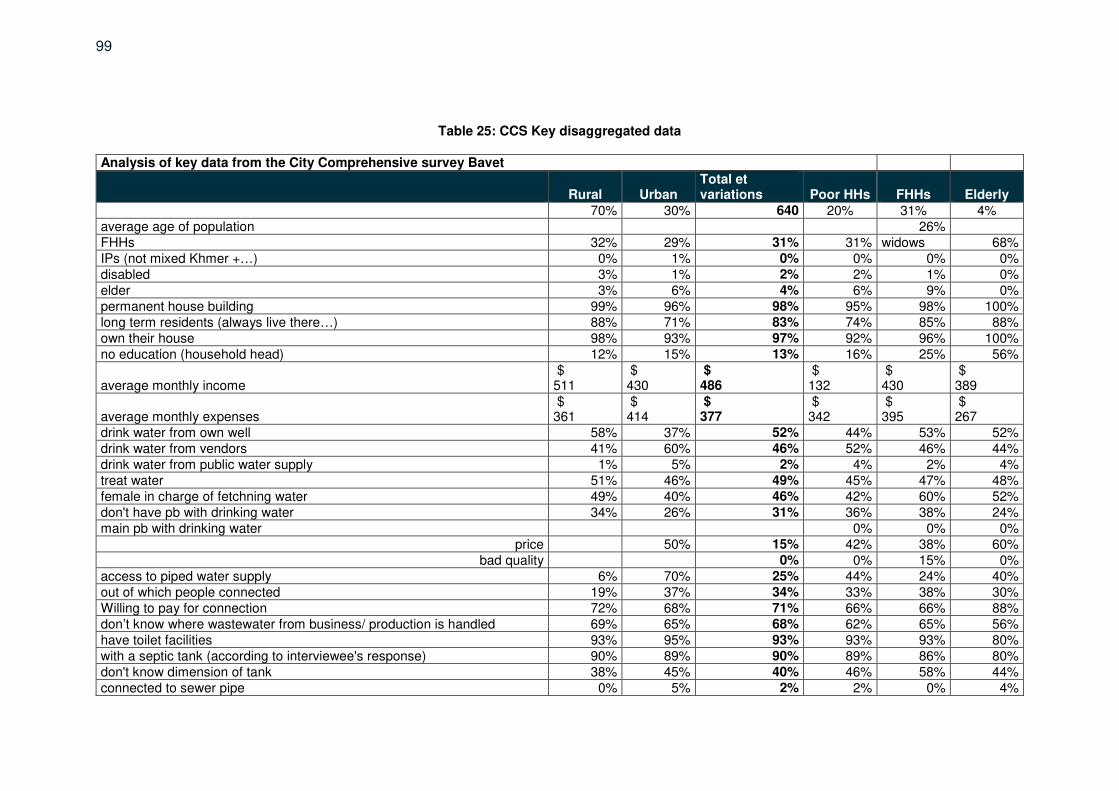
99
Table 25: CCS Key disaggregated data
Analysis of key data from the City Comprehensive survey Bavet
Rural Urban Total et variations Poor HHs FHHs Elderly
70% 30% 640 20% 31% 4% average age of population 26% FHHs 32% 29% 31% 31% widows 68% IPs (not mixed Khmer +…) 0% 1% 0% 0% 0% 0% disabled 3% 1% 2% 2% 1% 0% elder 3% 6% 4% 6% 9% 0% permanent house building 99% 96% 98% 95% 98% 100% long term residents (always live there…) 88% 71% 83% 74% 85% 88% own their house 98% 93% 97% 92% 96% 100% no education (household head) 12% 15% 13% 16% 25% 56%
average monthly income $ 511
$ 430
$ 486
$ 132
$ 430
$ 389
average monthly expenses $ 361
$ 414
$ 377
$ 342
$ 395
$ 267
drink water from own well 58% 37% 52% 44% 53% 52% drink water from vendors 41% 60% 46% 52% 46% 44% drink water from public water supply 1% 5% 2% 4% 2% 4% treat water 51% 46% 49% 45% 47% 48% female in charge of fetchning water 49% 40% 46% 42% 60% 52% don't have pb with drinking water 34% 26% 31% 36% 38% 24% main pb with drinking water 0% 0% 0%
price 50% 15% 42% 38% 60% bad quality 0% 0% 15% 0%
access to piped water supply 6% 70% 25% 44% 24% 40% out of which people connected 19% 37% 34% 33% 38% 30% Willing to pay for connection 72% 68% 71% 66% 66% 88% don’t know where wastewater from business/ production is handled 69% 65% 68% 62% 65% 56% have toilet facilities 93% 95% 93% 93% 93% 80% with a septic tank (according to interviewee's response) 90% 89% 90% 89% 86% 80% don't know dimension of tank 38% 45% 40% 46% 58% 44% connected to sewer pipe 0% 5% 2% 2% 0% 4%

100
Analysis of key data from the City Comprehensive survey Bavet
Rural Urban Total et variations Poor HHs FHHs Elderly
out of which, don’t know construction cost 0% 90% 90% 0% 0% 100% out of which, don’t know monthly fee 0% 100% 100% 0% 0% 0%
connected to open channel drain 0% 0% 0% 3% 1% 0% out of which don/t know cost of connection 0% 0% 0% 25% 0% 0% willingness to build septic tank/flush latrines 2% 6% 3% 3% 4% 4% NOT willing to take a loan for sanitation 96% 93% 95% 91% 92% 92% do not need pumping servcies 0% 0% 0% 96% 0% 0% do no need to empty manually 96% 95% 96% 92% 0% 0% do NOT know wher septic sludge are transported 96% 97% 96% 95% 95% 92% do not face any environmental issues 60% 29% 51% 50% 52% 40% think there is a solid waste problem (bad smell, scattered on the road) 53% 79% 60% 60% 59% 60% observe wastes piling often/ very often 59% 85% 67% 74% 57% 64% think wastes piling can cause env. and health pbs 62% 80% 67% 63% 56% 84% have waste collection service 4% 22% 10% 15% 9% 20% collect is irregular hours 22% 23% 22% 0% 0% 0% pay for collection fees 5% 25% 11% 16% 12% 20% evaluate the state of solid waste collection in their area as good 3% 7% 4% 10% 7% 0% find state of solid waste collection is not good (1- be cleaner, 2- be more regular, 3-be cheaper) 28% 29% 28% 30% 30% 40% did not participate to environmental campaign 80% 82% 81% 80% 88% 92% sort wastes before disposal (organic wastes= animal feed in rural) 73% 74% 73% 74% 71% 68% willing to sort more 48% 61% 52% 49% 48% 40% link diseases to waste water and garbages 33% 47% 37% 40% 30% 52% link disease to drinking water 2% 5% 3% 2% 1% 0%
average annual spendings for health $ 94.63
$ 150.41
$ 84.56
$ 130.85
$ 166.86
average annual spending for water borne disease $ 103.30
$ 101.58
$ 71.18
$ 78.90
$ 63.27
never flooded (yard)/ ward 65% 57% 63% 3% 4% 60% flooded during heavy rains only 27% 38% 30% 22% 25% 32% NOt informed on risk of flooding 11% 16% 12% 15% 9% 12% source of information tv/RADIO 16% 12% 15% 10% 18% 28% social media 8% 14% 10% 9% 6% 0% MoWRAM 0% 0% 0% 0% 0% 0%

101
Analysis of key data from the City Comprehensive survey Bavet
Rural Urban Total et variations Poor HHs FHHs Elderly
no easy access to health centers when flooding 29% 36% 31% 26% 30% 32% no schools/work when flooding 29% 10% 24% 6% 7% 8% no issues with drainage system 36% 23% 32% 30% 35% 8% main issue: clogged with solid wastes 0% 0% 12% 28% main action to mitigate climate change: 0% 0% 0% 0% planting trees 35% 51% 40% 50% 31% 36% raising roads 27% 19% 25% 18% 21% 40% filling raising land/ house Improve drainage 0% 1% 3% 0% think their area area is polluted 67% 63% 66% 60% 67% 76% don;'t think their area is polluted 29% 31% 30% 34% 30% 20% main nuisances Dust 48% 42% 47% 38% 47% 68% Bad smells from garbage 30% 18% 23% 21% 32% noise 19% 24% 36% satisfaction with water supply satisfaction with wastewater satisfaction with drainage satisfaction with solid waste management How to improve the city build more public spaces and playground 35% 47% 39% 53% 42% 44% build more house in the outskirts 27% 16% 23% 16% 22% 20% rehabilitate heritage buildings 17% 6% 14% 7% 15% 8% improving urban infrastructure 12% 19% 14% 10% 9% 12% improving social welfare and services 14% 4% 14% 13% 16% know dimensions of septic tank 39% 32% 37% 26% 14% 28% agree to take pictures of toilets 65% 49% 61% 51% 57% 56% agree to take pictures of waste disposal 97% 97% 97% 93% 95% 92%

Table 26: Affordability analysis
Rural Urban Total Poor Hhs FHHs Elders Cost of connection to piped water supply % % % % % %
20000 41% 35% 39% 31% 38% 44% 40000 28% 19% 25% 23% 19% 16% 80000 6% 5% 5% 7% 7% 0%
100000 4% 6% 5% 3% 5% 0% 150000 3% 3% 3% 2% 2% 0% 200000 6% 15% 8% 14% 13% 16%
Monthly fee rate for water supply Free of Charge 0% 0% 0% 0% 0% 0%
Don’t know 9% 12% 10% 14% 13% 12% 1,000 to 10,000 included 4% 7% 5% 5% 6% 12%
10,000 to 15,000 included 0% 0% 0% 0% 0% 0% 15,000 to 20,000 included 41% 34% 39% 31% 38% 44%
40000 28% 18% 25% 23% 19% 16% 80000 6% 5% 5% 7% 7% 0%
>80,000 12% 23% 15% 19% 19% 16% Cost of connection to sewerage pipe
Free of Charge 0% 0% 0% 0% 0% 0% don't know 69% 53% 64% 62% 67% 76%
<5,000 included 0% 1% 0% 1% 0% 0% 5,000 to 8,000 included 0% 0% 0% 0% 0% 0%
8,000 to 15,000 included 1% 4% 2% 2% 3% 0% 20,000 to 25,000 included 6% 7% 6% 4% 9% 8%
30000 1% 3% 2% 1% 3% 0% 40000 3% 3% 3% 3% 2% 0%
>40,000 19% 31% 23% 26% 17% 16% average >40,000
Monthly fee rate for sewerage Free of Charge 0% 1% 0% 0% 0% 0%
Don’t know 70% 53% 65% 60% 66% 76% <10,000 17% 34% 22% 24% 17% 24%
10,000 to 20,000 included 7% 8% 7% 10% 10% 0% 20,000 to 40,000 included 3% 3% 3% 6% 5% 0% 40,000 to 60,000 included 3% 1% 2% 0% 1% 0%

103
Rural Urban Total Poor Hhs FHHs Elders Cost of connection to piped water supply % % % % % %
80,000 to 100,000 included 1% 1% 1% 0% 2% 0% >100,000 1% 1% 1% 1% 1% 0%
Monthly fee rate for waste collection fee Free of Charge 0% 1% 0% 1% 1% 0%
don't know 76% 55% 69% 66% 73% 76% <4,000 included 7% 10% 8% 9% 7% 12%
4,000 to 6,000 included 6% 17% 9% 6% 7% 8% 7,000 to 8,000 included 0% 2% 1% 1% 0% 4%
9,000 to 12,000 included 4% 7% 5% 5% 4% 0% 12,000 to 20,000 included 4% 3% 4% 5% 6% 0%
>20,000 3% 5% 3% 7% 3% 0%

Table 27: Households Expenses
average value KHR
% of total
average value KHR
% of total
1- Food consumption 489,195 32% 419,482 26% 2- Shopping for appliances and amenities 46,930 3% 50,348 3% 3- Electricity for lighting/electrical appliances 90,679 6% 103,327 6% 4- Energy/fuel for cooking 32,461 2% 33,434 2% 5- Water consumption 7,536 0% 5,232 0% 6- Solid waste collection 1,707 0% 945 0% 7- Toilet facility 12,565 1% 10,759 1% 8- Drainage - 0% - 0% 9- Transport including fuel 104,009 7% 104,960 6% 10- Clothing 65,722 4% 81,572 5% 11 Housing i.e. rental, maintenance, decoration 35,574 2% 11,859 1% 12- Healthcare 160,059 10% 212,055 13% 13- Education 108,614 7% 79,301 5% 14- Communication, i.e., telephone, internet, etc. 48,418 3% 54,492 3% 15 Entertainment/Leisure, i.e., out for a drink, cigarette, etc. 62,181 4% 98,945 6% 16- Social event and ceremony i.e. wedding, festivals 278,979 18% 350,015 22% 17- Other, specify (text) 0% 0% Average total 1,544,629 1,616,726
Table 28: Households Occupation
BAVET
Occupation All HHs Female head of
household
Male head of
household Small scale business owner 28% 34% 26% Housewife 12% 36% 1% Farmers 19% 13% 22% Construction workers 9% 1% 12% Factory worker 7% 8% 7% transportation services including mototaxi 6% 1% 9% Not working 6% 4% 7% unstable jobs 4% 4% 4% Other 5% 1% 6% government employee 4% 0% 4% NGO/IO staff 3% 0% 3% solider/ police 0% 0% 0%
Table 29: Households Assets
BAVET Type of assets All HHs FHHs MHHs Motorbike 94% 89% 96% Television 76% 71% 78% Bicycle 59% 63% 58% Cellphone 93% 87% 95% Gas cooker 90% 86% 91% Car 12% 9% 13% Washing machiner 9% 7% 10% Computer 7% 7% 7%

105
8. Stakeholder consultation
Table 30: List of meeting workshop FGD, and number of participants
Phnom Penh
Date Location Purpose of meeting
Number of
Participant
s
27-08-2019 MEF Kick of meeting with stakeholders at level
22
05-09-2019 MEF, Phnom Penh
Wrap up a meeting with MEF 18
21-11-2019 Phnom Penh (MPWT)
Meeting with MPWT for getting a comment on the last version of UDS
7
12-12-2019 Sofitel Pukitra Hotel, Phnom Penh
National workshop on UDS for three target cities 81
22-01-2020 Phnom Penh (MPWT)
Meeting with MPWT to discuss and approve the design criteria for the Master Plans
7
10-03-2020 Phnom Penh (MPWT)
Orientation Meeting on SMP results, and discussion on Criteria for a feasibility study (FS) with MPWT/PD/PMU members
7
29-04-2020 Phnom Penh (MPWT)
Orientation Meeting on SMP results with PA (SVR) and MA (Bavet), and discussion on Criteria for FS
10
14-09-2020 Phnom Penh (MPWT)
Present the results of the Comprehensive Technical Option (CTOP) study to MPWT
7
25-09-2020 MEF, Phnom Penh
Present the results of the Comprehensive Technical Option (CTOP) study to MEF and MPWT
12
MEF, Phnom Penh
Final workshop/meeting with MEF and MPWT
Svay Rieng
Date Location Purpose of meeting
Number of Participant
s 27-08-2019 Svay Rieng Kick-off meeting with Svay Rieng provincial administration 21
28-08-2019 Manhathan SEZ, in Bavet
Meeting with SEZ and site visit WWTP facility 15
28-08-2019 Bavet city kick of meeting with Bavet Municipality Administration (MA)
14
01-10-2019 Provincial Hall of Svay Rieng
Meeting with SVR province stakeholders For UDS preparation, and data collection
16
02-10-2019 Bavet Meeting with Bavet stakeholders for UDS preparation, data collection
10
14-10-2019 Bavet municipal hall
Site selection for the landfill with Bavet municipality 9
06-11-2019 Provincial Hall of Svay Rieng
Results of UDS workshop 49
12-12-2019 Sofitel Pukitra Hotel, Phnom Penh
National workshop on UDS for three target cities 81
29-01-2020 Provincial Hall of Svay Rieng
Sector Master Plan (SMP) preparation, more data collection
23

106
Svay Rieng
Date Location Purpose of meeting
Number of Participant
s 29-01-2020
Bavet, Svay Rieng
FGD with Chrak Leav, Prasat, Chrak Mtes villagers (CCS survey)
22
30-01-2020 Bavet, Svay Rieng
FGD with Prasab Leak villagers (CCS survey) 13
30-01-2020 Bavet, Svay Rieng
FGD with Manhattan SEZ 7
30-01-2020 Bavet, Svay Rieng
FGD with Bavet Kandal, Ta Pov, Bavet leu, Ta boeb villagers (CCS survey)
24
02-09-2020 Bavet General consultation with Local Authority (Urban) 16
02-09-2020 Bavet FGD general consultation (Urban area, ID poor, FFHs, Elders)
51
03-09-2020 Bavet General consultation with Local Authority (Rural) 27
03-09-2020 Bavet FGD with the indigenous group, high school and disable people
33
12-09-2020 Bavet Public consultation meeting for the establishment, announcement, and concurrence on the declaration of the Cut-Off-Date (COD
11-09-2020 Chrak Leav, Bavet
1st Public consultation Meeting (Social Resettlement) 23
11-09-2020 Ta Boeb, Bavet
2nd Public consultation Meeting (Social Resettlement) 32
12-09-2020 Bavet Leu, Bavet
3rd Public consultation Meeting (Social Resettlement) 23
12-09-2020 Kandal, Bavet 4th Public consultation Meeting (Social Resettlement) 25
29-09-2020 Provincial Hall of Svay Rieng
Workshop on FS results 34
20-10-2020 Bavet Kandal, Bavet
Collecting additional data on Gender (Group 1) 13
20-10-2020 Ta Boeb, Bavet
Collecting additional data on Vietnamese/ IP (Group 2) 8

107
9. Social surveys
Social survey report- Bavet, September 2020 (separate file)

10. Gender Equality and Social Inclusion Action Plan
Gender and Social Inclusion Objectives
Activities / Indicators / Targets Responsibilities Quarter/ Year
Outcome: Access to urban infrastructure and services in participating cities improved.
Inclusive access to basic infrastructure services
a. Improved sanitation facilities provided to at least 632 poor and vulnerable households, including 90 female headed households, in the project area.90 (2021 baseline:0) (OP 1.3) (DMF b)
DCS Q4/2027
Output 1: Policy and regulatory environment improved
1.1 Sector regulatory environment is gender-responsive and inclusive.
1.1.1Guidelines on financial planning, tariff setting, and reporting, that are gender responsive and inclusive, are developed for each participating city91. (2021 baseline: 0) (OP 2.3.2; OP 6.2.2) (DMF 1a)
DCS
Q4/2024
1.1.2 Operational guidelines on wastewater, stormwater drainage and municipal solid waste, that are gender responsive and inclusive, are developed for each participating city (2021 baseline: 0). (OP 2.3.2) (DMF 1b) (refer footnote 2)
DCS Q4/2024
1.1.3 At least 40% of participants in trainings and workshops on financial planning and management, project management, service delivery and O&M with the MPWT, PDPWT, and municipal administration, are women.
DCS Q3/2027
Output 2: Urban infrastructure improved
2.1 Infrastructure and services developed respond to the needs of targeted population.
2.1.2 One behavior change analysis and strategy development on wastewater and solid waste management targeting all community members, including women and vulnerable groups in the project area is completed.92
DCS Q2/2027
2.1.3 Community surveys are undertaken to track if and how the infrastructure services respond to the needs of the targeted population ensuring minimum participation of 50% women and fair representation from other vulnerable groups93 (proportional to their representation in the target area).94
DCS Q2/2027
90 Equivalent to at least 80% of eligible ID poor and vulnerable populations in the project area. 91 Guidelines and plans will consider the different factors affecting male and female clientele, and vulnerable groups. For example, guidelines on financial planning will consider
level of income and affordability. 92 Specifying key messages, information and education contents, pictures and training method targeting specific groups: men, women, vulnerable and other specific groups. 93 Vulnerable groups could include people living close to the poverty line, infants, children, pregnant women, families with food insecurity, people with disabilities and the elderly,
as defined by the legal and regulatory framework. 94 Surveys will be conducted at least at the commencement of the project (baseline) and at the end of the project (endline).

109
Gender and Social Inclusion Objectives
Activities / Indicators / Targets Responsibilities Quarter/ Year
2.2 Infrastructure and service activities offer inclusive opportunities to the population
2.2.1 All works contractors will include a commitment that 30% of construction and other project related unskilled jobs will go to local men and women, (of whom at least 10% are local women) in all contract documents.95
Contractor/ PMU Q4/2024
2.2.2 All works contractors will include a commitment that at least 20% of construction and other project unskilled jobs will go to women (local and non-local women).
Contractor/ PMU
2.2.3 The works contracts commit to ensure equal pay for work of equal value for male and female employees, including those from different ethnic groups, in all contract documents.
Contractor/ PMU
2.2.4 All workers are trained at least once during the project implementation to raise awareness on HIV/STIs, COVID-19, and GBV/SEAH prevention and response in the workplace, to ensure respectful interactions between the consultants, contractors, PMU and other stakeholders at the community level.
Contractor
Output 3: Institutional effectiveness and governance improved
3.1 MA-PWTESPO is a gender-responsive and inclusive institution.
3.1.1 A recruitment, continuous training96, mobility and promotion plan, that is gender responsive and inclusive, is developed and implemented within each municipal administration. (2021 baseline: 0) (OP 2.3.2) (DMF 3b) (refer footnote 2)
DCS97 Q4/2025
3.1.2 At least one technical position or 20% of technical positions98 within each MA-PWTESPO are held by women (2021 baseline: 0) (OP 2.1)
EA, IA, Municipal Administration
Q2/2027
3.1.3 At least one decision-making position or 15 % of decision-making positions99 within each MA-PWTESPO are held by women. (2021 baseline: 0). (OP 2.3)
EA, IA, Municipal Administration
Q2/2027
3.1.4. A MOU agreed with accredited institutes or universities to promote women’s careers in engineering, sciences and technical studies. (OP 2.2.1, DMF 3c).
PMU Q4/2022
3.1.5 At least 20 scholarships100 are awarded to female employees of MPWT, PDPWT, or municipal administration to study engineering and/other relevant sciences at an accredited institution to advance their careers in the water and sanitation sector (2021 baseline: 0). (OP 2.2.1) (DMF 3d)
PMU Q2/2027
95 Local refer to men and women residing within the project area. 96 Planning, project management, asset management, O&M, financial management, tariff collection and cost recovery. Selection and eligibility criteria to be developed during
the project implementation by the DCS, in consultation with the EA and ADB. 97 The Institutional Specialist will work with the Gender and Social Specialist to ensure that gender mainstreaming is included. 98 Technical positions include engineers, technicians, trainers. accountant, officer. The indicator refers to the new positions to be created under the municipal administration to
manage the new services for Bavet and Poipet only. Kampot has been excluded as the institutional set up is covered under L3314 Second Greater Mekong Subregion Corridor Towns Development Project.
99 Refers to positions such as director, chief office and vice chief. Number refers to the new positions to be created under the municipal administration to manage the new services for Bavet and Poipet only. Kampot has been excluded as the institutional set up is covered under the GMS 2.
100 Refer to any graduate level equivalent or higher than a bachelor’s degree.
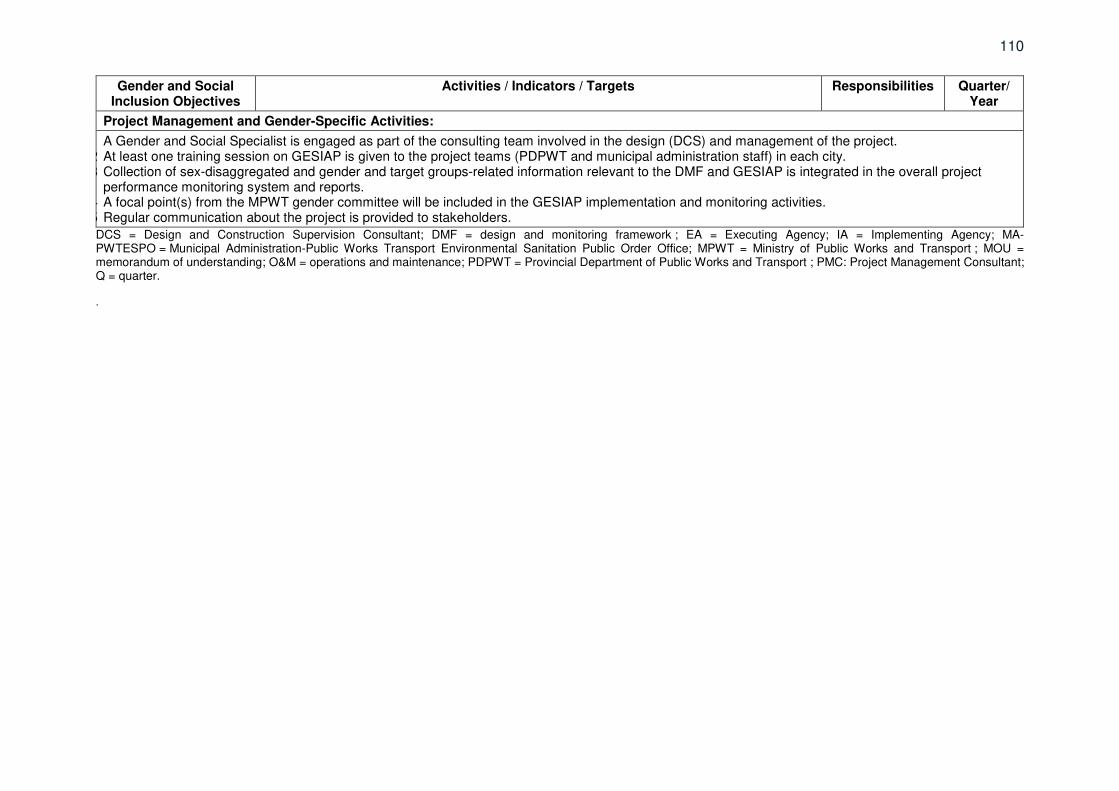
110
Gender and Social Inclusion Objectives
Activities / Indicators / Targets Responsibilities Quarter/ Year
Project Management and Gender-Specific Activities:
4.1 A Gender and Social Specialist is engaged as part of the consulting team involved in the design (DCS) and management of the project. 4.2 At least one training session on GESIAP is given to the project teams (PDPWT and municipal administration staff) in each city. 4.3 Collection of sex-disaggregated and gender and target groups-related information relevant to the DMF and GESIAP is integrated in the overall project
performance monitoring system and reports. 4.4 A focal point(s) from the MPWT gender committee will be included in the GESIAP implementation and monitoring activities. 4.5 Regular communication about the project is provided to stakeholders.
DCS = Design and Construction Supervision Consultant; DMF = design and monitoring framework ; EA = Executing Agency; IA = Implementing Agency; MA-PWTESPO = Municipal Administration-Public Works Transport Environmental Sanitation Public Order Office; MPWT = Ministry of Public Works and Transport ; MOU = memorandum of understanding; O&M = operations and maintenance; PDPWT = Provincial Department of Public Works and Transport ; PMC: Project Management Consultant; Q = quarter.
.