Lithologic and mineral information extraction for gold ...
12
Lithologic and mineral information extraction for gold exploration using ASTER data in the south Chocolate Mountains (California) Xianfeng Zhang a, ⁎ , Micha Pazner a,1 , Norman Duke b a Department of Geography, University of Western Ontario, London, Canada N6A 5C2 b Department of Earth Sciences, University of Western Ontario, London, Canada Received 6 June 2005; received in revised form 16 April 2007; accepted 17 April 2007 Available online 19 July 2007 Abstract An ASTER image covering the south Chocolate Mountains area, California, U.S.A. was evaluated for gold-related lithologic mapping and alteration mineral detection. A supervised classifier was first applied to the 14-channel ASTER radiance data to map lithologies related to gold deposits. Subsequently, four alteration indices were extracted from the six SWIR channels and transformed to delineate alteration zones using a PCA transformed mineralogic indices approach. Finally, a subpixel unmixing algorithm, the constrained energy minimization (CEM) technique was used to detect significant alteration minerals using the ASTER VNIR and SWIR surface reflectance data and reference spectra from the ASTER spectral library. The classification results show that the ASTER data were capable of mapping flood basalt, quartz-biotite gneiss, muscovite schist, granitic, volcanic, and metasedimentary rock units. The ASTER-derived rock units show excellent correlation with those on the reference geologic map. The overall classification accuracy is 82% and the Kappa coefficient 0.76. A group of gneisses, locally the most favorable host rocks of gold deposits, were mapped with the ASTER data with a Producer's accuracy of 86%, and more importantly were also mapped in some areas that were not shown on the field geologic map. Four alteration minerals: alunite, kaolinite, muscovite and montmorillonite were detected by subpixel unmixing analysis of the ASTER reflectance data. This study compared different methods for extracting mineralogic information from ASTER data, compared the remotely derived maps to the mapped field geology, and used the ASTER data to map minerals and lithologies related to gold exploration. © 2007 International Society for Photogrammetry and Remote Sensing, Inc. (ISPRS). Published by Elsevier B.V. All rights reserved. Keywords: ASTER sensor; Constrained energy minimization; Subpixel unmixing; Lithologic classification; Alteration mineral detection 1. Introduction Remote sensing instruments can provide detailed information on the mineralogy and geochemistry of the rock types comprising the Earth's surface, and have been used for decades to map rocks, mineral assem- blages and weathering characteristics (Rowan et al., 1977; Goetz et al., 1983; Boardman and Kruse, 1994; Papp and Cudahy, 2002; Kruse et al., 2003; Perry, 2004). Spaceborne multispectral systems such as Land- sat MSS, TM and SPOT have four to seven spectral channels. Landsat MSS data have mainly been utilized for structural and geomorphic interpretation at regional scales (Goetz et al., 1983; Abrams et al., 1983; Sultan et al., 1987; Perry, 2004). Landsat TM imagery has been ISPRS Journal of Photogrammetry & Remote Sensing 62 (2007) 271 – 282 ⁎ Corresponding author. Mailing Address: Institute of Remote Sensing and GIS, Peking University, 5 Summer Palace Road, Beijing 100871, PR China. Tel.: +86 10 62759123; fax: +86 10 62754739. E-mail addresses: [email protected], [email protected] (X. Zhang), [email protected] (M. Pazner), [email protected] (N. Duke). 1 Tel.: +1 519 6612111x84501; fax: +1 519 661 3750. 0924-2716/$ - see front matter © 2007 International Society for Photogrammetry and Remote Sensing, Inc. (ISPRS). Published by Elsevier B.V. All rights reserved. doi:10.1016/j.isprsjprs.2007.04.004 转载 http://www.paper.edu.cn
-
Upload
khangminh22 -
Category
Documents
-
view
0 -
download
0
Transcript of Lithologic and mineral information extraction for gold ...
emote Sensing 62 (2007) 271–282
http://www.paper.edu.cn
ISPRS Journal of Photogrammetry & R
Lithologic and mineral information extraction for gold explorationusing ASTER data in the south Chocolate Mountains (California)
Xianfeng Zhang a,⁎, Micha Pazner a,1, Norman Duke b
a Department of Geography, University of Western Ontario, London, Canada N6A 5C2b Department of Earth Sciences, University of Western Ontario, London, Canada
Received 6 June 2005; received in revised form 16 April 2007; accepted 17 April 2007Available online 19 July 2007
Abstract
An ASTER image covering the south Chocolate Mountains area, California, U.S.A. was evaluated for gold-related lithologicmapping and alteration mineral detection. A supervised classifier was first applied to the 14-channel ASTER radiance data to maplithologies related to gold deposits. Subsequently, four alteration indices were extracted from the six SWIR channels andtransformed to delineate alteration zones using a PCA transformed mineralogic indices approach. Finally, a subpixel unmixingalgorithm, the constrained energy minimization (CEM) technique was used to detect significant alteration minerals using theASTER VNIR and SWIR surface reflectance data and reference spectra from the ASTER spectral library.
The classification results show that the ASTER data were capable of mapping flood basalt, quartz-biotite gneiss, muscoviteschist, granitic, volcanic, and metasedimentary rock units. The ASTER-derived rock units show excellent correlation with those onthe reference geologic map. The overall classification accuracy is 82% and the Kappa coefficient 0.76. A group of gneisses, locallythe most favorable host rocks of gold deposits, were mapped with the ASTER data with a Producer's accuracy of 86%, and moreimportantly were also mapped in some areas that were not shown on the field geologic map. Four alteration minerals: alunite,kaolinite, muscovite and montmorillonite were detected by subpixel unmixing analysis of the ASTER reflectance data. This studycompared different methods for extracting mineralogic information from ASTER data, compared the remotely derived maps to themapped field geology, and used the ASTER data to map minerals and lithologies related to gold exploration.© 2007 International Society for Photogrammetry and Remote Sensing, Inc. (ISPRS). Published by Elsevier B.V. All rights reserved.
Keywords: ASTER sensor; Constrained energy minimization; Subpixel unmixing; Lithologic classification; Alteration mineral detection
1. Introduction
Remote sensing instruments can provide detailedinformation on the mineralogy and geochemistry of the
⁎ Corresponding author. Mailing Address: Institute of RemoteSensing and GIS, Peking University, 5 Summer Palace Road, Beijing100871, PR China. Tel.: +86 10 62759123; fax: +86 10 62754739.
E-mail addresses: [email protected],[email protected] (X. Zhang), [email protected] (M. Pazner),[email protected] (N. Duke).1 Tel.: +1 519 6612111x84501; fax: +1 519 661 3750.
0924-2716/$ - see front matter © 2007 International Society for PhotogramAll rights reserved.doi:10.1016/j.isprsjprs.2007.04.004
rock types comprising the Earth's surface, and havebeen used for decades to map rocks, mineral assem-blages and weathering characteristics (Rowan et al.,1977; Goetz et al., 1983; Boardman and Kruse, 1994;Papp and Cudahy, 2002; Kruse et al., 2003; Perry,2004). Spaceborne multispectral systems such as Land-sat MSS, TM and SPOT have four to seven spectralchannels. Landsat MSS data have mainly been utilizedfor structural and geomorphic interpretation at regionalscales (Goetz et al., 1983; Abrams et al., 1983; Sultanet al., 1987; Perry, 2004). Landsat TM imagery has been
metry and Remote Sensing, Inc. (ISPRS). Published by Elsevier B.V.
转载

272 X. Zhang et al. / ISPRS Journal of Photogrammetry & Remote Sensing 62 (2007) 271–282
中国科技论文在线 http://www.paper.edu.cn
used more routinely for mineral exploration because thetwo SWIR channels may be used to detect associatedalteration mineral assemblages (Podwysocki et al.,1984; Okada et al., 1993; Sabins, 1996; Sabine, 1997;Abdelsalam et al., 2000). In the past 10 years, newspaceborne multispectral and hyperspectral remotesensing instruments have been launched and haveprovided higher spectral resolution data that can beused for mineral exploration. In addition, the availabilityof laboratory-measured spectral data for rocks andminerals complements remote spectral measurementsand allows geologists to identify unique lithologies (e.g.JPL, USGS, and ASU spectral libraries). These recentdevelopments have enabled remote sensing technologyto become an increasingly important tool for mineralexploration, particularly for remote areas with little orno access, or areas that lack detailed topographic orgeologic base maps.
The Advanced Spaceborne Thermal Emission andReflection Radiometer (ASTER) is a multispectralimager that was launched on board NASA's Terraspacecraft in December, 1999. ASTER covers the visible,near infrared (VNIR), short wave infrared (SWIR), andthermal infrared (TIR) spectral regions with 14 channelswith high spatial, spectral and radiometric resolution(Yamaguchi et al., 1998; Abrams and Hook, 2001). Thespatial resolution varies with wavelength region (seeTable 1) and each ASTER scene covers an area of60×60 km2. ASTER channels are more spectrallycontiguous than other multispectral sensors such as theLandsat 5 Thematic Mapper and the Landsat 7 EnhancedThematic Mapper, especially in shortwave and thermalinfrared wavelength ranges. Thus, the ASTER sensor canachieve a higher degree of accuracy in the spectral
Table 1Characteristics of the ASTER sub-sensor systems (Yamaguchi et al., 1998)
Subsystem Band No. Spectral range (μm) Radiometric resolution Ab
VNIR 1 0.52–0.602 0.63–0.693 0.78–0.86 NEΔρ≤0.5% ≤
3N 0.78–0.86SWIR 4 1.60–1.70 NEΔρ≤0.5%
5 2.145–2.185 NEΔρ≤1.3%6 2.185–2.225 NEΔρ≤1.3% ≤7 2.235–2.285 NEΔρ≤1.3%8 2.295–2.365 NEΔρ≤1.0%9 2.360–2.430 NEΔρ≤1.3%
TIR 10 8.125–8.475 ≤11 8.475–8.825 ≤12 8.925–9.275 NEΔT≤0.3 K ≤13 10.25–10.95 ≤14 10.95–11.65
identification of rocks and minerals (Crosta and Filho,2003). Previous studies indicate that ASTER comparesfavorably to other similar sensors for lithologic mapping(Zhang and Pazner, 2007). Also, the ASTER sensor wasthe first spaceborne instrument with a high resolutionmultispectral TIR subsystem capable of differentiatingbetween surface minerals based on spectral emissivityvariations. Because of the low-cost, large coverage area,and availability of ASTER data, it is an ideal tool formineral exploration applications provided that it canaccurately map lithologic and mineralogic units on thesurface.
The objective of the study was to use ASTER data tomap lithologies and alteration minerals associated withgold mineralization in a large mining district in southernCalifornia. The ASTER image data were used to extractlithologic information using a spectral classificationmethod and alteration zones associated with goldmineralization were mapped using principal compo-nents analysis (PCA) of mineralogic indices extractedfrom the ASTER band ratios. Finally, the fractionalabundances of significant alteration minerals aredetected using a matched filtering technique.
2. Geology and morphology of the study area
The south Chocolate Mountains area in ImperialCounty, California was selected as the study area(Fig. 1). The gold prospecting in the nearby ChocolateMountains area is likely to be most fruitful in areasunderlain by rocks of the Chuckwalla Complex andOrocopia Schist (Morton, 1977). However, groundaccess is restricted in the mid-west part of the studyarea due to a military gunnery range is located in the
solute accuracy Spatial resolution (m) Signal quantization (bits)
±4% 15 8
±4% 30 8
3 K (200–240 K)2 K (240–270 K)1 K (270–340 K) 90 122 K (340–370 K)

Fig. 1. The location of the south Chocolate Mountains (Study area: 45×27 km2).
273X. Zhang et al. / ISPRS Journal of Photogrammetry & Remote Sensing 62 (2007) 271–282
中国科技论文在线 http://www.paper.edu.cn
mountains. The climate in this region of California isextremely arid, with a mean annual rainfall of only75 mm. As a result, the area is suitable for remotesensing based investigation because the landscape isvery sparsely vegetated. The area encompasses approx-imately 1200 km2, with the Paymaster mine districtlocated in the center part (Morton, 1977). The earliestgold production in California came from this area. Thesouth Chocolate Mountains have been mined for lodeand placer gold, silver, lead, copper, manganese, clay,and pyrophyllite, but most of the historical explorationfocused on the search for gold (Morton, 1977; Willis,1988; Durning et al., 1998). The Mesquite mine is themost famous in the study area. The oldest rock exposedin this district is quartz-biotite gneiss, which iscorrelated with the Precambrian Chuckwalla Complex(mc) (Morton, 1977; Willis, 1988; Liebler, 1988). Thegneiss is overlain by highly foliated muscovite-chloriteschist, tentatively correlated with Orocopia Schist(mso). The gneiss outcrops occur mainly in a largebody that lies along the western boundary of the districtsouth and southwest of Imperial Gables. LimitedMesozoic metavolcanic and metasedimentary rocks(mmc) cover the southeastern part of the study area. Awide range of Tertiary volcanic rocks (Tv) cover muchof the district. Undivided Tertiary intrusive, extrusiveand pyroclastic volcanic rocks ranging from rhyolite toandesite underlie much of the southwest flanks of theChocolate Mountains in the southwestern part of the
district and the mountains in the northern and easternparts. Gently tilted Pliocene flood basalts (Tvb) underliethe area that comprises Black Mountain. Moderately topoorly sorted, consolidated siltstone, sandstone andconglomerate (Tc) are exposed in the eastern part of thestudy area.
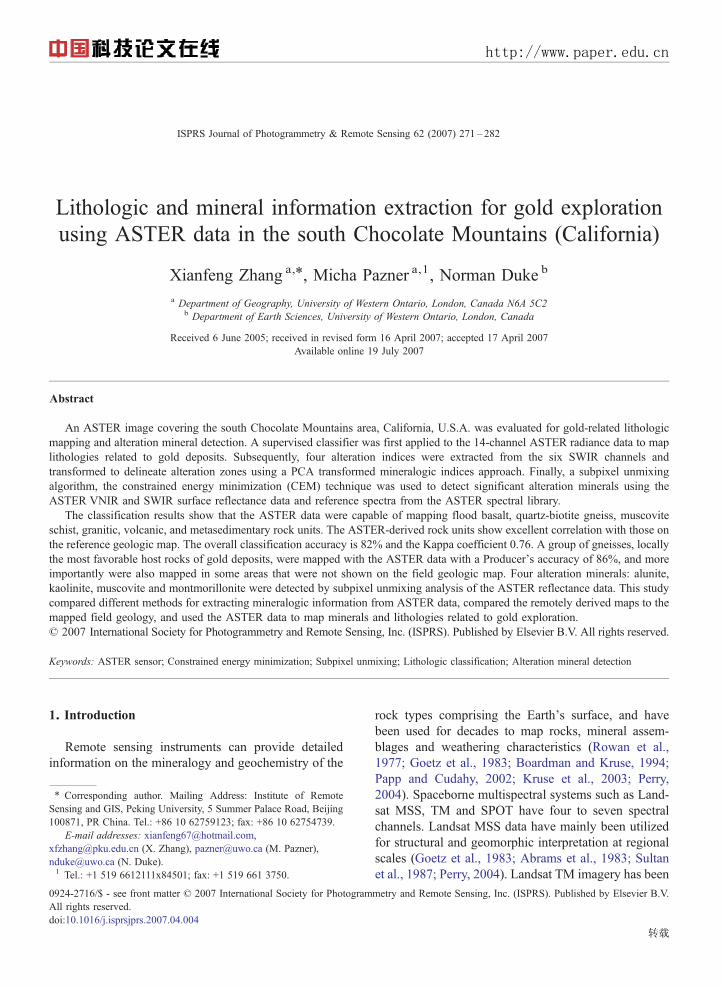
Most of the gold deposits in the study area are limitedto the Precambrian metamorphic bedrock such asquartz-biotite gneiss and muscovite schist, and theMesozoic granites (Liebler, 1988). The gold deposits inthe Mesquite mine area were derived from gneissimmediately underlying the pedimented surfaces (Mor-ton, 1977). This suggests that gold prospecting in thenearby Chocolate Mountains area is likely to be mostfruitful in areas underlain by rocks of the ChuckwallaComplex and Orocopia Schist (Morton, 1977). Remotesensing data such as that from ASTER and ETM areparticularly useful for lithologic mapping, especially atthe initial stage of gold prospecting. The significant rockunits shown in the geologic map (Fig. 2) were extractedfrom the ASTER image used in this study.
3. Gold-related lithologic information extractionfrom ASTER
3.1. Lithologic classification
An ASTER image covering the study area acquiredon October 3, 2003 was used for the lithologic mapping.
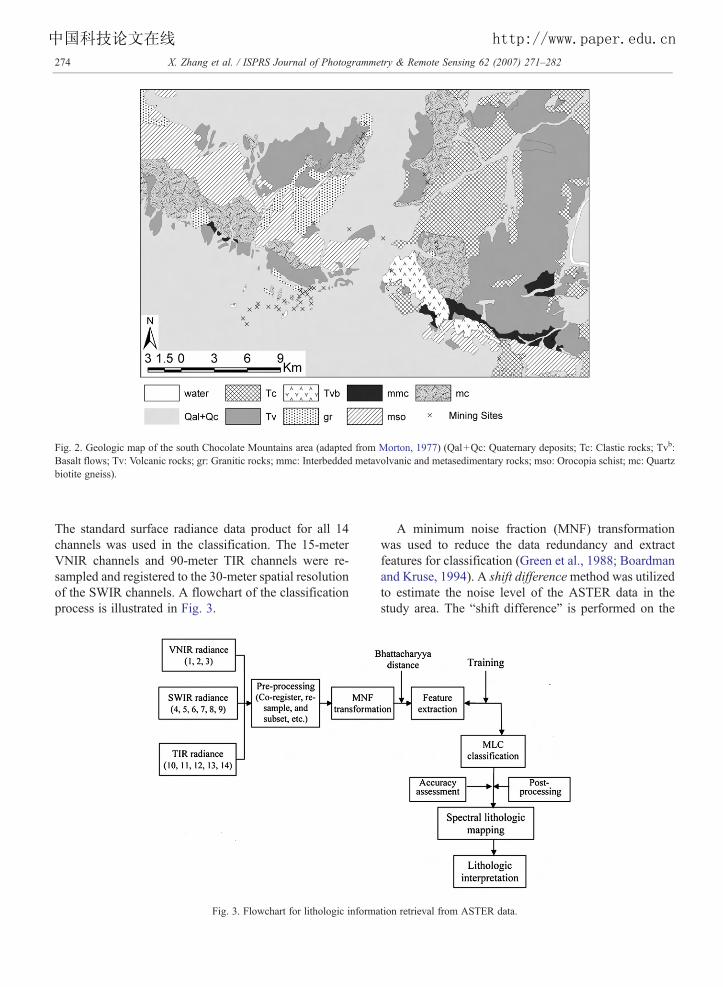
Fig. 2. Geologic map of the south Chocolate Mountains area (adapted from Morton, 1977) (Qal+Qc: Quaternary deposits; Tc: Clastic rocks; Tvb:Basalt flows; Tv: Volcanic rocks; gr: Granitic rocks; mmc: Interbedded metavolvanic and metasedimentary rocks; mso: Orocopia schist; mc: Quartzbiotite gneiss).
274 X. Zhang et al. / ISPRS Journal of Photogrammetry & Remote Sensing 62 (2007) 271–282
中国科技论文在线 http://www.paper.edu.cn
The standard surface radiance data product for all 14channels was used in the classification. The 15-meterVNIR channels and 90-meter TIR channels were re-sampled and registered to the 30-meter spatial resolutionof the SWIR channels. A flowchart of the classificationprocess is illustrated in Fig. 3.
Fig. 3. Flowchart for lithologic informa
A minimum noise fraction (MNF) transformationwas used to reduce the data redundancy and extractfeatures for classification (Green et al., 1988; Boardmanand Kruse, 1994). A shift differencemethod was utilizedto estimate the noise level of the ASTER data in thestudy area. The “shift difference” is performed on the
tion retrieval from ASTER data.

275X. Zhang et al. / ISPRS Journal of Photogrammetry & Remote Sensing 62 (2007) 271–282
中国科技论文在线 http://www.paper.edu.cn
data by differencing adjacent pixels to the right andabove of each pixel and averaging the results to obtainthe “noise” value to assign to the pixel being processed.A portion of homogeneous sand cover on the image wasselected for the noise level estimate because the noiseestimated from a homogeneous area on the image ismore representative of noise than that from the wholeimage. A three-band false-color composite image wasselected to delineate rock units by examining differentfalse color composite images of the MNF bands.Training samples for each rock type were selectedwith the help of field photography, a geologic map, and1-meter false-color aerial orthophotos. The 1-meteraerial photos were used to aid in identifying the surfacefeatures because most of the study area is not accessible.The training stage is critical for supervised classificationsuch as maximum likelihood classifier. The Bhatta-charyya distance was used to measure the separabilitybetween classes based on selected training samples(Fukunaga, 1990). The Bhattacharyya distance assumesthat the two classes, c and d, have a Gaussiandistribution, and is calculated from the statistics oftraining samples (Jensen, 1996). The training samplesthat had largest average Bhattacharyya distance wereemployed for the classification. This approach aids inthe selection of training samples to define a suitable set.
Fig. 4. Classification result of rock types in the south Chocolate Mountainmapped on the geologic map.
Due to large spectral variations in rocks, rocksubtypes were used as classes to maximize the inter-class separation and minimize the differences betweentraining samples within a class (Jensen, 1996, 2002;Lillesand and Kiefer, 2004). This was especiallyrelevant for Quaternary deposits such as Qal and Qc.These subtypes are particularly spectrally variablebecause they originate from different bedrock types,which determine their mineral composition. Thevolcanic rocks Tv were differentiated as intrusive(Tvi), pyroclastic (Tvp), intrusive andesite (Tvia), andandesitic (Tva). The spectral appearance of intrusive andpyroclastic volcanic rocks on the MNF false-colorcomposite image was clearly different. The differencemay be caused by grain size, mineral composition (e.g.bulk SiO2, Mg–Fe–O), different combinations of rockmixtures, topographic texture, and surface roughness.The subdivision of the rock types improved theclassification result.
Once the training process was completed, themaximum likelihood classifier was applied using the14 ASTER channels. A majority filter was used toimprove the classification during the post-processingstage. The final lithologic classification of the study areais shown in Fig. 4. Compared with the geologic map(Fig. 2), the classification result from the ASTER image
s area. Note: Circled areas indicate mc rock units by ASTER and not
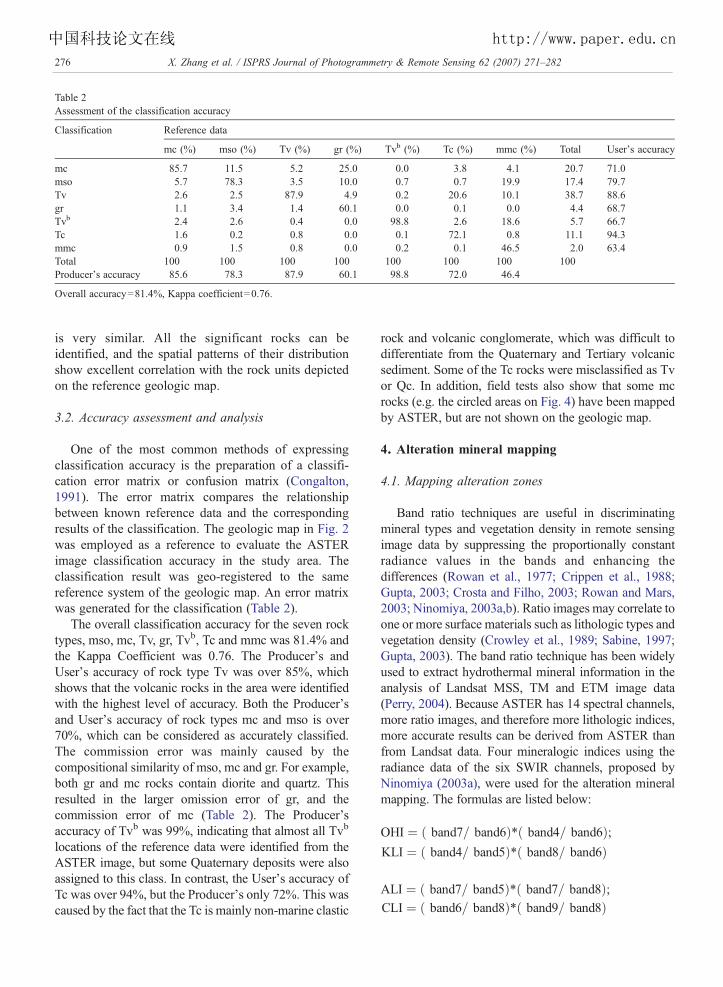
Table 2Assessment of the classification accuracy
Classification Reference data
mc (%) mso (%) Tv (%) gr (%) Tvb (%) Tc (%) mmc (%) Total User's accuracy
mc 85.7 11.5 5.2 25.0 0.0 3.8 4.1 20.7 71.0mso 5.7 78.3 3.5 10.0 0.7 0.7 19.9 17.4 79.7Tv 2.6 2.5 87.9 4.9 0.2 20.6 10.1 38.7 88.6gr 1.1 3.4 1.4 60.1 0.0 0.1 0.0 4.4 68.7Tvb 2.4 2.6 0.4 0.0 98.8 2.6 18.6 5.7 66.7Tc 1.6 0.2 0.8 0.0 0.1 72.1 0.8 11.1 94.3mmc 0.9 1.5 0.8 0.0 0.2 0.1 46.5 2.0 63.4Total 100 100 100 100 100 100 100 100Producer's accuracy 85.6 78.3 87.9 60.1 98.8 72.0 46.4
Overall accuracy=81.4%, Kappa coefficient=0.76.
276 X. Zhang et al. / ISPRS Journal of Photogrammetry & Remote Sensing 62 (2007) 271–282
中国科技论文在线 http://www.paper.edu.cn
is very similar. All the significant rocks can beidentified, and the spatial patterns of their distributionshow excellent correlation with the rock units depictedon the reference geologic map.
3.2. Accuracy assessment and analysis
One of the most common methods of expressingclassification accuracy is the preparation of a classifi-cation error matrix or confusion matrix (Congalton,1991). The error matrix compares the relationshipbetween known reference data and the correspondingresults of the classification. The geologic map in Fig. 2was employed as a reference to evaluate the ASTERimage classification accuracy in the study area. Theclassification result was geo-registered to the samereference system of the geologic map. An error matrixwas generated for the classification (Table 2).
The overall classification accuracy for the seven rocktypes, mso, mc, Tv, gr, Tvb, Tc and mmc was 81.4% andthe Kappa Coefficient was 0.76. The Producer's andUser's accuracy of rock type Tv was over 85%, whichshows that the volcanic rocks in the area were identifiedwith the highest level of accuracy. Both the Producer'sand User's accuracy of rock types mc and mso is over70%, which can be considered as accurately classified.The commission error was mainly caused by thecompositional similarity of mso, mc and gr. For example,both gr and mc rocks contain diorite and quartz. Thisresulted in the larger omission error of gr, and thecommission error of mc (Table 2). The Producer'saccuracy of Tvb was 99%, indicating that almost all Tvb
locations of the reference data were identified from theASTER image, but some Quaternary deposits were alsoassigned to this class. In contrast, the User's accuracy ofTc was over 94%, but the Producer's only 72%. This wascaused by the fact that the Tc is mainly non-marine clastic
rock and volcanic conglomerate, which was difficult todifferentiate from the Quaternary and Tertiary volcanicsediment. Some of the Tc rocks were misclassified as Tvor Qc. In addition, field tests also show that some mcrocks (e.g. the circled areas on Fig. 4) have been mappedby ASTER, but are not shown on the geologic map.
4. Alteration mineral mapping
4.1. Mapping alteration zones
Band ratio techniques are useful in discriminatingmineral types and vegetation density in remote sensingimage data by suppressing the proportionally constantradiance values in the bands and enhancing thedifferences (Rowan et al., 1977; Crippen et al., 1988;Gupta, 2003; Crosta and Filho, 2003; Rowan and Mars,2003; Ninomiya, 2003a,b). Ratio images may correlate toone or more surface materials such as lithologic types andvegetation density (Crowley et al., 1989; Sabine, 1997;Gupta, 2003). The band ratio technique has been widelyused to extract hydrothermal mineral information in theanalysis of Landsat MSS, TM and ETM image data(Perry, 2004). Because ASTER has 14 spectral channels,more ratio images, and therefore more lithologic indices,more accurate results can be derived from ASTER thanfrom Landsat data. Four mineralogic indices using theradiance data of the six SWIR channels, proposed byNinomiya (2003a), were used for the alteration mineralmapping. The formulas are listed below:
OHI ¼ ð band7= band6Þ⁎ð band4= band6Þ;KLI ¼ ð band4= band5Þ⁎ð band8= band6Þ
ALI ¼ ð band7= band5Þ⁎ð band7= band8Þ;CLI ¼ ð band6= band8Þ⁎ð band9= band8Þ
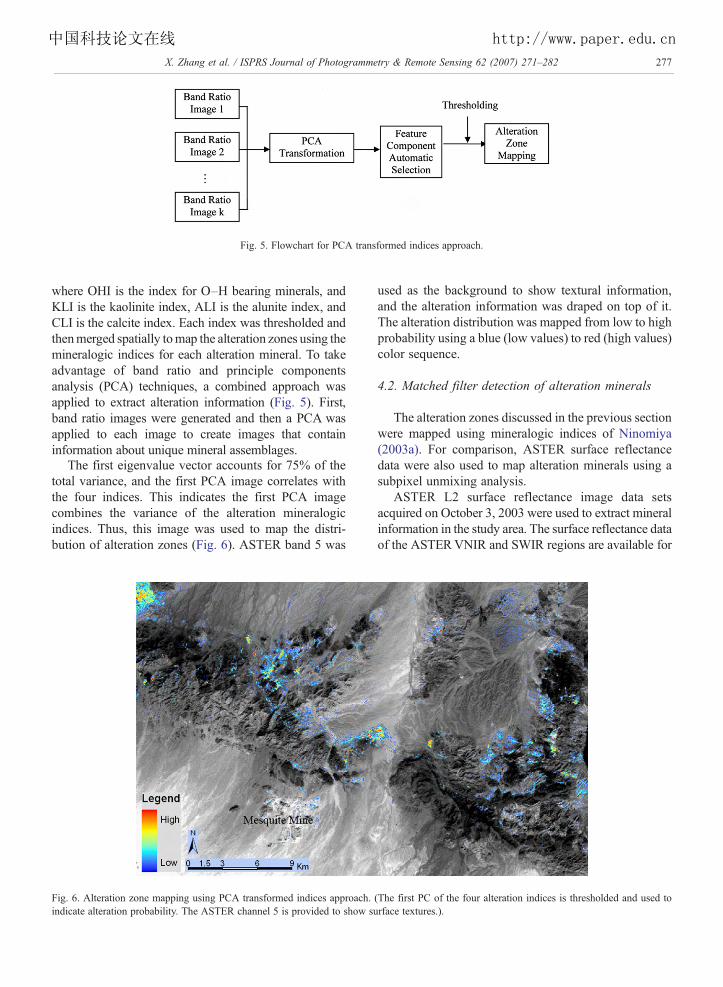
Fig. 5. Flowchart for PCA transformed indices approach.
277X. Zhang et al. / ISPRS Journal of Photogrammetry & Remote Sensing 62 (2007) 271–282
中国科技论文在线 http://www.paper.edu.cn
where OHI is the index for O–H bearing minerals, andKLI is the kaolinite index, ALI is the alunite index, andCLI is the calcite index. Each index was thresholded andthenmerged spatially tomap the alteration zones using themineralogic indices for each alteration mineral. To takeadvantage of band ratio and principle componentsanalysis (PCA) techniques, a combined approach wasapplied to extract alteration information (Fig. 5). First,band ratio images were generated and then a PCA wasapplied to each image to create images that containinformation about unique mineral assemblages.
The first eigenvalue vector accounts for 75% of thetotal variance, and the first PCA image correlates withthe four indices. This indicates the first PCA imagecombines the variance of the alteration mineralogicindices. Thus, this image was used to map the distri-bution of alteration zones (Fig. 6). ASTER band 5 was
Fig. 6. Alteration zone mapping using PCA transformed indices approach.indicate alteration probability. The ASTER channel 5 is provided to show s
used as the background to show textural information,and the alteration information was draped on top of it.The alteration distribution was mapped from low to highprobability using a blue (low values) to red (high values)color sequence.
4.2. Matched filter detection of alteration minerals
The alteration zones discussed in the previous sectionwere mapped using mineralogic indices of Ninomiya(2003a). For comparison, ASTER surface reflectancedata were also used to map alteration minerals using asubpixel unmixing analysis.
ASTER L2 surface reflectance image data setsacquired on October 3, 2003 were used to extract mineralinformation in the study area. The surface reflectance dataof the ASTERVNIR and SWIR regions are available for
(The first PC of the four alteration indices is thresholded and used tourface textures.).

278 X. Zhang et al. / ISPRS Journal of Photogrammetry & Remote Sensing 62 (2007) 271–282
中国科技论文在线 http://www.paper.edu.cn
downloading at the EROS Data Center. The nine VNIRand SWIR channels were used for alteration mineralmappingbecausemany alterationminerals have diagnosticabsorption features in these wavelength regions (Fig. 7).
4.2.1. The mapping method for subpixel mineralsMineralogic indices can map the distribution of some
mineral assemblages, but it is difficult to define thedistribution of unique minerals. The thresholds used inthe process of band ratioing are subjective and scene-dependent. To detect minerals important for explorationactivity in the study area, advanced spectral analysismethods were used. The Constrained Energy Minimi-zation (CEM) technique is an implementation ofmatched filtering methods in the context of hyperspec-tral analysis (Farrand and Harsanyi, 1994, 1997). Thistechnique was used to identify the abundance ofsignificant minerals in the study area. The CEMtechnique was developed by analogy to the solution ofthe typical adaptive beam-forming problem in the signalprocessing community (Resmini et al., 1997; Farrandand Harsanyi, 1997). The CEM algorithm attempts tomaximize the response of a target spectrum and suppressthe response of the unknown background signature(s).Mathematical details of the CEM operator can be foundin the related references.
The CEM algorithm performs a partial unmixing ofspectra to estimate the abundance of user-defined end-member materials from a set of reference spectra (eitherimage or laboratory spectra) (Harsanyi et al., 1994;Boardman et al., 1995; Boardman, 1998). The strengthsof the CEM technique are its ability to deal with avariety of spectral backgrounds and to accommodate
Fig. 7. Reference spectra from the ASTER spectral library (v1.2) (
nonlinear mixing among background materials (Farrandand Harsanyi, 1997). CEM is optimal for detection ofdistributed subpixel targets such as mineral occurrencesor sparse vegetation (Resmini et al., 1997).
4.2.2. Spectral unmixing of the ASTER reflectance dataThe mineralogic indices discussed in Section 4.1
mapped the possible alteration zones, but the CEMmatched filtering mapping can not only map thealteration mineral distribution, it can also be used tocheck the consistency between the results of the twomethods.
Four alteration minerals: alunite, kaolinite, musco-vite and montmorillonite were identified from theVNIR/SWIR surface reflectance data. The referencespectra of these four minerals (Fig. 7) were extractedfrom the ASTER spectral library (Version 1.2,http://speclib.jpl.nasa.gov), and were convolved to the spec-tral response function of ASTER's VNIR/SWIR chan-nels. These spectral data were used to extract fractionalabundance from the VNIR/SWIR reflectance data usingthe CEM technique. The resultant abundance images ofthese four alteration minerals are shown in Fig. 8.
Fig. 7A shows the laboratory spectra of the fouralteration minerals: alunite (KAl_3(SO_4)_2(OH)_6),kaolinite (Al_2Si_2O_5(OH)_4), montmorillonite ((Na,Ca)_0.33(Al, Mg)_2Si_4O_10(OH)_2H_2O) and mus-covite (KAl_2(Si_3Al)O_10(OH, F)_2), and the spectrain Fig. 7B are of the four alteration minerals convolvedto the ASTER bandpasses. The resultant abundanceimages in Fig. 8 show that the distribution of the fouralteration minerals agrees very well with the alterationzones extracted from the mineralogic index images in
A) and the spectra convolved to the ASTER bandpasses (B).
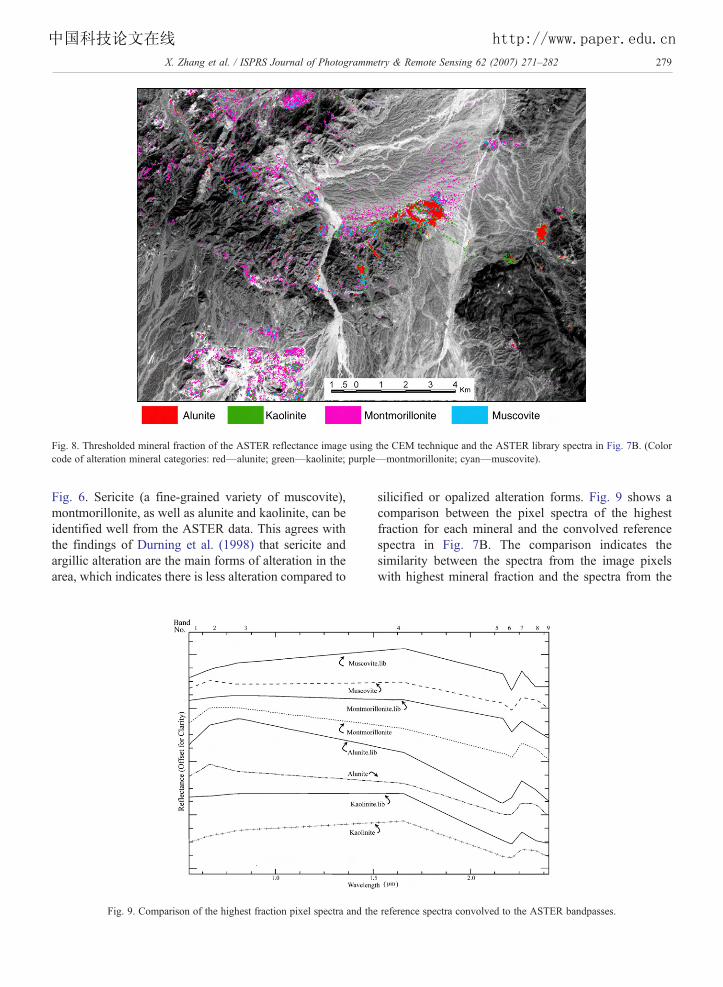
Fig. 8. Thresholded mineral fraction of the ASTER reflectance image using the CEM technique and the ASTER library spectra in Fig. 7B. (Colorcode of alteration mineral categories: red—alunite; green—kaolinite; purple—montmorillonite; cyan—muscovite).
279X. Zhang et al. / ISPRS Journal of Photogrammetry & Remote Sensing 62 (2007) 271–282
中国科技论文在线 http://www.paper.edu.cn
Fig. 6. Sericite (a fine-grained variety of muscovite),montmorillonite, as well as alunite and kaolinite, can beidentified well from the ASTER data. This agrees withthe findings of Durning et al. (1998) that sericite andargillic alteration are the main forms of alteration in thearea, which indicates there is less alteration compared to
Fig. 9. Comparison of the highest fraction pixel spectra and th
silicified or opalized alteration forms. Fig. 9 shows acomparison between the pixel spectra of the highestfraction for each mineral and the convolved referencespectra in Fig. 7B. The comparison indicates thesimilarity between the spectra from the image pixelswith highest mineral fraction and the spectra from the
e reference spectra convolved to the ASTER bandpasses.

280 X. Zhang et al. / ISPRS Journal of Photogrammetry & Remote Sensing 62 (2007) 271–282
中国科技论文在线 http://www.paper.edu.cn
ASTER spectral library. The absorption features formuscovite and montmorillonite are quite similar and,consequently, make the discrimination of the twominerals difficult. However, if checking the spectralcurves in Figs. 7B and 9, we can see that there is a weakreflectance peak at ASTER channel 4 in the spectra ofmuscovite. Thus, it seems that the muscovite andmontmorillonite in the study area can be differentiatedto some extent. The muscovite was mainly detected inthe middle of the study area (the middle part in Fig. 8),while the montmorillonite was mapped in the MesquiteMine area (lower-left corner in Fig. 8) and the northernpart of the study area. The different bedrocks (muscoviteis usually from gneiss rock, while montmorillonite isrelated to base igneous rocks such as Tv in the studyarea) resulted in these patterns. The unmixing resultsfrom the ASTER reflectance data are very similar to thefindings of other geologic and mineralization studies inthe same area (Morton, 1977; Willis, 1988; Durninget al., 1998).
Although Rowan and Mars (2003) reported thatASTER surface reflectance data have an atmosphericover-correction of 10–20%, the matched filtering-basedmapping of hydrothermal alteration minerals indicatesthat ASTER reflectance data are still useful for accuratemineral mapping. Thus, compared to other multispectraldata, the six SWIR channels enable ASTER reflectancedata to accurately map alteration mineral assemblages inthe south Chocolate Mountains area.
5. Summary and conclusions
This study used ASTER data to map lithologic andmineralogic units related to gold exploration in the southChocolate Mountains area. The important lithologicunits were mapped using the ASTER surface radiancedata and a maximum likelihood classification technique.The overall accuracy of the classification is about 82%with a Kappa Coefficient of 0.76 when the geologic mapis used as a reference. The accuracy assessmentillustrates excellent correlation between the classifica-tion units and the lithologic map units. A group ofgneisses (mc) on the lithologic maps (Figs. 2 and 4),consists of the most favorable host rocks for golddeposits in this area and was identified from ASTERdata with a Producer's accuracy of 86%. In addition,different types of volcanic and intrusive rocks rangingfrom basalt to rhyolite were discriminated spectrally dueto their different compositions. However, while theywere not differentiated on the geologic map, they weremapped very well by ASTER. Field checks also showedthat some mc rock units not mapped on the geologic
map can be differentiated by ASTER, which ispotentially important for gold exploration in the area.Considering the large spectral variations of lithologiesand the generalization of the reference geologic map, theASTER lithologic map is accurate and provides usefulinformation for gold exploration in the south ChocolateMountains area.
Analysis of ASTER surface radiance data provides abasis for mapping alteration zones. The alteration zonesof the study area were mapped from the radiance datausing band ratio and PCA analyses. The results indicatethat hydrothermal alteration is not well developed in thestudy area and it was found that the Mesquite gold minelacks widespread clay alteration at the surface. Theresultant map of alteration zones includes all thealteration areas mapped by Durning et al. (1998) inthe same area.
The four alteration minerals mapped from theASTER surface reflectance data: alunite, kaolinite,montmorillonite and muscovite, were detected usingthe CEM technique complemented by laboratoryspectra. The distribution patterns of these four mineralsagree very well with the alteration zones derived by themineralogic indices that were derived using radiancedata. All the results extracted from the ASTER dataprovide detailed mineralogic and lithologic informationfor gold exploration in the south Chocolate Mountainsarea. This case study shows that the CEM technique is apowerful subpixel unmixing analysis tool for analyzingASTER reflectance data.
This study adds to the volume of literature thatsupports the use of ASTER as a mineral explorationtool. Three methods were used and all work well in thelithologic and mineralogic information extraction of theASTER surface radiance and reflectance data. Thecentral-north and northwestern parts of the study areamay be potential areas for gold exploration based on thealteration mineral and lithologic mapping results. In thefuture, ASTER reflectance data needs to be verifiedfurther using field spectral analysis and the use ofASTER TIR channels in detailed lithologic mappingneeds to be studied further as well.
Acknowledgement
This manuscript was substantially improved due toreviews by Dr. Greg Vaughan and an anonymousreviewer. We also would like to express our greatappreciation to Dr. Bill Church at the Department ofEarth Sciences, University of Western Ontario, Canada,for his valuable input of gold geology in the southernChocolate Mountains area, California.

281X. Zhang et al. / ISPRS Journal of Photogrammetry & Remote Sensing 62 (2007) 271–282
中国科技论文在线 http://www.paper.edu.cn
References
Abdelsalam, M.G., Stern, R.J., Berhane, W.G., 2000. Mappinggossans in arid regions with Landsat TM and SIR-C images: theBeddaho alteration zone in northern Eritrea. Journal of AfricanEarth Sciences 30 (4), 903–916.
Abrams, M., Hook, S., 2001. ASTER Users Handbook (Version 2). JetPropulsion Laboratory, Pasadena, CA, USA.
Abrams, M.J., Brown, D., Lepley, L., Sadowski, R., 1983. Remotesensing of porphyry copper deposits in Southern Arizona.Economic Geology 78 (4), 591–604.
Boardman, J., 1998. Leveraging the high dimensionality of AVIRISdata for improved sub-pixel target unmixing and rejection of falsepositives: mixture tuned matched filtering. In: Green, R.O. (Ed.),Summaries of the Seventh Annual JPL Airborne GeoscienceWorkshop, Pasadena, CA, 12–16 January 1998, pp. 55–56.
Boardman, J.W. Kruse, F.A. 1994. Automated spectral analysis: ageological example using AVIRIS data, north Grapevine Moun-tains, Nevada. In ERIM (Ed.) Proc. 10th Thematic Conference onGeological Remote Sensing, San Antonio, TX, 9–12 May 1994pp. I-407–418.
Boardman, J.W., Kruse, F.A., Green, R.O., 1995. Mapping targetsignatures via partial unmixing of AVIRIS data. In: Green, R.O.(Ed.), Summaries of the Fifth JPL Airborne Earth ScienceWorkshop, JPL Publication 95-1, Pasadena, CA, 23–26 January1995, vol. 1, pp. 23–26.
Congalton, R.G., 1991. A review of assessing the accuracy ofclassifications of remotely sensed data. Remote Sensing ofEnvironment 37 (1), 35–46.
Crippen, R.E., Blom, R.G., Heyada, J.R., 1988. Directed band ratioingfor the retention of perceptually-independent topographic expres-sion in chromaticity-enhanced imagery. International Journal ofRemote Sensing 9 (4), 749–765.
Crosta, A.P., Filho, C.R., 2003. Searching for gold with ASTER. EarthObservation Magazine 12 (5), 38–41.
Crowley, J.K., Brickey, D.W., Rowan, L.C., 1989. Airborne imagingspectrometer data of the Ruby Mountains, Montana: mineraldiscrimination using relative absorption band-depth images.Remote Sensing of Environment 29 (2), 121–134.
Durning, P., Polis, S.R., Frost, E.G., Kaiser, J.V., 1998. Integrated Use ofRemote Sensing andGIS forMineral Exploration. Report of LaCuestaInternational, Inc., http://www.gis.usu.edu/docs/data/nasa_arc/nasa_arc97/SDSU/LaCuesta.pdf (Last accessed on 5 April 2007).
Farrand, W.H., Harsanyi, J.C., 1994. Mapping distributed geologicaland botanical targets through constrained energy minimization.Proc. 10th Thematic Conference on Geological Remote Sensing,San Antonio, TX, 9–12 May 1994, pp. I-419–I-429.
Farrand, W.H., Harsanyi, J.C., 1997. Mapping the distribution of minetailings in the Coeur d'Alene River Valley, Idaho, through the useof a constrained energy minimization technique. Remote Sensingof Environment 59 (1), 64–76.
Fukunaga, K., 1990. Introduction to Statistical Pattern Recognition,second ed. Academic Press, New York, USA.
Goetz, A.F.H., Rock, B.N., Rowan, L.C., 1983. Remote sensing forexploration: an overview. Economic Geology 78 (4), 573–590.
Green, A.A., Berman, M., Switzer, P., Craig, M.D., 1988. Atransformation for ordering multispectral data in terms of imagequality with implications for noise removal. IEEE Transactions onGeoscience and Remote Sensing 26 (1), 65–74.
Gupta, R.P., 2003. Remote Sensing Geology, second ed. Springer-Verlag, Berlin.
Harsanyi, J.C., Farrand, W.H., Chang, C.I., 1994. Detection ofsubpixel signatures in hyperspectral image sequences. In: Lyon, J.(Ed.), Proc. American Society for Photogrammetry and RemoteSensing (ASPRS) Annual Meeting, Reno, Nevada, 25–28 April1994, pp. 236–247.
Jensen, J.R., 1996. Introductory Digital Image Processing: A RemoteSensing Perspective, Prentice Hall Series in Geographic Informa-tion Sciencesecond ed. Prentice Hall, Upper Saddle River, NewJersey, USA.
Jensen, J.R., 2002. Remote Sensing of the Environment: An EarthResource Perspective. Prentice Hall International Limited, Lon-don, UK.
Kruse, F.A., Boardman, J.W., Huntington, J.F., 2003. Comparison ofairborne hyperspectral data and EO-1 Hyperion for mineralmapping. IEEE Transactions on Geoscience and Remote Sensing41 (6), 1388–1400.
Liebler, G.S., 1988. Geology and gold mineralization at the PicachoMine, Imperial County, California. In: Schafer, R.W., Cooper, J.J.,Virke, P.G. (Eds.), Bulk Mineable Precious Metal Deposits of theWestern United States-Symposium Proceedings. the GeologicalSociety of Nevada, Reno, Nevada, pp. 453–472.
Lillesand, T.M., Kiefer, R.W., 2004. Remote Sensing and ImageInterpretation, fifth ed. John Wiley and Sons, Inc., New York.
Morton, P.K., 1977. Geology and Mineral Resources of ImperialCounty. County Report, vol. 7. California Division of Mines andGeology, Sacramento, CA, USA.
Ninomiya, Y., 2003a. A stabilized vegetation index and severalmineralogic indices defined for ASTER VNIR and SWIR data.Proc. IEEE 2003 International Geoscience and Remote SensingSymposium (IGARSS'03) v. 3, Toulouse, France, 21–25 July2003, pp. 1552–1554.
Ninomiya, Y., 2003b. Advanced remote lithologic mapping inophiolite zone with ASTER multispectral thermal infrared data.Proc. IEEE 2003 International Geoscience and Remote SensingSymposium (IGARSS'03) v. 3, Toulouse, France, 21–25 July2003, pp. 1561–1563.
Okada, K., Segawa, K., Hayashi, I., 1993. Removal of the vegetationeffect from LANDSAT TM and GER imaging spectroradiometerdata. ISPRS Journal of Photogrammetry and Remote Sensing 48(6), 16–27.
Papp, E., Cudahy, T., 2002. Hyperspectral remote sensing. In: Papp, E.(Ed.), Geophysical and Remote Sensing Methods for RegolithExploration. CRC LEME Open File Report, vol. 144. Canberra,Australia, pp. 13–21.
Perry, S.L., 2004. Spaceborne and airborne remote sensing systems formineral exploration-case histories using infrared spectroscopy. In:King, P.L., Ramsey, M.S., Swayze, G.A. (Eds.), InfraredSpectroscopy in Geochemistry, Exploration Geochemistry, andRemote Sensing. Mineralogic Association of Canada, London,Canada, pp. 227–240.
Podwysocki, M.H., Mimms, D.L., Salisbury, J.W., Bender, L.V.,Jones, O.D., 1984. Analysis of Landsat-4 TM data for lithologicand image mapping purpose. In: Barker, J. (Ed.), Landsat-4Science Investigations Summary, v. 2, NASA ConferencePublication 2326, Greenbelt, MD, 6 December 1984, pp. 35–39.
Resmini, R.G., Kappus, M.E., Aldrich, W.S., Harsanyi, J.C.,Anderson, M., 1997. Mineral mapping with hyperspectral digitalimagery collection experiment (HYDICE) sensor data at Cuprite,Nevada, USA. International Journal of Remote Sensing 18 (7),1553–1570.
Rowan, L.C., Mars, J.C., 2003. Lithologic mapping in the MountainPass, California area using Advanced Spaceborne Emission and

282 X. Zhang et al. / ISPRS Journal of Photogrammetry & Remote Sensing 62 (2007) 271–282
中国科技论文在线 http://www.paper.edu.cn
Reflection Radiometer (ASTER) data. Remote Sensing ofEnvironment 84 (3), 350–366.
Rowan, L.C., Goetz, A.F.H., Ashley, R.P., 1977. Discrimination ofhydrothermally altered and unaltered rocks in visible and near-infrared multispectral images. Geophysics 42 (3), 522–535.
Sabine, C., 1997. Remote sensing strategies for mineral exploration.In: Rencz, A.E. (Ed.), Remote Sensing for the Earth Sciences. JohnWiley & Sons, Inc., New York, pp. 375–447.
Sabins, F.F., 1996. Remote Sensing Principles and Interpretation,third ed. Freeman & Co, New York, USA.
Sultan, M., Arvidson, R.E., Sturchio, N.C., Guinness, E.A., 1987.Lithologic mapping in arid regions with Landsat thematic mapperdata: Meatiq dome, Egypt. Geological Society of America Bulletin99 (6), 748–762.
Willis, G.F., 1988. Geology and mineralization of the Mesquite OpenPit Gold Mine. In: Schafer, R.W., Cooper, J.J., Virke, P.G. (Eds.),Bulk Mineable Precious Metal Deposits of the Western UnitedStates-Symposium Proceedings. the Geological Society ofNevada, Reno, Nevada, pp. 473–486.
Yamaguchi, Y., Kahle, A.B., Tsu, H., Kawakami, T., Pniel, M., 1998.Overview of advanced spaceborne thermal emission and reflectionradiometer (ASTER). IEEE Transactions on Geoscience andRemote Sensing 36 (4), 1062–1071.
Zhang, X., Pazner, M., 2007. Comparison of Lithologic Mapping withASTER, Hyperion and ETM Data in the southeastern ChocolateMountains, USA. Photogrammetric Engineering and RemoteSensing 73 (5), 555–561.