
List of Symbols and Abbreviations - Biomedical Laser ...
95
Abstract Annamarie Lembares STUDY OF SOFT TISSUE INTERACTION WITH OPTICAL RADIATION. (Under the direction of Dr. Xin-Hua Hu) Department of Physics, April 1997. The purpose of this thesis is to study the interaction between optical radiation and soft tissues. This is an initial part of a long-term research project to develop a clear understanding of the fundamental mechanisms underlying tissue ablation using short laser pulses. The thesis study is separated into two parts. In the first part, we investigate the absorbance spectra of corneas in a wide spectral region from 2600 to 190nm using a dual- beam spectrophotometer. For the first time, we measure the far ultraviolet absorption spectra of porcine and human corneas from 230 to 190nm. The experimental results show three distinct segments in corneal absorption in the far ultraviolet region. The linear absorption coefficients are determined from the absorbance spectra at specific wavelengths. Furthermore, a “window of ablation” in the far ultraviolet region between 220 and 190nm is determined. We conduct a statistical analysis to correlate the far ultraviolet absorption between the porcine and human corneas and investigate the effect of freezing on the far ultraviolet, visible and infrared absorption. The second part of the thesis study concentrates on skin tissue ablation using nanosecond pulses. Various tissue- processing techniques are tested for the quantitative measurement of ablation parameters. A set of procedures are identified and refined that can well control tissue conditions for histology examination. This provides a solid foundation for a quantitative investigation of surface ablation of skin tissue samples.
-
Upload
khangminh22 -
Category
Documents
-
view
1 -
download
0
Transcript of List of Symbols and Abbreviations - Biomedical Laser ...
Abstract
Annamarie Lembares STUDY OF SOFT TISSUE INTERACTION WITH OPTICAL RADIATION. (Under the direction of Dr. Xin-Hua Hu) Department of Physics, April 1997.
The purpose of this thesis is to study the interaction between optical radiation and soft
tissues. This is an initial part of a long-term research project to develop a clear
understanding of the fundamental mechanisms underlying tissue ablation using short laser
pulses. The thesis study is separated into two parts. In the first part, we investigate the
absorbance spectra of corneas in a wide spectral region from 2600 to 190nm using a dual-
beam spectrophotometer. For the first time, we measure the far ultraviolet absorption
spectra of porcine and human corneas from 230 to 190nm. The experimental results
show three distinct segments in corneal absorption in the far ultraviolet region. The
linear absorption coefficients are determined from the absorbance spectra at specific
wavelengths. Furthermore, a “window of ablation” in the far ultraviolet region between
220 and 190nm is determined. We conduct a statistical analysis to correlate the far
ultraviolet absorption between the porcine and human corneas and investigate the effect
of freezing on the far ultraviolet, visible and infrared absorption. The second part of the
thesis study concentrates on skin tissue ablation using nanosecond pulses. Various tissue-
processing techniques are tested for the quantitative measurement of ablation parameters.
A set of procedures are identified and refined that can well control tissue conditions for
histology examination. This provides a solid foundation for a quantitative investigation
of surface ablation of skin tissue samples.
Study of Soft Tissue Interaction with Optical Radiation
A Thesis
Presented to
the Faculty of the Department of Physics
East Carolina University
In Partial Fulfillment
of the Requirements for the Degree
Master of Physics in Physics
by
Annamarie Lembares
April 1997
Study of Soft Tissue Interaction with Optical Radiation
by
Annamarie Lembares
APPROVED BY:
DIRECTOR OF THESIS___________________________________________________ XIN-HUA HU, Ph.D.
CHAIR OF THE DEPARTMENT OF PHYSICS AND COMMITTEE MEMBER
___________________________________________________ MUMTAZ A. DINNO, Ph.D.
COMMITTEE MEMBER__________________________________________________ GERHARD W. KALMUS, Ph.D.
COMMITTEE MEMBER__________________________________________________
GEORGE A. BISSINGER, Ph.D. DEAN OF THE GRADUATE SCHOOL______________________________________
THOMAS L. FELDBUSH, Ph.D.
Acknowledgments
First, I would like to sincerely thank the physics department for their support and
confidence in my abilities to perform to their expectations. Most of all, I would like to
extend my sincere gratitude to Dr. Xin-Hua Hu for giving me his time and patience, and
sharing his laboratory. His ability as a researcher, professor and friend has made this
project and preparation of this manuscript possible.
I would also like to thank Dr. Mumtaz Dinno for suggesting that I speak to Dr. Hu
about his and my research interests, for the encouragement throughout the project, and for
being a friendly listener when personal situations arose. I also wish to thank Dr. Gerhard
Kalmus for teaching the sectioning and histology techniques necessary to complete this
project. Without his guidance, the details of the techniques, which can only be learned
through experience, would have probably never been perfected. Thanks and appreciation
are also due to Dr. George Bissinger for serving on my committee, which reviewed this
manuscript, and for making sure I met all the graduation requirements set by the
department.
Many thanks to the machine shop technicians, Carl Hartsfield and Jim Gilbert, for
making the sample holders, and helping to redesign and repair them.
I would also like to thank my family and friends for their support and
encouragement throughout the graduate program. I owe much gratitude to my fiancée,
William Bodnar, for the encouragement to pursue my goals no matter how many miles
are between us.
Table of Contents
List of Tables ..................................................................................................................viii
List of Figures ................................................................................................................... ix
List of Symbols and Abbreviations...............................................................................xiii
Chapter 1: Background ................................................................................................... 1
1.1 Introduction............................................................................................................... 1
1.2 Part One: Cornea Absorption Study......................................................................... 6
1.3 Part Two: Skin Ablation Study................................................................................ 8
Chapter 2: Experimental Methods ............................................................................... 10
2.1 Part One .................................................................................................................. 10
2.1.1 Cornea Samples ................................................................................................ 10
2.1.2 Excising the Cornea from the Eye Globe ......................................................... 11
2.1.3 Sectioning of the Corneas................................................................................. 11
2.1.4 Sample Holder .................................................................................................. 12
2.1.4.1 Cornea Absorbance Measurement ............................................................. 12
2.1.4.2 Distilled Water Absorbance Measurement ................................................ 13
2.1.5 Absorbance Measurement ................................................................................ 13

2.1.6 Measurement of Corneal Thickness ................................................................. 15
2.2 Part Two................................................................................................................. 16
2.2.1 Handling of the Porcine Skin Samples Before and After the Ablation ............ 16
2.2.2 Histology Procedures for Ablation Measurement ............................................ 17
2.2.2 Porcine Skin Ablation....................................................................................... 17
Chapter 3: Experimental Results.................................................................................. 18
3.1 Part One .................................................................................................................. 18
3.1.1 UV Absorbance Measurements ........................................................................ 18
3.1.2 VIS-IR Absorbance Measurements .................................................................. 23
3.2 Part Two.................................................................................................................. 24
3.2.1 Skin Ablation Study.......................................................................................... 24
Chapter 4: Discussion .................................................................................................... 25
4.1 Corneal Absorbance Measurements........................................................................ 25
4.2 Skin Ablation Study................................................................................................ 28
4.3 Summary................................................................................................................. 28
Figures .............................................................................................................................. 30
References ........................................................................................................................ 47
Appendix A: Cornea Sectioning ................................................................................... 50
A.1 Preparing the Cryostat-Microtome......................................................................... 51
A.2 Preparing the Specimen Blocks ............................................................................. 52
A.3 Preparing the Cornea for Sectioning ...................................................................... 52
A.4 Sectioning the Cornea ............................................................................................ 53
A.5 Transferring the Cornea Section to the Sample Holder ......................................... 54
Appendix B: Calibration of the Spectrophotometer................................................... 55
B.1 Cleaning ................................................................................................................. 55
B.2 Zero T Check.......................................................................................................... 55
B.2.1 For UV-VIS Detector....................................................................................... 55
B.2.2 For IR Detector ................................................................................................ 55
B.2.3 For UV-VIS Detector....................................................................................... 56
B.2.4 For IR Detector ................................................................................................ 56
B.3 Checking the Wavelength Counter versus Time.................................................... 56
B.4 Checking the Relationship Between the Spectrophotometer’s Digital Display and
the Computer Reading ............................................................................................ 57
B.5 Starting and Warm-up of Spectrophotometer ........................................................ 57
B.6 Zero Absorbance Baseline for UV, VIS, and IR Wavelengths .............................. 57
B.7 Testing the UV Absorbance Reading Using a Standard Dye Solution .................. 58
B.8 Checking the Wavelength Calibration using a Mercury UV Lamp ....................... 58
B.9 Figures .................................................................................................................... 58
Appendix C: Procedure for UV Absorbance Spectra of Corneas .............................. 64
C.1 Set-up Parameters................................................................................................... 64
C.1.1 Spectrophotometer Settings ............................................................................. 64
C.1.2 Data Acquisition Parameters for Computer Program ...................................... 64
C.2 Procedure for Measuring Absorbance.................................................................... 64
Appendix D: Procedure for VIS-IR Absorbance Spectra of Corneas........................ 67
D.1 Set-up Parameters .................................................................................................. 67
D.1.1 Spectrophotometer Settings ............................................................................. 67
D.1.2 Data Acquisition Parameters for Computer Program...................................... 67
D.2 Procedure for Measuring Absorbance.................................................................... 67
Appendix E: Preparing Porcine Skin Tissue Slides .................................................... 70
E.1 Fixation................................................................................................................... 70
E.2 Dehydration ............................................................................................................ 70
E.3 Clearing .................................................................................................................. 71
E.4 Infiltration............................................................................................................... 72
E.5 Embedding.............................................................................................................. 72
E.6 Preparing the Sample Block and Microtome for Sectioning.................................. 73
E.7 Sectioning of the Sample Block ............................................................................. 74
E.8 Preparing the Slides................................................................................................ 74
E.9 Staining the Slides .................................................................................................. 75
Appendix F: Student’s t-test.......................................................................................... 77
List of Tables
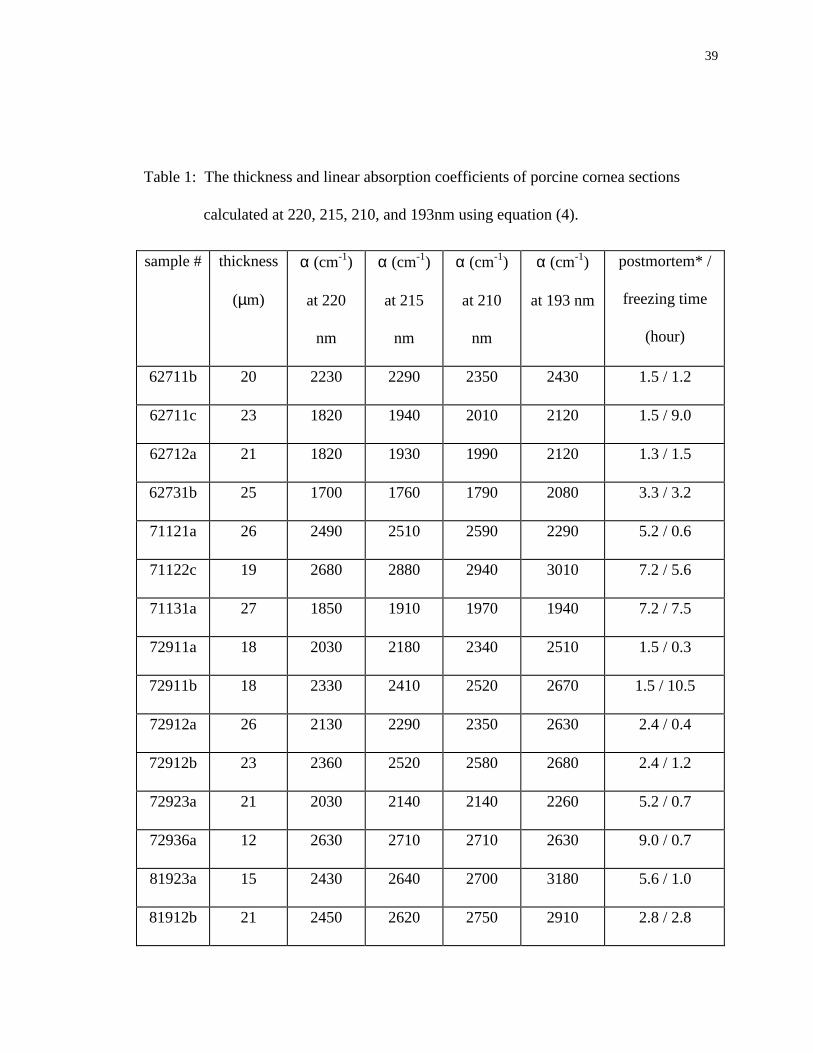
Table 1: The thickness and linear absorption coefficients of porcine cornea sections
calculated at 220, 215, 210, and 193nm using equation (4).............................. 39
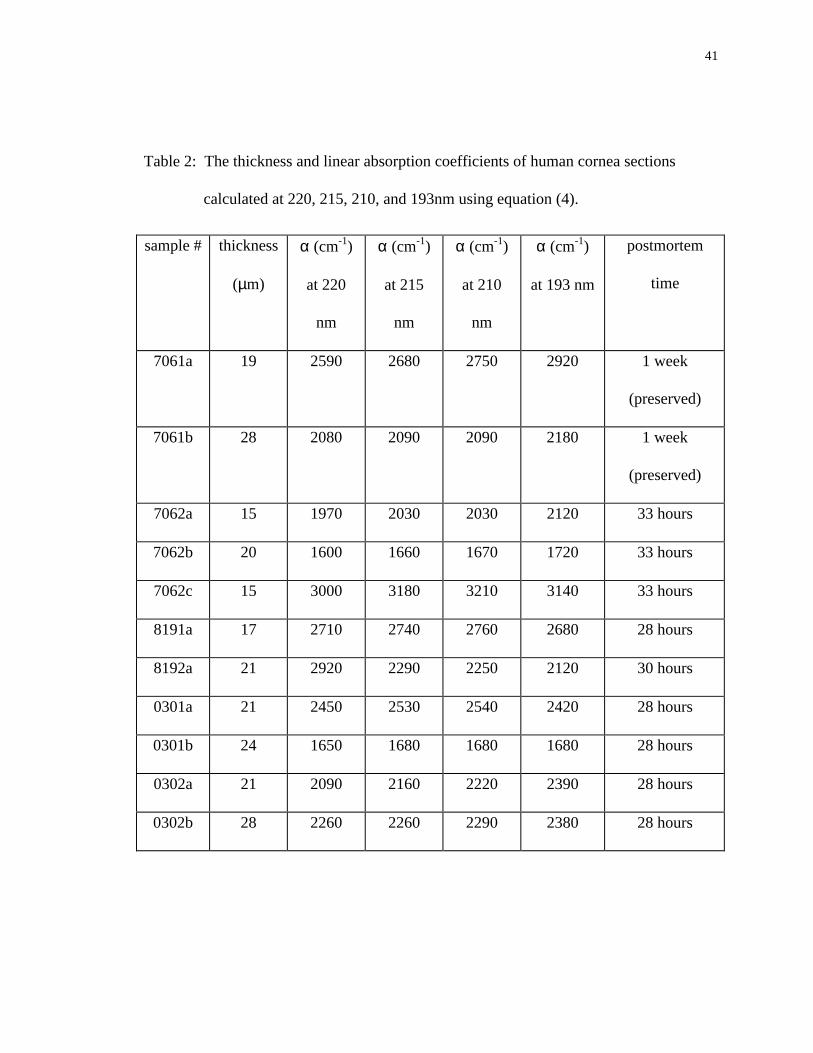
Table 2: The thickness and linear absorption coefficients of human cornea sections
calculated at 220, 215, 210, and 193nm using equation (4).............................. 41
ix
List of Figures
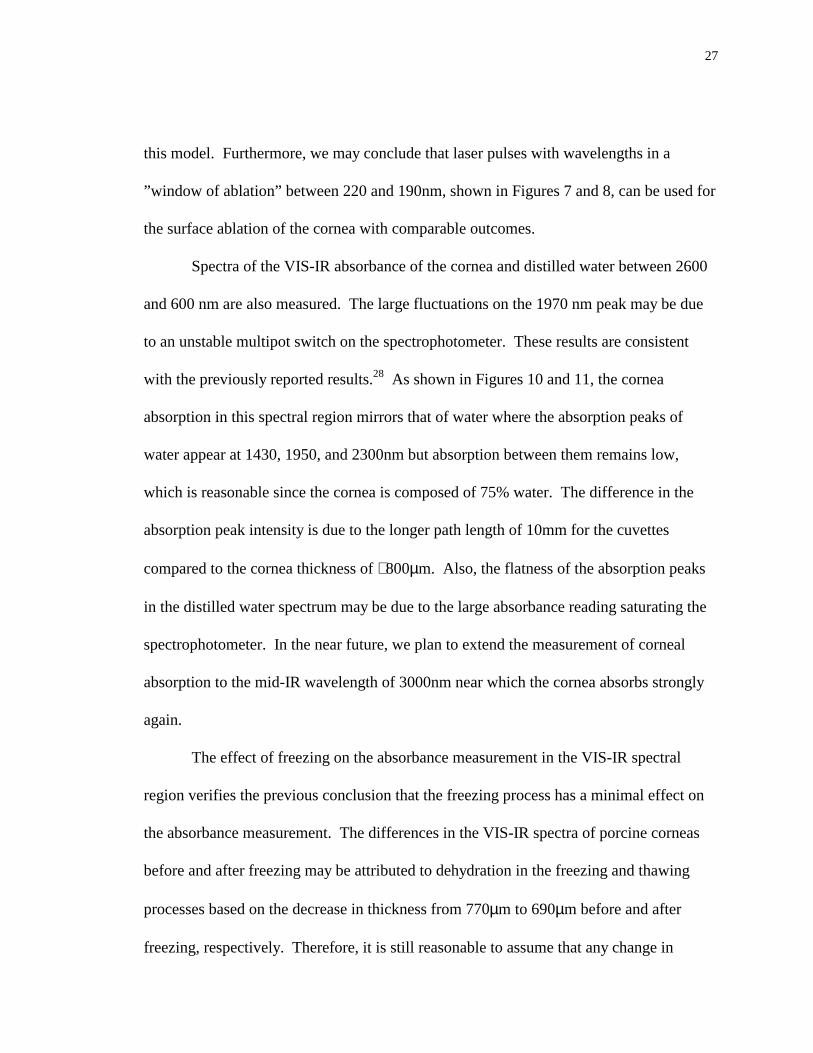
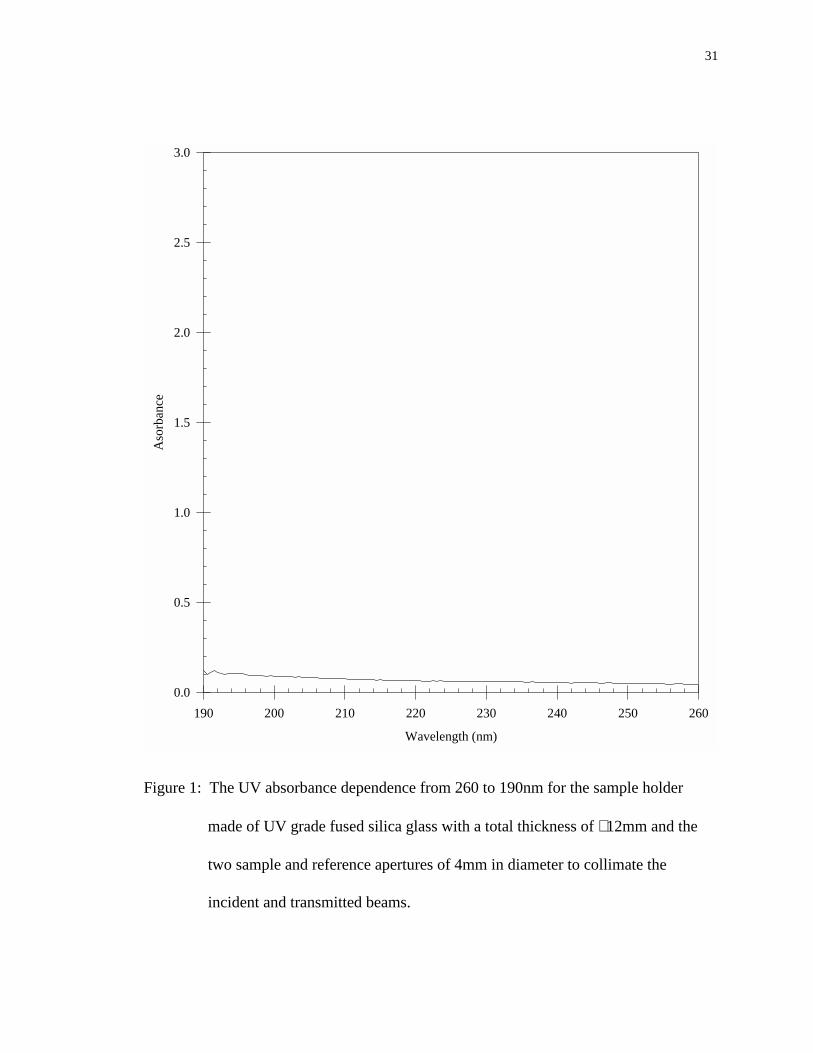
Figure 1: The UV absorbance dependence from 260 to 190nm for the sample holder
made of UV grade fused silica glass with a total thickness of ∼ 12mm and the
two sample and reference apertures of 4mm in diameter to collimate the
incident and transmitted beams. ........................................................................ 31
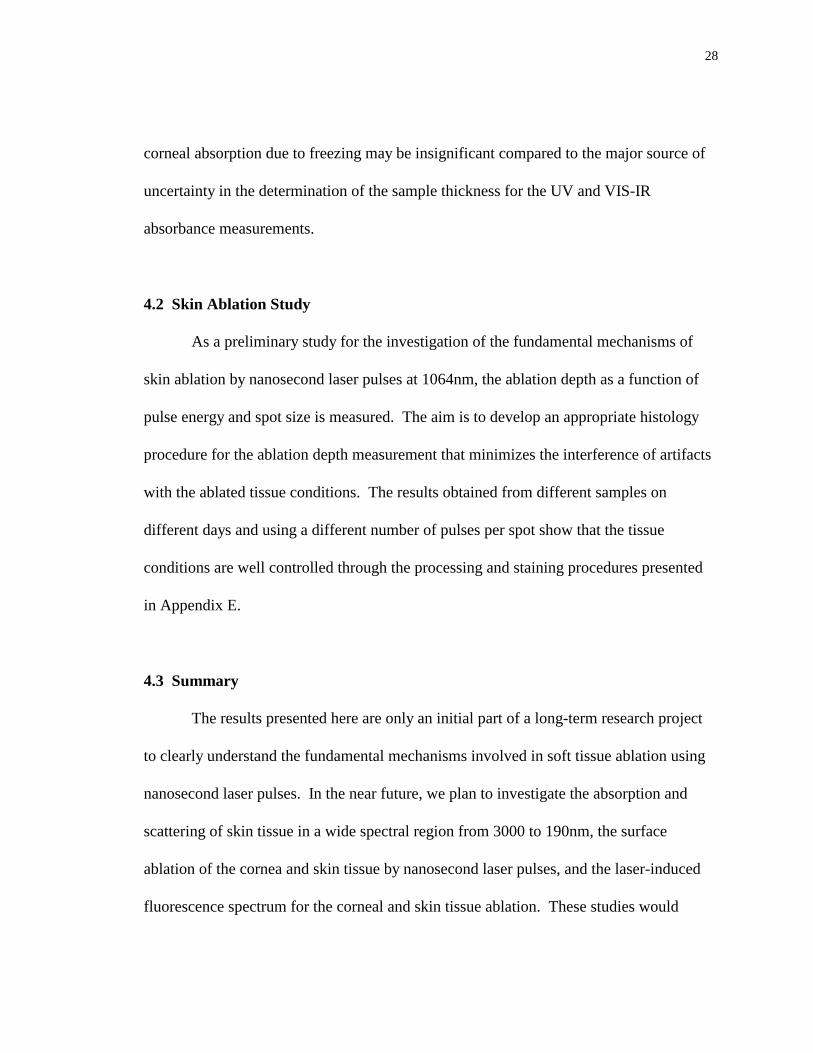
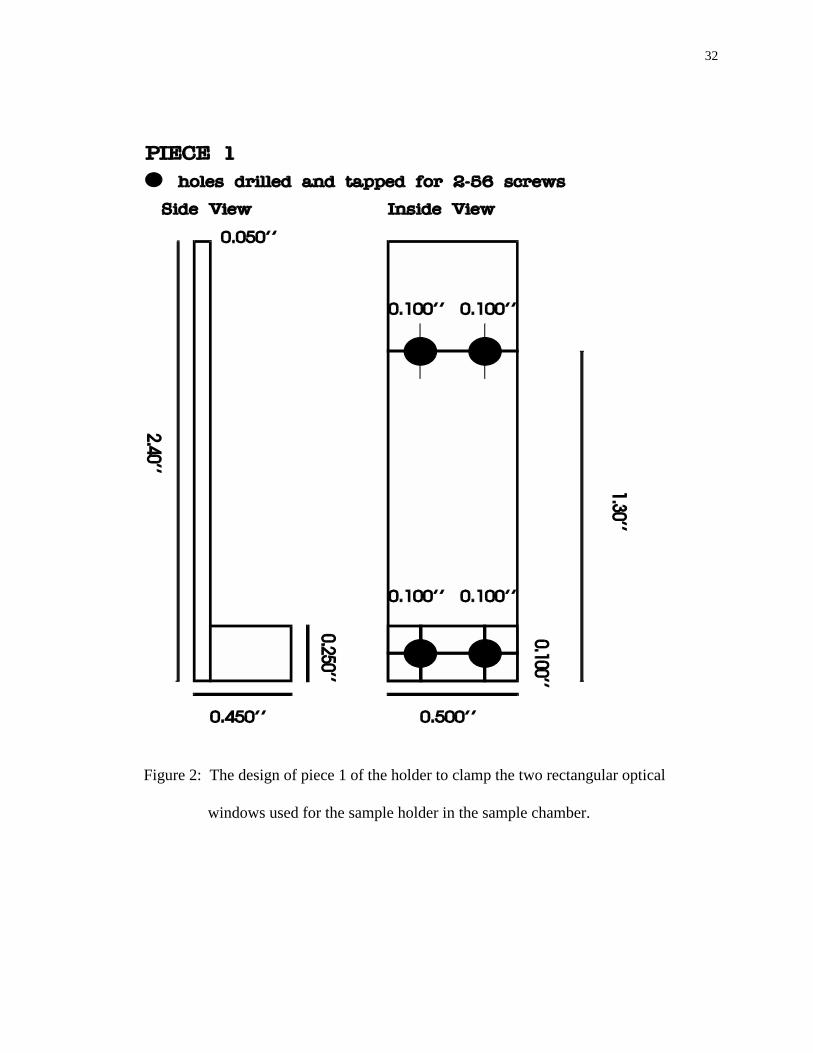
Figure 2: The design of piece 1 of the holder to clamp the two rectangular optical
windows used for the sample holder in the sample chamber. ........................... 32
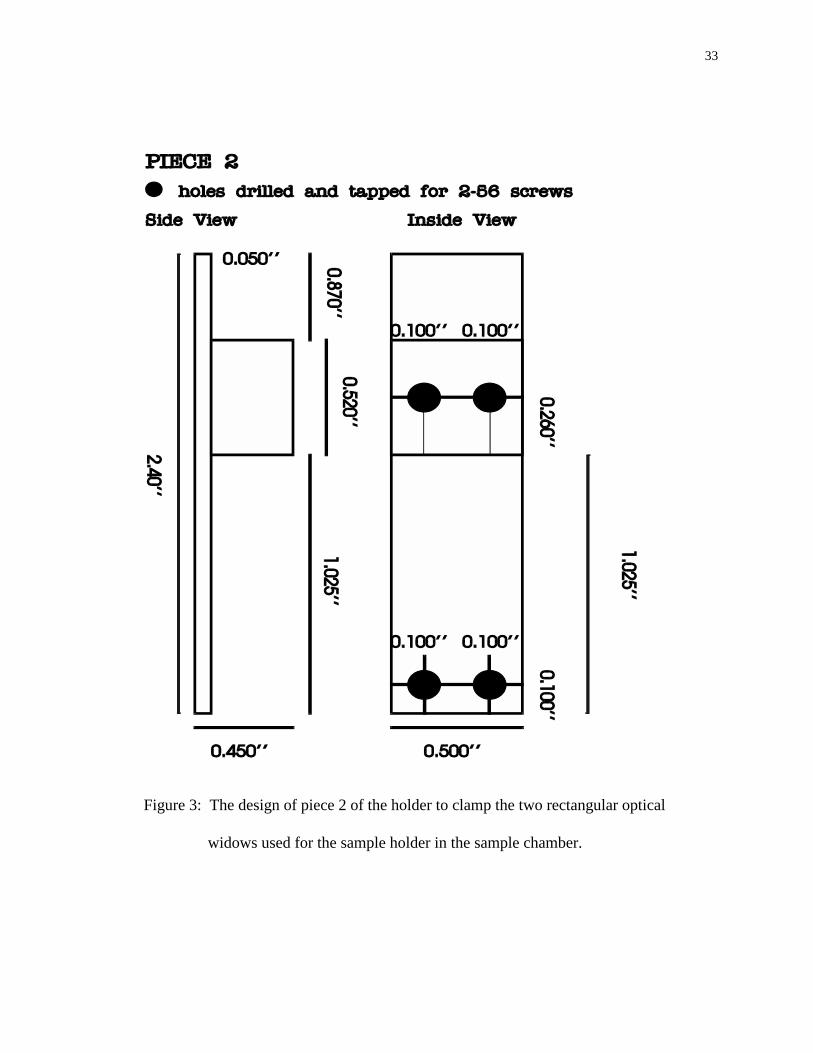
Figure 3: The design of piece 2 of the holder to clamp the two rectangular optical
widows used for the sample holder in the sample chamber. ............................. 33
Figure 4: The configuration of the sample holder, cornea section and aperture plates.
The incident ray (I0) is reflected at the four interfaces with R2 = R3 = R and
R2 = R4 = R′. The reflected rays are translated for a clear view. ...................... 34
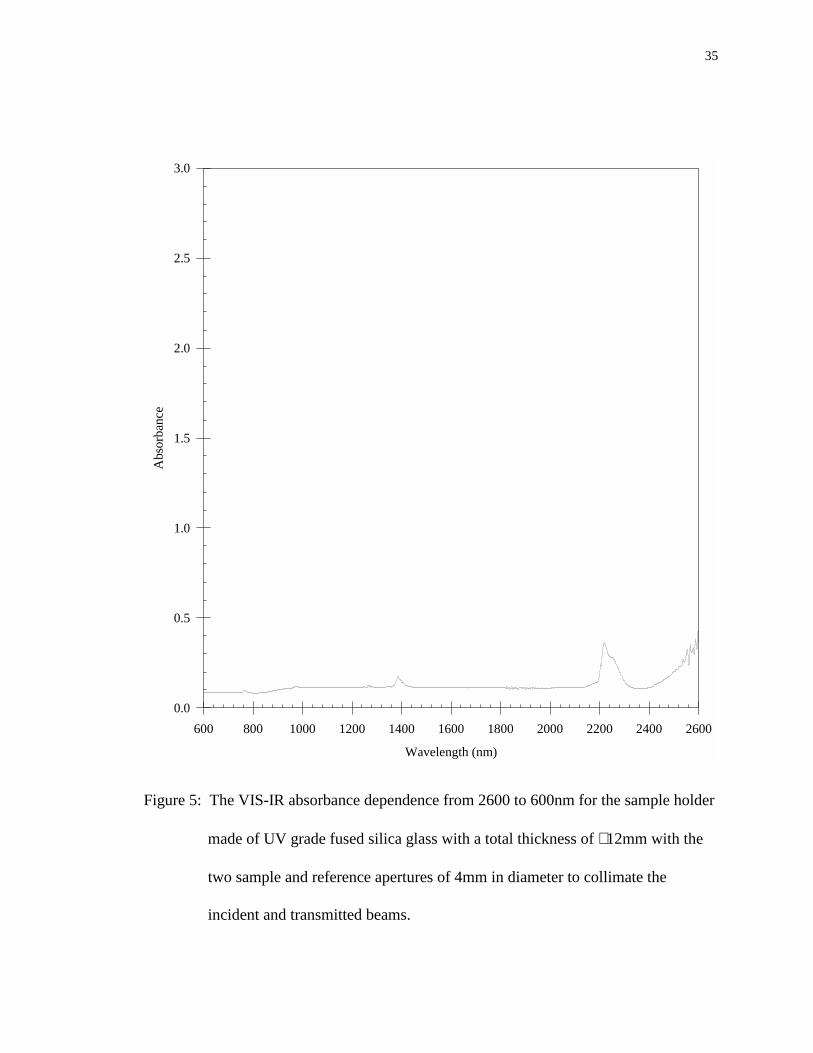
Figure 5: The VIS-IR absorbance dependence from 2600 to 600nm for the sample holder
made of UV grade fused silica glass with a total thickness of ∼ 12mm with the
two sample and reference apertures of 4mm in diameter to collimate the
incident and transmitted beams. ........................................................................ 35
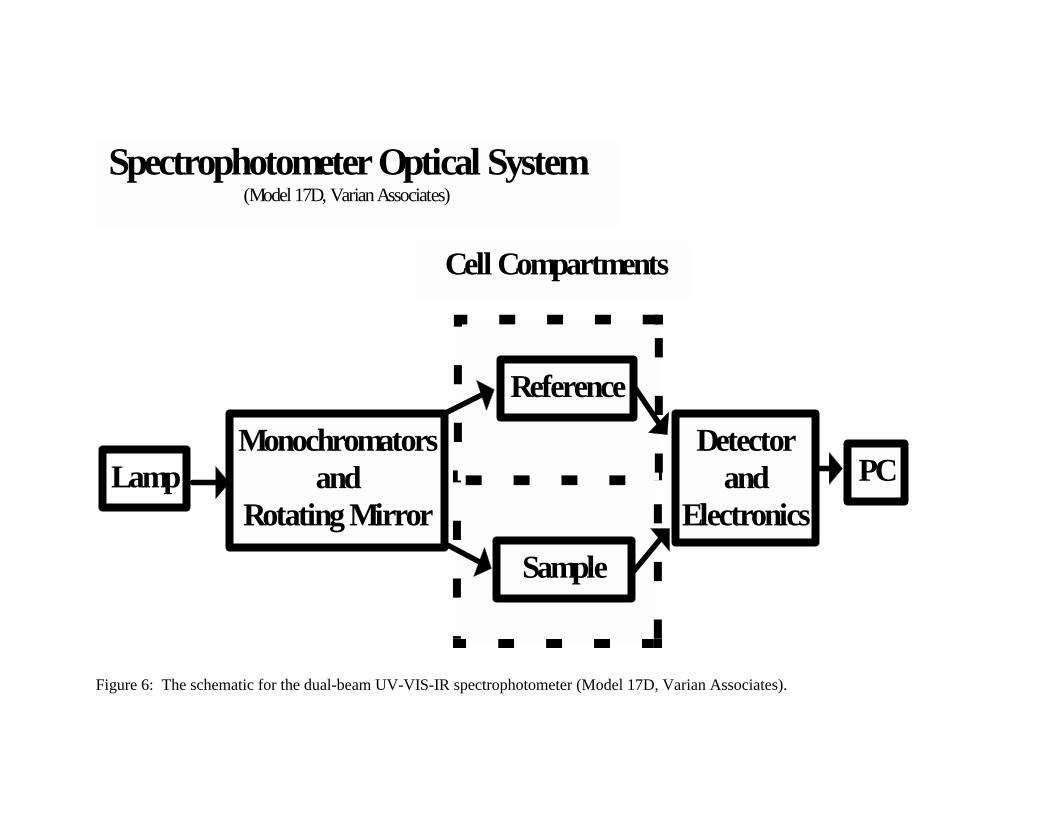
Figure 6: The schematic for the dual-beam UV-VIS-IR spectrophotometer (Model 17D,
Varian Associates)............................................................................................. 36
x
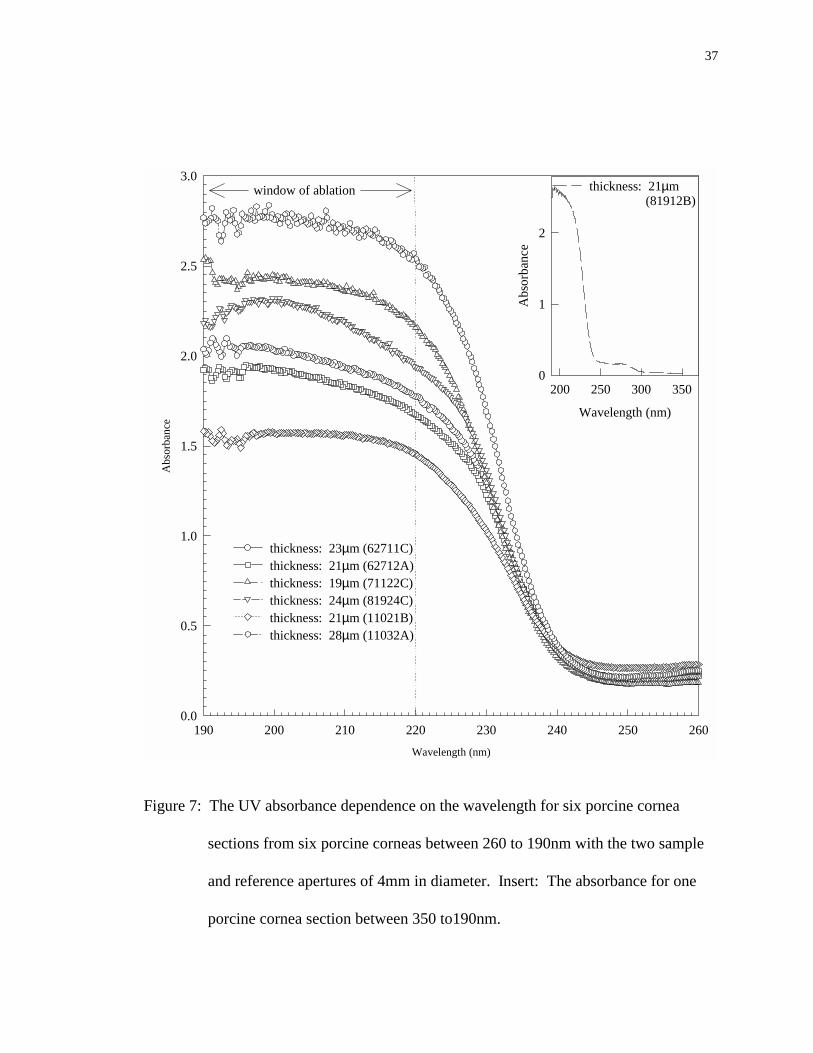
Figure 7: The UV absorbance dependence on the wavelength for six porcine cornea
sections from six porcine corneas between 260 to 190nm with the two sample
and reference apertures of 4mm in diameter. Insert: The absorbance for one
porcine cornea section between 350 to190nm. ................................................. 37
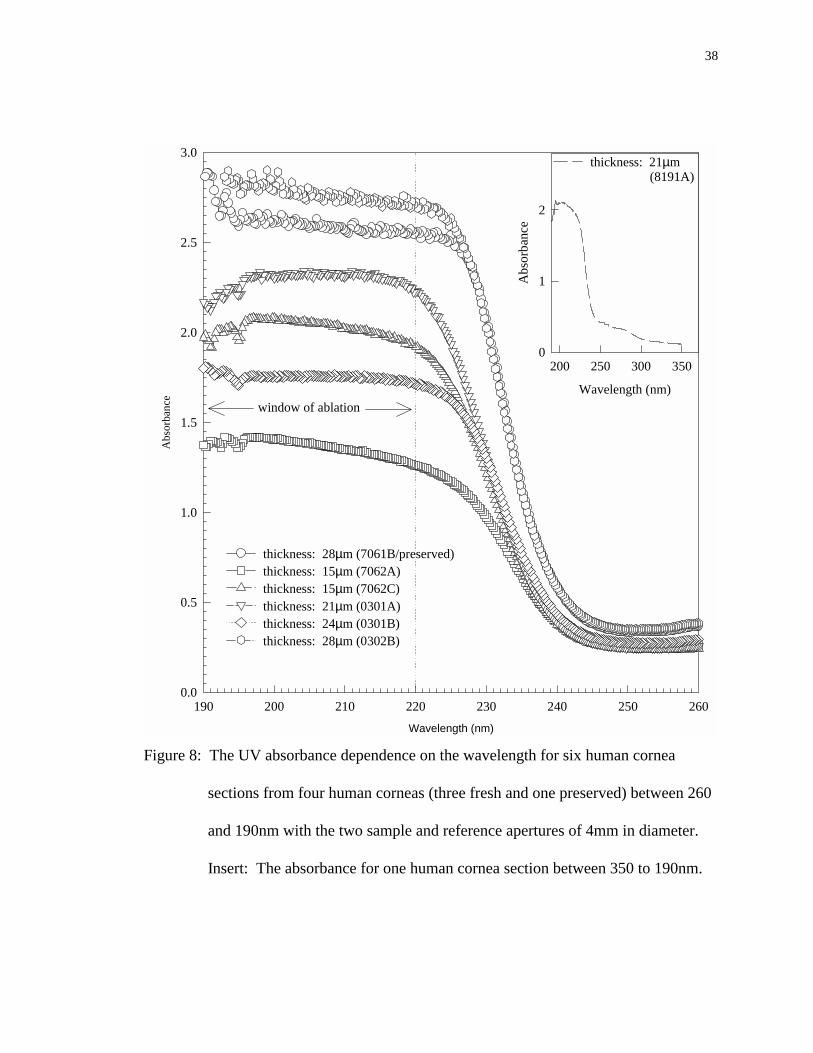
Figure 8: The UV absorbance dependence on the wavelength for six human cornea
sections from four human corneas (three fresh and one preserved) between 260
and 190nm with the two sample and reference apertures of 4mm in diameter.
Insert: The absorbance for one human cornea section between 350 to 190nm.38
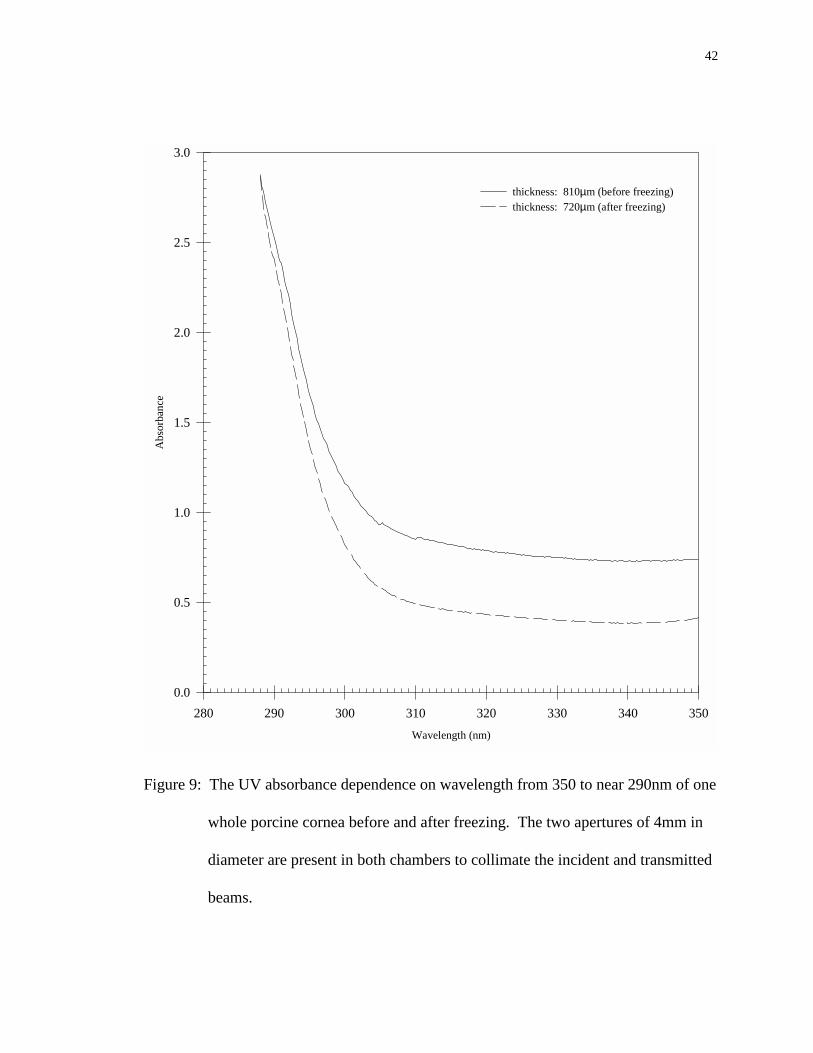
Figure 9: The UV absorbance dependence on wavelength from 350 to near 290nm of one
whole porcine cornea before and after freezing. The two apertures of 4mm in
diameter are present in both chambers to collimate the incident and transmitted
beams................................................................................................................. 42
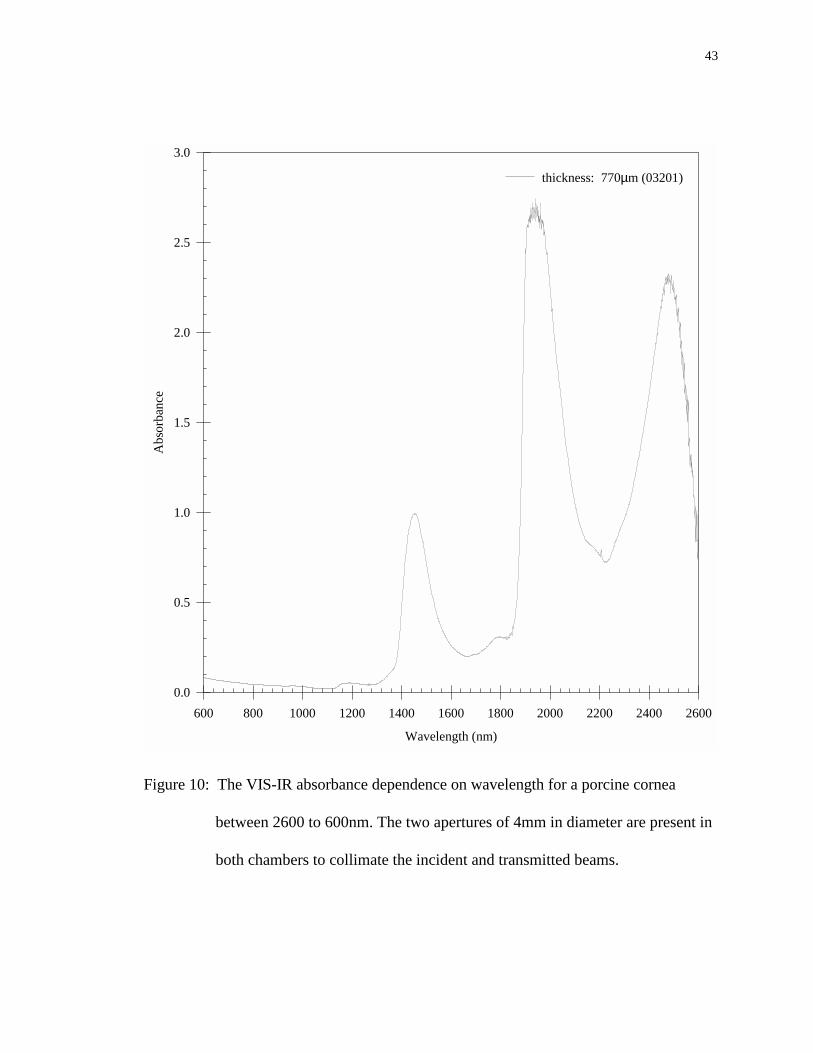
Figure 10: The VIS-IR absorbance dependence on wavelength for a porcine cornea
between 2600 to 600nm. The two apertures of 4mm in diameter are present in
both chambers to collimate the incident and transmitted beams....................... 43
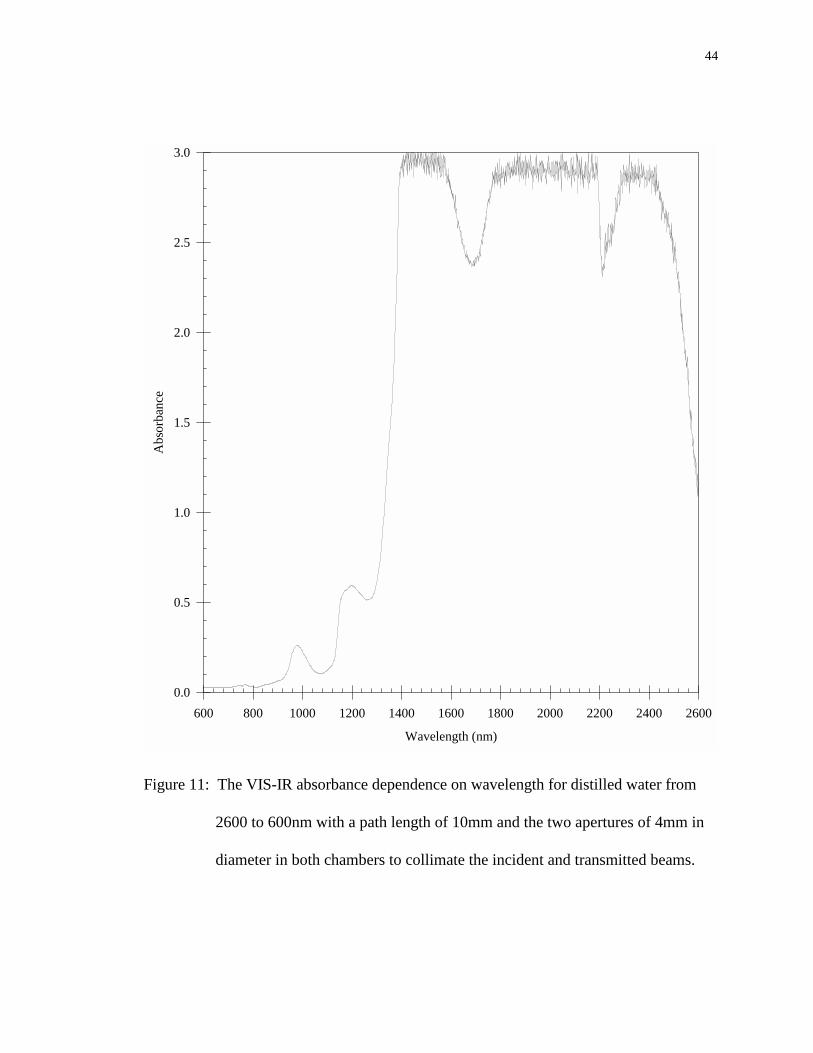
Figure 11: The VIS-IR absorbance dependence on wavelength for distilled water from
2600 to 600nm with a path length of 10mm and the two apertures of 4mm in
diameter in both chambers to collimate the incident and transmitted beams.... 44
Figure 12: The VIS-IR absorbance dependence on wavelength from 2600 to 600nm of
one whole porcine cornea before and after freezing. The two apertures of 4mm
in diameter are present in both chambers to collimate the incident and
transmitted beams.............................................................................................. 45
xi
Figure 13: The UV absorbance dependence on the wavelength for distilled water from
260 to 190nm with a path length of 10mm without the two apertures of 4mm in
diameter in both chambers in order to increase the signal strength for the
absorbance measurement................................................................................... 46
Figure B. 1: The zero absorbance baseline for the UV wavelengths using a dual-beam
UV-VIS-IR spectrophotometer (Varian Associates) with the two apertures of
4mm in diameter present in both the reference and sample chambers to
collimate the incident and transmitted beams. ............................................. 59
Figure B. 2: The zero absorbance baseline for the VIS wavelengths using a dual-beam
UV-VIS-IR spectrophotometer (Varian Associates) with the two apertures of
4mm in diameter present in both the reference and sample chambers to
collimate the incident and transmitted beams. ............................................. 60
Figure B. 3: The zero absorbance baseline for the VIS-IR wavelengths using a dual-beam
UV-VIS-IR spectrophotometer (Varian Associates) with the two apertures of
4mm in diameter present in both the reference and sample chambers to
collimate the incident and transmitted beams. ............................................. 61
Figure B. 4: The absorbance spectrum of a standard dye solution (Epolite 111-125) of a
concentration of 3mg/l which has a maximum wavelength of 949nm......... 62
Figure B. 5: The absorbance spectrum of a mercury UV lamp from 450nm to 225nm
used test the wavelength calibration of the spectrophotometer.................... 63

xii
xiii
List of Symbols and Abbreviations
α....................................................... linear absorption coefficient
A...................................................... absorbance measurement from spectrophotometer
A/D.................................................. analog/digital
ArF................................................... argon fluorine excimer laser
d....................................................... cornea section thickness
ETOH............................................... ethanol alcohol
GAH................................................. glutaraldehyde
I........................................................ intensity of light on the sample
Io...................................................... intensity of transmitted light through the sample
IR..................................................... infrared
LIF................................................... laser induced fluorescence
M...................................................... molar
mid-IR.............................................. mid-infrared
NIR.................................................. near-infrared
ns.................................................. nanosecond
R...................................................... Fresnel reflectivity of the glass-cornea interfaces
OCT................................................. freezing preservation medium
σ....................................................... standard deviation
T....................................................... transmittance
UV................................................... ultraviolet

xiv
VIS…………………………………. visible
VIS-IR……………………………... visible and infrared
Chapter 1: Background
1.1 Introduction
Albert Einstein's model of radiation-matter interaction gave life to the concepts
and principles necessary to create a functional laser. However, almost 38 years passed
before an ammonia gas MASER, the first device to utilize these concepts, was developed
by C.H. Townes with assistance from J.P. Gordon and H. Zeigerin in the U.S., and
followed closely by N.G. Basov and A.M. Prokhorov in the Soviet Union. From 1956 to
1958, N. Bloembergen and C.H. Townes suggested infrared and optical lasers. The first
functional laser system was developed by T.H. Maiman in 1960 with a ruby crystal.1
Since then laser technology has been dramatically improved and immediately adopted for
medical uses.
The past three decades has refined "laser" technology and enabled the medical use
of lasers to prosper. The pioneers of laser surgery used the intense heat generated by the
beam of light in the forms of continuous-wave or long pulses for its ablative and
coagulate effects which can be very selective and well controlled.2 In addition to heating
the tissue, photons from laser pulses can induce chemical reactions, break atomic and
molecular bonds, and produce shock waves and various acoustic transients. These forms
of interactions could lead to ablation, the removal of tissue, when the wavelength,
duration of laser pulse, and pulse energy are matched with the specific physical and
chemical properties of the target tissues.3,4 The target tissue can be characterized by the
following properties: optical (absorption and scattering); thermal (heat capacity and
2
diffusivity); mechanical (viscoelasticity and tensile strength); chemical (water and other
chromophores); anatomy (arrangement of organelles, cells and tissues); and physiology
(metabolic states and functions).3 For the conversion of the laser light energy into other
forms of energy in a specified target tissue, the absorption property is one of the most
important tissue parameters. The absorption of laser radiation in the targeted tissue is
caused by chromophores. A chromophore is a molecule, or a portion of a molecule, that
absorbs light of a particular wavelength. The absorption of the photon's energy by tissue
chromophores relates closely to the ablation process of the tissue.5-8
In the medical field, nanosecond laser pulses are of great interest for precision
surgery. The pulses can be generated by Q-switched lasers of simple structures in
comparison with other short pulsed lasers. A Q-switched laser contains an intracavity
shutter that remains closed and thus prevents light amplification inside the cavity until a
large population inversion is attained inside the gain medium of the laser. At the
appropriate time, the intracavity shutter is opened to allow the occurrence of light
amplification. Oscillation and amplification follow quickly with emission of a short high-
energy pulse of duration ranging from 1 to 100ns. The "Q" refers to the quality factor of
the laser cavity defined as the quotient of the energy in the cavity and the energy lost per
cycle of oscillation. Rapid extraction of high power is accomplished as the intracavity
shutter switches the “Q” of the cavity.
Ablation-based laser surgery using nanosecond laser pulses is being actively
studied due to the potential of high precision and little collateral tissue damage.
However, the fundamental mechanisms of tissue ablation by nanosecond laser pulses
3
have not been clearly understood. Three major models have been proposed to explain the
soft tissue ablation by nanosecond laser pulses in the spectral region from far ultraviolet
(UV) to near-infrared (NIR): the selective photothermolysis model, the photochemical
model, and the plasma mediated ablation model.
The selective photothermolysis model assumes a thermal ablation mechanism in
soft tissue ablation with visible and NIR laser pulses.5 Due to the target tissue’s
characteristic absorption properties, the target tissue can be ablated with limited damage
to the collateral tissue if the target has a greater optical absorption than the collateral
tissue at the wavelength of the laser pulse and if the laser pulse has a duration shorter than
the time for heat to diffuse into collateral tissue.5 In general, thermal ablation models
consider only the conversion of optical energy from the laser light into thermal energy in
tissue.6 When the laser irradiance (the peak power divided by the illuminated area)
approaches the ablation threshold, rapid heating leads to the vaporization of water in the
soft tissue. In turn, there is a steep increase in the internal pressure of the exposed tissue.
Once the pressure overcomes the tensile strength of the tissue, ablation occurs.
The photochemical model has been the conventional model for corneal ablation
by far UV nanosecond pulses. It assumes that high-energy photons (~ 6 eV) break down
macromolecules in the cornea. When the laser irradiance exceeds the ablation threshold,
the fragmentation process becomes the major channel of molecular relaxation. Tissue
ablation is accomplished by the expulsion of molecular fragments from the tissue with the
excess energy after the breakage of the chemical bonds.9 Both of the above ablation
models assume that ionization does not occur above the ablation threshold and the
4
ablation rate is primarily determined by pigment or chromophore absorption in the target
tissue.5,9
Another model that has been used to describe the corneal ablation with
nanosecond laser pulses at visible and NIR wavelengths is the plasma mediated ablation
model.7,10 A very short laser pulse produces an electromagnetic field that is high enough
to breakdown the tissue through the creation of a highly energized gas of ions and
electrons, also known as a plasma. When the laser irradiance reaches the ablation
threshold, enough free electrons are generated to initialize an avalanche to form a plasma.
The electrons in a plasma can effectively absorb photon energy from the laser pulse
which results in a steep increase of temperature to 104 K or higher. The resultant high
pressure from the plasma causes tissue ablation. When it cools down, shock wave and
acoustic transients are generated to dissipate the energy in all directions which cause
collateral tissue damage proportional to the energy deposited in tissue.7,10,11 It has been
widely accepted that the ablation of the cornea in the spectral region of visible and NIR
occurs only when a plasma is formed because the tissue absorption in this spectral region
is negligible.7,10
These different models have led to different designs of nanosecond laser systems
for surgery, but each with the same goal: to efficiently ablate the target tissue with
minimal damage to collateral tissue. However, the different ablation models for
nanosecond laser pulses utilize assumptions that are not compatible to each other.
Furthermore, the selective photothermolysis and photochemical models are not consistent
with some important experimental results and the plasma model has not answered certain
5
fundamental questions such as the relation between tissue absorption and the formation of
a plasma. This strongly indicates the need for a clear understanding of the fundamental
mechanisms underlying soft tissue ablation using nanosecond laser pulses. For example,
the investigation of corneal ablation curves by nanosecond laser pulses at 193nm and
picosecond pulses at 211nm indicates that the measured ablation rates are far from the
values predicted by the photochemical model.8,12 Furthermore, several research groups
including this lab have observed laser induced fluorescence (LIF) in corneal ablation by
nanosecond pulses at 193nm and skin ablation by visible and NIR pulses.13-15 At high
laser irradiance, the LIF spectrum resembles closely to the blackbody radiation measured
from water due to the optical breakdown induced by visible nanosecond pulses. These
results suggest that temperature in the ablation area can reach up to 104 K for which the
photochemical and the selective photothermolysis models do not provide a convincing
explanation. Based on these considerations, it is very possible that plasma is formed in
the corneal ablation by far UV nanosecond laser pulses and in skin ablation by visible and
NIR nanosecond pulses. However, the source of the initial free electrons for the plasma
formation in soft tissue ablated by nanosecond pulses has not been identified. These
fundamental questions can only be answered through a detailed study of the interaction
between optical radiation and soft tissue and the ablation process by nanosecond laser
pulses in a wide spectral region from far UV to VIS-IR. This is undertaken by the studies
presented in this thesis as an initial part of a long-term research project.
The study presented here is divided into two major parts. In part one we measure
the absorption spectra of corneas in a wide spectral region from 2600 to 190nm, using a
6
dual-beam spectrophotometer, and study the far UV absorption of corneas from 350 to
190nm. The absorbance curves of the corneas are also compared with that of distilled
water to develop a better understanding of the role of water in the absorption for each
spectral region. The linear absorption coefficients are calculated from the absorbance
measurement at 220, 215, 210, and 193nm. Statistical analysis is performed to correlate
the far ultraviolet absorption spectra between the porcine and human corneas at the above
wavelengths. The effect of tissue conditions on the far ultraviolet absorption due to
procedural methods is also investigated. This enables the direct correlation of corneal
ablation with nanosecond laser pulses from solid state lasers near 210nm to the results of
ArF excimer lasers at 193nm since the ablation process strongly depends on the far UV
absorption. The second part of the thesis study deals with the investigation and
identification of optimal processing procedures for ablated soft tissue and skin ablation
using nanosecond laser pulses. It is mainly devoted to analysis of ablated skin tissue to
quantitatively measure the ablation depth as a function of laser pulse energy and spot size
of nanosecond laser pulses at 1064nm using a Q-switched Nd:YAG laser system. For this
purpose, histology techniques for studying surface ablation of the soft tissue samples are
performed.
1.2 Part One: Cornea Absorption Study
Nanosecond ultraviolet laser pulses from the excimer (ArF) laser are used
clinically to correct refractive errors of the eye through surface ablation of the cornea. It
is well known that the cornea strongly absorbs far UV radiation at 193nm16 which makes

7
the ArF laser systems the current choice for precise ablation of the cornea. Hence, a
significant amount of data has been collected on the corneal ablation at 193nm for the
excimer laser systems.16-18 But excimer lasers pose safety issues in clinics because of the
toxic gases used as the gain medium. These gas laser systems are also undesirable for
their low energy efficiency, large size and high maintenance cost. Solid state laser
systems, together with a nonlinear harmonic generator, are being investigated as a
possible replacement to the ArF laser systems for treating refractive errors of the eye
through corneal ablation. The solid state laser systems can provide short UV pulses
through harmonic generation at wavelengths near 210nm.8,19 These laser systems use
solid state materials as the gain medium and thus avoid the shortcomings of the gas
systems mentioned above. However, the measurement of the corneal absorption between
190 to 230nm has not been reported.20 Thus, it is difficult to directly correlate corneal
ablation with solid state laser pulses near 210nm to the results of the ArF lasers at 193nm
since the ablation process strongly depends on the far UV absorption.
An earlier investigation of corneal ablation with picosecond laser pulses at 211
and 263nm suggests that the corneal absorption in the far UV region may be divided into
three segments based on the analysis of damage zones in collateral tissue.8 It is
concluded that the corneal absorption is relatively weak from 266 to 248nm, increases
steeply from 248 to 213nm, and remains strong from 213 to 193nm. A plasma model
assisted by chromophore absorption is proposed to explain the corneal ablation by both
picosecond and nanosecond UV laser pulses.8 Using this model it is suggested that the
threshold of laser ablation of the cornea depends on both linear absorption coefficient of
8
the cornea and the duration of the laser pulses. By measuring the linear absorption
coefficient in the far UV spectral region, the above hypothesis can be indirectly tested.
Following the above investigation, we set out to extend the measurement of the
corneal absorption to the mid-IR region. It is well known that the cornea is transparent in
the visible and mid-IR regions.21 However, corneal absorption in the mid-IR region (up
to 3000nm) has not been directly measured. The VIS-IR absorption spectrum of cornea is
expected to mirror the absorption spectrum of water that accounts for more than 70% of
wet weight of cornea. The objective of this part of the research is to provide a detailed
absorption spectra of both the cornea and water in the IR region from 3000 to 1000nm.
These results are very important for the clear understanding of the corneal ablation near
2000 and 3000nm. Due to the limitation of our spectrophotometer, we only complete the
absorption spectra from 2600 to 600nm. In measurements to be performed in near future,
the spectrum will be extended to 3000nm for both the cornea and water. With the
absorbance measurement in this spectral region, we also investigate the effects of the
freezing on corneal absorbance.
1.3 Part Two: Skin Ablation Study
The ablation-based laser surgery in dermatology with nanosecond laser pulses has
gained increasing acceptance in the last decade.22 As discussed earlier, we are interested
in the study of the fundamental mechanism underlying the skin tissue ablation by
nanosecond laser pulses. For this purpose we want to determine an appropriate animal
model for the study of skin tissue ablation and identify optimal procedures for tissue
9
processing to obtain quantitative measurement of ablation parameters. Human skin has
many peculiar properties that make finding an animal model difficult. Many laboratory
animals demonstrate distinct morphologic differences from human skin: the epidermis is
thinner, lacks basal cell heterogeneity and has a relatively flat dermal-epidermal
junction.23 It is postulated that one of the reasons for the epidermal differences is the
protective fur coat.24 Lavker et al. report that the Yucatan hairless micropig shows
important similarities in morphology, cellular compositions, and immunoreactivity to the
human plantar and palmar skin and responds similarly pharmacologically.25 The features
that are similar to human skin, and important in the ablation of the tissue, are skin
pigmentation, keratin filaments, and melanocytes. Therefore, the hairless micropig offers
several advantages over other laboratory animals for the evaluation of cutaneous
interactions, such as with laser pulses. Bartell et al. also show that the skin of human and
younger porcine have comparable hair density and an epidermal layer of similar
thickness.26 They also observe that porcine has a tighter collagen-reticulin packing than
human skin.
The purpose of this part of the thesis study is to develop a histology technique to
reliably measure the ablation depth per pulse as a function of laser pulse energy and spot
size of nanosecond laser pulses at 1064nm using a Q-switched Nd:YAG laser system.
Fresh skin from young porcine is used to better understand the fundamental mechanisms
involved for skin tissue ablation. Different tissue processing techniques are studied to
identify an optimal approach for histology examination that will produce minimal
artifacts interfering with the measurement of the ablation cuts.
10
Chapter 2: Experimental Methods
2.1 Part One
2.1.1 Cornea Samples
Porcine and human corneas are used for the absorbance measurements.
Institutional guidelines regarding the use of tissue and organs are followed. Fresh porcine
eye globes are obtained from Robersonville Meats, Inc. (Robersonville, NC) and the
School of Medicine, East Carolina University. The protocol for the use of animal tissues
is approved by the University Animal Care and Use Committee. All procedures
involving animals are performed in compliance with the ARVO Statement for the Use of
Animals in Ophthalmic and Vision Research. A total of 23 cornea sections from 18
porcine corneas and 6 whole porcine corneas are used for the absorbance measurements
where some of the measurements come from the same cornea. All eye globes are
removed from the animals immediately after death and stored on ice until the corneas are
excised from the globes. Absorbance measurements of the porcine cornea sections are
performed within 12 hours postmortem except those samples used for studying the effect
of freezing. Human corneas are provided by the North Carolina Eye and Human Tissue
Bank, Inc. (Winston-Salem, NC). A total of 11 cornea sections from 5 fresh human
corneas and 1 preserved cornea are used for the absorbance measurements where some of
the measurements come from the same cornea. The absorbance measurements of the
11
fresh human cornea sections are performed within 33 hours postmortem and the
preserved human cornea section at 1 week postmortem.
2.1.2 Excising the Cornea from the Eye Globe
The eye globes are stored on ice until the corneas are excised from the globe. To
excise the cornea from the eye globe, a small hole is made through the eye globe near the
conjunctiva. From this small hole the cornea is excised by cutting along the conjunctiva.
The cornea is then removed, rinsed and stored in 0.9% saline solution and kept on ice
until sectioning.
2.1.3 Sectioning of the Corneas
For UV absorbance measurements, the section thickness needs to be in the
neighborhood of 20µm to keep the absorbance within the scale of the spectrophotometer
because the cornea strongly absorbs in this spectral region. To obtain a thin contiguous
cornea section of uniform thickness, a microtome-cryostat (Model 4551, Ames Company)
is used to section the frozen cornea at -18 °C (see Appendix A). The excised cornea is
frozen in the cryostat for 15 minutes or longer before sectioning. The superficial layers of
the cornea, including the epithelium and the Bowman’s layer, are removed until a
uniform section from the corneal stroma is obtained. The cornea section is then
transferred to a sample holder.
For VIS-IR absorbance measurements, the whole cornea with a thickness near
800µm is used because the cornea does not absorb as strongly as the far UV wavelengths.
12
Therefore, the excised cornea is transferred to the sample holder without the sectioning
process.
2.1.4 Sample Holder
2.1.4.1 Cornea Absorbance Measurement
In the UV absorbance measurements, two rectangular optical windows made of
UV grade fused silica glass (Type 7940, Corning Inc.) are used as a sample holder to keep
the thin cornea section intact and total absorbance low for the UV absorbance
measurements. The sample holder has a total thickness of ∼ 12mm and a very low thermal
expansion coefficient that helps to protect the cornea section in the course of thawing and
transferring to the spectrophotometer. The absorbance of the sample holder increases
slowly as the wavelength decreases in the far UV region (see Figure 1), which is
measured to be less than 0.01 at 260nm and 0.011 at 190nm after the surface reflection
contribution is deducted.
Before the cornea section is transferred to the sample holder, the optical windows
are cleaned thoroughly with acetone. The cornea section is sandwiched between the two
optical windows and clamped by a holder as shown in Figures 2 and 3. This helps to
prevent dehydration of the section during the absorbance measurement and to remove any
trapped air bubbles in the section. Two blackened metal plates with an aperture of 4mm
in diameter for each are used at the front and back surfaces of the sample holder to
collimate the incident and transmitted light beams, as shown in Fig.4.
13
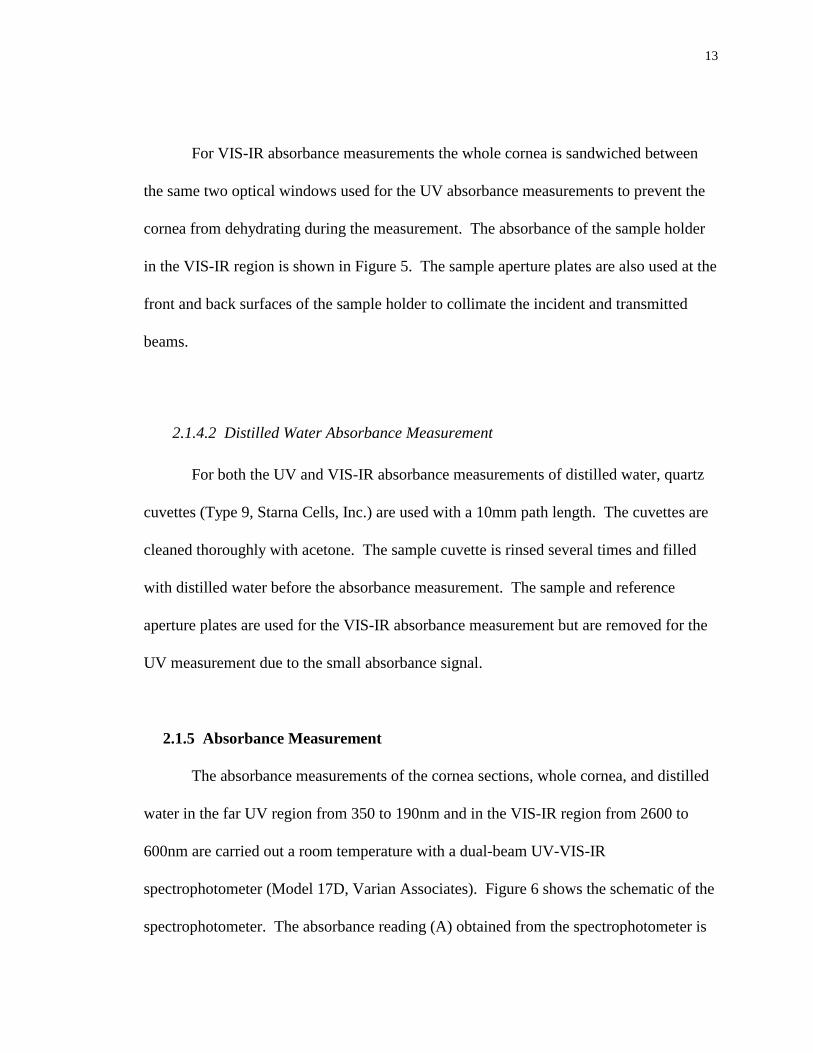
For VIS-IR absorbance measurements the whole cornea is sandwiched between
the same two optical windows used for the UV absorbance measurements to prevent the
cornea from dehydrating during the measurement. The absorbance of the sample holder
in the VIS-IR region is shown in Figure 5. The sample aperture plates are also used at the
front and back surfaces of the sample holder to collimate the incident and transmitted
beams.
2.1.4.2 Distilled Water Absorbance Measurement
For both the UV and VIS-IR absorbance measurements of distilled water, quartz
cuvettes (Type 9, Starna Cells, Inc.) are used with a 10mm path length. The cuvettes are
cleaned thoroughly with acetone. The sample cuvette is rinsed several times and filled
with distilled water before the absorbance measurement. The sample and reference
aperture plates are used for the VIS-IR absorbance measurement but are removed for the
UV measurement due to the small absorbance signal.
2.1.5 Absorbance Measurement
The absorbance measurements of the cornea sections, whole cornea, and distilled
water in the far UV region from 350 to 190nm and in the VIS-IR region from 2600 to
600nm are carried out a room temperature with a dual-beam UV-VIS-IR
spectrophotometer (Model 17D, Varian Associates). Figure 6 shows the schematic of the
spectrophotometer. The absorbance reading (A) obtained from the spectrophotometer is

14
the logarithmic ratio of the incident light on the sample Io (measured from the reference
beam in the reference chamber) and the transmitted light through the section I (from the
sample beam through the sample chamber),
A IIo= log ( ).10 (1)
The spectrophotometer can be used to measure absorbance from 0.0 to 3.0 in 5 scales
between 2600 and 190nm in wavelength. The UV wavelength reading is calibrated
using a standard UV mercury lamp and the absorbance reading with a dye solution of
known absorbance (see Appendix B). Both are found to be within the manufacturer’s
specifications. The VIS-IR wavelength reading has yet to be calibrated. The output
signal from the spectrophotometer is digitized and averaged by a personal computer with
an A/D board.
The sample holder with the cornea section or whole cornea is placed in the sample
chamber while the reference chamber only contains the two identical apertures of 4mm in
diameter. Starting at 350nm, for the UV absorbance measurements, or 2600nm, for the
VIS-IR absorbance measurements, the spectrophotometer measures the total absorbance
of the sample holder and the corneal sample. When the absorbance reading reaches the
about one third of the full scale for a decreasing reading or about two thirds of the full
scale for an increasing reading, the scale is changed accordingly to accommodate the level
of absorption with the best sensitivity. The different segments of the same absorbance
measurement are overlapped to ensure accurate reading over the whole spectrum (see
Appendix C). The process is repeated until the minimum wavelength of 190nm is
15
reached for the UV absorbance measurements and 600nm for the VIS-IR absorbance
measurements (see Appendix D). Then the difference between the absorbance reading
and the absorbance of the sample holder without the corneal sample is plotted against the
wavelength (see Appendix C and D).
For the distilled water absorbance measurements, an empty cuvette is placed in
the reference chamber and a cuvette filled with distilled water in the sample chamber.
For the VIS-IR absorbance measurements, both chambers contain the two identical
apertures of 4mm in diameter. Because of the small signal for the UV absorbance reading
of the distilled water, the two identical apertures are removed from both chambers. The
UV and VIS-IR absorbance spectra are measured using the same procedure as the cornea.
However, the absorbance measurement obtained by the spectrophotometer is only of the
distilled water since the cuvettes are present in both the reference and sample chambers as
equation (1) shows.
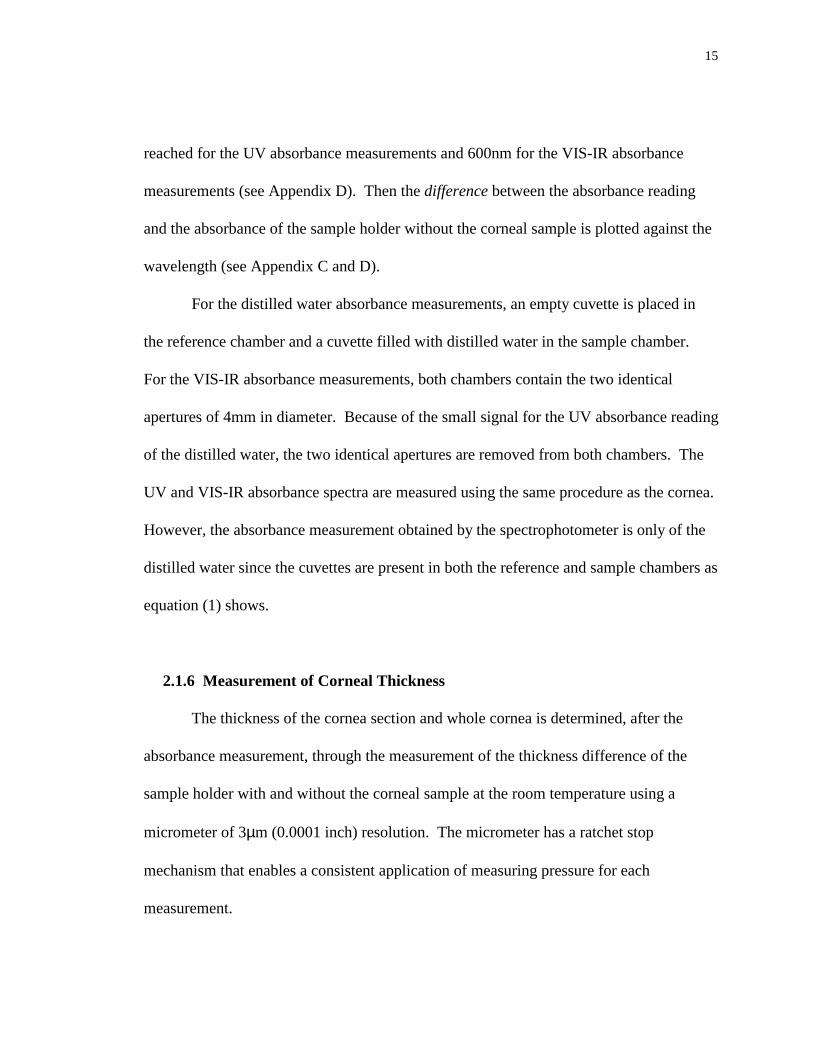
2.1.6 Measurement of Corneal Thickness
The thickness of the cornea section and whole cornea is determined, after the
absorbance measurement, through the measurement of the thickness difference of the
sample holder with and without the corneal sample at the room temperature using a
micrometer of 3µm (0.0001 inch) resolution. The micrometer has a ratchet stop
mechanism that enables a consistent application of measuring pressure for each
measurement.
16
The thickness measured by the micrometer for the cornea sections, used for the
UV absorbance measurements, is also verified by the setting of the knife advancement in
the microtome. The thickness setting in the microtome can be changed from 2 to 100µm
in steps of 2, 4, 6, 8 or 10µm. It is found that the thickness settings of the microtome that
are most consistent with the micrometer measurement are around 20 µm. Samples are
discarded if the micrometer measurement is different from thickness setting by more than
10µm. The estimated uncertainty in the thickness measurement is less than 20%.
2.2 Part Two
2.2.1 Handling of the Porcine Skin Samples Before and After the Ablation
Fresh porcine skin is obtained from the Department of Comparative Medicine,
East Carolina University and Robersonville Meats, Inc. (Robersonville, NC). All skin
samples are of fair complexion and removed from the back of the neck of the animals
immediately after death and stored on ice until the ablation study. Ablation is performed
within 36 hours postmortem. A skin strip of about 10mm wide and 50mm long, with
subcutaneous fat removed and hair shaved, is clamped in a sample holder with the surface
facing the incoming laser beam. After ablation, the ablated area of the skin sample is
immediately trimmed and placed in a fixer to stop the deterioration of the tissue.
17
2.2.2 Histology Procedures for Ablation Measurement
Three different fixers of ablated skin tissues are tested for the histology analysis:
0.1 M Cacodylate and 2% GAH with a pH of 7.2, Bouins’ solution, and 10% buffered
formalin. After fixation, the tissue is prepared for staining. Preparation of the sample
involves dehydration and clearing of the tissue, and infiltrating the tissue with paraffin.
Each of these steps involve precise timing in order to obtain quality sections and reduce
distortion of the ablation cuts, therefore different timing sequences are tested. Once the
tissue is infiltrated with paraffin, then it is embedded in a paraffin block for sectioning
purposes. For sectioning, a microtome (2030 Biocut, Reichert-Jung) is used to section
10µm sections of skin. Once the sections are obtained, they are placed on slides and
stained with hemotoxylin and eosin to show better contrast between the epidermis and
subsequent layers of the skin.
2.2.2 Porcine Skin Ablation
A Q-switched Nd:YAG laser (Surelite I, Continuum) is used to generate 8ns
pulses at a wavelength of 1064nm and a repetition rate of 10Hz. The laser pulse energy is
controlled with a half-waveplate and a polarizer beam splitter. The laser beam is focused
on the surface of the skin sample with a single spherical lens. By changing focusing lens
with different focal lengths, we can change the size of the illuminated area on the sample.
The diameter of the focal spot is determined by a knife-edge method. This method
measures the transmitted power of the laser beam as a sharp edge of a translating knife
changes position. During the laser ablation, the sample holder is translated at a constant
18
speed by a stepping motor to form a linear cut. The skin sample is showered with 0.9%
saline solution every 8 minutes to keep it from dehydration during the ablation. Five to
seven lines, 3mm or 4mm in length, are cut on the skin surface at a specific spot size and
pulse energy. The ablation depth is determined by measuring the depth of the linear cut
of the stained sample under an optical microscope with 5µm resolution. To increase the
sensitivity of measurement of the depth per pulse near the ablation threshold, a large
number of laser pulses is used.
Chapter 3: Experimental Results
3.1 Part One
3.1.1 UV Absorbance Measurements
Figure 7 shows the absorbance of six cornea sections from different porcine
corneas as function of wavelength from 260 to 190nm. One full spectrum of the
absorbance is plotted in the insert of Figure 7 from 350 to 190nm. The absorbance of six
human cornea sections as a function of wavelength from 260 to 190nm is shown in
Figure 8 with one full spectrum from 350 to 190nm displayed in the insert. One of the
human corneas in Figure 8 had been placed in a preservation solution (Optisol, Chiron
Vision) for 1 week before measurement and exhibited a light pink color after it was
removed from the preservation cell. Figures 7 and 8 show that the absorbance readings
have a larger fluctuation in the shorter wavelength region below 195nm than in the longer
wavelength region. This is expected due to the relative large noise presented in the weak

19
signal caused by the strong absorption of the cornea section and the low light intensity
near the shorter wavelength end of the emission spectrum of the light source.
Although the absorbance fluctuates from sample to sample with similar thickness,
our measurements clearly indicate that the dependence of the corneal absorption on
wavelength is very consistent between 260 and 190nm for both the porcine and human
corneas. All the absorbance spectra show that the corneal absorption increases
significantly when wavelength decreases from 240 to 220nm. Based on this steep
increase, the corneal absorption in the far UV region between 260 and 190nm can be
represented by three segments with clear boundaries at 240 and 220nm: a weak
absorption segment between 260 and 240nm, a steeply increasing segment between 240
and 220nm, and a high absorption segment below 220nm.
Since the scattering of UV radiation by the cornea is significantly less than the
absorption of the UV radiation, we can use Lambert’s law to find the transmittance of the
corneal sample and the sample holder as:
T II
R R eo d= = − − −( ) ( ' ) ,1 12 2 α (2A)
and the transmittance for the sample holder as:
T II
Ro''
( ' ) ,= = −1 2 (2B)
where we neglect the absorption of the sample holder and Io and I (or I’) are the light
intensity at the front and rear surfaces of the sample holder, respectively, R is the Fresnel
reflectivity of the glass-cornea interfaces and R’ of the air-glass interface (see Fig.4), α is
20
the linear absorption coefficient of the cornea and d is the thickness of the cornea sample.
The corneal absorbance (A) is obtained by subtracting the absorbance of the sample
holder from the total absorbance of the cornea sample and the sample holder. Therefore,
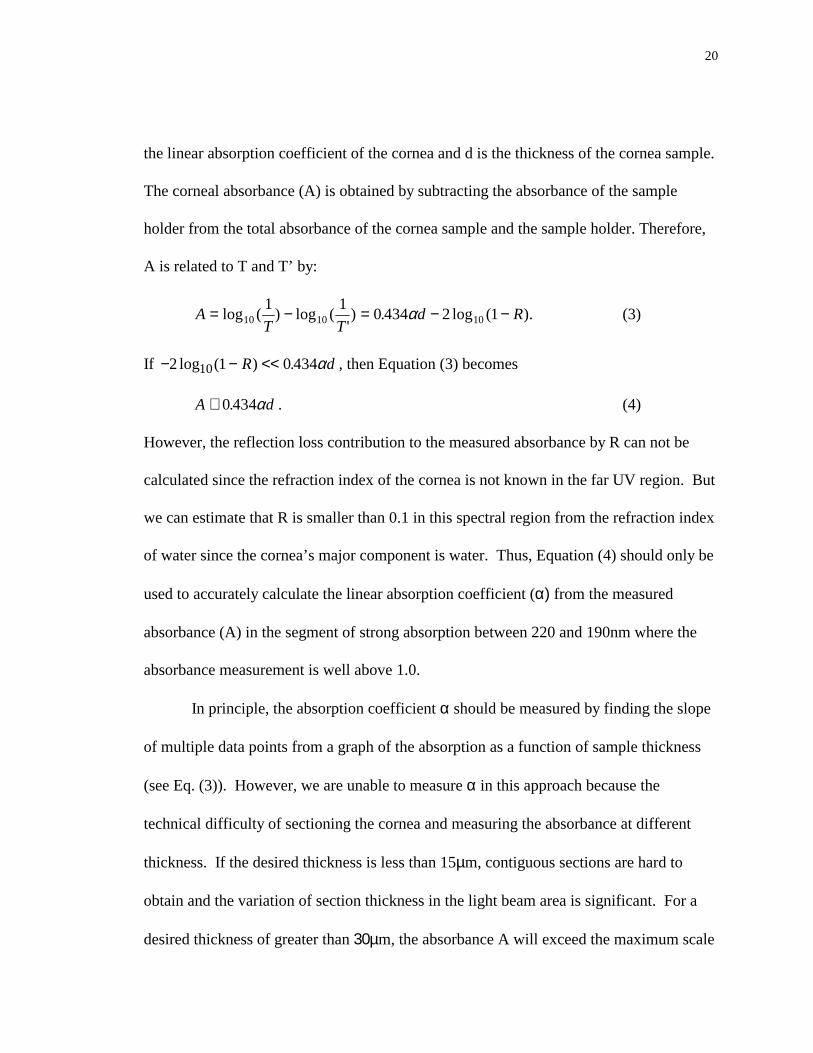
A is related to T and T’ by:
AT T
d R= − = − −log ( ) log (') . log ( ).10 10 10
1 1 0 434 2 1α (3)
If − − <<2 1 0 43410log ( ) .R dα , then Equation (3) becomes
A d≅ 0 434. α . (4)
However, the reflection loss contribution to the measured absorbance by R can not be
calculated since the refraction index of the cornea is not known in the far UV region. But
we can estimate that R is smaller than 0.1 in this spectral region from the refraction index
of water since the cornea’s major component is water. Thus, Equation (4) should only be
used to accurately calculate the linear absorption coefficient (α) from the measured
absorbance (A) in the segment of strong absorption between 220 and 190nm where the
absorbance measurement is well above 1.0.
In principle, the absorption coefficient α should be measured by finding the slope
of multiple data points from a graph of the absorption as a function of sample thickness
(see Eq. (3)). However, we are unable to measure α in this approach because the
technical difficulty of sectioning the cornea and measuring the absorbance at different
thickness. If the desired thickness is less than 15µm, contiguous sections are hard to
obtain and the variation of section thickness in the light beam area is significant. For a
desired thickness of greater than 30µm, the absorbance A will exceed the maximum scale
21
of the spectrophotometer. In this limited range of thickness, the slope approach is
statistically unreliable. Instead we choose to calculate the absorption coefficient α by
averaging a large number of data from corneal sections of thickness near 20µm.
Table 1 shows the results of thickness measurements and the calculated α of
porcine corneas, from Equation (4), at four wavelengths of 220, 215, 210, and 193nm.
The linear absorption coefficients α are determined to be 2130 ± 310 (cm-1) at 220nm,
2240 ± 320 (cm-1) at 215nm, 2300 ± 330 (cm-1) at 210m, and 2410 ± 370 (cm-1) at 193nm
from 23 sections out of 18 porcine corneas. Table 2 lists similar results for human
corneas where α is calculated to be 2300 ± 480 (cm-1) at 220nm, 2300 ± 460 (cm-1) at
215nm, 2320 ± 470 (cm-1) at 210nm, and 2340 ± 450 (cm-1) at 193nm from 11 sections
out of 6 human corneas (5 from fresh eye globes and 1 preserved). The standard
deviations in the absorption coefficients for the porcine corneas are consistent with our
expected dominant source of error in the thickness measurement. The large standard
deviations in the linear absorption coefficients for the human corneas may be attributed to
the large statistical fluctuation associated with a relatively small number of samples.
The correlation between the porcine and human linear absorption coefficients at
220, 215, 210, and 193nm is analyzed by the unpaired Student’s t-test. This test is used
to find a critical value, t, for statistical correlation between sets of samples taken
randomly from a population with sizes less than 30 (see Appendix F). The relevant ratio
of t for testing the difference between the average linear absorption coefficients of the
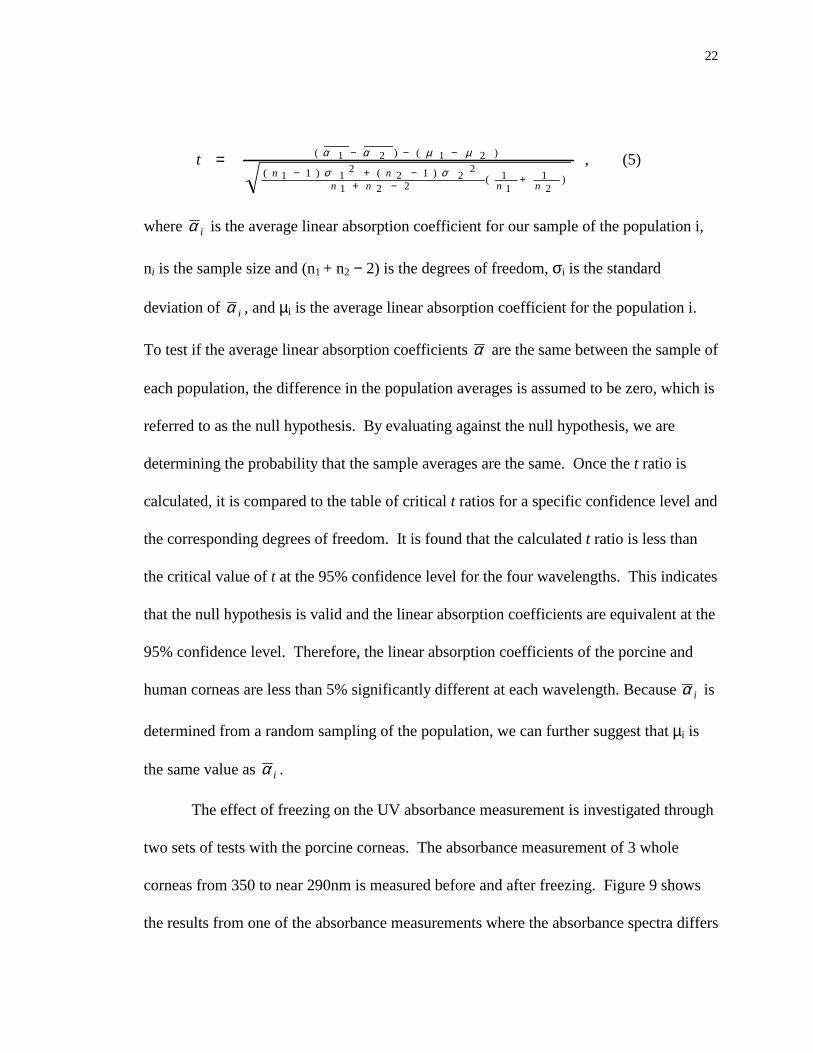
porcine corneas and human corneas can be calculated by:
22
tn n
n n n n
= − − −
− + −+ − +
( ) ( )
( ) ( ) ( )
α α µ µ
σ σ1 2 1 2
1 1 1 2 2 1 2 2
1 2 211
12
, (5)
where α i is the average linear absorption coefficient for our sample of the population i,
ni is the sample size and (n1 + n2 − 2) is the degrees of freedom, σi is the standard
deviation of α i , and µi is the average linear absorption coefficient for the population i.
To test if the average linear absorption coefficients α are the same between the sample of
each population, the difference in the population averages is assumed to be zero, which is
referred to as the null hypothesis. By evaluating against the null hypothesis, we are
determining the probability that the sample averages are the same. Once the t ratio is
calculated, it is compared to the table of critical t ratios for a specific confidence level and
the corresponding degrees of freedom. It is found that the calculated t ratio is less than
the critical value of t at the 95% confidence level for the four wavelengths. This indicates
that the null hypothesis is valid and the linear absorption coefficients are equivalent at the
95% confidence level. Therefore, the linear absorption coefficients of the porcine and
human corneas are less than 5% significantly different at each wavelength. Because α i is
determined from a random sampling of the population, we can further suggest that µi is
the same value as α i .
The effect of freezing on the UV absorbance measurement is investigated through
two sets of tests with the porcine corneas. The absorbance measurement of 3 whole
corneas from 350 to near 290nm is measured before and after freezing. Figure 9 shows
the results from one of the absorbance measurements where the absorbance spectra differs
23
in the longer wavelength region but converges towards 290nm when the absorbance
reading approaches the maximum of the scale. A decrease in corneal thickness is also
observed after freezing. The effect of freezing time on the absorbance measurement is
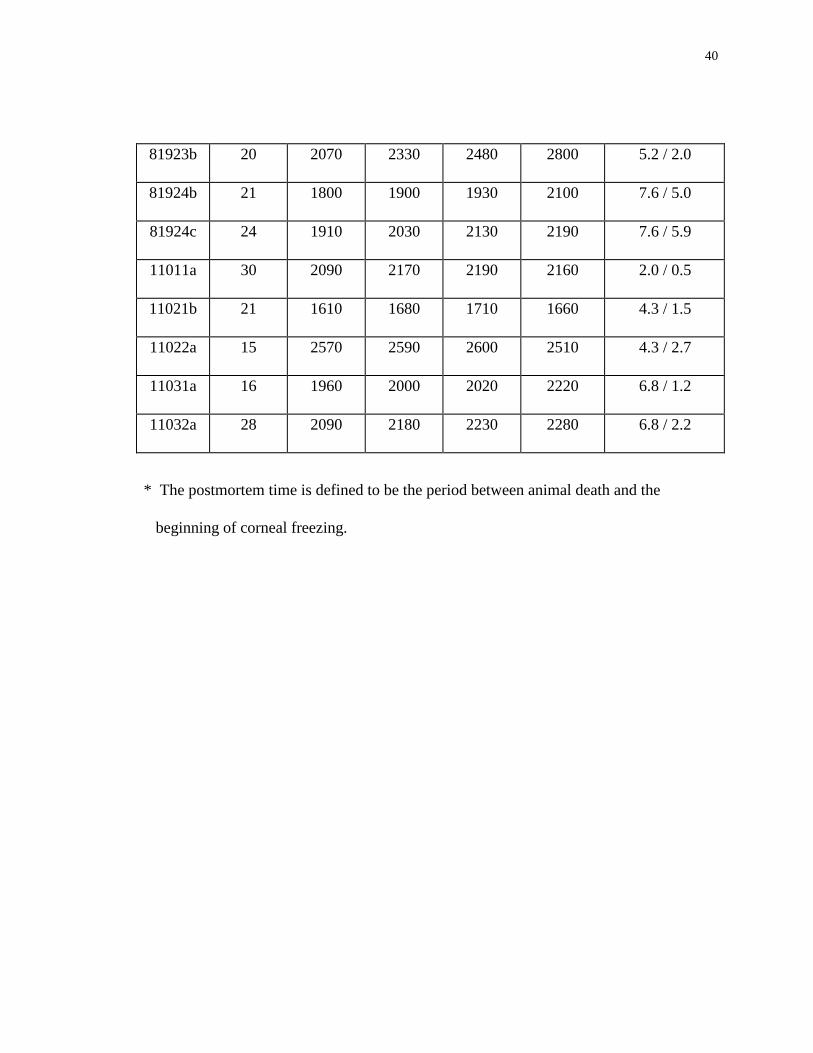
also studied with the variation in freezing time from 15 minutes to 10 hours, which is
shown in Table 1. There is no significant change found due to the length of freezing time
in the spectral region from 260 to 190nm. Because of the technical difficulty in quality
sectioning fresh corneas, a direct measurement of the effect of freezing on cornea
absorbance in the far UV region is not conducted.
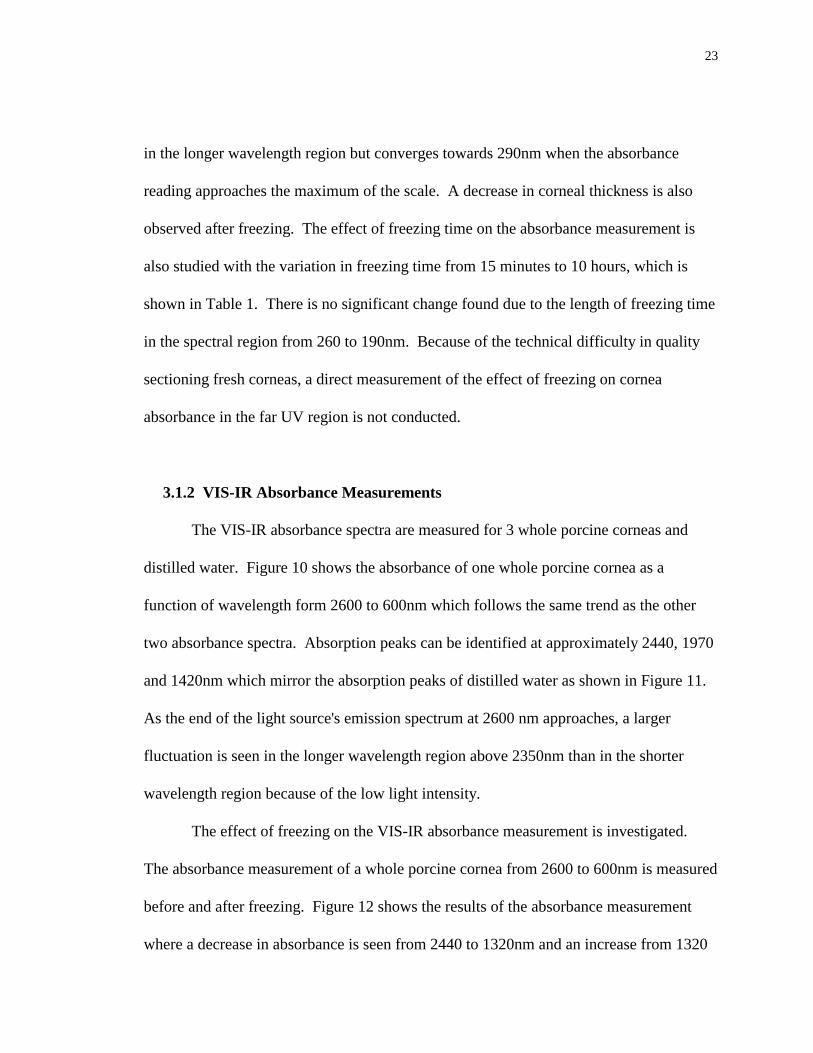
3.1.2 VIS-IR Absorbance Measurements
The VIS-IR absorbance spectra are measured for 3 whole porcine corneas and
distilled water. Figure 10 shows the absorbance of one whole porcine cornea as a
function of wavelength form 2600 to 600nm which follows the same trend as the other
two absorbance spectra. Absorption peaks can be identified at approximately 2440, 1970
and 1420nm which mirror the absorption peaks of distilled water as shown in Figure 11.
As the end of the light source's emission spectrum at 2600 nm approaches, a larger
fluctuation is seen in the longer wavelength region above 2350nm than in the shorter
wavelength region because of the low light intensity.
The effect of freezing on the VIS-IR absorbance measurement is investigated.
The absorbance measurement of a whole porcine cornea from 2600 to 600nm is measured
before and after freezing. Figure 12 shows the results of the absorbance measurement
where a decrease in absorbance is seen from 2440 to 1320nm and an increase from 1320
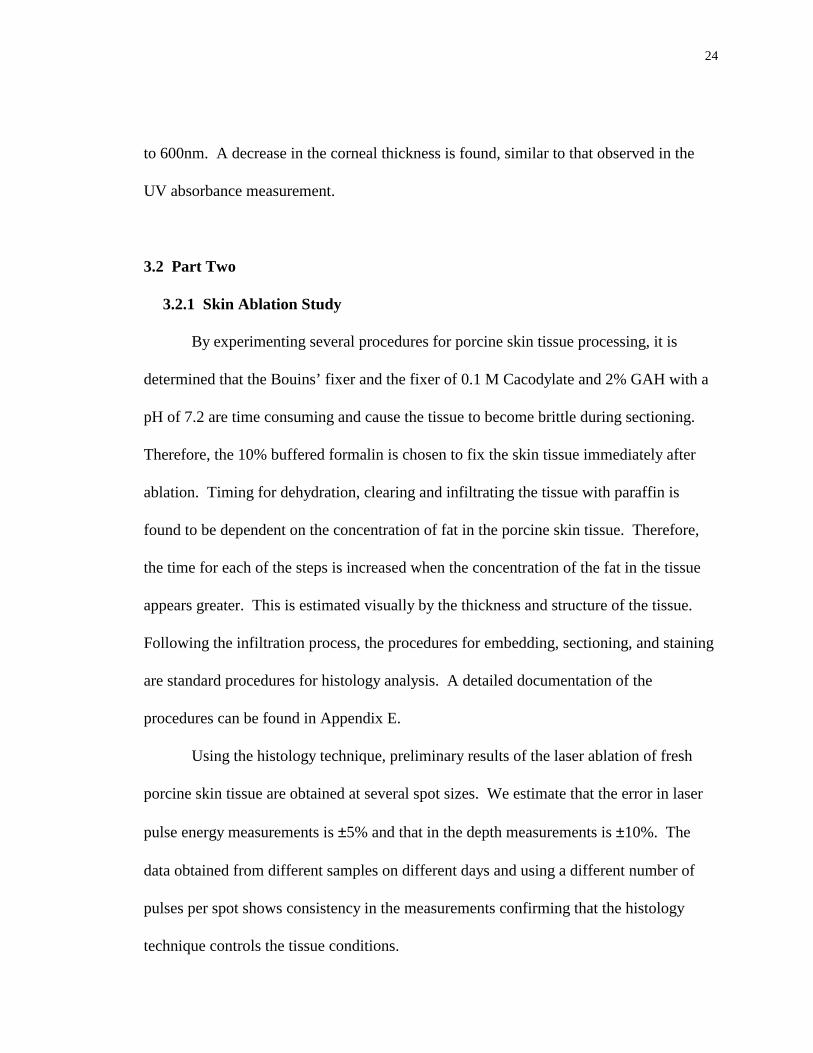
24
to 600nm. A decrease in the corneal thickness is found, similar to that observed in the
UV absorbance measurement.
3.2 Part Two
3.2.1 Skin Ablation Study
By experimenting several procedures for porcine skin tissue processing, it is
determined that the Bouins’ fixer and the fixer of 0.1 M Cacodylate and 2% GAH with a
pH of 7.2 are time consuming and cause the tissue to become brittle during sectioning.
Therefore, the 10% buffered formalin is chosen to fix the skin tissue immediately after
ablation. Timing for dehydration, clearing and infiltrating the tissue with paraffin is
found to be dependent on the concentration of fat in the porcine skin tissue. Therefore,
the time for each of the steps is increased when the concentration of the fat in the tissue
appears greater. This is estimated visually by the thickness and structure of the tissue.
Following the infiltration process, the procedures for embedding, sectioning, and staining
are standard procedures for histology analysis. A detailed documentation of the
procedures can be found in Appendix E.
Using the histology technique, preliminary results of the laser ablation of fresh
porcine skin tissue are obtained at several spot sizes. We estimate that the error in laser
pulse energy measurements is ±5% and that in the depth measurements is ±10%. The
data obtained from different samples on different days and using a different number of
pulses per spot shows consistency in the measurements confirming that the histology
technique controls the tissue conditions.
25
Chapter 4: Discussion
4.1 Corneal Absorbance Measurements
Complete far UV absorbance spectra of the cornea and distilled water between
260 and 190nm are measured in this thesis study. The results show that corneal
absorption between 260 and 190nm can be divided into three segments with clear
boundaries at 240 and 220nm. Also, the average value of the linear absorption coefficient
of the cornea sections remains approximately the same as the wavelength decreases from
220 to 190nm. These conclusions confirm a hypothesis based on the analysis of collateral
tissue damage zones in the corneal ablation with picosecond laser pulses in the far UV
region.8
In examining the measurement of the linear absorption coefficient of the cornea at
193nm, it is found that it is about 15% less than that measured by Puliafito et al..16
Thickness measurements taken of 3 whole porcine corneas show a decrease in the
average thickness from 810µm before freezing to 720µm after freezing. This may be
attributed to dehydration in the freezing and thawing processes. If a similar reduction in
thickness occurred in the cornea sections, the determination of the linear absorption
coefficient from the measured absorbance may overestimate the coefficient by about
10%. In addition to the effects of freezing on the absorbance spectra, the porcine eyes
obtained from the slaughterhouse are removed from scalded pigs while the porcine eyes
used for the last five samples in Table 1 are obtained from the School of Medicine
26
without scalding. No significant effect due to scalding is found in the measurement of the
far UV absorbance of porcine corneas.
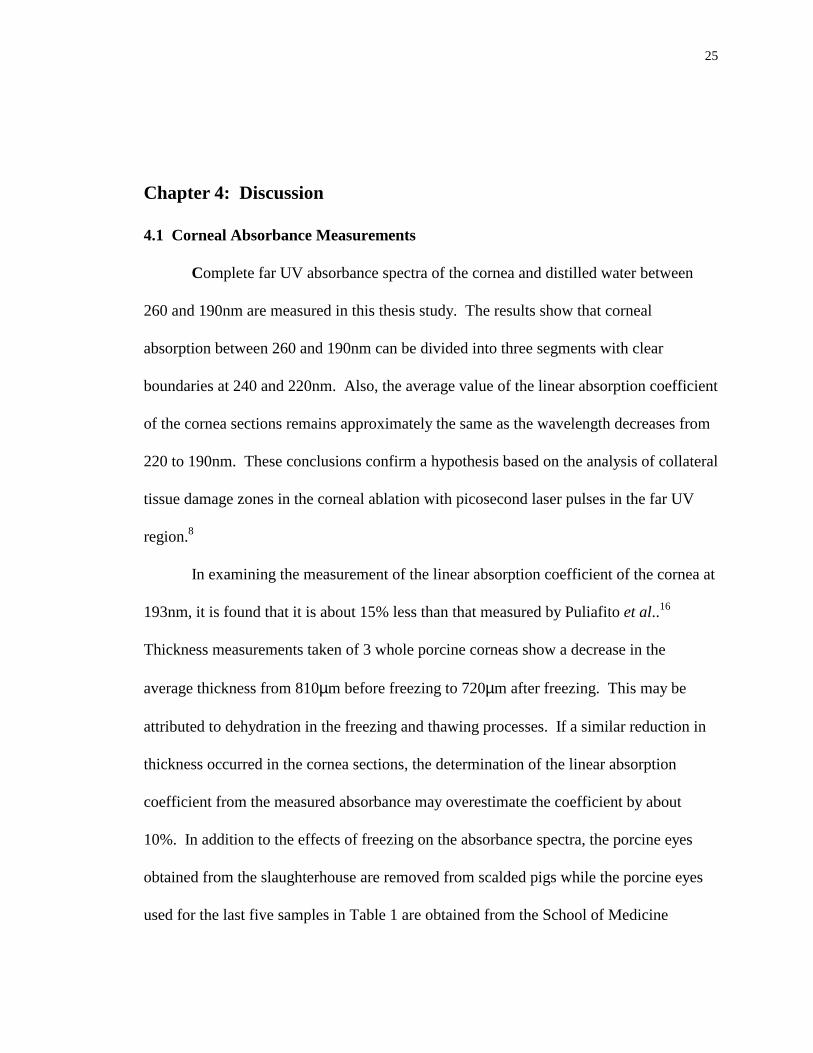
The effect of freezing on the absorbance measurement has not been directly
studied in the far UV region between 260 and 190nm. Therefore, some uncertainty exists
in correlating our results to the clinical investigations of corneal ablation. It is well
known that water does not significantly absorb radiation between 193 and 293nm, as our
results show in Figure 13, therefore the solid components of the cornea must be
responsible for the tissue’s absorption.4 Previous studies indicate that among the major
corneal components only collagen has shown a steep rise in the UV absorption spectrum
below 240nm,27 which is also similar to the results reported here. Since small amino
acids linked in long molecular chains by peptide bonds compose collagen and freezing
only involves the phase transition between water and ice, it is reasonable to assume that
freezing has a minimal effect on corneal collagen. Thus, any change in corneal
absorption due to freezing may be insignificant compared to the major source of
uncertainty in the determination of the sample thickness.
In a previous study on the corneal ablation with short laser pulses in the far UV
region, a model is proposed of plasma ablation assisted by chromophore absorption.8 In
this model the threshold of laser ablation of the cornea depends on the linear absorption
coefficient of the cornea, nonlinear absorption by water component of cornea and the
duration of the laser pulses. It is also suggested that the size of the collateral tissue
damage zones is primarily dependent on the linear absorption coefficient of the cornea.
Our measurement of the far UV cornea absorption provides an indirect confirmation of
27
this model. Furthermore, we may conclude that laser pulses with wavelengths in a
”window of ablation” between 220 and 190nm, shown in Figures 7 and 8, can be used for
the surface ablation of the cornea with comparable outcomes.
Spectra of the VIS-IR absorbance of the cornea and distilled water between 2600
and 600 nm are also measured. The large fluctuations on the 1970 nm peak may be due
to an unstable multipot switch on the spectrophotometer. These results are consistent
with the previously reported results.28 As shown in Figures 10 and 11, the cornea
absorption in this spectral region mirrors that of water where the absorption peaks of
water appear at 1430, 1950, and 2300nm but absorption between them remains low,
which is reasonable since the cornea is composed of 75% water. The difference in the
absorption peak intensity is due to the longer path length of 10mm for the cuvettes
compared to the cornea thickness of ∼ 800µm. Also, the flatness of the absorption peaks
in the distilled water spectrum may be due to the large absorbance reading saturating the
spectrophotometer. In the near future, we plan to extend the measurement of corneal
absorption to the mid-IR wavelength of 3000nm near which the cornea absorbs strongly
again.
The effect of freezing on the absorbance measurement in the VIS-IR spectral
region verifies the previous conclusion that the freezing process has a minimal effect on
the absorbance measurement. The differences in the VIS-IR spectra of porcine corneas
before and after freezing may be attributed to dehydration in the freezing and thawing
processes based on the decrease in thickness from 770µm to 690µm before and after
freezing, respectively. Therefore, it is still reasonable to assume that any change in
28
corneal absorption due to freezing may be insignificant compared to the major source of
uncertainty in the determination of the sample thickness for the UV and VIS-IR
absorbance measurements.
4.2 Skin Ablation Study
As a preliminary study for the investigation of the fundamental mechanisms of
skin ablation by nanosecond laser pulses at 1064nm, the ablation depth as a function of
pulse energy and spot size is measured. The aim is to develop an appropriate histology
procedure for the ablation depth measurement that minimizes the interference of artifacts
with the ablated tissue conditions. The results obtained from different samples on
different days and using a different number of pulses per spot show that the tissue
conditions are well controlled through the processing and staining procedures presented
in Appendix E.
4.3 Summary
The results presented here are only an initial part of a long-term research project
to clearly understand the fundamental mechanisms involved in soft tissue ablation using
nanosecond laser pulses. In the near future, we plan to investigate the absorption and
scattering of skin tissue in a wide spectral region from 3000 to 190nm, the surface
ablation of the cornea and skin tissue by nanosecond laser pulses, and the laser-induced
fluorescence spectrum for the corneal and skin tissue ablation. These studies would

29
provide critical results that are needed to develop a comprehensive model of soft tissue
ablation using nanosecond laser pulses.

30
Figures
31
Wavelength (nm)
190 200 210 220 230 240 250 260
Aso
rban
ce
0.0
0.5
1.0
1.5
2.0
2.5
3.0
Figure 1: The UV absorbance dependence from 260 to 190nm for the sample holder
made of UV grade fused silica glass with a total thickness of ∼ 12mm and the
two sample and reference apertures of 4mm in diameter to collimate the
incident and transmitted beams.
32
Figure 2: The design of piece 1 of the holder to clamp the two rectangular optical
windows used for the sample holder in the sample chamber.
33
Figure 3: The design of piece 2 of the holder to clamp the two rectangular optical
widows used for the sample holder in the sample chamber.

34
Glass and Cornea
Incident Rays Reflective Rays
R1 R2 R3 R4
6mm 6mm
AperturePlate
I0 I 4mm
Figure 4: The configuration of the sample holder, cornea section and aperture plates.
The incident ray (I0) is reflected at the four interfaces with R2 = R3 = R and
R2 = R4 = R′. The reflected rays are translated for a clear view.
35
Wavelength (nm)
600 800 1000 1200 1400 1600 1800 2000 2200 2400 2600
Abs
orba
nce
0.0
0.5
1.0
1.5
2.0
2.5
3.0
Figure 5: The VIS-IR absorbance dependence from 2600 to 600nm for the sample holder
made of UV grade fused silica glass with a total thickness of ∼ 12mm with the
two sample and reference apertures of 4mm in diameter to collimate the
incident and transmitted beams.
LampMonochromators
andRotating Mirror
Detectorand
Electronics
Spectrophotometer Optical System(Model 17D, Varian Associates)
Cell Compartments
Reference
Sample
PC
Figure 6: The schematic for the dual-beam UV-VIS-IR spectrophotometer (Model 17D, Varian Associates).
37
Wavelength (nm)
190 200 210 220 230 240 250 260
Abs
orba
nce
0.0
0.5
1.0
1.5
2.0
2.5
3.0
thickness: 23µm (62711C)thickness: 21µm (62712A) thickness: 19µm (71122C) thickness: 24µm (81924C) thickness: 21µm (11021B)thickness: 28µm (11032A)
Wavelength (nm)
200 250 300 350
Abs
orba
nce
0
1
2
thickness: 21µm (81912B)
window of ablation
Figure 7: The UV absorbance dependence on the wavelength for six porcine cornea
sections from six porcine corneas between 260 to 190nm with the two sample
and reference apertures of 4mm in diameter. Insert: The absorbance for one
porcine cornea section between 350 to190nm.
38
Wavelength (nm)
190 200 210 220 230 240 250 260
Abs
orba
nce
0.0
0.5
1.0
1.5
2.0
2.5
3.0
thickness: 28µm (7061B/preserved) thickness: 15µm (7062A) thickness: 15µm (7062C) thickness: 21µm (0301A) thickness: 24µm (0301B) thickness: 28µm (0302B)
Wavelength (nm)
200 250 300 350
Abs
orba
nce
0
1
2
thickness: 21µm (8191A)
window of ablation
Figure 8: The UV absorbance dependence on the wavelength for six human cornea
sections from four human corneas (three fresh and one preserved) between 260
and 190nm with the two sample and reference apertures of 4mm in diameter.
Insert: The absorbance for one human cornea section between 350 to 190nm.
39
Table 1: The thickness and linear absorption coefficients of porcine cornea sections
calculated at 220, 215, 210, and 193nm using equation (4).
sample # thickness
(µm)
α (cm-1)
at 220
nm
α (cm-1)
at 215
nm
α (cm-1)
at 210
nm
α (cm-1)
at 193 nm
postmortem* /
freezing time
(hour)
62711b 20 2230 2290 2350 2430 1.5 / 1.2
62711c 23 1820 1940 2010 2120 1.5 / 9.0
62712a 21 1820 1930 1990 2120 1.3 / 1.5
62731b 25 1700 1760 1790 2080 3.3 / 3.2
71121a 26 2490 2510 2590 2290 5.2 / 0.6
71122c 19 2680 2880 2940 3010 7.2 / 5.6
71131a 27 1850 1910 1970 1940 7.2 / 7.5
72911a 18 2030 2180 2340 2510 1.5 / 0.3
72911b 18 2330 2410 2520 2670 1.5 / 10.5
72912a 26 2130 2290 2350 2630 2.4 / 0.4
72912b 23 2360 2520 2580 2680 2.4 / 1.2
72923a 21 2030 2140 2140 2260 5.2 / 0.7
72936a 12 2630 2710 2710 2630 9.0 / 0.7
81923a 15 2430 2640 2700 3180 5.6 / 1.0
81912b 21 2450 2620 2750 2910 2.8 / 2.8
40
81923b 20 2070 2330 2480 2800 5.2 / 2.0
81924b 21 1800 1900 1930 2100 7.6 / 5.0
81924c 24 1910 2030 2130 2190 7.6 / 5.9
11011a 30 2090 2170 2190 2160 2.0 / 0.5
11021b 21 1610 1680 1710 1660 4.3 / 1.5
11022a 15 2570 2590 2600 2510 4.3 / 2.7
11031a 16 1960 2000 2020 2220 6.8 / 1.2
11032a 28 2090 2180 2230 2280 6.8 / 2.2
* The postmortem time is defined to be the period between animal death and the
beginning of corneal freezing.
41
Table 2: The thickness and linear absorption coefficients of human cornea sections
calculated at 220, 215, 210, and 193nm using equation (4).
sample # thickness
(µm)
α (cm-1)
at 220
nm
α (cm-1)
at 215
nm
α (cm-1)
at 210
nm
α (cm-1)
at 193 nm
postmortem
time
7061a 19 2590 2680 2750 2920 1 week
(preserved)
7061b 28 2080 2090 2090 2180 1 week
(preserved)
7062a 15 1970 2030 2030 2120 33 hours
7062b 20 1600 1660 1670 1720 33 hours
7062c 15 3000 3180 3210 3140 33 hours
8191a 17 2710 2740 2760 2680 28 hours
8192a 21 2920 2290 2250 2120 30 hours
0301a 21 2450 2530 2540 2420 28 hours
0301b 24 1650 1680 1680 1680 28 hours
0302a 21 2090 2160 2220 2390 28 hours
0302b 28 2260 2260 2290 2380 28 hours
42
Wavelength (nm)
280 290 300 310 320 330 340 350
Abs
orba
nce
0.0
0.5
1.0
1.5
2.0
2.5
3.0
thickness: 810µm (before freezing)thickness: 720µm (after freezing)
Figure 9: The UV absorbance dependence on wavelength from 350 to near 290nm of one
whole porcine cornea before and after freezing. The two apertures of 4mm in
diameter are present in both chambers to collimate the incident and transmitted
beams.
43
Wavelength (nm)
600 800 1000 1200 1400 1600 1800 2000 2200 2400 2600
Abs
orba
nce
0.0
0.5
1.0
1.5
2.0
2.5
3.0
thickness: 770µm (03201)
Figure 10: The VIS-IR absorbance dependence on wavelength for a porcine cornea
between 2600 to 600nm. The two apertures of 4mm in diameter are present in
both chambers to collimate the incident and transmitted beams.
44
Wavelength (nm)
600 800 1000 1200 1400 1600 1800 2000 2200 2400 2600
Abs
orba
nce
0.0
0.5
1.0
1.5
2.0
2.5
3.0
Figure 11: The VIS-IR absorbance dependence on wavelength for distilled water from
2600 to 600nm with a path length of 10mm and the two apertures of 4mm in
diameter in both chambers to collimate the incident and transmitted beams.
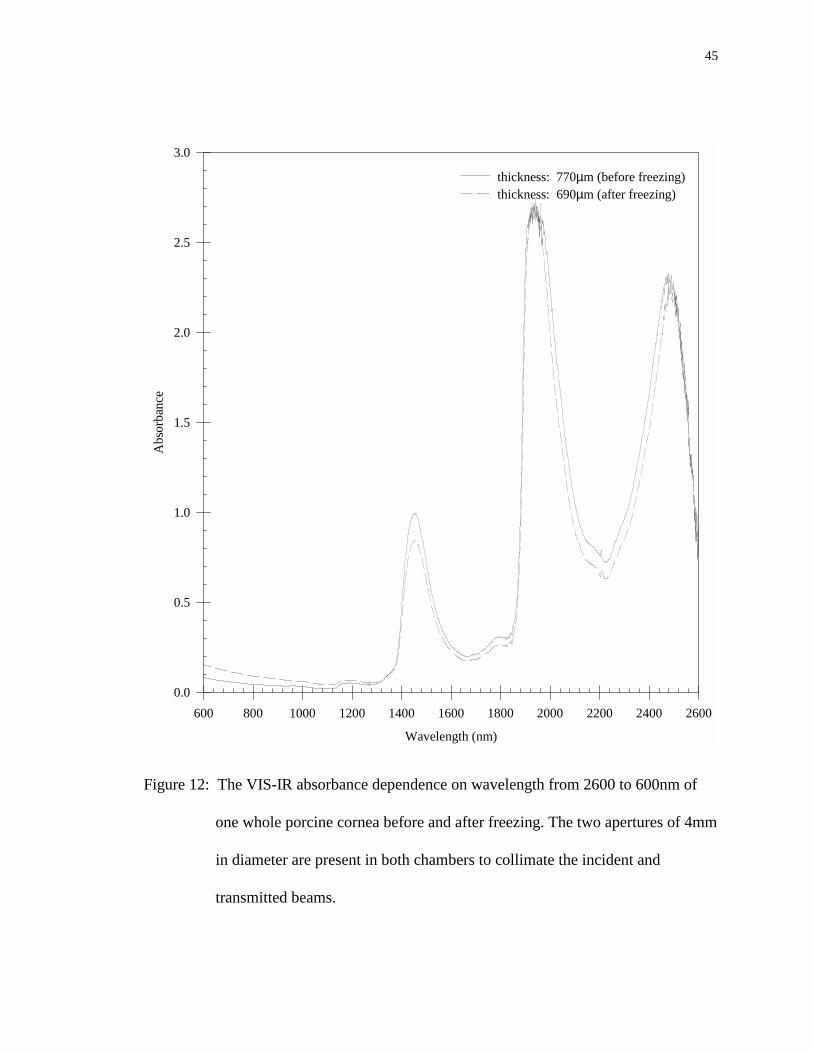
45
Wavelength (nm)
600 800 1000 1200 1400 1600 1800 2000 2200 2400 2600
Abs
orba
nce
0.0
0.5
1.0
1.5
2.0
2.5
3.0
thickness: 770µm (before freezing)thickness: 690µm (after freezing)
Figure 12: The VIS-IR absorbance dependence on wavelength from 2600 to 600nm of
one whole porcine cornea before and after freezing. The two apertures of 4mm
in diameter are present in both chambers to collimate the incident and
transmitted beams.
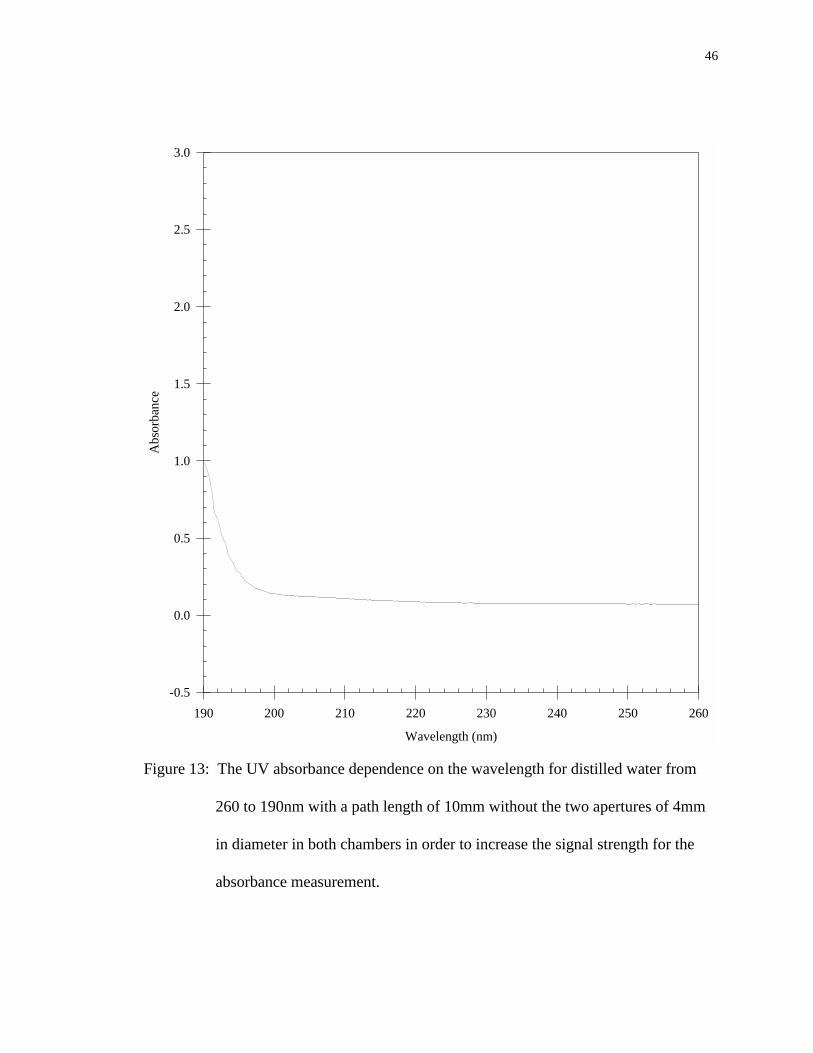
46
Wavelength (nm)
190 200 210 220 230 240 250 260
Abs
orba
nce
-0.5
0.0
0.5
1.0
1.5
2.0
2.5
3.0
Figure 13: The UV absorbance dependence on the wavelength for distilled water from
260 to 190nm with a path length of 10mm without the two apertures of 4mm
in diameter in both chambers in order to increase the signal strength for the
absorbance measurement.
47
References
1 Siegman AE, Lasers, Mill Valley, CA: University Science Books, 1986 2 Berns MW, "Laser surgery", Scientific American, :84-90, June 1991 3 Thomsen S, "Pathologic analysis of photothermal and photomechanical effects of
laser-tissue interactions", Photochem. Photobio., 53:825-835, 1991 4 Krauss JM, Puliafito CA, "Lasers in Ophthalmology", Lasers Surg. Med., 17:102-
159, 1995 5 Anderson RR, Parrish JA, "Selective photothermolysis: precise microsurgery by
selective absorption of pulsed Radiation", Science, 220:524-527, 1983 6 For review see, Welch AJ, Motamedi M, Raasteger S, LeCarpentier GL, Jansen
D, "Laser thermal ablation", Photochem. Photobio., 53:815-823, 1991 and references therein
7 Fuhimoto JG, Linn WZ, Eppen EP, Puliafito CA, Steinert RF, “Time-resolved
studies of Nd:YAG laser induced breakdown: plasma formation, acoustic wave generation, and cavitation”, Invest. Ophthalmol. Vis. Sci., 26:1771-1777, 1985
8 Hu XH, Juhasz T, "Study of corneal ablation with picosecond laser pulses at
211nm and 263nm", Laser Surg. Med., 18:373-380, 1996 9 Srinivasan R, Sutcliffe E, "Dynamic of the ultraviolet laser ablation of corneal
tissue", American Journal of Ophthalmology, 103:470-471, 1987 10 Steinert RF, Puliafito CA, Trokel S: “Plasma formation and shielding by three
ophthalmic Nd:YAG lasers, Am. J. Ophthalmol., 96:427-434 (1983) 11 Vogel A, Schwelger P, Frieser A, Asiyo MN, Birrngruber R, “Intraocular
Nd:YAG laser surgery: light-tissue interaction, damage range, and reduction of the collateral effects”, IEEE J. Quan. Electron., 26:2240-2260 (1990)
12 Ediger MN, Petit GH, Weiblinger RP, Chen CH, "Transmission of corneal
collagen during ArF excimer laser ablation", Lasers Surg. Med., 13:204-210, 1993 13 Watanabe S, Flotte TJ, McAuliffe DJ, Jacques SL, "Putative photoacoustic
damage in skin by pulsed ArF excimer laser", J. Invest. Dermatol., 90:761-766, 1988
48
14 Tuft S, Al-Dhahir R, Dyer P, Zhu ZH, "Characterization of the fluorescence
spectra produced by excimer laser irradiation of the cornea", Invest. Ophthalmol. Vis. Sci., 31:1512-1518, 1990
15 Ediger MN, "Excimer-laser-induced fluorescence of rabbit cornea: radiometric
measurement through the cornea", Lasers Surg. Med., 11:93-98, 1991 16 Puliafito CA, Steinert RF, Deutsch TF, Hillenkamp F, Dehm EJ, Adler CM,
"Excimer laser ablation of cornea and lens", Ophthalmology, 92:741-748, 1987 17 Trokel SL, Srinivasan R, Braren B, "Excimer laser surgery of the cornea", Amer.
J. Ophthalmology, 96:710-715, 1983 18 Krueger RR, Trokel SL, Schubert HD, "Interaction of ultraviolet laser light with
the cornea", Inv. Ophthalmol. Vis. Sci., 26:1455-1464, 1985 19 Ren Q, Galilitis RP, Thompson KP, Lin JT, "Ablation of the cornea and synthetic
polymers using a UV (213nm) solid state laser", IEEE J. Quan. Electron. 26:2284-2288, 1990
20 Mitchell J, Cenedella RJ, "Quantitation of ultraviolet light absorbing fractions of
the cornea", Cornea, 14:266-272, 1995 21 Krauss JM, Puliafito CA, Steinert RF, "Laser interaction with the cornea", Surv.
Ophthalmol., 31:37-53, 1986 22 Wheeland RG, "Clinical uses of lasers in dermatology", Lasers Surg. Med., 16:2-
23, 1995 23 Mackenzie IC, “Ordered structure of the epidermis”, J. Invest. Dermatol.,
65:45-51, 1975 24 Kligman AM, “The biology of the stratum corneum”, In Lobitz WC Jr,
Montagna W, eds. The Epidermis, New York: Academic Press, 1964 25 Lavker RM, Dong G, Zheng P, Murphy GF, "Hairless micropig skin: a novel
model for studies of cutaneous biology", American Journal of Pathology, 138:687-697, 1991
26 Bartell TH, Mustoe TA, “Animal models of human tissue expansion”, Plast.
Reconstru. Surg., 83:681-686, 1989

49
27 Loofbourow JR, Gould BS, Sizer IW, "Studies on the ultraviolet absorption of
collagen", Arch. Biochem., 22:406-411, 1949 28 Boettner EA, Wolter JR, “Transmission of the ocular media”, Investigative
Ophthalmology, 1:776-783, 1962 29 Lab Tek Products, Operating Manual: Tissue-Tek microtome-cryostat,
Naperville: Lab Tek, 1974 30 Varian Associates, Operating Manual: model 17D spectrophotometer system,
Palo Alto: Varian 31 Brown GG, An introduction to histotechnology, New York: Appleton-Century-
Crofts, 1978. 32 Preece A, A manual for histologic technicians, 3rd ed., New York:
Churchill/Livingston, 1972 33 Kachigan SK, Statistical analysis: an interdisciplinary introduction to univariate
and multivariate methods, New York: Radius Press, 1986 34 Milewski EG, The essentials of statistics II, New Jersey: REA, 1994
50
Appendix A: Cornea Sectioning
While preparing to study the absorption properties of the cornea, the challenge is
to design a sectioning procedure that preserves the absorption properties of the cornea. A
frozen sectioning method is chosen due to two advantages. First, there is the absence of
fixing agents that may distort tissue properties. Second, the duration of time before
examination of the section is greatly reduced. This is a supplement to the operating
manual29 for the Ames Tissue-Tek® Microtome /Cryostat: Microtome model no. 4551
and Cryostats nos. 4550 115 VAC/60HZ and 4552 220 VAC/50Hz. The procedure is
designed to slice 10 to 40µm contiguous sections of cornea in steps of 10µm while frozen
in a freezing preservation medium (OCT).
The advances in frozen sectioning developed from practice rather than theory
making the process an art before a science. There are many critical factors that effect the
quality of the slices attained. The tissue, knife, and tools must be maintained at a correct
temperature. If the temperature of the tissue is too low, the sections may crumble during
sectioning. In contrast, if the temperature is too high, the tissue and the OCT will not
remain frozen during sectioning. The optimal temperature of the tissue for sectioning the
cornea is approximately - 18°C. Likewise if the knife temperature is too high, the
sections may adhere to the knife making it difficult to transfer the section to the sample
holder. The knife’s sharpness and angle are also of critical importance. A dull, dirty
knife may tear the sections during the sectioning process. An improper knife angle may
cause tissue scraping, inconsistencies of section thickness, and also tearing of the section

51
during sectioning. The operating manual29 recommends a 5° angle, but experience and
personal preference will produce better sections. Also, the motion of turning the hand
wheel during the sectioning of the cornea will effect the quality of the sections obtained.
In order to obtain a contiguous section with uniform thickness, the hand wheel must be
turned with a fluid motion at approximately a constant rate for every section.
The following procedure mirrors the operating manual29 to an extent. The
additions are developed from trial and error.
A.1 Preparing the Cryostat-Microtome
1. The microtome-cryostat is cleaned from debris. All the movable parts are lubricated
with oil for better fluid motion while sectioning.
2. All tools, including the specimen blocks, used for the sectioning process are cleaned
and placed in the cryostat.
3. The knife is sharpened and placed in the cryostat and the knife advancement set to
10µm.
4. The cryostat is set at -18°C and allowed to cool for at least 12 hours before sectioning
takes place.

52
A.2 Preparing the Specimen Blocks
1. The specimen block is removed form the cryostat and its face warmed by rubbing it
with a finger which allows the OCT to adhere better to the specimen block and
prevents slippage during sectioning.
2. Enough OCT is placed on the specimen block to form a platform. The specimen
block is returned to the freeze bar to allow the OCT to freeze. (Freezing is complete
when the OCT turns solid white.)
3. The specimen block is mounted in the chuck of the microtome and the chuck
tightened to secure the specimen block in the uppermost position.
4. The knife’s edge is brought close to the frozen OCT platform by turning the gross
adjusting wheel clockwise. Then the hand wheel is turned to slice the OCT until a
large enough surface area results to occupy the cornea specimen.
5. The plate-type anti-roll device is lowered onto the knife to determine if the sections
will lay flat on the knife. The hand wheel is turned to obtain a section. If the section
does not lay flat on the knife, the plate-type anti-roll device is adjusted so that it is
parallel with the knife’s edge. The sectioning process is repeated until the section of
OCT lays flat on the knife.
6. The specimen block is removed from the chuck and returned to the freeze bar.
A.3 Preparing the Cornea for Sectioning
1. The cornea is prepared by rinsing any excess viscous fluid from it with saline. This
helps the cornea remain embedded in the OCT during sectioning.
53
2. The specimen block is removed from the freeze bar and placed outside the cryostat.
3. The cornea is placed, as flat as possible so no air will be trapped between the cornea
and the OCT, over the surface area of the OCT platform. The entire cornea is then
covered with OCT.
4. The specimen block is then returned to the freeze bar to allow the cornea to freeze for
15 minutes or longer. (Freezing is complete when the OCT is solid white.)
5. Once frozen, the specimen block is mounted in the chuck of the microtome and the
chuck tightened to secure the specimen block in the uppermost position.
A.4 Sectioning the Cornea
1. The knife’s edge is retreated by rotating the gross adjusting wheel counterclockwise
until the knife’s edge is just above the OCT. The hand wheel is turned to section the
OCT until the cornea is reached. This is apparent when a yellowish discoloration
appears representing the cornea specimen.
2. Slicing is continued until a full section of the corneal stroma (position dependent on
species of cornea), without holes or tears, appears with the desired surface area.
3. All debris is cleared away from the knife and plate-type anti-roll device.
4. The plate-type anti-roll device is lowered onto the knife.
5. The hand wheel is turned to obtain the desired thickness of the cornea section. Since
the knife advancement is set at 10µm, the hand wheel is turned clockwise until the
section is almost sliced and then back counterclockwise to obtain a 20µm section.

54
The knife is advanced immediately before sectioning, so rotating the hand wheel in
this manner advances the knife twice, 20µm, before the section is sliced.
6. The cornea section is allowed to remain on the knife for a few seconds to allow the
section to recool before transferring to the sample holder.
A.5 Transferring the Cornea Section to the Sample Holder
1. The optical window of the sample holder is cleaned thoroughly with acetone and
placed at room temperature.
2. The plate-type anti-roll device is lifted from the knife.
3. The optical window is placed directly above the cornea section, so that the cornea
section is directly below the exact desired position on the optical window.
4. The optical window is then lowered to barely touch the cornea section.
5. Once the cornea section adheres to the optical window, the optical window is
removed from the cryostat and allowed to return to room temperature. The cornea
section is then clamped between the two optical windows forming the sample holder.
55
Appendix B: Calibration of the Spectrophotometer
B.1 Cleaning
The lenses and mirrors are cleaned with acetone and the optical compartment is
purged for 15 minutes with nitrogen at 1.5 l/min.
B.2 Zero T Check (refer to Section 1.6 pp. 1-44)30
B.2.1 For UV-VIS Detector
With the detector set on UV-VIS, the Absorbance Drift Test Switch is set to
Absorbance Drift (the out position) giving an absorbance reading of +0.0005. Then the
Absorbance Drift Test Switch is set to Operate (the in position) giving an absorbance
reading of +0.0000.
B.2.2 For IR Detector
With the detector set on IR, the Absorbance Drift Test Switch is set to
Absorbance Drift (the out position) giving an absorbance reading of -0.0005. Then the
Absorbance Drift Test Switch is set to Operate (the in position) giving an absorbance
reading of ±0.0100.
Since the absorbance readings are greater than ±0.0004 for both the UV-VIS and
IR detectors, the adjustment procedure is followed in Section 13.5.4.6.1 pp. 13-57 in the
56
spectrophotometer’s manual.30 Once the procedure is finished, then the Zero T Check is
repeated.
B.2.3 For UV-VIS Detector
With the detector set on UV-VIS, the Absorbance Drift Test Switch is set to
Absorbance Drift (the out position) giving an absorbance reading of +0.0001. Then the
Absorbance Drift Test Switch is set to Operate (the in position) giving an absorbance
reading of +0.0000.
B.2.4 For IR Detector
With the detector set on IR, the Absorbance Drift Test Switch is set to
Absorbance Drift (the out position) giving an absorbance reading of 0.0000. Then the
Absorbance Drift Test Switch is set to Operate (the in position) giving an absorbance
reading that fluctuates between ±0.0005.
B.3 Checking the Wavelength Counter versus Time
The Wavelength Scan Speed is set at 0.5nm/sec and the time is taken with a
stopwatch every 10nm. A consistent change in time is seen as the wavelength scanned
which shows linearity in the scan speed. The test is repeated for a Wavelength Scan
Speed of 0.1nm/sec and shows the same result.
57
B.4 Checking the Relationship Between the Spectrophotometer’s Digital Display
and the Computer Reading
The wavelength is set at 550nm and the Slit Knob at 3.0. In order to change the
Digital Display reading, the Balance is adjusted and various colored filters are placed in
the sample chamber to obtain a higher absorbance. The graph of the Computer Reading
versus the Digital Display shows a 1:1 ratio between the two readings.
B.5 Starting and Warm-up of Spectrophotometer
The spectrophotometer is turned on and set at the settings that will be used during
the scan as described on pp. 5-7 of the spectrophotometer’s manual.30 It is important to
allow the spectrophotometer to warm-up for at least one hour at the initial settings before
any measurements are taken. This allows for the electronics to come to an operating
temperature.
B.6 Zero Absorbance Baseline for UV, VIS, and IR Wavelengths
In order to have a zero reading without a sample, the spectrophotometer has to be
calibrated to eliminate very slight differences in beam geometry that can cause the zero
absorbance to vary from one wavelength to another. The spectrophotometer has a
multiple potentiometer (Multipots) systems that may be adjusted to eliminate such
variations from the measurement of zero absorbance level. The procedure used to
straighten and zero the baseline is on pp. 5-23 of the spectrophotometer’s manual.30 This
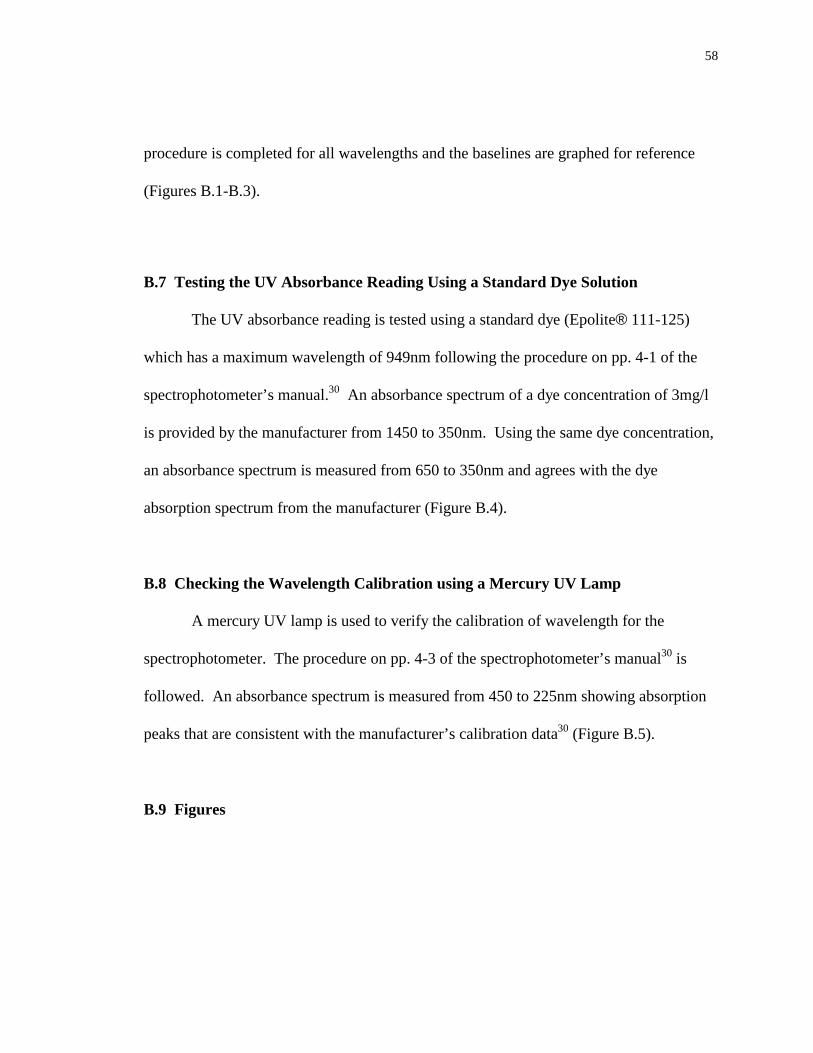
58
procedure is completed for all wavelengths and the baselines are graphed for reference
(Figures B.1-B.3).
B.7 Testing the UV Absorbance Reading Using a Standard Dye Solution
The UV absorbance reading is tested using a standard dye (Epolite® 111-125)
which has a maximum wavelength of 949nm following the procedure on pp. 4-1 of the
spectrophotometer’s manual.30 An absorbance spectrum of a dye concentration of 3mg/l
is provided by the manufacturer from 1450 to 350nm. Using the same dye concentration,
an absorbance spectrum is measured from 650 to 350nm and agrees with the dye
absorption spectrum from the manufacturer (Figure B.4).
B.8 Checking the Wavelength Calibration using a Mercury UV Lamp
A mercury UV lamp is used to verify the calibration of wavelength for the
spectrophotometer. The procedure on pp. 4-3 of the spectrophotometer’s manual30 is
followed. An absorbance spectrum is measured from 450 to 225nm showing absorption
peaks that are consistent with the manufacturer’s calibration data30 (Figure B.5).
B.9 Figures
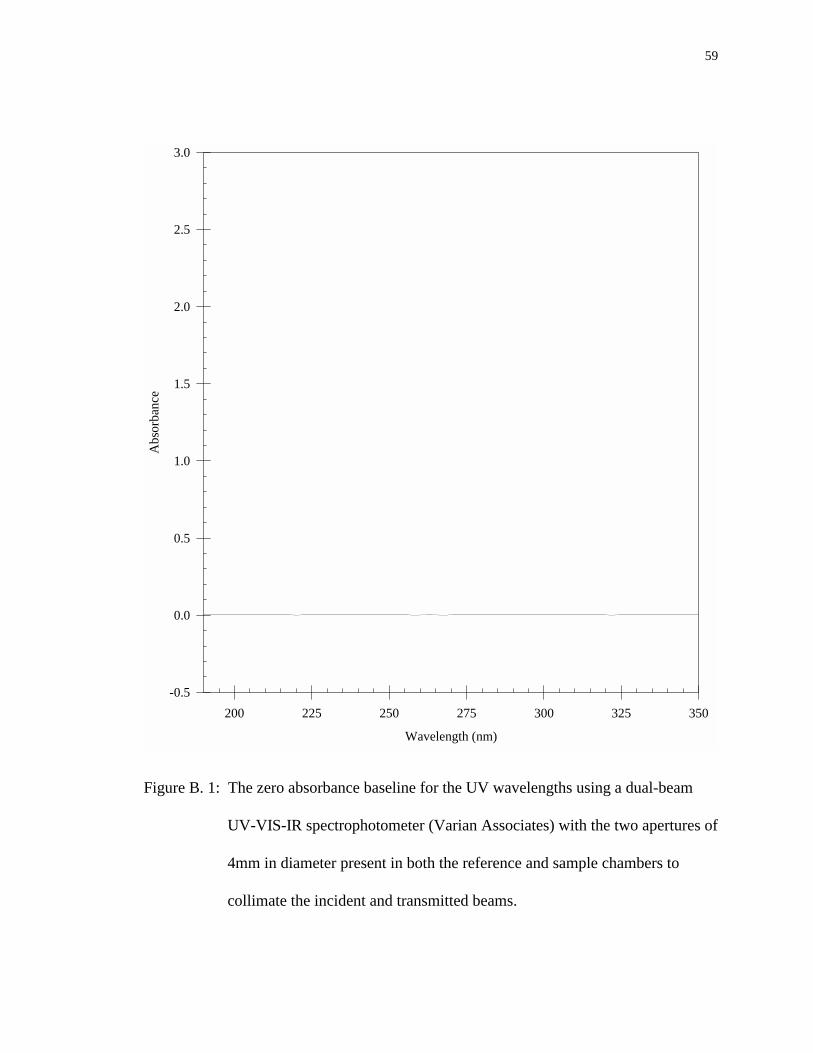
59
Wavelength (nm)
200 225 250 275 300 325 350
Abs
orba
nce
-0.5
0.0
0.5
1.0
1.5
2.0
2.5
3.0
Figure B. 1: The zero absorbance baseline for the UV wavelengths using a dual-beam
UV-VIS-IR spectrophotometer (Varian Associates) with the two apertures of
4mm in diameter present in both the reference and sample chambers to
collimate the incident and transmitted beams.

60
Wavelength (nm)
350 400 450 500 550 600 650 700 750 800
Abs
orba
nce
-0.5
0.0
0.5
1.0
1.5
2.0
2.5
3.0
Figure B. 2: The zero absorbance baseline for the VIS wavelengths using a dual-beam
UV-VIS-IR spectrophotometer (Varian Associates) with the two apertures of
4mm in diameter present in both the reference and sample chambers to
collimate the incident and transmitted beams.

61
Wavelength (nm)
600 800 1000 1200 1400 1600 1800 2000 2200 2400 2600
Abs
orba
nce
-0.5
0.0
0.5
1.0
1.5
2.0
2.5
3.0
Figure B. 3: The zero absorbance baseline for the VIS-IR wavelengths using a dual-beam
UV-VIS-IR spectrophotometer (Varian Associates) with the two apertures of
4mm in diameter present in both the reference and sample chambers to
collimate the incident and transmitted beams.
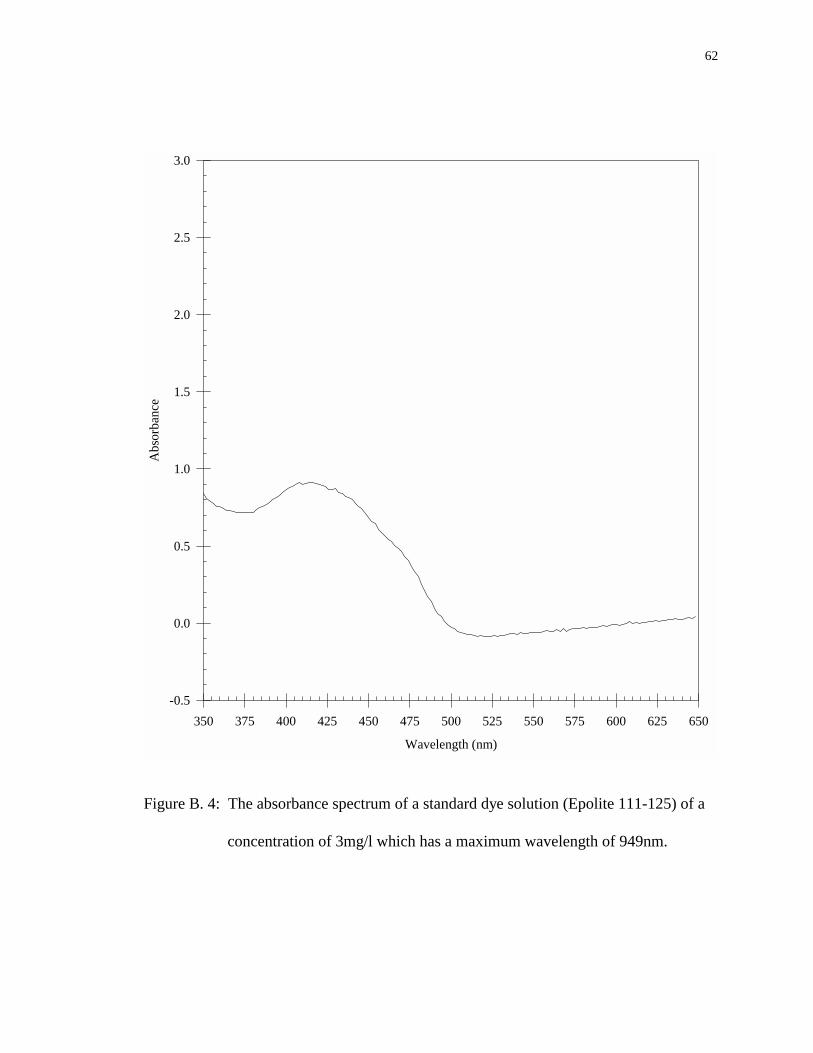
62
Wavelength (nm)
350 375 400 425 450 475 500 525 550 575 600 625 650
Abs
orba
nce
-0.5
0.0
0.5
1.0
1.5
2.0
2.5
3.0
Figure B. 4: The absorbance spectrum of a standard dye solution (Epolite 111-125) of a
concentration of 3mg/l which has a maximum wavelength of 949nm.
63
Wavelength (nm)
225 250 275 300 325 350 375 400 425 450
Abs
orba
nce
0.0
0.5
1.0
1.5
2.0
2.5
3.0
435.55nm
434.50nm
407.75nm
404.40nm
366.10nm
365.30nm
364.80nm
334.25nm
312.85nm
312.30nm
302.25nm
296.40nm
289.00nm282.63nm
282.00nm
280.25nm
265.13nm
253.35nm
248.00nm
Figure B. 5: The absorbance spectrum of a mercury UV lamp from 450nm to 225nm
used test the wavelength calibration of the spectrophotometer.
64
Appendix C: Procedure for UV Absorbance Spectra of Corneas
C.1 Set-up Parameters
C.1.1 Spectrophotometer Settings
Slit Knob: 3.0
Pen Period: 1.0
Lamp Source: UV High
Multipots: UV
Scan Speed: 0.05nm/sec
Detector: UV/VIS
Wavelength Counter: set on 350nm or 260nm
Absorbance Suppression: 0.0 but changes throughout spectrum
C.1.2 Data Acquisition Parameters for Computer Program
Number of points was usually set at 2000
Time between each data point: 5 seconds
C.2 Procedure for Measuring Absorbance
1. The spectrophotometer is allowed to warm up for 1 hour while the parameters are set
on the settings to be used during the scan to allow the electronics to come to an
operating temperature.
65
2. Once the spectrophotometer is warmed up, a cornea section is obtained and placed in
the sample holder in the sample compartment. Both the reference compartment and
the sample compartment are closed.
3. The absorbance reading is taken at 350 or 260nm with the Absorbance Suppression
set at 0.0. If the reading is exceeds the scale, the Absorbance Suppression setting is
increased until the absorbance reading is on scale. The Absorbance Suppression
setting is noted and the scan is taken.
4. When the absorbance reading during the scan exceeds the scale, the scan was stopped,
data saved, and wavelength noted. The Absorbance Suppression setting is increased
or decreased by one scale and the scan is resumed while overlapping the previous
scan by ~5nm. The wavelength at which the scan begins and the new Absorbance
Suppression setting are noted.
5. The previous step is repeated until a full spectrum is obtained to 190nm.
6. Once the spectrum is completed, the sample holder is removed from the sample
compartment and the cornea thickness is obtained.
7. The cornea thickness is obtained by taking the difference of the sample holder with
and without the cornea section.
8. The data is then plotted on SigmaPlot.
9. To convert the computer data into total absorbance (which includes the absorbance of
the cornea section and sample holder), the computer data is imported and the
66
following formula is used:
Total Absorbance Measurementcomputer data Absorbance Suppression
=
+( )4096
(C.1)
10. The portions of the spectrum that overlapped are averaged.
11. The total absorbance measurement, including the absorbance of the cornea section
and the sample holder, is subtracted by the absorbance of the sample holder to obtain
the absorbance of the cornea section.
12. The absorbance measurement of the cornea section is then plotted as a function of
wavelength.
67
Appendix D: Procedure for VIS-IR Absorbance Spectra of Corneas
D.1 Set-up Parameters
D.1.1 Spectrophotometer Settings
Slit Knob: 3.0
Pen Period: 1.0
Lamp Source: VIS-IR adjustable
Lamp Voltage: 90V
Multipots: IR
Scan Speed: 0.5nm/sec
Detector: IR
Wavelength Counter: set on 2600nm
Absorbance Suppression: 0.0 but changes throughout spectrum
D.1.2 Data Acquisition Parameters for Computer Program
Number of points was usually set at 205
Time between each data point: 2 seconds
D.2 Procedure for Measuring Absorbance
1. The spectrophotometer is allowed to warm up for 1 hour while the parameters are set
on the settings that are going to be used during the scan to allow the electronics to
come to an operating temperature.
68
2. Once the spectrophotometer is warmed up, a whole excised cornea is obtained and
placed in the sample holder in the sample compartment. Both the reference
compartment and the sample compartment are closed.
3. The absorbance reading is taken at 2600nm with the Absorbance Suppression set at
0.0. If the reading exceeds the scale, the Absorbance Suppression setting is increased
until the absorbance reading is on scale. The Absorbance Suppression setting is noted
and the scan is taken.
4. When the absorbance reading during the scan exceeds the scale, the scan is stopped,
data saved, and wavelength and the number of computer data points noted. Then the
Absorbance Suppression setting is increased or decreased by one scale and the scan is
resumed while overlapping the previous scan by ~5nm. The wavelength at which the
scan begins and the new Absorbance Suppression setting are noted.
5. There is a 5% error in the computer’s timer that is more critical in scans over 200nm.
Therefore, the scan is stopped and resumed, while overlapping the previous scan by
~5nm, every 200nm if the absorbance reading during the scan does not exceed the
scale of the spectrophotometer first.
6. The previous steps are repeated until a full spectrum is obtained to 600nm.
7. Once the spectrum is completed, the sample holder is removed from the sample
compartment and the cornea thickness is obtained.
8. The cornea thickness is obtained by taking the difference of the sample holder with
and without the cornea.
9. The data is then plotted on SigmaPlot.
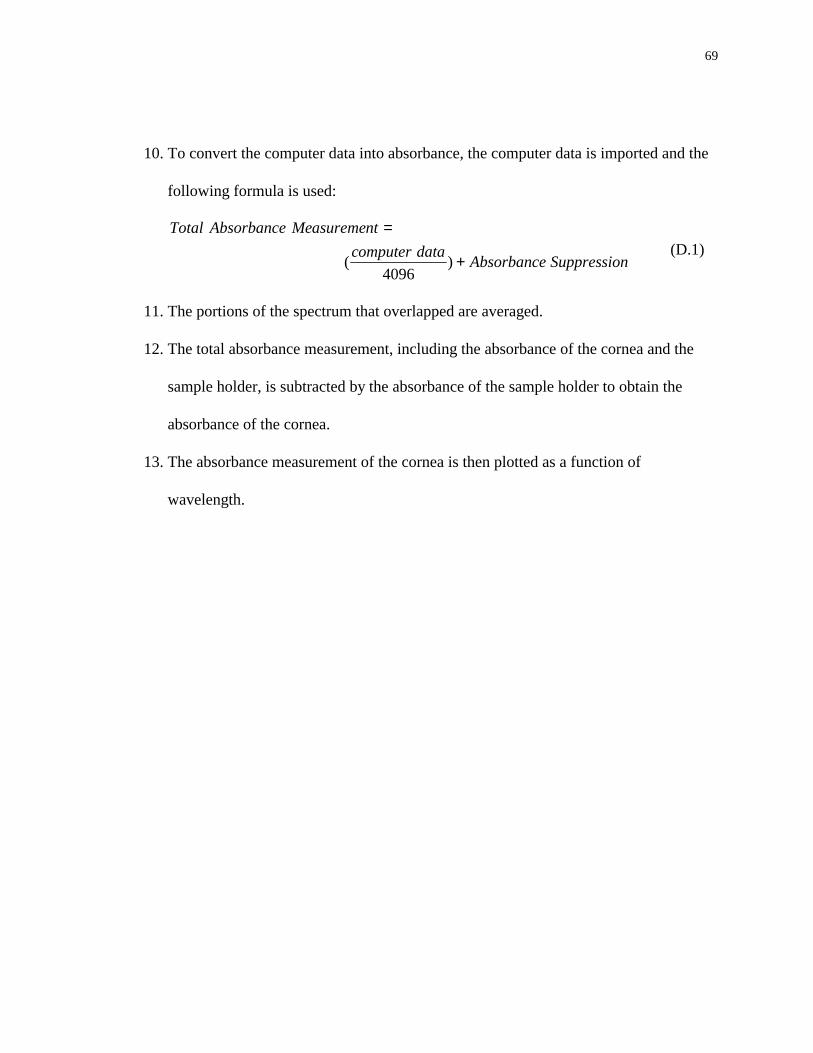
69
10. To convert the computer data into absorbance, the computer data is imported and the
following formula is used:
Total Absorbance Measurementcomputer data Absorbance Suppression
=
+( )4096
(D.1)
11. The portions of the spectrum that overlapped are averaged.
12. The total absorbance measurement, including the absorbance of the cornea and the
sample holder, is subtracted by the absorbance of the sample holder to obtain the
absorbance of the cornea.
13. The absorbance measurement of the cornea is then plotted as a function of
wavelength.
70
Appendix E: Preparing Porcine Skin Tissue Slides
The histology technique chosen to quantitatively measure the ablation depth as a
function of laser pulse energy and spot size insures the minimum amount of artifacts and
ablation cut distortion. It is important to use a fixer that will penetrate quickly without
causing the tissue to become to brittle to section. The amount of time for the dehydration,
clearing, and infiltration processes is a difficult obstacle due to the thickness of the skin
samples and the fat concentration. The timing sequences for the dehydration, clearing,
and infiltration with paraffin in the tissue are based on the visually averaged thickness of
the tissue. For skin samples that are thicker than the average, another 30 minutes is added
to each step of the of the dehydration, clearing and infiltration procedures. However, a
shorter time is never used than stated in the following procedure. The remainder of the
technique mirrors that presented in many histology references.25,31,32
E.1 Fixation
After ablation, the skin is trimmed and placed in 10% Buffered Formalin for at
least 24 hours.
E.2 Dehydration
1. After 24 hours, the formalin in the vial containing the skin is removed with a pipette
and replaced with 70% ETOH for at least 30 minutes. The skin may remain in the
70% ETOH until ready to proceed.
71
2. After at least 30 minutes, the 70% ETOH in the vial containing the skin is removed
with a pipette and replaced with 95% ETOH. Once this is done, the procedure must
be followed through to step 3 of Clearing. The skin should remain in the 95% ETOH
for 30 minutes.
3. After 30 minutes, the 95% ETOH in the vial containing the skin is removed with a
pipette and replaced with Absolute Alcohol. The skin should remain in the Absolute
Alcohol for 30 minutes.
E.3 Clearing
1. After 30 minutes, the Absolute Alcohol in the vial containing the skin is removed
with a pipette and replaced with Xylene. If the Xylene turns cloudy immediately after
its addition, then the skin is returned to Absolute Alcohol for another 30 minutes to
remove the remaining water in the skin. The skin should remain in the Xylene for 30
minutes.
2. After 30 minutes, the Xylene in the vial containing the skin is removed with a pipette
and replaced with 1:1 Xylene:Methanol Salicylate. The skin should remain in the 1:1
Xylene:Methanol Salicylate for 30 minutes.
3. After 30 minutes, the 1:1 Xylene:Methanol Salicylate in the vial containing the skin is
removed with a pipette and replaced with Methanol Salicylate. The skin should
remain in the Methanol Salicylate for at least 30 minutes. The skin may remain in the
Methanol Salicylate until ready to proceed.

72
E.4 Infiltration
1. After at least 30 minutes, the Methanol Salicylate in the vial containing the skin is
removed with a pipette. The skin is then transfer to melted Paraplast in a dish and
placed in an oven (set at 60°C, which is 2 or 3° above the melting point of Paraplast)
for 1 hour.
2. After 1 hour, the paraffin is poured off the skin into a waste container and the dish is
refilled with fresh Paraplast. The dish is then returned to the oven for another hour.
3. After another hour, the paraffin is poured off the skin into a waste container and the
dish is refilled with fresh Paraplast. The dish is then returned to the oven for another
hour.
E.5 Embedding
1. During the last hour of infiltration, a metal mold should be prepared for the
embedding process. The metal mold is coated with glycerine to prevent the Paraplast
from adhering to it.
2. The dish containing the skin sample is removed from the oven and the excess paraffin
is poured into the waste container. The dish is then placed on a hot plate.
3. Melted Paraplast is then poured into the mold. The bottom and the sides are allowed
to solidify. The top portion of the paraffin is stirred with a warm needle to prevent it
from hardening in the center.
4. The skin sample is placed in the metal mold filled with paraffin and a warm needle is
used to orientate the skin sample in the position necessary for slicing. In this case, the
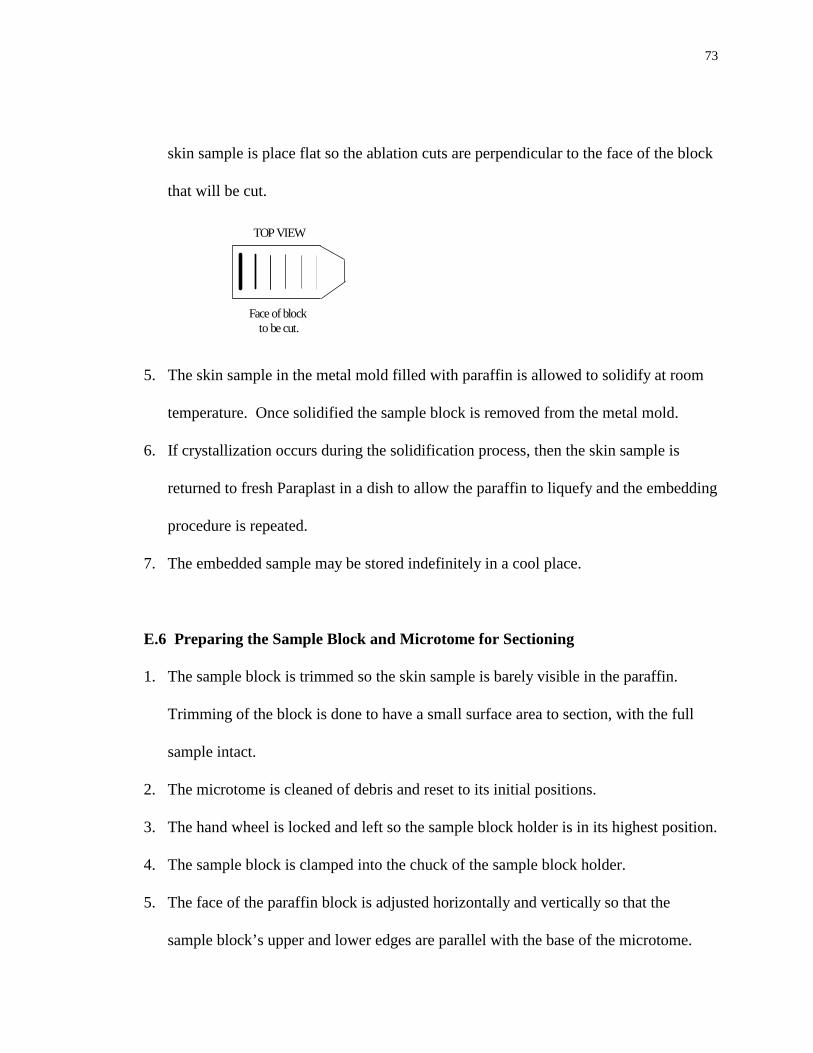
73
skin sample is place flat so the ablation cuts are perpendicular to the face of the block
that will be cut.
Face of block to be cut.
TOP VIEW
5. The skin sample in the metal mold filled with paraffin is allowed to solidify at room
temperature. Once solidified the sample block is removed from the metal mold.
6. If crystallization occurs during the solidification process, then the skin sample is
returned to fresh Paraplast in a dish to allow the paraffin to liquefy and the embedding
procedure is repeated.
7. The embedded sample may be stored indefinitely in a cool place.
E.6 Preparing the Sample Block and Microtome for Sectioning
1. The sample block is trimmed so the skin sample is barely visible in the paraffin.
Trimming of the block is done to have a small surface area to section, with the full
sample intact.
2. The microtome is cleaned of debris and reset to its initial positions.
3. The hand wheel is locked and left so the sample block holder is in its highest position.
4. The sample block is clamped into the chuck of the sample block holder.
5. The face of the paraffin block is adjusted horizontally and vertically so that the
sample block’s upper and lower edges are parallel with the base of the microtome.
74
6. The blade edge is cleaned with Xylene and placed in the microtome holder. The
angle of the blade should be approximately 20°.
7. The hand wheel is unlocked and the sample block is positioned so it is level with the
knife blade.
8. The knife holder is unlocked and positioned so the knife’s edge is almost in contact
with the face of the sample block. The knife holder is then locked back into position.
9. The desire thickness of the sections is set at 10µm.
E.7 Sectioning of the Sample Block
1. The hand wheel is turned at a steady rhythm.
2. Several sections are cut until the center of the ablation cuts is reached (approximately
1 to 1.5cm into the skin sample).
3. Once the center of the ablation cuts is reached and the previous sections are discarded,
a ribbon of sections about 10cm long is cut.
4. The ribbon is detached from the knife’s edge and laid on a flat surface.
5. When finished obtaining all of the necessary ribbons, the knife blade is cleaned with
Xylene and placed in the refrigerator.
E.8 Preparing the Slides
1. The slides are first cleaned with acid and 70% ETOH and then labeled.
2. The ribbons are divided into sections containing 5 to 7 sample sections.
75
3. A drop of albumen is placed on a cleaned slide and rubbed into the surface of the
slide with a clean finger. The excess albumen is removed with tissue paper.
4. The albumenized surface is covered with a thin layer of distilled water.
5. Using forceps, a ribbon section containing 5 to 7 sample sections is placed on the thin
layer of distilled water.
6. The slides are placed on a covered warming table (set at 42°C), in order to remove
wrinkles in the sections, overnight.
E.9 Staining the Slides
1. The slides are removed from the warming table and allowed to cool to room
temperature.
2. For each of the following steps, the slides are drained on a paper towel between the
solutions and left in the solutions for the appropriate time limit.
3. Xylene (3 minutes)
4. Xylene (3 minutes)
5. 100% ETOH (2 minutes)
6. 95% ETOH (2 minutes)
7. 70% ETOH (2 minutes)
8. A jar was placed in the sink and cold tap water is allowed to drip rapidly on the slides
(3 minutes)
9. Delafield’s (or Harris) Hematoxylin (5 Minutes)
10. Running tap water as in Step 3 (3 minutes)
76
11. 70% ETOH (3 minutes)
12. 70% ETOH (2 minutes)
13. Eosin (1 minute)
14. 95% ETOH (a few seconds)
15. 100% ETOH (2 minutes)
16. 100% ETOH (2 minutes)
17. Xylene (3 to 15 minutes)
18. Removing one slide from the Xylene at a time, a drop of thin mounting medium is
placed over the wet sections and carefully covered with a clean cover slip (avoiding
air bubbles).
19. The slides are store in the horizontal position until dry.
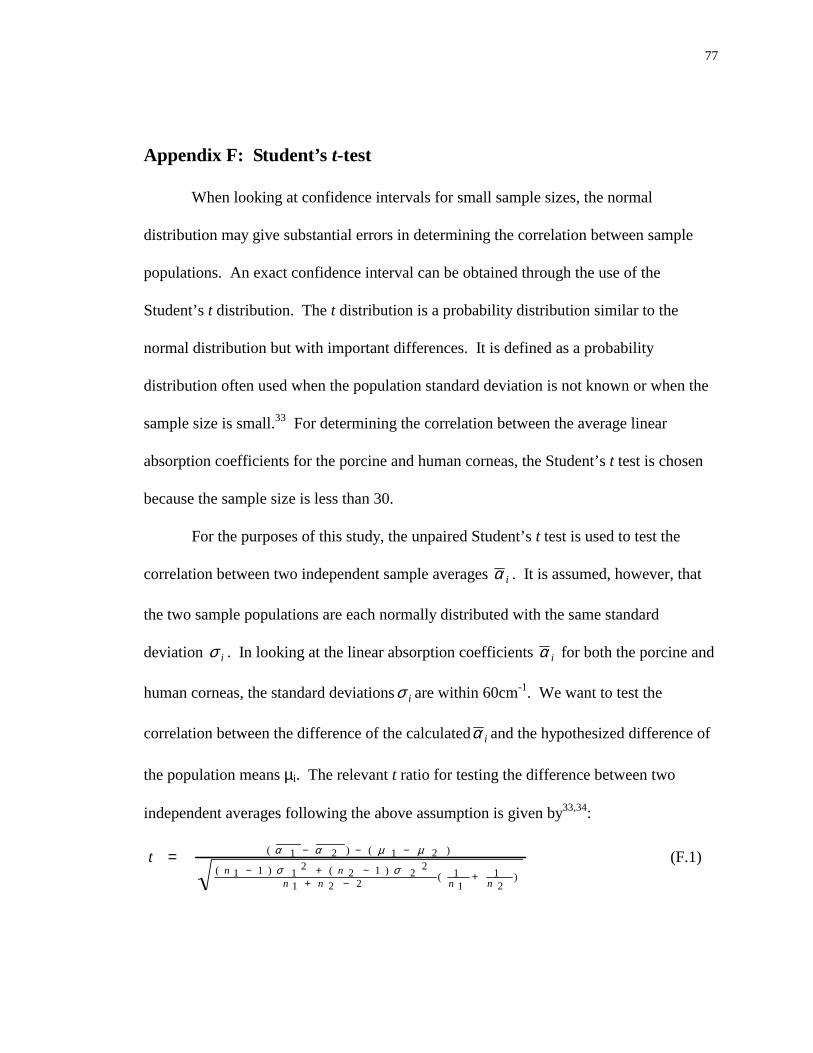
77
Appendix F: Student’s t-test
When looking at confidence intervals for small sample sizes, the normal
distribution may give substantial errors in determining the correlation between sample
populations. An exact confidence interval can be obtained through the use of the
Student’s t distribution. The t distribution is a probability distribution similar to the
normal distribution but with important differences. It is defined as a probability
distribution often used when the population standard deviation is not known or when the
sample size is small.33 For determining the correlation between the average linear
absorption coefficients for the porcine and human corneas, the Student’s t test is chosen
because the sample size is less than 30.
For the purposes of this study, the unpaired Student’s t test is used to test the
correlation between two independent sample averages α i . It is assumed, however, that
the two sample populations are each normally distributed with the same standard
deviation σ i . In looking at the linear absorption coefficients α i for both the porcine and
human corneas, the standard deviationsσ i are within 60cm-1. We want to test the
correlation between the difference of the calculatedα i and the hypothesized difference of
the population means µi. The relevant t ratio for testing the difference between two
independent averages following the above assumption is given by33,34:
tn n
n n n n
= − − −
− + −+ − +
( ) ( )
( ) ( ) ( )
α α µ µ
σ σ1 2 1 2
1 1 1 2 2 1 2 2
1 2 211
12
(F.1)
78
which is the unpaired Student’s t-test with degrees of freedom (n1 + n2 – 2) where α i is
the average linear absorption coefficient for our sample of the population i, ni is the
sample size, σi is the standard deviation of α i , and µi is the average linear absorption
coefficient for the population i.
To determine the correlation between the porcine and human cornea’s linear
absorption coefficients α at 220, 215, 210 and 193nm, the t ratio is found using Eq. (F.1)
where the difference in the population averages is assumed to be zero, which is referred
to as the null hypothesis. By evaluating against the null hypothesis, we are determining
the probability that the sample means are the same.
Once the t ratio is calculated, a confidence level is chosen to evaluate if the null
hypothesis should be rejected.33,34 For the cornea data, a 95% confidence level is chosen
using the two-tail approach. The two-tail approach tests if the probability is divided
between both the tails of distribution. Therefore, the probability of a difference in α is
not dependent on the direction of distribution. Once the t ratio is calculated, it is
compared to the table of critical t ratios for a specific confidence level and a
corresponding degree of freedom. It is found that the calculated t ratio is less than the
critical value of t at the 95% confidence level for the four wavelengths. This indicates
that the null hypothesis is valid and shows that the average linear absorption coefficients
have a 95% probability of being equivalent. Therefore, it is determined that the linear
absorption coefficients of the porcine and human corneas are less than 5% significantly

79
different. Because α i is determined from a random sampling of the population, we also
conclude that µi is the same value as α i .


![Index Abbreviations, 1.4.2.1.[A] Absorbent materials ...](https://static.fdokumen.com/doc/165x107/632130edaa6c954bc707258c/index-abbreviations-1421a-absorbent-materials-.jpg)

