Linux Systems Performance: Tracing, Profiling, and Visualization
91
Linux Systems Performance Tracing, Profiling, and Visualization G. Amadio (EP-SFT) Nov, 2020
-
Upload
khangminh22 -
Category
Documents
-
view
2 -
download
0
Transcript of Linux Systems Performance: Tracing, Profiling, and Visualization

Linux Systems PerformanceTracing, Profiling, and Visualization
G. Amadio (EP-SFT) Nov, 2020

Performance is challenging
Some things that can go wrong:
● Measurement
○ Overhead from instrumentation and measurement○ Variable CPU frequency scaling (turbo boost, thermal throttling)○ Missing symbols (JIT, interpreted languages, stripped binaries)○ Broken stack unwinding (deep call stacks, inlining, missing frame pointer)
● Optimization and Tuning
○ Concurrency issues (shared resources with hyperthreading, contention)○ Compiler optimizations (exceptions vs vectorization, denormals, dead code)○ Memory alignment, access patterns, fragmentation○ Addressing the wrong issue (optimizing compute for memory bound problem and vice-versa)
2

A pinch of UNIX wisdom – on handling complexityRule 1 You can't tell where a program is going to spend its time. Bottlenecks occur in surprising places, so don't try to second guess and put in a speed hack until you've proven that's where the bottleneck is.
Rule 2 Measure. Don't tune for speed until you've measured, and even then don't unless one part of the code overwhelms the rest.
Rule 3 Fancy algorithms are slow when n is small, and n is usually small. Fancy algorithms have big constants. Until you know that n is frequently going to be big, don't get fancy. (Even if n does get big, use Rule 2 first.)
Rule 4 Fancy algorithms are buggier than simple ones, and they're much harder to implement. Use simple algorithms as well as simple data structures.
Rule 5 Data dominates. If you've chosen the right data structures and organized things well, the algorithms will almost always be self-evident. Data structures, not algorithms, are central to programming.
Rule 6 There is no Rule 6.
3
from “Notes on C Programming”, by Rob Pike

Measuring Performance

● Official Linux profiler (source code is part of the kernel itself)● Both hardware and software based performance monitoring● Much lower overhead compared with instrumentation-based profiling● Kernel and user space● Counting and Sampling
○ Counting — count occurrences of a given event (e.g. cache misses)○ Event-based Sampling — a sample is recorded when a threshold of events has occurred○ Time-based Sampling — samples are recorded at a given fixed frequency○ Instruction-based Sampling — processor follows instructions and samples events they create
● Static and Dynamic Tracing○ Static — pre-defined tracepoints in software○ Dynamic — tracepoints created using uprobes (user) or kprobes (kernel)
5
perf – Performance analysis tools for Linux

perf – subcommandsbash ~ $ perf
usage: perf [--version] [--help] [OPTIONS] COMMAND [ARGS]
The most commonly used perf commands are: annotate Read perf.data (created by perf record) and display annotated code archive Create archive with object files with build-ids found in perf.data file c2c Shared Data C2C/HITM Analyzer. config Get and set variables in a configuration file. data Data file related processing diff Read perf.data files and display the differential profile evlist List the event names in a perf.data file list List all symbolic event types mem Profile memory accesses record Run a command and record its profile into perf.data report Read perf.data (created by perf record) and display the profile sched Tool to trace/measure scheduler properties (latencies) script Read perf.data (created by perf record) and display trace output stat Run a command and gather performance counter statistics timechart Tool to visualize total system behavior during a workload top System profiling tool. version display the version of perf binary probe Define new dynamic tracepoints trace strace inspired tool
See 'perf help COMMAND' for more information on a specific command.
6

perf – hardware and software eventsbash ~ $ perf list hw cache
List of pre-defined events (to be used in -e):
branch-instructions OR branches [Hardware event] branch-misses [Hardware event] cache-misses [Hardware event] cache-references [Hardware event] cpu-cycles OR cycles [Hardware event] instructions [Hardware event] stalled-cycles-backend OR idle-cycles-backend [Hardware event] stalled-cycles-frontend OR idle-cycles-frontend [Hardware event]
L1-dcache-load-misses [Hardware cache event] L1-dcache-loads [Hardware cache event] L1-dcache-prefetches [Hardware cache event] L1-icache-load-misses [Hardware cache event] L1-icache-loads [Hardware cache event] branch-load-misses [Hardware cache event] branch-loads [Hardware cache event] dTLB-load-misses [Hardware cache event] dTLB-loads [Hardware cache event] iTLB-load-misses [Hardware cache event] iTLB-loads [Hardware cache event]
7
bash ~ $ perf list sw
List of pre-defined events (to be used in -e):
alignment-faults [Software event] bpf-output [Software event] context-switches OR cs [Software event] cpu-clock [Software event] cpu-migrations OR migrations [Software event] dummy [Software event] emulation-faults [Software event] major-faults [Software event] minor-faults [Software event] page-faults OR faults [Software event] task-clock [Software event]
duration_time [Tool event]

perf – Intel Skylake eventsbash ~ $ perf list pipeline
List of pre-defined events (to be used in -e):
pipeline: arith.divider_active [Cycles when divide unit is busy executing divide or square root operations. Accounts for integer and floating-point operations] baclears.any [Counts the total number when the front end is resteered, mainly when the BPU cannot provide a correct prediction] br_inst_retired.all_branches [All (macro) branch instructions retired Spec update: SKL091] br_inst_retired.all_branches_pebs [All (macro) branch instructions retired Spec update: SKL091 (Must be precise)] br_inst_retired.conditional [Conditional branch instructions retired Spec update: SKL091 (Precise event)] br_inst_retired.far_branch [Counts the number of far branch instructions retired Spec update: SKL091 (Precise event)] br_inst_retired.near_call [Direct and indirect near call instructions retired Spec update: SKL091 (Precise event)] br_inst_retired.near_return [Return instructions retired Spec update: SKL091 (Precise event)] br_inst_retired.near_taken [Taken branch instructions retired Spec update: SKL091 (Precise event)] br_inst_retired.not_taken [Counts all not taken macro branch instructions retired Spec update: SKL091 (Precise event)] br_misp_retired.all_branches [All mispredicted macro branch instructions retired] ...
8

perf – AMD Ryzen eventsbash ~ $ perf list core
List of pre-defined events (to be used in -e):
core: ex_div_busy [Div Cycles Busy count] ex_div_count [Div Op Count] ex_ret_brn [Retired Branch Instructions] ex_ret_brn_far [Retired Far Control Transfers] ex_ret_brn_ind_misp [Retired Indirect Branch Instructions Mispredicted] ex_ret_brn_misp [Retired Branch Instructions Mispredicted] ex_ret_brn_resync [Retired Branch Resyncs] ex_ret_brn_tkn [Retired Taken Branch Instructions] ex_ret_brn_tkn_misp [Retired Taken Branch Instructions Mispredicted] ex_ret_cond [Retired Conditional Branch Instructions] ex_ret_cond_misp [Retired Conditional Branch Instructions Mispredicted] ...
9

perf – static tracepoint eventsbash ~ $ sudo perf list 'sched:*'
List of pre-defined events (to be used in -e):
sched:sched_kthread_stop [Tracepoint event] sched:sched_kthread_stop_ret [Tracepoint event] sched:sched_migrate_task [Tracepoint event] sched:sched_move_numa [Tracepoint event] sched:sched_pi_setprio [Tracepoint event] sched:sched_process_exec [Tracepoint event] sched:sched_process_exit [Tracepoint event] sched:sched_process_fork [Tracepoint event] sched:sched_process_free [Tracepoint event] sched:sched_process_wait [Tracepoint event] sched:sched_stat_runtime [Tracepoint event] sched:sched_stick_numa [Tracepoint event] sched:sched_swap_numa [Tracepoint event] sched:sched_switch [Tracepoint event] sched:sched_wait_task [Tracepoint event] sched:sched_wake_idle_without_ipi [Tracepoint event] sched:sched_wakeup [Tracepoint event] sched:sched_wakeup_new [Tracepoint event] sched:sched_waking [Tracepoint event]
11

perf – recording and reporting data
12

perf – recording from a running process
13

perf – reporting by self time
14

perf – hierarchical report
15

perf report --gtk
16
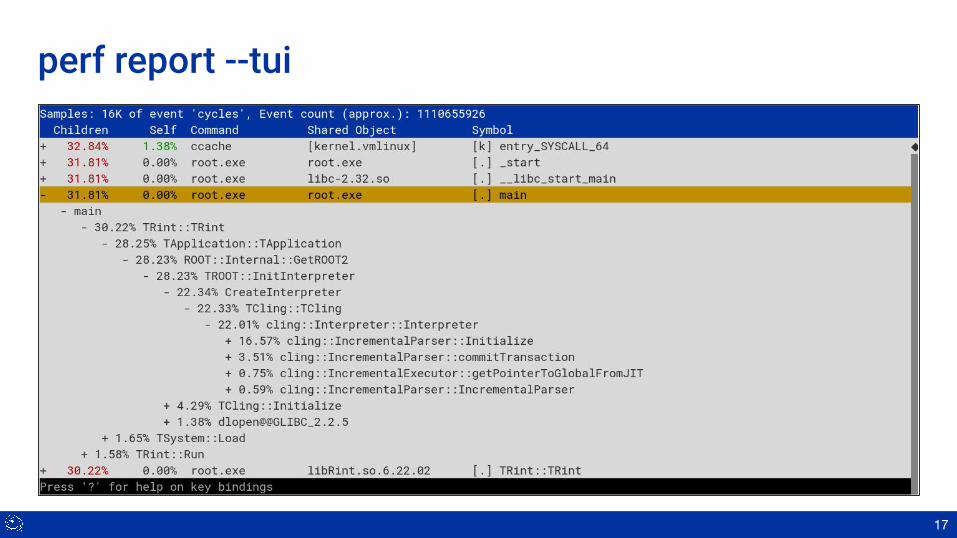
perf report --tui
17
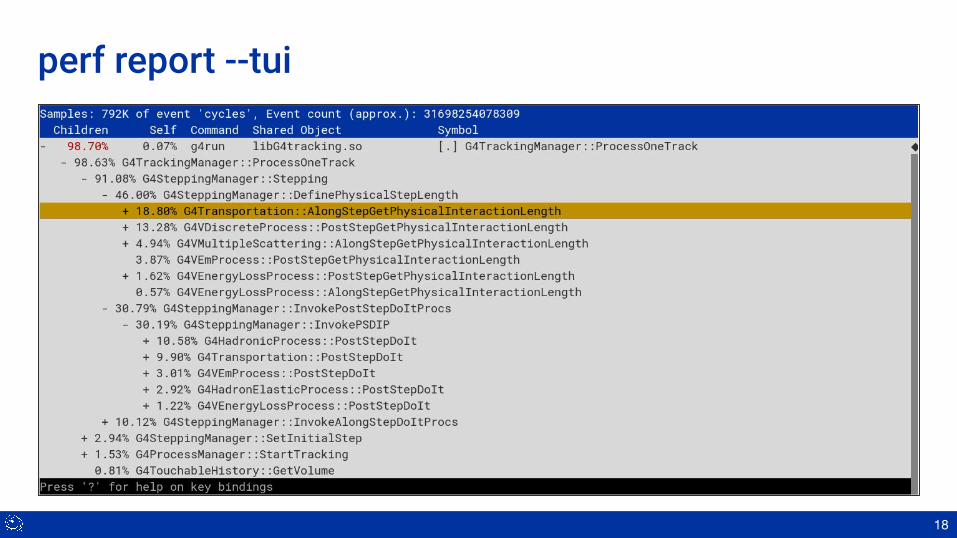
perf report --tui
18

perf – annotated source code
19

perf – functions where most cache misses happen
20
bash ~ $ perf record -e cache-misses -p $(pgrep cms) -o cache-misses.data sleep 60bash ~ $ perf report --stdio --quiet --percent-limit 1 -i cache-misses.data 15.05% cms libG4geometry.so [.] G4Navigator::LocateGlobalPointAndSetup 6.41% cms libG4geometry.so [.] G4VoxelNavigation::ComputeStep 4.45% cms libG4geometry.so [.] G4VoxelNavigation::LocateNextVoxel 3.78% cms libG4processes.so [.] G4VEnergyLossProcess::ComputeLambdaForScaledEnergy 3.02% cms libG4processes.so [.] G4ElectroNuclearCrossSection::GetElementCrossSection 2.95% cms libG4processes.so [.] G4VEmProcess::PostStepGetPhysicalInteractionLength 2.90% cms libG4processes.so [.] G4ChipsNeutronElasticXS::CalculateCrossSection 2.52% cms libG4geometry.so [.] G4VPhysicalVolume::GetObjectTranslation 2.43% cms libG4modeling.so [.] G4AffineTransform::G4AffineTransform 2.02% cms libG4processes.so [.] G4VEnergyLossProcess::AlongStepGetPhysicalInteractionLength 1.76% cms libG4processes.so [.] G4VEnergyLossProcess::AlongStepDoIt 1.56% cms ld-2.25.so [.] __tls_get_addr 1.43% cms libG4global.so [.] G4PhysicsVector::Value 1.33% cms libG4geometry.so [.] G4VPhysicalVolume::GetFrameRotation 1.10% cms libG4geometry.so [.] G4NavigationLevel::operator= 1.05% cms libG4particles.so [.] G4IonTable::FindIon 1.03% cms libG4processes.so [.] G4VEmProcess::ComputeIntegralLambda 1.02% cms libG4processes.so [.] G4CollisionOutput::reset 1.02% cms libG4processes.so [.] G4WentzelVIModel::ComputeTruePathLengthLimitbash ~ $

perf – script subcommand for post processing data
21
Profiling Data Post-processing & Visualization

gprof2dot – convert profiling data to a graph
23

gprof2dot – convert profiling data to a graph
24
All of Geant4, down to nodes with at least 0.5%

gprof2dot – convert profiling data to a graph
25
Filtered to G4SteppingManager::Stepping() and below

FlameGraph – convert profiling data to a flamegraph
26
bash ~ $ flamegraph.pl --helpUSAGE: flamegraph.pl [options] infile > outfile.svg
--title TEXT # change title text--subtitle TEXT # second level title (optional)--width NUM # width of image (default 1200)--height NUM # height of each frame (default 16)--minwidth NUM # omit smaller functions (default 0.1 pixels)--fonttype FONT # font type (default "Verdana")--fontsize NUM # font size (default 12)--countname TEXT # count type label (default "samples")--nametype TEXT # name type label (default "Function:")--colors PALETTE # set color palette. choices are: hot (default), mem, # io, wakeup, chain, java, js, perl, red, green, blue, # aqua, yellow, purple, orange--bgcolors COLOR # set background colors. gradient choices are yellow # (default), blue, green, grey; flat colors use "#rrggbb"--hash # colors are keyed by function name hash--cp # use consistent palette (palette.map)--reverse # generate stack-reversed flame graph--inverted # icicle graph--flamechart # produce a flame chart (sort by time, do not merge stacks)--negate # switch differential hues (blue<->red)--notes TEXT # add notes comment in SVG (for debugging)--help # this message
eg,flamegraph.pl --title="Flame Graph: malloc()" trace.txt > graph.svg
https://github.com/brendangregg/FlameGraph

FlameGraph – convert profiling data to a flamegraph
27
system (red)
C++ (yellow)
kernel (orange)
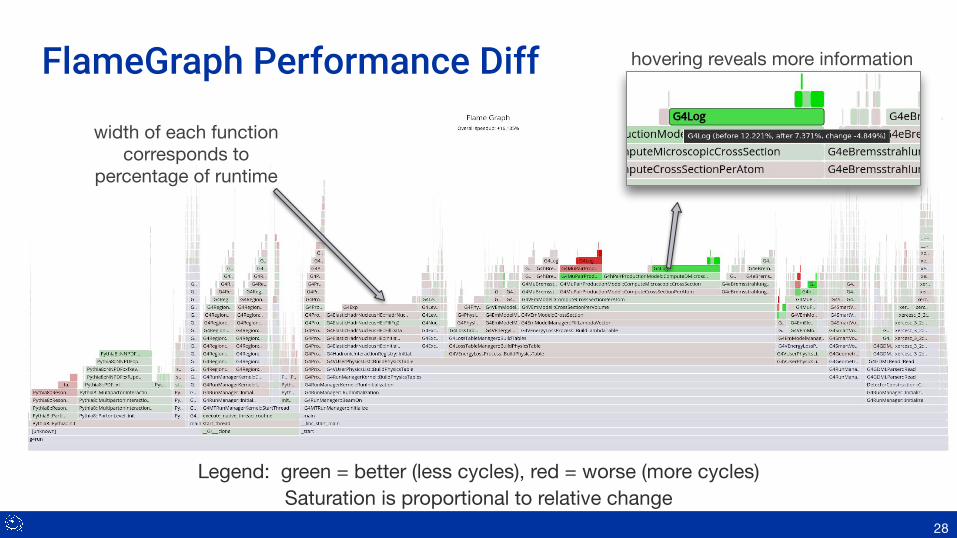
Legend: green = better (less cycles), red = worse (more cycles)Saturation is proportional to relative change
28
FlameGraph Performance Diff hovering reveals more information
width of each function corresponds to
percentage of runtime

Treemap from perf report output using Perl + d3.js
29
● Created from perf report output after conversion to JSON
● Hierarchical instead of using stack traces○ Binary○ Library○ Class○ Method / Function
● Good to see if leaves from multiple stacks amount to large time

Caveats and Gotchas

31
ROOT startup flamegraph for various configurations
perf record --call-graph=fp(debugging info not available)
perf record --call-graph=dwarf(frame pointer not available)
perf record --call-graph=fp(frame pointer and debugging info)

32
ROOT startup flamegraph for various configurations
Missing symbols
perf record --call-graph=fp(debugging info not available)
perf record --call-graph=dwarf(frame pointer not available)
perf record --call-graph=fp(frame pointer and debugging info)

33
perf record --call-graph=fp(debugging info not available)
perf record --call-graph=dwarf(frame pointer not available)
perf record --call-graph=fp(frame pointer and debugging info)
ROOT startup flamegraph for various configurations
Broken stack unwinding

34
ROOT startup flamegraph for various configurationsCorrectly merged stacks
perf record --call-graph=fp(debugging info not available)
perf record --call-graph=dwarf(frame pointer not available)
perf record --call-graph=fp(frame pointer and debugging info)
Avoid broken stack traces and missing symbols
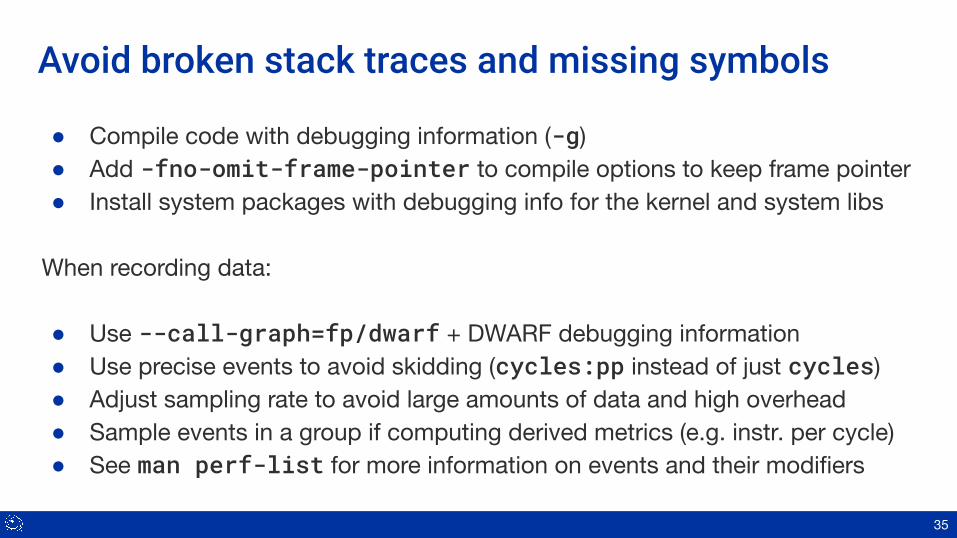
● Compile code with debugging information (-g)● Add -fno-omit-frame-pointer to compile options to keep frame pointer● Install system packages with debugging info for the kernel and system libs
When recording data:
● Use --call-graph=fp/dwarf + DWARF debugging information● Use precise events to avoid skidding (cycles:pp instead of just cycles)● Adjust sampling rate to avoid large amounts of data and high overhead● Sample events in a group if computing derived metrics (e.g. instr. per cycle)● See man perf-list for more information on events and their modifiers
35

On-CPU Performance Analysis

perf stat -d – overview of Geant4 initialization
37
Whoa, that’s a lot of backend cycles idle!

Record Geant4 initialization for further analysis
38

G4{h,Mu}PairProd. account for ~40% of initialization
39

Top 3 models account for ~60% of backend stalls
40

Use perf annotate to find hottest parts of the code
41
hottest instructions

Source code exerpt (1)
42
this call to G4Logcan be avoided whenzeta1 <= 0.0
result of division used right away
this if statement for treating hydrogen differently can be replaced by branchless
code (index based on boolean result)

Example of code change applied
43
Source code exerpt (2)
44
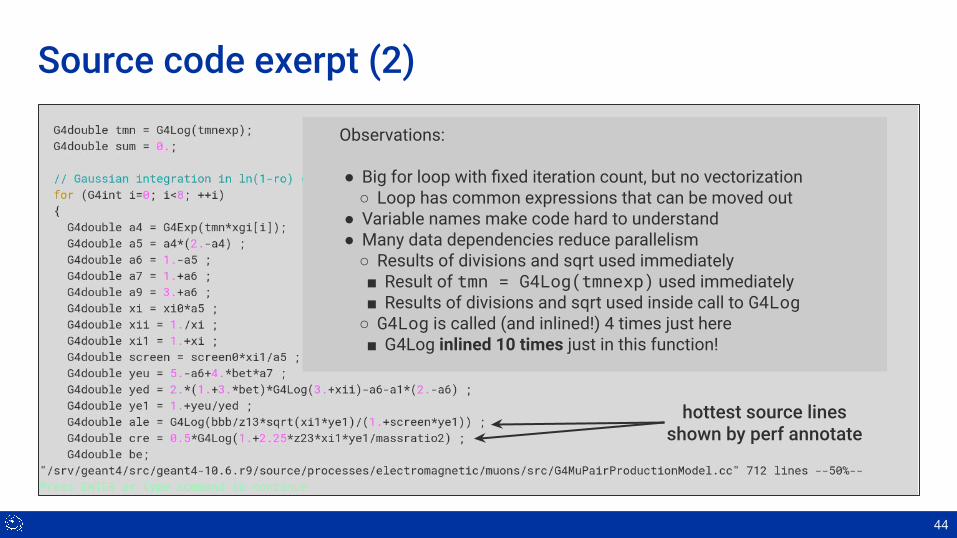
hottest source lines shown by perf annotate
Observations:
● Big for loop with fixed iteration count, but no vectorization○ Loop has common expressions that can be moved out
● Variable names make code hard to understand● Many data dependencies reduce parallelism○ Results of divisions and sqrt used immediately■ Result of tmn = G4Log(tmnexp) used immediately■ Results of divisions and sqrt used inside call to G4Log○ G4Log is called (and inlined!) 4 times just here■ G4Log inlined 10 times just in this function!

How to improve performance?
● Look for pair production model in Geant4 Physics Manual○ Rework expressions for cross sections with pencil/paper to reduce arithmetic operations
● Avoid unnecessary calls to G4Log function when calculating zeta● Remove data dependencies
○ Break up large for loop into several smaller for loops■ Compute together things that don’t depend on each other■ Hide latency from divisions■ When calling G4Log, input is already available
○ Move common expressions out of for loop all together
● Remove code duplication from the two classes with essentially the same version of this function by inheriting the base version in the derived class
45

How to improve performance?
● Look for pair production model in Geant4 Physics Manual○ Rework expressions for cross sections with pencil/paper to reduce arithmetic operations
● Avoid unnecessary calls to G4Log function when calculating zeta● Remove data dependencies
○ Break up large for loop into several smaller for loops○ Compute together things that don’t depend on each other○ Hide latency from divisions○ When calling G4Log, input is already available○ Move common expressions out of for loop
● Remove code duplication from the two classes with essentially the same version of this function by inheriting the base version in the derived class
46

From ~40% of initialization to ~27%, not bad!
47

Revisiting overview of Geant4 initialization (before)
48

Revisiting overview of Geant4 initialization (after)
49

DWARF can show time spent in inlined functions
50

DWARF also allows to sort by source line
51
Physics models call G4Log and G4Exp many times during
initialization, so the results on the left are expected.
However, this is also an indication that there may be room
for optimization in G4Log and G4Exp as well, since we see
backend stall cycles without many L1 cache misses.
G4Log at least is also called many times in the event loop to
fetch cross section data with energy interpolated as log(E).
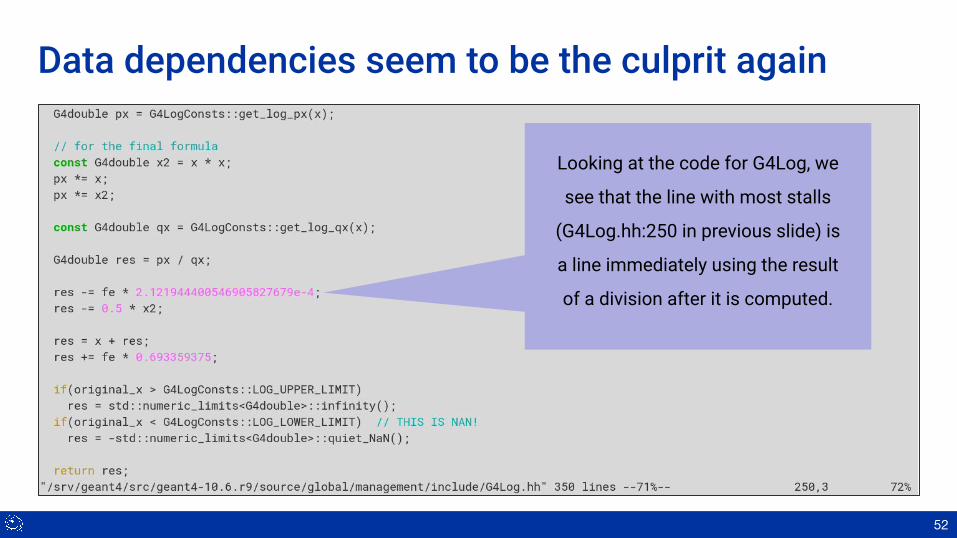
Data dependencies seem to be the culprit again
52
Looking at the code for G4Log, we
see that the line with most stalls
(G4Log.hh:250 in previous slide) is
a line immediately using the result
of a division after it is computed.

DWARF also allows to sort by source line (2)
53
Same as before, but sampled in the event loop.

G4Log inlined many times, maybe that’s a problem?
54
G4Log inlined at least 932 times in physics processes.Makes libG4processes.so 1–2% larger because of this.
(release ~300K larger / debug 10MB larger)

55
G4Log function inlined G4Log function not inlined
No big difference, so problem is not due to code bloat
G4Log inlined many times, but it’s not the problem

What happens if we use std::log and std::exp?
56
Extra ~10% speedup! Could make sense to use std::log at initialization only.

Conclusions and performance tips
● Problems don’t always happen where we expect○ Always measure to make sure your hypothesis for the cause is correct
● The fastest thing you can do is to not do anything○ Avoid unnecessary work in your code (e.g. checking field manager for neutral particles)
● Beware of data dependencies○ Reoder computations to take advantage of instruction level parallelism○ Strong dependencies can make your code slow even if L1 misses are low
● Beware of indirect accesses via pointers and calls to other shared objects○ Patterns like obj->GetFoo()->GetBar()->GetBaz() are too common in C++○ Accessing Baz becomes as expensive as traversing a list every time, bad for locality○ Frequent calls across shared objects are expensive, it’s better to merge into a single library
57

Memory Access and Latency Analysis

Using perf stat to measure average load latency
59
in CPU cycles
Avg. load latency = L1 miss pending cycles / (L1 misses + LFB hits)
60
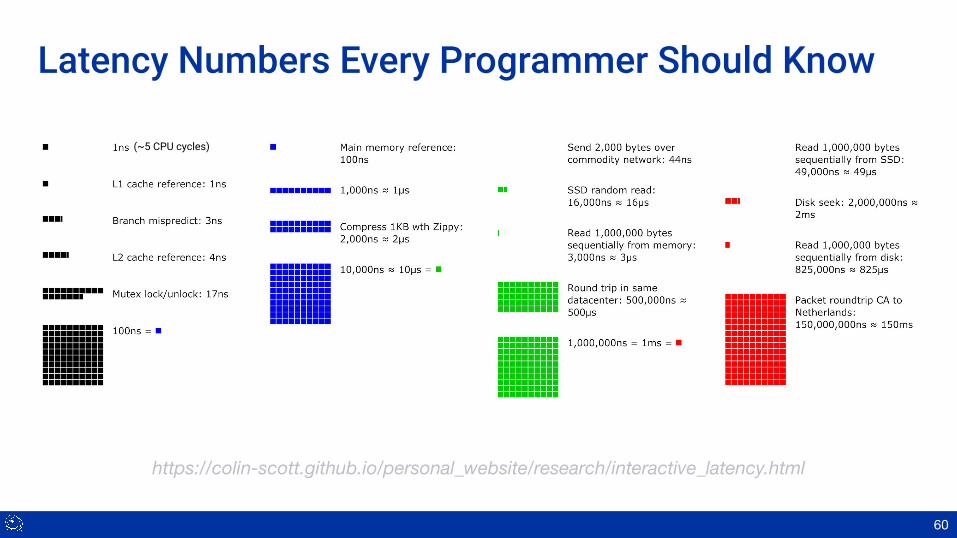
https://colin-scott.github.io/personal_website/research/interactive_latency.html
Latency Numbers Every Programmer Should Know
(~5 CPU cycles)

perf – memory access analysis: loads and stores
61

perf – memory access analysis: loads and stores
62
See also: https://community.intel.com/t5/Intel-Moderncode-for-Parallel/What-is-the-aim-of-the-line-fill-buffer/td-p/1180777
Line Fill Buffer (sits between L1 and L2)
Red flag, too many remote cache accesses

perf mem report -s mem
63

perf mem report -s dso,symbol
64
~46% of high latency loads happen in functions related to RDF filters...

perf mem report – symbol annotation
65
per-thread values in contiguous memory

perf mem report -s phys_daddr
66
high load latency happens in nearby addresses

perf – memory access analysis: false sharing
67
See also: https://hpc-wiki.info/hpc/FalseSharing

perf c2c report
68

perf c2c report
69
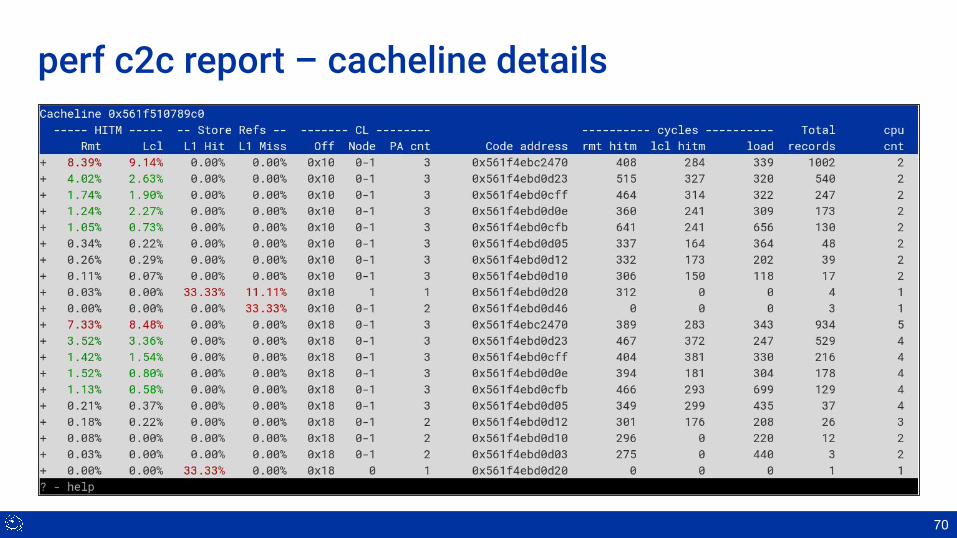
perf c2c report – cacheline details
70

71
perf c2c report – cacheline details, more columns

72
perf c2c report – cacheline details, expanded stack

Top-down Microarchitecture Analysis

Microarchitecture Utilization Overview from VTune
74
Front-End Bound(instruction cache misses)
Back-End Bound(cache misses, divisions)
Retiring(useful work)
Bad Speculation(branch mispredictions)
28.1%
49.0%
31.7%
6.5%
Cycles split into categories based on type of bottleneck
Geant4 CMS Example
https://software.intel.com/content/www/us/en/develop/documentation/vtune-cookbook/top/methodologies/top-down-microarchitecture-analysis-method.html
75
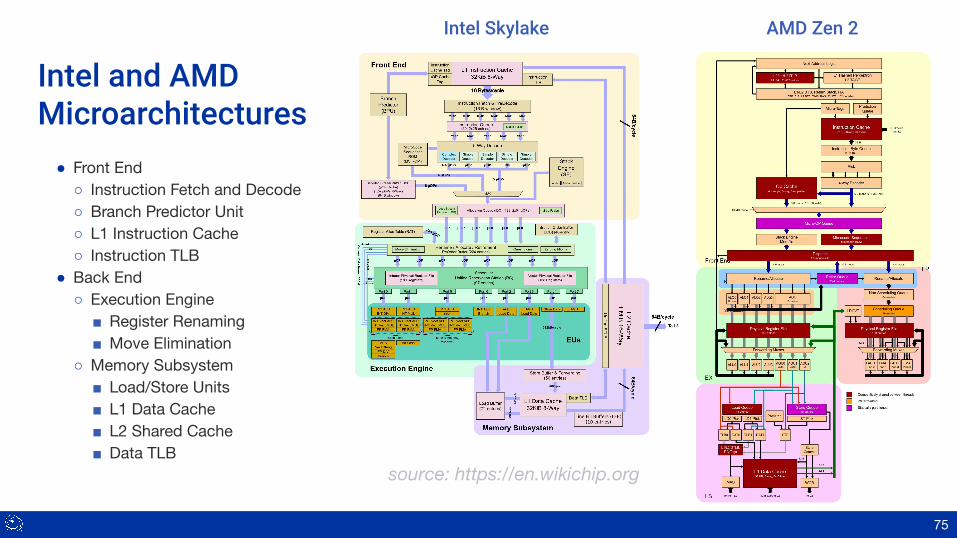
Intel and AMDMicroarchitectures● Front End○ Instruction Fetch and Decode○ Branch Predictor Unit○ L1 Instruction Cache○ Instruction TLB
● Back End○ Execution Engine
■ Register Renaming■ Move Elimination
○ Memory Subsystem■ Load/Store Units■ L1 Data Cache■ L2 Shared Cache■ Data TLB
Intel Skylake AMD Zen 2
source: https://en.wikichip.org

The Translation Lookaside Buffer“A translation lookaside buffer (TLB) is a memory cache that is used to reduce the time taken to access a user memory location. It is a part of the chip's memory management unit (MMU). The TLB stores the recent translations of virtual memory to physical memory and can be called an address-translation cache.”
76
https://en.wikipedia.org/wiki/Translation_lookaside_buffer
CPU
TLB
MMU
Page Table(Main Memory)
L1 L2
TLB miss
TLB hit
VirtualAddress
PhysicalAddress
Virtual to Physical Translation
Disk
PageFault

perf – pre-packaged metrics (Intel only)bash ~ $ perf list metrics Metrics:
Backend_Bound [This category represents fraction of slots where no uops are delivered due to a lack of required resources for accepting new uops in the Backend] Bad_Speculation [This category represents fraction of slots wasted due to incorrect speculations] BpTB [Branch instructions per taken branch] CLKS [Per-Logical Processor actual clocks when the Logical Processor is active] CPI [Cycles Per Instruction (per Logical Processor)] CPU_Utilization [Average CPU Utilization] CoreIPC [Instructions Per Cycle (per physical core)] Frontend_Bound [This category represents fraction of slots where the processor's Frontend undersupplies its Backend] ILP [Instruction-Level-Parallelism (average number of uops executed when there is at least 1 uop executed)] IPC [Instructions Per Cycle (per Logical Processor)] Instructions [Total number of retired Instructions] IpB [Instructions per Branch (lower number means higher occurance rate)] IpCall [Instruction per (near) call (lower number means higher occurance rate)] IpL [Instructions per Load (lower number means higher occurance rate)] ...
77

perf – pre-packaged metrics (Intel only)bash ~ $ perf stat -M Frontend_Bound,Backend_Bound,Bad_Speculation,Retiring -- root -l -q
Performance counter stats for 'root -l -q':
535853293 cycles # 0.32 Frontend_Bound (50.07%) 676507752 idq_uops_not_delivered.core (50.07%) 803157447 uops_issued.any # 0.10 Bad_Speculation # 0.28 Backend_Bound (49.93%) 540449552 cycles # 0.31 Retiring (49.93%) 676523326 idq_uops_not_delivered.core (49.93%) 19393734 int_misc.recovery_cycles (49.93%) 667220596 uops_retired.retire_slots (49.93%)
0.243072802 seconds time elapsed
0.158384000 seconds user 0.088028000 seconds sys
bash ~ $
78

Microarchitecture Analysis with perfMetrics are only available with perf stat. To be able to get metrics per-symbol with perf record:
● Use classification from Intel VTune
● Use formulas for each category based on events known to perf and properties of the hardware
● Record all perf events in the same sampling group
● Report counts per symbol using perf
● Post-process with AWK to calculate metrics per symbol
● Can also use similar events and own formulas to create new relevant metrics
79
A. Yasin, "A Top-Down method for performance analysis and counters architecture," 2014 IEEE International Symposium on Performance Analysis of Systems and Software (ISPASS),
Monterey, CA, 2014, pp. 35-44, doi: 10.1109/ISPASS.2014.6844459.

Microarchitecture Analysis with perfMetrics are only available with perf stat. To be able to get metrics per-symbol with perf record:
● Use classification from Intel VTune
● Use formulas for each category based on events known to perf and properties of the hardware
● Record all perf events in the same sampling group
● Report counts per symbol using perf
● Post-process with AWK to calculate metrics per symbol
● Can also use similar events and own formulas to create new relevant metrics
80
A. Yasin, "A Top-Down method for performance analysis and counters architecture," 2014 IEEE International Symposium on Performance Analysis of Systems and Software (ISPASS),
Monterey, CA, 2014, pp. 35-44, doi: 10.1109/ISPASS.2014.6844459.

Microarchitecture Analysis with perfMetrics are only available with perf stat. To be able to get metrics per-symbol with perf record:
● Use classification from Intel VTune
● Use formulas for each category based on events known to perf and properties of the hardware
● Record all perf events in the same sampling group
● Report counts per symbol using perf
● Post-process with AWK to calculate metrics per symbol
● Can also use similar events and own formulas to create new relevant metrics
81
A. Yasin, "A Top-Down method for performance analysis and counters architecture," 2014 IEEE International Symposium on Performance Analysis of Systems and Software (ISPASS),
Monterey, CA, 2014, pp. 35-44, doi: 10.1109/ISPASS.2014.6844459.

Example – using perf + awk to get percent retiring
82

Example – using perf + awk to get percent retiring
83

Thread State and Scheduling Analysis

Linux Thread States
85
Running (R)
Uninterruptible Sleep (D)
Interruptible Sleep (S)
Runnable (R)
Stopped (T)Zombie (Z)
preemption ortime slice expired
schedule
disk I/O
wakeup
sleep, lock, wait
wakeup exit() SIGCONTSIGSTOP
new process or thread

perf sched – thread state analysis
86

perf sched – thread state analysis
87

perf sched – thread state analysis
88

Final Thoughts

“Programmers waste enormous amounts of time thinking about,
or worrying about, the speed of noncritical parts of their
programs, and these attempts at efficiency actually have a
strong negative impact when debugging and maintenance are
considered. We should forget about small efficiencies, say about
97% of the time: premature optimization is the root of all evil.
Yet we should not pass up our opportunities in that critical 3%”
— Donald Knuth
90

91