LINKING WATER QUALITY TO LIVING RESOURCES IN A MID-ATLANTIC LAGOON SYSTEM, USA
15
Ecological Applications, 17(5) Supplement, 2007, pp. S64–S78 Ó 2007 by the Ecological Society of America LINKING WATER QUALITY TO LIVING RESOURCES IN A MID-ATLANTIC LAGOON SYSTEM, USA CATHERINE E. WAZNIAK, 1,5 MATTHEW R. HALL, 1 TIM J. B. CARRUTHERS, 2 BRIAN STURGIS, 3 WILLIAM C. DENNISON, 2 AND ROBERT J. ORTH 4 1 Maryland Department of Natural Resources, Resource Assessment Service, 580 Taylor Avenue, Annapolis, Maryland 21401 USA 2 Integration and Application Network, University of Maryland Center for Environmental Science, P.O. Box 775, Cambridge, Maryland 21613 USA 3 Assateague Island National Seashore, 7206 National Seashore Lane, Berlin, Maryland 21811 USA 4 Virginia Institute of Marine Science, School of Marine Science, College of William and Mary, Gloucester Point, Virginia 23062 USA Abstract. The mid-Atlantic coastal bays are shallow coastal lagoons, separated from the Atlantic Ocean by barrier sand islands with oceanic exchanges restricted to narrow inlets. The relatively poor flushing of these lagoon systems makes them susceptible to eutrophication resulting from anthropogenic nutrient loadings. An intensive water quality and seagrass monitoring program was initiated to track ecological changes in the Maryland and Virginia coastal bays. The purpose of this study was to analyze existing monitoring data to determine status and trends in eutrophication and to determine any associations between water quality and living resources. Analysis of monitoring program data revealed several trends: (1) decadal decreases in nutrient and chlorophyll concentrations, followed by recently increasing trends; (2) decadal increases in seagrass coverage, followed by a recent period of no change; (3) blooms of macroalgae and brown tide microalgae; and (4) exceedance of water quality thresholds: chlorophyll a (15 lg/L), total nitrogen (0.65 mg/L or 46 lmol/L), total phosphorus (0.037 mg/L or 1.2 lmol/L), and dissolved oxygen (5 mg/L) in many areas within the Maryland coastal bays. The water quality thresholds were based on habitat requirements for living resources (seagrass and fish) and used to calculate a water quality index, which was used to compare the bay segments. Strong gradients in water quality were correlated to changes in seagrass coverage between segments. These factors indicate that these coastal bays are in a state of transition, with a suite of metrics indicating degrading conditions. Continued monitoring and intensified management will be required to avert exacerbation of the observed eutrophication trends. Coastal lagoons worldwide are experiencing similar degrading trends due to increasing human pressures, and assessing status and trends relative to biologically relevant thresholds can assist in determining monitoring and management priorities and goals. Key words: chlorophyll; coastal bay; coastal lagoon; eutrophication; Maryland, USA; mid-Atlantic; nutrients; seagrass; Virginia, USA; water quality. INTRODUCTION Coastal lagoons worldwide, including the U.S. mid- Atlantic bays, are currently threatened by anthropogenic inputs of nutrients. Like other lagoon systems, the coastal embayments of Maryland and Virginia, USA, are highly susceptible to nutrient over-enrichment. These are seagrass-dominated coastal lagoons (Wazniak et al. 2005a, Orth et al. 2006), and due to the high light requirements of seagrass (Dennison et al. 1993), such systems are more rapidly impacted by nutrient addition than those dominated by other primary producers, such as phytoplankton (NRC 2000, Cloern 2001). The coastal bays also have low tidal flushing and limited freshwater inflow (Pritchard 1960, Lung 1994, Boynton et al. 1996), and they have been classified by a nationwide survey as highly susceptible to eutrophication (Bricker et al. 1999). Due to these factors, the Maryland Coastal Bays National Estuary Program, MCBP, identified nutrient over-enrichment as the primary threat to the Maryland coastal bays (MCBP 1999). Several signs of ecosystem stress related to nutrient over-enrichment have become evident in the coastal bays. A recent study indicated elevated macroalgae biomass (Goshorn et al. 2001) in areas coinciding with seagrass increases, which provides some evidence for a transition to a more eutrophic state (Fourqurean and Rutten 2003). Another indicator of stress is an annual bloom of Aureococcus anophagefferens, the phytoplank- ton species that causes brown tide, especially in the southern coastal bays (Trice et al. 2004, Wazniak and Glibert 2004), as well as the presence of other harmful algal bloom species (Tango et al. 2005). These shallow, wind-dominated bays are not known to stratify, but seasonal hypoxic events do occur in localized areas Manuscript received 4 October 2005; revised 6 July 2006; accepted 24 July 2006; final version received 20 September 2006. Corresponding Editor: A. R. Townsend. For reprints of this Special Issue, see footnote 1, p. S1. 5 E-mail: [email protected] S64
Transcript of LINKING WATER QUALITY TO LIVING RESOURCES IN A MID-ATLANTIC LAGOON SYSTEM, USA

Ecological Applications, 17(5) Supplement, 2007, pp. S64–S78� 2007 by the Ecological Society of America
LINKING WATER QUALITY TO LIVING RESOURCESIN A MID-ATLANTIC LAGOON SYSTEM, USA
CATHERINE E. WAZNIAK,1,5 MATTHEW R. HALL,1 TIM J. B. CARRUTHERS,2 BRIAN STURGIS,3 WILLIAM C. DENNISON,2
AND ROBERT J. ORTH4
1Maryland Department of Natural Resources, Resource Assessment Service, 580 Taylor Avenue, Annapolis, Maryland 21401 USA2Integration and Application Network, University of Maryland Center for Environmental Science, P.O. Box 775,
Cambridge, Maryland 21613 USA3Assateague Island National Seashore, 7206 National Seashore Lane, Berlin, Maryland 21811 USA
4Virginia Institute of Marine Science, School of Marine Science, College of William and Mary, Gloucester Point, Virginia 23062 USA
Abstract. The mid-Atlantic coastal bays are shallow coastal lagoons, separated from theAtlantic Ocean by barrier sand islands with oceanic exchanges restricted to narrow inlets. Therelatively poor flushing of these lagoon systems makes them susceptible to eutrophicationresulting from anthropogenic nutrient loadings. An intensive water quality and seagrassmonitoring program was initiated to track ecological changes in the Maryland and Virginiacoastal bays. The purpose of this study was to analyze existing monitoring data to determinestatus and trends in eutrophication and to determine any associations between water qualityand living resources. Analysis of monitoring program data revealed several trends: (1) decadaldecreases in nutrient and chlorophyll concentrations, followed by recently increasing trends;(2) decadal increases in seagrass coverage, followed by a recent period of no change; (3)blooms of macroalgae and brown tide microalgae; and (4) exceedance of water qualitythresholds: chlorophyll a (15 lg/L), total nitrogen (0.65 mg/L or 46 lmol/L), total phosphorus(0.037 mg/L or 1.2 lmol/L), and dissolved oxygen (5 mg/L) in many areas within theMaryland coastal bays. The water quality thresholds were based on habitat requirements forliving resources (seagrass and fish) and used to calculate a water quality index, which was usedto compare the bay segments. Strong gradients in water quality were correlated to changes inseagrass coverage between segments. These factors indicate that these coastal bays are in astate of transition, with a suite of metrics indicating degrading conditions. Continuedmonitoring and intensified management will be required to avert exacerbation of the observedeutrophication trends. Coastal lagoons worldwide are experiencing similar degrading trendsdue to increasing human pressures, and assessing status and trends relative to biologicallyrelevant thresholds can assist in determining monitoring and management priorities and goals.
Key words: chlorophyll; coastal bay; coastal lagoon; eutrophication; Maryland, USA; mid-Atlantic;nutrients; seagrass; Virginia, USA; water quality.
INTRODUCTION
Coastal lagoons worldwide, including the U.S. mid-
Atlantic bays, are currently threatened by anthropogenic
inputs of nutrients. Like other lagoon systems, the
coastal embayments of Maryland and Virginia, USA,
are highly susceptible to nutrient over-enrichment.
These are seagrass-dominated coastal lagoons (Wazniak
et al. 2005a, Orth et al. 2006), and due to the high light
requirements of seagrass (Dennison et al. 1993), such
systems are more rapidly impacted by nutrient addition
than those dominated by other primary producers, such
as phytoplankton (NRC 2000, Cloern 2001). The coastal
bays also have low tidal flushing and limited freshwater
inflow (Pritchard 1960, Lung 1994, Boynton et al. 1996),
and they have been classified by a nationwide survey as
highly susceptible to eutrophication (Bricker et al. 1999).
Due to these factors, the Maryland Coastal Bays
National Estuary Program, MCBP, identified nutrient
over-enrichment as the primary threat to the Maryland
coastal bays (MCBP 1999).
Several signs of ecosystem stress related to nutrient
over-enrichment have become evident in the coastal
bays. A recent study indicated elevated macroalgae
biomass (Goshorn et al. 2001) in areas coinciding with
seagrass increases, which provides some evidence for a
transition to a more eutrophic state (Fourqurean and
Rutten 2003). Another indicator of stress is an annual
bloom of Aureococcus anophagefferens, the phytoplank-
ton species that causes brown tide, especially in the
southern coastal bays (Trice et al. 2004, Wazniak and
Glibert 2004), as well as the presence of other harmful
algal bloom species (Tango et al. 2005). These shallow,
wind-dominated bays are not known to stratify, but
seasonal hypoxic events do occur in localized areas
Manuscript received 4 October 2005; revised 6 July 2006;accepted 24 July 2006; final version received 20 September 2006.Corresponding Editor: A. R. Townsend. For reprints of thisSpecial Issue, see footnote 1, p. S1.
5 E-mail: [email protected]
S64

(Maryland DNR 2002, Hall and Wazniak 2005; B.
Sturgis, unpublished data). Even though there has been
extensive expansion of seagrass acreage over the past
three decades, this trend has leveled during recent years
(Orth et al. 2006). In relation to this, seagrass-dependent
bay scallops (Argopecten irradians), while present, are
only found in low densities, suggesting the long-term
viability of the population is in question (Tarnowski
2005). These observations suggest that these coastal bays
are undergoing ecosystem change consistent with
increasing anthropogenic nutrient addition.
Like many coastal areas, the local economy of the
coastal bays is linked to the ecological health of the
estuaries. As population increases, dependence on the
estuary to support economic activities such as fisheries and
tourism also increases. The coastal bays’ watershed
population has doubled between 1980 and 2000 and is
expected to nearly double again by 2020 (Fig. 1; Hager
1996). Additionally, .11 3 106 tourists visit the region
annually, and tourist numbers are also projected to grow
significantly (MCBP 2005). These population increases
could exacerbate the biological impairment caused by
anthropogenic disturbance, including nutrient enrich-
ment, physical alteration, introduction of toxins, and
changes in overall biotic structure (Day et al. 1989).
Additionally, anthropogenic changes in hydrodynamics
(through the long-term stabilization of inlets, dredging,
and development on the barrier islands themselves) have
altered the natural resilience of many of these systems.
These factors may contribute to the deteriorating condi-
tions of bay resources on which the economy depends and
make attaining management goals more difficult.
The Comprehensive Conservation Management Plan
for the Coastal Bays included decreasing nutrients,
increasing seagrass populations, and maintaining viable
fishery populations as key management goals (MCBP
1999). Hence, effectively assessing the health of the
system in a relevant ecological framework and deter-
mining change over time among ecosystem components
was needed to guide management decisions. However,
defining and assessing the eutrophic status or health of
lagoon systems, and coastal systems as a whole,
continues to prove challenging to ecosystem managers.
Current national assessments seek to compare a
diversity of coastal systems using the same criteria
(Bricker et al. 2003, U.S. Environmental Protection
Agency [EPA] 2004). Furthermore, the application of
‘‘threshold risk levels’’ needs to be verified for each type
of estuarine system.
Ensuring that metrics are chosen that can be linked to
causes, allow future predictions, and are sensitive
enough to assess changes resulting from management
actions is essential (Suter 1993). Additionally, whether
different groups of metrics (biotic, water quality,
physical) should be combined (Ferreira 2000, Kiddon
et al. 2003) and whether these combined indices should
be weighted or not (Borja et al. 2004) are important
factors to consider. Lastly, determining whether the
combination of chosen parameters is related to indirect
ecosystem responses (Phase II conceptual model of
Cloern [2001]) will increase our understanding of
different estuarine types.
To clarify these issues, the current paper addresses
three key questions: Are conditions in the coastal bays
suitable for key living resources? Are conditions
improving or degrading? Are differences in water quality
associated with status and trends in living resources?
METHODS
Site description
The coastal embayments of Maryland and Virginia,
USA, are temperate systems located on the Delmarva
Peninsula (the coastal plain peninsula between the
Chesapeake Bay and the Atlantic Ocean; Fig. 2). These
FIG. 1. Decadal human population rise in the Marylandcoastal-bays watershed (Hager 1996).
FIG. 2. General location of the Maryland coastal baysalong the east coast of the United States. The watershed area ofeach of the bay segments and the water quality monitoring sitesare shown.
July 2007 S65EUTROPHICATION IN COASTAL BAYS

coastal bays comprise a series of estuarine lagoons that
were divided into six segments (i.e., subwatersheds),
based on major drainage and inlet characteristics, for this
analysis (Fig. 2). The total watershed is small (452 km2)
with a watershed-to-water-surface-area ratio of 1.6. Due
to relatively low and constant elevation as well as sandy
soils, groundwater is the major pathway of freshwater
input to the bays, with the St. Martin River providing the
largest stream input (Lung 1994). Salinities range from
polyhaline (30–35ø) in the open bays to fresh in some
tributaries. Circulation is wind- and tide-dominated:
tidal exchange with the Atlantic Ocean is limited to two
inlets, one at Ocean City and the other at the south of
Chincoteague Bay (Fig. 2). Flushing is slow compared
with other estuaries (e.g., Chincoteague flushing rate is
62 days), causing protracted residence times for contam-
inants, including nutrients (Pritchard 1960, Bricker et al.
1999). Nutrient loads to the coastal bays are dominated
by nonpoint sources (e.g., surface runoff, groundwater,
atmospheric deposition, and shoreline erosion) (Boynton
et al. 1996, Wells et al. 2004) with recent estimates
suggesting one-half to two-thirds of nutrients entering
the bays come from agricultural sources, the dominant
land use in the area (Boynton et al. 1996).
Data collection and sample analysis
The National Park Service (NPS) at Assateague Island
National Seashore and the Maryland Department of
Natural Resources (DNR) water quality monitoring
programs conducted routine monthly sampling and
provided the data used in this paper. The NPS measured
water quality parameters monthly at 18 stations in the
southern coastal bays since 1987 or 1991, depending on the
station (Fig. 2). The NPS sites were not monitored over
winter months during the first five years. The DNR
measured water quality monthly at 28 sites in the St.
Martin River, Isle of Wight Bay, and Newport Bay
segments since 1999 and 17 sites inAssawomanBay, Isle of
Wight Bay, and Chincoteague Bay since 2001 (Fig. 2). All
stations were tidal, except for five DNR stations, and all
were monitored in accordance with U.S. EPA-approved
quality assurance plans (CBP 2001, Sturgis 2001) and in
conjunction with the Maryland Coastal Bays Program’s
Eutrophication Monitoring Plan (Wazniak 1999).
Both programs recorded on-site water quality param-
eters (including dissolved oxygen [DO]) and collected
samples to send to laboratories for nutrient and
chlorophyll a analyses. Whole water samples were
collected just below the surface and stored on ice and
in the dark until being filtered (less than four hours). The
DNR samples were analyzed by the University of
Maryland Center for Environmental Science (UMCES)
Chesapeake Biological Laboratory for total dissolved
nitrogen (D’Elia et al. 1977, Valderrama 1981), partic-
ulate nitrogen (U.S. EPA 1997), total dissolved phos-
phorus (Valderrama 1981), and particulate phosphorus
(Aspila et al. 1976). Chlorophyll a concentration was
determined by the Maryland Department of Health and
Mental Hygiene (APHA 1985). Total nitrogen (TN) and
total phosphorus (TP) were calculated by adding the
total dissolved fractions to the particulate fractions. The
NPS samples were analyzed by UMCES Horn Point
Laboratory for TN and TP, using persulfate digestion
(Valderrama 1981), and chlorophyll a, using high-
performance liquid chromatography (Van Heukelem et
al. 1994, Van Heukelem and Thomas 2001). All three
laboratories were evaluated as part of the Chesapeake
Bay Program quality assurance protocol and found to
not differ significantly (Zimmerman and Keefe 2004).
Seagrass coverage
Annual black-and-white aerial photography, 1986–
2003, was obtained by the Virginia Institute of Marine
Sciences (VIMS) at a scale of 1:24 000 from three flight
lines and examined to identify all visible seagrass beds
(Orth et al. 2004). Ground survey information was also
collected by VIMS, tabulated, and entered into the
seagrass geographic information system (GIS). This
provided a digital database for analysis of bed areas and
locations. Current seagrass habitat is defined as a
composite of the past three years (2001–2003) of
observed seagrass coverage. Potential seagrass habitat
was identified, in the Maryland portion only due to data
limitations, as being ,1.5 m in mean water depth (based
on a composite seagrass layer showing 93% of all
seagrasses digitized between 1986–2003 were �1.3 m
deep) and having a silt/clay content of ,35% (E. M.
Koch, unpublished data).
Determination of biologically relevant thresholds
The current study used historically collected data to
assess system health by summarizing four common
water quality indicators (TN, TP, chlorophyll a [algae:
chl a], and DO) and compared these to biologically
relevant thresholds, established for maintenance of
seagrass (Stevenson et al. 1993, Kemp et al. 2004) and
fish communities (e.g., Breitburg 2002). The use of
nutrients, phytoplankton, and dissolved oxygen is
common in evaluating estuarine systems (Bricker et al.
1999, Kiddon et al. 2003, Jones et al. 2004, U.S. EPA
2004) and, specifically, habitat quality for submerged
aquatic vegetation (Valdes-Murtha 1997, Lea et al. 2003,
Kemp et al. 2004). An evenly weighted water quality
index of these parameters was used to assess eutrophic
status. Water quality status was then related to the
current distribution of seagrasses within the bays.
Since seagrasses and fisheries are important biological
components of the coastal bays, they are the basis of
management focus (MCBP 1999). Biologically relevant
threshold values for variables used to assess eutrophi-
cation (Table 1) were set based on literature values for
seagrass habitat requirements (Dennison et al. 1993,
Stevenson et al. 1993, Valdes-Murtha 1997, Lea et al.
2003) as well as dissolved oxygen requirements for fish
(Howell and Simpson 1994, Diaz and Solow 1999,
Breitburg et al. 2001, Breitburg 2002) and benthic
CATHERINE E. WAZNIAK ET AL.S66Ecological Applications
Special Issue

communities (Baden et al. 1990, Pihl et al. 1991, 1992,
Smith and Dauer 1994, Ritter and Montagna 1999)
(Table 2). Five threshold categories were determined for
status analyses while a single biologically relevant
threshold was used to develop a water quality index to
compare coastal-bay segments.
Measures of total nutrients (rather than dissolved
inorganics) were used to reduce variability associated
when measuring dissolved nutrients only. Additionally
these coastal bays have been shown to have high regional
organic nutrient concentrations (Glibert et al. 2001) that
are at least partially bioavailable (Seitzinger and Sanders
1999, Seitzinger et al. 2002, Mulholland et al. 2004,
Glibert et al. 2006; Wiegner et al. 2006; M. R. Mulhol-
land, G. Boneillo, and E. C. Minor, unpublished
manuscript). Therefore, total nutrients were determined
to be better than dissolved inorganic nutrients as
indicators of relative nutrient availability in this system
that is known to have high organic inputs, as well as long
residence times. Maryland State guidelines were used to
set the borderline threshold at 5 mg/L DO (COMAR
1995), although the references above support this value
for healthy fish and benthic communities in shallow-
water ecosystems.
Water quality index assessment
An evenly weighted water quality index was devel-
oped to compare coastal-bay segments. A single,
biologically relevant threshold value for each indicator
was chosen from those used for status analysis and data
condensed into a single index of water quality.
Threshold values were: chlorophyll a, ,15 lg/L; totalnitrogen, ,0.65 mg/L or ,46 lmol/L; total phosphorus,
,0.037 mg/L or ,1.2 lmol/L; and dissolved oxygen, .5
mg/L (Dennison et al. 1993, Stevenson et al. 1993, Ritter
and Montagna 1999, Breitburg 2002).
For the 60 sampling stations with at least 10 records
for all variables between 2001 and 2003, median values
for TN, TP, and chl a and a second percentile for DO
were calculated. Calculated values were then compared
to established threshold values and scored as one (met
criteria) or zero (failed to meet criteria). These scores
were summed for all four variables and divided by the
number of variables to result in an index value ranging
from zero to one for each station. Therefore, an index
value of zero indicated that a station met none of the
water quality criteria and would not be expected tosupport seagrasses or fisheries, while a score of one
indicated a station met all water quality criteria and
should support ecosystem services. Intermediate values
indicated the system was variable and that someecosystem functions (seagrass beds or fisheries) would
be expected to be present periodically.
Once an index value was calculated for each sampling
station, a mean of the individual index variables for allstations within each segment was calculated and these
are presented by measured variable (Table 3) and
combined segment index values. Standard errors asso-
ciated with mean index values represent spatial variationbetween sites within a segment only and do not include
temporal variability.
Statistical analyses
Three types of statistical analyses were performed on
the data sets, including three-year water quality status,
linear trends, and nonlinear trends. Status analysis
compared three-year medians of water quality indicatorsto biologically relevant thresholds. This analysis pro-
vided a current assessment of eutrophication effects. To
determine whether or not these effects were changing
over time, linear seasonal trend analysis and nonlineartrend analyses that could detect trend reversals were
performed on data collected over the past 13–17 years.
Potential implications of these trends in water quality on
seagrasses were also investigated.For status analysis, chl a was assessed during the
putative seagrass growing season of March through
TABLE 1. Biologically relevant thresholds for nutrients and chlorophyll a in the Maryland coastalbays.
Biologically relevant threshold
Cutoff values
TN (mg/L) TP (mg/L) Chlorophyll a (lg/L)
Better than seagrass objective ,0.55 ,0.025 ,7.5Meets seagrass objective ,0.64 ,0.037 ,15Does not meet seagrass objective 0.65–1 0.38–0.043 15–30Does not meet STAC objectives and/ordissolved oxygen threatened
1–2 0.44–0.1 30–50
Does not meet any objectives .2 .0.1 .50
Notes: Critical time periods for nutrients, total nitrogen (TN), and total phosphorus (TP) areannual, and the critical time period for chlorophyll is March–November (SAV growing season).‘‘STAC’’ stands for Scientific and Technical Advisory Committee.
TABLE 2. Biologically relevant thresholds for dissolved oxygenin the Maryland coastal bays.
Threshold criteria category forfisheries and benthic community
DO cutoff(mg/L)
Better than objective .7Meets objective .6Borderline for community 5–6Community threatened 3–5Does not meet objectives ,3
Notes: The critical time period for oxygen is summer, June–August. Values are the median dissolved oxygen cutoff.
July 2007 S67EUTROPHICATION IN COASTAL BAYS

November. This was decided because the two species
present, Zostera marina and Ruppia maritima, overlap in
growing seasons. Zostera marina grows during two
seasons in a typical year (March through May and
October through November), while R. maritima tends to
grow during a single protracted season (April through
October) (Moore et al. 2000, Kemp et al. 2004).
Dissolved oxygen was assessed during the summer
season (June through September) since most low DO
events (sustained concentrations below 5 mg/L) tended
to occur during these months (Funderburk et al. 1991,
Wazniak et al. 2005b). Nutrient loading was a probable
factor in high algal production and subsequent drops in
DO in the coastal bays (Boynton et al. 1996). Since
nutrient loading took place throughout the year (albeit at
varying seasonal rates), TN and TP were evaluated based
on the entire year. For each indicator at each station,
medians were calculated for chl a, TN, and TP, and a
lower second percentile was calculated for DO within the
delineated seasons over three years (2001–2003). Medi-
ans were used for chl a, TN, and TP instead of means to
insure that the highest and lowest monthly concentra-
tions had smaller effects on central tendency. The second
percentile was used for DO to most critically evaluate the
available daytime data while excluding extreme values
that may not be typical for the time period. Three years
were chosen to minimize natural interannual variability
(e.g., differences in flow). Each three-year station median
was then tested against all five threshold values by a
Wilcoxon rank sum test (a¼0.01 to protect against Type
I error), a nonparametric test of position. The five
threshold values formed five threshold categories as
depicted in Tables 1 and 2. If the Wilcoxon test was
significant (the median was significantly different from
all of the thresholds) then the median was said to be
significant (there was confidence in which threshold
category the median fell). If the Wilcoxon test was not
significant, then the actual status of the median was not
as certain (i.e., there was a question regarding in which of
two adjacent threshold categories the median fell).
Trends, defined as the amount an indicator has
changed over time, were calculated for chl a, TN, and
TP. Dissolved oxygen was not tested for trend due to
natural diel variability of concentrations and variation
in the time of day that measurements were taken. Only
stations with 10 years or longer of data collection were
analyzed for trends, meaning only the 18 NPS stations
south of the Ocean City inlet were used (Fig. 2). Thisdata set was further trimmed to exclude winter months
(November through March), as these were not uniform-ly sampled, especially in earlier years. Half of the 18
stations were sampled beginning in 1987 and the otherhalf began sampling in 1991 (Fig. 6). The seasonal
Kendall test was used to identify trends, and Sen’s slopeestimator was used to test the magnitude of change overtime when a significant trend was present (Hirsch et al.
1982, VanBelle and Hughes 1984, Ebersole et al. 2002).The seasonal Kendall test was derived from Kendall’s
tau, a nonparametric correlation statistic, and was usedto provide a distribution-free test of trend unaffected byseasonality (month effects over years, in this case)
(Hirsch et al. 1982, Van Belle and Hughes 1984). Theseasonal Kendall test for trend was considered signifi-
cant at a , 0.01. Confidence intervals were calculatedaround each Sen slope as a general retrospective test of
power (Thomas 1997), though this method cannotdirectly evaluate study design.Observations of raw data plots revealed potential
reversals in trend direction in the water quality data.Quadratic (nonlinear) regression was used to evaluate
these potential trends. Total nitrogen, TP, and chl awere each regressed using
log½indicatorðTN; etc:Þ�¼ b0 þ b1ðtimeÞ þ b2ðtimeÞ2
þ ðb3 � � � b10Þðindividual monthsÞ þ error: ð1Þ
Month terms were included in the model to reduce
seasonality effects. The data were first standardized to acentralized date. This caused the time and the time2 terms
to become orthogonal, reducing the chances of misinter-preting correlated regression terms (E. Perry, personal
communication). Those stations with significant quadratic(time2) terms (i.e., trend reversals) at a , 0.05 wereanalyzed further. The direction of the trend after reversal
determined whether concentrations were increasing (par-abolic up) or decreasing (parabolic down).Themagnitude
of this post-reversal trend was evaluated by examining95% confidence limits around the curve. If the ordinate
value of the point atwhich the trend reversal occurredwasencompassed by the confidence limits, the trend wassignificant. If this condition was not met, the trend was
effectively asymptotic at the ordinate trend reversal value(inflection point). Confidence limits also served as an
indirect test of retrospective power (Thomas 1997).
TABLE 3. Breakdown of water quality index variables by segment. Each variable shows the proportion of sites meeting threshold(mean with SE in parentheses).
Segment Chlorophyll Total N Total P Dissolved oxygen
Assawoman 0.33 (0.21) 0.00 (0.00) 0.00 (0.00) 0.83 (0.17)St. Martin 0.36 (0.14) 0.00 (0.00) 0.00 (0.00) 0.09 (0.09)Isle of Wight 0.89 (0.11) 0.33 (0.17) 0.00 (0.00) 0.33 (0.17)Sinepuxent 1.00 (0.00) 1.00 (0.00) 0.40 (0.24) 0.80 (0.20)Newport 0.43 (0.14) 0.08 (0.08) 0.08 (0.08) 0.42 (0.15)North Chincoteague 1.00 (0.00) 0.64 (0.15) 0.18 (0.12) 0.73 (0.11)South Chincoteague 1.00 (0.00) 1.00 (0.00) 0.33 (0.21) 1.00 (0.00)
CATHERINE E. WAZNIAK ET AL.S68Ecological Applications
Special Issue

RESULTS
Are conditions in the coastal bays suitable
for key living resources?
Nutrient status.—The upper tributaries, mostly in the
northern coastal bays, and Newport Bay were severely
nitrogen enriched (Fig. 3A). This is expected since these
areas have the most intense development and the largest
streamflow and surface runoff inputs. Conversely, thesouthern coastal bays, Sinepuxent and Chincoteague,
had the lowest TN concentrations. These areas havesmaller watersheds, large wetland areas, and aregroundwater-dominated. Overall, 61% of the stations
failed the TN seagrass threshold. Phosphorus enrich-ment appeared to be even more widespread (Fig. 3B),
with only the Sinepuxent and Chincoteague Bay
FIG. 3. Water quality status maps for 2001–2003: (A) TN, median total nitrogen (annual); (B) TP, median total phosphorus(annual); (C) Chl a, median chlorophyll a (March–November); and (D) DO, dissolved oxygen, second percentile (June–September).
July 2007 S69EUTROPHICATION IN COASTAL BAYS

segments maintaining phosphorus levels suitable for
seagrass growth. Overall, 88% of the stations failed the
TP seagrass threshold.
Chlorophyll a status.—Despite many areas failing
nutrient thresholds, chl a concentrations were generally
low in the open bays and also in the nontidal stations
(Fig. 3C). The higher chlorophyll values that were
observed in the main tributaries, where development and
surface runoff are concentrated, was expected. The open
bays are downstream of the turbidity maximum and
may be light-limited from natural resuspension and,
hence, have lower chlorophyll values. A total of 66% of
the sites passed the chl a threshold for seagrass growth
(three-year medians for the other 34% of the sites fell
between 15.2 and 61.3 lg/L with 14% of sites having
chlorophyll values .30 lg/L).Dissolved oxygen status.—The coastal bays are
shallow (,2 m) lagoons, which typically do not
vertically stratify. Status analysis of the second percen-
tile of DO over the three summer periods indicated that
40% of the stations did not meet summer oxygen
objectives (Fig. 3D). Dissolved oxygen fell below 5
mg/L in the upper St. Martin River, most of Newport
Bay, areas of Chincoteague Bay, and in tributaries to
Isle of Wight and Assawoman Bays (Fig. 3D). Analysis
of daytime minimum values revealed that 70% of
stations did not meet summertime oxygen objectives.
Areas that had ,5 mg/L DO during the day may stress
living organisms at night when respiration further
reduces DO levels.
Water quality index.—Overall, the coastal bays had
generally poor or degraded water quality in or close to
tributaries and good or excellent water quality in better
flushed, open-bay regions (Fig. 4). Water quality index
values at upstream stations that rated better than
downstream values were due to lower chl a values in
fresh nontidal stations.
FIG. 4. Results of water quality index and biological thresholds used. The molar equivalents of the biological threshold for TNand TP are 46 mmol/L and 1.2 mmol/L, respectively.
CATHERINE E. WAZNIAK ET AL.S70Ecological Applications
Special Issue

Segment summaries identified that Sinepuxent andsouth Chincoteague exhibited excellent water quality,north Chincoteague had good water quality, Isle ofWight had poor water quality, and Assawoman, St.Martin, and Newport all displayed degraded waterquality (Fig. 5). Variations in water quality betweensegments reflect variation in nutrient concentrations(Fig. 5). However, many stations throughout the systemdisplayed effects of high phytoplankton biomass andreduced dissolved oxygen.
Is water quality improving or declining?
Trends.—Linear trend results showed mostly improv-ing conditions (17% of sites for TN, 50% for TP, and33% for chl a) with just two stations having increasingtrends (Fig. 6A). When the same 18 stations were testedfor polynomial trends, 89% had significant quadratictrends (concave or U-shaped) in TN, 78% for TP, and50% for chl a (Table 4, Fig. 6B). All of these significantquadratic trends were from a decreasing condition toeither an increasing or not significant (asymptotic)condition. No stations were found to have quadratictrends going from increasing to decreasing conditions.For example, station 2 had significant quadratic trendsin TN and TP, but not for chl a (Fig. 7). Further, onlyTN had a significant trend after the inflection point atthis station (i.e., was currently increasing; Fig. 7A).Critical inflection points for all significant quadratictrends ranged between the years 1995 and 2000, whichwas apparently a time of vital change for the estuary.
Total nitrogen concentrations were found to besignificantly decreasing at three stations and significantlyincreasing at one station over the sampling period, basedon linear seasonal Kendall tau trend analyses (Fig. 6A).Conversely, 89% of stations had significant quadratictrends and 83% were significantly degrading (currentlyincreasing TN) after their inflection point in TN.
Fifty percent of the stations sampled were found tohave significantly decreasing linear TP trends, while 11%
of stations had significantly increasing trends. Thesestations were also above the seagrass threshold for three-year median TP. Nonlinear trend results indicated 61%
of stations were significantly increasing post-inflectionpoint for TP (Fig. 6B).
Linear chl a concentrations were found to be signifi-cantly decreasing at one-third of the stations and signifi-cantly increasing at only one station (Fig. 6A). In contrast,one-third of the stations were significantly degrading post-inflection in the nonlinear analysis (Fig. 6B).
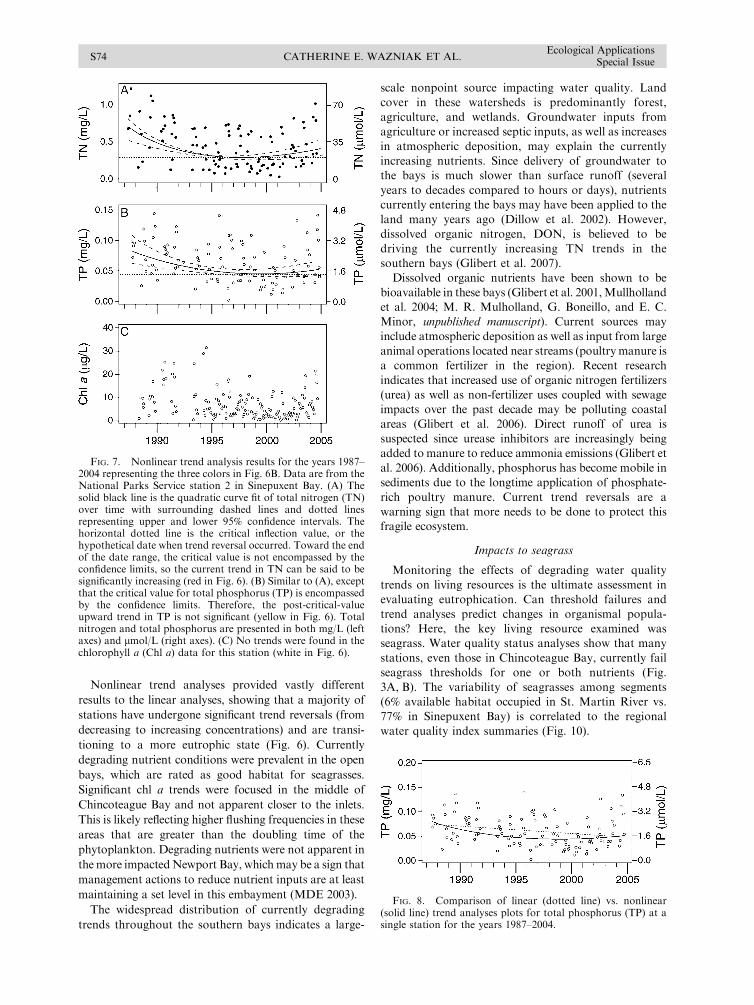
Several stations exhibited significant linear andnonlinear trends for individual parameters as a resultof ending concentrations being significantly less thanbeginning concentrations (Fig. 8).
Are differences in water quality associated with status
and trends in living resources?
Status and trends of seagrass coverage.—Throughout
the coastal bays, seagrass abundance increased steadily
since monitoring began, with an approximate threefold
increase since 1986 (Fig. 9). However, these increases
leveled over the last several years (Orth et al. 2004, 2006;Fig. 9). Currently, seagrass coverage is estimated to
occupy 67% of the potential habitat in the Marylandportion of the bays with the greatest percentage of
seagrass habitat occupied in Sinepuxent and Chinco-teague Bays (Fig. 5). Between bay segments, a positivecorrelation was observed between seagrass cover (as a
percentage of potential habitat occupied) and thesynthetic water quality index (Fig. 10).
DISCUSSION
Are conditions suitable for living resources?
Large areas of the coastal bays can be classified aseutrophic. This is most evident near the major tributar-
ies, but even the relatively pristine open bay areas areshowing signs of ecosystem change. Phosphorus enrich-
ment is more widespread than nitrogen enrichment, butboth macronutrients are above seagrass survival thresh-olds throughout large areas of the bays. Dissolved
oxygen measurements also show clear indications ofsystem degradation throughout, while only about half of
the sampled sites had chl a concentrations below thethreshold for seagrass survival. Although the coastal
bays are shallow lagoons that typically do not stratify,oxygen values were frequently low in some areas.
Observed low DO values may be due to the respirationof large algae blooms (caused by elevated nutrient
levels), high sediment oxygen demand from organicallyenriched sediments in many areas (Wells and Conk-
wright 1999, Bailey et al. 2004), and the decay ofphytoplankton, macroalgae, seagrasses, and/or marsh
vegetation. These effects are all compounded by limitedcirculation within the system, especially at stations far
removed from the two inlets.Despite many areas exceeding nutrient thresholds in
the coastal bays, chl a concentrations were generally lowin the open bays. Probable reasons for this include that(1) the majority of the algal biomass (organic matter)
produced in the tributaries is deposited within theseareas (Wells and Conkwright 1999) or (2) nutrients are
sequestered in or utilized by other forms such as benthicmicroalgae (microphytobenthos), benthic macroalgae,
and seagrasses instead of water column phytoplankton.Although current chl a status has not surpassed
threshold risk levels, degrading trends are an indicatorthey will be surpassed in time if nutrient reduction
strategies are not implemented.Water transparency is not thought to be a good
response variable in shallow lagoon systems due tonaturally high turbidity and temporal variability. In
addition to the previously mentioned factors, colorationof water due to tannins in some parts of the coastal bays
and generally limited data availability (monthly) has ledto no agreement on light thresholds. Therefore, this was
not included as a key variable.The water quality index was used to rank the bays
health from best to worst as follows: Sinepuxent Bay,
July 2007 S71EUTROPHICATION IN COASTAL BAYS

Chincoteague Bay, Isle of Wight Bay, Assawoman Bay,
Newport Bay, and St. Martin River (Fig. 5). The index
results indicated tributaries were generally poor to very
degraded due to high nutrient inputs, while the open
bays had good to excellent water quality. Regional
differences in the index have implications for aquatic
communities, suggesting that many regions within the
coastal bays do not provide suitable habitat for seagrass
and/or fish. The water quality index was useful in
communicating scientific results to the public (Wazniak
et al. 2004) and for comparing bay segments in relative
terms and may be useful for tracking system changes
over time. Nontidal stations that had better index scores
than downstream sites were not truly representative of
improved water quality in these areas. These stations
were located above the chlorophyll maximum for
streams, thereby meeting chl a thresholds. Future
analyses will reevaluate chl a threshold levels for non-
tidal stations.
The techniques described here built upon past
methods for assessing eutrophication. Historical con-
centrations, narrative statements, or comparisons to
reference stations, on their own, have not been effective
at communicating regional differences or the connec-
tions between water quality and biota. The use of
biologically relevant thresholds provides a link between
water quality and aquatic organisms that depend on
these waters for survival. The link to changes in seagrass
coverage indicated that these are meaningful indicators
of ecological changes for the system under consideration
(Fig. 10). Further, by synthesizing individual metrics
into an overall index, general patterns in eutrophication
emerged (Fig. 5).
Integrated assessments should ideally use as many
independent parameters measuring system state as
possible (e.g., nutrients, dissolved oxygen) as well as
primary (e.g., phytoplankton abundance) and secondary
ecological responses (e.g., seagrass occurence). This
combination of diverse measures ensures that the
approach is broadly applicable along the typical
eutrophication transition within a system from ben-
thic-dominated to water-column-dominated primary
production (Fig. 5). Different parameters will provide
information about changes within the system at different
times in this process. This was observed in the relatively
unimpacted Chincoteague Bay, where seagrass abun-
dance is high and phytoplankton often low, but
increases in nutrients indicate a potential eutrophication
transition (Figs. 3 and 5). Once secondary ecological
features are impaired (e.g., seagrass loss), measuring
nutrients will provide information on whether manage-
ment initiatives are effective in reducing nutrient loads
FIG. 5. Conceptual diagram of impacts of increasing nutrient loads. Water quality index (WQI) values are given as mean withSE in parentheses.
CATHERINE E. WAZNIAK ET AL.S72Ecological Applications
Special Issue

and ultimately whether biotic communities respond to
these reductions. For these reasons, it is ideal to also
include further metrics on macroalgae, fisheries, andwetlands in a fully integrated assessment for tracking
ecosystem status.
Is water quality improving or degrading?
Trend analyses allowed us to track changes over time
to determine whether management actions were helping
to improve conditions in the bays (Fig. 6). Linear trends
were the historic method for analyzing change in thecoastal bays. This method showed a majority of stations
with no significant trend and among those with a trend
more were significantly decreasing in nutrients (Fig. 6A).
Only two stations were significantly increasing in
nutrients, both in Chincoteague Bay. These two stations
had no proximate point source discharges, so increases
in nutrients and, subsequently, chl a concentrations,
may have been due to groundwater intrusion or another
local nonpoint source. Recent nitrogen isotope ratio
studies revealed sources of highly processed nitrogen in
the areas of these two stations, which may indicate
sewage/septic inputs (Jones et al. 2004).
FIG. 6. (A) Linear and (B) nonlinear water quality trend analyses (NS indicates no significant change) for total nitrogen (TN),total phosphorus (TP), and chlorophyll a (Chl a). Panel (B) gives trends for two periods: ‘‘before’’ and ‘‘current.’’ Trends cover theperiods 1987–2004 (dashed circles) or 1991–2004 (solid circles).
TABLE 4. Comparison of the percentage of sites with significant trends based on linear trend analyses vs. nonlinear trend analyses.
Parameter
Linear trend analyses Quadratic trend analyses
Significantlyimproving
Significantlydegrading
Significantparabola
Currentlyimproving
Currentlydegrading
Chlorophyll a 22 6 61 0 39Total N 11 6 94 0 89Total P 44 11 78 0 50
Note: The ‘‘Significant parabola’’ column reports the percentage of sites that have a significant quadratic term (trend reversal),while the ‘‘Currently degrading’’ quadratic results are the percentages of sites that had trends significantly increasing after theinflection point (see Fig. 7).
July 2007 S73EUTROPHICATION IN COASTAL BAYS
Nonlinear trend analyses provided vastly different
results to the linear analyses, showing that a majority of
stations have undergone significant trend reversals (from
decreasing to increasing concentrations) and are transi-
tioning to a more eutrophic state (Fig. 6). Currently
degrading nutrient conditions were prevalent in the open
bays, which are rated as good habitat for seagrasses.
Significant chl a trends were focused in the middle of
Chincoteague Bay and not apparent closer to the inlets.
This is likely reflecting higher flushing frequencies in these
areas that are greater than the doubling time of the
phytoplankton. Degrading nutrients were not apparent in
themore impactedNewport Bay, whichmay be a sign that
management actions to reduce nutrient inputs are at least
maintaining a set level in this embayment (MDE 2003).
The widespread distribution of currently degrading
trends throughout the southern bays indicates a large-
scale nonpoint source impacting water quality. Land
cover in these watersheds is predominantly forest,
agriculture, and wetlands. Groundwater inputs from
agriculture or increased septic inputs, as well as increases
in atmospheric deposition, may explain the currently
increasing nutrients. Since delivery of groundwater tothe bays is much slower than surface runoff (several
years to decades compared to hours or days), nutrients
currently entering the bays may have been applied to the
land many years ago (Dillow et al. 2002). However,
dissolved organic nitrogen, DON, is believed to be
driving the currently increasing TN trends in the
southern bays (Glibert et al. 2007).
Dissolved organic nutrients have been shown to be
bioavailable in these bays (Glibert et al. 2001,Mullhollandet al. 2004; M. R. Mulholland, G. Boneillo, and E. C.
Minor, unpublished manuscript). Current sources may
include atmospheric deposition as well as input from large
animal operations located near streams (poultry manure is
a common fertilizer in the region). Recent research
indicates that increased use of organic nitrogen fertilizers
(urea) as well as non-fertilizer uses coupled with sewageimpacts over the past decade may be polluting coastal
areas (Glibert et al. 2006). Direct runoff of urea is
suspected since urease inhibitors are increasingly being
added to manure to reduce ammonia emissions (Glibert et
al. 2006). Additionally, phosphorus has become mobile in
sediments due to the longtime application of phosphate-
rich poultry manure. Current trend reversals are a
warning sign that more needs to be done to protect thisfragile ecosystem.
Impacts to seagrass
Monitoring the effects of degrading water quality
trends on living resources is the ultimate assessment in
evaluating eutrophication. Can threshold failures and
trend analyses predict changes in organismal popula-tions? Here, the key living resource examined was
seagrass. Water quality status analyses show that many
stations, even those in Chincoteague Bay, currently fail
seagrass thresholds for one or both nutrients (Fig.
3A, B). The variability of seagrasses among segments
(6% available habitat occupied in St. Martin River vs.
77% in Sinepuxent Bay) is correlated to the regional
water quality index summaries (Fig. 10).
FIG. 7. Nonlinear trend analysis results for the years 1987–2004 representing the three colors in Fig. 6B. Data are from theNational Parks Service station 2 in Sinepuxent Bay. (A) Thesolid black line is the quadratic curve fit of total nitrogen (TN)over time with surrounding dashed lines and dotted linesrepresenting upper and lower 95% confidence intervals. Thehorizontal dotted line is the critical inflection value, or thehypothetical date when trend reversal occurred. Toward the endof the date range, the critical value is not encompassed by theconfidence limits, so the current trend in TN can be said to besignificantly increasing (red in Fig. 6). (B) Similar to (A), exceptthat the critical value for total phosphorus (TP) is encompassedby the confidence limits. Therefore, the post-critical-valueupward trend in TP is not significant (yellow in Fig. 6). Totalnitrogen and total phosphorus are presented in both mg/L (leftaxes) and lmol/L (right axes). (C) No trends were found in thechlorophyll a (Chl a) data for this station (white in Fig. 6).
FIG. 8. Comparison of linear (dotted line) vs. nonlinear(solid line) trend analyses plots for total phosphorus (TP) at asingle station for the years 1987–2004.
CATHERINE E. WAZNIAK ET AL.S74Ecological Applications
Special Issue

Throughout the coastal bays seagrass abundance has
been increasing since monitoring began in 1986, with an
overall 320% increase that may be related to historically
improving nutrient trends. However, these increases
have leveled off over the past several years (Fig. 9; Orth
et al. 2004, 2006). One possible explanation is that
seagrasses have occupied all viable habitat. However,
recent analyses estimate that current seagrass coverage
occupies 67% of the total potential habitat (area of
suitable depth and sediment type) in the Maryland
portion of the bays. Another hypothesis is that the
leveling of seagrass abundance coincides with the
inflection period of nutrient and chlorophyll a trend
reversals, suggesting that seagrass coverage may also be
in an inflection period and may begin moving toward a
decline if current trends continue.
Impact to fisheries
While no estimates of fish health in relation to the DO
threshold have been calculated in this study, the State of
Maryland criteria for oxygen was codified to protect fish
and other aquatic resources (COMAR 1995). Recent
analyses of a long-term fishery data set collected in the
coastal bays used nonmetric multidimensional scaling to
assess relatedness of fish communities within the bays.
Discrete groups were associated with the same bay
segments defined for water quality, and the groupings
clustered similarly to the ranking of embayments by the
water quality index (Murphy and Secor 2006).
Murphy and Secor (2006) also reported higher relative
abundances of fish in the northern bays (Assawoman
and Isle of Wight Bays) than in the southern bays
(Chincoteague or Sinepuxent Bays). The northern bays
were most affected by anthropogenic eutrophication,
but also exhibited higher connectivity to the ocean inlet.
The influence of increased eutrophication was a likely
explanation for increased productivity levels of fish
(Nixon and Buckley 2002) that were observed in the
northern bays, particularly given that lower levels of
seagrass and reduced water quality also occurred in the
northern bays. Fishery abundance and diversity was
shown to peak in early summer (June, July) compared to
other seasons but decreased significantly in late summer
(August, September; Murphy and Secor 2006). This
trend tracked the seasonal rise and fall of DO in the
coastal bays and provided evidence to support the DO
threshold. However, a greater understanding of the
interaction between DO, temperature, flushing, and fish
communities is required.
Future monitoring and analyses
The current monthly monitoring effort is essential for
assessing the effectiveness of management practices.
FIG. 9. Annual seagrass coverage in the Maryland coastal bays. A seagrass goal (dashed line) of 7669 ha was identified aspotential seagrass habitat in the Maryland portion of the bays based on depth and sediment type. Data are taken from the VirginiaInstitute of Marine Sciences hwww.vims.edu/bio/sav/i. ND indicates no data.
FIG. 10. Water quality index vs. percentage of potentialseagrass habitat occupied.
July 2007 S75EUTROPHICATION IN COASTAL BAYS

Long-term trend analyses allow managers to evaluate
past nutrient control efforts and project future needs in a
region. However, this type of monitoring does not
differentiate sources of nutrient pollution. Stable-iso-
tope studies are currently underway to evaluate the
effectiveness of this method for source detection.
Another drawback, especially pertinent to DO measure-
ments where minimum values are observed between the
hours of 05:00 and 07:00, is that single monthly samples
may not truly represent average conditions. Spatial
coverage may also be inadequate for some analyses.
These issues of temporal and spatial scale are being
addressed in the Maryland coastal bays by the
placement of in situ continuous monitors and intensive
spatial mapping, respectively. Generally speaking, spa-
tial variability is not as great in the Maryland coastal
bays as temporal variability. More frequent measures of
oxygen are essential in shallow, unstratified systems, and
diel measurements are recommended to better assess
eutrophication impacts.
The inclusion or exclusion of indicators can be a
contentious issue in water quality management. The
water quality and biotic indicators used in this study
work well for this system and may be useful in other
shallow coastal lagoons. Since these systems are
naturally dominated by seagrass, the relationship of
the water quality index to seagrass abundance should be
further explored in other lagoons. However, as nutrient
load increases and resulting higher chlorophyll levels
lead to declines in seagrasses due to light attenuation,
seagrass-dominated production gives way to macro-
algae-dominated production and, finally, to phytoplank-
ton-dominated production (Fig. 5; Duarte 1995, Taylor
et al. 1995, Valiela et al. 1997). Therefore, additional
monitoring of other primary producers (i.e., epiphytes,
microphytobenthos, macroalgae) would be a useful
indicator of eutrophication severity level. Better quan-
tification of diffuse nutrient sources, especially atmo-
spheric and groundwater inputs, are needed to assess the
influences on eutrophication. And, finally, a more
detailed look at changes in nutrient components would
provide insights on nutrient sources as well as biotic
changes (see Glibert et al. 2006, 2007).
Conclusion
Primary symptoms of water quality degradation in the
Maryland coastal bays are increasing nutrient and
chlorophyll levels. Secondary symptoms include low
dissolved oxygen, leveling of seagrass area, and
increased harmful algae blooms (Glibert et al. 2007).
Are conditions in the coastal bays suitable for key
living resources? Overall, no. Large areas of the bays
exhibited nutrient enrichment above threshold levels
needed to maintain biotic communities. Are conditions
improving or degrading? Generally degrading. Large
areas of what was thought to be pristine habitat showed
significantly degrading water quality trends and living
resource impacts. Are differences in water quality
associated with status and trends in living resources?
Yes, the water quality index was related to seagrass
habitat, and water quality trends were also related to
seagrass trends.
ACKNOWLEDGMENTS
We thank Susanne Bricker and Mike Kennish for inviting usto submit a manuscript for this Special Issue. We are alwaysthankful for the DNR and NPS field crews. We especially thankKristen Heyer, Debbie Howard, Chris Trumbauer, JohnZimmerelli, Tim Herb, Greg Gruber, and Alex Almario fortheir dedication to ensuring high-quality data collection. Muchappreciation also goes to Tyrone Lee, Lenora Dennis, andRenee Randall for tracking, processing, and maintaining thelarge amounts of data associated with the DNR monitoringprogram. We express deep gratitude to Jane Thomas whoprovided expert advice on science communication. We aregrateful to Patricia Glibert and Thomas Parham for reviewingthis manuscript. Finally, we are indebted to Elgin Perry,Elizabeth Ebersole, Marcia Olson, and William Romano fortheir statistical analyses consultations. This is manuscriptnumber 4019 from the University of Maryland Center forEnvironmental Science and number 2825 from the VirginiaInstitute of Marine Science.
LITERATURE CITED
APHA [American Public Health Association]. 1985. Method1002 G, chlorophyss (trichromatic). In Standard methods forthe examination of water and wastewater. Sixteenth edition.American Public Health Association, Washington, D.C.,USA.
Aspila, I., H. Agemian, and A. S. Y. Chau. 1976. A semi-automatedmethod for the determination of inorganic, organicand total phosphate in sediments. Analyst 101:187–197.
Baden, S. P., L. Loo, L. Pihl, and R. Rosenberg. 1990. Effectsof eutrophication on benthic communities including fish:Swedish west coast. Ambio 19:113–122.
Bailey, E. K. M., P. W. Smail, and W. R. Boynton. 2004.Monitoring of sediment oxygen and nutrient exchanges inMaryland’s coastal bays in support of TMDL development.Draft Report. Maryland Department of the Environment,Baltimore, Maryland, USA.
Borja, A., V. Valencia, J. Franco, I. Muxika, J. Bald, M. J.Belzunce, and O. Solaun. 2004. The water frameworkdirective: Water alone, or in association with sediment andbiota, in determining quality standards? Marine PollutionBulletin 49:8–11.
Boynton, W. R., L. Murray, J. D. Hagy, C. Stokes, and W. M.Kemp. 1996. A comparative analysis of eutrophicationpatterns in a temperate coastal lagoon. Estuaries 19:408–421.
Breitburg, D. L. 2002. Effects of hypoxia, and the balancebetween hypoxia and enrichment, on coastal fishes andfisheries. Estuaries 25:767–781.
Breitburg, D. L., L. Pihl, and S. E. Kolesar. 2001. Effects of lowdissolved oxygen on the behavior, ecology and harvest offishes: a comparison of the Chesapeake and Baltic systems.Pages 241–267 in N. N. Rabalais and R. E. Turner, editors.Coastal hypoxia: consequences for living resources andecosystems, Coastal and Estuarine Studies 58. AmericanGeophysical Union, Washington, D.C., USA.
Bricker, S. B., C. G. Clement, D. E. Pirhalla, S. P. Orlando, andD. R. G. Farrow. 1999. National estuarine eutrophicationassessment: effect of nutrient enrichment in the nation’sestuaries. National Oceanic and Atmospheric Administra-tion, National Ocean Service, Special Projects Office and theNational Centers for Coastal Ocean Science, Silver Spring,Maryland, USA.
Chesapeake Bay Program (CBP). 2001. Final quality assuranceproject plan for the Maryland Department of NaturalResources Chesapeake Bay Water Quality Monitoring
CATHERINE E. WAZNIAK ET AL.S76Ecological Applications
Special Issue

Program—chemical and physical properties component forthe period July 1, 2001–June 30, 2002. Chesapeake BayProgram Office, Annapolis, Maryland, USA.
Cloern, J. 2001. Our evolving conceptual model of the coastaleutrophication problem. Marine Ecology Progress Series 210:223–253.
COMAR [Code of Maryland Regulations]. 1995. Code ofMaryland Regulations: 26.08.02.03-3—water quality criteriaspecific to designated uses. Title 26, Maryland Department ofthe Environment. Subtitle 08. Water Pollution. Chapter 02.Water Quality. Environmental Article, §§9-303.1, 9-313–9-316, 9-319, 9-320–9-325, 9-327, and 9-328, Annotated Codeof Maryland. Maryland Department of the Environment,Annapolis, Maryland, USA.
Day, J. W., C. A. S. Hall, W. M. Kemp, and A. Yanez-Arancibia. 1989. Estuarine ecology. John Wiley and Sons,New York, New York, USA.
Dennison, W. C., R. J. Orth, K. A. Moore, J. C. Stevenson, V.Carter, S. Kollar, P. W. Bergstrom, and R. A. Batiuk. 1993.Assessing water quality with submersed aquatic vegetation.BioScience 43:86–94.
Diaz, R. J., and A. Solow. 1999. Ecological and economicconsequences of hypoxia. Topic 2. Gulf of Mexico hypoxiaassessment. National Oceanic and Atmospheric Administra-tion Coastal Ocean Program Decision Analysis Series.NOAA Coastal Ocean Program, Silver Spring, Maryland,USA.
Dillow, J. A., W. S. L. Banks, and M. J. Smigaj. 2002. Ground-water quality and discharge to Chincoteague and SinepuxentBays adjacent to Assateague Island National Seashore,Maryland. Water-Resources Investigations Report 02-4029.U.S. Geological Survey, Baltimore, Maryland, USA.
DNR [Maryland Department of Natural Resources]. 2002.Dissolved oxygen in the Coastal Bays. Maryland Departmentof Natural Resources, Annapolis, Maryland, USA. hhttp://www.dnr.state.md.us/coastalbays/res_protect/pubs/oxygen_report.pdfi
Duarte, C. M. 1995. Submerged aquatic vegetation in relationto different nutrient regimes. Ophelia 41:87–112.
Ebersole, E., M. Lane, M. Olson, E. Perry, and W. Romano.2002. Assumptions and procedures for calculating waterquality status and trends in tidal waters of the ChesapeakeBay and its tributaries: a cumulative history. Report preparedfor Chesapeake Bay Program, Tidal Monitoring andAnalysis Workgroup. Maryland Department of NaturalResources, Annapolis, Maryland, USA. hhttp://www.dnr.state.md.us/bay/tribstrat/stat_trend_hist.pdfi
Ferreira, J. G. 2000. Development of an estuarine quality indexbased on key physical and biogeochemical features. Oceanand Coastal Management 43:99–122.
Fourqurean, J. W., and L. M. Rutten. 2003. Competing goalsof spatial and temporal resolution: monitoring seagrasscommunities on a regional scale. Pages 257–288 in D. E.Busch and J. C. Trexler, editors. Monitoring ecosystems:interdisciplinary approaches for evaluating ecoregional ini-tiatives. Island Press, Washington, D.C., USA.
Funderburk, S. L., S. J. Jordan, J. A. Mihursky, and D. Riley.1991. Habitat requirements for Chesapeake Bay livingresources. Second edition. Chesapeake Bay Program report.Prepared by the Chesapeake Bay Program Habitat ObjectivesWorkgroup of the Living Resources Subcommittee. Ches-apeake Bay Program Office, Annapolis, Maryland, USA.
Glibert, P. M., J. Harrison, C. Heil, and S. Seitzinger. 2006.Escalating worldwide use of urea—a global change contrib-uting to coastal eutrophication. Biogeochemistry 77:441–463.
Glibert, P. M., R. Magnien, M. W. Lomas, J. Alexander, C.Fan, E. Haramoto, M. Trice, and T. M. Kana. 2001.Harmful algae blooms in the Chesapeake and coastal bays ofMaryland, USA: comparison of 1997, 1998, and 1999 events.Estuaries 24(6A):875–883.
Glibert, P. M., C. E. Wazniak, M. R. Hall, and B. Sturgis. 2007.Seasonal and interannual trends in nitrogen and brown tide
in Maryland’s coastal bays. Ecological Applications 17:S79–S87.
Goshorn, D., M. McGinty, C. Kennedy, C. Jordan, C.Wazniak, K. Schwenke, and K. Coyne. 2001. An examina-tion of benthic macroalgae communities as indicators ofnutrients in middle Atlantic coastal estuaries. MarylandComponent Final Report 1998–1999. Maryland Departmentof Natural Resources, Annapolis, Maryland, USA.
Hager, P. 1996. Worcester County, MD. Pages 20–24 in K.Beidler, P. Gant, M. Ramsay, and G. Schultz, editors.Proceedings—Delmarva’s Coastal Bay watersheds: not yetup the creek. EPA/600/R-95/052. U.S. EnvironmentalProtection Agency, National Health and EnvironmentalEffects Research Laboratory, Atlantic Ecology Division,Narragansett, Rhode Island, USA.
Hall, M., and C. Wazniak. 2005. Continuous water qualitymonitoring in the Maryland Coastal Bays: 2004 annualreport. Maryland Department of Natural Resources, Annap-olis, Maryland, USA.
Hirsch, R. M., J. R. Slack, and R. A. Smith. 1982. Techniquesof trend analysis for monthly water quality data. WaterResources Research 18:107–121.
Howell, P., and D. Simpson. 1994. Abundance of marineresources to dissolved oxygen in Long Island Sound.Estuaries 17:394–402.
Jones, A., T. Carruthers, F. Pantus, J. Thomas, T. Saxby,and W. Dennison. 2004. A water quality assessment ofthe Maryland Coastal Bays including nitrogen sourceidentification using stable isotopes: data report. Univer-sity of Maryland Center for Environmental Science,Cambridge, Maryland, USA. hhttp://ian.umces.edu/pdfs/md_coastal_bays_report.pdfi
Kemp, W. M., et al. 2004. Habitat requirements for submergedaquatic vegetation in Chesapeake Bay: water quality, lightregime, and physical-chemical factors. Estuaries 27:363–377.
Kiddon, J. A., J. F. Paul, H. W. Buffam, C. S. Strobel, S. S.Hale, D. Cobb, and B. S. Brown. 2003. Ecological conditionof US Mid-Atlantic estuaries 1997–1998. Marine PollutionBulletin 46:1224–1244.
Lea, C., R. L. Pratt, T. E. Wagner, E. W. Hawkes, and A. E.Almario. 2003. Use of submerged aquatic vegetation habitatrequirements as targets for water quality in Maryland andVirginia Coastal Bays. Assateague Island National Seashore,Maryland and Virgina. National Parks Service TechnicalReport NPS/NRWRD/NRTR-2003/316. National ParksService Water Resources Division, Fort Collins, Colorado,USA.
Lung, W. S. 1994. Water quality modeling of the St. MartinRiver, Assawoman and Isle of Wight Bays. MarylandDepartment of the Environment, Baltimore, Maryland,USA.
MCBP [Maryland Coastal Bays Program]. 1999. Today’streasures for tomorrow: towards a brighter future. AComprehensive Conservation Management Plan for Mary-land’s Coastal Bays. Maryland Department of NaturalResources, Annapolis, Maryland, USA.
MCBP [Maryland Coastal Bays Program]. 2005. About theMaryland Coastal Bays Program. Maryland Department ofNatural Resources, Annapolis, Maryland, USA. hhttp://www.mdcoastalbays.org/i
MDE [Maryland Department of the Environment]. 2003.TMDLs of nitrogen for three tidal tributaries and TMDLof biochemical oxygen demand (BOD) for one tributaryin the Newport Bay System, Worcester County, MD.Maryland Department of the Environment, Baltimore,Maryland, USA. hhttp://www.mde.state.md.us/Programs/Wa t e rP rog r ams /TMDL/App rov edF ina lTMDL/tmdl_newportbay_final_nutrient.aspi
Moore, K. A., D. J. Wilcox, and R. J. Orth. 2000. Analysis ofthe abundance of submersed aquatic vegetation communitiesin the Chesapeake Bay. Estuaries 23:115–127.
July 2007 S77EUTROPHICATION IN COASTAL BAYS

Mulholland, M. R., G. Boneillo, and E. C. Minor. 2004. Acomparison of N and C uptake during brown tide(Aureococcus anophagefferens) blooms from two coastal bayson the east coast of the USA. Harmful Algae 3:361–376.
Murphy, R. F., and D. H. Secor. 2006. Fish and blue crabassemblage structure in a U.S. Mid-Atlantic coastal lagooncomplex. Estuaries and Coasts 29:1121–1131.
Nixon, S., and B. Buckley. 2002. ‘‘A strikingly rich zone’’—nutrient enrichment and secondary production in coastalmarine ecosystems. Estuaries 25:782–796.
NRC [National Research Council]. 2000. Clean CoastalWaters: understanding and reducing the effects of nutrientpollution. National Academies Press, Washington, D.C.,USA.
Orth, R. J., M. L. Luckenbach, S. R. Marion, K. A. Moore,and D. J. Wilcox. 2006. Seagrass recovery in the DelmarvaCoastal Bays, USA. Aquatic Botany 84:26.
Orth, R. J., D. J. Wilcox, L. S. Nagey, A. L. Owens, J. R.Whiting, and A. Serio. 2004. 2003 distribution of submergedaquatic vegetation in Chesapeake Bay and Coastal Bays.Virginia Institute of Marine Science special scientific reportnumber 139. Virginia Institute of Marine Science, Gloucester,Virginia, USA. hwww.vims.edu/bio/sav/sav03/index.htmli
Pihl, L., S. P. Baden, and R. J. Diaz. 1991. Effects of periodichypoxia on distribution of demersal fish and crustaceans.Marine Biology 108:349–360.
Pihl, L., S. P. Baden, R. J. Diaz, and L. C. Schaffner. 1992.Hypoxia-induced structural changes in the diet of bottom-feeding fish and crustacea. Marine Biology 112:349–361.
Pritchard, D. W. 1960. Salt balance and exchange rate forChincoteague Bay. Chesapeake Science 1:48–57.
Ritter, M. C., and P. A. Montagna. 1999. Seasonal hypoxia andmodels of benthic response in a Texas bay. Estuaries 22:7–20.
Seitzinger, S. P., and R. W. Sanders. 1999. Atmospheric inputsof dissolved organic nitrogen stimulate estuarine bacteria andphytoplankton. Limnology and Oceanography 44:721–730.
Seitzinger, S. P., R. W. Sanders, and R. V. Styles. 2002.Bioavailability of DON from natural and anthropogenicsources to estuarine plankton. Limnology and Oceanography47:353–366.
Smith, M. E., and D. M. Dauer. 1994. Eutrophication andmacrobenthic communities of the lower Chesapeake Bay: I.Acute effects of low dissolved oxygen in the RappahannockRiver. Pages 76–84 in P. Hill and S. Nelson, editors. Towarda sustainable watershed: the Chesapeake experiment. Pro-ceedings of the 1994 Chesapeake Research Conference,Chesapeake Research Consortium Publication Number 149.Norfolk, Virginia, USA.
Stevenson, J. C., L. W. Staver, and K. W. Staver. 1993. Waterquality associated with survival of submersed aquaticvegetation along an estuarine gradient. Estuaries 16:346–361.
Sturgis, B. 2001. Quality assurance project plan for AssateagueIsland National Seashore’s water quality monitoring pro-gram: chemical and physical properties. Assateague IslandNational Seashore, Berlin, Maryland, USA.
Suter, G. W., editor. 1993. Ecological risk assessment. Lewis,Chelsea, Michigan, USA.
Tango, P., W. Butler, and C. Wazniak. 2005. Assessment ofharmful algae bloom species in the Maryland coastal bays.Pages 8-2–8-32 in C. Wazniak and M. Hall, editors. Mary-land’s coastal bays ecosystem health assessment 2004. DNR-12-1202-0009. Maryland Department of Natural Resources,Tidewater Ecosystem Assessment, Annapolis, Maryland,USA.
Taylor, D. I., S. W. Nixon, S. L. Granger, B. A. Buckley, J. P.McMahon, and H.-J. Lin. 1995. Responses of coastal lagoonplant communities to different forms of nutrient enrich-ment—a mesocosm experiment. Aquatic Botany 52:19–34.
Thomas, L. 1997. Retrospective power analysis. ConservationBiology 11:276–280.
Trice, T. M., P. M. Glibert, and L. Van Heukelem. 2004. HPLCpigment ratios provide evidence of past blooms of Aureo-coccus anaophagefferens in the coastal bays of Maryland andVirginia, USA. Harmful Algae 3:295–304.
U.S. EPA [Environmental Protection Agency]. 2004. NationalCoastal Condition Report II. EPA-620/R-03/002. EPA,Washington, D.C., USA.
Valderrama, J. C. 1981. The simultaneous analysis of totalnitrogen and total phosphorus in natural waters. MarineChemistry 10:109–122.
Valdes-Murtha, L. M. 1997. Analysis of critical habitatrequirements for restoration and growth of submergedvascular plants in the Delaware and Maryland coastal bays.Thesis. Marine Studies, University of Delaware, Newark,Delaware, USA.
Valiela, I., J. McClelland, J. Hauxwell, P. J. Behr, D. Hersh,and K. Foreman. 1997. Macroalgal blooms in shallowestuaries: controls and ecophysiological and ecosystemconsequences. Limnology and Oceanography 42:1105–1118.
Van Heukelem, L., and C. S. Thomas. 2001. Computer-assistedhigh-performance liquid chromatography method develop-ment with applications to the isolation and analysis ofphytoplankton pigments. Journal of Chromatography A 910:31–49.
Wazniak, C. E. 1999. Eutrophication monitoring plan. Appen-dix A of the Maryland Coastal Bays ComprehensiveConservation Management Plan. Maryland Coastal BaysProgram, Berlin, Maryland, USA.
Wazniak, C. E., and P. M. Glibert. 2004. Potential impacts ofbrown tide, Aurecoccus anophagefferens, on juvenile hardclams, Mercenaria mercenaria, in the coastal bays ofMaryland, USA. Harmful Algae 3:321–329.
Wazniak, C., M. Hall, C. Cain, D. Wilson, R. Jesien, J.Thomas, T. Carruthers, and W. Dennison. 2004. State of theMaryland coastal bays. Maryland Department of NaturalResources, Maryland Coastal Bays Program, Annapolis,Maryland, USA, and University of Maryland Center forEnvironmental Science, Cambridge, Maryland, USA.
Wazniak, C., B. Sturgis, M. Hall, and W. Romano. 2005a.Dissolved oxygen status and trends in the Maryland coastalbays. Pages 4-47–4-58 in C. Wazniak and M. Hall, editors.Maryland’s coastal bays ecosystem health assessment 2004.DNR-12-1202-0009. Maryland Department of Natural Re-sources, Tidewater Ecosystem Assessment, Annapolis, Mary-land, USA.
Wazniak, C., M. Trice, B. Sturgis, W. Romano, and M. Hall.2005b. Status and trends of phytoplankton in the MarylandCoastal Bays. Pages 4-18–4-46 in C. Wazniak and M. Hall,editors. Maryland’s coastal bays ecosystem health assessment2004. DNR-12-1202-0009. Maryland Department of NaturalResources, Tidewater Ecosystem Assessment, Annapolis,Maryland, USA.
Wells, D. V., and R. Conkwright. 1999. The Maryland CoastalBays Sediment Mapping Project—physical and chemicalcharacteristics of the shallow sediments: synthesis report andatlas. Coastal and Estuarine Geology Program File Report99-5. Maryland Department of Natural Resources, MarylandGeological Survey, Baltimore, Maryland, USA.
Wells, D. V., E. L. Hennessee, and J. M. Hill. 2004. Shorelineerosion as a source of sediments and nutrients, Maryland’scoastal bays. Maryland Geological Survey, Baltimore,Maryland, USA.
Wiegner, T. N., S. P. Seitzinger, P. M. Glibert, and D. A.Bronk. 2006. Bioavailability of dissolved organic nitrogenand carbon from nine rivers in the eastern United States.Aquatic Microbial Ecology 43:277–287.
Zimmerman, C., and C. Keefe. 2004. Shoreline erosion as asource of sediments and nutrients, Maryland’s coastal bays.Technical Report Series Number TS-442-04-CBL. UMCESnumber CBL 04-077. University of Maryland Center forEnvironmental Science, Cambridge, Maryland, USA.
CATHERINE E. WAZNIAK ET AL.S78Ecological Applications
Special Issue