
LINEAR AND NONLINEAR INTEREST RATE EXPOSURE OF SPANISH FIRMS
26
1 LINEAR AND NONLINEAR INTEREST RATE EXPOSURE OF SPANISH FIRMS Cristóbal González University of Valencia (Spain) Román Ferrer University of Valencia (Spain) Gloria M. Soto University of Murcia (Spain) This version March 2006 Cristóbal González (Corresponding author) Dpto. de Economía Financiera, Universidad de Valencia (Spain) E-mail: [email protected] Facultad de Economía, Avda. Tarongers, S/N, Valencia 46071, Spain. Phone: +34 96 3828399; Fax: +34 96 3828370 Román Ferrer Dpto. de Economía Financiera, Universidad de Valencia (Spain) E-mail: [email protected] Facultad de Economía, Avda. Tarongers, S/N, Valencia 46071, Spain. Phone: +34 96 3828399; Fax: +34 96 3828370 Gloria M. Soto Dpto. de Economía Aplicada, Universidad de Murcia (Spain) E-mail: [email protected] Campus de Espinardo, Murcia 30100, Spain. Phone: +34 968 363 742; Fax: +34 968 363 745;
-
Upload
independent -
Category
Documents
-
view
1 -
download
0
Transcript of LINEAR AND NONLINEAR INTEREST RATE EXPOSURE OF SPANISH FIRMS
1
LINEAR AND NONLINEAR INTEREST RATE EXPOSURE OF SPANISH FIRMS
Cristóbal González
University of Valencia (Spain)
Román Ferrer
University of Valencia (Spain)
Gloria M. Soto
University of Murcia (Spain)
This version March 2006 Cristóbal González (Corresponding author) Dpto. de Economía Financiera, Universidad de Valencia (Spain) E-mail: [email protected] Facultad de Economía, Avda. Tarongers, S/N, Valencia 46071, Spain. Phone: +34 96 3828399; Fax: +34 96 3828370 Román Ferrer Dpto. de Economía Financiera, Universidad de Valencia (Spain) E-mail: [email protected] Facultad de Economía, Avda. Tarongers, S/N, Valencia 46071, Spain. Phone: +34 96 3828399; Fax: +34 96 3828370 Gloria M. Soto Dpto. de Economía Aplicada, Universidad de Murcia (Spain) E-mail: [email protected] Campus de Espinardo, Murcia 30100, Spain. Phone: +34 968 363 742; Fax: +34 968 363 745;

2
STRUCTURED ABSTRACT
Linear and nonlinear interest rate exposure of Spanish firms
Research paper Purpose This paper investigates the incidence of the interest rate risk on the Spanish firms at a sector level along the period 1993-2001.
Design/Methodology The methodology employed has its origin in the two-index linear regression model proposed by Stone (1974). This traditional linear interest rate exposure model has been extended in this paper to allow for the possibility of a nonlinear exposure component as well as the presence of asymmetric behaviour in the exposure pattern. Findings The obtained results show a significant interest rate exposure for some sectors, especially with regard to changes in the long-term interest rates. Moreover, it is documented that in the Spanish case the linear exposure profile prevails over the nonlinear and asymmetric exposure patterns. In particular, Construction is the sector with the highest degree of interest rate exposure. Practical implications The exact knowledge of the impact of interest rate changes on the value of firms is an extremely important piece of information needed in the interest rate exposure management. In particular, the decision making of all the parties involved in the exposure process, such as investors, financial analysts, firm managers, financial engineers, and regulators, can be reconsidered in the light of this information. Originality/value This is the first paper which tackles the analysis of the impact of interest rate risk on the Spanish firms from a comprehensive perspective, taking into account not only the linear interest rate exposure profile, but also the nonlinear one. Key words: interest rate exposure, stock, firm, sector, risk management.
3
LINEAR AND NONLINEAR INTEREST RATE EXPOSURE OF SPANISH FIRMS
Abstract This paper carries out a comprehensive analysis of the interest rate risk borne by the Spanish
firms on a sector basis. The traditional linear interest rate exposure model has been extended
to allow for the possibility of a nonlinear exposure component as well as the presence of
asymmetric behaviour in the exposure pattern. The obtained results show a significant interest
rate exposure for some sectors, especially with regard to changes in the long-term interest
rates. Moreover, it is documented that the linear exposure profile prevails over the
asymmetric and nonlinear exposure patterns. In particular, the Construction sector is the
sector that shows the highest incidence of interest rate risk in the Spanish case.
Key words: interest rate exposure, stock, firm, sector, risk management.
Introduction
Nowadays, it is widely accepted that interest rates represent an important source of
uncertainty for the value of firms, since interest rate changes affect both the expectations
about future cash flows and the rate at which these firms’ expected future cash flows will be
discounted in the traditional valuation models. Therefore, the corporate exposure to the
interest rate risk has become recently a key concern not only for corporate managers, but also
for investors, analysts, regulators or even academics. The substantial rise in interest rate
volatility along last years and the important level of financial leverage for most of the
companies constitute factors that have contributed to increase the relevance of the interest rate
risk.
In this context, interest rate risk refers to the possibility that the market value of a company,
usually measured through its stock price, could be adversely affected by the interest rate
fluctuations. So far, the bulk of the research on interest rate exposure has focused on financial
institutions, whereas the impact of interest rate risk on the value of nonfinancial companies
has rarely been studied. The greater concern for financial institutions is due to the special
nature of the financial intermediation business.
4
However, as Bartram (2002) points out, interest rate risk may have a remarkable influence on
the value of nonfinancial firms as well. On the one hand, interest rate variations have, as in
the financial companies case, a direct effect on the cash flows and the market value of their
financial assets and liabilities. On the other hand, changes in interest rates can also have a
prominent influence on both real assets and investment projects of nonfinancial firms. In
particular, since interest rates are –through their direct relationship with the cost of capital–
one of the main determinants of the investment behaviour of firms, and they are also closely
linked to changes in the business cycle of the economy, it is predictable they affect
significantly the expected future cash flows and the value of real assets and projects, and thus
firm value.
The standard approach in the literature to this topic has been to quantify the interest rate
exposure of the firms by estimating the sensitivity of their stock returns to interest rate
changes within the traditional framework of linear and symmetric regression models (Lynge
and Zumwalt, 1980; Sweeney and Warga, 1986; Madura and Zarruk, 1995; and Faff and
Howard, 1999). However, taking into account that interest rate fluctuations affect both the
expected cash flows and the rates used to discount them it could be quite interesting to
analyze whether the relationship between the interest rates and the firm value is strictly linear,
in line with the assumption that is implicit in the classical approach, or whether, on the
contrary, a significant nonlinear exposure component may be also identified. In this sense,
like the fixed income securities exhibit a nonlinear exposure profile to interest rate risk,
usually quantified through a convexity term, stocks could be also affected by the interest rate
changes in a more complex way than the linear one.
Additionally, it could be also possible that the interest rate exposure had an asymmetric
behaviour. This asymmetry could turn into two different ways. On the one hand, interest rate
rises may have a significantly different impact on the value of the firm than interest rate falls
(sign asymmetry). On the other hand, larger interest rate variations may have a significantly
different impact on the firm value than smaller interest rate variations (size or magnitude
asymmetry). All these factors imply that the classical method to measure the interest rate
exposure might not be the most appropriate.
The main contribution of this paper is to carry out a comprehensive analysis of the impact of
the interest rate risk on the Spanish firms at a sector level, by extending the research typically
developed in the literature with the purpose of presenting a more complete picture of this
5
issue. Specifically, this analysis examines whether the interest rate exposure profile in the
Spanish case is predominantly linear, or whether there exists also a significant nonlinear or
asymmetric exposure component. Spanish stock market is specially indicated to the study of
the interest rate exposure due to the great importance that financial, regulated, and highly
leveraged firms have in this market, all of these companies being distinguished for their high
dependency on the interest rates.
The exact knowledge of the impact of interest rate changes on the value of firms and,
consequently, on the value of their stocks, is an extremely important piece of information
needed in the interest rate exposure management. In particular, the decision making of all the
parties involved in the exposure process, such as investors, financial analysts, firm managers,
financial engineers, and regulators, can be reconsidered in the context of this information.
Additionally, the accurate estimation of the sensitivity of stock prices to interest rate
variations has also important practical implications in other areas of finance such as capital
markets, asset pricing, portfolio management, and performance measurement.
The rest of the paper is structured as follows. Section 2 briefly reviews the existing literature.
Methodology employed and data used are described in Sections 3 and 4, respectively. Section
5 reports the main results from the empirical analysis carried out and, finally, Section 6
presents the most relevant conclusions.
Previous Research
The incidence of interest rate risk on the value of firms has been the object of an interesting
stream of literature developed along the last three decades. The bulk of the empirical research
about corporate interest rate exposure has been carried out within the framework of the two-
index linear regression model proposed by Stone (1974). This formulation constitutes an
extended version of the traditional market model of Sharpe and Lintner, where an interest rate
change factor is included as an additional independent variable to the usual market portfolio
return in order to explain the stock returns.
As said above, the literature concerning interest rate exposure has generally focused on
financial sector firms (Lynge and Zumwalt, 1980; Madura and Zarruk, 1995; Dinenis and
Staikouras, 1998; Oertmann et al., 2000; and Fraser et al., 2002). In contrast, the analysis of
6
the interest rate risk of nonfinancial firms has received much less attention, and often with the
only purpose to compare the results with the corresponding to the financial companies.
The majority of research on interest rate exposure has documented a significant negative
effect of interest rate changes on financial institutions’ stock returns. This significant interest
rate sensitivity has been usually explained by the traditional role of financial intermediation
played by these institutions which hold primarily in their balance sheets financial assets and
liabilities, by its own nature specially sensitive to interest rate changes, and also by the fact
that banks traditionally perform maturity transformation, i.e. taking short-term deposits and
investing these funds in long-term loans. So, such a maturity transformation implies that the
banks will be exposed to losses in the event of a sudden increase in interest rates. Thus, the
longer the maturity mismatch between the financial assets and liabilities of banks, the greater
is their interest rate risk. Nevertheless, as Akella and Chen (1990) and Faff and Howard
(1999), among others, indicate the interest rate sensitivity of stock returns of financial
institutions has been declining over time possibly motivated to the development of better
systems for measuring and managing the interest rate risk.
With regard to nonfinancial corporations, however, the obtained evidence concerning the
impact of interest rate risk is quite less conclusive than in the previous case and it varies
substantially across sectors, although the interest rate exposure is generally lower in
magnitude than the observed for financial institutions.
Sweeney and Warga (1986) conduct an extensive study of interest rate sensitivity in the U.S.
stock market using industry portfolios. These authors provide evidence that the majority of
industry sectors does not exhibit a significant interest rate exposure, being the utility industry
the nonfinancial sector which presents a greater exposure to interest rate risk. Prasad and
Rajan (1995) examine jointly the effect of exchange rate and interest rate risk factors on the
equity markets of Germany, Japan, the U.K., and the U.S. on the basis of industry portfolios.
Their results show that it is not possible in general to identify a significant interest rate
exposure on an industry level.
In contrast, Ferrer et al. (1999) show a remarkable interest rate sensitivity of the Spanish
stock market on a sector level. In a comparative study, Oertmann et al. (2000) find that
portfolios of nonfinancial corporations in France, Germany, Switzerland, but not in the U.K.,
are significantly affected by both domestic and international interest rate movements. Finally,
7
in a comprehensive study of the impact of interest rate risk on a large sample of German
nonfinancial corporations, Bartram (2002) also identifies some sectors with significant
interest rate exposure.
In summary, among the nonfinancial firms significantly affected by interest rate risk, the
companies belonging to regulated and highly leveraged sectors are the ones which habitually
show the greater sensitivity to interest rate changes. As possible explanations for this finding
usually two factors have been suggested. First, regulated firms such as utilities adjust the
prices of their products and services with a substantial lag to increases in costs due to
constraints imposed by regulators, which can contribute to accentuate the negative effect of
interest rate rises on the stock values. Second, a typical feature of the firms with a high degree
of financial leverage is their great dependence of the interest rates’ behaviour, since the cost
of debt of these companies –directly related to the level of interest rates– has a very important
weight in their profit and loss accounts.
It is important to stand out, however, that the existing studies in this area have been limited
almost exclusively to the measurement of the interest rate exposure in the framework of a
simple linear model. In comparison, it has been paid much less attention to other possible
interest rate risk structures which do not hold the assumption of an uniform, symmetric and
linear exposure that is implicit in the classical approach of Stone. In fact, the majority of
empirical studies of corporate exposure to macroeconomic risks (such as exchange rate,
interest rate, and inflation) examining the existence of nonlinear or asymmetric exposure
components have been focused on the exchange rate risk (e.g. Di Iorio and Faff, 2000;
Koutmos and Martin, 2003; and Bartram, 2004). In spite of this, it is still possible to find
some empirical papers where the existence of a more complex profile of interest rate exposure
than the classical linear one is detected.
Chen and Chan (1989) provide the seminal work for the empirical investigation of the
asymmetrical interest rate effect on the US financial institutions’ stock returns during
different interest rate cycles. Their results reveal a significant interest rate asymmetry during
up- and down- cycles of interest rates, suggesting that the interest rate sensitivities of stocks
are highly sample dependent. In a broad study of the relationship between stock returns and
interest rates in the Dutch market, Hallerbach (1994) reports evidence of a certain non-
stationarity of sensitivities to the interest rate changes and points out that the specification of a
nonlinear model could explain the asymmetry between sensitivities for interest rate increases
8
and decreases. In addition, Bartram (2002) presents empirical evidence in the German case for
the existence of significant linear and nonlinear exposures with regard to movements in
various interest rates.
Methodology
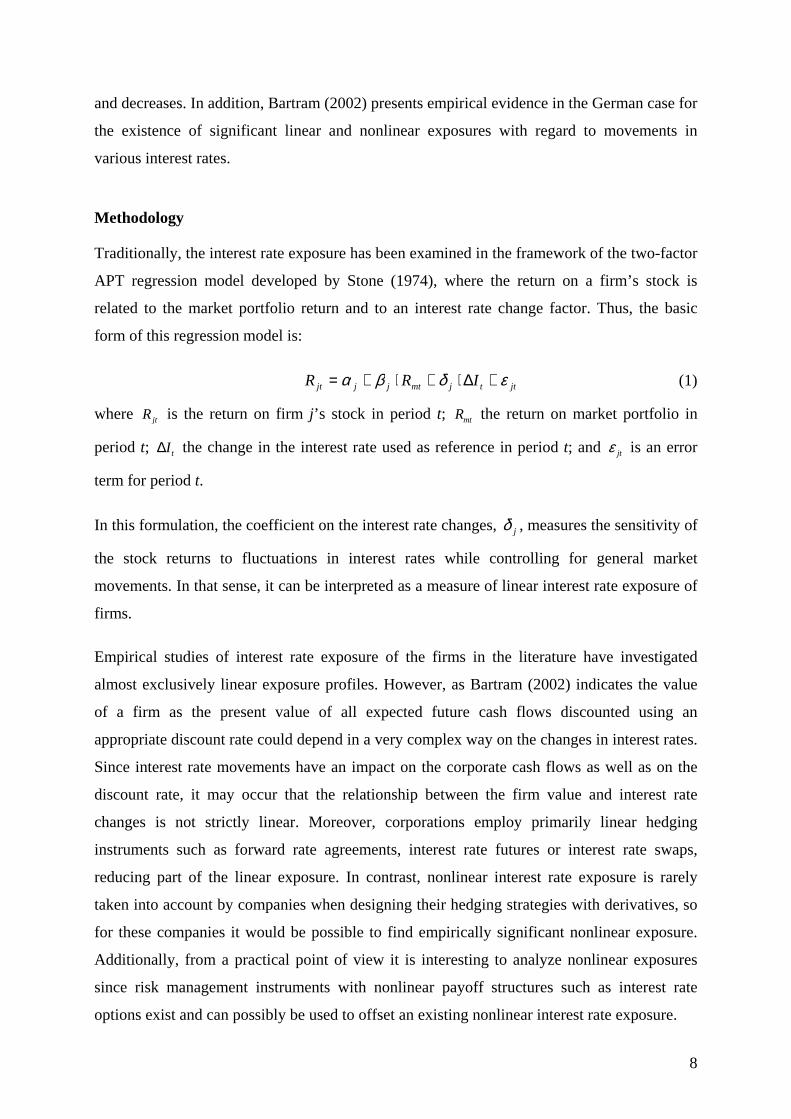
Traditionally, the interest rate exposure has been examined in the framework of the two-factor
APT regression model developed by Stone (1974), where the return on a firm’s stock is
related to the market portfolio return and to an interest rate change factor. Thus, the basic
form of this regression model is:
jttjmtjjjt IRR εδβα +∆⋅+⋅+= (1)
where jtR is the return on firm j’s stock in period t; mtR the return on market portfolio in
period t; tI∆ the change in the interest rate used as reference in period t; and jtε is an error
term for period t.
In this formulation, the coefficient on the interest rate changes, jδ , measures the sensitivity of
the stock returns to fluctuations in interest rates while controlling for general market
movements. In that sense, it can be interpreted as a measure of linear interest rate exposure of
firms.
Empirical studies of interest rate exposure of the firms in the literature have investigated
almost exclusively linear exposure profiles. However, as Bartram (2002) indicates the value
of a firm as the present value of all expected future cash flows discounted using an
appropriate discount rate could depend in a very complex way on the changes in interest rates.
Since interest rate movements have an impact on the corporate cash flows as well as on the
discount rate, it may occur that the relationship between the firm value and interest rate
changes is not strictly linear. Moreover, corporations employ primarily linear hedging
instruments such as forward rate agreements, interest rate futures or interest rate swaps,
reducing part of the linear exposure. In contrast, nonlinear interest rate exposure is rarely
taken into account by companies when designing their hedging strategies with derivatives, so
for these companies it would be possible to find empirically significant nonlinear exposure.
Additionally, from a practical point of view it is interesting to analyze nonlinear exposures
since risk management instruments with nonlinear payoff structures such as interest rate
options exist and can possibly be used to offset an existing nonlinear interest rate exposure.
9
Nevertheless, it is very difficult to suggest a priori a certain nonlinear exposure profile since
the shape of the exposure may not be uniform across firms, but firm-specific. In particular, the
exact nonlinear relationship may be a complex function of some firm specific characteristics
such as leverage ratio, liquidity ratio, firm size, and risk management strategy, among others.
Therefore, since this study represents a first approach to assessing nonlinear interest rate
exposure for the Spanish firms, a conservative approach has been taken, where the basic
objective is to estimate some standard and simple types of nonlinear functions such a
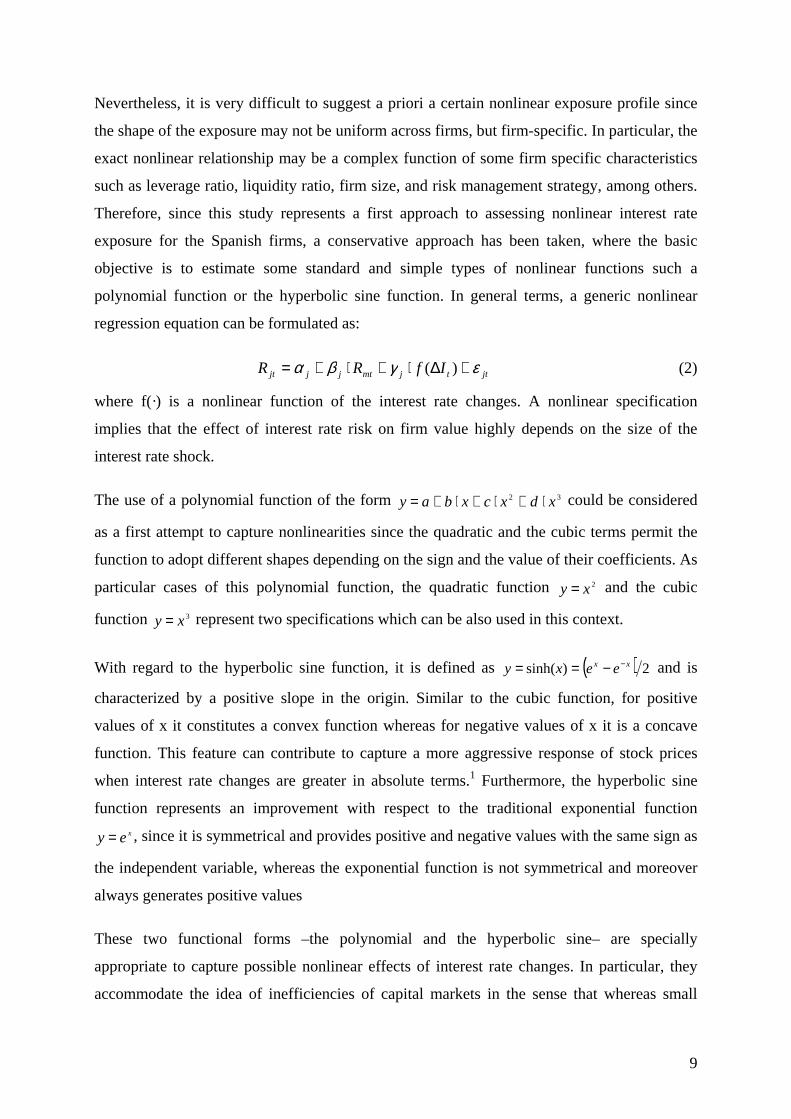
polynomial function or the hyperbolic sine function. In general terms, a generic nonlinear
regression equation can be formulated as:
jttjmtjjjt IfRR εγβα +∆⋅+⋅+= )( (2)
where f(·) is a nonlinear function of the interest rate changes. A nonlinear specification
implies that the effect of interest rate risk on firm value highly depends on the size of the
interest rate shock.
The use of a polynomial function of the form 32 xdxcxbay ⋅+⋅+⋅+= could be considered
as a first attempt to capture nonlinearities since the quadratic and the cubic terms permit the
function to adopt different shapes depending on the sign and the value of their coefficients. As
particular cases of this polynomial function, the quadratic function 2xy = and the cubic
function 3xy = represent two specifications which can be also used in this context.
With regard to the hyperbolic sine function, it is defined as ( ) 2)sinh( xx eexy −−== and is
characterized by a positive slope in the origin. Similar to the cubic function, for positive
values of x it constitutes a convex function whereas for negative values of x it is a concave
function. This feature can contribute to capture a more aggressive response of stock prices
when interest rate changes are greater in absolute terms.1 Furthermore, the hyperbolic sine
function represents an improvement with respect to the traditional exponential function xey = , since it is symmetrical and provides positive and negative values with the same sign as
the independent variable, whereas the exponential function is not symmetrical and moreover
always generates positive values
These two functional forms –the polynomial and the hyperbolic sine– are specially
appropriate to capture possible nonlinear effects of interest rate changes. In particular, they
accommodate the idea of inefficiencies of capital markets in the sense that whereas small
10
interest rate movements are possibly dominated by other price relevant information and, thus,
are reflected less in prices or even neglected, large interest rate changes may impact firm
value more strongly. Moreover, these functions permit to distinguish between the effect of
interest rates increases or decreases.
In addition, an alternative way of detecting a nonlinear exposure could consist of analyzing
the existence of asymmetric reactions of the firm value to interest rate movements, so the
interest rate exposure being dependent on the sign and the size of the interest rate shock. On
the one hand, stock returns may react differently in response to interest rate increases and
decreases (sign asymmetry). On the other hand, stock returns can be affected differently by
large or small interest rate changes (size or magnitude asymmetry).
In order to allow possible asymmetries in interest rate exposure, equation (1) has been
extended by the addition of dummy variables. Specifically, the sign asymmetry is analyzed by
using the following specification:
( ) jttsignISImtjjjt IDRR εβββα +∆⋅⋅++⋅+= , (3)
This formulation incorporates a dummy variable, Dsign, to capture the potential sign
asymmetry in the response of stock returns to interest rate changes. In particular, Dsign= 1 if
∆It>0 and zero otherwise. The existence of sign asymmetry is assessed by examining the
statistical significance of βS,I. For a given value of the market portfolio return, the response of
stock returns will be equal to βI when ∆It<0 and βI+βS,I for ∆It>0.
On the other hand, the size or magnitude asymmetry is analyzed by an analogous regression
equation, as indicated below:
( ) jttmagIMImtjjjt IDRR εβββα +∆⋅⋅++⋅+= , (4)
In this case, the dummy variable, Dmag, captures the potential size asymmetry. So, Dmag=1 if
z≥∆ tI and zero otherwise, where z is the filter or threshold level that separates small from
large interest rate changes. The existence of size asymmetry is assessed by examining the
statistical significance of the coefficient βM,I.
An important question that arises in this context is concerned to the choice of the most
appropriate interest rate to employ in the empirical analysis. In this regard, in the literature it
is usually assumed that long-term interest rates are the most relevant rates for firms because

11
they incorporate the expectations of economic agents on the future and they determine the
cost of corporate borrowing. Thereby, long-term rates are assumed to have a lot of influence
over the evolution of the economic activity and the investment decisions of firms and,
consequently, to affect the value of the companies. Nevertheless, with the aim of providing
more robustness to the results and to allow comparisons with other studies corresponding to
different markets, short-term interest rates and the spread between long-term and short-term
rates have been used as well. With regard to the interest rate spread, it constitutes a good
proxy for the slope of the term structure of interest rates and, as Bartram (2002) points out,
can act as an indicator of the evolution of business cycle.
Data
The sample period extends from January 1993 until December 2001, spanning a time interval
in which Spanish interest rates varied substantially within an overall downward trend, as they
did in other European countries.
The stock data employed are weekly returns on the major Spanish sector indices. The equity
sectors covered are: Banking, Construction, Chemicals, Communications, Electrical, Food,
Investment Trusts, Primary Metals, Utilities, and Other. The proxy for the market portfolio
used is the Indice General de la Bolsa de Madrid, the widest Spanish stock market index. The
data on sector and equity market indices have been gathered from the Bolsa de Madrid
Spanish stock exchange database.
This study has been carried out by using sector portfolios since in previous studies it has been
documented that Spanish individual firms are very homogeneous with regard to their interest
rate exposure (Ferrer et al., 2005 or Gonzalez et al., 2004). When the components of a
portfolio have similar exposure, the analysis at a portfolio level is more convenient that the
analysis at a firm level because of two reasons. First, the formation of sector portfolios has the
advantage of smoothing out the noisiness in the data. So, the idiosyncratic effects caused by
transitory shocks to individual firms that could difficult the identification of the interest rate
exposure are reduced through diversification. Second, it is very unlikely the existence of an
aggregation effect where the individual firm exposures may partially offset each other,
diminishing the statistical significance of the sector exposure.
12
Concerning to the interest rates, the yield on ten-year Spanish government bonds and the
three-month average rate of the Spanish interbank market have been taken as the
representative proxies for long-term and short-term interest rates, respectively. In addition, the
interest rate spread has been calculated as the difference between the ten-year government
bond yield and the three-month interbank rate. All interest rate data have been obtained from
the Bank of Spain historical database.
Empirical Results
Linear interest rate exposure
The empirical analysis begins with the estimation of the linear interest rate exposure
coefficients at a sector level. With that purpose, regression model (1) has been estimated for
each sector portfolio using OLS techniques. Standard errors of the coefficients have been
corrected for autocorrelation and heteroskedasticity using the Newey-West method. The
regression results with weekly data using different proxies for the interest rate changes are
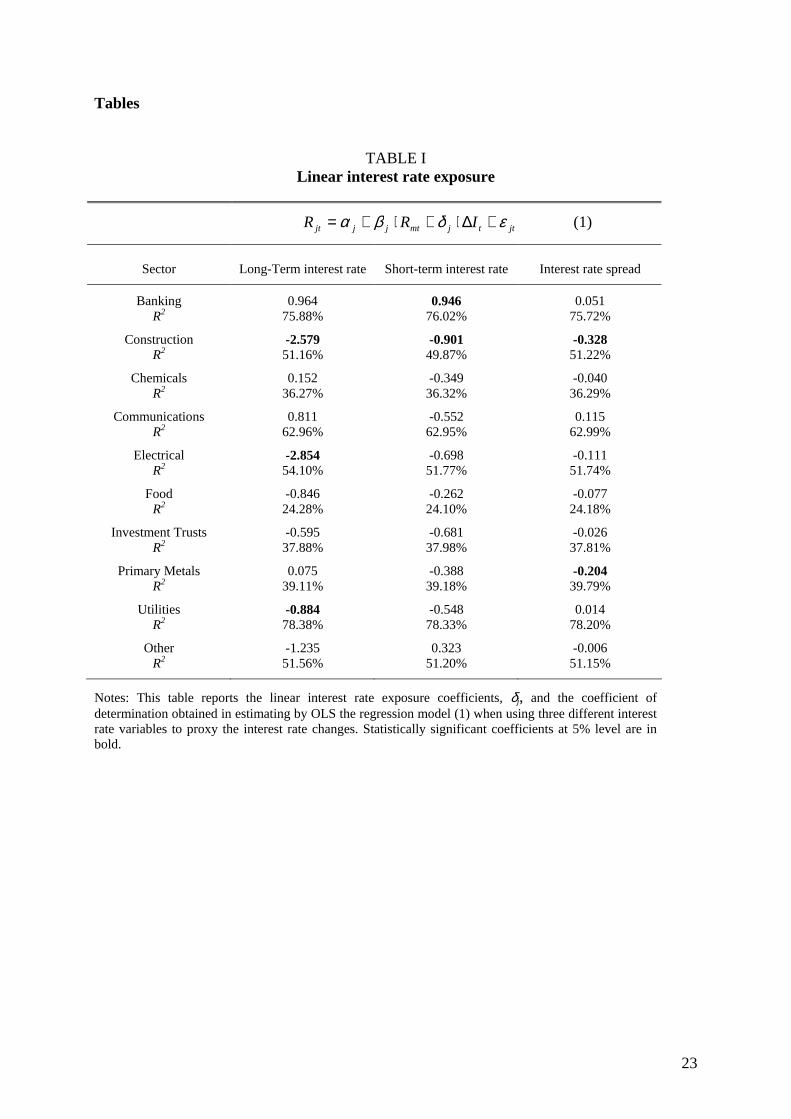
summarized in Table I. For each regression, the linear interest rate exposure coefficient and
the value of the coefficient of determination are included but, in order to conserve space,
intercept and market betas are not reported.
Take in Table I
In terms of significant interest rate exposure, the best results correspond to the changes in the
long-term interest rate. In particular, Construction, Electrical and Utilities sectors have
negative and significant exposure coefficients at the 5% level, suggesting that these sectors
benefit from a decrease in long-term interest rates. Results for the short-term interest rate
changes reveal only two sectors with significant coefficients. The Banking sector displays a
positive and significant exposure to short-term interest rate risk, indicating that Spanish
financial institutions take advantage of the interest rate increases. On the other hand, the
Construction sector has a negative significant exposure coefficient, indicating again that stock
returns for this sector decline in the face of rising short-term interest rates. Furthermore, only
the Construction and the Primary Metals sectors exhibit a negative and significant sensitivity
at the usual levels to the spread between long-term and short-term interest rates. According to
this, a negative interest rate differential implies the expectation of decreasing interest rates
and may be reflected positively in stock prices due to the expected consequences for
investment activity.
13
Overall, the evidence presented suggests that in the Spanish case regulated sectors such as
Utilities and sectors characterised by a high degree of leverage such as Construction and
Electrical or even Utilities are those which show greater linear exposure to interest rate risk.
In fact, this finding is totally consistent with the interest rate exposure patterns reported in
Sweeney and Warga (1986), Prasad and Rajan (1995) and O’Neal (1998). Moreover, the sign
of the interest rate exposure is predominantly negative for all interest rate variables
considered, which is coherent with prior empirical evidence and with the widely extended
notion in the literature of stock returns and interest rate changes being inversely related.
One surprising result refers to the fact that for the period of study considered the Spanish
Banking sector shows a significant exposure to short-term interest rates, whereas its exposure
to long-term interest rates is insignificant. This means that financial markets participants pay
more attention to short-term interest rate changes than they do to long-term rate changes in
their evaluation of the value of banks. Furthermore, this finding is contrary to the results of
Lynge and Zumwalt (1980), Madura and Zarruk (1995), and Elyasiani and Mansur (1998),
amongst others.
One possible explanation for this result is as follows. Historically, financial institutions have
had a substantial exposure to long-term interest rate risk as a result of the maturities mismatch
between the main components of the banks’ balance sheet in the form of long-term loans and
short-term deposits (Flannery and James, 1984). More recently, however, an important
transformation in the banking activity has occurred in the Spanish market, where the
traditional bank product mix has dramatically declined and the bank products related to a
shorter time horizon have grown considerably. In fact, nowadays the bulk of mortgage and
corporate credit tends to be in the form of floating rate loans linked to short-term interest
rates. Furthermore, the non-interest income has become a major source of revenue and also
the securitization of loans has experimented a spectacular growth in recent years. In addition,
the weight of long-term bond portfolios in the banks’ balance sheets has been reduced. As a
result, the influence of long-term interest rates on the Banking sector may have declined
particularly during the last years. The process of transformation in the typical bank balance
sheet would therefore explain the documented decrease in long-term interest rate sensitivity
found in the more recent literature (Faff and Howard, 1999; and Ryan and Worthington,
2002).
14
Alternatively, another explanation for the lack of a significant long-term interest rate exposure
for banks argues that the interest rate sensitivity has decreased in the last years due to the
increasing use of interest rate derivatives contracts for hedging purposes. Traditionally, banks
have been more cautious about long-term interest rate risk than to short-term interest rate risk
and, therefore, have undertaken a more rigorous hedging action for that long-term risk
exposure.
Another important point is concerned to the significant positive relationship detected between
changes in short-term interest rates and the stock returns of the Spanish financial institutions.
This apparently anomalous result may be closely linked to the transformation in banking
business above mentioned and to the context of historically low interest rates in Spain during
last years. On the one hand, interest rates of the interbank market have achieved enormous
relevance for the financial institutions, since these short-term interest rates serve actually as a
reference for the lending and deposit rates applied by the financial institutions in their usual
retail banking operations within the prevailing trend of floating-rate operations. On the other
hand, in a framework of interest rates showing a clear downward trend –they have reached the
smallest figures ever–, and characterized by a remarkable increase of banking competition in
the Spanish market during the period of study, the financial institutions have lost market
power to establish the retail banking rates. Thus, the market agents may be interpreting that
interest rate decreases have an unfavourable impact on the bank margins, which is translated
to the value of their stocks.
As expected, for all sectors and independently of the interest rate variable used, a highly
significant and positive market beta –close to one in most of cases– is found. This result
supports the idea that no specific sector considered as a whole may be used as a hedge asset
against the systematic movements on the stock market. Due to this high significance, it can be
seen that the explanatory power of the model, measured by the R-squares of the regression,
for each sector is very similar when using alternatively long-term interest rate changes, short-
term interest rate changes or the spread between these rates as the second explanatory
variable. Nevertheless, the intercepts are not statistically significant to the usual levels in any
sector.
In order to test the robustness of these results, the linear interest rate exposure has been also
measured using monthly data. The results are practically identical to those obtained using
weekly data so only the latter have been showed here due to the greater degrees of freedom
15
corresponding to this case.2 With the aim of gaining an insight into the incidence of the
interest rate changes on the Spanish firms, the impact of the lagged interest rate variations on
the different sectors has been analysed as well. However, no evidence is found that lagged
interest rate changes have a significant effect on sector stock returns. This result seems to
indicate that the impact of interest rate fluctuations is quickly reflected in stock prices,
suggesting market efficiency.
Nonlinear interest rate exposure
The existence of nonlinear structures in the interest rate exposure has been investigated using
the nonlinear specifications mentioned in section 3 both for the long- and short-term interest
rate changes and for the interest rate spread.
With regard to the results obtained, the estimation of the polynomial function has permitted to
detect a greater number of sectors with nonlinear exposure than those identified through the
estimation of the hyperbolic sine function. Additionally, when using the polynomial function,
in most of cases the presence of a significant nonlinear exposure component can be attributed
to the cubic term of this function. This result, together with its advantages over the quadratic
function to capture nonlinear effects3, has motivated the use of a simplified version of the
polynomial function such as the cubic function. In fact, the results obtained with the cubic
function considered on its own show a larger number of sectors with significant nonlinear
interest rate exposure than the amount obtained when using the hyperbolic sine function.
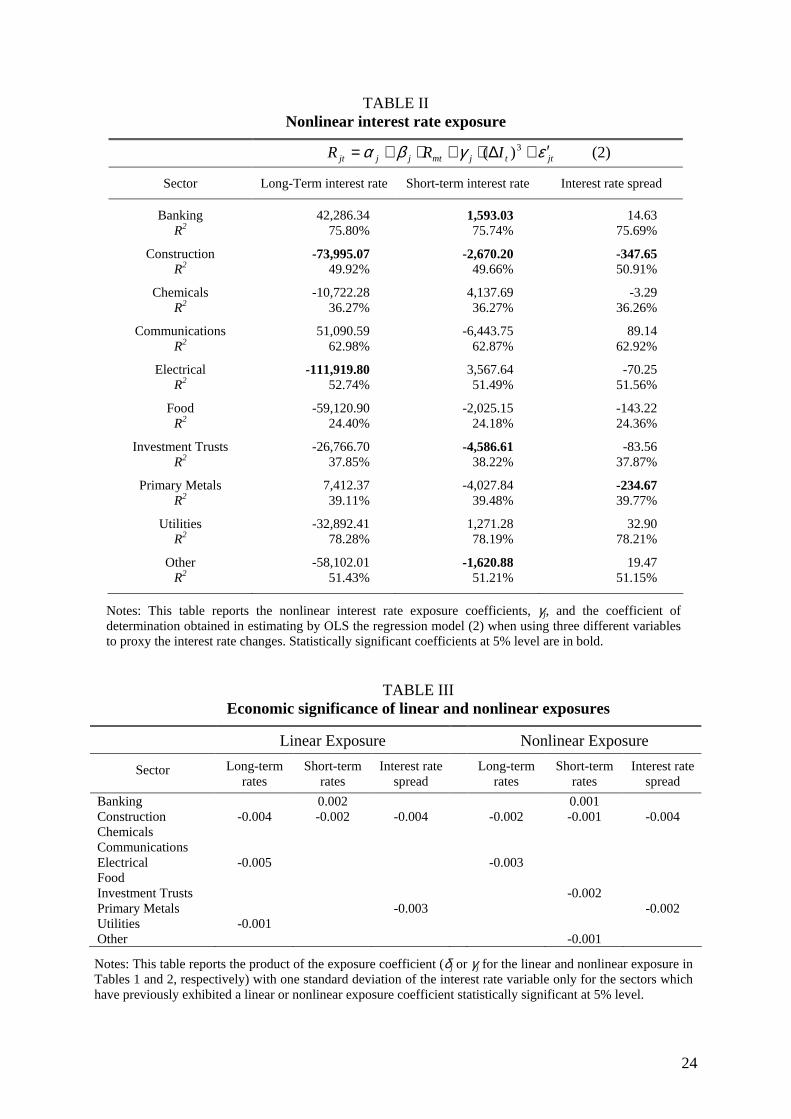
From the above, Table II summarizes the results achieved with the cubic function.
Take in Table II
As can be seen, the number of sectors subject to a significant nonlinear exposure is slightly
higher to that obtained with the linear specification, mainly due to the fact that the quantity of
sectors with significant nonlinear exposure substantially increases when nonlinear changes in
the short-term interest rate are considered. Again, the sign of the exposure is preponderantly
negative, confirming that, in general terms, the Spanish firms significantly exposed to interest
rate risk benefit from interest rates’ decreases.
Interestingly, only Construction sector has a significant and negative nonlinear interest rate
exposure either with long- and short-term interest rates changes and the interest rate spread.
As a matter of fact, the observation of the results for the linear and nonlinear specifications

16
indicates that the Construction sector is the most strongly exposed to interest rate risk. In
particular, this sector appears as the only one where the exposure coefficient is negative and
statistically significant whatever the interest rate variable and the specification are used.
Specifically, the Construction sector is composed by the firms listed at the Spanish stock
market whose main activity is any kind of construction, residential building or civil
engineering, and also by the companies dedicated to make products used in the construction.
Unfortunately, there does not exist a bigger level of disintegration which would permit to
analyse separately the stock behaviour of the construction firms focused on the residential
building and the companies focused on the civil works. In this respect, two essential features
of the Spanish Construction sector in the last years are: first, the important weight of the
residential building over the total construction, due to several factors such as low interest
rates, a booming tourist industry, the remarkable increase of population caused by the
immigration, and the use of real estate as an alternative to other forms of investing4, and
second, the high degree of diversification of activities of the Spanish construction firms.
In the same way, Banking is the only sector which exhibits a significant and positive
nonlinear exposure when using the short-term interest rates, in line with the results obtained
for the linear specification.
In order to compare the economic significance of linear and nonlinear interest rate exposures,
for all the sectors which exhibit a significant linear or nonlinear exposure the product of the
exposure coefficient with one standard deviation of the interest rate variable has been
calculated. This procedure makes the coefficients comparable as it standardizes the variables
across specifications. As can be seen in Table III, in all sectors where both significant linear
and nonlinear exposures were detected, the resulting coefficient associated to the linear
exposure is greater, in absolute terms, to the coefficient corresponding to the nonlinear
exposure. This means that the linear interest rate exposure has generally more impact on stock
prices than the nonlinear exposure.
Take in Table III
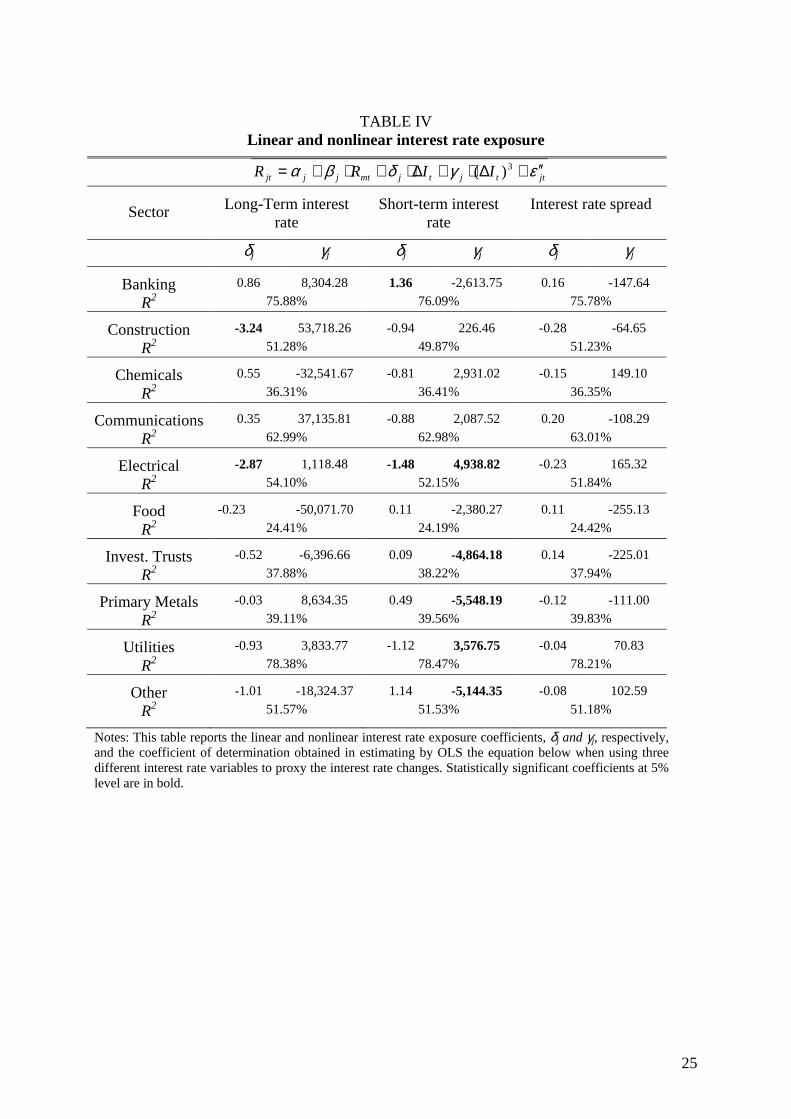
To investigate the possible relationship between linear and nonlinear exposures further,
regressions incorporating jointly both types of functions have been estimated in Table IV. The
results show that in general terms the total number of significant coefficients has decreased
with respect to that obtained in the analysis of linear and nonlinear interest rate exposure
17
carried out separately, possibly due to the presence of multicolinearity. It can also be seen that
in those sectors which previously presented both a significant linear and nonlinear exposure
component, such as the Banking, Construction, and Electrical sectors, now the linear exposure
component predominates over the nonlinear one. In addition, similarly to the previous
nonlinear exposure analysis, a significant nonlinear effect of short-term interest rate changes
is observed for a high number of sectors. Finally, the interest rate spread loses completely its
statistical significance when the linear and nonlinear effects are jointly examined. This
evidence seems to confirm that linear interest rate exposure prevails relative to the nonlinear
exposure in the Spanish case.
Take in Table IV
Analysis of asymmetries
The presence of sign and magnitude asymmetries in the response of stock returns to the
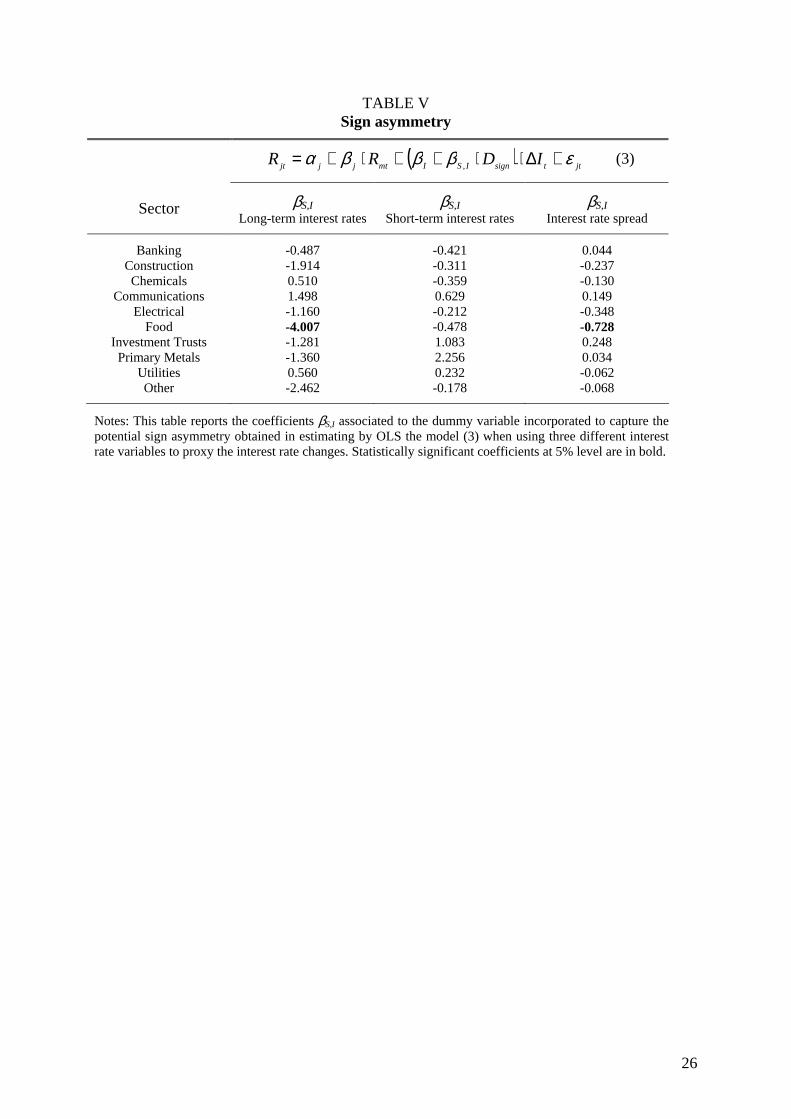
interest rate changes has been analysed as well. As can be observed in Table V, the evidence
of significant sign asymmetries in the Spanish stock market is very low. In particular, Food is
the only sector which shows a significant asymmetric effect, where the long-term interest rate
increases have a significantly stronger effect on stock returns than long-term rate decreases.
According to this, it can be stated that, in general terms, the Spanish sector stock returns do
not respond differently to interest rate increases and decreases.
Take in Table V
Regarding to the presence of a significant magnitude or size asymmetry, firstly it has been
necessary to settle a filter to separate small from large interest rate fluctuations. For each
interest rate series considered, this filter has been computed as the sample-period mean plus
or minus two standard deviations. The results obtained with this procedure suggest the
absence of significant size asymmetry in interest rate exposure for the Spanish stock market,
independently of the interest rate variable used and the particular sector considered.5 In order
to increase the robustness of the results, several additional filters have been also used to
separate large from small interest rate changes. However, the evidence achieved has
confirmed the lack of a clear pattern of magnitude asymmetry.
18
Conclusions
Understanding the impact of interest rate risk is a critical element for purposes of firm
valuation and risk management. This study has investigated the incidence of interest rate risk
on the Spanish firms at a sector level over the period 1993-2001. The classical linear interest
rate exposure model has been extended to allow for the possibility of a nonlinear exposure
component as well as the presence of asymmetric behaviour in the exposure pattern.
In general terms, the interest rate exposure is not homogeneous for all the Spanish equity
sectors. In fact, there is evidence of significant interest rate exposure for less than half of the
sectors considered, especially with regard to changes in the long-term interest rates.
Moreover, it is documented that in the Spanish case the linear exposure profile prevails over
the nonlinear and asymmetric exposure patterns.
The results obtained indicate that regulated and highly leveraged sectors such as Construction,
Electrical, and Utilities are those which show the greatest incidence of interest rate risk. As
expected, the sign of the exposure is predominantly negative, so indicating that the majority
of Spanish industry sectors significantly exposed to interest rate risk benefit from the interest
rate decreases. In particular, the sector with the highest degree of interest rate exposure is the
Construction sector. This finding might be attributed to two main factors. First, the
construction industry is a capital intensive sector which has substantially taken advantage of
the general downward trend in interest rates observed during most of the period of study.
Second, the Spanish Construction sector, characterised in the last years by the clear
prevalence of the residential building over the civil engineering, has been particularly
favoured by the housing boom occurred during this period driven by a historically low interest
rate environment, becoming the major engine of the Spanish economic growth.
Surprisingly, the Banking sector does not exhibit significant sensitivity to changes in long-
term interest rates, although a significant positive exposure to short-term interest rate
variations has been found. This result may be probably due to the transformation in the
banking business observed in the last years and to the development of improved risk
management techniques by the financial institutions.
From all the above, it can be concluded that the assumption of a symmetric and linear
exposure that is implicit in the classical approach for interest rate exposure appears to be quite

19
appropriate for the Spanish case. Concerning to the corporate risk management, the
prevalence of the classical linear interest rate exposure profile suggests that the use of
derivative instruments with linear payoff profiles (such as forward rate agreements, interest
rate swaps, or future contracts) is enough to properly hedge the interest rate risk.
The results of this study have important implications for a wide group of agents. The list
includes regulators who wish to understand the links between interest rate policies and
relative wealth; investors –either individual or institutional– and financial analysts who are
very interested in knowing how stock returns of various sectors react to interest rate
fluctuations; and also portfolio managers to whom it is worth consider the effects of interest
rate movements in value-at-risk, performance measurement, and other analysis that seek to
improve the knowledge about the sources of risk of stock returns.

20
Endnotes [1] The hyperbolic sine function represents an improvement with respect to the traditional exponential function
xey = , since it is symmetrical and provides positive and negative values with the same sign as the independent
variable, whereas the exponential function is not symmetrical and moreover always generates positive values.
[2] The results achieved using monthly data can be obtained from the authors by request.
[3] Whereas the quadratic function does not distinguish between the effect of negative and positive values for the independent variable, the cubic function does.
[4] In this sense, for example 675,000 new dwellings were initiated during 2004, a number larger than in Italy, France, and Germany altogether. In fact, 21% of the total number of houses in Spain has been built during the last 10 years and the weight of the construction sector has increased from 14% to 18% of the Spanish GNP during this period.
[5] To save space the results achieved in testing the magnitude asymmetry have not been included. These results can be obtained from the authors by request.
21
References Akella, S.R. and Chen, S.J. (1990) “Interest Rate Sensitivity of Bank Stock Returns:
Specification Effects and Structural Change”, Journal of Financial Research, Vol 13, No 2, pp. 147-154.
Bartram, S.M. (2002) “The Interest Rate Exposure of Nonfinancial Corporations”, European Finance Review, Vol 6, No 1, pp. 101-125.
Bartram, S.M. (2004) “Linear and nonlinear foreign exchange rate exposures of German Nonfinancial Corporations”, Journal of International Money and Finance, Vol 23, No 4, pp. 673-699.
Chen, C.R. and Chan, A. (1989) “Interest rate sensitivity, asymmetry, and the stock returns of financial institutions”, Financial Review, Vol 24, No 3, pp. 457-473.
Di Iorio, A. and Faff, R.W. (2000) “An analysis of asymmetry in foreign currency exposure of the Australian equities market”, Journal of Multinational Financial Management, Vol 10, No 2, pp. 133-159.
Dinenis, E. and Staikouras, S.K. (1998) “Interest rate changes and common stock returns of financial institutions: evidence from the UK”, European Journal of Finance Vol 4, No 2, pp.113-127.
Elyasiani, E. and Mansur, I. (1998) “Sensitivity of the bank stock returns distribution to changes in the level and volatility of interest rate: A GARCH-M Model”, Journal of Banking and Finance, Vol 22, No 5, pp. 535-563.
Faff, R.W. and Howard, P.F. (1999) “Interest rate risk of Australian financial sector companies in a period of regulatory change”, Pacific-Basin Finance Journal, Vol 7, No 1, pp. 83-101.
Ferrer, R., Gonzalez, C. and Soto, G. (2005) “Oportunidades de crecimiento empresariales y riesgo de interés en el mercado bursátil español”, Revista Española de Financiación y Contabilidad, Vol XXXIV, No 126, pp. 595-612.
Ferrer, R., Santoma, J. and Sebastian, A. (1999) “El riesgo de interés en el mercado español de acciones. Una aproximación sectorial”, Revista Española de Financiación y Contabilidad, Vol XXVIII, No 98, pp. 43-75.
Flannery, M.J. and James, C.M. (1984) “The effect of interest rate changes on the common stock returns of financial institutions”, Journal of Finance, Vol 39, No 4, pp. 1141-1153.
Fraser, D.R., Madura, J. and Weigand, R.A. (2002) “Sources of Bank Interest Rate Risk”, Financial Review, Vol 37, No 3, pp. 351-368.
Gonzalez, C., Ferrer, R., and Soto, G. (2004) “Determinants of the interest rate exposure of non-financial Spanish firms”, paper presented at the 57th International Atlantic Economic Conference, Lisbon, Portugal, March 10-14, 2004.
Hallerbach, W.G. (1994), “Theoretical and Empirical Aspects of the Relation between Interest Rates and Common Stock Returns” in D’Ecclesia, R.L. and Zenios, S.A. (Eds.), Operations Research Models in Quantitative Finance, Physica/Springer Verlag, Heidelberg, pp. 112-133.
Koutmos, G. and Martin, A.D. (2003) “Asymmetric exchange rate exposure: theory and evidence”, Journal of International Money and Finance, Vol 22, No 3, pp. 365-383.
22
Lynge, M.J. and Zumwalt, J.K. (1980) “An empirical study of the interest rate sensitivity of commercial bank returns: A multi-index approach”, Journal of Financial and Quantitative Analysis, Vol 15, No 3, pp. 731-742.
Madura, M. and Zarruk, E. (1995) “Bank exposure to interest rate risk: A global perspective”, Journal of Financial Research, Vol 18, No 1, pp. 1-13.
O’Neal, E.S. (1998) “Why electric utility stocks are sensitive to interest rates”, Financial Review, Vol 33, No 1, pp.147-162
Oertmann, P., Rendu, C. and Zimmermann, H. (2000) “Interest Rate Risk of European Financial Corporations”, European Financial Management, Vol 6, No 4, pp. 459-478.
Prasad, A.M. and Rajan, M. (1995) “The role of exchange and interest risk in equity valuation: A comparative study of international stock markets”, Journal of Economics and Business, Vol 47, No 5, pp. 457-472.
Stone, B.K.(1974) “Systematic interest rate risk in a two-index model of returns”, Journal of Financial and Quantitative Analysis, Vol 9, No 5, pp. 709-721.
Sweeney, R.J. and Warga, A.D. (1986) “The pricing of interest rate risk: evidence from the stock market”, Journal of Finance, Vol 41, No 2, pp. 393-410.
23
Tables
TABLE I Linear interest rate exposure
jttjmtjjjt IRR εδβα +∆⋅+⋅+= (1)
Sector Long-Term interest rate Short-term interest rate Interest rate spread
Banking 0.964 0.946 0.051 R2 75.88% 76.02% 75.72%
Construction -2.579 -0.901 -0.328 R2 51.16% 49.87% 51.22%
Chemicals 0.152 -0.349 -0.040 R2 36.27% 36.32% 36.29%
Communications 0.811 -0.552 0.115 R2 62.96% 62.95% 62.99%
Electrical -2.854 -0.698 -0.111 R2 54.10% 51.77% 51.74%
Food -0.846 -0.262 -0.077 R2 24.28% 24.10% 24.18%
Investment Trusts -0.595 -0.681 -0.026 R2 37.88% 37.98% 37.81%
Primary Metals 0.075 -0.388 -0.204 R2 39.11% 39.18% 39.79%
Utilities -0.884 -0.548 0.014 R2 78.38% 78.33% 78.20%
Other -1.235 0.323 -0.006 R2 51.56% 51.20% 51.15%
Notes: This table reports the linear interest rate exposure coefficients, δj, and the coefficient of determination obtained in estimating by OLS the regression model (1) when using three different interest rate variables to proxy the interest rate changes. Statistically significant coefficients at 5% level are in bold.
24
TABLE II Nonlinear interest rate exposure
jttjmtjjjt IRR εγβα ′+∆⋅+⋅+= 3)( (2)
Sector Long-Term interest rate Short-term interest rate Interest rate spread
Banking 42,286.34 1,593.03 14.63 R2 75.80% 75.74% 75.69%
Construction -73,995.07 -2,670.20 -347.65 R2 49.92% 49.66% 50.91%
Chemicals -10,722.28 4,137.69 -3.29 R2 36.27% 36.27% 36.26%
Communications 51,090.59 -6,443.75 89.14 R2 62.98% 62.87% 62.92%
Electrical -111,919.80 3,567.64 -70.25 R2 52.74% 51.49% 51.56%
Food -59,120.90 -2,025.15 -143.22 R2 24.40% 24.18% 24.36%
Investment Trusts -26,766.70 -4,586.61 -83.56 R2 37.85% 38.22% 37.87%
Primary Metals 7,412.37 -4,027.84 -234.67 R2 39.11% 39.48% 39.77%
Utilities -32,892.41 1,271.28 32.90 R2 78.28% 78.19% 78.21%
Other -58,102.01 -1,620.88 19.47 R2 51.43% 51.21% 51.15%
Notes: This table reports the nonlinear interest rate exposure coefficients, γj, and the coefficient of determination obtained in estimating by OLS the regression model (2) when using three different variables to proxy the interest rate changes. Statistically significant coefficients at 5% level are in bold.
TABLE III Economic significance of linear and nonlinear exposures
Linear Exposure Nonlinear Exposure
Sector Long-term rates
Short-term rates
Interest rate spread
Long-term rates
Short-term rates
Interest rate spread
Banking 0.002 0.001 Construction -0.004 -0.002 -0.004 -0.002 -0.001 -0.004 Chemicals Communications Electrical -0.005 -0.003 Food Investment Trusts -0.002 Primary Metals -0.003 -0.002 Utilities -0.001 Other -0.001
Notes: This table reports the product of the exposure coefficient (δj or γj for the linear and nonlinear exposure in Tables 1 and 2, respectively) with one standard deviation of the interest rate variable only for the sectors which have previously exhibited a linear or nonlinear exposure coefficient statistically significant at 5% level.
25
TABLE IV
Linear and nonlinear interest rate exposure
jttjtjmtjjjt IIRR εγδβα ′′+∆⋅+∆⋅+⋅+= 3)(
Sector Long-Term interest rate
Short-term interest rate
Interest rate spread
δj γj δj γj δj γj
Banking 0.86 8,304.28 1.36 -2,613.75 0.16 -147.64
R2 75.88% 76.09% 75.78%
Construction -3.24 53,718.26 -0.94 226.46 -0.28 -64.65
R2 51.28% 49.87% 51.23%
Chemicals 0.55 -32,541.67 -0.81 2,931.02 -0.15 149.10
R2 36.31% 36.41% 36.35%
Communications 0.35 37,135.81 -0.88 2,087.52 0.20 -108.29
R2 62.99% 62.98% 63.01%
Electrical -2.87 1,118.48 -1.48 4,938.82 -0.23 165.32
R2 54.10% 52.15% 51.84%
Food -0.23 -50,071.70 0.11 -2,380.27 0.11 -255.13
R2 24.41% 24.19% 24.42%
Invest. Trusts -0.52 -6,396.66 0.09 -4,864.18 0.14 -225.01
R2 37.88% 38.22% 37.94%
Primary Metals -0.03 8,634.35 0.49 -5,548.19 -0.12 -111.00
R2 39.11% 39.56% 39.83%
Utilities -0.93 3,833.77 -1.12 3,576.75 -0.04 70.83
R2 78.38% 78.47% 78.21%
Other -1.01 -18,324.37 1.14 -5,144.35 -0.08 102.59
R2 51.57% 51.53% 51.18%
Notes: This table reports the linear and nonlinear interest rate exposure coefficients, δj and γj, respectively, and the coefficient of determination obtained in estimating by OLS the equation below when using three different interest rate variables to proxy the interest rate changes. Statistically significant coefficients at 5% level are in bold.
26
TABLE V Sign asymmetry
( ) jttsignISImtjjjt IDRR εβββα +∆⋅⋅++⋅+= , (3)
Sector βS,I Long-term interest rates
βS,I Short-term interest rates
βS,I Interest rate spread
Banking -0.487 -0.421 0.044 Construction -1.914 -0.311 -0.237 Chemicals 0.510 -0.359 -0.130
Communications 1.498 0.629 0.149 Electrical -1.160 -0.212 -0.348
Food -4.007 -0.478 -0.728 Investment Trusts -1.281 1.083 0.248 Primary Metals -1.360 2.256 0.034
Utilities 0.560 0.232 -0.062 Other -2.462 -0.178 -0.068
Notes: This table reports the coefficients βS,I associated to the dummy variable incorporated to capture the potential sign asymmetry obtained in estimating by OLS the model (3) when using three different interest rate variables to proxy the interest rate changes. Statistically significant coefficients at 5% level are in bold.