Limits to the potential distribution of light brown apple moth in Arizona–California based on...
13
ORIGINAL PAPER Limits to the potential distribution of light brown apple moth in Arizona–California based on climate suitability and host plant availability Andrew Paul Gutierrez • Nicholas J. Mills • Luigi Ponti Received: 21 July 2009 / Accepted: 29 January 2010 / Published online: 20 February 2010 Ó The Author(s) 2010. This article is published with open access at Springerlink.com Abstract The highly polyphagous light brown apple moth (LBAM) (Epiphyas postvittana (Walk.): Tortricidae) is indigenous to Australia and was first found in California in 2006. It is currently found in 15 coastal counties in California, but nowhere has it reached outbreak status. The USDA projects the geographic range of LBAM will include much of Arizona and California and the southern half of the US, which together with economic estimates of potential crop losses have been used as the rationale for an eradication program in California. We report a temperature-driven demographic model to predict the likely distribution and relative abundance of LBAM using the detailed biology reported by Danthanara- yana and colleagues, and climate data from 151 locations in California and Arizona for the period 1995–2006. The predictions of our model suggest that the near coastal regions of California are most favorable for LBAM, the northern Central Valley of California being less favorable, and the desert regions of Arizona and California being unfavorable. The model also predicts that LBAM populations can develop at two of the hottest locations in SE Australia where it is has long been known to occur. This reassessment of the potential distribution of LBAM in California and Arizona suggests that its likely eco- logical and economic impacts would be less than previously assessed by USDA and that its current pest status warrants re-evaluation. Keywords Light brown apple moth Geographic distribution Invasive species Eradication Modeling GIS Introduction The light brown apple moth (LBAM, Epiphyas postvittana (Walk.): Tortricidae) is indigenous to Australia where it is considered a pest of pome fruits and grape, but it has been recorded from a broad range of host plant species including crops, ornamentals and herbaceous weeds (Danthanarayana 1975; Geier and Briese 1981; Suckling and Brockerhoff 2010). This A. P. Gutierrez N. J. Mills Department of Environmental Science Policy and Management, College of Natural Resources, University of California, Berkeley, CA 94720-3114, USA A. P. Gutierrez L. Ponti Center for the Analysis of Sustainable Agricultural Systems (CASAS Global), 37 Arlington Ave, Kensington, CA 94707, USA L. Ponti ENEA, Dipartimento BAS, Gruppo ‘‘Lotta alla Desertificazione’’, S.P. Anguillarese 301, 00123 S. Maria di Galeria (Rome), Italy A. P. Gutierrez (&) Ecosystem Science, University of California, 137 Mulford Hall, Berkeley, CA 94720, USA e-mail: [email protected] 123 Biol Invasions (2010) 12:3319–3331 DOI 10.1007/s10530-010-9725-8
Transcript of Limits to the potential distribution of light brown apple moth in Arizona–California based on...

ORIGINAL PAPER
Limits to the potential distribution of light brown applemoth in Arizona–California based on climate suitabilityand host plant availability
Andrew Paul Gutierrez • Nicholas J. Mills •
Luigi Ponti
Received: 21 July 2009 / Accepted: 29 January 2010 / Published online: 20 February 2010
� The Author(s) 2010. This article is published with open access at Springerlink.com
Abstract The highly polyphagous light brown apple
moth (LBAM) (Epiphyas postvittana (Walk.):
Tortricidae) is indigenous to Australia and was first
found in California in 2006. It is currently found in 15
coastal counties in California, but nowhere has it
reached outbreak status. The USDA projects the
geographic range of LBAM will include much of
Arizona and California and the southern half of the
US, which together with economic estimates of
potential crop losses have been used as the rationale
for an eradication program in California. We report a
temperature-driven demographic model to predict the
likely distribution and relative abundance of LBAM
using the detailed biology reported by Danthanara-
yana and colleagues, and climate data from 151
locations in California and Arizona for the period
1995–2006. The predictions of our model suggest that
the near coastal regions of California are most
favorable for LBAM, the northern Central Valley of
California being less favorable, and the desert regions
of Arizona and California being unfavorable. The
model also predicts that LBAM populations can
develop at two of the hottest locations in SE Australia
where it is has long been known to occur. This
reassessment of the potential distribution of LBAM in
California and Arizona suggests that its likely eco-
logical and economic impacts would be less than
previously assessed by USDA and that its current pest
status warrants re-evaluation.
Keywords Light brown apple moth �Geographic distribution � Invasive species �Eradication � Modeling � GIS
Introduction
The light brown apple moth (LBAM, Epiphyas
postvittana (Walk.): Tortricidae) is indigenous to
Australia where it is considered a pest of pome fruits
and grape, but it has been recorded from a broad range
of host plant species including crops, ornamentals and
herbaceous weeds (Danthanarayana 1975; Geier and
Briese 1981; Suckling and Brockerhoff 2010). This
A. P. Gutierrez � N. J. Mills
Department of Environmental Science Policy and
Management, College of Natural Resources, University
of California, Berkeley, CA 94720-3114, USA
A. P. Gutierrez � L. Ponti
Center for the Analysis of Sustainable Agricultural
Systems (CASAS Global), 37 Arlington Ave,
Kensington, CA 94707, USA
L. Ponti
ENEA, Dipartimento BAS, Gruppo ‘‘Lotta alla
Desertificazione’’, S.P. Anguillarese 301, 00123
S. Maria di Galeria (Rome), Italy
A. P. Gutierrez (&)
Ecosystem Science, University of California,
137 Mulford Hall, Berkeley, CA 94720, USA
e-mail: [email protected]
123
Biol Invasions (2010) 12:3319–3331
DOI 10.1007/s10530-010-9725-8

pest was accidentally introduced into England,
Hawaii, New Caledonia and New Zealand, and was
first found in the San Francisco Bay area by Univer-
sity of California Emeritus Professor Jerry Powell in
2006 (Brown 2007). LBAM is currently found in 15
coastal and near coastal counties in California
suggesting it has been present in the state for several
years. To date the pest has not reached outbreak status
at any location in California.
The United States Department of Agriculture
(USDA) posits that the potential distribution of
LBAM includes all areas having sufficient thermal
units for the completion of three generations (i.e.,
California and the Southern half of the United States)
with estimated losses of $118 million per annum from
apple, grape, orange and pear production (Fowler
et al. 2009). In response to this perceived threat, the
USDA considers LBAM to be an actionable quaran-
tine pest, and has placed quarantine on California
produce in affected counties as well as all counties in
Hawaii (Federal Quarantine Order of May 2, 2007). In
late 2007, the California Department of Agriculture
(CDFA) began an eradication program using phero-
mones, sprays and other techniques. The pheromone
spray program engendered considerable public protest
concerning claimed public health effects, the lack of
hard evidence that LBAM is a serious pest and the
proposed expenditure of nearly 100 million dollars for
the program in California alone. Because of public
outcry, an eradication program based on the sterile
insect technology (SIT) has now been proposed.
The potential ecological and economic impact of
invasive species can be influenced by many factors
(Parker et al. 1999; Levine et al. 2003; Buckley
2008), but for invasive arthropod pests, climate and
temperature in particular have played a central role in
the assessment of risk (e.g., Fowler et al. 2009;
Migeon et al. 2009; Sutherst and Bourne 2009). A
variety of climate matching models have been used to
predict the potential distribution of invaders (Coetzee
et al. 2009; Rodda et al. 2009; Sutherst and Bourne
2009), but there have been few attempts to include
biotic interactions in addition to abiotic drivers into
such models (e.g., Gutierrez and Baumgartner 1984;
Gutierrez et al. 2008). Here, we analyze the potential
distribution of LBAM in Arizona and California
using a temperature-driven demographic model to
provide a more quantitative and realistic approach for
assessment of the risk of this invasive pest.
Biology of light brown apple moth
Danthanarayana (1975) reviewed the sparse literature
on the biology of LBAM prior to 1975 (Dumbleton
1932, 1939; Evans 1937; Geier 1965; Lawrence and
Bartell 1972; Bartell and Lawrence 1973; MacLellan
1973). In a series of papers, Danthanarayana (1975,
1976a, b, c), Danthanarayana et al. (1995), Gu and
Danthanarayana (1990a, b, 1992) described the biol-
ogy of LBAM, and this body of work is the basis for
our analysis. The developmental biology of E. post-
vittana is summarized below and in Figs. 1 and 2.
Light brown apple moth does not have a diapause
period and feeds on numerous plant species across
family lines; the lower threshold for development of all
stages was estimated as 7.5�C (Danthanarayana 1975),
but reanalysis of the data for eggs and larvae yields a
non linear relationship with a slightly lower threshold
of 6.8�C (Fig. 1). The mean duration of the egg stage is
5.7 days at 28�C (120.8 degree days; dd[6.8�C) with no
eggs hatching above 31.3�C. Larval and pupal devel-
opmental times are 335 and 142 dd, respectively with
an upper threshold for development for larvae and
pupae of approximately 31.5�C. The generation time is
594 dd. Fifty-percent of eggs are laid by 646 dd; mean
Fig. 1 The effect of temperature (T) on the developmental
rates of LBAM eggs (a) and larvae (b) (data from Danthan-
arayana 1975)
3320 A. P. Gutierrez et al.
123

fecundity is approximately 384 but varies considerably
(0–1492) with female size, larval food and temperature
(Danthanarayana et al. 1995; Gu and Danthanarayana
1990a, b, 1992), but only temperature is used in the
model. The optimum temperature for oviposition is
near 20�C. At constant temperatures of 20 and 25�C,
[50 and 80% of the eggs are laid by the fourth and the
seventh day after emergence respectively with peak
oviposition occurring when adult females are 2–3 days
old. Body weight of both male and female moths at
emergence increases with increasing temperature up to
25�C. Danthanarayana (1976a, b, c) provides infor-
mation on the diel and lunar periodicities, seasonal
variation in flight activity and the influence of food and
temperature on flight performance in the field. Flight
duration increases with temperature in the range
15–28�C, with males being stronger fliers than females
with the longest flights occurring on day four. Mating
in females begins within 24 h of emergence with
nearly all being mated within 4 days. The average
number of matings is 2, although by day 11 some
females may mate as many as five times (Gu and
Danthanarayana 1990a, b, 1992). Geier et al. (1978)
found that a small proportion of LBAM females
produce predominantly female progeny resulting in
the proportion of males in field samples to range from
0.43 to 0.45. Based on LBAM’s biology, theoretical
considerations suggest that this value is near the
theoretical optimum assuring that nearly all females
are mated (see Geier et al. 1978). The resulting sex
ratio in our model is 1.1 $:0.9 #.
Data from Danthanarayana (1975) were used to
estimate the effects of adult age and temperature on
per capita fecundity (Fig. 2a–c). The data are illus-
trated in days for ease of interpretation, but all
calculations in the model are made in physiological
time units. The effect of temperature (T) and age (x)
on per capita daily fecundity is modeled as the product
of the function for maximum fecundity (E(x, Topt)) at
the optimum temperature (Topt = 20�C, Fig. 2a) and a
scalar function of the effects of temperature above and
below the optimum (/T, Fig. 2b) yielding Eðx; TÞ ¼/TðTÞ � Eðx; ToptÞ (Fig. 2c). The rightward displace-
ment of the fecundity function from the y-axis
(Fig. 2a, c) reflects the short pre-oviposition period.
Sources of mortality
Three sources of LBAM mortality are included in the
model: (1) Intrinsic mortality in the favorable range
between 6.8 and 28�C is accounted for by the
differing progression of the population members with
temperature through the distributed maturation time
model, (2) mortality due to extremes of temperatures,
and (3) mortality due to the combined action of
Fig. 2 The effects of
LBAM adult age and daily
average temperature (T) on
fecundity: a per capita daily
fecundity on female age (x)
at 20�C, b a scalar
(0 B /TB 1) of the effects
of average temperature on
fecundity, c the combined
effects of subfigures a, b(data from Danthanarayana
1975), and the effects of
extreme temperature d on
the mortality rate per day
(0 B lT B 1). Note that the
symbol (filled circle)
represents data and (opencircle) represents linear
extrapolations
Potential distribution of light brown apple moth 3321
123

natural enemies and other factors. Only mortality
sources (2) and (3) require further explanation.
Extremes of temperature
Data on the lethal effects of low temperature on
LBAM are sparse, and hence we used estimates from
an ongoing study by Buergi and Mills (unpublished
observations) showing that 30% of larvae die within
1 day at -10�C and all larvae died within 1 day at
-16�C. We computed the daily mortality rate from
low temperatures as the integral of time and temper-
ature below the developmental threshold (lT; Eq. 1i;
Fig. 2d; Gutierrez et al. 2005), and used it to model
the daily over-wintering mortality rate.
if Tmin\6:8�C; 0:01\lT ¼ 1
� 0:015 expð0:323dd\6:8�CÞ\1 i
if Tmax [ 28�C; 0:01\lT ¼ 1
� 0:125 expð0:025dd[ 28�CÞ\1 ii
else lT ¼ 0
ð1Þ
The daily mortality rate at high average temper-
atures (Eq. 1ii) was estimated from data in figure 11
in Danthanarayana (1975) showing the percent sur-
vivorship from egg hatch to adult emergence at
several temperatures (T). The daily proportional
mortality was computed from the percent mortality
at the four highest temperatures shown in the figure
by dividing by the egg to adult period (477.5 dd),
multiplying by the dd[6.8�C at each temperature (T),
and dividing by 100. The mortality rate increases
with average daily temperature above 28–45�C
(Eq. 1ii, Fig. 2d). Mean daily temperatures above
45�C are unlikely to be encountered in the field.
Other mortality
Field life table studies summarized by Danthanara-
yana (1983) in Victoria, Australia estimate the action
of various mortality factors affecting LBAM life
stages. Total generation mortality was approximately
98–99.5% with egg mortality being a key factor
during spring and autumn, and egg mortality and
losses of first instar during dispersal being key factors
during summer. Predation of eggs and first instar
larvae by generalist predators acting in a density
independent manner increased with hot dry weather
and nearly eliminated summer generations. Similar
high rates of mortality were also observed by Geier
and Briese (1980) including widespread nuclear
polyhedrosis virus infection (Geier and Briese 1979).
Despite having been present in California for
several years, LBAM has failed to reach outbreak
levels, even though it has invaded a Mediterranean
climate similar to that of SE Australia. Recent field
observations in California have also shown that the
egg and larval stages of LBAM are attacked by a
suite of generalist predators and parasitoids (NJ
Mills, unpublished observations). In the absence of
field life tables for LBAM in California, we take a
composite approach to incorporating this mortality in
a manner that reflects the population levels of LBAM
observed in the invaded areas. We develop a
functional response model (Eq. 2) wherein the daily
proportional mortality (lc) increases with both tem-
perature (Dt = dd[6.8�C) and prey density (Neggs ?
Nlarvae) at a decreasing rate. The coefficient 0.0025 in
Eq. 2 is the proportion of eggs and larvae attacked
dd-1, and was chosen iteratively to produce the low
population levels that are currently observed in the
field.
0� lc ¼ 1� e�0:0025ðNeggsþNlarvaeÞDt\1 ð2Þ
Rainfall
Rainfall can have an important indirect effect on
LBAM dynamics through host plant availability.
Outside of irrigated crops, herbaceous weedy plants
are important hosts for LBAM, and as it is an insect
with no winter diapause these are often the only host
plants available for the period from late summer
through spring (Geier and Briese 1981). To examine
the effect of rainfall on annual host plant distribution
and consequently the potential distribution of LBAM,
we use the well-studied drought tolerant Mediterra-
nean yellow starthistle (Centaurea solstitialis L.;
YST) as a surrogate annual plant species (see
Gutierrez et al. 2005).
Model overview
The biology of LBAM is embedded in an Erlang
distributed maturation time demographic model that
3322 A. P. Gutierrez et al.
123
simulates the dynamics of an age structured popula-
tion (Vansickle 1977; DiCola et al. 1999, p. 523–
524). The general model for the ith age class of a
population is:
dNi
dt¼ kDx
D½Ni�1ðtÞ � NiðtÞ� � liðtÞNiðtÞ: ð3Þ
Ni is the abundance of the ith age class, dt is the
change in time (dd/day computed using the non linear
model), k is the number of age classes, D is the
expected mean developmental time, Dx is a daily
increment of age, and li(t) includes the proportional
net loss rate of births as modified by temperature and
age (Fig. 2c), the death rate due to extremes of
temperature (lT, Eq. 1) and to composite mortality
effects (lc, Eq. 2).
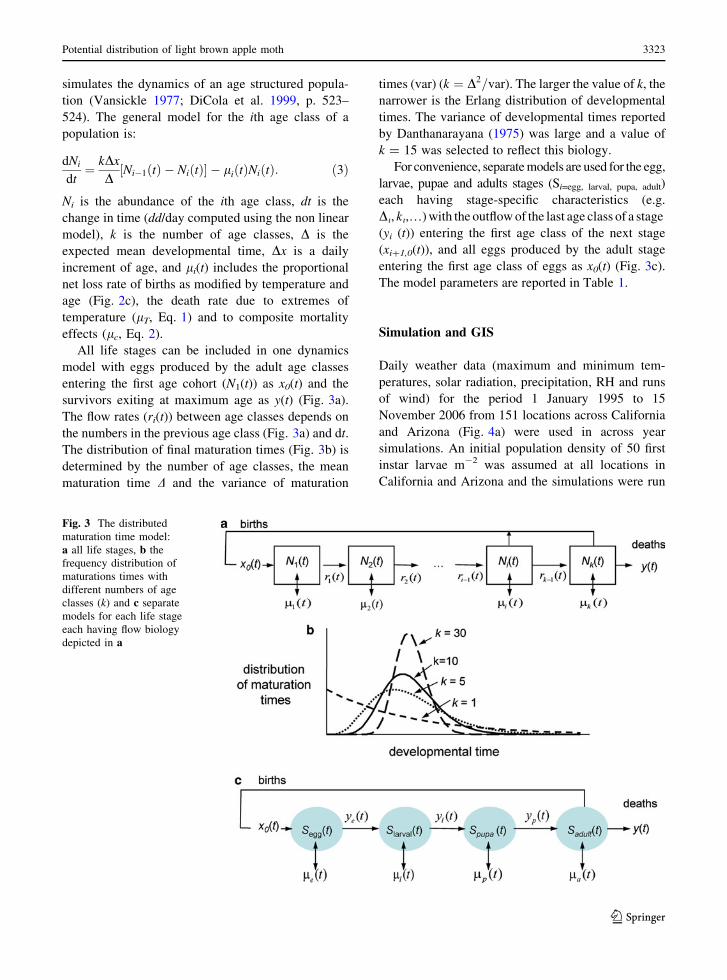
All life stages can be included in one dynamics
model with eggs produced by the adult age classes
entering the first age cohort (N1(t)) as x0(t) and the
survivors exiting at maximum age as y(t) (Fig. 3a).
The flow rates (ri(t)) between age classes depends on
the numbers in the previous age class (Fig. 3a) and dt.
The distribution of final maturation times (Fig. 3b) is
determined by the number of age classes, the mean
maturation time D and the variance of maturation
times (var) (k ¼ D2=var). The larger the value of k, the
narrower is the Erlang distribution of developmental
times. The variance of developmental times reported
by Danthanarayana (1975) was large and a value of
k = 15 was selected to reflect this biology.
For convenience, separate models are used for the egg,
larvae, pupae and adults stages (Si=egg, larval, pupa, adult)
each having stage-specific characteristics (e.g.
Di, ki,…) with the outflow of the last age class of a stage
(yi (t)) entering the first age class of the next stage
(xi?1,0(t)), and all eggs produced by the adult stage
entering the first age class of eggs as x0(t) (Fig. 3c).
The model parameters are reported in Table 1.
Simulation and GIS
Daily weather data (maximum and minimum tem-
peratures, solar radiation, precipitation, RH and runs
of wind) for the period 1 January 1995 to 15
November 2006 from 151 locations across California
and Arizona (Fig. 4a) were used in across year
simulations. An initial population density of 50 first
instar larvae m-2 was assumed at all locations in
California and Arizona and the simulations were run
Fig. 3 The distributed
maturation time model:
a all life stages, b the
frequency distribution of
maturations times with
different numbers of age
classes (k) and c separate
models for each life stage
each having flow biology
depicted in a
Potential distribution of light brown apple moth 3323
123

continuously over the 1995–2006 period. Data from
the first year of simulation were not included in the
analysis to allow populations to adjust to the effects
of site-specific weather.
Data from the simulation for all locations were geo-
referenced and written to files for mapping at eleva-
tions below 1,000 m. The open source geographic
information system (Grass GIS) originally developed
by the United State Army Corp of Engineers was used
to map the data (Geographic Resources Analysis
Support System (GRASS) Software, ITC-irst, Trento,
Italy (http://grass.itc.it)). Raster-based triangulation
kriging on a one km grid was used to interpolate the
simulation data. The cumulative larval days per year
Table 1 Biological
parameters for the light
brown apple moth
Process Parameter/eqn Light brown apple moth
Thermal threshold (in �C) s 6.8�C
Daily degree days
335:3� ð0:0003ðT � sÞ=ð1þ 1:9ðT�31:5ÞÞÞDdd(t)
Duration of life stages in degree days at 20�C dd Egg (120.8)
Larvae (335.5)
Pupa (142.0)
Adult (290.4)
Maximum age (x) per capita fecundity/
day at age x and temperature T
Fðx;TÞ ¼ /ðTÞ � aðx� 0:5Þ=bx�0:5
a
b
28.50
1.36
/ðTÞ ¼ 1� ðT�Tmin�TmidÞTmid
h i2
Tmin
Tmax
Tmidx
6.8�C
31.50�C
19.15�C
Sex ratio 1.1$:0.9#
Delay parameter k 15
Fig. 4 Weather stations
used in the regional study
(a), and maximum and
minimum temperatures and
simulation dynamics of
LBAM egg and larval
dynamics at Salinas (b, c)
and Davis, California (d, e)
during 1/1/2005 and 15/10/
2006. The lower (6.8�C)
and upper (28�C) thresholds
below and above which
temperature mortality
accrues are shown as
dashed lines in sub figs.
b and d. The location of
Salinas (open circle) and
Davis (filled circle) are
illustrated in a
3324 A. P. Gutierrez et al.
123
from the simulation was used as an index of the
favorability of the climate for the occurrence of
LBAM at a particular location. This index should not
be considered a prediction of either absolute popula-
tion densities of LBAM or potential damage caused
by LBAM at a particular location. Its purpose is
merely to reflect the favorability of the climate for
LBAM population growth.
Three simulation analyses were performed:
1. The relative abundance and phenology of LBAM
under mild conditions of Salinas, CA and more
extreme conditions common to Davis, CA to
show the effects of temperature assuming non
limiting host plant availability.
2. A regional analysis of the favorability of tem-
perature for LBAM across all locations in
California and Arizona assuming non limiting
host plant availability.
3. A regional analysis of climatic favorability for
LBAM using the limiting effect of rainfall on a
surrogate annual plant to illustrate the potential
effects of rainfall on the availability of weedy
host plants for LBAM in California and Arizona.
Results
Simulation for Salinas and Davis, CA
Simulations of egg and larval population dynamics
using observed maximum and minimum temperatures
at Salinas, Monterey County in coastal Northern
California and Davis, Yolo County in Central Cali-
fornia (Fig. 4) were conducted for the period 1
January 2005 to 15 October 2006 to illustrate the
effects of differing climatic temperatures on the
relative abundance and phenology of LBAM. Tem-
peratures in Salinas were generally mild throughout
the year (Fig. 4b) allowing the development of three
generations (Fig. 4c). In contrast, temperatures at
Davis were colder during winter though rarely
freezing, while summers were often very hot
(Fig. 4d). The resulting generations at Davis are less
distinct (Fig. 4e) with extremes of temperature reduc-
ing fecundity and increasing mortality and restricting
population growth to the milder times of the year.
Consequently the relative abundance of egg and larval
populations at Salinas were predicted to be six and
two fold greater, respectively than those at Davis.
Regional analysis: influence of temperature
with non-limiting host plants
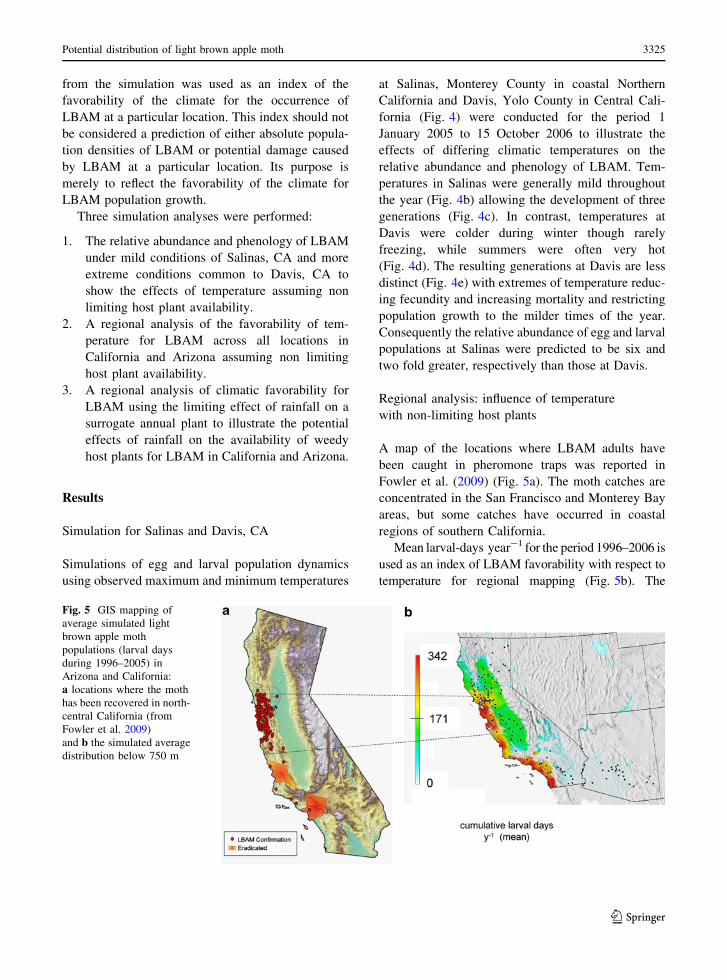
A map of the locations where LBAM adults have
been caught in pheromone traps was reported in
Fowler et al. (2009) (Fig. 5a). The moth catches are
concentrated in the San Francisco and Monterey Bay
areas, but some catches have occurred in coastal
regions of southern California.
Mean larval-days year-1 for the period 1996–2006 is
used as an index of LBAM favorability with respect to
temperature for regional mapping (Fig. 5b). The
Fig. 5 GIS mapping of
average simulated light
brown apple moth
populations (larval days
during 1996–2005) in
Arizona and California:
a locations where the moth
has been recovered in north-
central California (from
Fowler et al. 2009)
and b the simulated average
distribution below 750 m
Potential distribution of light brown apple moth 3325
123
simulation shows good correspondence between the
predicted distribution of LBAM and the recorded trap
catches in California, especially in the San Francisco and
Monterey Bay areas. The model also suggests that the
potential distribution of LBAM could extend southward
along the coastal into Southern California (Fig. 5b, areas
of red–orange-yellow), and eastward from San Fran-
cisco Bay into parts of the Central Valley (e.g., Davis)
where areas of intermediate favorability (yellow) are
created by the moderating influence of easterly ocean
breezes during summer. These areas of intermediate to
high favorability include some important apple, pear and
grape growing regions of California. In contrast, most of
the Central Valley shows low to intermediate favorabil-
ity (green), while the desert valleys of Southern
California and the deserts of Arizona are predicted
largely unfavorable because of very high summer
temperatures that reduce fecundity and increase mor-
tality (very light blue to absence of color).
The regional simulation data were analyzed using a
multiple linear regression (Eq. 4) to assess the relative
influence of high and low extremes of temperature on
the index of favorability. The dependent variable was
regressed on cumulative yearly dd[6.8�C, dd[28�C and
dd\6.8�C together with their interactions and only those
variables and interactions with slopes significantly
different from zero (P \ 0.01) were retained in the
final model:
larval days ¼ 251:09� 0:223dd\6:8�C
� 0:297dd [ 28�C � 0:0007dd\6:8�C � dd[ 28�C
n ¼ 1490; R2 ¼ 0:80; F ¼ 1989:2 ð4Þ
These results show that on average, dd[28�C had a
33% greater marginal effect on the index of favorabil-
ity than dd\6.8�C (i.e. oy=odd[ 28�C [ oy=odd\6:8�C).
The assumption of this analysis is that host plant
availability is not limiting, but this is obviously not
the case as experience from Australia shows that
annual plants are an integral component of the
LBAM life system (Geier and Briese 1981).
Regional analysis: influence of temperature
and rainfall-limited host plants
Many Mediterranean annual plants germinate during
fall and early winter periods of rain and favorable
temperatures. For these plants to persist without
irrigation, sufficient rainfall for them to grow and
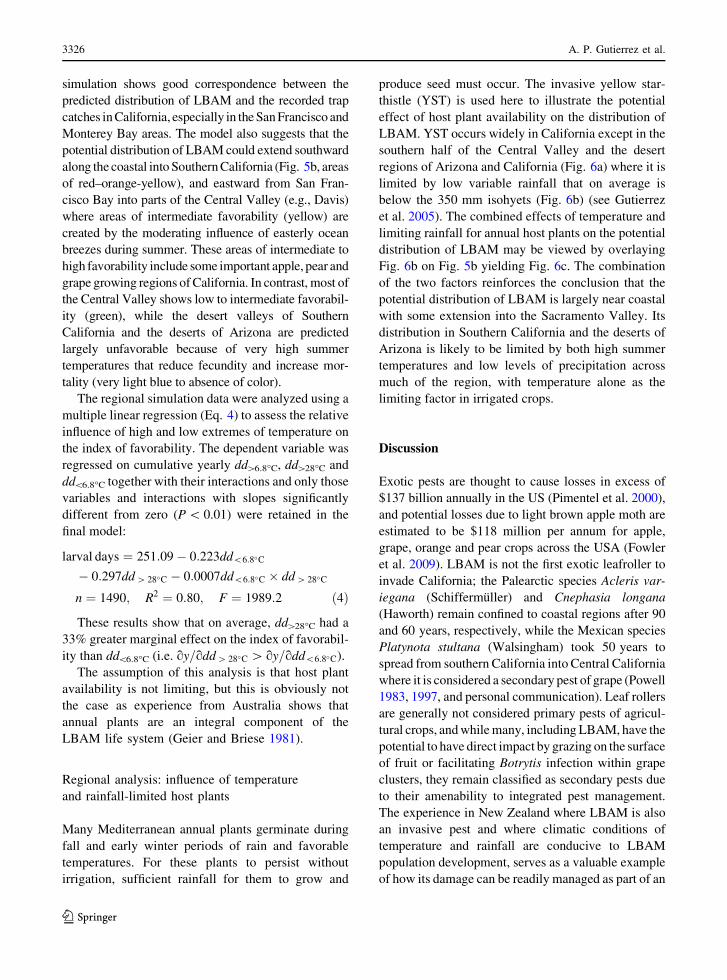
produce seed must occur. The invasive yellow star-
thistle (YST) is used here to illustrate the potential
effect of host plant availability on the distribution of
LBAM. YST occurs widely in California except in the
southern half of the Central Valley and the desert
regions of Arizona and California (Fig. 6a) where it is
limited by low variable rainfall that on average is
below the 350 mm isohyets (Fig. 6b) (see Gutierrez
et al. 2005). The combined effects of temperature and
limiting rainfall for annual host plants on the potential
distribution of LBAM may be viewed by overlaying
Fig. 6b on Fig. 5b yielding Fig. 6c. The combination
of the two factors reinforces the conclusion that the
potential distribution of LBAM is largely near coastal
with some extension into the Sacramento Valley. Its
distribution in Southern California and the deserts of
Arizona is likely to be limited by both high summer
temperatures and low levels of precipitation across
much of the region, with temperature alone as the
limiting factor in irrigated crops.
Discussion
Exotic pests are thought to cause losses in excess of
$137 billion annually in the US (Pimentel et al. 2000),
and potential losses due to light brown apple moth are
estimated to be $118 million per annum for apple,
grape, orange and pear crops across the USA (Fowler
et al. 2009). LBAM is not the first exotic leafroller to
invade California; the Palearctic species Acleris var-
iegana (Schiffermuller) and Cnephasia longana
(Haworth) remain confined to coastal regions after 90
and 60 years, respectively, while the Mexican species
Platynota stultana (Walsingham) took 50 years to
spread from southern California into Central California
where it is considered a secondary pest of grape (Powell
1983, 1997, and personal communication). Leaf rollers
are generally not considered primary pests of agricul-
tural crops, and while many, including LBAM, have the
potential to have direct impact by grazing on the surface
of fruit or facilitating Botrytis infection within grape
clusters, they remain classified as secondary pests due
to their amenability to integrated pest management.
The experience in New Zealand where LBAM is also
an invasive pest and where climatic conditions of
temperature and rainfall are conducive to LBAM
population development, serves as a valuable example
of how its damage can be readily managed as part of an
3326 A. P. Gutierrez et al.
123
ongoing integrated fruit production program (Walker
et al. 1999; Delate et al. 2008).
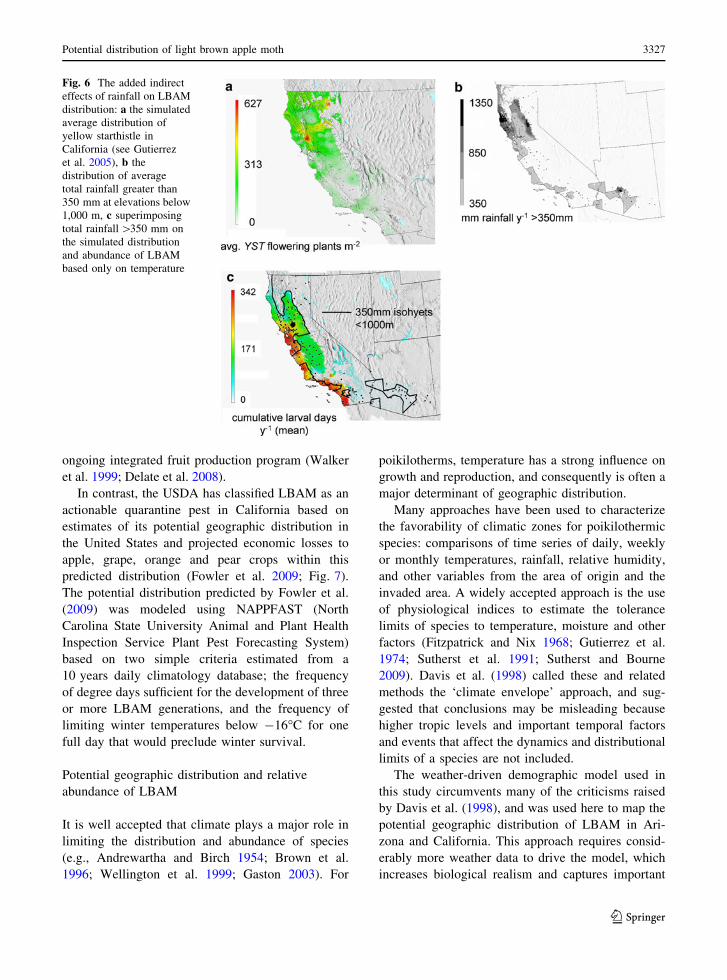
In contrast, the USDA has classified LBAM as an
actionable quarantine pest in California based on
estimates of its potential geographic distribution in
the United States and projected economic losses to
apple, grape, orange and pear crops within this
predicted distribution (Fowler et al. 2009; Fig. 7).
The potential distribution predicted by Fowler et al.
(2009) was modeled using NAPPFAST (North
Carolina State University Animal and Plant Health
Inspection Service Plant Pest Forecasting System)
based on two simple criteria estimated from a
10 years daily climatology database; the frequency
of degree days sufficient for the development of three
or more LBAM generations, and the frequency of
limiting winter temperatures below -16�C for one
full day that would preclude winter survival.
Potential geographic distribution and relative
abundance of LBAM
It is well accepted that climate plays a major role in
limiting the distribution and abundance of species
(e.g., Andrewartha and Birch 1954; Brown et al.
1996; Wellington et al. 1999; Gaston 2003). For
poikilotherms, temperature has a strong influence on
growth and reproduction, and consequently is often a
major determinant of geographic distribution.
Many approaches have been used to characterize
the favorability of climatic zones for poikilothermic
species: comparisons of time series of daily, weekly
or monthly temperatures, rainfall, relative humidity,
and other variables from the area of origin and the
invaded area. A widely accepted approach is the use
of physiological indices to estimate the tolerance
limits of species to temperature, moisture and other
factors (Fitzpatrick and Nix 1968; Gutierrez et al.
1974; Sutherst et al. 1991; Sutherst and Bourne
2009). Davis et al. (1998) called these and related
methods the ‘climate envelope’ approach, and sug-
gested that conclusions may be misleading because
higher tropic levels and important temporal factors
and events that affect the dynamics and distributional
limits of a species are not included.
The weather-driven demographic model used in
this study circumvents many of the criticisms raised
by Davis et al. (1998), and was used here to map the
potential geographic distribution of LBAM in Ari-
zona and California. This approach requires consid-
erably more weather data to drive the model, which
increases biological realism and captures important
Fig. 6 The added indirect
effects of rainfall on LBAM
distribution: a the simulated
average distribution of
yellow starthistle in
California (see Gutierrez
et al. 2005), b the
distribution of average
total rainfall greater than
350 mm at elevations below
1,000 m, c superimposing
total rainfall [350 mm on
the simulated distribution
and abundance of LBAM
based only on temperature
Potential distribution of light brown apple moth 3327
123
temporal factors that affect the distribution and
abundance of a species (e.g., Gutierrez et al. 1994;
Gurney et al. 1996; Gutierrez 1996; Holst and Ruggle
1997; Rochat and Gutierrez 2001; Gutierrez and
Baumgartner 1984, 2007).
The developmental biology of LBAM is relatively
simple; it lacks an overwintering diapause, it is polyph-
agous, and its populations are suppressed by a combi-
nation of dispersal mortality, extremes of temperature,
host plant availability, and in Australia, by native natural
enemies that operate in a density independent manner
(Danthanarayana and colleagues). This combination of
factors is able to keep LBAM populations at a relatively
low level of abundance in Australia, except occasionally
in irrigated crops where natural enemies are disrupted
through use on non-selective insecticides (Geier and
Briese 1981). LBAM populations, although currently
established in California, remain sparsely distributed
and generally low. Here the species is also affected by
patterns of temperature and plant availability similar to
the patterns in SE Australia, and LBAM in California is
also attacked by a suite of native generalist predators and
parasitoids (N. J. Mills, unpublished observations).
Using only temperature, our demographic model
predicts the distribution of LBAM in California to be
restricted largely to near coastal areas with some
extension eastward into the northern part of the
Central valley (Fig. 5b). The majority of the Central
Valley shows less than intermediate favourability due
to summer temperatures that exceed the tolerance of
LBAM. This suggests that if populations could persist
in these areas, the relative abundance of larvae would
be lower than those at Davis and approximately one-
third the abundance predicted in more favorable
coastal areas. The limiting effect of rainfall on the
potential distribution of YST, a surrogate annual host
plant, reinforces the greater favorability of the coastal
regions and further highlights the lack of suitable
environmental conditions for LBAM in the southern
half of the Central Valley (Fig. 6). These predictions
of our demographic model differ markedly from
those of the Fowler et al. (2009) model for Arizona
and California (Figs. 5, 6 vs. 7). The differences stem
primarily from the level of biological detail built into
the two models, that of Fowler et al. (2009) being a
simple degree-day accumulation model versus our
mechanistic simulation model. Our dynamic simula-
tion model has the advantages of incorporating biotic
as well as abiotic influences, and daily temperatures
rather than weekly, monthly or yearly means, and can
more readily track the influence of limiting climatic
conditions on LBAM populations. The disparity in
Fig. 7 The proposed
USDA geographic
distribution of
favorableness for the
establishment of LBAM
(from Fowler et al. 2009)
3328 A. P. Gutierrez et al.
123
predictions of the two models also provides support
to Sutherst and Maywald (2005) and Sutherst and
Bourne (2009), who have highlighted both model
structure, and format and choice of climate variables,
in influencing predictions of species distributions.
Critics may ask why we have not validated the
model by predicting the distribution of LBAM in
Australia, and may posit that LBAM is present in
regions of Australia that are much hotter than the
regions of California that our model predicts as
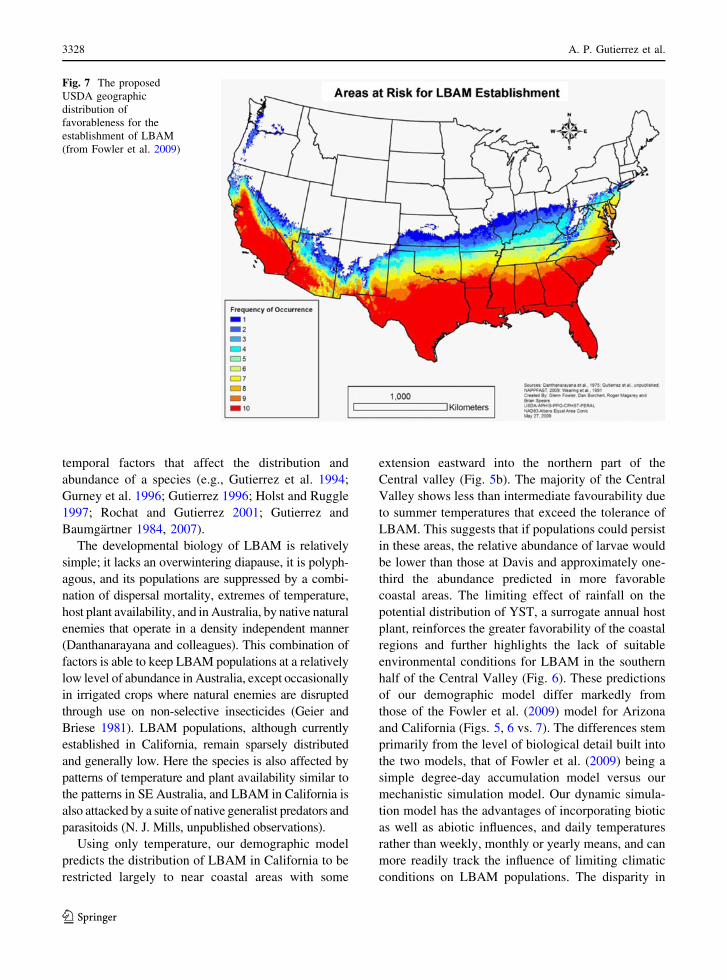
unfavorable. In the absence of sufficient daily climate
data to validate the model for the whole country, we
examined daily climate data for the period 1/1/1998–
1/1/2009 from five locations in SE Australia (Victoria
and New South Wales) where LBAM is known to
occur. Mean daily maximum summer temperatures at
Mildura (VIC) and Griffith (NSW), the two hottest
locations, prove similar to those at Davis, CA, while
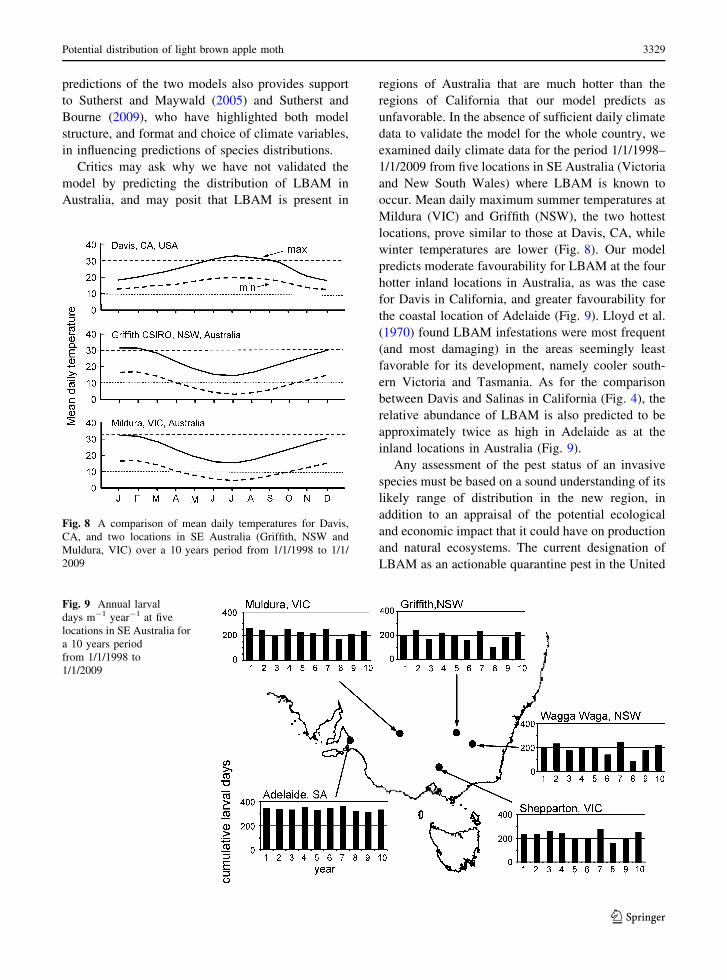
winter temperatures are lower (Fig. 8). Our model
predicts moderate favourability for LBAM at the four
hotter inland locations in Australia, as was the case
for Davis in California, and greater favourability for
the coastal location of Adelaide (Fig. 9). Lloyd et al.
(1970) found LBAM infestations were most frequent
(and most damaging) in the areas seemingly least
favorable for its development, namely cooler south-
ern Victoria and Tasmania. As for the comparison
between Davis and Salinas in California (Fig. 4), the
relative abundance of LBAM is also predicted to be
approximately twice as high in Adelaide as at the
inland locations in Australia (Fig. 9).
Any assessment of the pest status of an invasive
species must be based on a sound understanding of its
likely range of distribution in the new region, in
addition to an appraisal of the potential ecological
and economic impact that it could have on production
and natural ecosystems. The current designation of
LBAM as an actionable quarantine pest in the United
Fig. 8 A comparison of mean daily temperatures for Davis,
CA, and two locations in SE Australia (Griffith, NSW and
Muldura, VIC) over a 10 years period from 1/1/1998 to 1/1/
2009
Fig. 9 Annual larval
days m-1 year-1 at five
locations in SE Australia for
a 10 years period
from 1/1/1998 to
1/1/2009
Potential distribution of light brown apple moth 3329
123
States by USDA is in part based upon the predicted
distribution of Fowler et al. (2009). The strong
decline in favourability from coastal to interior
regions of California and its likely absence from
Arizona, as predicted by our model, question the
accuracy of the USDA assessment of risk to produc-
tion and natural ecosystems and suggest the need for
re-evaluation of the current pest status of LBAM in
the United States.
Open Access This article is distributed under the terms of the
Creative Commons Attribution Noncommercial License which
permits any noncommercial use, distribution, and reproduction
in any medium, provided the original author(s) and source are
credited.
References
Andrewartha HG, Birch LC (1954) The distribution and abun-
dance of animals. University of Chicago Press, Chicago
Bartell RJ, Lawrence LA (1973) Reduction in responsiveness
of males of Epiphyas postvittana (Lepidoptera) to sex
pheromone following previous brief pheromonal expo-
sure. J Insect Physiol 19:845–855
Brown JW (2007) Discovery of light brown apple moth in North
America. http://www.tortricidae.com/TORTS_newsletter
8%282%29.pdf
Brown JH, Stevens GC, Kaufman DM (1996) The geographic
range: size, shape, boundaries and internal structure. Annu
Rev Ecol Syst 27:597–623
Buckley YM (2008) The role of research for integrated man-
agement of invasive species, invaded landscapes and
communities. J Appl Ecol 45:397–402
Coetzee JA, Hill MP, Schlange D (2009) Potential spread of
the invasive plant Hydrilla verticillata in South Africa
based on anthropogenic spread and climate suitability.
Biol Invasions 11:801–812
Danthanarayana W (1975) The bionomics, distribution and
host range of the light brown apple moth, Epiphyaspostvittana (Walk.) (Tortricidae). Aust J Zool 23:419–437
Danthanarayana W (1976a) Diel and lunar flight periodicities
in the light brown apple moth, Epiphyas postvittana(Walker) (Tortricidae) and their possible adaptive signif-
icance. Aust J Zool 24:65–73
Danthanarayana W (1976b) Flight threshold and seasonal
variations in flight activity of the light brown apple moth,
Epiphyas postvittana (Walk.) (Tortricidae), in Victoria,
Australia. Oecologia 23:271–282
Danthanarayana W (1976c) Environmentally cued size varia-
tion in the light-brown apple moth, Epiphyas postvittana(Walk.) (Tortricidae), and its adaptive value in dispersal.
Oecologia 26:121–132
Danthanarayana W (1983) Population ecology of the light
brown apple moth, Epiphyas postvittana (Lepidoptera:
Tortricidae). J Anim Ecol 52:1–33
Danthanarayana W, Gu H, Ashley S (1995) Population growth
potential of Epiphyas postvittana, the lightbrown apple
moth (Lepidoptera: Tortricidae) in relation to diet, tem-
perature and climate. Aust J Zool 43:381–394
Davis AJ, Jenkinson LS, Lawton JH, Shorrocks B, Wood S
(1998) Making mistakes when predicting shifts in species
range in response to global warming. Nature 391:783–786
Delate K, McKern A, Turnbull R, Walker JTS, Volz R, White
A, Bus V, Rogers D, Cole L, How N, Guernsey S,
Johnston J (2008) Organic apple production in two humid
regions: comparing progress in pest management strate-
gies in Iowa and New Zealand. Hortic Sci 43:12–21
DiCola G, Gilioli G, Baumgartner J (1999) Mathematical
models for age-structured population dynamics. In:
Huffaker CB, Gutierrez AP (eds) Ecological entomology,
2nd edn. Wiley, New York, pp 503–531
Dumbleton LJ (1932) The apple leaf roller (Tortrix postvittanaWalker). NZ J Sci Technol 14:83–92
Dumbleton LJ (1939) Contribution to the physical ecology of
Tortrix postvittana, Walk. (Lep.). Bull Entomol Res 30:
309–319
Evans JW (1937) The light-brown apple moth (Tortrix post-vittana, Walk.). Tasman J Agric 8:125–128
Fitzpatrick EA, Nix HA (1968) The climatic factor in Aus-
tralian grasslands ecology. In: Moore RM (ed) Australian
grasslands. Australian National University Press, Can-
berra, pp 3–26
Fowler G, Garrett L, Neeley A, Margarey R, Borchert D,
Spears B (2009) Economic analysis: risk to U.S. apple,
grape, orange and pear production from the light brown
apple moth, Epiphyas postvittana (Walker). USDA-
APHIS-PPQ-CPHST-PERAL, 28 pp
Gaston KJ (2003) The structure and dynamics of geographical
ranges. Oxford University Press, Oxford
Geier PW (1965) Conditions of management of two orchard
pests, one exotic and the other native to South-Eastern
Australia. In: Proceedings of 12th International Congress
of Entomology 1964, p 598
Geier PW, Briese DT (1979) The light-brown apple moth,
Epiphyas postvittana (Walker): 3. Differences in suscepti-
bility to a nuclear polyhedrosis virus. Aust J Ecol 4:187–194
Geier PW, Briese DT (1980) The light brown apple moth
Epiphyas postvittana (Walker): 4. Studies on population
dynamics and injuriousness to apples in the AustralianCapital Territory. Aust J Ecol 5:63–95
Geier PW, Briese DT (1981) The light-brown apple moth,
Epiphyas postvittana (Walker): a native leafroller fostered
by European settlement. In: Kitching R, Jones R (eds) The
ecology of pests. CSIRO, Melbourne, pp 131–155
Geier PW, Briese DT, Lewis T (1978) Light-brown apple
moth, Epiphyas postvittana (Walker). 2. Uneven sex-
ratios and a condition contributing to them in the field.
Aust J Ecol 3:467–488
Gu H, Danthanarayana W (1990a) Age-related flight and
reproductive performance of the light brown apple moth,
Epiphyas postvittana. Entomol Exp Appl 54:109–115
Gu H, Danthanarayana W (1990b) The role of availability of
food and water to the adult Epiphyas postvittana, the light
brown apple moth, in its reproductive performance.
Entomol Exp Appl 54:101–108
Gu H, Danthanarayana W (1992) Influence of larval rearing
conditions on the body size and flight capacity of
Epiphyas postvittana moths. Aust J Zool 40:573–581
3330 A. P. Gutierrez et al.
123
Gurney WSC, Middleton DAJ, Nisbet RM, McCauley E,
Murdoch WW, De Roos A (1996) Individual energetics
and the equilibrium demography of structured popula-
tions. Theor Popul Biol 49:344–368
Gutierrez AP (1996) Applied population ecology: a supply–
demand approach. Wiley, New York
Gutierrez AP, Baumgartner J (1984) Multitrophic level models
of predator-prey energetics: II. A realistic model of plant-
herbivore-parasitoid-predator interactions. Can Entomol
116:933–949
Gutierrez AP, Baumgartner J (2007) Modeling the dynamics of
tritrophic population interactions. In: Kogan M, Jepson P
(eds) Perspectives in ecology and integrated pest manage-
ment. Cambridge University Press, Cambridge, pp 301–360
Gutierrez AP, Nix HA, Havenstein DE, Moore PA (1974) The
ecology of Aphis craccivora Koch and Subterranean
Clover Stunt Virus in south-east Australia. III. A regional
perspective of the phenology and migration of the cowpea
aphid. J Appl Ecol 11:21–35
Gutierrez AP, Mills NJ, Schreiber SJ, Ellis CK (1994) A
physiologically based tritrophic perspective on bottom
up–top down regulation of populations. Ecology 75:2227–
2242
Gutierrez AP, Pitcairn MJ, Ellis CK, Carruthers N, Ghezelbash
R (2005) Evaluating biological control of yellow star-
thistle (Centaurea solstitialis) in California: a GIS based
supply–demand demographic model. Biol Control 34:
115–131
Gutierrez AP, Daane KM, Ponti L, Walton VM, Ellis CK
(2008) Prospective evaluation of the biological control of
vine mealybug: refuge effects and climate. J Appl Ecol
45:524–536
Holst N, Ruggle P (1997) A physiologically based model of
pest–natural enemy interactions. Exp Appl Acarol 21:
325–341
Lawrence LA, Bartell RJ (1972) The effect of age on calling
behaviour of virgin females of Epiphyas postvittana(Lepidoptera) and on their pheromone content and ovarian
development. Entomol Exp Appl 15:455–464
Levine JM, Vila M, D’Antonio CM, Dukes SJ, Grigulis K,
Lavorel S (2003) Mechanisms underlying the impacts of
exotic plant invasions. Proc R Soc Lond B Biol Sci 270:
775–781
Lloyd NC, Jones EL, Morris DS, Webster WJ, Harris WB,
Lower HE, Hudson NM, Geier PW (1970) Managing
apple pests: a new perspective. J Aust Instit Agric Sci:
251–258
MacLellan CR (1973) Natural enemies of the light brown apple
moth, Epiphyas postvittana, in the Australian Capital
Territory. Can Entomol 105:681–700
Migeon A, Ferragut F, Escudero-Colomar LA, Fiaboe K,
Knapp M, de Moraes GJ, Ueckermann E, Navajas M
(2009) Modelling the potential distribution of the invasive
tomato red spider mite, Tetranychus evansi (Acari: Tetr-
anychidae). Exp Appl Acarol 48:199–212
Parker IM, Simberloff D, Lonsdale WM, Goodell K, Wonham
M, Kareiva PM, Williamson MH, Von Holle B, Moyle
PB, Byers JE, Goldwasser L (1999) Impact: toward a
framework for understanding the ecological effects of
invaders. Biol Invasions 1:3–19
Pimentel D, Lach L, Zuniga R, Morrison D (2000) Environ-
mental and economic costs of nonindigenous species in
the United States. Bioscience 50:53–65
Powell JA (1983) Expanding geographical and ecological
range of Platynota stultana in California (Lepidoptera:
Tortricidae). Pan-Pac Entomol 59:233–239
Powell JA (1997) Occurrence of the Palaearctic moth,
Cnephasia longana (Tortricidae), on Santa Rosa Island,
California. J Lepid Soc 51:93–95
Rochat J, Gutierrez AP (2001) Weather mediated regulation of
olive scale by two parasitoids. J Anim Ecol 70:476–490
Rodda GH, Jarnevich CS, Reed RN (2009) What parts of the
US mainland are climatically suitable for invasive alien
pythons spreading from Everglades National Park? Biol
Invasions 11:241–252
Suckling DM, Brockerhoff EG (2010) Invasion biology, ecol-
ogy, and management of the light brown apple moth
(Tortricidae). Annu Rev Entomol 55:285–306
Sutherst RW, Bourne AS (2009) Modelling non-equilibrium
distributions of invasive species: a tale of two modelling
paradigms. Biol Invasions 11:1231–1237
Sutherst RW, Maywald G (2005) A climate-model of the red
imported fire ant, Solenopsis invicta Buren (Hymenoptera:
Formicidae): implications for invasion of new regions,
particularly Oceania. Environ Entomol 34:317–335
Sutherst RW, Maywald GF, Bottomly W (1991) From CLI-
MEX to PESKY, a generic expert system for risk
assessment. EPPO Bull 21:595–608
Vansickle J (1977) Attrition in distributed delay models. IEEE
Trans Syst Manage Cyber 7:635–638
Walker JTS, Wearing CH, Bradley SJ, Shaw PW, Burnip GM,
Tomkins AR, Richardson CA Hodson AJ (1999) Inte-grated fruit production (IFP) for New Zealand pipfruit:
evaluation of pest management recommendations. In:
Proc 51st NZ Plant Protection Conference, pp 166–172
Wellington WG, Johnson DL, Lactin DJ (1999) Weather and
insects. In: Huffaker CB, Gutierrez AP (eds) Ecological
entomology, 2nd edn. Wiley, New York, pp 313–353
Potential distribution of light brown apple moth 3331
123