Lime and Cement Treatments of Subgrades in Southern Italy: Facing Interports Issues and Challenges
10
Procedia - Social and Behavioral Sciences 53 (2012) 389 – 398 1877-0428 © 2012 The Authors. Published by Elsevier Ltd. Selection and/or peer-review under responsibility of SIIV2012 Scientific Committee doi:10.1016/j.sbspro.2012.09.890 SIIV - 5th International Congress - Sustainability of Road Infrastructures Lime And Cement Treatments Of Subgrades In Southern Italy: Facing Interports Issues And Challenges Filippo G. Praticò a *, Anand J. Puppala b a University Mediterranea of Reggio Calabria, Via Graziella, Feo di Vito, Reggio Calabria, 89100, Italy. b Department of Civil Engineering, The University of Texas at Arlington, Arlington, Texas 76019-0308, U.S.A. Abstract The objectives of this paper are confined to the assessment of the best stabilization techniques to improve soils, thereby optimizing pavement performance and sustainability for a given type of soil. In order to pursue these objectives, an experimental plan was conceived and implemented. The results led to several conclusions pertaining to lime stabilization potential for improving the performance of weak soils, proportionality between ITS and UCS properties, and potential of combined treatments as a strategy for improving the immediate achievement of the target performance in a short duration. Outcomes of this study are expected to benefit both practitioners and researchers. Keywords: road; pavement; combined stabilization; freight terminal. 1. Introduction As is well known, intermodal freight transport involves the transportation of freight in an intermodal container or vehicle, using multiple modes of transportation (rail, ship, and truck). The processing node for freight is often called freight terminal. Most freight terminals are located at ports. They may include airports, seaports, railroad terminals, and trucking terminals. Freight is usually loaded onto and off of the transport terminal. The key element in intermodal freight transport is the intermodal container, which is a standardized, reusable steel box used for the safe and efficient storage and movement of products within a global containerized intermodal freight transport system. Freight terminals have pavements which have to perform well under the low frequency and high pressure loads of containers and cranes (e.g., asphalt concrete - wearing, binder, base - on crushed aggregate base, interlocking concrete paver blocks on cement treated base, Portland cement concrete on crushed aggregate base, roller compacted concrete with 3-inch asphalt concrete wearing surface on crushed aggregate base, see [1]). * Corresponding author. Tel.: +39-0965-875230; fax: +39-0965-875247. E-mail address: [email protected] Available online at www.sciencedirect.com © 2012 The Authors. Published by Elsevier Ltd. Selection and/or peer-review under responsibility of SIIV2012 Scientific Committee
Transcript of Lime and Cement Treatments of Subgrades in Southern Italy: Facing Interports Issues and Challenges
Procedia - Social and Behavioral Sciences 53 ( 2012 ) 389 – 398
1877-0428 © 2012 The Authors. Published by Elsevier Ltd. Selection and/or peer-review under responsibility of SIIV2012 Scientifi c Committeedoi: 10.1016/j.sbspro.2012.09.890
SIIV - 5th International Congress - Sustainability of Road Infrastructures
Lime And Cement Treatments Of Subgrades In Southern Italy: Facing Interports Issues And Challenges
Filippo G. Praticòa*, Anand J. Puppalab aUniversity Mediterranea of Reggio Calabria, Via Graziella, Feo di Vito, Reggio Calabria, 89100, Italy.
bDepartment of Civil Engineering, The University of Texas at Arlington, Arlington, Texas 76019-0308, U.S.A.
Abstract
The objectives of this paper are confined to the assessment of the best stabilization techniques to improve soils, thereby optimizing pavement performance and sustainability for a given type of soil. In order to pursue these objectives, an experimental plan was conceived and implemented. The results led to several conclusions pertaining to lime stabilization potential for improving the performance of weak soils, proportionality between ITS and UCS properties, and potential of combined treatments as a strategy for improving the immediate achievement of the target performance in a short duration. Outcomes of this study are expected to benefit both practitioners and researchers. © 2012 The Authors. Published by Elsevier Ltd. Selection and/or peer-review under responsibility of SIIV2012 Scientific Committee
Keywords: road; pavement; combined stabilization; freight terminal.
1. Introduction
As is well known, intermodal freight transport involves the transportation of freight in an intermodal container or vehicle, using multiple modes of transportation (rail, ship, and truck). The processing node for freight is often called freight terminal. Most freight terminals are located at ports. They may include airports, seaports, railroad terminals, and trucking terminals. Freight is usually loaded onto and off of the transport terminal. The key element in intermodal freight transport is the intermodal container, which is a standardized, reusable steel box used for the safe and efficient storage and movement of products within a global containerized intermodal freight transport system. Freight terminals have pavements which have to perform well under the low frequency and high pressure loads of containers and cranes (e.g., asphalt concrete - wearing, binder, base - on crushed aggregate base, interlocking concrete paver blocks on cement treated base, Portland cement concrete on crushed aggregate base, roller compacted concrete with 3-inch asphalt concrete wearing surface on crushed aggregate base, see [1]).
* Corresponding author. Tel.: +39-0965-875230; fax: +39-0965-875247. E-mail address: [email protected]
Available online at www.sciencedirect.com
© 2012 The Authors. Published by Elsevier Ltd. Selection and/or peer-review under responsibility of SIIV2012 Scientific Committee
390 Filippo G. Praticò and Anand J. Puppala / Procedia - Social and Behavioral Sciences 53 ( 2012 ) 389 – 398
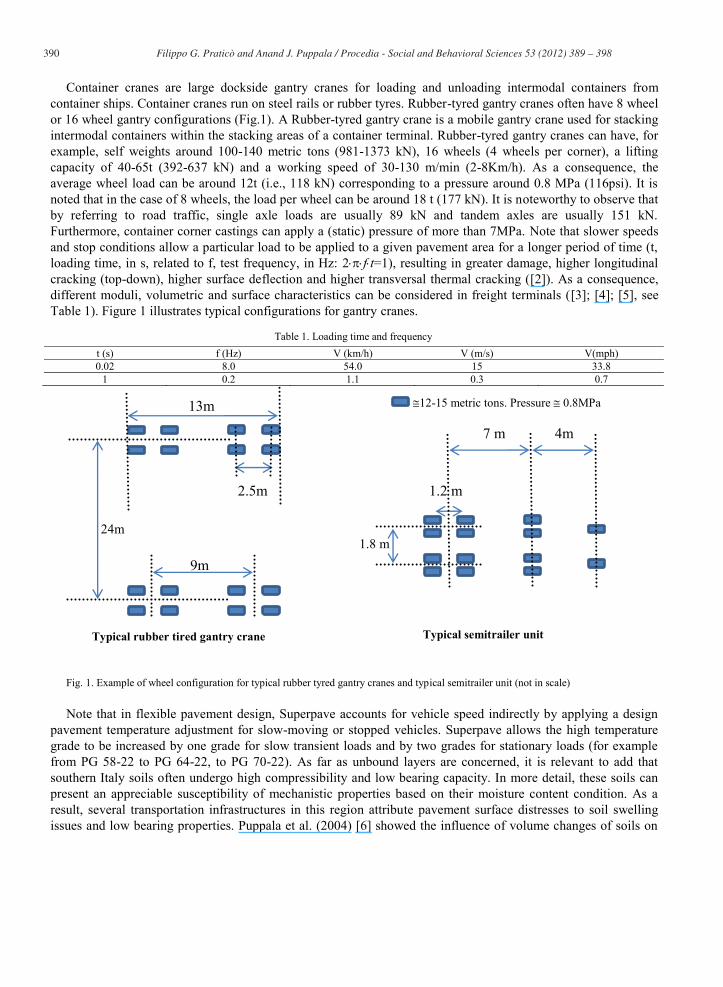
Container cranes are large dockside gantry cranes for loading and unloading intermodal containers from container ships. Container cranes run on steel rails or rubber tyres. Rubber-tyred gantry cranes often have 8 wheel or 16 wheel gantry configurations (Fig.1). A Rubber-tyred gantry crane is a mobile gantry crane used for stacking intermodal containers within the stacking areas of a container terminal. Rubber-tyred gantry cranes can have, for example, self weights around 100-140 metric tons (981-1373 kN), 16 wheels (4 wheels per corner), a lifting capacity of 40-65t (392-637 kN) and a working speed of 30-130 m/min (2-8Km/h). As a consequence, the average wheel load can be around 12t (i.e., 118 kN) corresponding to a pressure around 0.8 MPa (116psi). It is noted that in the case of 8 wheels, the load per wheel can be around 18 t (177 kN). It is noteworthy to observe that by referring to road traffic, single axle loads are usually 89 kN and tandem axles are usually 151 kN. Furthermore, container corner castings can apply a (static) pressure of more than 7MPa. Note that slower speeds and stop conditions allow a particular load to be applied to a given pavement area for a longer period of time (t, loading time, in s, related to f, test frequency, in Hz: 2 f t=1), resulting in greater damage, higher longitudinal cracking (top-down), higher surface deflection and higher transversal thermal cracking ([2]). As a consequence, different moduli, volumetric and surface characteristics can be considered in freight terminals ([3]; [4]; [5], see Table 1). Figure 1 illustrates typical configurations for gantry cranes.
Table 1. Loading time and frequency t (s) f (Hz) V (km/h) V (m/s) V(mph) 0.02 8.0 54.0 15 33.8
1 0.2 1.1 0.3 0.7
Fig. 1. Example of wheel configuration for typical rubber tyred gantry cranes and typical semitrailer unit (not in scale) Note that in flexible pavement design, Superpave accounts for vehicle speed indirectly by applying a design
pavement temperature adjustment for slow-moving or stopped vehicles. Superpave allows the high temperature grade to be increased by one grade for slow transient loads and by two grades for stationary loads (for example from PG 58-22 to PG 64-22, to PG 70-22). As far as unbound layers are concerned, it is relevant to add that southern Italy soils often undergo high compressibility and low bearing capacity. In more detail, these soils can present an appreciable susceptibility of mechanistic properties based on their moisture content condition. As a result, several transportation infrastructures in this region attribute pavement surface distresses to soil swelling issues and low bearing properties. Puppala et al. (2004) [6] showed the influence of volume changes of soils on
24m
9m
2.5m
13m
1.8 m
1.2 m
4m 7 m
Typical rubber tired gantry crane Typical semitrailer unit
12-15 metric tons. Pressure 0.8MPa

391 Filippo G. Praticò and Anand J. Puppala / Procedia - Social and Behavioral Sciences 53 ( 2012 ) 389 – 398
the performance of pavements. Other pavement damages related to distortion, rutting, corrugation and shoving might result from such things as excessive loading, creep, densification, consolidation, swelling, or, more rarely, frost action. Hence, when an interport with a large number of roads is planned to be constructed in such areas, several pavement problems can occur. Also, high pressures and low frequencies of the traffic loads can pose severe pavement damages. Soil stabilization is thereby needed to support the roads which otherwise would result in severe problems to overlying pavement structures. The mechanistic-empirical pavement design guide (M-EPDG [7]) provides a conceptual and operational framework for designing road pavement and can be used to optimize the design process. If the stabilization of the soils emerges as a sustainable and effective solution, the main materials inputs required for lime stabilized subgrade layers in the M-E Design Guide Approach include: i) pavement structural response (resilient modulus (MR ) and Poisson’s ratio (μ); ii) climatic effects (unit weight, specific heat, and thermal conductivity of lime-stabilized materials); iii) distress prediction (number of repetition for fatigue cracking vs. the tensile stress at the bottom of the lime-stabilized layer and modulus of rupture or flexural strength (MR) of the lime-stabilized layer, see [8]). As is well known, Level 1 requires a thorough knowledge of the input properties (MR,[9]). In contrast, Level 3 relies on historical records or engineering judgment: resilient moduli of 30,000 to 60,000 psi (207 to 414 MPa), with an average of 45 ksi (310 MPa), for reactive soils with 25% of them passing No. 200 sieve and whose PI is at least 10. Finally, in Level 2, MR of the lime stabilized soils can be estimated from 28-day unconfined compressive strength (qu=UCS) of the cured soil-lime samples ([9]):
MR = 0.124(qu) + 9.98 (1) Where MR = resilient modulus, ksi; and qu = unconfined compressive strength, UCS, in psi. Based on the
abovementioned range (30-60 ksi), it would follow that a potential range of UCS of treated soils varies around 1.1-2.8 N/mm2. It should be noted that several authors (see [10] and [11]) found that MR should assume higher values (1.2 2.1 times higher). The Poisson’s ratio (μ) is usually considered in the range 0.15-0.20 for lime stabilizations, and the same is 0.10-0.15 for cement stabilizations. A value of 0.15 is usually accepted as default value for lime/cement treated soils. As for the physical soil behavior with ground treatments, as is well known, the addition of lime to a fine-grained soil in the presence of water initiates several reactions including cationic exchange; flocculation–agglomeration; progressive pozzolanic reaction; and carbonation. This treatment acts in three major ways: (decrease of LL; increase of PL; decrease of the MDD; increase of the OMC; increase of soil strength and MR. It is noted that lime-stabilized soils have typical immediate CBR range of 20-40, and their typical MR range is 30-60 ksi (207 to 414 MPa). In contrast, for a good soil, the typical MR range is 25-45 ksi (172-310 MPa, see part four). It should be noted that when the 1993 AASHTO Guide is used, the required inputs are the structural layer coefficient and the drainage coefficient (base course) or the resilient modulus (subgrade). As a base course, cement-treated bases are supposed to have a structural layer coefficient, a, in the range 0.15-0.23 (as a function of an UCS in the range 400psi or less- 650 psi or more). Note that 400psi are 2.8 MPa, while 600 psi are 4.1 MPa. Similarly, the same source details a structural layer coefficient of 0.10-0.15 for lime-treated bases.
2. Research objectives and plan
A new freight terminal is going to be built in the area of Eastern Sicily, Italy. Two types of pavements are designed: a rigid pavement structure (mainly for the storage of containers: Portland cement concrete slab, 30 cm; cement-treated base course, 20cm; unbound base course, 25 cm; soil substitution or stabilization, variable; in-situ soil) and a flexible pavement structure (mainly for the connection among the different areas: HMA courses, 22cm; cement-treated base course, 20cm; unbound base course, 25 cm; soil substitution or stabilization, variable; in-situ soil). The sustainability of the solution was analyzed and validated based on life cycle cost analysis
392 Filippo G. Praticò and Anand J. Puppala / Procedia - Social and Behavioral Sciences 53 ( 2012 ) 389 – 398
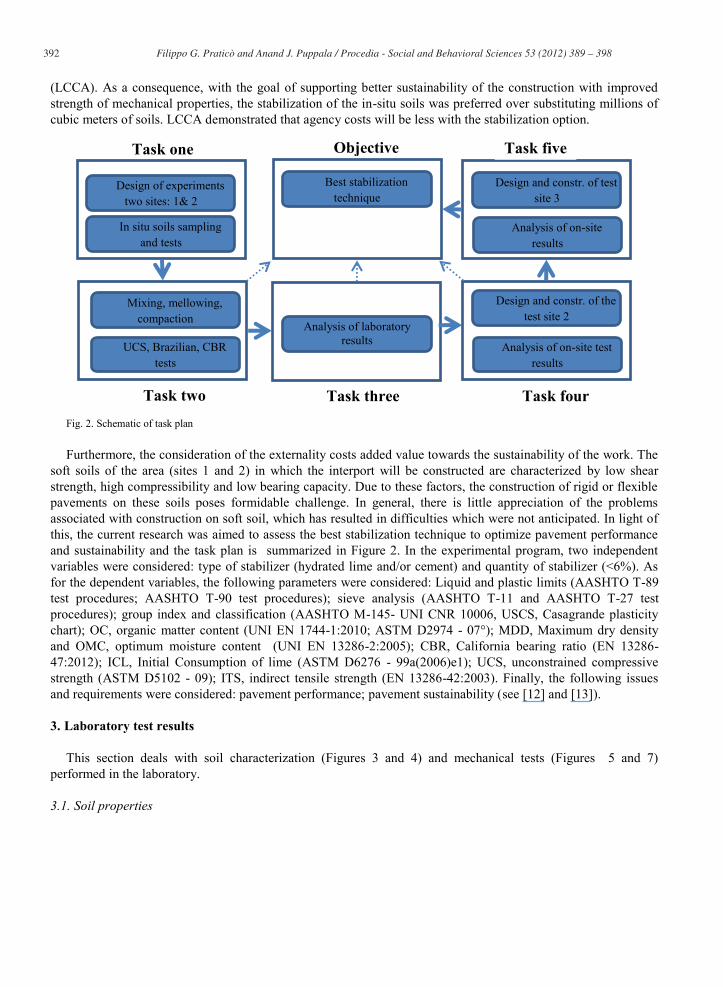
(LCCA). As a consequence, with the goal of supporting better sustainability of the construction with improved strength of mechanical properties, the stabilization of the in-situ soils was preferred over substituting millions of cubic meters of soils. LCCA demonstrated that agency costs will be less with the stabilization option.
Fig. 2. Schematic of task plan Furthermore, the consideration of the externality costs added value towards the sustainability of the work. The
soft soils of the area (sites 1 and 2) in which the interport will be constructed are characterized by low shear strength, high compressibility and low bearing capacity. Due to these factors, the construction of rigid or flexible pavements on these soils poses formidable challenge. In general, there is little appreciation of the problems associated with construction on soft soil, which has resulted in difficulties which were not anticipated. In light of this, the current research was aimed to assess the best stabilization technique to optimize pavement performance and sustainability and the task plan is summarized in Figure 2. In the experimental program, two independent variables were considered: type of stabilizer (hydrated lime and/or cement) and quantity of stabilizer (<6%). As for the dependent variables, the following parameters were considered: Liquid and plastic limits (AASHTO T-89 test procedures; AASHTO T-90 test procedures); sieve analysis (AASHTO T-11 and AASHTO T-27 test procedures); group index and classification (AASHTO M-145- UNI CNR 10006, USCS, Casagrande plasticity chart); OC, organic matter content (UNI EN 1744-1:2010; ASTM D2974 - 07°); MDD, Maximum dry density and OMC, optimum moisture content (UNI EN 13286-2:2005); CBR, California bearing ratio (EN 13286-47:2012); ICL, Initial Consumption of lime (ASTM D6276 - 99a(2006)e1); UCS, unconstrained compressive strength (ASTM D5102 - 09); ITS, indirect tensile strength (EN 13286-42:2003). Finally, the following issues and requirements were considered: pavement performance; pavement sustainability (see [12] and [13]).
3. Laboratory test results
This section deals with soil characterization (Figures 3 and 4) and mechanical tests (Figures 5 and 7) performed in the laboratory.
3.1. Soil properties
In situ soils sampling and tests
Design of experiments two sites: 1& 2
Analysis of laboratory results
Mixing, mellowing, compaction
UCS, Brazilian, CBR tests
Task one
Task two Task three
Design and constr. of the test site 2
Analysis of on-site test results
Task four
Design and constr. of test site 3
Analysis of on-site results
Task five
Best stabilization technique
Objective
393 Filippo G. Praticò and Anand J. Puppala / Procedia - Social and Behavioral Sciences 53 ( 2012 ) 389 – 398
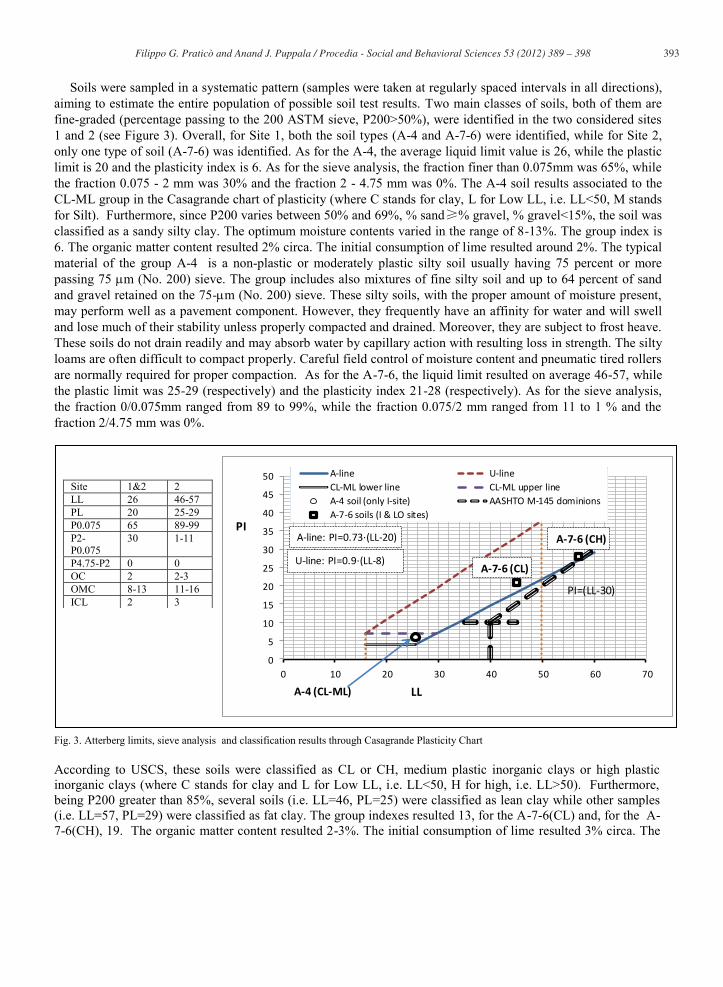
Soils were sampled in a systematic pattern (samples were taken at regularly spaced intervals in all directions), aiming to estimate the entire population of possible soil test results. Two main classes of soils, both of them are fine-graded (percentage passing to the 200 ASTM sieve, P200>50%), were identified in the two considered sites 1 and 2 (see Figure 3). Overall, for Site 1, both the soil types (A-4 and A-7-6) were identified, while for Site 2, only one type of soil (A-7-6) was identified. As for the A-4, the average liquid limit value is 26, while the plastic limit is 20 and the plasticity index is 6. As for the sieve analysis, the fraction finer than 0.075mm was 65%, while the fraction 0.075 - 2 mm was 30% and the fraction 2 - 4.75 mm was 0%. The A-4 soil results associated to the CL-ML group in the Casagrande chart of plasticity (where C stands for clay, L for Low LL, i.e. LL<50, M stands for Silt). Furthermore, since P200 varies between 50% and 69%, % sand % gravel, % gravel<15%, the soil was classified as a sandy silty clay. The optimum moisture contents varied in the range of 8-13%. The group index is 6. The organic matter content resulted 2% circa. The initial consumption of lime resulted around 2%. The typical material of the group A-4 is a non-plastic or moderately plastic silty soil usually having 75 percent or more passing 75 m (No. 200) sieve. The group includes also mixtures of fine silty soil and up to 64 percent of sand and gravel retained on the 75- m (No. 200) sieve. These silty soils, with the proper amount of moisture present, may perform well as a pavement component. However, they frequently have an affinity for water and will swell and lose much of their stability unless properly compacted and drained. Moreover, they are subject to frost heave. These soils do not drain readily and may absorb water by capillary action with resulting loss in strength. The silty loams are often difficult to compact properly. Careful field control of moisture content and pneumatic tired rollers are normally required for proper compaction. As for the A-7-6, the liquid limit resulted on average 46-57, while the plastic limit was 25-29 (respectively) and the plasticity index 21-28 (respectively). As for the sieve analysis, the fraction 0/0.075mm ranged from 89 to 99%, while the fraction 0.075/2 mm ranged from 11 to 1 % and the fraction 2/4.75 mm was 0%.
Fig. 3. Atterberg limits, sieve analysis and classification results through Casagrande Plasticity Chart According to USCS, these soils were classified as CL or CH, medium plastic inorganic clays or high plastic inorganic clays (where C stands for clay and L for Low LL, i.e. LL<50, H for high, i.e. LL>50). Furthermore, being P200 greater than 85%, several soils (i.e. LL=46, PL=25) were classified as lean clay while other samples (i.e. LL=57, PL=29) were classified as fat clay. The group indexes resulted 13, for the A-7-6(CL) and, for the A-7-6(CH), 19. The organic matter content resulted 2-3%. The initial consumption of lime resulted 3% circa. The
Site 1&2 2 LL 26 46-57 PL 20 25-29 P0.075 65 89-99 P2-P0.075
30 1-11
P4.75-P2 0 0 OC 2 2-3 OMC 8-13 11-16 ICL 2 3
0
5
10
15
20
25
30
35
40
45
50
0 10 20 30 40 50 60 70
A-line U-lineCL-ML lower line CL-ML upper lineA-4 soil (only I-site) AASHTO M-145 dominionsA-7-6 soils (I & LO sites)
LL
PI
U-line: PI=0.9·(LL-8)
A-line: PI=0.73·(LL-20)
A-4 (CL-ML)
PI=(LL-30)
A-7-6 (CL)
A-7-6 (CH)

394 Filippo G. Praticò and Anand J. Puppala / Procedia - Social and Behavioral Sciences 53 ( 2012 ) 389 – 398
optimum moisture contents resulted in the range 11-16%. The subgroup A-7-6 (PI>LL-30) includes those materials with high PI in relation to LL which can have extremely high volume change. It should be noted that these soils are not suitable as sub-base, while their performance value as subgrade material is poor to fair. Furthermore, it is noted that CL soils often present a medium to high dry strength, a medium toughness, and negligible dilatancy. ML soils present no to low dry strength, no toughness, and quick-to-slow dilatancy. CH soils present a high to very high dry strength, a high toughness, and no dilatancy. Finally, MH soils present a low to medium dry strength, a low to medium toughness, and slow to no dilatancy. OH soils present a medium to high dry strength and a low to medium toughness. Based on the abovementioned data and under the hypothesis of validity of the relationship between MR and UCS properties, it is possible to derive the values in Figure 4, where L-stab soils refer to soils stabilized through the lime treatment. It is noted that in Figure 4, for each class of soil, four values are reported: minimum and maximum MR (MPa) and UCS (kPa). Therefore, based on the above figure, lime-stabilized soils have the potential for fulfilling the requirements for a subgrade.
Fig. 4. Typical MR ranges (M-EPDG) with respect to in situ soils
Due to budget restrictions, laboratory experiments only focused on A-7-6 soils which resulted in expected performance of both rigid and flexible pavements. Note that according to the M-EPDG (appendix cc-1), A-4 typical CBR range is 10-20, and the corresponding typical MR range is 12-18 ksi (83-124MPa), with a default MR of 14ksi (97 MPa). Similarly, A-7-6 typical CBR range is 1-5, and the typical MR range is 2.5-7 ksi (17-48 MPa), with a default MR of 4ksi (28 MPa). As for CL typical CBR range is 5-15, and their typical MR range is 7-14 ksi (48-97 MPa), with a default MR of 9ksi (62 MPa), while ML typical CBR range of soil is 8-16, and their typical MR range is 9-16 ksi (62-110 MPa), with a default MR of 11ksi (76 MPa). Finally, CH typical CBR range is 1-5, and their typical MR range is 2.5-7 ksi (17-48 MPa), with a default MR of 4ksi (28 MPa), while MH typical CBR range is 2-8, and their typical MR range is 4-9.5 ksi (28-66 MPa), with a default MR of 6ksi (41 MPa).
3.2. In-lab soil treatments
After soil evaluation and the determination of the approximate lime, A-7-6 soil was treated with lime and/or cement. The following steps were followed: i) Determine optimum moisture content (OMC) and maximum dry density (MDD) of the treated soils: Soil, stabilizer and water were mixed at a given water content; sealed in an airtight, moisture proof bag; and stored at room temperature. Afterwards, OMC and MDD were determined by performing Proctor compaction tests; ii) Conduct unconfined compressive strength (UCS) and indirect tension strength (ITS) tests: Specimens of soil, stabilizer and water, using a given amount of stabilizer, were mixed. The mixture was stored in an airtight, waterproof bag. In the case of combined treatment, a mellowing time was observed prior to adding cement. Successively, test specimens were fabricated. iii) Cure and condition the UCS/ITS specimens: Field curing conditions were approximated by wrapping the specimens in a plastic wrap and sealing them in an airtight and moisture proof bag. Afterwards they were cured for seven days at 40°C. iv)
Target UCS=150psi Target MR =29 ksi

395 Filippo G. Praticò and Anand J. Puppala / Procedia - Social and Behavioral Sciences 53 ( 2012 ) 389 – 398
Determine the UCS (ASTM D 5102) and ITS strengths. The above laboratory steps represented the main phases of the mix design process aimed to define type and content of stabilizer. Based on [14] and [15], a minimum UCS of 150 psi (1MPa) was assumed (see Figure 4). In more detail, Figure 5 refers to the dependence of UCS and ITS on water content for a given lime and cement (combined) treatment, while Figure 6 illustrates how UCS and ITS varied as a function of stabilizer content. Combined treatments (lime, L + cement, C) showed an OMC around 16-18% for both UCS and ITS.
Fig. 5. UCS and ITS vs. moisture content (combined treatments)
Furthermore, when lime content was higher than 3%, both UCS and ITS properties exhibited a tendency to approach asymptotically a constant value (the higher the stabilizer content the closer to zero the first derivative). As a consequence, a 3% percentage was considered a viable solution. As a consequence of lime addition, the UCS increased around 5-15 times when lime content varied between 3 and 10%. Little (2000), [9], also noted an increase in UCS values of around 1-20 times with the addition of lime. As a consequence of cement addition, a similar increase of UCS was noted. In both the cases, when stabilizer content approached 4%, UCS increased 10 times circa.
Fig. 6. UCS and ITS vs. stabilizer content
For given water content, combined treatments showed an appreciable increase of strength for lime contents
lower than 3%. For higher values, UCSs showed a decrease in first derivatives. As for the indirect tensile strength, for a given moisture content, ITS increased as a function of lime content even if a saturation tendency
350psi 70psi

396 Filippo G. Praticò and Anand J. Puppala / Procedia - Social and Behavioral Sciences 53 ( 2012 ) 389 – 398
was observed for lime contents higher than 3%. As far as the ITS was analysed as a function of the percentage of cement, the first derivative did not show the tendency to decrease in the range 0-3.5. As far as the relationship between UCS and ITS concerned (see figure 7), the high R2 values justify the use of a linear regression. The usefulness of UCS/ITS relationship for the optimization of stabilization treatment relies in the potential for fulfilling different contract requirements.
Fig. 7. UCS vs. ITS Relationship Between Treated Soils
4. On-site results
In-situ results are summarized in Figures 8 and 9 and Table 3. Test fields construction (Sites 1 and 2) was carried out according to the following series of operations (both for stabilized and untreated sections): i) Site preparation: pulverization, water spreading (the target range of water content was 17-20%), shaping the grade; ii) Spreading the stabilizer (if needed); iii) Mixing in-situ soils with the stabilizer (if any); and iv) Compaction, shaping and trimming. A steel compactor was used, with a frequency of 27-30Hz, amplitude of 1-2 mm, centrifuge force 240-330 kN (front), total weight of 200 kN (front: steel - 130kN, 560 N/cm; rear: tire - 70 kN). A dynamic cone penetrometer, DCP, was used for preliminary investigations, following the standard ASTM D 6951-03. The structure of the DCP consists of two vertical shafts connected to each other at the anvil. The upper shaft has a handle and hammer (8 kg, i.e.17.6 lb), and the handle is used to provide a standard drop height of 575 mm (22.6 in). The lower shaft has an anvil at the top and a pointed cone on the bottom. When the hammer is dropped and hits the anvil, the cone is driven into the ground. The DCP penetration distance per drop is known as the DCP Penetration Index (DPI) or Penetration Rate (PR, cfr. ASTM). The DPI is used to estimate the shear strength, California Bearing Ratio, CBR, and modulus (EDPI) of unbound materials using empirical relationships. Grading number (sum of the percentages of particles passing several sieves) and moisture content have a strong influence on the DPI ([16]; [17]). Among the others, the following relationships can be listed, where EDPI is expressed in terms of MPa, DPI in mm/blow ([17]; [18]; [19]; ASTM D 6951-03):
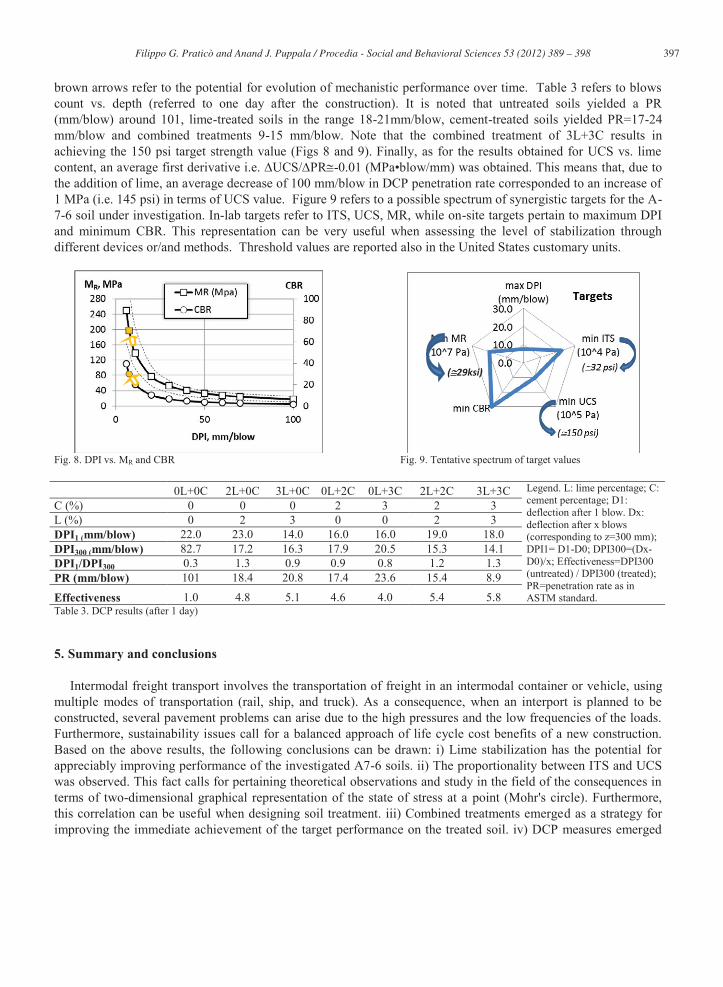
)log(0166.104758.310 DPIDPIE ; 6645.076.537 DPIEDPI ; 12.1*292 PRCBR (2, 3, 4) The following Figure 8 summarizes the abovementioned relationships, where MR (MPa) is the average value
of resilient modulus (among the ones derived after [18] and [19]) and it was supposed that DPI=PR(mm/blow). Brown indicators refer to the possible targets in terms of CBR and MR. The target MR (brown indicator) was supposed to derive from the target UCS (=150 psi=1.04MPa) under the validity of the abovementioned MR -UCS relationship. Dotted lines refer to the minimum and maximum values among the mentioned correlations. The
397 Filippo G. Praticò and Anand J. Puppala / Procedia - Social and Behavioral Sciences 53 ( 2012 ) 389 – 398
brown arrows refer to the potential for evolution of mechanistic performance over time. Table 3 refers to blows count vs. depth (referred to one day after the construction). It is noted that untreated soils yielded a PR (mm/blow) around 101, lime-treated soils in the range 18-21mm/blow, cement-treated soils yielded PR=17-24 mm/blow and combined treatments 9-15 mm/blow. Note that the combined treatment of 3L+3C results in achieving the 150 psi target strength value (Figs 8 and 9). Finally, as for the results obtained for UCS vs. lime content, an average first derivative i.e. UCS/ PR -0.01 (MPa•blow/mm) was obtained. This means that, due to the addition of lime, an average decrease of 100 mm/blow in DCP penetration rate corresponded to an increase of 1 MPa (i.e. 145 psi) in terms of UCS value. Figure 9 refers to a possible spectrum of synergistic targets for the A-7-6 soil under investigation. In-lab targets refer to ITS, UCS, MR, while on-site targets pertain to maximum DPI and minimum CBR. This representation can be very useful when assessing the level of stabilization through different devices or/and methods. Threshold values are reported also in the United States customary units.
Fig. 8. DPI vs. MR and CBR Fig. 9. Tentative spectrum of target values 0L+0C 2L+0C 3L+0C 0L+2C 0L+3C 2L+2C 3L+3C Legend. L: lime percentage; C:
cement percentage; D1: deflection after 1 blow. Dx: deflection after x blows (corresponding to z=300 mm); DPI1= D1-D0; DPI300=(Dx-D0)/x; Effectiveness=DPI300 (untreated) / DPI300 (treated); PR=penetration rate as in ASTM standard.
C (%) 0 0 0 2 3 2 3 L (%) 0 2 3 0 0 2 3 DPI1 (mm/blow) 22.0 23.0 14.0 16.0 16.0 19.0 18.0 DPI300 (mm/blow) 82.7 17.2 16.3 17.9 20.5 15.3 14.1 DPI1/DPI300 0.3 1.3 0.9 0.9 0.8 1.2 1.3 PR (mm/blow) 101 18.4 20.8 17.4 23.6 15.4 8.9
Effectiveness 1.0 4.8 5.1 4.6 4.0 5.4 5.8 Table 3. DCP results (after 1 day)
5. Summary and conclusions
Intermodal freight transport involves the transportation of freight in an intermodal container or vehicle, using multiple modes of transportation (rail, ship, and truck). As a consequence, when an interport is planned to be constructed, several pavement problems can arise due to the high pressures and the low frequencies of the loads. Furthermore, sustainability issues call for a balanced approach of life cycle cost benefits of a new construction. Based on the above results, the following conclusions can be drawn: i) Lime stabilization has the potential for appreciably improving performance of the investigated A7-6 soils. ii) The proportionality between ITS and UCS was observed. This fact calls for pertaining theoretical observations and study in the field of the consequences in terms of two-dimensional graphical representation of the state of stress at a point (Mohr's circle). Furthermore, this correlation can be useful when designing soil treatment. iii) Combined treatments emerged as a strategy for improving the immediate achievement of the target performance on the treated soil. iv) DCP measures emerged
( 29ksi)

398 Filippo G. Praticò and Anand J. Puppala / Procedia - Social and Behavioral Sciences 53 ( 2012 ) 389 – 398
as a tool for high-speed assessment of soil stabilization compliance to UCS requirements; and v) A tentative augmentation of the spectrum of potential targets to the ITS values was carried out and a synergetic set of values was proposed. Several issues call for more research and evaluation. Further enhancement of the study (evolution over the time of single vs. combined treatments) in light of the measurements which are in progress are also recommended.
References
[1] Smallridge M. (2010). RCC Pavement Success at Mobile Container Terminal, proceedings of conference Florida Ports 2010: Building on the Past, Respecting the Future, pp. 901-911. [2] Kim S., Ceylan H., Heitzman M. (2005). Sensitivity Study of Design Input Parameters for Two Flexible Pavement Systems Using the Mechanistic-Empirical Pavement Design Guide. Proceedings of the 2005 Mid-Continent Transportation Research Symposium, Ames, Iowa. [3] Boscaino, G., Pratico, F.G. (2001). A classification of surface texture indices of pavement surfaces [Classification et inventaire des indicateurs de la texture superficielle des revêtements des chaussées]”. Bulletin des Laboratoires des Ponts et Chaussees (234), pp. 17-34+123+125+127. [4] Pratico’ F.G., Moro A., Ammendola R. (2009). Modeling HMA Bulk Specific Gravities: a Theoretical and Experimental Investigation, International Journal of Pavement Research and Technology, 2(3):115-122- ISSN: 1997-1400 (on-line) 1996-6814 (print). [5] Praticò F.G., Ammendola R., Moro A. (2010). Factors affecting the environmental impact of pavement wear. Transportation Research Part D: Transport and Environment, Volume 15, Issue 3, Pages 127-133, ISSN 1361-9209, DOI: 10.1016/j.trd.2009.12.002. Elsevier Science Ltd. [6] Puppala, A.J., Katha, B., Hoyos, L.R. (2004). Volumetric shrinkage strain measurements in expansive soils using digital imaging technology”. Geotechnical Testing Journal 27 (6) , pp. 547-556. [7] M-EPDG (2007). Guide for Mechanistic-Empirical Design of New and Rehabilitated Pavement Structures. www.trb.org/mepdg. National Cooperative Highway Research Program, Transportation Research Board, Washington, D.C., 2007. [8] Mallela J, Von Quintus H., Smith K. (2004). Consideration of lime-stabilized layers in Mechanistic-Empirical Pavement Design. [9] Little, D.L. (2000). Evaluation of Structural Properties of Lime Stabilized Soils and Aggregates, Mixture Design and Testing Protocol for Lime Stabilized Soils, (Vol. 3). National Lime Association report. (http://www.lime.org/SOIL3.PDF). [10] Arellano, D. and Thompson, M.R. (1998). Stabilized Base Properties (Strength, Modulus, Fatigue) for Mechanistic-Based Airport Pavement Design. Final Report, COE Report No. 4, University of Illinois at Urbana-Champaign. [11] Mooney M.A, Toohey N.M. (2010). Accelerated curing and strength-modulus correlation for lime-stabilized soils. Report No. CDOT-2010-1, Final Report, Colorado Department Of Transportation Dtd Applied Research And Innovation Branch. [12] Praticò F.G., Casciano A., Tramontana D. (2011). Pavement Life Cycle Cost and Asphalt Binder quality: A theoretical and experimental investigation, J. Constr. Engrg. and Mgmt. Volume 137, Issue 2, pp. 99-107, ISSN: 0733-9364. [13] Praticò F.G., Sireesh S., Puppala A. (2011). Comprehensive Life Cycle Cost Analysis for the Selection of Stabilization Alternatives for Better Performance of Low Volume Roads. U.S. Transportation Research Board, TRB transportation research record N.o 2204, vol.2, pp.120-129. [14] Veisi M., Chittoori B., Celaya M., Nazarian S., Puppala A. J. , Solis C (2010). Accelerated stabilization design of subgrade soils, Research Report 0-5569-1, Texas Department of Transportation. [15] Italferr, (2000). Capitolato costruzioni opera civili, movimenti terra, Specifica tecnica – Trattamento delle terre con calce, Italferr. [16] Oman, M. (2004). Advancement of Grading & Base Material Testing, Office of Materials, Minnesota Department of Transportation, Maplewood, MN, USA. [17] Siekmeier J., Pinta C., Merth S., Jensen J., Davich P., Camargo F., Beyer M. (2009). Using the Dynamic Cone Penetrometer and Light Weight Deflectometer for Construction Quality Assurance, Final Report, Minnesota Department of Transportation, Research Services Section. [18] Lockwood, D., De Franca V.M.P., Ringwood B., and DeBeer M. (1992). Analysis and Classification of DCP Survey Data. Technology and Information Management Programme, CSIR Transportek, Pretoria, South Africa. [19] NTNU, NVF/BR[19]A Symposium Oslo Feb. 13 and 14, 2008: Helge Mork, Light weight deflectometer (LWD) - Dang-Fong Lin, 2006.