Life Cycle of Oil and Gas Fields in the Mississippi River Delta
29
water Review Life Cycle of Oil and Gas Fields in the Mississippi River Delta: A Review John W. Day 1, *, H. C. Clark 2 , Chandong Chang 3 , Rachael Hunter 4, * and Charles R. Norman 5 1 Department of Oceanography and Coastal Sciences, Louisiana State University, Baton Rouge, LA 70803, USA 2 Department of Earth, Environmental and Planetary Science, Rice University, Houston, TX 77005, USA; [email protected] 3 Department of Geological Sciences, Chungnam National University, Daejeon 34134, Korea; [email protected] 4 Comite Resources, Inc., P.O. Box 66596, Baton Rouge, LA 70896, USA 5 Charles Norman & Associates, P.O. Box 5715, Lake Charles LA 70606, USA; [email protected] * Correspondence: [email protected] (J.W.D.); [email protected] (R.H.) Received: 20 April 2020; Accepted: 20 May 2020; Published: 23 May 2020 Abstract: Oil and gas (O&G) activity has been pervasive in the Mississippi River Delta (MRD). Here we review the life cycle of O&G fields in the MRD focusing on the production history and resulting environmental impacts and show how cumulative impacts affect coastal ecosystems. Individual fields can last 40–60 years and most wells are in the final stages of production. Production increased rapidly reaching a peak around 1970 and then declined. Produced water lagged O&G and was generally higher during declining O&G production, making up about 70% of total liquids. Much of the wetland loss in the delta is associated with O&G activities. These have contributed in three major ways to wetland loss including alteration of surface hydrology, induced subsidence due to fluids removal and fault activation, and toxic stress due to spilled oil and produced water. Changes in surface hydrology are related to canal dredging and spoil placement. As canal density increases, the density of natural channels decreases. Interconnected canal networks often lead to saltwater intrusion. Spoil banks block natural overland flow affecting exchange of water, sediments, chemicals, and organisms. Lower wetland productivity and reduced sediment input leads to enhanced surficial subsidence. Spoil banks are not permanent but subside and compact over time and many spoil banks no longer have subaerial expression. Fluid withdrawal from O&G formations leads to induced subsidence and fault activation. Formation pore pressure decreases, which lowers the lateral confining stress acting in the formation due to poroelastic coupling between pore pressure and stress. This promotes normal faulting in an extensional geological environment like the MRD, which causes surface subsidence in the vicinity of the faults. Induced reservoir compaction results in a reduction of reservoir thickness. Induced subsidence occurs in two phases especially when production rate is high. The first phase is compaction of the reservoir itself while the second phase is caused by a slow drainage of pore pressure in bounding shales that induces time-delayed subsidence associated with shale compaction. This second phase can continue for decades, even after most O&G has been produced, resulting in subsidence over much of an oil field that can be greater than surface subsidence due to altered hydrology. Produced water is water brought to the surface during O&G extraction and an estimated 2 million barrels per day were discharged into Louisiana coastal wetlands and waters from nearly 700 sites. This water is a mixture of either liquid or gaseous hydrocarbons, high salinity (up to 300 ppt) water, dissolved and suspended solids such as sand or silt, and injected fluids and additives associated with exploration and production activities and it is toxic to many estuarine organisms including vegetation and fauna. Spilled oil has lethal and sub-lethal effects on a wide range of estuarine organisms. The cumulative effect of alterations in surface hydrology, induced subsidence, and toxins interact such that overall impacts are enhanced. Restoration of coastal wetlands degraded by O&G activities should be informed by these impacts. Water 2020, 12, 1492; doi:10.3390/w12051492 www.mdpi.com/journal/water
-
Upload
khangminh22 -
Category
Documents
-
view
0 -
download
0
Transcript of Life Cycle of Oil and Gas Fields in the Mississippi River Delta

water
Review
Life Cycle of Oil and Gas Fields in the MississippiRiver Delta: A Review
John W. Day 1,*, H. C. Clark 2, Chandong Chang 3 , Rachael Hunter 4,* and Charles R. Norman 5
1 Department of Oceanography and Coastal Sciences, Louisiana State University, Baton Rouge, LA 70803, USA2 Department of Earth, Environmental and Planetary Science, Rice University, Houston, TX 77005, USA;
[email protected] Department of Geological Sciences, Chungnam National University, Daejeon 34134, Korea; [email protected] Comite Resources, Inc., P.O. Box 66596, Baton Rouge, LA 70896, USA5 Charles Norman & Associates, P.O. Box 5715, Lake Charles LA 70606, USA; [email protected]* Correspondence: [email protected] (J.W.D.); [email protected] (R.H.)
Received: 20 April 2020; Accepted: 20 May 2020; Published: 23 May 2020�����������������
Abstract: Oil and gas (O&G) activity has been pervasive in the Mississippi River Delta (MRD). Here wereview the life cycle of O&G fields in the MRD focusing on the production history and resultingenvironmental impacts and show how cumulative impacts affect coastal ecosystems. Individual fieldscan last 40–60 years and most wells are in the final stages of production. Production increasedrapidly reaching a peak around 1970 and then declined. Produced water lagged O&G and wasgenerally higher during declining O&G production, making up about 70% of total liquids. Much ofthe wetland loss in the delta is associated with O&G activities. These have contributed in three majorways to wetland loss including alteration of surface hydrology, induced subsidence due to fluidsremoval and fault activation, and toxic stress due to spilled oil and produced water. Changes insurface hydrology are related to canal dredging and spoil placement. As canal density increases,the density of natural channels decreases. Interconnected canal networks often lead to saltwaterintrusion. Spoil banks block natural overland flow affecting exchange of water, sediments, chemicals,and organisms. Lower wetland productivity and reduced sediment input leads to enhanced surficialsubsidence. Spoil banks are not permanent but subside and compact over time and many spoilbanks no longer have subaerial expression. Fluid withdrawal from O&G formations leads to inducedsubsidence and fault activation. Formation pore pressure decreases, which lowers the lateral confiningstress acting in the formation due to poroelastic coupling between pore pressure and stress. Thispromotes normal faulting in an extensional geological environment like the MRD, which causessurface subsidence in the vicinity of the faults. Induced reservoir compaction results in a reductionof reservoir thickness. Induced subsidence occurs in two phases especially when production rateis high. The first phase is compaction of the reservoir itself while the second phase is caused by aslow drainage of pore pressure in bounding shales that induces time-delayed subsidence associatedwith shale compaction. This second phase can continue for decades, even after most O&G has beenproduced, resulting in subsidence over much of an oil field that can be greater than surface subsidencedue to altered hydrology. Produced water is water brought to the surface during O&G extractionand an estimated 2 million barrels per day were discharged into Louisiana coastal wetlands andwaters from nearly 700 sites. This water is a mixture of either liquid or gaseous hydrocarbons, highsalinity (up to 300 ppt) water, dissolved and suspended solids such as sand or silt, and injected fluidsand additives associated with exploration and production activities and it is toxic to many estuarineorganisms including vegetation and fauna. Spilled oil has lethal and sub-lethal effects on a wide rangeof estuarine organisms. The cumulative effect of alterations in surface hydrology, induced subsidence,and toxins interact such that overall impacts are enhanced. Restoration of coastal wetlands degradedby O&G activities should be informed by these impacts.
Water 2020, 12, 1492; doi:10.3390/w12051492 www.mdpi.com/journal/water
Water 2020, 12, 1492 2 of 29
Keywords: oil and gas production; produced water; oil and gas wetland impacts; induced subsidence;wetland restoration
1. Introduction
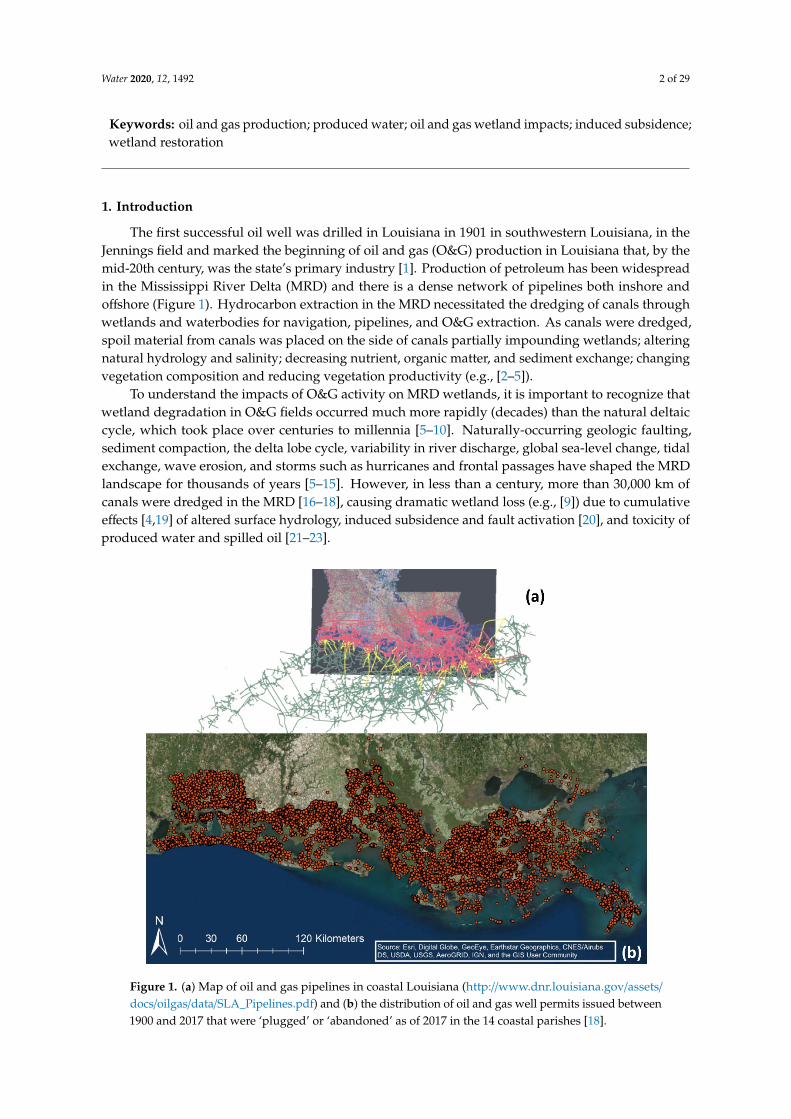
The first successful oil well was drilled in Louisiana in 1901 in southwestern Louisiana, in theJennings field and marked the beginning of oil and gas (O&G) production in Louisiana that, by themid-20th century, was the state’s primary industry [1]. Production of petroleum has been widespreadin the Mississippi River Delta (MRD) and there is a dense network of pipelines both inshore andoffshore (Figure 1). Hydrocarbon extraction in the MRD necessitated the dredging of canals throughwetlands and waterbodies for navigation, pipelines, and O&G extraction. As canals were dredged,spoil material from canals was placed on the side of canals partially impounding wetlands; alteringnatural hydrology and salinity; decreasing nutrient, organic matter, and sediment exchange; changingvegetation composition and reducing vegetation productivity (e.g., [2–5]).
To understand the impacts of O&G activity on MRD wetlands, it is important to recognize thatwetland degradation in O&G fields occurred much more rapidly (decades) than the natural deltaiccycle, which took place over centuries to millennia [5–10]. Naturally-occurring geologic faulting,sediment compaction, the delta lobe cycle, variability in river discharge, global sea-level change, tidalexchange, wave erosion, and storms such as hurricanes and frontal passages have shaped the MRDlandscape for thousands of years [5–15]. However, in less than a century, more than 30,000 km ofcanals were dredged in the MRD [16–18], causing dramatic wetland loss (e.g., [9]) due to cumulativeeffects [4,19] of altered surface hydrology, induced subsidence and fault activation [20], and toxicity ofproduced water and spilled oil [21–23].
Water 2020, 12, x FOR PEER REVIEW 2 of 30
Keywords: oil and gas production; produced water; oil and gas wetland impacts; induced subsidence; wetland restoration
1. Introduction
The first successful oil well was drilled in Louisiana in 1901 in southwestern Louisiana, in the Jennings field and marked the beginning of oil and gas (O&G) production in Louisiana that, by the mid-20th century, was the state’s primary industry [1]. Production of petroleum has been widespread in the Mississippi River Delta (MRD) and there is a dense network of pipelines both inshore and offshore (Figure 1). Hydrocarbon extraction in the MRD necessitated the dredging of canals through wetlands and waterbodies for navigation, pipelines, and O&G extraction. As canals were dredged, spoil material from canals was placed on the side of canals partially impounding wetlands; altering natural hydrology and salinity; decreasing nutrient, organic matter, and sediment exchange; changing vegetation composition and reducing vegetation productivity (e.g., [2–5]).
To understand the impacts of O&G activity on MRD wetlands, it is important to recognize that wetland degradation in O&G fields occurred much more rapidly (decades) than the natural deltaic cycle, which took place over centuries to millennia [5–10]. Naturally-occurring geologic faulting, sediment compaction, the delta lobe cycle, variability in river discharge, global sea-level change, tidal exchange, wave erosion, and storms such as hurricanes and frontal passages have shaped the MRD landscape for thousands of years [5–15]. However, in less than a century, more than 30,000 km of canals were dredged in the MRD [16–18], causing dramatic wetland loss (e.g., [9]) due to cumulative effects [4,19] of altered surface hydrology, induced subsidence and fault activation [20], and toxicity of produced water and spilled oil [21–23].
Figure 1. (a) Map of oil and gas pipelines in coastal Louisiana (http://www.dnr.louisiana.gov/assets/docs/oilgas/data/SLA_Pipelines.pdf) and (b) the distribution of oil and gas well permits issued between 1900 and 2017 that were ‘plugged’ or ‘abandoned’ as of 2017 in the 14 coastal parishes [18].
Figure 1. (a) Map of oil and gas pipelines in coastal Louisiana (http://www.dnr.louisiana.gov/assets/docs/oilgas/data/SLA_Pipelines.pdf) and (b) the distribution of oil and gas well permits issued between1900 and 2017 that were ‘plugged’ or ‘abandoned’ as of 2017 in the 14 coastal parishes [18].

Water 2020, 12, 1492 3 of 29
Our objective in this paper is to review the literature on the life cycle of O&G fields in the MRDby (1) describing the production history of hydrocarbons and produced water and (2) reviewing theimpacts of surface alterations, induced subsidence, and toxic materials. Although, these impacts havebeen well documented, their interacting affects have been less well addressed. Thus, an importantobjective is to consider their cumulative and indirect impacts on coastal ecosystems, especially wetlands,in the MRD and to show how this information informs restoration.
2. Production History of Oil and Gas Fields
Hydrocarbon extraction has occurred in the MRD for over a century. Production increased rapidlyand then declined as reserves were depleted and fluid output was dominated by produced water(Figures 2 and 3). This is true for the overall production history and for individual fields that wereactive for 30–50 years or more.
Water 2020, 12, x FOR PEER REVIEW 3 of 30
Our objective in this paper is to review the literature on the life cycle of O&G fields in the MRD by (1) describing the production history of hydrocarbons and produced water and (2) reviewing the impacts of surface alterations, induced subsidence, and toxic materials. Although, these impacts have been well documented, their interacting affects have been less well addressed. Thus, an important objective is to consider their cumulative and indirect impacts on coastal ecosystems, especially wetlands, in the MRD and to show how this information informs restoration.
2. Production History of Oil and Gas Fields
Hydrocarbon extraction has occurred in the MRD for over a century. Production increased rapidly and then declined as reserves were depleted and fluid output was dominated by produced water (Figures 2 and 3). This is true for the overall production history and for individual fields that were active for 30–50 years or more.
Figure 2. Annual oil and gas production in southern Louisiana between 1945 and 2019. Data source: (http://www.dnr.louisiana.gov/assets/TAD/OGTables/Table03.pdf).
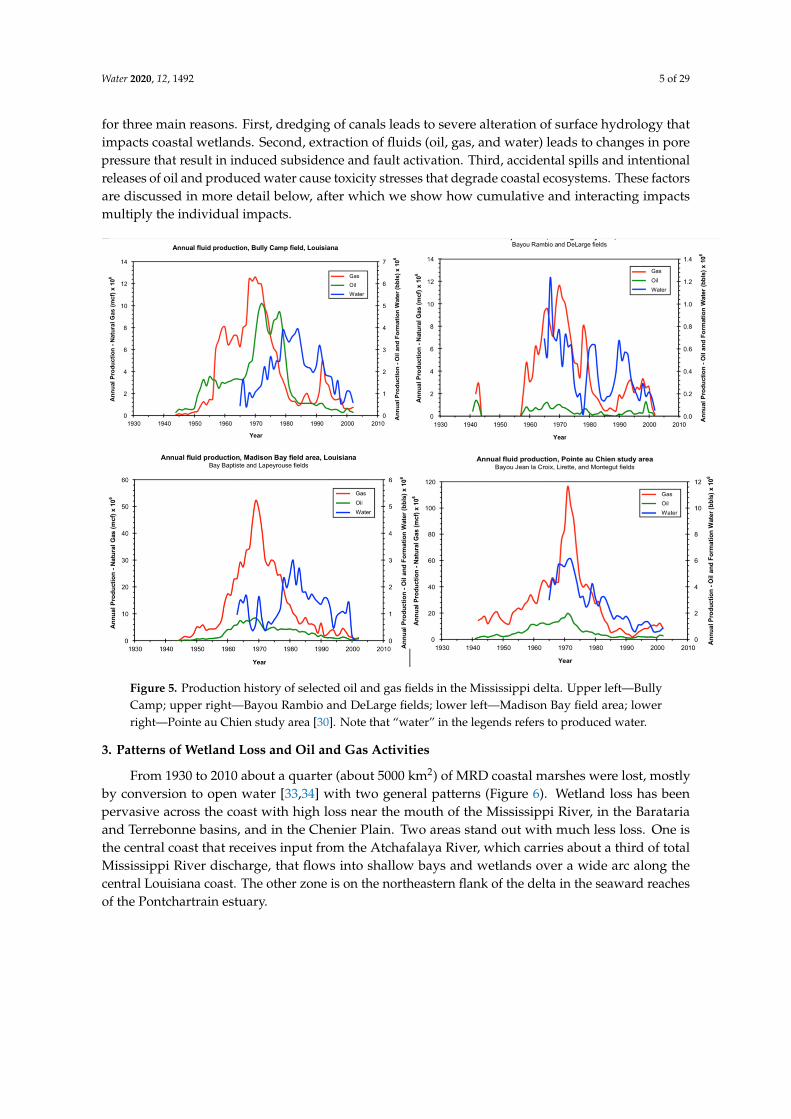
Wetland loss in coastal Louisiana has been quantified [19,24,25]. Researchers have used different proxies of field development to correlate this land loss with specific oil and gas activities [26–29]. The authors of [30] reported the highest rates of wetland loss in the MRD correlated with peak hydrocarbon production (Figure 3). In [18] it was reported that the annual number of well drilling permits, a proxy for production, correlated with wetland loss rates (Figure 4). In this paper we investigate the factors contributing to these relationships.
Figure 2. Annual oil and gas production in southern Louisiana between 1945 and 2019. Data source:(http://www.dnr.louisiana.gov/assets/TAD/OGTables/Table03.pdf).
Wetland loss in coastal Louisiana has been quantified [19,24,25]. Researchers have used differentproxies of field development to correlate this land loss with specific oil and gas activities [26–29].The authors of [30] reported the highest rates of wetland loss in the MRD correlated with peakhydrocarbon production (Figure 3). In [18] it was reported that the annual number of well drillingpermits, a proxy for production, correlated with wetland loss rates (Figure 4). In this paper weinvestigate the factors contributing to these relationships.
Water 2020, 12, 1492 4 of 29Water 2020, 12, x FOR PEER REVIEW 4 of 30
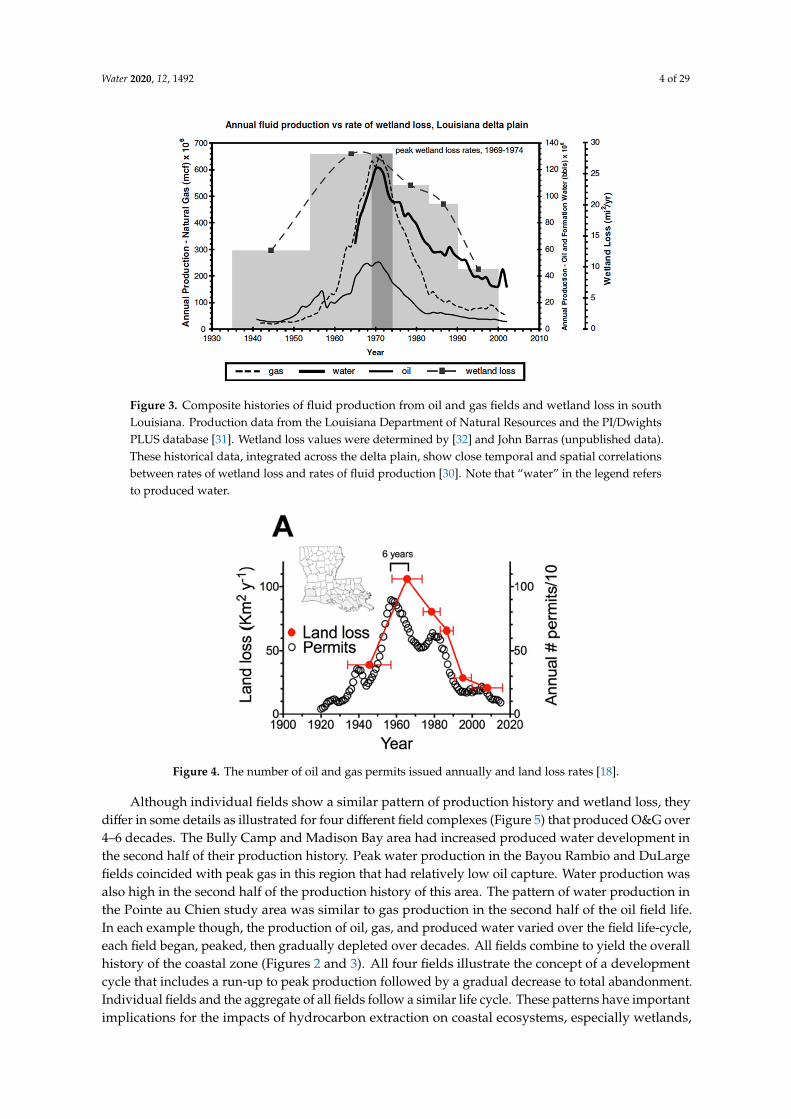
Figure 3. Composite histories of fluid production from oil and gas fields and wetland loss in south Louisiana. Production data from the Louisiana Department of Natural Resources and the PI/Dwights PLUS database [31]. Wetland loss values were determined by [32] and John Barras (unpublished data). These historical data, integrated across the delta plain, show close temporal and spatial correlations between rates of wetland loss and rates of fluid production [30]. Note that “water” in the legend refers to produced water.
Figure 4. The number of oil and gas permits issued annually and land loss rates [18].
Although individual fields show a similar pattern of production history and wetland loss, they differ in some details as illustrated for four different field complexes (Figure 5) that produced O&G over 4–6 decades. The Bully Camp and Madison Bay area had increased produced water development in the second half of their production history. Peak water production in the Bayou Rambio and DuLarge fields coincided with peak gas in this region that had relatively low oil capture. Water production was also high in the second half of the production history of this area. The pattern of water production in the Pointe au Chien study area was similar to gas production in the second half of the oil field life. In each example though, the production of oil, gas, and produced water varied over the field life-cycle, each field began, peaked, then gradually depleted over decades. All fields combine to yield the overall history of the coastal zone (Figures 2 and 3). All four fields illustrate the concept of a development cycle that includes a run-up to peak production followed by a gradual decrease to total abandonment. Individual fields and the aggregate of all fields follow a similar life
Figure 3. Composite histories of fluid production from oil and gas fields and wetland loss in southLouisiana. Production data from the Louisiana Department of Natural Resources and the PI/DwightsPLUS database [31]. Wetland loss values were determined by [32] and John Barras (unpublished data).These historical data, integrated across the delta plain, show close temporal and spatial correlationsbetween rates of wetland loss and rates of fluid production [30]. Note that “water” in the legend refersto produced water.
Water 2020, 12, x FOR PEER REVIEW 4 of 30
Figure 3. Composite histories of fluid production from oil and gas fields and wetland loss in south Louisiana. Production data from the Louisiana Department of Natural Resources and the PI/Dwights PLUS database [31]. Wetland loss values were determined by [32] and John Barras (unpublished data). These historical data, integrated across the delta plain, show close temporal and spatial correlations between rates of wetland loss and rates of fluid production [30]. Note that “water” in the legend refers to produced water.
Figure 4. The number of oil and gas permits issued annually and land loss rates [18].
Although individual fields show a similar pattern of production history and wetland loss, they differ in some details as illustrated for four different field complexes (Figure 5) that produced O&G over 4–6 decades. The Bully Camp and Madison Bay area had increased produced water development in the second half of their production history. Peak water production in the Bayou Rambio and DuLarge fields coincided with peak gas in this region that had relatively low oil capture. Water production was also high in the second half of the production history of this area. The pattern of water production in the Pointe au Chien study area was similar to gas production in the second half of the oil field life. In each example though, the production of oil, gas, and produced water varied over the field life-cycle, each field began, peaked, then gradually depleted over decades. All fields combine to yield the overall history of the coastal zone (Figures 2 and 3). All four fields illustrate the concept of a development cycle that includes a run-up to peak production followed by a gradual decrease to total abandonment. Individual fields and the aggregate of all fields follow a similar life
Figure 4. The number of oil and gas permits issued annually and land loss rates [18].
Although individual fields show a similar pattern of production history and wetland loss, theydiffer in some details as illustrated for four different field complexes (Figure 5) that produced O&G over4–6 decades. The Bully Camp and Madison Bay area had increased produced water development inthe second half of their production history. Peak water production in the Bayou Rambio and DuLargefields coincided with peak gas in this region that had relatively low oil capture. Water production wasalso high in the second half of the production history of this area. The pattern of water production inthe Pointe au Chien study area was similar to gas production in the second half of the oil field life.In each example though, the production of oil, gas, and produced water varied over the field life-cycle,each field began, peaked, then gradually depleted over decades. All fields combine to yield the overallhistory of the coastal zone (Figures 2 and 3). All four fields illustrate the concept of a developmentcycle that includes a run-up to peak production followed by a gradual decrease to total abandonment.Individual fields and the aggregate of all fields follow a similar life cycle. These patterns have importantimplications for the impacts of hydrocarbon extraction on coastal ecosystems, especially wetlands,
Water 2020, 12, 1492 5 of 29
for three main reasons. First, dredging of canals leads to severe alteration of surface hydrology thatimpacts coastal wetlands. Second, extraction of fluids (oil, gas, and water) leads to changes in porepressure that result in induced subsidence and fault activation. Third, accidental spills and intentionalreleases of oil and produced water cause toxicity stresses that degrade coastal ecosystems. These factorsare discussed in more detail below, after which we show how cumulative and interacting impactsmultiply the individual impacts.
Water 2020, 12, x FOR PEER REVIEW 5 of 30
cycle. These patterns have important implications for the impacts of hydrocarbon extraction on coastal ecosystems, especially wetlands, for three main reasons. First, dredging of canals leads to severe alteration of surface hydrology that impacts coastal wetlands. Second, extraction of fluids (oil, gas, and water) leads to changes in pore pressure that result in induced subsidence and fault activation. Third, accidental spills and intentional releases of oil and produced water cause toxicity stresses that degrade coastal ecosystems. These factors are discussed in more detail below, after which we show how cumulative and interacting impacts multiply the individual impacts.
Figure 5. Production history of selected oil and gas fields in the Mississippi delta. Upper left—Bully Camp; upper right—Bayou Rambio and DeLarge fields; lower left—Madison Bay field area; lower right—Pointe au Chien study area [30]. Note that “water” in the legends refers to produced water.
3. Patterns of Wetland Loss and Oil and Gas Activities
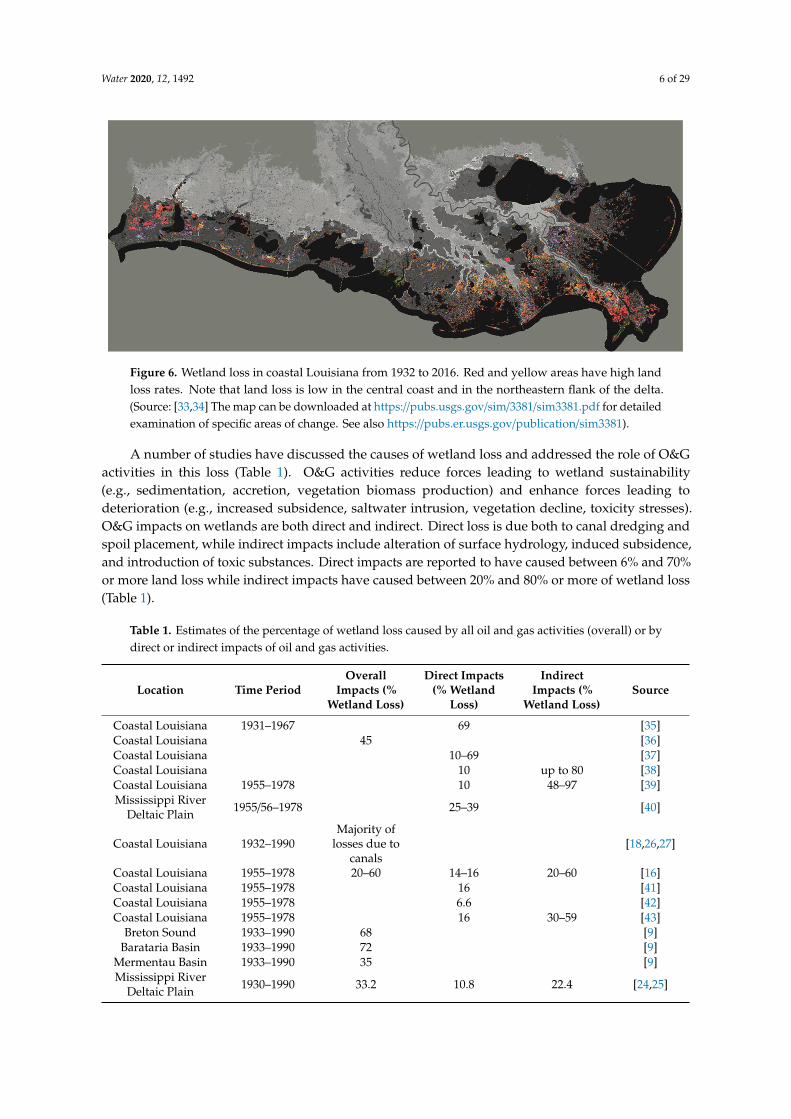
From 1930 to 2010 about a quarter (about 5000 km2) of MRD coastal marshes were lost, mostly by conversion to open water [33,34] with two general patterns (Figure 6). Wetland loss has been pervasive across the coast with high loss near the mouth of the Mississippi River, in the Barataria and Terrebonne basins, and in the Chenier Plain. Two areas stand out with much less loss. One is the central coast that receives input from the Atchafalaya River, which carries about a third of total Mississippi River discharge, that flows into shallow bays and wetlands over a wide arc along the central Louisiana coast. The other zone is on the northeastern flank of the delta in the seaward reaches of the Pontchartrain estuary.
Figure 5. Production history of selected oil and gas fields in the Mississippi delta. Upper left—BullyCamp; upper right—Bayou Rambio and DeLarge fields; lower left—Madison Bay field area; lowerright—Pointe au Chien study area [30]. Note that “water” in the legends refers to produced water.
3. Patterns of Wetland Loss and Oil and Gas Activities
From 1930 to 2010 about a quarter (about 5000 km2) of MRD coastal marshes were lost, mostlyby conversion to open water [33,34] with two general patterns (Figure 6). Wetland loss has beenpervasive across the coast with high loss near the mouth of the Mississippi River, in the Baratariaand Terrebonne basins, and in the Chenier Plain. Two areas stand out with much less loss. One isthe central coast that receives input from the Atchafalaya River, which carries about a third of totalMississippi River discharge, that flows into shallow bays and wetlands over a wide arc along thecentral Louisiana coast. The other zone is on the northeastern flank of the delta in the seaward reachesof the Pontchartrain estuary.
Water 2020, 12, 1492 6 of 29Water 2020, 12, x FOR PEER REVIEW 6 of 30
Figure 6. Wetland loss in coastal Louisiana from 1932 to 2016. Red and yellow areas have high land loss rates. Note that land loss is low in the central coast and in the northeastern flank of the delta. (Source: [33,34] The map can be downloaded at https://pubs.usgs.gov/sim/3381/sim3381.pdf for detailed examination of specific areas of change. See also https://pubs.er.usgs.gov/publication/sim3381).
A number of studies have discussed the causes of wetland loss and addressed the role of O&G activities in this loss (Table 1). O&G activities reduce forces leading to wetland sustainability (e.g., sedimentation, accretion, vegetation biomass production) and enhance forces leading to deterioration (e.g., increased subsidence, saltwater intrusion, vegetation decline, toxicity stresses). O&G impacts on wetlands are both direct and indirect. Direct loss is due both to canal dredging and spoil placement, while indirect impacts include alteration of surface hydrology, induced subsidence, and introduction of toxic substances. Direct impacts are reported to have caused between 6% and 70% or more land loss while indirect impacts have caused between 20% and 80% or more of wetland loss (Table 1).
Table 1. Estimates of the percentage of wetland loss caused by all oil and gas activities (overall) or by direct or indirect impacts of oil and gas activities.
Location Time
Period
Overall Impacts (%
Wetland Loss)
Direct Impacts (% Wetland
Loss)
Indirect Impacts (%
Wetland Loss) Source
Coastal Louisiana
1931–1967 69 [35]
Coastal Louisiana
45 [36]
Coastal Louisiana 10–69 [37]
Coastal Louisiana
10 up to 80 [38]
Coastal Louisiana
1955–1978 10 48–97 [39]
Mississippi River
Deltaic Plain
1955/56–1978 25–39 [40]
Coastal Louisiana 1932–1990
Majority of losses due to
canals [18,26,27]
Figure 6. Wetland loss in coastal Louisiana from 1932 to 2016. Red and yellow areas have high landloss rates. Note that land loss is low in the central coast and in the northeastern flank of the delta.(Source: [33,34] The map can be downloaded at https://pubs.usgs.gov/sim/3381/sim3381.pdf for detailedexamination of specific areas of change. See also https://pubs.er.usgs.gov/publication/sim3381).
A number of studies have discussed the causes of wetland loss and addressed the role of O&Gactivities in this loss (Table 1). O&G activities reduce forces leading to wetland sustainability(e.g., sedimentation, accretion, vegetation biomass production) and enhance forces leading todeterioration (e.g., increased subsidence, saltwater intrusion, vegetation decline, toxicity stresses).O&G impacts on wetlands are both direct and indirect. Direct loss is due both to canal dredging andspoil placement, while indirect impacts include alteration of surface hydrology, induced subsidence,and introduction of toxic substances. Direct impacts are reported to have caused between 6% and 70%or more land loss while indirect impacts have caused between 20% and 80% or more of wetland loss(Table 1).
Table 1. Estimates of the percentage of wetland loss caused by all oil and gas activities (overall) or bydirect or indirect impacts of oil and gas activities.
Location Time PeriodOverall
Impacts (%Wetland Loss)
Direct Impacts(% Wetland
Loss)
IndirectImpacts (%
Wetland Loss)Source
Coastal Louisiana 1931–1967 69 [35]Coastal Louisiana 45 [36]Coastal Louisiana 10–69 [37]Coastal Louisiana 10 up to 80 [38]Coastal Louisiana 1955–1978 10 48–97 [39]Mississippi River
Deltaic Plain 1955/56–1978 25–39 [40]
Coastal Louisiana 1932–1990Majority of
losses due tocanals
[18,26,27]
Coastal Louisiana 1955–1978 20–60 14–16 20–60 [16]Coastal Louisiana 1955–1978 16 [41]Coastal Louisiana 1955–1978 6.6 [42]Coastal Louisiana 1955–1978 16 30–59 [43]
Breton Sound 1933–1990 68 [9]Barataria Basin 1933–1990 72 [9]
Mermentau Basin 1933–1990 35 [9]Mississippi River
Deltaic Plain 1930–1990 33.2 10.8 22.4 [24,25]

Water 2020, 12, 1492 7 of 29
Wetland loss patterns are generally similar to temporal patterns of production (Figure 7).The different studies were done using different methods and represent different conceptualizations ofthe delta and sub-areas sampled. Regardless of the proxy used to describe the oil and gas life-cycle,the relation to land loss is unmistakable. The rates of land loss differ because they are for differentareas (e.g., total coast vs. deltaic and Chenier plains) and for different time periods and the studymethods, though similar, are not the same [32,34,44]. Peak loss occurred generally between 1960 and1980. The curve for total O&G production is sharper than that of land loss likely because of delayedimpacts of O&G as well as other causes of land loss (e.g., isolation from riverine input, edge erosion,hurricane impacts).
Water 2020, 12, x FOR PEER REVIEW 7 of 30
Coastal Louisiana
1955–1978 20–60 14–16 20–60 [16]
Coastal Louisiana 1955–1978 16 [41]
Coastal Louisiana 1955–1978 6.6 [42]
Coastal Louisiana
1955–1978 16 30–59 [43]
Breton Sound 1933–1990 68 [9]
Barataria Basin 1933–1990 72 [9]
Mermentau Basin
1933–1990 35 [9]
Mississippi River
Deltaic Plain
1930–1990 33.2 10.8 22.4 [24,25]
Wetland loss patterns are generally similar to temporal patterns of production (Figure 7). The different studies were done using different methods and represent different conceptualizations of the delta and sub-areas sampled. Regardless of the proxy used to describe the oil and gas life-cycle, the relation to land loss is unmistakable. The rates of land loss differ because they are for different areas (e.g., total coast vs. deltaic and Chenier plains) and for different time periods and the study methods, though similar, are not the same [32,34,44]. Peak loss occurred generally between 1960 and 1980. The curve for total O&G production is sharper than that of land loss likely because of delayed impacts of O&G as well as other causes of land loss (e.g., isolation from riverine input, edge erosion, hurricane impacts).
0
50
100
150
200
250
300
350
400
450
-20
0
20
40
60
80
100
120
140
160
1930 1950 1970 1990 2010
Sout
h Lo
uisia
na O
il an
d G
as P
rodu
ctio
n (O
il bb
ls*10
-6
, Gas
mcf
*10-
7)
Land
Los
s Rat
e (km
2/ye
ar)
Britsch and Dunbar1993 Delta change rate
Britsch and Dunbar1993 Chenier changerateBritsch and Dunbar1993 Total Coastchange rateBarras et al 2008 Deltachange rate
Barras et al 2008Chenier change rate
Barras et al 2008 TotalCoast change rate
Barras delta hurricanes
Figure 7. Oil and gas production and land loss studies for coastal Louisiana. Loss values arefrom [32,34,44] where rate values represent an average over the time interval shown. Production dataare from Louisiana Department of Natural Resources. These historical data show close temporal andspatial correlations between rates of wetland loss and rates of hydrocarbon production.
4. Indirect Impacts of Oil and Gas Exploration and Production on Coastal Louisiana Wetlands
4.1. Alteration of Surface Hydrology Due to Canal Dredging and Spoil Placement
MRD wetlands are dependent on sheet flow for exchange of water, sediments, and nutrients tosustain wetland health. Unimpeded wetland hydrology facilitates alternating flooding and draining ofwetlands. Canals and spoil banks are linear and intersecting, and spoil banks are higher in elevation thansurrounding wetlands and normal high tides [4,9,15,45]. Placement of dredge spoil impounds wetlands,reducing or eliminating surface water exchange and tidal influence, reducing sediment depositiononto wetlands, impeding the exchange of materials (e.g., nutrients, sediments, organisms) betweensemi-impounded marshes and the surrounding marsh, and increasing inundation duration whiledecreasing inundation frequency [2,4,16,46–50]. Spoil banks trap water, increasing water logging anddecreasing drainage, sediment accretion, and vegetation productivity (Figure 8) [4,15,16,19,46,48,51–63].
Water 2020, 12, 1492 8 of 29
As surface flow is minimized by spoil banks, water may only be introduced into impounded wetlandswhen water levels are elevated during frontal passages or major storms.
Water 2020, 12, x FOR PEER REVIEW 8 of 30
Figure 7. Oil and gas production and land loss studies for coastal Louisiana. Loss values are from [32,34,44] where rate values represent an average over the time interval shown. Production data are from Louisiana Department of Natural Resources. These historical data show close temporal and spatial correlations between rates of wetland loss and rates of hydrocarbon production.
4. Indirect Impacts of Oil and Gas Exploration and Production on Coastal Louisiana Wetlands
4.1. Alteration of Surface Hydrology Due to Canal Dredging and Spoil Placement
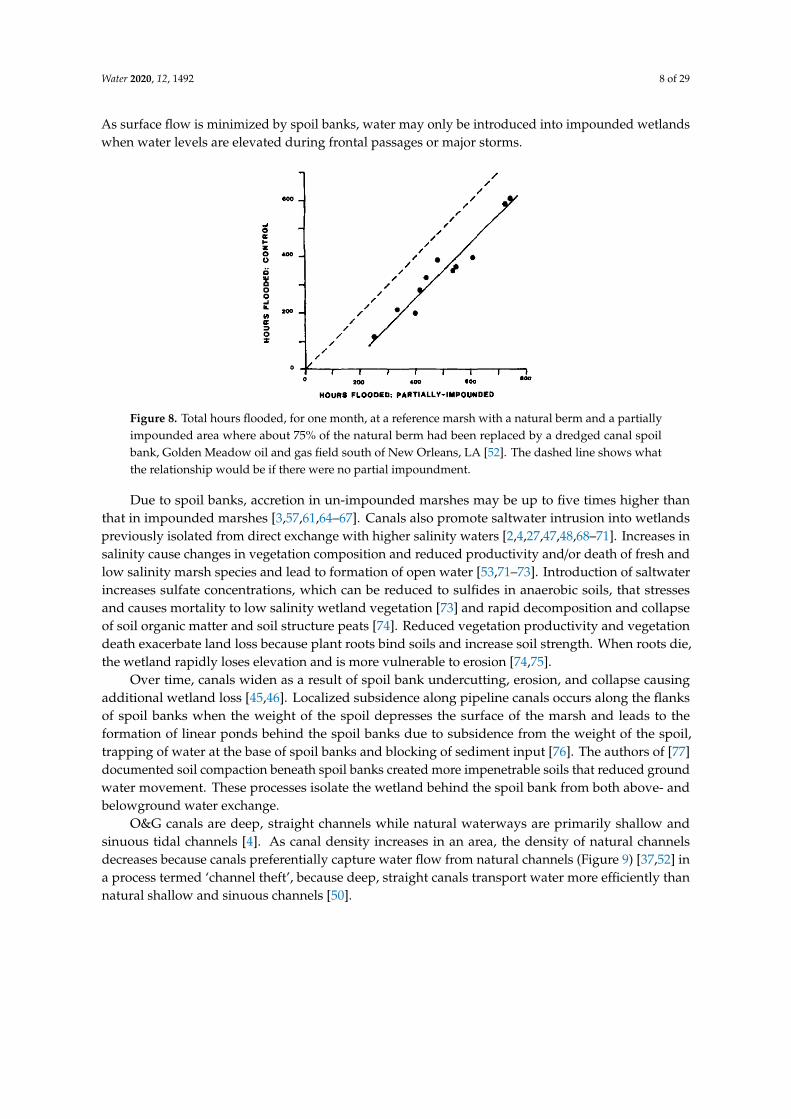
MRD wetlands are dependent on sheet flow for exchange of water, sediments, and nutrients to sustain wetland health. Unimpeded wetland hydrology facilitates alternating flooding and draining of wetlands. Canals and spoil banks are linear and intersecting, and spoil banks are higher in elevation than surrounding wetlands and normal high tides [4,9,15,45]. Placement of dredge spoil impounds wetlands, reducing or eliminating surface water exchange and tidal influence, reducing sediment deposition onto wetlands, impeding the exchange of materials (e.g., nutrients, sediments, organisms) between semi-impounded marshes and the surrounding marsh, and increasing inundation duration while decreasing inundation frequency [2,4,16,46–50]. Spoil banks trap water, increasing water logging and decreasing drainage, sediment accretion, and vegetation productivity (Figure 8) [4,15,16,19,46,48,51–63]. As surface flow is minimized by spoil banks, water may only be introduced into impounded wetlands when water levels are elevated during frontal passages or major storms.
Figure 8. Total hours flooded, for one month, at a reference marsh with a natural berm and a partially impounded area where about 75% of the natural berm had been replaced by a dredged canal spoil bank, Golden Meadow oil and gas field south of New Orleans, LA [52]. The dashed line shows what the relationship would be if there were no partial impoundment.
Due to spoil banks, accretion in un-impounded marshes may be up to five times higher than that in impounded marshes [3,57,61,64–67]. Canals also promote saltwater intrusion into wetlands previously isolated from direct exchange with higher salinity waters [2,4,27,47,48,68–71]. Increases in salinity cause changes in vegetation composition and reduced productivity and/or death of fresh and low salinity marsh species and lead to formation of open water [53,71–73]. Introduction of saltwater increases sulfate concentrations, which can be reduced to sulfides in anaerobic soils, that stresses and causes mortality to low salinity wetland vegetation [73] and rapid decomposition and collapse of soil organic matter and soil structure peats [74]. Reduced vegetation productivity and vegetation death exacerbate land loss because plant roots bind soils and increase soil strength. When roots die, the wetland rapidly loses elevation and is more vulnerable to erosion [74,75].
Over time, canals widen as a result of spoil bank undercutting, erosion, and collapse causing additional wetland loss [45,46]. Localized subsidence along pipeline canals occurs along the flanks of spoil banks when the weight of the spoil depresses the surface of the marsh and leads to the formation
Figure 8. Total hours flooded, for one month, at a reference marsh with a natural berm and a partiallyimpounded area where about 75% of the natural berm had been replaced by a dredged canal spoilbank, Golden Meadow oil and gas field south of New Orleans, LA [52]. The dashed line shows whatthe relationship would be if there were no partial impoundment.
Due to spoil banks, accretion in un-impounded marshes may be up to five times higher thanthat in impounded marshes [3,57,61,64–67]. Canals also promote saltwater intrusion into wetlandspreviously isolated from direct exchange with higher salinity waters [2,4,27,47,48,68–71]. Increases insalinity cause changes in vegetation composition and reduced productivity and/or death of fresh andlow salinity marsh species and lead to formation of open water [53,71–73]. Introduction of saltwaterincreases sulfate concentrations, which can be reduced to sulfides in anaerobic soils, that stressesand causes mortality to low salinity wetland vegetation [73] and rapid decomposition and collapseof soil organic matter and soil structure peats [74]. Reduced vegetation productivity and vegetationdeath exacerbate land loss because plant roots bind soils and increase soil strength. When roots die,the wetland rapidly loses elevation and is more vulnerable to erosion [74,75].
Over time, canals widen as a result of spoil bank undercutting, erosion, and collapse causingadditional wetland loss [45,46]. Localized subsidence along pipeline canals occurs along the flanksof spoil banks when the weight of the spoil depresses the surface of the marsh and leads to theformation of linear ponds behind the spoil banks due to subsidence from the weight of the spoil,trapping of water at the base of spoil banks and blocking of sediment input [76]. The authors of [77]documented soil compaction beneath spoil banks created more impenetrable soils that reduced groundwater movement. These processes isolate the wetland behind the spoil bank from both above- andbelowground water exchange.
O&G canals are deep, straight channels while natural waterways are primarily shallow andsinuous tidal channels [4]. As canal density increases in an area, the density of natural channelsdecreases because canals preferentially capture water flow from natural channels (Figure 9) [37,52] ina process termed ‘channel theft’, because deep, straight canals transport water more efficiently thannatural shallow and sinuous channels [50].

Water 2020, 12, 1492 9 of 29
Water 2020, 12, x FOR PEER REVIEW 9 of 30
of linear ponds behind the spoil banks due to subsidence from the weight of the spoil, trapping of water at the base of spoil banks and blocking of sediment input [76]. The authors of [77] documented soil compaction beneath spoil banks created more impenetrable soils that reduced ground water movement. These processes isolate the wetland behind the spoil bank from both above- and belowground water exchange.
O&G canals are deep, straight channels while natural waterways are primarily shallow and sinuous tidal channels [4]. As canal density increases in an area, the density of natural channels decreases because canals preferentially capture water flow from natural channels (Figure 9) [37,52] in a process termed ‘channel theft’, because deep, straight canals transport water more efficiently than natural shallow and sinuous channels [50].
Figure 9. The relationship between canal density and the density of natural channels. The data are averages of replicate 1-km2 grids (numbers shown by symbol) in the region of Leeville, LA, a saline marsh area [37].
Once dredged, spoil banks are not permanent features and have a life cycle of their own. They disappear over time due to compaction, subsidence, sea-level rise, and erosion. Spoil banks protect remnant marsh from wave erosion and as spoil banks disappear remnant marsh can be lost due to wave attack, leading to further wetlands loss. In Figure 10, subaerial land that disappeared between the two mapping dates (center panel in Figure 10) in the Leeville Field includes both spoil banks and marsh.
Figure 9. The relationship between canal density and the density of natural channels. The data areaverages of replicate 1-km2 grids (numbers shown by symbol) in the region of Leeville, LA, a salinemarsh area [37].
Once dredged, spoil banks are not permanent features and have a life cycle of their own.They disappear over time due to compaction, subsidence, sea-level rise, and erosion. Spoil banksprotect remnant marsh from wave erosion and as spoil banks disappear remnant marsh can be lostdue to wave attack, leading to further wetlands loss. In Figure 10, subaerial land that disappearedbetween the two mapping dates (center panel in Figure 10) in the Leeville Field includes both spoilbanks and marsh.
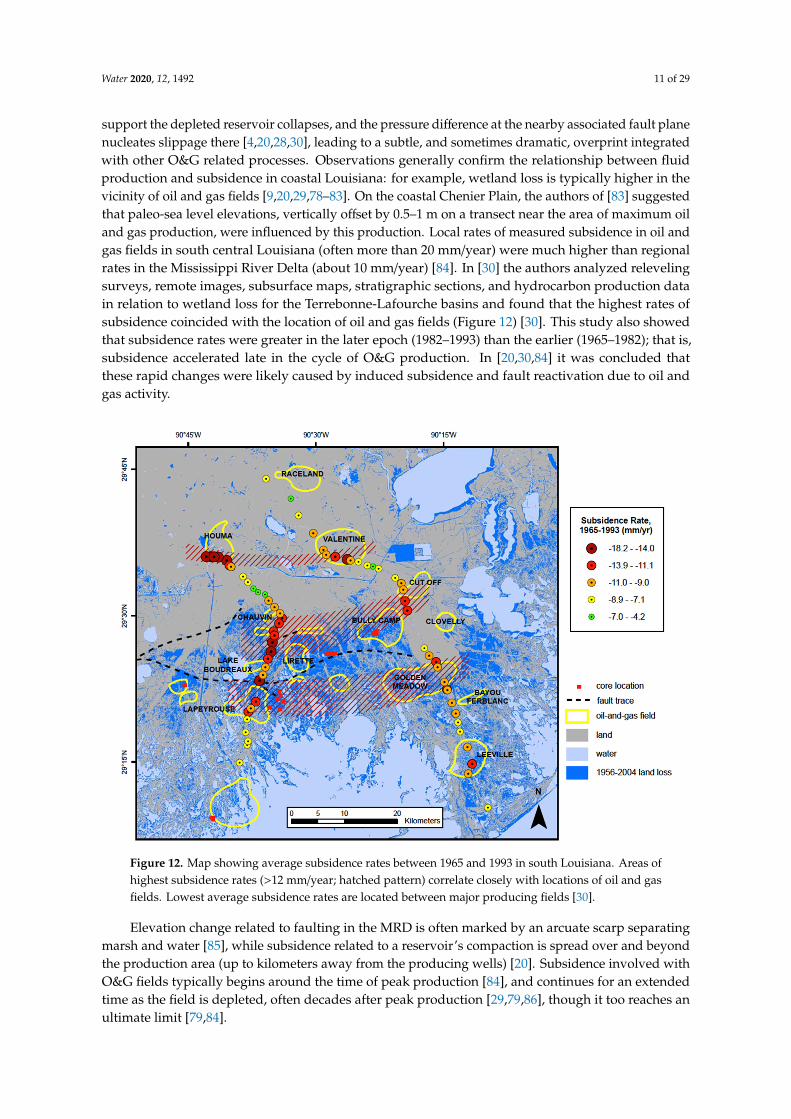
As O&G canals are so pervasive, it has been suggested that canals are responsible for practicallyall wetlands loss. For example, the authors of [18,27] plotted land loss from 15-min quadrangles againstcanal density and concluded that land loss was directly related to the percent of canals in each map,indicating that almost all land loss was related to canals (Figure 11). However, in [5] and [9] the authorsshowed that this approach is flawed because it statistically relates all land loss in 15-min quadrangles(which cover about 66,000 ha) to canal density in the quadrangle even when it is neither spatiallyor functionally related to land loss patterns. Additionally, as we discuss below, induced subsidencecauses land loss but is not functionally related to surface alterations in hydrology. In addition, toxicstress due to spilled oil and produced water cause vegetation stress and mortality. However, alteredhydrology, induced subsidence, and toxic compounds interact synergistically and cause wetland lossas indicated by the interactions demonstrated in the Leeville field (Figure 10).
Water 2020, 12, 1492 10 of 29Water 2020, 12, x FOR PEER REVIEW 10 of 30
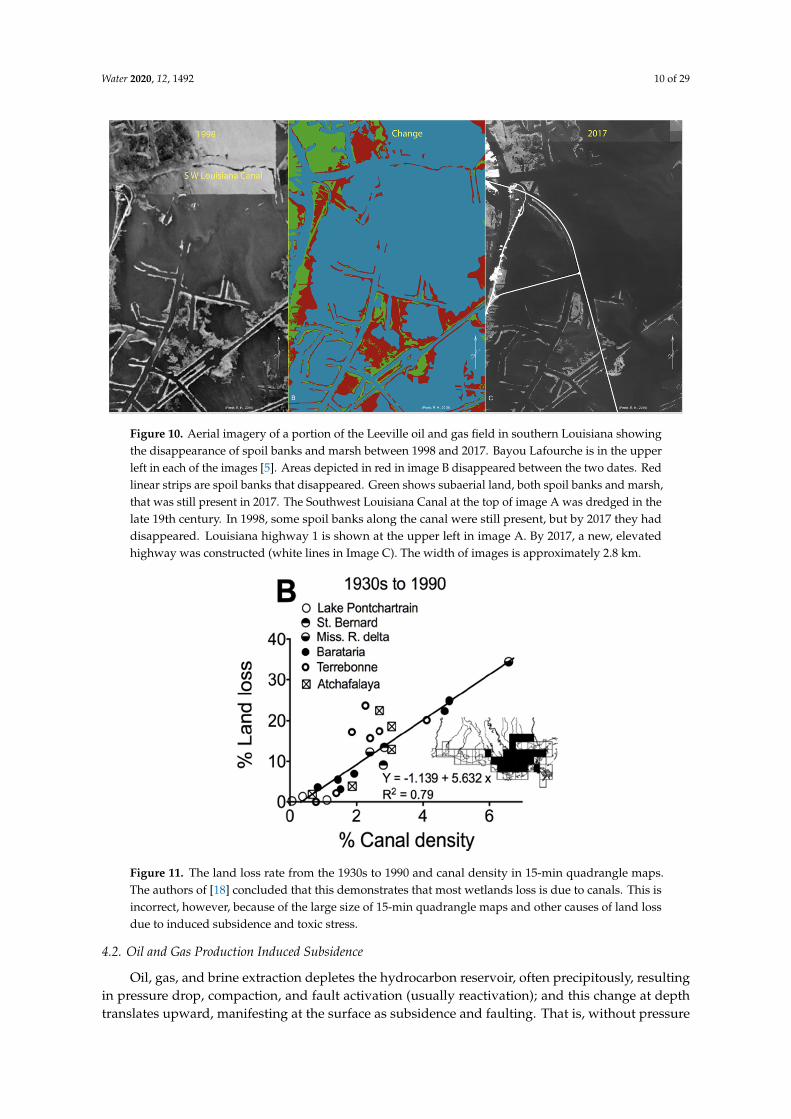
Figure 10. Aerial imagery of a portion of the Leeville oil and gas field in southern Louisiana showing the disappearance of spoil banks and marsh between 1998 and 2017. Bayou Lafourche is in the upper left in each of the images [5]. Areas depicted in red in image B disappeared between the two dates. Red linear strips are spoil banks that disappeared. Green shows subaerial land, both spoil banks and marsh, that was still present in 2017. The Southwest Louisiana Canal at the top of image A was dredged in the late 19th century. In 1998, some spoil banks along the canal were still present, but by 2017 they had disappeared. Louisiana highway 1 is shown at the upper left in image A. By 2017, a new, elevated highway was constructed (white lines in Image C). The width of images is approximately 2.8 km.
As O&G canals are so pervasive, it has been suggested that canals are responsible for practically all wetlands loss. For example, the authors of [18,27] plotted land loss from 15-min quadrangles against canal density and concluded that land loss was directly related to the percent of canals in each map, indicating that almost all land loss was related to canals (Figure 11). However, in [5] and [9] the authors showed that this approach is flawed because it statistically relates all land loss in 15-min quadrangles (which cover about 66,000 ha) to canal density in the quadrangle even when it is neither spatially or functionally related to land loss patterns. Additionally, as we discuss below, induced subsidence causes land loss but is not functionally related to surface alterations in hydrology. In addition, toxic stress due to spilled oil and produced water cause vegetation stress and mortality. However, altered hydrology, induced subsidence, and toxic compounds interact synergistically and cause wetland loss as indicated by the interactions demonstrated in the Leeville field (Figure 10).
Figure 10. Aerial imagery of a portion of the Leeville oil and gas field in southern Louisiana showingthe disappearance of spoil banks and marsh between 1998 and 2017. Bayou Lafourche is in the upperleft in each of the images [5]. Areas depicted in red in image B disappeared between the two dates. Redlinear strips are spoil banks that disappeared. Green shows subaerial land, both spoil banks and marsh,that was still present in 2017. The Southwest Louisiana Canal at the top of image A was dredged in thelate 19th century. In 1998, some spoil banks along the canal were still present, but by 2017 they haddisappeared. Louisiana highway 1 is shown at the upper left in image A. By 2017, a new, elevatedhighway was constructed (white lines in Image C). The width of images is approximately 2.8 km.
Water 2020, 12, x FOR PEER REVIEW 11 of 30
Figure 11. The land loss rate from the 1930s to 1990 and canal density in 15-min quadrangle maps. The authors of [18] concluded that this demonstrates that most wetlands loss is due to canals. This is incorrect, however, because of the large size of 15-min quadrangle maps and other causes of land loss due to induced subsidence and toxic stress.
4.2. Oil and Gas Production Induced Subsidence
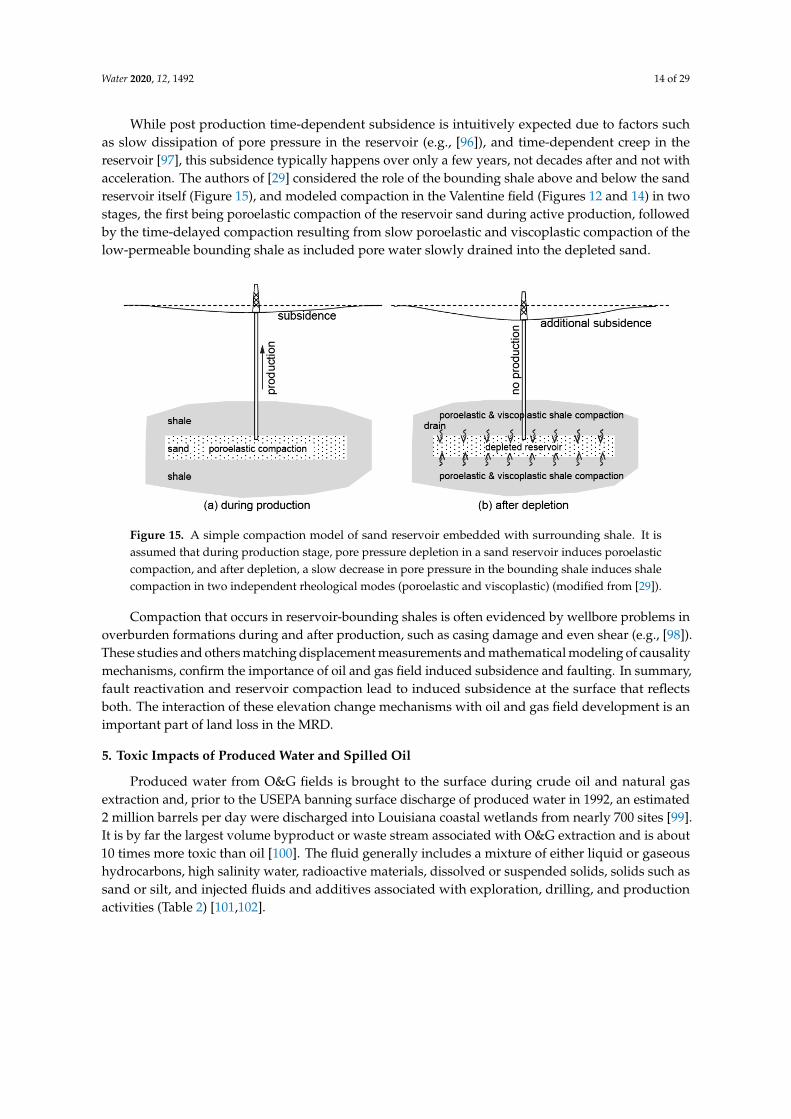
Oil, gas, and brine extraction depletes the hydrocarbon reservoir, often precipitously, resulting in pressure drop, compaction, and fault activation (usually reactivation); and this change at depth translates upward, manifesting at the surface as subsidence and faulting. That is, without pressure support the depleted reservoir collapses, and the pressure difference at the nearby associated fault plane nucleates slippage there [4,20,28,30], leading to a subtle, and sometimes dramatic, overprint integrated with other O&G related processes. Observations generally confirm the relationship between fluid production and subsidence in coastal Louisiana: for example, wetland loss is typically higher in the vicinity of oil and gas fields [9,20,29,78–83]. On the coastal Chenier Plain, the authors of [83] suggested that paleo-sea level elevations, vertically offset by 0.5–1 m on a transect near the area of maximum oil and gas production, were influenced by this production. Local rates of measured subsidence in oil and gas fields in south central Louisiana (often more than 20 mm/year) were much higher than regional rates in the Mississippi River Delta (about 10 mm/year) [84]. In [30] the authors analyzed releveling surveys, remote images, subsurface maps, stratigraphic sections, and hydrocarbon production data in relation to wetland loss for the Terrebonne-Lafourche basins and found that the highest rates of subsidence coincided with the location of oil and gas fields (Figure 12) [30]. This study also showed that subsidence rates were greater in the later epoch (1982–1993) than the earlier (1965–1982); that is, subsidence accelerated late in the cycle of O&G production. In [20,30,84] it was concluded that these rapid changes were likely caused by induced subsidence and fault reactivation due to oil and gas activity.
Figure 11. The land loss rate from the 1930s to 1990 and canal density in 15-min quadrangle maps.The authors of [18] concluded that this demonstrates that most wetlands loss is due to canals. This isincorrect, however, because of the large size of 15-min quadrangle maps and other causes of land lossdue to induced subsidence and toxic stress.
4.2. Oil and Gas Production Induced Subsidence
Oil, gas, and brine extraction depletes the hydrocarbon reservoir, often precipitously, resultingin pressure drop, compaction, and fault activation (usually reactivation); and this change at depthtranslates upward, manifesting at the surface as subsidence and faulting. That is, without pressure
Water 2020, 12, 1492 11 of 29
support the depleted reservoir collapses, and the pressure difference at the nearby associated fault planenucleates slippage there [4,20,28,30], leading to a subtle, and sometimes dramatic, overprint integratedwith other O&G related processes. Observations generally confirm the relationship between fluidproduction and subsidence in coastal Louisiana: for example, wetland loss is typically higher in thevicinity of oil and gas fields [9,20,29,78–83]. On the coastal Chenier Plain, the authors of [83] suggestedthat paleo-sea level elevations, vertically offset by 0.5–1 m on a transect near the area of maximum oiland gas production, were influenced by this production. Local rates of measured subsidence in oil andgas fields in south central Louisiana (often more than 20 mm/year) were much higher than regionalrates in the Mississippi River Delta (about 10 mm/year) [84]. In [30] the authors analyzed relevelingsurveys, remote images, subsurface maps, stratigraphic sections, and hydrocarbon production datain relation to wetland loss for the Terrebonne-Lafourche basins and found that the highest rates ofsubsidence coincided with the location of oil and gas fields (Figure 12) [30]. This study also showedthat subsidence rates were greater in the later epoch (1982–1993) than the earlier (1965–1982); that is,subsidence accelerated late in the cycle of O&G production. In [20,30,84] it was concluded thatthese rapid changes were likely caused by induced subsidence and fault reactivation due to oil andgas activity.Water 2020, 12, x FOR PEER REVIEW 12 of 30
Figure 12. Map showing average subsidence rates between 1965 and 1993 in south Louisiana. Areas of highest subsidence rates (>12 mm/year; hatched pattern) correlate closely with locations of oil and gas fields. Lowest average subsidence rates are located between major producing fields [30].
Elevation change related to faulting in the MRD is often marked by an arcuate scarp separating marsh and water [85], while subsidence related to a reservoir’s compaction is spread over and beyond the production area (up to kilometers away from the producing wells) [20]. Subsidence involved with O&G fields typically begins around the time of peak production [84], and continues for an extended time as the field is depleted, often decades after peak production [29,79,86], though it too reaches an ultimate limit [79,84].
The Mississippi Delta is particularly susceptible to subsidence and faulting since rapid deposition of sands and clays has created a weak, metastable situation that responded from early in its geologic history with “landslide-like” faulting (down to the coast listric normal faulting) parallel to the coast, and that faulting has progressed upward as deposition continued—that is, growth faulting [14,87–89]. The sedimentary section developed so rapidly that there was little time for consolidation, cementation, or in many cases, normal pressure equilibration. At the same time, these faults and related rollover anticlines on their downthrown side, formed hydrocarbon traps, the basis for many of the present-day O&G fields on the delta (Figure 13). To add complexity, the low density, easily deformed Louann salt layer that began near the base of the geologic section flowed upward in various geometries, creating salt domes dragging up steeply tilted beds, faults, and anticlinal features that became hydrocarbon traps as well. Growth faults in the delta move episodically over their lifetime, and along segments a few kilometers in length (e.g., [90]). Over the cycle of MRD petroleum development, a number of these growth faults related to oil and gas fields have been reactivated, with consequent displacement and surface subsidence on the fault downthrown side. The mechanism of reactivation along these growth faults is expedited by a poroelastic reduction of horizontal confining stress, which occurs as a result of the fluid withdrawal and consequent pore pressure decrease [91,92]. That is, faults related to MRD O&G fields that break the surface today are mostly
Figure 12. Map showing average subsidence rates between 1965 and 1993 in south Louisiana. Areas ofhighest subsidence rates (>12 mm/year; hatched pattern) correlate closely with locations of oil and gasfields. Lowest average subsidence rates are located between major producing fields [30].
Elevation change related to faulting in the MRD is often marked by an arcuate scarp separatingmarsh and water [85], while subsidence related to a reservoir’s compaction is spread over and beyondthe production area (up to kilometers away from the producing wells) [20]. Subsidence involved withO&G fields typically begins around the time of peak production [84], and continues for an extendedtime as the field is depleted, often decades after peak production [29,79,86], though it too reaches anultimate limit [79,84].

Water 2020, 12, 1492 12 of 29
The Mississippi Delta is particularly susceptible to subsidence and faulting since rapid depositionof sands and clays has created a weak, metastable situation that responded from early in its geologichistory with “landslide-like” faulting (down to the coast listric normal faulting) parallel to the coast,and that faulting has progressed upward as deposition continued—that is, growth faulting [14,87–89].The sedimentary section developed so rapidly that there was little time for consolidation, cementation,or in many cases, normal pressure equilibration. At the same time, these faults and related rolloveranticlines on their downthrown side, formed hydrocarbon traps, the basis for many of the present-dayO&G fields on the delta (Figure 13). To add complexity, the low density, easily deformed Louann saltlayer that began near the base of the geologic section flowed upward in various geometries, creatingsalt domes dragging up steeply tilted beds, faults, and anticlinal features that became hydrocarbontraps as well. Growth faults in the delta move episodically over their lifetime, and along segmentsa few kilometers in length (e.g., [90]). Over the cycle of MRD petroleum development, a number ofthese growth faults related to oil and gas fields have been reactivated, with consequent displacementand surface subsidence on the fault downthrown side. The mechanism of reactivation along thesegrowth faults is expedited by a poroelastic reduction of horizontal confining stress, which occurs as aresult of the fluid withdrawal and consequent pore pressure decrease [91,92]. That is, faults related toMRD O&G fields that break the surface today are mostly reactivated growth faults involved with thereservoirs below—reservoirs that these faults created in the first place.
Water 2020, 12, x FOR PEER REVIEW 13 of 30
reactivated growth faults involved with the reservoirs below—reservoirs that these faults created in the first place.
Figure 13. Typical Mississippi River Delta oil and gas reservoir, a rollover anticline on the downthrown side of a down-to-the-coast normal fault. Oil, gas, and water production affects the subsurface in and around the producing reservoir. The depletion process leads to production induced fault activation, reservoir compaction with additional compaction of bounding shales as shown in the subsurface. The surface manifestation of these subsurface changes is shown as a composite of land loss on the downthrown side the activated fault plus subsidence over the compacted oil, gas, and water producing reservoir.
The mechanism of O&G subsidence is involved with the collapse of the reservoir itself. Subsidence happens when production of oil, gas, and water (and sometimes sand) reduces reservoir sand pore pressure to the point where it can no longer support the overburden [93]. Thus, the delta’s young, often poorly consolidated reservoir sands, sandwiched between shales, often undergo compaction with production drainage and this deformation is transferred to the surface as a subsidence bowl form. The authors of [94] modeled this reservoir compaction and surface deformation process using the concept of a nucleus-of-strain (the impacted reservoir), together with an elastically deforming half-space (the geologic section above), spreading the effect and reducing the displacement to produce a halo-like effect in and around the O&G field. In [79] the authors used this concept along with 1982–1993 epoch releveling at the Leeville, Golden Meadow, Cut Off, and Valentine fields and the authors of [95] modeled the Lapeyrouse field (Figure 12). At Lapeyrouse, modeling matched the measured releveling when a reactivated down-to-the-coast growth fault was added to the deformation of the compacted disc reservoir sand. This reservoir compaction subsidence process is found in fields along the Louisiana coast and often acts in concert with O&G field related faulting.
In [29] the authors considered the extended timeframe of subsidence where displacement related to depleted O&G fields did not stop as the production cycle ended, but accelerated significantly for decades. As shown in Figure 14, this study indicates (a) greater subsidence over traversed O&G fields
Figure 13. Typical Mississippi River Delta oil and gas reservoir, a rollover anticline on the downthrownside of a down-to-the-coast normal fault. Oil, gas, and water production affects the subsurfacein and around the producing reservoir. The depletion process leads to production induced faultactivation, reservoir compaction with additional compaction of bounding shales as shown in thesubsurface. The surface manifestation of these subsurface changes is shown as a composite of land losson the downthrown side the activated fault plus subsidence over the compacted oil, gas, and waterproducing reservoir.
The mechanism of O&G subsidence is involved with the collapse of the reservoir itself. Subsidencehappens when production of oil, gas, and water (and sometimes sand) reduces reservoir sand porepressure to the point where it can no longer support the overburden [93]. Thus, the delta’s young,often poorly consolidated reservoir sands, sandwiched between shales, often undergo compaction

Water 2020, 12, 1492 13 of 29
with production drainage and this deformation is transferred to the surface as a subsidence bowlform. The authors of [94] modeled this reservoir compaction and surface deformation process usingthe concept of a nucleus-of-strain (the impacted reservoir), together with an elastically deforminghalf-space (the geologic section above), spreading the effect and reducing the displacement to producea halo-like effect in and around the O&G field. In [79] the authors used this concept along with1982–1993 epoch releveling at the Leeville, Golden Meadow, Cut Off, and Valentine fields and theauthors of [95] modeled the Lapeyrouse field (Figure 12). At Lapeyrouse, modeling matched themeasured releveling when a reactivated down-to-the-coast growth fault was added to the deformationof the compacted disc reservoir sand. This reservoir compaction subsidence process is found in fieldsalong the Louisiana coast and often acts in concert with O&G field related faulting.
In [29] the authors considered the extended timeframe of subsidence where displacement relatedto depleted O&G fields did not stop as the production cycle ended, but accelerated significantly fordecades. As shown in Figure 14, this study indicates (a) greater subsidence over traversed O&G fieldsfor each epoch (panels A and B), (b) increased subsidence rates (accelerated subsidence) in the laterepoch (panel C), and (c) areas of greatest subsidence and rates likely related to fault displacement.
Water 2020, 12, x FOR PEER REVIEW 14 of 30
for each epoch (panels A and B), (b) increased subsidence rates (accelerated subsidence) in the later epoch (panel C), and (c) areas of greatest subsidence and rates likely related to fault displacement.
Figure 14. Elevation changes during epoch 1 (1965–1982; A) and epoch 2 (1983–1993; B), and the rates of subsidence in the two epochs (C). Over the entire transect, subsidence rates were greater in epoch 2 than in epoch 1. The yellow squares in (A) and (B) indicate an arbitrarily selected reference station approximately 8 km south and outside of the projected Leeville (see Figure 10) to estimate the magnitudes of local production-related subsidence signals [29].
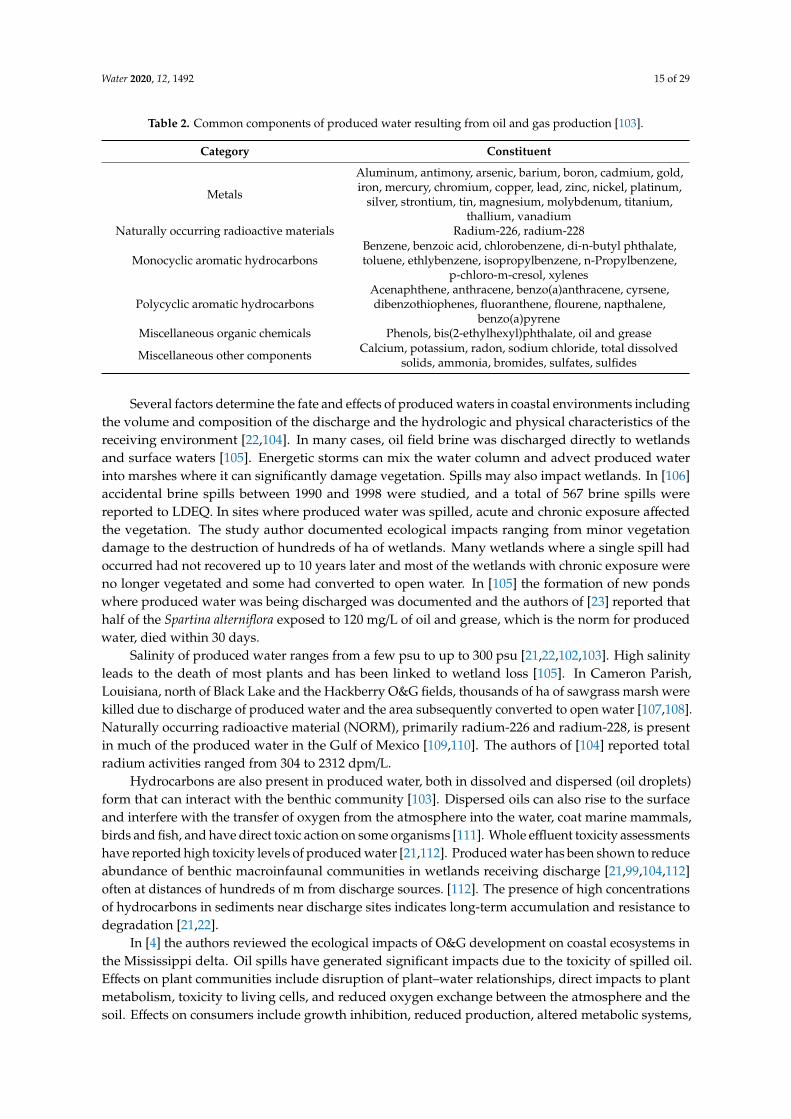
While post production time-dependent subsidence is intuitively expected due to factors such as slow dissipation of pore pressure in the reservoir (e.g., [96]), and time-dependent creep in the reservoir [97], this subsidence typically happens over only a few years, not decades after and not with acceleration. The authors of [29] considered the role of the bounding shale above and below the sand reservoir itself (Figure 15), and modeled compaction in the Valentine field (Figures 12 and 14) in two stages, the first being poroelastic compaction of the reservoir sand during active production, followed by the time-delayed compaction resulting from slow poroelastic and viscoplastic compaction of the low-permeable bounding shale as included pore water slowly drained into the depleted sand.
Figure 14. Elevation changes during epoch 1 (1965–1982; A) and epoch 2 (1983–1993; B), and therates of subsidence in the two epochs (C). Over the entire transect, subsidence rates were greater inepoch 2 than in epoch 1. The yellow squares in (A) and (B) indicate an arbitrarily selected referencestation approximately 8 km south and outside of the projected Leeville (see Figure 10) to estimate themagnitudes of local production-related subsidence signals [29].
Water 2020, 12, 1492 14 of 29
While post production time-dependent subsidence is intuitively expected due to factors suchas slow dissipation of pore pressure in the reservoir (e.g., [96]), and time-dependent creep in thereservoir [97], this subsidence typically happens over only a few years, not decades after and not withacceleration. The authors of [29] considered the role of the bounding shale above and below the sandreservoir itself (Figure 15), and modeled compaction in the Valentine field (Figures 12 and 14) in twostages, the first being poroelastic compaction of the reservoir sand during active production, followedby the time-delayed compaction resulting from slow poroelastic and viscoplastic compaction of thelow-permeable bounding shale as included pore water slowly drained into the depleted sand.Water 2020, 12, x FOR PEER REVIEW 15 of 30
Figure 15. A simple compaction model of sand reservoir embedded with surrounding shale. It is assumed that during production stage, pore pressure depletion in a sand reservoir induces poroelastic compaction, and after depletion, a slow decrease in pore pressure in the bounding shale induces shale compaction in two independent rheological modes (poroelastic and viscoplastic) (modified from [29]).
Compaction that occurs in reservoir-bounding shales is often evidenced by wellbore problems in overburden formations during and after production, such as casing damage and even shear (e.g., [98]). These studies and others matching displacement measurements and mathematical modeling of causality mechanisms, confirm the importance of oil and gas field induced subsidence and faulting. In summary, fault reactivation and reservoir compaction lead to induced subsidence at the surface that reflects both. The interaction of these elevation change mechanisms with oil and gas field development is an important part of land loss in the MRD.
5. Toxic Impacts of Produced Water and Spilled Oil
Produced water from O&G fields is brought to the surface during crude oil and natural gas extraction and, prior to the USEPA banning surface discharge of produced water in 1992, an estimated 2 million barrels per day were discharged into Louisiana coastal wetlands from nearly 700 sites [99]. It is by far the largest volume byproduct or waste stream associated with O&G extraction and is about 10 times more toxic than oil [100]. The fluid generally includes a mixture of either liquid or gaseous hydrocarbons, high salinity water, radioactive materials, dissolved or suspended solids, solids such as sand or silt, and injected fluids and additives associated with exploration, drilling, and production activities (Table 2) [101,102].
Table 2. Common components of produced water resulting from oil and gas production [103].
Category Constituent
Metals Aluminum, antimony, arsenic, barium, boron, cadmium, gold, iron,
mercury, chromium, copper, lead, zinc, nickel, platinum, silver, strontium, tin, magnesium, molybdenum, titanium, thallium, vanadium
Naturally occurring radioactive materials
Radium-226, radium-228
Monocyclic aromatic hydrocarbons
Benzene, benzoic acid, chlorobenzene, di-n-butyl phthalate, toluene, ethlybenzene, isopropylbenzene, n-Propylbenzene, p-chloro-m-cresol,
xylenes Polycyclic aromatic
hydrocarbons Acenaphthene, anthracene, benzo(a)anthracene, cyrsene,
dibenzothiophenes, fluoranthene, flourene, napthalene, benzo(a)pyrene
Figure 15. A simple compaction model of sand reservoir embedded with surrounding shale. It isassumed that during production stage, pore pressure depletion in a sand reservoir induces poroelasticcompaction, and after depletion, a slow decrease in pore pressure in the bounding shale induces shalecompaction in two independent rheological modes (poroelastic and viscoplastic) (modified from [29]).
Compaction that occurs in reservoir-bounding shales is often evidenced by wellbore problems inoverburden formations during and after production, such as casing damage and even shear (e.g., [98]).These studies and others matching displacement measurements and mathematical modeling of causalitymechanisms, confirm the importance of oil and gas field induced subsidence and faulting. In summary,fault reactivation and reservoir compaction lead to induced subsidence at the surface that reflectsboth. The interaction of these elevation change mechanisms with oil and gas field development is animportant part of land loss in the MRD.
5. Toxic Impacts of Produced Water and Spilled Oil
Produced water from O&G fields is brought to the surface during crude oil and natural gasextraction and, prior to the USEPA banning surface discharge of produced water in 1992, an estimated2 million barrels per day were discharged into Louisiana coastal wetlands from nearly 700 sites [99].It is by far the largest volume byproduct or waste stream associated with O&G extraction and is about10 times more toxic than oil [100]. The fluid generally includes a mixture of either liquid or gaseoushydrocarbons, high salinity water, radioactive materials, dissolved or suspended solids, solids such assand or silt, and injected fluids and additives associated with exploration, drilling, and productionactivities (Table 2) [101,102].
Water 2020, 12, 1492 15 of 29
Table 2. Common components of produced water resulting from oil and gas production [103].
Category Constituent
Metals
Aluminum, antimony, arsenic, barium, boron, cadmium, gold,iron, mercury, chromium, copper, lead, zinc, nickel, platinum,
silver, strontium, tin, magnesium, molybdenum, titanium,thallium, vanadium
Naturally occurring radioactive materials Radium-226, radium-228
Monocyclic aromatic hydrocarbonsBenzene, benzoic acid, chlorobenzene, di-n-butyl phthalate,toluene, ethlybenzene, isopropylbenzene, n-Propylbenzene,
p-chloro-m-cresol, xylenes
Polycyclic aromatic hydrocarbonsAcenaphthene, anthracene, benzo(a)anthracene, cyrsene,dibenzothiophenes, fluoranthene, flourene, napthalene,
benzo(a)pyreneMiscellaneous organic chemicals Phenols, bis(2-ethylhexyl)phthalate, oil and grease
Miscellaneous other components Calcium, potassium, radon, sodium chloride, total dissolvedsolids, ammonia, bromides, sulfates, sulfides
Several factors determine the fate and effects of produced waters in coastal environments includingthe volume and composition of the discharge and the hydrologic and physical characteristics of thereceiving environment [22,104]. In many cases, oil field brine was discharged directly to wetlandsand surface waters [105]. Energetic storms can mix the water column and advect produced waterinto marshes where it can significantly damage vegetation. Spills may also impact wetlands. In [106]accidental brine spills between 1990 and 1998 were studied, and a total of 567 brine spills werereported to LDEQ. In sites where produced water was spilled, acute and chronic exposure affectedthe vegetation. The study author documented ecological impacts ranging from minor vegetationdamage to the destruction of hundreds of ha of wetlands. Many wetlands where a single spill hadoccurred had not recovered up to 10 years later and most of the wetlands with chronic exposure wereno longer vegetated and some had converted to open water. In [105] the formation of new pondswhere produced water was being discharged was documented and the authors of [23] reported thathalf of the Spartina alterniflora exposed to 120 mg/L of oil and grease, which is the norm for producedwater, died within 30 days.
Salinity of produced water ranges from a few psu to up to 300 psu [21,22,102,103]. High salinityleads to the death of most plants and has been linked to wetland loss [105]. In Cameron Parish,Louisiana, north of Black Lake and the Hackberry O&G fields, thousands of ha of sawgrass marsh werekilled due to discharge of produced water and the area subsequently converted to open water [107,108].Naturally occurring radioactive material (NORM), primarily radium-226 and radium-228, is presentin much of the produced water in the Gulf of Mexico [109,110]. The authors of [104] reported totalradium activities ranged from 304 to 2312 dpm/L.
Hydrocarbons are also present in produced water, both in dissolved and dispersed (oil droplets)form that can interact with the benthic community [103]. Dispersed oils can also rise to the surfaceand interfere with the transfer of oxygen from the atmosphere into the water, coat marine mammals,birds and fish, and have direct toxic action on some organisms [111]. Whole effluent toxicity assessmentshave reported high toxicity levels of produced water [21,112]. Produced water has been shown to reduceabundance of benthic macroinfaunal communities in wetlands receiving discharge [21,99,104,112]often at distances of hundreds of m from discharge sources. [112]. The presence of high concentrationsof hydrocarbons in sediments near discharge sites indicates long-term accumulation and resistance todegradation [21,22].
In [4] the authors reviewed the ecological impacts of O&G development on coastal ecosystems inthe Mississippi delta. Oil spills have generated significant impacts due to the toxicity of spilled oil.Effects on plant communities include disruption of plant–water relationships, direct impacts to plantmetabolism, toxicity to living cells, and reduced oxygen exchange between the atmosphere and thesoil. Effects on consumers include growth inhibition, reduced production, altered metabolic systems,
Water 2020, 12, 1492 16 of 29
and biomagnification of hydrocarbon compounds. The combination of these factors increases plantstress and plant death.
6. Interactive, Cumulative, and Indirect Impacts of Oil and Gas Impacts
Each of the three types of oil and gas activity (alteration of surface hydrology, induced subsidence,and production of toxic contaminants) causes significant impacts. However, when the effects of allthree activities interact in cumulative and indirect ways, the impacts are much greater.
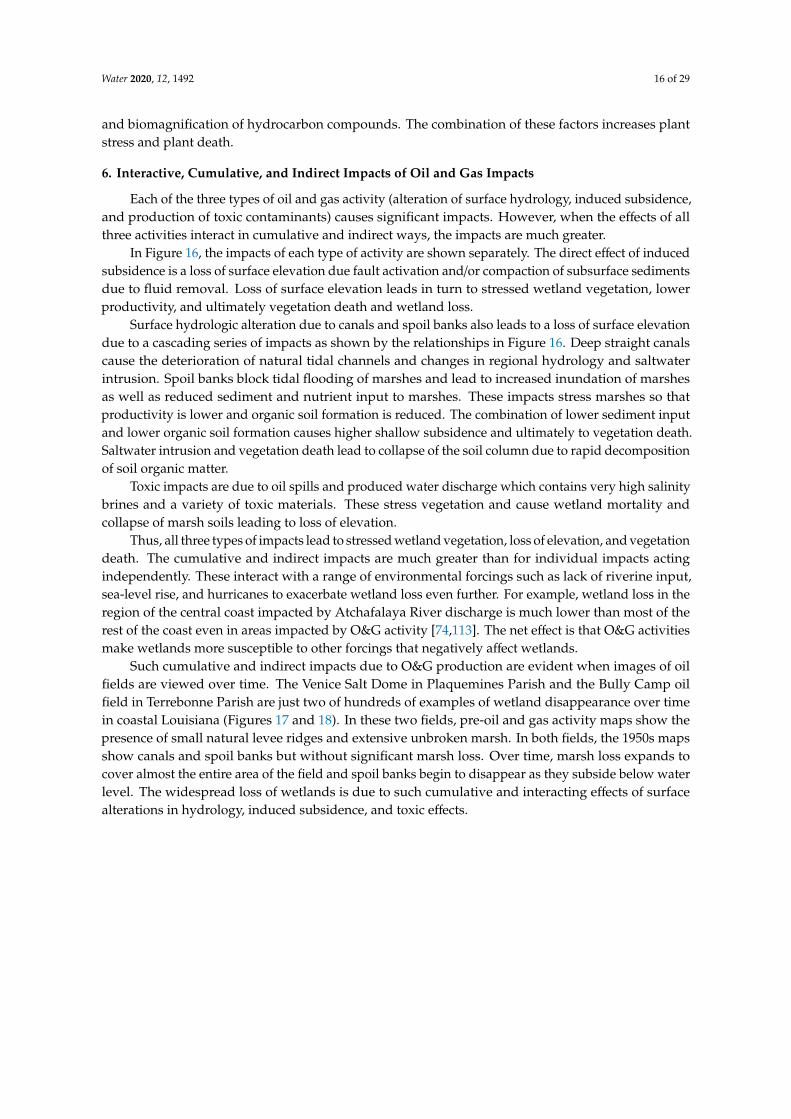
In Figure 16, the impacts of each type of activity are shown separately. The direct effect of inducedsubsidence is a loss of surface elevation due fault activation and/or compaction of subsurface sedimentsdue to fluid removal. Loss of surface elevation leads in turn to stressed wetland vegetation, lowerproductivity, and ultimately vegetation death and wetland loss.
Surface hydrologic alteration due to canals and spoil banks also leads to a loss of surface elevationdue to a cascading series of impacts as shown by the relationships in Figure 16. Deep straight canalscause the deterioration of natural tidal channels and changes in regional hydrology and saltwaterintrusion. Spoil banks block tidal flooding of marshes and lead to increased inundation of marshesas well as reduced sediment and nutrient input to marshes. These impacts stress marshes so thatproductivity is lower and organic soil formation is reduced. The combination of lower sediment inputand lower organic soil formation causes higher shallow subsidence and ultimately to vegetation death.Saltwater intrusion and vegetation death lead to collapse of the soil column due to rapid decompositionof soil organic matter.
Toxic impacts are due to oil spills and produced water discharge which contains very high salinitybrines and a variety of toxic materials. These stress vegetation and cause wetland mortality andcollapse of marsh soils leading to loss of elevation.
Thus, all three types of impacts lead to stressed wetland vegetation, loss of elevation, and vegetationdeath. The cumulative and indirect impacts are much greater than for individual impacts actingindependently. These interact with a range of environmental forcings such as lack of riverine input,sea-level rise, and hurricanes to exacerbate wetland loss even further. For example, wetland loss in theregion of the central coast impacted by Atchafalaya River discharge is much lower than most of therest of the coast even in areas impacted by O&G activity [74,113]. The net effect is that O&G activitiesmake wetlands more susceptible to other forcings that negatively affect wetlands.
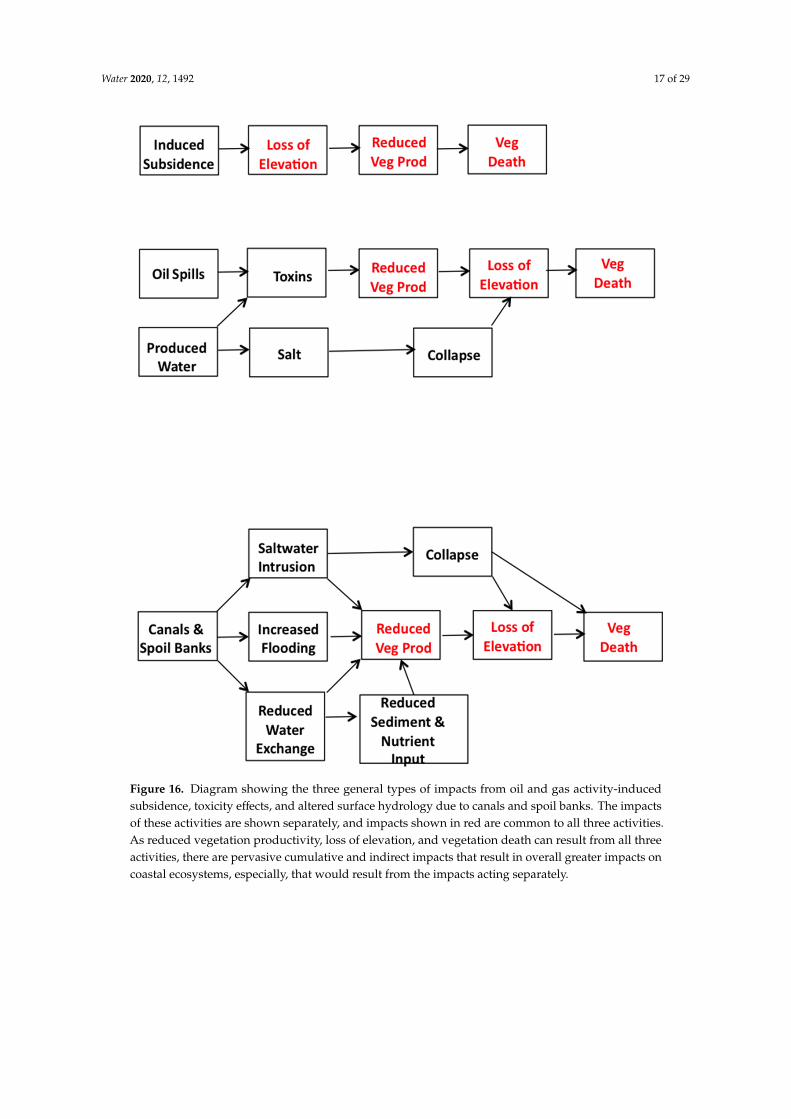
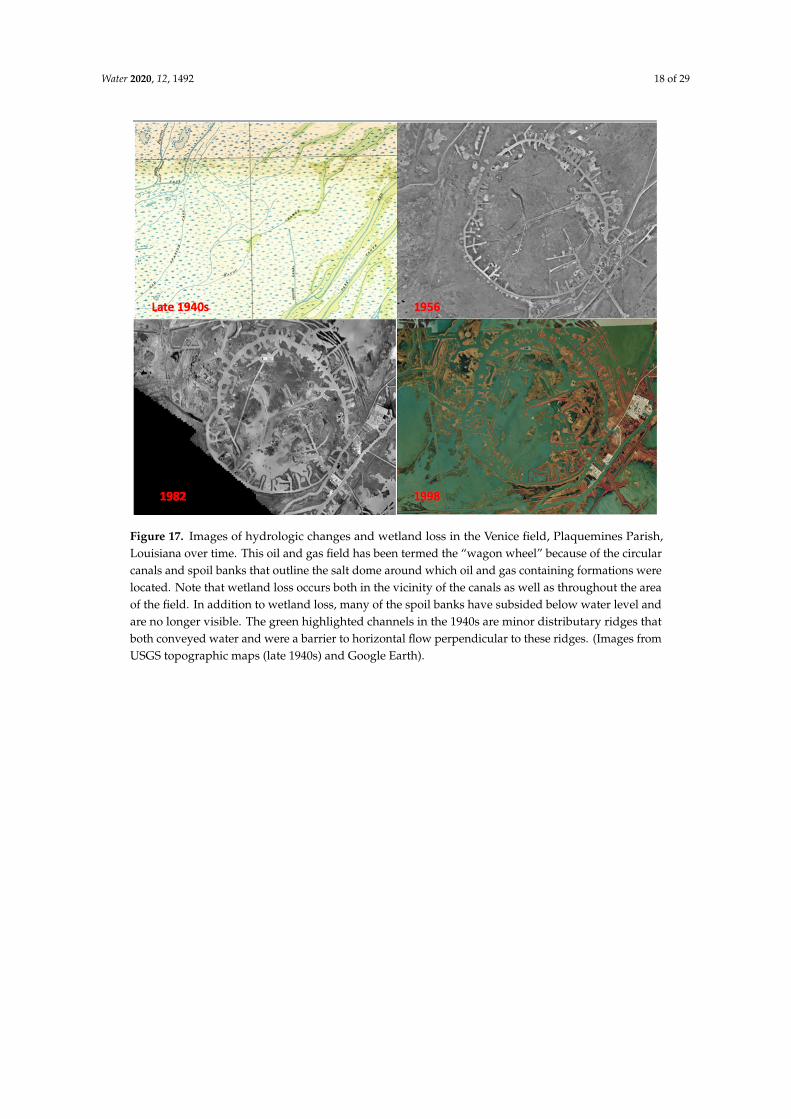
Such cumulative and indirect impacts due to O&G production are evident when images of oilfields are viewed over time. The Venice Salt Dome in Plaquemines Parish and the Bully Camp oilfield in Terrebonne Parish are just two of hundreds of examples of wetland disappearance over timein coastal Louisiana (Figures 17 and 18). In these two fields, pre-oil and gas activity maps show thepresence of small natural levee ridges and extensive unbroken marsh. In both fields, the 1950s mapsshow canals and spoil banks but without significant marsh loss. Over time, marsh loss expands tocover almost the entire area of the field and spoil banks begin to disappear as they subside below waterlevel. The widespread loss of wetlands is due to such cumulative and interacting effects of surfacealterations in hydrology, induced subsidence, and toxic effects.
Water 2020, 12, 1492 17 of 29Water 2020, 12, x FOR PEER REVIEW 18 of 30
Figure 16. Diagram showing the three general types of impacts from oil and gas activity-induced subsidence, toxicity effects, and altered surface hydrology due to canals and spoil banks. The impacts of these activities are shown separately, and impacts shown in red are common to all three activities. As reduced vegetation productivity, loss of elevation, and vegetation death can result from all three activities, there are pervasive cumulative and indirect impacts that result in overall greater impacts on coastal ecosystems, especially, that would result from the impacts acting separately.
Such cumulative and indirect impacts due to O&G production are evident when images of oil fields are viewed over time. The Venice Salt Dome in Plaquemines Parish and the Bully Camp oil field in Terrebonne Parish are just two of hundreds of examples of wetland disappearance over time in coastal Louisiana (Figures 17 and 18). In these two fields, pre-oil and gas activity maps show the presence of small natural levee ridges and extensive unbroken marsh. In both fields, the 1950s maps show canals and spoil banks but without significant marsh loss. Over time, marsh loss expands to cover almost the entire area of the field and spoil banks begin to disappear as they subside below
Figure 16. Diagram showing the three general types of impacts from oil and gas activity-inducedsubsidence, toxicity effects, and altered surface hydrology due to canals and spoil banks. The impactsof these activities are shown separately, and impacts shown in red are common to all three activities.As reduced vegetation productivity, loss of elevation, and vegetation death can result from all threeactivities, there are pervasive cumulative and indirect impacts that result in overall greater impacts oncoastal ecosystems, especially, that would result from the impacts acting separately.
Water 2020, 12, 1492 18 of 29
Water 2020, 12, x FOR PEER REVIEW 19 of 30
water level. The widespread loss of wetlands is due to such cumulative and interacting effects of surface alterations in hydrology, induced subsidence, and toxic effects.
Figure 17. Images of hydrologic changes and wetland loss in the Venice field, Plaquemines Parish, Louisiana over time. This oil and gas field has been termed the “wagon wheel” because of the circular canals and spoil banks that outline the salt dome around which oil and gas containing formations were located. Note that wetland loss occurs both in the vicinity of the canals as well as throughout the area of the field. In addition to wetland loss, many of the spoil banks have subsided below water level and are no longer visible. The green highlighted channels in the 1940s are minor distributary ridges that both conveyed water and were a barrier to horizontal flow perpendicular to these ridges. (Images from USGS topographic maps (late 1940s) and Google Earth).
Figure 17. Images of hydrologic changes and wetland loss in the Venice field, Plaquemines Parish,Louisiana over time. This oil and gas field has been termed the “wagon wheel” because of the circularcanals and spoil banks that outline the salt dome around which oil and gas containing formations werelocated. Note that wetland loss occurs both in the vicinity of the canals as well as throughout the areaof the field. In addition to wetland loss, many of the spoil banks have subsided below water level andare no longer visible. The green highlighted channels in the 1940s are minor distributary ridges thatboth conveyed water and were a barrier to horizontal flow perpendicular to these ridges. (Images fromUSGS topographic maps (late 1940s) and Google Earth).
Water 2020, 12, 1492 19 of 29Water 2020, 12, x FOR PEER REVIEW 20 of 30
Figure 18. Images of the Bully Camp oil and gas field over time. The yellow line denotes an ownership tract in the field and red dots show locations of oil and gas wells. Note that land loss has been pervasive over the general area of the field. The central water body in the 1989 image is over an area of sulfur production on the top of the salt dome underlying this field. The narrow blue lines in the 1935 map are abandoned minor distributary ridges that were breached by canals (images from [76]).
7. Restoration
A well-designed restoration plan should be based on information about the impacts during the life cycle of O&G fields. Restoration of wetlands lost due to O&G activities will involve a synergistic approach that deals with the damage of O&G impacts and rebuilds a functioning coastal wetland system. A central objective in restoration is rebuilding elevation due to both surface subsidence caused by altered hydrology and subsurface induced subsidence. Subsurface induced subsidence cannot be reversed, so sediment must be added at the surface to offset both subsurface and surface subsidence. Options for restoration include (1) marsh creation and restoration using dredged sediments [114–117]; (2) full use of all available sediment resources including Mississippi River, GIWW, and sediments resuspended during storms [118,119]; and (3) hydrologic restoration such as backfilling canals and spoil bank management, and restoration of hydrologic networks [119–123]. Rebuilding natural levee ridges that have been severed by canals can help restore natural hydrology to prevent saltwater intrusion and reduce increased hydrologic energy caused by more direct connections between interior parts of the delta and the Gulf of Mexico.
Elevation can be built up by adding dredged material to shallow water bodies, some that were previously wetlands, to an elevation that will support marsh vegetation [115,124,125]. Restoration of open water and degraded wetland areas to sustainable marsh are of tremendous importance in coastal Louisiana. The 2017 Coastal Master Plan (CMP) for restoration of the Mississippi delta dedicates nearly $18 billion to marsh creation (the largest investment in a single type of restoration
Figure 18. Images of the Bully Camp oil and gas field over time. The yellow line denotes an ownershiptract in the field and red dots show locations of oil and gas wells. Note that land loss has been pervasiveover the general area of the field. The central water body in the 1989 image is over an area of sulfurproduction on the top of the salt dome underlying this field. The narrow blue lines in the 1935 map areabandoned minor distributary ridges that were breached by canals (images from [76]).
7. Restoration
A well-designed restoration plan should be based on information about the impacts during thelife cycle of O&G fields. Restoration of wetlands lost due to O&G activities will involve a synergisticapproach that deals with the damage of O&G impacts and rebuilds a functioning coastal wetlandsystem. A central objective in restoration is rebuilding elevation due to both surface subsidence causedby altered hydrology and subsurface induced subsidence. Subsurface induced subsidence cannot bereversed, so sediment must be added at the surface to offset both subsurface and surface subsidence.Options for restoration include (1) marsh creation and restoration using dredged sediments [114–117];(2) full use of all available sediment resources including Mississippi River, GIWW, and sedimentsresuspended during storms [118,119]; and (3) hydrologic restoration such as backfilling canals and spoilbank management, and restoration of hydrologic networks [119–123]. Rebuilding natural levee ridgesthat have been severed by canals can help restore natural hydrology to prevent saltwater intrusion andreduce increased hydrologic energy caused by more direct connections between interior parts of thedelta and the Gulf of Mexico.
Elevation can be built up by adding dredged material to shallow water bodies, some that werepreviously wetlands, to an elevation that will support marsh vegetation [115,124,125]. Restoration ofopen water and degraded wetland areas to sustainable marsh are of tremendous importance in coastal
Water 2020, 12, 1492 20 of 29
Louisiana. The 2017 Coastal Master Plan (CMP) for restoration of the Mississippi delta dedicatesnearly $18 billion to marsh creation (the largest investment in a single type of restoration project) andmany of those projects include both a short-term and a long-term phase [126]. The short-term phasefocuses on immediate actions needed to protect vulnerable marshes from the proximal causes of loss(saltwater intrusion, erosion, and other consequences of significant hydrologic modifications) using acombination of restoration techniques (especially hydrologic restoration and marsh creation usingdredged sediments). Successful implementation of short-term strategies reduces rates of wetlandsloss and provides the foundation for longer-term strategies. The long-term phase focuses on wetlandsgains through Mississippi River sediment diversions and capture of sediments advected over themarsh surface, with the intent of encouraging development of a sustainable wetland ecosystem(https://www.lacoast.gov/new/about/Basin_data/te/Default.aspx).
Introduction of sediments, through placement of fill material and/or spray dredging, is a necessarycomponent of marsh restoration in degraded O&G fields and sediment can be pumped long distances,as is the case for many 2017 CMP projects [127–132]. Containment dikes are utilized to confineunconsolidated material until it settles and dewaters [120]. Then these dikes can be degraded orgapped to the same elevation as the marsh platform in order to allow water exchange and marshdrainage, to improve productivity and aeration, and increase capture of suspended sediments that areadvected over the marsh surface.
Sediment addition increases marsh surface elevation, thus reducing flood stress to the plantcommunity. The authors of [114] showed that raising the surface of a deteriorating Spartina alterniflorasalt marsh by 10 cm using dredge spoil resulted in a twofold increase in aboveground biomassproduction after the second growing season. In [115] it was found that increased elevation through thedeposition of a 2 cm layer of dredged material in a deteriorated Louisiana marsh increased percentcover of S. alterniflora three-fold within one year. The authors of [125] studied dead marshes nearLeeville that were restored using dredged material and found that sediment-slurry addition increasedthe elevation of the marsh surface and alleviated stress associated with excessive inundation and highsalinity. Primary production was highest at elevations ranging from 29 to 36 cm NAVD 88 (12–20 cmabove ambient marsh), and decreased at elevations above 36 cm NAVD 88, where primary productionwas limited by insufficient flooding and low nutrient availability. Sediment subsidy increases soilmineral matter, soil fertility, and marsh elevation, and thereby reduces nutrient deficiency, flooding, andinterstitial sulfide stresses, generating a more favorable environment for plant growth and potentially,marsh sustainability [116,117].
After containment dikes are gapped, restored marsh will have connectivity with surroundingecosystem and plants will naturally recruit to the area or they can be planted. Although the createdmarsh will be initially higher than surrounding marshes, it will settle and have a higher bulk density.It is likely that these created marshes will have a higher productivity and production of organic matterthan surrounding marshes. The plant species richness should the same as surrounding marshes,which is not very high in brackish and salt marshes of coastal Louisiana compared to fresh marshes.Plant diversity and soil organic matter content are higher in brackish marsh than in salt marsh. Brackishmarsh is typically dominated by Spartina patens (marshhay cordgrass). Other significant associatedspecies include Distichlis spicata (salt grass), Schoenoplectus olneyi (three-cornered grass), S. robustus(salt marsh bulrush), Eleocharis parvula (dwarf spikesedge), Ruppia maritima (widgeon grass), Paspalumvaginatum (seashore paspalum), Juncus roemerianus (black rush), Bacopa monnieri (coastal water hyssop),S. alterniflora (smooth cordgrass), and S. cynosuroides (big cordgrass) [130]. Salt marsh has the leastplant diversity of any marsh type. The community is often totally dominated by smooth cordgrass.Significant associate species includes marshhay cordgrass, salt grass, black rush, and Batis maritima(salt wort).
A tidal network needs to develop in the restored marsh. All restoration plans need a componentthat focuses on natural hydrological functioning. A large-scale restoration project on Delaware Bayindicated that if a few primary channels were dredged, the system would naturally then develop a full
Water 2020, 12, 1492 21 of 29
tidal channel network [130,131]. The project involved restoration of tidal flooding by breeching dikesaround formerly diked salt-hay farm and re-excavation of tidal creeks. Hydrologic design occurred ina “self-design” fashion after only initial cuts by construction of the largest (class 1) channels.
Spoil bank and canal management should be part of a restoration plan. Some canals should bebackfilled as much as possible by pushing spoil banks back into canals. As spoil banks have settledand organic matter has decomposed, canals cannot be fully filled in using material from spoil banks.Thus, dredged material will have to be used to fully fill canals. In some cases, spoil banks should beleft in place to protect remaining marshes from wave attack (see Figure 13).
After the marsh is restored and natural hydrology has been re-established, full use of all availablesediments should be incorporated into the restoration design. Important sources of sediments includeMississippi/Atchafalaya Rivers as well as smaller rivers, sediment diversions, the Gulf IntracoastalWaterway, and sediments resuspended by storms [118]. Water sources with appreciable levels ofnutrients should be used where possible to enhance marsh production including upland runoff,agricultural drainage, and treated municipal effluent [133,134].
When planning restoration priorities, consideration should be given to the more stable underlyinggeologic framework choices, and avoidance of those areas still in the actively degrading part of thecycle. Examples include marsh construction on the more stable upthrown side of a fault, rather thanthe subsidence compaction and fault affected O&G field on the downthrown side. The authors of [14]discussed the role of faulting in wetland loss in the Mississippi delta. In [135] the authors pointed tofailed restoration projects where faulting has not been considered. Thus, taking into considerationunderlying geology can lead to more successful and sustainable restoration.
Decontamination of restored sites is an integral part of restoration. In many cases, toxins canbe buried in place but in some instances the contaminants have to be removed [4]. In addition toenvironmental impacts associated with land loss from O&G production operations, there often isenvironmental damage to soil and groundwater contamination that may have occurred from thesesame types of O&G operations. These damages include contamination to soils, groundwater, and insome cases underground sources of drinking water. These types of damages require extensive testingand the restoration includes soil treatment or removal and the cleanup of contaminated freshwaterzones. Dealing with contamination can involve removal of the surface waste, excavation of ‘hotspots’ of concentrated pollution (chemicals of concern, COC) followed by treatment and disposal,and pumping and treatment of contaminated groundwater followed by treatment or subsurfaceinjection. The goal of the remediation effort is to return the soil and groundwater to agreed-uponstandards such as background soil standards contained in the La. DNR/OC regulations known as29B (the section of the rules) and the La. DEQ RECAP (Risk Evaluation/Corrective Action Program)for both soil and groundwater. A mix of the standards is sometimes used. The term ‘agreed upon’is used because cleanup is usually done in the context of a legal action with the involvement ofthe landowner-plaintiff, the oil companies(s), DNR, DEQ, and the Court. The DNR 29B (Title 43,Part XIX, statewide order 29B) standards were/are heavily influenced by the oil and gas explorationand production industry (E&P) while the DEQ RECAP standards are based on risk science (LAC 33,2003; https://www.deq.louisiana.gov/assets/docs/Land/RECAP/RECAPfinal.pdf). RECAP providesnumerical screening standards for many chemicals in soil and groundwater and three managementoptions. In many cases, addressing land loss and environmental cleanup must be done at the sametime to fully restore the land.
In planning for restoration of degraded wetlands in O&G fields, there should be coordinationwith other projects. For example, beneficial use of dredged sediments, where available, can be usedto raise elevation. There are numerous wetland restoration projects taking place in the MississippiDelta. These include marsh creation, river diversions, hydrologic restoration, barrier island restoration,rebuilding of distributary ridges, and shoreline protection [126,136]. Restoration of the impacts of O&Gactivities involves to a lessor or greater degree all of these activities. For example, where sedimentdiversions are planned in the vicinity of an O&G field that is being restored, maximum use of diverted
Water 2020, 12, 1492 22 of 29
sediments should be a goal of the project. As noted above, beneficial use of sediments dredged for otheractivities such as navigation canal maintenance should be considered for marsh creation in restoringwetlands degraded by O&G activities. Hydrologic restoration and natural levee restoration in thevicinity of a restoration project in an O&G field should be done in a way that compliments the largerefforts. In this way, the restoration of and O&G field can be done to increase benefits over a larger area.
8. Summary and Conclusions
Oil and gas activity has been pervasive in the Mississippi delta and both production andenvironmental impacts follow a predictable life cycle. There are hundreds of O&G fields in coastalLouisiana, as well as a dense network of canals associated with drilling access, navigation, and pipelines.The production history for individual fields can last 40–60 years with production rising rapidly to apeak around 1970 and then declining. Since most drilling started in the 1940s and 1950s, most wellsare no longer producing or are in the final stages of production and this cycle conclusion holds true foraggregate MRD production. Most fields had very low levels of production by the 2000s. Producedwater generally lagged O&G production and was generally higher during declining O&G production.
Oil and gas activities have contributed in three major ways to environmental impacts on coastalecosystems and specifically to wetland loss. These include alteration of surface hydrology due to canaldredging and spoil placement, induced subsidence and fault re-activation due to fluids withdrawal,and toxic stress due to pollution by spilled oil and produced water. Wetland loss due to O&G gasactivity is initially due mainly to direct impacts of canal dredging and spoil placement, but grows overtime due to cumulative and interactive effects. This wetland loss then grows over time to encompassmuch of the field and adjacent areas. Networks of interconnected canals form new patterns of waterflow and often lead to saltwater intrusion. Interestingly, spoil banks are not necessarily a permanentlandscape feature and have a life cycle of their own. They subside and compact over time and a quarterto a third of spoil banks likely have no subaerial expression.
Fluid withdrawal from O&G formations leads to induced subsidence and fault activation [91].Induced subsidence occurs in two phases. Withdrawal of O&G and produced water induce reservoircompaction resulting in a reduction of reservoir thickness. A slow drainage of pore pressure in thebounding shale mainly due to water pumping induces time-delayed shale compaction and subsidencecan continue for decades after most O&G has been produced. This results in subsidence over much ofthe oil fields that can be greater than surface subsidence due to altered hydrology.
Produced water from O&G fields is water brought to the surface during O&G extraction andgenerally includes a mixture of either liquid or gaseous hydrocarbons, high salinity produced water,dissolved or suspended solids, produced solids such as sand or silt, and injected fluids and additivesassociated with exploration and production activities. Produced water has been shown to be toxic tomany estuarine organisms including vegetation and consumers. Spilled oil has been shown to havelethal and sub-lethal effects of a wide range of estuarine organisms. The three main types of impact ofO&G activities act in cumulative, synergistic, and indirect ways that lead to greater overall impact.Restoration of wetlands lost due to O&G activities will involve a synergistic approach that deals withthe damage of O&G impacts and rebuilds a functioning coastal wetland system.
Restoration should be the final stage in the life cycle of O&G fields. A central objective ofrestoration is restoring lost elevation. Options for restoration include marsh creation and restorationusing dredged sediments, full use of all available sediment resources, and hydrologic restoration.Decontamination of restored sites is an integral part of restoration.
Author Contributions: All authors contributed to the writing of this review manuscript. All authors have readand agreed to the published version of the manuscript.
Funding: This research did not receive any specific grant from funding agencies in the public, commercial, ornot-for-profit sectors.
Water 2020, 12, 1492 23 of 29
Conflicts of Interest: J.W.D., H.C.C., R.G.H., and C.R.N. state that they are engaged as experts in lawsuitsregarding the environmental impacts of oil and gas activity on coastal ecosystems. No funding from these activitieswas used for the preparation of this paper.
References
1. Theriot, J.P. Oilfield battleground: Louisiana’s legacy lawsuits in historical perspective. La. Hist. J. La. Hist.Assoc. 2016, 57, 403–462.
2. Bass, A.S.; Turner, R.E. Relationships between salt marsh loss and dredged canals in three Louisiana estuaries.J. Coast. Res. 1997, 13, 895–903.
3. Cahoon, D.; Turner, R.E. Accretion and canal impacts in a rapidly subsiding wetland II. Feldspar markerhorizon technique. Estuaries 1989, 12, 260–268. [CrossRef]
4. Ko, J.Y.; Day, J.W. A review of ecological impacts of oil and gas development on coastal ecosystems in theMississippi Delta. Ocean Coast. Manag. 2004, 47, 597–623. [CrossRef]
5. Day, J.; Shaffer, G.; Cahoon, D.; DeLaune, R. Canals, backfilling and wetland loss in the Mississippi Delta.Estuar. Coast. Shelf Sci. 2019. [CrossRef]
6. Gould, H.R.; McFarlan, E., Jr. Geologic history of the Chenier Plain, southwestern Louisiana.Trans. Gulf Coast Assoc. Geol. Soc. 1959, 9, 261–270.
7. Penland, S.; Sutor, J.R. The geomorphology of the Mississippi River chenier plain. Mar. Geol. 1989, 90,231–240. [CrossRef]
8. Roberts, H.H. Dynamic changes of the holocene Mississippi river delta plain: The delta cycle. J. Coast. Res.1997, 13, 605–627.
9. Day, J.W., Jr.; Britsch, L.D.; Hawes, S.R.; Shaffer, G.P.; Reed, D.J.; Cahoon, D. Pattern and process of landloss in the Mississippi Delta: A spatial and temporal analysis of wetland habitat change. Estuaries 2000, 23,425–438. [CrossRef]
10. Blum, M.D.; Roberts, H.H. The Mississippi delta region: Past, present, and future. Annu. Rev. Earth Planet.Sci. 2012, 40, 655–683. [CrossRef]
11. Williams, S.J.; Penland, S.; Roberts, H.H. Processes affecting coastal wetland loss in the Louisiana deltaicplain. In Processes of Coastal Wetlands Loss in Louisiana; Presented at Coastal Zone ’93; USGS Open-File Report94-0275; Williams, S.J., Cichon, H.A., Eds.; USGS: New Orleans, LA, USA, 1994; pp. 21–29.
12. Kulp, M.A. Holocene Stratigraphy, History, and Subsidence: Mississippi River Delta Region, North-CentralGulf of Mexico. Ph.D. Thesis, University of Kentucky, Lexington, KY, USA, 2000; p. 336.
13. Reed, D.J. Sea-level rise and coastal marsh sustainability: Geological and ecological factors in the Mississippidelta plain. Geomorphology 2002, 48, 233–243. [CrossRef]
14. Gagliano, S.M.; Kemp, E.B.; Wicker, K.M.; Wiltenmuth, K.S. Active Geological Faults and Land Change inSoutheastern Louisiana, Final Report; Contract No. DACW 29-00-C-0034; Coastal Environments, Inc., UnitedStates Army Corps of Engineers: New Orleans, LA, USA, 2003; p. 177.
15. Reed, D.J.; Wilson, L. Coast 2050: A new approach to restoration of Louisiana coastal wetlands. Phys. Geogr.2004, 25, 4–21. [CrossRef]
16. Turner, R.E.; Cahoon, D.R. (Eds.) Causes of Wetland Loss in the Coastal Central Gulf of Mexico, Volume II: TechnicalNarrative; Contract No. 14-12-0001-30252. OCS Study/MMS 87-0120; Prepared for Minerals ManagementService: New Orleans, LA, USA, 1987; p. 400.
17. USACE (U.S. Dept of the Army Corps of Engineers). Louisiana Coastal Area (LCA), Louisiana EcosystemRestoration Study, Final Volume 1—LCA Study, Main Report. 2004. Available online: http://www.lca.gov/
final_report.aspx (accessed on 20 January 2020).18. Turner, R.E.; McClenachan, G. Reversing wetland death from 35,000 cuts: Opportunities to restore Louisiana’s
dredged canals. PLoS ONE 2018, 13, e0207717. [CrossRef] [PubMed]19. Olea, R.A.; Coleman, J.L., Jr. A synoptic examination of causes of land loss in Southern Louisiana as related
to the exploitation of subsurface geologic rsources. J. Coast. Res. 2014, 30, 1025–1044. [CrossRef]20. Morton, R.A.; Bernier, J.C.; Barras, J.A. Evidence of regional subsidence and associated interior wetland loss
induced by hydrocarbon production, Gulf Coast region, USA. Environ. Geol. 2006, 50, 261–274. [CrossRef]
Water 2020, 12, 1492 24 of 29
21. Pe, K.M. An Assessment of Produced Water Impacts to Low-Energy Brackish Water Systems in Southeast Louisiana;Louisiana Department of Environmentally Quality, Water Pollution Control Division: Baton Rouge, LA,USA, 1990; p. 204.
22. Rabalais, N.N.; McKee, B.A.; Reed, D.J.; Means, J.C. Fate and effects of produced water discharges in coastalLouisiana, Gulf of Mexico, USA. In Produced Water; Springer: Boston, MA, USA, 1992; pp. 355–369.
23. Neto, A.G.; Costa, C.S.B. Survival and growth of the dominant salt marsh grass Spartina alterniflora in an oilindustry saline wastewater. Int. J. Phytoremediation 2009, 11, 640–650. [CrossRef]
24. Penland, S.; Wayne, L.; Britsch, L.D.; Williams, S.J.; Beall, A.D.; Butterworth, V.C. Geomorphic classification ofcoastal land loss between 1932 and 1990 in the Mississippi River delta plain, southeastern Louisiana; U.S. GeologicalSurvey Open-File Report 00-417, 1 sheet; USGS: New Orleans, LA, USA, 2000.
25. Penland, S.; Wayne, L.; Britsch, L.D.; Williams, S.J.; Beall, A.D.; Butterworth, V.C. Process classification of coastalland loss between 1932 and 1990 in the Mississippi River delta plain, southeastern Louisiana; U.S. Geological SurveyOpen-File Report 00-418, 1 sheet; USGS: New Orleans, LA, USA, 2000.
26. Turner, R.E. Relationship between Canal and Levee Density and Coastal Land Loss in Louisiana; US Fish WildlifeService Biological Report 85(14); Department of Interior: Washington, DC, USA, 1987; p. 58.
27. Turner, R.E. Wetland loss in the Northern Gulf of Mexico: Multiple working hypotheses.Coast. Estuar. Res. Fed. 1997, 20, 1–13. [CrossRef]
28. Chan, A.W.; Zoback, M.D. The role of hydrocarbon production on land subsidence and fault reactivation inthe Louisiana coastal zone. J. Coast. Res. 2007, 23, 771–786. [CrossRef]
29. Chang, C.; Mallman, E.; Zoback, M. Time-dependent subsidence associated with drainage-inducedcompaction in Gulf of Mexico shales bounding a severely depleted gas reservoir. AAPG Bull. 2014,98, 1145–1159. [CrossRef]
30. Morton, R.A.; Bernier, J.C.; Barras, J.A.; Ferina, N.F. Rapid subsidence and historical wetland loss in thesouth-central Mississippi delta plain: Likely causes and future implications. U.S. Geological Survey Open-fileReport 2005–1216; 2005. Available online: http://www.pubs.usgs.gov/of/2005/1216 (accessed on 6 June 2019).
31. IHS Energy Group. PI/Dwights Plus U.S. Production Data on CD: Available from IHS Energy Group, 15 InvernessWay East, D205; IHS Energy Group: Englewood, CO, USA, 2003.
32. Britsch, L.D.; Dunbar, J.B. Land loss rates: Louisiana coastal plain. J. Coast. Res. 1993, 9, 324–338.33. Couvillion, B.; Barras, J.; Steyer, G.; Sleavin, W.; Fishcher, M.; H, B.; Trahan, N.; Griffin, B.; Heckman, D.
Land area change in coastal Louisiana from 1932 to 2010; Scientific Investigations Map 3164, scale 1, 265,000;U.S. Geological Survey: New Orleans, LA, USA, 2011; 12p. Available online: https://pubs.usgs.gov/sim/3381/
sim3381.pdf (accessed on 23 July 2016).34. Couvillion, B.R.; Beck, H.; Schoolmaster, D.; Fischer, M. Land Area Change in Coastal Louisiana 1932 to 2016;
Scientific Investigations Map 3381; U.S. Geological Survey: New Orleans, LA, USA, 2017; 16p.35. Gagliano, S.M.; van Beek, J.L. Geologic and geomorphic aspects of deltaic processes, Mississippi delta system.
In Hydrologic and Geologic Studies of Coastal Louisiana; Gagliano, S.M., Muller, R., Light, P., Al-Awady, M., Eds.;La State Univ, Coastal Studies Institute and Dept of Marine Sciences: Baton Rouge, LA, USA, 1970; Volume I,p. 140.
36. Gagliano, S.M. Canals, dredging and land reclamation in the Louisiana coastal zone. In Hydrologic andGeologic Studies of Coastal Louisiana; Report no. 14; Center for Wetland Resources, Louisiana State University:Baton Rouge, LA, USA, 1973; p. 104.
37. Craig, N.J.; Turner, R.E.; Day, J.W., Jr. Land loss in coastal Louisiana (U.S.A.). Environ. Manag. 1979, 3,133–144. [CrossRef]
38. Turner, R.E.; Costanza, R.; Scaife, W. Canals and land loss in coastal Louisiana. In Proceedings of the Conferenceon Coastal Erosion and Wetland Modification in Louisiana: Causes, consequences, and options, Baton Rouge, LA,USA, 5–7 October 1981, pp. 73–84; Boesch, D.F., Ed.; National Coastal Ecosystems Team, Office of BiologicalServices, Fish and Wildlife Service, US Department of the Interior, Washington, DC, USA, 1982; p. 256.
39. Scaife, W.W.; Turner, R.E.; Costanza, R. Coastal Louisiana recent land loss and canal impacts. Environ. Manag.1983, 7, 433–442. [CrossRef]
40. Deegan, L.A.; Kennedy, H.M.; Neill, C. Natural factors and human modifications contributing to marsh lossin Louisiana’s Mississippi River deltaic plain. Environ. Manag. 1984, 8, 519–528. [CrossRef]
41. Turner, R.E. Landscape development and coastal wetland losses in the Northern Gulf of Mexico. Am. Zool.1990, 30, 89–105. [CrossRef]
Water 2020, 12, 1492 25 of 29
42. Baumann, R.H.; Turner, R.E. Direct impacts of outer continental shelf activities on wetland loss in the centralGulf of Mexico. Environ. Geol. Wat. Sci. 1990, 15, 189–198. [CrossRef]
43. Boesch, D.F.; Josselyn, M.N.; Mehta, A.J.; Morris, J.T.; Nuttle, W.K.; Simenstad, C.A.; Swift, D.J.P. Scientificassessment of coastal wetland loss, restoration and management. J. Coast. Res. Special Issue No. 1994, 20,1–103.
44. Barras, J.A. 2006, Land area change in coastal Louisiana after the 2005 hurricanes—A series of three maps:U.S. Geological Survey Open-File Report 2006–1274. Available online: http://pubs.usgs.gov/of/2006/1274/
(accessed on 19 October 2018).45. Doiron, L.N.; Whitehurst, C.A. Geomorphic Processes Active in the Southeast Louisiana Canal; Research
Monographs, Division of Engineering Research–RM 5: LaFourche Parish, LA, USA, 1974; p. 48.46. Davis, D.W. Louisiana canals and their influence on wetland development. Ph.D. Thesis, Louisiana State
University, Baton Rouge, LA, USA, 1973; p. 234.47. Gagliano, S.M.; Wicker, K.M. Processes of wetland erosion in the Mississippi River Deltaic Plain, p. 28–48.
In Marsh Management in Coastal Louisiana: Effects and Issues—Proceedings of a Symposium; United States Fishand Wildlife Service Biological Report; Duffy, W.G., Clark, D., Eds.; United States Fish and Wildlife Serviceand Louisiana Department of Natural Resources: Washington, DC, USA, 1989.
48. Reed, D.J. Status and Historical Trends of Hydrologic Modification, Reduction in Sediment Availability, and HabitatLoss/Modification in the Barataria and Terrebonne Estuarine System; BTNEP Publ. No. 20; Barataria-TerrebonneNational Estuary Program: Thibodaux, LA, USA, 1995; p. 338.
49. Day, J.; Rybczyk, J.; Scarton, F.; Rismondo, A.; Are, D.; Cecconi, G. Soil accretionary dynamics, sea-level riseand the survival of wetlands in Venice Lagoon: A field and modeling approach. Estuar. Coast. Shelf Sci. 1999,49, 607–628. [CrossRef]
50. Johnston, J.B.; Cahoon, D.R.; la Peyre, M.K. Outer Continental Shelf (OCS)-Relatedpipelines and Navigation Canalsin the Western and Central Gulf of Mexico: Relative Impacts on Wetland Habitats and Effectiveness of Mitigation;OCS Study MMS 2009-048; U.S. Dept. of the Interior, Minerals Management Service, Gulf of Mexico OCSRegion: New Orleans, LA, USA, 2009; p. 200.
51. Swenson, E.M. Marsh Hydrological Studies, 1982–1983 Data Report; Prepared for the National Marine FisheriesService, Southeast Region, St. Petersburg, Florida. Contract no. NA81-BA-P00006. Publication no.LSU-CEFI-83-18; Coastal Ecology Institute, Center for Wetland Resources, Louisiana State University: BatonRouge, LA, USA, 1983.
52. Swenson, E.M.; Turner, R.E. Spoil banks: Effects on a coastal marsh water-level regime. Estuar. Coast. ShelfSci. 1987, 24, 599–609. [CrossRef]
53. Mendelssohn, I.A.; McKee, K.L. Spartina alterniflora die-back in Louisiana: Time-course investigation of soilwaterlogging effects. J. Ecol. 1988, 76, 509–521. [CrossRef]
54. Day, R.; Holz, R.; Day, J. An inventory of wetland impoundments in the coastal zone of Louisiana, USA:Historical trends. Environ. Manag. 1990, 14, 229–240. [CrossRef]
55. Taylor, N.C.; Day, J.W.; Neusaenger, G.E. Ecological characterization of Jean Lafitte National HistoricalPark, Louisiana: Basis for a management plan. In Marsh Management in Coastal Louisiana: Effects andIssues—Proceedings of a Symposium; Baton Rouge, LA, USA, 7–10 June 1988; Duffy, W.G., Clark, D., Eds.;United States Fish and Wildlife Service and Louisiana Department of Natural Resources: Washington, DC,USA, 1989.
56. Cahoon, D.R.; Groat, C.G. A Study of Marsh Management Practice in Coastal Louisiana; Executive Summary;U.S. Dept. of the Interior, Minerals Management Service, Gulf of Mexico OCS Region: New Orleans, LA,USA, 1990; Volume 1, p. 36.
57. Reed, D.J. Effect of weirs on sediment deposition in Louisiana coastal marshes. Environ. Manag. 1992, 16,55–65. [CrossRef]
58. Reed, D.J.; Cahoon, D.R. The relationship between marsh surface topography and vegetation parameters ina deteriorating Louisiana Spartina alterniflora salt marsh. J. Coast. Res. 1992, 8, 77–87.
59. Rogers, D.R.; Rogers, B.D.; Herke, W.H. Effects of a marsh management plan on fishery communities incoastal Louisiana. Wetlands 1992, 12, 53–62. [CrossRef]
60. Boumans, R.M.; Day, J.W. Effects of two Louisiana marsh management plans on water and materials fluxand short-term sedimentation. Wetlands 1994, 14, 247–261. [CrossRef]
Water 2020, 12, 1492 26 of 29
61. Cahoon, D.R. Recent accretion in two managed marsh impoundments in coastal Louisiana. Ecol. Appl. 1994,4, 166–176. [CrossRef]
62. Asano, T. Sediment transport under sheet-flow conditions. J. Waterw. Port Coast. Ocean Eng. ASCE 1995, 121,239–246. [CrossRef]
63. Gascuel-Odux, C.; Cros-Cayot, S.; Durand, P. Spatial variations of sheet flow and sediment transport on anagricultural field. Earth Surf. Process. Landf. 1996, 21, 843–851. [CrossRef]
64. Neill, C.; Turner, R.E. Backfilling canals to mitigate wetland dredging in Louisiana coastal marshes. Environ.Manag. 1987, 11, 823–836. [CrossRef]
65. Taylor, N.C. Ecological characterization of Jean Lafitte National Historical Park. Louisiana: Basis for amanagement plan. Master’s Thesis, Louisiana State University, Baton Rouge, LA, USA, 1988.
66. Reed, D.J.; de Luca, N.; Foote, A.L. Effect of hydrologic management on marsh surface sediment depositionin coastal Louisiana. Estuaries 1997, 20, 301–311. [CrossRef]
67. Jarvis, J.C. Vertical Accretion Rates in Coastal Louisiana: A Review of the Scientific Literature; ERDC/EL TN-10-5;U.S. Army Engineer Research and Development Center: Vicksburg, MS, USA, 2010; p. 15.
68. Sasser, C.E.; Dozier, M.D.; Gosselink, J.G.; Hill, J.M. Spatial and temporal changes in Louisiana’s Baratariabasin marshes, 1945–1980. Environ. Manag. 1986, 10, 671–680. [CrossRef]
69. Wang, F.C. Dynamics of saltwater intrusion in coastal channels. J. Geophys. Res. 1988, 93, 6937–6946.[CrossRef]
70. Turner, R.E.; Rao, Y.S. Relationships between wetland fragmentation and recent hydrologic changes in adeltaic coast. Estuaries 1990, 13, 72–281. [CrossRef]
71. Shaffer, G.; Day, J.; Mack, S.; Kemp, P.; van Heerden, I.; Poirrier, M.; Westphal, K.; FitzGerald, D.; Milanes, A.;Morris, C.; et al. The MRGO navigation project: A massive human-induced environmental, economic, andstorm disaster. J. Coast. Res. 2009, 54, 206–224. [CrossRef]
72. McKee, K.L.; Mendelssohn, I.A. Response of a freshwater marsh plant community to increased salinity andincreased water level. Aquat. Bot. 1989, 34, 301–316. [CrossRef]
73. Mendelssohn, I.A.; Morris, J.T. Eco-physiological controls on the productivity of Spartina alterniflora loisel.In Concepts and Controversies in Tidal Marsh Ecology; Weinstein, M.P., Kreeger, D.A., Eds.; Kuwer AcademicPublishers: Boston, MA, USA, 2000; pp. 59–80.
74. Day, J.W.; Kemp, G.P.; Reed, D.J.; Cahoon, D.R.; Boumans, R.M.; Suhayda, J.M.; Gambrell, R. Vegetationdeath and rapid loss of surface elevation in two contrasting Mississippi delta salt marshes: The role ofsedimentation, autocompaction and sea-level rise. Ecol. Eng. 2011, 37, 229–240. [CrossRef]
75. Nyman, J.A.; DeLaune, R.D.; Patrick, W.H., Jr. Wetland soil formation in the rapidly subsiding MississippiRiver Deltaic Plain: Mineral and organic matter relationships. Estuar. Coast. Shelf Sci. 1990, 31, 57–69.[CrossRef]
76. Gagliano, S. Assessment of Environmental Impacts Associated with Oil and Gas Exploration and Development in theBully Camp Oil and Gas Field Lafourche Parish, Louisiana; Jones, Swanson, Huddell & Garrison: New Orleans,LA, USA, 2017.
77. Nichols, L.G. Technical Report of the Louisiana Wildlife and Fisheries Commission, Rockefeller Refuge levee study;Louisiana Wildlife and Fisheries Commission, Refuge Division: New Orleans, LA, USA, 1959.
78. Bondesan, M.; Castiglioni, G.; Elmi, C.; Gabbianelli, G.; Marocco, R.; Pirazzoli, P.; Tomasin, A. Coastal areasat risk from storm surges and sea-level rise in northeastern Italy. J. Coast. Res. 1995, 11, 1354–1379.
79. Mallman, E.P.; Zoback, M.D. Subsidence in the Louisiana Coastal Zone due to hydrocarbon production.J. Coast. Res. 2007, 50, 443–449.
80. Dokka, R.K. The role of deep processes in late 20th century subsidence of New Orleans and coastal areas ofsouthern Louisiana and Mississippi. J. Geophys. Res. 2011, 116, B06403. [CrossRef]
81. Caro Guenca, M.; Hanssen, R.; Hooper, A.; Arikan, M. Surface deformation of the whole Netherlands afterPSI analysis. In Proceedings of the Fringe 2011 Workshop, Frascati, Italy, 19–23 September 2011. ESA SP-697.
82. Kolker, A.S.; Allison, M.A.; Hameed, S. An evaluation of subsidence rates and sea level variability in thenorthern Gulf of Mexico. Geophys. Res. Lett. 2011, 38, L21404. [CrossRef]
83. Yu, S.-Y.; Tornqvist, T.E.; Hu, P. Quantifying Holocene lithospheric subsidence rates underneath theMississippi Delta. Earth Planet. Sci. Lett. 2012, 331, 21–30. [CrossRef]
84. Morton, R.A.; Buster, N.A.; Krohn, M.D. Subsurface controls on historical subsidence rates and associatedwetland loss in southcentral Louisiana. Trans. Gulf Coast Assoc. Geol. Soc. 2002, 52, 767–778.

Water 2020, 12, 1492 27 of 29
85. Gagliano, S.M.; Haggar, K.S. Effects of D-shaped fault deformation on south Louisiana landscape (abs.); AnnualConvention 2010 Programs and Abstracts; American Association of Petroleum Geologists: New Orleans, LA,USA, 2010.
86. Morton, R.A.; Bernier, J.C. Recent subsidence-rate reductions in the Mississippi delta and their geologicalimplications. J. Coast. Res. 2010, 29, 555–561. [CrossRef]
87. Armstrong, C.; Mohrig, D.; Hess, T.; George, T.; Straub, K. Influence of growth faults on coastal fluvialsystems: Examples from the late Miocene to Recent Mississippi River Delta. Sediment. Geol. 2014, 301,120–132. [CrossRef]
88. Levesh, J.L.; McLindon, C.; Kulp, M.A. A Detailed Study of the Delacroix Island Major Fault and Its Roleon Stratigraphic Horizons from the Middle Miocene to Present, Abstract. In Proceedings of the AGU FallMeeting, New Orleans, LA, USA, 11–15 December 2017.
89. Culpepper, M.; McDade, E.C.; Dawers, N.; Zhang, R. Synthesis of Fault Traces in SE Louisiana Relative toInfrastructure: Project No. 17GTLSU12; Transportation Consortium of South Central States: San Antonio, TX,USA, 2019; p. 53.
90. Straub, K.; Mohrig, D. Subsidence Associated with Active Growth Faulting on the Mississippi Delta: DisplacementRates and Steering of the Mississippi River; Presented at Long Term Estuary Assessment Group: NewOrleans, LA, USA, 2010; Available online: http://leag.tulane.edu/PDFs/Straub-LEAG-4.28.10.pdf (accessedon 12 February 2019).
91. Hillis, R. Pore pressure/stress coupling and its implications for seismicity. Explor. Geophys. 2000, 31, 448–454.[CrossRef]
92. Zoback, M.D.; Zinke, J.C. Production-induced normal faulting in the Valhall and Ekofisk oil fields. In TheMechanism of Induced Seismicity; Trifu, C.I., Ed.; Pageoph Topical Volumes, Birkhauser: Basel, Switzerland,2002; pp. 403–420.
93. Pratt, W.E.; Johnson, D.W. Local subsidence of the Goose Creek oil field. J. Geol. 1926, 34, 577–590. [CrossRef]94. Geertsma, J. Land subsidence above compacting oil and gas reservoirs. J. Pet. Technol. 1973, 25, 734–744.
[CrossRef]95. Chang, C.; Zoback, M.D. Viscous creep in room-dried unconsolidated Gulf of Mexico shale (I): Experimental
results. J. Pet. Sci. Eng. 2009, 69, 239–246. [CrossRef]96. Baú, D.; Gambolati, G.; Teatini, P. Residual land subsidence over depleted gas fields in the Northern Adriatic
Basin. Environ. Eng. Geosci. 1999, 5, 389–405. [CrossRef]97. Hettema, M.; Papamichos, E.; Schutjens, P.M.T.M. Subsidence delay: Field observations and analysis.
Oil Gas Sci. Technol. 2002, 57, 443–458. [CrossRef]98. Dusseault, M.B.; Bruno, M.S.; Barrera, J. Casing shear: Causes, cases, cures. SPE Drill. Completion 2001, 16,
98–107. [CrossRef]99. Boesch, D.F.; Rabalais, N.N. (Eds.) Produced Waters in Sensitive Coastal Habitats: An Analysis of Impacts, Central
Coastal Gulf of Mexico; OCS Report/MMS 89-0031; U.S. Dept. of the Interior, Minerals Management Service,Gulf of Mexico OCS Regional Office: New Orleans, LA, USA, 1989; p. 157.
100. Veil, J.A.; Puder, G.M.; Elcock, D.; Redweik, R.J. A White Paper Describing Produced Water from Production ofCrude Oil, Natural Gas, and Coal Bed Methane; No. ANL/EA/RP-112631; Argonne National Lab: Lemont, IL,USA, 2004.
101. American Petroleum Institute (API). Produced water impacts on Louisiana wetlands. Health and EnvironmentalSciences API Publication Number 4517; API: Washington, DC, USA, 2000.
102. Veil, J.A.; Kimmell, T.A.; Rechner, A.C. Characteristics of Produced Water Discharged to the Gulf of MexicoHypoxic Zone; Report to the U.S. Dept. of Energy; National Energy Technology Laboratory, Argonne NationalLaboratory: Washington, DC, USA, 2005.
103. Neff, J.; Lee, K.; DeBlois, E.M. Produced water: Overview of composition, fates, and effects. In ProducedWater; Springer: New York, NY, USA, 2011; pp. 3–54.
104. Rabalais, N.N.; McKee, B.A.; Reed, D.J.; Means, J.C. Fate and Effects of Nearshore Discharges of OCS ProducedWaters; Executive Summary; OCS Study/MMS 91-0004; U.S. Dept. of the Interior, Minerals ManagementService, Gulf of Mexico OCS Regional Office: New Orleans, LA, USA, 1991; Volume 1, p. 48.
105. Haque, S.M. Effects of surface brine disposal on the marshes of coastal Louisiana. In Proceedings of theCoastal Zone, New Orleans, LA, USA, 19–23 July 1993.

Water 2020, 12, 1492 28 of 29
106. Bass, A.S. Accidental Oilfield Brine Spill Impact Study: A Survey of the Magnitude and Distribution of Accidental BrineSpills in the Louisiana Coastal Wetlands Conservation Area; Final Report; Louisiana Geological Survey Reportsubmitted to the Louisiana Coastal Management Division, Louisiana Department of Natural Resources:Baton Rouge, LA, USA, 1998; 55p.
107. Lehto, B.; Marcantel, R.; Paul, W.B. Calcasieu-Sabine Cooperative River Basin Study Report; Report prepared forthe United States Department of Agricultural and Soil Conservation Service; US Dept of Agricultural andSoil Cons Service: Baton Rouge, LA, USA, 1999; p. 293.
108. Louisiana Coastal Wetlands Conservation and Restoration Task Force. Hydrologic Investigation of the LouisianaChenier Plain; Louisiana Department of Natural Resources, Coastal Restoration Division: Baton Rouge, LA,USA, 2002; p. 135.
109. Hamilton, L.D.; Meinhold, A.F.; Nagy, J. Produced Water Radionuclide Hazard/risk Assessment–Phase 1; APIPublication Number 4532; American Petroleum Institute: Washington, DC, USA, 1991; p. 176.
110. Totten, S.; Matthew, W.; Hanan, M.A.; Simpson, S. Natural remediation of marsh soil contaminated byoil-field brine containing elevated radium levels, southern Louisiana. Environ. Geosci. 2007, 14, 113–122.[CrossRef]
111. McGenity, T.J.; Folwell, B.D.; McKew, B.A.; Sanni, G.O. Marine crude-oil biodegradation: A central role forinterspecies interactions. Aquat. Biosyst. 2012, 8, 10. [CrossRef] [PubMed]
112. USEPA (United States Environmental Protection Agency). Water Quality Benefits Analysis of Final EffluentLimitations Guidelines and Standards for the Coastal Subcategory of the Oil and Gas Extraction Point Source Category;EPA-821-R-96-024; EPA: Washington, DC, USA, 1996.
113. Twilley, R.; Bentley, S.; Chen, Q.; Edmonds, D.; Hagen, S.; Lam, N.; Willson, C.; Xu, K.; Braud, D.; Peele, R.;et al. Co-evolution of wetland landscapes, flooding, and human settlement in the Mississippi River DeltaPlain. Sustain. Sci. 2016, 11, 711–731. [CrossRef]
114. DeLaune, R.D.; Pezeshki, S.R.; Pardue, J.H.; Whitcomb, J.H.; Patrick, W.H., Jr. Some influences of sedimentaddition to a deteriorating salt marsh in the Mississippi River deltaic plain: A pilot study. J. Coast. Res. 1990,6, 181–188.
115. Ford, M.A.; Cahoon, D.R.; Lynch, J.C. Restoring marsh elevation in a rapidly subsiding salt marsh bythin-layer deposition of dredged material. Ecol. Eng. 1999, 12, 189–205. [CrossRef]
116. Mendelssohn, I.A.; Kuhn, N.L. Sediment subsidy: Effects on soil plant responses in a rapidly submergingcoastal salt marsh. Ecol. Eng. 2003, 21, 115–128. [CrossRef]
117. La Peyre, M.K.; Gossman, B.; Piazza, B.P. Short- and long-term response of deteriorating brackish marshesand open-water ponds to sediment enhancement by thin-layer dredge disposal. Estuaries Coasts 2009, 32,390–402. [CrossRef]
118. Perez, B.; Day, J.; Rouse, L.; Shaw, R.; Wang, M. Influence of Atchafalaya River discharge and winter frontalpassage on suspended sediment concentration and flux in Fourleague Bay, Louisiana. Estuar. Coast. Shelf Sci.2000, 50, 271–290. [CrossRef]
119. Day, J.W.; Boesch, D.F.; Clairain, E.J.; Kemp, G.P.; Laska, S.B.; Mitsch, W.J.; Orth, K.; Mashriqui, H.; Reed, D.J.;Shabman, L.; et al. Whigham. Restoration of the Mississippi delta: Lessons from hurricanes Katrina andRita. Science 2007, 315, 1679–1684. [CrossRef]
120. Turner, R.E.; Streever, B. Approaches to Coastal Wetland Restoration: Northern Gulf of Mexico; Kugler Publications:Amsterdam, The Netherlands, 2002; p. 147.
121. DeLaune, R.; Jugsujindaa, A.; Peterson, G.; Patrick, W. Impact of Mississippi River freshwater reintroductionon enhancing marsh accretionary processes in a Louisiana estuary. Estuar. Coast. Shelf Sci. 2003, 58, 653–662.[CrossRef]
122. Baustian, J.; Turner, R.E. Restoration Success of Backfilling Canals in Coastal Louisiana Marshes. Restor. Ecol.2006, 14, 636–644. [CrossRef]
123. Day, J.; Paul, K.; Angelina, F. Summary and Conclusions. pp. 185-192. In Perspectives on the restoration of theMississippi Delta; Day, J., Kemp, P., Freeman, A., Muth, D., Eds.; Springer: New York, NY, USA, 2014.
124. Ray, G.L. Thin Layer Placement of Dredged Material on Coastal Wetlands: A Review of the Technical and ScientificLiterature; ERDC/EL Technical Notes Collection (ERDC/EL TN-07-1); U.S. Army Engineer Research andDevelopment Center: Vicksburg, MS, USA, 2007.
125. Stagg, C.L.; Mendelssohn, I.A. Restoring ecological function to a submerged salt marsh. Restor. Ecol. 2010,18, 10–17. [CrossRef]
Water 2020, 12, 1492 29 of 29
126. CPRA–Coastal Protection and Restoration Authority. Louisiana’s Comprehensive Master Plan for a SustainableCoast; CPRA: Baton Rouge, LA, USA, 2017; p. 93.
127. Cahoon, D.R.; Cowan, J.H., Jr. Environmental impacts and regulatory policy implications spray disposal ofdredged material in Louisiana wetlands. Coast. Manag. 1988, 16, 341–362. [CrossRef]
128. Lester, G.D.; Sorensen, S.G.; Faulkner, P.L.; Reid, C.S.; Maxit, I.E. Louisiana Comprehensive Wildlife ConservationStrategy; Louisiana Department of Wildlife and Fisheries: Baton Rouge, LA, USA, 2005; p. 455.
129. Teal, J.M.; Weinstein, M.P. Ecological engineering, design, and construction considerations for marshrestorations in Delaware Bay, USA. Ecol. Eng. 2002, 18, 607–618. [CrossRef]
130. Peterson, S.B.; Teal, J.M.; Mitsch, W.J. Delaware Bay Salt Marsh Restoration. Spec. Issue Ecol. Eng. 2005, 25,199–314.
131. Slocum, M.G.; Mendelssohn, I.A.; Kuhn, N.L. Effects of sediment slurry enrichment on salt marshrehabilitation—Plant and soil responses over seven years. Estuaries 2005, 28, 519–528. [CrossRef]
132. Croft, A.L.; Leonard, L.A.; Alphin, T.; Cahoon, L.B.; Posey, M. The effects of thin layer sand renourishmenton tidal marsh processes: Masonboro Island, North Carolina. Estuaries Coasts 2006, 29, 737–750. [CrossRef]
133. Shaffer, G.; Day, J.; Lane, R. Optimum use of freshwater to restore bald cypress–water tupelo swamps andfreshwater marshes and protect against salt water intrusion: A case study of the Lake Pontchartrain Basin.In Mississippi Delta Restoration; Day, J., Erdman, J., Eds.; Springer: New York, NY, USA, 2018; pp. 61–76.
134. Hunter, R.; Day, J.W.; Lane, R.; Shaffer, G.; Day, J.N.; Conner, W.; Rybczyk, J.; Mistich, J.; Ko, J. Using naturalwetlands for municipal effluent assimilation: A half-century of experience for the Mississippi delta andsurrounding environs. In Multifunctional Wetlands, Environmental Contamination Remediation and Management;Nagabhatla, N., Metcalfe, C., Eds.; Springer: New York, NY, USA, 2018; pp. 15–81.
135. McLindon, C. Using Oil and Gas Industry Data to Achieve Coastal Sustainability. SOC Block VI. Availableonline: https://sites.law.lsu.edu/coast/2016/06/state-of-the-coast-2016/ (accessed on 3 March 2020).
136. Wiegman, R.; Day, J.; D’Elia, C.; Rutherford, J.; Morris, J.; Roy, E.; Lane, R.; Dismukes, D.; Snyder, B. Modelingimpacts of sea-level rise, oil price, and management strategy on the costs of sustaining Mississippi deltamarshes with hydraulic dredging. Sci. Total Environ. 2017, 618, 1547–1559. [CrossRef]
© 2020 by the authors. Licensee MDPI, Basel, Switzerland. This article is an open accessarticle distributed under the terms and conditions of the Creative Commons Attribution(CC BY) license (http://creativecommons.org/licenses/by/4.0/).