Leribe District
212
INFORMATION HANDBOOK Leribe District Report 1 2009 Local Governance & Non-state actors Support Programme - LGNSP
-
Upload
khangminh22 -
Category
Documents
-
view
3 -
download
0
Transcript of Leribe District

INFORMATION HANDBOOK
Leribe District
Report 1 2009
Lo
cal G
over
nan
ce &
No
n-s
tate
act
ors
Su
pp
ort
Pro
gram
me
- L
GN
SP


Edited by:Miguel Fernández Trillo-Figueroa
Contributions by:Moipone Letsie, Mpopo Tsoele, Matseliso Mapetla
Series editor:François Dronnet, Matseliso Ntsoelikane
Photos by:Miguel Fernández Trillo-Figueroa
INFORMATION HANDBOOK
Leribe District
Report 1 2009

This publication has been produced with the assistance of the European Union. The contents of this publication are the sole responsibility of its author(s) and can in no way be taken to reflect the views of the European Union, the views of the Local Governance and Non-state actors Support Programme (LGNSP) or any of the Lesotho institutions participating in this programme.
Neither the European Commission nor any person acting on behalf of the Commission is responsible for use which might be made of the following information.
Published by LGNSP in Maseru (Lesotho), 2009
ISBN 978-92-79-12038-1
© European Communities, 2009 Reproduction is authorised provided the source is acknowledged.
Copies of this publication can be obtained by writing to: LGNSP Programme Management Unit, Private Bag A478, Maseru 100, Kingdom of Lesotho or to [email protected]. When ordering, please quote ISBN number. This publication can also be downloaded from http://www. lgnsp.co.ls.
For further information on the European Union:http://ec.europa.eu/worldhttp://ec.europa.eu/europeaidhttp://www.dellso.ec.europa.eu/
Designed by: The Media ChilliIllustrations by: Santiago Fernández Trillo-FigueroaPhotos by: Miguel Fernández Trillo-FigueroaProduced and printed by: Saysouk Creation graphique s.c.s.

CONTENTS
Table of contents PAGE 3Acronyms and abbreviations PAGE 6List of maps, tables, figures, pictures and graphs PAGE 8
CHAPTER 1 PAGE 11Background 1.1. Introduction 1.2. Methodology
CHAPTER 2 PAGE 15Profile of the district 2.1. Introduction 2.2. Administrative structure 2.3. History 2.4. Agro-ecological characteristics 2.5. Natural resources 2.6. Climate 2.7. Topography and soils 2.8. Rivers and water reservoirs
CHAPTER 3 PAGE 31Social profile 3.1. Population distribution and density 3.2. Demography 3.3. Poverty 3.4. Economic profile 3.5. Gender aspects 3.6. Out-migration rate
CHAPTER 4 PAGE 43Agriculture profile 4.1. Introduction 4.2. Crop profile analysis 4.3. Livestock production 4.4. Wool and mohair 4.5. Goats and sheep 4.6. Range management
HANDBOOK
12009

CONTENTS
CHAPTER 5 PAGE 53 Health and HIV/AIDS
CHAPTER 6 PAGE 65 Education
CHAPTER 7 PAGE 67Water and sanitation
CHAPTER 8 PAGE 69Energy
CHAPTER 9 PAGE 73Communications
CHAPTER 10 PAGE 77Roads
CHAPTER 11 PAGE 81Non-State Actors
CHAPTER 12 PAGE 83Security
CHAPTER 13 PAGE 87Trade and commerce
CHAPTER 14 PAGE 91Tourism
CHAPTER 15 PAGE 95Annexes •SummaryofDistrictInformation (Templates) •DistrictCouncilFactSheet •CommunityCouncilFactSheet
HANDBOOK
1 2009

District Council Leribe
6
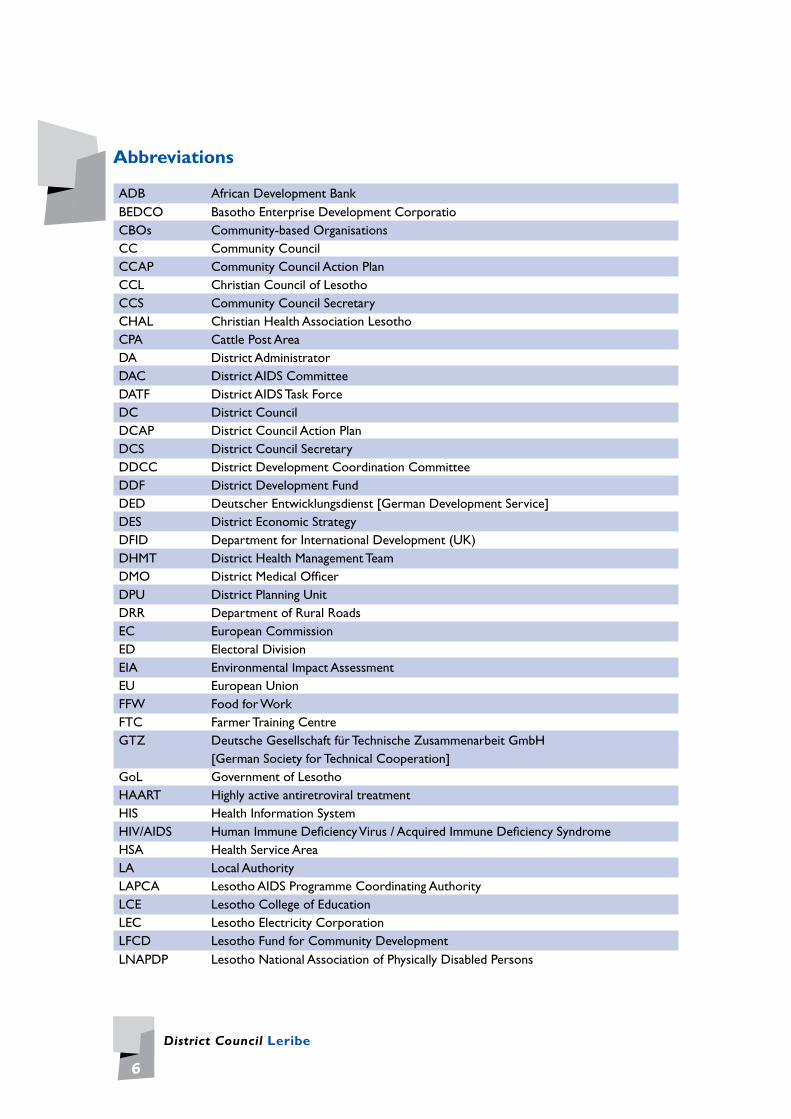
Abbreviations
ADB African Development BankBEDCO Basotho Enterprise Development CorporatioCBOs Community-based OrganisationsCC Community CouncilCCAP Community Council Action PlanCCL Christian Council of LesothoCCS Community Council SecretaryCHAL Christian Health Association LesothoCPA Cattle Post AreaDA District AdministratorDAC District AIDS CommitteeDATF District AIDS Task ForceDC District CouncilDCAP District Council Action PlanDCS District Council SecretaryDDCC District Development Coordination CommitteeDDF District Development FundDED Deutscher Entwicklungsdienst [German Development Service]DES District Economic StrategyDFID Department for International Development (UK)DHMT District Health Management TeamDMO District Medical OfficerDPU District Planning UnitDRR Department of Rural RoadsEC European CommissionED Electoral DivisionEIA Environmental Impact AssessmentEU European UnionFFW Food for WorkFTC Farmer Training CentreGTZ Deutsche Gesellschaft für Technische Zusammenarbeit GmbH [German Society for Technical Cooperation]GoL Government of LesothoHAART Highly active antiretroviral treatmentHIS Health Information SystemHIV/AIDS Human Immune Deficiency Virus / Acquired Immune Deficiency SyndromeHSA Health Service AreaLA Local AuthorityLAPCA Lesotho AIDS Programme Coordinating AuthorityLCE Lesotho College of EducationLEC Lesotho Electricity CorporationLFCD Lesotho Fund for Community DevelopmentLNAPDP Lesotho National Association of Physically Disabled Persons

7
Local Governance and Non-state actors Support Programme - LGNSP
LGNSP Local Governance and Non-state actors Support Programme LCN Lesotho Council of Non-Governmental OrganisationsLNCW Lesotho National Council of WomenLSMHP Lesotho Society of Mentally Handicapped PersonsLG Local GovernmentLGA Local Government Act 1996LPMS Livestock Produce Marketing ServicesLPPA Lesotho Planned Parenthood AssociationLSL Maloti (international acronym)LSPP Department of Land Survey and Physical Planning of MoLGMoA Ministry of AgricultureMoE Ministry of EducationMoHA Ministry of Home AffairsMDTP Maluti Drakensberg Transfrontier ProjectMET Ministry of Environment and TourismMoFDP Ministry of Finance and Development PlanningMoFLR Ministry of Forestry and Land ReclamationMoLG Ministry of Local GovernmentMoTICM Ministry of Trade, Industry, Cooperatives and MarketingMNR Ministry of Natural ResourcesMPS Ministry of Public ServiceMPW Ministry of Public WorksNAC National AIDS CommitteeNGO Non-Governmental OrganisationNSAs Non-State ActorsPHC Primary Health CarePRS Poverty Reduction StrategyPSIRP Public Service Improvement Programme PTB Pulmonary TuberculosisRWS Department of Rural Water Supply SADC South African Development CommunitySADPMA Sustainable Agricultural Development Programme for Mountain AreasSDC Swiss Development CooperationSIA Supplementary immunization activitiesSMARDT Southern Mountain Association for Rural Development and TransformationTA Technical Assistance TC Technical CooperationToR Terms of ReferenceUNDP United Nations Development ProgrammeUNICEF United Nations Children’s Fund VCT Voluntary Counselling and Testing WASA Water and Sewerage Authority WB World BankWFP World Food ProgrammeWHO World Health Organisation
District Council Leribe
8
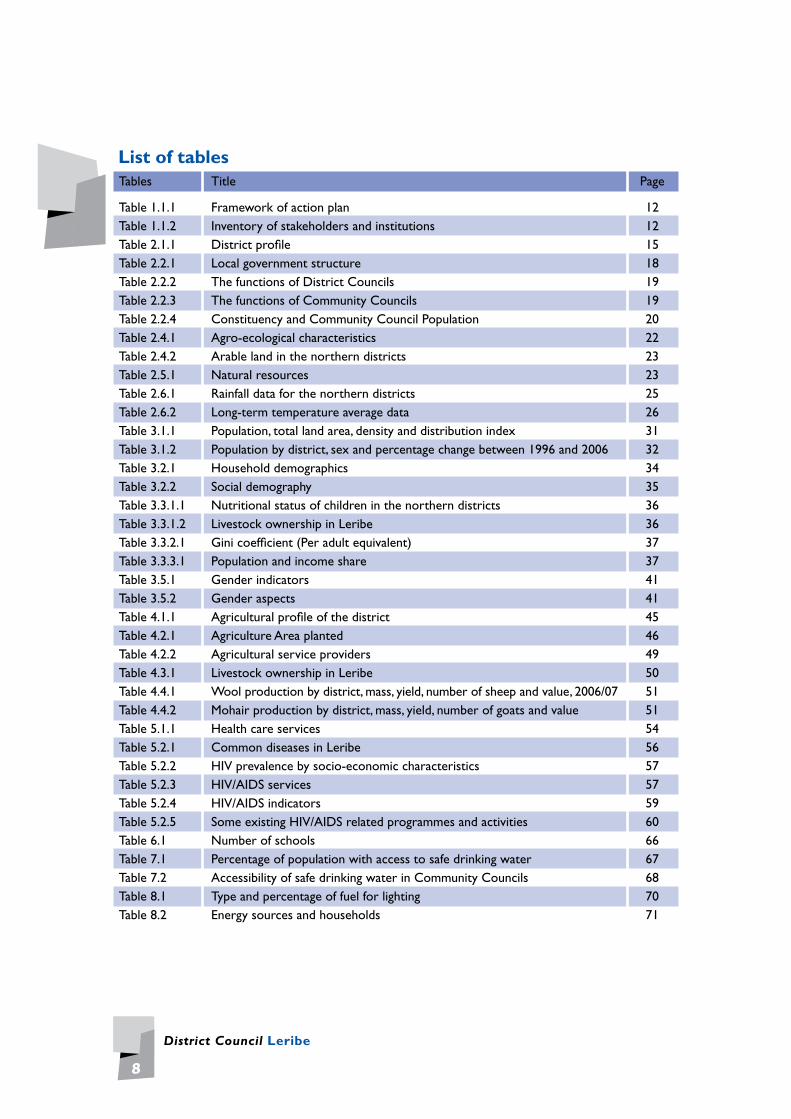
List of tablesTables Title Page
Table 1.1.1 Framework of action plan 12Table 1.1.2 Inventory of stakeholders and institutions 12Table 2.1.1 District profile 15Table 2.2.1 Local government structure 18Table 2.2.2 The functions of District Councils 19Table 2.2.3 The functions of Community Councils 19Table 2.2.4 Constituency and Community Council Population 20Table 2.4.1 Agro-ecological characteristics 22Table 2.4.2 Arable land in the northern districts 23Table 2.5.1 Natural resources 23Table 2.6.1 Rainfall data for the northern districts 25Table 2.6.2 Long-term temperature average data 26Table 3.1.1 Population, total land area, density and distribution index 31Table 3.1.2 Population by district, sex and percentage change between 1996 and 2006 32Table 3.2.1 Household demographics 34Table 3.2.2 Social demography 35Table 3.3.1.1 Nutritional status of children in the northern districts 36Table 3.3.1.2 Livestock ownership in Leribe 36Table 3.3.2.1 Gini coefficient (Per adult equivalent) 37Table 3.3.3.1 Population and income share 37Table 3.5.1 Gender indicators 41Table 3.5.2 Gender aspects 41Table 4.1.1 Agricultural profile of the district 45Table 4.2.1 Agriculture Area planted 46Table 4.2.2 Agricultural service providers 49Table 4.3.1 Livestock ownership in Leribe 50Table 4.4.1 Wool production by district, mass, yield, number of sheep and value, 2006/07 51Table 4.4.2 Mohair production by district, mass, yield, number of goats and value 51Table 5.1.1 Health care services 54Table 5.2.1 Common diseases in Leribe 56Table 5.2.2 HIV prevalence by socio-economic characteristics 57Table 5.2.3 HIV/AIDS services 57Table 5.2.4 HIV/AIDS indicators 59Table 5.2.5 Some existing HIV/AIDS related programmes and activities 60Table 6.1 Number of schools 66Table 7.1 Percentage of population with access to safe drinking water 67Table 7.2 Accessibility of safe drinking water in Community Councils 68Table 8.1 Type and percentage of fuel for lighting 70Table 8.2 Energy sources and households 71

9
Local Governance and Non-state actors Support Programme - LGNSP
Table 9.1 Communication facilities 74Table 10.1 Road networks and initiatives in Leribe 78Table 12.1 Number and percentage distribution of all serious cases of crime by district 2005 84Table 12.2 Crime statistics and security services 84Table 13.1 Types and number of business 87Table 14.1 Tourist accommodations in the district 93
List of mapsMaps Title Page
Map 2.1.1 General district and Community Council map 17Map 2.4.1 Agro-ecological zone 21Map 2.5.1 Rainfall distribution 26Map 2.7.1 Lesotho northern district topography 28Map 2.8.1 Rivers and drainage 29Map 3.1.1 Population density in Leribe 32Map 4.1 Agricultural land 44Map 5.1.1 Health facilities 54Map 5.2.2 HIV prevalence in Lesotho 58Map 9.1 Postal services 75Map 10.1 Road networks and urban areas 78Map 12.1 Police stations 85Map 14.1 Tourism 91
List of diagramsDiagrams Title Page
Diagram 2.6.1 Average rainfall for the northern districts 27Diagram 2.6.2 Average temperature for the northern districts 27Diagram 4.2.2 Crop distribution in Leribe 46Diagram 4.2.3 Area of wheat planted in district 47Diagram 4.2.4 Area of sorghum planted in district 47Diagram 4.3.1 Livestock herd size 50Diagram 4.5.1 Sheep flock size 52
Exchange ratesSaturday, 4 April 2009
1 Euro = 12.25145 Lesotho Loti1 Lesotho Loti (LSL) = 0.08162 Euro (EUR)
The Lesotho Loti (LSL) – plural Maloti – is pegged to the South African Rand (ZAR)

District Council Leribe
10
Local Governance and Non-state actors Support Programme - LGNSP
11
Background
1.1 IntroductionThe Government of Lesotho, through the Ministry of Local Government (MoLG), is pur-suing the policy of decentralisation to strengthen public service delivery at the local level, to entrench democratic roots and to realise the goals set in the national vision (2020) of the country.
The process is driven by the government to achieve the reforms needed to deepen democracy and improve service delivery in the districts. Although the Local Government Act was enacted in 1997, the process only began effectively in 2005 with the local gov-ernment elections and the subsequent creation of the local councils. The MoLG, holding the overall responsibility for the process, articulated according to the Local Government Act the devolution of responsibilities to: a) the municipality (only Maseru), b) the districts, and c) the Community Councils.
The EC has recently launched the Local Governance and Non-state actors Support Pro- gramme (LGNSP) to strengthen local government structures at district and Community Council level and to promote greater involvement and effective participation of NSA in local governments.
In this context, the EC is working closely with the LGNSP to develop district and Com-munity Council profiles in the northern districts of Lesotho in order to assist the Dis-trict Councils (DC), the Community Councils (CC) and the CBOs in their planning, budgeting and monitoring capacities.
This handbook is the result of the profiling exercise to assist the development planning efforts of the MoLG.
Bac
kgro
un
d
1
CHAPTER

District Council Leribe
12
The handbook presents detailed, up-to-date, relevant, accessible and accurate informa-tion describing the major characteristics of the District, and is to serve as a useful refer-ence guide for all stakeholders involved in district planning efforts.
The main purpose of this handbook is to create a baseline survey for further local development interventions and to serve as a planning tool at community and district level.
1.2 MethodologyThis handbook is the result of a methodological process of both quantitative and qualita-tive investigation. The profiling exercise started by conducting several appraisals in the field of the physical and geographic features of the region, followed by a broad review of secondary sources and standard national statistics from different official sources. These data were combined with surveys, discussions, workshops and interviews with major stakeholders at the national, district and community level.
Table 1.2.1: Framework of action plan
PHASE IReview of secondary information and description of geophysical features of the study areaPHASE IIReconnaissance field visit, elaboration of the methodology for the investigation and implementationPHASE IIIField assessment comprising District and Community Council Data collection sessions and keyinformant interviewsPHASE IVAnalysis, systematisation and layout of the findings
Table 1.2.2: Inventory of stakeholders and institutions
1. Community and district council members2. Traditional leaders: head men, area chiefs, principal chiefs3. Staff of decentralised sector ministries operating in the districts4. Members of district committees: a. District Planning Unit (DPU) b. District Development Coordination Committee (MDDC) c. District Finance Committee (DFC)5. Representatives of Non-State Actors (civil society organisations)6. Political and administrative leadership of the districts7. District Council secretary8. District Administrator9. Constituency office and members of parliament10. Private sector11. Statistical Office 12. District office of the National Statistical Office
Bac
kgro
un
d

Local Governance and Non-state actors Support Programme - LGNSP
13
The information was collected through various means of validation, workshops in Com-munity and District Councils, quantitative questionnaires to complete a set of data tem-plates, and key Informant Interviews to complete more qualitative aspects. The district and community profiling assignment was carried out in four sequential phases.The respective outputs of each phase contributed to the overall composition of the dis-trict and Community Council information profiling.
Bac
kgro
un
d

District Council Leribe
14

Local Governance and Non-state actors Support Programme - LGNSP
15
Dis
tric
t p
rofi
le
District profile
2.1 IntroductionLeribe is situated in the north eastern part of the country and is bordered by Botha-Bothe in the north, Mokhotlong in the east and Berea and Thaba-Tseka in the south. The western part of the district forms the international border with South Africa. The Leribe district covers 282,810 hectares or 9.32% of the country’s surface area. Consistent with the country’s topography, it consists of 42% of lowlands (below 1,800 m), 28% foothills (between 1,800 m – 2,300 m) and 30% mountain areas (above 2,300 m). Most of this landmass is non arable but suitable for livestock grazing. Fifteen hectares of the landmass are covered by forest.
According to the 2006 National Census, the District of Leribe has a total population of 298,352, which represents 15.86% of the population of Lesotho. Hlotse (constituency) is the administrative town of Leribe with a population of 25,497 and Maputsoe (constitu-ency), with a population of 26,866, is the second largest town in Leribe.
The district stretches from the Mohokare (Caledon) River and the lowlands through the foothill zone across the Maluti mountains and the Maliba-Matšo valley. The Leribe low-land zone is one of the best agricultural areas in the country. This zone also has major urban settlements with industrial establishments. Roads, electricity supply and infrastruc-ture have facilitated urban expansion along the A1motorway, which connects Leribe with the Botha-Bothe and Berea districts.
Future urbanisation is expected primarily in the lowlands in conjunction with the existing infrastructure. Infrastructure is developed primarily in the lowland areas of the district. The major motorway (A1) runs north-south through the lowlands, connecting the main centres inside and outside the district . The bigger part of the mountain region is less ac-cessible, although the Pitseng-Lejone-Katse road has improved the situation significantly.
2
CHAPTER

District Council Leribe
16
Dis
tric
t p
rofi
le
Table 2.1.1: Leribe district profile
1 2006, Census, Population and Housing Preliminary Report, Bos., August 2007. Through workshops and interviews, alternative primary and secondary information on population has been collected for the profile from each Community Council and District Council. These sources unavoidably do not perfectly match the information from the Census, but have a reasonable margin of error. Both sources will need to be harmonised in the future.
LAND TOTAL OBSERVATIONS
Land area 282,810 ha 9.32% of the country’s surface1
Arable land 48,800 ha
Highest point 3,200 m Mountains to the east of the district
Lowest point 1,500 m Mohokare valley
ADMINISTRATION
Number of community councils
15
LimamarelaMphorosaneSeshoteMatlamengPitsengMotatiFenyaneSerupaneMalaoanengMenkhoanengMaisa-PhokaSephokongLinareLitjotjelaKhomokhoanaHleohengMankaTsoili-Tsoili
Number of constituencies
13
Chief and wards 2 Ward Principal Chief
Gazetted chiefs Leribe Chief Joel Motšoene
Tsikoane Peka le Kolbere
Chief Pontšo Mathealira
CLIMATE
Lowest average temperature
2°C
Highest average temperature
32°C
POPULATION
Population 298,352
Net migration 14,827
Population density 128 km2 Second densely populated district

Local Governance and Non-state actors Support Programme - LGNSP
17
Dis
tric
t p
rofi
le
Map 2.1.1: General District and Community Council maps
2.2 Administrative structureLocal government in Lesotho enjoys constitutional status. According to the country’s constitution (Section 106.1), ‘Parliament shall establish such local authorities as it deems necessary to enable urban and rural communities to determine their affairs and to de-velop themselves. Such authorities shall perform such functions as may be conferred by an Act of Parliament.’1
In 1997, the parliament passed Local Government Act no 6, and in1998 the Local Govern-ment Election Act. In 2004, amendments were enacted in the Act to reduce the number of local councils, and to ensure that one third of all seats was reserved for women. Ac-cording to the local government legislation, urban areas have single-tier municipal or ur-ban councils. In rural areas, directly elected Community Councils are the lower tier and the indirectly elected District Councils representing Community Councils are second tier. There are ten administrative districts, 128 Community Councils, ten District Coun-cils, and the municipal council of the capital city of Maseru.
Local government elections were held on 30 April 2005 based on a first-past-the-post electoral system. This was a significant democratic development.
1 Country Profile: Lesotho. Commonwealth Local Government Forum, p. 108. Available from www.clgf.org.uk (accessed 10 July 2008).

District Council Leribe
18
Dis
tric
t p
rofi
le
The establishment of the current local government structure was adopted by the Cabi-net on 10 February 2004, envisioning the Local Government system as based on political devolution and decentralisation of functions, staff, and finances within the framework of a unitary state. The aim was therefore to bring democracy and its opportunities closer to the communities.
Key local functions as stipulated in the Local Government Act are: natural resources, land allocation, grazing rights, markets, building permits, local administration of central licences and regulations, bus terminals, burial, fire protection, education, family welfare and public health, physical planning, roads and public transportation, cemeteries, environ-ment, parks, sports and recreation, forestry and agricultural improvement.
Table 2.2.1: Local government structure
The District Council (DC) is formed with government officials who are indirectly elected by the Government. Two members are nominated by each Community Council from among its members, one of whom must be the chairperson of the Community Council. Traditional authorities are represented through two gazetted chiefs of the district, who also have to be members of the Community Councils. According to the law at least one third (33%) of the members of all councils must be women. The District Council elects

Local Governance and Non-state actors Support Programme - LGNSP
19
Dis
tric
t p
rofi
le
a chairperson and vice chairpersons. The chairperson serves as the head of the elected body, presides over all meetings of the council and is responsible for giving policy direc-tives to the DC Secretary.
Table 2.2.2: The functions of District Councils
Management of functions outlined in the Local Government Act 1997
Monitor performance of Community Councils in the provision of services
Assist and support Community Councils in the provision of services
Monitor performance of line ministries and other service providers in the district
Coordinate activities of service providers in the district
Monitor the implementation of the district plan
Converge sources of funding to respond to the priorities of Community Councils
Community Councils (CCs) consist of a minimum of 9 and a maximum of 15 elected members. The members include a maximum of 2 gazetted chiefs, who are nominated by the chiefs in the Community Council area. Each elected councillor serves a period of five years. There are currently 1,508 elected community counsellors in all – 54% of whom are women – and 249 chiefs in councils.
Table 2.2.3: The functions of Community Councils
Identify and discuss local opportunities and needs
Formulate, implement, monitor and evaluate community-based plans
Provide a forum for contacts by and between community representatives, local leaders and politicians
to enhance the flow of information
Represent the community in development matters and serve as a point of reference in matters pertaining
to community development
Coordinate development activities to enhance smooth planning and implementation
Coordinate national activities as outlined in the Local Government Act 1997
Leribe has two major urban centres: Hlotse and Maputsoe. Hlotse is the administrative centre of the district, while Maputsoe is a commercial and industrial centre and home to several small factories and a small industrial estate. There are 2 principal chiefs in the district. The district has 13 constituencies. Maliba-Matšo is the most populated con-stituency with 27,603 people, followed by Mphosong with 27,290 people and Likhetlane. Mahobong and Kolonyama are the least populated constituencies. Table 2.2.4 shows the constituencies and population densities.
The introduction of local government administration in Lesotho divided the Leribe dis-trict and the constituencies into the following 18 Community Councils.

District Council Leribe
20
Table 2.2.4: Constituency and Community Council population
Constituencies Community
Constituency Population Community Council
Population andNo of households
Hlotse 25,497 Limamarela 8,733 2,722
Kolonyama 18,643 Mphorosane 9,392 1,869
Likhetlane 27,239 Seshote 9,693 2,161
Mahobong 19,214 Matlameng 10,238 2,207
Maliba-Matšo 27,603 Pitseng 18,948 3,790
Maputsoe 26,866 Motati 10,080 9,700
Matlakeng 21,094 Fenyane 10,766 2,394
Mohobollo 21,110 Serupane 10,143 8,112
Mphosong 27,290 Malaoaneng 15,943 2,423
Peka 20,801 Menkhoaneng 22,502 3,326
Pela-Tsoeu 21,420 Maisa-Phoka 12,630 2,119
Thaba-Phatsoa 20,366 Sephokong 19,199 5,504
Tsikoane 21,389 Linare 24,713 3,965
Litjotjela 21,283 3,376
Khomo-khoana 26,851 11,014
Hleoheng 27,576 11,610
Manka 17,881 4,085
Tsoili-Tsoili 18,456 3,772
Total 295,027 84,149
2.3 HistoryThe district of Leribe has gained historical importance as the birth place of legendary leader Moshoeshoe I, who was born in Menkhoaneng in or around 1786. In 1840 his sec-ond son, Molapo, inherited his father’s responsibilities . Later on, under the colonial gov-ernment, the Hlotse camp was established around the borders of the northern lowlands where Leribe was founded. The region was also called “Molapo” country, named after the first Prime Minister, Jonathan Molapo, who was born in the village of Kolonyama2.
The district has traditionally been governed under two wards of Tsikoane and Leribe, each headed by a principal chief. The principal chief of Tsikoane has 35 Gazetted chiefs, 30 headmen and 95 customary chiefs under his jurisdiction. The principal chief of Leribe heads 37 Gazetted chiefs, 21 headmen, and 161 customary chiefs3. Within the context of the current national development and democratisation period, the chiefs share the administration of the district along with modern institutions.
2 Peter Sanders 2000. The Last of the Queen’s Men Standing – A Lesotho Experience. Witwatersrand University Press. 3 District councillor and CCs.
Dis
tric
t p
rofi
le

Local Governance and Non-state actors Support Programme - LGNSP
21
2.4 Agro-ecological zonesThe Leribe district lies on the north eastern side of Lesotho and shares three completely different agro-ecological zones of lowlands, foothills and mountains.
Map 2.4.1: Agro-ecological zones
The district covers the 3 ecological zones – lowlands, foothills and mountains – as described in the table and map, where conditions diverge substantially. They have very different potential, but all three show limited possibilities for sustainable agriculture.
Dis
tric
t p
rofi
le
Maseru
Leribe
Botha-Bothe
Mokhotlong
Liqhobong
LekupaPeka
Teyateyaneng
Ha Mantsebo
Matsieng
Ha Marakabei
Mafeteng
Matelile
Mohale's Hoek
Ketane
Mount Moorosi
QuthingAlwynskop
Qacha's Nek
SehlabathebeHa Paulus
ParayThaba-Tseka
Katse
Muela
Pitseng
Semonkong
Khabo
Botha-Bothe
South Africa Leribe
Berea
Maseru
Thaba - Tseka
Qacha's Nek
Mafeteng
Mohale's Hoek
Quthing
Mokhotlong
South Africa
South Africa
Lowland
Foothill
Mountain
Senqu River Valley
District Boundary
Main Town
LESOTHOGEOGRAPHICAL ZONES
Agro-ecological Regions of Lesotho
District Council Leribe
22
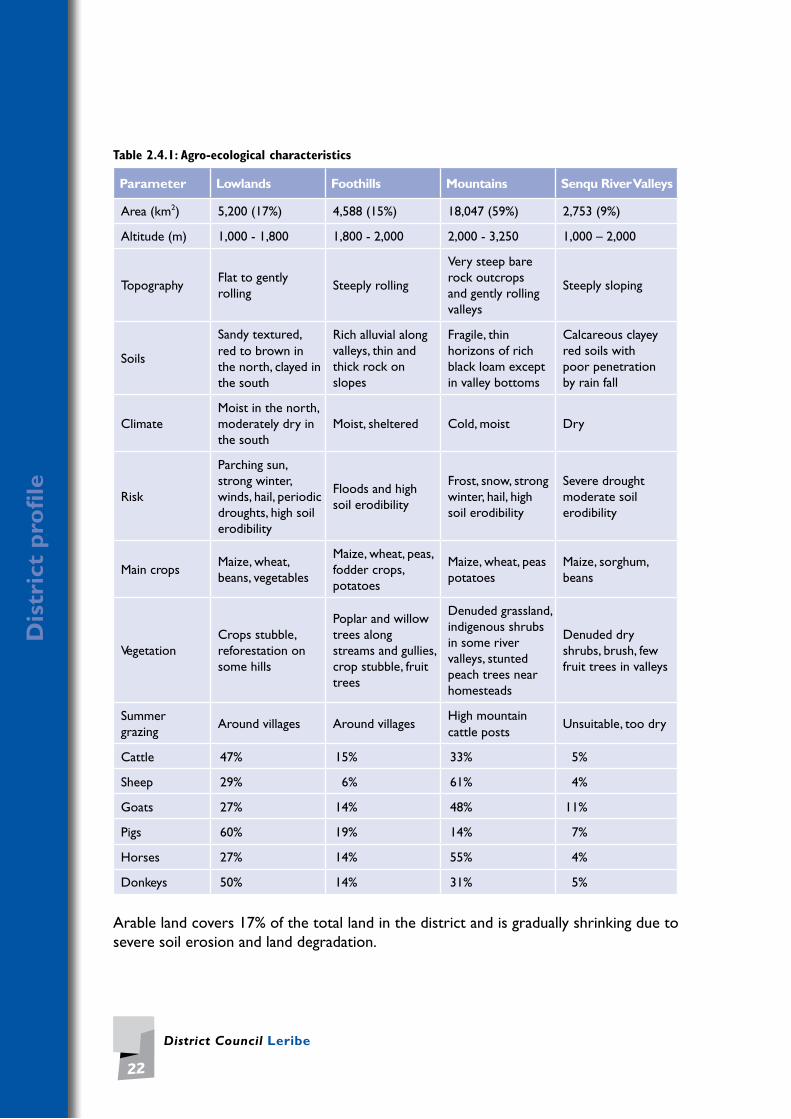
Table 2.4.1: Agro-ecological characteristics
Parameter Lowlands Foothills Mountains Senqu River Valleys
Area (km2) 5,200 (17%) 4,588 (15%) 18,047 (59%) 2,753 (9%)
Altitude (m) 1,000 - 1,800 1,800 - 2,000 2,000 - 3,250 1,000 – 2,000
TopographyFlat to gently rolling
Steeply rolling
Very steep bare rock outcrops and gently rolling valleys
Steeply sloping
Soils
Sandy textured,red to brown in the north, clayed in the south
Rich alluvial along valleys, thin and thick rock on slopes
Fragile, thin horizons of rich black loam except in valley bottoms
Calcareous clayey red soils with poor penetration by rain fall
ClimateMoist in the north, moderately dry in the south
Moist, sheltered Cold, moist Dry
Risk
Parching sun, strong winter, winds, hail, periodic droughts, high soil erodibility
Floods and high soil erodibility
Frost, snow, strong winter, hail, high soil erodibility
Severe drought moderate soil erodibility
Main cropsMaize, wheat, beans, vegetables
Maize, wheat, peas, fodder crops, potatoes
Maize, wheat, peas potatoes
Maize, sorghum, beans
VegetationCrops stubble, reforestation on some hills
Poplar and willow trees along streams and gullies, crop stubble, fruit trees
Denuded grassland, indigenous shrubs in some river valleys, stunted peach trees near homesteads
Denuded dry shrubs, brush, few fruit trees in valleys
Summer grazing
Around villages Around villagesHigh mountaincattle posts
Unsuitable, too dry
Cattle 47% 15% 33% 5%
Sheep 29% 6% 61% 4%
Goats 27% 14% 48% 11%
Pigs 60% 19% 14% 7%
Horses 27% 14% 55% 4%
Donkeys 50% 14% 31% 5%
Arable land covers 17% of the total land in the district and is gradually shrinking due to severe soil erosion and land degradation.
Dis
tric
t p
rofi
le
Local Governance and Non-state actors Support Programme - LGNSP
23
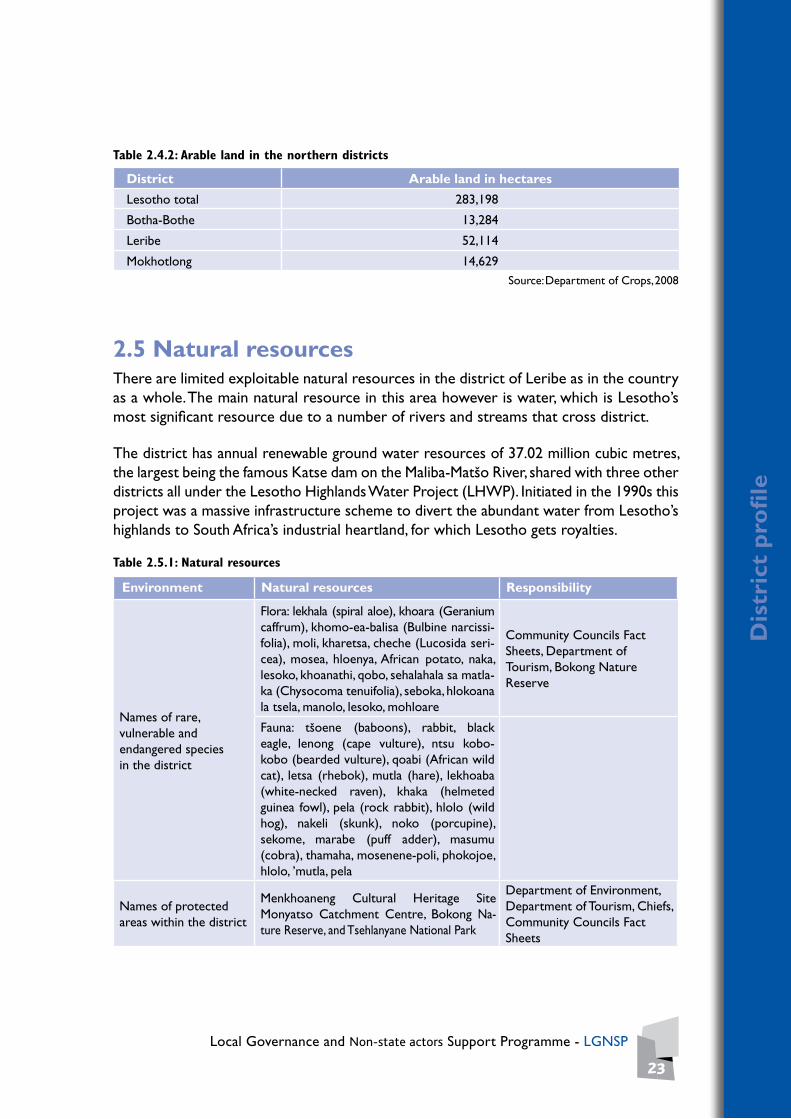
Table 2.4.2: Arable land in the northern districts
District Arable land in hectares
Lesotho total 283,198
Botha-Bothe 13,284
Leribe 52,114
Mokhotlong 14,629Source: Department of Crops, 2008
2.5 Natural resourcesThere are limited exploitable natural resources in the district of Leribe as in the country as a whole. The main natural resource in this area however is water, which is Lesotho’s most significant resource due to a number of rivers and streams that cross district.
The district has annual renewable ground water resources of 37.02 million cubic metres, the largest being the famous Katse dam on the Maliba-Matšo River, shared with three other districts all under the Lesotho Highlands Water Project (LHWP). Initiated in the 1990s this project was a massive infrastructure scheme to divert the abundant water from Lesotho’s highlands to South Africa’s industrial heartland, for which Lesotho gets royalties.
Table 2.5.1: Natural resources
Environment Natural resources Responsibility
Names of rare, vulnerable and endangered species in the district
Flora: lekhala (spiral aloe), khoara (Geranium caffrum), khomo-ea-balisa (Bulbine narcissi-folia), moli, kharetsa, cheche (Lucosida seri-cea), mosea, hloenya, African potato, naka, lesoko, khoanathi, qobo, sehalahala sa matla-ka (Chysocoma tenuifolia), seboka, hlokoana la tsela, manolo, lesoko, mohloare
Community Councils Fact Sheets, Department of Tourism, Bokong Nature Reserve
Fauna: tšoene (baboons), rabbit, black eagle, lenong (cape vulture), ntsu kobo-kobo (bearded vulture), qoabi (African wild cat), letsa (rhebok), mutla (hare), lekhoaba (white-necked raven), khaka (helmeted guinea fowl), pela (rock rabbit), hlolo (wild hog), nakeli (skunk), noko (porcupine), sekome, marabe (puff adder), masumu (cobra), thamaha, mosenene-poli, phokojoe, hlolo, ’mutla, pela
Names of protected areas within the district
Menkhoaneng Cultural Heritage Site Monyatso Catchment Centre, Bokong Na-ture Reserve, and Tsehlanyane National Park
Department of Environment, Department of Tourism, Chiefs, Community Councils Fact Sheets
Dis
tric
t p
rofi
le

District Council Leribe
24
Environment Natural resources Responsibility
Names of areas to be protected and their community areas
1. Lehaha la Molapo-Limamarela CC2. Lejoe motho-Mphorosane CC3. Khopung Fall, Khokhoba Cave, Leaoa &
Maieane Wetlands-Seshote CC4. Koasa, Nkoeng-Matlameng CC5. Lehaha la Pitseng, Letša la Tsunyane,
Molimo Nthuse-Pitseng CC6. Mohloling, Mokurisi-Fenyane7. Komeng San Drawings, Lefika le
Mokhamo at Malefane, Seetsa Fortress Setibing-Malaoaneng CC
Community Councils Fact Sheets, Bokong Nature Reserve office, chiefs
Natural resource management projects (e.g. tree planting, gully rehabilitation, rehabilitation of wetlands etc.)
1. Maluti Drakensberg Transfrontier Project
2. Highlands Natural Resource & Rural Income Enhancement (Hnrriep)
3. Community/social forestry (within CCs)4. Community gully rehabilitation
(for poverty alleviation/fato-fato)5. Rehabilitation of wetlands6. Capacity building to local authorities7. Reforestation of degraded areas natural
resource management projects (e.g. tree planting, gully rehabilitation, rehabilitation of wetlands etc.)
Department ofEnvironment
Department of Forestry and Land Reclamation
Water resources in Lesotho generate more than 50% of the country’s electricity require-ments. Whereas, following international agreements, most of the water is dedicated to for South Africa, a joint treaty provides for Lesotho to extract water during severe droughts which have occurred at least 3 times since the dam was commissioned twenty years ago. The water is released into the Mohokare River which provides water for the Leribe district as well as the downstream towns on both sides of the Lesotho/South Africa border, including Hlotse and Maputsoe. With the completion of the LHWP, activi-ties associated with the export of water and electricity have continued to provide jobs and foreign exchange.
In the rural areas, perennial springs provide drinking water for inhabitants in communi- ties, while the rivers and streams are used for bathing, washing and watering livestock. The urban inhabitants are supplied with water by the Water and Sanitation Authority (WASA).
Apart from water, Leribe has other natural resources such as diamonds at Nqechane and Kuenaneng, a substantial deposit of uranium at Kolonyama, and dolerites at Hleo-heng. Sand and sandstone are also sources of raw materials for economic activities in various parts of the district. The district moreover boasts good farming lands in the lowlands, and 17% of the land is regarded as arable.
Dis
tric
t p
rofi
le

Local Governance and Non-state actors Support Programme - LGNSP
25
2.6 ClimateThe Leribe district presents variable climatic patterns. The difference in altitude between the lowlands and the highlands is reflected in the type of weather found in the district. The temperature in the lowlands ranges from a minimum of -2°C in winter to a maxi-mum of 32°C and higher in summer. The climatic conditions in the mountains are harsh with colder, longer winters, while summer is generally cooler. Snow falls during the winter months, between April and October. On the other hand the lowland climate is cold and dry in winter but not noticeably hot in summer. There is frost throughout the winter months and hail storms in summer4. The average precipitation in Leribe ranges between 500 mm and 800 mm, with the highland zone receiving a greater proportion of the total rainfall.
Table 2.6.1: Rainfall data for the northern districts
Year Botha-Bothe Leribe Mokhotlong
2000 845 879.9 857.1
2001 710.48 771.8 690.5
2002 716.1 859.2 658.1
2003 450.8 591.8 460.8
2004 590.9 700 597
2005 806 842.5 786.6
2006 986.1 992.3 837.9
2007 643.2 738.4 499.9
Normal 706.1 784.8 598.1
Source: Lesotho Meteorological Services
4 Department of Lands, Surveys and Physical Planning LSPP (1992). Leribe District Physical Plan: Final Draft. Maseru, Lesotho.
Dis
tric
t p
rofi
le

District Council Leribe
26
Dis
tric
t p
rofi
le
Map 2.6.1: Rainfall distribution
Table 2.6.2: Long-term temperature average data
Months Maximum (°C) Minimum (°C) Rainfall (mm)
Jan 27.4 13.9 125.9
Feb 26.7 13.4 117.3
Mar 24.8 11.4 98.9
Apr 21.9 7.5 60.3
May 18.8 2.7 29.3
Jun 15.9 -0.7 11.0
Jul 16.2 -1.0 8.5
Aug 18.9 1.7 19.5
Sep 22.4 6.2 30.8
Oct 24.0 9.2 76.9
Nov 25.3 11.0 93.3
Dec 26.7 12.7 108.0
Maseru
Botha-Bothe
South Africa Leribe
Berea
Maseru
Thaba - Tseka
Qacha's Nek
Mafeteng
Mohale's Hoek
Quthing
Mokhotlong
South Africa
South Africa
Lesotho Border
District Boundary
LESOTHONORMAL RAINFALL DISTRIBUTION
1250
1200
1150
1100
1050
1000
950
900
850
800
750
700
650
600
550

Local Governance and Non-state actors Support Programme - LGNSP
27
Dis
tric
t p
rofi
le
Figure 2.6.1: Average rainfall for the northern districts
0
37.5
75.0
112.5
150.0Jan
Feb
Mar
Apr
May Jun Jul
Aug
Sep
Oct
Nov Dec
Average Rainfall
Rainfall (mm)
Botha-BotheLeribeMokhotlong
-7.5
0
7.5
15.0
22.5
30.0
Jan
Feb
Mar
Apr
May Jun Jul
Aug
Sep
Oct
Nov Dec
Average Maximum and Minimum Temperatures
Temperatures (°C)
Botha-Bothe-MaxLeribe-MaxMokhotlong-MaxBotha-Bothe-MinLeribe-MinMokhotlong-Min
Figure 2.6.2: Average temperature for the northern districts

District Council Leribe
28
Dis
tric
t p
rofi
le
2.7 Topography and soils
2.7.1 TopographyLeribe has a wide-ranging topography, featuring lowlands, foothills and mountain zones (i.e. Maluti and Drakensberg Ranges). The lowlands are situated in the extreme west of the district. They form part of the South African Highveld. The greater proportion of the mountain zone lies in the eastern region. In between the two zones lie the foothills. The general elevation of the district ranges from 1,500 m in the lowlands to over 3,000 m in the highlands.
Map 2.7.1: Lesotho northern district topography
2.7.2 SoilsLesotho soils5 are classified in relation to their agricultural potential. Some regions of Leribe have deep permeable soils with potential for good agricultural production. The lowlands of Leribe have the best soils and the foothills have a medium to high potential for agriculture. Leribe has a number of soil associations6, outlined below:• Popa-lockland-Matsanaassociationintheeasternhighlands• Ralebese-Matsaba-Machacheassociationinthefoothills• Leribe-Berea-Sephulaassociationinthewesternlowlands
5 A land use study conducted in 1967 by Bawden & Caroll. 6 Own sources for profiling exercise and according to the Leribe District Economic Strategy of 2002-2007.
Senqu
nyan
e Rv.
Mal
ibam
atso
Rv.
Matsoku Rv.
Ora
nge
Rv.
Khubelu R
v.
Orange R
v.
Dinakeng Rv.
Liothloaneng Rv.
Malaoaneng Rv.
Mokotong Rv.
Hololo Rv.
Khatibe Rv.
Ngoahaoe Rv.
Sakeng Rv.
Senqu Rv.
Baphali Rv.
Maseru
Leribe
Botha-Bothe
Mokhotlong
Botha-Bothe
South Africa
Leribe
Berea
Maseru
Thaba - Tseka
Mokhotlong
South Africa
Liqhobong
LekupaPeka
Muela
Pitseng
Khabo
Mapholaneng
Linakaneng
Lesotho Border
District Boundary
Community CouncilBoundary
Main Town
LESOTHONORTHERN DISTRICTS
Main Road
Small Road
Dirt Road
Main River

Local Governance and Non-state actors Support Programme - LGNSP
29
Dis
tric
t p
rofi
le
The Maliba-Matšo River valley has the best soils, some of which have been flooded by the Katse dam. The strategy further stated that the Leribe soil series, especially in the western lowlands, are subject to erosion, and as a result they need careful management to maintain their fertility. These soils were also associated with low to moderate holding capacity.
2.8 Rivers and water reservoirsLeribe has plenty of water from plentiful rivers. Like most districts in the country, many of the rivers and tributaries in the lowlands drain the watersheds of the eastern high-lands. Major rivers are the Mohokare (Caledon) River which runs along the western border with South Africa; the Phuthiatsana and Menyameng Rivers mark the southern border with the Berea district. Flowing from the highlands and into the Caledon River are the Makabelane, Mokotakoti, Likhetlane, Khomokhoana and Hlotse Rivers, with their associated tributaries. The Phuthiatsana and Menyameng mark the district's southern border with the Berea district. Other main rivers are the Mofoqoi, Maqu, Tsoinyane, Liphofung, Tsehlanyane, Sehauli, and Koeneng.
In the rural areas perennial springs provide drinking water for inhabitants in communities, while the rivers and streams are used for bathing, washing and watering livestock. The urban inhabitants are supplied with water by the Water and Sanitation Authority.
In the past, the availability of water influenced the pattern of settlements in rural areas, and water from rivers and dams was used for household purposes. Map 2.8.1 shows the major dams and rivers in the district, with an abundance of water resources consisting of both major and minor rivers in the highlands and the lowlands.

District Council Leribe
30
Dis
tric
t p
rofi
le
Map 2.8.1: Rivers and drainage

Local Governance and Non-state actors Support Programme - LGNSP
31
So
cial
ass
essm
ent
Social assessment
3.1 Population distribution and densityToday, Leribe’s population1 is 298,352 (42,109 people were reported to be working out-side the district, and 22,905 of these were residing and working in South Africa2). These statistics show a significant decline of around –1.42 % in the population of the district in ten years (1996-2006). Despite this negative population growth, the district is facing population pressure especially on arable land, which is likely to have a negative impact on the agricultural production of the district.
Leribe shares 9 % of the total land area of Lesotho and is the second most densely popu-lated district with a population density of 128 km2 in 2001 and 106 km2 in 2006. It is the most densely populated district after Maseru, as shown in Table 3.1.1.
Table 3.1.1: Population, total land area, density and distribution index
Percentage of population by district, percentage of area, density and distribution index in 1996 and 2006
Density (per km2)
Percent of population
Area (km2)
Distribution index
District 1996 2001 2006 1996(a) 2001(b) 1996 2001 1996 2001
Botha-Bothe 62 72 62 5.90 % 5.90 % 1,767 1,767 1.0 1.0
Leribe 106 128 105 13.10 % 13.90 % 2,828 2,828 1.7 1.8
Mokhotlong 21 22 24 4.60 % 4.20 % 4,075 4,075 0.3 0.3
Source: 1996, (a) Lesotho Census of Population2006, (b) Lesotho Demographic Survey 2001
1 Lesotho Census of Population and Housing, Preliminary Results, 2006. 2 The Leribe District Economic Strategy 2002-2007.
3
CHAPTER

District Council Leribe
32
So
cial
ass
essm
ent
The total area of the Leribe district is 2,828 km2. The population distribution over the district is uneven, with high densities in the mountain areas, the lowlands, especially in Maputsoe, and the foothills, especially in Mphosong. Some parts of the foothills and the lowlands have low population densities.
Map 3.1.1 below shows the population distribution in Leribe by constituency and by Community Council. Figure 3.1.1 also indicates the population density across the three ecological zones in the district.
Map 3.1.1: Population density in Leribe
The map above shows that the highlands and a small portion of the lowlands (Maputsoe urban area) have the highest population in the district.
Table 3.1.2: Population by district, sex and percentage change between 1996 and 2006
Percentage of the population by district, percentage of area, density and distribution index in 1996 and 2006
1996 2006 % CHANGE (1996-2006)District Males Females Total Males Females Total
Botha-Bothe 54,340 55,565 109,905 54,063 55,466 109,529 -0,,34
Leribe 147,851 154,813 302,664 145,683 152,669 298,352 -1,,42
Mokhotlong 42,667 43,801 86,486 47,419 48,921 96,340 11,,42
Source: 2006, Lesotho Census of Population
Leribe
Botha-Bothe
Thaba - Tseka
Tetetebeng
Sephokong
Lipelaneng
Maisa-Phoka
Menkhoaneng
MalaoanengSerupane
Linare
Litjotjela
Khomokhoana
Hleoheng
Manka
Tsoili-Tsoili
Motati
Fenyane Pitseng
Limamarela
Mphorosane
Seshote
Matlameng
CPA
CPA
CPA
South Africa
Mokhotlong
KatseDamMalut i
Mountains
LERIBE DISTRICTPOPULATION DENSITY
Lesotho BorderDistrict BoundaryCommunity CouncilBoundaryCPANatural ParkC.C. POPULATION01 - 1027110272 - 1263012631 - 2250222503 - 27576

Local Governance and Non-state actors Support Programme - LGNSP
33
So
cial
ass
essm
ent
3.2 DemographyBasotho households differ considerably by location. It is imperative to recognise that certain types of households are more disadvantaged irrespective of the district and the agro-ecological zone in which they are found. Head of household characteristics also affect the poverty level of the families in the country.
Table 11 gives a picture of household characteristics in the district. There are 81,382 house-holds in the entire district. Hleoheng with 11,610 inhabitants and Khomokhoana Com-munity Councils with 11,014 inhabitants have the highest number of households in the region, while Limamarela and Mphorosane CC in the mountain area have the lowest with 1,695 and 1,869 inhabitants respectively. The average household size in the district is 5.4 members. The table also shows a relatively high number of 24,711 female-headed households.
More than half of the households in the Linare and Hleoheng Community Councils are headed by women. There are altogether 6,431 child-headed households in Leribe, and most of them (30%) are in Hleoheng, with half (15 %) this number in the Litjotjela CC. The district has a total of 36,941 orphans, of whom 38 % are paternal, 32 % maternal and 30 % double orphans.

District Council Leribe
34
So
cial
ass
essm
ent
Table 3.2.1: Household demographics
CommunityCouncil
Number of households
Average household
size
Number of female-
headedhouseholds
%Number of child-headed
%
Limamarela C01 2,722 5 600 22,0 % 135 5.0 %
Mphorosane C02 1,869 5 374 20.0 % 92 4.9 %
Seshote C03 2,161 4 546 25.3 % 0 0.0 %
Matlameng C04 2,207 6 634 28.7 % 142 6.4 %
Pitseng C05 3,790 5 397 10.5 % 60 1.6 %
Motati C06 9,700 6 822 8.5 % 0 0.0 %
Fenyane C07 2,394 6 640 26.7 % 325 13.6 %
Serupane C08 8,112 6 958 11.8 % 231 2.8 %
Malaoaneng C09 2,423 7 508 21.0 % 119 4.9 %
Menkhoaneng C010 3,326 6 1,206 36.3 % 388 11.7 %
Maisa phoka C011 2,119 6 303 14.3 % 17 0.8 %
Sephokong C012 5,504 6 1,566 28.5 % 137 2.5 %
Linare C013 3,965 5 2,100 53.0 % 50 1.3 %
Litjotjela C014 3,376 4 820 24.3 % 490 14.5 %
Khomokhoana C015 11,014 6 4,696 42.6 % 412 3.7 %
Hleoheng C016 11,610 5 6,966 60.0 % 3,455 29.8 %
Manka C017 4,085 4 202 4.9 % 261 6.4 %
Tsoili-Tsoili C018 3,772 5 1,373 36.4 % 117 3.1%
Total 84,149 5.4 24,711 28.5 % 6,431 100 %
Source: IEC, Bos., 2006, Census Report, community counsellors, CCS, Chiefs, Ministry of Finance,Ministry of Development and Planning, Bos., 2006 Census Report and updates

Local Governance and Non-state actors Support Programme - LGNSP
35
So
cial
ass
essm
ent
Table 3.2.2: Social demography
Community Council
Number of households
Averagehousehold
size
Number offemale-headed
household
%
Number of Child-headed
household
%
Number of
double orphans
Number of
paternal orphans
Number of
maternal orphans
Number of persons receiving food aid
% persons receiving food aid
Number of persons
with disabilities
Limamarela C01
2,722 5 600 60.0% 135 5.0% 290 330 720 300 11% 84
Mphorosane C02
1,869 5 374 20.0% 92 4.9% 459 122 122 600 32% 18
Seshote C03 2,161 4 546 25.3% 138 6.4% 340 534 389 259 12% 113
Matlameng C04
2,207 6 634 28.7% 142 6.4% 295 257 332 139 6% 86
Pitseng C05 3,790 5 397 10.5% 60 1.6% 212 -393 310 90 2% 185
Motati C06 9,700 6 822 8.5% 0 0.0% 203 307 185 98 1% 59
Fenyane C07 2,394 6 640 26.7% 123 5.1% 212 393 310 663 28% 81
Serupane C08 8,112 6 958 11.8% 231 2.8% 330 430 393 116 1% 153
Malaoaneng C09
2,423 7 508 21.0% 119 4.9% 250 338 202 105 4% 70
Menkhoaneng C010
3,326 6 1,206 36.3% 388 11.7% 516 882 553 220 7% 229
Maisa phoka C011
2,119 6 303 14.3% 17 0.8% 50 146 73 50 2% 22
Sephokong C012
5,504 6 1,566 28.5% 137 2.5% 416 503 576 159 3% 148
Linare C013 3,965 5 2,100 53.0% 50 1.3% 550 290 260 70 2% 250
Litjotjela C014
3,376 4 820 24.3% 490 14.5% 740 350 530 32 1% 78
Khomokhoana C015
11,014 6 4,696 42.6% 412 3.7% 1,655 69 197 414 4% 385
Hleoheng C016
11,610 5 6,966 60.0% 3,455 29.8% 3,440 7,740 6,020 0 0% 645
Manka C017 4,085 4 202 4.9% 261 6.4% 900 1,600 1,000 300 7% 126
Tsoili-Tsoili C018
3,772 5 1,373 36.4% 117 3.1% 344 399 130 74 2% 150
Total 84,149 5.4 24,711 28.5% 6,367 6.2% 11,202 14,297 12,302 3,689 7.0% 2,882
Source: IEC, Bos., 2006, Census Report, Community Counsellors, CCS, Chiefs, Ministry of Finance, Ministry of Development and Planning, 2006 Census Report and updates

District Council Leribe
36
So
cial
ass
essm
ent
3.3 Poverty
3.3.1 The incidence of povertyFollowing international standard definitions, the terms “poor” and “ultra poor,” as used in Table 3.3.1.2, are defined as those households who cannot afford to meet more than 50% and 25% respectively of the mean household consumption level necessary to maintain the minimum daily requirement of 2,500 calories.
The Leribe district has a similar incidence of poverty as the national average. Female-headed households and households without land or livestock are considered the most vulnerable in the district, and the period October to March is the time when food is in shortest supply. As shown in Table 3.3.1.1 poverty in the District of Leribe has resulted in a high incidence of child malnutrition.
Table 3.3.1.1: Nutritional status of children in the northern districts
Height for age (stunting) Weight for height (wasting) Weight for age (underweight)
DistrictPercentage below -3
SD
Percentage below -2
SD
Mean Z
score
Percentage below -3
SD
Percentage below -2
SD
Mean Z
score
Percentage below -3
SD
Percentage below -2
SD
Mean Z
score
Number of children
Lesotho Total 15.2 38 1.6 1.2 4.3 0.00 3.6 19.8 1.0 1,620
Botha-Bothe 11.2 30.4 1.5 0.4 3.7 0.1 2.1 16.1 0.8 108.0
Leribe 13.4 30.7 1.2 2.3 3.7 0.1 6.0 17.2 0.9 208.0
Mokhotlong 22.9 49.2 2.0 0.8 4.5 - 7.6 25.9 1.2 106.0
Source: Lesotho Demographic and Health Survey 2004
Another determinant of poverty in Lesotho is livestock ownership. Analysis suggests that 88%3 of households own livestock and at least 13% of households do not have access to land. These factors along with declining livestock numbers, stock theft, falling remit-tances from migrant workers, HIV/AIDS, social problems and inadequate physical and social infrastructure are the main causes of poverty in the district.
Table 3.3.1.2: Livestock ownership in Leribe
Type of livestock Lowlands (%) Foothills (%) Highlands (%)
Sheep 28.9 19 40.7Goats 16.7 19 29.6Draught cattle 30.4 31 18.5Donkeys 41 38.1 37Pigs 30.4 33.3 22.2Poultry 61.3 69 55.6Other cattle 48 54 59.3Horses 15.7 24.6 11.1
Source:The Leribe district economic strategy 2002-2007
3 MoACLR Baseline Survey 2001.

Local Governance and Non-state actors Support Programme - LGNSP
37
So
cial
ass
essm
ent
The per capita “poverty line”4 in Lesotho is 146 Maluti per person per month, an amount based on actual expenditure5 incurred on non-food items by households from the more deprived segments of the population. The “ultra poverty line” was defined by half this level at 73 Maluti per person per month.
3.3.2 InequalityAnother major constraint to growth is the persistently large inequalities in the distribu-tion of income. The Gini6 coefficient:
Table 3.3.2.1: Gini coefficient (per adult equivalent)
District 2002/03 1994/95
Lesotho Total 0.52 0.57
Botha-Bothe 0.49 0.49
Leribe 0.49 0.56
Mokhotlong 0.52 0.56
Source: Bos. Household budget survey 1994/95, 2002/03
The Gini coefficient computed for all districts shows that inequality has decreased in the last decade, although levels remain high. Leribe shows slightly lower levels on average than the national levels.
3.3.3 Distribution of povertyVirtually all analyses and household surveys show striking variations of poverty in rela-tion to gender, household size, livelihood patterns, access to basic services, and geo-graphic location. The greatest determinant of variation is geography.
Table 3.3.3.1: Population and income share
2002/03 1994/95
District Population share Income share Population share Income share
Lesotho total 56.7 20.5 66.6 24.9
Botha-Bothe 7 5.3 6.8 6.1
Leribe 16.9 14.2 15.6 19.8
Mokhotlong 7 8.1 4.7 3.1
Source: Bos. Household budget survey 1994/95, 2002/03
4 Based on constant 2002 prices.5 Lesotho’s poverty line is the result of converting expenditure on 30 items of food and 10 own-produced consumption items into
quantities and calories. The minimum expenditure on food necessary to meet the internationally accepted threshold of 2,200 kilo-calories required for a healthy and active life is based on the cost per calorie actually incurred by a Basotho family.
6 Most commonly used inequality statistic: ranges from 0 (perfect equality) to 1 (perfect inequality).
District Council Leribe
38
So
cial
ass
essm
ent
The analysis shows that the mountain areas of Leribe are significantly poorer by all indi-cators. Extreme poverty is concentrated in the rural areas not only as a proportion of the population but also in absolute numbers.
Gender shows a significant variation in poverty. In Leribe, an estimated 40% of households in 2009 were headed by women who were single, divorced, widowed or abandoned by their husbands. Female-headed households had the highest incidence of poverty vulner-ability (65% and 62%) because they are typically headed by young unemployed women and/or ageing widows, who may have lost the assets they once possessed, are less likely to own agricultural assets such as livestock (35%, compared to 55% of male-headed households), and have difficulties securing cash incomes.
The most common socioeconomic aspects of poverty, i.e. health and education, are dis-cussed in the next sections.
3.3.4 Coping strategiesCoping strategies during lean periods include assistance from neighbours and relatives (ho sobelana), relief programmes (including cash-for-work), school supplementary fee- ding schemes, casual labour, small business activities, relief programmes and small savings groups (burial societies).
“Mafisa” is a custom whereby animals are borrowed from and shared with one another. This custom is an important source of income for households without livestock. The owner lends and shares animals in return for access to herders and better grazing. The recipient benefits by using these animals for labour and even enjoys certain limited prod-ucts (e.g. milk). “Lesielo,” the lending of female animals in order to share offspring –is a similar customary practice which may benefit poorer households.
The following chapters present how Leribe, along with the other mountain districts, lags behind the national average in key social indicators such as education, health or water and sanitation.
3.4 Economic profile
3.4.1 The economy of the northern districtsOver the past decade, the economy of Leribe, following similar patterns in the neigh-bouring northern districts, has experienced three important external shocks that have had a significant impact on the private sector.
Local Governance and Non-state actors Support Programme - LGNSP
39
So
cial
ass
essm
ent
The first relates to activities associated with the Lesotho Highlands Water Project (LHWP). The project, initiated in the 1990s, was a massive infrastructure scheme to di-vert the abundant water from Lesotho’s highlands to one of South Africa’s largest indus-trial provinces. During its implementation, LHWP contributed to an overall expansion of the economy and to the composition of the private sector in Leribe. The construction sub- sector, which benefited substantially from the LHWP, became unusually large, accounting for 23% of GDP, and unfortunately did not bring enough wealth to the district.
With the completion of the LHWP, activities associated with the export of water and electricity have continued to provide jobs and foreign exchange, but most construction workers needed to look for alternative employment.
The second shock is related to retrenchments in the South African gold mines, which had traditionally employed more than a third of the male Basotho labour force in the region. This has had two negative effects in the last decade: (i) a dramatic decline in Basotho miners’ remittances from 46% in the 80s to 21% of GNP this decade; and (ii) an increas-ing number of retrenched miners returning to Lesotho looking unsuccessfully for jobs.
In addition, men with little or no education, who traditionally depended on jobs in the South African mining sector, have now been forced to seek jobs elsewhere, without the necessary skills to take advantage of opportunities in other sectors such as manufactur-ing or agriculture in Leribe. Both facts further aggravate the unemployment situation in Leribe7.
The third shock is related to the arrival and rapid expansion of the textile and garments industry, initially, from across the border in the RSA and then followed by high levels of Chinese and Taiwanese foreign direct investment (FDI) in Lesotho, but particularly in Leribe.
In addition to the government’s offer of tax incentives and provision of infrastructure in enclaves, the market-opening opportunities provided by agreements such as the Africa Growth and Opportunity Act (AGOA) and Multi-Fiber Agreement (MFA) enabled Lesot-ho’s exports to enter the U.S. market on a preferential basis so that Lesotho’s exports increased almost fivefold in 6 years, reaching $ 321 million in 2002 and $ 456 million in 2004.
Over 2005-2006, however, there was an increase in the number of firms from 48 to 52 while total employment also increased by over 8,700 workers.
7 Household Budget Survey, 2002/2003.

District Council Leribe
40
So
cial
ass
essm
ent
One of the outcomes of the rapid inflow of garment-related FDI in Leribe is a striking dichotomy in the private sector. On the one hand, there are close to 50 foreign-owned garment factories providing close to 50,000 jobs, well connected to global supply chains and exporting almost all of their output mostly to the U.S. market. On the other hand, there is a small Basotho-owned private sector comprising mostly micro and small firms providing goods and services for the domestic market, in competition with imports.
They are engaged primarily in trade, services, local construction, sandstone quarrying and, to a limited extent, manufacturing.They are moreover completely disconnected from the regional supply chains of South Africa and/or other SADC countries. Also, they are not benefiting from the diffusion of managerial and technical skills or from backward and forward linkages to the FDI manufacturing firms operating in Lesotho, despite the latter’s presence in the country for nearly two decades.
3.4.2 The economy of LeribeLeribe is characterised by low levels of average income, high unemployment, high degree of inequality and severe land and soil degradation which restrains agricultural potential. Leribe has been hit by persistent food insecurity, caused mainly by successive drought-related crop failures, coupled with chronic poverty and HIV.
Maputsoe is the border town between Lesotho and the Orange Free State of South Africa. It has a border post which connects to Ficksburg across the Mohokare River. It is the second busiest border post in Lesotho with high economic development po-tential for trade with South Africa. It is the second largest industrial centre which was initially processing maize, producing umbrellas, and has lately been producing clothing and shoes Shortly after Independence, the Lesotho National Development Corporation chose Maputsoe as the site for Lesotho’s second industrial estate. By the early 1970s, an industrial estate had been laid out with sites fully serviced by tarred roads, electricity, water and other services. Early industries included maize milling, furniture manufacture, electric light fittings, umbrellas, tractor assembly, shoes and clothing. It is the last of these, the manufacturing of clothes, including jeans and leisure wear, which has subsequently become the most important industry. A second industrial estate has been established just west of the village of Ha Nyenye, two kilometres south of the original estate. The manufacturing sector increased employment.
3.5 Gender aspectsThere is a general concern in Lesotho about gender inequality and women’s empower-ment, in spite of the fact that Basotho women have attained in recent year higher levels of education. This is evident in politics and in decision-making positions which are still male dominated.
Local Governance and Non-state actors Support Programme - LGNSP
41
So
cial
ass
essm
ent
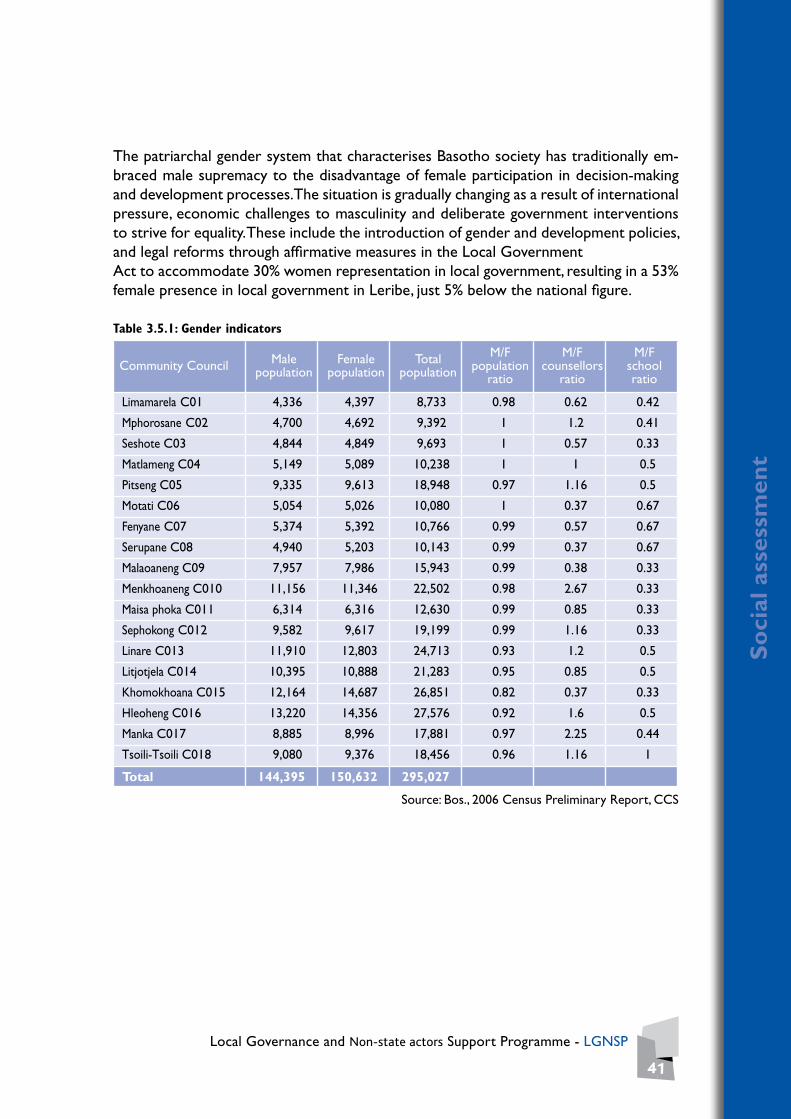
The patriarchal gender system that characterises Basotho society has traditionally em-braced male supremacy to the disadvantage of female participation in decision-making and development processes. The situation is gradually changing as a result of international pressure, economic challenges to masculinity and deliberate government interventions to strive for equality. These include the introduction of gender and development policies, and legal reforms through affirmative measures in the Local GovernmentAct to accommodate 30% women representation in local government, resulting in a 53% female presence in local government in Leribe, just 5% below the national figure.
Table 3.5.1: Gender indicators
Community Council Male population
Female population
Total population
M/F population
ratio
M/F counsellors
ratio
M/F school ratio
Limamarela C01 4,336 4,397 8,733 0.98 0.62 0.42
Mphorosane C02 4,700 4,692 9,392 1 1.2 0.41
Seshote C03 4,844 4,849 9,693 1 0.57 0.33
Matlameng C04 5,149 5,089 10,238 1 1 0.5
Pitseng C05 9,335 9,613 18,948 0.97 1.16 0.5
Motati C06 5,054 5,026 10,080 1 0.37 0.67
Fenyane C07 5,374 5,392 10,766 0.99 0.57 0.67
Serupane C08 4,940 5,203 10,143 0.99 0.37 0.67
Malaoaneng C09 7,957 7,986 15,943 0.99 0.38 0.33
Menkhoaneng C010 11,156 11,346 22,502 0.98 2.67 0.33
Maisa phoka C011 6,314 6,316 12,630 0.99 0.85 0.33
Sephokong C012 9,582 9,617 19,199 0.99 1.16 0.33
Linare C013 11,910 12,803 24,713 0.93 1.2 0.5
Litjotjela C014 10,395 10,888 21,283 0.95 0.85 0.5
Khomokhoana C015 12,164 14,687 26,851 0.82 0.37 0.33
Hleoheng C016 13,220 14,356 27,576 0.92 1.6 0.5
Manka C017 8,885 8,996 17,881 0.97 2.25 0.44
Tsoili-Tsoili C018 9,080 9,376 18,456 0.96 1.16 1
Total 144,395 150,632 295,027
Source: Bos., 2006 Census Preliminary Report, CCS
District Council Leribe
42
So
cial
ass
essm
ent
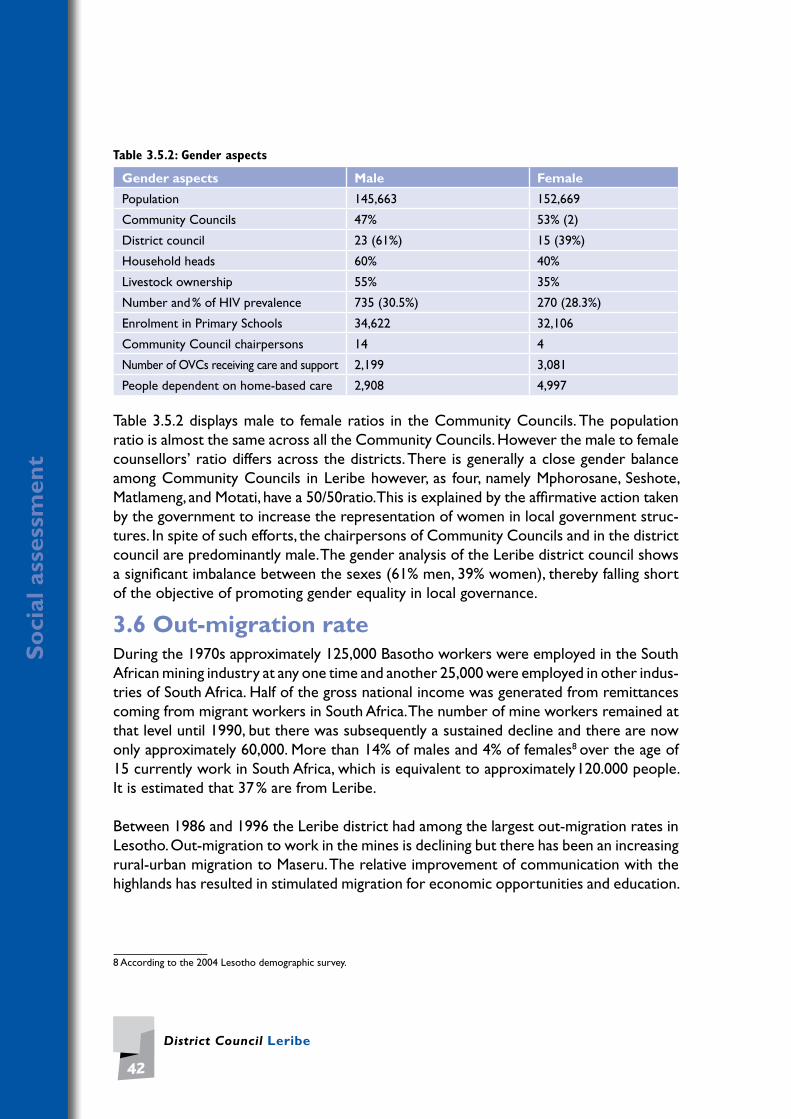
Table 3.5.2: Gender aspects
Gender aspects Male Female
Population 145,663 152,669
Community Councils 47% 53% (2)
District council 23 (61%) 15 (39%)
Household heads 60% 40%
Livestock ownership 55% 35%
Number and % of HIV prevalence 735 (30.5%) 270 (28.3%)
Enrolment in Primary Schools 34,622 32,106
Community Council chairpersons 14 4
Number of OVCs receiving care and support 2,199 3,081
People dependent on home-based care 2,908 4,997
Table 3.5.2 displays male to female ratios in the Community Councils. The population ratio is almost the same across all the Community Councils. However the male to female counsellors’ ratio differs across the districts. There is generally a close gender balance among Community Councils in Leribe however, as four, namely Mphorosane, Seshote, Matlameng, and Motati, have a 50/50ratio. This is explained by the affirmative action taken by the government to increase the representation of women in local government struc-tures. In spite of such efforts, the chairpersons of Community Councils and in the district council are predominantly male. The gender analysis of the Leribe district council shows a significant imbalance between the sexes (61% men, 39% women), thereby falling short of the objective of promoting gender equality in local governance.
3.6 Out-migration rateDuring the 1970s approximately 125,000 Basotho workers were employed in the South African mining industry at any one time and another 25,000 were employed in other indus-tries of South Africa. Half of the gross national income was generated from remittances coming from migrant workers in South Africa. The number of mine workers remained at that level until 1990, but there was subsequently a sustained decline and there are now only approximately 60,000. More than 14% of males and 4% of females8 over the age of 15 currently work in South Africa, which is equivalent to approximately120.000 people. It is estimated that 37 % are from Leribe.
Between 1986 and 1996 the Leribe district had among the largest out-migration rates in Lesotho. Out-migration to work in the mines is declining but there has been an increasing rural-urban migration to Maseru. The relative improvement of communication with the highlands has resulted in stimulated migration for economic opportunities and education.
8 According to the 2004 Lesotho demographic survey.

Local Governance and Non-state actors Support Programme - LGNSP
43
Agr
icu
ltu
ral p
rofi
le
Agricultural profile
4.1 IntroductionThe Leribe district is considered to be one of the main agricultural production zones in the country due to its fertile soils, high rainfall and large agricultural areas. Maize, sor-ghum and beans are said to be the most common crops in Leribe across the Community Councils. The district produces a large quantity of maize. It plants 21% of the national maize area and harvests 24.8% of the national production [LBES 2002]. 30,000 hectares were planted with maize, 5,550 hectares with sorghum, and 2,000 hectares with wheat in previous years.
The majority of households in the district depend on income from agriculture, livestock production, manufacturing and remittances from migrant labour sources, which are the mainstay of the district’s economy. Agriculture contributes 16.5% to the GDP and it constitutes the main activity for about 80% of the population [UNDP (2007)]. However agriculture is predominantly subsistence in nature, with the majority of farmers cultivat-ing less than half a hectare of land9. Remittances from migrant workers used to play a critical role in household incomes in Lesotho. Most families supplemented their incomes from the remittances and invested in farming activities. However, retrenchments from the mining industry in South Africa influenced agricultural production in terms of farm input purchases and affected agricultural production negatively in the country.
9 Lesotho National Development Report (2006).
4
CHAPTER

District Council Leribe
44
Agr
icu
ltu
ral p
rofi
le
Map 4.1: Agricultural land
Botha-Bothe
Thaba - Tseka
Tetetebeng
Sephokong
Maisa-Phoka
Menkhoaneng
MalaoanengSerupane
Linare
Litjotjela
Hleoheng
Manka
Tsoili-tsoili
Motati
Fenyane Pitseng
Limamarela
Mphorosane
Seshote
Matlameng
CPA
CPA
CPA
South Africa
Mokhotlong
KatseDamMalut i
Mountains
Lesotho Border
District Boundary
Community CouncilBoundary
CPA
Degraded Land
Cropland Arable Land
Rangeland Catle PostArea
Natural Park
LERIBE DISTRICTAGRICULTURE
Leribe
Lipelaneng
Khomokhoana

Local Governance and Non-state actors Support Programme - LGNSP
45
Agr
icu
ltu
ral p
rofi
le
Table 4.1.1: Agricultural profile of the district
CommunityCouncil
Number of households
with agricultural
plots
Average size of
agricultural plots
(hectares)
Size of public land
(Km2)
Main crops produced
Main livestock in area
Limamarela C01 1,892 4 472Maize, wheat, beans
Cattle, sheep, goats
Mphorosane C02 1,121 0.04 99Maize, sorghum,beans
Cattle, sheep, goats
Seshote C03 546 4 274Maize, sorghum,beans
Cattle, sheep, goats
Matlameng C04 1,986 2 364Maize, sorghum,beans
Cattle, sheep, goats
Pitseng C05 4,835 1.2 263Maize, sorghum,beans
Cattle, sheep, goats
Motati C06 1,693 2 382Maize, sorghum,beans
Cattle, sheep, goats
Fenyane C07 763 1.2 371Maize, sorghum,beans
Cattle, sheep, goats
Serupane C08 2,447 2 215Maize, sorghum,beans
Cattle, sheep, goats
Malaoaneng C09 2,365 10 455Maize, sorghum,beans
Cattle, sheep, goats
Menkhoaneng C010 2,974 5 33Maize, sorghum,beans
Cattle, sheep, goats
Maisa phoka C011 11,000 1.5 192Maize, sorghum,beans
Cattle, sheep, goats
Sephokong C012 3,331 3 200Maize, sorghum,beans
Cattle, sheep, horses
Linare C013 3,205 1.4 167Maize, sorghum,beans
Cattle, sheep, goats
Litjotjela C014 3,200 4 372Maize, sorghum,beans
Cattle, sheep, goats
Khomokhoana C015 2,974 5 251Maize, sorghum,wheat
Cattle, sheep, pig
Hleoheng C016 3,400 4 382Maize, sorghum,beans
Cattle, sheep, goats
Manka C017 2,941 5,571 372Maize, sorghum,beans
Cattle, sheep, goats
Tsoili-Tsoili C018 3,172 4 51Maize, sorghum,beans
Cattle, sheep, goats
Total 45,808 5,625 4,915

District Council Leribe
46
Agr
icu
ltu
ral p
rofi
le
4.2. Crop profile analysisAgriculture in Leribe is uneconomical and production is inadequate. The government has to a certain extent been held to account for this as it subsidises cereal crop production. On the other hand, over the years households have also subsidised their agricultural costs by diverting income from mine remittances to crop production. In a self-subsist-ence framework, few households keep proper records and are aware that costs often exceed their returns.
Table 4.2.1: Agriculture area planted
-
7,500
15,000
22,500
30,000
Maiz
e
Whea
t
Sorghu
m
Beans
Peas
Sorghu
m &
Bean
s
Maiz
& B
eans
Maiz
e & S
orghu
m
Beans
& P
eas
Other
Mix
Barley
Oats
Other
crop
s
Potatoes
Lowlands Foothils Mountains
Source: Ministry of Agriculture, 2008
Figure 4.2.2: Crop distribution in Leribe
Source: Ministry of Agriculture, 2007
Area Planted in Summer by Crop Type in Leribe in 2007

Local Governance and Non-state actors Support Programme - LGNSP
47
Agr
icu
ltu
ral p
rofi
le
Figure 4.2.3: Area of wheat planted in district
Source: Ministry of Agriculture, 2008
In the mountains, where direct agricultural costs are lower because people tend to use animal traction, manure and their own seeds, crop production is profitable but the amounts grown fall far short of the requirements. Altogether, fewer than 5% of house- holds produce enough cereals to feed their families throughout the year, with the re- mainder having to purchase part or all of their cereals.
Figure 4.2.4: Area of sorghum planted in district
Source: Ministry of Agriculture, 2008
Leribe produces around 30% of the total food required to feed its population in a normal year. This means that 60% of the annual cereal requirement has to be imported at the going regional market price. Household purchasing power therefore plays an important role in household food security. This in effect means that, overall, households are more vulnerable to increases in the price of maize than they are to low crop production as a result of erratic weather patterns.
0
2250
4500
6750
9000
1981 1983 1985 1987 1989 1991 1993 1995 1997 1999 2001 2003 2005 2007
AREA OF WHEAT PLANTED IN DISTRICT (Hectares)
Hec
tare
s
0
3750
7500
11250
15000
1981
1982
1983
1984
1985
1986
1987
1988
1989
1990
1991
1992
1993
1994
1995
1996
1997
1998
1999
2000
2001
2002
2003
200420
0520
0620
07
AREA OF SORGHUM Planted (Hectares)
Botha-Bothe Leribe Mokhotlong
Hec
tare
s
0
2250
4500
6750
9000
1981 1983 1985 1987 1989 1991 1993 1995 1997 1999 2001 2003 2005 2007
AREA OF WHEAT PLANTED IN DISTRICT (Hectares)
Hec
tare
s
0
3750
7500
11250
15000
1981
1982
1983
1984
1985
1986
1987
1988
1989
1990
1991
1992
1993
1994
1995
1996
1997
1998
1999
2000
2001
2002
2003
200420
0520
0620
07
AREA OF SORGHUM Planted (Hectares)
Botha-Bothe Leribe Mokhotlong
Hec
tare
s

District Council Leribe
48
Agr
icu
ltu
ral p
rofi
le
Most rural dwellers face food income deficits. The current food access problem in Leribe is a result of low food production, increases in the price of staple foods and depressed employment markets.
The decline in mine remittances has had a serious impact on food production as far fewer households have the necessary income to invest in the required inputs. For poor house- holds the annual practice of procuring the required inputs for cereal production is almost insurmountable. In the past this would have been overcome through sharecropping with other households but as the number of people without wage employment grows, the prospects for sharecropping have declined.
Because of changing weather patterns and the harsh conditions of the highlands in Leribe, the Basotho live far from their fields and their cattle. The pattern of settlement is such that people and animals are separated from the land which they use to produce their food. The most serious implication of this is that it is virtually impossible to maintain fertility as the distance between the sources of soil nutrition (manure) and the fields is excessive.
Fertility and soil conditions steadily decline as the majority of families are unable to find the means to transport manure to the fields and are unable to afford artificial fertilisers. Depletion of organic matter in the soil results in a reduction of the soil’s capacity to retain moisture, which in turn means that crops are increasingly vulnerable to dry spells that they might otherwise have survived in the past.
The Ministry of Agriculture and Forestry (MoAFS) is the leading public service provider through resource centres to which all Community Councils have access. Private service providers include: LHDA, the Red Cross, UNICEF, FAO and other NGOs. There are about 50,000 households with agricultural plots. LHDA is engaged in three main programme areas, the first being mountain horticulture and field crops. This programme involved the establishment of village nurseries for fruit tree and seed multiplication, highland maize, potatoes, wheat and beans. LHDA supplies inputs and training for farmers. The second of these areas is the livestock and range management project. The third area is fisheries, where LHDA provides loans, licensing and training for farmers10.
10 Lesotho National Development Report, 2006.

Local Governance and Non-state actors Support Programme - LGNSP
49
Agr
icu
ltu
ral p
rofi
le
Table 4.2.5: Agricultural service providers
Community Council
Government service providers
Non-State Actorsservice providers
Planned Agric projects
Limamarela C01 MOAFS LHDA
Mphorosane C02 MOAFS LHDA
Seshote C03 MOAFS LHDA
Matlameng C04Mahobong resource centre
LHDA
Pitseng C05 MOAFS FAOFAO agricultural project
Motati C06 MOAFS LHDA
Fenyane C07 MOAFS LHDA
Serupane C08 MOAFS FAO, UNICEF, NGOs
Malaoaneng C09 MOAFS FAO, NGOs
Menkhoaneng C010 MOAFS Red CrossPiggery, sheep, stock farming
Maisa phoka C011 MOAFS Red Cross
Sephokong C012Tale and Hlotse Resource Centres FAO, UNICEF, Red Cross
Linare C013 MOAFS FAO, UNICEF, NGOs
Litjotjela C014 MOAFS FAO, UNICEF, NGOs
Khomokhoana C015Khomokhoana Resource Centre
None Block Farming
Hleoheng C016 MOAFS Red Cross
Manka C017 MOAFS Red Cross
Tsoili-Tsoili C018 MOAFS Red Cross
4.3 Livestock productionAbout 80% of the population of Leribe own livestock. The table below gives a picture of livestock ownership in the district, providing a summary of ownership patterns in differ-ent agro-ecological zones. The highlands have the highest percentage of cattle, sheep and goat ownership in Leribe, while the foothills and the lowlands have the highest poultry and draught cattle ownership respectively. The table also shows high dairy cattle owner-ship (14.3%) in the foothills compared to 8.8% and 7.4% in the lowlands and highlands respectively.

District Council Leribe
50
Agr
icu
ltu
ral p
rofi
le
Table 4.3.1: Livestock ownership in Leribe
Type of livestock Lowlands % Foothills % Highlands %
Poultry 61.3 69 55.6
Cattle 48 54 59.3
Donkeys 41 38.1 37
Pigs 30.4 33.3 22.2
Draught cattle 30.4 31 18.5
Sheep 28.9 19 40.7
Goats 16.7 19 29.6
Horses 15.7 24.6 11.1
Dairy cattle 8.8 14.3 7.4
Indigenous cattle 2 - -
Beef cattle 0.5 - 3.7
Mules 0.5 - -
Source:The Leribe District Economic Strategy, 2002-2007
Leribe has a large size of cattle herds, contributing 17% to the national cattle popula-tion11. Cattle are used mainly for dairy production and draught, especially in the highlands. They are also slaughtered during traditional ceremonies. With a high HIV prevalence among herders, cattle herds are likely to decrease since the Basotho traditionally slaugh-ter cattle for their deceased. A cattle herd is still a symbol of wealth and prestige in many rural areas of Lesotho.
Figure 4.3.1: Livestock herd size
Source: Ministry of Agriculture, 2008
11 The Leribe District Economic Strategy, 2002-2007.
0
50000
100000
150000
200000
1983 1985 1987 1989 1991 1993 1995 1997 1999 2001 2003 2005
HERD SIZE (Heads)
Botha-Bothe Leribe Mokhotlong
Hea
ds
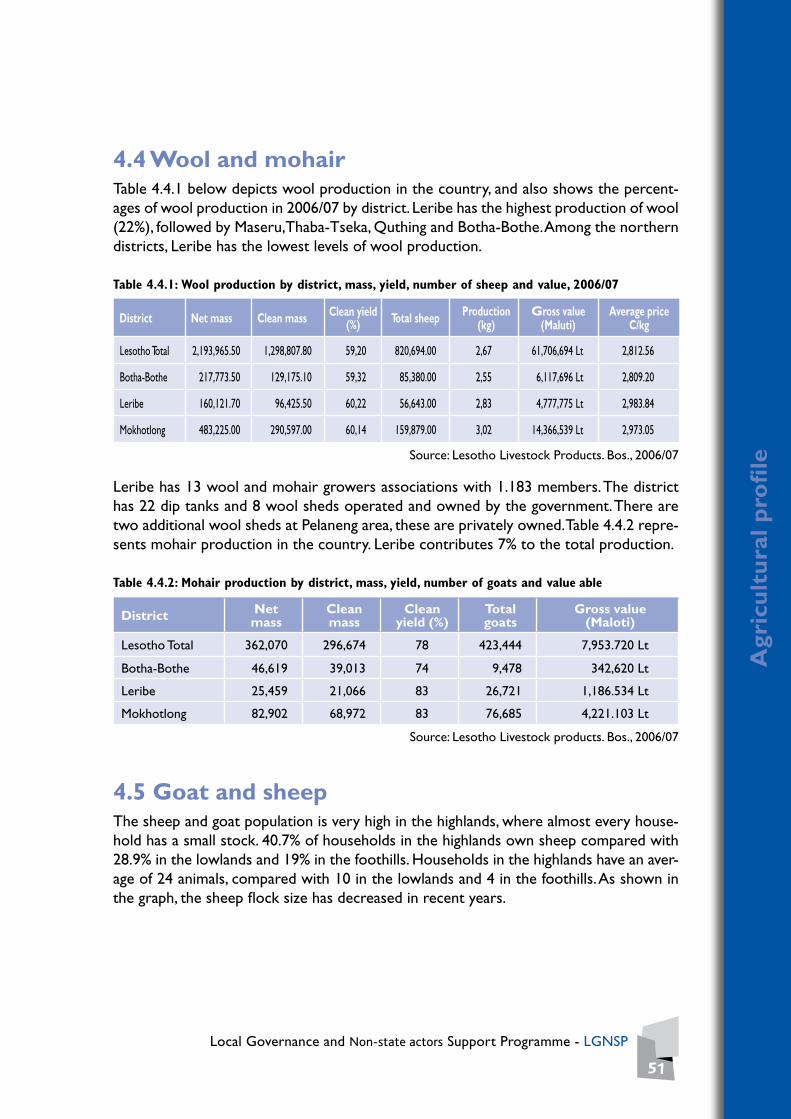
Local Governance and Non-state actors Support Programme - LGNSP
51
Agr
icu
ltu
ral p
rofi
le
4.4 Wool and mohairTable 4.4.1 below depicts wool production in the country, and also shows the percent-ages of wool production in 2006/07 by district. Leribe has the highest production of wool (22%), followed by Maseru,Thaba-Tseka, Quthing and Botha-Bothe. Among the northern districts, Leribe has the lowest levels of wool production.
Table 4.4.1: Wool production by district, mass, yield, number of sheep and value, 2006/07
District Net mass Clean mass Clean yield (%) Total sheep Production
(kg)Gross value
(Maluti)Average price
C/kg
Lesotho Total 2,193,965.50 1,298,807.80 59,20 820,694.00 2,67 61,706,694 Lt 2,812.56
Botha-Bothe 217,773.50 129,175.10 59,32 85,380.00 2,55 6,117,696 Lt 2,809.20
Leribe 160,121.70 96,425.50 60,22 56,643.00 2,83 4,777,775 Lt 2,983.84
Mokhotlong 483,225.00 290,597.00 60,14 159,879.00 3,02 14,366,539 Lt 2,973.05
Source: Lesotho Livestock Products. Bos., 2006/07
Leribe has 13 wool and mohair growers associations with 1.183 members. The district has 22 dip tanks and 8 wool sheds operated and owned by the government. There are two additional wool sheds at Pelaneng area, these are privately owned. Table 4.4.2 repre-sents mohair production in the country. Leribe contributes 7% to the total production.
Table 4.4.2: Mohair production by district, mass, yield, number of goats and value able
District Net mass
Clean mass
Clean yield (%)
Total goats
Gross value (Maloti)
Lesotho Total 362,070 296,674 78 423,444 7,953.720 Lt
Botha-Bothe 46,619 39,013 74 9,478 342,620 Lt
Leribe 25,459 21,066 83 26,721 1,186.534 Lt
Mokhotlong 82,902 68,972 83 76,685 4,221.103 Lt
Source: Lesotho Livestock products. Bos., 2006/07
4.5 Goat and sheepThe sheep and goat population is very high in the highlands, where almost every house-hold has a small stock. 40.7% of households in the highlands own sheep compared with 28.9% in the lowlands and 19% in the foothills. Households in the highlands have an aver-age of 24 animals, compared with 10 in the lowlands and 4 in the foothills. As shown in the graph, the sheep flock size has decreased in recent years.

District Council Leribe
52
Agr
icu
ltu
ral p
rofi
le
Figure 4.5.1: Sheep flock size
Source: Ministry of Agriculture, 2007
4.6 Range managementLesotho is a grassland country, with very limited forest cover, where the mountains form the largest part of grazing areas. Until lately, natural resource management in Lesotho used to be the responsibility of the chiefs and village development councils. With the introduction of local government, natural resource management has become the respon-sibility of the local Community Councils.
Before the introduction of local government in the country, the two principal chiefs of Leribe were responsible for the overall range and grazing management. This included grazing permits for cattle posts in the highlands as well as for allocating land to the grazing associations. There are three registered grazing associations in the district: Matsoku in the Maliba-Matšo catchment area, Bokong in Pelaneng in the Katse catchment area, and Ha Khabo.
Due to high livestock ownership in the district, the rangelands are vulnerable to over-stocking, which is likely to result in poor quality vegetation, poor soil fertility and thus to affect livestock production and quality. Wild fires are also a serious threat to rangelands in the country.
In the Leribe district there is a very efficient system of range management associations and grazing associations, which were established during the construction of Katse and Mohale dams in the catchments to reduce reservoir sedimentation risk. In the Bokong and Tsehlanyane areas the community and area chiefs have dedicated thousands of hectares of rangeland to a community-based nature conservation tourism initiative in collaboration with LHWP.
0
75000
150000
225000
300000
1983 1985 1987 1989 1991 1993 1995 1997 1999 2001 2003 2005
Botha-Bothe Leribe Mokhotlong
Heads

Local Governance and Non-state actors Support Programme - LGNSP
53
Hea
lth
an
d H
IV/A
IDS
Health and HIV/AIDS
5.1 HealthAfter showing signs of improvement in the 1990s, the health conditions of Leribe population appear to have worsened over the past decade. Average life expectancy has declined (presumably due to HIV/AIDS). Poverty has increased and with it the infant mortality, under-five child mortality, and maternal mortality rates. Morbidity and mortality from communicable diseases such as Tuberculosis, HIV/AIDS and non-communicable diseases have all increased in recent years. The HIV/AIDS epidemic in Lesotho (29 % of the population aged 15-49 are infected with HIV) has contributed to these negative trends in Leribe, but there is an overall sense that quality of health services has also declined compared to the higher quality primary care system that existed in the 1980s.
Leribe has two hospitals, Motebang Government Hospital in Hlotse and Mission Mamamohau Hospital in Seshote. Leribe being situated along the route leading to the Katse dam, has benefited from provision of various resources, including the construction of two clinics at Ha Lejone and Mphorosane, and a trauma unit at Motebang Hospital. These initiatives significantly improved geographic access for the population in this district. There are 34 health centres in Leribe; one filter clinic in Maputsoe town, 24 privately owned by CHAL, and 10 owned by the government. There are 5 private practitioners in the district. Even though the health infrastructure seems to be well developed, most highland resi-dents still travel long distances for health services, well beyond the 5-10/2 hours recom-mended by WHO. Map 5.1.1 below shows the distribution of health care facilities and road networks, and the accessibility of these services in the district.
5
CHAPTER

District Council Leribe
54
Hea
lth
an
d H
IV/A
IDS
Map 5.1.1: Health facilities
The government of Lesotho has for many years pursued a primary health care strategy which entails making health care services accessible and available within walking distance. The District Profiling exercise shows how more than 225 villages still have a very poor access to health facilities. Table 5.1.1 provides a picture of health care accessibility in the different Community Councils of the district. Fifty-five villages in Sephokong Community Council have very limited access to health services. People in Fenyane travel 60 km to the nearest health centre.
Table 5.1.1: Health care services
Community CouncilGovernment health centres
Health services by NGOs and private providers
Average distance (km) to reach nearest health centre
3 most prevalent diseases
Number of households
Number of households with toilets
%
Number of villages with worst access to HC
%Number of affected people
Limamarela C01 0 1 15 HIV/AIDS, tuberculosis 2,722 1,663 61% 6 8% 5,335
Mphorosane C02 0 2 22Diabetes, diarrhoea, pneumonia, vomiting
1,869 1,717 92% 4 5% 8,628
Seshote C03 0 2 23 Skin disorder, STIs 2,161 1,686 78% 24 65% 5,705
Leribe
Botha-Bothe
Thaba - Tseka
Tetetebeng
Sephokong
Lipelaneng
Maisa-Phoka
Menkhoaneng
MalaoanengSerupane
Linare
Litjotjela
Khomokhoana
Hleoheng
Manka
Tsoili-tsoili
Motati
Fenyane Pitseng
Limamarela
Mphorosane
Seshote
Matlameng
CPA
CPA
CPA
South Africa
Mokhotlong
KatseDamMalut i
Mountains
Lesotho Border
District Boundary
Community CouncilBoundary
CPA
Main Road
Smal l Road
Dir t Road
Heal th Centre
LERIBE DISTRICTHEALTH CENTRES

Local Governance and Non-state actors Support Programme - LGNSP
55
Hea
lth
an
d H
IV/A
IDS
Matlameng C04 1 0 17HIV/AIDS, cardiovascular, respiratory
2,207 135 6% 27 49% 626
Pitseng C05 1 1 15 Tuberculosis, HIV/AIDS, malnutrition
3,790 700 18% 3 6% 3,500
Motati C06 1 1 11Tuberculosis, HIV/AIDS, Hypertension
9,700 624 6% 16 46% 648
Fenyane C07 1 0 60Tuberculosis, HIV/AIDS, diabetes
2,394 134 6% 35 92% 603
Serupane C08 1 1 2Tuberculosis, STI, Hypertension
8,112 768 9% 3 4% 960
Malaoaneng C09 1 0 3Pulmonary, tuberculosis, HIV/AIDS, hypertension
2,423 600 25% 0 0% 3,948
Menkhoaneng C010 1 1 2HIV/AIDS, tuberculosis, diabetes
3,326 1,098 33% 4 4% 7,429
Maisa phoka C011 0 1 27HIV/AIDS, tuberculosis, diabetes
2,119 451 21% 2 3% 2,688
Sephokong C012 0 1 10HIV/AIDS, tuberculosis, diabetes
5,504 224 4% 59 40% 781
Linare C013 1 0 15HIV/AIDS, diabetes, hypertension
3,965 1,400 35% 5 8% 8,726
Litjotjela C014 1 1 18STIs, chest infections, diarrhoea
3,376 2,200 65% 1 2% 13,869
Khomokhoana C015 1 9 5 Tuberculosis, HIV/AIDS 11,014 2 0% 5 42% 4
Hleoheng C016 0 1 12HIV/AIDS, STIs, tuberculosis
11,610 2,122 18% 6 13% 5,040
Manka C017 1 3 25HIV/AIDS, tuberculosis, diarrhoea
4,085 684 17% 22 34% 2,994
Tsoili-Tsoili C018 0 1 14Hypertension, tuberculosis, HIV/AIDS
3,772 1,894 50% 3 6% 9,267
Source: IEC, Bos., 2006, Census Report, community counsellors, CCS, chiefs, Ministry of Finance, Ministry of Development and Plannning, Bos. 2006, Census Report and updates
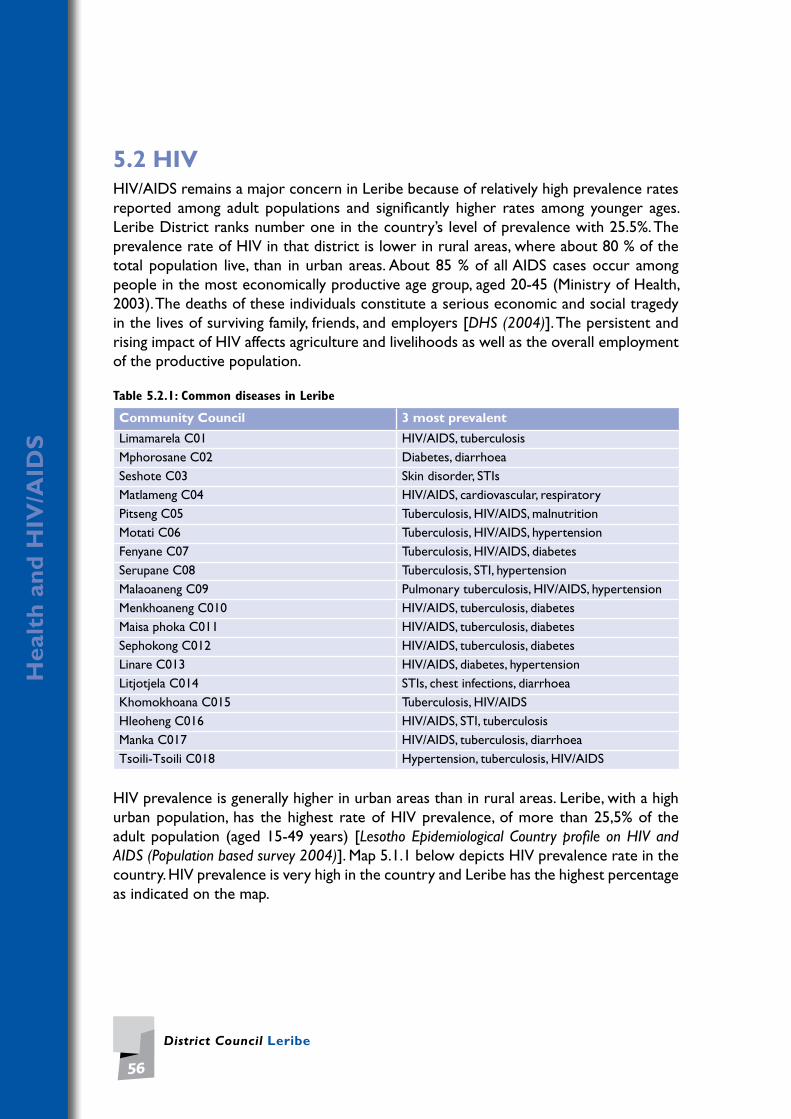
District Council Leribe
56
Hea
lth
an
d H
IV/A
IDS
5.2 HIVHIV/AIDS remains a major concern in Leribe because of relatively high prevalence rates reported among adult populations and significantly higher rates among younger ages. Leribe District ranks number one in the country’s level of prevalence with 25.5%. The prevalence rate of HIV in that district is lower in rural areas, where about 80 % of the total population live, than in urban areas. About 85 % of all AIDS cases occur among people in the most economically productive age group, aged 20-45 (Ministry of Health, 2003). The deaths of these individuals constitute a serious economic and social tragedy in the lives of surviving family, friends, and employers [DHS (2004)]. The persistent and rising impact of HIV affects agriculture and livelihoods as well as the overall employment of the productive population.
Table 5.2.1: Common diseases in Leribe
Community Council 3 most prevalent
Limamarela C01 HIV/AIDS, tuberculosisMphorosane C02 Diabetes, diarrhoeaSeshote C03 Skin disorder, STIsMatlameng C04 HIV/AIDS, cardiovascular, respiratoryPitseng C05 Tuberculosis, HIV/AIDS, malnutritionMotati C06 Tuberculosis, HIV/AIDS, hypertensionFenyane C07 Tuberculosis, HIV/AIDS, diabetesSerupane C08 Tuberculosis, STI, hypertensionMalaoaneng C09 Pulmonary tuberculosis, HIV/AIDS, hypertensionMenkhoaneng C010 HIV/AIDS, tuberculosis, diabetesMaisa phoka C011 HIV/AIDS, tuberculosis, diabetesSephokong C012 HIV/AIDS, tuberculosis, diabetesLinare C013 HIV/AIDS, diabetes, hypertensionLitjotjela C014 STIs, chest infections, diarrhoeaKhomokhoana C015 Tuberculosis, HIV/AIDSHleoheng C016 HIV/AIDS, STI, tuberculosisManka C017 HIV/AIDS, tuberculosis, diarrhoeaTsoili-Tsoili C018 Hypertension, tuberculosis, HIV/AIDS
HIV prevalence is generally higher in urban areas than in rural areas. Leribe, with a high urban population, has the highest rate of HIV prevalence, of more than 25,5% of the adult population (aged 15-49 years) [Lesotho Epidemiological Country profile on HIV and AIDS (Population based survey 2004)]. Map 5.1.1 below depicts HIV prevalence rate in the country. HIV prevalence is very high in the country and Leribe has the highest percentage as indicated on the map.

Local Governance and Non-state actors Support Programme - LGNSP
57
Table 5.2.2: HIV prevalence by socioeconomic characteristics
HIV positive percentage among women and men aged 15-49 who were tested, by background characteristics in the northern districts
Women Men Total
DistrictPercentage
HIVpositive
NumberPercentage
HIVpositive
NumberPercentage
HIVpositive
Number
Leribe 30.6 735 28.3 270 29.7 704Mokhotlong 20.6 153 13.0 97 17.7 250Botha-Bothe 25.3 195 12.4 128 20.2 323
Source: Lesotho Demographic and Health Survey Bos., 2004
Leribe now has 300 support groups, 13 ART sites, 11 professional HIV testing and coun-selling service providers in health facilities, providing support for 37,800 people relying on home-based care, and 37,800 orphans, and has 3,700 food aid recipients.
There is generally a high level of readiness to go for voluntary counselling and testing (VCT), and high interest to get the results of the test.
Table 5.2.3: HIV/AIDS services
Community Council
Readiness to undergo VCT
Level of interest to get results
Number of people depend-ent on home-based care
% people dependent on home-based care
Number of HIV/AIDS support groups
Limamarela C01 High High 120 1% 9
Mphorosane C02 High High 262 3% 9
Seshote C03 High High 49 1% 1
Matlameng C04 High High 50 0% 29
Pitseng C05 High High 500 3% 49
Motati C06 Very high High 56 1% 9
Fenyane C07 Very high High 267 2% 36
Serupane C08 Very high High 320 3% 14
Malaoaneng C09 High High 21 0% 28
Menkhoaneng C010 High High 1,311 6% 13
Maisa phoka C011 Low (10%) High 79 1% 9
Sephokong C012 High High 194 1% 14
Linare C013 High High 613 2% 14
Hea
lth
an
d H
IV/A
IDS

District Council Leribe
58
Hea
lth
an
d H
IV/A
IDS
Community Council
Readiness to undergo VCT
Level of interest to get results
Number of people depend-ent on home-based care
% people dependent on home-based care
Number of HIV/AIDS support groups
Litjotjela C014 High High 1,653 8% 8
Khomokhoana C015 Very high Medium 267 1% 14
Hleoheng C016 High High 644 2% 2
Manka C017 High High 220 1% 44
Tsoili-Tsoili C018 Medium High 343 2% 30
Total 6,969 2.8% 332
Map 5.2.1: HIV prevalence in Lesotho
Source: Lesotho Demographic and Health Survey, 2004
Botha-Bothe
Leribe
Berea
Maseru
Thaba - Tseka
Qacha's Nek
Mafeteng
Mohale's Hoek
Quthing
Mokhotlong
South Africa
South Africa
South Africa
NORTHERN DISTRICTS HIV PREVALENCE
Maseru
Leribe
Botha-Bothe
Mokhotlong
Lesotho Border
District Boundary
< 18.2
18.2 --- 21.5
21.5 --- 23.9
23.9 --- 29.5
> 29.5
LESOTHO
Total HIV Prevalence (%)
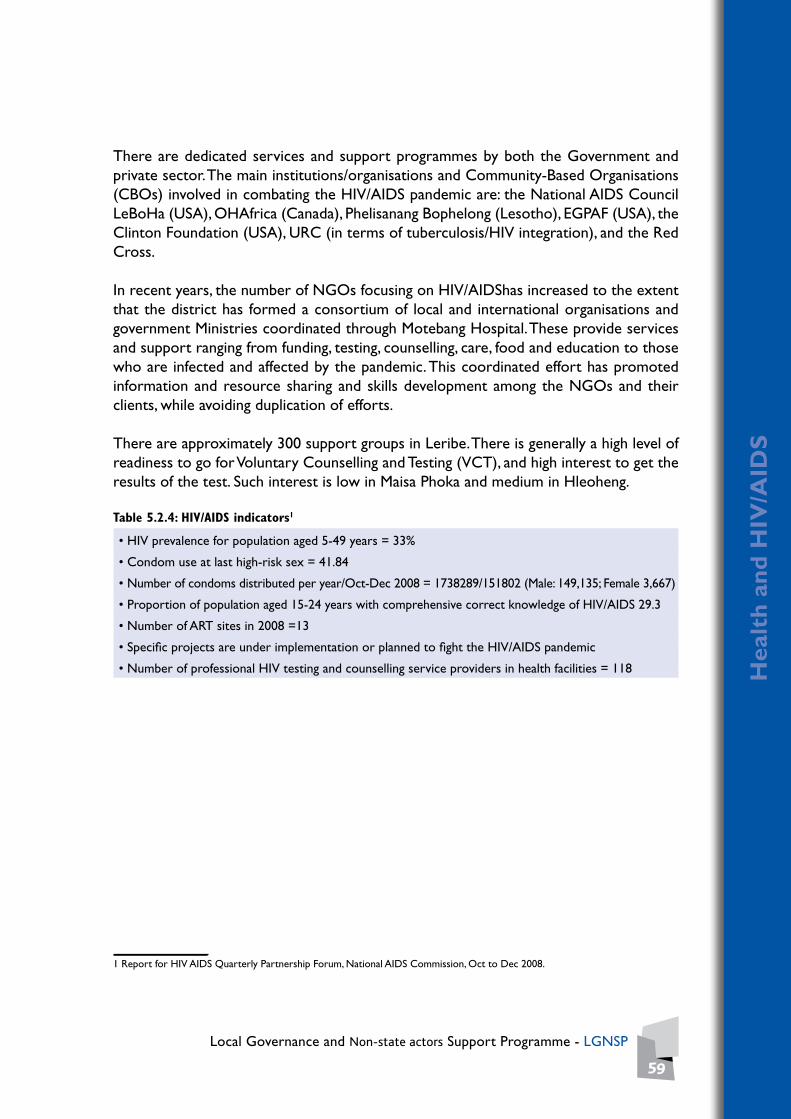
Local Governance and Non-state actors Support Programme - LGNSP
59
Hea
lth
an
d H
IV/A
IDS
There are dedicated services and support programmes by both the Government and private sector. The main institutions/organisations and Community-Based Organisations (CBOs) involved in combating the HIV/AIDS pandemic are: the National AIDS Council LeBoHa (USA), OHAfrica (Canada), Phelisanang Bophelong (Lesotho), EGPAF (USA), the Clinton Foundation (USA), URC (in terms of tuberculosis/HIV integration), and the Red Cross.
In recent years, the number of NGOs focusing on HIV/AIDShas increased to the extent that the district has formed a consortium of local and international organisations and government Ministries coordinated through Motebang Hospital. These provide services and support ranging from funding, testing, counselling, care, food and education to those who are infected and affected by the pandemic. This coordinated effort has promoted information and resource sharing and skills development among the NGOs and their clients, while avoiding duplication of efforts.
There are approximately 300 support groups in Leribe. There is generally a high level of readiness to go for Voluntary Counselling and Testing (VCT), and high interest to get the results of the test. Such interest is low in Maisa Phoka and medium in Hleoheng.
Table 5.2.4: HIV/AIDS indicators1
•HIVprevalenceforpopulationaged5-49years=33%
•Condomuseatlasthigh-risksex=41.84
•Number of condoms distributed per year/Oct-Dec 2008 = 1738289/151802 (Male: 149,135; Female 3,667)
•Proportion of population aged 15-24 years with comprehensive correct knowledge of HIV/AIDS 29.3
•NumberofARTsitesin2008=13
•SpecificprojectsareunderimplementationorplannedtofighttheHIV/AIDSpandemic
•NumberofprofessionalHIVtestingandcounsellingserviceprovidersinhealthfacilities=118
1 Report for HIV AIDS Quarterly Partnership Forum, National AIDS Commission, Oct to Dec 2008.

District Council Leribe
60
Hea
lth
an
d H
IV/A
IDS
The following are examples of current HIV/AIDS related programmes in the district:
Table 5.2.5: Some existing HIV/AIDS related programmes and activities
a) Tuberculosis/HIV integration (in collaboration with Motebang Ward, URC, EGPAF, LeBoHa)
b) Decentralisation of HIV services to district health centres
c) LeBoHa/Africa joint training and capacity development of health workers
d) Defaulter tracking programme for Leribe district
e) Structural and human resources development of Leribe district health centres
f) Essential package implemented by 18 community councils
g) Condom use education
h) Registration of OVCs and chronically ill persons
i) Capacity building of CBOs in home-based care
j) Male focused discussions
k) Income generating activities by agriculture
l) Food assistance to chronically ill people and their households by WFP
m) Cash transfers to child-headed households by Touch Roots Africa n) Grandmothers Support
o) PMTCT by Mothers to Mothers
p) IGA Programme by Action Aid
q) Livelihoods programme by Red Cross
r) Youth leadership programmes by Help Lesotho; and healthy lifestyles by KYS
s) Support centre for people Living with HIV/AIDS
t) World Vision is engaged in agricultural projects
u) PSI offers counselling and testing services
5.3 Physical accessLeribe district has two hospitals, Motebang Government Hospital and Mamohau Hospi-tal, and 29 health centres with 1,036 hospital beds. The average bed occupancy for the year 2007 was 20% and neither the hospitals nor the health centres achieved accredita-tion status during the recent assessment. The total budget for the district in 2007/08 was M 31,757,200 million, or M 106.44 per capita. Of the district budget, 75% was allocated to hospital services but there were no data on allocation for public health. As regards human resources, 10 out of 29 health facilities required additional staff at the time of the interview (34%).
5.4 Services access in 2007About 75% of the core posts are filled but only 21% of the planned meetings were held and no data reflect the frequency of supervisory visits The team still does not have dedi-cated offices and health centres do not have functional advisory boards.

Local Governance and Non-state actors Support Programme - LGNSP
61
Hea
lth
an
d H
IV/A
IDS
5.5 Access to selected services
5.5.1 Tuberculosis and HIV/AIDSThere were 873 cases of tuberculosis reported in 2007, and 36% of new PTB smears among them were found to be positive. The treatment success rate was 73%. Of the 26,047 people tested, 5,822 were HIV positive (22%). People living with HIV and AIDS on ARVs were: 669women, 881 men and 306 children under the age of 14. There were no data for pregnant mothers on ARV prophylaxis or HAART, and 13,342 people were put on ARTs.
5.5.2 Child survival and maternal healthMeasles coverage in the district was 91%, with vitamin A coverage at 87% and Albendazole at 77%. Health institutions were at no time out of EPI vaccines in Leribe. No case of non polio AFP was reported in 2007. There were 3 maternal deaths. There were about 2,607 deliveries in the health institutions.
5.5.3 Strengthening OVCsThere are 2 Social Welfare officers in Leribe. . The Leribe district started OVCs registra-tion in 2000. It registered 400 children out of 350 (88%) who were receiving a defined package during the reporting period.
Community Council Workshop in February 2009

District Council Leribe
62
Hea
lth
an
d H
IV/A
IDS
5.6 Motebang HospitalMotebang Hospital has 288 beds and a bed occupancy rate of 20%. In 2007, there were 8 doctors and 40 professional nurses on average.
5.6.1 Access to quality services at Motebang Hospital
5.6.1.1: Child and maternal healthThere were 3 maternal deaths reported, but no confidential inquiries into those deaths. 195 children under five were admitted for diarrhoea and 41 of them (21%) died. 117 children were admitted for pneumonia and 38 (21%) died.
5.7 Tuberculosis, HIV/AIDS and other diseasesThere were 829 PTB cases in 2007 and 36% of them were smear positive. Of 493 preg-nant mothers tested, 24% were HIV positive, and 104 of them who were eligible received ARV prophylaxis or HAART.
5.8 Pharmacy and laboratoryMotebang Hospital was never out of stock of cotrimoxazole for more than a month. The same applies to ARVs. All sputum received was returned within 28 hours. There were no data on whether facilities reported out of stock for HIV test kits.
The average waiting time for clients at Motebang Hospital was 6 hours 46 minutes. Only 48% of clients managed to get all prescribed medicines.
5.9 Mamohau HospitalThe hospital has 52 beds and a bed occupancy rate of 45%. In 2007 there were 2 doc-tors and 13 nurses on average. None of the facilities have advisory boards. Only 62% of planned meetings were held.

Local Governance and Non-state actors Support Programme - LGNSP
63
Hea
lth
an
d H
IV/A
IDS
5.10 Access to quality services at Mamohau hospital
5.10.1 Child and maternal healthMamohau Hospital did not experience any maternal mortality. 27 children under five were admitted for diarrhoea and none died. 6 were admitted for pneumonia. There were no deaths from pneumonia.
5.11 Tuberculosis, HIV/AIDS and other diseasesThere were 49 PTB cases reported in 2007 and 69% of them were smear positive. Of 266 pregnant mothers tested , 20% were HIV positive. 34% of all HIV positive mothers who were eligible got ARV prophylaxis or HAART.
5.12 Pharmacy and laboratoryMamohau Hospital was never out of stock of cotrimoxazole and ARVs for more than a month. All sputum specimens were returned within 48 hours. The average waiting time for clients at Mamohau Hospital was 1 hour 53 minutes. All clients at Mamohau Hospital managed to get all prescribed.
Table 5.2.5: Deliverables in health Institutions
0
23
45
68
90
National Berea LeribeMaseru
Mafeteng
Mohale´s Hoek Mokhotlong
Quacha´s NekQuthing
Thaba-TsekaButha Buthe
85
22
38
62
48
3231
68
3944
47
NationalBereaLeribeMaseruMafetengMohale´s Hoek MokhotlongQuacha´s NekQuthingThaba-TsekaButha Buthe

District Council Leribe
64
Hea
lth
an
d H
IV/A
IDS
Table 5.2.6: Current number of HIV Testing and Counselling (HTC) service providers by district
Number of professionalcouncellors providing HTC providers in the health facilities
Number of community lay counsellors trained
Lesotho Total 116 3,590
Botha-Bothe 8 192
Leribe 11 490
Mokhotlong 5 162
Source: Report for HIV and AIDS Quarterly Partnership Forum, National AIDS Commission, Oct to Dec 2008
Table 5.2.7: Number of Orphans and Vulnerable Children (OVC) who received care and support by district
District Male Female
Lesotho Total
Botha-Bothe 1 454 1 680
Leribe 2 199 3 081
Mokhotlong 497 561
Total
Source: Report for HIV and AIDS Quarterly Partnership Forum, National AIDS Commission, Oct to Dec 2008
1,454 1,680
2,199 3,081
497 561
4,150 5,322

Local Governance and Non-state actors Support Programme - LGNSP
65
Ed
uca
tio
n
Education
Didactic activity in a school in Leribe
Much of the progress made in the education sector during the 1970s and 1980s was lost when enrolment rates started to decline in the 1990s. Primary enrolment fell from 71% of children aged 6 to 12 in 1996 to 61% in 1999.
In the year 2000, the GoL introduced free primary education to reverse the trend, which is being implemented every year. By 2002 this had raised enrolment to 85% of children between 6 and 12. Enrolment increased dramatically and the gap between boys and girls narrowed. However, at the same time there was an increase in the pupil-teacher ratio and a decline in the percentage of qualified teachers.
Leribe's educational system shows high repetition and dropout rates, with at least one half of primary enrolment traditionally dropping out before completing the primary cycle and about two thirds of secondary enrolment dropping out before graduating.
Leribe has 196 primary schools, 33 secondary and 39 high schools. There are also 4 voca-tional training schools: the Technical School of Leribe (TSL), St Mary’s Home Economics School, the Institute of Extra Mural Studies (IEMS) (NUL) at Mahobong and a technical school at St. Monica’s Mission. Maseru has the highest percentage (ca. 23%) of the 228 secondary schools in the country, followed by Leribe with 22 %.
Like other places in the country, Leribe has a number of initiation schools. The entire district has 2,777 initiation schools, attended mostly by male and a few female initiates. Linare and Hloeheng Community Councils did not have any initiates, while the rest of the councils have more than 100 initiates.
6
CHAPTER

District Council Leribe
66
Ed
uca
tio
n
Table 6.1: Number of schools
Community Council
Number of primary schools
Number of secondary schools
Number of of high schools
Number of vocational training schools
TypeNumber of initiates
Limamarela C01 9 1 1 0 None 235
Mphorosane C02 10 0 0 0 None 267
Seshote C03 13 1 1 0 None 120
Matlameng C04 8 1 0 0 None 231
Pitseng C05 10 4 3 1Knitting and sewing
130
Motati C06 7 2 1 None 119
Fenyane C07 8 2 0 0 None 123
Serupane C08 6 1 1 2 None 115
Malaoaneng C09 4 1 0 0 None 107
Menkhoaneng C010 20 2 2 0 None 296
Maisa phoka C011 7 0 2 0 None 260
Sephokong C012 17 6 3 0 None 234
Linare C013 14 0 6 0Agric College, Technical
0
Litjotjela C014 10 3 1 0 None 110
Khomokhoana C015 11 4 4 1Knitting and sewing
46
Hleoheng C016 8 0 7 0 None 0
Manka C017 18 3 4 0 None 169
Tsoili-Tsoili C018 17 2 3 0 None 277
Total 197 33 39 4 3 2,839
Source: Ministry of Education, Counsellors, Chiefs, Local Schools
There are 1,681 primary school teachers, of which 767 are male and 914 are female; and there are 768 secondary and high school teachers, 366 male and 402 female. The aver-age teacher/pupil ratio is 1:5 in primary schools, while it is 1:40 for both lower and high school and universities in the district. There are a number of planned initiatives in the district, such as 6 primary schools planned for Serupane Community Council, and three in Leribe.
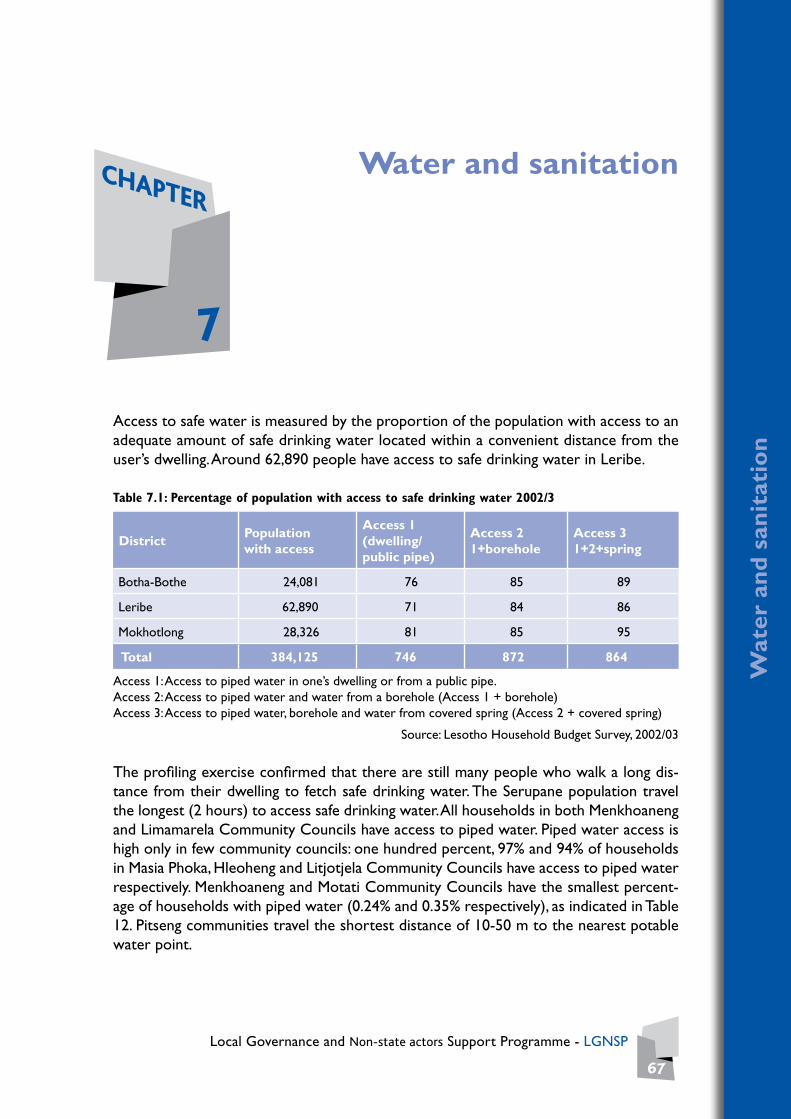
Local Governance and Non-state actors Support Programme - LGNSP
67
Wat
er a
nd
san
itat
ion
Water and sanitation
Access to safe water is measured by the proportion of the population with access to an adequate amount of safe drinking water located within a convenient distance from the user’s dwelling. Around 62,890 people have access to safe drinking water in Leribe.
Table 7.1: Percentage of population with access to safe drinking water 2002/3
DistrictPopulation with access
Access 1 (dwelling/ public pipe)
Access 21+borehole
Access 31+2+spring
Botha-Bothe 24,081 76 85 89
Leribe 62,890 71 84 86
Mokhotlong 28,326 81 85 95
Total 384,125 746 872 864
Access 1: Access to piped water in one’s dwelling or from a public pipe.Access 2: Access to piped water and water from a borehole (Access 1 + borehole)Access 3: Access to piped water, borehole and water from covered spring (Access 2 + covered spring)
Source: Lesotho Household Budget Survey, 2002/03
The profiling exercise confirmed that there are still many people who walk a long dis-tance from their dwelling to fetch safe drinking water. The Serupane population travel the longest (2 hours) to access safe drinking water. All households in both Menkhoaneng and Limamarela Community Councils have access to piped water. Piped water access is high only in few community councils: one hundred percent, 97% and 94% of households in Masia Phoka, Hleoheng and Litjotjela Community Councils have access to piped water respectively. Menkhoaneng and Motati Community Councils have the smallest percent-age of households with piped water (0.24% and 0.35% respectively), as indicated in Table 12. Pitseng communities travel the shortest distance of 10-50 m to the nearest potable water point.
7
CHAPTER

District Council Leribe
68
Wat
er a
nd
san
itat
ion
Table 7.2: Accessibility of safe drinking water in Community Councils
Community Council
Number of house- holds with access to piped water
Total households
% of house-holds with piped water
Number of springs/ water points
Average time distance to nearest potable water point
Water supply project under implemen- tation
Natural dams
Man-made dams
Limamarela C01 1,361 1,695 80% 54 2km - 13m Tanks installation 0 0
Mphorosane C02 196 1,869 10% 45 1.5km - 10m Reservoir, pump station 1 0
Seshote C03 297 2,161 14% 47 20min average Tank installation 0 1
Matlameng C04 198 2,207 9% 81 25min - 5min Boreholes, stand-pipes 0 4
Pitseng C05 4,348 3,790 50% 70 50m - 10m Water installation 0 2
Motati C06 34 9,700 0.35% 54 3km - 100m Water installation 13 56
Fenyane C07 121 2,394 5% 153 1.3hrs - 10m Water installation 0 2
Serupane C08 3,306 8,112 41% 7 2hrs - 1hr Water installation 7 0
Malaoaneng C09 75 2,423 3% 34 1.3hrs - 5min Piped water system 6 3
Menkhoaneng C010 8 3,326 0.24% 18 5km - 50m Boreholes, stand-pipes 3 4
Maisa phoka C011 2,119 2,119 100% 15 2km - 1km Boreholes, stand-pipes 3 4
Sephokong C012 3,361 5,504 61% 66 2km - 500km Stand pipes maintenance 5 23
Linare C013 1,520 3,800 40% 24 1km - 15m Borehole construction 0 5
Litjotjela C014 3,182 3,376 94% 27 30min - 2min Borehole maintenance 0 19
Khomokhoana C015 3,021 11,014 27% 13 1km - 10m Reservoir, pump station 6 4
Hleoheng C016 11,263 11,610 97% 215 150m - 50m Reservoir, pump station 0 0 5
Manka C017 1,152 4,085 28% 47 500m - 5m Construction of water points 3 7
Tsoili-Tsoili C018 3,772 3,772 100 36 30m - 1min Reservoir, pump station 26 53
Total 33,586 77,463

Local Governance and Non-state actors Support Programme - LGNSP
69
En
ergy
Energy
Leribe is experiencing a considerable energy shortage. Almost 80% of energy consump- tion in the rural areas is sourced from indigenous biomass fuels consisting of shrubs, firewood, crop residues and animal waste. This has resulted in the depletion of reserves of woody plants and animal droppings that might have been used to enrich the soil. Elec-tricity access was limited to about 17% of households in 2007 and most connections are found in the lowlands.
Paraffin is used for cooking, heating and lighting, but access to it in rural areas remains a problem mainly due to inaccessibility and high prices. Other fuels such as liquefied petroleum gas and coal play a minor role in rural areas. A few rural households use pho-tovoltaic (PV) systems or diesel/petrol generators.
The poorer the household, the more time spent per day collecting fuel. The wealthiest households spend an average of eight minutes a day collecting fuel, compared to more than two hours a day for the poorest. In some mountain areas, school children spend almost one day a week collecting fuel for the school kitchen. The percentage of house- holds that depend on collected fuel in Leribe is around 66%.
A considerable proportion of the urban lowland population of the Leribe District has electricity. There are a number of sub-stations in the district. These are: Maputsoe, which passes on to Pitseng and Ha Lejone sub-stations, then the Katse sub-station.
The majority of rural households still rely on biomass for fuel. They use mainly crop residue and cow dung. Most households also use imported fossil fuels like paraffin for lighting, cooking and heating.
8
CHAPTER
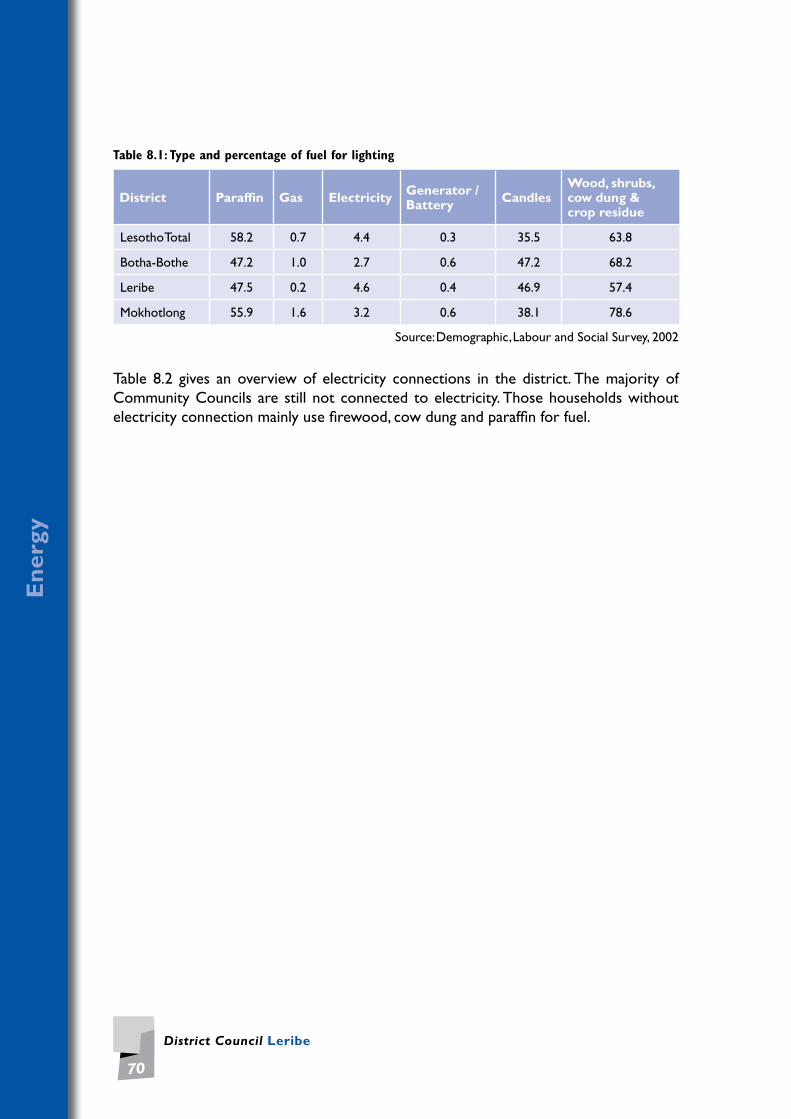
District Council Leribe
70
En
ergy
Table 8.1: Type and percentage of fuel for lighting
District Paraffin Gas Electricity Generator / Battery Candles
Wood, shrubs, cow dung & crop residue
Lesotho Total 58.2 0.7 4.4 0.3 35.5 63.8
Botha-Bothe 47.2 1.0 2.7 0.6 47.2 68.2
Leribe 47.5 0.2 4.6 0.4 46.9 57.4
Mokhotlong 55.9 1.6 3.2 0.6 38.1 78.6
Source: Demographic, Labour and Social Survey, 2002
Table 8.2 gives an overview of electricity connections in the district. The majority of Community Councils are still not connected to electricity. Those households without electricity connection mainly use firewood, cow dung and paraffin for fuel.

Local Governance and Non-state actors Support Programme - LGNSP
71
En
ergy
Table 8.2: Energy sources and households
Community Council
Households with electricity connection %
Villages without electricity %
Institutions in charge of electricity
Main sources of energy
Number of households on solar energy
Limamarela C01 2.0 90 L.E.C Cow dung, firewood 0
Mphorosane C02 0.0 100 L.E.C Firewood, cow, dung 2
Seshote C03 1.0 99 L.E.C Firewood 0
Matlameng C04 0.0 100 L.E.C Firewood 3
Pitseng C05 3.0 69 L.E.C Firewood 0
Motati C06 0.0 100 L.E.C Firewood 1
Fenyane C07 0.0 100 L.E.C Solar 116
Serupane C08 2.0 89 L.E.C Firewood 18
Malaoaneng C09 0.0 100 L.E.C Firewood, paraffin 170
Menkhoaneng C010 2.0 98 L.E.C Firewood 0
Maisa phoka C011 2.0 95 L.E.C Firewood 29
Sephokong C012 6.4 69 L.E.C Firewood, paraffin 144
Linare C013 20.0 30 L.E.C Gas, firewood 5
Litjotjela C014 5.0 94.6 L.E.C Firewood, paraffin, gas 56
Khomokhoana C015 4.0 93 L.E.C Electricity 0
Hleoheng C016 84.0 12 L.E.C Wood, gas, coal, paraffin, electricity 0
Manka C017 8.0 79.7 L.E.C Firewood 1,389
Tsoili-Tsoili C018 12.0 84 L.E.C Firewood 50
Total 1,983
Source: counsellors, chiefs

District Council Leribe
72

Local Governance and Non-state actors Support Programme - LGNSP
73
Co
mm
un
icat
ion
s
Communications
The Ministry of Communications is responsible for policy formulation, the Lesotho Telecom-munications Authority (LTA) is responsible for regulating operations in the sector, and service providers are responsible for service delivery.
Over the last few years, privatisation has made a significant contribution to improving access, but communication development is largely concentrated in Maseru and the low-land parts of the northern and southern regions of Lesotho. In the last five years, the number of fixed telephone lines (21,000) has been exceeded by mobile phones (27,000). In mid-2005 mobile telephone subscribers totalled 35,000 with an average of 1.35 mobile phones per 100 people. In Lesotho there are 21,416 fixed telephone network connec-tions, translating to one telephone line for a population of 100 people. Maseru accounts for 71% of the main telephone lines, leaving the other nine districts to share the remain-ing 29%.
The lowlands of the district of Leribe, including Hlotse, Maputsoe, Kolonyama, Peka and their surrounding areas, are well served by landline telephones. The introduction of mo-bile telephones has increased telephone penetration in the country. There are two mo-bile communication providers in the country.
Table 9.1 illustrates different means of communication available in the villages of Leribe these include: landline telephones, cell phones, local radio stations and postal mail ser- vices. Linare has the highest number of villages with telephone lines and cell-phone and local radio reception.
The district, like the rest of the country, has access to a number of radio stations oper-ating in the country. A state-run TV station, Lesotho TV, is aired on satellite and is now accessible throughout the country to those households with satellite dishes.
9
CHAPTER

District Council Leribe
74
Co
mm
un
icat
ion
s
Table 9.1: Communication of facilities
District
Number of villages with available tele-phone landline
Number of villageswith cell-phonereception
Number of villageswith local radioreception
Number of villages with mail postal services
Limamarela C01 10 1 0 0
Mphorosane C02 0 60 60 0
Seshote C03 0 2 39 39
Matlameng C04 0 19 55 0
Pitseng C05 9 49 49 49
Motati C06 1 35 35 0
Fenyane C07 0 35 38 0
Serupane C08 26 40 69 69
Malaoaneng C09 2 42 42 42
Menkhoaneng C010 0 52 102 102
Maisa phoka C011 1 62 62 0
Sephokong C012 12 116 146 87
Linare C013 66 62 65 18
Litjotjela C014 2 55 55 55
Khomokhoana C015 12 12 12 12
Hleoheng C016 22 46 46 0
Manka C017 13 64 62 8
Tsoili-Tsoili C018 28 49 49 49
Total 204 801 986 530
There are a number of internet cafés in Hlotse and Maputsoe. Both towns are also served with 3G Internet connection introduced in 2008 by Vodacom Lesotho. It is worth noting that these towns are among a few which have access to this technology in the country.
There are a number of post offices in the country, which are lately also being used for savings banking since the establishment of the Lesotho post bank. These post offices are also used as pay-points for the pensioners. Map 9.1 below shows the location of post offices in the district and the road network therebygiving an indication of accessibility of post offices.
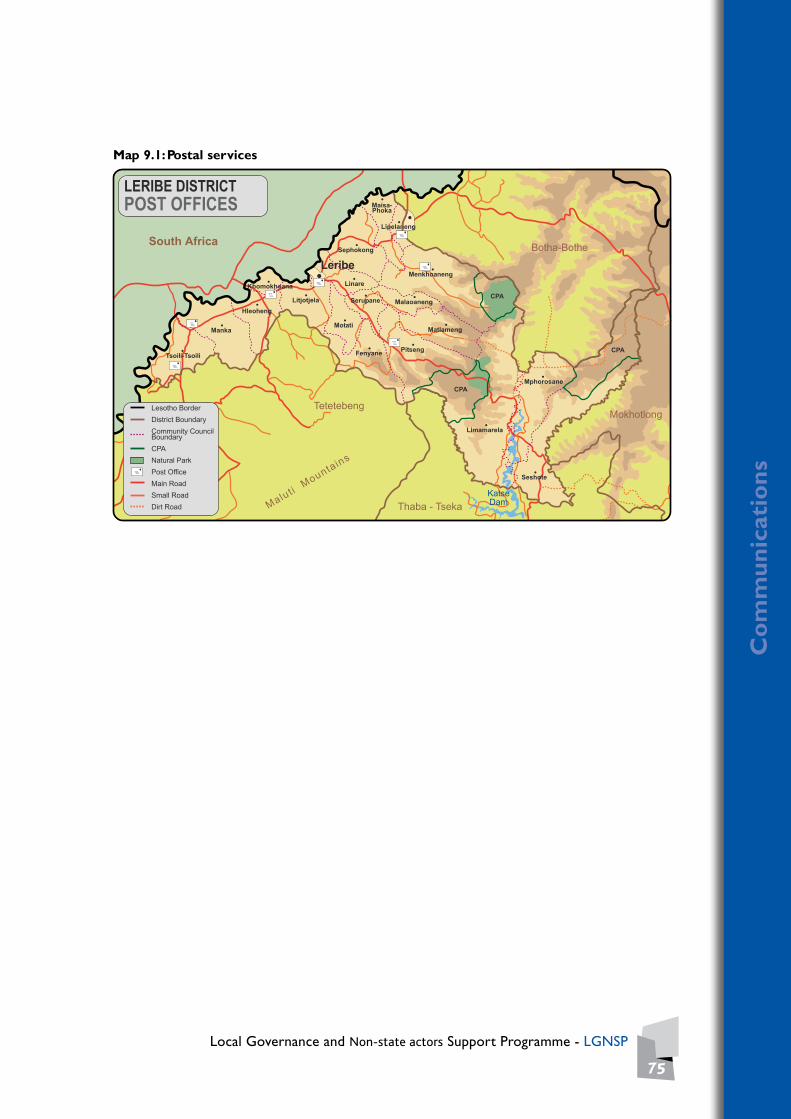
Local Governance and Non-state actors Support Programme - LGNSP
75
Co
mm
un
icat
ion
s
Map 9.1: Postal services
Leribe
Botha-Bothe
Thaba - Tseka
Tetetebeng
Sephokong
Lipelaneng
Maisa-Phoka
Menkhoaneng
MalaoanengSerupane
Linare
Litjotjela
Khomokhoana
Hleoheng
Manka
Tsoili-Tsoili
Motati
Fenyane Pitseng
Limamarela
Mphorosane
Seshote
Matlameng
CPA
CPA
CPA
South Africa
Mokhotlong
KatseDamMalut i
Mountains
LERIBE DISTRICTPOST OFFICES
Lesotho Border
District Boundary
Community CouncilBoundary
CPA
Natural Park
Post Office
Main Road
Small Road
Dirt Road

76
District Council Leribe

Local Governance and Non-state actors Support Programme - LGNSP
77
Ro
ads
Roads
The Leribe district has a large percentage of isolated mountain regions with a challenging access to commercial, urban areas as well as the capital - Maseru. Road transport links are vital to any district development strategy. Given Leribe´s location and mountainous terrain, it is critical to have an efficient transport system that ensures cost-effective ac-cessibility to economic opportunities, markets and basic services, as well as reliable links to external markets and ports.
The road network in the district, like in the rest of the country, is still under develop-ment. The district is served by two tarred roads, one running northeast from Teyatey-aneng (TY) in the Berea district to Botha-Bothe District, and the other from Hlotse to Katse, running southeast through the centre of the District. There are also two stretches of all-weather roads from Ha Nyenye to Koeneng village, and from Nyenye to Likhetlane village. The remaining roads consist in the main of double – and single – lane gravel roads, tracks and bridleways with short stretches of fair weather roads feeding into the Katse dam Area.
Good road networks facilitate accessibility to other facilities and services, as is the case of the Hlotse to Katse road. Communities in this area were previously inaccessible and far from services. The map below shows the road network in the district.
10
CHAPTER

District Council Leribe
78
Ro
ads
Map 10.1: Road networks and urban areas
Within and across Community Councils in the District there are access roads made up of 355.3 km gravel roads and 329 km earth roads. However, there are still some villages without road access, where community members walk for more than 23 km to access health services, schools, shops etc. There are also secondary roads which are in good condition, but need upgrading. The table below shows the total length of paved, unpaved, gravel and earth roads in the district.
Table 10.1 below shows the road conditions and accessibility in each Community Council as well as the road projects under implementation and those planned for the future.
Leribe
Botha-Bothe
Thaba - Tseka
Tetetebeng
Sephokong
Maisa-Phoka
Menkhoaneng
MalaoanengSerupane
Linare
Litjotjela
Khomokhoana
Hleoheng
Manka
Tsoili-tsoili
Motati
Fenyane Pitseng
Limamarela
Mphorosane
Seshote
Matlameng
CPA
CPA
CPA
South Africa
Mokhotlong
KatseDamMalut i
Mountains
Lipelaneng
Lesotho Border
District Boundary
Community CouncilBoundary
Urban Aeas
Main Town
Village
Main Road
Small Road
Dirt Road
LERIBE DISTRICTURBAN AREAS & VILLAGES
Thaba-NtšoMakong
Ha Thaba
Tale
Phatšo
Lithlokoaneng
Chafo
Ha Topisi
Ha SetsomiKanyane
LenyakoaneHa Tšabalira
Matukeng
Ha Makele
HaSechubata
Ha KotolaHaRantuba
Peka
Ha Napo
Ha Seetsa
Ha MosaeKolonyama
Ha Rampa
Lithabaneng
HaLeboea
Ha Rakolo
HaKotsana
HaMositi
Ha Makhoa
HaRatomo
Mahobong
HaMolapo
HaPhakiso
HaMafona
Ha Seetsa
Ha Makuka
Khabo
Ha Leabua George
Botsola
Ha Mohale
Ha Pentši
Ha Mali
Ha Koasa
Sebalabala
Ha Sekhonyana
MatlamengHa Lota
Ha Nchee
Ha Pontšeng
Ha MahloanaHa Botšo
Lejone
Lepaqoa
Ha Poli
Kobong
Maphutseng
Ha Matšoele
Ha Mpeli
Mphorosane
Taung
TipingKutung
Makoabating
Ha Theko
Ha Kanono
Ha Mpeli
HaMahlomola
HaRalebese
HaPalama
HaMatete

Local Governance and Non-state actors Support Programme - LGNSP
79
Ro
ads
Table 10.1: Road of networks and initiatives in Leribe
Community Council
Number of vil-lages without road access
Road projects underimplemen-tation
Names and km of existing roads maintained by DRR
Average km to good roads
Road projects planned
Limamarela C01 2 Lepaqoa road construction
Lejone-Pelaneng 4 km, Mporosane-Tsepo 40 km, Taunyane-Kutung 9 km
10Matsoele road construction
Mphorosane C02 2 Earth roadsmaintenance
Taunyane Kutung 9 km, Taunyane-Mphorosane 14.8 km, Mporosane-Theko 24.2 km
30 Gravel roadconstruction
Seshote C03 4Makopela-Palama 12 km, Seshote-Leaoa 18 km 50
Ntsirele Ramanemane & Palama
Matlameng C04 0 Lekhoathakhoatha 1.8 km 1Gravel roadconstruction
Pitseng C05 0Construction of access road
Pitseng-Maduna 10 km, Tauoa-Nchee 6 km 22 Gravel road
construction
Motati C06 0
Road constructionin 2 villages
Setene-Mositi 9 km 1Thaba Phatsoa Makhoa, Thaba Phatsoa Tente
Fenyane C07 1 Lipetu-Fako road
Ramapepe-Likileng 6.7 km, Maduna-Lepetu 22 km 3 Earth road
construction
Serupane C08 2Upgrading Menkhoaneng- Tsoinyane road
Setene-Moqathinyane 10 km 2 Gravel road
construction
Malaoaneng C09 0 0 Malefane-Chachele 6.8 km 18.8 Road construction
Menkhoaneng C010 0 Tarred road construction
Kramel-Mahlehle 2.5 km, Menkhoaneng-Kramel 9 km, Khabo-Pentsi 14 km
0 Gravel roadconstruction
Maisa phoka C011 0 Construction of gravel roads
Rampai-‘Monase 19.2 km, Pits’sNek-Ntsekalle 8 km 7 Road
construction

District Council Leribe
80
Ro
ads
Community Council
Number of vil-lages without road access
Road projects underimplemen-tation
Names and km of existing roads maintained by DRR
Average km to good roads
Road projects planned
Sephokong C012 0 Construction of gravel roads
Koenaneng-Pitsi’sNek 7km, Phahameng-Phelantaba 9km
13 Gravel roadconstruction
Linare C013 0 Construction of gravel roads Sekota-Khobotlana 4.7km 15
Road construction
Litjotjela C014 0Construction of gravel roads Leshoe-Mojapela 31km 4
Road construction
Khomokhoana C015 0 Construction of gravel roads Nyenye-St.Monica 16km 13
Gravel road construction at lower Popopo
Hleoheng C016 0 Earth road upgrading
Likhetlane-Matukeng 5km, Hleoheng-Qamo 5km, Nyenye-StMonica’s 3km
5 Gravel road construction
Manka C017 0 Construction of access road
Kotola-Ramaboella 11km, Tebatso-Mpeke 7.4km, Tjopa-Tabola 13.3km
18 Gravel road construction
Tsoili-Tsoili C018 0 Construction of access road
Rakolo-Peka 22km, Kolonyama-Mafata 23km, Kolonyama-Molelle 9km
3 Gravel road construction
Total 12.99

Local Governance and Non-state actors Support Programme - LGNSP
81
No
n-S
tate
Act
ors
(N
SA
s)
Non-State Actors (NSAs)
Many Non-State Actors (NSAs) in Lesotho are actively involved in providing a means for expressing and actively addressing the varied and complex needs of different social groups.
There are over 30 Non-State Actors operating in the district of Leribe, mostly in the two prominent towns of Hlotse and Maputsoe, the administrative and commercial hubs of the District respectively. These include faith-based, community-based and Non-Governmental Organisations.
The private sector includes 2 commercial banks, insurance companies and credit unions which, in some communities, provide mostly lowland residents with relatively better access to financial services for personal and commercial purposes. There are 1,432 busi-nesses, including 82 small enterprises mainly in town centres, including construction, retail, beverages, and milling, and small cafés in the rural areas. Others comprise 4 edu-cational institutions, and 12 private security companies. There are 3 main public utility providers in Leribe: the Lesotho Electricity Company (PTY) LTD (LEC), the Water and Sanitation Authority (WASA), and Telecom. LEC is responsible for the distribution, instal-lation and maintenance of electricity. Other parastatal institutions include the Lesotho Revenue Authority (LRA), the Lesotho Post Bank, Basotho Development Enterprise Co., and the Lesotho Highlands Development Authority (LHDA).
The development partners in Leribe are: the Food and Agricultural Organisation, the World Food Programme, World Vision International, Irish Aid, UNICEF, DFID, the Ger-man Red Cross, the European Commission, and Anglo American Mines. These institu-tions contribute funding and technical assistance in food security, child protection and advocacy, education, health, nutrition, water and sanitation, as well as support to those infected and affected by HIV/AIDS, general development projects, environmental con-servation and homestead gardens, seedling production and gully restoration, operating mostly in rural areas.
11
CHAPTER

District Council Leribe
82
No
n-S
tate
Act
ors
(N
SA
s)
NGOs constitute the largest component of NSAs. There are over 30 such organisations operating mostly in the villages with the respective communities. The organisations are diverse in nature and area of expertise, and are representative of different areas of the community. There are associations fighting against crime, against HIV/AIDS, associations of the physically disabled, associations for education, arts and culture, parenting, humanitarian and associations focusing on poverty reduction. Though they specifically continue to focus on their different thematic programme areas, they are also diversifying their activities in response to the nation’s as well as the district’s priority concerns of poverty reduction, HIV/AIDS and food security, which are invariably integrated in their programme activities.
Community Council Workshop in February 2009
The Lesotho fund for community development has several programmes in the district, whose main aim is to alleviate poverty, create jobs and protect the environment. It has a watershed conservation project and works with rural communities. Another NGO actively involved in the district, CARE Lesotho, operates mainly in the highlands area. It has a highland community forestry project in partnership with LHDA. World Vision Inter-national also has community-based projects in the areas of Kota, Ha Khabo and Tsehlan-yane. They work mainly with vulnerable children, but also on environmental conservation and homestead gardens [LDES (2002)]. Red Cross Lesotho, TEBA development and MS Danish Aid are involved in woodlots, poultry, small scale irrigation and seedling produc-tion and gully restoration. Most of these organisations operate in rural areas.
The Community-Based Organisations (CBOs) also represent several local interests and concerted efforts at community level. These are collective initiatives to serve the inter-ests of families or stakeholders in communities. There are: 391 cooperatives (198 multi-purpose, 100 agricultural co-operatives, 13 savings and credit associations, 6 handicrafts, 2 wood and steel initiatives, 11 secondary and 61 other initiatives), 300 support groups, and 13 wool and mohair growing associations.

Local Governance and Non-state actors Support Programme - LGNSP
83
Sec
uri
ty
Security
Leribe´s security forces comprise the Lesotho Defence Force (LDF) which is account-able to the prime minister through the Ministry of Defence. There is also the Lesotho Mounted Police Service (LMPS) which reports to the Minister for Home Affairs. The National Security Service (NSS) also features on the security list and is also directly ac-countable to the Prime Minister and private security companies.
The Lesotho Defence Force, responsible for national security and the protection of the royal family has an army, an air force and a newly formed paramilitary wing. The paramili-tary LMPS is responsible for internal policing.
Apart from police services and the military, Mokhotlong, like the rest of the country in general and Leribe in particular, has a limited number of private security firms. These were initially used only to protect businesses, but are now being used also by a growing number of households. The increase in the number of private security firms is believed to be directly related to negative perceptions of crime. There are 6 police stations (Hlotse, Maputsoe, Lejone, Pitseng, Kolonyama and Peka) and 14 private security companies op-erating in the district, as well as 202 crime prevention committees. There are 375 police officers and the police/population ratio is 1:797.
Leribe has the second highest crime rate in the country and serious cases include: murder, attempted murder, rape, robbery, housebreaking, stock theft, armed robbery and car theft. Table 12.1.1 gives the crime numbers and percentages in the country.
12
CHAPTER

District Council Leribe
84
Sec
uri
ty
Table 12.1: Number and percentage distribution of all serious cases of crime by district 2005
District Number Percentage
Botha-Bothe 905 5.7
Leribe 2,461 15.5
Mokhotlong 990 6.2
Thaba-Tseka 971 6.1
Total 15,847 100.0
Source: Bureau of Statistics of Lesotho: Crime Statistics Report 2005
The Table 12.2 below lists reported cases of stock theft in the country. Leribe has the third highest number of such cases, accounting for 15.6% of the total, which corresponds to the aforementioned high livestock ownership. The most common crime in the district is stock theft with 11,211 animals stolen. The table also presents the distance travelled to the nearest police station. Communities with the longest distance to a police station are Seshote and Menkhaneng Community Councils (20-70 km from the nearest police station).
Table 12.2: Crime statistics and security services
Community Council
Number of security service providers
Number of crime preventioncommittees in council area
Common types of crime
Number of stolen stock
Distance (km) to nearest police station
Government (police) Private
Limamarela C01 1 1 1 Stock theft, assault, sexual offences 3,208 28
Mphorosane C02 2 1 1 Stock common theft, sexual offences 2,405 30
Seshote C03 2 1 1 Stock theft, assault, sexual offences 3,897 70
Matlameng C04 1 0 1 Stock theft, assault, sexual offences 308 27
Pitseng C05 1 9 9 Stock theft, assault, housebreaking 154 15
Motati C06 1 0 24 Stock theft 110 5
Fenyane C07 0 1 4 Stock theft, sexual offences 73 62
Serupane C08 1 0 58 Housebreaking, rape, stock theft 78 20
Malaoaneng C09 1 0 42Stock theft, housebreaking, sexual offences
64 28
Menkhoaneng CC10
1 0 1 Stock theft, murder, rape 300 70
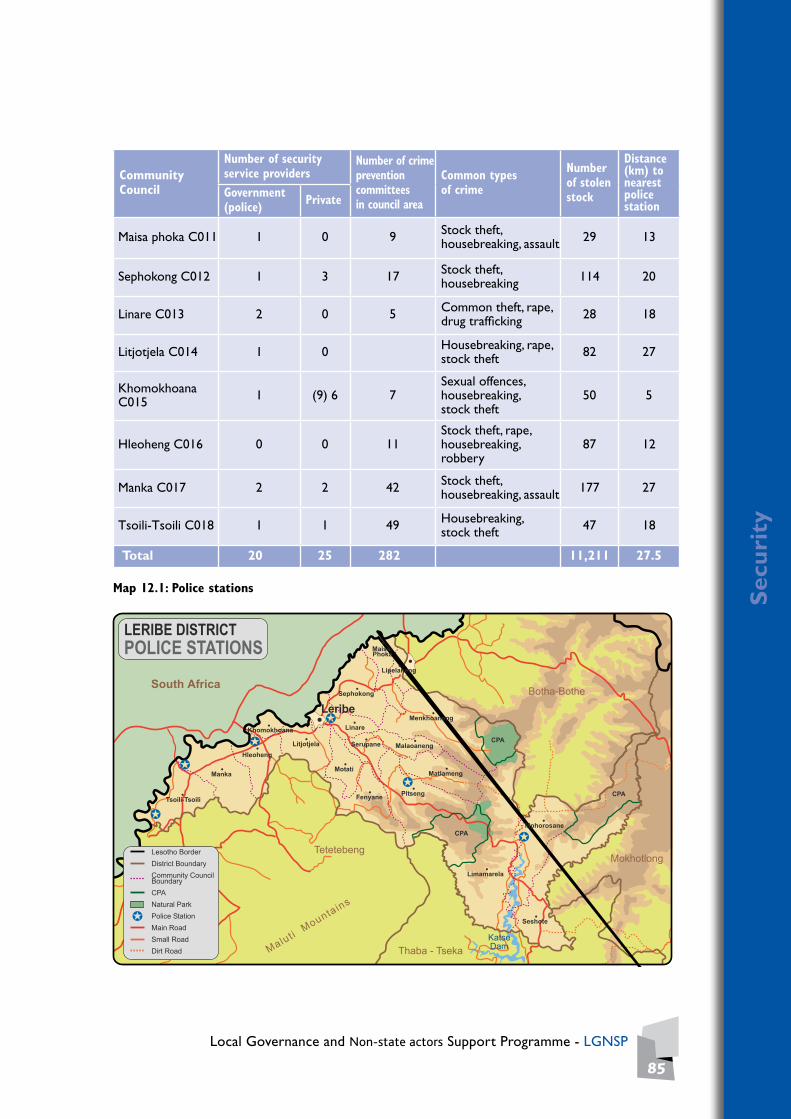
Local Governance and Non-state actors Support Programme - LGNSP
85
Sec
uri
ty
Community Council
Number of security service providers
Number of crime preventioncommittees in council area
Common types of crime
Number of stolen stock
Distance (km) to nearest police station
Government (police) Private
Maisa phoka C011 1 0 9 Stock theft, housebreaking, assault 29 13
Sephokong C012 1 3 17 Stock theft, housebreaking 114 20
Linare C013 2 0 5 Common theft, rape, drug trafficking 28 18
Litjotjela C014 1 0 Housebreaking, rape, stock theft 82 27
Khomokhoana C015 1 (9) 6 7
Sexual offences, housebreaking, stock theft
50 5
Hleoheng C016 0 0 11Stock theft, rape, housebreaking, robbery
87 12
Manka C017 2 2 42 Stock theft, housebreaking, assault 177 27
Tsoili-Tsoili C018 1 1 49 Housebreaking, stock theft 47 18
Total 20 25 282 11,211 27.5
Map 12.1: Police stations
Botha-Bothe
Thaba - Tseka
Tetetebeng
South Africa
Mokhotlong
KatseDamMalut i
Mountains
POLICE STATIONS
Leribe
Sephokong
Lipelaneng
Maisa-Phoka
Menkhoaneng
MalaoanengSerupane
Linare
Litjotjela
Khomokhoana
Hleoheng
Manka
Tsoili-Tsoili
Motati
Fenyane Pitseng
Limamarela
Mphorosane
Seshote
Matlameng
CPA
CPA
CPA
LERIBE DISTRICT
Lesotho Border
District Boundary
Community CouncilBoundary
CPA
Natural Park
Police Station
Main Road
Small Road
Dirt Road

District Council Leribe
86

Local Governance and Non-state actors Support Programme - LGNSP
87
Tra
de
and
co
mm
erce
Trade and commerce
After independence, the Government of Lesotho established LNDC to work with for-eign investors and large enterprises and BEDCO to encourage local small enterprises. Both corporations promote industry and commerce, as well as employment in the coun-try. They have both established activities in the Leribe district and play an important role in trade.
Leribe is involved in both domestic and international trade transactions. Domestic trade basically involves distribution of locally produced and imported goods in wholesale and retail shops. There is a fair distribution of retail shops, most of which are concentrated in the lowlands. Hlotse and Maputsoe have major chain stores like Shoprite, Lewis, Ellerines, Pep Stores, OK Furniture and others. These two urban centres also have higher purchasing power and infrastructural facilities. Other settlements like Pitseng and Ha Khabo are also economically active. The Khomokhoana Community Council has the highest number of businesses and small enterprises.
Table 13.1:Types and number of businesses
CommunityCouncil
Number of businesses & small enterprises
Type of business Access to market
Financial institutions available in CC
Limamarela C01 29Transport, retailers, guest house, agric market
Yes None
Mphorosane C02 14Wool & mohair,retailers Yes
None
Seshote C03 21Wool & mohair, millers,garage, bars, shops Yes
None
Matlameng C04 32Grocers, liquor shops gas retailer
Yes None
13
CHAPTER

District Council Leribe
88
Tra
de
and
co
mm
erce
Pitseng C05 65
Supermarkets, general dealers, butcheries, banks, insurance companies, mortuary, hotels
Yes Post Bank Credit Union
Motati C06 95 General dealers,grinding mills Yes None
Fenyane C07 12 Millers, general cafés Yes None
Serupane C08 26 General cafés, restaurants Yes None
Malaoaneng C09 33 General cafés, grind mill, taxis, liquor taverns Yes None
Menkhoaneng C010 55
Supermarkets, general dealers, butcheries, banks, insurance companies, mortuary, hotels
No None
Maisa phoka C011 38 Poultry, mortuary, taxis,general cafés, bars No None
Sephokong C012 57
Taverns, cafés, taxis, car repairs, grinding mill, butchery, hair salon, public phones, cinema shop, supermarket
Yes 2 Credit Unions
Linare C013 23
Supermarkets, general dealers, butcheries, banks, insurance companies, mortuary, hotels
YesNedbank, FNB, StandardLesotho Bank
Litjotjela C014 58 Cafés, public bars,commercial agriculture Yes None
Khomokhoana C015 385
Supermarkets, general dealers, butcheries, banks, insurance companies, mortuary, hotels
Yes
Nedbank, FNB, Standard Lesotho Letsete Investment, Sechaba Finance, JP Finance, Personal Post Bank Lesotho National Insurance
Hleoheng C016 192 Cafés bars, commercial agriculture, informal sector Yes None
Manka C017 89Millers, butchery, supermarkets, cafés, poultry farm, Yes Trade Union
Tsoili-Tsoili C018 70
Mortuary, filling station, mini-markets, open market, restaurants, egg circle, taxis, hair-salon, seamstresses, driving schools
No None
Total 1,294
Source: Community Councils Dept. of Trade

Local Governance and Non-state actors Support Programme - LGNSP
89
Tra
de
and
co
mm
erce
In terms of international trade, most of the locally produced goods from the factories in Maputsoe are exported to countries like South Africa, the United States of America, and the UK. Manufacturing, textiles, clothing and footwear are the major contributors to the national GDP. The manufacturing sector has grown in the Leribe district in the last dec-ade. This growth has in turn facilitated growth in other sectors such as financial services, transport, communications and trade, especially in Maputsoe.
Apart from large, medium and small industries in the district, there are around 100 registered and active cooperatives, consisting basically of multi-purpose undertakings, farmers, marketing credit unions, handicrafts, dairy, thrift and credit, artisan and poultry cooperatives.

District Council Leribe
90

Local Governance and Non-state actors Support Programme - LGNSP
91
Tou
rism
14
CHAPTERTourism
Tourism in Leribe is increasing annually. The district has great tourism potential with beautiful natural landscapes in the mountains, and archaeological and historical sites. There are fossil footprints at the Tsikoane Plateau, Menoaneng Cave and at Subeng. Pitseng Cave is another archaeological site of importance.
Map 14.1: Tourism
Leribe
Botha-Bothe
Thaba - Tseka
Tetetebeng
Sephokong
MalaoanengSerupane
Linare
T t
Motati
FenyanePitseng
Limamarela
Mphorosane
Seshote
Matlameng
CPA
CPA
CPA
South Africa
Mokhotlong
KatseDamMalut i
Mountains
Lesotho Border
District Boundary
Community CouncilBoundary
Urban Area
Rest Room
Waterfall
Wetland
Highest Peak
LERIBE DISTRICTTOURISM
Information CentreBotanical Garden
WaterTunnel Intake
BokongNature
Reserve
Info CentreMalika LisiuPass 2950
Letele'sPass
Liseleng
3063
Lesotho HighlandsWater Project
3125
Ts'helanyaneNational Park
Maloti Range
3198
Mothae3346
OutwardBoundCentre
Koeneng
2235
1871
Maisa-Phoka
Menkhoaneng
Litjotjela
Khomokhoana
Hleoheng
Manka
soili- soili
Lipelaneng

District Council Leribe
92
Tou
rism
The oldest building in the town is the Anglican Church (1877). Leribe hosts the Leribe Craft Centre, originally established by Anglican women missionaries who taught the Basotho women the craft of weaving. Here visitors can see and buy a variety of handicrafts (e.g. ponchos and Basotho blankets).
From Leribe/Hlotse there is an attractive excursion through beautiful scenery to the Katse Dam, where there is a hotel.
Hlotse was founded in 1876 when the resident magistrate and an Anglican mission-ary were given permission to build by the local chief. The small fort at the mission was constantly under Basotho attack during the Gun War of 1880. Major Bell’s Tower, a part of the original fort, remains a landmark on the main street to this day. In recent years, Hlotse has gained importance as the starting point for the Katse Dam road, which was renamed after Nelson Mandela when he visited the town in 1995. Motebang Hospital in Hlotse, named after a pioneer Mosotho doctor, houses a trauma unit for the Highlands Water Project and contains a helipad for helicopter evacuations from project construc-tion sites.
Leribe district, the birth place of Moshoeshoe I (the founder of the Basotho nation), has an important role to play in the country’s history. The district consequently boasts several historical sites and ruins which form part of the nation’s historical and cultural heritage. These include Menkhoaneng (Moshoeshoe I’s birth place), seliba sa Mokhachane (Moshoeshoe I’s father’s well) and lehaha la Kholu (Moshoeshoe Cave). Old buildings and monuments of historical importance in the district include those at St Monica’s Mission, St Saviour’s Church dating back to 1877 and Major Bell’s Tower at Hlotse.
Leribe was an important habitat for the mighty dinosaurs in primeval times. The Subeng Stream Dinosaur Trackway in Leribe is a fine example of such a habitat in this part of the world. The area consists of various paths and trackways which were used by the dino-saurs. The tracks still have fossilised dinosaur footprints. The region is mostly made up of layers of sandstone and the footprints are very prominent on them. The Subeng Stream Dinosaur Trackway is one of the popular tourist attractions in Leribe, one of the impor-tant districts in Lesotho. The capital of Leribe is the city of Hlotse. Leribe is well known for its ancient species and scenic surroundings. Tourists and nature lovers from all over the world come to see the Subeng Stream Dinosaur Trackway in Leribe to discover the relics of the prehistoric times.
The Leribe Craft Centre sells handmade wool items ranging from scarves to jackets. The craft centre is located on the roadside on entering Hlotse. The statue in front of the District Administration building dates back to English rule of Lesotho. It is located in the central part of the city. The old military lookout also dates back to English rule and is located in the central part of the city..

Local Governance and Non-state actors Support Programme - LGNSP
93
Tou
rism
Major Bell’s Tower in Hlotse is an important monument dating from the 1870s. It was besieged by Basotho warriors during the Gun War of 1880- 1881. Tsikoane and Subeng, both of which are close to Hlotse, are important dinosaur trackways. The Thaba Phatsoa Outward Bound Centre is situated in the foothills of the Maloti range near the Lionel Collet Dam.
Table 14.1:Tourist accommodations in the district
Hotel Lodge Other TotalNumber of rooms available
Number of beds
Occupancy ratio
Botha-Bothe 1 3 3 7 147 237 11.13
Leribe 2 1 7 10 190 379 20.75
Mokhotlong 2 2 6 10 193 420 23.88
Source: Department of Crops, 2008
There are fewer hotels (2) than lodges and other types of establishments in the district.Nevertheless, as hotels are usually bigger in terms of capacity, they have more rooms, beds and bed space available.
An occupancy analysis reveals that Leribe has a relatively high rate, followed by Mokhot-long and Botha-Bothe with 23.9 % and 20.8 % respectively. The higher occupancy rate is an indication that the accommodation establishments in the district have visitors who actually stayed overnight, unlike the low rates in the neighbouring district Botha-Bothe. The conclu-sion is that the occupancy rate is low as is the demand for accommodation.

District Council Leribe
94

Local Governance and Non-state actors Support Programme - LGNSP
95
An
nex
1
Landscape
Annex 1
District Council Profiling MatrixName of District: Leribe
Demography Data Source
Population density 128/km2 1996 Population census
Total population (year 2008) 298,352Bos., 2006 Census of Population and Housing - Preliminary Report Results, 2007, p. 8/13
Communities1 with high population density
Khomokhoana, Linare, Serupane, Hleoheng, Litjotjela
Bos., 2006 Census of Populationand Housing - Preliminary Report
Communities with low population density
Limamarela, Mphorosane, Seshote, Maisaphoka
Bos., 2006 Census of Populationand Housing - Preliminary Report
Physiographic and natural conditions Data Source
Highest point3,200 m (mountains to the East of the district)
District Strategic Plan 2002-07, 2002
Lowest point 1,500 m Mohokare valleyDistrict Strategic Plan 2002-07, 2002
Total area in ha/km²282,810 ha - 2,828 km2
(9.32% of country surface2)
Leribe District EconomicStrategy Report 2002-2007, Community Councils, chiefs
1
ANNEX
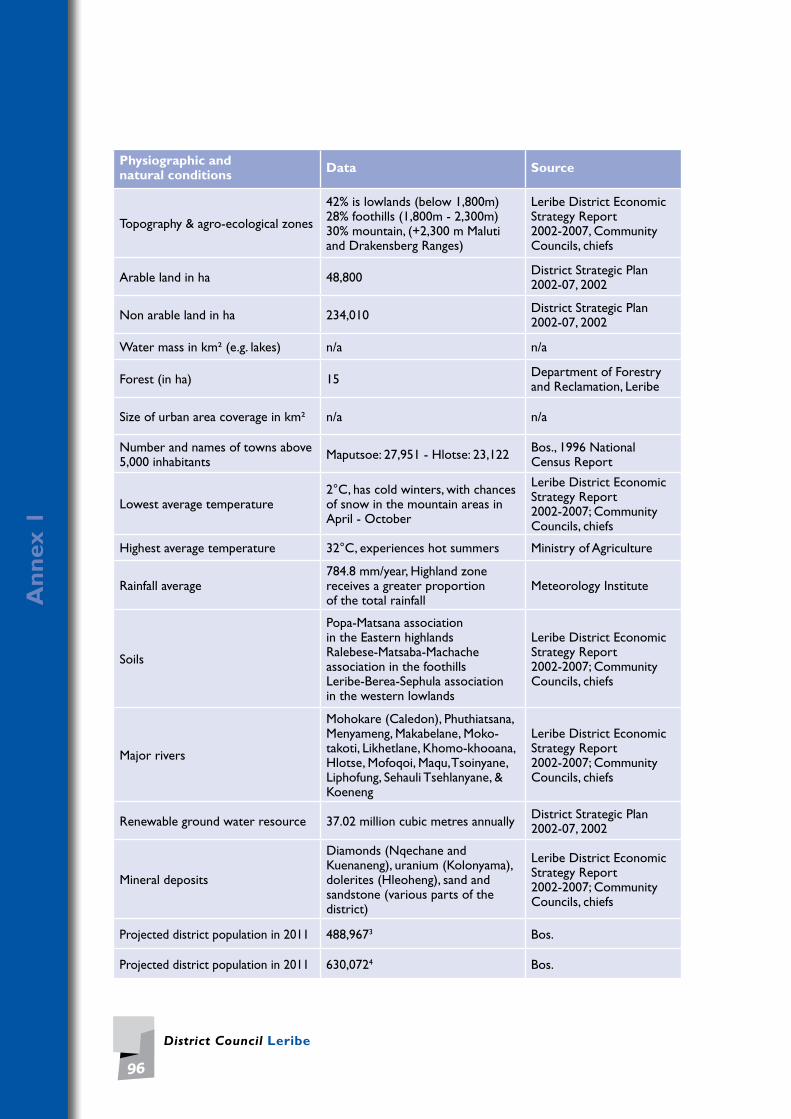
District Council Leribe
96
An
nex
1
Physiographic and natural conditions Data Source
Topography & agro-ecological zones
42% is lowlands (below 1,800m)28% foothills (1,800m - 2,300m)30% mountain, (+2,300 m Malutiand Drakensberg Ranges)
Leribe District EconomicStrategy Report 2002-2007, Community Councils, chiefs
Arable land in ha 48,800 District Strategic Plan 2002-07, 2002
Non arable land in ha 234,010 District Strategic Plan 2002-07, 2002
Water mass in km² (e.g. lakes) n/a n/a
Forest (in ha) 15 Department of Forestry and Reclamation, Leribe
Size of urban area coverage in km² n/a n/a
Number and names of towns above 5,000 inhabitants Maputsoe: 27,951 - Hlotse: 23,122 Bos., 1996 National
Census Report
Lowest average temperature2°C, has cold winters, with chances of snow in the mountain areas in April - October
Leribe District EconomicStrategy Report 2002-2007; Community Councils, chiefs
Highest average temperature 32°C, experiences hot summers Ministry of Agriculture
Rainfall average784.8 mm/year, Highland zone receives a greater proportion of the total rainfall
Meteorology Institute
Soils
Popa-Matsana association in the Eastern highlandsRalebese-Matsaba-Machache association in the foothillsLeribe-Berea-Sephula association in the western lowlands
Leribe District EconomicStrategy Report 2002-2007; Community Councils, chiefs
Major rivers
Mohokare (Caledon), Phuthiatsana, Menyameng, Makabelane, Moko- takoti, Likhetlane, Khomo-khooana, Hlotse, Mofoqoi, Maqu, Tsoinyane, Liphofung, Sehauli Tsehlanyane, & Koeneng
Leribe District EconomicStrategy Report 2002-2007; Community Councils, chiefs
Renewable ground water resource 37.02 million cubic metres annually District Strategic Plan 2002-07, 2002
Mineral deposits
Diamonds (Nqechane and Kuenaneng), uranium (Kolonyama), dolerites (Hleoheng), sand and sandstone (various parts of the district)
Leribe District EconomicStrategy Report 2002-2007; Community Councils, chiefs
Projected district population in 2011 488,9673 Bos.
Projected district population in 2011 630,0724 Bos.

Local Governance and Non-state actors Support Programme - LGNSP
97
An
nex
1
Social indicators Data Source
What are the names of the communities5 in the district?
Limamarela C01, Mphorosane C02, Seshote C03, Matlameng C04, Pitseng C05, Motati C06, Fenyane C07, Serupane C08, Malaoaneng C09, Menkhoaneng C10, Maisa Phoka C11, Sephokong C12, Linare C13, Litjotjela C14, Khomokhoana C15, Hleoheng C16, Manka C17, Tsoili Tsoili C18
DCS, Leribe
Which of the above listed communities are of town/urban nature?
Linare, Pitseng, Khomokhoana DCS
Total number of villages in the district 1,073 Aggregate Community Council
Fact Sheets own data, IEC
Total number of households in the district 84,149 Aggregate Community Council
Fact Sheets, own data, IEC
Average household size 5 Aggregate Community Council Fact Sheets, own data, IEC
Number of female-headed households 24,711 Aggregate Community Council
Fact Sheets, own data, IEC
Total number of child-headed households 6,367 Aggregate Community Council
Fact Sheets, UNICEF
Percentage of total district population living in towns above 5.000 inhabitants
35% Bos., 2006 Census of Populationand Housing -Preliminary Report
Total number of orphans in the district 36,941 (less pending data)
Aggregate Community Council Fact Sheets, Report for HIV/AIDS Quarterly PartnershipForum, National AIDS Commission (2008)
a) paternal orphans 14,297
Aggregate Community Council Fact Sheets, Report for HIV/AIDS Quarterly PartnershipForum, National AIDS Commission (2008)
b) maternal orphans 12,203
Aggregate Community Council Fact Sheets, Report for HIV/AIDS Quarterly PartnershipForum, National AIDS Commission (2008)
c) double orphans 11,202
Aggregate Community Council Fact Sheets, Report for HIV/AIDS Quarterly PartnershipForum, National AIDS Commission (2008)

District Council Leribe
98
An
nex
1
Socio-economic indicators Data Source
Number of persons receiving food aid 11,80466 - 3,689
WFP Leribe, Aggregate Community Council Fact Sheet
Number of persons with disabilities 2,882 Aggregate Community
Council Fact Sheet
Average household incomes 32,000 Maloti per year Aggregate CommunityCouncil Fact Sheet
Proportion of population living below 10 Loti (PPP) per day 37 % Aggregate Community
Council Fact SheetProportion of employed people living below $1 (PPP) per day 75 % Aggregate Community
Council Fact SheetProportion of own-account and contributing family workers in total employment
95 % Aggregate CommunityCouncil Fact Sheet
Number of households employed in agriculture and livestock 46,446 Aggregate Community
Council Fact SheetNumber of people generating incomesfrom other sources
n/a n/a
No of women in wage employmentin the non-agricultural sector
No accurate statistics found but it is estimated that of the 10,365 employees in wage sector employment 50 % and 35 % respectively are the manufacturing and retail sector and they are mostly female. Women also dominate the informal sector
Department of Labour, Leribe
Employment-to-population ratio n/a n/a
Gender aspects Data Source
Male/female population145,683 (48% M) 152,660 (52% F)
Bos., 2006 Census ofPopulation & Housing -Preliminary Report
Population sex ratio 0.95 District Council Office
Ratio of male/female district counsellors
1.5: 61% M - 39% F District Council Office
% of male/female community counsellors
47% M - 53% FDCO, Community Council Secretaries
Ratio of male/female community counsellors
n/a n/a
Ratio of male/female teachers 0.20 MOE Bulletin, 2006
Household heads 60% M - 40%F MOE Bulletin, 2006
Household heads livestock ownership
55% M - 35% F MOE Bulletin, 2006
HIV prevalence 30.5% M - 28% F MOE Bulletin, 2006

Local Governance and Non-state actors Support Programme - LGNSP
99
An
nex
1
Sector Data Source
Number of households with agriculturalplots 46,446 Community Council Fact Sheets,
Department of Agriculture, Leribe
Average plot size in acre 3.7 (1.5 ha) Community Council Fact Sheets, Department of Agriculture, Leribe
Number of households having land titles n/a Community Council Fact Sheets,
Department of Agriculture, Leribe
Three main crops produced Maize, sorghum, wheat, beans Community Council Fact Sheets, Department of Agriculture, Leribe
Three main livestock herded Cattle, sheep, goats Community Council Fact Sheets, Department of Agriculture, Leribe
Size of forested area (in ha) 3,005.15 ha Department of Forestry & Land Reclamation, Leribe
Size of common land (ha of rangeland) within the district 5,160 km2 (approx.) Community Council Fact Sheets,
Department of Agriculture, Leribe
Which agricultural service providers are available at district level (governmental and non governmental)?
Ministry of Agriculture through agricultural staff in all divisions
Department of Agriculture, Leribe
Agricultural service providers (governmental and non governmental) and their representation in which communities
Agricultural extension personnel in all communities
Department of Agriculture, Leribe
What kind of agricultural projects are planned or under implementation?
Ongoing: Kota Agricultural Development Project (Kota A.D.P)Planned: Matlameng Development Project (Matlameng A.D.P.)
Department of Agriculture,Leribe
Health sector Data Source
Prevalence of underweight children under-five years of age 17.2 2004 Demographic and
health survey, Bos.
Proportion of population belowminimum level of dietary energyconsumption
n/a n/a
Three most prevalent diseasesHIV/AIDS, tuberculosis, diabetes, and PCP or Cryptococcal meningitis
Health centres, Community Councils
Under-five mortality rate 118/1000 live births
Infant mortality rate 93/1000 live births

District Council Leribe
100
An
nex
1
Health sector Data Source
Proportion of 1 year-old children immunised against measles 87.2 2004 Demographic and
Health Survey, Bos.
Maternal mortality ratio n/a 2004 Demographic and Health Survey, Bos.
Proportion of births attended by skilled health personnel 51,4% 2004 Demographic and
Health Survey Bos.
Contraceptive prevalence rate 42.5 2004 Demographic and Health Survey, Bos.
Antenatal care coverage n/a n/a
Adolescent birth rate 17.1 2004 Demographic and Health Survey, Bos.
Unmet need for family planning 31.0 2004 Demographic and Health Survey Bos.
Doctor / patient ratio at district hospitals 1/5000 or 1/3000; 1/2000 DMO
Number and names of health centres
2 hospitals: Motebang at Hlotse, and Mamohau in Seshote
26 health centres: St. Rose - Peka, St. Monicas, Pontman (CHAL), Maryland (CHAL), Ha Mositi Our Lady of Lourdes (CHAL), Louis Gerard (CHAl), St. Anne (CHAL), Springfield (CHAL), Peka, Maputsoe filter clinic, Maputsoe SDA Clinic, Mahobong Holy Trinity (CHAL), Seetsa, Matlameng, Linotsing, Mahobong, Limamarela, Khabo, Sepinare, Palama, Thaba- Phatsoa, Little flower (CHAL), St. Denis (CHAL), Tšepong clinic Motebang, new star clinic Maputsoe, St Magaret clinic (CHAL), Fobane clinic
DMO
Health Facilities List: MOH & SW. 2009 p.6-7
NAC
Average distance to nearest health centre (in km or hours) 1.5 km - 2 hours Interview with health
officers
Readiness of undergoing VCT (voluntary counselling and testing) High and steadily improving7 Community Councils,
health centres, NAC
Level of interest to get the results of the tests Considerably high level of interest Community Councils,
health centres
Number of persons dependent on home-based care 10,978 NAC database, CC Fact
Sheet, Red Cross

Local Governance and Non-state actors Support Programme - LGNSP
101
An
nex
1
Health sector Data Source
Incidence, prevalence and death rates associated with tuberculosis
Prevalence: 3250 (171/100,000) in 2007 Deaths: 1926 (107/100,000) in 2005
Interview with health officers, community counsellors
Proportion of tuberculosis cases detected and cured under directly observed treatment short course
52% in 2004, 73% in 2005 and 72% in 2006
Interview with health officers, community counsellors
HIV/AIDS Data Source
HIV prevalence among population aged 15-24 years for 5-49 years 33%8 Lesotho MDC Status Report
2008, p.4
Condom use at last high-risk sex 41.8 2004 Demographic and Health Survey Bos.
Number of condoms distributed per year Oct-Dec 2008
1,738,289 151,802 (149,135 M - 3,667 F) NAC quarterly report, 2009
Proportion of population aged 15-24 years with comprehensive correct knowledge of HIV/AIDS
29.3 high based on implementation of ESP
2004 Demographic and Health Survey, Bos. NAC, Leribe Office
Ratio of school attendance of orphans to school attendance of non-orphans aged 10-14 years
1-1 at primary school level due to FPE DEO, NAC
Proportion of population with advanced HIV infection with access to antiretroviral drugs
294: Apr-Jun 2008 5,179: Jul-Sep 2008 6,664: Oct-Dec 2008
NAC Quarterly Report, 2009
Number of art sites by 2008 139 NAC Quarterly Report, 2009
Main institutions/organisations and Community-Based Organisations (CBOs) involved in combating the HIV/AIDS pandemic?
300 CBOs; 28 health centres and 2 orphanages
Main institutions: National AIDS Council LeBoHa (USA), OHAfrica (Canada), Phelisanang Bophelong (Lesotho), EGPAF (USA), the Clinton Foundation (USA), and URC (in terms ofTB/HIV integration). The Red Cross, SWAALES, PSI, LPPA, Help Lesotho, WFP, LENEPWA, Tšoanelo care centre, Touch Roots, Help Lesotho, Action Aid, LENASO, TEBA,Thakaneng, Rachel’s COMFA, Mothers to Mothers
Interviews with heads of departments

District Council Leribe
102
An
nex
1
HIV/AIDS Data Source
Specific projects are under implementation or planned to fight the HIV/AIDS pandemic?
a) TB/HIV integration (in collaboration with Motebang Ward, URC, EGPAF, LeBoHa
b) Decentralisation of HIV services to district health centres
c) LeBoHa/Africa joint training and capacity development of health workers
d) Defaulter tracking programme for Leribe district
e) Structural and human resources development of Leribe district health centres
f) Essential package implemented by 18 Community Councils
g) Condom use educationh) Registration of OVCs &
chronically ill personsi) Capacity building of CBOs in
home-based carej) Male focused discussionsk) Income generating activities
by agriculturel) Food assistance to chronically ill
and their households by WFPm) Cash transfers to child-headed
households by Touch Roots Africa
n) Grandmothers Supporto) PMTCT by Mothers to Mothersp) IGA Programme by Action Aidq) Livelihoods Programme by Red
Crossr) Youth leadership programmes
by Help Lesotho and health styles by KYS
s) Support centre for people living with HIV/AIDS
NAC, health centres, NGOs and DMO, Leribe
Individual interviews with various stakeholders
Number of Professional HIV Testing & Counselling service providers in health facilities
1110 NAC quarterly report, 2009
Number of Community lay counsellors trained
49011 NAC, health centres

Local Governance and Non-state actors Support Programme - LGNSP
103
An
nex
1
Education sector Data Source
Net enrolment ratio in primary education
0.15 District Education Office, Leribe
Proportion of pupils starting grade 1 who reach last grade of primary school
n/a n/a
Literacy rate of 15-24 year-olds women and men
n/a n/a
Number of primary schools 198 DEO Leribe, MOE 2006 Bulletin, DEO
Number of pupils in primary schools Boys: 33,056, Girls: 69,100 DEO Leribe, MOE 2006 Bulletin, DEO
Number of secondary schools 32 DEO Leribe, MOE 2006 Bulletin, DEO
Number of pupils in secondary schools
Boys: 16,010, Girls: 19,19012 DEO Leribe, MOE 2006 Bulletin, DEO
Number of high schools 31 DEO, CCS, school principals, Community Councils
Number of pupils in high schools n/a n/a
Average years of school attendance:
a) primary schools Boys: 9, Girls: 8 DEO, CCS, school principals, Community Councils
b) secondary schools Boys: 3, Girls: 3 DEO, CCS, school principals, Community Councils
c) high schools Boys: 2, Girls: 2 DEO, CCS, school principals, Community Councils
Average teacher/pupil ratio: 40 District Education Office Leribe, MOE 2006 Bulletin
a) primary schools 1:60 District Education Office, Leribe
b) secondary schools 1:40 District Education Office, Leribe
c) high schools 1:40 District Education Office, Leribe
Total loss of teachers (Number and %) in the 6-year period 2000 - 2005 in primary, secondary and high schools due to illness or death
n/a Ministry of Education Statistics & Planning unit
No and location of existing and planned Farmer Training Centres (FTCs)
Agriculture Collegein Hlotse
District Education Office, Leribe
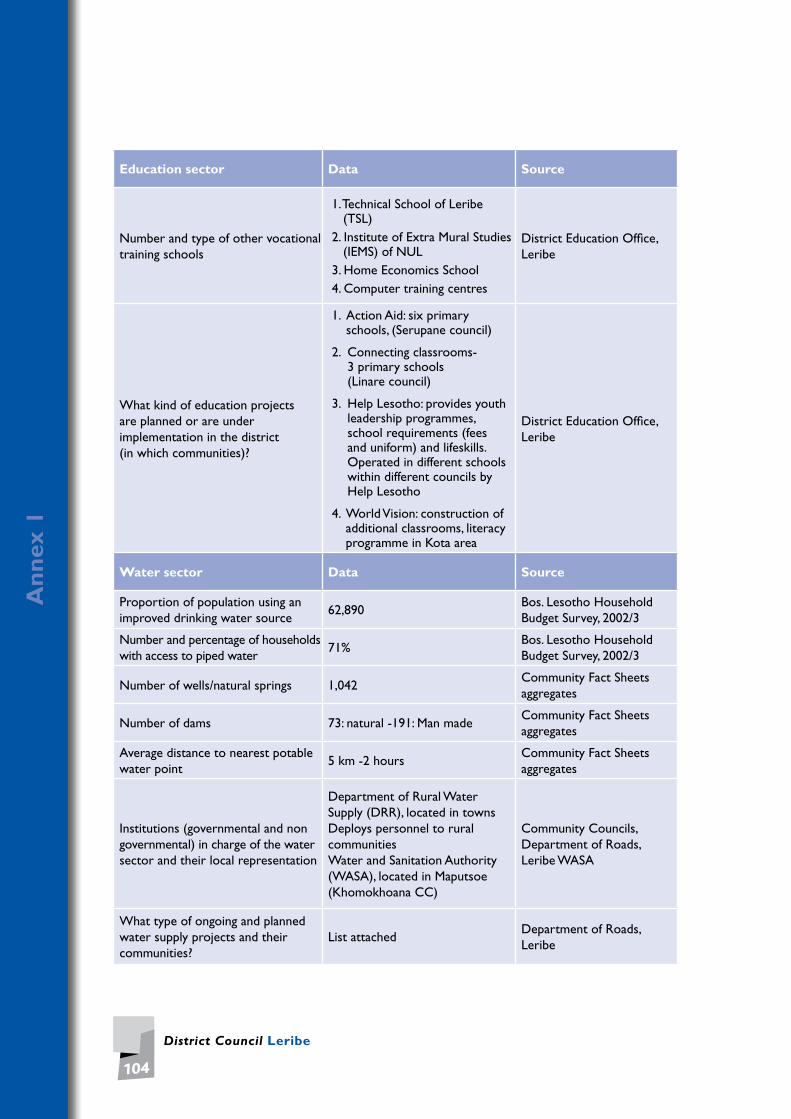
District Council Leribe
104
An
nex
1
Education sector Data Source
Number and type of other vocational training schools
1. Technical School of Leribe (TSL)
2. Institute of Extra Mural Studies (IEMS) of NUL
3. Home Economics School 4. Computer training centres
District Education Office, Leribe
What kind of education projectsare planned or are underimplementation in the district (in which communities)?
1. Action Aid: six primary schools, (Serupane council)
2. Connecting classrooms- 3 primary schools (Linare council)
3. Help Lesotho: provides youth leadership programmes, school requirements (fees and uniform) and lifeskills. Operated in different schools within different councils by Help Lesotho
4. World Vision: construction of additional classrooms, literacy programme in Kota area
District Education Office,Leribe
Water sector Data Source
Proportion of population using an improved drinking water source
62,890 Bos. Lesotho Household Budget Survey, 2002/3
Number and percentage of households with access to piped water
71% Bos. Lesotho Household Budget Survey, 2002/3
Number of wells/natural springs 1,042 Community Fact Sheets aggregates
Number of dams 73: natural -191: Man made Community Fact Sheets aggregates
Average distance to nearest potable water point
5 km -2 hours Community Fact Sheets aggregates
Institutions (governmental and non governmental) in charge of the water sector and their local representation
Department of Rural Water Supply (DRR), located in townsDeploys personnel to rural communitiesWater and Sanitation Authority (WASA), located in Maputsoe (Khomokhoana CC)
Community Councils, Department of Roads, Leribe WASA
What type of ongoing and planned water supply projects and their communities?
List attached Department of Roads, Leribe

Local Governance and Non-state actors Support Programme - LGNSP
105
An
nex
1
Roads sector Data Source
Total km of trunk roads (i.e. national roads) in the district
Paved roads: 228.0 km13
Unpaved roads: 64.2km14Department of Roads, Leribe
Total km of access roads 694.2 – 355.3 gravel roads 338.9 earth roads
Department of Roads, Leribe and MoLGCA
Number of villages without road access 13 Department of Roads,
Leribe
Average distance (km) of settlements to nearest “good” road
5 km in lowlands – 10 km highlands15
Department of Roads, Leribe
Apart from district and Community Councils, other institutions in charge of the road sector. Location of communities they work in
Department of Roads, Departmentof Rural Roads (DRR), Leribe
DRR, Leribe
Road projects planned or underimplementation and communitiesaffected
Planned: upgrading of Literapeng to Pela-Tsoeu road to bitumen Standard-Pitseng & Matlameng CCs Ongoing: B14 – Literapeng – Pela-Tsoeu 31.0 km B804 - Mphosong River vented for road construction
DRR, Leribe, communitycouncils Fact Sheets
Electricity sector Data Source
Number and percentage of households with electricity connections
10,700 Lesotho Electricity Company (PTY)
Number and percentage of villages without electricity 1,327 CCs
Which institutions are in charge of electricity?In which communities are they represented?
Lesotho Electricity Company (PTY) Hlotse & Maputsoe Sub-stations in Linare and Khomokhoana Community Councils respectively
Lesotho Electricity Company (PTY)
What kind of electricity projects are planned or under implementation? In which communities?
On-going: electrification project at Mahobong Village. 150 households to be connected
Lesotho Electricity Company (PTY)
Communication sector Data Source
Number and percentage of households with telephone connections
Over 2,045 Community Councils FactSheets Telecom office, Leribe
Communities where a telephone land line is available16
Limamarela, Pitseng, Serupane, Malaoaneng, Sephokong, Linare, Litjotjela, Khomokhoana, Hleoheng, Manka,Tsoilitsoili
Community Councils FactSheets Telecom office, Hlotse
Communities where there is cell phone reception All communities Community Councils Fact
Sheets

District Council Leribe
106
An
nex
1
Communication sector Data Source
Communities with local radio reception
Limamarela has Moafrika Radio station
Community Councils Fact Sheets
Communities with TV reception All, but it requires owning a satellite dish
CCS, Ministry of Communications
Percentage of the villages covered by mail service
80%17 not available in Limmarela, Mphorosane, Matlameng, Motati, Fenyane, Maisa Phoka, Hleoheng
Post office, Leribe
Trade and Commerce Data Source
Number of businesses and Number of small entrepreneurs
1,432 - 82 Department of Trade & Commerce, Leribe
Type of businesses and smallentrepreneurs
Number and type of cooperatives
General cafés (421), specialised dealer (168), builder & contractor (163), footwear & textiles (155), general dealers (62), household furniture (6), hair & beauty salon (46), butchery (45), music shop (44), hardware (33), motor garage (31), mini supermarket (30), supermarket (24), wholesale (24), snack bar (23), domestic fuel (16), funeral undertaker (15), motor dealer (10), hawking (9), broker (7), pharmacy (7), petrol dealer (7), consultants (6), photographic studio (6), street photographer (4), book store (4), agents of a foreign firm (3), workshop (3), cinema theatre (2), dry cleaner (2), scrap yard (1)
Block making (25), sewing (9), knitting and sewing (4), carpentry (3), metal & carpentry (3), handicrafts (1), leather works (1), metal works (1), others (35)
381 registered coops (57 preregistered coops)198: multipurpose, 100: agricultural cooperatives, 13: savings and credit, 6: handicrafts, 2: wood and steel, 11: secondary cooperatives, 61: others
Department of Trade &Commerce, Leribe,
Community Council Fact Sheets
Dept. of Cooperatives,Leribe

Local Governance and Non-state actors Support Programme - LGNSP
107
An
nex
1
Chieftainship Data Source
Number and names of wards and chiefs
Ward: Leribe Principal chief: Joel MotšoeneGazetted chiefs: 37Headmen: 21Customary chiefs: 161
District administrationoffice, Leribe,chiefs, CCs
Ward: Tsikoane, Peka & KolberePrincipal chief: Pontšo MathealiraGazetted chiefs: 35Headmen: 30Customary chiefs: 95
District AdministrationOffice, Leribe,chiefs, CCs
Security services Data Source
Number of security service providers Government
Private
Government: 6 substations, 375 police men
14: Top Flight Security, Mata Security,Leta Security, Gas Security, MountainView Security, AA Security, BB AlertSecurity, G4 Security, Security Lesotho, Combined Security, Double R. Security (PTY) LTD, North Security, Get Well Security & JM Security
LMPS, Leribe
Number of crime prevention committees in the district
202 CCS
Environment Data Source
Names of rare, vulnerable &endangered species in the district
Flora: lekhala (spiral aloe), khoara(Geranium caffrum), Khomo-ea-balisa(Bulbine narcissifolia), moli, kharetsa, cheche (Lucosida sericea), mosea, hloenya, African potato, naka, lesoko, khoanathi, qobo, sehalahala sa matlaka (Chysocoma tenuifolia), seboka, hlokoana la tsela, manolo, lesoko, mohloare
Community Councils Fact Sheets, Department ofTourism, Bokong Nature Reserve
Fauna: tsoene (baboons), rabbit, black eagle, lenong (cape vulture), ntsu kobo-kobo (bearded vulture), qoabi (African wild cat), letsa (rhebok), mutla (hare), lekhoaba (white-necked raven), khaka (helmeted guinea fowl), pela (rock rabbit), hlolo (wild hog), nakeli (skunk), noko (porcupine), sekome, marabe (puff adder), masumu (cobra), thamaha, mosenene-poli, phokojoe, hlolo, ’mutla, pela
Community Councils Fact Sheets, Department ofTourism, Bokong Nature Reserve

District Council Leribe
108
An
nex
1
Environment Data Source
Names of protected areas withinthe district
Menkhoaneng Cultural Heritage Site, Monyatso Catchment Centre, Bokong Nature Reserve, and Tsehlanyane National Park
Department of Environment, Department of Tourism, chiefs, Community Councils Fact Sheets
Names of areas to be protected and their community areas
1. Lehaha la Molapo- Limamarela CC
2. Lejoe motho- Mphorosane CC
3. Khopung Fall, Khokhoba Cave, Leaoa & Maieane wetlands-Seshote CC
4. Koasa, Nkoeng-Matlameng CC
5. Lehaha la Pitseng, Letša la Tsunyane, Molimo Nthuse-Pitseng CC
5. Mohloling, Mokurisi-Fenyane6. Komeng San Drawings,
Lefika le Mokhamo at Malefane, Seetsa Fortress.
7. Setibing-Malaoaneng CC
Community Councils Fact Sheets, Bokong Nature Reserve office, chiefs
Natural resource managementprojects (e.g. tree planting, gullyrehabilitation, rehabilitation ofwetlands etc.)
1. Maluti Drakensberg Transfrontier Project
2. Highlands Natural Resource & Rural Income Enhancement Project (HNRRIEP)
3. Community/social forestry (within CCs)
4. Community Gully Rehabilitation (for poverty alleviation/Fato-Fato)
5. Rehabilitation of wetlands6. Capacity building to local
authorities7. Reforestation of degraded
areas natural resource management projects (e.g. tree planting, gully rehabilitation, rehabilitation of wetlands etc.)
Department of Environment,Department of Forestry and Land Reclamation

Local Governance and Non-state actors Support Programme - LGNSP
109
An
nex
1
Tourism Data Source
Number and type of tourist facilities (e.g. guesthouses, parks, etc.)
Tšehlanyane Lodge, Bokong Game Reserve
Tourist Office Maseru-Research Office
Others
Major Bell’s Tower, part of the original fort at the Anglican mission in Hlotse, remains a landmark on the main streetFossil footprints at Tsikoane plateau, at Menoaneng Cave and at Subeng Dinossaur Trackway and PitsengCave is another archaeologicalsite of importance in the districtLeribe Craft CentreHlotse has gained importance as the starting point for the KatseDam Road, which was renamed after Nelson Mandela when he visited the town in 1995Motebang Hospital in Hlotse, named after a pioneer Mosotho doctor, houses a trauma unit for the highlands water project and contains a helipad for helicopter evacuations from project construction sitesMenkhoaneng is the birth place of Moshoeshoe I, the founder of the Basotho NationThe well of Moshoeshoe’s father, the cave of Moshoeshoe’s mother’sSt Saviour’s church dating backto 1877Thaba Phatsoa OutwardBound Centre is situated in the foothills of the Maloti Range near the Lionel Collet DamThere are two hotels and many lodges
Literature review

District Council Leribe
110
An
nex
1
Millennium Development Goals Indicators
Goal 1: Eradicate extreme poverty & hunger
Data Source
Target 1.A. Halve, between 1990 and 2015, the proportion of people whose income is less than one dollar a day
1.1 Proportion of population below $1 (PPP) per day a*
75.0%Aggregate Community Council Fact Sheets
Target 1.C: Halve, between 1990 and 2015, the proportion of people who suffer from hunger
1.8 Prevalence of underweight children under-five years of age
17.2% 2004 Demographic and health survey, Bos.
Goal 2: Achieve universal primary education
Data Source
Target 2.A: Ensure that, by 2015, children, boys and girls alike, will be able to complete a full course of primary schooling
2.1 Net enrolment ratio in primary education
0.15 District Education Office, Leribe
Goal 4: Reduce child mortality Data Source
Target 4: Reduce by two thirds, between 1990 and 2015, the under-five mortality rate
4.1 Under-five mortality rate 118/1000 live births
2004 Demographic and Health Survey, Bos.
4.2 Infant mortality rate 93/1000 live births
2004 Demographic and Health Survey, Bos.
4.3 Proportion of 1 year-old children immunised against measles
87.2% 2004 Demographic and Health Survey, Bos.
Goal 5: Improve maternal health Data Source
Target 5.A: Reduce by three quarters, between 1990 and 2015, the maternal mortality ratio
5.2 Proportion of births attended by skilled health personnel
51.4% 2004 Demographic and Health Survey, Bos.
Target 5.B: Achieve, by 2015, universal access to reproductive health
5.3 Contraceptive prevalence rate 42.5% 2004 Demographic and Health Survey, Bos.
5.4 Adolescent birth rate 17.1% 2004 Demographic and Health Survey, Bos.
5.6 Unmet need for family planning 31.0% 2004 Demographic and Health Survey, Bos.

Local Governance and Non-state actors Support Programme - LGNSP
111
An
nex
1
Goal 6: Combat HIV/AIDS,malaria and other diseases
Data Source
Target 6.A: Have halted by 2015 and begun to reverse the spread of HIV/AIDS
6.1 HIV prevalence among population aged 15-24 years
33.0% Lesotho MDC Status Report 2008, p.4
6.2 Condom use at last high-risk sex 41.8% 2004 Demographic and Health Survey, Bos.
6.3 Proportion of population aged 15-24 years with comprehensive correct knowledge of HIV/AIDS
29.3 high based on implementation of ESP
2004 Demographic and Health Survey, Bos., NAC, Leribe Office
6.4 Ratio of school attendance of orphans to school attendance of non-orphans aged 10-14 years
1:1 at primary school level due to FPE
Teachers, counsellors, chiefs, support groups, Red Cross, World Vision, social welfare
Target 6.B:Achieve, by 2010, universal access to treatment for HIV/AIDS for all those who need it
6.5 Proportion of population with advanced HIV infection with access to antiretroviral drugs 25% of eligible PLWHA are on ARV DEO, NAC
25% of eligible PLWHA are on ARV
DEO, NAC
Target 6.C: Have halted by 2015 and begun to reverse the incidence of malaria and other major diseases
6.9 Incidence, prevalence and death rates associated with tuberculosis Prevalence: 3.250 (171/100.000) in 2007 Deaths: 1.926 (107/100.000) in 2005 Interview with health officers, community counsellors
Prevalence: 3,250 (171/100,000)in 2007Deaths: 1,926 (107/100,000) in 2005
Interview with health officers,community counsellors
6.10 Proportion of tuberculosis cases detected and cured under directly observed treatment short course
52% in 2004, 73% in 2005 and 72% in 2006
Interview with health officers, community counsellors
Goal 7: Ensure environmentalsustainability
Data Source
Target 7.C: Halve, by 2015, the proportion of people without access to safe drinking water and basic sanitation
7.8 Proportion of population using an improved drinking water source
21% Lesotho Household Budget Survey 2002/03
7.9 Proportion of population using an improved sanitation facility
Low Percentage RWS

District Council Leribe
112
An
nex
1
Goal 8: Develop a global partnership for development
Data Source
Target 8.F: In cooperation with the private sector, make available the benefits of new technologies, especially information and communications
8.14 Telephone lines per 100 population
1:100Community Councils FactSheets Telecom office, Leribe
Footnotes1. For the purpose of this profiling exercise, the term “Community“ refers to the people and to the area within the demarcated
boundaries of a Community Council.2. Leribe District Economic Strategy 2002-2007 (Sept. 2002, p.8).3. 247-509 females + 241-458 males.4. 317-986 females + 312-086.5. Taken to mean Community Councils.6. 11,804 = 2,316 OVCs; 2.241 recipients at health centres + 7,247 households beneficiaries.7. 1,798.75 hectares are fully stocked, 1,241.05 hectares are eucaliptus trees; 405.20 hectares are pine trees; 65.50 hectares are
other species.8. NB: 20% for Botha-Bothe, 195 for Mokhotlong.9. 11 in BB; 8 in Mokhotlong.10. For BB 8; for Mokhotlong 5.11. For BB 420, for Mokhotlong 162.12. 2009.13. Paved 228.0 km: A1: Kolonyama - Lipelaneng River = 71.0 km; A8: Hlotse – Katse = 122.0; A11: Peka - Peka Bridge = 5.0 kms;
A12: Sir Seretse Khama Junction - Maputsoe 5.0 km; B13: Nyenye - Lekhalong = 8.0 km; B131: Mpharane -‘Muela = 7.0 km; B101: Kolonyama - Rakolo = 10 km.
14. Unpaved 31.0 km: B801: Sebothoane – Borokhong = 11.2 km; B803: Semolo - Ramapepe = 7.0 km; B804: Pitseng - Ha Koasa = 25.0 km; B805: Mahobong - Ha Seetsa = 18.0 km; C801: B8O3 -Thaba Phatsoa = 3.0 km.
15. If “good” means passable all year (F.M. Kokobela).16. Lisemeng II (650), Lisemeng I (400), Mankoaneng (350 ), Ha Tai-Tlai (237), Ha Molibeli (100), Sebothoane (70), Mtukeng (62) Leribe
Moreneng (20), Likhakeng (19) Ha Malesaoane(18), Khanyane(18),Tsikoane (15), Ha Peete (13),Tsifa-li-mali (12), Qoqolosing (12), Litlhoatsaneng (10), Ha Leshoele (9), Leqhutsung (7), Linotsing (5), Ha Ben (5), Ha Mpopo (4), Phatsoe (3), Ha Qokoko (3), Nqechane (2), Lenyakoane (1), Kolonyama.
17. Major Post Offices: Maputsoe (with 3 agencies), Leribe (with 9 agencies), Pitseng (with 2 agencies), Peka (1 agency). Agents include individual households, Church missions, shops, and/or schools.
Endnotes1. Females demonstrate a much higher level of readiness.

Local Governance and Non-state actors Support Programme - LGNSP
113
An
nex
2
Annex 2
1. Community Council profileDistrict: Leribe
Community Council
Km2 surface
Number of electoral divisions
Number of villages
Number of households Population
Average population of village
Population in the district
Males %
Females %
Population density
Limamarela C01 241.17 9 73 2,722 8,733 119.6 3% 50 50 36.2Mphorosane C02 165.20 9 75 1,869 9,392 125.2 3% 49 51 56.9Seshote C03 203.74 9 37 2,161 9,693 262.0 3% 50 50 47.6Matlameng C04 183.51 9 55 2,207 10,238 186.1 3% 50 50 55.8Pitseng C05 186.24 9 49 3,790 18,948 386.7 6% 49 51 101.7Motati C06 63.31 9 35 9,700 10,080 288.0 3% 50 50 159.2Fenyane C07 118.25 9 38 2,394 10,766 283.3 4% 45 55 91.0Serupane C08 76.73 9 69 8,112 10,143 147.0 3% 43 57 132.2Malaoaneng C09 96.28 9 42 2,423 15,943 379.6 5% 50 50 165.6Menkhoaneng C010 179.40 11 100 3,326 22,502 225.0 8% 50 50 125.4Maisa phoka C011 60.15 9 62 2,119 12,630 203.7 4% 50 50 210.0Sephokong C012 122.24 11 146 5,504 19,199 131.5 7% 50 50 157.1Linare C013 437.12 11 66 3,965 24,713 374.4 8% 48 52 56.5Litjotjela C014 99.76 11 55 3,376 21,283 387.0 7% 49 51 213.3Khomokhoana C015 185.00 9 12 11,014 26,851 2.237.6 9% 45 55 145.1Hleoheng C016 97.06 11 46 11,610 27,576 599.5 9% 48 52 284.1Manka C017 166.96 11 64 4,085 17,881 279.4 6% 49 51 107.1Tsoili-Tsoiili C018 146.16 11 49 3,772 18,456 376.7 6% 49 51 126.3Total 2,828.28 176 1,073 84,149 295,027 388.5 5.6% 48.6 51.4 104.31
Source: IEC, Bos., 2006, Census Report, community counsellors, CCS, chiefs, Ministry of Finance, Ministry of Development and Plannning, 2006 Census Report and updates
2
ANNEX

District Council Leribe
114
An
nex
2
2. Social IndicatorsC
CommunityCouncil
Number ofhouseholds
AverageHouse-hold size
Number offemale-headedhouse-holds
%
Number ofchild-headedhouseholds
%
Number ofdoublesorphans
Number ofpaternalorphans
Number ofmaternalorphans
Number of personsreceivingfood aid
% ofpersonsreceivingfood aid
Limamarela C01 2,722 5 600 60.0% 135 5.0% 290 330 720 300 11% Mphorosane C02 1,869 5 374 20.0% 92 4.9% 459 122 122 600 32% Seshote C03 2,161 4 546 25.3% 138 6.4% 340 534 389 259 12% Matlameng C04 2,207 6 634 28.7% 142 6.4% 295 257 332 139 6% Pitseng C05 3,790 5 397 10.5% 60 1.6% 212 -393 310 90 2% Motati C06 9,700 6 822 8.5% 0 0.0% 203 307 185 98 1% Fenyane C07 2,394 6 640 26.7% 123 5.1% 212 393 310 663 28% Serupane C08 8,112 6 958 11.8% 231 2.8% 330 430 393 116 1% Malaoaneng C09 2,423 7 508 21.0% 119 4.9% 250 338 202 105 4% Menkhoaneng C010 3,326 6 1,206 36.3% 388 11.7% 516 882 553 220 7% Maisa phoka C011 2,119 6 303 14.3% 17 0.8% 50 146 73 50 2% Sephokong C012 5,504 6 1,566 28.5% 137 2.5% 416 503 576 159 3% Linare C013 3,965 5 2,100 53.0% 50 1.3% 550 290 260 70 2% Litjotjela C014 3,376 4 820 24.3% 490 14.5% 740 350 530 32 1% Khomokhoana C015 11,014 6 4,696 42.6% 412 3.7% 1,655 69 197 414 4% Hleoheng C016 11,610 5 6,966 60.0% 3.455 29.8% 3.440 7,740 6,020 0 0% Manka C017 4,085 4 202 4.9% 261 6.4% 900 1,600 1,000 300 7% Tsoili-Tsoiili C018 3,772 5 1,373 36.4% 117 3.1% 344 399 130 74 2% Total 84,149 5.4 24,711 28.5 6.367 6.2% 11,202 14,297 12,302 3,689 7,0%
Source: IEC. Bos.. 2006, Census Report, community counsellors, CCS, chiefs, Ministry of Finance, Ministry of Development and Planning, 2006 Census Report and updates
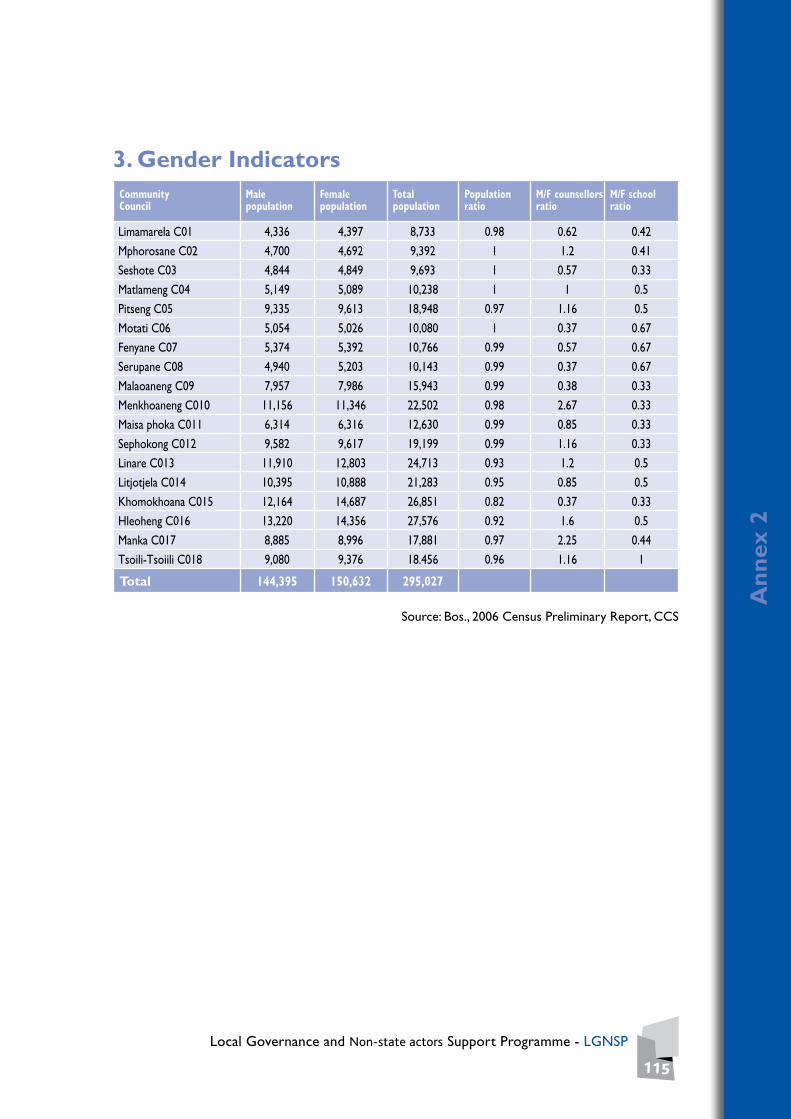
Local Governance and Non-state actors Support Programme - LGNSP
115
An
nex
2
3. Gender IndicatorsCommunityCouncil
Malepopulation
Femalepopulation
Totalpopulation
Populationratio
M/F counsellorsratio
M/F school ratio
Limamarela C01 4,336 4,397 8,733 0.98 0.62 0.42 Mphorosane C02 4,700 4,692 9,392 1 1.2 0.41 Seshote C03 4,844 4,849 9,693 1 0.57 0.33 Matlameng C04 5,149 5,089 10,238 1 1 0.5 Pitseng C05 9,335 9,613 18,948 0.97 1.16 0.5 Motati C06 5,054 5,026 10,080 1 0.37 0.67 Fenyane C07 5,374 5,392 10,766 0.99 0.57 0.67 Serupane C08 4,940 5,203 10,143 0.99 0.37 0.67 Malaoaneng C09 7,957 7,986 15,943 0.99 0.38 0.33 Menkhoaneng C010 11,156 11,346 22,502 0.98 2.67 0.33 Maisa phoka C011 6,314 6,316 12,630 0.99 0.85 0.33 Sephokong C012 9,582 9,617 19,199 0.99 1.16 0.33 Linare C013 11,910 12,803 24,713 0.93 1.2 0.5 Litjotjela C014 10,395 10,888 21,283 0.95 0.85 0.5 Khomokhoana C015 12,164 14,687 26,851 0.82 0.37 0.33 Hleoheng C016 13,220 14,356 27,576 0.92 1.6 0.5 Manka C017 8,885 8,996 17,881 0.97 2.25 0.44 Tsoili-Tsoiili C018 9,080 9,376 18.456 0.96 1.16 1
Total 144,395 150,632 295,027
Source: Bos., 2006 Census Preliminary Report, CCS

District Council Leribe
116
An
nex
2
4. Agriculture Profile
CommunityCouncil
Number of households with agricultural plots
Average size of agricultural plots (ha)
Government services providers
Non-State Actor service providers
Limamarela C01 1,892 4.0 MoAFS LHDA
Mphorosane C02 1,121 0.0 MoAFS LHDA
Seshote C03 546 4.0 MoAFS LHDA
Matlameng C04 1,986 2.0Mahobong Resource Centre LHDA
Pitseng C05 763 5.0 MoAFS FAO
Motati C06 1,693 2.0 MoAFS LHDA
Fenyane C07 638 5.0 MoAFS LHDA
Serupane C08 2,447 2.0 MoAFS FAO, UNICEF, NGOs
Malaoaneng C09 2,365 10.0 MoAFS FAO, UNICEF, NGOs
Menkhoaneng C010 2,974 5.0 MoAFS Red Cross
Maisa phoka C011 11,000 1.5 MoAFS Red Cross
Sephokong C012 3,331 3.0Tale & Hlotse Resource Centre
FAO, UNICEF, NGOs
Linare C013 3,205 1.4 MoAFS FAO, UNICEF, NGOs
Litjotjela C014 3,200 4.0 MoAFS FAO, UNICEF, NGOs
Khomokhoana C015 2,974 5.0Khomokhoana Resource Centre
None
Hleoheng C016 3,400 4.0 MoAFS Red Cross
Manka C017 2,941 5,571.0 MoAFS Red Cross
Tsoili-Tsoiili C018 3,172 4.0 MoAFS Red Cross
Total 49,648 312.9
Source: Department of Agriculture, Community Councils

Local Governance and Non-state actors Support Programme - LGNSP
117
An
nex
2
5. Trade and Commerce
CommunityCouncil
Number of businesses and small enterprises
Access to market Financial institutions available in CC
Limamarela C01 29 Yes None
Mphorosane C02 14 Yes None
Seshote C03 21 Yes None
Matlameng C04 32 Yes None
Pitseng C05 65 Yes Post Bank, Credit Union
Motati C06 95 Yes None
Fenyane C07 12 Yes None
Serupane C08 26 Yes None
Malaoaneng C09 33 Yes None
Menkhoaneng C010 55 No None
Maisa phoka C011 38 No None
Sephokong C012 57 Yes 2 Credit Unions
Linare C013 23 YesNedbank, FNB, Standard Lesotho Bank
Litjotjela C014 58 Yes None
Khomokhoana C015 385 NoNedbank, FNB, Standard Lesotho Letsete Investment, Sechaba Finance, JP Finance, Personal Fin.Post Bank Lesotho National Insurance
Hleoheng C016 192 Yes None
Manka C017 89 Yes Trade Union
Tsoili-Tsoiili C018 70 No
Total 1.294
Source: Community Councils, Department of Trade and Industry

District Council Leribe
118
An
nex
2
6. Health Indicators
CommunityCouncil
Government health centre
Health services by NGOsand private providers
Average distance (km) to reach nearest health centre
3 most prevalent diseases
Number ofhouseholds
Number of households with toilets
%
Limamarela C01 0 1 15 HIV/AIDS, tuberculosis 2,722 1,663 61%
Mphorosane C02 0 2 22Diabetes, diarrhoea, pneumonia, vomiting
1,869 1,717 92%
Seshote C03 0 2 23 Skin disorder, STIs 2,161 1,686 78%
Matlameng C04 1 0 17HIV/AIDS, cardiovascular, respiratory
2,207 135 6%
Pitseng C05 1 1 15Tuberculosis, HIV/AIDS, malnutrition
3,790 700 18%
Motati C06 1 1 11Tuberculosis, HIV/AIDS, Hypertension
9,700 624 6%
Fenyane C07 1 0 60Tuberculosis, HIV/AIDS, diabetes
2,394 134 6%
Serupane C08 1 1 2Tuberculosis, STI,Hypertension 8,112 768 9%
Malaoaneng C09 1 0 3Pulmonary, tuberculosis, HIV/AIDS, hypertension
2,423 600 25%
Menkhoaneng C010 1 1 2HIV/AIDS, tuberculosis,diabetes
3,326 1,098 33%
Maisa phoka C011 0 1 27HIV/AIDS, tuberculosis,diabetes
2,119 451 21%
Sephokong C012 0 1 10HIV/AIDS, tuberculosis,diabetes
5,504 224 4%
Linare C013 1 0 15HIV/AIDS, diabetes,hypertension
3,965 1,400 35%
Litjotjela C014 1 1 18STIs, chest infections,diarrhoea
3,376 2,200 65%
Khomokhoana C015 1 9 5 Tuberculosis, HIV/AIDS 11,014 2 0%
Hleoheng C016 0 1 12HIV/AIDS, STIs,tuberculosis
11,610 2,122 18%
Manka C017 1 3 25HIV/AIDS, tuberculosis,diarrhoea
4,085 684 17%
Tsoili-Tsoiili C018 0 1 14Hypertension,tuberculosis, HIV/AIDS
3,772 1,894 50%
Total 11 26 16.4 84,149.0 18,101.7 30.3%
Source: IEC, Bos., 2006 Census Report, community counsellors, CCS, chiefs, Ministry of Finance, Ministry of Development and Plannning, Bos., 2006 Census Report and updates

Local Governance and Non-state actors Support Programme - LGNSP
119
An
nex
2
7. HIV/AIDS
CommunityCouncil
Readiness to undergo VCT
Level of interest to get results
Number of people dependent on home-based care
Number of HIV/AIDS support groups
Limamarela C01 High High 953 9
Mphorosane C02 High High 262 9
Seshote C03 High High 49 1
Matlameng C04 High High 50 29
Pitseng C05 High High 500 49
Motati C06 Very high High 56 9
Fenyane C07 Very high High 540 36
Serupane C08 Very high High 320 14
Malaoaneng C09 High High 21 28
Menkhoaneng C010 High High 1,311 13
Maisa phoka C011 Low (10%) High 79 9
Sephokong C012 High High 194 14
Linare C013 High High 613 14
Litjotjela C014 High High 1,653 8
Khomokhoana C015 Very high Medium 264 14
Hleoheng C016 High High 644 2
Manka C017 High High 220 44
Tsoili-Tsoiili C018 Medium High 343 30
Total 8,072 332
Source: NAC, counsellors

District Council Leribe
120
An
nex
2
8. Education
CommunityCouncil
Number of primaryschools
Number of lower secondaryschools
Number ofof high school and universities
Number of vocationaltraining schools
Total
Limamarela C01 9 1 1 0 11
Mphorosane C02 10 0 0 0 10
Seshote C03 13 1 1 0 15
Matlameng C04 8 1 0 0 9
Pitseng C05 10 4 3 1 18
Motati C06 7 2 1 0 10
Fenyane C07 8 2 0 0 10
Serupane C08 6 1 1 2 10
Malaoaneng C09 4 1 0 0 5
Menkhoaneng C010 20 2 2 0 24
Maisa phoka C011 7 0 2 0 9
Sephokong C012 17 6 3 0 26
Linare C013 14 0 6 0 20
Litjotjela C014 10 3 1 0 14
Khomokhoana C015 11 4 4 1 20
Hleoheng C016 8 0 7 0 15
Manka C017 18 3 4 0 25
Tsoili-Tsoiili C018 17 2 3 0 22
Total 197 33 39 4 273
Source: Ministry of Education, counsellors, chiefs, local schools

Local Governance and Non-state actors Support Programme - LGNSP
121
An
nex
2
9. Water
Community Council
Number of households with access
to piped water
Number of
springs - water points
Average time distance to nearest potable water point
Water supply project under implementation
Limamarela C01 0 54 2 km - 13 m Tanks installation
Mphorosane C02 196 45 1.5 km - 10m Reservoir, pump station
Seshote C03 297 83 20 min Tanks installation
Matlameng C04 198 81 25 min - 5 min Boreholes, stand pipes
Pitseng C05 226 70 50 m - 10 m Water installation
Motati C06 34 54 3 km - 100 m Water installation
Fenyane C07 121 153 1.3 hr - 10 m Water installation
Serupane C08 3,306 7 2 hr - 1 hr Water installation
Malaoaneng C09 75 34 1.3 hr - 5 min Piped water system
Menkhoaneng C010 8 18 5 km - 50 m Boreholes, stand pipes
Maisa phoka C011 2,119 15 2 km - 1 km Boreholes, stand pipes
Sephokong C012 3,361 66 2 km - 500 m Stand pipes maintenance
Linare C013 0 24 1 km - 15 m Borehole construction
Litjotjela C014 3,182 27 30 min - 2 min Borehole maintenance
Khomokhoana C015 3,021 13 1 km - 10 m Reservoir, pump station
Hleoheng C016 11,263 215 150 m - 50 m Reservoir, pump station
Manka C017 1,152 47 500 m - 5 m Construction of water points
Tsoili-Tsoiili C018 3,772 36 30 m - 1 min Reservoir, pump station
Total 32,331 1,042
Source: RWS, counsellors, chiefs

District Council Leribe
122
An
nex
2
10. Roads
CommunityCouncil
Number of villages without road access
Road projects under implementation
Names and km of existing roads maintained by DRR
Limamarela C01 2 Lepaqoa road construction
Lejone-Pelaneng 4 km Mphorosane-Tsepo 12 km
Mphorosane C02 2 Earth roadsmaintenance
Taunyane-Kutung 9 km Taunyane-Mphorosane 14.8 km Mphorosane-Theko 24.2 km
Seshote C03 0 Makopela-Palama 12 km Seshote-Leaoa 18 km
Matlameng C04 0 Lekhoathakhoatha 1.8 km
Pitseng C05 0 Construction of access road Khoaba-Mpotso 12 km, Tau
Motati C06 0 Road constructionin 2 villages Setene-Mositi 9 km
Fenyane C07 1 Ramapepe-Likileng 6.7 km Maduna-Lepetu 22 km
Serupane C08 2Upgrade Makhoaneng- Tsoinyane
Setene-Moqathinyane 10 km
Malaoaneng C09 0 Malefane-Chalole 6.8 km
Menkhoaneng C010 0 Tarred road construction
Kramel-Mahlehle 2.5 km Menkhoaneng-Kramel 9 km Khabo-Pentsi 14 km
Maisa phoka C011 0Construction of gravel roads
Rampai-’Monase 19.2 km Pits’sNek- Ntsekalle 8 km
Sephokong C012 0Construction of gravel roads
Koenaneng-Pitsi’sNek 7 km Phahameng-Phelantaba 9 km
Linare C013 0Construction of gravel roads Sekota-Khobotlana 4.7 km
Litjotjela C014 0Construction of gravel roads Leshoe-Mojapela 31 km
Khomokhoana C015 0Construction of gravel roads Nyenye-St.Monica 16 km
Hleoheng C016 0Earth road upgrading
Likhetlane-Matukeng 13 km Hleoheng-Qamo 13.2
Manka C017 0Construction of access road
Kotola-Ramaboella 11km Tebatso-Mpeke 7.4 Tjopa-Tabola 13.3
Tsoili-Tsoiili C018 0 Construction of access road
Rakolo-Peka 22 km Kolonyama-Mafata 23 km Kolonyama-Molelle 9 km
Total 7
Source: DRR, Community Councils

Local Governance and Non-state actors Support Programme - LGNSP
123
An
nex
2
11. Energy
Community CouncilHouseholds with
electricity connection %Villages without
electricity %
Limamarela C01 2 90
Mphorosane C02 0 100
Seshote C03 1 99
Matlameng C04 0 100
Pitseng C05 3 69
Motati C06 0 100
Fenyane C07 0 100
Serupane C08 2 89
Malaoaneng C09 0 100
Menkhoaneng C010 2 98
Maisa phoka C011 2 95
Sephokong C012 6 69
Linare C013 20 30
Litjotjela C014 5 94.6
Khomokhoana C015 4 93
Hleoheng C016 84 12
Manka C017 8 79.7
Tsoili-Tsoiili C018 12 84
Total 151 83.46
Source: Counsellors, chiefs

District Council Leribe
124
An
nex
2
12. Communications
CommunityCouncil
Number of villages
with available telephone landline
Number of villages
with cell-phone reception
Number of villages with local radio reception
Number of villages with mail postal
services
Limamarela C01 10 1 0 0
Mphorosane C02 0 60 60 0
Seshote C03 0 2 39 39
Matlameng C04 0 19 55 0
Pitseng C05 9 49 49 49
Motati C06 1 35 35 0
Fenyane C07 0 35 38 0
Serupane C08 26 40 69 69
Malaoaneng C09 2 42 42 42
Menkhoaneng C010 0 52 102 102
Maisa phoka C011 1 62 62 0
Sephokong C012 12 116 146 87
Linare C013 66 62 65 18
Litjotjela C014 2 55 55 55
Khomokhoana C015 12 12 12 12
Hleoheng C016 22 46 46 0
Manka C017 13 64 62 8
Tsoili-Tsoiili C018 28 49 49 49
Total 204 801 986 530
Source: Counsellors, Telecom

Local Governance and Non-state actors Support Programme - LGNSP
125
An
nex
2
13. Security
Community Council
Number of security services providers Number of crime prevention committees
in council areaGovernment (police) private
Limamarela C01 1 1 1
Mphorosane C02 2 1 1
Seshote C03 2 1 1
Matlameng C04 1 0 1
Pitseng C05 1 0 9
Motati C06 1 0 24
Fenyane C07 0 9 4
Serupane C08 1 1 58
Malaoaneng C09 1 0 42
Menkhoaneng C010 1 0 1
Maisa phoka C011 1 0 9
Sephokong C012 1 0 17
Linare C013 2 3 5
Litjotjela C014 1 0 0
Khomokhoana C015 1 6 7
Hleoheng C016 0 0 11
Manka C017 2 2 42
Tsoili-Tsoiili C018 1 1 49
Total 20 25 282
Sources: LMPS, chiefs, counsellors

District Council Leribe
126
An
nex
2

Local Governance and Non-state actors Support Programme - LGNSP
127
An
nex
3
Annex 3
Community Council: Limamarela (C01)
Population Data Source
Total population 8,733 Limamarela CC
Male population 4,336 CC
Female population 4,397 CC
Average population per village 376 CC
Number of births in the last year 76 CC
Number of 5+ mortality rate per 1000 in the last year 45 CC
Under 5 mortality rate per 1000 in the last year 15 CC
Community council profile Data Source
Total area of community (km2) 241.17 CC
Number of electoral divisions 9 CC
Number of villages 67 CC
Estimated distance from district town (in km) 80 CC
Social indicators Data Source
Total number of households 2,722 DMA
Average number of persons per household (average household size) 5 DMA
Number of female-headed households 600 CC
Number of child-headed households 135 CC
Number of orphans 1,340 CC
a) paternal orphans 290 CC
b) maternal orphans 330 CC
c) double orphans 720 CC
3
ANNEX

District Council Leribe
128
An
nex
3
Socio-economic indicators Data Source
Number of herd boys not attending school (below 18 years of age) n/a CC
Number of persons with disabilities 84 CC
Socio-economic indicators Data Source
Number of persons receiving food aid 300 Support groups
Proportion of population under M 10.00 per day 12 % MoFDP 12 % MoFDP
Employment to population ratio 1:3 MoFDP
Children under 5 years of age - prevalence of underweight 72 Clinics
Proportion of population below minimum level of dietary energy consumption n/a Agricultural
Resource Centre
Main sources of income and number of households concerned Fishing, agriculture CC
Average household income (Maloti per year) M 18,000 CC
Number of people employed in agriculture and livestock 892 CC
Number of people generating income from other sources 457: civil servants CC
Names and types of associations n/a n/a
Agriculture sector Data Source
Number of households with agricultural fields 1,892 Agricultural Resource Centre
Average field size in hectares (has) 4 Agricultural Resource Centre
Three main crops produced Maize, wheat, beans CC
Three main livestock herded Cattle, goats, sheep, donkeys CC
Size of public land (hectares of range land) 3,000 – 5,000 CC
What kind of agricultural service providers are available (governmental and NGOs)? Government, LHDA CC
What kind of agricultural projects are planned or under implementation? SMEC, LHDA CC
Health sector Data Source
Three most prevalent diseases HIV/AIDS, tuberculosis Support groups
Number and names of health centres2 hospitals: Mamohau, Sepinare Clinic
CC
Longest and shortest distance to nearest health centre (in hours or km)
Longest: 28 km Shortest: 3 km CC
Readiness of undergoing Voluntary Counselling and Testing (VCT) High CC
Names of villages where access to health facilities is worstMats’oele, Ts’epo, Sepinare, Selomong, Konstabole, Mallane
CC

Local Governance and Non-state actors Support Programme - LGNSP
129
An
nex
3
Health sector Data Source
Level of interest to get the results of the test High CC
Number of people dependent on home-based care 120 CC
Number of households with toilets VIP: 1,695 WC: 15 CC
HIV prevalence among population aged 15-24; proportion of population aged 15-24 years with comprehensive correct knowledge of HIV/AIDS
60 % MoH
Ratio of school attendance of orphans to school attendance of non-orphans aged 10-14 years 1:3 MoH
Proportion of population with HIV infection with access to antiretroviral advanced drugs Moderate access MoH
Number of HIV/AIDS Support groups 9 MoH
Education sector Data Source
Number of primary schools 1: government 8: church
Teachers
Number of secondary schools 1 Teachers
Number of high schools and universities (government and privately owned) 1 Teachers
Average years of school attendance 6 Teachers
a) primary school 7 Teachers
b) secondary school 14 Teachers
c) high school 16 Teachers
Ratio of girls to boys in secondary and high school 7:3 Teachers
Number of and names of Farmers Training Centres (FTCs)3: Mphorosane, Matsoku, Lejoe-Motho
CC
Number and field of other vocational training schools None CC
Number of initiates for the last year to date 235 CC
Water sector Data Source
Number of households with access to piped water a) public stand pipes, b) private, c) hand pumps 1 CC
Number of wells 54 CC
Number of dams. Indicate whether they are natural or man-made and whether they are communally or privately owned 0 CC
Longest and shortest distance to the nearest potable water point (hour or km)
Longest: 2 km Shortest: 13 m CC
What kind of water supply projects are planned or under implementation?
Thibeli, Sekhele, Mallane, Konstabole, Khubetsoana
CC
Which institutions are in charge of water supply? RWS CC

District Council Leribe
130
An
nex
3
Roads sector Data Source
Total kilometres of main or tarred roads (i.e. national roads) n/a Roads Department
Longest and shortest distance (km) of villages to the nearest ‘good’ road
Longest: 14 km Shortest: 0.5 km
Roads Department
Number and names of villages without road access Number of households concerned
Planned: Mats’oele Under implementa-tion: Lepaqoa
CC
What kind of road projects are planned or under implementation?
Mats’oele CC
What are the transport infrastructure requirements? Intensive roads construction, bridges CC
Which institutions are in charge of the road sector? DRR, Roads Department
CC
Names and lengths of existing roads maintained by DRR
4 km: Lejone-Pelaneng 40 km: Mphorosane-Ts’epo
DRR
Energy sector Data Source
Number and percentage of households with electricity connections (i.e. LEC connections)
10 % LEC
Number and percentage of villages without electricity 90 % CCS
Which institutions are in charge of the electricity sector? Are they locally represented?
LEC CC
Main source of energy Firewood, cow dung CC
Communication sector Data Source
Number of households using solar energy None CC
Number of villages with landline telephone. Specify number of households with connections
1: Lejone village10: households
Telecom
Number of villages with cell phone reception 8 CCS
Number of villages with access to postal/mail services 8 CCS
Number of villages with local radio reception None CCS
Number of villages with local TV reception None CCS
Trade and commerce sector Data Source
Number of businesses (specify type)
29: transport, retailers, markets, agricultural guesthouse
CC
Do they have access to specific markets for their products? Yes CCS
Are there any financial institutions (i.e. banks, insurance companies, credit unions etc); if yes provide names and locations
None CCS

Local Governance and Non-state actors Support Programme - LGNSP
131
An
nex
3
Security services Data Source
Number of security service providers Governmental: LMPS, NSS Private: BB Alert
LMPS, NSS, BB alert security companies
Number of crime prevention committees 1 CC
Names of villages least covered by security services Matsoele, Mallane,Tsepo, Konsetabole
CC
Common types of crime cases reported Stock theft, assaults, housebreaking, sexual offence
CC
Number of stock stolen in the last year 3208 CC
Longest and shortest distance to the nearest police station or post
Longest: 28 km Shortest: 3 km
CC
Environment Data Source
Names of rare, vulnerable or endangered species
Flora: aloe, kharetsa, khomo ea balisa Fauna: baboons scub, rabbit, cape vulture, black tag
MET, Bokong Nature Reserve, CC
Names of protected areas Bokong Nature Reserve
CC
Names of areas of interest that could be protected Lehaha la Molapo Ha Matsoele
CC
Names of villages that are facing severe soil erosion Ha Thibeli Ha Konstabole Lepaqoa - Sebotha
CC
What are the natural resource management projects ongoing, planned or under implementation?
Ongoing: Nil Planned: gallery rehabilitation Matsoele Sepinare
CC

District Council Leribe
132
An
nex
3
Community Council: Mphorosane (C02)Population Data Source
Total population 9,392 Bureau of Statistics
Male population 4,700 Bureau of Statistics
Female population 4,692 Bureau of Statistics
Average population per village 1,043 Bureau of Statistics
No of births in the last year 190 Chiefs
No of 5+ mortality rate per 1000 in the last year 144 Chiefs
Under 5 mortality rate per 1000 in the last year 27 Chiefs
Community council profile Data Source
Total area of community (km2) 165.2 IEC
Number of electoral divisions 9 IEC
Number of villages 8 CC
Names of villages List attached CC
Estimated distance from district town in km 85 CC
Social indicators Data Source
Total Number of households 1,869 Bureau of Statistics
Average Number of persons per household (average household size) 5 Bureau of Statistics
Number of female-headed households 374 Bureau of Statistics
Number of child-headed households 373 Bureau of Statistics
Number of orphans 703 CC
a) paternal orphans 122 CC
b) maternal orphans 122 CC
c) double orphans 459 CC
Number of herd boys not attending school (below 18 years of age) 188 CC
Number of persons with disabilities 18 CC
Socio-economic indicators Data Source
Number of persons receiving food aid 600 Support groups
Proportion of population under M 10.00 per day 20 % MoFDP
Employment to population ratio 1:3 MoFDP
Children under 5 years of age - prevalence of underweight 40 % Clinics
Proportion of population below minimum level of dietary energy consumption 16 % Clinics
Main sources of income and number of concerned households Agriculture CC
Average household income (Maloti per year) 800 CC
Number of people employed in agriculture and livestock 5,635 CC

Local Governance and Non-state actors Support Programme - LGNSP
133
An
nex
3
Socio-economic indicators Data Source
Number of people generating incomes from other sources 3,757: informal sector CC
Names and types of associations LHDA corporations, livestock
CC
Agriculture sector Data Source
Number of households with agricultural fields 1,121 CC
Average field size in hectares (has) 46.3 CC
Three main crops produced Maize, wheat, beans CC
Three main livestock herded Sheep, cattle, goats CC
Size of public land (hectares of range land) 99 CC
What kind of agricultural service providers are available (governmental and NGOs)? LHDA, MoA CC
What kind of agricultural projects are planned or under implementation? LHDA CC
Health sector Data Source
Three most prevalent diseases Diarrhoea, pneumonia, diabetes
Community health workers
Number and names of health centres None CC
Longest and shortest distance to nearest health centre (in hours or km)
Longest: 30 km Shortest: 5 km CC
Readiness of undergoing Voluntary Counselling and Testing (VCT) High CC
Names of villages where access to health facilities is worst Manamolela, Sephapho, Nts’eli, Vuka Mosotho CC
Level of interest to get the results of the test High CC
Number of people dependent on home-based care 362 CC
Number of households with toilets VIP: 1,717 CC
HIV prevalence among population aged 15-24; proportion of population aged 15-24 years with comprehensive correct knowledge of HIV/AIDS
25 % Support groups
Ratio of school attendance of orphans to school attendance of non-orphans aged 10-14 years 1:4 Support groups
Proportion of population with HIV infection with access to antiretroviral advanced drugs 45 % Support groups
Number of HIV/AIDS Support groups 9 Support groups
Education sector Data Source
Number of primary schools 10 Schools
Number of secondary schools None CC
Number of high school and universities (government and privately owned) None CC

District Council Leribe
134
An
nex
3
Education indicators Data Source
Average years of school attendance
a) primary school 7 Schools
b) secondary school 3 Schools
c) high school 2 Schools
Ratio of girls to boys in secondary and high school 1:3 Schools
Number of and names of Farmers Training Centres (FTCs) Sub area Mphorasane, forestry subcentre
CC
Number and field of other vocational training schools n/a n/a
Number of initiates for the last year to date 267 CC
Water sector Data Source
Number of households with access to piped water: a) public stand pipesb) privatec) hand pumps
196: public stand pipes CC
Number of wells 45 CC
Number of dams. Indicate whether they are natural or man-made and whether they are communally or privately owned
1: man-made CC
Longest and shortest distance to the nearest potable water point (hour or km)
Longest:1.5 km Shortest: 10 m
CC
What kind of water supply projects are planned or under implementation?
Tanks CC
Which institutions are in charge of water supply? RWS, LHDA CC
Roads sector Data Source
Total kilometres of main or tarred roads (i.e. national roads) 55 CC
Longest and shortest distance (km) of villages to the nearest ‘good’ road
Longest: 30 km Shortest: 1 km
CC
Number and names of villages without road accessNumber of households concerned
Manamolela (97) Senyenyane (273)
DRR
What kind of road projects are planned or under implementation?
Earth roads maintenance, DRR maintenance
DRR
What are the transport infrastructure requirements? Bridges, gravel roads DRR
Which institutions are in charge of the road sector? DRR DRR
Names and lengths of existing roads maintained by DRR
12 km: Mphorosane-Theko, 30 km: Mphorosane -Taunyane
DRR

Local Governance and Non-state actors Support Programme - LGNSP
135
An
nex
3
Energy sector Data Source
Number and percentage of households with electricity connections (i.e. LEC connections) None CC
Number and percentage of villages without electricity 100 % CC
Which institutions are in charge of the electricity sector? Are they locally represented?
LEC No CC
Main source of energy Wood, cow dung CC
Number of households using solar energy 2 CC
Communication sector Data Source
Number of villages with landline telephone. Specify number of households with connections 10 villages CC
Number of villages with cell phone reception 60 CC
Number of villages with access to postal/mail services 0 CC
Number of villages with local radio reception 9 electoral divisions CC
Number of villages with local TV reception None CC
Trade and commerce sector Data Source
Number of businesses (specify type) 14: shops CC
Do they have access to specific markets for their products? Yes CC
Are there any financial institutions (i.e. banks, insurance companies, credit unions etc); if yes provide names and locations No CC
Trade and commerce sector Data Source
Number of security service providers 1: governmental (LMPS/NSS) 9: private
CC
Number of crime prevention committees 1 CC
Names of villages least covered by security services Manamolela, Senyenyane CC
Common types of crime cases reported Stock theft, common theft, sexual offences CC
Number of stock stolen in the last year 2.405 CC
Longest and shortest distance to the nearest police station or post Longest: 30 km Shortest: 5 km CC
Environment Data Source
Names of rare, vulnerable or endangered species Fauna: kharetsa, khoaraFlora: qoabi
MET
Names of protected areas 0 MET
Names of areas of interest that could be protected Lejoe Motho, Vuka Mosotho CC
Names of villages that are facing severe soil erosion Nkisi, Bereng, Senyenyane CC
What are the natural resource management projects ongoing, planned or under implementation?
Planned:Tiping, Manamolela CC

District Council Leribe
136
An
nex
3
Community Council: Seshote (C03)Population Data Source
Total population 9,693 CCS
Male population 4,854 CCS
Female population 4,839 CCS
Average population per village 262 CCS
Number of births in the last year 275 CCS
Number of 5+ mortality rate per 1000 in the last year 140 CCS
Under 5 mortality rate per 1000 in the last year n/a CCS
Community council profile Data Source
Total area of community (km2) 203.74 IEC
Number of electoral divisions 9 IEC
Number of villages 37 IEC
Names of villages List attached IEC
Estimated distance from district town (in km) 150 DRR
Social indicators Data Source
Total number of households 2,161 CCS
Average number of persons per household (average household size) 4 CCS
Number of female-headed households 546 CCS
Number of child-headed households None CCS
Number of orphans 1,263 NAC
a) paternal orphans 534 NAC
b) maternal orphans 389 NAC
c) double orphans 340 NAC
Number of herd boys not attending school (below 18 years of age) 215 CCS
Number of persons with disabilities 113 CCS
Socio-economic indicators Data Source
Number of persons receiving food aid 259 DMA
Proportion of population under M 10.00 per day 30 % DMA
Employment to population ratio 1:5 CCS
Children under 5 years of age - prevalence of underweight 34 CCS
Proportion of population below minimum level of dietary energy consumption 12 % CCS
Main sources of income and Number of concerned households
Agriculture CCS
Average household income (Maloti per year) M 6,000 CCS
Number of people employed in agriculture and livestock 2,161 CCS

Local Governance and Non-state actors Support Programme - LGNSP
137
An
nex
3
Socio-economic indicators Data Source
Number of people generating incomes from other sources 84 % CC S
Names and types of associations Terateng MultiCo-op, rangemanagement
CCS
Agriculture sector Data Source
Number of households with agricultural fields 546 CCS
Average field size in hectares (has) 203.74 IEC
Three main crops produced Maize, wheat, beans CCS
Three main livestock herded Cattle, goats, sheep CCS
Size of public land (hectares of range land) 274 CCS
What kind of agricultural service providers are available (governmental and NGOs)? LHDA, MoA CCS
What kind of agricultural projects are planned or under implementation? None CCS
Health sector Data Source
Three most prevalent diseases Skin disease, sexually transmitted diseases Clinic
Number and names of health centres 2- Seshote, Palama Clinic
Longest and shortest distance to nearest health centre (in hours or km)
Longest: 23 km Shortest: 1 km Seshote Clinic
Readiness of undergoing (Voluntary Counselling and Testing) VCT High Seshote Clinic
Names of villages where access to health facilities is worst Listed below Seshote Clinic
Level of interest to get the results of the test High Seshote Clinic
Number of people dependent on home-based care 49 Seshote Clinic
Number of households with toilets VIP: 4,686 Seshote Clinic
HIV prevalence among population aged 15-24; proportion of population aged 15-24 years with comprehensive correct knowledge of HIV/AIDS
High Seshote Clinic
Ratio of school attendance of orphans to school attendance of non-orphans aged 10-14 years 1:3 Support groups
Proportion of population with HIV infection with access to antiretroviral advanced drugs 57 % Support groups
Number of HIV/AIDS Support groups 1 Support groups
Education sector Data Source
Number of primary schools 13 Schools
Number of secondary schools 1 Schools
Number of high school and universities (government and privately owned) 1 Schools
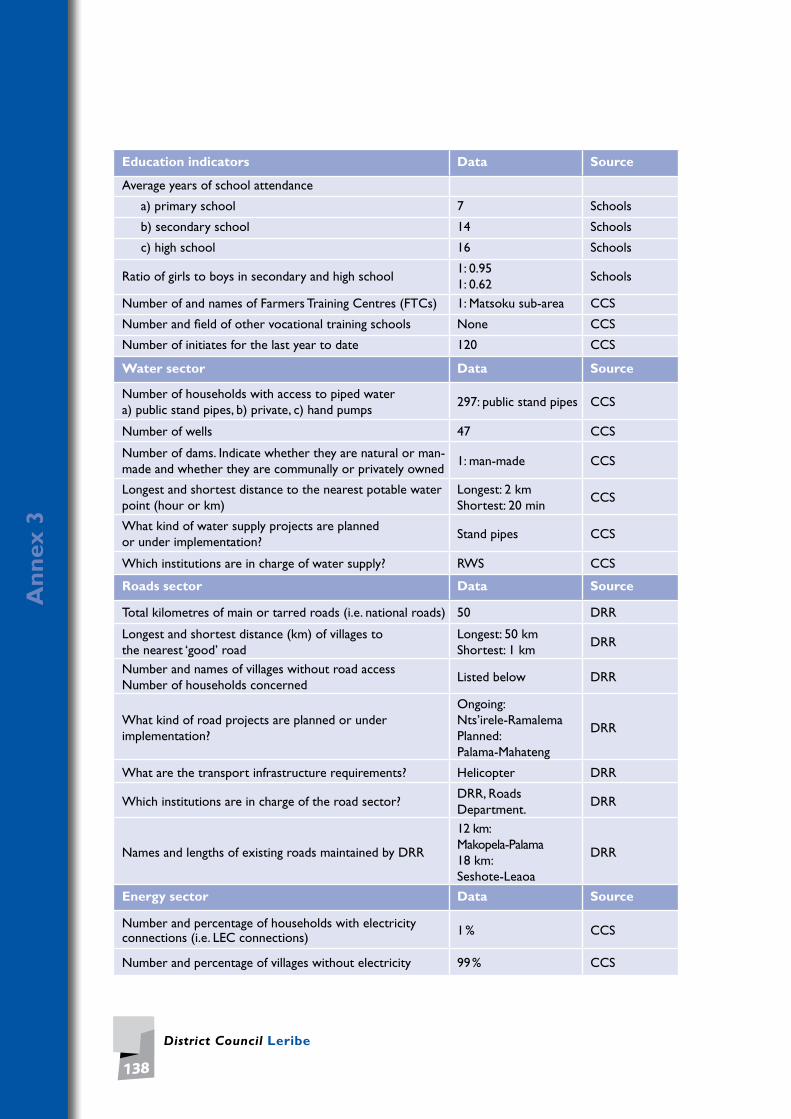
District Council Leribe
138
An
nex
3
Education indicators Data Source
Average years of school attendance
a) primary school 7 Schools
b) secondary school 14 Schools
c) high school 16 Schools
Ratio of girls to boys in secondary and high school 1: 0.95 1: 0.62
Schools
Number of and names of Farmers Training Centres (FTCs) 1: Matsoku sub-area CCS
Number and field of other vocational training schools None CCS
Number of initiates for the last year to date 120 CCS
Water sector Data Source
Number of households with access to piped water a) public stand pipes, b) private, c) hand pumps
297: public stand pipes CCS
Number of wells 47 CCS
Number of dams. Indicate whether they are natural or man-made and whether they are communally or privately owned
1: man-made CCS
Longest and shortest distance to the nearest potable water point (hour or km)
Longest: 2 km Shortest: 20 min
CCS
What kind of water supply projects are planned or under implementation?
Stand pipes CCS
Which institutions are in charge of water supply? RWS CCS
Roads sector Data Source
Total kilometres of main or tarred roads (i.e. national roads) 50 DRR
Longest and shortest distance (km) of villages to the nearest ‘good’ road
Longest: 50 km Shortest: 1 km
DRR
Number and names of villages without road accessNumber of households concerned
Listed below DRR
What kind of road projects are planned or under implementation?
Ongoing: Nts’irele-Ramalema Planned: Palama-Mahateng
DRR
What are the transport infrastructure requirements? Helicopter DRR
Which institutions are in charge of the road sector? DRR, Roads Department.
DRR
Names and lengths of existing roads maintained by DRR
12 km: Makopela-Palama 18 km: Seshote-Leaoa
DRR
Energy sector Data Source
Number and percentage of households with electricity connections (i.e. LEC connections) 1 % CCS
Number and percentage of villages without electricity 99 % CCS

Local Governance and Non-state actors Support Programme - LGNSP
139
An
nex
3
Energy sector Data Source
Which institutions are in charge of the electricity sector? Are they locally represented? LEC CCS
Main source of energy Firewood CCS
Number of households using solar energy None CCS
Communication sector Data Source
Number of villages with landline telephone. Specify number of households with connections None CCS
Number of villages with cell phone reception 5 CCS
Number of villages with access to postal/mail services 37 CCS
Number of villages with local radio reception 37 CCS
Number of villages with local TV reception None CCS
Trade and commerce sector Data Source
Number of businesses (specify type) 21 CCS
Do they have access to specific markets for their products? Yes CCS
Are there any financial institutions (i.e. banks, insurance companies, credit unions etc); if yes provide names and locations
None CCS
Security services Data Source
Number of security service providers 1: governmental Chiefs
Number of crime prevention committees 1 Chiefs
Names of villages least covered by security services Listed Below Chiefs
Common types of crime cases reported Stock theft, common theft Chiefs
Number of stock stolen in the last year 47 Chiefs
Longest and shortest distance to the nearest police station or post
Longest: 70 km Shortest: 20 km Chiefs
Environment Data Source
Names of rare, vulnerable or endangered species
Flora: aloe, Geranium caffrum, Bulbine narcissifolia Fauna: rhebok, African wild cat, hare, helmeted guinea fowl, white-necked raven
MET
Names of protected areas Seshote MET
Names of areas of interest that could be protected Khapung Fall, Khokhoba Fall, Leaoa, Maleane Wetlands
MET
Names of villages that are facing severe soil erosion Sekutlu, Mapeleng, Leaoa MET
What are the natural resource management projects ongoing, planned or under implementation?
Ongoing: Maieane, Seloloane MET

District Council Leribe
140
An
nex
3
Community Council: Matlameng (C04)Population Data Source
Total population 8,000 Chiefs Male population 4,510 Bureau of StatisticsFemale population 3,490 Bureau of StatisticsAverage population per village 340 Bureau of StatisticsNumber of births in the last year 57 Chiefs Number of 5+ mortality rate per 1000 in the last year 92 Chiefs Under 5 mortality rate per 1000 in the last year 79 Chiefs Community council profile Data SourceTotal area of community (km2) 126.04 LSPP Number of electoral divisions 9 CC Number of villages 55 CC Names of villages List attached CC Estimated distance from district town (in km and travel time) 55 km -110 min CC Social indicators Data SourceTotal number of households 2,207 CC Average number of persons per household (average household size) 6 CC
Number of female-headed households 261 CC Number of child-headed households 142 Chiefs Number of orphans 884 Chiefs
a) paternal orphans 257 Chiefs b) maternal orphans 332 Chiefs c) double orphans 295 Chiefs
Number of herd boys not attending school (below 18 years of age) 181 CC
Number of persons with disabilities 86 CC
Socio-economic indicators Data Source
Number of persons receiving food aid 139 Matlameng Health Centre
Proportion of population under M 10.00 per day 34 % CC Employment to population ratio 1:2 CC
Children under 5 years of age - prevalence of underweight 25 Matlameng Health Centre
Proportion of population below minimum level of dietary energy consumption 45 % Matlameng Health
Centre Main sources of income and number of concerned households
Agriculture CC
Average household income (Maloti per year) M 250 CC Number of people employed in agriculture and livestock 900 CC Number of people generating income from other sources 10 % CC
Names and types of associations 80: societies CC

Local Governance and Non-state actors Support Programme - LGNSP
141
An
nex
3
Agriculture sector Data Source
Number of households with agricultural fields 1 CC
Average field size in hectares 2 CC
Three main crops produced Maize, wheat, beans CC
Three main livestock herded Cattle, goats, sheep CC
Size of public land (hectares of range land) 48 CC
What kind of agricultural service providers are available (governmental and NGOs)?
Workshops, supervision for farmers
CC
What kind of agricultural projects are planned or under implementation?
Provision of needs, workshops for farmers
CC
Health sector Data Source
Three most prevalent diseases Respiratory diseases, cardiovascular diseases, HIV/AIDS
Matlameng Health Centre
Number and names of health centres 1: Matlameng Health Centre
Matlameng Health Centre
Longest and shortest distance to nearest health centre (in hours or km)
Longest: 3 km Shortest: 5 min CC
Readiness of undergoing Voluntary Counselling and Testing (VCT) High Matlameng
Health Centre
Names of villages where access to health facilities is worst 27 Matlameng Health Centre
Level of interest to get the results of the test High Matlameng Health Centre
Number of people dependent on home-based care 50 Support groups
Number of households with toilets VIP: 135 Support groups
HIV prevalence among population aged 15-24; proportion of population aged 15-24 years with comprehensive correct knowledge of HIV/AIDS
80 % Matlameng Health Centre
Ratio of school attendance of orphans to school attendance of non-orphans aged 10-14 years 1:2 Matlameng
Health Centre
Proportion of population with HIV infection with access to antiretroviral advanced drugs 25 % Matlameng
Health Centre
Number of HIV/AIDS Support groups 29 Support groups

District Council Leribe
142
An
nex
3
Education sector Data Source
Number of primary schools 8 Schools
Number of secondary schools 1 Schools
Number of high school and universities (government and privately owned) None Schools
Average years of school attendance
a) primary school 7 Schools
b) secondary school 13 Schools
c) high school 15 Schools
Ratio of girls to boys in secondary and high school 2:1 Schools
Number of and names of Farmers Training Centres (FTCs) Mahobong Resource Centre MoA
Number and field of other vocational training schools None MoA
Number of initiates for the last year to date 220: males – 11: females CC
Water sector Data Source
Number of households with access to piped water a) public stand pipes, b) private, c) hand pumps
1,264: public stand pipes CC
Number of wells 83 CC
Number of dams. Indicate whether they are natural or man-made and whether they are communally or privately owned
4: man-made (public) CC
Longest and shortest distance to the nearest potable water point (hour or km)
Longest: 2 km Shortest: 5 min
CC
What kind of water supply projects are planned or under implementation?
Planned: Letsie, Nts’irele, Nkoeng, Phalole, Makhoaba, Ha-Moshoeshoe
CC
Which institutions are in charge of water supply? RWS CC
Roads sector Data Source
Total kilometres of main or tarred roads (i.e. national roads) 27 CC
Longest and shortest distance (km) of villages to the nearest ‘good’ road
Longest: 6 km Shortest: 300 m
CC
Number and names of villages without road access Number of households concerned
Nkoeng, Sekoaing, Fako, Lenka
CC
What kind of road projects are planned or under implementation?
Under implementation: Lekhoatha-Khoatha road Planned: Nkoeng-Sekhonyana
What are the transport infrastructure requirements? Bridges, good roads CC
Which institutions are in charge of the road sector? DRR CC
Names and lengths of existing roads maintained by DRR 1.8 km: Lekhotha-Khoatha road
CC

Local Governance and Non-state actors Support Programme - LGNSP
143
An
nex
3
Energy sector Data Source
Number and percentage of households with electricity connections (i.e. LEC connections) 1,500 (27.7 %) CC
Number and percentage of villages without electricity 55 (100 %) CC
Which institutions are in charge of the electricity sector? Are they locally represented? None CC
Main source of energy Wood CC
Number of households using solar energy 3 CC
Communication sector Data Source
Number of villages with landline telephone. Specify number of households with connections None CC
Number of villages with cell phone reception 19 CC
Number of villages with access to postal/mail services None CC
Number of villages with local radio reception All CC
Number of villages with local TV reception None CC
Trade and commerce sector Data Source
Number of businesses (specify type) 19: grocery shops5: liquor restaurants1: gas retailer
MoTICM
Do they have access to specific markets for their products? Yes CCS
Are there any financial institutions (i.e. banks, insurance companies, credit unions etc); if yes provide names and locations
80: associations CC
Security services Data Source
Number of security service providers 1: governmental (LMPS) CC
Number of crime prevention committees 10 CC
Names of villages least covered by security services Ha Sankoela, Nkoeng LMPS
Common types of crime cases reported Assault, housebreaking, sexual offences LMPS
Number of stock stolen in the last year 23 LMPS
Longest and shortest distance to the nearest police station or post
Longest: 27 km Shortest: 7 km LMPS
Environment Data Source
Names of rare, vulnerable or endangered species
Flora: khoara, cheche, hloenya, mosea,African potatoFauna: monkeys, hare, phokojoe, matsa
CC
Names of protected areas None CC
Names of areas of interest that could be protected Koasa, Nkoeng CC
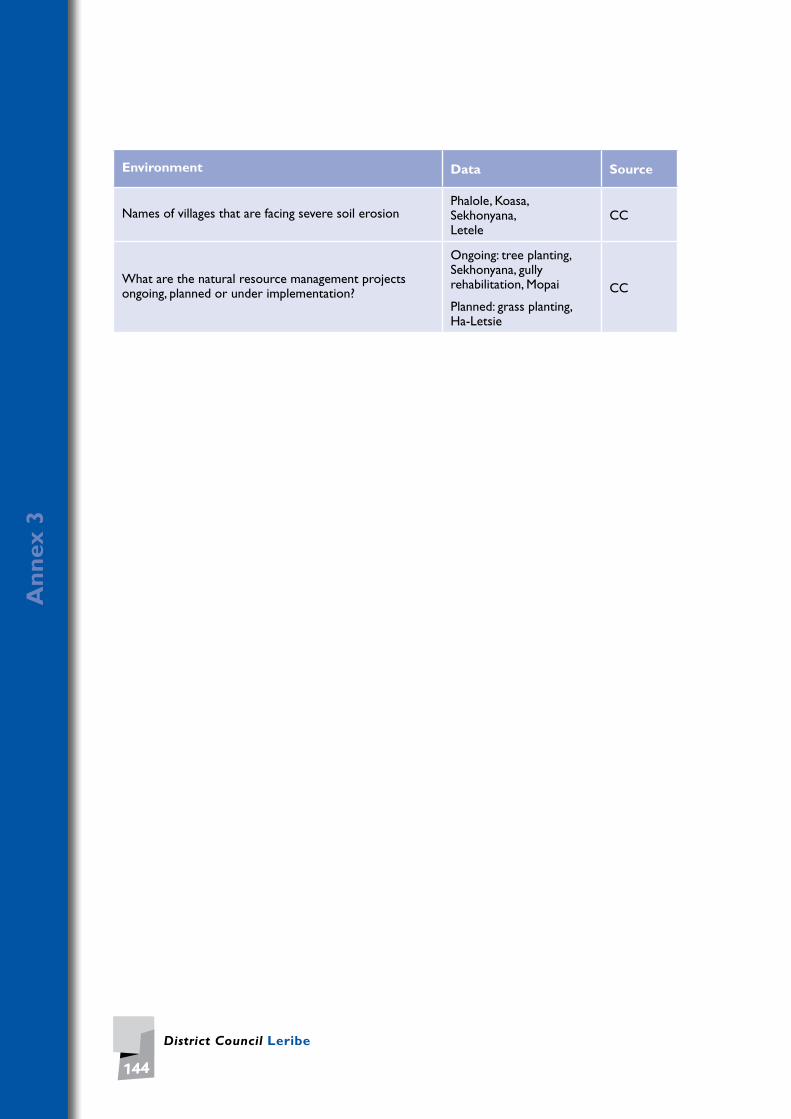
District Council Leribe
144
An
nex
3
Environment Data Source
Names of villages that are facing severe soil erosion Phalole, Koasa,Sekhonyana,Letele
CC
What are the natural resource management projects ongoing, planned or under implementation?
Ongoing: tree planting, Sekhonyana, gully rehabilitation, Mopai
Planned: grass planting, Ha-Letsie
CC

Local Governance and Non-state actors Support Programme - LGNSP
145
An
nex
3
Community Council: Pitseng (C05)
Population Data Source
Total population 18,948 Statistical Office
Male population 9,335 Bureau of Statistics
Female population 9,613 Bureau of Statistics
Average population per village 567 Bureau of Statistics
Number of births in the last year 80 Chiefs
Number of 5+ mortality rate per 1000 in the last year 150 Chiefs
Under 5 mortality rate per 1000 in the last year 39/1000 (district) Pontmain Health Centre
Community council profile Data Source
Total area of community (km2) 186.24 Capital Funds Authority
Number of electoral divisions 9 IEC
Number of villages 49 CC
Names of villages List attached CC
Estimated distance from district town (in km and travel time) 26 km Road sign (LHDA)
Social indicators Data Source
Total number of households 3,790 Bureau of Statistics
Average number of persons per household (average household size) 5 Counsellors
Number of female-headed households 397 Counsellors, support groups
Number of child-headed households 60 Counsellors, support groups
Number of orphans 1,497 Counsellors, support groups
a) paternal orphans 397 Counsellors, support groups
b) maternal orphans 400 Counsellors, support groups
c) double orphans 700 Counsellors, support groups
Number of herd boys not attending school (below 18 years of age) 151 Counsellors
Number of persons with disabilities 185 Phelisanong, counsellors
Socio-economic indicators Data Source
Number of persons receiving food aid 90 Pontmain Health Centre
Proportion of population under M 10.00 per day 10 % Pontmain Health Centre
Socio-economic indicators Data Source

District Council Leribe
146
An
nex
3
Employment to population ratio 1:2 Pontmain HealthCentre
Children under 5 years of age - prevalence of underweight 175 Pontmain HealthCentre
Proportion of population below minimum level of dietary energy consumption 15 % CC
Main sources of income and number of concerned households
Agriculture CC
Average household income (Maloti per year) M 6,000 CC
Number of people employed in agriculture and livestock 5,471Counsellors, chiefs, Resource Centre
Number of people generating income from other sources 60 %Counsellors, chiefs, Resource Centre
Names and types of associations Taxi associations, burial societies, grocery associations
Counsellors
Agriculture sector Data Source
Number of households with agricultural fields 4,835 Resource Centre
Average field size in hectares 1.2 Resource Centre
Three main crops produced Maize, sorghum, beans Counsellors
Three main livestock herded Cattle, goats, sheep Counsellors
Size of public land (hectares of range land) 263 Ranger office
What kind of agricultural service providers are available (governmental and NGOs)?
FAO, training livestock advice agricultural shows
Counsellors, chiefs
What kind of agricultural projects are planned or under implementation? FAO Counsellors, chiefs
Health sector Data Source
Three most prevalent diseases Tuberculosis, malnutrition, HIV/AIDS, infections
Pontmain HealthCentre
Number and names of health centres 1- Pontmain Health Centre
Pontmain HealthCentre, counsellors
Longest and shortest distance to nearest Health Centre (in hours or km)
Longest: 15 km Shortest: 500 m
Pontmain HealthCentre, counsellors
Readiness of undergoing Voluntary Counselling and Testing (VCT) High Pontmain Health
Centre counsellors
Names of villages where access to health facilities is worst Mphosong, Majara, Sekoang 8,000 people
Counsellors, chiefs
Level of interest to get the results of the test High Pontmain HealthCentre counsellors
Health sector Data Source
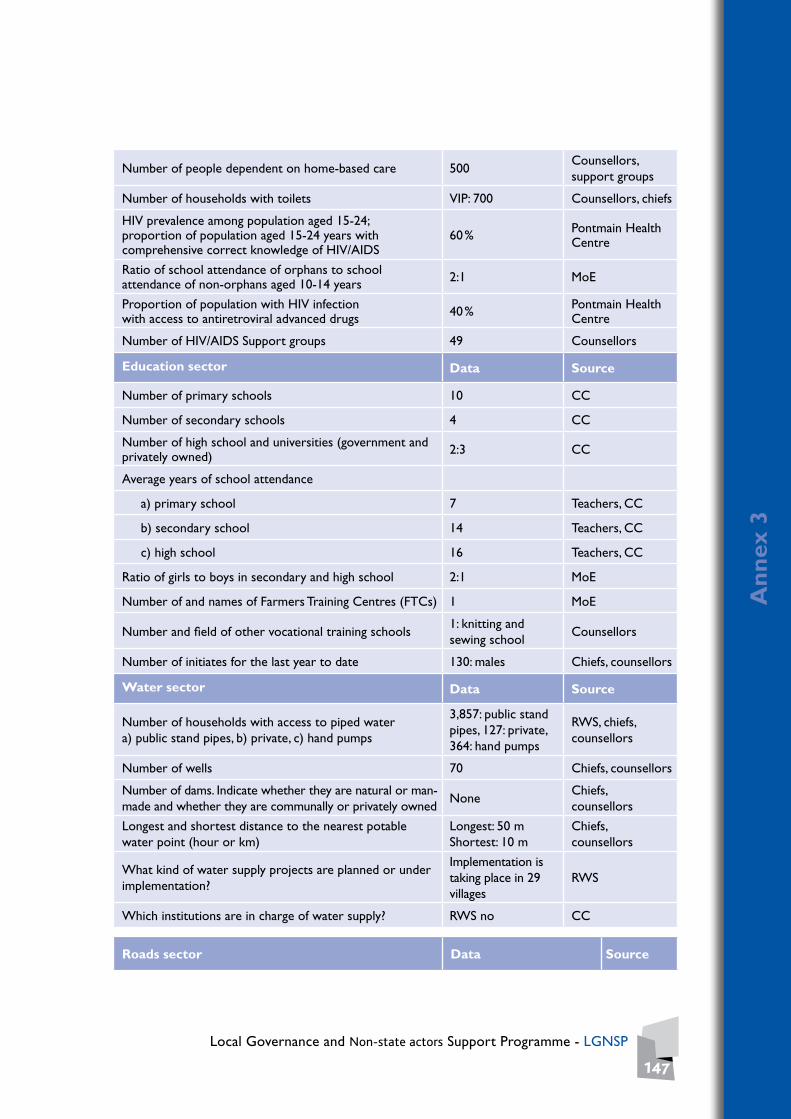
Local Governance and Non-state actors Support Programme - LGNSP
147
An
nex
3
Number of people dependent on home-based care 500Counsellors, support groups
Number of households with toilets VIP: 700 Counsellors, chiefs
HIV prevalence among population aged 15-24; proportion of population aged 15-24 years with comprehensive correct knowledge of HIV/AIDS
60 % Pontmain Health Centre
Ratio of school attendance of orphans to school attendance of non-orphans aged 10-14 years 2:1 MoE
Proportion of population with HIV infection with access to antiretroviral advanced drugs 40 % Pontmain Health
Centre
Number of HIV/AIDS Support groups 49 Counsellors
Education sector Data Source
Number of primary schools 10 CC
Number of secondary schools 4 CC
Number of high school and universities (government and privately owned) 2:3 CC
Average years of school attendance
a) primary school 7 Teachers, CC
b) secondary school 14 Teachers, CC
c) high school 16 Teachers, CC
Ratio of girls to boys in secondary and high school 2:1 MoE
Number of and names of Farmers Training Centres (FTCs) 1 MoE
Number and field of other vocational training schools 1: knitting and sewing school
Counsellors
Number of initiates for the last year to date 130: males Chiefs, counsellors
Water sector Data Source
Number of households with access to piped water a) public stand pipes, b) private, c) hand pumps
3,857: public stand pipes, 127: private, 364: hand pumps
RWS, chiefs, counsellors
Number of wells 70 Chiefs, counsellors
Number of dams. Indicate whether they are natural or man-made and whether they are communally or privately owned
None Chiefs, counsellors
Longest and shortest distance to the nearest potable water point (hour or km)
Longest: 50 m Shortest: 10 m
Chiefs, counsellors
What kind of water supply projects are planned or under implementation?
Implementation is taking place in 29 villages
RWS
Which institutions are in charge of water supply? RWS no CC
Roads sector Data Source

District Council Leribe
148
An
nex
3
Total kilometres of main or tarred roads (i.e. national roads) 22 CC
Longest and shortest distance (km) of villages to the nearest ‘good’ road
Longest: 10 km Shortest: 15 m
CC
Number and names of villages without road access Number of households concerned
None CC
What kind of road projects are planned or under implementation?
Under construction: Nkoana-Sekoaing
CC
What are the transport infrastructure requirements? Roads, bridges, access roads
CC
Which institutions are in charge of the road sector? DRR, Roads Department CC
Names and lengths of existing roads maintained by DRR 10 km: Pitseng-Maduna 6 km: Tauoa-Nchee
DRR
Energy sector Data Source
Number and percentage of households with electricity connections (i.e. LEC connections) 1,050 (27.7 %) LEC
Number and percentage of villages without electricity 34 (69.4 %) CC
Which institutions are in charge of the electricity sector? Are they locally represented? LEC CC
Main source of energy Wood, paraffin, gas CC
Number of households using solar energy None CC
Communication sector Data Source
Number of villages with landline telephone. Specify number of households with connections n/a Counsellors,
chiefs
Number of villages with cell phone reception 49 Counsellors, chiefs
Number of villages with access to postal/mail services 49 Post office
Number of villages with local radio reception 49 CC
Number of villages with local TV reception 49 CC
Trade and commerce sector Data Source
Number of businesses (specify type) 65: supermarkets, shops, filling station, brick making industry, salons, guesthouse
MoTICM, CC
Do they have access to specific markets for their products? Yes CC
Are there any financial institutions (i.e. banks, insurance companies credit unions etc); if yes provide names and locations
Post bank, Credit Union (currently out of service)
CC
Security services Data Source

Local Governance and Non-state actors Support Programme - LGNSP
149
An
nex
3
Number of security service providers 1: Governmental 9: Private
LMPS, counsellors
Number of crime prevention committees 9 LMPS
Names of villages least covered by security services Listed below LMPS
Common types of crime cases reported Stock theft, housebreaking, assault, sexual offences
LMPS
Number of stock stolen in the last year 154 LMPS
Longest and shortest distance to the nearest police station or post
Longest: 15 km Shortest: 50 m
LMPS
Environment Data Source
Names of rare, vulnerable or endangered species Flora: cheche, mofifi, mosea. Fauna: hare, monkeys, springboks
MET, counsellors
Names of protected areas None CC
Names of areas of interest that could be protected Pitseng cave, Molimo Nthuse, Lets’a la Tsunyane
Counsellors
Environment Data Source
Names of villages that are facing severe soil erosion Romeng, Khoitising, Ha Nchee
Counsellors
What are the natural resource management projects ongoing, planned or under implementation?
Ongoing: tree planting Planned: gully rehabilitation
CC
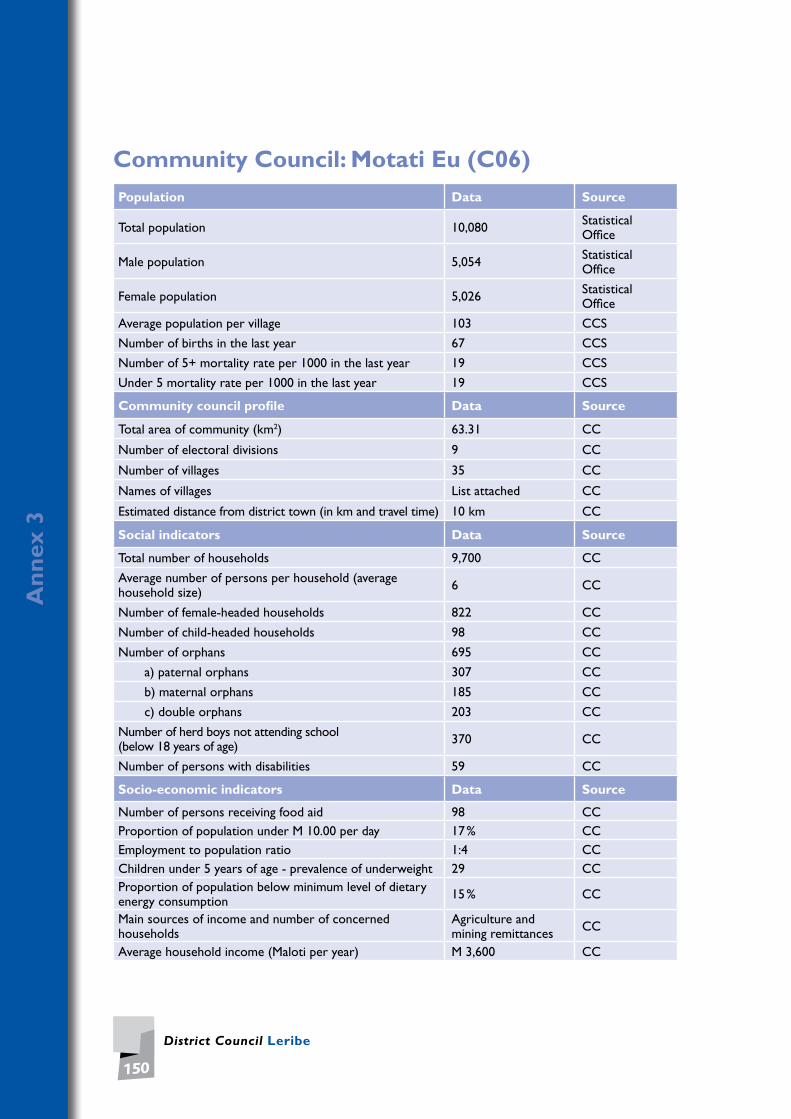
District Council Leribe
150
An
nex
3
Community Council: Motati Eu (C06)Population Data Source
Total population 10,080 Statistical Office
Male population 5,054 Statistical Office
Female population 5,026 Statistical Office
Average population per village 103 CCS
Number of births in the last year 67 CCS
Number of 5+ mortality rate per 1000 in the last year 19 CCS
Under 5 mortality rate per 1000 in the last year 19 CCS
Community council profile Data Source
Total area of community (km2) 63.31 CC
Number of electoral divisions 9 CC
Number of villages 35 CC
Names of villages List attached CC
Estimated distance from district town (in km and travel time) 10 km CC
Social indicators Data Source
Total number of households 9,700 CC
Average number of persons per household (average household size) 6 CC
Number of female-headed households 822 CC
Number of child-headed households 98 CC
Number of orphans 695 CC
a) paternal orphans 307 CC
b) maternal orphans 185 CC
c) double orphans 203 CC
Number of herd boys not attending school (below 18 years of age) 370 CC
Number of persons with disabilities 59 CC
Socio-economic indicators Data Source
Number of persons receiving food aid 98 CC Proportion of population under M 10.00 per day 17 % CC Employment to population ratio 1:4 CC Children under 5 years of age - prevalence of underweight 29 CC Proportion of population below minimum level of dietary energy consumption 15 % CC
Main sources of income and number of concerned households
Agriculture and mining remittances CC
Average household income (Maloti per year) M 3,600 CC

Local Governance and Non-state actors Support Programme - LGNSP
151
An
nex
3
Socio-economic indicators Data Source
Number of people employed in agriculture and livestock 2,400 CC
Number of people generating income from other sources 90 % CC
Names and types of associations Burial societies, farmers’ associations CC
Agriculture sector Data Source
Number of households with agricultural fields 1,693 Agricultural Resource Centre
Average field size in hectares (has) 2 Agricultural Resource Centre
Three main crops produced Maize, sorghum, beans CC
Three main livestock herded Cattle, goats, sheep CC
Size of public land (hectares of range land) 382 MoFLR
What kind of agricultural service providers are available (governmental and NGOs)?
MOAFS, extensionservices CC
What kind of agricultural projects are planned or under implementation? None Agricultural
Resource Centre
Health sector Data Source
Three most prevalent diseases HIV/AIDS, tuberculosis, hypertension
CC
Number and names of health centres 2:Thaba-Phatsoa, Mositi health centres CC
Longest and shortest distance to nearest health centre (in hours or km)
Longest: 5 km Shortest: 100 m CC
Readiness of undergoing Voluntary Counselling and Testing (VCT) High CC
Names of villages where access to health facilities is worst
Kalaele, Nyokoto, Likatane, Motlatsi, ‘Mako,Thabo, Ntoahae,‘Meche, Pontšo, Lekhanya
CC
Level of interest to get the results of the test High CC
Number of people dependent on home-based care 34 CC
Number of households with toilets VIP: 1,900 (50 %) WC: 1,140 (30 %) CC
HIV prevalence among population aged 15-24; proportion of population aged 15-24 years with comprehensive correct knowledge of HIV/AIDS
25 % Mositi Health Centre
Ratio of school attendance of orphans to school attendance of non-orphans aged 10-14 years 1:5 CC
Proportion of population with HIV infection with access to antiretroviral advanced drugs 20 % CC
Number of HIV/AIDS Support groups 9 CC

District Council Leribe
152
An
nex
3
Education sector Data Source
Number of primary schools 6 CC
Number of secondary schools 2 CC
Number of high school and universities (government and privately owned) 1 CC
Average years of school attendance
a) primary school 7 Schools
b) secondary school 3 Schools
c) high school 2 Schools
Ratio of girls to boys in secondary and high school 4:5 Schools
Number of and names of Farmers Training Centres (FTCs) None CC
Number and field of other vocational training schools None CC
Number of initiates for the last year to date 119 CC
Water sector Data Source
Number of households with access to piped water a) public stand pipes, b) private, c) hand pumps
16: public stand pipes 18: private RWS CC
Number of wells 54
Number of dams. Indicate whether they are natural or man-made and whether they are communally or privately owned
13: natural 56: man-made CC
Longest and shortest distance to the nearest potable water point (hour or km)
Longest: 3km Shortest: 100m CC
What kind of water supply projects are planned or under implementation?
2: Thaba Phatšoa Ha Tabolela RWS
Which institutions are in charge of water supply? RWS (district level) RWS
Roads sector Data Source
Total kilometres of main or tarred roads (i.e. national roads) None CC
Longest and shortest distance (km) of villages to the nearest ‘good’ road Shortest: 10km CC
Number and names of villages without road access Number of households concerned Listed below CC
What kind of road projects are planned or under implementation?
Ongoing : upgrading Ntoahae-‘Meche, Planned: Setene-Mositi, Thaba-Phatsoa-Makhoa, Thaba-Phatsoa-Tente
CC
What are the transport infrastructure requirements? Road upgrading CC
Which institutions are in charge of the road sector? Roads Department, DRR CC
Names and lengths of existing roads maintained by DRR 8.3km: Setene-Mositi DRR

Local Governance and Non-state actors Support Programme - LGNSP
153
An
nex
3
Energy sector Data Source
Number and percentage of households with electricity connections (i.e. LEC connections) 0 % CC
Number and percentage of villages without electricity 35 (100 %) CC
Which institutions are in charge of the electricity sector? Are they locally represented? LEC CC
Main source of energy Firewood CC
Number of households using solar energy 1 % CC
Communication sector Data Source
Number of villages with landline telephone. Specify number of households with connections
1: Mositi Health Centre CC
Number of villages with cell phone reception 35 (100 %) CC
Number of villages with access to postal/mail services 35 (100 %) CC
Number of villages with local radio reception None CC
Number of villages with local TV reception 35 (100 %) CC
Trade and commerce sector Data Source
Number of businesses (specify type) 9 CC
Do they have access to specific markets for their products? Yes CC
Are there any financial institutions (i.e. banks, insurance companies, credit unions etc); if yes provide names and locations
None CC
Security services Data Source
Number of security service providers 1: governmental CC
Number of crime prevention committees 24 CC
Names of villages least covered by security services Listed below CC
Common types of crime cases reported Stock theft CC
Number of stock stolen in the last year 110 CC
Longest and shortest distance to the nearest police station or post
Longest: 18km Shortest: 5km CC
Environment Data Source
Names of rare, vulnerable or endangered species
Fauna: matsa phokojoe lenong, Flora: aloe, lengana, cheche
MET
Names of protected areas Outward Bound, Thaba Phatsoa dam MET
Names of areas of interest that could be protected None CC
Names of villages that are facing severe soil erosion Likatane, Nokote, Kalaele CC
What are the natural resource management projects ongoing, planned or under implementation?
Ongoing: tree planting, donga rehabilitation Planned: dam construction
CC

District Council Leribe
154
An
nex
3
Community Council: Fenyane (C07)Population Data Source
Total population 10,766 CCS
Male population 4,800 Counsellors
Female population 5,966 Counsellors
Average population per village 288.3 Counsellors
Number of births in the last year 300 Support groups, chiefs
Number of 5+ mortality rate per 1000 in the last year 439 Support groups, chiefs
Under 5 mortality rate per 1000 in the last year 140 Support groups, chiefs
Community council profile Data Source
Total area of community (km2) 118.25 CCS
Number of electoral divisions 9 CCS
Number of villages 38 CCS
Names of villages Listed below CCS
Estimated distance from district town (in km and travel time) 25 CCS
Social indicators Data Source
Total number of households 2,394 Chiefs
Average number of persons per household (average household size) 6 Chiefs
Number of female-headed households 640 Chiefs, counsellors
Number of child-headed households 325 Chiefs, counsellors
Number of orphans 915 Support groups
a) paternal orphans 393 Support groups
b) maternal orphans 310 Support groups
c) double orphans 212 Support groups
Number of herd boys not attending school (below 18 years of age) 300 Chiefs, counsellors
Number of persons with disabilities 81 Chiefs, counsellors
Socio-economic indicators Data Source
Number of persons receiving food aid 663 Counsellors, chiefs, support groups
Proportion of population under M 10.00 per day 24 % Counsellors, chiefs, support groups
Employment to population ratio 1:3 Counsellors, chiefs, support groups
Children under 5 years of age - prevalence of underweight 94 Counsellors, chiefs, support groups
Proportion of population below minimum level of dietary energy consumption 25 % Counsellors, chiefs,
support groups

Local Governance and Non-state actors Support Programme - LGNSP
155
An
nex
3
Socio-economic indicators Data Source
Main sources of income and number of concerned households
Agriculture, livestock
Counsellors, chiefs, support groups
Average household income (Maloti per year) M 25,000 Counsellors, chiefs, support groups
Number of people employed in agriculture and livestock 333 Counsellors, chiefs, support groups
Number of people generating income from other sources 649 Counsellors, chiefs, support groups
Names and types of associations None Counsellors, chiefs, support groups
Agriculture sector Data Source
Number of households with agricultural fields 763 CCS
Average field size in hectares (has) 1.2 DAO, CCS
Three main crops produced Maize, sorghum, beans Chiefs, counsellors
Three main livestock herded Cattle, goats, sheep Chiefs, counsellors
Size of public land (hectares of range land) 539 Chiefs, counsellors
What kind of agricultural service providers are available (governmental and NGOs)? MoA MoFLR
What kind of agricultural projects are planned or under implementation? None CCS
Health sector Data Source
Three most prevalent diseases HIV/AIDS, tuberculosis, sugar diabetes
MoH
Number and names of health centres 1: Ramapepe Health Centre MoH
Longest and shortest distance to nearest health centre (in hours or km)
Longest: 24hr Shortest: 3min Villagers
Readiness of undergoing Voluntary Counselling and Testing (VCT) High 85 % Support groups
Names of villages where access to health facilities is worst 35: excluding Ramapepe, Likileng, Matoli
Support groups
Level of interest to get the results of the test High Support groups
Number of people dependent on home-based care 267 Support groups
Number of households with toilets VIP: 134 Counsellors
HIV prevalence among population aged 15-24; proportion of population aged 15-24 years with comprehensive correct knowledge of HIV/AIDS
45 % Support groups
Ratio of school attendance of orphans to school attendance of non-orphans aged 10-14 years 1:4 Local schools
Proportion of population with HIV infection with access to antiretroviral advanced drugs 37 % MoH
Number of HIV/AIDS Support groups 36 Support groups

District Council Leribe
156
An
nex
3
Education sector Data Source
Number of primary schools 2: governmental 6: private Local schools
Number of secondary schools 2 Local schools
Number of high school and universities (government and privately owned) None Local schools
Average years of school attendance Local schools
a) primary school 6:8 Local schools
b) secondary school 1:3 Local schools
c) high school n/a Local schools
Ratio of girls to boys in secondary and high school 2:1 Local schools
Number of and names of Farmers Training Centres (FTCs) None Local schools
Number and field of other vocational training schools None Local schools
Number of initiates for the last year to date 123 Chiefs, schools, counsellors
Water sector Data Source
Number of households with access to piped water a) public stand pipes, b) private, c) hand pumps
Ramapepe, ‘Mamotjepela Chiefs, counsellors
Number of wells 153 Chiefs, counsellors
Number of dams. Indicate whether they are natural or man-made and whether they are communally or privately owned 2 Chiefs, counsellors
Longest and shortest distance to the nearest potable water point (hour or km)
Longest: 90 min Shortest: 10 min Chiefs, counsellors
What kind of water supply projects are planned or under implementation? None Chiefs, counsellors
Which institutions are in charge of water supply? RWS Chiefs, counsellors
Roads sector Data Source
Total kilometres of main or tarred roads (i.e. national roads) 22 DRR
Longest and shortest distance (km) of villages to the nearest ‘good’ road
Longest: 6 hr Shortest: 1 min Chiefs, counsellors
Number and names of villages without road access Number of households concerned
Mahlabatheng (791) Ramotjalo-Tjalo (869)
Chiefs, counsellors
What kind of road projects are planned or under implementation?
Upgrade: Lipetu-Fako Chiefs, counsellors
What are the transport infrastructure requirements? Machinery Chiefs, counsellors
Which institutions are in charge of the road sector? DRR Chiefs, counsellors
Names and lengths of existing roads maintained by DRR
Matona-Lipetu, Tsoinyane-Likileng, Tsoinyane-Leqhutsung
Chiefs, counsellors
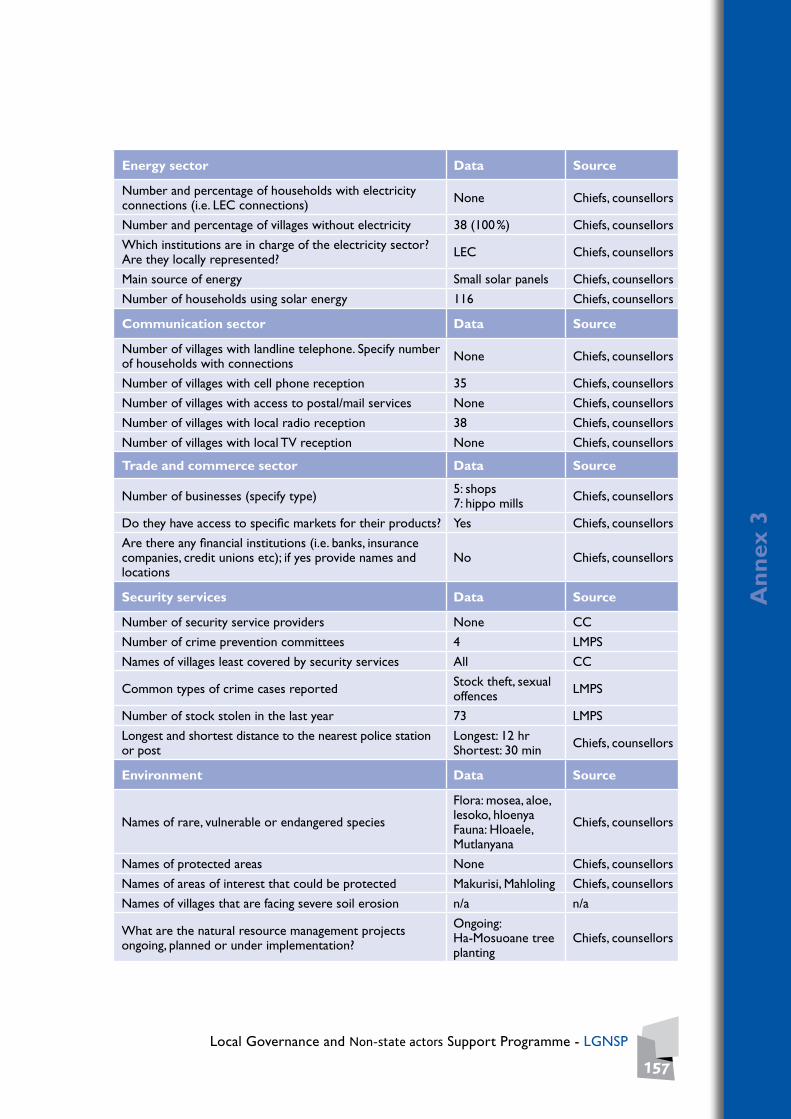
Local Governance and Non-state actors Support Programme - LGNSP
157
An
nex
3
Energy sector Data Source
Number and percentage of households with electricity connections (i.e. LEC connections) None Chiefs, counsellors
Number and percentage of villages without electricity 38 (100 %) Chiefs, counsellors
Which institutions are in charge of the electricity sector? Are they locally represented? LEC Chiefs, counsellors
Main source of energy Small solar panels Chiefs, counsellors
Number of households using solar energy 116 Chiefs, counsellors
Communication sector Data Source
Number of villages with landline telephone. Specify number of households with connections None Chiefs, counsellors
Number of villages with cell phone reception 35 Chiefs, counsellors
Number of villages with access to postal/mail services None Chiefs, counsellors
Number of villages with local radio reception 38 Chiefs, counsellors
Number of villages with local TV reception None Chiefs, counsellors
Trade and commerce sector Data Source
Number of businesses (specify type) 5: shops 7: hippo mills Chiefs, counsellors
Do they have access to specific markets for their products? Yes Chiefs, counsellors
Are there any financial institutions (i.e. banks, insurance companies, credit unions etc); if yes provide names and locations
No Chiefs, counsellors
Security services Data Source
Number of security service providers None CC
Number of crime prevention committees 4 LMPS
Names of villages least covered by security services All CC
Common types of crime cases reported Stock theft, sexual offences LMPS
Number of stock stolen in the last year 73 LMPS
Longest and shortest distance to the nearest police station or post
Longest: 12 hr Shortest: 30 min Chiefs, counsellors
Environment Data Source
Names of rare, vulnerable or endangered species
Flora: mosea, aloe, lesoko, hloenya Fauna: Hloaele, Mutlanyana
Chiefs, counsellors
Names of protected areas None Chiefs, counsellors
Names of areas of interest that could be protected Makurisi, Mahloling Chiefs, counsellors
Names of villages that are facing severe soil erosion n/a n/a
What are the natural resource management projects ongoing, planned or under implementation?
Ongoing: Ha-Mosuoane tree planting
Chiefs, counsellors

District Council Leribe
158
An
nex
3
Community Council: Serupane (C08)Population Data Source
Total population 10,143 CC
Male population 4,366 CC
Female population 5,763 CC
Average population per village 147 CC
Number of births in the last year 554 Clinics
Number of 5+ mortality rate per 1000 in the last year 95 Chiefs
Under 5 mortality rate per 1000 in the last year 9 Chiefs
Community council profile Data Source
Total area of community (km2) 46.73 CC
Number of electoral divisions 9 CC
Number of villages 69 CC
Names of villages List attached CC
Estimated distance from district town (in km and travel time) 23 km CC Social indicators Data Source
Total number of households 8,112 CC Average number of persons per household (average household size) 6 CC
Number of female-headed households 958 CC Number of child-headed households 231 CC Number of orphans 1,153 Support groups
a) paternal orphans 430 Support groups b) maternal orphans 393 Support groups c) double orphans 330 Support groups
Number of herd boys not attending school (below 18 years of age) 122 CC
Number of persons with disabilities 153 Support groups Socio-economic indicators Data Source
Number of persons receiving food aid 116 Clinics Proportion of population under M 10.00 per day 60 % CC Employment to population ratio 1,648Children under 5 years of age - prevalence of underweight 43 Clinics Proportion of population below minimum level of dietary energy consumption 660 MoH
Main sources of income and number of households concerned 530 CC
Average household income (Maloti per year) 0 - 500 = 853 501 - 1000 = 530 > 1000 = 265
CC
Number of people employed in agriculture and livestock 4,479 Resource CentreNumber of people generating income from other sources 101 CC
Names and types of associations 2: Mathula, Action Aid
CC

Local Governance and Non-state actors Support Programme - LGNSP
159
An
nex
3
Agriculture sector Data Source
Number of households with agricultural fields 2,447 CC
Average field size in hectares (has) 2,400 Resource Centre
Three main crops produced Maize, sorghum, beans
CC
Three main livestock herded Cattle, horses, sheep CC
Size of public land (hectares of range land) 1,215.2 LSPP
What kind of agricultural service providers are available (governmental and NGOs)?
Agricultural organisations
Resource Centre
What kind of agricultural projects are planned or under implementation? Irrigation projects Resource Centre
Health sector Data Source
Three most prevalent diseases Tuberculosis, hypertension, STI
CC
Number and names of health centres 2: Holy TrinityClinic, Mahobong Clinic
CC
Longest and shortest distance to nearest health centre (in hours or km)
Longest: 11km Shortest: 200m
CC
Readiness of undergoing Voluntary Counselling andTesting (VCT) High CC
Names of villages where access to health facilities is worst Makhoaneng, Setene, Likhotolieng
Health Centre
Level of interest to get the results of the test High Health Centre
Number of people dependent on home-based care 320 Health Centre
Number of households with toilets VIP: 893 CC
HIV prevalence among population aged 15-24; proportion of population aged 15-24 years with comprehensive correct knowledge of HIV/AIDS
520 -1,596 CC
Ratio of school attendance of orphans to school attendance of non-orphans aged 10-14 years 1:2
Schools, support groups
Proportion of population with HIV infection with access to antiretroviral advanced drugs 519 Support groups
Number of HIV/AIDS Support groups 14 Support groups
Education sector Data Source
Number of primary schools 6 MoE
Number of secondary schools 1 MoE
Number of high school and universities (government and privately owned) 1 MoE
Average years of school attendance 15 MoE
a) primary school 7 MoE

District Council Leribe
160
An
nex
3
Education sector Data Source
b) secondary school 3 MoE
c) high school 2 MoE
Ratio of girls to boys in secondary and high school 3:2 MoE
Number of and names of Farmers Training Centres (FTCs) 0 MoE
Number and field of other vocational training schools 2 CC
Number of initiates for the last year to date 115 CC
Water sector Data Source
Number of households with access to piped water a) public stand pipesb) privatec) hand pumps
3,306: public stand pipes CC
Number of wells 7 CC
Number of dams. Indicate whether they are natural or man-made and whether they are communally or privately owned 7: natural CC
Longest and shortest distance to the nearest potable water point (hour or km)
Longest: 2 hr Shortest: 1 hr
CC
What kind of water supply projects are planned or under implementation? RWS CC
Which institutions are in charge of water supply? Communities CC
Roads sector Data Source
Total kilometres of main or tarred roads (i.e. national roads) 19 DRR
Longest and shortest distance (km) of villages to the nearest ‘good’ road
Longest: 7 km Shortest: 200 m
DRR
Number and names of villages without road access Number of households concerned
Ha - Mahala, Lobiane, Likhotolieng, Lekhalong, Seiso, Botilo
DRR
What kind of road projects are planned or under implementation?
5.1 km: maintenance of Makhoaneng -Tsoinyane
DRR
What are the transport infrastructure requirements? Bridges, dirt roads DRR
Which institutions are in charge of the road sector? DRR CC
Names and lengths of existing roads maintained by DRR
5.3 km: Lesiamo - Moqathinyane 6 km: Makhoaneng -Tsoinyane
CC

Local Governance and Non-state actors Support Programme - LGNSP
161
An
nex
3
Energy sector Data Source
Number and percentage of households with electricity connections (i.e. LEC connections) 166 (1.63 %) CC
Number and percentage of villages without electricity 63 (91 %) CC Which institutions are in charge of the electricity sector? Are they locally represented? LEC CC
Main source of energy Wood CC Number of households using solar energy 18 CC
Communication sector Data Source
Number of villages with landline telephone. Specify number of households with connections
3: villages 26: households
Vodacom Lesotho, Econet
Number of villages with cell phone reception 40 CC Number of villages with access to postal/mail services 69 CC Number of villages with local radio reception 69 CC Number of villages with local TV reception 7 CC
Trade and commerce sector Data Source
Number of businesses (specify type) 16: general cafés10: restaurants CC
Do they have access to specific markets for their products? Yes CC Are there any financial institutions (i.e. banks, insurance companies, credit unions etc); if yes provide names and locations
No CC
Security services Data Source
Number of security service providers 1: governmental1: private CC
Number of crime prevention committees 58 CC Names of villages least covered by security services Listed below CC
Common types of crime cases reported Housebreaking, stock theft, rape CC
Number of stock stolen in the last year 78 CC Longest and shortest distance to the nearest police station or post
Longest: 20 km Shortest: 6 km CC
Environment Data Source
Names of rare, vulnerable or endangered species Fauna: aloe Flora: lipela CC
Names of protected areas Monyatso catchment area CC
Names of areas of interest that could be protected Makhoaneng, Somololo, Lekhalong, Ha Monyatso
CC
Names of villages that are facing severe soil erosion
Mapeshoane, Makhoaneng, Litaung, Likhotolieng
CC
What are the natural resource management projects ongoing, planned or under implementation?
Ongoing: tree planting Planned: tree planting, terraces
CC
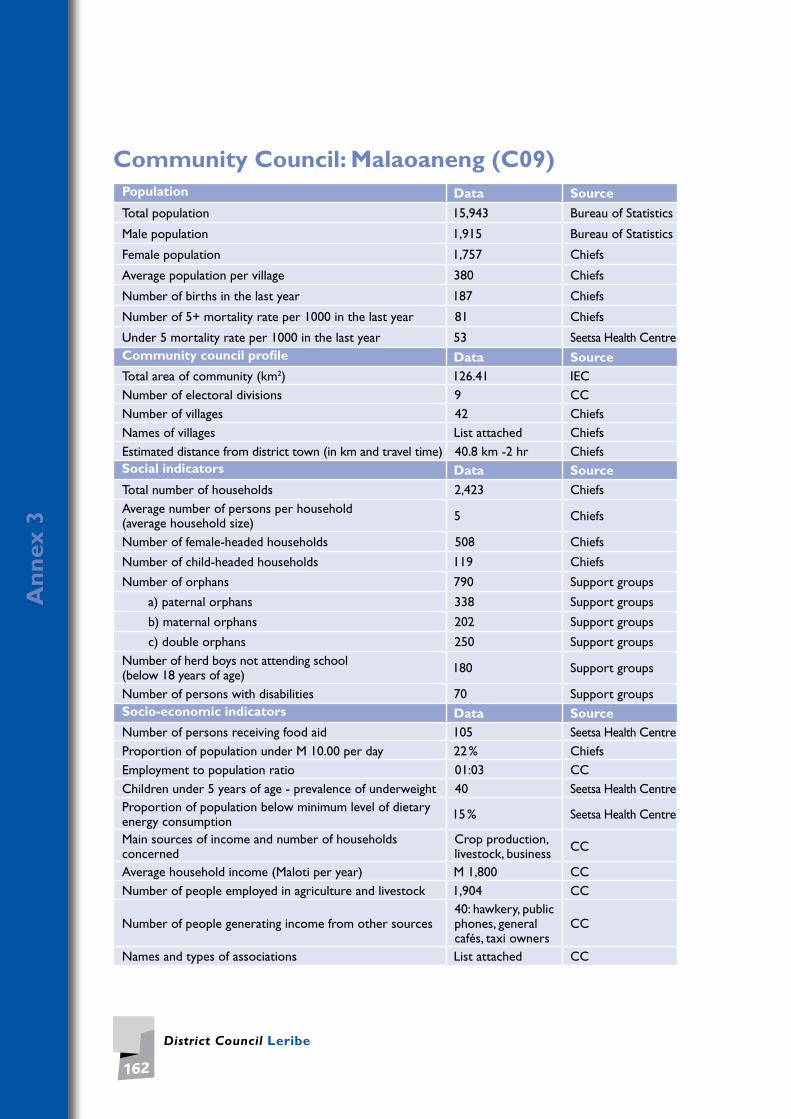
District Council Leribe
162
An
nex
3
Community Council: Malaoaneng (C09)Population Data Source
Total population 15,943 Bureau of Statistics
Male population 1,915 Bureau of Statistics
Female population 1,757 Chiefs
Average population per village 380 Chiefs
Number of births in the last year 187 Chiefs
Number of 5+ mortality rate per 1000 in the last year 81 Chiefs
Under 5 mortality rate per 1000 in the last year 53 Seetsa Health Centre Community council profile Data SourceTotal area of community (km2) 126.41 IEC Number of electoral divisions 9 CC Number of villages 42 Chiefs Names of villages List attached Chiefs Estimated distance from district town (in km and travel time) 40.8 km -2 hr Chiefs Social indicators Data Source
Total number of households 2,423 Chiefs Average number of persons per household (average household size) 5 Chiefs
Number of female-headed households 508 Chiefs
Number of child-headed households 119 Chiefs
Number of orphans 790 Support groups
a) paternal orphans 338 Support groups
b) maternal orphans 202 Support groups
c) double orphans 250 Support groups Number of herd boys not attending school (below 18 years of age) 180 Support groups
Number of persons with disabilities 70 Support groups Socio-economic indicators Data SourceNumber of persons receiving food aid 105 Seetsa Health Centre Proportion of population under M 10.00 per day 22 % Chiefs Employment to population ratio 01:03 CC Children under 5 years of age - prevalence of underweight 40 Seetsa Health Centre Proportion of population below minimum level of dietary energy consumption 15 % Seetsa Health Centre
Main sources of income and number of households concerned
Crop production, livestock, business CC
Average household income (Maloti per year) M 1,800 CC Number of people employed in agriculture and livestock 1,904 CC
Number of people generating income from other sources 40: hawkery, public phones, general cafés, taxi owners
CC
Names and types of associations List attached CC

Local Governance and Non-state actors Support Programme - LGNSP
163
An
nex
3
Agriculture sector Data Source
Number of households with agricultural fields 2,365 Chiefs
Average field size in hectares 10 Chiefs
Three main crops produced Maize, beans sorghum CC
Three main livestock herded Cattle, donkeys, horses CC
Size of public land (hectares of range land) 4,558.3 MoFLR
What kind of agricultural service providers are available (governmental and NGOs)? FAO CC
What kind of agricultural projects are planned or under implementation? None CC
Health sector Data Source
Three most prevalent diseases
Pulmonary diseases, hypertension, HIV/AIDS
Health
Number and names of health centres 1: Seetsa Health Centre Health
Longest and shortest distance to nearest health centre (in hours or km)
Longest: 11.8 km Shortest: 3 min CC
Readiness of undergoing Voluntary Counselling andTesting (VCT) High Seetsa Health
Centre
Names of villages where access to health facilities is worst None Seetsa Health Centre
Level of interest to get the results of the test High Seetsa Health Centre
Number of people dependent on home-based care 21 Seetsa Health Centre
Number of households with toilets VIP: 291 Chiefs
HIV prevalence among population aged 15-24; proportion of population aged 15-24 years with comprehensive correct knowledge of HIV/AIDS
25 -166 Seetsa Health Centre
Ratio of school attendance of orphans to school attendance of non-orphans aged 10-14 years 1:2 Teachers
Proportion of population with HIV infection with access to antiretroviral advanced drugs 36 % Seetsa Health
Centre
Number of HIV/AIDS Support groups 28 Support groups
Education sector Data Source
Number of primary schools 4 CC
Number of secondary schools 1 CC
Number of high school and universities (government and privately owned) None CC

District Council Leribe
164
An
nex
3
Education sector Data Source
Average years of school attendance
a) primary school 7 Schools
b) secondary school 14 Schools
c) high school 16 Schools
Ratio of girls to boys in secondary and high school 2:1 Schools
Number of and names of Farmers Training Centres (FTCs) None CC
Number and field of other vocational training schools None CC
Number of initiates for the last year to date 99: males 8: females Chiefs
Water sector Data Source
Number of households with access to piped water a) public stand pipes, b) private, c) hand pumps
75: public stand pipes Chiefs
Number of wells 34 Chiefs
Number of dams. Indicate whether they are natural or man-made and whether they are communally or privately owned 9 Chiefs
Longest and shortest distance to the nearest potable water point (hour or km)
Longest: 90min Shortest: 5min Chiefs
What kind of water supply projects are planned or under implementation?
One piped water system (implemented)
Chiefs
Which institutions are in charge of water supply? RWS Chiefs
Roads sector Data Source
Total kilometres of main or tarred roads (i.e. national roads) 18.8km CC
Longest and shortest distance (km) of villages to the nearest ‘good’ road
Longest: 6.8km Shortest: 3min CC
Number and names of villages without road access Number of households concerned
42: villages 2,423: households CC
What kind of road projects are planned or under implementation?
1: road construction CC
What are the transport infrastructure requirements?
4: footbridges 2: bridges 45: road construction
CC
Which institutions are in charge of the road sector? DRR CC
Names and lengths of existing roads maintained by DRR 6.8km: Malefane-Chachele CC
Energy sector Data Source
Number and percentage of households with electricity connections (i.e. LEC connections) None CC
Number and percentage of villages without electricity None CC
Which institutions are in charge of the electricity sector? Are they locally represented? LEC CC
Main source of energy Firewood, paraffin CC
Number of households using solar energy 170 CC
Communication sector Data Source

Local Governance and Non-state actors Support Programme - LGNSP
165
An
nex
3
Number of villages with landline telephone. Specify number of households with connections 2 Chiefs
Number of villages with cell phone reception 42 Chiefs
Number of villages with access to postal/mail services 42 Chiefs
Number of villages with local radio reception 42 Chiefs
Number of villages with local TV reception 39 Chiefs
Trade and commerce sector Data Source
Number of businesses (specify type)
16: general cafés12: taxis2: grind mills 3: tavern
Chiefs
Do they have access to specific markets for their products? No Chiefs
Are there any financial institutions (i.e. banks, insurance companies, credit unions etc); if yes provide names and locations
No Chiefs
Security services Data Source
Number of security service providers 1: governmental Police
Number of crime prevention committees 42 Police
Names of villages least covered by security services Listed below Police
Common types of crime cases reported Stock theft, housebreaking, sexual offences
Police
Number of stock stolen in the last year 64 Chiefs
Longest and shortest distance to the nearest police station or post
Longest: 28km Shortest: 17km CC
Environment Data Source
Names of rare, vulnerable or endangered species
Flora: khoara, sehala, hala sa matlaka Fauna: letsa, phokojoe, hlolo
Chiefs
Names of protected areas None Chiefs
Names of areas of interest that could be protected Attached Chiefs
Names of villages that are facing severe soil erosion All Chiefs
What are the natural resource management projects ongoing, planned or under implementation?
Ongoing: tree planting, Donga rehabilitation Planned: Donga rehabilitation
Chiefs
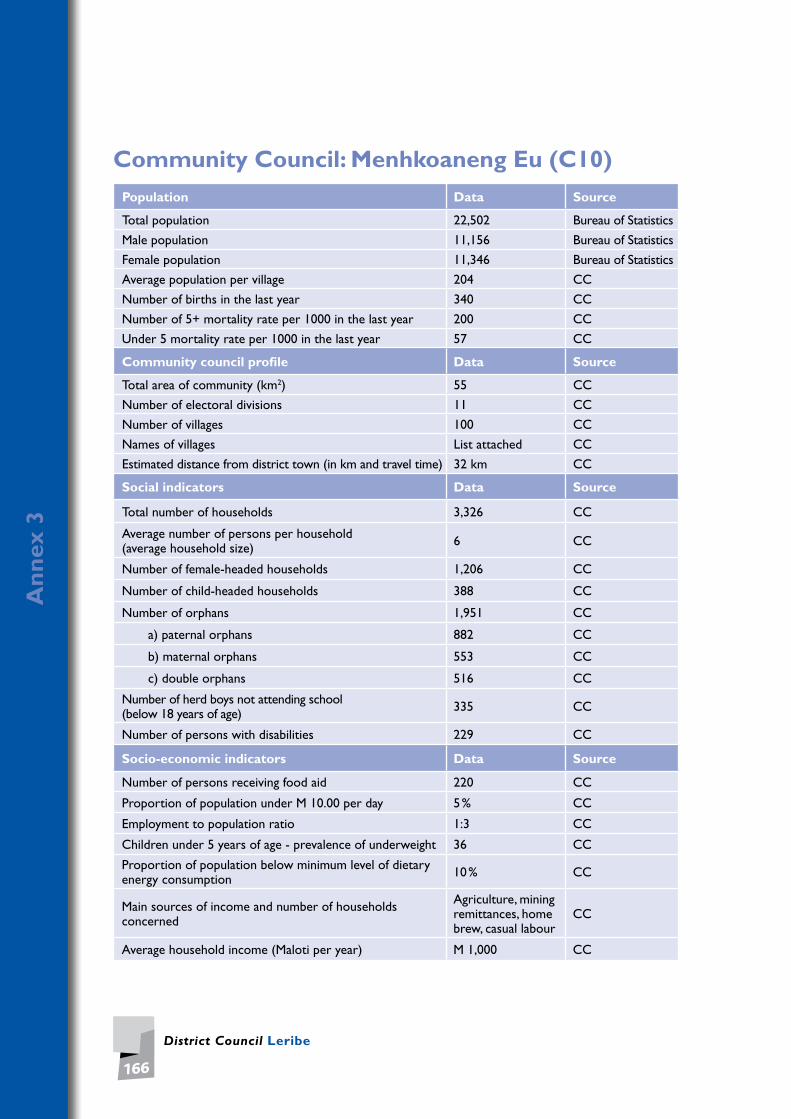
District Council Leribe
166
An
nex
3
Community Council: Menhkoaneng Eu (C10)Population Data Source
Total population 22,502 Bureau of Statistics
Male population 11,156 Bureau of Statistics
Female population 11,346 Bureau of Statistics
Average population per village 204 CC
Number of births in the last year 340 CC
Number of 5+ mortality rate per 1000 in the last year 200 CC
Under 5 mortality rate per 1000 in the last year 57 CC
Community council profile Data Source
Total area of community (km2) 55 CC
Number of electoral divisions 11 CC
Number of villages 100 CC
Names of villages List attached CC
Estimated distance from district town (in km and travel time) 32 km CC
Social indicators Data Source
Total number of households 3,326 CC
Average number of persons per household (average household size) 6 CC
Number of female-headed households 1,206 CC
Number of child-headed households 388 CC
Number of orphans 1,951 CC
a) paternal orphans 882 CC
b) maternal orphans 553 CC
c) double orphans 516 CC
Number of herd boys not attending school (below 18 years of age) 335 CC
Number of persons with disabilities 229 CC
Socio-economic indicators Data Source
Number of persons receiving food aid 220 CC
Proportion of population under M 10.00 per day 5 % CC
Employment to population ratio 1:3 CC
Children under 5 years of age - prevalence of underweight 36 CC
Proportion of population below minimum level of dietary energy consumption 10 % CC
Main sources of income and number of households concerned
Agriculture, mining remittances, home brew, casual labour
CC
Average household income (Maloti per year) M 1,000 CC

Local Governance and Non-state actors Support Programme - LGNSP
167
An
nex
3
Socio-economic indicators Data Source
Number of people employed in agriculture and livestock 200 CC
Number of people generating income from other sources 11 % CC
Names and types of associations
TsehlanyaneCCF, Lithakalimultipurpose, Tsehlanyanemultipurpose, Lentsoaneng farmersassociation, ComfaItjareng Lihoai
CC
Agriculture sector Data Source
Number of households with agricultural fields 11,000 CC
Average field size in hectares (has) 3.5 CC
Three main crops produced Maize, sorghum, beans CC
Three main livestock herded Cattle, goats, sheep CC
Size of public land (hectares of range land) 33 CC
What kind of agricultural service providers are available (governmental and NGOs)?
Training service delivery CC
What kind of agricultural projects are planned or under implementation?
Piggery, sheep, stock farming CC
Health sector Data Source
Three most prevalent diseases HIV/AIDS, tuberculosis, sugar diabetes
CC
Number and names of health centres 2: Khabo Health Centre, St. Denis Heath Centre
CC
Longest and shortest distance to nearest health centre (in hours or km)
Longest: 15 km Shortest: 350 m CC
Readiness of undergoing Voluntary Counselling andTesting (VCT) Low CC
Names of villages where access to health facilities is worst Kota, Makepe, ‘Mate, Ts’ehlanyane CC
Level of interest to get the results of the test Medium CC
Number of people dependent on home-based care Few CC
Number of households with toilets VIP: 16,875 CC
HIV prevalence among population aged 15-24; proportion of population aged 15-24 years with comprehensive correct knowledge of HIV/AIDS
30 % CC
Ratio of school attendance of orphans to school attendance of non-orphans aged 10-14 years 1:3 CC

District Council Leribe
168
An
nex
3
Health sector Data Source
Proportion of population with HIV infection with access to antiretroviral advanced drugs 23 CC
Number of HIV/AIDS Support groups 13 % CC
Education sector Data Source
Number of primary schools 20 CC
Number of secondary schools 2 CC
Number of high schools (government and privately owned) 2 CC
Average years of school attendance 15
a) primary school 7 CC
b) secondary school 3 CC
c) high school 2 CC
Ratio of girls to boys in secondary and high school 4:5 CC
Number of and names of Farmers Training Centres (FTCs) Khabo Resource Centre CC
Number and field of other vocational training schools None CC
Number of initiates for the last year to date 296 CC
Water sector Data Source
Number of households with access to piped water a) public stand pipes, b) private, c) hand pumps 8: public stand pipes RWS
Number of wells 18 CC
Number of dams. Indicate whether they are natural or man-made and whether they are communally or privately owned None CC
Longest and shortest distance to the nearest potable water point (hour or km)
Longest: 5 km Shortest: 50 m CC
What kind of water supply projects are planned or under implementation?
Standpipes, hand pumps RWS
Which institutions are in charge of water supply? RWS RWS
Roads sector Data Source
Total kilometres of main or tarred roads (i.e. national roads) None CC
Longest and shortest distance (km) of villages to the nearest ‘good’ road
Longest: 12 km Shortest: 30 m CC
Number and names of villages without road accessNumber of households concerned 16: listed below CC
What kind of road projects are planned or under implementation?
Literapeng - Ts’ehlanyane tarred road
CC
What are the transport infrastructure requirements? Bus stop shelters, street lights CC
Which institutions are in charge of the road sector? DRR, CC CC
Names and lengths of existing roads maintained by DRR Nts’ekaile - Pela-Tsoeu, Kota - Krammel
CC

Local Governance and Non-state actors Support Programme - LGNSP
169
An
nex
3
Energy sector Data Source
Number and percentage of households with electricity connections (i.e. LEC connections) 2 % CC
Number and percentage of villages without electricity 98 % CC
Which institutions are in charge of the electricity sector? Are they locally represented? LEC CC
Main source of energy Firewood CC
Number of households using solar energy None CC
Communication sector Data Source
Number of villages with landline telephone. Specify number of households with connections None CC
Number of villages with cell phone reception 52 % CC
Number of villages with access to postal/mail services 94 % CC
Number of villages with local radio reception 94 % CC
Number of villages with local TV reception 94 % CC
Trade and commerce sector Data Source
Number of businesses (specify type) 55 CC
Do they have access to specific markets for their products? No CC
Are there any financial institutions (i.e. banks, insurance companies, credit unions etc); if yes provide names and locations
No CC
Security services Data Source
Number of security service providers 1: governmental CC
Number of crime prevention committees 1: private CC
Names of villages least covered by security services Kota, Matjana, ha Khabo CC
Common types of crime cases reported Stock theft, murder, rape CC
Number of stock stolen in the last year 300 CC
Longest and shortest distance to the nearest police station or post
Longest: 70 km Shortest: 40 km CC
Environment Data Source
Names of rare, vulnerable or endangered species Flora: aloe, mofifi Fauna: vulture MET
Names of protected areas Ts’ehlanyane National Park MET
Names of areas of interest that could be protected Menkhoaneng CC
Names of villages that are facing severe soil erosion Menkhoaneng, ‘Mate, Kota CC
What are the natural resource management projects ongoing, planned or under implementation?
Planned: tree planting, dam construction
CC

District Council Leribe
170
An
nex
3
Community Council: Maisa Phoka Eu (C11)Population Data Source
Total population 12,630 Bureau of Statistics
Male population 6,314 Bureau of Statistics
Female population 6,315 Statistical Office
Average population per village 204 Community Council
Number of births in the last year 136 Chiefs
Number of 5+ mortality rate per 1000 in the last year 226 Chiefs
Under 5 mortality rate per 1000 in the last year 59 Chiefs
Community council profile Data Source
Total area of community (km2) 60.15 MoFDP
Number of electoral divisions 9 CC
Number of villages 62 IEC
Names of villages List attached CC
Estimated distance from district town (in km and travel time) 27 km MoLE
Social indicators Data Source
Total number of households 2,119 CC Average number of persons per household (average household size) 6 CC
Number of female-headed households 303 Chiefs
Number of child-headed households 17 Chiefs
Number of orphans 309 Chiefs
a) paternal orphans 146 Chiefs
b) maternal orphans 73 Chiefs
c) double orphans 90 Chiefs Number of herd boys not attending school (below 18 years of age) 42 Chiefs
Number of persons with disabilities 22 Chiefs
Socio-economic indicators Data Source
Number of persons receiving food aid 50 CC
Proportion of population under M 10.00 per day 72 % CC
Employment to population ratio 01:03 MoLE
Children under 5 years of age - prevalence of underweight 64 MoH
Proportion of population below minimum level of dietary energy consumption 10 % MoH
Main sources of income and number of households concerned
22: government employed 44: private 10: miners
CC
Average household income (Maloti per year) M 10.7 MoFDP

Local Governance and Non-state actors Support Programme - LGNSP
171
An
nex
3
Socio-economic indicators Data Source
Number of people employed in agriculture and livestock 1,060 CC
Number of people generating income from other sources 260: hawkers CC
Names and types of associations Burial societies, support groups,cooperatives
CC
Agriculture sector Data Source
Number of households with agricultural fields 1,528 Chiefs
Average field size in hectares (has) 1.5 MoA
Three main crops produced Maize, sorghum, beans CC
Three main livestock herded Cattle, sheep, goats CC
Size of public land (hectares of range land) 192 CC
What kind of agricultural service providers are available (governmental and NGOs)?
Ploughing and planting CC
What kind of agricultural projects are planned or under implementation?
Irrigation, vegetable gardens CC
Health sector Data Source
Three most prevalent diseases Tuberculosis, HIV/AIDS, diabetes MoH
Number and names of health centres None MoH
Longest and shortest distance to nearest health centre (in hours or km) 27km MoH
Readiness of undergoing Voluntary Counselling andTesting (VCT) 10 % MoH
Names of villages where access to health facilities is worst Mojapela (400m) Tlhakoli (15km) CC
Level of interest to get the results of the test Low New Start
Number of people dependent on home-based care 79 MoH
Number of households with toilets VIP: 451 CC
HIV prevalence among population aged 15-24; proportion of population aged 15-24 years with comprehensive correct knowledge of HIV/AIDS
45 % MoH
Ratio of school attendance of orphans to school attendance of non-orphans aged 10-14 years 01:04 MoE
Proportion of population with HIV infection with access to antiretroviral advanced drugs 43 % MoH
Number of HIV/AIDS Support groups 9 CC
Education sector Data Source
Number of primary schools 7 CC
Number of secondary schools None CC
Number of high schools (government and privately owned) 2 CC

District Council Leribe
172
An
nex
3
Education sector Data Source
Average years of school attendance
a) primary school 6 CC
b) secondary school 13 CC
c) high school 16 CC
Ratio of girls to boys in secondary and high school 3:1 CC
Number of and names of Farmers Training Centres (FTCs) 1:Tale ResourceCentre CC
Number and field of other vocational training schools None CC
Number of initiates for the last year to date 260 CC
Water sector Data Source
Number of households with access to piped water a) public stand pipes, b) private, c) hand pumps
2,119: public stand pipes CC
Number of wells 15 CC
Number of dams. Indicate whether they are natural or man-made and whether they are communally or privately owned
4: man-made3: natural CC
Longest and shortest distance to the nearest potable water point (hour or km)
Longest: 2km Shortest: 1km CC
What kind of water supply projects are planned or under implementation?
Boreholes,standpipes CC
Which institutions are in charge of water supply? RWS CC
Roads sector Data Source
Total kilometres of main or tarred roads (i.e. national roads)
6.5km: tarred road 7.5km: main roads
CC
Longest and shortest distance (km) of villages to the nearest ‘good’ road
Longest: 4km Shortest: 20m CC
Number and names of villages without road access Number of households concerned Mojapela,Tlhakoli CC
What kind of road projects are planned or under implementation? Road maintenance CC
What are the transport infrastructure requirements? Gravel roads CC
Which institutions are in charge of the road sector? DRR CC
Names and lengths of existing roads maintained by DRR 6.5: Rampai-Mashili CC
Energy sector Data Source
Number and percentage of households with electricity connections (i.e. LEC connections) 39 (1.84 %) CC
Number and percentage of villages without electricity 59 (95.2 %) CC
Which institutions are in charge of the electricity sector? Are they locally represented? LEC CC
Main source of energy Wood CC
Number of households using solar energy 29 CC
Communication sector Data Source

Local Governance and Non-state actors Support Programme - LGNSP
173
An
nex
3
Number of villages with landline telephone. Specify number of households with connections
I: village10: households CC
Number of villages with cell phone reception 62 CC
Number of villages with access to postal/mail services None CC
Number of villages with local radio reception 62 CC
Number of villages with local TV reception 8 CC
Trade and commerce sector Data Source
Number of businesses (specify type)
1: poultry 1: brewery depot2: taverns1: mortuary23: cafés10: taxi owners
CC
Do they have access to specific markets for their products? Yes CC
Are there any financial institutions (i.e. banks, insurance companies, credit unions etc); if yes provide names and locations
None CC
Security services Data Source
Number of security service providers 1: governmental CC
Number of crime prevention committees 9 CC
Names of villages least covered by security services None CC
Common types of crime cases reported Stock theft, housebreaking, assault
CC
Number of stock stolen in the last year 29 CC
Longest and shortest distance to the nearest police station or post
Longest: 13km Shortest: 3km CC
Environment Data Source
Names of rare, vulnerable or endangered species
Flora: lesoko, hloenya, hlokoana la tsela, manolo Fauna:‘mutla, pela, noko
CC
Names of protected areas None CC
Names of areas of interest that could be protected None CC
Names of villages that are facing severe soil erosion All CC
What are the natural resource management projects ongoing, planned or under implementation?
Ongoing: gully rehabilitation, tree planting
CC

District Council Leribe
174
An
nex
3
Community Council: Sephokong (C12)Population Data Source
Total population 19,199 Bureau of Statistics
Male population 9,582 Bureau of Statistics
Female population 9,617 Bureau of Statistics
Average population per village 302 CC
Number of births in the last year 245 Chiefs
Number of 5+ mortality rate per 1000 in the last year 294 Chiefs
Under 5 mortality rate per 1000 in the last year 71 Chiefs
Community council profile Data Source
Total area of community (km2) 122.24 CC
Number of electoral divisions 11 CC
Number of villages 146 IEC
Names of villages List attached CC
Estimated distance from district town (in km and travel time) 13 km MoLE
Social indicators Data Source
Total number of households 5,504 CC
Average number of persons per household (average household size) 6 CC
Number of female-headed households 1,566 Chiefs
Number of child-headed households 137 Chiefs
Number of orphans 1,495 Chiefs
a) paternal orphans 503 Chiefs
b) maternal orphans 576 Chiefs
c) double orphans 416 CC
Number of herd boys not attending school (below 18 years of age) 123 CC
Number of persons with disabilities 148 Chiefs
Socio-economic indicators Data Source
Number of persons receiving food aid 159 CC
Proportion of population under M 10.00 per day 15 % CC
Employment to population ratio 1:3 Clinics
Children under 5 years of age : prevalence of underweight 45 MoLE
Proportion of population below minimum level of dietary energy consumption 10 % MoH
Main sources of income and number of concerned households Agriculture (3,437) MoH
Average household income (Maloti per year) M 60 CC
Number of people employed in agriculture and livestock 2,683 MoA

Local Governance and Non-state actors Support Programme - LGNSP
175
An
nex
3
Socio-economic indicators Data Source
Number of people generating incomes from other sources
651: total 543: informal sector14: taxi, 24: poultry5: contractors19: brewery4: selling herbs1: shoe mending
CC
Names and types of associations Burial societies, support groups,cooperatives
CC
Agriculture sector Data Source
Number of households with agricultural fields 3,331 CC
Average field size in hectares (has) 3 CC
Three main crops produced Maize, sorghum, beans CC
Three main livestock herded Cattle, sheep, horses CC
Size of public land (hectares of range land) 8,000 CC
What kind of agricultural service providers are available (Governmental and NGOs)?
Tale, HlotseagriculturalResource Centres
CC
What kind of agricultural projects are planned or under implementation?
Block farmingongoing CC
Health sector Data Source
Three most prevalent diseases HIV/AIDS,tuberculosis, sugardiabetes
CC
Number and names of health centres
4: Maryland ClinicEmmanuel ClinicSt. Margaret ClinicPhelisa HealthCentre
CC
Longest and shortest distance to nearest health centre (in hours or km)
Longest: 10km Shortest: 500m CC
Readiness of undergoing Voluntary Counselling and Testing (VCT) High (80 %) Support groups
Names of villages where access to health facilities is worst
Nqechane (23 villages), Lejakane (10 villages),Alexander (14 villages), Boribeng (13 villages)
CC
Level of interest to get the results of the test High MoH
Number of people dependent on home-based care 194 CC
Number of households with toilets VIP: 242 CC
Health sector Data Source

District Council Leribe
176
An
nex
3
HIV prevalence among population aged 15-24; proportion of population aged 15-24 years with comprehensive correct knowledge of HIV/AIDS
30 % CC
Ratio of school attendance of orphans to school attendance of non-orphans aged 10-14 years 1:4 CC
Proportion of population with HIV infection with access to antiretroviral advanced drugs 45 % CC
Number of HIV/AIDS Support groups 31 CC
Education sector Data Source
Number of primary schools 17 CC
Number of secondary schools 6 CC
Number of high school and universities (government and privately owned) 3 CC
Average years of school attendance
a) primary school 7 CC
b) secondary school 3 CC
c) high school 2 CC
Ratio of girls to boys in secondary and high school 03:01 CC
Number of and names of Farmers Training Centres (FTCs) None CC
Number and field of other vocational training schools None CC
Number of initiates for the last year to date 209: males 25: females CC
Water sector Data Source
Number of households with access to piped water a) public stand pipesb) privatec) hand pumps
2,445: public stand pipes23: private 883: hand pumps
CC
Number of wells 66 CC
Number of dams. Indicate whether they are natural or man-made and whether they are communally or privately owned
5: natural 23: public CC
Longest and shortest distance to the nearest potable water point (hour or km)
Longest: 2km Shortest: 500m CC
What kind of water supply projects are planned or under implementation?
Lithantsang, Phahameng, Boribeng, Ha Motseki, Ha Simon, Phelendaba, Nqechane, Phatsoa,Tsielala, Tota
CC
Which institutions are in charge of water supply? RWS CC
Roads sector Data Source
Total kilometres of main or tarred roads (i.e. national roads) 6: tarred road 25: main road CC
Longest and shortest distance (km) of villages to the nearest ‘good’ road
Longest: 4kmShortest: 500m CC
Roads sector Data Source

Local Governance and Non-state actors Support Programme - LGNSP
177
An
nex
3
Number and names of villages without road access Number of households concerned 45: list below CC
What kind of road projects are planned or under implementation?
Road maintenance: Levi`s Nek-Mabuleng, ‘Monase, Phahameng to Phelendaba,Tale-Boribeng
CC
What are the transport infrastructure requirements? Gravel roads CC
Which institutions are in charge of the road sector? Roads Department, DRR CC
Names and lengths of existing roads maintained by DRR
9 km: Manase-Matlakeng, 9 km: Phahameng- Phelandaba 7 km: Tale-Boribeng 2 km: Qoqolosing-‘Mate
CC
Energy sector Data Source
Number and percentage of households with electricity connections (i.e. LEC connections) 253 (6.4 %) CC
Number and percentage of villages without electricity 101 (69 %) CC Which institutions are in charge of the electricity sector? Are they locally represented? LEC no CC
Main source of energy Firewood, paraffin CC Number of households using solar energy 144 (3 %) CC
Communication sector Data Source
Number of villages with landline telephone. Specify number of households with connections
12: villages 39: households CC
Number of villages with cell phone reception 116 (79 %) CC
Number of villages with access to postal/mail services 87 (59.5 %) CC
Number of villages with local radio reception 100 % CC
Number of villages with local TV reception 20 (14 %) CC
Trade and commerce sector Data Source
Number of businesses (specify type)
38: cafés 5: taverns 2: car repairs 4: grinding mills 2: butchery1: salon 1: public phones 1: cinema café 2: supermarket taxi operators
CC
Do they have access to specific markets for their products? Yes CCAre there any financial institutions (i.e. banks, insurance companies, credit unions etc); if yes provide names and locations
None CC
Security services Data Source

District Council Leribe
178
An
nex
3
Number of security service providers None CC
Number of crime prevention committees 17 CC
Names of villages least covered by security services All (146) CC
Common types of crime cases reported Stock theft, housebreaking CC
Number of stock stolen in the last year 114 CC
Longest and shortest distance to the nearest police station or post
Longest: 20 km Shortest: 12 km CC
Environment Data Source
Names of rare, vulnerable or endangered species
Fauna: skunk, hare,porcupine, cobra, pelaFlora: lesoko,hloenya, hlokoanala tsela, khoara,aloe, khomo eabalisa, mohloare
MET
Names of protected areas None MET
Names of areas of interest that could be protected
Meribengbushman paintings,‘Mantoaneng Dinasaur foot-prints, Leribe Makotokongbotanic gardens,Matsoaing KoungBushmen paintings,Mohobollo-Khalolo-NqechaneBushmen paintings,Leribe MorenengBohomeng
CC
Names of villages that are facing severe soil erosion All CC
What are the natural resource management projects ongoing, planned or under implementation?
Ongoing: tree planting, gully rehabilitation Nqechane, Maoana Masooana, Matsoaing Planned: Lithoatseng tree planting
CC
Community Council: Linare Eu (C13)Population Data Source
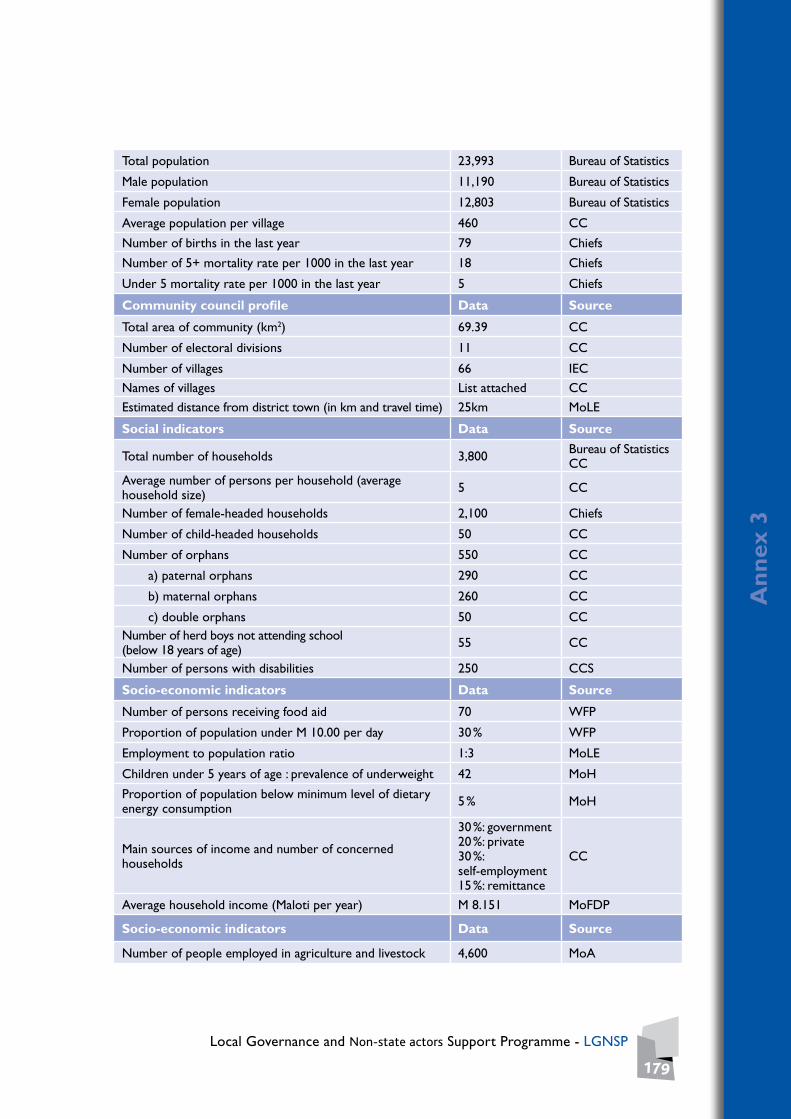
Local Governance and Non-state actors Support Programme - LGNSP
179
An
nex
3
Total population 23,993 Bureau of Statistics
Male population 11,190 Bureau of Statistics
Female population 12,803 Bureau of Statistics
Average population per village 460 CC
Number of births in the last year 79 Chiefs
Number of 5+ mortality rate per 1000 in the last year 18 Chiefs
Under 5 mortality rate per 1000 in the last year 5 Chiefs
Community council profile Data Source
Total area of community (km2) 69.39 CC
Number of electoral divisions 11 CC
Number of villages 66 IEC
Names of villages List attached CC
Estimated distance from district town (in km and travel time) 25km MoLE
Social indicators Data Source
Total number of households 3,800 Bureau of Statistics CC
Average number of persons per household (average household size) 5 CC
Number of female-headed households 2,100 Chiefs
Number of child-headed households 50 CC
Number of orphans 550 CC
a) paternal orphans 290 CC
b) maternal orphans 260 CC
c) double orphans 50 CC Number of herd boys not attending school (below 18 years of age) 55 CC
Number of persons with disabilities 250 CCS
Socio-economic indicators Data Source
Number of persons receiving food aid 70 WFP
Proportion of population under M 10.00 per day 30 % WFP
Employment to population ratio 1:3 MoLE
Children under 5 years of age : prevalence of underweight 42 MoH
Proportion of population below minimum level of dietary energy consumption 5 % MoH
Main sources of income and number of concerned households
30 %: government20 %: private 30 %: self-employment 15 %: remittance
CC
Average household income (Maloti per year) M 8.151 MoFDP
Socio-economic indicators Data Source
Number of people employed in agriculture and livestock 4,600 MoA

District Council Leribe
180
An
nex
3
Number of people generating incomes from other sources 35 % CCS
Names and types of associations Terateng, Multi Co-op, range management
CCS
Agriculture sector Data Source
Number of households with agricultural fields 320 MoA
Average field size in hectares (has) 1.4 MoA
Three main crops produced Maize, sorghum, wheat CC
Three main livestock herded Cattle, goats, sheep CC
Size of public land (hectares of range land) 168 MoA
What kind of agricultural service providers are available (governmental and NGOs)? MoA CCS
What kind of agricultural projects are planned or under implementation? None CCS
Health sector Data Source
Three most prevalent diseases HIV/AIDS, diabetes, hypertension
MoH
Number and names of health centres 1: Motebang Hospital MoH
Longest and shortest distance to nearest health centre (in hours or km)
Longest: 25 km Shortest: 15 km MoH
Readiness of undergoing Voluntary Counselling andTesting (VCT) High MoH
Names of villages where access to health facilities is worst Khoarai, Maqhaoe, Subeng, Kampa MoH
Level of interest to get the results of the test High MoH
Number of people dependent on home-based care 34 MoH
Number of households with toilets VIP: 1,900 (50 %) WC: 1,140 (30 %) CC
HIV prevalence among population aged 15-24; proportion of population aged 15-24 years with comprehensive correct knowledge of HIV/AIDS
n/a n/a
Ratio of school attendance of orphans to school attendance of non-orphans aged 10-14 years n/a n/a
Proportion of population with HIV infection with access to antiretroviral advanced drugs 15 % Support groups
Number of HIV/AIDS Support groups 14 CC
Education sector Data Source
Number of primary schools 14 CC Number of secondary schools None CC

Local Governance and Non-state actors Support Programme - LGNSP
181
An
nex
3
Number of high school and universities (government and privately owned) 6 CC
Average years of school attendance a) primary school 7 CCS b) secondary school 3 CCS c) high school 2 CCS
Ratio of girls to boys in secondary and high school 2:1 MoE Number of and names of Farmers Training Centres (FTCs) None CCS Number and field of other vocational training schools 2 CCS Number of initiates for the last yearto date None CC
Water sector Data Source
Number of households with access to piped water a) public stand pipesb) privatec) hand pumps
304: public standpipes 1,140: private 76: hand pumps
CCS
Number of wells 24
Number of dams. Indicate whether they are natural or man-made and whether they are communally or privately owned 5: man-made CCS
Longest and shortest distance to the nearest potable water point (hour or km)
Longest: 15 km Shortest: 1 km CCS
What kind of water supply projects are planned or under implementation?
Under implementa-tion: bore holes CCS
Which institutions are in charge of water supply? WASA CCS
Roads sector Data Source
Total kilometres of main or tarred roads (i.e. national roads) 6 CC Longest and shortest distance (km) of villages to the nearest ‘good’ road
Longest: 15 km Shortest: 1 km CC
Number and names of villages without road access Number of households concerned 10: listed below CC
What kind of road projects are planned or under implementation?
Ongoing: earth road (Sekota-Khobong)
CC
What are the transport infrastructure requirements? Bridges, roads CC
Which institutions are in charge of the road sector? Roads Department, DRR MoLE
Names and lengths of existing roads maintained by DRR 3.2 km: Sekota-Khobotlong MoLE
Energy sector Data Source
Number and percentage of households with electricity connections (i.e. LEC connections) 20 % LEC
Number and percentage of villages without electricity 30 % LEC Which institutions are in charge of the electricity sector? Are they locally represented? LEC CC
Energy sector Data Source
Main source of energy Gas CC
Number of households using solar energy 5 % CC

District Council Leribe
182
An
nex
3
Communication sector Data Source
Number of villages with landline telephone. Specify number of households with connections none CC
Number of villages with cell phone reception 62 % CC
Number of villages with access to postal/mail services 30 % CC
Number of villages with local radio reception 95 % CC
Number of villages with local TV reception 80 % CC
Trade and commerce sector Data Source
Number of businesses (specify type) Supermarkets,butcheries, cafés,utility companies
CC
Do they have access to specific markets for their products? Yes CC
Are there any financial institutions (i.e. banks, insurance companies, credit unions etc); if yes provide names and locations
NedBank,StandardLesotho Bank,Metropolitan
CC
Security services Data Source
Number of security service providers 1: governmental3: private CC
Number of crime prevention committees 5 CC
Names of villages least covered by security services Qoqolosing, Sekota. Maqhaoe CC
Common types of crime cases reported Rape, theft, drugs CC
Number of stock stolen in the last year 28 CC
Longest and shortest distance to the nearest police station or post
Longest: 27 km Shortest: 100 m CC
Environment Data Source
Names of rare, vulnerable or endangered species Fauna: Rabbits MET
Names of protected areas None MET
Names of areas of interest that could be protected Qoqolosing, Subeng CC
Names of villages that are facing severe soil erosion Qoqolosing, Subeng, Khanyane CC
What are the natural resource management projects ongoing, planned or under implementation?
Ongoing: tree plating CC
Community Council: Litjotjela Eu (C14)
Population Data Source

Local Governance and Non-state actors Support Programme - LGNSP
183
An
nex
3
Total population 21,283 IEC
Male population 10,445 IEC
Female population 10,938 IEC
Average population per village 372 IEC
Number of births in the last year 197 Chiefs
Number of 5+ mortality rate per 1000 in the last year 334 Chiefs
Under 5 mortality rate per 1000 in the last year n/a
Community council profile Data Source
Total area of community (km2) 99.76 IEC
Number of electoral divisions 11 CC
Number of villages 55 CC
Names of villages List attached CC
Estimated distance from district town (in km and travel time) 26 km -90 min Public Works
Social indicators Data Source
Total number of households 3,376 CC
Average number of persons per household (average household size) 4 CC
Number of female-headed households 820 CC
Number of child-headed households 490 CC
Number of orphans 1,620 CC
a) paternal orphans 350 CC
b) maternal orphans 530 CC
c) double orphans 740 CC
Number of herd boys not attending school (below 18 years of age) 140 Chiefs
Number of persons with disabilities 78 Chiefs
Socio-economic indicators Data Source
Number of persons receiving food aid 32 Linots’ing Health Centre
Proportion of population under M 10.00 per day 20 % Linots’ing Health Centre
Employment to population ratio 01:02 Statistics
Children under 5 years of age: prevalence of underweight 98 Linots’ing Health Centre
Proportion of population below minimum level of dietary energy consumption 37 % Linots’ing Health
Centre
Socio-economic indicators Data Source
Main sources of income and number of households concerned Agriculture CC

District Council Leribe
184
An
nex
3
Average household income (Maloti per year) M 500 CC Number of people employed in agriculture and livestock 4,937 MoAFS Number of people generating incomes from other sources 16,600 (78 %) MoAFS
Names and types of associations Burial societies, Push push CC
Agriculture sector Data Source
Number of households with agricultural fields 3,200 Chiefs Average field size in hectares (has) 4 MoA
Three main crops produced Maize, sorghum, beans MoA
Three main livestock herded Cattle sheep, goats MoA Size of public land (hectares of range land) 473 MoFLR What kind of agricultural service providers are available (governmental and NGOs)?
Extension services from MoA CC
What kind of agricultural projects are planned or under implementation? None CC
Health sector Data Source
Three most prevalent diseases Transmitted diseases, chest infections, diarrhoea
Linots’ing Health Centre
Number and names of health centres 2 Linots’ing Health Centre, Likhakeng Health Centre
CC
Longest and shortest distance to nearest health centre (in hours or km)
Longest: 18 km Shortest: 100 m CC
Readiness of undergoing Voluntary Counselling andTesting (VCT) High Linots’ing Health
Centre
Names of villages where access to health facilities is worst Ts’aba Lira (740 people affected)
Linots’ing Health Centre
Level of interest to get the results of the test High Linots’ing Health Centre
Number of people dependent on home-based care 84 Linots’ing Health Centre
Number of households with toilets VIP: 2,200 Linots’ing Health Centre
HIV prevalence among population aged 15-24; proportion of population aged 15-24 years with comprehensive correct knowledge of HIV/AIDS
12 % New Start
Ratio of school attendance of orphans to school attendance of non-orphans aged 10-14 years 03:04 MoA
Proportion of population with HIV infection with access to antiretroviral advanced drugs 01:03 Linots’ing Health
Centre
Number of HIV/AIDS Support groups 8 Linots’ing Health Centre
Education sector Data Source
Number of primary schools 10 MoA

Local Governance and Non-state actors Support Programme - LGNSP
185
An
nex
3
Number of secondary schools 3 MoA Number of high school and universities (government and privately owned) 1 MoA
Average years of school attendance
a) primary school 7 MoA
b) secondary school 14 MoA
c) high school 16 MoA
Ratio of girls to boys in secondary and high school 2:1 MoA
Number of and names of Farmers Training Centres (FTCs) 1: resource centre CC
Number and field of other vocational training schools None CC
Number of initiates for the last year to date 110 Chiefs
Water sector Data Source
Number of households with access to piped water a) public stand pipesb) privatec) hand pumps
1,462: public standpipes 1,720: hand pumps
CC
Number of wells 27 CC
Number of dams. Indicate whether they are natural or man-made and whether they are communally or privately owned
19: man-madedams (communallyowned)
CC, RW
Longest and shortest distance to the nearest potable water point (hour or km)
Longest: 30 min Shortest: 2 min CC
What kind of water supply projects are planned or under implementation?
Ongoing: maintenance of bores in all electoral divisionsPlanned: water project at Linots’ing,Leshoele, Ts’aba Lira
CC
Which institutions are in charge of water supply? RWS CC
Roads sector Data Source
Total kilometres of main or tarred roads (i.e. national roads) 8 km: HlotseBridge toKhomokhoana
CC
Longest and shortest distance (km) of villages to the nearest ‘good’ road
Longest: 27 km Shortest: 500 m CC
Number and names of villages without road access Number of households concerned
Ts’aba Lira, Sents’onyane(255 households)
CC
Roads sector Data Source

District Council Leribe
186
An
nex
3
What kind of road projects are planned or under implementation?
Ongoing:Matukeng-Nthako earth road constructionPlanned: 2 earth roads construction
CC
What are the transport infrastructure requirements? Access roads andbridges CC
Which institutions are in charge of the road sector? DRR CC
Names and lengths of existing roads maintained by DRR
7 km: Leshoele-Ben22 km: Matukeng-Likhetlane
DRR
Energy sector Data Source
Number and percentage of households with electricity connections (i.e. LEC connections) 181 (5 %) CC
Number and percentage of villages without electricity 3,195 (60 %) CC
Which institutions are in charge of the electricity sector? Are they locally represented? LEC CC
Main source of energy Paraffin, gas, firewood CC
Number of households using solar energy 56 CC
Communication sector Data Source
Number of villages with landline telephone. Specify number of households with connections None Telecom Lesotho
Number of villages with cell phone reception None Telecom Lesotho
Number of villages with access to postal/mail services 55 Chiefs
Number of villages with local radio reception 55 Chiefs
Number of villages with local TV reception 55 Chiefs
Trade and commerce sector Data Source
Number of businesses (specify type) 58 CC
Do they have access to specific markets for their products? No CC
Are there any financial institutions (i.e. banks, insurance companies, credit unions etc); if yes provide names and locations
No CC
Security services Data Source

Local Governance and Non-state actors Support Programme - LGNSP
187
An
nex
3
Number of security service providers 1: governmental Chiefs
Number of crime prevention committees None CC
Names of villages least covered by security services Herisi CC
Common types of crime cases reported Stock theft, housebreaking, rape CC
Number of stock stolen in the last year 82 Chiefs
Longest and shortest distance to the nearest police station or post
Longest: 27 km Shortest: 4 km CC
Environment Data Source
Names of rare, vulnerable or endangered species Flora: hloenya,African potatoFauna: rabbits
MET
Names of protected areas None CC
Names of areas of interest that could be protected Rock prints atMatukeng CC
Names of villages that are facing severe soil erosion Herisi, MatjelongHa Mpopo,Mojapela
MoFLR
What are the natural resource management projects ongoing, planned or under implementation?
Ongoing: gully rehabilitation at Sehauli, Hlotsenyane, tree planting at Likhakeng
Planned: tree planting, gully rehabilitation, dams building
MoFLR

District Council Leribe
188
An
nex
3
Community Council: Khomokhoana Eu (C15)
Population Data Source
Total population 26,851 Bureau of Statistics
Male population 12,164 Bureau of Statistics
Female population 14,687 Bureau of Statistics
Average population per village 2,238 Bureau of Statistics
Number of births in the last year 107 Chiefs
Number of 5+ mortality rate per 1000 in the last year 59 Chiefs
Under 5 mortality rate per 1000 in the last year 59 Chiefs
Community council profile Data Source
Total area of community (km2) 55Maputsoe Structure Plan (1996)
Number of electoral divisions 9 CC
Number of villages 12 CC
Names of villages List attached CC
Estimated distance from district town (in km and travel time) 15 km -15 min CC
Social indicators Data Source
Total number of households 11,014 DMA
Average number of persons per household (average household size) 5 DMA
Number of female-headed households 4,696 DMA
Number of child-headed households 412 DMA
Number of orphans 1,921 CC
a) paternal orphans 69 Support groups
b) maternal orphans 197 Support groups
c) double orphans 1,655 CC
Number of herd boys not attending school (below 18 years of age) 142 CC
Number of persons with disabilities 385 CC
Socio-economic indicators Data Source
Number of persons receiving food aid 414 CC
Proportion of population under M 10.00 per day 10 % CC
Employment to population ratio 01:02 CC
Children under 5 years of age : prevalence of underweight 26 CC
Proportion of population below minimum level of dietary energy consumption 30 % CC

Local Governance and Non-state actors Support Programme - LGNSP
189
An
nex
3
Socio-economic indicators Data Source
Main sources of income and number of households concerned
1: formal sector (textile firms, supermarkets, clothing shops)2: informal sector (hawkers)3: commercial farming
CC
Average household income (Maloti per year) M 10,000 CC
Number of people employed in agriculture and livestock 482 CC
Number of people generating incomes from other sources 20,138.25 (75 %) CC
Names and types of associations n/a CC
Agriculture sector Data Source
Number of households with agricultural fields 2,974Khomokhoana Resource Centre
Average field size in hectares (has) 5Khomokhoana Resource Centre
Three main crops produced Maize, sorghum, wheat
Khomokhoana Resource Centre
Three main livestock herded Cattle, sheep, pig Khomokhoana Resource Centre
Size of public land (hectares of range land) 251Khomokhoana Resource Centre
What kind of agricultural service providers are available (governmental and NGOs)?
Khomokhoana resource centre
CC
What kind of agricultural projects are planned or under implementation? Block farming
Khomokhoana Resource Centre
Health sector Data Source
Three most prevalent diseases Tuberculosis, HIV/AIDS
CC
Number and names of health centres
1: government5: Maputsoe FilterClinic, Maluti Adventist Clinic, Medical Arts Health Clinic, Jessi Polyclinic
CC
Longest and shortest distance to nearest health centre (in hours or km) Shortest: 5 km CC
Readiness of undergoing voluntary counselling and testing (VCT) Very Ready
New Start Maputsoe
Names of villages where access to health facilities is worst
5: Popopo, Ha Matsoete, Ha Chaka, Makitiring,Taung (16 households)
CC

District Council Leribe
190
An
nex
3
Health sector Data Source
Level of interest to get the results of the test Medium New Start Maputsoe
Number of people dependent on home-based care 267 Health centres
Number of households with toilets 1,683 Health centres
HIV prevalence among population aged 15-24; proportion of population aged 15-24 years with comprehensive correct knowledge of HIV/AIDS
80 % New Start Maputsoe
Ratio of school attendance of orphans to school attendance of non-orphans aged 10-14 years 2:3 CC
Proportion of population with HIV infection with access to antiretroviral advanced drugs 50 % New Start
Maputsoe
Number of HIV/AIDS Support groups 14 CC
Education sector Data Source
Number of primary schools 4: government 7: private CC
Number of secondary schools 4 CC Number of high school and universities (government and privately owned)
1: government 3: private CC
Average years of school attendance a) primary school 7 MoE b) secondary school 3 MoE c) high school 2 MoE
Ratio of girls to boys in secondary and high school 2:3 MoE
Number of and names of Farmers Training Centres (FTCs) 1: Khomokhoana Resource Centre CC
Number and field of other vocational training schools 1: knitting, sewing school CC
Number of initiates for the last year to date 36 (boys only) Khooana initiation school
Water sector Data Source
Number of households with access to piped water a) public stand pipesb) privatec) hand pumps
3: public stand pipes 3,000: private 18: hand pump
RWS,WASA
Number of wells 13 CC
Number of dams. Indicate whether they are natural or man-made and whether they are communally or privately owned
6: natural 3: man-made 1: private
CC
Longest and shortest distance to the nearest potable water point (hour or km)
Longest: 1 km Shortest: 10 m CC
What kind of water supply projects are planned or under implementation?
2: pump station construction 2: reservoir construction
WASA
Which institutions are in charge of water supply? WASA CC
Roads sector Data Source

Local Governance and Non-state actors Support Programme - LGNSP
191
An
nex
3
Total kilometres of main or tarred roads (i.e. national roads) 3 km CC
Longest and shortest distance (km) of villages to the nearest ‘good’ road
Longest: 5 km Shortest: 150 m
CC
Number and names of villages without road access Number of households concerned
None CC
What kind of road projects are planned or under implementation?
1: earth road 7: gravel roads
CC
What are the transport infrastructure requirements? Road in Lower Popopo
CC
Which institutions are in charge of the road sector? DRR, Roads Department, CC (local)
CC
Names and lengths of existing roads maintained by DRR 6 km: Nyenye- St. Monica
CC
Energy sector Data Source
Number and percentage of households with electricity connections (i.e. LEC connections) 4,500 (80 %) LEC
Number and percentage of villages without electricity 1 % CC
Which institutions are in charge of the electricity sector? Are they locally represented? LEC CC
Main source of energy Electricity, gas CC
Number of households using solar energy None CC
Communication sector Data Source
Number of villages with landline telephone. Specify number of households with connections
All (12 villages) 900 households
Econet,Telecom Lesotho
Number of villages with cell phone reception All CC
Number of villages with access to postal/mail services All CC
Number of villages with local radio reception All CC
Number of villages with local TV reception All CC
Trade and commerce sector Data Source
Number of businesses (specify type) 385 MoTICM
Do they have access to specific markets for their products? Yes MoTICM
Are there any financial institutions (i.e. banks, insurance companies, credit unions etc)? If yes provide names and locations
Banks: NedBank (Maputsoe CBD) Standard Lesotho bank (Maputsoe CBD) Post bank (Maputsoe CBD) Insurance companies: Lesotho National Insurance Group (Mp. CBD) MKM Starlion Group (Map. CBD) Letsete Investment (Map. CBD) Money Lenders: B.Blues (Map. CB) JP Finance (Map. CBD) Sechaba Personal Financial Advisor (Map.CBD)
Security services Data Source

District Council Leribe
192
An
nex
3
Number of security service providers 1: governmental 9: private
CC
Number of crime prevention committees 7 LMPS Maputsoe
Names of villages least covered by security services None LMPS Maputsoe
Common types of crime cases reported Sexual offences, housebreaking, stock theft
LMPS Maputsoe
Number of stock stolen in the last year 50 LMPS Maputsoe
Longest and shortest distance to the nearest police station or post
Longest: 5 km Shortest: 600 m
LMPS Maputsoe
Environment Data Source
Names of rare, vulnerable or endangered species
Flora: aloe, cape gecko Fauna: wild dogs, hare, agama atra
MET
Names of protected areas None CC
Names of areas of interest that could be protected None CC
Names of villages that are facing severe soil erosion Kholokoe Ha Matsoete Ha Moholisa
CC
What are the natural resource management projects ongoing, planned or under implementation?
Ongoing: Donga rehabilitation
CC

Local Governance and Non-state actors Support Programme - LGNSP
193
An
nex
3
Community Council: Hleoheng (C16)Population Data Source
Total population 27,576 IEC
Male population 13,220 IEC
Female population 14,356 IEC
Average population per village 641 Chiefs
Number of births in the last year 645 Chiefs
Number of 5+ mortality rate per 1000 in the last year 86 Chiefs
Under 5 mortality rate per 1000 in the last year 46 Chiefs
Community council profile Data Source
Total area of community (km2) 97.06 IEC
Number of electoral divisions 11 CC
Number of villages 46 CC
Names of villages Attached CC
Estimated distance from district town (in km and travel time) 12 km - 6 min MoPW
Social indicators Data Source
Total number of households 11,610 IEC
Average number of persons per household (average household size) 5 IEC
Number of female-headed households 6,966 Chiefs
Number of child-headed households 3,455 Social Welfare
Number of orphans 1,800 Social Welfare
a) paternal orphans 740 Social Welfare
b) maternal orphans 620 Social Welfare
c) double orphans 440 Social Welfare
Number of herd boys not attending school (below 18 years of age) 215 Social Welfare
Number of persons with disabilities 645 Social Welfare
Socio-economic indicators Data Source
Number of persons receiving food aid 256 Bureau of Statistics
Proportion of population under M 10.00 per day 40 % Bureau of Statistics
Employment to population ratio 01:04 Bureau of Statistics
Children under 5 years of age: prevalence of underweight 154 MoH
Proportion of population below minimum level of dietary energy consumption 35 % MoH
Main sources of income and number of households concerned
Agriculture, factories, informal sector
MoA
Average household income (Maloti per year) M 12,000 Bureau of Statistics
Number of people employed in agriculture and livestock 7,492 Bureau of Statistics

District Council Leribe
194
An
nex
3
Socio-economic indicators Data Source
Number of people generating incomes from other sources 38 % Statistical Office
Names and types of associations List attached Chiefs
Agriculture sector Data Source
Number of of households with agricultural fields 3,400 Maputsoe ResourceCentre
Average field size in hectares (has) 4 Maputsoe ResourceCentre
Three main crops produced Maize, sorghum, beans
Maputsoe ResourceCentre
Three main livestock herded Cattle, sheep, goats Maputsoe ResourceCentre
Size of public land (hectares of range land) 382 MoFLR
What kind of agricultural service providers are available (governmental and NGOs)? MoA MoA
What kind of agricultural projects are planned or under implementation?
Irrigation, poultry, orchard CC
Health sector Data Source
Three most prevalent diseases
STI, tuberculosis,malnutrition,HIV/AIDS,opportunisticinfections
Likhetlane FilterClinic, St. Monica’sClinic
Number of and names of health centres 1: St. Monica’s Clinic CC
Longest and shortest distance to nearest health centre (in hours or km)
Longest: 12 km Shortest: 4 km CC
Readiness of undergoing Voluntary Counselling andTesting (VCT)
At least 50 %,though some stillfear testing
New Start Maputsoe,Likhetlane FilterClinic, St. Monica’sClinic
Names of villages where access to health facilities is worst
Qamo, Lepamo,Likhetlane,Mashapha,Hleoheng,Mpharane
Chiefs
Level of interest to get the results of the test High New Start
Number of people dependent on home-based care 644 Support groups
Number of households with toilets VIP: 2,110WC: 12 Chiefs
HIV prevalence among population aged 15-24; proportion of population aged 15-24 years with comprehensive correct knowledge of HIV/AIDS
18 % - 4:5
New start MaputsoeFilter Clinic St. Monica’s Clinic
Ratio of school attendance of orphans to school attendance of non-orphans aged 10-14 years 1:2 Support groups

Local Governance and Non-state actors Support Programme - LGNSP
195
An
nex
3
Health sector Data Source
Proportion of population with HIV infection with access to antiretroviral advanced drugs 14 %
New start, MaputsoeFilter Clinic, St. Monica’s Clinic
Number of HIV/AIDS Support groups 2 Chiefs
Education sector Data Source
Number of primary schools 8 CC
Number of secondary schools None CC
Number of high school and universities (government and privately owned) 7 CC
Average years of school attendance 12 CC
a) primary school 8 MoE
b) secondary school None MoE
c) high school 7 MoE
Ratio of girls to boys in secondary and high school 02:01 MoE
Number of and names of Farmers Training Centres (FTCs) None CC
Number and field of other vocational training schools None CC
Number of initiates for the last year to date 46 Chiefs
Water sector Data Source
Number of households with access to piped water a) public stand pipesb) privatec) hand pumps
8,063: public standpipes 3,200: hand pumps
RWS, WASA, chiefs,counsellors
Number of wells 215 Chiefs
Number of dams. Indicate whether they are natural or man-made and whether they are communally or privately owned 5: public MoFLR
Longest and shortest distance to the nearest potable water point (hour or km)
Longest:150 m Shortest: 50 m RWS, WASA
What kind of water supply projects are planned or under implementation?
Malereko-Senei,Mafata-Ralikuku,Qamo-Ramoruti,Polaki, St. Monica’s,Mpharane
RWS
Which institutions are in charge of water supply? RWS CC
Roads sector Data Source
Total kilometres of main or tarred roads (i.e. national roads) 36 km MoPW
Longest and shortest distance (km) of villages to the nearest ‘good’ road
Longest: 5 km Shortest: 3 km Chiefs
Number and names of villages without road access Number of households concerned
Ralikuku Mongali,Mothamane, Senei,Lepamo, Matumo,Barete, Matasane
Chiefs
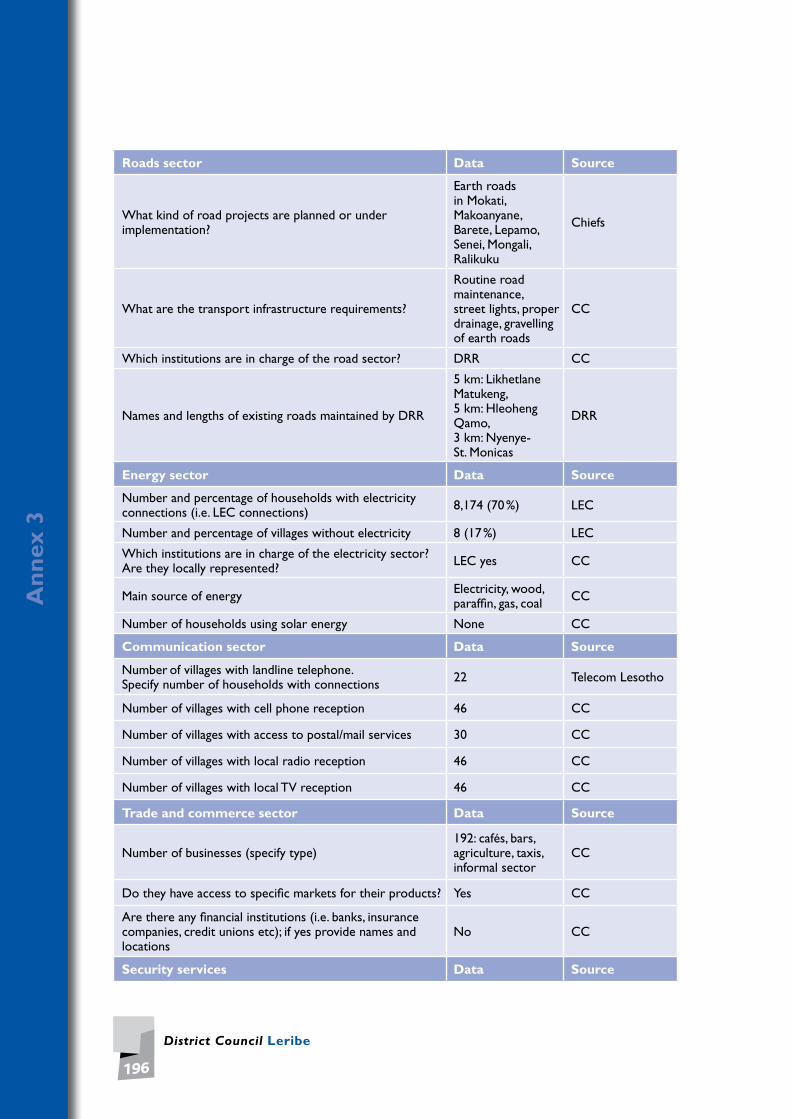
District Council Leribe
196
An
nex
3
Roads sector Data Source
What kind of road projects are planned or under implementation?
Earth roadsin Mokati,Makoanyane,Barete, Lepamo,Senei, Mongali,Ralikuku
Chiefs
What are the transport infrastructure requirements?
Routine road maintenance, street lights, proper drainage, gravelling of earth roads
CC
Which institutions are in charge of the road sector? DRR CC
Names and lengths of existing roads maintained by DRR
5 km: LikhetlaneMatukeng,5 km: HleohengQamo,3 km: Nyenye- St. Monicas
DRR
Energy sector Data Source
Number and percentage of households with electricity connections (i.e. LEC connections) 8,174 (70 %) LEC
Number and percentage of villages without electricity 8 (17 %) LEC
Which institutions are in charge of the electricity sector? Are they locally represented? LEC yes CC
Main source of energy Electricity, wood, paraffin, gas, coal CC
Number of households using solar energy None CC
Communication sector Data Source
Number of villages with landline telephone. Specify number of households with connections 22 Telecom Lesotho
Number of villages with cell phone reception 46 CC
Number of villages with access to postal/mail services 30 CC
Number of villages with local radio reception 46 CC
Number of villages with local TV reception 46 CC
Trade and commerce sector Data Source
Number of businesses (specify type) 192: cafés, bars, agriculture, taxis, informal sector
CC
Do they have access to specific markets for their products? Yes CC
Are there any financial institutions (i.e. banks, insurance companies, credit unions etc); if yes provide names and locations
No CC
Security services Data Source

Local Governance and Non-state actors Support Programme - LGNSP
197
An
nex
3
Number of security service providers None CC
Number of crime prevention committees 11 CC
Names of villages least covered by security services None CC
Common types of crime cases reported Stock theft, rape, housebreaking, robbery
Police Maputsoe
Number of stock stolen in the last year 87 Police Maputsoe
Longest and shortest distance to the nearest police station or post 12 km Chiefs
Environment Data Source
Names of rare, vulnerable or endangered species Flora: aloeFauna: rabbits MET
Names of protected areas None Chiefs
Names of areas of interest that could be protected Cemetery sitesalong main roadsin CC
CC
Names of villages that are facing severe soil erosion
Likhetlane,Mpharane, Hleoheng, St. Monica’s, Lepamo
CC
What are the natural resource management projects ongoing, planned or under implementation?
Ongoing: tree planting, gully rehabilitation
Planned: tree planting, gully rehabilitation
MoFLR

District Council Leribe
198
An
nex
3
Community Council: Manka Eu (C17)Population Data Source
Total population 17,881 Bureau of Statistics
Male population 8,731 Bureau of Statistics
Female population 9,150 Bureau of Statistics
Average population per village 380 Bureau of Statistics
Number of births in the last year 782 Chiefs
Number of 5+ mortality rate per 1000 in the last year 684 Chiefs
Under 5 mortality rate per 1000 in the last year 1/10 Chiefs
Community council profile Data Source
Total area of community (km2) 166.96 CC
Number of electoral divisions 11 CC
Number of villages 64 CC
Names of villages List attached CC
Estimated distance from district town (in km and travel time) 28 km CC
Social indicators Data Source
Total number of households 4,085 CC
Average number of persons per household (average household size) 5 CC
Number of female-headed households 202 CC
Number of child-headed households 261 CC
Number of orphans 3,500 CC
a) paternal orphans 1,600 CC
b) maternal orphans 1,000 CC
c) double orphans 900 CC
Number of herd boys not attending school (below 18 years of age) 200 CC
Number of persons with disabilities 126 Chiefs
Socio-economic indicators Data Source
Number of persons receiving food aid 300 Bureau of Statistics
Proportion of population under M 10.00 per day 60 % Bureau of Statistics
Employment to population ratio 1:3 Bureau of Statistics
Children under 5 years of age: prevalence of underweight 2,875 MoH
Proportion of population below minimum level of dietary energy consumption 45 % MoH
Main sources of income and number of households concerned
Miners, factory workers (1,021 households)
CC
Average household income (Maloti per year) 15,600 CC
Number of people employed in agriculture and livestock 12,874 CC

Local Governance and Non-state actors Support Programme - LGNSP
199
An
nex
3
Socio-economic indicators Data Source
Number of people generating income from other sources 3,576 CC
Names and types of associations List attached CC
Agriculture sector Data Source
Number of households with agricultural fields 2,941 MoA
Average field size in hectares (has) 5,571 MoA
Three main crops produced Grain crops,cereal cropsvegetable crops
MoA
Three main livestock herded Small stock, largestock, poultry,piggery
MoA
Size of public land (hectares of range land) 582 MoFLR
What kind of agricultural service providers are available (governmental and NGOs)? Red Cross, MoA CC
What kind of agricultural projects are planned or under implementation?
Fruit tree production,seedling production,irrigation scheme, piggery and poultryproduction
CC
Health sector Data Source
Three most prevalent diseases Tuberculosis, HIV/AIDS, diarrhoea
CC
Number and names of health centres
4: St. Anne Health Centre, Fobane Health Centre, St. Rose Health Centre, Peka Health Centre
CC
Longest and shortest distance to nearest health centre (in hours or km)
Longest: 5 hr Shortest: 1 min
CC
Readiness of undergoing Voluntary Counselling and Testing (VCT) High CC
Names of villages where access to health facilities is worst List attached(6,147 people affected)
CC
Level of interest to get the results of the test High CC
Number of people dependent on home-based care 220 CC
Number of households with toilets VIP: 4,629WC: 60
CC
HIV prevalence among population aged 15-24; proportion of population aged 15-24 years with comprehensivecorrect knowledge of HIV/AIDS
13 % CC
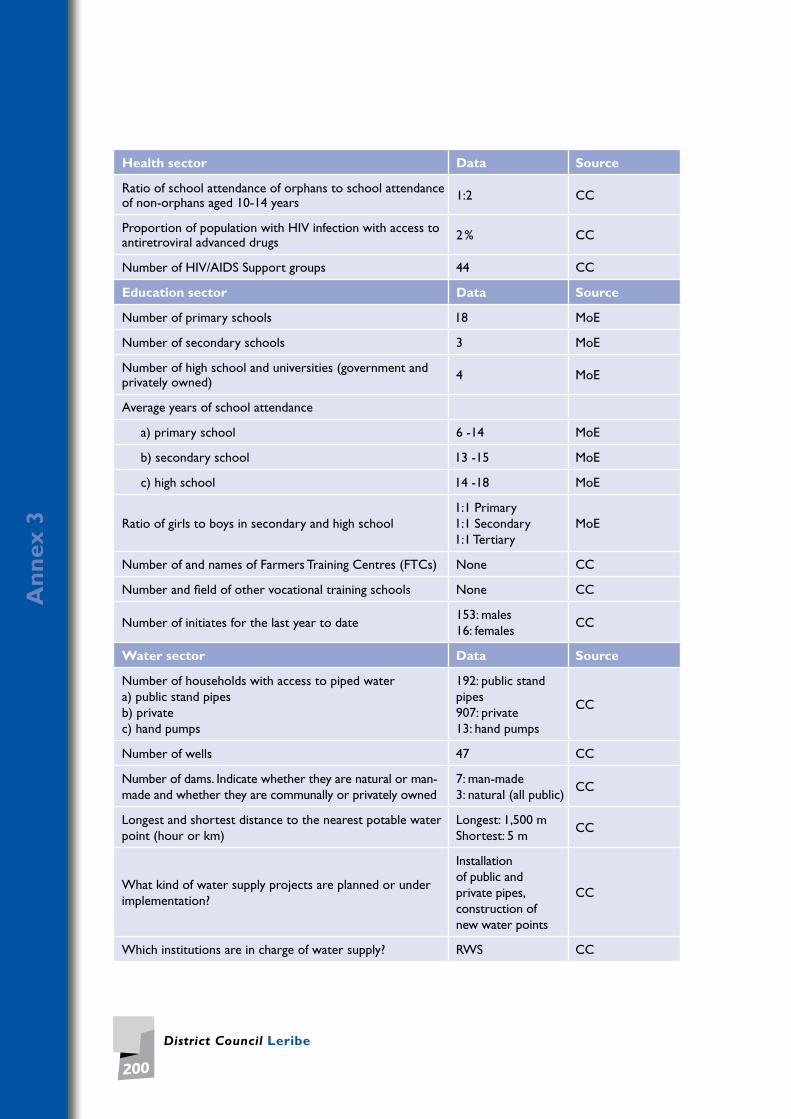
District Council Leribe
200
An
nex
3
Health sector Data Source
Ratio of school attendance of orphans to school attendance of non-orphans aged 10-14 years 1:2 CC
Proportion of population with HIV infection with access to antiretroviral advanced drugs 2 % CC
Number of HIV/AIDS Support groups 44 CC
Education sector Data Source
Number of primary schools 18 MoE
Number of secondary schools 3 MoE
Number of high school and universities (government and privately owned) 4 MoE
Average years of school attendance
a) primary school 6 -14 MoE
b) secondary school 13 -15 MoE
c) high school 14 -18 MoE
Ratio of girls to boys in secondary and high school 1:1 Primary 1:1 Secondary 1:1 Tertiary
MoE
Number of and names of Farmers Training Centres (FTCs) None CC
Number and field of other vocational training schools None CC
Number of initiates for the last year to date153: males 16: females
CC
Water sector Data Source
Number of households with access to piped water a) public stand pipesb) privatec) hand pumps
192: public stand pipes 907: private13: hand pumps
CC
Number of wells 47 CC
Number of dams. Indicate whether they are natural or man-made and whether they are communally or privately owned
7: man-made3: natural (all public)
CC
Longest and shortest distance to the nearest potable water point (hour or km)
Longest: 1,500 mShortest: 5 m
CC
What kind of water supply projects are planned or under implementation?
Installationof public andprivate pipes,construction ofnew water points
CC
Which institutions are in charge of water supply? RWS CC

Local Governance and Non-state actors Support Programme - LGNSP
201
An
nex
3
Roads sector Data Source
Total kilometres of main or tarred roads (i.e. national roads) 15 km CC
Longest and shortest distance (km) of villages to the nearest ‘good’ road
Longest: 14 km Shortest: 15 m
CC
Number and names of villages without road access Number of households concerned
Mpapa, Rankoane,Patsa, Rantho,Monyane, Napo,Thipane, Ha Motako, ‘Marana, Nkanyane
CC
What kind of road projects are planned or under implementation?
Planned: bridge,maintenance of earth and gravel roads Under implementa-tion: upgrading both gravel and tarred roads
CC
What are the transport infrastructure requirements?
Construction of a bridge, maintenance of both earth andgravel roads
CC
Which institutions are in charge of the road sector? DRR CC
Names and lengths of existing roads maintained by DRR
17 km: Kotola-Mokhosi, 7.6 km: Hlanami-Mosamo, 9.1 km: Tabola-Ntahli, 13,.2 km: Tabola-Tjopa, 12 km: Likoche-Motinyane
CC
Energy sector Data Source
Number and percentage of households with electricity connections (i.e. LEC connections) 305 (7.5 %) CC
Number and percentage of villages without electricity 51 (79.7 %) CC
Which institutions are in charge of the electricity sector? Are they locally represented? LEC CC
Main source of energy Firewood CC
Number of households using solar energy 1,389 CC
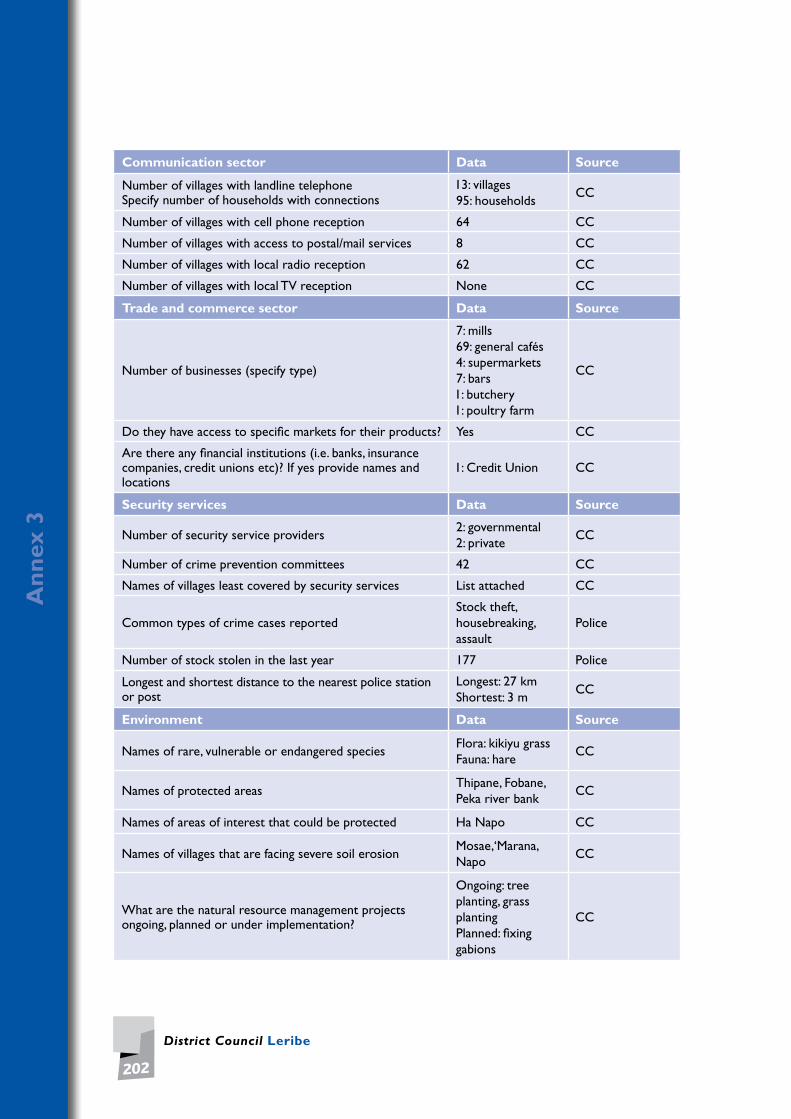
District Council Leribe
202
An
nex
3
Communication sector Data Source
Number of villages with landline telephone Specify number of households with connections
13: villages95: households
CC
Number of villages with cell phone reception 64 CC
Number of villages with access to postal/mail services 8 CC
Number of villages with local radio reception 62 CC
Number of villages with local TV reception None CC
Trade and commerce sector Data Source
Number of businesses (specify type)
7: mills 69: general cafés 4: supermarkets7: bars1: butchery1: poultry farm
CC
Do they have access to specific markets for their products? Yes CC
Are there any financial institutions (i.e. banks, insurance companies, credit unions etc)? If yes provide names and locations
1: Credit Union CC
Security services Data Source
Number of security service providers 2: governmental2: private
CC
Number of crime prevention committees 42 CC
Names of villages least covered by security services List attached CC
Common types of crime cases reported Stock theft, housebreaking, assault
Police
Number of stock stolen in the last year 177 Police
Longest and shortest distance to the nearest police station or post
Longest: 27 km Shortest: 3 m
CC
Environment Data Source
Names of rare, vulnerable or endangered species Flora: kikiyu grass Fauna: hare
CC
Names of protected areas Thipane, Fobane, Peka river bank
CC
Names of areas of interest that could be protected Ha Napo CC
Names of villages that are facing severe soil erosion Mosae,‘Marana, Napo
CC
What are the natural resource management projects ongoing, planned or under implementation?
Ongoing: tree planting, grass planting Planned: fixing gabions
CC

Local Governance and Non-state actors Support Programme - LGNSP
203
An
nex
3
Community Council: Tsoili-Tsoili (C18)
Population Data Source
Total population 18,456 StatisticalOffice
Male population 9,080 StatisticalOffice
Female population 9,376 StatisticalOffice
Average population per village 376 StatisticalOffice
Number of births in the last year 136 Support groups
Number of 5+ mortality rate per 1000 in the last year 175 Chiefs
Under 5 mortality rate per 1000 in the last year 21 Chiefs
Community council profile Data Source
Total area of community (km2) 146.16 LSPP
Number of electoral divisions 11 CC
Number of villages 49 CC
Names of villages List attached CC
Estimated distance from district town (in km and travel time) 27 km CC
Social indicators Data Source
Total number of households 2,592 StatisticalOffice
Average number of persons per household (average household size) 5 Statistical
Office
Number of female-headed households 1,373 Chiefs, CC, support groups
Number of child-headed households 117 Chiefs, CC, support groups
Number of orphans 874 Chiefs, CC, support groups
a) paternal orphans 399 Chiefs, CC, support groups
b) maternal orphans 130 Chiefs, CC, support groups
c) double orphans 344 Chiefs, CC, support groups
Number of herd boys not attending school (below 18 years of age) 27 Chiefs, CC,
support groups
Number of persons with disabilities 150 Chiefs, CC, support groups

District Council Leribe
204
An
nex
3
Socio-economic indicators Data Source
Number of persons receiving food aid 74 CC
Proportion of population under M 10.00 per day 25 %StatisticalOffice
Employment to population ratio 1:7StatisticalOffice
Children under 5 years of age: prevalence of underweight 42 MoH
Proportion of population below minimum level of dietary energy consumption 30 % MoH
Main sources of income and number of households concerned
Salary earned Self-employment Agriculture
CC
Average household income (Maloti per year) M 800 CC
Number of people employed in agriculture and livestock 13,000 CC
Number of people generating incomes from other sources 200 (9.2 %) CC
Names and types of associations List attached CC
Agriculture sector Data Source
Number of households with agricultural fields 3,172Kolonyama Resource Centre
Average field size in hectares (has) 8Kolonyama Resource Centre
Three main crops produced Grain crops, cereal crops, vegetable crops
Kolonyama Resource Centre
Three main livestock herded Small stock, large stock, poultry, piggery
Kolonyama Resource Centre
Size of public land (hectares of range land) 510 MoFLR
What kind of agricultural service providers are available (governmental and NGOs)?
Red Cross, Global FundMoA
CC
What kind of agricultural projects are planned or under implementation?
Fruit tree production, seedling, irrigation scheme, piggery, poultry
CC
Health sector Data Source
Three most prevalent diseases Tuberculosis, HIV/AIDS, hypertension
MoH
Number and names of health centres 1: Little Flower Health Centre
CC
Longest and shortest distance to nearest health centre (in hours or km)
Longest: 2 hr Shortest: 10 min
CC
Readiness of undergoing Voluntary Counselling and Testing (VCT) High CC
Names of villages where access to health facilities is worst Ha Ralehlatsa, Mohlokaqala, Matala
CC
Health sector Data Source

Local Governance and Non-state actors Support Programme - LGNSP
205
An
nex
3
Level of interest to get the results of the test Medium MoH
Number of people dependent on home-based care 20 Support groups
Number of households with toilets VIP: 1,884 WC: 10
Ts’epong, Bophelong
HIV prevalence among population aged 15-24; proportion of population aged 15-24 years with comprehensive correct knowledge of HIV/AIDS
60 %Ts’epong, Bophelong
Ratio of school attendance of orphans to school attendance of non-orphans aged 10-14 years 1:7 CC
Proportion of population with HIV infection with access to antiretroviral advanced drugs 53 %
Ts’epong, Bophelong
Number of HIV/AIDS Support groups 30 CC
Education sector Data Source
Number of primary schools 17 CC
Number of secondary schools 2 CC
Number of high school and universities (government and privately owned) 3 CC
Average years of school attendance
a) primary school 7 MoE
b) secondary school 14 MoE
c) high school 16 MoE
Ratio of girls to boys in secondary and high school 2:1 MoE
Number of and names of Farmers Training Centres (FTCs) 1: Agricultural Resource Centre
CC
Number and field of other vocational training schools None CC
Number of initiates for the last year to date 277 CC
Water sector Data Source
Number of households with access to piped water a) public stand pipes, b) private, c) hand pumps
200 (9.2 %) Chiefs
Number of wells 36 Chiefs
Number of dams. Indicate whether they are natural or man-made and whether they are communally or privately owned
44: man-made (public) 26: natural 9: privately owned
Chiefs
Longest and shortest distance to the nearest potable water point (hour or km)
Longest: 30 min Shortest: 1 min
Chiefs
What kind of water supply projects are planned or under implementation?
List attached RWS
Which institutions are in charge of water supply? RWS Chiefs
Roads sector Data Source

District Council Leribe
206
An
nex
3
Total kilometres of main or tarred roads (i.e. national roads) 23 km: Peka-Kolonyama
DRR, Roads Department
Longest and shortest distance (km) of villages to the nearest ‘good’ road
Longest: 300 m Shortest: 50 m
DRR, Roads Department
Number and names of villages without road access Number of households concerned
Ha Thokoa, Motse Mocha (26 households)
CC
What kind of road projects are planned or under implementation?
Ongoing: 1.7 km Manama-Rakolo, 1.3 km Ntsekele-Sekhutloaneng Planned: upgrade earth roads in all 11 electoral divisions
CC
What are the transport infrastructure requirements?
All roads within 11 electoral divisions to be upgraded from earth roads to gravel roads, footbridge at Ha Rakobeli
CC
Which institutions are in charge of the road sector? DRR, Roads Department
CC
Names and lengths of existing roads maintained by DRR List attached CC
Energy sector Data Source
Number and percentage of households with electricity connections (i.e. LEC connections) 7 (16 %) LEC
Number and percentage of villages without electricity 41 (84 %) LEC
Which institutions are in charge of the electricity sector? Are they locally represented? LEC CC
Main source of energy Wood CC
Number of households using solar energy 50 Chiefs
Communication sector Data Source
Number of villages with landline telephone Specify number of households with connections 28 CC
Number of villages with cell phone reception 49 CC
Number of villages with access to postal/mail services 49 CC
Number of villages with local radio reception 49 CC
Number of villages with local TV reception 49 CC
Trade and commerce sector Data Source

Local Governance and Non-state actors Support Programme - LGNSP
207
An
nex
3
Number of businesses (specify type) 70 CC
Do they have access to specific markets for their products? Yes CC
Are there any financial institutions (i.e. banks, insurance companies, credit unions etc); if yes provide names and locations
No CC
Security services Data Source
Number of security service providers 1: governmental 1: private CC
Number of crime prevention committees 1: with 49 sub-committees Chiefs
Names of villages least covered by security services
Ha Ntsekele Ha Ralehlatsa Ha Lints’a Ha Jobo Manganeng Ha Thokoa Ha Rampa
Chiefs
Common types of crime cases reported Stock theft, housebreaking Chiefs
Number of stock stolen in the last year 47 Chiefs
Longest and shortest distance to the nearest police station or post
Longest: 18 km Shortest: 10 m CC
Environment Data Source
Names of rare, vulnerable or endangered species Flora: hloenya,‘mankilingFauna: rabbits, monkeys
MET
Names of protected areas None CC
Names of areas of interest that could be protected SehlabengKolonyama CC
Names of villages that are facing severe soil erosion
Ha NtsekeleHa MakhulaManganeng Ha MohlokaqalaHa MotlokoaHa TlalinyaneMakhalongMoramang
CC
What are the natural resource management projects ongoing, planned or under implementation?
Ongoing: water conservation at Ha Tokoto, Ha Molipa, Ha ‘Nena, tree planting at Manganeng, Ntsekele Planned: tree planting at Ralehlatsa, Moqathinyane, gully rehabilitation- Moqathinyane, dams building
CC

District Council Leribe
208


About LGNSPThe Local Governance & Non State Actor Support Programme (LGNSP) is a European Union funded initiative implemented in partnership with the Ministry of Finance and Development Planning. It aims to deepen lo-cal democracy, improve local governance and reduce poverty through the creation of a supportive and enabling environment at community and dis-trict level which strengthens dialogue around effecting social change and furthers citizen participation in Lesotho.To this end, the programme broadly aims to enhance the active participa-tion of citizens, local authorities and non-state actors in Lesotho in the debate about local governance and decentralisation legal and regulatory framework. It aims also at generating confidence in the government re-form and the institutions of democracy, ensuring the promotion and pro-tection of political, socio and economic rights, and supporting a culture of accountability, transparency and equity. It also operates a grant-making fund for local development initiatives, capacity building and organizational development interventions.
About this publicationThis handbook presents detailed, up-to-date, relevant, accessible and accurate information describing the major characteristics of the district, serving as a useful reference guide for all stakeholders involved in district planning efforts. This handbook is the result of a methodological process of both quantitative and qualitative investigation. The profiling exercise started by conducting several field work appraisals of the physical and geographic features of the region, followed by a broad review of secondary sources and standard national statistics from different official sources. These data were combined with surveys, discussions, workshops and interviews with major stakeholders at national, district and Community Council level.
LS-80-09-603-EN-C