Lecture 1 SOIL RESOURCE INVENTORY CONCEPTS What ...
156
Lecture 1 SOIL RESOURCE INVENTORY CONCEPTS What do you mean by soil resource inventory? Soil survey, or more properly, soil resource inventory, is the process of determining the pattern of the soil cover, characterizing it, and presenting it in understandable and interpretable form to various consumers ( or) SRI meant to secure information needed to manage soil sustainability, protect water quality, vegetation communities and wildlife communities (or) Creating a SRI involves recording of various physical, chemical, biological properties of soil and its potential and limitation for specific use Consumers of Soil Resource Inventory • Land managers - Farmers, ranchers, foresters, plantation managers. • Advisors to land managers - extensionists. • Service industries related to land use - credit agencies, banks, investment groups. • Land-use planners - prohibits, advises, or facilitates certain kinds of land use in different areas • Regulatory agencies - specific legal authority to regulate land use • Taxation authorities - taxed on its productive potential • Environmental managers - an element of landscape ecology • Researchers - agricultural experimentalists SRI includes: • Maps of the locations and extent of soils • Data about physical, chemical, and biological properties of those soils • Information derived from those data about potentialities and problems of use on each kind of soil • The information is sufficient and in detailed manner for application by planners, engineers, and scientists to specific areas of concern. • The Inventory & Monitoring (I&M) Program supports soils mapping and inventory is based on standard terminology and techniques of Soil Survey. Soil Resource Inventory according to professionals • Botanists - called soils as prairie soils, pine soils and oak soils • Geologists - granite soils, limestone soils, shale soils • Climatologists - classified soils as temperate soils, tropical soils etc • Engineers - considered soil as regolith or unconsolidated material • Liebig - store house of nutrients or bank –balance concept of nutrients was employed in studying the nutrient cycling in soil and plants Modern concepts of Soil Resource Inventory – Pedological Dokuchaev (1879) : product specific from a parent rock Glinka (1927) - whole layer of the earth’s crust Hilgard (1906) - loose and friable material in which plants find their anchorage and Nourishment
-
Upload
khangminh22 -
Category
Documents
-
view
1 -
download
0
Transcript of Lecture 1 SOIL RESOURCE INVENTORY CONCEPTS What ...

Lecture 1
SOIL RESOURCE INVENTORY CONCEPTS
What do you mean by soil resource inventory? Soil survey, or more properly, soil resource inventory, is the process of determining the pattern of the soil cover, characterizing it, and presenting it in understandable and interpretable form to various consumers ( or) SRI meant to secure information needed to manage soil sustainability, protect water quality, vegetation communities and wildlife communities (or) Creating a SRI involves recording of various physical, chemical, biological properties of soil and its potential and limitation for specific use
Consumers of Soil Resource Inventory • Land managers - Farmers, ranchers, foresters, plantation managers.
• Advisors to land managers - extensionists.
• Service industries related to land use - credit agencies, banks, investment groups.
• Land-use planners - prohibits, advises, or facilitates certain kinds of land use in different areas
• Regulatory agencies - specific legal authority to regulate land use
• Taxation authorities - taxed on its productive potential
• Environmental managers - an element of landscape ecology
• Researchers - agricultural experimentalists SRI includes:
• Maps of the locations and extent of soils • Data about physical, chemical, and biological properties of those soils • Information derived from those data about potentialities and problems of use on each
kind of soil • The information is sufficient and in detailed manner for application by planners,
engineers, and scientists to specific areas of concern. • The Inventory & Monitoring (I&M) Program supports soils mapping and inventory is
based on standard terminology and techniques of Soil Survey.
Soil Resource Inventory according to professionals • Botanists - called soils as prairie soils, pine soils and oak soils
• Geologists - granite soils, limestone soils, shale soils
• Climatologists - classified soils as temperate soils, tropical soils etc
• Engineers - considered soil as regolith or unconsolidated material
• Liebig - store house of nutrients or bank –balance concept of nutrients was employed in studying the nutrient cycling in soil and plants
Modern concepts of Soil Resource Inventory – Pedological Dokuchaev (1879) : product specific from a parent rock Glinka (1927) - whole layer of the earth’s crust Hilgard (1906) - loose and friable material in which plants find their anchorage and Nourishment

King (1902) - soil as a scene of life and energy Coffee (1912) - products of complex interactions with landscape Marbut ( 1922) - fundamental concepts in relation to soil and formulated the concept of mature soils Whitney (1925) - physical and chemical nature of soils and their genetic relationships As per USDA soil survey manual (1951) SRI means Natural medium, Recognition of individual soil, Dynamic three-dimensional, Natural body, Equilibrium with environment Reflects its history and Unique kinds of soil exist
Objectives of SRI 1) Characterize and classify the soils into units based on their morphological, physical and chemical properties and map them on a standard scale. 2) Developing a database on soils at Panchayat level.3) Assessing the potentials and constraints of the soil. 4) Evaluating the soils by various interpretative groupings. 5) Suggesting land use strategies for enhancing agricultural production
Importance of soil resource Inventory a) Gives detailed information about various properties of soil. b) Gives potential and limitation of particular soil. c) SRI information is in sufficient detail for application scientist, engineers to specific area of concern. d) Information is sufficient to place soil in taxonomic class. e) Information about soil properties and land is vital for making decisions on proper land use management, environmental protection, and land use planning. f) To motivate for systematic soil surveys and interpretations, maps of soil properties required by empirical models.
Basic Concept and Procedure of SRI Soil Survey Soil resource inventories are usually presented as area-class maps which divide the survey
area into polygons, with an accompanying report that describes the soils in groups of polygons known as map units, each of which contains one or more named soil types. Rarely, continuous-field maps of soil properties or types are presented. Another kind of inventory is a database of point observations, usually with analytical data from the laboratory.
Components of SRI Soil information: various data concerning type, texture, mapping and so on; Landform information : includes slope data.
Soil information WSD (World Soil Database) provides information on standardized soil parameters for top
and subsoil for each soil unit composition.. In particular, database contains information on dominant and associate soils, texture and phases, and physical and chemical characteristics of topsoil and subsoil.
Soil mapping unit composition At the exploratory level, a soil mapping unit only rarely comprises a single soil; usually it
consists of one main soil with minor associates. When various soils of a soil mapping unit occur in a recognizable geographical pattern in defined proportions, and constitute a soil
association; if such a pattern is absent, they form a soil complex. Each soil mapping unit in the study region may contains soil type, with different proportions and characteristics
Landform information As indicated above, slope as a limiting factor for land workability, was used as proxy to
define the landform of the terrain in the region. Slope information was derived from the Digital Elevation Model (DEM) database and is expressed in percentage.
Soil Resource Inventory- Products 1. Soil Survey Manuscript (manual and digital format): This document contains series
descriptions, detailed soil map unit descriptions, general soil map unit descriptions, and soil properties and interpretation tables.
2. General Soil Map: General soil map unit names listed in the legend with their descriptions of the map units.
3. Detailed Soil Maps: This is an index map to view the soil delineations and map unit symbols within the subject area.
4. Thematic map : Map depicting a particular soil property
CONCEPTS OF STANDARD SOIL SURVEY, ITS SCOPE AND OBJECTIVES History of Soil Survey in India
• 1846 – Geological Survey started
• 1880 – Dept. Of Agriculture formed
• 1889 - Dr . J.A. Volecker visited India
• 1893 – Central and provincial Agrl. Dept. started soil studies for growing of crops
• 1904 – Dr. Leather visited India : Grouping of soils as Alluvial, Black cotton, Red and Laterite
• 1928 - Royal commission on Agrl. Started Dokuchaiev’s concept of classification Introduced Pre Irrigation Survey at lower Bhavani and Cauvery, Soil fertility Survey at Cauvery, Godavari and Krishna
� 1947- Dr. A.B. Stewart visited India, Soil Survey initiated in Madras, Bihar, Bengal and U.P.
� 1953 – USAID and ICAR jointly started Soil Survey in 6 Regions and 40 centers � 1955 – All India Soil Survey and Land Use Organization (AISS&LUO) was
Established and Started Standard Soil Survey � 1958 – AISS & LUO expanded , Sub centers at Delhi (AS )Nagpur (BS), Calcutta
(R&LS) and Bangalore (R&LS) � 1975-76- Directorate of Soil Survey started by ICAR NBSS&LUP at Nagpur,
Regional centers at Bangalore, Baroda, Calcutta, Jorhat and New Delhi Tamil Nadu � 1965 – Soil survey unit was started at Coimbatore, Tanjore (1971), Vellore (1977),
Palayamkottai 1978) Systematic Study of Soils of Tamil Nadu a) Soils of Cauvery Delta -Fertility status (1912) , b) Soils of the irrigation projects - Lower
Bhavani, Toludur, Cauvery – Mettur projects (1934-36)m c) Soil mapping of individual

taluks of Tamil Nadu (1965-1986), d) Studies on Coastal soils of Tamil Nadu (1980-84) and e) Soil resource mapping of Tamil Nadu - by NBSS&LUP and State Soil Survey Organization (1994-97)
SOIL SURVEY Soil Surveys provide basic information on soils for planning developmental program Soil survey – fact-finding mission, followed by a report on the findings Definition Soil survey is study and mapping of soils in the field in their natural environment ( or) soil
survey is Systematic examination, description, identification, classification, correlation and mapping the geographic distribution of different soils in the landscape
Soil survey comprises a group of interlinked operations involving: 1) Field work to study the important characteristics of soils and the associated land features 2) Laboratory analysis to supplement the field observations 3) Correlation and classification of soils into defined taxonomic units 4) Mapping of soils to establish and draw boundaries of different kinds of soils on standard
topographical base maps 5) Soil survey interpretations that make predictions about the potential of soils for alternate
uses 6) Transfer of agro technology from research station to farmers
Purpose of Soil Survey • Provide comprehensive information about soils
• Provide soil resource inventory of that area Objectives of Soil Survey Fundamental
• Helps in expanding our knowledge and understanding of different soils
• With regard to their properties, genesis and classification for sustainable development. Applied
• Helps in making predictions about the behaviour of different soils
• Transfer of technology by correlating the characteristics of soils of known behaviour.
• Predicting their adaptability to various uses and productivity under defined set of management practices.
• To provide information needed for developing optimum land use plans
• To bring new areas under irrigation and drainage net works
• To delineate the degraded soils
• To suggest soil and water conservation measures.
Lecture 2
SOIL SYSTEMATICS
Systematics is the fundamental scientific and deductive ordering of objects into systematic units. ... The identification requires that the category-forming characteristics can be measured (e.g., for soil systematics, these are the soil-forming processes and factors)
The Language of Soils Loamy, siliceous, hyperthermic grossarenic paleudult
Land and soil are often confused by people as synonyms Land: Includes not only soil but also the living organisms, the air and water bodies within or on it and rocks below Soil: A part of the land and comparatively narrowly defined concept. Soil is the medium where active biological and chemical process that takes place and supports plant growth What is soil? Soil is a natural three dimensional dynamic body of mineral and organic constituents differentiated into horizons which differ among themselves as well as from the underlying parent material in morphology, physical make up, chemical characteristics and biological properties
What Is Meant By Soil Formation? It involves two stages
1) Horizon formation 2) Sequences of horizonation
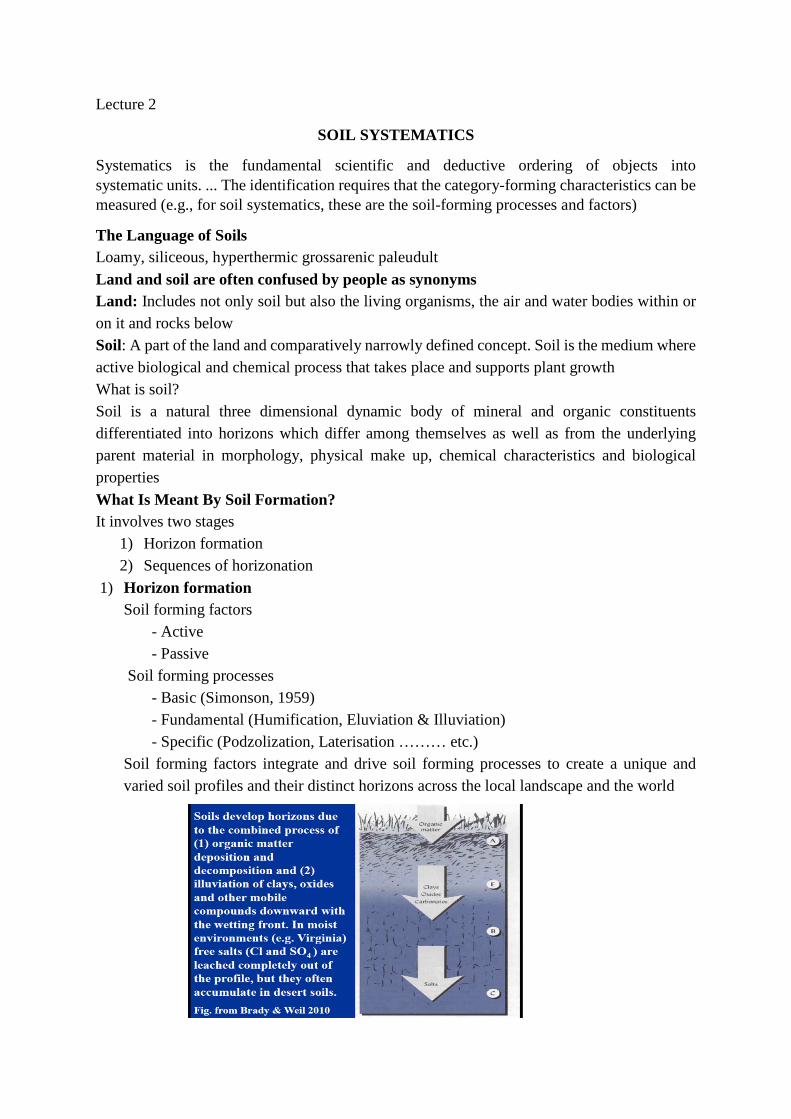
1) Horizon formation Soil forming factors - Active - Passive Soil forming processes - Basic (Simonson, 1959) - Fundamental (Humification, Eluviation & Illuviation) - Specific (Podzolization, Laterisation ……… etc.) Soil forming factors integrate and drive soil forming processes to create a unique and varied soil profiles and their distinct horizons across the local landscape and the world
Horizon A layer of soil or soil material approximately parallel to the land surface differing from the adjacent layers in many morphological, chemical, physical and biological properties, such as colour, texture, structure, consistence, pH and roots. Intergrade horizon – No clear cut boundary between the horizons Standard horizon – Clear cut boundary between the horizons Horizonation – Pathways leading to the development of horizons
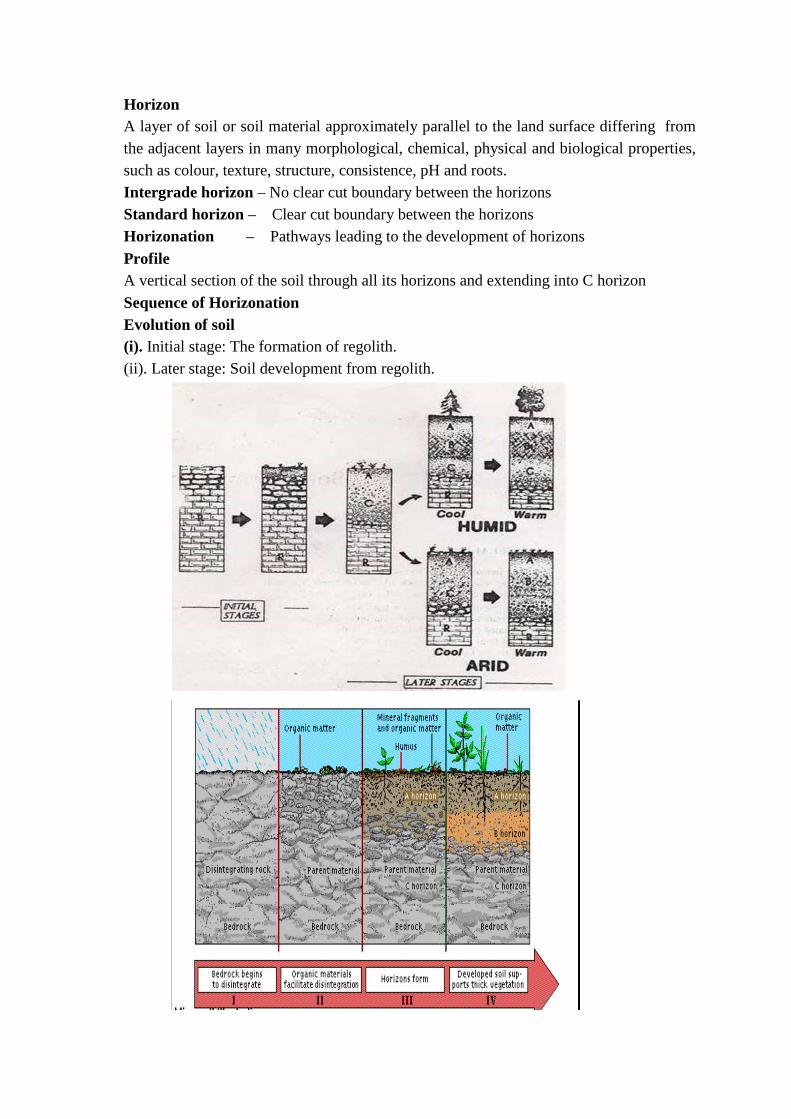
Profile A vertical section of the soil through all its horizons and extending into C horizon
Sequence of Horizonation Evolution of soil (i). Initial stage: The formation of regolith. (ii). Later stage: Soil development from regolith.

Soil Horizon designations Soil Horizons: first step in classification
Master Horizon Subdivisions As soils age, they may develop more horizons than the basic master horizons. Some of these layers are between the master horizons both in position and properties. These layers are identified by the two master letters, with the dominant one written first. Thus, an AB layer lies between the A and B horizons and resembles both, but is more like the A than the B. Transitional Horizons Zone of transition between master horizons AB A B ; A dominates BA A B ; B dominates AC A C ; A dominates EB E B ; E dominates
Numbers after letters Changes within master horizon for which there is no sub horizon designation e.g., A1 A2 for color change within A
Mixed horizons One horizon scattered within another horizon. B/A mixed A & B; B is matrix for A , E/B E is matrix for B. etc….
Numbers before letters Lithological discontinuities (e.g., soil has A, E, B horizon formed on one parent material and a second soil formed on another)
Subordinate Distinctions within Master Horizons a - highly decomposed organic material; used with O b - Buried genetic horizon
c - Concretions (or nodules) of Fe, Al, Mn, or Ti; not used for carbonates or soluble salts d - Physical root restriction e - Organic material of intermediate decomposition; used with O f - Permanently frozen soil ff - dry permafrost g - Strong Gleying; dominant color has chroma of 2 or less h - Illuvial accumulation of organic matter; used with B i - Slightly decomposed organic material; used with O j - Accumulation of jarosite jj - evidence of cryoturbation k - Accumulation of carbonates m - Cementation or induration; used with symbol for cementing material, i.e. Bkm, Bsm, etc. n - Accumulation of sodium o - Residual accumulation of Sequioxides; B only p - Plowing; used only with surface horizon (A) q - Accumulation of silica r - Weathered or soft bedrock; only used with C, i.e. Cr s - Illuvial accumulation of Sesquioxide and organic matter; B ss - Slickensides t - Illuvial accumulation of silicate clay; clay films or bridges; B v – Plinthite; B w - Development of color or structure; used with B horizon x - Brittle consistence; B y - Accumulation of gypsum z - Accumulation of salts more soluble than gypsum
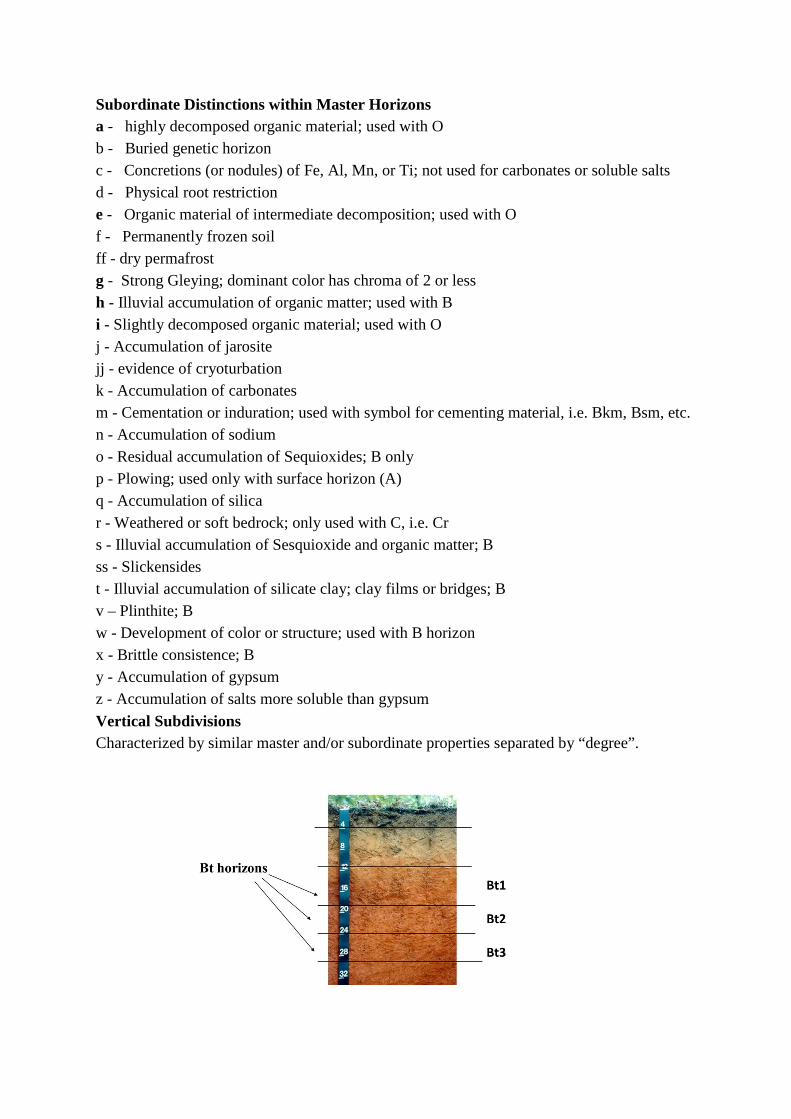
Vertical Subdivisions Characterized by similar master and/or subordinate properties separated by “degree”.
Nomenclature / Designations of horizons Master horizons. (O, A, E, B, C, R) Subordinate horizons. ( t, a, i, e, o, b, e, …..etc.) - Ah, Ap, By Transitional horizons. (AE, EA, EB, BE ….etc.)
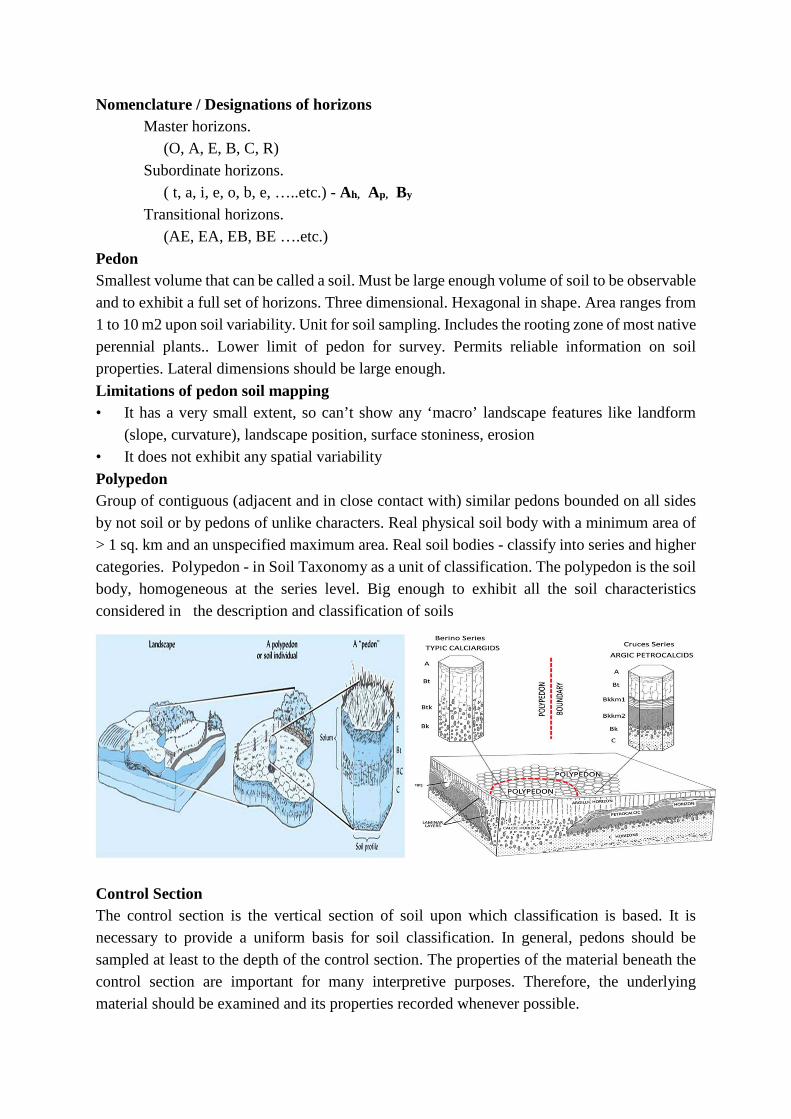
Pedon Smallest volume that can be called a soil. Must be large enough volume of soil to be observable and to exhibit a full set of horizons. Three dimensional. Hexagonal in shape. Area ranges from 1 to 10 m2 upon soil variability. Unit for soil sampling. Includes the rooting zone of most native perennial plants.. Lower limit of pedon for survey. Permits reliable information on soil properties. Lateral dimensions should be large enough.
Limitations of pedon soil mapping • It has a very small extent, so can’t show any ‘macro’ landscape features like landform
(slope, curvature), landscape position, surface stoniness, erosion • It does not exhibit any spatial variability
Polypedon Group of contiguous (adjacent and in close contact with) similar pedons bounded on all sides by not soil or by pedons of unlike characters. Real physical soil body with a minimum area of > 1 sq. km and an unspecified maximum area. Real soil bodies - classify into series and higher categories. Polypedon - in Soil Taxonomy as a unit of classification. The polypedon is the soil body, homogeneous at the series level. Big enough to exhibit all the soil characteristics considered in the description and classification of soils
Control Section The control section is the vertical section of soil upon which classification is based. It is necessary to provide a uniform basis for soil classification. In general, pedons should be sampled at least to the depth of the control section. The properties of the material beneath the control section are important for many interpretive purposes. Therefore, the underlying material should be examined and its properties recorded whenever possible.
There are several control sections in Soil Taxonomy Subgroup, great group, suborder, order –Moisture •Family –Particle-size classes or their substitutes –Mineralogy –Cation-exchange activity –Temperature –Calcareous and reaction classes –Classes of coatings –Classes of permanent cracks The family category provides information for engineering use and agronomic use. • Series control section Series Control Section (SCS) -vertical section of soil - distinguishing series with families.
Upper limit of SCS is below the plough or surface layer (20 – 25 cm). Lower limit is extended up to the zone of biological activity (up to 1.0 m/ 1.5 m.)
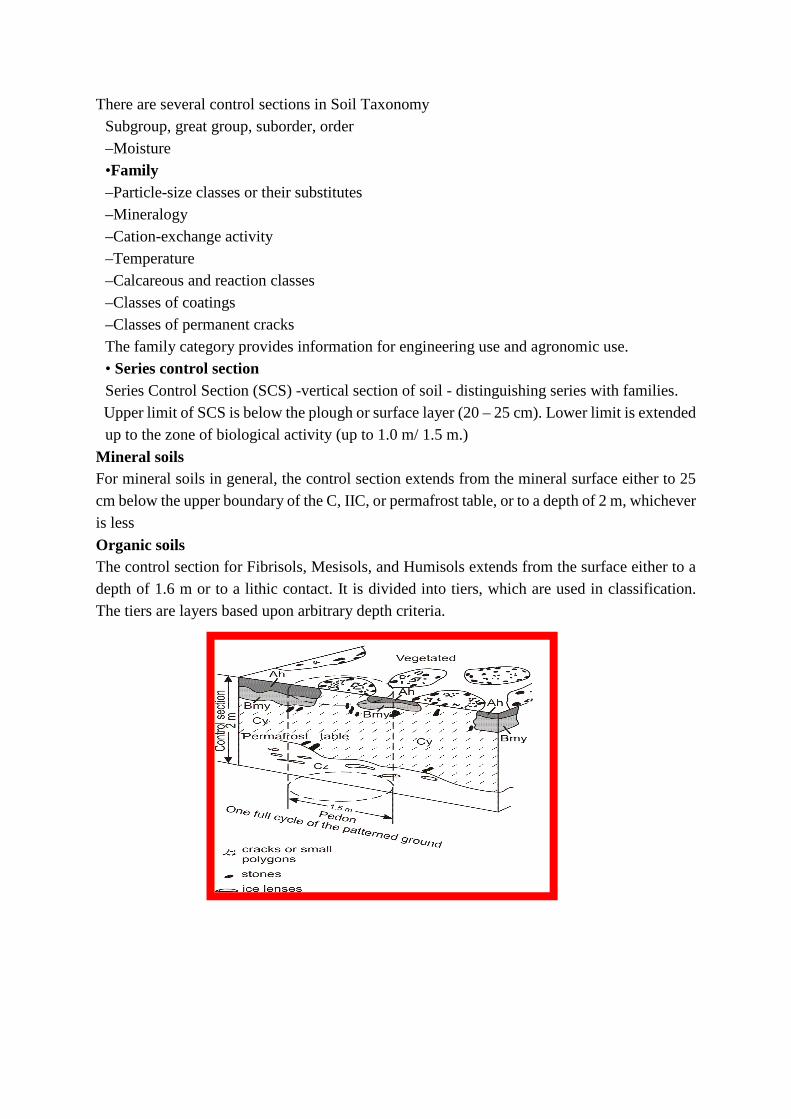
Mineral soils For mineral soils in general, the control section extends from the mineral surface either to 25 cm below the upper boundary of the C, IIC, or permafrost table, or to a depth of 2 m, whichever is less
Organic soils The control section for Fibrisols, Mesisols, and Humisols extends from the surface either to a depth of 1.6 m or to a lithic contact. It is divided into tiers, which are used in classification. The tiers are layers based upon arbitrary depth criteria.

Lecture 3.
SOIL MAPPING UNITS
Soil Mapping Process
Soil mapping is the process of delineating natural bodies of soils, classifying and grouping the delineated soils into map units, and capturing soil property information for interpreting and depicting soil spatial distribution on a map.
Soils differ in the size and shape of their areas, in their degree of contrast with adjacent soils, and in their geographic relationships due to soil formation or land use. Soil surveys use four kinds of map units to distinguish the different relationships: consociations, complexes, associations, and undifferentiated groups. The distribution of different soil series on the landscape is often intricate and necessitates some simplification for mapping. This is achieved by means of soil mapping unit which is the smallest area of a map that can be delineated by a single boundary at the scale used. In large scale maps, simple mapping units, each representing a narrowly defined soil series are delineated to attain 80% purity within that unit. As the map scale decreases (from 1:25000 to 1:50000 or 1:100000), complex mapping units are used. Soil boundaries are shown on maps by lines. The area enclosed by a boundary is called “soil delineation
DEFINITIONS It is an area of soil that is delineated from adjacent soil on a map (or) Any unit describing the spatial distribution of soils which can be mapped (Or) Defined as the classification of areas having similar soil components
Feature of Soil Mapping Units • The soil mapping units are recognized through profile examination
• Soil mapping units may be simple, consisting of one type of soil or complex, consisting of two or more types of soil
• These are identified by a unique symbol, color or name
• Soil maps generally contain more than one map unit
Consociations In a consociation, delineated areas use a single name from the dominant component in the map unit. Dissimilar components are minor in extent. The soil component in a consociation may be identified at any taxonomic level. Soil series is the lowest taxonomic level. A consociation map unit that is named for a miscellaneous area is dominantly that kind of area and any minor components present do not significantly affect the use of the map unit 1) Soil series 2) Soil Types 3) Soil Phases Soil complex, soil association, catena and legend are also used as mapping unit
Soil series The soil series is a group of soils having soil horizons similar in differentiating characteristics and arrangement in the soil profile except for the texture of the surface soil. Soil series is the lowest category in Soil Taxonomy. It is the fundamental unit of soil classification and basic unit of soil mapping. Soil series are differentiated on the basis of significant variation in morphological features of soil profile. The soils within the series are

essentially homogenous in all soil profile features. The series brings the units of mapping together in an organized manner to help us to remember soil properties and the relationship among soils It is given a geographical name either of the place where it was first recognized eg Madukkur series, Irugur series, Pattukottai series, Noyyal series. Minimum 2000 acres required to name The criteria used for mapping at series level include 1) Physiography (basins, depressions etc. reflect the pedogenesis of soils) 2) Parent material 3) Texture, soil depth 4) Drainage class 5) Profile development 6) STR and SMR Environmental characteristics such as slope, topography, stoniness, rockiness, erosion and surface layers are not taken into consideration for characterizing a soil series unless they influence the arrangement of soil horizons. Under Indian conditions, a new series should cover at least 1000 ha on a medium-scale map. On the soil map, each soil series is represented by a three letter symbol. Ex. Irugur series (Igr), Peelamedu series (Plm), Palathurai series (Pth)
Soil types The soil type is a sub division of soil series based on the texture of the surface soil. The soil type consists of the series name plus the textural class name of A horizon eg Knd- Cl Series A horizon texture The soil type is the lowest and most nearly homogenous unit in the natural system of classification. A soil type may include defined variation in slope, stoniness, degree of erosion or the depth of rock. To be allowed within a soil type, soils cannot vary in these features beyond a range of significance to the genesis of the natural soil
Soil phases: They mainly indicate differences of practical significance. The phase is the lowest category in the new soil classification that takes care of all features of the surface and sub soil such as soil texture, salinity, sloppiness, slope etc., In the map, it is indicated as a 3-letter symbol depicting texture, slope and stoniness or salinity. For eg Knd ( soil series) Knd-Cl ( Soil type) Knd- C ( Soil type) Knd –Cl- e1 ( Soil phase) Knd- Cl- e3 ( soil phases) Knd – C-d2 ( soil phases) Knd- C –d5 (soil phases)
Soil complexes and soil associations Naturally occurring groupings of two or more soil series with different use and management requirements which occur in a regular pattern across the landscape, but that cannot be separated at the scale of mapping that is used. Soil complexes are used to map two or more series that are commonly intermixed on similar landforms in detailed county soil maps. Soil associations are utilized in more general and less detailed regional soil maps. Soil association on a soil map is represented by three letter symbol of the soil series forming an association. The soil series covering the maximum area is denoted first followed by soil series having lesser geographical area. E.g. (Pth – Pch) (Plm – Pth – Pch)
Soil variant Soils of established series differing in some properties of the series. They are indicated as variant in reconnaissance. These soil will be proposed as new series in detailed soil survey. Variant has characteristics outside the limit of any known soil series which is less than 1000 ha in extent. The variants may be recognized as series if found in larger extent. Ex. Madukkur clay loam calcareous variant, Ariyalur silt loam dark coloured variant
Inclusions Soils components which occupy less than 20 % of the mappable area is called inclusions. These are the soil components which are not classified and not mapped because of the following - Areas occupied by them is too less to be mapped - The soil components cannot be classified by routine field investigations. - Inclusions reduce the homogeneity of mapping units and may affect interpretation.
Undifferentiated Mapping unit consisting of a number of taxonomic units Merged so that separation into different units are impossible at any reasonable mapping scale
Miscellaneous land types These include areas which are having little or more soil to support any vegetation unless they are reclaimed. They are used in detailed reconnaissance soil survey. Some of the miscellaneous land types are sand dunes, salt pan, swamps, water bodies, gullied land, ravines and bog lands
The basic distinction between soil mapping units and soil taxa is that The soil taxa is an abstract concept in that it is a grouping according to specific ranges of soil properties for purposes of scientific categorization. Whereas a soil mapping unit is a cartographic representation on a map of the polypedon as they actually occur in the field.
Map Unit Vs Taxonomic Unit Both soil units and taxonomic units in soil resource inventories focus attention on soils. The two have different concepts A soil delineation or map unit representing an area of soils on a landscape may belong to two or more taxonomic unit (eg. Association of Typic Haplusterts and Vertic Ustochrepts). Thus basic difference between the two is – Taxonomic units define specific ranges of soil properties.

Soil map units define areas on a landscape and result from grouping of soil delineation’s which have the same colour and symbol
Some terminologies associated with soil mapping Map unit : A conceptual group of delineation that represent similar landscape areas comprised of either the same kind of component soil, plus inclusion or of two or more kind soils that may or may not occur together in various delineations, but all have similar, special use and management Map scale: The ratio between the distances measured on a map (d) and the same distance measured on the ground (D) S = d D Soil map: A map showing the distribution of different kinds of soils in relation to the major geographical features of an area Soil mapping: Work consisting of the delineation on a map of the mapping unit identified in the area surveyed Soil mapping unit: Any unit describing the spatial distribution of soils which can be mapped. Base map: It is fundamental requirement for all mapping activity. It is important for surveyor to delineate soil boundaries correctly and conveniently Legend : It is list of defined mapping units with their symbols (colour, number or letter)
BASE MAPS Irrespective of type of soil survey, a fundamental requirement of all mapping activities is a suitable base map. The base map should be complete in details of features and accurate in their in location to enable the surveyor to delineate soil boundaries more correctly and conveniently Based on the intensity of mapping, following base maps are used
CADASTRAL MAPS: It is of scale 1:2640(24”:1 mile) to 1: 7920( 8” : 1 mile) or 1:15,840( 4” :1 mile) in plain areas and 1: 1200 ( 52.8” : 1mile) in hilly areas for detailed mapping Cadastral maps shows field boundaries and field or revenue survey number, however they lack the topographical features (contours, elevations). Advantage in using cadastral map is that soil survey interpretation can be communicated to individual farmers. Cadastral map can be obtained from VAO. It is also called as village map

TOPOGRAPHICAL MAP Topographical maps are published in scale of 1:25,000, 1:50,000 and 1:250,000. These maps shows not only physical features but also contain topographical details in the form of contours and elevation above mean sea level. These maps have reliable planimetric accuracy facilitating measurement of distances and easy preparation of soil maps. In India it is prepared and published by Survey of India, Dehradun
AERIAL PHOTOGRAPH Aerial photographs are taken from cameras fitted in an aircraft and fly over the terrain at a predetermined height depending upon the scale of aerial photograph and focal length of camera Aerial photographs gives bird’s eye view of large areas. Aerial photographs ranging in the scale from 1:8000 to 1: 60,000 are used in different types of soil survey. Conventional panchromatic (black and white) photography, color photography, and infrared photography used as base maps for the soil survey. They provide important clues about kinds of soil from the shape and color of the surface and the vegetation Aerial photographs using spectral bands not visible to the eye, such as color infrared, enable subtle differences in plant communities to be observed
SATELLITE IMAGERIES It is obtained through remote sensing technique. Sensing devices located at distance captures the earth features. The earth features so captured are available in the form of False color composite (FCC) for visual interpretation and in computer compatible disc (CCD) which is amenable for changes by computer through a process called digital image processing. Satellite imageries are available in different scale like 1:10,000, 1: 25000, 1: 50000, 1:250,000, 1: 1000,000. Final scale preparation with help of satellite imageries is supported by ground truth check

Soil Map Soil map is a map showing distribution of soil types and/or soil properties (soil pH, textures, organic matter, depths of horizons etc.) in the area of interest. It is typically the end result of a soil survey inventory, i.e. soil survey. Soil maps are most commonly used for land evaluation, spatial planning, agricultural extension, environmental protection and similar projects. Traditional soil maps typically show only general distribution of soils, accompanied by the soil survey report. Many new soil maps are derived using digital soil mapping techniques. Such maps are typically richer in context and show higher spatial detail then the traditional soil maps. Soil maps produced using (geo) statistical techniques also include an estimate of the model uncertainty.
Map Scale A scale is a statement of the relationship between distances on a map and distances in real life
Three Types of Scale Stated scale For example 1 cm = 8 km A stated scale says exactly how much distance is represented by 1 cm in this case 8 km. It is useful for calculating distances
Linear scale Linear scale is seen in most of maps. It tells us how much map distance represent a certain real distance
Ratio scale It is almost always found in maps. It is very accurate Eg 1: 25,000 It means one unit in map is equal to 25000 unit in real life 1 cm= 25,000 cm or 1m = 25,000 m
Lecture 4
METHODS OF SOIL SURVEY
Steps in soil Survey programme
Stage 1 - Pre field activities Stage 2 - Field survey - 1) Soil mapping 2) Evaluation and field activities Stage 3.- Post field activities
Pre-field Preparations These include,
� collection and study of existing data of the area i.e. maps, reports, toposheets and analytical data ,
� general field reconnaissance , � aerial photo assemblage and interpretation, � Design and Planning of field survey.
Field Survey Activities include,
• Soil mapping operation and
• Land evaluation operation. A. The soil mapping operation involves identification and classification of the soil types
present in the area, and surveying their distribution, leading to the production of a soil map. B. The land evaluation operation includes field activities for assessing the potentials of the
various soils for a range of alternative types of land use, and the identification of possible development hazards
There are two methods of soil survey 1) Free Survey 2) Grid Survey
Free Survey The surveyor uses his judgment of the objectives of the survey and all the available aerial photos and ground evidence to locate profile pits of the most useful and representative sites. The number of the profile pits depends on the requirements of the survey and the complexity of the soil pattern. The free survey is only feasible in “open” areas, in grass or arable regions. The surveyor uses a lot of observable field marks and taking auger borings in relation to every change of vegetation or edaphic features Aerial photo interpretation will be of immense help in this method. Density of observations On small scale, the inferred boundaries - soil boundaries . (1:2,50,000 or smaller) On large scale, recognition of several new boundaries (1:50000 or larger) Grouping of soils into defined soil units For large areas (state or country) the mapping is generally undertaken on small scale (1:250,000 or 1:1 M) Ex. Soil resource map of India
Provide information and database on various attributes used for mapping and laboratory investigations. Useful to various consumers Generation of several thematic maps. Helps in determining fertilizers, amendments and other needs for optimizing land use. 5000 ha and above, free survey methodology adopted
Advantages & Disadvantages Advantages - Cheaper - Less number of observation points. Disadvantages - Very inaccurate - Boundary placement is more difficult.
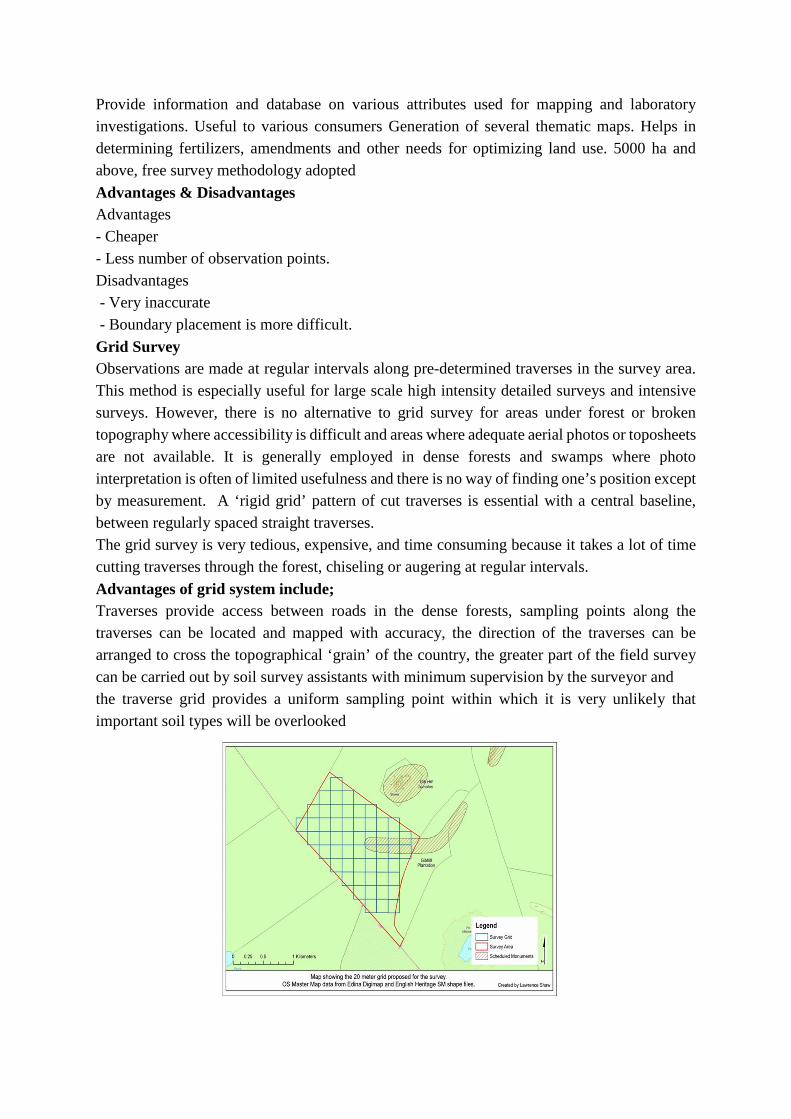
Grid Survey Observations are made at regular intervals along pre-determined traverses in the survey area. This method is especially useful for large scale high intensity detailed surveys and intensive surveys. However, there is no alternative to grid survey for areas under forest or broken topography where accessibility is difficult and areas where adequate aerial photos or toposheets are not available. It is generally employed in dense forests and swamps where photo interpretation is often of limited usefulness and there is no way of finding one’s position except by measurement. A ‘rigid grid’ pattern of cut traverses is essential with a central baseline, between regularly spaced straight traverses. The grid survey is very tedious, expensive, and time consuming because it takes a lot of time cutting traverses through the forest, chiseling or augering at regular intervals.
Advantages of grid system include; Traverses provide access between roads in the dense forests, sampling points along the traverses can be located and mapped with accuracy, the direction of the traverses can be arranged to cross the topographical ‘grain’ of the country, the greater part of the field survey can be carried out by soil survey assistants with minimum supervision by the surveyor and the traverse grid provides a uniform sampling point within which it is very unlikely that important soil types will be overlooked
Mapping small areas. Traverse lines are located on a grid pattern. Density of mapping varies according to the area surveyed. No. of observations per cm2 of the final map is independent of the scale. Generally 4 / 5 observations/ ha are recommended. Points of comparable observations are drawn. Grid survey at geo referenced points (with latitude and longitude) Digitizing the database. Generating several thematic maps. Expensive Recommended for experimental station
Field Observations Soil profile observations include, description of the environment, general information on the soils and brief and detailed profile descriptions. Others include brief descriptions and classification of chisel holes, site descriptions – including vegetation / land use, slope measurement, drainage and geology .Also, detailed descriptions of modal soil profiles and sampling for laboratory analysis must be carried out. Soil mapping operations involve, identification and classification of the soil types, their distribution and production of a soil map
Post Field Operations Aerial photo interpretation is revised in the light of field observations. The soil samples collected are analysed. The data are analysed. The survey report is written .The unit of mapping is usually the soil series

Lecture 5 and 6
TYPES OF SOIL SURVEY
Different types of soil survey depends on
• Objectives
• Methods
• Types of base material
• Type of map unit
• Intensity of survey Types of survey
• Reconnaissance survey
• Detailed survey
• Detailed reconnaissance survey
• Semi detailed survey (added later)
• Rapid reconnaissance survey (added later)
• Exploratory Steps involved in Soil survey
• General Traversing
• Preliminary studies
• Field study of soils
• Preparation of a field mapping legend Conducting a Soil Survey Before any surveying begins, a plan is made & information is collected
• Conferences
• Collect aerial photographs
• Satellite images
• Initial field reviews Preparation of a legend
• Initial field reviews conducted in soil pits in the most extensive landforms Soil-mapping unit:
• Area of soil that is delineated from adjacent areas on a map Differences may be:
• Slope
• Erosion
• Soil profile BASE MAPS
• Cadastral maps (1:5000 to 8000 scale)
• Topographical maps (1:25,000 to 1:2,50,000)
• Aerial photographs (1:10,000 to 1:50,000)
• IRS data (1:25,000 to 1:2,50,000
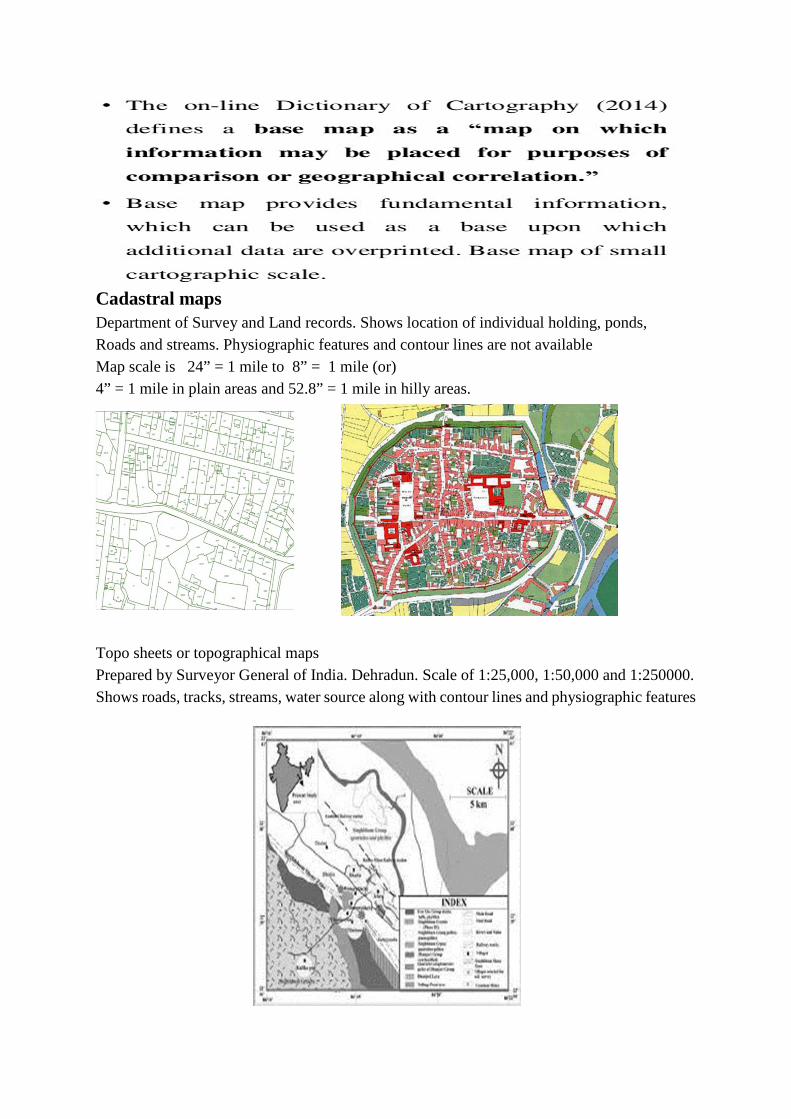
Cadastral maps Department of Survey and Land records. Shows location of individual holding, ponds, Roads and streams. Physiographic features and contour lines are not available Map scale is 24” = 1 mile to 8” = 1 mile (or) 4” = 1 mile in plain areas and 52.8” = 1 mile in hilly areas.
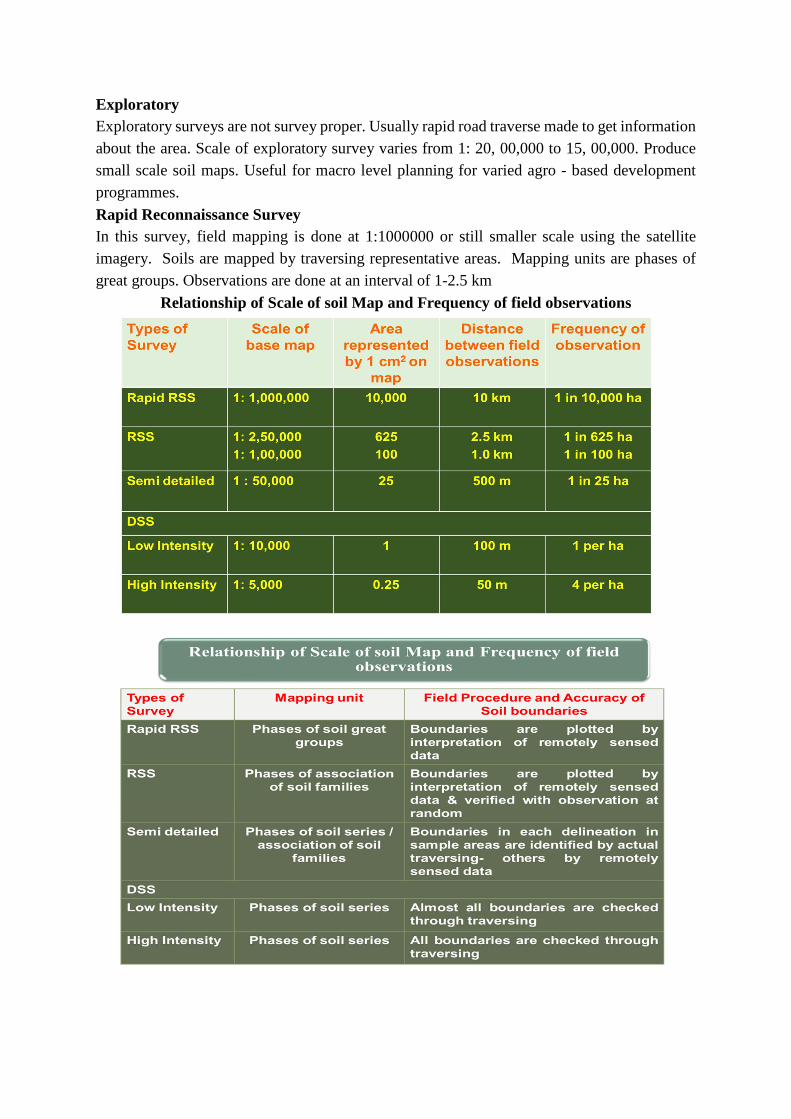
Topo sheets or topographical maps Prepared by Surveyor General of India. Dehradun. Scale of 1:25,000, 1:50,000 and 1:250000. Shows roads, tracks, streams, water source along with contour lines and physiographic features

Aerial photographs Photographs of land surface taken from air craft - in vertical angle. Viewed stereoscopically- three dimensional view. Landforms, vegetation, land use, roads and tracks can be directly seen. Soil properties, geology and other land properties require indirect interpretation. Scale of map (1:10,000 to 1:50,000)
Earth resources satellite or Landsat Imagery Gives synoptic view of large areas (185 x 185 km) on one image.
Reconnaissance Soil Survey (RSS) Traversing for RSS
Steps involved in RSS • Prefield study using base map
• Rapid traversing of the area (by jeep)
• Fixation of soil legends
• Regular field work
• Collection of soil samples It is undertaken for soil resource inventory of large areas. Its purpose is to identify possible areas for further intensive soil survey. It is used to assess broad potentialities of soils and recognition of areas suitable for intensive agriculture. The RSS soil maps provides information needed for broad or regional level land use planning.( taluk or district). The boundaries are delineated from observations made at broad intervals (2-3 km). The land types, land uses,

texture, mottling are used as a basis for boundary delineation. Boundaries are checked at random to confirm the relationship between soil and land types. If boundaries are delineated by satellite imageries, ground truth checks are made. The entire boundaries are not traversed and it is done by extrapolation. The base map used may be top sheets/aerial photos/imageries The scale of the base map used is 1: 100,000/1:250000/ 1 inch =1mile. The soil mapping unit is soil series or soil associations (combination one or more soil series due to scale problem). One sq cm in map = 625 ha and 1000 ha according to the scale used. Profile intervals - 2 to 4 miles (3 to 6 kms) or shorter intervals depending upon the soil heterogeneity. Auger sampling for every ¼ to 1 km/profiles showing similar characters within narrowly defined limits are grouped together into ‘series’. Less time consuming and less expensive than detailed. It is low intensity soil survey. Target - 1000 acres/day
Detailed Soil Survey (DSS) Steps involved in DSS
• Conduct RSS in that area
• Initial traverse of the study area
• Legend
• Regular field work This type of survey is undertaken in priority areas like ARS, urban development, watersheds, catchment areas, command areas, etc. to furnish the detailed information required for a proper assessment of the soil properties, terrain features, erosional aspects and other related factors which help in working out the details about use capability and the management practices that would be needed for conservation and better crop production. Cadastral maps of 1:4000/1:8000/aerial photo of 1:10000 scale are used as base map. Soil boundaries are demarcated by actual traverse throughout the course. Traverse lines are on grid pattern Scale of mapping: 8” = 1 mile; 16” = 1 mile Intensity of Observation: Soil profile is examined at every one ha and auger sampling at an interval of 0.25 to 0.5 km. This helps in identification of soil units up to soil types and phases of series. Soils are examined in detail at closed intervals in order to detect any differences that can be significant in their use and management. It helps in development and planning of individual parcel of lands. Purpose of RSS: It provides information needed for village/farm and block level planning. Target: 200 acres / day / soil survey party (SSP) – 40,000 acres per year. Two types under DSS is noticed- high and low intensive survey
Low intensity detailed survey Used for village planning Scale used – 1:10,000 1 sq cm in map represent 1 ha of land area One observation per hectare is taken Distance between the field observations is 100 m
High intensity detailed survey Scale – 1:5,000 1 sq cm = 0.25 ha

4 observation per ha Distance between field observations 50 m
Mapping units for a DSS The mapping units for a DSS are written like a formula. It consists of name of the series, surface texture, depth class, slope and erosion class. Eg. pth-sl-d5 B-e2 Where, pth - Name of the soil series sl - surface texture of the soil series d5 - Depth of solum B - Slope percentage e2 - Erosion class pth-sl-d5 - Soil type B-e2 - Soil phase
Merits of detailed survey • Furnish information needed for proper assessment of
• Soil properties
• Terrain features
• Erosion aspect and related properties Demerits
• Time consuming
• Expensive Detailed – Reconnaissance survey (DRSS) This survey combines reconnaissance and detailed soil surveys. Part of area by detailed and remaining by reconnaissance survey. In the beginning RSS is carried out and later the selected areas (15%) that have better development potentialities are surveyed in detail. It helps in understanding distribution of basic soil classes of series or families and their phases. The region of low potentialities for agriculture uses are surveyed according to RSS while areas of better agricultural potentialities are surveyed in detail.
Semi Detailed Soil Survey (SDSS) It consists of a very detailed survey of some selected strips cutting across many physiographic units and soils. Thus soils of one unit (comprising two families) may belong to different taxa and land use recommendations are to be revised when boundaries between two soil families are delineated. Developing correlation between physiographic units and soils. Random checking to find out the validity of correlation developed. Rest of the area is checked at random and soil boundaries based on physiographic units delineated. Provides sufficient information about various kinds of soils including problematic or degraded soils. Scale of base maps (aerial photographs or satellite imagery) 1:50,000. Mapping unit -association of soil series or families. Final map scale - 1:50,000. It provides a basis for alternative strategies for land use, settlement or agricultural development. According to FAO this survey is referred to “Pre-investment survey
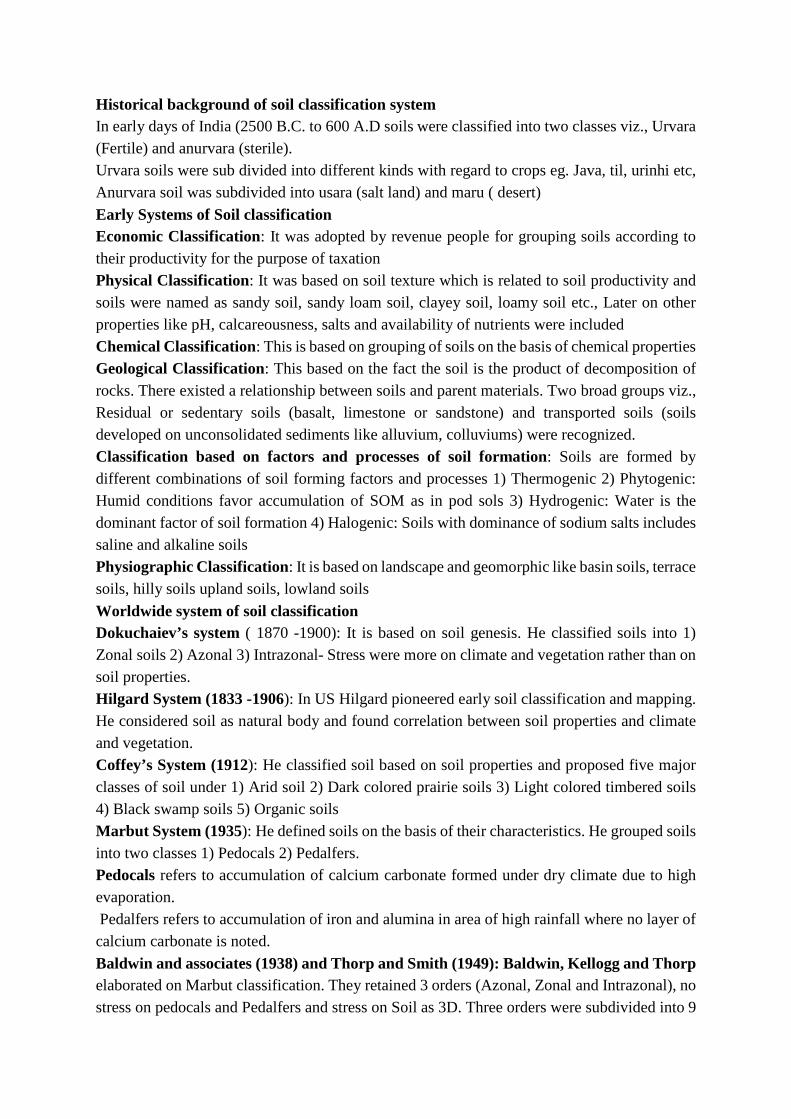
Exploratory Exploratory surveys are not survey proper. Usually rapid road traverse made to get information about the area. Scale of exploratory survey varies from 1: 20, 00,000 to 15, 00,000. Produce small scale soil maps. Useful for macro level planning for varied agro - based development programmes.
Rapid Reconnaissance Survey In this survey, field mapping is done at 1:1000000 or still smaller scale using the satellite imagery. Soils are mapped by traversing representative areas. Mapping units are phases of great groups. Observations are done at an interval of 1-2.5 km
Relationship of Scale of soil Map and Frequency of field observations

Lecture 8
SOIL CLASSIFICATION
Classification essentially refers to grouping of objects in more orderly and logical manner. But an object like soil which has multitudinal characters is difficulty to classify. Hence the categorization of soils into groups at varying levels of generalization can be termed as soil classification. The soil individuals are grouped into classes of low category which are further grouped into classes of higher categories. The lower categories are comprised of a larger number of differentiating characters and higher categories by means of few differentiating characters
BASIC PRINCIPLES OF SOIL CLASSIFICATION We classify soils for the following purposes
� To organize our knowledge about soils � To provide an organizational chart or map of the world of soils as we perceive it the
soil survey � To develop principles and guidelines for proper use and management
a. to predict behaviour b. to identify best uses c. to estimate productivity d. to identify potential problems
� To facilitate easier transfer of information and technology � To provide a basis for research and experimentation � To understand relationships among individuals of the population
Pioneers in soil classification
Historical background of soil classification system In early days of India (2500 B.C. to 600 A.D soils were classified into two classes viz., Urvara (Fertile) and anurvara (sterile). Urvara soils were sub divided into different kinds with regard to crops eg. Java, til, urinhi etc, Anurvara soil was subdivided into usara (salt land) and maru ( desert)
Early Systems of Soil classification Economic Classification: It was adopted by revenue people for grouping soils according to their productivity for the purpose of taxation Physical Classification: It was based on soil texture which is related to soil productivity and soils were named as sandy soil, sandy loam soil, clayey soil, loamy soil etc., Later on other properties like pH, calcareousness, salts and availability of nutrients were included Chemical Classification: This is based on grouping of soils on the basis of chemical properties Geological Classification: This based on the fact the soil is the product of decomposition of rocks. There existed a relationship between soils and parent materials. Two broad groups viz., Residual or sedentary soils (basalt, limestone or sandstone) and transported soils (soils developed on unconsolidated sediments like alluvium, colluviums) were recognized. Classification based on factors and processes of soil formation : Soils are formed by different combinations of soil forming factors and processes 1) Thermogenic 2) Phytogenic: Humid conditions favor accumulation of SOM as in pod sols 3) Hydrogenic: Water is the dominant factor of soil formation 4) Halogenic: Soils with dominance of sodium salts includes saline and alkaline soils Physiographic Classification: It is based on landscape and geomorphic like basin soils, terrace soils, hilly soils upland soils, lowland soils
Worldwide system of soil classification Dokuchaiev’s system ( 1870 -1900): It is based on soil genesis. He classified soils into 1) Zonal soils 2) Azonal 3) Intrazonal- Stress were more on climate and vegetation rather than on soil properties. Hilgard System (1833 -1906): In US Hilgard pioneered early soil classification and mapping. He considered soil as natural body and found correlation between soil properties and climate and vegetation. Coffey’s System (1912): He classified soil based on soil properties and proposed five major classes of soil under 1) Arid soil 2) Dark colored prairie soils 3) Light colored timbered soils 4) Black swamp soils 5) Organic soils Marbut System (1935): He defined soils on the basis of their characteristics. He grouped soils into two classes 1) Pedocals 2) Pedalfers. Pedocals refers to accumulation of calcium carbonate formed under dry climate due to high evaporation. Pedalfers refers to accumulation of iron and alumina in area of high rainfall where no layer of calcium carbonate is noted.
Baldwin and associates (1938) and Thorp and Smith (1949): Baldwin, Kellogg and Thorp elaborated on Marbut classification. They retained 3 orders (Azonal, Zonal and Intrazonal), no stress on pedocals and Pedalfers and stress on Soil as 3D. Three orders were subdivided into 9

sub orders based on climate and vegetation, each sub order were divided into great soil groups which were further subdivided into numerous soil families, series and soil types
Order Suborder Great soil groups
Zonal soils 1. Soils of the cold zone Tundra soils
2. Light colored soils of arid regions Sierozem soils, Desert soils
3. Dark colored soils of semi-arid, sub humid and humid grasslands
Prairie soils, Chestnut soils
4. Soils of the forest grassland transition Degraded Chernozem soils
5. Light coloured podzolised soils Podzolic soils
6. Lateritic soils of warm-temperate and topical regions
Laterite soils
Intrazonal soils 1. Halomorphic soils Solonchak or saline soils
2. Hydromorphic soils Bog soils
3. Calcimorphic soils Rendzina soils
Azonal soils No suborder Alluvial soils, Regosols
Limitation of Genetic systems • Two highest categories - genetic terms, not based on soil properties
• Definitions and concepts of the highest category is not clear
• Great soil group concepts and definitions are based on environmental factors rather than soil properties.
• Properties of some soils were obvious under virgin soil conditions & Destroyed during cultivation - classification of arable soils became ambiguous.
• Definition of units in lower categories based on soil properties for one interpretation does not hold good for the other interpretation.
• Nomenclature in the higher categories laid emphasis on colour or vegetation rather than the salient properties of the soils.
• Nomenclature evolved from several languages and it was difficult to name the intergrades.
• Hence a desirable system of soil classification should be based on combinations of soil characteristics (genesis and behavior)

Lecture 8
INTRODUCTION
To overcome the shortcomings of the earlier systems of soil classification, the U.S. Soil Survey Staff under the leadership of Guy D.Smith has developed a Comprehensive System of Soil Classification. Initially started in 1951, several approximations were made and a comprehensive system of soil classification, popularly called the 7th approximation was published in 1960 with supplements in 1964 and 1967. In 1975, the system was brought out as soil taxonomy (Soil Survey Staff, 1975).
Milestone in development in soil taxonomy 1951 – Guy D. Smith led the team 1953 – 1st Approximation produced and tested 1960 – 7th Approximation (Comprehensive System) 1964 – 1st Supplement issued 1967 – 2nd Supplement issued 1975 – Soil Taxonomy (1st Edition) 1999- Soil Taxonomy (2nd Edition) Soils are classified based on morphological properties: surface horizons, subsurface horizons. Presence/absence of particular soil horizons and climate regime are important for classification
Salient Features
SOIL CLASSIFICATION: USDA SOIL TAXONOMY
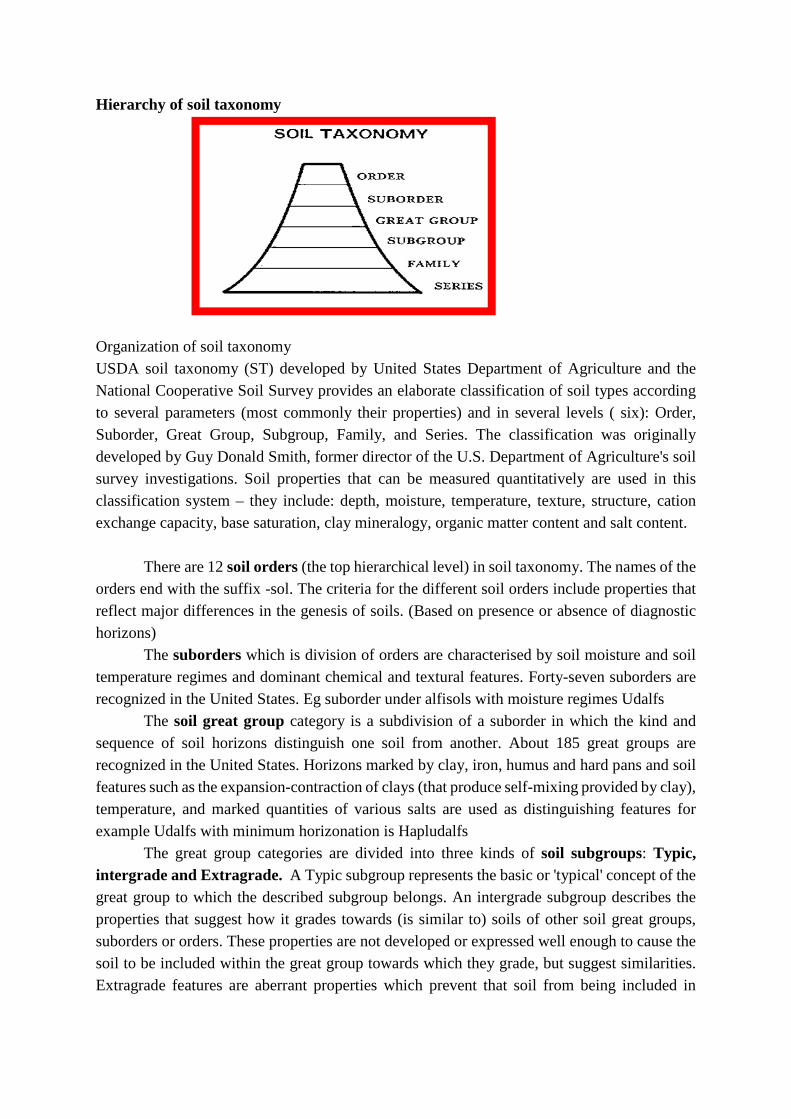
Hierarchy of soil taxonomy Organization of soil taxonomy USDA soil taxonomy (ST) developed by United States Department of Agriculture and the National Cooperative Soil Survey provides an elaborate classification of soil types according to several parameters (most commonly their properties) and in several levels ( six): Order, Suborder, Great Group, Subgroup, Family, and Series. The classification was originally developed by Guy Donald Smith, former director of the U.S. Department of Agriculture's soil survey investigations. Soil properties that can be measured quantitatively are used in this classification system – they include: depth, moisture, temperature, texture, structure, cation exchange capacity, base saturation, clay mineralogy, organic matter content and salt content. There are 12 soil orders (the top hierarchical level) in soil taxonomy. The names of the orders end with the suffix -sol. The criteria for the different soil orders include properties that reflect major differences in the genesis of soils. (Based on presence or absence of diagnostic horizons) The suborders which is division of orders are characterised by soil moisture and soil temperature regimes and dominant chemical and textural features. Forty-seven suborders are recognized in the United States. Eg suborder under alfisols with moisture regimes Udalfs The soil great group category is a subdivision of a suborder in which the kind and sequence of soil horizons distinguish one soil from another. About 185 great groups are recognized in the United States. Horizons marked by clay, iron, humus and hard pans and soil features such as the expansion-contraction of clays (that produce self-mixing provided by clay), temperature, and marked quantities of various salts are used as distinguishing features for example Udalfs with minimum horizonation is Hapludalfs The great group categories are divided into three kinds of soil subgroups: Typic, intergrade and Extragrade. A Typic subgroup represents the basic or 'typical' concept of the great group to which the described subgroup belongs. An intergrade subgroup describes the properties that suggest how it grades towards (is similar to) soils of other soil great groups, suborders or orders. These properties are not developed or expressed well enough to cause the soil to be included within the great group towards which they grade, but suggest similarities. Extragrade features are aberrant properties which prevent that soil from being included in
another soil classification. About 1,000 soil subgroups are defined in the United States Eg Typic Durargids, Haploxerollic Durargid and Abruptic Durargids A soil family category is a group of soils within a subgroup and describes the physical and chemical properties which affect the response of soil to agricultural management and engineering applications. The principal characteristics used to differentiate soil families include texture, mineralogy, pH, permeability, structure, consistency, the locale's precipitation pattern, and soil temperature. A family may contain several soil series which describe the physical location using the name of a prominent physical feature such as a river or town near where the soil sample was taken A soil phase of series, originally called 'soil type' describes the soil surface texture, slope, stoniness, saltiness, erosion, and other conditions
Criticism of Soil Taxonomy 1. Soil taxonomy (1975) departs from the genetic approach 2. Does not have strong geographic bias (four orders - Entisol, Vertisol, Inceptisol and
Histosol) 3. Soils with a different genesis but with identical properties are classified within the same
unit 4. No particular order for hydromorphic and saline-sodic soils
Appreciation of soil taxonomy 1. Most elaborate system marked by great care and precision 2. Different classes are identified based on soil properties 3. Nomenclature gives a definite composition of the major soil characteristics 4. Permit addition of new soil groups.( Andosols & Gelisols) 5. Permits classification of soils rather than soil forming process 6. Permits the classification of soils of unknown genesis.

Lecture 9
DIAGONSTIC HORIZONS
Definition
A diagnostic horizon is one which is formed as a result of pedogenic processes and having distinct properties or features that can be measured in terms of measurable soil properties. They are not only useful in identifying soils but also in classifying soils at great group’s level
Epipedon (Surface horizon) An epipedon is the surface, or uppermost soil horizon. (Epi-over, pedon-soil) It may be thinner than the soil profile A horizon, or include the E or part or all of the B horizon
Nine identified Anthropic, Folistic, Grossarenic, Histic, Melanic, Mollic, Ochric, Plaggen, Umbric 1) Mollic epipedon: Dark coloured, value and chroma <3 under moist,
high organic carbon > 6 per cent and BSP > 80
2) Umbric epipedon: It is similar to Mollic epipedon except BSP < 50
3) Ochric epipedon Too thin, too light in colour or too low in organic carbon
4) Melanic epipedon( specific)
It is dark coloured, organic carbon ranges from 6 to 25%. It is found in volcanic ash soils High P fixation. Presence of amorphous clay minerals viz., imogolite and allophane
Present in Andosol order 5) Histic epipedon (specific)
Surface organic horizon, saturated more than 30 days, more than 20 % Organic matter if clay is present and if no clay more than 8 % Organic matter It is present in Histosol order
6) Folistic Comprise organic soil materials that remains saturated for less than one month. BD < 0.1Mg /m3.
7) Grossarenic A sandy (loamy fine sand or coarser) horizon; 100 cm or more thick over an argillic horizon
8) Anthropic Evidence of human disturbance, man-made Mollic, high available P content Centuries in use
9) Plaggen Human made layer with 50 cm thickness due to manuring, organic carbon< 0.6%

Diagnostic subsurface horizon (Endopedon) 1) Not all soils will have subsurface horizon eg. Soils under Entisol and Histosol 2) There are nineteen sub surface horizon 3) Usually they are given B horizon designation except albic horizon which is given E
horizon
Eight important in Indian soils Argillic Natric Agric Spodic Sombric Placic Albic
cambic Kandic Oxic Sulphuric Salic Glossic Calcic
Gypsic Duripan Fragipan Petroclacic Petrogypsic
1) Albic horizon Strong leached Eluvial E horizon, removal of clays, oxides, organic C
Found in spodosol 2) Argillic horizon Illuvial accumulation of high activity silicate clays (Phyllosilicates) Clay films on peds or pores is called clay skins or cutans
It is designated by Bt 3) Cambic horizon Weakly developed B horizon, formation of weak colour or structure Development. Designated as Bw. Found in Inceptisols. Potential To develop to other horizon like argillic or others over period of time 4) Natric horizon It is similar to argillic but it contains more than 15% ESP. columnar or prismatic structure Designated as Btn . Found in arid and semi-arid region With little leaching 5) Oxic horizon Highly weathered B horizon, have high low activity clay, low CEC < 10 % weatherable primary minerals, Fe and Al oxides clay, designated As Bo , found in tropical soils 6) Spodic horizon Illuvial accumulation of Al oxides (with or without Fe oxides) and humus , designated as Bh ( humus), Bs ( Sequioxides) or Bhs found in spodosol (cool climate with coarse textured soil) 7) Calcic horizon A calcium or magnesium carbonate enriched horizon It occurs when evapotranspiration more than precipitation It is found in hot and dry climate (Aridisol). It is designated As Bca or Bk, 15 cm thick
Oi
E
Bh
S
Bs
C
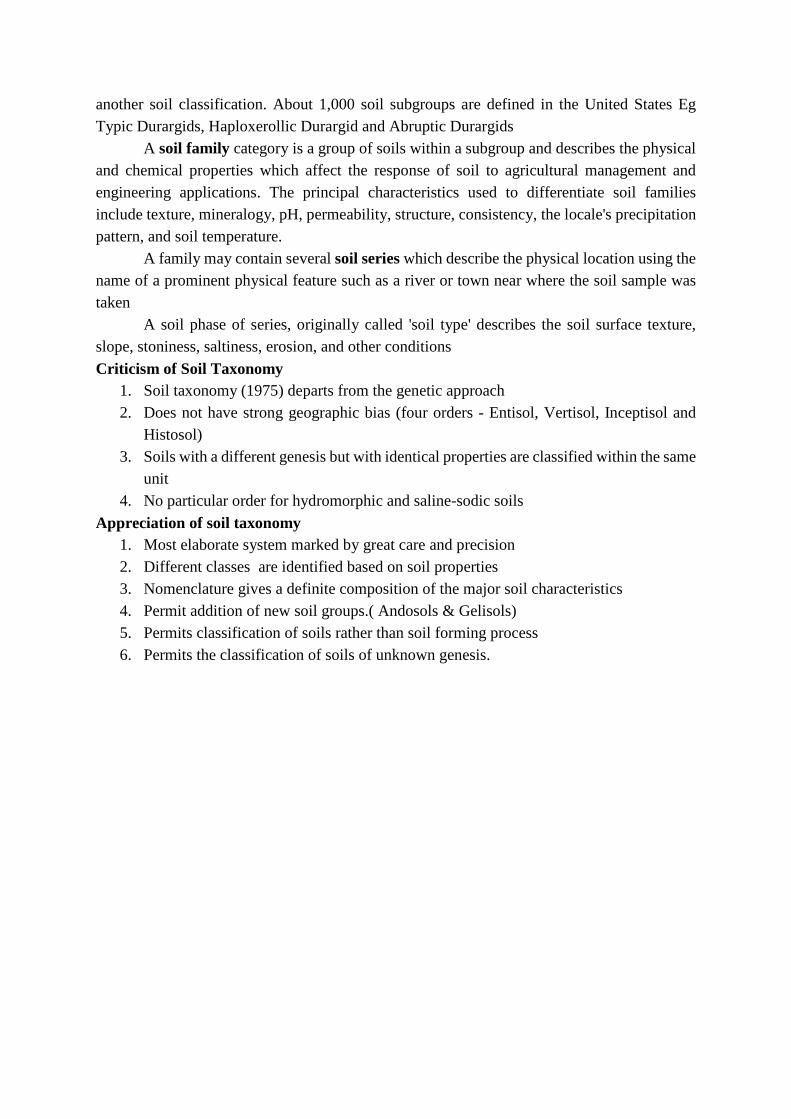
8) Gypsic horizon A calcium or magnesium sulfate enriched horizon, more than 15% Accumulation, found in arid climate, 15 cm thick 9) Glossic horizon Parts of eluvial horizon formed from develops as a result of the degradation of an argillic
horizon from which clay and free iron oxides are removed. Glossic horizons occur in several orders besides Alfisols, including Mollisols, Aridisols, Ultisols, and Spodosols.
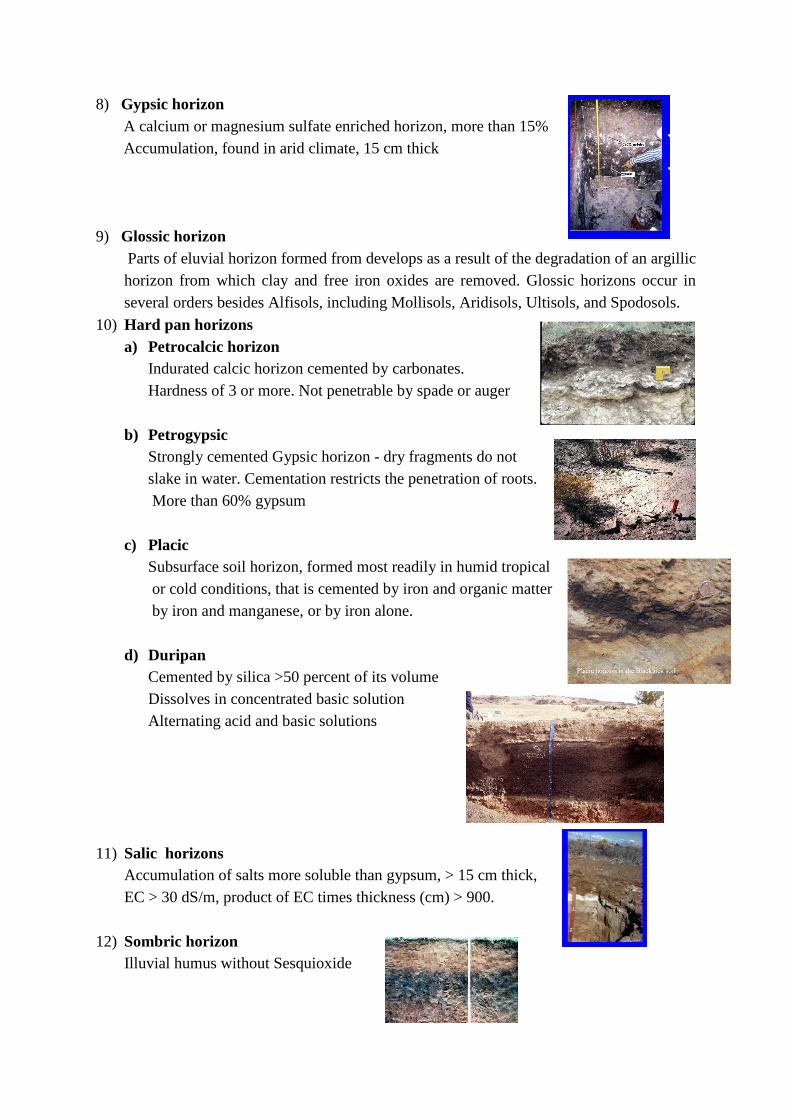
10) Hard pan horizons a) Petrocalcic horizon
Indurated calcic horizon cemented by carbonates. Hardness of 3 or more. Not penetrable by spade or auger
b) Petrogypsic
Strongly cemented Gypsic horizon - dry fragments do not slake in water. Cementation restricts the penetration of roots. More than 60% gypsum
c) Placic Subsurface soil horizon, formed most readily in humid tropical or cold conditions, that is cemented by iron and organic matter by iron and manganese, or by iron alone.
d) Duripan Cemented by silica >50 percent of its volume Dissolves in concentrated basic solution Alternating acid and basic solutions
11) Salic horizons Accumulation of salts more soluble than gypsum, > 15 cm thick, EC > 30 dS/m, product of EC times thickness (cm) > 900.
12) Sombric horizon Illuvial humus without Sesquioxide
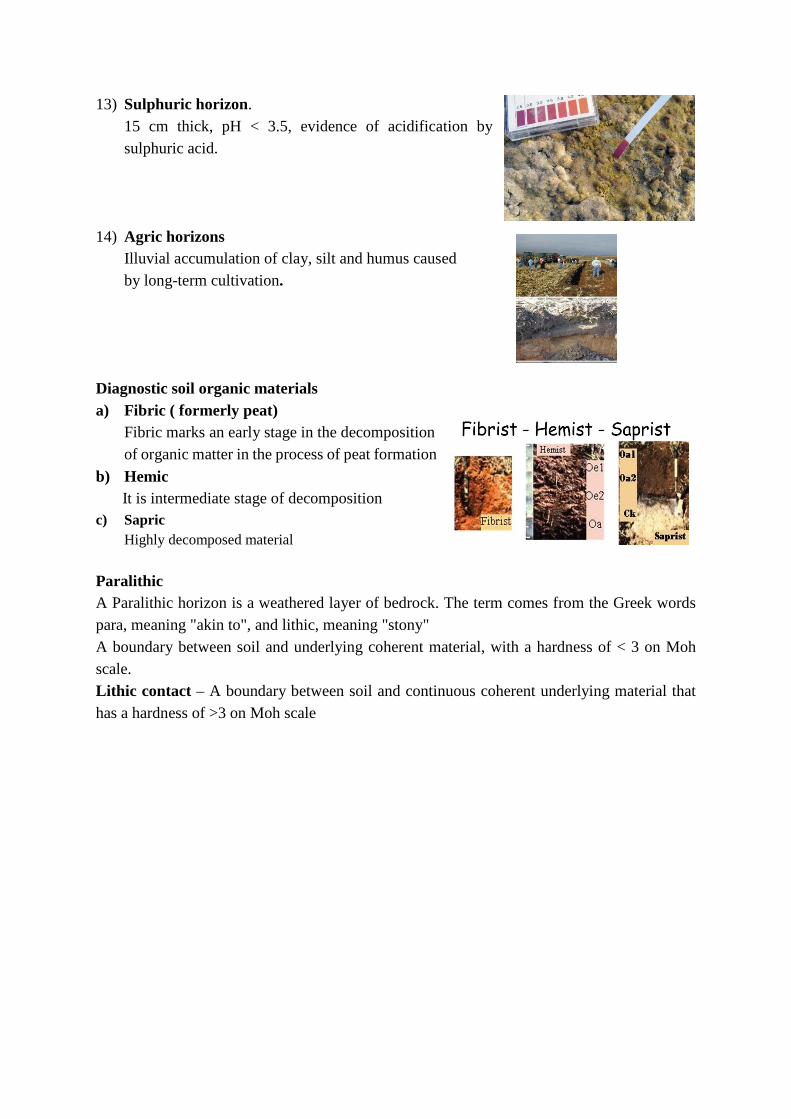
13) Sulphuric horizon. 15 cm thick, pH < 3.5, evidence of acidification by sulphuric acid.
14) Agric horizons Illuvial accumulation of clay, silt and humus caused by long-term cultivation.
Diagnostic soil organic materials a) Fibric ( formerly peat)
Fibric marks an early stage in the decomposition of organic matter in the process of peat formation
b) Hemic It is intermediate stage of decomposition c) Sapric
Highly decomposed material
Paralithic A Paralithic horizon is a weathered layer of bedrock. The term comes from the Greek words para, meaning "akin to", and lithic, meaning "stony" A boundary between soil and underlying coherent material, with a hardness of < 3 on Moh scale. Lithic contact – A boundary between soil and continuous coherent underlying material that has a hardness of >3 on Moh scale

Lecture 10
SOIL MOISTURE REGIME Introduction Soil moisture and soil temperature are two important attributes of soil that are directly determined by the climate and weather characterizing a given area of the world. Both plus soil air determine soil climate or what we call pedoclimate. The amount of rainfall that percolates the soil and is retained by the soil is called soil moisture. It is soil moisture that determines the kind and rate of weathering and the leaching state of soil. As a result, it is the potent agent in soil genesis. Besides this, it is the transport medium for plant nutrients. It varies with time in soil, describing three states of soil moisture namely; dry, moist and wet (saturated) states
What is Soil Moisture Regime? Soil moisture regime is the soil property that expresses the change in soil moisture over time as determined by soil and climate. For example, shortly after a heavy rain the soil may be wet (saturated), about 48 hours after the rain it may remain moist, and thereafter be dry (hygroscopic moisture state} if rain does not fall soon. If for days or months rain does not fall, then the soil becomes droughty. Sandy soils are more prone to drought than loamy or clayey soils. Soil moisture regime changes with climate. Soils in humid climates receive moisture constantly, so they are moist always or most of the time in a year. In contrast, soils in arid climates receive little or no rain for a long period in a year, so they generally remain dry for most part of the year
Soil Moisture Regimes (SMR) CONCEPT—cumulative and consecutive periods of dryness and moistness in the soil moisture control section. Dry—water potential less than -1500 kPa (- 15 bars). Moist—water potential greater the - 1500 kPa.
Soil Moisture Control Section (SMCS) Upper boundary—depth to which dry (but not air-dry) soil is wet by 2.5 cm of water in 24 h. Lower boundary—depth to which dry soil is wet by 7.5 cm of water in 48 h. Rule of thumb estimates of SMCS: Sandy textures: 30 - 90 cm Coarse-loamy textures (<18% clay, but not sandy): 20 - 60 cm Other textures: 10 - 30 cm Aridic (or torric ) -- arid climate, usually dry, irrigation required for crop production. SMCS dry > ½ the time that T50 > 5 °C and not moist for 90 consecutive days when T50 > 8° C. Ustic—semiarid climate, rainfall during a growing season. Not applied to cryic STR. SMCS moist ½ to ¾ of time or moist 90 consecutive days. SMCS dry < 45 consecutive days in summer. Xeric—semiarid climate, Mediterranean climate, cool, moist winters, dry summers, dryland crop possible from stored soil water. Not applied to hyperthermic or iso-STR. SMCS moist ½ to ¾ of time, moist > 45 consecutive days in winter, and dry > 45 consecutive days in summer. Udic—humid climate, usually moist, generally irrigation not required for crop production. SMCS dry < 90 cumulative days and < 45 consecutive days in summer.
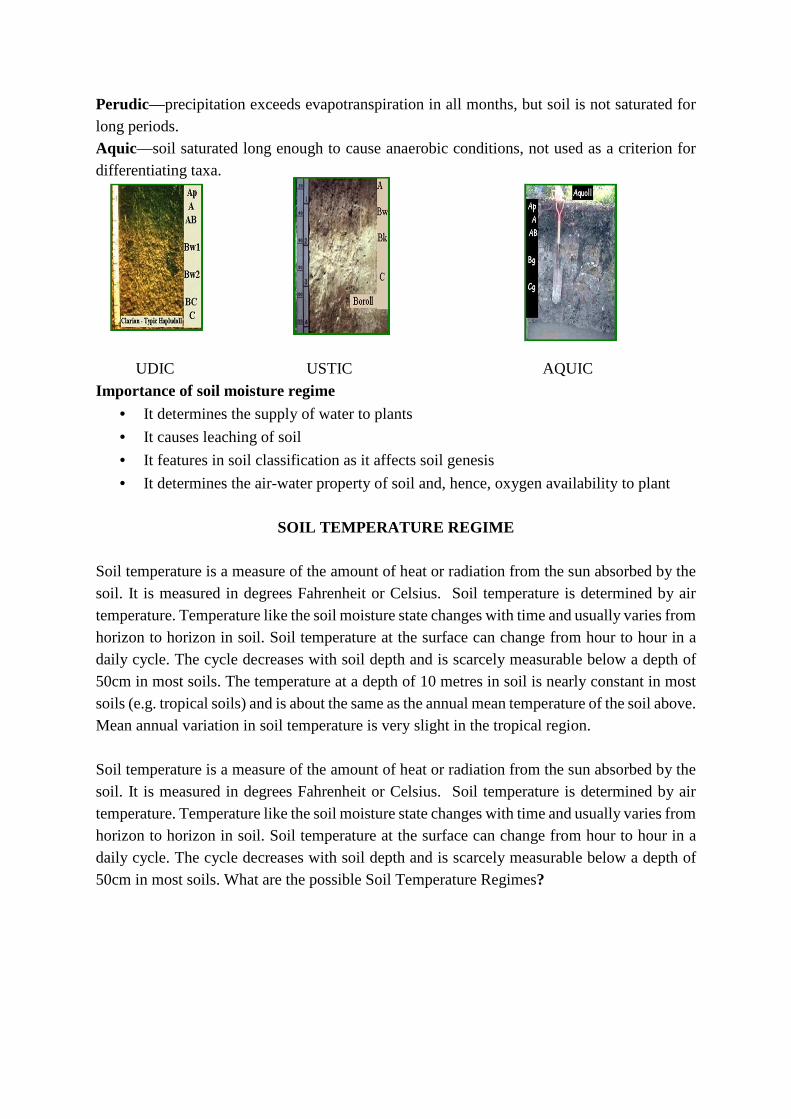
Perudic—precipitation exceeds evapotranspiration in all months, but soil is not saturated for long periods. Aquic—soil saturated long enough to cause anaerobic conditions, not used as a criterion for differentiating taxa.
UDIC USTIC AQUIC
Importance of soil moisture regime • It determines the supply of water to plants
• It causes leaching of soil
• It features in soil classification as it affects soil genesis
• It determines the air-water property of soil and, hence, oxygen availability to plant
SOIL TEMPERATURE REGIME
Soil temperature is a measure of the amount of heat or radiation from the sun absorbed by the soil. It is measured in degrees Fahrenheit or Celsius. Soil temperature is determined by air temperature. Temperature like the soil moisture state changes with time and usually varies from horizon to horizon in soil. Soil temperature at the surface can change from hour to hour in a daily cycle. The cycle decreases with soil depth and is scarcely measurable below a depth of 50cm in most soils. The temperature at a depth of 10 metres in soil is nearly constant in most soils (e.g. tropical soils) and is about the same as the annual mean temperature of the soil above. Mean annual variation in soil temperature is very slight in the tropical region. Soil temperature is a measure of the amount of heat or radiation from the sun absorbed by the soil. It is measured in degrees Fahrenheit or Celsius. Soil temperature is determined by air temperature. Temperature like the soil moisture state changes with time and usually varies from horizon to horizon in soil. Soil temperature at the surface can change from hour to hour in a daily cycle. The cycle decreases with soil depth and is scarcely measurable below a depth of 50cm in most soils. What are the possible Soil Temperature Regimes?
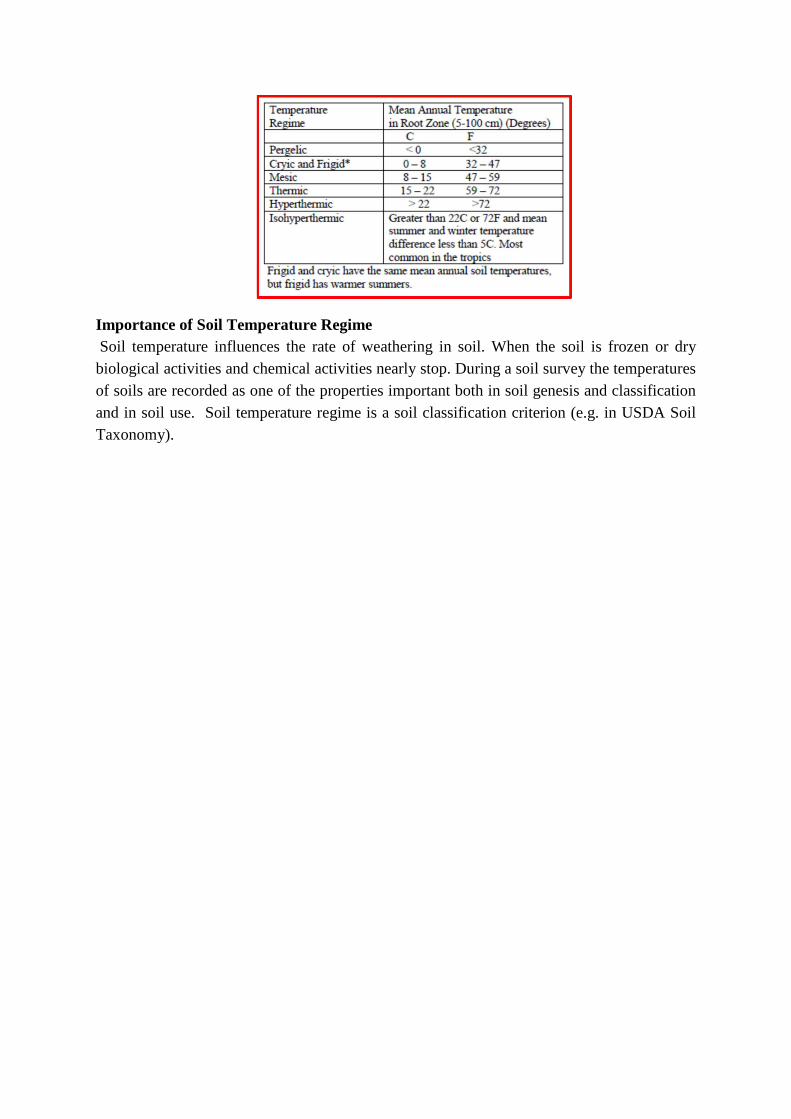
Importance of Soil Temperature Regime Soil temperature influences the rate of weathering in soil. When the soil is frozen or dry biological activities and chemical activities nearly stop. During a soil survey the temperatures of soils are recorded as one of the properties important both in soil genesis and classification and in soil use. Soil temperature regime is a soil classification criterion (e.g. in USDA Soil Taxonomy).
Lecture 11
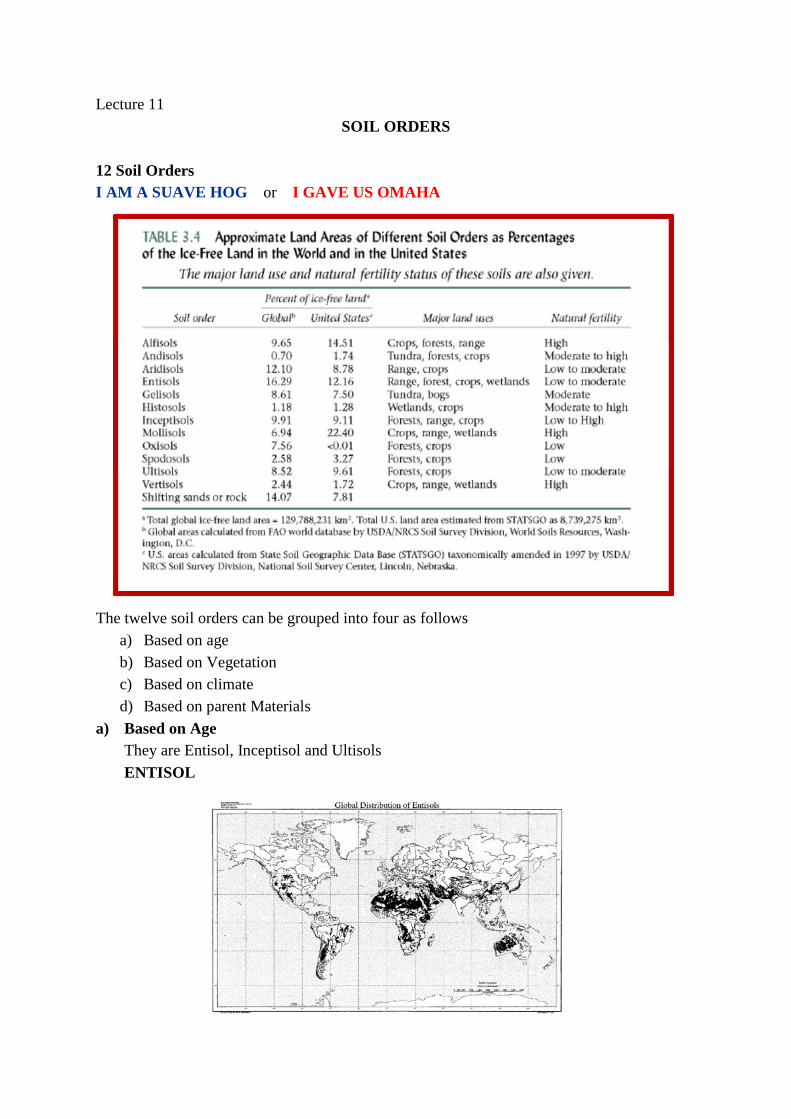
SOIL ORDERS 12 Soil Orders I AM A SUAVE HOG or I GAVE US OMAHA
The twelve soil orders can be grouped into four as follows a) Based on age b) Based on Vegetation c) Based on climate d) Based on parent Materials
a) Based on Age They are Entisol, Inceptisol and Ultisols
ENTISOL
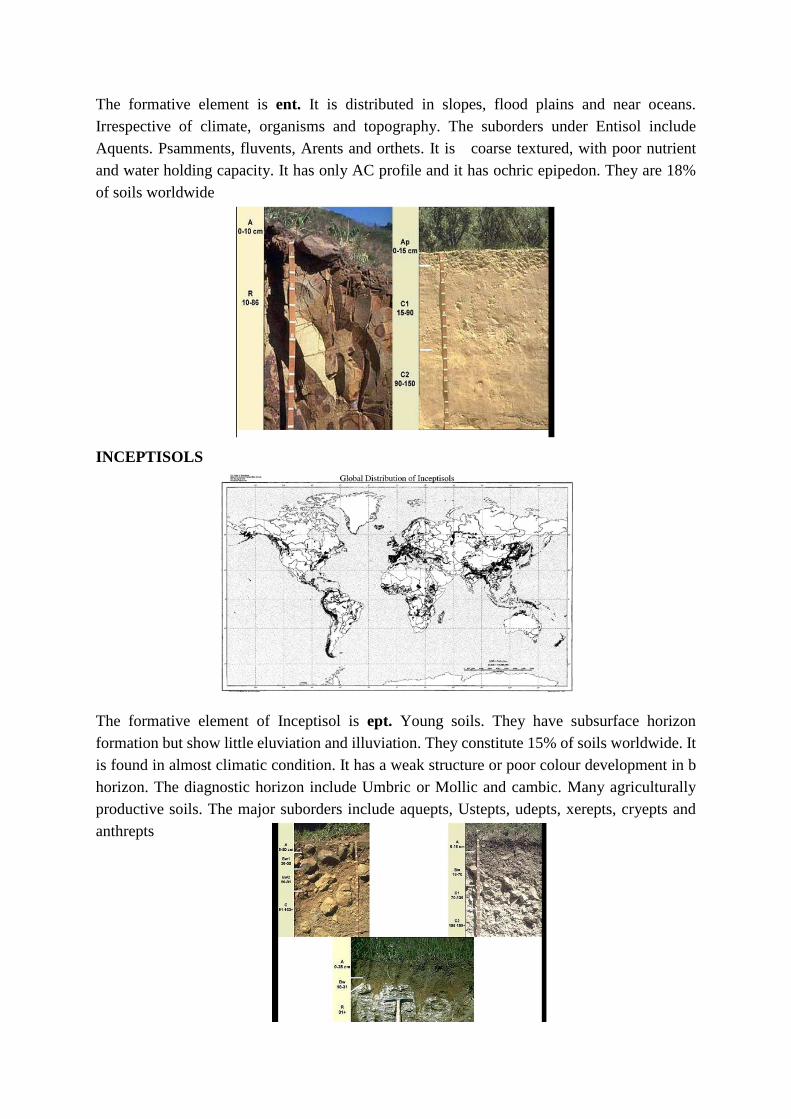
The formative element is ent. It is distributed in slopes, flood plains and near oceans. Irrespective of climate, organisms and topography. The suborders under Entisol include Aquents. Psamments, fluvents, Arents and orthets. It is coarse textured, with poor nutrient and water holding capacity. It has only AC profile and it has ochric epipedon. They are 18% of soils worldwide
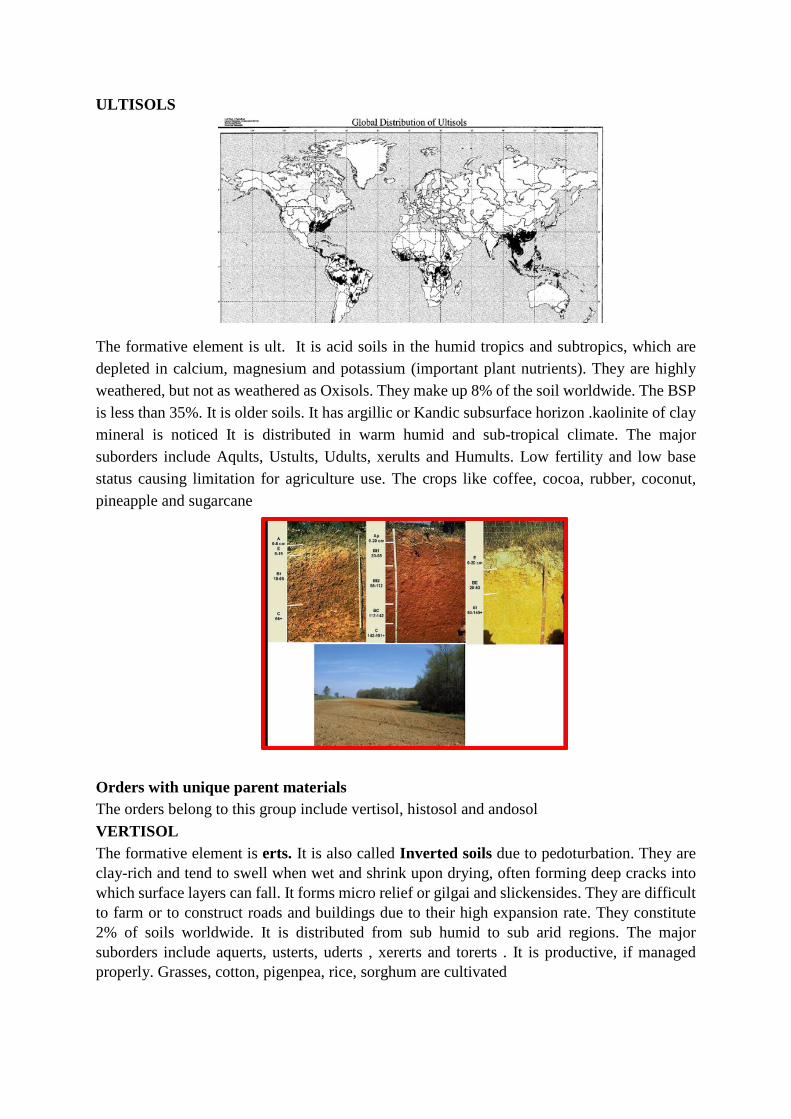
INCEPTISOLS The formative element of Inceptisol is ept. Young soils. They have subsurface horizon formation but show little eluviation and illuviation. They constitute 15% of soils worldwide. It is found in almost climatic condition. It has a weak structure or poor colour development in b horizon. The diagnostic horizon include Umbric or Mollic and cambic. Many agriculturally productive soils. The major suborders include aquepts, Ustepts, udepts, xerepts, cryepts and anthrepts
ULTISOLS The formative element is ult. It is acid soils in the humid tropics and subtropics, which are depleted in calcium, magnesium and potassium (important plant nutrients). They are highly weathered, but not as weathered as Oxisols. They make up 8% of the soil worldwide. The BSP is less than 35%. It is older soils. It has argillic or Kandic subsurface horizon .kaolinite of clay mineral is noticed It is distributed in warm humid and sub-tropical climate. The major suborders include Aqults, Ustults, Udults, xerults and Humults. Low fertility and low base status causing limitation for agriculture use. The crops like coffee, cocoa, rubber, coconut, pineapple and sugarcane
Orders with unique parent materials The orders belong to this group include vertisol, histosol and andosol
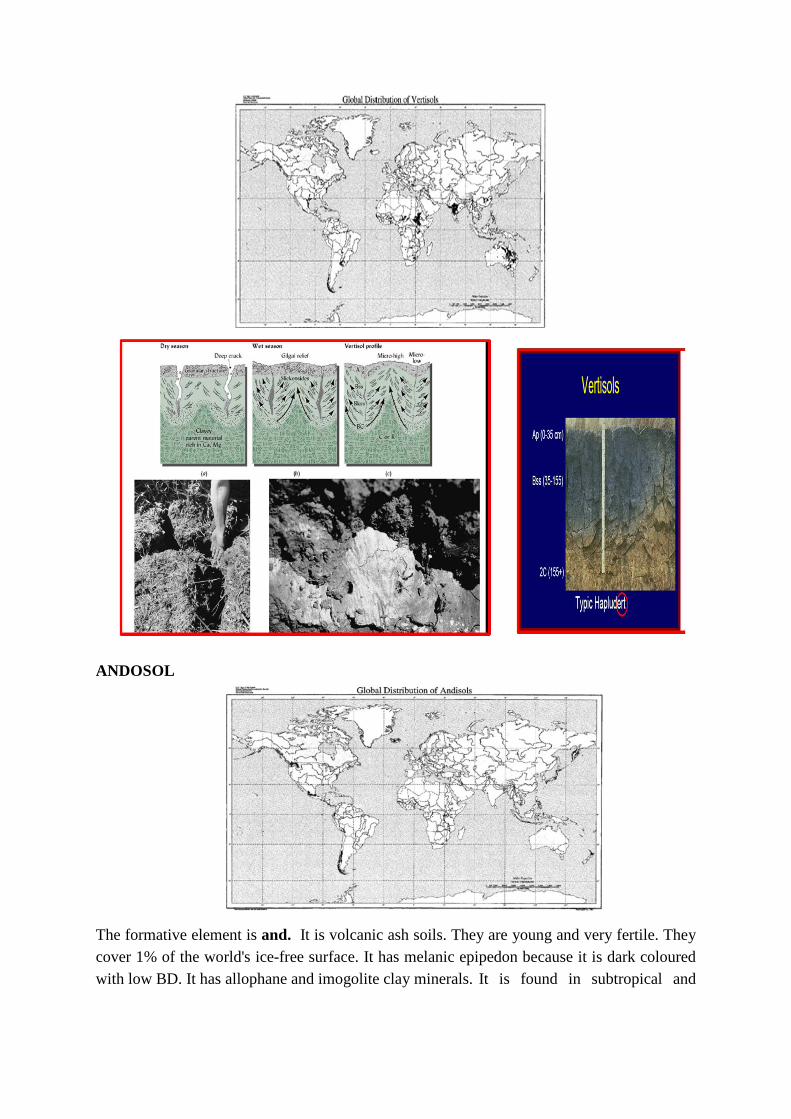
VERTISOL The formative element is erts. It is also called Inverted soils due to pedoturbation. They are clay-rich and tend to swell when wet and shrink upon drying, often forming deep cracks into which surface layers can fall. It forms micro relief or gilgai and slickensides. They are difficult to farm or to construct roads and buildings due to their high expansion rate. They constitute 2% of soils worldwide. It is distributed from sub humid to sub arid regions. The major suborders include aquerts, usterts, uderts , xererts and torerts . It is productive, if managed properly. Grasses, cotton, pigenpea, rice, sorghum are cultivated
ANDOSOL The formative element is and. It is volcanic ash soils. They are young and very fertile. They cover 1% of the world's ice-free surface. It has melanic epipedon because it is dark coloured with low BD. It has allophane and imogolite clay minerals. It is found in subtropical and

Mediterranean climate and not in cold temperate climate. The suborders include aquands Cryands, Torrands, Ustands, and Udands. High P fixing capacity
HISTOSOLS The formative elements is ists. It is organic soils with OC profile. Formerly called bog soils, are 1% of soils worldwide. It has histic epipedon. The organic matter content ranges from 20 to 30 %. The suborders include Hemists, Folists, Fibrist and Saprists
Orders formed in unique environments. ARIDISOLS
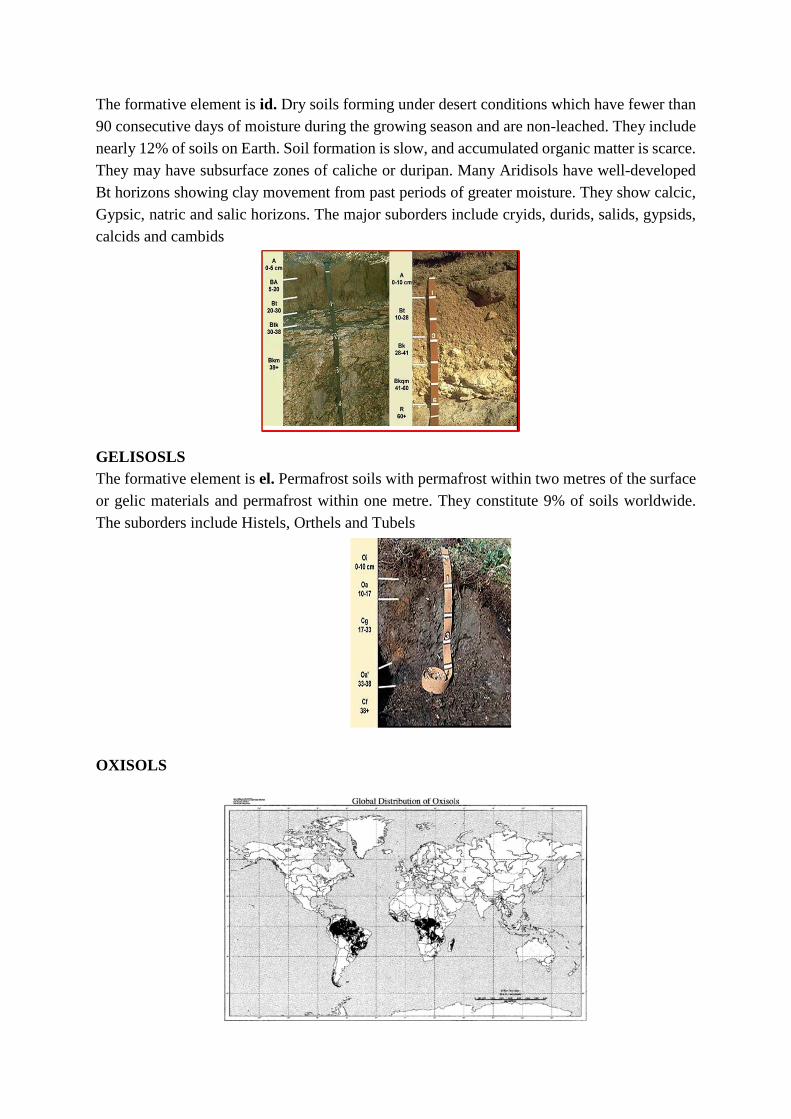
The formative element is id. Dry soils forming under desert conditions which have fewer than 90 consecutive days of moisture during the growing season and are non-leached. They include nearly 12% of soils on Earth. Soil formation is slow, and accumulated organic matter is scarce. They may have subsurface zones of caliche or duripan. Many Aridisols have well-developed Bt horizons showing clay movement from past periods of greater moisture. They show calcic, Gypsic, natric and salic horizons. The major suborders include cryids, durids, salids, gypsids, calcids and cambids
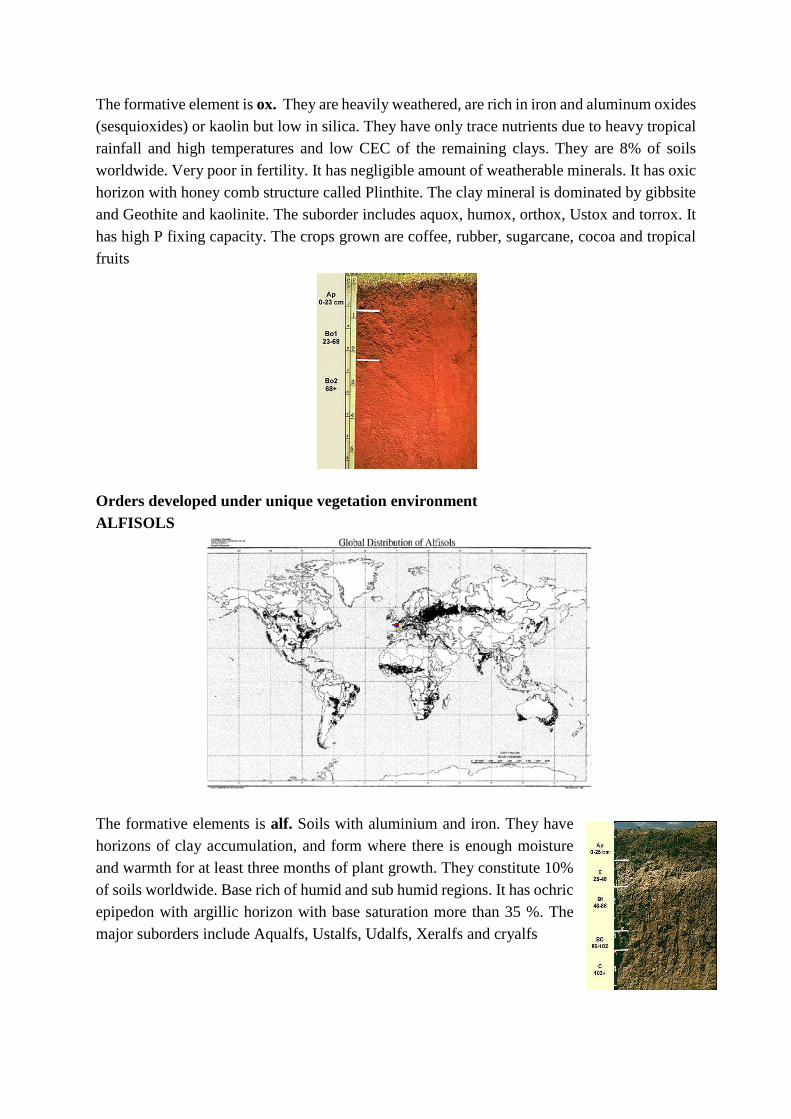
GELISOSLS The formative element is el. Permafrost soils with permafrost within two metres of the surface or gelic materials and permafrost within one metre. They constitute 9% of soils worldwide. The suborders include Histels, Orthels and Tubels
OXISOLS
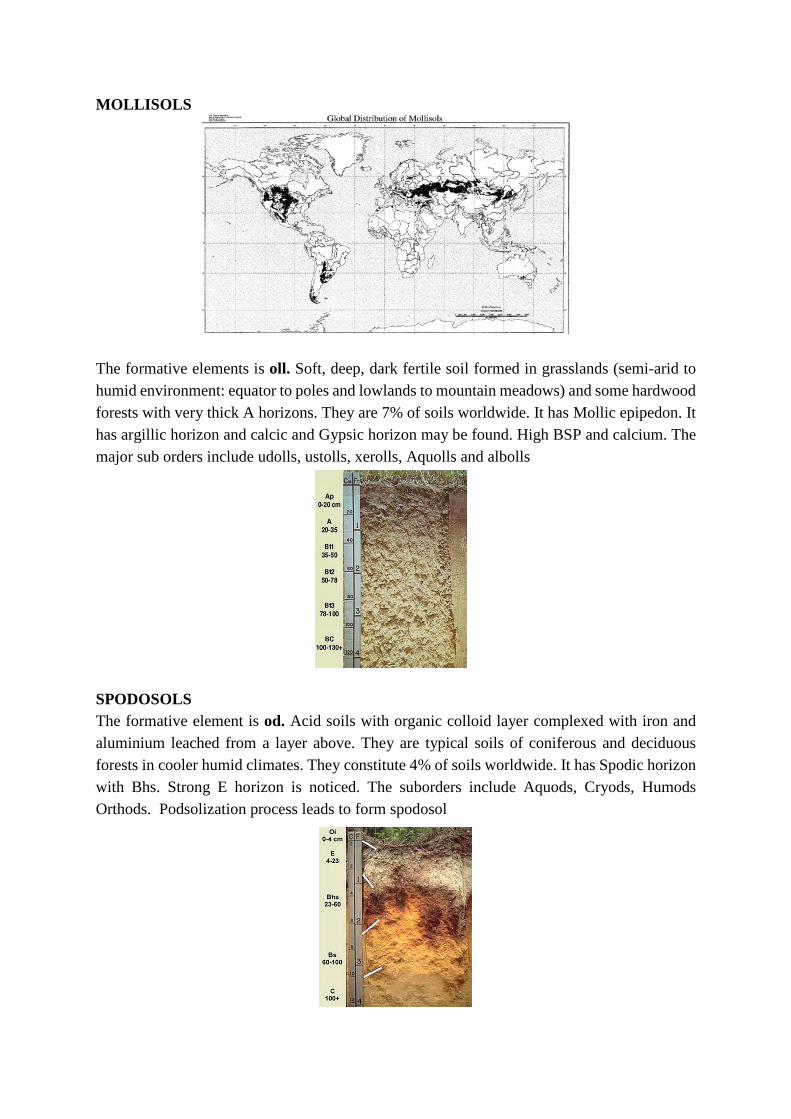
The formative element is ox. They are heavily weathered, are rich in iron and aluminum oxides (sesquioxides) or kaolin but low in silica. They have only trace nutrients due to heavy tropical rainfall and high temperatures and low CEC of the remaining clays. They are 8% of soils worldwide. Very poor in fertility. It has negligible amount of weatherable minerals. It has oxic horizon with honey comb structure called Plinthite. The clay mineral is dominated by gibbsite and Geothite and kaolinite. The suborder includes aquox, humox, orthox, Ustox and torrox. It has high P fixing capacity. The crops grown are coffee, rubber, sugarcane, cocoa and tropical fruits
Orders developed under unique vegetation environment ALFISOLS
The formative elements is alf. Soils with aluminium and iron. They have horizons of clay accumulation, and form where there is enough moisture and warmth for at least three months of plant growth. They constitute 10% of soils worldwide. Base rich of humid and sub humid regions. It has ochric epipedon with argillic horizon with base saturation more than 35 %. The major suborders include Aqualfs, Ustalfs, Udalfs, Xeralfs and cryalfs
MOLLISOLS The formative elements is oll. Soft, deep, dark fertile soil formed in grasslands (semi-arid to humid environment: equator to poles and lowlands to mountain meadows) and some hardwood forests with very thick A horizons. They are 7% of soils worldwide. It has Mollic epipedon. It has argillic horizon and calcic and Gypsic horizon may be found. High BSP and calcium. The major sub orders include udolls, ustolls, xerolls, Aquolls and albolls
SPODOSOLS The formative element is od. Acid soils with organic colloid layer complexed with iron and aluminium leached from a layer above. They are typical soils of coniferous and deciduous forests in cooler humid climates. They constitute 4% of soils worldwide. It has Spodic horizon with Bhs. Strong E horizon is noticed. The suborders include Aquods, Cryods, Humods Orthods. Podsolization process leads to form spodosol

Simplified Keys for Soil Orders

Lecture 12
SOILS OF INDIA AND TAMILNADU The physiography of India can be broadly grouped into triangular plateau, mountains, Indo- gangetic plains and islands India is divided into twenty agro ecological regions and sixty five agro ecological sub regions as per NBSS and LUP Agro ecological regions( AER) is referred to identification and demarcation of land units having comparable landform, soils, bioclimatic conditions and the length of growing period (LGP)
There are 8 major group of soils in India which are furnished below 1) Red soils 2) Black soils 3) Alluvial soils 4) Laterite soils 5) Desert soils 6) saline sodic
soils 7) Peat and marshy soils 8 ) Forest soils
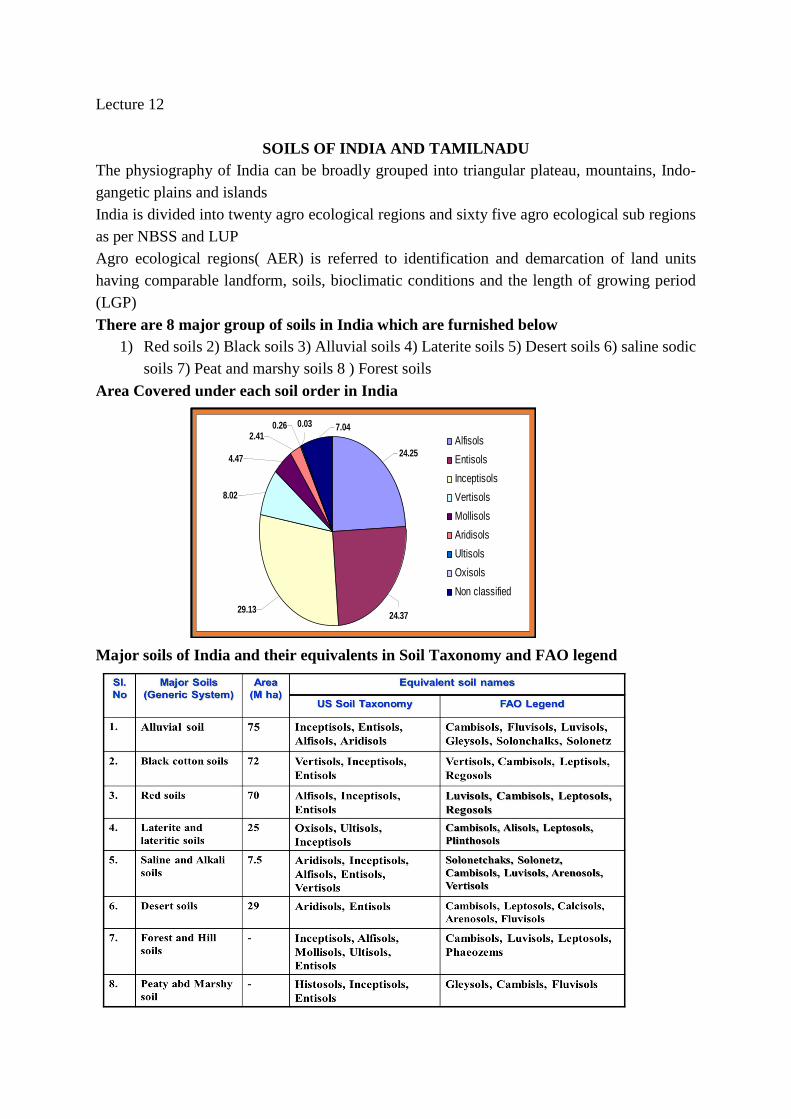
Area Covered under each soil order in India Major soils of India and their equivalents in Soil Taxonomy and FAO legend
0.26
24.25
24.3729.13
8.02
2.410.03 7.04
4.47
Alfisols
Entisols
Inceptisols
Vertisols
Mollisols
Aridisols
Ultisols
Oxisols
Non classified

ALLUVIAL SOILS These are the most important soils from the agriculture point of view. The soils are sandy loam to clay loam with light grey color to dark color, structure is loose and more fertile. But the oils are low in NPK and humus. They are well supplied with lime; Base Exchange capacity is low, pH ranges from 7 to 8 . These soils are distributed in Indo-Gangetic plains, Brahmaputra valley and all most all states of North and South. Most of the alluvial soils have been classified in the orders ' Entisol', ' Inceptisols' and ' Alfisols'. Occupy 75 m ha. There are different types of alluvium depending on the nature and places of their deposition 1) Coastal alluvium: influence of sea water and suffer from salinity 2) Deltaic alluvium: Heterogeneous type of sediments brought by rivers and deposited at their mouth 3) Lacustrine alluvium: The deposits formed in the lakes 4) Recent alluvium: Deposits by river flowing streams which are of recent origin. 5) Old alluvium: The depth of alluvium is great and extend more than 100 meters. These water deposited sediments are old, though newer deposits are continuously being added
New alluvium is termed as Khadar and old alluvium is termed as Bhangar. BLACK SOILS These soils occur in areas ranging from semi-arid to sub humid climates. This is well known group of soils characterized by dark grey to black color with high clay content. They are neutral to slightly alkaline in reaction Deep cracks develop during summer, the depth of the soil varies from less than a meter to several meters. Poor free drainage results in the soils, Base Exchange is high with high pH and rich in lime and potash. They may be classified as shallow (< 30 cm depth), medium (30-100 cm) and deep (100-200 cm) black soils. Most of the Deccan is occupied by Black soil. Their limitation for crop production is because of their poor workability. Cotton is most favorable crop to be grown in these soils. These soils are classified in the order 'Entisol', Inceptisols' and ' Vertisols”. It is also called as regur soils. Rich in: Iron, lime, calcium, potassium, aluminum and magnesium. Deficient in: Nitrogen, Phosphorous and organic matter.
RED SOILS They are well drained soils derived from granites. The clay mineral is kaolinite with A horizon being dark reddish brown, B horizon dark brown color. Red color is due to various oxides of iron. They are poor in N, P, K and with pH varying 7 to 7.5. These soils are light textured with porous structure. Lime is absent with low soluble salts. Red soils occurs extensively in Andhra Pradesh, Assam, Bihar, Goa, Parts of Kerala, Maharashtra, Karnataka, Tamilnadu and West
Bengal Wheat, cotton, pulses, tobacco, oilseeds, potato etc are cultivated. Texture: Sandy to clay and loamy. Most of the red soils have been classified in the order ' Alfisols’ and ‘Ultisols
LATERITES AND LATERITIC SOILS Name from Latin word ‘Later’ which means Brick. Seen in high rainfall areas, under high rainfall conditions. Silica is released and leached down wards. The upper horizons of soils become rich in oxides of iron and aluminum. The texture is light with free drainage structure Clay is predominant and lime is deficient. pH 5 to 6 with low in base exchange capacity, contained more humus and are well drained . Occupy 25 m ha. Toxicity of Al and Mn (low

pH). Paddy, Banana, Coconut, Arecanut (low level) Cocoa, Cashew, Tea, Coffee, Rubber (High level). They are distributed in summits of hills of Dakshin Karnataka, Kerala, Madhya Pradesh, Ghat regions of Orissa, Andhra Pradesh, Maharashtra and also in West Bengal, Tamilnadu and Assam. Most of the laterite soils have been classified in the order ' Ultisols’ and a few under ' Oxisols”
DESERT SOILS Seen under Arid and Semi-Arid conditions. Deposited mainly by wind activities. These soils are mostly sandy to loamy fine sand with brown to yellow brown color, contains large amounts of soluble salted lime with pH ranging 8.0 to 8.5. Lack of moisture and Humus. Kankar or Impure Calcium carbonate content is high which restricts the infiltration of water. The presence of Phosphate and Nitrate make the desert soils fertile and productive under water supply. They are distributed in Haryana, Punjab, and Rajasthan. They are classified in the order ' Aridisols' and “Entisols”. Occupy 29 m ha
PEATY AND MARSHY SOILS These soils occur in humid regions with accumulation of high organic matter. During monsoons the soils get submerged in water and the water receipts after the monsoon during which period rice is cultivated. Soils are black clay and highly acidic with pH of 3.5. Free aluminium and ferrous sulphate are present. The depressions formed by dried rivers and lakes in alluvial and coastal areas sometimes give rise to water logged soils and such soils are blue in colour due to the presence of ferrous iron. Peaty soils are found more in Kerala and marshy soils are found more in coastal tracks of Orissa, West Bengal and South - East coast of Tamilnadu
SALINE - SODIC SOILS Saline soils contain excess of natural soluble salts dominated by chlorides and sulphate which affects plant growth. Sodic or alkali soils contain high exchangeable sodium salts. Both kinds of salt effected soils occur in different parts of India like Uttar Pradesh, Haryana, Punjab, Maharashtra, Tamilnadu, Gujarat, Rajasthan and Andhra Pradesh These soils are classified under ' Aridisols', ' Entisols' and ' Vertisols'. Confined to arid, semi-arid and sub humid. Occupy 10 m ha- 50 % Indo - Gangetic; 30 % Black soil; 20 % Coastal
FOREST SOILS This group of soils occur in Himalayas. Soils are dark brown with more sub-soil humus content. They are more acidic

SOILS OF TAMILNADU
ENTISOLS: The Entisols cover an area of 18.3 lakh hectares which include river alluvium, coastal alluvium and eroded soils. They are characterized by sandy texture or fine textured alternated with sandy layers. They are poor in N,P and organic matter but rich in K and lime. The base exchange capacity is on an average 25 cmol (p+ ) kg-1 and silica Sesquioxide ratio is 12.5. The dominant clay mineral is 2:1 type (illite). The river alluvium is used for the cultivation of wetland crops like rice, sugarcane and banana. Coastal alluvium is made use for casuarinas plantations. The eroded soils are made use for development of pastures. It is distributed in Niligris, North Arcot, Pudukottai, Ramanathapuram, Sivagangai, Cuddalore, Salem, Trichy, Thirunelveli, Tanjore, Coimbatore, Dharmapuri, Kanyakumari, Coastal soils( Nagapatinam) and Virudhunagar
16
12
3
7
62
Red soils
Alluvial soils
Black soils
Laterite & Lateritic soils
Coastal soils
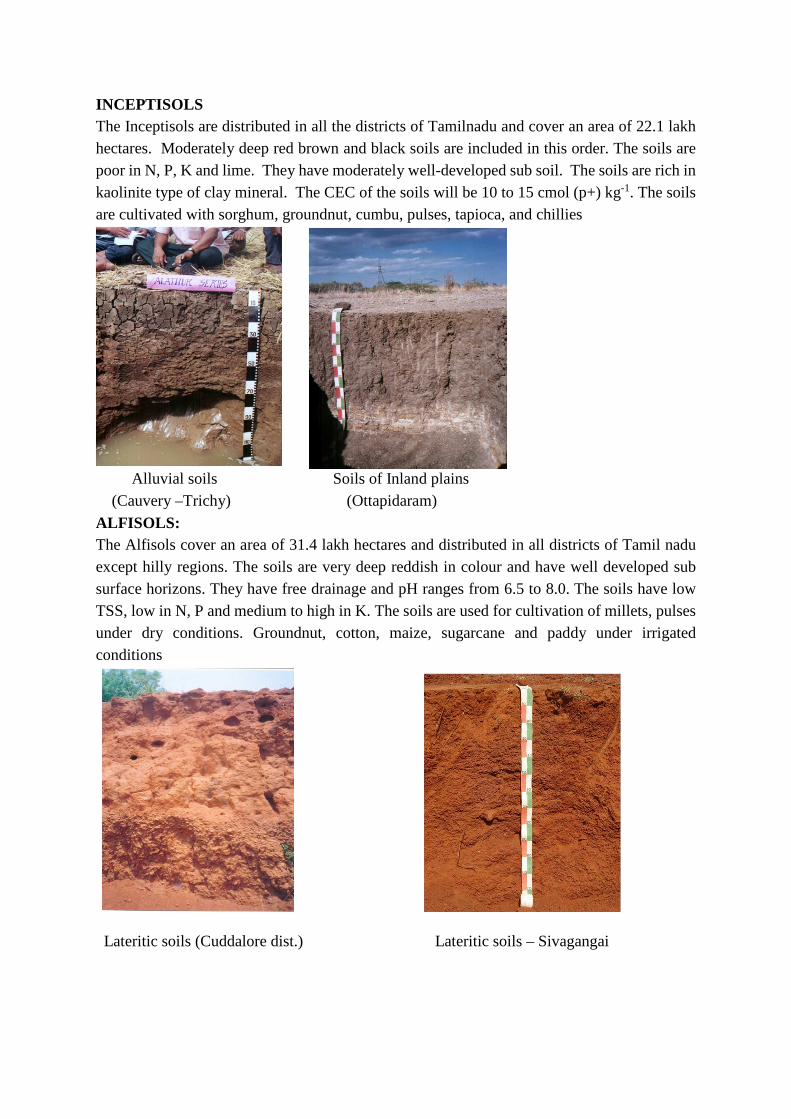
INCEPTISOLS The Inceptisols are distributed in all the districts of Tamilnadu and cover an area of 22.1 lakh hectares. Moderately deep red brown and black soils are included in this order. The soils are poor in N, P, K and lime. They have moderately well-developed sub soil. The soils are rich in kaolinite type of clay mineral. The CEC of the soils will be 10 to 15 cmol (p+) kg-1. The soils are cultivated with sorghum, groundnut, cumbu, pulses, tapioca, and chillies
Alluvial soils Soils of Inland plains (Cauvery –Trichy) (Ottapidaram)
ALFISOLS: The Alfisols cover an area of 31.4 lakh hectares and distributed in all districts of Tamil nadu except hilly regions. The soils are very deep reddish in colour and have well developed sub surface horizons. They have free drainage and pH ranges from 6.5 to 8.0. The soils have low TSS, low in N, P and medium to high in K. The soils are used for cultivation of millets, pulses under dry conditions. Groundnut, cotton, maize, sugarcane and paddy under irrigated conditions
Lateritic soils (Cuddalore dist.) Lateritic soils – Sivagangai

ULTISOLS: The Ultisols are distributed in area of 0.36 lakh hectares and are found in Salem, Dharmapuri, and Niligris. The soils are very deep and highly weathered. The surface soils are darker due to high organic matter. The soils are acidic in reaction The CEC of soils ranges from 8 to 15 cmol (p+) kg-1. The soils have low amounts of silica and high amounts of Sesquioxide and silica Sesquioxide ratio is below 1.33. The soils are poor in bases. The soils are cultivated for tea, coffee, cocoa, cold vegetables Soils-Western Ghats Ooty series (Pechiparai series) VERTISOLS: The Vertisols cover an area of 17.9 lakh hectares and are distributed in all districts except in Niligris and Kanyakumari districts. Deep black soils and old alluvial soils are included under this order. The soils are very deep, clayey, calcareous and poorly drained. They develop deep cracks during summer and have kankar nodules in the profile. They contain high amounts of iron, calcium, magnesium but poor in organic matter, N and P but fairly rich in lime and K. The soil pH is alkaline, CEC is 30-70 cmol (p+) kg-1. The soils are cultivated for rice, cotton, pulses and sorghum under irrigated conditions
Inland plains- Kovilpatti series Kalathur series Cauvery delta- Aduthurai

Lecture 13
SOIL MAPS, KINDS OF SOIL MAPS AND THEIR PREPARATION
Soil map is a map i.e. a geographical representation showing diversity of soil types and/or soil properties (soil pH, textures, organic matter, depths of horizons etc.) in the area of interest. It is typically the end result of a soil survey inventory, i.e. soil survey
Types of maps based on scale of mapping Smaller map scale - degree of details & precision of map decreases Large map scale: degree of details & precision of map increases
1. General maps (1:10,00,000 and smaller) Not accurate, General features of Soil cover, Territories of states (or) district Compiled for students, mapping units -associations of series, Made by combining DSS Maps 2. Small scale maps (1:50,000 to 1:2, 50,000) Compiled for dept. To assess the land resources, rational planning & development To select priority areas 3. Medium scale maps (1:40,000 to 1:25,000) For admin. Like districts & regions Planning the location of Agrl. Enterprises like co-op farms & amelioration 4. Large scale maps (1:15,000) For the small admin. Like taluks & blocks guidance - soil fertility - rational soil use 5. Detailed maps (1:10,000 to 1:2,000) For villages, exp. stations, plantations and accurately accounts for differences in soil
Types of maps based on utility a) Generalized Soil Maps Made to reveal geographic relationships not seen on detailed maps. Most survey reports includes general soil map for the area. Scale of maps depends on intended use. Detailed map generalized -enclosing larger areas. Few kinds of soil predominate in relatively consistent proportions and patterns. Larger areas are described by dominant soils Associations of soil series or their phases combined into larger areas
Generalized soil maps of state Scale - 1:10, 00, 000 to 1:15, 00,000 Map units associations of soil series or higher taxa .Distribution of the more extensive soils of the state. Useful in broad land use planning. They merge with the 4th order soil survey – DSS
Regional and National Soil Maps Scale - smaller than 1:10,00,000. Units - associations of great groups or suborders. Accompanying booklets National soil maps – studying broad capabilities and limitations
Uses of Generalized soil maps Appraising basic soil resources of countries. Assisting farm & guiding commercial interests

Compiled for country and regional land-use planning. Predicting general suitability of large areas of soils for residential, recreational, wildlife, and other nonfarm uses, as well as for agriculture. Alternative routes for roads and pipelines -least problems with soils are expected
b) Schematic Soil Maps Compiled from information other than pre-existing soil maps. Scale 1:10, 00,000 or smaller or sometimes larger scales. Schematic soil maps - preliminary step to locate areas where further investigation is justified. Useful for undeveloped regions in advance of an organized field survey. Information about climate, vegetation, geology, landforms, and other factors related to soil are gathered and studied. Data obtained by remote sensing technique - aerial photography. Merge with 5th-order (exploratory) soil surveys.
c) Thematic maps: These maps are developed for different application processes by using GIS, eg. Soil suitability maps, soil quality maps etc
d) Digital soil maps: These maps are generated from the existing soil maps after scanning and digitization by using ground control points
e) Soil survey maps: Maps generated out of standard soil surveys
Aerial photographs in soil mapping Black and white, colour, infra-red (IR) and colour infra-red (CIR) aerial photographs. Scale of 1:40,000 to 1:60,000 -reconnaissance soil mapping. 1:10,000 to 1:25,000 for detailed soil mapping. Aerial photographs permit 3D view through stereoscopes and hence slope, drainage pattern, natural features like hills, valleys, and plains can be easily distinguished in a given geological formation
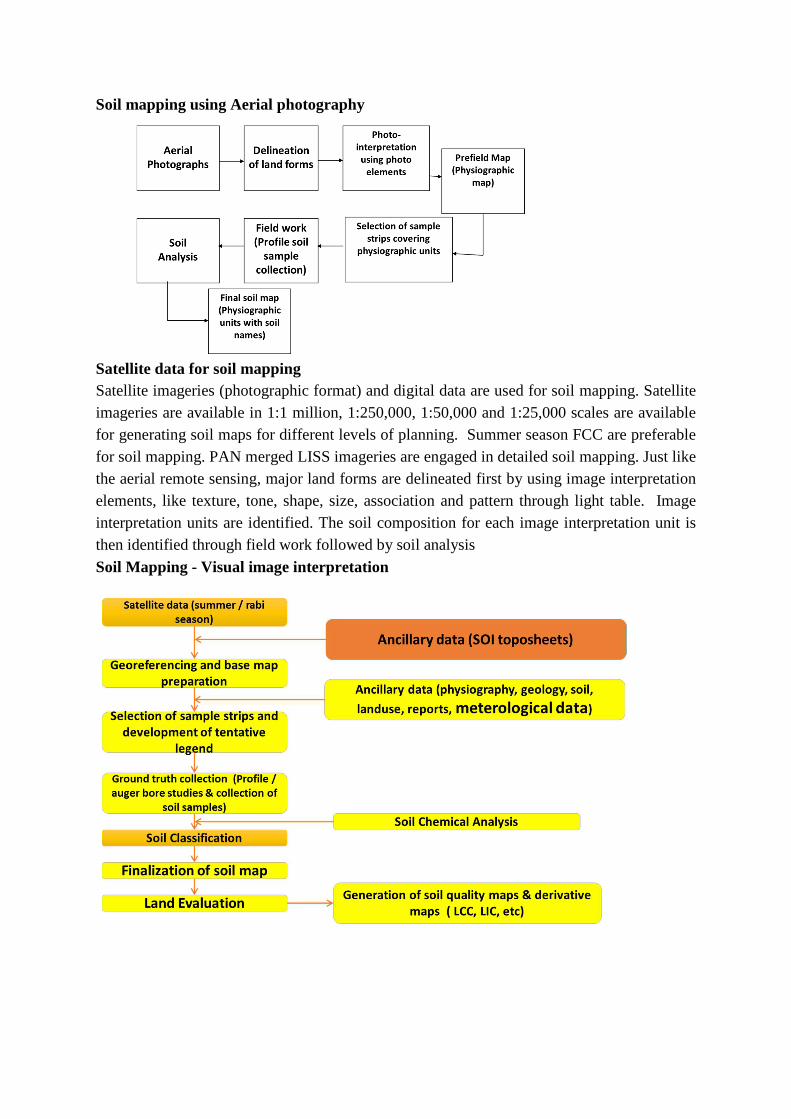
Soil mapping using Aerial photography
Satellite data for soil mapping Satellite imageries (photographic format) and digital data are used for soil mapping. Satellite imageries are available in 1:1 million, 1:250,000, 1:50,000 and 1:25,000 scales are available for generating soil maps for different levels of planning. Summer season FCC are preferable for soil mapping. PAN merged LISS imageries are engaged in detailed soil mapping. Just like the aerial remote sensing, major land forms are delineated first by using image interpretation elements, like texture, tone, shape, size, association and pattern through light table. Image interpretation units are identified. The soil composition for each image interpretation unit is then identified through field work followed by soil analysis
Soil Mapping - Visual image interpretation

Lecture 14
SOIL SURVEY REPORTS
Introduction
It is the ultimate product and forms the essence of all field investigations It provides good and complete information that could be used by many end users
Requirement 1) It should be attractive to look in both inside and outside 2) Besides text, it should be supported by with good illustrations in the form of photograph,
table and diagram 3) It should meet the requirements of different users
How to write a report • The writings must be simple, direct, positive statements, wherever technical terms are
used to clarify the points, terms must be clearly defined
• Good reports needs lot of working and reworking
Outline of the report Memoirs It consists of two parts Maps 1. It describes the area surveyed, kind of soil shown on the map and interpretation suitability
of crops, specific problems and their management 2. A good report will have description of the mapping unit, discussion on management
problems and yield predictions The following outline for writing the report is made use by NBSS and LUP
1) Abstract: facts, conclusions and recommendations 2) How to use soil survey report : map scale & symbols 3) Table of contents 4) Introduction: purpose of the - survey area, intensity –organization- location map 5) General description of the area
a) location and extent : Latitude & longitude, boundaries, main geographic names – rivers, towns, main roads etc.
b) Climate – Temp & RF, drought, wet periods & floods, form and intensity of rain, snow, hail, local variations ombrothermic diagram c) Physiography, relief, drainage d) Geology e) Natural vegetation f) Water supply h) Socio economic condition 6) Present land use and agriculture - - Land use: areas of cropped fields, forests, orchards, grasslands etc, - Agriculture: Acreage & production of principal crops, crop rotations, area under crops seasons, cultural practices, harvesting & storage
- Socio-economic condition - Settlement and population - Industries - Transportation and markets - Community facilities 7) Soil survey methodology Procedure of soil survey, base maps used etc 8) Soils of that area
• Series identified
• Soil genesis
• General description of the soil series 9) Soil survey interpretations
• Thematic interpretative classification
• Land Capability Classification
• Land Irrigability Classification
• Land Suitability Classification
• Productivity Classification Annexure 1) Morphological descriptions of soil series 2) Index to village wise mapping units 3) Legends for soil symbols 4) Analytical data of representative soil profile samples
Lecture 15 to 18
SOIL SURVEY INTERPRETATION Introduction Kellogg (1966) defined soil survey interpretation as predictions of soil behaviour for specific land and management practices
• Interpretation of soil is aimed at predicting the use potential of a soil for specific purpose such as productivity of soils, capability of soils for raising specific kinds of crops, predicting behaviour of soils towards water applied through irrigation
• Soil survey interpretation comprises the organization and presentation of knowledge about characteristics, qualities, and behaviour of soils as they are classified and outlined on maps.
• This knowledge should be organized and presented in ways that will help people to make more intelligent decisions in their uses of soils.
� Agricultural users - to make proper choices from available alternatives in use and management of soils for plant production.
� Engineering users - make choices among possible designs for subgrades, types of foundations, and the like.
� Hydrologists - to estimate runoff and water yields more accurately. Soil survey interpretations should help these and other users to make full and effective application of the knowledge available about soils
Interpretations: 1) Agriculture - Designing drainage and irrigation networks - Planning ameliorative measures for salt affected soils - Assessment in loan sanctioning - Developing perspective land use plans - Used for monitoring soil health - Existing land use, Suitability of soils for different crops - Suggest site suitability for different options 2) Non Agriculture - Sewage and human waste disposal - High way constructions - Water and gas supply - Recreations - Wild life - Urban and industrial structures
Application of soil survey depends on 1. Quality of soil maps 2. Choosing decision making factors while interpretations
Interpretative Groupings - Land capability classification - Land irrigability classification

- Land suitability classification - Storie index of soil rating - Soil productivity rating
LAND CAPABILITY CLASSIFICATION (LCC) Land capability classification is an interpretative grouping of soil mapping units mainly based on inherent soil characteristics, external land features and environmental factors that limit the use of land for agriculture, pasture, or other uses on a sustained basis (IARI, 1971).
Grouping of soils based on their limitations - Asses suitability of the land for cultivation, grazing, forest and plantations
Factors under consideration - Inherent soil characteristics - External land features - Environmental factors limiting land
Factors determining the capability of soils - Depth of soil - Texture and structure - Permeability - Slope - Erosion - Susceptibility to flooding - Salt / Alkali / pH / Gypsum presence - Severity of climate
Capability classification consists of - Capability classes - Capability sub classes - Capability Units Land capability classification is defined as the grouping of land unit (s) into defined class (es) based on its capability. This method was established by the USDA according to the system proposed by Klingebiel and Montgomery (1961) Land capability classes indicates the degree of total limitations on the land use. A capability class is a group of capability subclasses that have a same relative degree of limitation or hazard. A capability subclasses is defined as a group of capability units that have same major conservation problems. Land capability units are sub-division of subclasses
Capability classes - I to VIII - Class I - High response to management & least limitations - Class VIII - Less response to management & greatest limitations

Capability sub classes - Based on dominant limitation wetness (w), climate(c), soil(s), erosion (e) - Indicates degree and kind of limitation - II w, III c
Capability units - Based on uniformity in characteristics, potentialities and limitations requiring fairly uniform conservation / management
SALIENT FEATURES OF LAND CAPABILITY CLASSES Capability classes, the broadest groups, are designated by the numbers I through VIII. The numbers indicate progressively greater limitations and narrower choices for practical use. The classes are defined as follows
Classes Land suitability classes
Land Suitable for Cultivation
Class I Very good cultivable land; soils have almost no limitations that restrict their use
Shows as green in maps
Class II Good cultivable land; soils have slight limitations that restrict the choice of plants or
that require moderate conservation practices. Shows as Yellow in maps
Class III Moderately good cultivable land; soils have moderate limitations that restrict the
choice of plants or that require special conservation practices, or both Shows as
Brown in maps
Class IV Fairly good land; soils have very severe limitations that restrict the choice of plants or
that require very careful and intensive management, or both. Shows as pink in maps
Land unsuitable for Cultivation but suitable for permanent vegetation (Grazing)
Class V Not suitable for arable farming; very suitable for grazing; Limitations for use of
implements due to stony or rocky and marshyness Shows as dark grey in maps
Class VI Non-arable land; well suited for grazing or forestry; Have moderate limitations such
as slope, severe erosion, limited soil depth, strongly gypsiferous etc. Shows as orange
in maps
Class VII Fairly well suited for grazing or forestry; not cultivable. Have severe limitations such
as very steep land subjected to erosion and very shallow, stony soil, not enough
moisture Shows as Red in maps
Class VIII Non-arable; have very severe, imitations; eg. Highly eroded land, barren mountain
tops Shows as purple in maps
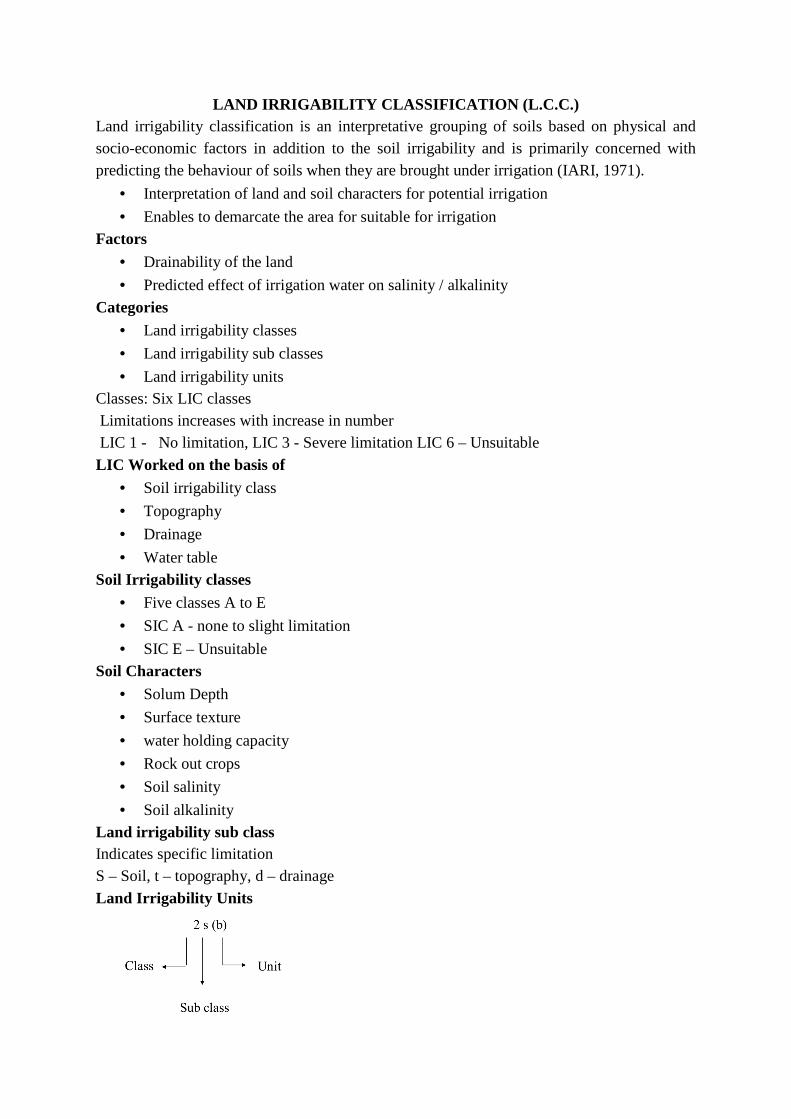
LAND IRRIGABILITY CLASSIFICATION (L.C.C.) Land irrigability classification is an interpretative grouping of soils based on physical and socio-economic factors in addition to the soil irrigability and is primarily concerned with predicting the behaviour of soils when they are brought under irrigation (IARI, 1971).
• Interpretation of land and soil characters for potential irrigation
• Enables to demarcate the area for suitable for irrigation Factors
• Drainability of the land
• Predicted effect of irrigation water on salinity / alkalinity
Categories • Land irrigability classes
• Land irrigability sub classes
• Land irrigability units Classes: Six LIC classes Limitations increases with increase in number LIC 1 - No limitation, LIC 3 - Severe limitation LIC 6 – Unsuitable
LIC Worked on the basis of • Soil irrigability class
• Topography
• Drainage
• Water table Soil Irrigability classes
• Five classes A to E
• SIC A - none to slight limitation
• SIC E – Unsuitable Soil Characters
• Solum Depth
• Surface texture
• water holding capacity
• Rock out crops
• Soil salinity
• Soil alkalinity Land irrigability sub class Indicates specific limitation S – Soil, t – topography, d – drainage
Land Irrigability Units
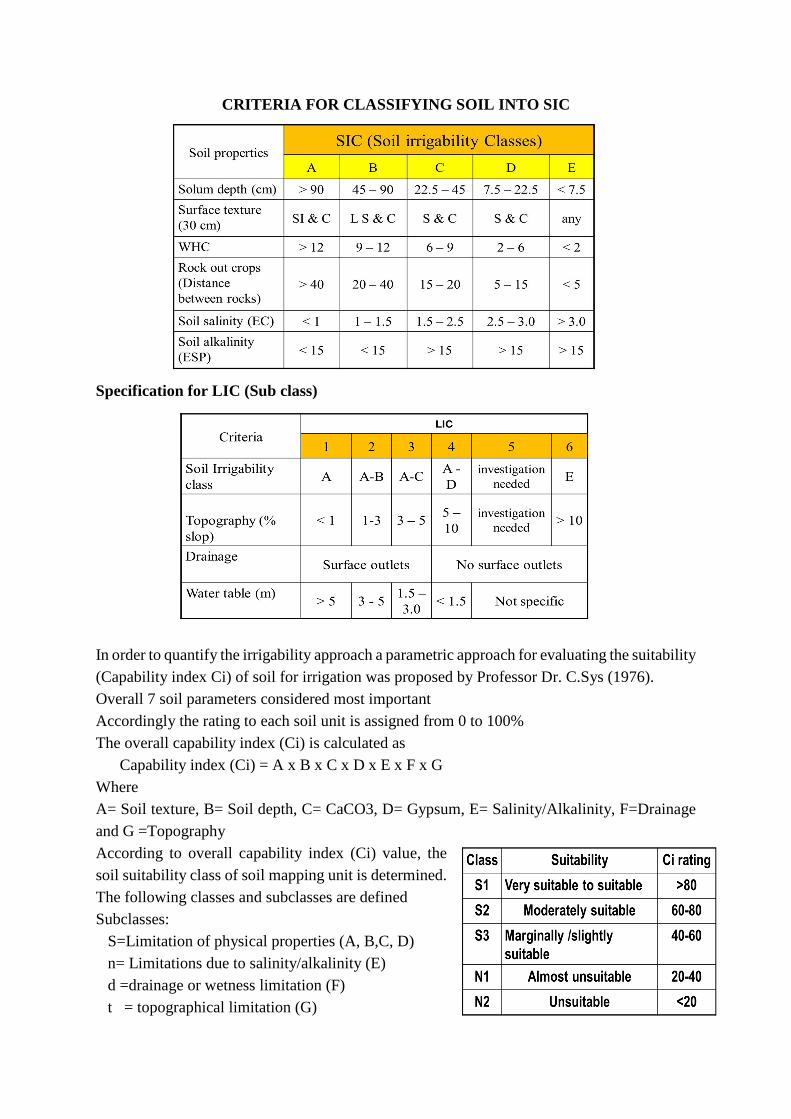
CRITERIA FOR CLASSIFYING SOIL INTO SIC Specification for LIC (Sub class) In order to quantify the irrigability approach a parametric approach for evaluating the suitability (Capability index Ci) of soil for irrigation was proposed by Professor Dr. C.Sys (1976). Overall 7 soil parameters considered most important Accordingly the rating to each soil unit is assigned from 0 to 100% The overall capability index (Ci) is calculated as Capability index (Ci) = A x B x C x D x E x F x G Where A= Soil texture, B= Soil depth, C= CaCO3, D= Gypsum, E= Salinity/Alkalinity, F=Drainage and G =Topography According to overall capability index (Ci) value, the soil suitability class of soil mapping unit is determined. The following classes and subclasses are defined Subclasses: S=Limitation of physical properties (A, B,C, D) n= Limitations due to salinity/alkalinity (E) d =drainage or wetness limitation (F) t = topographical limitation (G)
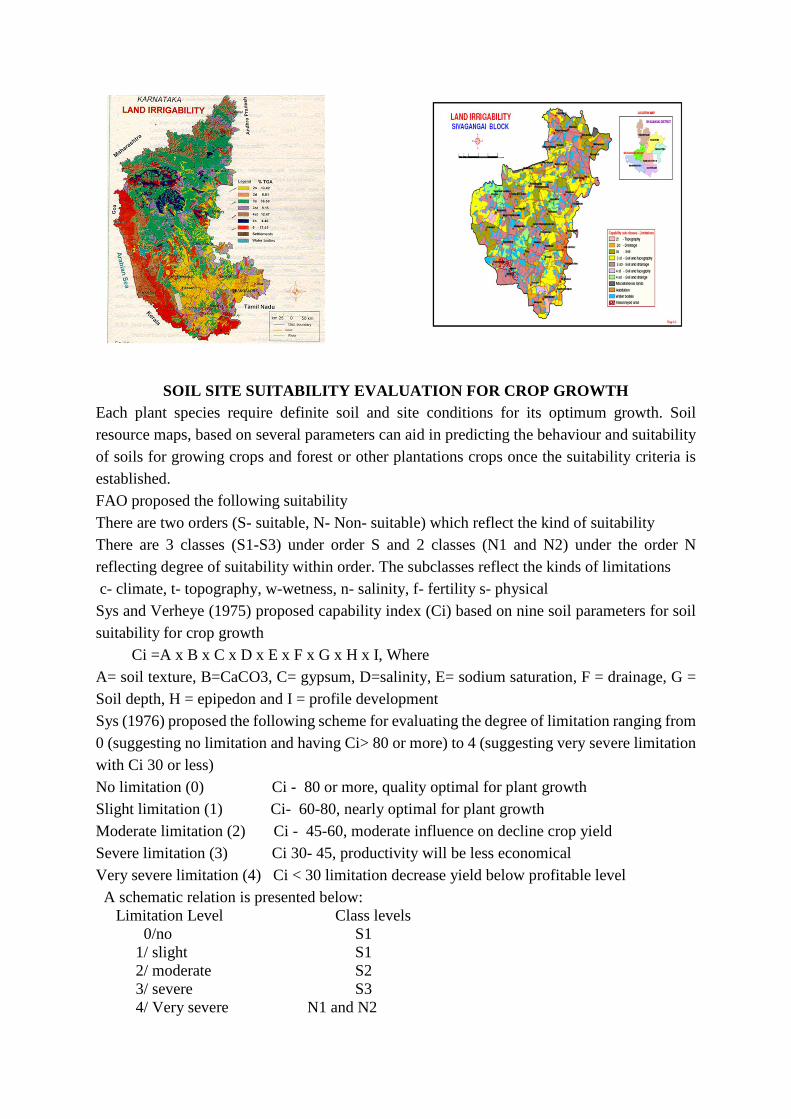
SOIL SITE SUITABILITY EVALUATION FOR CROP GROWTH Each plant species require definite soil and site conditions for its optimum growth. Soil resource maps, based on several parameters can aid in predicting the behaviour and suitability of soils for growing crops and forest or other plantations crops once the suitability criteria is established. FAO proposed the following suitability There are two orders (S- suitable, N- Non- suitable) which reflect the kind of suitability There are 3 classes (S1-S3) under order S and 2 classes (N1 and N2) under the order N reflecting degree of suitability within order. The subclasses reflect the kinds of limitations c- climate, t- topography, w-wetness, n- salinity, f- fertility s- physical Sys and Verheye (1975) proposed capability index (Ci) based on nine soil parameters for soil suitability for crop growth Ci =A x B x C x D x E x F x G x H x I, Where A= soil texture, B=CaCO3, C= gypsum, D=salinity, E= sodium saturation, F = drainage, G = Soil depth, H = epipedon and I = profile development Sys (1976) proposed the following scheme for evaluating the degree of limitation ranging from 0 (suggesting no limitation and having Ci> 80 or more) to 4 (suggesting very severe limitation with Ci 30 or less) No limitation (0) Ci - 80 or more, quality optimal for plant growth Slight limitation (1) Ci- 60-80, nearly optimal for plant growth Moderate limitation (2) Ci - 45-60, moderate influence on decline crop yield Severe limitation (3) Ci 30- 45, productivity will be less economical Very severe limitation (4) Ci < 30 limitation decrease yield below profitable level A schematic relation is presented below: Limitation Level Class levels 0/no S1 1/ slight S1 2/ moderate S2 3/ severe S3 4/ Very severe N1 and N2

STORIE INDEX The Storie Index is a semi-quantitative method for evaluating potential soil productivity by multiplying ratings for individual soil attributes. The rated attributes are the soil profile, essentially the features of the subsurface layers (factor A), the texture of the surface soil (factor B), the slope (factor C), and conditions of the soil exclusive of A, B, C, such as drainage, alkali content, nutrient level, erosion, and micro-relief (factor X) Stories index (1933) of soil rating is a function of 4 major factors: A-Physical profile B- Surface Texture C- Slope X- Drainage, fertility and erosion Storie index soil rating is obtained by multiplying the four factors as follows A x B x C x X Each factor is rated in percentage ranging from 0 to 100%. Thus index is expressed in percentage .It is an inductive method. With this index, general agricultural soil uses can be evaluated (hence it is a soil-capability evaluation method
Eg. Storie index rating Properties marks SIR = = 46.29 Accordingly there are six classes or grades: 1) Grade-1 (Excellent) - SIR is between 80 - 100% .It is suitable for wide variety of crops 2) Grade-2 (Good)- SIR is between 60- 79% and suitable for most crops 3) Grade-3 (Fair) – SIR between 40- 59% and it has fair quality with less wide range of
suitability than grade 1&2 4) Grade -4 (Poor) - SIR between 20 to 39% and have narrow possibilities for agriculture 5) Grade- 5 (V. Poor) – SIR between 10 to 19% and have very limited use except for pasture 6) Grade- 6(Non-Agriculture) – SIR less than 10% include tide land, steep broken land etc
PRODUCTIVITY INDEX OF RIQUIER et al .( 1970) The basic concept of this method is that agricultural-soil productivity, under optimal management conditions, depends on the intrinsic characteristics. This is a multiplicative parametric method to evaluate soil productivity, from a scheme similar to the Storie index. The concept of actual soil productivity (P) is defined as the capacity to produce a certain quantity of harvest per hectare per year, expressed as a percentage of optimal productivity, which would provide a suitable soil in its first year of cultivation. The introduction of improvement practices leads to a potential soil productivity ( P/). The quotient between the productivity and the potentiality is called the improvement coefficient. (P/ / P). The evaluation is made for three general types of use: agricultural crops, cultivation of shallow-rooted plants (pastures), and deep-rooted plants (fruit trees and forestation). The determining factors of soil depth are: wetness, drainage, effective depth, texture/structure, base saturation of the adsorbent complex, soluble-salt concentration, organic matter, cation-exchange capacity/nature of the clay and mineral reserves. The parameters of the soil surface (e.g., slope, erosion, flood tendency, or climate) are not considered
Productivity is expressed as the product of all these factors expressed in percentages Five productivity classes are defined Class P1 = excellent; ( 65-100) P/ - I Class P2 = good, for all types of agricultural crops ;( 35-64) P/ II Class P3 = medium, for marginal agricultural use, suitable for non-fruiting trees; (20-34) P/ --III

Class P4 = poor, for pasture or forestation or recreation; (8-19) P/ -IV Class P5 = very poor or null, soils not adequate for any type of exploitation (0-7) P/ -V
SOIL FERTILITY CAPABILITY CLASSIFICATION (FCC) This was proposed by Buol et al., (1975) and modified by Sanchez et al. (1982) to evaluate soil fertility. This system helps in grouping the soils with the same kind of fertility limitations and fertilizer response. The physical and chemical properties of the soils are considered for fertility capability classification. Type, substrata type and condition modifiers form the soil fertility capability classification In this system, three levels or categories were established. The first, the type, was determined by the texture of the arable layer, or of the first 20 cm, if this is thinner. Its denomination and range are: S, sandy (sandy and sandy loam); L, loams <35% clay (excluding sandy and sandy loam); C, clayey > 35% clay; O, organic > 30% organic matter to 50 cm or more. .Substrata type refers to the texture of subsoil between 20 and 50 cm depth (C, L, S, R). Condition modifiers indicate the physical and chemical properties of the soil that influence the soil and fertilizer interactions. The modifiers are; g (gleying), d (dry condition), e (low CEC), a (aluminum toxicity), h (acid condition), I (P fixation by iron compounds), x (presence of amorphous clays), v (vertic character), k (K deficiency), b (basic reaction), s (salinity), n (natric character) and c (cat clay
Lecture 19
LAND USE PLANNING Land, a valuable and finite resource Land includes benefits to arise out of land, and things attached to the earth or permanently fastened to anything attached to the earth. Land is the most important component of the life support system. It is the most important natural resource which embodies soil, water and associated flora and fauna involving the ecosystem on which all man’s activities are based. Land is a finite resource. Land availability is only about 20 %of the earth’s surface. Land is crucial for all developmental activities, for natural resources, ecosystem services and for agriculture. Growing population, growing needs and demands for common development, clean water, food and other products from natural resources, as well as degradation of land and negative environmental impacts are posing increasing pressures to the land resources in many countries of world. For India, though the seventh largest country in the world, land resource management in becoming very important. India, has over 17% of world population living on 2.4% of the world’s geographical area
Use of land must be judicious There is need for optimal utilization of land resources. The country can no longer afford to neglect land, the most important natural resources so as to ensure sustainability and avoid adverse land use conflicts. There is a need to cater land for industrialization and for development of essential infrastructure facilities and for urbanization. While at same time, there is need to ensure high quality delivery of services of ecosystem that come from natural resource base and to cater to the needs of farmers that enable food security, both of which are of vital significance for the whole nation. Also, there is a need for preservation of the country’s natural, cultural and historic heritage areas. In every case, there is a need for optimal utilization of land resources
Land use planning and management- a solution for sustainable management Proper planning of land and its resources allows for rational and sustainable use of land catering to various needs, including social, economic, development and environmental needs. Proper land use planning based on sound scientific and technical procedures, and land utilization strategies supported by participatory approaches empowers people to make decisions on how to appropriately allocate and utilize lands and its resources comprehensively consistently catering to the present and future demands. There is a need for scientific, aesthetic and orderly disposition of land resources, facilities and services with a view to securing the physical, economic and social efficiency, health and wellbeing of communities. There is a need for an integrated land use planning which inter alia includes agriculture industry, commerce, forest, mining, housing infrastructure and urban area settlements, transportation infrastructure to settle claims, counter claims of these activities The National Commission on Agriculture (1976) emphasized on scientific land use planning for achieving for achieving food security, self-reliance and enhanced livelihood security. The National policy for farmers (2007) has recommended revival of existing land use boards and their linkage to district level land use committees, so that they can provide quality and proactive
advise to farmers on land use. The committee on “State Agrarian relations and the unfinished task in land reforms” (2009) has also emphasized the need for land use planning in the country. The sustainable development strategy of agenda 21, a non –binding and voluntarily implemented action plan of the United Nations that was ratified by more than 170 countries at UNCED in 1992, advocates achievement of sustainable development through appropriate land use planning and management
Definition Land-use planning is the process of regulating the use of land in an effort to promote more desirable social and environmental outcomes as well as a more efficient use of resources (or) LUP refers to the rational and judicious approach of allocating available land resources to different land using activities and for different functions consistent with the overall development vision/goal of a particular area Land-use planning often leads to land-use regulation, which typically encompasses zoning. Zoning regulates the types of activities that can be accommodated on a given piece of land, as well as the amount of space devoted to those activities, Goals of land-use planning may include environmental conservation, restraint of urban sprawl, minimization of transport costs, prevention of land-use conflicts, and a reduction in exposure to pollutants. By and large, the uses of land determine the diverse socioeconomic activities that occur in a specific area, the patterns of human behaviour they produce, and their impact on the environment
Objectives • To promote efficient utilization, acquisition and disposition of land ensure the highest and
best use of land
• To direct, harmonize and influence discussions and activities of the private and public sectors relative to the use and management of lands
• To reconcile land use conflicts and proposals between and among individuals, private and government entities relative to the present and future need for the land
• To promote desirable patterns of land uses to prevent wasteful development and minimize the cost of public infrastructure and utilities and other social services
• To preserve areas of ecological, aesthetic, historical and cultural significance
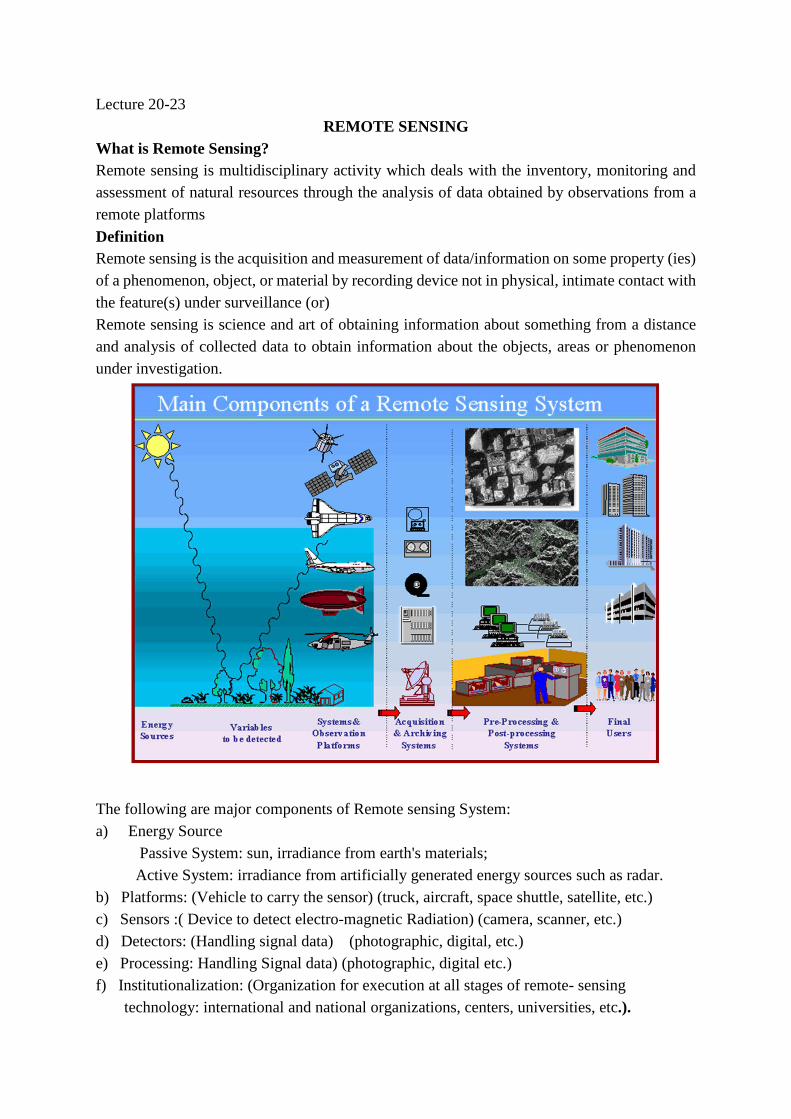
Lecture 20-23
REMOTE SENSING What is Remote Sensing? Remote sensing is multidisciplinary activity which deals with the inventory, monitoring and assessment of natural resources through the analysis of data obtained by observations from a remote platforms
Definition Remote sensing is the acquisition and measurement of data/information on some property (ies) of a phenomenon, object, or material by recording device not in physical, intimate contact with the feature(s) under surveillance (or) Remote sensing is science and art of obtaining information about something from a distance and analysis of collected data to obtain information about the objects, areas or phenomenon under investigation.
The following are major components of Remote sensing System: a) Energy Source Passive System: sun, irradiance from earth's materials; Active System: irradiance from artificially generated energy sources such as radar. b) Platforms: (Vehicle to carry the sensor) (truck, aircraft, space shuttle, satellite, etc.) c) Sensors :( Device to detect electro-magnetic Radiation) (camera, scanner, etc.) d) Detectors: (Handling signal data) (photographic, digital, etc.) e) Processing: Handling Signal data) (photographic, digital etc.) f) Institutionalization: (Organization for execution at all stages of remote- sensing
technology: international and national organizations, centers, universities, etc.).

PRINCIPLE OF REMOTE SENSING 1. Energy Source or Illumination (A) - the first requirement for remote sensing is to have an energy source which illuminates or provides electromagnetic energy to the target of interest. 2. Radiation and the Atmosphere (B) - as the energy travels from its source to the target, it will come in contact with and interact with the atmosphere it passes through. This interaction may take place a second time as the energy travels from the target to the sensor 3. Interaction with the Target (C) - once the energy makes its way to the target through the atmosphere, it interacts with the target depending on the properties of both the target and the radiation.
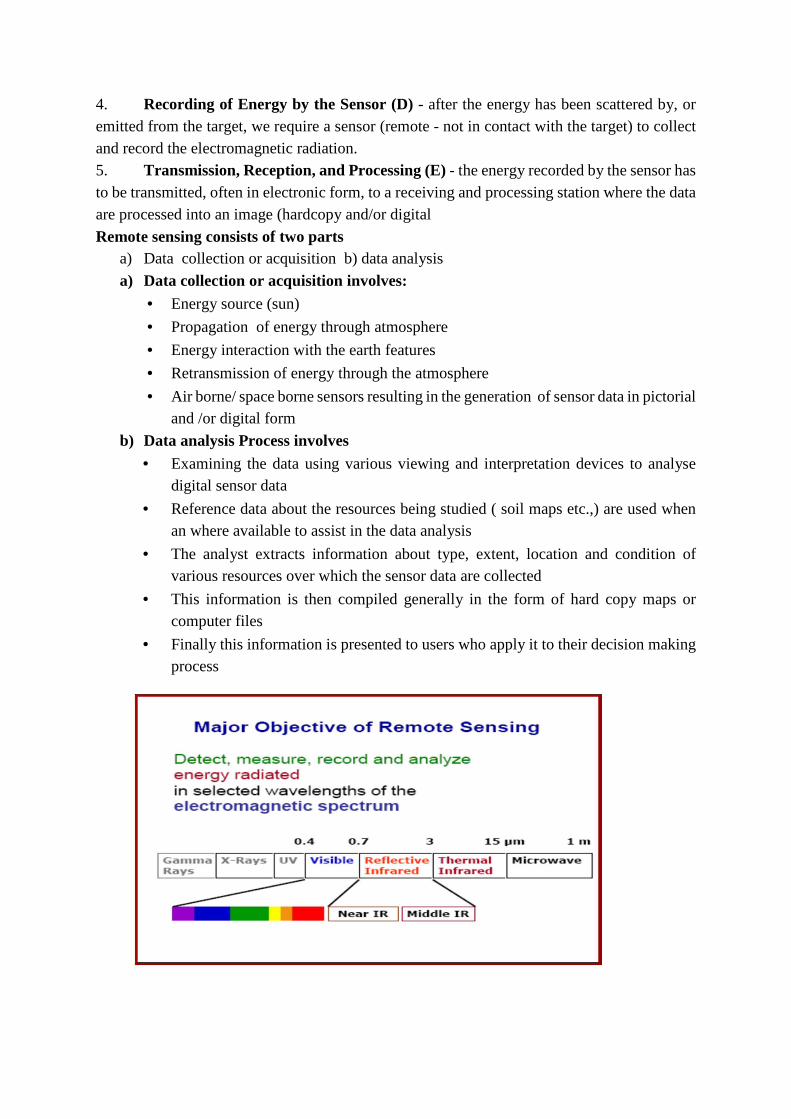
4. Recording of Energy by the Sensor (D) - after the energy has been scattered by, or emitted from the target, we require a sensor (remote - not in contact with the target) to collect and record the electromagnetic radiation. 5. Transmission, Reception, and Processing (E) - the energy recorded by the sensor has to be transmitted, often in electronic form, to a receiving and processing station where the data are processed into an image (hardcopy and/or digital
Remote sensing consists of two parts a) Data collection or acquisition b) data analysis
a) Data collection or acquisition involves: • Energy source (sun)
• Propagation of energy through atmosphere
• Energy interaction with the earth features
• Retransmission of energy through the atmosphere
• Air borne/ space borne sensors resulting in the generation of sensor data in pictorial and /or digital form
b) Data analysis Process involves • Examining the data using various viewing and interpretation devices to analyse
digital sensor data
• Reference data about the resources being studied ( soil maps etc.,) are used when an where available to assist in the data analysis
• The analyst extracts information about type, extent, location and condition of various resources over which the sensor data are collected
• This information is then compiled generally in the form of hard copy maps or computer files
• Finally this information is presented to users who apply it to their decision making process

BASIC CONCEPTS The ES is a continuum of all electromagnetic waves arranged according to frequency and wavelength
Is it possible to apply the principles of remote sensing in all wavelengths? Atmospheric Windows Gases absorb electromagnetic energy in very specific regions of the spectrum. They influence where (in the spectrum) we can "look" for remote sensing purposes. Those areas of the spectrum which are not severely influenced by atmospheric absorption and thus, are useful to remote sensors, are called atmospheric windows
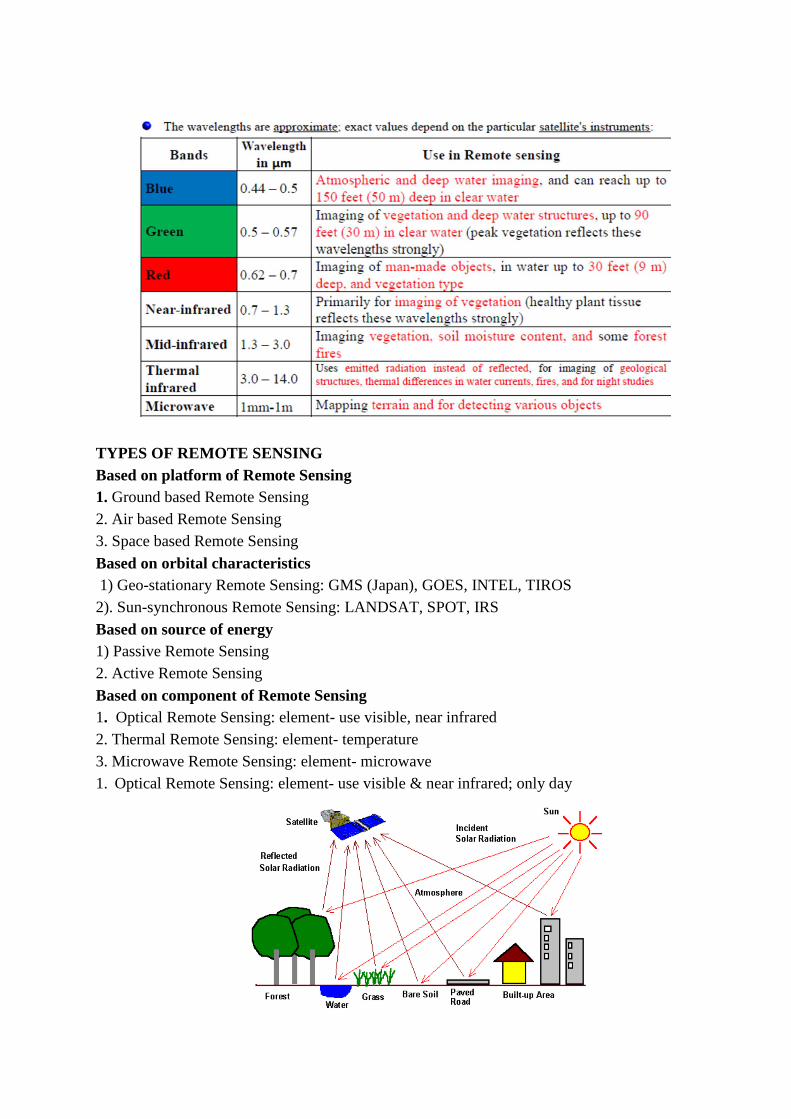
TYPES OF REMOTE SENSING Based on platform of Remote Sensing 1. Ground based Remote Sensing 2. Air based Remote Sensing 3. Space based Remote Sensing
Based on orbital characteristics 1) Geo-stationary Remote Sensing: GMS (Japan), GOES, INTEL, TIROS 2). Sun-synchronous Remote Sensing: LANDSAT, SPOT, IRS
Based on source of energy 1) Passive Remote Sensing 2. Active Remote Sensing
Based on component of Remote Sensing 1. Optical Remote Sensing: element- use visible, near infrared 2. Thermal Remote Sensing: element- temperature 3. Microwave Remote Sensing: element- microwave 1. Optical Remote Sensing: element- use visible & near infrared; only day
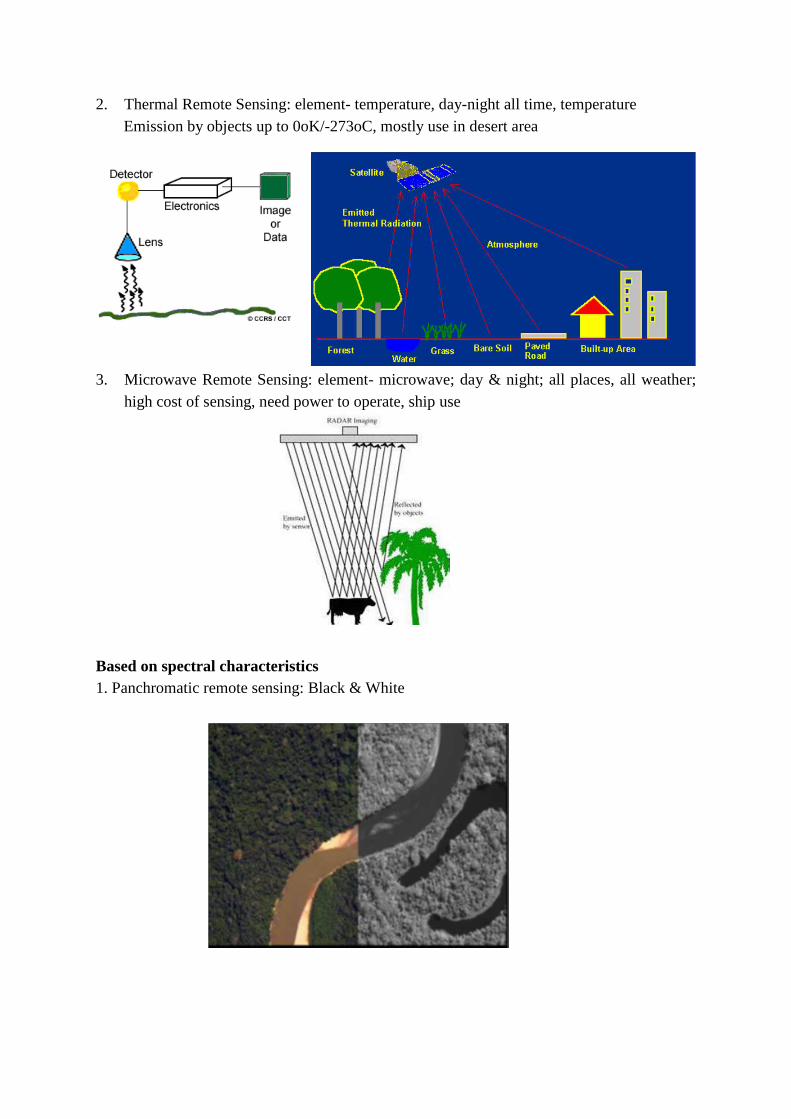
2. Thermal Remote Sensing: element- temperature, day-night all time, temperature Emission by objects up to 0oK/-273oC, mostly use in desert area
3. Microwave Remote Sensing: element- microwave; day & night; all places, all weather;
high cost of sensing, need power to operate, ship use
Based on spectral characteristics 1. Panchromatic remote sensing: Black & White
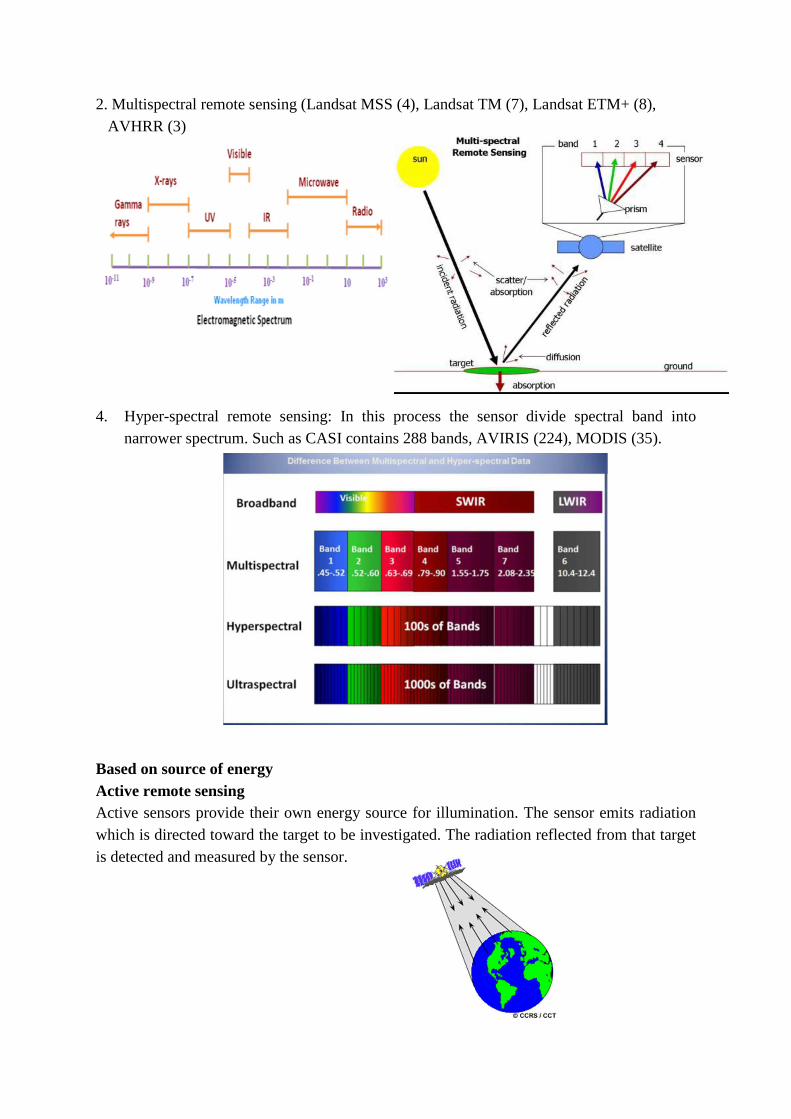
2. Multispectral remote sensing (Landsat MSS (4), Landsat TM (7), Landsat ETM+ (8), AVHRR (3)
4. Hyper-spectral remote sensing: In this process the sensor divide spectral band into
narrower spectrum. Such as CASI contains 288 bands, AVIRIS (224), MODIS (35).
Based on source of energy Active remote sensing Active sensors provide their own energy source for illumination. The sensor emits radiation which is directed toward the target to be investigated. The radiation reflected from that target is detected and measured by the sensor.

Passive remote sensing The radiometer (measuring instrument) on board the plane or the satellite picks up the radiation that is reflected by the Earth surface when the Earth is lit by the Sun. The Sun is the source of energy. Passive sensors measure energy that is naturally available from the sun (or as re-emitted by the earth). Reflected energy during the daytime only. Thermal IR can be detected at night too. Clouds can be problematic
Energy-Matter Interactions Electromagnetic radiation is only detected when it interacts with matter. When electromagnetic radiation interacts with matter, it may be transmitted, reflected, scattered or absorbed. Transmission allows the electromagnetic energy to pass through matter, although it will be refracted if the transmission mediums have different densities. Reflection, or more precisely specular reflection, occurs when incident electromagnetic radiation bounces off a smooth surface. Scattering, or diffuse reflection occurs when incident electromagnetic radiation is dispersed in all directions from a rough surface. Absorption occurs when electromagnetic energy is taken in by an opaque medium. Absorption will raise the energy level of the opaque object and some electromagnetic energy will later be re-emitted as long wave (thermal) electromagnetic

Physical basis of remote sensing Different objects receiving the same radiation absorb and reflect different wavelengths of the electromagnetic spectrum, depending on their physical and chemical properties. Two identical objects at unequal temperatures and moisture levels respond differently. Every object has a repeatable characteristic reflectance pattern which can be used to represent it and is called its spectral signature. (Or) The variation in reflectance according to the wavelength is called spectral signature. Energy of l reflected from object x 100 = ______% (reflectance) Energy of l incident from object When percent reflectance as function of wavelength is plotted as graph, it is called as spectral reflectance curve. It forms the basis for identification of objects in the earth It is important to know typical spectral signatures for vegetation, water and soil
Vegetation General example of a reflectance plot for some (unspecified) vegetation type with the dominating factor influencing each interval of the curve indicated
� Visible - Chlorophyll absorption in blue and red, reflection in green � Near IR (0.7 – 1.3 um) – reflectance increases dramatically, plant leaf reflects 40 –
50%, absorption is minimal so remainder is transmitted. Reflection is due to the internal structure of plants. Allows discrimination of species Plant stresses – alters reflection.
� SWIR (1.3 – 3.0mm) - incident energy is absorbed or reflected, little is transmitted. Water absorption bands in this range
How to differentiate healthy from unhealthy plants?
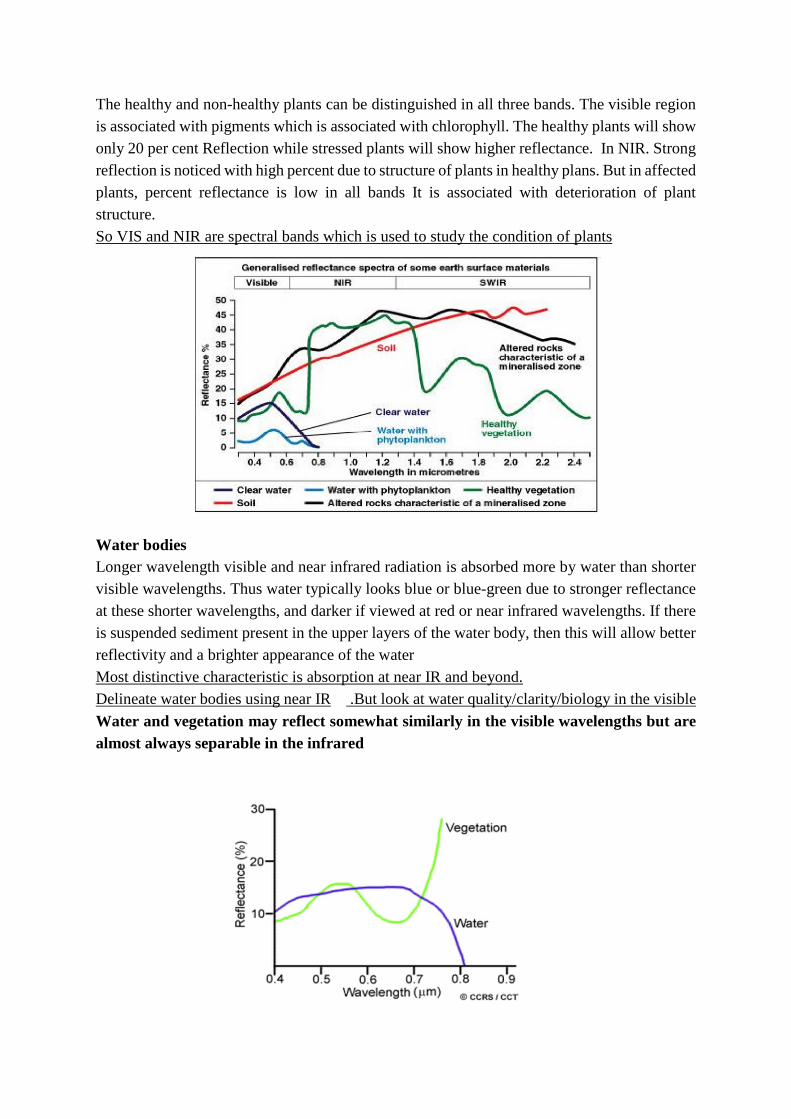
The healthy and non-healthy plants can be distinguished in all three bands. The visible region is associated with pigments which is associated with chlorophyll. The healthy plants will show only 20 per cent Reflection while stressed plants will show higher reflectance. In NIR. Strong reflection is noticed with high percent due to structure of plants in healthy plans. But in affected plants, percent reflectance is low in all bands It is associated with deterioration of plant structure. So VIS and NIR are spectral bands which is used to study the condition of plants
Water bodies Longer wavelength visible and near infrared radiation is absorbed more by water than shorter visible wavelengths. Thus water typically looks blue or blue-green due to stronger reflectance at these shorter wavelengths, and darker if viewed at red or near infrared wavelengths. If there is suspended sediment present in the upper layers of the water body, then this will allow better reflectivity and a brighter appearance of the water Most distinctive characteristic is absorption at near IR and beyond. Delineate water bodies using near IR .But look at water quality/clarity/biology in the visible
Water and vegetation may reflect somewhat similarly in the visible wavelengths but are almost always separable in the infrared
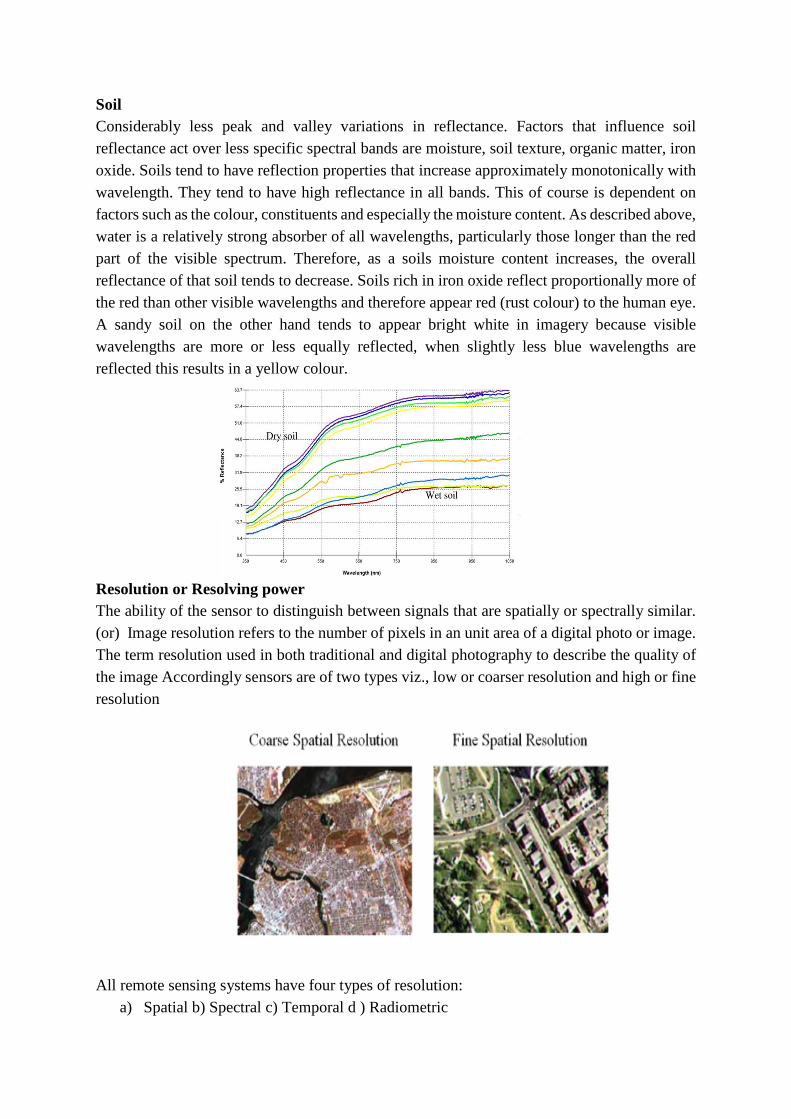
Soil Considerably less peak and valley variations in reflectance. Factors that influence soil reflectance act over less specific spectral bands are moisture, soil texture, organic matter, iron oxide. Soils tend to have reflection properties that increase approximately monotonically with wavelength. They tend to have high reflectance in all bands. This of course is dependent on factors such as the colour, constituents and especially the moisture content. As described above, water is a relatively strong absorber of all wavelengths, particularly those longer than the red part of the visible spectrum. Therefore, as a soils moisture content increases, the overall reflectance of that soil tends to decrease. Soils rich in iron oxide reflect proportionally more of the red than other visible wavelengths and therefore appear red (rust colour) to the human eye. A sandy soil on the other hand tends to appear bright white in imagery because visible wavelengths are more or less equally reflected, when slightly less blue wavelengths are reflected this results in a yellow colour.
Resolution or Resolving power The ability of the sensor to distinguish between signals that are spatially or spectrally similar. (or) Image resolution refers to the number of pixels in an unit area of a digital photo or image. The term resolution used in both traditional and digital photography to describe the quality of the image Accordingly sensors are of two types viz., low or coarser resolution and high or fine resolution
All remote sensing systems have four types of resolution:
a) Spatial b) Spectral c) Temporal d ) Radiometric
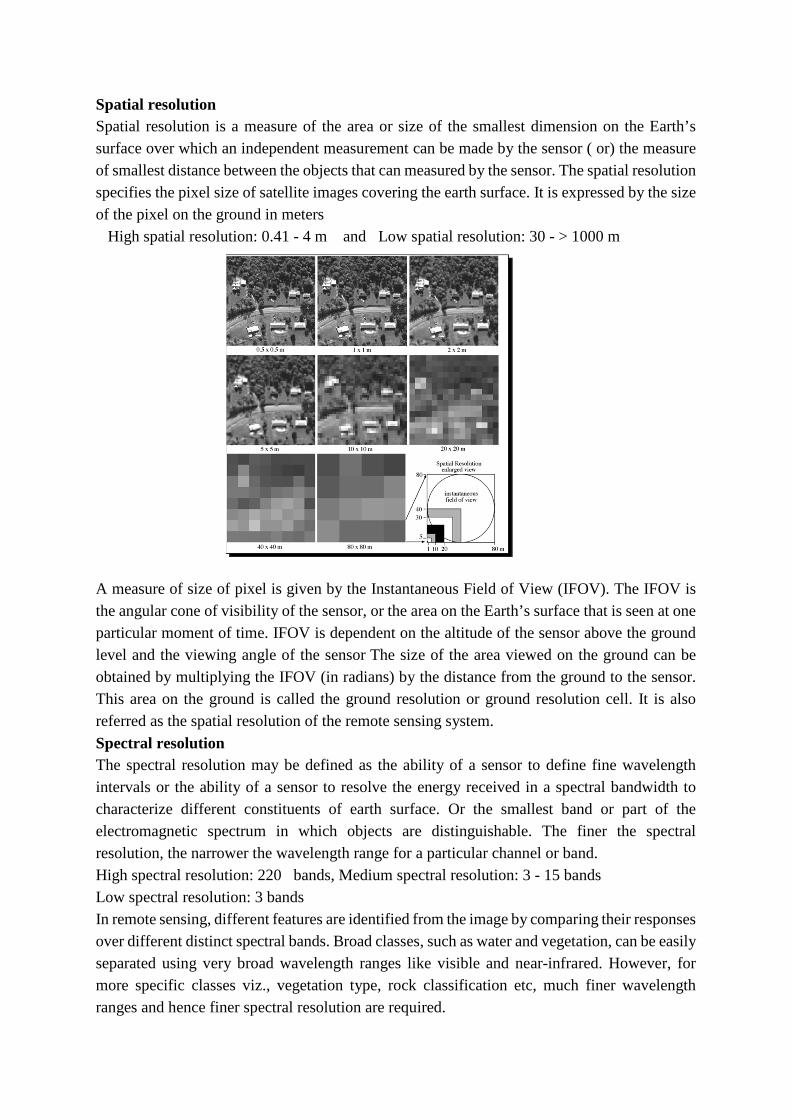
Spatial resolution Spatial resolution is a measure of the area or size of the smallest dimension on the Earth’s surface over which an independent measurement can be made by the sensor ( or) the measure of smallest distance between the objects that can measured by the sensor. The spatial resolution specifies the pixel size of satellite images covering the earth surface. It is expressed by the size of the pixel on the ground in meters High spatial resolution: 0.41 - 4 m and Low spatial resolution: 30 - > 1000 m A measure of size of pixel is given by the Instantaneous Field of View (IFOV). The IFOV is the angular cone of visibility of the sensor, or the area on the Earth’s surface that is seen at one particular moment of time. IFOV is dependent on the altitude of the sensor above the ground level and the viewing angle of the sensor The size of the area viewed on the ground can be obtained by multiplying the IFOV (in radians) by the distance from the ground to the sensor. This area on the ground is called the ground resolution or ground resolution cell. It is also referred as the spatial resolution of the remote sensing system.
Spectral resolution The spectral resolution may be defined as the ability of a sensor to define fine wavelength intervals or the ability of a sensor to resolve the energy received in a spectral bandwidth to characterize different constituents of earth surface. Or the smallest band or part of the electromagnetic spectrum in which objects are distinguishable. The finer the spectral resolution, the narrower the wavelength range for a particular channel or band. High spectral resolution: 220 bands, Medium spectral resolution: 3 - 15 bands Low spectral resolution: 3 bands In remote sensing, different features are identified from the image by comparing their responses over different distinct spectral bands. Broad classes, such as water and vegetation, can be easily separated using very broad wavelength ranges like visible and near-infrared. However, for more specific classes viz., vegetation type, rock classification etc, much finer wavelength ranges and hence finer spectral resolution are required.
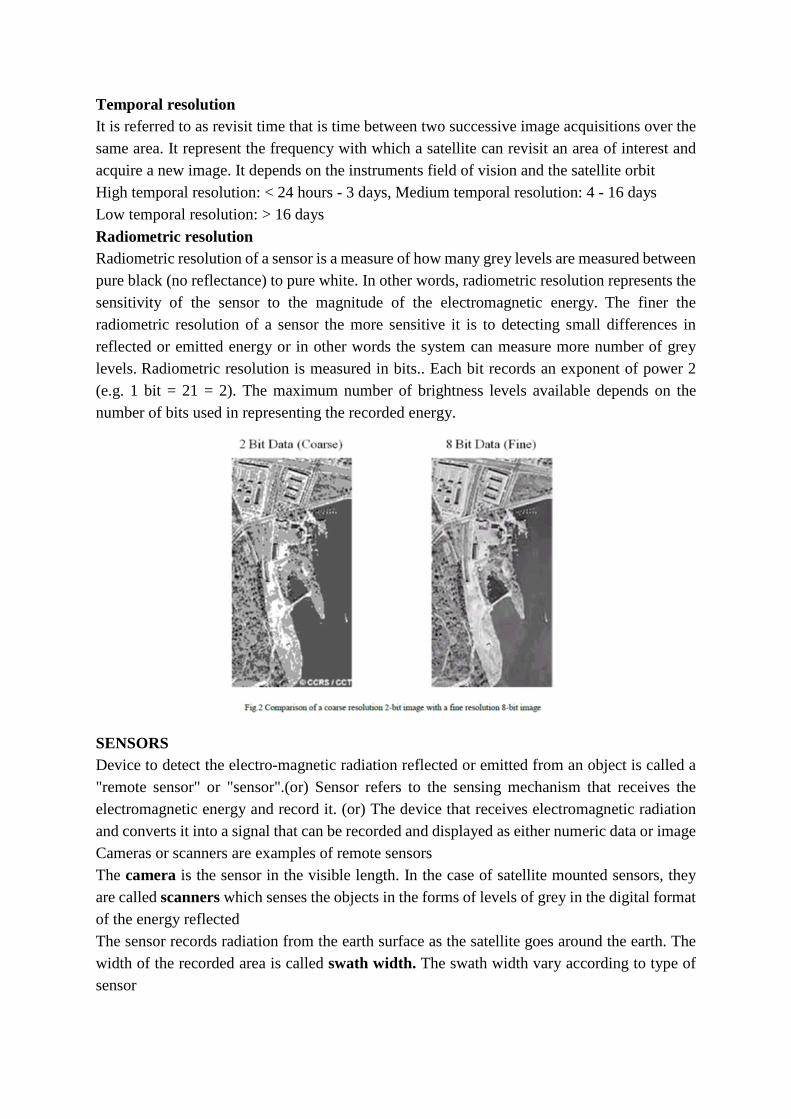
Temporal resolution It is referred to as revisit time that is time between two successive image acquisitions over the same area. It represent the frequency with which a satellite can revisit an area of interest and acquire a new image. It depends on the instruments field of vision and the satellite orbit High temporal resolution: < 24 hours - 3 days, Medium temporal resolution: 4 - 16 days Low temporal resolution: > 16 days
Radiometric resolution Radiometric resolution of a sensor is a measure of how many grey levels are measured between pure black (no reflectance) to pure white. In other words, radiometric resolution represents the sensitivity of the sensor to the magnitude of the electromagnetic energy. The finer the radiometric resolution of a sensor the more sensitive it is to detecting small differences in reflected or emitted energy or in other words the system can measure more number of grey levels. Radiometric resolution is measured in bits.. Each bit records an exponent of power 2 (e.g. 1 bit = 21 = 2). The maximum number of brightness levels available depends on the number of bits used in representing the recorded energy.
SENSORS Device to detect the electro-magnetic radiation reflected or emitted from an object is called a "remote sensor" or "sensor".(or) Sensor refers to the sensing mechanism that receives the electromagnetic energy and record it. (or) The device that receives electromagnetic radiation and converts it into a signal that can be recorded and displayed as either numeric data or image Cameras or scanners are examples of remote sensors The camera is the sensor in the visible length. In the case of satellite mounted sensors, they are called scanners which senses the objects in the forms of levels of grey in the digital format of the energy reflected The sensor records radiation from the earth surface as the satellite goes around the earth. The width of the recorded area is called swath width. The swath width vary according to type of sensor
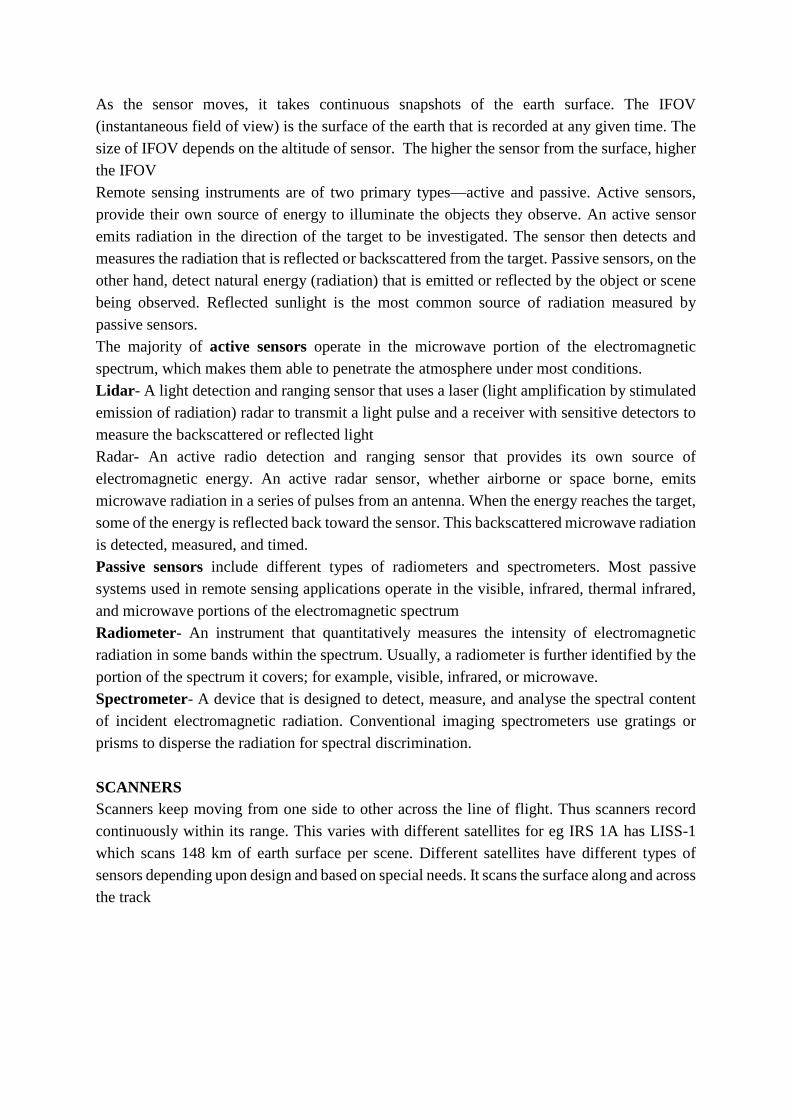
As the sensor moves, it takes continuous snapshots of the earth surface. The IFOV (instantaneous field of view) is the surface of the earth that is recorded at any given time. The size of IFOV depends on the altitude of sensor. The higher the sensor from the surface, higher the IFOV Remote sensing instruments are of two primary types—active and passive. Active sensors, provide their own source of energy to illuminate the objects they observe. An active sensor emits radiation in the direction of the target to be investigated. The sensor then detects and measures the radiation that is reflected or backscattered from the target. Passive sensors, on the other hand, detect natural energy (radiation) that is emitted or reflected by the object or scene being observed. Reflected sunlight is the most common source of radiation measured by passive sensors. The majority of active sensors operate in the microwave portion of the electromagnetic spectrum, which makes them able to penetrate the atmosphere under most conditions. Lidar - A light detection and ranging sensor that uses a laser (light amplification by stimulated emission of radiation) radar to transmit a light pulse and a receiver with sensitive detectors to measure the backscattered or reflected light Radar- An active radio detection and ranging sensor that provides its own source of electromagnetic energy. An active radar sensor, whether airborne or space borne, emits microwave radiation in a series of pulses from an antenna. When the energy reaches the target, some of the energy is reflected back toward the sensor. This backscattered microwave radiation is detected, measured, and timed. Passive sensors include different types of radiometers and spectrometers. Most passive systems used in remote sensing applications operate in the visible, infrared, thermal infrared, and microwave portions of the electromagnetic spectrum Radiometer- An instrument that quantitatively measures the intensity of electromagnetic radiation in some bands within the spectrum. Usually, a radiometer is further identified by the portion of the spectrum it covers; for example, visible, infrared, or microwave. Spectrometer- A device that is designed to detect, measure, and analyse the spectral content of incident electromagnetic radiation. Conventional imaging spectrometers use gratings or prisms to disperse the radiation for spectral discrimination.
SCANNERS Scanners keep moving from one side to other across the line of flight. Thus scanners record continuously within its range. This varies with different satellites for eg IRS 1A has LISS-1 which scans 148 km of earth surface per scene. Different satellites have different types of sensors depending upon design and based on special needs. It scans the surface along and across the track
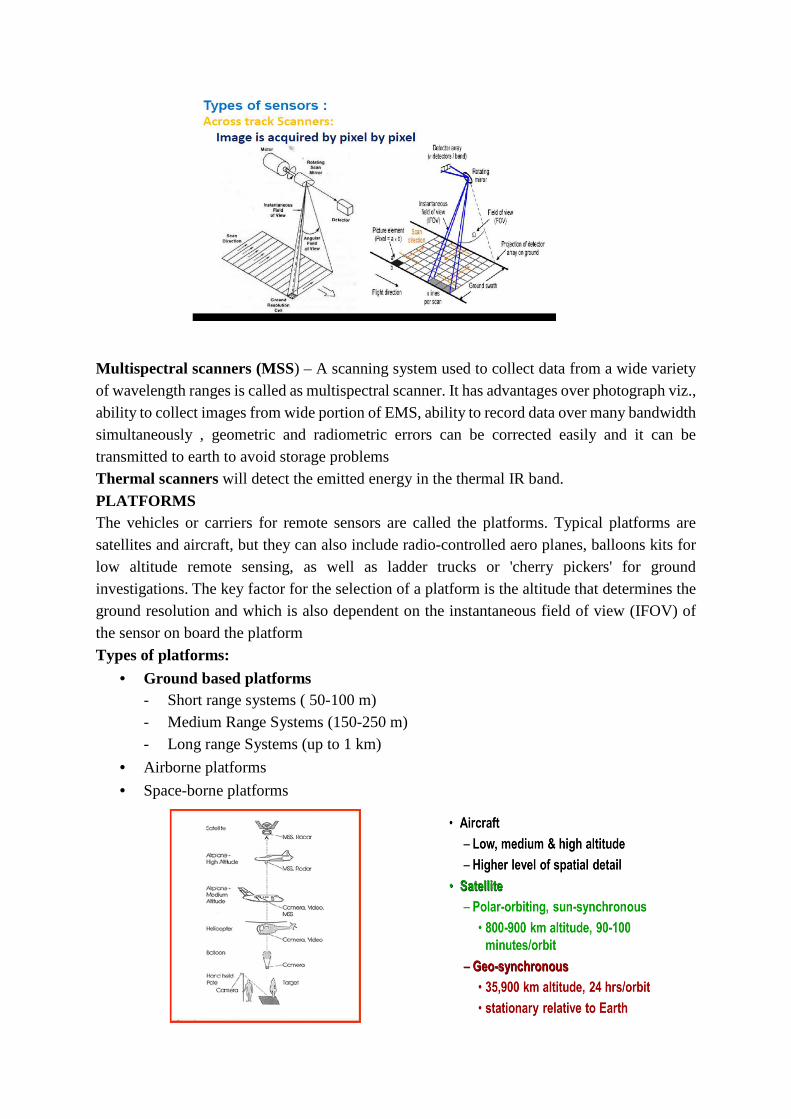
Multispectral scanners (MSS) – A scanning system used to collect data from a wide variety of wavelength ranges is called as multispectral scanner. It has advantages over photograph viz., ability to collect images from wide portion of EMS, ability to record data over many bandwidth simultaneously , geometric and radiometric errors can be corrected easily and it can be transmitted to earth to avoid storage problems Thermal scanners will detect the emitted energy in the thermal IR band.
PLATFORMS The vehicles or carriers for remote sensors are called the platforms. Typical platforms are satellites and aircraft, but they can also include radio-controlled aero planes, balloons kits for low altitude remote sensing, as well as ladder trucks or 'cherry pickers' for ground investigations. The key factor for the selection of a platform is the altitude that determines the ground resolution and which is also dependent on the instantaneous field of view (IFOV) of the sensor on board the platform
Types of platforms:
• Ground based platforms - Short range systems ( 50-100 m) - Medium Range Systems (150-250 m) - Long range Systems (up to 1 km)
• Airborne platforms
• Space-borne platforms
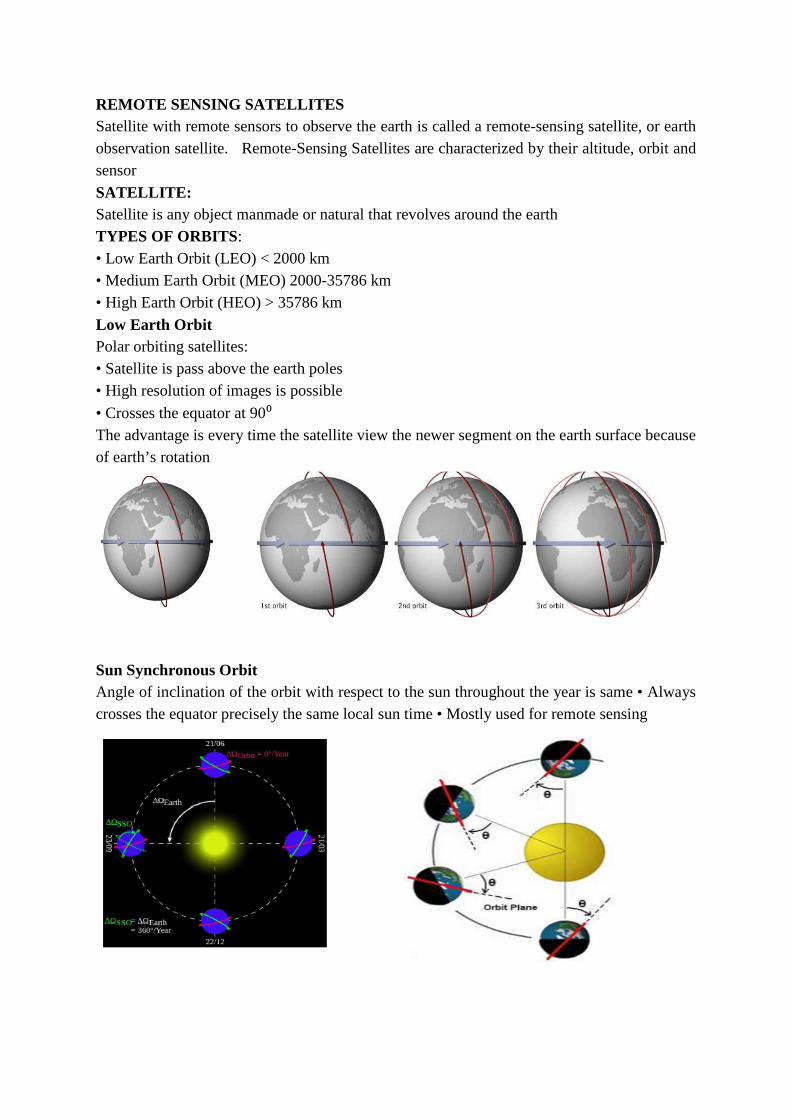
REMOTE SENSING SATELLITES Satellite with remote sensors to observe the earth is called a remote-sensing satellite, or earth observation satellite. Remote-Sensing Satellites are characterized by their altitude, orbit and sensor
SATELLITE: Satellite is any object manmade or natural that revolves around the earth TYPES OF ORBITS: • Low Earth Orbit (LEO) < 2000 km • Medium Earth Orbit (MEO) 2000-35786 km • High Earth Orbit (HEO) > 35786 km
Low Earth Orbit Polar orbiting satellites: • Satellite is pass above the earth poles • High resolution of images is possible
• Crosses the equator at 90⁰ The advantage is every time the satellite view the newer segment on the earth surface because of earth’s rotation
Sun Synchronous Orbit Angle of inclination of the orbit with respect to the sun throughout the year is same • Always crosses the equator precisely the same local sun time • Mostly used for remote sensing

Near polar orbit • Orbital plane inclined at small angle with respect to the earth rotational axis For eg Landsat, IRS1A, IRs1B, IRS 1C, IRS1D
High Earth Orbit Geostationary Orbits A geostationary (GEO=geosynchronous) orbit is one in which the satellite is always in the same position with respect to the rotating Earth. The satellite orbits at an elevation of approximately 35,790 km because that produces an orbital period (time for one orbit) equal to the period of rotation of the Earth (23 hrs, 56 mins, 4.09 secs). By orbiting at the same rate, in the same direction as Earth, the satellite appears stationary (synchronous with respect to the rotation of the Earth). Geostationary satellites provide a "big picture" view, enabling coverage of weather events. This is especially useful for monitoring severe local storms and tropical cyclones. Satellites rotate around the equatorial plane and it is used mainly for weather and communication purpose Eg NOAA, INSAT-1A, 1B, 2A, 2B, 2C, 2D
Choice of orbit: • It is dependent on the its mission • Remote sensing satellites placed in LEO because it needs high resolution • Commercial broadcast or Communication satellites are provided in HEO because it should receive and send signals from large geographical are
DATA PRE- PROCESSING The data acquired by the sensor suffers from number of errors. The errors are due to 1) Imaging characteristics of the sensor 2) Non- uniformity of illumination Radiometric error 3) Atmospheric effects

4) Scene surface characteristics 5) Stability and orbit characteristics of the platform Geometric error 6) Motion of the earth and earth curvature Data acquired from the sensor is processed to correct these errors so that inherent quality of the original information scene is brought (Geocoded)
DATA INTERPRETATIONS One of the most widespread techniques for data interpretation involves the transformation of the captured data into an image and the visual or computer-assisted analysis of that image. The term image is used for any pictorial representation of the data. There are two types of images: a photograph and a digital image. Although a digital image appears to be a continuous tone photograph, it is actually composed of a two-dimensional array of discrete picture elements called pixels. Nature of the Image Image – model target features described through the use of spectral reflectance. Software and hardware specially designed to analyse these images give us the ability to see a pictorial rendition of targets. Images that we see on a computer screen are made up of picture elements called pixels .Pixel - picture element having both spatial and spectral properties. The spatial property defines the "on ground" height and width. The spectral property defines the intensity of spectral response for a cell in a particular band Human eyes only ‘measure’ visible light. Sensors can measure other portions of EMS
Types of images 1) Panchromatic Images 2) True colour composite 3) False color composite
Panchromatic Images A panchromatic image consists of only one band. It is usually displayed as a grey scale image, i.e. the displayed brightness of a particular pixel is proportional to the pixel digital number which is related to the intensity of solar radiation reflected by the targets in the pixel and detected by the detector. Thus, a panchromatic image may be similarly interpreted as a black-and-white aerial photograph of the area.
Multispectral Images A multispectral image consists of several bands of data. For visual display, each band of the image may be displayed one band at a time as a grey scale image, or in combination of three

bands at a time as a colour composite image. Interpretation of a multispectral colour composite image will require the knowledge of the spectral reflectance signature of the targets in the scene. In this case, the spectral information content of the image is utilized in the interpretation. The following three images show the three bands of a multispectral image extracted from a SPOT multispectral scene at a ground resolution of 20 m. The area covered is the same as that shown in the above panchromatic image. Note that both the XS1 (green) and XS2 (red) bands look almost identical to the panchromatic image shown above. In contrast, the vegetated areas now appear bright in the XS3 (near infrared) band due to high reflectance of leaves in the near infrared wavelength region. Several shades of grey can be identified for the vegetated areas, corresponding to different types of vegetation. Water mass (both the river and the sea) appear dark in the XS3 (near IR) band. SPOT XS1 (green band) SPOT XS2 (red band) SPOT XS3 (Near IR band)
Colour Composite Images In displaying a colour composite image, three primary colours (red, green and blue) are used. When these three colours are combined in various proportions, they produce different colours in the visible spectrum. Associating each spectral band (not necessarily a visible band) to a separate primary colour results in a colour composite image
True Colour Composite If a multispectral image consists of the three visual primary colour bands (red, green, blue), the three bands may be combined to produce a "true colour" image. For example, the bands 3 (red band), 2 (green band) and 1 (blue band) of a LANDSAT TM image or an IKONOS multispectral image can be assigned respectively to the R, G, and B colours for display. In this way, the colours of the resulting colour composite image resemble closely what would be observed by the human eyes.
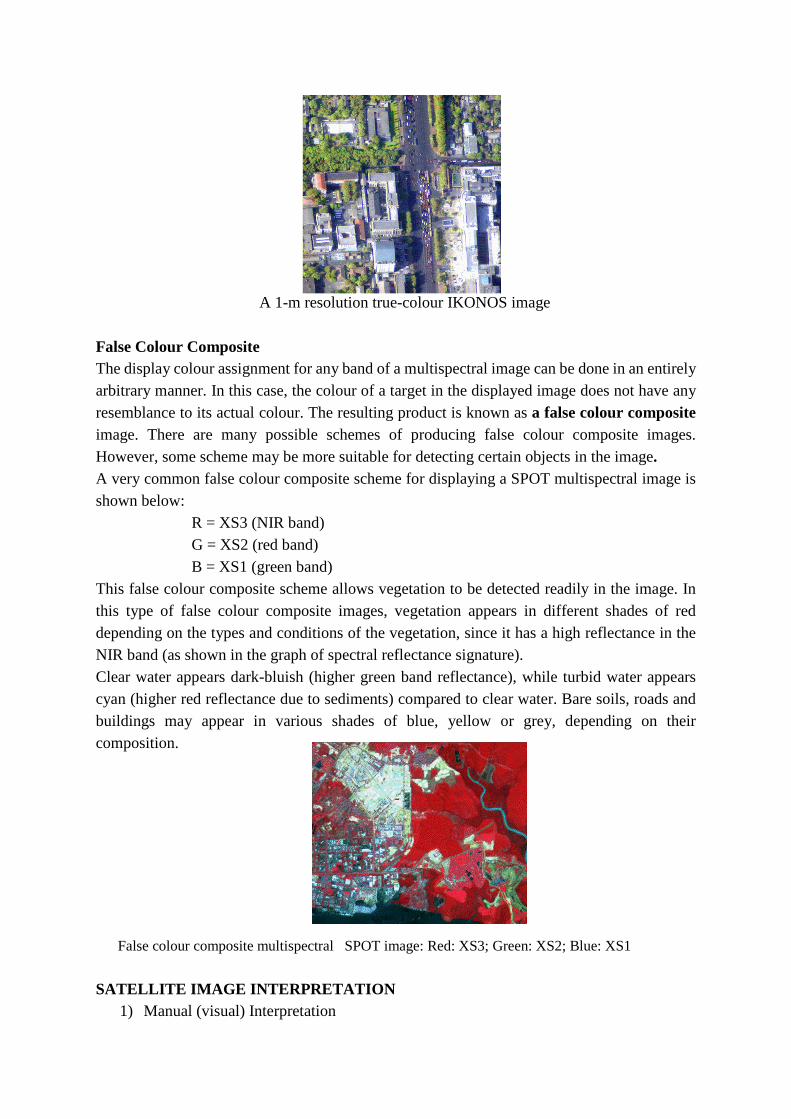
A 1-m resolution true-colour IKONOS image
False Colour Composite The display colour assignment for any band of a multispectral image can be done in an entirely arbitrary manner. In this case, the colour of a target in the displayed image does not have any resemblance to its actual colour. The resulting product is known as a false colour composite image. There are many possible schemes of producing false colour composite images. However, some scheme may be more suitable for detecting certain objects in the image. A very common false colour composite scheme for displaying a SPOT multispectral image is shown below: R = XS3 (NIR band) G = XS2 (red band) B = XS1 (green band) This false colour composite scheme allows vegetation to be detected readily in the image. In this type of false colour composite images, vegetation appears in different shades of red depending on the types and conditions of the vegetation, since it has a high reflectance in the NIR band (as shown in the graph of spectral reflectance signature). Clear water appears dark-bluish (higher green band reflectance), while turbid water appears cyan (higher red reflectance due to sediments) compared to clear water. Bare soils, roads and buildings may appear in various shades of blue, yellow or grey, depending on their composition. False colour composite multispectral SPOT image: Red: XS3; Green: XS2; Blue: XS1
SATELLITE IMAGE INTERPRETATION 1) Manual (visual) Interpretation
2) Digital image interpretation i.e. by a human interpreter imagery displayed in a pictorial or photograph-type format, or a digital image on a computer screen False color composite (FCC) is used for visual Visual interpretation is based on relating colours and patterns to real-world features Seven interpretation elements provide guidelines to recognise certain objects a) tone/hue, b) texture, c) pattern, d) shape, e) size f) height/elevation g) location/association
• Tone is the relative brightness in a black-and-white image. Tonal variations are related to the amount of light reflected
• Texture relates to the frequency of tonal change and may be described as coarse or fine, smooth or rough, etc
• Pattern refers to spatial arrangement: concentric, radial, checkerboard, rivers with their branches, patterns related to erosion,
• Shape or form characterises the two-dimensional projection and the height of an object. • Size can be considered in a relative or absolute sense • Height is important for distinguishing among different vegetation types, building types,
etc. • Location/association refers to the situation in the terrain or in relation to its
surroundings 2) Digital interpretation It is done through digital image processing. It is defined as Computer-based manipulation
and interpretation of digital images Digital image processing focuses on two major tasks � Improvement of pictorial information for human interpretation � processing of image data for storage, transmission and representation for autonomous machine perception In digital image processing, two types of classification is adopted a) Unsupervised (calculated by software) and b) supervised (human-guided) classification.
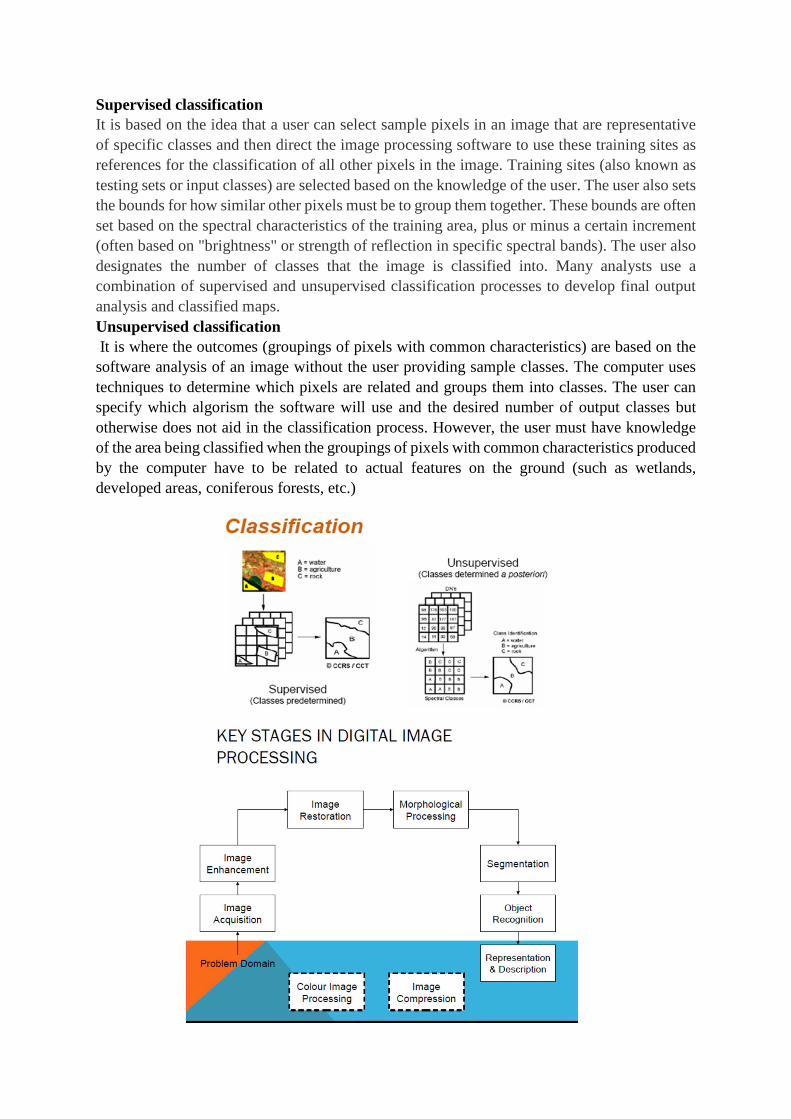
Supervised classification It is based on the idea that a user can select sample pixels in an image that are representative of specific classes and then direct the image processing software to use these training sites as references for the classification of all other pixels in the image. Training sites (also known as testing sets or input classes) are selected based on the knowledge of the user. The user also sets the bounds for how similar other pixels must be to group them together. These bounds are often set based on the spectral characteristics of the training area, plus or minus a certain increment (often based on "brightness" or strength of reflection in specific spectral bands). The user also designates the number of classes that the image is classified into. Many analysts use a combination of supervised and unsupervised classification processes to develop final output analysis and classified maps. Unsupervised classification It is where the outcomes (groupings of pixels with common characteristics) are based on the software analysis of an image without the user providing sample classes. The computer uses techniques to determine which pixels are related and groups them into classes. The user can specify which algorism the software will use and the desired number of output classes but otherwise does not aid in the classification process. However, the user must have knowledge of the area being classified when the groupings of pixels with common characteristics produced by the computer have to be related to actual features on the ground (such as wetlands, developed areas, coniferous forests, etc.)

APPLICATION OF REMOTE SENSING IN AGRICULTURE Remote sensing has been found to be a valuable tool in evaluation, monitoring and management of land, water and crop resources. The launching of the Indian remote sensing satellite (IRS) has enhanced the capabilities for better utilization of this technology and significant progress has been made in soil and land cover mapping, land degradation studies, monitoring of waste land, assessment of crop conditions crop acreage and production estimates (Das, 2000). Applications in agriculture 1. Crop identification 2. Crop acreage estimation 3. Crop condition assessment and stress detection 4. Identification of planting and harvesting dates 5. Crop yield modelling and estimation 6. Identification of pest and disease infestation 7. Soil moisture estimation 8. Irrigation monitoring and management 9. Soil mapping 10. Monitoring of droughts 11. Land cover and land degradation mapping 12. Identification of problematic soils 1) Crop production forecasting: Remote sensing is used to forecast the expected crop
production and yield over a given area and determine how much of the crop will be harvested under specific conditions. Researchers can be able to predict the quantity of crop that will be produced in a given farmland over a given period of time.
2). Assessment of crop damage and crop progress: In the event of crop damage or crop progress, remote sensing technology can be used to penetrate the farmland and determine
exactly how much of a given crop has been damaged and the progress of the remaining crop in the farm. 3) Crop Identification : Remote sensing has also played an important role in crop identification especially in cases where the crop under observation is mysterious or shows some mysterious characteristics. The data from the crop is collected and taken to the labs where various aspects of the crop including the crop culture are studied. 4) Crop acreage estimation: Remote sensing has also played a very important role in the estimation of the farmland on which a crop has been planted. This is usually a cumbersome procedure if it is carried out manually because of the vast sizes of the lands being estimated. 5) Crop condition assessment and stress detection: Remote sensing technology plays an important role in the assessment of the health condition of each crop and the extent to which the crop has withstood stress. This data is then used to determine the quality of the crop. 6) Identification of planting and harvesting dates: Because of the predictive nature of the remote sensing technology, farmers can now use remote sensing to observe a variety of factors including the weather patterns and the soil types to predict the planting and harvesting seasons of each crop. 7) Crop yield modelling and estimation: Remote sensing also allows farmers and experts to predict the expected crop yield from a given farmland by estimating the quality of the crop and the extent of the farmland. This is then used to determine the overall expected yield of the crop. 8) Identification of pests and disease infestation: Remote sensing technology also plays a significant role in the identification of pests in farmland and gives data on the right pests control mechanism to be used to get rid of the pests and diseases on the farm. 9) Soil moisture estimation: Soil moisture can be difficult to measure without the help of remote sensing technology. Remote sensing gives the soil moisture data and helps in determining the quantity of moisture in the soil and hence the type of crop that can be grown in the soil. 10) Irrigation monitoring and management: Remote sensing gives information on the moisture quantity of soils. This information is used to determine whether a particular soil is moisture deficient or not and helps in planning the irrigation needs of the soil. 11) Soil mapping: Soil mapping is one of the most common yet most important uses of remote sensing. Through soil mapping, farmers are able to tell what soils are ideal for which crops and what soil require irrigation and which ones do not. This information helps in precision agriculture. 12) Monitoring of droughts : Remote sensing technology is used to monitor the weather patterns including the drought patterns over a given area. The information can be used to predict the rainfall patterns of an area and also tell the time difference between the current rainfall and the next rainfall which helps to keep track of the drought. 13) Land cover and land degradation mapping: Remote sensing has been used by experts to map out the land cover of a given area. Experts can now tell what areas of the land have been degraded and which areas are still intact. This also helps them in implementing measures to curb land degradation. 14) Identification of problematic soils: Remote sensing has also played a very important role in the identification of problematic soils that have a problem in sustaining optimum crop yield throughout a planting season. 15) Crop nutrient deficiency detection: Remote sensing technology has also helped farmers and other agricultural experts to determine the extent of crop nutrients deficiency and come up
with remedies that would increase the nutrients level in crops hence increasing the overall crop yield. 16) Reflectance modelling: Remote sensing technology is just about the only technology that can provide data on crop reflectance. Crop reflectance will depend on the amount of moisture in the soil and the nutrients in the crop which may also have a significant impact on the overall crop yield. 17) Determination of water content of field crops: Apart from determining the soil moisture content, remote sensing also plays an important role in the estimation of the water content in the field crops. 18) Crop yield forecasting: Remote sensing technology can give accurate estimates of the expected crop yield in a planting season using various crop information such as the crop quality, the moisture level in the soil and in the crop and the crop cover of the land. When all of this data is combined it gives almost accurate estimates of the crop yield. 19) Flood mapping and monitoring: Using remote sensing technology, farmers and agricultural experts can be able to map out the areas that are likely to be hit by floods and the areas that lack proper drainage. This data can then be used to avert any flood disaster in future. 20) Collection of past and current weather data: Remote sensing technology is ideal for collection and storing of past and current weather data which can be used for future decision making and prediction. 21) Crop intensification: Remote sensing can be used for crop intensification that includes collection of important crop data such as the cropping pattern, crop rotation needs and crop diversity over a given soil. 22) Water resources mapping: Remote sensing is instrumental in the mapping of water resources that can be used for agriculture over a given farmland. Through remote sensing, farmers can tell what water resources are available for use over a given land and whether the resources are adequate. 23) Precision farming: Remote sensing has played a very vital role in precision agriculture. Precision agriculture has resulted in the cultivation of healthy crops that guarantees farmers optimum harvests over a given period of time. 24) Climate change monitoring: Remote sensing technology is important in monitoring of climate change and keeping track of the climatic conditions which play an important role in the determination of what crops can be grown where. 25) Soil management practices: Remote sensing technology is important in the determination of soil management practices based on the data collected from the farms. 26) Air moisture estimation: Remote sensing technology is used in the estimation of air moisture which determines the humidity of the area. The level of humidity determines the type of crops to be grown within the area. 27) Land mapping: Remote sensing helps in mapping land for use for various purposes such as crop growing and landscaping. The mapping technology used helps in precision agriculture where specific land soils are used for specific purposes ADVANTAGES OF REMOTE SENSING 1) Improved vantage point that is synoptic view or birds view 2) Broadened spectral sensitivity 3) Increased spatial resolution 4) 3 D perspective

5) Capability to stop action 6) Historical record 7) Comparability of data 8) Receptivity 9) Rapid data collection 10) Quantitative analysis 11) Coverage of inaccessible areas 12) Cost savings
DISADVANTAGES OF REMOTE SENSING 1) Expensive for small areas especially for one time analysis 2) Requires specialized training to interpret images 3) Remote Sensing instruments often become uncalibrated, resulting in uncalibrated remote
sensing data.
REMOTE SENSING IN INDIA National Remote Sensing Centre (NRSC) at Hyderabad is responsible for remote sensing satellite data acquisition and processing, data dissemination, aerial remote sensing and decision support for disaster management. NRSC has a data reception station at Shadnagar near Hyderabad for acquiring data from Indian remote sensing satellites as well as others. NRSC Ground station at Shadnagar acquires Earth Observation data from Indian remote-sensing satellites as well as from different foreign satellites. NRSC is also engaged in executing remote sensing application projects in collaboration with the users. The Aerial Services and Digital Mapping (ASDM) Area provides end-to-end Aerial Remote Sensing services and value-added solutions for various large scale applications like aerial photography and digital mapping, infrastructure planning, scanner surveys, aeromagnetic surveys, large scale base map, topographic and cadastral level mapping, etc. Regional Remote Sensing Centres (RRSCs) support various remote sensing tasks specific to their regions as well as at the national level. RRSCs are carrying out application projects encompassing all the fields of natural resources. RRSCs are also, involved in software development, customisation and packaging specific to user requirements and conducting regular training programmes for users in geo-spatial technology, particularly digital image processing and Geographical Information System (GIS) applications.
Launching vehicles The Geosynchronous Satellite Launch Vehicle usually known by its abbreviation, GSLV operated by the Indian Space Research Organization (ISRO). It was developed to enable India to launch INSAT-type satellites into geostationary orbit and to make India less dependent on foreign rockets. The Polar Satellite Launch Vehicle commonly known by its abbreviation PSLV, developed and operated by the Indian Space Research Organization (ISRO). It was developed to allow India to launch its Indian Remote Sensing (IRS) satellites into sun synchronous orbits The Polar Satellite Launch Vehicle (PSLV-C42) of Indian Space Research Organisation (ISRO) today (16 Sept 2018, Sunday) successfully launched two satellites -- NovaSAR and S1-4

IRS launch log The initial versions are composed of the 1 (A, B, C, D). The later versions are named based on their area of application including OceanSat, CartoSat, and ResourceSat. Some of the satellites have alternate designations based on the launch number and vehicle (P series for PSLV).
Serial No. Satellite Date of Launch Launch Vehicle Status
1 IRS-1A 17 March 1988 Vostok, USSR Mission Completed
2 IRS-1B 29 August 1991 Vostok, USSR Mission Completed
3 IRS-P1 (also IE) 20 September 1993 PSLV-D1
Crashed, due to launch failure of PSLV
4 IRS-P2 15 October 1994 PSLV-D2 Mission Completed
5 IRS-1C 28 December 1995 Molniya, Russia Mission Completed
6 IRS-P3 21 March 1996 PSLV-D3 Mission Completed
7 IRS 1D 29 September 1997 PSLV-C1 Mission Completed
8 IRS-P4 (Oceansat-1) 27 May 1999 PSLV-C2 Mission Completed
9 Technology Experiment Satellite (TES)
22 October 2001 PSLV-C3 Mission Completed
10 IRS P6 (Resourcesat-1) 17 October 2003 PSLV-C5 In Service
11 IRS P5 (Cartosat 1) 5 May 2005 PSLV-C6 In Service
12 IRS P7 (Cartosat 2) 10 January 2007 PSLV-C7 In Service
13 Cartosat 2A 28 April 2008 PSLV-C9 In Service
14 IMS 1 28 April 2008 PSLV-C9 In Service
15 Oceansat-2 23 September 2009 PSLV-C14 In Service
16 Cartosat-2B 12 July 2010 PSLV-C15 In Service
17 Resourcesat-2 20 April 2011 PSLV-C16 In Service
18 Megha- Tropiques 12 October 2011 PSLV-C18 In Service
19 RISAT-1 26 April 2012 PSLV-C19 In Service
20 SARAL 25 Feb 2013 PSLV-C20 In Service
21 RESOURCESAT-2A 07 Dec 2016 PSLV-C36 In Service
22 Cartosat-2D 15 Feb 2017 PSLV-C37 In Service
23 Cartosat-2E 23 June 2017 PSLV-C38 In Service
Communication satellites The Indian National Satellite (INSAT) system is one of the largest domestic communication satellite systems in Asia-Pacific region with nine operational communication satellites placed in Geo-stationary orbit. Established in 1983 with commissioning of INSAT-1B, it initiated a major revolution in India’s communications sector and sustained the same later. GSAT-17 joins the constellation of INSAT System consisting 15 operational satellites, namely - INSAT-3A, 3C, 4A, 4B, 4CR and GSAT-6, 7, 8, 9, 10, 12, 14, 15, 16 and 18. The INSAT system with more than 200 transponders in the C, Extended C and Ku-bands provides services to telecommunications, television broadcasting, satellite

newsgathering, societal applications, weather forecasting, disaster warning and Search and Rescue operations
FACT FILE • The father of remote sensing in India is Pisharoth Rama Pisharoty
• The first Indian remote sensing satellite is IRS 1A launched March 1988
• India’s first experimental remote sensing geostationary satellite is APPLE June 1981
• First satellite launched by India is aryabatta from Soviet Union April 1975
• Father of modern space science in India Dr Vikram Sarabhai
• Currently, 13 operational satellites are in Sun-synchronous orbit and 4 in Geostationary orbit

Lecture 24
AERIAL PHOTOGRAPHY What is aerial photography? Aerial photography (or airborne imagery) is the taking of photographs from an aircraft or other flying object. Platforms for aerial photography include fixed-wing aircraft, helicopters, unmanned aerial vehicles (UAVs or "drones"), balloons, blimps and dirigibles, rockets, pigeons, kites, parachutes, stand-alone telescoping and vehicle-mounted poles. Mounted cameras may be triggered remotely or automatically; hand-held photographs may be taken by a photographer.
History of aerial photography Aerial photography was first practiced by the French photographer and balloonist Gaspard-Félix Tournachon, known as "Nadar", in 1858 over Paris, France. However, the photographs he produced no longer exist and therefore the earliest surviving aerial photograph is titled 'Boston, as the Eagle and the Wild Goose See It.' Taken by James Wallace Black and Samuel Archer King on October 13, 1860, it depicts Boston from a height of 630m. Aerial photography
was pioneered by British meteorologist E.D. Archibald in 1882. He used an explosive charge on a timer to take photographs from the air.[5] Frenchman Arthur Batut began using kites for photography in 1888, and wrote a book on his methods in 1890. Samuel Franklin Cody developed his advanced 'Man-lifter War Kite' and succeeded in interesting the British War Office with its capabilities. The use of aerial photography rapidly matured during the war, as reconnaissance aircraft were equipped with cameras to record enemy movements and defences.
Definition Aerial photography is defined as science of taking photographs form the point in the air for the purpose of making some study about the earth surface
Attributes of aerial photography Aerial photography and its planning generally includes selection of types of aeroplane and camera, trend of run, film and filter combinations, which is important for aerial photo interpretation. Most of the conventional aerial photography is done at 1: 30,000 to 1:60,000 scale on a conventional black and white panchromatic film. The scale of the photography further depends on objectives of the work, which governs the speed of the aircraft and its flying height and camera type used. In aerial photography for more specific and detailed information such as land use planning, town planning, mineral exploration, large scale photograph on scale 1: 5000 to 1: 10,000 are most suitable . In such type of aerial photographs, low speed aeroplane ( 200 to 350 kmph) are used and flying height is normally not more than 8000 to 10,000 m. Low flying speed and height are one of the most important aspects in obtaining sufficiently large scale photographs with sharp image of objects There should be complete stereographic coverage of terrain i.e. all features of the terrain should occur on at least two photographs for stereoscopic viewing. Photographs are taken in runs in the direction of flight in such away there will be minimum 60% overlap between adjacent photos and 30 % side lap between adjacent runs. The quality of aerial photographs depends on a) Flight and weather condition, camera lens, film and filters and developing and printing process. As far as possible photograph should
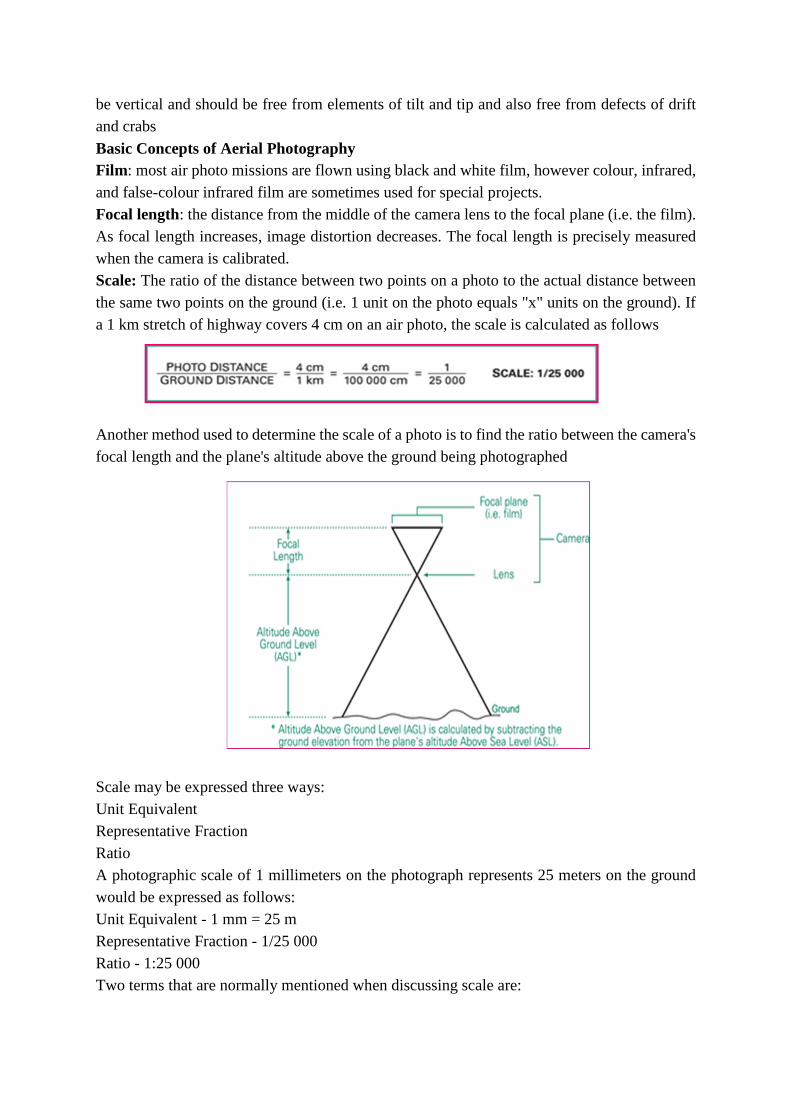
be vertical and should be free from elements of tilt and tip and also free from defects of drift and crabs
Basic Concepts of Aerial Photography Film : most air photo missions are flown using black and white film, however colour, infrared, and false-colour infrared film are sometimes used for special projects. Focal length: the distance from the middle of the camera lens to the focal plane (i.e. the film). As focal length increases, image distortion decreases. The focal length is precisely measured when the camera is calibrated. Scale: The ratio of the distance between two points on a photo to the actual distance between the same two points on the ground (i.e. 1 unit on the photo equals "x" units on the ground). If a 1 km stretch of highway covers 4 cm on an air photo, the scale is calculated as follows
Another method used to determine the scale of a photo is to find the ratio between the camera's focal length and the plane's altitude above the ground being photographed Scale may be expressed three ways: Unit Equivalent Representative Fraction Ratio A photographic scale of 1 millimeters on the photograph represents 25 meters on the ground would be expressed as follows: Unit Equivalent - 1 mm = 25 m Representative Fraction - 1/25 000 Ratio - 1:25 000 Two terms that are normally mentioned when discussing scale are:

Large Scale - Larger-scale photos (e.g. 1/25000) cover small areas in greater detail. A large scale photo simply means that ground features are at a larger, more detailed size. The area of ground coverage that is seen on the photo is less than at smaller scales. Small Scale - Smaller-scale photos (e.g. 1/50000) cover large areas in less detail. A small scale photo simply means that ground features are at a smaller, less detailed size. The area of ground coverage that is seen on the photo is greater than at larger scales Overlap: It is the amount by which one photograph includes the area covered by another photograph, and is expressed as a percentage. The photo survey is designed to acquire 60 per cent forward overlap (between photos along the same flight line) and 30 per cent lateral overlap (between photos on adjacent flight lines).
Stereoscopic Coverage: The three-dimensional view which results when two overlapping photos (called a stereo pair), are viewed using a stereoscope. Each photograph of the stereo pair provides a slightly different view of the same area, which the brain combines and interprets as a 3-D view. Ground control points (GCP) A point on the surface of the earth of known location (i.e. latitude, longitude) which is used to geo-reference Image data sources, such as remotely sensed images or scanned maps. GCPs are recognizable on both remotely sensed images, maps and aerial photographs and can be accurately located on each of these.
Drift Drift is the lateral shift or displacement of the aircraft from the planned flight line caused by the action of wind, navigational errors, or others like carelessness of the pilot. Drift may cause serious gap in the photographic coverage between adjoining strips of photographs. �For excessive drifts (more than 50), reflight is necessary
Planned flight line

Crab Crab is the condition caused by the failure to orient the camera with respect to the planned flight line. Crab should not affect more than 5% of the photograph
Tilt Tilt is the displacement of the optical line of the camera from its original position during taking vertical photographs. Distortion Distortion is any shift in position of an image on a photograph that alters the perspective characteristic of the image.
Displacement Displacement is any shift in the position of an image on a photograph that does not alter the perspective characteristic of the photograph
Three photo centers • Principal Point - The principal point is the point where the perpendicular projected through
the center of the lens intersects the photo image
• Nadir - The Nadir is the point vertically beneath the camera center at the time of exposure.
• Iso center - The point on the photo that falls on a line half- way between the principal point and the Nadir point.
Principal point isocentre Nadir Stereo and Non-Stereo Imagery Stereoscopic imagery is the result of overlap, which is the amount by which one photograph includes an area covered by a neighbouring photograph. Air photo coverage is generally designed to provide about 60 percent forward overlap between photographs. This allows
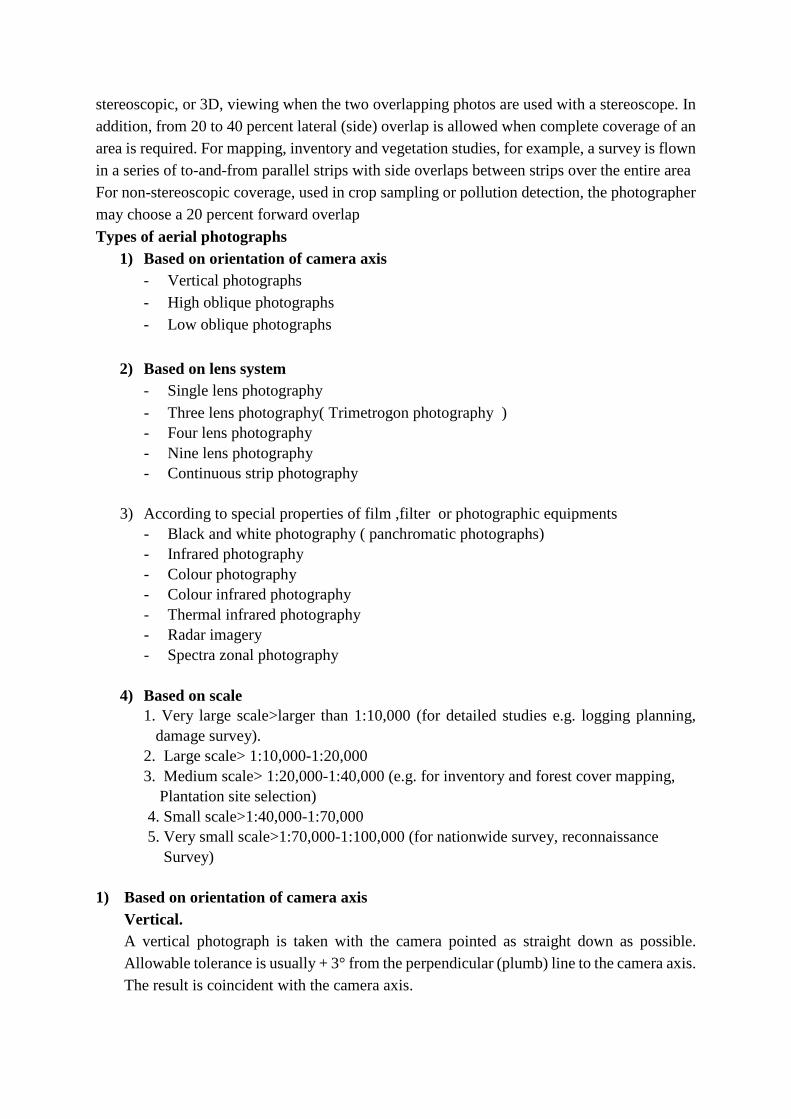
stereoscopic, or 3D, viewing when the two overlapping photos are used with a stereoscope. In addition, from 20 to 40 percent lateral (side) overlap is allowed when complete coverage of an area is required. For mapping, inventory and vegetation studies, for example, a survey is flown in a series of to-and-from parallel strips with side overlaps between strips over the entire area For non-stereoscopic coverage, used in crop sampling or pollution detection, the photographer may choose a 20 percent forward overlap
Types of aerial photographs 1) Based on orientation of camera axis
- Vertical photographs - High oblique photographs - Low oblique photographs
2) Based on lens system - Single lens photography - Three lens photography( Trimetrogon photography ) - Four lens photography - Nine lens photography - Continuous strip photography
3) According to special properties of film ,filter or photographic equipments
- Black and white photography ( panchromatic photographs) - Infrared photography - Colour photography - Colour infrared photography - Thermal infrared photography - Radar imagery - Spectra zonal photography
4) Based on scale
1. Very large scale>larger than 1:10,000 (for detailed studies e.g. logging planning, damage survey). 2. Large scale> 1:10,000-1:20,000 3. Medium scale> 1:20,000-1:40,000 (e.g. for inventory and forest cover mapping, Plantation site selection) 4. Small scale>1:40,000-1:70,000 5. Very small scale>1:70,000-1:100,000 (for nationwide survey, reconnaissance Survey) 1) Based on orientation of camera axis
Vertical. A vertical photograph is taken with the camera pointed as straight down as possible. Allowable tolerance is usually + 3° from the perpendicular (plumb) line to the camera axis. The result is coincident with the camera axis.

Relationship of the vertical aerial Photograph with the ground Vertical photograph Low Oblique. This is a photograph taken with the camera inclined about 30° from the vertical
Relationship of low oblique photograph to the ground Low oblique photograph High Oblique. The high oblique is a photograph taken with the camera inclined about 60° from the vertical
Relationship of high oblique photograph to the ground High oblique photograph
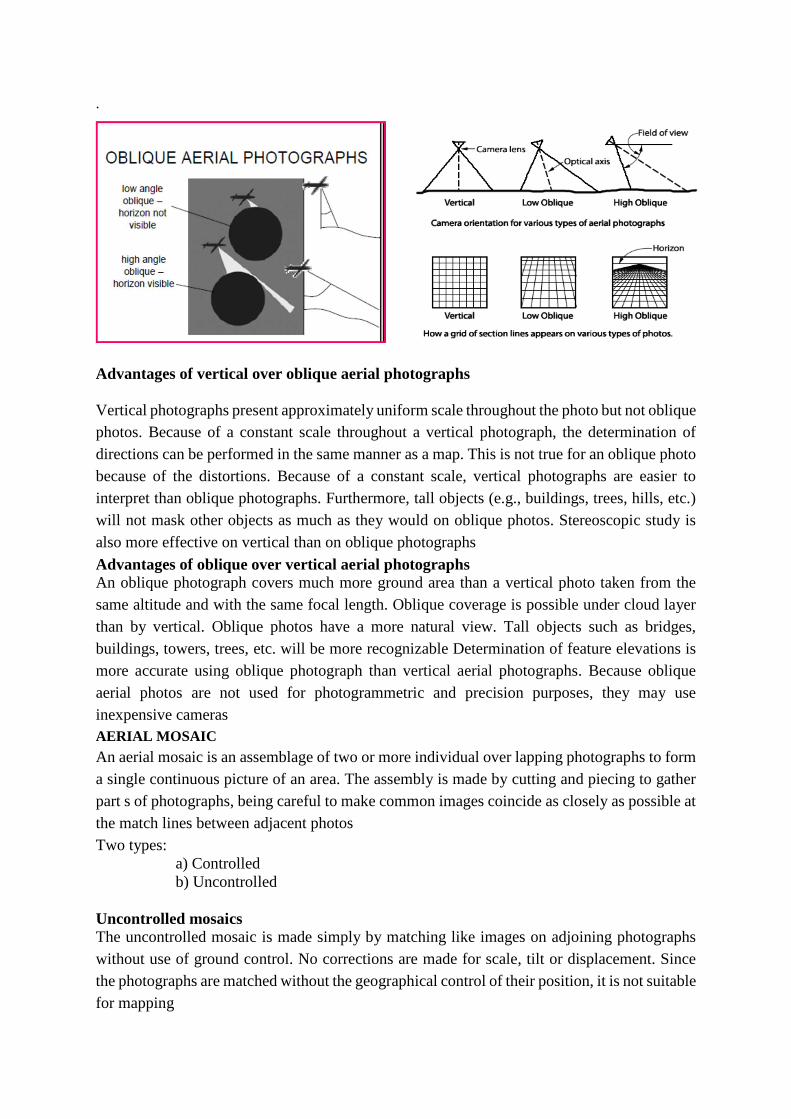
.
Advantages of vertical over oblique aerial photographs Vertical photographs present approximately uniform scale throughout the photo but not oblique photos. Because of a constant scale throughout a vertical photograph, the determination of directions can be performed in the same manner as a map. This is not true for an oblique photo because of the distortions. Because of a constant scale, vertical photographs are easier to interpret than oblique photographs. Furthermore, tall objects (e.g., buildings, trees, hills, etc.) will not mask other objects as much as they would on oblique photos. Stereoscopic study is also more effective on vertical than on oblique photographs
Advantages of oblique over vertical aerial photographs An oblique photograph covers much more ground area than a vertical photo taken from the same altitude and with the same focal length. Oblique coverage is possible under cloud layer than by vertical. Oblique photos have a more natural view. Tall objects such as bridges, buildings, towers, trees, etc. will be more recognizable Determination of feature elevations is more accurate using oblique photograph than vertical aerial photographs. Because oblique aerial photos are not used for photogrammetric and precision purposes, they may use inexpensive cameras AERIAL MOSAIC An aerial mosaic is an assemblage of two or more individual over lapping photographs to form a single continuous picture of an area. The assembly is made by cutting and piecing to gather part s of photographs, being careful to make common images coincide as closely as possible at the match lines between adjacent photos Two types: a) Controlled b) Uncontrolled Uncontrolled mosaics The uncontrolled mosaic is made simply by matching like images on adjoining photographs without use of ground control. No corrections are made for scale, tilt or displacement. Since the photographs are matched without the geographical control of their position, it is not suitable for mapping

Controlled mosaics Aerial photographs are not planimetric map, because they have geometric errors In the controlled mosaics the photographs are adjusted to ground control. Distances and direction are measurable, photographs are brought to correct scale, corrected for tilt and displacement. Each photograph is matched and adjusted so that points on the photograph fall in their geographic position
Advantage: 1) Cover large area in one photograph, so less sheet is needed 2) It can be used to cover a specific area 3) Controlled mosaic has got better accuracy than the individual photograph Disadvantages: 1) It cannot be used for stereoscopic study 2) Accuracy cannot be always assessed by its appearance
STEREOSCOPIC VISION: One of the limitations of the vertical aerial photograph is the lack of apparent relief. Stereoscopic vision (or as it is more commonly known, stereovision or depth perception) is the ability to see three dimensionally or to see length, width, and depth (distance) at the same time. This requires two views of a single object from two slightly different positions. Most people have the ability to see three dimensionally. Whenever an object is viewed, it is seen twice--once with the left eye and once with the right eye. The fusion or blending together of these two images in the brain permits the judgment of depth or distance. In taking aerial photographs, it is rare for only a single picture to be taken. Generally, the aircraft flies over the area to be photographed taking a series of pictures, each of which overlaps the photograph preceding it and the photograph following it so that an unbroken coverage of the area is obtained .The amount of overlap is usually 56 percent, which means that 56 percent of the ground detail appearing on one photo also appears on the next photograph. When a single flight does not give the necessary coverage of an area, additional flights must be made. These additional flights are parallel to the first and must have an overlap between them. This overlap between flights is known as side lap and usually is between 15 and 20 percent. The requirement for stereovision can be satisfied by overlapping photographs if one eye sees the object on one photograph and the other eye sees the same object on another photograph. While this can be done after practice with the eyes alone, it is much easier if an optical aid is used. These optical aids are known as stereoscopes. There are many types of stereoscopes, but only the two most commonly used are discussed in this manual.
Types of stereoscope Pocket stereoscope. The pocket stereoscope, sometimes known as a lens stereoscope, consists of two magnifying lenses using the principle of refraction. mounted in a metal frame. Because of its simplicity and ease of carrying, it is the type used most frequently by military personnel. It gives a distorted images

Mirror stereoscope. The mirror stereoscope is larger, heavier, and more subject to damage than the pocket stereoscope. It consists of four mirrors mounted in a metal frame using the principle of reflection Placement of stereoscope over stereo pair
Air Photo Interpretation Elements Aerial photographs need to be interpreted to simplify the information, using the elements below
Advantages
• Aerial photographs show more ground detail, permit three dimensional view of the features.

• Physical and cultural features are represented infinite detail in aerial photograph.
• It helps in understanding areas which are inaccessible and cover a large area in a shorter time.
• Stereoscope vision or the ability to see the depth is possible in aerial photograph
Disadvantages • Elevations are not shown
• It lacks uniform scale throughout the area because variation in elevation
• Differences of scale between adjoining photographs create some minor difficulties
• Distance and direction cannot be accurately measured because of distortion due to tilt and displacement

Lecture 25
GEOGRAPHIC INFORMATION SYSTEM DEFINITION A GIS is a system of hardware, software and procedures to facilitate the management, manipulation, analysis, modelling, representation and display of geo referenced data to solve complex problems regarding planning and management resources ( or) A geographic Information System (GIS) is a system for capturing, storing, analyzing and managing data and associated attributes which are spatially referenced to the earth Geographic, because data collected is associated with some location in space. Informational , because attributes, or the characteristics (data), about the space is what we want to learn about. System, because there must be a tie from the information to the geography in a seamless operation.
History of development The first known use of the term "geographic information system" was by Roger Tomlinson in the year 1968 in his paper "A Geographic Information System for Regional Planning".
Tomlinson is also acknowledged as the "father of GIS”. He stated that GIS is not a field by itself but rather the common ground between information processing and the many fields utilizing spatial analysis techniques
Why GIS? a) Inventory and monitoring of resources b) To simulate the potential impacts of management alternatives c) Facilitates faster process of operations d) Provides solution for many real world problems with options of many scenarios e) Decision making tool with the support of organized data f) Integrating technology g) Dynamic map display and interactive query h) Very good visualization tool
Technologies that support GIS • Remote Sensing
• Photogrammetry
• Cartography (Manual/Automated)
• Positioning technology
• CAD/CADM
• AM/FM
• Geodesy/Surveying/Mapping
• Geo-ICT Where it is used?
• Natural resource management
• Infrastructure development
• Utility services

• Business applications • Investigation services • e-governance • Scientific research • Environment & Disaster management
Types of GIS 1) Desktop GIS. 2) Professional GIS, 3) Enterprise GIS, 4) Mobile GIS, 5) Internet GIS
CONCEPT OF GIS It consists of a variety of data sets derived from systematic surveys, aerial photographs, remotely sensed data from space platforms, topographical and thematic maps. Appropriate software to access these data sets to perform logical, statistical and cartographic operations is an indispensable component of the system COMPONENTS OF GIS A working GIS integrates five components:
• Hardwar e Hardware is the computer on which a GIS operates. Today, GIS software runs o a wide range of hardware types, from centralized computer servers to desktop computers used in stand-alone or networked configurations
• Software GIS software provides the functions and tools needed to store, analyse, and display geographic information.
• Data Possibly the most important component of a GIS is the data. Geographic data and related tabular data can be collected in-house or purchased from a commercial data provider. A GIS will integrate spatial data with other data resources
• People GIS technology is of limited value without the people who manage the system and develop plans for applying it to real-world problems. GIS users range from technical specialists who design and maintain the system to those who use it to help them perform
• Methods HOW GIS WORKS
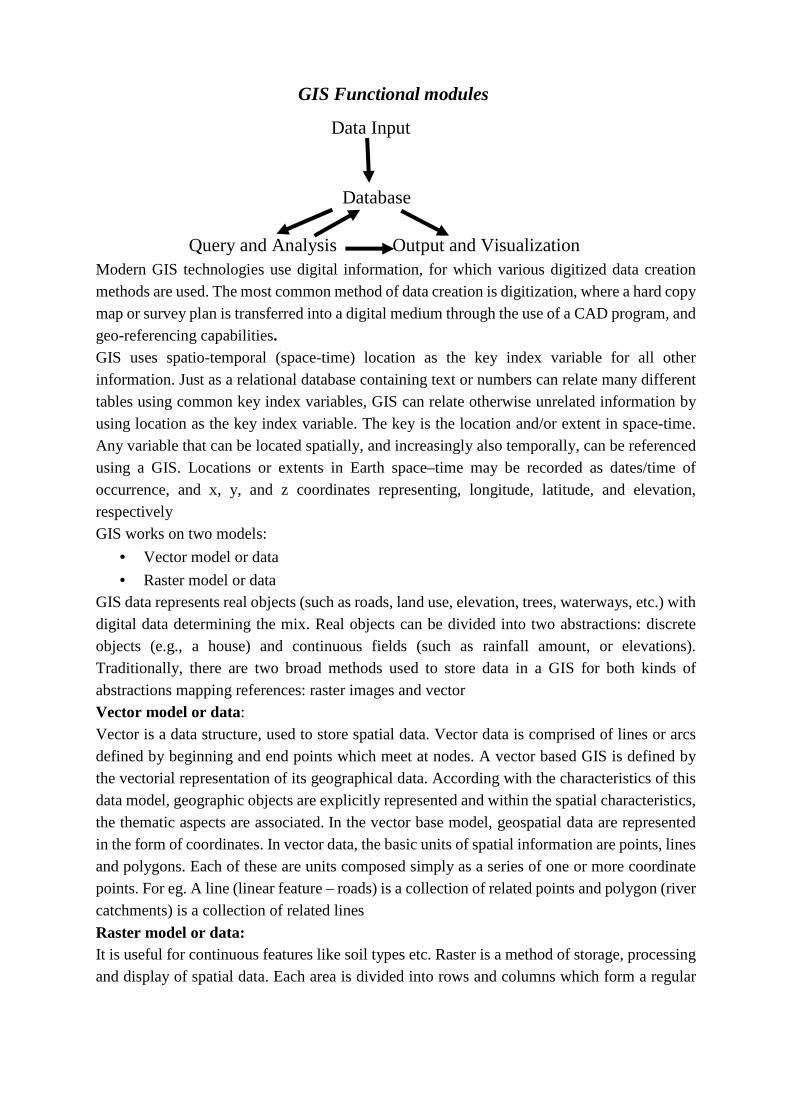
Data Input
Database
Query and Analysis Output and Visualization Modern GIS technologies use digital information, for which various digitized data creation methods are used. The most common method of data creation is digitization, where a hard copy map or survey plan is transferred into a digital medium through the use of a CAD program, and geo-referencing capabilities. GIS uses spatio-temporal (space-time) location as the key index variable for all other information. Just as a relational database containing text or numbers can relate many different tables using common key index variables, GIS can relate otherwise unrelated information by using location as the key index variable. The key is the location and/or extent in space-time.
Any variable that can be located spatially, and increasingly also temporally, can be referenced using a GIS. Locations or extents in Earth space–time may be recorded as dates/time of occurrence, and x, y, and z coordinates representing, longitude, latitude, and elevation, respectively GIS works on two models:
• Vector model or data
• Raster model or data GIS data represents real objects (such as roads, land use, elevation, trees, waterways, etc.) with digital data determining the mix. Real objects can be divided into two abstractions: discrete objects (e.g., a house) and continuous fields (such as rainfall amount, or elevations). Traditionally, there are two broad methods used to store data in a GIS for both kinds of abstractions mapping references: raster images and vector Vector model or data: Vector is a data structure, used to store spatial data. Vector data is comprised of lines or arcs defined by beginning and end points which meet at nodes. A vector based GIS is defined by the vectorial representation of its geographical data. According with the characteristics of this data model, geographic objects are explicitly represented and within the spatial characteristics, the thematic aspects are associated. In the vector base model, geospatial data are represented in the form of coordinates. In vector data, the basic units of spatial information are points, lines and polygons. Each of these are units composed simply as a series of one or more coordinate points. For eg. A line (linear feature – roads) is a collection of related points and polygon (river catchments) is a collection of related lines
Raster model or data: It is useful for continuous features like soil types etc. Raster is a method of storage, processing and display of spatial data. Each area is divided into rows and columns which form a regular
GIS Functional modules

grid structure. Each cell must be rectangular in shape, but not necessarily square .Each cell within its matrix contains location coordinates as well as an attribute value Software available in vector mode are ARC/INFO, GIMMS, UDMS and in Raster mode ERDAS, USEMAP, MAP and GRIDS
Vector Coverage Different means of representing features
Vector
Advantages of GIS Exploring both geographical and thematic components of data in a holistic way Stresses geographical aspects of a research question Large volumes of data Integration of data from widely disparate sources Allows a wide variety of forms of visualisation
Disadvantages of GIS Data are expensive Learning curve on GIS software can be long Shows spatial relationships but does not provide absolute solutions Origins in the Earth sciences and computer science. Solutions may not be appropriate for humanities research

Lecture 26 GLOBAL POSITIONING SYSTEM
What is GPS? GPS, which stands for Global Positioning System, is the only system today able to show you your exact position on the Earth anytime, in any weather, anywhere (OR) A network of satellites that continuously transmit coded information, which makes it possible to precisely identify locations on earth by measuring distance from the satellites.
GPS Facts Developed by Department of Defenses as a military navigational tool. Systems birth was in the early 1970’s. 24 Satellites orbiting at high altitudes (11,000 miles) First Satellite launched in 1978. Became fully operational in April 1995. Useful night & day – rain or shine. Use of radio waves. Accuracy depends on unit, some are accurate to a centimeter. Each satellite is built to last about 10 years. Replacements are constantly being built and launched into orbit. A GPS satellite weighs approximately 2,000 pounds and is about 17 feet across with the solar panels extended. Transmitter power is only 50 watts or less.
Parts of a GPS System
Space segment

GPS Satellites The 24 satellites that make up the GPS space segment are orbiting the earth about 12,000 miles above us. They are constantly moving, making two complete orbits in less than 24 hours. These satellites are travelling at speeds of roughly 7,000 miles an hour. GPS satellites are powered by solar energy. They have backup batteries on board to keep them running in the event of a solar eclipse, when there's no solar power. Small rocket boosters on each satellite keep them flying in the correct path. The GPS satellites (also called NAVSTAR, the official U.S. Department of defence name for GPS):
Control segment
The second part of the GPS system is the ground station, comprised of a receiver and antenna, as well as communication tools to transmit data to the data center. User segment or receiver

GPS units are made to communicate with GPS satellites (which have a much better view of the Earth) to find out exactly where they are on the global scale of things.
How GPS works? The principle behind GPS is the measurement of distance (or “range”) between the satellites and the receiver. The satellites tell us exactly where they are in their orbits by broadcasting data the receiver uses to compute their positions. GPS uses trilateration to determine a user's position. To be able to apply trilateration, we need to know the exact distance that our GPS receiver is from the orbiting satellites to be able to calculate an accurate position. By applying some basic mathematics the receiver can work out this distance. Distance = Speed x Travel Time
• GPS signals are a radio signal, therefore they travel at the speed of light
• If we know the time the signal was sent and the time the signal was received we can work out travel time.
• By subtracting the sent time from the received time, we can determine the travel time
• Now we can multiply travel time by the speed of light and we can determine distance To calculate the travel time, each satellite transmits it's own pseudo code, as illustrated below
To determine distance, both the satellite and GPS receiver generate the same pseudocode at the same time. The satellite transmits the pseudocode which is received by the GPS receiver. The receiver is still producing the pseudocode while the satellite's code is travelling through the sky. The 2 signals are eventually compared and the difference between the 2 signals is the travel time.
If we know the distance between the satellite and the receiver for: 1 satellite, the receiver's location is known within a sphere. 2 satellites, the receiver's location is known within 3D ring 3 satellites, the receiver's location is somewhere on at most 2 3D regions 4 satellites, the region gets smaller because of the sphere of the new satellite
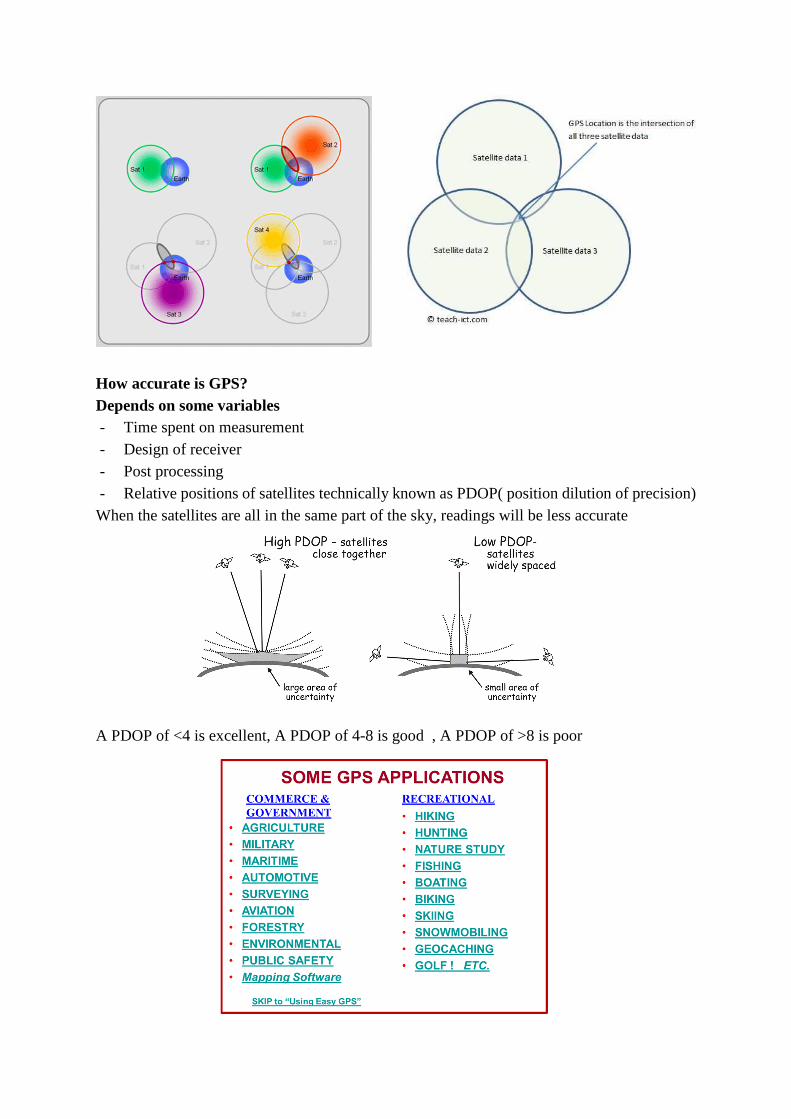
How accurate is GPS? Depends on some variables - Time spent on measurement - Design of receiver - Post processing - Relative positions of satellites technically known as PDOP( position dilution of precision) When the satellites are all in the same part of the sky, readings will be less accurate A PDOP of <4 is excellent, A PDOP of 4-8 is good , A PDOP of >8 is poor

Lecture 27
PROBLEM SOILS PHYSICAL CONSTRAINTS
Problem soils The soils which owe characteristics that they cannot be economically used for the cultivation of crops without adopting proper reclamation measures are known as problem soils. CLASSIFICATION OF PROBLEM SOILS The problem soils are classified based on soil properties
Problem soils Physical problem or Chemical problems or Physical constraints Chemical constraints Due to textural and structural condition Due to presence of salts or beyond of soils permissible limit of nutrients present in exch. Complex
• Surface hard pan a) Acid soil • Sub surface hard pan b) saline soil • Highly permeable soil c) sodic soil • Very slow permeable soil d) saline sodic soil • Soil crusting e) degraded alkali • Fluffy soil
Soil physical constraints A successful farming system depends on the maintenance of the soil structure and its productivity. Crop production in any region is largely determined by the physical and climate features of the soil. The soil physical problem restricts the emergence of seedlings, root growth thereby reduce the crop yields. Physical problems manifest in many ways. These are characterized by their texture, aggregate stability, mechanical impedances, topography or erosion. Out of total cultivable area of 140.5 Mha, about 79 Mha has physical constraints in one form or other
The major soil physical constraints are • Surface hardening
• Soils having shallow depth and rocky layer
• Soils having hard layer or hard pan in the Rhizosphere
• Highly permeable layer
• Very slow permeable soil
• Soil crusting
• Fluffy soil
• Undulating and rolling topography The soil physical constraints which are identified visually, nature and magnitude of the soil problem is confirmed by digging a soil profile at the site and taking undisturbed soil cores from
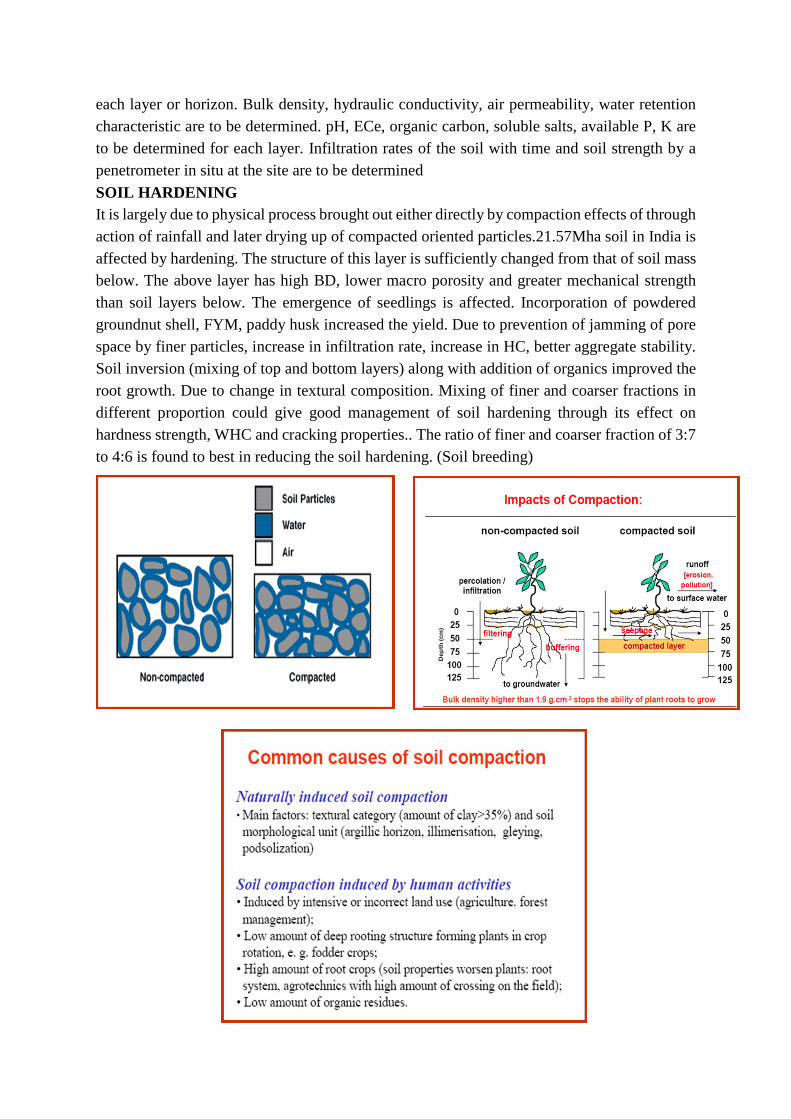
each layer or horizon. Bulk density, hydraulic conductivity, air permeability, water retention characteristic are to be determined. pH, ECe, organic carbon, soluble salts, available P, K are to be determined for each layer. Infiltration rates of the soil with time and soil strength by a penetrometer in situ at the site are to be determined
SOIL HARDENING It is largely due to physical process brought out either directly by compaction effects of through action of rainfall and later drying up of compacted oriented particles.21.57Mha soil in India is affected by hardening. The structure of this layer is sufficiently changed from that of soil mass below. The above layer has high BD, lower macro porosity and greater mechanical strength than soil layers below. The emergence of seedlings is affected. Incorporation of powdered groundnut shell, FYM, paddy husk increased the yield. Due to prevention of jamming of pore space by finer particles, increase in infiltration rate, increase in HC, better aggregate stability. Soil inversion (mixing of top and bottom layers) along with addition of organics improved the root growth. Due to change in textural composition. Mixing of finer and coarser fractions in different proportion could give good management of soil hardening through its effect on hardness strength, WHC and cracking properties.. The ratio of finer and coarser fraction of 3:7 to 4:6 is found to best in reducing the soil hardening. (Soil breeding)
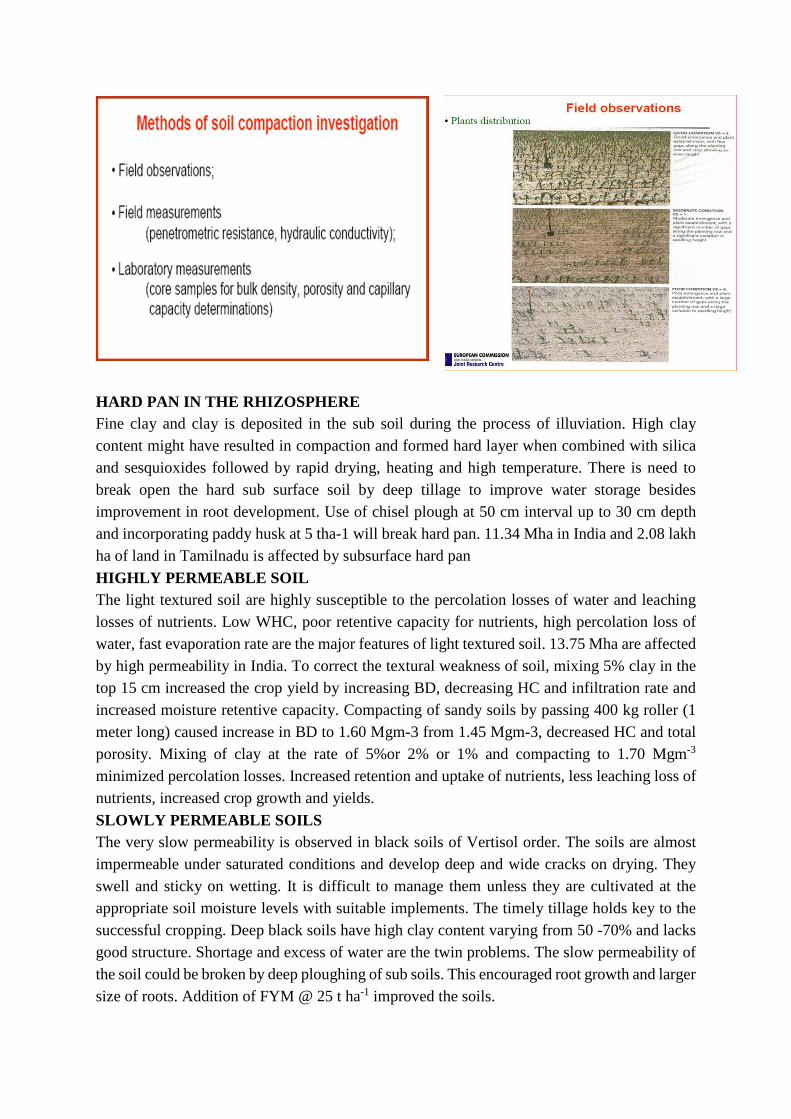
HARD PAN IN THE RHIZOSPHERE Fine clay and clay is deposited in the sub soil during the process of illuviation. High clay content might have resulted in compaction and formed hard layer when combined with silica and sesquioxides followed by rapid drying, heating and high temperature. There is need to break open the hard sub surface soil by deep tillage to improve water storage besides improvement in root development. Use of chisel plough at 50 cm interval up to 30 cm depth and incorporating paddy husk at 5 tha-1 will break hard pan. 11.34 Mha in India and 2.08 lakh ha of land in Tamilnadu is affected by subsurface hard pan
HIGHLY PERMEABLE SOIL The light textured soil are highly susceptible to the percolation losses of water and leaching losses of nutrients. Low WHC, poor retentive capacity for nutrients, high percolation loss of water, fast evaporation rate are the major features of light textured soil. 13.75 Mha are affected by high permeability in India. To correct the textural weakness of soil, mixing 5% clay in the top 15 cm increased the crop yield by increasing BD, decreasing HC and infiltration rate and increased moisture retentive capacity. Compacting of sandy soils by passing 400 kg roller (1 meter long) caused increase in BD to 1.60 Mgm-3 from 1.45 Mgm-3, decreased HC and total porosity. Mixing of clay at the rate of 5%or 2% or 1% and compacting to 1.70 Mgm-3 minimized percolation losses. Increased retention and uptake of nutrients, less leaching loss of nutrients, increased crop growth and yields.
SLOWLY PERMEABLE SOILS The very slow permeability is observed in black soils of Vertisol order. The soils are almost impermeable under saturated conditions and develop deep and wide cracks on drying. They swell and sticky on wetting. It is difficult to manage them unless they are cultivated at the appropriate soil moisture levels with suitable implements. The timely tillage holds key to the successful cropping. Deep black soils have high clay content varying from 50 -70% and lacks good structure. Shortage and excess of water are the twin problems. The slow permeability of the soil could be broken by deep ploughing of sub soils. This encouraged root growth and larger size of roots. Addition of FYM @ 25 t ha-1 improved the soils.
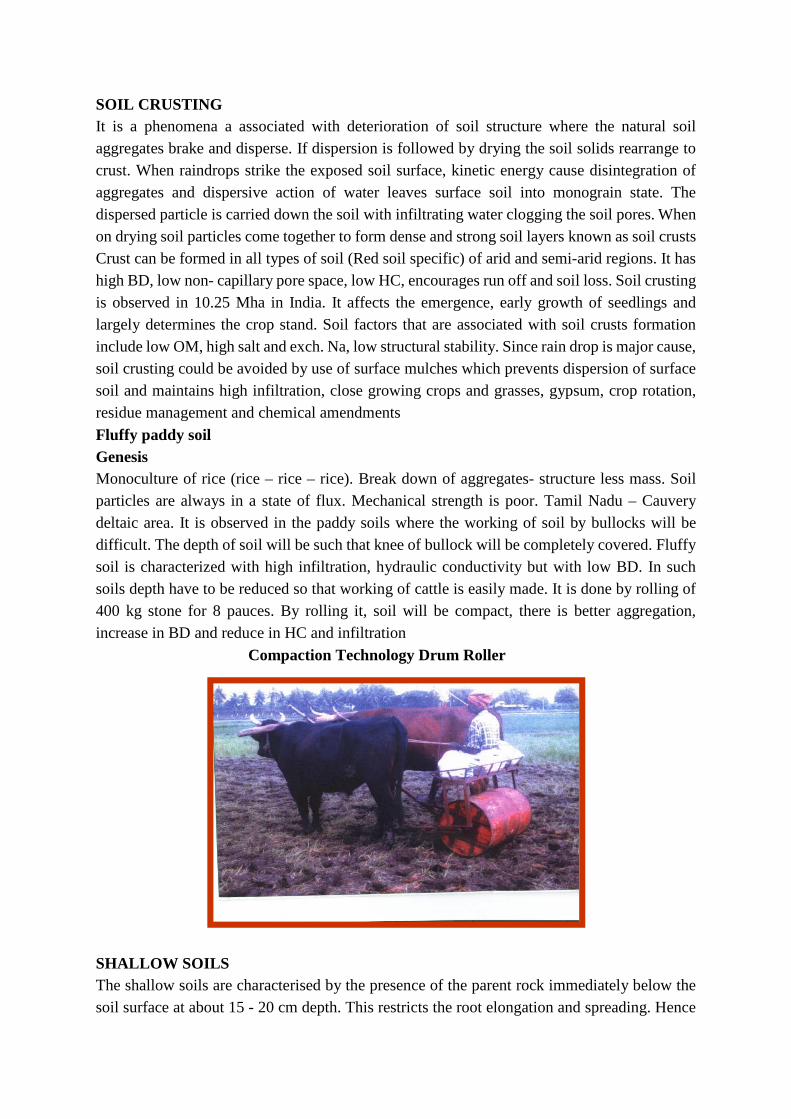
SOIL CRUSTING It is a phenomena a associated with deterioration of soil structure where the natural soil aggregates brake and disperse. If dispersion is followed by drying the soil solids rearrange to crust. When raindrops strike the exposed soil surface, kinetic energy cause disintegration of aggregates and dispersive action of water leaves surface soil into monograin state. The dispersed particle is carried down the soil with infiltrating water clogging the soil pores. When on drying soil particles come together to form dense and strong soil layers known as soil crusts Crust can be formed in all types of soil (Red soil specific) of arid and semi-arid regions. It has high BD, low non- capillary pore space, low HC, encourages run off and soil loss. Soil crusting is observed in 10.25 Mha in India. It affects the emergence, early growth of seedlings and largely determines the crop stand. Soil factors that are associated with soil crusts formation include low OM, high salt and exch. Na, low structural stability. Since rain drop is major cause, soil crusting could be avoided by use of surface mulches which prevents dispersion of surface soil and maintains high infiltration, close growing crops and grasses, gypsum, crop rotation, residue management and chemical amendments
Fluffy paddy soil Genesis Monoculture of rice (rice – rice – rice). Break down of aggregates- structure less mass. Soil particles are always in a state of flux. Mechanical strength is poor. Tamil Nadu – Cauvery deltaic area. It is observed in the paddy soils where the working of soil by bullocks will be difficult. The depth of soil will be such that knee of bullock will be completely covered. Fluffy soil is characterized with high infiltration, hydraulic conductivity but with low BD. In such soils depth have to be reduced so that working of cattle is easily made. It is done by rolling of 400 kg stone for 8 pauces. By rolling it, soil will be compact, there is better aggregation, increase in BD and reduce in HC and infiltration
Compaction Technology Drum Roller
SHALLOW SOILS The shallow soils are characterised by the presence of the parent rock immediately below the soil surface at about 15 - 20 cm depth. This restricts the root elongation and spreading. Hence
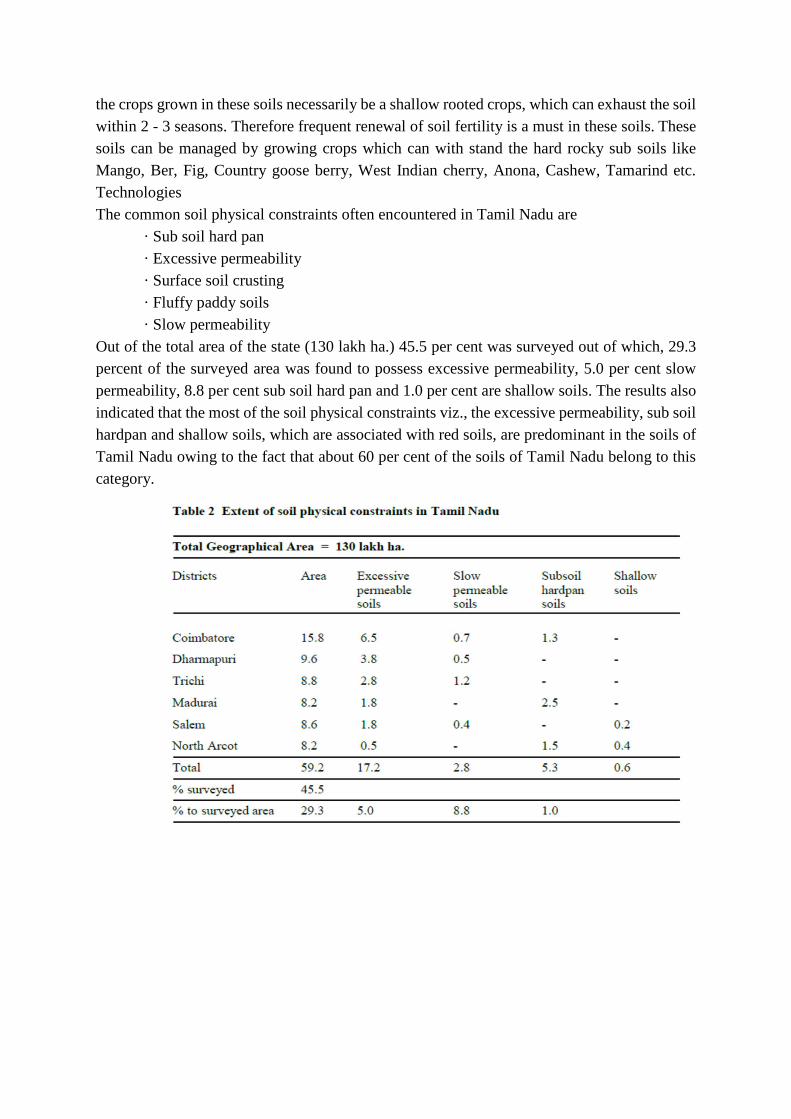
the crops grown in these soils necessarily be a shallow rooted crops, which can exhaust the soil within 2 - 3 seasons. Therefore frequent renewal of soil fertility is a must in these soils. These soils can be managed by growing crops which can with stand the hard rocky sub soils like Mango, Ber, Fig, Country goose berry, West Indian cherry, Anona, Cashew, Tamarind etc. Technologies The common soil physical constraints often encountered in Tamil Nadu are · Sub soil hard pan · Excessive permeability · Surface soil crusting · Fluffy paddy soils · Slow permeability Out of the total area of the state (130 lakh ha.) 45.5 per cent was surveyed out of which, 29.3 percent of the surveyed area was found to possess excessive permeability, 5.0 per cent slow permeability, 8.8 per cent sub soil hard pan and 1.0 per cent are shallow soils. The results also indicated that the most of the soil physical constraints viz., the excessive permeability, sub soil hardpan and shallow soils, which are associated with red soils, are predominant in the soils of Tamil Nadu owing to the fact that about 60 per cent of the soils of Tamil Nadu belong to this category.

Lecture 28
EOLIAN SOIL, ILL DRAINED SOIL AND POLLUTED SOIL
EOLIAN SOILS Introduction Wind processes are typically referred to as eolian processes, which produce eolian land forms. The term eolian is derived from AEOLUS , the Greek god of wind. It is important to understand the role that wind play with respect to land form evolution because more than one third of the land on our planet is characterized as arid or semi-arid. Wind action can be divided into three parts
a) Erosion b) Transportation c) Deposition
Types of Erosion a) Deflaction b) Abrasion c) Attrition
a) Deflaction The process of lowering land surface is called as Deflaction. Removal of sediments from surface by wind action. In Latin verb deflatus means blown away a) Desert pavement A resistant, pavement like surface created when fine particles blown way and coarse particle like pebbles and gravel are left behind. Protect underlying layers of fine particles from further deflaction by capping them
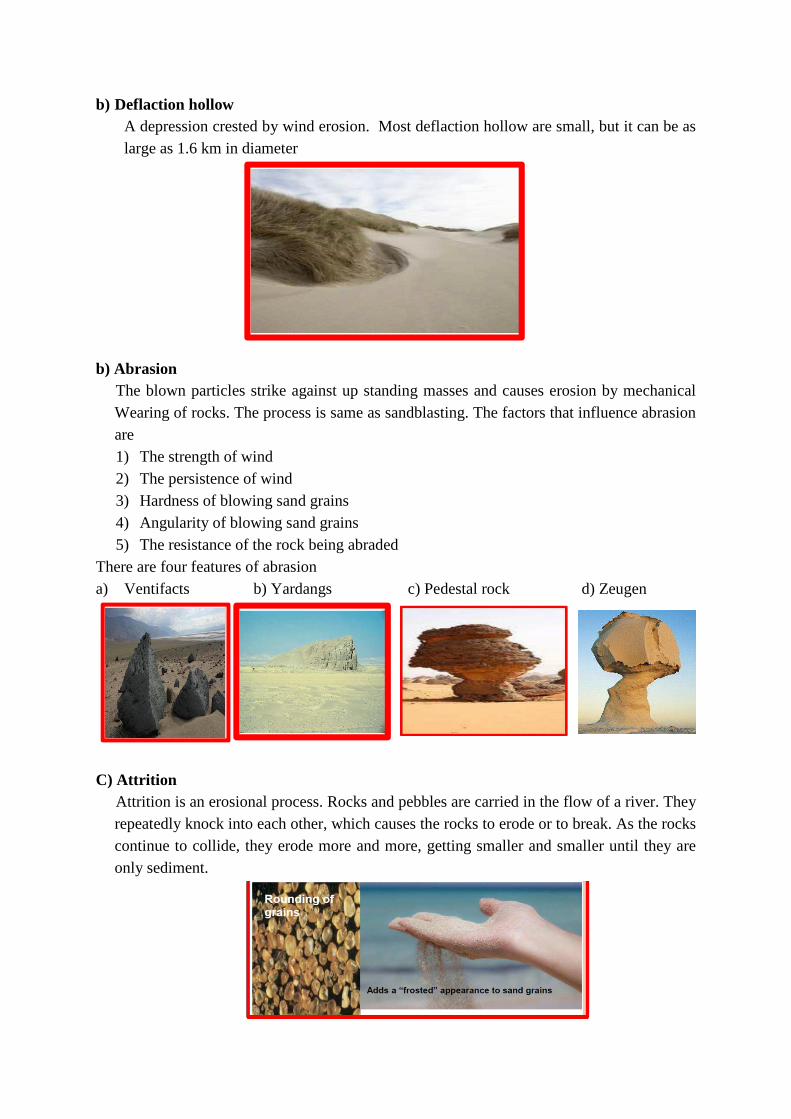
b) Deflaction hollow A depression crested by wind erosion. Most deflaction hollow are small, but it can be as
large as 1.6 km in diameter
b) Abrasion The blown particles strike against up standing masses and causes erosion by mechanical
Wearing of rocks. The process is same as sandblasting. The factors that influence abrasion are 1) The strength of wind 2) The persistence of wind 3) Hardness of blowing sand grains 4) Angularity of blowing sand grains 5) The resistance of the rock being abraded
There are four features of abrasion a) Ventifacts b) Yardangs c) Pedestal rock d) Zeugen
C) Attrition Attrition is an erosional process. Rocks and pebbles are carried in the flow of a river. They
repeatedly knock into each other, which causes the rocks to erode or to break. As the rocks continue to collide, they erode more and more, getting smaller and smaller until they are only sediment.
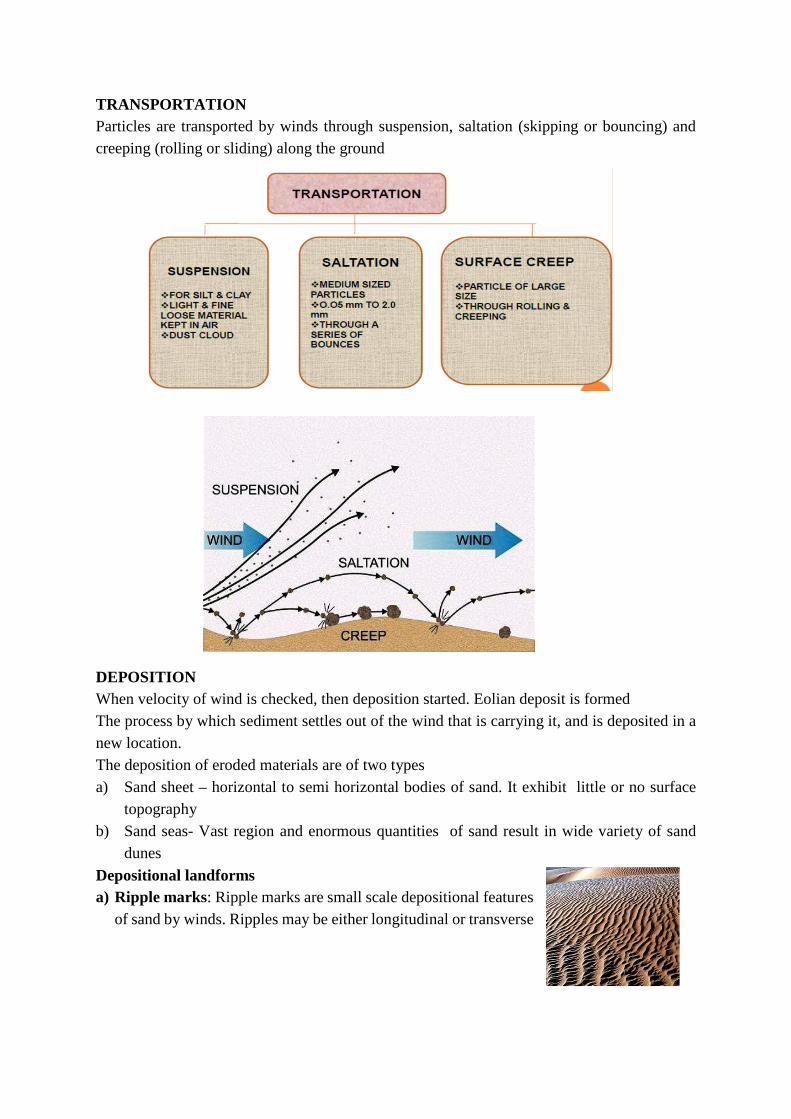
TRANSPORTATION Particles are transported by winds through suspension, saltation (skipping or bouncing) and creeping (rolling or sliding) along the ground
DEPOSITION When velocity of wind is checked, then deposition started. Eolian deposit is formed The process by which sediment settles out of the wind that is carrying it, and is deposited in a new location. The deposition of eroded materials are of two types a) Sand sheet – horizontal to semi horizontal bodies of sand. It exhibit little or no surface
topography b) Sand seas- Vast region and enormous quantities of sand result in wide variety of sand
dunes
Depositional landforms a) Ripple marks: Ripple marks are small scale depositional features
of sand by winds. Ripples may be either longitudinal or transverse
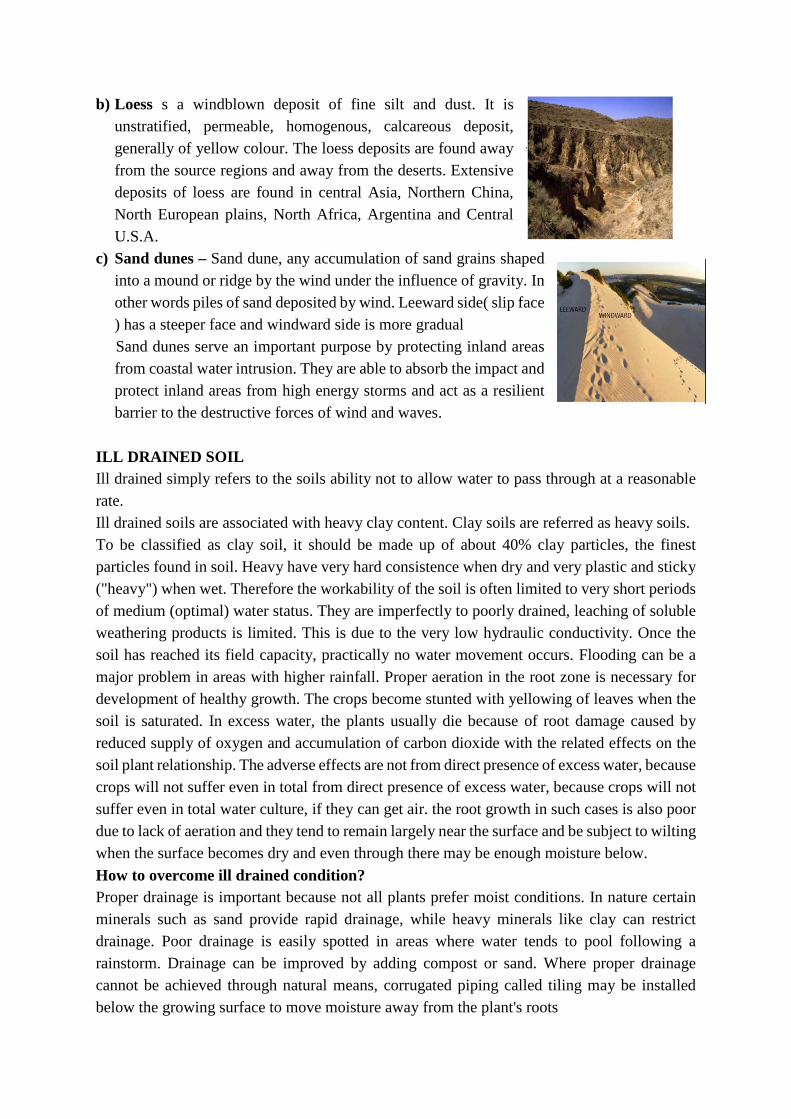
b) Loess s a windblown deposit of fine silt and dust. It is unstratified, permeable, homogenous, calcareous deposit, generally of yellow colour. The loess deposits are found away from the source regions and away from the deserts. Extensive deposits of loess are found in central Asia, Northern China, North European plains, North Africa, Argentina and Central U.S.A.
c) Sand dunes – Sand dune, any accumulation of sand grains shaped into a mound or ridge by the wind under the influence of gravity. In other words piles of sand deposited by wind. Leeward side( slip face ) has a steeper face and windward side is more gradual
Sand dunes serve an important purpose by protecting inland areas from coastal water intrusion. They are able to absorb the impact and protect inland areas from high energy storms and act as a resilient barrier to the destructive forces of wind and waves.
ILL DRAINED SOIL Ill drained simply refers to the soils ability not to allow water to pass through at a reasonable rate. Ill drained soils are associated with heavy clay content. Clay soils are referred as heavy soils. To be classified as clay soil, it should be made up of about 40% clay particles, the finest particles found in soil. Heavy have very hard consistence when dry and very plastic and sticky ("heavy") when wet. Therefore the workability of the soil is often limited to very short periods of medium (optimal) water status. They are imperfectly to poorly drained, leaching of soluble weathering products is limited. This is due to the very low hydraulic conductivity. Once the soil has reached its field capacity, practically no water movement occurs. Flooding can be a major problem in areas with higher rainfall. Proper aeration in the root zone is necessary for development of healthy growth. The crops become stunted with yellowing of leaves when the soil is saturated. In excess water, the plants usually die because of root damage caused by reduced supply of oxygen and accumulation of carbon dioxide with the related effects on the soil plant relationship. The adverse effects are not from direct presence of excess water, because crops will not suffer even in total from direct presence of excess water, because crops will not suffer even in total water culture, if they can get air. the root growth in such cases is also poor due to lack of aeration and they tend to remain largely near the surface and be subject to wilting when the surface becomes dry and even through there may be enough moisture below.
How to overcome ill drained condition? Proper drainage is important because not all plants prefer moist conditions. In nature certain minerals such as sand provide rapid drainage, while heavy minerals like clay can restrict drainage. Poor drainage is easily spotted in areas where water tends to pool following a rainstorm. Drainage can be improved by adding compost or sand. Where proper drainage cannot be achieved through natural means, corrugated piping called tiling may be installed below the growing surface to move moisture away from the plant's roots

POLLUTED SOIL Definition Soil pollution is defined as the change in physical, chemical and biological conditions of the soil through man’s intervention resulting in degradation in quality. Or Soil pollution is the reduction in the productivity of soil due to the presence of soil pollutants Soil pollutants have an adverse effect on the physical chemical and biological properties of the soil and reduce its productivity. Pesticides, fertilizers, organic manure, chemicals, radioactive wastes, discarded food, clothes, leather goods, plastics, paper, bottles, tins-cans and carcasses- all contribute towards causing soil pollution. Chemicals like iron lead mercury, copper, zinc, cadmium, aluminium, cyanides, acids and alkalies etc. are present in industrial wastes and reach the soil either directly with water or indirectly through air. (E.g. through acid rain). The improper and continuous use of herbicides, pesticides and fungicides to protect the crops from pests, fungi etc. alter the basic composition of the soils and make the soil toxic for plant growth. Organic insecticides like DDT, aldrin, benzene hex chloride etc. are used against soil borne pests. They accumulate in the soil as they degrade very slowly by soil and water bacteria. Consequently, they have a very deleterious effect on the plant growth stunting their growth and reducing the yield and size of fruit. Their degradation products may be absorbed by the plants from where they reach the animals and man through the food chains .Radioactive wastes from mining and nuclear processes may reach the soil via water or as ‘fall-out’. From the soil they reach the plants and then into the grazing animals (livestock) from where ultimately reach man through milk and meat etc. resulting in retarded and abnormal growth of man. Human and animal excreta used as organic manure to promote crop yield, pollute the soil by contaminating the soil and vegetable crops with the pathogens that may be present in the excreta. Nitrification, which is the process of forming soluble nitrates from the elemental atmospheric nitrogen or from originally harmless organic materials actually contribute towards water pollution when the nitrates leach out of the soil and accumulate to toxic levels in the water supply. Soil pollution can lead to water pollution if toxic chemicals leach into groundwater, or if contaminated runoff reaches streams, lakes, or oceans. Soil also naturally contributes to air pollution by releasing volatile compounds into the atmosphere. Nitrogen escapes through ammonia volatilization and denitrification. The decomposition of organic materials in soil can release sulfur dioxide and other sulfur compounds, causing acid rain. Heavy metals and other Potentially toxic elements are the most serious soil pollutants in sewage. Sewage sludge contains heavy metals and, if applied repeatedly or in large amounts, the treated soil may accumulate heavy metals and consequently become unable to even support plant life. Therefore, intensification of agricultural production by practices of irrigation (causes Salinisation), excessive fertilisers, pesticides, insecticides etc. have created the problems of soil pollution. The rapid industrialization of agriculture, expansion of the chemical industry, and the need to generate cheap forms of energy has caused the continuous release of manmade organic chemicals into natural ecosystems. Consequently, the atmosphere, bodies of water, and many

soil environments have become polluted by a large variety of toxic compounds. Many of these compounds at high concentrations or following prolonged exposure have the potential to produce adverse effects in humans and other organisms: These include the danger of acute toxicity, mutagenesis (genetic changes) , carcinogenesis, and teratogenesis (birth defects) for humans and other organisms. Some of these manmade toxic compounds are also resistant to physical, chemical, or biological degradation and thus represent an environmental burden of considerable magnitude
Control of soil pollution A number of ways have been suggested to curb the pollution rate. Attempts to clean up the environment require plenty of time and resources. Some the steps to reduce soil pollution are: • Ban on use of plastic bags below 20 microns thickness. • Recycling of plastic wastes. • Ban on deforestation. • Encouraging plantation programmes. • Encouraging social and agro forestry programmes. • Undertaking awareness programmes. • Reducing the use of chemical fertilizer and pesticides. • Recycling paper, plastics and other materials. • Ban on use of plastic bags, which are a major cause of pollution. • Reusing materials. • Avoiding deforestation and promoting forestation. • Suitable and safe disposal of including nuclear wastes. • Chemical fertilizers and pesticides should be replaced by organic fertilizers and pesticides. • Encouraging social and agro forestry programs. • Undertaking many pollution awareness
Lecture 29 and 30
ACID SOIL AND ACID SULFATE SOIL The chemical constraints or chemical problems can be grouped as follows
Acid soil Soil with low pH contain relatively high amounts of exchangeable H+ & Al 3+considered as the acid soil. The degree of acidity based on pH are as follows • Ultra acidic: 3.3 • Extremely acidic: 3.5 to 4.5 •Very strong acidic: 4.5 to 5.0 • Strong acidic: 5.1 to 5.5 •Moderately acidic: 5.6 to 6.0 • Slightly acidic: 6.1 to 6.5
Occurrence 157 M ha cultivable land in India – 49 Mha of land are acidic pH < 5.6 - 26 Mha pH 5.6 - 6.5 – 23 Mha Acid soil occupies only 8% of the total geographical area in India Soil acidity increases when H+ producing processes exceed H+ consuming processes
Hydrogen producing processes are or sources of formation of acid soil are 1) Rainfall 2) parent material 3) Fertilizer application 4) Plant root activity 5) decomposition
of organic matter 6) climate 7) vegetation 8) topography 9) pedogeneic processes
Rainfall It is located in high rainfall areas due to leaching of bases (cation) from soil and rain water is slightly acidic. This creates base unsaturation. Increases the percentages of hydrogen and aluminium
Parent material The acid soils are developed from acidic rocks like granite, genesis and quartz silica. When these rocks lacks bases, produces acidity in soil after decomposition by weathering
Fertilizer Use Repeated application ammoniated fertilizer in soil leads to formation of acid soil. When Ammonium sulfate, ammonium nitrate and ammonium chloride are added to soil produces hydrogen ion during nitrification processes. Hence they are called acid forming fertilizers
Root activity Plant take up nutrients in the form of cations and anions through root. The plants has to maintain neutral charge around roots. In order to compensate for extra positive charge, it produces hydrogen ions. Some plants produces organic acids
Decomposition of organic matter Decomposition of organic matter needs microorganisms. The microorganism produces carbon dioxides on decomposition and it combines with water to form carbonic acid , which leads to acid soil
Climate In humid region, precipitation is more than evapotranspiration. Hence there is leaching loss of bases from soil retaining hydrogen and aluminium in soil exchange complex. Acid soil should receive more than 750 mm annual rainfall. In temperate region, although rainfall is scanty, due to high amount of organic matter accumulation, acid soil are produced.
Vegetation cover In temperate regions, it is covered by acid producing conifers- so acid soils are produced easily Leaf litter on ground on decomposition produces variety of organic acids which causes formation of acid soils. In coastal regions with marshy plants on death and after decay produces acid which render soil acidic
Topography Sloppy lands favour formation acid soils due to high amount of surface run off leading to removal of bases
Pedogeneic processes. • Laterisation: In tropical regions where high rainfall with high temperature causes
laterisation which in turn leads to intense weathering and leaching of bases like Ca, Mg
• Podsolization: in area with sub temperate to temperate climate, where organic matter content is high (low temperature and high rainfall)
• Marshy and Peaty condition: With significant amount of under decomposed and partly decomposed O M
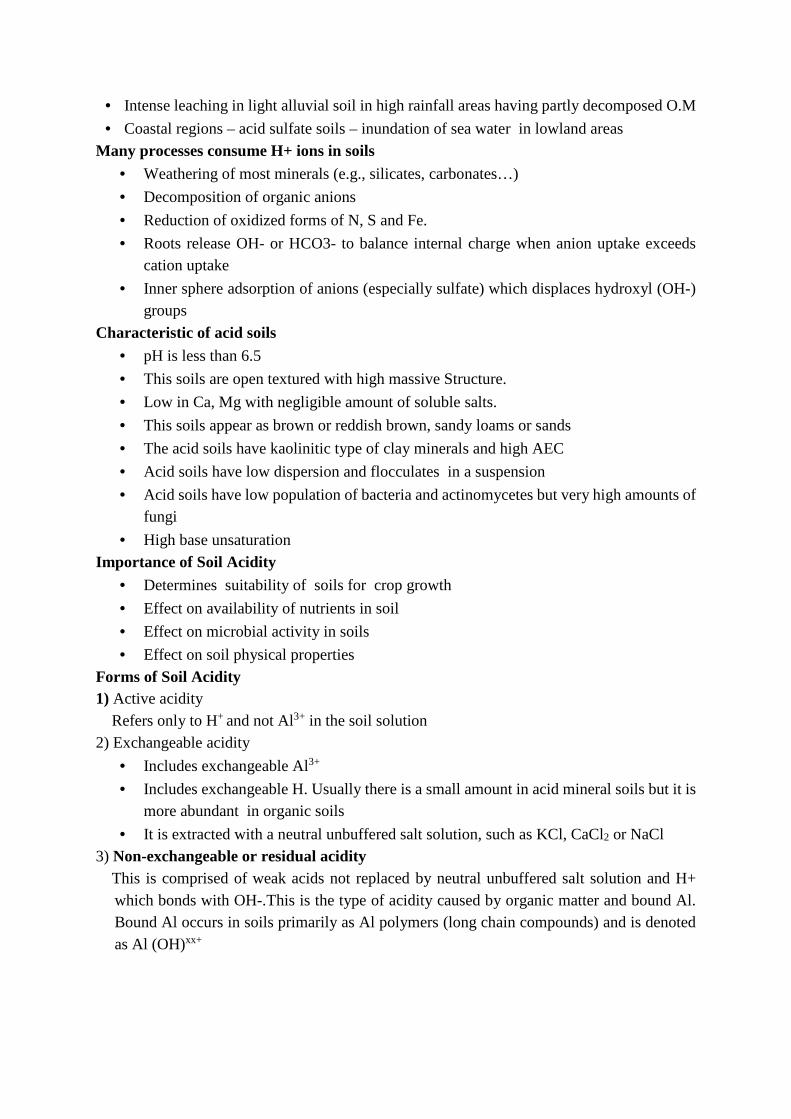
• Intense leaching in light alluvial soil in high rainfall areas having partly decomposed O.M
• Coastal regions – acid sulfate soils – inundation of sea water in lowland areas Many processes consume H+ ions in soils
• Weathering of most minerals (e.g., silicates, carbonates…)
• Decomposition of organic anions
• Reduction of oxidized forms of N, S and Fe.
• Roots release OH- or HCO3- to balance internal charge when anion uptake exceeds cation uptake
• Inner sphere adsorption of anions (especially sulfate) which displaces hydroxyl (OH-) groups
Characteristic of acid soils • pH is less than 6.5
• This soils are open textured with high massive Structure.
• Low in Ca, Mg with negligible amount of soluble salts.
• This soils appear as brown or reddish brown, sandy loams or sands
• The acid soils have kaolinitic type of clay minerals and high AEC
• Acid soils have low dispersion and flocculates in a suspension
• Acid soils have low population of bacteria and actinomycetes but very high amounts of fungi
• High base unsaturation Importance of Soil Acidity
• Determines suitability of soils for crop growth
• Effect on availability of nutrients in soil
• Effect on microbial activity in soils
• Effect on soil physical properties Forms of Soil Acidity 1) Active acidity Refers only to H+ and not Al3+ in the soil solution 2) Exchangeable acidity
• Includes exchangeable Al3+
• Includes exchangeable H. Usually there is a small amount in acid mineral soils but it is more abundant in organic soils
• It is extracted with a neutral unbuffered salt solution, such as KCl, CaCl2 or NaCl 3) Non-exchangeable or residual acidity This is comprised of weak acids not replaced by neutral unbuffered salt solution and H+
which bonds with OH-.This is the type of acidity caused by organic matter and bound Al. Bound Al occurs in soils primarily as Al polymers (long chain compounds) and is denoted as Al (OH)xx+
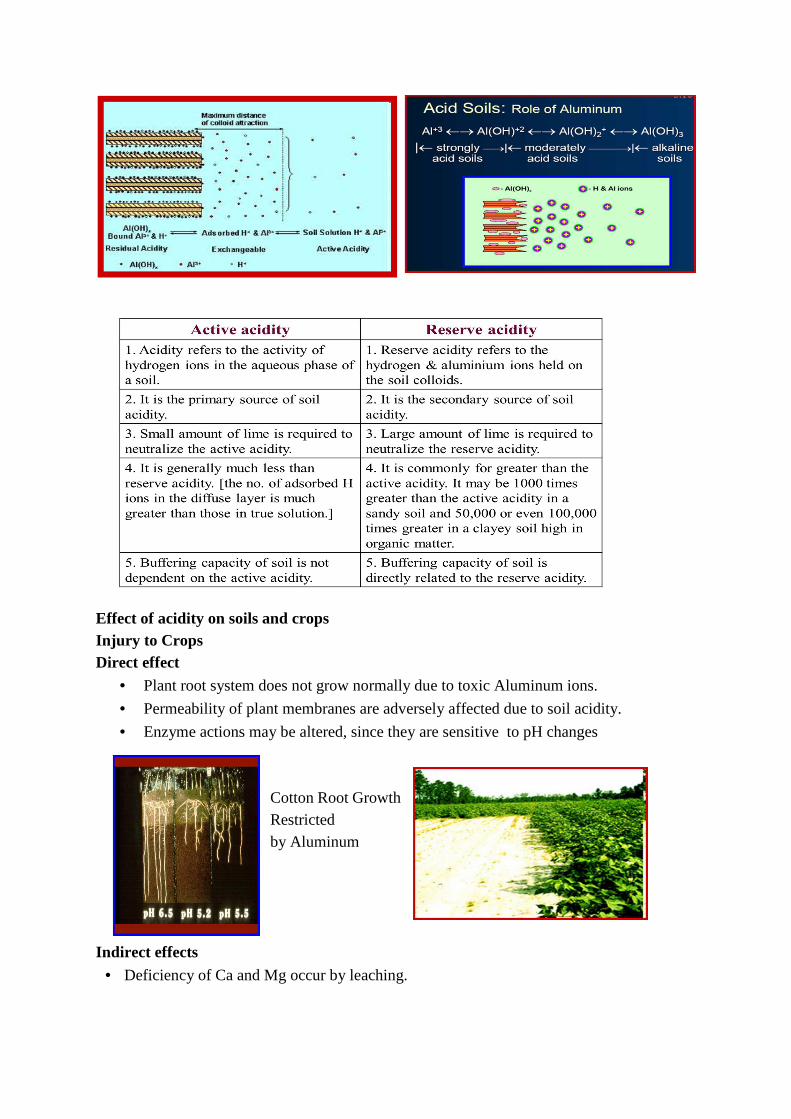
Effect of acidity on soils and crops Injury to Crops Direct effect
• Plant root system does not grow normally due to toxic Aluminum ions.
• Permeability of plant membranes are adversely affected due to soil acidity.
• Enzyme actions may be altered, since they are sensitive to pH changes Cotton Root Growth Restricted by Aluminum
Indirect effects • Deficiency of Ca and Mg occur by leaching.
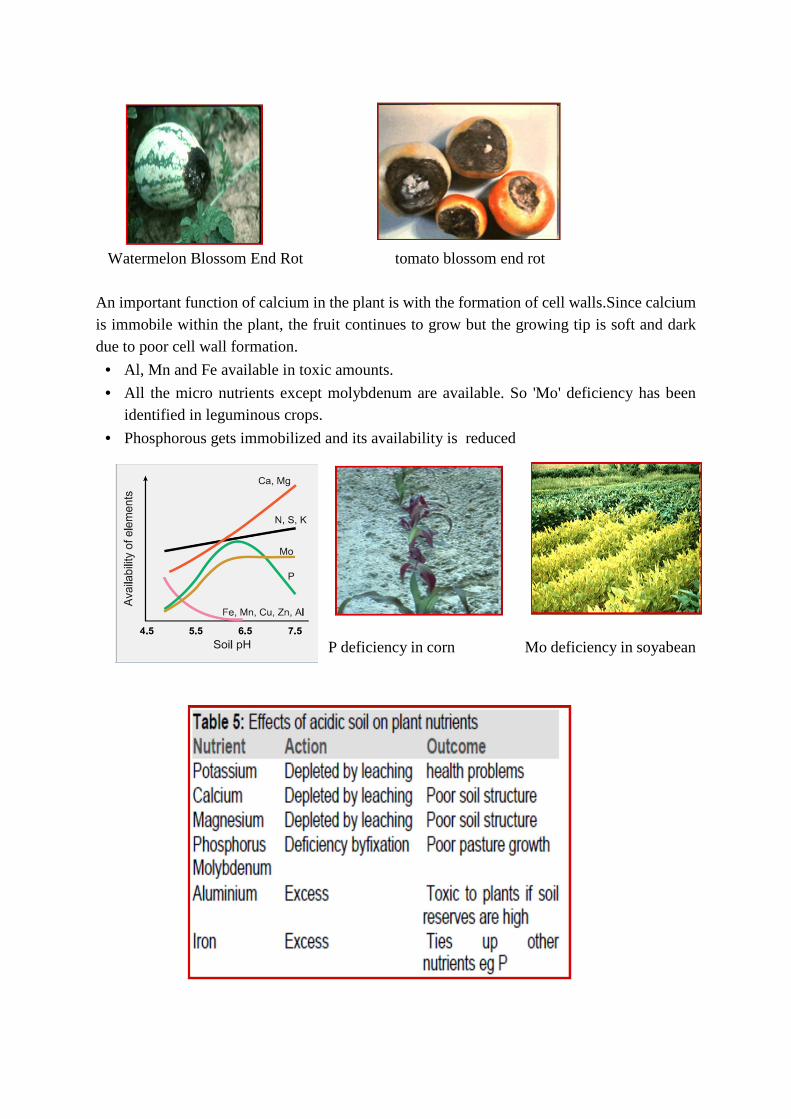
Watermelon Blossom End Rot tomato blossom end rot An important function of calcium in the plant is with the formation of cell walls.Since calcium is immobile within the plant, the fruit continues to grow but the growing tip is soft and dark due to poor cell wall formation.
• Al, Mn and Fe available in toxic amounts.
• All the micro nutrients except molybdenum are available. So 'Mo' deficiency has been identified in leguminous crops.
• Phosphorous gets immobilized and its availability is reduced
P deficiency in corn Mo deficiency in soyabean

Activity of Micro Organisms Most of the activities of beneficial organisms like Azotobacter and nodule forming bacteria of legumes are adversely effected as acidity increases
Microorganisms Nitrification is reduced at lower pH values
Rhizobium activity is increased as the pH value increases
HOW TO CORRECT SOIL ACIDITY Apply lime well ahead of planting
Benefits of liming • Prevents aluminium and manganese toxicity
• Increases phosphorus , molybdenum availability
• Improves n fixation by microbes
• Improves P and K efficiency
• Enhances soil exploration by roots
• Improves physical condition of soil
• Improves CEC in variable charge soil
• Improves availability of soil nutrients What happens when lime is added to acid soil?

A major reason for crop response to lime is due to the precipitation of exchangeable Al
VERY IMPORTANT! The beneficial effects of liming on crop growth are often related to neutralization of Al and not directly to the change in pH.
FACTORS DETERMINING EFFECTIVENESS OF LIME • Method of application
• Particle size
• Reactivity viz., neutralizing value
• Moisture content in soil
Particle size Lime is lowly soluble in water . So it has be to powdered to neutralize soil acidity Effectiveness depends on purity and how finely divided the lime materials
Neutralizing value The ability to neutralize acids expressed in terms of calcium carbonate equivalent. Calcium carbonate is the standard by which other materials are measured ( 100%) Molecular weight of CaCO3 is 100 MgCO3 is 84 1 molecule of each will neutralize the same amount of acid but on a weight basis it only takes 84g of MgCO3 to do the job of 100g of CaCO3
Relative neutralizing value of some common lime materials Liming materials Neutralizing value
1. Calcium carbonate 100 2. Dolomitic lime 95-108 3. Calcitic lime 85- 100 4. Baked oyster shells 80- 90 5. Marl 50 - 90 6. Gypsum none 7. Basic slag 50-70
Frequency of liming Liming is repeated after 3-4 years of first application. The frequency of liming depends on a) Texture b) N fertilizing rate c) Ca and Mg crop removal d) amount of lime added e) soil
pH desired
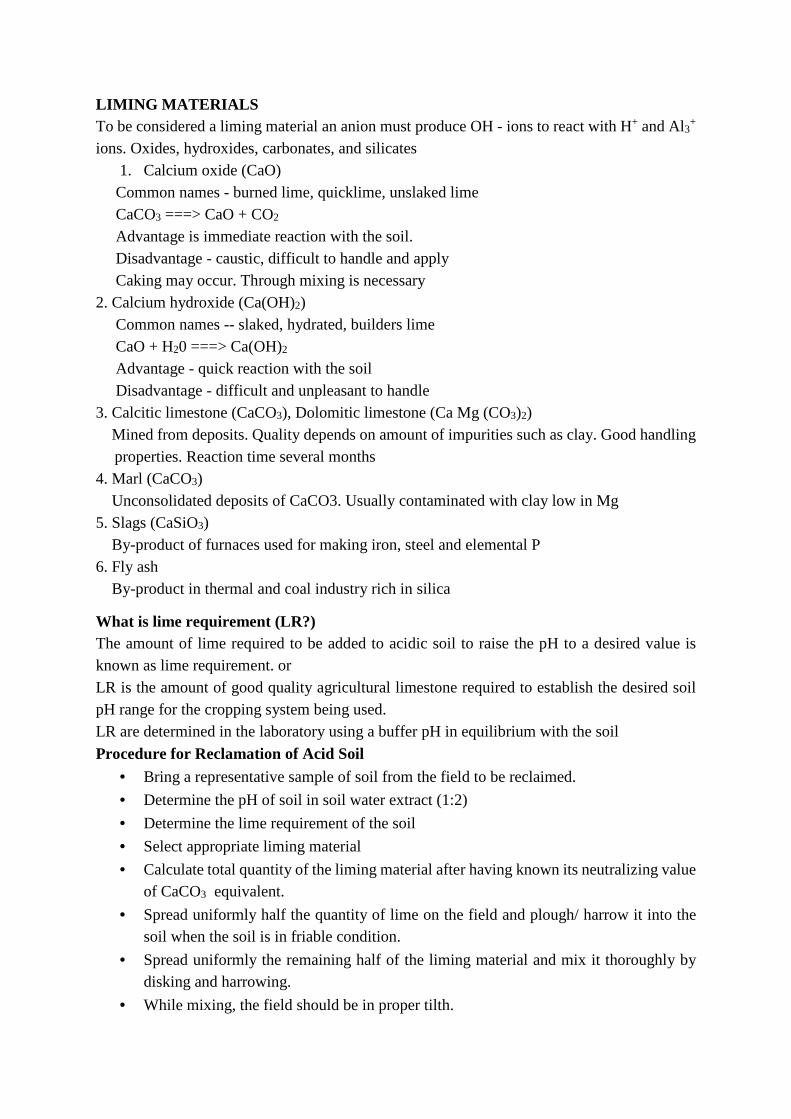
LIMING MATERIALS To be considered a liming material an anion must produce OH - ions to react with H+ and Al3+ ions. Oxides, hydroxides, carbonates, and silicates
1. Calcium oxide (CaO) Common names - burned lime, quicklime, unslaked lime CaCO3 ===> CaO + CO2 Advantage is immediate reaction with the soil. Disadvantage - caustic, difficult to handle and apply Caking may occur. Through mixing is necessary 2. Calcium hydroxide (Ca(OH)2) Common names -- slaked, hydrated, builders lime CaO + H20 ===> Ca(OH)2 Advantage - quick reaction with the soil Disadvantage - difficult and unpleasant to handle 3. Calcitic limestone (CaCO3), Dolomitic limestone (Ca Mg (CO3)2) Mined from deposits. Quality depends on amount of impurities such as clay. Good handling
properties. Reaction time several months 4. Marl (CaCO3) Unconsolidated deposits of CaCO3. Usually contaminated with clay low in Mg 5. Slags (CaSiO3) By-product of furnaces used for making iron, steel and elemental P 6. Fly ash By-product in thermal and coal industry rich in silica
What is lime requirement (LR?) The amount of lime required to be added to acidic soil to raise the pH to a desired value is known as lime requirement. or LR is the amount of good quality agricultural limestone required to establish the desired soil pH range for the cropping system being used. LR are determined in the laboratory using a buffer pH in equilibrium with the soil
Procedure for Reclamation of Acid Soil • Bring a representative sample of soil from the field to be reclaimed.
• Determine the pH of soil in soil water extract (1:2)
• Determine the lime requirement of the soil
• Select appropriate liming material
• Calculate total quantity of the liming material after having known its neutralizing value of CaCO3 equivalent.
• Spread uniformly half the quantity of lime on the field and plough/ harrow it into the soil when the soil is in friable condition.
• Spread uniformly the remaining half of the liming material and mix it thoroughly by disking and harrowing.
• While mixing, the field should be in proper tilth.

Crops Suitable For Cultivation in Acid Soils
ACID SULPHATE SOILS Acid sulphate soils are drained coastal wetland soils that have become acid (pH<4) due to oxidation of the pyritic minerals in the soil. (or) Soils formed from weathering of sulphide bearing parent materials which results in the formation of extreme low pH (< 3.0) and precipitation of sulfate salts Undrained soils containing pyrites need not be acid and they are called potential acid sulphate soils.
Types of acid sulphate soils Potential acid sulphate soils ASS which have not been oxidised by exposure to air are known as potential acid sulfate soils (PASS). They are neutral in pH (6.5–7.5) , contain unoxidized iron sulphides, are usually soft, sticky and saturated with water and are usually gel-like muds but can include wet sands and gravels have the potential to produce acid if exposed to oxygen
Actual acid sulphate soils When PASS are exposed to oxygen, the iron sulfides are oxidised to produce sulfuric acid and the soil becomes strongly acidic (usually below pH 4). These soils are then called actual acid sulfate soils (AASS). They have a pH of less than 4, contain oxidised iron sulfides, vary in texture and often contain jarosite (a yellow mottle produced as a by-product of the oxidation process).
Occurrence in India Soil with sufficient sulphides (FeS2 and others) to become strongly acidic when drained are termed acid sulphate soils or as the Dutch refer to those soils cat clays. When allowed to develop acidity, these soils are usually more acidic than pH 4.0. Before drainage, such soils may have normal soil pH and are only potential acid sulphate soils. Generally acid sulphate soils are found in coastal areas where the land is inundated by salt water. In India, acid sulphate soil is, mostly found in Kerala (kuttanad) and West Bengal (Sunderban).

Formation of Acid Sulphate Soils Land inundated with waters that contain sulphates, particularly salt waters, accumulate sulphur compounds, which in poorly aerated soils are bacterially reduced to sulphates. Such soils are not usually very acidic when first drained in water. When the soil is drained and then aerated, the sulphide (S2-) is oxidized to sulphate (SO4
-2) by a combination of chemical and bacterial actions, forming sulphuric acid (H2SO4). The magnitude of acid development depends on the amount of sulphide present in the soil and the conditions and time of oxidation. If iron pyrite (FeS2) is present, the oxidized iron accentuates the acidity but not as much as aluminium in normal acid soils because the iron oxides are less soluble than aluminium oxides and so hydrolyze less.
Characteristics Acid sulphate soils contain a sulphuric horizon which has a pH of the 1: 1 soil: water ratio of less than 3.5, plus some other evidences of sulphide content (Yellow colour). Such strong acidity in acid sulphate soils results toxicities of aluminium and iron, soluble salts (unless leached), manganese and hydrogen sulphide (H2S) gas. Hydrogen sulphide (H2S) often formed in lowland rice soils causing Akiochi disease that prevents rice plant roots from absorbing nutrients
Agricultural problems actual acid sulfate soils
Management of Acid Sulphate Soils Management techniques are extremely variable and depend on many specific factors viz, the extent of acid formation, the thickness of the sulphide layer, possibilities of leaching or draining the land etc. The general approaches for reclamation are suggested bellow: Keeping the area flooded. Maintaining the reduced (anaerobic). Soil inhibits acid development, the use of the

area to rice growing. Unfortunately, droughts occur and can in short time periods cause acidification of these soils. The water used to flood the potential acid sulphate soils often develop acidity and injure crops. Controlling water table. If a non-acidifying layer covers the sulphuric horizon, drainage to keep only the sulphuric layer under water (anaerobic) is possible. Liming and leaching. Liming is the primary way to reclaim any type of acid soil. If these soils are leached during early years of acidification, lime requirements are lowered. Leaching, however, is difficult because of the high water table commonly found in this type of soil and low permeability of the clay. Sea water is sometimes available for preliminary leaching
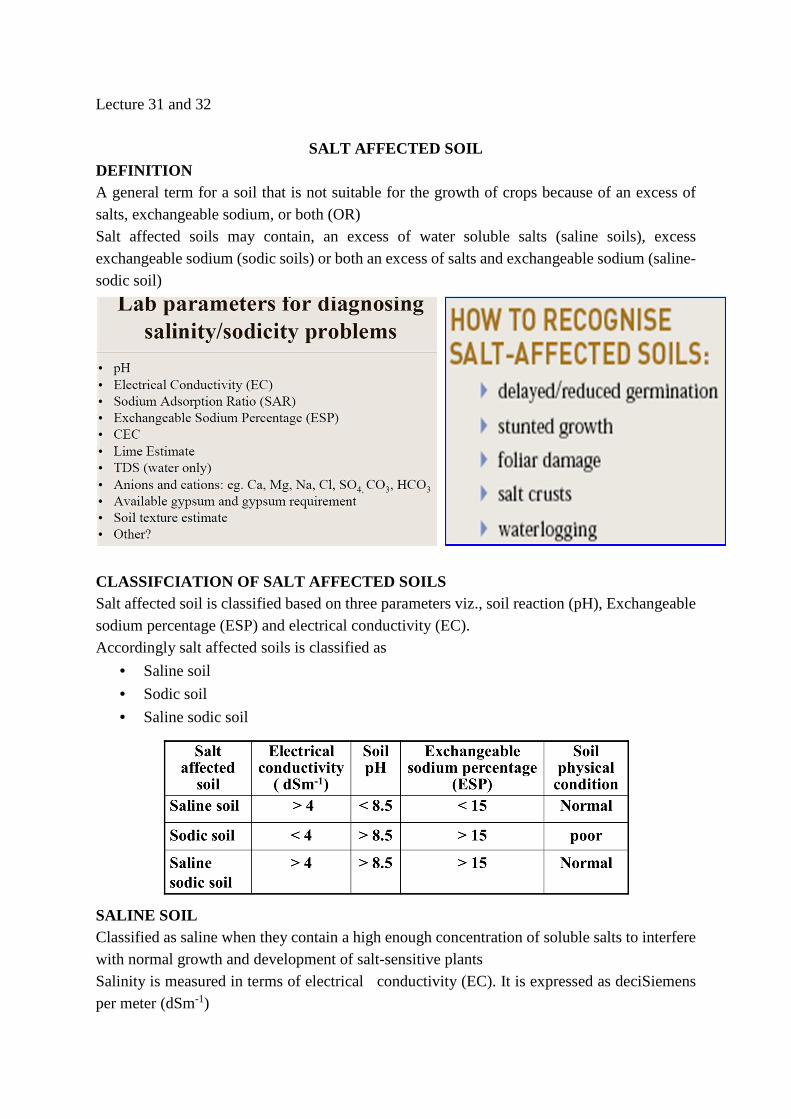
Lecture 31 and 32
SALT AFFECTED SOIL DEFINITION A general term for a soil that is not suitable for the growth of crops because of an excess of salts, exchangeable sodium, or both (OR) Salt affected soils may contain, an excess of water soluble salts (saline soils), excess exchangeable sodium (sodic soils) or both an excess of salts and exchangeable sodium (saline- sodic soil)
CLASSIFCIATION OF SALT AFFECTED SOILS Salt affected soil is classified based on three parameters viz., soil reaction (pH), Exchangeable sodium percentage (ESP) and electrical conductivity (EC). Accordingly salt affected soils is classified as
• Saline soil
• Sodic soil
• Saline sodic soil
SALINE SOIL Classified as saline when they contain a high enough concentration of soluble salts to interfere with normal growth and development of salt-sensitive plants Salinity is measured in terms of electrical conductivity (EC). It is expressed as deciSiemens per meter (dSm-1)

The saline soils contains toxic concentration of soluble salts in the root zone. Soluble salts consists of chlorides and sulphates of sodium, calcium, magnesium. Because of the white encrustation formed due to salts, the saline soils are also called white alkali soils.
Reasons for Salinity In arid and semi-arid areas salts formed during weathering are not fully leached. During the periods of higher rainfall the soluble salts are leached from the more permeable high laying areas to low laying areas and where ever the drainage is restricted, salts accumulate on the soil surface, as water evaporates. The excessive irrigation of uplands containing salts results in the accumulation of salts in the valleys. In areas having salt layer at lower depths in the profile, seasonal irrigation may favour the upward movement of salts. Salinity is also caused if the soils are irrigated with saline water. In coastal areas the ingress of sea water induces salinity in the soil
CHARACTERISTICS • Saline soils are in flocculated state
• Their permeability is higher than alkali soils
• Their physical condition is good and hence water can pass through them
• These soils have white encrust on soils surface
• Soluble salts in soils: soil water is held tightly enough by the ions that plants cannot use it (apparent moisture stress)
• Saline soils characteristically remain moist longer than the rest of the field
• Saline soils are usually barren but potentially productive soils

Major production constraints Presence of salts leads to alteration of osmotic potential of the soil solution. Consequently water intake by plants restricted and thereby nutrients uptake by plants are also reduced. In this soil due to high salt levels microbial activity is reduced. Specific ion effects on plants are also seen due to toxicity of ions like chloride, sulphate, etc.
MANAGEMENT OF SALINE SOILS Removal of excess salt to a desired level in the rooting zone is the basic principle of reclamation of saline soils. Leaching with good quality water followed by adequate drainage are the two essential components of any permanent solution of the salinity problem. Flooding and leaching down of soluble salts is the first step in reclamation. Leaching is defined as the process of transporting soluble salts by downward movement of water in the soil by the application water Leaching requirement (LR) is defined as that fraction of water that must be leached through the root zone to control salinity at specified level
Procedure for reclamation • Level the plots, divide into sub-plots of suitable size
• Dig a trench(45-60 cm) deep on one side of the plot to remove excess water
• Make a strong bund( 30-45 cm high) around the plot and flood it with good quality water
• Plough the soil for uniform mixing of soil and water to ensure dissolution of soluble salts
• Allow the water to stand for 2-3 days
• Remove the standing water through the channel in to trench
• Add well decomposed organics and raise salt tolerant crops Irrigation management Proportional mixing of good quality (if available) water with saline water and then using for irrigation reduces the effect of salinity.. Alternate furrow irrigation favours growth of plant than flooding. Drip, sprinkler and pitcher irrigation have been found to be more efficient than

the conventional flood irrigation method since relatively lesser amount of water is used under these improved methods
Fertilizer management Addition of extra dose of nitrogen to the tune of 20-25% of recommended level will compensate the low availability of N in these soils. Addition of organic manures like, FYM, compost, etc helps in reducing the ill effect of salinity due to release of organic acids produced during decomposition. Green manuring (Sunhemp, Daincha, Kolingi) and or green leaf manuring also counteracts the effects of salinity.
Crop choice / Crop management Crops are to be chosen based on the soil salinity level. The relative salt tolerance of different crops is as follows
Relative tolerance of crops to salinity
Soil / cultural management Planting the seed in the centre of the raised bed / ridge may affect the germination as it is the spot of greatest salt accumulation. A better salinity control can be achieved by using sloping beds with seeds planted on the sloping side just above the water line. Alternate furrow irrigation is advantageous as the salts can be displaced beyond the single seed row. Application of straw mulch had been found to curtail the evaporation from soil surface resulting in the reduced salt concentration in the root zone profile within 30 days.
ALKALI SOIL Alkali soils are formed due to concentration of exchangeable sodium and high pH. Because of high alkalinity resulting from sodium carbonate the surface soil is discoloured to black; hence the term black alkali is used.
Reasons for Alkalinity The excessive irrigation of uplands containing Na salts results in the accumulation of salts in the valleys. In arid and semi-arid areas salt formed during weathering are not fully leached. In coastal areas if the soil contains carbonates the ingression of sea water leads to the formation
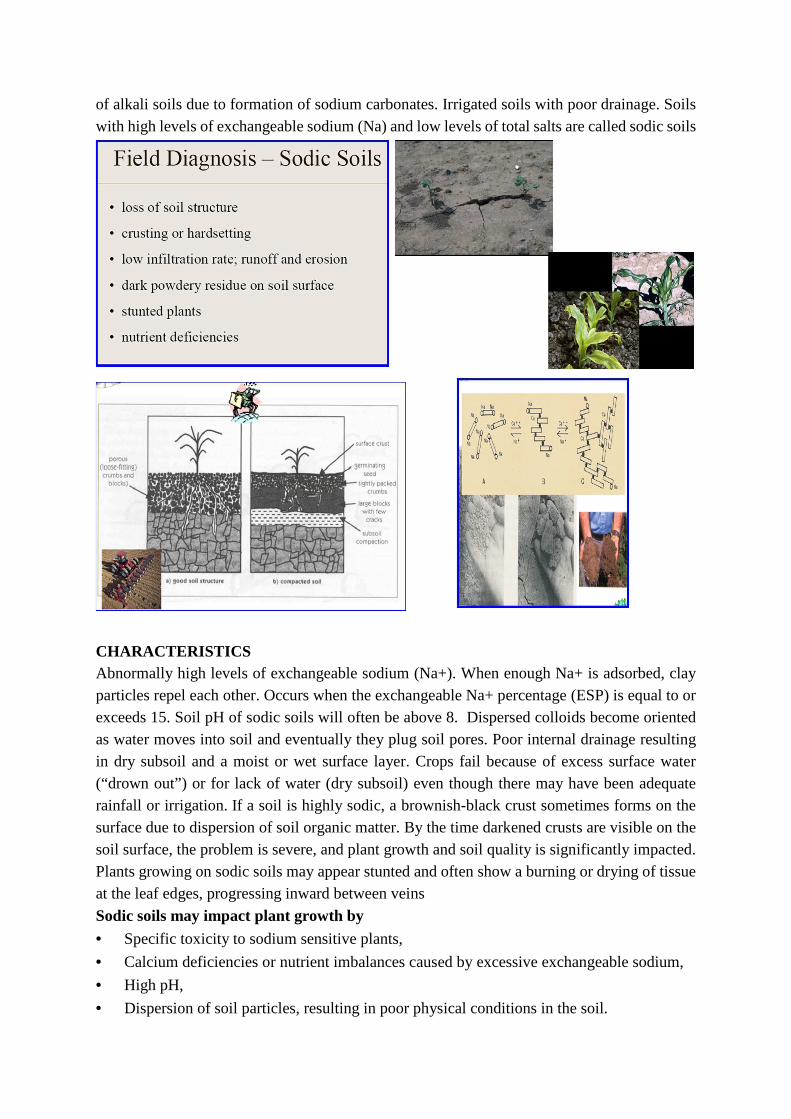
of alkali soils due to formation of sodium carbonates. Irrigated soils with poor drainage. Soils with high levels of exchangeable sodium (Na) and low levels of total salts are called sodic soils
CHARACTERISTICS Abnormally high levels of exchangeable sodium (Na+). When enough Na+ is adsorbed, clay particles repel each other. Occurs when the exchangeable Na+ percentage (ESP) is equal to or exceeds 15. Soil pH of sodic soils will often be above 8. Dispersed colloids become oriented as water moves into soil and eventually they plug soil pores. Poor internal drainage resulting in dry subsoil and a moist or wet surface layer. Crops fail because of excess surface water (“drown out”) or for lack of water (dry subsoil) even though there may have been adequate rainfall or irrigation. If a soil is highly sodic, a brownish-black crust sometimes forms on the surface due to dispersion of soil organic matter. By the time darkened crusts are visible on the soil surface, the problem is severe, and plant growth and soil quality is significantly impacted. Plants growing on sodic soils may appear stunted and often show a burning or drying of tissue at the leaf edges, progressing inward between veins
Sodic soils may impact plant growth by • Specific toxicity to sodium sensitive plants,
• Calcium deficiencies or nutrient imbalances caused by excessive exchangeable sodium,
• High pH,
• Dispersion of soil particles, resulting in poor physical conditions in the soil.
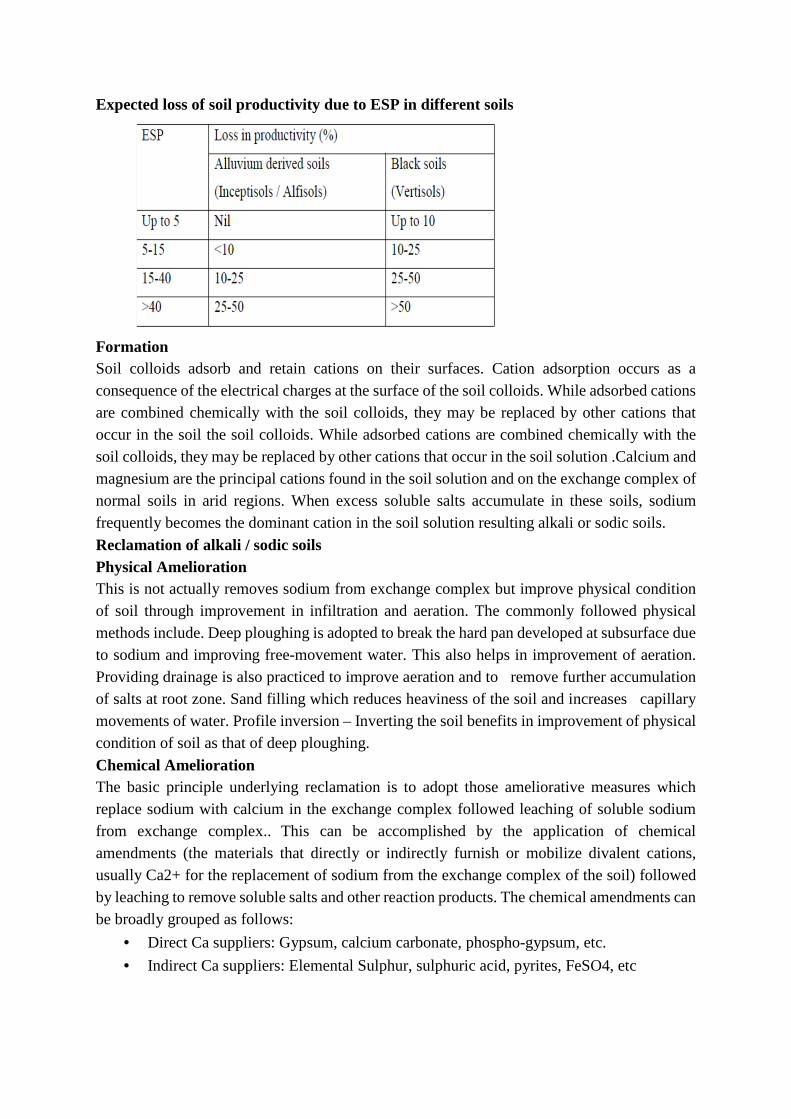
Expected loss of soil productivity due to ESP in different soils
Formation Soil colloids adsorb and retain cations on their surfaces. Cation adsorption occurs as a consequence of the electrical charges at the surface of the soil colloids. While adsorbed cations are combined chemically with the soil colloids, they may be replaced by other cations that occur in the soil the soil colloids. While adsorbed cations are combined chemically with the soil colloids, they may be replaced by other cations that occur in the soil solution .Calcium and magnesium are the principal cations found in the soil solution and on the exchange complex of normal soils in arid regions. When excess soluble salts accumulate in these soils, sodium frequently becomes the dominant cation in the soil solution resulting alkali or sodic soils.
Reclamation of alkali / sodic soils Physical Amelioration This is not actually removes sodium from exchange complex but improve physical condition of soil through improvement in infiltration and aeration. The commonly followed physical methods include. Deep ploughing is adopted to break the hard pan developed at subsurface due to sodium and improving free-movement water. This also helps in improvement of aeration. Providing drainage is also practiced to improve aeration and to remove further accumulation of salts at root zone. Sand filling which reduces heaviness of the soil and increases capillary movements of water. Profile inversion – Inverting the soil benefits in improvement of physical condition of soil as that of deep ploughing.
Chemical Amelioration The basic principle underlying reclamation is to adopt those ameliorative measures which replace sodium with calcium in the exchange complex followed leaching of soluble sodium from exchange complex.. This can be accomplished by the application of chemical amendments (the materials that directly or indirectly furnish or mobilize divalent cations, usually Ca2+ for the replacement of sodium from the exchange complex of the soil) followed by leaching to remove soluble salts and other reaction products. The chemical amendments can be broadly grouped as follows:
• Direct Ca suppliers: Gypsum, calcium carbonate, phospho-gypsum, etc.
• Indirect Ca suppliers: Elemental Sulphur, sulphuric acid, pyrites, FeSO4, etc
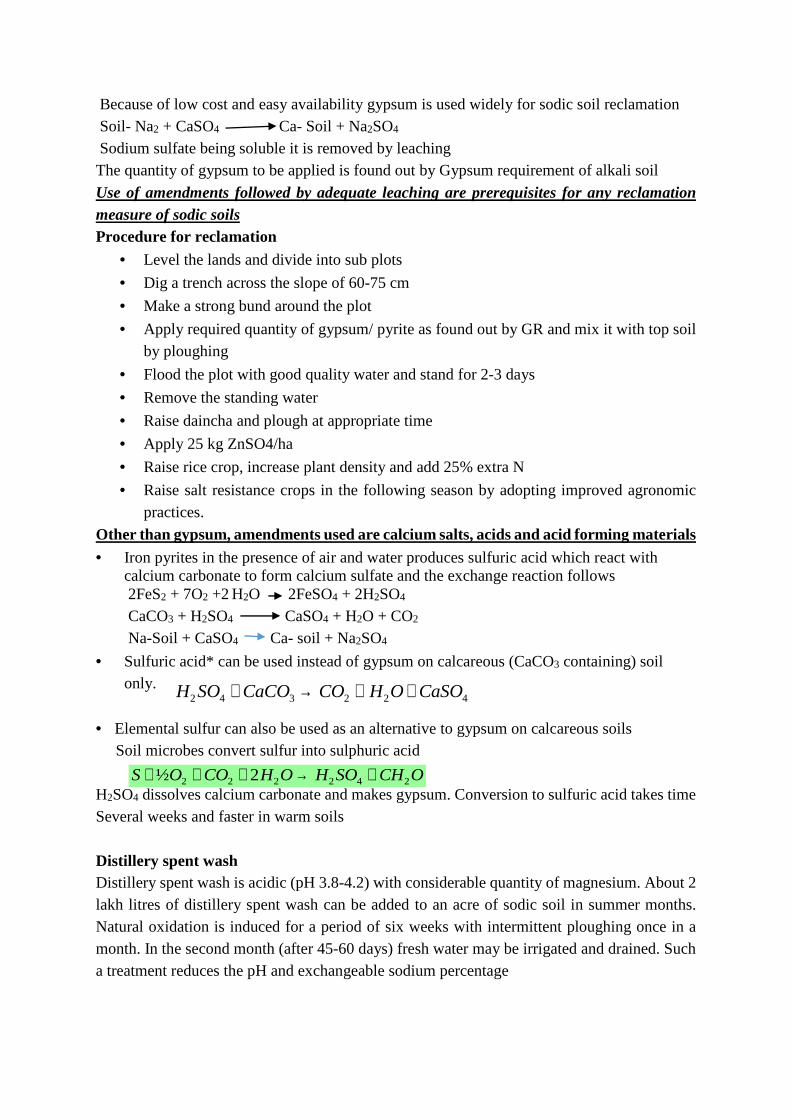
Because of low cost and easy availability gypsum is used widely for sodic soil reclamation Soil- Na2 + CaSO4 Ca- Soil + Na2SO4 Sodium sulfate being soluble it is removed by leaching The quantity of gypsum to be applied is found out by Gypsum requirement of alkali soil
Use of amendments followed by adequate leaching are prerequisites for any reclamation measure of sodic soils Procedure for reclamation
• Level the lands and divide into sub plots
• Dig a trench across the slope of 60-75 cm
• Make a strong bund around the plot
• Apply required quantity of gypsum/ pyrite as found out by GR and mix it with top soil by ploughing
• Flood the plot with good quality water and stand for 2-3 days
• Remove the standing water
• Raise daincha and plough at appropriate time
• Apply 25 kg ZnSO4/ha
• Raise rice crop, increase plant density and add 25% extra N
• Raise salt resistance crops in the following season by adopting improved agronomic practices.
Other than gypsum, amendments used are calcium salts, acids and acid forming materials • Iron pyrites in the presence of air and water produces sulfuric acid which react with
calcium carbonate to form calcium sulfate and the exchange reaction follows 2FeS2 + 7O2 +2 H2O 2FeSO4 + 2H2SO4 CaCO3 + H2SO4 CaSO4 + H2O + CO2 Na-Soil + CaSO4 Ca- soil + Na2SO4
• Sulfuric acid* can be used instead of gypsum on calcareous (CaCO3 containing) soil only.
• Elemental sulfur can also be used as an alternative to gypsum on calcareous soils Soil microbes convert sulfur into sulphuric acid
H2SO4 dissolves calcium carbonate and makes gypsum. Conversion to sulfuric acid takes time Several weeks and faster in warm soils
Distillery spent wash Distillery spent wash is acidic (pH 3.8-4.2) with considerable quantity of magnesium. About 2 lakh litres of distillery spent wash can be added to an acre of sodic soil in summer months. Natural oxidation is induced for a period of six weeks with intermittent ploughing once in a month. In the second month (after 45-60 days) fresh water may be irrigated and drained. Such a treatment reduces the pH and exchangeable sodium percentage
H SO CaCO CO H O CaSO2 4 3 2 2 4+ → + +
S O CO H O H SO CH O+ + + → +½ 2 2 2 2 4 22
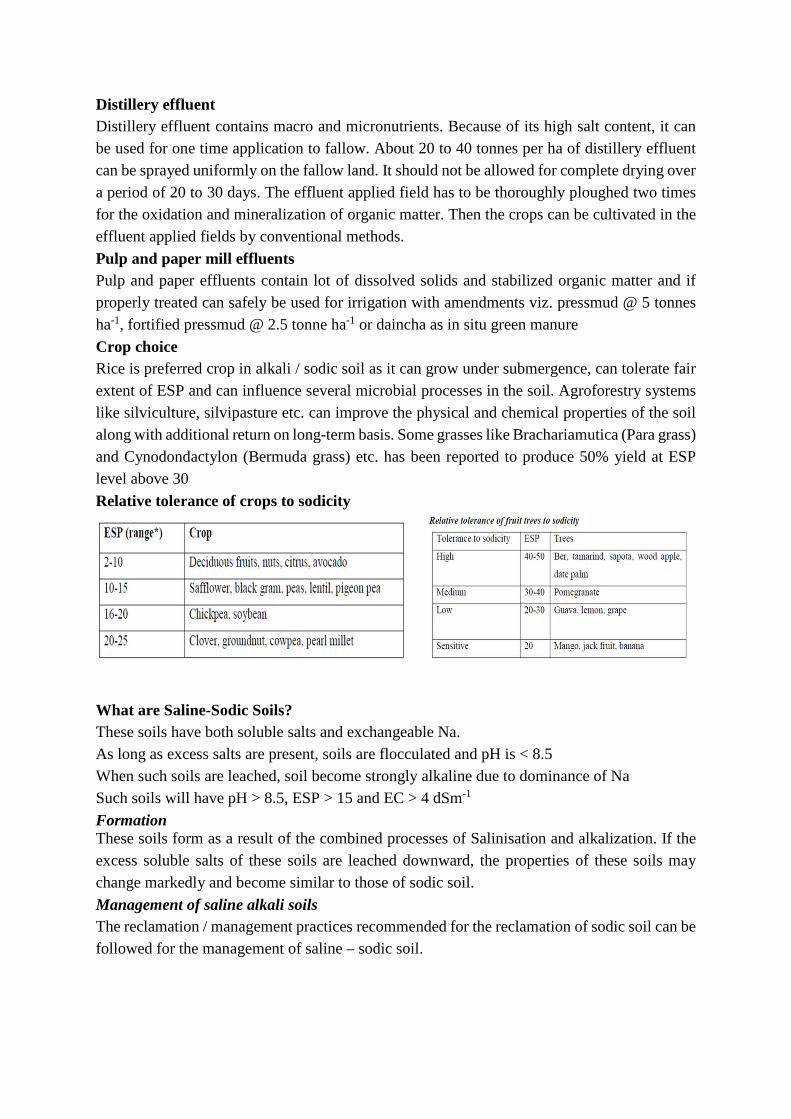
Distillery effluent Distillery effluent contains macro and micronutrients. Because of its high salt content, it can be used for one time application to fallow. About 20 to 40 tonnes per ha of distillery effluent can be sprayed uniformly on the fallow land. It should not be allowed for complete drying over a period of 20 to 30 days. The effluent applied field has to be thoroughly ploughed two times for the oxidation and mineralization of organic matter. Then the crops can be cultivated in the effluent applied fields by conventional methods.
Pulp and paper mill effluents Pulp and paper effluents contain lot of dissolved solids and stabilized organic matter and if properly treated can safely be used for irrigation with amendments viz. pressmud @ 5 tonnes ha-1, fortified pressmud @ 2.5 tonne ha-1 or daincha as in situ green manure
Crop choice Rice is preferred crop in alkali / sodic soil as it can grow under submergence, can tolerate fair extent of ESP and can influence several microbial processes in the soil. Agroforestry systems like silviculture, silvipasture etc. can improve the physical and chemical properties of the soil along with additional return on long-term basis. Some grasses like Brachariamutica (Para grass) and Cynodondactylon (Bermuda grass) etc. has been reported to produce 50% yield at ESP level above 30
Relative tolerance of crops to sodicity
What are Saline-Sodic Soils? These soils have both soluble salts and exchangeable Na. As long as excess salts are present, soils are flocculated and pH is < 8.5 When such soils are leached, soil become strongly alkaline due to dominance of Na Such soils will have pH > 8.5, ESP > 15 and EC > 4 dSm-1
Formation These soils form as a result of the combined processes of Salinisation and alkalization. If the excess soluble salts of these soils are leached downward, the properties of these soils may change markedly and become similar to those of sodic soil.
Management of saline alkali soils The reclamation / management practices recommended for the reclamation of sodic soil can be followed for the management of saline – sodic soil.

Degraded alkali soils In areas of excess rainfall due to absence of Ca and Mg, part of Exch. Na (in alkali soils) is replaced by hydrogen
Na-Soil + H2O NaOH + H-Soil 2NaOH + CO2 Na2CO3 + H2O
Hydrogen soils so formed undergo degradation to form silicic acid and forms Sesquioxide Such soils will have acidic pH at the surface and subsurface will have pH > 8.5. Such soils are called degraded alkali soils
Lecture 33 and 34
QUALITY OF IRRIGATION WATER
PROBLEMS WITH POOR QUALITY WATER Poor quality of water is one of the main factors turning good soil into saline or sodic. Several salts dissolved in it, as universal solvent. Irrigation with saline water adversely affects crop growth and productivity. High subsoil water table, aridity, seepage from canals, poor drainage, back water flow, intrusion of sea water also leads to salinity and sodicity. Around 1.5 Mha areas are affected by poor quality water in India. The most affected state is Rajasthan. In world, over 50 million ha are affected by salinity spread over 24 countries
1) Extraction of Water If excess soluble salts of irrigation water accumulated in crop root zone, crop has difficulty in extracting enough water. Root growth is also suppressed; increasing the difficulty of water uptake. Salinity stress in plants is often called physiological drought. Due to reduced uptake of water and other effects, yields are reduced. The reduction in yield due to salinity is more in warm climate than cool climate.
2) Soil permeability Soil permeability is reduced due to the deflocculation effect of sodium. If permeability is
reduced, infiltration of water into and through the soil is reduced. Adequate root penetration is inhibited due to the presence of impermeable soil layer caused by CaCO3 and high exch. Na %. Crusting of seed bed, Water logging, reduced oxygen and nutrient supply to the crops are the problems due to high sodium content relative of Ca & Mg.
3) Toxicity Symptoms More uptake of B, Cl, Na, sulphate and bicarbonate by plant creates toxicity problems.
Vegetative growth decrease as osmotic pressure of the soil solution increases. Reduction in growth takes place even without any external toxic symptoms. Increase in salinity, salt injury appears. Thick cuticle, waxy bloom and deep blue-green colour of leaves. At high salt levels, leaf burn appears in barley, sorghum and field beans
4) Anatomical and Physiological Effects Salinity reduces cell division, cell enlargement and protein synthesis. It affects the structure
and integrity of plant membranes and causes mitochondria and chloroplast to swell. Sodium and chloride at toxic levels disrupt the structure of the protein molecules. High chloride content hinders the development of xylem tissue.
5) Nutritional Effects Higher level of certain ions affect the absorption of other nutrient elements. High
concentration of sulphate reduces the uptake of calcium enhances the uptake of sodium. This process causes high level of sodium in plants, thus causing sodium toxicity. High concentration of Ca reduces the uptake of K. High concentration of Mg induces Ca deficiency
6) Soil Microorganisms NO2 & NO3 producing bacteria sensitive to high salt concentration than NH4 producing bacteria. Azotobacter is resistance to salt concentration
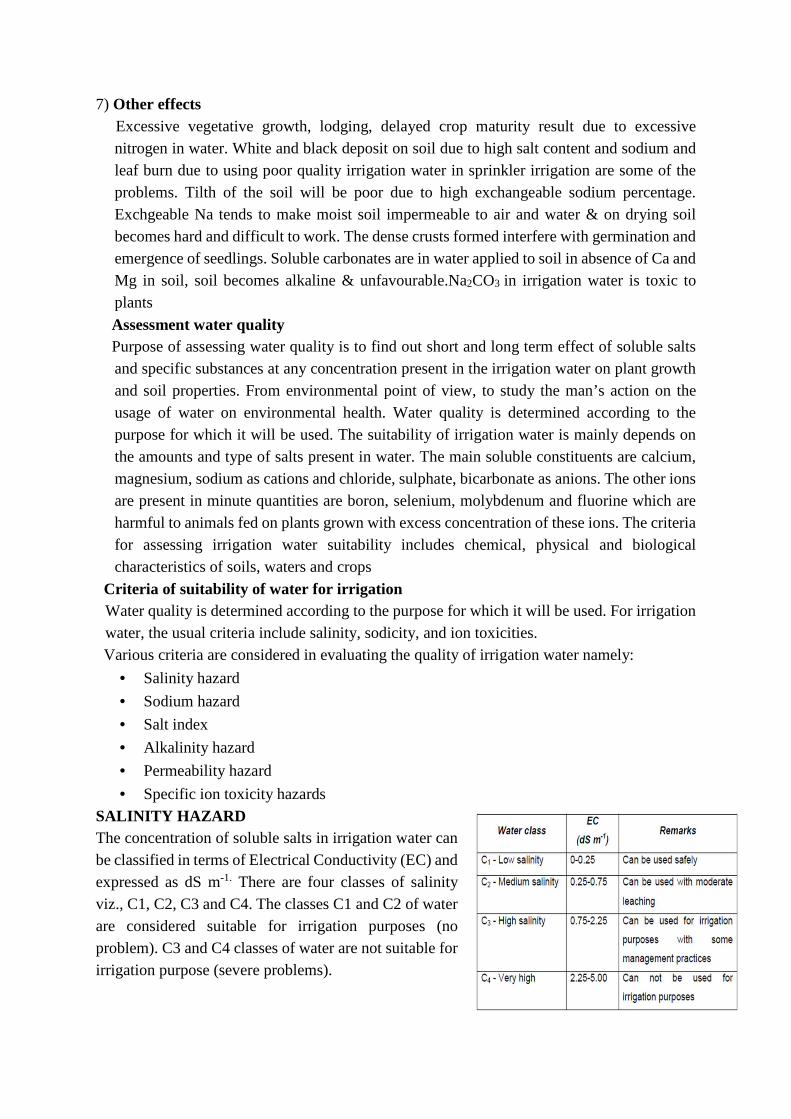
7) Other effects Excessive vegetative growth, lodging, delayed crop maturity result due to excessive
nitrogen in water. White and black deposit on soil due to high salt content and sodium and leaf burn due to using poor quality irrigation water in sprinkler irrigation are some of the problems. Tilth of the soil will be poor due to high exchangeable sodium percentage. Exchgeable Na tends to make moist soil impermeable to air and water & on drying soil becomes hard and difficult to work. The dense crusts formed interfere with germination and emergence of seedlings. Soluble carbonates are in water applied to soil in absence of Ca and Mg in soil, soil becomes alkaline & unfavourable.Na2CO3 in irrigation water is toxic to plants
Assessment water quality Purpose of assessing water quality is to find out short and long term effect of soluble salts
and specific substances at any concentration present in the irrigation water on plant growth and soil properties. From environmental point of view, to study the man’s action on the usage of water on environmental health. Water quality is determined according to the purpose for which it will be used. The suitability of irrigation water is mainly depends on the amounts and type of salts present in water. The main soluble constituents are calcium, magnesium, sodium as cations and chloride, sulphate, bicarbonate as anions. The other ions are present in minute quantities are boron, selenium, molybdenum and fluorine which are harmful to animals fed on plants grown with excess concentration of these ions. The criteria for assessing irrigation water suitability includes chemical, physical and biological characteristics of soils, waters and crops
Criteria of suitability of water for irrigation Water quality is determined according to the purpose for which it will be used. For irrigation water, the usual criteria include salinity, sodicity, and ion toxicities.
Various criteria are considered in evaluating the quality of irrigation water namely:
• Salinity hazard
• Sodium hazard
• Salt index
• Alkalinity hazard
• Permeability hazard
• Specific ion toxicity hazards SALINITY HAZARD The concentration of soluble salts in irrigation water can be classified in terms of Electrical Conductivity (EC) and expressed as dS m-1. There are four classes of salinity viz., C1, C2, C3 and C4. The classes C1 and C2 of water are considered suitable for irrigation purposes (no problem). C3 and C4 classes of water are not suitable for irrigation purpose (severe problems).
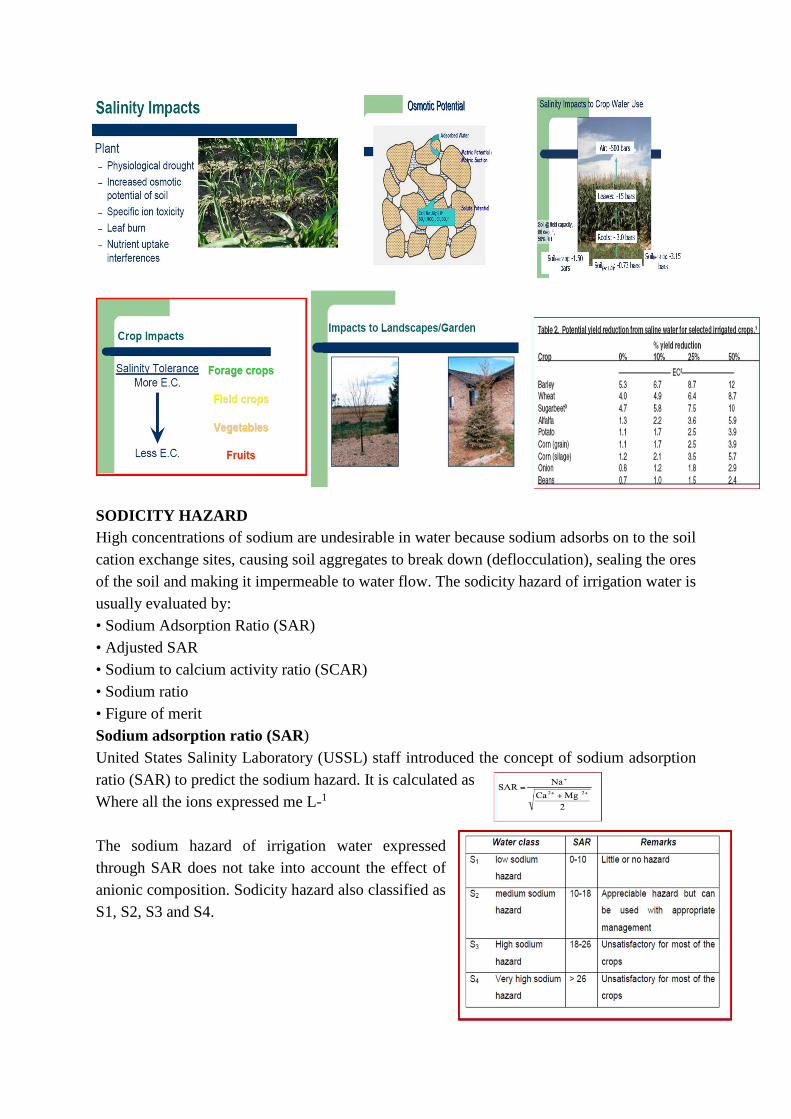
SODICITY HAZARD High concentrations of sodium are undesirable in water because sodium adsorbs on to the soil cation exchange sites, causing soil aggregates to break down (deflocculation), sealing the ores of the soil and making it impermeable to water flow. The sodicity hazard of irrigation water is usually evaluated by: • Sodium Adsorption Ratio (SAR) • Adjusted SAR • Sodium to calcium activity ratio (SCAR) • Sodium ratio • Figure of merit Sodium adsorption ratio (SAR) United States Salinity Laboratory (USSL) staff introduced the concept of sodium adsorption ratio (SAR) to predict the sodium hazard. It is calculated as Where all the ions expressed me L-1
The sodium hazard of irrigation water expressed through SAR does not take into account the effect of anionic composition. Sodicity hazard also classified as S1, S2, S3 and S4.
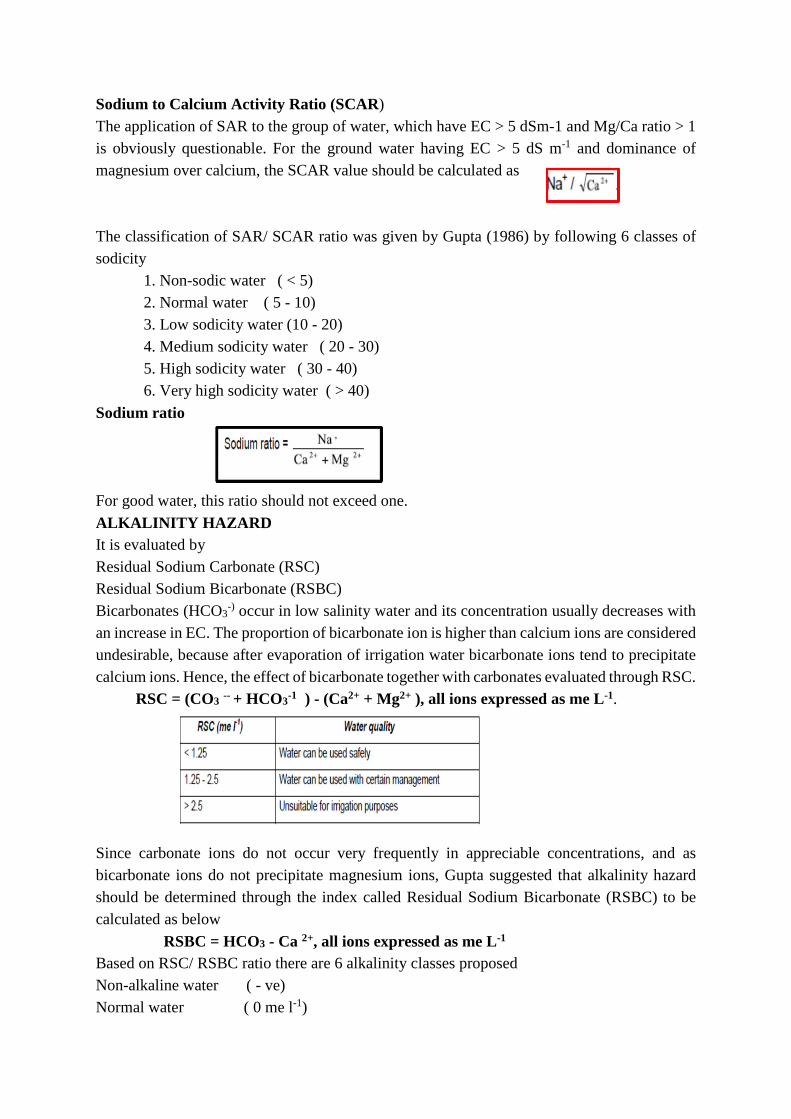
Sodium to Calcium Activity Ratio (SCAR) The application of SAR to the group of water, which have EC > 5 dSm-1 and Mg/Ca ratio > 1 is obviously questionable. For the ground water having EC > 5 dS m-1 and dominance of magnesium over calcium, the SCAR value should be calculated as The classification of SAR/ SCAR ratio was given by Gupta (1986) by following 6 classes of sodicity 1. Non-sodic water ( < 5) 2. Normal water ( 5 - 10) 3. Low sodicity water (10 - 20) 4. Medium sodicity water ( 20 - 30) 5. High sodicity water ( 30 - 40) 6. Very high sodicity water ( > 40)
Sodium ratio For good water, this ratio should not exceed one.
ALKALINITY HAZARD It is evaluated by Residual Sodium Carbonate (RSC) Residual Sodium Bicarbonate (RSBC) Bicarbonates (HCO3-) occur in low salinity water and its concentration usually decreases with an increase in EC. The proportion of bicarbonate ion is higher than calcium ions are considered undesirable, because after evaporation of irrigation water bicarbonate ions tend to precipitate calcium ions. Hence, the effect of bicarbonate together with carbonates evaluated through RSC. RSC = (CO3 -- + HCO3-1 ) - (Ca2+ + Mg2+ ), all ions expressed as me L-1. Since carbonate ions do not occur very frequently in appreciable concentrations, and as bicarbonate ions do not precipitate magnesium ions, Gupta suggested that alkalinity hazard should be determined through the index called Residual Sodium Bicarbonate (RSBC) to be calculated as below
RSBC = HCO3 - Ca 2+, all ions expressed as me L-1 Based on RSC/ RSBC ratio there are 6 alkalinity classes proposed Non-alkaline water ( - ve) Normal water ( 0 me l-1)
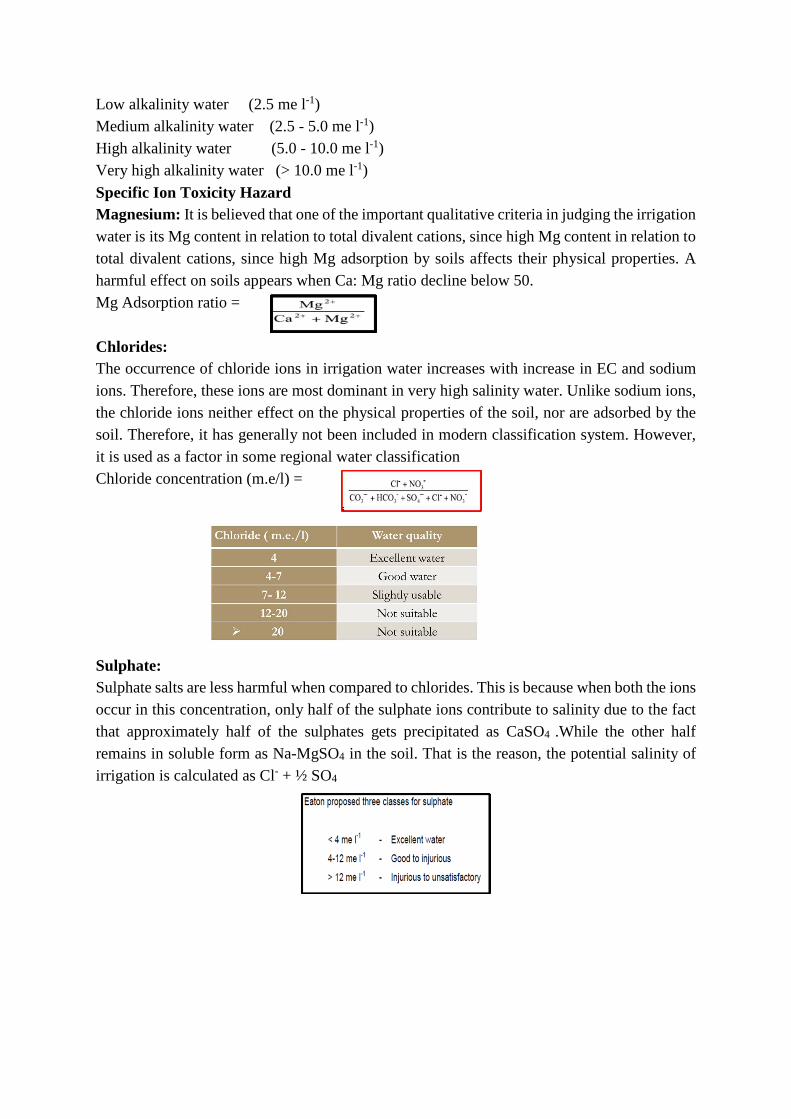
Low alkalinity water (2.5 me l-1) Medium alkalinity water (2.5 - 5.0 me l-1) High alkalinity water (5.0 - 10.0 me l-1) Very high alkalinity water (> 10.0 me l-1)
Specific Ion Toxicity Hazard Magnesium: It is believed that one of the important qualitative criteria in judging the irrigation water is its Mg content in relation to total divalent cations, since high Mg content in relation to total divalent cations, since high Mg adsorption by soils affects their physical properties. A harmful effect on soils appears when Ca: Mg ratio decline below 50. Mg Adsorption ratio =
Chlorides: The occurrence of chloride ions in irrigation water increases with increase in EC and sodium ions. Therefore, these ions are most dominant in very high salinity water. Unlike sodium ions, the chloride ions neither effect on the physical properties of the soil, nor are adsorbed by the soil. Therefore, it has generally not been included in modern classification system. However, it is used as a factor in some regional water classification Chloride concentration (m.e/l) =
Sulphate: Sulphate salts are less harmful when compared to chlorides. This is because when both the ions occur in this concentration, only half of the sulphate ions contribute to salinity due to the fact that approximately half of the sulphates gets precipitated as CaSO4 .While the other half remains in soluble form as Na-MgSO4 in the soil. That is the reason, the potential salinity of irrigation is calculated as Cl- + ½ SO4
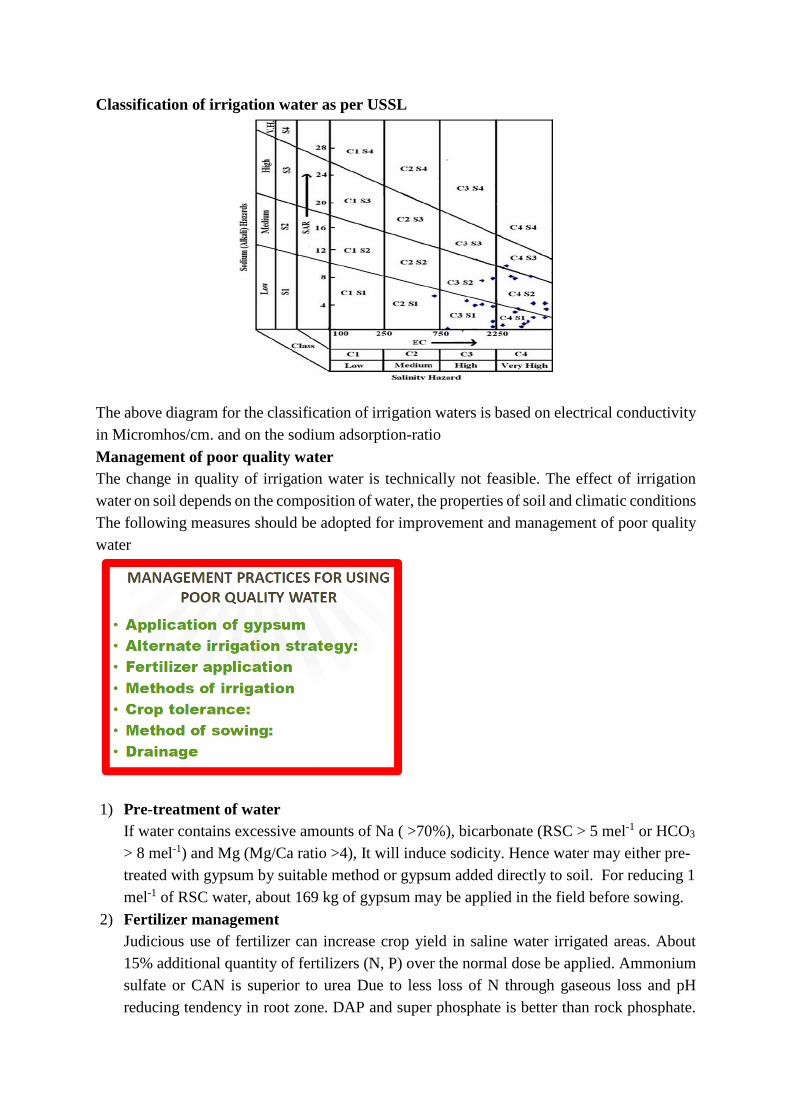
Classification of irrigation water as per USSL The above diagram for the classification of irrigation waters is based on electrical conductivity in Micromhos/cm. and on the sodium adsorption-ratio
Management of poor quality water The change in quality of irrigation water is technically not feasible. The effect of irrigation water on soil depends on the composition of water, the properties of soil and climatic conditions The following measures should be adopted for improvement and management of poor quality water
1) Pre-treatment of water If water contains excessive amounts of Na ( >70%), bicarbonate (RSC > 5 mel-1 or HCO3
> 8 mel-1) and Mg (Mg/Ca ratio >4), It will induce sodicity. Hence water may either pre-treated with gypsum by suitable method or gypsum added directly to soil. For reducing 1 mel-1 of RSC water, about 169 kg of gypsum may be applied in the field before sowing.
2) Fertilizer management Judicious use of fertilizer can increase crop yield in saline water irrigated areas. About 15% additional quantity of fertilizers (N, P) over the normal dose be applied. Ammonium sulfate or CAN is superior to urea Due to less loss of N through gaseous loss and pH reducing tendency in root zone. DAP and super phosphate is better than rock phosphate.

Response of fertilizers decreases as the salinity and SAR of water increases, so Fertilizers should be added @ 1.25 -1.5 times the normal rate of their application and in split application to improve the yields. Application of zinc @ 20kg ha-1 reduces the adverse effect of higher salinity and sodicity
3) Agronomic management Salts tend to accumulate closer to the soil surface and tend to move downwards with reclamation and irrigation. Deep ploughing will loosen the sub soil and reduce salinity Mulching reduces salt accumulation on the surface. Planting technique like sowing on the slope of the ridge than flat sowing. Pitcher or drip irrigation is good when water quality is poor since it keeps soil moist. Quantity of water need for irrigation is calculated based on tolerance limit of crops, degree of salt accumulation in soil and quality of water used
4) Salt tolerance of crops Sensitive crops like wheat, barley, cow pea, pearl millet totally fail to grow under high
saline water. There are certain crops which can grow under high salt stress since it has certain specific characters which offer resistance to grow in saline water. Among leguminous crop daincha is well known tolerance crop
5) Crop rotation Crops vary in their water requirement as well as in frequency with which they need water Crop with long duration of evapo transpiration will enhance much more salt accumulations compared to short duration crops. Crops like rice, alfa alfa, and berseem require frequent helps reclamation irrigation. A best crop rotation not only provided good return but also help to control salinity of growing soil. Generally rice as first crop after burial of green manures followed by an alkali tolerant crops
6) Soil incorporation of organic materials Organic materials (organic manures and organic wastes) could be incorporated in soil for improving physical properties and lowering the pH, EC and SAR of soil irrigated with saline water For sodic water, use of FYM along with gypsum is more beneficial

7) Cyclic use with good quality water 8) Under situation of limiting quantity of good water, saline water can be used for irrigation
in conjunction with good water. Pre sowing and first irrigation after germination should be done with good quality water
9) Treatment with amendments In water containing excess sodium, gypsum can be used. On addition of gypsum, proportion of sodium to other ions is reduced