Learning the Link between Architectural Form and Structural ...
8
Citation: Kazemi, P.; Ghisi, A.; Mariani, S. Learning the Link between Architectural Form and Structural Efficiency: A Supervised Machine Learning Approach. Comput. Sci. Math. Forum 2021, 2, 18. https:// doi.org/10.3390/IOCA2021-10891 Academic Editor: Frank Werner Published: 22 September 2021 Publisher’s Note: MDPI stays neutral with regard to jurisdictional claims in published maps and institutional affil- iations. Copyright: © 2021 by the authors. Licensee MDPI, Basel, Switzerland. This article is an open access article distributed under the terms and conditions of the Creative Commons Attribution (CC BY) license (https:// creativecommons.org/licenses/by/ 4.0/). Proceeding Paper Learning the Link between Architectural Form and Structural Efficiency: A Supervised Machine Learning Approach † Pooyan Kazemi * , Aldo Ghisi and Stefano Mariani Department of Civil and Environmental Engineering, Politecnico di Milano, Piazza Leonardo da Vinci, 32, 20133 Milano, Italy; [email protected] (A.G.); [email protected] (S.M.) * Correspondence: [email protected] † Presented at the 1st International Electronic Conference on Algorithms, 27 September–10 October 2021; Available online: https://ioca2021.sciforum.net/. Abstract: In this work, we exploit supervised machine learning (ML) to investigate the relationship between architectural form and structural efficiency under seismic excitations. We inspect a small dataset of simulated responses of tall buildings, differing in terms of base and top plans within which a vertical transformation method is adopted (tapered forms). A diagrid structure with members having a tubular cross-section is mapped on the architectural forms, and static loads equivalent to the seismic excitation are applied. Different ML algorithms, such as kNN, SVM, Decision Tree, Ensemble methods, discriminant analysis, Naïve Bayes are trained, to classify the seismic response of each form on the basis of a specific label. Presented results rely upon the drift of the building at its top floor, though the same procedure can be generalized and adopt any performance characteristic of the considered structure, like e.g., the drift ratio, the total mass, or the expected design weight. The classification algorithms are all tested within a Bayesian optimization approach; it is then found that the Decision Tree classifier provides the highest accuracy, linked to the lowest computing time. This research activity puts forward a promising perspective for the use of ML algorithms to help architectural and structural designers during the early stages of conception and control of tall buildings. Keywords: supervised machine learning; classification; tall building; architectural form; structural efficiency 1. Introduction Architects and designers have always been curious about building novel forms, though there were lots of restrictions for exploring complex forms. While in some cases there are less limitations in the design, on other occasions engineering fields dictate many considera- tions, for example in the case of tall buildings, which represent one of the most complicated design processes [1]. Tall buildings are an outstanding architectural production and require amazing resources with immense expenses due to their large scale. Since they became nowadays more sophisticated, it is essential to feature suitable and efficient structural configurations. Design teams are currently looking for specialists with a knowledge about efficient, or optimal structural design [2]. The entire design process also requires a close collaboration between architects and engineers, who look for a software that provides them clear requirements for the architectural form and identifies the alternative with the highest structural efficiency and, at the same time, provides a portfolio of different options. Such a software might help contractors and clients to reduce the total costs of construction [2], since about one third of the total expenses are related to the structure; accordingly, structural considerations should be allowed for in the early stage of the design process [3]. Although the early-stage design phase is a negligible part of the whole design process, it thus plays a relevant role in the whole procedure, see [4]. In our modern, smart-city age, the design of tall buildings has become the outcome of the close teamwork of architects, structural and Comput. Sci. Math. Forum 2021, 2, 18. https://doi.org/10.3390/IOCA2021-10891 https://www.mdpi.com/journal/csmf
-
Upload
khangminh22 -
Category
Documents
-
view
1 -
download
0
Transcript of Learning the Link between Architectural Form and Structural ...
�����������������
Citation: Kazemi, P.; Ghisi, A.;
Mariani, S. Learning the Link between
Architectural Form and Structural
Efficiency: A Supervised Machine
Learning Approach. Comput. Sci.
Math. Forum 2021, 2, 18. https://
doi.org/10.3390/IOCA2021-10891
Academic Editor: Frank Werner
Published: 22 September 2021
Publisher’s Note: MDPI stays neutral
with regard to jurisdictional claims in
published maps and institutional affil-
iations.
Copyright: © 2021 by the authors.
Licensee MDPI, Basel, Switzerland.
This article is an open access article
distributed under the terms and
conditions of the Creative Commons
Attribution (CC BY) license (https://
creativecommons.org/licenses/by/
4.0/).
Proceeding Paper
Learning the Link between Architectural Form and StructuralEfficiency: A Supervised Machine Learning Approach †
Pooyan Kazemi * , Aldo Ghisi and Stefano Mariani
Department of Civil and Environmental Engineering, Politecnico di Milano, Piazza Leonardo da Vinci, 32,20133 Milano, Italy; [email protected] (A.G.); [email protected] (S.M.)* Correspondence: [email protected]† Presented at the 1st International Electronic Conference on Algorithms, 27 September–10 October 2021;
Available online: https://ioca2021.sciforum.net/.
Abstract: In this work, we exploit supervised machine learning (ML) to investigate the relationshipbetween architectural form and structural efficiency under seismic excitations. We inspect a smalldataset of simulated responses of tall buildings, differing in terms of base and top plans within whicha vertical transformation method is adopted (tapered forms). A diagrid structure with membershaving a tubular cross-section is mapped on the architectural forms, and static loads equivalent to theseismic excitation are applied. Different ML algorithms, such as kNN, SVM, Decision Tree, Ensemblemethods, discriminant analysis, Naïve Bayes are trained, to classify the seismic response of eachform on the basis of a specific label. Presented results rely upon the drift of the building at its topfloor, though the same procedure can be generalized and adopt any performance characteristic ofthe considered structure, like e.g., the drift ratio, the total mass, or the expected design weight. Theclassification algorithms are all tested within a Bayesian optimization approach; it is then foundthat the Decision Tree classifier provides the highest accuracy, linked to the lowest computingtime. This research activity puts forward a promising perspective for the use of ML algorithmsto help architectural and structural designers during the early stages of conception and control oftall buildings.
Keywords: supervised machine learning; classification; tall building; architectural form; structural efficiency
1. Introduction
Architects and designers have always been curious about building novel forms, thoughthere were lots of restrictions for exploring complex forms. While in some cases there areless limitations in the design, on other occasions engineering fields dictate many considera-tions, for example in the case of tall buildings, which represent one of the most complicateddesign processes [1]. Tall buildings are an outstanding architectural production and requireamazing resources with immense expenses due to their large scale. Since they becamenowadays more sophisticated, it is essential to feature suitable and efficient structuralconfigurations. Design teams are currently looking for specialists with a knowledge aboutefficient, or optimal structural design [2]. The entire design process also requires a closecollaboration between architects and engineers, who look for a software that provides themclear requirements for the architectural form and identifies the alternative with the higheststructural efficiency and, at the same time, provides a portfolio of different options. Such asoftware might help contractors and clients to reduce the total costs of construction [2], sinceabout one third of the total expenses are related to the structure; accordingly, structuralconsiderations should be allowed for in the early stage of the design process [3]. Althoughthe early-stage design phase is a negligible part of the whole design process, it thus plays arelevant role in the whole procedure, see [4]. In our modern, smart-city age, the design oftall buildings has become the outcome of the close teamwork of architects, structural and
Comput. Sci. Math. Forum 2021, 2, 18. https://doi.org/10.3390/IOCA2021-10891 https://www.mdpi.com/journal/csmf
Comput. Sci. Math. Forum 2021, 2, 18 2 of 8
mechanical engineers that resulted in a considerable efficiency. By the advance of technol-ogy and the constructability of complex forms, the structural efficiency may fade and, evenmore regrettably, it can lead to depleting the Earth resources in case of an inefficient useof materials load bearing capacity [5]. In the contemporary tall building design approach,structural considerations are not fully taken into account, till when the architectural formis appropriately generated; this procedure compels the structural intervention to fix thesingle, individual problem rather than really integrating the structural model into the initialarchitectural form. Since the design process in the early-stage is so critical, a workflowshould be utilized to assure that all aspects are considered simultaneously, see e.g., [6,7].Moreover, architects should simultaneously consider various design objectives, includingstructural efficiency, since the 80% of the consumption of construction materials is definedat this stage.
Some researchers investigated the relation of architecture and structural efficiencyfor tall buildings [8]. On some occasions, it was claimed that hyperboloid form has betterstructural efficiency in comparison to the cylindrical form. Others also considered the effectof the architectural form on the structural efficiency, the investigation resting on different,alternate geometries [9–12].
Within the frame of a parametric design paradigm, all the design features such as form,can be modified at any time during the design process [13]. In the so-called computationaldesign approach, a steady capability to create complex models in terms of form is pursued;with this approach, ordinary structural modeling performances are supplied through asimulation tool, to cope with the problem complexity and speed up requirement compliance:several alternatives can be thus adopted in the current model of a building at a glance [13].It turns out that parameters that define the architectural and structural components of themodel, are flexible and can be adjusted on the fly.
There is currently a lack of research activities regarding the application of ML in thefield of architecture. For example, in [14] ML was adopted to generate non-conventionalstructural forms that can be classified as objectives or subjective of the design product. MLindeed provides the designer with an insight on the structural efficiency of the solutions [15].Alternatively, artificial intelligence has been exploited to add more creativity to the designprocess, e.g., by using a variational autoencoder in a design framework: the algorithmgenerates some samples and then a the autoencoder can start training the model.
In this work, we focus on the use of ML tools to learn the link between the outer shapeof tall buildings, their load bearing frame and the overall capacity to resist earthquakeexcitations. Different algorithms are trained by exploiting a rather small dataset of resultsregarding the response of buildings of different shapes excited by a seismic-like loading,and a comparison in provided in terms of their efficiency to get trained and their capabilityto provide accurate surrogates of the real structures.
2. Proposed Methodology
The present approach consists of three stages: (i) architectural form generation; (ii)structural analysis; and (iii) supervised ML. Out of these three stages, only the last oneprovides novelties, since it addresses the question as to whether it would be possible toobtain accurate surrogates within a ML-based process. It was indeed time consumingto generate all the architectural forms, and then build the structural model for all theconsidered 144 forms, apply loads, and finally carry out the structural analysis. Forexample, if only a part of the 144 forms would be investigated for modelling and trainingthe ML tool, the result for the remaining part of the dataset could be generated automatically.The main goal of this research is so to apply ML on the aforementioned problem or, moreprecisely, to find an optimal case-dependent classification algorithm.
2.1. Architectural Form Generation
The architectural form of a tall building has been interpreted here as a top and bottomplan and a vertical transformation method consisting of morph, twist, or a curvilinear
Comput. Sci. Math. Forum 2021, 2, 18 3 of 8
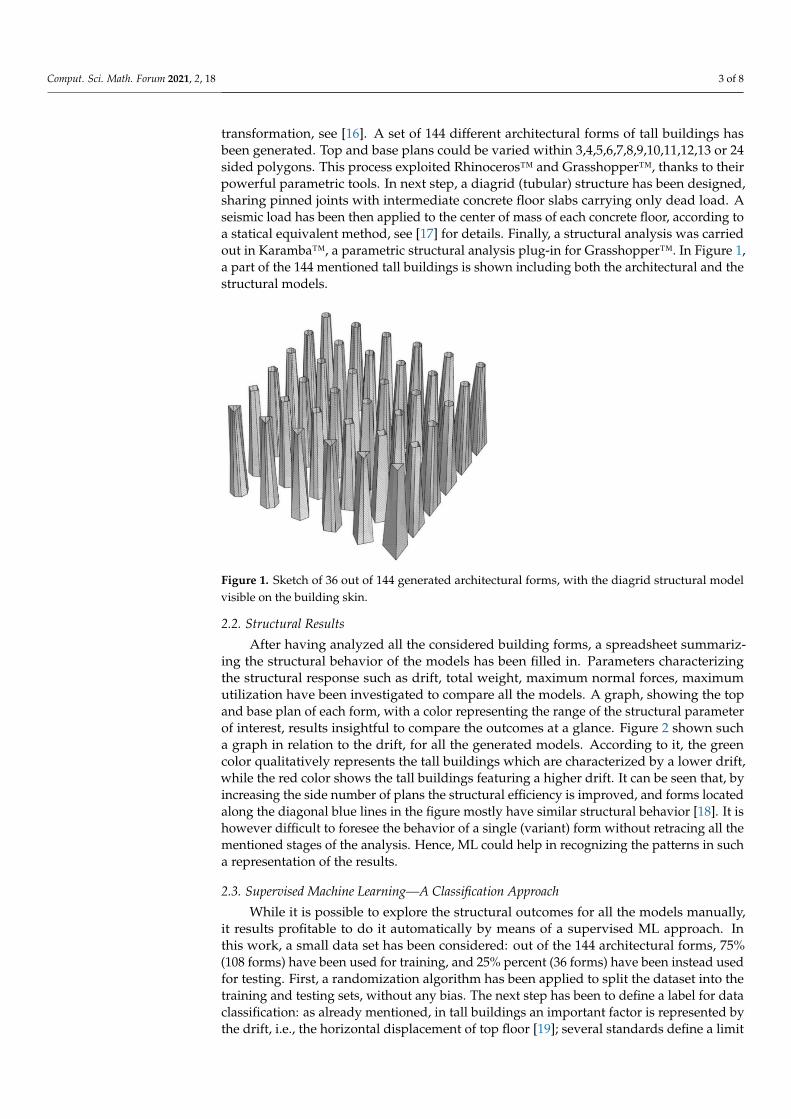
transformation, see [16]. A set of 144 different architectural forms of tall buildings hasbeen generated. Top and base plans could be varied within 3,4,5,6,7,8,9,10,11,12,13 or 24sided polygons. This process exploited Rhinoceros™ and Grasshopper™, thanks to theirpowerful parametric tools. In next step, a diagrid (tubular) structure has been designed,sharing pinned joints with intermediate concrete floor slabs carrying only dead load. Aseismic load has been then applied to the center of mass of each concrete floor, according toa statical equivalent method, see [17] for details. Finally, a structural analysis was carriedout in Karamba™, a parametric structural analysis plug-in for Grasshopper™. In Figure 1,a part of the 144 mentioned tall buildings is shown including both the architectural and thestructural models.
Comput. Sci. Math. Forum 2021, 2, 18 3 of 8
2.1. Architectural Form Generation The architectural form of a tall building has been interpreted here as a top and bottom
plan and a vertical transformation method consisting of morph, twist, or a curvilinear transformation, see [16]. A set of 144 different architectural forms of tall buildings has been generated. Top and base plans could be varied within 3,4,5,6,7,8,9,10,11,12,13 or 24 sided polygons. This process exploited Rhinoceros™ and Grasshopper™, thanks to their powerful parametric tools. In next step, a diagrid (tubular) structure has been designed, sharing pinned joints with intermediate concrete floor slabs carrying only dead load. A seismic load has been then applied to the center of mass of each concrete floor, according to a statical equivalent method, see [17] for details. Finally, a structural analysis was car-ried out in Karamba™, a parametric structural analysis plug-in for Grasshopper™. In Fig-ure 1, a part of the 144 mentioned tall buildings is shown including both the architectural and the structural models.
Figure 1. Sketch of 36 out of 144 generated architectural forms, with the diagrid structural model visible on the building skin.
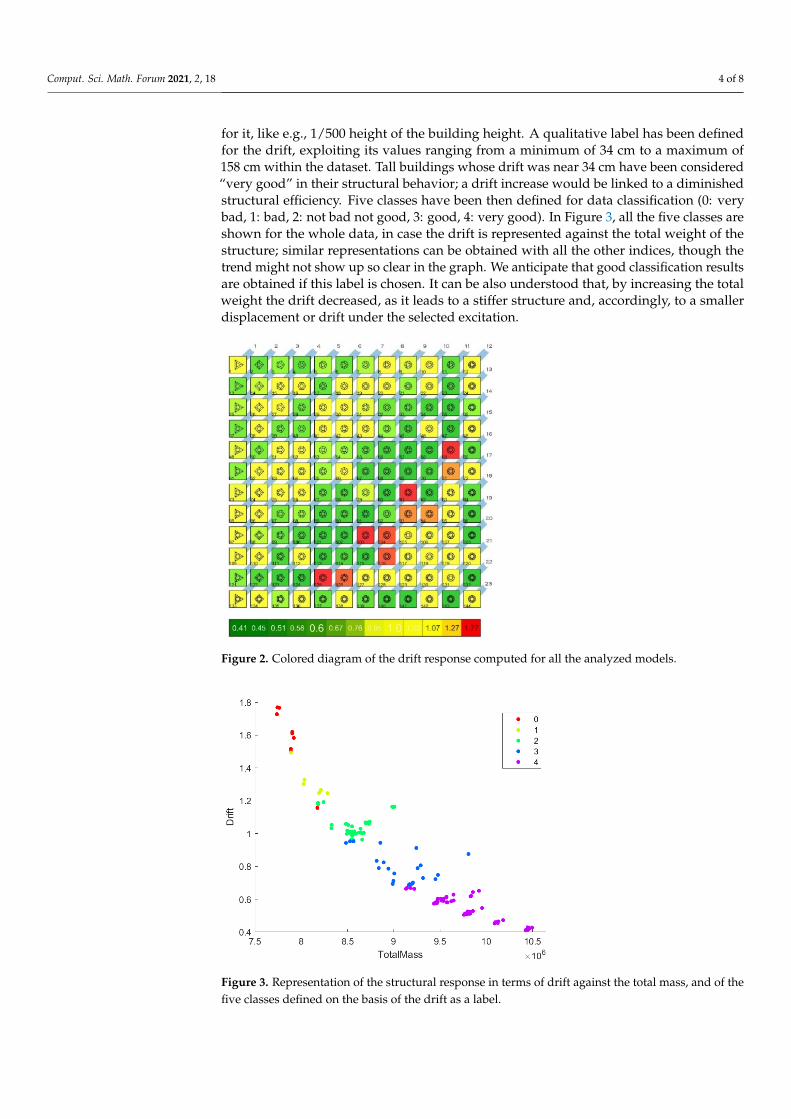
Figure 2. Colored diagram of the drift response computed for all the analyzed models.
2.2. Structural Results After having analyzed all the considered building forms, a spreadsheet summarizing
the structural behavior of the models has been filled in. Parameters characterizing the
Figure 1. Sketch of 36 out of 144 generated architectural forms, with the diagrid structural modelvisible on the building skin.
2.2. Structural Results
After having analyzed all the considered building forms, a spreadsheet summariz-ing the structural behavior of the models has been filled in. Parameters characterizingthe structural response such as drift, total weight, maximum normal forces, maximumutilization have been investigated to compare all the models. A graph, showing the topand base plan of each form, with a color representing the range of the structural parameterof interest, results insightful to compare the outcomes at a glance. Figure 2 shown sucha graph in relation to the drift, for all the generated models. According to it, the greencolor qualitatively represents the tall buildings which are characterized by a lower drift,while the red color shows the tall buildings featuring a higher drift. It can be seen that, byincreasing the side number of plans the structural efficiency is improved, and forms locatedalong the diagonal blue lines in the figure mostly have similar structural behavior [18]. It ishowever difficult to foresee the behavior of a single (variant) form without retracing all thementioned stages of the analysis. Hence, ML could help in recognizing the patterns in sucha representation of the results.
2.3. Supervised Machine Learning—A Classification Approach
While it is possible to explore the structural outcomes for all the models manually,it results profitable to do it automatically by means of a supervised ML approach. Inthis work, a small data set has been considered: out of the 144 architectural forms, 75%(108 forms) have been used for training, and 25% percent (36 forms) have been instead usedfor testing. First, a randomization algorithm has been applied to split the dataset into thetraining and testing sets, without any bias. The next step has been to define a label for dataclassification: as already mentioned, in tall buildings an important factor is represented bythe drift, i.e., the horizontal displacement of top floor [19]; several standards define a limit
Comput. Sci. Math. Forum 2021, 2, 18 4 of 8
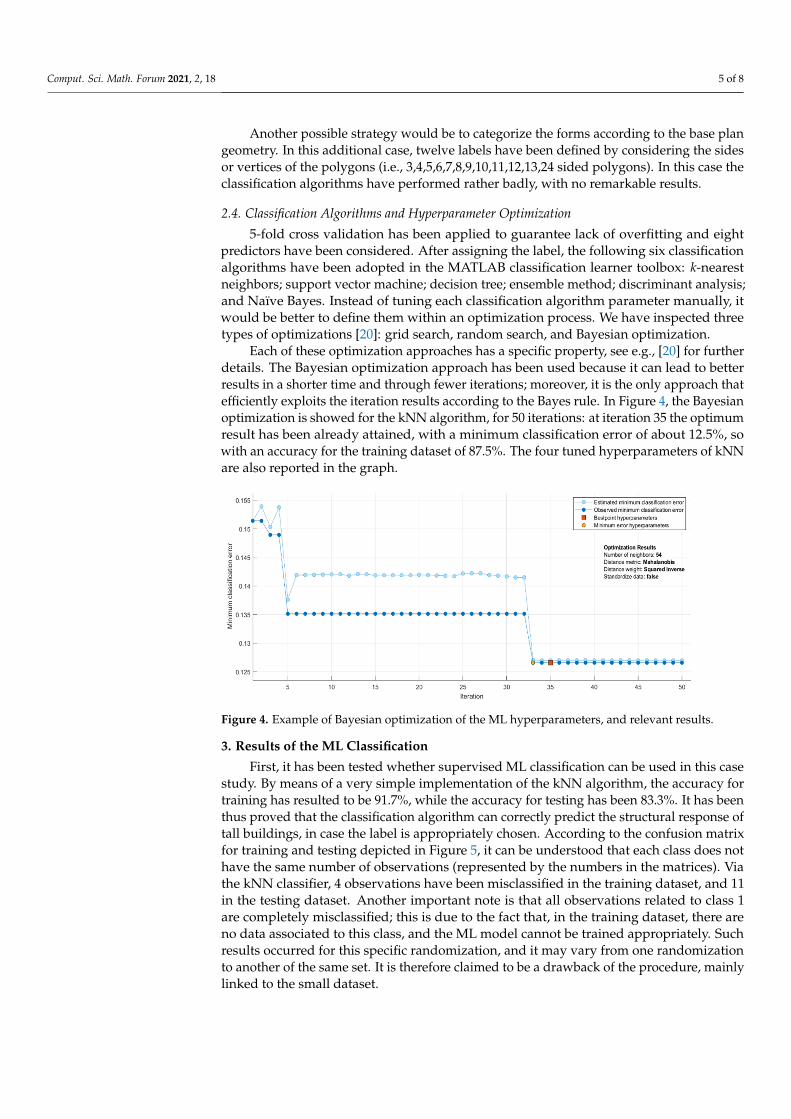
for it, like e.g., 1/500 height of the building height. A qualitative label has been definedfor the drift, exploiting its values ranging from a minimum of 34 cm to a maximum of158 cm within the dataset. Tall buildings whose drift was near 34 cm have been considered“very good” in their structural behavior; a drift increase would be linked to a diminishedstructural efficiency. Five classes have been then defined for data classification (0: verybad, 1: bad, 2: not bad not good, 3: good, 4: very good). In Figure 3, all the five classes areshown for the whole data, in case the drift is represented against the total weight of thestructure; similar representations can be obtained with all the other indices, though thetrend might not show up so clear in the graph. We anticipate that good classification resultsare obtained if this label is chosen. It can be also understood that, by increasing the totalweight the drift decreased, as it leads to a stiffer structure and, accordingly, to a smallerdisplacement or drift under the selected excitation.
Comput. Sci. Math. Forum 2021, 2, 18 3 of 8
2.1. Architectural Form Generation The architectural form of a tall building has been interpreted here as a top and bottom
plan and a vertical transformation method consisting of morph, twist, or a curvilinear transformation, see [16]. A set of 144 different architectural forms of tall buildings has been generated. Top and base plans could be varied within 3,4,5,6,7,8,9,10,11,12,13 or 24 sided polygons. This process exploited Rhinoceros™ and Grasshopper™, thanks to their powerful parametric tools. In next step, a diagrid (tubular) structure has been designed, sharing pinned joints with intermediate concrete floor slabs carrying only dead load. A seismic load has been then applied to the center of mass of each concrete floor, according to a statical equivalent method, see [17] for details. Finally, a structural analysis was car-ried out in Karamba™, a parametric structural analysis plug-in for Grasshopper™. In Fig-ure 1, a part of the 144 mentioned tall buildings is shown including both the architectural and the structural models.
Figure 1. Sketch of 36 out of 144 generated architectural forms, with the diagrid structural model visible on the building skin.
Figure 2. Colored diagram of the drift response computed for all the analyzed models.
2.2. Structural Results After having analyzed all the considered building forms, a spreadsheet summarizing
the structural behavior of the models has been filled in. Parameters characterizing the
Figure 2. Colored diagram of the drift response computed for all the analyzed models.
Comput. Sci. Math. Forum 2021, 2, 18 4 of 8
structural response such as drift, total weight, maximum normal forces, maximum utili-zation have been investigated to compare all the models. A graph, showing the top and base plan of each form, with a color representing the range of the structural parameter of interest, results insightful to compare the outcomes at a glance. Figure 2 shown such a graph in relation to the drift, for all the generated models. According to it, the green color qualitatively represents the tall buildings which are characterized by a lower drift, while the red color shows the tall buildings featuring a higher drift. It can be seen that, by in-creasing the side number of plans the structural efficiency is improved, and forms located along the diagonal blue lines in the figure mostly have similar structural behavior [18]. It is however difficult to foresee the behavior of a single (variant) form without retracing all the mentioned stages of the analysis. Hence, ML could help in recognizing the patterns in such a representation of the results.
2.3. Supervised Machine Learning—A Classification Approach While it is possible to explore the structural outcomes for all the models manually, it
results profitable to do it automatically by means of a supervised ML approach. In this work, a small data set has been considered: out of the 144 architectural forms, 75% (108 forms) have been used for training, and 25% percent (36 forms) have been instead used for testing. First, a randomization algorithm has been applied to split the dataset into the training and testing sets, without any bias. The next step has been to define a label for data classification: as already mentioned, in tall buildings an important factor is represented by the drift, i.e., the horizontal displacement of top floor [19]; several standards define a limit for it, like e.g., 1/500 height of the building height. A qualitative label has been de-fined for the drift, exploiting its values ranging from a minimum of 34 cm to a maximum of 158 cm within the dataset. Tall buildings whose drift was near 34 cm have been consid-ered “very good” in their structural behavior; a drift increase would be linked to a dimin-ished structural efficiency. Five classes have been then defined for data classification (0: very bad, 1: bad, 2: not bad not good, 3: good, 4: very good). In Figure 3, all the five classes are shown for the whole data, in case the drift is represented against the total weight of the structure; similar representations can be obtained with all the other indices, though the trend might not show up so clear in the graph. We anticipate that good classification results are obtained if this label is chosen. It can be also understood that, by increasing the total weight the drift decreased, as it leads to a stiffer structure and, accordingly, to a smaller displacement or drift under the selected excitation.
Figure 3. Representation of the structural response in terms of drift against the total mass, and of the five classes defined on the basis of the drift as a label.
Another possible strategy would be to categorize the forms according to the base plan geometry. In this additional case, twelve labels have been defined by considering the sides
Figure 3. Representation of the structural response in terms of drift against the total mass, and of thefive classes defined on the basis of the drift as a label.
Comput. Sci. Math. Forum 2021, 2, 18 5 of 8
Another possible strategy would be to categorize the forms according to the base plangeometry. In this additional case, twelve labels have been defined by considering the sidesor vertices of the polygons (i.e., 3,4,5,6,7,8,9,10,11,12,13,24 sided polygons). In this case theclassification algorithms have performed rather badly, with no remarkable results.
2.4. Classification Algorithms and Hyperparameter Optimization
5-fold cross validation has been applied to guarantee lack of overfitting and eightpredictors have been considered. After assigning the label, the following six classificationalgorithms have been adopted in the MATLAB classification learner toolbox: k-nearestneighbors; support vector machine; decision tree; ensemble method; discriminant analysis;and Naïve Bayes. Instead of tuning each classification algorithm parameter manually, itwould be better to define them within an optimization process. We have inspected threetypes of optimizations [20]: grid search, random search, and Bayesian optimization.
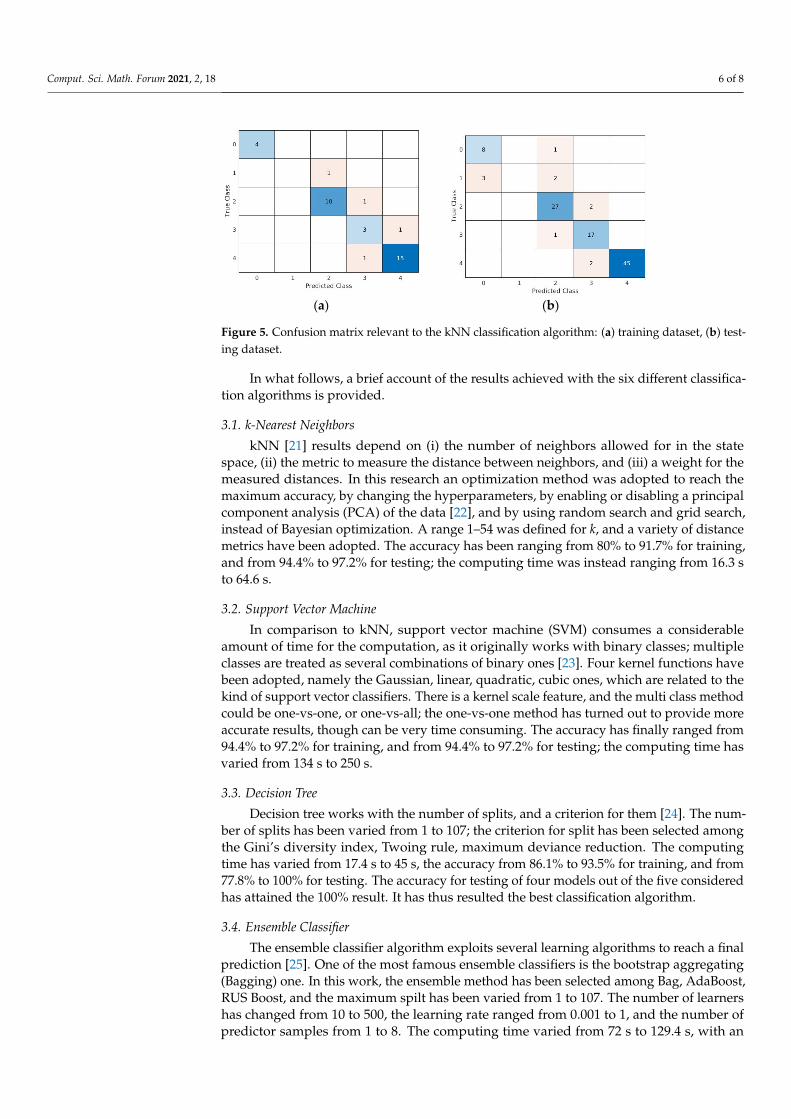
Each of these optimization approaches has a specific property, see e.g., [20] for furtherdetails. The Bayesian optimization approach has been used because it can lead to betterresults in a shorter time and through fewer iterations; moreover, it is the only approach thatefficiently exploits the iteration results according to the Bayes rule. In Figure 4, the Bayesianoptimization is showed for the kNN algorithm, for 50 iterations: at iteration 35 the optimumresult has been already attained, with a minimum classification error of about 12.5%, sowith an accuracy for the training dataset of 87.5%. The four tuned hyperparameters of kNNare also reported in the graph.
Comput. Sci. Math. Forum 2021, 2, 18 5 of 8
or vertices of the polygons (i.e., 3,4,5,6,7,8,9,10,11,12,13,24 sided polygons). In this case the classification algorithms have performed rather badly, with no remarkable results.
2.4. Classification Algorithms and Hyperparameter Optimization 5-fold cross validation has been applied to guarantee lack of overfitting and eight
predictors have been considered. After assigning the label, the following six classification algorithms have been adopted in the MATLAB classification learner toolbox: k-nearest neighbors; support vector machine; decision tree; ensemble method; discriminant analy-sis; and Naïve Bayes. Instead of tuning each classification algorithm parameter manually, it would be better to define them within an optimization process. We have inspected three types of optimizations [20]: grid search, random search, and Bayesian optimization.
Each of these optimization approaches has a specific property, see e.g., [20] for fur-ther details. The Bayesian optimization approach has been used because it can lead to better results in a shorter time and through fewer iterations; moreover, it is the only ap-proach that efficiently exploits the iteration results according to the Bayes rule. In Figure 4, the Bayesian optimization is showed for the kNN algorithm, for 50 iterations: at itera-tion 35 the optimum result has been already attained, with a minimum classification error of about 12.5%, so with an accuracy for the training dataset of 87.5%. The four tuned hy-perparameters of kNN are also reported in the graph.
Figure 4. Example of Bayesian optimization of the ML hyperparameters, and relevant results.
3. Results of the ML Classification First, it has been tested whether supervised ML classification can be used in this case
study. By means of a very simple implementation of the kNN algorithm, the accuracy for training has resulted to be 91.7%, while the accuracy for testing has been 83.3%. It has been thus proved that the classification algorithm can correctly predict the structural response of tall buildings, in case the label is appropriately chosen. According to the confusion ma-trix for training and testing depicted in Figure 5, it can be understood that each class does not have the same number of observations (represented by the numbers in the matrices). Via the kNN classifier, 4 observations have been misclassified in the training dataset, and 11 in the testing dataset. Another important note is that all observations related to class 1 are completely misclassified; this is due to the fact that, in the training dataset, there are no data associated to this class, and the ML model cannot be trained appropriately. Such results occurred for this specific randomization, and it may vary from one randomization to another of the same set. It is therefore claimed to be a drawback of the procedure, mainly linked to the small dataset.
Figure 4. Example of Bayesian optimization of the ML hyperparameters, and relevant results.
3. Results of the ML Classification
First, it has been tested whether supervised ML classification can be used in this casestudy. By means of a very simple implementation of the kNN algorithm, the accuracy fortraining has resulted to be 91.7%, while the accuracy for testing has been 83.3%. It has beenthus proved that the classification algorithm can correctly predict the structural response oftall buildings, in case the label is appropriately chosen. According to the confusion matrixfor training and testing depicted in Figure 5, it can be understood that each class does nothave the same number of observations (represented by the numbers in the matrices). Viathe kNN classifier, 4 observations have been misclassified in the training dataset, and 11in the testing dataset. Another important note is that all observations related to class 1are completely misclassified; this is due to the fact that, in the training dataset, there areno data associated to this class, and the ML model cannot be trained appropriately. Suchresults occurred for this specific randomization, and it may vary from one randomizationto another of the same set. It is therefore claimed to be a drawback of the procedure, mainlylinked to the small dataset.
Comput. Sci. Math. Forum 2021, 2, 18 6 of 8Comput. Sci. Math. Forum 2021, 2, 18 6 of 8
(a) (b)
Figure 5. Confusion matrix relevant to the kNN classification algorithm: (a) training dataset, (b) testing dataset.
In what follows, a brief account of the results achieved with the six different classifi-cation algorithms is provided.
3.1. k-Nearest Neighbors kNN [21] results depend on (i) the number of neighbors allowed for in the state space,
(ii) the metric to measure the distance between neighbors, and (iii) a weight for the meas-ured distances. In this research an optimization method was adopted to reach the maxi-mum accuracy, by changing the hyperparameters, by enabling or disabling a principal component analysis (PCA) of the data [22], and by using random search and grid search, instead of Bayesian optimization. A range 1-54 was defined for k, and a variety of distance metrics have been adopted. The accuracy has been ranging from 80% to 91.7% for training, and from 94.4% to 97.2% for testing; the computing time was instead ranging from 16.3 s to 64.6 s.
3.2. Support Vector Machine In comparison to kNN, support vector machine (SVM) consumes a considerable
amount of time for the computation, as it originally works with binary classes; multiple classes are treated as several combinations of binary ones [23]. Four kernel functions have been adopted, namely the Gaussian, linear, quadratic, cubic ones, which are related to the kind of support vector classifiers. There is a kernel scale feature, and the multi class method could be one-vs-one, or one-vs-all; the one-vs-one method has turned out to pro-vide more accurate results, though can be very time consuming. The accuracy has finally ranged from 94.4% to 97.2% for training, and from 94.4% to 97.2% for testing; the compu-ting time has varied from 134 s to 250 s.
3.3. Decision Tree Decision tree works with the number of splits, and a criterion for them [24]. The num-
ber of splits has been varied from 1 to 107; the criterion for split has been selected among the Gini’s diversity index, Twoing rule, maximum deviance reduction. The computing time has varied from 17.4 s to 45 s, the accuracy from 86.1% to 93.5% for training, and from 77.8% to 100% for testing. The accuracy for testing of four models out of the five consid-ered has attained the 100% result. It has thus resulted the best classification algorithm.
3.4. Ensemble Classifier The ensemble classifier algorithm exploits several learning algorithms to reach a final
prediction [25]. One of the most famous ensemble classifiers is the bootstrap aggregating (Bagging) one. In this work, the ensemble method has been selected among Bag, Ada-Boost, RUS Boost, and the maximum spilt has been varied from 1 to 107. The number of learners has changed from 10 to 500, the learning rate ranged from 0.001 to 1, and the
Figure 5. Confusion matrix relevant to the kNN classification algorithm: (a) training dataset, (b) test-ing dataset.
In what follows, a brief account of the results achieved with the six different classifica-tion algorithms is provided.
3.1. k-Nearest Neighbors
kNN [21] results depend on (i) the number of neighbors allowed for in the statespace, (ii) the metric to measure the distance between neighbors, and (iii) a weight for themeasured distances. In this research an optimization method was adopted to reach themaximum accuracy, by changing the hyperparameters, by enabling or disabling a principalcomponent analysis (PCA) of the data [22], and by using random search and grid search,instead of Bayesian optimization. A range 1–54 was defined for k, and a variety of distancemetrics have been adopted. The accuracy has been ranging from 80% to 91.7% for training,and from 94.4% to 97.2% for testing; the computing time was instead ranging from 16.3 sto 64.6 s.
3.2. Support Vector Machine
In comparison to kNN, support vector machine (SVM) consumes a considerableamount of time for the computation, as it originally works with binary classes; multipleclasses are treated as several combinations of binary ones [23]. Four kernel functions havebeen adopted, namely the Gaussian, linear, quadratic, cubic ones, which are related to thekind of support vector classifiers. There is a kernel scale feature, and the multi class methodcould be one-vs-one, or one-vs-all; the one-vs-one method has turned out to provide moreaccurate results, though can be very time consuming. The accuracy has finally ranged from94.4% to 97.2% for training, and from 94.4% to 97.2% for testing; the computing time hasvaried from 134 s to 250 s.
3.3. Decision Tree
Decision tree works with the number of splits, and a criterion for them [24]. The num-ber of splits has been varied from 1 to 107; the criterion for split has been selected amongthe Gini’s diversity index, Twoing rule, maximum deviance reduction. The computingtime has varied from 17.4 s to 45 s, the accuracy from 86.1% to 93.5% for training, and from77.8% to 100% for testing. The accuracy for testing of four models out of the five consideredhas attained the 100% result. It has thus resulted the best classification algorithm.
3.4. Ensemble Classifier
The ensemble classifier algorithm exploits several learning algorithms to reach a finalprediction [25]. One of the most famous ensemble classifiers is the bootstrap aggregating(Bagging) one. In this work, the ensemble method has been selected among Bag, AdaBoost,RUS Boost, and the maximum spilt has been varied from 1 to 107. The number of learnershas changed from 10 to 500, the learning rate ranged from 0.001 to 1, and the number ofpredictor samples from 1 to 8. The computing time varied from 72 s to 129.4 s, with an

Comput. Sci. Math. Forum 2021, 2, 18 7 of 8
accuracy from 85.2% to 98.1% for training, and from 94.4% to 100% for testing. After thedecision tree, ensemble turns out to be the best possible classification algorithm.
3.5. Naïve Bayes
Naïve Bayes classifier works within a stochastic frame [26], by applying the Bayestheorem. This algorithm features only two hyperparameters: distribution type, and kerneltype. Specifically, the kernel type can be one out of Gaussian, Box, Epanechnikov, Triangularones. The computing time varied from 13.7 s to 109.7 s, with an accuracy for training from82.4% to 92.6%, and from 83.3% to 91.7% for testing.
3.6. Discriminant Analysis
A discriminant classifier assumes that different classes produce data according todifferent Gaussian distributions [27]. The only model hyperparameter to select is thediscriminant type, which can be linear, quadratic, diagonal linear, or diagonal quadratic. Inthis case, the computing time varied from 45.3 s to 48.7 s, and the accuracy from 85.2% to94.4%, and from 83.3% to 91.7% for training and testing, respectively.
For the sake of brevity, all the results are not directly compared here. A detailedanalysis, in terms of accuracy and computational costs to go beyond the brief accountprovided here above, is going to be given in the conference presentation. Readers aretherefore directed to it for a thorough discuss on the efficiency of the adopted ML tools.
4. Conclusions
In this work, the relation between architectural form and structural efficiency of tallbuildings has been studied via a data-driven approach. Several architectural and structuralmodel generation methods could be used to get insights into which architectural detail ormodification may increase the structural efficiency, moving in the direction of morphing orsmart structures. A novel view has been provided by adopting machine learning tools tolearn the links between shape and structural response under seismic excitations, by alsoreducing the computing time: a sample dataset has been used to predict the performanceof new architectural forms of tall buildings.
It has been proven that supervised machine learning can be successfully applied to thiscase study. Moreover, among the six investigated classification algorithms, even thougheach of them provides advantages and disadvantages, the ensemble and the decision treeclassifier algorithms have attained the best results.
Supplementary Materials: The conference presentation files are available at https://www.mdpi.com/article/10.3390/IOCA2021-10891/s1.
Author Contributions: Conceptualization and methodology, all the authors; validation, P.K.; datacuration, P.K.; writing—original draft preparation, P.K.; writing—review and editing, A.G. and S.M.All authors have read and agreed to the published version of the manuscript.
Funding: This research received no external funding.
Institutional Review Board Statement: Not applicable.
Informed Consent Statement: Not applicable.
Conflicts of Interest: The authors declare no conflict of interest.
References1. Moon, K.S. Sustainable Structural Design of Contemporary Tall Buildings of Various Forms. In Proceedings of the CTBUH 2012
9th World Congress, Shanghai, China, 19–21 September 2012; pp. 271–279.2. Elnimeiri, M.; Almusharaf, A. Structure and Architectural Form of Tall Buildings. In Proceedings of the International Conference
on Sustainable Building Asia, Seoul, Korea, 27–29 June 2010; pp. 54–61.3. Park, S.M. Innovative Tall Building Form Development. In Proceedings of the CTBUH 2005 7th World Congress, New York, NY,
USA, 16–19 October 2005.
Comput. Sci. Math. Forum 2021, 2, 18 8 of 8
4. Elnimeiri, M.; Nicknam, M. A Design Optimization Workflow for Tall Buildings Using Parametric Algorithm. In Proceedings ofthe CTBUH 2011 Seoul Conference, Seoul, Korea, 10–12 October 2011; pp. 561–569.
5. Kloft, H. Non-Standard Structural Design for Non-standard Architecture. In Performative Architecture: Beyond Instrumentality;Kolarevic, B., Malkawi, A., Eds.; Spon Press: London, UK, 2005; pp. 256–264.
6. Brown, N.; Mueller, C. Early-stage integration of architectural and structural performance in a parametric multi-objective designtool. In Proceedings of the 3rd Annual Conference on Structures and Architecture, Guimarães, Portugal, 27–29 July 2016.
7. Elnimeiri, M.; Park, S.M.; Sharpe, D.; Krawczyk, R. Tall building form generation by parametric design process. In Proceedings ofthe CTBUH Seoul Conference, Seoul, Korea, 10–13 October 2004; pp. 1–7.
8. Afghani, R.; Kazemi, P.; Tahcildoost, M. Adaptation of hyperboloid structure for high-rise buildings with exoskeleton. InProceedings of the 5th International Conference on Architecture and Built Environment with AWARDs Book of Abstracts, Venice,Italy, 22–24 May 2017; p. 62.
9. Khodadadi, A.; Buelow, P.V.O.N. Form Exploration and GA-Based Optimization of Lattice Towers Comparing with ShukhovWater Tower. In Proceedings of the IASSSLTE 2014 Symposium “Shells, Membranes and Spatial Structures: Footprints”, Brasília,Brazil, 15–19 September 2014.
10. Oliyan Torghabehi, O.; Buelow, P.V. Performance oriented generative design of structural double skin facades inspired by cellmorphologies. In Proceedings of the IASS-SLTE 2014 Symposium “Shells, Membranes and Spatial Structures: Footprints, Brasília,Brazil, 15–19 September 2014. [CrossRef]
11. Buelow, P.V.; Oliyan Torghabehi, O.; Mankouche, S.; Vliet, K. Combining parametric form generation and design exploration toproduce a wooden reticulated shell using natural tree crotches. In Proceedings of the IASS-SLTE 2018 Symposium Creativity inStructural Design, Boston, MA, USA, 16–20 July 2018.
12. Von Buelow, P.; Khodadadi, A. Computational form exploration of branching columns using concepts of formex algebra and theParaGen method. In proceedings of Proceedings of the IASS Annual Symposium 2020/21 and the 7th International Conferenceon Spatial Structures Inspiring the Next Generation, Guilford, UK, 23–27 August 2021.
13. Ho, G.; Liu, P.; Liu, G.L. Parametric analysis and design engine for tall building structures. Int. J. High-Rise Build. 2012, 1, 643–648.[CrossRef]
14. Saldana Ochoa, K.; Ohlbrock, P.O.; D’Acunto, P.; Moosavi, V. Beyond typologies, beyond optimization: Exploring novel structuralforms at the interface of human and machine intelligence. Int. J. Archit. Comput. 2020, 19, 466–490. [CrossRef]
15. Danhaive, R.; Mueller, C. Design subspace learning: Structural design space exploration using performance-conditionedgenerative modeling. Autom. Constr. 2021, 127, 103664. [CrossRef]
16. Park, S.M. Tall Building form Generation by Parametric Design Process. Ph.D. Thesis, Illinois Institute of Technology, 2005.Available online: http://www.proquest.com (accessed on 1 May 2018).
17. Kazemi, P.; Afghani, R.; Tahcildoost, M. Investigating the effect of architectural form on the structural response of lateral loads ondiagrid structures in tall buildings. In Proceedings of the 5th International Conference on Architecture and Built Environmentwith AWARDs Book of Abstracts, Venice, Italy, 22–24 May 2017; p. 25.
18. Kazemi, P.; Afghani Khoraskani, R.; Tahcildoost, M. Achieving Structural Efficiency of Tall Buildings by means of ParametricGenerative Design. In Polycentric Cities: The Future of Vertical Urbanism, Proceedings of the CTBUH 2018 International Conference,Dubai & Abu Dhabi, United Arab Emirates, 20–25 October 2018; Council on Tall Buildings and Urban Habitat: Chicago, IL, USA, 2018.
19. Bennett, D. Skyscraper: Form and Function; Simon & Schuster: New York, NY, USA, 1995.20. Yang, L.; Shami, A. On Hyperparameter Optimization of Machine Learning Algorithms: Theory and Practice. Neurocomputing
2020, 415, 295–316. [CrossRef]21. Cunningham, P.; Delany, S. k-Nearest neighbour classifiers. ACM Comput. Surv. 2007, 54, 1–25. [CrossRef]22. Jolliffe, I. Principal Component Analysis. In International Encyclopedia of Statistical Science; Lovric, M., Ed.; Springer:
Berlin/Heidelberg, Germany, 2011; pp. 63–76. [CrossRef]23. Brereton, R.; Lloyd, G. Support Vector Machines for classification and regression. Analyst 2010, 135, 230–267. [CrossRef] [PubMed]24. Song, Y.; Lu, Y. Decision tree methods: Applications for classification and prediction. Shanghai Arch. Psychiatry 2015, 27, 130–135.
[PubMed]25. Ren, Y.; Zhang, L.; Suganthan, P. Ensemble Classification and Regression-Recent Developments, Applications and Future
Directions [Review Article]. IEEE Comput. Intell. Mag. 2016, 11, 41–53. [CrossRef]26. Rish, I. An Empirical Study of the Naïve Bayes Classifier. In Proceedings of the IJCAI 2001 Workshop on Empirical Methods in
Artificial Intelligence, Seattle, WA, USA, 4–6 August 2001.27. Tharwat, A.; Gaber, T.; Ibrahim, A.; Hassanien, A.E. Linear discriminant analysis: A detailed tutorial. AI Commun. 2017, 30,
169–190. [CrossRef]