
Sunsilk Hijab Shampoo (International Product) and Sariayu ...
Upload
khangminh22Category
view
3download
0
THE ROLE OF ABA IN REGULATING THE MOVEMENT OF
CHLAMYDOMONAS REINHARDTII IN RESPONSE TO STRESS
Layla AL hijab
A thesis submitted in partial fulfilment of the requirements of the University of the West of
England, Bristol for the degree of Doctor of Philosophy
Faculty of Health and Applied Sciences, University of the West of England, Frenchay
Campus, Coldharbour Lane, Frenchay, Bristol, BS16 1QY
May 2019

This copy has been supplied on the understanding that it is copyright material and that no
quotation from the thesis may be published without proper acknowledgement.

Author’s Declaration
Page i
I. Author’s Declaration
This thesis is submitted in fulfilment of the requirements of a Ph.D., and except
where duly acknowledged or referenced, it is entirely my work. It has not been submitted,
either in whole or part, for any other award at the University of the West of England or
elsewhere.
Signed .................................................... Date 10/05/2019

Project Supervisors’ Declarations
Page ii
II. Project Supervisors’ Declarations
I confirm that I have read this PhD thesis and that the work it describes was
undertaken under my supervision.
Prof. Michael R. Ladomery Associate Professor in Biomedical Science & Senior Fellow HEA Faculty of Health and Applied Sciences
University of the West of England, Bristol
T: +44-117-3283531
www.ladomerylab.org
Signed Date 10/05/2019

Abstract
Page iii
III. Abstract
Plant hormones such as auxin, gibberellin, cytokinin, ethylene, and abscisic acid play key
roles in growth and developmental processes in higher plants, for instance, Arabidopsis
thaliana. However, the effect of these hormones on algal physiology is still unclear.
Results suggest that these plant hormones do not affect the growth rate of
Chlamydomonas reinhardtii. The effect of these hormones was examined in the
movement of C. reinhardtii. C.reinhardtii cultures were transferred to a glass measuring
cylinder then treated with 50µM of Abscisic Acid (ABA), 1 aminocyclopropane-1-
carboxylic acid(ACC), Hydrogen peroxide (H2O2), 1-Naphthaleneacetic Acid (NAA) and
combinations of ABA and ACC in either the light or dark. All these hormones except
ABA did not alter the phototropic response of C.reinhardtii. In addition, the results
showed that exogenous ABA significantly altered the HCO3- uptake of C. reinhardtii in
a light-intensity-dependent manner. In high light ABA enhanced HCO3- uptake, while
under low light uptake was diminished. Algae were sampled at different time points over
24h in a cyclic 16h photoperiod and were treated with, or without 50 µM ABA in either
the light or dark and their position in the water column was monitored by measuring the
A750 at different depths. The actual position attained by the algae in the water column
correlated with the time at which they were sampled in the cycle; in general, ABA-
induced upward movement of the algae. The algae also showed a differential, light-
dependent directional taxis response to a fixed ABA source, moving horizontally towards
the source in the light and away in the dark.
Plants possess glycine-rich RNA-binding proteins (class IV GRPs) that are involved
in stress responses and are regulated by ABA. The sequence analysis revealed that C.
reinhardtii appears to possess only a single class IV GRP gene, which we named
CrGRP1; it encodes a flagellum-associated RNA-binding protein. The researcher shows
that CrGRP1 is expressed in circadian rhythm and in response to abiotic stresses. The
expression of CrGRP1 was also assessed during the algal movement experiments and
appeared to decline to the greatest extent when ABA-induced the greatest upward
movement of the algae. To determine the potential role of the CrGRP1 gene in ABA and
light-mediated movement, recombinant pChlamy4 constructs were made to overexpress
and knock-down CrGRP1. Ongoing experiments suggest that CrGRP1 negatively
regulates the ABA-induced upward movement of the algae, presumably by binding
mRNAs required for this response. The data suggest that the development of this response
mechanism in motile algae may have been an essential step in the evolution of terrestrial
plants and anticipate that these results will initiate novel algal research that may help to
clarify the involvement of ABA in plant tropisms.

Acknowledgements
Page iv
IV. Acknowledgements
I take this opportunity to thank everyone who provided their valuable support both in my
academic and personal life in and out of the University.
I wholeheartedly thank my supervisors Prof. Michael Ladomery, Dr Ian Wilson and Dr
Heather Macdonald for their sustained support and valuable guidance throughout my
research programme.
I would also like to thank AL-Baha University for funding and the UWE technical
staff especially Dave Corry, Dr Natasha McGuire and Jeff Davey for training me to get
hands-on experience with instruments and associated techniques. I would also like to
thank Adam Gregy for doing some of the work.
I would like to thank my friends Noor, Waffa and her family, Alla, Maryam, for
their advice, support, and help during my PhD. Without their moral support, I would have
been distressed and lost track of my goals, they reminded me constantly of my
responsibilities and encouraged me to move forward with greater zeal.
I would like to thank my family, primarily my parents Mr&Mrs AL-hijab and my loving
husband Mr Ammar AL Awadh for their unconditional love, support and believe in my
ability to accomplish my PhD.
With complete honour and satisfaction, I dedicate this Thesis to my parents and
my daughter Hajar.

Table of Contents
Page v
V. Table of Contents
Contents
I. Author’s Declaration ............................................................................................. i
II. Project Supervisors’ Declarations ........................................................................ ii
III. Abstract............................................................................................................... iii
IV. Acknowledgements............................................................................................. iv
V. Table of Contents ................................................................................................. v
VI. List of Figures .................................................................................................... viii
VII. List of Tables ................................................................................................... xi
VIII. Abbreviations ................................................................................................. xii
1 Chapter One: Introduction ................................................................................... 1 1.1 Chlamydomonas reinhardtii and biofuels ..................................................................... 1
1.1.1 Chlamydomonas reinhardtii as a model organism ................................................... 2 1.1.2 The life cycle of C. reinhardtii ................................................................................. 3 1.1.3 How algae move and why ........................................................................................ 5 1.1.4 Chlamydomonas reinhardtii transgenesis ................................................................ 7 1.1.5 B Biotechnological applications of C. reinhardtii and other algae ........................... 9 1.1.6 Chlamydomonas reinhardtii as an ideal biofuel source .......................................... 11
1.2 Abscisic acid (ABA) and the stress responses ............................................................ 14 1.2.1 ABA and its biosynthesis in higher plants .............................................................. 15 1.2.2 Where and when does ABA biosynthesis occur? ..................................................... 18 1.2.3 Role of ABA in plants ............................................................................................ 18 1.2.4 ABA signalling in plants ........................................................................................ 19 1.2.5 ABA and abiotic stress signalling .......................................................................... 22 1.2.6 ABA and algae ...................................................................................................... 30
1.3 The class IV glycine-rich RNA-binding proteins (GRPs) ........................................... 35 1.3.1 Structural properties of class IV GRPs .................................................................. 35 1.3.2 Functional conservation of class IV GRPs ............................................................. 37 1.3.3 Role of class IV GRPs in stress adaptation ............................................................ 40
1.4 Hypothesis and Aims ................................................................................................. 42 1.4.1 Hypothesis ............................................................................................................ 42 1.4.2 Aims ...................................................................................................................... 42
2 Chapter Two: General Methodology .................................................................. 44 2.1 Sources of reagents .................................................................................................... 44 2.2 Bacterial strains, gene construct and plasmids ............................................................ 44 2.3 Algal strains, culture conditions, and stress treatments ............................................... 44 2.4 Isolation of RNA from C. reinhardtii culture ............................................................. 46 2.5 Quantification of nucleic acids................................................................................... 47 2.6 Analysis of RNA samples by agarose gel electrophoresis ........................................... 47 2.7 DNase treatment of RNA ........................................................................................... 47 2.8 Reverse transcription ................................................................................................. 48 2.9 Polymerase chain reaction ......................................................................................... 48
2.9.1 Primer design ........................................................................................................ 48

Table of Contents
Page vi
2.9.2 Standard Polymerase Chain Reaction (PCR) ......................................................... 49 2.10 Extraction of DNA from agarose gels ........................................................................ 50 2.11 Plasmid DNA extraction from E. coli ........................................................................ 51 2.12 Restriction digests ..................................................................................................... 53 2.13 Movement assays ...................................................................................................... 54
2.13.1 Measuring the motility of C.reinhardtii with different treatments ........................... 54 2.13.2 Measuring the motility of C.reinhardtii following ABA and ACC treatments .......... 55 2.13.3 Measuring the motility of C. reinhardtii with ABA treatment .................................. 55
2.14 Circadian rhythm experiments ................................................................................... 57 2.15 Measuring ABA levels during the circadian cycle ...................................................... 57 2.16 Effect of abscisic acid (ABA) on HCO3- uptake by C. reinhardtii exposed to different light levels ............................................................................................................................. 61 2.17 Preparing expression vectors to investigate the function of CrGRP1 in C. reinhardtii . 62
2.17.1 Design of pChlamy4 constructs ............................................................................. 62 2.17.2 Ligation into plasmid pChlamy4-TOPO ................................................................. 65 2.17.3 Generating of transgenic organisms (pChlamy4 - CrGRP1- TOP10) ..................... 65
2.18 Transformation and verification of CrGRP1 constructs .............................................. 67 2.18.1 Transformation of C. reinhardtii............................................................................ 67
2.19 Statistical analysis ..................................................................................................... 68 2.20 Bioinformatic analysis ............................................................................................... 69
2.20.1 Analysis of promoter elements ............................................................................... 69 2.20.2 Alignments and Photogenetic tree analysis ............................................................ 69
3 Chapter Three: The effect of plant hormones on C. reinhardtii growth and movement ................................................................................................................. 70 3.1 Introduction ............................................................................................................... 70 3.2 Results ...................................................................................................................... 75
3.2.1 Algal culture ......................................................................................................... 75 3.2.2 Effect of phytohormones on C. reinhardtii growth rates ......................................... 76 3.2.3 Effect of plant hormones on algal movement .......................................................... 78
3.3 Responses of Chlamydomonas reinhardtii to the phytohormone abscisic acid (ABA) during the circadian cycle ...................................................................................................... 89
3.3.1 Effect of ABA on movement one hour into the photoperiod ..................................... 90 3.3.2 Effect of ABA on movement eight hours into the photoperiod ................................. 93 3.3.3 Effect of ABA on movement fifteen hours into the photoperiod ............................... 96 3.3.4 Effect of ABA on movement one hour into the dark ................................................ 99 3.3.5 Effect of ABA on movement four hours into the dark ............................................ 102 3.3.6 Effect of ABA on movement seven hours into the dark .......................................... 105
3.4 Horizontal movement of C. reinhardtii cells in response to ABA in the light and dark
………………………………………………………………………………………...109 3.5 Measuring ABA levels in algae across the Circadian rhythm.................................... 111 3.6 ABA alters the photosynthetic efficiency of C. reinhardtii ....................................... 113 3.7 Discussion ............................................................................................................... 114
3.7.1 ABA alters photosynthesis, but not the growth of Chlamydomonas ....................... 114 3.7.2 In the dark ABA-induced a negative geotropic response in Chlamydomonas ........ 115 3.7.3 The ABA response in Chlamydomonas may be under light-mediated circadian
control ………………………………………………………………………………………………..116 3.7.4 How does this algal ABA response relate to plants? ............................................ 119 3.7.5 Is ABA a gravitropic hormone? ........................................................................... 122
4 Chapter Four: Characterisation of the CrGRP1 gene and analysis of its expression ............................................................................................................... 127

Table of Contents
Page vii
4.1 Introduction ............................................................................................................. 127 4.2 The Sequence of CrGRP1........................................................................................ 129
4.2.1 The CrGRP1 promoter and transcribed sequence ................................................ 129 4.2.2 Exon and intron structure of the CrGRP1 transcript ............................................ 133 4.2.3 Features of CrGRP1 amino-acid sequence and alignment with homologues across
species ………………………………………………………………………………………………..135 4.3 Expression of CrGRP1 ............................................................................................ 142
4.3.1 Expression of CrGRP1 during the Circadian cycle. ............................................. 142 4.3.2 Expression of CrGRP1 in response to abiotic stress............................................. 145 4.3.3 Expression of CrGRP1 in relation to ABA treatment and C. reinhardtii movement.
………………………………………………………………………………………………..148 4.4 Discussion ............................................................................................................... 150
4.4.1 Analysis of the expression of CrGRP1 during the Circadian cycle ....................... 150 4.4.2 Analysis of the expression of CrGRP1 in response to abiotic stress ...................... 151 4.4.3 Analysis the expression of CrGRP1 in relation to ABA treatment and C. reinhardtii
movement. ....................................................................................................................... 153
5 Chapter Five: Functional analysis of CrGRP1 .................................................... 155 5.1 Introduction ............................................................................................................. 155 5.2 Results .................................................................................................................... 156
5.2.1 Generation of a pChlamy4 - CrGRP1 construct ................................................... 156 5.2.2 Genetic transformation of C. reinhardtii with the pChlamy4 constructs ............... 162 5.2.3 Effect of ABA on the movement of transgenic C. reinhardtii ................................. 164
5.3 Discussion ............................................................................................................... 166
6 Chapter Six: General Discussion and Conclusion .............................................. 168 6.1 Summary of key findings and main conclusions....................................................... 168 6.2 Future work ............................................................................................................. 173
7 References ....................................................................................................... 175
8 Appendices ...................................................................................................... 211 8.1 Buffers and Solutions .............................................................................................. 211 8.2 Sequence of CrGRP1 .............................................................................................. 213 8.3 PChlamy_4 vector sequence .................................................................................... 215 8.4 Diagram illustrating the primers designed ................................................................ 217 8.5 Relative Cell Density Data Analysis ........................................................................ 218 8.6 Sequence Data ......................................................................................................... 234 8.7 More figure for some experiments ........................................................................... 252 8.8 Abstract of a paper submitted to Scientific Reports ................................................... 256 8.9 Permission Form from American Society of Plant Biologists ................................... 257

List of Figures
Page viii
VI. List of Figures Figure 1.1: Chlamydomonas reinhardtii................................................................................... 2
Figure 1.2: Life cycle of Chlamydomonas reinhardtii. .............................................................. 5
Figure 1.3: Structure of phytohormone abscisic acid (adapted from Cutler et al., 2010). ........ 15
Figure 1.4: Indirect ABA biosynthesis pathway in higher plants ............................................. 17
Figure 1.5: The main components in the core ABA signal transduction pathway (adapted from
Fernando and Schroeder, 2016). ............................................................................................ 20
Figure 1.6: The relationship between SnRK2.2 and SnRK2.3 and ABA signalling (taken from
Fujii et al., 2007). .................................................................................................................. 28
Figure 1.7: The structures for the four main classes of GRPs. ................................................ 36
Figure 1.8: Biological activities of Arabidopsis thaliana GRPs (at GRP7 and GRP8 containing
RRMs) and (at GRP2 containing a CSD) (adapted from Ciuzan et al., 2015). ......................... 41
Figure 2.1: Described the method of how the experiment was done and how the movement of cells
was measuring. ...................................................................................................................... 57
Figure 2.2: Description of the process of ABA ELISA Kit to measure ABA concentrations levels
during the circadian cycle. ..................................................................................................... 60
Figure 2.3: Map of vector pChlamy_4 engineered to express CrGRP1 with or without a histidine
tag, and the antisense construct designed to knockdown CrGRP1 expression. ........................ 64
Figure 3.1: Growth curve of C. reinhardtii ............................................................................. 75
Figure 3.2: Plant hormones did not affect the growth rates of C. reinhardtii .......................... 77
Figure 3.3: ABA altered the positioning of C. reinhardtii in the water column in the dark ...... 79
Figure 3.4: After 50 minutes in the dark ABA induces the C. reinhardtii to move upward ....... 80
Figure 3.5: 1-aminocyclopropane-1-carboxylic acid (ACC) did not significantly affect the
vertical positioning of C. reinhardtii in the dark ..................................................................... 82
Figure 3.6: Hydrogen peroxide (H2O2) did not significantly affect the vertical positioning of C.
reinhardtii in the dark ............................................................................................................ 84
Figure 3.7: Exogenous 1-naphthaleneacetic acid (NAA) did not significantly affect the vertical
positioning of C. reinhardtii in the dark ................................................................................. 86
Figure 3.8: ACC did not alter the ABA-associated negative geotropic response of C. reinhardtii
in the dark ............................................................................................................................. 88
Figure 3.9: Sampling time points during the light/dark cycle .................................................. 89
Figure 3.10: ABA altered the positioning of C. reinhardtii in the water column when sampled at
one hour into the photoperiod and incubated in the dark ........................................................ 92

List of Figures
Page ix
Figure 3.11: ABA alters the positioning of C. reinhardtii in the water column when sampled at
eight hours into the photoperiod and incubated in the dark .................................................... 95
Figure 3.12: ABA alters the positioning of C. reinhardtii in the water column when sampled at
fifteen hours into the photoperiod and incubated in the dark................................................... 98
Figure 3.13: ABA alters the positioning of C. reinhardtii in the water column when sampled at
one hour into a dark period and incubated in the dark.......................................................... 101
Figure 3.14: ABA alters the positioning of C. reinhardtii in the water column when sampled at
four hours into a dark period and incubated in the dark ....................................................... 104
Figure 3.15: ABA alters the positioning of C. reinhardtii in the water column when sampled at
seven hours into the dark period and incubated in the dark .................................................. 107
Figure 3.16: ABA alters the positioning of C. reinhardtii in the water column when sampled at
different time points during the light/dark cycle and incubated in the dark ........................... 109
Figure 3.17: Opposing direction of travel of C. reinhardtii cells in response to ABA in the light
and dark .............................................................................................................................. 110
Figure 3.18: Endogenous abscisic acid (ABA) levels in C. reinhardtii .................................. 112
Figure 4.1: Structure sequences for C. reinhardtii CrGRP1 and its promoter sequences and
structure. ............................................................................................................................. 132
Figure 4.2: Exons and introns of the CrGRP1 gene. ............................................................. 133
Figure 4.3: Mapping of exons of CrGRP1 to the mRNA. ....................................................... 134
Figure 4.4: Amino-acid alignment of Arabidopsis thaliana AtGRP7 with C. reinhardtii CrGRP1.
............................................................................................................................................ 136
Figure 4.5: Alignment of CrGRP1 with similar class IVa GRPs proteins in Arabidopsis thaliana.
............................................................................................................................................ 138
Figure 4.6: Alignment of similar class IVa GRPs protein present in a wide range of species across
taxa...................................................................................................................................... 140
Figure 4.7: Alignment of similar class IVa GRPs protein present in different algal species. .. 142
Figure 4.8: Expression analysis of CrGRP1 in the Circadian rhythm in C. reinhardii. ......... 144
Figure 4.9: Expression of CrGRP1 in response to exposure to H2O2. .................................... 146
Figure 4.10: mRNA levels of CrGRP1 after changing the light conditions through the light/dark
cycle. ................................................................................................................................... 147
Figure 4.11: Expression of CrGRP1 following ABA treatment at different time points in the
circadian cycle. .................................................................................................................... 149
Figure 5.1: Restriction digest confirming the presence of the CrGRP1 ORF in the pChlamy4
vector................................................................................................................................... 157
Figure 5.2: Map of vector pChlamy_4. ................................................................................. 158

List of Figures
Page x
Figure 5.3: Over-expression vector construct. ...................................................................... 159
Figure 5.4: Over-expression with V5-6×His tag vector construct. ........................................ 160
Figure 5.5: Antisense vector construct. ................................................................................ 161
Figure 5.6: Restriction digest of CrGRP1 using Sca1 restriction enzyme. ............................. 162
Figure 5.7: Transformed C. reinhardtii colonies after three weeks of growth. ....................... 163
Figure 5.8: Growth of recombinant C. reinhardtii in TAP media with or without zeocin. ...... 164
Figure 5.9: The movement of recombinant C. reinhardtii cells is differentially affected by ABA.
............................................................................................................................................ 165
Figure 6.1: The model of the relationship between circadian clock, light and ABA on the
movement of Chlamydomonas reinhardtii and arrows are the direction of movement in light and
dark. .................................................................................................................................... 171
Figure 6.2: Exogenous abscisic acid (ABA) induced a negative geotropic movement response in
C. reinhardtii. ...................................................................................................................... 172
Figure 8.1:Diagram illustrating the primers designed and used in this study in relation to
CrGRP1 exons. .................................................................................................................... 217
Figure 8.2: Opposing direction of travel of C. reinhardtii cells in response to ABA in the light
and dark. ............................................................................................................................. 252
Figure 8.3: Exogenous abscisic (ABA) acid differentially altered HCO3- uptake by C. reinhardtii
in a light-dependent manner. ................................................................................................ 253
Figure 8.4: Expression analysis of CrGRP1 in the Circadian rhythm in C. reinhardii. ......... 254
Figure 8.5: Expression analysis of CrGRP1 in the Circadian rhythm in C. reinhardii. ......... 254
Figure 8.6:Transformed C. reinhardtii colonies after three weeks of growth and the movement of
recombinant C. reinhardtii cells is differentially affected by ABA ......................................... 255

List of Tables
Page xi
VII. List of Tables
Table 1-1: Biofuel types and their feedstock (from Amaro et al ., 2011; Balat, 2011). ........... 11
Table 1-2: Expected production of biofuels from different sources and their land area (from
Chisti, 2007). ......................................................................................................................... 12
Table 2-1: Oligonucleotide primers ........................................................................................ 49
Table 2-2: Restriction digestion enzyme sites used for Plasmid. .......................................... 66
Table 2-3: Oligonucleotide primers for sequencing of transgenic organisms. ......................... 67
Table 4-1: Splice sites (SS) at the boundaries of CrGRP1 exons. The 3’ splice sites include the
putative pyrimidine tract. The exonic sequence is in capitals. ............................................... 135
Table 8-1:The primer name and the expected size of band .................................................... 217

Abbreviations
Page xii
VIII. Abbreviations
µg microgram
µm micrometer
µM micromolar
µs microsecond
A. thaliana Arabidopsis thaliana
ABA Abscisic Acid
ABFs ABA-responsive element Binding Factors
ABRE ABA-Responsive Elements
ACC 1-aminocyclopropane-1-carboxylic acid
AtGRP Arabidopsis thaliana- Glycine-Rich Proteins
ATP Adenosine Triphosphate
BLAST Basic Local Alignment Search Tool
bp base pair
C. reinhardtii Chlamydomonas reinhardtii
C2H4 Ethylene
CaCl2 Calcium chloride
Cdna Complementary DNA
CIRP-A Cold-inducible RNA-binding protein A
CrGRP1 Chlamydomonas reinhardtii - Glycine-Rich Protein1
CSD Cold Shock Domain
CSPs Cold Shock Proteins
DNA Deoxyribonucleic acid
DNase I DeoxyriboNuclease I
dNTP Deoxynucleotide triphosphate
E. coli Escherichia coli
EDTA Ethylenediaminetetraacetic acid
EDTA Ethylene Diamine Tetra Acetic Acid
et al. et alia
EtBr Ethidium Bromide
FBS Filner's Beijerincks Solution
GA3 Gibberellic Acid
gDNA Genomic DNA
GRPs Glycine-Rich Proteins
H2O2 Hydrogen peroxide
IAA Indole-3-Acetic Acid
IPTG Isoprophyl-ß-D-thiogalactopyranoside
kb kilobase
kDa kilodalton (s)
KIN kinetin
L Litre
LB Luria-Bertani
LHCB light-harvesting chlorophyll binding

Abbreviations
Page xiii
M Molar
mg milligram
MgCl2 Magnesium chloride
min minute(s)
ml millilitre
mM milliMolar
NAA 1-Naphthaleneacetic Acid
NaCl Sodium chloride
NADH Nicotinamide Adenine Dinucleotide
NADPH Nicotinamide Adenine Dinucleotide Phosphate
NCBI National Centre for Biotechnology Information
ng nanogram
NH3 Ammonia
nm nanometer
NOS Nitric Oxide Synthases
OD Optical Density
OsGRP Oryza sativa - Glycine-Rich Proteins
PCR Polymerase Chain Reaction
PEG Polyethylene Glycol
PSII photosystem II
RBM3 Mammalian RNA-binding protein 3
ROS Reactive Oxygen Species
RRMs RNA Recognition Motif
SDS Sodium Dodecyl Sulfate
SDW Sterilized De-ion Water
SE Standard Error
Taq DNA polymerase from Thermus aquaticus
TE Tris, EDTA
Temp Temperature
TRAF Tumor necrosis Receptor Associate Factor
TRIA 1-Triacontanol
U Unit(s) of enzyme activity
Unr Upstream of N-ras
UV Ultraviolet
V Volts
v volume
v/v volume/volume
W Weight
w/v weight/volume
WRKY transcription factors
WT wildtype
xg times gravity(s)
Z. mays Zea maysbp -base pair
λ lambda

Chapter One: Introduction
Page 1
1 Chapter One: Introduction
1.1 Chlamydomonas reinhardtii and biofuels
Approximately ten micrometres in diameter, Chlamydomonas reinhardtii (C. reinhardtii)
belongs to a well-studied genus of unicellular green algae. It has two flagella, a large
cup-shaped chloroplast, a cell wall made of hydroxyproline-rich glycoproteins, and a
large pyrenoid in the chloroplast. It also has an eye-spot which is light-sensitive, allowing
the cell to undergo phototaxis (Figure 1.1) allowing it to swim away from high light and
towards low light (Bennett and Golestanian, 2015). Like many other algae,
Chlamydomonas utilises a circadian clock system, and its potential for genetic analysis
increases its utility as a model for this area of research (Merchant et al., 2007).
Chapter One: Introduction
Page 2
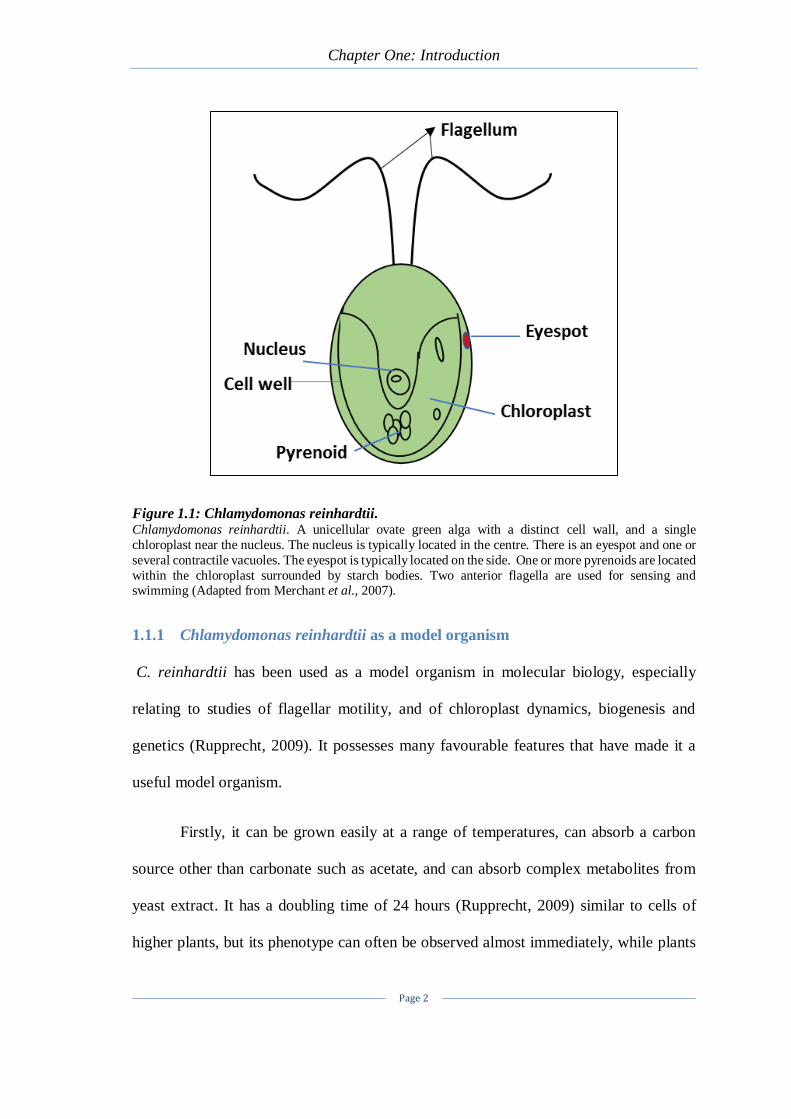
Figure 1.1: Chlamydomonas reinhardtii. Chlamydomonas reinhardtii. A unicellular ovate green alga with a distinct cell wall, and a single
chloroplast near the nucleus. The nucleus is typically located in the centre. There is an eyespot and one or
several contractile vacuoles. The eyespot is typically located on the side. One or more pyrenoids are located
within the chloroplast surrounded by starch bodies. Two anterior flagella are used for sensing and swimming (Adapted from Merchant et al., 2007).
1.1.1 Chlamydomonas reinhardtii as a model organism
C. reinhardtii has been used as a model organism in molecular biology, especially
relating to studies of flagellar motility, and of chloroplast dynamics, biogenesis and
genetics (Rupprecht, 2009). It possesses many favourable features that have made it a
useful model organism.
Firstly, it can be grown easily at a range of temperatures, can absorb a carbon
source other than carbonate such as acetate, and can absorb complex metabolites from
yeast extract. It has a doubling time of 24 hours (Rupprecht, 2009) similar to cells of
higher plants, but its phenotype can often be observed almost immediately, while plants

Chapter One: Introduction
Page 3
often must be left to mature for many weeks or months to observe a phenotype. Secondly,
mating experiments are readily carried out in C. reinhardtii, with subsequent benefits for
classical genetics studies of linkage, dominance, and suppression (Goodenough et al.,
1995). Only two mating types are present in this organism, plus and minus; in contrast,
multiple mating types exist in some algae (Goodenough et al., 1995). Third, C.
reinhardtii is normally haploid, and any mutations and their effects are seen immediately
without the need for further crosses (Goodenough et al., 1995). Fourth, many known
mutants of C. reinhardtii are available (Rupprecht, 2009). Fifth, like a plant cell, the cell
of C. reinhardtii has a cell wall. Sixth, like animal sperm cells, C. reinhardtii has a
flagellum, which makes phototaxis possible, moving towards or away from light to
optimise the conditions for photosynthesis and to minimise photodamage when at risk.
Thus, in some aspects, C. reinhardtii most closely models plant cells and in others,
animal cells making it a powerful and versatile system for the study of a variety of
molecular and cellular processes.
1.1.2 The life cycle of C. reinhardtii
There are two types of life cycles in C. reinhardtii: asexual and sexual life cycles.
Usually, asexual reproduction occurs by fission so that the protoplast divides to form 4-
8 zoospores almost the same size as the parent cell. In the sexual cycle, nitrogenous
compound deprivation encourages the cells to create isogametes, which fuse in pairs,
forming a fertilised egg. The fertilised egg loses its flagella and forms a thick wall which
is resistant to adverse conditions. When conditions become favourable, the fertilised egg
goes through meiosis to form four haploid zoospores (Figure 1.2).
In the sexual life cycle of C. reinhardtii, gametes are created from haploid
vegetative cells, and they may merge to form diploid zygotes. After a period of

Chapter One: Introduction
Page 4
maturation, the zygotes are ready for germination and meiosis (Hoober, 1989). Light is
required for gamete formation, the maintenance of mating competence in gametes, and
zygote germination (Saito et al., 1998; Treier et al., 1989). There are two signals needed
for gametogenesis, nitrogen starvation which is considered as the first signal, and
exposure to blue light as a second signal. Incubating vegetative cells in the dark caused
the formation of mating-incompetent pregametes; however, they can regain their mating
ability when they are exposed to irradiation with blue light. In higher plants and several
lower eukaryotes, the action spectrum of this response suggests that the photoreceptor
involved has properties characteristic of blue-light receptors (Weissig and Beck, 1991).
Although light encourages the conversion of pre-gametes to gametes, it is a slow
operation that requires protein synthesis (Beck and Acker, 1992; Huang and Beck, 2003).
Some separate signalling pathways appear to control these light responses. For example
in the last step of the life cycle, zygote germination, initiating irradiation for ≈3h is
sufficient for induction of meiosis. In the dark during the following 20h, subsequent
processes such as meiosis and germination may happen (Huang and Beck, 2003).
Analysis of mutants has indicated that at least one common gene product is involved in
light signalling pathways that control pregamete to gamete conversion and zygote
germination; the participation of the same photoreceptors in these response pathways has
been predicted (Huang and Beck, 2003).

Chapter One: Introduction
Page 5
Figure 1.2: Life cycle of Chlamydomonas reinhardtii. In the asexual cycle in C. reinhardtii: the zoospores are liberated from the parent cell or zoosporangium
by gelatinisation or rupture of the cell wall. The zoospores are similar to the parent cell in structure but
smaller in size. On the other hand, the sexual life cycle of C. reinhardtii consists primarily of four critical
stages – gametogenesis, zygote formation, zygote maturation (zygospore formation), and meiosis
(zygospore germination). When gametes of opposite mating types are mixed, flagellar adhesion triggers
gamete activation that leads to the cell-cell fusion (zygote formation). Zygotes will develop into zygospores
with a thick cell wall, which is a dormant stage in the life cycle. The cycle begins again when the
appropriate environmental conditions stimulate the dormant zygote to undergo germination, in order to
produce new haploid cells (adapted from Huang and Beck, 2003).
1.1.3 How algae move and why
Algae such as C. reinhardtii have two flagella and an eyespot which is light-sensitive. C.
reinhardtii uses its flagella both for swimming and mating; it uses flagella for rotating its
body to get to the correct position in the water. In addition, a study by Bennett and
Golestanian (2015) reported that these organisms move towards or away from a light
source in phototaxis. C. reinhardtii is a unicellular photosynthetic alga, and it has two
types of phototaxis - positive and negative phototaxis (moving towards or away from a
light source). Interestingly, the eyespot is placed on the side of the cell instead of in an
anterior or posterior position. The equatorial position is advantageous because C.
reinhardtii rotates its body during forward swimming, allowing the eyespot to scan the

Chapter One: Introduction
Page 6
incoming light from different directions. Then it can perceive the right position to protect
itself from environmental stress such as strong light (Bennett and Golestanian, 2015).
Regulation of flagellar movements by calcium signalling
Flagella and cilia are well-conserved structures in eukaryotic cells. In many eukaryotes,
Ca2+ is the critical intracellular factor affecting changes in the motility of cilia and flagella
in response to extracellular environments (Inaba, 2015). Algae such as Chlamydomonas
use rhodopsin-initiated Ca2+ currents to regulate flagella movements, and thus their
orientation to light and phototactic responses (Harz and Hegemann, 1991). Light
excitation of the eyespot triggers photocurrents causing an influx of Ca2+ ions to the
flagella (Harz, and Hegemann, 1991). The response to the influx of Ca2+ ions is different
in the cis-flagellum (closest to the eyespot) and trans-flagellum (furthest from the
eyespot) depending on the movement of the body, the direction of light and amount of
light received. Kamiya and Witman (1984) studied axonemes in reactivated
demembranated models. After incubating the dememranated cells in the standard
reactivation solution containing a different concentration of Ca2+, they observed that
increasing Ca2+ concentration decreases the beat amplitude of the cis-axoneme while
decreasing Ca2+ concentration decreases the beat amplitude of the trans-flagellum
(Kamiya and Witman, 1984).
Pigments of green algae
Chloroplast pigments in green algae are similar to those of higher plants. There are three
pigments in green algae: chlorophyll a and b, carotenoids and phycobilins. Carotenoids
include both carotenes (oxygen-free hydrocarbons) and xanthophylls (oxygen derivatives
of carotenes). In all photosynthetic algae, the main pigment is chlorophyll a and no

Chapter One: Introduction
Page 7
species are known to lack this pigment. Chlorophyll b, β -carotene and lutein (the main
carotenoid) are important general accessory pigments of the Chlorophyceae (Larkum and
Howe, 1997). Some genera are found to have siphonoxanthin and its esters siphonein
(Yoshida et al., 2003). Carotenoid pigments are also commonly present outside the
chloroplasts, especially in resting cells and in the terrestrial Trentepholia, as well as in
the eye-spots of the motile stages. These red or yellow coloured substances, known as
haematochromes are made of two or more carotenoid pigments. In many cases, they are
dissolved in fat globules. Accumulation of carotenoids happens under conditions of
salinity, nitrogen deficiency or high light irradiance. A good example is in Dunaliella,
where β- carotene accumulates between thylakoids in the chloroplast, and
Haematococcus, where astaxanthin accumulates in lipid globules outside the chloroplast
(Hagen et al., 2000; Wang et al., 2003). Accumulation of haematochromes colours the
cells orange or red, with haematochrome accumulating up to 8–12 % of total cellular
contents in Dunaliella (Orset and Young 1999). In contrast, animals cannot synthesise
carotenoids, and they acquire the pigments through the food chain by consuming the
primary producers. Haematochromes are responsible for colouring in some fish,
crustaceans and birds (such as the pink flamingos) (Yoshida et al., 2003).
1.1.4 Chlamydomonas reinhardtii transgenesis
Many mutant strains of C. reinhardtii are publicly available at the Chlamydomonas
Center (http://www.chlamy.org/). Previously, it was difficult to express foreign genes in
C. reinhardtii, such as antibiotic resistance and reporter genes due to codon usage bias,
because its chloroplast and nuclear genomes are highly GC and AT-rich, respectively
(Matsuo and Ishiura, 2011). However, the development and widespread use of artificial
gene synthesis have solved this issue; different codon adapted reporter genes, such as

Chapter One: Introduction
Page 8
green fluorescence proteins and luciferases, can be expressed in the chloroplasts and
nuclei of C. reinhardtii (Franklin et al., 2002; Fuhrmann et al., 2004). The sequencing of
the nuclear, mitochondrial and chloroplast genomes of C. reinhardtii made it one of the
models for post-genomic research (Gray and Boer, 1988; Michaelis et al., 1990). Several
studies have been carried out on the introduction of native or foreign genes into C.
reinhardtii. The first successful DNA transformation of C. reinhardtii was achieved by
Rochaix and van Dillewijn (1982) more than 30 years ago, a method which led to the
development of many molecular tools for genetic manipulation (Walker et al., 2005). As
an example, production of a given chemical compound within the chloroplast could be
achieved via the expression of a specific gene from the chloroplast genome, expression
from the nucleus (and potentially directing the protein into the chloroplast via targeting
signals), or application of a knockdown/knockout strategy to attenuate respective
antagonistic pathways (Walker et al., 2005).
Upon transformation, foreign DNA is inserted randomly in the C. reinhardtii
genome. Polymerase chain reaction (PCR) and Southern blotting are standard DNA
screening procedures that can detect the presence of recombinant DNA; RNA can be
detected by RT-PCR or Northern blotting and proteins by Western blotting (Durmaz et
al., 2015). Dominant and non-dominant markers are commonly used in the genetic
manipulation of C. reinhardtii. The dominant marker “ble” gene confers resistance to the
bleomycin antibiotic used for the nuclear transformation of C. reinhardtii (Lumbreras et
al., 1998). Several techniques have been developed for the introduction of foreign DNA
into C. reinhardtii. These include glass bead and vortexing techniques (Kindle, 1990),
electroporation (Shimogawara et al., 1998) and Agrobacterium-mediated transformation

Chapter One: Introduction
Page 9
(Kumar et al., 2004). The expression of foreign genes needs to be driven by an
appropriate promoter to work in C. reinhardtii. The most widely used constitutive
promoter in C. reinhardtii is derived from the constitutively expressed RbcS2 gene,
encoding ribulose bisphosphate carboxylase oxygenase small subunit 2 (Stevens et al.,
1996). The transcription level of genes driven by this promoter can be increased
significantly if the promoter elements of the C. reinhardtii heat shock protein genes are
fused upstream of the RbcS2 promoter (Schroda et al., 2000).
1.1.5 B Biotechnological applications of C. reinhardtii and other algae
Algae are an important group of organisms for biotechnological exploitation, especially
for food and pharmaceutical industries as well as in public health (Chu, 2012). For
example, in Mexico, Spirulina is collected from Lake Texcoco and used for making a dry
cake called tecuitlatl. Additionally, algae produce a different range of metabolites with
various bioactivities that are yet to be fully exploited (Cardozo et al ., 2007). Microalgae
such as Chlorella and Spirulina have been consumed as food supplements (nutraceuticals)
by humans and also used as animal feeds. Some green algae are well recognised in skin
care products such as anti-ageing creams, sun protection products and emollients. For
example, an extract from Chlorella vulgaris (Dermochlorella, France) stimulates
collagen synthesis in the skin, thus supporting tissue regeneration and wrinkle reduction.
Moreover, microalgae have been exploited for wastewater treatment and used as a
biological tool for assessment of environmental toxicants. Some of the marine microalgae
are a potential source of long-chain polyunsaturated fatty acids (LC-PUFA), especially
eicosapentaenoic acid (EPA) and docosahexaenoic acid (DHA), which have been
implicated to be beneficial in the prevention of cardiovascular disease. In humans, DHA

Chapter One: Introduction
Page 10
is significant for the proper development of the brain and eye in infants and has been
shown to support cardiovascular health in adults (Ward and Singh., 2005).
Energy derived from living organisms, whether plant or animal, represents one of
the most important sources of renewable energy (Chisti, 2007). One way to reduce the
increasing amount of carbon dioxide in the atmosphere is by the use of biofuels to replace
non-renewable energy sources. Therefore, according to Chisti (2007) biofuel research is
now considering microalgae as a potential energy resource as fuels derived from other
plants cannot meet even a fraction of the current energy demand throughout the world
because it impinges on issues to do with land area and growth rate of plants (Chisti, 2007).
Furthermore, the benefits of biofuels may include increased income from plant material
and increased energy security in countries without oil reserves.
Table 1.1 lists the renewable energy resources derived from biomass (Amaro et
al ., 2011; Balat, 2011). There are three types or generations of biofuels depending on
the feedstock, as shown in Table 1.1 Rapeseed, soybeans, sunflower and palm, are
considered as first-generation biofuel because they were the first crops to be used to
produce biodiesel. However, it has faced several problems such as food markets and food
security. After that, to reduce the dependency on edible oil, alternative biofuel sources,
such as non-food feedstocks, have been developed to produce biodiesel. Energy crops
form the second generation such as Jatropha, mahua, tobacco seed, and salmon oil.
However, it faces a problem as well, as the products from the second generation may not
be enough to replace first-generation feedstocks (Amaro et al., 2011; Balat, 2011).
Therefore, the third generation, which is derived from microalgae, has emerged as one of
the most promising alternative sources of lipid for use in biodiesel production because of
their high photosynthetic efficiency to produce biomass and their higher growth rates and

Chapter One: Introduction
Page 11
productivity compared to conventional crops (Amar et al ., 2011). The third-generation
biofuels derived from algal biomass have been considered as the best alternative
bioresource that avoids the disadvantages of first and second-generation biofuels (Amar
et al ., 2011; Balat, 2011).
TYPE FEEDSTOCK
First generation Rapeseed, soybeans, sunflower, palm,
Second generation Jatropha, mahua, tobacco seed, salmon oil,
Third generation Microalgae
Table 1-1: Biofuel types and their feedstock (from Amaro et al ., 2011; Balat, 2011).
Potentially, biofuels open up new avenues to increase competition with oil
markets and offer a mechanism for the moderation of oil prices, in addition to ensuring a
healthy supply of alternative energy sources. This will help in the fight against high
gasoline prices and reduce dependence on fossil fuels, especially in the transport sector
(Amaro et al ., 2011; Balat, 2011; Chisti, 2007). First and second-generation feedstocks
have been researched for many years. Currently, much research is aimed at third
generation biofuels, the production of fuels from algae. It was reported by researchers
from the Netherlands that the production of biofuels from algae could become a reality
in the next 10 to 15 years, because algae may potentially help to decrease global
dependence on fossil fuels, especially in the transport sector which requires gas or liquid
fuels (Amaro et al ., 2011; Balat, 2011).
1.1.6 Chlamydomonas reinhardtii as an ideal biofuel source
Algae are capable of producing ten times the amount of biofuel per unit area when
compared with wheat and rapeseed (Chisti, 2007). Furthermore, algal production does

Chapter One: Introduction
Page 12
not directly compete with land for food crop production. In addition, unlike higher plants,
algal biofuel production is considered carbon neutral as carbon dioxide is both utilised
during algal growth and released during the subsequent use of algal-derived biofuel
(Ahmad et al., 2011; Chisti, 2007). Table 1.2 gives information regarding the expected
production of oil from algal farms compared with those from traditional agriculture. From
this table it can be seen that the yield of biodiesel from microalgae is more than ten times
that of palm oil, the largest oil crop source, yet uses only one-tenth of the land (Chisti,
2007), suggesting that its production per hectare could be a hundred times greater.
CROPS OIL YIELD
(L/ha) a
LAND AREA
(M/ha)
Corn 172 1540
Soybean 446 594
Canola 1190 223
Jatropha 1892 140
Coconut 2689 99
Palm oil 5950 45
Microalgae b 136,900 2
Microalgae c 58,700 4.5
Table 1-2: Expected production of biofuels from different sources and their land area (from
Chisti, 2007).
a - For meeting 50% of all transport fuel needs of the United States
b -70% oil in biomass by dry weight
c - 30% oil in biomass by dry weight
Benefits of using algae as a source of biofuel
There are some benefits to using microalgae as a source of biofuel, including the fact that
firstly, microalgae are readily available in the environment and can be cultured under a
range of climatic condition across the world, in contrast to higher plants (such as palm

Chapter One: Introduction
Page 13
oil), which are more climatically restricted. Algae are known to have the highest growth
potential compared to other photosynthetic organisms (Hirano et al., 1997). Secondly,
microalgae can grow in both fresh and brackish water. Growing them in brackish water
will reduce the rates of freshwater use for agriculture (Hill et al., 2006). Thirdly,
according to Leite (2013), algae can be considered a renewable source of fuels because
they harvest sunlight energy to produce the organic compound as biomass. Fourth, the
rate of algal growth is generally limited by carbon, in this case, carbon dioxide; rapid and
large growth will, therefore, require large amounts of carbon dioxide. Carbon dioxide
emitted in large quantities from the use of fossil fuels could be potentially diverted from
increasing the atmospheric concentration into large-scale algal growth facilities (Amin,
2009; Demirbas, 2010). Finally, when comparing the productivity of microalgae to that
of land plants, algae have a higher rate of biomass accumulation than plants. For example,
the most common microalgae have oil levels in the range of 20 to 50% by their weight of
dry biomass (Scott et al., 2010; Singh and Gu, 2010).
One area of microalgal research that has perhaps lagged behind higher plants is
in the area of molecular biology. This area of microalgae research is limited in areas of
understanding how microalgae can adapt and respond to environmental stress (biotic and
abiotic). A specific area that needs development is understanding the molecular biology
of plant hormones. Sequencing of the C. reihardtii genome has shown that this flagellate,
motile, freshwater, photosynthetic green alga is also capable of synthesising and
responding to abscisic acid (ABA) and other plant hormones (Wang, 2015). The function
of the main stress hormone ABA will be described in the next section.

Chapter One: Introduction
Page 14
1.2 Abscisic acid (ABA) and the stress responses
Plant hormones are small organic molecules which influence many physiological
functions at low concentrations; one of these is abscisic acid (ABA). Initially, there were
two names for it; one group called it an 'abscisin II' because they thought it played an
important role in abscission of fruits. Other groups at the same time called it a 'dormant'
because they thought it played a role in bud dormancy. After that both groups agreed to
call it an 'abscisic acid (ABA)', and they thought that in general ABA plays mostly
inhibitory roles. However, it has many other roles (Arteca, 2013). It is also called a stress
hormone because the production of ABA is stimulated by drought, water logging and
other adverse environmental conditions.
ABA is a sesquiterpenoid (C15H20O4) with a 15-carbon ring (Figure 1.3). The
molecular structure of ABA has several significant features that facilitate its biological
purposes. The side chain with the two double bonds and ABA’s stereocenter are two such
essential features. Exposure to UV light changes the confirmation from active to an
inactive form (Fernando and Schroeder, 2016). ABA plays key roles in the growth and
developmental process in higher plants. As a major plant hormone, it is involved in the
regulation of essential physiological processes such as seed development and bud
dormancy and the control of stomatal closure (Vishwakarma et al., 2017).

Chapter One: Introduction
Page 15
Figure 1.3: Structure of phytohormone abscisic acid (adapted from Cutler et al., 2010).
1.2.1 ABA and its biosynthesis in higher plants
In plants and other organisms, such as cyanobacteria, algae, and fungi, ABA levels
increase with exposure to stress, suggesting a possible role of ABA in stress signal
transduction (Lumba et al., 2014). There are two pathways for ABA biosynthesis in
plants: direct and indirect, in which ABA is derived from the C15 compound farnesyl
pyrophosphate and a C40 carotenoid, respectively (Zeevaart and Creelman, 1988;
Zeevaart, 1999). The main pathway of ABA is the indirect pathway (Figure 1.4) that was
reported by a study describing an ABA-deficient mutant that was completely different
from other related genes (Fernando and Schroeder, 2016).
The biosynthetic pathway of carotenoids is well defined. Carotenoids, like other
isoprenoids, are made from the C5 predictor, isopentenyl pyrophosphate (IPP). IPP is
created from mevalonic acid in the cytosol, whereas in plastids where carotenoid
combination occurs, it is produced via 1-deoxy-D-xylulose-5-phosphate (DXP) from
pyruvate and glyceraldehyde-3-phosphate. DXP synthase is the enzyme that helps in the

Chapter One: Introduction
Page 16
synthesis of the first step of non-mevalonic acid IPP creation pathway (Eisenreich et al.,
2001; Lichtenthaler, 1999). IPP is converted to a C20 product, geranylgeranyl
pyrophosphate (GGPP). Transformation of GGPP to a C40 carotenoid phytoene
produced by phytoene synthase (PSY) is the first committed and rate-limiting stage in
the synthesis of carotenoids and is followed by phytoene being converted to ζ-carotene,
lycopene, β-carotene and then to a xanthophyll, zeaxanthin. Phytoene desaturase (PDS)
helps in the transformation of phytoene to β-carotene and is also one of the enzymes
dedicated to carotenoid formation. (Cunningham and Gantt, 1998; Hirschberg, 2001).
Zeaxanthin is then converted to xanthoxin and is exported to the cytosol where it is
converted to abscisic aldehyde by a short-chain alcohol dehydrogenase/reductase (SDR),
and then oxidised by the abscisic aldehyde oxidase (AAO) to form ABA (Nambara and
Marion-Poll, 2005).

Chapter One: Introduction
Page 17
Figure 1.4: Indirect ABA biosynthesis pathway in higher plants ABA comes from β-carotene (C40) through an oxidative cleavage reaction in plastids. The first stage of
the ABA biosynthesis pathway is the conversion of zeaxanthin and antheraxanthin to all trans-violaxanthin,
which will be catalysed by zeaxanthin epoxidase (ZEP). Antheraxanthin is the intermediate product. All–
trans-violaxanthin is converted to 9-cis-violaxanthin or 9′-cis-neoxanthin by the 9-cis-epoxy carotenoid
dioxygenase (NCED), which yields a C15 intermediate product called xanthoxin. Then the product
xanthoxin is exported to the cytosol where xanthoxin is converted to ABA. Xanthoxin is then converted
into ABA by two enzymatic reactions. Xanthoxin is first converted by the enzyme short-chain alcohol dehydrogenase/reductase (SDR), to an ABA aldehyde which is subsequently oxidised to ABA by the
abscisic aldehyde oxidase (AAO) (adapted from Mehrotra et al., 2014).

Chapter One: Introduction
Page 18
1.2.2 Where and when does ABA biosynthesis occur?
ABA is produced in many parts of the plants but more abundantly inside the chloroplasts
of green cells. For example, it is produced in response to environmental stress, such as
heat stress, water stress, salt stress and synthesised in green fruits at the beginning of the
winter period and in maturing seeds, establishing dormancy. The hormone is formed from
mevalonic acid or xanthophyll, and it can be found everywhere in plant parts for example,
in roots, flowers, leaves and stems. It is transported to all parts of the plant through
diffusion as well as transport channels.
1.2.3 Role of ABA in plants
There were many physiological roles of ABA found after its discovery. Firstly, the ability
of ABA to antagonise several gibberellins (GA) effects such as the promotion of seedling
growth and α-amylase synthesis was reported by Wareing’s group (Thomas et al., 1965).
After that, other roles for ABA were reported, specifically, in guard cell responses and
water retention. A good example for that is in the wilty tomato flacca mutant that was
deficient in ABA where its phenotype could be rescued by exogenous ABA treatment
(Imber and Tal., 1970, Tal et al., 1970), and in Xanthium stomatal closure after treating
with ABA (Jones and Mansfield, 1970). In the early 1970s, a physiological model for
ABA’s critical role in guard cell regulation emerged, when ABA levels increase
substantially after water deprivation (Jones and Mansfield, 1970). According to Sharp et
al. (2004), the action of different hormonal signalling pathways and ABA help protect
root growth during water deficit. ABA and other signalling pathways involve regulation
of stress-responsive gene expression in cases where water uptake and water loss cannot
be balanced by primary adaptive responses through different mechanisms that could be

Chapter One: Introduction
Page 19
exploited to avoid and/or tolerate dehydration (Zhu, 2002). ABA has also been found to
affect pathogen responses (Ton et al., 2009). Additionally, ABA regulates important
processes of plant growth and development, like germination, embryo and seed
development, vegetative development including heterophylly as well as general growth,
promotion of seed desiccation tolerance and dormancy, seedling establishment, and
reproduction. Severe ABA-deficiency or ABA-insensitive mutants display a lack of
osmocompatible solutes: small molecules accumulated by cells to permit osmotic
adjustment to a dehydrating environment without interfering with cellular function
(Barrero et al., 2005; Fujii and Zhu, 2009).
1.2.4 ABA signalling in plants
Although ABA has a wide range of biological functions in plant development and growth,
the primary function is to regulate osmotic stress tolerance and plant water balance
(Raghavendra et al., 2010). Hence, understanding ABA signalling is important to
improving crop performance. Genetic screens in Arabidopsis thaliana have revealed
many downstream ABA signalling components. Recent findings in the area of ABA
signalling reveal a unique hormone mechanism (Figure 1.5) where ABA binds to the
ABA receptors Regulatory Components of ABA Receptor/Pyrabactin Resistance
Protein1/PYR-like Proteins (RCAR/PYR1/PYLs). Proteins such as RCAR/PYR/PYL
belong to the START-domain superfamily and have soluble ligand-binding properties.
RCAR/PYR/PYL receptors are found in both cytoplasm and nucleus. ABA binding to
RCAR/PYR/PYLs leads to inactivation of type 2C protein phosphatases (PP2Cs) like
Abscisic Acid Insensitive 1 (ABI1) and its close homolog ABI2 (Nishimura et al., 2010).
The RCAR family of proteins that have 14 members, all of them bind to ABA and interact
with PP2Cs. All the RCAR members are positive regulators of ABA signalling except

Chapter One: Introduction
Page 20
RCAR7/PYL13. In Arabidopsis, there are 80 PP2Cs identified, and six out of nine clades
A PP2Cs act as negative controllers of ABA signalling (Nishimura et al., 2007).
RCAR/PYR1/PYLs and these PP2Cs phosphatases function as co-receptors and form a
high-affinity ABA-binding site. Sucrose non-fermenting Kinase-1-Related protein kinase
2s (SnRK2s), are necessary positive regulators of ABA signalling but lead to suppression
of PP2C-mediated dephosphorylation when the PP2Cs are inactive. Therefore, ABA-
dependent gene expression and ion channels are targetted by activated SnRK2s (Cutler
et al., 2010; Raghavendra et al., 2010). Phosphorylated SnRK2s then phosphorylate
ABA-responsive element Binding Factors (ABFs), which are essential leucine zipper
transcription factors that bind to ABA-Responsive Elements (ABRE) (PyACGTGG/TC),
the primary cis-element in the promoter region of downstream genes that are induced by
ABA (Busk and Pagès, 1998; Lumba et al., 2014).
Figure 1.5: The main components in the core ABA signal transduction pathway (adapted
from Fernando and Schroeder, 2016). When ABA binds with RCAR/PYR/PYLs, it leads to inactivation of type 2C protein phosphatases (PP2Cs).
Inactivation of PP2Cs causes suppression of PP2C-mediated dephosphorylation of sucrose nonfermenting
kinase-1-associated protein kinase 2s (SnRK2s) that are advantageous critical regulators of ABA

Chapter One: Introduction
Page 21
signalling. Then, activated SnRK2 target ABA-based gene expression and ion channels. Phosphorylated
SnRK2s ultimately phosphorylate ABA-responsive binding elements (ABFs), which are primary leucine
zipper transcription factors that bind to ABA-Responsive Elements (ABRE) (PyACGTGG/TC), the
predominant cis-element within the promoter region of downstream genes that are induced by ABA. On
the other hand, when ABA is absent, the PP2Cs dephosphorylate SnRK2s, inhibiting kinase activity and thereby preventing downstream gene expression.
An ABA response eventually leads to changes in gene expression as with most
signal transduction pathways, which may involve changes in transcription, stability and
transcript processing. The specific changes depend on the developmental stage and cell
type, such that there is no universal set of ABA-regulated genes, but they are generally
thought to contribute to tolerance of dehydrating conditions. This dehydration may be
developmentally imposed, as in seed or pollen maturation or response to environmental
stresses such as drought, salinity, or low temperatures (Cutler et al., 2010).
A study by Fairley-Grenot and Assmann (1991) confirms that there is the
involvement of a G-protein-coupled ABA signal transduction pathway in plants. A study
by Wang et al. (2001) reported that loss-of-function alleles in the sole A. thaliana G-
alpha subunit gene (GPA1) exhibit wild-type response to ABA-induced stomatal closure
while they showed hypersensitivity to ABA at the level of germination and reduced guard
cell sensitivity to ABA inhibition of stomatal opening. This and other research by Pandey
et al. (2006) propose that a G-protein-coupled receptor (GPCR) might participate in ABA
signal transduction. According to Colucci et al. (2002) the overexpression of GCR1,
which is the sole classical GPCR encoded by the A. thaliana genome, reduces seed
dormancy; however, genetic analyses of loss-of-function alleles did not involve GCR1 in
direct ABA perception. The gcr1 knockout mutants exhibit ABA hypersensitivity; while
the data also point to pleiotropic roles for GCR1 in other signalling pathways (Chen et
al., 2004).

Chapter One: Introduction
Page 22
1.2.5 ABA and abiotic stress signalling
ABA is an important hormone in development and a key player in stress responses to
environmental stimuli. Plants experience more than a few abiotic stresses which include
accumulation of salt (saltiness), chilling or freezing temperatures, normal temperature
(warmth) and water shortage (a dry spell or lack of hydration) (Fujita et al., 2011). Plants
make use of ABA to adapt and remain unaffected by a stress situation and might change
ABA levels continuously, based on changing physiological and environmental conditions
relating to seed dormancy and development, initiation of growth, promoting stomatal
closure, embryo morphogenesis, production of storage proteins and lipids, leaf
senescence as well as resistance toward pathogens (Tuteja, 2007). Exposure to
environmental stress such as drought can produce harmful effects on the development of
plants. Abiotic stress is a damaging stress condition and stops crop production and yields
even on watered land worldwide (Mahajan and Tuteja, 2005). Overall, stress is a many-
sided event which happens throughout plant development. Plant responses differ
depending on the degree of the stress and plant metabolic activity. In response to abiotic
stresses, gene expression patterns change in drought, cold, high salt, or following ABA
application; hence ABA metabolism and stress signals synergise to achieve cell
homeostasis (Tuteja, 2007). It has been explored in a review by Rizwan et al. (2017) that
plant tolerance against metal stress, increased plant growth and biomass, photosynthetic
colours, and gas exchange features can be improved by application of endogenous and
exogenous ABA.

Chapter One: Introduction
Page 23
Water Stress
Regarding crops, it is believed that lack of water is a chief limiting factor for plant growth
under field conditions since plants are exposed to different levels of water stress daily.
Water shortage destroys many plant abilities such as making food from light, evaporation
of water from leaves, stomatal conductance, and metabolite accumulation (Sangtarash et
al., 2009), and therefore results in a significant decrease in plant growth and productivity
(Reddy, Chaitanya and Vivekanandan, 2004). Plant responses to drought incorporate
changes in morphology and biochemistry, leading to acclimation in moderate conditions,
and cause harm to plants and plant ingredients in extreme cases (Vishwakarma et al.,
2017). Since water-stressed green plants have a higher concentration of ABA than well-
hydrated crops, Sangtarash et al. (2009) suggested that the consequences of ABA
application will improve the sufficiently-watered plants more than water-stressed plants.
It has been assumed for the past 25 years that an increasing concentration of ABA
in drought-resistant plants also restricts the growth of the plant, mostly through stopping
shoot growth (Trewavas and Jones, 1991). Some research has discussed the relationship
between the ABA concentration of plant tissue or xylem sap and growth inhibition and
recommended that the improved concentration of endogenous ABA in the drought-
resistant plant was enough to support a part of plant growth and that not all growth
inhibition results from water stress (Sangtarash et al., 2009).
It has also been reported that ABA stops shoot growth in appropriately watered
plants. A series of reports has found that ABA deficiency in the plant under drought
conditions causes improvement of shoot growth, which is also consistent with
upregulation of endogenous ABA accumulation being responsible for plant growth
inhibition. It was found that the rate of shoot elongation was high in ABA-deficient maize

Chapter One: Introduction
Page 24
seedlings (fluridone- treated or vp5 mutant) in comparison with the control (Sharp et al.,
1994). A study by Bray (2002) illustrated that increased levels of ABA must inhibit
increased ethylene production from tissues under water stress conditions. As a result,
ABA accumulation in the course of drought could result in maintaining shoot progress as
well as root development, instead of retarded growth, which was previously believed.
ABA is known to control the balance between intrinsic growth and surrounding
conditions responses. AtABCG25 acts as a cell-membrane ABA transporter exporting
ABA from cytoplasm to outside of the cells. Plants that over-express AtABCG25 show
phenotypes of reduced evaporation of water from leaf without any growth retardation. A
study by Kuromori et al. (2016) observed that AtABCG25 over-expression stimulated a
local ABA response in guard cells. Furthermore, AtABCG25 overexpression increased
drought tolerance, probably resulting from the maintenance of water content over the
common threshold for survival after drought stress treatment (Kuromori et al., 2016).
Drought is one of the principal abiotic stresses that negatively influences the
growth and crop yield of plants (Tripathi et al., 2016). Greater than half of the land area
where crops can grow well can easily be harmed or influenced by drought (Kogan, 1997).
Drought conditions create osmotic stress in organisms, which eventually cause
desiccation and resistance to water uptake in plants. During osmotic stress conditions,
ABA builds up and acts as a controller of stress response in plants (Nakashima and
Yamaguchi-Shinozaki, 2013; Yamaguchi-Shinozaki and Shinozaki, 2006). It is known
that ABA has positive effects on stress tolerance following exogenous application or
through overexpressing the genes for its increased endogenous content in plants. A recent
study by Li et al. (2016) reported that ABA could effectively improve drought-induced
damage in creeping bentgrass (Agrostis stolonifera) by maintaining membrane stability

Chapter One: Introduction
Page 25
and leaf water status when a salicylic acid (SA), ABA, and γ-aminobutyric acid (GABA)
are added exogenously. It was discovered that ABA, GABA, and SA had impacted the
common metabolic pathways and furthermore caused differential changes in metabolite
collection under drought stress (Li et al., 2016).
Work by Weiner et al. (2010) has provided evidence that a lack of water can have
an impact on the expression of core ABA signalling parts, which includes the action of
PYL /PYR/ RCAR ABA receptors, protein phosphatases 2C (PP2Cs), and subclass III
SnRK2 protein kinases. Osmotic stresses such as cold, drought, and high salinity can
cause cells not to have enough water at the time of seed improvement in vegetative
development (Fujita et al., 2011). This results in hyperstimulation of active and effective
plant ABA metabolism (Nambara and Marion-Poll, 2005) and transport (Kuromori et al.,
2010). It was thought that drought-induced stress enforces high ABA levels in
Arabidopsis leaves and safeguards the plant against disease connected with an avirulent
strain of Pseudomonas syringae pv tomato (Mohr and Cahill, 2003). In growing and
spreading tissues, the amount of ABA is 40-fold higher when under drought and salt
stress (Zeevaart and Creelman, 1988). Mutants with non-functional ABA biosynthesis
are adversely affected by surrounding conditions when compared to transgenic plants,
which can elicit a greater hormonal response and have higher tolerance against biotic
stress than the wild type (Iuchi et al., 2001; Qin and Zeevaart, 2002). A study by Huang
et al. (2016) has shown that the ramie BnbZIP3 gene was upregulated in the presence of
drought, high salt water and ABA. The BnbZIP3 gene belongs to the group of bZIP
transcription factors. This might account for the increase of BnbZIP3 as it may contain

Chapter One: Introduction
Page 26
some cis-acting elements that are involved in ABA signalling and different stress
responses.
Major ABA signalling components actively control both fast and slow ABA
communication pathways to tackle not having enough water. Previous studies have found
that there is a relationship between osmotic stress from high salt or drought and the two
cellular pathways: one is ABA-direct, and the other is ABA-indirect. The cold stress
response is achieved through changed gene expression via an ABA-indirect pathway. The
ABA-direct pathway depends upon the availability of a cis-acting element called ABRE
element (ABA-responsive element) (Tuteja, 2007). Gene-related studies point to a
correlation between ABA-dependent and ABA-independent pathways and crosstalk or
association of involved molecules in the signalling pathway. Calcium acts as a secondary
messenger in response to stress and is a possible candidate to help cross communication.
Extensive research has shown that ABA, drought, cold and high salt cause a sudden rise
in calcium levels in plant cells (Mahajan and Tuteja, 2005; Tuteja, 2007).
ABA regulation of seed germination and root growth
Abscisic acid is one of the extremely important phytohormones that help in the regulation
of developmental as well as physiological events which occur in plants (Cutler et al.,
2010; Fujita et al., 2014, 2013, 2011). These events involve seed inactivity, seedling
development and growth, and limiting the responses of many biotic stresses
(Vishwakarma et al., 2017). Some studies have looked at genes involved in these
processes. For example, a study by Fujii et al. (2007) confirmed that the ABA-insensitive
mutants abi1 and abi2 interfere with some ABA responses, which involves inhibition of
growth onset, the process of seedling growth, and support of stomatal closure. On the

Chapter One: Introduction
Page 27
other hand, other mutants such as abi3, abi4, and abi5 only display ABA insensitivity
during seed germination and premature seedling development.
Another important process in signalling is protein phosphorylation. The
importance of phosphorylation has been identified with the analysis of the triggering of
ABA response elements; in other words, ABRE binding factors, also known as
ABFs/ABREs. ABFs are transcription factors referred to as basic leucine zipper-type
(bZIP), a transcription factor which is involved in ABA-mediated signalling. The proteins
encoded by these ABA-responsive genes include proteins that recognise events that
protect against attack, enzyme requirement for osmolyte production, or different
transcription factors responsible for controlling other changes in gene expression (Bray,
2002; Zhu, 2002).
Although there are some known genes that are concerned with the signalling of
ABA, certain significant components are still under study. The signalling process
mediated by ABA is believed to be a very branched system. As discussed earlier,
SnRK2.6 has been involved in the positive regulation of ABA signalling (section 1.2.4);
however, it only completes its function in ABA responses of guard cells (Fujii et al.,
2007; Mustilli et al., 2002). Also, ABI 1 and ABI 2 are negative regulators of the growth
of seedlings, seed germination and closure of stomata (Fujii et al., 2007). This poses the
question; what protein kinases might be present in the positive regulation of ABA
signalling during the growth of seedling and beginning of the growth of the seed? snrk2.2
snrk2.3 plants show insensitivity towards ABA during early seed growth and show that
SnRK2.2 and SnRK2.3 are the protein kinases responsible for positively controlling the
signalling at the beginning of seed growth. SnRK2.2 and SnRK2.3 are also connected to
other roles in seed dormancy, stopping of seedling development, and gene expression

Chapter One: Introduction
Page 28
caused by ABA. Many of the ABA-induced genes showing decreased ABA
responsiveness in snrk2.2 snrk2.3 mutants are thought to carry ABREs in their promoter
area. Therefore, SnRK2.2 and SnRK2.3 are likely to influence the expression of those
genes via phosphorylating one or more ABFs and, in that way, influence the binding of
ABF to ABRE (Figure 1.6) (Fujii et al., 2007).
Figure 1.6: The relationship between SnRK2.2 and SnRK2.3 and ABA signalling (taken
from Fujii et al., 2007). Panel (A) Seed Germination and Dormancy Assays.(1) and (2) Photographs of Col-0, snrk2.2, snrk2.3, and
snrk2.2 snrk2.3 seedlings on control (Murashige and Skoog [MS]) medium with 3% sucrose (1) or 0.6 mM
ABA medium (2) at 9 d after the end of stratification. (3) Germination of nonstratified seeds at 7 d after
sowing on MS medium with 3% sucrose. Panel (B)ABA Inhibition of Seedling Growth. Photographs of

Chapter One: Introduction
Page 29
seedlings at 14 d after transfer to control medium (MS medium with 3% sucrose) or medium containing 50
mM ABA. Seedlings were 4 d old at the time of transfer and had equal root lengths at that time. Panel (C)
Expression of SnRK2.2 and SnRK2.3. RT-PCR analysis of tissue distribution of SnRK2.2 and SnRK2.3
expression. Numbers at right indicate the number of PCR cycles performed.
The continued cycle of reproduction critically depends on controlling the
beginning of seed germination and seedling growth. There are some critical checkpoints
at the stage of change transition from inactive state to the early growth stage and from
the early growth stage until maturation (Kermode, 2005). It was reported that rare earth
elements (REEs) show an adverse biological effect on the growth and yield of the plant
(Jianrong et al., 2014). However, the point at which these REEs are incorporated in
phytohormone ABA signalling is not clear. The interaction of Lanthanum (La3+) occurred
with ABA signal in the growth of Arabidopsis root (Jianrong et al., 2014). Also, the
amount of ABA that was used affected this process. For example, when 1µmol/L of ABA
was added, the seed germination was stopped, and the root was subjected to elongation
in Arabidopsis, but when 10 µmol/L of La3+ was introduced, the effects produced by
ABA were rescued. In addition, root hair development was increased by ABA whereas
the same was stopped by La3+. Further, some studies showed that H2O2 formation that
was caused by ABA was further inhibited by La3+ (Jianrong et al., 2014). Altogether, the
interaction of La3+ with ABA may show a close relation with an H2O2 signal controlled
by La3+ in root cells. La3+ may antagonistic ABA upstream of H2O2 formation.
Different genetic studies on the ABA-mediated regulation of seed germination as
well as gene expression have recognised that different mutants of Arabidopsis have
various sensitivities to ABA (Chen et al., 2008). A study by Lopez-Molina, Mongrand
and Chua (2001) found that one of the ABA-insensitive mutants, abi5, was discovered
for its ability to improve plant growth under high levels of exogenous ABA. ABI5 codes

Chapter One: Introduction
Page 30
for a bZIP transcription factor which, if accumulated, causes initial growth of seedling
and inhibition of the seed germination. A study by Carles et al. (2002) suggested that
ABI5 controls the synthesis of seed-specific ABA, and AtEM genes which code for the
class I late embryogenesis (LEA) proteins that are extremely important for seed maturing
during drought stress. ABA may also negatively regulate root gravitropism (Han et al.,
2009) and root hydrotropism (Moriwaki et al., 2012), but the underlying signalling
mechanisms remain unclear.
1.2.6 ABA and algae
Photosynthetic green algae evolved 1 to 1.5 billion years ago when a eukaryotic
heterotroph encapsulated a cyanobacterium which ultimately formed a plastid (Leliaert
et al., 2012). Many lineages diverged since (Yoon et al., 2004), including the
chlorophytes and charophytes, the progenitors of terrestrial plants which appeared ≈500
million years ago (Delwiche and Cooper, 2015). The water to earth move must have
posed a significant challenge to algae, and environmental differences required the
adaptive evolution of protective mechanisms enabling them to become high-light and
desiccation tolerant and sessile at the water surface. It is likely such mechanisms derived
from those which had already evolved to ensure their survival. For example,
Chlamydomonas sp alter their depth depending on light level and quality to attenuate
photo-oxidative stress (Hegemann and Berthold, 2009). As protective mechanisms
became more active, the depth to which algae needed to descend presumably reduced,
enabling them to pass closer into the shoreline. Algal genomes encode primitive synthesis
and signalling pathways for the majority of phytohormones, including ABA (Wang et
al., 2015). In terrestrial plants, ABA plays a role in seed dormancy and germination,
stomatal movements and in other responses to many stresses that alter their water status

Chapter One: Introduction
Page 31
(Vishwakarma et al., 2017). However, its algal role remains poorly defined with only a
few papers suggesting its involvement in stress responses such as those resulting from
desiccation (Holzinger and Becker, 2015) and salinity (Cowan and Rose, 1991) and in
the initiation of the cell cycle (Kobayashi et al., 2016; Kobayashi and Tanaka, 2016).
ABA treatment has also been shown to increase lipid accumulation in Chlorella (Wu et
al., 2018).
A hundred species of algae have been examined for the presence of ABA, 96%
of which contained ABA (Hartung and Gimmler, 1994; Hirsch, Hartung and
Gimmler,1989; Jameson 1993). The investigations incorporated the following algal
divisions: Rhodophyta, Heterokontophyta, Haptophyta, Cryptophyta, Dinophyta,
Euglenophyta, Chlorophyta and Streptophyta. In the different cases in which ABA could
not be distinguished, the negative outcome is likely to be the result of inadequacies in the
analytical methods applied (Porphyra, Zhang, Yamane and Chapman, 1993; Fritschiella
tuberose, Tietz and Kasprik 1986; Caulerpa paspaloides, Jacobs, 1986; Enteromorpha
compressa, Niemann and Dörffling,1980). Studies by Hirsch, Hartung and Gimmler
(1989) and Yokoya et al. (2009) reported that there were more than 12 Brazilian species
with positive reports of ABA, including Rhodophyta, Heterokontophyta, Haptophyta,
Cryptophyta, Dinophyta, Euglenophyta, Chlorophyta and Streptophyta. ABA content in
algal cells varied between 7 and 34 nmol ABA kg–1 FW. These numbers are similar to
those of liverwort growing beneath the water (Hartung and Gimmler, 1994) but
drastically lower than those of unstressed terrestrial plant life.
The effect of stress on algal ABA concentration has been examined. Salt stress
has been applied to Dunaliella species (Cowan, Rose and Horne, 1992; Cowan and Rose,

Chapter One: Introduction
Page 32
1991; Hirsch, Hartung and Gimmler, 1989) and Chlorella vulgaris (Maršálek,
Zahradníčková and Hronková, 1992). In all instances, salt stress elevated ABA levels.
ABA production was stimulated by using nitrogen deficiency in Dunaliella sp.
(Tominaga, Takahata and Tominaga, 1993), heat stress in Chlorella vulgaris (Bajguz,
2009), drought and acid stress in Stichococcus bacillaris and Chlorella vulgaris
(Maršálek, Zahradníčková and Hronková, 1992), oxidative stress in Haematococcus
pluvialis (Kobayashi et al., 1998,1997), light stress in Chlorella minutissima (Stirk et al.,
2005), and alkaline shock in Dunaliella acidophila (Hirsch et al., 1989). Compared with
cormophytes (10–20-fold increase), the stress-induced increase of ABA biosynthesis of
cyanophytes and algae is much weaker (2–5-fold increase). In all instances, stress-
induced ABA seems to be released across the plasma membrane to the surrounding
medium, and frequently it has been analysed only in the latter. Because of the sturdy
ABA efflux, cell ABA levels may not increase appreciably. Any impact of ABA that has
been released from the algae to the surrounding environment on aquatic organisms inside
the neighbourhood, as suggested by Hussain and Boney (1973), appears to be
extraordinarily unlikely due to the fact that it is extremely diluted.
ABA biosynthesis and metabolism in algae
Incorporation of mevalonolacton into ABA of Dunaliella parva was observed by Cowan
and Rose (1991); under salt stress condition the incorporation was increased. Moreover,
they did inhibitor experiments with fluridone, norflurazon and AMO 1618; compounds
which inhibit the formation of those carotenoids that are thought to be essential
precursors of ABA. Due to a relatively weak reduction of ABA biosynthesis, they
conclude that at least a significant part of ABA is not formed from carotenoids. On the

Chapter One: Introduction
Page 33
other hand, in green algae that contain chlorophyll a and b the 90-cis-neoxanthin was
found, which is a suitable substrate for ABA synthesis. However, it was not found in
other algal divisions such as heterokontophyta, rhodophyta and photoautotrophic
prokaryotes, although all these organisms form ABA. Therefore, the latter may synthesise
ABA through a direct synthesis pathway via farnesyl-diphosphate.
Effect of ABA on algae
There have been numerous attempts to elucidate the physiological function of ABA in
algae by way of the treatment of algae with external ABA. Most of these experiments
have been conducted in a situation of extremely poor understanding of the physiology of
ABA in algae (e.g. prevalence, inner concentration, uptake and metabolism,
permeabilities of membranes for ABA). Moreover, in most instances, extremely high
external ABA concentration have been applied. This significantly excessive
concentrations yield outcomes of marginal physiological relevance. Experiments do not
deliver a consistent picture (Hartung and Gimmler 1994; Jameson 1993). For example, it
has been proven that permeability of membranes to specific solutes became both
stimulated in Chara (Ord et al., 1977; Wanless et al., 1973) or decreased in Dunaliella
(Hirsch et al., 1989) while ion uptake was stimulated and inhibited, respectively.
Photosynthesis was not affected in most cases. Stimulation of respiration was observed
(Ullrich and Kunz, 1984), as well as its inhibition (Huang, 1991).
A study by Hartung (2010) reported that algal differentiation had been shown to
be affected; gametogenesis in Chlamydomonas (Ishiura, 1976) and abscission of
oospores in Chara (Driessche, Petiau-de Vries and Guisset, 1997). ABA promotes a
growth inside the cyanobacteria Nostoc and Anacystis (Ahmad et al., 1978) and inhibits

Chapter One: Introduction
Page 34
growth in Coscinodiscus (Kentzer and Mazur, 1991; Hirsch et al., 1989). It was
speculated that within algae, a high correlation might also exist between ABA content
and the level of differentiation.
Moreover, a study by Tanaka, Ikeda and Miyasaka (2004) showed that
halotolerant Chlamydomonas strains express LEA genes (cw80 Lea3), stimulated by salt
and cold stresses, however not associated with ABA. This indicates that despite the fact
that ABA is present and may be induced by stress, a clear physiological response (e.g. in
gene expression patterns) could not be determined yet.
ABA was confirmed to have a protective effect against oxidative damage caused
by salt and osmotic stress in the same species such as Chlamydomonas reinhardtii
(Yoshida, 2005; Yoshida et al., 2004, 2003). When cells were treated with ABA, catalase
and ascorbate peroxidase activities were shown to be significantly higher (Yoshida et al.,
2003). ABA also protects Haematococcus pluvialis against oxidative stress, it may be
necessary for the mitigation of oxidative damage in stressed algae (Kobayashi et al.,
1998, 1997). Additional research is required in this field to address this issue fully.
ABA plays a role in the gravitropic/gravitaxis response of algae that is modulated
by exposure to light. According to Fujii et al. (2009) there are no orthologues of the genes
encoding the plant cytosol/nuclear localised PYR/PYL/RCAR receptor family in the
Chlamydomonas reinhardtii genome. On the other hand, there are potential orthologues
of genes encoding the G-protein coupled receptor (GPCR) protein, GCR2 (Liu et al.,
2007) and GPCR-types, GTG1 and GTG2 (Pandey et al., 2009) in the genome of this
alga. It is still unclear whether or not these proteins act as ABA receptors (Christmann
and Grill, 2009; Guo et al., 2011; Risk et al., 2009). Thus, it will be important to
determine the mechanisms through which algae such as Chlamydomonas perceive ABA

Chapter One: Introduction
Page 35
and mechanistically how its perception interacts with light signalling to determine both
the orientation and direction of movement.
There is a connection between abscisic acid (ABA) and the expression and
function of glycine-rich RNA-binding proteins (class IV GRPs) in plants such as
Arabidopsis thaliana. Sequencing the C. reihardtii genome has suggested that there is
only a single GRP gene, termed CrGRP1. Now, the attention is focused on the GRPs.
1.3 The class IV glycine-rich RNA-binding proteins (GRPs)
1.3.1 Structural properties of class IV GRPs
In general, plants contain a high level of glycine (20 % up to 70 %). The reason is thought
to be the presence of abundant glycine-rich proteins (GRPs) (Condit and Meaher, 1986).
Currently, four classes of GRPs have been categorised. The first class of GRPs has a
signal peptide followed by a glycine-rich domain, and it consists of (GIyGIyX) n repeats.
Most of the GRPs in a signal peptide class have a cell-wall localisation, a structure-
function (Cassab, 1998). The second class of GRPs has a glycine-rich domain which is
followed by a C-terminal cysteine-rich region which involves (Gly Gly XXX Gly Gly) n
repeats while the third class of GRPs has the lowest level of glycine when compared to
other classes. They are characterised by the presence of (GlyXGlyx) repeats and by a
higher degree of structural diversity. Both class II and III GRPs can also include a signal
peptide, commonly at the amino terminus. In contrast, the defining feature of class IV
GRPs is that they include nucleic acid binding domains (Figure 1.7; Kar, Nayak and
Joshi, 2012).

Chapter One: Introduction
Page 36
Figure 1.7: The structures for the four main classes of GRPs. SP, signal peptide; CR, cysteine-rich; Gly, glycine; Oleosin, domain conserved in oleosin (adapted from
Ciuzan et al., 2015).
RNA Recognition Motif (RRM) and Cold Shock Domain (CSD) are the two types
of RNA-binding domains contained in class IV GRPs. A review by Ciuzan et al. (2015)
describes these as type A and type B of class IV GRPs respectively. In Arabidopsis
thaliana, the most studied GRPs, AtGRP7 and AtGRP8, are type A, whereas AtGRP2 is
type B. The class IV proteins are a distinct subgroup within the very heterogenous
superfamily of glycine-rich proteins (GRPs), exemplified by the well-studied
Arabidopsis thaliana protein AtGRP7 (Ciuzan et al., 2015; Schmidt et al., 2010).
RRMs are found in a wide range of RNA-binding proteins including small nuclear
ribonucleoprotein (snRNP) associated proteins, chloroplast RNA binding proteins,
poly(A)-binding protein, heterogeneous RNPs and SR proteins (splice factors with
serine–arginine-rich domains; Lunde et al., 2007). RNP-1 and RNP-2 are two of the
conserved motifs in RRMs. RNP-1 contain eight amino acid residues with consensus

Chapter One: Introduction
Page 37
(K/R)G(F/Y)(G/A)FVX(F/Y). RNP-2 consists of a six amino acid consensus
(L/I)(F/Y)(V/I)(G/K)(G/N)L. RNA-binding proteins that have RRMs are involved in pre-
mRNA processing such as capping, polyadenylation and splicing (Hall, 2002). The cold
shock domain (CSD) can bind both DNA and RNA. Cold-shock proteins (CSPs) is the
name that derived from a conserved family of small prokaryotic cold-shock proteins.
These proteins contain a CSD which is similar to an RRM and described as a beta-barrel
structure with conserved protruding basic and aromatic residues required for RNA
binding. A study by Sachs et al. (2012) reported that CSPs contain a single CSD and are
thought to contribute to cold adaptation by working as RNA chaperones. Transcription
factors contain a CSD in eukaryotes. A single CSD is present in the eukaryotic Y-box
transcription factors. However up to five CSD have been documented in the protein UNR,
an RNA-binding protein found in mRNA turnover (Doniger et al., 1992). The CSD in
the Y-box proteins is required for their DNA-binding activity, and it also binds RNA and
allows Y-box proteins to repress mRNA translation in both somatic cells and germline
cells (Sommerville and Ladomery, 1996). In plants, the CSD is present in different
proteins often in association with glycine-rich domains (Sasaki and Imai, 2012).
According to Manival et al. (2001) both the RRM and the CSD bind single-stranded
RNA.
1.3.2 Functional conservation of class IV GRPs
Research increasingly suggests that the class IV GRPs are involved in adapting to stress,
mainly because of their increased expression after exposure to cold, abscisic acid (ABA)
treatment, salicylic acid treatment, wounding or water stress. The following example
illustrates this point. MhGR-RBP1 is a class IVa GRPs from Malus hupehensis (apple)
with a high level of sequence identity with other GRPs such as from Malus prunifolia

Chapter One: Introduction
Page 38
(MpRBP1 - 96%), Oryza sativa (OsGRP3 - 81%) and A. thaliana (AtGRP7 - 80%;
AtGRP8 - 75%). MhGR-RBP1 is highly expressed in leaves compared with shoots and
roots. Expression levels of MhGR-RBP1 increases when trees are subjected to drought,
high salt, H2O2 and wounding stress. In contrast, when trees are treated with ABA for 24
hours the expression of MhGR-RBP1 decreases (Wang et al., 2012). Thus, the class IV
GRPs may be helping apple trees adapt to surrounding or adverse environmental
conditions.
At least six class IV GRPs are present in the rice genome (OsGRP1 to OsGRP6).
Cold stress increases the expression of all six by more than double (except for OsGRP3).
OsGRP1 and OsGRP6 are able to restore cold modification to a sensitive Escherichia
coli mutant strain, confirming the conserved functional protection of these proteins (Kim
et al., 2010). Kim et al. (2010) went on to examine the ability of OsGRPs to complement
the cold sensitivity of an Arabidopsis atgrp7 mutant, a class IVa GRP. They created
plants that ectopically expressed OsGRP1, OsGRP4 and OsGRP6. OsGRP1 and OsGRP4
rescued the sensitivity to cold of the atgrp7 mutant, whereas freezing tolerance was
provided by OsGRP6 (Kim et al., 2010). Yang et al. (2014) created transgenic rice plants
that express AtGRP7 and AtGRP2. The result was improved grain production under
drought stress conditions, in addition to high preservation of plants, and also showed
striking sequence homology between plant class IV GRPs and vertebrates.
Cold-inducible RNA-binding protein A (CIRP-A) is a class IV GRP found in
Xenopus laevis. This protein has shown increased levels of expression when the liver and
brain are exposed to lower temperatures. Its expression in the brain of Xenopus is
controlled in a circadian fashion (Saito et al., 2000). This has become of interest since it
is known that AtGRP7 expression is also controlled in a similar manner (Carpenter et al.,

Chapter One: Introduction
Page 39
1994). CIRP-A plays a role in the migration and differentiation of cells of the pronephros
during embryonic development; in this context, its functions are not restricted to cold
adaptation (Peng et al., 2006).
Mammalian RNA-binding protein 3 (RBM3) is very much alike in sequence to
CIRP-A and AtGRP7. Its expression is caused by dangerously low body temperatures
and low oxygen tension (Chip et al., 2011). RBM3 is highly expressed in the liver and
muscles of the bear Ursus americanus during winter hibernation. Its expression increases
up to 7.28-fold in several tissues. RBM3 is the most upregulated protein during
hibernation over the winter (Fedorov et al., 2009). Therefore, RBM3, a mammalian
protein, appears to be involved in cold adaptation, like the class IV plant GRPs is involved
in plant cold adaptation.
RBM3 is involved in the regulation of protein translation in response to cold. It
is not yet clear how this regulation occurs. One possible way could be through direct
interaction with ribosomes (Dresios et al., 2005). Consistent with this suggestion, RBM3
associates with the 60S ribosomal subunit in an RNA-independent manner. Another
possibility is that RBM3 interacts with microRNAs (small non-coding RNAs that can
downregulate translation by binding target mRNAs). In favour of the microRNA
interaction hypothesis, one study observed the levels of a small complex (<40S) that
contain micro RNAs were reduced in cells that over-express RBM3 (Dresios et al., 2005).
Because of the similarity of RBM3 and plant class IV GRPs, it is tempting to suggest that
AtGRP7 might also affect translation and microRNA function, but this remains to be
examined.

Chapter One: Introduction
Page 40
RBM3 expression also increases in hypoxia. The upregulation of RBM3 is
thought to happen independently of hypoxia-inducible factor 1 (HIF-1) (Wellmann et al.,
2010). The mechanisms through which RBM3 helps cells adapt to hypoxic conditions
are not yet known. RBM3 is required for cell growth and proliferation and protects cells
from cell death caused by serum starvation (Wellmann et al., 2010), further suggesting
that it might even be part of a new generation of RNA-binding proto-oncogenes
(Lleonart, 2010).
1.3.3 Role of class IV GRPs in stress adaptation
In A. thaliana, AtGRP7 appears to play a key role in the regulation of ABA and stress
responses. In plants, ABA is involved in stress, water, cold and heat responses. In
addition, ABA is involved in specific physiological events, such as stomatal opening and
closing in the guard cells of A. thaliana (Kim et al., 2008). The expression of AtGRP7
in A. thaliana was repressed when treated with ABA, high salt and mannitol
concentrations (Cao et al., 2006). Furthermore, when comparing the transcript levels of
two stress-induced genes RD29A and RAB18 with a wild-type plant, the transcript levels
were higher in the atgrp7 knockout plants than with wild-type plants. Evidence suggests
that AtGRP7 is involved in the regulation of ABA-induced and stress-induced genes (Cao
et al., 2006). Kim et al. (2008) extended these findings, and they reported that after using
another type of AtGRP7 knock-out, the mutants were able to germinate and survive on
both media with high concentrations of NaCl and with mannitol in comparison to either
wild-type or over-expressed plants (Kim et al., 2008). Another study by Kim et al.
(2007b) found that seed germination was affected by AtGRP2 (a type B class IV GRP)
under salt stress but not osmotic stress. Either the presence or absence of AtGRP2 did not
influence the seedling growth and plant development, thus suggesting that AtGRP2 is

Chapter One: Introduction
Page 41
independent of the ABA pathway. The evidence indicated that AtGRP2 and AtGRP7 are
involved in response to similar abiotic stresses, but their function may be antagonising
each other (Figure1.8).
Figure 1.8: Biological activities of Arabidopsis thaliana GRPs (at GRP7 and GRP8
containing RRMs) and (at GRP2 containing a CSD) (adapted from Ciuzan et al., 2015).
Initial analysis of its sequenced genome suggests that there is only one member
of the class IV GRPs in C. reinhardtii. It is called CrGRP1, and it will be described in
detail in Chapter 4. It is hypothesised that class IV GRPs are equally important for the
ability of C. reinhardtii to adapt to stress, intersecting with ABA-regulated pathways.
The class IV glycine-rich proteins are likely to function by regulating gene expression at
multiple levels on their mRNA targets by modifying alternative splicing, mRNA export,
mRNA translation, and mRNA degradation.

Chapter One: Introduction
Page 42
1.4 Hypothesis and Aims
1.4.1 Hypothesis
ABA is one of the essential phytohormones required for the regulation of developmental
as well as physiological events occurring in plants. Such events involve seed dormancy,
seedling development and growth. In parallel, the class IV GRP proteins play critical
roles in the adaptation to biotic and abiotic stresses that include pathogens, osmotic and
salt stress, oxidative stress, and cold stress in high plants such as Arabidopsis thaliana. I
hypothesized that ABA and GRPs also play a significant role in the adaptation to biotic
and abiotic stresses in C. reinhardtii. Long term, it may be possible to manipulate GRPs
to improve the use of C. reinhardtii in biotechnological applications, for example as a
potential biofuel.
1.4.2 Aims
1- To investigate the role of plant hormones and particularly ABA in regulating the
movement of C. reinhardtii in response to stress by pursuing the objectives:
• To explore the effect of plant hormones on the growth rate of C. reinhardtii.
• To explore the effect of plant hormones in the movement of C. reinhardtii in
response to stress.
• To explore the effect of ABA in the movement of C. reinhardtii during circadian
rhythm. Then, measuring ABA concertation through circadian rhythm as well.
2- To investigate the expression of the class IVa GRP CrGRP1 in stress adaptation in C.
reinhardtii by following the objectives:
• Characterise class IV in C. reinhardtii
• Determine the structure of CrGRP1 gene

Chapter One: Introduction
Page 43
• Examine the expression of CrGRP1 during the Circadian cycle with and without
exposure to the phytohormone ABA. Then, examine the expression of CrGRP1
in response to abiotic stresses such as H2O2-induced oxidative stress and changes
to light conditions during the circadian rhythm.
• Examine the expression of CrGRP1 following light-regulated movements of C.
reinhardtii after treatment with ABA.
3- To investigate the expression and function of the class IVa GRP CrGRP1 in stress
adaptation in C. reinhardtii in order to:
• Determine the effect of overexpression and knock-down of CrGRP1.
• Characterise the phenotype and effect on target RNA.
• Examine the effect on the mobilisation of hormone responses.

Chapter Two: General Methodology
Page 44
2 Chapter Two: General Methodology
2.1 Sources of reagents
All reagents and analytical grade chemicals were obtained from Sigma-Aldrich Co.
Limited. Agarose was supplied by Bio Line Limited. Agar for bacteria was obtained
from Sigma and algal agar from Melford Laboratories Limited. Restriction enzymes and
DNA-modifying enzymes were purchased from New England Bio Labs UK Limited.
DNA molecular weight markers were obtained from Bio Line Limited. And Gene
Pulser®/MicroPulser™ Electroporation Cuvettes, 0.4cm gap, were purchased from Bio-
Rad Laboratories Limited.
2.2 Bacterial strains, gene construct and plasmids
Escherichia coli is a non-photosynthetic bacterium that is commonly found in the lower
intestine of warm-blooded animals and is widely used in genetic studies. Some strains
possess flagella and are motile, whereas other strains lack flagella. TOP10 chemically
competent E. coli cells (TOP10 cells; Invitrogen, Thermo Fisher Scientific) were
purchased frozen and stored at -80°C to be used as hosts for most E. coli plasmids.
2.3 Algal strains, culture conditions, and stress treatments
C. reinhardtii wild‐type strain CC1021 with cell wall (mt+) and CC849 without cell
wall (mt) were obtained from Dr Man-Kim Cheung, the University of the West of
England, Bristol. Wild‐ type strain 137 C with cell wall were bought from the
Chlamydomonas Center (http://www.chlamy.org/). All C. reinhardtii strains used in this
study were grown on TAP agar plates. For confocal experiments and RNA isolation,

Chapter Two: General Methodology
Page 45
algae were grown at 25 ºC, 16 h photoperiod, 133 rpm, 980 Lux in TAP media (2.42 g
Tris base ,12.5 ml solution #1 (40 X FBS)), 5 ml solution #2 (phosphate (KPO4), 5 ml
solution #3 (trace mineral), then adjusted to pH 7.2 with diluted 1/10 glacial acetic acid
to make up to 1 liter with distilled water and then autoclaved (see Appendix 8.1 to prepare
the solutions #1, 2 and 3). Cultures were grown until A750 = 0.3 which is a mid-log phase.
Growth was measured by following A750 nm. For protein and RNA extraction cells were
collected by centrifugation at 4 °C for 10 min at 2500rpm (Beckman Coulter Allegra x
22r) before being stored at -80ºC.
For growth assays, C. reinhardtii cultures were grown as described above. Plant
hormones such as Abscisic acid ABA (dissolving 2.64 mg of ABA (Sigma) in 1 ml of
100% (v/v) ethanol to give 10 mM-final concentration), 1-aminocyclopropane-1-
carboxylic acid (ACC; dissolving 1.0 mg in 1 ml of water giving a 10 mM final
concentration), indole-3-acetic acid (IAA; dissolving 1.75 mg in 1 ml of 95 % (v/v)
ethanol, giving a 10mM final concentration) and 1-naphthaleneacetic acid (NAA;
dissolving 1.86 mg (Sigma) in 1 ml of 1N NaOH giving a 10 mM final concentration)
were added at various concentrations. The growth of the cultures was monitored over a
48h period by measuring A750 nm.
For stress treatments, C. reinhardtii wild‐type strain CC1021 (mt+) algae
were grown as described above and then cells were used for different stress treatments.
For hydrogen peroxide (H2O2) stress treatment, the cells were directly cultured in TAP
medium with H2O2 added in various concentrations (0.1µM, 1µM, 10µM, 100µM,
10mM, and 1mM). Cells were harvested and centrifuged at 4°C for 10 min at 2500 rpm.
and then the cell pellets were stored at -80°C for RNA extraction.

Chapter Two: General Methodology
Page 46
Another stress was altering light conditions through the light/dark cycle. The
culture was grown as described above and then the light condition was changed to 8h
light and 16h night. Cells were harvested every two hours and centrifuged at 4°C for 10
min at 2500 rpm. Cell pellets were stored at -80°C for RNA extraction.
2.4 Isolation of RNA from C. reinhardtii culture
Total RNA was extracted from the mid-log phase of strain CC1021 of C. reinhardtii,
using Trizol reagent (Sigma-Aldrich). Culture (25 ml) at 0.3 A750 were centrifuged at
4°C for 10 min at 2500 rpm, and the pellet was ground separately to a fine powder using
a pestle and mortar and homogenised in 1ml of Trizol reagent. Samples were vortexed
for five minutes and incubated at room temperature for five minutes. 0.2 ml of
chloroform was added to the samples and tubes were shaken vigorously by hand for 15
seconds and incubated at room temperature for five minutes. Samples were centrifuged
at 12000 rpm for 3-4 minutes (Fisher Scientific Centrifuge). The clear aqueous phase
was transferred to a fresh tube and RNA was precipitated by the addition of 0.5 ml of
isopropanol and incubated in liquid nitrogen for five minutes and then at room
temperature for ten minutes. Samples were then centrifuged at 12000 rpm for 15-20
minutes (Fisher Scientific centrifuge). The supernatant was removed, and the pellet was
washed with 200 μl of 80% ethanol. The tubes were centrifuged at 7500 rpm (a Fisher
Scientific Centrifuge) for five minutes. The final RNA pellet was dried by leaving it at
room temperature for five minutes and then it was dissolved in 20 μl of RNase- free
water. The RNA concentration was then quantified using a Nanodrop (Thermo Scientific)
and then stored at -80°C until further use.

Chapter Two: General Methodology
Page 47
2.5 Quantification of nucleic acids
Sample concentrations were determined by using a Nanodrop (Thermo Scientific).
Samples (1.5 μl) were used for quantification. Concentrations were determined by
measuring the absorbance at 260 nm as calculated based on the absorbance measured at
260nm, ×40 for RNA or ×50 for DNA. The samples were checked for purity by
measuring the absorbance ratio at 260nm/280nm for any protein contamination and
260nm/230nm for any solvent and salt contamination.
2.6 Analysis of RNA samples by agarose gel electrophoresis
Agarose gels (1.2 & 2% w/v) were used to analyse the quality of the RNA or DNA
samples (Sambrook et al., 1989). Agarose was mixed with 1X TAE buffer (10 mM Tris-
Acetate, 0.5 mM EDTA, pH adjusted to 7.8.) and melted in a microwave oven. The
mixture was cooled to 60°C, 3 μl EtBr (10 μg/ml) was added, and then it was mixed
gently to avoid bubble formation. The mixture was poured into ae gel mould containing
suitable well combs and was allowed to solidify. A 1X TAE buffer was poured into the
gel buffer reservoir in the electrophoresis apparatus to about 2mm above the gel surface.
RNA or DNA samples were mixed with a loading dye at a ratio of 5:1. The contents
were loaded in respective gel slots and electrophoresis was carried out at 90 V for 45
minutes. After the run, the gel was visualised on a UV transilluminator (Alpha Innotech)
with an Alpha Innotech camera.
2.7 DNase treatment of RNA
Removal of genomic DNA contamination from RNA samples was done by adding two
units of DNase I and 5 μl of DNase I Reaction Buffer (10X) (New England Bio-labs) to

Chapter Two: General Methodology
Page 48
10 μg of RNA, making up a final volume of 50 μl which was incubated at 30 °C for 10
minutes. Finally, the DNAse was heat inactivated at 55 °C for five minutes. The RNA
quality was checked by agarose gel electrophoresis, as described above (see Section 2.6).
2.8 Reverse transcription
First strand complementary DNA (cDNA) was synthesised from 5 μg of total RNA in a
total reaction volume of 25 μl. RNA was mixed with 4 μl of 50 μM anchored oligo(dT)
primer and spiked with 3 ng of human Tumour Necrosis Receptor Associating Factor 1
transcript (TRAF) in 3.25 μl of sterile distilled water and incubated at 70 °C for 10
minutes. Following that, it was kept on ice for a few seconds, then microfuged briefly
and allowed to anneal at room temperature for five minutes. 2.5 μl of 10 X RT buffer,
1.25 μl of 20 mM dNTPs mix and 1μl of RNAse inhibitor enzyme were added and
microfuged briefly. 1μl of Superscript III reverse transcriptase (200 U/μl, Invitrogen) was
added to the reaction mixture, briefly mixed, and then incubated at 42 °C for two and half
hours. The reverse transcriptase was heat inactivated at 65 °C for 10 minutes. Finally,
the cDNA synthesis reaction was diluted ten times with sterile distilled water and used
for RT-PCR. A negative control was included without RNA (template control) and RT
(enzyme control).
2.9 Polymerase chain reaction
Polymerase chain reaction (PCR) was performed in a PTC200 Peltier Thermocycler (MJ
Research). Genomic DNA or cDNA was used as a template. The PCR products were
analysed by agarose gel electrophoresis (see section 2.6).
2.9.1 Primer design

Chapter Two: General Methodology
Page 49
All primer pairs were aligned with the C. reinhardtii genome sequence from the NCBI
database using the nucleotide BLAST search engine to determine their uniqueness. The
chosen primers were synthesised by Eurofins Genomics, Germany (Table 2-1).
Table 2-1: Oligonucleotide primers **European Molecular Biology Laboratory (EMBL)
2.9.2 Standard Polymerase Chain Reaction (PCR)
The polymerase chain reaction (PCR) mixture of 50μl contained: 1μl of diluted first
strand cDNA solution, 1μl of forward primer, 1μl reverse primer (Eurofins MWG
Operon, EBersberg, Germant) (see Table 2.1 ), 1.25μl of 20mM dNTP mix, 5μl of 10X
PCR buffer, 2μl of 25mM MgCl2, 0.5 Units of Taq DNA polymerase and 38.25μl of
sterile distilled water. Samples were aspirated to mix and incubated under the following
conditions in a thermocycler (A Bio-Rad PTC-200, Bio-Rad Laboratories Limited): 95°C
initial denaturation for one minute, 50-60°C annealing for one minute, (exact
temperatures were dependent on average melting temperature for each primer), 72°C
extension for teo minutes repeated ×34-35, followed by a 72°C final extension for five
minutes. During these incubation steps, samples were also heated above to prevent
Primer Name Forward primer (5' - 3') Primer
Name
Reverse primer ( 5' - 3') Fragment
size
E1F CGGAACCATGTCGACCAAGC E2R CGAACTTGCTGAACAGGTTCG 119bp
E1F CGGAACCATGTCGACCAAGC E3R GAGCAGGCGCTCTTGGCAGCG 224bp
E1F CGGAACCATGTCGACCAAGC E72R TTACAGCCATAGTAGAGAGCCG 2500kb
E72F CTGGAATTACGAATACGTGTGG E72R TTACAGCCATAGTAGAGAGCCG 226bp
CBLPF ATGACCACCAACCCCATCATC CBLPR GGTCCCACAGCATGGCAATG 187bp
ROC15** GCCGGTCCAGCAACAACAAC ROC15 GTGTGCATGCGCCAGAAGAG
142bp
Zeocin_F1
GCCATGACCGAGATCGGCGAGCAGC
UTR_R1 CAAGGCTCAGATCAACGAGCGCCTC
FMDV2A_
F1
GGTGAAGCAGACCCTGAACTTCGAC
UTR_R2 GATCAACGAGCGCCTCCATTTACAC

Chapter Two: General Methodology
Page 50
evaporation. The amplified products were mixed with a loading dye at a ratio of 5:1 and
20μl of PCR amplified product was electrophoresed on 2% (w/v) agarose gel with 10
mg/ml ethidium bromide alongside DNA molecular markers and visualised under a
transilluminator.
2.10 Extraction of DNA from agarose gels
The DNA fragment was cut from the agarose gel with a sharp, clean scalpel. The size of
the gel slice was minimised by removing extra agarose. The gel slice was then weighed
in an Eppendorf tube. Three volumes of Buffer QG (Qiagen) was added to one volume
of gel (100 mg ~ 100 μl) and incubated at 50 °C for ten minutes (or until the gel slice had
completely dissolved). After the gel slice had dissolved completely, one gel volume of
isopropanol was added to the sample and mixed. Next, a QIAquick spin column was
placed in a provided 2ml collection tube. Following that, 0.5 ml of Buffer QG was added
to the QIAquick column and centrifuged at 20,000 ×g for one minute. For the wash step,
0.75 ml of Buffer PE was added to the QIAquick column and centrifuged at 20,000 ×g
for one minute. The column was placed in a clean 1.5 ml microcentrifuge tube. Finally,
to elute DNA, 50 μl of H2O was added to the centre of the QIAquick membrane and the
column was centrifuged for 1 min. The purification of DNA fragments was verified on a
1.5 % agarose gel by the addition of two volumes of dye into five volumes of purified
DNA. Confirmation of extraction of the desired product was verified by sequencing both
strands of the fragments using Eurofins MWG Operon sequencing service (Germany).

Chapter Two: General Methodology
Page 51
2.11 Plasmid DNA extraction from E. coli
Plasmid DNA was extracted using the alkaline lysis method with PEG purification. 200
ml of the culture of E. coli cells containing the plasmid (with or without a histidine tag
and the antisense) in a suitable medium, such as LB containing the 70 % of ampicillin,
was grown overnight at 37 °C. The following day, cultures were centrifuged (1000 xg,
4 °C, 15 min). The pellet was allowed to drain for a few minutes and the remaining drops
of liquid removed with a pipette. Then, the cells were thoroughly swirled in 25 ml of ice-
cold solution I (50 mM D [+]-glucose, 25 mM Tris-HCl, pH 8.0, 10 mM EDTA) to
produce a cellular suspension. 50ml of freshly prepared, room temperature solution II
(0.2 M NaOH, 1% (w/v) SDS) was added carefully by pouring it down the inside of the
tube. Tightly capped, the tube was mixed with a mild end-to-end action to lyse the cells
(N.B. not shaken or mixed vigorously but ensuring that all the inner surfaces of the tube
came into contact with the solution). 7.5 ml of freshly prepared, ice-cold solution III
(prepared by mixing 60ml of 5M potassium acetate with 11.5ml of glacial acetic acid and
28.5 ml of SDW) was added to the clear cell lysate. Tightly capped, the tube was remixed
thoroughly, but gently with a similar end-over-end action and then placed on ice for 20
minutes. The suspensions were clarified by centrifugation (10,000 xg, 4°C, 15 min) and
the clear supernatant filtered through a plug of glass wool in a filter funnel into a new
500ml tube/bucket.
After that, 250 ml of –20 °C ethanol was added, mixed well and then placed on
ice for 15 min to allow efficient precipitation of material to occur. The precipitated
material was pelleted by centrifugation (10,000 xg, 4 °C, and 30 min) and the supernatant

Chapter Two: General Methodology
Page 52
discarded. The inverted tube was allowed to drain for a few minutes, and the traces of
ethanol were removed with a pipette. The pelleted material was then dissolved in exactly
10ml of SDW, and the solution was transferred to a 50 ml oak ridge centrifuge tube with
a cap. Then, 2 grams of solid, A.R. grade ammonium acetate was added to the solution
and dissolved by gently pipetting up and down (N.B. at this stage a fine precipitate of E.
coli cell wall carbohydrates formed as the ammonium ions complex with these to form
insoluble macromolecules). The suspensions were clarified by centrifugation (10,000
xg, 4 °C, and 5 min) and then the supernatant was transferred to a new 50 ml tube and 25
ml –20 °C ethanol was added, mixed well and placed on ice for 15 minutes to allow
efficient precipitation of material to occur. Next, the precipitated material was pelleted
by centrifugation (10,000 xg, 4 °C, 20 min), the supernatant was removed, and the pellet
was completely dissolved in 4.5 ml of SDW with 0.5 ml of 5 M NaCl. 5 ml of
phenol/chloroform (1:1) was added and then, tightly capped, the tube was shaken
thoroughly, and the phases were separated by centrifugation (10,000 xg, 21 °C, 10 min).
The upper aqueous layer was transferred to a new 50 ml tube, and 12.5 ml of –20
°C ethanol was added, mixed well and placed on ice for 15 minutes. The precipitated
nucleic acids were pelleted by centrifugation (10,000 xg, 4 °C, and 20 min) and the
supernatant discarded. The inverted tube was allowed to drain for a few minutes and the
last traces of ethanol were removed with a pipette. The pellets were dissolved in 200 µl
of 10 µg ml-1 DNase-free, calf pancreatic RNase A solution and then transferred to a 1.5
ml Eppendorf tube. The tube was incubated at room temperature for 20 min for the RNA
in the solution to be completely degraded. 15µl of 5M potassium acetate pH 5.5 and 800
µl of ethanol were added and mixed well for 10 min.

Chapter Two: General Methodology
Page 53
The pelleted plasmid DNA was completely dissolved in 140 µl of SDW and the
solution was transferred to a new Eppendorf tube. 20 µl of 5 M NaCl and 40 µl of 50 %
(w/v) PEG 8000 were added to the plasmid solution and mixed well by vortexing for a
few seconds, before the tube was placed on ice for 15 minutes. The precipitated pellet of
plasmid DNA was centrifuged for 10 min and then all the supernatant was removed
carefully and the pellet was dissolved in 200 µl of SDW. The plasmid solution was
sequentially extracted by shaking with a micro-centrifugation partition with TE pH 8.0
buffered phenol, phenol/chloroform (1:1) and, finally, chloroform.
The final upper aqueous phases were transferred to a new Eppendorf tube and the
plasmid DNA precipitated by the addition of 15 µl of 5 M potassium acetate pH 5.5 and
1.0 ml of ethanol. The precipitated plasmid DNA was collected by microcentrifugation
(13,000 rpm, room temp., and 10 min) and the supernatant was removed. The pellet was
washed by adding 500 µl of 80 % (v/v) ethanol and microcentrifugation (13,000 rpm,
room temp, 10 mins). The 80 % (v/v) ethanol was removed by washing and drying the
plasmid DNA pellet under vacuum. Finally, the plasmid DNA pellet was dissolved in
50µl of SDW and stored at –20 °C.
2.12 Restriction digests
Restriction digests were carried out in a total volume of 50 μL. The reaction mixture
contained the appropriate reaction buffer (1X) and the restriction enzymes (10,000 U) to
restrict up to 1 μg of DNA. The reaction mixture was incubated at 37˚C overnight. The
following day, 50 μL of water was added. Then, 300 μL of Buffer QG (Qiagen) was
added followed by 100 μl isopropanol. The solution was then mixed. Next, a QIAquick

Chapter Two: General Methodology
Page 54
spin column was placed in a 2 ml collection tube and centrifuged for one minute at
(10,000 xg, 4 °C). 0.5 ml of Buffer QG was then added again to the QIAquick column
and centrifuged for one minute at (10,000 xg, 4 °C). For the wash step, 0.75 ml of Buffer
PE was added to the QIAquick column and centrifuged for one minute at (10,000 xg, 4
°C). The column was placed into a clean 1.5 ml microcentrifuge tube. Finally, to elute
DNA, 20 μl of SDW was added to the centre of the QIAquick membrane and the column
was centrifuged for one minute at maximum speed. The purification of DNA fragments
was verified on 1.5 % agarose gel was performed by the addition of two volumes of dye
into five volumes of purified DNA.
2.13 Movement assays
For the movement assays, the C. reinhardtii wild‐type strain CC1021 (mt+) algae were
grown as described above (see Section 2.3).
2.13.1 Measuring the motility of C.reinhardtii with different treatments
25 ml aliquots were transferred to a glass measuring cylinder and either 125 µl of ethanol
(control) or 125 µl of (10mM H2O2, ACC and NAA) 100 % (v/v) ethanol was added.
There were four tubes for each light and dark experiment; 25 ml of culture in the light
(control), another 25 ml in the dark (control), 25 ml of culture treated with 50 µM of
(H2O2, ACC and NAA) in the light, and the last 25ml of culture treated with 50 µM of
(H2O2, ACC and NAA) in the dark. The cylinders were then placed at 25ºC, either in the
dark or under overhead illumination at 1660 Lux for 50 minutes. After incubation, the
cylinders were photographed and then the A750 of the culture was measured by
spectrophotometry at various depths from the surface by taking 1 ml of culture.

Chapter Two: General Methodology
Page 55
2.13.2 Measuring the motility of C.reinhardtii following ABA and ACC treatments
The following assay was with 50 µM ABA and a different concentration of ethylene
(ACC) in (light-dark) experiments. 25 ml of mid‐exponentially growing cells were
harvested as described above. There were eight tubes for these experiments: 25 ml of
culture in the light, another 25 ml in the dark, 25 ml of culture treated with 50 µM ABA
plus 5 µM ACC, 10 µM ACC and 50 µM ACC in the light condition, and the remaining
25 ml of cultures were treated with 50 µM of ABA plus, 5µM ACC, 10 µM ACC and
50 µM ACC in the dark condition. The cylinders were then placed at 25 ºC, either in the
dark or under overhead illumination at 1660 Lux for 50 minutes. After incubation, the
A750 of the culture defined at various depths from the surface and the cylinders was
photographed.
Finally, 50 µM ethylene (ACC) and different concentrations of ABA treatment in
(light-dark)) experiments .25 ml of mid‐exponentially growing cells were harvested as
described above. There were eight tubes for these experiments: 25 ml of culture in the
light, another 25 ml in the dark, 25 ml of culture treated with 50 µM of ACC plus 5 µM
ABA 10 µM ABA and 50 µM ABA in the light, and the remaining 25 ml of cultures
treated with 50 µM of ACC plus 5 µM ABA, 10 µM ABA and 50 µM ABA in the dark.
The cylinders were then placed at 25ºC, either in the dark or under overhead illumination
at 1660 Lux for 50 minutes. After incubation, the cylinders were photographed and then
the A750 of the culture defined was measured by spectrophotometry at various depths from
the surface by taking 1 ml of culture.
2.13.3 Measuring the motility of C. reinhardtii with ABA treatment
25 ml aliquots were transferred to a glass measuring cylinders and either 125 µl of ethanol
(control) or 12 5µl of 10 mM ABA in 100 %(v/v) ethanol was added. There were four

Chapter Two: General Methodology
Page 56
tubes for these experiments: 25 ml of culture in the light (control), another 25 ml in the
dark (control), 25 ml of culture treated with 50 µM of ABA in the light, and the last 25ml
of culture treated with 50 µM of ABA in the dark. The cylinders were then placed at
25ºC, either in the dark or under overhead illumination at 1660 Lux for 50 minutes. After
incubation, the cylinders photographed, and then the A750 of the culture defined was
measured by spectrophotometry at various depths from the surface by taking 1 ml of
culture. This experiment was monitored at different points of time during the culture; for
example, the cells were harvested one hour in the photoperiod, eight hours in the
photoperiod and 15 hours in the photoperiod, one hour in the dark period, four hours in
the dark period and seven hours in the dark period. The experiment was repeated five
times.
After that, the effect of ABA was measured on the horizontal movement of
C.reinhardt cells. Cultures of C.reinhardtii were grown as described earlier. 25 ml
aliquots of the cultures were transferred to a glass test tube (15cm in height and 1.5cm
wide) in which 1 ml plugs of 1×TAP media,1.5 % (w/v) agar containing a different
concentration of ABA had been set at the bottom. The tubes were then placed in the dark
or under overhead illumination at 1570 Lux for two hours at 25ºC. After incubation, the
tubes were photographed to illustrate the position attained by the of alga as described in
(Figure 2.1). All experiments were repeated three times.

Chapter Two: General Methodology
Page 57
Figure 2.1: Described the method of how the experiment was done and how the movement of
cells was measuring.
2.14 Circadian rhythm experiments
C. reinhardtii wild‐type strain, CC1021 with cell wall, were grown at 25 ºC, in a 16-
hour photoperiod, shaker 133 rpm, at 980 Lux in TAP media until A750 = 0.3, which is a
mid-log phase. Growth was measured by following A750nm. Cells were harvested every
hour with and without 50 µM ABA. For RNA extraction, cells were collected by
centrifugation at 4°C for 10 minutes at 2500 rpm before being stored at -80 ºC.
2.15 Measuring ABA levels during the circadian cycle
Freeze dried sample cells as finely ground material were added into a centrifuge tube
containing 200 ml of sample extraction buffer (1x) (20 ml of sample extraction buffer
concentrate (25 x)) were diluted into deionised or distilled water. Then samples were
shaken overnight in the cold (4-5 °C) and dark. On the following day, solids were spun
down and the supernatant was used directly. Standards were carried out according to the

Chapter Two: General Methodology
Page 58
plant hormone abscisic acid (ABA) ELISA Kit (My BioSource). The standard vial was
centrifuged at 6000-10000 rpm for 30 seconds before opening. Then, the standard (10 x)
was diluted with Sample Diluent (50 μl of standard (10 x) + 450 μl of Sample Diluent).
This diluted standard (S7) served as the high standard (10 μg/ml). The standard was
mixed for 15 minutes to ensure complete dilution with gentle agitation. 250 μl of Sample
Diluent was pipetted into each tube (S0-S6) using the diluted standard (S7). Each tube
was mixed thoroughly before the next transfer. Sample Diluent served as the zero
standard (0 μg/ml). Next, a blank well was set without any solution. After that, 50 μl
sample was added per well. Then, 50μl of antibody (1x) (10 μl of antibody + 990 μl of
antibody diluent) was added to each well (but not to a blank well). After mixing, each
well was incubated for 30 minutes at 37°C. Each well was aspirated and washed. This
process was repeated twice for a total of three washes. 200 μl of Wash Buffer (1 x) (Dilute
20 ml of Wash Buffer Concentrate (25 x) into deionised or distilled water) was added to
each well, which was left to stand for 10 seconds. Complete removal of liquid at each
step was vital for a good assay performance. After the final wash, any remaining wash
buffer was removed by aspiration or decanting. The plate was inverted and blotted on
clean paper towels. 100 μl of Horseradish peroxidase enzyme (HRP-conjugate) (1x)
(dilution 10 μl of HRP-conjugate + 990 μl of HRP-conjugate diluent) was added to each
well (except to the blank well). Then, the well was mixed and incubated for 30 minutes
at 37°C. An aspiration/wash process was repeated five times. 90 μl of TMB substrate
(TMB is a chromogenic substrate used in staining procedures in immunohistochemistry)
was added to each well, mixed and incubated for 20 minutes at 37°C. The plate was kept
in the dark away from drafts and temperature fluctuations. Then, 50 μl of stop solution
was added to each well and the plate was gently tapped to ensure thorough mixing. The

Chapter Two: General Methodology
Page 59
optical density of each well was determined within ten minutes by using a microplate
reader set to 450 nm as described in Figure 2.2.

Chapter Two: General Methodology
Page 60
Figure 2.2: Description of the process of ABA ELISA Kit to measure ABA concentrations
levels during the circadian cycle.

Chapter Two: General Methodology
Page 61
2.16 Effect of abscisic acid (ABA) on HCO3- uptake by C.
reinhardtii exposed to different light levels
A 1.0 L culture of C. reinhardtii was grown until the mid-log phase (A750 = 0.3), and
the cells were collected by centrifugation (200 x g, five minutes, at 23°C). The cell pellet
was then gently resuspended in 50 mL of TAP media before mixing with 50 mL of 3 %
(w/v) sodium alginate and the suspension was subdivided before the addition of ABA to
get final concentrations of between zero and 50 μM. The alginate cell suspensions were
immediately dropped through the nozzles of individual 25 mL syringes from a height of
40 cm into an excess volume of 0.18 M CaCl2 to form spherical 2mm diameter gel beads
of encapsulated algae +/- ABA. Replicates (n=5 for each combination of ABA
concentration and light levels) with 1g aliquots of beads were then placed in sealed thin-
walled glass vials containing 19.82 mL of TAP media with 180 μL of freshly prepared
bicarbonate indicator buffer (0.47 mM thymol blue, 0.27 mM cresol red, 100 mM
NaHCO3, 1.1 M KCl) with no head space and were then immediately placed in a light
tunnel at distance from a photosynthetic light source (minus UV) that exposed the
samples to a range of light intensities of between 253 and 7440 Lux. The samples were
incubated at 23 °C for 1 hour and the δA550 of the indicator buffer relative to time zero
was recorded as an indication of the relative HCO3- depletion of the media.

Chapter Two: General Methodology
Page 62
2.17 Preparing expression vectors to investigate the function of
CrGRP1 in C. reinhardtii
2.17.1 Design of pChlamy4 constructs
The expression vector pChlamy4 contains a C. reinhardtii Hsp70A/RbcS2 chimeric
promoter and a C. reinhardtii RbcS2 terminator, both cloned into the polylinker of the C.
reinhardtii vector pSP124S. To create the CrGRP1 transformation construct pChlamy4-
CrGRP1, the CrGRP1 open reading frame was ligated into pChlamy4 at a different site
between the Hsp70A/RbcS2 promoter and RbcS2 terminator, depending on the plasmid
(see Figure 2.3).

Chapter Two: General Methodology
Page 63

Chapter Two: General Methodology
Page 64
Figure 2.3: Map of vector pChlamy_4 engineered to express CrGRP1 with or without a histidine tag, and the antisense construct designed to knockdown
CrGRP1 expression.

Chapter Two: General Methodology
Page 65
2.17.2 Ligation into plasmid pChlamy4-TOPO
Ligation into pChlamy4-TOPO was carried out according to a GeneArt®
Chlamydomonas Protein Expression Kit (Invitrogen). Briefly, each TOPO cloning
reaction comprised: 4μL of the PCR product, 1μl of salt solution (provided by the
manufacturers), and 1μl of TOPO vector/enzyme conjugate. The total volume of the
reaction was 6μl and it was mixed gently and incubated for 5 minutes at room temperature
before being placed on ice in readiness for transformation into E. coli. A control ligation
of pUC19 TOPO (without any CrGRP1 ORF inserted) was performed to provide a check
for the pET101 E. coli plasmid size in subsequent steps. To give an indication of ligation
efficiency, colony numbers in the control ligation/transformation vis-a-vis the pChlamy4
(GRP1) ligations/transformations were cengued. The control TOPO ligation reaction
comprised: 4 μl of sterile milliQ water, 1μl of salt solution (provided by the
manufacturers), and 1μl of TOPO vector/enzyme conjugate. The total volume of the
reaction was 6μl and it was mixed gently and incubated for five minutes at room
temperature before being placed on ice in readiness for transformation into E. coli.
2.17.3 Generating of transgenic organisms (pChlamy4 - CrGRP1- TOP10)
Transforming pChlamy4 - CrGRP1 into E. coli Top10 cells
An aliquot (3μl) of each TOPO cloning reaction was added to a phial each of One Shot
TOP10 chemically competent E. coli cells (provided by Invitrogen). Each was mixed
gently and incubated on ice for 15 minutes. Each combination of cells and DNA was
then heated-shocked at 42 °C for 30 seconds and then transferred onto ice and
immediately 250 μl of SOC medium (2% Tryptone, 0.5 % Yeast Extract, 10 mM NaCl,
2.5 mM KCl, 10 mM MgCl2, 10 mM MgSO4, 20 mM glucose-Invitrogen) was added
and the mix was shaken at 37°C for one hour. The transformants were then plated onto

Chapter Two: General Methodology
Page 66
LB agar (Sigma) plates containing sterile filtered ampicillin (100 μg/mL final
concentrations) and incubated overnight at 37°C. Colonies were screened the following
day by plasmid DNA extraction and restriction enzyme digestion.
DNA extraction and restriction digests
Transformant colonies from each ligation were screened by streaking onto a fresh LB
agar plate containing 100 μg/mL of ampicillin, then subculturing each of these onto a
liquid LB containing 100 μg/mL of ampicillin, with growth overnight at 37°C. Plasmid
DNA was extracted using the Alkaline Lysis Method with PEG Purification (see Section
2.11), before analysis by restriction digestion. The screening was accomplished with
restriction enzymes (see Table 2.2) (New England Bio Labs, Ipswich, Massachusetts,
USA). Restriction digestions were carried out in a total volume of 50μL. The reaction
mixture contained the appropriate reaction buffer (1X), and the restriction enzymes
(10,000U) used to cut 1μg of DNA. The reaction mixture was incubated at 37˚C overnight
(as described in Section 2.12), according to the manufacturer’s instructions. Restricted
DNA was electrophoresed in a 1% agarose gel (1xTAE; 10 mM Tris-Acetate, 0.5 mM
EDTA pH adjusted to 7.8) for visualisation.
Table 2-2: Restriction digestion enzyme sites used for Plasmid.
Plasmid Name Plasmid
Number
Restriction sites
used
Calc Mol Weight
pChlamy4-CrGRP1 DCP1842 EcoRI / XhoI 15783.8 Da
pChlamy4-CrGRP1-V5-6xHis DCP1843 EcoRI / XbaI 18566.9 Da
pChlamy4-CrGRP1 antisense DCP1844 XhoI / BamHI N/A

Chapter Two: General Methodology
Page 67
Sequencing of recombinant plasmids
Sequencing of the recombinant section of pChlamy4-CrGRP1 was carried out using the
primers (see Table 2.3) which had been designed for this purpose (see Appendix 8.3).
Sequencing reactions were accomplished by adding only primers to purified plasmid and
sent to Eurofins MWG Operon (Germany) to be sequenced.
Table 2-3: Oligonucleotide primers for sequencing of transgenic organisms.
2.18 Transformation and verification of CrGRP1 constructs
2.18.1 Transformation of C. reinhardtii
Algal culture
C. reinhardtii cells, strain 173 C, were grown to early-phase in TAP medium. The culture
was centrifuged in Falcon tubes for five minutes at 2500 rpm min-1 at 4˚C. The pellet was
aseptically resuspended in 10mL of GeneArt® MAX Efficiency® Transformation Reagent
and used for transformation.
Transformation of constructs into C. reinhardtii by electroporation
The transformation vector (pChlamy4-GRP1) was cut with Sca1 enzyme and prepared
for transformation (see Section 2.12). C. reinhardtii cells were prepared for
Plasmid
Name
Plasmid
Number
Forward primer (5' -3') Reverse primer (5' -3')
pChlamy4-CrGRP1
DCP1842 pChlamyFMDVfor 5' -
GTGGCCGAGGAGCAGGACGCCC
3'
pChlamyUTRrev 5'-
AGCGCCTCCATTTACACGGAGCGG
3'
pChlamy4-
CrGRP1-
V5-6xHis
DCP1843 pChlamyFMDVfor
5'-
GTGGCCGAGGAGCAGGACGCCC
3'
pChlamyUTRrev
5'-
AGCGCCTCCATTTACACGGAGCGG
3'
pChlamy4-
CrGRP1
antisense
DCP1844 pChlamyFMDVfor
5'-
GTGGCCGAGGAGCAGGACGCCC
3'
pChlamyUTRrev
5'-
AGCGCCTCCATTTACACGGAGCGG
3'

Chapter Two: General Methodology
Page 68
transformation according to Section 2.17.3. The cell pellet was resuspended again in
10mL of GeneArt® MAX Efficiency® Transformation Reagent, and the cells
centrifuged once more at 2500 rpm for five minutes. Cell pellets were resuspended in
GeneArt® MAX Efficiency® Transformation Reagent at 2×10⁸-3×10⁸ cells/mL. Then,
2–4 μg of linearised DNA was added per 250μL of cell suspension and incubated at 2°C–
8 °C for five minutes. Electroporation (the Gene Pulser® II-bio rad) was performed at
500 V, capacitance 50 μF, resistance 800 Ohms. Pulse time length was over 30
milliseconds for every electroporation. The cells were allowed to recover on the bench
for 15 minutes and transferred to a 50mL Falcon tube containing 10 mL of TAP-40 mM
sucrose solution (44 mL of 1 M sucrose to 1 L of TAP medium) at room temperature and
then incubated at 26°C and 50 μE m–2 s–1 for 14–16 hours. The next day, the supernatant
was discarded, and the cells were harvested by centrifugation at 2500 rpm for five
minutes and then resuspended in 200 μL TAP medium at room temperature. An aliquot
of the cells in TAP (200 μL) was spread-plated on TAP agar containing 5 μg/mL (final
concentration in agar) of zeocin and incubated at 26°C in constant light for two to three
weeks.
2.19 Statistical analysis
Where appropriate, groups of data were assessed for normality by Shapiro Wilk tests and
for between-group homogeneity of variances around the means by Bartlett’s tests. For
HCO3- depletion data, overall between data group comparisons of means were made by
one- and two-way ANOVAs and post hoc pairwise mean comparisons by Tukey Kramer
tests. For the algal movement data, comparisons of the relative distributions of the algae
in response to the treatments were undertaken using χ2 tests of independence with post

Chapter Two: General Methodology
Page 69
hoc χ2 tests of goodness of fit. Endogenous ABA data were analysed by one-way
ANOVA and selected pairwise comparisons by two sample t-tests. All tests were
performed at the α=0.05 level of confidence.
2.20 Bioinformatic analysis
2.20.1 Analysis of promoter elements
Promoter analysis was done by using Scan-pL programme to locate the ABA promoter
element in the CrGRP1 gene by comparing it with a GRPs plant genes promoter such as
A.thaliana.
2.20.2 Alignments and Photogenetic tree analysis
NCBI software was used at protein levels to find how similar class IVa GRP1 to A.
thaliana gens class IVa GRPs by using GRP1 sequencing, then searched for a similar
class IVa GRP protein in a wide range of species and in different species of algae. After
that, protein sequences were aligned using MUSCLE, and Neighbour-joining trees were
drawn in Paup 4.0. To test the confidence of the clustering, bootstrap values were
determined with 500 replicates.

Chapter Three: The effect of plant hormones on C. reinhardtii growth and movement
70
3 Chapter Three: The effect of plant hormones on C.
reinhardtii growth and movement
3.1 Introduction
Plant hormones stimulate processes that are necessary for them to survive.
Phytohormones such as auxin, gibberellin, cytokinin, ethylene, and abscisic acid (ABA)
play key roles in the growth and developmental processes of higher plants such as
Arabidopsis thaliana and regulate responses to different abiotic stresses (Wani et al.,
2016). However, the role of these phytohormones is poorly understood in green algae.
Algae evolved approximately one billion years ago, while terrestrial plants appeared
later, approximately 400-600 million years ago (Delwiche and Cooper, 2015). Algae such
as Chlamydomonas possess some, but not all, the phytohormone signalling pathways
found in higher plants (Wang et al., 2015) and those that are found in algae are either not
as highly developed or as complex as in plants. Indeed, with such comparative single cell
simplicity in mind, one could suggest, therefore, that the study of basic plant hormone
signalling should have been examined first in algae. However, for obvious agronomic
reasons researchers were more interested in understanding the signalling mechanisms in
plants. Interestingly, while green algae seem to possess only rudimentary signalling
pathways for auxin and ethylene, one of the more evolved phytohormone signalling
pathways that they possess is that for ABA (Wang et al., 2015).
In plants, the effect of the circadian clock has been recognised both in the gene
expression and the regulation of physiological processes controlled by ABA (Dodd et al.,
2007; Finkelstein and Gibson, 2002; Zhu, 2002). A number of ABA metabolic enzymes
are controlled by environmental signals including drought, salinity, temperature, and

Chapter Three: The effect of plant hormones on C. reinhardtii growth and movement
71
light, as well as by other hormones and circadian rhythms (Nowak et al., 1988;
Piotrowska-Niczyporuk and Bajguz, 2014;). ABA regulates plant responses to various
abiotic stresses, and diurnal rhythms that alter their water status and both light and water
are essential resources for plants. Therefore, plants have developed an internal regulator
that allows them to detect and adapt to water availability and sunlight throughout the
seasons (Fankhauser and Staiger, 2002). Plant physiological processes in a changing
environment are regulated by the circadian clock in a 24-hour cycle (Staiger and
Heintzen,1999). There are three gene components of the circadian clock in plants: input,
oscillator and output genes. Output genes enable growth processes, leaf movements and
flower opening (Staiger and Heintzen, 1999). The regulation of output genes by the
circadian clock is mostly carried out at the transcriptional level through clock-response
elements in promoters (Staiger, 2002), and up to 30% of the transcriptome may be
regulated so. Genes such as AtGRP7 and AtGRP8 in Arabidopsis (Heintzen et al., 1997;
Staiger and Green, 2011) may act as oscillators (Schmal, Reimann and Staiger, 2013),
determining the timing of expression of numerous output genes under the overall control
of the circadian pacemaker, a specialised oscillator that activates independently of other
oscillators to drive balanced outputs and which is entrained by environmental cues.
The connection between ABA and clock signalling pathways is bidirectional as
treatment with ABA lengthens the circadian period of gene promoter activity (Hanano et
al., 2006). A good example of this is stomatal opening and closing. ABA is less effective
at closing the stomata in the morning than in the afternoon (Correia et al.,1995; Kim et
al., 2008), when increased light intensity and higher temperatures may cause water‐
deficit conditions (Robertson et al., 2009).

Chapter Three: The effect of plant hormones on C. reinhardtii growth and movement
72
In plants, ethylene often antagonises ABA responses, such as, for example, during
germination. ABA promotes seed dormancy and inhibits germination, while ethylene
promotes germination (Zhou et al., 1998). Green algae are known to synthesise ACC and
make ethylene (Booker and DeLong, 2015) and possess many recognisable components
of the ethylene signal transduction pathway found in terrestrial plants (Ju et al., 2015;
Wang et al., 2015). Therefore, the effect on the vertical movement of C. reinhardtii of
ACC combined with various concentrations of ABA and ABA with different
concentrations of ACC was studied in either the light or dark. Also, the effect of the
second messenger, hydrogen peroxide (H2O2), was also investigated because in plant
stomata it is made in response to ABA and is required for ABA-induced stomatal closure
to occur during the day (light) and night (dark) rhythm.
Since algae have phytohormone synthesis and signalling mechanisms, it is likely
that they have a functional role in these microorganisms. A study by Iqbal et al. (2017),
reported that phytohormones such as ethylene play an essential role in the growth and
development of higher plants. For example, ripening usually starts in one region of
climacteric fruit and spreads to the other regions that lag behind. This process is initiated,
accelerated and integrated by ethylene, which diffuses from cell to cell throughout the
fruit (Bleecker and Kende, 2000). Similarly, ethylene has been shown to be involved in
cell differentiation and biochemical responses in algae (Plettner et al., 2005). A circadian
rhythm of cell wall retention and release of ACC and its conversion to ethylene has been
shown in the alga Acetabularia. mediterranean (Driessche et al., 1988). Ethylene
addition affects cap formation in this species and could be stimulatory or inhibitory
depending on the timing of application (Driessche et al., 1988). Plettner, Steinke and
Malin (2005) undertook experiments with the green alga, U. intestinalis, showing that

Chapter Three: The effect of plant hormones on C. reinhardtii growth and movement
73
exogenous ethylene altered the concentration of chlorophyll a. A 3d incubation of U.
intestinalis in 40 µM ethephon resulted in a 30% loss of chlorophyll in comparison to
untreated controls. Such studies would suggest that ethylene may have physiological
roles in algae and would indicate the presence of ethylene receptors and possible signal
transduction pathways. In plants, ethylene is known to be involved in leaf senescence,
which involves the loss of chlorophyll (Iqbal et al., 2017). A study by Plettner, Steinke
and Malin (2005) suggested a similar role in algae. However, this begs the question as to
why algae would want to undergo such a senescence-related process. One possible
answer is that the algae may reduce chlorophyll levels under high light conditions to
protect against photo-oxidation. Plants have organ-specific programmes of cell death and
senescence coordinated by ethylene by which they lose leaves and recycle their
mobilisable components under environmental conditions where either light levels are
photosynthetically inefficient or the temperature is non-permissive, for example in the
winter (Woo et al., 2013). Whether algae such as Chlamydomonas similarly use ethylene
to coordinate such a programme of senescence during changes in their environment
remains to be determined.
A role for auxin has not yet been conclusively found in algae (Kiseleva et al.,
2012). Green algae have been shown to contain and metabolise auxins (Žižková et al.,
2017) and exogenous applications of either indoleacetic acid (IAA) or 1-
naphthaleneacetic acid (NAA) have been shown to improve their growth rate (Park et al.,
2013) and to induce tolerance to salinity and temperature (Nowak et al., 1988;
Piotrowska-Niczyporuk and Bajguz, 2014). However, more than a hundred species of
algae have been examined for ABA, 96% of which contained this phytohormone (Wang
et al., 2015). To date, the algal role of ABA appears to be one of involvement in stress

Chapter Three: The effect of plant hormones on C. reinhardtii growth and movement
74
responses and increasing photosynthetic ability (Cowan and Rose, 1991; Holzinger and
Becker, 2015). ABA treatment has also been shown to increase lipid accumulation in
Chlorella (Wu et al., 2018). Thus, this study examined the effects of these hormones on
the movement and growth rate of the green alga, C. reihardtii. To achieve this, the
following was investigated:
1- The effect of plant hormones on C. reinhardtii growth rate by adding different
concentrations of hormones such as ABA, NAA, IAA and ACC.
2- The effect of plant hormones on C. reinhardtii movement, either in the light or
dark, with 50µM of either ABA, ACC, NAA or H2O2 and combinations of ABA
and ACC.
3- The effect of 50µM ABA on the movement of in C. reinhardtii sampled at
different time points during their day/night growth cycle.
4- The endogenous concentration of ABA in C. reinhardtii at different time points
during their day/night growth cycle.

Chapter Three: The effect of plant hormones on C. reinhardtii growth and movement
75
3.2 Results
3.2.1 Algal culture
Cultures of C. reinhardtii were grown at 25ºC with rotary shaking (133 rpm) with a 16 h
photoperiod (980 Lux) in TAP media until A750 ~ 0.250 to 0.350 (mid-log phase – see
Figure 3.1). The cell culture became light green in colour. At this point, the cell cultures
were ready for use.
Figure 3.1: Growth curve of C. reinhardtii The growth curve was used to determine the mid-log phase of C. reinhardtii strain CC1021. Cells were
harvested at an absorbance of ~ 0.3. Growth was measured by measuring absorbance at A750 nm. Replicate (n=3).

Chapter Three: The effect of plant hormones on C. reinhardtii growth and movement
76
3.2.2 Effect of phytohormones on C. reinhardtii growth rates
C. reinhardtii wild‐type strain, CC1021 (mt+) algae, were grown as described in Chapter
2. At inoculation, 20ml cultures of C. reinhardtii were separately treated with either 0, 1,
10, 50 or 100µM concentrations of either abscisic acid (ABA), 1-aminocyclopropane-1-
carboxylic acid (ACC), indole-3-acetic acid (IAA), or 1-naphthaleneacetic acid (NAA)
and the growth of the algae was measured by following the A750 nm every 22 hours.
Figure 3.2 shows that, compared to the control, ABA did not affect the growth rate of C.
reinhardtii whereas NAA slowed algal growth at 100µM. IAA also did not affect the
growth rate of C. reinhardtii. ACC marginally reduced growth when compared to the
control. Overall, and bearing in mind that the experiment was only replicated once (n=2)
(and therefore lacks statistical rigor), the results suggested that these plant hormones did
not greatly affect the growth rate of C. reinhardtii.

Chapter Three: The effect of plant hormones on C. reinhardtii growth and movement
77
Figure 3.2: Plant hormones did not affect the growth rates of C. reinhardtii C. reinhardtii cultures which were grown in TAP media until their A750 = 0.3 were divided between 25mL
measuring cylinders. ABA, ACC, IAA and NAA were added to the TAP growth medium in concentrations
ranging from 0 to 100µM. The growth of cultures was monitored over a 48-hour period by measuring A750
nm. Values represent the means of n=2 experiments. (A) Abscisic acid (ABA), (B) 1-naphthaleneacetic
acid (NAA), (C) indole-3-acetic acid (IAA) and (D) 1-aminocyclopropane-1-carboxylic acid (ACC).

Chapter Three: The effect of plant hormones on C. reinhardtii growth and movement
78
3.2.3 Effect of plant hormones on algal movement
ABA-induced a negative geotropic response in dark-incubated C. reinhardtii
Cultures of C. reinhardtii were grown at 25ºC with rotary shaking (133 rpm) with a 16-
hour photoperiod (980 Lux) in TAP media until A750 = 0.3. To study the effects of ABA
on movement in both light and dark conditions, 25 ml aliquots were transferred to glass
measuring cylinders and either 125µl of ethanol (control) or 125µl of 10mM ABA in
100% (v/v) ethanol was added. The cylinders were then placed at 25ºC, either in the dark
or under overhead illumination at 1660 Lux for 50 minutes. After incubation, the A750 of
the cultures was determined by spectrophotometry at various depths from the surface and
the relative cell densities calculated within each treatment (see Figure 3.3). In the light,
the control algae retreated away from the source of illumination (see Figure 3.3B) such
that a significantly (P<0.05 by χ2 test of goodness of fit) increased proportion of the cells
accumulated at increased depths with 3.4 fold more cells at a depth of 8cm than at 2cm
from the surface (Figure 3.3A). In the light, compared to the control, 50µM ABA had no
significant (P>0.05 by the χ2 test of independence) effect on the distribution of the algae
(see Figure 3.3A). In the dark, untreated algae generally remained more dispersed (see
Figure 3.3B) but did settle downwards such that a significantly (P<0.05 by the χ2 test of
goodness of fit) increased proportion of the cells were at the 8cm depth from the surface
than at the other depths sampled (see Figure 3.3A). In this case 1.7-fold more cells were
at a depth of 8cm compared to 2cm from the surface. In the dark, treatment of the algae
with 50µM ABA-induced a marked and significant (P<0.05 by the χ2 test of
independence) change in their distribution compared to the untreated cells (see Figure
3.3A). In this case, a significant (P<0.05 by the χ2 test of goodness of fit) proportion of
the algae banded at the 2cm depth from the surface with a much-reduced proportion of
the cells remaining at the lower depths. Approximately 70% of the algae moved to the

Chapter Three: The effect of plant hormones on C. reinhardtii growth and movement
79
2cm depth over the incubation period (see Figure 3.3A). Thus, preliminary investigations
indicated that ABA induced a negative geotropic movement of the algae towards the
surface of the water column.
Figure 3.3: ABA altered the positioning of C. reinhardtii in the water column in the dark C. reinhardtii cultures were grown in TAP media until their A750 = 0.3 were divided between 25mL
measuring cylinders and were treated +/- 50µM ABA with incubation in either the dark or the light for 50
minutes. Following incubation, the A750 of the cultures in each of the cylinders was measured at the depths
from the surface indicated and the mean (n=3) relative cell densities +/- the 95% confidence intervals
around the means calculated in each case (A). Within either the light or dark incubations, only significant
(P<0.05 by χ2 tests of goodness of fit) differences in the distribution of the algae resulting from the ABA
treatments at specific depths are indicated(*) along with the χ2stat values (larger χ2
stat indicates a more significant difference). A representative image of the distribution of the algae in the measuring cylinders
immediately following incubation and the light levels (Lux) at each of the depths sampled are shown in
(B).

Chapter Three: The effect of plant hormones on C. reinhardtii growth and movement
80
The speed of algal movement in response to ABA treatment in the dark
To study how quickly the motile algae moved up in the dark when treated with ABA,
grown 25 ml aliquots of culture were transferred to glass measuring cylinders and 125µl
of 10mM ABA in 100% (v/v) ethanol was added. The cylinders were then placed at 25ºC
in the dark for a range of incubation times (5, 10, 20, 30 and 50 minutes). After
incubation, the cylinders were immediately photographed to illustrate the positions
attained by the algae in each case. After 30 minutes of incubation the algae had noticeably
started to move upwards, while at 50 minutes approximately 80 % of algae were visually
at a depth of up to 2cm from the surface of the media (see Figure 3.4).
Figure 3.4: After 50 minutes in the dark ABA induces the C. reinhardtii to move upward C. reinhardtii cultures were grown in TAP media until their A750 = 0.3 were divided between 25mL
measuring cylinders and were treated +50µM ABA with incubation in the dark for different incubation
times of 5, 10, 20, 30, 50 and 70 minutes. Following incubation, the cylinders were photographed to
illustrate how quickly the motile algae can move up in the dark when treated with ABA. Replicate (n=3).

Chapter Three: The effect of plant hormones on C. reinhardtii growth and movement
81
No effect of aminocyclopropane-1-carboxylic acid (ACC) on C. reinhardtii
movement
Cultures of C. reinhardtii were grown at 25ºC with rotary shaking (133 rpm) with a 16-
hour photoperiod (980 Lux) in TAP media until A750 = 0.3. To study the effect of ACC
on the movement of the algae in both light and dark conditions, 25 ml aliquots were
transferred to glass measuring cylinders and either 125µl of water (control) or 125µl of
10mM ACC dissolved in water was added. Cylinders were then placed at 25ºC, either in
the dark or under overhead illumination at 1660 Lux for 50 minutes. After incubation,
the A750 of the cultures was determined by spectrophotometry at various depths from the
surface and the relative cell densities calculated within each treatment (see Figure 3.5).
In the light, control algae retreated downwards away from the source of illumination as
before, such that approximately a 2.6-fold higher cell density was recorded at a depth of
8cm compared to 2cm from the surface of the media. The addition of 50µM ACC had no
significant (P>0.05 by the χ2 test of independence) effect on the overall distribution in
the light. In the dark the untreated algae similarly settled downwards and again the
addition of ACC had no significant (P>0.05 by the χ2 test of independence) effect on their
distribution under these conditions. In summary, ACC treatment did not appear to affect
the vertical positioning of the algae in the water column when they were incubated in
either the light or the dark (see Figure 3.5A).

Chapter Three: The effect of plant hormones on C. reinhardtii growth and movement
82
Figure 3.5: 1-aminocyclopropane-1-carboxylic acid (ACC) did not significantly affect the
vertical positioning of C. reinhardtii in the dark C. reinhardtii cultures were grown in TAP media until their A750 = 0.3 were divided between 25mL
measuring cylinders and were treated +/- 50µM ACC with incubation in either the dark or the light for 50 minutes. Following incubation, the A750 of the cultures in each of the cylinders was measured at the depths
from the surface indicated and the mean (n=3) relative cell densities +/- the 95% confidence intervals
around the means were calculated in each case (A). Within the light or dark incubations no significant
(P>0.05 by χ2 tests of goodness of fit) differences were apparent. A representative image of the distribution
of the algae in the measuring cylinders immediately following incubation and the light levels (Lux) at each
of the depths sampled are shown in (B).

Chapter Three: The effect of plant hormones on C. reinhardtii growth and movement
83
No effect of hydrogen peroxide (H2O2) on C. reinhardtii movement in both light
and dark condition
In plants, hydrogen peroxide (H2O2) is a reactive molecule that integrates signalling
networks in response to biotic and abiotic stress. The effect of H2O2 on the positioning
of C. reinhardtii movement was examined in a similar way here (see Figure 3.6). As for
the ACC treatment, the results showed that in comparison to the untreated control algae
the 50µM H2O2 treatment had no significant (P>0.05 by the χ2 test of independence)
effect on the vertical positioning and distribution of the algae in the water column when
they were incubated in either the light or the dark (see Figure 3.6A).

Chapter Three: The effect of plant hormones on C. reinhardtii growth and movement
84
Figure 3.6: Hydrogen peroxide (H2O2) did not significantly affect the vertical positioning of
C. reinhardtii in the dark C. reinhardtii cultures were grown in TAP media until their A750 = 0.3 were divided between 25mL
measuring cylinders and were treated +/- 50µM H2O2 with incubation in either the dark or the light for 50
minutes. Following incubation, the A750 of the cultures in each of the cylinders was measured at the depths
from the surface indicated and the mean (n=3) relative cell densities +/- the 95% confidence intervals
around the means were calculated in each case (A). Within the light or dark incubations no significant
(P>0.05 by χ2 tests of goodness of fit) differences were apparent. A representative image of the distribution
of the algae in the measuring cylinders immediately following incubation and the light levels (Lux) at each
of the depths sampled are shown in (B).

Chapter Three: The effect of plant hormones on C. reinhardtii growth and movement
85
No effect of naphthaleneacetic acid (NAA) on C. reinhardtii movement either
in the dark or light
Cultures of C. reinhardtii were grown as before and 25 ml aliquots were transferred to
glass measuring cylinders and either 125µl of 1N NaOH (control) or 125µl of 10mM
NAA dissolved in 1N NaOH was added. The cylinders were then placed at 25ºC, either
in the dark or under overhead illumination at 1660 Lux for 50 minutes. After incubation,
the A750 of the cultures was determined by spectrophotometry at various depths from the
surface and the relative cell densities calculated within each treatment (see Figure 3.7).
Compared to the untreated control algae, NAA at 50µM had no significant (P>0.05 by
the χ2 test of independence) effect on the vertical positioning of the algae in the water
column when they were incubated in either the light or the dark. When the algae were
incubated in the light there was some indication that NAA had a small effect and although
the algae still generally retreated downwards away from the high-light, the proportion
remaining at shallower depths was increased with the auxin treatment, but overall the
distribution of the algae with and without NAA was not statistically significantly different
(see Figure 3.7A). In summary, the 50µM NAA treatment did not alter either the
phototropic response of C. reinhardtii or their vertical positioning in the water column in
the dark.

Chapter Three: The effect of plant hormones on C. reinhardtii growth and movement
86
Figure 3.7: Exogenous 1-naphthaleneacetic acid (NAA) did not significantly affect the
vertical positioning of C. reinhardtii in the dark C. reinhardtii cultures were grown in TAP media until their A750 = 0.3 were divided between 25mL
measuring cylinders and were treated +/- 50µM NAA with incubation in either the dark or the light for 50
minutes. Following incubation, the A750 of the cultures in each of the cylinders was measured at the depths
from the surface indicated and the mean (n=5) relative cell densities +/- the 95% confidence intervals
around the means were calculated in each case (A). Within the light or dark incubations no significant
(P>0.05 by χ2 tests of goodness of fit) differences were apparent. A representative image of the distribution of the algae in the measuring cylinders immediately following incubation and the light levels (Lux) at each
of the depths sampled are shown in (B).

Chapter Three: The effect of plant hormones on C. reinhardtii growth and movement
87
Effect of combining ACC with ABA on C. reinhardtii movement
In terrestrial plants, ethylene often works antagonistically to inhibit ABA responses. To
examine the potential antagonistic effect of ACC on the observed effects of ABA on
movement of the algae, 25 ml aliquots of similarly grown algae were transferred to glass
measuring cylinders and either 125µl of ethanol (control) or 125µl of 10mM ACC was
added with 125µl of 10mM ABA. The cylinders were then placed at 25ºC either in the
dark or under overhead illumination at 1660 Lux for 50 minutes and the A750 of the
cultures wase determined by spectrophotometry at various depths from the surface and
the relative cell densities calculated within each treatment (see Figure 3.8A). As for the
experiment shown in Figure 3.3, untreated algae moved downwards in the light and their
overall distribution in the water column was not significantly (P>0.05 by χ2 test of
independence) altered by the combined addition of 50µM ABA and 50µM ACC in these
conditions. In the dark, as with the treatment of the cells with 50µM ABA alone (see
Figure 3.3), treatment of the cells with a combination of 50µM ABA and 50µM ACC
induced a significant (P<0.05 by χ2 test of independence) alteration in the distribution of
the algae in the water column with a significant (P<0.05 by χ2 test of goodness of fit)
proportion of the cells banding at a 2cm depth from the surface compared to the untreated
control cells. Thus, ACC treatment did not alter the ABA response observed previously.

Chapter Three: The effect of plant hormones on C. reinhardtii growth and movement
88
Figure 3.8: ACC did not alter the ABA-associated negative geotropic response of C.
reinhardtii in the dark C. reinhardtii cultures were grown in TAP media until their A750 = 0.3 were divided between 25mL
measuring cylinders and were treated +/- 50µM ACC + 50µM ABA with incubation in either the dark or
the light for 50 minutes. Following incubation, the A750 of the cultures in each of the cylinders was
measured at the depths from the surface indicated and the mean (n=3) relative cell densities +/- the 95%
confidence intervals around the means were calculated in each case (A). Within either the light or dark
incubations, only significant (P<0.05 by χ2 tests of goodness of fit) differences in the distribution of the
algae resulting from the ABA treatments at specific depths are indicated(*) along with the χ2stat values
(larger χ2stat indicates a more significant difference). A representative image of the distribution of the algae
in the measuring cylinders immediately following incubation and the light levels (Lux) at each of the depths sampled is shown in (B).

Chapter Three: The effect of plant hormones on C. reinhardtii growth and movement
89
3.3 Responses of Chlamydomonas reinhardtii to the
phytohormone abscisic acid (ABA) during the circadian
cycle
Pphytohormone abscisic acid (ABA) regulates plant responses to various abiotic stresses
and diurnal rhythms. Sequencing of the C. reihardtii genome has shown that this
flagellate, motile, freshwater, photosynthetic green alga is also capable of synthesising
and responding to ABA. Algae were sampled at different time-points during both a 16-
hour photoperiod and a dark period of a 24-hour growth cycle (see Figure 3.9) and were
treated +/- 50µM ABA in either the light or dark and their position in the water column
was monitored by measuring the A750 at different depths.
Figure 3.9: Sampling time points during the light/dark cycle Cultures of C. reinhardtii were grown at 25ºC, 133rpm, over a 16-hour photoperiod/8-hour dark period at
980 Lux in TAP media until A750 = 0.3. 25. After that, cells were collected at a different time point during
the circadian rhythm. Then, the effect of ABA on C. reinhardtii movement was observed.

Chapter Three: The effect of plant hormones on C. reinhardtii growth and movement
90
3.3.1 Effect of ABA on movement one hour into the photoperiod
Similarly grown cultures of C. reinhardtii were sampled 1 hour after the start of the
photoperiod and algae were again similarly assayed for their vertical position in the water
column 50 minutes after their treatment +/- 50µM ABA and incubation in either the light
or dark (see Figure 3.10 C). Following incubation, significant (P<0.05 by Kruskal Wallis)
differences in the mean ranks of the A750 absorbances at different depths within each of
the treatments were apparent. In the light, the algae retreated towards the bottom of the
tube such that the A750 at a depth of 8cm was significantly (P<0.05 by Mann Whitney U
test) higher than that at the 2cm, 4cm or 6cm depths (see Figure 3.10 A) with 3.4 fold
more algae accumulating at a depth of 8cm than at 2cm. The addition of 50µM ABA in
the light retarded this downward movement of the algae to a small extent such that while
the A750 at the 8cm depth remained significantly (P<0.05 by Mann Whitney U test) higher
than that at the 2cm depth, it was no longer significantly different from that at the 4cm
and 6cm depths (Figure 3.10A). In the dark, a proportion of the algae remained near the
surface with the majority settling downwards such that, overall, they remained more
dispersed. The A750 at the 2cm depth was significantly (P<0.05 by Mann Whitney U test)
higher than at 4cm, while that at the 8cm depth was significantly (P<0.05 by Mann
Whitney U test) higher than that at all the other depths measured with 1.7 fold more algae
at this depth compared to that at 2cm (see Figure 3.10A). The addition of 50µM ABA in
the dark caused the algae to move upwards and accumulate near to the surface of the
water column such that the A750 at the 2cm depth was significantly (P<0.05 by Mann
Whitney U test) higher than at all the other depths measured, with approximately 70%
reaching this position over the incubation period (see Figure 3.10A).
In order to compare the effect of ABA on the overall distribution of the algae

Chapter Three: The effect of plant hormones on C. reinhardtii growth and movement
91
in either the light or the dark, relative cell densities were calculated from the A750
measurements. When comparing the distribution of the algae following their incubation
either in the light or in the light with 50µM ABA, there was no overall significant (P>0.05
by χ2 test of independence) difference observed (see Figure 3.10B). However, in the dark
the addition of ABA caused a marked and significant (P<0.05 by χ2 test of independence)
change in the overall distribution of the algae in the water column with those algae
accumulating near to the surface at the 2cm depth being predominantly responsible for
the significance (P<0.05 by χ2 test of goodness of fit) of this observation (Figure 3.10 B).
Significantly (P<0.05 by χ2 test of goodness of fit) fewer algae were also apparent at the
6cm and 8cm depths in the dark +ABA treatment compared to when the algae were
incubated in the dark alone. Thus, overall, when sampled at 1 hour into the photoperiod,
ABA treatment induced the majority of the algae to swim upwards towards the surface
when they were subsequently incubated in the dark.

Chapter Three: The effect of plant hormones on C. reinhardtii growth and movement
92
Figure 3.10: ABA altered the positioning of C. reinhardtii in the water column when sampled
at one hour into the photoperiod and incubated in the dark C. reinhardtii cultures were grown in TAP media until their A750 = 0.3 were sampled 1 hour into the
photoperiod and were divided between 25mL measuring cylinders and treated +/- 50µM ABA with
incubation in either the light or dark for 50 minutes. Following incubation, the A750 of the cultures in each
of the cylinders was measured at the depths from the surface indicated and the mean (n=5) absorbances
calculated (A). Significant pairwise differences (p<0.05 by Mann-Whitney U-Test) in the mean ranks of the A750 measurements at different depths within treatment cylinders are indicated (a to k). The relative cell
densities +/- the 95% confidence intervals around the means are shown in (B). Within either the light or
dark incubations, only significant (P<0.05 by χ2 tests of goodness of fit) differences in the distribution of

Chapter Three: The effect of plant hormones on C. reinhardtii growth and movement
93
the algae resulting from the ABA treatments at specific depths are indicated(*) along with the χ2stat values
(larger χ2stat indicates a more significant difference). A representative image of the distribution of the algae
in the measuring cylinders immediately following incubation and the light levels (Lux) at each of the depths
sampled is shown in (C).
3.3.2 Effect of ABA on movement eight hours into the photoperiod
C. reinhardtii cultures were similarly sampled 8 hours after the start of the photoperiod
and algae were again assayed for their vertical position in the water column 50 minutes
after their treatment +/- 50µM ABA and incubation in either the light or dark (see Figure
3.11). Following incubation, significant (P<0.05 by Kruskal Wallis) differences in the
mean ranks of the A750 absorbances at different depths within each of the treatments were
apparent. In the light, the algae retreated towards the bottom of the tube such that the A750
at the 8cm depth was significantly (P<0.05 by Mann Whitney U test) higher than that at
the 2cm, 4cm or 6cm depths (see Figure 3.11A) with 8.7 fold more algae accumulating
at a depth of 8cm than at 2cm. The addition of 50µM ABA in the light retarded this
downward movement of the algae to a small extent such that while the A750 at the 8cm
depth remained significantly (P<0.05 by Mann Whitney U test) higher than that at the
2cm depth, only the 6cm depth was no longer significantly different from that at 8cm (see
Figure 3.11A). In the dark, a proportion of the algae remained near the surface with the
majority settling downwards such that, overall, they remained more dispersed. The A750
at the 8cm depth was significantly (P<0.05 by Mann Whitney U test) higher than that at
all the other depths measured with 2.1-fold more algae at this depth compared to that at
2cm (see Figure 3.11A). The addition of 50µM ABA in the dark caused the algae to move
upwards and accumulate near to the surface of the water column such that the A750 at the
2cm depth was significantly (P<0.05 by Mann Whitney U test) higher than at all the other
depths measured, with approximately 55% reaching this position over the incubation
period (see Figure 3.11A).

Chapter Three: The effect of plant hormones on C. reinhardtii growth and movement
94
Again, in order to compare the effect of ABA on the overall distribution of the
algae in either the light or the dark, the relative cell densities were calculated from the
A750 measurements. When comparing the distribution of the algae following their
incubation either in the light or in the light with 50µM ABA, there was no overall
significant (P>0.05 by χ2 test of independence) difference observed (see Figure 3.11B).
However, in the dark the addition of ABA caused a marked and significant (P<0.05 by
χ2 test of independence) change in the overall distribution of the algae in the water
column, with those algae accumulating near to the surface at the 2cm depth being
predominantly responsible for the significance (P<0.05 by χ2 test of goodness of fit) of
this observation (see Figure 3.11B). There was no significant difference in the algal
distribution at the 4cm and 6cm depths when comparing dark alone with dark +ABA.
Thus, overall, when sampled at 8 hours into the photoperiod, ABA treatment induced the
majority of the algae to swim upwards towards the surface when they were subsequently
incubated in the dark.

Chapter Three: The effect of plant hormones on C. reinhardtii growth and movement
95
Figure 3.11: ABA alters the positioning of C. reinhardtii in the water column when sampled
at eight hours into the photoperiod and incubated in the dark C. reinhardtii cultures were grown in TAP media until their A750 = 0.3 were sampled 8 hours into the
photoperiod and were divided between 25mL measuring cylinders and were treated +/- 50µM ABA with
incubation in either the light or dark for 50 minutes. Following incubation, the A750 of the cultures in each
of the cylinders was measured at the depths from the surface indicated and the mean (n=5) absorbances
calculated (A). Significant pairwise difference (p<0.05 by Mann-Whitney U-Test)) in the mean ranks of
the A750 measurements at different depths within treatment cylinders are indicated (a to m). The relative
cell densities +/- the 95% confidence intervals around the means are shown in (B). Within either the light
or dark incubations, only significant (P<0.05 by χ2 tests of goodness of fit) differences in the distribution of the algae resulting from the ABA treatments at specific depths are indicated(*) along with the χ2
stat values

Chapter Three: The effect of plant hormones on C. reinhardtii growth and movement
96
(larger χ2stat indicates a more significant difference). A representative image of the distribution of the algae
in the measuring cylinders immediately following incubation and the light levels (Lux) at each of the depths
sampled is shown in (C).
3.3.3 Effect of ABA on movement fifteen hours into the photoperiod
C. reinhardtii were sampled 15 hours after the start of the photoperiod and algae were
again similarly assayed for their vertical position in the water column 50 minutes after
their treatment +/- 50µM ABA and incubation, in either the light or dark (see Figure
3.12). Following incubation, significant (P<0.05 by Kruskal Wallis) differences in the
mean ranks of the A750 absorbances at different depths within some of the treatments
were apparent, as at earlier sampling time points. However, in contrast to earlier
sampling time points, when incubated in the light the algae showed less of a tendency to
retreat towards the bottom of the tubes and remained more dispersed such that the A750
at the 8cm depth was not significantly (P>0.05 by Mann Whitney U test) different from
that at the 2cm, 4cm or 6cm depths (see Figure 3.12 A). The addition of 50µM ABA in
the light retarded this downward movement of the algae to a small extent such that while
the A750 at the 8cm depth remained significantly (P<0.05 by Mann Whitney U test) higher
than that at the 2cm and 4cm depths (Figure 3.12 A). In the dark, a proportion of the algae
remained near the surface with the majority settling downwards such that, overall, they
remained more dispersed. The A750 at the 8cm depth showed no significant (P<0.05 by
Mann Whitney U test) difference than in the algal distribution at all the other depths (see
Figure 3.12 A). The addition of 50µM ABA in the dark again caused the algae to move
upwards and accumulate near to the surface of the water column such that the A750 at the
2cm depth was significantly (P<0.05 by Mann Whitney U test) higher than at all the other
depths measured, with approximately 60% reaching this position over the incubation
period (see Figure 3.12 A).

Chapter Three: The effect of plant hormones on C. reinhardtii growth and movement
97
In order to compare the effect of ABA on the overall distribution of the algae in
either the light or the dark, the relative cell densities were calculated from the A750
measurements. When comparing the distribution of the algae following their incubation
either in the light or in the light with 50µM ABA, no overall significant (P>0.05 by χ2
test of independence) difference was observed (see Figure 3.12B). However, in the dark
the addition of ABA again caused a marked and significant (P<0.05 by χ2 test of
independence) change in the overall distribution of the algae in the water column, with
those algae accumulating near to the surface at the 2cm depth being predominantly
responsible for the significance (P<0.05 by χ2 test of goodness of fit) of this observation
(see Figure 3.12 B). No significant difference in the algal distribution at the 4cm and 6cm
depths when comparing dark alone with dark +ABA was observed. Thus, overall, when
sampled at 15 hours into the photoperiod, ABA treatment induced the majority of the
algae to swim upwards towards the surface when they were subsequently incubated in
the dark.

Chapter Three: The effect of plant hormones on C. reinhardtii growth and movement
98
Figure 3.12: ABA alters the positioning of C. reinhardtii in the water column when sampled
at fifteen hours into the photoperiod and incubated in the dark C. reinhardtii cultures were grown in TAP media until their A750 = 0.3 were sampled 15 hours into the
photoperiod and were divided between 25mL measuring cylinders and were treated +/- 50µM ABA with
incubation in either the light or dark for 50 minutes. Following incubation, the A750 of the cultures in each
of the cylinders was measured at the depths from the surface indicated and the mean (n=5) absorbances
calculated (A). Significant pairwise difference (p<0.05 by Mann-Whitney U-Test)) in the mean ranks of
the A750 measurements at different depths within treatment cylinders are indicated (a to f). The relative cell densities +/- the 95% confidence intervals around the means are shown in (B). Within either the light or
dark incubations, only significant (P<0.05 by χ2 tests of goodness of fit) differences in the distribution of
the algae resulting from the ABA treatments at specific depths are indicated(*) along with the χ2stat values

Chapter Three: The effect of plant hormones on C. reinhardtii growth and movement
99
(larger χ2stat indicates a more significant difference). A representative image of the distribution of the algae
in the measuring cylinders immediately following incubation and the light levels (Lux) at each of the depths
sampled is shown in (C).
3.3.4 Effect of ABA on movement one hour into the dark
Again, C. reinhardtii were similarly sampled 1 hour after the start of the dark period and
algae were again assayed for their vertical position in the water column 50 minutes after
their treatment +/- 50µM ABA and incubation in either the light or dark (see Figure 3.13).
Following incubation, significant (P<0.05 by Kruskal Wallis) differences in the mean
ranks of the A750 absorbances at different depths within some of the treatments were
apparent. When incubated in the light, the algae moved downwards to a small extent but
generally remained dispersed such that the A750 of the culture at any depth was not
significantly (P>0.05 by Mann Whitney U test) different from that at any other depth
measured (see Figure 3.13A). The addition of 50µM ABA in the light appeared to have
no significant affect in this respect (see Figure 3.13A). In the dark the algae generally
settled downwards such that the A750 at the 8cm depth was significantly (P<0.05 by Mann
Whitney U test) higher than that at all the other depths measured, with 2.6 fold more
algae at this depth compared to that at 2cm (see Figure 3.13A). The addition of 50µM
ABA in the dark caused the algae to move upwards and accumulate near to the surface
of the water column such that the A750 at the 2cm depth was significantly (P<0.05 by
Mann Whitney U test) higher than at all the other depths measured, with approximately
30% reaching this position over the incubation period (Figure 3.13A).
In order to compare the effect of ABA on the overall distribution of the algae in
either the light or the dark, the relative cell densities were again calculated from the A750
measurements. When comparing the distribution of the algae following their incubation
either in the light or in the light with 50µM ABA, no overall significant (P>0.05 by χ2
test of independence) difference was observed (see Figure 3.13B). However, in the dark

Chapter Three: The effect of plant hormones on C. reinhardtii growth and movement
100
the addition of ABA again caused a significant (P<0.05 by χ2 test of independence)
change in the overall distribution of the algae in the water column, with those algae
accumulating near to the surface at the 2cm depth again being predominantly responsible
for the significance (P<0.05 by χ2 test of goodness of fit) of this observation (see Figure
3.13B). As before, the algae moved upwards significantly (P<0.05 by χ2 tests of
goodness of fit) to form a band near to the surface, but at this sampling time point the
proportion of the algae that did so was noticeably less than at earlier sampling time points
(Figure 3.13 C). In this case, 2.1-fold more cells were at a depth of 2cm depth compared
to 8cm from the surface. Thus, overall, when sampled at 1 hour into the dark period, ABA
treatment induced the algae to swim upwards towards the surface when they were
subsequently incubated in the dark, but to a lesser extent than when sampled at earlier
time points during the photoperiod.

Chapter Three: The effect of plant hormones on C. reinhardtii growth and movement
101
Figure 3.13: ABA alters the positioning of C. reinhardtii in the water column when sampled
at one hour into a dark period and incubated in the dark C. reinhardtii cultures were grown in TAP media until their A750 = 0.3 were sampled 1 hour into the dark
period and were divided between 25mL measuring cylinders and were treated +/- 50µM ABA with
incubation in either the light or dark for 50 minutes. Following incubation, the A750 of the cultures in each
of the cylinders was measured at the depths from the surface indicated and the mean (n=5) absorbances
calculated (A). Significant pairwise difference (p<0.05 by Mann-Whitney U-Test)) in the mean ranks of
the A750 measurements at different depths within treatment cylinders are indicated (a to f). The relative cell densities +/- the 95% confidence intervals around the means are shown in (B). Within either the light or
dark incubations, only significant (P<0.05 by χ2 tests of goodness of fit) differences in the distribution of
the algae resulting from the ABA treatments at specific depths are indicated(*) along with the χ2stat values

Chapter Three: The effect of plant hormones on C. reinhardtii growth and movement
102
(larger χ2stat indicates a more significant difference). A representative image of the distribution of the algae
in the measuring cylinders immediately following incubation and the light levels (Lux) at each of the depths
sampled is shown in (C).
3.3.5 Effect of ABA on movement four hours into the dark
C. reinhardtii cultures were similarly sampled 4 hours after the start of the dark period
and algae were again assayed for their vertical position in the water column 50 minutes
after their treatment +/- 50µM ABA and incubation, in either the light or dark (see Figure
3.14). Following incubation, significant (P<0.05 by Kruskal Wallis) differences in the
mean ranks of the A750 absorbances at different depths within each of the treatments were
apparent. In the light, the algae retreated towards the bottom of the tube such that the A750
at 8cm depth was significantly (P<0.05 by Mann Whitney U test) higher than that at the
2cm, 4cm or 6cm depths (see Figure 3.14A), with 2.5 fold more algae accumulating at a
depth of 8cm than at 2cm. The addition of 50µM ABA in the light retarded this downward
movement of the algae to a small extent such that while the A750 at the 8cm depth
remained significantly (P<0.05 by Mann Whitney U test) higher than that at the 2cm
depth, it was no longer significantly different from that at the 4cm and 6cm depths (Figure
3.14A). At this time point, the algae generally settled downwards in the dark. The A750 at
the 8cm depth was significantly (P<0.05 by Mann Whitney U test) higher from that at all
the other depths measured with 2.5-fold more algae at this depth compared to that at 2cm
(see Figure 3.14A). The addition of 50µM ABA in the dark caused the algae to move
upwards and accumulate near to the surface of the water column such that the A750 at the
2cm depth was significantly (P<0.05 by Mann Whitney U test) higher than at all the other
depths (see Figure 3.14A).
In order to compare the effect of ABA on the overall distribution of the algae in
either the light or the dark, the relative cell densities were calculated from the A750

Chapter Three: The effect of plant hormones on C. reinhardtii growth and movement
103
measurements. When comparing the distribution of the algae following their incubation
either in the light or in the light with 50µM ABA, there was no overall significant (P>0.05
by χ2 test of independence) difference observed (see Figure 3.14B). However, in the dark
the addition of ABA caused a significant (P<0.05 by χ2 test of independence) change in
the overall distribution of the algae in the water column with those algae accumulating
near to the surface at the 2cm depth being predominantly responsible for the significance
(P<0.05 by χ2 test of goodness of fit) of this observation (see Figure 3.14B). The algae
moved upwards significantly (P<0.05 by χ2 tests of goodness of fit) to form a discrete
band at the 2cm depth, but again at this sampling time point the proportion of algae that
did this was less than what occurred when the algae were sampled during the photoperiod
(see Figure 3.14 C). Thus, overall, when sampled at 4 hours into the dark period, ABA
treatment induced the algae to swim upwards towards the surface when they were
subsequently incubated in the dark.

Chapter Three: The effect of plant hormones on C. reinhardtii growth and movement
104
Figure 3.14: ABA alters the positioning of C. reinhardtii in the water column when sampled
at four hours into a dark period and incubated in the dark C. reinhardtii cultures were grown in TAP media until their A750 = 0.3 were sampled 4 hours into the dark
period and were divided between 25mL measuring cylinders and were treated +/- 50µM ABA with incubation in either the light or dark for 50 minutes. Following incubation, the A750 of the cultures in each
of the cylinders was measured at the depths from the surface indicated and the mean (n=5) absorbances
calculated (A). Significant pairwise difference (p<0.05 by Mann-Whitney U-Test)) in the mean ranks of
the A750 measurements at different depths within treatment cylinders are indicated (a to q). The relative cell
densities +/- the 95% confidence intervals around the means are shown in (B). Within either the light or
dark incubations, only significant (P<0.05 by χ2 tests of goodness of fit) differences in the distribution of

Chapter Three: The effect of plant hormones on C. reinhardtii growth and movement
105
the algae resulting from the ABA treatments at specific depths are indicated(*) along with the χ2stat values
(larger χ2stat indicates a more significant difference). A representative image of the distribution of the algae
in the measuring cylinders immediately following incubation and the light levels (Lux) at each of the depths
sampled is shown in (C).
3.3.6 Effect of ABA on movement seven hours into the dark
Cultures of C. reinhardtii were sampled 7 hours after the start of the dark period and
algae were again assayed for their vertical position in the water column 50 minutes after
their treatment +/- 50µM ABA and incubation, in either the light or dark (see Figure
3.15). Following incubation, significant (P<0.05 by Kruskal Wallis) differences in the
mean ranks of the A750 absorbances at different depths within each of the treatments were
apparent. In the light, the algae retreated towards the bottom of the tube such that the A750
at the 6cm and 8cm depths were significantly (P<0.05 by Mann Whitney U test) higher
than that at the 2cm depth (see Figure 3.15A), with 1.5 fold more algae accumulating at
a depth of 8cm than at 2cm. The addition of 50µM ABA in the light retarded this
downward movement of the algae. The A750 at the 8cm depth remained significantly
(P<0.05 by Mann Whitney U test) higher than that at the 2cm and 4cm depths (see Figure
3.15A). In the dark, a proportion of the algae remained near the surface, with the majority
settling downwards such that, overall, they remained more dispersed. The A750 at the 8cm
depth was significantly (P<0.05 by Mann Whitney U test) higher from the 2cm and 4cm
depths (see Figure 3.15A). The addition of 50µM ABA in the dark caused the algae to
move upwards and accumulate near to the surface of the water column. However, there
was no significant difference in A750 at the 2cm depth (P<0.05 by Mann Whitney U test)
from the algal distribution at all the other depths (see Figure 3.15A).
In order to compare the effect of ABA on the overall distribution of the algae in
either the light or the dark, the relative cell densities were calculated from the A750
measurements. When comparing the distribution of the algae following their incubation

Chapter Three: The effect of plant hormones on C. reinhardtii growth and movement
106
either in the light or in the light with 50µM ABA, there was no overall significant (P>0.05
by χ2 test of independence) difference observed (see Figure 3.15B). However, in the dark
the addition of ABA caused a marked and significant (P<0.05 by χ2 test of independence)
change in the overall distribution of the algae in the water column with those algae
accumulating near to the bottom at the 8cm depth being predominantly responsible for
the significance (P<0.05 by χ2 test of goodness of fit) of this observation (see Figure
3.15B). Significantly (P<0.05 by χ2 test of goodness of fit) less algae were also apparent
at the 8cm depths in the dark +ABA treatment compared to when the algae were
incubated in the dark alone. Thus, overall, when sampled at 7 hours into the dark period,
ABA treatment induced the majority of the algae to swim upwards towards the surface
when they were subsequently incubated in the dark but less pronounced.

Chapter Three: The effect of plant hormones on C. reinhardtii growth and movement
107
Figure 3.15: ABA alters the positioning of C. reinhardtii in the water column when sampled
at seven hours into the dark period and incubated in the dark C. reinhardtii cultures were grown in TAP media until their A750 = 0.3 were sampled 7 hours into the dark
period and were divided between 25mL measuring cylinders and were treated +/- 50µM ABA with incubation in either the light or dark for 50 min. Following incubation, the A750 of the cultures in each of
the cylinders was measured at the depths from the surface indicated and the mean (n=5) absorbances
calculated (A). Significant pairwise difference (p<0.05 by Mann-Whitney U-Test)) in the mean ranks of
the A750 measurements at different depths within treatment cylinders are indicated (a to j). The relative cell
densities +/- the 95% confidence intervals around the means are shown in (B). Within either the light or
dark incubations, only significant (P<0.05 by χ2 tests of goodness of fit) differences in the distribution of

Chapter Three: The effect of plant hormones on C. reinhardtii growth and movement
108
the algae resulting from the ABA treatments at specific depths are indicated(*) along with the χ2stat values
(larger χ2stat indicates a more significant difference). A representative image of the distribution of the algae
in the measuring cylinders immediately following incubation and the light levels (Lux) at each of the depths
sampled is shown in (C).
In summary, ABA led to the upward movement of algae when they were
incubated in the dark to an extent dependent on their sampling time over the 24-hour
cycle. For example, when sampled at the beginning of the photoperiod the response of
the dark-incubated algae to the ABA treatment was very pronounced and after incubation
12.8-fold more algae accumulated at a depth of 2cm than at 8cm (see Figure 3.16). As
the photoperiod progressed, the effect of the ABA on the dark-incubated algae was
reduced, albeit insignificantly. However, at the end of the photoperiod and during the
dark period, although ABA treatment still induced upwards movement of the algae in the
dark, the effect was significantly (P<0.05 by Mann Whitney U test) less pronounced such
that only approximately 2 fold more algae accumulated at 2cm depth than at 8cm from
the surface.

Chapter Three: The effect of plant hormones on C. reinhardtii growth and movement
109
Figure 3.16: ABA alters the positioning of C. reinhardtii in the water column when sampled
at different time points during the light/dark cycle and incubated in the dark C. reinhardtii cultures were grown in TAP media until their A750 = 0.3, were sampled at different time
points during the light/dark and were divided between 25mL measuring cylinders and were treated with 50µM ABA with incubation in the dark for 50 minutes. Following incubation, the A750 of the cultures in
each of the cylinders was measured at the depths from the surface indicated and the mean (n=5) absorbances
calculated. Significant pairwise difference (p<0.05 by Mann-Whitney U-Test)) in the mean ranks of the
A750 measurements at different depths within treatment cylinders are indicated (a to i).
3.4 Horizontal movement of C. reinhardtii cells in response to
ABA in the light and dark
Next, the effect of a fixed source of ABA on the movement of the algae in horizontal
tubes was examined to separate the ABA effect from any gravity-dependent effects. After
growing the cultures of C. reinhardtii in TAP media until A750 = 0.3, 25ml aliquots of the
cultures were transferred to glass test tubes (15cm height and 1.5cm wide) in which 2ml
plugs of 1×TAP media,1.5% (w/v) agar containing different concentrations of ABA had
been placed at the bottom. The tubes were placed horizontally, either in the dark or under
surrounding illumination, at 980 Lux for 2 hours at 25ºC. After incubation, they were
photographed to illustrate the position attained by the motile algae (see Figure 3.17). In
0.0
5.0
10.0
15.0
20.0
25.0
1h 8h 15h 17h 20h 23h
Fold
Cha
nge
Sampling Time Point
c, f, ib, e, ha, d, g
a, b, c
g, h, id, e, f

Chapter Three: The effect of plant hormones on C. reinhardtii growth and movement
110
the light, the algae moved towards the ABA gel plug while, conversely, in the dark they
swam away (see Figure 3.17). Lower levels of ABA resulted in a similar, but intermediate
response.
Figure 3.17: Opposing direction of travel of C. reinhardtii cells in response to ABA in the
light and dark Algal cultures were grown under a 16-hour photoperiod to the mid-log phase (A750 = 0.3) growth stage and
were sampled mid photoperiod. Fully dispersed samples of the algal culture were placed in sealed tubes
with a plug of agarose containing the concentrations of ABA indicated and were immediately placed
horizontally in the light (980 Lux) or the dark for 50 minutes. Shown is a representative image indicating
the positions attained by the algae immediately following the incubation period.
1mM
0.25mM
Control
Light
Agarose plug +ABA
1mM
0.25mM
Control
Dark

Chapter Three: The effect of plant hormones on C. reinhardtii growth and movement
111
3.5 Measuring ABA levels in algae across the Circadian rhythm
The endogenous levels of ABA throughout a single diurnal growth cycle were determined
by competitive ELISA. The endogenous ABA concentrations differed through the day
and night cycle, suggesting an oscillatory pattern (see Figure 3.18). During the first 10
hours of the photoperiod, ABA levels increased significantly (P<0.05 by 2 sample t-test)
by 1.8x to a maximum, and then declined significantly (P<0.05 by 2 sample t-test) to a
minimum at 13 hours. After that, ABA levels significantly (P<0.05 by 2 sample t-test)
increased again, reaching close to their maximum 2 hours into the dark period, before
stabilising until the end of the 24-hour period. Interestingly, the time at which the level
of ABA was lowest was that at which they began to form multiple bands when placed in
the dark with ABA.

Chapter Three: The effect of plant hormones on C. reinhardtii growth and movement
112
Figure 3.18: Endogenous abscisic acid (ABA) levels in C. reinhardtii Algal cultures were grown under a 16-hour photoperiod to the mid-log phase (A750 = 0.3) growth stage and
were sampled at the time points indicated over a subsequent 24-hour period, where the 16-hour photoperiod
commenced at time = 0h. Algal cells were pelleted from n=3 replicate 25mL aliquots of culture. At each sampling point, the A750 of the cultures was determined to assess cell numbers. Pellets were extracted and
assessed for ABA content by competitive ELISA (MyBioSource Inc.). The standard curve of ABA
concentration are shown (A). Data are shown as the mean ABA content cell-1 with error bars shown as +/-
the 95% confidence interval around the mean in each case (B). Selected significant (P<0.05 by 2 sample t-
test) pairwise differences in mean ABA levels are indicated (a to d).

Chapter Three: The effect of plant hormones on C. reinhardtii growth and movement
113
3.6 ABA alters the photosynthetic efficiency of C. reinhardtii
Alginate-bead-encapsulated C. reinhardtii with different concentrations of ABA were
incubated under various light levels in media containing a bicarbonate indicator. The
mean rate of HCO3- depletion of the medium by the algae generally increased with
increasing light levels. Under comparatively high-light illumination (7440 Lux), 50μM
ABA significantly (P<0.05 by Tukey Kramer’s test) increased mean HCO3- depletion of
the media by the algae by ≈20% compared to the control algae under the same light levels.
However, at low-light (253 Lux) 50μM ABA significantly reduced the mean HCO3-
depletion of the media by the algae by ≈14.5% (see Figure 8.3 in Appendix 8.7). Lower
levels of ABA treatment had an an intermediate effect in this regard. At 1060 Lux ABA
had no significant effect on the mean HCO3- depletion of the media by the algae
regardless of the treatment used (this experiment was performed by Adam Gregg).

Chapter Three: The effect of plant hormones on C. reinhardtii growth and movement
114
3.7 Discussion
3.7.1 ABA alters photosynthesis, but not the growth of Chlamydomonas
Initially, this study examined the effect of various concentrations of abscisic acid (ABA),
the ethylene precursor 1-aminocyclopropane-1-carboxylic acid (ACC), indole-3-acetic
acid (IAA) and 1-naphthaleneacetic acid (NAA) on the growth of C. reihardtii. The
results indicated that the algal growth rate was not affected by ABA and IAA at all the
concentrations tested (see Figure 3.1). When NAA was used, it slowed down the growth
at a higher concentration of 100µM. ACC application also reduced growth a little bit
when compared to the control of algae. A study by Park et al. (2013) indicated that, with
the exception of ABA, plant hormones such as IAA, gibberellic acid (GA3), kinetin
(KIN), and 1-triacontanol (TRIA) increased the growth rate of C. reinhardtii.
Additionally, a study by Contreras-Pool et al. (2016) reported that the growth rate of
Chlorella saccharophila was positively affected by ABA at various concentrations.
However, Contreras-Pool et al. (2016) investigated the effect of ABA by
measuring cell volume and dry biomass accumulation. The weight increased because the
cells got larger and became heavier when treated with ABA; the effect was not due to
increased cell numbers. At higher light levels this study showed that ABA had the effect
of increasing CO2 uptake and perhaps this corresponded with the increased mass
observed by Contreras-Pool et al. (2016); they grew their algae at 2970 Lux, a light
intensity at which this study showed ABA increased HCO3- depletion of the media by C.
reinhardtii. Park et al. (2013) grew their algae at a light intensity of 6600 Lux. Perhaps,
under these relatively high light conditions, auxin treatment does enhance C. reinhardtii
growth. However, under the more ambient growth conditions used here (1485 Lux) this
study could provide no evidence that ABA, IAA, NAA and ACC had any significant

Chapter Three: The effect of plant hormones on C. reinhardtii growth and movement
115
effect on the growth rate of this alga. The question, then, is what ABA and the other
phytohormones do in algae such as Chlamydomonas?
3.7.2 In the dark ABA-induced a negative geotropic response in Chlamydomonas
Since there was an indication that light levels had a bearing on the effect of the
phytohormones, in particular ABA, on the growth of the alga, and since high light is
likely a major source of abiotic stress to these microorganisms, this research next made
a preliminary examination of the effect of NAA, ACC and ABA on the vertical
movement of C. reinhardtii in response to high light and in the dark. Here, the results
indicated that neither NAA, ACC nor H2O2 affected the vertical movement of C.
reihardtii in the water column (see Figure 3.2) in either the light or dark. However, ABA
significantly induced C. reihardtii to swim upwards in the dark (see Figure 3.3). C.
reinhardtii are known to use their flagella to move to an appropriate environment,
including a photosynthetically optimum distance from a light source (Foster and Smyth,
1980). Algal cells exposed to intense light move away from the light and stay there.
However, here, when algae were treated with ABA, they retreated to a lesser extent from
such a high light source. This suggests that the ABA affected the algal flagella
movements in a way that led to a decrease in the extent of their avoidance movement in
the light and an upward movement in the absence of light (see Figure 3.3). Thus, the data
presented here suggests that ABA was involved in the algal movement in response to
changes in the light levels in their environment.
ACC alone did not have any significant effect on the movement of the algae over
the range of concentrations tested in this study or any significant antagonistic effect on
the observed ABA responses in either the light or dark (see Figure 3.8). Thus, this study
would suggest that, while the algae obviously respond to ABA, many of the

Chapter Three: The effect of plant hormones on C. reinhardtii growth and movement
116
phytohormone signalling interactions and responses arose after the terrestrial transition
and evolution of multicellular plants. However, it is clear that Chlamydomonas do
respond to ABA. Recent sequencing of the C. reinhardtii genome has shown that it
encodes most of the enzymes involved in ABA synthesis and metabolism and numerous
genes with promoters containing ABA-responsive elements that potentially enable
regulation by ABA in various contexts (Finkelstein, 2013). Thus, the question is how the
alga perceives ABA. Chlamydomonas must have an ABA receptor. The alga does possess
most of the ABA response and transport components, including ABFs, group A PP2C,
SnRK2s, PDRs, ABCG25, and AITs (Wang et al., 2015). However, there are no
orthologues of the genes encoding the plant cytosol/nuclear localised PYR/PYL/RCAR
ABA receptor family (Fujii et al., 2009) in the C. reinhardtii genome (Wang et al., 2015).
Potential orthologues of genes encoding the G-protein coupled receptor (GPCR) protein,
GCR2 (Liu et al., 2007) and GPCR-types, GTG1 and GTG2, (Pandey et al., 2009) can
be identified in the genome of this alga, but it is still unclear whether or not, as has been
proposed for plants, these proteins really do act as ABA receptors (Christmann and Grill,
2009; Guo et al., 2011; Risk et al., 2009).
3.7.3 The ABA response in Chlamydomonas may be under light-mediated
circadian control
Since ABA induced a response that appeared linked to ABA and light, it was determined
whether that response also altered over a 24-hour period. Algae were sampled at different
time-points over the 24-hour growth cycle (16-hour photoperiod), were treated with
ABA, incubated in either the light or dark and their position in the water column
monitored (see Fig 3.10). The result indicated that the actual resulting position of the
algae in the water column depended on what time point they were sampled in the cycle.

Chapter Three: The effect of plant hormones on C. reinhardtii growth and movement
117
For example, at the beginning of the photoperiod more 70 % of algae moved to the surface
when treated with ABA in the dark (see Figure 3.10). In the middle of and later in the
photoperiod, they also moved upwards in the dark when treated with ABA (see figures
3.11 and 3.12), but to a lower depth. During the dark period of the growth cycle,
progressively less of the ABA-treated algae moved upwards in the dark and showed a
more diffuse distribution in response to this hormone (see figures 3.13, 3.14 and 3.15).
Such a differential response indicated the involvement of the circadian rhythm whereby
the algae were only fully responsive to ABA in terms of their upward movement at the
appropriate time, i.e. at dawn. This and other data suggest that just before sunrise and in
the early morning algae respond to ABA and swim to the surface in order to
photosynthesise. As the day progresses, they retreat from the increased light intensity and
during the night swim down to repair their photosynthetic machinery and prepare for the
next photoperiod. Early morning sunlight is less intense, and there is typically more red
than blue light, meaning that the algae can tolerate being at the surface. In contrast, in the
middle of the day, when there is a considerable increase in blue light intensity, remaining
at the surface would likely result in photo-oxidative damage to their photosystems and so
the algae retreat downwards (Fundamentals of Environmental-Measurements, 2014).
There is also likely an evolutionary selective pressure for motile algae to remain at the
bottom during the dark period. Many organisms swim up from the bottom during the
night to feed and might well prey on algae that remained at the surface (Picapedra et al.,
2018). Thus, those algae which retreated to the bottom at night likely had an increased
chance of survival and thus instigated this rhythmic, ABA-driven response in the species.
In the dark, ABA-induced the algae to abandon their usual run and tumble manner
of locomotion (Bennett & Golestanian, 2015) and to swim upwards. The question was,

Chapter Three: The effect of plant hormones on C. reinhardtii growth and movement
118
then, how the algal cells use the ABA signal to do this? Chlamydomonas exhibit both
positive and negative phototaxis depending on how much light the eyespot receives
(Schaller et al., 1997). As the cell rotates about its body axis, the light intensity seen by
the eyespot varies, and this produces differential movement of the two flagella, resulting
in the algae swimming a helical path either towards or away from the light depending on
its intensity. Here, one possibility was that the algal response to ABA in the dark was
reversed by light. Thus, glass tubes, in which were placed at one end gel plugs of agarose
containing various concentrations of ABA, were filled with well-dispersed suspensions
of algae, immediately closed and placed horizontally, either with surrounding
illumination or in the dark. Interestingly, in the light, the algae moved towards the ABA
gel plug, while in the dark the algae swam away from the ABA source (see Figure 3.16).
When lower levels of ABA were used in the gel plug the algae showed a similar, but an
intermediate, response. Presumably, as the ABA diffused out of the gel plug, it formed a
decreasing concentration gradient away from the agarose. Thus, the suggestion here is
that either the algae orientated themselves using either an ABA concentration or
perception gradient and that their direction of movement in response to the gradient
depended on the presence or absence of light, or that light directly reversed the ABA
response which occurred beyond a threshold concentration of the hormone.
Chlamydomonas use rhodopsin-initiated Ca2+ currents to regulate flagella movements,
and thus their orientation to light and phototactic responses (Harz and Hegemann, 1991).
Ca2+ signalling is also known to regulate the gravitaxis of the alga, Euglena
(Schwartzbach and Shigeoka, 2017). In higher plants, many ABA responses similarly
involve Ca2+ signalling (Kudla et al., 2018). For example, the opening and closing of
fully-hydrated Arabidopsis stomata in the light/dark cycle is an ABA-controlled process

Chapter Three: The effect of plant hormones on C. reinhardtii growth and movement
119
(Ribeiro et al., 2009) involving downstream Ca2+ movement and signalling (Kudla et al.,
2018). The case may be similar in motile algae such as Chlamydomonas.
Overall, the results suggest that ABA signals for upward movement of the algae
and that this response is mediated by light levels and potentially the circadian rhythm. To
better understand the potential involvement of the circadian rhythm underlying these
observations, measurements were made of the endogenous ABA levels of the algae over
a 24-hour period (see Figure 3.17). Through this incubation period the mean ABA levels
varied between 2.2x10⁻⁹ to 4.3x10⁻⁹ µg cell-1, which, assuming the mean volume of a
Chlamydomonas cell to be 270 µM3, equates to an endogenous concentration range of
≈30.8 to 60.3nM, which is similar to that described in other reports (Hartung, 2010).
Interestingly, the time at which the minimum level of ABA was recorded is also that at
which they began to band at multiple lower depths when placed in the dark with ABA
treatment. Thus, although the change in ABA levels was considerably less than that
observed in plants during stress (Hartung, 2010), there is evidence of a change during the
daily cycle, and this does appear to coincide with the timing of altered responsiveness to
the hormone.
3.7.4 How does this algal ABA response relate to plants?
Galvez-Valdivieso et al. (2009), reported that ABA is involved in plant responses to high-
light, which reduces photo-oxidative damage to PSII. In maize leaves an increase in the
production of ABA occurs following exposure to UV-B and is required for the associated
synthesis of nitric oxide, which acts to ameliorate the damaging effects of such irradiation
(Tossi et al., 2009). UV-B exposure similarly induces increased ABA synthesis in
Arabidopsis plants (Rakitin et al., 2008). Other studies have also concluded that ABA
improves the tolerance of grapevines to UV-B (Berli et al., 2010, 2011) and that the

Chapter Three: The effect of plant hormones on C. reinhardtii growth and movement
120
increased levels of ABA that occur during drought stress reduce the sensitivity of several
plant species to UV-B exposure (Berli and Bottini, 2013). ABA has also been shown to
play a significant role in the regulation of expression of the light-harvesting chlorophyll
a/b-binding protein (LHCB) under conditions of environmental stress. LHCB expression
was inhibited when tomato leaves, Arabidopsis seedlings, Lemma gibba cells and
developing seeds of soybean were treated with high concentrations of ABA
(Bartholomew et al., 1991; Staneloni et al., 2008; Weatherwax et al., 1996), while
treatment with low levels of ABA increased LHCB1.2 transcripts in Arabidopsis
seedlings and cab3 (GmLHCB) expression in soybean seeds (Chang and Walling, 1991;
Voigt et al., 2010). Thus, physiological levels of ABA enhance LHCB expression (Liu
et al., 2013), likely through the activity of the WRKY40 transcription factor, and may be
required to adaptively fine-tune the photosynthetic capability of plants under conditions
of environmental stress under varying light levels. Signalling via GCR1, GPA1, RPN1
and nuclear factor Y has been shown to integrate blue light and ABA signalling in order
to regulate LHCB expression in etiolated Arabidopsis seedlings (Warpeha et al., 2007).
The results presented here suggest that an ABA signalling and high-light
interaction increased algal photosynthetic efficiency in terms of HCO3- uptake. Why
ABA reduced algal HCO3- uptake under low light is unclear. Wang et al. (2016)
suggested that in terrestrial plants ABA initiates PSII repair mechanisms under low light
conditions. Perhaps under low light conditions and in the dark ABA similarly initiates
such processes in Chlamydomonas cells, which may explain their reduced photosynthetic
efficiency. Previous studies by Saradhi et al. (2000) have reported that ABA may protect
Chlamydomonas against photoinhibition and the results presented here would be
consistent with such findings. What is interesting is the differential photosynthetic

Chapter Three: The effect of plant hormones on C. reinhardtii growth and movement
121
response to ABA under various light levels and the fact that, at more ambient light
intensities, ABA had no significant effect. Thus, the data suggest that ABA signalling
and downstream responses in Chlamydomonas, as in plants, may be controlled by light
and it may prove interesting to reassess this algal response under different light intensities
and wavelengths.
The phytohormones control various aspects of plant growth and development and
regulate responses to different abiotic stresses (Kim et al., 2008; Wani et al., 2016). ABA
is involved in specific developmental events in plants, a good example being the light-
dependent diurnal movements of guard cells that lead to stomatal opening and closing
(Wani et al., 2016). Studies on seed germination also show that light plays a crucial role
in regulating the expression of genes required for ABA metabolism and ABA levels. For
example, in Arabidopsis and lettuce (Lactuca sativa) seeds, endogenous ABA levels are
decreased under red light but increased under far-red light (Sawada et al., 2008; Seo et
al., 2006; Toyomasu et al., 1994). High light levels induce stomatal closure in plants via
an ABA-regulated process. As part of the stomatal closure process, calcium channels are
activated by H2O2. The production of hydrogen peroxide by NADPH oxidases is induced
by ABA (Pei et al., 2000). Loss of function mutation of the NADPH oxidases disrupts
the activation of calcium channels, and the subsequent closure of stomata is impaired
unless H2O2 is exogenously applied (Kwak et al., 2003). The growth and seed
germination of such mutants are also less sensitive to ABA, the suggestion being that the
function of H2O2 acts downstream of ABA in different physiological contexts. The ABA
insensitive 1 (abi1) and abi2 mutants, defective in genes encoding protein phosphatase
2C-like enzymes, show reduced ABA induction of H2O2 and stomatal closure in response
to H2O2 (Murata et al., 2001) and Meinhard and Grill, (2001) and Meinhard et al, (2002)

Chapter Three: The effect of plant hormones on C. reinhardtii growth and movement
122
found that the activities of these protein phosphatases are negatively regulated by H2O2
in vitro. Chlamydomonas possess the phosphatases and operate calcium signalling
mechanisms during the flagella movements that dictate their phototaxis responses, but
here finds no evidence that H2O2 was involved could be found. Perhaps the involvement
of reactive oxygen species signalling evolved as an additional stress signalling
mechanism in sessile plants that are inevitable, and therefore exposed to an increased
chance of photo-oxidative stress.
Such ABA responses may have evolved from the light stress responses of algae
which dictate their movement up and down to reach optimal photosynthetic conditions.
These responses probably evolved over millions of years, and when algae moved out of
the water to become simple land-dwelling plants, they likely took this biochemical
machinery with them (Delwiche and Cooper, 2015). During this evolutionary process,
such cells may have retained their core ABA signalling mechanisms while expanding
their downstream responses as they developed into multicellular species and simple
plants with multiple organs and reproductive strategies. It is then interesting that the
etiolation/de-etiolation response in plants appears to involve the expression of many
ABA-related genes (Humplík et al., 2015) and that plants grow upwards more at night in
the pre-dawn hours than they do during the day (Seluzicki et al .2017). Perhaps this
suggests the retention in higher plants of the algal ABA response observed here.
3.7.5 Is ABA a gravitropic hormone?
When Chlamydomonas are placed in complete darkness together with ABA, the algae
move upwards to the surface. This begs the question of how the cells determine which
way is up. Dogma would dictate that the algae perceive gravity and that ABA-induced

Chapter Three: The effect of plant hormones on C. reinhardtii growth and movement
123
the cells to swim agravitropically. But this then raises the further question as to how the
cells may perceive gravity?
Much research has been conducted into the gravitropic mechanisms in plants, but
the evidence remains inconclusive as to how they actually detect gravity and even less is
known about how algae might achieve this. In plants, one proposal is the starch–statolith
hypothesis, whereby the physical sedimentation of starch-filled amyloplasts (statoliths)
in gravity-sensing cells (statocytes) triggers biochemical and physiological signals that
are relayed to the responding tissues (Kiss, 2000). The transmitted signals induce
differential cellular growth, resulting in the downward curvature of roots or upward
curvature of shoots. The primary signal believed to trigger such differential growth is, of
course, the plant hormone auxin (Band et al., 2012; Muday and Rahman, 2008), which
accumulates to higher levels along one flank of the root or shoot, resulting in either
differential growth inhibition or promotion and thus bending in the appropriate direction.
Starch synthesis mutants are typically less gravitropic (Vitha et al., 2007), but this may
be a result of the disruption of their energy balance and thus a general inability to be
responsive to stimuli. Chlamydomonas do form starch granules in their chloroplast (Koo
et al., 2017), but these would be almost non-existent at the end of the night, which is just
when they are most responsive to ABA in terms of their upward movement. Thus,
although it cannot be ruled out, it would seem unlikely that this alga uses such a starch
granule sedimentation mechanism to sense gravity.
An alternative hypothesis is that the algae do not, in fact, perceive gravity at all,
but are simply light responsive. Algae and the cyanobacteria from which they evolved
are ancient organisms and evolved billions of years ago (Umen, 2014). Perhaps, then, in
considering how these aquatic organisms orientate themselves, one must look even

Chapter Three: The effect of plant hormones on C. reinhardtii growth and movement
124
further back in evolutionary history to the earliest forms of life. The current “best guess”
is that very simple life forms with a genetic code based on RNA originated 3.8 billion
years ago around alkaline thermal vents and used proton gradient mechanisms linked to
a rudimentary ATP synthase to generate energy (Jheeta, 2017; Lodish, 2000). Such
organisms may have moved up and down in the thermal incline using the change in pH
across their outer membrane to drive internal energy production. The obvious question is
why such very early, simple, single-cell life forms with no mechanisms of independent
movement would have had any gravity sensing mechanisms. Presumably, floating around
in the turbulence of the thermal vents, orientation with respect to gravity was not a
selective evolutionary pressure in such cells. At some point, life escaped from the thermal
vents and this required organisms to evolve alternative mechanisms for forming a proton
gradient across a membrane. In the plant lineage, the mechanism that evolved was
photosynthesis, which uses light to drive the movement of hydrogen ions across a
membrane (Lodish, 2000). Photosynthetic cyanobacteria, which are already complex at
a molecular level, may have evolved as early as 2.5 billion years ago (Schirrmeister et al.
2011). Of course, the prerequisite of the evolution of photosynthesis is that, first, an even
more ancient organism must have evolved a protein/pigment based mechanism which
enabled the perception of light (Leliaert, 2012). As soon as this occurred, such an
organism would have been able to orientate itself towards the light. In other words, it
would have been able to perceive which way was up and down without any inherent
mechanism of sensing gravity per se. Presumably, photosynthesis evolved in organisms
that lived at depth and were exposed to light levels considerably lower than that of
terrestrial plants today. As such organisms evolved motility and came closer to the
surface and encountered higher light intensities, they would have had to evolve

Chapter Three: The effect of plant hormones on C. reinhardtii growth and movement
125
mechanisms to protect their photosystems. Thus, carotenoid biosynthesis and the
inclusion of these photo-protective pigments in the photosynthetic machinery likely
evolved at this time (Takaichi, 2011). They would also have needed to develop stress-
related signalling mechanisms that enabled them to respond to diurnally increased light
intensities, and of course ABA synthesis is intrinsically linked downstream to that of the
carotenoids (Ruiz-Sola and Rodríguez-Concepción, 2012). The results of the experiments
presented here would certainly support the hypothesis that such organisms used ABA in
this context. The only intriguing molecular question remaining is how, in the absence of
gravity sensing, such organisms maintain a perception of which way is up in the complete
absence of light.
More interesting is the concept that, since land plants evolved from algae, ABA
may thus be directly involved in their apparent gravitropic responses. There is increasing
evidence that the terrestrial orientation of plants results as much from phototropism
(Vandenbrink et al., 2014) and hydrotropism (Shkolnik and Fromm, 2016) as it does from
gravitropism, and experiments conducted in the “microgravity” environment of the space
station have done much to separate the contribution made by each of these tropisms in
determining plant morphology (Poulet et al., 2016). The simple fact that seeds germinate
normally on the space station and show normal meristem cell arrangement during this
process would indicate that gravity is not required per se in the determination of plant
morphology. Perhaps, as in the algal experiments described here, ABA may modulate the
extent of the phototropic and hydrotropic responses exhibited by plants in a manner
dependent on the environmental conditions. Further studies with Chlamydomonas may
help to elucidate the interactive ABA signalling mechanisms that operate in algae, and

Chapter Three: The effect of plant hormones on C. reinhardtii growth and movement
126
thus terrestrial plants, to optimise their biochemistry and physiology in a changing
environment.

Chapter Four: Characterisation of the CrGRP1 gene and analysis of its expression
127
4 Chapter Four: Characterisation of the CrGRP1
gene and analysis of its expression
4.1 Introduction
In plants such as Arabidopsis thaliana, at least eight genes encode GRPs (Kim et al.,
2007). AtGRP7 is regulated in response to the circadian rhythm, stress and ABA (Kim et
al., 2008). There are strong indications that class IV GRP proteins play key roles in
adaptation to biotic and abiotic stress which include pathogens, osmotic and salt stress,
oxidative stress, and cold stress in plants such as A. thaliana (Fu et al., 2007; Kim et al.,
2010, 2008, 2007; Schöning et al., 2008, 2007; Staiger and Green, 2011).
Chlamydomonas appears to possess only a single class IV GRP which we have named
CrGRP1. C. reinhardtii use flagella to move to an appropriate environment including the
right distance from a light source. A study by Pazour et al. (2005), found that flagella
contain more than 600 proteins. One of them is CrGRP1 strongly suggesting that
CrGRP1 is involved in post-transcriptional control of its target mRNAs within flagella.
The class IV GRP proteins are a distinct subgroup within the heterogenous
superfamily of glycine-rich proteins (GRPs), exemplified by the well-studied circadian
A. thaliana protein AtGRP7 (Schmidt et al., 2010). The class IV glycine-rich proteins are
likely to work by regulating gene expression at multiple levels on their mRNA targets by
modifying alternative splicing, mRNA export, mRNA translation, mRNA localisation
and mRNA degradation (Kim et al., 2010).
The green alga C. reinhardtii is a well-studied unicellular flagellate alga. It grows
rapidly and is amenable to biochemical analysis, cell biology, and classical genetics, as
well as providing a useful tool for the study of basic biological processes. There is

Chapter Four: Characterisation of the CrGRP1 gene and analysis of its expression
128
considerable interest in developing it as a potential biofuel source in an economically
viable bioreactor (Siaut et al., 2011). However, before this can be achieved, it is important
to understand how the alga can adapt to biotic and abiotic stress.
It is hypothesised that the class IV GRPs are necessary for C. reinhardtii to adapt
to stress; this question has not yet been addressed. Analysis of the alga’s genome by
BLAST suggested the presence of a single class IV GRP gene which named CrGRP1.
To investigate the expression and function of CrGRP1, the following experiments were
undertaken:
1- Examined the expression of CrGRP1 in the Circadian cycle with and without
exposure to the phytohormone ABA.
2- Examined the expression of CrGRP1 in response to abiotic stresses such as H2O2.
induced oxidative stress and changes to light conditions during the circadian
rhythm.
3- Examined the expression of CrGRP1 following light-regulated movements of C.
reinhardtii after treatment with ABA.

Chapter Four: Characterisation of the CrGRP1 gene and analysis of its expression
129
4.2 The Sequence of CrGRP1
4.2.1 The CrGRP1 promoter and transcribed sequence
In A. thaliana there are at least eight genes that encode class IV GRPs. At the start of this
project, we wished to identify the class IV GRP gene sequences in algae. First, BLASTP
was used to search in the C. reinhardtii genome for class IV GRP proteins, and found a
single class IV GRP, which named CrGRP1. Figure 4.1 describes the CrGRP1 gene,
including its putative promoter, followed by its exons and introns. The promoter contains
several potential binding sites for known transcription factors, some of which are linked
to ABA signalling pathways. The size of the whole gene is ˜4801 bp including an
upstream region that contain a promoter transcription factors binding site. However, the
CrGRP1 gene size with the seven introns and exons is 2821bp while it is 1743bp for
mRNA after splicing.

Chapter Four: Characterisation of the CrGRP1 gene and analysis of its expression
130

Chapter Four: Characterisation of the CrGRP1 gene and analysis of its expression
131

Chapter Four: Characterisation of the CrGRP1 gene and analysis of its expression
132
Figure 4.1: Structure sequences for C. reinhardtii CrGRP1 and its promoter sequences and structure.
The pink, gray, yellow, turquoise and dark yellow shaded sequences represent potential transcription binding sites
in the promoter. DPBF=Dc3–promoter binding factor family, DRE=Dehydration-responsive element, ABRE/CAL=
ABA responsive elements / CAULIFLOWER, ABRE/GBOX = ABA‐responsive elements and ARE. The 5’UTR
and 3’UTR are highlighted in orange text. The open reading frame is highlighted in green. Intron sequences are
italicised in blue text. The light blue arrows denote primers which were designed across the various exons and the
red highlight labels are potential apolyadenylation site.

Chapter Four: Characterisation of the CrGRP1 gene and analysis of its expression
133
4.2.2 Exon and intron structure of the CrGRP1 transcript
The CrGRP1 gene appears to include seven exons and introns; their sequences are
presented in Figure 4.2 and the mapping of CrGRP1 exons to the mRNA is shown in
Figure 4.3. The splice sites are listed in Table 4.1
Figure 4.2: Exons and introns of the CrGRP1 gene. (A) Diagram showing the exon/intron structure of CrGRP1. (B) Capital letters in colours are the exon
sequences (exon1- exon7), and small lowercase letters in italics correspond intron sequences. A potential
poly(A) site is highlighted in yellow at the end of exon 7.
1 CTGTATTCCA ATCAAGTTTC CTGTTTGGTT TCCTGGTTTG AGTATCTAGG CGTGGTAGAC
61 GCCTTTTCCT TTCAGCAGGC CAATCACCTG CTTTCTCCGG TTCCCTTCCT CTCGGAACCA
121 TGTCGACCAA GCTCTACGTC Ggtgagcaat cataggcatg caactgggct gcgcgaagtc
181 gcgaaagctc gcgcgggaaa ggcggctggg gtcagccgcc tcaaaagcgc gcgctaaacc
241 tctcggaacg gcctcgcacc tcctctcact cgctggccgc agGCAACCTG TCGTGGGACA
301 CCCGCGCTGA TGACCTGACG AACCTGTTCA GCAAGTTCGG CGCCGTCGAG gtgagctttc
361 gtctcgatgg gcccgaactg catctcggtt cagctggagg gccactctca gggcttgtcg
421 cccggatccc cgaatatgca tgcactaatc gcaagtcttc atttgctttg ttccgcgcag
481 GATGCCTTCG TCGCCACCGA CCGCGAGACT GGCCGGTCGC GCGGCTTTGG CTTCGTGACT
541 CTCGAGGCCA ACGCTGCCAA GAGCGCCTGC T TGAGTGCG ACGGCACCGA GTTCATGGGC
601 CGgtaagttt caacttatgt cggaaacgtt tcggtattgg gcgccgcaga aagagatgca
661 ccatagatgc cttccgacac tcgtgaatct catgtatttg ctttgtattt caacttcctg
721 cagCACCATT CGCGTGAACG AGGCTACTCC CCTGGGCGAG CGCCCACCTG gtgagttcaa
781 ggctgccgag atcgcatgca actgtgtcta caaccccagg atacgctgat gcctggatac
841 ctgttgtgga ggctttgtat tctgacgcat agtattgcat cactccaatc aatgacggct
901 gctgcgggcg ttgggaagtt ccgaaatatc ctgctcgcca ggtatctccg tgcggcccgc
961 cactgaccgc tttcctccct tgtcctcttc ccttgatccc gagcagGCGG CCGCGGCGGT
1021 GGCCGTGGGT ACGGTGGTGG TGGCCGTGGC CGTGGCGGTG ACTACGGCGG CGGCCGTGGC
1081 GGCTACGGTG GCGGTGGCTA CGgtgagcct tgcgagtgtc ctgttccaag caaaccacct
1141 gtgcgcccaa ggatcatctc gagtccgaca cttcggtgta gcgcttcaca aggcttccaa
1201 gggcatccaa gcagtgttgt gcgagtgcct tacagcgtgt gtttcggaat gctgacatgt
1261 tctgtttgtg tgtagGTGGC GGCGGCTACG GTGGCGGCCG CGGCGGCGGC GGCTACGGCG
1321 GCGGTGGCAG CGGCGGCTAC GGCGGCGGCG GTTACGgtga ggccaacaca ggttcggccg
1381 attcttgcaa cgcgcgcttt gacgattggg tcacatctgc ttgatgttga gtcttgggtc
1441 gtgtgccaag ttgctgcaaa ggtttttttg ccaatgcctc tagtgttggt tgcttaaagt
1501 tgcctgacag gtttttcttc tgcctctctt tccagGCGGC AACGGTGGCG GCGGCTACGG
1621 TGCCGGTGGC GGCGGCTACG GTGGCGGCGG CTACTAAGCC CGCGGCTGAA GTCAGCGCAC
1681 GTCATGCCGC AGCACGCGGC ATGTTGAGGA GCCATCAAGG GAGCGTCAGA TTGGTGTAGG
1741 AGCAGTCTGC GAGACTTCTA AAGAGGCTTT GCAAGATCGT TGCCGAGGAC GCCGTGTACC
1801 GACGGGCGAT TTTCGCGTGC AAGCTTGAGT CATGAGACAA GGGCACGTTA GCGCGCGCCA
1861 GATGGTGCGT GCGGGCTCGG CGCGTTGGTA GTACAGGTGG CAAGCTTGCA CAACTTGTTT
1921 GGACGTCCAT CCACCGTATC AGTTCTACAA ACATAGCGTG GTGTGTTTCG GTCGAACGAA
1981 GAAACACATT ATGTGCTATG CATTGTTGTG CCGATTGCTG TGTGTGTACT GCGCATGTCT
2041 GCATGACAGA TGCAAAGCGC AAACTGCAGC CGGTGCTTTT GTGGTTCTGT GTATTGTGTG
2101 TTGGTTGATG AGGAAGTTGA GGGCAACAGG GGCGCAAGTC ACTCAGGCCC CGATGCCGAT
2161 TCCGTATCCT TTCCGGTGGT GGTTAGTGTT GCATACCGGT GTGTGTGTAG TTTGGTTTTG
2221 CGTTGGTTTG CACTTCTCAC ATGGTTTCTT CGTGTTTTCC AGTCGATGTT TGCCTGTATC
2281 CCCTATCCTC GAGCGCACCC TGGTCTGCAC GCCGTAAGCT GGGGCCCGGA AGCCTCTGCT
2341 GTGGCGGTGT GCGAGTCTCT TGGTTGCGTG CGGTTCCCGT AAGGCTTCCC GTGGTGGCGC
2401 AACACCGCGG CGACGTTTGC GTGGCGCGGG TGTGGTGAGG CTGCTGGATG GCGCCTCAAA
2461 CACTGGCGGC GCTTGGTGTT GTACCCTGTG CGCATCGGAT CCGAGTGTGT ATATGGCGAA
2521 TTACAGAACT ATGCCATATG CAACCACGTG CGGTGTACAT ACTCTGACCT TCTGCTTCGC
2581 ATGAGCGAGA GAGAGGACAC TGCCATGCTA CCCCAATTCA TCGGCTGGAA TTACGAATAC
2641 GTGTGGTGTT GCTTGATGCG TTACTCAAGT CCAATGGTGT TTCCAGTTCG GGTGCGAGAT
2701 ACGGGCGGCG CAAGTGGATT GACCCTTGCG TCTGCAAACG TACGAGCTAT CAGGTACTTG
2761 GTCCCCAGTC CGGAACTCAA TTGTCCGCTA CGGCTTCAAA ATACTGTCTC CCGGCTCTCT
2821 ACTATGGCTG TAAACTTAAA AGCGGAAA
A

Chapter Four: Characterisation of the CrGRP1 gene and analysis of its expression
134
Figure 4.3: Mapping of exons of CrGRP1 to the mRNA. (A) Mapping of exons of CrGRP1 to the mRNA. (B) The CrGRP1 mRNA sequence. Marked in green is
the 5’ UTR and in grey is the 3’ UTR. The other colours are the exons in the mRNA (exon1- exon7); start
and stop codons are also indicated, as well as the poly(A) signal.

Chapter Four: Characterisation of the CrGRP1 gene and analysis of its expression
135
3’SS 5’SS
Exon 1 NA TCGgtgagc
Exon 2 gcctcctctcactcgctggccgcagG GAGgtgagc
Exon 3 tcttcatttgctttgttccgcgcagG CCGgtaagt
Exon 4 tgctttgtatttcaacttcctgcagC CTGgtgagt
Exon 5 gtcctcttcccttgatcccgagcagG ACGgtgagc
Exon 6 gctgacatgttctgtttgtgtgtagG ACGgtgagg
Exon 7 gtttttcttctgcctctctttccagG NA
Table 4-1: Splice sites (SS) at the boundaries of CrGRP1 exons. The 3’ splice sites include
the putative pyrimidine tract. The exonic sequence is in capitals.
4.2.3 Features of CrGRP1 amino-acid sequence and alignment with homologues
across species
There are eight class IV GRP genes in A. thaliana. When comparing their sequences
with C. reinhardtii CrGRP1, the most similar is AtGRP7 (Figures 4.4 and 4.5). AtGRP7
is regulated in response to circadian rhythm, stress and ABA (Cao et al, 2006). Searching
for a similar class IVa GRP protein in a wide range of species revealed a very similar
class IVa GRPs protein in different species such as Oryza sativa OsGRP2, Xenopus laevis
CIRP-A (NP_001080069), human RBM3 (NP_006734), Camelina sativa CsGRP2a
(AFK08576) and CsGRP4 (XP_010512958.1) as shown in Figure 4.6). Class IVa GRP
proteins contain an RNA regulating motif (RRM) in the N-terminus and a glycine-rich
domain in the C-terminus. Moreover, similar class IVa GRPs were in other algal species
such as Volvox carteri f. nagariensis (XP_002947747.1), Polytomella sp. Pringsheim
(glycine-rich RNA binding protein - CAC86462.1) and Monoraphidium neglectum
(RNP-1 like RNA-binding protein- XP_013904303.1), Figure 4.7.

Chapter Four: Characterisation of the CrGRP1 gene and analysis of its expression
136
Figure 4.4: Amino-acid alignment of Arabidopsis thaliana AtGRP7 with C. reinhardtii
CrGRP1. The RNA Recognition Motif (RRM) with its characteristic RNP1 and RNP2 motifs is indicated; * denotes identity: denotes high conservation and weaker conservation.

Chapter Four: Characterisation of the CrGRP1 gene and analysis of its expression
137

Chapter Four: Characterisation of the CrGRP1 gene and analysis of its expression
138
Figure 4.5: Alignment of CrGRP1 with similar class IVa GRPs proteins in Arabidopsis
thaliana. Class IVa proteins contain an RRM in the N-terminus and a glycine-rich domain in the C-terminus. (A) The alignment includes A. thaliana proteins AtGRP2, AtGRP4, AtGRP6, AtGRP7; AtGRP8; and C.
reinhardtii CrGRP1; * denotes identity: high conservation and weaker conservation. (B) the phylogenetic
tree deduced from the alignment. The RNA Recognition Motif (RRM) with its characteristic RNP1 and
RNP2 motifs is shown. Protein sequences were aligned using MUSCLE and Neighbour-joining trees were
drawn in Paup 4.0. To test the confidence of the clustering, bootstrap values were determined with 500
replicates. The scale bar denotes number of amino acid substitutions per site.

Chapter Four: Characterisation of the CrGRP1 gene and analysis of its expression
139

Chapter Four: Characterisation of the CrGRP1 gene and analysis of its expression
140
Figure 4.6: Alignment of similar class IVa GRPs protein present in a wide range of species
across taxa. Class IVa proteins contain an RRM in the N-terminus and a glycine-rich domain in the C-terminus. (A) The alignment includes A.thaliana proteins AtGRP7, Oryza sativa OsGRP2; Xenopus laevis CIRP-A
(NP_001080069); human RBM3 (NP_006734); Camelina sativa CsGRP2a(AFK08576); Camelina sativa
CsGRP4 (XP_010512958.1) and C. reinhardtii CrGRP1, * denotes identity, high conservation and weaker
conservation. (B) The phylogenetic tree deduced from the alignment. The RNA Recognition Motif (RRM)
with its characteristic RNP1 and RNP2 motifs is shown. Protein sequences were aligned using MUSCLE
and Neighbour-joining trees were drawn in Paup 4.0. To test the confidence of the clustering, bootstrap
values were determined with 500 replicates. The scale bar denotes number of amino acid substitutions per
site.

Chapter Four: Characterisation of the CrGRP1 gene and analysis of its expression
141

Chapter Four: Characterisation of the CrGRP1 gene and analysis of its expression
142
Figure 4.7: Alignment of similar class IVa GRPs protein present in different algal species. Class IVa proteins contain an RRM in the N-terminus and a glycine-rich domain in the C-terminus. (A)
The alignment includes Volvox carteri f. nagariensi s(XP_002947747.1), Polytomella sp. Pringsheim
(glycine-rich RNA binding protein - CAC86462.1), Monoraphidium neglectum (RNP-1 like RNA-binding
protein- XP_013904303.1) and C. reinhardtii CrGRP: * denotes identity: high conservation and weaker
conservation. (B) The phylogenetic tree deduced from the alignment. The RNA Recognition Motif (RRM) with its characteristic RNP1 and RNP2 motifs is shown. . Protein sequences were aligned using MUSCLE
and Neighbour-joining trees were drawn in Paup 4.0. To test the confidence of the clustering, bootstrap
values were determined with 500 replicates. The scale bar denotes number of amino acid substitutions per
site.
4.3 Expression of CrGRP1
4.3.1 Expression of CrGRP1 during the Circadian cycle.
Cells of C. reinhardtii wild‐type strain, CC1021 (mt +) were grown as described in
Chapter 2. Cells were harvested every hour with and without 50µM ABA treatments and
centrifuged at 4°C for ten minutes; cell pellets were stored at -80°C for RNA extraction.
cDNA was synthesised from RNA extracted from mid-log growth phase and used for
PCR amplification using CrGRP1-specific primers. Primers to CrGRP1 were designed
across several exons (Fig 4.1). Consistent amplification of the Chlamydomonas beta
subunit-like polypeptide (CBLP) housekeeping gene confirmed that cDNA synthesis had
worked, giving an amplicon of 187bp (Fig 4.8). Figure 4.1 B shows amplification of
ROC15, a circadian gene, giving as expected an amplicon of 142bp (Mittag et al., 2014).
The successful amplification of CrGRP1 formally confirmed that the gene expresses a
viable mRNA. Samples which were positive for the expression of CrGRP1 using the
primer combination 1F/2R yielded the expected amplicon size of 89bp (Fig 4.8) in
samples that were treated with 50M ABA, whereas in untreated samples the expression
of CrGRP1 was a bit lower during the daylight phase and started higher at the end of
daylight and during the dark phase (Fig 4.8). These data suggested that CrGRP1 is
expressed in a circadian rhythm.

Chapter Four: Characterisation of the CrGRP1 gene and analysis of its expression
143

Chapter Four: Characterisation of the CrGRP1 gene and analysis of its expression
144
Figure 4.8: Expression analysis of CrGRP1 in the Circadian rhythm in C. reinhardii. PCR products from ABA treated (50 µM) and untreated culture were resolved on 1xTAE, 1.2% (w/v) agarose gel electrophoresis and visualised under UV light following EtBr
staining. Molecular weight markers (Lane M – 100 bp DNA ladder) were used to confirm amplicon sizes, n=3 replicates. Lanes 1-8 contain the representative mRNA levels
from a circadian experiment on the light condition at 2h, 4h, 6h, 8h,10h, 12h, 14h and 16h. Lane 9-12 represents the same as above from a circadian experiment on the dark
condition at 18h , 20h , 22h and 24h. Lane C: control without cDNA added.

Chapter Four: Characterisation of the CrGRP1 gene and analysis of its expression
145
4.3.2 Expression of CrGRP1 in response to abiotic stress
Expression of CrGRP1 following hydrogen peroxide (H2O2)-induced
oxidative stress
Cultures of C. . reinhardtii wild‐type strain, CC1021 (mt +) were grown and subjected to
oxidative stress. For hydrogen peroxide (H2O2) stress treatment, cells were directly
cultured in TAP medium with H2O2 at different concentrations (0.1 µM, 1 µM, 10 µM,
100 µM, 0.1 mM, and 1.0 mM). Cells were harvested from mid-log growth phase and
centrifuged at 4 °C for 10 min for RNA extraction. First strand cDNA was synthesised
from C. reinhardtii culture that had been treated with different concentrations of H2O2.
To amplify CrGRP1, a range of primer combinations were tested including 1F-2R
primers (89 bp amplicon), 1F-3R primers (190 bp) and 72F-R primers (224 bp); amplicon
sizes were as expected (Fig 4.9 B, C, and D). Two bands were also produced in panel B.
The band at 100 bp is the correct size for RNA in contrast to the other band of 250 bp
which could be the RNA with intron included. Panel C shows three bands. The first one
was at 190 bp confirms that the CrGRP1 was expressed at the correct size consistent with
spliced mRNA. The other band would be consistent with CrGRP1 that was expressed as
the mRNA retaining an intron as the splice was at size 500bp, but the identity of the 700
bp band is not known yet. However, it proved difficult to amplify the whole CrGRP1
mRNA with primers exon 1F and 72R, with an expected amplicon size of 1743bp in
treated cells (Fig 4.9, E), whereas the full-length sequence could be amplified in untreated
cells (Lane 1, Fig 4.9, E). Both large amplicons, when sequenced separately, appeared to
contain the exact same, full length CrGRP1 amplicon, suggesting that the double band at
this position is a gel running artefact (see Appendix 6). The larger amplicons in panels B
and C, state result of the sequencing was also sequenced (see Appendix 6).

Chapter Four: Characterisation of the CrGRP1 gene and analysis of its expression
146
Figure 4.9: Expression of CrGRP1 in response to exposure to H2O2. Total mRNA was extracted as earlier described. PCR output was performed with appropriate primers after
cDNA synthesised. Amplicons were resolved in 1.2 %(w/v) agarose gel electrophoresis and viewed under
UV light with ethidium bromide staining. n=3 replicates. Untreated cells express the full-length transcript
(E) also, with all primers there was at least one band of the correct size. When cells were treated with

Chapter Four: Characterisation of the CrGRP1 gene and analysis of its expression
147
H2O2 the full-length transcript disappeared (red circle). The 3´ end of the transcript is still there (D). When
H2O2 levels increased the result was a reduction in CrGRP1 expression (B &C). A, B, C, D and E: Lane
M, 100 bp DNA ladder; Lane 1, Untreated; Lane 2, treated with 1mM H2O2; Lane 3, 0.1mM H2O2; Lane
4, no template control.
The expression of CrGRP1 in response to altering light conditions through the
light/dark cycle.
The light/dark cycle was modified to 8h light and 16 h dark simulating short days. Cells
were harvested every 2 hours, RNA was isolated, and cDNA was synthesised. ROC15 is
a circadian gene (Mittag et al., 2014); it was amplified giving an expected amplicon of
142 bp (Fig 4.10 B); and as expected its expression peaked during light conditions
(Mittag et al., 2014). CrGRP1 expression (190 bp amplicon) similarly peaked during the
day. There was no apparent expression of the CrGRP1 gene during the night (Fig 4.10
A). These data strongly suggest that CrGRP1 is expressed in a circadian rhythm,
comparable to its A. thaliana homologue AtGRP7.
Figure 4.10: mRNA levels of CrGRP1 after changing the light conditions through the
light/dark cycle. A, B and C: Lanes 1-2-3 represent the cDNA from a circadian experiment on the light condition (day) at 9 h, 13 h, 15 h. Lanes 4-5-6 represent the cDNA from a circadian experiment on the dark condition (night)
at 17 h, 19 h, 21 h. Lane 7, control without cDNA and Lane M, 100 bp DNA ladder. n=3 replicates.

Chapter Four: Characterisation of the CrGRP1 gene and analysis of its expression
148
4.3.3 Expression of CrGRP1 in relation to ABA treatment and C. reinhardtii
movement.
An aliquot of 25 ml (1×10⁶-2×10⁶ cells/mL) of cell suspension was transferred to glass
measuring cylinder and treated with 50 µM of ABA. Cylinders were then placed at 25ºC
either in the dark or under overhead illumination at 1660 Lux for 50 min. After an
incubation period (50 min) the A750nm of the culture obtained at various depths from the
surface and the cylinders were photographed. This experiment was done at different time
points throughout the culture period such that cells in the group labelled A were harvested
after 1h in the photoperiod (Fig. 4.11). In B cells were harvested after 8h in the
photoperiod representing the middle of the light phase; C after 15 h in the photoperiod;
D harvested after 1h in the dark; E after 4 h in the dark representing the middle of dark
phase and F after 7h in the dark. Samples were taken from each of these time points, and
then treated for an hour with ABA either in dark or light conditions. RNA extraction was
performed from cells in the logarithmic phase of growth and then frozen at -80 °C. This
was followed by cDNA synthesis and PCR analysis of CrGRP1 expression.
Results suggest an apparent decrease of CrGRP1 expression in the ABA-treated
group during the photoperiod compared to untreated samples (Fig 4.11). In contrast,
CrGRP1 levels appeared to be unaffected during the dark except the middle of the dark
period when mRNA levels did appear decreased. When algae were taken from the middle
of the dark phase and placed into the light phase, CrGRP1 expression was restored. When
ABA treated cells were placed either in the light or dark, CrGRP1 expression decreased
(Fig 4.11E). Similarly, when untreated cells grown in dark conditions, CrGRP1
expression decreased as well. Together the data suggest that ABA reduces the expression
of CrGRP1 during the photoperiod and inhibits the expression of CrGRP1 in the middle
of the dark phase.

Chapter Four: Characterisation of the CrGRP1 gene and analysis of its expression
149
Figure 4.11: Expression of CrGRP1 following ABA treatment at different time points in the
circadian cycle. Samples were either treated with or without ABA. Amplicons were resolved in 1.2 %(w/v) agarose gel
electrophoresis and viewed under UV light post ethidium bromide staining. n=3 replicates. A, B, C, D, E
and F: Lane M, 100 bp DNA ladder; Lane 1, untreated in light; Lane 2, treated with ABA in light; Lane
3, untreated in the dark; Lane 4, treated with ABA in the dark and Lane 5, no template control.

Chapter Four: Characterisation of the CrGRP1 gene and analysis of its expression
150
4.4 Discussion
4.4.1 Analysis of the expression of CrGRP1 during the Circadian cycle
The closest to C. reinhardtii CrGRP1 sequence is that of A. thaliana AtGRP7. AtGRP7
is regulated in response to circadian response, stress and ABA. Frequently, C. reinhardtii
cells use flagella to move to an appropriate environment including the right distance from
a light source. The expression of CrGRP1 appears to be circadian regulated. CrGRP1
showed lower expression during the day phase and highest expression during the dark
phase (Fig 4.8), similar to the established circadian gene ROC15. In higher plants such
as A. thaliana AtGRP7 was the first gene encoding an RNA-binding protein to be
considered circadian (Schmidt et al., 2010). The authors noted that the protein level was
high during the day, but not during the night. In the present study, it was observed that
the expression of CrGRP1 was high during the day and not during the night.
Additionally, there is a functional relationship between ABA and GRPs in plants.
When looking at the expression of AtGRP7 and AtGRP2 and their knockouts, both are
expressed in contexts in which ABA plays important roles, for instance, plants do not
germinate very well in an AtGRP7 knockout (Kim et al., 2008 ; 2007). However, AtGRP2
knockouts germinate very easily with ABA, and the phenotype looks like an ABA
signalling pathway mutant (Kim et al., 2007). The evidence from A.thaliana suggests
that CrGRP1 may be involved in the ABA-mediated movement in response to
environmental cues.

Chapter Four: Characterisation of the CrGRP1 gene and analysis of its expression
151
4.4.2 Analysis of the expression of CrGRP1 in response to abiotic stress
Expression of CrGRP1 following hydrogen peroxide (H2O2)-induced oxidative
stress
It was observed that H2O2 alters CrGRP1expression, presumably, by causing oxidative
stress. C. reinhardtii cultures were treated with different concentrations of H2O2
(0 mM to 1.0 mM). The results show that the untreated cells express the full-length
transcript (Fig 4.9). Also, using all primers, it obtained at least one band of the correct
size. In algae treated with H2O2, the full-length transcript apparently decreased. However,
the 3´ ends of the transcript were still detectable. When H2O2 concentration was increased,
the result was a reduction in CrGRP1 expression (Fig 4.9 B & C). Amplification of the
housekeeping CBLP gene confirmed that cDNA synthesis had worked in each sample.
Also, the use of –RT (no reverse transcription) controls, and the fact that CBLP primers
are in adjoining exons, demonstrates that the signals were not due to contaminating
genomic DNA. In the event of genomic DNA contamination, the band size of CBLP
would have been bigger, 335 bp but instead, it was observed that the processed product
was 187bp representing processed mRNA (Fig 4.9 C). Two bands were observed in
Figure 4.8 B for CrGRP1. The band at 100 bp is the expected size for mRNA, in contrast
to the other band measuring 250bp which may represent an mRNA with intron retention.
Also, Figure 4.9 C shows three bands. The first one at 190 bp confirms that the CrGRP1
was expressed at the correct size consistent with spliced mRNA. The second band was
confirmed by sequencing to be an intron-containing CrGRP1 mRNA with amplicon size
of 500 bp, whereas the third band with amplicon size of 700 bp could not be sequenced
(see Appendix 6 for sequence data). The 700 bp band could be a PCR artefact, or a non-
specific band, or potentially an additional transcript expressed in response to H2O2 which
would need further investigation. The data suggest that intron sequences are being

Chapter Four: Characterisation of the CrGRP1 gene and analysis of its expression
152
retained in CrGRP1mRNA; this might be a form of regulation of CrGRP1 expression.
Another possibility is that H2O2 causes degradation of CrGRP1 transcript, perhaps
through cleavage at a specific site. In summary, it appears that CrGRP1 expression is
regulated post transcriptionally, for example by regulating rates of intron retention.
The expression of CrGRP1 in response to altering light conditions through the
light/dark cycle.
Next, the expression of CrGRP1 was examined after changes in light conditions through
the light /dark cycle. CrGRP1 expression appeared clearly circadian on a diurnal basis.
Amplification of CrGRP1 gene mRNA from mid-log phase sample exposed to light/dark
cycles shows that the CrGRP1 gene is expressed in light conditions (day) and not as much
in the dark (night) (Fig. 4.10 A). The ROC15 gene (circadian gene) was also expressed
in the light, not in the dark confirming that the CrGRP1 was expressed in a similar
circadian rhythm.
There are two circadian rhythms in C. reinhardtii through the night, the first one
is called chemotaxis (to ammonium); it allows C. reinhardtii to find and store nutrients
when solar energy is not available (Straley and Bruce, 1979). Another circadian rhythm
in C. reinhardtii that peaks during the night is the ability of the cells to adhere to a glass
surface (Mittag et al, (2005). ABA treatment significantly decreased the movement of C.
reinhardtii whose flagella contain more than 600 proteins, and interestingly, one of which
is CrGRP1. This suggests that ABA may be involved in the regulation of CrGRP1
expression which then affects C. reinhardtii mobility in response to light stimuli. It is
hypothesised that CrGRP1 might be binding to key transcripts in the flagella, regulating
their translation in response to changing environmental conditions (including day and
night cycles).

Chapter Four: Characterisation of the CrGRP1 gene and analysis of its expression
153
4.4.3 Analysis the expression of CrGRP1 in relation to ABA treatment and C.
reinhardtii movement.
Finally, when the expression of CrGRP1 was assessed during the algal movement
experiments, it appeared to decline to the greatest extent when ABA-induced the greatest
upward movement of the algae. Algal cells exposed to intense light move down the vessel
and stay there. However, when algae were treated with ABA, algal cell movement was
reduced. The suggests that ABA affects flagella movement which led to a decrease in the
movement of C. reinhardtii cells and a possible decrease in CrGRP1 mRNA levels (Fig
4.11) although, when looking at the expression of CrGRP1 in the control samples , they
all appeared similar (Fig 4.11A, B and C). Interestingly, in the middle of the dark phase,
ABA appeared to inhibit the expression of CrGRP1 only in the light. When the samples
from the middle of the dark were returned to light, the expression was reversed to normal,
but when treated with ABA and returned to light or dark condition, CrGRP1 expression
was inhibited by ABA.
An example that validates these findings is the expression of MhGR-RBP1, which
is a class IVa GRP in apple trees that was highly expressed in the leaves when compared
with shoots and roots. When trees are treated with ABA for 24h, the expression of MhGR-
RBP1 decreases (Wang et al., 2012). In addition, in A. thaliana AtGRP7 appears to play
a key role in the regulation of ABA and stress response. The expression of AtGRP7 in
Arabidopsis thaliana was repressed when treated with ABA and NaCl or mannitol (Cao
et al., 2006). Furthermore, when comparing the transcript levels in the mutants of RD29A
and RAB18 that have ABA-induced and stress-induced genes with a wild-type plant, the
transcript levels were higher in the AtGRP7 knockout plants than in wild-type plants (Cao
et al., 2006). Kim et al. (2008) extended these findings and reported that after using
another type of AtGRP7 knock-out, the mutants were able to germinate and survive on

Chapter Four: Characterisation of the CrGRP1 gene and analysis of its expression
154
both media with high concentrations of NaCl or mannitol in comparison to either wild-
type or overexpressed plant. Another study by Kim et al. (2007) found that the seed
germination was affected by AtGRP2 under salt stress but not in the osmotic stress. Either
in presence or absence of AtGRP2, AtGRP2 did not influence the growth of seedlings and
plant development. This suggests that AtGRP2, in contrast to AtGRP7, is independent of
the ABA pathway. The evidence indicated that AtGRP2 and AtGRP7 are involved in
response to similar abiotic stresses, but their function may be antagonistic. Since CrGRP1
is most closely related to AtGRP7, it is hypothesised that in the middle of the dark period
when CrGRP1 levels drop, they release bound mRNAs. As a result, if CrGRP1
disappears, then target mRNAs might be available for translation. If CrGRP1 is not
released, it would continue to repress the translation of the mRNAs it is bound to and
ABA will be less effective, the light response will be more intense, and the algae will
move down to the bottom of the growth vessel to avoid light stress. In summary the data
presented here strongly suggest that ABA helps to regulate CrGRP1 expression; future
experiments will address the underlying mechanism.

Chapter Five: Functional analysis of CrGRP1
155
5 Chapter Five: Functional analysis of CrGRP1
5.1 Introduction
In the previous chapters, data indicated that ABA regulates the movement of C.
reinhardtii in the water column to position itself to optimise photosynthesis, and that
CrGRP1 may regulate the ABA-induced upward movement of the algae, presumably by
binding mRNAs required for this response. Additionally, CrGRP1 expression was
observed to follow a Circadian rhythm. Together these findings suggest that there is a
relationship between ABA signalling pathways and CrGRP1 function. Therefore, in this
chapter, we aimed to investigate the effect of overexpressing or silencing CrGRP1 in
transgenic lines on ABA-mediated movement responses.
There are several techniques that have been developed for the introduction of
foreign DNA into C. reinhardtii such as glass beads and vortexing techniques (Kindle,
1990), electroporation (Shimogawara et al., 1998) and Agrobacterium-mediated
transformation (Kumar et al., 2004). The electroporation technique was the method of
choice here.
The aims of this chapter were:
1. To determine the effect of the overexpression with and without V5 6×His tag and
knock-down of CrGRP1 on overall phenotype. The V5-His tag allows detection and
subsequent purification of the CrGRP1 protein.
2. To determine the effect of overexpression and knock-down of CrGRP1 on the
movement of C. reinhardtii in response to ABA.

Chapter Five: Functional analysis of CrGRP1
156
5.2 Results
5.2.1 Generation of a pChlamy4 - CrGRP1 construct
The restriction-cut CrGRP1 open reading frame was cloned into pChlamy4 using T4
ligase. The cloning was carried out by Dundee Cell Products Ltd, James Lindsay Place,
Dundee Technopole, Scotland U.K. The overexpression with and without V5 6×His tag
and antisense constructs were transformed into TOP10 chemically competent E. coli
cells. Transformations were plated onto LB plates containing 100 μg/mL of ampicillin
and grown overnight at 37˚C. Colonies were then screened the following day by
restriction digestion of their DNA using EcoRI and XbaI for overexpression, EcoRI and
XhoI for overexpression plus a V5-6×His tag, BamHI-Hf and XhoI for the antisense
construct. Recombinant plasmids were selected for further work. Restriction cut
recombinant plasmids were electrophoresed in a 1% agarose 1xTAE gel for visualisation
(Figure 5.1). The band of ~3640 bp represents the expected length of the vector; the
various constructs are shown in Figures 5.2 - 5.5. A band at ~480bp confirmed the
presence of the CrGRP1 open reading frame (5.1).

Chapter Five: Functional analysis of CrGRP1
157
Figure 5.1: Restriction digest confirming the presence of the CrGRP1 ORF in the pChlamy4
vector. Electrophoresis data obtained by digestion of recombinant E. coli plasmid pChlamy4 - CrGRP1. EcoRI and XbaI for overexpression, EcoRI and XhoI for overexpression V5-6×His tag, BamHI-Hf and XhoI for
the antisense. The CrGRP1 ORF corresponds to a band of ~480bp (red circles). Markers (1 kb ladder) are
shown on the left.

Chapter Five: Functional analysis of CrGRP1
158
Figure 5.2: Map of vector pChlamy_4. This vector pChlamy4 contains a C. reinhardtii Hsp70A/RbcS2 chimeric promoter and a C. reinhardtii
RbcS2 terminator, both cloned into the polylinker of the C. reinhardtii vector pSP124S.

Chapter Five: Functional analysis of CrGRP1
159
Figure 5.3: Over-expression vector construct. The CrGRP1 ORF was amplified from C. reinhardtii genomic DNA by PCR. The product was then purified, and adapters ligated to the ORF. This fragment was then ligated into the vector via EcoRI and
XbaI restriction sites. The cloning was carried out by Dundee Cell Products Ltd, James Lindsay Place,
Dundee Technopole, Scotland U.K.

Chapter Five: Functional analysis of CrGRP1
160
Figure 5.4: Over-expression with V5-6×His tag vector construct. The CrGRP1 ORF was amplified from Chlamydomonas reinhardtii genomic DNA by PCR. The product
was then purified, and adapters ligated. The fragment was then ligated into the vector via EcoRI and XhoI
restriction sites. The cloning was carried out by Dundee Cell Products Ltd, James Lindsay Place, Dundee Technopole, Scotland U.K.

Chapter Five: Functional analysis of CrGRP1
161
Figure 5.5: Antisense vector construct. The CrGRP1 ORF was amplified from C. reinhardtii genomic DNA by PCR. The product was then
purified, and adapters ligated. The fragment was then cloned in the inverse orientation via BamHI-Hf and
XhoI restriction sites. The cloning was carried out by Dundee Cell Products Ltd, James Lindsay Place,
Dundee Technopole, Scotland U.K.
To check the orientation in which the CrGRP1 ORF was incorporated into the
pChlamy4 vector, plasmids from this colony were cut with the Sca1 restriction enzyme.

Chapter Five: Functional analysis of CrGRP1
162
The electrophoresis data (Figure 5.6) confirmed the correct orientation of the ORF;
correctly oriented clones were chosen for transformation into C. reinhardtii.
Figure 5.6: Restriction digest of CrGRP1 using Sca1 restriction enzyme. Electrophoresis of recombinant E. coli plasmid (1842-43-44) following linearisation with Sca1 to check
the orientation in which the CrGRP1 ORF was incorporated into the pChlamy4 vector. Sca1 digestion of
recombinant colony produced a band of ~4120 bp confirming that these recombinant plasmids carried the CrGRP1 ORF in the correct orientation. Marker bands (1 kb ladder) are shown on the left.
5.2.2 Genetic transformation of C. reinhardtii with the pChlamy4 constructs
The expression construct pChlamy4 - CrGRP1, linearised with Sca1, was transformed
into C. reinhardtii 137C cells by the electroporation method. C. reinhardtii strain 137C
cultures were grown to early log phase in TAP medium. Cells were collected by

Chapter Five: Functional analysis of CrGRP1
163
centrifugation and resuspended in transformation medium containing linearised
pChlamy4 - CrGRP. Following electroporation (as described in 21.1.2), cells were
incubated at 26°C in constant light for ~14–16 hours. Cells were plated on TAP agar
containing 5μg/mL of zeocin. After 2-3 weeks of growth, zeocin resistant colonies
appeared in each case (Figure 5.7).
Figure 5.7: Transformed C. reinhardtii colonies after three weeks of growth. Only cells which received and integrated the ble zeocin resistance gene grew to form colonies. A. No
plasmid zeocin control. B. No plasmid control with no zeocin. C. Empty plasmid in the TAP- zeocin
agar. D. Overexpression plasmid in the TAP- zeocin agar. E. Overexpression with V5 6-his tag plasmid
in the TAP- zeocin agar. F. Antisense plasmid in the TAP- zeocin agar.

Chapter Five: Functional analysis of CrGRP1
164
Transgenic algae were grown (at 25 ºC,16 h photoperiod,133 rpm, at 980 Lux) in
TAP media with and without 2.5 μg/mL of zeocin until mid-log-phase (A750 = 0.3).
Growth was measured by following A750 nm. Figure 5.8 shows that transgenic C.
reinhardtii cells did not grow well in media that contained zeocin when compared with
those carrying pChlamy4 only. However, they grew normally in TAP media without
zeocin.
Figure 5.8: Growth of recombinant C. reinhardtii in TAP media with or without zeocin. 25 ml of C. reinhardtii culture at the stage of inoculation were grown in (25 ºC, 16 h photoperiod, 133 rpm,
at 980 Lux) in TAP medium. Cultures were treated without and with 2.5 μg/mL of zeocin (final
concentration in media). Growth was measured by following A750 nm. A. Non-recombinant plasmid. B.
Overexpressed plasmid. C. Overexpression plasmid with V5 6-his tag. D. Antisense plasmid.
5.2.3 Effect of ABA on the movement of transgenic C. reinhardtii
Transgenic C. reinhardti were grown in standard conditions (25ºC, 133 rpm, 16 h
photoperiod at 980 Lux) in TAP media until A750 = 0.3. The effects of ABA on movement
in dark conditions were examined; 25 ml aliquots were transferred to a glass measuring
cylinder and either 125 µl of ethanol (control) or 125 µl of 10 mM ABA in 100 %(v/v)
ethanol was added. The cylinders were then placed at 25 ºC in the dark for 50 min. Most

Chapter Five: Functional analysis of CrGRP1
165
of the cells moved up in control conditions. Algae containing overexpression plasmid
(with and without V5 6 his tag) moved up, whereas they moved down in the case of algae
carrying the antisense plasmid (Figure 5.9).
Figure 5.9: The movement of recombinant C. reinhardtii cells is differentially affected by
ABA. After growth in TAP media until A750 = 0.3, cultures were treated with 50 µM of ABA in the dark for
50min. Images of the cylinder were taken immediately after the 50 min incubation. A. Empty plasmid; B.
Overexpression; C. Overexpression with the V5 6-his tag plasmid; D. Antisense plasmid.

Chapter Five: Functional analysis of CrGRP1
166
5.3 Discussion
In order to determine the potential role of the CrGRP1 gene in ABA and light mediated
movement, recombinant pChlamy4 constructs were made. The non-recombinant,
overexpression of CrGRP1, overexpression of CrGRP1 with a V5 6-his tag and an
antisense plasmid were transformed into algae. In addition, the expression construct
pChlamy4 - CrGRP1 was linearised with Sca1 and transformed into C. reinhardtii 137C
cells by electroporation. Following electroporation, cells were incubated at 26°C in
constant light for ~14–16 hours. Cells were plated on TAP agar containing 5μg/mL of
zeocin. After 2-3 weeks of growth, zeocin resistant colonies were apparent for each
plasmid (Figure 5.7). However, the number of colonies were different for each plasmid;
the numbers of colonies carrying the overexpression plasmid were more than those
transformed with the antisense construct. These observations suggest that the
transformation of C. reinhardtii cells was successful. When the transformed algae were
grown in standard conditions (at 25 ºC,16 h photoperiod,133 rpm, at 980 Lux) in TAP
media with 2.5 μg/mL of zeocin, C. reinhardtii cells did not grow well, compared to cells
growing in TAP media without zeocin (Fig 5.8). It is likely that transformed algae cells
can not tolerate zeocin in growth media and it appeared that zeocin affected chlorophyll
levels. Unfortunately, due to the lack of time, it was not possible to verify the
transformations; however, work is currently in progress to address this.
The effects of ABA on movement in dark conditions were also examined. Most of
the cells moved up in standard conditions. Transformants containing the overexpression
plasmid, with and without V5 6 his tag, moved up, while all the algae moved down when
transformed with the antisense plasmid (Figure 5.9). These data suggest that the
presumed knock-down of CrGRP1 prevents algae from moving up and instead they move

Chapter Five: Functional analysis of CrGRP1
167
down. A study by Pazour et al. (2005) found that flagella contain more than 600 proteins;
including CrGRP1.
In addition, Ciuzan et al. (2015) reported that in plants such as A. thaliana, the
glycine-rich RNA-binding proteins are essential for plants’ response to biotic and abiotic
stresses. The phenotypic characteristics of A. thaliana knock-out mutants of genes that
encode the glycine-rich proteins AtGRP2 and AtGRP7 were studied, comparing them to
knock-out mutants of ABI3, ABI4 and ABI5, genes linked to cell signalling through ABA.
Results confirm that the abscisic acid insensitive (ABI) mutants developed faster than
wild-type plants. In contrast, the glycine-rich protein knock-out mutants (grp7-1 and
grp2) did not grow as well, suggesting an involvement of these genes in key early
developmental processes. Another study looked at the effect of overexpression of
AtGRP7 on seed germination, seedling growth, and stress tolerance under high salinity,
drought, or cold stress conditions. It appears that AtGRP7 affects the growth and stress
tolerance of A. thaliana. It also appears to confer freezing tolerance, particularly via the
regulation of stomatal closing and opening by the guard cells (Kim et al., 2008). As
discussed in Chapter 3, the CrGRP1 gene is closely related to AtGRP7; therefore, it is
reasonable to speculate that the CrGRP1 gene in algae has similar roles in the response
to biotic and abiotic stresses, including in processes regulated by ABA.
Although much remains to be done, including verification of the transgenic lines,
and ideally the generation of a CrGRP1 knock-out as well, and using a specific antibody
to detect CrGRP1, work presented in this chapter has at least laid the foundations for a
full functional characterisation of the CrGRP1 gene.

Chapter Six: General Discussion and Conclusion
168
6 Chapter Six: General Discussion and Conclusion
6.1 Summary of key findings and main conclusions
Currently, the culturing of microalgae has become a subject of interest as a result of
shrinking supplies of fossil fuels and the limited amount of agricultural land that supplies
the competing needs of food production and cultivation of plants for technical products
such as biodiesel and ethanol (Douskova et al., 2009). Moreover, it could be used for
other applications such as food and public health as well as in pharmaceutical industries
Microalgae also offer very interesting possibilities for sewage and wastewater treatment
and CO2 sequestration (Douskova et al., 2009).
Before culturing algae on an industrial scale, understanding how algae adapt to
biotic and abiotic stress is critical. In plants, some hormones play important roles in the
many physiological processes, one of them is ABA (Kim et al., 2008). Moreover, GRP
proteins play key roles in the adaptation to biotic and abiotic stresses in higher plants
such as A. thaliana. Sequencing of the C. reihardtii genome has shown that this motile
flagellate and freshwater photosynthetic green alga is also capable of synthesising and
responding to ABA. Moreover, C. reinhardtii expresses at least one conserved member
of the class IV GRPs which are involved in stress adaptation, and circadian rhythms etc.
Therefore, the aims of this study were to investigate the role of plant hormones in C.
reihardtii in response to stress and to investigate the expression and function of the class
IV GRP RNA binding proteins in stress adaptation in C. reinhardtii.
This study confirmed that plant hormones, used in this study at different
concentrations, did not affect the growth rate of C. reinhardtii. Additionally, these
hormones did not affect the movement of C. reinhardtii with the exception of ABA. ABA

Chapter Six: General Discussion and Conclusion
169
led to the upward movement of algae in the dark which was dependent on their sampling
time over the 24h cycle. It was observed that algae cells move towards ABA in the light
and away in the dark. This suggests that ABA may have a role in regulating the direction
and orientation of movement in C. reinhardtii. Overall, ABA may modulate the extent
of the phototropic and hydrotropic responses exhibited by plants dependent on the
environmental conditions. More research with C. reinhardtii may help to explain the
interactive ABA signalling mechanisms that operate in algae and, by implication,
terrestrial plants to optimise their biochemistry in a changing environment.
In plants, ABA changes gene expression (Cutler et al., 2010). Consequently, this
study explored the expression of CrGRP1 in the circadian cycle with and without
exposure to 50µM ABA. It also examined the expression of CrGRP1 in response to
abiotic stress such as H2O2 - induced oxidative stress and changes to light conditions
during the circadian rhythm and examined the expression of CrGRP1 following light-
regulated movements of C. reinhardtii after treatment with 50M ABA. Analysis of
CrGRP1 showed that it was expressed as a function of the circadian rhythm. From the
bioinformatic analysis, data suggested that CrGRP1 is closely related to AtGRP7, itself
an circadian regulated gene. CrGRP1 expression and pre-mRNA processing was affected
by H2O2 treatment; when cells were treated with H2O2, CrGRP1 was expressed as
normal. However, it was not possible to amplify the full-length transcript from the
untreated control culture. Analysis of CrGRP1 in response to altering light conditions
through the light/dark cycle showed that the CrGRP1 gene did not display any expression
during the dark while it was expressed very well in the light. Furthermore, ABA reduced
the expression of CrGRP1 during the photoperiod and inhibited the expression of
CrGRP1 in the middle of the dark phase.

Chapter Six: General Discussion and Conclusion
170
In brief, the results presented in this thesis suggest that: i) CrGRP1 is a bona fide
gene, it describes its sequence and can confirm that it expresses mRNA; ii) the
transcript’s processing (pre-mRNA splicing) might be regulated specifically through
intron retention; and it describes its expression in the circadian rhythm and in response
to ABA and abiotic stress; iii) for the first time it reports that ABA has a clear role in the
regulation of algal movement particularly in response to light stimuli; and that iv)
CrGRP1 may negatively regulate the ABA-induced upward movement of the algae,
presumably by binding mRNAs in the flagellum and associated structures required for
this response.
Flagella contain more than 600 proteins, one of them is CrGRP1 (Pazour et al.,
2005). The responses to ABA may involve regulation of CrGRP1 expression. Therefore,
the effect of overexpressing or silencing CrGRP1 in transgenic lines on ABA responses
was investigated. The initial, preliminary results showed that most of the cells moved up
in both overexpression vector transformants, with and without V5 6 his tag, whereas in
contrast, all algae moved down when transformed with the antisense. These results are
only preliminary due to time constraints; however, they are beginning to confirm that
CrGRP1 is involved in ABA-regulated responses specifically movement. These findings
have interesting evolutionary implications. In the long term, it may be possible to
manipulate class IVa GRPs to improve the use of C. reinhardtii as a potential biofuel.

Chapter Six: General Discussion and Conclusion
171
Figure 6.1: The model of the relationship between circadian clock, light and ABA on the
movement of Chlamydomonas reinhardtii and arrows are the direction of movement in light
and dark. The movement of algae was affected by the quality and quantity of the light during the day; they move
from the surface to the bottom to avoid stress. However, algae move upward of surface in the dark when
treated with ABA but also, their movement level was different from the beginning of the dark until dawn.
So, there is a relationship between circadian clock, light and ABA on the movement of C. reinhardtii.
Here we propose a model for interaction between circadian clock, light and ABA
on the movement of C. reinhardtii (Figure 6.1). Since ABA treatment differentially
altered the photosynthetic efficiency of the algae in a light dependent manner, thus
indicating an ABA/light signalling interaction, it was reasoned that ABA signalling could
be involved in determining their vertical position in the water column. C. reinhardtii cells
move upwards in the dark while they move downwards in the day when they treated with
ABA. However, the movement away from the light during the day depends on light
quality and quantity. Additionally, the movement of the cells in the dark depends on the

Chapter Six: General Discussion and Conclusion
172
time of the cycle as shown in experiment in the algae were treated with ABA throughout
the circadian rhythm (Fig 6.2). C. reinhardtii cells use flagella and eyespots to protect
themselves from the stress. A presumed knockdown of CrGRP1, a class IVa GRP protein
found in flagella, causes cells to move down (preliminary findings). In summary, ABA
regulates the movement of C. reinhardtii in the water column to position itself to optimise
photosynthesis and that CrGRP1 negatively regulates the ABA-induced upward
movement of the algae.
Figure 6.2: Exogenous abscisic acid (ABA) induced a negative geotropic movement response
in C. reinhardtii. Algal samples were placed either illuminated from above (A and B) or placed in the dark (C and D). Shown
is a representative image of the positions attained by the algae immediately following the period of
incubation in either the light or dark.

Chapter Six: General Discussion and Conclusion
173
6.2 Future work
Light is the crucial thing that affects the plant's growth and their development (Stagnari
et al., 2018). However, there are three factors regarding light that affect this process. The
first factor is that intensity of light, for example, how bright the light is. Duration is
considered as a second factor; how long the plant receives the light which varies
depending on the seasons. The last factor is that both red and blue light are essential for
plants to flourish at different stages of growth (Stagnari et al., 2018). Therefore, further
work on the effect of ABA on movement could focus on the light /dark cycle, but with
modified parameters. For example, in this study, the cultures were grown in the 16 light/
8 h dark. Experiments could be repeated using 12h light /12 h dark, 8h light /16 h dark,
10h light/14h dark, and so on. In this study, it used only the white filter while a range of
colour combinations could be deployed. In plants, different light colours help plants
achieve different goals (Kami et al., 2010). For example, fluorescent light is optimal for
cultivating plants indoors. Vegetative leaf growth is encouraged by blue light while red
light, when combined with blue, helps plants flower. It would be of interest to examine
the expression of CrGRP1 in these different conditions. Furthermore, work on the effect
of plant hormones such as ABA on C. reinhardtii in different light conditions could be
performed in space, to eliminate the effects of gravity.
Further research is immediately needed to verify and fully characterise the
phenotype of pChlamy4 transformants, thus building up a clearer understanding of the
function of CrGRP1. The use of His- and V5-tagged CrGRP1 will facilitate the
purification of CrGRP1 and associated proteins and mRNAs using a nickel column. The
class IV glycine-rich proteins are likely to work by regulating gene expression at multiple
levels on their mRNA targets by modifying alternative mRNA splicing, export,

Chapter Six: General Discussion and Conclusion
174
translation, and degradation. Once a suitable antibody is generated, pull-down assays
could also be used to investigate the molecular partners and RNA targets of CrGRP1. In
terms of intracellular localisation, it will be of interest to confirm the localisation of
CrGRP1 in flagella (and potentially in other cellular locations).
There is also a need to examine the expression of CrGRP1 in different
environmental conditions, in the circadian rhythm, and in response to ABA, more
quantitatively using qPCR. It will also be of interest to determine how CrGRP1
expression might be regulated post-transcriptionally, for example via intron retention,
given the results presented in this thesis.

References
175
7 References
Ahmad, A.L., Yasin, N.M., Derek, C.J.C. and Lim, J.K. (2011). Microalgae as a
sustainable energy source for biodiesel production: a review. Renewable and
Sustainable Energy Reviews, 15(1), pp.584-593.
Ahmad, M.R., Saxena, P.N., Amla, D.V. and Shyam, R. (1978). Effect of abscisic acid
on the blue-green algae anacystis nidulans and nostoc muscorum. Beitrage zur
Biologie der Pflanzen.
Amaro, H.M., Guedes, A.C. and Malcata, F.X. (2011). Advances and perspectives in
using microalgae to produce biodiesel. Applied Energy, 88(10), pp.3402-3410.
Amin, S. (2009). Review on biofuel oil and gas production processes from microalgae.
Energy Conversion and Management, 50(7), pp.1834-1840.
Arteca, R.N. (2013). Plant growth substances: principles and applications. Berlin:
Springer Science & Business Media.
Assmann, S.M. (2003). Open stomata1 opens the door to ABA signaling in Arabidopsis
guard cells. Trends in Plant Science, 8(4), pp.151-153.
Bajguz, A. (2009). Brassinosteroid enhanced the level of abscisic acid in chlorella
vulgaris subjected to short-term heat stress. Journal of Plant Physiology, 166(8),
pp.882-886.
Balat, M. (2011). Potential alternatives to edible oils for biodiesel production–A review
of current work. Energy Conversion and Management, 52(2), pp.1479-1492.
Band, L.R., Wells, D.M., Larrieu, A., Sun, J., Middleton, A.M., French, A.P., Brunoud,
G., Sato, E.M., Wilson, M.H., Péret, B. and Oliva, M. (2012). Root gravitropism is

References
176
regulated by a transient lateral auxin gradient controlled by a tipping-point
mechanism. Proceedings of the National Academy of Sciences, pp.1-6.
Barrero, J.M., Piqueras, P., González-Guzmán, M., Serrano, R., Rodríguez, P.L., Ponce,
M.R. and Micol, J.L. (2005). A mutational analysis of the ABA1 gene of
Arabidopsis thaliana highlights the involvement of ABA in vegetative
development. Journal of Experimental Botany, 56(418), pp.2071-2083.
Bartholomew, D.M., Bartley, G.E. and Scolnik, P.A. (1991). Abscisic acid control of
rbcS and cab transcription in tomato leaves. Plant Physiology, 96(1), pp.291-296.
Beck, C.F. and Acker, A. (1992). Gametic differentiation of Chlamydomonas reinhardtii:
Control by nitrogen and light. Plant Physiology, 98(3), pp.822-826.
Bennett, R.R. and Golestanian, R. (2015). A steering mechanism for phototaxis in
Chlamydomonas. Journal of the Royal Society Interface, 12(104), pp.1-7.
Berli, F.J. and Bottini, R. (2013). UV-B and abscisic acid effects on grape berry
maturation and quality. Journal of Berry Research, 3(1), pp.1-14.
Berli, F.J., Fanzone, M., Piccoli, P. and Bottini, R. (2011). Solar UV-B and ABA are
involved in phenol metabolism of vitis vinifera L. increasing biosynthesis of berry
skin polyphenols. Journal of Agricultural and Food Chemistry, 59(9), pp.4874-
4884.
Berli, F.J., Moreno, D., Piccoli, P., Hespanhol-Viana, L., Silva, M.F., Bressan-Smith, R.,
Cavagnaro, J. B., and Bottini, R. (2010). Abscisic acid is involved in the response
of grape (vitis vinifera L.) cv. Malbec leaf tissues to ultraviolet‐B radiation by
enhancing ultraviolet‐absorbing compounds, antioxidant enzymes and membrane
sterols. Plant, Cell & Environment, 33(1), pp.1-10.

References
177
Bleecker, A.B. and Kende, H. (2000). Ethylene: a gaseous signal molecule in
plants. Annual Review of Cell and Developmental Biology, 16(1), pp.1-18.
Booker, M.A. and DeLong, A. (2015). Producing the ethylene signal: regulation and
diversification of ethylene biosynthetic enzymes. Plant Physiology, 169(1), pp.42-
50.
Boudsocq, M., Barbier-Brygoo, H. and Laurière, C. (2004). Identification of nine SNF1-
related protein kinases 2 activated by hyperosmotic and saline stresses in
Arabidopsis thaliana. Journal of Biological Chemistry, 279(40), pp .41758- 41766.
Bray, E.A. (2002). Abscisic acid regulation of gene expression during water‐deficit stress
in the era of the Arabidopsis genome. Plant, Cell & Environment, 25(2), pp.153-
161.
Busk, P.K. and Pagès, M. (1998). Regulation of abscisic acid-induced
transcription. Plant Molecular Biology, 37(3), pp.425-435.
Cao, S., Jiang, L., Song, S., Jing, R. and Xu, G. (2006). AtGRP7 is involved in the
regulation of abscisic acid and stress responses in Arabidopsis. Cellular &
Molecular Biology letters, 11(4), p.526.
Cardozo, K.H., Guaratini, T., Barros, M.P., Falcão, V.R., Tonon, A.P., Lopes, N.P.,
Campos, S., Torres, M.A., Souza, A.O., Colepicolo, P. and Pinto, E. (2007).
Metabolites from algae with economic impact. Comparative Biochemistry and
Physiology Part C: Toxicology & Pharmacology, 146(1-2), pp.60-78.
Carles, C., Bies‐Etheve, N., Aspart, L., Léon‐Kloosterziel, K.M., Koornneef, M.,
Echeverria, M. and Delseny, M. (2002). Regulation of Arabidopsis thaliana Em
genes: role of ABI5. The Plant Journal, 30(3), pp.373-383.

References
178
Carpenter, C.D., Kreps, J.A. and Simon, A.E. (1994). Genes encoding glycine-rich
Arabidopsis thaliana proteins with RNA-binding motifs are influenced by cold
treatment and an endogenous circadian rhythm. Plant Physiology, 104(3), pp.1015-
1025.
Cassab, G.I. (1998). Plant cell wall proteins. Annual Review of Plant Biology, 49(1),
pp.281-309.
Chang, Y.C. and Walling, L.L. (1991). Abscisic acid negatively regulates expression of
chlorophyll a/b binding protein genes during soybean embryogeny. Plant
Physiology, 97(3), pp.1260-1264.
Chen, H., Zhang, J., Neff, M.M., Hong, S.W., Zhang, H., Deng, X.W. and Xiong, L.
(2008). Integration of light and abscisic acid signaling during seed germination and
early seedling development. Proceedings of the National Academy of Sciences,
105(11), pp.4495-4500.
Chen, J.G., Pandey, S., Huang, J., Alonso, J.M., Ecker, J.R., Assmann, S.M. and Jones,
A.M. (2004). GCR1 can act independently of heterotrimeric G-protein in response
to brassinosteroids and gibberellins in Arabidopsis seed germination. Plant
Physiology, 135(2), pp.907-915.
Cheong, Y.H., Pandey, G.K., Grant, J.J., Batistic, O., Li, L., Kim, B.G., Lee, S.C., Kudla,
J. and Luan, S. (2007). Two calcineurin B‐like calcium sensors, interacting with
protein kinase CIPK23, regulate leaf transpiration and root potassium uptake in
Arabidopsis. The Plant Journal, 52(2), pp.223-239.
Chip, S., Zelmer, A., Ogunshola, O.O., Felderhoff-Mueser, U., Nitsch, C., Bührer, C. and
Wellmann, S. (2011). The RNA-binding protein RBM3 is involved in hypothermia
induced neuroprotection. Neurobiology of Disease, 43(2), pp.388-396.

References
179
Chisti, Y. (2007). Biodiesel from microalgae. Biotechnology Advances, 25(3), pp.294-
306.
Christmann, A. and Grill, E. (2009). Are GTGs ABA's biggest fans? Cell, 136(1), pp.21-
23.
Chu, W.L.(2012). Biotechnological applications of microalgae. IeJSME, 6(1), pp. S24-
S37.
Ciuzan, O., Hancock, J., Pamfil, D., Wilson, I. and Ladomery, M. (2015). The
evolutionarily conserved multifunctional glycine‐rich RNA‐binding proteins play
key roles in development and stress adaptation. Physiologia Plantarum, 153(1),
pp.1-11.
Colucci, G., Apone, F., Alyeshmerni, N., Chalmers, D. and Chrispeels, M.J. (2002).
GCR1, the putative Arabidopsis G protein-coupled receptor gene is cell cycle-
regulated, and its overexpression abolishes seed dormancy and shortens time to
flowering. Proceedings of the National Academy of Sciences, 99(7), pp.4736-4741.
Condit, C.M. and Meagher, R.B. (1986). A gene encoding a novel glycine-rich structural
protein of petunia. Nature, 323(6084), pp.178-181.
Contreras-Pool, P.Y., Peraza-Echeverria, S., Ku-González, Á.F. and Herrera-Valencia,
V.A. (2016). The phytohormone abscisic acid increases triacylglycerol content in
the green microalga Chlorella saccharophila (Chlorophyta). Algae, 31(3), pp.267-
276.
Correia, M.J., Pereira, J.S., Chaves, M.M., Rodrigues, M.L. and Pacheco, C.A. (1995).
ABA xylem concentrations determine maximum daily leaf conductance of field‐
grown vitis vinifera L. plants. Plant, Cell & Environment, 18(5), pp.511-521.

References
180
Covington, M.F. and Harmer, S.L. (2007). The circadian clock regulates auxin signaling
and responses in Arabidopsis. PLoS Biology, 5(8), p. 1773- 1784.
Cowan, A.K. and Rose, P.D. (1991). Abscisic acid metabolism in salt-stressed cells of
Dunaliella salina: Possible interrelationship with β-carotene accumulation. Plant
Physiology, 97(2), pp.798-803.
Cowan, A.K., Rose, P.D. and Horne, L.G. (1992). Dunaliella salina: a model system for
studying the response of plant cells to stress. Journal of Experimental
Botany, 43(12), pp.1535-1547.
Cunningham Jr, F.X. and Gantt, E. (1998). Genes and enzymes of carotenoid biosynthesis
in plants. Annual Review of Plant Biology, 49(1), pp.557-583.
Cutler, S.R., Rodriguez, P.L., Finkelstein, R.R. and Abrams, S.R. (2010). Abscisic acid:
emergence of a core signaling network. Annual Review of Plant Biology, 61,
pp.651-679.
Debuchy, R., Purton, S. and Rochaix, J.D. (1989). The argininosuccinate lyase gene of
Chlamydomonas reinhardtii: an important tool for nuclear transformation and for
correlating the genetic and molecular maps of the ARG7 locus. The EMBO Journal,
8(10), p.2803.
Delwiche, C.F. and Cooper, E.D. (2015). The evolutionary origin of a terrestrial
flora. Current Biology, 25(19), pp. R899-R910.
Demirbas, A. (2010). Use of algae as biofuel sources. Energy Conversion and
Management, 51(12), pp.2738-2749.
Dodd, A.N., Gardner, M.J., Hotta, C.T., Hubbard, K.E., Dalchau, N., Love, J., Assie,
J.M., Robertson, F.C., Jakobsen, M.K., Gonçalves, J. and Sanders, D. (2007). The

References
181
Arabidopsis circadian clock incorporates a cADPR-based feedback loop. Science,
318(5857), pp.1789-1792.
Doniger, J., Landsman, D., Gonda, M.A. and Wistow, G. (1992). The product of unr, the
highly conserved gene upstream of N-ras, contains multiple repeats similar to the
cold-shock domain (CSD), a putative DNA-binding motif. The New Biologist, 4(4),
pp.389-395.
Douskova, I., Doucha, J., Livansky, K., Machat, J., Novak, P., Umysova, D., Zachleder,
V. and Vitova, M. (2009). Simultaneous flue gas bioremediation and reduction of
microalgal biomass production costs. Applied Microbiology and
Biotechnology, 82(1), pp.179-185.
Dresios, J., Aschrafi, A., Owens, G.C., Vanderklish, P.W., Edelman, G.M. and Mauro,
V.P. (2005). Cold stress-induced protein Rbm3 binds 60S ribosomal subunits,
alters microRNA levels, and enhances global protein synthesis. Proceedings of the
National Academy of Sciences of the United States of America, 102(6), pp.1865-
1870.
Driessche, T.V., Kevers, C., Collet, M. and Gaspar, T. (1988). Acetabularia
mediterranea and ethylene: production in relation with development, circadian
rhythms in emission, and response to external application. J Plant Physiol, 133,
pp.635-639.
Driessche, T.V., Petiau-de Vries, G.M. and Guisset, J.L. (1997). Tansley Review No. 91
Differentiation, growth and morphogenesis: Acetabularia as a model system. The
New Phytologist, 135(1), pp.1-20.

References
182
Durmaz, A.A., Karaca, E., Demkow, U., Toruner, G., Schoumans, J. and Cogulu, O.
(2015). Evolution of genetic techniques: past, present, and beyond. BioMed
Research International, 2015, p 1-7.
Eisenreich, W., Rohdich, F. and Bacher, A. (2001). Deoxyxylulose phosphate pathway
to terpenoids. Trends in Plant Science, 6(2), pp.78-84.
Fairley-Grenot, K. and Assmann, S.M. (1991). Evidence for G-protein regulation of
inward K+ channel current in guard cells of fava bean. The Plant Cell, 3(9),
pp.1037-1044.
Fankhauser, C. and Staiger, D. (2002). Photoreceptors in Arabidopsis thaliana: light
perception, signal transduction and entrainment of the endogenous clock. Planta,
216(1), pp.1-16.
Fedorov, V.B., Goropashnaya, A.V., Tøien, Ø., Stewart, N.C., Gracey, A.Y., Chang, C.,
Qin, S., Pertea, G., Quackenbush, J., Showe, L.C. and Showe, M.K. (2009).
Elevated expression of protein biosynthesis genes in liver and muscle of
hibernating black bears (Ursus americanus). Physiological genomics, 37(2),
pp.108-118.
Fernando, V.D. and Schroeder, D.F. (2016). Role of ABA in Arabidopsis salt, drought,
and desiccation tolerance. In Abiotic and Biotic Stress in Plants-Recent Advances
and Future Perspectives. InTech.
Finkelstein, R. (2013). Abscisic acid synthesis and response. The Arabidopsis
book/American Society of Plant Biologists, 11, pp. e0166.
Finkelstein, R.R. and Gibson, S.I. (2002). ABA and sugar interactions regulating
development: cross-talk or voices in a crowd? Current Opinion in Plant Biology,
5(1), pp.26-32.

References
183
Foster, K.W. and Smyth, R.D. (1980). Light Antennas in phototactic
algae. Microbiological Reviews, 44(4), p.572.
Franklin, S., Ngo, B., Efuet, E. and Mayfield, S.P. (2002). Development of a GFP reporter
gene for Chlamydomonas reinhardtii chloroplast. The Plant Journal, 30(6),
pp.733-744.
Fu, Z.Q., Guo, M., Jeong, B.R., Tian, F., Elthon, T.E., Cerny, R.L., Staiger, D. and
Alfano, J.R. (2007). A type III effector ADP-ribosylates RNA-binding proteins and
quells plant immunity. Nature, 447(7142), pp.284-288.
Fuhrmann, M., Hausherr, A., Ferbitz, L., Schödl, T., Heitzer, M. and Hegemann, P.
(2004). Monitoring dynamic expression of nuclear genes in Chlamydomonas
reinhardtii by using a synthetic luciferase reporter gene. Plant Molecular
Biology, 55(6), pp.869-881.
Fujii, H. and Zhu, J.K. (2009). Arabidopsis mutant deficient in 3 abscisic acid-activated
protein kinases reveals critical roles in growth, reproduction, and
stress. Proceedings of the National Academy of Sciences, 106(20), pp.8380-8385.
Fujii, H., Verslues, P.E. and Zhu, J.K. (2007). Identification of two protein kinases
required for abscisic acid regulation of seed germination, root growth, and gene
expression in Arabidopsis. The Plant Cell, 19(2), pp.485-494.
Fujita, Y., Fujita, M., Shinozaki, K. and Yamaguchi-Shinozaki, K. (2011). ABA-
mediated transcriptional regulation in response to osmotic stress in plants. Journal
of Plant Research, 124(4), pp.509-525.
Fujita, Y., Nakashima, K., Yoshida, T., Fujita, M., Shinozaki, K. and Yamaguchi‐
Shinozaki, K. (2014). Role of Abscisic Acid signaling in drought tolerance and

References
184
preharvest sprouting under climate change. Climate Change and Plant Abiotic
Stress Tolerance, pp.521-554.
Fujita, Y., Yoshida, T. and Yamaguchi‐Shinozaki, K. (2013). Pivotal role of the
AREB/ABF‐SnRK2 pathway in ABRE‐mediated transcription in response to
osmotic stress in plants. Physiologia Plantarum, 147(1), pp.15-27.
Fundamentals of Environmental-Measurements (2014) Algae, Phytoplankton and
Chlorophyll. Available from: https://www.fondriest.com/environmental-
measurements/parameters/water-quality/algae-phytoplankton-chlorophyll/ [Accessed
30 November 2017].
Galvez-Valdivieso, G., Fryer, M.J., Lawson, T., Slattery, K., Truman, W., Smirnoff, N.,
Asami, T., Davies, W.J., Jones, A.M., Baker, N.R. and Mullineaux, P.M. (2009).
The high light response in Arabidopsis involves ABA signaling between vascular
and bundle sheath cells. The Plant Cell, 21(7), pp.2143-2162.
Goodenough, U.W., Armbrust, E.V., Campbell, A.M. and Ferris, P.J. (1995). Molecular
genetics of sexuality in Chlamydomonas. Annual Review of Plant Biology, 46(1),
pp.21-44.
Gray, M.W. and Boer, P.H. (1988). Organization and expression of algal
(Chlamydomonas reinhardtii) mitochondrial DNA. Phil. Trans. R. Soc. Lond.
B, 319(1193), pp.135-147.
Guo, J., Yang, X., Weston, D.J. and Chen, J.G. (2011). Abscisic Acid Receptors: Past,
Present and Future F. Journal of Integrative Plant Biology, 53(6), pp.469-479.
Hagen, C., Grünewald, K., Schmidt, S. and Müller, J. (2000). Accumulation of secondary
carotenoids in flagellates of Haematococcus pluvialis (Chlorophyta) is

References
185
accompanied by an increase in per unit chlorophyll productivity of
photosynthesis. European Journal of Phycology, 35(1), pp.75-82.
Hall, T.M.T. (2002). Poly (A) tail synthesis and regulation: recent structural insights.
Current Opinion in Structural Biology, 12(1), pp.82-88.
Han, W., Rong, H., Zhang, H. and Wang, M.H. (2009). Abscisic acid is a negative
regulator of root gravitropism in Arabidopsis thaliana. Biochemical and
Biophysical Research Communications, 378(4), pp.695-700.
Hanano, S., Domagalska, M.A., Nagy, F. and Davis, S.J. (2006). Multiple
phytohormones influence distinct parameters of the plant circadian clock. Genes to
Cells, 11(12), pp.1381-1392.
Hartung, W. and Gimmler, H. (1994). A stress physiological role for abscisic acid (ABA)
in lower plants. In Progress in Botany (pp. 157-173). Springer, Berlin, Heidelberg.
Hartung, W. (2010). The evolution of abscisic acid (ABA) and ABA function in lower
plants, fungi and lichen. Functional Plant Biology, 37(9), pp.806-812.
Harz, H. and Hegemann, P. (1991). Rhodopsin-regulated calcium currents in
Chlamydomonas. Nature, 351(6326), p.489.
Hegemann, P. and Berthold, P. (2009). Sensory photoreceptors and light control of
flagellar activity. In the Chlamydomonas Sourcebook (pp. 395-429).
Heintzen, C., Nater, M., Apel, K. and Staiger, D. (1997). AtGRP7, a nuclear RNA-
binding protein as a component of a circadian-regulated negative feedback loop in
Arabidopsis thaliana. Proceedings of the National Academy of Sciences, 94(16),
pp.8515-8520.
Hill, J., Nelson, E., Tilman, D., Polasky, S. and Tiffany, D. (2006). Environmental,
economic, and energetic costs and benefits of biodiesel and ethanol biofuels.

References
186
Proceedings of the National Academy of sciences, 103(30), pp.11206-11210.
Hirano, A., Ueda, R., Hirayama, S. and Ogushi, Y. (1997). CO2 fixation and ethanol
production with microalgal photosynthesis and intracellular anaerobic
fermentation. Energy, 22(2-3), pp.137-142.
Hirsch, R., Hartung, W. and Gimmler, H. (1989). Abscisic acid content of algae under
stress. Botanica Acta, 102(4), pp.326-334.
Hirschberg, J. (2001). Carotenoid biosynthesis in flowering plants. Current Opinion in
Plant Biology, 4(3), pp.210-218.
Holzinger, A. and Becker, B. (2015). Desiccation tolerance in the streptophyte green alga
Klebsormidium: The role of phytohormones. Communicative & Integrative
Biology, 8(4), pp. e1059978.
Hoober, J.K. (1989). The Chlamydomonas sourcebook: a comprehensive guide to
biology and laboratory use. Science, 246(4936), pp.1503-1505.
Huang, C., Zhou, J., Jie, Y., Xing, H., Zhong, Y., She, W., Wei, G., Yu, W. and Ma, Y.
(2016). A ramie (Boehmeria nivea) bZIP transcription factor BnbZIP3 positively
regulates drought, salinity and heavy metal tolerance. Molecular Breeding, 36(8),
p.120.
Huang, C.Y. (1991). Regulation of ionic fluxes and protein release from Anabaena
HA101 by exogenous abscisic acid. Botanical Bulletin Academia Sinica, 32,
pp.265-270.
Huang, K. and Beck, C.F. (2003). Phototropin is the blue-light receptor that controls
multiple steps in the sexual life cycle of the green alga Chlamydomonas
reinhardtii. Proceedings of the National Academy of Sciences, 100(10), pp.6269-
6274.

References
187
Humplík, J.F., Bergougnoux, V., Jandová, M., Šimura, J., Pěnčík, A., Tomanec, O.,
Rolčík, J., Novák, O. and Fellner, M. (2015). Endogenous abscisic acid promotes
hypocotyl growth and affects endoreduplication during dark-induced growth in
tomato (Solanum lycopersicum L.). PLoS One, 10(2), p. e0117793.
Hussain, A. and Boney, A.D. (1973). Hydrophilic growth inhibitors from Laminaria and
Ascophyllum. New Phytologist, 72(2), pp.403-410.
Imber, D. and Tal, M. (1970). Phenotypic reversion of flacca, a wilty mutant of tomato,
by abscisic acid. Science, 169(3945), pp.592-593.
Inaba, K. (2015). Calcium sensors of ciliary outer arm dynein: functions and phylogenetic
considerations for eukaryotic evolution. Cilia, 4(1), p.6.
Iqbal, N., Khan, N.A., Ferrante, A., Trivellini, A., Francini, A. and Khan, M.I.R. (2017).
Ethylene role in plant growth, development and senescence: interaction with other
phytohormones. Frontiers in Plant Science, 8, p.475.
Ishiura, M. (1976). Gametogenesis of Chlamydomonas in the dark. Plant and Cell
Physiology, 17(6), pp.1141-1150.
Iuchi, S., Kobayashi, M., Taji, T., Naramoto, M., Seki, M., Kato, T., Tabata, S., Kakubari,
Y., Yamaguchi‐Shinozaki, K. and Shinozaki, K. (2001). Regulation of drought
tolerance by gene manipulation of 9‐cis‐epoxycarotenoid dioxygenase, a key
enzyme in abscisic acid biosynthesis in Arabidopsis. The Plant Journal, 27(4),
pp.325-333.
Jacobs, W.P. (1986). Are angiosperm hormones present in, and used as hormones by,
algae? In Plant Growth Substances 1985 (pp. 249-256). Springer, Berlin,
Heidelberg.
Jameson, P.E. (1993). Plant hormones in the algae. Progress in Phycological

References
188
Research, 9, pp.239-279.
Jheeta, S. (2017). The landscape of the emergence of life. Life, 7(2), p.27.
Jianrong, W.A.N.G., Lei, W.A.N.G., Ting, H.U., Wenchao, L.I. and Shaowu, X.U.E.
(2014). Effects of lanthanum on abscisic acid regulation of root growth in
Arabidopsis. Journal of Rare Earths, 32(1), pp.78-82.
Jones, R.J. and Mansfield, T.A. (1970). Suppression of stomatal opening in leaves treated
with abscisic acid. Journal of Experimental Botany, 21(3), pp.714-719.
Ju, C., Van de Poel, B., Cooper, E.D., Thierer, J.H., Gibbons, T.R., Delwiche, C.F. and
Chang, C. (2015). Conservation of ethylene as a plant hormone over 450 million
years of evolution. Nature Plants, 1(1), p.14004.
Kami, C., Lorrain, S., Hornitschek, P. and Fankhauser, C. (2010). Light-regulated plant
growth and development. In Current Topics in Developmental Biology (Vol. 91,
pp. 29-66). Academic Press.
Kamiya, R. and Witman, G.B. (1984). Submicromolar levels of calcium control the
balance of beating between the two flagella in demembranated models of
Chlamydomonas. The Journal of Cell Biology, 98(1), pp.97-107.
Kar, B., Nayak, S. and Joshi, R.K. (2012). Classification and comparative analysis of
Curcuma longa L. expressed sequences tags (ESTs) encoding glycine-rich proteins
(GRPs). Bioinformation, 8(3), p.142.
Kentzer, T. and Mazur, H. (1991). Abscisic acid as endogenous inhibitor of the marine
diatom Coscinodiscus granii. Acta Physiologiae Plantarum, 13, pp.153-157.
Kermode, A.R. (2005). Role of abscisic acid in seed dormancy. Journal of Plant Growth
Regulation, 24(4), pp.319-344.
Kim, J. S., Park, S. J., Kwak, K. J., Kim, Y. O., Kim, J. Y., Song, J., Kang, H. (2007).

References
189
Cold shock domain proteins and glycine-rich RNA-binding proteins from
Arabidopsis thaliana can promote the cold adaptation process in Escherichia coli.
Nucleic Acids Research, 35(2), 506–516.
Kim, J.S., Jung, H.J., Lee, H.J., Kim, K., Goh, C.H., Woo, Y., Oh, S.H., Han, Y.S. and
Kang, H. (2008). Glycine‐rich RNA‐binding protein7 affects abiotic stress
responses by regulating stomata opening and closing in Arabidopsis thaliana. The
Plant Journal, 55(3), pp.455-466.
Kim, J.Y., Kim, W.Y., Kwak, K.J., Oh, S.H., Han, Y.S. and Kang, H. (2010). Glycine-
rich RNA-binding proteins are functionally conserved in Arabidopsis thaliana and
Oryza sativa during cold adaptation process. Journal of Experimental Botany,
61(9), pp.2317-2325.
Kim, J.Y., Park, S.J., Jang, B., Jung, C.H., Ahn, S.J., Goh, C.H., Cho, K., Han, O. and
Kang, H. (2007b). Functional characterization of a glycine‐rich RNA‐binding
protein 2 in Arabidopsis thaliana under abiotic stress conditions. The Plant
Journal, 50(3), pp.439-451.
Kindle, K.L. (1990). High-frequency nuclear transformation of Chlamydomonas
reinhardtii. Proceedings of the National Academy of Sciences, 87(3), pp.1228-
1232.
Kiseleva, A.A., Tarachovskaya, E.R. and Shishova, M.F. (2012). Biosynthesis of
phytohormones in algae. Russian Journal of Plant Physiology, 59(5), pp.595-610.
Kiss, J.Z. (2000). Mechanisms of the early phases of plant gravitropism. Critical Reviews
in Plant Sciences, 19(6), pp.551-573.
Kobayashi, M., Hirai, N., Kurimura, Y., Ohigashi, H. and Tsuji, Y. (1997). Abscisic acid-
dependent algal morphogenesis in the unicellular green alga Haematococcus

References
190
pluvialis. Plant Growth Regulation, 22(2), pp.79-85.
Kobayashi, M., Todoroki, Y., Hirai, N., Kurimura, Y., Ohigashi, H. and Tsuji, Y. (1998).
Biological activities of abscisic acid analogs in the morphological change of the
green alga Haematococcus pluvialis. Journal of Fermentation and
Bioengineering, 85(5), pp.529-531.
Kobayashi, Y. and Tanaka, K. (2016). Transcriptional regulation of tetrapyrrole
biosynthetic genes explains abscisic acid-induced heme accumulation in the
unicellular red alga Cyanidioschyzon merolae. Frontiers in Plant Science, 7,
p.1300.
Kobayashi, Y., Ando, H., Hanaoka, M. and Tanaka, K. (2016). Abscisic acid participates
in the control of cell cycle initiation through heme homeostasis in the unicellular
red alga Cyanidioschyzon merolae. Plant and Cell Physiology, 57(5), pp.953-960.
Kogan, F.N. (1997). Global drought watch from space. Bulletin of the American
Meteorological Society, 78(4), pp.621-636.
Koo, K.M., Jung, S., Lee, B.S., Kim, J.B., Jo, Y.D., Choi, H.I., Kang, S.Y., Chung, G.H.,
Jeong, W.J. and Ahn, J.W. (2017). The Mechanism of starch over-accumulation in
Chlamydomonas reinhardtii high-starch mutants identified by comparative
transcriptome analysis. Frontiers in Microbiology, 8, p.858.
Kudla, J., Becker, D., Grill, E., Hedrich, R., Hippler, M., Kummer, U., Parniske, M.,
Romeis, T. and Schumacher, K. (2018). Advances and current challenges in
calcium signaling. New Phytologist, 218(2), pp.414-431.
Kumar, S.V., Misquitta, R.W., Reddy, V.S., Rao, B.J. and Rajam, M.V. (2004). Genetic
transformation of the green alga—Chlamydomonas reinhardtii by agrobacterium
tumefaciens. Plant Science, 166(3), pp.731-738.

References
191
Kuromori, T., Fujita, M., Urano, K., Tanabata, T., Sugimoto, E. and Shinozaki, K. (2016)
Overexpression of AtABCG25 enhances the abscisic acid signal in guard cells and
improves plant water use efficiency. Plant Science, 251, pp.75-81.
Kuromori, T., Miyaji, T., Yabuuchi, H., Shimizu, H., Sugimoto, E., Kamiya, A.,
Moriyama, Y. and Shinozaki, K. (2010). ABC transporter AtABCG25 is involved
in abscisic acid transport and responses. Proceedings of the National Academy of
Sciences, 107(5), pp.2361-2366
Kwak, J.M., Mori, I.C., Pei, Z.M., Leonhardt, N., Torres, M.A., Dangl, J.L., Bloom, R.E.,
Bodde, S., Jones, J.D. and Schroeder, J.I. (2003). NADPH oxidase AtrbohD and
AtrbohF genes function in ROS‐dependent ABA signaling in Arabidopsis. The
EMBO Journal, 22(11), pp.2623-2633.
Larkum, T. and Howe, C.J. (1997). Molecular aspects of light-harvesting processes in
algae. In Advances in Botanical Research Vol. 27, pp. 257-330.
Leite, G.B., Abdelaziz, A.E. and Hallenbeck, P.C. (2013). Algal biofuels: challenges and
opportunities. Bioresource Technology, 145, pp.134-141.
Leliaert, F., Smith, D.R., Moreau, H., Herron, M.D., Verbruggen, H., Delwiche, C.F. and
De Clerck, O. (2012). Phylogeny and molecular evolution of the green
algae. Critical Reviews in Plant Sciences, 31(1), pp.1-46.
Li, B., Feng, Z., Xie, M., Sun, M., Zhao, Y., Liang, L., Liu, G., Zhang, J. and Jia, W.
(2010). Modulation of the root-sourced ABA signal along its way to the shoot in
Vitis riparia× Vitis labrusca under water deficit. Journal of Experimental
Botany, 62(6), pp.1731-1741.
Li, C., Yue, J., Wu, X., Xu, C. and Yu, J. (2014). An ABA-responsive DRE-binding
protein gene from Setaria italica, SiARDP, the target gene of SiAREB, plays a

References
192
critical role under drought stress. Journal of Experimental Botany, 65(18),
pp.5415-5427.
Li, Z., Yu, J., Peng, Y. and Huang, B. (2016). Metabolic pathways regulated by abscisic
acid, salicylic acid and γ‐aminobutyric acid in association with improved drought
tolerance in creeping bentgrass (Agrostis stolonifera). Physiologia Plantarum,
159(1), pp.42-58.
Lichtenthaler, H.K. (1999). The 1-deoxy-D-xylulose-5-phosphate pathway of isoprenoid
biosynthesis in plants. Annual Review of Plant Biology, 50(1), pp.47-65.
Liu, R., Xu, Y.H., Jiang, S.C., Lu, K., Lu, Y.F., Feng, X.J., Wu, Z., Liang, S., Yu, Y.T.,
Wang, X.F. and Zhang, D.P. (2013). Light-harvesting chlorophyll a/b-binding
proteins, positively involved in abscisic acid signalling, require a transcription
repressor, WRKY40, to balance their function. Journal of Experimental Botany,
64(18), pp.5443-5456.
Liu, X., Yue, Y., Li, B., Nie, Y., Li, W., Wu, W.H. and Ma, L. (2007). AG protein-
coupled receptor is a plasma membrane receptor for the plant hormone abscisic
acid. Science, 315(5819), pp.1712-1716.
Lleonart, M.E. (2010). A new generation of proto-oncogenes: cold-inducible RNA
binding proteins. Biochimica et Biophysica Acta (BBA)-Reviews on Cancer,
1805(1), pp.43-52.
Lodish, H., Berk, A., Zipursky, S.L., Matsudaira, P., Baltimore, D. and Darnell, J. (2000).
Photosynthetic stages and light-absorbing pigments. In Molecular Cell Biology. 4th
edition. WH Freeman.
Lopez-Molina, L., Mongrand, S. and Chua, N.H. (2001). A postgermination
developmental arrest checkpoint is mediated by abscisic acid and requires the ABI5

References
193
transcription factor in Arabidopsis. Proceedings of the National Academy of
Sciences, 98(8), pp.4782-4787.
Lumba, S., Toh, S., Handfield, L.F., Swan, M., Liu, R., Youn, J.Y., Cutler, S.R.,
Subramaniam, R., Provart, N., Moses, A. and Desveaux, D. (2014). A mesoscale
abscisic acid hormone interactome reveals a dynamic signaling landscape in
Arabidopsis. Developmental Cell, 29(3), pp.360-372.
Lumbreras, V., Stevens, D.R. and Purton, S. (1998). Efficient foreign gene expression in
Chlamydomonas reinhardtii mediated by an endogenous intron. The Plant Journal,
14(4), pp.441-447.
Lunde, B.M., Moore, C. and Varani, G. (2007). RNA-binding proteins: modular design
for efficient function. Nature Reviews Molecular Cell Biology, 8(6), p.479.
Mahajan, S. and Tuteja, N. (2005). Cold, salinity and drought stresses: an overview.
Archives of Biochemistry and Biophysics, 444(2), pp.139-158.
Manival, X., Ghisolfi-Nieto, L., Joseph, G., Bouvet, P. and Erard, M. (2001). RNA-
binding strategies common to cold-shock domain-and RNA recognition motif-
containing proteins. Nucleic Acids Research, 29(11), pp.2223-2233.
Maršálek, B., Zahradníčková, H. and Hronková, M. (1992). Extracellular production of
abscisic acid by soil algae under salt, acid or drought stress. Zeitschrift für
Naturforschung C, 47(9-10), pp.701-704.
Matsuo, T. and Ishiura, M. (2011). Chlamydomonas reinhardtii as a new model system
for studying the molecular basis of the circadian clock. FEBS letters, 585(10),
pp.1495-1502.

References
194
Mehrotra, R., Bhalothia, P., Bansal, P., Basantani, M.K., Bharti, V. and Mehrotra, S.
(2014). Abscisic acid and abiotic stress tolerance–Different tiers of
regulation. Journal of Plant Physiology, 171(7), pp.486-496.
Meinhard, M. and Grill, E. (2001). Hydrogen peroxide is a regulator of ABI1, a protein
phosphatase 2C from Arabidopsis. FEBS Letters, 508(3), pp.443-446.
Meinhard, M., Rodriguez, P.L. and Grill, E. (2002). The sensitivity of ABI2 to hydrogen
peroxide links the abscisic acid-response regulator to redox signalling. Planta,
214(5), pp.775-782.
Merchant, S.S., Prochnik, S.E., Vallon, O., Harris, E.H., Karpowicz, S.J., Witman, G.B.,
Terry, A., Salamov, A., Fritz-Laylin, L.K., Maréchal-Drouard, L. and Marshall,
W.F. (2007). The Chlamydomonas genome reveals the evolution of key animal and
plant functions. Science, 318(5848), pp.245-250.
Michaelis, G., Vahrenholz, C. and Pratje, E. (1990). Mitochondrial DNA of
Chlamydomonas reinhardtii: the gene for apocytochrome b and the complete
functional map of the 15.8 kb DNA. Molecular and General Genetics, 223(2),
pp.211-216.
Mittag, M., Kiaulehn, S. and Johnson, C.H. (2005). The circadian clock in
Chlamydomonas reinhardtii. What is it for? What is it similar to?. Plant
Physiology, 137(2), pp.399-409.
Mohr, P.G. and Cahill, D.M. (2003). Abscisic acid influences the susceptibility of
Arabidopsis thaliana to Pseudomonas syringae pv. tomato and Peronospora
parasitica. Functional Plant Biology, 30(4), pp.461-469.
Moriwaki, T., Miyazawa, Y., Fujii, N. and Takahashi, H. (2012). Light and abscisic acid
signalling are integrated by MIZ1 gene expression and regulate hydrotropic

References
195
response in roots of Arabidopsis thaliana. Plant, Cell & Environment, 35(8),
pp.1359-1368.
Muday, G.K. and Rahman, A. (2008). Auxin transport and the integration of gravitropic
growth. Plant Tropisms, 3, pp.47-78.
Mundy, J. and Chua, N.H. (1988). Abscisic acid and water-stress induce the expression
of a novel rice gene. The EMBO Journal, 7(8), p.2279.
Murata, Y., Pei, Z.M., Mori, I.C. and Schroeder, J. (2001). Abscisic acid activation of
plasma membrane Ca2+ channels in guard cells requires cytosolic NAD (P) H and
is differentially disrupted upstream and downstream of reactive oxygen species
production in abi1-1 and abi2-1 protein phosphatase 2C mutants. The Plant Cell,
13(11), pp.2513-2523.
Mustilli, A.C., Merlot, S., Vavasseur, A., Fenzi, F. and Giraudat, J. (2002). Arabidopsis
OST1 protein kinase mediates the regulation of stomatal aperture by abscisic acid
and acts upstream of reactive oxygen species production. The Plant Cell, 14(12),
pp.3089-3099.
Nakashima, K. and Yamaguchi-Shinozaki, K. (2013). ABA signaling in stress-response
and seed development. Plant Cell Reports, 32(7), pp.959-970.
Nambara, E. and Marion-Poll, A. (2005). Abscisic acid biosynthesis and catabolism.
Annu. Rev. Plant Biol., 56, pp.165-185.
Niemann, D.I. and Dörffling, K. (1980). Growth- inhibitors and growth-promoters in
enteromorpha compress A (Chlorophyta). Journal of Phycology, 16(3), pp.383-
389.
Nishimura, N., Sarkeshik, A., Nito, K., Park, S.Y., Wang, A., Carvalho, P.C., Lee, S.,
Caddell, D.F., Cutler, S.R., Chory, J. and Yates, J.R. (2010). PYR/PYL/RCAR

References
196
family members are major in‐vivo ABI1 protein phosphatase 2C‐interacting
proteins in Arabidopsis. The Plant Journal, 61(2), pp.290-299.
Nishimura, N., Yoshida, T., Kitahata, N., Asami, T., Shinozaki, K. and Hirayama, T.
(2007). ABA‐Hypersensitive Germination1 encodes a protein phosphatase 2C, an
essential component of abscisic acid signaling in Arabidopsis seed. The Plant
Journal, 50(6), pp.935-949.
Nowak, J., Sonaike, B. and Lawson, G.W. (1988). Auxin induced stress tolerance in
algae. Environmental Pollution, 51(3), pp.213-218.
Ord, G.S.G., Cameron, I.F. and Fensom, D.S. (1977). The effect of pH and ABA on the
hydraulic conductivity of Nitella membranes. Canadian Journal of Botany, 55(1),
pp.1-4.
Orset, S. and Young, A.J. (1999). Low‐temperature‐induced synthesis of α‐carotene in
the microalga Dunaliella salina (Chlorophyta). Journal of Phycology, 35(3),
pp.520-527.
Pandey, S., Chen, J.G., Jones, A.M. and Assmann, S.M. (2006). G-protein complex
mutants are hypersensitive to abscisic acid regulation of germination and
postgermination development. Plant physiology, 141(1), pp.243-256.
Pandey, S., Nelson, D.C. and Assmann, S.M. (2009). Two novel GPCR-type G proteins
are abscisic acid receptors in Arabidopsis. Cell, 136(1), pp.136-148.
Pardha Saradhi, P., Suzuki, I., Katoh, A., Sakamoto, A., Sharmila, P., Shi, D.J. and
Murata, N. (2000). Protection of the photosystem II complex by abscisic acid
against photoinduced-inactivation. Plant Cell Environ, 23, pp.711-718.
Park, W.K., Yoo, G., Moon, M., Kim, C.W., Choi, Y.E. and Yang, J.W. (2013).
Phytohormone supplementation significantly increases growth of Chlamydomonas

References
197
reinhardtii cultivated for biodiesel production. Applied Biochemistry and
Biotechnology, 171(5), pp.1128-1142.
Pazour, G.J., Agrin, N., Leszyk, J. and Witman, G.B. (2005). Proteomic analysis of a
eukaryotic cilium. J Cell Biol, 170(1), pp.103-113.
Pei, Z.M., Murata, Y., Benning, G., Thomine, S., Klüsener, B., Allen, G.J., Grill, E. and
Schroeder, J.I. (2000). Calcium channels activated by hydrogen peroxide mediate
abscisic acid signalling in guard cells. Nature, 406(6797), pp.731-734.
Peng, Y., Yang, P.H., Tanner, J.A., Huang, J.D., Li, M., Lee, H.F., Xu, R.H., Kung, H.F.
and Lin, M.C. (2006). Cold-inducible RNA binding protein is required for the
expression of adhesion molecules and embryonic cell movement in Xenopus laevis.
Biochemical and Biophysical Research Communications, 344(1), pp.416-424.
Picapedra, P.H.S., Sanches, P.V. and Lansac-Tôha, F.A. (2018). Effects of light-dark
cycle on the spatial distribution and feeding activity of fish larvae of two co-
occurring species (Pisces: Hypophthalmidae and Sciaenidae) in a Neotropical
floodplain lake. Brazilian Journal of Biology,78 (4), pp. 763-772.
Piotrowska-Niczyporuk, A. and Bajguz, A. (2014). The effect of natural and synthetic
auxins on the growth, metabolite content and antioxidant response of green alga
Chlorella vulgaris (Trebouxiophyceae). Plant Growth Regulation, 73(1), pp.57-
66.
Plettner, I.N.A., Steinke, M. and Malin, G. (2005). Ethene (ethylene) production in the
marine macroalga Ulva (Enteromorpha) intestinalis L. (Chlorophyta,
Ulvophyceae): effect of light‐stress and co‐production with dimethyl
sulphide. Plant, Cell & Environment, 28(9), pp.1136-1145.

References
198
Poljakoff-Mayber, A., Popilevski, I., Belausov, E. and Ben-Tal, Y. (2002). Involvement
of phytohormones in germination of dormant and non-dormant oat (Avena sativa
L.) seeds. Plant Growth Regulation, 37(1), pp.7-16.
Poulet, L., Fontaine, J.P. and Dussap, C.G. (2016). Plant’s response to space
environment: a comprehensive review including mechanistic modelling for future
space gardeners. Botany Letters, 163(3), pp.337-347.
Qin, X. and Zeevaart, J.A. (2002). Overexpression of a 9-cis-epoxycarotenoid
dioxygenase gene in Nicotiana plumbaginifolia increases abscisic acid and phaseic
acid levels and enhances drought tolerance. Plant Physiology, 128(2), pp.544-551.
Raghavendra, A.S., Gonugunta, V.K., Christmann, A. and Grill, E. (2010). ABA
perception and signalling. Trends in Plant Science, 15(7), pp.395-401.
Rakitin, V.Y., Karyagin, V.V., Rakitina, T.Y., Prudnikova, O.N. and Vlasov, P.V.
(2008). UV-B stress-induced ABA production in Arabidopsis thaliana mutants
defective in ethylene signal transduction pathway. Russian Journal of Plant
Physiology, 55(6), pp.854-856.
Reddy, A.R., Chaitanya, K.V. and Vivekanandan, M. (2004). Drought-induced responses
of photosynthesis and antioxidant metabolism in higher plants. Journal of Plant
Physiology, 161(11), pp.1189-1202.
Ribeiro, D.M., Desikan, R., Bright, J.O., Confraria, A.N.A., Harrison, J., Hancock, J.T.,
Barros, R.S., Neill, S.J. and Wilson, I.D. (2009). Differential requirement for NO
during ABA‐induced stomatal closure in turgid and wilted leaves. Plant, Cell &
Environment, 32(1), pp.46-57.
Risk, J.M., Day, C.L. and Macknight, R.C. (2009). Reevaluation of abscisic acid-binding
assays shows that G-protein-coupled receptor2 does not bind abscisic acid. Plant

References
199
Physiology, 150(1), pp.6-11.
Rizwan, M., Ali, S., Abbas, F., Adrees, M., Zia-ur-Rehman, M. and Gill, R.A. (2017).
Role of organic and inorganic amendments in alleviating heavy metal stress in oil
seed crops. Oil Seed Crops: Yield and Adaptations Under Environmental Stress,
ed. P. Ahmad (Hoboken, NJ: John Wiley & Sons), pp.224-235.
Robertson, F.C., Skeffington, A.W., Gardner, M.J. and Webb, A.A. (2009). Interactions
between circadian and hormonal signalling in plants. Plant Molecular Biology,
69(4), p.419.
Rochaix, J.D. and Van Dillewijn, J. (1982). Transformation of the green alga
Chlamydomonas reinhardii with yeast DNA. Nature, 296(5852), p.70.
Ruiz-Sola, M.Á. and Rodríguez-Concepción, M. (2012). Carotenoid biosynthesis in
Arabidopsis: a colorful pathway. The Arabidopsis book/American Society of Plant
Biologists, 10.
Rupprecht, J. (2009). From systems biology to fuel—Chlamydomonas reinhardtii as a
model for a systems biology approach to improve biohydrogen production. Journal
of Biotechnology, 142(1), pp.10-20.
Sachs, R., Max, K.E., Heinemann, U. and Balbach, J. (2012). RNA single strands bind to
a conserved surface of the major cold shock protein in crystals and
solution. RNA, 18(1), pp.65-76.
Saito, T., Inoue, M., Yamada, M. and Matsuda, Y. (1998). Control of gametic
differentiation and activity by light in Chlamydomonas reinhardtii. Plant and Cell
Physiology, 39(1), pp.8-15.
Saito, T., Sugimoto, K., Adachi, Y., Wu, Q. and Mori, K.J. (2000). Cloning and
characterization of amphibian cold inducible RNA-binding protein. Comparative

References
200
Biochemistry and Physiology Part B: Biochemistry and Molecular Biology, 125(2),
pp.237-245.
Sambrook, J., Fritsch, E.F. and Maniatis, T. (1989). Molecular Cloning: A laboratory
manual, 2nd edition, Cold Spring Harbour Laboratory, New York. ISBN 0-87969-
309-6.
Sangtarash, M.H., Qaderi, M.M., Chinnappa, C.C. and Reid, D.M. (2009). Differential
sensitivity of canola (Brassica napus) seedlings to ultraviolet-B radiation, water
stress and abscisic acid. Environmental and Experimental Botany, 66(2), pp.212-
219.
Saradhi, P.P., Suzuki, I., Katoh, A., Sakamoto, A., Sharmila, P., Shi, D.J. and Murata, N.
(2000). Protection against the photo‐induced inactivation of the photosystem II
complex by abscisic acid. Plant, Cell & Environment, 23(7), pp.711-718.
Sasaki, K. and Imai, R. (2012). Pleiotropic roles of cold shock domain proteins in
plants. Frontiers in Plant Science, 2, p.116.
Sawada, Y., Aoki, M., Nakaminami, K., Mitsuhashi, W., Tatematsu, K., Kushiro, T.,
Koshiba, T., Kamiya, Y., Inoue, Y., Nambara, E. and Toyomasu, T. (2008).
Phytochrome-and gibberellin-mediated regulation of abscisic acid metabolism
during germination of photoblastic lettuce seeds. Plant Physiology, 146(3),
pp.1386-1396.
Schaller, K., David, R. and Uhl, R. (1997). How Chlamydomonas keeps track of the light
once it has reached the right phototactic orientation. Biophysical Journal, 73(3),
pp.1562-1572.
Schirrmeister, B.E., Antonelli, A. and Bagheri, H.C. (2011). The origin of
multicellularity in cyanobacteria. BMC Evolutionary Biology, 11(1), p.45.

References
201
Schmal, C., Reimann, P. and Staiger, D. (2013). A circadian clock-regulated toggle
switch explains AtGRP7 and AtGRP8 oscillations in Arabidopsis thaliana. PLoS
Computational Biology, 9(3), p. e1002986.
Schmidt, F., Marnef, A., Cheung, M.K., Wilson, I., Hancock, J., Staiger, D. and
Ladomery, M. (2010). A proteomic analysis of oligo (dT)-bound mRNP containing
oxidative stress-induced Arabidopsis thaliana RNA-binding proteins ATGRP7 and
ATGRP8. Molecular Biology Reports, 37(2), pp.839-845.
Schöning, J.C., Streitner, C., Meyer, I.M., Gao, Y. and Staiger, D. (2008). Reciprocal
regulation of glycine-rich RNA-binding proteins via an interlocked feedback loop
coupling alternative splicing to nonsense-mediated decay in Arabidopsis. Nucleic
Acids Research, 36(22), pp.6977-6987.
Schöning, J.C., Streitner, C., Page, D.R., Hennig, S., Uchida, K., Wolf, E., Furuya, M.
and Staiger, D. (2007). Auto‐regulation of the circadian slave oscillator component
AtGRP7 and regulation of its targets is impaired by a single RNA recognition motif
point mutation. The Plant Journal, 52(6), pp.1119-1130.
Schroda, M., Blöcker, D. and Beck, C.F. (2000). The HSP70A promoter as a tool for the
improved expression of transgenes in Chlamydomonas. The Plant Journal, 21(2),
pp.121-131.
Schwartzbach, S.D. and Shigeoka, S. eds. (2017). Euglena: Biochemistry, Cell and
Molecular Biology (Vol. 979). Springer.
Scialdone, A. and Howard, M. (2015). How plants manage food reserves at night:
quantitative models and open questions. Frontiers in Plant Science, 6, p.204.
Scott, S.A., Davey, M.P., Dennis, J.S., Horst, I., Howe, C.J., Lea-Smith, D.J. and Smith,
A.G. (2010). Biodiesel from algae: challenges and prospects. Current Opinion in

References
202
Biotechnology, 21(3), pp.277-286.
Seluzicki, A., Burko, Y. and Chory, J. (2017). Dancing in the dark: darkness as a signal
in plants. Plant, Cell & Environment, 40(11), pp.2487-2501.
Seo, M., Hanada, A., Kuwahara, A., Endo, A., Okamoto, M., Yamauchi, Y., North, H.,
Marion‐Poll, A., Sun, T.P., Koshiba, T. and Kamiya, Y. (2006) Regulation of
hormone metabolism in Arabidopsis seeds: phytochrome regulation of abscisic
acid metabolism and abscisic acid regulation of gibberellin metabolism. The Plant
Journal, 48(3), pp.354-366.
Sharp, R.E., Poroyko, V., Hejlek, L.G., Spollen, W.G., Springer, G.K., Bohnert, H.J. and
Nguyen, H.T. (2004). Root growth maintenance during water deficits: physiology
to functional genomics. Journal of Experimental Botany, 55(407), pp.2343-2351.
Sharp, R.E., Wu, Y., Voetberg, G.S., Saab, I.N. and LeNoble, M.E. (1994). Confirmation
that abscisic acid accumulation is required for maize primary root elongation at low
water potentials. Journal of Experimental Botany, 45, pp.1743-1751.
Shimogawara, K., Fujiwara, S., Grossman, A. and Usuda, H. (1998). High-efficiency
transformation of Chlamydomonas reinhardtii by electroporation. Genetics,
148(4), pp.1821-1828.
Shkolnik, D. and Fromm, H. (2016). The Cholodny-Went theory does not explain
hydrotropism. Plant Sci. 252: 400-403.
Siaut, M., Cuiné, S., Cagnon, C., Fessler, B., Nguyen, M., Carrier, P., Beyly, A., Beisson,
F., Triantaphylidès, C., Li-Beisson, Y. and Peltier, G. (2011). Oil accumulation in
the model green alga Chlamydomonas reinhardtii: characterization, variability
between common laboratory strains and relationship with starch reserves. BMC
Biotechnology, 11(1), p.7.

References
203
Singh, J. and Gu, S. (2010) Commercialization potential of microalgae for biofuels
production. Renewable and Sustainable Energy Reviews, 14(9), pp.2596-2610.
Sommerville, J. and Ladomery, M. (1996) Transcription and masking of mRNA in germ
cells: involvement of Y-box proteins. Chromosoma, 104(7), pp.469-478.
Stagnari, F., Di Mattia, C., Galieni, A., Santarelli, V., D'Egidio, S., Pagnani, G. and
Pisante, M. (2018). Light quantity and quality supplies sharply affect growth,
morphological, physiological and quality traits of basil. Industrial Crops and
Products, 122, pp.277-289.
Staiger, D. (2002). Circadian rhythms in Arabidopsis: time for nuclear proteins. Planta,
214(3), pp.334-344.
Staiger, D. and Green, R. (2011). RNA-based regulation in the plant circadian clock.
Trends in Plant Science, 16(10), pp.517-523.
Staiger, D. and Heintzen, C. (1999). The Orcadian System of Arabidopsis thaliana:
Forward and Reverse Genetic Approaches. Chronobiology International, 16(1),
pp.1-16.
Staneloni, R.J., Rodriguez-Batiller, M.J. and Casal, J.J. (2008). Abscisic acid, high-light,
and oxidative stress down-regulate a photosynthetic gene via a promoter motif not
involved in phytochrome-mediated transcriptional regulation. Molecular Plant,
1(1), pp.75-83.
Stevens, D.R., Purton, S. and Rochaix, J.D. (1996). The bacterial phleomycin resistance
geneble as a dominant selectable marker in Chlamydomonas. Molecular and
General Genetics MGG, 251(1), pp.23-30.
Stirk, W.A., Drimalova, D., Strnad, M., van Staden, J., Oerdoeg, V. and Balint, P. (2005,
July). Diurnal fluctuations in the phytohormones of Chlorella minutissima.

References
204
In Phycologia (Vol. 44, No.4, pp. 98-99).
Straley, S.C. and Bruce, V.G. (1979). Stickiness to glass circadian changes in the cell
surface of Chlamydomonas reinhardi. Plant Physiology, 63(6), pp.1175-1181.
Takaichi, S. (2011). Carotenoids in algae: distributions, biosyntheses and
functions. Marine Drugs, 9(6), pp.1101-1118.
Tal, M., Imber, D. and Itai, C. (1970). Abnormal stomatal behavior and hormonal
imbalance in flacca, wilty mutant of tomato. Plant Physiol, 46, pp.367-372.
Tanaka, S., Ikeda, K. and Miyasaka, H. (2004). Isolation of a new member of group 3
late embryogenesis abundant protein gene from a halotorelant green alga by a
functional expression screening with cyanobacterial cells. FEMS Microbiology
letters, 236(1), pp.41-45.
Thomas, T.H., Wareing, P.F. and Robinson, P.M. (1965). Chemistry and physiology of
‘dormins’ in sycamore: action of the sycamore ‘dormin’as a gibberellin
antagonist. Nature, 205(4978), p.1270
Tietz, A. and Kasprik, W. (1986). Identification of abscisic acid in a green
alga. Biochemie und Physiologie der Pflanzen, 181(4), pp.269-274.
Tominaga, N., Takahata, M. and Tominaga, H. (1993). Effects of NaCl and KNO3
concentrations on the abscisic acid content of Dunaliella sp. (Chlorophyta).
In Saline Lakes V (pp. 163-168). Springer, Dordrecht.
Ton, J., Flors, V. and Mauch-Mani, B. (2009). The multifaceted role of ABA in disease
resistance. Trends in Plant Science, 14(6), pp.310-317.
Tossi, V., Lamattina, L. and Cassia, R. (2009). An increase in the concentration of
abscisic acid is critical for nitric oxide‐mediated plant adaptive responses to UV‐B
irradiation. New Phytologist, 181(4), pp.871-879.

References
205
Toyomasu, T., Yamane, H., Murofushi, N. and Inoue, Y. (1994). Effects of exogenously
applied gibberellin and red light on the endogenous levels of abscisic acid in
photoblastic lettuce seeds. Plant and Cell Physiology, 35(1), pp.127-129.
Treier, U., Fuchs, S., Weber, M., Wakarchuk, W.W. and Beck, C.F. (1989). Gametic
differentiation in Chlamydomonas reinhardtii: light dependence and gene
expression patterns. Archives of Microbiology, 152(6), pp.572-577.
Trewavas, A.J. and Jones, H.G. (1991). An assessment of the role of ABA in plant
development. Abscisic acid: Physiology and Biochemistry, pp.169-188.
Tripathi, D.K., Singh, S., Singh, S., Chauhan, D.K., Dubey, N.K. and Prasad, R. (2016).
Silicon as a beneficial element to combat the adverse effect of drought in
agricultural crops. Water Stress and Crop Plants: A Sustainable Approach, pp.682-
694.
Tuteja, N. (2007). Abscisic acid and abiotic stress signaling. Plant Signaling & Behavior,
2(3), pp.135-138.
Ullrich, W.R. and Kunz, G. (1984). Effect of abscisic acid on nitrate uptake, respiration
and photosynthesis in green algae. Plant Science Letters, 37(1-2), pp.9-14.
Umen, J.G. (2014). Green algae and the origins of multicellularity in the plant
kingdom. Cold Spring Harbor Perspectives in Biology, p. a016170.
Vandenbrink, J.P., Kiss, J.Z., Herranz, R. and Medina, F.J. (2014). Light and gravity
signals synergize in modulating plant development. Frontiers in Plant Science, 5,
p.563.
Vishwakarma, K., Upadhyay, N., Kumar, N., Yadav, G., Singh, J., Mishra, R.K., Kumar,
V., Verma, R., Upadhyay, R.G., Pandey, M. and Sharma, S. (2017). Abscisic acid
signaling and abiotic stress tolerance in plants: a review on current knowledge and

References
206
future prospects. Frontiers in Plant Science, 8, p.161.
Vitha, S., Yang, M., Sack, F.D. and Kiss, J.Z. (2007). Gravitropism in the starch excess
mutant of Arabidopsis thaliana. American Journal of Botany, 94(4), pp.590-598.
Voigt, C., Oster, U., Börnke, F., Jahns, P., Dietz, K.J., Leister, D. and Kleine, T. (2010).
In‐depth analysis of the distinctive effects of norflurazon implies that tetrapyrrole
biosynthesis, organellar gene expression and ABA cooperate in the GUN‐type of
plastid signalling. Physiologia Plantarum, 138(4), pp.503-519.
Walker, T.L., Becker, D.K. and Collet, C. (2005). Characterisation of the Dunaliella
tertiolecta RbcS genes and their promoter activity in Chlamydomonas reinhardtii.
Plant Cell Reports, 23(10-11), pp.727-735.
Wang, B., Zarka, A., Trebst, A. and Boussiba, S. (2003). Astaxanthin Accumulation in
Haematococcus pluvialis (Chlorophyceae) AS An active photoprotective process
under high irradiance 1. Journal of Phycology, 39(6), pp.1116-1124.
Wang, C., Liu, Y., Li, S.S. and Han, G.Z. (2015). Insights into the origin and evolution
of the plant hormone signaling machinery. Plant Physiology, 167(3), pp.872-886.
Wang, F., Liu, J., Chen, M., Zhou, L., Li, Z., Zhao, Q., Pan, G. and Cheng, F. (2016).
Involvement of abscisic acid in PSII photodamage and D1 protein turnover for
light-induced premature senescence of rice flag leaves. PloS One, 11(8), p.
e0161203.
Wang, S., Wang, R., Liang, D., Ma, F. and Shu, H. (2012). Molecular characterization
and expression analysis of a glycine-rich RNA-binding protein gene from Malus
hupehensis Rehd. Molecular Biology Reports, 39(4), pp.4145-4153.
Wang, X.Q., Ullah, H., Jones, A.M. and Assmann, S.M. (2001). G protein regulation of
ion channels and abscisic acid signaling in Arabidopsis guard

References
207
cells. Science, 292(5524), pp.2070-2072.
Wani, S.H., Kumar, V., Shriram, V. and Sah, S.K. (2016). Phytohormones and their
metabolic engineering for abiotic stress tolerance in crop plants. The Crop
Journal, 4(3), pp.162-176.
Wanless, I.R., Bryniak, N. and Fensom, D.S. (1973). The effect of some growth-
regulating compounds upon electroosmotic measurements, transcellular water
flow, and Na, K, and Cl influx in Nitella flexilis. Canadian Journal of
Botany, 51(5), pp.1055-1070.
Ward, O.P. and Singh, A. (2005). Omega-3/6 fatty acids: alternative sources of
production. Process Biochemistry, 40(12), pp.3627-3652.
Warpeha, K.M., Upadhyay, S., Yeh, J., Adamiak, J., Hawkins, S.I., Lapik, Y.R.,
Anderson, M.B. and Kaufman, L.S. (2007). The GCR1, GPA1, PRN1, NF-Y signal
chain mediates both blue light and abscisic acid responses in Arabidopsis. Plant
Physiology, 143(4), pp.1590-1600.
Weatherwax, S.C., Ong, M.S., Degenhardt, J., Bray, E.A. and Tobin, E.M. (1996). The
interaction of light and abscisic acid in the regulation of plant gene expression.
Plant Physiology, 111(2), pp.363-370.
Weiner, J.J., Peterson, F.C., Volkman, B.F. and Cutler, S.R. (2010). Structural and
functional insights into core ABA signaling. Current Opinion in Plant Biology,
13(5), pp.495-502.
Weissig, H. and Beck, C.F. (1991). Action spectrum for the light-dependent step in
gametic differentiation of Chlamydomonas reinhardtii. Plant Physiology, 97(1),
pp.118-121.
Wellmann, S., Truss, M., Bruder, E., Tornillo, L., Zelmer, A., Seeger, K. and Bührer, C.

References
208
(2010). The RNA-binding protein RBM3 is required for cell proliferation and
protects against serum deprivation-induced cell death. Pediatric Research, 67(1),
pp.35-41.
Woo, H.R., Kim, H.J., Nam, H.G. and Lim, P.O. (2013). Plant leaf senescence and death–
regulation by multiple layers of control and implications for aging in general. J Cell
Sci, pp.109116.
Wu, G., Gao, Z., Du, H., Lin, B., Yan, Y., Li, G., Guo, Y., Fu, S., Wei, G., Wang, M. and
Cui, M. (2018). The effects of abscisic acid, salicylic acid and jasmonic acid on
lipid accumulation in two freshwater Chlorella strains. The Journal of General and
Applied Microbiology, 64(1), pp.42-49.
Yamaguchi-Shinozaki, K. and Shinozaki, K. (2006). Transcriptional regulatory networks
in cellular responses and tolerance to dehydration and cold stresses. Annu. Rev.
Plant Biol., 57, pp.781-803.
Yang, D.H., Kwak, K.J., Kim, M.K., Park, S.J., Yang, K.Y. and Kang, H. (2014).
Expression of Arabidopsis glycine-rich RNA-binding protein AtGRP2 or AtGRP7
improves grain yield of rice (Oryza sativa) under drought stress conditions. Plant
Science, 214, pp.106-112.
Yokoya, N.S., Stirk, W., Strnad, M. and van Staden, J. (2009). Endogenous cytokinins,
auxins and abscisic acid in Brazilian red algae. Phycologia, 48(4), pp.147-148.
Yoon, H.S., Hackett, J.D., Ciniglia, C., Pinto, G. and Bhattacharya, D., 2004. A molecular
timeline for the origin of photosynthetic eukaryotes. Molecular Biology and
Evolution, 21(5), pp.809-818.
Yoshida, K. (2005). Evolutionary process of stress response systems controlled by
abscisic acid in photosynthetic organisms. Yakugaku zasshi: Journal of the

References
209
Pharmaceutical Society of Japan, 125(12), pp.927-936.
Yoshida, K., Igarashi, E., Mukai, M., Hirata, K. and Miyamoto, K. (2003). Induction of
tolerance to oxidative stress in the green alga, Chlamydomonas reinhardtii, by
abscisic acid. Plant, Cell & Environment, 26(3), pp.451-457.
Yoshida, K., Igarashi, E., Wakatsuki, E., Miyamoto, K. and Hirata, K. (2004). Mitigation
of osmotic and salt stresses by abscisic acid through reduction of stress-derived
oxidative damage in Chlamydomonas reinhardtii. Plant Science, 167(6), pp.1335-
1341.
Yoshida, R., Hobo, T., Ichimura, K., Mizoguchi, T., Takahashi, F., Aronso, J., Ecker,
J.R. and Shinozaki, K. (2002). ABA-activated SnRK2 protein kinase is required for
dehydration stress signaling in Arabidopsis. Plant and Cell Physiology, 43(12),
pp.1473-1483.
Zeevaart, J.A.D. and Creelman, R.A. (1988). Metabolism and physiology of abscisic
acid. Annual Review of Plant Physiology and Plant Molecular Biology, 39(1),
pp.439-473.
Zhang, D.P. ed. (2014). Abscisic acid: metabolism, transport and signaling. Springer
Netherlands.
Zhang, W., Yamane, H. and Chapman, D.J. (1993). The phytohormone profile of the red
alga Porphyra perforata. Botanica Marina, 36(3), pp.257-266.
Zhou, L., Jang, J.C., Jones, T.L. and Sheen, J. (1998). Glucose and ethylene signal
transduction crosstalk revealed by an Arabidopsis glucose-insensitive
mutant. Proceedings of the National Academy of Sciences, 95(17), pp.10294-
10299.

References
210
Zhu, J.K. (2002). Salt and drought stress signal transduction in plants. Annual Review of
Plant Biology, 53(1), pp.247-273.
Žižková, E., Kubeš, M., Dobrev, P.I., Přibyl, P., Šimura, J., Zahajská, L., Záveská
Drábková, L., Novák, O. and Motyka, V. (2016). Control of cytokinin and auxin
homeostasis in cyanobacteria and algae. Annals of Botany, 119(1), pp.151-166.

Appendices
211
8 Appendices
8.1 Buffers and Solutions
TAE buffer (50X)
Tris: 242 g+ Glacial Acetic acid: 57.1 ml +EDTA: 100 ml from 0.5 M stock +
Distilled water: make up to 1L.
Loading dye (6X)
Bromophenol blue: 0.25 per cent + Glycerol: 30 per cent in water
Ethidium bromide
10 mg of sodium salt of Ethidium bromide (Et Br) was dissolved in 1ml of sterile water
and stored at room temperature in amber vials.
Western Buffers
10x running buffer (1L)
30g Tris (250mM) +140g glycine (1.9M) + 10g SDS made up to 1L with D.I. water. pH
8.3
1x running buffer (1L)
70mL 10x running buffer + 630mL D.I. water
10x transfer buffer (1L)
30.29g Tris (250mM) + 142.63g glycine (1.9M) made up to 1L with D.I. water
1x transfer buffer (1L)
100mL 10x transfer buffer + 200mL methanol + 700mL H2O
10x TBS (1L)
Dissolve 60.6g Tris + 87.6g NaCl in 600mL D.I. water. Add 100mL of dilute HCl (1N).
pH to 7.6 with HCl. Make up to 1L with D.I. water.
Staining solution
Coomassie Brilliant Blue (R250)
25mg in 100ml of destaining solution Destaining solution: (for 100ml)
Double distilled water - 50ml
Methanol - 40 ml
Glacial acetic acid - 10 ml
TAP medium
Tris-Acetate-Phosphate (TAP) growth medium for Chlamydomonas reinhardtii was
prepared as following described
1. FBS (Filner's Beijerincks Solution) 40 X Strength.
0.6M NH4Cl 32g/L NH4Cl
32Mm MgSO4. 7H2O 8g/L MgSO4
27Mm CaCl2. 2H2O 4g/L CaCl2

Appendices
212
Make up in 1L distilled water Autoclave. Store at 4˚C.
2. Phosphate solution (KPO4) 200 X strength.
62ml 1M K2HPO4 179.18g
41ml 1M KH2PO4 136.09g
397ml distilled water
Final volume = 500ml. autoclave. Store at 4˚C.
3. Modified trace mineral Solution-200 X strength.
27mM EDTA 5g Na2 EDTA. 2H2O
Or 5.6g Na4 EDTA. 2H2O
Dissolve in 400 ml distilled water by heating and stirring. pH to 6.5 with 5 M NaOH
The FeSO4 should be prepared last to avoid oxidation.
Add the following in order – dissolve each fully before adding next component:
3.6 mMFeSO4 0.5g FeSO4 • 7H2O
15mMZnSO4 2.2g ZnSO4 • 7H2O
37mMH3BO3 1.14g H3BO3
5.2mMMnCl2 0.51g MnCl2 • 4H2O
1.3 mMCuCl2 0.11g CoCl2 • 2H2O
1.1mMH2MoO4 0.10g MH2MoO4.H2O or0.13 g Na2MoO4. 2H2O
1.3 mM CoCl2 0.16g CoCl2 • 6H2O
Make up to 500ml with distilled water. Autoclave. Store at 4˚C.
The solution should be clear and pale green but will turn purple upon storage.
To make the final liquid TAP medium, mix the following:
For 1liter:
To 900ml de-ionised water add:
2.42g Tris base
12.5ml solution #1 (40 X FBS)
5ml solution #2 (phosphate (KPO4)
5ml solution #3 (trace mineral)
Adjust the pH 7.2 with diluted 1/10 glacial acetic acid
Make up 1 liter with distilled water.
pH should be 7.2. Autoclave.
For solid TAP medium, add 15g/L agar. Autoclave.

Appendices
213
8.2 Sequence of CrGRP1
Gene ID: 5720095; exons in yellow, introns in italics
1 CTGTATTCCA ATCAAGTTTC CTGTTTGGTT TCCTGGTTTG AGTATCTAGG CGTGGTAGAC
61 GCCTTTTCCT TTCAGCAGGC CAATCACCTG CTTTCTCCGG TTCCCTTCCT CTCGGAACCA E1F
121 TGTCGACCAA GCTCTACGTC GGTGAGCAAT CATAGGCATG CAACTGGGCT GCGCGAAGTC
181 GCGAAAGCTC GCGCGGGAAA GGCGGCTGGG GTCAGCCGCC TCAAAAGCGC GCGCTAAACC
241 TCTCGGAACG GCCTCGCACC TCCTCTCACT CGCTGGCCGC AGGCAACCTG TCGTGGGACA
301 CCCGCGCTGA TGACCTGACG AACCTGTTCA GCAAGTTCG GCGCCGTCGAG GTGAGCTTTC E2F/E2R
361 GTCTCGATGG GCCCGAACTG CATCTCGGTT CAGCTGGAGG GCCACTCTCA GGGCTTGTCG
421 CCCGGATCCC CGAATATGCA TGCACTAATC GCAAGTCTTC ATTTGCTTTG TTCCGCGCAG
481 GATGCCTTCG TCGCCACCGA CCGCGAGACT GGCCGGTCGC GCGGCTTTGG CTTCGTGACT E3F
541 CTCGAGGCCA ACGCTGCCAA GAGCGCCTGC T TGAGTGCG ACGGCACCGA GTTCATGGGC E3R
601 CGGTAAGTTT CAACTTATGT CGGAAACGTT TCGGTATTGG GCGCCGCAGA AAGAGATGCA
661 CCATAGATGC CTTCCGACAC TCGTGAATCT CATGTATTTG CTTTGTATTT CAACTTCCTG
721 CAGCACCATT CGCGTGAACG AGGCTACTCC CCTGGGCGAG CGCCCACCTG GTGAGTTCAA E4F/E4R
781 GGCTGCCGAG ATCGCATGCA ACTGTGTCTA CAACCCCAGG ATACGCTGAT GCCTGGATAC
841 CTGTTGTGGA GGCTTTGTAT TCTGACGCAT AGTATTGCAT CACTCCAATC AATGACGGCT
901 GCTGCGGGCG TTGGGAAGTT CCGAAATATC CTGCTCGCCA GGTATCTCCG TGCGGCCCGC
961 CACTGACCGC TTTCCTCCCT TGTCCTCTTC CCTTGATCCC GAGCAGGCGG CCGCGGCGGT
1021 GGCCGTGGGT ACGGTGGTGG TGGCCGTGGC CGTGGCGGTG ACTACGGCGG CGGCCGTGGC
1081 GGCTACGGTG GCGGTGGCTA CGGTGAGCCT TGCGAGTGTC CTGTTCCAAG CAAACCACCT E5F/E5R
1141 GTGCGCCCAA GGATCATCTC GAGTCCGACA CTTCGGTGTA GCGCTTCACA AGGCTTCCAA
1201 GGGCATCCAA GCAGTGTTGT GCGAGTGCCT TACAGCGTGT GTTTCGGAAT GCTGACATGT
1261 TCTGTTTGTG TGTAGGTGGC GGCGGCTACG GTGGCGGCCG CGGCGGCGGC GGCTACGGCG
1321 GCGGTGGCAG CGGCGGCTAC GGCGGCGGCG GTTACGGTGA GGCCAACACA GGTTCGGCCG E6F/E6R
1381 ATTCTTGCAA CGCGCGCTTT GACGATTGGG TCACATCTGC TTGATGTTGA GTCTTGGGTC
1441 GTGTGCCAAG TTGCTGCAAA GGTTTTTTTG CCAATGCCTC TAGTGTTGGT TGCTTAAAGT
1501 TGCCTGACAG GTTTTTCTTC TGCCTCTCTT TCCAGGCGGC AACGGTGGCG GCGGCTACGG
1561 TGCCGGTGGC GGCGGCTACG GTGGCGGCGG CTACTAAGCC CGCGGCTGAA GTCAGCGCAC
1621 GTCATGCCGC AGCACGCGGC ATGTTGAGGA GCCATCAAGG GAGCGTCAGA TTGGTGTAGG E71F/E71R
1681 GTTATTGTGC TGGCCGCAGC ACCTGCGACA ATGGCGGGCG GACTCATTGC GCCTTGCCGG
1741 AGCAGTCTGC GAGACTTCTA AAGAGGCTTT GCAAGATCGT TGCCGAGGAC GCCGTGTACC
1801 GACGGGCGAT TTTCGCGTGC AAGCTTGAGT CATGAGACAA GGGCACGTTA GCGCGCGCCA
1861 GATGGTGCGT GCGGGCTCGG CGCGTTGGTA GTACAGGTGG CAAGCTTGCA CAACTTGTTT
1921 GGACGTCCAT CCACCGTATC AGTTCTACAA ACATAGCGTG GTGTGTTTCG GTCGAACGAA
1981 GAAACACATT ATGTGCTATG CATTGTTGTG CCGATTGCTG TGTGTGTACT GCGCATGTCT
2041 GCATGACAGA TGCAAAGCGC AAACTGCAGC CGGTGCTTTT GTGGTTCTGT GTATTGTGTG
2101 TTGGTTGATG AGGAAGTTGA GGGCAACAGG GGCGCAAGTC ACTCAGGCCC CGATGCCGAT
2161 TCCGTATCCT TTCCGGTGGT GGTTAGTGTT GCATACCGGT GTGTGTGTAG TTTGGTTTTG
2221 CGTTGGTTTG CACTTCTCAC ATGGTTTCTT CGTGTTTTCC AGTCGATGTT TGCCTGTATC
2281 CCCTATCCTC GAGCGCACCC TGGTCTGCAC GCCGTAAGCT GGGGCCCGGA AGCCTCTGCT
2341 GTGGCGGTGT GCGAGTCTCT TGGTTGCGTG CGGTTCCCGT AAGGCTTCCC GTGGTGGCGC
2401 AACACCGCGG CGACGTTTGC GTGGCGCGGG TGTGGTGAGG CTGCTGGATG GCGCCTCAAA
2461 CACTGGCGGC GCTTGGTGTT GTACCCTGTG CGCATCGGAT CCGAGTGTGT ATATGGCGAA
2521 TTACAGAACT ATGCCATATG CAACCACGTG CGGTGTACAT ACTCTGACCT TCTGCTTCGC
2581 ATGAGCGAGA GAGAGGACAC TGCCATGCTA CCCCAATTCA TCGGCTGGAA TTACGAATAC E72F
2641 GTGTGGTGTT GCTTGATGCG TTACTCAAGT CCAATGGTGT TTCCAGTTCG GGTGCGAGAT
2701 ACGGGCGGCG CAAGTGGATT GACCCTTGCG TCTGCAAACG TACGAGCTAT CAGGTACTTG
2761 GTCCCCAGTC CGGAACTCAA TTGTCCGCTA CGGCTTCAAA ATACTGTCTC CCGGCTCTCT E72R
2821 ACTATGGCTG TAAACTTAAA AGCGGAAA
Green: forward primers, and where shown, the complement is the reverse primer too.
Blue: reverse primer alone
Purple: overlap (applies to exon 2 primers only).

Appendices
214
Messenger RNA: 1 ctgtattcca atcaagtttc ctgtttggtt tcctggtttg agtatctagg cgtggtagac
61 gccttttcct ttcagcaggc caatcacctg ctttctccgg ttcccttcct ctcggaacca
121 tgtcgaccaa gctctacgtc ggcaacctgt cgtgggacac ccgcgctgat gacctgacga
181 acctgttcag caagttcggc gccgtcgagg atgccttcgt cgccaccgac cgcgagactg
241 gccggtcgcg cggctttggc ttcgtgactc tcgaggccaa cgctgccaag agcgcctgct
301 ctgagtgcga cggcaccgag ttcatgggcc gcaccattcg cgtgaacgag gctactcccc
361 tgggcgagcg cccacctggc ggccgcggcg gtggccgtgg gtacggtggt ggtggccgtg
421 gccgtggcgg tgactacggc ggcggccgtg gcggctacgg tggcggtggc tacggtggcg
481 gcggctacgg tggcggccgc ggcggcggcg gctacggcgg cggtggcagc ggcggctacg
541 gcggcggcgg ttacggcggc aacggtggcg gcggctacgg tgccggtggc ggcggctac
601 gtggcggcgg ctactaagcc cgcggctgaa gtcagcgcac gtcatgccgc agcacgcggc
661 atgttgagga gccatcaagg gagcgtcaga ttggtgtagg gttattgtgc tggccgcagc
721 acctgcgaca atggcgggcg gactcattgc gccttgccgg agcagtctgc gagacttcta
781 aagaggcttt gcaagatcgt tgccgaggac gccgtgtacc gacgggcgat tttcgcgtgc
841 aagcttgagt catgagacaa gggcacgtta gcgcgcgcca gatggtgcgt gcgggctcgg
901 cgcgttggta gtacaggtgg caagcttgca caacttgttt ggacgtccat ccaccgtatc
961 agttctacaa acatagcgtg gtgtgtttcg gtcgaacgaa gaaacacatt atgtgctatg
1021 cattgttgtg ccgattgctg tgtgtgtact gcgcatgtct gcatgacaga tgcaaagcgc
1081 aaactgcagc cggtgctttt gtggttctgt gtattgtgtg ttggttgatg aggaagttga
1141 gggcaacagg ggcgcaagtc actcaggccc cgatgccgat tccgtatcct ttccggtggt
1201 ggttagtgtt gcataccggt gtgtgtgtag tttggttttg cgttggtttg cacttctcac
1261 atggtttctt cgtgttttcc agtcgatgtt tgcctgtatc ccctatcctc gagcgcaccc
1321 tggtctgcac gccgtaagct ggggcccgga agcctctgct gtggcggtgt gcgagtctct
1381 tggttgcgtg cggttcccgt aaggcttccc gtggtggcgc aacaccgcgg cgacgtttgc
1441 gtggcgcggg tgtggtgagg ctgctggatg gcgcctcaaa cactggcggc gcttggtgtt
1501 gtaccctgtg cgcatcggat ccgagtgtgt atatggcgaa ttacagaact atgccatatg
1561 caaccacgtg cggtgtacat actctgacct tctgcttcgc atgagcgaga gagaggacac
1621 tgccatgcta ccccaattca tcggctggaa ttacgaatac gtgtggtgtt gcttgatgcg
1681 ttactcaagt ccaatggtgt ttccagttcg ggtgcgagat acgggcggcg caagtggatt
1741 gacccttgcg tctgcaaacg tacgagctat caggtacttg gtccccagtc cggaactcaa
1801 ttgtccgcta cggcttcaaa atactgtctc ccggctctct actatggctg taaacttaaa
1861 agcggaaa
Protein:
1 mstklyvgnl swdtraddlt nlfskfgave dafvatdret grsrgfgfvt leanaaksac
61 secdgtefmg rtirvneatp lgerppggrg ggrgyggggr grggdygggr ggyggggygg
121 ggygggrggg gyggggsggy ggggyggngg ggygaggggy ggggy

Appendices
215
8.3 PChlamy_4 vector sequence
TCGCTGAGGCTTGACATGATTGGTGCGTATGTTTGTATGAAGCTACAGGACTGATTTGGCGGGCTATGAG
GGCGGGGGAAGCTCTGGAAGGGCCGCGATGGGGCGCGCGGCGTCCAGAAGGCGCCATACGGCCCGCTGGC
GGCACCCATCCGGTATAAAAGCCCGCGACCCCGAACGGTGACCTCCACTTTCAGCGACAAACGAGCACTT
ATACATACGCGACTATTCTGCCGCTATACATAACCACTCAGCTAGCTTAAGATCCCATCAAGCTTGCATG
CCGGGCGCGCCAGAAGGAGCGCAGCCAAACCAGGATGATGTTTGATGGGGTATTTGAGCACTTGCAACCC
TTATCCGGAAGCCCCCTGGCCCACAAAGGCTAGGCGCCAATGCAAGCAGTTCGCATGCAGCCCCTGGAGC
GGTGCCCTCCTGATAAACCGGCCAGGGGGCCTATGTTCTTTACTTTTTTACAAGAGAAGTCACTCAACAT
CTTAAAATGGCCAGGTGAGTCGACGAGCAAGCCCGGCGGATCAGGCAGCGTGCTTGCAGATTTGACTTGC
AACGCCCGCATTGTGTCGACGAAGGCTTTTGGCTCCTCTGTCGCTGTCTCAAGCAGCATCTAACCCTGCG
TCGCCGTTTCCATTTGCAGGATGGCCATGCAT
ATGGCCAAGCTGACCAGCGCCGTTCCGGTGCTCACCGC
GCGCGACGTCGCCGGAGCGGTCGAGTTCTGGACCGACCGGCTCGGGTTCTCCCGGGACTTCGTGGAGGAC
GACTTCGCCGGTGTGGTCCGGGACGACGTGACCCTGTTCATCAGCGCGGTCCAGGACCAGGTGAGTCGAC
GAGCAAGCCCGGCGGATCAGGCAGCGTGCTTGCAGATTTGACTTGCAACGCCCGCATTGTGTCGACGAAG
GCTTTTGGCTCCTCTGTCGCTGTCTCAAGCAGCATCTAACCCTGCGTCGCCGTTTCCATTTGCAGGACCA
GGTGGTGCCGGACAACACCCTGGCCTGGGTGTGGGTGCGCGGCCTGGACGAGCTGTACGCCGAGTGGTCG
GAGGTCGTGTCCACGAACTTCCGGGACGCCTCCGGGCCGGCCATGACCGAGATCGGCGAGCAGCCGTGGG
GGCGGGAGTTCGCCCTGCGCGACCCGGCCGGCAACTGCGTGCACTTCGTGGCCGAGGAGCAGGACGCCCC
GGTGAAGCAGACCCTGAACTTCGACCTGCTGAAGCTGGCGGGCGACGTGGAGAGCAACCCGGGCCCCGAA
TTCCTCGAGCACCACCACCACCACCACGGCAAGCCCATCCCCAACCCCCTGCTGGGCCTGGACAGCACCG
AGAACCTGTACTTCCAGGGGGTACCAGGATCCGGAAGATCTGGTCTAGAGGGCAAGCCCATCCCCAACCC
CCTGCTGGGCCTGGACAGCACCCGTACCGGTCACCACCACCACCACCACTAACTGCAGCCGCTCCGTGTA
AATGGAGGCGCTCGTTGATCTGAGCCTTGCCCCCTGACGAACGGCGGT
GGATGGAAGATACTGCTCTCAA
GTGCTGAAGCGGTAGCTTAGCTCCCCGTTTCGTGCTGATCAGTCTTTTTCAACACGTAAAAAGCGGAGGA
GTTTTGCAATTTTGTTGGTTGTAACGATCCTCCGTTGATTTTGGCCTCTTTCTCCATGGGCGGGCTGGGC
GTATTTGAAGCGGCGGTATTTCACACCGCATCAGGTGGCACTTTTCGGGGAAATGTGCGCGGAACCCCTA
TTTGTTTATTTTTCTAAATACATTCAAATATGTATCCGCTCATGAGATTATCAAAAAGGATCTTCACCTA
GATCCTTTTAAATTAAAAATGAAGTTTTAAATCAATCTAAAGTATATATGAGTAAACTTGGTCTGACAGT
TACCAATGCTTAATCAGTGAGGCACCTATCTCAGCGATCTGTCTATTTCGTTCATCCATAGTTGCCTGAC
TCCCCGTCGTGTAGATAACTACGATACGGGAGGGCTTACCATCTGGCCCCAGTGCTGCAATGATACCGCG
AGACCCACGCTCACCGGCTCCAGATTTATCAGCAATAAACCAGCCAGCCGGAAGGGCCGAGCGCAGAAGT
GGTCCTGCAACTTTATCCGCCTCCATCCAGTCTATTAATTGTTGCCGGGAAGCTAGAGTAAGTAGTTCGC
CAGTTAATAGTTTGCGCAACGTTGTTGCCATTGCTACAGGCATCGTGGTGTCACGCTCGTCGTTTGGTAT
GGCTTCATTCAGCTCCGGTTCCCAACGATCAAGGCGAGTTACATGATCCCCCATGTTGTGCAAAAAAGCG
GTTAGCTCCTTCGGTCCTCCGATCGTTGTCAGAAGTAAGTTGGCCGCAGTGTTATCACTCATGGTTATGG
CAGCACTGCATAATTCTCTTACTGTCATGCCATCCGTAAGATGCTTTTCTGTGACTGGTGAGTACTCAAC
CAAGTCATTCTGAGAATAGTGTATGCGGCGACCGAGTTGCTCTTGCCCGGCGTCAATACGGGATAATACC
GCGCCACATAGCAGAACTTTAAAAGTGCTCATCATTGGAAAACGTTCTTCGGGGCGAAAACTCTCAAGGA
TCTTACCGCTGTTGAGATCCAGTTCGATGTAACCCACTCGTGCACCCAACTGATCTTCAGCATCTTTTAC
TTTCACCAGCGTTTCTGGGTGAGCAAAAACAGGAAGGCAAAATGCCGCAAAAAAGGGAATAAGGGCGACA
CGGAAATGTTGAATACTCATACTCTTCCTTTTTCAATATTATTGAAGCATTTATCAGGGTTATTGTCTCA
TGACCAAAATCCCTTAACGTGAGTTTTCGTTCCACTGAGCGTCAGACCCCGTAGAAAAGATCAAAGGATC
TTCTTGAGATCCTTTTTTTCTGCGCGTAATCTGCTGCTTGCAAACAAAAAAACCACCGCTACCAGCGGTG
GTTTGTTTGCCGGATCAAGAGCTACCAACTCTTTTTCCGAAGGTAACTGGCTTCAGCAGAGCGCAGATAC
CAAATACTGTTCTTCTAGTGTAGCCGTAGTTAGGCCACCACTTCAAGAACTCTGTAGCACCGCCTACATA
CCTCGCTCTGCTAATCCTGTTACCAGTGGCTGTTGCCAGTGGCGATAAGTCGTGTCTTACCGGGTTGGAC
TCAAGACGATAGTTACCGGATAAGGCGCAGCGGTCGGGCTGAACGGGGGGTTCGTGCACACAGCCCAGCT
TGGAGCGAACGACCTACACCGAACTGAGATACCTACAGCGTGAGCTATGAGAAAGCGCCACGCTTCCCGA
AGGGAGAAAGGCGGACAGGTATCCGGTAAGCGGCAGGGTCGGAACAGGAGAGCGCACGAGGGAGCTTCCA
GGGGGAAACGCCTGGTATCTTTATAGTCCTGTCGGGTTTCGCCACCTCTGACTTGAGCGTCGATTTTTGT
GATGCTCGTCAGGGGGGCGGAGCCTATGGAAAAACGCCAGCAACGCGGCCTTTTTACGGTTCCTGGCCTT
TTGCTGGCCTTTTGCTCACATGTTCTTTCCTGCGTTATCCCCTGATTCTGTGGATAACCGTATTACCGCC

Appendices
216
TTTGAGTGAGCTGATACCGCTCGCCGCAGCCGAACGACCGAGCGCAGCGAGTCAGTGAGCGAGGAAGCGG
Zeocin_F1 5’-GCCATGACCGAGATCGGCGAGCAGC-3’
FMDV2A_F1 5’-GGTGAAGCAGACCCTGAACTTCGAC-3’
UTR_R1 5’-CAAGGCTCAGATCAACGAGCGCCTC-3’
UTR_R2 5’-GATCAACGAGCGCCTCCATTTACAC-3’
FMDV 2A
MCS1
6×His
V5 epitope
TEV
MCS2
V5 epitope
6×His
MCS3
3UTR

Appendices
217
8.4 Diagram illustrating the primers designed
Figure 8.1:Diagram illustrating the primers designed and used in this study in relation to CrGRP1 exons.
Primer name Expected band from
RNA only Expected band from
RNA and intron
E1F+E2R 89bp 230bp
E1F+E3R 190bp 471bp
E1F+E72R 1,743bp 2,728bp
Table 8-1:The primer name and the expected size of band

Appendices
218
8.5 Relative Cell Density Data Analysis
(a) 1h into Photoperiod (t=1h) For Figure 3.11
Incubation
(Light/Dark)
Light Light Light Light Light Light Light Light
Dark Dark Dark Dark
Dark Dark Dark Dark
Treatment Control Control Control Control
50µM
ABA
50µM
ABA
50µM
ABA
50µM
ABA
Control Control Control Control
50µM
ABA
50µM
ABA
50µM
ABA
50µM
ABA
Depth from
Surface (cm) 2 4 6 8
2 4 6 8
2 4 6 8
2 4 6 8
Mean
Relative Cell
Density
Ratio
13 20 23 44
19 21 23 37
23 16 22 39
70 13 9 8
Standard
Deviation 4 7 6 8
5 4 5 7
4 3 3 3
15 6 5 5
Standard
Error 2 3 3 4
2 2 2 3
2 1 1 1
7 3 2 2
95%
Confidence
Interval
5 9 8 10
6 5 6 9
5 4 4 4
19 7 6 6

Appendices
219
Chi- Squared test of Independence
Chi-Squared test of Goodness of Fit Depth from Surface (cm)
2 4 6 8
Dark 23 16 22 39
Dark + ABA 70 13 9 8
P value 0.00 0.53 0.02 0.00
Significant (Y/N) Y N Y Y
Chi2 Stat 24.3 0.4 5.6 20.4
Effect Rank 1 4 3 2
Depth from Surface (cm)
CHI-
SQUARE
2 4 6 8
chi-sq p-value x-crit sig Cramer
V
Light 13 20 23 44
Pearson's 1.7 0.6 7.8 no 0.1
Light + ABA 19 21 23 37
Max
likelihood
1.7 0.6 7.8 no 0.1
CHI-
SQUARE
Dark 23 16 22 39
chi-sq p-value x-crit sig Cramer
V
Dark + ABA 70 13 9 8
Pearson's 50.7 0.0 7.8 yes 0.5 Max
likelihood
53.9 0.0 7.8 yes 0.5

Appendices
220
(b) 8h into Photoperiod (t=8h) For Figure 3.12
Incubation
(Light/Dark)
Light Light Light Light
Light Light Light Light
Dark Dark Dark Dark
Dark Dark Dark Dark
Treatment Control Control Control Control
50µM
ABA
50µM
ABA
50µM
ABA
50µM
ABA
Control Control Control Control
50µM
ABA
50µM
ABA
50µM
ABA
50µM
ABA
Depth from
Surface (cm) 2 4 6 8
2 4 6 8
2 4 6 8
2 4 6 8
Mean
Relative Cell
Density
Ratio
7 9 23 61
6 11 23 61
17 22 25 36
53 24 16 7
Standard
Deviation 3 5 4 8
2 8 6 10
2 2 2 4
10 5 4 2
Standard
Error 1 2 2 4
1 3 3 5
1 1 1 2
5 2 2 1
95%
Confidence
Interval
3 6 5 10
2 10 7 13
2 2 3 4
13 6 5 2

Appendices
221
Chi-Squared test of Independence
Depth from Surface (cm)
CHI-
SQUARE
2 4 6 8
chi-sq p-value x-crit sig Cramer
V
Light 7 9 23 61
Pearson's 0.4 0.9 7.8 no 0.0
Light + ABA 6 11 23 61
Max likelihoo
d
0.4 0.9 7.8 no 0.0
CHI-
SQUARE
Dark 17 22 25 36
chi-sq p-value x-crit sig Cramer
V
Dark + ABA 53 24 16 7
Pearson's 39.5 0.0 7.8 yes 0.4 Max
likelihood
42.3 0.0 7.8 yes 0.5
Chi-Squared test of Goodness of Fit Depth from Surface (cm)
2 4 6 8
Dark 17 22 25 36
Dark + ABA 53 24 16 7
P value 0.00 0.75 0.20 0.00
Significant (Y/N) Y N N Y
Chi2 Stat 17.8 0.1 1.7 20.0
Effect Rank 2 4 3 1

Appendices
222
(c) 15h into Photoperiod (t=15h) For Figure 3.13
Incubation
(Light/Dark)
Light Light Light Light
Light Light Light Light
Dark Dark Dark Dark
Dark Dark Dark Dark
Treatment Control Control Control Control
50µM
ABA
50µM
ABA
50µM
ABA
50µM
ABA
Control Control Control Control
50µM
ABA
50µM
ABA
50µM
ABA
50µM
ABA
Depth from
Surface (cm) 2 4 6 8
2 4 6 8
2 4 6 8
2 4 6 8
Mean
Relative Cell
Density
Ratio
17 19 23 41
12 17 24 47
20 22 22 36
58 16 16 9
Standard
Deviation 3 3 4 6
3 3 6 9
6 4 7 7
7 5 4 4
Standard
Error 1 1 2 3
2 1 3 4
3 2 3 3
3 2 2 2
95%
Confidence
Interval
4 3 5 7
4 3 8 11
7 5 8 8
9 6 5 5

Appendices
223
Chi-Squared test of Independence
Depth from Surface (cm)
CHI-SQUARE
2 4 6 8
chi-sq p-value x-crit sig Cramer
V
Light 17 19 23 41
Pearson's 1.2 0.8 7.8 no 0.1
Light + ABA 12 17 24 47
Max
likelihoo
d
1.2 0.8 7.8 no 0.1
CHI-
SQUARE
Dark 20 22 22 36
chi-sq p-value x-crit sig Cramer
V
Dark + ABA 58 16 16 9
Pearson's 36.8 0.0 7.8 yes 0.4 Max
likelihoo
d
38.8 0.0 7.8 yes 0.4
Chi-Squared test of Goodness of Fit Depth from Surface (cm)
2 4 6 8
Dark 20 22 22 36
Dark + ABA 58 16 16 9
P value 0.00 0.35 0.34 0.00
Significant (Y/N) Y N N Y
Chi2 Stat 19.2 0.9 0.9 15.9
Effect Rank 1 4 3 2

Appendices
224
(d) 1h into Dark Period (t=17h) For Figure 3.14
Incubation
(Light/Dark)
Light Light Light Light
Light Light Light Light
Dark Dark Dark Dark
Dark Dark Dark Dark
Treatment Control Control Control Control
50µM
ABA
50µM
ABA
50µM
ABA
50µM
ABA
Control Control Control Control
50µM
ABA
50µM
ABA
50µM
ABA
50µM
ABA
Depth from
Surface (cm) 2 4 6 8
2 4 6 8
2 4 6 8
2 4 6 8
Mean
Relative Cell
Density
Ratio
24 24 26 26
13 26 27 33
14 23 26 37
37 22 22 19
Standard
Deviation 8 3 3 3
4 3 5 5
7 3 3 8
16 6 9 4
Standard
Error 3 1 1 1
2 1 2 2
3 1 1 3
7 2 4 2
95%
Confidence
Interval
9 4 4 3
5 4 6 6
9 4 4 9
20 7 12 6

Appendices
225
Chi-Squared test of Independence Depth from Surface (cm)
CHI-
SQUARE
2 4 6 8
chi-sq p-value x-crit sig Cramer
V
Light 24 24 26 26
Pearson's 4.1 0.2 7.8 no 0.1
Light + ABA 13 26 27 33
Max
likelihoo
d
4.2 0.2 7.8 no 0.1
CHI-
SQUARE
Dark 14 23 26 37
chi-sq p-value x-crit sig Cramer
V
Dark + ABA 37 22 22 19
Pearson's 17.3 0.0 7.8 yes 0.3 Max
likelihoo
d
17.8 0.0 7.8 yes 0.3
Chi-Squared test of Goodness of Fit Depth from Surface (cm)
2 4 6 8
Dark 14 23 26 37
Dark + ABA 37 22 22 19
P value 0.00 0.95 0.50 0.01
Significant (Y/N) Y N N Y
Chi2 Stat 10.8 0.0 0.5 6.0
Effect Rank 1 4 3 2

Appendices
226
(e) 4h into Dark Period (t=20h) For Figure 3.15
Incubation
(Light/Dark)
Light Light Light Light
Light Light Light Light
Dark Dark Dark Dark
Dark Dark Dark Dark
Treatment Control Control Control Control
50µM
ABA
50µM
ABA
50µM
ABA
50µM
ABA
Control Control Control Control
50µM
ABA
50µM
ABA
50µM
ABA
50µM
ABA
Depth from
Surface (cm) 2 4 6 8
2 4 6 8
2 4 6 8
2 4 6 8
Mean
Relative Cell
Density
Ratio
13 22 29 35
17 26 25 32
14 19 25 42
45 20 16 19
Standard
Deviation 1 2 2 3
2 1 2 3
2 1 2 3
7 6 4 4
Standard
Error 0 1 1 1
1 0 1 1
1 0 1 1
3 3 2 2
95%
Confidence
Interval
1 2 2 3
3 1 2 3
3 1 3 3
9 7 5 5

Appendices
227
Chi-Squared test of Independence
Depth from Surface (cm)
CHI-
SQUARE
2 4 6 8
chi-sq p-value x-crit sig Cramer
V
Light 13 22 29 35
Pearson's 1.1 0.8 7.8 no 0.1
Light + ABA 17 26 25 32
Max
likelihoo
d
1.1 0.8 7.8 no 0.1
CHI-
SQUARE
Dark 14 19 25 42
chi-sq p-value x-crit sig Cramer
V
Dark + ABA 45 20 16 19
Pearson's 27.5 0.0 7.8 yes 0.4 Max
likelihoo
d
28.7 0.0 7.8 yes 0.4
Chi-Squared test of Goodness of Fit Depth from Surface (cm)
2 4 6 8
Dark 14 19 25 42
Dark + ABA 45 20 16 19
P value 0.00 0.90 0.16 0.00
Significant (Y/N) Y N N Y
Chi2 Stat 16.7 0.0 2.0 8.8
Effect Rank 1 4 3 2

Appendices
228
(f) 7h into Dark Period (t=23h) For Figure 3.16
Incubation
(Light/Dark)
Light Light Light Light
Light Light Light Light
Dark Dark Dark Dark
Dark Dark Dark Dark
Treatment Control Control Control Control
50µM
ABA
50µM
ABA
50µM
ABA
50µM
ABA
Control Control Control Control
50µM
ABA
50µM
ABA
50µM
ABA
50µM
ABA
Depth from
Surface (cm) 2 4 6 8
2 4 6 8
2 4 6 8
2 4 6 8
Mean
Relative Cell
Density
Ratio
17 25 25 32
14 24 28 34
18 20 24 37
30 25 23 21
Standard
Deviation 3 3 2 6
2 1 1 1
2 2 3 3
7 3 4 2
Standard
Error 1 2 1 3
1 0 1 1
1 1 1 1
3 1 2 1
95%
Confidence
Interval
4 4 2 8
2 1 1 1
3 3 4 3
9 3 5 3

Appendices
229
Chi-Squared test of Independence
Depth from Surface (cm)
CHI-SQUARE
2 4 6 8
chi-sq p-value x-crit sig Cramer
V
Light 17 25 25 32
Pearson's 0.5 0.9 7.8 no 0.1
Light + ABA 14 24 28 34
Max
likelihood
0.5 0.9 7.8 no 0.1
CHI-
SQUARE
Dark 18 20 24 37
chi-sq p-value x-crit sig Cramer V
Dark + ABA 30 25 23 21
Pearson's 8.1 0.0 7.8 yes 0.2 Max
likelihood 8.2 0.0 7.8 yes 0.2
Chi-Squared test of Goodness of Fit
Depth from Surface (cm) 2 4 6 8
Dark 18 20 24 37
Dark + ABA 30 25 23 21
P value 0.08 0.46 0.90 0.03
Significant (Y/N) N N N Y
Chi2 Stat 3.1 0.5 0.0 4.5
Effect Rank 2 3 4 1

Appendices
230
Effect of Sampling Time
Depth from Surface (cm)
CHI-
SQUARE
2 4 6 8
chi-sq p-value x-crit sig Cramer
V
Light 1h into photoperiod 13 20 23 44
Pearson's 25.0 0.0 21.0 yes 0.1
Light 8h into photoperiod 7 9 23 61
Max
likelihood
26.0 0.0 21.0 yes 0.1
Light 15h into photoperiod 17 19 23 41
Light 4h into dark period 13 22 29 35
Light 7h into dark period 17 25 25 32
P value 0.29 0.11 0.91 0.02
Significant (Y/N) N N N Y
Chi2 Stat 4.9 7.6 1.0 11.4
Effect Rank 3 2 4 1

Appendices
231
Depth from Surface (cm)
CHI-
SQUARE
2 4 6 8
chi-sq p-value x-crit sig Cramer
V
Light + ABA 1h into
photoperiod
19 21 23 37
Pearson's 28.5 0.0 21.0 yes 0.1
Light + ABA 8h into
photoperiod
6 11 23 61
Max
likelihood
29.4 0.0 21.0 yes 0.1
Light + ABA 15h into photoperiod
12 17 24 47
Light + ABA 4h into dark
period
17 26 25 32
Light + ABA 7h into dark
period
14 24 28 34
P value 0.11 0.12 0.96 0.01
Significant (Y/N) N N N Y
Chi2 Stat 7.4 7.3 0.7 13.2
Effect Rank 2 3 4 1

Appendices
232
Depth from Surface (cm)
CHI-
SQUARE
2 4 6 8
chi-sq p-value x-crit sig Cramer
V
Dark 1h into photoperiod 23 16 22 39
Pearson's 4.2 1.0 21.0 no 0.1
Dark 8h into photoperiod 17 22 25 36
Max
likelihood
4.3 1.0 21.0 no 0.1
Dark 15h into photoperiod 20 22 22 36
Dark 4h into dark period 14 19 25 42
Dark 7h into dark period 18 20 24 37
P value N/A N/A N/A N/A
Significant (Y/N) N/A N/A N/A N/A
Chi2 Stat N/A N/A N/A N/A
Effect Rank N/A N/A N/A N/A

Appendices
233
Depth from Surface (cm)
CHI-
SQUARE
2 4 6 8
chi-sq p-value x-crit sig Cramer
V
Dark + ABA 1h into
photoperiod
70 13 9 8
Pearson's 42.9 0.0 21.0 yes 0.2
Dark + ABA 8h into
photoperiod
53 24 16 7
Max
likelihood
43.8 0.0 21.0 yes 0.2
Dark + ABA 15h into photoperiod
58 16 16 9
Dark + ABA 4h into dark
period
45 20 16 19
Dark + ABA 7h into dark
period
30 25 23 21
P value 0.00 0.22 0.19 0.01
Significant (Y/N) Y N N Y
Chi2 Stat 17.1 5.7 6.1 13.9
Effect Rank 1 4 3 2

Appendices
234
8.6 Sequence Data

Appendices
235

Appendices
236

Appendices
237

Appendices
238

Appendices
239

Appendices
240

Appendices
241

Appendices
242

Appendices
243

Appendices
244

Appendices
245

Appendices
246

Appendices
247

Appendices
248

Appendices
249

Appendices
250

Appendices
251

Appendices
252
8.7 More figure for some experiments
• Related to chapter 3
Figure 8.2: Opposing direction of travel of C. reinhardtii cells in response to ABA in the light
and dark. Algal cultures were grown under a 16h photoperiod to the mid-log phase (A750 = 0.3) growth stage and
were sampled mid photoperiod. Fully dispersed samples of the algal culture were placed in sealed tubes
with a plug of agarose containing the concentrations of ABA indicated and were immediately placed
horizontally in the light (at 980 Lux) or the dark for 50 min. Shown is a representative image indicating
the positions attained by the algae immediately following the incubation period.

Appendices
253
Figure 8.3: Exogenous abscisic (ABA) acid differentially altered HCO3- uptake by C.
reinhardtii in a light-dependent manner. Mid-log phase (A750 = 0.3) algal cultures were immobilised in alginate gel beads containing the
concentrations of ABA indicated and were incubated for 1 hour under different light intensities with
bicarbonate indicator buffer in TAP media. Depletion of HCO3- in the media was monitored as the change
in absorbance in the indicator buffer at 550nm after the incubation period. Shown are the mean δA550 h-1
of n=5 replicates with errors as the 95% confidence intervals around the means in each case.

Appendices
254
• Related to chapter 4
Figure 8.4: Expression analysis of CrGRP1 in the Circadian rhythm in C. reinhardii. After treating cells without and with 50µM ABA PCR products were resolved on 1xTAE, 1.2% (w/v)
agarose gel electrophoresis and visualised under UV light following EtBr staining. Molecular weight
markers (Lane M – 100 bp DNA ladder) were used to confirm amplicon sizes, n=3 replicates. Lane 1-8 represents the representative mRNA levels from a circadian experiment on the light condition at 2h, 4h,
6h, 8h,10h, 12h, 14h and 16h. Lane 9-12 represents the same as above from a circadian experiment on the
dark condition at 18h , 20h , 22h and 24h. Lane C: control without cDNA added.
Figure 8.5: Expression analysis of CrGRP1 in the Circadian rhythm in C. reinhardii. After treating cells without and with 50µM ABAm PCR products were resolved on 1xTAE, 1.2% (w/v) agarose gel electrophoresis and visualised under UV light following EtBr staining. Molecular weight
markers (Lane M – 100 bp DNA ladder) were used to confirm amplicon sizes, n=3 replicates. Lane 1-8
represents the representative mRNA levels from a circadian experiment on the light condition at 2h, 4h,
6h, 8h,10h, 12h, 14h and 16h. Lane 9-12 represents the same as above from a circadian experiment on the
dark condition at 18h , 20h , 22h and 24h. Lane C: control without cDNA added.

Appendices
255
• Related to chapter 5
Figure 8.6:Transformed C. reinhardtii colonies after three weeks of growth and the
movement of recombinant C. reinhardtii cells is differentially affected by ABA Panel 1, only cells which received and integrated the ble zeocin resistance gene grew to form colonies. A. Empty plasmid in the TAP- zeocin agar; B. Overexpression plasmid; C. Overexpression with V5 6-his tag
plasmid; D. Antisense plasmid in the TAP- zeocin agar. Panel 2, some colonies were growing in the TAP-
zeocin media but the transgenic cells were white colour. Panel 3, then growth some colonies with TAP
media without zeocin and they were growth very well. Panel 4, cells were seeing under microscope. Panel
5, After growth in TAP media until A750 = 0.3, cultures were treated with 50 µM of ABA in the dark for
50min. Images of the cylinder were taken immediately after the 50 min incubation. A. Empty plasmid; B.
Overexpression; C. Overexpression with the V5 6-his tag plasmid; D. Antisense plasmid.

Appendices
256
8.8 Abstract of a paper submitted to Scientific Reports
Abscisic acid induced a negative geotropic response in dark-incubated
Chlamydomonas reinhardtii
Layla Al-Hijab, Adam Gregg, Rhiannon Davies, Heather Macdonald, Michael
Ladomery# and Ian Wilson*#
University of the West of England, Bristol, Dept. Applied Sciences, HAS, Frenchay
Campus, Coldharbour Lane, Bristol BS16 1QY, UK.
*Corresponding Author: Dr Ian Wilson [email protected] #Joint senior authors
Abstract
The phytohormone abscisic acid (ABA) plays a role in stresses that alter plant water
status and may also regulate root gravitropism and hydrotropism. ABA also exists in the
aquatic algal progenitors of land plants, but other than its involvement in stress responses,
its physiological role in these microorganisms remains elusive. We show that exogenous
ABA significantly altered the HCO3 - uptake of Chlamydomonas reinhardtii in a light-
intensity dependent manner. In high light ABA enhanced HCO3 - uptake, while under
low light uptake was diminished. In the dark, ABA induced a negative geotropic
movement of the algae to an extent dependent on the time of sampling during the
light/dark cycle. The algae also showed a differential, light-dependent directional taxis
response to a fixed ABA source, moving horizontally towards the source in the light and
away in the dark. We conclude that light and ABA signal competitively for algae to
position themselves in the water column to minimise photo-oxidative stress and optimise
photosynthetic efficiency. We suggest that the development of this response mechanism
in motile algae may have been an important step in the evolution of terrestrial plants and
that its retention therein strongly implicates ABA in the regulation of their relevant
tropisms.

Appendices
257
8.9 Permission Form from American Society of Plant Biologists
• Related to chapter 1 for Figure 1.6

Appendices
258
Copyright © 2022 FDOKUMEN