Late Pleistocene Sea level on the New Jersey Margin: Implications to eustasy and deep-sea...
7
Late Pleistocene Sea level on the New Jersey Margin: Implications to eustasy and deep-sea temperature James D. Wright a, ⁎, Robert E. Sheridan a , Kenneth G. Miller a , Jane Uptegrove b , Benjamin S. Cramer c , James V. Browning a a Department Geological Sciences, 610 Taylor Road, Rutgers University, Piscataway, NJ 08854, United States b New Jersey Geological Survey, Trenton, NJ 08625, United States c Department of Geological Sciences, 1272 University of Oregon, Eugene, OR 97403, United States abstract article info Article history: Accepted 14 March 2008 Available online 30 November 2008 Keywords: sea level climate change We assembled and dated a late Pleistocene sea-level record based on sequence stratigraphy from the New Jersey margin and compared it with published records from fossil uplifted coral reefs in New Guinea, Barbados, and Araki Island, as well as a composite sea-level estimate from scaling of Red Sea isotopic values. Radiocarbon dates, amino acid racemization data, and superposition constrain the ages of large (20–80 m) sea-level falls from New Jersey that correlate with Marine Isotope Chrons (MIC) 2, 3b, 4, 5b, and 6 (the past 130 kyr). The sea-level records for MIC 1, 2, 4, 5e, and 6 are similar to those reported from New Guinea, Barbados, Araki, and the Red Sea; some differences exist among records for MIC 3. Our record consistently provides the shallowest sea level estimates for MIC3 (∼25–60 m below present); it agrees most closely with the New Guinea record of Chappell (2002; ∼35–70 m), but contrasts with deeper estimates provided by Araki (∼85–95 m) and the Red Sea (50–90 m). Comparison of eustatic estimates with benthic foraminiferal δ 18 O records shows that the deep sea cooled ∼2.5 °C between MIC 5e and 5d (∼120–110 ka) and that near freezing conditions persisted until Termination 1a (14–15 ka). Sea-level variations between MIC 5b and 2 (ca. 90–20 ka) follow a well-accepted 0.1‰/10 m linear variation predicted by ice-growth effects on foraminiferal δ 18 O values. The pattern of deep-sea cooling follows a previously established hysteresis loop between two stable modes of operation. Cold, near freezing deep-water conditions characterize most of the past 130 kyr punctuated only by two warm intervals (the Holocene/MIC 1 and MIC 5e). We link these variations to changes in Northern Component Water (NCW). © 2009 Elsevier B.V. All rights reserved. 1. Introduction Large changes in northern hemisphere ice sheets (NHIS, the “ice ages”) during the past 2.6 myr have caused large and rapid changes in sea level (Shackleton and Opdyke, 1973), particularly during the Brunhes chron (past 780 kyr) when the 100-kyr Milankovitch-scale terminations resulted in over 100 m sea-level rises in less than 10 kyr (Broecker et al., 1968; Fairbanks, 1989). Two such terminations (1 and 2 of Broecker et al., 1968; ca. 10–18 and 130–135 ka, respectively) occurred during the past 130 kyr (the late Pleistocene), in addition to several smaller precessional- (19/23 kyr) and obliquity- (∼ 41 kyr) scale changes (e.g., Shackleton, 2000; Waelbroeck et al., 2002). Oxygen isotopic records of marine carbonates reflect ice-growth and decay events as increases (e.g., MIC 1 2, 3b, 4, 5b, 5d, and 6) and decreases (e.g., MIC 1, 3a, 3c, 5a, 5c, and 5e) but also reflect changes in seawater temperature and local δ 18 O seawater variations in surface waters. Untangling the effects of global compositional changes in δ 18 O (global δ 18 O seawater , the ice-volume effect) from deep-sea or upper ocean water temperature changes has been the holy grail of Pleistocene paleoceanography. Mg/Ca provides one independent means of evaluating temperature effects, though this method has its limitations also (e.g., Rosenthal et al., 1997). Sea level varies as a function of ice-volume changes; thus, if global sea-level changes are known, this places constraints on the temperature and ice-volume components of the δ 18 O record (e.g., Chappell and Shackleton, 1986; Cutler et al., 2003; Waelbroeck et al., 2002). One complicating factor to understanding δ 18 O seawater variations has been that the history of sea-level change has been poorly known. For example, prior to the work of Fairbanks (1989), the position of sea- level at the last glacial maximum (LGM, ∼ 20 ka) was not known within a factor of two and could have been anywhere between 80 and 150 m below present (Milliman and Emery, 1968). Fairbanks (1989) established that sea level at the LGM was 120 m below present by drilling and radiometrically dating corals (Acropora palmata) offshore of Barbados. The Barbados estimates for the past 20 kyr have been Global and Planetary Change 66 (2009) 93–99 1 Although dubbed oxygen isotopic stages by paleoceanographers for decades, the term stage is a stratigraphic term reserved for characterizing time-rock units (Hedberg, 1976). The proper term for isotopic variations are zones in depth and chron in time and to maintain consistency with prior terminology we use the term Marine Isotopic Chron (MIC). ⁎ Corresponding author. E-mail addresses: [email protected] (J.D. Wright), [email protected] (K.G. Miller). 0921-8181/$ – see front matter © 2009 Elsevier B.V. All rights reserved. doi:10.1016/j.gloplacha.2008.03.013 Contents lists available at ScienceDirect Global and Planetary Change journal homepage: www.elsevier.com/locate/gloplacha
-
Upload
independent -
Category
Documents
-
view
6 -
download
0
Transcript of Late Pleistocene Sea level on the New Jersey Margin: Implications to eustasy and deep-sea...
Global and Planetary Change 66 (2009) 93–99
Contents lists available at ScienceDirect
Global and Planetary Change
j ourna l homepage: www.e lsev ie r.com/ locate /g lop lacha
Late Pleistocene Sea level on the New Jersey Margin: Implications to eustasy anddeep-sea temperature
James D. Wright a,⁎, Robert E. Sheridan a, Kenneth G. Miller a, Jane Uptegrove b,Benjamin S. Cramer c, James V. Browning a
a Department Geological Sciences, 610 Taylor Road, Rutgers University, Piscataway, NJ 08854, United Statesb New Jersey Geological Survey, Trenton, NJ 08625, United Statesc Department of Geological Sciences, 1272 University of Oregon, Eugene, OR 97403, United States
1 Although dubbed oxygen isotopic stages by paleoceanstage is a stratigraphic term reserved for characterizing timeproper term for isotopic variations are zones in depth andconsistency with prior terminology we use the term Marin
⁎ Corresponding author.E-mail addresses: [email protected] (J.D. Wri
(K.G. Miller).
0921-8181/$ – see front matter © 2009 Elsevier B.V. Aldoi:10.1016/j.gloplacha.2008.03.013
a b s t r a c t
a r t i c l e i n f oArticle history:
We assembled and dated a la Accepted 14 March 2008Available online 30 November 2008Keywords:sea levelclimate change
te Pleistocene sea-level record based on sequence stratigraphy from the New Jerseymargin and compared it with published records from fossil uplifted coral reefs in New Guinea, Barbados, andAraki Island, as well as a composite sea-level estimate from scaling of Red Sea isotopic values. Radiocarbondates, amino acid racemization data, and superposition constrain the ages of large (20–80m) sea-level falls fromNew Jersey that correlate with Marine Isotope Chrons (MIC) 2, 3b, 4, 5b, and 6 (the past 130 kyr). The sea-levelrecords for MIC 1, 2, 4, 5e, and 6 are similar to those reported from New Guinea, Barbados, Araki, and the RedSea; some differences exist among records for MIC 3. Our record consistently provides the shallowest sea levelestimates for MIC3 (∼25–60 m below present); it agrees most closely with the New Guinea record ofChappell (2002; ∼35–70 m), but contrasts with deeper estimates provided by Araki (∼85–95 m) and the RedSea (50–90 m). Comparison of eustatic estimates with benthic foraminiferal δ18O records shows that the deepsea cooled ∼2.5 °C between MIC 5e and 5d (∼120–110 ka) and that near freezing conditions persisted untilTermination 1a (14–15 ka). Sea-level variations between MIC 5b and 2 (ca. 90–20 ka) follow a well-accepted0.1‰/10 m linear variation predicted by ice-growth effects on foraminiferal δ18O values. The pattern of deep-seacooling follows a previously established hysteresis loop between two stable modes of operation. Cold, nearfreezing deep-water conditions characterize most of the past 130 kyr punctuated only by two warm intervals(the Holocene/MIC 1 and MIC 5e). We link these variations to changes in Northern Component Water (NCW).
© 2009 Elsevier B.V. All rights reserved.
1. Introduction
Large changes in northern hemisphere ice sheets (NHIS, the “iceages”) during the past 2.6 myr have caused large and rapid changes insea level (Shackleton and Opdyke, 1973), particularly during theBrunhes chron (past 780 kyr) when the 100-kyr Milankovitch-scaleterminations resulted in over 100 m sea-level rises in less than 10 kyr(Broecker et al., 1968; Fairbanks, 1989). Two such terminations (1 and 2of Broecker et al.,1968; ca.10–18 and 130–135 ka, respectively) occurredduring the past 130 kyr (the late Pleistocene), in addition to severalsmaller precessional- (19/23 kyr) and obliquity- (∼41 kyr) scale changes(e.g., Shackleton, 2000; Waelbroeck et al., 2002).
Oxygen isotopic records of marine carbonates reflect ice-growthand decay events as increases (e.g., MIC1 2, 3b, 4, 5b, 5d, and 6) and
ographers for decades, the term-rock units (Hedberg, 1976). Thechron in time and to maintaine Isotopic Chron (MIC).
ght), [email protected]
l rights reserved.
decreases (e.g., MIC 1, 3a, 3c, 5a, 5c, and 5e) but also reflect changes inseawater temperature and local δ18Oseawater variations in surfacewaters. Untangling the effects of global compositional changes in δ18O(global δ18Oseawater, the ice-volume effect) from deep-sea or upperocean water temperature changes has been the holy grail ofPleistocene paleoceanography. Mg/Ca provides one independentmeans of evaluating temperature effects, though this method has itslimitations also (e.g., Rosenthal et al., 1997). Sea level varies as afunction of ice-volume changes; thus, if global sea-level changes areknown, this places constraints on the temperature and ice-volumecomponents of the δ18O record (e.g., Chappell and Shackleton, 1986;Cutler et al., 2003; Waelbroeck et al., 2002).
One complicating factor to understanding δ18Oseawater variationshas been that the history of sea-level change has been poorly known.For example, prior to the work of Fairbanks (1989), the position of sea-level at the last glacial maximum (LGM, ∼20 ka) was not knownwithin a factor of two and could have been anywhere between 80 and150 m below present (Milliman and Emery, 1968). Fairbanks (1989)established that sea level at the LGM was 120 m below present bydrilling and radiometrically dating corals (Acropora palmata) offshoreof Barbados. The Barbados estimates for the past 20 kyr have been
94 J.D. Wright et al. / Global and Planetary Change 66 (2009) 93–99
confirmed in the uplifted Huon terraces of New Guinea (Cutler et al.,2003), in Tahiti (Bard et al., 1996), the Sunda shelf (southeast Asia;Hanebuth et al., 2000), and Bonepart Gulf (northwest Australia;Yokoyama et al., 2001)(see summary in Lambeck and Chappell, 2001);sea-level changes in these regions were similar, though details of theTermination 1 rise, in particular the exact timing and amplitude of theTermination 1a rise (14–15 ka), still require verification.
Studies of the uplifted fossil reefs in Barbados (Mesollela et al., 1969;Matthews, 1973; Fairbanks and Matthews, 1978), Haiti (Dodge et al.,1983), and New Guinea (Bloom et al., 1974; Chappell and Shackleton,1986; Chappell et al., 1996; Chappell, 2002; Cutler et al., 2003) haveprovided calibrations for late Pleistocene sea-level changes from MIC 2to 6 (150–20 ka). Studies of uplifted fossil reefs from Araki atoll (Urmos,1985) and Barbados (Peltier and Fairbanks, 2006) have providedestimates for MIC 3 sea level. Detailed sea-level records have beenrecently derived and used to deconvolve the effects of temperature fromthe δ18O record (Cutler et al., 2003; Waelbroeck et al., 2002). However,all of these regions used in sea-level reconstructions are experiencinguplift and the assumption of constant uplift rates over a 100+ kyrintroduces a source of error of up to ±15 m. For example, Peltier (1998)showed that the late Pleistocene uplift rate assumed for the Huonpeninsula (1.9mm/yr) is too high for the Holocene (0.65mm/yr). Siddallet al. (2003) provided a different estimate of eustatic changes by usingRed Sea δ18O values as a proxy for salinity changes caused by sea-levelchanges; this record is dependent on the models for salinity variationsand needs verification. Sea-level records from tectonically quiescentregions such as the New Jersey margin spanning the last 150 kyr arevaluable to constrain eustatic history.
Studies in New Jersey of the Holocene (Miller et al., this volume)and upper Pleistocene (Ashley et al., 1991) have provided a record ofsea-level change back to the LGM. The Pleistocene section on thispassive continental margin is thin and spotty due to low sedimentaccommodation space during an interval of rapid eustatic change.Therefore, a continuous late Pleistocene record cannot be obtained atone location. By using seismic stratigraphy to map upper Pleistocenesequences across the New Jersey continental shelf, Sheridan et al.(2000) pieced together a history of late Pleistocene sea-level change.
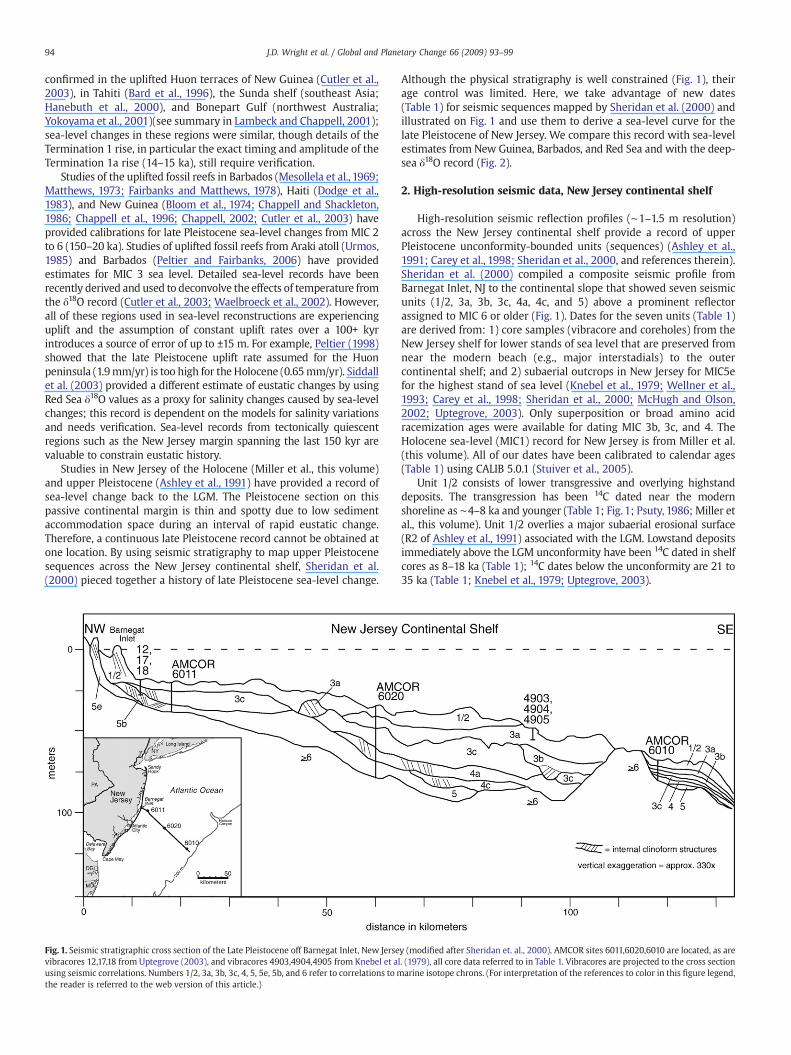
Fig. 1. Seismic stratigraphic cross section of the Late Pleistocene off Barnegat Inlet, New Jersevibracores 12,17,18 from Uptegrove (2003), and vibracores 4903,4904,4905 from Knebel et ausing seismic correlations. Numbers 1/2, 3a, 3b, 3c, 4, 5, 5e, 5b, and 6 refer to correlations to mthe reader is referred to the web version of this article.)
Although the physical stratigraphy is well constrained (Fig. 1), theirage control was limited. Here, we take advantage of new dates(Table 1) for seismic sequences mapped by Sheridan et al. (2000) andillustrated on Fig. 1 and use them to derive a sea-level curve for thelate Pleistocene of New Jersey. We compare this record with sea-levelestimates from New Guinea, Barbados, and Red Sea and with the deep-sea δ18O record (Fig. 2).
2. High-resolution seismic data, New Jersey continental shelf
High-resolution seismic reflection profiles (∼1–1.5 m resolution)across the New Jersey continental shelf provide a record of upperPleistocene unconformity-bounded units (sequences) (Ashley et al.,1991; Carey et al., 1998; Sheridan et al., 2000, and references therein).Sheridan et al. (2000) compiled a composite seismic profile fromBarnegat Inlet, NJ to the continental slope that showed seven seismicunits (1/2, 3a, 3b, 3c, 4a, 4c, and 5) above a prominent reflectorassigned to MIC 6 or older (Fig. 1). Dates for the seven units (Table 1)are derived from: 1) core samples (vibracore and coreholes) from theNew Jersey shelf for lower stands of sea level that are preserved fromnear the modern beach (e.g., major interstadials) to the outercontinental shelf; and 2) subaerial outcrops in New Jersey for MIC5efor the highest stand of sea level (Knebel et al., 1979; Wellner et al.,1993; Carey et al., 1998; Sheridan et al., 2000; McHugh and Olson,2002; Uptegrove, 2003). Only superposition or broad amino acidracemization ages were available for dating MIC 3b, 3c, and 4. TheHolocene sea-level (MIC1) record for New Jersey is from Miller et al.(this volume). All of our dates have been calibrated to calendar ages(Table 1) using CALIB 5.0.1 (Stuiver et al., 2005).
Unit 1/2 consists of lower transgressive and overlying highstanddeposits. The transgression has been 14C dated near the modernshoreline as ∼4–8 ka and younger (Table 1; Fig. 1; Psuty, 1986; Miller etal., this volume). Unit 1/2 overlies a major subaerial erosional surface(R2 of Ashley et al., 1991) associated with the LGM. Lowstand depositsimmediately above the LGM unconformity have been 14C dated in shelfcores as 8–18 ka (Table 1); 14C dates below the unconformity are 21 to35 ka (Table 1; Knebel et al., 1979; Uptegrove, 2003).
y (modified after Sheridan et. al., 2000). AMCOR sites 6011,6020,6010 are located, as arel. (1979), all core data referred to in Table 1. Vibracores are projected to the cross sectionarine isotope chrons. (For interpretation of the references to color in this figure legend,
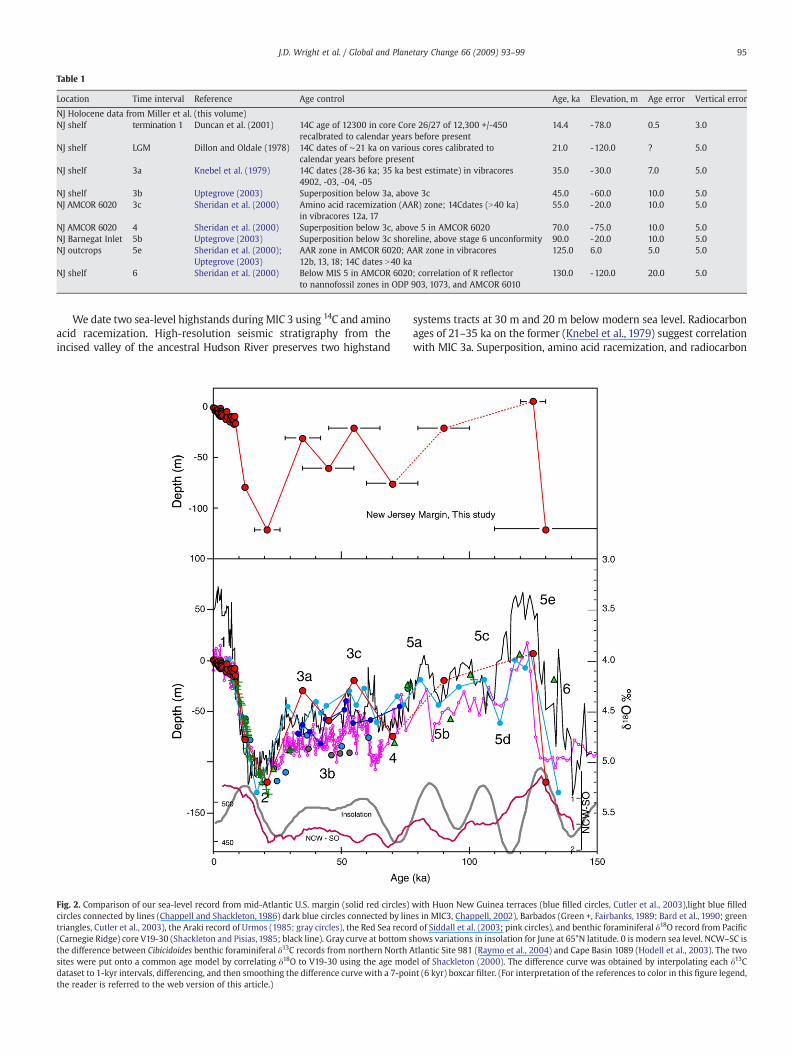
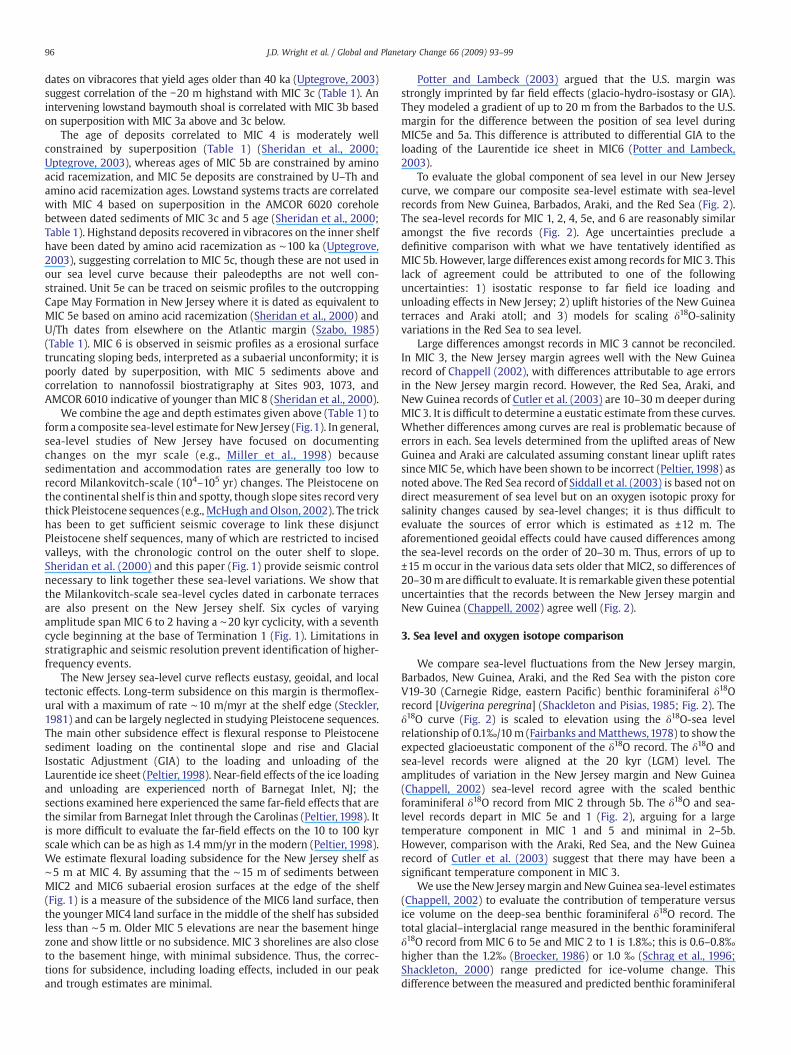
Table 1
Location Time interval Reference Age control Age, ka Elevation, m Age error Vertical error
NJ Holocene data from Miller et al. (this volume)NJ shelf termination 1 Duncan et al. (2001) 14C age of 12300 in core Core 26/27 of 12,300 +/-450
recalbrated to calendar years before present14.4 -78.0 0.5 3.0
NJ shelf LGM Dillon and Oldale (1978) 14C dates of ∼21 ka on various cores calibrated tocalendar years before present
21.0 -120.0 ? 5.0
NJ shelf 3a Knebel et al. (1979) 14C dates (28-36 ka; 35 ka best estimate) in vibracores4902, -03, -04, -05
35.0 -30.0 7.0 5.0
NJ shelf 3b Uptegrove (2003) Superposition below 3a, above 3c 45.0 -60.0 10.0 5.0NJ AMCOR 6020 3c Sheridan et al. (2000) Amino acid racemization (AAR) zone; 14Cdates (N40 ka)
in vibracores 12a, 1755.0 -20.0 10.0 5.0
NJ AMCOR 6020 4 Sheridan et al. (2000) Superposition below 3c, above 5 in AMCOR 6020 70.0 -75.0 10.0 5.0NJ Barnegat Inlet 5b Uptegrove (2003) Superposition below 3c shoreline, above stage 6 unconformity 90.0 -20.0 10.0 5.0NJ outcrops 5e Sheridan et al. (2000);
Uptegrove (2003)AAR zone in AMCOR 6020; AAR zone in vibracores12b, 13, 18; 14C dates N40 ka
125.0 6.0 5.0 5.0
NJ shelf 6 Sheridan et al. (2000) Below MIS 5 in AMCOR 6020; correlation of R reflectorto nannofossil zones in ODP 903, 1073, and AMCOR 6010
130.0 -120.0 20.0 5.0
95J.D. Wright et al. / Global and Planetary Change 66 (2009) 93–99
We date two sea-level highstands during MIC 3 using 14C and aminoacid racemization. High-resolution seismic stratigraphy from theincised valley of the ancestral Hudson River preserves two highstand
Fig. 2. Comparison of our sea-level record from mid-Atlantic U.S. margin (solid red circles)circles connected by lines (Chappell and Shackleton, 1986) dark blue circles connected by lintriangles, Cutler et al., 2003), the Araki record of Urmos (1985; gray circles), the Red Sea recor(Carnegie Ridge) core V19-30 (Shackleton and Pisias, 1985; black line). Gray curve at bottom sthe difference between Cibicidoides benthic foraminiferal δ13C records from northern North Asites were put onto a common age model by correlating δ18O to V19-30 using the age moddataset to 1-kyr intervals, differencing, and then smoothing the difference curve with a 7-poithe reader is referred to the web version of this article.)
systems tracts at 30 m and 20 m below modern sea level. Radiocarbonages of 21–35 ka on the former (Knebel et al., 1979) suggest correlationwith MIC 3a. Superposition, amino acid racemization, and radiocarbon
with Huon New Guinea terraces (blue filled circles, Cutler et al., 2003),light blue filledes in MIC3, Chappell, 2002), Barbados (Green +, Fairbanks, 1989; Bard et al., 1990; greend of Siddall et al. (2003; pink circles), and benthic foraminiferal δ18O record from Pacifichows variations in insolation for June at 65°N latitude. 0 is modern sea level. NCW–SC istlantic Site 981 (Raymo et al., 2004) and Cape Basin 1089 (Hodell et al., 2003). The twoel of Shackleton (2000). The difference curve was obtained by interpolating each δ13Cnt (6 kyr) boxcar filter. (For interpretation of the references to color in this figure legend,
96 J.D. Wright et al. / Global and Planetary Change 66 (2009) 93–99
dates on vibracores that yield ages older than 40 ka (Uptegrove, 2003)suggest correlation of the −20 m highstand with MIC 3c (Table 1). Anintervening lowstand baymouth shoal is correlated with MIC 3b basedon superposition with MIC 3a above and 3c below.
The age of deposits correlated to MIC 4 is moderately wellconstrained by superposition (Table 1) (Sheridan et al., 2000;Uptegrove, 2003), whereas ages of MIC 5b are constrained by aminoacid racemization, and MIC 5e deposits are constrained by U–Th andamino acid racemization ages. Lowstand systems tracts are correlatedwith MIC 4 based on superposition in the AMCOR 6020 coreholebetween dated sediments of MIC 3c and 5 age (Sheridan et al., 2000;Table 1). Highstand deposits recovered in vibracores on the inner shelfhave been dated by amino acid racemization as ∼100 ka (Uptegrove,2003), suggesting correlation to MIC 5c, though these are not used inour sea level curve because their paleodepths are not well con-strained. Unit 5e can be traced on seismic profiles to the outcroppingCape May Formation in New Jersey where it is dated as equivalent toMIC 5e based on amino acid racemization (Sheridan et al., 2000) andU/Th dates from elsewhere on the Atlantic margin (Szabo, 1985)(Table 1). MIC 6 is observed in seismic profiles as a erosional surfacetruncating sloping beds, interpreted as a subaerial unconformity; it ispoorly dated by superposition, with MIC 5 sediments above andcorrelation to nannofossil biostratigraphy at Sites 903, 1073, andAMCOR 6010 indicative of younger than MIC 8 (Sheridan et al., 2000).
We combine the age and depth estimates given above (Table 1) toform a composite sea-level estimate for New Jersey (Fig.1). In general,sea-level studies of New Jersey have focused on documentingchanges on the myr scale (e.g., Miller et al., 1998) becausesedimentation and accommodation rates are generally too low torecord Milankovitch-scale (104–105 yr) changes. The Pleistocene onthe continental shelf is thin and spotty, though slope sites record verythick Pleistocene sequences (e.g., McHugh andOlson, 2002). The trickhas been to get sufficient seismic coverage to link these disjunctPleistocene shelf sequences, many of which are restricted to incisedvalleys, with the chronologic control on the outer shelf to slope.Sheridan et al. (2000) and this paper (Fig. 1) provide seismic controlnecessary to link together these sea-level variations. We show thatthe Milankovitch-scale sea-level cycles dated in carbonate terracesare also present on the New Jersey shelf. Six cycles of varyingamplitude span MIC 6 to 2 having a ∼20 kyr cyclicity, with a seventhcycle beginning at the base of Termination 1 (Fig. 1). Limitations instratigraphic and seismic resolution prevent identification of higher-frequency events.
The New Jersey sea-level curve reflects eustasy, geoidal, and localtectonic effects. Long-term subsidence on this margin is thermoflex-ural with a maximum of rate ∼10 m/myr at the shelf edge (Steckler,1981) and can be largely neglected in studying Pleistocene sequences.The main other subsidence effect is flexural response to Pleistocenesediment loading on the continental slope and rise and GlacialIsostatic Adjustment (GIA) to the loading and unloading of theLaurentide ice sheet (Peltier, 1998). Near-field effects of the ice loadingand unloading are experienced north of Barnegat Inlet, NJ; thesections examined here experienced the same far-field effects that arethe similar from Barnegat Inlet through the Carolinas (Peltier, 1998). Itis more difficult to evaluate the far-field effects on the 10 to 100 kyrscale which can be as high as 1.4 mm/yr in the modern (Peltier, 1998).We estimate flexural loading subsidence for the New Jersey shelf as∼5 m at MIC 4. By assuming that the ∼15 m of sediments betweenMIC2 and MIC6 subaerial erosion surfaces at the edge of the shelf(Fig. 1) is a measure of the subsidence of the MIC6 land surface, thenthe younger MIC4 land surface in the middle of the shelf has subsidedless than ∼5 m. Older MIC 5 elevations are near the basement hingezone and show little or no subsidence. MIC 3 shorelines are also closeto the basement hinge, with minimal subsidence. Thus, the correc-tions for subsidence, including loading effects, included in our peakand trough estimates are minimal.
Potter and Lambeck (2003) argued that the U.S. margin wasstrongly imprinted by far field effects (glacio-hydro-isostasy or GIA).They modeled a gradient of up to 20 m from the Barbados to the U.S.margin for the difference between the position of sea level duringMIC5e and 5a. This difference is attributed to differential GIA to theloading of the Laurentide ice sheet in MIC6 (Potter and Lambeck,2003).
To evaluate the global component of sea level in our New Jerseycurve, we compare our composite sea-level estimate with sea-levelrecords from New Guinea, Barbados, Araki, and the Red Sea (Fig. 2).The sea-level records for MIC 1, 2, 4, 5e, and 6 are reasonably similaramongst the five records (Fig. 2). Age uncertainties preclude adefinitive comparison with what we have tentatively identified asMIC 5b. However, large differences exist among records for MIC 3. Thislack of agreement could be attributed to one of the followinguncertainties: 1) isostatic response to far field ice loading andunloading effects in New Jersey; 2) uplift histories of the New Guineaterraces and Araki atoll; and 3) models for scaling δ18O-salinityvariations in the Red Sea to sea level.
Large differences amongst records in MIC 3 cannot be reconciled.In MIC 3, the New Jersey margin agrees well with the New Guinearecord of Chappell (2002), with differences attributable to age errorsin the New Jersey margin record. However, the Red Sea, Araki, andNew Guinea records of Cutler et al. (2003) are 10–30 m deeper duringMIC 3. It is difficult to determine a eustatic estimate from these curves.Whether differences among curves are real is problematic because oferrors in each. Sea levels determined from the uplifted areas of NewGuinea and Araki are calculated assuming constant linear uplift ratessince MIC 5e, which have been shown to be incorrect (Peltier, 1998) asnoted above. The Red Sea record of Siddall et al. (2003) is based not ondirect measurement of sea level but on an oxygen isotopic proxy forsalinity changes caused by sea-level changes; it is thus difficult toevaluate the sources of error which is estimated as ±12 m. Theaforementioned geoidal effects could have caused differences amongthe sea-level records on the order of 20–30 m. Thus, errors of up to±15 m occur in the various data sets older that MIC2, so differences of20–30m are difficult to evaluate. It is remarkable given these potentialuncertainties that the records between the New Jersey margin andNew Guinea (Chappell, 2002) agree well (Fig. 2).
3. Sea level and oxygen isotope comparison
We compare sea-level fluctuations from the New Jersey margin,Barbados, New Guinea, Araki, and the Red Sea with the piston coreV19-30 (Carnegie Ridge, eastern Pacific) benthic foraminiferal δ18Orecord [Uvigerina peregrina] (Shackleton and Pisias, 1985; Fig. 2). Theδ18O curve (Fig. 2) is scaled to elevation using the δ18O-sea levelrelationship of 0.1‰/10m (Fairbanks andMatthews,1978) to show theexpected glacioeustatic component of the δ18O record. The δ18O andsea-level records were aligned at the 20 kyr (LGM) level. Theamplitudes of variation in the New Jersey margin and New Guinea(Chappell, 2002) sea-level record agree with the scaled benthicforaminiferal δ18O record from MIC 2 through 5b. The δ18O and sea-level records depart in MIC 5e and 1 (Fig. 2), arguing for a largetemperature component in MIC 1 and 5 and minimal in 2–5b.However, comparison with the Araki, Red Sea, and the New Guinearecord of Cutler et al. (2003) suggest that there may have been asignificant temperature component in MIC 3.
We use the New Jerseymargin and NewGuinea sea-level estimates(Chappell, 2002) to evaluate the contribution of temperature versusice volume on the deep-sea benthic foraminiferal δ18O record. Thetotal glacial–interglacial range measured in the benthic foraminiferalδ18O record from MIC 6 to 5e and MIC 2 to 1 is 1.8‰; this is 0.6–0.8‰higher than the 1.2‰ (Broecker, 1986) or 1.0 ‰ (Schrag et al., 1996;Shackleton, 2000) range predicted for ice-volume change. Thisdifference between the measured and predicted benthic foraminiferal
97J.D. Wright et al. / Global and Planetary Change 66 (2009) 93–99
18O ranges indicates that there was a ∼2.5 °C temperature change inaddition to the ice volume component over these glacial–interglacialcycles. This warming in deep-water temperature suggests a switch toa new deep-water mode at these times.
Various studies have plotted late Pleistocene benthic foraminiferalδ18O values versus sea level (Chappell and Shackleton, 1986; Chappellet al., 1996, Chappell, 2002; Waelbroeck et al., 2002; Cutler et al.,2003) as we have here (Fig. 3). Previous studies have argued that thedeep sea alternated between cold versus warm modes. Cutler et al.(2003) and Waelbroeck et al. (2002) recognized that warm (similar totoday) deep-sea conditions were associated with MIC 5 and HoloceneMIC 1 versus near freezing conditions throughout most of the last130 kyr. However, these previous studies did not recognize that thesewarm intervals represented a distinctly different mode of climateoperation.
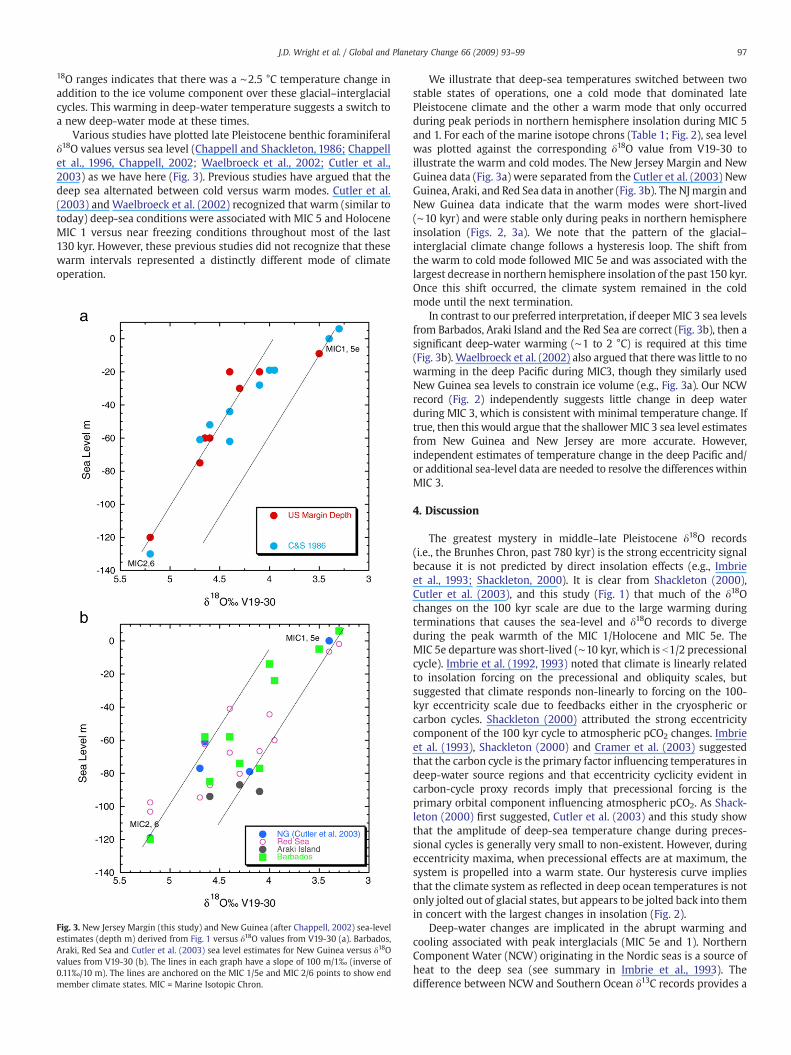
Fig. 3. New Jersey Margin (this study) and New Guinea (after Chappell, 2002) sea-levelestimates (depth m) derived from Fig. 1 versus δ18O values from V19-30 (a). Barbados,Araki, Red Sea and Cutler et al. (2003) sea level estimates for New Guinea versus δ18Ovalues from V19-30 (b). The lines in each graph have a slope of 100 m/1‰ (inverse of0.11‰/10 m). The lines are anchored on the MIC 1/5e and MIC 2/6 points to show endmember climate states. MIC = Marine Isotopic Chron.
We illustrate that deep-sea temperatures switched between twostable states of operations, one a cold mode that dominated latePleistocene climate and the other a warm mode that only occurredduring peak periods in northern hemisphere insolation during MIC 5and 1. For each of the marine isotope chrons (Table 1; Fig. 2), sea levelwas plotted against the corresponding δ18O value from V19-30 toillustrate the warm and cold modes. The New Jersey Margin and NewGuinea data (Fig. 3a) were separated from the Cutler et al. (2003) NewGuinea, Araki, and Red Sea data in another (Fig. 3b). The NJmargin andNew Guinea data indicate that the warm modes were short-lived(∼10 kyr) and were stable only during peaks in northern hemisphereinsolation (Figs. 2, 3a). We note that the pattern of the glacial–interglacial climate change follows a hysteresis loop. The shift fromthe warm to cold mode followed MIC 5e and was associated with thelargest decrease in northern hemisphere insolation of the past 150 kyr.Once this shift occurred, the climate system remained in the coldmode until the next termination.
In contrast to our preferred interpretation, if deeper MIC 3 sea levelsfrom Barbados, Araki Island and the Red Sea are correct (Fig. 3b), then asignificant deep-water warming (∼1 to 2 °C) is required at this time(Fig. 3b). Waelbroeck et al. (2002) also argued that there was little to nowarming in the deep Pacific during MIC3, though they similarly usedNew Guinea sea levels to constrain ice volume (e.g., Fig. 3a). Our NCWrecord (Fig. 2) independently suggests little change in deep waterduring MIC 3, which is consistent with minimal temperature change. Iftrue, then this would argue that the shallower MIC 3 sea level estimatesfrom New Guinea and New Jersey are more accurate. However,independent estimates of temperature change in the deep Pacific and/or additional sea-level data are needed to resolve the differences withinMIC 3.
4. Discussion
The greatest mystery in middle–late Pleistocene δ18O records(i.e., the Brunhes Chron, past 780 kyr) is the strong eccentricity signalbecause it is not predicted by direct insolation effects (e.g., Imbrieet al., 1993; Shackleton, 2000). It is clear from Shackleton (2000),Cutler et al. (2003), and this study (Fig. 1) that much of the δ18Ochanges on the 100 kyr scale are due to the large warming duringterminations that causes the sea-level and δ18O records to divergeduring the peak warmth of the MIC 1/Holocene and MIC 5e. TheMIC 5e departure was short-lived (∼10 kyr, which is b1/2 precessionalcycle). Imbrie et al. (1992, 1993) noted that climate is linearly relatedto insolation forcing on the precessional and obliquity scales, butsuggested that climate responds non-linearly to forcing on the 100-kyr eccentricity scale due to feedbacks either in the cryospheric orcarbon cycles. Shackleton (2000) attributed the strong eccentricitycomponent of the 100 kyr cycle to atmospheric pCO2 changes. Imbrieet al. (1993), Shackleton (2000) and Cramer et al. (2003) suggestedthat the carbon cycle is the primary factor influencing temperatures indeep-water source regions and that eccentricity cyclicity evident incarbon-cycle proxy records imply that precessional forcing is theprimary orbital component influencing atmospheric pCO2. As Shack-leton (2000) first suggested, Cutler et al. (2003) and this study showthat the amplitude of deep-sea temperature change during preces-sional cycles is generally very small to non-existent. However, duringeccentricity maxima, when precessional effects are at maximum, thesystem is propelled into a warm state. Our hysteresis curve impliesthat the climate system as reflected in deep ocean temperatures is notonly jolted out of glacial states, but appears to be jolted back into themin concert with the largest changes in insolation (Fig. 2).
Deep-water changes are implicated in the abrupt warming andcooling associated with peak interglacials (MIC 5e and 1). NorthernComponent Water (NCW) originating in the Nordic seas is a source ofheat to the deep sea (see summary in Imbrie et al., 1993). Thedifference between NCW and Southern Ocean δ13C records provides a
98 J.D. Wright et al. / Global and Planetary Change 66 (2009) 93–99
proxy for NCW intensity (Oppo and Fairbanks, 1997). The mostsignificant features in the difference record (Fig. 2) are the low valuesrecorded during MIC 5e and 1. This is interpreted to reflect a strongNorth Atlantic contribution to the Southern Ocean. In MIC 3a, 3c, 5a,and 5c, which represent interglacials with respect to ice volume, theconveyor contribution to the Antarctic wasmuch lower relative to MIC1 and 5e. Thus, the geochemical data indicates that the conveyor isresponsible for the temperature anomalies in the deep-sea δ18Orecord during MIC 5e and the Holocene.
5. Conclusions
Though fossil sunshine of coral reefs (including uplifted terraces)is considered the gold standard for reconstructing late Pleistocenesea-level changes, we show that a siliciclastic margin such as NewJersey canprovide reasonable limits on sea level over the past 130 kyr.Our New Jersey sea level record agrees well with coral records formost of the past 130 kyr with the exception of MIC3 when all recordsshow considerable differences. Though our record for this interval isthe shallowest, it does compare well with the New Guinea coralrecord of Chappell (2002), but differs most for those in Araki Islandand limited data from Barbados. Following previous studies, we showthat the deep sea alternated between a warm and cold mode on100 kyr short eccentricity scale, with likely little change onprecessional or obliquity scales. We link these two modes to changesin NCW.
Acknowledgments
We thank G.M. Ashley, M.E. Katz, and D.V. Kent for comments andG.M. Ashley for discussions and J.D. Milliman, G. Camoin, and threeanonymous reviewers for comments. Supported by National ScienceFoundation grants OCE0084032, EAR97-08664, EAR99-09179, andEAR0307112 (Miller).
References
Ashley, G.N., Wellner, R.W., Esker, D., Sheridan, R.E., 1991. Clastic sequences developedduring late Quaternary glacio-eustatic sea-level fluctuations on a passive margin:example from the inner continental shelf near Barnegat Inlet, New Jersey.Geological Society of America Bulletin 103, 1607–1621.
Bard, E., Hamelin, B., Fairbanks, R.G., Zindler, A., 1990. Comparison of 14C and Th agesobtained by mass spectrometry in corals from Barbados. Implications for the sea levelduring the last glacial cycle and for the production of 14C by cosmic rays during the last30,000 years. Nature 345, 405–410.
Bard, E., Hamelin, B., Arnold, M., Montaggioni, L.F., Cabioch, G., Faure, G., Rougerie, F., 1996.Deglacial sea level record from Tahiti corals and the timing of global meltwaterdischarge. Nature 382, 241–244.
Bloom, A.L., Broecker, W.A., Chappell, J.M.A., Matthews, R.K., Mesolella, K.J., 1974.Quaternary sea level fluctuations on a tectonic coast: new 230Th/234U dates from theHuon Peninsula, New Guinea. Quaternary Research 4, 185–205.
Broecker, W.S., 1986. Oxygen isotope constraints on surface ocean temperatures.Quaternary Research 26, 121–134.
Broecker, W.S., Thurber, D.L., Goddard, J., Ku, T.L., Matthews, R.K., Mesollela, K.J., 1968.Milankovitch hypothesis supported by precise dating of coral reefs and deep seasediments. Science 159, 297–300.
Carey, J.S., Sheridan, R.S., Ashley, G.M., 1998. Late Quaternary sequence stratigraphy of aslowly subsiding passive margin, New Jersey continental shelf. American Associa-tion of Petroleum Geologists Bulletin 82, 773–791.
Chappell, J., 2002. Sea-level changes forced ice breakouts in the last glacial cycle: newresults from coral terraces. Quaternary Science Reviews 21, 1229–1240.
Chappell, J., Shackleton, N.J., 1986. Oxygen isotopes and sea level. Nature 324, 137–140.Chappell, J., Omura, A., Esat, T., McMulloch, M., Pandelfi, J., Ota, Y., Pillans, B., 1996.
Reconciliation of Late Quaternary sea levels derived from coral terraces at HuonPeninsula with deep sea oxygen isotope records. Earth and Planetary ScienceLetters 141, 227–236.
Cramer, B.S., Wright, J.D., Kent, D.V., Aubry, M.-P., 2003. Orbital climate forcing of δ13Cexcursions in the late Paleocene–early Eocene (Chrons C24n–C25n). Paleoceano-graphy 18, 1097, doi:10.1029/2003PA000909.
Cutler, K.B., Edwards, R.L., Taylor, F.W., Cheng, H., Adkins, J., Gallup, C.D., Cutler, P.M.,Burr, G.S., Bloom, A.L., 2003. Rapid sea-level fall and deep-ocean temperaturechange since the last interglacial period. Earth and Planetary Science Letters 206,253–271.
Dodge, R.E., Fairbanks, R.G., Benninger, L.K., Maurasse, F., 1983. Pleistocene sea levelsfrom raised coral reefs of Haiti. Science 219, 1423–1425.
Fairbanks, R., Matthews, R.K., 1978. The marine oxygen isotope record in Pleistocenecoral, Barbados, West Indies. Quaternary Research 10, 181–196.
Fairbanks, R.G., 1989. A 17,000-year glacio-eustatic sea level record influence of glacialmelting rates on the Younger Dryas event and deep-ocean circulation. Nature 342,637–642.
Hanebuth, T., Stattegger, K., Grootes, P.M., 2000. Rapid flooding of the Sunda Shelf:a late-glacial sea-level record. Science 288, 1033–1035.
International stratigraphic guide: a guide to stratigraphic classification, terminologyand procedure. In: Hedberg, H.D. (Ed.), International Subcommission on Strati-graphic Classification of IUGS Commission on Stratigraphy. John Wiley and Sons,New York, New York. 200 pp.
Hodell, D.A., Charles, C.D., Curtis, J.H., Mortyn, P.G., Ninnemann, U.S., Venz, K.A., 2003.Data report: oxygen isotope stratigraphy of ODP Leg 177 sites 1088, 1089, 1090,1093, and 1094. In: Gersonde, R., Hodell, D.A., Blum, P. (Eds.), Proceedings of theOcean Drilling Program, Scientific Results, vol. 177. [Online]. Available from WorldWide Web: bhttp://www-odp.tamu.edu/publications/177_SR/chap_09/chap_09.htmN. [Cited 2004-08-10].
Imbrie, J., Boyle, E., Clemens, S., Duffy, A., Howard,W., Kukla, G., Kutzback, J., Martinson, D.,McIntyre, A., Mix, A., Molfino, B., Morley, J., Peterson, L., Pisias, N., Prell, W., Raymo,M.,Shackleton, N., Toggweiler, J., 1992. On the structure and origin of major glaciationcycles, 1. Linear responses to Milankovitch forcing. Paleoceanography 7, 701–738.
Imbrie, J., Berger, A., Boyle, E.A., Clemens, S.C., Duffy, A., Howard, W.R., Kukla, G.,Kutzback, J., Martinson, D.G., McIntyre, A., Mix, A.C., Molfino, B., Morley, J.J.,Peterson, L.C., Pisias, N.G., Prell, W.L., Raymo, M.E., Shackleton, N.J., Toggweiler, J.R.,1993. On the structure and origin of major glaciation cycles, 2. The 100,000-yearcycle. Paleoceanography 8, 699–735.
Knebel, H.J., Wood, S.A., Spiker, E.C., 1979. Hudson River: evidence for extensive migrationon the exposed continental shelf during Pleistocene time. Geology 17, 254–258.
Lambeck, K., Chappell, J., 2001. Sea-level change through the last glacial cycle. Science292, 679–686.
Matthews, R.K., 1973. Relative elevation of late Pleistocene high sea level stands:Barbados uplift rates and their implication. Quaternary Research 3, 147–153.
McHugh, C.M.G., Olson, H.C., 2002. Pleistocene chronology of continental marginsedimentation: new insights into traditional models, New Jersey. Marine Geology86, 389–411.
Mesollela, K.J., Matthews, R.K., Broecker, W.S., Thurber, D.L., 1969. The astronomicaltheory of climate change: Barbados data. Journal of Geology 77, 250–274.
Miller, K.G., Mountain, G.S., Browning, J.V., Kominz, M., Sugarman, P.J., Christie-Blick, N.,Katz, M.E., Wright, J.D., 1998. Cenozoic global sea-level, sequences, and the NewJersey Transect: results from coastal plain and slope drilling. Reviews of Geophysics36, 569–601.
Milliman, J.D., Emery, K.O., 1968. Sea levels during the past 35,000 years. Science 162,1121–1123.
Oppo, D., Fairbanks, R.G., 1997. Variability in the deep and intermediate watercirculation of the Atlantic Ocean during the past 25,000 years: Northernhemisphere modulation of the Southern Ocean. Earth and Planetary ScienceLetters 86, 1–15.
Peltier, W.R., 1998. Postglacial variations in the level of the sea: implications for climatedynamics and solid-earth geophysics. Reviews of Geophysics 36, 603–689.
Peltier, W.R., Fairbanks, R.G., 2006. Global glacial ice volume and Last Glacial Maximumduration from an extended Barbados sea level record. Quaternary Science Reviews25, 3322–3337.
Potter, E., Lambeck, K., 2003. Reconciliation of sea-level observations in the WesternNorth Atlantic during the last glacial cycle. Earth and Planetary Science Letters 217,171–181.
Psuty, N.P., 1986. Holocene sea level in New Jersey. Physical Geography 7, 156–167.Raymo, M.E., Oppo, D.W., Flower, B.P., Hodell, D.A., McManus, J.F., Venz, K.A., Kleiven,
K.F., McIntyre, K., 2004. Stability of North Atlantic water masses in face ofpronounced climate variability during the Pleistocene. Paleoceanography 19,PA2008–PA2021.
Rosenthal, Y., Boyle, E.A., Slowey, N., 1997. Temperature control on the incorporation ofMg, Sr, F and Cd into benthic foraminiferal shells from Little Bahama Bank:prospects for thermocline paleoceanography. Geochim. Cosmochim. Acta 61,3633–3643.
Schrag, D.P., Hampt, G., Murray, D.W., 1996. Pore fluid constraints on the temperatureand oxygen isotopic composition of the glacial ocean. Science 272, 1930–1932.
Shackleton, N.J., 2000. The 100,000-year ice-age cycle identified and fund to lagtemperature, carbon dioxide and orbital eccentricity. Science 289, 1897–1902.
Shackleton, N.J., Opdyke, N.D., 1973. Oxygen isotope and paleomagnetic stratigraphy ofequatorial Pacific core V28–238: oxygen isotope temperatures and ice volumes on a105 year and 106 year scale. Quaternary Research 3, 39–55.
Shackleton, N.J., Pisias, N.G., 1985. Atmospheric carbon dioxide, orbital forcing, andclimate. In: Sunquist, E.T., Broecker, W.S. (Eds.), The Carbon Cycle and AtmosphericCO2: Natural Variations Archean to Present. American Geophysical Union, Washing-ton, D.C., pp. 303–317.
Sheridan, R.E., Ashley, G.M., Miller, K.G., Waldner, J.S., Hall, D.W., Uptegrove, J., 2000.Onshore–offshore correlation of upper Pleistocene strata, New Jersey coastal plainto continental shelf and slope. Sedimentary Geology 134, 197–207.
Siddall, M., Rohling, E.J., Almogi-Labin, A., Hemleben, Ch., Meischner, D., Schmelzer, I.,Smeed, D.A., 2003. Sea-level fluctuations during the last glacial cycle. Nature 423,853–858.
Szabo, B.J., 1985. Uranium-series dating of fossil corals from marine sediments ofsoutheastern United States Atlantic Coastal Plain. Geological Society of AmericaBulletin 96, 398–406.
Steckler,M.S.,1981, Thermal andmechanical evolutionofAtlantic-typemargins (Ph.D. thesis):New York, Columbia University, 261p.

99J.D. Wright et al. / Global and Planetary Change 66 (2009) 93–99
Stuiver, M., Reimer, P.J., Reimer, R., 2005. Radiocarbon Calibration Program Revision5.0.1. Copyright 1986–2005.
Uptegrove, J., 2003, Late Pleistocene facies distribution, sea level changes andpaleogeography of the inner continental shelf off Long Beach Island, New Jersey[M.S. thesis]: New Brunswick, NJ, Rutgers University, 238 p.
Waelbroeck, C., Labeyrie, L., Michel, E., Duplessy, J.-C., McManus, J., Lambeck, K., Balbon, E.,Labracherie, M., 2002. Sea-level and deep water temperature changes derived frombenthic foraminifera isotopic records. Quaternary Science Review 21, 295–305.
Wellner, R.W., Ashley, G.M., Sheridan, R.E., 1993. Seismic stratigraphic evidence for asubmerged middle Wisconsin barrier: implications for sea-level history. Geology21, 109–112.
Urmos, J.P., Oxygen isotopes, sea levels, and uplift of reef terraces, Araki Island, Vanuatu.1985, M.S. thesis, Cornell University, 123pp.
Yokoyama, Y., Esat, T.M., Lambeck, K., 2001. Coupled climate and sea-level changesdeduced from Huon Peninsula coral terraces of the last ice age. Earth and PlanetaryScience Letters 193, 579–587.